DURABILITY OF TERNARY BLENDED CEMENTS IN BRIDGE APPLICATIONS A Thesis presented to the Faculty of the Graduate School University of Missouri-Columbia In Partial Fulfillment of the Requirements for the Degree Master of Science by CURTIS J. STUNDEBECK Dr. V.S. Gopalaratnam, Thesis Supervisor MAY 2007

Welcome message from author
This document is posted to help you gain knowledge. Please leave a comment to let me know what you think about it! Share it to your friends and learn new things together.
Transcript
DURABILITY OF TERNARY BLENDED CEMENTS IN BRIDGE APPLICATIONS
A Thesis presented to
the Faculty of the Graduate School University of Missouri-Columbia
In Partial Fulfillment of the Requirements for the Degree
Master of Science
by CURTIS J. STUNDEBECK
Dr. V.S. Gopalaratnam, Thesis Supervisor
MAY 2007
The undersigned, appointed by the dean of the Graduate School, have examined the thesis entitled
DURABILITY OF TERNARY BLENDED CEMENTS IN BRIDGE APPLICATIONS
presented by Curtis Stundebeck, a candidate for the degree of master of science, and hereby certify that, in their opinion, it is worthy of acceptance.
Professor V. S. Gopalaratnam
Professor Hani Salim
Professor Allen Thompson
ii
ACKNOWLEDGEMENTS
The Portland Cement Association is gratefully acknowledged for their generous
award of the PCA Research Fellowship. Without the financial support from this
fellowship, I would not have been able to complete this project.
I would like to personally thank my thesis supervisor Dr. V. S. Gopalaratnam for
his continuous guidance and support throughout the testing and completion of my thesis.
A special thanks goes to the College of Engineering technicians. The knowledge of
electronics and instrumentation by Mr. Richard Oberto are greatly appreciated.
Construction of the RCPT testing apparatus would not have been possible without his
assistance. Thanks also to Mr. Rick Wells for his assistance in machining the RCPT cells
and the building of various other testing components.
Furthermore, I would like to extend my gratitude to a number of fellow graduate
students. I would like to especially thank Mr. Patrick Earney for his help and input as we
worked on this project together. Also deserving acknowledgement are Mr. Michael Ash,
Mr. Ben Davis, Mr. John Meyer, Mr. Kenny DeYoung, and Mr. Wenqing Hu, who all
provided great friendship and support throughout my career as a graduate student.
I would like to thank my parents, Bernie and Lois Stundebeck, and my brothers,
Clint, Cliff, and Casey, for their constant encouragement and support as I completed my
long career as a student at the University of Missouri-Columbia. Also deserving a
tremendous word of gratitude is my fiancée, Lisa, for her continuous patience,
encouragement, and proof-reading support as I completed my thesis. Finally, I would
like to thank God for providing guidance and direction throughout the entire project.
iii
TABLE OF CONTENTS
ACKNOWLEDGEMENTS................................................................................................ ii
LIST OF FIGURES ........................................................................................................... vi
LIST OF TABLES.............................................................................................................. x
ABSTRACT....................................................................................................................... xi
CHAPTER 1 INTRODUCTION............................................................................. 1
1.1 Project Motivation and Significance................................................................... 1
1.2 Objective of the Research ................................................................................... 2
1.3 Thesis Organization ............................................................................................ 2
CHAPTER 2 LITERATURE REVIEW ................................................................ 4
2.1 Ternary Blend HPC for Bridge Applications...................................................... 4
2.1.1 Pore Structure Difference .......................................................................4
2.1.2 Bridge Component Requirements........................................................... 5
2.2 Chloride Penetration ........................................................................................... 6
2.2.1 Testing Methods...................................................................................... 6
2.2.2 Effects of Cement Composition............................................................ 10
2.2.3 Effects of Water to Binder Ratio .......................................................... 14
2.2.4 Effects of Curing Time ......................................................................... 14
2.3 Freeze Thaw...................................................................................................... 16
2.3.1 Effects of Air Entrainment.................................................................... 17
2.3.2 Effects of Cement Composition............................................................ 20
2.3.3 Effects of Water to Binder Ratio .......................................................... 22
2.3.4 Effects of Curing Time ......................................................................... 22
iv
CHAPTER 3 EXPERIMENTAL PROGRAM.................................................... 24
3.1 Mixes and Test Parameters ............................................................................... 24
3.2 Mix Design........................................................................................................ 25
3.3 Constituent Material Properties ........................................................................ 27
3.4 Specimen Preparation ....................................................................................... 28
3.5 Curing ............................................................................................................... 29
CHAPTER 4 EQUIPMENT AND PROCEDURE.............................................. 31
4.1 Chloride Penetration Test ................................................................................. 31
4.1.1 Test Setup.............................................................................................. 31
4.1.2 Specimen Conditioning......................................................................... 34
4.1.3 Procedure .............................................................................................. 35
4.2 Freeze Thaw Test.............................................................................................. 36
4.2.1 Test Setup.............................................................................................. 36
4.2.2 Procedure .............................................................................................. 37
4.3 Compressive Strength Test ............................................................................... 39
CHAPTER 5 TEST RESULTS AND DISCUSSION.......................................... 41
5.1 Fresh Concrete Properties ................................................................................. 41
5.2 Compressive Strength ....................................................................................... 43
5.2.1 Effect of Water to Binder Ratio ............................................................ 44
5.2.2 Effect of Cement Composition ............................................................. 47
5.2.3 Effect of Moist Curing Time................................................................. 49
5.3 Chloride Permeability ....................................................................................... 53
5.3.1 Current vs. Time Response................................................................... 53
5.3.2 Effects of Water to Binder Ratio .......................................................... 59
5.3.3 Effects of Cement Composition in Ternary Blended Mixtures ............ 62
v
5.3.4 Effects of Curing Time ......................................................................... 65
5.4 Freeze-Thaw ..................................................................................................... 69
5.4.1 Effects of Water to Binder Ratio .......................................................... 71
5.4.2 Effects of Cement Composition............................................................ 71
CHAPTER 6 CONCLUSIONS ............................................................................. 73
6.1 Summary........................................................................................................... 73
6.2 Conclusions....................................................................................................... 73
6.2.1 Chloride Penetration ............................................................................. 73
6.2.2 Freeze-Thaw Durability ........................................................................ 75
6.2.3 Compressive Strength ........................................................................... 75
LIST OF REFERENCES.................................................................................................. 77
APPENDIX A CHLORIDE PERMEABILITY DATA......................... ............... 80
APPENDIX B FREEZE-THAW DATA AND RESULTS ................................... 87
APPENDIX C COMPRESSIVE STRENGTH DATA.......................................... 93
APPENDIX D FLY ASH LAB TEST RESULTS.................................................. 97
APPENDIX E CHLORIDE PERMEABILITY TEST SETUP ................... ........ 99
vi
LIST OF FIGURES
PAGE
Figure 2-1: AASHTO T-259 salt ponding setup ........................................................... 7
Figure 2-2: Nordtest setup ............................................................................................. 8
Figure 2-3: Rapid chloride permeability test setup........................................................ 9
Figure 2-4: Rapid migration test setup ........................................................................ 10
Figure 2-5: Influence of age on chloride permeability for control, binary, and ternary mixtures. ..................................................................................... 13
Figure 2-6: Effects of air entrainment on the freeze-thaw resistance of silica fume HPC and control mixtures. .............................................................. 19
Figure 4-1: Rapid chloride penetration test setup........................................................ 32
Figure 4-2: Front panel display of LabVIEW data acquisition program for RCPT .... 33
Figure 4-3: Diagram of specimen slicing to be used for the rapid chloride penetration test .......................................................................................... 34
Figure 4-4: Photograph of the rapid chloride penetration test specimen conditioning equipment ............................................................................ 35
Figure 4-5: Freeze-thaw cabinet shown during thawing portion of a cycle ................ 37
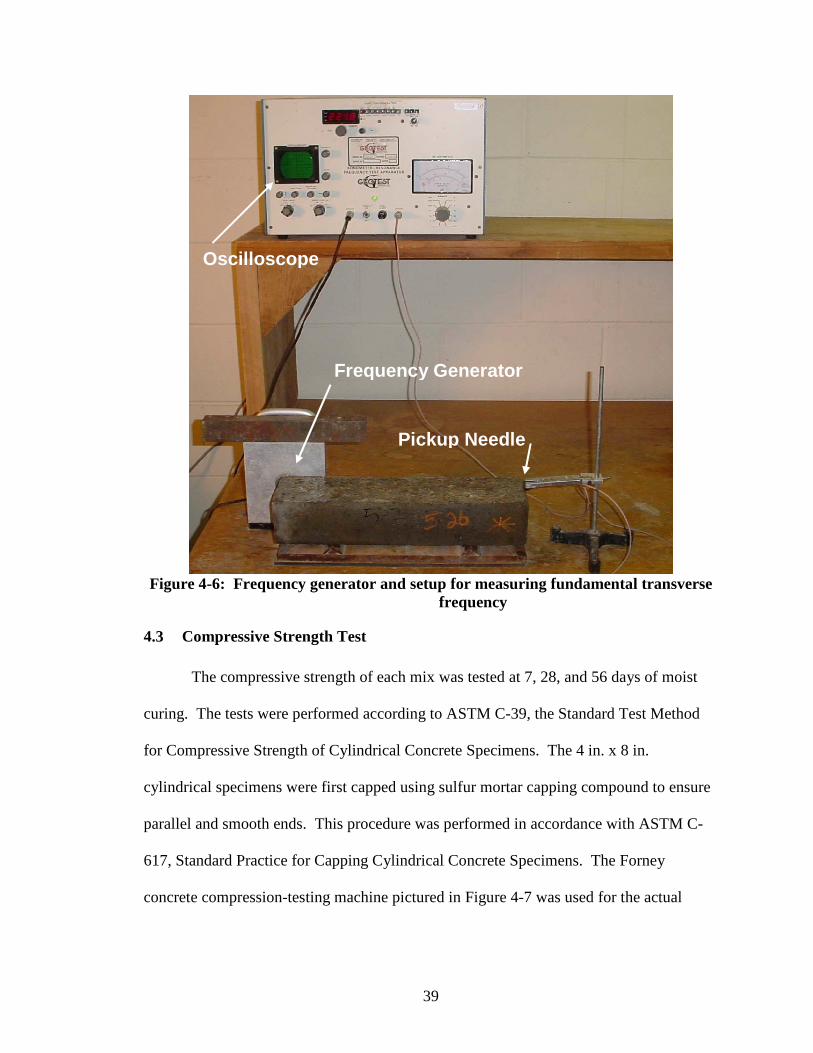
Figure 4-6: Frequency generator and setup for measuring fundamental transverse frequency ................................................................................. 39
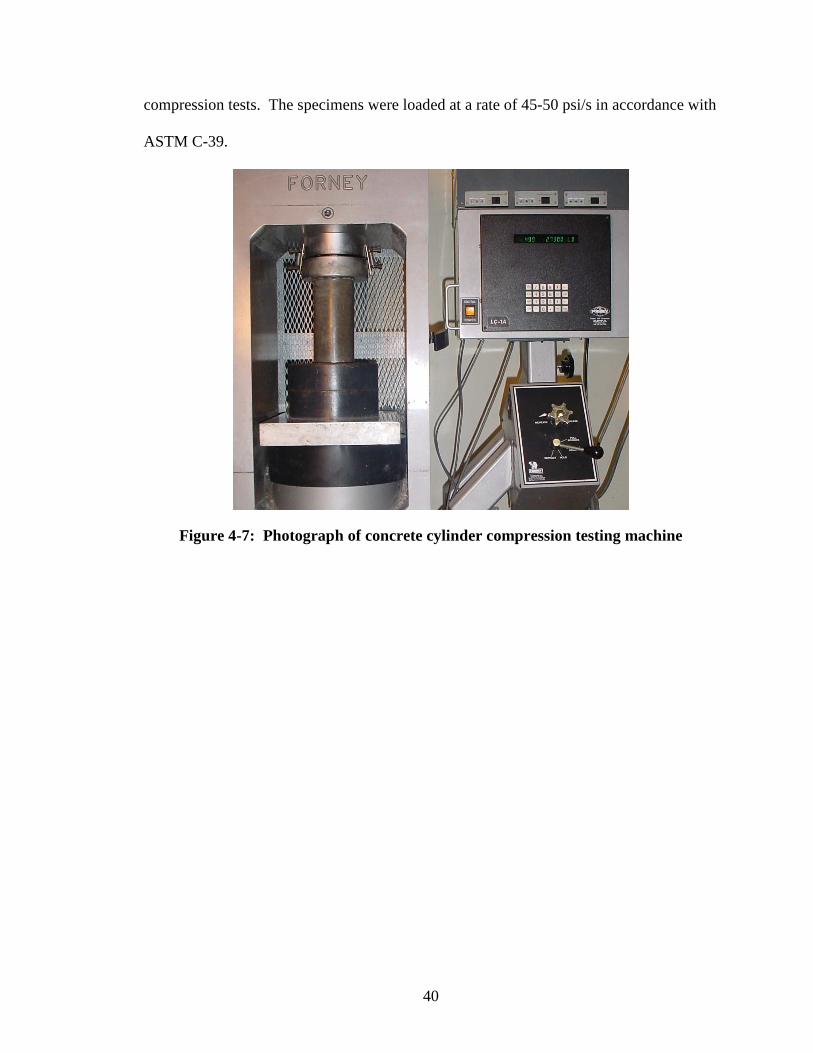
Figure 4-7: Photograph of concrete cylinder compression testing machine................ 40
Figure 5-1: Effect of air content on unit weight of fresh concrete .............................. 43
Figure 5-2: Influence of water to binder ratio on compressive strength at 7 days moist cure.................................................................................................. 44
Figure 5-3: Influence of water to binder ratio on compressive strength at 28 days moist cure.................................................................................................. 45
vii
Figure 5-4: Influence of water to binder ratio on compressive strength at 56 days moist cure.................................................................................................. 46
Figure 5-5: Influence of cement composition on compressive strength at 7 days moist cure for 0.3 w/b mixes..................................................................... 47
Figure 5-6: Influence of cement composition on compressive strength at 28 days moist cure for 0.3 w/b mixes..................................................................... 48
Figure 5-7: Influence of cement composition on compressive strength at 56 days moist cure for 0.3 w/b mixes..................................................................... 48
Figure 5-8: Influence of moist cure time on compressive strength of 0.25 water to binder ratio mixes .................................................................................49
Figure 5-9: Influence of moist cure time on compressive strength of 0.3 water to binder ratio mixes ..................................................................................... 50
Figure 5-10: Influence of moist cure time on compressive strength of 0.35 water to binder ratio mixes .................................................................................51
Figure 5-11: Influence of moist cure time on compressive strength of 0.40 water to binder ratio mixes .................................................................................52
Figure 5-12: Time-Current response for Mix 5: 0.25 water to binder ratio, 10% silica fume................................................................................................. 54
Figure 5-13: Time-Current response for Mix 11: 0.30 water to binder ratio, 5% silica fume, 50% Fly Ash.......................................................................... 56
Figure 5-14: Chloride penetration depth on 2 split specimens from each hour of the RCPT................................................................................................... 57
Figure 5-15: Comparison of charge passed values for 6-hour test and 30-minutes*12................................................................................................ 58
Figure 5-16: Influence of water to binder ratio on the RCPT total charge passed at 7 days moist cure ...................................................................................... 59
Figure 5-17: Influence of water to binder ratio on the RCPT total charge passed at 28 days moist cure ....................................................................................60
Figure 5-18: Influence of water to binder ratio on the RCPT total charge passed at 56 days moist cure ....................................................................................61
Figure 5-19: Influence of cement composition on the RCPT total charge passed at 7 days moist cure for 0.3 w/b mixes ......................................................... 62
viii
Figure 5-20: Influence of cement composition on the RCPT total charge passed at 28 days moist cure for 0.3 w/b mixes ....................................................... 63
Figure 5-21: Influence of cement composition on the RCPT total charge passed at 56 days moist cure for 0.3 w/b mixes ....................................................... 64
Figure 5-22: Influence of moist cure time on the RCPT total charge passed for 0.25 water to binder ratio concretes.......................................................... 65
Figure 5-23: Influence of moist cure time on the RCPT total charge passed for 0.30 water to binder ratio concretes.......................................................... 66
Figure 5-24: Influence of moist cure time on the RCPT total charge passed for 0.35 water to binder ratio concretes.......................................................... 67
Figure 5-25: Influence of moist cure time on the RCPT total charge passed for 0.40 water to binder ratio concretes.......................................................... 67
Figure B-1: Influence of w/b ratio on freeze-thaw durability factor for Control mixtures..................................................................................................... 88
Figure B-2: Influence of w/b ratio on freeze-thaw durability factor for 25% fly ash mixtures .............................................................................................. 88
Figure B-3: Influence of w/b ratio on freeze-thaw durability factor for 5% silica fume mixtures ........................................................................................... 89
Figure B-4: Influence of w/b ratio on freeze-thaw durability factor for 10% silica fume mixtures ........................................................................................... 89
Figure B-5: Influence of w/b ratio on freeze-thaw durability factor for 5% silica fume and 25% fly ash ternary mixtures .................................................... 90
Figure B-6: Influence of cement composition on freeze-thaw durability factor for 0.25 w/b ratio mixtures ............................................................................. 90
Figure B-7: Influence of cement composition on freeze-thaw durability factor for 0.30 w/b ratio mixtures ............................................................................. 91
Figure B-8: Influence of cement composition on freeze-thaw durability factor for 0.35 w/b ratio mixtures ............................................................................. 91
Figure B-9: Influence of cement composition on freeze-thaw durability factor for 0.40 w/b ratio mixtures ............................................................................. 92
Figure D-1: Fly ash lab test results sheet...................................................................... 98
Figure E-1: AutoCAD Drawing of circuit board used for 60 V regulator and current measurement in Rapid Chloride Permeability Test.................... 100
ix
Figure E-2: Mirrored image used to make circuit boards used for 60 V regulator and current measurement in Rapid Chloride Permeability Test ............. 101
Figure E-3: 60 Volt Regulator and Current Measurement Circuit Board for Rapid Chloride Permeability Test........................................................... 102
x
LIST OF TABLES
PAGE
Table 3.1: Test variables used to develop mix designs................................................. 24
Table 3.2: Summary of mixes and parameters for each................................................ 25
Table 3.3: Design batch quantities per cubic yard........................................................ 27
Table 3.4: Chemical composition for fly ash used........................................................ 28
Table 3.5: Summary of specimens cast and uses .......................................................... 29
Table 4.1: ASTM designation for chloride ion penetrability based on charge passed . 33
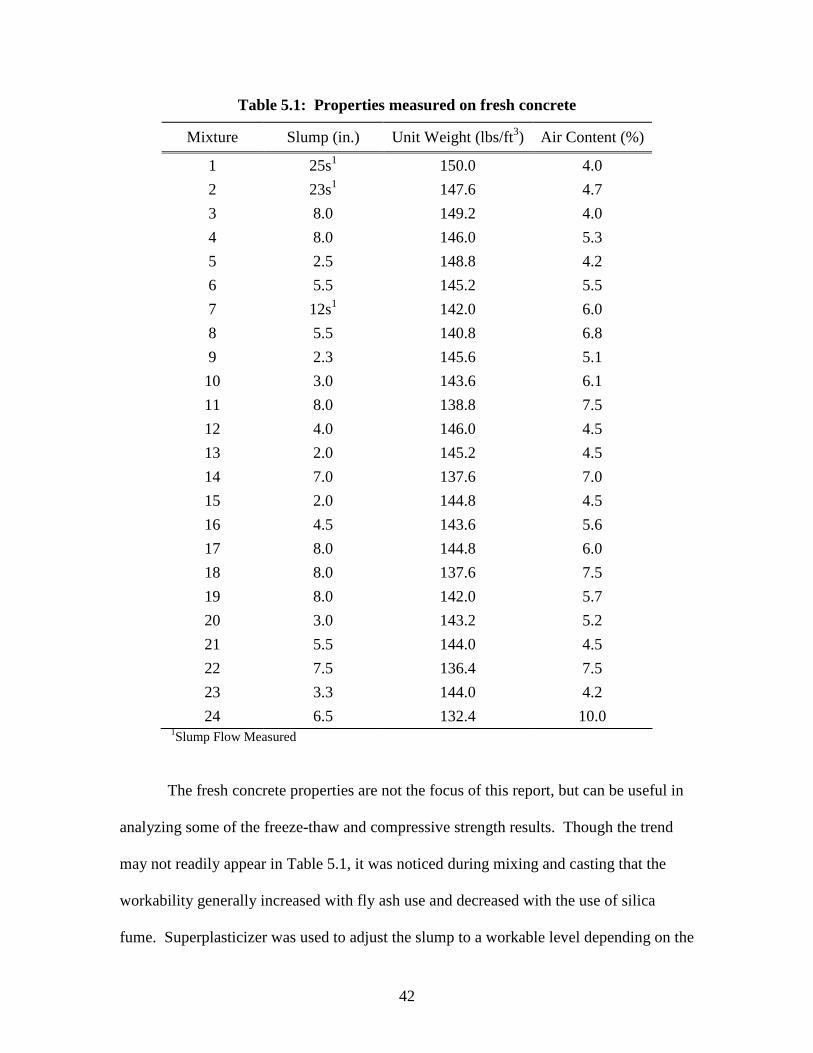
Table 5.1: Properties measured on fresh concrete ........................................................ 42
Table 5.2: Freeze-thaw results listed by mixture .......................................................... 70
Table A.1: 7 Day Chloride Permeability Data - 6 Hour Test ........................................ 81
Table A.2: 28 Day Chloride Permeability Data - 6 Hour Test ...................................... 82
Table A.3: 56 Day Chloride Permeability Data - 6 Hour Test ...................................... 83
Table A.4: 7 Day Chloride Permeability Data - 30 Min x 12 Test ................................ 84
Table A.5: 28 Day Chloride Permeability Data - 30 Min x 12 Test .............................. 85
Table A.6: 56 Day Chloride Permeability Data - 30 Min x 12 Test .............................. 86
Table C.1: 7 Day Compressive Strength Data............................................................... 94
Table C.2: 28 Day Compressive Strength Data............................................................. 95
Table C.3: 56 Day Compressive Strength Data............................................................. 96
xi
DURABILITY OF TERNARY BLENDED CEMENTS IN BRIDGE
APPLICATIONS
Curtis Stundebeck
Dr. V.S. Gopalaratnam, Thesis Supervisor
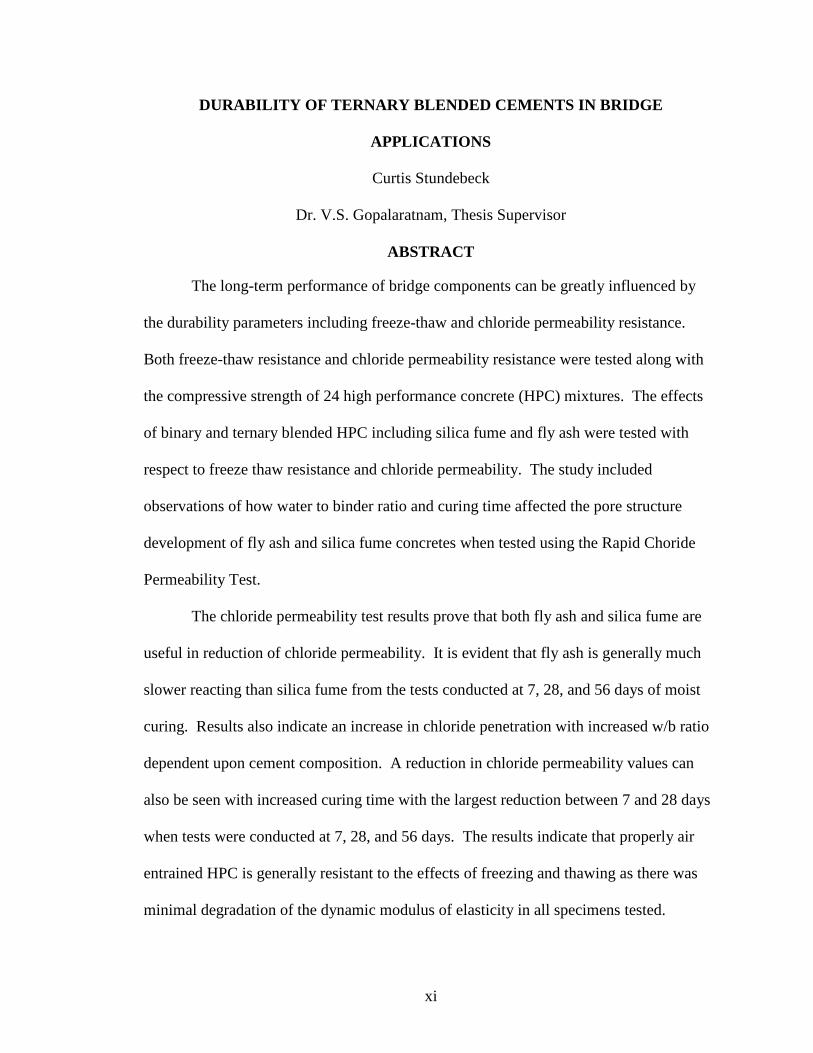
ABSTRACT
The long-term performance of bridge components can be greatly influenced by
the durability parameters including freeze-thaw and chloride permeability resistance.
Both freeze-thaw resistance and chloride permeability resistance were tested along with
the compressive strength of 24 high performance concrete (HPC) mixtures. The effects
of binary and ternary blended HPC including silica fume and fly ash were tested with
respect to freeze thaw resistance and chloride permeability. The study included
observations of how water to binder ratio and curing time affected the pore structure
development of fly ash and silica fume concretes when tested using the Rapid Choride
Permeability Test.
The chloride permeability test results prove that both fly ash and silica fume are
useful in reduction of chloride permeability. It is evident that fly ash is generally much
slower reacting than silica fume from the tests conducted at 7, 28, and 56 days of moist
curing. Results also indicate an increase in chloride penetration with increased w/b ratio
dependent upon cement composition. A reduction in chloride permeability values can
also be seen with increased curing time with the largest reduction between 7 and 28 days
when tests were conducted at 7, 28, and 56 days. The results indicate that properly air
entrained HPC is generally resistant to the effects of freezing and thawing as there was
minimal degradation of the dynamic modulus of elasticity in all specimens tested.
1
CHAPTER 1 INTRODUCTION
1.1 Project Motivation and Significance
The use of high performance concrete in the construction of highway bridges has
become more important in recent years. Using high performance concrete (HPC) has the
potential to lower both initial and life-cycle costs of bridges. Over the life of a bridge,
improved serviceability performance achieved with the use of HPC can reduce
maintenance and repair costs and increase the life of the structure. Durability issues that
often degrade the performance of bridge structures are freeze-thaw damage and chloride
permeability. Chlorides from roadway de-icing salts penetrate into the concrete and can
be detrimental to the reinforcing steel in bridge decks. Other concrete serviceability
issues that can be improved by the use of specially engineered cement blends are time
dependent characteristics such as creep and shrinkage. In addition, the higher strength
generally produced by HPC allows for longer girder spans and larger girder spacing, thus
decreasing the number of girder lines and interior bents. This most often results in a
reduction in initial bridge costs. The properties related to increased strength in HPC are
generally well understood in the literature. However, there appears to be less of an
understanding of the durability and time dependent properties of HPC in the available
literature.
In addition to the enhanced performance of HPC, there are environmental
advantages due to the use of industrial process byproducts. Both fly ash and silica fume
are byproducts that must normally be disposed of with some cost and environmental risk.
These risks are greatly reduced by using them in concrete. Concrete using fly ash can
2
actually be more economical than standard Portland cement concrete due to its
availability and low cost.
1.2 Objective of the Research
The project was designed to develop a material level optimization of ternary
blended high performance concrete for use in bridge applications. Such applications
include the construction of girders, decks, columns, and foundations. The overall project
included both time dependent performance properties such as creep and shrinkage as well
as durability issues including chloride permeability and freeze-thaw resistance. The
focus of the study included in this report is on the effect of pore structure and its
development on durability issues tested on laboratory specimens.
This project involved measuring the chloride permeability and freeze-thaw
resistance of 24 different high performance concrete mixes. This allowed for testing the
performance of varying water to binder ratios and cement compositions. The effect of
curing time of the specimens was also tested on chloride permeability resistance. These
tests were conducted to develop an understanding of the microstructure effects and
physical phenomenon behind chloride penetration and freeze-thaw resistance of high
performance concrete. This study is unique as it provides a systematic variation of
cement composition, water to binder ratios, and curing time having single variable for
each test.
1.3 Thesis Organization
Chapter Two includes a literature review of the use of ternary blended HPC for
bridge applications, describes tests used to measure durability, and explores the effects of
3
several parameters on the chloride permeability and freeze-thaw resistance. Chapter
Three details the experimental program selected and the variables that were investigated
in this study of high performance concrete. Chapter Four explains the test equipment and
procedures used in conducting this study of HPC durability. Chapter Five provides plots
of compressive strength, freeze-thaw, and chloride permeability results and discusses
these results in detail. Chapter Six provides a summary of the project and conclusions
drawn from the test results.
4
CHAPTER 2 LITERATURE REVIEW
2.1 Ternary Blend HPC for Bridge Applications
Durability issues, including freeze thaw and chloride permeability resistance, can
greatly influence the long-term performance of bridges. The reduction in costs associated
with the use of supplementary cementitious materials is also significant in reducing initial
bridge costs. Fly ash is a by-product of coal combustion in power plants; therefore, its
use in concrete provides an environmentally friendly solution to disposal. Blomberg
(2003) reported costs of fly ash, silica fume, and Portland cement as $22, $800, and $83
per ton, respectively. The availability and lower cost for fly ash indicate that it could be
an economical replacement for Portland cement in suitable applications. Silica fume,
being relatively expensive in comparison to Portland cement, can still be used effectively
to provide desirable durability and other physical characteristics that would not be
possible with Portland cement only. Silica fume is rarely used as more than a 10%
cement replacement. This increase for silica fume concrete is generally offset by reduced
maintenance and repair costs and reduced initial costs from the resulting higher strength
concrete.
2.1.1 Pore Structure Difference
Reduced chloride permeability results from a finer pore structure and a smaller
amount of calcium hydroxide in the hardened paste. Permeability is generally governed
by the pore structure in concrete rather than the porosity. Porous concretes can have a
low permeability if the pores are not connected (Chia and Zhang 2002). In the hydration
process of Portland cement, large capillary pores are filled with hydration products,
5
decreasing the size of the large pores and increasing the volume of fine gel pores.
Supplementary cementitious materials react with calcium hydroxide formed in the
hydration process of the Portland cement. This allows an even further refining of the
concrete’s pore structure, as products of this secondary reaction are added to the hardened
paste. The volume previously taken by calcium hydroxide is also filled in. This
reduction in pore size is the main reason for concrete’s increased resistance to
permeability with the use of fly ash, silica fume, and ground granulated blast furnace slag
(Hooton 1986).
2.1.2 Bridge Component Requirements
In the process of optimizing high performance concrete mixtures for highway
bridge applications, it is important to understand that various bridge components require
different physical and mechanical properties. In pre-stressed concrete I-girders, strength,
stiffness, creep, and shrinkage properties are more important than durability since they
are protected from direct exposure to water and de-icing salts. Higher strength and
stiffness can lead to longer spans and larger girder spacing. Reduction in time dependent
effects, including both creep and shrinkage, are significant in minimizing long-term pre-
stressing loss and stresses created at girder ends. Concrete bridge decks and foundations,
on the other hand, generally require lower strength and stiffness, but increased resistance
to freeze-thaw and chloride penetration is essential in areas where the possibility of
exposure to de-icing salts and ponded water in freezing temperatures is more prevalent.
It is necessary to optimize concrete mixtures with respect to its application in various
different bridge components.
6
2.2 Chloride Penetration
Resistance to chloride permeability is an important issue in the optimization of
concrete mixtures to be used in bridge decks. A number of variables exist in concrete’s
mix design and curing regime that can affect its chloride penetration resistance. Chloride
ions penetrate concrete by a number of different mechanisms, including capillary
absorption, hydrostatic pressure, and diffusion. Diffusion, the most common method of
chloride ion movement, requires a continuous liquid phase and a chloride ion
concentration gradient. The second means for chloride ingression is permeation due to an
applied hydraulic head with chlorides present on the concrete surface. Absorption, also a
common method for chloride transport, involves water potentially containing chlorides to
be drawn into the pore structure through capillary suction. This method is driven by
moisture gradients and will generally not independently bring chlorides to the level of the
reinforcing steel, unless the concrete quality is poor or the steel is very shallow (Stanish
et al. 1997).
2.2.1 Testing Methods
There are standard tests prescribed for measuring the permeability of chloride into
concrete. Three common tests are the Rapid Chloride Penetration Test, 90-day Chloride
Ponding Test, and the Rapid Migration Test. Many researchers have modified the
standard tests to better suit permeability testing of high performance concrete.
The Standard Method of Test for Resistance of Concrete to Chloride Penetration
(AASHTO T 259 2001), commonly known as the Chloride Ponding Test, is the oldest
test for measuring chloride ion penetration. Three inch thick by 12 inch square slabs are
cast and moist cured for 14 days and stored in a drying room until 28 days of age. A dam
7
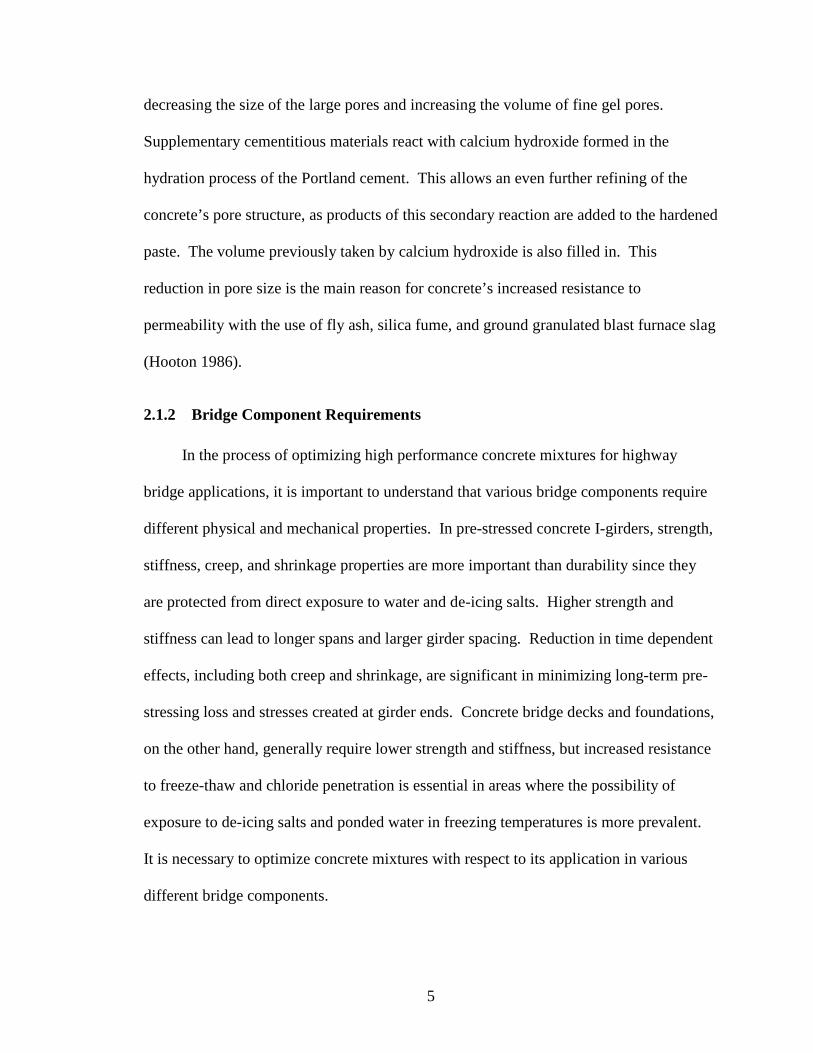
approximately ¾-inch tall is placed around the perimeter of the slab. Following an
additional 13 days in the drying room, the slabs are subjected to a 90 day continuous
ponding with ½-inch of 3% sodium chloride solution as shown in Figure 2-1. Samples of
the specimen are taken using a grinding procedure from 1/16-inch to ½-inch and ½-inch
to 1-inch. The chloride contents of the samples are then determined with chemical
titration process defined by (AASHTO T 260 2001). Companion specimens are cast and
not subjected to the chloride ponding to determine the baseline chloride content in the
specimens.
Concrete sample
3% NaCl Solution
> 3”
Sealed sides ½”
50% Relative Humidity
Figure 2-1: AASHTO T-259 salt ponding setup (Stanish et al. 1997)
A number of criticisms of the ponding test have been stated in the literature. The
90 day time for ponding is often criticized, especially since this time period may not
allow for high quality concretes to develop a sufficient chloride penetration profile.
Another problem with the test is it does not distinguish different chloride penetration
mechanisms. The period of 28 days of drying prior to the beginning of the test allows for
absorption when the specimen is initially subjected to the chloride solution. The fact that
the bottom surface is exposed to 50% relative humidity also introduces the concept of
wicking of the chloride solution from the wet surface toward the drier bottom face, due to
8
the large relative humidity gradient. These allow for chloride to be drawn into the
concrete by mechanisms other than pure diffusion. There are also arguments that
grinding ½” layers does not provide enough resolution to accurately see the chloride
profile (Stanish et al. 1997).
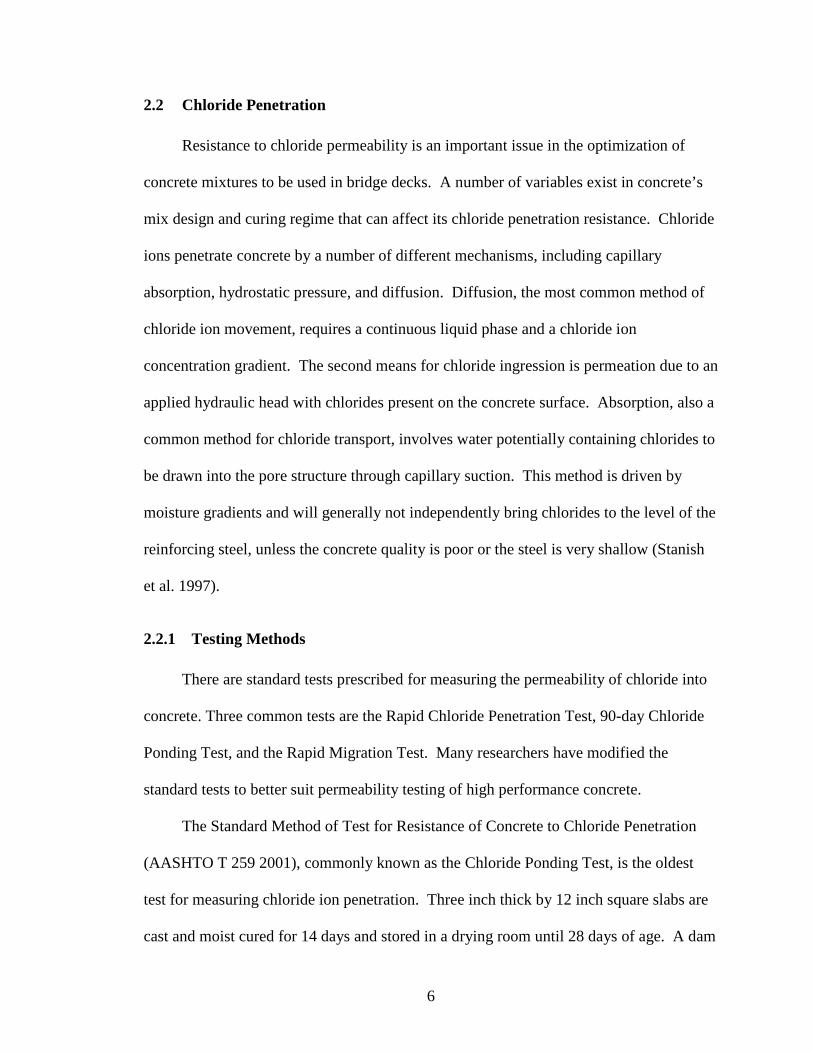
To overcome some deficiencies of the ponding test, the bulk diffusion test
(NordTest NTBuild 443) has been developed to measure chloride diffusion. To eliminate
initial absorption effects, the specimens are saturated in limewater rather than allowing
them to dry for 28 days prior to the test (Stanish et al. 1997).
Concrete sample
2.8 M NaCl Solution
60 mm
Three faces sealed
Figure 2-2: Nordtest setup (Stanish et al. 1997)
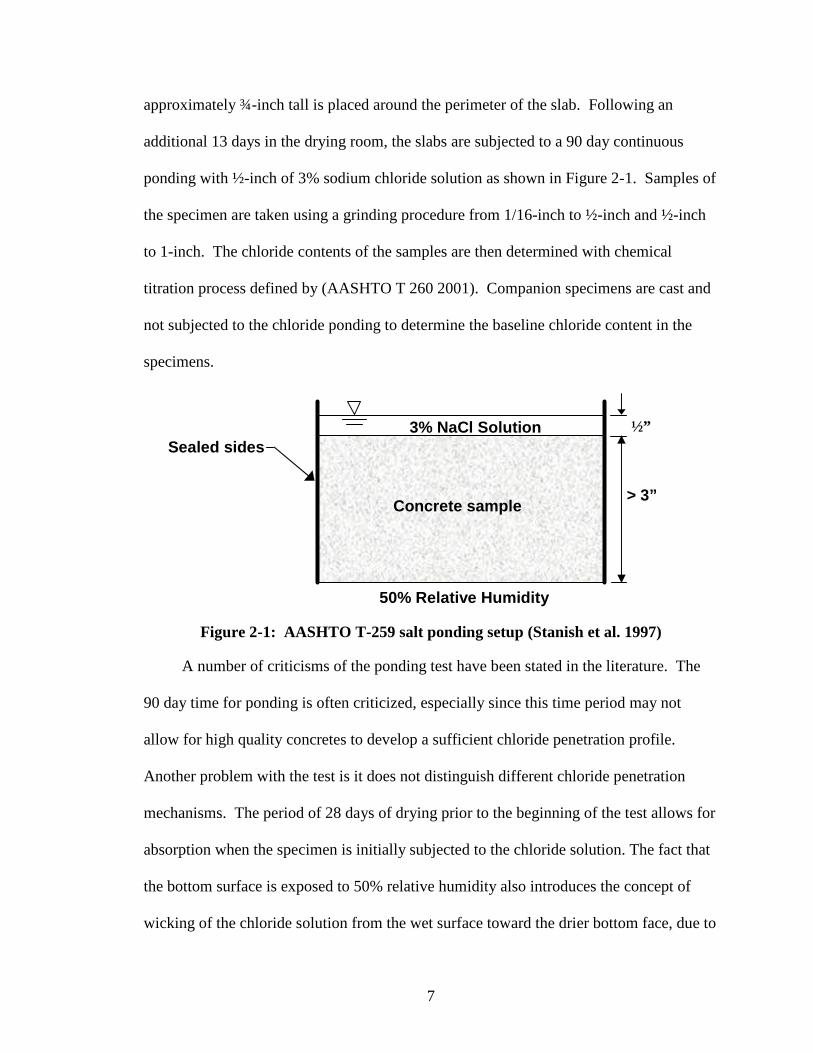
The Rapid Chloride Penetration Test, detailed in (American Society for Testing
And Materials 1997b) and AASHTO T-277, was utilized in this project. The test
monitors the electrical current during a 6-hour period that passes through a saturated 2-
inch slice from the middle of a 4-inch diameter cylinder or core. One end of the
specimen is immersed in a sodium chloride solution, and the other end is immersed in a
sodium hydroxide solution as shown in Figure 2-3. A potential difference of 60 Volts is
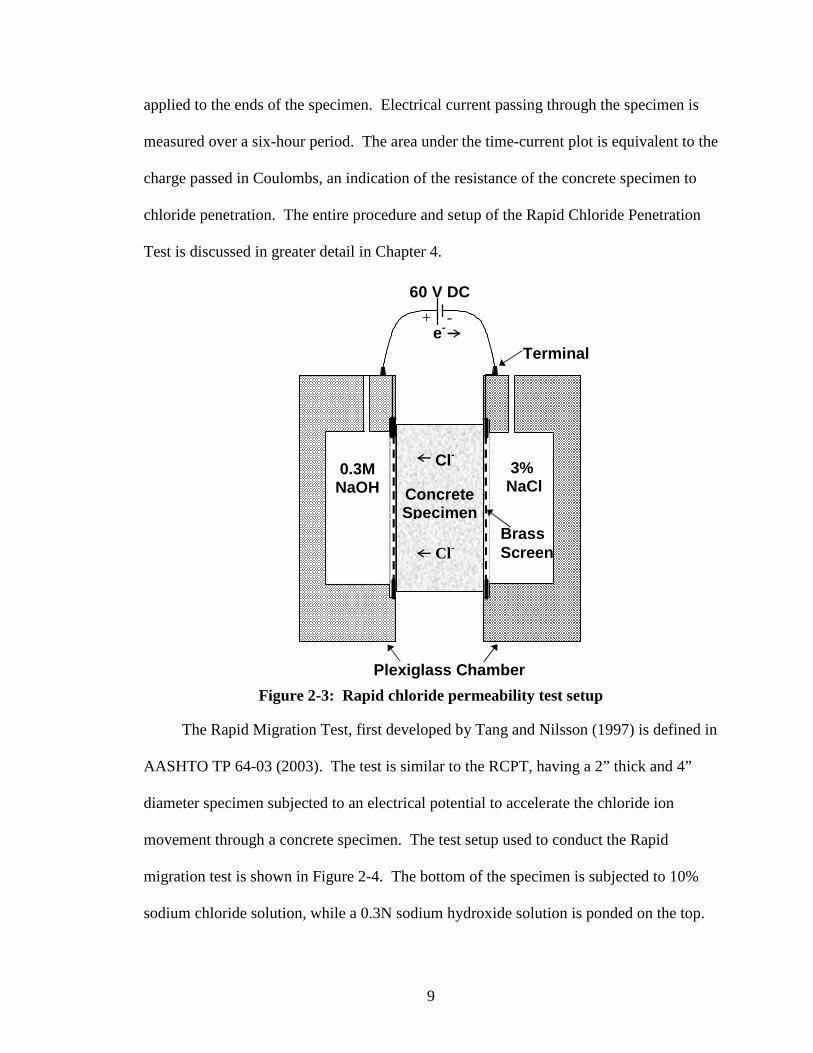
9
applied to the ends of the specimen. Electrical current passing through the specimen is
measured over a six-hour period. The area under the time-current plot is equivalent to the
charge passed in Coulombs, an indication of the resistance of the concrete specimen to
chloride penetration. The entire procedure and setup of the Rapid Chloride Penetration
Test is discussed in greater detail in Chapter 4.
Plexiglass Chamber
+ -
Concrete Specimen
60 V DC
e-
Cl-
Cl-
3% NaCl
0.3M NaOH
Terminal
Brass Screen
Figure 2-3: Rapid chloride permeability test setup
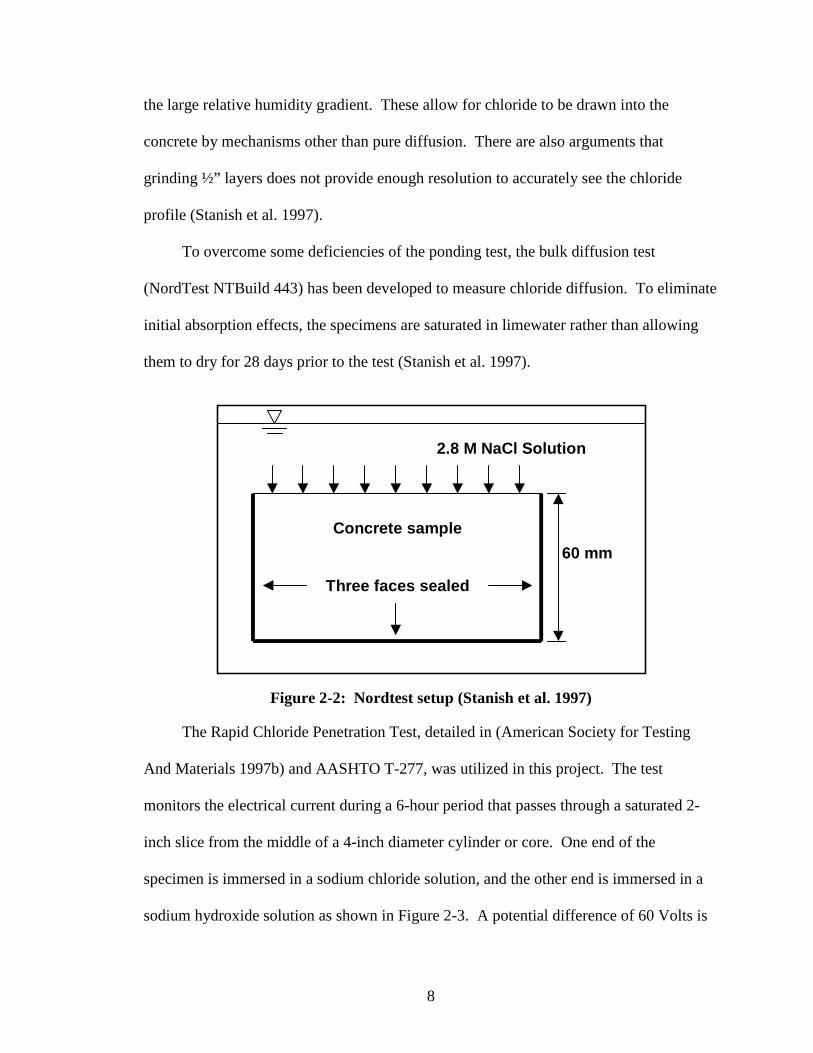
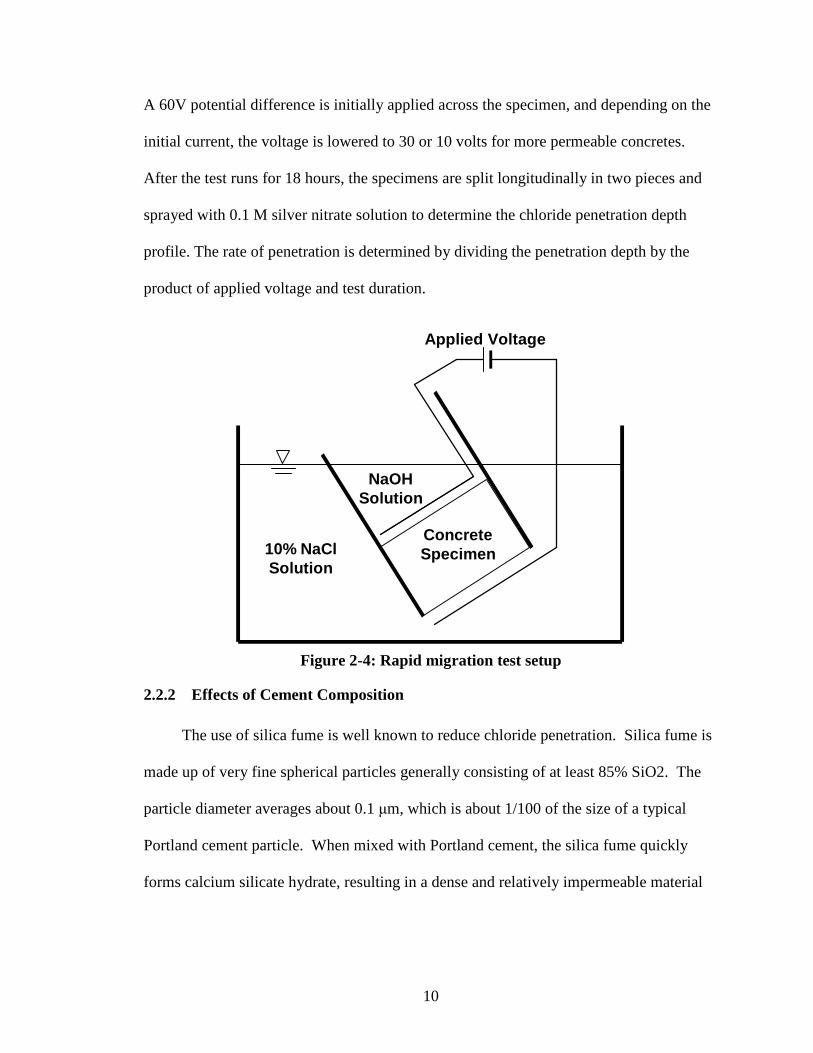
The Rapid Migration Test, first developed by Tang and Nilsson (1997) is defined in
AASHTO TP 64-03 (2003). The test is similar to the RCPT, having a 2” thick and 4”
diameter specimen subjected to an electrical potential to accelerate the chloride ion
movement through a concrete specimen. The test setup used to conduct the Rapid
migration test is shown in Figure 2-4. The bottom of the specimen is subjected to 10%
sodium chloride solution, while a 0.3N sodium hydroxide solution is ponded on the top.
10
A 60V potential difference is initially applied across the specimen, and depending on the
initial current, the voltage is lowered to 30 or 10 volts for more permeable concretes.
After the test runs for 18 hours, the specimens are split longitudinally in two pieces and
sprayed with 0.1 M silver nitrate solution to determine the chloride penetration depth
profile. The rate of penetration is determined by dividing the penetration depth by the
product of applied voltage and test duration.
Applied Voltage
Concrete Specimen 10% NaCl
Solution
NaOH Solution
Figure 2-4: Rapid migration test setup
2.2.2 Effects of Cement Composition
The use of silica fume is well known to reduce chloride penetration. Silica fume is
made up of very fine spherical particles generally consisting of at least 85% SiO2. The
particle diameter averages about 0.1 µm, which is about 1/100 of the size of a typical
Portland cement particle. When mixed with Portland cement, the silica fume quickly
forms calcium silicate hydrate, resulting in a dense and relatively impermeable material
11
as the hydrate fills in normally weak spaces between the cement paste and aggregate
particles.
In tests performed by (Oh et al. 2002) the chloride permeability of mixtures with
water to binder ratios of 0.28 and 0.43 was observed. Silica fume had the greatest effect
on reduction of chloride permeability compared to fly ash and slag. Silica fume mixes
had chloride permeability values in the negligible range defined by ASTM C-1202, but
cement replacement by silica fume of greater than 10% provided negligible effect to
chloride permeability. The chloride permeability of mixtures with a 15% fly ash
replacement level is about half compared to the control mixture.
Ozyildirim (1987) found that cement replacement by 5% silica fume in mixes
with a w/b ratio of 0.35 and 0.4 the chloride permeability was reduced by a factor of 3-4.
The tests were conducted using the RCPT after 56 days with two weeks of moist curing.
The AASHTO Ponding test was also performed along with the RCPT tests. Mixes with
silica fume had a chloride content in the ¼” to ¾” depth, about one half that of the
control mix.
Plante and Bilodeau (1989) also observed that the addition of 8% silica fume to
concrete mixtures reduced the charge passed in the RCPT by a factor 4-6 after 28 days of
moist curing depending on the w/b ratio. The value of the reduction in chloride
permeability was greater for the higher w/b ratio concretes.
Chia and Zhang (2002) conducted permeability tests on light-weight aggregate
concrete and normal weight concrete with and without silica fume. Cement replacement
by 10% silica fume in these mixtures reduced the chloride permeability by 5-6 times
when tested by the RCPT. Results were similar from the ponding test and an immersion
12
test, where the chloride permeability depth was measured from the side casting surface of
specimens split parallel to the top and bottom surface. With the addition of silica fume
the chloride permeability depth was reduced to about half that of the control specimens
with both light weight and normal weight concrete. The use of an expanded clay type
aggregate in the lightweight concrete rather than crushed granite in the normal weight
concrete had relatively no affect on the chloride permeability.
Luther and Mikols (1992) performed tests using the RCPT and found that
concrete mixtures with less than 5% replacement of cement with silica fume had a
chloride permeability in the very low range defined by ASTM. Addition of 34% slag
replacement of cement reduced the total charge passed using the RCPT by more than 200
Coulombs.
Using the 90-day ponding test and a test similar to the RCPT but having only a
40V power supply, (Cabrera and Claisse 1990) found that the 20% replacement of
cement with silica fume greatly reduced the chloride permeability. After 28 days of
curing, the charge passed according to ASTM was in the very low or negligible range for
the silica fume mixes but in the moderate range for the OPC mixes.
Babu (2001) showed that increased slag replacement and increased strength
provides increased resistance to chloride permeability. The slag replacement level only
had a significant effect on the mixtures with a design strength of 30 and 60 MPa. With
mixtures having a compressive strength 80 to 90 MPa at 90 days and a water-binder ratio
less than 0.3, the addition of slag had little effect on the chloride permeability resistance
since it was near the ASTM low range without slag.
13
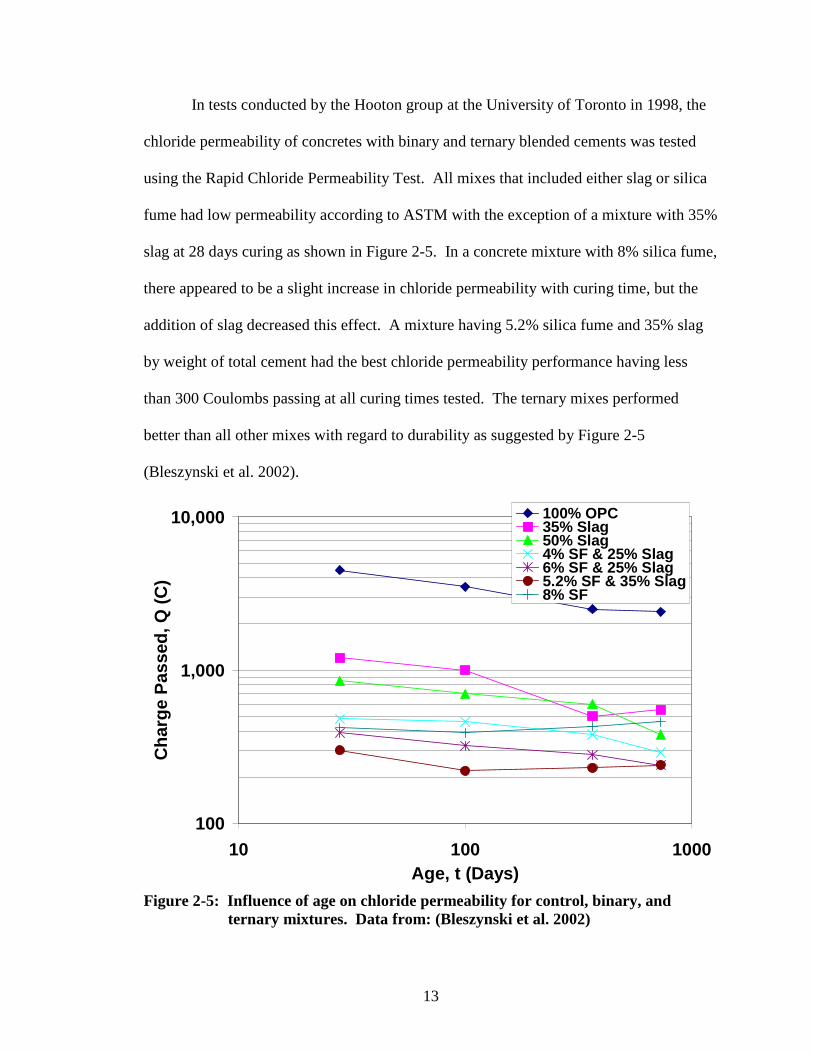
In tests conducted by the Hooton group at the University of Toronto in 1998, the
chloride permeability of concretes with binary and ternary blended cements was tested
using the Rapid Chloride Permeability Test. All mixes that included either slag or silica
fume had low permeability according to ASTM with the exception of a mixture with 35%
slag at 28 days curing as shown in Figure 2-5. In a concrete mixture with 8% silica fume,
there appeared to be a slight increase in chloride permeability with curing time, but the
addition of slag decreased this effect. A mixture having 5.2% silica fume and 35% slag
by weight of total cement had the best chloride permeability performance having less
than 300 Coulombs passing at all curing times tested. The ternary mixes performed
better than all other mixes with regard to durability as suggested by Figure 2-5
(Bleszynski et al. 2002).
100
1,000
10,000
10 100 1000Age, t (Days)
Cha
rge
Pas
sed,
Q (
C)
100% OPC35% Slag50% Slag4% SF & 25% Slag6% SF & 25% Slag5.2% SF & 35% Slag8% SF
Figure 2-5: Influence of age on chloride permeability for control, binary, and
ternary mixtures. Data from: (Bleszynski et al. 2002)
14
2.2.3 Effects of Water to Binder Ratio
The porosity of concrete is widely known to increase with increased water to
binder ratio. More porous concrete allows for easier diffusion of chlorides and therefore
larger values for permeability.
Ozyildirim (1987) observed that reducing the w/b ratio from 0.40 to 0.35 reduced
the chloride permeability 60-70% when tested using the RCPT. The difference was more
evident in the control mixes having no silica fume than mixes with 5% silica fume as the
values for the mixtures containing silica fume were about one-third those of the control
mixtures.
A noticeable reduction in chloride permeability in silica fume mixtures was
observed by Plante and Bilodeau (1989) as the w/b ratios decreased from 0.66 to 0.21.
The chloride permeability was related to the reduction in total porosity resulting from
lower water to binder ratios.
Tests performed using the RCPT resulted in decreased permeability by a factor of
approximately 5 with decreased w/b ratio from 0.43 to 0.28 (Oh et al. 2002). Values were
in the “very low” or “negligible” range for chloride permeability defined by ASTM C-
1202.
2.2.4 Effects of Curing Time
It appears that there are varying effects of curing time based on cement
composition and water to binder ratio. In a study conducted by Blomberg (2003) at the
Missouri Department of Transportation-Research, Development, Technology, 11 mixes
designed for use on bridge decks were studied. The mixtures included control mixtures
and binary and ternary HPC mixes containing fly ash, silica fume, and ground granulated
15
blast furnace slag. Most of the mixtures had a decrease in chloride permeability from 28
to 56 days of curing time that ranged from 25 to 45% as measured using the RCPT. The
decrease was less significant from 56 to 90 days. The fly ash mixtures had further
reductions in chloride permeability values of 20 to 30%, while silica fume and slag
mixtures saw negligible chloride permeability reduction between 56 and 90 days.
A decrease in chloride permeability is evident with increased curing time from 1-
7 and 7-28 days in silica fume mixes tested by Plante and Bilodeau (1989). The effect of
reduction from increased curing time was also more evident in the concretes having
higher w/b ratios. The chloride permeability was proportional to the porosity, which also
was reduced with curing time.
Cabrera and Claisse (1990) also found a reduction in chloride permeability with
the increased curing time. Control mixtures and mixtures with 20% silica fume, cured at
20°C and 100% relative humidity, were tested using a test similar to the RCPT having
only 40V. The curing time had the greatest effect on a silica fume mix with a w/b ratio of
0.46. The charge passed decreased from over 6,000 Coulombs to about 500 Coulombs
when tested at 3 and 28 days, respectively. The decrease from 28 to 90 days was around
200 Coulombs. A silica fume mix with a w/b ratio had similar results at 28 and 90 days,
but at 3 days, the charge passed was only about 2,000 Coulombs.
Bleszynski et al.(2002) showed that curing time was important in the reduction of
chloride permeability as seen in Figure 2-5. Chloride permeability was measured on the
different mixes at 28, 100, 365, and 728 days. The reduction in permeability was reduced
by the largest amount between 28 and 100 days.
16
2.3 Freeze Thaw
Significant damage caused by freeze-thaw resistance can generally be avoided with
the use of quality aggregates, low water to cement ratio, proper air entrainment, and
adequate curing before exposure to freeze-thaw cycles (ACI Committee 201 2001).
Many investigations have indicated that HPC has a lower total porosity than normal
concretes. The temperature at which water freezes in the capillary pores is dependent on
the size of the pores. Water in 10 nm pores will freeze at -5˚C, however, water in 3.5 nm
pores will not freeze until the temperature reaches -20˚C. As water freezes in saturated
concrete, ice forms in the capillary pores, causing the remaining water to be compressed
and create a hydraulic pressure. As additional pore water progressively freezes with
lowering temperatures, the pressure increases, unless the water can escape to unfrozen
pores with lower pressure. If the water does not escape, the capillaries expand, causing
internal stresses and micro cracking in the concrete (Zia et al. 1991).
ASTM C-666 is used to determine the resistance of concrete to rapid freezing and
thawing cycles. The specimens used for test prisms or cylinders are between 3 and 5
inches in width, depth or diameter and between 11 and 16 inches in length. Before the
freeze-thaw test begins, the specimens are cured for 14 days unless otherwise specified
for the testing of curing time effects. Before the test begins the weight and the
fundamental transverse frequency of each specimen are measured. The fundamental
transverse frequency is measured in order to calculate the dynamic modulus of elasticity.
Specimens are inserted into metal containers filled with water to be placed in the freezing
and thawing chamber. The temperature in the chamber cycles from 40°F ± 3°F to 0°F ±
3°F and back to 40°F ± 3°F in a time period between 2 and 5 hours. The test has two
17
different procedures that can be used. In Procedure A, the specimens are surrounded by
water in both the freezing and the thawing cycles. In Procedure B the specimens are
surrounded by air during the freezing phase and surrounded by water in the thawing
phase. The fundamental transverse frequency of each specimen is measured when
thawed at no more than every 36 cycles. The freeze-thaw test is stopped after 300 cycles
or when the relative dynamic modulus reaches 60% of the initial value. The durability
factor can then be calculated from the following equation.
M
PNDF = Eq. (2.1)
DF = Durability Factor
P = Relative Dynamic Modulus at N cycles expressed as a percentage
N = The least value of the number of cycles when P reaches a minimum value for
terminating the test or the number of cycles for terminating the test
M = Specified number of cycles when the test is to be terminated
(American Society for Testing And Materials 1997a)
2.3.1 Effects of Air Entrainment
Entrained air in concrete provides space in the paste for excess capillary water to
escape and freeze without causing severe damage. ACI Committee 201 (2001)
recommends air contents of 3 to 7.5%, depending on the maximum aggregate size and
exposure condition. Concrete without proper air entrainment will not be properly
protected from freeze-thaw resistance; however, air entrainment beyond what is needed
will cause a sacrifice in compressive strength. Entrained air provides empty space in the
paste for excess capillary water to escape and freeze without causing damage to the
18
concrete. There are a number of articles that address the issue of whether air entrainment
is needed for the freeze-thaw resistance of high performance concrete.
For mixes with a total cementitious materials content of at least 822 lb/ft3 and a
w/b ratio less than 0.28 the presence of entrained air increased the durability to at least 95
(Kashi and Weyers 1989). The durability factor at 300 cycles seems largely dependent
upon the air content for mixtures with 19% Class C Fly Ash. All mixtures had a
Durability Factor greater than 90 except for those with less than 3% air entrainment
(Cramer 2001). For mixes with a w/b ratio of 0.33, mixes with and without silica fume
failed the ASTM C-666 test having a relative dynamic modulus less than 0.6 after 300
cycles, air-entrained mixes all had relative dynamic modulus greater than 0.90 (Cohen et
al. 1992).
In tests conducted prior to 1994 by Ghosh and Nasser, concrete mixtures with
ternary blended cement having 10% silica fume and 20% fly ash and a w/b ratio of 0.27,
the addition of air entrainment raised the durability factor only from 64 to 68 and 70 with
with 4% and 8% air, respectively. With higher levels of fly ash, the addition of air
entrainment was not advantageous in increasing the freeze-thaw durability (Ghosh and
Nasser 1995). In tests conducted by Cohen, Zhou, and Dolch (1992) when properly air
entrained there did not seem to be any effect positive or negative with the addition of 9%
silica fume.
19
0
20
40
60
80
100
0 2 4 6 8 10Air Content, (%)
Dur
abili
ty F
acto
r
Control Mixes3- 5% SF6-9.1% SF10-13% SF
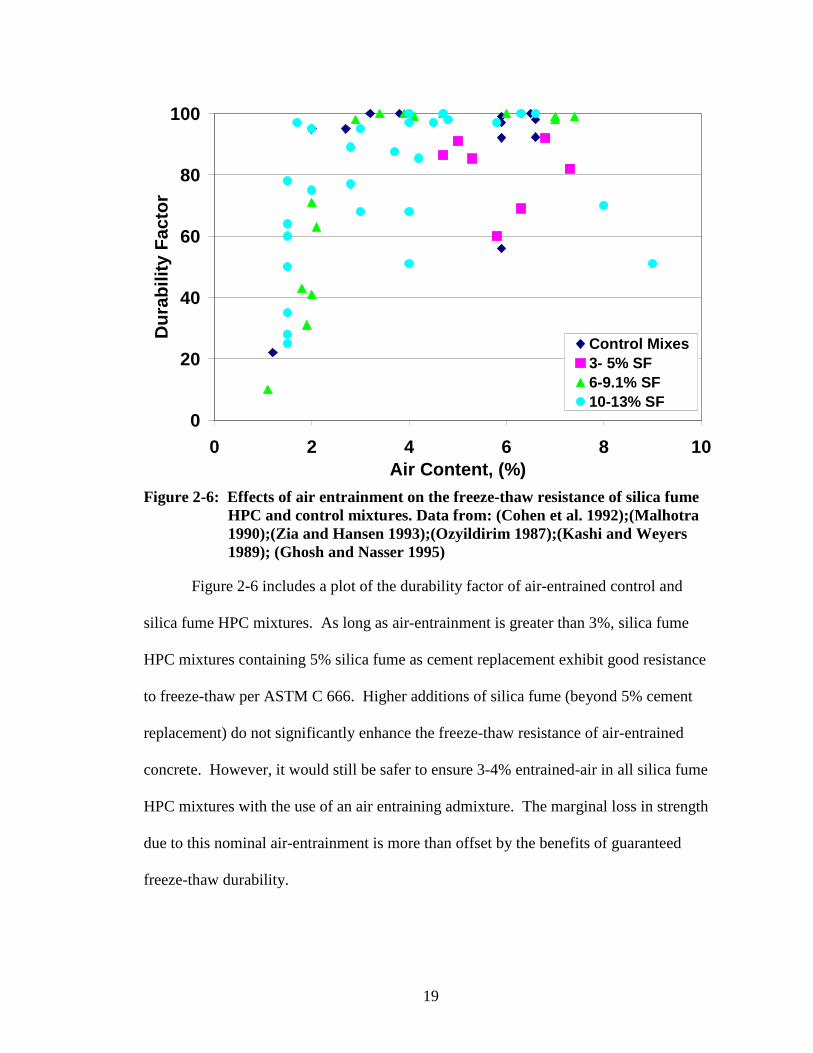
Figure 2-6: Effects of air entrainment on the freeze-thaw resistance of silica fume
HPC and control mixtures. Data from: (Cohen et al. 1992);(Malhotra 1990);(Zia and Hansen 1993);(Ozyildirim 1987);(Kashi and Weyers 1989); (Ghosh and Nasser 1995)
Figure 2-6 includes a plot of the durability factor of air-entrained control and
silica fume HPC mixtures. As long as air-entrainment is greater than 3%, silica fume
HPC mixtures containing 5% silica fume as cement replacement exhibit good resistance
to freeze-thaw per ASTM C 666. Higher additions of silica fume (beyond 5% cement
replacement) do not significantly enhance the freeze-thaw resistance of air-entrained
concrete. However, it would still be safer to ensure 3-4% entrained-air in all silica fume
HPC mixtures with the use of an air entraining admixture. The marginal loss in strength
due to this nominal air-entrainment is more than offset by the benefits of guaranteed
freeze-thaw durability.
20
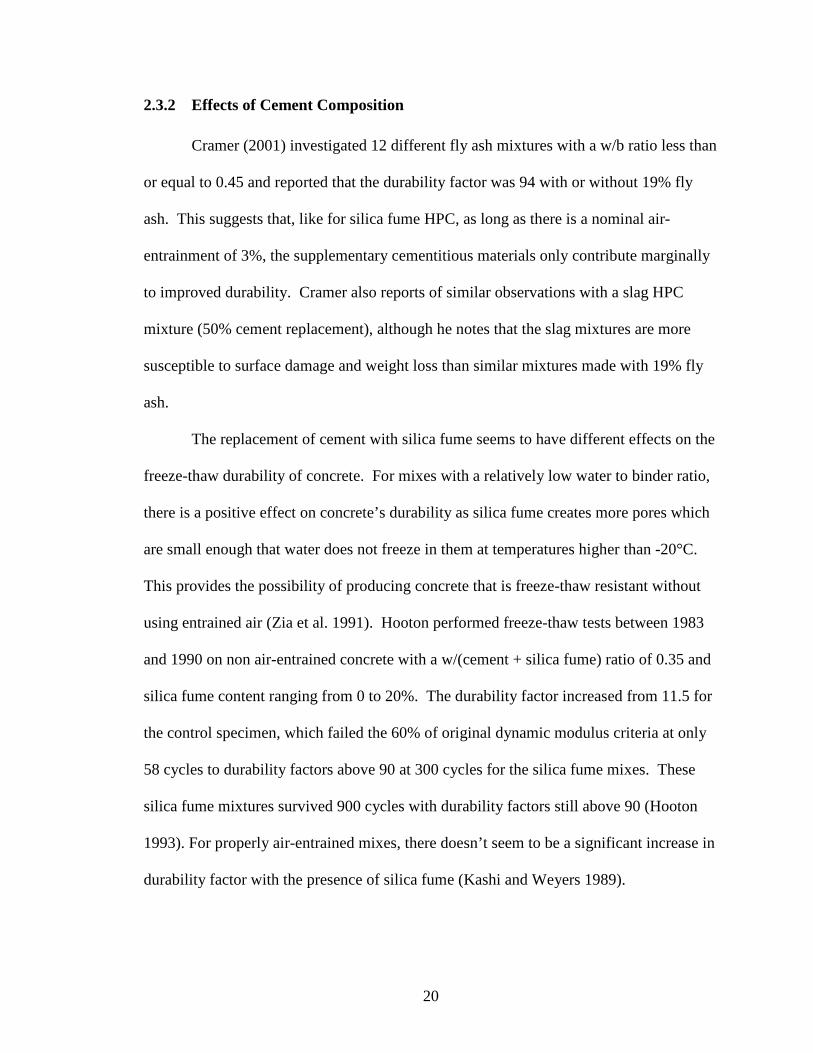
2.3.2 Effects of Cement Composition
Cramer (2001) investigated 12 different fly ash mixtures with a w/b ratio less than
or equal to 0.45 and reported that the durability factor was 94 with or without 19% fly
ash. This suggests that, like for silica fume HPC, as long as there is a nominal air-
entrainment of 3%, the supplementary cementitious materials only contribute marginally
to improved durability. Cramer also reports of similar observations with a slag HPC
mixture (50% cement replacement), although he notes that the slag mixtures are more
susceptible to surface damage and weight loss than similar mixtures made with 19% fly
ash.
The replacement of cement with silica fume seems to have different effects on the
freeze-thaw durability of concrete. For mixes with a relatively low water to binder ratio,
there is a positive effect on concrete’s durability as silica fume creates more pores which
are small enough that water does not freeze in them at temperatures higher than -20°C.
This provides the possibility of producing concrete that is freeze-thaw resistant without
using entrained air (Zia et al. 1991). Hooton performed freeze-thaw tests between 1983
and 1990 on non air-entrained concrete with a w/(cement + silica fume) ratio of 0.35 and
silica fume content ranging from 0 to 20%. The durability factor increased from 11.5 for
the control specimen, which failed the 60% of original dynamic modulus criteria at only
58 cycles to durability factors above 90 at 300 cycles for the silica fume mixes. These
silica fume mixtures survived 900 cycles with durability factors still above 90 (Hooton
1993). For properly air-entrained mixes, there doesn’t seem to be a significant increase in
durability factor with the presence of silica fume (Kashi and Weyers 1989).
21
The increase in silica fume from 0 to 10% causes a decrease in the durability
factor from 94 to 85 at 210 cycles for mixtures with a water to cement ratio of 0.5 (Sabir
1997). The resistance to freezing and thawing was found to be reduced with the addition
of silica fume in non-air entrained mixtures possibly due to the variance in the amount of
High Range Water Reducer, however, when properly air entrained the silica fume had
little to no effect (Cohen et al. 1992). With proper air entrainment and adequate strength
of only 3500 psi before exposing to freezing and thawing there should be no significant
difference in the resistance to freeze-thaw of concrete with or without fly ash. (ACI
Committee 232 1996)
In tests performed by Ghosh and Nasser (1995) according to ASTM C-666, with a
ternary blended cement having 10% silica fume, no air entrainment, and a water to binder
ratio of 0.27, the addition of fly ash caused a reduction in the freeze-thaw resistance of
the mixtures. The mixtures having 40% or more fly ash performed poorly with durability
factors less than 60.
Cramer (2001) reported results in 2001 for 12 different fly ash mixtures with a
water to binder ratio less than or equal to 0.45. The durability factor was 94 with or
without 19% fly ash. This indicates that freeze-thaw durability is largely dependent on
air entrainment.
The presence of slag in mixtures with up to 50% replacement of Portland cement
gave durability factors greater than 90 provided the air content of these mixtures was
greater than 3%. The slag mixtures seemed to be more susceptible to surface damage and
weight loss than similar mixes with 19% Fly Ash. (Cramer 2001)
22
2.3.3 Effects of Water to Binder Ratio
The literature suggests that with a low water to binder ratio, a high strength
concrete that is freeze-thaw resistant can be produced. The Durability factor is increased
by about 30 with a decrease in the water to binder ratio from 0.40 to 0.35 for the control
mixes and the mixtures containing 5% silica fume. This seems to have the greatest effect
on the durability factor (Ozyildirim 1987).
2.3.4 Effects of Curing Time
Before specimens are subjected to the actual freeze-thaw test, the curing time and
method have been varied so that the effects of curing on freeze-thaw resistance of the
concrete can be examined. ASTM C-666 specifies that specimens be cured for only 14
days before exposure to freeze-thaw. There are arguments suggesting that this time is not
long enough especially in some mixtures containing fly ash. The effect of curing on
freeze-thaw resistance seems to be very small in most cases. There is only a slight
increase in durability factor of the mixes that performed relatively well for a 12 hr heat
cure at 65° C over a 23° C lime-water bath (Mokhtarzadeh 1995). An increase in moist
cure time from 14 to 28 days doesn’t cause a significant increase in the durability factor.
However, it is important to recognize that these mixtures all had cementitious material
contents of at least 822 lb/yd3 (Kashi and Weyers 1989). Effects of moist curing in lime
water were examined using different periods of time before exposing to the freeze-thaw
test. In the air-entrained concrete there did not seem to be a major difference between
curing times. For the non-air entrained mixes there was a greater difference between the
relative dynamic modulus for specimens cured for different periods especially between 7

23
and 21 days. Longer curing times did not appear to have a large effect in freeze-thaw
resistance (Cohen et al. 1992).
24
CHAPTER 3 EXPERIMENTAL PROGRAM
3.1 Mixes and Test Parameters
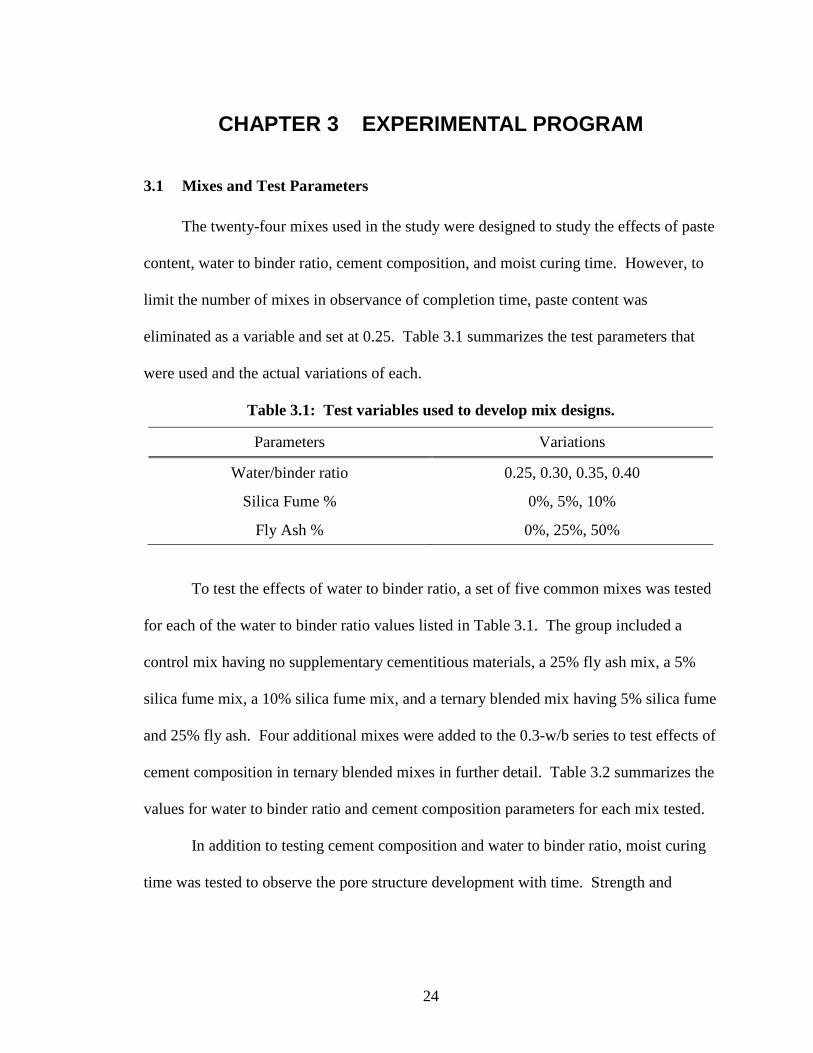
The twenty-four mixes used in the study were designed to study the effects of paste
content, water to binder ratio, cement composition, and moist curing time. However, to
limit the number of mixes in observance of completion time, paste content was
eliminated as a variable and set at 0.25. Table 3.1 summarizes the test parameters that
were used and the actual variations of each.
Table 3.1: Test variables used to develop mix designs.
Parameters Variations
Water/binder ratio 0.25, 0.30, 0.35, 0.40
Silica Fume % 0%, 5%, 10%
Fly Ash % 0%, 25%, 50%
To test the effects of water to binder ratio, a set of five common mixes was tested
for each of the water to binder ratio values listed in Table 3.1. The group included a
control mix having no supplementary cementitious materials, a 25% fly ash mix, a 5%
silica fume mix, a 10% silica fume mix, and a ternary blended mix having 5% silica fume
and 25% fly ash. Four additional mixes were added to the 0.3-w/b series to test effects of
cement composition in ternary blended mixes in further detail. Table 3.2 summarizes the
values for water to binder ratio and cement composition parameters for each mix tested.
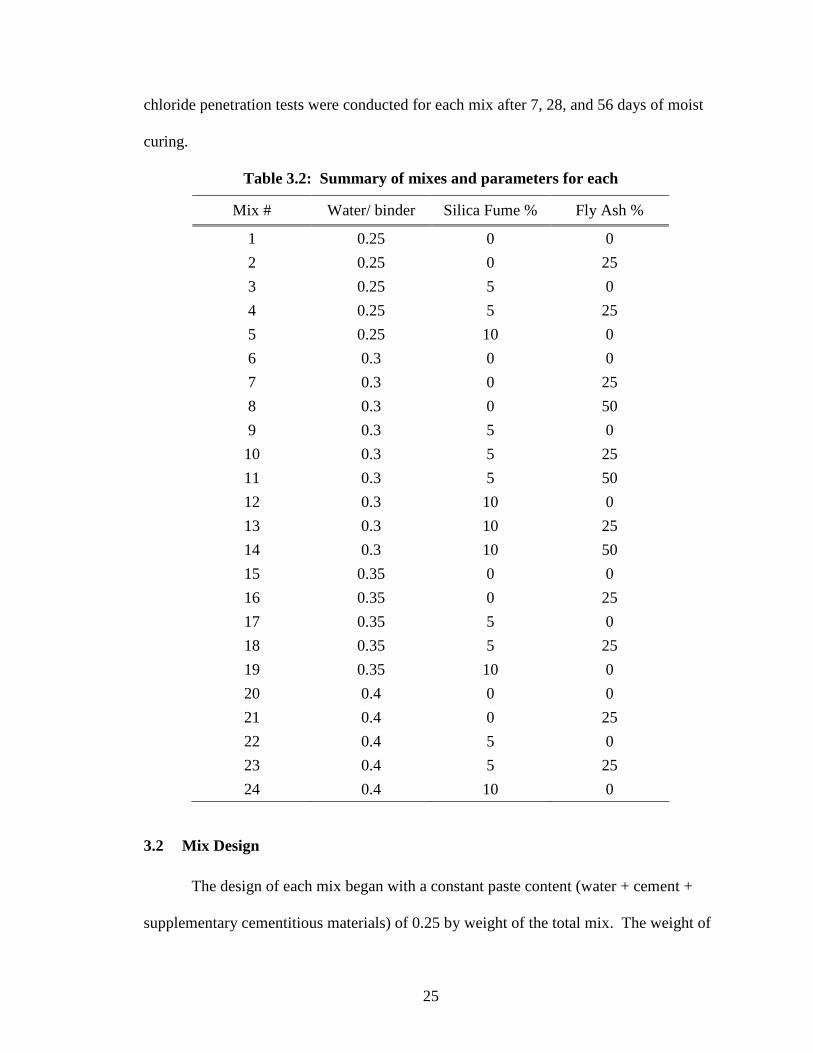
In addition to testing cement composition and water to binder ratio, moist curing
time was tested to observe the pore structure development with time. Strength and
25
chloride penetration tests were conducted for each mix after 7, 28, and 56 days of moist
curing.
Table 3.2: Summary of mixes and parameters for each
Mix # Water/ binder Silica Fume % Fly Ash %
1 0.25 0 0
2 0.25 0 25
3 0.25 5 0
4 0.25 5 25
5 0.25 10 0
6 0.3 0 0
7 0.3 0 25
8 0.3 0 50
9 0.3 5 0
10 0.3 5 25
11 0.3 5 50
12 0.3 10 0
13 0.3 10 25
14 0.3 10 50
15 0.35 0 0
16 0.35 0 25
17 0.35 5 0
18 0.35 5 25
19 0.35 10 0
20 0.4 0 0
21 0.4 0 25
22 0.4 5 0
23 0.4 5 25
24 0.4 10 0
3.2 Mix Design
The design of each mix began with a constant paste content (water + cement +
supplementary cementitious materials) of 0.25 by weight of the total mix. The weight of
26
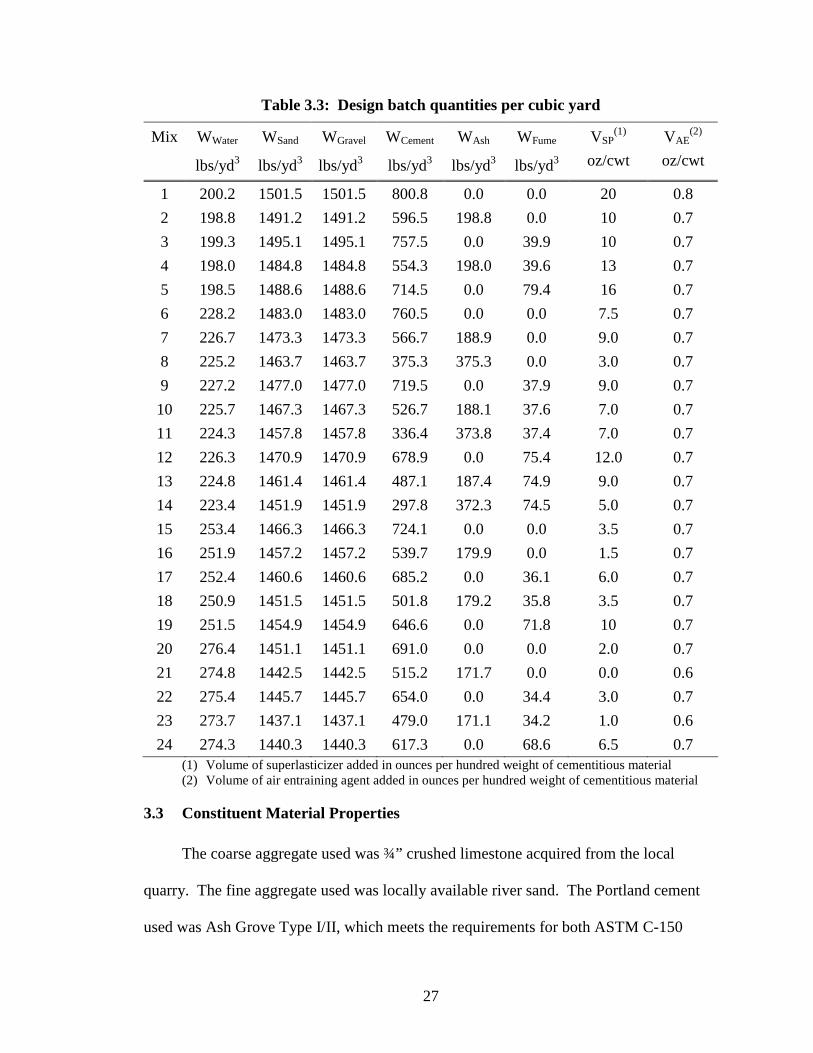
cement and water was adjusted based on the specified water to binder ratio. The
remainder of the mixture consisted of an equal weight of fine and course aggregate.
Superplasticizer and air entraining agent were added based on experience and trial mixing
prior to beginning the test program. Table 3.3 details the actual weights of the mixture
components used on a per cubic yard basis.
27
Table 3.3: Design batch quantities per cubic yard
Mix WWater WSand WGravel WCement WAsh WFume VSP(1) VAE
(2)
lbs/yd3 lbs/yd3 lbs/yd3 lbs/yd3 lbs/yd3 lbs/yd3 oz/cwt oz/cwt
1 200.2 1501.5 1501.5 800.8 0.0 0.0 20 0.8
2 198.8 1491.2 1491.2 596.5 198.8 0.0 10 0.7
3 199.3 1495.1 1495.1 757.5 0.0 39.9 10 0.7
4 198.0 1484.8 1484.8 554.3 198.0 39.6 13 0.7
5 198.5 1488.6 1488.6 714.5 0.0 79.4 16 0.7
6 228.2 1483.0 1483.0 760.5 0.0 0.0 7.5 0.7
7 226.7 1473.3 1473.3 566.7 188.9 0.0 9.0 0.7
8 225.2 1463.7 1463.7 375.3 375.3 0.0 3.0 0.7
9 227.2 1477.0 1477.0 719.5 0.0 37.9 9.0 0.7
10 225.7 1467.3 1467.3 526.7 188.1 37.6 7.0 0.7
11 224.3 1457.8 1457.8 336.4 373.8 37.4 7.0 0.7
12 226.3 1470.9 1470.9 678.9 0.0 75.4 12.0 0.7
13 224.8 1461.4 1461.4 487.1 187.4 74.9 9.0 0.7
14 223.4 1451.9 1451.9 297.8 372.3 74.5 5.0 0.7
15 253.4 1466.3 1466.3 724.1 0.0 0.0 3.5 0.7
16 251.9 1457.2 1457.2 539.7 179.9 0.0 1.5 0.7
17 252.4 1460.6 1460.6 685.2 0.0 36.1 6.0 0.7
18 250.9 1451.5 1451.5 501.8 179.2 35.8 3.5 0.7
19 251.5 1454.9 1454.9 646.6 0.0 71.8 10 0.7
20 276.4 1451.1 1451.1 691.0 0.0 0.0 2.0 0.7
21 274.8 1442.5 1442.5 515.2 171.7 0.0 0.0 0.6
22 275.4 1445.7 1445.7 654.0 0.0 34.4 3.0 0.7
23 273.7 1437.1 1437.1 479.0 171.1 34.2 1.0 0.6
24 274.3 1440.3 1440.3 617.3 0.0 68.6 6.5 0.7 (1) Volume of superlasticizer added in ounces per hundred weight of cementitious material (2) Volume of air entraining agent added in ounces per hundred weight of cementitious material
3.3 Constituent Material Properties
The coarse aggregate used was ¾” crushed limestone acquired from the local
quarry. The fine aggregate used was locally available river sand. The Portland cement
used was Ash Grove Type I/II, which meets the requirements for both ASTM C-150
28
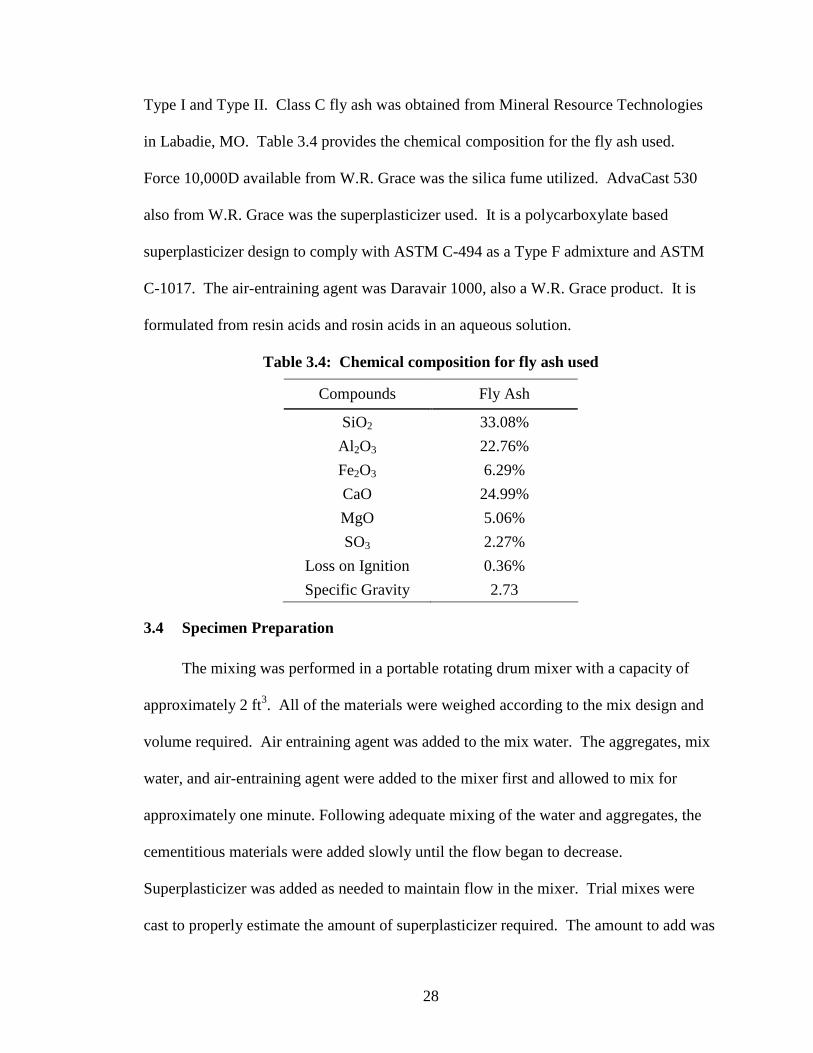
Type I and Type II. Class C fly ash was obtained from Mineral Resource Technologies
in Labadie, MO. Table 3.4 provides the chemical composition for the fly ash used.
Force 10,000D available from W.R. Grace was the silica fume utilized. AdvaCast 530
also from W.R. Grace was the superplasticizer used. It is a polycarboxylate based
superplasticizer design to comply with ASTM C-494 as a Type F admixture and ASTM
C-1017. The air-entraining agent was Daravair 1000, also a W.R. Grace product. It is
formulated from resin acids and rosin acids in an aqueous solution.
Table 3.4: Chemical composition for fly ash used
Compounds Fly Ash
SiO2 33.08%
Al 2O3 22.76%
Fe2O3 6.29%
CaO 24.99%
MgO 5.06%
SO3 2.27%
Loss on Ignition 0.36%
Specific Gravity 2.73
3.4 Specimen Preparation
The mixing was performed in a portable rotating drum mixer with a capacity of
approximately 2 ft3. All of the materials were weighed according to the mix design and
volume required. Air entraining agent was added to the mix water. The aggregates, mix
water, and air-entraining agent were added to the mixer first and allowed to mix for
approximately one minute. Following adequate mixing of the water and aggregates, the
cementitious materials were added slowly until the flow began to decrease.
Superplasticizer was added as needed to maintain flow in the mixer. Trial mixes were
cast to properly estimate the amount of superplasticizer required. The amount to add was
29
based on experience and the amount needed for mixes with similar compositions. After
all of the materials were added, they were allowed to mix for approximately five minutes
to ensure adequate flow and effectiveness of the superplasticizer. Testing of fresh
concrete properties including slump, air content, and unit weight began immediately
following mixing.
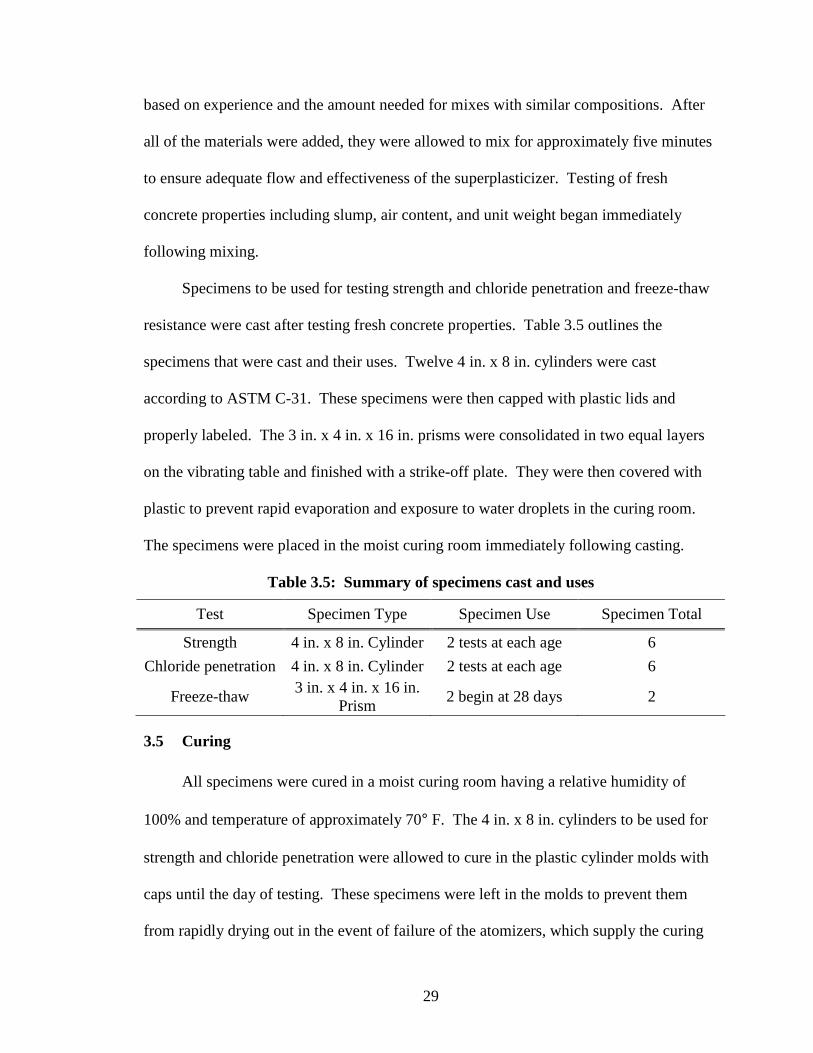
Specimens to be used for testing strength and chloride penetration and freeze-thaw
resistance were cast after testing fresh concrete properties. Table 3.5 outlines the
specimens that were cast and their uses. Twelve 4 in. x 8 in. cylinders were cast
according to ASTM C-31. These specimens were then capped with plastic lids and
properly labeled. The 3 in. x 4 in. x 16 in. prisms were consolidated in two equal layers
on the vibrating table and finished with a strike-off plate. They were then covered with
plastic to prevent rapid evaporation and exposure to water droplets in the curing room.
The specimens were placed in the moist curing room immediately following casting.
Table 3.5: Summary of specimens cast and uses
Test Specimen Type Specimen Use Specimen Total
Strength 4 in. x 8 in. Cylinder 2 tests at each age 6
Chloride penetration 4 in. x 8 in. Cylinder 2 tests at each age 6
Freeze-thaw 3 in. x 4 in. x 16 in.
Prism 2 begin at 28 days 2
3.5 Curing
All specimens were cured in a moist curing room having a relative humidity of
100% and temperature of approximately 70° F. The 4 in. x 8 in. cylinders to be used for
strength and chloride penetration were allowed to cure in the plastic cylinder molds with
caps until the day of testing. These specimens were left in the molds to prevent them
from rapidly drying out in the event of failure of the atomizers, which supply the curing

30
room with constant 100% relative humidity. The prisms to be used for freeze-thaw
testing were removed from the steel molds on the day following casting. These
specimens were marked and immediately returned to the moist curing room until testing
began after 28 days.
31
CHAPTER 4 EQUIPMENT AND PROCEDURE
4.1 Chloride Penetration Test
All chloride penetration tests in this study were conducted according to ASTM C-
1202 or AASHTO T-277, the Standard Test Method for Electrical Indication of
Concrete’s Ability to Resist Chloride Ion Penetration. All of the equipment and setup to
complete this test was designed and constructed according to the standard.
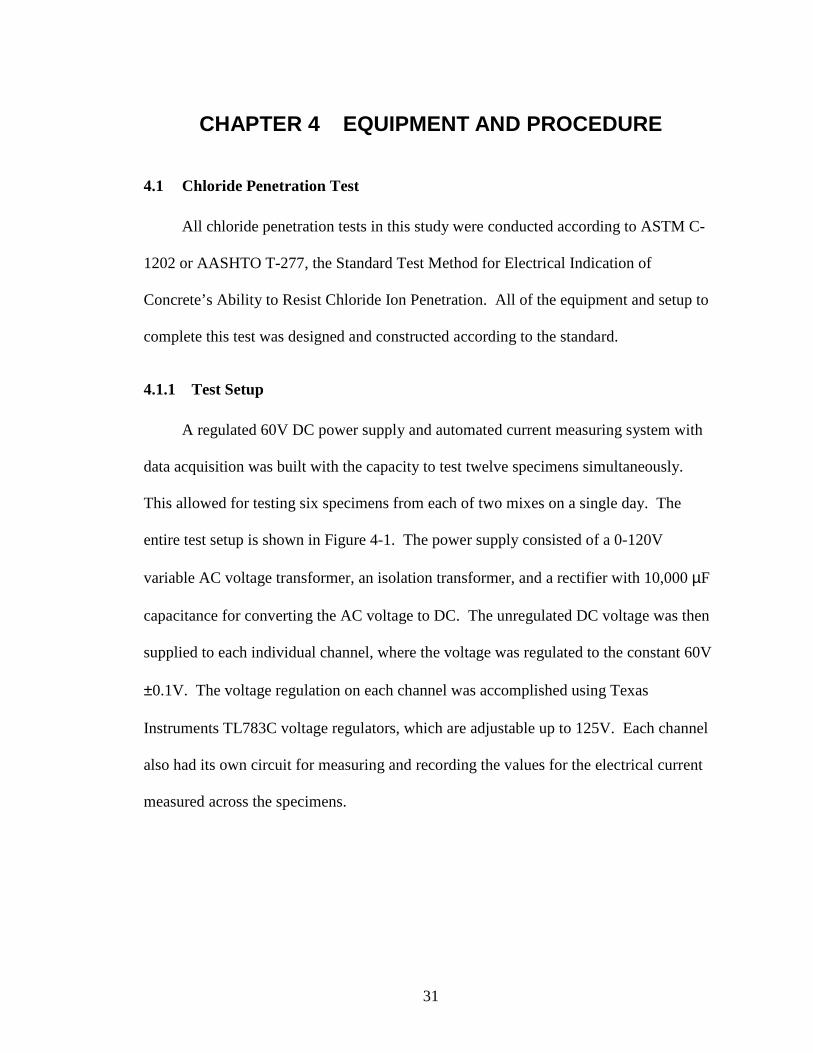
4.1.1 Test Setup
A regulated 60V DC power supply and automated current measuring system with
data acquisition was built with the capacity to test twelve specimens simultaneously.
This allowed for testing six specimens from each of two mixes on a single day. The
entire test setup is shown in Figure 4-1. The power supply consisted of a 0-120V
variable AC voltage transformer, an isolation transformer, and a rectifier with 10,000 µF
capacitance for converting the AC voltage to DC. The unregulated DC voltage was then
supplied to each individual channel, where the voltage was regulated to the constant 60V
±0.1V. The voltage regulation on each channel was accomplished using Texas
Instruments TL783C voltage regulators, which are adjustable up to 125V. Each channel
also had its own circuit for measuring and recording the values for the electrical current
measured across the specimens.
32
Figure 4-1: Rapid chloride penetration test setup
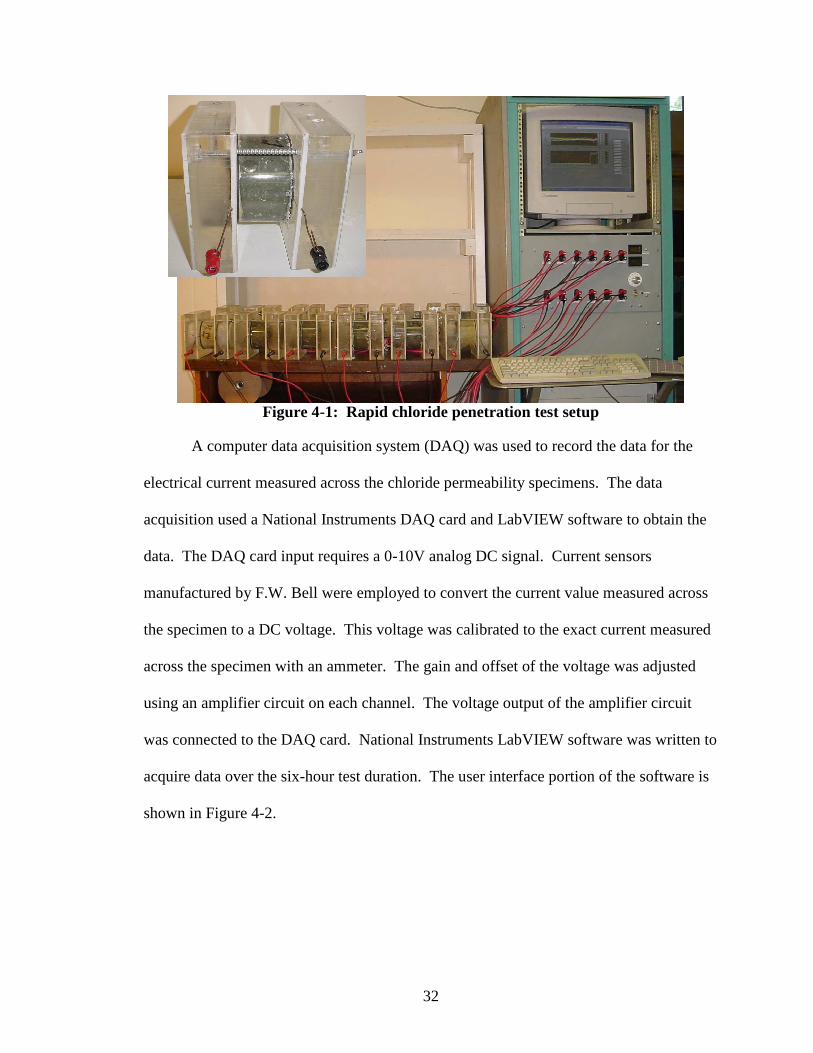
A computer data acquisition system (DAQ) was used to record the data for the
electrical current measured across the chloride permeability specimens. The data
acquisition used a National Instruments DAQ card and LabVIEW software to obtain the
data. The DAQ card input requires a 0-10V analog DC signal. Current sensors
manufactured by F.W. Bell were employed to convert the current value measured across
the specimen to a DC voltage. This voltage was calibrated to the exact current measured
across the specimen with an ammeter. The gain and offset of the voltage was adjusted
using an amplifier circuit on each channel. The voltage output of the amplifier circuit
was connected to the DAQ card. National Instruments LabVIEW software was written to
acquire data over the six-hour test duration. The user interface portion of the software is
shown in Figure 4-2.
33
Figure 4-2: Front panel display of LabVIEW data acquisition program for RCPT
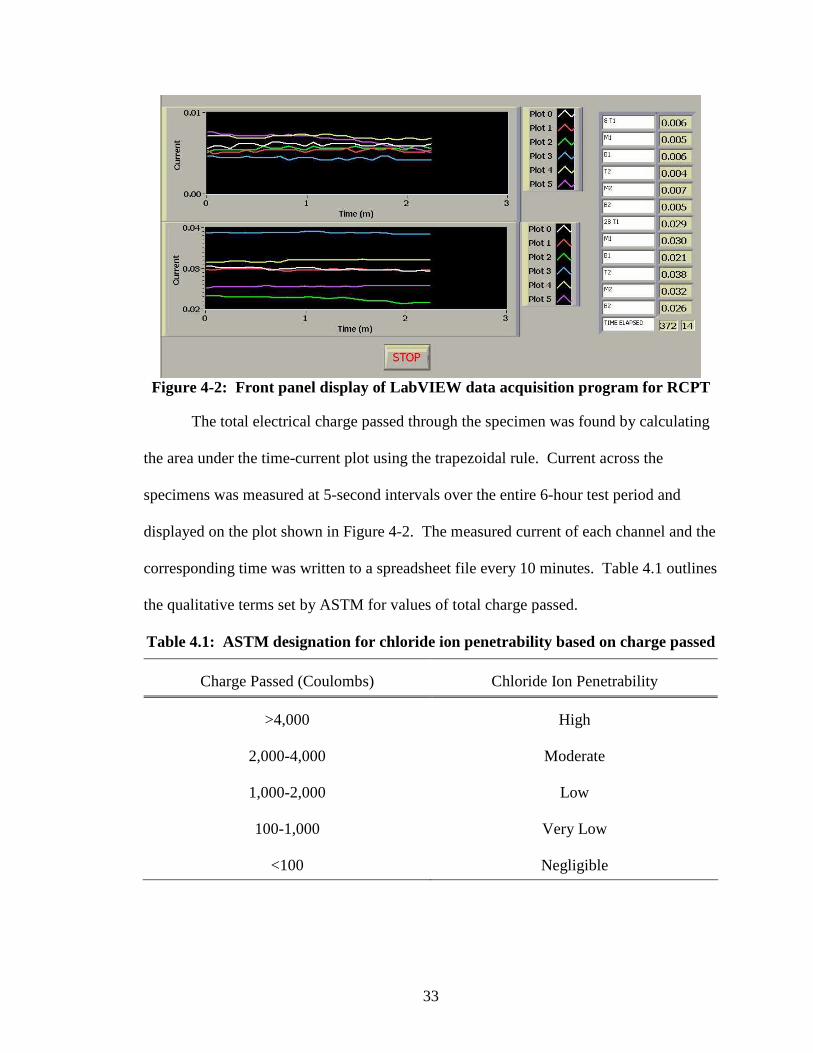
The total electrical charge passed through the specimen was found by calculating
the area under the time-current plot using the trapezoidal rule. Current across the
specimens was measured at 5-second intervals over the entire 6-hour test period and
displayed on the plot shown in Figure 4-2. The measured current of each channel and the
corresponding time was written to a spreadsheet file every 10 minutes. Table 4.1 outlines
the qualitative terms set by ASTM for values of total charge passed.
Table 4.1: ASTM designation for chloride ion penetrability based on charge passed
Charge Passed (Coulombs) Chloride Ion Penetrability
>4,000 High
2,000-4,000 Moderate
1,000-2,000 Low
100-1,000 Very Low
<100 Negligible
34
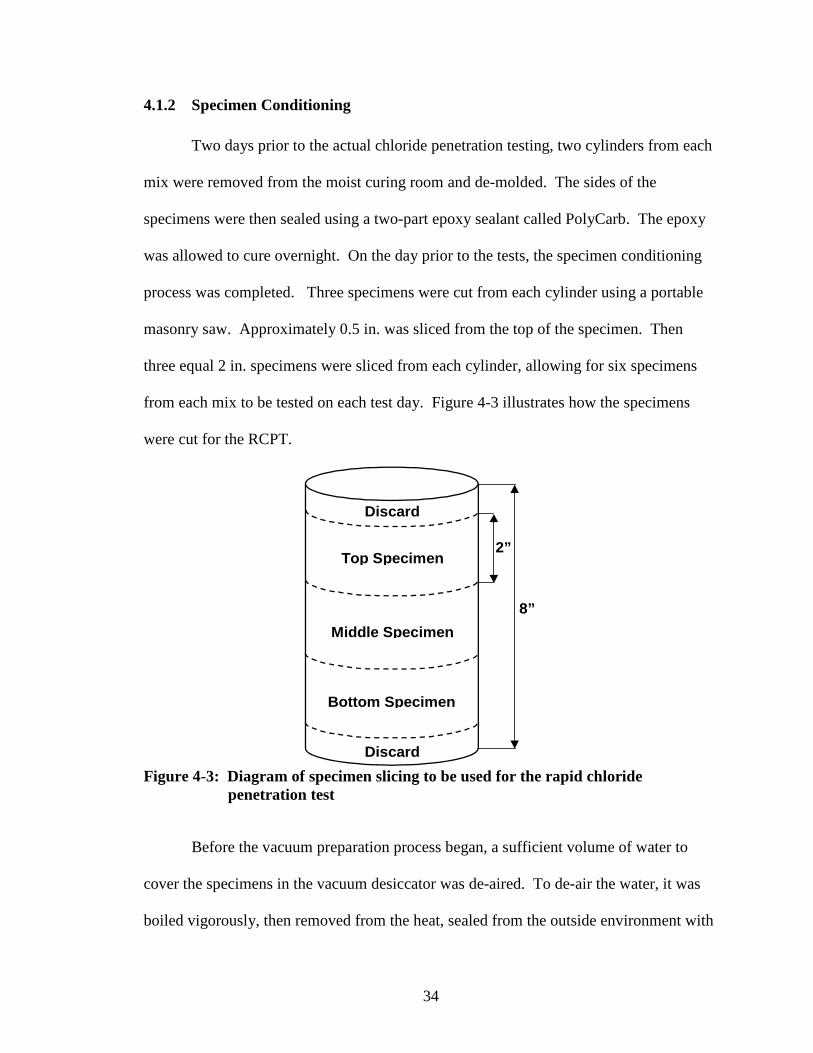
4.1.2 Specimen Conditioning
Two days prior to the actual chloride penetration testing, two cylinders from each
mix were removed from the moist curing room and de-molded. The sides of the
specimens were then sealed using a two-part epoxy sealant called PolyCarb. The epoxy
was allowed to cure overnight. On the day prior to the tests, the specimen conditioning
process was completed. Three specimens were cut from each cylinder using a portable
masonry saw. Approximately 0.5 in. was sliced from the top of the specimen. Then
three equal 2 in. specimens were sliced from each cylinder, allowing for six specimens
from each mix to be tested on each test day. Figure 4-3 illustrates how the specimens
were cut for the RCPT.
Discard
Middle Specimen
Discard
Top Specimen
Bottom Specimen
8”
2”
Figure 4-3: Diagram of specimen slicing to be used for the rapid chloride
penetration test
Before the vacuum preparation process began, a sufficient volume of water to
cover the specimens in the vacuum desiccator was de-aired. To de-air the water, it was
boiled vigorously, then removed from the heat, sealed from the outside environment with
35
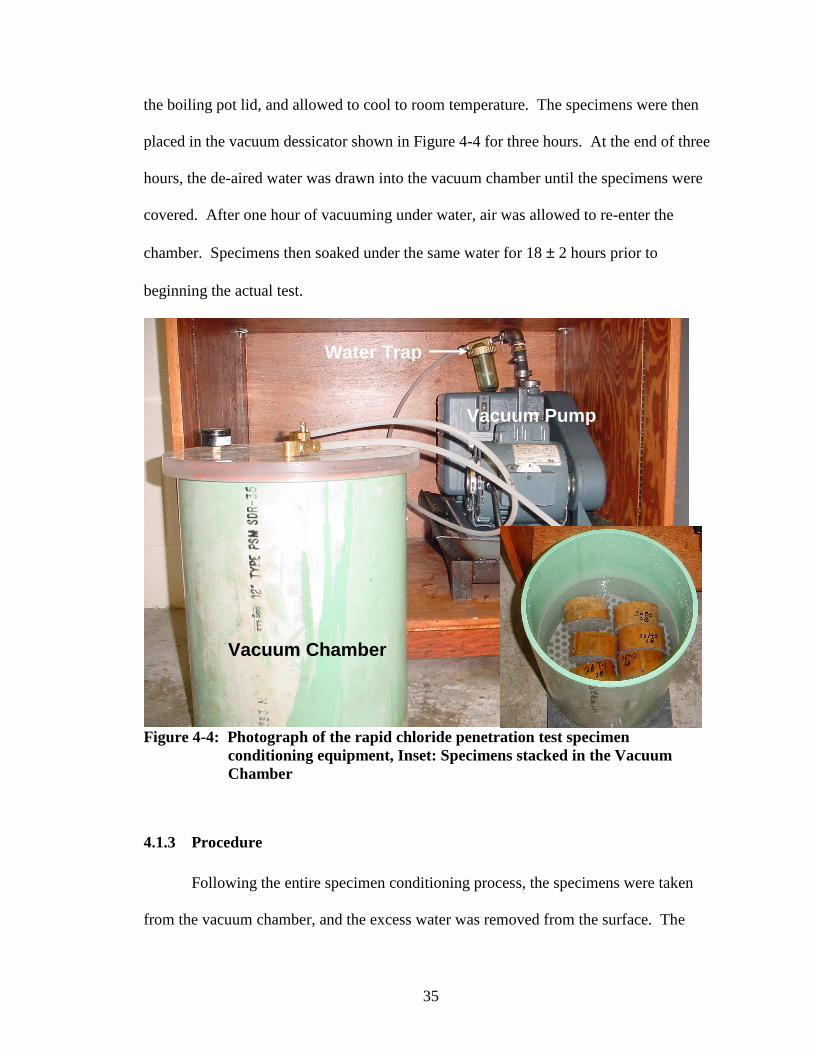
the boiling pot lid, and allowed to cool to room temperature. The specimens were then
placed in the vacuum dessicator shown in Figure 4-4 for three hours. At the end of three
hours, the de-aired water was drawn into the vacuum chamber until the specimens were
covered. After one hour of vacuuming under water, air was allowed to re-enter the
chamber. Specimens then soaked under the same water for 18 ± 2 hours prior to
beginning the actual test.
Figure 4-4: Photograph of the rapid chloride penetration test specimen
conditioning equipment, Inset: Specimens stacked in the Vacuum Chamber
4.1.3 Procedure
Following the entire specimen conditioning process, the specimens were taken
from the vacuum chamber, and the excess water was removed from the surface. The
Vacuum Pump
Water Trap
Vacuum Chamber
36
specimens were then placed into the cells with rubber gaskets between the specimen and
the brass terminal in each side of the cell to seal them from leaking. After the cells were
bolted together, as pictured in Figure 4-1, the side connected to the positive terminal of
the power supply was filled with 0.3N NaOH, and the side connected to the negative
terminal was filled with 3.0% NaCl Solution. Before the specimen’s electrical leads were
plugged into the terminals on each channel, the voltage of each channel was checked to
ensure that it was equal to 60.0 V, and the offset for the data acquisition of current was
verified to be zero. The specimens were finally connected to the 60 V, and the data
acquisition program was started. At the end of the 6-hour test, the power was switched
off and the DAQ was stopped. The calculation of total charge passed was completed
using Microsoft Excel.
4.2 Freeze Thaw Test
The freeze-thaw tests were conducted according to Procedure A of ASTM C-666,
the Standard Test Method for resistance of concrete to rapid freezing and thawing.
4.2.1 Test Setup
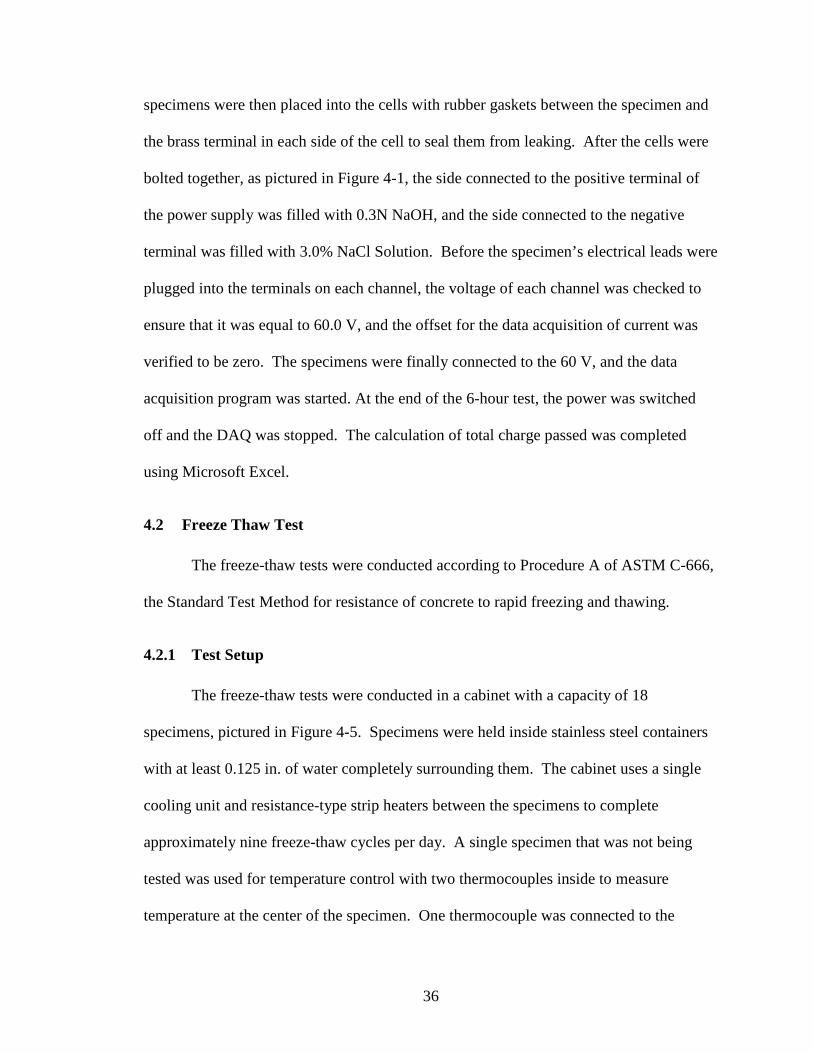
The freeze-thaw tests were conducted in a cabinet with a capacity of 18
specimens, pictured in Figure 4-5. Specimens were held inside stainless steel containers
with at least 0.125 in. of water completely surrounding them. The cabinet uses a single
cooling unit and resistance-type strip heaters between the specimens to complete
approximately nine freeze-thaw cycles per day. A single specimen that was not being
tested was used for temperature control with two thermocouples inside to measure
temperature at the center of the specimen. One thermocouple was connected to the
37
temperature control circuit, while the other was connected to a chart recorder to observe
the actual temperature and to keep record of the number of cycles.
Figure 4-5: Freeze-thaw cabinet shown during thawing portion of a cycle
4.2.2 Procedure
The specimens used for this test were 3 in. x 4 in. x 16 in. prisms. Testing began
on the freeze-thaw specimens after a period of 28 days of moist curing. Immediately
following removal of the specimens from the curing room, they were brought to a
temperature of approximately 40 °C by placing them in the cabinet for one cycle. Next,
the specimens were removed from the cabinet, and the fundamental transverse frequency
and weight were measured prior to starting the freeze-thaw cycles. This allowed a
baseline dynamic modulus of elasticity to be calculated. Specimens were also removed
from the freeze-thaw cabinet at intervals of approximately every 30 cycles to measure the
fundamental transverse frequency and weight of each specimen. The specimens were
38
returned to the cabinet in reverse order and turned over to provide even exposure to all
specimens.
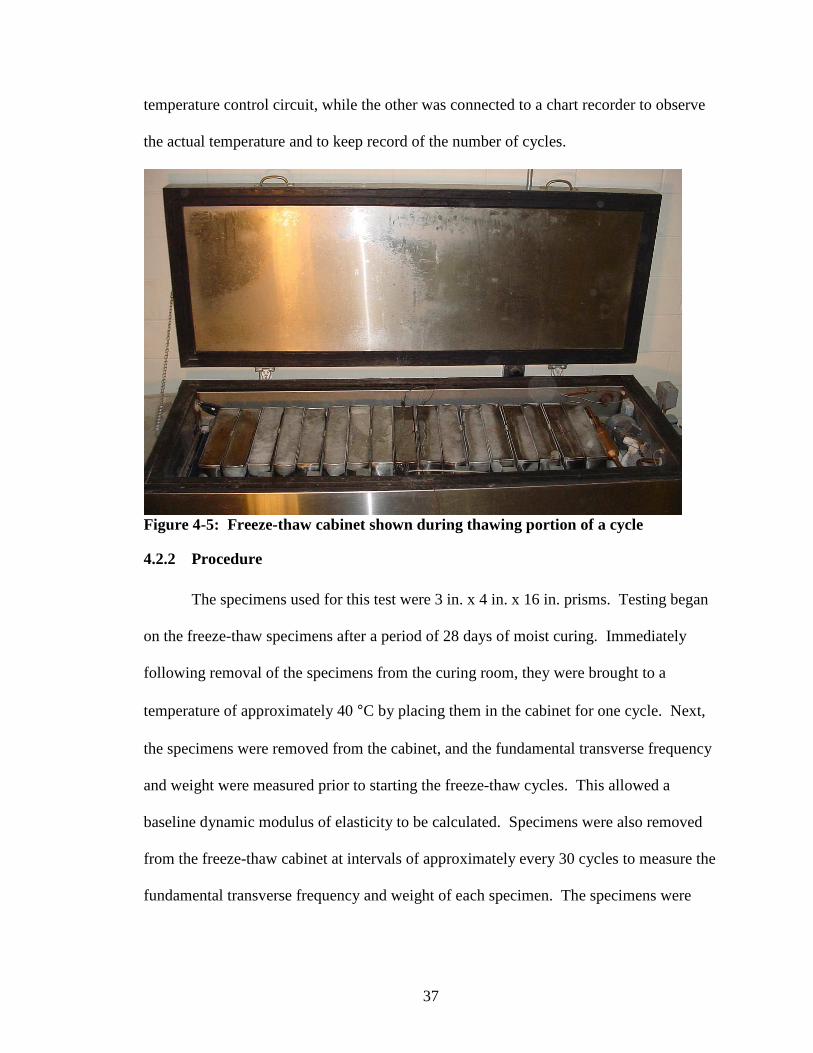
The fundamental transverse frequency was measured according to ASTM C-215
using the equipment shown in Figure 4-6. The frequency was adjusted until the electro-
mechanical driving unit pictured on the left end of the specimen and the pickup needle on
the right end were in phase. The oscilloscope on the control console indicated when the
ends of the specimen were in phase, or the fundamental transverse frequency had been
reached. The weight of each specimen was also recorded in order to calculate the
dynamic modulus of elasticity. The relative dynamic modulus of elasticity is the ratio of
the dynamic modulus at a given number of cycles to the original dynamic modulus. The
relative modulus is then used to calculate the durability factor. The durability factor is
defined as the relative dynamic modulus of elasticity times the ratio of the number of
cycles at which the test was discontinued to the specified number of cycles for
terminating freeze-thaw exposure. This value is then multiplied by 100 to give a value in
percent.
39
Figure 4-6: Frequency generator and setup for measuring fundamental transverse
frequency
4.3 Compressive Strength Test
The compressive strength of each mix was tested at 7, 28, and 56 days of moist
curing. The tests were performed according to ASTM C-39, the Standard Test Method
for Compressive Strength of Cylindrical Concrete Specimens. The 4 in. x 8 in.
cylindrical specimens were first capped using sulfur mortar capping compound to ensure
parallel and smooth ends. This procedure was performed in accordance with ASTM C-
617, Standard Practice for Capping Cylindrical Concrete Specimens. The Forney
concrete compression-testing machine pictured in Figure 4-7 was used for the actual
Frequency Generator
Pickup Needle
Oscilloscope
40
compression tests. The specimens were loaded at a rate of 45-50 psi/s in accordance with
ASTM C-39.
Figure 4-7: Photograph of concrete cylinder compression testing machine
41
CHAPTER 5 TEST RESULTS AND DISCUSSION
5.1 Fresh Concrete Properties
Immediately following concrete mixing, fresh concrete properties including slump,
unit weight, and air content were measured and recorded. The results of these tests are
listed in Table 5.1. Air content was measured using the pressure method according to
ASTM C-231 (2003b). Unit weight was measured according to ASTM C-138 (2001)
using the 0.25 ft3 pot from the air content measuring apparatus. Slump was measured
using the standard method according to ASTM C-143 (2003a) for the majority of
mixtures. However, a few mixtures required measurement of slump flow when the slump
was too high to be measured using the standard test. The slump flow test, typically used
for self-consolidating concrete (SCC), is a measure of the viscosity of the concrete
mixture. The slump flow test measures the time taken for the concrete to reach a spread
diameter of 30 inches from the instant the standard slump cone is lifted. This test
allowed a measure of the workability for the mixtures that would be considered a self
consolidating concrete.
42
Table 5.1: Properties measured on fresh concrete
Mixture Slump (in.) Unit Weight (lbs/ft3) Air Content (%)
1 25s1 150.0 4.0
2 23s1 147.6 4.7
3 8.0 149.2 4.0
4 8.0 146.0 5.3
5 2.5 148.8 4.2
6 5.5 145.2 5.5
7 12s1 142.0 6.0
8 5.5 140.8 6.8
9 2.3 145.6 5.1
10 3.0 143.6 6.1
11 8.0 138.8 7.5
12 4.0 146.0 4.5
13 2.0 145.2 4.5
14 7.0 137.6 7.0
15 2.0 144.8 4.5
16 4.5 143.6 5.6
17 8.0 144.8 6.0
18 8.0 137.6 7.5
19 8.0 142.0 5.7
20 3.0 143.2 5.2
21 5.5 144.0 4.5
22 7.5 136.4 7.5
23 3.3 144.0 4.2
24 6.5 132.4 10.0 1Slump Flow Measured
The fresh concrete properties are not the focus of this report, but can be useful in
analyzing some of the freeze-thaw and compressive strength results. Though the trend
may not readily appear in Table 5.1, it was noticed during mixing and casting that the
workability generally increased with fly ash use and decreased with the use of silica
fume. Superplasticizer was used to adjust the slump to a workable level depending on the
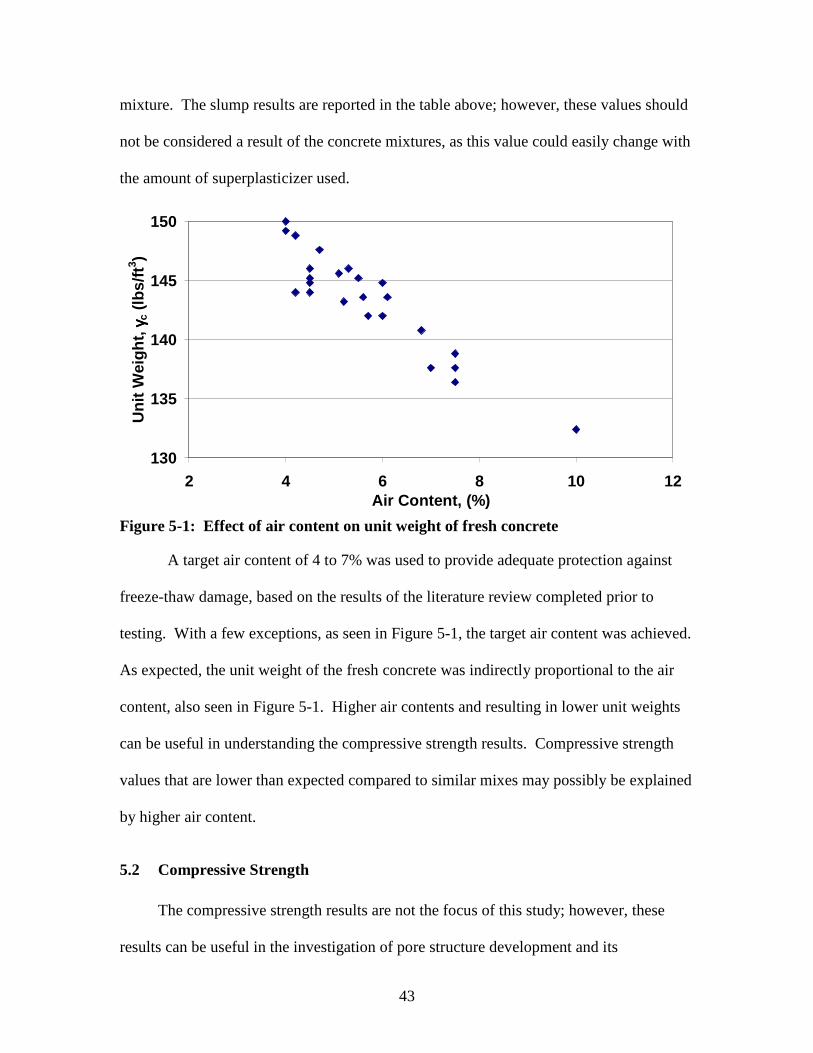
43
mixture. The slump results are reported in the table above; however, these values should
not be considered a result of the concrete mixtures, as this value could easily change with
the amount of superplasticizer used.
130
135
140
145
150
2 4 6 8 10 12Air Content, (%)
Uni
t Wei
ght,
γγ γγ c (
lbs/
ft3 )
Figure 5-1: Effect of air content on unit weight of fresh concrete
A target air content of 4 to 7% was used to provide adequate protection against
freeze-thaw damage, based on the results of the literature review completed prior to
testing. With a few exceptions, as seen in Figure 5-1, the target air content was achieved.
As expected, the unit weight of the fresh concrete was indirectly proportional to the air
content, also seen in Figure 5-1. Higher air contents and resulting in lower unit weights
can be useful in understanding the compressive strength results. Compressive strength
values that are lower than expected compared to similar mixes may possibly be explained
by higher air content.
5.2 Compressive Strength
The compressive strength results are not the focus of this study; however, these
results can be useful in the investigation of pore structure development and its
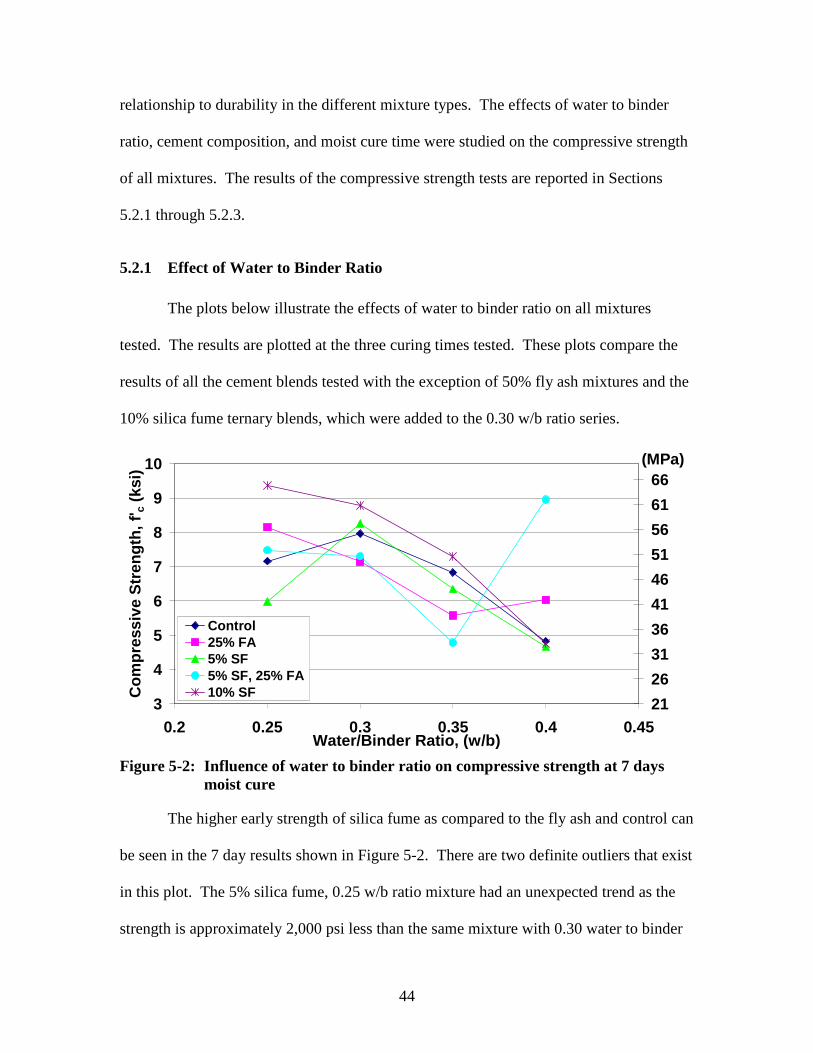
44
relationship to durability in the different mixture types. The effects of water to binder
ratio, cement composition, and moist cure time were studied on the compressive strength
of all mixtures. The results of the compressive strength tests are reported in Sections
5.2.1 through 5.2.3.
5.2.1 Effect of Water to Binder Ratio
The plots below illustrate the effects of water to binder ratio on all mixtures
tested. The results are plotted at the three curing times tested. These plots compare the
results of all the cement blends tested with the exception of 50% fly ash mixtures and the
10% silica fume ternary blends, which were added to the 0.30 w/b ratio series.
3
4
5
6
7
8
9
10
0.2 0.25 0.3 0.35 0.4 0.45Water/Binder Ratio, (w/b)
Com
pres
sive
Str
engt
h, f'
c (k
si)
21
26
31
36
41
46
51
56
61
66
Control25% FA5% SF5% SF, 25% FA10% SF
(MPa)
Figure 5-2: Influence of water to binder ratio on compressive strength at 7 days
moist cure
The higher early strength of silica fume as compared to the fly ash and control can
be seen in the 7 day results shown in Figure 5-2. There are two definite outliers that exist
in this plot. The 5% silica fume, 0.25 w/b ratio mixture had an unexpected trend as the
strength is approximately 2,000 psi less than the same mixture with 0.30 water to binder
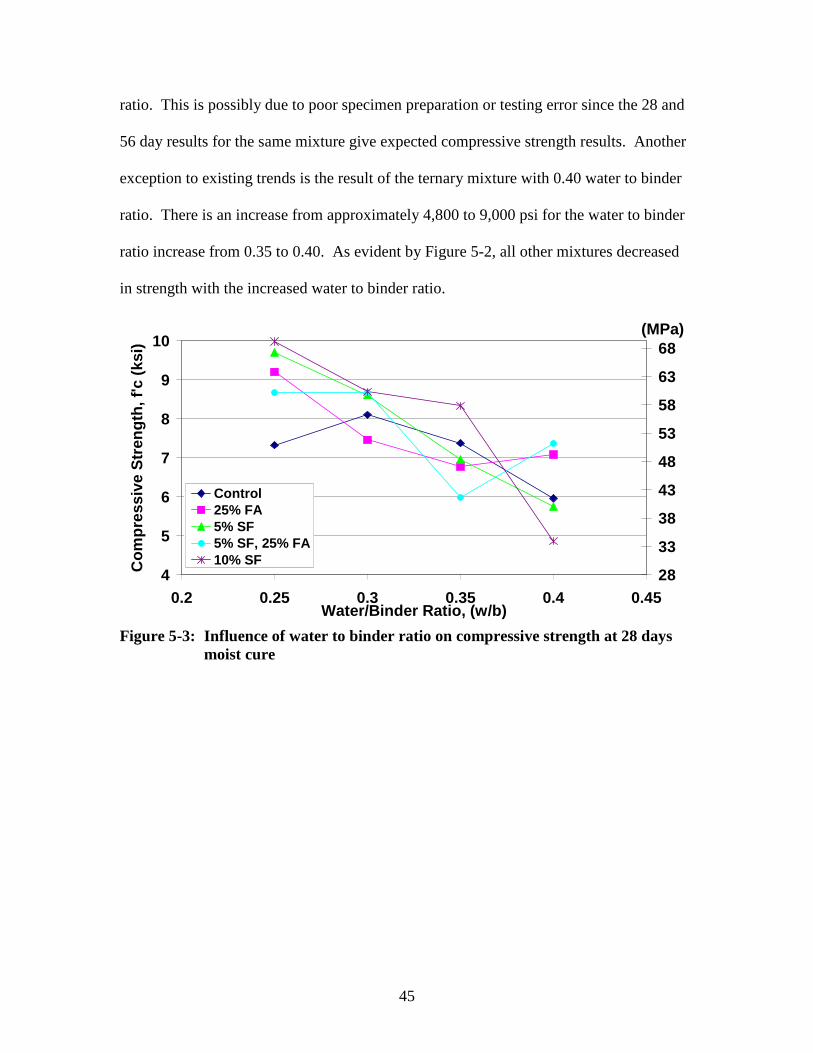
45
ratio. This is possibly due to poor specimen preparation or testing error since the 28 and
56 day results for the same mixture give expected compressive strength results. Another
exception to existing trends is the result of the ternary mixture with 0.40 water to binder
ratio. There is an increase from approximately 4,800 to 9,000 psi for the water to binder
ratio increase from 0.35 to 0.40. As evident by Figure 5-2, all other mixtures decreased
in strength with the increased water to binder ratio.
4
5
6
7
8
9
10
0.2 0.25 0.3 0.35 0.4 0.45Water/Binder Ratio, (w/b)
Com
pres
sive
Str
engt
h, f'
c (k
si)
28
33
38
43
48
53
58
63
68
Control25% FA5% SF5% SF, 25% FA10% SF
(MPa)
Figure 5-3: Influence of water to binder ratio on compressive strength at 28 days
moist cure
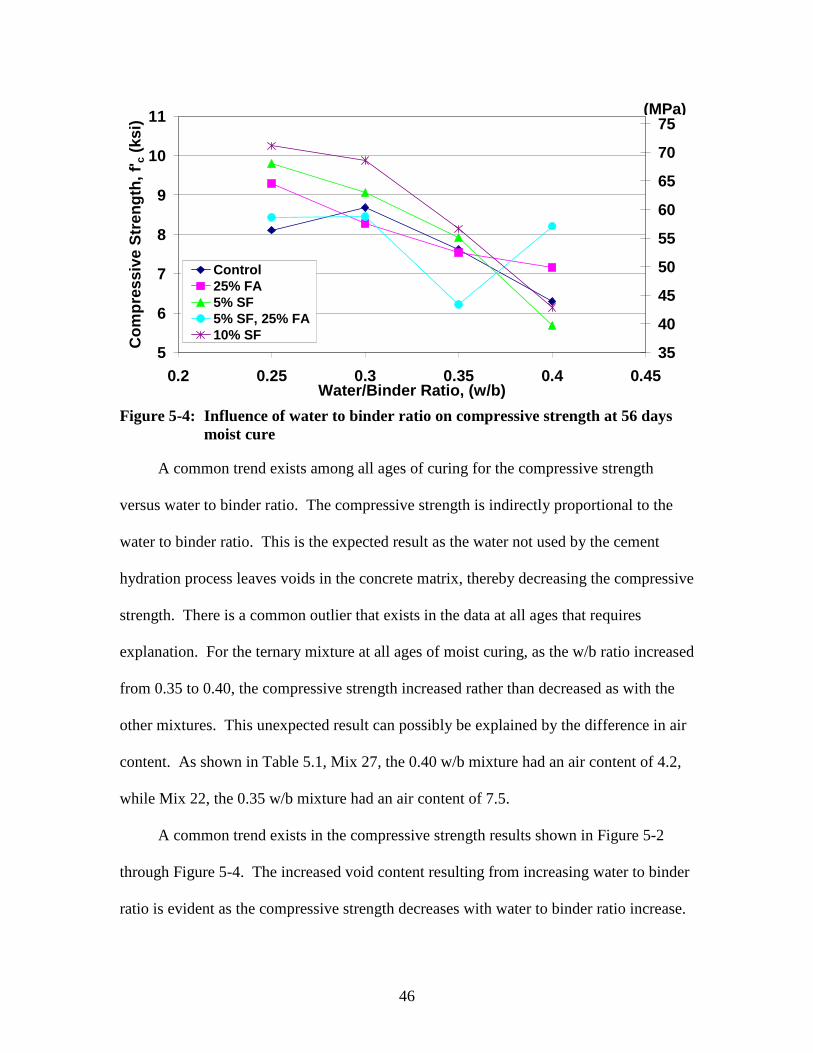
46
5
6
7
8
9
10
11
0.2 0.25 0.3 0.35 0.4 0.45Water/Binder Ratio, (w/b)
Com
pres
sive
Str
engt
h, f'
c (k
si)
35
40
45
50
55
60
65
70
75
Control25% FA5% SF5% SF, 25% FA10% SF
(MPa)
Figure 5-4: Influence of water to binder ratio on compressive strength at 56 days
moist cure
A common trend exists among all ages of curing for the compressive strength
versus water to binder ratio. The compressive strength is indirectly proportional to the
water to binder ratio. This is the expected result as the water not used by the cement
hydration process leaves voids in the concrete matrix, thereby decreasing the compressive
strength. There is a common outlier that exists in the data at all ages that requires
explanation. For the ternary mixture at all ages of moist curing, as the w/b ratio increased
from 0.35 to 0.40, the compressive strength increased rather than decreased as with the
other mixtures. This unexpected result can possibly be explained by the difference in air
content. As shown in Table 5.1, Mix 27, the 0.40 w/b mixture had an air content of 4.2,
while Mix 22, the 0.35 w/b mixture had an air content of 7.5.
A common trend exists in the compressive strength results shown in Figure 5-2
through Figure 5-4. The increased void content resulting from increasing water to binder
ratio is evident as the compressive strength decreases with water to binder ratio increase.
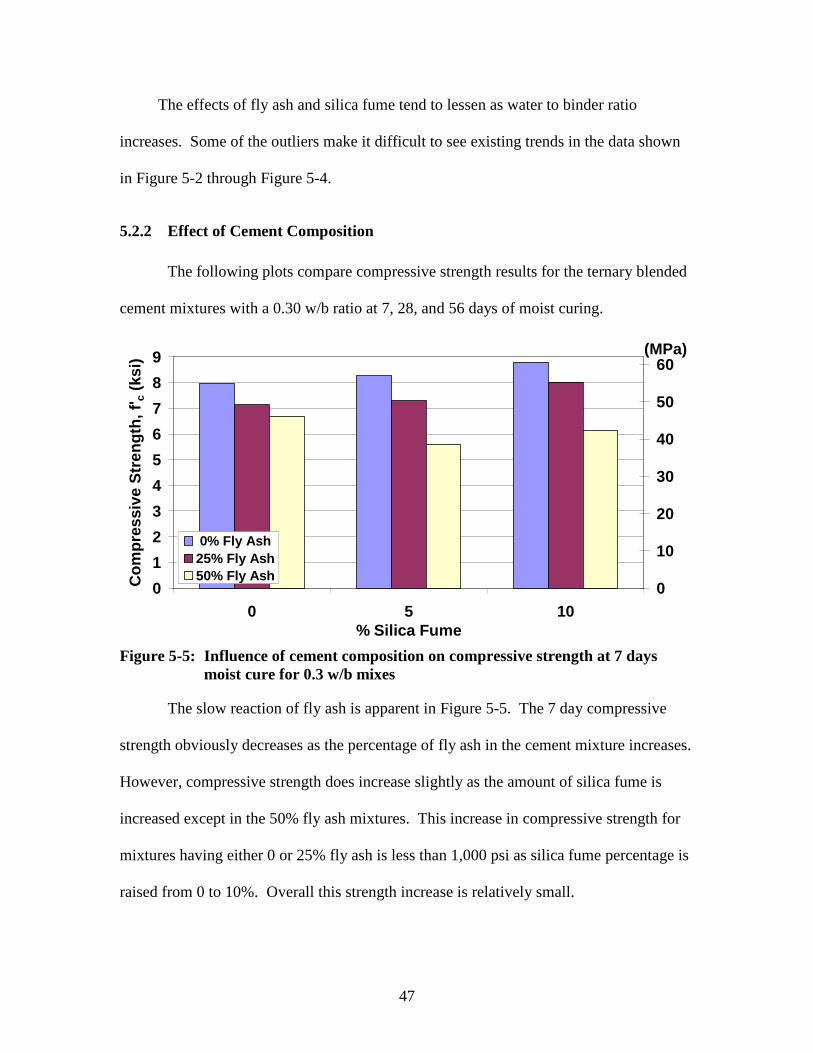
47
The effects of fly ash and silica fume tend to lessen as water to binder ratio
increases. Some of the outliers make it difficult to see existing trends in the data shown
in Figure 5-2 through Figure 5-4.
5.2.2 Effect of Cement Composition
The following plots compare compressive strength results for the ternary blended
cement mixtures with a 0.30 w/b ratio at 7, 28, and 56 days of moist curing.
0
1
2
3
4
5
6
7
8
9
0 5 10% Silica Fume
Com
pres
sive
Str
engt
h, f'
c (k
si)
0
10
20
30
40
50
60
0% Fly Ash25% Fly Ash50% Fly Ash
(MPa)
Figure 5-5: Influence of cement composition on compressive strength at 7 days
moist cure for 0.3 w/b mixes
The slow reaction of fly ash is apparent in Figure 5-5. The 7 day compressive
strength obviously decreases as the percentage of fly ash in the cement mixture increases.
However, compressive strength does increase slightly as the amount of silica fume is
increased except in the 50% fly ash mixtures. This increase in compressive strength for
mixtures having either 0 or 25% fly ash is less than 1,000 psi as silica fume percentage is
raised from 0 to 10%. Overall this strength increase is relatively small.
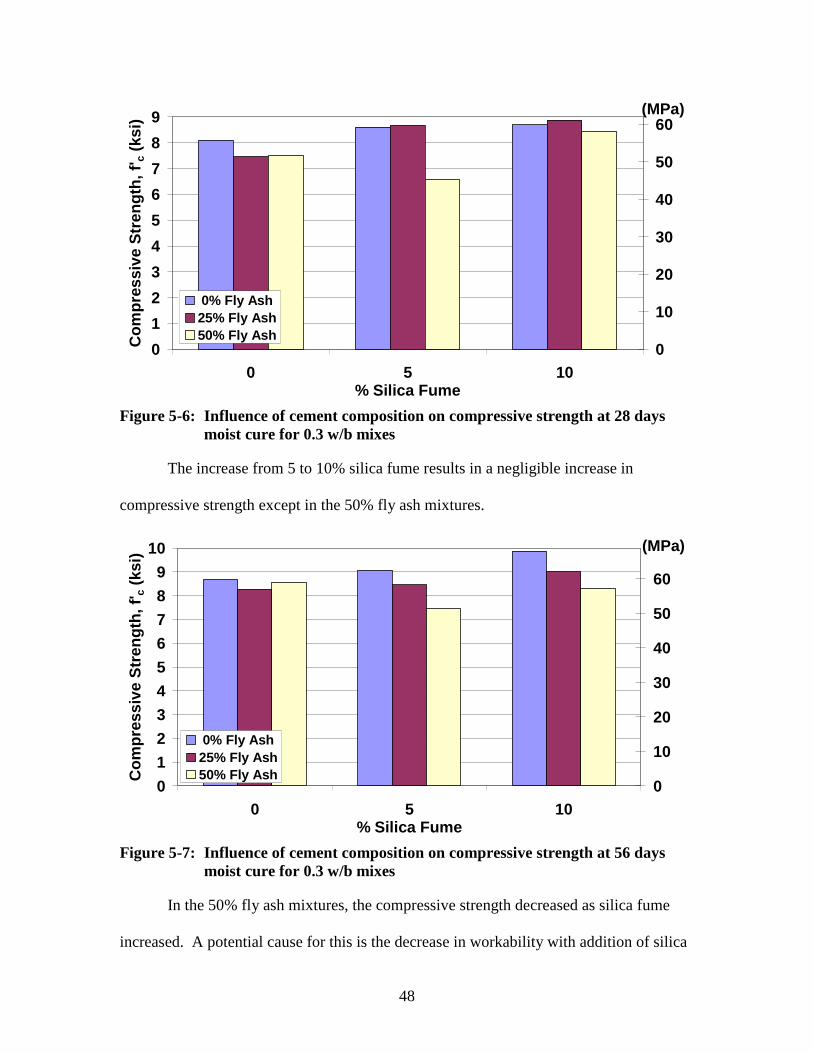
48
0
1
2
3
4
5
6
7
8
9
0 5 10% Silica Fume
Com
pres
sive
Str
engt
h, f'
c (k
si)
0
10
20
30
40
50
60
0% Fly Ash25% Fly Ash50% Fly Ash
(MPa)
Figure 5-6: Influence of cement composition on compressive strength at 28 days
moist cure for 0.3 w/b mixes
The increase from 5 to 10% silica fume results in a negligible increase in
compressive strength except in the 50% fly ash mixtures.
0
1
2
3
4
5
6
7
8
9
10
0 5 10% Silica Fume
Com
pres
sive
Str
engt
h, f'
c (k
si)
0
10
20
30
40
50
60
0% Fly Ash25% Fly Ash50% Fly Ash
(MPa)
Figure 5-7: Influence of cement composition on compressive strength at 56 days
moist cure for 0.3 w/b mixes
In the 50% fly ash mixtures, the compressive strength decreased as silica fume
increased. A potential cause for this is the decrease in workability with addition of silica
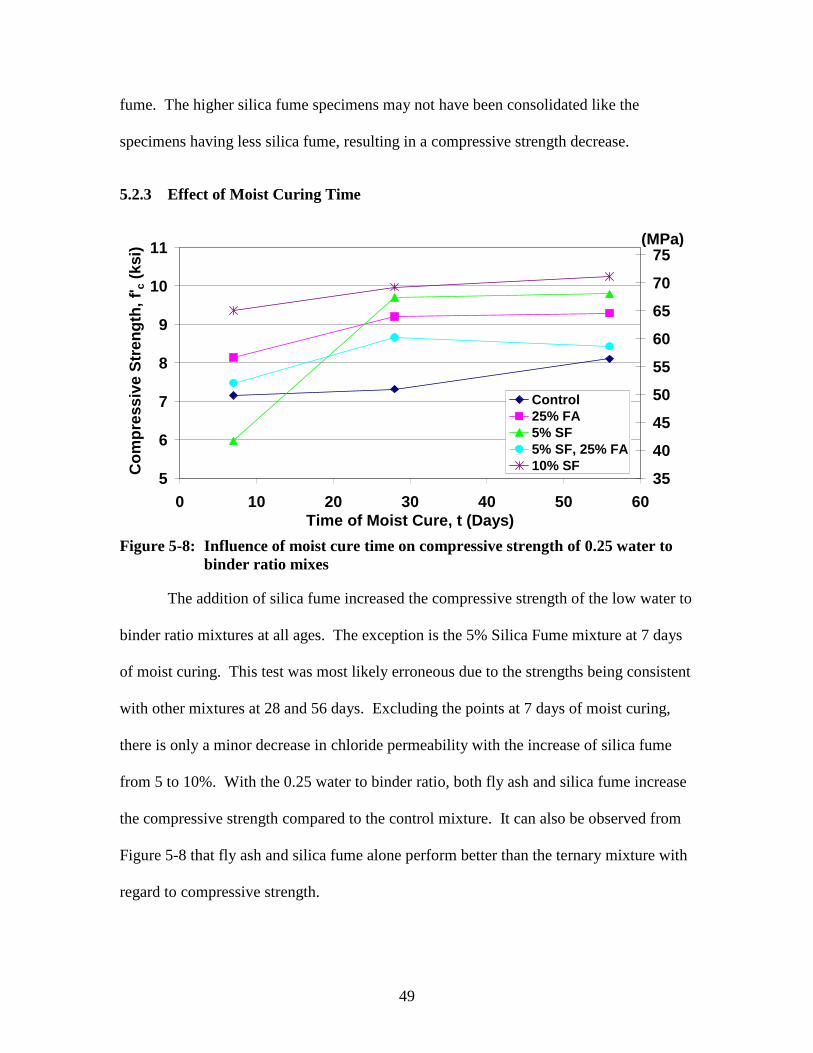
49
fume. The higher silica fume specimens may not have been consolidated like the
specimens having less silica fume, resulting in a compressive strength decrease.
5.2.3 Effect of Moist Curing Time
5
6
7
8
9
10
11
0 10 20 30 40 50 60Time of Moist Cure, t (Days)
Com
pres
sive
Str
engt
h, f'
c (k
si)
35
40
45
50
55
60
65
70
75
Control25% FA5% SF5% SF, 25% FA10% SF
(MPa)
Figure 5-8: Influence of moist cure time on compressive strength of 0.25 water to
binder ratio mixes
The addition of silica fume increased the compressive strength of the low water to
binder ratio mixtures at all ages. The exception is the 5% Silica Fume mixture at 7 days
of moist curing. This test was most likely erroneous due to the strengths being consistent
with other mixtures at 28 and 56 days. Excluding the points at 7 days of moist curing,
there is only a minor decrease in chloride permeability with the increase of silica fume
from 5 to 10%. With the 0.25 water to binder ratio, both fly ash and silica fume increase
the compressive strength compared to the control mixture. It can also be observed from
Figure 5-8 that fly ash and silica fume alone perform better than the ternary mixture with
regard to compressive strength.
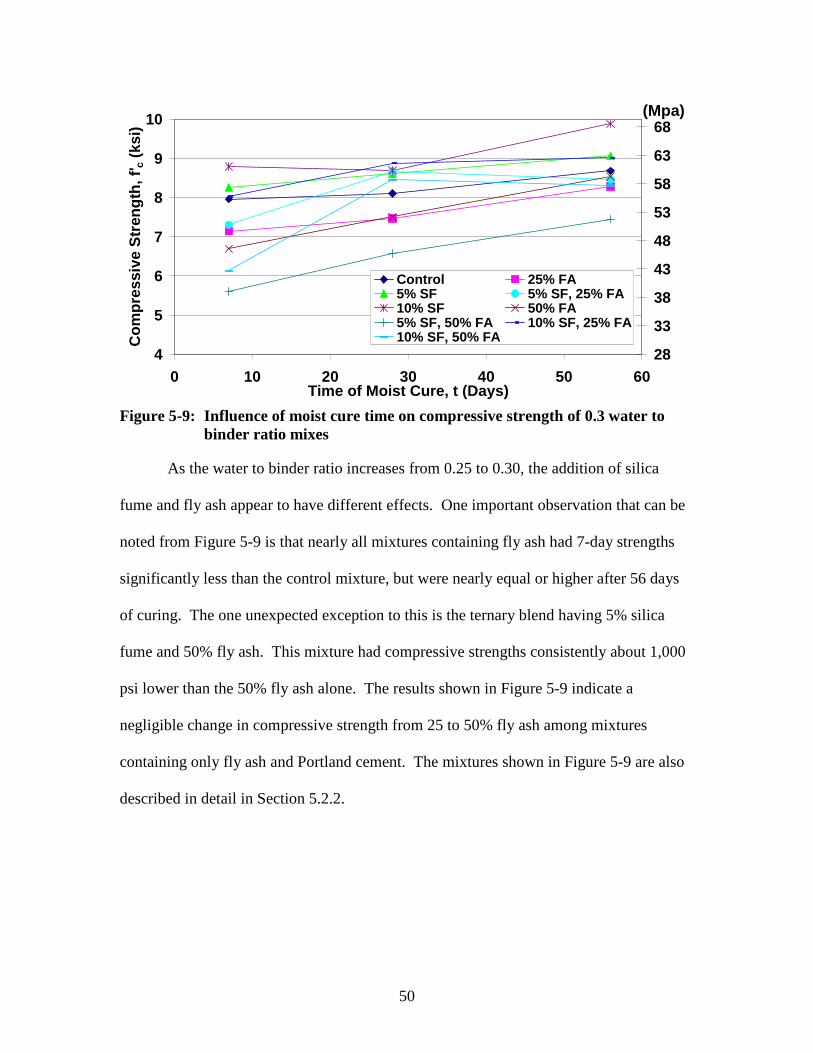
50
4
5
6
7
8
9
10
0 10 20 30 40 50 60Time of Moist Cure, t (Days)
Com
pres
sive
Str
engt
h, f'
c (k
si)
28
33
38
43
48
53
58
63
68
Control 25% FA5% SF 5% SF, 25% FA10% SF 50% FA5% SF, 50% FA 10% SF, 25% FA10% SF, 50% FA
(Mpa)
Figure 5-9: Influence of moist cure time on compressive strength of 0.3 water to
binder ratio mixes
As the water to binder ratio increases from 0.25 to 0.30, the addition of silica
fume and fly ash appear to have different effects. One important observation that can be
noted from Figure 5-9 is that nearly all mixtures containing fly ash had 7-day strengths
significantly less than the control mixture, but were nearly equal or higher after 56 days
of curing. The one unexpected exception to this is the ternary blend having 5% silica
fume and 50% fly ash. This mixture had compressive strengths consistently about 1,000
psi lower than the 50% fly ash alone. The results shown in Figure 5-9 indicate a
negligible change in compressive strength from 25 to 50% fly ash among mixtures
containing only fly ash and Portland cement. The mixtures shown in Figure 5-9 are also
described in detail in Section 5.2.2.
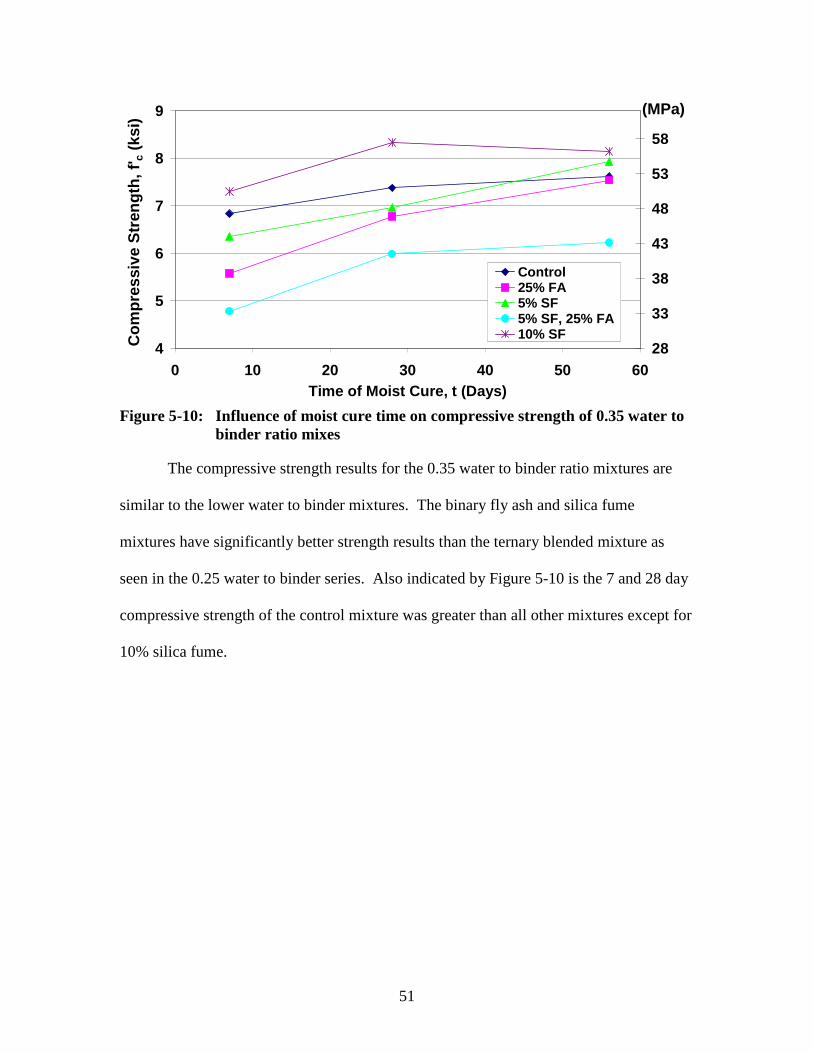
51
4
5
6
7
8
9
0 10 20 30 40 50 60Time of Moist Cure, t (Days)
28
33
38
43
48
53
58
Control25% FA5% SF5% SF, 25% FA10% SFC
ompr
essi
ve S
tren
gth,
f'c
(ksi
)
(MPa)
Figure 5-10: Influence of moist cure time on compressive strength of 0.35 water to
binder ratio mixes
The compressive strength results for the 0.35 water to binder ratio mixtures are
similar to the lower water to binder mixtures. The binary fly ash and silica fume
mixtures have significantly better strength results than the ternary blended mixture as
seen in the 0.25 water to binder series. Also indicated by Figure 5-10 is the 7 and 28 day
compressive strength of the control mixture was greater than all other mixtures except for
10% silica fume.
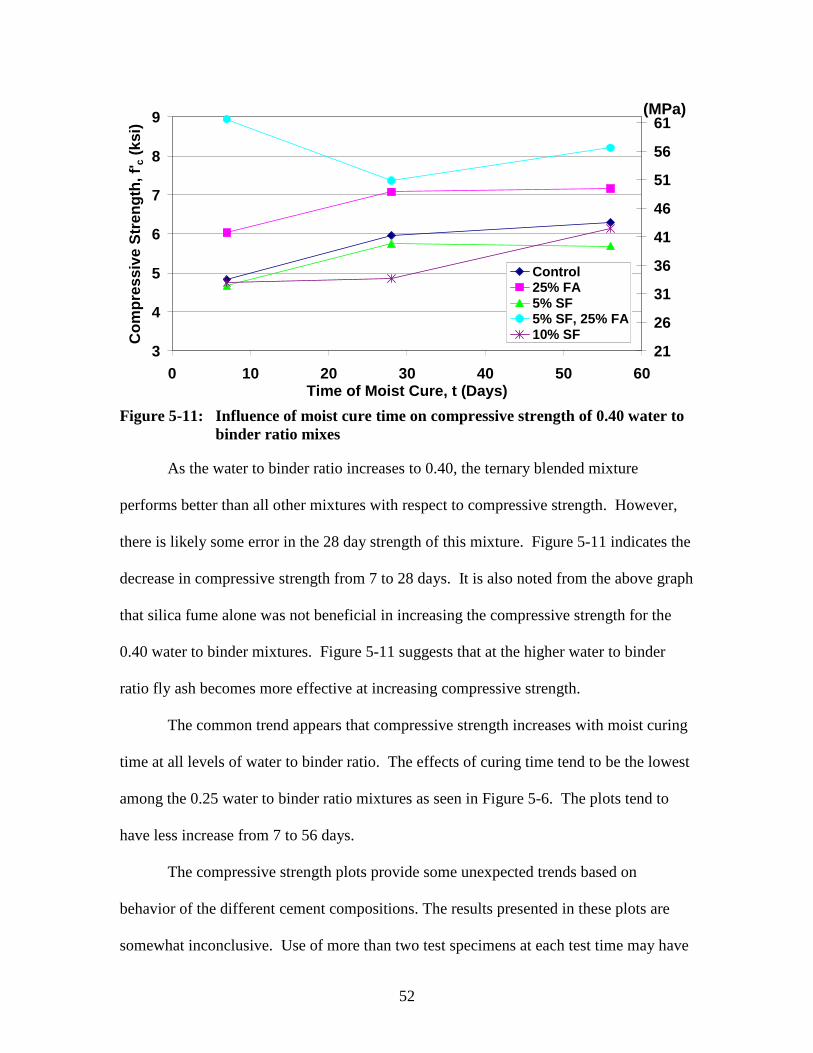
52
3
4
5
6
7
8
9
0 10 20 30 40 50 60Time of Moist Cure, t (Days)
Com
pres
sive
Str
engt
h, f'
c (k
si)
21
26
31
36
41
46
51
56
61
Control25% FA5% SF5% SF, 25% FA10% SF
(MPa)
Figure 5-11: Influence of moist cure time on compressive strength of 0.40 water to
binder ratio mixes
As the water to binder ratio increases to 0.40, the ternary blended mixture
performs better than all other mixtures with respect to compressive strength. However,
there is likely some error in the 28 day strength of this mixture. Figure 5-11 indicates the
decrease in compressive strength from 7 to 28 days. It is also noted from the above graph
that silica fume alone was not beneficial in increasing the compressive strength for the
0.40 water to binder mixtures. Figure 5-11 suggests that at the higher water to binder
ratio fly ash becomes more effective at increasing compressive strength.
The common trend appears that compressive strength increases with moist curing
time at all levels of water to binder ratio. The effects of curing time tend to be the lowest
among the 0.25 water to binder ratio mixtures as seen in Figure 5-6. The plots tend to
have less increase from 7 to 56 days.
The compressive strength plots provide some unexpected trends based on
behavior of the different cement compositions. The results presented in these plots are
somewhat inconclusive. Use of more than two test specimens at each test time may have
53
been useful in some cases to determine erroneous data points. Eliminating any data
points caused by invalid compressive strength tests or improperly prepared specimens
could potentially reduce the number of unexpected results like those shown in the above
plots.
5.3 Chloride Permeability
As stated previously, all chloride penetration tests were conducted according to
ASTM C-1202, commonly known as the Rapid Chloride Penetration Test (RCPT). There
is a discussion of the time-current response during the RCPT and the effects of specimen
heating during the six hour test. The effects of water to binder ratio, cement composition,
and curing time are reported and discussed in detail in Sections 5.3.2 through 5.3.4.
5.3.1 Current vs. Time Response
The current versus time response varied greatly for the different types of mixtures
tested. A study of the current vs. time plots assists in understanding RCPT results and
how they are affected by different mixtures. The following plots are average current vs.
time responses of six specimens from each mixture. The two plots shown are from the
mixture with the least permeability and a mixture that was among those with the highest
permeability.
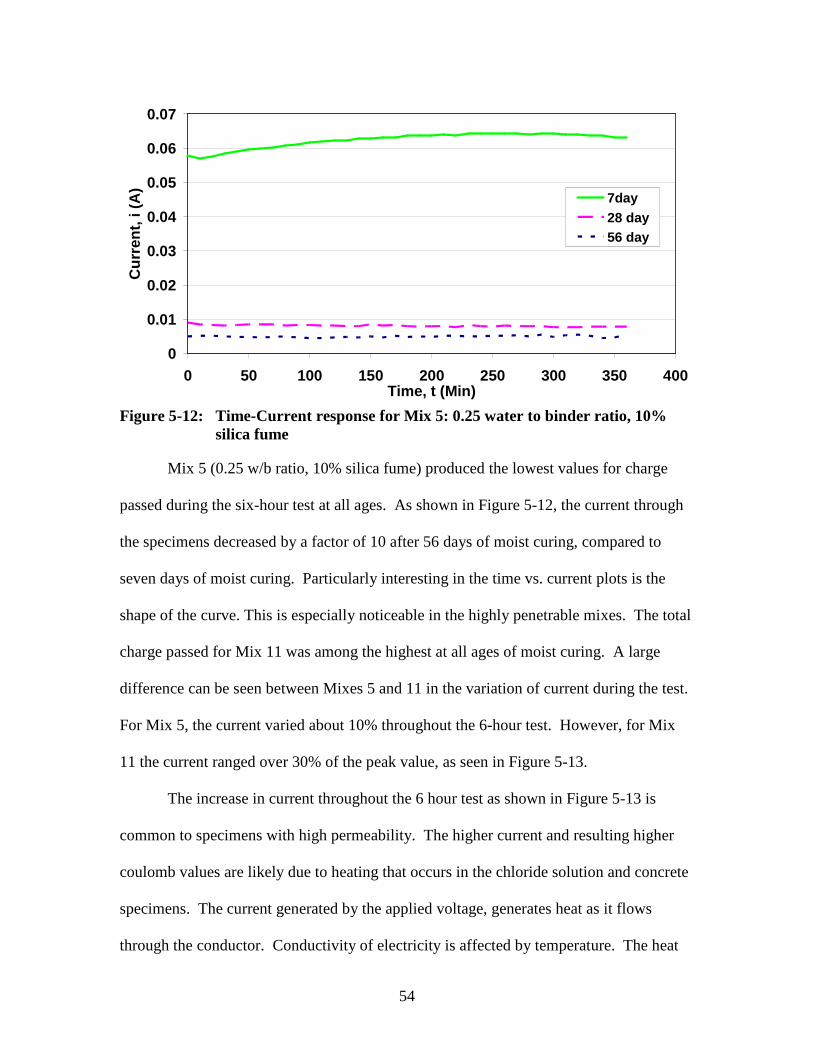
54
0
0.01
0.02
0.03
0.04
0.05
0.06
0.07
0 50 100 150 200 250 300 350 400Time, t (Min)
Cur
rent
, i (
A) 7day
28 day56 day
Figure 5-12: Time-Current response for Mix 5: 0.25 water to binder ratio, 10%
silica fume
Mix 5 (0.25 w/b ratio, 10% silica fume) produced the lowest values for charge
passed during the six-hour test at all ages. As shown in Figure 5-12, the current through
the specimens decreased by a factor of 10 after 56 days of moist curing, compared to
seven days of moist curing. Particularly interesting in the time vs. current plots is the
shape of the curve. This is especially noticeable in the highly penetrable mixes. The total
charge passed for Mix 11 was among the highest at all ages of moist curing. A large
difference can be seen between Mixes 5 and 11 in the variation of current during the test.
For Mix 5, the current varied about 10% throughout the 6-hour test. However, for Mix
11 the current ranged over 30% of the peak value, as seen in Figure 5-13.
The increase in current throughout the 6 hour test as shown in Figure 5-13 is
common to specimens with high permeability. The higher current and resulting higher
coulomb values are likely due to heating that occurs in the chloride solution and concrete
specimens. The current generated by the applied voltage, generates heat as it flows
through the conductor. Conductivity of electricity is affected by temperature. The heat
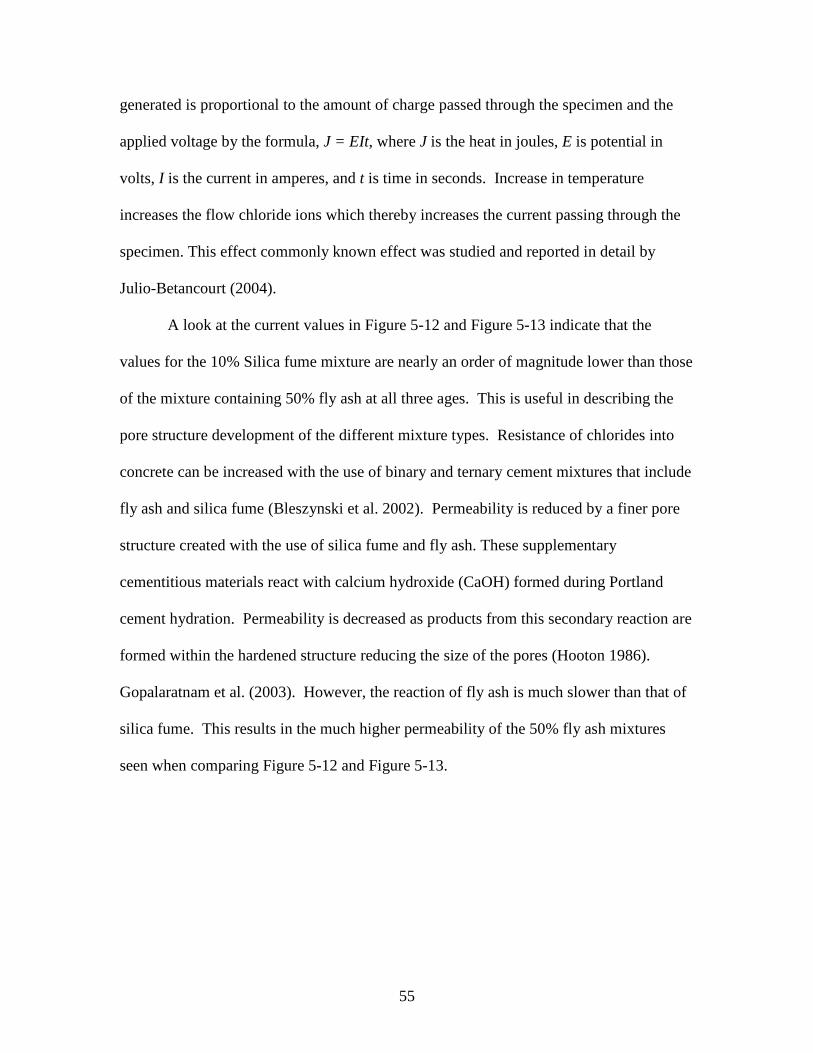
55
generated is proportional to the amount of charge passed through the specimen and the
applied voltage by the formula, J = EIt, where J is the heat in joules, E is potential in
volts, I is the current in amperes, and t is time in seconds. Increase in temperature
increases the flow chloride ions which thereby increases the current passing through the
specimen. This effect commonly known effect was studied and reported in detail by
Julio-Betancourt (2004).
A look at the current values in Figure 5-12 and Figure 5-13 indicate that the
values for the 10% Silica fume mixture are nearly an order of magnitude lower than those
of the mixture containing 50% fly ash at all three ages. This is useful in describing the
pore structure development of the different mixture types. Resistance of chlorides into
concrete can be increased with the use of binary and ternary cement mixtures that include
fly ash and silica fume (Bleszynski et al. 2002). Permeability is reduced by a finer pore
structure created with the use of silica fume and fly ash. These supplementary
cementitious materials react with calcium hydroxide (CaOH) formed during Portland
cement hydration. Permeability is decreased as products from this secondary reaction are
formed within the hardened structure reducing the size of the pores (Hooton 1986).
Gopalaratnam et al. (2003). However, the reaction of fly ash is much slower than that of
silica fume. This results in the much higher permeability of the 50% fly ash mixtures
seen when comparing Figure 5-12 and Figure 5-13.
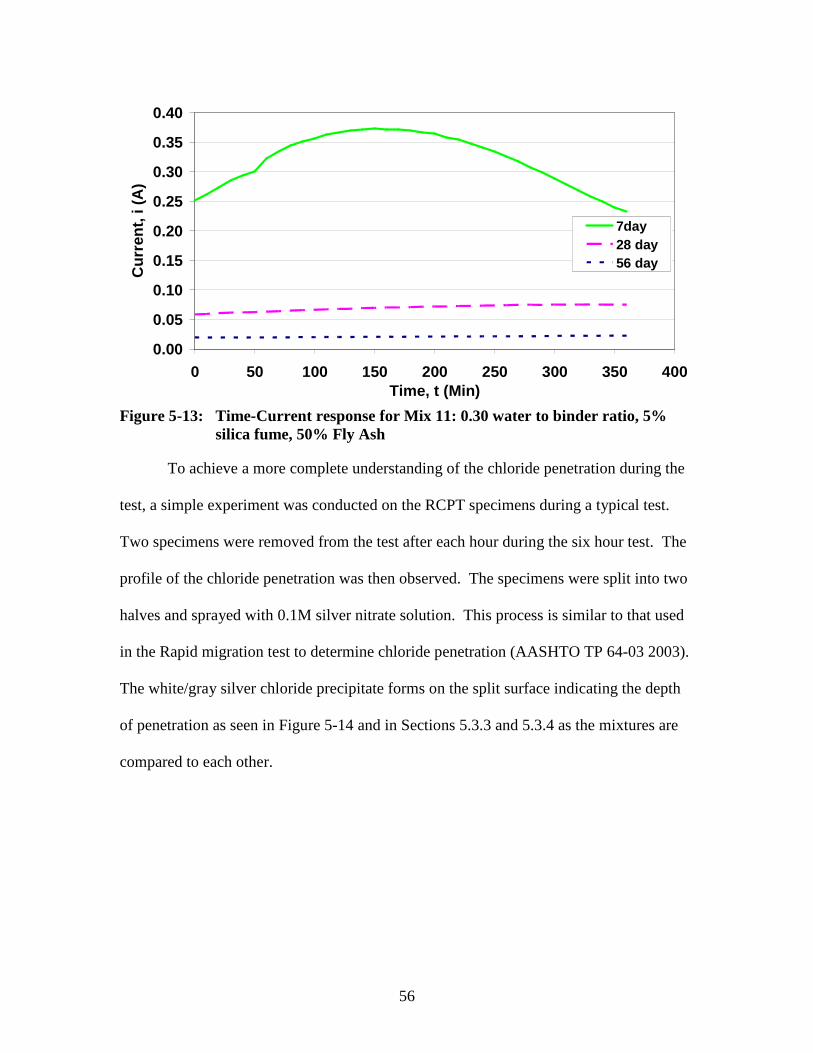
56
0.00
0.05
0.10
0.15
0.20
0.25
0.30
0.35
0.40
0 50 100 150 200 250 300 350 400Time, t (Min)
Cur
rent
, i (
A)
7day28 day56 day
Figure 5-13: Time-Current response for Mix 11: 0.30 water to binder ratio, 5%
silica fume, 50% Fly Ash
To achieve a more complete understanding of the chloride penetration during the
test, a simple experiment was conducted on the RCPT specimens during a typical test.
Two specimens were removed from the test after each hour during the six hour test. The
profile of the chloride penetration was then observed. The specimens were split into two
halves and sprayed with 0.1M silver nitrate solution. This process is similar to that used
in the Rapid migration test to determine chloride penetration (AASHTO TP 64-03 2003).
The white/gray silver chloride precipitate forms on the split surface indicating the depth
of penetration as seen in Figure 5-14 and in Sections 5.3.3 and 5.3.4 as the mixtures are
compared to each other.
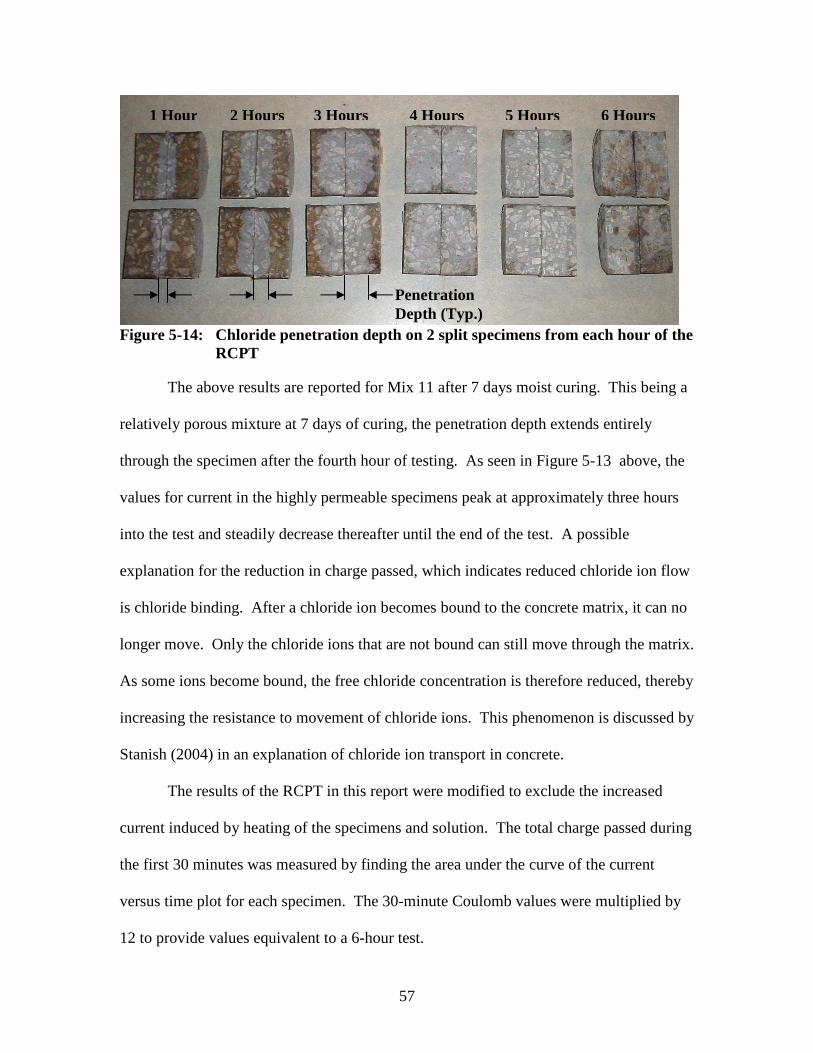
57
Figure 5-14: Chloride penetration depth on 2 split specimens from each hour of the
RCPT
The above results are reported for Mix 11 after 7 days moist curing. This being a
relatively porous mixture at 7 days of curing, the penetration depth extends entirely
through the specimen after the fourth hour of testing. As seen in Figure 5-13 above, the
values for current in the highly permeable specimens peak at approximately three hours
into the test and steadily decrease thereafter until the end of the test. A possible
explanation for the reduction in charge passed, which indicates reduced chloride ion flow
is chloride binding. After a chloride ion becomes bound to the concrete matrix, it can no
longer move. Only the chloride ions that are not bound can still move through the matrix.
As some ions become bound, the free chloride concentration is therefore reduced, thereby
increasing the resistance to movement of chloride ions. This phenomenon is discussed by
Stanish (2004) in an explanation of chloride ion transport in concrete.
The results of the RCPT in this report were modified to exclude the increased
current induced by heating of the specimens and solution. The total charge passed during
the first 30 minutes was measured by finding the area under the curve of the current
versus time plot for each specimen. The 30-minute Coulomb values were multiplied by
12 to provide values equivalent to a 6-hour test.
1 Hour 2 Hours 3 Hours 4 Hours 5 Hours 6 Hours
Penetration Depth (Typ.)
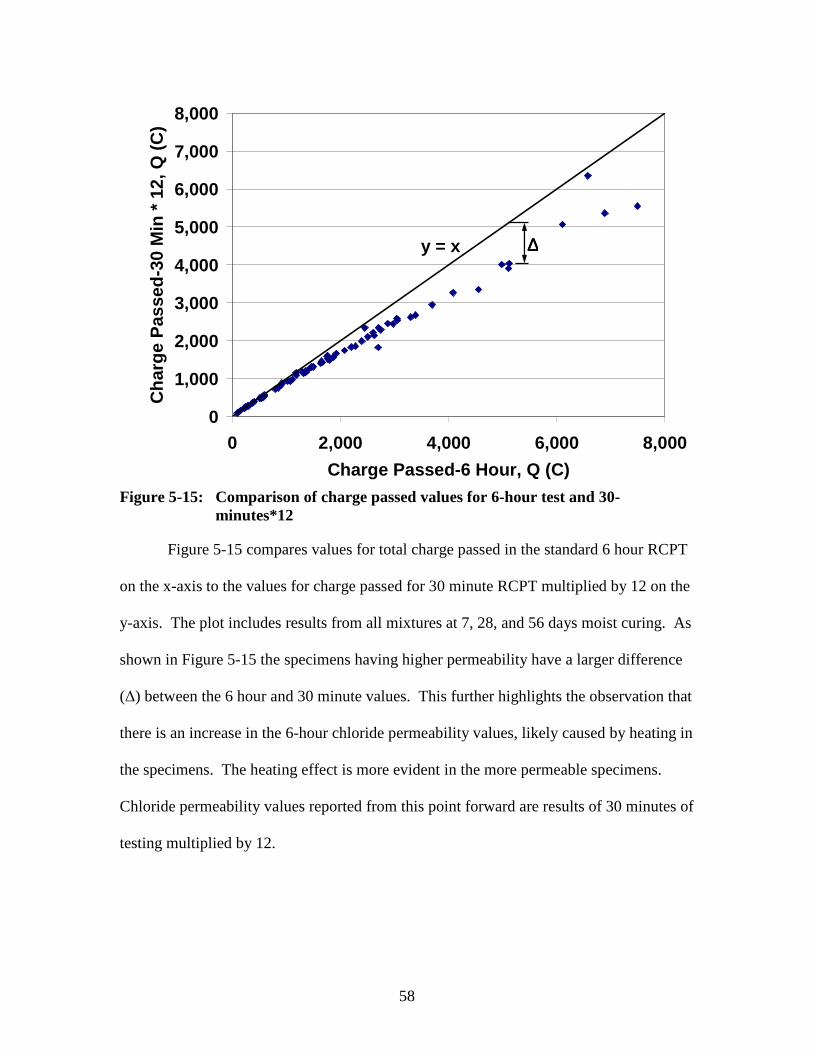
58
y = x
0
1,000
2,000
3,000
4,000
5,000
6,000
7,000
8,000
0 2,000 4,000 6,000 8,000
Charge Passed-6 Hour, Q (C)
Cha
rge
Pas
sed-
30 M
in *
12,
Q (
C)
∆∆∆∆
Figure 5-15: Comparison of charge passed values for 6-hour test and 30-
minutes*12
Figure 5-15 compares values for total charge passed in the standard 6 hour RCPT
on the x-axis to the values for charge passed for 30 minute RCPT multiplied by 12 on the
y-axis. The plot includes results from all mixtures at 7, 28, and 56 days moist curing. As
shown in Figure 5-15 the specimens having higher permeability have a larger difference
(∆) between the 6 hour and 30 minute values. This further highlights the observation that
there is an increase in the 6-hour chloride permeability values, likely caused by heating in
the specimens. The heating effect is more evident in the more permeable specimens.
Chloride permeability values reported from this point forward are results of 30 minutes of
testing multiplied by 12.
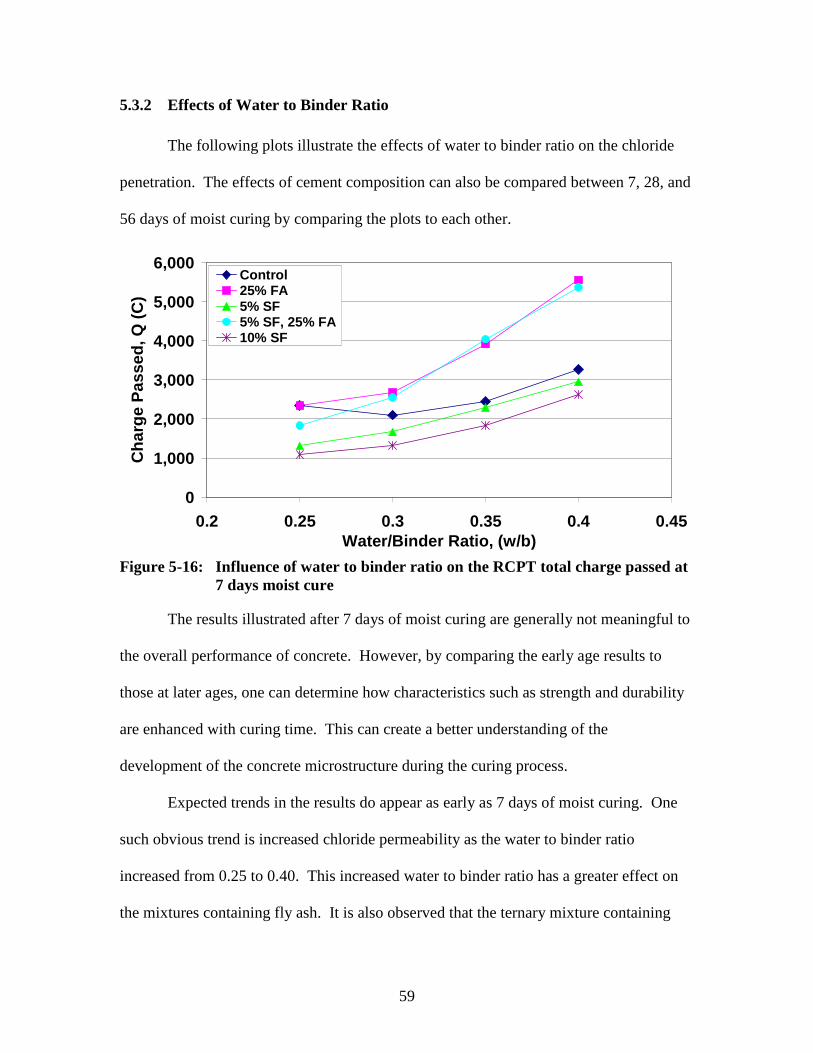
59
5.3.2 Effects of Water to Binder Ratio
The following plots illustrate the effects of water to binder ratio on the chloride
penetration. The effects of cement composition can also be compared between 7, 28, and
56 days of moist curing by comparing the plots to each other.
0
1,000
2,000
3,000
4,000
5,000
6,000
0.2 0.25 0.3 0.35 0.4 0.45Water/Binder Ratio, (w/b)
Cha
rge
Pas
sed,
Q (
C)
Control25% FA5% SF5% SF, 25% FA10% SF
Figure 5-16: Influence of water to binder ratio on the RCPT total charge passed at
7 days moist cure
The results illustrated after 7 days of moist curing are generally not meaningful to
the overall performance of concrete. However, by comparing the early age results to
those at later ages, one can determine how characteristics such as strength and durability
are enhanced with curing time. This can create a better understanding of the
development of the concrete microstructure during the curing process.
Expected trends in the results do appear as early as 7 days of moist curing. One
such obvious trend is increased chloride permeability as the water to binder ratio
increased from 0.25 to 0.40. This increased water to binder ratio has a greater effect on
the mixtures containing fly ash. It is also observed that the ternary mixture containing
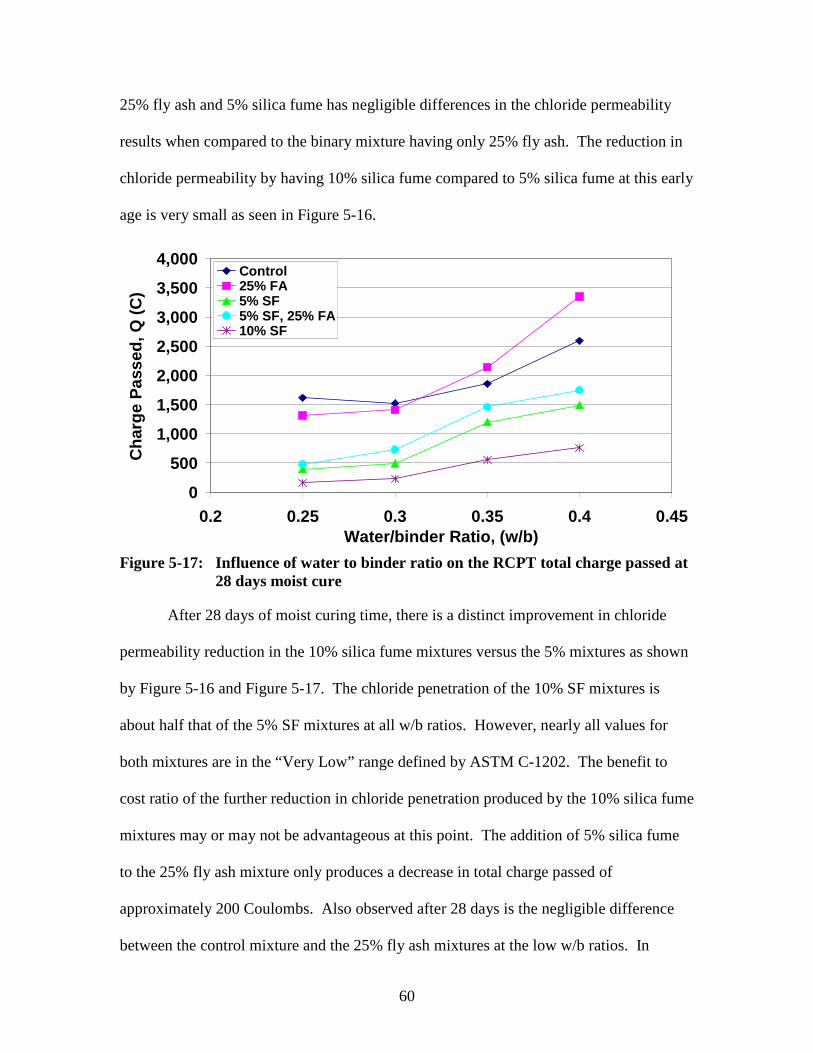
60
25% fly ash and 5% silica fume has negligible differences in the chloride permeability
results when compared to the binary mixture having only 25% fly ash. The reduction in
chloride permeability by having 10% silica fume compared to 5% silica fume at this early
age is very small as seen in Figure 5-16.
0
500
1,000
1,500
2,000
2,500
3,000
3,500
4,000
0.2 0.25 0.3 0.35 0.4 0.45Water/binder Ratio, (w/b)
Cha
rge
Pas
sed,
Q (
C)
Control25% FA5% SF5% SF, 25% FA10% SF
Figure 5-17: Influence of water to binder ratio on the RCPT total charge passed at
28 days moist cure
After 28 days of moist curing time, there is a distinct improvement in chloride
permeability reduction in the 10% silica fume mixtures versus the 5% mixtures as shown
by Figure 5-16 and Figure 5-17. The chloride penetration of the 10% SF mixtures is
about half that of the 5% SF mixtures at all w/b ratios. However, nearly all values for
both mixtures are in the “Very Low” range defined by ASTM C-1202. The benefit to
cost ratio of the further reduction in chloride penetration produced by the 10% silica fume
mixtures may or may not be advantageous at this point. The addition of 5% silica fume
to the 25% fly ash mixture only produces a decrease in total charge passed of
approximately 200 Coulombs. Also observed after 28 days is the negligible difference
between the control mixture and the 25% fly ash mixtures at the low w/b ratios. In
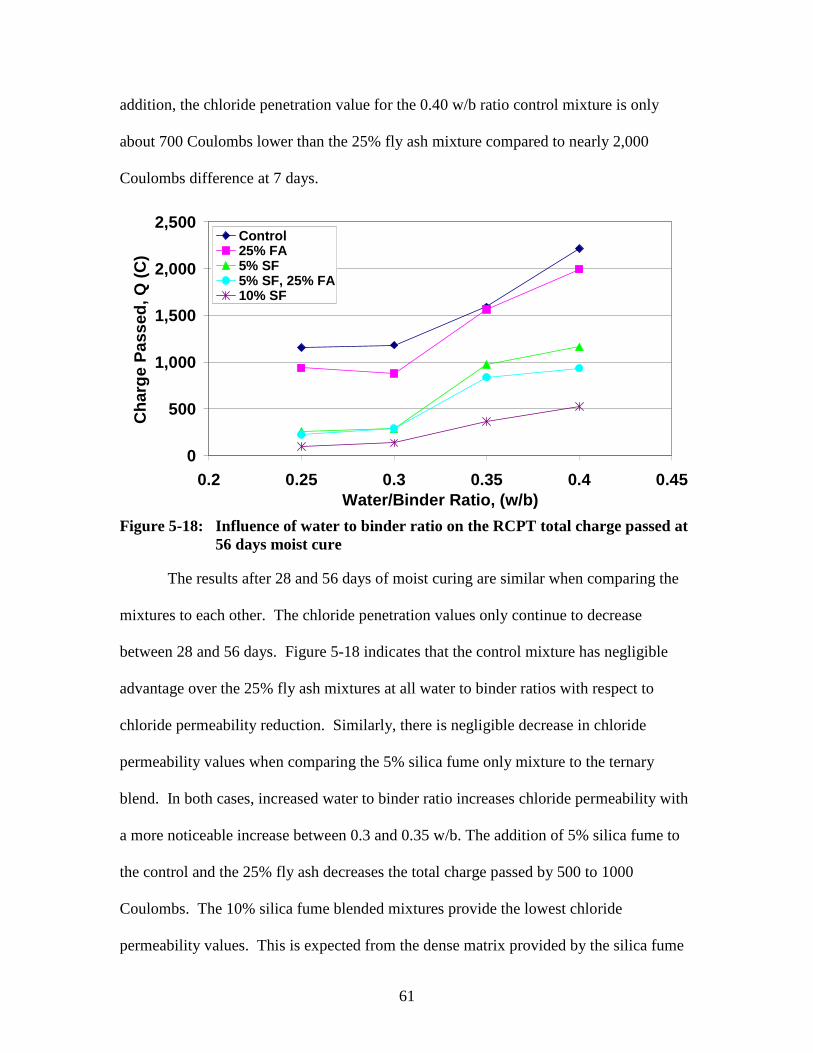
61
addition, the chloride penetration value for the 0.40 w/b ratio control mixture is only
about 700 Coulombs lower than the 25% fly ash mixture compared to nearly 2,000
Coulombs difference at 7 days.
0
500
1,000
1,500
2,000
2,500
0.2 0.25 0.3 0.35 0.4 0.45Water/Binder Ratio, (w/b)
Cha
rge
Pas
sed,
Q (
C)
Control25% FA5% SF5% SF, 25% FA10% SF
Figure 5-18: Influence of water to binder ratio on the RCPT total charge passed at
56 days moist cure
The results after 28 and 56 days of moist curing are similar when comparing the
mixtures to each other. The chloride penetration values only continue to decrease
between 28 and 56 days. Figure 5-18 indicates that the control mixture has negligible
advantage over the 25% fly ash mixtures at all water to binder ratios with respect to
chloride permeability reduction. Similarly, there is negligible decrease in chloride
permeability values when comparing the 5% silica fume only mixture to the ternary
blend. In both cases, increased water to binder ratio increases chloride permeability with
a more noticeable increase between 0.3 and 0.35 w/b. The addition of 5% silica fume to
the control and the 25% fly ash decreases the total charge passed by 500 to 1000
Coulombs. The 10% silica fume blended mixtures provide the lowest chloride
permeability values. This is expected from the dense matrix provided by the silica fume
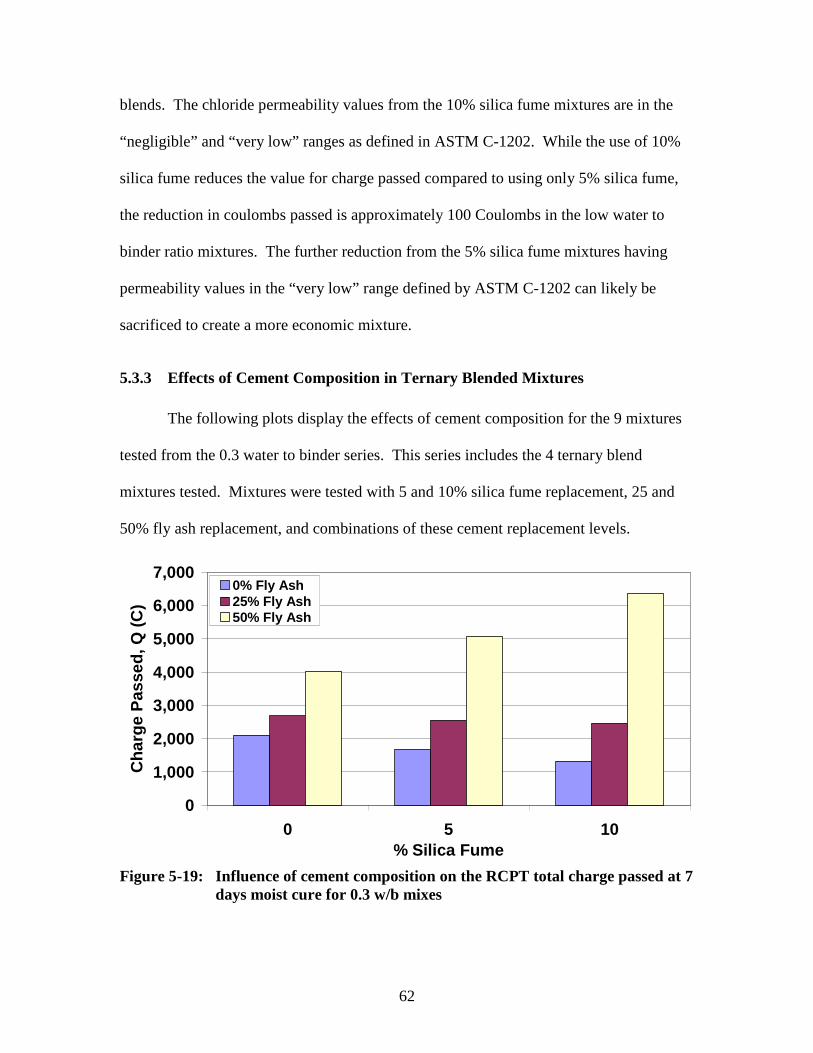
62
blends. The chloride permeability values from the 10% silica fume mixtures are in the
“negligible” and “very low” ranges as defined in ASTM C-1202. While the use of 10%
silica fume reduces the value for charge passed compared to using only 5% silica fume,
the reduction in coulombs passed is approximately 100 Coulombs in the low water to
binder ratio mixtures. The further reduction from the 5% silica fume mixtures having
permeability values in the “very low” range defined by ASTM C-1202 can likely be
sacrificed to create a more economic mixture.
5.3.3 Effects of Cement Composition in Ternary Blended Mixtures
The following plots display the effects of cement composition for the 9 mixtures
tested from the 0.3 water to binder series. This series includes the 4 ternary blend
mixtures tested. Mixtures were tested with 5 and 10% silica fume replacement, 25 and
50% fly ash replacement, and combinations of these cement replacement levels.
0
1,000
2,000
3,000
4,000
5,000
6,000
7,000
0 5 10% Silica Fume
Cha
rge
Pas
sed,
Q (
C)
0% Fly Ash25% Fly Ash50% Fly Ash
Figure 5-19: Influence of cement composition on the RCPT total charge passed at 7
days moist cure for 0.3 w/b mixes
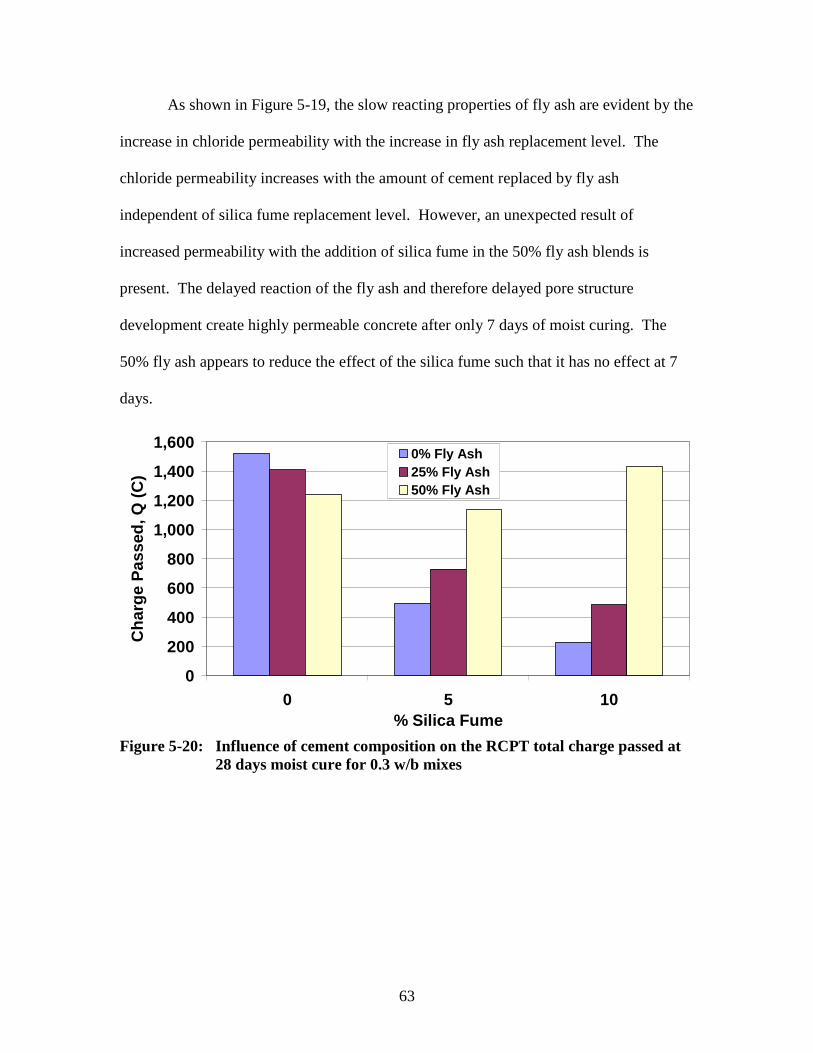
63
As shown in Figure 5-19, the slow reacting properties of fly ash are evident by the
increase in chloride permeability with the increase in fly ash replacement level. The
chloride permeability increases with the amount of cement replaced by fly ash
independent of silica fume replacement level. However, an unexpected result of
increased permeability with the addition of silica fume in the 50% fly ash blends is
present. The delayed reaction of the fly ash and therefore delayed pore structure
development create highly permeable concrete after only 7 days of moist curing. The
50% fly ash appears to reduce the effect of the silica fume such that it has no effect at 7
days.
0
200
400
600
800
1,000
1,200
1,400
1,600
0 5 10% Silica Fume
Cha
rge
Pas
sed,
Q (
C)
0% Fly Ash25% Fly Ash50% Fly Ash
Figure 5-20: Influence of cement composition on the RCPT total charge passed at
28 days moist cure for 0.3 w/b mixes
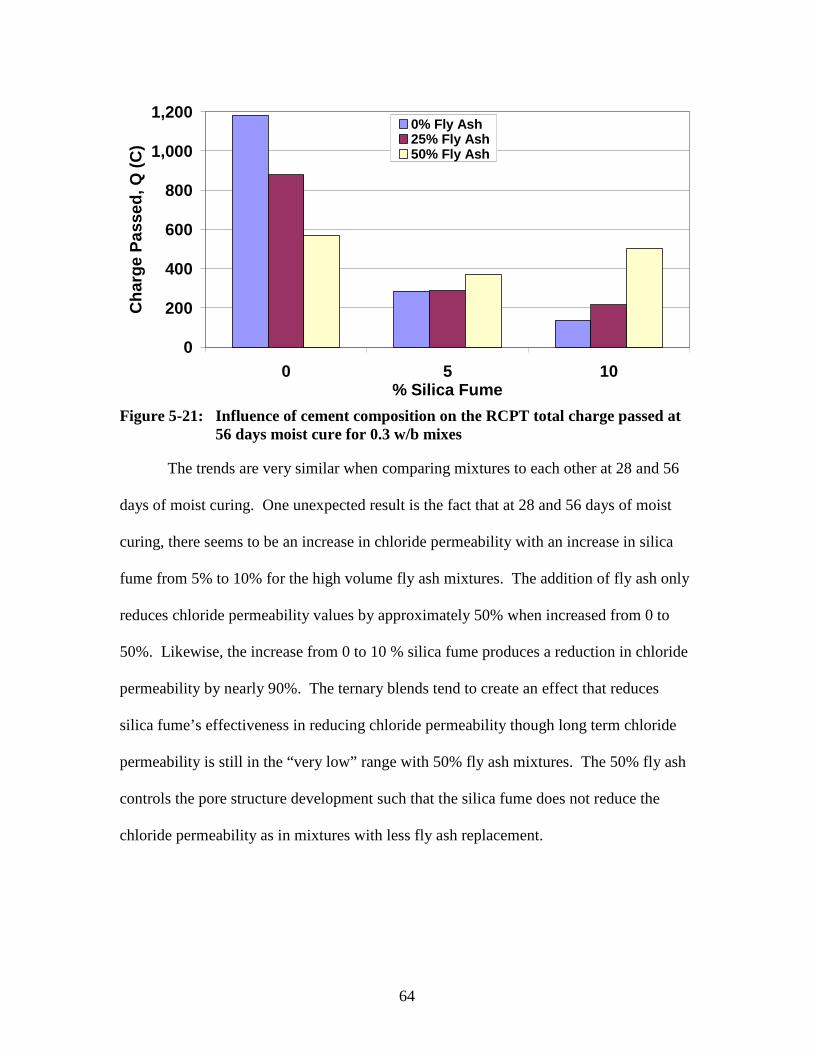
64
0
200
400
600
800
1,000
1,200
0 5 10% Silica Fume
Cha
rge
Pas
sed,
Q (
C)
0% Fly Ash25% Fly Ash50% Fly Ash
Figure 5-21: Influence of cement composition on the RCPT total charge passed at
56 days moist cure for 0.3 w/b mixes
The trends are very similar when comparing mixtures to each other at 28 and 56
days of moist curing. One unexpected result is the fact that at 28 and 56 days of moist
curing, there seems to be an increase in chloride permeability with an increase in silica
fume from 5% to 10% for the high volume fly ash mixtures. The addition of fly ash only
reduces chloride permeability values by approximately 50% when increased from 0 to
50%. Likewise, the increase from 0 to 10 % silica fume produces a reduction in chloride
permeability by nearly 90%. The ternary blends tend to create an effect that reduces
silica fume’s effectiveness in reducing chloride permeability though long term chloride
permeability is still in the “very low” range with 50% fly ash mixtures. The 50% fly ash
controls the pore structure development such that the silica fume does not reduce the
chloride permeability as in mixtures with less fly ash replacement.
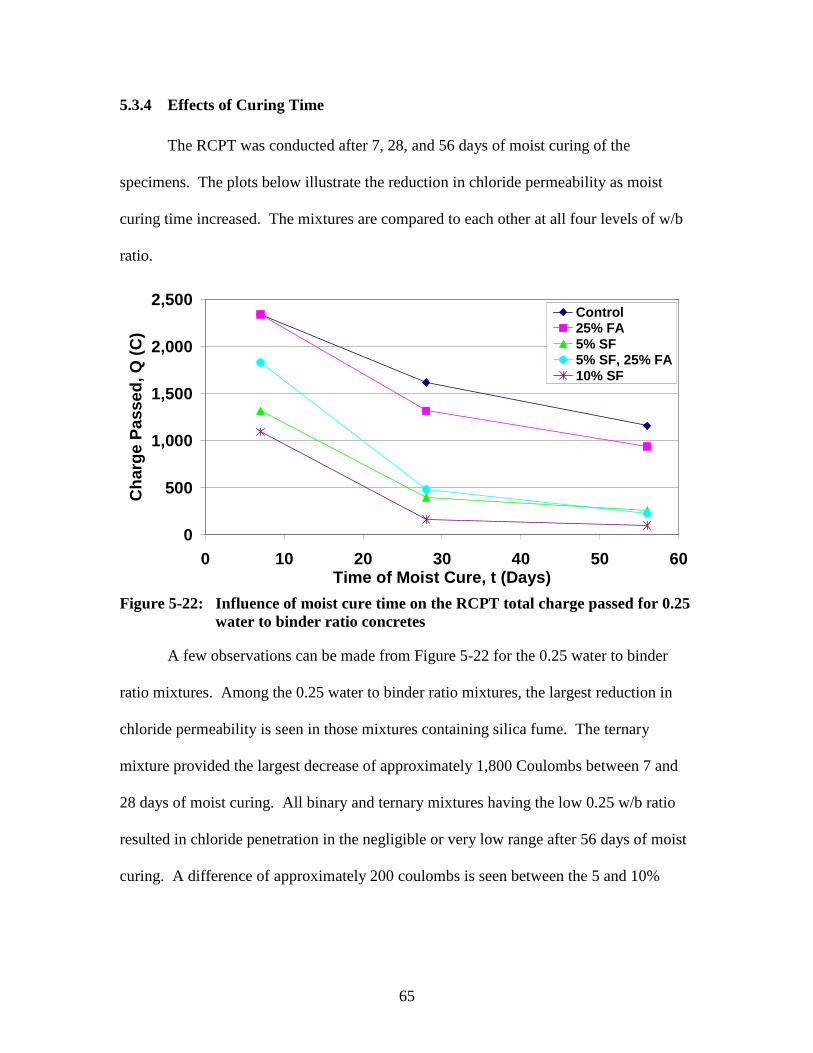
65
5.3.4 Effects of Curing Time
The RCPT was conducted after 7, 28, and 56 days of moist curing of the
specimens. The plots below illustrate the reduction in chloride permeability as moist
curing time increased. The mixtures are compared to each other at all four levels of w/b
ratio.
0
500
1,000
1,500
2,000
2,500
0 10 20 30 40 50 60Time of Moist Cure, t (Days)
Cha
rge
Pas
sed,
Q (
C)
Control25% FA5% SF5% SF, 25% FA10% SF
Figure 5-22: Influence of moist cure time on the RCPT total charge passed for 0.25
water to binder ratio concretes
A few observations can be made from Figure 5-22 for the 0.25 water to binder
ratio mixtures. Among the 0.25 water to binder ratio mixtures, the largest reduction in
chloride permeability is seen in those mixtures containing silica fume. The ternary
mixture provided the largest decrease of approximately 1,800 Coulombs between 7 and
28 days of moist curing. All binary and ternary mixtures having the low 0.25 w/b ratio
resulted in chloride penetration in the negligible or very low range after 56 days of moist
curing. A difference of approximately 200 coulombs is seen between the 5 and 10%
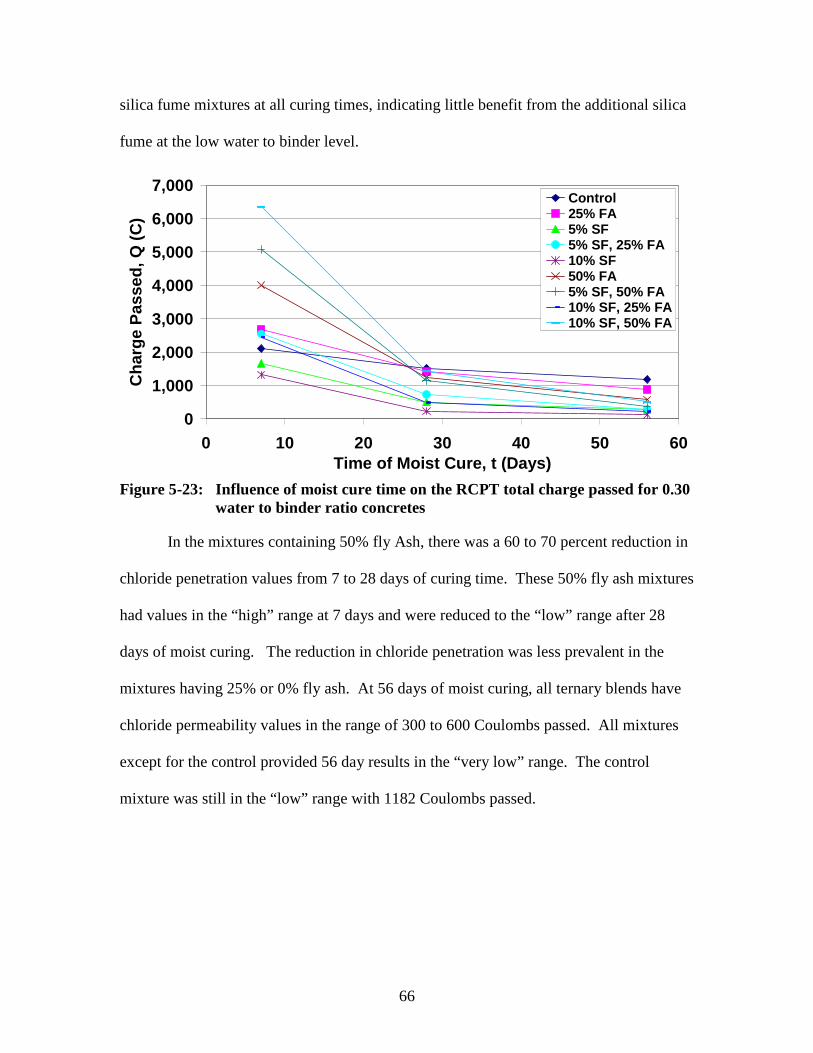
66
silica fume mixtures at all curing times, indicating little benefit from the additional silica
fume at the low water to binder level.
0
1,000
2,000
3,000
4,000
5,000
6,000
7,000
0 10 20 30 40 50 60Time of Moist Cure, t (Days)
Cha
rge
Pas
sed,
Q (
C)
Control25% FA5% SF5% SF, 25% FA10% SF50% FA5% SF, 50% FA10% SF, 25% FA10% SF, 50% FA
Figure 5-23: Influence of moist cure time on the RCPT total charge passed for 0.30
water to binder ratio concretes
In the mixtures containing 50% fly Ash, there was a 60 to 70 percent reduction in
chloride penetration values from 7 to 28 days of curing time. These 50% fly ash mixtures
had values in the “high” range at 7 days and were reduced to the “low” range after 28
days of moist curing. The reduction in chloride penetration was less prevalent in the
mixtures having 25% or 0% fly ash. At 56 days of moist curing, all ternary blends have
chloride permeability values in the range of 300 to 600 Coulombs passed. All mixtures
except for the control provided 56 day results in the “very low” range. The control
mixture was still in the “low” range with 1182 Coulombs passed.
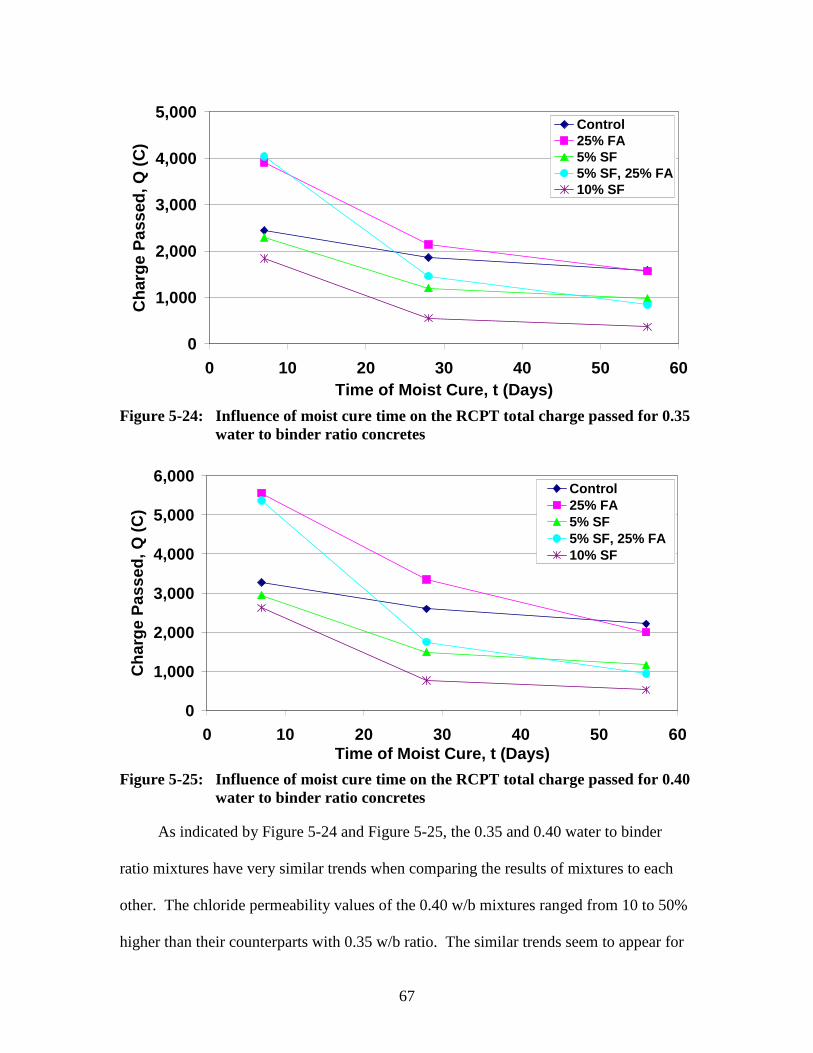
67
0
1,000
2,000
3,000
4,000
5,000
0 10 20 30 40 50 60Time of Moist Cure, t (Days)
Cha
rge
Pas
sed,
Q (
C)
Control25% FA5% SF5% SF, 25% FA10% SF
Figure 5-24: Influence of moist cure time on the RCPT total charge passed for 0.35
water to binder ratio concretes
0
1,000
2,000
3,000
4,000
5,000
6,000
0 10 20 30 40 50 60Time of Moist Cure, t (Days)
Cha
rge
Pas
sed,
Q (
C)
Control25% FA5% SF5% SF, 25% FA10% SF
Figure 5-25: Influence of moist cure time on the RCPT total charge passed for 0.40
water to binder ratio concretes
As indicated by Figure 5-24 and Figure 5-25, the 0.35 and 0.40 water to binder
ratio mixtures have very similar trends when comparing the results of mixtures to each
other. The chloride permeability values of the 0.40 w/b mixtures ranged from 10 to 50%
higher than their counterparts with 0.35 w/b ratio. The similar trends seem to appear for
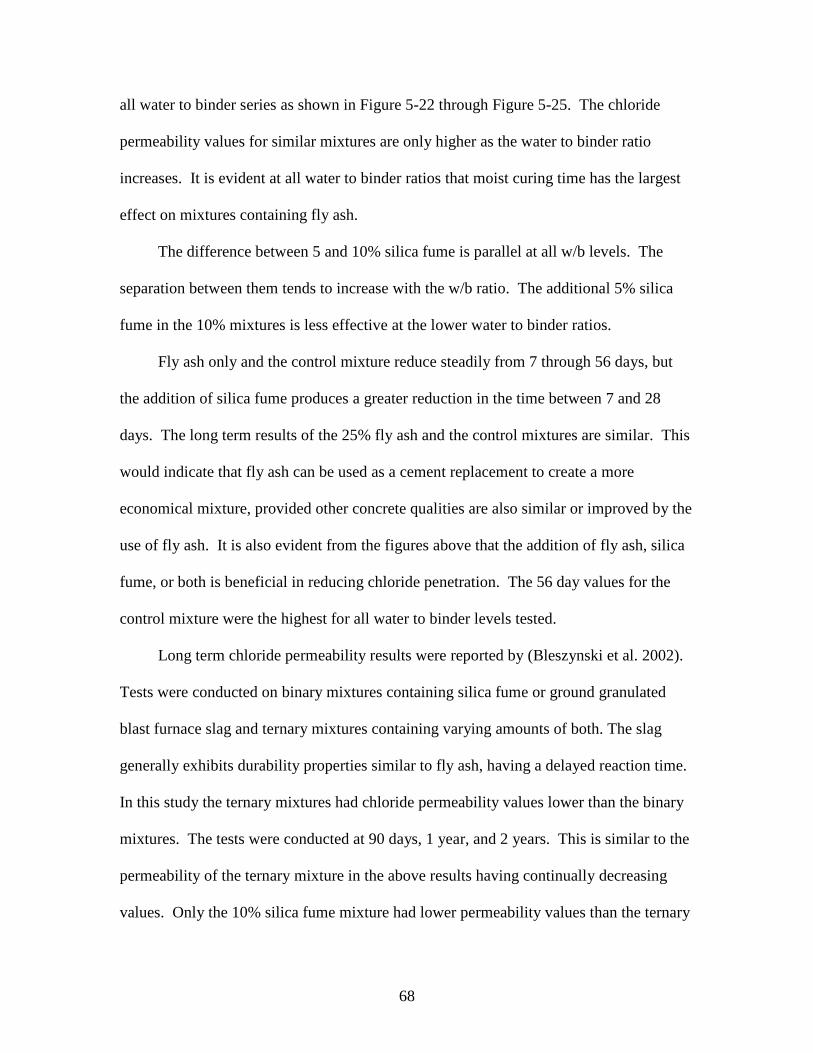
68
all water to binder series as shown in Figure 5-22 through Figure 5-25. The chloride
permeability values for similar mixtures are only higher as the water to binder ratio
increases. It is evident at all water to binder ratios that moist curing time has the largest
effect on mixtures containing fly ash.
The difference between 5 and 10% silica fume is parallel at all w/b levels. The
separation between them tends to increase with the w/b ratio. The additional 5% silica
fume in the 10% mixtures is less effective at the lower water to binder ratios.
Fly ash only and the control mixture reduce steadily from 7 through 56 days, but
the addition of silica fume produces a greater reduction in the time between 7 and 28
days. The long term results of the 25% fly ash and the control mixtures are similar. This
would indicate that fly ash can be used as a cement replacement to create a more
economical mixture, provided other concrete qualities are also similar or improved by the
use of fly ash. It is also evident from the figures above that the addition of fly ash, silica
fume, or both is beneficial in reducing chloride penetration. The 56 day values for the
control mixture were the highest for all water to binder levels tested.
Long term chloride permeability results were reported by (Bleszynski et al. 2002).
Tests were conducted on binary mixtures containing silica fume or ground granulated
blast furnace slag and ternary mixtures containing varying amounts of both. The slag
generally exhibits durability properties similar to fly ash, having a delayed reaction time.
In this study the ternary mixtures had chloride permeability values lower than the binary
mixtures. The tests were conducted at 90 days, 1 year, and 2 years. This is similar to the
permeability of the ternary mixture in the above results having continually decreasing
values. Only the 10% silica fume mixture had lower permeability values than the ternary
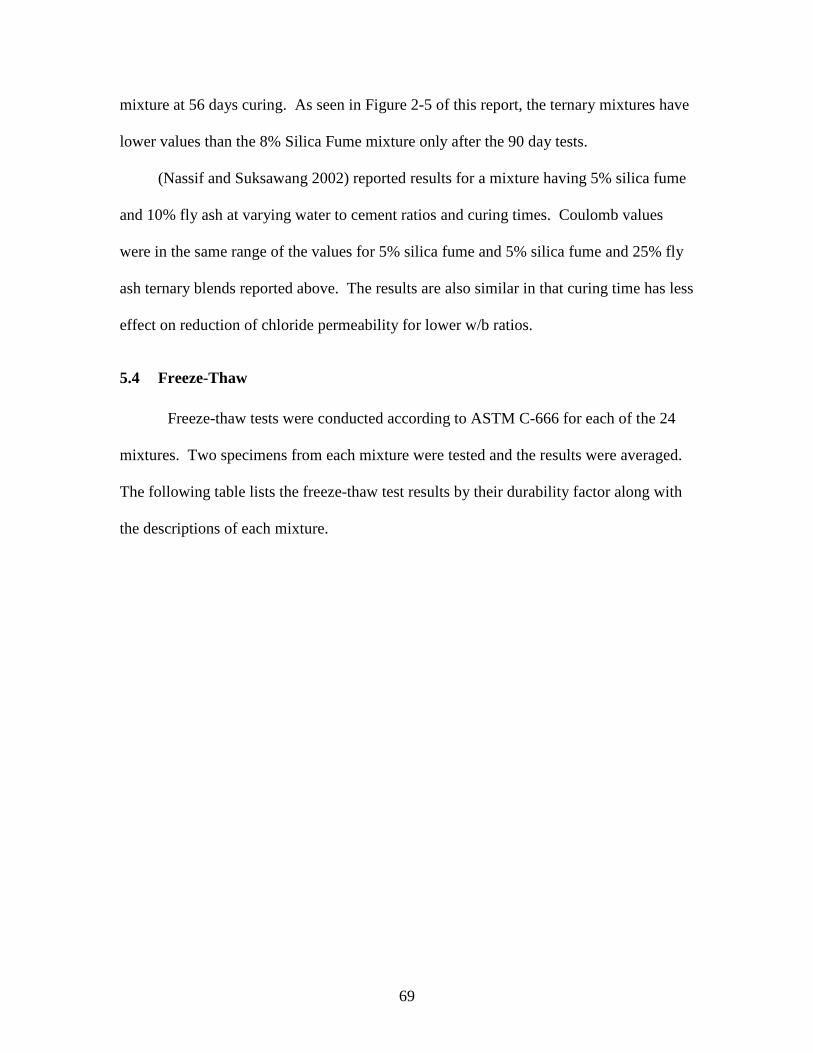
69
mixture at 56 days curing. As seen in Figure 2-5 of this report, the ternary mixtures have
lower values than the 8% Silica Fume mixture only after the 90 day tests.
(Nassif and Suksawang 2002) reported results for a mixture having 5% silica fume
and 10% fly ash at varying water to cement ratios and curing times. Coulomb values
were in the same range of the values for 5% silica fume and 5% silica fume and 25% fly
ash ternary blends reported above. The results are also similar in that curing time has less
effect on reduction of chloride permeability for lower w/b ratios.
5.4 Freeze-Thaw
Freeze-thaw tests were conducted according to ASTM C-666 for each of the 24
mixtures. Two specimens from each mixture were tested and the results were averaged.
The following table lists the freeze-thaw test results by their durability factor along with
the descriptions of each mixture.
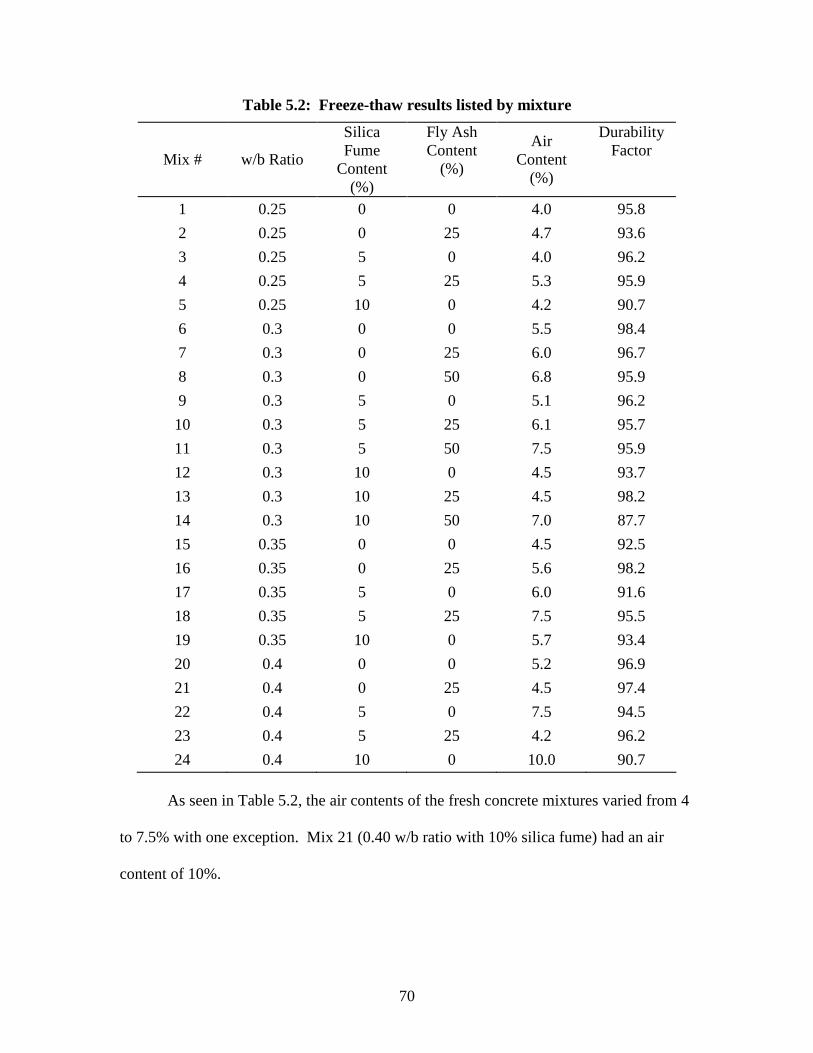
70
Table 5.2: Freeze-thaw results listed by mixture
Mix # w/b Ratio
Silica Fume
Content (%)
Fly Ash Content
(%)
Air Content
(%)
Durability Factor
1 0.25 0 0 4.0 95.8
2 0.25 0 25 4.7 93.6
3 0.25 5 0 4.0 96.2
4 0.25 5 25 5.3 95.9
5 0.25 10 0 4.2 90.7
6 0.3 0 0 5.5 98.4
7 0.3 0 25 6.0 96.7
8 0.3 0 50 6.8 95.9
9 0.3 5 0 5.1 96.2
10 0.3 5 25 6.1 95.7
11 0.3 5 50 7.5 95.9
12 0.3 10 0 4.5 93.7
13 0.3 10 25 4.5 98.2
14 0.3 10 50 7.0 87.7
15 0.35 0 0 4.5 92.5
16 0.35 0 25 5.6 98.2
17 0.35 5 0 6.0 91.6
18 0.35 5 25 7.5 95.5
19 0.35 10 0 5.7 93.4
20 0.4 0 0 5.2 96.9
21 0.4 0 25 4.5 97.4
22 0.4 5 0 7.5 94.5
23 0.4 5 25 4.2 96.2
24 0.4 10 0 10.0 90.7
As seen in Table 5.2, the air contents of the fresh concrete mixtures varied from 4
to 7.5% with one exception. Mix 21 (0.40 w/b ratio with 10% silica fume) had an air
content of 10%.
71
5.4.1 Effects of Water to Binder Ratio
The results of the freeze-thaw tests are plotted versus number of cycles in
Appendix B. Figures B-1 through B-5 separates the results of each of the cement
composition series. Each plot includes the results of each of the four w/b ratios. A
definite trend does not appear in these plots for the affect of water to binder ratio on the
freeze-thaw durability. The relative dynamic modulus of elasticity ranged between 0.92
and 0.98 for nearly all mixtures.
5.4.2 Effects of Cement Composition
Figures B-6 through B-9 in Appendix B display durability factor versus number of
cycles for each of the different cement compositions. The plots are separated for each
w/b ratio. The effects of cement composition are not apparent by these results after 300
freeze-thaw cycles.
All mixtures resulted in durability factors greater than 90 except for Mix 14. This
mixture had cement replacement with 10% silica fume and 50% fly ash and a resulting
durability factor of 87.7. The lower durability factor may be expected in the mixtures
containing 50% fly ash. The freeze-thaw specimens were placed into the chamber at 28
days. The pore structure of the high volume fly ash concrete was likely still developing
at 28 days of curing according to the chloride permeability and compressive strength
results. At this time, the hydration process was likely halted due to the freezing of the
specimens.
The range of the relative dynamic modulus of elasticity for the mixes is within
approximately 10%. It could be argued that this is easily within acceptable error of the
ASTM C-666 and ASTM C-215 tests. The fundamental transverse frequency of the

72
specimens was measured according to ASTM C-215, which lists a single operator margin
of error of 2%. When comparing mixtures to other there is a possibility of 4% error,
more than half the difference in durability factor between all mixtures.
73
CHAPTER 6 CONCLUSIONS
6.1 Summary
This project involved a comprehensive study of high performance concrete
durability with respect to its resistance to chloride permeability and freeze-thaw damage.
The project concentrated on studying the effects of binary and ternary blended cements
containing silica fume and/or fly ash, along with varying water to binder ratio and curing
time, on the pore structure of HPC. A full understanding of the pore structure provides
the ability to engineer high performance concrete mixtures for durability. The results of
this study can be combined with the results from the overall project, which includes time-
dependent properties such as creep and shrinkage, to optimize HPC blends for uses in
bridge applications.
6.2 Conclusions
Conclusions drawn from the chloride permeability, freeze-thaw, and compressive
strength test components of this experimental program are listed below.
6.2.1 Chloride Penetration
This study comprehensively looks at the effects of w/b ratio, cement composition
and curing time on the chloride permeability of 24 different concrete mixtures.
The RCPT results were modified to include only the first 30 minutes of the test.
This excluded increased current and resulting increased values for total charge passed
caused by heating in the relatively high permeable mixtures. The values for the 30
minutes of testing were converted to values equivalent to the standard 6-hour test by
74
simply multiplying them by 12. A look at the time current responses of the specimens in
this study indicates that the mixtures most affected by heating from the “Joule Effect” are
those tested at 7 days of curing. The mixtures containing fly ash appear the most
affected. While results from 7 days of curing are useful in understanding pore structure
development, results from 28 and 56 days are more useful as they serve as standard
reference times for compressive strength tests on concrete cylinders with and without fly
ash, respectively.
Binary and ternary mixtures containing 25% fly ash provides chloride
permeability resistance at 56 days similar to control mixtures without fly ash. There
would likely be continued reduction in permeability beyond 56 days of curing provided
by continued reaction of the fly ash. The cost of fly ash being approximately one fourth
that of Portland cement provides cost saving benefit that does not reduce the quality of
the concrete with regard to durability. Fly ash use is also more environmentally friendly
than the use of Portland cement.
The 50% fly ash replacement also provides resistance to chloride permeability
that is superior to the control mixture and the 25% fly ash binary mixture. The high
volume (50%) fly ash mixture provides chloride permeability that is approximately one-
half that of the control mixture. This advantage is not evident, however, until after 28
days of curing time. High volume fly ash mixtures can provide adequate durability
provided the pore structure is allowed enough time to develop prior to chloride exposure.
The efficiency of silica fume replacement tends to decrease with lower w/b ratios.
At the lower w/b ratios tested, 0.25 and 0.30, there is negligible advantage with regard to
chloride penetration of having 10% silica fume over 5% silica fume. It is likely that
75
additional water is not available for the reaction of more than 5% silica fume at the low
water to binder levels.
The direct effects of water to binder ratio on durability are relatively better
known. Lower w/b ratio concretes have a finer pore structure and are therefore more
resistant to chloride permeability. This effect is also readily noticeable in the results
presented in this report. However, water to binder ratio had different effects depending
on the cement composition. Higher chloride permeability values caused by increasing
the w/b ratio were reduced in mixtures with silica fume replacement of cement. Low
water to binder ratios (≤0.30) resulted in all binary and ternary blended mixtures with
chloride permeabilty values in the “very low” range at 56 days of curing.
6.2.2 Freeze-Thaw Durability
Results from the freeze-thaw testing completed during this project were very
similar to those found in published literature (ACI Committee 201 2001), (Cramer 2001),
and (Ozyildirim 1987). There were no clearly identifiable trends to compare the mixtures
to each other given the very limited change in durability factor and experimental scatter
typical with testing concrete mixtures. The tests proved that properly air entrained
concrete is generally resistant to the effects of freeze-thaw cycles provided the air content
is equal to at least 4%.
6.2.3 Compressive Strength
The compressive strength results from this study generally follow trends that are
accepted from available literature. The increased porosity and less dense microstructure
that results from higher water to binder ratios were evident among all mixtures.
76
Compressive strengths were reduced with increased water to binder ratio in nearly all
cases as would be expected.
The 56 day results for the ternary blends indicate that the addition of silica fume
has a relatively small effect on increasing compressive strength. In mixtures containing
fly ash, the addition of silica fume resulted in compressive strength increases that were
less than 10%. The lower compressive strengths seen in the fly ash mixtures at 7 days are
an indication of the longer reaction time of fly ash and its delayed pore structure
development.
The effect of curing time on high volume fly ash concrete tends to be different for
compressive strength and chloride permeability. The compressive strength values
continue a steady increase from 7 to 56 days of curing. The chloride permeability
decrease between 7 and 28 days is much more dramatic than between 28 and 56 days of
curing. Development of the concrete microstructure with curing is evident among all mix
types.
77
LIST OF REFERENCES
AASHTO T 259. (2001). Standard method of test for resistance of concrete to chloride ion penetration, American Association of State Highway and Transportation Officials.
AASHTO T 260. (2001). Standard method of Test for Sampling and Testing for Chloride Ion in Concrete and Concrete Raw Materials, American Association of State Highway and Transportation Officials.
AASHTO TP 64-03. (2003). Standard Method of Test for Predicting Chloride Penetration of Hydraulic Cement Concrete by the Rapid Migration Procedure, American Association of State Highway and Transportation Officials.
ACI Committee 201. (2001). Guide to durable concrete, American Concrete Institute, Detroit, Mich.
ACI Committee 232. (1996). Use of fly ash in concrete, American Concrete Institute, Farmington Hills, MI.
American Society for Testing And Materials. (1997a). ASTM C 666 - 97: Standard test method for resistance of concrete to rapid freezing and thawing, Astm, Philadelphia, PA.
American Society for Testing And Materials. (1997b). ASTM C 1202 - 97: Standard test method for electrical indication of concrete's ability to resist chloride ion penetration, Astm, Philadelphia, PA.
American Society for Testing And Materials. (2001). ASTM C 138-01: Standard Test Method for Density (Unit Weight), Yield, and Air Content (Gravimetric) of Concrete, Astm, Philadelphia, PA.
American Society for Testing And Materials. (2003a). ASTM C 143-03: Standard Test Method for Slump of Hydraulic-Cement Concrete, Astm, Philadelphia, PA.
American Society for Testing And Materials. (2003b). ASTM C 231-03: Standard Test Method for Air Content of Freshly Mixed Concrete by the Pressure Method, Astm, Philadelphia, PA.
Babu, K. G. a. K., V. Sree Rama. "Chloride Diffrusivity of GGBFS Concretes." Fly Ash, Silica Fume, Slag and Natural Pozzolans in Concrete, SP-1199, Chennai (Madras), India, 611-620.
Bleszynski, R. F., Hooton, R. D., Thomas, M. D. A., and Rogers, C. A. (2002). "Investigations into the Durability of Ternary Blend Concrete: Laboratory and Outdoor Exposure Site Studies." TRB 2002 Annual Meeting CD-Rom, Federal Highway Administration, Washington, D.C.
Blomberg, J. M. (2003). "Laboratory Testing of Bridge Deck mixes." RDT 03-004, Missouri Department of Transportation Research, Development, and Technology.
Cabrera, J. G., and Claisse, P. A. (1990). "Measurement of chloride penetration into silica fume concrete." Cement & Concrete Composites, 12(3), 157-161.
Chia, K. S., and Zhang, M.-H. (2002). "Water permeability and chloride penetrability of high-strength lightweight aggregate concrete." Cement & Concrete Research, 32(4 April), 639-645.
Cohen, M. D., Zhou, Y., and Dolch, W. L. (1992). "Non-air-entrained high-strength concrete - Is it frost resistant?" ACI Materials Journal, 89(4 Jul-Aug), 406-415.
78
Cramer, S. M. "Mix Parameters Controlling the Extended Freeze-Thaw durability of Concrete containing Cementitious Additives." Proceedings: 81st Transportation Research Board Conference, Papers CD-Rom, Washington D.C.
Ghosh, S., and Nasser, K. W. (1995). "Creep, shrinkage, frost, and sulphate resistance of high strength concrete." Canadian Journal of Civil Engineering, 22(3n), 621-636.
Gopalaratnam, V. S., Earney, T. P., and Stundebeck, C. J. "High Performance Concrete for Bridge Applications -- Issues Related to Durability and Time Dependant Response." Advances in Cement and Concrete, Copper Mountain, Colorado, 303-313.
Hooton, R. D. (1986). "Permeability and Pore Structure of Cement Pastes Containing Fly Ash, Slag, and Silica Fume." ASTM Special Technical Publication 897. Publ by ASTM, Philadelphia, PA, USA, 128-143.
Hooton, R. D. (1993). "Influence of silica fume replacement of cement on physical properties and resistance to sulfate attack, freezing and thawing, and alkali-silica reactivity." ACI Materials Journal, 90(2 Mar-Apr), 143-151.
Julio-Betancourt, G. A. a. H., R. D. (2004). "Study of the Joule effect on rapid chloride permeability values and evaluation of related electrical properties of concretes." Cement & Concrete Research, 34, 1007-1015.
Kashi, M. G., and Weyers, R. E. "Freezing and thawing durability of high strength silica fume concrete." Proc Sess Relat Struct Mater Struct Congr. Publ by ASCE, New York, NY, USA. 89, 138-148.
Luther, M. D., and Mikols, W. J. "Ternary and Quaternary Concrete Mixtures Containing GGBF Slag." Use of Fly Ash, Silica Fume, Slag, and Other By-Products in Concrete and Construction Materials, Milwaukee, WI.
Malhotra, V. M. (1990). "Durability of concrete incorporating high-volume of low-calcium (ASTM Class F) fly ash." Cement & Concrete Composites, 12(4), 271-277.
Mokhtarzadeh, A. (1995). "Mechanical properties and durability of high-strength concrete for prestressed bridge girders." Transportation research record. No. 1478, 20-29.
Nassif, H., and Suksawang, N. "Effect of Curing Method on Durability of High Performance Concrete." TRB Anual Meeting CD-ROM, Washington, DC.
Oh, B. H., Cha, S. W., Jang, B. S., and Jang, S. Y. (2002). "Development of high-performance concrete having high resistance to chloride penetration." Nuclear Engineering & Design, 212(1-3 March), 221-231.
Ozyildirim, C. (1987). "Laboratory Investigation of Concrete Containing Silica Fume for Use in Overlays." ACI Materials Journal, 84(1), 3-7.
Plante, P., and Bilodeau, A. (1989). "Rapid Chloride Permeability Test: Data on Concrete Incorporating Supplementary Cementing Materials." Fly Ash, Silica Fume, Slag and Natural Pozzolans in Concrete, V. M. Malhotra, ed., American Concrete Institute, Trondheim, Norway, 626-644.
Sabir, B. B. (1997). "Mechanical properties and frost resistance of silica fume concrete." Cement & Concrete Composites, 19(4 Aug), 285-294.
Stanish, K., Hooton, R.D., and Thomas, M.D.A. (2004). "A novel method for describing chloride ion transport due to an electrical gradient in concrete: Part 1. Theoretical description." Cement and Concrete Research, 34, 43-49.
79
Stanish, K. D., Hooton, R. D., and Thomas, M. D. A. (1997). "Testing the Chloride Penetration Resitance of Concrete: A Literature Review."
Tang, L., and Nilsson, L.-O. (1997). "Rapid determination of the chloride diffusivity in concrete by applying an electrical field." ACI Materials Journal, 89(1), 40-53.
Zia, P., and Hansen, M. R. (1993). "Durability of high performance concrete." Pacific Rim TransTech Conference, ASCE, New York, NY, 398-404.
Zia, P., Leming, M. L., Ahmad, S. H., and Program, C. A. S. H. R. (1991). High performance concretes : a state-of-the-art report, Strategic Highway Research Program National Research Council, Washington, D.C.
80
APPENDIX A CHLORIDE PERMEABILITY DATA
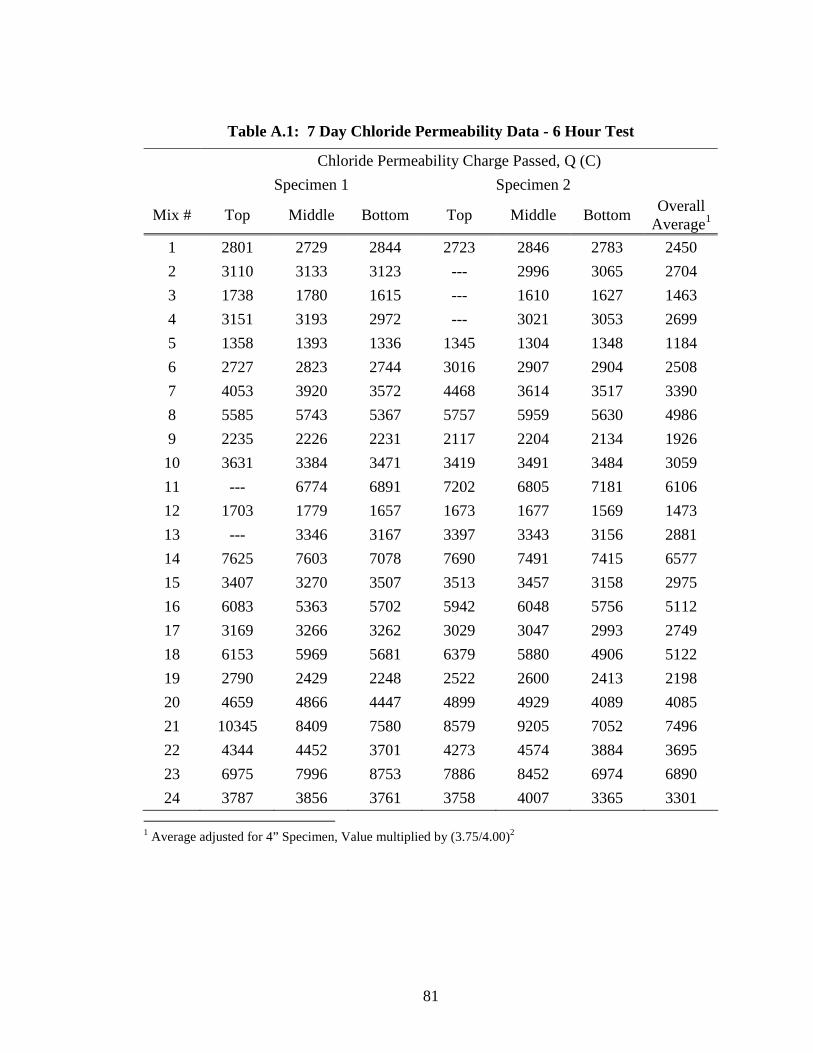
81
Table A.1: 7 Day Chloride Permeability Data - 6 Hour Test
Chloride Permeability Charge Passed, Q (C)
Specimen 1 Specimen 2
Mix # Top Middle Bottom Top Middle Bottom Overall
Average1
1 2801 2729 2844 2723 2846 2783 2450
2 3110 3133 3123 --- 2996 3065 2704
3 1738 1780 1615 --- 1610 1627 1463
4 3151 3193 2972 --- 3021 3053 2699
5 1358 1393 1336 1345 1304 1348 1184
6 2727 2823 2744 3016 2907 2904 2508
7 4053 3920 3572 4468 3614 3517 3390
8 5585 5743 5367 5757 5959 5630 4986
9 2235 2226 2231 2117 2204 2134 1926
10 3631 3384 3471 3419 3491 3484 3059
11 --- 6774 6891 7202 6805 7181 6106
12 1703 1779 1657 1673 1677 1569 1473
13 --- 3346 3167 3397 3343 3156 2881
14 7625 7603 7078 7690 7491 7415 6577
15 3407 3270 3507 3513 3457 3158 2975
16 6083 5363 5702 5942 6048 5756 5112
17 3169 3266 3262 3029 3047 2993 2749
18 6153 5969 5681 6379 5880 4906 5122
19 2790 2429 2248 2522 2600 2413 2198
20 4659 4866 4447 4899 4929 4089 4085
21 10345 8409 7580 8579 9205 7052 7496
22 4344 4452 3701 4273 4574 3884 3695
23 6975 7996 8753 7886 8452 6974 6890
24 3787 3856 3761 3758 4007 3365 3301 1 Average adjusted for 4” Specimen, Value multiplied by (3.75/4.00)2
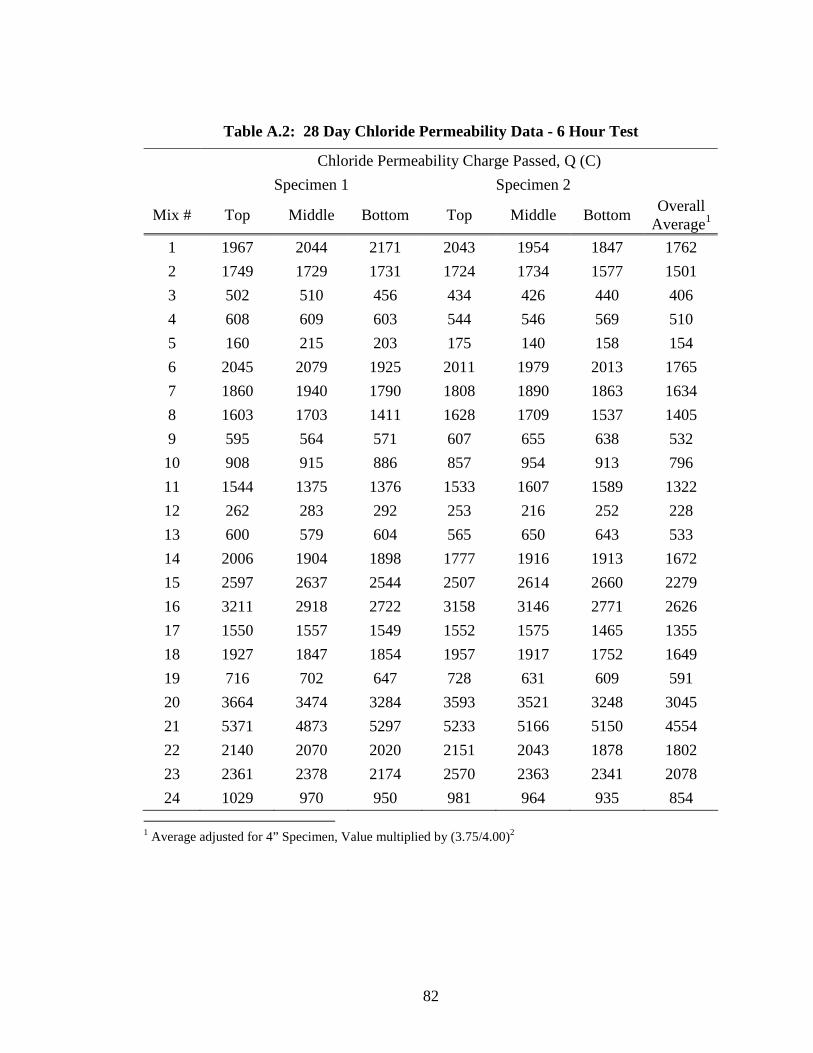
82
Table A.2: 28 Day Chloride Permeability Data - 6 Hour Test
Chloride Permeability Charge Passed, Q (C)
Specimen 1 Specimen 2
Mix # Top Middle Bottom Top Middle Bottom Overall
Average1
1 1967 2044 2171 2043 1954 1847 1762
2 1749 1729 1731 1724 1734 1577 1501
3 502 510 456 434 426 440 406
4 608 609 603 544 546 569 510
5 160 215 203 175 140 158 154
6 2045 2079 1925 2011 1979 2013 1765
7 1860 1940 1790 1808 1890 1863 1634
8 1603 1703 1411 1628 1709 1537 1405
9 595 564 571 607 655 638 532
10 908 915 886 857 954 913 796
11 1544 1375 1376 1533 1607 1589 1322
12 262 283 292 253 216 252 228
13 600 579 604 565 650 643 533
14 2006 1904 1898 1777 1916 1913 1672
15 2597 2637 2544 2507 2614 2660 2279
16 3211 2918 2722 3158 3146 2771 2626
17 1550 1557 1549 1552 1575 1465 1355
18 1927 1847 1854 1957 1917 1752 1649
19 716 702 647 728 631 609 591
20 3664 3474 3284 3593 3521 3248 3045
21 5371 4873 5297 5233 5166 5150 4554
22 2140 2070 2020 2151 2043 1878 1802
23 2361 2378 2174 2570 2363 2341 2078
24 1029 970 950 981 964 935 854 1 Average adjusted for 4” Specimen, Value multiplied by (3.75/4.00)2
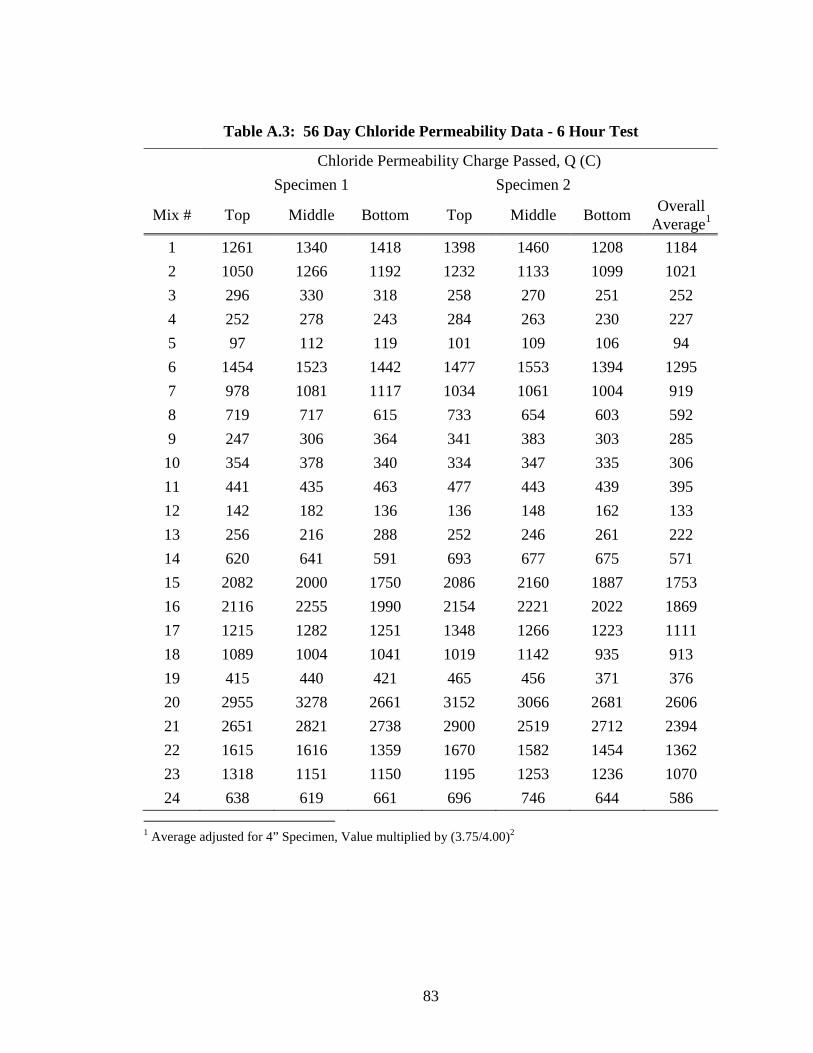
83
Table A.3: 56 Day Chloride Permeability Data - 6 Hour Test
Chloride Permeability Charge Passed, Q (C)
Specimen 1 Specimen 2
Mix # Top Middle Bottom Top Middle Bottom Overall
Average1
1 1261 1340 1418 1398 1460 1208 1184
2 1050 1266 1192 1232 1133 1099 1021
3 296 330 318 258 270 251 252
4 252 278 243 284 263 230 227
5 97 112 119 101 109 106 94
6 1454 1523 1442 1477 1553 1394 1295
7 978 1081 1117 1034 1061 1004 919
8 719 717 615 733 654 603 592
9 247 306 364 341 383 303 285
10 354 378 340 334 347 335 306
11 441 435 463 477 443 439 395
12 142 182 136 136 148 162 133
13 256 216 288 252 246 261 222
14 620 641 591 693 677 675 571
15 2082 2000 1750 2086 2160 1887 1753
16 2116 2255 1990 2154 2221 2022 1869
17 1215 1282 1251 1348 1266 1223 1111
18 1089 1004 1041 1019 1142 935 913
19 415 440 421 465 456 371 376
20 2955 3278 2661 3152 3066 2681 2606
21 2651 2821 2738 2900 2519 2712 2394
22 1615 1616 1359 1670 1582 1454 1362
23 1318 1151 1150 1195 1253 1236 1070
24 638 619 661 696 746 644 586 1 Average adjusted for 4” Specimen, Value multiplied by (3.75/4.00)2
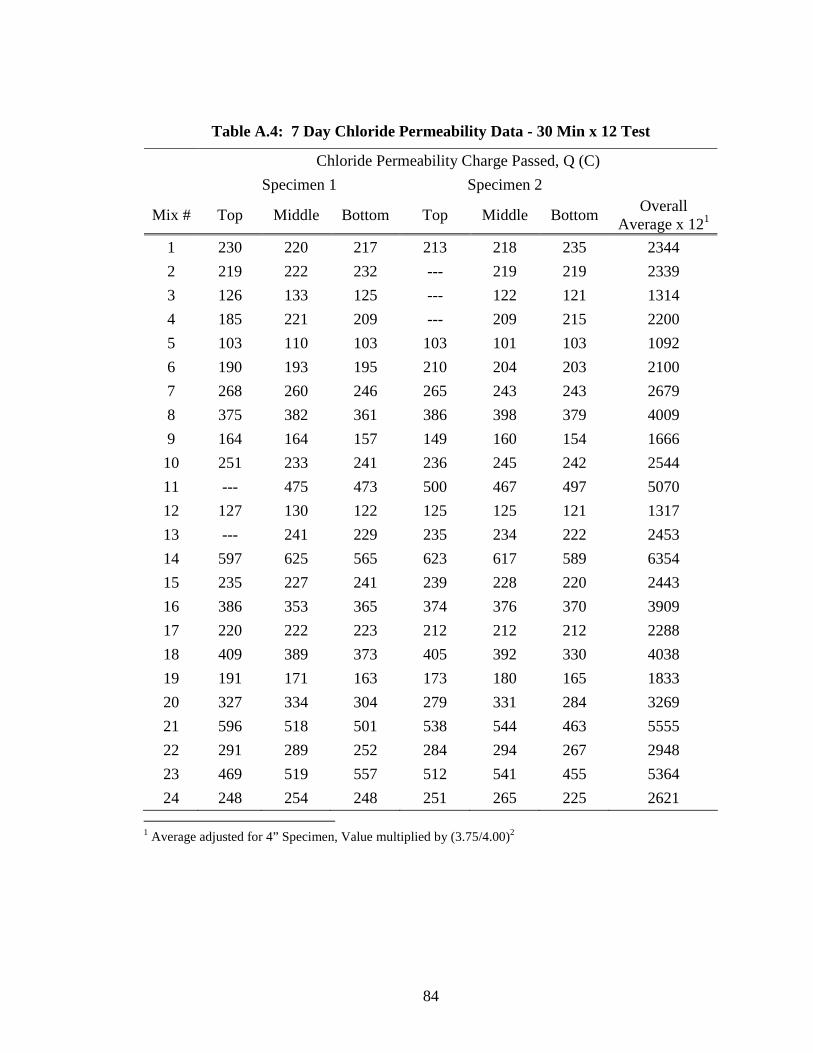
84
Table A.4: 7 Day Chloride Permeability Data - 30 Min x 12 Test
Chloride Permeability Charge Passed, Q (C)
Specimen 1 Specimen 2
Mix # Top Middle Bottom Top Middle Bottom Overall
Average x 121
1 230 220 217 213 218 235 2344
2 219 222 232 --- 219 219 2339
3 126 133 125 --- 122 121 1314
4 185 221 209 --- 209 215 2200
5 103 110 103 103 101 103 1092
6 190 193 195 210 204 203 2100
7 268 260 246 265 243 243 2679
8 375 382 361 386 398 379 4009
9 164 164 157 149 160 154 1666
10 251 233 241 236 245 242 2544
11 --- 475 473 500 467 497 5070
12 127 130 122 125 125 121 1317
13 --- 241 229 235 234 222 2453
14 597 625 565 623 617 589 6354
15 235 227 241 239 228 220 2443
16 386 353 365 374 376 370 3909
17 220 222 223 212 212 212 2288
18 409 389 373 405 392 330 4038
19 191 171 163 173 180 165 1833
20 327 334 304 279 331 284 3269
21 596 518 501 538 544 463 5555
22 291 289 252 284 294 267 2948
23 469 519 557 512 541 455 5364
24 248 254 248 251 265 225 2621 1 Average adjusted for 4” Specimen, Value multiplied by (3.75/4.00)2
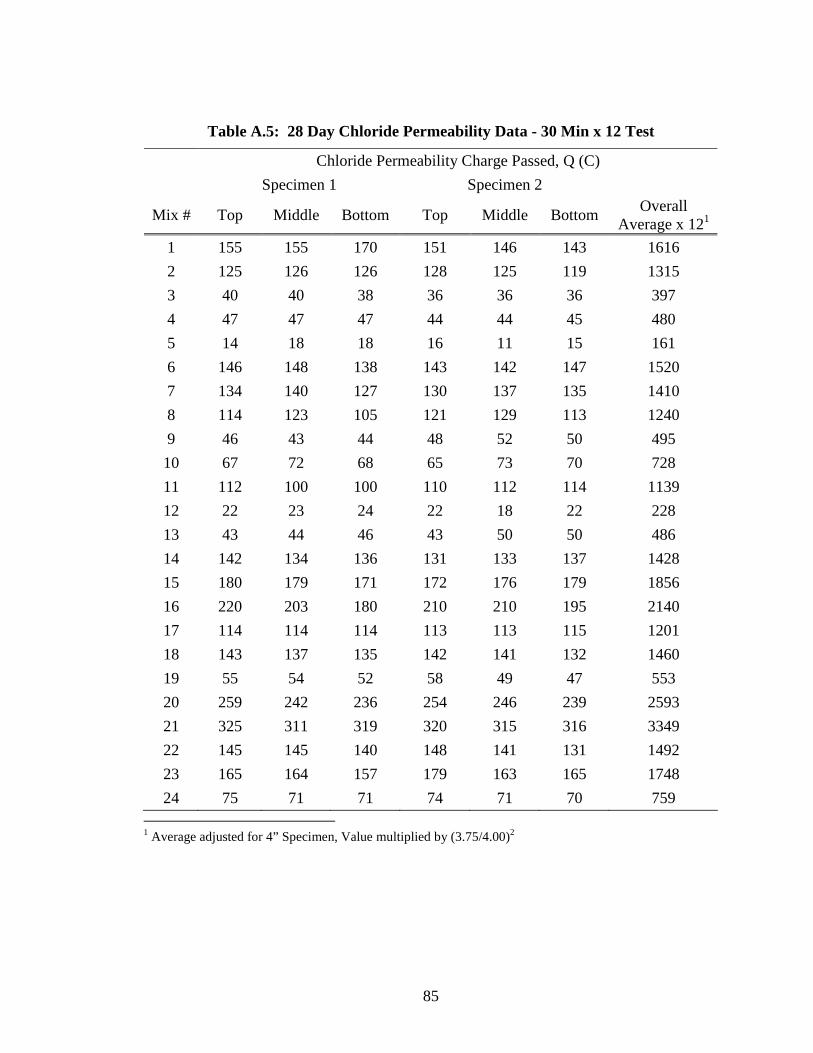
85
Table A.5: 28 Day Chloride Permeability Data - 30 Min x 12 Test
Chloride Permeability Charge Passed, Q (C)
Specimen 1 Specimen 2
Mix # Top Middle Bottom Top Middle Bottom Overall
Average x 121
1 155 155 170 151 146 143 1616
2 125 126 126 128 125 119 1315
3 40 40 38 36 36 36 397
4 47 47 47 44 44 45 480
5 14 18 18 16 11 15 161
6 146 148 138 143 142 147 1520
7 134 140 127 130 137 135 1410
8 114 123 105 121 129 113 1240
9 46 43 44 48 52 50 495
10 67 72 68 65 73 70 728
11 112 100 100 110 112 114 1139
12 22 23 24 22 18 22 228
13 43 44 46 43 50 50 486
14 142 134 136 131 133 137 1428
15 180 179 171 172 176 179 1856
16 220 203 180 210 210 195 2140
17 114 114 114 113 113 115 1201
18 143 137 135 142 141 132 1460
19 55 54 52 58 49 47 553
20 259 242 236 254 246 239 2593
21 325 311 319 320 315 316 3349
22 145 145 140 148 141 131 1492
23 165 164 157 179 163 165 1748
24 75 71 71 74 71 70 759 1 Average adjusted for 4” Specimen, Value multiplied by (3.75/4.00)2
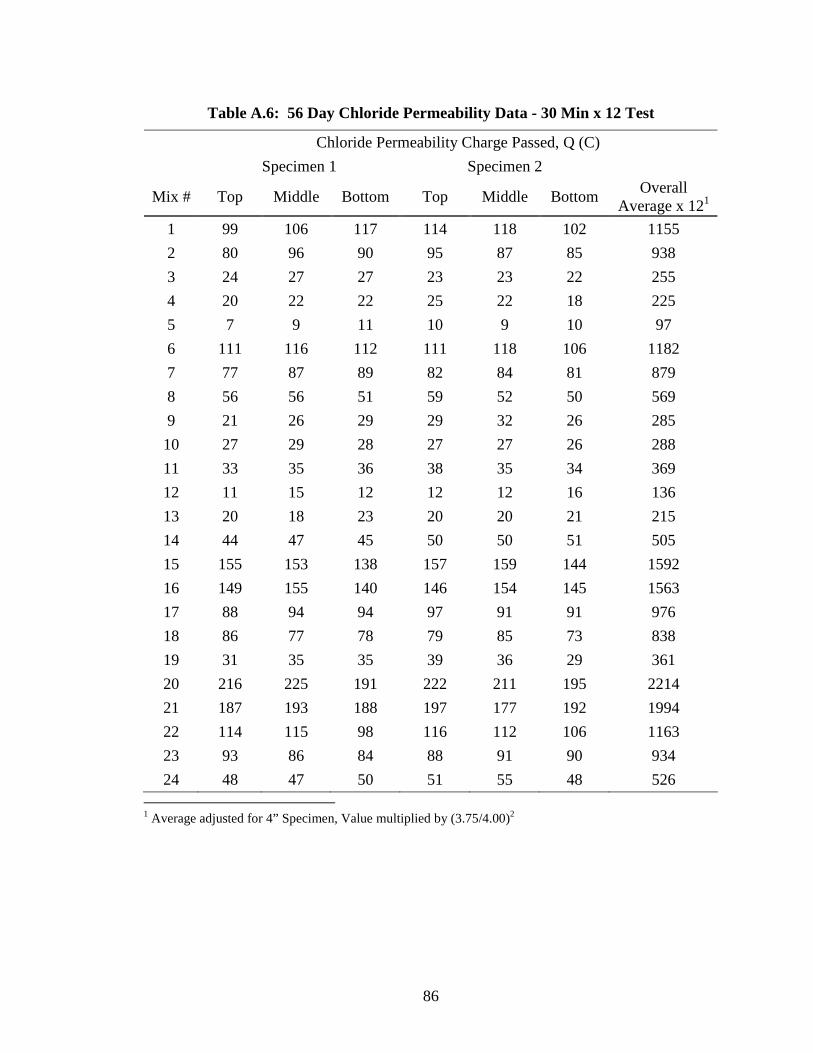
86
Table A.6: 56 Day Chloride Permeability Data - 30 Min x 12 Test
Chloride Permeability Charge Passed, Q (C)
Specimen 1 Specimen 2
Mix # Top Middle Bottom Top Middle Bottom Overall
Average x 121
1 99 106 117 114 118 102 1155
2 80 96 90 95 87 85 938
3 24 27 27 23 23 22 255
4 20 22 22 25 22 18 225
5 7 9 11 10 9 10 97
6 111 116 112 111 118 106 1182
7 77 87 89 82 84 81 879
8 56 56 51 59 52 50 569
9 21 26 29 29 32 26 285
10 27 29 28 27 27 26 288
11 33 35 36 38 35 34 369
12 11 15 12 12 12 16 136
13 20 18 23 20 20 21 215
14 44 47 45 50 50 51 505
15 155 153 138 157 159 144 1592
16 149 155 140 146 154 145 1563
17 88 94 94 97 91 91 976
18 86 77 78 79 85 73 838
19 31 35 35 39 36 29 361
20 216 225 191 222 211 195 2214
21 187 193 188 197 177 192 1994
22 114 115 98 116 112 106 1163
23 93 86 84 88 91 90 934
24 48 47 50 51 55 48 526 1 Average adjusted for 4” Specimen, Value multiplied by (3.75/4.00)2

87
APPENDIX B FREEZE-THAW DATA AND RESULTS
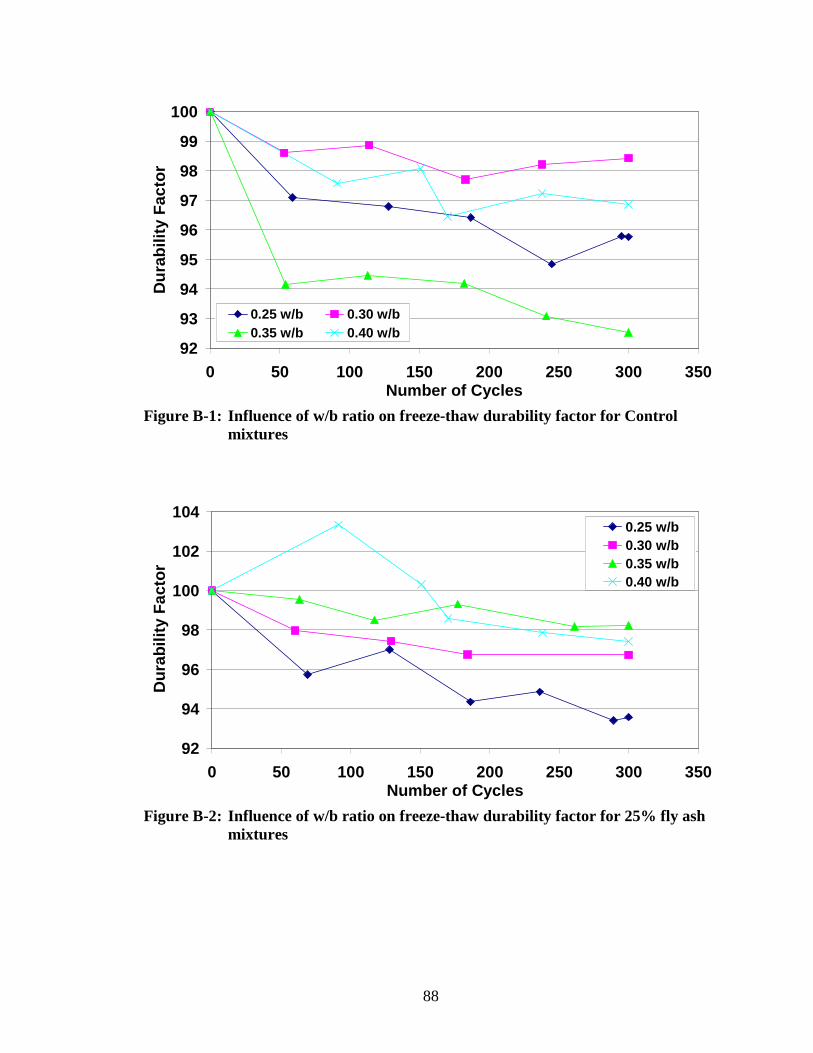
88
92
93
94
95
96
97
98
99
100
0 50 100 150 200 250 300 350Number of Cycles
Dur
abili
ty F
acto
r
0.25 w/b 0.30 w/b0.35 w/b 0.40 w/b
Figure B-1: Influence of w/b ratio on freeze-thaw durability factor for Control
mixtures
92
94
96
98
100
102
104
0 50 100 150 200 250 300 350Number of Cycles
Dur
abili
ty F
acto
r
0.25 w/b0.30 w/b0.35 w/b0.40 w/b
Figure B-2: Influence of w/b ratio on freeze-thaw durability factor for 25% fly ash
mixtures
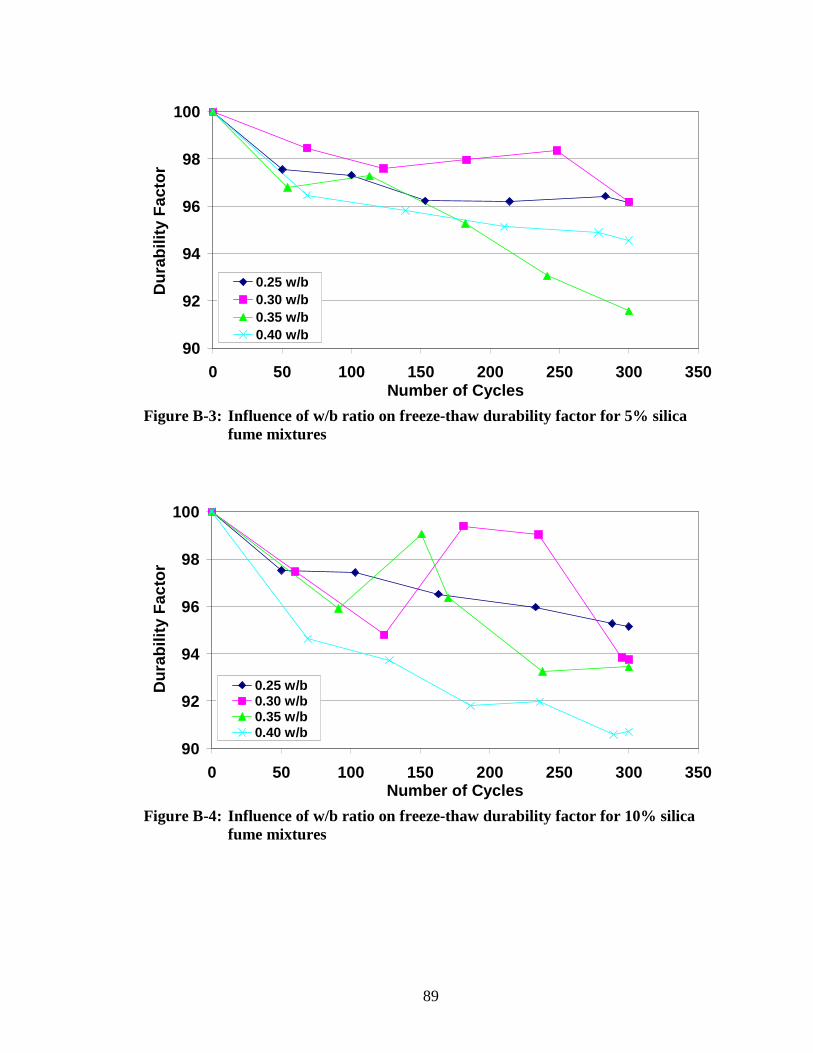
89
90
92
94
96
98
100
0 50 100 150 200 250 300 350Number of Cycles
Dur
abili
ty F
acto
r
0.25 w/b0.30 w/b0.35 w/b0.40 w/b
Figure B-3: Influence of w/b ratio on freeze-thaw durability factor for 5% silica
fume mixtures
90
92
94
96
98
100
0 50 100 150 200 250 300 350Number of Cycles
Dur
abili
ty F
acto
r
0.25 w/b0.30 w/b0.35 w/b0.40 w/b
Figure B-4: Influence of w/b ratio on freeze-thaw durability factor for 10% silica
fume mixtures
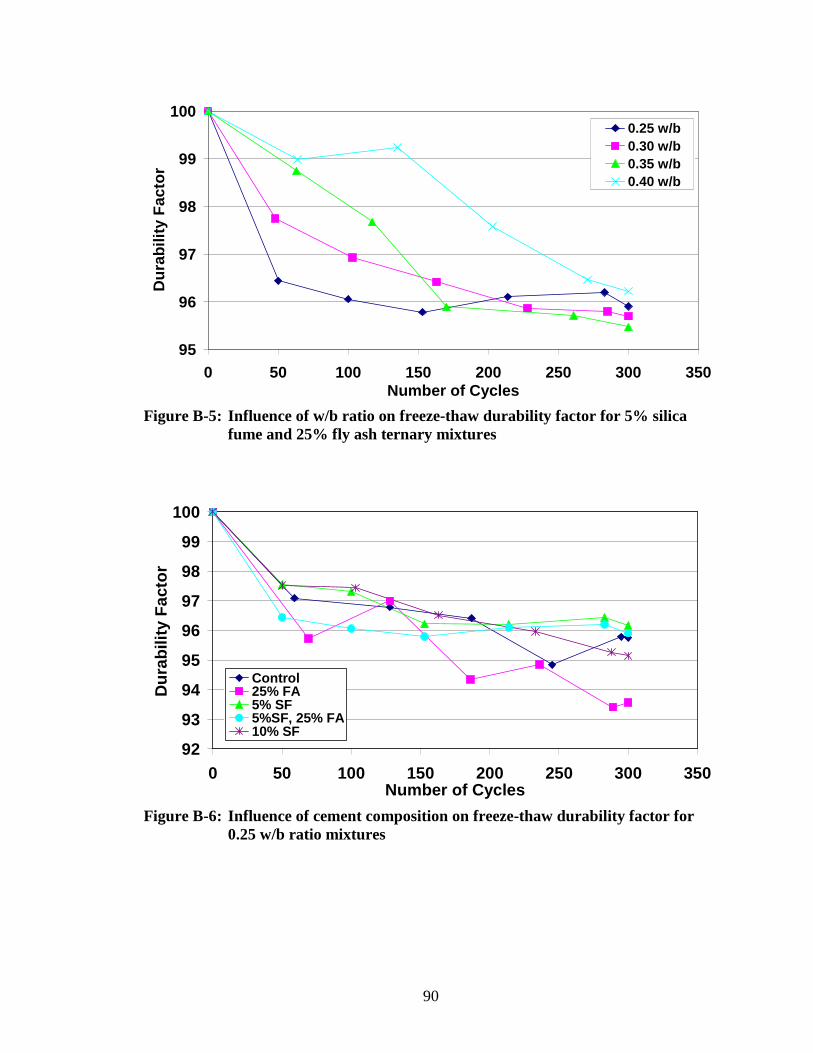
90
95
96
97
98
99
100
0 50 100 150 200 250 300 350Number of Cycles
Dur
abili
ty F
acto
r
0.25 w/b0.30 w/b0.35 w/b0.40 w/b
Figure B-5: Influence of w/b ratio on freeze-thaw durability factor for 5% silica
fume and 25% fly ash ternary mixtures
92
93
94
95
96
97
98
99
100
0 50 100 150 200 250 300 350Number of Cycles
Dur
abili
ty F
acto
r
Control25% FA5% SF5%SF, 25% FA10% SF
Figure B-6: Influence of cement composition on freeze-thaw durability factor for
0.25 w/b ratio mixtures
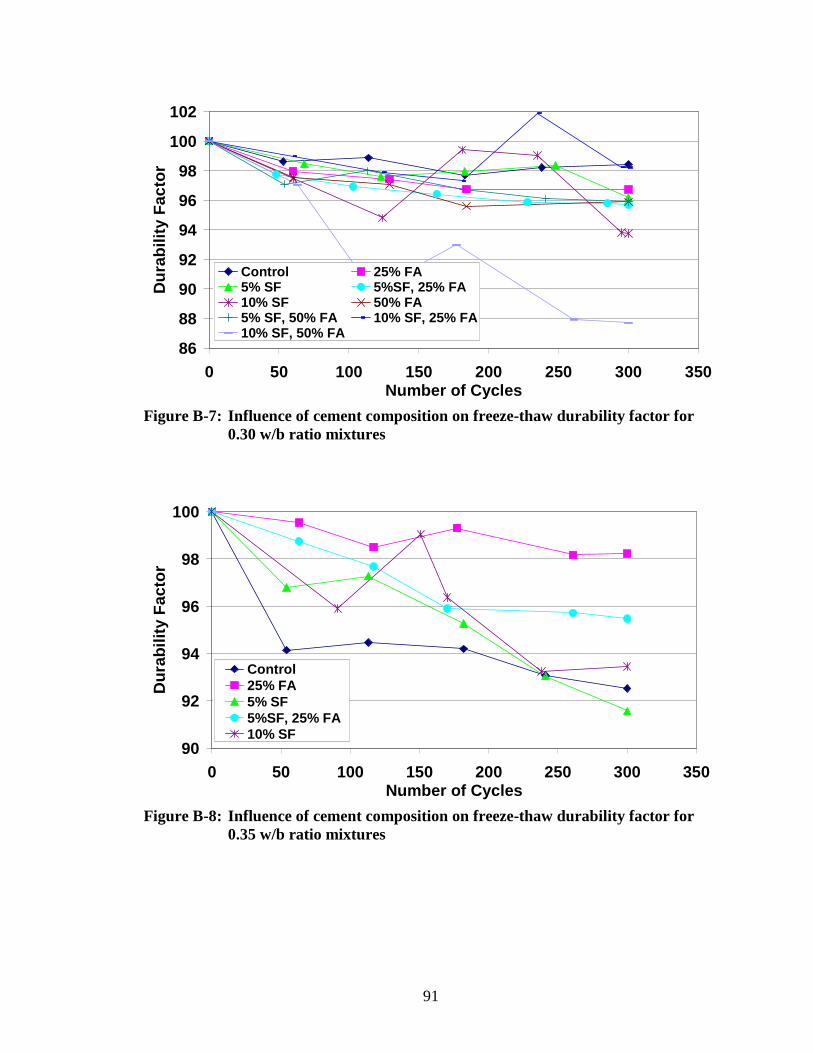
91
86
88
90
92
94
96
98
100
102
0 50 100 150 200 250 300 350Number of Cycles
Dur
abili
ty F
acto
r
Control 25% FA5% SF 5%SF, 25% FA10% SF 50% FA5% SF, 50% FA 10% SF, 25% FA10% SF, 50% FA
Figure B-7: Influence of cement composition on freeze-thaw durability factor for
0.30 w/b ratio mixtures
90
92
94
96
98
100
0 50 100 150 200 250 300 350Number of Cycles
Dur
abili
ty F
acto
r
Control25% FA5% SF5%SF, 25% FA10% SF
Figure B-8: Influence of cement composition on freeze-thaw durability factor for
0.35 w/b ratio mixtures
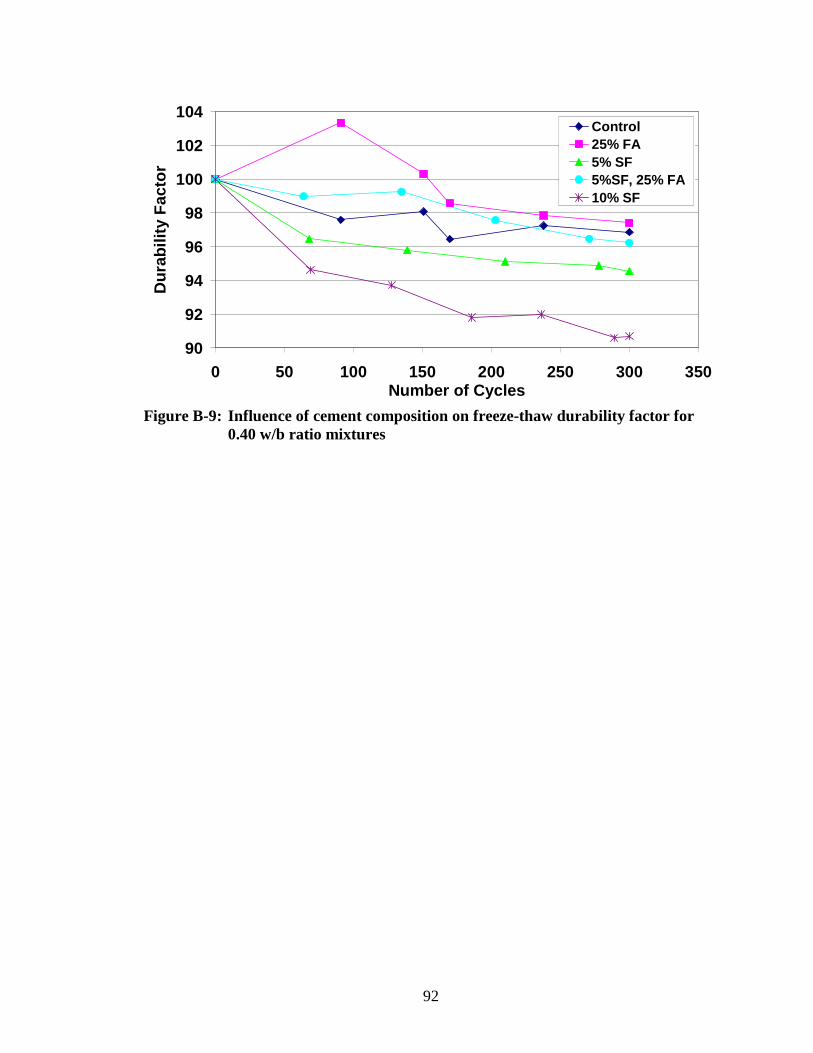
92
90
92
94
96
98
100
102
104
0 50 100 150 200 250 300 350Number of Cycles
Dur
abili
ty F
acto
r
Control25% FA5% SF5%SF, 25% FA10% SF
Figure B-9: Influence of cement composition on freeze-thaw durability factor for
0.40 w/b ratio mixtures
93
APPENDIX C COMPRESSIVE STRENGTH DATA
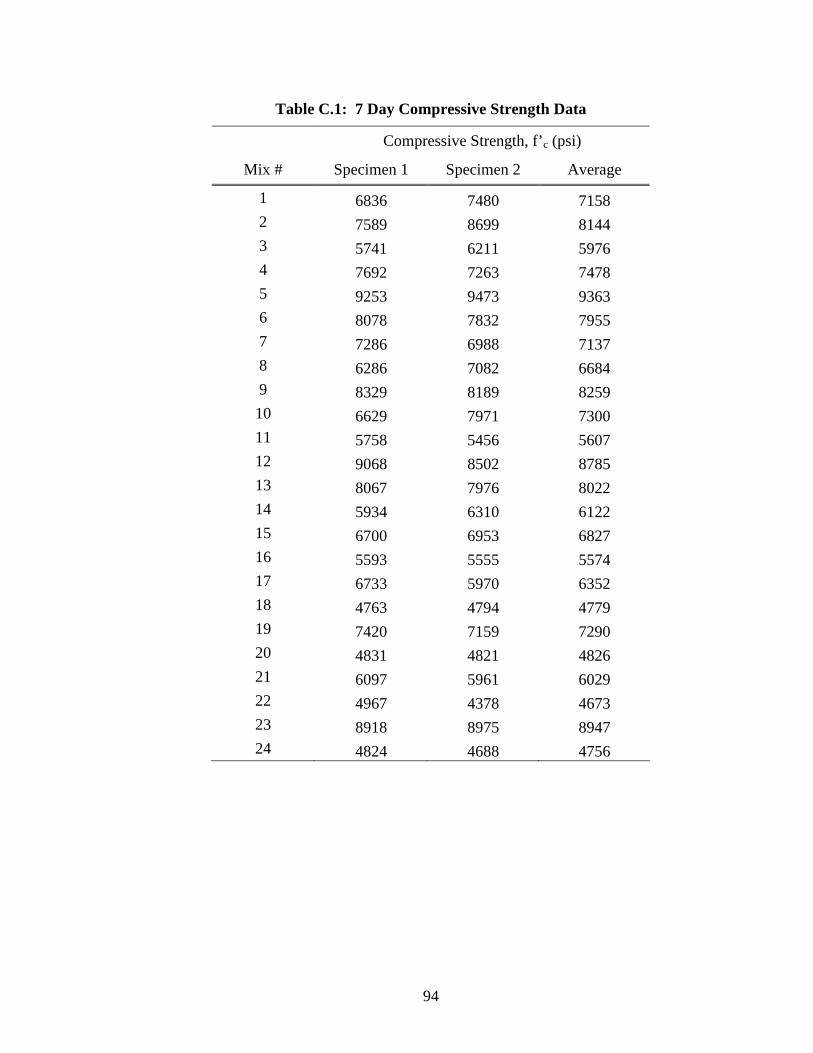
94
Table C.1: 7 Day Compressive Strength Data
Compressive Strength, f’c (psi)
Mix # Specimen 1 Specimen 2 Average
1 6836 7480 7158 2 7589 8699 8144 3 5741 6211 5976 4 7692 7263 7478 5 9253 9473 9363 6 8078 7832 7955 7 7286 6988 7137 8 6286 7082 6684 9 8329 8189 8259 10 6629 7971 7300 11 5758 5456 5607 12 9068 8502 8785 13 8067 7976 8022 14 5934 6310 6122 15 6700 6953 6827 16 5593 5555 5574 17 6733 5970 6352 18 4763 4794 4779 19 7420 7159 7290 20 4831 4821 4826 21 6097 5961 6029 22 4967 4378 4673 23 8918 8975 8947 24 4824 4688 4756
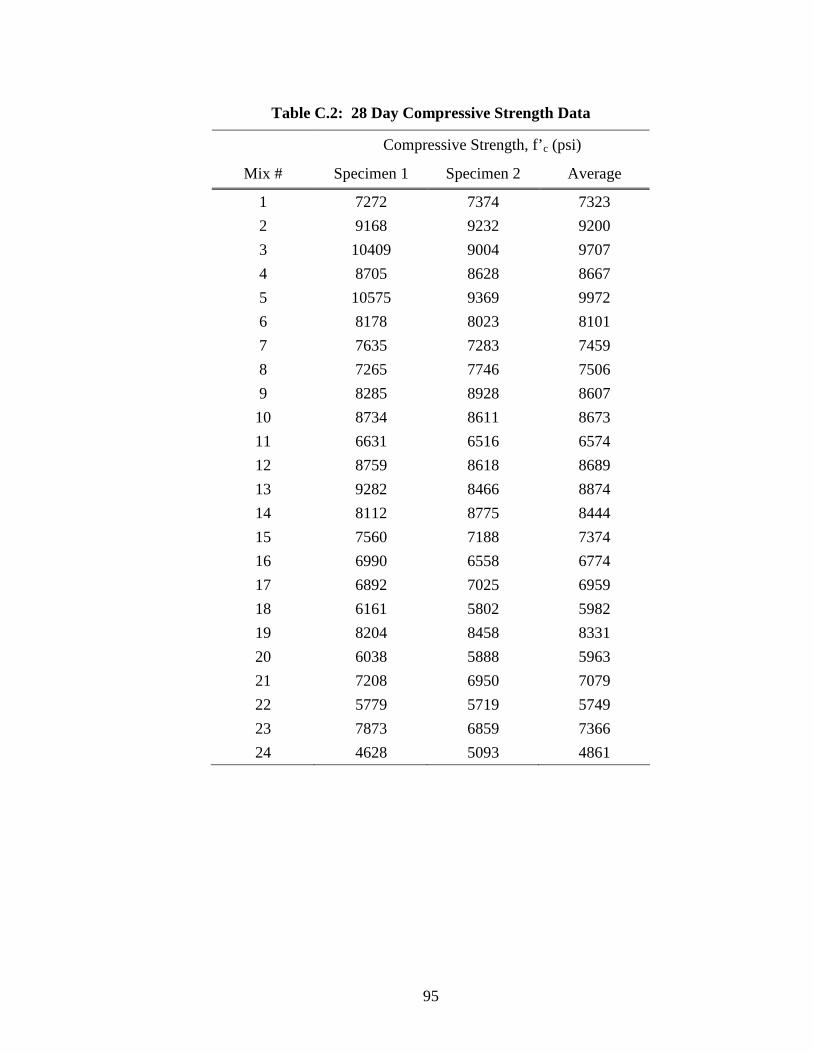
95
Table C.2: 28 Day Compressive Strength Data
Compressive Strength, f’c (psi)
Mix # Specimen 1 Specimen 2 Average
1 7272 7374 7323
2 9168 9232 9200
3 10409 9004 9707
4 8705 8628 8667
5 10575 9369 9972
6 8178 8023 8101
7 7635 7283 7459
8 7265 7746 7506
9 8285 8928 8607
10 8734 8611 8673
11 6631 6516 6574
12 8759 8618 8689
13 9282 8466 8874
14 8112 8775 8444
15 7560 7188 7374
16 6990 6558 6774
17 6892 7025 6959
18 6161 5802 5982
19 8204 8458 8331
20 6038 5888 5963
21 7208 6950 7079
22 5779 5719 5749
23 7873 6859 7366
24 4628 5093 4861
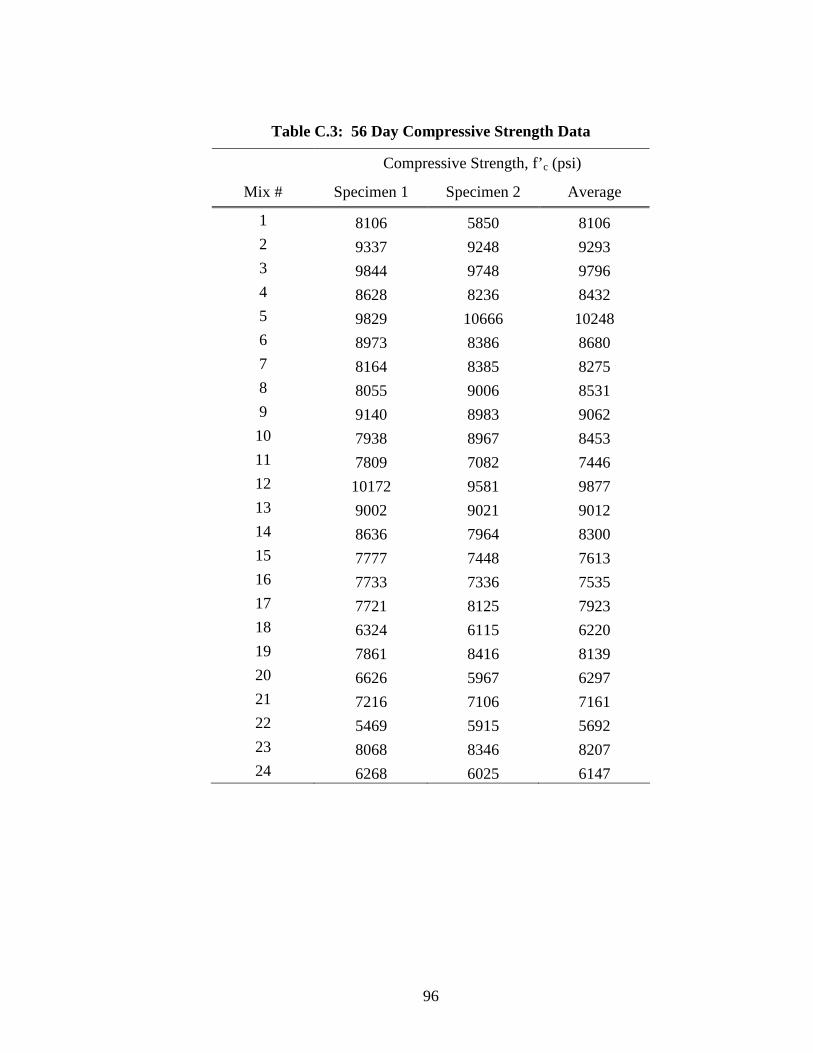
96
Table C.3: 56 Day Compressive Strength Data
Compressive Strength, f’c (psi)
Mix # Specimen 1 Specimen 2 Average
1 8106 5850 8106 2 9337 9248 9293 3 9844 9748 9796 4 8628 8236 8432 5 9829 10666 10248 6 8973 8386 8680 7 8164 8385 8275 8 8055 9006 8531 9 9140 8983 9062 10 7938 8967 8453 11 7809 7082 7446 12 10172 9581 9877 13 9002 9021 9012 14 8636 7964 8300 15 7777 7448 7613 16 7733 7336 7535 17 7721 8125 7923 18 6324 6115 6220 19 7861 8416 8139 20 6626 5967 6297 21 7216 7106 7161 22 5469 5915 5692 23 8068 8346 8207 24 6268 6025 6147
97
APPENDIX D FLY ASH LAB TEST RESULTS
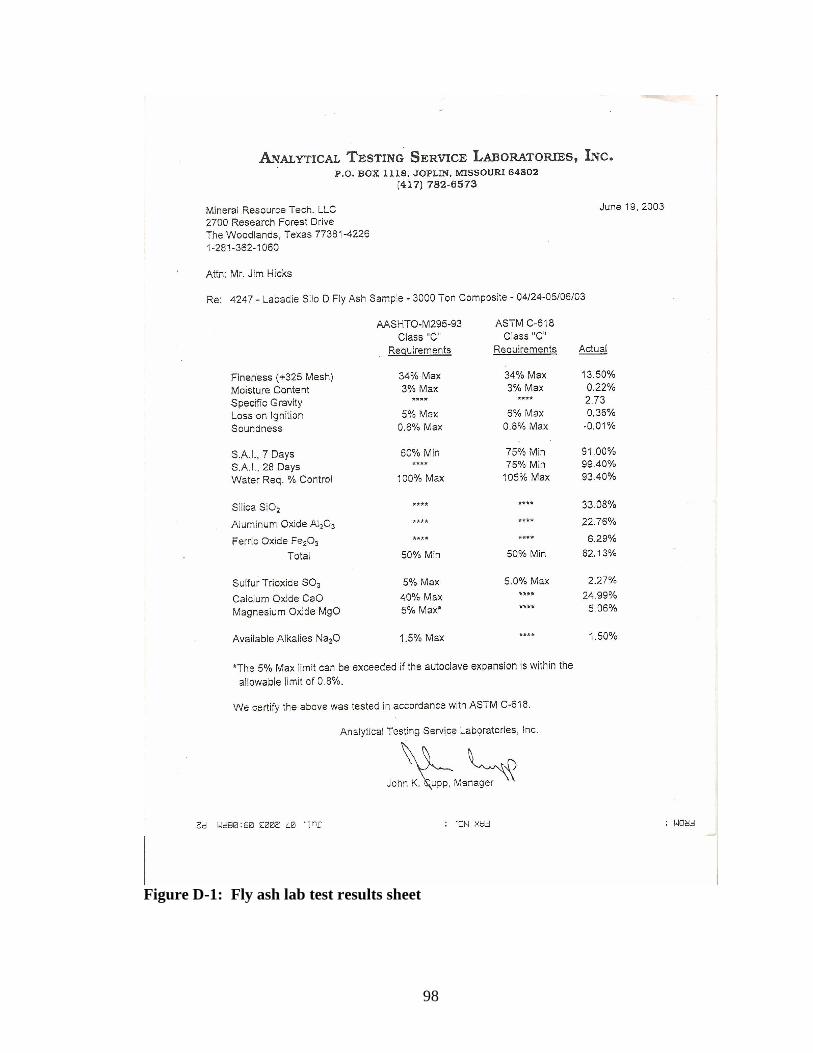
98
Figure D-1: Fly ash lab test results sheet
99
APPENDIX E CHLORIDE PERMEABILITY TEST SETUP
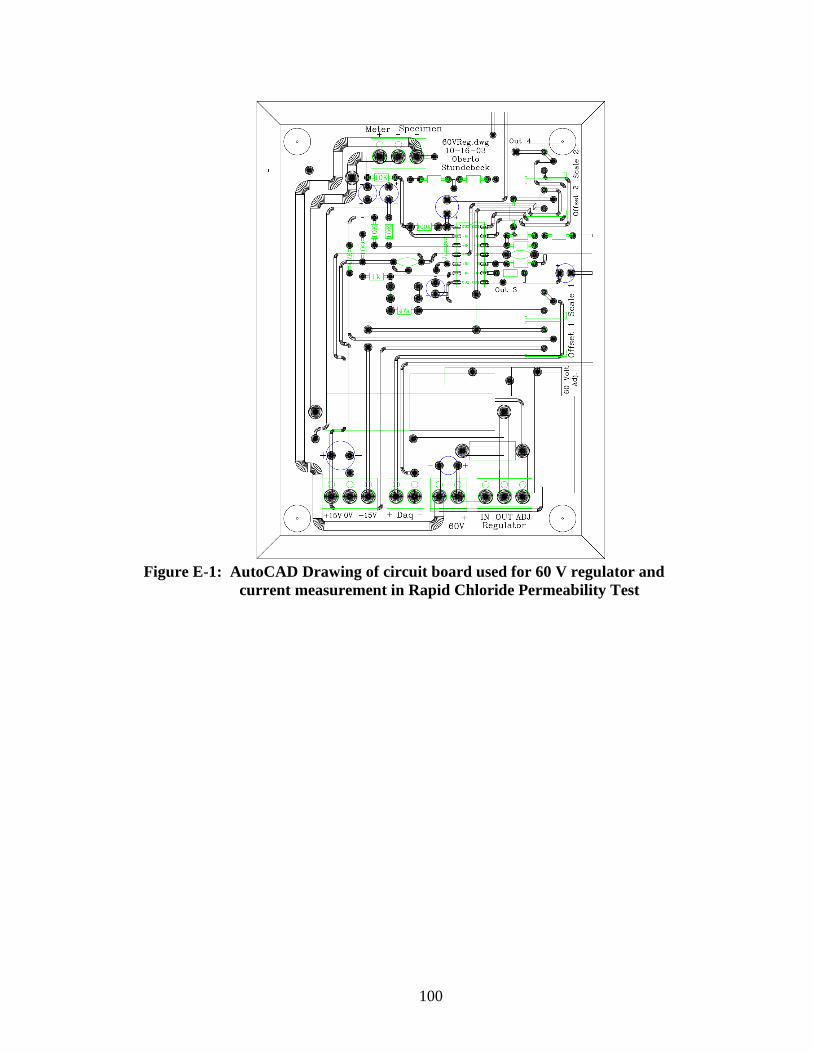
100
Figure E-1: AutoCAD Drawing of circuit board used for 60 V regulator and
current measurement in Rapid Chloride Permeability Test
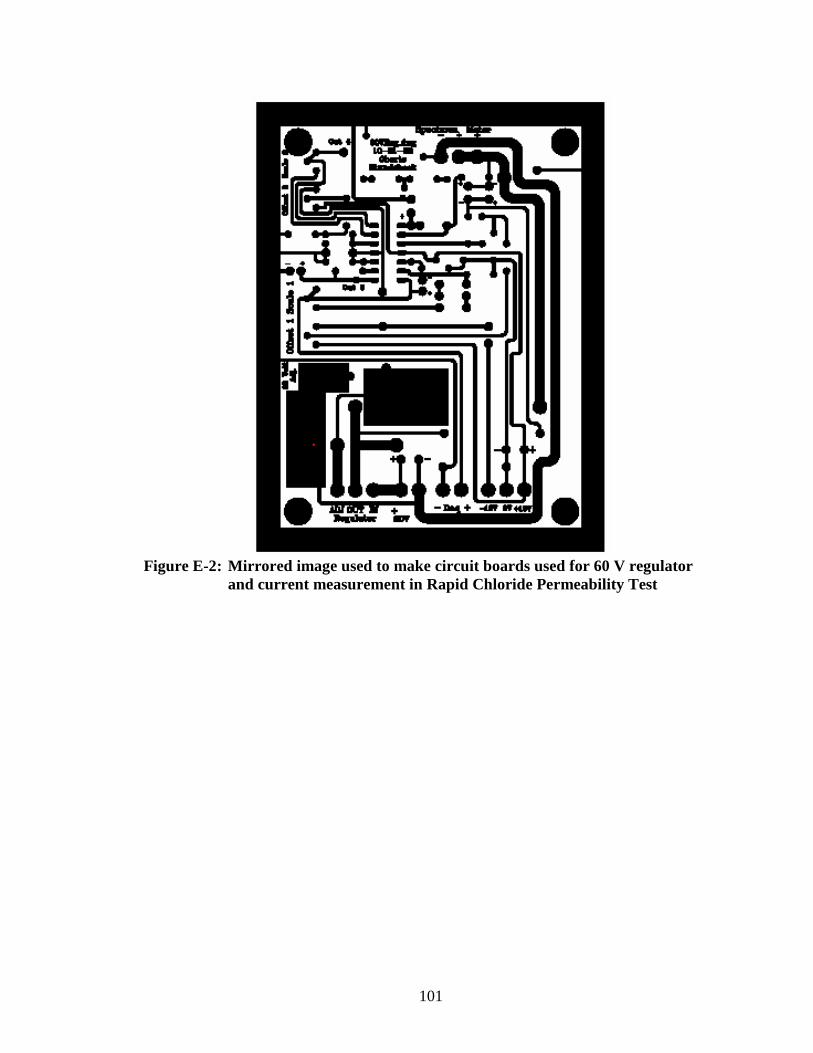
101
Figure E-2: Mirrored image used to make circuit boards used for 60 V regulator
and current measurement in Rapid Chloride Permeability Test
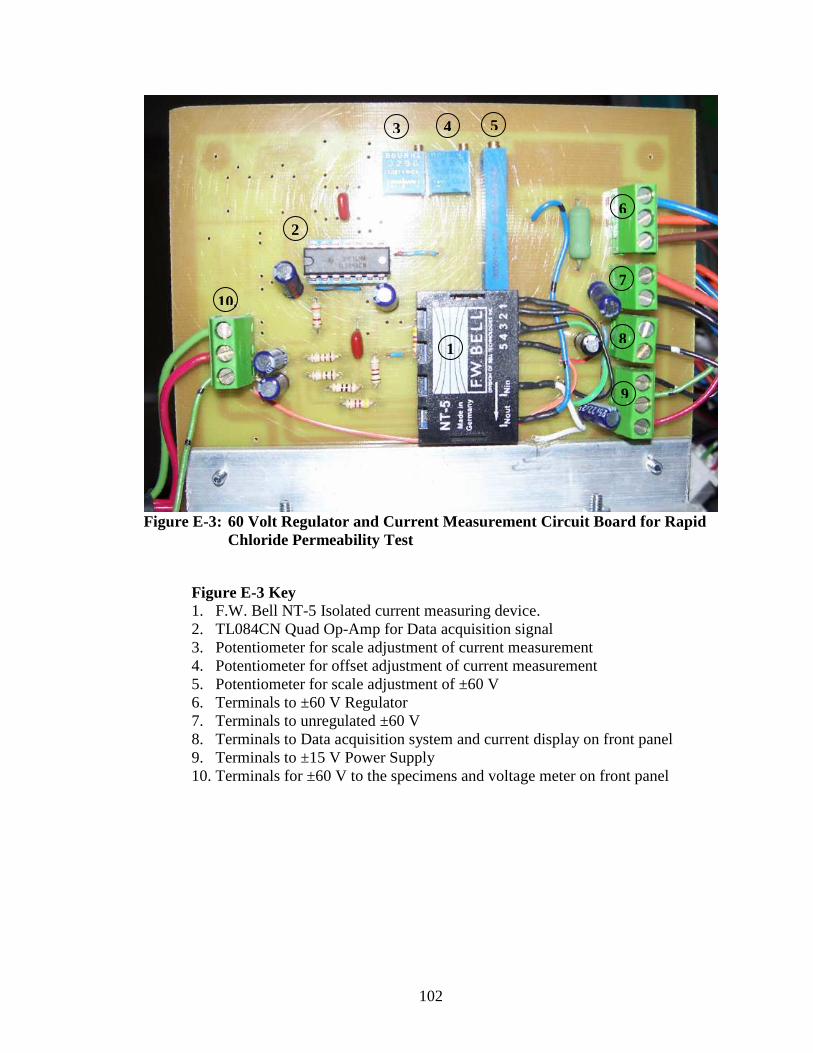
102
Figure E-3: 60 Volt Regulator and Current Measurement Circuit Board for Rapid
Chloride Permeability Test
Figure E-3 Key 1. F.W. Bell NT-5 Isolated current measuring device. 2. TL084CN Quad Op-Amp for Data acquisition signal 3. Potentiometer for scale adjustment of current measurement 4. Potentiometer for offset adjustment of current measurement 5. Potentiometer for scale adjustment of ±60 V 6. Terminals to ±60 V Regulator 7. Terminals to unregulated ±60 V 8. Terminals to Data acquisition system and current display on front panel 9. Terminals to ±15 V Power Supply 10. Terminals for ±60 V to the specimens and voltage meter on front panel
10
3 4 5
8
6
7
9
2
1
Related Documents