Dublin City University Faculty of Engineering and Computing School of Electronic Engineering Quality-Oriented Adaptation Scheme for Multimedia Streaming in Local Broadband Multi-Service IP Networks Submitted for the fulfilment of the requirements for the degree of Doctor in Philosophy (Ph.D.) Gabriel-Miro Muntean Supervisors: Dr. John Murphy Dr. Liam Murphy September 2003

Welcome message from author
This document is posted to help you gain knowledge. Please leave a comment to let me know what you think about it! Share it to your friends and learn new things together.
Transcript
Dublin City University
Faculty of Engineering and Computing
School of Electronic Engineering
Q u a l i t y - O r i e n t e d A d a p t a t i o n Scheme for Mu l t i m e d i a S t r eami ng in Local Br o a d b a n d M u l t i - S e r v i c e
IP Ne t wo r k s
Submitted for the fulfilment of the requirements for the degree of
Doctor in Philosophy (Ph.D.)
Gabriel-Miro Muntean
Supervisors: Dr. John Murphy Dr. Liam Murphy
September
2003

D E C L A R A T I O N
I hereby certify that this material, which I now submit for assessment on the programme of
study leading to the award of Doctor of Philosophy is entirely my own work and has not been taken
from the work of others save an to the extent that such work has been cited and acknowledged
within the text of my work.
ID No.: 98970178

To m y dear paren ts an d to m y lovely wife

Life is an ocean, fo-ve is a 6oat
In trouUfedwaters tíiat ¡jeeps us affoat
Wlìen we started tfie voy age, tfiere was just me andyou
Now gathered rounci us we flave our oxvn crew.
Dahon, “The Voyage”
Se Casa seara, Moffy Mafone,
atama funa cCefranjurii cetii,
zeii t.fin ceruri motaie-n tron
in pu6-uri canta petrecaretii.
Si infierii anta ispitefe mute
cupe (Le whisky si anason
Sifocuri sacre se-aprind nevazute-
Se (asa seara, Moffy iMa fone.
Se fasa seara, Moffy 'Mafone
si toate-s parca o reverie,
Iar din sageata fui Cupidbn
picura-ntr-una stropi de magie.
Tnsa cand fiaufcu neagra-i cange
pe nesimtite de tine se-agata,
toti zeii Cumii-s mute falange,
tacuti ca pestìi tai din (Piata,
Si Cumea-i toata un <Ba6ifon.
Ce neagra-i noaptea, Moffy Mafone!
Ivo Muncian, “Noapte !a Dublin”

A c k n o w l e d g e m e n t s
First of all I want to express my gratitude to my supervisor Dr. Liam Murphy who was
supporting me not only professionally, but also from other points of view during all this time. I have
leamt much from his technical advises regarding different aspects encountered during the time when I have worked closely with him. I especially thank him for understanding me during the times
when I was not sure about the direction I should take and for granting the support I needed.
I want to thank from all my heart to Dr. John Murphy. His support was invaluable because
he provided extremely important assistance in many aspects that included the best working
environment and the necessary equipment, advises in problematic issues, administrative help and at
last, but not at least optimism, joviality and enthusiasm.
I also want to thank and to express my appreciation for Dr. Philip Perry who has been not
only a very good professional adviser, but also a person one can rely on in difficult situations. It was
a pleasure working with him and I hope that I was not too difficult for him to work with me.
I hope that I can count on their support also in the future, because it means very much for
me and not only from a professional point of view.
Also I want to thank to all the other members of the Performance Engineering
Laboratory, both from Dublin City University and University College Dublin, Ireland for their
cheerful presence, without which the labs would not have been the same.
I very much thank to the technical staff, especially to Robert Clare and John Whelan
from School of Electronic Engineering, Dublin City University for their valuable support.
Next I want to thank to my close friend Dr. Valentin Muresan whose "fault" is that I am in
Dublin now and who offered me the first helpful hand in Ireland, to Dr. Prince Anandarajah, my
good friend who corrected my first English errors years ago and introduced me into some of the
Asian kitchen secrets, to my special friends Adrian Ivan and Doru Todinca and to other friends I
made since I came to Ireland or I left back in Romania for being close to me during this time.
I

I cannot forget the important contribution teachers, lecturers and professors from the
"Banatean" College, the "Grigore Moisil" Informatics High School and the Computer Science
Department of "Politehnica" University, all from my home city Timisoara - Romania, have made
to my technical background and my education in general. I hereby express my gratitude to their
competence, effort and passion put into action even in very difficult conditions for the benefit of
generations of young people. In this context, special thanks I express to my principal Prof. Dorina
Margineantu and my supervisor during the work on both B.Eng. final project and M.Sc. research,
Prof. Dr. Stefan Holban.
I must specially thank to my Irish angel Ms. Eileen M cEvoy who has warmly welcomed
me and my wife in her house and her life, not only helping us to learn more about Ireland and Irish
people and constantly supporting us, but most importantly making us feel part of her family. We
miss her so much...
I also thank to our special friend Clare Grogan W hite who unconditionally gives us a
helping hand or an advice when needed and to whole McEvoy family for being very supportive
when we needed the most.
At last but not the least I want to dedicate the current thesis to my dear parents and to my
lovely wife. My parents Dora and Ivo have guided my journey through the life with so much love, care and patience, making many sacrifices to allow me to be where I am today. I owe them
everything I become and there are no real words to express my gratitude for their effort. My wife
Cristina proved to be not only a very good family partner, but also a reliable and valuable
professional associate that offered me her helping hand in many occasions during my research and
especially while writing this thesis. She was unconditionally supporting me at work and at home
and I cannot thank her enough for what she has done and she is doing.
Dublin, September 2003
Gabriel-Miro Muntean
II
Gabriel-Miro Muntean - Ph.D. Thesis Abstract
A b s t r a c t
The research reported in this thesis proposes, designs and tests the Quality-Oriented
Adaptation Scheme (QOAS), an application-level adaptive scheme that offers high quality
multimedia services to home residences and business premises via local broadband IP-networks in
the presence of other traffic of different types. QOAS uses a novel client-located grading scheme
that maps some network-related parameters’ values, variations and variation patterns (e.g. delay,
jitter, loss rate) to application-level scores that describe the quality of delivery. This grading scheme
also involves an objective metric that estimates the end-user perceived quality, increasing its
effectiveness. A server-located arbiter takes content and rate adaptation decisions based on these
quality scores, which is the only information sent via feedback by the clients.
QOAS has been modelled, implemented and tested through simulations and an instantiation
of it has been realized in a prototype system. The performance was assessed in terms of estimated
end-user perceived quality, network utilisation, loss rate and number of customers served by a fixed
infrastructure. The influence of variations in the parameters used by QOAS and of the network-
related characteristics was studied. The scheme’s adaptive reaction was tested with background
traffic of different type, size and variation patterns and in the presence of concurrent multimedia
streaming processes subject to user-interactions. The results show that the performance of QOAS
was very close to that of an ideal adaptive scheme. In comparison with other adaptive schemes
QOAS allows for a significant increase in the number of simultaneous users while maintaining a good end-user perceived quality. These results are verified by a set of subjective tests that have been
performed on viewers using a prototype system.
Ill
Gabriel-Miro Muntean - Ph.D. Thesis Contents
Content sACKNOWLEDGEMENTS.................................................................................................... I
ABSTRACT.........................................................................................................................................I ll
TABLE OF CO NTENTS................................................................................................................ IV
LIST OF FIGURE CAPTIONS...................................................................................................XII
LIST OF TABLE CAPTIONS....................................................................................................XIX
1 INTRODUCTION............................................................................................................................. 1
1.1 Multimedia Presentations........................................................................................1
1.1.1 Delivery Networks................................................................................................... 3
1.1.2 Offered Services................... 3
1.1.3 Distribution Solutions.............................................................................................. 4
1.2 RESEARCH MOTIVATION................................................................................................. 4
1.3 Problem and Go a l .......................................................................................................7
1.4 Solution and Contributions.................................................................................... 8
1.5 Short Outline of the Th esis.....................................................................................9
1.6 Summary........................ 10
2 RELATED W O RK S...................................................................................................................... 11
2.1 Overview...................................................................................................................... 11
2.2 High-Quality On-Demand Multimedia Presentations....................................13
2.2.1 Delivery Networks............................................................................................... 13
2.2.1.1 Wireless Solutions.......................................................................................... 13
2.2.1.2 Wireline Solutions ....................................................................................... 14
2.2.1.3 Cable-based Solutions versus Satellite Broadcast..........................................15
2.2.1.4 Broadband Multi-service IP Networks.......................................................... 16
IV
Gabriel-Miro Muntean - Ph.D. Thesis Contents
2.2.2 Offered Services...................................................................................................... 17
2.2.2.1 Digital and Interactive TV ...............................................................................18
2.2.2.2 Digital and Interactive Audio.......................................................... 18
2.2.2.3 High Speed Data Transmission....................................................................... 19
2.2.2.4 Other Interactive Services............................................................................... 19
2.2.3 Distribution Solutions.............................................................................................20
2.2.3.1 Defining Quality of Service (QoS).................................................................20
2.2.3.2 Providing QoS..................................................................................................21
2.2.3.3 Assessing QoS.................................................................................................29
2.3 Com pression Te c h n iq u e s ......................................................................................... 30
2.3.1 Entropy-Coding (Lossless) Techniques................................. 32
2.3.2 Lossy Techniques....................................................................................................33
2.3.3 Hybrid Techniques................................................................................................. 34
2.3.3.1 The JPEG Standards....................................................................................... 35
2.3.3.2 The MPEG Standards..................................................................................... 35
2.3.3.3 The ITU-T Standards...................................................................................... 37
2.3.3.4 Proprietary Solutions...................................................................................... 38
2.3.4 Conclusion..............................................................................................................38
2.4 Adaptive Solutions for Delivering Mu ltim ed ia ...............................................39
2.4.1 Source-based Adaptive Control Techniques.................. 41
2.4.2 Receiver-based Adaptive Control Schemes.......................................................... 45
2.4.3 Hybrid Adaptive Control Mechanisms............. ................. 48
2.4.4 Transcoder-based Adaptive Control Solutions.....................................................49
2.4.5 Conclusions.................... 50
2.5 User Perceived Quality (Resea rch , M etrics , Testing) ................................... 51
2.5.1 Necessity of User Perceived Quality Assessment.............................................. 51
V
Gabriel-Miro Muntean - Ph.D. Thesis Contents
2.5.2 Possible Impairments of Remotely Delivered Video Streams............................. 52
2.5.3 Objective Assessment of User Perceived Quality.................................................53
2.5.3.1 Mathematical Metrics .............................................................................54
2.5.3.2 Model-based Metrics......................................... 56
2.5.4 Subjective Assessment of User Perceived Quality...............................................60
2.5.5 Conclusions.............................................................................................................61
2.6 Improving Performances of Multimedia Deliveries..................................... 61
2.6.1 Error Control...........................................................................................................62
2.6.1.1 FEC-based Mechanisms.................................................................................. 62
2.6.1.2 Retransmissions.............................................................................................. 63
2.6.1.3 Error-resilient Encoding..................................................................................64
2.6.1.4 Error Concealment.......................................................................................... 64
2.6.1.5 Comments........................................................................................................65
2.6.2 Protocols.................................................................................................................65
2.6.2.1 Network-level Protocols.................................................................................66
2.6.2.2 Transport Protocols......................................................................................... 66
2.6.2.3 Session Control Protocols...............................................................................66
2.6.2.4 Comments........................................................................................................66
2.6.3 Solutions for Delivery Architectures.....................................................................67
2.6.3.1 Proxy Servers.................................................................................................. 67
2.6.3.2 Caching............................................................................................................67
2.6.3.3 Mirorring......................................................................................................... 69
2.6.3.4 Content Delivery Networks............................................................................69
2.6.3.5 Peer-to-peer Systems...................................................................................... 70
2.6.3.6 Comments....................................................................................................... 70
2.6.4 Delivery Techniques.............................................................................................. 70
VI

Gabriel-Miro Muntean - Ph.D. Thesis Contents
2.6.4.1 Broadcasting................................................................................................... 70
2.6.4.2 Multicasting.....................................................................................................71
2.6.4.3 Unicast.............................................................................................................71
2.6.4.4 Comments........................................................................................................71
2.6.5 Conclusions .............................................................................................. 72
2.7 Summary....................................................................................................................72
3 QOAS IN LOCAL BROADBAND MULTI-SERVICE IP NETW ORKS.................... 73
3.1 Overview...................................................................................................................... 73
3.2 Broadband IP-Network Architectures to Home Residences and Business
Premises...........................................................................................................................................74
3.2.1 Centralised Architecture....................... 74
3.2.2 Distributed Architecture......................................................................................... 75
3.2.3 Hybrid Architecture.............................................................. 76
3.2.4 Comments...............................................................................................................77
3.3 QOAS in Local Broadband Multi-service IP-Network.................................. 78
3.4 Designing QOAS.........................................................................................................80
3.5 Conclusion.................................................................................................................. 82
3.6 Summary...................................................................................................................... 83
4 QOAS FOR MULTIMEDIA STREAM ING..........................................................................84
4.1 QOAS Overview..........................................................................................................84
4.2 QOAS-based System Architecture.......................................................................86
4.2.1 High-Level Architecture........................................................................................ 86
4.2.2 Block-Level Architecture.......................................................................................88
4.3 IntrA-Stream QOAS................................................................................................. 90
4.4 Q - End-User Quality Assessment.........................................................................94
4.5 Client-Located QoD Grading Scheme (QoDGS)................................................97
4.5.1 QoDGS Overview................................................................................................ 97VII
Gabriel-Miro Muntean - Ph.D. Thesis Contents
4.5.2 QoDGS Principles...................................................................................................97
4.5.3 Monitored Parameters....................................................... 99
4.5.4 Measurements Accuracy...................................................................................... 104
4.5.5 QoDGS Design.....................................................................................................106
4.6 Server Arbitration Scheme (SAS)....................................................................... 117
4.6.1 SAS Overview......................................................................................................117
4.6.2 SAS Principles......................................................................................................117
4.6.3 SAS Design........................................................................................................... 118
4.7 Data Transmission and Feedback Mechanism................................................. 119
4.8 Inter-stream QOAS.................................................................................................123
4.9 Applicability Considerations.............................................................................. 127
4.10 Summary.................................................................................................................. 128
5 IMPLEMENTATION DETAILS................................................................................... 130
5.1 Implementation of the Simulation Model System .......................................130
5.1.1 Network Simulator version 2 ............................................................................... 130
5.1.2 Simulation Model’s Implementation Overview.................................................. 131
5.1.2.1 RTP-based Transport of Multimedia Data Packets......................................131
5.1.2.2 Drop-Tail Router Queue............................................................................... 131
5.1.2.3 QOAS Server Controller Application.......................................................... 132
5.1.3 Implementation of the QOAS Server Application Model...................................133
5.1.3.1 Multimedia Acquirer, MPEG Encoder and Multimedia Database.............133
5.1.3.2 Server Communication Manager and Transmission Shaper....................... 133
5.1.3.3 Feedback Manager and Server Core............................................................ 134
5.1.4 Implementation of the QOAS Client Application Model...................................135
5.1.4.1 MPEG Decoder and Multimedia Player..................................................... .135
5.1.4.2 Client Communication Manager...................................................................135
VIII
Gabriel-Miro Muntean - Ph.D. Thesis Contents
5.1.4.3 Feedback Indication Unit and Client Core................................................. 136
5.2 Implementation of the Real Prototype System .............................................137
5.2.1 Prototype System’s Implementation Overview...................................... 137
5.2.1.1 Applications’ Inter-communication..............................................................137
5.2.1.2 Data Buffering and Statistical Data Collection............................................ 138
5.2.1.3 Complex Producer-Consumer Problem........................................................141
5.2.2 Implementation of the QOAS Server Application.............................................. 142
5.2.2.1 Multimedia Acquirer and MPEG Encoder................................................... 143
5.2.2.2 Server Communication Manager and Transmission Shaper........................144
5.2.2.3 Feedback Manager and Server Application Core........................................145
5.2.2.4 Database Support for Pre-recorded Streams................................................ 145
5.2.3 Implementation of the QOAS Client Application............................................... 147
5.2.3.1 MPEG Decoder and Multimedia Player...................................................... 148
5.2.3.2 Client Communication Manager...................................................................149
5.2.3.3 Feedback Indication Unit and Client Core.................................... 149
5.3 Summary.................................................................................................................... 150
6 EXPERIMENTAL RESULTS..................................................................................................151
6.1 Overview.................................................................................................................... 151
6.2 Objective Testing.....................................................................................................152
6.2.1 Simulation-based Testing..................................................................................... 152
6.2.1.1 Network Simulator Version 2 (NS-2)...........................................................153
6.2.1.2 Simulation Topology.................................................................................... 153
6.2.1.3 QOAS Model.................................................................................................155
6.2.1.4 Multimedia Clips............................................................... 155
6.2.1.5 Performance Assessment.............................................................................. 156
6.2.2 Tuning QOAS.......................................................................................................157
IX
Gabriel-Miro Muntean - Ph.D. Thesis Contents
6.2.3 Testing QOAS.......................................................................................................164
6.2.3.1 Single QOAS-based Streaming Against Different Types of Traffic........... 164
6.2.3.2 Comparison to an Ideal Adaptive Scheme................................................... 195
6.2.3.3 Single QOAS-based Streaming Against Multimedia Traffic...................... 197
6.2.3.4 Single QOAS - Comparison to Other Streaming Solutions........................ 208
6.2.3.5 Multiple QOAS-based Streaming in Highly Loaded Conditions................211
6.2.3.6 Multiple QOAS - Comparison to Other Streaming Solutions.....................214
6.2.3.7 Effect of Feedback Frequency on End-user Perceived Quality..................216
6.2.3.8 Effect of Delivery Latency on End-user Perceived Quality........................219
6.2.4 Comments.............................................................................................................221
6.3 Subjective Testing................................................................................................ 221
6.3.1 Motivations...........................................................................................................221
6.3.2 Setup Conditions.................................................................................................. 222
6.3.2.1 Test Setup.......................................................................................................222
6.3.2.2 Applications’ Setup.......................................................................................223
6.3.2.3 Tested Approaches................ 223
6.3.2.4 Test Environment.......................................................................................... 224
6.3.2.5 Multimedia Clips.......................................................................................... 224
6.3.2.6 Test Method.................................................................................................. 225
6.3.2.7 Grading Scale................................................................................................ 225
6.3.3 Tests Description and Goals................................................................................226
6.3.3.1 Test Goals..................................................................................................... 226
6.3.3.2 Tests’ Description.........................................................................................227
6.3.4 Tests Results........................................................................................................ 230
6.3.4.1 Test 1 - Staircase-up Multimedia-like Background Traffic........................230
6.3.4.2 Test 2 - Periodic Multimedia-like Background Traffic............................... 234
Gabriel-Miro Muntean - Ph.D. Thesis Contents
6.3.5 Comments.....................................................................................................237
6.4 C onclusions..............................................................................................................238
6.5 Summary....................................................................................................................238
7 CONCLUSIONS AND FURTHER W O R K .........................................................................240
7.1 Main A chievem ents................................................................................................ 240
7.2 N ovel C o n tr ib u tio n s ............................................................................................. 242
7.3 QOAS B enefits ..........................................................................................................243
7.4 F u tu re W o rk .............................................................................................................245
7.5 Summary....................................................................................................................248
A APPENDIX - DEFINITIONS FOR TECHNICAL TERM S.........................................249
B APPENDIX - MPEG 1 AND MPEG 2 ENCODING SCHEM ES.................................253
B. 1 MPEG 1 AND MPEG 2 VIDEO...................................................................................253
B.2 MPEG 1 AND MPEG 2 AUDIO...................................................................................255
B.3 MPEG -1 Systems and MPEG 2 P ro g ra m ........................................................... 256
C APPENDIX - DOCUMENTS FOR SUBJECTIVE TESTING.................................... 258
PUBLICATIONS AND AW ARDS............................................................................................. 263
REFERENCES..................................................................................................................................264
XI

Gabriel-Miro Muntean - Ph.D. Thesis Figure Captions
List of F igure Capt i ons
Figure 3-1 Centralised architecture distributing multimedia to residential users.............................. 74
Figure 3-2 Distributed architecture for delivering multimedia to home residences.......................... 75
Figure 3-3 Hybrid approach for distributing multimedia-based services to residential users............77
Figure 3-4 Horizontal solution for local distribution of services to home residences....................... 78
Figure 3-5 Local service distribution to home residences in a tree-like manner ................... 79
Figure 3-6 Architecture for local multimedia delivery to residential customers............................... 79
Figure 3-7 QOAS deployment at the level of an adaptive client-server system ......80
Figure 4-1 The architecture of the Quality Oriented Adaptation Scheme - based multimedia
streaming system........................................................................................................................... 87
Figure 4-3 The block structure of the QOAS-based multimedia streaming system.......................... 88
Figure 4-4 Schematic description of QOAS’s adaptation principle.............................. 91
Figure 4-5 A five-state model that could be used by the QOAS’s server...........................................92
Figure 4-6 Switching between different quality streams with the same multimedia content is
performed at certain checkpoints............................................................... 93
Figure 4-7 The end-user quality (Q) variation with the mean bitrate for a multimedia stream with
average motion content, plotted for different packet loss ratios in the interval [0.001, 0.01] ...96
Figure 4-8 QoDGS takes into consideration both traffic-related parameters and end-user quality .106
Figure 4-9 DelayGrade computation in the QoDGS first grading stage based on historic statistics
about one-way delays.................................................................................................................. 108
Figure 4-10 DelayGrade linear variation when AvgDelay varies between MinDelay (AvgVar=0)
and MaxDelay (AvgVar=l)........................................................................................................109
Figure 4-12 Delay jitter grading scheme that computes Jitter Grades in the first stage of QoDGS 110
Figure 4-13 JitterGrade with AvgJitter variation between 0-50 ms (JThresh =20 ms, n =3) I l l
Figure 4-14 Loss Rate grading scheme computes Loss Rate Grades in the first stage of QoDGS..112
XII
Gabriel-Miro Muntean - Ph.D. Thesis Figure Captions
Figure 4-15 LossGrade variation when LossRate varies between 0 and 5 % for LTarget 1%..........113
Figure 4-16 Short-term QoDGS second grading stage.................................................................. 115
Figure 4-17 Long-term QoDGS second grading stage.................................................................. 115
Figure 4-18 SAS block-level structure.......................................................................................... 119
Figure 4-19 Multimedia data transmission and control data exchange between QOAS server and
client applications.................................................................................................................120
Figure 4-20 RTCP addition - QOAS receiver report packet type.................................................. 122
Figure 4-21 Example of a RTSP session.......................................................................................123
Figure 4-22 QOAS Server Controller in permanent contact with QOAS server application instances
in charge with the deployment of the inter-stream QOAS......................................................124
Figure 5-1 QOAS Client-server inter-application communication.................................................138
Figure 5-2 Basic structure of the Circular Buffer..........................................................................139
Figure 5-3 Enhanced structure of the Circular Buffer................................................................... 140
Figure 5-4 Solution for the copier-decoder-player problem.......................................................... 141
Figure 6-1 The “Dumbbell” topology includes a bottleneck link, a QOAS server and N QOAS
receivers (clients), as well as a number of sources and receivers of background traffic 154
Figure 6-2 Background traffic variation on top of 95.5 Mb/s CBR traffic.....................................158
Figure 6-3 QOAS bitrate adaptation versus CBR periodic background traffic with size: 0.5 Mb/s and frequency: 20 s on - 40 s off.......................................................................................... 166
Figure 6-4 End-user perceived quality: QOAS versus ideal adaptive streaming subject to CBR
periodic background traffic with size: 0.5 Mb/s and frequency: 20 s on - 40 s off................ 166
Figure 6-5 Link utilisation for QOAS-based multimedia streaming with CBR periodic background
traffic size: 0.5 Mb/s and frequency: 20 s on - 40 s off......................................................... 166
Figure 6-6 QOAS bitrate adaptation versus CBR periodic background traffic with size: 0.5 Mb/s
and frequency: 30 s on - 60 s off.......................................................................................... 167
Figure 6-7 End-user perceived quality: QOAS versus ideal adaptive streaming subject to CBR
periodic background traffic with size: 0.5 Mb/s and frequency: 30 s on - 60 s off................ 167
XIII
Gabriel-Miro Muntean - Ph.D. Thesis Figure Captions
Figure 6-8 Link utilisation for QOAS-based multimedia streaming with CBR periodic background
traffic size: 0.5 Mb/s and frequency: 30 s on - 60 s off.............................................................167
Figure 6-9 QOAS bitrate adaptation versus CBR periodic background traffic with size: 0.5 Mb/s
and frequency: 40 s on - 80 s off................................................................................................168
Figure 6-10 End-user perceived quality: QOAS versus ideal adaptive streaming subject to CBR
periodic background traffic with size: 0.5 Mb/s and frequency: 40 s on - 80 s off................. 168
Figure 6-11 Link utilisation for QOAS-based multimedia streaming with CBR periodic background
traffic size: 0.5 Mb/s and frequency: 40 s on - 80 s off.............................................................168
Figure 6-12 QOAS bitrate adaptation versus CBR periodic background traffic with size: 0.7 Mb/s
and frequency: 20 s on - 40 s off................................................................................................169
Figure 6-13 End-user perceived quality: QOAS versus ideal adaptive streaming subject to CBR
periodic background traffic with size: 0.7 Mb/s and frequency: 20 s on - 40 s off................. 169
Figure 6-14 Link utilisation for QOAS-based multimedia streaming with CBR periodic background
traffic size: 0.7 Mb/s and frequency: 20 s on - 40 s off.............................................................169
Figure 6-15 QOAS bitrate adaptation versus CBR periodic background traffic with size: 0.7 Mb/s
and frequency: 30 s on - 60 s off................................................................................................170
Figure 6-16 End-user perceived quality: QOAS versus ideal adaptive streaming subject to CBR
periodic background traffic with size: 0.7 Mb/s and frequency: 30 s on - 60 s off................. 170
Figure 6-17 Link utilisation for QOAS-based multimedia streaming with CBR periodic background
traffic size: 0.7 Mb/s and frequency: 30 s on - 60 s off.............................................................170
Figure 6-18 QOAS bitrate adaptation versus CBR periodic background traffic with size: 0.7 Mb/s
and frequency: 40 s on - 80 s off................................................................................................171
Figure 6-19 End-user perceived quality: QOAS versus ideal adaptive streaming subject to CBR
periodic background traffic with size: 0.7 Mb/s and frequency: 40 s on - 80 s off................. 171
Figure 6-20 Link utilisation for QOAS-based multimedia streaming with CBR periodic background
traffic size: 0.7 Mb/s and frequency: 40 s on - 80 s off.............................................................171
Figure 6-21 QOAS bitrate adaptation vs. CBR staircase background traffic with steps of 0.4 Mb/s
..................................................................................................................................................... 174
Figure 6-22 End-user perceived quality: QOAS versus ideal adaptive streaming subject to CBR
staircase background traffic with steps of 0.4 Mb/s...................................................................174
XIV
Gabriel-Miro Muntean - Ph.D. Thesis Figure Captions
Figure 6-23 Link utilisation for QOAS-based multimedia streaming with CBR staircase background
traffic with steps of 0.4 Mb/s......................................................................................................174
Figure 6-24 QOAS bitrate adaptation vs. CBR staircase background traffic with steps of 0.6 Mb/s
..................................................................................................................................................... 175
Figure 6-25 End-user perceived quality: QOAS versus ideal adaptive streaming subject to CBR
staircase background traffic with steps of 0.6 Mb/s...................................................................175
Figure 6-26 Loss rate variation for QOAS-based multimedia streaming with CBR staircase
background traffic with steps of 0.6 M b/s................................................................................. 175
Figure 6-27 Link utilisation for QOAS-based multimedia streaming with CBR staircase background
traffic with steps of 0.6 Mb/s......................................................................................................176
Figure 6-28 QOAS bitrate adaptation versus VBR background traffic with size: 1.0 Mb/s and
burstiness: 0.001 s o n -0 .1 s off.................................................................................................179
Figure 6-29 End-user perceived quality: QOAS versus ideal adaptive streaming subject to VBR
background traffic with size: 1.0 Mb/s and burstiness: 0.001 s o n - 0.1 s off......................... 179
Figure 6-30 Link utilisation for QOAS-based multimedia streaming with VBR background traffic
size: 1.0 Mb/s and burstiness: 0.001 s on - 0.1 s off..................................................................179
Figure 6-31 QOAS bitrate adaptation versus VBR background traffic with size: 1.0 Mb/s and
burstiness: 0.01 s on - 0.1 s off...................................................................................................180
Figure 6-32 End-user perceived quality: QOAS versus ideal adaptive streaming subject to VBR
background traffic with size: 1.0 Mb/s and burstiness: 0.01 s on-0 .1 s off........................... 180
Figure 6-33 Link utilisation for QOAS-based multimedia streaming with VBR background traffic
size: 1.0 Mb/s and burstiness: 0.01 s on - 0.1 s off....................................................................180
Figure 6-34 QOAS bitrate adaptation versus VBR background traffic with size: 1.0 Mb/s and
burstiness: 0.1 s on -0 .1 s off.....................................................................................................181
Figure 6-35 End-user perceived quality: QOAS versus ideal adaptive streaming subject to VBR
background traffic with size: 1.0 Mb/s and burstiness: 0.1 s on - 0.1 s off............................. 181
Figure 6-36 Link utilisation for QOAS-based multimedia streaming with VBR background traffic
size: 1.0 Mb/s and burstiness: 0.1 s on - 0.1 s off......................................................................181
Figure 6-37 QOAS bitrate adaptation versus VBR background traffic with size: 0.8 Mb/s and
burstiness: 0.001 s on -0 .1 s off.................................................................................................183
XV
Gabriel-Miro Muntean - Ph.D. Thesis Figure Captions
Figure 6-38 End-user perceived quality: QOAS versus ideal adaptive streaming subject to VBR
background traffic with size: 0.8 Mb/s and burstiness: 0.001 s on - 0.1 s off..........................183
Figure 6-39 Link utilisation for QOAS-based multimedia streaming with VBR background traffic
size: 0.8 Mb/s and burstiness: 0.001 s on - 0.1 s off..................................................................184
Figure 6-40 QOAS bitrate adaptation versus VBR background traffic with size: 1.0 Mb/s and
burstiness: 0.001 s on - 0.1 s off.................................................................................................184
Figure 6-41 End-user perceived quality: QOAS versus ideal adaptive streaming subject to VBR
background traffic with size: 1.0 Mb/s and burstiness: 0.001 s on - 0.1 s off..........................184
Figure 6-42 Link utilisation for QOAS-based multimedia streaming with VBR background traffic
size: 1.0 Mb/s and burstiness: 0.001 s on - 0.1 s off..................................................................185
Figure 6-43 QOAS bitrate adaptation versus VBR background traffic with size: 1.2 Mb/s and
burstiness: 0.001 s on - 0.1 s off.................................................................................................185
Figure 6-44 End-user perceived quality: QOAS versus ideal adaptive streaming subject to VBR
background traffic with size: 1.2 Mb/s and burstiness: 0.001 s on - 0.1 s off..........................185
Figure 6-45 Link utilisation for QOAS-based multimedia streaming with VBR background traffic
size: 1.2 Mb/s and burstiness: 0.001 s on - 0.1 s off..................................................................186
Figure 6-46 QOAS bit-rate adaptation versus 50 FTP flows as background traffic........................188
Figure 6-47 End-user perceived quality: QOAS versus ideal adaptive streaming subject to 50 FTP
flows as background traffic.........................................................................................................188
Figure 6-48 Link utilisation for QOAS-based multimedia streaming with 50 FTP flows as
background traffic....................................................................................................................... 188
Figure 6-49 QOAS bitrate adaptation versus 54 FTP flows as background traffic......................... 189
Figure 6-50 End-user perceived quality: QOAS versus ideal adaptive streaming subject to 54 FTP
flows as background traffic.........................................................................................................189
Figure 6-51 Loss rate variation when QOAS-based multimedia streaming with 54 FTP flows as
background traffic....................................................................................................................... 189
Figure 6-52 Link utilisation when streaming multimedia using QOAS with 54 FTP flows as
background traffic...................................................................................................................... 190
Figure 6-53 QOAS bit-rate adaptation versus 40 WWW sessions as background traffic............... 192
XVI
Gabriel-Miro Muntean - Ph.D. Thesis Figure Captions
Figure 6-54 End-user perceived quality: QOAS versus ideal adaptive streaming subject to 40
WWW sessions as background traffic........................................................................................192
Figure 6-55 Link utilisation for QOAS-based multimedia streaming with 40 WWW sessions as
background traffic.......................................................................................................................193
Figure 6-56 QOAS bitrate adaptation versus 50 WWW sessions as background traffic................. 193
Figure 6-57 End-user perceived quality: QOAS versus ideal adaptive streaming subject to 50
WWW sessions as background traffic........................................................................................193
Figure 6-58 Link utilisation for streaming multimedia using QOAS with 50 WWW sessions as
background traffic.......................................................................................................................194
Figure 6-59 Background traffic variation on top of 95.5 Mb/s CBR traffic.....................................201
Figure 6-60 QOAS bit-rate adaptation versus complex multimedia traffic..................................... 202
Figure 6-61 End-user perceived quality: QOAS versus ideal adaptive streaming subject to complex
multimedia background traffic................................................... 202
Figure 6-62 Loss rate variation when QOAS-based multimedia streaming with complex multimedia
as background traffic...................................................................................................................202
Figure 6-63 Link utilisation when QOAS-based multimedia streaming with complex multimedia as
background traffic.......................................................................................................................203
Figure 6-64 TFRCP bit-rate adaptation versus complex multimedia traffic.................................... 204
Figure 6-65 End-user perceived quality: TFRCP versus ideal adaptive streaming subject to complex
multimedia background traffic................................................................................................... 204
Figure 6-66 Loss rate variation when TFRCP-based multimedia streaming with complex
multimedia as background traffic.............................................................................................. 204
Figure 6-67 Link utilisation when TFRCP-based multimedia streaming with complex multimedia as
background traffic............................... 205
Figure 6-68 LDA+ bit-rate adaptation versus complex multimedia traffic..................................... 205
Figure 6-69 End-user perceived quality: LDA+ versus ideal adaptive streaming subject to complex
multimedia background traffic................................................................................................... 206
Figure 6-70 Loss rate variation when LDA+-based multimedia streaming with complex multimedia
as background traffic.................................................... 206
XVII
Gabricl-Miro Muntean - Ph.D. Thesis Figure Captions
Figure 6-71 Link utilisation when LDA+-based multimedia streaming with complex multimedia as
background traffic....................................................................................................................... 206
Figure 6-72 NoAd bit-rate versus complex multimedia traffic......................................................... 207
Figure 6-73 End-user perceived quality: NoAd versus ideal adaptive streaming subject to complex
multimedia background traffic................................................................................................... 207
Figure 6-74 Loss rate variation when NoAd-based multimedia streaming with complex multimedia
as background traffic...................................................................................................................208
Figure 6-75 Link utilisation when NoAd-based multimedia streaming with complex multimedia as
background traffic....................................................................................................................... 208
Figure 6-76 Loss rate vs. increase in the number of served clients above a base line of 23............212
Figure 6-77 End-user average quality versus increase in the number of clients simultaneously
served above a base line of 2 3 ................................................................................................... 212
Figure 6-78 Bottleneck link utilization using different approaches, while increasing the number of
simultaneous viewers..................................................................................................................213
Figure 6-79 Multimedia-like background traffic variation on top of 95.5 Mb/s CBR traffic 216
Figure 6-80 Multimedia-like background traffic variation on top of 95.5 Mb/s CBR traffic 219
Figure 6-81 Test bed setup consisting of a local Server and a local Client part of different networks
interconnected by a Router on which an emulator allows for bandwidth and delay variation 222
Figure 6-82 Staircase-up background traffic on top of 95.5 Mb/s CBR traffic during Test 1.........228
Figure 6-83 Periodic background traffic on top of 95.5 Mb/s CBR traffic during Test 2 ...............228
Figure 6-84 QOAS bit-rate adaptation with background traffic variation when streaming Die Hard 1
clip during Test 1 ........................................................................................................................232
Figure 6-85 QOAS bit-rate adaptation with background traffic variation when streaming Die Hard 1
clip during Test 2 ........................................................................................................................235
Figure B-l The Spatial Compression Technique...............................................................................254
Figure B-2 The Temporal Compression Technique...........................................................................255
XVIII
Gabriel-Miro Muntean - Ph.D. Thesis Table Captions
List of Table Capt i ons
Table 4-1 Quality scale for subjective testing...................................................................................... 94
Table 6-1 Peak/mean ratio for all the MPEG-2 encoded quality versions associated to the
multimedia clips used during simulations...................................................................................155
Table 6-2 Categorisation of the multimedia clips used during simulations (based on their 2.0
Mbits/s MPEG-2 encoded quality versions).............................................................................. 156
Table 6-3 Quality scale for subjective testing.................................................................................... 157
Table 6-4 Average end-user perceived quality when varying WDeiay in QoDGS.............................159
Table 6-5 Average end-user perceived quality when varying Wjitterin QoDGS..............................159
Table 6-6 Average end-user perceived quality when varying WLossin QoDGS............................. 160
Table 6-7 Average end-user perceived quality when varying WQin QoDGS.................................160
Table 6-8 Minimum and maximum limits for the QoDGS weights when the highest end-user
perceived quality was achieved during QOAS-based streaming of the average motion content
movie jurassic3............................................................................................................................160
Table 6-9 Intervals for QoDGS weights when QOAS has achieved the highest end-user perceived
quality when streaming the high motion content movie diehardl............................................ 161
Table 6-10 Suggested limits for QoDGS weights in tests that have involved streaming using QOAS
of the low motion content movie: familyman............................................ 161
Table 6-11 Suggested contributions for the parameters in the QoDGS............................................162
Table 6-12 Suggested contributions for short-term and long-term monitoring in the QoDGS......162
Table 6-13 Average end-user perceived quality when varying QoDGS’s wA and wB for different
motion content movies: jurassic3, diehardl and familyman.................................................... 163
Table 6-14 Different shapes and variation patters for the tested UDP-CBR periodic background
traffic............................................................................................................................................173
Table 6-15 Statistical results for UDP-CBR periodic background traffic.......................................173
XIX
Gabriel-Miro Muntean - Ph.D. Thesis Table Captions
Table 6-16 Different shapes and variation patters for the tested UDP-CBR staircase background
traffic............................................................................................................................................177
Table 6-17 Statistical results for UDP-CBR staircase background traffic......................................178
Table 6-18 Constant average bit-rate and variable burstiness background traffic of type UDP - VBR
exponential........................ 182
Table 6-19 Statistical results for tests with constant average bit-rate and variable burstiness
background traffic of type UDP - VBR exponential................................................................182
Table 6-20 Constant burstiness and variable average bit-rate background traffic of type UDP - VBR
exponential..................................................................................................................................186
Table 6-21 Statistical results for tests with constant burstiness and variable average bit-rate
background traffic of type UDP - VBR exponential................................................................187
Table 6-22 Characteristics of the long-lived TCP background traffic............................................. 191
Table 6-23 Statistical results for tests with long-lived TCP background traffic..............................191
Table 6-24 Characteristics of the TCP background traffic................................................................194
Table 6-25 Statistical results for tests with TCP background traffic................................................ 195
Table 6-26 Background traffic of different types, shapes and sizes when testing QOAS............... 196
Table 6-27 Comparison between QOAS and ideal streaming subject to concurrent traffic............ 197
Table 6-28 Statistical comparison between QOAS, TFRCP, LDA+ and NoAd when streaming
diehard 1 in multimedia-like background traffic conditions.....................................................210
Table 6-29 Statistical comparison between QOAS, TFRCP, LDA+ and NoAd when streaming
multiple multimedia clips.......................................................................................................... 214
Table 6-30 Performance comparison between QOAS, TFRCP, LDA+ and NoAd when streaming
multiple multimedia clips to the same number of clients.........................................................215
Table 6-31 Effect of feedback frequency on the QOAS performance when streaming diehardl in
multimedia-like background traffic conditions..........................................................................217
Table 6-32 Effect of delivery latency on the QOAS performance when streaming diehardl in
multimedia-like background traffic conditions..........................................................................220
Table 6-33 Quality scale for subjective testing........................................................ 226
XX

Gabriel-Miro Muntean - Ph.D. Thesis Table Captions
Table 6-34 Statistical results related to subjective quality assessment on the 1-5 grading scale
obtained for Test 1 for all the Die Hard 1, Don’t Say a Word, Family Man and Road to El Dorado multimedia clips............................................................................................................231
Table 6-35 Statistical results related to what the subjects have appreciated the most when streaming
Die Hard 1 (A), Don’t Say a Word (B), Family Man (C) and Road to El Dorado (D)
multimedia clips during Test 1................................................................................................... 232
Table 6-36 Statistical results related to what the subjects have disliked the most when streaming Die
Hard 1 (A), Don V Say a Word (B), Family Man (C) and Road to El Dorado (D) multimedia
clips during Test 1....................................................................................................................... 233
Table 6-37 Statistical results related to subjective quality assessment on the 1-5 grading scale
obtained for Test 2 for all the Die Hard 1, Don't Say a Word, Family Man and Road to El Dorado multimedia clips............................................................................................................234
Table 6-38 Statistical results related to what the subjects have appreciated the most when streaming
Die Hard 1 (A), Don’t Say a Word (B), Family Man (C) and Road to El Dorado (D)
multimedia clips during Test 2................................................................................................... 236
Table 6-39 Statistical results related to what the subjects have disliked the most when streaming Die Hard 1 (A), Don’t Say a Word (B), Family Man (C) and Road to El Dorado (D) multimedia
clips during Test 2................................. ........ ............................................................................236
XXI
Gabriel-Miro Muntean - Ph.D. Thesis 1. Introduction
Chapter I
I n t r o d u c t i o n
Abstract
As an introductory chapter o f this thesis, the first chapter presents the current situation
in the market of multimedia presentations that tends to hugely develop and expand by changing
the very manner these services are delivered to customers. It seems that this significant change is
related to providing high quality, interactive and/or on-demand multimedia-related services to
home residences and business premises. The chapter starts with a presentation o f this tendency,
the associated problems and the challenges that come with this development. Different existing
solutions are then mentioned looking at network-related technologies, provided services,
technical solutions for multimedia distribution and the consequent provided quality and
necessary efforts. Next the chapter describes the motivations o f the work that stands behind this
thesis and states the problem and the goal o f the research. The proposed solution is then
presented and the significant contributions o f the thesis are listed. A short outline o f the thesis
ends this chapter.
1.1 Multimedia PresentationsMultimedia presentations have taken at least four major divergent directions: i) shows in
cinema theatres, presentation halls etc., ii) programs delivered via broadcast TV, radio, cable TV,
etc., iii) movies and documentaries played from tapes and DVDs rented and/or bought and iv)
multimedia streaming over different types of networks, including the Internet. Each of these directions has significant advantages and important disadvantages that make it more or less popular
than the others. The cinema spectators for example may appreciate the high quality of the shows
and the opportunity to socialise, but this involves physical presence of many people in hub like halls
with inherent problems such as booking, traffic, parking, etc. The home comfort as opposed to the
latter made the delivery of multimedia programs to homes via TV or radio very popular. The latest
enhancements such as cable TV and digital TV provide the viewers with a wider choice, offer
Gabriel-Miro Muntean - Ph.D. Thesis 1. Introduction
interactivity, and introduce new services like for example tele-voting, T-mailing and T-gaming.
Apart from this, a large number of viewers have found that the rented/bought video tapes are very
convenient since they allow for choosing both the show and the time of presentation. This has shown that the one-fits-many approach, which is economically beneficial, is not what the customers
desire, but rather one-fits-one solutions that allow for choice flexibility. The DVDs and the latest
home theatre systems, that have added high quality to multimedia presentations, brought them
closer to the cinema experience while offering to the users the TV-related conveniences and the
possibility of both content and showing time selection.
The computer-based multimedia streaming, a very different type of multimedia
presentation, has become increasingly popular lately, especially over the Internet, attracting millions
of users. The exponential increase in computer users, in Internet-connected computers and in
quantity of information, including multimedia data, available and exchanged via the Internet that
have exceeded a linear increase in available resources, made very likely congestion to appear. The congestion and the consequent losses that affect the multimedia viewers in their perceived quality
are the greatest disadvantage of multimedia streaming. Another disadvantage is the need for some basic training in order to allow for using computer-based services. Also today the quality of these
multimedia presentations is much lower than that of the other presentations previously mentioned.
A definite advantage is the large variety of available services offered (for example in the same class
of multimedia streaming-based services there are radio, Web-TV, pre-recorded and live multimedia
transmissions, educational presentation, etc.). Another advantage is the convenience of using these
services in conjunction with other ones, Internet-related or computer-based.
Currently there is a trend that very likely will cause a major change in the way information
and entertainment are delivered to consumers (a significant part of them in the form of multimedia
presentations) [1, 2, 3]. It seems that the existing parallel directions of multimedia presentations are
going to merge in the form of on-demand access to rich media and fiill-motion high quality
multimedia to home residences or business premises, as part of a large set of personalised high-
quality services. This will take advantage of some of the benefits and will minimise some of the
disadvantages related to different types of multimedia presentations. The success or failure of this trend depends on widespread market acceptance, which, in turn, relies heavily on the technical
solutions involved, on the popularity and the quality of services provided, and on the price the end- user must pay.
2
Gabriel-Miro Muntean - Ph.D. Thesis 1. Introduction
Briefly, for the on-demand access to high-quality multimedia presentations from homes to
be successful, there is a need for:
• A delivery network that can support increased resource requirements related to high-
quality multimedia streaming and the delivery of other heterogeneous services
• A wide range of attractive personalised on-demand high-quality services that can
determine the customers to choose paying for the new solution
• A delivery solution that offers high quality services that will both attract the customers
and will allow for the service providers to make profits.
Next possible solutions for each of the above-mentioned problems are briefly presented.
1.1.1 Delivery Networks
The problem of choosing a delivery network for high-bitrate multimedia traffic to the
homes with tightly imposed cost constraints is not simple. This becomes even more complex when,
due to economic pressures, other types of services are required to use the same infrastructure in
order to reach the customers. This is unlike what happened in the past when service providers and
network operators have built separate networks for different services provided (e.g. telephony, cable
TV, etc.).
The technologies that allow access to residential users could be either wireless or wireline.
Wireless distribution options include fixed terrestrial wireless, wireless local area networks
(WLAN), mobile wireless and satellite systems. Wireline solutions include the telephone network,
the cable TV, the power line network and the separate distribution infrastructure built by so-called over-builders. More details about these solutions are given in the second chapter that presents the
related works. It is worth to mention that the emerging wireline broadband IP networks constitute
an important solution for distributing these high bit-rate multimedia-based services to the viewers. However, for their success, other services have to be offered as well, and solutions for their
distribution have to be proposed in order to make them more appealing to the customers.
1.1.2 Offered Services
Some of the most important services that could be offered via broadband networks are
digital and interactive TV, digital and interactive audio, high-speed data transmission, and other
3
Gabriel-Miro Muntean - Ph.D. Thesis 1. Introduction
services such as gaming, betting, voting, banking, shopping etc. More details about these services
are presented in the second chapter. However it is important also to use a distribution solution for
these services in order to ensure their high quality and good utilisation of the existing infrastructure.
1.1.3 Distribution Solutions
The new services associated with broadband connectivity can become successful and attract
a large number of customers if their quality is high, their price is low and they bring benefits to both
network operators and service providers. The quality is assessed depending on the service provided, varies with the technical solution chosen for the delivery of the service and is subject to subjective
considerations. The price paid by the customers and the benefits for the network operators and
service providers are influenced by the overall performance of the delivery solution. Significant components of the service distribution performance are the infrastructure utilisation, the number of
customers simultaneously served with a certain service or group of services, and the quality of these services.
In the next chapter the term “quality of service” (QoS) is defined and its meaning in relation
with the quality of broadband services is explained in detail. Then, different solutions for providing
desired QoS, their advantages and disadvantages are presented along with different options for
assessing the quality of the provided services, mainly multimedia-based. Among the best-known
solutions for providing QoS are bandwidth over-provisioning, traffic engineering, QoS
architectures and application-level adaptive solutions. The application-level adaptive schemes,
which take the distribution networks as they are, provide the least complex and the most flexible mechanisms for providing certain QoS, although with no guarantees. These are the main reasons,
for focusing the research presented in this thesis on an approach based on application-level adaptive
schemes.
1.2 Research MotivationFor 2003 and the near future, in spite of the global economic slowdown, IDC1 estimates a
sustained growth in the number of broadband connections to residential users (e.g. broadband connections will surpass 20 million in Europe alone), while the equipment and product markets will
continue to grow in volumes (i.e. the expansion drive will be the differentiated product offerings
1 IDC, http://www.idc.com
4
Gabriel-Miro Muntean - Ph.D. Thesis 1. Introduction
and an increase in the availability of broadband specific content and applications). However a
further deterioration of price levels will affect the revenues of service providers and network
operators (e.g. a 9% drop is expected for 2003) [4], Therefore the trend towards multi-service IP-
networks that would allow the use of popular IP-based applications and low cost hardware predicted
in [1, 2, 3] may be accelerated. At the same time a GartnerG2 study [5] concluded that the
consumers are prepared to pay a premium for broadband connectivity only in conjunction with a
“must have” application that may convince them they need broadband (e.g. fewer than 10 percent of
Internet households think broadband alone currently provides good value). Related to possible services to be attracted by, a 2002 study2 found that the broadband services the most US households
would pay for are those that have multimedia components, especially entertainment services (44%
of the subjects), communications-based services (42%), and education-related services (39%). All
of these have both high bandwidth requirements and timing constraints that may put significant
pressure on the network providers’ delivery infrastructure. They also suggest that the service
providers have to offer a wide range of services with rich content in order to become attractive for
the residential customers.
In consequence, as previously mentioned, the networks used for delivery, the attractiveness, range and quality of the provided services and the technical solutions for distributing these services to their receivers are of a paramount importance for a successful wide-
scale deployment of these high-quality services. Different possible solutions have already been
discussed, and their advantages for the network operators, the service providers and the customers
have been assessed. In this context the motivations for this work are presented briefly as follows.
Need to Support High Diversity of Services
The service providers, the network operators and the customers look forward at providing,
respectively having access at highly diverse services such as VoD, VoIP (IP telephony), high rate
data transfers, etc. However these services have different types and therefore various requirements
that have to be accommodated, while being delivered by the same multi-service broadband IP-based
infrastructure. In this context there is a need for multimedia-based services that influence or are influenced in a minimal manner by traffic produced by other type of services (e.g. data transfer).
2 Michael Pastore, “Broadband Lacks a European Audience”, CyberAtlas, Feb. 5,2002, http://cyberatlas.intemet.com
Gabriel-Miro Muntean - Ph.D. Thesis 1. Introduction
Increased Network Infrastructure Utilisation
Service providers and network operators have to take full advantage of the existing network
infrastructure and make incremental investments to support revenue-producing services in order to
increase service penetration and improve infrastructure utilisation. Increasing the number of
simultaneously served customers and the network utilisation decreases the quality of service in
general. Thus there is a need to balance the goals of providing high-quality rich content services of
diverse types, and of reducing the network infrastructure necessary for the provision of these
services.
Personalised Services to Heterogeneous Customers
The scalability issue may have another dimension apart from number of viewers: heterogeneity of customers. In order to be considered acceptable, any novel multimedia-based
solution has to be able to satisfy customers with different expectations. Therefore there is a need for
the “one-fits-many” approach to be replaced by “one-fits-one”, providing personalised, interactive
services to customers that may be connected via heterogeneous links.
Trade-off Between Performance and Quality
QoS solutions in generally involve many trade-offs. For example in multimedia streaming
in order to reduce the quantity of data to be sent across the network, compression algorithms are
being used that remove streams’ redundancies, but leave the streams vulnerable to transmission
errors. To further reduce the quantity of data lossy multimedia encoding techniques purposely leave aside some information, reducing the quality of the streams. As results, the higher the compression
rate is and therefore the narrower bandwidth necessary for transmission, the lower the streams’
quality and the lower their resilience to potential transmission errors. Similarly for time-sensitive applications, smaller size buffers help reducing streaming delays, but cannot accommodate highly
bursty traffic causing losses that more severely affect the quality of the remotely transmitted
streams. In consequence there is a need for very good trade-off between the performance and quality, especially in the presence of different types of traffic.
6
Gabriel-Miro Muntean - Ph.D. Thesis 1. Introduction
1.3 Problem and Goal
Broadband multi-service IP networks are either being deployed by over-builders or through
transformation of existing cable TV networks, and many popular IP applications are ready to be
provided as services. However, a technical solution to the provision of these services is still
required.
The problem this thesis addresses consists of delivering multimedia-based services via
local broadband multi-service IP networks while balancing:
• customers’ need for high quality service
• service providers ’ and network operators ’ goal o f increased infrastructure utilisation
and more customers served.
Since apart from being time-sensitive, these services have very high bandwidth
requirements that make their support expensive, the latter is achieved by building an inexpensive
application-layer adaptive mechanism that would adjust the transmitted quality level to the
delivery conditions only when congestion is building up and may severely affect the quality of the
service provided. This mechanism should allow for serving a higher number o f customers from
limited resources, which would constitute the main benefit of the proposed solution. However, due
to the routine-like daily and weekly schedule for the customers with periods of very high and very low usage of the multimedia-based services that are the highest bandwidth consumers, it is expected
that such adjustments to be only temporary matching current peak times of the cable TV service
audience (i.e. mainly evening). This adaptive mechanism should maintain good end-user
perceived quality for the delivered services in order to meet the customers’ quality expectations.
The goal of this work is to propose, design and test an application-level end-to-end
adaptive mechanism for streaming multimedia that offers high quality of services to home residences via local broadband IP-networks subject to very high traffic of different type, with
various size and variation pattern. The scheme should not interfere with the provided services’ interactivity and personalisation characteristics and should find a solution for the adaptation that has
the least effect on the end-user perceived quality.
7
Gabriel-Miro Muntean - Ph.D. Thesis 1. Introduction
1.4 Solution and ContributionsThe work’s goal was achieved by proposing the Quality-Oriented Adaptation Scheme
(QOAS) for adaptive multimedia deliveries via local broadband multi-service IP networks. This
scheme relies on estimates of the end-user perceived quality as the best assessment of the degree of
QoS provided made at the client. For this estimation to be accurate, some network-based parameter
values, variations and variation patterns were mapped into application level QoS grades that reflect
the quality of delivery. These grades are then send via feedback to the server and used to trigger adaptive adjustments of the streaming process according to the reported delivery conditions in order
to provide best quality given the situation.
The proposed adaptive scheme has been designed, modeled, implemented and tested through simulations and a real prototype system in order to both verify and validate the scheme’s
performance. Also the end-user perceived performance as estimated by an objective metric has been measured and the scheme’s behavior has been assessed according to the test results. These tests
have first checked the scheme’s adaptive reaction to sudden changes in network’s traffic and have
included traffic of different type, size and variation patterns. Then the effect some variations in the
parameters used by the adaptive scheme have on its performance has been tested, along with the
influence of some network-related parameters characteristics on its functionality. It was also very
important to test the benefits brought by this adaptive scheme in terms of estimated end-user
perceived quality, network utilization, loss rate and number of customers served by a fixed
infrastructure in comparison with an ideal scheme that would use all the available bandwidth, would
achieve 100% utilization and 0% loss. The QOAS performance was also compared with other proposed mechanisms for delivering multimedia.
Since there is not a generally accepted metric for the objective assessment of the quality of
video streams, subjective tests have been performed on real viewers. For this a prototype system has been built that makes use of the proposed adaptive scheme and a test bed that would allow for
different other traffic to interfere with the multimedia traffic generated by the prototype system was
used in order to test the scheme’s performance. The subjective test results have verified and confirmed the good results obtained from the simulated tests.
Next the contributions of the QOAS - the proposed application-level adaptive solution for
high quality multimedia streaming in local broadband multi-service IP-networks - are highlighted:
• QOAS uses a novel client-located grading scheme that maps some network-related
parameters’ values, variation and variation patterns on application-level QoS scores that
Gabriel-Miro Muntean - Ph.D. Thesis 1. Introduction
describe the network’s traffic conditions. The QOAS adaptation is based only on
transmitting these client-computed QoS scores that estimate the current quality of
delivery to the server
• The end-user perceived quality as estimated by an objective metric is actively
considered during the adaptation process, increasing the effectiveness of the adaptation
and the estimated end-user perceived quality
• The scheme’s behaviour is very close to one of an ideal adaptive scheme in terms of
estimated end-user perceived quality, loss rate and link utilisation when used for multimedia streaming in the presence of traffic of different types, size and variation
pattern. During testing the end-user perceived quality while using QOAS was within
1% from the one if the ideal adaptive scheme was used, the loss rate was almost 0% and
the link utilisation was more than 99.6% in the large majority of cases.
• The scheme allows for a significant increase in the number of customers that can be
simultaneous served while maintaining a good end-user perceived quality, even in
comparison with other existing solutions for delivering multimedia. The results of the
tests performed show that 23% more customers could be served by using QOAS than
by using TFRCP [6], 33% more clients than by using LDA+ [7], and 39% more users
than by using a non-adaptive solution.
1.5 Short Outline of the ThesisThis thesis is organised in eight chapters that present the subject of the research performed,
the related works, the proposed solution and its testing and conclusions drawn.
This first chapter has mainly presented the motivation for the research, the problem to be
solved, the goal, the solution and the contributions. The second chapter presents different related
works, whereas the third describes the context of the solution. The forth chapter focuses on the
detailed presentation of the proposed application-layer adaptive scheme - QOAS and includes the
architecture of the multimedia delivery system that implements it. The fifth chapter aims at
presenting both the simulation model and the prototype system that have implemented QOAS and
were used for testing it, whereas the sixth chapter presents the tests performed and their results. The
seventh chapter draws some conclusions and highlights possible future work directions. The list of
references and the appendixes end the thesis.
9
Gabriel-Miro Muntean - Ph.D. Thesis 1. Introduction
1.6 Summary
The first chapter starts with a presentation of existing divergent directions in multimedia
presentations including cinema shows, TV programs, tape and/or DVD movies and multimedia
streaming. It then presents their merging tendency in form of on-demand-based access to rich media
and full-motion high quality multimedia to home residences as part of a large set of personalised,
high-quality services. In order for this to be successful a delivery network that would support the
increased requirements in resources related to high-quality multimedia streaming and the delivery
of other heterogeneous services is needed as well as a wide range of attractive, personalised, on-
demand high-quality services that would make the customers pay for them and a delivery solution
that would offer high quality for the services at a low cost. Next this chapter mentions existing solutions related to these three issues. In this context the chapter also presents the motivation for the research, the problem to be solved and the research’s goal and it ends with a description of the
proposed solution and of the significant contributions made.
10
Gabriel-Miro Muntean - Ph.D. Thesis 2. Related Works
Chapt er II
Rel a t ed Works
Abstract
The second chapter o f this thesis presents significant works related to the proposed
Quality Oriented Adaptation Scheme (QOAS). These works were classified in directions o f
interest and span from different solutions for achieving success in providing high-quality
multimedia-based services to remote viewers to compression techniques, adaptive delivery
solutions and multimedia streams user-perceived quality assessment. Also solutions for
improving the performance o f multimedia deliveries are explored looking from a broad point o f
view and including error control, delivery techniques, protocols and delivery architectures.
Comments are made and conclusions are drawn in relation to the applicability o f the presented
works to QOAS in broadband IP-networks.
2.1 OverviewWhen multimedia data is transmitted over an IP network, including a broadband multi
service IP network, among the very few assumptions about the capabilities of the network that
could be made is that it is able of delivering packets to a destination. However, there are no
guarantees that all packets will be delivered and there is not any mechanism to inform if a packet
does not reach its destination. If a sequence of packets is sent to the same destination, the host
computer must not assume that the network will maintain packet order, and also it must not assume
that the network will maintain the relative timing of the packets. Also the source of data cannot
assume that there is any particular throughput rate, bandwidth, or end-to-end delay.
In this context extensive research has tried to find solutions in order to provide desired
Quality of Service (QoS) for applications with different requirements, mainly time sensitive or
resource intensive. This chapter defines QoS and then presents in detail proposals for providing
QoS and directions for QoS assessment.
11
Gabriel-Miro Muntean - Ph.D. Thesis 2. Related Works
Among the least complex and most flexible solutions for providing desired levels of QoS,
adaptive applications for multimedia streaming take the networks as they are and employ different
mechanisms that complement the IP network’s basic functionality. For example adaptive control
schemes could inform the applications about the loss rate, throughput or other network-related
parameters or about the estimated perceived quality at the end-users or could take adjustment
measures (e.g. modification of the transmission rate) in order to improve the quality of delivery if
decided to be necessary. Although these adaptive control solutions cannot guarantee the provision
of certain QoS, they will increase the quality of delivery over high loaded networks, trying to avoid
congestion. In this chapter, different research directions related to the adaptive control schemes are
presented and some of the most significant solutions.
Complementing the effort of these adaptive control schemes aimed at distributing high-
quality multimedia streams with high bandwidth requirements and tight timing constraints, other
proposed solutions can be used in conjunction, in order to provide increased quality with little
effort. Since bandwidth is a limited and expensive resource, among the mostly used solutions are
compression techniques that reduce the quantity of data to be sent across the networks, while
maintaining a good quality for multimedia streams subject to compression. Measuring the end-user
perceived quality is also significant in the effort to provide the adaptive control schemes with
accurate information about the effect the network conditions have on the quality of delivery. This is
also important during the development stage when the solutions have to be tested. Therefore there is
a need for the end-user perceived quality assessment.
Other solutions are used in conjunction in order to provide increased performance of multimedia deliveries in terms of quality, bandwidth requirements and cost. Among them the error control mechanisms have the capability to detect and correct errors, (i.e mainly transmission errors), minimising their effect on the quality of the service provided and increasing therefore the
expected end-user perceived quality. Different network approaches for the localisation of
information to be accessed were also taken into account, including caching, proxy servers and content distribution networks that were devised and used to bring the data closer to the customers
in order to minimise its transport paths over the loaded sections of the networks. Different delivery
solutions, including broadcast, multicast and unicast, were proposed to deliver the same content
to one or a group of receivers in a one-to-one or one-to-many approach, balancing the need for
reducing delivery effort with the increase in personalisation of provided services.
12
Gabriel-Miro Muntean - Ph.D. Thesis 2. Related Works
In this chapter these directions are also explored, proposed solutions are mentioned, their
performances are compared and the most suitable for the usage as part of the proposed application-
layer adaptive scheme (QOAS) are indicated.
2.2 High-Quality On-Demand Multimedia PresentationsAs previously mentioned, for the success of the on-demand high-quality multimedia
presentations services to home residences and business premises, there is a need for: a delivery
network that can support resource-intensive heterogeneous services, a wide range o f attractive
personalised on-demand high-quality services and a delivery solution that offers high quality
services while best utilising the infrastructure. Possible solutions for each of these problems are presented in detail next.
2.2.1 Delivery Networks
The technologies that allow access to residential users could be either wireless or wireline. Wireless distribution solutions include fixed terrestrial wireless, wireless local area networks
(WLAN), mobile wireless and satellite systems. Wireline solutions include the telephone network, the cable TV, the power line network and the separate distribution infrastructure built by so-called
over-builders.
2.2.1.1 Wireless Solutions
Wireless solutions are cheaper than wireline ones, having the advantage of low deployment
cost (no wires), although there is a licence fee for the spectrum. Among them, fixed terrestrial wireless services provide connectivity from a base station to a stationary point (e.g. home). First- generation of commercially proprietary systems could provide data rates of 1 - 10 Mb/s making use
of certain spectrum bands. For this purpose local multipoint distribution service (LMDS) and
multipoint multi-channel distribution service (MMDS) were defined. In reality operators like Sprint3
and MCI WorldCom4 have provided only 1 Mb/s. Although second-generation LMDS and MMDS
have been assessed for standardisation by bodies like IEEE in its 802.16 Working Group5, the
3 Sprint, http://www.sprint.com
4 MCI WorldCom, http://www.mci.com
5 IEEE 802.16 Working Group on Broadband Wireless Access Standards, http://grouper.ieee.org/groups/802/16
13
Gabriel-Miro Muntean - Ph.D. Thesis 2. Related Works
bandwidth provided is not enough for delivering very high-quality multimedia. Providing real
broadband will be possible by addressing, WLAN technologies or by using the future IEEE 802.11
and its variants6 and the European Telecommunications Standards Institute (ETSI) HIPERLAN/27
standards that are meant to provide speeds of up to 50 Mb/s. Unfortunately the coverage area of
WLAN-based solutions is limited to microcells with a typical radius of less than several hundred
feet that does not eliminate totally the need for broadband wired access. Mobile wireless has a
completely different approach, targeting portable and mobile communication and computing
devices, instead of broadband. However even speeds of 2 Mb/s theoretically achieved by the International Telecommunication Union (ITU) 3G standard IMT-20008 (limited in practice to
hundreds of kilobits per second) are not enough for real broadband local networks [8], Satellite- based solutions already provide broadband services mainly for broadcasting programs, but have
performance limitations that make them unsuitable especially for interactive and bi-directional communications. These limitations refer to high latencies and uplink-related problems.
2.2.1.2 Wireline Solutions
Wireline solutions, although more expensive due to the cost of wiring, could be more
effective if already existing infrastructures are used. Telephone networks, mainly twisted-pair
copper-based, with slight upgrades, have already been used to provide near-broadband connectivity
using Digital Subscriber Line (DSL)-based solutions. Different DSL flavours such as asymmetric
DSL (ADSL), G.lite DSL and very high-data rate DSL (VDSL) were proposed to either reduce cost
by providing a very narrow upstream channel, to operate concurrently with the telephone service or
to provide speeds of tens of megabits per second. The latter operates only if fiber is introduced into
the network to reduce the copper lines’ lengths. This is because the biggest problem with DSL is that it does not work over wires longer than a certain distance (18,000 feet for ADSL) [8], The DSL
transmissions could be also affected by interference from signals from adjacent lines. These problems limit the usage of the telephone networks as support for broadband connectivity. Power lines could be used for data communications and although the technology allows for a 10 Mb/s connectivity9, there is a strong concern about the interference with well-established wireless
6 IEEE 802.11 Working Group for WLAN Standards, http://grouper.ieee.org/groups/802/! 1
7 The European Telecommunications Standards Institute, HIPERLAN/2, http://www.etsi.org/tcchnicalactiv/hiperlan/hiperlan2.htm
8 ITU - International Mobile Telecommunications-2000 (IMT-2000), http://www.itu.int/home/imt.html
9 LEA, http://www.lanergy.com
14
Gabriel-Miro Muntean - Ph.D. Thesis 2. Related Works
applications such as amateur radio, emergency broadcast services, etc. Using them on large scale is not a viable solution until these reasons of concern are dealt with. Cable TV networks, the existing
hybrid-fiber-coax (HFC) systems that feed the conventional TV sets or set-top boxes and over
builders’ cable infrastructures (e.g. RCN10), the newly deployed structures with fiber at their core
offer services that could be easily upgraded to serve the distribution of rich content media and other
services, following the principle “pay-as-you-grow”. In this thesis cable networks and cable
operators terms refer to both of these cases.
2.2.1.3 Cable-based Solutions versus Satellite Broadcast
The cable operators are currently in a difficult position, after being challenged successfully
by satellite broadcasting companies that are offering more channels at a lower price, with a
significant impact on their subscriber base. Therefore many of them [1] have already started to
consider their competitive advantages and are trying to shift fundamentally their business approach.
• First they can easily move from broadcast to unicast, offering more personalised
content delivery, according to subscribers’ needs. Briefly they can offer what the customers want and when they want it (“on-demand”).
• Second, the possibility of using the return channel and the low latencies involved make
the introduction of a new set of interactive services possible.
• Third, upgrading their infrastructure by introducing fiber, the bandwidth offered
becomes very competitive.
• Fourth, by using Gigabit Ethernet and switching to IP-architectures many other services
could be offered to the subscribers based on numerous and very popular IP-based
applications, including high quality multimedia streaming, by taking advantage of the
broadband availability.
Therefore, many cable operators in different parts of the globe have already upgraded their
networks by introducing fiber into their systems offering broadband connectivity to residential users. For example if in 2001 the percentage of households with broadband connections was very
low in Europe (1.93% in Germany, France and Britain), and moderate in America (13%)2 and parts
10 RCN, http://www.rcn.com
15
Gabriel-Miro Muntean - Ph.D. Thesis 2. Related Works
of Asia (17% in Korea)", in 2002 the market for broadband services experienced a significant
increase (it doubled in Europe, reaching more than 12.6 million homes12). This is while the service
providers are continually introducing Fiber-to-the-home (FTTH) and Fiber-to-the-curb (FTTC)
systems on a large scale13 in order to offer even higher bandwidth. In USA, for example, besides
BellSouth14, Sprint3 and Verizon15, which already use FTTH and FTTC systems to service more than
300,000 households, several new broadband service providers are building large scale FTTC or FTTH systems in California, Tennessee and Texas [9] and municipalities or other public authorities
have launched FTTH projects in various towns. At the same time the estimates show13 that the
FTTH systems in the USA will reach 2.65 million homes by 2006 and FTTC systems - another 1.9
million in an on-going expansive process.
2.2.1.4 Broadband Multi-service IP Networks
Meanwhile, apart from cable operators’ interest, there is also an industry push for the
development of all-IP-multi-service distribution systems from key players such as the International Engineering Council (IEC)16 and Cisco [10], the market leader in IP routing. This push becomes
increasingly consistent with time and is accompanied by efforts driven by the Multi-service
Switching Forum (MSF) - founded in 1998 by Cisco17, Bellcore/Telcordia18 and MCI WorldCom4 -
that aim at developing standards and architectures for an open, standards-based network that
supports multiple services on a common network infrastructure [11], Part of this effort is the multi
service IP network seen as the next generation network that would support both the delivery of high
quality multimedia streams and different other IP-based services to both home residences and
businesses [2]. For instance, since 2001 there are companies on the market like GoldTV19, a
provider of broadband on-demand multimedia-related services based in Milan, Italy, and
11 “Korea Leads Broadband Internet Service Market” , KoreaNow, Nov. 30, 2002, http://kn.koreaherald.co.kr
12 J. H. Bakkers, “European Broadband Market Predictions And Preliminary Analysis” , Jan. 2003, http://www.idc.com
13 KMI Corporation, “Fiber-To-The-Home To Reach 2.65 Million Homes By 2006” , Press Release, 2001, http://www.kmicorp.eom/press/011015.htm
14 BellSouth, http://www.bellsouth.com
15 Verizon, http://www.verizon.com
16 International Engineering Consortium (IEC), http://www.iec.org
17 Cisco Systems, http://www.cisco.com
18 Bellcore/Telcordia Technologies, http://www.telcordia.com
19 GoldTV Italia, http://www.tvgold.it
16
Gabriel-Miro Muntean - Ph.D. Thesis 2. Related Works
NovaMedia20, a digital broadcast and on-demand multimedia provider based in Reykjavik, Iceland
that really do deliver rich content services over such a multi-service all-IP based infrastructure.
This significant evolution towards broadband connections and a large interest in providing
diverse services from a low-cost infrastructure will offer a large market opportunity for the IP-based
services. In the near future, a global evolution from the existing Hybrid Fibre Coax (HFC) networks
towards all-IP architectures that would allow an almost universal use of popular IP-based
applications and low cost hardware is predicted [1,2, 3], In consequence new services that make
use of this infrastructure, including on demand delivery of multimedia (“video-on-demand” - VoD),
that have already been launched, are waiting for very large-scale deployment. For this to happen,
other services have to be offered as well, and solutions for their distribution have to be proposed in
order to make them more appealing to the customers.
2.2.2 Offered Services
Broadband subscribers can be grouped in two basic classes: “lean forward” and “lean back”
users [12]. The first ones are typical PC users of high-speed Internet services and most of their
activity is very interactive in nature, “leaning” forward to access the service. The latter ones are
non-interactive by nature, passive, “leaning” back on the chair and enjoying the experience. Currently the first category constitutes the base for broadband subscribers and the corresponding
market is expanding slowly. The second type of potential subscribers represents a very large market
opportunity for the network operators and service providers, which could be transformed into
revenues by offering among other services ones that would make them interact. Shortly, the
customers will be able to watch selected movies on request, to send messages, to shop, to learn, to
explore websites with rich content, to watch live programs, to record them, to listen to high quality
audio, to select and listen to radio stations, to download quickly data, to take part in interactive
gaming and debates, etc. This will improve their experience of studying, communicating, shopping and mainly of being entertained. Introducing these services through their TV sets would make the
transition easier to a world in which the future-TV and the computer will be synonyms.
Some of the services that could be offered via broadband connections are presented next.
20 NovaMedia Iceland, http://www.media.is/pdf/interactivetv.pdf
17
Gabriel-Miro Muntean - Ph.D. Thesis 2. Related Works
2.2.2.1 Digital and Interactive TV
Digital and Interactive TV includes Digital Video Broadcast, Pay-Per-View, Personal
Video Recording, Video-On-Demand, Near-Video-On-Demand, Videoconferencing, Electronic
Program Guide, T-Commerce, etc.
Digital Video Broadcast or Digital TV, provides very high image quality, better resolution
and colour while using transmission related facilities more efficiently than the analog TV. It uses broadcast or multicast to reach the customers and it is seen only as a first stage in delivering rich content video broadband services, as it does not provide customer personalisation and flexibility.
Pay-Per-View (PPV) services represent Digital TV programs that are transmitted unicast or
multicast only to users that have paid to view them. These services are mainly used for live events.
Personal Video Recording (PVR) or Time-shifted TV (TsTV) allows for VCR-like controls for
the live transmitted programs: recording, pause, skip, rewind, etc. Video-on-Demand (VOD) and
Subscription Video-on-Demand (SVOD) are the ideal applications for broadband IP networks.
They provide entertainment-on-demand by taking advantage of the networks’ two-way
communication capabilities. They are like video or DVD rental and in general the specified content
is unicast streamed only to those users that have paid for the service. They provide full VCR-like
controls. SVoD refers to the subscription to an entire series. A VoD service is termed Near-VoD (NVoD), if the subscribers who order a particular movie to start within a specific time window are
grouped together [13] in order to save bandwidth. The major disadvantage of NVoD is the lower
flexibility offered to the customers. Videoconferencing allows for two or more people at different locations to see and hear each other at the same time, sometimes even to share computer
applications for collaboration. This offers new possibilities for schools, libraries, businesses,
including formal instruction, connections with guest speakers and experts, multi-party project
collaboration, professional activities, and community events. Interactive Program Guide (IPG) or
Electronic Program Guide (EPG) is an on-screen listing of the available programs, which can be
organised by channel, time, genre or personal interest in a user-friendly manner. The desired
program is regularly selected using the remote control. T-Commerce refers to online commerce
done through the TV environment (choose and buy using the remote control and the TV set).
2.2.2.2 Digital and Interactive Audio
Digital and Interactive Audio services include Digital Radio Broadcast, Audio-On-Demand
services, Voice over IP (capable of providing IP telephony, etc.).
18
Gabriel-Miro Muntean - Ph.D. Thesis 2. Related Works
Digital Radio Broadcast or Digital Audio Broadcast21 provides reliable interference free
reception - especially in-car - and near CD quality sound, and could be complemented by additional
data services, such as listing song titles, news and sports updates, next program to be broadcasted etc.. Audio-On-Demand (AoD) services are similar to VoD and provide music, news, and audio
related entertainment in general at request. Normally the specified content is unicast transmitted to
customers, allowing for VCR-like capabilities. Voice over IP (VoIP) describes the use of the
Internet Protocol (IP) [14] to transfer speech/voice between two or more sites. In general, this
means that the voice signal is sampled, compressed and encapsulated into data packets and then
transferred across an IP-based network along with all other data packets. VoIP is mainly used for IP Telephony, significantly reducing costs in comparison with classic circuit switching-based
solutions.
2.2.2.3 High Speed Data Transmission
High Speed Data Transmission refers to the transmission of different content data packets
with a significant higher speed in comparison with dial-up networks, for instance. The most important applicability is for downloading data files for later usage, transferring information to be
displayed during WWW browsing, etc. This enables shorter waiting times and determines
significant increases in customers’ satisfaction with the service provided.
2.2.2.4 Other Interactive Services
Typical interactive services offer the possibility for the viewer to interact with the television
set in multiple ways. VoD and AoD are interactive services, but the customers could also play
games, place bets, vote or provide immediate feedback to a program, debate on certain subjects, do
banking and shopping, etc.
Among the previously mentioned services the large majority are based on multimedia
delivery to the customers and the most complex of them is VoD. Some of the capabilities VoD offers to its viewers are high quality and extended choice in terms of content, playing time and control (VCR capabilities) making it the ultimate experience of home accessible entertainment.
Unfortunately these kinds of personalised multimedia services are important bandwidth consumers
and in order for the offered services to be cost-effective, significant effort has to be made to
21 “A Guide to digital radio (Digital Audio Broadcasting)”, http://www.radio-now.co.uk/faq2.htm
19
Gabriel-Miro Muntean - Ph.D. Thesis 2. Related Works
increase the number of VoD customers that could be served by a limited infrastructure. Naturally
the perceived quality of the provided service should not be affected by the increased number of
customers and by the rest of traffic carried by the same infrastructure. At the same time the service
must not severely affect the background traffic.
2.2.3 Distribution Solutions
In this thesis the distribution solutions for delivering these services to the customers are
assessed in terms of their quality and the utilisation of the existing infrastructure. The quality
depends very much on the service provided, varies with the technical solution chosen for the
delivery of the service and is subject to subjective considerations.
In this section first the term “quality of service” is defined and its meaning in relation with
the quality of broadband services is explained. Then, different solutions for providing certain level
of quality of service are presented and choices for gracefully reducing it if and when needed are
analysed such as the end-user perceived quality is maximised while better utilising the existing
infrastructure. At the end different options for assessing the quality of the provided service are
described, mainly in relation to multimedia presentations.
2.2.3.1 Defining Quality of Service (QoS)
The Quality of Service (QoS) is defined by the ITU in ITU-T R. E.800 [15] as the
“collective effect o f service performances that determine the degree of satisfaction by a user of the
service”, by the ISO/IEC 10746-2 [16] as “a set of qualities related to the collective behavior of one
or more objects” and by IETF in RFC 2386 [17] as "a set of service requirements to be met by the
network while transporting a flow’'. The ITU-T definition closely relates QoS to the users’
perception and expectations related to a certain service wheareas the ISO/IEC’s is more general, but
with direct applicability in networking. The IETF’s definition involves more the idea of a “flow”
than individual or group of packets suggesting QoS usage in connection with streams. At the same
time the industry leaders define QoS closer to their object of activity. For example for Cisco QoS
“refers to the capability o f a network to provide better service to selected network traffic over
various technologies” [18], while for Microsoft QoS “refers to the ability of the network to handle
the traffic such that it meets the service needs of certain applications” [19].
Detailing the QoS definition, the ISO/IEC’s view, which was also shared by ITU-T in R.
X.902 [20], is that QoS concerns characteristics like the rate of information transfer, the latency, the
20
Gabriel-Miro Muntean - Ph.D. Thesis 2. Related Works
probability of a communication being disrupted, the probability of system failure, the probability of
storage failure, etc. They also mention possible constraints that may affect the QoS, which include
temporal ones (e.g. deadlines), volume constraints (e.g. throughput) and dependability, involving
aspects of availability, reliability, maintainability, security and safety (e.g. mean time between
failures). ITU-T R X.641 [21] and ISO/IEC 13236 [22] define the QoS Framework and associated
concepts, which are described in order to highlight the QoS management. They present also the
QoS characteristics and how QoS requirements drive the selection and use of QoS management
functions and QoS mechanisms.
QoS is very complex and as there is not a widely accepted definition for QoS, there are not
general solutions for assessing, providing and quantifying QoS. However different aspects of QoS are explored according to certain interests that have driven extensive research in a direction or
another. Since the main interest of the research presented in this thesis is to provide high QoS levels
in broadband IP-networks while having certain constraints, details are given about research directions that have proposed solutions in this context. Therefore different solutions for providing
QoS are assessed next along with diverse proposed parameters that are associated with QoS.
2.2.3.2 Providing QoS
The IP-networks provide a single type of service often named “best effort”, because “best effort” is undertaken to deliver packets as quickly as possible, treating all of them equally, in a
perfect impartial and fair approach. This service is suitable for many applications and services such
as WWW-based document retrieval and FTP-based data transfers. However many of the services
meant to attract the customers like VoD are flow-based, have high resource requirements, and
mainly are time-sensitive, generating a different type of traffic for which the “best effort” is not
good enough to ensure certain QoS level at all times. At the same time these different types of services have to co-exist and be able to be served by the same network infrastructure. In
consequence different methods for providing QoS are required in order to support both existing and emerging applications and services, which have different characteristics.
Extensive research was focused on providing QoS in different conditions, for various
technologies and architectures and with different approaches. Among these the best known are
bandwidth over-provisioning, traffic engineering, QoS architectures and application-level
adaptive solutions.
21
Gabriel-Miro Muntean - Ph.D. Thesis 2. Related Works
2.2.3.2.1 Bandwidth Over-provisioning
One way to overcome the limitations of the “best effort” networks in providing QoS is by
over-provisioning, that is by allocating more bandwidth than the expected network peak requirements [23], Still, even though over-provisioning of network increases the probability of
having enough resources available for real-time applications, it still does not guarantee the desired
QoS at all times. The problem is that data, and especially multimedia data, are inherently bursty and
regardless of capacity, congestion is very likely to occur for short periods of time. Another
consideration is that the normal routing protocols do not know about load levels, so congestion will
build up on some paths while others have bandwidth to spare. Also bandwidth alone does not
ensure low and/or predictable delays, as even with huge bandwidth, there is still the possibility that large file transfers will interfere with real-time application traffic. On the other hand there will
always be a waste of resources in an over-provisioned network, for instance during off-peak times,
which is not economically justifiable. However, even a perfect solution based on over-provisioning is only temporary as a corollary of Moore’s Law22 states that “as one increases the capacity o f any
system to accommodate user demand, user demand will increase to consume system capacity”.
These considerations lead to the idea that other ways of providing QoS should be found.
2.2.3.2.2 Traffic Engineering
Traffic Engineering (TE) is concerned with “performance optimisation of operational
networks” and “encompasses the application of technology and scientific principles to the
measurement, modelling, characterisation, and control of network traffic" [24], Its goal is to apply different proposed techniques in order to achieve certain performance objectives.
Different TE solutions for providing certain QoS were proposed and several bodies have
shown interest towards their standardisation. Among the best known are IETF’s working groups
that have proposed Integrated Services (intserv)23, Differentiated Services (diffserv)24 and Multiprotocol Label Switching (mpls)25 which will be discussed next. Also ISO and IEEE have
standardised the IEEE 802.Ip eight-level priority tag-based solution in ISO/IEC 15802-3 [25] and
22 Gordon Moore, “Moore’s Law” , Intel, http://www.intel.com/research/silieon/mooreslaw.htm
23 IETF Integrated Services Working Group, http://www.ietf.org/html.charters/OLD/intserv-charter.html
24 IETF Differentiated Services Working Group, http://www.ietf.org/html.charters/OLD/diffserv-charter.html
25 IETF Multiprotocol Label Switching Working Group, http://www.ietf.org/html.charters/mpls-charter.html
22
Gabriel-Miro Muntean - Ph.D. Thesis 2. Related Works
IEEE P802.1D [26] respectively and ITU is working towards standardisation of its ITU-T R.
Y.1541 [27],
Integrated Services (IntServ) - RFC 1633 [28] is a reservation-based mechanism that
reserves resources explicitly for individual flows using a dynamic signalling protocol and employs
admission control, packet classification, and scheduling to achieve the desired QoS.
There are two services defined in this model: i) Guaranteed Service - RFC 2212 [29] offers
quantifiable firm delay limits to flows and ii) Controlled Load Service - RFC 2211 [30] offers delay
and packet loss like in a light loaded “best-effort” network. IntServ requires state information to be saved in each router along the path in order to ensure QoS guarantees. Usually, but not compulsory,
IntServ uses Resource ReSerVation Protocol (RSVP) - RFC 2205 [31] for signaling.
Signaling, processing power, the need for storing per flow information in each participating
node and possibility of unauthorized reservations lead to complexity, scalability and security
concerns of IntServ applicability - RFC 2208 [32].
Differentiated Services (DiffServ) - RFC 2475 [33] is a reservation-less based framework
introduced to overcome some of the IntServ limitations while provides certain QoS. In order to
solve the scalability problem, DiffServ does not differentiate the traffic per flow, but defines a small
number of classes for which differentiated services are provided. It divides the network in DiffServ
domains (DSD) that consist of nodes that support a common policy and requires state awareness
only in edges of such domains. At the edge, packets are classified into flows and marked
accordingly in order to ensure their differentiated treatment. Then the flows are aggregated and sent
across the DSD cloud. DiffServ Codepoints (DSCP) identify classes and their per-hop behaviours (PHB) and they are set in packet headers (DS-field that consists of six bits of the former ToS byte
of the IP header) - RFC 2474 [34], The PHB determines the forwarding to be applied to the packet
in each node of the DSD. The mapping between DSCPs and PHBs depends of the DSD and is not always 1:1.
Three important PHB are: i) Class Selector PHB - RFC 2474 [34] uses the IP precedence
field to indicate relative forwarding priorities, ii) Expedited Forwarding (EF) PHB - RFC 2598
[35] guarantees that packets will have a well-defined minimum departure rate which, if not exceeded, make the associated queues empty. This intends to support services that offer tightly
bounded loss, delay and delay variation, iii) Assured Forwarding (AF) PHB - RFC 2597 [36] offers
different levels of forwarding assurances for packets belonging to an aggregated flow. Each AF
23
Gabriel-Miro Muntean - Ph.D. Thesis 2. Related Works
group is independently allocated forwarding resources and their corresponding packets are marked
with one of three-drop precedence. Those with the highest drop precedence are dropped with lower
probability than those marked with the lowest drop precedence.
Multiprotocol Label Switching (MPLS) - RFC 3031 [37] is a strategy for streamlining the
backbone transport of IP packets across a network [38], In MPLS routing, the assignment of
particular packets to classes is done just once, as the packets enter the MPLS network. This is
unlike in the conventional IP routing when each packet is sent by each router along the path to the
next hop after two functions were performed. First all the packets were assigned to Forwarding
Equivalence Classes (FEC), that define a certain forwarding manner (e.g. same path, same
treatment, etc.) and then each FEC is mapped into a next hop.
At the edge of the MPLS network Label Switched Router-s (LSR) analyse the IP headers to
determine the desired service levels and the addressing information. Then 32-bit (4-byte) labels are
distributed by a dynamic Label Distribution Protocol (LDP) and added to the IP packets. These
labels allow the LSRs to forward the packets along predetermined paths named Label Switched
Path-s (LSP) according to, for example specified QoS levels. The forwarding is performed very
efficiently along the LSPs by LSRs since the forwarding engines look only at the labels and not at the entire packet headers. The labels are removed when the packets are leaving the MPLS network.
The LSPs can be set up in a variety of ways [39] for example the path could represent the normal
destination-based routing path, a policy-based explicit route, or a reservation-based flow path.
MPLS also permits explicit routing, where the hops a packet will take are specified in advance and
the label is used to indicate this route. Explicit routing is a useful capability for allowing QOS and
enabling network managers to set up defined paths through the MPLS network that apply to certain
traffic streams. This is when DiffServ could be used in conjunction with MPLS to provide certain
QoS. Therefore even if MPLS and DiffServ are perceived as rivals, they are in fact complementary to each other.
TE-based solutions help directly or indirectly for providing certain QoS, but they have also
limitations. There are significant concerns regarding the complexity of the solutions, some security
issues, size of the targeted networks, reaction in really congested conditions and deployment costs.
These concerns have to be traded carefully against the advantages the solutions provide in order to really benefit from providing certain QoS.
24
Gabriel-Miro Muntean - Ph.D. Thesis 2. Related Works
2.2.3.2.3 QoS Architectures
QoS Architectures are integrated models that include both end-systems and networks and
offer QoS support for a wide range of services, including multimedia applications [40, 41].
Different QoS architecture frameworks have been proposed with various goals but similar
motivations. The ideas behind some of the most important ones are presented next for an overview
on different alternatives for QoS architectural support.
The Lancaster’s QoS-Architecture (QoS-A) [42, 43] is “a layered architecture of services and mechanisms for QoS management and control of continuous media flows in multiservice networks” [42] that coherently apply different QoS concepts across all architectural layers and
integrate them into a complete framework.
Looking from a functional point of view the QoS-A is composed of a number of layers and
planes. Distributed systems-related issues are addressed by the two highest layers: the distributed-
applications platform that provides services for multimedia communications and QoS specification in an object-based environment and the orchestration layer which provides jitter correction and
multimedia synchronization services across multiple related application flows [44], End-to-end
related problems are dealt with at the transport layer, which contains a range of QoS-configurable
services and mechanisms. Lower layers-related issues are solved by the network, data link and
physical layers that offer the basis for end-to-end QoS support. QoS management is realised in three
vertical planes in the QoS-A. The protocol plane, which consists of distinct user and control
subplanes, divides the protocol profiles for the control and media components of flows because of
their different QoS requirements. The QoS maintenance plane contains a number of layer-specific
Quality of Service Managers (QM). These are responsible for the fine-grained monitoring and
maintenance of their associated protocol entities, at each layer. For example, at the orchestration layer [45], the QM is interested in the tightness of synchronization between multiple related flows,
whereas the transport QM is concerned with intra-flow QoS such as bandwidth, loss, jitter and delay. The flow management plane is responsible for flow establishment (including end-to-end
admission control, QoS-based routing and resource reservation), QoS mapping (which translates
QoS representations between layers) and QoS scaling (which constitutes QoS filtering and QoS adaptation for coarse-grained QoS maintenance control).
The OSI QoS Framework Model is based on an early contribution [46] and a long-term
effort and was standardised by both ITU in ITU-T R. X.641 [21] and ISO in ISO/IEC 13236 [22],
The model defines the architectural principles, the concepts and the structures that underlie the
25
Gabriel-Miro Muntean - Ph.D. Thesis 2. Related Works
provision of QoS, but does not specify any of the QoS parameters or QoS information that are
exchanged during the functionality. It relies on the concepts of the OSI Basic Reference Model, and
the OSI Management Framework and is built around QoS-related key concepts like: QoS
requirements, QoS characteristics, QoS categories, and QoS management functions. The
management of QoS is performed by entities and two classes of entities are defined: system QoS
entities (entities which have a system-wide role) and layer QoS entities (entities associated with the
operation of a particular subsystem). The system QoS entities coordinate the response to the
requirements imposed on the system and interact with layer QoS entities to monitor and control the performance of the system. The layer QOS entities implement direct control of other entities (e.g.
protocol entities, etc.) that are necessary for support the system’s QoS-related activities. The
collaboration of layer QoS entities will, in real open systems, typically be supported by stored
information and processing functions that are not specific to individual OSI layers. These information and functions following are not modelled as entities in open systems but are left to be
determined by implementation choice.
The Tenet Approach [47] is a real-time communication services model with emphasis on
network support for continuous media applications proposed at University of California at Berkeley
and the International Computer Science Institute - Berkeley. In this approach the main elements are
performance guarantees (mathematically provable, but not necessarily deterministic), contractual
relationships between client and server, parameterised user-network interfaces with multiple traffic
and QoS bounds and large heterogeneous packet-switching networking environments. The key
mechanisms Tenet relies on are: connection-oriented communication, per-connection admission
control, channel rate control and priority scheduling.
Heidelberg HeiProjects [48] at IBM’s European Networking Center in Heidelberg have
provided a distributed multimedia platform that includes a comprehensive QoS model that offers
guarantees in the end-system and network capabilities. The model includes H eiTS (the Heidelberg
Transport System) for transporting multimedia streams across the network [49] and H eiRAT (the
Heidelberg Resource Administration Technique) [50]. HeiTS provides the ability to exchange
streams of continuous-media data with QoS guarantees. In order to do this HeiTS makes use of both protocols for transport, network, and data link layers and components for resource management, buffer management, and operating system abstraction. HeiRAT manages all the resources, on a path
from source to destination(s), both in the local systems and the network, making use of admission
control, resource reservation and scheduling mechanisms. It offers two types of QoS: guaranteed
and statistical. For guaranteed QoS, the resources are reserved for the maximum demand, whereas
26
Gabriel-Miro Muntean - Ph.D. Thesis 2. Related Works
for the statistical QoS they are slightly overbooked. Applications are allowed to specify QoS
requirements in terms of maximum end-to-end delay, minimum throughput needed, and reliability
class (loss-related) values expressed from desired to the-worst-acceptable values and HeiRAT will answer with the best QoS it could guarantee.
Among other QoS architectures proposed are the Extended Integrated Reference Model
(XRM) [51] at Columbia University, OMEGA [52] at University of Pennsylvania, TINA QoS
Framework [53], NU-NET [54] andNetWorld [55] at University of Pittsburg, Server/Broker/Client System at Carleton University - Canada [56] and QoS Framework [57] at Swiss Federal Institute of
Technology (EPFL). More detailed information about QoS architectures, including a comparison of
the presented approaches is given in [40, 58]. However designing any complex QoS architecture involves sustained effort and implementing and deploying it require significant costs. Prior to using
any QoS architecture it is very important to balance its benefits for delivering different services or a particular service and the associated effort and to compare the outcome with the one if other
solutions (e.g. bandwidth over-provisioning, adaptive applications, etc.) are employed.
2.2.3.2.4 Application-Level Adaptive Solutions
Another approach that tries to provide certain QoS, although without any guarantees, is by
using application-level adaptive solutions. Named also application-layer QoS control-based
solutions, their goal is to avoid congestion and consequent packet loss and maximise QoS [59]. This
is realised by adjusting the bandwidth used by the applications according to the existing network
conditions without any QoS-related support from the networks. Extensive research, mainly interested in multimedia deliveries over “best-effort” networks, has tried to explore different
directions in order to offer best algorithms and mechanisms that would allow to achieve high
adaptiveness and responsiveness to network conditions and high quality for the provided services.
The design alternatives explored differ on how some important issues are taken into consideration. Some of these issues are:
• Signalling or feedback mechanism used to inform the applications about the currentnetwork state
• Specific adaptive mechanisms used in response to this information
• Localisation of the adjustment mechanism
• Responsiveness of the congestion control scheme in detecting and reacting to networkconditions
27
Gabriel-Miro Muntean - Ph.D. Thesis 2. Related Works
• Capability of the scheme to accommodate heterogeneous receivers that may differ in
their connectivity to the network, the amount of traffic to their delivery paths, their need
for quality
• Scalability of the control mechanism to a high number of receivers
• Sharing of bandwidth with competing traffic of different type (particularly with TCP)
• Perceived quality of adapted multimedia streams.
Each of these could constitute a good starting point for a categorisation of the existing
approaches and especially those used for multimedia adaptation. In [60] the authors have chosen the
localisation of the adjustment mechanism in response to information about the network delivery
conditions and they distinguish sender-driven, transcoder-based and received-driven adaptations.
In [59] the application-layer QoS control-based adaptive solutions are divided into congestion
control-based solutions, which involve congestion control mechanisms that help reducing packet
delays and loss rates and error control-related solutions, which help increasing the robustness to errors, recovering after errors or minimising the effect of errors, mainly caused by transmission.
Since these application-level adaptive solutions require no help from the networks’ point of
view, the efforts required by these solutions for deployment and exploitation are in general very
low. It is also noteworthy that upgrades are much easier to be performed. Also a very low
intrusiveness, due to the fact that the networks are use as they are, is very important, because the
designed adaptive solutions can be deployed in networks that are owned by third parties, increasing the generality of the deployment. As it is the case for the other solutions for providing QoS in order
for the application-level adaptive solutions to become effective, they have to be deployed in
networks with potential for congestion, otherwise the effort is not paid off. Also similar to other
QoS solutions if the networks become really congested and almost 100% of packets sent is lost,
they become ineffective. However their tendency to “back-off” would increase the chances of a
quick recovery for the network and such congested situations are generally avoided. The most
important limitation of these adaptive solutions is that they cannot guarantee any QoS level, although they try to maximize it.
Taking into consideration these comments that highlight the advantages and disadvantages
of these solutions and underscoring that their deployment and their operational costs are very low while still providing certain QoS, the research this thesis is focused on deals with the application-
level adaptive solutions. More details about related research will be given in section 2.4.
28
Gabriel-Miro Muntean - Ph.D. Thesis 2. Related Works
2.2.3.3 Assessing QoS
Looking at the process of providing diverse services to the customers via a broadband IP
multi-service network, in order to assess its overall QoS it is necessary to analyse the QoS from different points of view.
Looking at QoS from a traditional - network engineering - point of view the work of the
IETF’s IP Performance Metrics (IPPM) Working Group (WG)26 [61] is significant. It has proposed a set of standard metrics that can be applied to the quality, performance and reliability of data
delivery over networks. This set defined in the IPPM WG-proposed RFC 2330 [62] offer some
solutions for unbiased quantitative measures of network performance. These metrics are connectivity, one-way delay, round-trip delay, delay variation, loss rate, loss pattern, packet
reordering, bulk and link transfer capacity. As one could see they describe the network
performance, but are not directly related to the quality of the service provided. Also they
significantly depend on the type of this service. However they can be used in order to assess the network condition and suggest measures to be taken by an eventual QoS-aware mechanism for
certain application domain. In the context of adaptive multimedia applications some related
solutions are presented in chapter two. General recommendations and not hard limits are given in
ITU-T R X.641 [21] and ISO/IEC 13236 [22] for values of these network-related parameters in relation with different types of traffic such as:
• bulk data - high throughput, low error rate;
• interactive - low delay, low error rate;
• isochronous - high throughput, constant delay;
• time sensitive - constant delay, fixed throughput.
In relation to QoS, the ITU-T R. E.800 [15] defines “network performance” as a set of
parameters that are meaningful to the network provider, but are expressed in terms that can be easier
related to users’ QoS expectations. Among the defined terms are: service support performance,
service accessibility performance, mean service access delay, service integrity performance, time
between interruptions, interruption duration, reliability performance, maintainability, bit error ratio,
transmission performance, primary failure, execution error. However, although they are close
26 IETF IP Performance Metrics Working Group, http://www.ietf.org/html.charters/ippm-charter.html
29
Gabriel-Miro Muntean - Ph.D. Thesis 2. Related Works
related to the users’ QoS, it is difficult to directly quantify the effect of all these parameters or of
some of them on end-user perceived quality.
Looking at QoS from the end-user perspective, an ideal assessment of QoS would be a
totally objective one that would use trustworthy, general accepted metrics. However, first a problem
would be the fact the quality assessment greatly differs with the service provided and special
metrics would have to be provided for each service. Another difficulty comes from the fact that the
service users are very subjective by nature and the metrics have also to take this into account. A
third source of problems is the type of the content the service is providing which varies significantly due to encoding scheme, nature of the content or other issues. This makes even more difficult the
efforts that aim at the determination of an objective metric for assessment of end-user perceived
QoS. Therefore research is still on-going in this domain and different approaches are proposed with
various advantages and disadvantages. Current state-of-the-art in objective video quality assessment is presented in detail in section 2.5.
Since there is not a general accepted objective metric, in order to assess and to compare the
QoS as provided by the existing systems and the newly proposed delivery schemes, efforts were
made to define subjective quality metrics and methodologies for accurate measurements. For
example ITU-T R. P.910 [63] presents recommendations about methods, systems, clip contents and
environment conditions for testing and scales for assessing the end-user perceived quality while
viewing multimedia clips. Similarly ITU-T R. P.800 [64] presents recommendations about
conditions, systems, content of the sequences, noise levels, methods, assessment scales and data
analysis related to subjective testing of audio content. The former standard is used for the subjective
assessment of the quality of the VoD services provided, using the approach proposed and presented in this thesis.
2.3 Compression Techniques
One of the major problems associated with storing and transmitting of multimedia-related digital data is that the huge volume of uncompressed data may easily overwhelm the available
communication channels and storage systems. For example, a digital video sequence that has a resolution comparable to the National Television System Committee (NTSC) analog video signal
(720 x 486 pixels/frame, 30 frames/second and 16 bits/pixel), has an uncompressed data rate of 168
Mb/s that simply cannot be coped with for both transmission and storage (a typical two-hour movie
would require approximately 150 GB of disk space). This did not take into account the extra
30

Gabriel-Miro Muntean - Ph.D. Thesis 2. Related Works
bandwidth and consequent storage space required by one or more audio components associated with
this video sequence.
Therefore compression is necessary and different algorithms and techniques were developed, having different performances according to the requirements of the applications that use them. In [23] two types of applications are distinguished: dialogue (interactive) and retrieval (non
interactive) and therefore two sets of different requirements that differ mainly in timing-related and interactivity-related issues.
The compression solutions are also subject to certain constraints. Some of the most significant constraints are:
• The quality of the multimedia data reconstructed after decoding should be as good as
possible in order to offer high quality of the services to the end-users.
• The compression rate should be as high as possible in order to minimise the storage
space and/or the bandwidth for transmission
• The complexity of the technique should be minimal to allow for a cost-effective implementation
• The delay due to the coding and mainly decoding should be as short as possible not to interfere with time sensitive applications.
All modem methods used for multimedia data compression are compromises between the degrees in which they follow the requirements and respect the constraints.
In order to perform their tasks, the compression methods take into account some important facts related to sets of data and to multimedia data in special:
• some subsets of data are randomly repeated within a set of data
• some multimedia-related data is more significant than other from the human perception point of view
• there is very much redundancy in the set of multimedia data, spatial (between the pixels
of the same frame), spectral (within the color components of the same frame) and temporal (between different frames).
31
Gabriel-Miro Muntean - Ph.D. Thesis 2. Related Works
The authors of [65] divide the basic compression techniques into lossless and lossy
methods, whereas in [23] they are classified as entropy-coding and respectively source-coding
based. The hybrid-coding techniques are more complex and make use of a combination of the
above-mentioned elementary methods.
2.3.1 Entropy-Coding (Lossless) Techniques
The entropy-coding methods are lossless techniques since the data set obtained after
decoding is identical with the one that has been used for encoding. These methods do not take into account any specific characteristics of the streams to be encoded, ignoring the semantics of the data.
They consider the data streams to be compressed as simple sequences of bits and base their
operation on the observation that many sets of data, and especially audio and video streams’ data,
often contain sequences of identical bytes (symbols). Apart from their usage in hybrid video and
audio compression techniques, the entropy-coding methods are also used for compressing data in file systems and still images [23]. Some of the best-known and widely used entropy-coding
techniques are: run-length coding, Huffman coding and arithmetic coding.
Run-Length Coding’s main idea is to replace the repeating symbols with the pattern that is
repeated and with the number of times this happens and to signalise this with a special flag that does
not constitute a part of the stream. For Run-Length Coding to be really efficient, the data stream
must contain long sequences of identical characters. However, hybrid coding could employ other
techniques in an earlier phase that produce such long runs and then by using Run-Length Coding
very significant compression will be achieved.
Huffman Coding is a variable-length encoding technique that makes use of the occurrence
probability of repeating symbols in order to produce an optimal code by assigning the shortest bits
to the most frequently occurring symbol. This code is built using a bottom-up approach in a tree
like structure whose leaves are the symbols to be encoded. Huffman Coding requires the same tree (table) to be available for both encoding and decoding in order to decode correctly the compressed set of data.
Arithmetic Coding, proposed by IBM researchers in [66], is another variable-length
encoding method that encodes symbols using a non-integer numbers of bits per codeword. Unlike
Huffman Coding, Arithmetic coding does not encode each symbol of a set of data separately, but
computes a code representing the entire set of data, achieving better performance. A significant
disadvantage is that an encoded data stream must always be read from the beginning, making the
32
Gabriel-Miro Muntean - Ph.D. Thesis 2. Related Works
random access difficult. However, Arithmetic Coding is patented and its use is not free whereas
Huffman coding is.
2.3.2 Lossy Techniques
The lossy compression techniques introduce a one-way relation between the original set of
data and the decoded data set, which is similar, but not identical. They take into account the
semantics of the data and in consequence the degree of achievable compression depends on the data
contents. Good techniques make extensive use of the characteristics of the streams (e.g. spatial and temporal redundancies in multimedia streams). Some of the best-known lossy techniques employed
in multimedia compression are transform-based (e.g. Discrete Cosine Transform, Fourier Fast
Transform Wavelets Transform), prediction-based (e.g. Differential Pulse Code Modulation, Delta
Modulation), layered coding-based (e.g. sub-sampling, sub-band coding) and vector quantization.
Transform-based techniques are based on the observation that if the set of data is
represented into another mathematical domain is more suitable for processing. However, a very
important condition is that the inverse transformation must also exist. The most used
transformations in multimedia-related compression are Discrete Cosine Transform (DCT) and
Fast Fourier Transform (FFT), although lately Wavelets-based transform is also used for
specific applications. For example, DCT is applied in image compression on a N x N image block transforming the data from spatial domain into Discrete Cosine (DC) domain, resulting N2 DC
coefficients. Regularly N = 8, which ensures low memoiy requirements, low computational
complexity and high spatial correlation of the neighborhood related to the pixel in the center. It was
proven that the higher the order of the DC coefficients, the more sensitive their influence on the
human visual system is. Therefore in order to both reduce the data quantity and have as little as
possible influence on the perceived quality, another step called quantisation may delete some of the
low-order coefficients. The inverse DCT restores the data into the spatial domain. FFT transforms
data into the frequency domain in which either the complexity of the computation is lower or
information easier available. For example the audio-based compression uses 512 or 1024-point FFT
for getting detailed information about the spectrum of the original signal. Based on the
psychoacoustic model of the human ear it is decided which of these samples has a lower impact on
the quality of the overall stream and by masking them, the quantity of data is reduced. Unlike DCT
or FFT that are applied on homogeneous sets of data, wavelets are transforms characterised by
strong locality and could be very successfully applied to determine local specifics of signals or
33
Gabriel-Miro Muntean - Ph.D. Thesis 2. Related Works
images. If applied on the whole image, other techniques such as quantisation and entropy encoding
have to be used in conjunction in order to achieve compression. [65],
Prediction-based methods, also known as differential or relative encoding techniques, are
based on the idea that if a set of values are clearly different from zero and these values do not differ
much, encoding the differences from the previous values leads to compression. These methods are
best suited for encoding audio data because audio signals change rather slowly. Differential Pulse Code Modulation (DPCM) and its variation Delta Modulation (DM) use this approach. DM uses
only one bit to indicate whether the new value increases or decreases from the previous one,
achieving high compression, but lower accuracy in case that high variations occur.
Layered-coding-based techniques consider that the data to be compressed can be divided in different layers that could be treated differently, according to their importance. For example in
video compression Sub-sampling takes into account the fact that the human eye is more sensitive to differences in brightness than in color and therefore it divides the images in YUV components
(i.e. luminance Y and two chrominance difference components U and V), instead of using the RGB
components (i.e. Red, Green and Blue)27. The real benefit is achieved by another step that
compresses differently these components. Sub-band encoding, which is mainly used in audio
compression, divides the frequency spectrum into pre-defmed bands. Different quantisation
processes are then used, finer for more audible bands (e.g. between 100 Hz and 16000 Hz) and coarser for the rest.
Vector Quantisation is an asymmetric compression method having the decoding process
much simpler than the encoding one. It achieves very good compression and could be performed
quite fast, working directly in the spatial domain. Image compression is achieved by dividing the
input image in non-overlapping N x N blocks, seen as N2-dimensional vectors, and matching each of them to a codeword from a codebook, so that the distortion between them is minimum.
2.3.3 Hybrid Techniques
Hybrid techniques make use of a number of lossless and lossy compression techniques in
conjunction in order to achieve better data compression. Next some of the best known standardised encoding schemes and some proprietary solutions are presented. Since video accounts for the large
27 Y=0.30*R+0.59*G+0.11*B ;U =B-Y; V=R-Y
34
Gabriel-Miro Muntean - Ph.D. Thesis 2. Related Works
majority of data to be stored and transmitted, this section will give more details about hybrid video
compression techniques, but it will also present briefly the ideas behind image and audio-related
ones.
2.3.3.1 The JPEG Standards
The JPEG, standardised in ITU-T R. T.81 [67] and ISO/IEC 10918-1 [68], is an image
compression hybrid technique that offers the flexibility to either select very high picture quality
with low compression ratio or a very high compression ratio with low picture quality. The latter is
caused mainly by “blockiness” artifacts. To achieve compression JPEG employs DCT followed by
a quantization phase. The motion-JPEG (M-JPEG), an extension to JPEG standard for video, uses
a series of still pictures and achieve low compression by not reducing any temporal redundancy.
The JPEG2000, standardised in ITU-T R. T.800 [69] and ISO/IEC 15444-1 [70], uses
Wavelets-based transformation instead of JPEG’s DCT, increases the compression ratio, but also
the complexity and reduces the “blockiness” artifacts, but produces a slight “fuzzy” picture. The
motion-JPEG2000 (M-JPEG2000), although standardised in ISO/IEC 15444-3 [71], suffers from the same problems as M-JPEG.
2.3.3.2 The MPEG Standards
The goal of the ISO/IEC Moving Pictures Expert Group (MPEG)28 [72] was to develop international standards for compression, decompression, processing and coded representation of moving pictures, audio and their combination.
MPEG-1 [73], the first standard generated by this group, defines the coding of the
combined audio-visual signal at a bit-rate around 1.5 Mbps with VHS-quality (320 x 240 video
resolution) and was initially developed to operate from storage media, but it can be used more
widely than this. In different parts of the ISO/IEC 11172 document [73] the video, the audio and the system components of the standard are described.
MPEG-1 Video uses a number of lossy and lossless compression techniques in order to
achieve high compression ratios while still providing good quality for the decoded video stream. First, an appropriate spatial resolution is selected and then the algorithm uses block-based motion
28 ISO/IEC Moving Pictures Expert Group (MPEG), http://www.chiariglione.org/mpeg/index.htm
35
Gabriel-Miro Muntean - Ph.D. Thesis 2. Related Works
compensation to reduce the temporal redundancy. Motion compensation is used for causal
prediction of the current picture from a previous picture, for non-causal prediction of the current
picture from a future one, or for interpolation-based prediction from past and future pictures. The
difference signal (prediction error) is further compressed using DCT to remove spatial correlation
and is then quantised. Finally, the motion vectors are combined with the DCT information, and
coded using variable length codes. MPEG-1 Audio uses filters and sub-sampling to map the input
audio stream into a representation in the frequency domain and a psychoacoustic model that creates
a set of data to control the quantisation and the coding processes. These processes create a set of
coding symbols from the mapped input samples. The coded bitstream is then obtained from the output data and other information (e.g. error correction) if necessary. MPEG-1 System combines one or more MPEG video and audio streams, with timing information, to form a single stream well suited to digital storage and/or transmission.
MPEG-2 [74] was standardised by both ISO in ISO/IEC 13818 [74] and ITU in ITU-T H.262 [75] and defines the following components:
MPEG-2 Video, although similar to MPEG-1 Video, is targeting very high bit-rates of up to
20 Mb/s with full size pictures and very high quality. It also allows for higher flexibility in terms of
applications, bitrates, resolutions and qualities with the introduction of “profiles” that define subsets
of the MPEG-2 syntax and semantics and within each profile of “levels” that describe a set of
constraints imposed on parameters in the stream. MPEG-2 Audio is very similar to MPEG-1 Audio
having added multi-channel extensions. However, MPEG audio is backward and forwards
compatible. MPEG-2 Program is similar to MPEG-1 System and aims at combining one or more
elementary streams, which have a common time base, into a single stream. MPEG-2 Program is designed for use in relatively error-free environments and is suitable for applications which may
involve software processing. Program stream packets may have variable and large size. MPEG-2
Transport combines one or more elementary with one or more independent time bases into a single
stream. The Transport Stream is designed for use in environments where errors are likely, such as
storage or transmission in lossy or noisy media. Transport stream packets are 188 bytes long.
MPEG-4, standardised as ISO/IEC 14496 [76], targets the extremes from the bitrate range
point of view to the world of possible applications. It provides features like extended scalability, error resilience, interfaces to digital rights management systems and interactivity. It aims to achieve
robustness in any kind of environment, compression efficiency coding, allow for transmission
flexibility and provide support for objects with both natural and synthetic content.
36
Gabriel-Miro Muntean - Ph.D. Thesis 2. Related Works
It is significant to mention that a new scalable coding mechanism, different than classic
quality (SNR), spatial and temporal scalability, called fine granularity scalability (FGS) was
proposed for MPEG-4 and was described in [77]. The idea is that each stream should consist of a base layer (“must have”) and an enhancement layer. Parts of the latter could be optionally
transmitted to increase the overall quality if available bandwidth permits this. Progressive fine granularity scalability (PFGS) [78] extends the FGS idea, allowing for the existing of more than two layers.
2.3.3.3 The ITU-T Standards
The ITU-T has defined in the ITU-T R. H.320 [79] a standard for multimedia
telecommunications that ensures compatibility among terminals produced by different vendors. It
specifies certain standard protocols for video, audio, control, security etc. and provides mandatory
requirements to make sure all H.320 compatible systems can communicate with one another. There
are also optional requirements that can allow systems to provide additional functionality. However,
this functionality is sacrificed for compatibility when communicating with systems that only meet
the minimal requirements for H.320. The standards directly related to video and audio compression are presented next.
ITU-T R. H.261 [80] is a video-coding standard, designed originally to suit ISDN lines,
that has output bit rates multiples of 64 Kb/s, between 40 Kb/s and 2 Mb/s. The encoding algorithm
employed is a mixture of temporal and spatial coding to remove the redundancies in the video in a
similar fashion MPEG does. However, H.261 offers lower compression ratio and provides lower
flexibility in exchange for lower processing delays that may be required in videoconferencing. This is because H.261 was targeted at teleconferencing and videophone applications.
ITU-T R. H.262 [75] is common with MPEG-2 standard ISO/IEC 13818 [74].
ITU-T R. H.263 [81] is a video encoding standard that was originally designed for low
bitrate communication, less than 64 Kb/s, a limitation that has now been removed. The coding
algorithm of H.263 is similar to that used by H.261, but there are some changes that improve its
performance and flexibility. Among other features H.263 supports five standard source formats instead of two and uses half pixel precision for motion compensation rather than full pixel. It also makes use of 3-D variable-length coding and median motion vector prediction. H.263 also offers a
wide variety of optional modes that can be added to the baseline algorithm to improve the coding
37
Gabriel-Miro Muntean - Ph.D. Thesis 2. Related Works
performance or to broaden the application range. Further improvements have been proposed and
have lead to H.323+ and H.323++.
Lately significant effort is directed towards the emerging standard “Advanced Video
Coding (AVC)”, widely known by its working title, H.26L or by the ITU-T document number H.264 [82],
ITU-T R. G.711 [83] provides telephone quality sound at rates between 48 and 64 Kb/s and is the only audio protocol required for a system to be H.320 compliant.
ITU-T R. G.722 [84] provides stereo quality sound with output between 48 and 64 Kb/s.
ITU-T R. G.728 [85] is meant to be used videoconferences at speeds lower than 256 Kb/s and requires only 16 Kb/s, allowing more bandwidth for video.
2.3.3.4 Proprietary Solutions
Different commercial companies have proposed hybrid compression solutions that make
use of both lossy and lossless techniques in conjunction in order to maximise the benefit from their
usage according to the companies’ interests. Unfortunately majority of these solutions are
proprietary and very little information is offered about them. This makes their usage outside the multimedia systems they were initially designed for extremely difficult. Among the best-known
proprietary solutions are the Microsoft’s Windows Media (WM)29, Progressive Networks’ Real Media (RM)30 and Apple’s QuickTime31.
2.3.4 Conclusion
Different basic and hybrid methods proposed for multimedia data compression were
presented. The latter, using a combination of the former, achieve higher compression ratios while
providing high quality for the reconstructed multimedia data and are best suited for using while
delivering multimedia presentations to the residential homes. However, since the goal of this
research is to deliver very high quality multimedia streams with very little effort, the chosen
29 Microsoft, “Advanced Systems Format Specification” , http://www.microsoft.com/windows/windowsmedia/format/asfspec.aspx
30 Progressive Networks, http://www.realnetworks.com
31 Apple, QuickTime, http://www.apple.com/quicktime/
38
Gabriel-Miro Muntean - Ph.D. Thesis 2. Related Works
solution has to provide very good compression ratios, to be designed for very high quality streams and to be standardised and therefore offering good documentation and reducing the maintenance
costs. MPEG-2 was selected because it was standardised by both ITU-T and ISO bodies, it is already popular through the DVDs that use it for storing very high quality multimedia, it is
supported by a wide scale of software and hardware products and it is already used by current VoD
and multimedia broadcast providers. The latter increases the chances for the proposed application-
level adaptive solution to be accepted and used in existing systems, that requires only incremental
changes.
2.4 Adaptive Solutions for Delivering Multimedia
Bursty loss and excessive and extremely variable delays have a devastating effect on
multimedia deliveries, severely affecting the end-users’ perceived quality. In consequence any
effort that aims at reducing these delays and at lowering the loss rate helps to increase the quality of
the remote multimedia presentations. This is also the main objective of the adaptive solutions (or
adaptive control schemes) for multimedia deliveries.
Extensive research has focused on proposing different solutions for adaptive multimedia streaming and various directions have been taken. These directions differ due to a number of
options taken when designing the adaptive solutions. Among the most significant are the manner
the information about the delivery conditions is collected and used, who takes the adaptive
decisions and what adjustments are performed, how fast and how appropriate are the adaptive
measures taken and what is their effect on the end-user perceived quality. These are the characteristics that will be presented in relation to the proposed approaches.
Adaptive control schemes have been mainly classified in the literature [59, 60] according to
the place the adaptive decision is taken and this thesis uses also this approach. The source-based adaptive control techniques require the sender to respond to variations in the delivery conditions
or to changes in the quality of the reception. The receiver-based adaptive control schemes provide mechanisms that allow for the receivers to select the service quality and/or rate. The hybrid adaptive control mechanisms involve both the sender and the receiver in the adaptation. However the authors of [60] distinguish another category - the transcoder-based adaptive control solutions - that focus on matching the available bandwidth of heterogeneous receivers through transcoding or
filtering. These schemes imply an active involvement in the adaptation process at the level of
intermediary network nodes. Although adding intelligence to the network introduces supplementary
39
Gabriel-Miro Muntean - Ph.D. Thesis 2. Related Works
costs and has to have the acceptance of the network’s owner or the administrator, which does not
conform to the goal of this research, this approach is also presented along some other very
interesting solutions.
There are also works like [86] that have considered other criteria to classify the adaptive
schemes such as whether they are unicast or multicast, single-rate or multi-rate, end-to-end or
router-supported, TCP-friendly or not. Although complex, unicast solutions that look for the adaptation of the delivery to one receiver at a time are far less difficult to design than multicast
ones. The problem arises for multicast schemes from the fact that they have to scale to large number of receivers, often heterogeneous from both network and capabilities point of view. If there
is a common transmission rate for all the receivers, there is very difficult to determine how to adjust it according to the available information about delivery, since for example these receivers may
experience uncorrelated loss. Different problems related to multicast congestion control are
presented in detail in [87, 88], Single-rate solutions involve the data transmission at the same rate
for all the receivers and this is the case for all unicast schemes and for some multicast solutions.
Multi-rate schemes do not restrict the transmission rate to that of a bottleneck receiver, allowing
for more flexibility. They require the existence of more than one multicast group and provide the
choice for the receivers to join or leave the multicast groups according to their particular delivery
conditions. However the latency of the process of leaving a multicast group is a reason of concern
and it may take several seconds to complete. The end-to-end approach, chosen also in this thesis,
is designed for best-effort IP networks and does not rely on any support from the networks that are
taken as they are. Its biggest advantage is the low cost that makes it popular. The router-supported solutions rely on additional functionality from the networks and some proposals were presented in the first chapter. The schemes’ positive results come with increases in the costs of their deployment. A more detailed discussion about the advantages and disadvantages of these solutions is published
in [89]. Another issue is the solutions’ degree of TCP friendliness, which measures the effect the
adaptively controlled flow has on competing TCP flows. Although there is not a general accepted
definition for TCP friendliness and even a general agreement for the necessity of strong TCP
friendliness for time-sensitive flows, certain “social behaviour” from the solution is definitely
required to allow for other traffic to have its share of the bandwidth, especially during increased
traffic conditions. Definitions of TCP friendliness are given in [6, 86],
Apart from serving live content, which can be more flexible encoded at the required bitrate,
in order to be able to provide adaptively on-demand multimedia services, including VoD, solutions
for distributing pre-recorded multimedia streams are required. In the literature [90] there are
40

Gabriel-Miro Muntean - Ph.D. Thesis 2. Related Works
suggested several ways of providing quality adaptation for a pre-recorded stream, including
adaptive encoding, switching among multiple pre-encoded versions and hierarchical encoding.
Adaptive encoding involves re-encoding of the existing content on-the-fly, based on the available
bandwidth for transmission. However, this is computationally complex and has high CPU and
memory requirements and is very unlikely for the servers to be able to do this for a high number of clients. However the transcoder-based solutions use this approach, but do not involve the server.
Switching among multiple quality pre-encoded versions with the same content require increased
disk storage at the servers for these versions. However, lately the decrease in the price per gigabyte
makes this solution more popular. Hierarchical/layered encoding requires the server to use
layered encoding for the streams. As more bandwidth becomes available, extra layers can be delivered.
Next a review of work representative for the direction the research on adaptive control schemes have taken is presented, solutions classified according to the location where the adaptationdecision is taken.
2.4.1 Source-based Adaptive Control Techniques
In the source-based adaptive techniques the sender is responsible for adapting the
transmission rate to the delivery conditions. It is significant to mention that two main policies have
been adopted for adjusting the rate: the additive increase and the multiplicative decrease (AIMD) that slowly increases the rate in good reported conditions and sharply decreases it
otherwise and the multiplicative increase and the multiplicative decrease (MIMD) that uses roughly the same approach upwards and downwards. In relation to the adaptation approach, two
explored directions have been distinguished in [59, 91]: a probe-based approach and a model-based
approach. The probe-based solutions are based on probing experiments that try to detect the
available bandwidth of the network and try to maintain the loss rate below a certain threshold. The
model-based solutions follow a throughput model that determines the transmission rate in certain
conditions. However a third direction, which could be named heuristic-based and relies on
heuristic knowledge and experimental testing, encompasses many of the proposed schemes.
Kanakia, Mishra and Reibman present in [92] a heuristic-based unicast scheme that relies
on periodically received feedback by the server about the bottleneck queue’s buffer occupancy and
service rate received by the connection. The latency of the feedback is taken into account while estimating the current buffer occupancy and the service rate. These estimates are used to calculate
41
Gabriel-Miro Muntean - Ph.D. Thesis 2. Related Works
the most appropriate transmission rate for each video frame, according to its type, before it is
transmitted. The scheme uses MPEG encoding scheme and the adjustment in the quantity of data to
be transmitted is performed by reducing the streams’ quality by varying the encoder’s quantisation
factor (Q). The biggest problem related to this solution is that it is very difficult to expect to receive
the required type of feedback from the bottleneck link router for many connections. Apart from
scalability problems, not being end-to-end, the solution involves an increased deployment cost.
Jacobs and Eleftheriadis [93, 94] propose a protocol for transmitting multimedia that uses
the TCP’s congestion control window and hence TCP’s acknowledgement messages to acquire
information about the state of the network. The goal of their research is to find a TCP-friendly solution for multimedia streaming and therefore aim at adapting to network conditions in a similar
manner with TCP. Before being sent to the receiver, the packets carrying multimedia data are
placed into a local buffer at the sender. This buffer’s occupancy is used by a dynamic rate shaping
mechanism, which was described in [95] to control the encoder’s output rate. The encoding rate is reduced when necessary by eliminating a set of DC coefficients using a Lagrangian optimisation.
Bolot, Turletti and Wakeman propose in [96, 97] a heuristic-based adaptation scheme that
involves a server that is informed about the network conditions through feedback from the
receivers. Once congestion is detected, the server varies the output rate of a H.261 encoder by
adjusting the frame rate, the quantization factor and the movement detection threshold. This scheme
was extended to multicast [98] and in order to reduce the load on the server, the receivers send feedback only if they were selected by a probabilistic polling and only if they experience
congestion. The feedback is initiated by the server that sends probe messages with a random
generated key of a length that decreases logarithmically in time. These keys have to be matched by
the clients’ own key in order for the latter to be allowed to answer. The decrease in the key length is
performed in order to address more clients until the server receives an answer. The very good
scalability of this multicast scheme has a drawback in the fact that the congestion is discovered with
certain delay and until dealt with affects the quality of delivery.
Sisalem and Schulzrinnc have designed the Loss-Delay based Algorithm (LDA) [99]
that makes use of RTP [100] to deliver data and RTCP [100] to provide feedback. The scheme
looks at the overall multimedia delivery taking into account all the LDA adaptive streaming
processes. For each process, depending on whether was reported loss or not the transmission rate is
either additively increased or multiplicatively decreased. The additive rate increase is performed
with a parameter AIB, whose value depends on its former values, on the value of the transmission
rate and on the estimated bottleneck bandwidth. However the rate cannot exceed the rate suggested42
Gabriel-Miro Muntean - Ph.D. Thesis 2. Related Works
for these conditions by the TCP model proposed in [101]. The decrease brings the transmission rate
to a value equal to the current minimum rate experienced by the LDA receivers. The authors do not
suggest how these variations in the rate could be performed from the multimedia encoding point of
view and nor what would be their effect on the end-users’ perceived performance. The scheme was
tested for multicast deliveries and has shown certain TCP fairness, although no further tests have
been done to prove this. The main drawback of the scheme is that it has several parameters that
have to be set by the users.
Busse, Deffner and Schulzrinne have presented in [102] another adaptive scheme that
bases its operation on how the sender perceives the receiver state according to feedback-received
information. The receiver could be in “unloaded” state with no loss experienced and in consequence the server increases the transmission rate additively until it reaches the “loaded” state when the
maximum rate is matched and the rate is not varied anymore or in “congested” state when loss is
reported and the sender has to multiplicatively reduce the transmission rate until the loss rate decreases. A low-pass filter is used to smooth the reported packet loss rate and the resulting value
helps the sender to decide the receiver’s state. The multimedia data is transferred using RTP [100] and the feedback information using RTCP [100], When applied to multicast, a significant problem
is according to how many reports that inform about congestion the decision of setting the common
rate for transmission has to be taken. A solution is to take into account the poorest receiver’s report,
another to consider a fraction of the total number of receivers’ reports. The authors have examined
both. The scheme suffers from the same problem of the dependency of loss rate only as previously
mentioned.
Rejaie, Handley and Estrin have proposed in [103] the Rate Adaptation Protocol (RAP), an unicast adaptive solution that follows the TCP AIMD approach. In consequence each data packet require an acknowledgement from the receiver, according to which both the loss rate
and the round-trip time (RTT) are estimated. In case that congestion is detected the transmission
rate is halved, otherwise the rate is increased by one packet per RTT. RTT is also the interval between two possible decisions of rate adjustment. RAP additionally provides a fine-grained delay- based congestion avoidance mechanism based on short-term and long-term RTT averages that
modify the interval between consecutively sent data packets. More information about RAP and its application in multimedia quality adaptation is given in [104],
Pahye, Kurose and Towsley have used the TCP model presented in [101] to propose the
TCP-Friendly Rate Control Protocol (TFRCP) [6], a model-based solution that controls the
sending rate in a similar manner to TCP. The sender computes the sending rate at the beginning of43
Gabriel-Miro Muntean - Ph.D. Thesis 2. Related Works
every round of duration M units (recomputation interval), rate that is used to send data for the
duration of the round. If no loss was recorded the rate is doubled, otherwise the rate is computed
based on the TCP model. The data packets are acknowledged in a similar fashion with TCP, but each ACK packet gives supplementary acknowledgment information about the previous 8 data
packets, protecting against ACK losses. In this manner the loss is detected and its rate computed. Also, the sender maintains estimates of the round-trip time and of the base timeout as TCP does,
necessary for the rate computation. The protocol was tested for unicast transmissions and has shown
high TCP-faimess. However the tests have not included any reference to eventual user perceived
quality if used for delivering multimedia data and have not addressed the link utilisation.
Floyd, Handley, Padhye and Widmer have improved TFRCP [6] proposing a new TCP- Friendly Rate Control Protocol (TFRC) [105] that was designed for unicast communications, but
could also be adapted for multicast. Like TFRCP, TFRC uses the same equation of the TCP model
for determining the transmission rate, but uses more complex methods to determine the values of its
parameters. The scheme regularly computes the loss intervals taking into account the number of
packets between two consecutive losses. A weighted average is computed from a certain number of
loss intervals allowing for newer loss intervals to contribute more to the result and increase its
accuracy. The loss rate is measured then as the inverse of the weighted average loss interval, taking
into account that it should not react strongly to single loss events and should adapt quickly to long
periods of no loss. TFRC provides additional delay-based congestion avoidance by adjusting the
time between two consecutive packets sent. As result of these improvements, the scheme’s sending
rate is more stable, while still provides high responsiveness to changing traffic conditions.
Unfortunately the authors have not assessed the effect of using their proposed scheme on the end- users’ perceived quality.
Sisalem and Wolisz have improved LDA [99] and have proposed the Loss-Delay-based Adaptation Algorithm (LDA+) in [7], The adaptive scheme was designed for unicast
transmissions and it bases its functionality on using RTP [100] for data delivery and RTCP [100]
for feedback. LDA+ is an AIMD algorithm that changes its transmission rate with values
dynamically computed based on the current network situation and the share of the bandwidth a flow
is already utilising. In loss situations, the rate is decreased by the factor l-lossrate1/2, but the final
values should not be lower than the one the TCP model equation [101] would suggest for the transmission rate in these conditions. In no loss cases, the additive value is computed as the
minimum between three values. One is computed in inverse relation with the share of the bandwidth the current flow utilises. A second value is meant to limit the increase to the bottleneck link
44
Gabriel-Miro Muntean - Ph.D. Thesis 2. Related Works
bandwidth as it converges to 0 when this happens. The third value is determined in such a manner
that, at no time, the rate should increase faster than a TCP connection sharing the same link would
increase its rate. Although performance tests were performed, they were mainly focused on tuning LDA+, determining fairness to other flows and comparing it to other schemes and the effect on the
end-users was not taken into account.
Rejaie, Handley and Estrin have proposed in [90] the Layered Quality Adaptation (LQA) scheme for unicast transmissions that, based on a layered approach, provides the ability to
control the level of smoothing. LQA consists of two mechanisms: a coarse-grain mechanism for
adding and dropping layers and a fme-grain inter-layer bandwidth allocation mechanism. The
sender performs the coarse-grain adaptation by changing the number of active layers and varying therefore both the quality of the delivered stream and the quantity of data buffered at receiver. The fine-grain adaptation is performed at the level of an active layer. For example if there is spare
bandwidth, the sender could increase the rate the data is sent for an active layer, increasing the
quantity of data buffered at the receiver for that layer. Later on, if there is receiver buffered data for
a layer, the sender could reduce temporarily the allocated bandwidth for that layer under that layer’s
regular necessity by reducing its sender buffer’s drainage rate. Additionally a smoothing mechanism was introduced that trades short-term improvements for long-term stability of quality.
Apart from the techniques presented, different other sender-based adaptive control schemes
have been proposed, including a FGS-based solution [106], an adaptive TCP friendly scheme [107]
and a mechanism based on priority drop [108], that try to find the best answer to streaming
multimedia over best-effort IP networks. Unfortunately it was not reported any objective or
subjective testing of the effect these solutions may have on the end-users’ perceived quality and
therefore it is difficult to be assessed from the existing publications. Other sender-based adaptive solutions are presented or discussed in [59, 109, 110].
2.4.2 Receiver-based Adaptive Control Schemes
The receiver-based adaptive control solutions involve the receivers as the main actors in the
rate adaptation, while the senders either do not participate at this process or do not have a
significant contribution. Currently they are built around the idea of layers and take advantage of it.
Like the source-based rate control, the existing receiver-based adaptive control mechanisms were
classified in the literature [59, 91] in two approaches: the probe-based approach and the model- based approach. The probe-based approach relies on adding and dropping layers. When no
45
Gabriel-Miro Muntean - Ph.D. Thesis 2. Related Works
congestion is detected, a receiver does the probing for the available bandwidth by joining a new
layer, increasing its receiving rate. After the joining, if no loss occurs, the probing was successful,
otherwise, the receiver drops the newly added layer. When congestion is detected, the receiver drops a layer, resulting in reduction of its receiving rate. The model-based approach attempts to
explicitly estimate the available network bandwidth. Currently the only one model the solutions are
based on is the throughput model of a TCP connection presented in [101]. Next the most significant
receiver-based adaptive control solutions are presented.
McCanne, Jacobson and Vetterli have proposed the Receiver-driven Layered Multicast (RLM) in [111], a multicast adaptive solution especially designed to provide each receiver with the
best possible video quality according to the available bandwidth between the sender and that
receiver. In RLM, a probe-based approach, the sender splits the video into several layers and each is
transmitted to a different multicast group. If a receiver joins the multicast group that transmits the
first layer, it will receive the multimedia data associated with it. This process is named join
experiment. If no packet loss will be experienced for a certain period of time, the receiver will subscribe to the next layer. When a receiver experiences packet loss, it unsubscribes from the
highest layer it is currently receiving. The use of RLM to control congestion comes with many
problems, some of which were reported in [112]. Among them is the coarse adaptation and the
consequent variation of the end-user perceived quality when adding or dropping layers based only
on the detection of packet loss. Also leaving a multicast group has certain inertia, taking time on the
order of several seconds. Therefore a receiver, which has joined a higher layer immediately has to
leave it, adds unjustifiable cost in terms of the additional bandwidth it may use. Furthermore, this
increases with the number of receivers behind the same bottleneck link that take unsynchronised join and leave decisions.
Vicisano, Crowcroft and Rizzo address many of RLM’s [111] problems when have
proposed another probe-based solution, the Receiver-driven Layered Congestion Control (RLC) [113]. Their idea was such to dimension the layers that the bandwidth consumed by each new layer
increases exponentially. The time that a receiver has to wait before being allowed to join a new
layer also increases exponentially with each additional layer. However, a layer is dropped
immediately when packet loss occurs, halving the overall receiving rate. This AIMD behavior is
very similar to TCP’s. Noticing that the receivers’ synchronization is beneficial, synchronization
points (SP) have been defined and the receivers may join a layer only at these SPs. Since the SPs
are exponentially less frequent in higher layers than in lower layers, a low quality receiver is likely to catch up with receivers with a higher subscription level and, after some time, synchronization
46
Gabriel-Miro Muntean - Ph.D. Thesis 2. Related Works
will occur. In order to decrease the chance of a failed join experiment, the sender temporarily
doubles the rate of each layer before every SP and only if a receiver does not report loss is allowed
to join a higher layer. In spite of the efforts RLC has also problems [112] linked mainly by the
coarse granularity of the rate adaptations, related to the fact that the transmitted data must support
layering and in connection to the acceptability of the artificially introduced bursts. A general
criticism that applies to all layered-based schemes is that they “abuse” of the network resources.
Byers et. al have solved some of the deficiencies of RLC and have proposed Fair Layered
Increase/Decrease with Dynamic Layering (FLID-DL) [114], a model based solution.. The scheme makes use of a Digital Fountain [115] at the sender that encodes the original data and some redundancy information such that receivers can decode the data even if they receive only a certain
number of distinct packets. In order to reduce the join and leave latencies associated with adding or
dropping of layers, FLID-DL introduces the concept of Dynamic Layering (DL). DL involves
constant decrease in time of the bandwidth associated with a layer. In consequence if a receiver wants to maintain the received quality, it has to periodically join new layers. The receive rate is
reduced simply by not joining additional layers, whereas rate increase requires joining multiple
layers. After a while every layer will carry no data and therefore layers are reused after a period of
time of inactivity. DL is complemented by a Fair Layered Increase/Decrease (FLID) scheme that
involves the receivers’ subscription to additional layers only with a certain probability. These
probabilities are chosen so as to achieve a rate compatible with TCP. FLID retains RLC’s concepts
of sender-initiated synchronization points to coordinate receivers but does not transmit packet bursts
to probe for available bandwidth. FLID-DL is more flexible related to the data distribution between
the layers, but involves major overhead for the underlying multicast routing protocol as more
frequent join and leave decisions occur. It exhibits some rate oscillations caused by the use of TCP equation and has limited TCP-friendliness.
Other solutions have been proposed such as [116] that address some of the problems related
to the other approaches, but currently FLID-DL is seen as the best existing receiver-based adaptive control scheme [59]. However no objective or subjective assessment was done in relation to the
contribution towards the increase in the end-user perceived quality when streaming multimedia and therefore it is difficult to compare it to other approaches.
4 7
Gabriel-Miro Muntean - Ph.D. Thesis 2. Related Works
2.4.3 Hybrid Adaptive Control Mechanisms
The hybrid adaptive control mechanisms involve both the receivers and the senders in the
adaptive control, the solutions being a combination of sender-based and receiver-based schemes.
Next some of them are presented.
Sisalem and W olisz have extended the functionality of the LDA+ [7] to multicast
transmissions and have proposed Multicast LDA+ in [117]. MLDA is a typical example of hybrid
congestion control mechanisms because it distributes its adaptive decisions between the sender and the receivers. MLDA uses RTCP for feedback as in LDA+, but also for signalling between the
sender and the receivers. Unlike LDA+ MLDA bases its operation on layered multicast. It is very
significant that although the AIMD principle for rate adaptation is maintained, the appropriate rate
for each one of the receivers is computed by itself and feedback-ed to the sender. Exponentially
distributed timers make sure that the sender is not inundated by feedback messages. The sender
continuously adjusts the bandwidth distribution between the layers in order to support the receiver reported rates. Independently the receivers adjust their subscription level to the appropriate rate. The
computation of RTT-s at the receivers was very difficult and a complex solution was found to
estimate them accurately enough. The most significant benefit of this scheme is that by reducing the rate of a layer that causes congestion the adaptation is performed much faster than if the receivers
are cxpected to leave this multicasting group. At the same time the scheme is very complex and
requires further work related to the manner the data is distributed into the dynamic layers.
Rhee, Ozdemir and Yi have proposed in [118] the TCP Emulation At Receivers (TEAR)
a hybrid adaptive rate control scheme that uses aspects of window-based congestion control and
targets both unicast and multicast transmissions. The receivers maintain a congestion window
whose size is modified in a similar manner with TCP. The main difference from TCP whose
congestion window is located at the sender is that the TEAR receiver has to estimate the moments
when TCP would increase or decrease this window’s size. The receivers compute the transmission
rate as roughly a congestion window worth of data per RTT. To avoid TCP’s saw-tooth-like rate
shape, TEAR averages this rate over an epoch, which is defined as the time between consecutive rate reduction events. To minimize the effect of noise in the loss patterns, the rate is then smoothed
by weight averaging over a certain number of epochs. This value is then reported to the sender, which adjusts the sending rate. In the multicast case the TEAR sender sets the rate to the minimum of the reported rates. Although TEAR shows good TCP-friendly behavior while avoiding TCP’s
frequent rate changes, it is unclear what is the effect on the end-ser perceived quality if used for streaming high-quality multimedia.
48
Gabriel-Miro Muntean - Ph.D. Thesis 2. Related Works
Apart from the presented solutions, other mechanisms such as the destination set grouping
[119] and another layered multicast scheme [120] have been proposed. However they are all very
complex and mainly rely on the layered encoding which puts very much pressure on the
applications that have to control the data division into these layers in order to be effective from the
level of end-user quality point of view.
2.4.4 Transcoder-based Adaptive Control Solutions
The transcoder-based solutions provide a different approach than the end-to-end-based
adaptation. They make use of one or more multimedia gateways placed at appropriate locations in
the networks, which actively contribute to the adaptation process by modifying the bitrate to suit mainly heterogeneous receivers.
Yeadon, Garcia, Hutchison and Shepherd have proposed in [121] a multicast adaptive
solution based on a QoS filtering model. A filter is a mechanism that operates within the network
or at the network edge to control and/or modify some characteristics of transmitted media streams
to support heterogeneous receivers in terms of their capabilities and associated QoS requirements. A
significant part of their model is the filter propagation, which occurs when the levels of QoS
requirements of all outputs of a node are lower than the QoS associated with the input stream.
However, in order to avoid oscillations, the filters may only propagate when the difference of these
levels exceeds a certain threshold. Different types of filters have been proposed such as codec, frame-dropping, color reduction, DCT-fllters, mixing and splitting filters. More details about this solution can be found in [122, 123].
Amir, McCanne and Zhang propose in [124] a transcoder-based solution that, placed at
the level of a multimedia gateway in the network, can convert the multimedia stream from the input format into an intermediary representation by a decoder. This intermediary representation is
supposed to be encoded easily in a number of output formats supported by the transcoder. The
transcoder is configured by an external control interface that can select parameters such as the input
and output formats, streams’ characteristics etc. However the effort involved by these
encoding/decoding processes is significant and hardly can be accommodate for example at a router
level where a very high number of time-sensitive operations have to be performed.
Other works have been proposed that complement or improve the already existing
solutions. For example in [125] a control scheme meant to configure the transcoders from a
multicast tree to support receivers with low QoS is presented, in [126, 127] faster transcoding-based
49
Gabriel-Miro Muntean - Ph.D. Thesis 2. Related Works
solutions are described and in [128, 129] rate control schemes for MPEG or H.263+ transcoding are
proposed. However in [128] the authors have distinguished three major directions for very high
quality transcoding: Cascaded Pixel Domain Transcoding (CPDT), DCT-Domain Transcoding
(DDT) and Open-Loop Transcoding (OLT) [128]. CPDT involves first the total decoding of the
input stream and later on its encoding at a different rate and has high computational and memory
requirements that makes it inefficient for real-time streaming. Since many complex encoding
schemes use DCT as a phase for achieving lossy compression, DDT and OLT decompress partly the
input stream and use different level of DC coefficients requantisation.
2.4.5 Conclusions
This section has presented different solutions for adaptive control while delivering multimedia streams. Some of them were specially designed for multicast deliveries, others involve
fixed or propagating filtering or transcoding deployed at network nodes’ level, some use feedback from receivers to inform the sender about the network situation, others do not, some rely on layered coding, others are more general solutions.
Multicasting solutions distribute the same content or a limited set or versions to all the
receivers, being very efficient. These solutions may be accepted today when non-interactive
multimedia broadcasting still accounts for the large majority of multimedia based services. However, in the future the deployment of rich, high quality services require interaction with the
customers, personalisation of services and extended VRC control, difficult to be provided through
multicasting. Having access to the network nodes and adding intelligence to the network require the permission of the network operators and the service providers and add costs to the solution which
may affect the generality of the services and final price the customers may have to pay, both
influencing the chances for successful large scale deployment of these services to residential homes.
A very significant criticism of all the existing solutions is that they do not directly relate their adaptive decisions to the end-user perceived quality, whose maximisation should be the goal of any
adaptive control-based solutions employed in delivering multimedia-based services. Regardless of the adaptation mechanism, the results were mainly analysed in term of network-related metrics and
only in very few cases have been assessed from the end-user perceived quality point of view in terms of an objective metric or after subjective testing.
All these observations explain our choice towards an unicast adaptive solution that offers one-to-one relationship with the receiver, offering high degree of flexibility, with no support from
50
Gabriel-Miro Muntean - Ph.D. Thesis 2. Related Works
the network. Relative to the location where the adaptive decision is taken, the server was chosen,
although monitoring of the effect the delivery conditions have on the end-user quality and some
related computation was distributed to the clients. This allows for relative independence from the
encoding scheme (although MPEG-2 encoding is used), lower complexity of the application (that
does not have to distribute multimedia data into layers for example) and reduces the server’s load.
On the other hand, the sender has to be informed about the quality of delivery and feedback is
employed to carry the information from the clients. In relation to the solution for varying the quantity of data to be delivered according to the existing delivery conditions for the pre-recorded
streams, switching among multiple quality pre-encoded versions was chosen due to the late high
decrease in costs of the storage capacity that makes it more attractive. In both live and pre-recorded cases, the performed adaptive adjustments aim at modifying the transmission rate in an AIMD manner.
In consequence QOAS is a server-based adaptive control scheme for multimedia deliveries, that monitors the effect delivery conditions have on the end-user perceived quality at the clients and
report it to the sender via feedback in order adaptive decisions to be taken. For building the
confidence in its results, the scheme has to be assessed from end-user perceptual point of view both using an objective metric and using subjective testing.
2.5 User Perceived Quality (Research, Metrics, Testing)
2.5.1 Necessity of User Perceived Quality Assessment
The assessment of quality is a very important issue with the increasing use of digital
multimedia as a significant part of the emerging rich services such as digital TV, video on demand,
videoconference, etc. The competing research groups, in order to allow for achieving different
constraints (e.g. delay, complexity, etc.), have proposed schemes for compression, processing and
transmission of digital multimedia that very much differ in the manner their performances affect the
quality of the outputted streams. In general they introduce some impairments, which for example
for video are strongly dependent of the levels of details and motion in the scenes. Moreover, the
human perception of these impairments also depends on the characteristics of the content making
traditional evaluation methods inadequate for their quantification. In consequence there is a need for
evaluation methods that quantify the quality of digital streams in order to assess the performances
of both the proposed algorithms and of the systems that use them.
51
Gabriel-Miro Muntean - Ph.D. Thesis 2. Related Works
Since the proposed solution - QOAS focuses both on modifying of the video component of
the multimedia stream and on taking into account of the end-user perceived quality as an active
actor in the adaptive control scheme, next the efforts of user perceived quality assessment in relation to digital video are presented in detail.
There are two main directions the research that assesses the quality of digital video streams
has taken: objective methods and subjective testing. Next both of them are presented, after the
possible impairments of the remotely delivered video streams over IP networks are brief reminded.
2.5.2 Possible Impairments of Remotely Delivered Video Streams
Regardless of their categorisation the methods that assess the perceived quality of a
remotely transmitted stream over IP-networks have to take into account different types of artifacts that may appear. The most likely source of such impairments are coding and transmission. The
main types of impairments in a remotely delivered video sequence were presented and defined in
[130, 131, 132] and are mentioned next.
Encoding artifacts are mainly caused by the lossy quantisation step applied in most of the
existing encoding scheme which are based on Motion Compensation (MC) and block-based
Discrete Cosine Transform (DCT). Blocking effect or tiling is defined in [131] as a distortion of
the image characterised by the appearance of false blocks within a picture. Tiling is caused by the
independent quantisation of blocks and is the most apparent visual impairment. Blurring is a global
distortion over the entire image, characterised by reduced sharpness of edges and spatial detail
[131]. It is the result of the suppression of higher-frequency coefficients by a coarser quantisation.
The mosquito effect is defined as a form of edge busyness characterised by time-varying sharpness (shimmering) at the edges of objects. This temporal artifact is the result of different coding of the
same area of the image in subsequent frames [132]. Jagged motion is the result of poor motion
estimation, while jerky motion or jerkiness is defined in [131] as a continuous motion perceived
as a series of discontinuous images. This is due to lost motion when video is transmitted at lower
frame rates. Other possible artifacts are colour bleeding, random noise, and chrominance
mismatch [132]. Some of these effects are unique to block-based coding, while others are prevalent
in other compression algorithms. For example if using wavelets there are no block-related artifacts, but blurring may become more noticeable.
Transmission artifacts appear because the stream is fragmented into packets and sent over
the network, subject to loss and variable delays that cause data unavailability at required time at the
52
Gabriel-Miro Muntean - Ph.D. Thesis 2. Related Works
remote decoder and then player. The effect of data unavailability depends on the level of
redundancy of the encoded stream (for example, intra-coded bitstreams are more resilient to loss).
For MC/DCT codecs, like MPEG, interdependencies of syntax information can cause an undesired
effect in which the loss of a macro-block may corrupt subsequent macro-blocks until the decoder
can re-synchronise. These result in error blocks within the image (spatial propagation) and contrast greatly with adjacent blocks, having a major impact on perceived quality. Another problem
arises when blocks in subsequent frames are predicted from a corrupted macro-block - they will be
damaged as well and this will cause a temporal propagation of loss until the next intra-coded macro-block is available. More details about the propagation of errors in MPEG-2 streams are given in [133, 134],
2.5.3 Objective Assessment of User Perceived Quality
Objective methods aim at determining the quality of a video sequence in the absence of the human viewer. They are based on very different principles such as, for example: the comparison
between the original and the distorted version of the same sequence, the statistical assessment of a
large set of analysed cases, the analysis of the effect of possible interferences with the video streams
and the relationships from the video contents and subjective testing results. The researchers divide
the metrics associated to these objective methods into mathematical-based and model-based [135,
136]. The mathematical metrics rely on mathematical formulae or on functions based on intensive
psycho-visual experiments. The model metrics are based on complex models of the human visual
system. Apart from this categorisation, according to their possible usage, two approaches were
distinguished in [137]: out-of service metrics and in-service metrics. The out-of service metrics
base their operation on the fact that the full reference video is available and no time pressure is put
to perform the computation. Although the majority of existing metrics belong to this category, their
usage in real-time multimedia systems is limited. The in-service metrics are meant to operate
while systems are in-service, allowing to perform measurements regularly and eventually to take
actions if proved to be necessary. In general the original stream is not available and therefore the
associated algorithms estimate the perceived quality based on a-priori knowledge about the encoding scheme, multimedia content, expected artifacts etc. In [132, 138] the authors list three
approaches according to the requirement of the existence of the source video into: full reference
methods (FR) (also called picture comparison-based), reduced reference solutions (RR) (also
called feature extraction-based) and no reference methods (NR) (also called single-ended). Only the last category of methods is useful for in-service application.
53
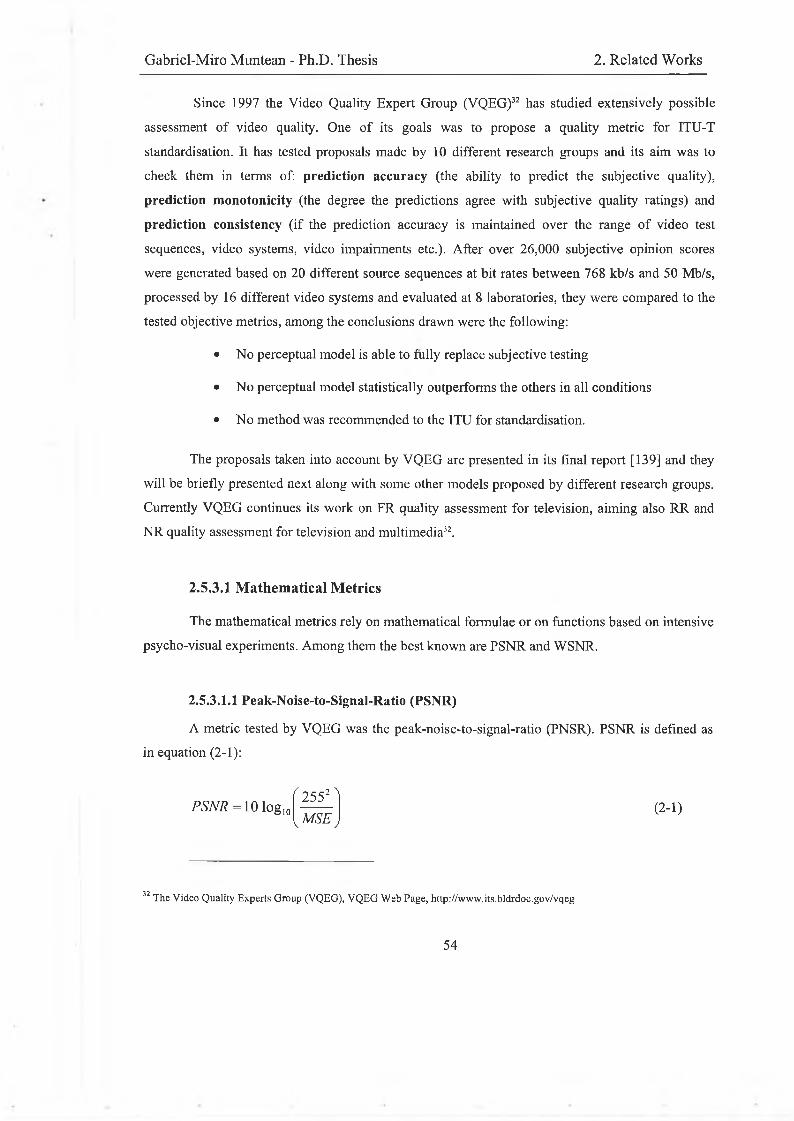
Gabriel-Miro Muntean - Ph.D. Thesis 2. Related Works
Since 1997 the Video Quality Expert Group (VQEG)32 has studied extensively possible
assessment of video quality. One of its goals was to propose a quality metric for ITU-T
standardisation. It has tested proposals made by 10 different research groups and its aim was to check them in terms of: prediction accuracy (the ability to predict the subjective quality),
prediction monotonicity (the degree the predictions agree with subjective quality ratings) and
prediction consistency (if the prediction accuracy is maintained over the range of video test
sequences, video systems, video impairments etc.). After over 26,000 subjective opinion scores
were generated based on 20 different source sequences at bit rates between 768 kb/s and 50 Mb/s,
processed by 16 different video systems and evaluated at 8 laboratories, they were compared to the
tested objective metrics, among the conclusions drawn were the following:
• No perceptual model is able to fully replace subjective testing
• No perceptual model statistically outperforms the others in all conditions
• No method was recommended to the ITU for standardisation.
The proposals taken into account by VQEG are presented in its final report [139] and they
will be briefly presented next along with some other models proposed by different research groups.
Currently VQEG continues its work on FR quality assessment for television, aiming also RR and NR quality assessment for television and multimedia32.
2.5.3.1 Mathematical Metrics
The mathematical metrics rely on mathematical formulae or on functions based on intensive psycho-visual experiments. Among them the best known are PSNR and WSNR.
2.5.3.1.1 Peak-Noise-to-Signal-Ratio (PSNR)
A metric tested by VQEG was the peak-noise-to-signal-ratio (PNSR). PSNR is defined as in equation (2-1):
PSNR = 10 log 10
^ 2552 A kMSEj
(2-1)
32 The Video Quality Experts Group (VQEG), VQEG Web Page, http://www.its.bldrdoc.gov/vqeg
54
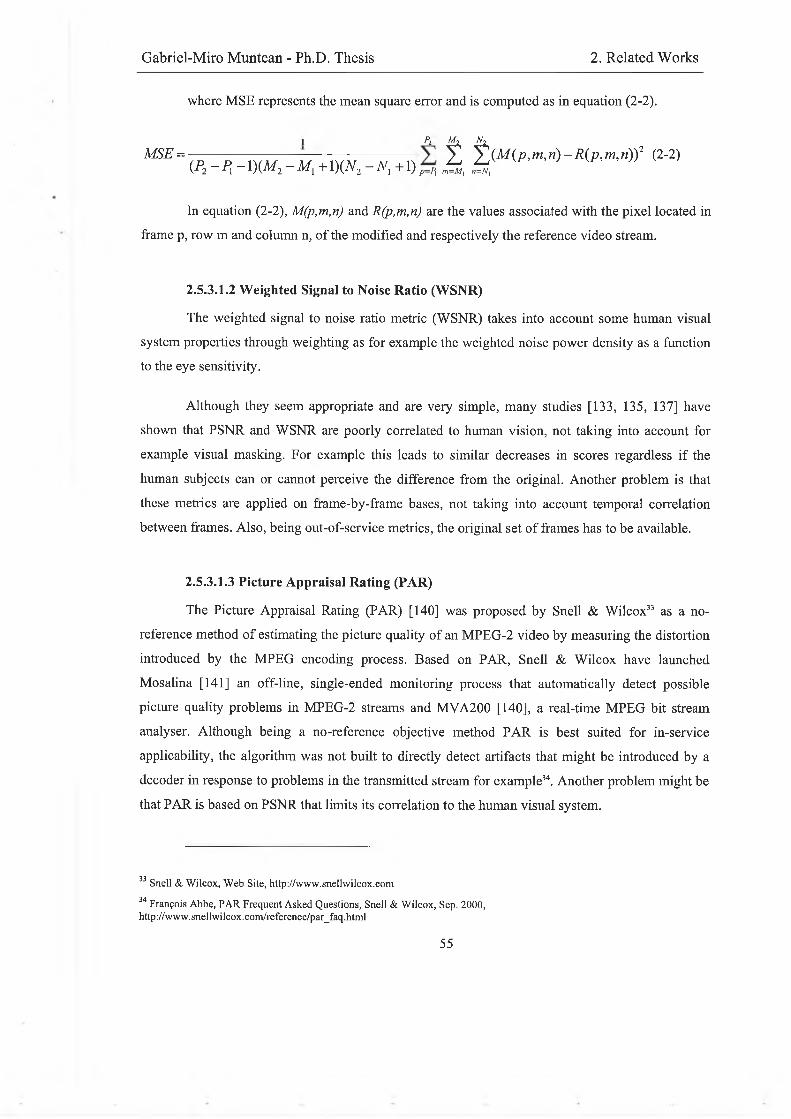
Gabriel-Miro Muntean - Ph.D. Thesis 2. Related Works
where MSE represents the mean square error and is computed as in equation (2-2).
1 Pi A /j N 2
MSE = J7>— p , 1Vw 77 - 7 7 7 7 X 'Z (M (p ,m ,n )-R (p ,m ,n ))2 (2-2)(/*2 - / J + 1 )(M 2 - M j + 1)(V2 -AT, + 1 ) ^ m=Mi n=Ni
In equation (2-2), M(p,m,n) and R(p,m,n) are the values associated with the pixel located in frame p, row m and column n, of the modified and respectively the reference video stream.
2.5.3.1.2 Weighted Signal to Noise Ratio (WSNR)
The weighted signal to noise ratio metric (WSNR) takes into account some human visual
system properties through weighting as for example the weighted noise power density as a function to the eye sensitivity.
Although they seem appropriate and are very simple, many studies [133, 135, 137] have
shown that PSNR and WSNR are poorly correlated to human vision, not taking into account for
example visual masking. For example this leads to similar decreases in scores regardless if the
human subjects can or cannot perceive the difference from the original. Another problem is that
these metrics are applied on frame-by-frame bases, not taking into account temporal correlation between frames. Also, being out-of-service metrics, the original set of frames has to be available.
2.5.3.1.3 Picture Appraisal Rating (PAR)
The Picture Appraisal Rating (PAR) [140] was proposed by Snell & Wilcox33 as a no
reference method of estimating the picture quality of an MPEG-2 video by measuring the distortion
introduced by the MPEG encoding process. Based on PAR, Snell & Wilcox have launched
Mosalina [141] an off-line, single-ended monitoring process that automatically detect possible
picture quality problems in MPEG-2 streams and MVA200 [140], a real-time MPEG bit stream
analyser. Although being a no-reference objective method PAR is best suited for in-service
applicability, the algorithm was not built to directly detect artifacts that might be introduced by a
decoder in response to problems in the transmitted stream for example34. Another problem might be
that PAR is based on PSNR that limits its correlation to the human visual system.
33 Snell & Wilcox, Web Site, http://www.snellwilcox.com
34 François Abbe, PAR Frequent Asked Questions, Snell & Wilcox, Sep. 2000, http://www.snellwilcox.com/reference/par_faq.html
55
Gabriel-Miro Muntean - Ph.D. Thesis 2. Related Works
2.5.3.2 Model-based Metrics
The model-based metrics are more complex and rely on human visual models in order to
quantify the quality of a video sequence.
2.5.3.2.1 Image Evaluation based on Segmentation (IES)
The Image Evaluation based on Segmentation (IES) model was proposed by CPqD35 to
VQEG for assessment. It bases its operation on scenes’ segmentation into plane, edge and texture
regions, and on the assignment of a number of objective parameters to each of these components. A
perceptual-based model that predicts subjective ratings based on the relationship between existing
subjective test results and their objective assessment is used to obtain an estimated impairment level for each parameter. The final result is achieved through a combination of estimated impairment
levels, based on their statistical reliabilities. An added scene classifier ensures scene independent evaluation. This model is very complex and its reliability limited which makes difficult its applicability, especially in real-time.
2.5.3.2.2 Picture Quality Rating (PQR)
The joint Tektronix36/Samoff7 VQEG submission, is the Picture Quality Rating (PQR)
metric based on Samoff s Human Vision Model (HVM) that simulates the responses of human
spatio-temporal visual system taking into account the perceptual magnitudes of differences between
source and processed sequences. From these differences, an overall metric of the discriminability of
the two sequences is calculated based on their proprietary JNDmetrix (Just Noticeable Difference)38.
The model was designed under the constraint of high-speed operation in standard image processing
hardware and thus represents a relatively straightforward, easy-to-compute solution. Tektronix has
already released two Picture Quality Analysis Systems PQA200 and PQA300 based on this. More details about PQR can be found in [142],
35 CPqD, http://www.cpqdusa.com
36 Tektronix, http://www.tek.com
37 Samoff, http://www.samoff.com
38 Just Noticeable Difference Metrics, (JNDmetrix), http://www.JNDmetrix.com
56
Gabriel-Miro Muntean - Ph.D. Thesis 2. Related Works
2.5.3.2.3 NHK/Mitsubishi Model
NHK Science and Technical Research Laboratories39 and Mitsubishi Electric Corp.40 have
jointly proposed to VQEG a model that emulates human-visual characteristics using 3D (spatio- temporal) filters, which are applied to differences between source and processed signals. The filters
characteristics are varied based on the luminance level. An output quality score is calculated as a
sum of weighted measures from these filters. The hardware version is available and can measure
picture quality in real-time. However being a FR method, it can be applied only when the presence of the original video source is available.
2.5.3.2.4 KDD Model
Kokusai Denshin Denwa (KDD) Research and Development Laboratories41, part of KDDI
Corporation - Japan, has proposed for VQEG consideration a model based on mean square error
(MSE) calculated by subtracting the test signal (Test) from the reference signal (Ref). MSE is then
weighted by a set of sequential Human Visual Filters FI, F2, F3 and F4. FI is a pixel-based spatial filter, F2 - a block-based filter, F3 - a frame-based filter and F4 - a sequence-based filter.
Lately KDD and Pixelmetrix42 have jointly launched VP2000 Series Picture Quality
Analyzer, based on the KDD’s model [143]. Unfortunately, very little information is provided about this full-reference proprietary model, which makes it difficult to be used.
2.5.3.2.5 Perceptual Distortion Metric (PDM)
The perceptual distortion metric (PDM) [134, 144] proposed by L'Ecole Polytechnique
Federale de Lausanne (EPFL) - Switzerland, is based on a spatio-temporal model of the human
visual system. It consists of four stages, through which both the reference and the processed
sequences pass. The first converts the input to an opponent-color space. The second stage
implements a spatio-temporal perceptual decomposition into separate visual channels of different
temporal frequency, spatial frequency and orientation. The third stage models effects of pattern
masking by simulating excitatory and inhibitory mechanisms according to a model of contrast gain
control. The fourth and final stage of the metric serves as pooling and detection stage and computes
39 NHK Science and Technical Research Laboratories, Japan, Web Site, http://www.nhk.or.jp/strl/aboutstrl/doc/introset01-e.html
40 Mitsubishi Electric, http://www.mitsubishielectric.com
41 Kokusai Denshin Denwa (KDD) Research and Development Laboratories, KDDI Corporation, http://www.kddilabs.jp/english
42 Pixelmetrix, http://www.pixelmetrix.com
57
Gabriel-Miro Muntean - Ph.D. Thesis 2. Related Works
a distortion measure from the difference between the sensor outputs of the reference and the
processed sequence. VQEG testing has also considered PDM. Although complex this metric has the
advantage that many of its details are made public. However the fact that is a full-reference metric makes impossible its usage in real-time.
2.5.3.2.6 Digital Video Quality (DVQ)
The Digital Video Quality (DVQ) model and metric [145] was proposed by NASA - USA and is subject to U.S. patent no. 6,493,023 [146], Being a full-reference model it requires as input a
pair of color video sequences: the reference and the test. In the first step the sequences are sampled, cropped, and subject to color transformations that restrict processing to a region of interest and to
represent the sequences in a perceptual color space. De-interlacing and de-gamma-correcting on the
input video is also performed. The sequences are then subjected to blocking and DCT and the
results are then transformed to local contrast. The next steps are a time filtering, a spatial filtering
and a contrast masking operation. Finally the masked differences are used to compute a quality
measure. Rhode and Schwarz43 use this technique in the commercially available Digital Video
Quality Analyzer DVQ. The greatest problem with this solution is the fact that is patented and using it requires a supplemental license cost.
2.5.3.2.7 Perceptual Video Quality Measure (PVQM)
The Perceptual Video Quality Measure (PVQM) [147] was proposed for VQEG assessment by KPN Netherlands and Swisscom CT Switzerland. It uses the same approach for measuring video quality as used in the Perceptual Speech Quality Measure (PSQM), standardised in the ITU-T R.
P.861 [148], for measuring speech quality. The method was designed to cope with spatial, temporal
distortions, and spatio-temporally-localised distortions like found in error conditions. It is a full-
reference metric and therefore uses two input video sequences (reference and modified) and it bases its operation on the fact that the Human Visual System is much more sensitive to the sharpness of
the luminance component than that of the chrominance components.
43 Rohde and Schwarz, http://www.rohde-schwarz.com
58
Gabriel-Miro Muntean - Ph.D. Thesis 2. Related Works
2.5.3.2.8 Video Quality Metric (VQM)
The Video Quality Model (VQM) was proposed by the Institute for Telecommunication
Sciences, the USA’s National Telecommunications and Information Administration (NTIA)44 and is
subject to U.S. patent no. 6,496,221 [149], Based on extensive research45 and on an earlier model
[150], VQM is a full-reference metric that uses reduced bandwidth features that are extracted from
spatial-temporal regions of processed input and output video scenes. These features characterise
spatial detail, motion, and color existent in the video sequences. Gain and loss parameters are
computed by comparing two parallel streams of feature samples, one from the input and the other
from the output. Gain and loss parameters are examined separately for each pair of feature streams
since they measure fundamentally different aspects of quality perception. A linear combination of the results is used for the subjective quality rating computation. Although some publications have
described the principle of VQM, detailed information about this patented metric was not revealed.
2.5.3.2.9 Full-reference Moving Pictures Quality Metric (MPQM)
Proposed by researchers from L'Ecole Polytechnique Federale de Lausanne (EPFL) - Switzerland and presented in [135, 151], the Moving Pictures Quality Metric (MPQM) is a full
reference video quality metric based on a basic multi-channel human visual model that takes into consideration modelling of contrast sensitivity and intra-channel masking. It is based on the
computation of a distortion metric E for each channel on 3D blocks that are defined by 2D blocks
that cover two-degree visual angles and roughly 100 ms in time that accounts for the persistence of
images on the retina. The formula is presented in equation (2-3).
E =N
c= l
1NxN y N,
N, Ny Nx
/ = ! y =1 x = l(2-3)
where e[x, y, t, c] is the masked error signal at position (x, y) at time t in channel c, Nx, Ny
and Nt are the 3D blocks’ dimensions and N is the number of channels. The exponent of the
Minkowski summation P is 4.
44 The Institute for Telecommunication Sciences, National Telecommunications and Information Administration (NTIA), USA, http://www.its.bldrdoc.gov
45 Video Quality Research, The Institute for Telecommunication Sciences, http://www.its.bldrdoc.gov/n3/video/Default.htm
59
Gabriel-Miro Muntean - Ph.D. Thesis 2. Related Works
The quality rating Q is computed from E as in equation (2-4):
Q ~ Y+n *e (2' 4)
where N=0.623 and was chosen on the basis of the human vision model.
The Color Moving Pictures Quality Metric [135, 152] applies the MPQM to the luminance
and two chrominance components, after they were separated from the input sequences.
2.5.3.2.10 No-reference Moving Pictures Quality Metric (Q)
The biggest problem with the MPQM-based metrics is that they require the presence of the original video sequence. However, the researchers from L'Ecole Polytechnique Federale de
Lausanne (EPFL) - Switzerland have also proposed a no-reference metric that estimates MPQM
results based on a-priory knowledge about encoding scheme (MPEG) and the effect of the loss on
the encoded stream [133]. Named Q the metric describes the joint impact of MPEG rate and data loss on video quality and has the formula presented in the equation (2-5).
Q = Qq + Xq *f — \ R
1I
v x r ,+ Xi * R * PLR (2-5)
In equation (2-5) PLR is the packet loss ratio, R is the stream’s mean bitrate, the
constant Q0 has a value close to the maximum quality 5, %q, \ r and %T are related to the complexity
of the sequence and %i depends also on the average bitrate of the stream. The fact that Q is a no
reference metric, is not proprietary and has a simple formula makes it easy to be used for in-service monitoring of video quality.
2.5.4 Subjective Assessment of User Perceived Quality
Formal subjective tests as defined by ITU-R BT.500 [153] have been used for many years
and lately the ITU-T R. P.910 [154] has specifically addressed subjective tests for multimedia
applications. Among the advantages of subjective testing one could mention that the tests could be
designed to accurately represent a specific application, direct users’ opinions are gathered and valid
results obtained regardless of the system used, the motion content of the sequences, the compression
used, etc. Among the drawbacks of the subjective testing are a wide variety of possible methods and60
Gabriel-Miro Muntean - Ph.D. Thesis 2. Related Works
test element parameters must be considered, complex setup and control are required, many
observers must be selected and tested, and it very time consuming and costly. Therefore subjective
tests are only applicable for development purposes and cannot be used for in-service quality monitoring. Details about testing conditions, testing methods, testing phases, rating scales, testing
sequences, etc. are given in [153, 154],
2.5.5 Conclusions
Although many subjective tests and objective methods can quite accurately measure the impairments of digital video sequences, there are still many problems related to both subjective and
objective testing and some of them were mentioned by the Intemet2’s QoS Working Group46 in its
QoS report [132]. Firstly subjective tests have been mostly defined for short video sequences
(approximately 10s duration) which are not long enough to experience all the types of impairments
that occur in a real video application and to allow the subject to assess them carefully. Secondly, the
existing objective models cannot yet accurately grade all the impairments caused when digital video
streams are transmitted over IP networks. On one hand, other mechanisms have to be used in
conjunction to account for non-visual distortions (delay and delay variations-based), on the other hand, in-service metrics have to be proposed not to require the presence of a reference stream for
quality level quantification. Thirdly, all the existing quality metrics are thought to grade only video sequences and does not account for audio components which are a significant part of the multimedia
experience and may influence the assessment of the sequences’ overall quality.
Therefore for best and confident results during the development phase, it is recommended to use both subjective and objective methods, in conjunction. For the in-service operation, no
reference methods are the only choice, although they are not fully matured yet.
2.6 Improving Performances of Multimedia Deliveries
Performance in terms of multimedia distribution can be looked at from different points of
view, among which the most important are the customers’ - on one hand and the service providers’ and the network operators’ - on the other. Taking into account all the interests involved, the performance of multimedia deliveries could be measured for example in terms of range of services
offered, their corresponding end-user perceived quality and used bandwidth. Different solutions
46 Intemet2 QoS Working Group, http://qos.intemet2.edu/wg/
Gabriel-Miro Muntean - Ph.D. Thesis 2. Related Works
were proposed in order to try to maximise one or some of these metrics, among which error control,
protocols and delivery solutions are mentioned. Next these directions are explored, presenting
different solutions, their advantages and disadvantages.
2.6.1 Error Control
Error controls aims at reducing the effect of loss on the quality of the remotely transmitted
and played multimedia streams. Loss occurs due to the either network congestion that leads to the network routers’ buffers overflowing and consequent dropping of the incoming packets or due to long or extremely variable delays that prevent the packets from arriving in time to be decoded and
played at the receiver. Also some packets may arrive corrupted at the destination. Among the most
significant for the effect of the correct data unavailability on the end-user perceived quality are the
loss characteristics (pattern, duration, etc.), the compression algorithms used and the delivery
solutions employed for data transmission. Among the worst affected by losses are the streams
encoded using some compression schemes that achieve high compression efficiency like MPEG-1
[73], MPEG-2/H.262 [74, 75] and H.261 [80]. For these streams even small losses severely degrade
their related video quality either due to the decoders’ loose of synchronisation that make them to
skip correctly received data until the next synchronisation point or because of error propagation that
causes an error that affects a frame to affect also other frames that depend on the first frame’s data in their decoding process.
Different error control mechanisms have partly addressed these problems and have
proposed different solutions. In [60] the authors have distinguished four approaches: forward error
control (FEC)-based mechanisms, retransmission, error-resilient encoding and error
concealment. These directions are presented next in relation to video deliveries. A detailed survey on audio-related error control mechanisms was published in [155],
2.6.1.1 FEC-based Mechanisms
The principle behind forward error correction (FEC) is to add redundant information to the
original data to be transmitted that would allow its reconstruction even in the presence of loss. In
[91] FEC-based mechanisms are classified in three categories: channel coding, source coding and joint channel/source coding.
Channel coding involves the division of the continuous stream in segments and each
segment is divided in k packets. For each segment a specific block code is applied on the K packets
62
Gabriel-Miro Muntean - Ph.D. Thesis 2. Related Works
resulting a group o f N coded packets (N > K ) that is send to the receiver. I f any number o f packets
greater than K is received, the receiver can reconstruct com pletely the original transmitted data. The
problem w ith channel coding solutions for error control is that the protection against errors they
offer is provided at cost o f increased used bandwidth for the w h o le duration o f the transm ission,
regardless o f the probability o f the appearance o f loss. Therefore these solutions are m ore lik ely to
be used i f the loss probability is high, severely affecting the v id eo quality or constant and i f
bandwidth can be spared for transmitting the required extra inform ation. M oreover, since channel
coding-based schem es are applied in generally to a set o f packets these solutions introduce delays
and burstiness in traffic that m ay affect the perform ances o f the m ultim edia delivery. Som e channel
coding-related error control schem es are involved in equal error protection (EEP), in w hich all
bits are equally treated, others in unequal error protection (UEP) w hen extra protection is applied
to m ore important data bits or in hierarchical FEC. Som e m echanism s are presented in [156, 157].
Source coding is sim ilar to channel coding in sense that it adds redundant information to
ensure that the data can be recovered after loss. The difference constitutes the fact that for exam ple
the N th packet contains the N th group o f b locks and a com pressed version o f the ( N - l) * group o f
blocks that w ould a llow the reconstruction o f the N th in case o f loss, but at a low er quality. Source
coding w ould suffer from the sam e problem s as channel coding in terms o f bandwidth requirement
and invariability to loss variations, but w ould involve low er delays. A n exam ple is presented in
[158],
Joint channel/source coding com bines the channel cod ing and source coding approaches.
M ore details are given in [91].
2.6.1.2 Retransmissions
Som e researchers [159, 160] have proposed retransm issions o f lost packets in order to
provide error control. Unfortunately since the retransmitted packet arrives at least three tim es the
one-w ay trip time after the transm ission o f the original packet, it is very likely for a retransmitted
packet, part o f a tim e-sensitive stream, to arrive at the destination after it is required and it w ill be
discarded, m aking the effort futile. H ow ever there are solutions like delaying frame p lay-out tim es
to allow for the arrival o f retransmitted m ultim edia packets, se lec tively retransmit only those
packets that, due to buffering, w ould have enough tim e to reach the destination before they are
needed and selectively retransmit on ly important packets and on ly i f it is estim ated they w ill arrive
in time. H ow ever, these solutions add significant latency and cannot be used for interactive or tim e-
63
Gabriel-Miro Muntean - Ph.D. Thesis 2. Related Works
sensitive m edia deliveries, unless the one-w ay delay is very short in com parison w ith the acceptable
delays, w hich lim its their applicability.
2.6.1.3 Error-resilient Encoding
The idea the error-resilient encoding is based on is to increase the robustness o f the
com pressed stream to packet loss and is in general performed at the source o f data. C lassic error
resilient encoding includes re-syncronisation marking, data partitioning and data recovery and they
were standardised as part o f M PEG -4 encoding schem e [75, 76]. Unfortunately these are targeting
m ore error-prone environm ents like w ireless channel and do not address low probability loss
infrastructures such as w ireline broadband IP-networks for exam ple. Related to the latter, the
authors o f [91] distinguish two directions error resilient cod ing have taken: optim al m ode se lection
and m ultiple description coding.
Optimal mode selection refers to the approach that tries to offer increased perform ance for
video deliveries subject to loss based on characteristics o f source, path and receiver behaviors [161].
A m ong them is for exam ple the manner o f choosing b etw een intra-m ode and inter-m ode o f coding
blocks o f v ideo data in order to achieve both good com pression and to lim it error propagation [162].
A higher number o f intra-m ode-encoded b locks m eans h igher robustness to loss, but low er
com pression ratio, whereas m ore inter-m ode-encoded b locks m ean higher com pression ratio, but
increased chance for error propagation.
Multiple description coding refers to the com pression o f a single v id eo sequence into
m ultiple streams (nam ed also descriptions) in such a manner that each provides acceptable quality,
but com bined offer a better visual quality [163]. A m ong the advantages is the increased robustness
to loss since the receivers do not have to get all the descriptions to v iew the content and additive
quality as i f the receivers get m ore descriptions their perceived quality becom es better. The
disadvantage is that in order to a llow for independent decom pression, the descriptions carry
redundant information relative to each other, decreasing the com pression efficien cy and therefore
requiring higher overall bandwidth.
2.6.1.4 Error Concealment
U nlike error-resilient encoding that in volves m ainly the source o f data and is performed
prior to loss, the error concealm ent m ethods involve the receivers and are applied after the loss has
occurred in order to m inim ise its effects on the quality o f the displayed video stream. There are two
64
Gabriel-Miro Muntean - Ph.D. Thesis 2. Related Works
main approaches for error concealm ent: spatial interpolation and temporal interpolation [59].
Spatial interpolation refers m ainly to the reconstruction o f m issin g parts o f fram es from the
neighboring b locks, whereas temporal interpolation in vo lves the reconstruction o f m issin g data
w ith information from previous frames. Three sim ple error concealm ent m ethods were
distinguished for block-based com pressed streams subject to loss in [164]: EC-1 the current frame
affected by packet loss is replaced by the previous frame, EC -2 the b lock corrupted b y loss is
replaced w ith the block from the sam e position from the previous frame and EC-3 the corrupted
block is replaced by a b lock from a previous frame pointed b y a m otion vector. E C -1 and EC-2
have a low er com plexity than EC-3, but the latter w ould achieve better quality. The sam e
relationship is betw een EC-1 and EC-2 with the latter ach ieving better reconstructed im age quality.
A m ong the advantages o f the error concealm ent m ethods are their reduced com plexity and lim ited
effort o f their application in com parison to other error control m ethods taken into consideration.
H ow ever detecting and repairing losses incur latency and in general the quality o f the reconstructed
im age is not very high.
2.6.1.5 Comments
Error control provides m eans for either offering greater protection against errors or, i f they
have already occurred, for m inim ising their im pact on the user-perceived performance. H ow ever
error control com es with a cost in terms o f necessary bandwidth, increased delays and
com putational requirements. These gains and costs have to be carefully balanced for each solution
in order to determine the correct approach to be taken. For exam ple in fully loaded broadband local
IP-networks there is no spare bandwidth for using FE C -like m ethods or retransm issions. H ow ever,
the latter are recom m ended anyway only in certain cases w hen delivering tim e-sensitive data such
as m ultim edia. D ifferent types o f error-resilient encoding can be used as w e ll as error concealm ent
m ethods, w hich are the easiest to be deployed am ong these solutions.
2.6.2 Protocols
Few protocols have been proposed and standardised in order to support the deliveries o f
continuous m ultim edia streams. A ccording to their functionality these protocols can be classified in
three categories: network-layer, transport and session control [59], N ex t each o f these categories is
presented and som e standard protocols that belong to it are m entioned.
65
Gabriel-Miro Muntean - Ph.D. Thesis 2. Related Works
2.6.2.1 Network-level Protocols
N etw ork-level protocols are supposed to provide basic network support such as network
addressing. For v id eo streaming over IP-networks, the Internet Protocol (IP) [14] provides these
services.
2.6.2.2 Transport Protocols
Transport protocols w ere proposed in order to provide end-to-end network transport
functions and am ong the best known are U ser Datagram Protocol (U D P) [165] and Transm ission
Control Protocol (TCP) [166] - lower-layer transport protocols and R ealtim e Transport Protocol
(RTP) [100] and R eal T im e Control Protocol (RTCP) [100] - upper-layer transport protocols. The
first ones support functions like m ultiplexing, error control, congestion control or flow control. The
m ost significant for RTP is that it provides tim e-stam ping, sequence num bering, payload type
identification and source identification, whereas for RTCP is that it allow s for providing QoS
feedback to the participants o f a RTP session , being a com panion protocol to RTP.
2.6.2.3 Session Control Protocols
Session control protocols in relation to m ultim edia stream s’ deliveries aim at controlling
m ultim edia sessions. A m ong the best know n are the R eal Tim e Stream ing Protocol (RTSP) [167]
and the Session Initiation Protocol (SIP) [168]. RTSP a llow s session establishm ent and control, as
w ell as m ultim edia presentation. It offers V C R functions such as p lay, pause, rewind, stop, etc. SIP
also initiates and controls m ultim edia sessions, providing also support for user m obility by proxying
and redirection.
2.6.2.4 Comments
Since TCP uses retransmission to ensure reliable transport o f data, it is not suitable for
transmitting data w ith tim ing constraints like in the case o f m ultim edia streaming. In these cases
UDP is m ainly used. S ince UDP does not guarantee the arrival o f packets at destinations, RTP is
regularly em ployed to detect packet loss. In general RTCP is used in order to provide feedback
about the Q oS o f the provided services. A session control protocol and more often RTSP, is used to
initiate and control the m ultim edia session , including the data delivery. This is also the approach
chosen in this thesis.
6 6
Gabriel-Miro Muntean - Ph.D. Thesis 2. Related Works
2.6.3 Solutions for Delivery Architectures
A m ong the best-know n com ponents or solutions for delivery architectures are proxy
servers, caches, mirrors, content distribution networks and peer-to-peer solutions. N ex t they w ill be
briefly presented.
2.6.3.1 Proxy Servers
A s their nam e w ould suggest proxy servers are agents that interm ediate betw een the real
service provider - the server - and the receiver. In general they are used in m ore com plex forms
acting as gatew ays, firew alls, caches, etc., alone or part o f a co-operating structure. R elated to v ideo
deliveries they could help reducing network bandwidth requirement, delays and delay variations
over W A N , decreasing the loads on the v id eo servers, decreasing the start-up delays by storing the
initial sequences o f som e video, sm oothing the v id eo streaming, im proving V C R functionality,
transcoding v ideo to adapt to heterogeneous bandwidth or custom ers’ requirements, etc.
2.6.3.2 Caching
Caching is based on the observation that som e content is m ore popular than other is. I f a
copy o f the already served data is p laced closer to the customers, in the case that it w ill be requested
significant benefits from the performance point o f v iew w ill be achieved. The m ore the sam e cached
content is requested, the m ore the benefit increases. This perform ance benefit is generally
considered in terms o f bandwidth, server load and service latency.
A lthough caching w as w ell studied in relation to sm all, static, W W W -related objects [169],
there are different issues related to caching that have to be taken into account in relation to storing
and retrieving o f m ultim edia content. The bandwidth requirem ents and the size associated with
m ultim edia files put pressure on the caches that have to support h igh bandwidth, to have increased
storage capacity and different p o licy since not all the content can be cached at a time. The
popularity o f continuous streams is not w ell defined and it is a generally agreed opinion about what
parts o f the video m ust be cached. A daptive control schem es and different delivery techniques m ay
have also a significant influence on the cach es’ design and functionality. M oreover the caches’
location, their number and the relation betw een them greatly determ ine the perform ance o f the
cache-based solutions. S ince there are m any issues related to caching o f m ultim edia sequences, next
som e o f them are presented: segm entation o f streaming objects, replacem ent p olicies, cache
consistency, pre-fetching, caching architectures and co-operative caching.
6 7
Gabriel-Miro Muntean - Ph.D. Thesis 2. Related Works
Since the caches cannot store all the data associated to a m ultim edia file, they have to
perform segmentation of streaming objects and to apply their p o lic ies at the level o f a segm ent.
This segm ent can be arbitrarily chosen from within the stream as in [170], can be the prefix o f a
popular stream as chosen in [171], can be the result o f a content-aw are segm entation process as in
[172] or can belong to one o f the layers o f a layered encoded stream as in [173], These segm ents
can have a fixed size as in [174] or a variable size as in [172].
Replacement policy refers to the algorithm according to w hich a cache w ould ch oose an
already stored content for deletion in order to create space for storing a m ore recent object.
Traditional replacem ent p o licies are [175]: the least recently used (LR U ) w hich evicts the least
recently requested object, least frequently used (LFU) w hich ev icts the least frequently used object
and Pitkow /R ecker w hich evicts objects in LR U order but betw een the objects accessed in the sam e
day ch ooses the largest. H ow ever w ith video deliveries and their associated characteristics other
policies have appeared like the eviction o f segm ents in the descending order o f their quality [173],
according to the principle o f tem poral locality [172, 174] or according to the clien ts’ bandwidth
[176],
Cache consistency or coherency methods aim at m aking sure that the cached objects
reflect existing objects from the server where they originated. Cache consistency w as subject to
extensive research in relation to regular W eb objects and different techniques were proposed such
as: client polling, invalidation callbacks, tim e-to-live and if-m odified-since [177], S ince continuous
m ultim edia streams are segm ented prior to caching, the sam e techniques can b e applied for ensuring
m ultim edia stream s’ objects cache consistency [174].
Pre-fetching refers to retrieving data from original servers in anticipation o f c lien ts’
requests [177]. S ince bandwidth requirem ents and ob jects’ sizes are larger, pre-fetching has to be
performed cautiously [172], but is necessary because it reduces the user-perceived latencies. In
[172] pre-fetching is perform ed based on a prediction algorithm that analyses the users’ interaction
w ith the video stream, the available bandwidth and storage space at the cache. In [173], apart from
bandwidth and storage constraints, the pre-fetching algorithm takes into account the quality o f the
cached segm ents w hose priority decreases with their quality level. H ow ever the gains o f pre
fetching com e w ith a cost in terms o f increase in traffic and in its burstiness [176].
Caching architectures in vo lve m ore caches that serve a higher com m unity o f users
increasing therefore the probability for requested object to b e found, increasing the perform ance o f
the caching process [169], A hierarchical caching architecture w as first proposed in the Harvest
6 8
Gabriel-Miro Muntean - Ph.D. Thesis 2. Related Works
project [178] and since then other works have used it [172], A totally distributed caching
architecture as in [179] has caches placed only at bottom level. H ybrid caching solutions a llow for
the existence o f a com plex architecture, w ith different levels . M ore inform ation about caching
architectures can be found in [175]. H ow ever there are several problem s [180] related to p lacing the
caches in the network, their co-operation, consistency, additional delays, bottlenecks, etc.
Co-operative caching refers to the collaboration b etw een several caches in order to
increase the performance o f the system . The idea is that i f the requested inform ation is not found in
a cache, it w ill be looked for in other caches. The Internet Cache Protocol (ICP) [181] w as proposed
to support this and in volves fetching a docum ent from a neighbouring cache w ith the low est RTT.
D ifferent co-operation approaches were tried in [170, 172, 182] for caching v ideo such as using a
master cache in a hierarchical solution, distributed caches or hybrid architecture. H ow ever
som etim es better perform ances are obtained i f this co-operation is lim ited as proposed in [183] that
suggests retrieving the content from the original server than using distant or slow caches.
2.6.3.3 Mirorring
Mirroring refers to p lacing copies o f the original m ultim edia files on servers situated at
different locations. In this w ay the clients can ch oose the location o f the server they can retrieve the
m ultim edia file from in order to have the best perform ances. This performance-related advantage
com es with increase cost o f the solution and com plex administration o f m ultiple cop ies o f the sam e
content.
2.6.3.4 Content Delivery Networks
Content delivery networks (C D N ) are dedicated co llections o f servers located
strategically across a w ide area network (e.g. Internet) w ith the goal o f offering services w ith very
low latencies and high quality from closer locations to the users. In general the distribution o f
content is contracted by content providers and is perform ed b y com m ercial distributors v ia their
CD Ns. R ecent studies [184, 185, 186] have analysed the benefits and the costs o f using CD Ns.
H ow ever, by bringing the data closer to the users significant advantage can be achieved, especially
for distributing continuous, tim e sensitive content such as m ultim edia.
69

Gabriel-Miro Muntean - Ph.D. Thesis 2. Related Works
2.6.3.5 Peer-to-peer Systems
Peer-to-peer system s base their latest popularity on the fact that they a llow exchanging
information through a structure based on peers that act both as servers and as clients. They can be
based on a centralised indexing architecture like Napster47, a fu lly distributed solution such used by
Gnutella48 or on hybrid architecture like Kazaa4'J. Form er and current peer-to-peer system s use to
non-interactively download o f data, including m ultim edia, but very recent the interest has increased
for using peer-to-peer solutions also for streaming m ultim edia lik e in an adaptive layered technique
presented in [187],
2.6.3.6 Comments
A lthough not exhaustive, this presentation gave som e idea about the delivery architectures
that can be em ployed for distributing m ultim edia. A lthough none o f them com es w ithout som e
disadvantages, their advantages are significant in terms o f bandwidth, delays and provided services.
For delivering m ultim edia to hom e residences via broadband IP-networks proxy servers and caches
could be used for large size networks as w ell as peer-to-peer system s.
2.6.4 Delivery Techniques
There are different delivery techniques that w ould a llow m ultim edia delivery to hom e
residences. A m ong them there are broadcasting, m ulticasting and unicast solutions that are
presented next.
2.6.4.1 Broadcasting
Broadcasting refers to the delivery o f a service to all the custom ers, regardless i f they want
it at the m om ent o f delivery or not. A lthough broadly used today due to its reduce cost o f
im plem entation in relation to the number o f custom ers served, the greatest disadvantages o f
broadcasting are that the resources, especially exp en sive bandwidth, are used anyway, it provides
lim ited services and there is no interaction with the users. There are different proposals that increase
4 7 N apste r, h ttp ://w w w .n ap s te r.co m
48 G nu te lla P ro toco l S p ec ifica tio n v 0 .4 , M arch 2001, C lip2 , h ttp ://w w w 9 .lim ew ire .eo m /d ev e lo p er/g n u te lla_ p ro to co l_ 0 .4 .p d f
49 K azaa , h ttp ://w w w .k azaa .co m
70
Gabriel-Miro Muntean - Ph.D. Thesis 2. Related Works
its friendliness to the users such as periodic broadcast proposed in [166], but its significant
lim itations have fuelled searches for other solutions.
2.6.4.2 Multicasting
M ulticasting in IP-networks allow s for the delivery o f a service, including m ultim edia
streaming, only to a group o f custom ers that have chosen to jo in this group. In this manner
m ulticasting so lves som e o f the problem s raised by broadcasting in terms o f m ore efficien t use o f
bandwidth, choice offered to the custom ers, m ore flex ib ility etc. D ifferent algorithm s have been
proposed in order to achieve certain perform ances w hile delivering services in a tree like manner
and addressing som e lim itations and introducing others. A m ong general lim itations it is worth
m ention that som e routers do not support m ulticasting and changing them in volves costs, there is a
significant overhead m ulticasting introduces through the group setup and m aintenance, there is a
certain latency o f leaving a group affecting the use o f bandwidth and restricts the possib ility o f
choice for the users. Significant research has addressed m ulticast delivery o f m ultim edia services to
customers, including som e adaptive solutions as presented earlier in this chapter (section 2.3).
2.6.4.3 Unicast
U nicast solutions involve a relationship one-to-one betw een the senders and the receivers o f
services. This a llow s for an increased flex ib ility for the personalisation o f the services provided to
the custom ers’ and for the efficient bandwidth usage. H ow ever it also has drawbacks such as poor
scaling to a h igh number o f customers and the n ecessity to know the other end prior to the
connection. D ifferent proposals were m ade in order to address these lim itations and a direction
related to m ultim edia deliveries is through adaptive applications and associated schem es. Som e
exam ples o f such adaptive schem es are presented in section 2.3 o f this chapter.
2.6.4.4 Comments
D ifferent techniques can be used to deliver inform ation to the custom ers and in particular
m ultim edia related data. Three different approaches were presented that have benefits and
disadvantages that have to be taken into account w hen selecting one or another for applicability. For
the success o f delivering rich content, high quality m ultim edia to the residential custom ers, very
significant is what services are offered, their facilities and their quality. Therefore a high degree o f
71
Gabriel-Miro Muntean - Ph.D. Thesis 2. Related Works
flexibility is important for both the users and the providers, on ly unicast provides it and this is the
reason for choosing an unicast technique for the delivery o f m ultim edia to residential users.
2.6.5 Conclusions
In this section error control solutions, protocols that support m ultim edia deliveries,
solutions for delivery architectures and techniques for deliveries were briefly presented as existing
solutions for increasing the perfonnances o f m ultim edia deliveries. A lso the advantages and the
disadvantages associated with these solutions were highlighted and com m ents in relation to their
applicability in m ultim edia deliveries over broadband IP-networks w ere presented. M oreover the
solutions se lected for usage as part o f the designed Q O A S-based m ultim edia streaming system were
also m entioned.
2.7 Summary
This chapter presents significant w orks related to the proposed Q O A S for adaptive
m ultim edia streaming in loca l broadband IP-networks. The chapter starts w ith an overview o f these
directions am ong w hich very important for the design o f Q O A S are com pression techniques,
adaptive solutions for delivering m ultim edia, solutions for assessing end-user perceived quality and
m ethods for im proving perform ances o f m ultim edia deliveries. Each o f these directions is then
detailed in a separate section that presents solutions, significant research, m etrics, protocols,
standards etc. related to the chosen subject. T hese sections also include conclusions and com m ents
related to the usage o f som e o f the presented solutions by the designed Q O A S.
72
Gabriel-Miro Muntean - Ph.D. Thesis 3. QOAS in Local Broadband IP Networks
Chapt er III
Qual i ty Or i ent ed A d a p t a t i o n
Scheme in Local B r o a d b a n d Mul t i -
Serv i ce IP Ne t wo r k s
A bstract
The third chapter specifies the context o f the QOAS, its applicability and its localisation
relative to the delivery o f multimedia-based services to the residential customers via broadband
multi-service IP-networks. It also aims at finding the best approach for designing QOAS,
presents its problems and reduces them to sub-problems, simpler to be solved in a top-down
manner.
3.1 OverviewThe goal o f this research, as w as already m entioned in the first chapter, is to propose the
Quality Oriented Adaptation Schem e (Q O A S), an inexpensive application-level end-to-end adaptive
m echanism for streaming m ultim edia, that helps offering h igh quality m ultim edia-based services to
hom e residences via local broadband IP-networks.
Before designing the Q O A S and other m echanism s it m ay rely on, significant issues related
to broadband IP networks are considered. A m ong these are p ossib le broadband IP-networks
architectures and the manner they m ay affect Q O A S ’s design. N ex t different proposed architectures
for delivering services to hom e residences and business prem ises are presented and their associated
advantages and disadvantages are m entioned and com m ented in relation to their influence on the
Q O A S’s design.
73
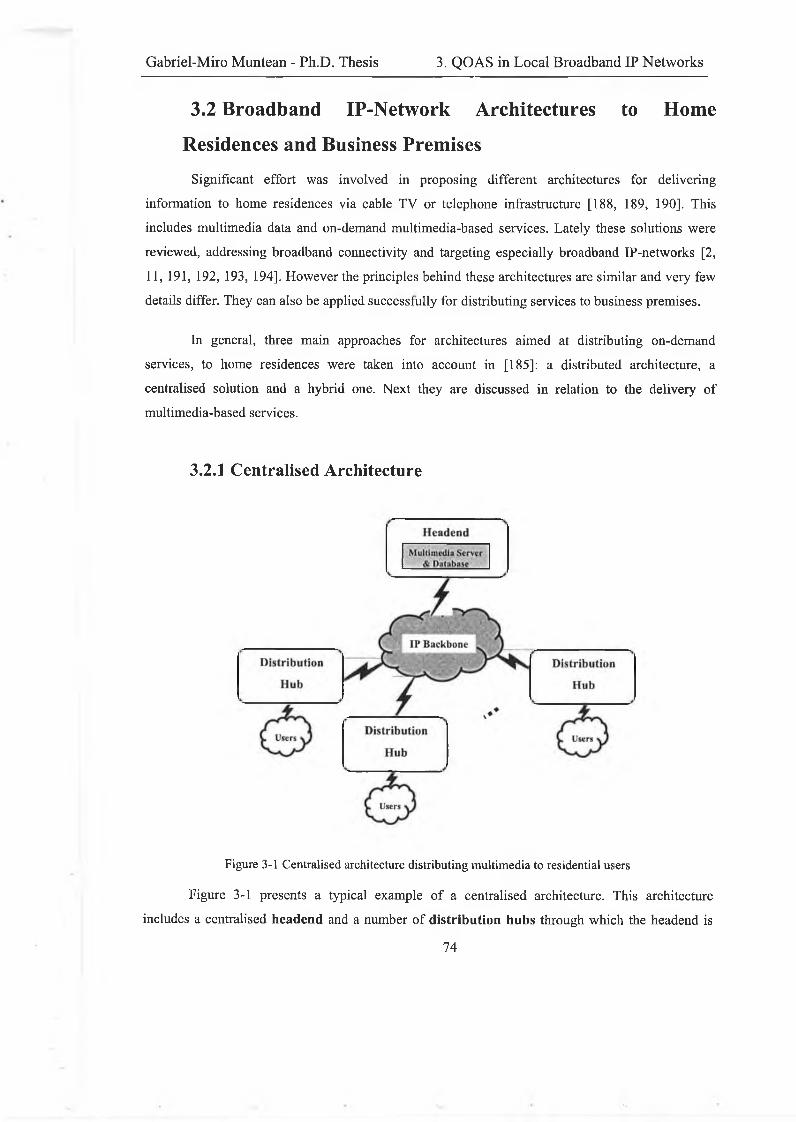
Gabriel-Miro Muntean - Ph.D. Thesis 3. QOAS in Local Broadband IP Networks
3.2 Broadband IP-Network Architectures to Home
Residences and Business PremisesSignificant effort was involved in proposing different architectures for delivering
information to hom e residences via cable TV or telephone infrastructure [188, 189, 190], This
includes m ultim edia data and on-dem and m ultim edia-based services. Lately these solutions w ere
reviewed, addressing broadband connectivity and targeting esp ecia lly broadband IP-networks [2,
11, 191, 192, 193, 194], H ow ever the principles behind these architectures are sim ilar and very few
details differ. They can also be applied su ccessfu lly for distributing services to business prem ises.
In general, three m ain approaches for architectures aim ed at distributing on-dem and
services, to hom e residences w ere taken into account in [185]: a distributed architecture, a
centralised solution and a hybrid one. N ext they are d iscussed in relation to the delivery o f
m ultim edia-based services.
3.2.1 Centralised Architecture
Figure 3-1 Centralised architecture distributing multimedia to residential users
Figure 3-1 presents a typical exam ple o f a centralised architecture. This architecture
includes a centralised headend and a number o f distribution hubs through w hich the headend is
74
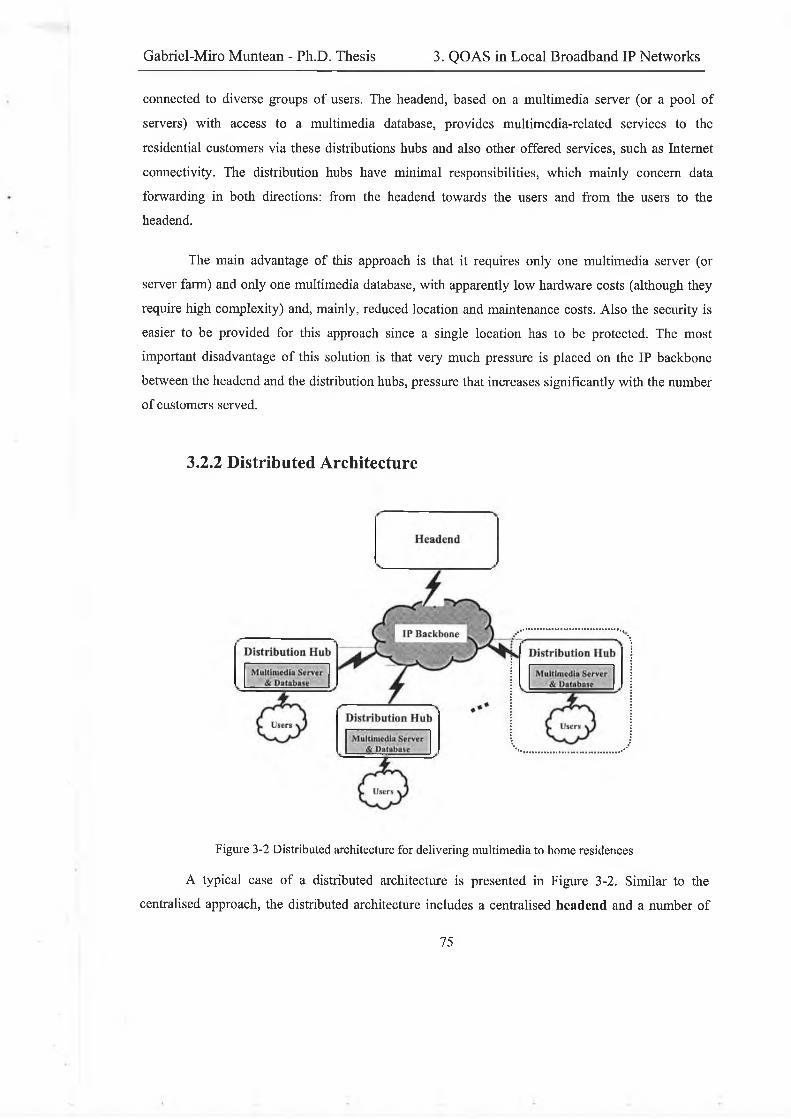
Gabriel-Miro Muntean - Ph.D. Thesis 3. QOAS in Local Broadband IP Networks
connected to diverse groups o f users. The headend, based on a m ultim edia server (or a p oo l o f
servers) w ith access to a m ultim edia database, provides m ultim edia-related services to the
residential custom ers via these distributions hubs and also other offered services, such as Internet
connectivity. The distribution hubs have m inim al responsibilities, w hich m ainly concern data
forwarding in both directions: from the headend towards the users and from the users to the
headend.
The m ain advantage o f this approach is that it requires on ly one m ultim edia server (or
server farm) and only one m ultim edia database, w ith apparently low hardware costs (although they
require high com plexity) and, m ainly, reduced location and m aintenance costs. A lso the security is
easier to be provided for this approach since a single location has to be protected. The m ost
important disadvantage o f this solution is that very m uch pressure is p laced on the IP backbone
betw een the headend and the distribution hubs, pressure that increases significantly w ith the number
o f customers served.
3.2.2 Distributed Architecture
Figure 3-2 Distributed architecture for delivering multimedia to home residences
A typical case o f a distributed architecture is presented in Figure 3-2. Sim ilar to the
centralised approach, the distributed architecture includes a centralised headend and a number o f
75
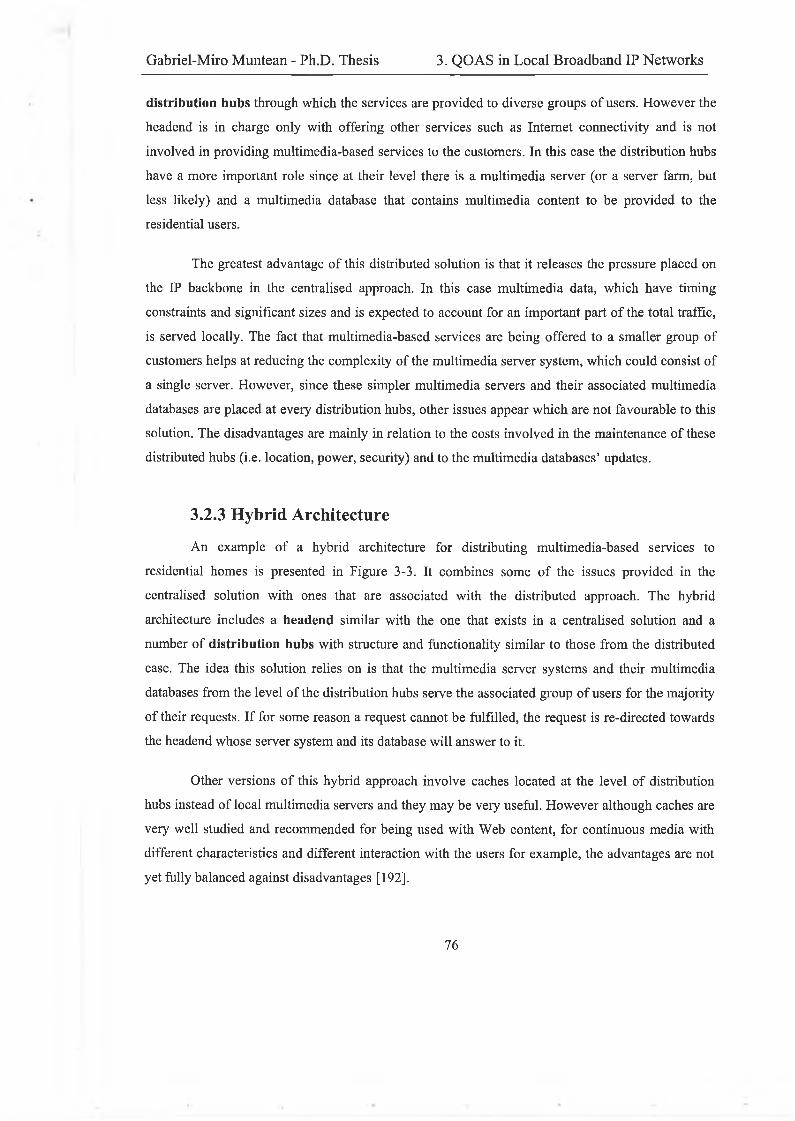
Gabriel-Miro Muntean - Ph.D. Thesis 3. QOAS in Local Broadband IP Networks
distribution hubs through w hich the services are provided to diverse groups o f users. H ow ever the
headend is in charge on ly with offering other services such as Internet connectivity and is not
involved in providing m ultim edia-based services to the custom ers. In this case the distribution hubs
have a m ore important role since at their level there is a m ultim edia server (or a server farm, but
less likely) and a m ultim edia database that contains m ultim edia content to be provided to the
residential users.
The greatest advantage o f this distributed solution is that it releases the pressure placed on
the IP backbone in the centralised approach. In this case m ultim edia data, w hich have tim ing
constraints and sign ificant sizes and is expected to account for an important part o f the total traffic,
is served locally . The fact that m ultim edia-based services are being offered to a sm aller group o f
customers helps at reducing the com plexity o f the m ultim edia server system , w hich could consist o f
a single server. H ow ever, since these sim pler m ultim edia servers and their associated m ultim edia
databases are placed at every distribution hubs, other issues appear w hich are not favourable to this
solution. The disadvantages are m ainly in relation to the costs in vo lved in the m aintenance o f these
distributed hubs (i.e . location, power, security) and to the m ultim edia databases’ updates.
3.2.3 Hybrid Architecture
A n exam ple o f a hybrid architecture for distributing m ultim edia-based services to
residential hom es is presented in Figure 3-3. It com bines som e o f the issues provided in the
centralised solution with ones that are associated with the distributed approach. The hybrid
architecture includes a headend sim ilar w ith the one that exists in a centralised solution and a
number o f distribution hubs w ith structure and functionality sim ilar to those from the distributed
case. The idea this solution relies on is that the m ultim edia server system s and their m ultim edia
databases from the leve l o f the distribution hubs serve the associated group o f users for the majority
o f their requests. I f for some reason a request cannot be fu lfilled , the request is re-directed towards
the headend w hose server system and its database w ill answer to it.
Other versions o f this hybrid approach in volve caches located at the leve l o f distribution
hubs instead o f local m ultim edia servers and they m ay b e very useful. H ow ever although caches are
very w ell studied and recom m ended for being used w ith W eb content, for continuous m edia with
different characteristics and different interaction w ith the users for exam ple, the advantages are not
yet fully balanced against disadvantages [192],
7 6
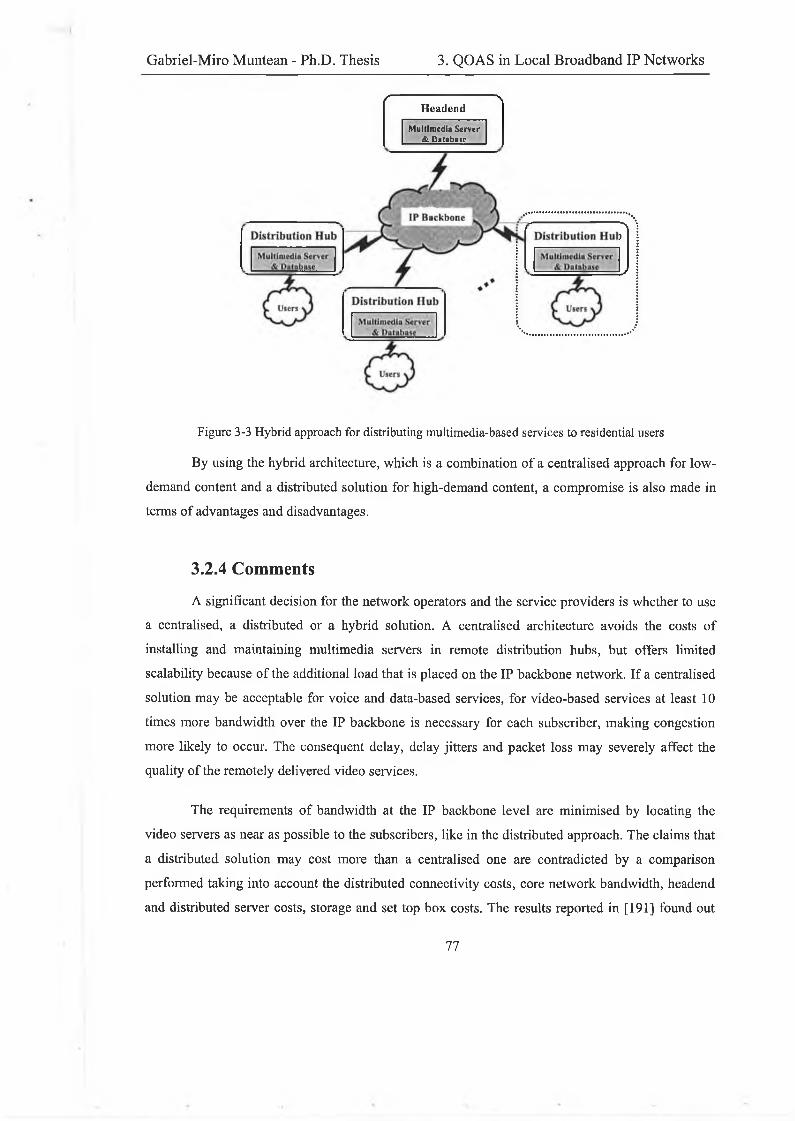
Gabriel-Miro Muntean - Ph.D. Thesis 3. QOAS in Local Broadband IP Networks
/ " \ H ead en d
Multimedia Server & Database
Figure 3-3 Hybrid approach for distributing multimedia-based services to residential users
B y using the hybrid architecture, w hich is a com bination o f a centralised approach for low -
demand content and a distributed solution for high-dem and content, a com prom ise is also m ade in
terms o f advantages and disadvantages.
3.2.4 Comments
A significant decision for the network operators and the service providers is whether to use
a centralised, a distributed or a hybrid solution. A centralised architecture avoids the costs o f
installing and m aintaining m ultim edia servers in rem ote distribution hubs, but offers lim ited
scalability because o f the additional load that is p laced on the IP backbone network. I f a centralised
solution m ay be acceptable for vo ice and data-based services, for v ideo-based services at least 10
times more bandwidth over the IP backbone is necessary for each subscriber, m aking congestion
m ore likely to occur. The consequent delay, delay jitters and packet loss m ay severely affect the
quality o f the rem otely delivered video services.
The requirements o f bandwidth at the IP backbone lev e l are m inim ised by locating the
video servers as near as possib le to the subscribers, like in the distributed approach. The claim s that
a distributed solution m ay cost m ore than a centralised one are contradicted by a com parison
performed taking into account the distributed connectivity costs, core network bandwidth, headend
and distributed server costs, storage and set top b ox costs. The results reported in [191] found out
77
Gabriel-Miro Muntean - Ph.D. Thesis 3. QOAS in Local Broadband IP Networks
that a distributed approach m ay cost less than a centralised solution, w hile it cou ld have
supplem entary benefits in terms o f perform ance for the end-users such as reducing delays and delay
variations in v ideo deliveries, for exam ple.
A lthough the hybrid solution seem s to m ake a com prom ise betw een the advantages and
disadvantages o f the previous two approaches, it also relies very m uch on the m ultim edia servers
from the distribution hubs to serve a large m ajority o f the requests in order to avoid the con gestion
o f the IP backbone, w hich w ill affect both m ultim edia and other provided services.
A s a direct consequence o f these findings the decision was to focus the research on the
local delivery of multimedia-based services in broadband IP-networks. This w as sin ce they
carry the very large majority o f the overall m ultim edia traffic in parallel w ith other types o f traffic
generated by the other provided services.
3.3 QOAS in Local Broadband Multi-service IP-NetworkThere are different w ays in terms o f architectural design for delivering the provided
services from distribution hubs to residential hom es [189, 191, 193]. A m ong them, Figure 3-4
show s as an exam ple a pure horizontal distribution structure whereas Figure 3-5 presents a tree-like
structure.
Figure 3-4 Horizontal solution for local distribution o f services to home residences
78
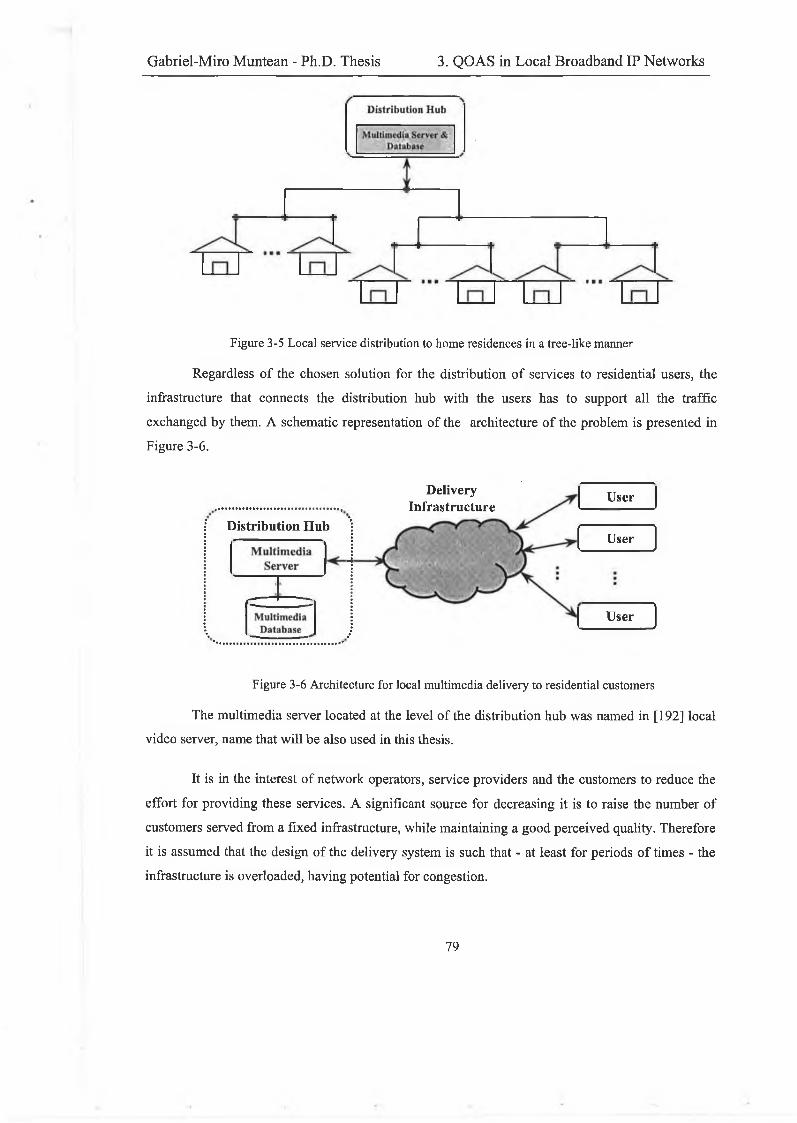
Gabriel-Miro Muntean - Ph.D. Thesis 3. QOAS in Local Broadband IP Networks
Figure 3-5 Local service distribution to home residences in a tree-like manner
Regardless o f the chosen solution for the distribution o f services to residential users, the
infrastructure that connects the distribution hub with the users has to support all the traffic
exchanged by them. A schem atic representation o f the architecture o f the problem is presented in
Figure 3-6.
User
User
Distribution Hub
DeliveryInfrastructure
User
Figure 3-6 Architecture for local multimedia delivery to residential customers
The m ultim edia server located at the level o f the distribution hub was named in [192] local
v ideo server, name that w ill be also used in this thesis.
It is in the interest o f network operators, service providers and the custom ers to reduce the
effort for providing these services. A significant source for decreasing it is to raise the number o f
custom ers served from a fixed infrastructure, w hile m aintaining a good perceived quality. Therefore
it is assum ed that the design o f the delivery system is such that - at least for periods o f tim es - the
infrastructure is overloaded, having potential for congestion.
79
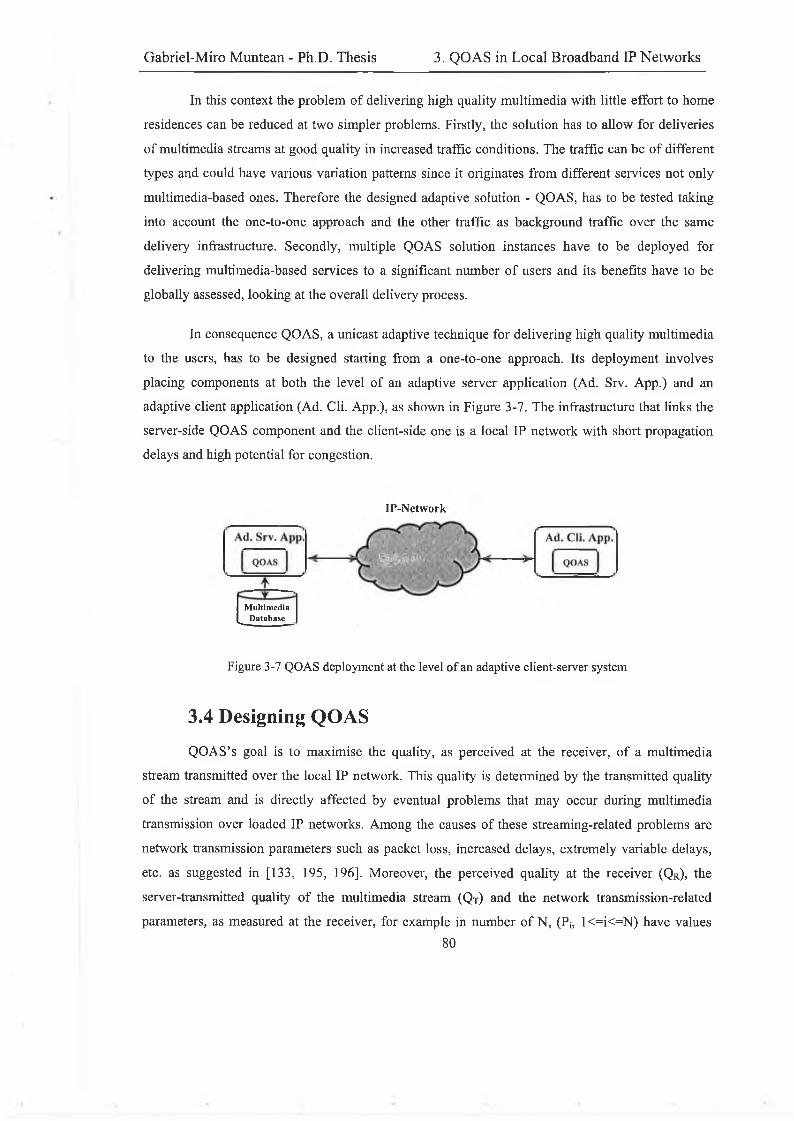
Gabriel-Miro Muntean - Ph.D. Thesis 3. QOAS in Local Broadband IP Networks
In this context the problem o f delivering high quality m ultim edia with little effort to hom e
residences can be reduced at tw o sim pler problems. Firstly, the solution has to a llow for deliveries
o f m ultim edia streams at good quality in increased traffic conditions. The traffic can be o f different
types and could have various variation patterns since it originates from different services not on ly
m ultim edia-based ones. Therefore the designed adaptive solution - Q O A S, has to be tested taking
into account the one-to-one approach and the other traffic as background traffic over the sam e
delivery infrastructure. Secondly, m ultiple Q O A S solution instances have to be deployed for
delivering m ultim edia-based services to a significant number o f users and its benefits have to be
globally assessed, looking at the overall delivery process.
In consequence Q O A S, a unicast adaptive technique for delivering high quality m ultim edia
to the users, has to be designed starting from a one-to-one approach. Its deploym ent in volves
placing com ponents at both the level o f an adaptive server application (Ad. Srv. A pp.) and an
adaptive client application (Ad. Cli. A pp.), as shown in Figure 3-7 . The infrastructure that links the
server-side Q O AS com ponent and the client-side one is a local IP network w ith short propagation
delays and high potential for congestion.
IP-Network
M ultim edia ^ D atabase
Figure 3-7 QOAS deployment at the level o f an adaptive client-server system
3.4 Designing QOAS
Q O A S’s goal is to m axim ise the quality, as perceived at the receiver, o f a m ultim edia
stream transmitted over the local IP network. This quality is determ ined by the transmitted quality
o f the stream and is directly affected by eventual problem s that m ay occur during m ultim edia
transmission over loaded IP networks. A m ong the causes o f these stream ing-related problem s are
network transmission parameters such as packet loss, increased delays, extrem ely variable delays,
etc. as suggested in [133, 195, 196]. M oreover, the perceived quality at the receiver ( Q r ) , the
server-transmitted quality o f the m ultim edia stream (Q T) and the network transm ission-related
parameters, as m easured at the receiver, for exam ple in number o f N , (Pj, l< = i< = N ) have values
80
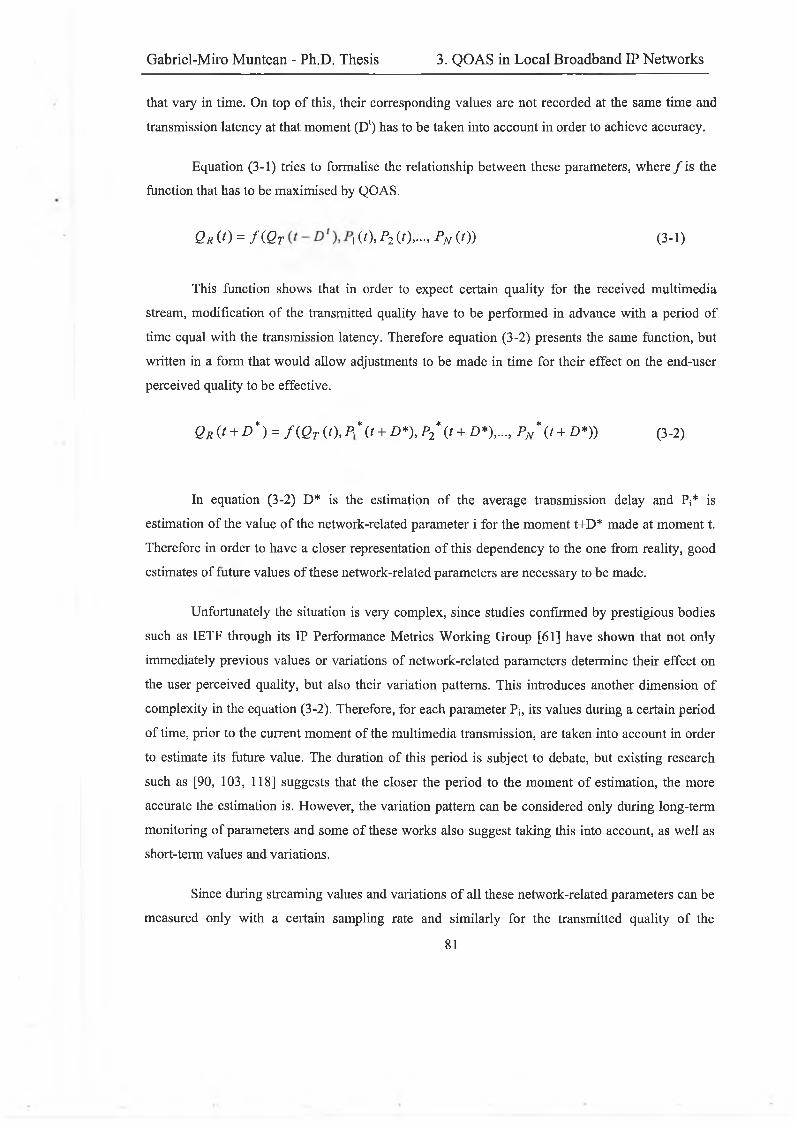
Gabriel-Miro Muntean - Ph.D. Thesis 3. QOAS in Local Broadband IP Networks
that vary in tim e. On top o f this, their corresponding values are not recorded at the sam e tim e and
transm ission latency at that m om ent (D l) has to b e taken into account in order to achieve accuracy.
Equation (3-1) tries to form alise the relationship betw een these parameters, where / i s the
function that has to be m axim ised by QOAS.
Q r (0 = A Q t 1 (0, Pi (0...., PN (0) (3-1)
This function sh ow s that in order to expect certain quality for the received m ultim edia
stream, m odification o f the transmitted quality have to be perform ed in advance w ith a period o f
tim e equal w ith the transm ission latency. Therefore equation (3 -2 ) presents the sam e function, but
written in a form that w ould allow adjustments to be m ade in tim e for their effect on the end-user
perceived quality to be effective.
Q r (t + D * ) = f { Q T (0, P * it + D*), P2\ t + D*),..., PN \ t + D *)) (3-2)
In equation (3 -2 ) D * is the estim ation o f the average transm ission delay and P;* is
estim ation o f the value o f the network-related parameter i for the m om ent t+D * m ade at m om ent t.
Therefore in order to have a closer representation o f this dependency to the one from reality, good
estim ates o f future values o f these network-related parameters are necessary to be made.
Unfortunately the situation is very com plex, sin ce studies confirm ed by prestigious bodies
such as IETF through its IP Performance M etrics W orking Group [61] have show n that not only
im m ediately previous values or variations o f network-related parameters determine their effect on
the user perceived quality, but also their variation patterns. This introduces another dim ension o f
com plexity in the equation (3-2). Therefore, for each parameter Pi, its values during a certain period
o f time, prior to the current m om ent o f the m ultim edia transm ission, are taken into account in order
to estimate its future value. The duration o f this period is subject to debate, but existing research
such as [90, 103, 118] suggests that the closer the period to the m om ent o f estim ation, the more
accurate the estim ation is. H ow ever, the variation pattern can be considered only during long-term
m onitoring o f parameters and som e o f these works also suggest taking this into account, as w ell as
short-term values and variations.
Since during stream ing values and variations o f all these network-related parameters can be
measured only with a certain sam pling rate and sim ilarly for the transmitted quality o f the
81
Gabriel-Miro Muntean - Ph.D. Thesis 3. QOAS in Local Broadband IP Networks
m ultim edia stream, the continuous function from equation (3 -2 ) is replaced by a discrete one: f 1 in
equation (3-3).
Q d R (t + D * ) = f d ( Q / ( t ) , P ld *( t + D*), P2d \ t + £ * ) , . . . , PN d * (t + D *)) (3-3)
where for each o f the N network-related parameters P i5 its value P|d* at m om ent t+D * is
using an estim ator EstinV , according to the generic form ula presented in equation (3-4). This
estimator bases its com putation on M; previously recorded valu es for the parameter P-> recorded at
m om ents tj prior to the m om ent t, with l< = j< = Mj.
P d \ t ) = Estim id ( P id ( t l ) , P id ( t 2 ) . . . ,Pid ( t M l )) (3-4)
Even i f the num ber o f very significant network-related parameters in relation to their effect
on the m ultim edia end-user perceived quality is reduced to a m inim um , proposing Estim ,{l
estimators for each o f them is very com plex. This is because each has different characteristics that
have to be taken into account. O nce these estimator functions have been defined, they are then used
as parameters in the function f 1 presented in equation (3-3). S ince Q O AS goal is to find the
necessary m easures for m axim ising the quality at the receiver based on existing information, the
problem is reduced to trying to m axim ise function f 1. H ow ever, supposing that even a sm all number
o f estimator functions have been added to f*, the function has a significant number o f parameters
and its m axim isation has a very difficult analytical solution.
In consequence I have decided to fo llow the path taken by all the existing research in this
domain. They have com bined heuristic and experim ental m ethods to design the proposed adaptive
schem es and the fo llow in g chapters g ive more details about the proposed solution.
3.5 Conclusion
After exploring the broadband IP-networks’ architectures for distributing m ultim edia-based
services to hom e residence, the decision was taken to deploy Q O A S at the level o f local video
servers since these servers serve the very large majority o f m ultim edia requests. The traffic
generated by other provided services is considered background traffic in relation to Q OAS.
Similarly, m ultim edia traffic served by the centralised video server located at the level o f the
headend in hybrid architectures is considered background traffic. D ue to the intended reduced cost
8 2
Gabriel-Miro Muntean - Ph.D. Thesis 3. QOAS in Local Broadband IP Networks
o f the solution, no cache or other solutions for im proving the quality o f the delivery as presented in
the previous chapter, is considered to be deployed. H ow ever, after the deploym ent o f Q O A S or in
conjunction with it other m echanism s can be used (e.g. error concealm ent), but they are not
addressed by this work.
In this context the Q O A S ’s problem o f delivering high quality m ultim edia-based services to
home residences with little effort via the local broadband m ulti-service IP-network w as form alised
and an analytical solution was sought. Since the solution is very com plex, the decision taken was to
fo llow a hybrid heuristic-experim ental approach. In order to a llow for finding an easier solution to
the Q O A S’s problem , two main sub-problem s were distinguished. The first aim s at finding a one-
to-one adaptive solution for delivering m ultim edia in h ighly loaded networks, subject to other
traffic o f different type, size and variation pattern w hile m aintaining a good perceived quality level.
The second aim s at using the solution already found for sim ultaneously delivering the highest
possible number o f streams, serving an increased number o f custom ers from the sam e
infrastructure, significantly reducing the associated costs in com parison to other solutions.
3.6 Summary
This chapter presents the context the Q O A S is designed for and tries to determine the best
manner for so lv ing the problem s it rises. The chapter starts w ith a presentation o f possib le
architectures for broadband IP-networks and m entions their advantages and disadvantages. N ex t a
possibility for im proving the quality o f the delivery o f m ultim edia-based services by using QO AS is
assessed in order to influence the m ost o f the traffic involved and to bring the best possib le benefits.
Consequently, Q O A S is then localised, having com ponents p laced at both the local v id eo server and
custom ers’ equipment. The chapter presents at the end how the decision to find a solution for
QO AS design using a hybrid heuristic-experim ental approach w as taken.
8 3
Gabriel-Miro Muntean - Ph.D. Thesis 4. QOAS for Multimedia Streaming
Chapt er IV
Qual i t y Or i ent ed A d a p t a t i o n
Scheme for Mu l t i me d i a S t r ea mi ng
Abstract
Network operators and service providers aim for high infrastructure utilisation and a
large number o f customers to increase their revenues. At the same time, the customers are
interested in receiving high quality streamed multimedia, having access to diverse services, and
paying a low price. This chapter presents the Quality Oriented Adaptation Scheme (QOAS) - an
adaptive solution for high bitrate multimedia streaming that balances these opposing goals. First
the QOAS’s principle is described and the QOAS’s main components are presented. The client-
located Quality o f Delivery Grading Scheme (QoDGS) is in charge with monitoring, grading and
reporting o f delivery quality; the server-situated Arbiter (Arb.) that implements the Server
Arbitration Scheme (SAS) is responsible with the analysis o f end-users’ reported quality and with
taking adjustment decisions; the Data Transmission and Feedback Mechanisms ensure the
delivery o f both multimedia data and control information - including feedback. This chapter also
presents quality assessment criteria fo r the QOAS and QOAS applicability considerations.
4.1 QOAS OverviewDuring high-quality m ultim edia stream delivery, end-user perceived quality could be
negatively affected by server-related problem s (e.g. server load, software, etc.), by network-related
problem s (e.g. congestion, extrem ely variable traffic, equipm ent failures, last-m ile low bandwidth
connection, etc.), and/or by client-related problem s (e.g. s low or incom patible software, old
hardware, etc.). These problem s directly or indirectly cause som e periods o f unpredictable delay
and/or loss (PU D L ) that affect the overall quality o f delivery.
8 4
Gabriel-Miro Muntean - Ph.D. Thesis 4. QOAS for Multimedia Streaming
Receiver buffering m ay be a good solution for m any cases o f PU D L s, but, used alone, it
does not a lw ays so lve streaming-related problem s that occur in d ifficu lt delivery conditions. S im ply
producing multimedia streams at a single lowest or respectively highest quality (and hence
low est or respectively highest bitrate) could also be a solution in case o f hom ogeneous custom ers,
but m ay leave heterogeneous clients permanently unhappy. I f the m ultim edia stream for rem ote
playback is stored on the server at a com m on low est quality, high-bandwidth clients w ill receive
poor quality despite the availability o f a large am ount o f bandwidth. H ow ever, i f the m ultim edia
stream is stored at a single high quality encoding on the server, for m any low -bandwidth clients the
high loss rate w ill m ake the rem otely played stream quality not acceptable. Another solution m ay be
for the service providers to allow for their clients to choose between different already encoded
streams at different bitrates at the beginning of streaming and to maintain the bitrate constant
for the w hole duration o f the streaming process. Unfortunately the bottleneck that causes problem s
m ay be in the backbone for exam ple at the provider’s links to the m ultim edia server and therefore
the user can not know the congestion leve l and its variation w ith the tim e. In consequence the
custom er cannot m ake a favorable choice betw een the offered different quality streams that w ould
guarantee high quality reception for the w hole duration o f the stream ing process.
Since static solutions seem to be unsuitable for a delivery environm ent in w hich the
available bandwidth m ay change in tim e due to the presence o f other traffic o f various types (som e
o f w hich has w ell-defined congestion control p olicies), it is necessary to propose a dynam ic
solution. The idea w as to allow the server to adjust dynam ically the quality o f the m ultim edia
streams it rem otely p lays so that the end-custom ers’ perceived quality is as high as the available
network bandwidth permits. This process w as named in [197] quality adaptation.
The proposed Quality-Oriented Adaptation Scheme (QOAS) is an end-to-end quality
adaptive solution for high quality - high bitrate multimedia streaming. It balances the network
operators’ and service providers’ desire to increase their revenues by serving a high number o f
custom ers from lim ited network resources w ith the custom ers’ interest in receiving high quality
m ultim edia and paying a low price. D esign in g any quality adaptation schem e is a com plex task.
N orm ally, by increasing the number o f remote sim ultaneous view ers o f different content
m ultim edia streams served by the sam e infrastructure, significant degradations in the end-users’
perceived quality are expected m ainly due to PU DL s. This is the case i f the m echanism s em ployed
to prevent or to m inim ise their effects are not h ighly effective (e.g . quality adaptation, post
processing techniques, etc.). Q O A S w as designed to try to prevent the P U D L s or to react to them. It
8 5
Gabriel-Miro Muntean - Ph.D. Thesis 4. QOAS for Multimedia Streaming
aim s at m axim ising the end-user perceived quality and the links utilisation in the existing delivery
conditions. It both varies the transm ission rate and adjusts the stream ed content i f necessary.
In order to achieve h igh performance in variable delivery conditions b y m aintaining both
good end-user quality and high links’ utilisation, the Q O AS is u sing the architecture presented in
detail in section 4.2. The Q O A S-based quality adaptation is perform ed by tw o m echanism s in
conjunction: IntrA-stream Q O A S and respectively InteR-stream Q O A S. IntrA-stream QOAS is
the main quality adaptation m echanism , involves streaming o f the current m ultim edia clip on ly and
creates betw een the Q O AS server and the QO AS client a one-to-one relation. Its idea, sim ilar to the
classic quality adaptation, is to adjust dynam ically the quality o f the streamed m ultim edia, w hich in
turn increases or decreases the quantity o f m ultim edia data to be transmitted according to the
feedback-reported state o f delivery conditions. The adaptation is performed w hile m aintaining
continuity o f the stream ing process and the quality is varied in a w ell-controlled manner. In
consequence the end-users benefit in their perceived quality com pared to the alternative random
losses that severely affect the quality o f the streaming process [59]. InteR-stream QOAS, an
extension o f the IntrA-stream Q O A S, aims at further im proving both the end-user quality and the
links utilisation. It in vo lves a server-located controller m odule w hich is in permanent contact with
all the individual IntrA-stream Q O A S-s. The controller looks at the delivery process g lobally and
m akes fine adjustments to the IntrA-stream Q O A S-s both in their initial stages and during their
adaptive streaming. M ore details about the IntrA-stream Q O A S and InteR-stream Q O A S are given
in sections 4.3 and 4.8.
4.2 QOAS-based System ArchitectureThis section presents the architecture o f a m ultim edia stream ing system that em beds the
Quality-Oriented Adaptation Schem e (Q O A S). First the overall architecture is presented at high
level and then in m ore detail at b lock-level. Both the server’s and the clien t’s com ponents are
described separately later on.
4.2.1 High-Level Architecture
The high-level architecture o f the adaptive m ultim edia system is presented in Figure 4-1 . It
includes m ultiple instances o f Q O A S-based adaptive client and server applications that
com m unicate bi-directionally through the delivery network. T hey exchange m ultim edia data and
control packets (including feedback m essages). S ince the system w as aim ed for streaming high
8 6
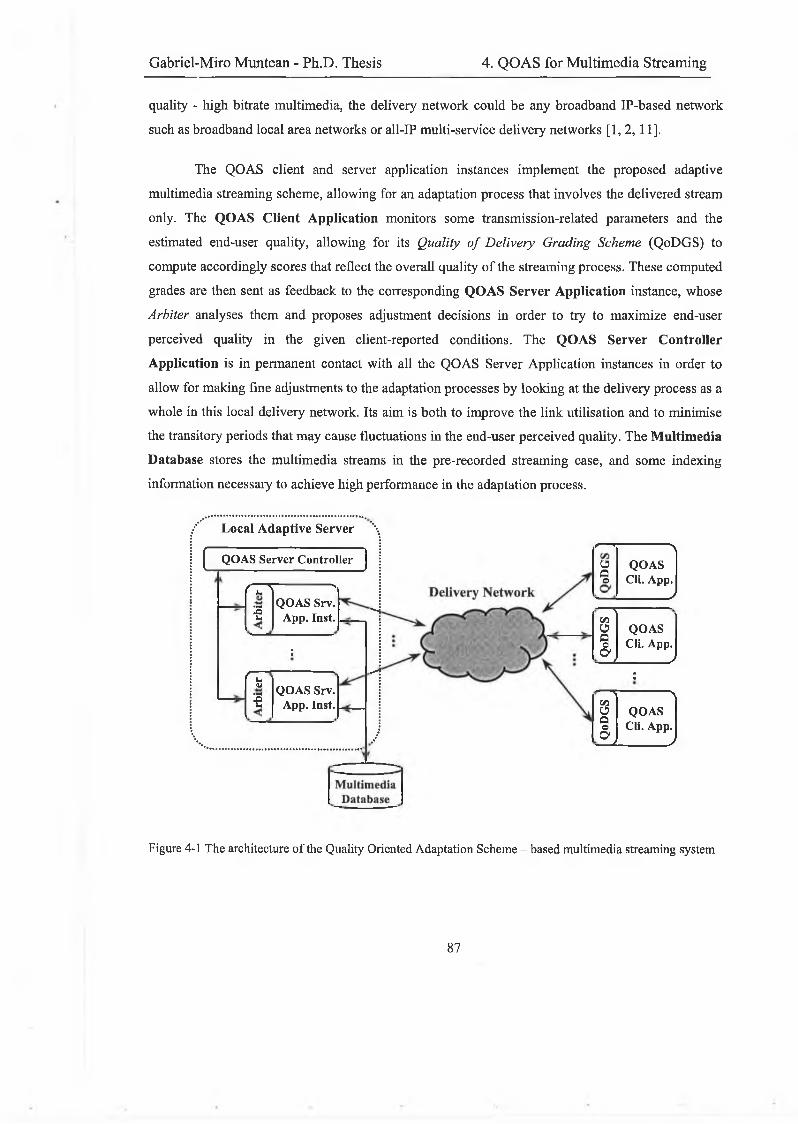
Gabriel-Miro Muntcan - Ph.D. Thesis 4. QOAS for Multimedia Streaming
quality - high bitrate m ultim edia, the delivery network could be any broadband IP-based network
such as broadband local area networks or all-IP m ulti-service delivery networks [1 ,2 , 11],
The QO AS client and server application instances im plem ent the proposed adaptive
m ultim edia streaming schem e, allow ing for an adaptation process that in volves the delivered stream
only. The QOAS Client Application m onitors som e transm ission-related parameters and the
estim ated end-user quality, allow ing for its Quality o f D elivery Grading Scheme (Q oD G S) to
com pute accordingly scores that reflect the overall quality o f the stream ing process. T hese com puted
grades are then sent as feedback to the corresponding QOAS Server Application instance, w hose
A rbiter analyses them and proposes adjustment d ecisions in order to try to m axim ize end-user
perceived quality in the g iven client-reported conditions. The QOAS Server Controller
Application is in perm anent contact w ith all the Q O AS Server A pplication instances in order to
allow for m aking fine adjustments to the adaptation p rocesses b y looking at the delivery process as a
w hole in this local delivery network. Its aim is both to im prove the link utilisation and to m inim ise
the transitory periods that m ay cause fluctuations in the end-user perceived quality. The Multimedia
Database stores the m ultim edia streams in the pre-recorded stream ing case, and som e indexing
information necessary to achieve high performance in the adaptation process.
Local Adaptive Server
QOAS Server Controller
f— \ 1«3In
” *QOAS Srv.
App. Inst.
;
' " 1 4>
‘IQOAS Srv.
App. Inst.
r~ *
ÜQ©
>QOAS
Cli. App.J
QoD
GS
v J 1
QOAS Cli. App.
J:
QoD
GS
J A
QOAS Cli. App.
J
Figure 4-1 The architecture o f the Quality Oriented Adaptation Scheme -- based multimedia streaming system
8 7
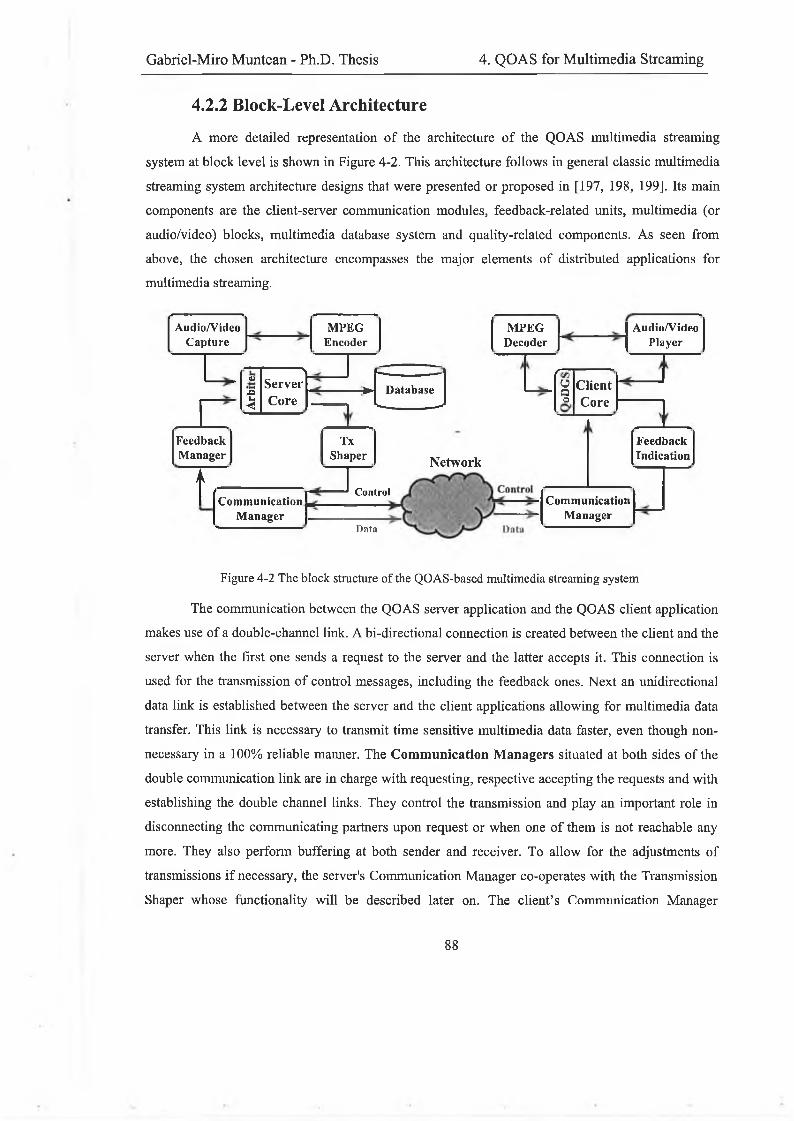
Gabriel-Miro Muntean - Ph.D. Thesis 4. QOAS for Multimedia Streaming
4.2.2 Block-Level Architecture
A more detailed representation o f the architecture o f the Q O A S m ultim edia streaming
system at b lock leve l is show n in Figure 4-2 . This architecture fo llow s in general classic m ultim edia
streaming system architecture designs that w ere presented or proposed in [197, 198, 199]. Its m ain
com ponents are the client-server com m unication m odules, feedback-related units, m ultim edia (or
audio/video) b locks, m ultim edia database system and quality-related com ponents. A s seen from
above, the chosen architecture encom passes the major elem ents o f distributed applications for
m ultim edia streaming.
Audio/V ideo M PEG M PE G A udio/V ideoC ap tu re E ncoder D ecoder P layer
NOiS Server - -> D atabaseu< Core ■----------------- -
(r.OQ Cliento Core
FeedbackM anager
TxS haper
I C om m unicationM an ag er
Network
C o n tro l
Data
F eedbackInd ica tion
C om m unicationM anager
Figure 4-2 The block structure o f the QO AS-based multimedia streaming system
The com m unication betw een the Q O AS server application and the Q O A S clien t application
m akes use o f a double-channel link. A bi-directional connection is created betw een the client and the
server w hen the first one sends a request to the server and the latter accepts it. This connection is
used for the transm ission o f control m essages, including the feedback ones. N ex t an unidirectional
data link is established betw een the server and the client applications a llow ing for m ultim edia data
transfer. This link is necessary to transmit tim e sensitive m ultim edia data faster, even though non
necessary in a 100% reliable manner. The Communication Managers situated at both sides o f the
double com m unication link are in charge w ith requesting, respective accepting the requests and w ith
establishing the double channel links. They control the transm ission and play an important role in
disconnecting the com m unicating partners upon request or w hen one o f them is not reachable any
more. They also perform buffering at both sender and receiver. To allow for the adjustments o f
transm issions i f necessary, the server's C om m unication M anager co-operates with the Transm ission
Shaper w hose functionality w ill be described later on. The clien t’s C om m unication M anager
8 8
Gabriel-Miro Muntean - Ph.D. Thesis 4. QOAS for Multimedia Streaming
forwards both control information and data to the C lient Core for processing and receives feedback
data from the Feedback Indication U nit to be sent to the server.
For acquiring m ultim edia data, a special Audio/Video Capture Unit w as provided as part
o f the server application. It works in conjunction w ith the Encoder Unit w hose task is to control the
m ultim edia data com pression process using the chosen M PEG encoding schem e. These units are
either actively involved in the live m ultim edia stream ing case or work off-lin e prior to the actual
streaming o f pre-recorded clips. As part o f the client application, the Decoder Unit is in charge
with the decoding o f the rem otely streamed m ultim edia data, w hich is then played b y the
Audio/Video Player. This unit separation is only conceptual, a llow ing for a software and/or a
hardware solution for decoding and playing.
The m ain goal o f the Feedback Indication Unit, situated at the client, is to co llect the
grading scores com puted by Quality o f D elivery Grading Scheme (Q oD G S) related to the quality o f
streaming. D etails about Q oD G S w ill be g iven in the next chapter. The Feedback Indication Unit
assem bles these scores in the feedback control m essages and transmits them to the server, informing
it about the quality o f the reception. The Feedback Manager, located at the server, receives the
feedback m essages, extracts the scores and sends them to the A rbiter (Arb.) for the analysis. The
Arbiter takes decisions concerning the transm ission according to their values. The Arbiter’s detailed
functionality w ill also be presented in the next chapter.
One o f the Transmission Shaper’s major goals is to reduce the burstiness o f the
transmissions (as the chosen encoding schem e M PEG is w e ll know n for its bursty streams [200,
201]), in environm ents that require a flat-like data f lo w (e .g Internet). H ow ever this can be sw itched
o ff in situations w hen statistical m ultip lexing effect o f data originating from m ultiple bursty sources
does not have a disturbing effect on the end-quality o f the m ultim edia streamed clips (e.g. loca l IP
networks where m ultim edia accounts for the m ajority o f traffic). The other m ain goal o f the
Transmission Shaper is to allow for the adaptive m odification o f the transm ission rate after the
analysis o f the feedback received from the Q O A S client. A m odified token bucket m echanism [202]
to which a variable token generation procedure has been added is used to a llow for an adjustable
transmission process. Both the token creation and the server side buffering (done prior to actual
transmission o f data) are feedback-controlled.
The Server Core is responsible not on ly for inter-connecting the other com ponents, but
also for applying the QOAS p olicy through its Arbiter. The Arbiter’s role is to assess the quality o f
8 9
Gabriel-Miro Muntean - Ph.D. Thesis 4. QOAS for Multimedia Streaming
streaming as reported by the Q O AS client through its feedback m essages, to take the adjustments
decisions, i f and w hen necessary and to apply them w ith the help o f the Transm ission Shaper.
The Client Core inter-connects the other client-located b locks in a sim ilar manner with its
counter-part, the Server Core. H ow ever the m ost important role in the Q O A S-based architecture is
played by the Quality o f D elivery Grading Scheme (Q oD G S). Q oD G S m onitors perm anently both
transm ission related parameters and end-user quality and grades regularly the overall quality o f
delivery in terms o f Quality o f D elivery (Q oD ) scores. These scores are sent as feedback to the
server and are used for adaptation.
More details about both the Server’s Arbiter and the C lient’s Q oD G S are presented later in
this chapter.
The D atab ase U nit, as part o f the server application, is m ainly used to store the m ultim edia
streams for pre-recorded stream transm ission, after the m ultim edia data acquired by the
A udio/V ideo Capture unit is com pressed b y the Encoder. The Database is also used for saving som e
indexing inform ation related to each stream, allow ing for ach ieving h igh performance w hile
applying the Q O A S-based server adjustments. M ore details are presented in this chapter w hen
describing Q O AS and in the fifth chapter w hen presenting im plem entation issues.
4.3 IntrA-Stream QOASIn trA -stream Q O A S has three m ain com ponents: the client-located Quality o f D elivery
Grading Schem e (Q oD G S), the Server Arbitration Schem e (S A S ) and the Data Transm ission and
Feedback M echanism s. D etailed information about these com ponents and their functionality are
given in separate sections o f this chapter. Since the IntrA-stream Q O A S is the m ain m echanism o f
Q O AS, in this section the sam e abréviation Q O AS is used to nam e it, unless exp licitely stated
otherwise. The fo llow in g terms are also used: “server” - nam ing an instance o f the QO AS Server
Application and “client” - refering to the Q O AS Client A pplication instance.
The IntrA-stream Q O AS or Q O AS is a feedback-controlled end-to-end adaptive schem e
that relies on both long term and short term m onitoring and assessm ent o f som e transmission
parameters and o f the end-user quality. This is performed by the Q oD G S, w hich also regularly
grades the quality o f the ongoing streaming process in terms o f Q uality o f D elivery (Q oD ) scores.
These scores are sent using the Q O A S ’s Feedback M echanism to the server w hose Arbiter
processes them. The Arbiter takes into consideration the values o f a number o f recent feedback
90
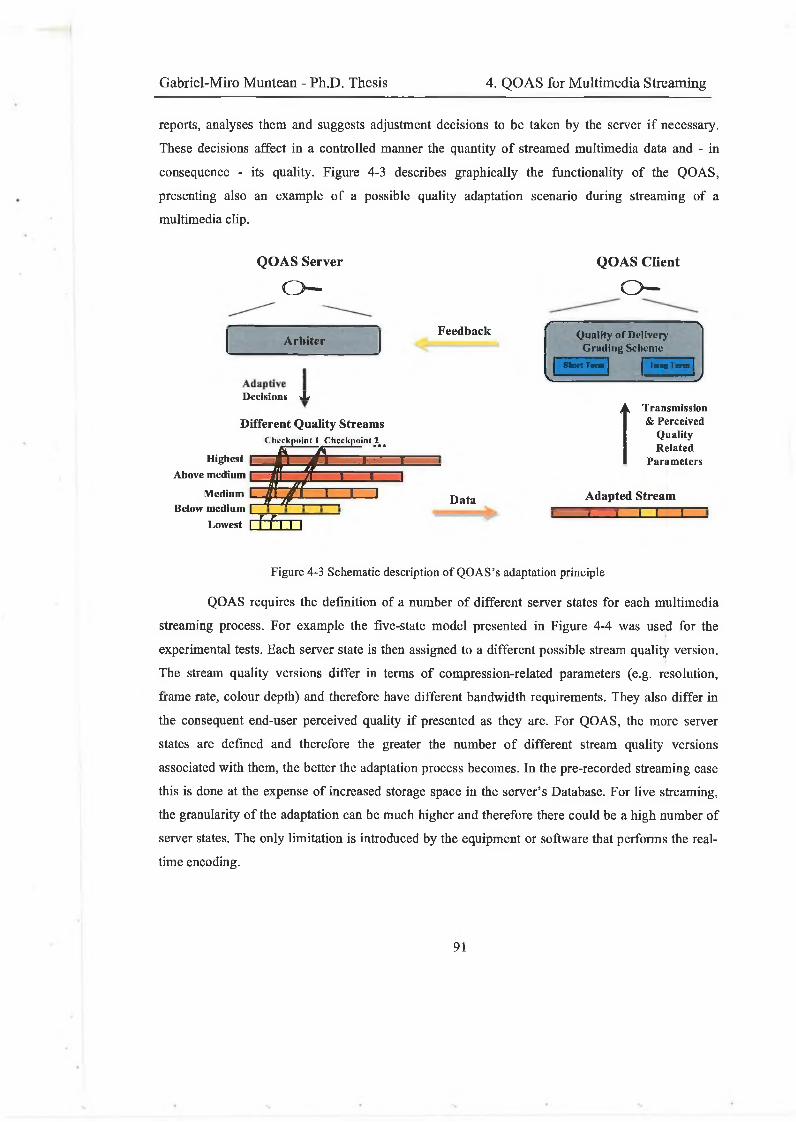
Gabriel-Miro Muntean - Ph.D. Thesis 4. QOAS for Multimedia Streaming
reports, analyses them and suggests adjustment decisions to be taken by the server i f necessary.
These decisions affect in a controlled manner the quantity o f streamed multimedia data and - in
consequence - its quality. Figure 4-3 describes graphically the functionality o f the Q O AS,
presenting also an exam ple o f a possible quality adaptation scenario during streaming o f a
multimedia clip.
QOAS Server
o -
QOAS Client
o -
ArbiterFeedback r \
Quality of Delivery Grading Scltcmc
S h o rt T oon lA o g T m n I
v — ------VDecisions X
Different Quality StreamsC heckpoint 1 Checkpoint 2m,
H ighest QAbove m edium [
M edium [Below m edium f
Lowest I I C l I I» Data
t Transmission & Perceived
Quality Related
Param eters
Adapted StreamJ - 1 1 I Z E
Figure 4-3 Schematic description o f QOAS’s adaptation principle
QOAS requires the definition o f a number o f different server states for each m ultim edia
streaming process. For exam ple the five-state m odel presented in Figure 4-4 was used for the
experimental tests. Each server state is then assigned to a different possible stream quality version.
The stream quality versions differ in terms o f com pression-related parameters (e.g. resolution,
frame rate, colour depth) and therefore have different bandwidth requirements. They also differ in
the consequent end-user perceived quality i f presented as they are. For QOAS, the m ore server
states are defined and therefore the greater the number o f different stream quality versions
associated with them, the better the adaptation process becom es. In the pre-recorded streaming case
this is done at the expense o f increased storage space in the server’s Database. For live streaming,
the granularity o f the adaptation can be much higher and therefore there could be a high number o f
server states. The only lim itation is introduced by the equipm ent or software that performs the real
tim e encoding.
91
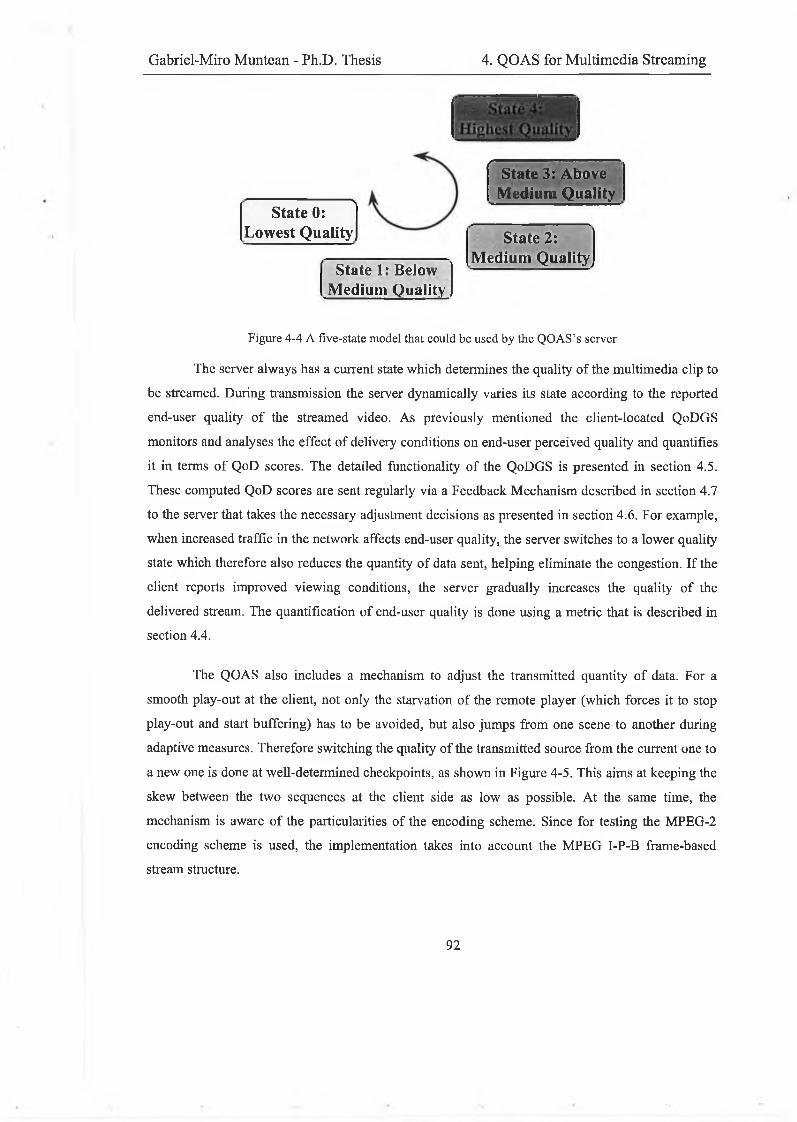
Gabriel-Miro Muntean - Ph.D. Thesis 4. QOAS for Multimedia Streaming
Lowest QualityState 0:
N
State 2: Medium Quality
( ---------------------------------State 3: Above
M edium Quality
State 1: Below Medium Quality
Figure 4-4 A five-state model that could be used by the QOAS’s server
The server alw ays has a current state w hich determines the quality o f the m ultim edia clip to
be streamed. During transm ission the server dynam ically varies its state according to the reported
end-user quality o f the streamed video. A s previously m entioned the client-located Q oD G S
m onitors and analyses the effect o f delivery conditions on end-user perceived quality and quantifies
it in terms o f Q oD scores. The detailed functionality o f the Q oD G S is presented in section 4.5.
These com puted Q oD scores are sent regularly v ia a Feedback M echanism described in section 4.7
to the server that takes the necessary adjustment decisions as presented in section 4 .6 . For exam ple,
w hen increased traffic in the network affects end-user quality, the server sw itches to a low er quality
state w hich therefore also reduces the quantity o f data sent, help ing elim inate the congestion. I f the
client reports im proved v iew in g conditions, the server gradually increases the quality o f the
delivered stream. The quantification o f end-user quality is done using a metric that is described in
section 4.4.
The QO AS also includes a m echanism to adjust the transmitted quantity o f data. For a
sm ooth play-out at the client, not on ly the starvation o f the rem ote player (which forces it to stop
play-out and start buffering) has to be avoided, but a lso jum ps from one scene to another during
adaptive measures. Therefore sw itching the quality o f the transmitted source from the current one to
a new one is done at w ell-determ ined checkpoints, as show n in Figure 4-5. This aim s at keeping the
skew between the tw o sequences at the client side as low as possib le. A t the sam e tim e, the
m echanism is aware o f the particularities o f the encoding schem e. S ince for testing the M PEG-2
encoding schem e is used, the im plem entation takes into account the M PEG I-P-B fram e-based
stream structure.
9 2
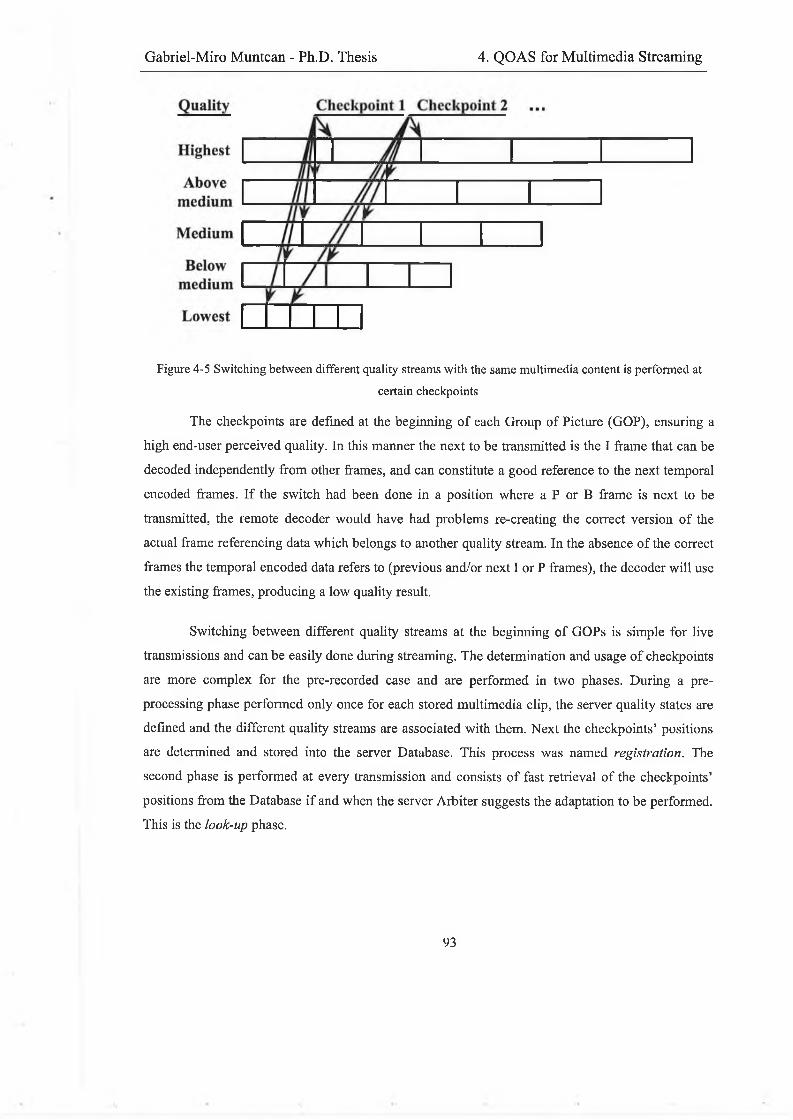
Gabriel-Miro Muntean - Ph.D. Thesis 4. QOAS for Multimedia Streaming
Figure 4-5 Switching between different quality streams with the same multimedia content is performed at
certain checkpoints
The checkpoints are defined at the beginning o f each Group o f Picture (GOP), ensuring a
high end-user perceived quality. In this manner the n ext to be transmitted is the I frame that can be
decoded independently from other frames, and can constitute a good reference to the next temporal
encoded frames. I f the sw itch had been done in a p osition where a P or B frame is next to be
transmitted, the rem ote decoder w ould have had problem s re-creating the correct version o f the
actual frame referencing data w hich belongs to another quality stream. In the absence o f the correct
frames the temporal encoded data refers to (previous and/or next I or P fram es), the decoder w ill use
the existing frames, producing a low quality result.
Switching betw een different quality streams at the beginning o f GOPs is sim ple for live
transmissions and can be easily done during streaming. The determination and usage o f checkpoints
are more com plex for the pre-recorded case and are performed in two phases. During a pre
processing phase perform ed only once for each stored m ultim edia clip, the server quality states are
defined and the different quality streams are associated w ith them. N ex t the checkpoints’ positions
are determined and stored into the server Database. This process w as nam ed registration. The
second phase is perform ed at every transm ission and consists o f fast retrieval o f the checkpoints’
positions from the Database i f and w hen the server Arbiter suggests the adaptation to be performed.
This is the look-up phase.
93
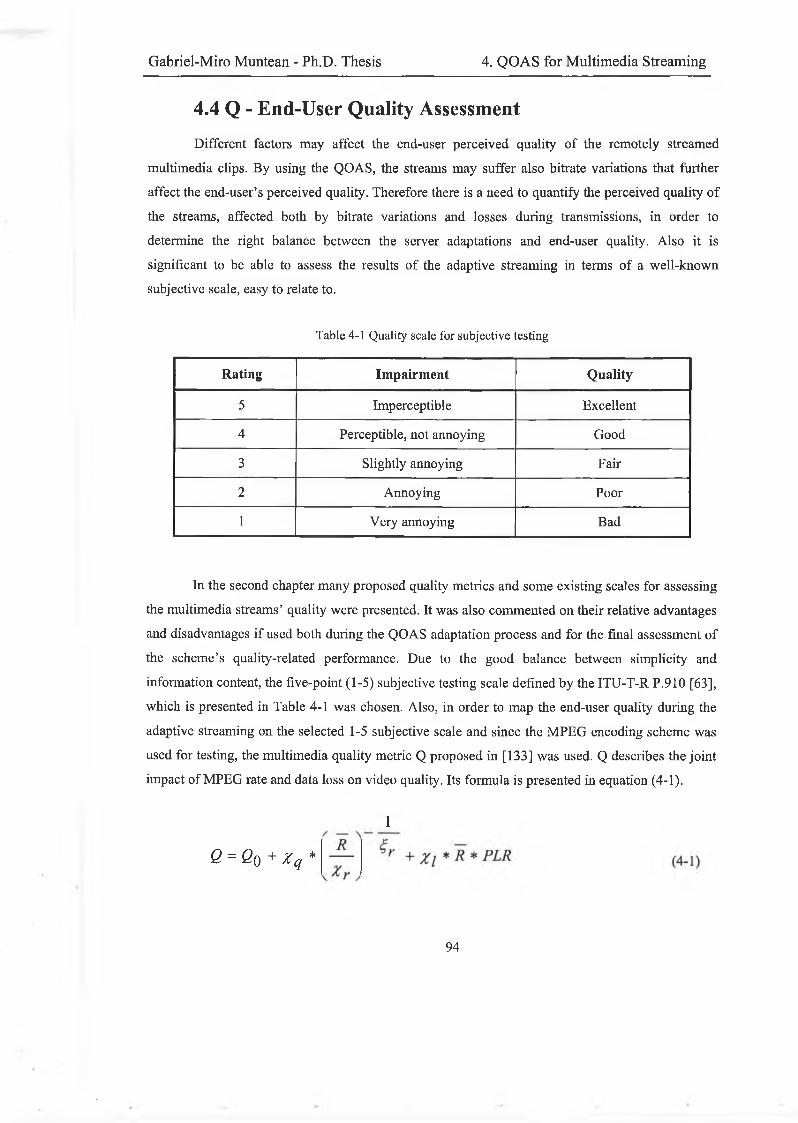
Gabriel-Miro Muntean - Ph.D. Thesis 4. QOAS for Multimedia Streaming
4.4 Q - End-User Quality Assessment
Different factors m ay affect the end-user perceived quality o f the rem otely streamed
m ultim edia clips. B y using the Q O A S, the streams m ay suffer also bitrate variations that further
affect the end-user’s perceived quality. Therefore there is a need to quantify the perceived quality o f
the streams, affected both by bitrate variations and losses during transm issions, in order to
determine the right balance betw een the server adaptations and end-user quality. A lso it is
significant to be able to assess the results o f the adaptive stream ing in terms o f a w ell-k now n
subjective scale, easy to relate to.
Table 4-1 Quality scale for subjective testing
Rating Impairment Quality
5 Im perceptible E xcellent
4 Perceptible, not annoying G ood
3 Slightly annoying Fair
2 A nnoying Poor
1 Very annoying Bad
In the second chapter m any proposed quality m etrics and som e existing scales for assessing
the m ultim edia stream s’ quality w ere presented. It w as also com m ented on their relative advantages
and disadvantages i f used both during the Q O A S adaptation process and for the final assessm ent o f
the sch em e’s quality-related performance. D ue to the good balance betw een sim plicity and
information content, the five-point (1-5) subjective testing scale defined by the ITU-T-R P .910 [63],
w hich is presented in Table 4-1 w as chosen. A lso , in order to m ap the end-user quality during the
adaptive streaming on the selected 1-5 subjective scale and since the M PEG encoding schem e w as
used for testing, the m ultim edia quality m etric Q proposed in [133] w as used. Q describes the joint
im pact o f M PEG rate and data loss on v ideo quality. Its form ula is presented in equation (4-1).
1
Q = Q0 + z q *
9 4
Gabriel-Miro Muntean - Ph.D. Thesis 4. QOAS for Multimedia Streaming
In equation (4-1) PLR is the packet loss ratio, R is the stream ’s m ean bitrate, the constant
Qo has a value close to the m axim um quality 5, Xq> £> r and %T are related to the com plexity o f the
sequence and %| depends also on the average bitrate.
Som e o f the m ost important advantages o f using Q are:
i) the possib ility for its in-service usage based on fact that is a no-reference metric
ii) its direct output on the ITU-T 1-5 scale w ithout another m apping stage that m ay reduce
the m easurem ent accuracy,
iii) its relatively sim ple form ula requires few com putations that can be performed very fast
and w ithout loading excessively the client m achine during the grading process,
iv) it uses parameters that are easy to m onitor and
v) it provides a good representation o f the expected evolution o f the perceived quality with
the variation o f loss rate and respectively stream bitrate (see Figure 4-6).
At the sam e tim e, som e o f the main disadvantages o f using Q are:
i) using m any constants that have values related to the stream s’ com plexity, the sam e
form ula for Q m ay not describe best the quality o f different m ultim edia clip types (e.g.
high m otion content, cartoons, etc.),
ii) being sim ple Q m ay not fu lly describe the relation betw een (m ainly) transm ission related
errors and the end-user perceived quality and
iii) being proposed for M PE G -encoded streams, Q is not independent from the encoding
schem e, requiring the M PEG com pression for obtaining significant results.
Since the advantages overcom e the disadvantages, it was decided to use Q for assessing the
end-user perceived quality during both Q O A S adaptation and adaptive stream ing results analysis.
95
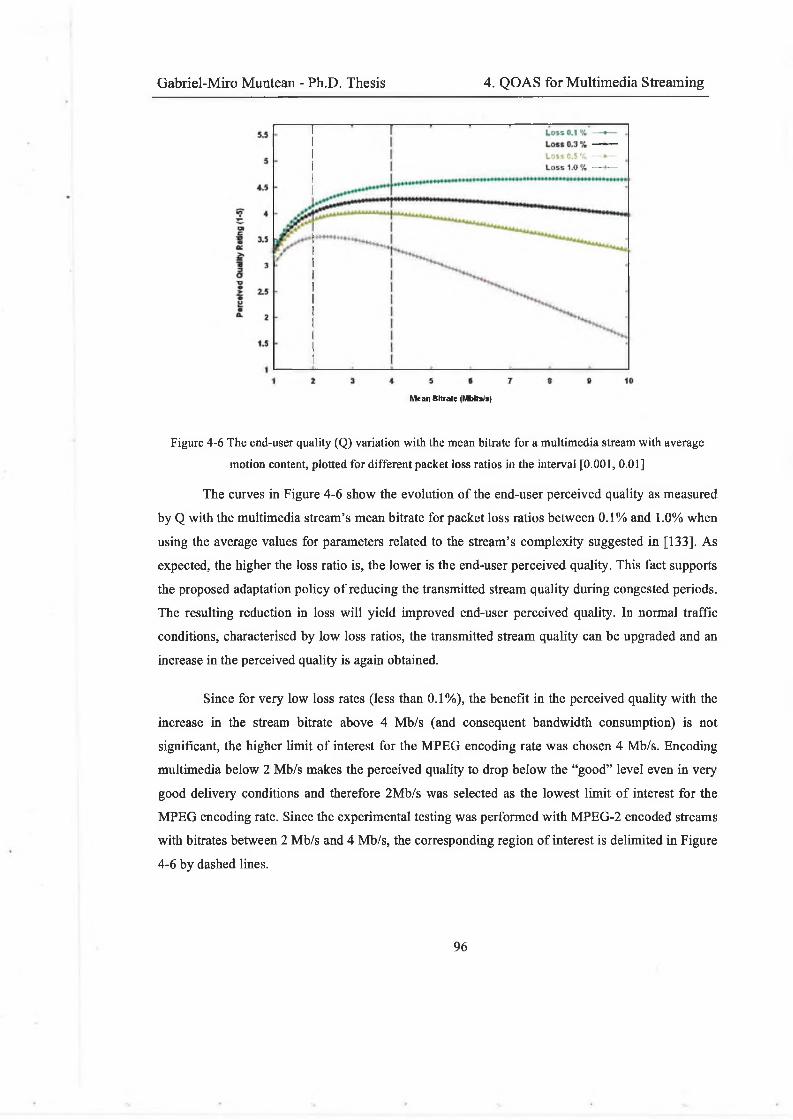
Gabriel-Miro Muntean - Ph.D. Thesis 4. QOAS for Multimedia Streaming
Mean Bitrate (Mritsis)
Figure 4-6 The end-user quality (Q) variation with the mean bitrate for a multimedia stream with average
motion content, plotted for different packet loss ratios in the interval [0.001, 0.01]
The curves in Figure 4-6 show the evolution o f the end-user perceived quality as measured
by Q with the multimedia stream’s mean bitrate for packet loss ratios betw een 0.1% and 1.0% when
using the average values for parameters related to the stream’s com plexity suggested in [133]. A s
expected, the higher the loss ratio is, the lower is the end-user perceived quality. This fact supports
the proposed adaptation p olicy o f reducing the transmitted stream quality during congested periods.
The resulting reduction in loss w ill yield im proved end-user perceived quality. In normal traffic
conditions, characterised by low loss ratios, the transmitted stream quality can be upgraded and an
increase in the perceived quality is again obtained.
Since for very low loss rates (less than 0.1% ), the benefit in the perceived quality with the
increase in the stream bitrate above 4 M b/s (and consequent bandwidth consumption) is not
significant, the higher lim it o f interest for the M PEG encoding rate w as chosen 4 M b/s. Encoding
m ultimedia below 2 M b/s makes the perceived quality to drop below the “good” level even in very
good delivery conditions and therefore 2M b/s was selected as the low est lim it o f interest for the
M PEG encoding rate. Since the experim ental testing w as performed with M PEG-2 encoded streams
with bitrates between 2 M b/s and 4 M b/s, the corresponding region o f interest is delim ited in Figure
4-6 by dashed lines.
96
Gabriel-Miro Muntean - Ph.D. Thesis 4. QOAS for Multimedia Streaming
4.5 Client-Located QoD Grading Scheme (QoDGS)
4.5.1 QoDGS Overview
One o f the m ost important com ponents o f the Q O AS is the client-located Q uality o f
D elivery Grading Schem e (Q oD G S), since on its functionality relies the perform ance o f the w hole
adaptive schem e. Its goal is:
• to m onitor continuously the streaming process,
• to collect both transm ission performance related data and inform ation related to the
end-user perceived quality,
• to analyse the data gathered over a recent period o f tim e,
• to grade the streaming process on a pre-defined scale com puting Q oD scores.
The resulted Q oD scores are regularly sent b y the feedback m echanism to the server w hose
Arbiter analyses them and takes adjustment decisions in order to im prove the quality o f delivery.
4.5.2 QoDGS Principles
In order to have a higher degree o f confidence that the proposed Q oD G S reflects the quality
o f delivery as accurate as possib le, som e design principles were formulated.
1. The Q oD G S allow s for both a long term and a short term m onitoring o f the m onitored
parameters related to the quality o f the streaming process. Short-term variations are
important for learning quickly about transient effects, such as sudden traffic changes or
operating system /softw are problem s, and for reacting as fast as p ossib le to the resulting
effects. Long-term variations are m onitored in order to track slo w changes in the
delivery environm ent (e.g. n ew users in the system ). The only difference betw een the
two sets o f collected data is the duration o f the co llection period. A suggested length is
an order and respectively two orders o f m agnitude greater than the feedback reporting
time. The analysis o f the collected data and the corresponding partial grading are
performed separately. A s a result two different Q oD grades are computed: one for long
term: Q oD LT, the other for short term: Q oD ST.
2. The Q oD G S takes into consideration all the parameters chosen to be m onitored such as:
the one-w ay delays, delay jitters, the lo ss rate and Q, but it is also very important to
9 7
Gabriel-Miro Muntean - Ph.D. Thesis 4. QOAS for Multimedia Streaming
allow for the possib ility to consider also other parameters related to the quality o f
streaming. This is significant both for testing purposes and for eventual extensib ility
and im provem ent o f the Q oDG S.
3. The Q oD G S allow s for considering different types o f parameters and for taking into
account their characteristics. For som e parameters it is very important to have a value
as lo w as possib le, for others a steady value is better. For som e parameters there are no
low and high lim its for their values, w hich depend on the network topology, network
state, streaming session , etc., for others, where a percentage describes their variation,
such lim its naturally exists. It is important for the Q oD G S to provide a m echanism to
accom m odate all these different particularities o f the m onitored quality o f delivery
related parameters.
4. The Q oD G S takes into consideration the relative im portance o f each o f the m onitored
parameters in com parison to the others. The proposed solution uses a w eighting
m echanism . The best values for the w eigh ts associated w ith each m onitored parameter
have to be determined during a detailed tuning phase, prior to the deploym ent o f the
Q O AS system that im plem ents the Q oD G S. The tuning aim s at achieving h igh Q O AS
performance in terms o f adaptiveness and stability.
5. The Q oD G S allow s for the consideration o f different im portance o f the short term and
long term grading processes. The solution proposed is to associate different w eights to
each o f them according to their relative importance. A s a result, the com putation o f the
overall Q oD score takes into account these associated w eights. For good tuning o f the
Q oD G S, a detailed testing phase is necessary to be performed.
6. The Q oD G S grading process is to b e perform ed very fast in order not to in fluence in a
negative w ay the performance o f the overall m ultim edia client application. A lso it has
to a llow to be com puted at any tim e, independent from the packet receiving process,
the m ultim edia data decoding procedure or the stream play-out process. In this w ay the
frequency o f the feedback control packets that carry the com puted Q oD scores can be
easily m odified. A high value for the feedback frequency w ill overload both the client
and the server, w hich have to be able to com pute the Q oD scores and to analyse them
and take decisions, to send and to receive the control packets and to send or receive
data packets. Apart from this, the network itse lf w ill b e overloaded, m aking the stream's
data transm ission m ore difficult. A low value for the feedback transm ission frequency
98
Gabriel-Miro Muntean - Ph.D. Thesis 4. QOAS for Multimedia Streaming
w ill not permit the system to react fast enough to the changes in delivery conditions. In
consequence a com prom ise value m ust be found during the testing phase.
7. The Q oD scores com puted by the Q oD G S should not be dependent on any other
parameters apart from the ones related to the stream ing process (e.g. the m achine, the
processor’s load, the type o f connections, etc.). This is to have a deterministic
behaviour o f the Q oD G S and therefore o f the Q O A S-based m ultim edia streaming
system that uses it.
4.5.3 Monitored Parameters
In order to build the Q oD G S it w as important to determine w hich parameters related to the
performance o f streaming process are correlated to the end-user perceived quality, in w hich w ay
and how strong is this link. It was equally important to determ ine i f som e m etrics exist that could be
used to m easure these parameters, how m uch effort their com putation takes and whether by using
them the Q oD G S is closer to achieve its goals and to fo llow the stated principles.
A nalysing the International Telecom m unication U nion (IT U )50 and the Internet Engineering
Task Force (IETF)51 proposals, one could notice that, although they have com m on goals, they tend
to have different paths to achieve them. Since the ITU tends to evaluate services in general and their
quality in particular, its m etrics can be used for assessing the stream quality. The IETF is more
network-oriented and since our interest is closer to the IETF’s, w e have tried to determine a
working group w ithin IETF that focuses on studying performance parameters that, i f m onitored by
Q oD G S, could g ive significant information about the state o f the network and its potential effect on
the end-user perceived quality.
IETF IP Performance M etrics (IPPM ) W orking Group26 has proposed a set o f standard
m etrics that can be applied to the quality, perform ance and reliability o f data delivery over
networks. The set o f m etrics defined in their fram ework that offer som e solutions for unbiased
quantitative m easures o f performance are: connectivity, one-w ay delay and loss, round-trip delay
and loss, delay variation, loss patterns, packet reordering, bulk transport capacity and link
50 T h e In te rna tiona l T e leco m m u n ica tio n U n io n (IT U ), h ttp ://w w w .itu .in t
51 T h e In terne t E n g in ee rin g T ask F o rce (IE T F ), h ttp ://w w w .ie tf.o rg
99
Gabriel-Miro Muntean - Ph.D. Thesis 4. QOAS for Multimedia Streaming
bandwidth capacity [62], Their potential usage by the Q oD G S w as assessed and the conclusions are
presented briefly next.
Connectivity refers to the fact that a host is reached or not b y a data packet sent to it [203].
Although obviously very important for the m ultim edia streaming, the connectivity-related problems
are taken care o f by the Com m unication M anagers, part o f the Q O A S Architecture in charge with
establishing and controlling the com m unication and by the server-located Arbiter, part o f the
QOAS. This is described in details in sections 4 .6 and 4.7.
One-way delay betw een tw o hosts is defined in [204] as the tim e betw een the m om ent
w hen the first bit o f a packet was sent from the first host to the secon d one and the m om ent w hen it
reaches the second host. It is expected that one-w ay delay and especia lly delay variation to be
correlated w ith packet loss, w hich in turn has a strong influence on the end-user perceived quality
for the case o f m ultim edia streaming as reported in [196, 205] and m entioned in the second chapter.
This is because w henever packets are delayed in the network, they are regularly stored in either
router queues or in buffers that have a finite capacity. In consequence i f one-w ay delay increases
high enough, loss occurs as those queues or buffers becom e full. H ow ever, i f there is enough
storage capacity to absorb considerable delay variations, this correlation w eakens. The relationship
betw een one-w ay delay and loss is further w eakened by the fact that delay and delay variation are
the result o f a repeated concatenation o f variations at each hop, w hile loss is caused by one or few
overloaded elem ents along this path. H ence, many elem ents w ill contribute to delay and delay
variation, but not also to loss. M any researchers have studied the on e-w ay delays [154, 195, 205,
206, 207, 208, 209] and their conclusion is that although the linkage betw een delay on one side and
loss and consequently quality o f service is not very strong, it cannot be neglected. E specially when
som e o f them [154] that have studied also the degree to w hich the delay reflects the available
bandwidth found out that the ratio betw een the delay a packet incurred due to its connection's own
loading o f the network path, versus the total delay it incurred correlates very w ell w ith the overall
throughput achieved by the connection. Others [209] have even found a direct connection between
the increase o f the one-w ay delay and the available bandwidth. T hese findings and the results o f
other works that have used previously one-w ay delay in adaptive streaming that w ere presented in
the second chapter have suggested taking the one-w ay delay into account w hen choosing the
parameters m onitored by the Q oD G S.
One-way loss related to a packet transmitted betw een tw o hosts is defined in [210] as 0 i f
the packet transmitted has reached its destination and 1 otherwise. In practice the one-w ay loss is
measured over a period o f tim e and is expressed as a percentage o f the total number o f packets sent.
100
Gabriel-Miro Muntean - Ph.D. Thesis 4. QOAS for Multimedia Streaming
The loss appears due to the fact that w hen the packets transmitted over the network are delayed,
they are regularly stored in either router queues or in buffers w ith a capacity that should norm ally
accom m odate them. In highly increased traffic conditions, the storage space in these intermediate
network elem ents is exceeded and the data that cannot be saved is lost. There is an important
connection betw een data loss and different application perform ances that are sign ificantly degraded
with the increase in loss rate [154, 205 , 207, 210], This is especially valid for tim e-sensitive
applications (including m ultim edia streaming ones) as reported in [133, 196]. The end-user quality
is the m ost affected by a phenom enon called error propagation particularly lately w hen
com pression based on reducing both spatial and temporal redundancies [201] (e.g . M PEG-1 [73],
M PEG-2 [74], etc.) is used to dim inish the quantity o f data to be transmitted. B ased on these
considerations and on results o f other research that have su ccessfu lly used one-w ay loss rate in
quality adaptation schem es [211, 6, 7], loss w as considered a sign ificant input parameter for the
Q oDG S.
Round-trip delay betw een tw o hosts is defined in [212] as the tim e betw een the m om ent
when the first bit o f a packet was sent from the first host to the second one and the m om ent w hen it
reaches again the first host, after the packet w as received by the second host and im m ediately w as
sent back to the first host. This m etric w as introduced to com plem ent the one-w ay delay since for
som e applications this is the quantity o f interest, it is sim pler to com pute and it can be determ ined
more accurately. Unfortunately in general the path from a source host to a destination m ay differ
from the path from the destination back to the source (“asym m etric paths”), such that different
sequences o f routers are used for the forward and reverse paths. Therefore round-trip m easurements
actually m easure the performance o f tw o distinct paths together. A lso , even w hen the tw o paths are
sym metric, they m ay have com pletely different performance characteristics due to asym m etric
queuing. On top o f this, the perform ance o f som e applications, especially m ultim edia streaming
ones, depend m ostly on the performance in one direction and therefore the m easurem ents o f the
round trip delay m ay not describe accurately enough the existing network situation the traffic o f
interest m ay have to face. In consequence the decision was taken not to m onitor round-trip delay in
the Q oDG S.
Round-trip loss w as defined52 as the percentage o f the packets sent by a host to another
host (meant to answer by sending a packet back) that were n ot fo llow ed by a corresponding
received packets from the total number o f packets sent. Round-trip loss, although w as listed by the
52 B T Ign ite , W eb site , h ttp ://ip p m .ig n ite .n e t/m o re_ in fo .h tm I
101
Gabriel-Miro Muntean - Ph.D. Thesis 4. QOAS for Multimedia Streaming
IPPM W orking Group as a metric o f interest, has not m ade the w orking group m em bers to propose
a RFC yet, due to its low er usage interest in com parison w ith the on e-w ay loss m etric. Therefore,
taking also into account the probability o f dealing w ith asym m etric paths for w hich the round-trip
loss w ill not g ive significant information related to the path the m ultim edia data takes to the
destination, the round-trip loss was not considered important to be m onitored by the Q oD G S.
One-way delay variation for a pair o f packets in a stream o f packets w as defined in [213]
as the difference betw een the one-w ay-delays com puted for the selected packets. A s previously
m entioned, in networks the one-w ay delays vary much due to the routers’ queuing and/or the usage
different paths by the packets to reach the destination. S ince the network congestion is a
phenom enon that builds up by increasing the number o f packets trafficked trough the network
forcing the routers to queue them and in consequence to introduce increasing delays, delay variation
(or delay jitter [214]) is an important m etric that signalises such a situation [215]. The effect o f a
highly variable delay jitter w as also studied, especially in relation to tim e-sensitive applications,
including those that stream m ultim edia. The conclusion was that although these applications w ould
best perform i f the delay w as constant for all the packets, a certain variation can be coped with
using receiver buffering. Unfortunately w hen the delay jitter exceeds a certain threshold, the
received buffering is not enough and the perform ances o f the applications are severely affected. For
the case o f m ultim edia streaming applications, a highly variable delay causes loss o f data by either
buffer over-run or under-run, sign ificantly reducing the end-user perceived quality. This was
confirm ed by researchers that have studied the delay variation [154, 195, 205 , 206, 207, 208], Their
conclusion that there is a certain correlation betw een the d elay variation and loss rate (and
consequent quality o f service) that neither can be fully described, nor can be neglected, m akes us to
suggest to use delay jitter as one o f the m onitored parameters by the Q oD G S.
Loss pattern (or loss distribution) is a key parameter for certain real-tim e applications (e.g.
m ultim edia-based ones) that determ ines the performance observed by the users. For the sam e loss
rate, tw o different loss distributions could potentially produce different perceptions o f performance
[216]. The im pact o f loss pattern is also extrem ely important for non-real-tim e applications that use
an adaptive protocol such as TCP. Research results that dem onstrate the im portance and existence
o f loss burstiness and its effect on packet vo ice and video applications are published in [217, 218,
219, 220], In [216] tw o m etrics, nam ed ’’loss distance” and “loss period” , w ere defined to describe
the loss pattern. The “loss period” m etric captures the frequency and length (burstiness) o f loss once
it starts, and the “loss distance” m etric captures the spacing betw een the loss periods. The Q oD G S
1 0 2
Gabriel-Miro Muntean - Ph.D. Thesis 4. QOAS for Multimedia Streaming
takes into account the loss pattern through its short-term and long-term grading m echanism s. These
m echanism s try to consider also the patterns o f other param eters’ variations.
Packet reordering w as considered a performance issue o f certain importance since has
determined the IETF IPPM W orking Group [61] to propose a m etric subject o f an Internet Draft
[220] that seem s likely to becom e a RFC soon. A reordering m etric is relevant for m any
applications, but significant only for tim e-sensitive ones and on ly w hen the extent o f reordering
affects the applications’ performance. In general packet order is not expected to change during
transm ission from a host to another one, but there are cases w hen it does change. For exam ple w hen
a single packet stream is sent from a host to another one b etw een w hich there are two paths, one
with slightly longer transfer tim e, the packets traversing the longer path m ay arrive out-of-order.
The ability to restore order at the destination w ill likely have finite lim its and m ainly due to the
receiver buffers’ finite size in terms o f packets, bytes, or time. A lso it is important to quantify the
extent o f reordering, or lateness, in all m eaningful dim ensions. S ince the percentage o f out-of-order
packets from the total number o f packets sent in the m easurem ents carried out and reported in [207,
221] w as very low , our decision w as for the Q oDG S not take this parameter into account. This is
also supported by the fact that the target network the m ultim edia stream ing application the Q oD G S
is aim ed for has little or no parallel paths that could constitute a cause for the out-of-order arrival o f
packets. H ow ever, the extensib ility o f the Q oD G S ’s design should a llow for adding the percentage
o f out-of-order packets as m onitored parameter i f Q O A S-based m ultim edia system is m eant to be
deployed in the Internet where lately, due to the increase in the num ber o f parallel paths, the packet
reordering is m ore com m on than thought [222],
Bulk transport capacity (BTC ) m etric, as defined b y IPPM W G in [223] w as m eant to
measure a network's ability to transfer significant quantities o f data w ith a single congestion-aware
transport connection (e.g ., TCP). The intuitive definition o f BT C is the expected long-term average
data rate (bits per second) o f a single ideal TCP im plem entation over the path in question. A lthough
there was som e interest for BTC [224] and it may be useful for som e applications, for m ultim edia
streaming applications the transport capacity using a reliable transport protocol is o f little interest,
more significant being the tim ely arrival o f data w hich affects m ore the quality o f service. In
consequence the BTC w as not taken into account as a parameter to be m onitored by the Q oDG S.
Link bandwidth capacity is an important m etric for m any applications, but o f more
interest is the available bandwidth related to a link. There is sign ificant research in this direction
[209, 225, 226] that has to face problem s o f scalability, intrusiveness, accuracy and high
com putation related to the determination o f the available bandwidth at any m om ent. Apart from
103
Gabriel-Miro Muntean - Ph.D. Thesis 4. QOAS for Multimedia Streaming
this, IETF IPPM W G ’s [61] Internet Draft referred in [227] su ggests a m ethod to m easure the
available bandwidth o f a path using an active approach that probes the path using TCP N ew R eno.
Since there is no general accepted m etric or m echanism to determ ine the available bandwidth at any
m om ent w ith significant accuracy, it was not taken into account directly as a parameter for the
Q oD G S. H ow ever, the InteR-stream Q O A S uses an estim ation o f the link bandwidth capacity that
is described in detail in section 4.8.
In conclusion, after assessing these performance m etrics proposed by IETF IPPM W orking
Group, the decision w as taken to m onitor and to grade the on e-w ay delay, the delay variation (jitter)
and the one-w ay loss rate by the Q oD G S. The loss pattern and the other param eters’ variation
patterns arc taken into consideration in the grading schem e w h ile the percentage o f out-of-order
packets is allow ed to be taken into account in future, i f the target network for Q O A S-based system s
is different. The Q oD G S m akes also use o f the Q m etric, w hich w as described in detail in section
4.4 in order to assess the end-user quality during the streaming process.
4.5.4 Measurements Accuracy
The one-w ay delay, the delay jitter and the one-w ay loss rate w ere the parameters taken into
account for m onitoring by the Q oD G S. A s m entioned in [204, 210 , 213] there is a significant
problem w hen m easuring these m etrics due to their sensitiv ity to clock-related errors and
uncertainties. There are tw o types o f errors and uncertainties: i) due to the difference betw een the
w ire-tim e and the h osts’ clocks tim es or betw een the real tim e (U T C ) and h osts’ clocks tim es and ii)
due to uncertainties in the clocks o f the source and the destination h osts’ clocks. These problem s are
summ arised next, according to their source: clock wire-tim e, clock offset, clock synchronisation ,
clock accuracy , clock resolution and clock skew.
The wire-time w as defined as the tim e at w hich a packet appeared on a link, without
exactly specify ing whether this refers to the first bit, the last bit, etc. Unfortunately there are metrics
defined using w ire-tim e, w hich has to be related to the h ost’s clock tim e, process that m ay introduce
errors. Q oD G S uses only IETF IPPM W G - defined m etrics that do not introduce this kind o f errors.
If there is a sign ificant interest in the high accuracy o f the results related to the real tim e
(universal tim e clock - U T C ), another source o f error m ay be caused by the clock offset which
represents the difference betw een the tim e reported by the clock and the "true" tim e as defined by
the UTC at a particular m om ent. Since the QO AS does not relate its results to the UTC, there w ill
not be such errors.
104
Gabriel-Miro Muntean - Ph.D. Thesis 4. QOAS for Multimedia Streaming
I f the source h ost’s clock and the destination h ost’s clock are not synchronised, this w ill
cause an error in the delay m easurement. The source c lock and the destination c lock have a
synchronisation error o f Tsynch i f the source clock is Tsynch ahead o f the destination clock. Thus,
i f the value o f Tsynch is know n exactly, the clock synchronisation error could be corrected by
adding Tsynch to the uncorrected value o f Tdest-Tsource. In practice the synchronisation error is
not know n precisely (and varies w ith the time) and therefore the synchronisation o f the tw o h osts’
clocks is recom m ended prior to the m easurements.
The clock accuracy is important only in identifying the exact tim e at w hich a g iven delay
or loss was measured. C lock accuracy as is has no im portance to the accuracy o f the m easurement
o f delay or loss. W hen com puting delays, including in the Q oD G S case, only the differences
betw een clock values are interesting and not also the values them selves.
The clock resolution adds a certain uncertainty about the tim e m easured w ith it. For
exam ple i f the source clock has a resolution o f 10 m sec, an uncertainty o f 10 m sec is added to any
tim e m easured w ith it, including the ones that are used to com pute the one-w ay delays.
The skew of a clock is not so m uch an additional issue as it is a realisation o f the fact that
Tsynch is itse lf a function of tim e. Thus, i f Tsynch is to be m easured or bound, this needs to be
done periodically.
S ince both the hardware and the software com puter clock s o f both the source and the
destination hosts are poor tim ekeepers [228], a good practical solution that both keeps the c lo ck s’
skew s to m inim um and m aintains them synchronised is to periodically synchronise the clocks w ith
a third, more reliable clock. For a very precise synchronization, special arrangements that include
GPS, a local atom ic clock or an ISD N synchronous clock board are needed [229]. H ow ever
m ultim edia streaming deals w ith m illisecond order delays, so N T P protocol [230] can be used for
synchronizing both clocks separately w ith a third external clock . This is the approach Q O A S takes
for maintaining a good lev e l o f accuracy in the m easurements related to the one-w ay delay, the on e
w ay loss and the delay jitter and it uses the U .S . atom ic clock located in Boulder - Colorado,
U S A 53,54,55 or any other public N TP tim e server56.
53 T h e O ffic ia l U .S . T im e, h ttp ://w w w .tim e .g o v
5 4 N a tio n a l In s titu te o f S tandards and T ech n o lo g y , U SA , A to m ic C lock , h ttp ://w w w .b o u ld e r.n is t.g o v /d o c-to u r/a to m ic_ cIo ck .h tm l
105
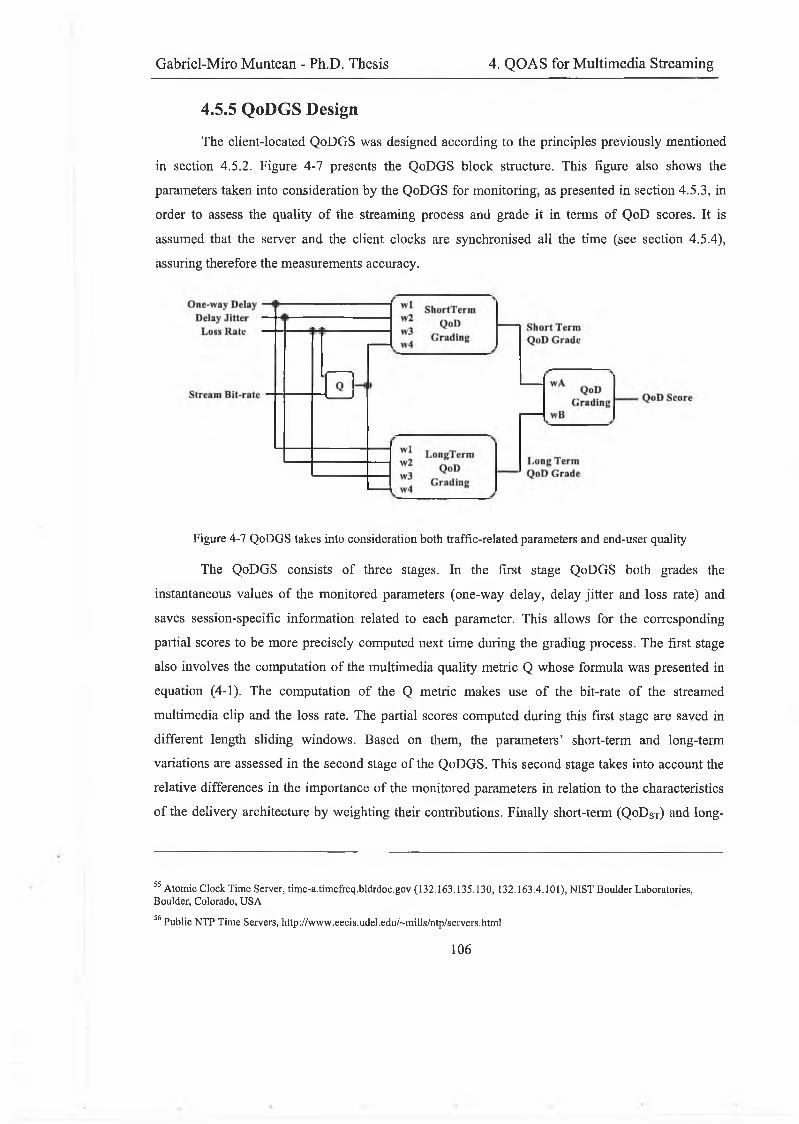
Gabriel-Miro Muntean - Ph.D. Thesis 4. QOAS for Multimedia Streaming
4.5.5 QoDGS Design
The client-located Q oD G S was designed according to the principles previously m entioned
in section 4 .5 .2 . Figure 4 -7 presents the Q oD G S block structure. This figure also sh ow s the
parameters taken into consideration by the Q oD G S for m onitoring, as presented in section 4 .5 .3 , in
order to assess the quality o f the streaming process and grade it in terms o f Q oD scores. It is
assum ed that the server and the client clocks are synchronised all the tim e (see section 4 .5 .4),
assuring therefore the m easurem ents accuracy.
Figure 4-7 QoDGS takes into consideration both traffic-related parameters and end-user quality
The Q oD G S consists o f three stages. In the first stage Q oD G S both grades the
instantaneous values o f the m onitored parameters (one-w ay delay, delay jitter and lo ss rate) and
saves session -sp ecific inform ation related to each parameter. This allow s for the corresponding
partial scores to be m ore precisely com puted next tim e during the grading process. The first stage
also involves the com putation o f the m ultim edia quality metric Q w hose formula was presented in
equation (4-1). The com putation o f the Q m etric m akes use o f the bit-rate o f the streamed
m ultim edia clip and the loss rate. The partial scores com puted during this first stage are saved in
different length sliding w indow s. B ased on them, the param eters’ short-term and long-term
variations are assessed in the second stage o f the Q oD G S. This second stage takes into account the
relative differences in the im portance o f the m onitored parameters in relation to the characteristics
o f the delivery architecture by w eighting their contributions. F inally short-term (QoDSt) and lon g
55 A to m ic C lock T im e S erver, tim e -a .tim efreq .b ld rd o c .g o v (132 .1 6 3 .1 3 5 .1 3 0 , 1 3 2 .1 63 .4 .101 ), N IS T B o u ld e r L abora to ries , B ou lder, C o lorado , U S A
5 6 P u b lic N T P T im e S ervers , h ttp ://w w w .ee c is .u d e l.ed u /~ m ills /n tp /serv ers .h tm l
106
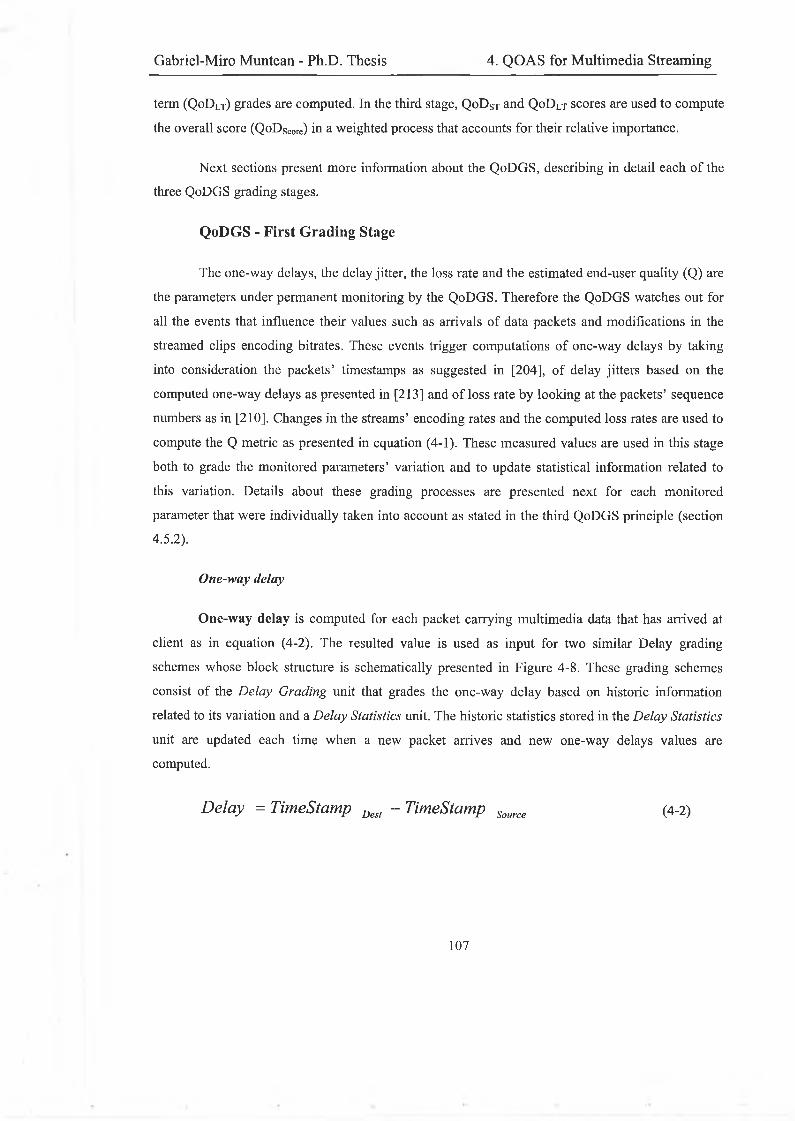
Gabriel-Miro Muntean - Ph.D. Thesis 4. QOAS for Multimedia Streaming
term (QoDLt) grades are com puted. In the third stage, QoDSt and QoDLt scores are used to com pute
the overall score ( Q o D Sc0r e ) i n a w eighted process that accounts for their relative importance.
N ext sections present m ore information about the Q oD G S, describing in detail each o f the
three Q oDG S grading stages.
QoDGS - First Grading Stage
The one-w ay delays, the delay jitter, the loss rate and the estim ated end-user quality (Q) are
the parameters under perm anent m onitoring by the Q oD G S. Therefore the Q oD G S w atches out for
all the events that in fluence their values such as arrivals o f data packets and m odifications in the
streamed clips encoding bitrates. These events trigger com putations o f one-w ay delays by taking
into consideration the packets’ timestamps as suggested in [204], o f delay jitters based on the
computed one-w ay delays as presented in [213] and o f loss rate by looking at the packets’ sequence
numbers as in [210], C hanges in the stream s’ encoding rates and the com puted loss rates are used to
com pute the Q m etric as presented in equation (4-1). These m easured values are used in this stage
both to grade the m onitored param eters’ variation and to update statistical information related to
this variation. D etails about these grading processes are presented next for each m onitored
parameter that w ere individually taken into account as stated in the third Q oD G S principle (section
4.5.2).
One-way delay
One-way delay is com puted for each packet carrying m ultim edia data that has arrived at
client as in equation (4-2). The resulted value is used as input for tw o sim ilar D elay grading
schem es w hose block structure is schem atically presented in Figure 4-8. These grading schem es
consist o f the D elay Grading unit that grades the on e-w ay delay based on historic information
related to its variation and a D elay Statistics unit. The historic statistics stored in the Delay Statistics
unit are updated each tim e w hen a new packet arrives and new one-w ay delays values are
computed.
Delay = TimeStamp Desl - TimeStamp Source (4-2)
1 0 7
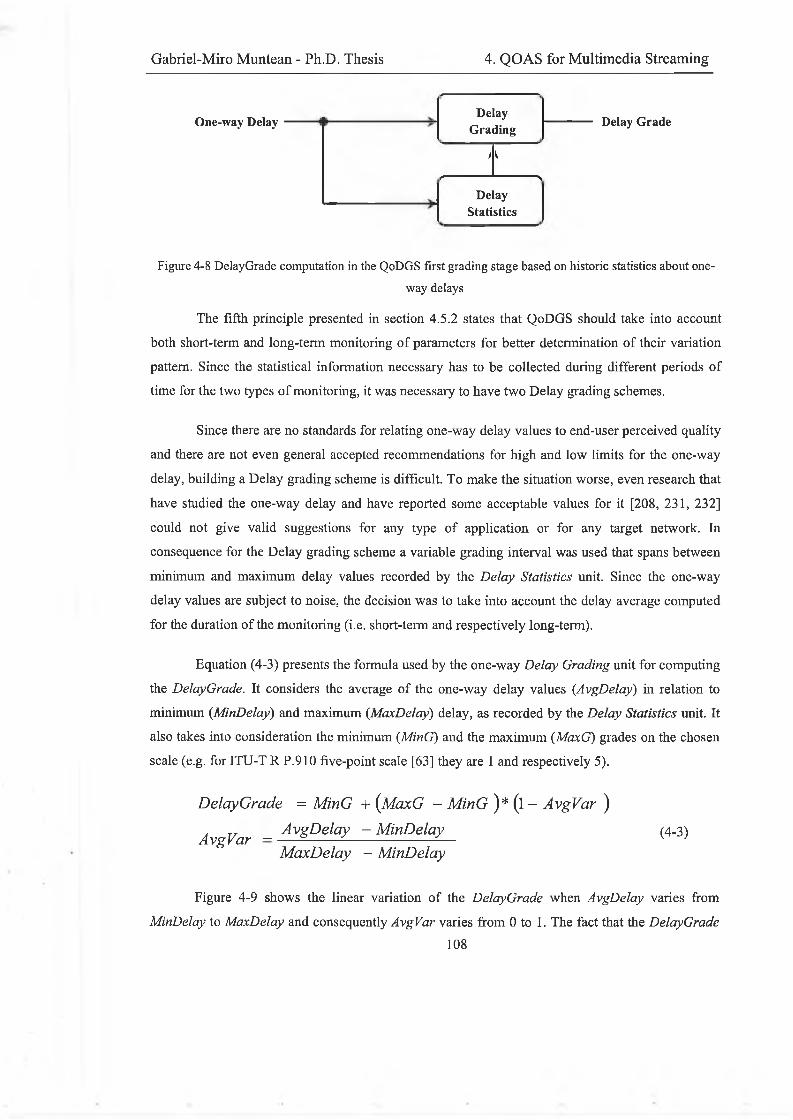
Gabriel-Miro Muntean - Ph.D. Thesis 4. QOAS for Multimedia Streaming
One-way DelayDelay
Grading
>\
r ■> Delay
Statistics
Delay Grade
Figure 4-8 DelayGrade computation in the QoDGS first grading stage based on historic statistics about one
way delays
The fifth principle presented in section 4 .5 .2 states that Q oD G S should take into account
both short-term and long-term m onitoring o f parameters for better determination o f their variation
pattern. S ince the statistical information necessary has to be co llected during different periods o f
tim e for the two types o f m onitoring, it was necessary to have tw o D elay grading schem es.
Since there are no standards for relating on e-w ay delay values to end-user perceived quality
and there are not even general accepted recom m endations for h igh and low lim its for the one-w ay
delay, building a D elay grading schem e is difficult. To m ake the situation w orse, even research that
have studied the one-w ay delay and have reported som e acceptable values for it [208, 231 , 232]
could not g ive valid suggestions for any type o f application or for any target network. In
consequence for the D elay grading schem e a variable grading interval was used that spans betw een
m inim um and m axim um delay values recorded by the D elay Statistics unit. S ince the one-w ay
delay values are subject to n oise, the decision w as to take into account the delay average com puted
for the duration o f the m onitoring (i.e. short-term and resp ectively long-term ).
Equation (4-3) presents the form ula used by the on e-w ay D elay Grading unit for com puting
the DelayGrade. It considers the average o f the on e-w ay d elay values (AvgDelay) in relation to
m inim um (M inDelay) and m axim um (M axDelay) delay, as recorded b y the D elay Statistics unit. It
also takes into consideration the m inim um (MinG) and the m axim um (MaxG) grades on the chosen
scale (e.g. for IT U-T R P .910 five-point scale [63] they are 1 and respectively 5).
DelayGrade = MinG + (MaxG - MinG )* (l - AvgVar )AvgVar _ AvgDelay -M inD elay (4-3)
MaxDelay - MinDelay
Figure 4 -9 show s the linear variation o f the D elayG rade w hen A vgD elay varies from
M inDelay to M axDelay and consequently AvgVar varies from 0 to 1. The fact that the D elayG rade
108
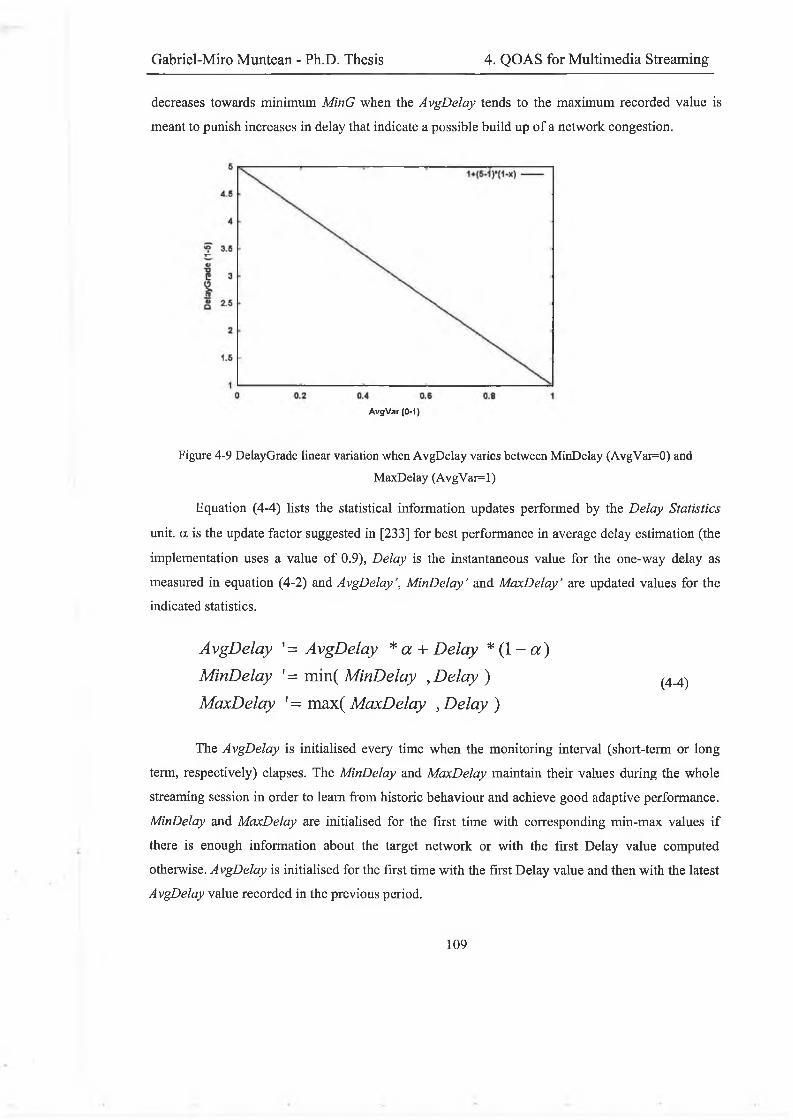
Gabriel-Miro Muntean - Ph.D. Thesis 4. QOAS for Multimedia Streaming
decreases towards m inim um M inG w hen the A vgD elay tends to the m axim um recorded value is
m eant to punish increases in delay that indicate a possib le build up o f a network congestion.
AvgVar (0-1)
Figure 4-9 DelayGrade linear variation when AvgDelay varies between MinDelay (AvgVar=0) and
MaxDelay (AvgVar=l)
Equation (4-4) lists the statistical inform ation updates performed by the D elay Statistics
unit, a is the update factor suggested in [233] for best perform ance in average delay estim ation (the
im plem entation u ses a value o f 0.9), D elay is the instantaneous value for the one-w ay delay as
m easured in equation (4 -2 ) and A vgD elay’, M inD elay’ and M axD elay’ are updated values for the
indicated statistics.
AvgDelay '= AvgDelay * a + D elay * (1 - a )
M inDelay '= min( MinDelay , D e la y ) 4.4^
M axDelay ' = max( MaxDelay , D elay )
The A vgD elay is initialised every tim e w hen the m onitoring interval (short-term or long
term, respectively) elapses. The M inDelay and M axDelay m aintain their values during the w hole
streaming session in order to learn from historic behaviour and achieve good adaptive performance.
MinDelay and M axDelay are initialised for the first tim e w ith corresponding m in-m ax values i f
there is enough inform ation about the target network or with the first D elay value com puted
otherwise. A vgD elay is in itialised for the first tim e w ith the first D elay value and then w ith the latest
AvgDelay value recorded in the previous period.
109
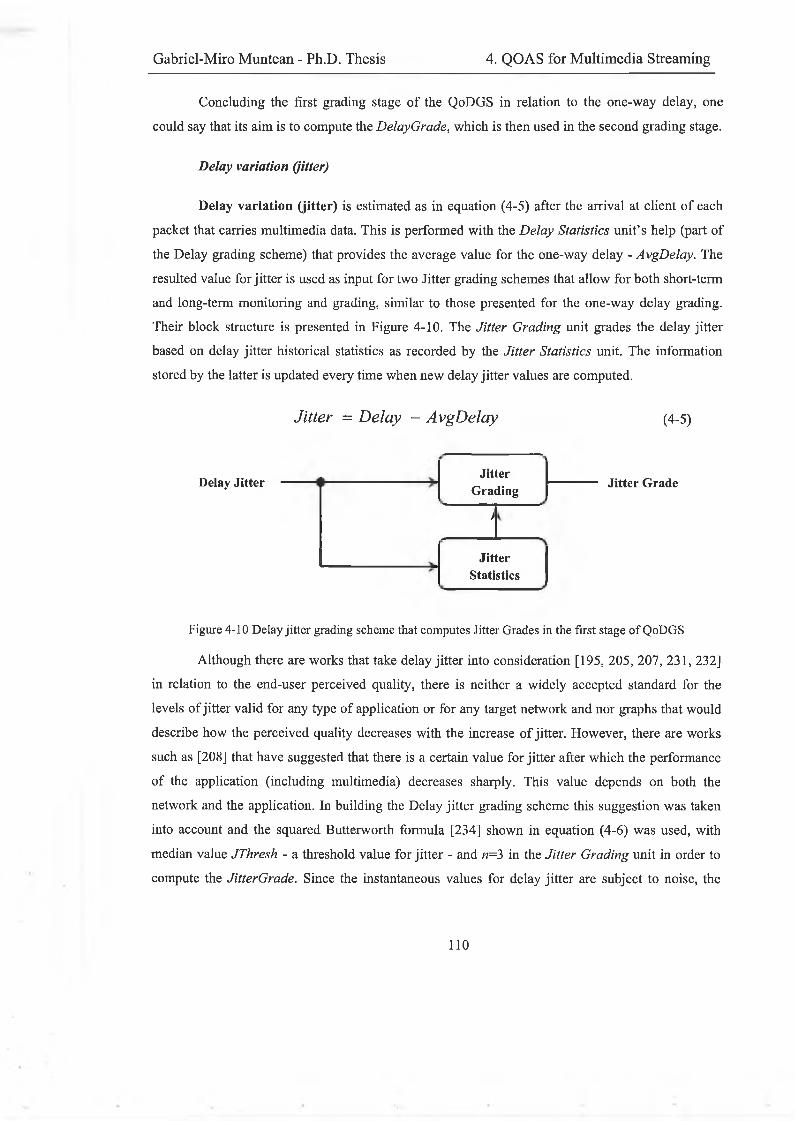
Gabriel-Miro Muntean - Ph.D. Thesis 4. QOAS for Multimedia Streaming
Concluding the first grading stage o f the Q oD G S in relation to the on e-w ay delay, one
could say that its aim is to com pute the DelayG rade, w hich is then used in the second grading stage.
Delay variation (jitter)
Delay variation (jitter) is estim ated as in equation (4-5) after the arrival at clien t o f each
packet that carries m ultim edia data. This is perform ed w ith the D elay Statistics unit’s help (part o f
the D elay grading schem e) that provides the average value for the one-w ay delay - AvgD elay. The
resulted value for jitter is used as input for two Jitter grading schem es that a llow for both short-term
and long-term m onitoring and grading, sim ilar to those presented for the on e-w ay delay grading.
Their block structure is presented in Figure 4-10. The Jitter Grading unit grades the delay jitter
based on delay jitter historical statistics as recorded by the Jitter Statistics unit. The information
stored by the latter is updated every tim e w hen new delay jitter values are com puted.
Jitter = Delay - AvgDelay (4-5)
Delay JitterJitter
Grading
;
JitterStatistics
Jitter Grade
Figure 4-10 Delay jitter grading scheme that computes Jitter Grades in the first stage o f QoDGS
A lthough there are works that take delay jitter into consideration [195, 205 , 207 , 231 , 232]
in relation to the end-user perceived quality, there is neither a w id ely accepted standard for the
levels o f jitter valid for any type o f application or for any target network and nor graphs that w ould
describe how the perceived quality decreases with the increase o f jitter. H ow ever, there are works
such as [208] that have suggested that there is a certain value for jitter after w hich the performance
o f the application (including m ultim edia) decreases sharply. This value depends on both the
network and the application. In building the D elay jitter grading schem e this suggestion w as taken
into account and the squared Butterworth form ula [234] shown in equation (4 -6 ) w as used, with
m edian value JThresh - a threshold value for jitter - and n= 3 in the Jitter Grading unit in order to
com pute the JitterGrade. S ince the instantaneous values for delay jitter are subject to noise, the
110
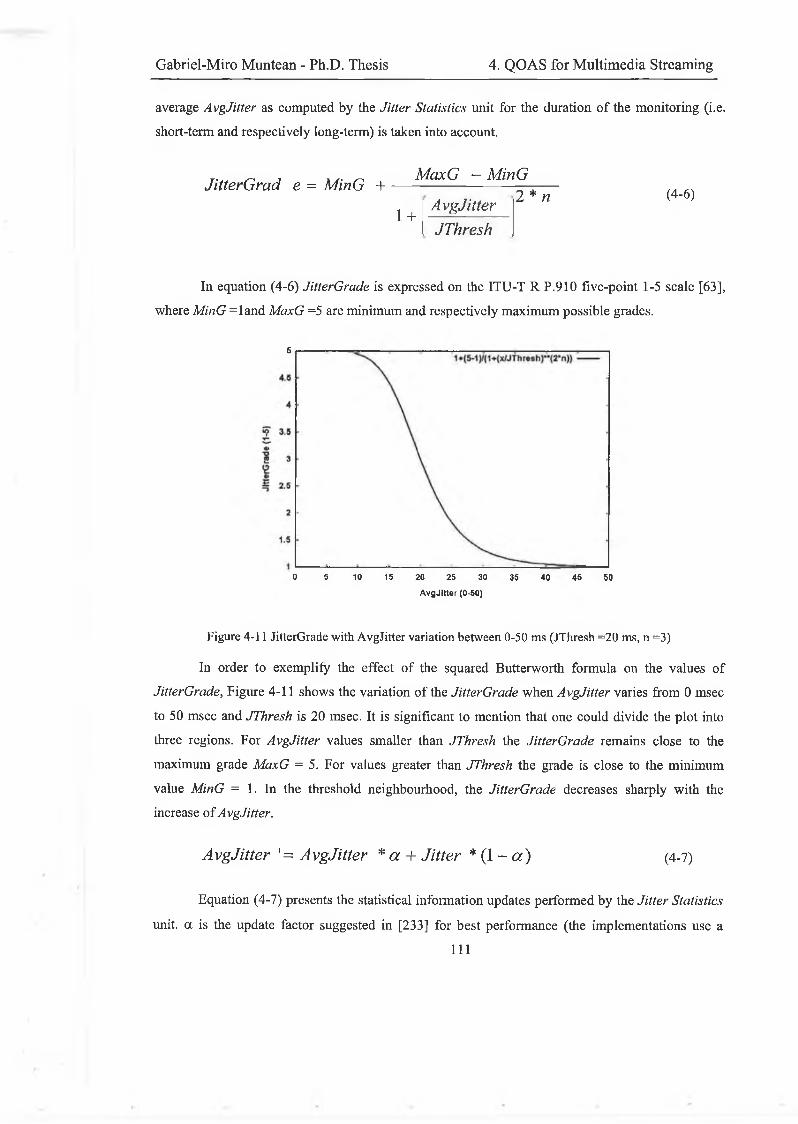
Gabriel-Miro Muntean - Ph.D. Thesis 4. QOAS for Multimedia Streaming
average AvgJitter as com puted by the Jitter Statistics unit for the duration o f the m onitoring (i.e.
short-term and respectively long-term ) is taken into account.
JitterG rad e = M inG +M axG - M inG
j + AvgJitter JThresh
2 * n (4-6)
In equation (4-6) JitterG rade is expressed on the IT U-T R P .910 five-point 1-5 scale [63],
where M inG = la n d MaxG =5 are m inim um and respectively m axim um p ossib le grades.
Figure 4-11 JitterGrade with AvgJitter variation between 0-50 ms (JThresh =20 ms, n =3)
In order to exem plify the effect o f the squared Butterworth form ula on the values o f
JitterGrade, Figure 4-11 show s the variation o f the JitterG rade w hen AvgJitter varies from 0 m sec
to 50 m sec and JThresh is 20 m sec. It is significant to m ention that one could divide the p lot into
three regions. For A vgJitter values sm aller than JThresh the JitterG rade remains c lose to the
m axim um grade M axG = 5. For values greater than JThresh the grade is c lose to the m inim um
value MinG = 1. In the threshold neighbourhood, the JitterG rade decreases sharply w ith the
increase o f AvgJitter.
6
0 5 10 15 20 25 30 35 40 45 50
AvgJitter (0-50)
AvgJitter '= AvgJitter * a + Jitter * (1 - a ) (4-7)
Equation (4-7) presents the statistical inform ation updates performed by the Jitter Statistics
unit, a is the update factor suggested in [233] for best performance (the im plem entations use a
111
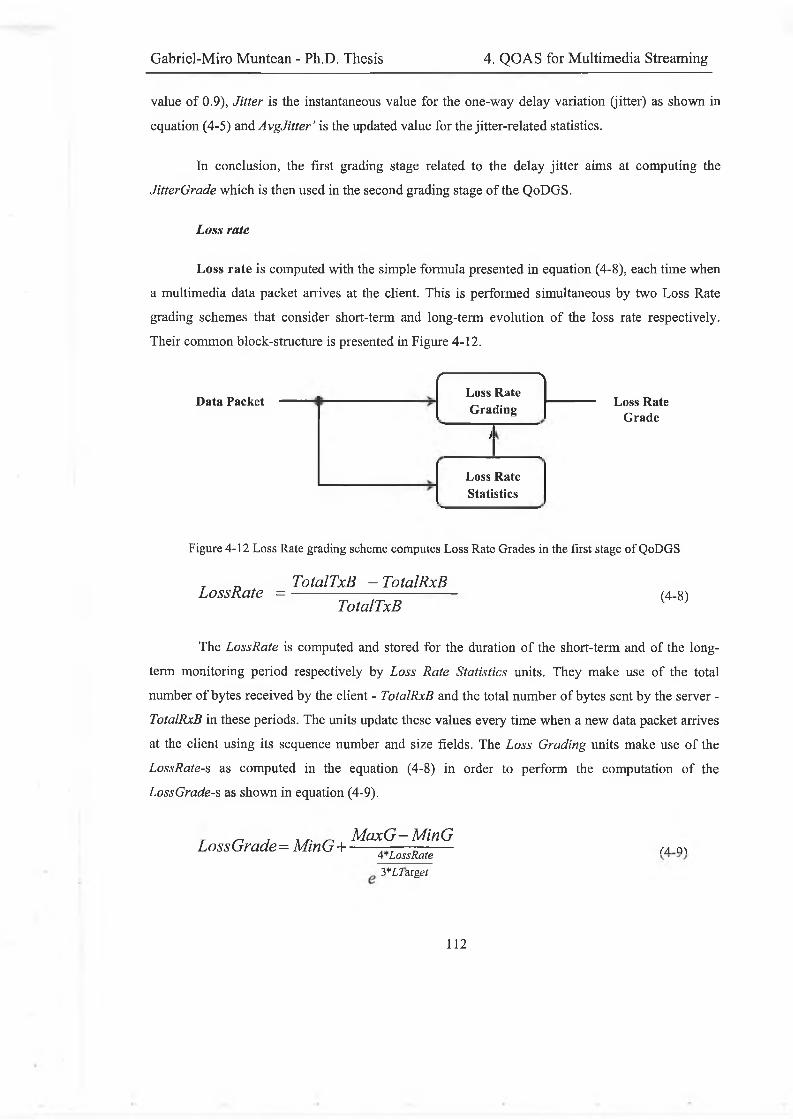
Gabriel-Miro Muntean - Ph.D. Thesis 4. QOAS for Multimedia Streaming
value o f 0 .9), Jitter is the instantaneous value for the one-w ay delay variation (jitter) as shown in
equation (4-5) and AvgJitter' is the updated value for the jitter-related statistics.
In conclusion, the first grading stage related to the delay jitter aim s at com puting the
JitterG rade w hich is then used in the second grading stage o f the Q oD G S.
Loss rate
Loss rate is com puted w ith the sim ple form ula presented in equation (4-8), each tim e w hen
a m ultim edia data packet arrives at the client. This is performed sim ultaneous by tw o L oss Rate
grading schem es that consider short-term and long-term evolution o f the loss rate respectively.
Their com m on block-structure is presented in Figure 4-12.
Data Packet
f >Loss Rate Grading
>
Loss Rate Statistics
Loss Rate Grade
Figure 4-12 Loss Rate grading scheme computes Loss Rate Grades in the first stage o f QoDGS
, _ TotalTxB - TotalRxBLossRate = ------------------------------- (4-8')TotalTxB K ’
The LossRate is com puted and stored for the duration o f the short-term and o f the long
term m onitoring period respectively by Loss Rate Statistics units. They m ake use o f the total
number o f bytes received by the client - TotalRxB and the total num ber o f bytes sent b y the server -
TotalRxB in these periods. The units update these values every tim e w hen a n ew data packet arrives
at the client using its sequence number and size fields. The Loss Grading units m ake use o f the
LossRate-s as com puted in the equation (4-8) in order to perform the com putation o f the
LossGrade-s as show n in equation (4-9).
„ , . . . M a x G -M in GLoss Grade = MinG A----— — (A q\A* Loss Rate
3*Z,7arge/
112
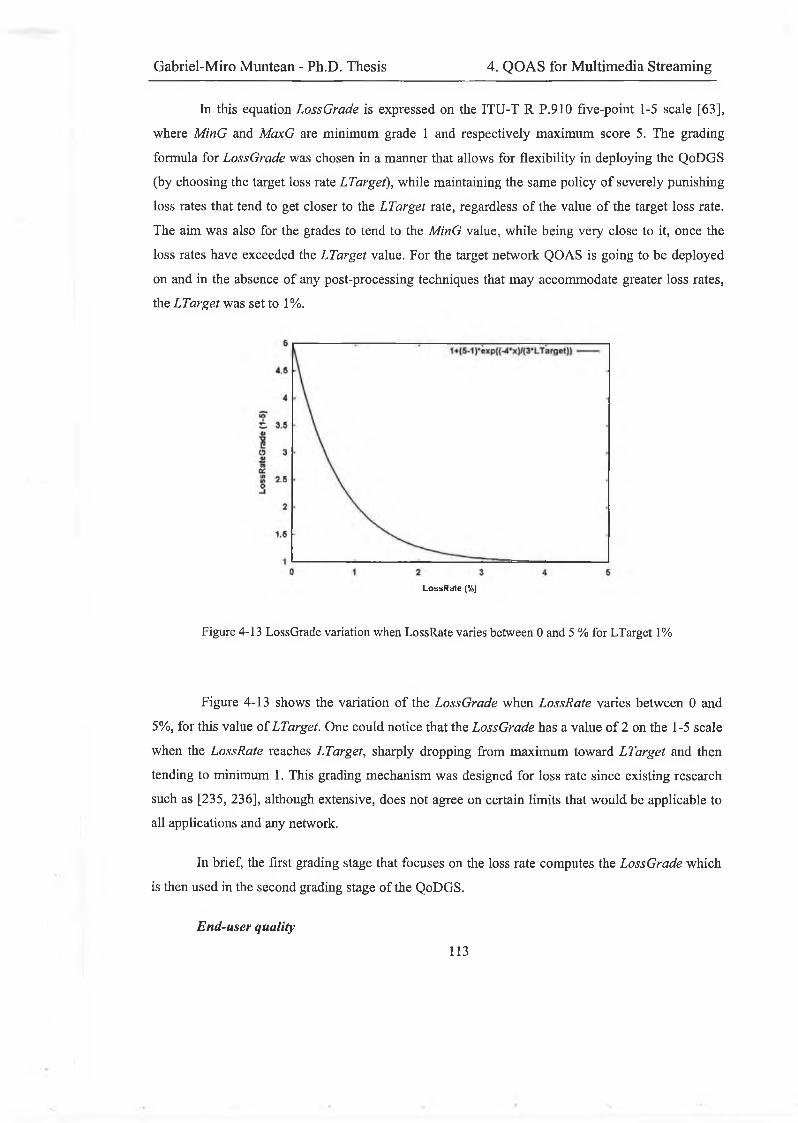
Gabriel-Miro Muntean - Ph.D. Thesis 4. QOAS for Multimedia Streaming
In this equation LossGrade is expressed on the IT U -T R P .910 five-point 1-5 scale [63],
where M inG and MaxG are m inim um grade 1 and respectively m axim um score 5. The grading
formula for LossG rade was chosen in a manner that a llow s for flexib ility in deploying the Q oD G S
(by choosing the target loss rate LTarget), w hile m aintaining the sam e p olicy o f severely punishing
loss rates that tend to get closer to the LTarget rate, regardless o f the value o f the target loss rate.
The aim w as also for the grades to tend to the MinG value, w h ile being very close to it, once the
loss rates have exceeded the LTarget value. For the target network Q O AS is going to be deployed
on and in the absence o f any post-processing techniques that m ay accom m odate greater loss rates,
the LTarget w as set to 1%.
LossRate (%)
Figure 4-13 LossGrade variation when LossRate varies between 0 and 5 % for LTarget 1%
Figure 4-13 show s the variation o f the LossG rade w hen LossRate varies betw een 0 and
5%, for this value o f LTarget. O ne could notice that the LossG rade has a value o f 2 on the 1 -5 scale
w hen the LossRate reaches LTarget, sharply dropping from m axim um toward LTarget and then
tending to m inim um 1. This grading m echanism w as designed for loss rate sin ce existing research
such as [235, 236], although extensive, does not agree on certain lim its that w ould be applicable to
all applications and any network.
In brief, the first grading stage that focu ses on the loss rate com putes the LossG rade w hich
is then used in the second grading stage o f the Q oD G S.
End-user quality
1 1 3
Gabriel-Miro Muntean - Ph.D. Thesis 4. QOAS for Multimedia Streaming
End-user quality is m easured by the m etric Q [133], w hich describes the joint im pact o f
M PEG rate and data loss on v id eo quality w hose formula is presented in equation (4-1). Figure 4 -6
plots the variation o f the Q value w ith the variation o f video bitrate for certain loss rates. Section 4 .4
also highlights the reasons Q w as chosen for m easuring the end-user quality.
For taking into consideration both short-term and long-term variations o f end-user quality
as estim ated by Q, the com putation o f Q requires values o f the loss rates for the corresponding
m onitoring periods. For retrieving these values, the Q grading schem e co-operates w ith the short
term and long-term Loss Rate grading sch em es’ Statistics units. This inform ation and instantaneous
streamed m ultim edia bitrates are used to com pute the Q m etric values that are used in the next
grading stage o f the QoDG S.
QoDGS - Second Grading Stage
The second stage in the Q oD grading process is focused on taking into account the relative
difference betw een the im portance o f the m onitored parameters and on com puting both the short
term score Q oD st score and the long-term grade Q oD Lt score- Short-term variations are important for
learning quickly about transient effects, such as sudden traffic changes or operating system /software
problem s, and for reacting as fast as p ossib le to the resulting effects (e.g . h igh loss, excessive
delays). Long-term variations are m onitored in order to track slow changes in the delivery
environm ent (e.g. new users in the system ). Their effects are not evident on short-term and therefore
longer m onitoring periods are necessary.
Figure 4 -14 presents graphically the short-term second grading stage o f the Q oD G S. The
only difference betw een the short-term and the long-term grading procedures is the duration o f the
period the statistics related to the m onitored parameters was co llected for. The short term grading
schem e focuses on the changes that occur on short term, regardless to w hat happens on a greater
scale, whereas the long-term grading schem e, presented in Figure 4-15 , grades variations that
happens on longer tim e scale. These short-term and long-term periods are considered, respectively,
an order and two orders o f m agnitude greater than the tim e betw een consecutive feedback reports.
114

Gabriel-Miro Muntean - Ph.D. Thesis 4. QOAS for Multimedia Streaming
DelayGradeST JitterGrade LossGrade
ST
Q Grade,ST
ST
wlw2w3w4
ShortTermQoD
GradingQoDST Score
Figure 4-14 Short-term QoDGS second grading stage
DelayGrade JitterGrade, LossGrade
Q Grade,
QoD LT Score
Figure 4-15 Long-term QoDGS second grading stage
Figure 4-14 and Figure 4-15 also show how each grade com puted in the Q oD G S ’s first
stage in relation to a certain m onitored parameter has associated a different w eight w, and
respectively w The m ore important the parameter i is, the higher the value o f the corresponding
w eight w, or w is, and therefore the higher the contribution o f its grade in the overall com puted
scores: Q o D St score or Q oD lt score- Equations (4-10) and (4 -11) present the formulas according to
w hich the Q oD short-term and long-term scores are com puted. The form ulas are similar, but they
use different values for both the w eights and the grades that were com puted for two different sets o f
statistically collected data.
QoDSTScore - w, * DelayGrade + w2 * JitterGrade
+ w3 * LossGrade + w4 * QGrade
QoDlt Score = w\* DelayGrade + w'2* JitterGrade(4-11)
+ w\* LossGrade + w'4* QGrade
For accurate results, it is necessary to respect the conditions from equations (4 -12) and (4-13).
4
X w i = 1 (4-12)i = 1
115
Gabriel-Miro Muntean - Ph.D. Thesis 4. QOAS for Multimedia Streaming
4
X W 'i = 1 (4-13)i = l
This Q oD G S design provides a high degree o f flex ib ility by defining two different sets o f
m onitored param eters-associated w eights for short-term and respectively long-term m onitoring. In
practice tuning such a system with so m any variables is very difficult and w e have suggested the
use o f identical sets o f w eights (w, =w ’,) in this second stage o f the grading process.
QoDGS - Third Grading Stage
The third grading stage in this three-stage grading process com bines the short-term and the
long-term Q oD grades com puted in the previous stage, taking into account their relative
importance. In order to a llow for fast com putation as stated in the sixth principle (section 4 .5 .2),
two different w eights wA and w B w ere associated w ith these scores. The final Q oD Sc0re is calculated
according to the form ula presented in the equation (4 -14), w ith values for wA and wB that respect the
condition presented in equation (4-15).
Q °D Score = W A * Q °D ST Score + W B * Q oD [T Score (4 -14)
W A + W B = 1 (4 -15)
The com puted Q o D S c0res are sent to the server via the Feedback M echanism that is described
in section 4.7 o f this chapter and used by the server Arbitration schem e as described in section 4.6
to assess the quality o f delivery and take adaptive decisions w hen necessary.
E xtensive testing was performed in order to tune the Q oD G S and to determine values for wA
and w B, and for w h w2, W3 and w 4 that best achieve the Q O A S ’s goals in local broadband IP-
networks. G ood adaptiveness and responsiveness to network traffic variations, significant quality
stability, high link utilisation and good end-user quality w ere obtained for the fo llow in g set o f
weights: wA = 0 .75, wB = 0 .25, wi = 0 .4 , w2 = 0.3, w 3 = 0 .2 , and w 4 = 0.1. Tests that in volve a
sim ulation m odel o f a Q O A S-based m ultim edia streaming system and their results are presented in
the sixth chapter that focuses on experim ental testing.
1 1 6
Gabriel-Miro Muntean - Ph.D. Thesis 4. QOAS for Multimedia Streaming
4.6 Server Arbitration Scheme (SAS)
4.6.1 SAS Overview
Apart from Q oD G S, another important com ponent o f the Q O A S is the Server Arbitration
Schem e (S A S ) that has to analyse the feedback-reported inform ation and to take adaptive decisions
i f and w hen necessary. Its goal is:
• to collect the feedback transmitted Q oD scores com puted by the Q oD G S,
• to analyse the Q oD scores received during a recent period o f time,
• to take decisions in relation to the reported quality o f delivery and to trigger quality
adaptations.
B y determining quality adaptations based on feedback-received Q oD scores, the SA S aims
at im proving the quality o f delivery in the existing streaming conditions.
4.6.2 SAS Principles
In order to achieve the S A S ’s goals, the fo llow in g principles related to the SA S design were
formulated.
1. The SAS takes into account the Q oD scores as received via feedback from the Q oD G S
located at the client. SA S should differently consider the p ositive feedback reports and
negative ones in relation to the current quality o f the streamed m ultim edia clip . An
asymmetric behaviour should ensure a fast reaction during difficult delivery conditions
that affect the end-user quality, reducing their length and a slow reaction to feedback
that indicates im proved streaming. In this manner the S A S helps in the elim ination o f
the cause o f the increased traffic condition, fast reducing its contribution to the overall
transferred data. B y cautiously reacting to p ositive reports, SAS intends to a llow for the
network to recover before upgrading the quality o f the streamed m ultim edia and
therefore to increase its contribution to the overall traffic.
2. The SAS takes into account more than a single feedback report in order to reduce the
influence o f eventual n oise in the received Q oD scores that m ay cause temporal
instability in selecting a quality for the streamed m ultim edia.
117
Gabriel-Miro Muntean - Ph.D. Thesis 4. QOAS for Multimedia Streaming
3. The SAS is allow ed to suggest only quality changes adjacent to the current quality o f
the streamed m ultim edia clip. This is in order to reduce the eventual negative influence
in the end-user perceived quality.
4. The SA S has to be able to help in the quality adaptation process even i f the feedback
reports do not arrive at the server. This is considered as an indication o f network
congestions and determ ines SAS to suggest quality degradations, trying to help in
solving this problem. I f the situation continues, the stream is transmitted at the low est
possib le quality.
5. The SAS analysis and decision taking has to be perform ed very fast in order not to
influence negatively the performance o f the m ultim edia server application. A lso it has
to be able to suggest quality variations at any time, independent from m ultim edia
streaming and from the process that effective ly perform s the quality variation at m edia
level. In this w ay the latter can be perform ed in such a manner that is the least
disturbing for the rem ote viewer.
6. The SA S decisions have to be dependent only on Q oD scores received from the
Q oD G S and the arrival or not o f the feedback m essages. They m ust not be dependent
on other parameters in order to have a detennin istic behaviour o f the Q O AS and
Q O A S-based m ultim edia streaming system that uses it.
4.6.3 SAS Design
The server-situated SA S w hose block structure is presented in Figure 4-16 was designed
according to the principles previously m entioned in section 4 .6 .2 . The figure also show s the input
parameter taken into consideration by the SAS - the Q oD scores com puted by the Q oD G S and sent
to the server via feedback. D ue to the fact that SA S asym m etrically assesses the feedback, SAS
consists o f two sim ilar m odules: the D owngrade Module - in charge w ith the analysis o f feedback
and assessing the opportunity o f a downgrade in the stream quality and the Upgrade Module -
which analyses i f an upgrade in stream quality is beneficial. T hese m odules suggest changes in
quality to the SAS D ecisions M odule that takes the decisions. The Timer's role is to driven
degradation decisions i f the feedback does not arrive at the server, suggesting that there is a delivery
problem.
1 1 8
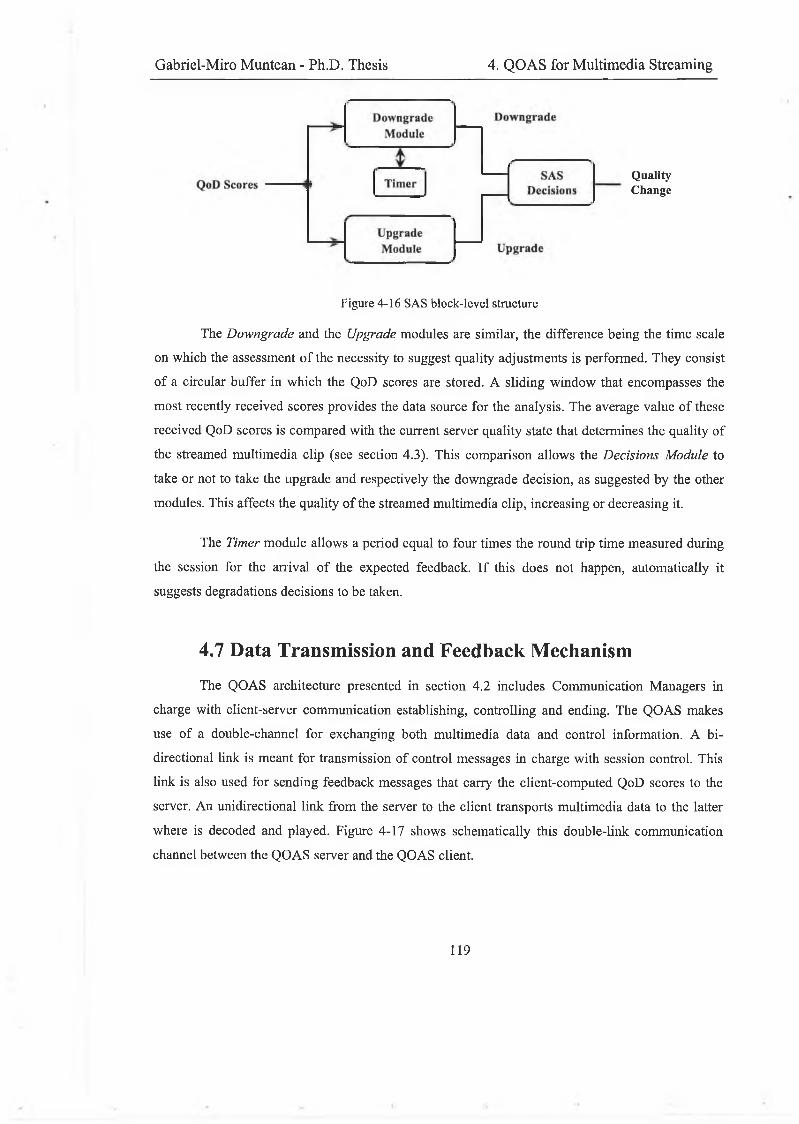
Gabriel-Miro Muntean - Ph.D. Thesis 4. QOAS for Multimedia Streaming
QualityChange
Figure 4-16 SAS block-level structure
The D owngrade and the Upgrade m odules are sim ilar, the difference being the tim e scale
on w hich the assessm ent o f the necessity to suggest quality adjustm ents is performed. They consist
o f a circular buffer in w hich the Q oD scores are stored. A slid in g w indow that encom passes the
m ost recently received scores provides the data source for the analysis. The average value o f these
received Q oD scores is com pared with the current server quality state that determines the quality o f
the streamed m ultim edia clip (see section 4 .3). This com parison a llow s the Decisions M odule to
take or not to take the upgrade and respectively the downgrade decision , as suggested by the other
m odules. This affects the quality o f the streamed m ultim edia clip , increasing or decreasing it.
The Timer m odule allow s a period equal to four tim es the round trip tim e m easured during
the session for the arrival o f the expected feedback. I f this does not happen, autom atically it
suggests degradations decisions to be taken.
4.7 Data Transmission and Feedback Mechanism
The QO AS architecture presented in section 4 .2 includes Com m unication M anagers in
charge with client-server com m unication establishing, controlling and ending. The Q O A S m akes
use o f a double-channel for exchanging both m ultim edia data and control information. A b i
directional link is meant for transm ission o f control m essages in charge w ith session control. This
link is also used for sending feedback m essages that carry the client-com puted Q oD scores to the
server. An unidirectional link from the server to the client transports m ultim edia data to the latter
where is decoded and played. Figure 4-17 show s schem atically this double-link com m unication
channel between the Q O A S server and the QOAS client.
119
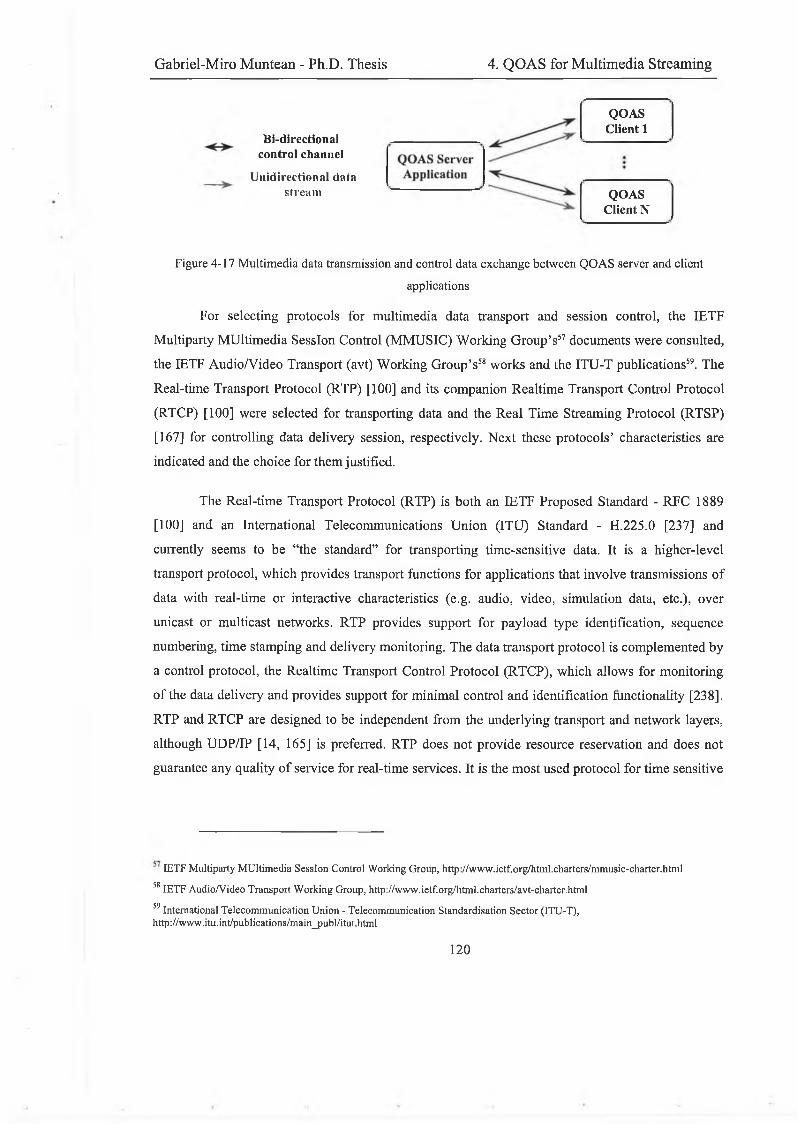
Gabriel-Miro Muntean - Ph.D. Thesis 4. QOAS for Multimedia Streaming
Bi-directional control channel
Unidirectional datastream
QOAS Client 1
QOAS Client N
Figure 4-17 Multimedia data transmission and control data exchange between QOAS server and client
applications
For selecting protocols for m ultim edia data transport and session control, the IETF
Multiparty M u ltim ed ia S ession Control (M M USIC ) W orking G roup’s57 docum ents w ere consulted,
the IETF A udio/V ideo Transport (avt) W orking G roup’s58 w orks and the ITU-T publications59. The
Real-tim e Transport Protocol (RTP) [100] and its com panion R ealtim e Transport Control Protocol
(RTCP) [100] were selected for transporting data and the R eal Tim e Stream ing Protocol (RTSP)
[167] for controlling data delivery session, respectively. N ext these p rotoco ls’ characteristics are
indicated and the choice for them justified.
The R eal-tim e Transport Protocol (RTP) is both an IETF Proposed Standard - RFC 1889
[100] and an International Telecom m unications U nion (ITU ) Standard - H .225.0 [237] and
currently seem s to be “the standard” for transporting tim e-sensitive data. It is a h igher-level
transport protocol, w hich provides transport functions for applications that in volve transm issions o f
data with real-tim e or interactive characteristics (e.g . audio, video, sim ulation data, etc.), over
unicast or m ulticast networks. RTP provides support for payload type identification, sequence
numbering, tim e stam ping and delivery m onitoring. The data transport protocol is com plem ented by
a control protocol, the R ealtim e Transport Control Protocol (RTCP), w hich allow s for m onitoring
o f the data delivery and provides support for m inim al control and identification functionality [238].
RTP and RTCP are designed to be independent from the underlying transport and network layers,
although U D P/IP [14, 165] is preferred. RTP does not provide resource reservation and does not
guarantee any quality o f service for real-tim e services. It is the m ost used protocol for tim e sensitive
IE T F M ultiparty M u ltim e d ia S e ssio n C ontro l W ork ing G roup , h ttp ://w w w .ie tf.o rg /h tm l.ch a r(ers/ram u sic -ch a rte r.h tm l
58 IE T F A ud io /V ideo T ran sp o rt W o rk in g G roup , h ttp ://w w w .ie tf.o rg /h tm l.ch a rte rs/av t-ch a rte r.h tm l
59 In te rna tional T e lec o m m u n ic a tio n U n io n - T e lecom m unication S ta n d ard isa tio n S e c to r (IT U -T ), h ttp ://w w w .itu .in t/p u b lica tio n s/m ain _ p u b l/itu t.h tm l
1 2 0
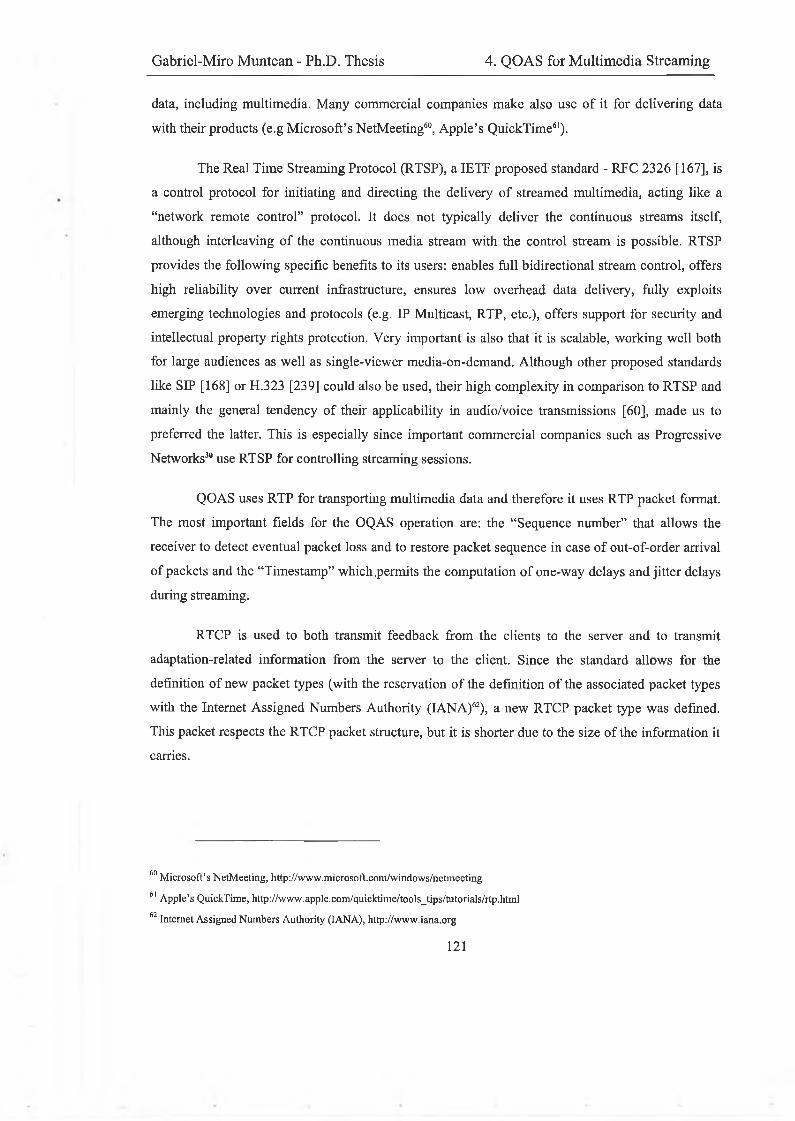
Gabriel-Miro Muntean - Ph.D. Thesis 4. QOAS for Multimedia Streaming
data, including m ultim edia. M any com m ercial com panies m ake also use o f it for delivering data
with their products (e.g M icrosoft’s N etM eeting60, A p p le’s Q uickT im e61).
The R eal T im e Stream ing Protocol (RTSP), a IETF proposed standard - RFC 2 3 2 6 [167], is
a control protocol for initiating and directing the delivery o f streamed m ultim edia, acting like a
“network rem ote control” protocol. It does not typically deliver the continuous stream s itself,
although interleaving o f the continuous m edia stream w ith the control stream is p ossib le. RTSP
provides the fo llow in g specific benefits to its users: enables fu ll bidirectional stream control, offers
high reliability over current infrastructure, ensures low overhead data delivery, fu lly exploits
em erging technologies and protocols (e.g. IP M ulticast, RTP, etc.), offers support for security and
intellectual property rights protection. V ery important is also that it is scalable, w orking w ell both
for large audiences as w e ll as single-view er m edia-on-dem and. A lthough other proposed standards
like SIP [168] or H .323 [239] could also be used, their high com plexity in com parison to RTSP and
m ainly the general tendency o f their applicability in audio/voice transm issions [60], m ade us to
preferred the latter. This is especially since important com m ercial com panies such as Progressive
N etworks30 use RTSP for controlling streaming sessions.
QO AS uses RTP for transporting m ultim edia data and therefore it uses RTP packet format.
The m ost important fields for the O Q AS operation are: the “Sequence number” that allow s the
receiver to detect eventual packet loss and to restore packet sequence in case o f out-of-order arrival
o f packets and the “Tim estam p” w hich perm its the com putation o f one-w ay delays and jitter delays
during streaming.
RTCP is used to both transmit feedback from the clients to the server and to transmit
adaptation-related inform ation from the server to the client. S ince the standard a llow s for the
definition o f new packet types (with the reservation o f the definition o f the associated packet types
with the Internet A ssign ed Num bers Authority (IA N A )62), a n ew RTCP packet type w as defined.
This packet respects the RTCP packet structure, but it is shorter due to the size o f the information it
carries.
f)0 M icro so ft’s N e tM ee tin g , h ttp ://w w w .m ic ro so ft.c o m /w in d o w s/n e tm eetin g
61 A p p le ’s Q u ickT im e, h ttp ://w w w .ap p Ie .co m /q u ick tim e /to o ls_ tip s /tu to ria ls /rtp .h tm l
62 In te rn e t A ssigned N u m b ers A u tho rity (IA N A ), h ttp ://w w w .ian a .o rg
121
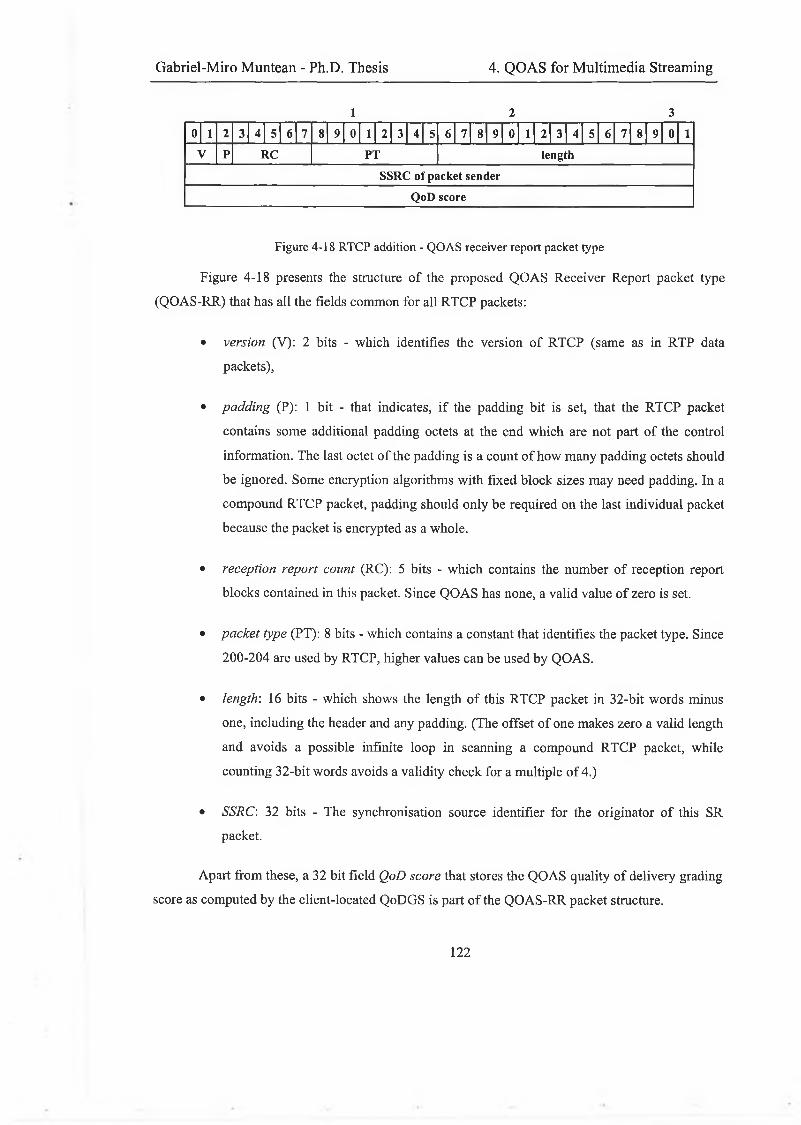
Gabriel-Miro Muntean - Ph.D. Thesis 4. QOAS for Multimedia Streaming
1 2 3
0 1 2 3 4 5 6 7 8 9 0 1 2 3 4 5 6 7 8 9 0 1 2 3 4 5 6 7 8 9 0 1V P RC PT length
SSRC of packet senderQoD score
Figure 4-18 RTCP addition - QOAS receiver report packet type
Figure 4-18 presents the structure o f the proposed Q O A S R eceiver Report packet type
(Q O A S-R R ) that has all the fields com m on for all RTCP packets:
• version (V): 2 bits - w hich identifies the version o f RTCP (sam e as in RTP data
packets),
• padding (P): 1 bit - that indicates, i f the padding bit is set, that the RTCP packet
contains som e additional padding octets at the end w hich are not part o f the control
information. The last octet o f the padding is a count o f how m any padding octets should
be ignored. Som e encryption algorithm s w ith fixed block sizes m ay need padding. In a
com pound RTCP packet, padding should on ly be required on the last individual packet
because the packet is encrypted as a w hole.
• reception report count (RC): 5 bits - w hich contains the num ber o f reception report
blocks contained in this packet. Since Q O A S has none, a valid value o f zero is set.
• packet type (PT): 8 bits - w hich contains a constant that identifies the packet type. Since
200-204 are used by RTCP, higher values can be used by Q O AS.
• length: 16 bits - w hich show s the length o f this RTCP packet in 32-bit w ords m inus
one, including the header and any padding. (The offset o f on e m akes zero a valid length
and avoids a possib le infinite loop in scanning a com pound RTCP packet, w hile
counting 32-bit words avoids a validity check for a m ultiple o f 4.)
• SSRC: 32 bits - The synchronisation source identifier for the originator o f this SR
packet.
Apart from these, a 32 bit field QoD score that stores the Q O AS quality o f delivery grading
score as com puted by the client-located Q oD G S is part o f the Q O A S-R R packet structure.
1 2 2
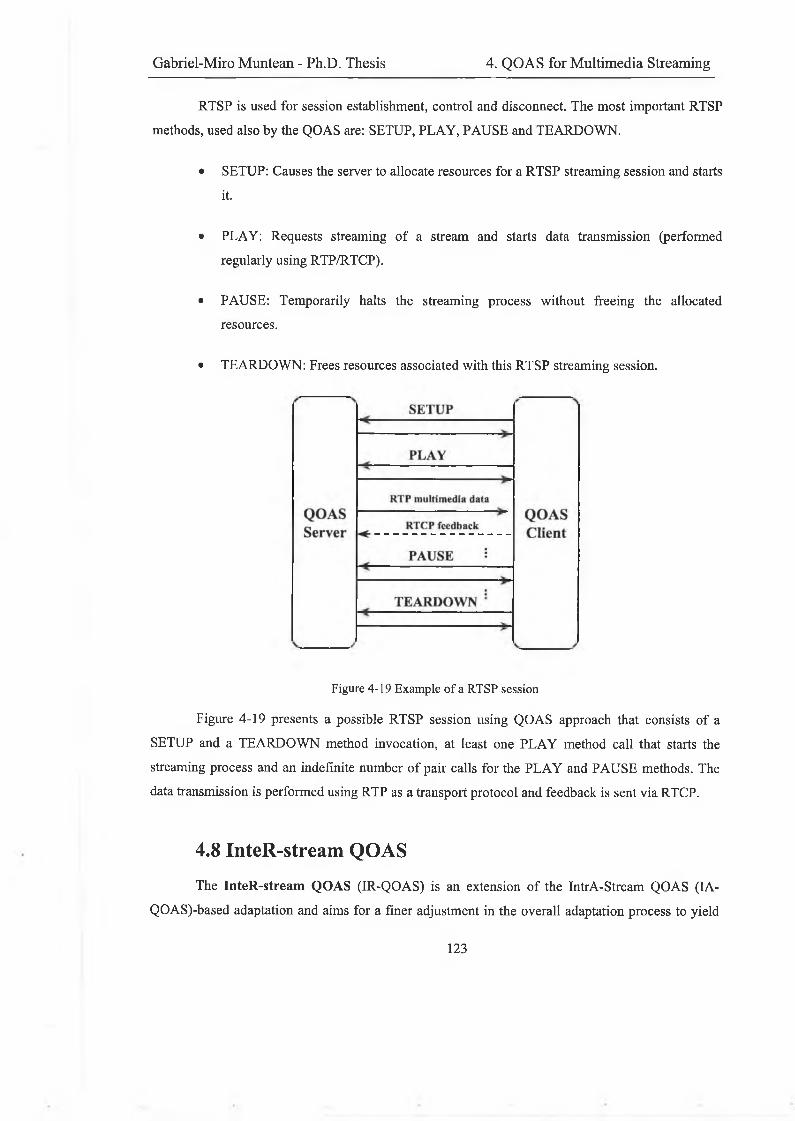
Gabriel-Miro Muntean - Ph.D. Thesis 4. QOAS for Multimedia Streaming
RTSP is used for session establishm ent, control and disconnect. The m ost important RTSP
m ethods, used also by the Q O A S are: SETUP, PL A Y , P A U SE and T E A RD O W N .
• SETUP: Causes the server to allocate resources for a R T SP streaming session and starts
it.
• PLAY: R equests streaming o f a stream and starts data transm ission (performed
regularly using RTP/RTCP).
• PAUSE: Temporarily halts the stream ing process w ithout freeing the allocated
resources.
• TEA RD O W N : Frees resources associated w ith this R TSP streaming session.
Figure 4-19 Example o f a RTSP session
Figure 4 -19 presents a p ossib le RTSP session using Q O A S approach that consists o f a
SETUP and a T E A R D O W N m ethod invocation, at least one P L A Y m ethod call that starts the
streaming process and an indefinite number o f pair calls for the P L A Y and P A U SE m ethods. The
data transm ission is performed using RTP as a transport protocol and feedback is sent v ia RTCP.
4.8 InteR-stream QOAS
The InteR-stream QOAS (IR -Q O A S) is an extension o f the IntrA-Stream Q O AS (LA-
Q O A S)-based adaptation and aims for a finer adjustment in the overall adaptation process to yield
1 2 3
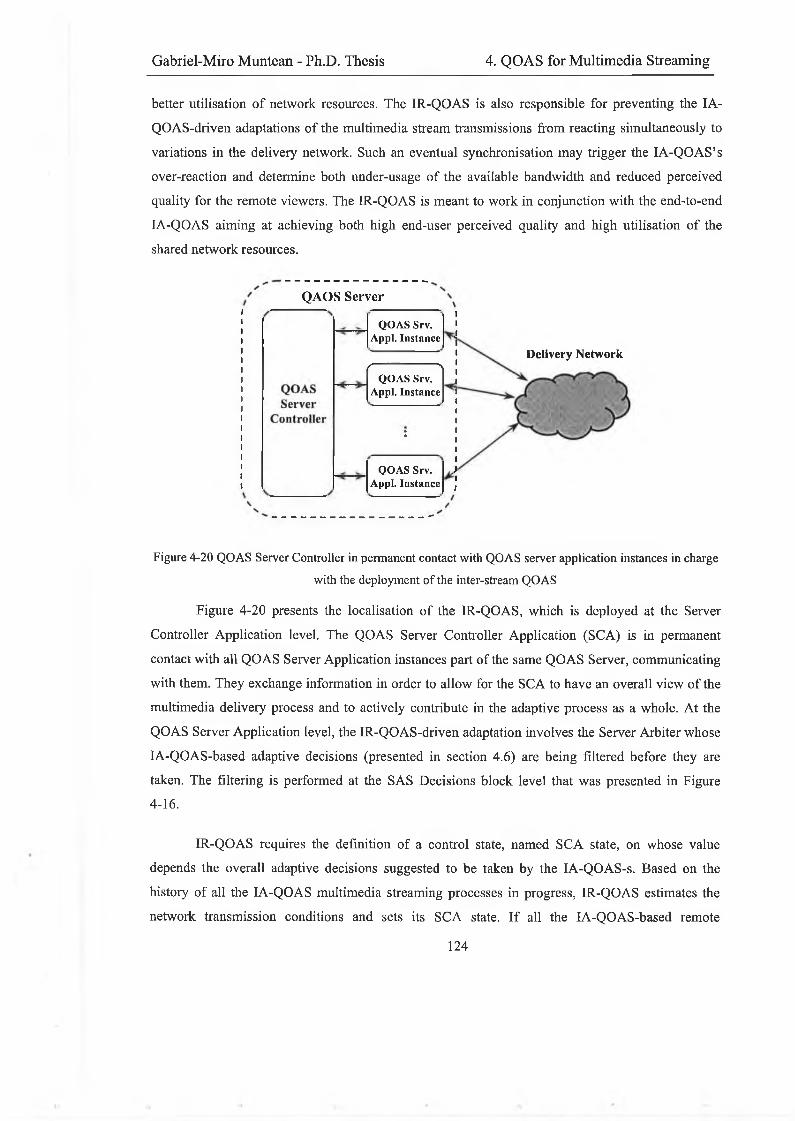
Gabriel-Miro Muntean - Ph.D. Thesis 4. QOAS for Multimedia Streaming
better utilisation o f network resources. The IR-Q O AS is also responsible for preventing the IA-
Q O A S-driven adaptations o f the m ultim edia stream transm issions from reacting sim ultaneously to
variations in the delivery network. Such an eventual synchronisation m ay trigger the IA -Q O A S ’s
over-reaction and determine both under-usage o f the available bandwidth and reduced perceived
quality for the rem ote viewers. The IR-Q O AS is m eant to work in conjunction w ith the end-to-end
IA-Q O AS aim ing at achieving both high end-user perceived quality and h igh utilisation o f the
shared network resources.
QAOS Server
QOAS Srv. Appi. Instance
/• NQOAS Srv.
Appi. Instance
■•
QOAS Srv. Appi. Instance
Delivery Network
Figure 4-20 QOAS Server Controller in permanent contact with QOAS server application instances in charge
with the deployment o f the inter-stream QOAS
Figure 4 -20 presents the localisation o f the IR -Q O A S, w hich is deployed at the Server
Controller A pplication level. The Q O A S Server Controller A pplication (SC A ) is in permanent
contact w ith all Q O AS Server A pplication instances part o f the sam e Q O A S Server, com m unicating
with them. They exchange information in order to a llow for the SC A to have an overall v iew o f the
m ultim edia delivery process and to actively contribute in the adaptive process as a w hole. A t the
QO AS Server A pplication level, the IR -Q O A S-driven adaptation in volves the Server Arbiter w hose
IA -Q O A S-based adaptive decisions (presented in section 4 .6) are being fdtered before they are
taken. The filtering is performed at the SA S D ecision s b lock leve l that w as presented in Figure
4-16.
IR-Q O AS requires the definition o f a control state, nam ed S C A state, on w hose value
depends the overall adaptive decisions suggested to be taken by the IA -Q O A S-s. B ased on the
history o f all the IA -Q O A S m ultim edia streaming processes in progress, IR-Q O AS estim ates the
network transm ission conditions and sets its SC A state. I f all the IA -Q O A S-based remote
124
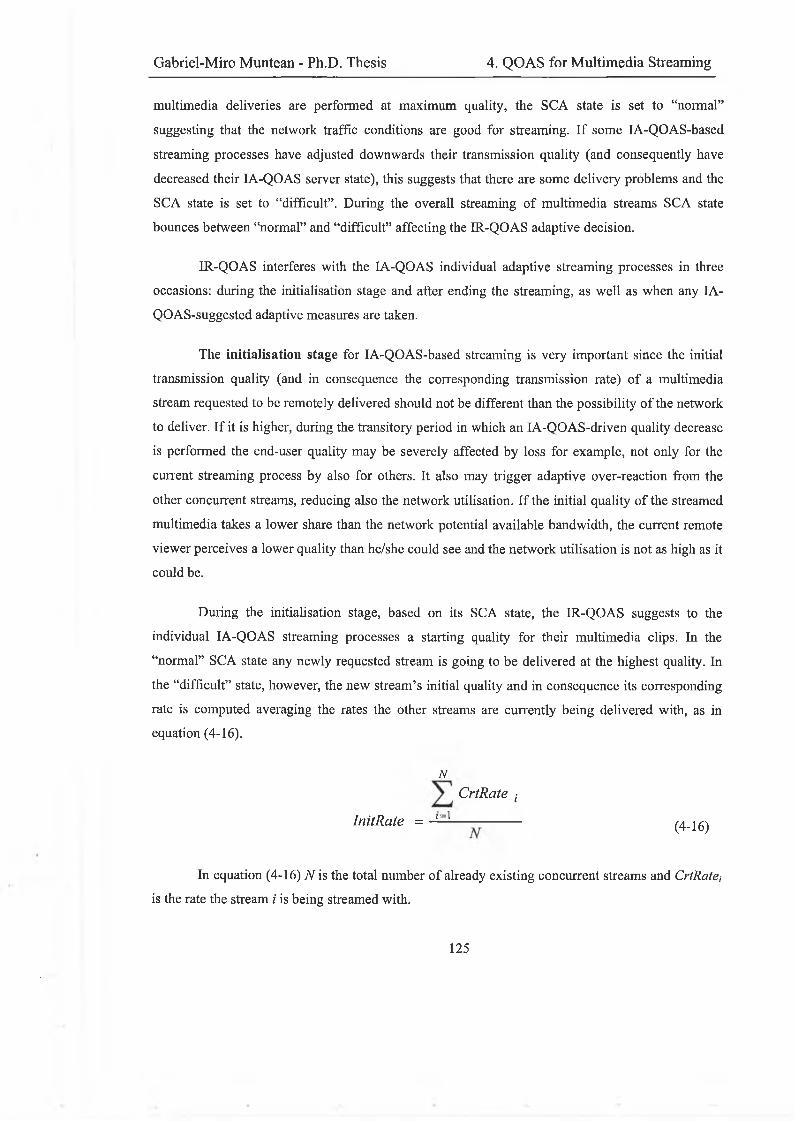
Gabriel-Miro Muntean - Ph.D. Thesis 4. QOAS for Multimedia Streaming
multimedia deliveries are performed at maximum quality, the SCA state is set to “normal”
suggesting that the network traffic conditions are good for streaming. If some IA-QOAS-based
streaming processes have adjusted downwards their transmission quality (and consequently have
decreased their IA-QOAS server state), this suggests that there are some delivery problems and the
SCA state is set to “difficult”. During the overall streaming of multimedia streams SCA state
bounces between “normal” and “difficult” affecting the IR-QOAS adaptive decision.
IR-QOAS interferes with the IA-QOAS individual adaptive streaming processes in three
occasions: during the initialisation stage and after ending the streaming, as well as when any IA-
QOAS-suggested adaptive measures are taken.
The initialisation stage for IA-QOAS-based streaming is very important since the initial
transmission quality (and in consequence the corresponding transmission rate) of a multimedia
stream requested to be remotely delivered should not be different than the possibility of the network
to deliver. If it is higher, during the transitory period in which an IA-QOAS-driven quality decrease
is performed the end-user quality may be severely affected by loss for example, not only for the
current streaming process by also for others. It also may trigger adaptive over-reaction from the
other concurrent streams, reducing also the network utilisation. If the initial quality of the streamed
multimedia takes a lower share than the network potential available bandwidth, the current remote
viewer perceives a lower quality than he/she could see and the network utilisation is not as high as it
could be.
During the initialisation stage, based on its SCA state, the IR-QOAS suggests to the
individual IA-QOAS streaming processes a starting quality for their multimedia clips. In the
“normal” SCA state any newly requested stream is going to be delivered at the highest quality. In
the “difficult” state, however, the new stream’s initial quality and in consequence its corresponding
rate is computed averaging the rates the other streams are currently being delivered with, as in
equation (4-16).
NCrtRate ,•
InitRate = i=1 --------- (4. 16)
In equation (4-16) N is the total number of already existing concurrent streams and CrtRatej
is the rate the stream i is being streamed with.
125
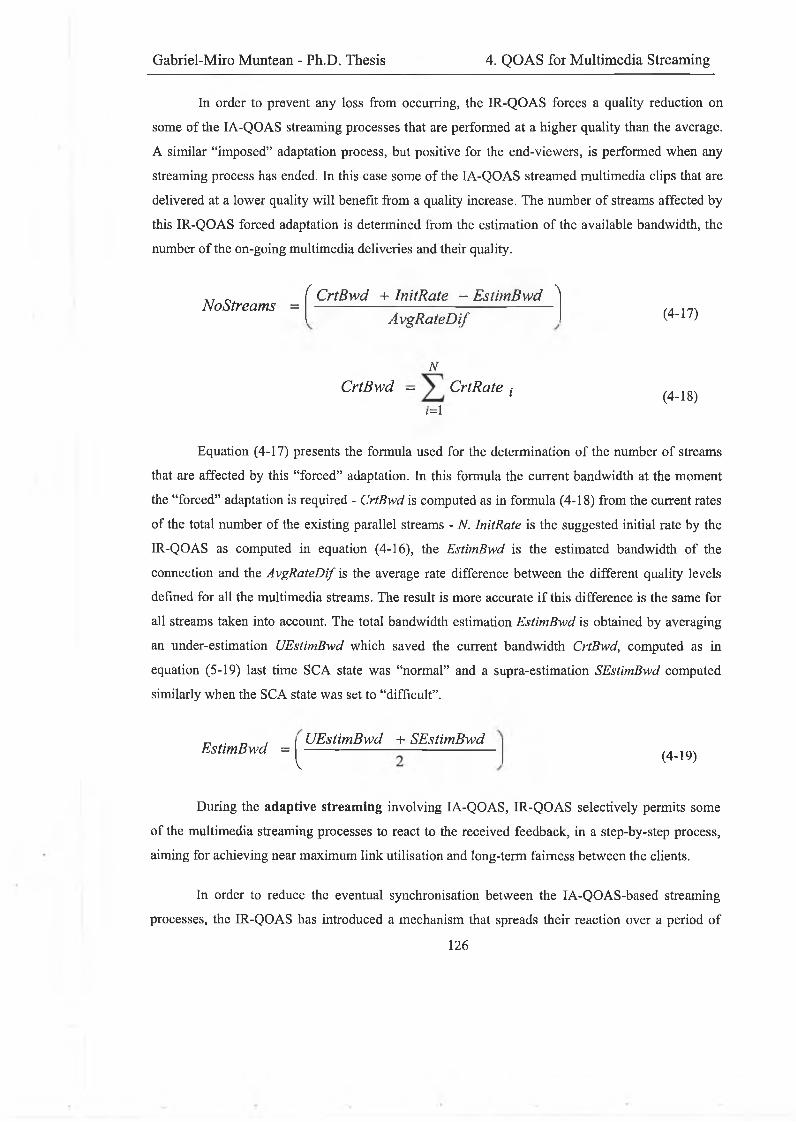
Gabriel-Miro Muntean - Ph.D. Thesis 4. QOAS for Multimedia Streaming
In order to prevent any loss from occurring, the IR-QOAS forces a quality reduction on
some of the IA-QOAS streaming processes that are performed at a higher quality than the average.
A similar “imposed” adaptation process, but positive for the end-viewers, is performed when any
streaming process has ended. In this case some of the IA-QOAS streamed multimedia clips that are
delivered at a lower quality will benefit from a quality increase. The number of streams affected by
this IR-QOAS forced adaptation is determined from the estimation of the available bandwidth, the
number of the on-going multimedia deliveries and their quality.
NoStreams =f CrtBwd + InitRate - EstimBwd N
AvgRateDif (4-17)
NCrtBwd - CrtRate ,•
i=l(4-18)
Equation (4-17) presents the formula used for the determination of the number of streams
that are affected by this “forced” adaptation. In this formula the current bandwidth at the moment
the “forced” adaptation is required - CrtBwd is computed as in formula (4-18) from the current rates
of the total number of the existing parallel streams - N. InitRate is the suggested initial rate by the
IR-QOAS as computed in equation (4-16), the EstimBwd is the estimated bandwidth of the
connection and the AvgRateDif is the average rate difference between the different quality levels
defined for all the multimedia streams. The result is more accurate if this difference is the same for
all streams taken into account. The total bandwidth estimation EstimBwd is obtained by averaging
an under-estimation UEstimBwd which saved the current bandwidth CrtBwd, computed as in
equation (5-19) last time SC A state was “normal” and a supra-estimation SEstimBwd computed
similarly when the SCA state was set to “difficult”.
EstimBwd =UEstimBwd + SEstimBwd
V(4-19)
During the adaptive streaming involving IA-QOAS, IR-QOAS selectively permits some
of the multimedia streaming processes to react to the received feedback, in a step-by-step process,
aiming for achieving near maximum link utilisation and long-term fairness between the clients.
In order to reduce the eventual synchronisation between the IA-QOAS-based streaming
processes, the IR-QOAS has introduced a mechanism that spreads their reaction over a period of
126
Gabriel-Miro Muntean - Ph.D. Thesis 4. QOAS for Multimedia Streaming
time, introducing random delays in their adjustment decision taking process. This is performed with
the hope that if some of the IA-QOAS-based adaptive processes that have noticed problems in the
delivery network decrease their contribution to the traffic by adjusting the quality of their streamed
multimedia, the traffic problem will be solved and the other will not have to adjust anymore. This
behaviour also depends on the IR-QOAS associated SCA state.
If the SCA state is “normal” any downward adaptation suggested by individual IA-QOAS
is performed without interference from the IR-QOAS. Once the adaptation is performed this affects
the SCA state that changes to “difficult” and the IR-QOAS reacts differently to quality adjustments.
A separate timer with a random timeout period is associated to each request for quality degradation
issued by individual IA-QOAS schemes, involving their SAS modules. When any of these timeout
periods expires, the IR-QOAS allows the SAS’s Decisions module presented in Figure 4-16, to
perform the suggested degradation. If the QoD scores received via feedback by the IA-QOAS do
not indicate an improvement in the quality of delivery when the first adaptive measures were taken,
the IA-QOAS downgrading in the quality of the streamed multimedia will continue when next
timeout periods expires. However if the delivery situation improves and the IA-QOAS-s that have
requested downwards adjustments in their streamed quality stop their requests, the timers are reset
and the decrease in quality will not take place. A similar process occurs when the IA-QOAS-based
streaming processes request increases in their streamed multimedia quality.
This IR-QOAS driven adaptation ensures not only increased quality of the end-user quality
mainly during the IA-QOAS initial stage, but also higher available network resource utilisation and,
very important, higher stability of the QOAS adaptive process in terms of quality variation that may
affect the end-user perceived quality.
4.9 Applicability Considerations
The QOAS relies on feedback in order to learn about the quality of the streaming process
and to take the necessary adjustment decisions. The existing research like [197, 6, 7] that took into
consideration feedback for performing adaptations shows that the faster the feedback messages
arrive at the server, the better the results of the adaptation process are. If the feedback takes too long
a time to arrive, the information the server has about the system does not reflect the current reality
anymore and the scheme may react too late to make the difference or out of synch. For example the
feedback-controlled scheme may not react in time to prevent losses from occurring once increased
delays have been reported or if the loss is already affecting the streamed multimedia. Also there is
127
Gabriel-Miro Muntean - Ph.D. Thesis 4. QOAS for Multimedia Streaming
the possibility that the adjustment measures to be taken when the cause of PUDL may have already
passed, decreasing the quality of the streamed multimedia when it is not required anymore.
Therefore the QOAS is best recommended to be applied in local or metropolitan area networks,
local cable delivery networks, or local all-IP broadband networks where fast feedback is feasible.
Experimental test results presented in the sixth chapter show how the performances of a QOAS-
based multimedia streaming system are influenced by network latencies.
The applicability of any adaptive scheme, including QOAS is most recommended in
networks with a potential for congestion. This is because this scheme offers significant benefits
in comparison to a non-adaptive approach only if shared bandwidth is limited. The benefits are also
significant in networks with highly increased traffic conditions, even if compared with other
feedback-based adaptive schemes like for example TFRCP [6] and LDA+ [7]. The results of tests
that have studied this comparison are also presented in the sixth chapter.
Very important is that the multimedia streams’ viewers targeted by the QOAS can tolerate
a certain degree of quality variation. In consequence QOAS does not target multimedia systems
whose viewing quality has life-threatening or research-quality consequences as for example some
areas of Medicine (e.g. Surgery), Physics (e.g. atomic phenomena) or Transport (e.g. Radar
systems). QOAS can be successfully applied in the entertainment industry, business for video-on-
demand applications, commercial presentations, video-conferencing in which a slight decrease in
the quality is not disturbing and is even preferred to interruptions in the play-out for buffering
performed by many existing solutions, as reported in [240].
The QOAS usage was considered in the absence of any error-concealment techniques’ [241] deployment that could improve the end-user perceived quality of a streamed multimedia clip
affected by loss during transmission. In principle any error concealment technique could be taken
into account in conjunction with QOAS to further improve the end-user perceived quality in the
tested conditions. However, further tests have to be performed to see the benefit of using QOAS in
conjunction with such error-control mechanisms if the multimedia transmissions are subjected to
higher loss rates.
4.10 Summary
The fourth chapter focuses on the detailed presentation of the Quality-Oriented Adaptation
Scheme (QOAS) for multimedia streaming. It starts with a general description of the scheme and of
the architecture of the QOAS-based multimedia streaming system that implements it. The chapter
128
Gabriel-Miro Muntean - Ph.D. Thesis 4. QOAS for Multimedia Streaming
then continues with the presentation of the QOAS’s main mechanism: the IntrA-stream QOAS (IA-
QOAS). Detailed information about the IA-QOAS’s main components and their functionality are
given in separate sections of this chapter: the client-located Quality of Delivery Grading Scheme
(QoDGS), the Server Arbitration Scheme (SAS) and the Data Transmission and Feedback
mechanisms. While multimedia data is being streamed via the Data Transmission mechanism,
QoDGS monitors and assesses both long term and short-term variation of some transmission
parameters and of the end-user quality. The QoDGS also regularly grades the quality of the ongoing
streaming process in terms of QoD scores in a three-stage process presented in detail. These scores
are sent using the Feedback mechanism to the server whose SAS processes them. The SAS takes
into consideration the values of a number of recent feedback reports, analyses them and suggests
adjustment decisions to be taken by the server. Detailed information is also offered about the
parameters taken into account by the QoDGS in its quality assessment process and about the metric
Q used to estimate the end-user perceived quality during multimedia streaming. The InteR-stream
QOAS (IR-QOAS) mechanism used to complement IA-QOAS in order to achieve better end-user
perceived quality and higher network utilisation when streaming multimedia was also described in
this chapter. At the end, QOAS applicability considerations are presented, indicating both the
recommendations and the limitations for the QOAS potential deployment.
129
Gabriel-Miro Muntean - Ph.D. Thesis 5. Implementation Details
Chapter V
I m p l e m e n t a t i o n De t a i l s
Abstract
Since the proposed Quality Oriented Adaptation Scheme (QOAS) needs extensive testing,
both simulations and emulations are employed in order to produce real-life like network delivery
conditions. In these conditions, both a simulation model system and a real prototype system that
instantiate QOAS have been implemented and tested. This chapter presents details about both
implementations o f the proposed QOAS, the simulation model and the real prototype system.
5.1 Implementation of the Simulation Model System
5.1.1 Network Simulator version 2
The simulations are performed using the Network Simulator version 2 (NS-2) [246], which
is an object-oriented discrete event simulator, written in C++, with an OTcl [247] interpreter as
front-end. In NS-2, the simulations are performed according to simulation scenarios that consist of
several components [242]. The most important are: a network topology, that specifies the physical
inter-connections between nodes and the characteristics of links and nodes, traffic models which
define the senders and the protocol(s) of the packet transmission and test scenarios which generate
traffic causing network dynamics designed to test a certain implementation.
The NS-2 simulator supports two class hierarchies: the compiled hierarchy, consisting of
C++ classes and the interpreted hierarchy written in OTcl. Extensions to the first hierarchy are done
through C++ classes if changes in the manner the exchanged packets are processed are required and
the behaviours provided by the existing C++ classes are not enough to solve these problems. The
second set of classes is appended with scripts written for configuration, setup and single-use
modifications of the overall NS-2-provided behaviour. In general the latter manipulate existing or
newly built C++ objects.
130
Gabriel-Miro Muntean - Ph.D. Thesis 5. Implementation Details
5.1.2 Simulation Model’s Implementation Overview
For fully testing QOAS NS-2 provides both network topology and components and
different traffic models for building various test scenarios. In consequence the implementation
involves only building the QOAS client-server model system that follows the architecture presented
in the fourth chapter.
Apart from QOAS client and server applications, some other mechanisms had to be
implemented in order to allow for extensive QOAS testing. Among these mechanisms are the RTP
transport of multimedia data packets model, the enhancement of the drop-tail router queue model
and the QOAS server controller application model. The implementation of these models is
presented next.
5.1.2.1 RTP-based Transport of Multimedia Data Packets
In order to allow for the RTP-like handling of the multimedia data packets, the UDP-related
classes are extended or used, both in C++ and in OTcl, as recommended in [249], In this context a
MultimediaHeaderClass was defined in C++ and was associated with the OTcl hierarchy name
“PacketHeader/Multimedia". Also a RTP agent class named UdpMmAgentClass that inherits the
TclClass base class was associated with the OTcl hierarchy name “Agent/UDP/UDPmm” and with
the C++ class UdpMmAgent that was implemented as an extension of the UdpAgent class. The most
important methods provided are the sendmsgQ that sends a number of bytes received from the
application level to the UDP level, after attaching the RTP header and the recv() which is
automatically called by the underlying UDP agent when a packet is received in order for the RTP
header to be removed and the data to be sent to the application level.
5.1.2.2 Drop-Tail Router Queue
Although a drop-tail queue is defined by the NS-2, since during simulations extensive
statistical information is needed for fully assessing the QOAS’s performances, an enhanced drop-
tail queue was implemented. It performs statistical-multiplexing of incoming data, drops packets if
they exceed the storing capacity and records statistics.
The StMuxSingleQueueClass was defined in C++ inheriting the TclClass and was
associated with both the OTcl hierarchy name “Queue/SlMuxSingleQueue” and with the C++ class
StMuxSingleQueue that was implemented as an extension of the Queue class. The most important
131
Gabriel-Miro Muntean - Ph.D. Thesis 5. Implementation Details
methods are enque() which enqueues an incoming packet if there is storage space left or drops it
otherwise and dequeQ which retrieves the packets in a FIFO manner. Both methods update also the
statistics information related to each data flow by a call to updatestatisticsQ . This makes use of a
specially designed complex list of statistic-related structures that was implemented by the
PacketQueueList class that extends the C++ TclObject class. Regularly the statistics are written to a
log file by calling the write_statistics() function. This is performed by a specially defined timeout
timer: StMuxStatisticsTimer.
5.1.2.3 QOAS Server Controller Application
The QOAS server controller application implements the Inter-stream QOAS as it was
described in section 4.8 of this thesis.
The defined AdSrvCtrlClass class inherits the TclClass and is associated to the OTcl
hierarchy name “Application/AdSrvCtrF and to the C++ class AdSrvCtrl that was implemented
which inherits the Application class. The most important methods of the AdSrvCtrl class and their
roles are presented next.
The function attachAppO adds the indicated QOAS server application to a specially built
list of applications registered with the server controller application. Only these applications will be
affected and affect the functionality of this controller and only when they are active. The activation
of a registered application is performed when a new streaming process starts by a call to the
activateAppO method and ends when the streaming process has ended by a call to the
deactivateAppQ function.
Function computeStartRate() computes the start rate for a new QOAS multimedia stream in
the presence of similar other streams in existing delivery conditions as their average streaming rates,
determined using the computeAverageRate() method. The computeStartRate() function also
applies the “imposed” rate adaptation for the streams with the highest delivery rate in order to
accommodate for the new stream by calls to the decreaseStreamStates() function.
The function computeEndState() triggers “imposed” rate adaptations to the existing QOAS
streams after a multimedia stream generated by a registered application has ended. This involves an
implicit increase in the transmission rate for the streaming processes with the lowest rate performed
by the function increaseStreamStates().
132
Gabriel-Miro Muntean - Ph.D. Thesis 5. Implementation Details
The functionality of both computestartRateQ and computeEndStateQ methods relies on
the bottleneck link bandwidth estimation performed using the function compuieTotalBandwidth().
5.1.3 Implementation of the QOAS Server Application Model
The QOAS server application model relies on the definition of the AdSrvAppClass, an
extension of the TclClass base class. This class makes the association between the OTcl hierarchy
name of “Application/AdSrvApp" and the C++ AdSrvApp implemented class that inherits the
Application class provided by the NS-2. The implementation of the latter follows the server
application architecture presented in the fourth chapter and is described next in terms of the most
important AdSrvApp class’s member functions and their roles. This description is structured based
on the server application’s architectural blocks.
5.1.3.1 Multimedia Acquirer, MPEG Encoder and Multimedia Database
Both multimedia capturing and MPEG encoding are performed offline using a Canopus
Amber MPEG hardware encoder card. For each multimedia content, different quality stream
versions were encoded from various clips at five bit-rates equally distributed between 2 and 4 Mb/s.
The resulting MPEG files are then parsed using a specially built application (named
Read_IPB Frames) that saves trace files in the following format: frame number, frame type (I, P
or B), display time (ms) and frame size (bytes). These traces are used as input by the QOAS server
when adaptively streaming multimedia data, acting like a multimedia database. The class that
accesses this database and adaptively reads the frame-related information was named
AdaptiveTraceFile and inherits the NS-2 NsObject class. Among its most important methods is
setup() that associates indexes to each of the different quality version files according to their
corresponding QOAS server quality states allowing for parsing of the correct quality file during
adaptive streaming. Similarly important is the get next() method which retrieves the information
related to the next frame to be streamed given the existing QOAS server quality state.
5.1.3.2 Server Communication Manager and Transmission Shaper
AdSrvApp class through its commandQ method defines control functions that allow for the
parameterised setup of the QOAS server application model via a OTcl script. Among these
functions are “attach-agent” and “attach-agent2” that associate transport layer agents, which are in
charge with the data transmission. In this implementation an RTP agent was already defined an is
133
Gabriel-Miro Muntean - Ph.D. Thesis 5. Implementation Details
used for this purpose, but since the implementation is flexible, it allows for other agents to be also
used if desired. Another important OTcl method is “attach-tracefile” that allows for associating a
trace file to a certain movie name and server quality state.
Other important methods of the AdSrvApp class are attachCtrlQ that links the QOAS server
application to the QOAS server controller application, initialise() that initialises the server
application related structures and decide_start_rate() that determines the adaptive streaming starting
rate based on the controller’s suggestion.
The AdSrvApp class also implements the RTSP-based session control mechanism and
processes the feedback messages using a set of methods presented next. recv_msg() is the function
called automatically when the underlying transport level receives any packet for this application,
and according to its type, a different method is called. The RTSP server-side SETUP is performed
by the process_connect() method, PLAY - by the process_request() member function and
SHUTDOWN - by the process_shutdown(). These are followed by server application answers by
calls to the sendackconnect_pkt(), sendjackrequest_pkt() and send ackshutdown_pkt(). The
feedback messages received by the recv_msg() are processed by the process J'eedbackQ method.
The process_connect() function initialises the resources necessary for adaptive streaming,
whereas the process requestQ selects the requested stream and starts streaming by calling
start_sending_mmdata(). The latter starts a timer mechanism implemented by SrvMmdataTimer
class. This class, which implements the Transmission Shaper, is in charge with performing the
timeout-driven streaming process at the rates associated with the different quality streams whose
tracefiles were registered with the multimedia database. The actual sending of data packets is
performed by the sendm m data_pkt() function that uses the underlying transport agent’s
capabilities in order to do this. The process_shutdown() function releases all the resources used by
the application.
5.1.3.3 Feedback Manager and Server Core
The Feedback Manager and the Server Core’s Seiver Arbitration Scheme (SAS) work in
conjunction in order to receive and process the incoming feedback and to take adaptive adjustments
if necessary. As previously mentioned the feedback is received by the recv_msg() and is processed
by the process_feedback() method. The latter implements the SAS mechanism which was described
in detail in section 4.6 in conjunction with the set_scale() method. The actual state change is
performed only at the beginning of a GOP after calling the setTxState() function.
134
Gabriel-Miro Muntean - Ph.D. Thesis 5. Implementation Details
In case that for some time no feedback is received, the QOAS server application estimates
that there is a delivery-related problem and decreases its quality state and therefore the multimedia
transmission rate. This mechanism is implemented by the SrvTimeoutTimer class and the
AdSrvApp's method reduce_pkt_txrate().
5.1.4 Implementation of the QOAS Client Application Model
The QOAS client application model is implemented by the AdSrvAppClass, an extension of
the TclClass base class. This class makes the association between the given OTcl name of
“Application/AdCliApp” and the C++ class AdCliApp that was implemented such as it inherits the
NS-2 Application class. Our implementation of the latter follows the client application architecture
presented in the fourth chapter and is described next based on its block-structure in terms of the
most important class methods and their roles.
5.1.4.1 MPEG Decoder and Multimedia Player
Since the simulation model does not play out the multimedia data received, there is no need
for the decoding process. However since the data received has to be consumed to prevent
overflowing the receiver buffer, the AdCliApp's method p la yd a ta Q does this as it plays the
multimedia data with the associated display frequency. This reading frequency is controlled by an
object that instantiates the specially defined CliPlayoutTimer class.
5.1.4.2 Client Communication Manager
Similar to the AdSrvApp class, the AdCliApp defines in its commandQ method control
functions that allow for setting up of the QOAS client application model via a OTcl script. The
“attach-agent" and “attach-agent2” functions associate transport layer agents in charge with the
data transmission to this application. In this implementation the RTP agent already presented is
used. A third function provided is “attach-recv-buffer” that associates a certain receiver buffer
implementation to the client Communication Manager. In the implemented solution this receiver
buffer was defined by the RecvBuffQueueClass that inherits the base class TclClass and associates
the OTcl name “RecvBuffer” with the C++ class RecvBuffQueue. The later extends the TclObject
C++ class and provides means of storing the packets that have arrived at the client using a FIFO
policy. Its main methods are enqueQ for storing and dequeQ for retrieving data.
135
Gabriel-Miro Muntean - Ph.D. Thesis 5. Implementation Details
The AdCliApp class implements the RTSP client-based session control mechanism using a
set of methods presented next. The RTSP client-side SETUP is performed by the start() method that
calls the send_connect_pkt() method. If the server’s answer is positive, the client sends the PLAY
command by calling the sendrequest_pkt() member function. When the client desires the end of
the streaming process SHUTDOWN command is sent to the server by calling the
send_shutdown_pkt() method. These commands are sent to the underlying transport agent which
does the actual sending of data by a call to the sendjcontrol_pkt() method. The server application
answers to control messages by sending corresponding ACKs. These messages are processed by the
AdCliApp application in its recv_msgO function by calling recvackconnect_pki(),
recv ackrequest_pkt() and respectively recv ackshutdown_pktQ. The recv_msg(), method called
automatically when the underlying transport level receives any packet for this application, receives
also all the multimedia data packets that are stored by the recv_mmdata_pkt() in the client receiver
buffer, an instance of the RecvBuffQueue class.
5.1.4.3 Feedback Indication Unit and Client Core
The Feedback Indication Unit and the Client Core co-operate in order to support the
functionality of the Quality of Delivery Grading Scheme (QoDGS) whose principle was presented
in detail in section 4.5. Presented briefly, the QoDGS’s goal is to monitor and to grade the network-
related parameters’ values and variations as well as the estimated end-user perceived quality during
multimedia streaming. In order to do this, QoDGS’s implementation makes use of the specially
built structures qojlransmission and qot_XXX, where XXX stands for the monitored parameter and
could be delay, loss, jitter and percvqual (i.e. end-user perceived quality). These structure
initialisation is performed by the init_qot_XXX() methods, the QoDGS-related information update
by the adjust_qot_XXX() functions and the partial parameters’ grading by the grade qot XXXQ
methods. The final computation of the QoDScore-s is performed by the grade_tx() function, member
of the AdCliApp class.
The initialisation of these feedback-related structures is done in the init_variables() method,
the adjustment of parameters’ values and variations in the recv_mmdata_pkt(), immediately after a
new data packet was received at the client and the QoDGS final grading every time a feedback
message is sent to the server. The frequency of the feedback messages is controlled by the timer
class CliFeedbackTimer whose timeout is set via the OTcl script, allowing for high testing
flexibility. Every time when the timeout occurs, a feedback packet is sent using
send Jeedback_pkt() to the RTP transport agent that actually does the actual transmission.
136
Gabriel-Miro Muntean - Ph.D. Thesis 5. Implementation Details
5.2 Implementation of the Real Prototype System
5.2.1 Prototype System’s Implementation Overview
The prototype system built in a Windows environment using Microsoft Visual C++ 6.0
follows the block-level architecture presented in the fourth chapter. The implemented system
consists of two applications: a server and a client, which inter-communicate via a network. Both the
design of the system and its implementation follow an object-oriented approach and make use of the
Microsoft Foundation Class (MFC) as the base class structure for the creation of the majority of the
implemented classes. The Windows event and messaging systems support the message and event
handling in both the client and the server applications. The implementation also makes use of the
threading support offered by the Win32 multi-tasking environment, of the sockets mechanism
provided by the Windows Sockets 2 (WinSock2) architecture for applications inter-communication
and of the Microsoft's Open Database Connectivity (ODBC) API for accessing the Microsoft
Access database used.
Before implementation details related to each of the system components, the server
application and respectively the client application are given, next information related to
implementation issues common for both of them are presented.
5.2.1.1 Applications’ Inter-communication
For the implementation of the two communication channels, one for bi-directionally
exchanged control messages, including feedback, and the second for unidirectional transport of data
packets from the server to the client application, WinSock2 sockets mechanism and MFC library
were used. The MFC's CSocket class is the base for the implementation of all the communication-
related classes built, which inherit from it the basic socket functionality.
Figure 5-1 presents the implemented classes involved in the process of establishment,
control and disconnection of the double client-server communication link and the two container
classes CMySrvDoc and CMyCliDoc, located at the server and respectively at the client. The figure
also schematically describes the process of double-channel creation for a requesting client and
involves two steps. The first step consists of the establishment of the control link, whereas the
second step involves the creation of the data link. During disconnection first the destruction of the
data link is performed and then the control link is terminated.
137
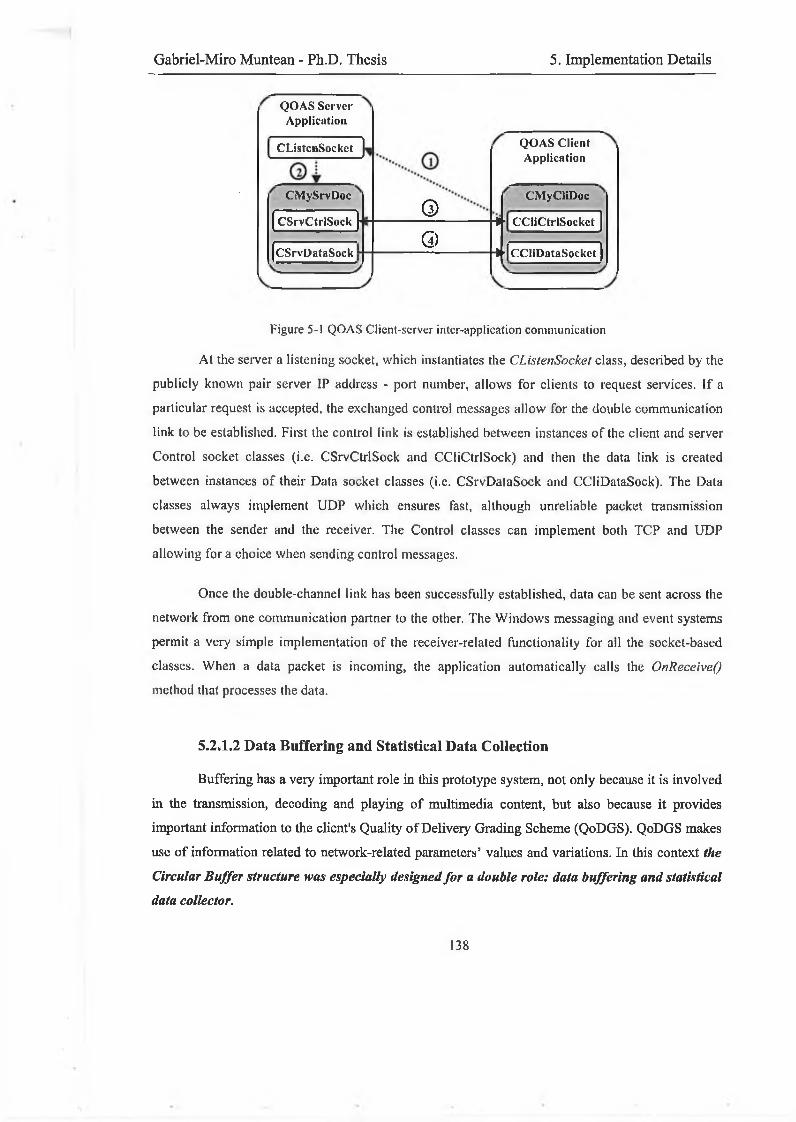
Gabriel-Miro Muntean - Ph.D. Thesis 5. Implementation Details
QOAS Server Application
CListcnSockct
CMySrvDoc
CSrvCtrlSock
CSrvDatnSock
Q
G>
QOAS Client Application
CMyCliDoc
* ■ CCIiCtrlSocket
< '[cCliDataSocket )
Figure 5-1 QOAS Client-server inter-application communication
At the server a listening socket, which instantiates the CListenSocket class, described by the
publicly known pair server IP address - port number, allows for clients to request services. If a
particular request is accepted, the exchanged control messages allow for the double communication
link to be established. First the control link is established between instances of the client and server
Control socket classes (i.e. CSrvCtrlSock and CCliCtrlSock) and then the data link is created
between instances of their Data socket classes (i.e. CSrvDataSock and CCliDataSock). The Data
classes always implement UDP which ensures fast, although unreliable packet transmission
between the sender and the receiver. The Control classes can implement both TCP and UDP
allowing for a choice when sending control messages.
Once the double-channel link has been successfully established, data can be sent across the
network from one communication partner to the other. The Windows messaging and event systems
permit a very simple implementation of the receiver-related functionality for all the socket-based
classes. When a data packet is incoming, the application automatically calls the OnReceiveQ
method that processes the data.
5.2.1.2 Data Buffering and Statistical Data Collection
Buffering has a very important role in this prototype system, not only because it is involved in the transmission, decoding and playing of multimedia content, but also because it provides important information to the client's Quality of Delivery Grading Scheme (QoDGS). QoDGS makes use of information related to network-related parameters’ values and variations. In this context the
Circular Buffer structure was especially designed fo r a double role: data buffering and statistical
data collector.
138
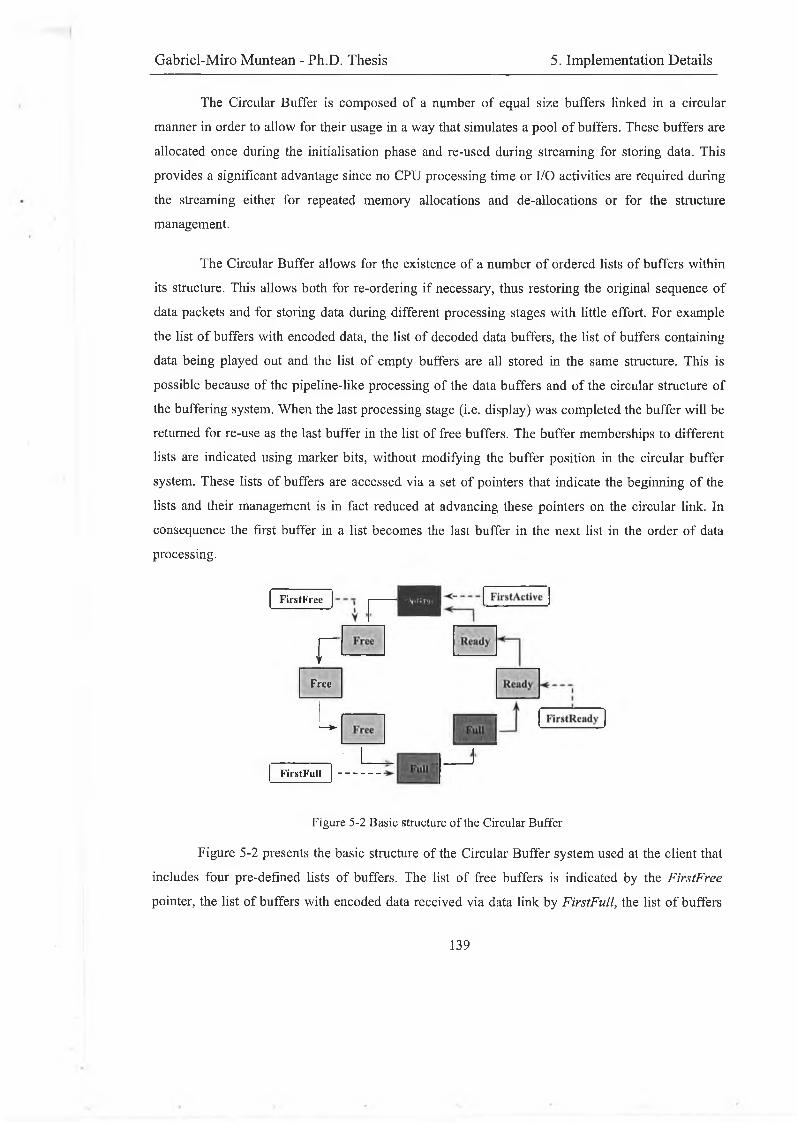
Gabriel-Miro Muntean - Ph.D. Thesis 5. Implementation Details
The Circular Buffer is composed of a number of equal size buffers linked in a circular manner in order to allow for their usage in a way that simulates a pool of buffers. These buffers are allocated once during the initialisation phase and re-used during streaming for storing data. This provides a significant advantage since no CPU processing time or I/O activities are required during the streaming either for repeated memory allocations and de-allocations or for the structure management.
The Circular Buffer allows for the existence of a number of ordered lists of buffers within its structure. This allows both for re-ordering if necessary, thus restoring the original sequence of data packets and for storing data during different processing stages with little effort. For example the list of buffers with encoded data, the list of decoded data buffers, the list of buffers containing data being played out and the list of empty buffers are all stored in the same structure. This is possible because of the pipeline-like processing of the data buffers and of the circular structure of the buffering system. When the last processing stage (i.e. display) was completed the buffer will be returned for re-use as the last buffer in the list of free buffers. The buffer memberships to different lists are indicated using marker bits, without modifying the buffer position in the circular buffer system. These lists of buffers are accessed via a set of pointers that indicate the beginning of the lists and their management is in fact reduced at advancing these pointers on the circular link. In consequence the first buffer in a list becomes the last buffer in the next list in the order of data processing.
FirstFree
rFree
LFirstFull
Figure 5-2 Basic structure of the Circular Buffer
Figure 5-2 presents the basic structure of the Circular Buffer system used at the client that includes four pre-defined lists of buffers. The list of free buffers is indicated by the FirstFree
pointer, the list of buffers with encoded data received via data link by FirstFull, the list of buffers
139
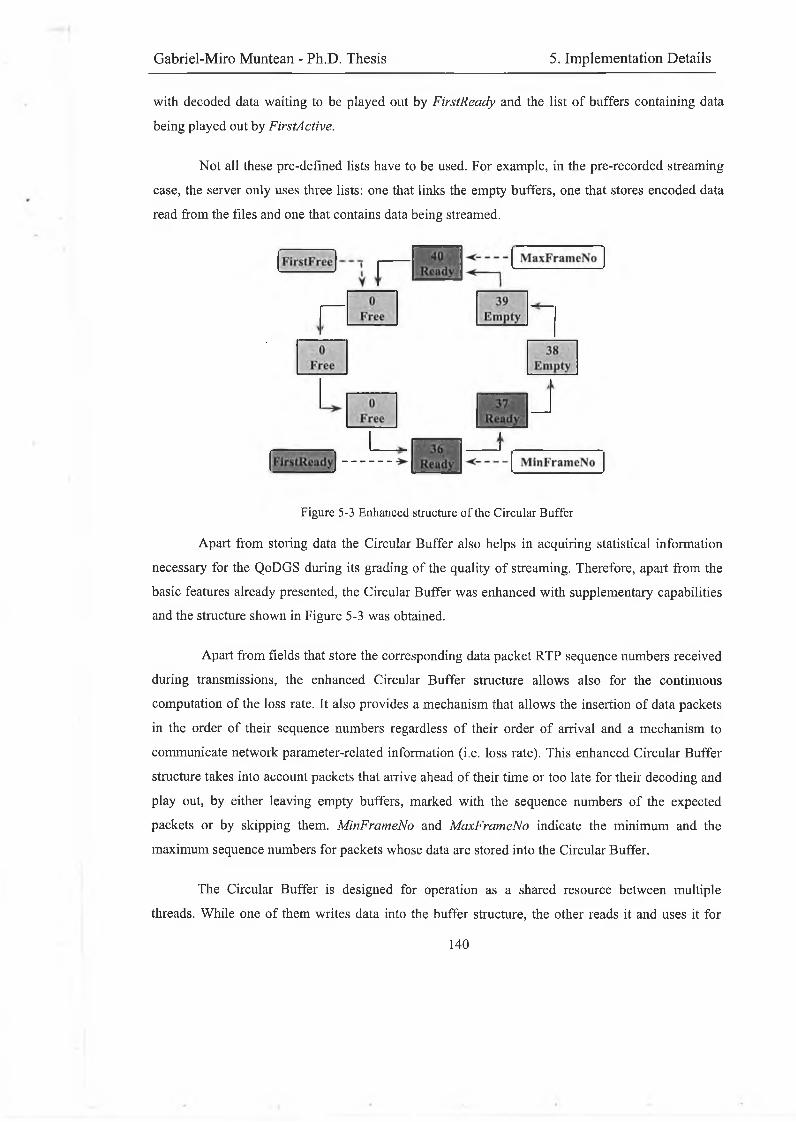
with decoded data waiting to be played out by FirstReady and the list of buffers containing data being played out by First Active.
Not all these pre-defined lists have to be used. For example, in the pre-recorded streaming case, the server only uses three lists: one that links the empty buffers, one that stores encoded data read from the files and one that contains data being streamed.
Gabriel-Miro Muntean - Ph.D. Thesis 5. Implementation Details
Figure 5-3 Enhanced structure of the Circular Buffer
Apart from storing data the Circular Buffer also helps in acquiring statistical information necessary for the QoDGS during its grading of the quality of streaming. Therefore, apart from the basic features already presented, the Circular Buffer was enhanced with supplementary capabilities and the structure shown in Figure 5-3 was obtained.
Apart from fields that store the corresponding data packet RTP sequence numbers received during transmissions, the enhanced Circular Buffer structure allows also for the continuous computation of the loss rate. It also provides a mechanism that allows the insertion of data packets in the order of their sequence numbers regardless of their order of arrival and a mechanism to communicate network parameter-related information (i.e. loss rate). This enhanced Circular Buffer structure takes into account packets that arrive ahead of their time or too late for their decoding and play out, by either leaving empty buffers, marked with the sequence numbers of the expected packets or by skipping them. MinFrameNo and MaxFrameNo indicate the minimum and the maximum sequence numbers for packets whose data are stored into the Circular Buffer.
The Circular Buffer is designed for operation as a shared resource between multiple threads. While one of them writes data into the buffer structure, the other reads it and uses it for
140
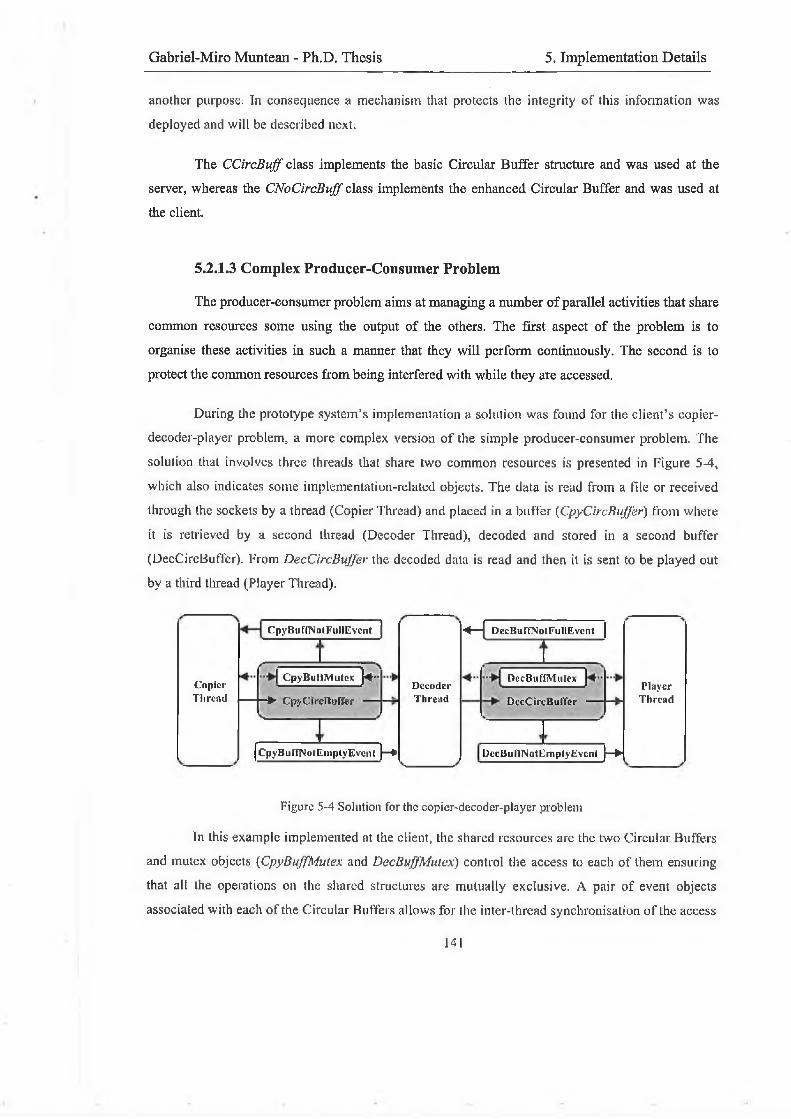
Gabriel-Miro Muntean - Ph.D. Thesis 5. Implementation Details
another purpose. In consequence a mechanism that protects the in tegrity o f this information was deployed and w ill be described next.
The CCircBujf class implements the basic Circular Buffer structure and was used at the server, whereas the CNoCircBuff class implements the enhanced Circular Buffer and was used at the client.
5.2.1.3 Complex Producer-Consumer Problem
The producer-consumer problem aims at managing a number of parallel activities that share common resources some using the output of the others. The first aspect of the problem is to organise these activities in such a manner that they will perform continuously. The second is to protect the common resources from being interfered with while they are accessed.
During the prototype system’s implementation a solution was found for the client’s copier- decoder-player problem, a more complex version of the simple producer-consumer problem. The solution that involves three threads that share two common resources is presented in Figure 5-4, which also indicates some implementation-related objects. The data is read from a file or received through the sockets by a thread (Copier Thread) and placed in a buffer {CpyCirc Buffer) from where it is retrieved by a second thread (Decoder Thread), decoded and stored in a second buffer (DecCircBuffer). From DecCircBuJfer the decoded data is read and then it is sent to be played out by a third thread (Player Thread).
CopierT hread
C pyBuffNotFullEvcnt
CpyBuffM ulex ]< •
-+■ CpyCircUurfcr —
C pyBuffNotEinplyEvent |—►
DecoderT hread
H DecBuffNolFullEvenl |
DecBuffMutex
DecC ircBuffer
DecBuffNolEinplyEvcnt J - H
PlayerT hread
Figure 5-4 Solution for the copier-decoder-player problem
In this example implemented at the client, the shared resources are the two Circular Buffers and mutex objects (CpyBuffMulex and DecBuffMutex) control the access to each of them ensuring that all the operations on the shared structures are mutually exclusive. A pair of event objects associated with each of the Circular Buffers allows for the inter-thread synchronisation of the access
141
Gabricl-Miro Muntean - Ph.D. Thesis 5. Implementation Details
to data. For example if the CpyCircBuffer is full, the Copier Thread is sent to sleep and is awaken by the CpyBuffNotFullEvent only after the Decoder Thread retrieves some data, emptying a slot. If for example the CpyCircBuffer is empty, the Decoder Thread is sent to sleep and is awaken by the CpyBuffNotEmptyEvent only when the Copier Thread writes some data in the buffer structure.
The server uses a similar structure, although not as complex, in order to solve its copier- transmitter problem. The solution involves two threads (Copier and Transmitter) and one shared circular buffer structure.
5.2.2 Implementation of the QOAS Server Application
Before giving details about the server application implementation at block level, as presented in the architecture introduced in the fourth chapter, the server’s application overall structure is presented next, in terms of defined classes and their roles.
As in the majority of MFC-based multiple document applications, MySrv consists of a main application class CMySrvApp that inherits the CWinApp class, a mainframe window class CMainFrame that extends the CMDIFrameWnd class and a main document-view structure that consists of three classes. The first class inherits the MFC’s CDocument class is called CMySrvDoc
and provides the container capabilities for the server application-related mechanisms. The second class inherits the CMDIChildWnd class is called CChildFrame and offers the multiple document child window-related functionality. Finally the third class, called CMySrvView, inherits MFC’s class CEditView and provides the viewing facility for the server application’s user. This structure is very flexible since it allows for a single server application instance to act as a pool of server applications, which share common resources, providing services to a high number of clients.
A second document-view structure was defined in order to implement the server-located Communication Manager. The components of this structure are the CMpegRemoteTxDoc class, which provides the container capabilities for most of the mechanisms, the CChildFrame class with the role of providing the child window functionality and the CRemoteTxView class that offers the viewing capabilities. Instances of the CMpegRemoteTxDoc class, that control the client-server communication at the session (control) level, are meant to work in conjunction with instances of the CMpegSystemSrv class, which was defined to work at the transport (data transmission) level. Therefore the latter encapsulates the server-side of the client-server communication mechanism- related objects, the server Copier and Transmitter threads, the server located circular buffer and the synchronisation mechanisms for the threads access to the shared resources which have been
142
Gabriel-Miro Muntean - Ph.D. Thesis 5. Implementation Details
previously discussed. It also includes the instances of the CSrvStateMonitor class that implements the Server Arbitration Scheme (SAS) and of the CPRecDatabase class that implements the database interrogation mechanism.
Next the implementation of each of the server's units is described, indicating the main classes and methods used.
5.2.2.1 Multimedia Acquirer and MPEG Encoder
Although in the block-level architecture of the server application, two units are indicated for audio-video capturing and MPEG encoding, this implementation uses the Canopus Amber MPEG hardware encoder-decoder card for both processes, since it uses directly analog signals as input. The implementation relies on the Canopus Amber's MPEG Development Kit MVR-D2000 version 3.20 [243] and on the associated API library.
For the multimedia acquiring and encoding another MFC-based document-view structure was defined and consists of a document-container class CEncOverlayDoc, a CEncOverlayView
class that provides viewing facilities and a child window class CEncRemoteOverlayChildFrame. The latter also provides all the methods directly related to the functionality of the hardware encoding process. This seven-step process is detailed next.
Since multiple encoding-decoding cards can be used at a time, the first step consists of selecting of the next available card and marking it as used. Next, the initialisation of the selected encoder card is performed. This second step indicates some encoding-related parameters such as the type of the encoded stream (MPEG-1 or MPEG-2, System or Program, Audio or Video), the buffer size, the place where to temporarily store the processed data to (memory or disk), input TV system format (PAL or NTSC) and the callback function which is called each time a new set of data is encoded in order to give the application access to it. This is performed in the OnCreateQ method of the CEncRemoteOverlayChildFrame class.
The third step is the creation of the control window that displays the video information being encoded and plays the associated sound. This is performed in the method CreateOverlayWindow(). The fourth step is the encoding, which is started when any of the following CEncRemoteOverlayChildFrame class's methods are called. OnEncodeAudioQ was defined for local MPEG Audio encoding, OnEncodeVideoO - for local MPEG Video stream encoding, OnEncodePsQ - for local MPEG System or Program stream encoding and
143
Gabriel-Miro Muntean - Ph.D. Thesis 5. Implementation Details
RemoteEncodePs() for live encoding used in conjunction with streaming, function supported only for MPEG System or Program. These functions initiate the encoding thread that acts as a copier in a producer-consumer-like situation, storing data in a local buffer from which a display or a transmitter thread retrieves it for local display and storage on disk or for streaming.
The encoding ends by calling the OnCloseQ method or RemoteEncodeStopO, according to the case and includes the destruction of the display control window and by the deactivation of the encoder card.
5.2.1.2 Server Communication Manager and Transmission Shaper
The principle and some implementation details in relation to the server's Communication Manager were described in section 5.2.1.1. Next the classes that implement the server-side communication mechanism are just mentioned.
CListenSocket is created to listen for incoming client link requests and if accepted, one of CSrvTCPSock or CSrvUDPSock classes is instantiated to create an object in charge with the server end of the control link. To this end the client is directed and consequently control messages can be then bi-directionally exchanged with the server. Next the unidirectional data link is established using the server side’s CSrvUDPSock class and a similar class at the client and data can be sent to the clients.
The Transmission Shaper, in charge of controlling the data transmission, is implemented by the CMpegSystemSrv class that acts as a container for the copier thread (CSrvCpThread), the transmission thread (CSrvTxThread), the shared transmission circular buffer (CCircBuff) and the related mechanisms (i.e. events and mutex-based). These represent a solution for a producer- consumer-like problem that was already described in section 5.2.1.3 and it aims at transmitting data to the clients. It is interesting from the implementation point of view that the copier thread selects the source of data based on the QOAS - Server Arbitration Scheme’s (SAS) decisions, taken on the basis of feedback received from the client. These decisions affect the server quality state and therefore the stream the data is read from. The exact position the switch between a source of data and the next one is determined after consulting the Multimedia Database whose implementation mechanism is detailed in section 5.2.2.4. Also the transmission thread adjusts the streaming rate according to the current quality state of the server.
144
Gabriel-Miro Muntcan - Ph.D. Thesis 5. Implementation Details
The server Communication Manager is also controlling the multimedia session using RTSP VCR-like commands. The server receives the client commands and processes them in the CMpegRemoteTxDoc's ExecuteCommand() method that is invoked by the CSrvCtrlSock’s OnReceiveQ method, automatically called by the framework when a new data packet is received. It then sends the acknowledgements by calling the CMpegRemoteTxDoc's SendMessage() method. ACK_SETUP, in form of PUT CTRL_CONNECT and PUT_DATA_CONNECT, confirms the setup process completion, whereas ACK PLAY (PUT_PREC_FILE) acknowledges starting streaming of the requested multimedia content. The server can initiate the destruction of the double link and the end of the session by sending TEARDOWN (SRVSHUTDOWN).
5.2.2.3 Feedback Manager and Server Application Core
One of the most important mechanisms operated in conjunction by the Feedback Manager and the Server Core is the Server Arbitration Scheme (SAS), which is implemented by the CSrvStateMonitor class. In the server application implementation the CMpegSystemSrv container class stores a reference to an object that instantiates CSrvStateMonitor class.
Among the most significant methods of the CSrvStateMonitor class are AddFeedbackQoDGradeQ that processes a newly received QoDGrade from the client and assesses the opportunity of a server quality state change and ChangeSrvStateQ that effectively changes this state.
Another important mechanism implemented in co-operation by the Feedback Manager and the Server Core is the quality timeout mechanism that determines a server quality state decrease if there is no information received from the client in form of feedback for a duration of time. This mechanism uses a timer from the MFC’s timer pool facility built-in the CView class which is inherited by our CRemoteTxView class. The latter’s OnTimerQ function is called every time timeout occurs and measures have to be taken. The timer is restarted every time the server’s Feedback Manager receives a feedback message from the client.
5.2.2.4 Database Support for Pre-recorded Streams
The goal of the database support is to provide a mean for storing, accessing and updating pre-recorded multimedia streams related information, necessary for the implementation of QOAS. This database implementation makes use of the Microsoft Open Database Connectivity (ODBC) a vendor-independent mechanism that allows access to data stored in a variety of data sources [244]
145
Gabriel-Miro Muntean - Ph.D. Thesis 5. Implementation Details
(including Microsoft Access used here) by executing SQL (Structured Query Language) statements against them.
In order to allow for any application to access a database with the ODBC mechanism, the database has to be first registered with the ODBC Administrator from the Windows Control Panel, indicating also the driver it can work with, as advised in [245], The registration name for the database can be different than the real name of the database file and it is meant to be used by any application that wants to access the registered database.
The defined class CPRecDatabase which inherits the MFC’s CDatabase class, provides methods (OpenPRecDbConnectionO and ClosePRecDbConnectionQ) for connecting and disconnecting from the registered database. Once a connection has been made, operations on the data source are possible using either an object that instantiates the MFC’s CRecordset class or executing the CPRecDatabase ExecuteSQLO member function. Since the latter does not return any result, only creation and deletion of tables, insertion of data can be performed, whereas for the database queries the MFC’s CRecordset class is used. Among other methods is CreatePRecDbTable() which creates a new table in the database with the given name. The newly created table will have its fields named and of the types as indicated in the transmitted parameters. ExistsPRecDbTableQ verifies whether or not the indicated table exists and if it does not, it creates it in a similar manner with the previous function. OpenPRecDbTableQ and ClosePRecDbTable()
open and close the indicated table, while DeletePRecDbTable() deletes it.
The MFC’s CRecordset class provides the functionality of an ODBC SQL statement, including the row set returned by the statement. Create PRecRecordsetf) and DeletePRecRecordset() are creating and destroying the object used to operate on the database. OpenPRecRecordsetQ and ClosePRecRecordset() allow for selecting a set of records from the database that fulfil the indicated constraints for further processing and respectively renounce at the selected set once the task has been performed. Its usage is very simple and employs two query structures DblntResult and DbStrResult. A call to OpenPRecRecordsetQ function requires a pointer to the CPRecDatabase object that manages the connection to the data source and two strings Filter and Sort that correspond to SQL’s WHERE and ORDER BY clauses. The most important result is the SQL’s selected set of records that is processed and essential information collected and retrieved via the query structures.
146
Gabriel-Miro Muntean - Ph.D. Thesis 5. Implementation Details
5.2.3 Implementation of the QOAS Client Application
As in the case of the server application, the implementation of the client application follows the block level architecture presented in the fourth chapter, section 4.2. Next the defined classes are presented and how they are used is discussed.
At the core of the MyCli application is the application class CMyCliApp that inherits MFC's CWinApp class, a mainframe window class CMainFrame that inherits MFC’s CMDIFrameWnd class and a document-view structure. The three document-view classes are CMyCliDoc that provides the container capabilities for the client-related mechanisms, CChildFrame that offers the child window related functionality and the CMyCliView that provides the viewing facility for the client’s user. The flexibility of this structure allows for the existence of multiple clients at the same time, which can connect to different server application instances and stream different multimedia content if wanted. In this way the single application acts as a pool of clients that run in parallel and share some resources.
A second document-view structure was defined in order to implement the client-located Communication Manager. The components of this structure are the CMpegRemoteCliDoc class, which provides the container capabilities for the most of the client-located streaming mechanisms, the CChildFrame class with the role of providing the child window functionality and the CMpegRemoteCliView class that offers the viewing capabilities. An extra view has been also added for real-time monitoring of the transmission-related parameters, class called CRemoteRxView.
Any instance of the CMpegRemoteCliDoc class, that controls the client-server communication at the session (control) level, is meant to work in conjunction with an instance of the CHardSystemCli class, which was defined to work at the transport (data transmission) level. The latter encapsulates the client-side of the client-server communication mechanism such as the client receiver (copier), decoder and player threads, two instances of the circular buffer and the associated synchronisation mechanisms, previously presented. It also includes the instances of the CQoDGSMonitor class that implements the Quality of Delivery Grading Scheme (QoDGS).
The implementation of each of the client's units is described next, indicating the main classes and methods used.
147
Gabriel-Miro Muntean - Ph.D. Thesis 5. Implementation Details
5.2.3.1 MPEG Decoder and Multimedia Player
Although in the architecture presented in the fourth chapter two separate units were indicated for MPEG decoding and respectively multimedia play-out, this implementation uses the Canopus Amber MPEG hardware decoder card for both processes. In a similar manner with the server application, the client relies on the Canopus MVR-D2000 Amber Development Kit version 3.20 [243] and its associated API.
Similar to the server-based acquiring and encoding processes, the MPEG decoding and multimedia playing has seven steps, which are described in detail next. They make use of an MFC- based document-view structure that was especially defined and consists of a document-container class CDecOverlayDoc, a CDecOverlayView class that provides viewing facilities and a child window class CDecRemoteOverlayChildFrame that contains all the methods used for decoding and playing as well as for the interaction with the rest of the client application units.
Since more than one MPEG encoding-decoding card can be used at a time, the first two steps consist of the selection of the next available card and its initialisation and are implemented in the CDecRemoteOverlayChildFrame's method OnCreate(). The initialisation sets the type of the stream to be decoded (the card accepts only MPEG System or Program), the buffer size, the place the encoded data is read from (memory or disk), the TV systems (PAL or NTCS) and indicates the callback data-related function which is called each time a new piece of data is decoded, the error callback function and the status callback function.
The third step is the creation of the control window in which the streamed multimedia information is played out for the viewer and this is done in the CreateOverlayWindowQ method of the CDecRemoteOverlayChildFrame class. The next step, the real decoding and playing of the multimedia data starts when the OnDecodePlay() method is called. This creates the copier-decoder- player thread and buffer structure that supports the play out. During the play out process, the card’s driver expects to be fed with encoded data by the application and this is performed by the data callback function, which acts as the decoder thread.
The last stages involve the termination of the decoding process, freeing of the associated resources, including the destruction of the card's display control window and the deactivation of the encoder card. These are performed by the CDecRemoteOverlayChildFrame's CloseFrame() member function.
148
Gabriel-Miro Muntean - Ph.D. Thesis 5. Implementation Details
5.2.3.2 Client Communication Manager
The client-side Communication Manager supports in conjunction with the server’s the double-link communication principle presented in section 5.2.1.1 First the client creates a control socket instantiating either of the classes CCliTCPSocket or CCliUDPSocket and tries to communicate with the server’s listening socket described by an IP address-port number pair. If accepted by the server, a control link is established between the two of them. Using this link, next the unidirectional data link is created using the client side’s CCliUDPSocket class and a similar class at the server for data to be received by the client.
The Communication Manager is also in charge of controlling the data reception and play out. This mechanism is implemented by the CHardSystemCU class that acts as a managing point for the receiver thread (CCliUDPSocket’s method OnReceive()), the decoder thread (CDecRemoteOverlayChildFrame's callback function ReadRemoteSectorProc() that was associated to the decoder card), the player thread (started by a call to the CDecRemoteOverlayChildFrame's DecodeRemotePlayQ method), the shared buffers (CCircBuff and the card driver’s buffer) and the related synchronisation mechanisms (i.e. events and mutex- based). These represent a solution for the complex producer-consumer-like problem that was already described in section 5.2.1.3 and here aims at receiving data, decode it and play it out to the viewer.
The client Communication Manager also implements the client-side RTSP-related multimedia streaming session control. The client sends session control commands such as SETUP (GET_CTRL_CONNECT and GET_DATA_CONNECT) for establishing the double client-server communication link and PLAY (GET_PREC_FILE) for requesting multimedia streaming of certain content. It also uses STOP (STOP_PREC_FILE) for stopping the streaming and TEARDOWN (SRVSHUTDOWN) for initiating the destruction of the double link and the end of the session. Processing the server’s answers is performed in the CMpegRemoteCliDoc's member function ExecuteCommandQ invoked from the CCliCtrlSocket's OnReceive() method, which is automatically called by the framework when a new packet is received.
5.2.3.3 Feedback Indication Unit and Client Core
One of the most important mechanisms provided in conjunction by the Feedback Indication Unit and the Client Core is the Quality of Delivery Grading Scheme (QoDGS), which is implemented by the CQoDGSMonitor class according to the principles described in section 4.5. A
149
Gabriel-Miro Muntean - Ph.D. Thesis 5. Implementation Details
reference to the object that instantiates this class is a member of the CHardSystemCli container class.
Among the most significant methods of the CQoDGSMonitor class are Update_QoD_After_ReceivePkt(), Grade_QoD() and InitQoDGSStruct(). The first method processes the information related to a newly received packet and updates the monitored parameters’ values and variations as well as the estimated quality of delivery. It bases its functionality on calls to Adjust_QoD_XXX() functions, where XXX stands for the name of the monitored parameter (e.g. Delay, Jitter, Loss, etc.). The second method computes the QoDScore-s after computing partial scores for the monitored parameters by calling their associated methods with the following form: Grade_QoD_XXX(). The third method initialises the QoDGS structure and all its components by calling individual functions like Init_QoD_XXX().
These computed QoDScores are sent to the server as part of feedback messages, using the control link provided by the client and server Communication Managers, informing it about the quality of delivery and allowing it to take adaptive measures.
5.3 Summary
This chapter has presented implementation details about both the simulation system model and the real prototype systems that were built in order to test the proposed QOAS for multimedia streaming using simulations and respectively emulations. The simulation environment used was Network Simulator version 2 and the implementation relies on some of the classes provided by it for lower level services such as transport-level communication. The programming environment used for building the prototype system was Microsoft’s Visual C++ version 6.0 and the implementation made use of its MFC class structure. In both cases, this chapter has presented server and client-located mechanisms in terms of architectural blocks and details about their implementation in terms of classes and their main methods whose role was explicitly indicated.
150
Gabriel-Miro Muntean - Ph.D. Thesis 6. Experimental Results
Chapt er VI
E x p e r i m e n t a l Resu l t s
A bstrac t
The sixth chapter presents experimental results o f tests that aim at both tuning the QOAS
parameters in order to obtain best results in local broadband multi-service IP-networks and
testing it in different delivery conditions to make sure that very good performances were
achieved. The scheme is tested both objectively using a simulation environment and simulation
models and subjectively using a prototype system and human subjects. The experimental test
results are presented and commented on.
6.1 Overview
QOAS was proposed as an inexpensive solution to deliver high quality multimedia-based services to home residences via the local broadband multi-service IP-network. During its design many issues were taken into account in order to better achieve this goal, as presented in the previous chapters. However, testing is required both during and following the design phase, helping to propose a good solution and in the final stage for its verification and validation. In order to do this, a model was built and extensive objective testing was performed, involving simulations. Although these simulations allow for measuring diverse parameters and assessing the performances of the QOAS in various conditions, even in comparison to other solutions, they can only estimate the users’ perceived quality with a certain degree of accuracy based on some metrics. Since currently there is not a total agreement that any of these metrics may reflect the viewers’ opinions in a wide range of situations, subjective tests were also performed in order to determine the real users’ perceptual assessment of the streamed multimedia clips’ quality. Next both these sets of tests are presented and their results are commented.
151
Gabriel-Miro Muntean - Ph.D. Thesis 6. Experimental Results
6.2 Objective Testing
6.2.1 Simulation-based Testing
There is a growing recognition within the research communities of the importance of simulation tools in helping to design and test different proposed algorithms and schemes. New mechanisms, especially in networking research, present huge challenges for testing. These challenges are mainly related to the required large and complex environments. Both the designers and the testers recognise the significant advantages of simulations in terms of necessary computing resources, associated costs and convenience over duplication of a real word system in the lab. Simulations allow performing large-scale tests that are controlled, reproducible and do not involve significant costs. Therefore it is easy to explain why research in general and networking research in particular increasingly depends on simulation to investigate new schemes’ behaviours, performances, and interactions.
There are different simulation tools or environments available for network simulations such as Network Simulator (NS-2) [246], Optimized Network Engineering Tool (Opnet)63, SIMSCRIPT II (former COMNET III)64 and CNET65. NS-2 was chosen because it is open-source and allows for easy extensibility, but mainly because it includes a large number of models for different layer protocols, traffic etc. such as UDP and TCP that can be used during testing.
The performed simulations include two different phases: tuning and testing. Since the QOAS design involves the existence of a number of parameters that have to be tuned in order to achieve best results in a given infrastructure, the tuning phase aims at determining these parameters’ values. The parameters whose values have to be assigned are the weights associated to the QOAS’s Quality of Delivery Grading Scheme (QoDGS), which was presented in the fourth chapter. The testing phase makes use of the tuning stage’s results and aims at showing that the QOAS solution achieves expected performances, even in comparison to other multimedia streaming approaches in different network delivery conditions and subject to various cross traffic. In this section both tuning and testing phases are presented.
63 Optimized Network Engineering Tool (Opnet), OPNET Technologies Inc., http://www.opnct.com
64 SIMSCRIPT, CACI International Inc., http://www.caciasl.com/products/simscript.cfm
65 The CNET network simulator, http://www.csse.uwa.edu.au/cnet/
152
Gabriel-Miro Muntean - Ph.D. Thesis 6. Experimental Results
Next the simulation environment, the aims of the performance assessment, the simulation topology, the QOAS model and the multimedia clips used for objective testing are presented.
6.2.1.1 N etw ork S im ulator V ersion 2 (N S-2)
Network Simulator version 2 (NS-2) [246] is an open source, object-oriented, discrete event, network simulation environment that was built at University of California at Berkely66 in order to test models proposed in the networking research area. It was developed and written in C++ and OTcl (an object-oriented extension to Tcl/Tk proposed at Massachusetts Institute of Technology) [247], but in order to be deployed, it also requires Tel, Tk, OTcl and TclCL to be installed. NS-2 is primarily used for simulating local and wide area IP-networks. It implements network protocols such as TCP (different flavors) and UDP, traffic source behavior such as FTP, Telnet, WWW, constant bit-rate (CBR) and variable bit-rate (VBR), router queue management mechanisms like Drop Tail, Random Early Drop (RED) and Class-Based Queuing (CBQ), routing algorithms such as Dijkstra, and more. NS-2 also supports multicasting and some of the MAC layer protocols for LAN simulations. The NS project is now a part of the Virtual InterNetwork Testbed (VINT) project67 and is supported by DARPA68. More information about NS-2 can be found in the NS Manual [248] or in one of the NS tutorials such as [249, 250],
6.2.1.2 S im ulation T opology
Regardless of the exact architecture of the local broadband multi-service IP-network chosen for the distribution of services (including multimedia-based ones) from the distribution hub to the residential users, there is in fact a single link that has to support all the traffic exchanged. Therefore, the problem is in fact the QOAS-based distribution of high quality multimedia to users behind a single bottleneck link situated between the distribution hub and the residential users. This bottleneck link may cause problems in term of increased or variable delays and/or loss that severely affect the quality of the provided services, especially of the multimedia-based ones. These problems not only originate in the multimedia traffic, but also in other types of traffic, with different size and variation patterns produced by other type of services provided through the same infrastructure. Therefore the problem of delivering multimedia-based services with little effort to residential users
66 University of California at Berkeley, http://www.berkeley.edu
67 Virtual InterNetwork Testbed (VINT) project, http://www.isi.edu/nsnam/vint/index.html
68 Defense Advanced Research Projects Agency (DARPA), http://www.darpa.mil
153
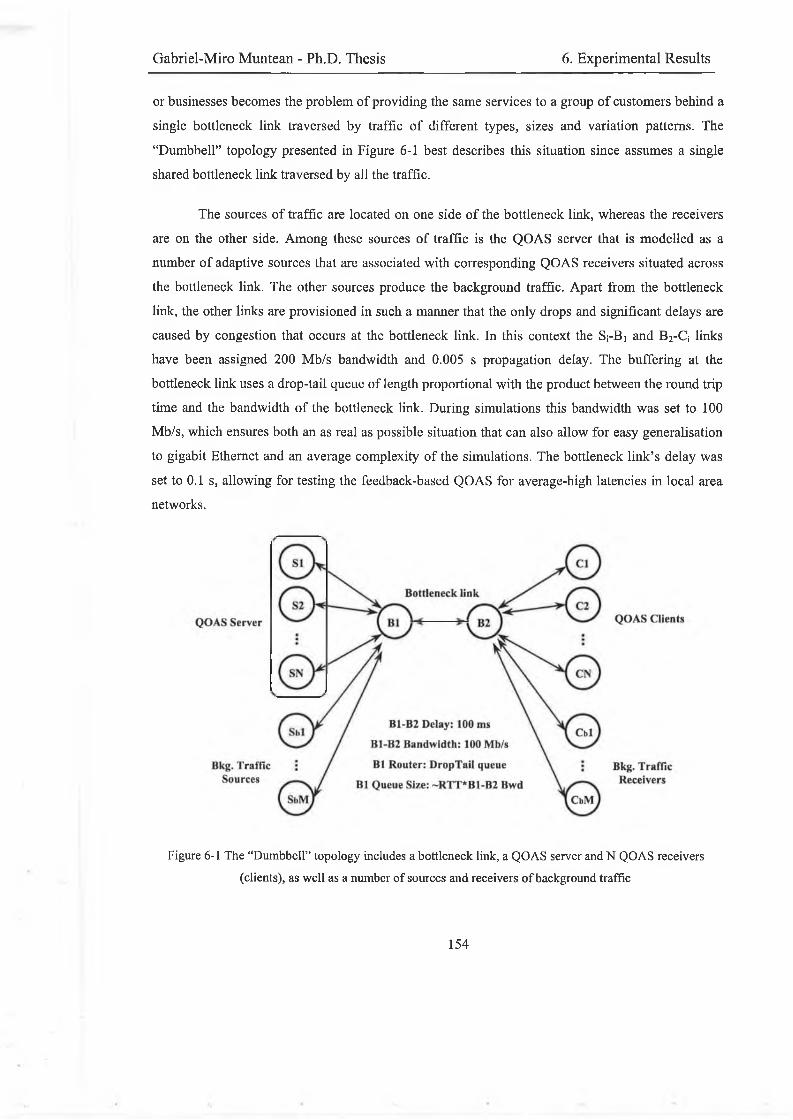
Gabriel-Miro Muntean - Ph.D. Thesis 6. Experimental Results
or businesses becomes the problem of providing the same services to a group of customers behind a single bottleneck link traversed by traffic of different types, sizes and variation patterns. The “Dumbbell” topology presented in Figure 6-1 best describes this situation since assumes a single shared bottleneck link traversed by all the traffic.
The sources of traffic are located on one side of the bottleneck link, whereas the receivers are on the other side. Among these sources of traffic is the QOAS server that is modelled as a number of adaptive sources that are associated with corresponding QOAS receivers situated across the bottleneck link. The other sources produce the background traffic. Apart from the bottleneck link, the other links are provisioned in such a manner that the only drops and significant delays are caused by congestion that occurs at the bottleneck link. In this context the S;-Bi and B2-Q links have been assigned 200 Mb/s bandwidth and 0.005 s propagation delay. The buffering at the bottleneck link uses a drop-tail queue of length proportional with the product between the round trip time and the bandwidth of the bottleneck link. During simulations this bandwidth was set to 100 Mb/s, which ensures both an as real as possible situation that can also allow for easy generalisation to gigabit Ethernet and an average complexity of the simulations. The bottleneck link’s delay was set to 0.1 s, allowing for testing the feedback-based QOAS for average-high latencies in local area networks.
Figure 6-1 The “Dumbbell” topology includes a bottleneck link, a QOAS server and N QOAS receivers (clients), as well as a number of sources and receivers of background traffic
154
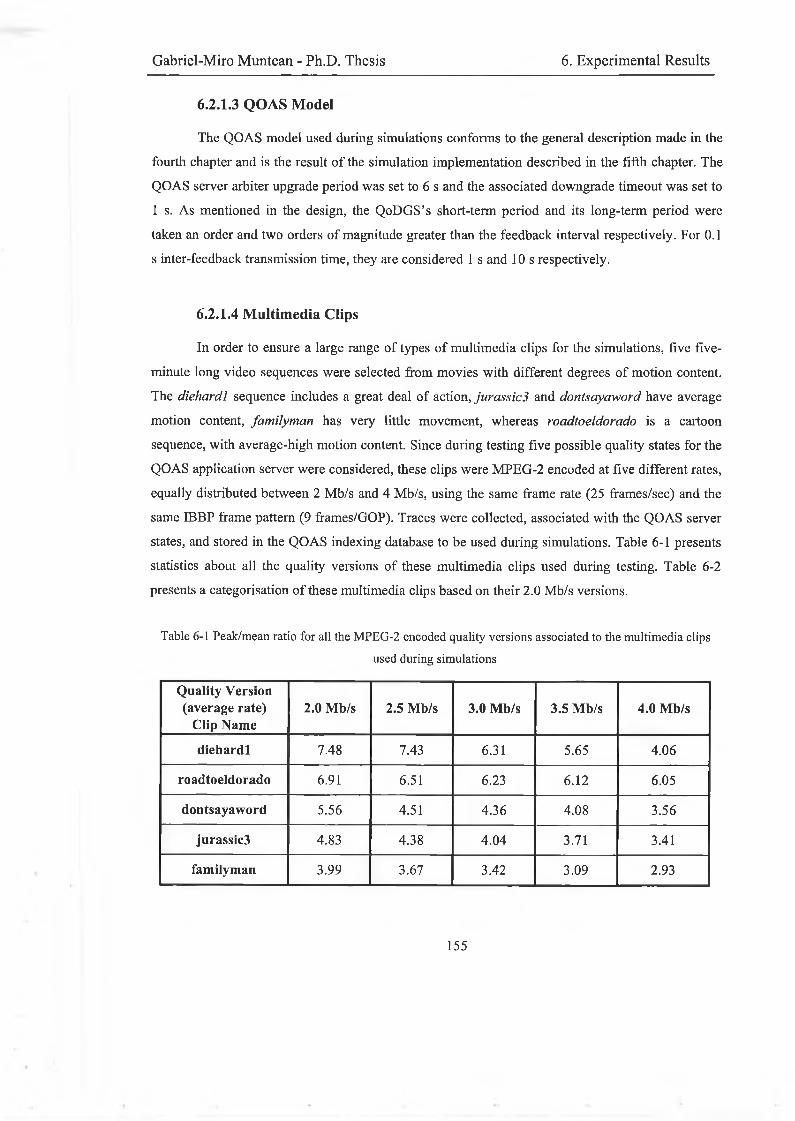
Gabriel-Miro Muntean - Ph.D. Thesis 6. Experimental Results
6.2.1.3 QOAS Model
The QOAS model used during simulations conforms to the general description made in the fourth chapter and is the result of the simulation implementation described in the fifth chapter. The QOAS server arbiter upgrade period was set to 6 s and the associated downgrade timeout was set to 1 s. As mentioned in the design, the QoDGS’s short-term period and its long-term period were taken an order and two orders of magnitude greater than the feedback interval respectively. For 0.1 s inter-feedback transmission time, they are considered 1 s and 10 s respectively.
6.2.1.4 Multimedia Clips
In order to ensure a large range of types of multimedia clips for the simulations, five five- minute long video sequences were selected from movies with different degrees of motion content. The diehardl sequence includes a great deal of action, jurassic3 and dontsayaword have average motion content, familyman has very little movement, whereas roadtoeldorado is a cartoon sequence, with average-high motion content. Since during testing five possible quality states for the QOAS application server were considered, these clips were MPEG-2 encoded at five different rates, equally distributed between 2 Mb/s and 4 Mb/s, using the same frame rate (25 frames/sec) and the same IBBP frame pattern (9 frames/GOP). Traces were collected, associated with the QOAS server states, and stored in the QOAS indexing database to be used during simulations. Table 6-1 presents statistics about all the quality versions of these multimedia clips used during testing. Table 6-2 presents a categorisation of these multimedia clips based on their 2.0 Mb/s versions.
Table 6-1 Peak/mean ratio for all the MPEG-2 encoded quality versions associated to the multimedia clipsused during simulations
Quality Version (average rate)
Clip Name2.0 Mb/s 2.5 Mb/s 3.0 Mb/s 3.5 Mb/s 4.0 Mb/s
diehardl 7.48 7.43 6.31 5.65 4.06
roadtoeldorado 6.91 6.51 6.23 6.12 6.05
dontsayaword 5.56 4.51 4.36 4.08 3.56
jurassic3 4.83 4.38 4.04 3.71 3.41
familyman 3.99 3.67 3.42 3.09 2.93
155
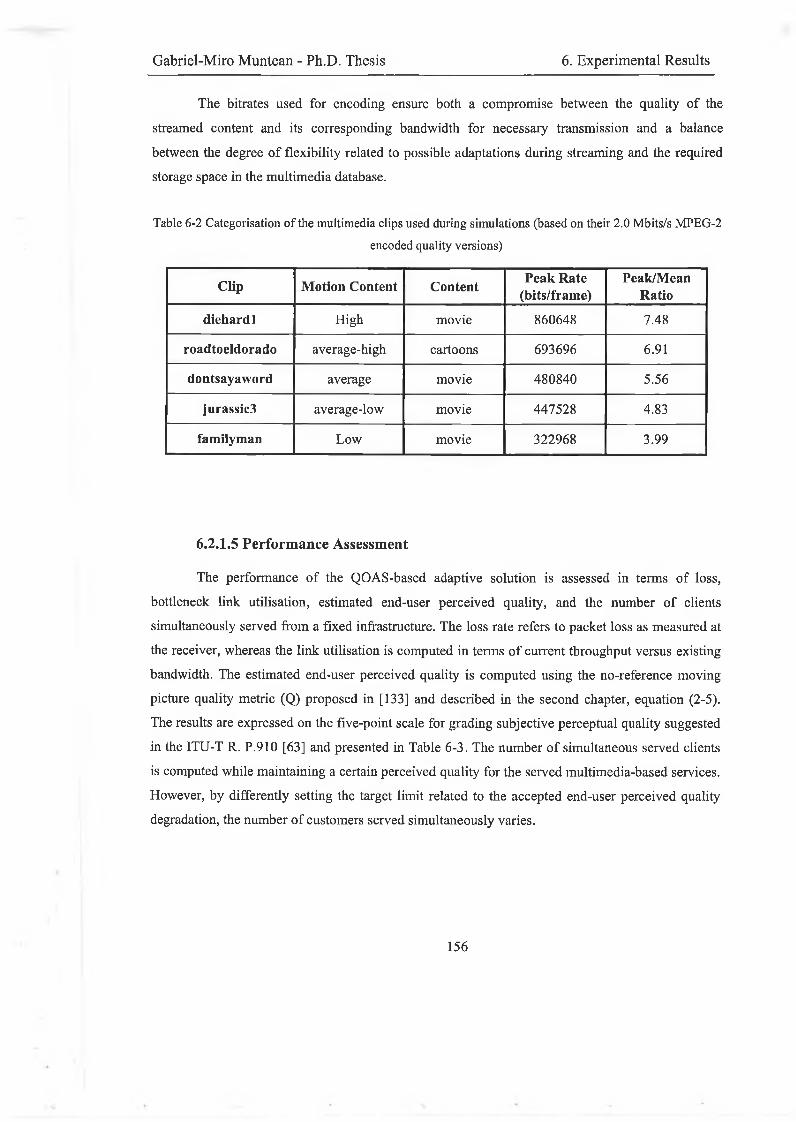
Gabriel-Miro Muntean - Ph.D. Thesis 6. Experimental Results
The bitrates used for encoding ensure both a compromise between the quality of the streamed content and its corresponding bandwidth for necessary transmission and a balance between the degree of flexibility related to possible adaptations during streaming and the required storage space in the multimedia database.
Tabic 6-2 Categorisation of the multimedia clips used during simulations (based on their 2.0 Mbits/s MPEG-2encoded quality versions)
Clip Motion Content ContentPeak Rate
(bits/frame)Peak/Mean
Ratio
diehardl High movie 860648 7.48
roadtoeldorado average-high cartoons 693696 6.91
dontsayaword average movie 480840 5.56
jurassic3 average-low movie 447528 4.83
familyman Low movie 322968 3.99
6.2.1.5 Performance Assessment
The performance of the QOAS-based adaptive solution is assessed in terms of loss, bottleneck link utilisation, estimated end-user perceived quality, and the number of clients simultaneously served from a fixed infrastructure. The loss rate refers to packet loss as measured at the receiver, whereas the link utilisation is computed in terms of current throughput versus existing bandwidth. The estimated end-user perceived quality is computed using the no-reference moving picture quality metric (Q) proposed in [133] and described in the second chapter, equation (2-5). The results are expressed on the five-point scale for grading subjective perceptual quality suggested in the ITU-T R. P.910 [63] and presented in Table 6-3. The number of simultaneous served clients is computed while maintaining a certain perceived quality for the served multimedia-based services. However, by differently setting the target limit related to the accepted end-user perceived quality degradation, the number of customers served simultaneously varies.
156
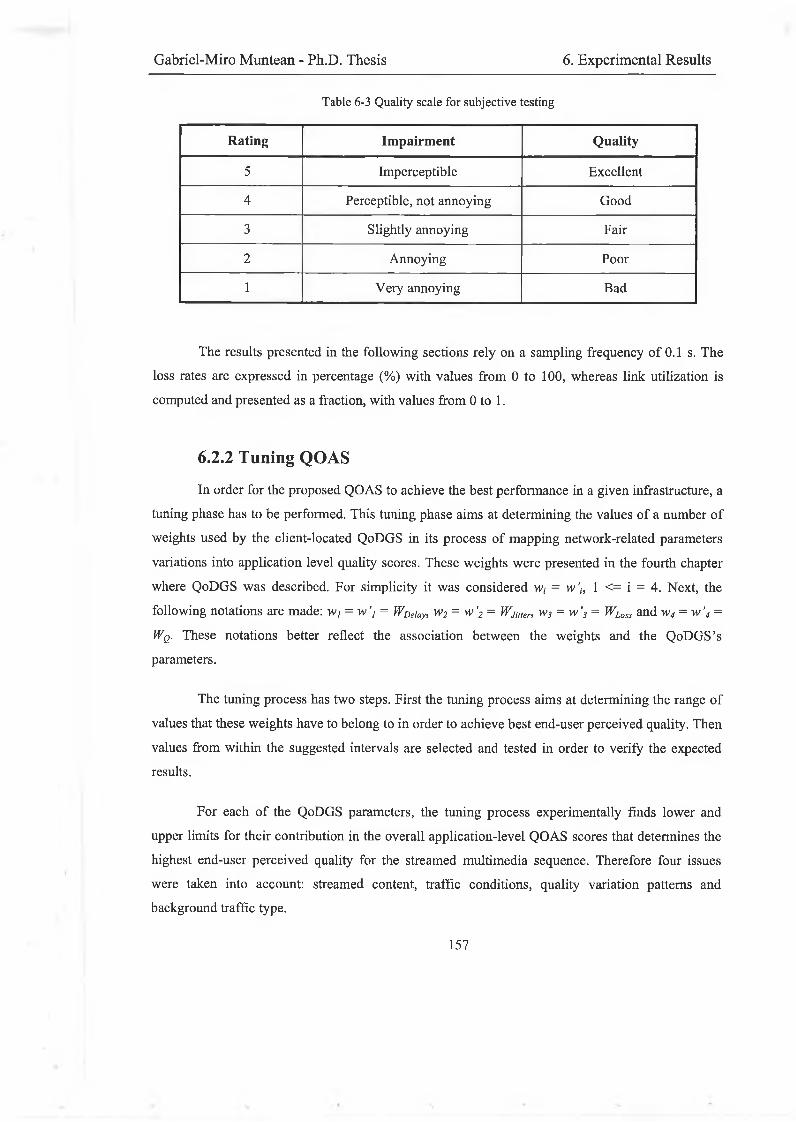
Gabricl-Miro Muntean - Ph.D. Thesis 6. Experimental Results
Table 6-3 Quality scale for subjective testing
Rating Impairment Quality
5 Imperceptible Excellent
4 Perceptible, not annoying Good
3 Slightly annoying Fair
2 Annoying Poor
1 Very annoying Bad
The results presented in the following sections rely on a sampling frequency of 0.1 s. The loss rates are expressed in percentage (%) with values from 0 to 100, whereas link utilization is computed and presented as a fraction, with values from 0 to 1.
6.2.2 Tuning QOAS
In order for the proposed QOAS to achieve the best performance in a given infrastructure, a tuning phase has to be performed. This tuning phase aims at determining the values of a number of weights used by the client-located QoDGS in its process of mapping network-related parameters variations into application level quality scores. These weights were presented in the fourth chapter where QoDGS was described. For simplicity it was considered wt = w ’h 1 <= i = 4. Next, the following notations are made: wI = w ’, = WDelay> w2 = w ’2= WJiner, w3 = w ’3= WLoss and w4 = w ’4 =
WQ. These notations better reflect the association between the weights and the QoDGS’s parameters.
The tuning process has two steps. First the tuning process aims at determining the range of values that these weights have to belong to in order to achieve best end-user perceived quality. Then values from within the suggested intervals are selected and tested in order to verify the expected results.
For each of the QoDGS parameters, the tuning process experimentally finds lower and upper limits for their contribution in the overall application-level QOAS scores that determines the highest end-user perceived quality for the streamed multimedia sequence. Therefore four issues were taken into account: streamed content, traffic conditions, quality variation patterns and background traffic type.
157
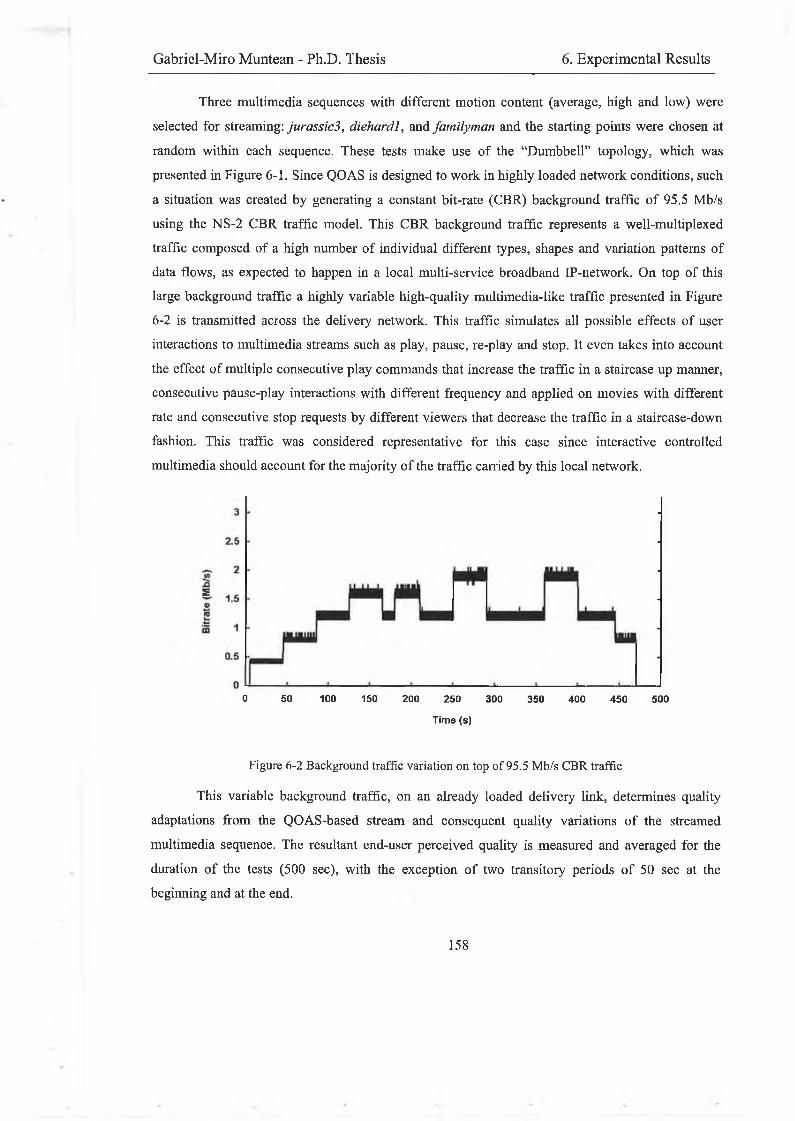
Gabriel-Miro Muntean - Ph.D. Thesis 6. Experimental Results
Three multimedia sequences with different motion content (average, high and low) were selected for streaming: jurassic3, diehardl, and familyman and the starting points were chosen at random within each sequence. These tests make use of the “Dumbbell” topology, which was presented in Figure 6-1. Since QOAS is designed to work in highly loaded network conditions, such a situation was created by generating a constant bit-rate (CBR) background traffic of 95.5 Mb/s using the NS-2 CBR traffic model. This CBR background traffic represents a well-multiplexed traffic composed of a high number of individual different types, shapes and variation patterns of data flows, as expected to happen in a local multi-service broadband IP-network. On top of this large background traffic a highly variable high-quality multimedia-like traffic presented in Figure 6-2 is transmitted across the delivery network. This traffic simulates all possible effects of user interactions to multimedia streams such as play, pause, re-play and stop. It even takes into account the effect of multiple consecutive play commands that increase the traffic in a staircase up manner, consecutive pause-play interactions with different frequency and applied on movies with different rate and consecutive stop requests by different viewers that decrease the traffic in a staircase-down fashion. This traffic was considered representative for this case since interactive controlled multimedia should account for the majority of the traffic carried by this local network.
0 50 100 150 200 250 300 350 400 450 500
Tim e (s )
Figure 6-2 Background traffic variation on top of 95.5 Mb/s CBR traffic
This variable background traffic, on an already loaded delivery link, determines quality adaptations from the QOAS-based stream and consequent quality variations of the streamed multimedia sequence. The resultant end-user perceived quality is measured and averaged for the duration of the tests (500 sec), with the exception of two transitory periods of 50 sec at the beginning and at the end.
158
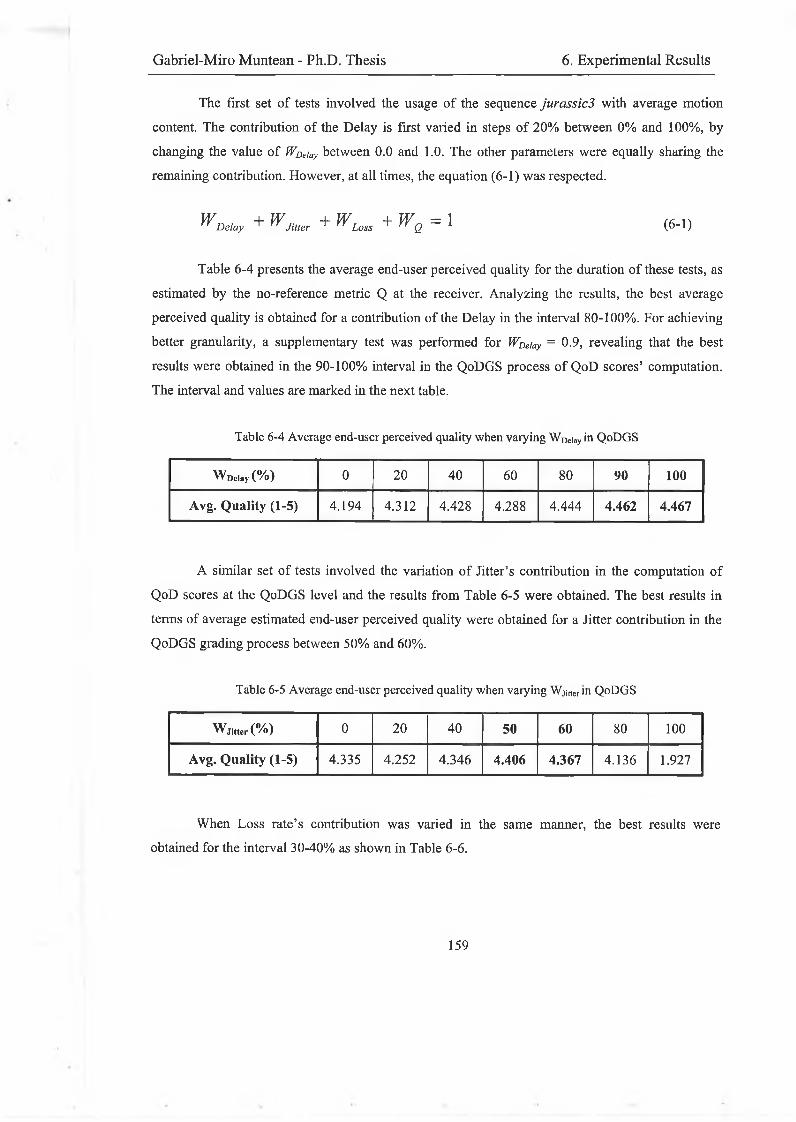
Gabriel-Miro Muntean - Ph.D. Thesis 6. Experimental Results
The first set of tests involved the usage of the sequence jurassic3 with average motion content. The contribution of the Delay is first varied in steps of 20% between 0% and 100%, by changing the value of JVDelay between 0.0 and 1.0. The other parameters were equally sharing the remaining contribution. However, at all times, the equation (6-1) was respected.
W D ela y + ^ J i t t e r + W Loss + W Q = \ (6-1)
Table 6-4 presents the average end-user perceived quality for the duration of these tests, as estimated by the no-reference metric Q at the receiver. Analyzing the results, the best average perceived quality is obtained for a contribution of the Delay in the interval 80-100%. For achieving better granularity, a supplementary test was performed for fVDe/ay = 0.9, revealing that the best results were obtained in the 90-100% interval in the QoDGS process of QoD scores’ computation. The interval and values are marked in the next table.
Table 6-4 Average end-user perceived quality when varying WDeiay in QoDGS
Wnelay (%) 0 20 40 60 80 90 100
Avg. Quality (1-5) 4.194 4.312 4.428 4.288 4.444 4.462 4.467
A similar set of tests involved the variation of Jitter’s contribution in the computation of QoD scores at the QoDGS level and the results from Table 6-5 were obtained. The best results in terms of average estimated end-user perceived quality were obtained for a Jitter contribution in the QoDGS grading process between 50% and 60%.
Table 6-5 Average end-user perceived quality when varying Wjitterin QoDGS
WJit,cr(%) 0 20 40 50 60 80 100
Avg. Quality (1-5) 4.335 4.252 4.346 4.406 4.367 4.136 1.927
When Loss rate’s contribution was varied in the same manner, the best results were obtained for the interval 30-40% as shown in Table 6-6.
159
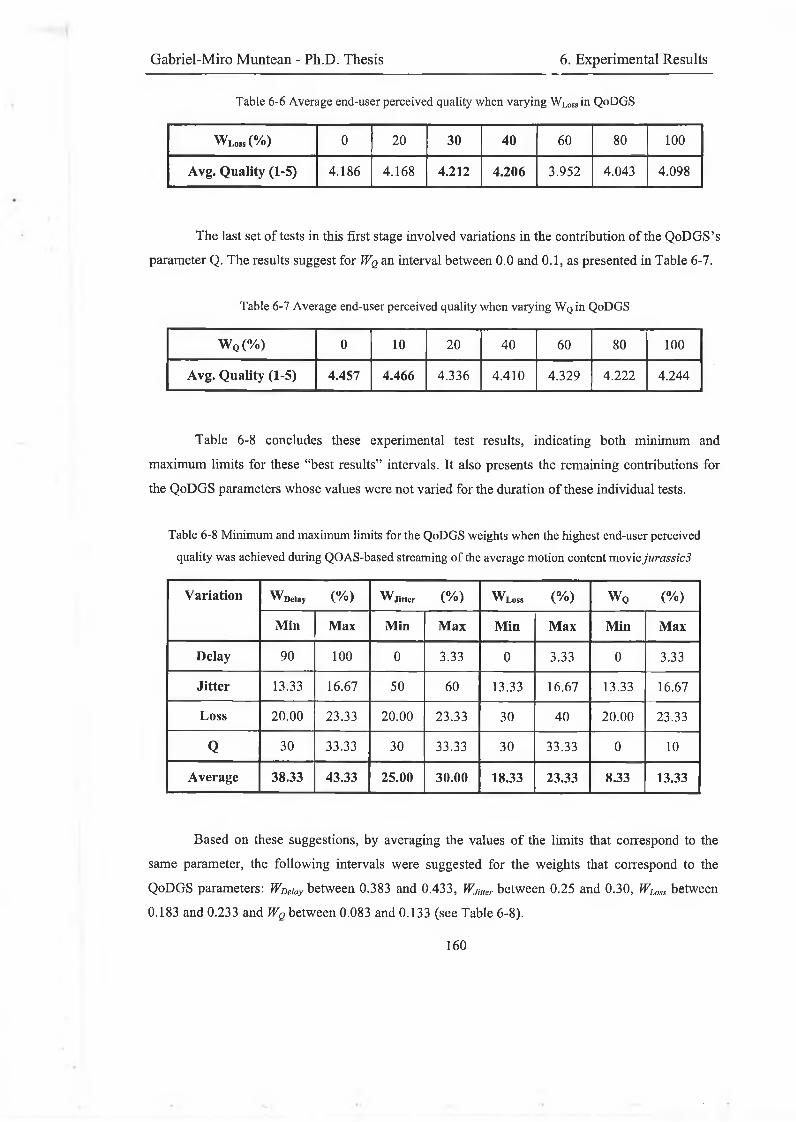
Gabriel-Miro Muntean - Ph.D. Thesis 6. Experimental Results
Table 6-6 Average end-user perceived quality when varying Wl0ss in QoDGS
w Loss(%) 0 20 30 40 60 80 100
Avg. Quality (1-5) 4.186 4.168 4.212 4.206 3.952 4.043 4.098
The last set of tests in this first stage involved variations in the contribution of the QoDGS’s parameter Q. The results suggest for Wq an interval between 0.0 and 0.1, as presented in Table 6-7.
Table 6 - 7 Average end-user perceived quality when varying W q in QoDGS
W Q(%) 0 10 20 40 60 80 100
Avg. Quality (1-5) 4.457 4.466 4.336 4.410 4.329 4.222 4.244
Table 6-8 concludes these experimental test results, indicating both minimum and maximum limits for these “best results” intervals. It also presents the remaining contributions for the QoDGS parameters whose values were not varied for the duration of these individual tests.
Table 6-8 Minimum and maximum limits for the QoDGS weights when the highest end-user perceived quality was achieved during QOAS-based streaming of the average motion content movie jurassic3
Variation W Delay (%) W Jitter (%) WLoss (%) W Q (%)
Min Max Min Max Min Max Min Max
Delay 90 100 0 3.33 0 3.33 0 3.33
Jitter 13.33 16.67 50 60 13.33 16.67 13.33 16.67
Loss 20.00 23.33 20.00 23.33 30 40 20.00 23.33
Q 30 33.33 30 33.33 30 33.33 0 10
Average 38.33 43.33 25.00 30.00 18.33 23.33 8.33 13.33
Based on these suggestions, by averaging the values of the limits that correspond to the same parameter, the following intervals were suggested for the weights that correspond to the QoDGS parameters: WDe/ay between 0.383 and 0.433, WJiiier between 0 . 2 5 and 0.30, WLoss between 0.183 and 0.233 and W q between 0.083 and 0.133 (see Table 6-8).
160
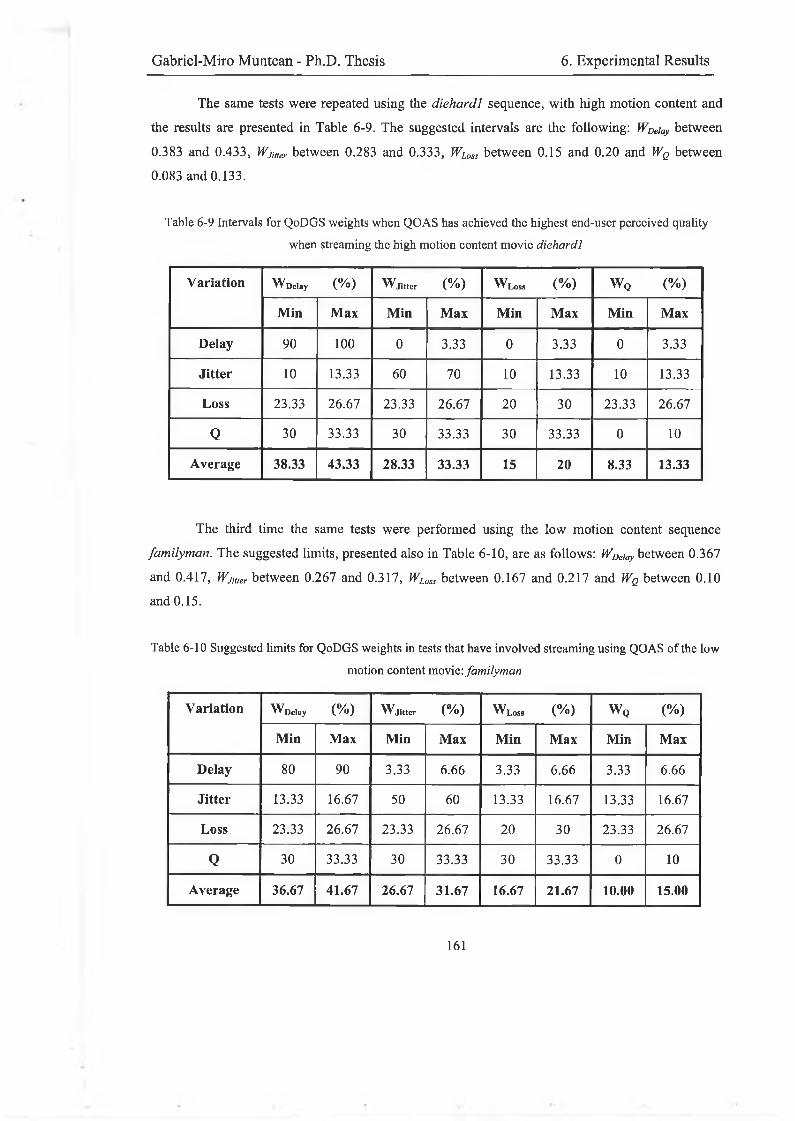
Gabriel-Miro Muntean - Ph.D. Thesis 6. Experimental Results
The same tests were repeated using the diehardl sequence, with high motion content and the results are presented in Table 6-9. The suggested intervals are the following: WDeiay between 0.383 and 0.433, WJiUer between 0.283 and 0.333, WLoss between 0.15 and 0.20 and Wq between 0.083 and 0.133.
Table 6-9 Intervals for QoDGS weights when QOAS has achieved the highest end-user perceived quality when streaming the high motion content movie diehardl
Variation WDelay (%) WJitter (%) WLoss (%) WQ (%)
Min Max Min Max Min Max Min Max
Delay 90 100 0 3.33 0 3.33 0 3.33
Jitter 10 13.33 60 70 10 13.33 10 13.33
Loss 23.33 26.67 23.33 26.67 20 30 23.33 26.67
Q 30 33.33 30 33.33 30 33.33 0 10
Average 38.33 43.33 28.33 33.33 15 20 8.33 13.33
The third time the same tests were performed using the low motion content sequence familyman. The suggested limits, presented also in Table 6-10, are as follows: WDeiay between 0.367 and 0.417, Wjjtter between 0.267 and 0.317, WLoss between 0.167 and 0.217 and Wq between 0.10 and 0.15.
Table 6-10 Suggested limits for QoDGS weights in tests that have involved streaming using QOAS of the lowmotion content movie: familyman
Variation Wflclay (%) Waitter (%) WLoss (%) W Q (%)
Min Max Min Max Min Max Min Max
Delay 80 90 3.33 6.66 3.33 6.66 3.33 6.66
Jitter 13.33 16.67 50 60 13.33 16.67 13.33 16.67
Loss 23.33 26.67 23.33 26.67 20 30 23.33 26.67
Q 30 33.33 30 33.33 30 33.33 0 10
Average 36.67 41.67 26.67 31.67 16.67 21.67 10.00 15.00
161
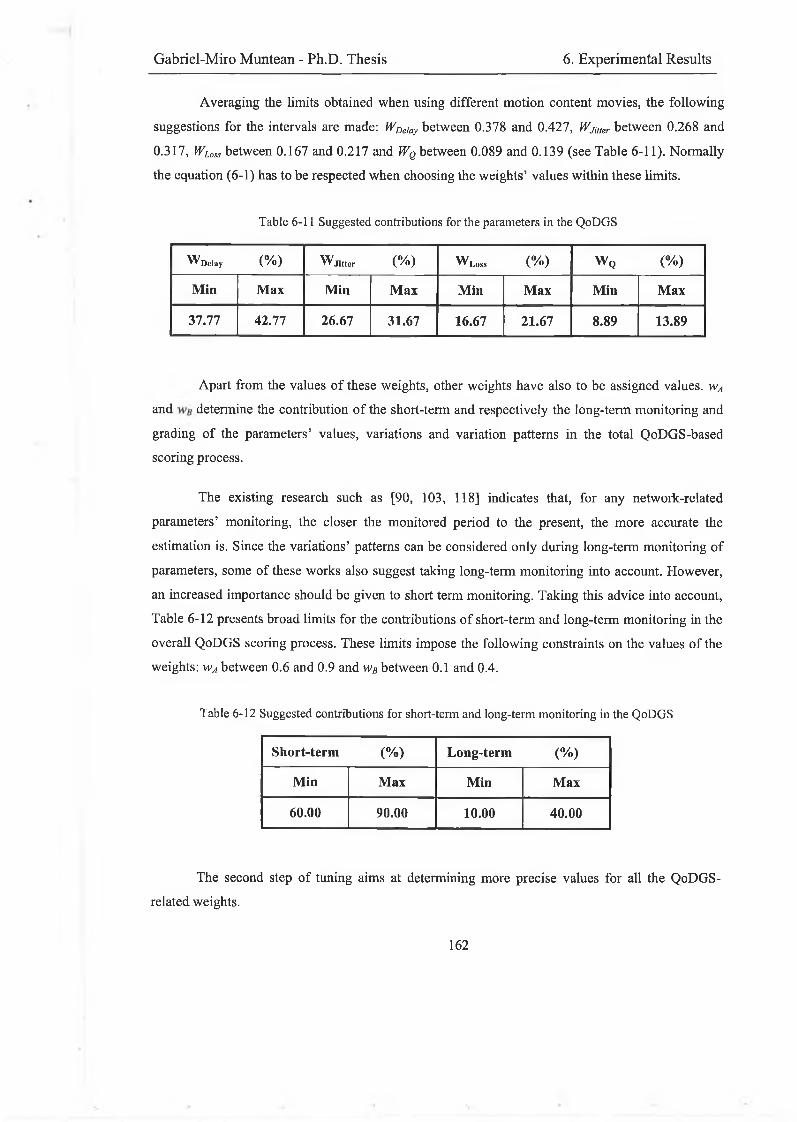
Gabriel-Miro Muntean - Ph.D. Thesis 6. Experimental Results
Averaging the limits obtained when using different motion content movies, the following suggestions for the intervals are made: WDeiay between 0.378 and 0.427, WJmer between 0.268 and 0.317, WLoss between 0.167 and 0.217 and WQ between 0.089 and 0.139 (see Table 6-11). Normally the equation (6-1) has to be respected when choosing the weights’ values within these limits.
Table 6-11 Suggested contributions for the parameters in the QoDGS
w Delay (%) WJi(tcr (%) W Loss (%) W Q (%)
Min Max Min Max Min Max Min Max
37.77 42.77 26.67 31.67 16.67 21.67 8.89 13.89
Apart from the values of these weights, other weights have also to be assigned values. wA and determine the contribution of the short-term and respectively the long-term monitoring and grading of the parameters’ values, variations and variation patterns in the total QoDGS-based scoring process.
The existing research such as [90, 103, 118] indicates that, for any network-related parameters’ monitoring, the closer the monitored period to the present, the more accurate the estimation is. Since the variations’ patterns can be considered only during long-term monitoring of parameters, some of these works also suggest taking long-term monitoring into account. However, an increased importance should be given to short term monitoring. Taking this advice into account, Table 6-12 presents broad limits for the contributions of short-term and long-term monitoring in the overall QoDGS scoring process. These limits impose the following constraints on the values of the weights: wA between 0.6 and 0.9 and wB between 0.1 and 0.4.
Table 6-12 Suggested contributions for short-term and long-term monitoring in the QoDGS
Short-term (%) Long-term (%)
Min Max Min Max
60.00 90.00 10.00 40.00
The second step of tuning aims at determining more precise values for all the QoDGS- related weights.
162
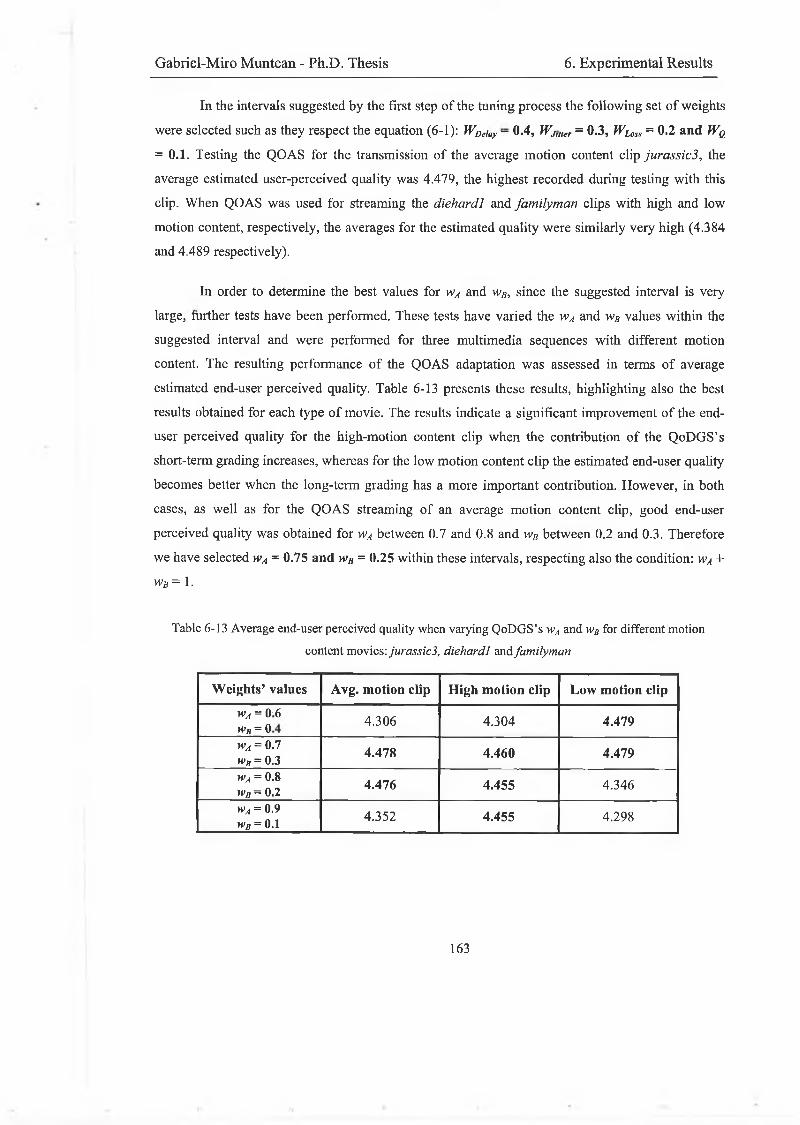
Gabriel-Miro Muntean - Ph.D. Thesis 6. Experimental Results
In the intervals suggested by the first step of the tuning process the following set of weights were selected such as they respect the equation (6-1): W Detay - 0.4, W j,ner = 0.3, W Loss = 0.2 and W Q
= 0.1. Testing the QOAS for the transmission of the average motion content clip jurassic3, the average estimated user-perceived quality was 4.479, the highest recorded during testing with this clip. When QOAS was used for streaming the diehardl and familyman clips with high and low motion content, respectively, the averages for the estimated quality were similarly very high (4.384 and 4.489 respectively).
In order to determine the best values for wA and wB, since the suggested interval is very large, further tests have been performed. These tests have varied the wA and wB values within the suggested interval and were performed for three multimedia sequences with different motion content. The resulting performance of the QOAS adaptation was assessed in terms of average estimated end-user perceived quality. Table 6-13 presents these results, highlighting also the best results obtained for each type of movie. The results indicate a significant improvement of the end- user perceived quality for the high-motion content clip when the contribution of the QoDGS’s short-term grading increases, whereas for the low motion content clip the estimated end-user quality becomes better when the long-term grading has a more important contribution. However, in both cases, as well as for the QOAS streaming of an average motion content clip, good end-user perceived quality was obtained for wA between 0.7 and 0.8 and wB between 0.2 and 0.3. Therefore we have selected wA = 0.75 and wB = 0.25 within these intervals, respecting also the condition: wA +
wB= 1.
Table 6-13 Average end-user perceived quality when varying QoDGS ’ s wA and wB for different motion content movies: jurassic3, diehardl and familyman
W eights’ values Avg. motion clip High motion clip Low motion clip
s s
Il II
o o ON 4.306 4.304 4.479
w A = 0.7 w B = 0.3 4.478 4.460 4.479
w A = 0.8 w B = 0.2 4.476 4.455 4.346w A = 0.9 w B = 0.1 4.352 4.455 4.298
163
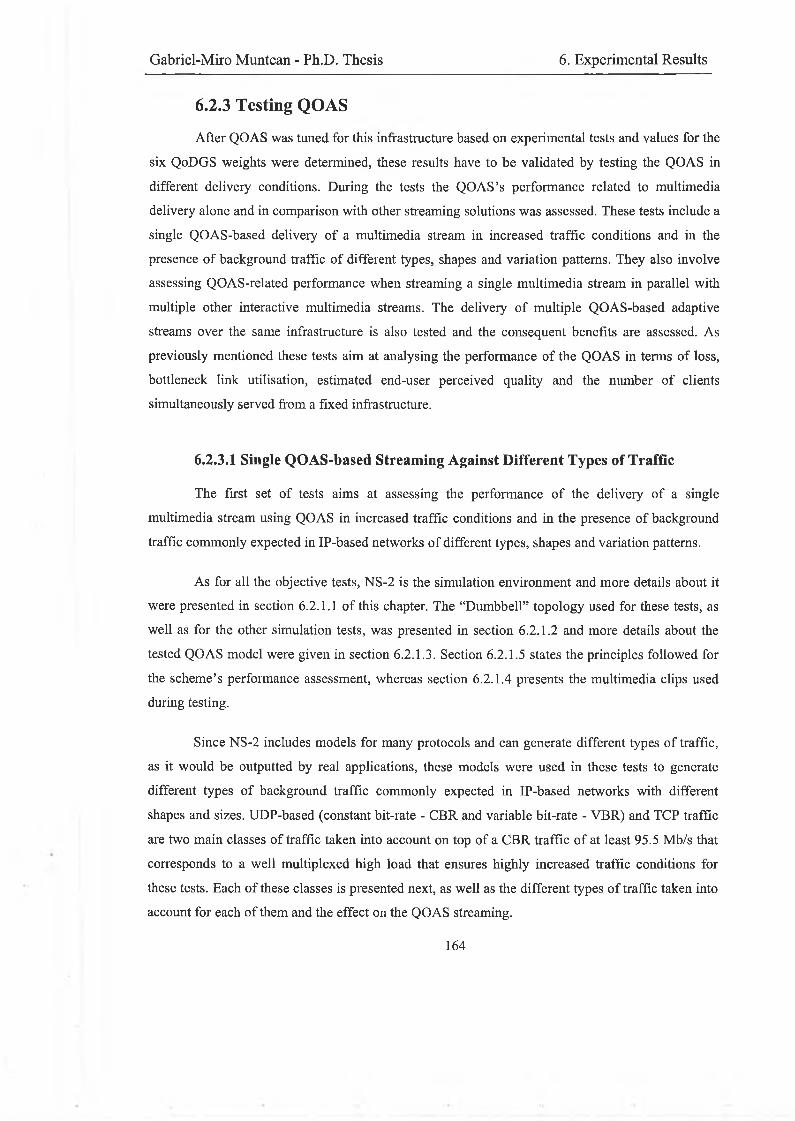
Gabriel-Miro Muntean - Ph.D. Thesis 6. Experimental Results
6.2.3 Testing QOAS
After QOAS was tuned for this infrastructure based on experimental tests and values for the
six QoDGS weights were determined, these results have to be validated by testing the QOAS in
different delivery conditions. During the tests the QOAS’s performance related to multimedia
delivery alone and in comparison with other streaming solutions was assessed. These tests include a
single QOAS-based delivery of a multimedia stream in increased traffic conditions and in the
presence of background traffic of different types, shapes and variation patterns. They also involve
assessing QOAS-related performance when streaming a single multimedia stream in parallel with
multiple other interactive multimedia streams. The delivery of multiple QOAS-based adaptive
streams over the same infrastructure is also tested and the consequent benefits are assessed. As
previously mentioned these tests aim at analysing the performance of the QOAS in terms of loss,
bottleneck link utilisation, estimated end-user perceived quality and the number of clients
simultaneously served from a fixed infrastructure.
6.2.3.1 Single QOAS-based Streaming Against Different Types of Traffic
The first set of tests aims at assessing the performance of the delivery of a single
multimedia stream using QOAS in increased traffic conditions and in the presence of background
traffic commonly expected in IP-based networks of different types, shapes and variation patterns.
As for all the objective tests, NS-2 is the simulation environment and more details about it
were presented in section 6.2.1.1 of this chapter. The “Dumbbell” topology used for these tests, as
well as for the other simulation tests, was presented in section 6.2.1.2 and more details about the
tested QOAS model were given in section 6.2.1.3. Section 6.2.1.5 states the principles followed for
the scheme’s performance assessment, whereas section 6.2.1.4 presents the multimedia clips used
during testing.
Since NS-2 includes models for many protocols and can generate different types of traffic,
as it would be outputted by real applications, these models were used in these tests to generate
different types of background traffic commonly expected in IP-based networks with different
shapes and sizes. UDP-based (constant bit-rate - CBR and variable bit-rate - VBR) and TCP traffic
are two main classes of traffic taken into account on top of a CBR traffic of at least 95.5 Mb/s that
corresponds to a well multiplexed high load that ensures highly increased traffic conditions for
these tests. Each of these classes is presented next, as well as the different types of traffic taken into
account for each of them and the effect on the QOAS streaming.
164
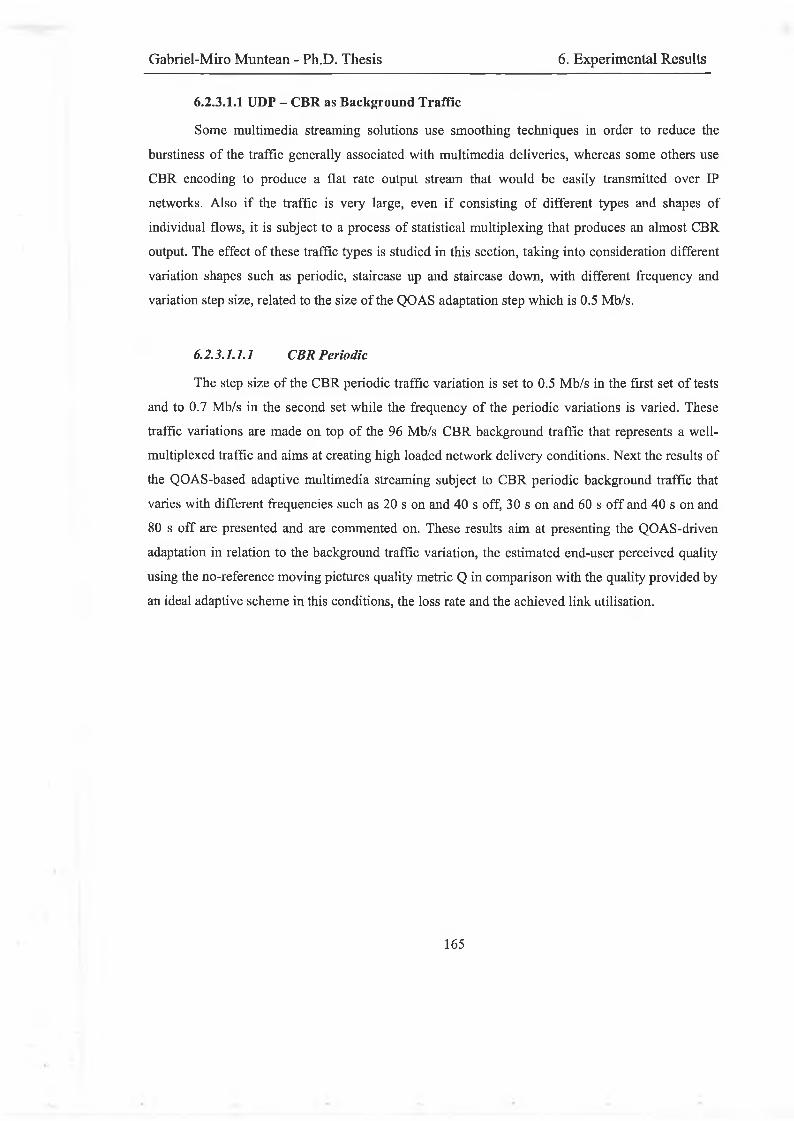
Gabriel-Miro Muntean - Ph.D. Thesis 6. Experimental Results
6.2.3.1.1 UDP - CBR as Background Traffic
Some multimedia streaming solutions use smoothing techniques in order to reduce the
burstiness of the traffic generally associated with multimedia deliveries, whereas some others use
CBR encoding to produce a flat rate output stream that would be easily transmitted over IP
networks. Also if the traffic is very large, even if consisting of different types and shapes of
individual flows, it is subject to a process of statistical multiplexing that produces an almost CBR
output. The effect of these traffic types is studied in this section, taking into consideration different
variation shapes such as periodic, staircase up and staircase down, with different frequency and
variation step size, related to the size of the QOAS adaptation step which is 0.5 Mb/s.
6.2.3.1.1.1 CBR Periodic
The step size of the CBR periodic traffic variation is set to 0.5 Mb/s in the first set of tests
and to 0.7 Mb/s in the second set while the frequency of the periodic variations is varied. These
traffic variations are made on top of the 96 Mb/s CBR background traffic that represents a well-
multiplexed traffic and aims at creating high loaded network delivery conditions. Next the results of
the QOAS-based adaptive multimedia streaming subject to CBR periodic background traffic that
varies with different frequencies such as 20 s on and 40 s off, 30 s on and 60 s off and 40 s on and
80 s off are presented and are commented on. These results aim at presenting the QOAS-driven
adaptation in relation to the background traffic variation, the estimated end-user perceived quality
using the no-reference moving pictures quality metric Q in comparison with the quality provided by
an ideal adaptive scheme in this conditions, the loss rate and the achieved link utilisation.
165
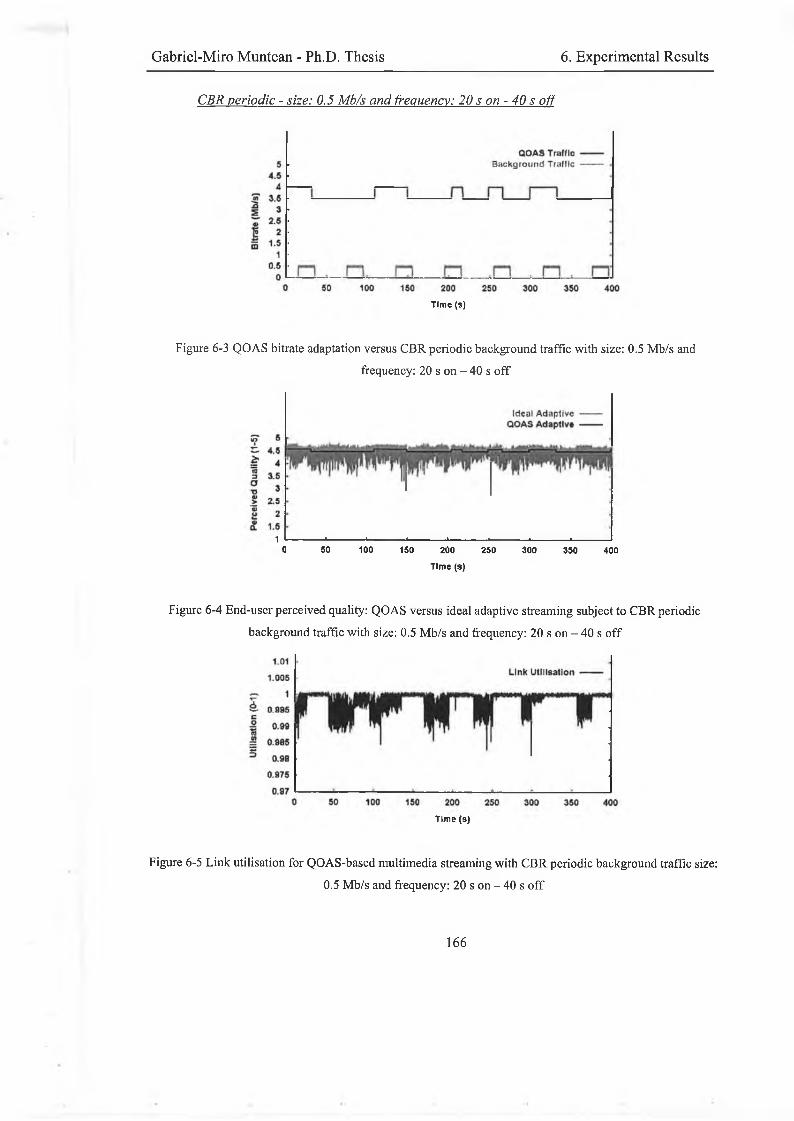
Gabriel-Miro Muntean - Ph.D. Thesis 6. Experimental Results
CBR periodic - size: 0.5 Mb/s and frequency: 20 s on - 40 s off
Time (s)
Figure 6-3 QOAS bitrate adaptation versus CBR periodic background traffic with size: 0.5 Mb/s andfrequency: 20 s on - 40 s off
1 . . 1 . , 1 .-------0 30 100 1S0 200 250 300 350 400
Time (s)
Figure 6-4 End-user perceived quality: QOAS versus ideal adaptive streaming subject to CBR periodic background traffic with size: 0.5 Mb/s and frequency: 20 s on - 40 s off
Time (s)
Figure 6-5 Link utilisation for QOAS-based multimedia streaming with CBR periodic background traffic size:0.5 Mb/s and frequency: 20 s on - 40 s off
166
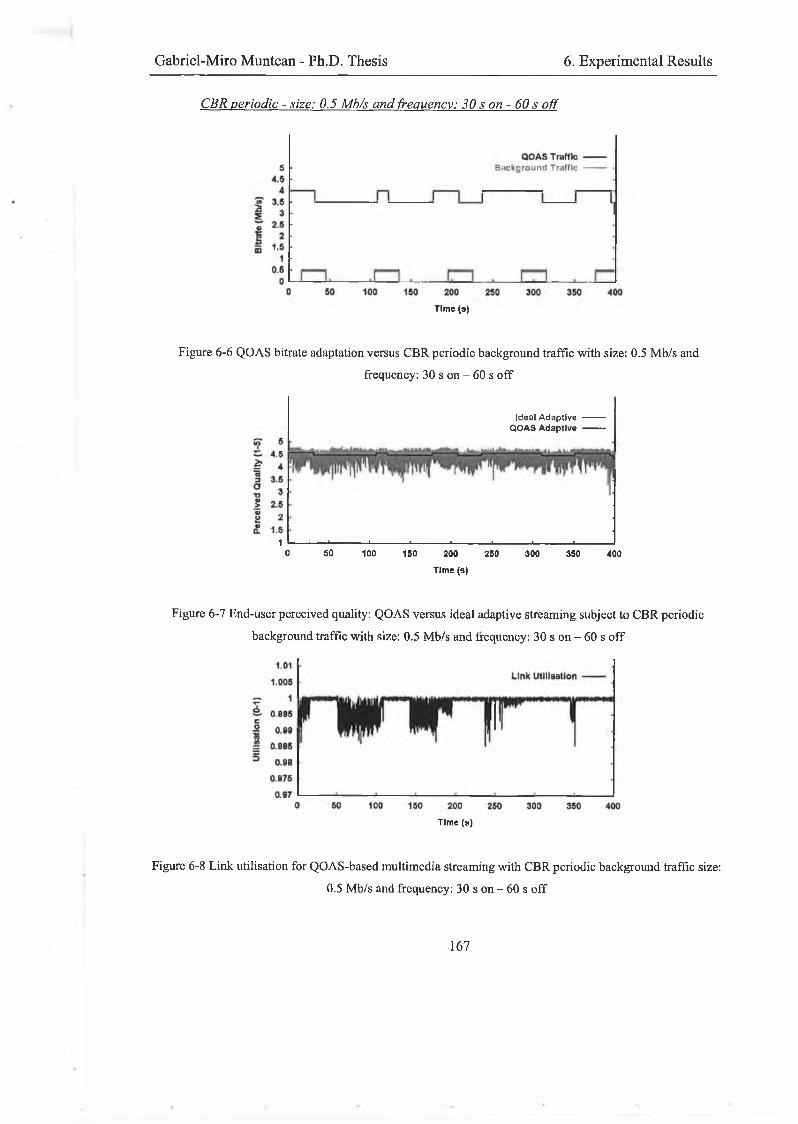
Gabriel-Miro Muntean - Ph.D. Thesis 6. Experimental Results
CBR periodic - size: 0.5 Mb/s and frequency: 30 s on - 60 s off
Time (s)
Figure 6-6 QOAS bitrate adaptation versus CBR periodic background traffic with size: 0.5 Mb/s andfrequency: 30 s on - 60 s off
Ideal Adaptive ----------QOAS Adaptive ----------
1 1 1 1 1 1 1 1---------------------------
0 SO 100 150 200 250 300 350 400
Time (s)
Figure 6-7 End-user perceived quality: QOAS versus ideal adaptive streaming subject to CBR periodic background traffic with size: 0.5 Mb/s and frequency: 30 s on - 60 s off
Time (s)
Figure 6-8 Link utilisation for QOAS-based multimedia streaming with CBR periodic background traffic size:0.5 Mb/s and frequency: 30 s on - 60 s off
167
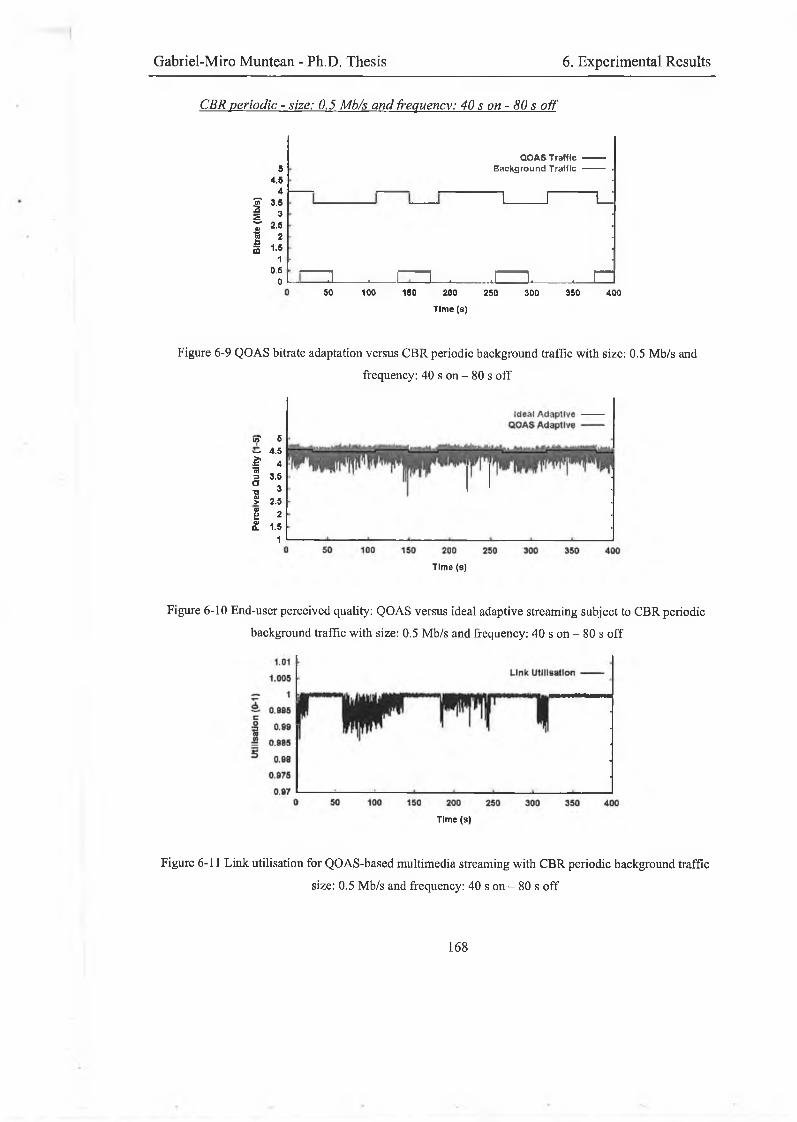
Gabriel-Miro Muntean - Ph.D. Thesis 6. Experimental Results
CBR periodic - size: 0.5 Mb/s and frequency: 40 s on - 80 s off
QOAS Traffic ----------Background Traffic ---------- ■
n i l_
n , r ~ i .______ .1— i. . r ~ i50 100 150 200 250 300 350 400
Time (s)
Figure 6-9 QOAS bitrate adaptation versus CBR periodic background traffic with size: 0.5 Mb/s andfrequency: 40 s on - 80 s off
uT 54.5
£73
43a
3.4TJ 3at> 2.501£ 2£ 1.5
1
Time (s)
Figure 6-10 End-user perceived quality: QOAS versus ideal adaptive streaming subject to CBR periodic background traffic with size: 0.5 Mb/s and frequency: 40 s on - 80 s off
Time (s)
Figure 6-11 Link utilisation for QOAS-based multimedia streaming with CBR periodic background trafficsize: 0.5 Mb/s and frequency: 40 s on - 80 s off
54.5
4Sf 3.5I 3"Z 2.5 ? 2£ 1.5
1 0.6
0
168

Gabriel-Miro Muntean - Ph.D. Thesis 6. Experimental Results
CBR periodic - size: 0.7 Mb/s and frequency: 20 s on - 40 s off
Tlm e(s)
Figure 6-12 QOAS bitrate adaptation versus CBR periodic background traffic with size: 0.7 Mb/s andfrequency: 20 s on - 40 s off
Id e a l A d a p tiv e QOAS Adaptive
ÍO 54.6
§ 4ra3 3 5
aT1 3§ 2.5«Ü 2Va. 1.6
150 100 150 200 250
Time (s)
300 350 400
Figure 6-13 End-user perceived quality: QOAS versus ideal adaptive streaming subject to CBR periodic background traffic with size: 0.7 Mb/s and frequency: 20 s on - 40 s off
1.01
1.005
- 1Link Utilisation
0.985
0.99
0.985
0.98
0.975
0.97
F T U T T "
50 100 150 200 250 300 350 400
Time (s)
Figure 6-14 Link utilisation for QOAS-based multimedia streaming with CBR periodic background trafficsize: 0.7 Mb/s and frequency: 20 s on - 40 s off
169
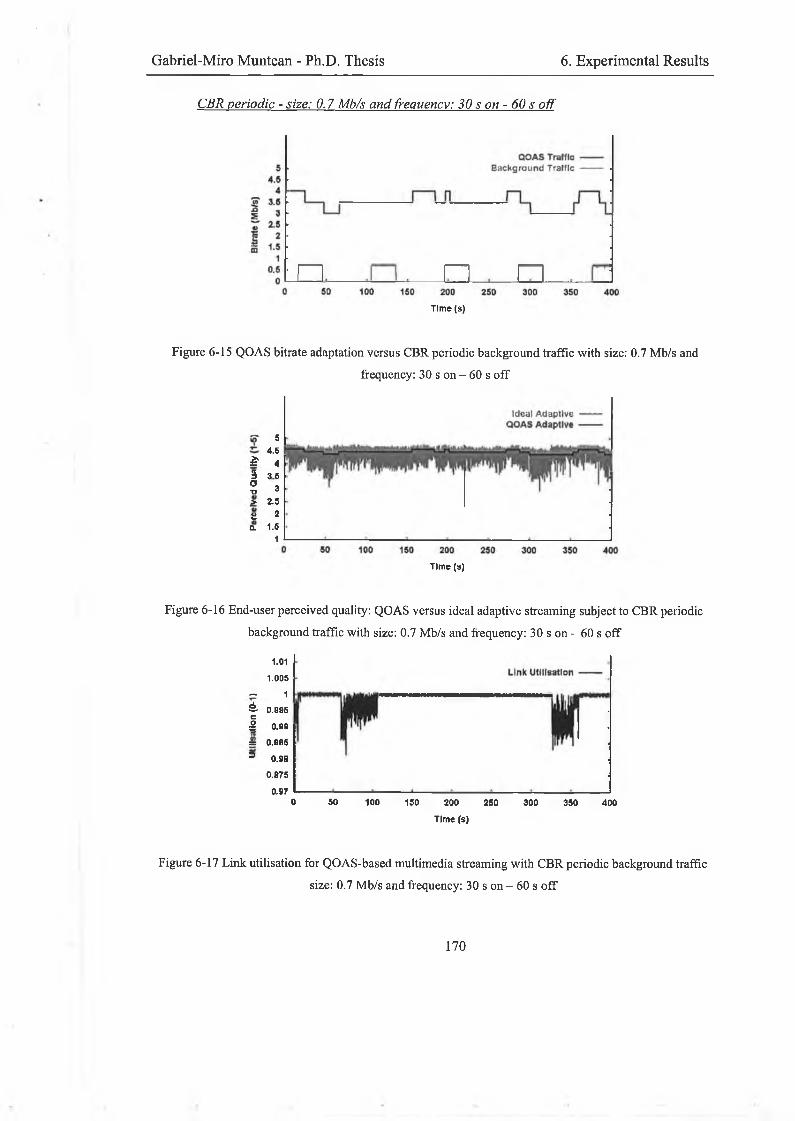
Gabriel-Miro Muntean - Ph.D. Thesis 6. Experimental Results
CBR periodic - size: 0.7 Mb/s and frequency: 30 s on - 60 s off
Time (s)
Figure 6-15 QOAS bitrate adaptation versus CBR periodic background traffic with size: 0.7 Mb/s andfrequency: 30 s on - 60 s off
54.5
£ 4n3 3 5oT> 3> 2.5
£ 2Q. 1.6
1
Time (s)
Figure 6-16 End-user perceived quality: QOAS versus ideal adaptive streaming subject to CBR periodic background traffic with size: 0.7 Mb/s and frequency: 30 s on - 60 s off
1.01
1 .005
- 1 £■ 0 .BBSC
| 0.39
= 0.995
= 0.99
0.975
0.970 50 100 150 200 250 300 350 400
Time (a)
Figure 6-17 Link utilisation for QOAS-based multimedia streaming with CBR periodic background trafficsize: 0.7 Mb/s and frequency: 30 s on - 60 s off
170
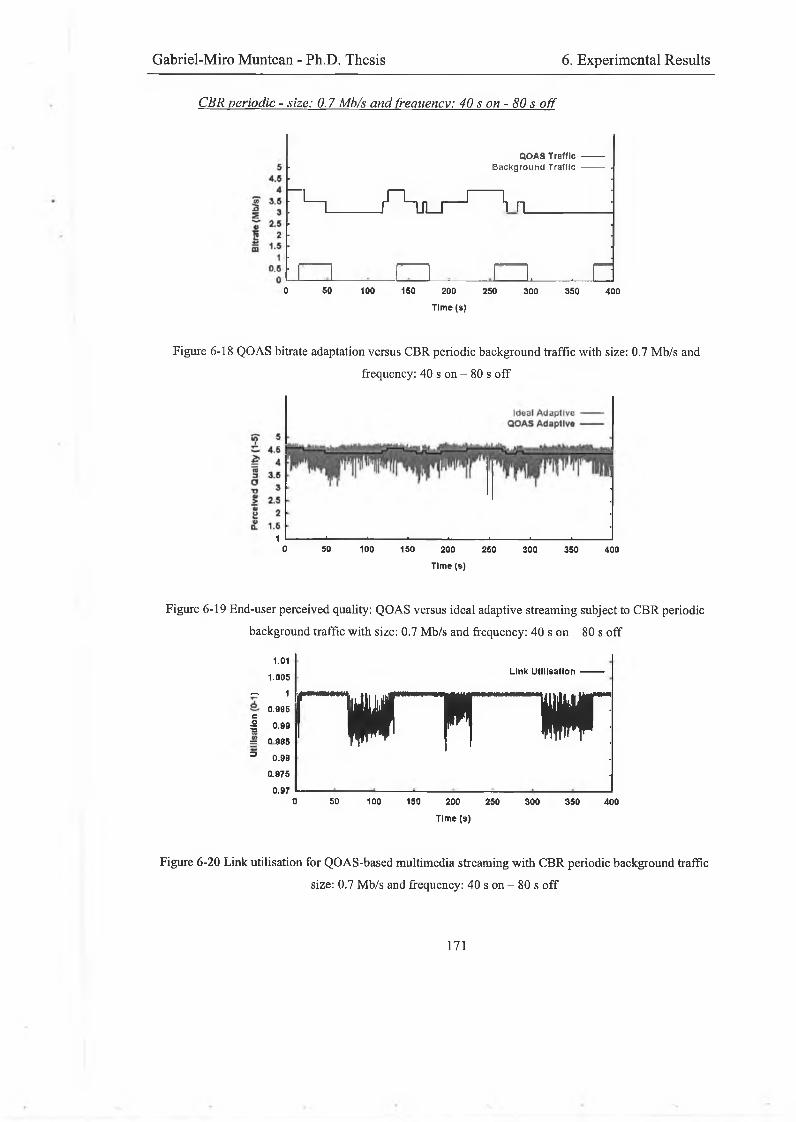
Gabriel-Miro Muntean - Ph.D. Thesis 6. Experimental Results
CBR periodic - size: 0.7 Mb/s and frequency: 40 s on - 80 s off
QOAS Traffic ----------Background Traffic ---------- ■
" S _ T - u ^ 'l n
. . r .0 50 100 1S0 200 250 300 350 400
Time (s)
Figure 6-18 QOAS bitrate adaptation versus CBR periodic background traffic with size: 0.7 Mb/s andfrequency: 40 s on - 80 s off
1 . . ■ , . . ,-------0 SO 100 150 200 2S0 300 350 400
Time (s)
Figure 6-19 End-user perceived quality: QOAS versus ideal adaptive streaming subject to CBR periodicbackground traffic with size: 0.7 Mb/s and frequency: 40 s on - 80 s off
1.01
1.005
— 10.996
C
I 0.99
= 0 985
3 0.90
0.975
0.970 50 100 150 200 250 300 350 400
Time (s)
Link utilisation----------
t— iiüiii.jü— m -----uuikyn—[ p H w ì
Figure 6-20 Link utilisation for QOAS-based multimedia streaming with CBR periodic background trafficsize: 0.7 Mb/s and frequency: 40 s on - 80 s off
171
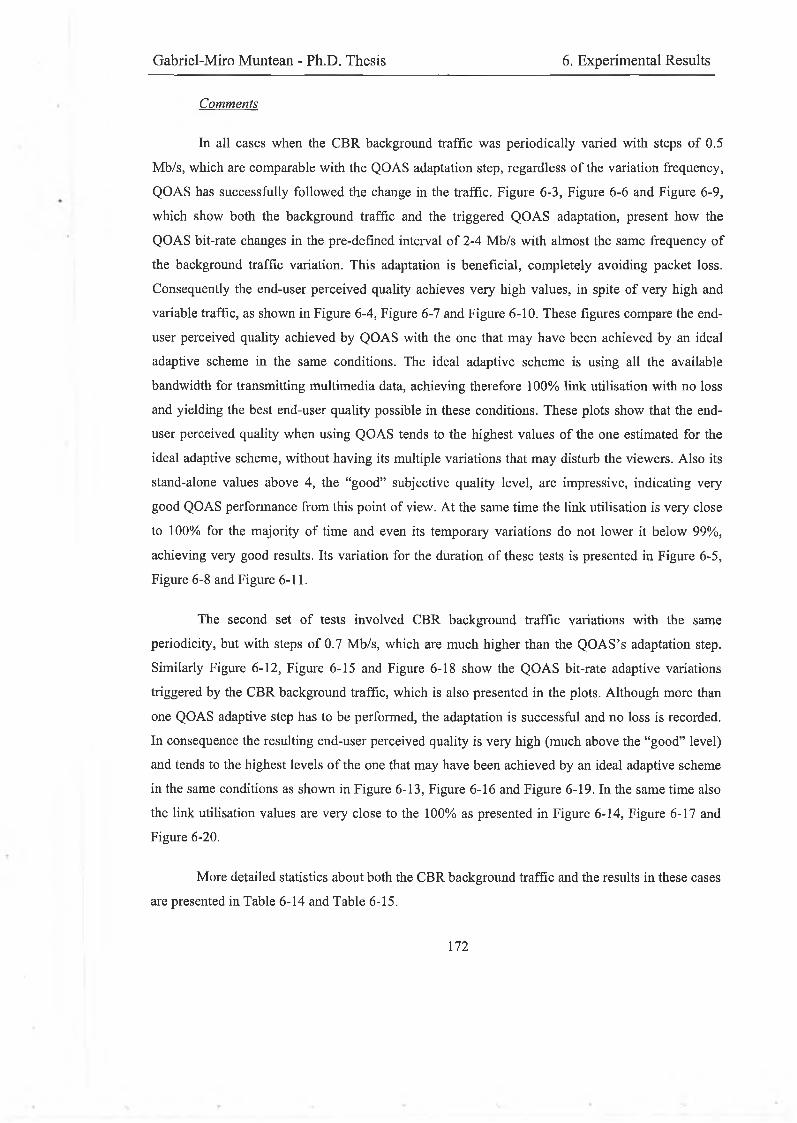
Gabriel-Miro Muntean - Ph.D. Thesis 6. Experimental Results
Comments
In all cases when the CBR background traffic was periodically varied with steps of 0.5 Mb/s, which are comparable with the QOAS adaptation step, regardless of the variation frequency, QOAS has successfully followed the change in the traffic. Figure 6-3, Figure 6-6 and Figure 6-9, which show both the background traffic and the triggered QOAS adaptation, present how the QOAS bit-rate changes in the pre-defmed interval of 2-4 Mb/s with almost the same frequency of the background traffic variation. This adaptation is beneficial, completely avoiding packet loss. Consequently the end-user perceived quality achieves very high values, in spite of very high and variable traffic, as shown in Figure 6-4, Figure 6-7 and Figure 6-10. These figures compare the end- user perceived quality achieved by QOAS with the one that may have been achieved by an ideal adaptive scheme in the same conditions. The ideal adaptive scheme is using all the available bandwidth for transmitting multimedia data, achieving therefore 100% link utilisation with no loss and yielding the best end-user quality possible in these conditions. These plots show that the end- user perceived quality when using QOAS tends to the highest values of the one estimated for the ideal adaptive scheme, without having its multiple variations that may disturb the viewers. Also its stand-alone values above 4, the “good” subjective quality level, are impressive, indicating very good QOAS performance from this point of view. At the same time the link utilisation is very close to 100% for the majority of time and even its temporary variations do not lower it below 99%, achieving very good results. Its variation for the duration of these tests is presented in Figure 6-5, Figure 6-8 and Figure 6-11.
The second set of tests involved CBR background traffic variations with the same periodicity, but with steps of 0.7 Mb/s, which are much higher than the QOAS’s adaptation step. Similarly Figure 6-12, Figure 6-15 and Figure 6-18 show the QOAS bit-rate adaptive variations triggered by the CBR background traffic, which is also presented in the plots. Although more than one QOAS adaptive step has to be performed, the adaptation is successful and no loss is recorded. In consequence the resulting end-user perceived quality is very high (much above the “good” level) and tends to the highest levels of the one that may have been achieved by an ideal adaptive scheme in the same conditions as shown in Figure 6-13, Figure 6-16 and Figure 6-19. In the same time also the link utilisation values are very close to the 100% as presented in Figure 6-14, Figure 6-17 and Figure 6-20.
More detailed statistics about both the CBR background traffic and the results in these cases are presented in Table 6-14 and Table 6-15.
172
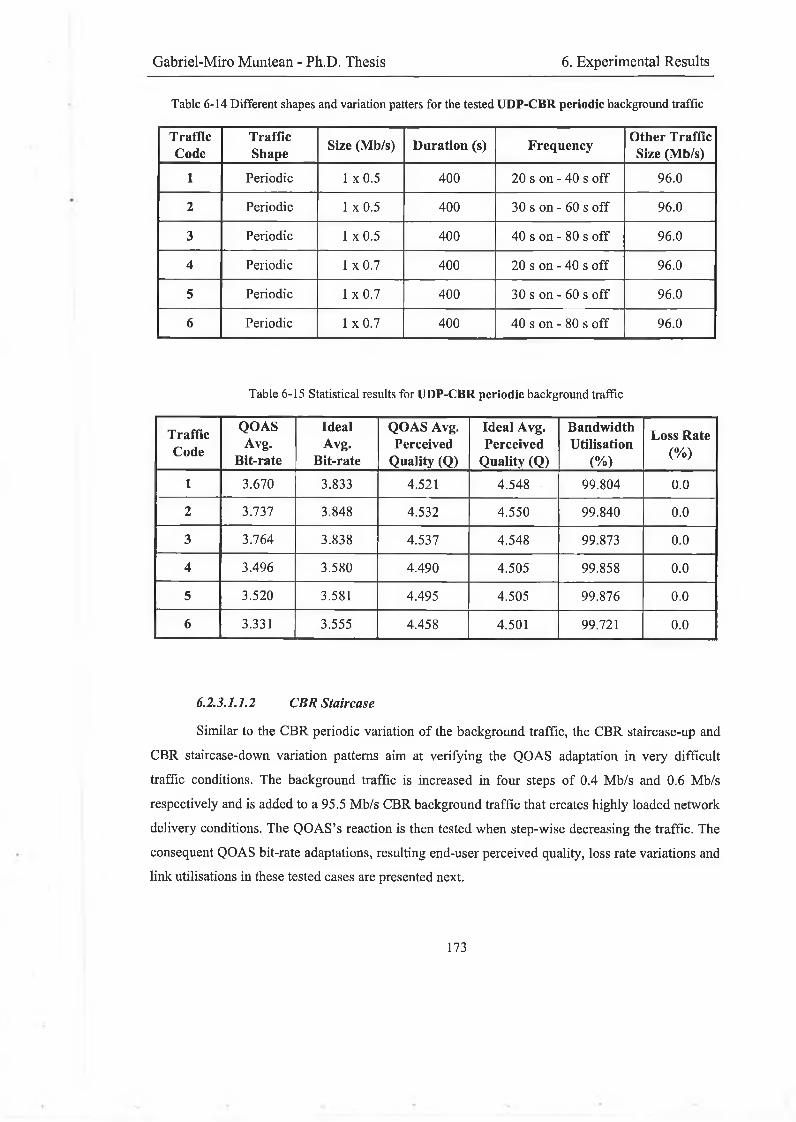
Gabriel-Miro Muntean - Ph.D. Thesis 6. Experimental Results
Table 6-14 Different shapes and variation patters for the tested UDP-CBR periodic background traffic
TrafficCode
TrafficShape Size (Mb/s) Duration (s) Frequency
Other Traffic Size (Mb/s)
1 Periodic 1 x0.5 400 20 s on - 40 s off 96.0
2 Periodic 1 x0.5 400 30 s on - 60 s off 96.0
3 Periodic 1 x0.5 400 40 s on - 80 s off 96.0
4 Periodic 1 x0.7 400 20 s on - 40 s off 96.0
5 Periodic 1 x0.7 400 30 s on - 60 s off 96.0
6 Periodic 1 x0.7 400 40 s on - 80 s off 96.0
Table 6-15 Statistical results for UDP-CBR periodic background traffic
TrafficCode
QOASAvg.
Bit-rate
IdealAvg.
Bit-rate
QOAS Avg. Perceived
Quality (Q)
Ideal Avg. Perceived
Quality (Q)
BandwidthUtilisation
(%)
Loss Rate(%)
1 3.670 3.833 4.521 4.548 99.804 0.0
2 3.737 3.848 4.532 4.550 99.840 0.0
3 3.764 3.838 4.537 4.548 99.873 0.0
4 3.496 3.580 4.490 4.505 99.858 0.0
5 3.520 3.581 4.495 4.505 99.876 0.0
6 3.331 3.555 4.458 4.501 99.721 0.0
6.2.3.1.1.2 CBR Staircase
Similar to the CBR periodic variation of the background traffic, the CBR staircase-up and CBR staircase-down variation patterns aim at verifying the QOAS adaptation in very difficult traffic conditions. The background traffic is increased in four steps of 0.4 Mb/s and 0.6 Mb/s respectively and is added to a 95.5 Mb/s CBR background traffic that creates highly loaded network delivery conditions. The QOAS’s reaction is then tested when step-wise decreasing the traffic. The consequent QOAS bit-rate adaptations, resulting end-user perceived quality, loss rate variations and link utilisations in these tested cases are presented next.
173
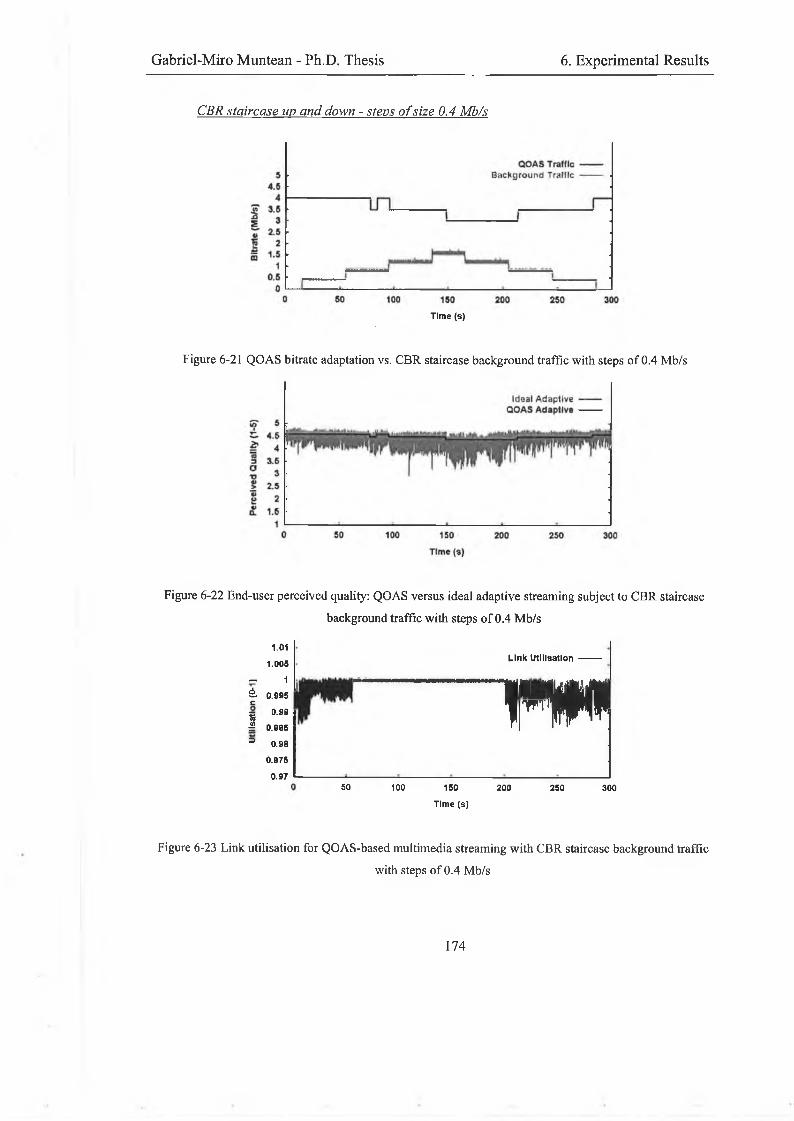
Gabriel-Miro Muntean - Ph.D. Thesis 6. Experimental Results
CBR staircase up and down - steps of size 0.4 Mb/s
Time (s)
Figure 6-21 QOAS bitrate adaptation vs. CBR staircase background traffic with steps of 0.4 Mb/s
Figure 6-22 End-user perceived quality: QOAS versus ideal adaptive streaming subject to CBR staircasebackground traffic with steps of 0.4 Mb/s
1.011.005
— 1è 0.095 c
5 0-991 0.885
3 0.98
0.975
0.97
Link Utilisation
H I muMiJM
IrPP50 100 150
Time (s)
200 250 300
Figure 6-23 Link utilisation for QOAS-based multimedia streaming with CBR staircase background trafficwith steps of 0.4 Mb/s
174
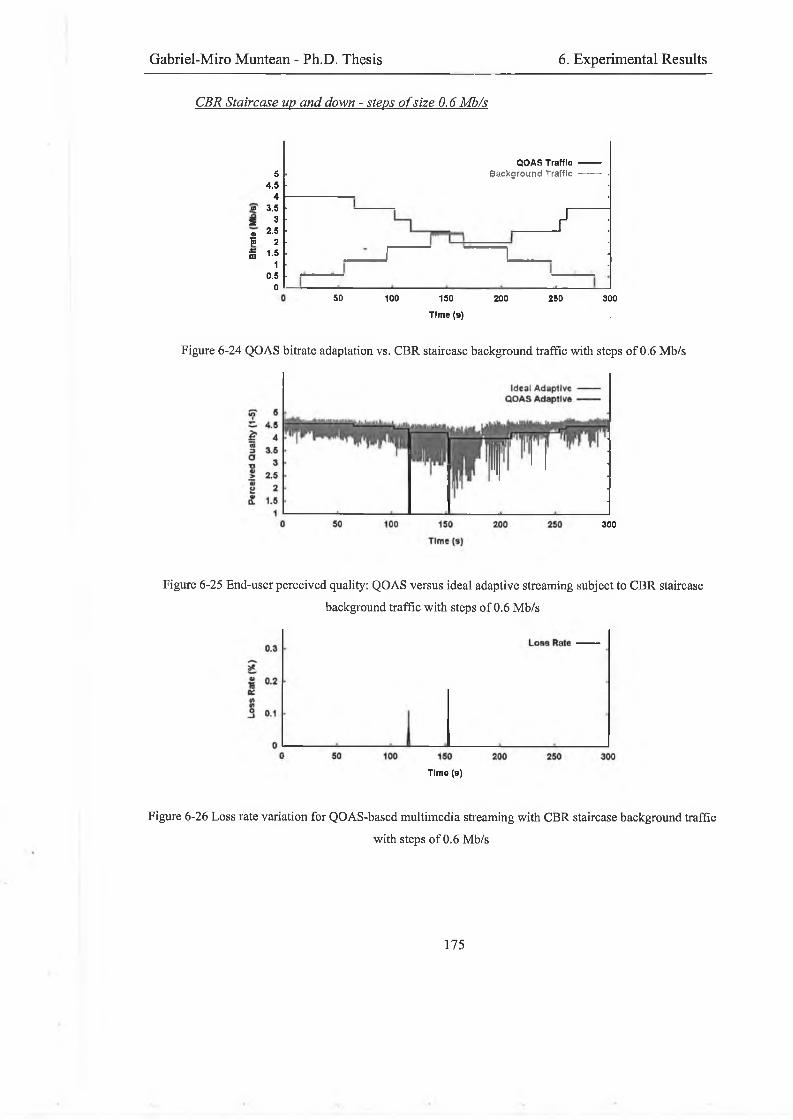
Gabriel-Miro Muntean - Ph.D. Thesis 6. Experimental Results
CBR Staircase up and down - steps of size 0.6 Mb/s
54.5
4tn 3.5? 3« 2.5Is 2s .m 1.5
10.5
0
QOAS TrafficBackground Traffic
/
50 100 150
Time (s)
200 250 300
Figure 6-24 QOAS bitrate adaptation vs. CBR staircase background traffic with steps of 0.6 Mb/s
300
Figure 6-25 End-user perceived quality: QOAS versus ideal adaptive streaming subject to CBR staircasebackground traffic with steps of 0.6 Mb/s
Time (s)
Figure 6-26 Loss rate variation for QOAS-based multimedia streaming with CBR staircase background trafficwith steps of 0.6 Mb/s
175
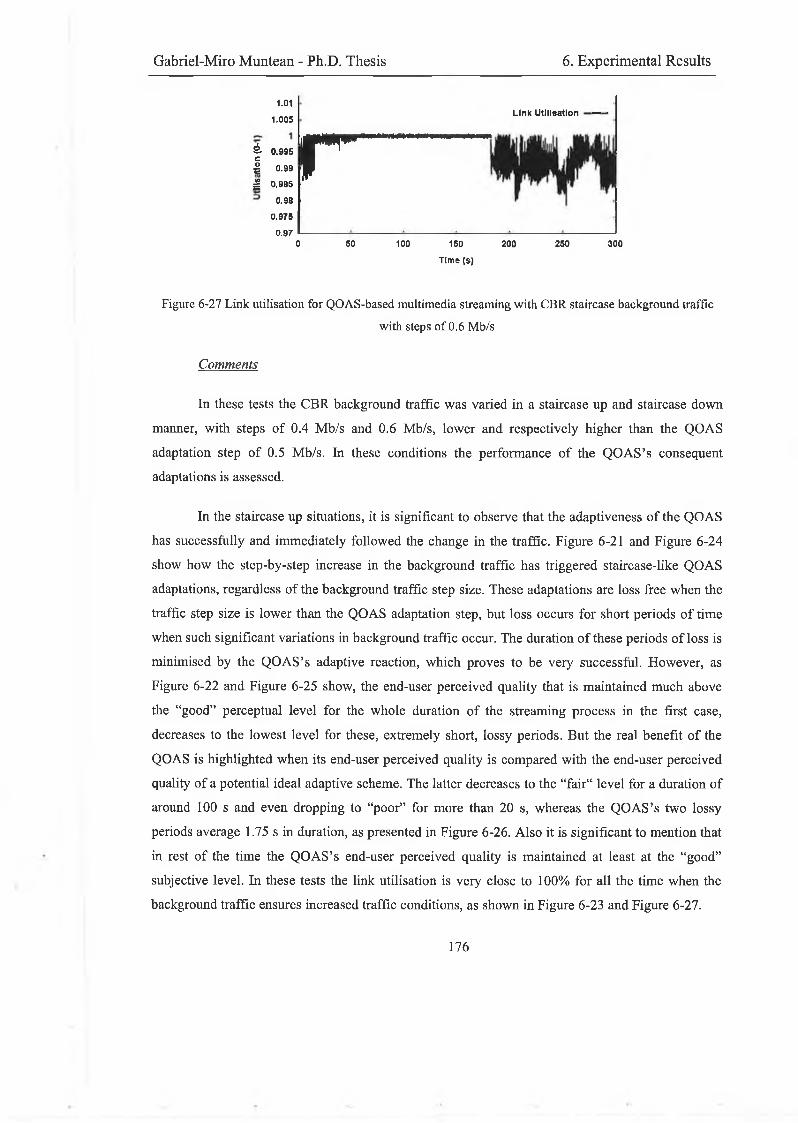
Gabriel-Miro Muntean - Ph.D. Thesis 6. Experimental Results
1.01Link Utilisation — ■
1.005
I 0.985
0.98
é - 0.995
g 0.99c
j p r -------------------------------------
0.975
0,970 50 100 150 200 250 300
Time (s)
Figure 6-27 Link utilisation for QOAS-based multimedia streaming with CBR staircase background trafficwith steps of 0.6 Mb/s
In these tests the CBR background traffic was varied in a staircase up and staircase down manner, with steps of 0.4 Mb/s and 0.6 Mb/s, lower and respectively higher than the QOAS adaptation step of 0.5 Mb/s. In these conditions the performance of the QOAS’s consequentadaptations is assessed.
In the staircase up situations, it is significant to observe that the adaptiveness of the QOAS has successfully and immediately followed the change in the traffic. Figure 6-21 and Figure 6-24 show how the step-by-step increase in the background traffic has triggered staircase-like QOAS adaptations, regardless of the background traffic step size. These adaptations are loss free when the traffic step size is lower than the QOAS adaptation step, but loss occurs for short periods of time when such significant variations in background traffic occur. The duration of these periods of loss is minimised by the QOAS’s adaptive reaction, which proves to be very successful. However, as Figure 6-22 and Figure 6-25 show, the end-user perceived quality that is maintained much above the “good” perceptual level for the whole duration of the streaming process in the first case, decreases to the lowest level for these, extremely short, lossy periods. But the real benefit of the QOAS is highlighted when its end-user perceived quality is compared with the end-user perceived quality of a potential ideal adaptive scheme. The latter decreases to the “fair“ level for a duration of around 100 s and even dropping to “poor” for more than 20 s, whereas the QOAS’s two lossy periods average 1.75 s in duration, as presented in Figure 6-26. Also it is significant to mention that in rest of the time the QOAS’s end-user perceived quality is maintained at least at the “good” subjective level. In these tests the link utilisation is very close to 100% for all the time when the background traffic ensures increased traffic conditions, as shown in Figure 6-23 and Figure 6-27.
Comments
176
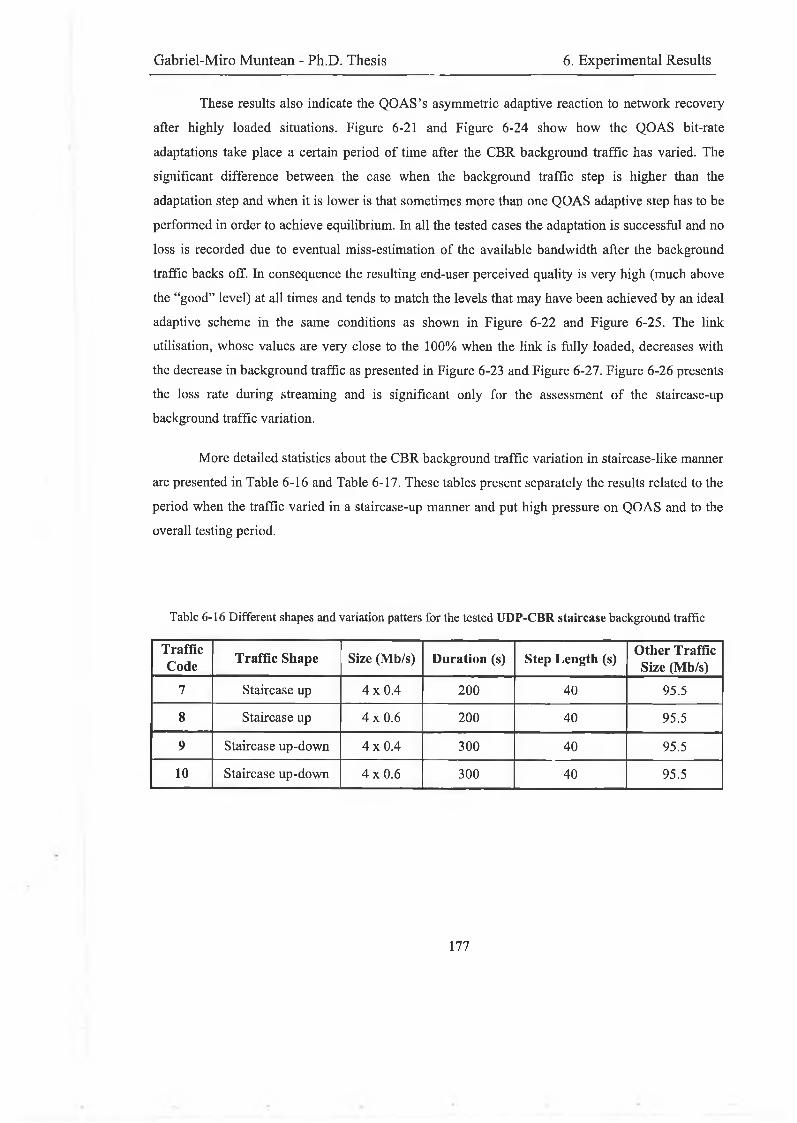
Gabriel-Miro Muntean - Ph.D. Thesis 6. Experimental Results
These results also indicate the QOAS’s asymmetric adaptive reaction to network recovery after highly loaded situations. Figure 6-21 and Figure 6-24 show how the QOAS bit-rate adaptations take place a certain period of time after the CBR background traffic has varied. The significant difference between the case when the background traffic step is higher than the adaptation step and when it is lower is that sometimes more than one QOAS adaptive step has to be performed in order to achieve equilibrium. In all the tested cases the adaptation is successful and no loss is recorded due to eventual miss-estimation of the available bandwidth after the background traffic backs off. In consequence the resulting end-user perceived quality is very high (much above the “good” level) at all times and tends to match the levels that may have been achieved by an ideal adaptive scheme in the same conditions as shown in Figure 6-22 and Figure 6-25. The link utilisation, whose values are very close to the 100% when the link is fully loaded, decreases with the decrease in background traffic as presented in Figure 6-23 and Figure 6-27. Figure 6-26 presents the loss rate during streaming and is significant only for the assessment of the staircase-up background traffic variation.
More detailed statistics about the CBR background traffic variation in staircase-like manner are presented in Table 6-16 and Table 6-17. These tables present separately the results related to the period when the traffic varied in a staircase-up manner and put high pressure on QOAS and to the overall testing period.
Table 6-16 Different shapes and variation patters for the tested UDP-CBR staircase background traffic
TrafficCode Traffic Shape Size (Mb/s) Duration (s) Step Length (s) Other Traffic
Size (Mb/s)
7 Staircase up 4x0.4 200 40 95.5
8 Staircase up 4 x 0.6 200 40 95.5
9 Staircase up-down 4x0.4 300 40 95.5
10 Staircase up-down 4x0.6 300 40 95.5
177
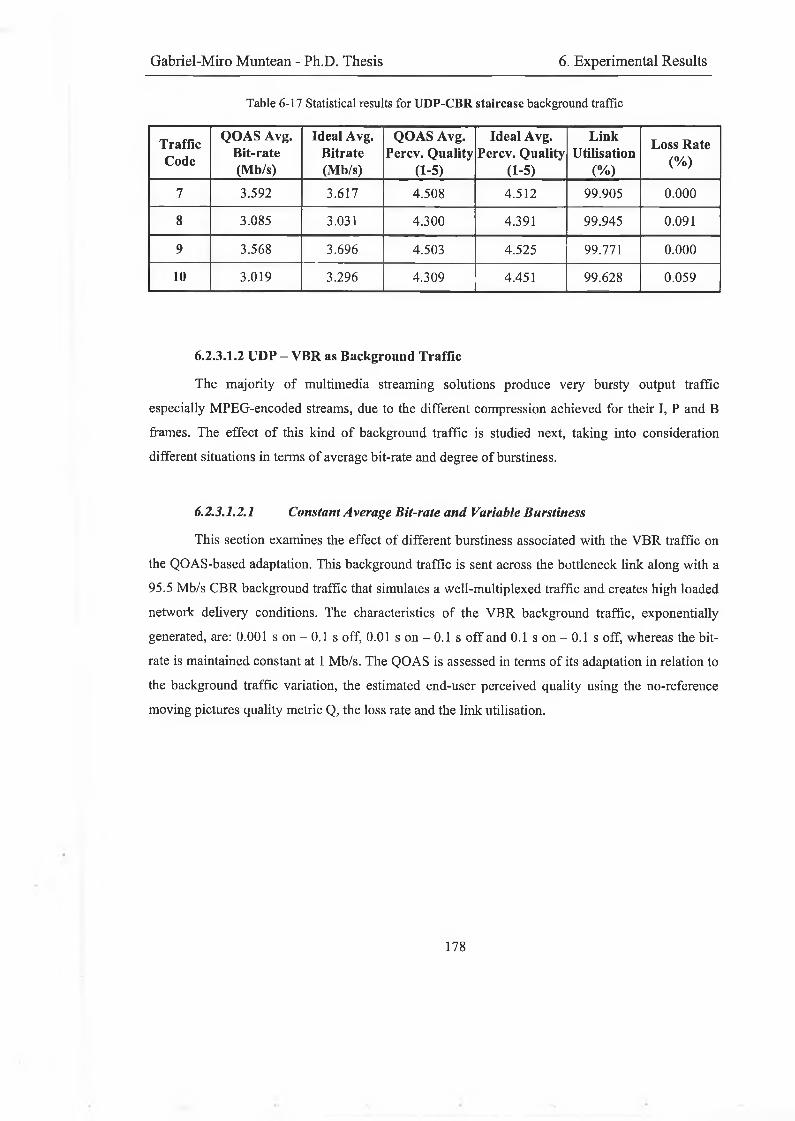
Gabriel-Miro Muntean - Ph.D. Thesis 6. Experimental Results
Table 6-17 Statistical results for UDP-CBR staircase background traffic
TrafficCode
QOAS Avg. Bit-rate (Mb/s)
Ideal Avg. Bitrate (Mb/s)
QOAS Avg. Percv. Quality
(1-5)
Ideal Avg. Percv. Quality
(1-5)
LinkUtilisation
(%)
Loss Rate (%)
7 3.592 3.617 4.508 4.512 99.905 0.000
8 3.085 3.031 4.300 4.391 99.945 0.091
9 3.568 3.696 4.503 4.525 99.771 0.000
10 3.019 3.296 4.309 4.451 99.628 0.059
6.2.3.1.2 UDP - VBR as Background Traffic
The majority of multimedia streaming solutions produce very bursty output traffic especially MPEG-encoded streams, due to the different compression achieved for their I, P and B frames. The effect of this kind of background traffic is studied next, taking into consideration different situations in terms of average bit-rate and degree of burstiness.
6.2.3.1.2.1 Constant Average Bit-rate and Variable Burstiness
This section examines the effect of different burstiness associated with the VBR traffic on the QOAS-based adaptation. This background traffic is sent across the bottleneck link along with a95.5 Mb/s CBR background traffic that simulates a well-multiplexed traffic and creates high loaded network delivery conditions. The characteristics of the VBR background traffic, exponentially generated, are: 0.001 s on - 0.1 s off, 0.01 s on - 0.1 s off and 0.1 s on - 0.1 s off, whereas the bit- rate is maintained constant at 1 Mb/s. The QOAS is assessed in terms of its adaptation in relation to the background traffic variation, the estimated end-user perceived quality using the no-reference moving pictures quality metric Q, the loss rate and the link utilisation.
178
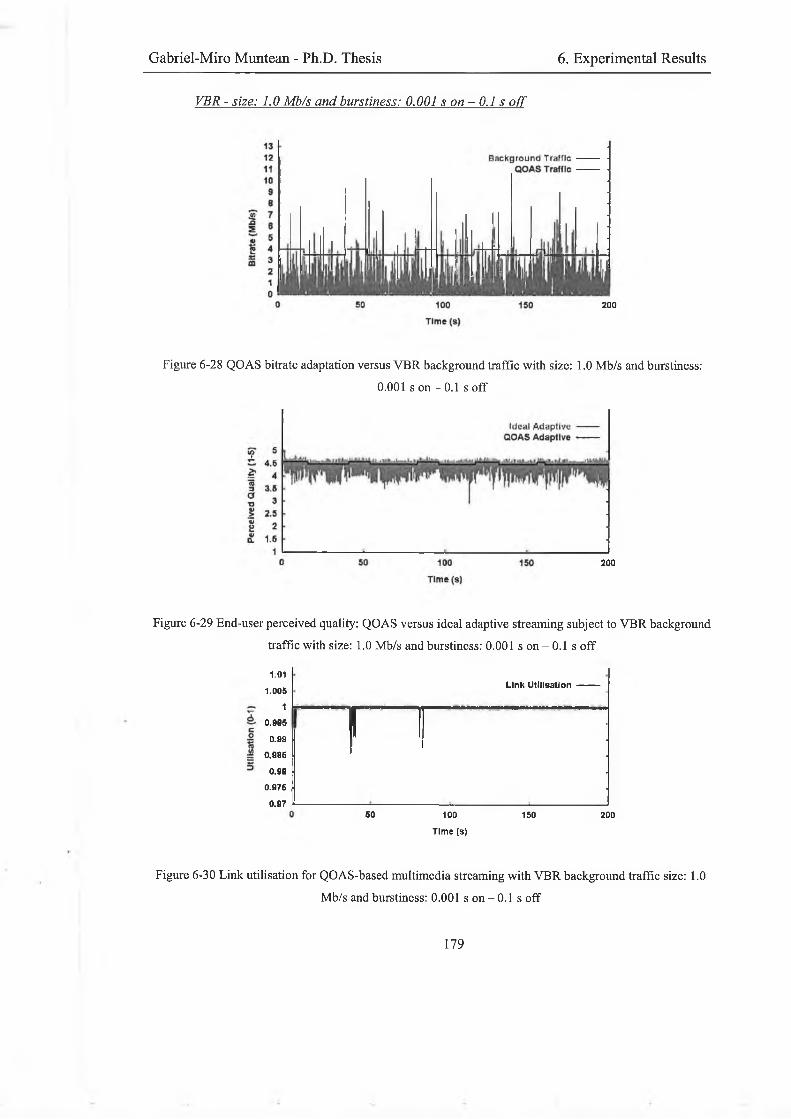
Gabriel-Miro Muntean - Ph.D. Thesis 6. Experimental Results
VBR - size: 1.0 Mb/s and burstiness: 0.001 s on - 0.1 s off
200
Figure 6-28 QOAS bitrate adaptation versus VBR background traffic with size: 1.0 Mb/s and burstiness:0.001 s on - 0.1 s off
200
Figure 6-29 End-user perceived quality: QOAS versus ideal adaptive streaming subject to VBR background traffic with size: 1.0 Mb/s and burstiness: 0.001 s on - 0.1 s off
1.01
1.005
10.985
0.99
0.985
0.98
0.975
0.97
Link Utilisation ----------
! [50 100
Time (s)
150 200
Figure 6-30 Link utilisation for QOAS-based multimedia streaming with VBR background traffic size: 1.0Mb/s and burstiness: 0.001 s on - 0.1 s off
179
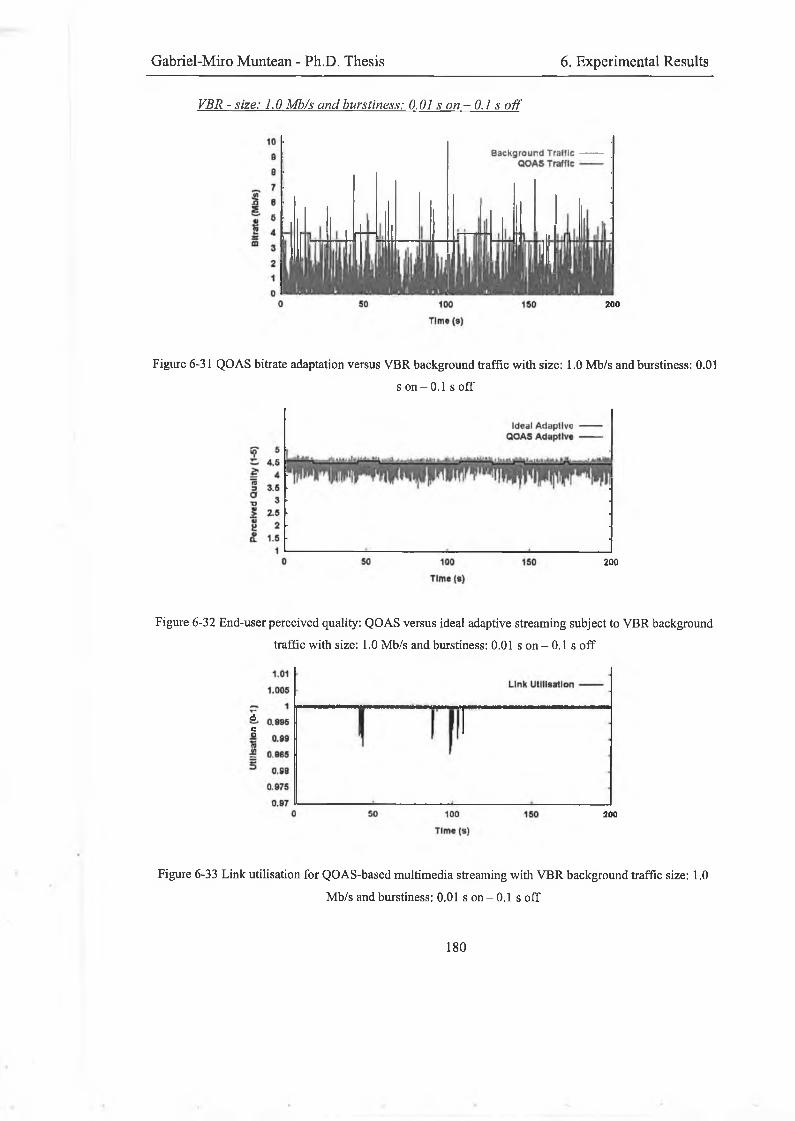
Gabriel-Miro Muntean - Ph.D. Thesis 6. Experimental Results
VBR - size: 1.0 Mb/s and burstiness: 0.01 s o n - 0.1 s off
200
Figure 6-31 QOAS bitrate adaptation versus VBR background traffic with size: 1.0 Mb/s and burstiness: 0.01s on-0.1 s off
200
Figure 6-32 End-user perceived quality: QOAS versus ideal adaptive streaming subject to VBR background traffic with size: 1.0 Mb/s and burstiness: 0.01 s on - 0.1 s off
óCo
200
Figure 6-33 Link utilisation for QOAS-based multimedia streaming with VBR background traffic size: 1.0Mb/s and burstiness: 0.01 s on - 0.1 s o f f
180
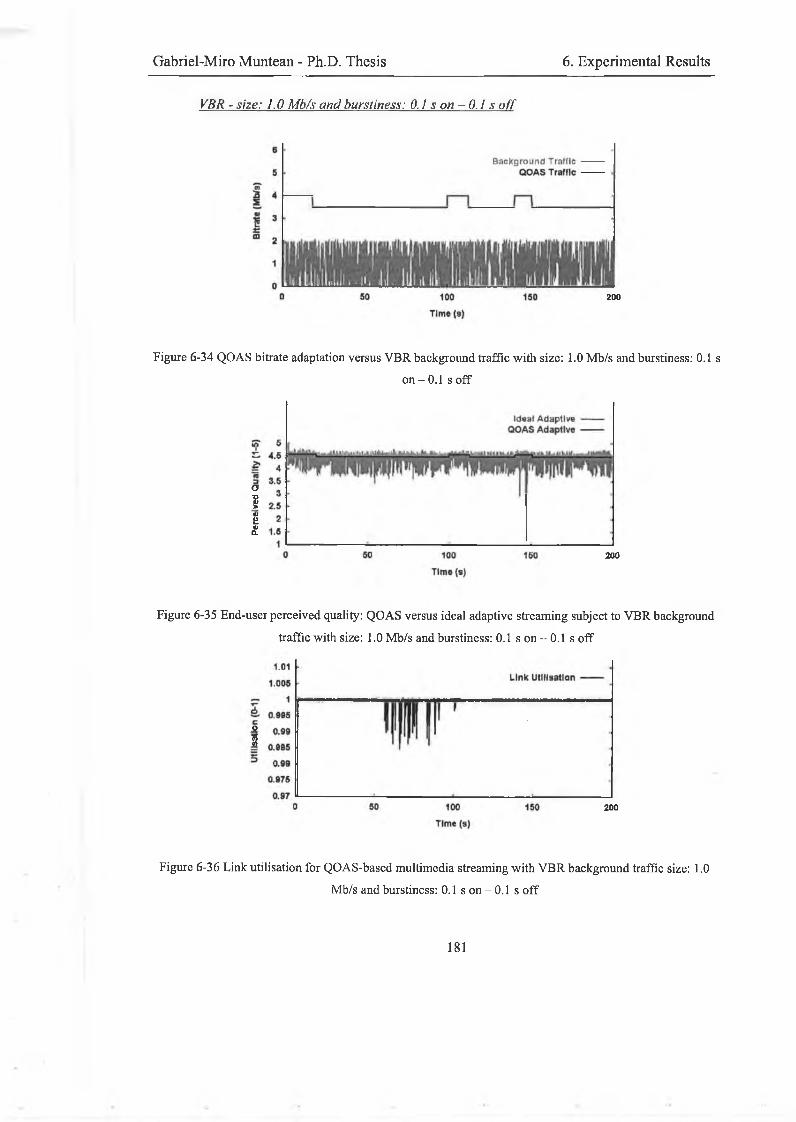
Gabriel-Miro Muntean - Ph.D. Thesis 6. Experimental Results
VBR - size: 1.0 Mb/s and burstiness: 0.1 s on - 0. J s off
200
Figure 6-34 QOAS bitrate adaptation versus VBR background traffic with size: 1.0 Mb/s and burstiness: 0.1 son - 0.1 s off
aS>«IHa>Q-
200
Figure 6-35 End-user perceived quality: QOAS versus ideal adaptive streaming subject to VBR background traffic with size: 1.0 Mb/s and burstiness: 0.1 s on - 0.1 s off
oÌ
200
Figure 6-36 Link utilisation for QOAS-based multimedia streaming with VBR background traffic size: 1.0Mb/s and burstiness: 0.1 s on - 0.1 s off
181
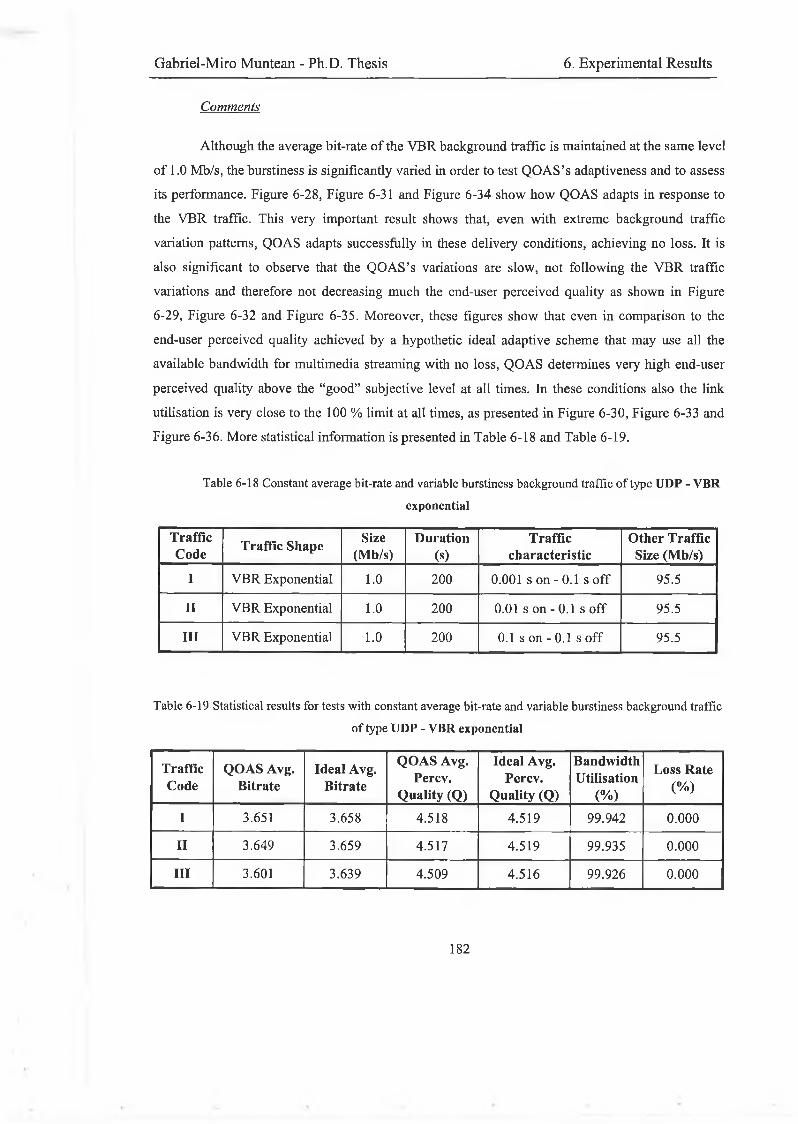
Gabriel-Miro Muntean - Ph.D. Thesis 6. Experimental Results
Comments
Although the average bit-rate of the VBR background traffic is maintained at the same level of 1.0 Mb/s, the burstiness is significantly varied in order to test QOAS’s adaptiveness and to assess its performance. Figure 6-28, Figure 6-31 and Figure 6-34 show how QOAS adapts in response to the VBR traffic. This very important result shows that, even with extreme background traffic variation patterns, QOAS adapts successfully in these delivery conditions, achieving no loss. It is also significant to observe that the QOAS’s variations are slow, not following the VBR traffic variations and therefore not decreasing much the end-user perceived quality as shown in Figure 6-29, Figure 6-32 and Figure 6-35. Moreover, these figures show that even in comparison to the end-user perceived quality achieved by a hypothetic ideal adaptive scheme that may use all the available bandwidth for multimedia streaming with no loss, QOAS determines very high end-user perceived quality above the “good” subjective level at all times. In these conditions also the link utilisation is very close to the 100 % limit at all times, as presented in Figure 6-30, Figure 6-33 and Figure 6-36. More statistical information is presented in Table 6-18 and Table 6-19.
Table 6-18 Constant average bit-rate and variable burstiness background traffic of type UDP - VBRexponential
TrafficCode
Traffic Shape Size(Mb/s)
Duration(s)
Trafficcharacteristic
Other TrafficSize (Mb/s)
I VBR Exponential 1.0 200 0.001 s on - 0.1 s off 95.5
II VBR Exponential 1.0 200 0.01 s on - 0.1 s off 95.5
III VBR Exponential 1.0 200 0.1 s on - 0.1 s off 95.5
Table 6-19 Statistical results for tests with constant average bit-rate and variable burstiness background trafficof type UDP - VBR exponential
TrafficCode
QOAS Avg. Bitrate
Ideal Avg. Bitrate
QOAS Avg.Percv.
Quality (Q)
Ideal Avg.Percv.
Quality (Q)
BandwidthUtilisation
(%)
Loss Rate (%)
I 3.651 3.658 4.518 4.519 99.942 0.000
II 3.649 3.659 4.517 4.519 99.935 0.000
III 3.601 3.639 4.509 4.516 99.926 0.000
182
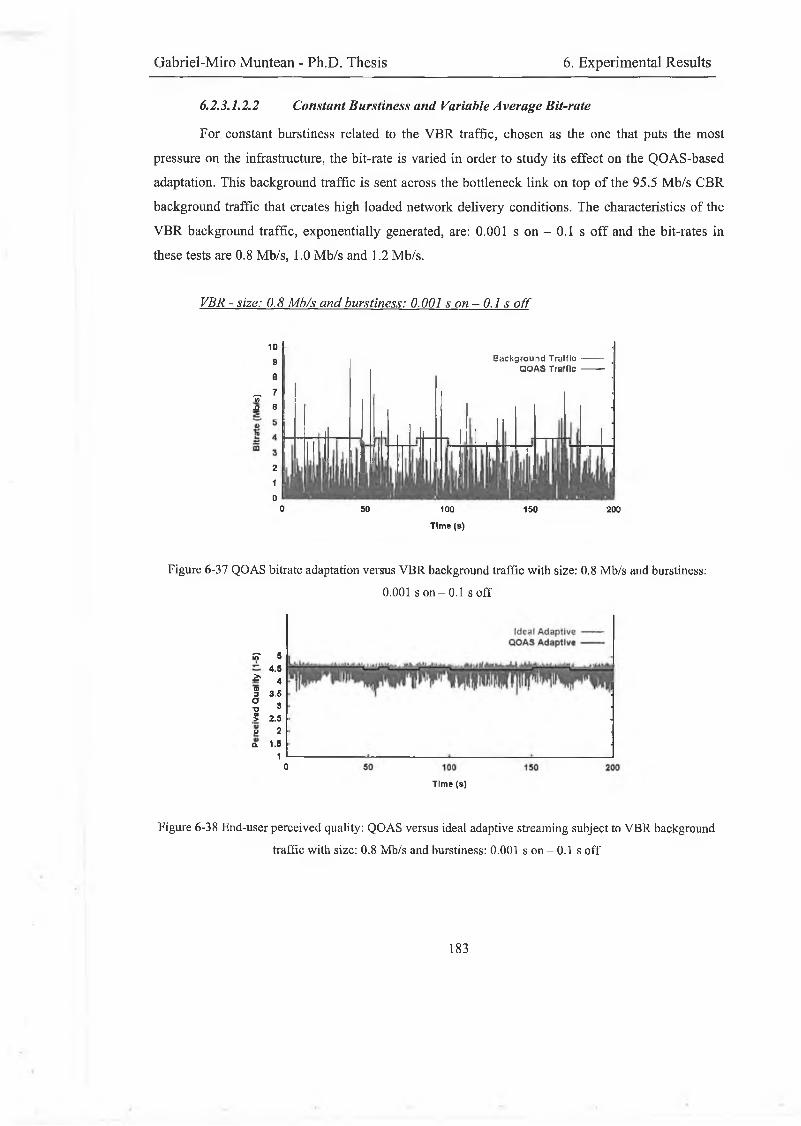
Gabriel-Miro Muntean - Ph.D. Thesis 6. Experimental Results
6.2.3.1.2.2 Constant Burstiness and Variable Average Bit-rate
For constant burstiness related to the VBR traffic, chosen as the one that puts the most pressure on the infrastructure, the bit-rate is varied in order to study its effect on the QOAS-based adaptation. This background traffic is sent across the bottleneck link on top of the 95.5 Mb/s CBR background traffic that creates high loaded network delivery conditions. The characteristics of the VBR background traffic, exponentially generated, are: 0.001 s on - 0.1 s off and the bit-rates in these tests are 0.8 Mb/s, 1.0 Mb/s and 1.2 Mb/s.
VBR - size: 0.8 Mb/s and burstiness: 0.001 s on —0.1 s off
10
9
a_ 7v>■o 6
2 1 0
0
Figure 6-37 QOAS bitrate adaptation versus VBR background traffic with size: 0.8 Mb/s and burstiness:0.001 s on - 0.1 s off
S' 54.5
& 4a3 3.5aT7 3s 2.5u 2a 1.5
1o
Time (s)
Figure 6-38 End-user perceived quality: QOAS versus ideal adaptive streaming subject to VBR background traffic with size: 0.8 Mb/s and burstiness: 0.001 s on - 0.1 s off
Background Traffic---------QOAS Traffic ----------
50 100 150 200
Time (s)
183
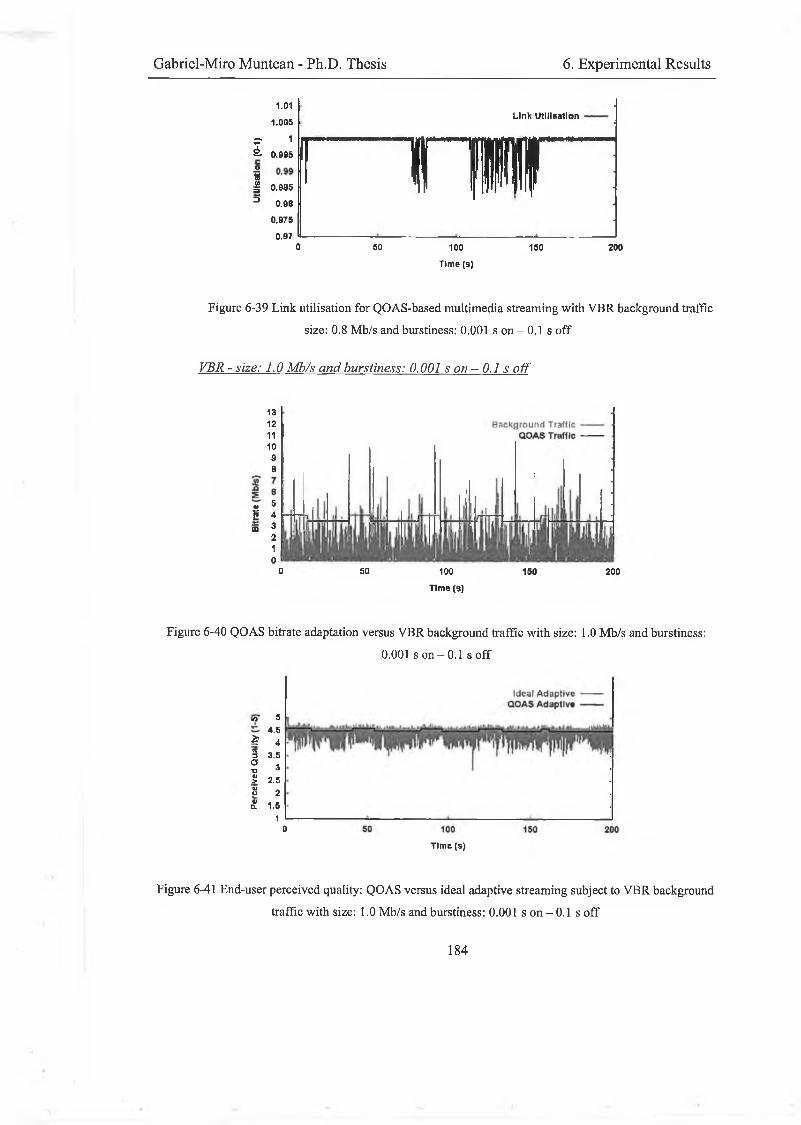
Gabriel-Miro Muntean - Ph.D. Thesis 6. Experimental Results
Link Utilisationriir50 100 150 200
Time (s)
Figure 6-39 Link utilisation for QOAS-based multimedia streaming with VBR background traffic size: 0.8 Mb/s and burstiness: 0.001 s on - 0.1 s off
VBR - size: 1.0 Mb/s and burstiness: 0.001 s on - 0.1 s off
1312111098
* 6 £ 4m 3
2 1 0
0 50 100 150 200
Time (s)
Figure 6-40 QOAS bitrate adaptation versus VBR background traffic with size: 1.0 Mb/s and burstiness:0.001 s on - 0.1 s off
(A 54.5
£ 4nj3 3 5
oTJ 3a»> 2.5Olu 2a*a 1.5
1 oTime (s)
Figure 6-41 End-user perceived quality: QOAS versus ideal adaptive streaming subject to VBR backgroundtraffic with size: 1.0 Mb/s and burstiness: 0.001 son-0.1 s off
1.01
1.005
p 1^ 0.995
II 0.985
3 0.98
0.975
0.970
184
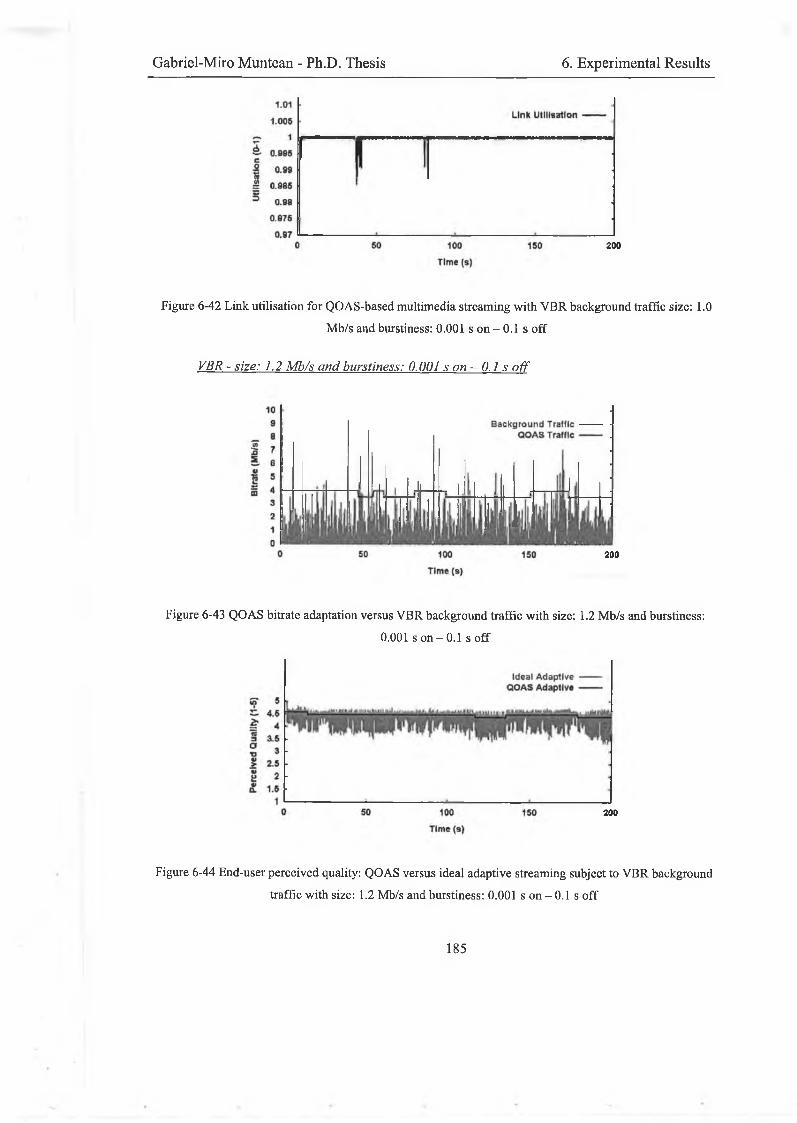
Gabriel-Miro Muntean - Ph.D. Thesis 6. Experimental Results
200
Figure 6-42 Link utilisation for QOAS-based multimedia streaming with VBR background traffic size: 1.0Mb/s and burstiness: 0.001 s on - 0.1 s off
VBR - size: 1.2 Mb/s and burstiness: 0.001 s on — 0.1 s off
200
Figure 6-43 QOAS bitrate adaptation versus VBR background traffic with size: 1.2 Mb/s and burstiness:0.001 s on - 0.1 s off
200
Figure 6-44 End-user perceived quality: QOAS versus ideal adaptive streaming subject to VBR backgroundtraffic with size: 1.2 Mb/s and burstiness: 0.001 s on - 0.1 s off
185
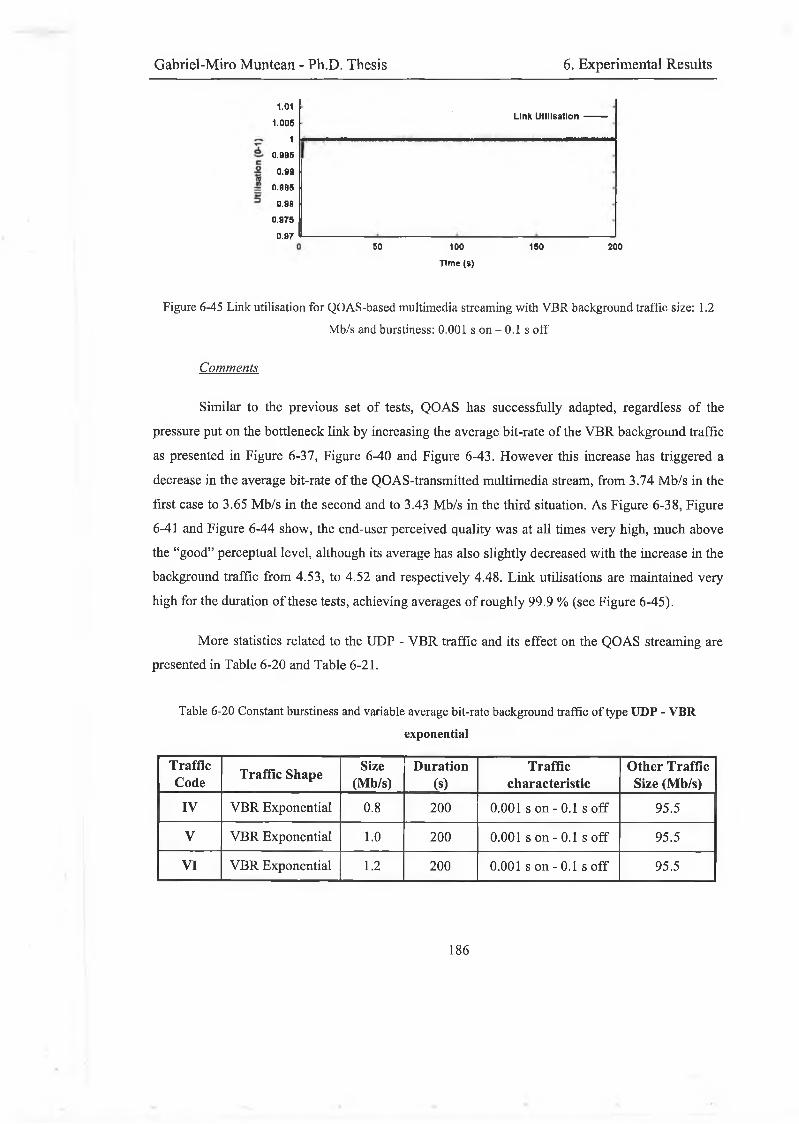
Gabriel-Miro Muntean - Ph.D. Thesis 6. Experimental Results
Link Utilisation----------
50 100 150 200
Time (s)
Figure 6-45 Link utilisation for QOAS-based multimedia streaming with VBR background traffic size: 1.2Mb/s and burstiness: 0.001 s on - 0.1 s off
Comments
Similar to the previous set of tests, QOAS has successfully adapted, regardless of the pressure put on the bottleneck link by increasing the average bit-rate of the VBR background traffic as presented in Figure 6-37, Figure 6-40 and Figure 6-43. However this increase has triggered a decrease in the average bit-rate of the QOAS-transmitted multimedia stream, from 3.74 Mb/s in the first case to 3.65 Mb/s in the second and to 3.43 Mb/s in the third situation. As Figure 6-38, Figure 6-41 and Figure 6-44 show, the end-user perceived quality was at all times very high, much above the “good” perceptual level, although its average has also slightly decreased with the increase in the background traffic from 4.53, to 4.52 and respectively 4.48. Link utilisations are maintained very high for the duration of these tests, achieving averages of roughly 99.9 % (see Figure 6-45).
More statistics related to the UDP - VBR traffic and its effect on the QOAS streaming are presented in Table 6-20 and Table 6-21.
Table 6-20 Constant burstiness and variable average bit-rate background traffic of type UDP - VBRexponential
TrafficCode Traffic Shape Size
(Mb/s)Duration
(s)Traffic
characteristicOther Traffic
Size (Mb/s)
IV VBR Exponential 0.8 200 0.001 s on - 0.1 s off 95.5
V VBR Exponential 1.0 200 0.001 s on - 0.1 s off 95.5
VI VBR Exponential 1.2 200 0.001 s on - 0.1 s off 95.5
1.011.006
10.995
0.99
0.985
0.98
0.975
0.97
186
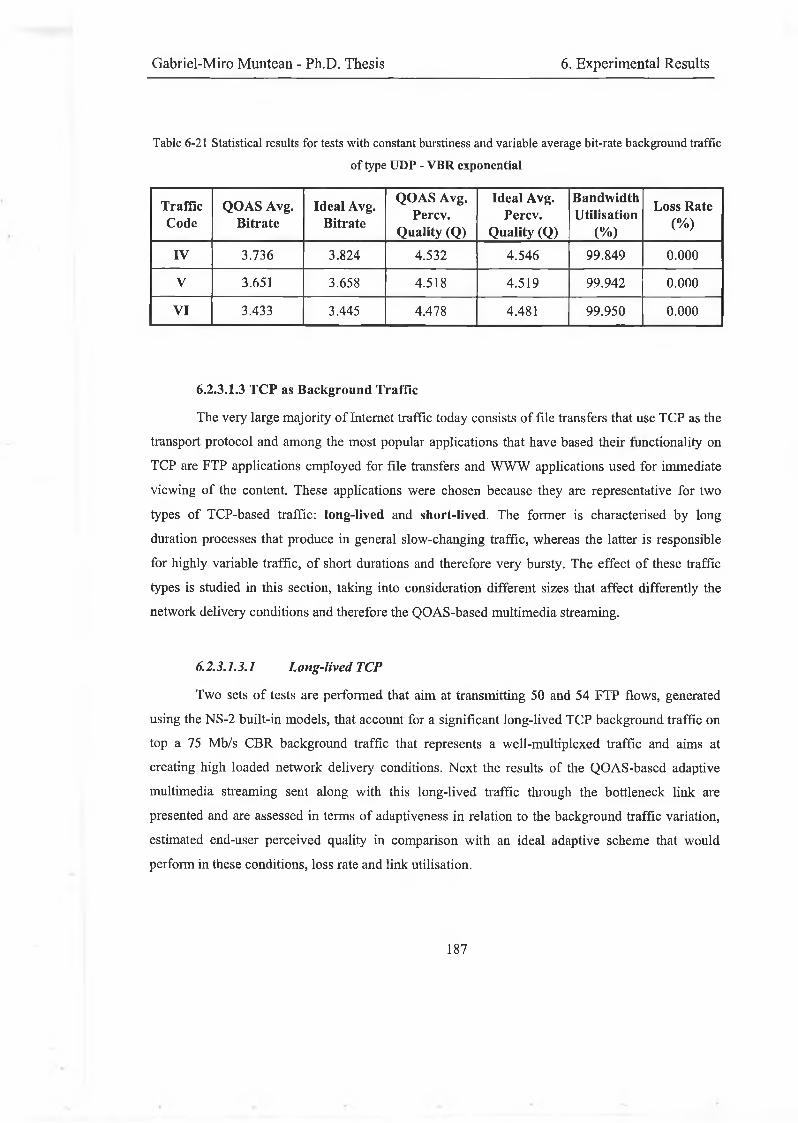
Gabriel-Miro Muntean - Ph.D. Thesis 6. Experimental Results
Table 6-21 Statistical results for tests with constant burstiness and variable average bit-rate background traffic
o f type UDP - VBR exponential
TrafficCode
QOAS Avg. Bitrate
Ideal Avg. Bitrate
QOAS Avg.Percv.
Quality (Q)
Ideal Avg.Percv.
Quality (Q)
BandwidthUtilisation
(% )
Loss Rate (% )
IV 3.736 3.824 4 .532 4 .546 99 .849 0 .000
V 3.651 3.658 4.518 4 .519 99 .942 0 .000
VI 3.433 3.445 4.478 4.481 99 .950 0.000
6.2.3.1.3 TCP as Background Traffic
The very large majority o f Internet traffic today consists o f file transfers that use TCP as the
transport protocol and am ong the m ost popular applications that have based their functionality on
TCP are FTP applications em ployed for file transfers and W W W applications used for im m ediate
view ing o f the content. These applications w ere chosen because they are representative for two
types o f TCP-based traffic: long-lived and short-lived. The former is characterised b y long
duration processes that produce in general slow -changing traffic, whereas the latter is responsible
for highly variable traffic, o f short durations and therefore very bursty. The effect o f these traffic
types is studied in this section, taking into consideration different sizes that affect differently the
network delivery conditions and therefore the Q O A S-based m ultim edia streaming.
6.2.3.1.3.1 Long-lived TCP
Tw o sets o f tests are performed that aim at transmitting 50 and 54 FTP flow s, generated
using the N S -2 built-in m odels, that account for a significant lon g-lived TCP background traffic on
top a 75 M b/s C B R background traffic that represents a w ell-m ultip lexed traffic and aims at
creating h igh loaded network delivery conditions. N ex t the results o f the Q O A S-based adaptive
m ultim edia streaming sent along w ith this lon g-lived traffic through the bottleneck link are
presented and are assessed in terms o f adaptiveness in relation to the background traffic variation,
estim ated end-user perceived quality in com parison w ith an ideal adaptive schem e that w ould
perform in these conditions, loss rate and link utilisation.
187
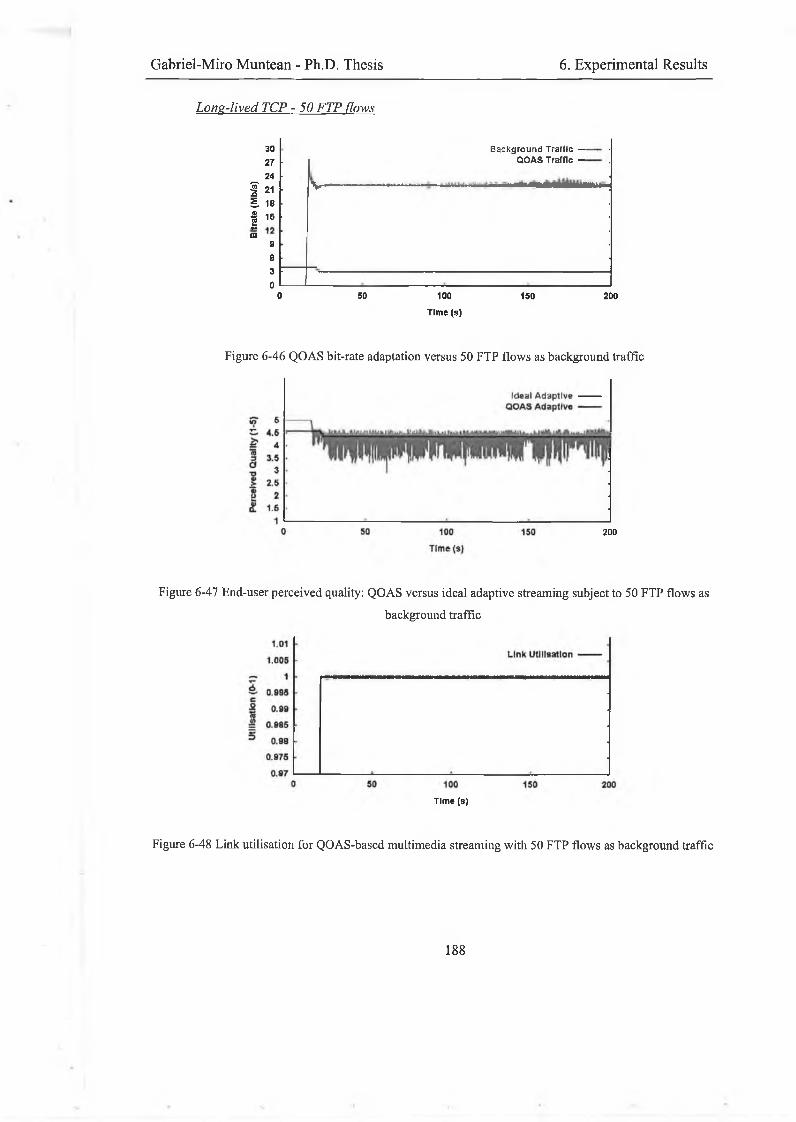
Gabriel-Miro Muntean - Ph.D. Thesis 6. Experimental Results
Lone-lived TCP - 50 FTP flows
30 27 24
f 21S. 18
i 15m9 6 3 0
0 SO 100 150 200
Time (s)
B ackground T ra ffic — QOAS Traffic -
V — * ..... ■
Figure 6-46 QOAS bit-rate adaptation versus 50 FTP flows as background traffic
200
Figure 6-47 End-user perceived quality: QOAS versus ideal adaptive streaming subject to 50 FTP flows as
background traffic
Time (s)
Figure 6-48 Link utilisation for QOAS-based multimedia streaming with 50 FTP flows as background traffic
188
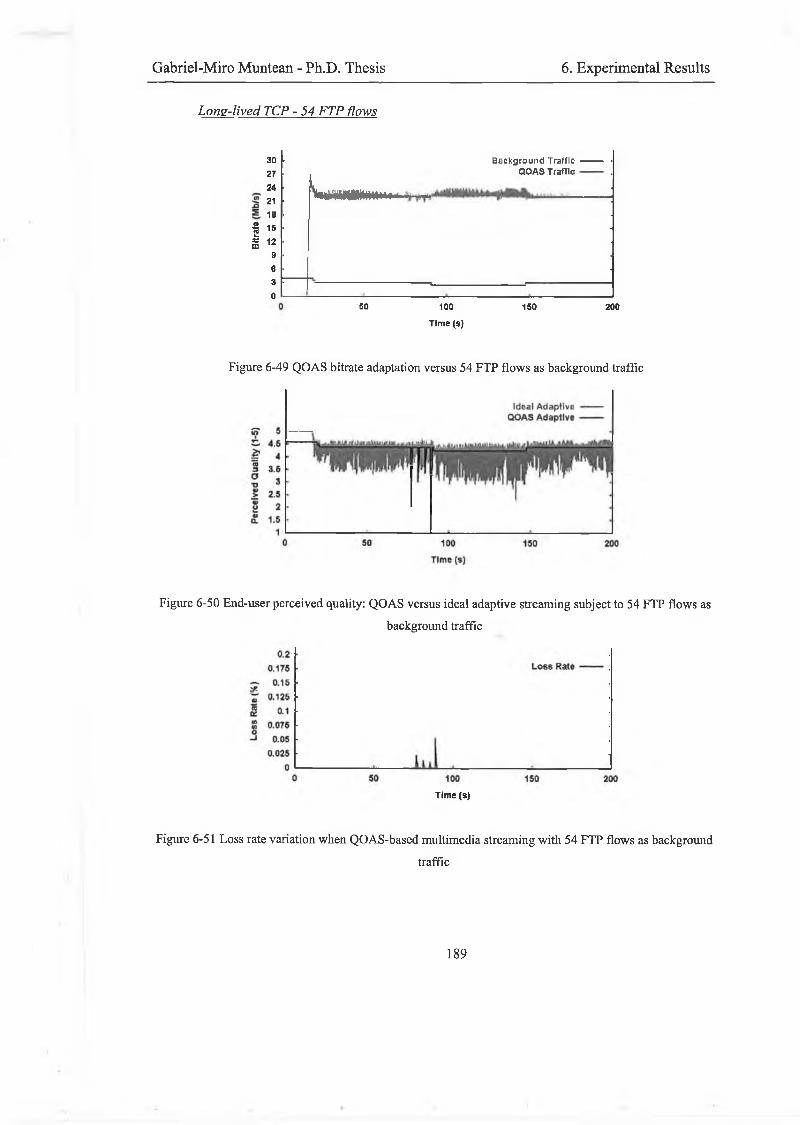
Gabriel-Miro Muntean - Ph.D. Thesis 6. Experimental Results
Lons-lìved TCP - 54 FTP flows
302724211B
f 16S 12
9630
Wmimwi.....
50 100
Time (s)
B ackground Trafile QOAS Traffic
150 200
Figure 6-49 QOAS bitrate adaptation versus 54 FTP flows as background traffic
Figure 6-50 End-user perceived quality: QOAS versus ideal adaptive streaming subject to 54 FTP flows as
background traffic
Time (s)
Figure 6-51 Loss rate variation when QOAS-based multimedia streaming with 54 FTP flows as background
traffic
189
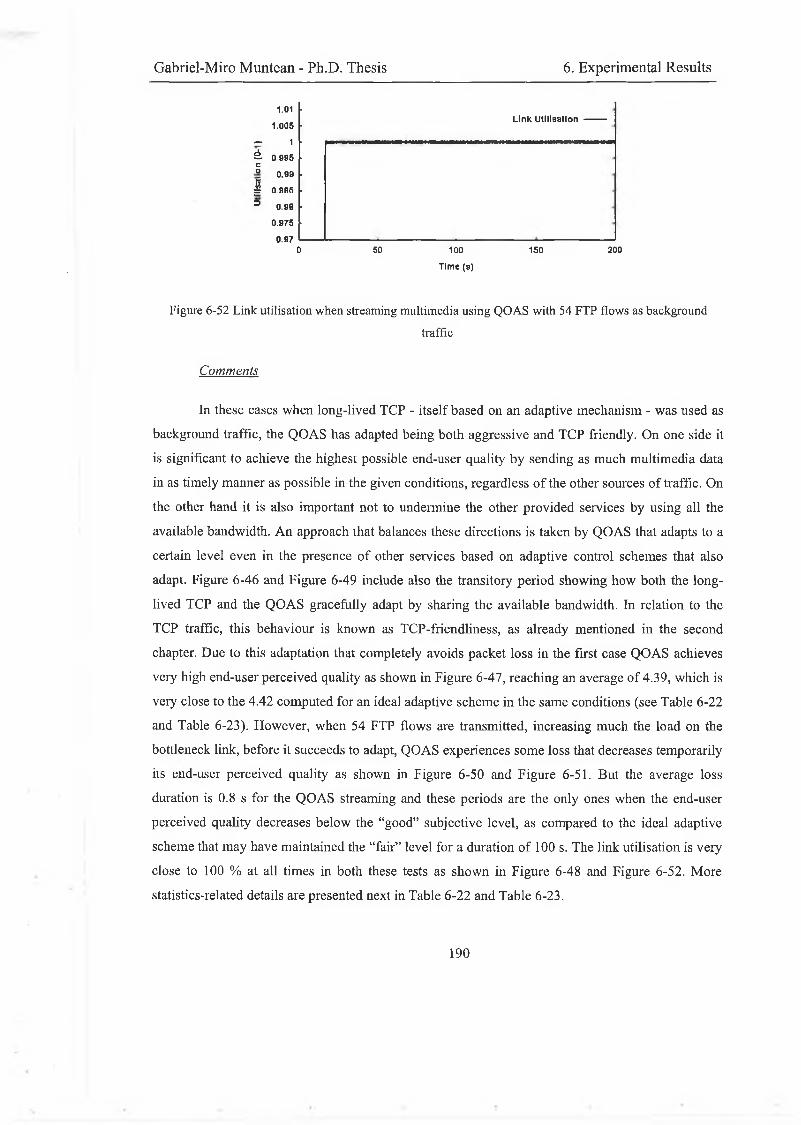
Gabriel-Miro Muntean - Ph.D. Thesis 6. Experimental Results
Link Utilisation ---------
50 100 150 200
Time (s)
Figure 6-52 Link utilisation when streaming multimedia using QOAS with 54 FTP flows as background
traffic
Comments
In these cases when long-lived TCP - itself based on an adaptive mechanism - was used as background traffic, the QOAS has adapted being both aggressive and TCP friendly. On one side it is significant to achieve the highest possible end-user quality by sending as much multimedia data in as timely manner as possible in the given conditions, regardless of the other sources of traffic. On the other hand it is also important not to undermine the other provided services by using all the available bandwidth. An approach that balances these directions is taken by QOAS that adapts to a certain level even in the presence of other services based on adaptive control schemes that also adapt. Figure 6-46 and Figure 6-49 include also the transitory period showing how both the long- lived TCP and the QOAS gracefully adapt by sharing the available bandwidth. In relation to the TCP traffic, this behaviour is known as TCP-friendliness, as already mentioned in the second chapter. Due to this adaptation that completely avoids packet loss in the first case QOAS achieves very high end-user perceived quality as shown in Figure 6-47, reaching an average of 4.39, which is very close to the 4.42 computed for an ideal adaptive scheme in the same conditions (see Table 6-22 and Table 6-23). However, when 54 FTP flows are transmitted, increasing much the load on the bottleneck link, before it succeeds to adapt, QOAS experiences some loss that decreases temporarily its end-user perceived quality as shown in Figure 6-50 and Figure 6-51. But the average loss duration is 0.8 s for the QOAS streaming and these periods are the only ones when the end-user perceived quality decreases below the “good” subjective level, as compared to the ideal adaptive scheme that may have maintained the “fair” level for a duration of 100 s. The link utilisation is very close to 100 % at all times in both these tests as shown in Figure 6-48 and Figure 6-52. More statistics-related details are presented next in Table 6-22 and Table 6-23.
1.01
1.005
— 1Ì 0-995C
° 0.99¡5J 0.905
3 0.9B
0.975
0.97 - 0
1 9 0
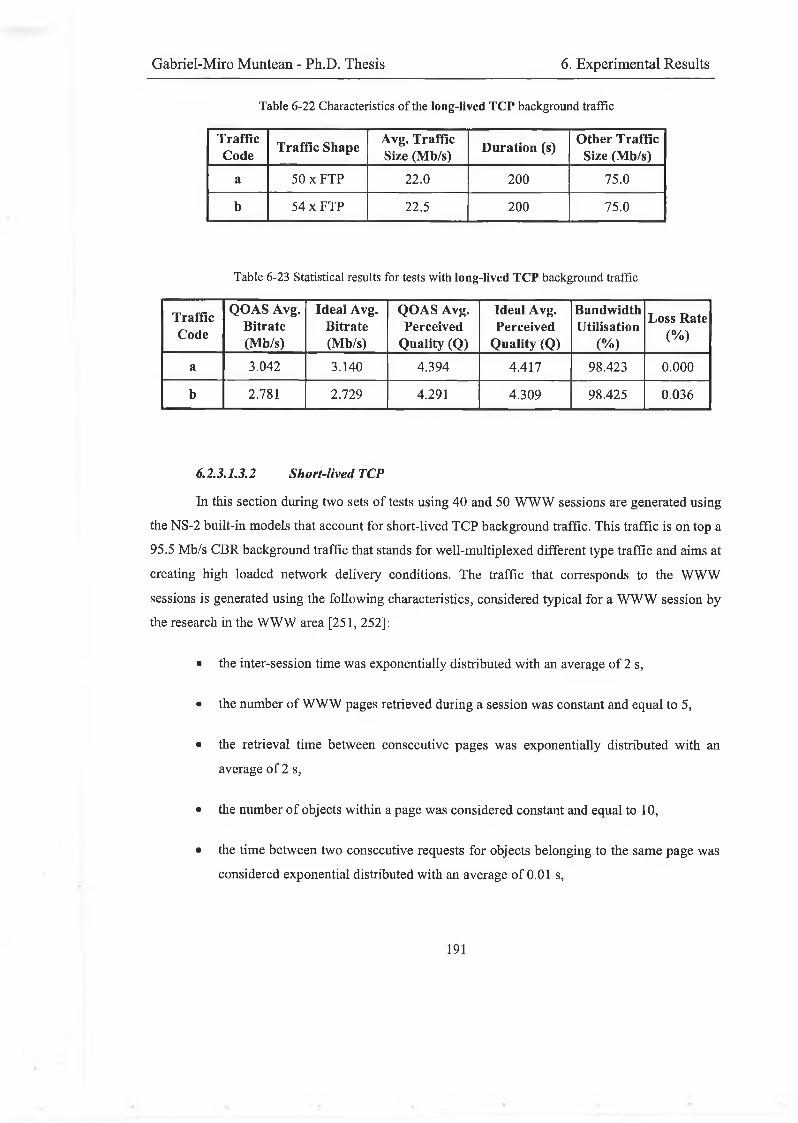
Gabriel-Miro Muntean - Ph.D. Thesis 6. Experimental Results
Table 6-22 Characteristics o f the long-lived TCP background traffic
TrafficCode Traffic Shape Avg. Traffic
Size (Mb/s) Duration (s)Other Traffic
Size (Mb/s)
a 50 x FTP 22.0 200 75.0
b 54 x FTP 22.5 200 75.0
Table 6-23 Statistical results for tests with long-lived TCP background traffic
TrafficCode
QOAS Avg. Bitrate (Mb/s)
Ideal Avg. Bitrate (Mb/s)
QOAS Avg. Perceived
Quality (Q)
Ideal Avg. Perceived
Quality (Q)
BandwidthUtilisation
(%)
Loss Rate (%)
a 3.042 3.140 4.394 4.417 98.423 0.000
b 2.781 2.729 4.291 4.309 98.425 0.036
6.2.3.1.3.2 Short-lived TCP
In this section during two sets of tests using 40 and 50 WWW sessions are generated using the NS-2 built-in models that account for short-lived TCP background traffic. This traffic is on top a 95.5 Mb/s CBR background traffic that stands for well-multiplexed different type traffic and aims at creating high loaded network delivery conditions. The traffic that corresponds to the WWW sessions is generated using the following characteristics, considered typical for a WWW session by the research in the WWW area [251, 252]:
• the inter-session time was exponentially distributed with an average of 2 s,
• the number of WWW pages retrieved during a session was constant and equal to 5,
• the retrieval time between consecutive pages was exponentially distributed with anaverage of 2 s,
• the number of objects within a page was considered constant and equal to 10,
• the time between two consecutive requests for objects belonging to the same page wasconsidered exponential distributed with an average of 0.01 s,
191
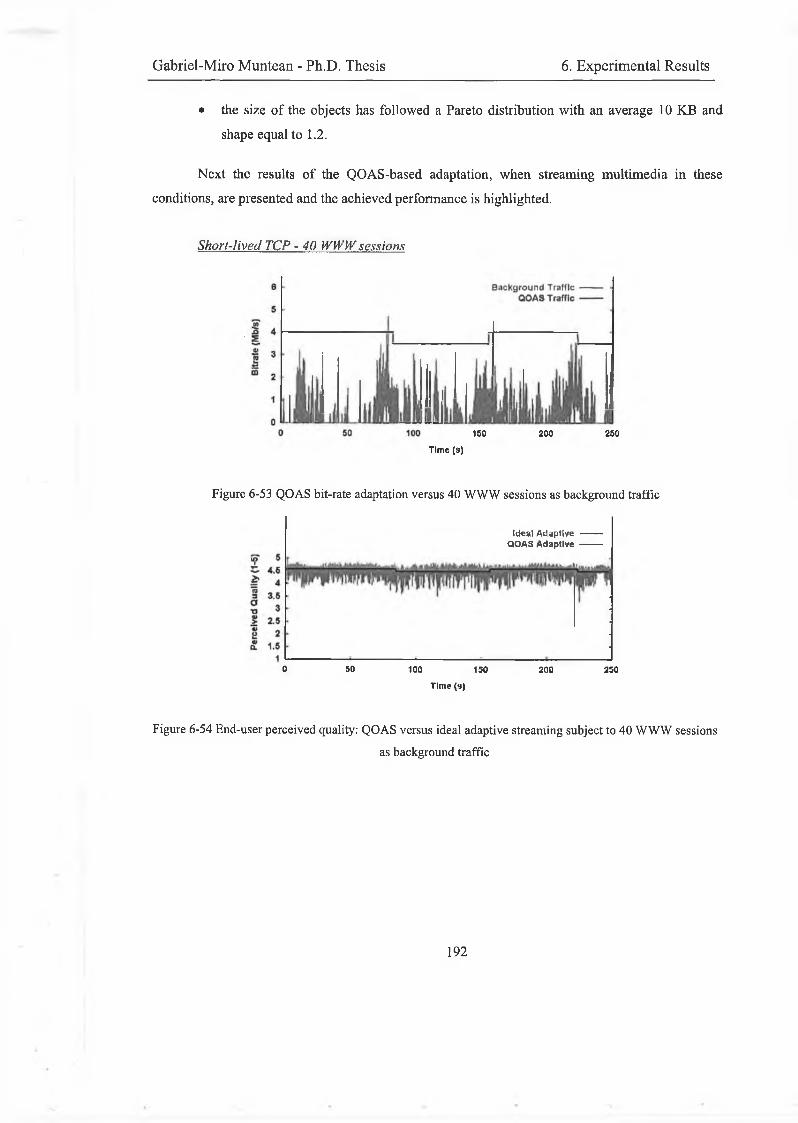
Gabriel-Miro Muntean - Ph.D. Thesis 6. Experimental Results
• the size of the objects has followed a Pareto distribution with an average 10 KB and shape equal to 1.2.
Next the results of the QOAS-based adaptation, when streaming multimedia in these conditions, are presented and the achieved performance is highlighted.
Short-lived TCP - 40 WWW sessions
150 200 250
Time (s)
Figure 6-53 QOAS bit-rate adaptation versus 40 WWW sessions as background traffic
Ideal A daptive --------QOAS Adaptive ---------
0 50 100 150 200 250
Time (s)
Figure 6-54 End-user perceived quality: QOAS versus ideal adaptive streaming subject to 40 WWW sessions
as background traffic
192
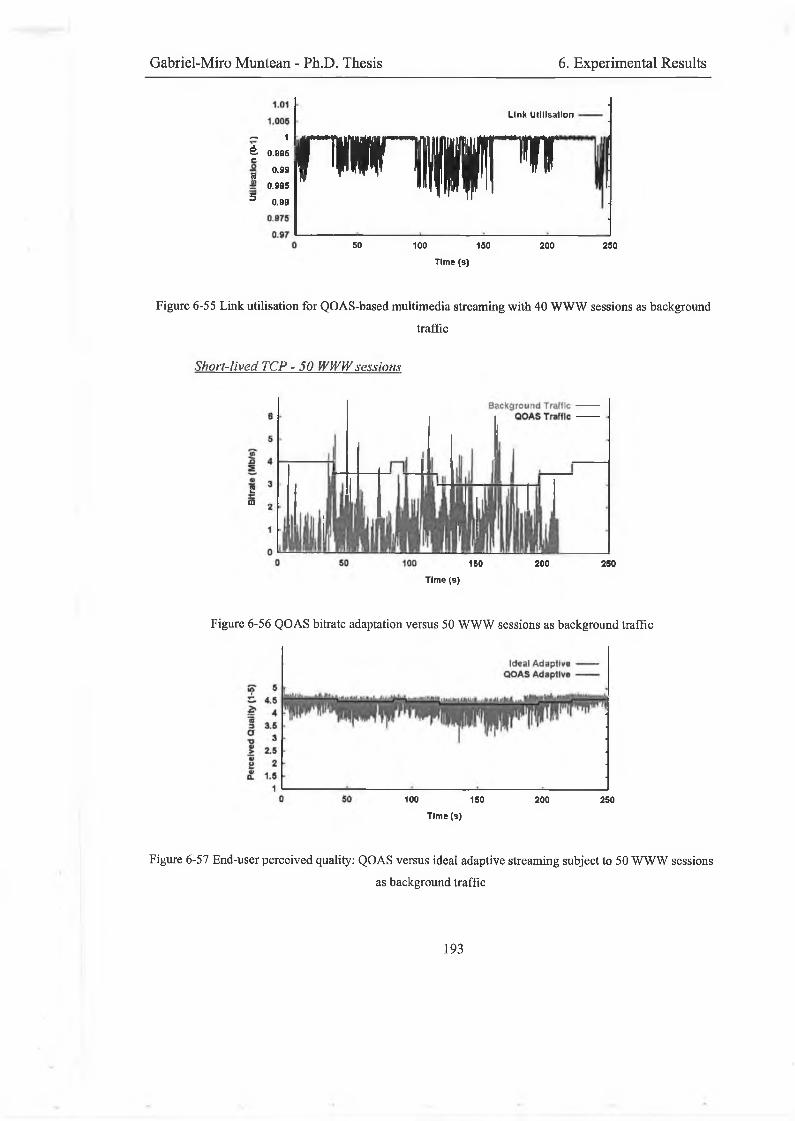
Gabriel-Miro Muntean - Ph.D. Thesis 6. Experimental Results
LtnK Utilisation
— 1è 0.995 e~ 0.998= 0.985
S 0.9B
r w r | ^50 100 150
Time (s)
200 250
Figure 6-55 Link utilisation for QOAS-based multimedia streaming with 40 WWW sessions as background
traffic
Short-lived TCP -50 WWW sessions
£10
150 200 250
Time (9)
Figure 6-56 QOAS bitrate adaptation versus 50 WWW sessions as background traffic
100 150
Time (s)
200 250
Figure 6-57 End-user perceived quality: QOAS versus ideal adaptive streaming subject to 50 WWW sessions
as background traffic
193
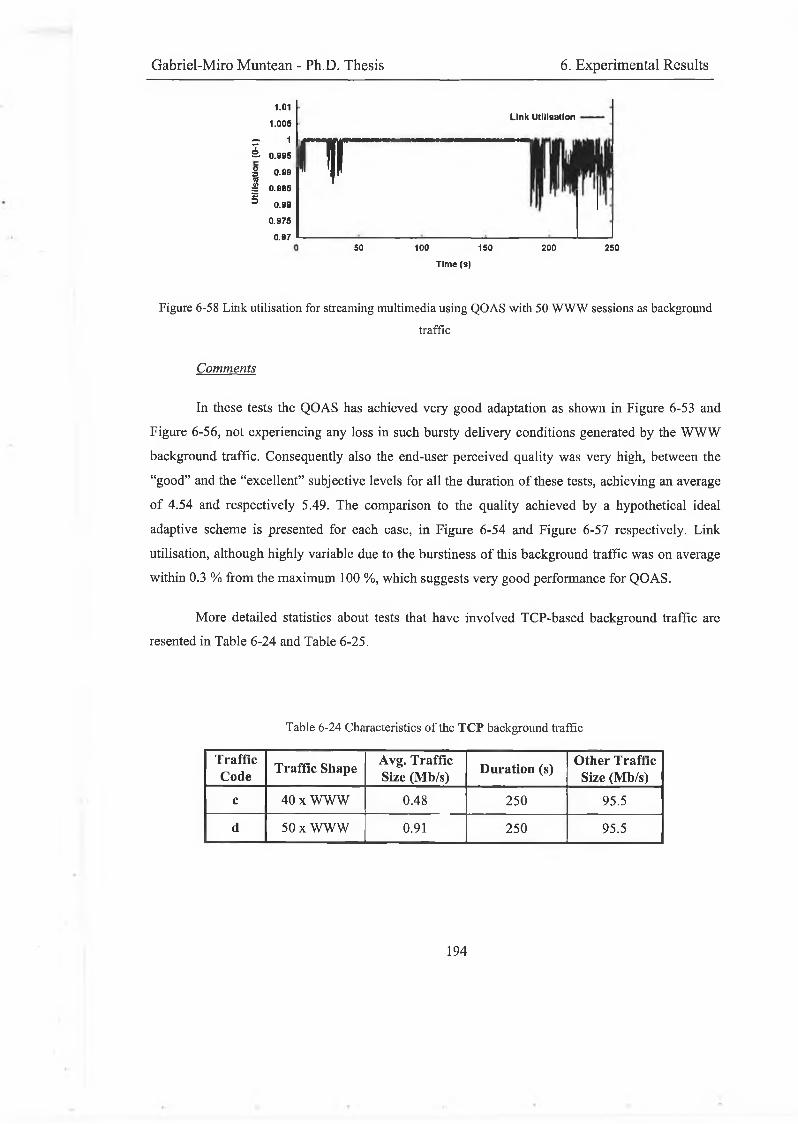
Gabriel-Miro Muntean - Ph.D. Thesis 6. Experimental Results
1.01
1.00S
p 1 è- 0.995
I 0.99
£ 0.985 g= 0.98
0.976
0.97
Link Utilisation
nrso 100 150
Time (s)
200 250
Figure 6-58 Link utilisation for streaming multimedia using QOAS with 50 WWW sessions as background
traffic
Comments
In these tests the QOAS has achieved very good adaptation as shown in Figure 6-53 and Figure 6-56, not experiencing any loss in such bursty delivery conditions generated by the WWW background traffic. Consequently also the end-user perceived quality was very high, between the “good” and the “excellent” subjective levels for all the duration of these tests, achieving an average of 4.54 and respectively 5.49. The comparison to the quality achieved by a hypothetical ideal adaptive scheme is presented for each case, in Figure 6-54 and Figure 6-57 respectively. Link utilisation, although highly variable due to the burstiness of this background traffic was on average within 0.3 % from the maximum 100 %, which suggests very good performance for QOAS.
More detailed statistics about tests that have involved TCP-based background traffic are resented in Table 6-24 and Table 6-25.
Table 6-24 Characteristics o f the TCP background traffic
TrafficCode Traffic Shape Avg. Traffic
Size (Mb/s) Duration (s) Other Traffic Size (Mb/s)
c 40 x WWW 0.48 250 95.5
d 50 x WWW 0.91 250 95.5
194
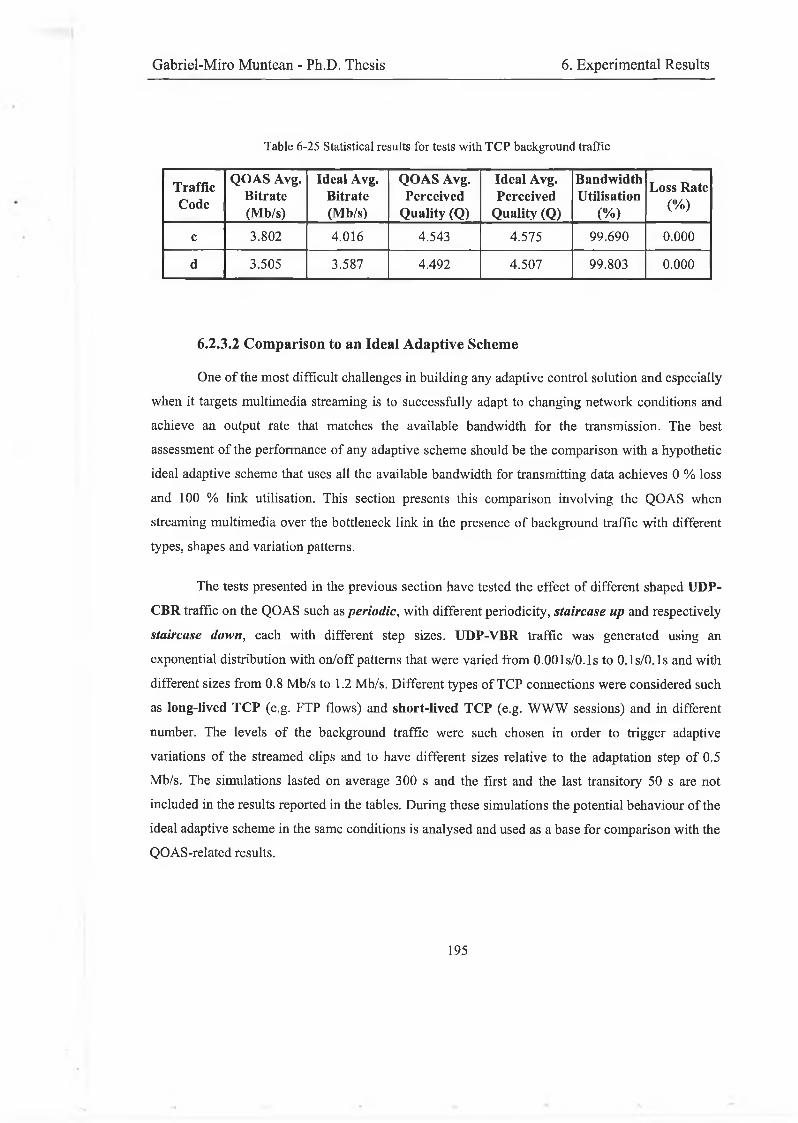
Gabriel-Miro Muntean - Ph.D. Thesis 6. Experimental Results
Tabic 6-25 Statistical results for tests with TCP background traffic
TrafficCode
QOAS Avg. Bitrate (Mb/s)
Ideal Avg. Bitrate (Mb/s)
QOAS Avg. Perceived
Quality (Q)
Ideal Avg. Perceived
Quality (Q)
BandwidthUtilisation
(%)
Loss Rate(%)
c 3.802 4.016 4.543 4.575 99.690 0.000
d 3.505 3.587 4.492 4.507 99.803 0.000
6.2.3.2 Comparison to an Ideal Adaptive Scheme
One of the most difficult challenges in building any adaptive control solution and especially when it targets multimedia streaming is to successfully adapt to changing network conditions and achieve an output rate that matches the available bandwidth for the transmission. The best assessment of the performance of any adaptive scheme should be the comparison with a hypothetic ideal adaptive scheme that uses all the available bandwidth for transmitting data achieves 0 % loss and 100 % link utilisation. This section presents this comparison involving the QOAS when streaming multimedia over the bottleneck link in the presence of background traffic with different types, shapes and variation patterns.
The tests presented in the previous section have tested the effect of different shaped UDP-
CBR traffic on the QOAS such as periodic, with different periodicity, staircase up and respectively staircase down, each with different step sizes. UDP-VBR traffic was generated using an exponential distribution with on/off patterns that were varied from O.OOls/O.ls to O.ls/O.ls and with different sizes from 0.8 Mb/s to 1.2 Mb/s. Different types of TCP connections were considered such as long-lived TCP (e.g. FTP flows) and short-lived TCP (e.g. WWW sessions) and in different number. The levels of the background traffic were such chosen in order to trigger adaptive variations of the streamed clips and to have different sizes relative to the adaptation step of 0.5 Mb/s. The simulations lasted on average 300 s and the first and the last transitory 50 s are not included in the results reported in the tables. During these simulations the potential behaviour of the ideal adaptive scheme in the same conditions is analysed and used as a base for comparison with the QOAS-related results.
1 9 5
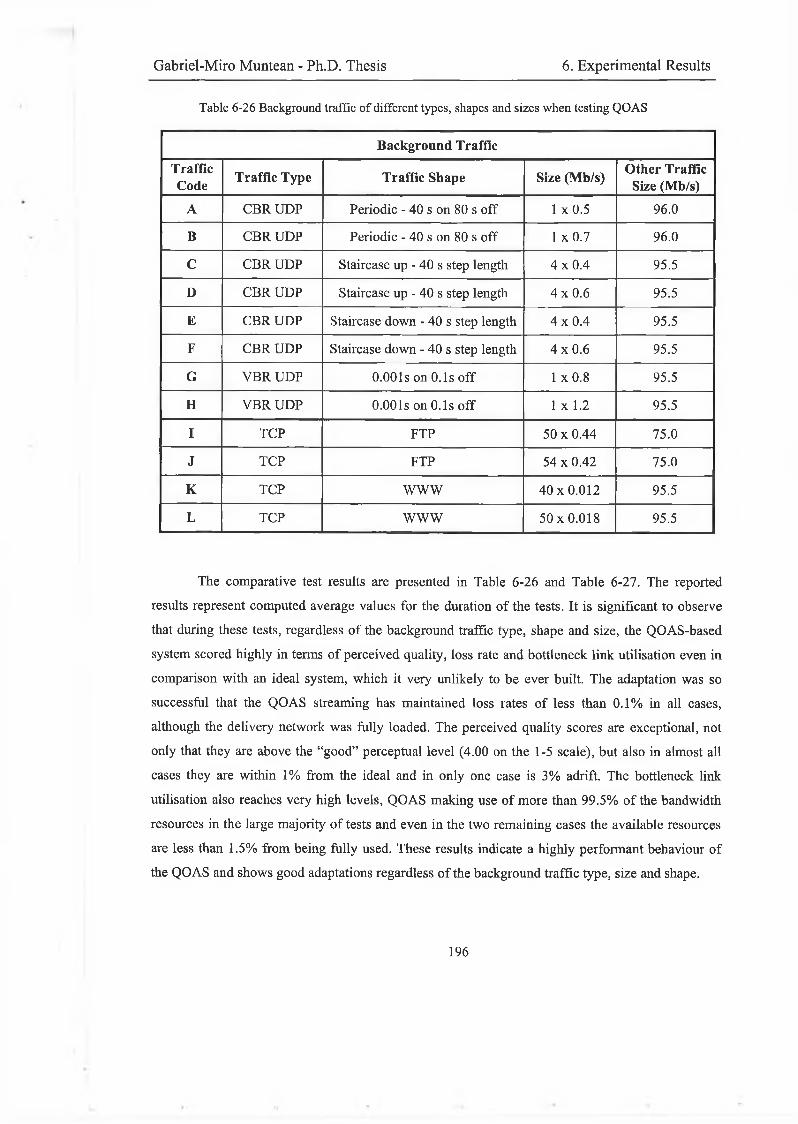
Gabriel-Miro Muntean - Ph.D. Thesis 6. Experimental Results
Table 6-26 Background traffic o f different types, shapes and sizes when testing QOAS
Background TrafficTrafficCode Traffic Type Traffic Shape Size (Mb/s) Other Traffic
Size (Mb/s)A CBR UDP Periodic - 40 s on 80 s off 1 x0.5 96.0
B CBR UDP Periodic - 40 s on 80 s off 1 x0.7 96.0
C CBR UDP Staircase up - 40 s step length 4x0.4 95.5
D CBR UDP Staircase up - 40 s step length 4x0.6 95.5
E CBR UDP Staircase down - 40 s step length 4x0.4 95.5
F CBR UDP Staircase down - 40 s step length 4x0.6 95.5
G VBR UDP 0.001s on 0.1s off 1 x 0.8 95.5
H VBR UDP 0 .001s on 0 .1s off 1 x 1.2 95.5
I TCP FTP 50 x 0.44 75.0
J TCP FTP 54 x 0.42 75.0
K TCP WWW 40x0.012 95.5
L TCP WWW 50x0.018 95.5
The comparative test results are presented in Table 6-26 and Table 6-27. The reported results represent computed average values for the duration of the tests. It is significant to observe that during these tests, regardless of the background traffic type, shape and size, the QOAS-based system scored highly in terms of perceived quality, loss rate and bottleneck link utilisation even in comparison with an ideal system, which it very unlikely to be ever built. The adaptation was so successful that the QOAS streaming has maintained loss rates of less than 0.1% in all cases, although the delivery network was fully loaded. The perceived quality scores are exceptional, not only that they are above the “good” perceptual level (4.00 on the 1-5 scale), but also in almost all cases they are within 1% from the ideal and in only one case is 3% adrift. The bottleneck link utilisation also reaches very high levels, QOAS making use of more than 99.5% of the bandwidth resources in the large majority of tests and even in the two remaining cases the available resources are less than 1.5% from being fully used. These results indicate a highly performant behaviour of the QOAS and shows good adaptations regardless of the background traffic type, size and shape.
196
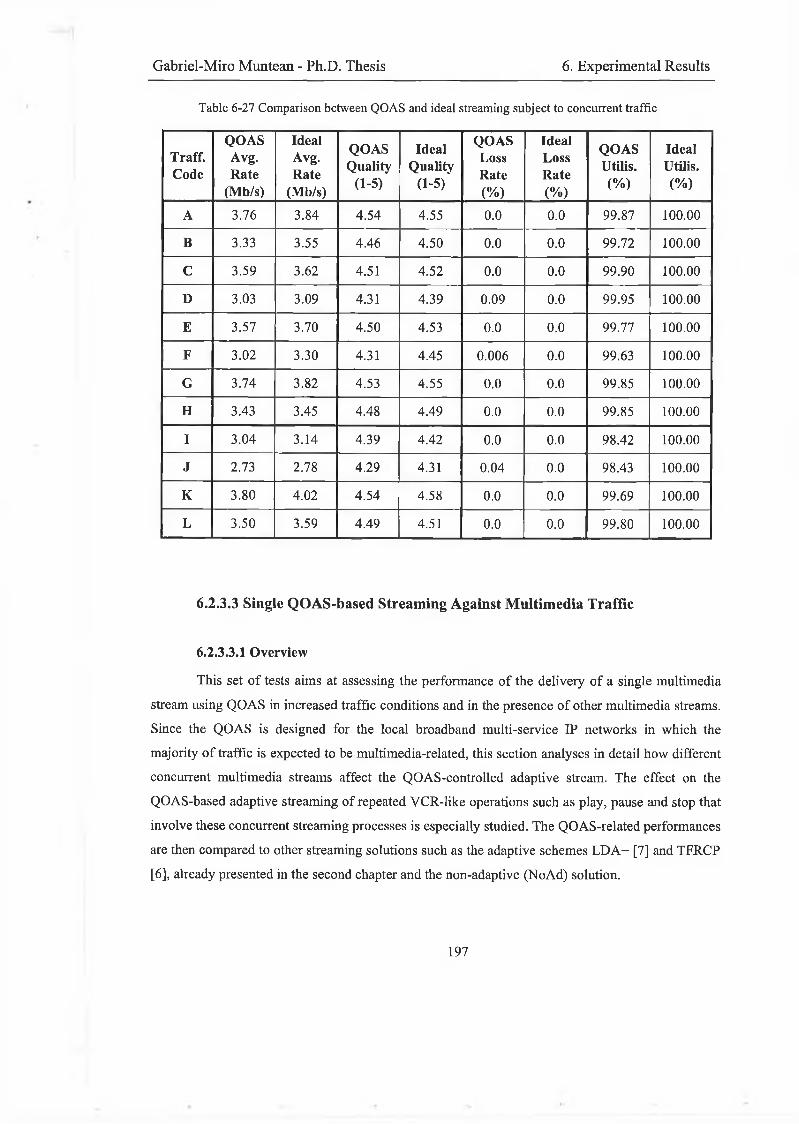
Gabriel-Miro Muntean - Ph.D. Thesis 6. Experimental Results
Table 6-27 Comparison between QOAS and ideal streaming subject to concurrent traffic
Traff.Code
QOASAvg.Rate
(Mb/s)
IdealAvg.Rate
(Mb/s)
QOASQuality
(1-5)
IdealQuality
(1-5)
QOASLossRate(%)
IdealLossRate(%)
QOASUtilis.(%)
IdealUtilis.(%)
A 3.76 3.84 4.54 4.55 0.0 0.0 99.87 100.00
B 3.33 3.55 4.46 4.50 0.0 0.0 99.72 100.00
C 3.59 3.62 4.51 4.52 0.0 0.0 99.90 100.00
D 3.03 3.09 4.31 4.39 0.09 0.0 99.95 100.00
E 3.57 3.70 4.50 4.53 0.0 0.0 99.77 100.00
F 3.02 3.30 4.31 4.45 0.006 0.0 99.63 100.00
G 3.74 3.82 4.53 4.55 0.0 0.0 99.85 100.00
H 3.43 3.45 4.48 4.49 0.0 0.0 99.85 100.00
I 3.04 3.14 4.39 4.42 0.0 0.0 98.42 100.00
J 2.73 2.78 4.29 4.31 0.04 0.0 98.43 100.00
K 3.80 4.02 4.54 4.58 0.0 0.0 99.69 100.00
L 3.50 3.59 4.49 4.51 0.0 0.0 99.80 100.00
6.2.3.3 Single QOAS-based Streaming Against Multimedia Traffic
6.2.3.3.1 Overview
This set of tests aims at assessing the performance of the delivery of a single multimedia stream using QOAS in increased traffic conditions and in the presence of other multimedia streams. Since the QOAS is designed for the local broadband multi-service IP networks in which the majority of traffic is expected to be multimedia-related, this section analyses in detail how different concurrent multimedia streams affect the QOAS-controlled adaptive stream. The effect on the QOAS-based adaptive streaming of repeated VCR-like operations such as play, pause and stop that involve these concurrent streaming processes is especially studied. The QOAS-related performances are then compared to other streaming solutions such as the adaptive schemes LDA+ [7] and TFRCP [6], already presented in the second chapter and the non-adaptive (NoAd) solution.
197
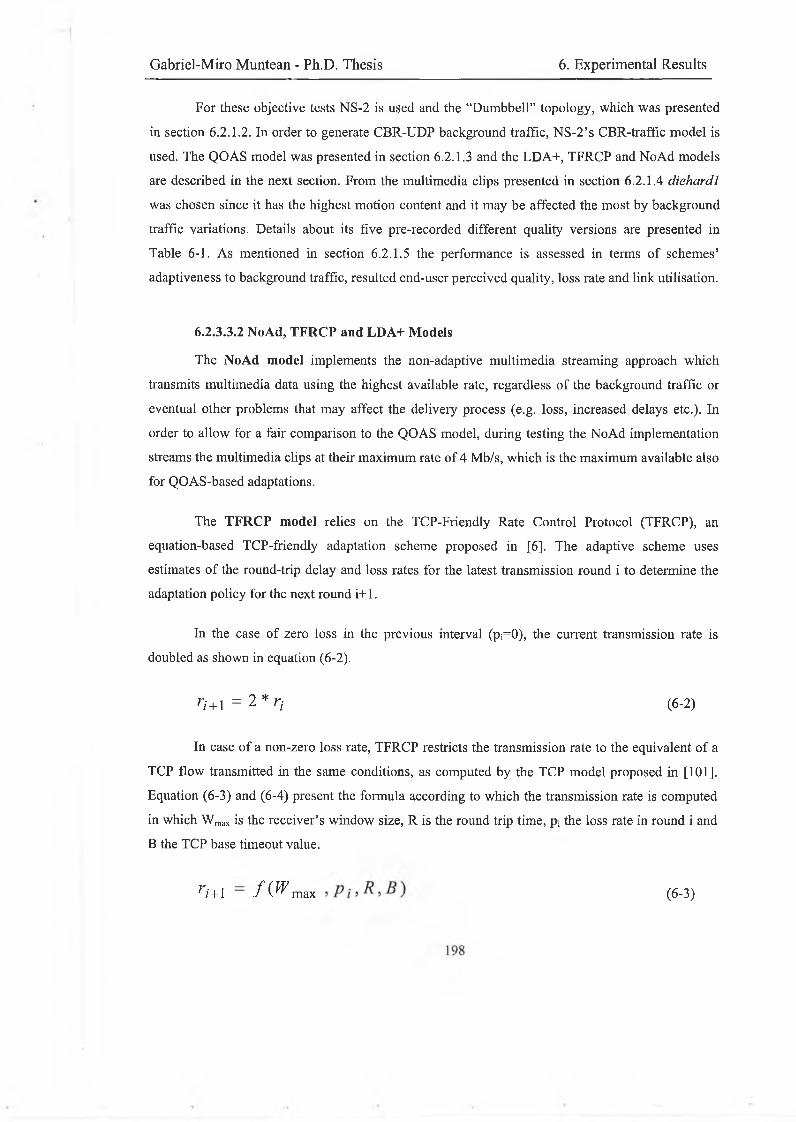
Gabriel-Miro Muntean - Ph.D. Thesis 6. Experimental Results
For these objective tests NS-2 is used and the “Dumbbell” topology, which was presented in section 6.2.1.2. In order to generate CBR-UDP background traffic, NS-2’s CBR-traffic model is used. The QOAS model was presented in section 6 .2 .1.3 and the LDA+, TFRCP and NoAd models are described in the next section. From the multimedia clips presented in section 6.2.1.4 diehardl was chosen since it has the highest motion content and it may be affected the most by background traffic variations. Details about its five pre-recordcd different quality versions are presented in Table 6-1. As mentioned in section 6.2.1.5 the performance is assessed in terms of schemes’ adaptiveness to background traffic, resulted end-user perceived quality, loss rate and link utilisation.
6.2.3.3.2 NoAd, TFRCP and LDA+ Models
The NoAd model implements the non-adaptive multimedia streaming approach which transmits multimedia data using the highest available rate, regardless of the background traffic or eventual other problems that may affect the delivery process (e.g. loss, increased delays etc.). In order to allow for a fair comparison to the QOAS model, during testing the NoAd implementation streams the multimedia clips at their maximum rate of 4 Mb/s, which is the maximum available also for QOAS-based adaptations.
The TFRCP model relies on the TCP-Friendly Rate Control Protocol (TFRCP), an equation-based TCP-friendly adaptation scheme proposed in [6]. The adaptive scheme uses estimates of the round-trip delay and loss rates for the latest transmission round i to determine theadaptation policy for the next round i+1.
In the case of zero loss in the previous interval (pi=0), the current transmission rate is doubled as shown in equation (6-2).
ri+1 = 2 * r-L (6-2)
In case of a non-zero loss rate, TFRCP restricts the transmission rate to the equivalent of a TCP flow transmitted in the same conditions, as computed by the TCP model proposed in [101], Equation (6-3) and (6-4) present the formula according to which the transmission rate is computed in which Wmax is the receiver’s window size, R is the round trip time, p, the loss rate in round i and B the TCP base timeout value.
r i + 1 f (W max ( 6 - 3 )
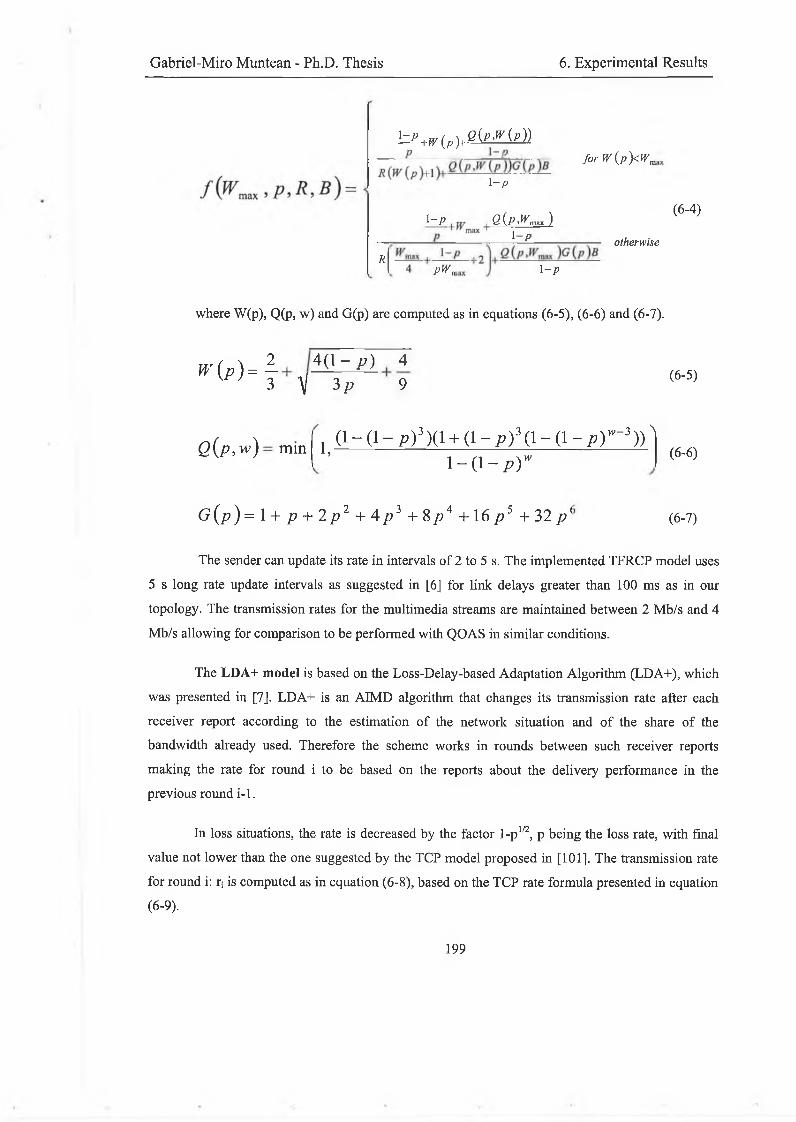
Gabriel-Miro Muntean - Ph.D. Thesis 6. Experimental Results
h £ + r ( „ ) t g ( g g , (* »
\-p
\-p Q(pWnmx )i -/>
f o r W ( p ) < W m
(6-4)
RpW„
otherwise
1 -p
where W(p), Q(p, w) and G(p) are computed as in equations (6-5), (6-6) and (6-7).
„ r ^ . 1 4 0 - p ) 4V ’ 3 V 3p 9
(6-5)
Q(p,w) m m 1,a - (i - p ) 3x i + a - p )3(i - a - P y - 3) ) '
i - ( i - p Y(6-6)
G ( p ) = 1 + p + 2 p 2 + 4 p 2 + Sp* +16 p 5 + 3 2 p ( (6-7)
The sender can update its rate in intervals of 2 to 5 s. The implemented TFRCP model uses 5 s long rate update intervals as suggested in [6] for link delays greater than 100 ms as in our topology. The transmission rates for the multimedia streams are maintained between 2 Mb/s and 4 Mb/s allowing for comparison to be performed with QOAS in similar conditions.
The LDA+ model is based on the Loss-Delay-based Adaptation Algorithm (LDA+), which was presented in [7]. LDA+ is an AIMD algorithm that changes its transmission rate after each receiver report according to the estimation of the network situation and of the share of the bandwidth already used. Therefore the scheme works in rounds between such receiver reports making the rate for round i to be based on the reports about the delivery performance in the previous round i-1.
In loss situations, the rate is decreased by the factor l-p1/2, p being the loss rate, with final value not lower than the one suggested by the TCP model proposed in [101]. The transmission rate for round i: r; is computed as in equation (6-8), based on the TCP rate formula presented in equation (6-9).
1 9 9
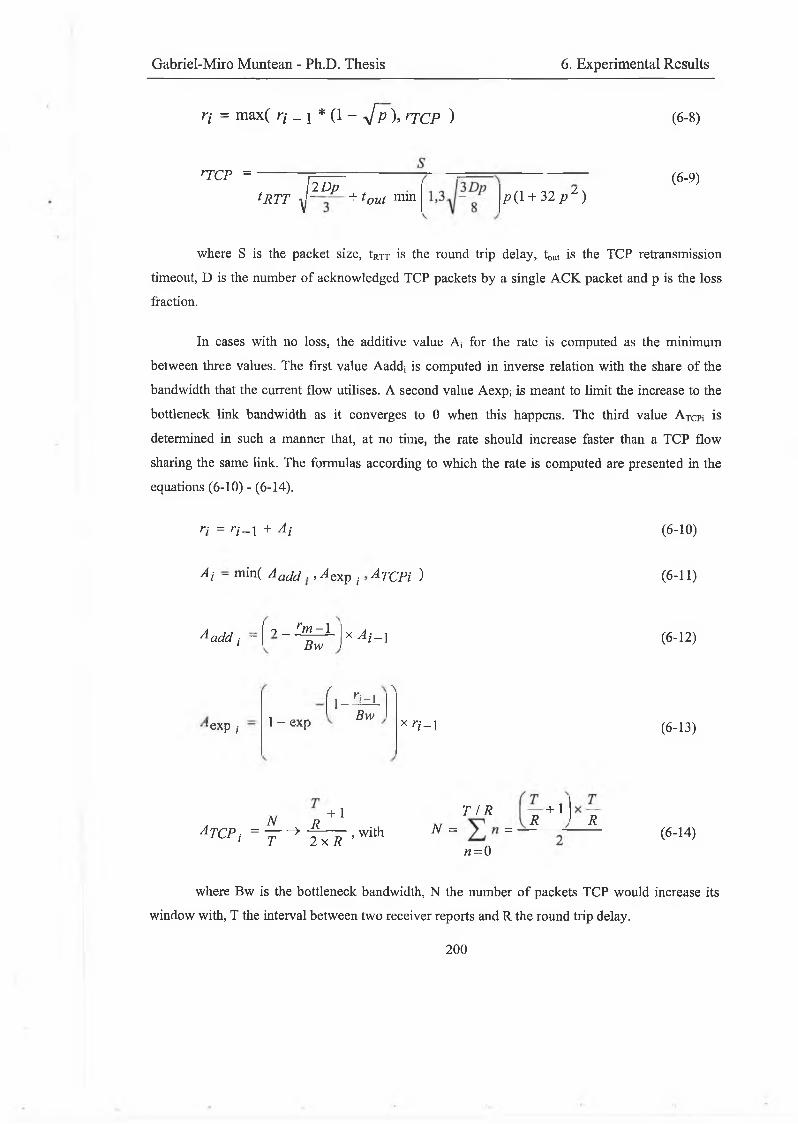
Gabriel-Miro Muntean - Ph.D. Thesis 6. Experimental Results
n = m ax ( rt _ j * (1 - J p ), rTCp ) (6-8)
r-TCp =
t2 Dp
*RTT + 1 out mm(6-9)
p(l + 3 2 ^ z )
where S is the packet size, tRTT is the round trip delay, tout is the TCP retransmission timeout, D is the number of acknowledged TCP packets by a single ACK packet and p is the loss traction.
In cases with no loss, the additive value A, for the rate is computed as the minimum between three values. The first value Aaddi is computed in inverse relation with the share of the bandwidth that the current flow utilises. A second value Aexp; is meant to limit the increase to the bottleneck link bandwidth as it converges to 0 when this happens. The third value A TCpi is determined in such a manner that, at no time, the rate should increase faster than a TCP flow sharing the same link. The formulas according to which the rate is computed are presented in the equations (6-10) - (6-14).
n = n -1 + Ai (6- 10)
A i - min( A a(]d . , /lexp t ^TCPi ) (6-11)
A addj ~ ? _ rm- I Bw x A i - l (6- 12)
‘exp i 1 - exp
f ,. >l_3bL
Bwx n-1 (6-13)
N - +1A tc p ‘ = 7 ' ^ t r T ' wi,h
T /R N = =
n = 0
R+ 1
R(6-14)
where Bw is the bottleneck bandwidth, N the number of packets TCP would increase its window with, T the interval between two receiver reports and R the round trip delay.
200
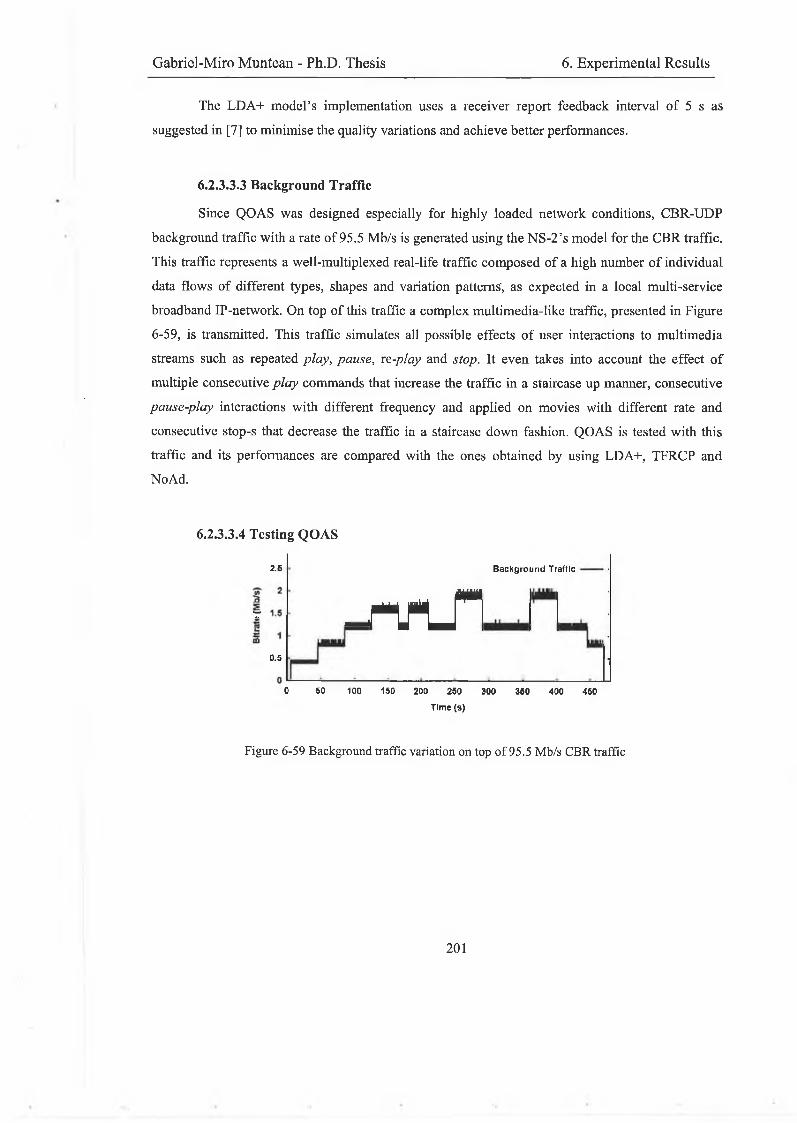
Gabriel-Miro Muntean - Ph.D. Thesis 6. Experimental Results
The LDA+ model’s implementation uses a receiver report feedback interval of 5 s as suggested in [7] to minimise the quality variations and achieve better performances.
6.2.3.3.3 Background Traffic
Since QOAS was designed especially for highly loaded network conditions, CBR-UDP background traffic with a rate of 95.5 Mb/s is generated using the NS-2’s model for the CBR traffic. This traffic represents a well-multiplexed real-life traffic composed of a high number of individual data flows of different types, shapes and variation patterns', as expected in a local multi-service broadband IP-network. On top of this traffic a complex multimedia-like traffic, presented in Figure 6-59, is transmitted. This traffic simulates all possible effects of user interactions to multimedia streams such as repeated play, pause, re-play and stop. It even takes into account the effect of multiple consecutive play commands that increase the traffic in a staircase up manner, consecutive pause-play interactions with different frequency and applied on movies with different rate and consecutive stop-s that decrease the traffic in a staircase down fashion. QOAS is tested with this traffic and its performances are compared with the ones obtained by using LDA+, TFRCP and NoAd.
6.2.3.3.4 Testing QOAS
2.6
r
0.5
Background Traffic
_rtn_r0 50 100 150 200 250 300 350 400 450
Time (s)
Figure 6-59 Background traffic variation on top o f 95.5 Mb/s CBR traffic
201

Gabriel-Miro Muntean - Ph.D. Thesis 6. Experimental Results
Time (s)
Figure 6-60 QOAS bit-rate adaptation versus complex multimedia traffic
Ideal A daptive ---------
1 ------------------ 1------------------ 1--------------------* ■ - I-------------------1 I-----------------1--------------- 1--------------■----------
0 SO 100 150 200 250 300 350 400 450
Time (S)
Figure 6-61 End-user perceived quality: QOAS versus ideal adaptive streaming subject to complex
multimedia background traffic
Time (s)
Figure 6-62 Loss rate variation when QOAS-based multimedia streaming with complex multimedia as
background traffic
202
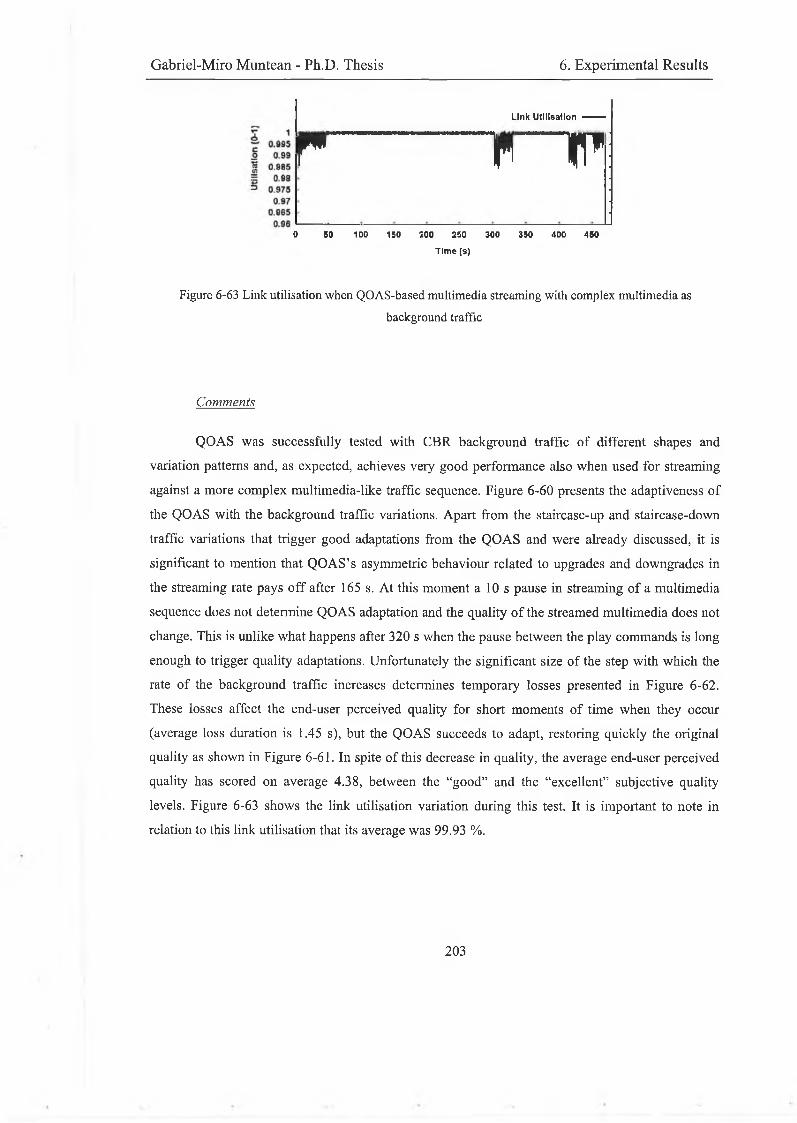
Gabriel-Miro Muntean - Ph.D. Thesis 6. Experimental Results
Link Utilisation ---------
r lr IT;0 50 100 150 200 250 300 350 400 450
Time (s)
Figure 6-63 Link utilisation when QOAS-based multimedia streaming with complex multimedia asbackground traffic
Comments
QOAS was successfully tested with CBR background traffic of different shapes and variation patterns and, as expected, achieves very good performance also when used for streaming against a more complex multimedia-like traffic sequence. Figure 6-60 presents the adaptiveness of the QOAS with the background traffic variations. Apart from the staircase-up and staircase-down traffic variations that trigger good adaptations from the QOAS and were already discussed, it is significant to mention that QOAS’s asymmetric behaviour related to upgrades and downgrades in the streaming rate pays off after 165 s. At this moment a 10 s pause in streaming of a multimedia sequence does not determine QOAS adaptation and the quality of the streamed multimedia does not change. This is unlike what happens after 320 s when the pause between the play commands is long enough to trigger quality adaptations. Unfortunately the significant size of the step with which the rate of the background traffic increases determines temporary losses presented in Figure 6-62. These losses affect the end-user perceived quality for short moments of time when they occur (average loss duration is 1.45 s), but the QOAS succeeds to adapt, restoring quickly the original quality as shown in Figure 6-61. In spite of this decrease in quality, the average end-user perceived quality has scored on average 4.38, between the “good” and the “excellent” subjective quality levels. Figure 6-63 shows the link utilisation variation during this test. It is important to note in relation to this link utilisation that its average was 99.93 %.
203
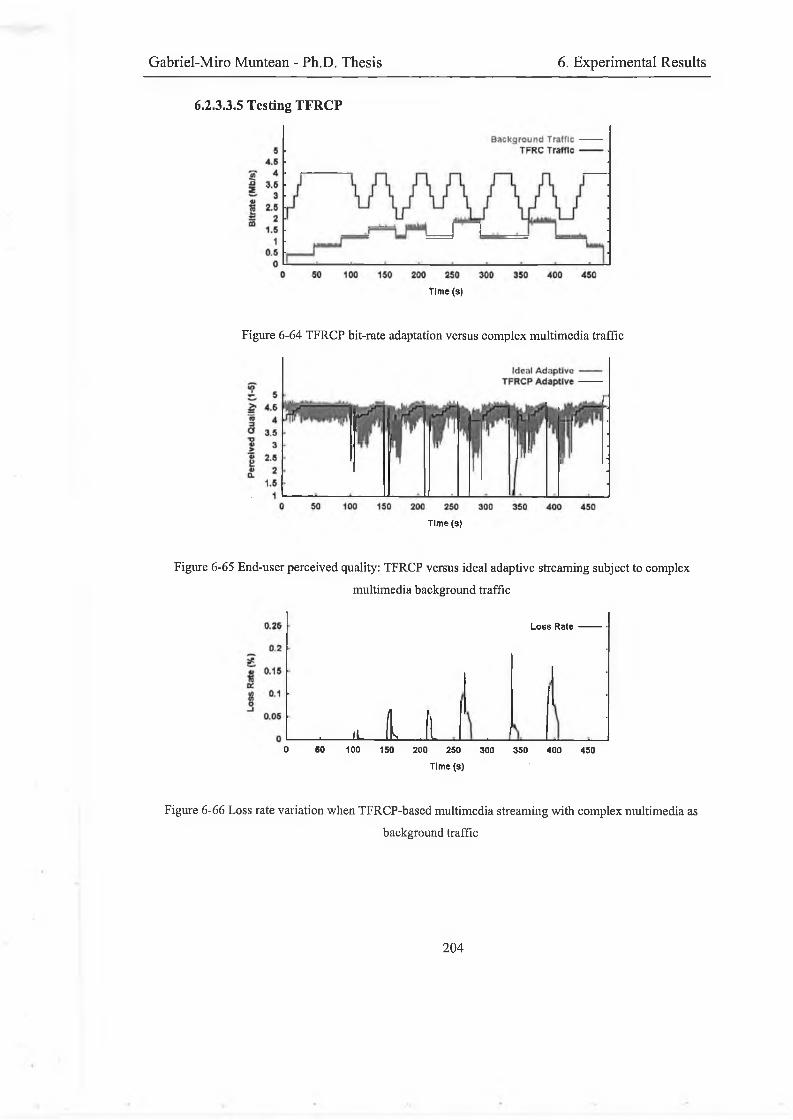
Gabriel-Miro Muntean - Ph.D. Thesis 6. Experimental Results
6.2.3.3.5 Testing TFRCP
Time (s)
Figure 6-64 TFRCP bit-rate adaptation versus complex multimedia traffic
Time (s)
Figure 6-65 End-user perceived quality: TFRCP versus ideal adaptive streaming subject to complex
multimedia background traffic
Loss R a te -----------
■
, ,L 1 .It .0 50 100 150 200 250 300 350 400 450
Time (s)
Figure 6-66 Loss rate variation when TFRCP-based multimedia streaming with complex multimedia as
background traffic
204
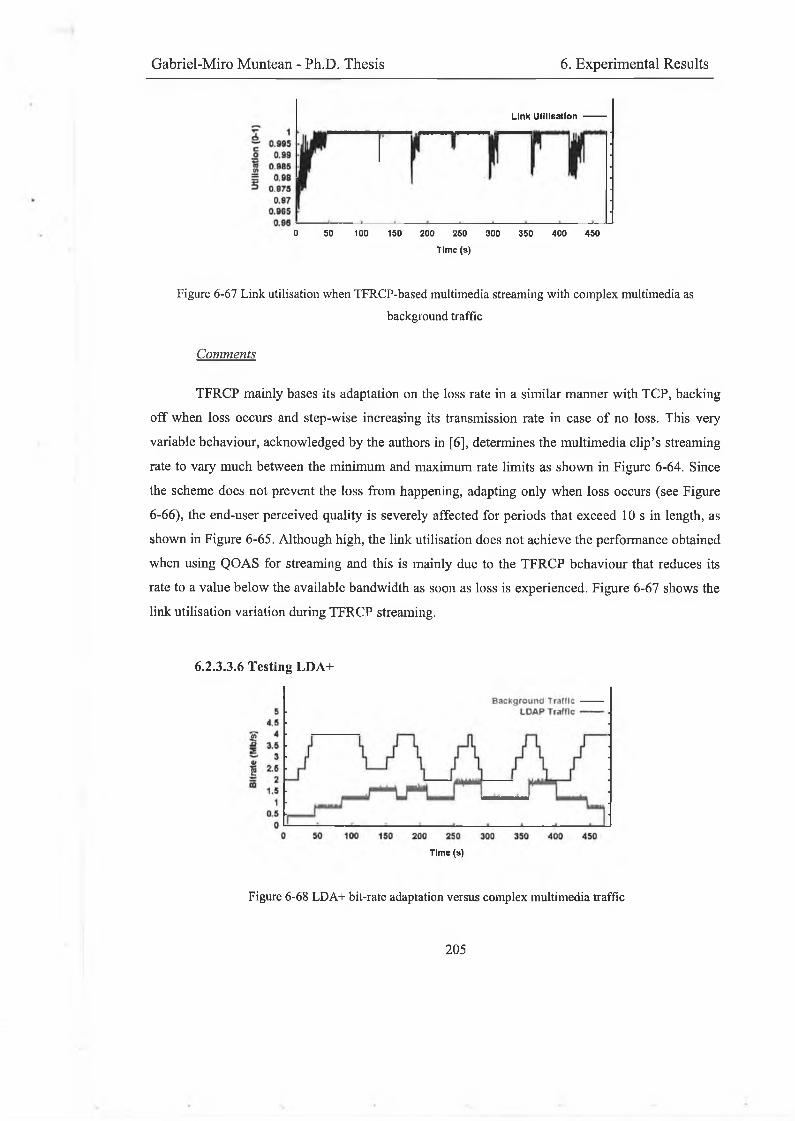
Gabriel-Miro Muntean - Ph.D. Thesis 6. Experimental Results
Link Utilisation ---------
0 50 100 150 200 250 300 350 400 450
Time (s)
Figure 6-67 Link utilisation when TFRCP-based multimedia streaming with complex multimedia as
background traffic
Comments
TFRCP mainly bases its adaptation on the loss rate in a similar manner with TCP, backing off when loss occurs and step-wise increasing its transmission rate in case of no loss. This very variable behaviour, acknowledged by the authors in [6], determines the multimedia clip’s streaming rate to vary much between the minimum and maximum rate limits as shown in Figure 6-64. Since the scheme does not prevent the loss from happening, adapting only when loss occurs (see Figure 6-66), the end-user perceived quality is severely affected for periods that exceed 10 s in length, as shown in Figure 6-65. Although high, the link utilisation does not achieve the performance obtained when using QOAS for streaming and this is mainly due to the TFRCP behaviour that reduces its rate to a value below the available bandwidth as soon as loss is experienced. Figure 6-67 shows the link utilisation variation during TFRCP streaming.
6.2.3.3.6 Testing LDA+
Tlme (s)
Figure 6-68 LDA+ bit-rate adaptation versus complex multimedia traffic
205
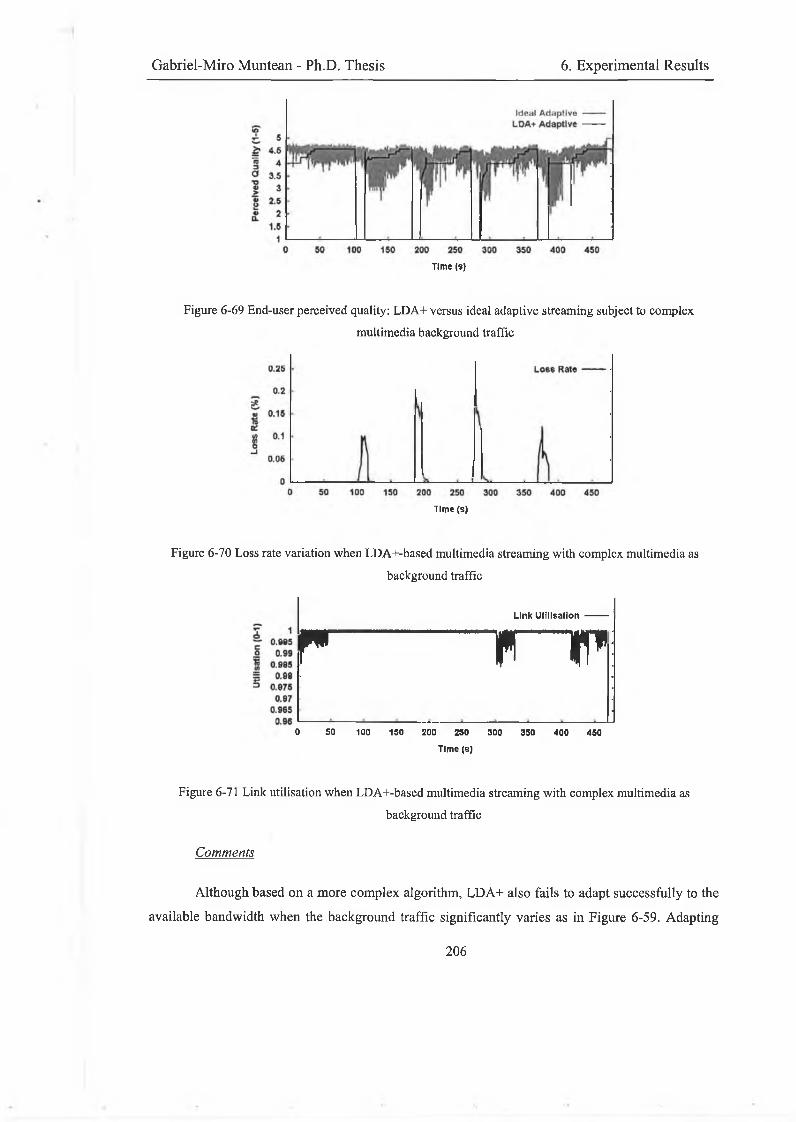
Gabriel-Miro Muntean - Ph.D. Thesis 6. Experimental Results
Time (s)
Figure 6-69 End-user perceived quality: LDA+ versus ideal adaptive streaming subject to complex
multimedia background traffic
Time (s)
Figure 6-70 Loss rate variation when LDA+-based multimedia streaming with complex multimedia as
background traffic
Link U tilisa tio n ---------
H n m v0 50 100 150 200 250 300 350 400 450
Time (s)
Figure 6-71 Link utilisation when LDA+-based multimedia streaming with complex multimedia as
background traffic
Comments
Although based on a more complex algorithm, LDA+ also fails to adapt successfully to the available bandwidth when the background traffic significantly varies as in Figure 6-59. Adapting
206
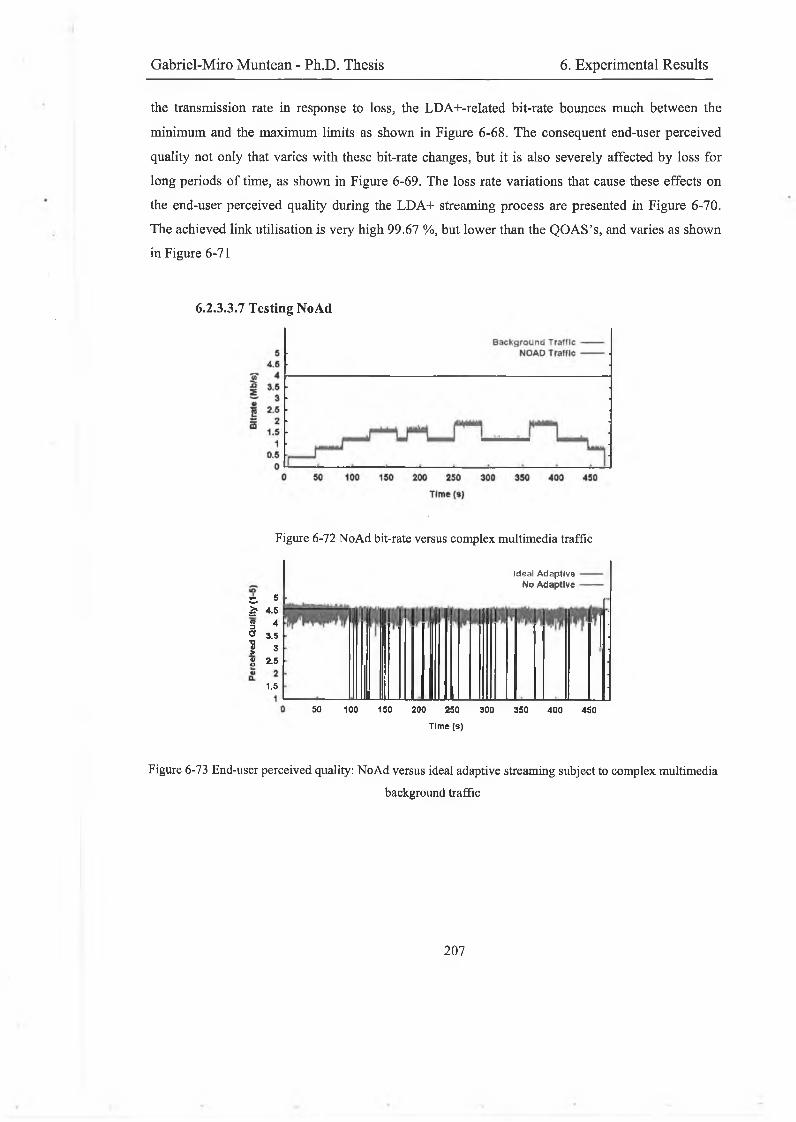
Gabriel-Miro Muntean - Ph.D. Thesis 6. Experimental Results
the transmission rate in response to loss, the LDA+-related bit-rate bounces much between the minimum and the maximum limits as shown in Figure 6-68. The consequent end-user perceived quality not only that varies with these bit-rate changes, but it is also severely affected by loss for long periods of time, as shown in Figure 6-69. The loss rate variations that cause these effects on the end-user perceived quality during the LDA+ streaming process are presented in Figure 6-70. The achieved link utilisation is very high 99.67 %, but lower than the QOAS’s, and varies as shown in Figure 6-71
6.2.3.3.7 Testing NoAd
Figure 6-72 NoAd bit-rate versus complex multimedia traffic
c. 5è 1 4.5 3 4° 3.5I 3 S 2-5
1.5
Ideal A d aptive No Adaptive
50 100 150 200 250 300 350 400 450
Time (s)
Figure 6-73 End-user perceived quality: NoAd versus ideal adaptive streaming subject to complex multimedia
background traffic
207
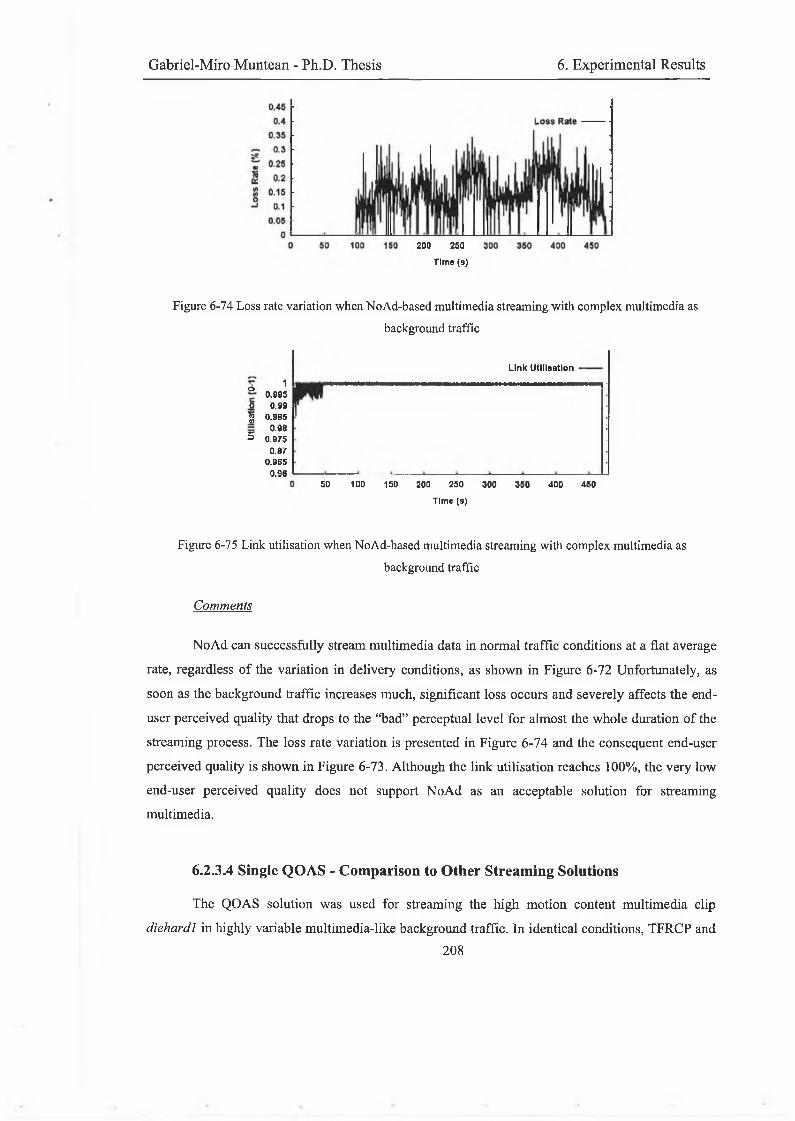
Gabriel-Miro Muntean - Ph.D. Thesis 6. Experimental Results
200 250
Time (s)
Figure 6-74 Loss rate variation when NoAd-based multimedia streaming with complex multimedia as
background traffic
£ 10.995
0 0.99«</> 0.995
0.985 0.975
0.970.965
0.3650
Link Utilisation
100 150 200 250
Time (s)
300 350 400 450
Figure 6-75 Link utilisation when NoAd-based multimedia streaming with complex multimedia as
background traffic
Comments
NoAd can successfully stream multimedia data in normal traffic conditions at a flat average rate, regardless of the variation in delivery conditions, as shown in Figure 6-72 Unfortunately, as soon as the background traffic increases much, significant loss occurs and severely affects the end- user perceived quality that drops to the “bad” perceptual level for almost the whole duration of the streaming process. The loss rate variation is presented in Figure 6-74 and the consequent end-user perceived quality is shown in Figure 6-73. Although the link utilisation reaches 100%, the very low end-user perceived quality does not support NoAd as an acceptable solution for streaming multimedia.
6.2.3.4 Single QOAS - Comparison to Other Streaming Solutions
The QOAS solution was used for streaming the high motion content multimedia clip diehardl in highly variable multimedia-like background traffic. In identical conditions, TFRCP and
208
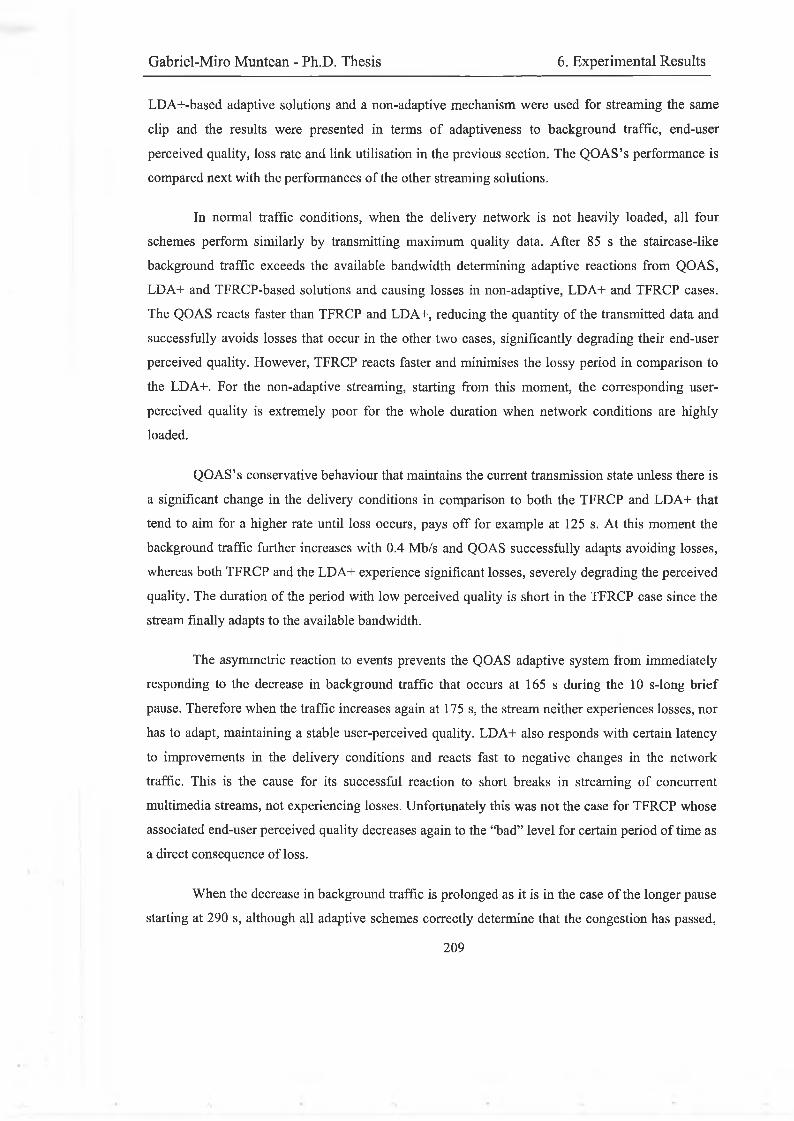
Gabriel-Miro Muntean - Ph.D. Thesis 6. Experimental Results
LDA+-based adaptive solutions and a non-adaptive mechanism were used for streaming the same clip and the results were presented in terms of adaptiveness to background traffic, end-user perceived quality, loss rate and link utilisation in the previous section. The QOAS’s performance is compared next with the performances of the other streaming solutions.
In normal traffic conditions, when the delivery network is not heavily loaded, all four schemes perform similarly by transmitting maximum quality data. After 85 s the staircase-like background traffic exceeds the available bandwidth determining adaptive reactions from QOAS, LDA+ and TFRCP-based solutions and causing losses in non-adaptive, LDA+ and TFRCP cases. The QOAS reacts faster than TFRCP and LDA+, reducing the quantity of the transmitted data and successfully avoids losses that occur in the other two cases, significantly degrading their end-user perceived quality. However, TFRCP reacts faster and minimises the lossy period in comparison to the LDA+. For the non-adaptive streaming, starting from this moment, the corresponding user- perceived quality is extremely poor for the whole duration when network conditions are highly loaded.
QOAS’s conservative behaviour that maintains the current transmission state unless there is a significant change in the delivery conditions in comparison to both the TFRCP and LDA+ that tend to aim for a higher rate until loss occurs, pays off for example at 125 s. At this moment the background traffic further increases with 0.4 Mb/s and QOAS successfully adapts avoiding losses, whereas both TFRCP and the LDA+ experience significant losses, severely degrading the perceived quality. The duration of the period with low perceived quality is short in the TFRCP case since the stream finally adapts to the available bandwidth.
The asymmetric reaction to events prevents the QOAS adaptive system from immediately responding to the decrease in background traffic that occurs at 165 s during the 10 s-long brief pause. Therefore when the traffic increases again at 175 s, the stream neither experiences losses, nor has to adapt, maintaining a stable user-perceived quality. LDA+ also responds with certain latency to improvements in the delivery conditions and reacts fast to negative changes in the network traffic. This is the cause for its successful reaction to short breaks in streaming of concurrent multimedia streams, not experiencing losses. Unfortunately this was not the case for TFRCP whose associated end-user perceived quality decreases again to the “bad” level for certain period of time as a direct consequence of loss.
When the decrease in background traffic is prolonged as it is in the case of the longer pause starting at 290 s, although all adaptive schemes correctly determine that the congestion has passed,
2 0 9
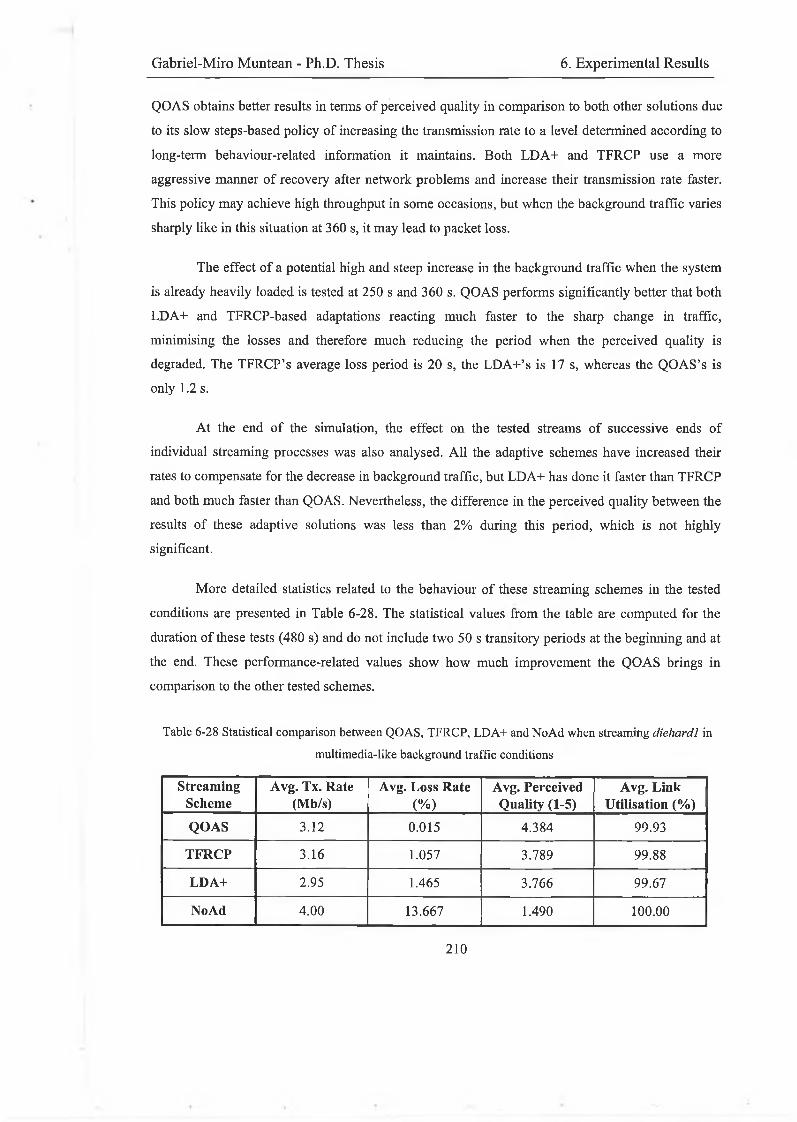
Gabriel-Miro Muntean - Ph.D. Thesis 6. Experimental Results
QOAS obtains better results in terms of perceived quality in comparison to both other solutions due to its slow steps-based policy of increasing the transmission rate to a level determined according to long-term behaviour-related information it maintains. Both LDA+ and TFRCP use a more aggressive manner of recovery after network problems and increase their transmission rate faster. This policy may achieve high throughput in some occasions, but when the background traffic varies sharply like in this situation at 360 s, it may lead to packet loss.
The effect of a potential high and steep increase in the background traffic when the system is already heavily loaded is tested at 250 s and 360 s. QOAS performs significantly better that both LDA+ and TFRCP-based adaptations reacting much faster to the sharp change in traffic, minimising the losses and therefore much reducing the period when the perceived quality is degraded. The TFRCP’s average loss period is 20 s, the LDA+’s is 17 s, whereas the QOAS’s is only 1.2 s.
At the end of the simulation, the effect on the tested streams of successive ends of individual streaming processes was also analysed. All the adaptive schemes have increased their rates to compensate for the decrease in background traffic, but LDA+ has done it faster than TFRCP and both much faster than QOAS. Nevertheless, the difference in the perceived quality between the results of these adaptive solutions was less than 2% during this period, which is not highly significant.
More detailed statistics related to the behaviour of these streaming schemes in the tested conditions are presented in Table 6-28. The statistical values from the table are computed for the duration of these tests (480 s) and do not include two 50 s transitory periods at the beginning and at the end. These performance-related values show how much improvement the QOAS brings in comparison to the other tested schemes.
Table 6-28 Statistical comparison between QOAS, TFRCP, LDA+ andNoAd when streaming diehardl in
multimedia-like background traffic conditions
StreamingScheme
Avg. Tx. Rate (Mb/s)
Avg. Loss Rate (%)
Avg. Perceived Quality (1-5)
Avg. Link Utilisation (%)
QOAS 3.12 0.015 4.384 99.93
TFRCP 3.16 1.057 3.789 99.88
LDA+ 2.95 1.465 3.766 99.67
NoAd 4.00 13.667 1.490 100.00
2 1 0
Gabriel-Miro Muntean - Ph.D. Thesis 6. Experimental Results
6.2.3.5 Multiple QOAS-based Streaming in Highly Loaded Conditions
6.2.3.5.1 Overview
The set of tests reported in this section focuses on assessing the performance of the delivery of multiple multimedia streams using QOAS. The number of these streams is incrementally increased so that increased traffic delivery conditions are determined. The “Dumbbell” topology, already presented in section 6.2.1.2, is used for testing. Since the QOAS is designed for local broadband multi-service IP networks in which the majority of traffic is expected to be multimedia- based, this section analyses in detail the benefits brought by using QOAS for streaming a high number of concurrent multimedia clips of different types. These benefits are related at all times to other streaming solutions’ such as LDA+, TFRCP andNoAd.
The tests presented in this section use the QOAS model that was presented in section6.2.1.3 and LDA+, TFRCP and NoAd models, described in section 6.2.3.3.2. The multimedia clips used during testing are: diehardl with high motion content, jurassic3 and dontsayaword with average motion content and familyman with low degree of action, as well as the roadtoeldorado, a cartoons movie. The clips were encoded at five different rates between 2 Mb/s and 4 Mb/s and traces were collected, associated to corresponding quality states and used during simulation. Statistics about these sequences and more information about the collected traces are presented in section 6.2.1.4. As mentioned in section 6.2.1.5 these streaming solutions’ related performances are assessed in terms of resulted end-user perceived quality, loss rate and link utilisation. The estimated end-user perceived quality is computed using the no-reference moving pictures quality metric (Q) presented in section 2.4.3.2.10 and described in detail in section 4.4 and expressed using the ITU-T R P.910 five-point scale for grading subjective perceptual quality [63],
6.2.3.5.2 QOAS, TFRCP, LDA+ and NoAd Testing
The simulations involve a number of clients that randomly select both the movie clip and the starting sequence from within the chosen clip. They do not take into account other factors such as for example the popularity of the movies. The length of the simulations was 250 s, but when statistics were gathered the first and last transitory 50 s were not taken into account.
The QOAS, TFRCP, LDA+ and NoAd approaches were used in turn as the video streaming method, and the number of clients was gradually increased above a base line of 23 in each case. This number of clients was chosen because it allowed for lossless streaming and maximum end-user perceived quality in each of the four cases. Figure 6-76 shows the loss rate as a function of the
211

Gabriel-Miro Muntean - Ph.D. Thesis 6. Experimental Results
increase in the number of simultaneously served clients, Figure 6-77 presents the end-user quality as a function of the increase in the number of simultaneously served clients, and Figure 6-78 plots the bottleneck link utilisation values when the number of clients similarly increases.
Increase in Number of Simultaneous Viewers (%)
Figure 6-76 Loss rate vs. increase in the number o f served clients above a base line of 23
Increase in Number of Simultaneous Viewers (%)
Figure 6-77 End-user average quality versus increase in the number of clients simultaneously served above a
base line o f 23
The results presented in Figure 6-76 show that in the NoAd case, an increase of only 4% in the number of clients caused a loss rate of just below 1%. When the number of clients was increased by more than 15%, the loss exceeded 10%, severely affecting the perceived quality, which drops quickly to the minimum level 1 (“bad”) on the ITU-T R. P.910 five-point scale.
Under identical conditions, when QOAS was used, an increase of up to 40% in the number of clients (32 viewers) had very little effect on the loss rate, which remained below 0.5%. Figure 6-77 shows how for QOAS the resulting end-user quality remained above the “good” level of 4. Increases of up to 70% in the number of clients (39 viewers) resulted in loss rates of around 1%, which did not significantly affect the stream quality, which remained above the “fair” level of 3. Further increases in the number of clients caused both an increase in the loss rate and a fall in the
212
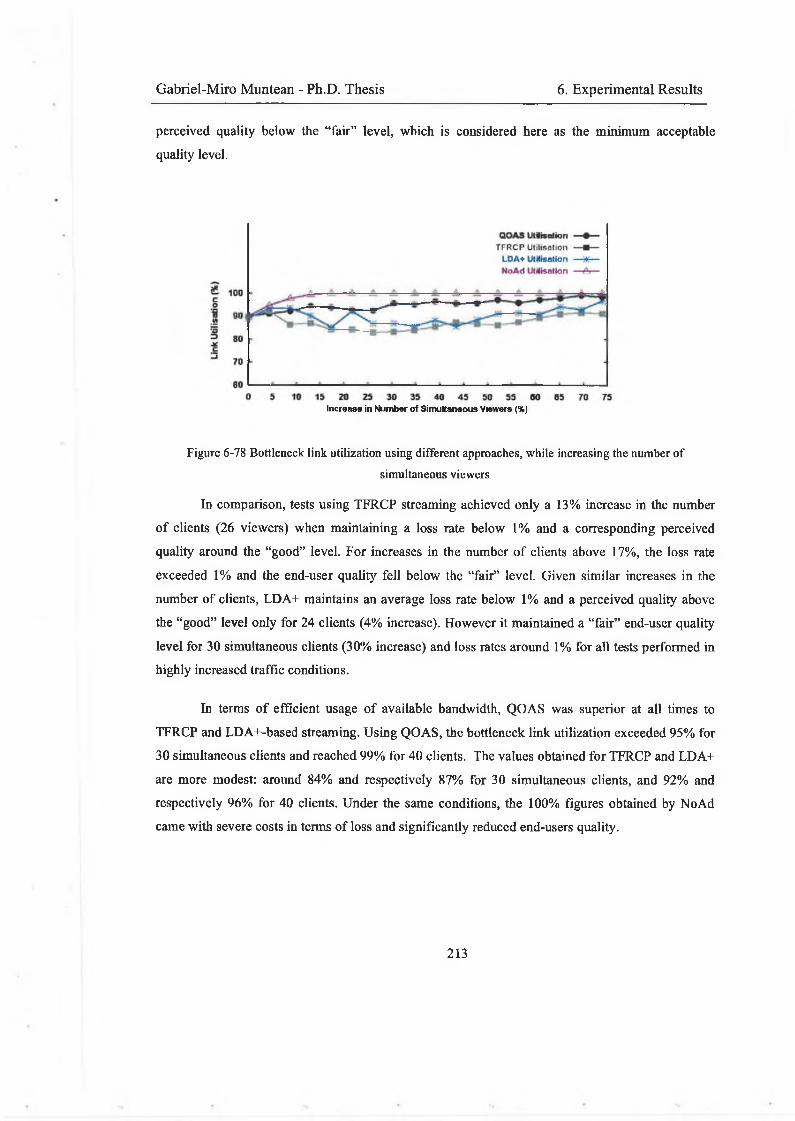
Gabriel-Miro Muntean - Ph.D. Thesis 6. Experimental Results
perceived quality below the “fair” level, which is considered here as the minimum acceptable quality level.
Increase in Number of Simultaneous Viewers (%)
Figure 6-78 Bottleneck link utilization using different approaches, while increasing the number of
simultaneous viewers
In comparison, tests using TFRCP streaming achieved only a 13% increase in the number of clients (26 viewers) when maintaining a loss rate below 1% and a corresponding perceived quality around the “good” level. For increases in the number of clients above 17%, the loss rate exceeded 1% and the end-user quality fell below the “fair” level. Given similar increases in the number of clients, LDA+ maintains an average loss rate below 1% and a perceived quality above the “good” level only for 24 clients (4% increase). However it maintained a “fair” end-user quality level for 30 simultaneous clients (30% increase) and loss rates around 1% for all tests performed in highly increased traffic conditions.
In terms of efficient usage of available bandwidth, QOAS was superior at all times to TFRCP and LDA+-based streaming. Using QOAS, the bottleneck link utilization exceeded 95% for 30 simultaneous clients and reached 99% for 40 clients. The values obtained for TFRCP and LDA+ are more modest: around 84% and respectively 87% for 30 simultaneous clients, and 92% and respectively 96% for 40 clients. Under the same conditions, the 100% figures obtained by NoAd came with severe costs in terms of loss and significantly reduced end-users quality.
213
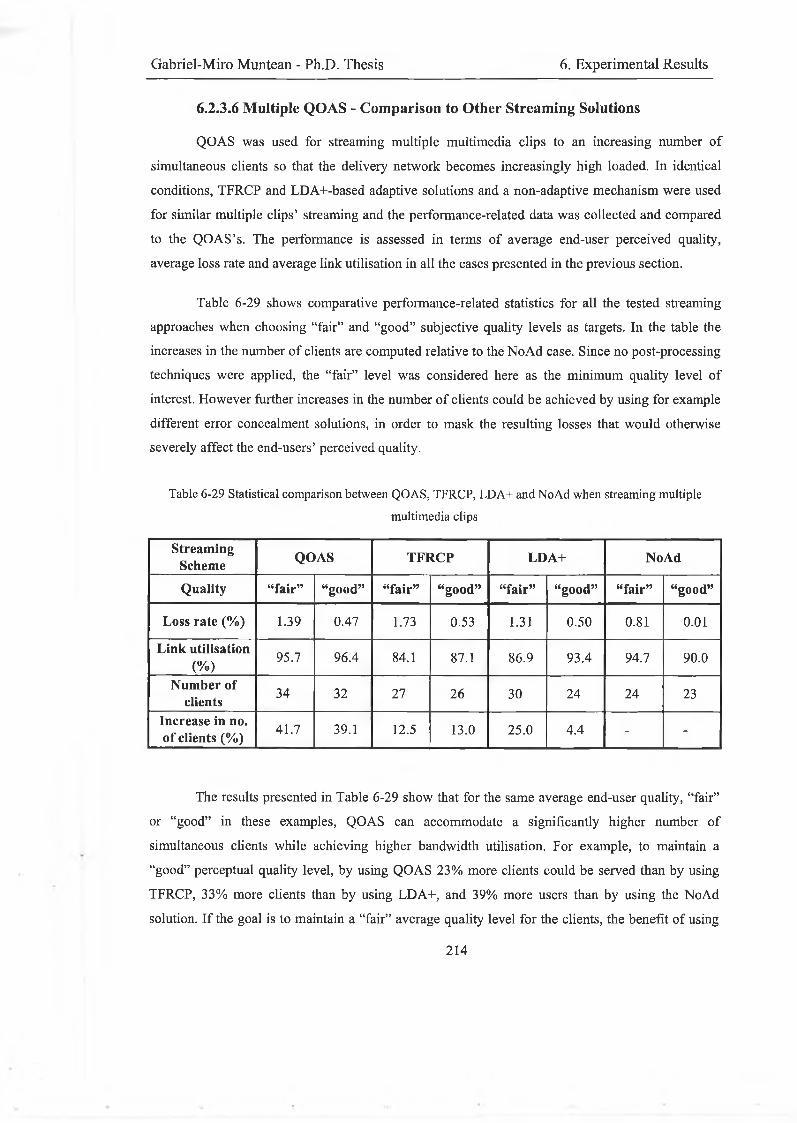
Gabriel-Miro Muntcan - Ph.D. Thesis 6. Experimental Results
6.2.3.6 Multiple QOAS - Comparison to Other Streaming Solutions
QOAS was used for streaming multiple multimedia clips to an increasing number of simultaneous clients so that the delivery network becomes increasingly high loaded. In identical conditions, TFRCP and LDA+-based adaptive solutions and a non-adaptive mechanism were used for similar multiple clips’ streaming and the performance-related data was collected and compared to the QOAS’s. The performance is assessed in terms of average end-user perceived quality, average loss rate and average link utilisation in all the cases presented in the previous section.
Table 6-29 shows comparative performance-related statistics for all the tested streaming approaches when choosing “fair” and “good” subjective quality levels as targets. In the table the increases in the number of clients are computed relative to the NoAd case. Since no post-processing techniques were applied, the “fair” level was considered here as the minimum quality level of interest. However further increases in the number of clients could be achieved by using for example different error concealment solutions, in order to mask the resulting losses that would otherwise severely affect the end-users’ perceived quality.
Table 6-29 Statistical comparison between QOAS, TFRCP, LDA+ and NoAd when streaming multiple
multimedia clips
StreamingScheme QOAS TFRCP LDA+ NoAd
Quality “fair” “good” “fair” “good” “fair” “good” “fair” “good”
Loss rate (%) 1.39 0.47 1.73 0.53 1.31 0.50 0.81 0.01
Link utilisation(%)
95.7 96.4 84.1 87.1 86.9 93.4 94.7 90.0
Number of clients
34 32 27 26 30 24 24 23
Increase in no. of clients (%) 41.7 39.1 12.5 13.0 25.0 4.4 - -
The results presented in Table 6-29 show that for the same average end-user quality, “fair” or “good” in these examples, QOAS can accommodate a significantly higher number of simultaneous clients while achieving higher bandwidth utilisation. For example, to maintain a “good” perceptual quality level, by using QOAS 23% more clients could be served than by using TFRCP, 33% more clients than by using LDA+, and 39% more users than by using the NoAd solution. If the goal is to maintain a “fair” average quality level for the clients, the benefit of using
214
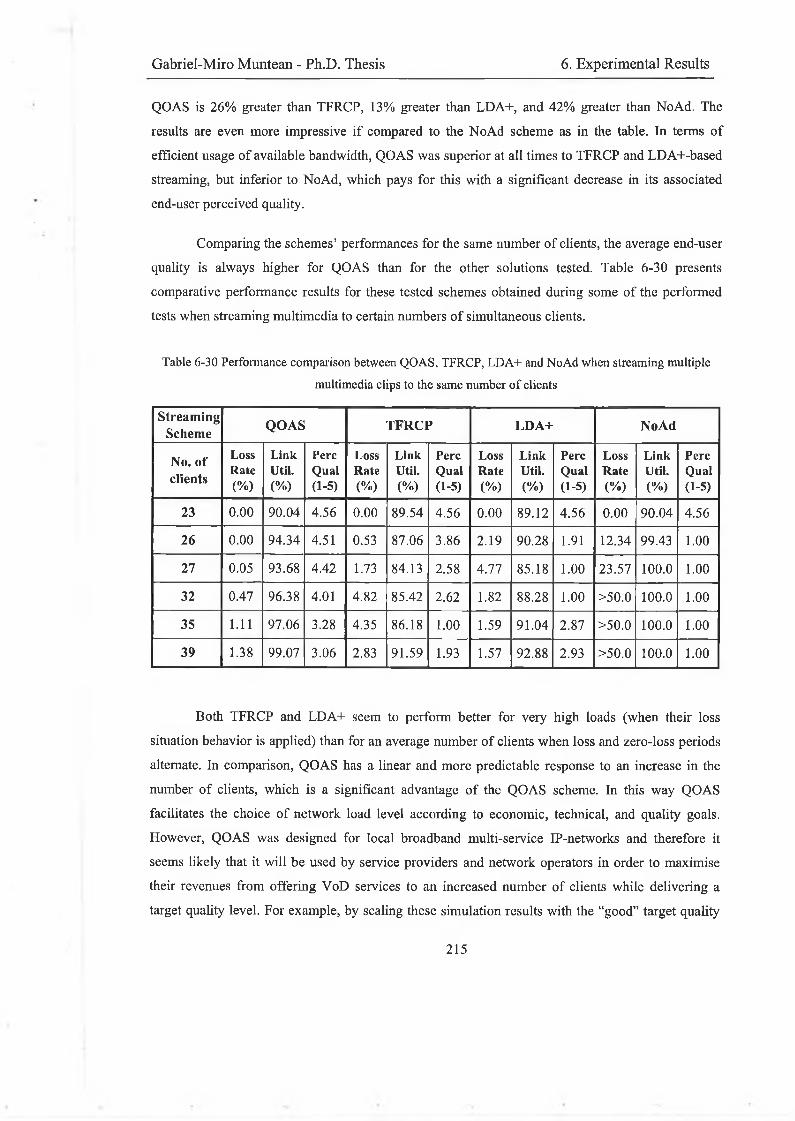
Gabriel-Miro Muntean - Ph.D. Thesis 6. Experimental Results
QOAS is 26% greater than TFRCP, 13% greater than LDA+, and 42% greater than NoAd. The results are even more impressive if compared to the NoAd scheme as in the table. In terms of efficient usage of available bandwidth, QOAS was superior at all times to TFRCP and LDA+-based streaming, but inferior to NoAd, which pays for this with a significant decrease in its associated end-user perceived quality.
Comparing the schemes’ performances for the same number of clients, the average end-user quality is always higher for QOAS than for the other solutions tested. Table 6-30 presents comparative performance results for these tested schemes obtained during some of the performed tests when streaming multimedia to certain numbers of simultaneous clients.
Table 6-30 Performance comparison between QOAS, TFRCP, LDA+ and NoAd when streaming multiple
multimedia clips to the same number o f clients
StreamingScheme QOAS TFRCP LDA+ NoAd
No. of clients
LossRate(%)
LinkUtil.(%)
PereQual(1-5)
LossRate(%)
LinkUtil.(%)
PereQual(1-5)
LossRate(%)
LinkUtil.(%)
PereQual(1-5)
LossRate(%)
LinkUtil.(%)
PereQual(1-5)
23 0.00 90.04 4.56 0.00 89.54 4.56 0.00 89.12 4.56 0.00 90.04 4.56
26 0.00 94.34 4.51 0.53 87.06 3.86 2.19 90.28 1.91 12.34 99.43 1.00
27 0.05 93.68 4.42 1.73 84.13 2.58 4.77 85.18 1.00 23.57 100.0 1.00
32 0.47 96.38 4.01 4.82 85.42 2.62 1.82 88.28 1.00 >50.0 100.0 1.00
35 1.11 97.06 3.28 4.35 86.18 1.00 1.59 91.04 2.87 >50.0 100.0 1.00
39 1.38 99.07 3.06 2.83 91.59 1.93 1.57 92.88 2.93 >50.0 100.0 1.00
Both TFRCP and LDA+ seem to perform better for very high loads (when their loss situation behavior is applied) than for an average number of clients when loss and zero-loss periods alternate. In comparison, QOAS has a linear and more predictable response to an increase in the number of clients, which is a significant advantage of the QOAS scheme. In this way QOAS facilitates the choice of network load level according to economic, technical, and quality goals. However, QOAS was designed for local broadband multi-service IP-networks and therefore it seems likely that it will be used by service providers and network operators in order to maximise their revenues from offering VoD services to an increased number of clients while delivering a target quality level. For example, by scaling these simulation results with the “good” target quality
215
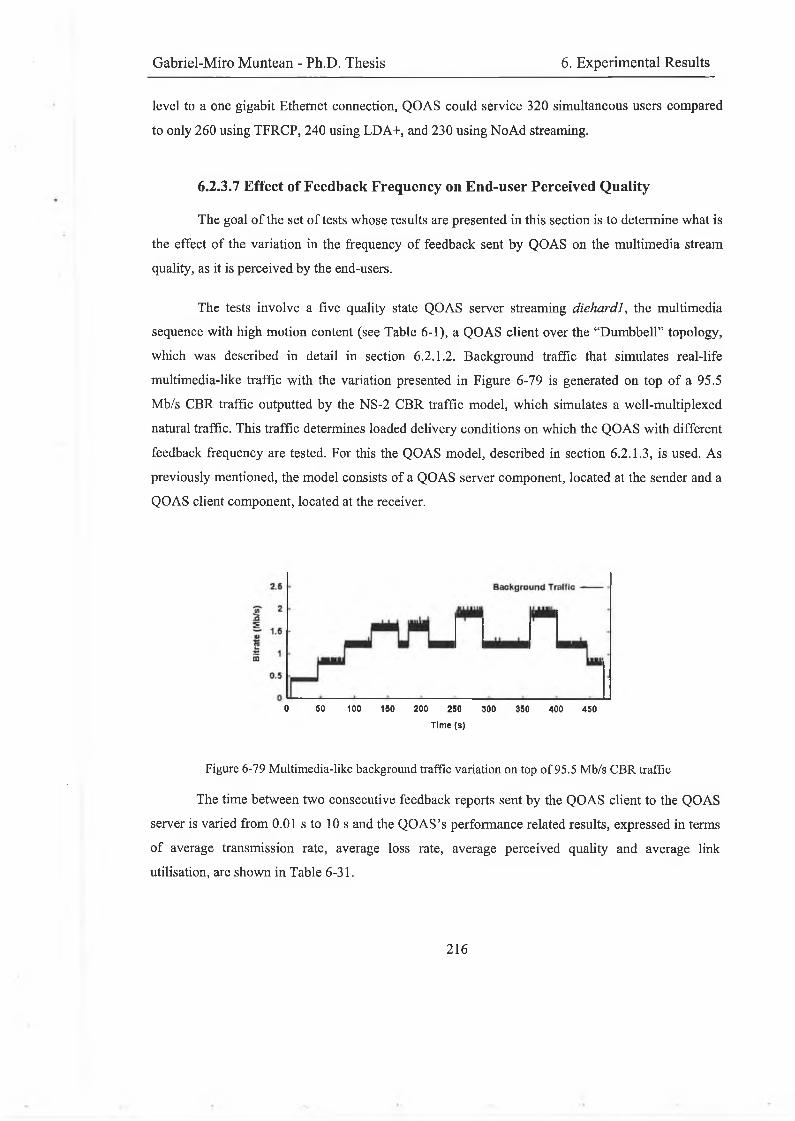
Gabriel-Miro Muntean - Ph.D. Thesis 6. Experimental Results
level to a one gigabit Ethernet connection, QOAS could service 320 simultaneous users compared to only 260 using TFRCP, 240 using LDA+, and 230 using NoAd streaming.
6.2.3.7 Effect of Feedback Frequency on End-user Perceived Quality
The goal of the set of tests whose results are presented in this section is to determine what is the effect of the variation in the frequency of feedback sent by QOAS on the multimedia stream quality, as it is perceived by the end-users.
The tests involve a five quality state QOAS server streaming diehard 1, the multimedia sequence with high motion content (see Table 6-1), a QOAS client over the “Dumbbell” topology, which was described in detail in section 6.2.1.2. Background traffic that simulates real-life multimedia-like traffic with the variation presented in Figure 6-79 is generated on top of a 95.5 Mb/s CBR traffic outputted by the NS-2 CBR traffic model, which simulates a well-multiplexed natural traffic. This traffic determines loaded delivery conditions on which the QOAS with different feedback frequency are tested. For this the QOAS model, described in section 6.2.1.3, is used. As previously mentioned, the model consists of a QOAS server component, located at the sender and a QOAS client component, located at the receiver.
0 SO 100 150 200 250 300 350 400 450
Time (s)
Figure 6-79 Multimedia-like background traffic variation on top o f 95.5 Mb/s CBR traffic
The time between two consecutive feedback reports sent by the QOAS client to the QOAS server is varied from 0.01 s to 10 s and the QOAS’s performance related results, expressed in terms of average transmission rate, average loss rate, average perceived quality and average link utilisation, are shown in Table 6-31.
216
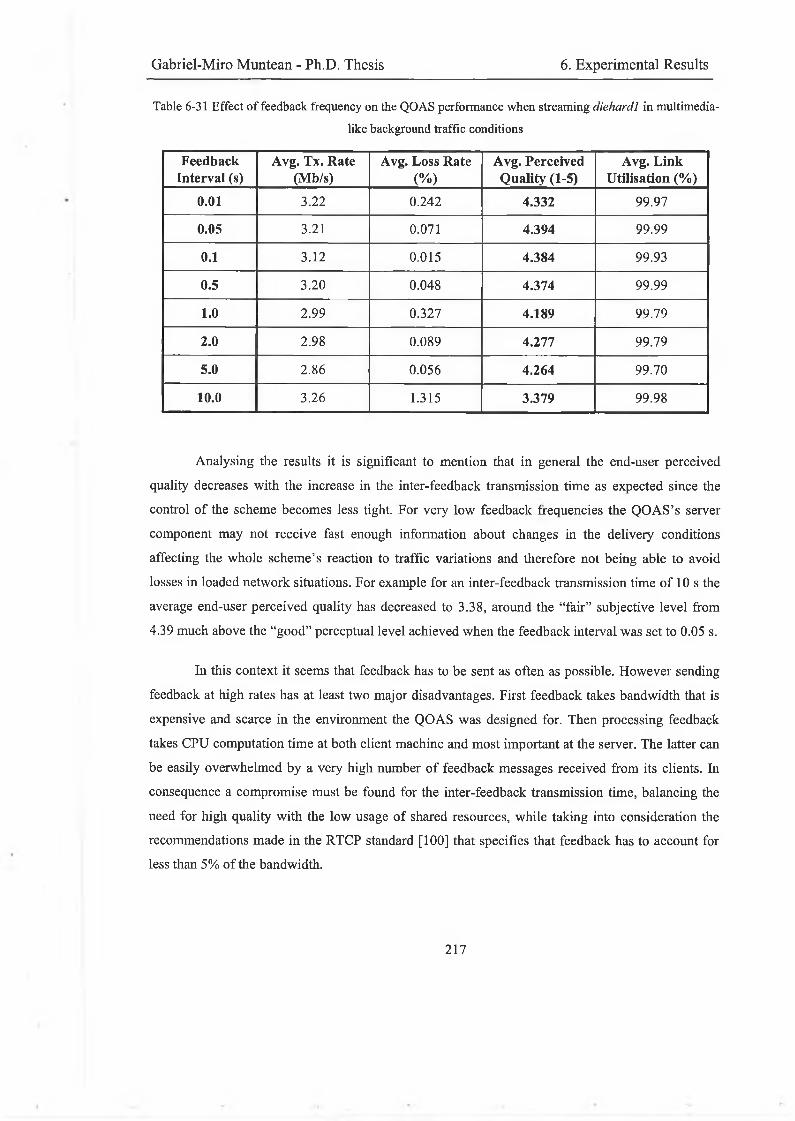
Gabriel-Miro Muntean - Ph.D. Thesis 6. Experimental Results
Table 6-31 Effect of feedback frequency on the QOAS performance when streaming diehard 1 in multimedialike background traffic conditions
Feedback Interval (s)
Avg. Tx. Rate (Mb/s)
Avg. Loss Rate (%)
Avg. Perceived Quality (1-5)
Avg. Link Utilisation (%)
0.01 3.22 0.242 4.332 99.97
0.05 3.21 0.071 4.394 99.99
0.1 3.12 0.015 4.384 99.93
0.5 3.20 0.048 4.374 99.99
1.0 2.99 0.327 4.189 99.79
2.0 2.98 0.089 4.277 99.79
5.0 2.86 0.056 4.264 99.70
10.0 3.26 1.315 3.379 99.98
Analysing the results it is significant to mention that in general the end-user perceived quality decreases with the increase in the inter-feedback transmission time as expected since the control of the scheme becomes less tight. For very low feedback frequencies the QOAS’s server component may not receive fast enough information about changes in the delivery conditions affecting the whole scheme’s reaction to traffic variations and therefore not being able to avoid losses in loaded network situations. For example for an inter-feedback transmission time of 10 s the average end-user perceived quality has decreased to 3.38, around the “fair” subjective level from 4.39 much above the “good” perceptual level achieved when the feedback interval was set to 0.05 s.
In this context it seems that feedback has to be sent as often as possible. However sending feedback at high rates has at least two major disadvantages. First feedback takes bandwidth that is expensive and scarce in the environment the QOAS was designed for. Then processing feedback takes CPU computation time at both client machine and most important at the server. The latter can be easily overwhelmed by a very high number of feedback messages received from its clients. In consequence a compromise must be found for the inter-feedback transmission time, balancing the need for high quality with the low usage of shared resources, while taking into consideration the recommendations made in the RTCP standard [100] that specifies that feedback has to account for less than 5% of the bandwidth.
217

Gabriel-Miro Muntean - Ph.D. Thesis 6. Experimental Results
At the beginning the bandwidth used for the feedback transmission (BWfee(Jback) is computed for a single customer as in equation (6-15) and (6-16), where Timefcc<Jt,ack is the inter-feedback transmission time.
B W feedback ~ * Size feedback (6-15)Time feedback
Size feedback ~ ^ zeIPheader ^ zeUDPheader^~ ^ zeRTCPheader^~ zePayload (6-16)
For standard values for the headers’ sizes (i.e. 20 bytes — IP header, 8 bytes - UDP header and 8 bytes - RTCP QOAS receiver report packet header) and for the size of the payload of 4 bytes, the feedback packet size becomes 40 bytes. At a very low average inter-feedback transmission time of 0.01 s the bandwidth used by feedback for a single client becomes BWfeedback = 4,000 bytes/s. Taking into consideration that QOAS solution was designed for delivering multimedia in increased traffic over local broadband multi-service IP-networks, for a one gigabit Ethernet on which 320 customers are being served with “good” perceived quality as shown in section 6.2.3.6, the total bandwidth used by feedback sent with this frequency is: 320*4,000=1,280,000 bytes/s. This figure, in fact 9.77 Mb/s, is less than 1 % of the total available bandwidth and does not add too much to the existing traffic. Unfortunately the number of feedback messages ( N o feedback) that the QOAS server application must deal with in the presence of an increased number of customers ( N o customi;rs)
becomes veiy high as computed with the formula from equation (6-17) and reaches (1/0.01)*320=32,000 every second for 0.001 s feedback interval.
N o feedback ~ ~ customers (6-17)Time feedback
In order to lower the load from the server, decreasing at least ten times the feedback frequency is recommended. The expected benefit in reducing ten times the number of feedback messages that have to be processed by the QOAS server is followed by reducing ten times the used bandwidth that decreases to 0.1 % of the existing capacity. However, the end-user perceived quality is also reduced, but with not a significant value. Further decreases in the feedback transmission frequency may lead to more significant effects on the end-user perceived quality, which is decreasing to pay for further lowering the pressure on the QOAS server and the used bandwidth for feedback.
2 1 8
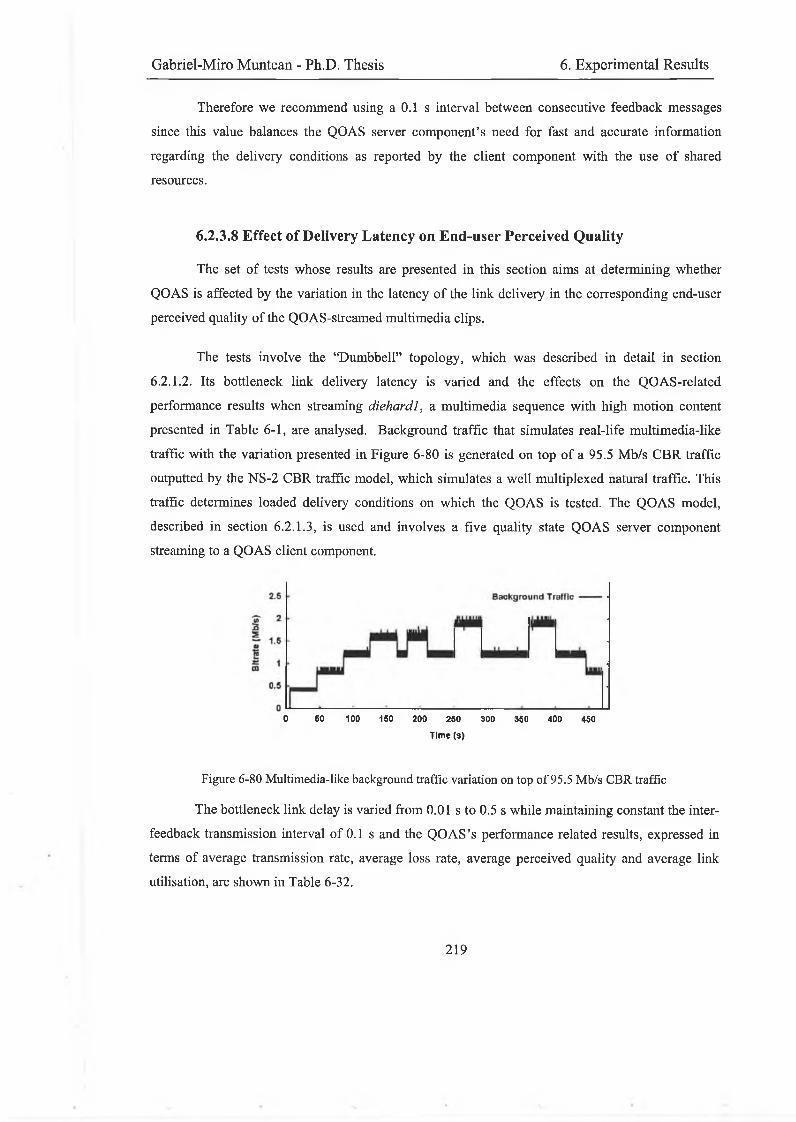
Gabriel-Miro Muntcan - Ph.D. Thesis 6. Experimental Results
Therefore we recommend using a 0.1 s interval between consecutive feedback messages since this value balances the QOAS server component’s need for fast and accurate information regarding the delivery conditions as reported by the client component with the use of shared resources.
6.2.3.8 Effect of Delivery Latency on End-user Perceived Quality
The set of tests whose results are presented in this section aims at determining whether QOAS is affected by the variation in the latency of the link delivery in the corresponding end-user perceived quality of the QOAS-streamed multimedia clips.
The tests involve the “Dumbbell” topology, which was described in detail in section 6.2.1.2. Its bottleneck link delivery latency is varied and the effects on the QOAS-related performance results when streaming diehard 1, a multimedia sequence with high motion content presented in Table 6-1, are analysed. Background traffic that simulates real-life multimedia-like traffic with the variation presented in Figure 6-80 is generated on top of a 95.5 Mb/s CBR traffic outputted by the NS-2 CBR traffic model, which simulates a well multiplexed natural traffic. This traffic determines loaded delivery conditions on which the QOAS is tested. The QOAS model, described in section 6.2.1.3, is used and involves a five quality state QOAS server component streaming to a QOAS client component.
0 50 100 150 200 250 300 350 400 450
Time (s)
Figure 6-80 Multimedia-like background traffic variation on top o f 95.5 Mb/s CBR traffic
The bottleneck link delay is varied from 0.01 s to 0.5 s while maintaining constant the interfeedback transmission interval of 0.1 s and the QOAS’s performance related results, expressed in terms of average transmission rate, average loss rate, average perceived quality and average link utilisation, are shown in Table 6-32.
2 1 9
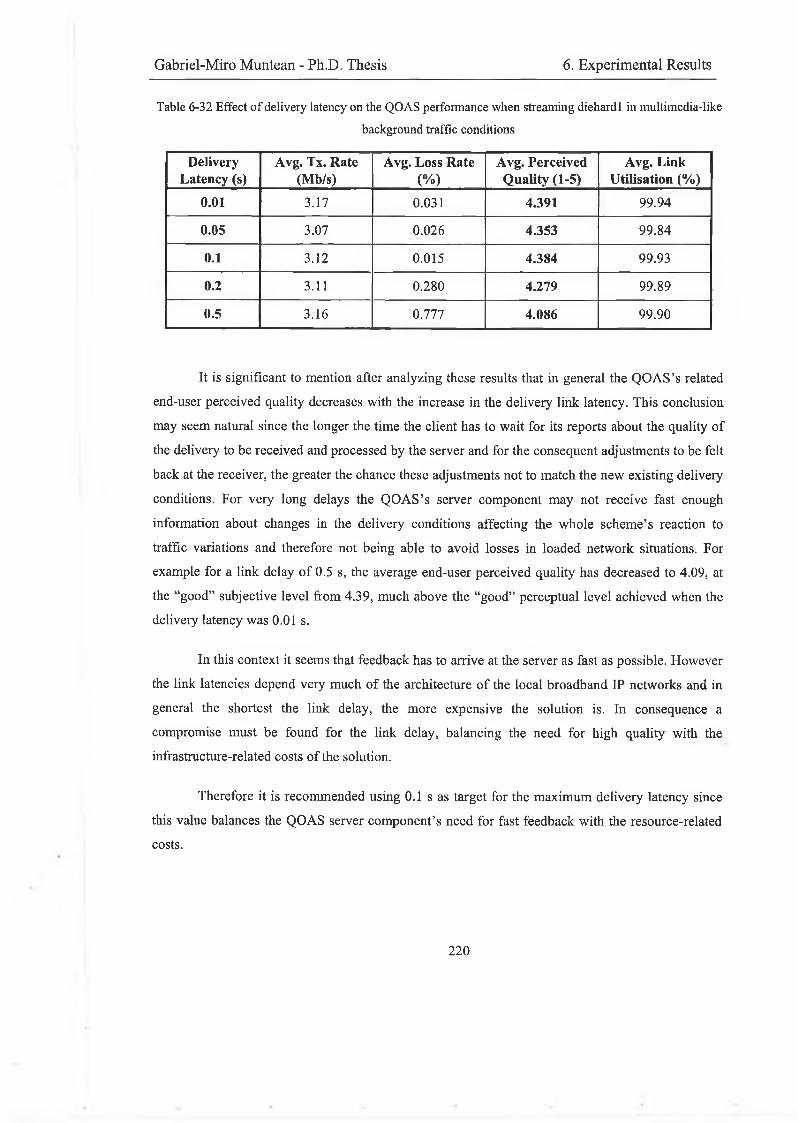
Gabriel-Miro Muntean - Ph.D. Thesis 6. Experimental Results
Table 6-32 Effect o f delivery latency on the QOAS performance when streaming diehardl in multimedia-like
background traffic conditions
Delivery Latency (s)
Avg. Tx. Rate(Mb/s)
Avg. Loss Rate(%)
Avg. Perceived Quality (1-5)
Avg. Link Utilisation (%)
0.01 3.17 0.031 4.391 99.94
0.05 3.07 0.026 4.353 99.84
0.1 3.12 0.015 4.384 99.93
0.2 3.11 0.280 4.279 99.89
0.5 3.16 0.777 4.086 99.90
It is significant to mention after analyzing these results that in general the QOAS’s related end-user perceived quality decreases with the increase in the delivery link latency. This conclusion may seem natural since the longer the time the client has to wait for its reports about the quality of the delivery to be received and processed by the server and for the consequent adjustments to be felt back at the receiver, the greater the chance these adjustments not to match the new existing delivery conditions. For very long delays the QOAS’s server component may not receive fast enough information about changes in the delivery conditions affecting the whole scheme’s reaction to traffic variations and therefore not being able to avoid losses in loaded network situations. For example for a link delay of 0.5 s, the average end-user perceived quality has decreased to 4.09, at the “good” subjective level from 4.39, much above the “good” perceptual level achieved when the delivery latency was 0.01 s.
In this context it seems that feedback has to arrive at the server as fast as possible. However the link latencies depend very much of the architecture of the local broadband IP networks and in general the shortest the link delay, the more expensive the solution is. In consequence a compromise must be found for the link delay, balancing the need for high quality with the infrastructure-related costs of the solution.
Therefore it is recommended using 0.1 s as target for the maximum delivery latency since this value balances the QOAS server component’s need for fast feedback with the resource-related costs.
220
Gabriel-Miro Muntean - Ph.D. Thesis 6. Experimental Results
6.2.4 Comments
Extensive objective simulation tests, based on NS-2 and both on its built-in and our specially built models, were performed in order to both tune the QOAS and test it. Tuning aimed at determining the design parameters for QOAS that lead to obtaining the best results in terms of estimated average end-user perceived quality of the QOAS-streamed multimedia clips over local broadband multi-service IP-networks. Once the values for these parameters were set, the goal of testing was to determine the QOAS’s performances in terms of end-user perceived quality, loss rate, link utilisation and the number of simultaneous viewers served from a finite infrastructure. In consequence these tests have involved single QOAS-based multimedia streaming in loaded delivery conditions and subject to different background traffic. This traffic has included traffic of different types, shapes and variation patterns commonly encountered in IP-networks as well as multimedialike background traffic. The results were both analysed as they are and compared to those obtained by an ideal adaptive scheme and by existing other streaming solutions such as TFRCP, LDA+ and non-adaptive. Multiple QOAS-based multimedia streaming processes were simulated next and the results were compared to those obtained when using other streaming solutions. The effects of feedback transmission interval and of delivery link delay were also analysed.
In all tested situations QOAS has achieved very good results related to performance, even compared to the ideal adaptive scheme from whose performances QOAS’s were very close. The results were significantly better than the ones obtained when using other streaming schemes in all tested conditions. Therefore these objective tests have shown that QOAS achieves link utilisations very close to 100 %, very low loss rates, a significant increase in the number of customers served from the same infrastructure and high estimated end-user perceived quality. However since there is not a generally accepted metric for measuring the latter, subjective tests are necessary to verify these objective results obtained using the no-reference moving picture quality metric (Q). The results of the subjective testing are presented in the following section.
6.3 Subjective Testing
6.3.1 Motivations
The objective testing results related to the performances of multimedia streaming when using QOAS were very significant, showing important benefits brought in terms of high end-user perceived quality, low loss rates, increased link utilisation and high number of simultaneous
221
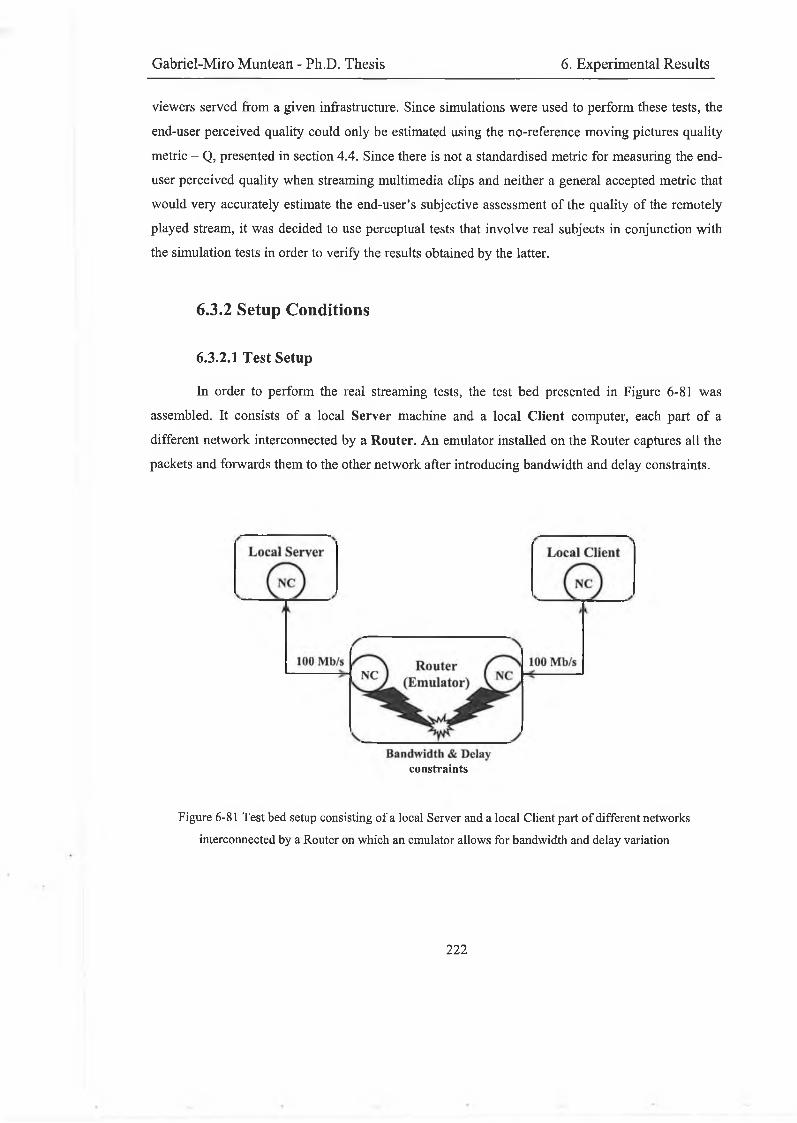
Gabriel-Miro Muntcan - Ph.D. Thesis 6. Experimental Results
viewers served from a given infrastructure. Since simulations were used to perform these tests, the end-user perceived quality could only be estimated using the no-reference moving pictures quality metric - Q, presented in section 4.4. Since there is not a standardised metric for measuring the end- user perceived quality when streaming multimedia clips and neither a general accepted metric that would very accurately estimate the end-user’s subjective assessment of the quality of the remotely played stream, it was decided to use perceptual tests that involve real subjects in conjunction with the simulation tests in order to verify the results obtained by the latter.
6.3.2 Setup Conditions
6.3.2.1 Test Setup
In order to perform the real streaming tests, the test bed presented in Figure 6-81 was assembled. It consists of a local Server machine and a local Client computer, each part of a different network interconnected by a Router. An emulator installed on the Router captures all the packets and forwards them to the other network after introducing bandwidth and delay constraints.
constraints
Figure 6-81 Test bed setup consisting o f a local Server and a local Client part o f different networks
interconnected by a Router on which an emulator allows for bandwidth and delay variation
222
Gabriel-Miro Muntean - Ph.D. Thesis 6. Experimental Results
The Server is an IBM Netfmity 6000 R computer with two 700 MHz processors and 1 GB RAM on which Microsoft Server 2000 Advanced Edition is installed. The Client is a Fujitsu- Siemens Scenic machine with one 800 MHz processor and 512 MB RAM, with Microsoft Windows 2000 Professional as the operating system, whereas the Router is another Fujitsu-Siemens Scenic computer with one 800 MHz processor and 512 MB RAM, on which Linux was installed in order to facilitate the deployment of the NistNet Emulator [254]. The network cards (NC) are 3Com EtherLink XL PCI Combo NIC 3C900B at 100 Mb/s and UTP connections are used. The client has a Desktop PC with a 19 inch monitor.
6.3.2.2 Applications’ Setup
QOAS server application, part of the QOAS prototype system whose implementation details were given in the fifth chapter, was installed on the server computer. In order to allow for the MPEG encoding of multimedia clips, a Canopus Amber Encoder/Decoder card was also installed on the server machine. Then the multimedia database that includes the multiple versions of prerecorded multimedia clips was registered with the ODBC Data Source Administrator allowing it to be accessed and communicated with. The QOAS client application was deployed on the client machine. It makes use of a Canopus Amber MPEG Decoder card which was installed on the same machine.
On the server computer the latest Microsoft version of Media Producer69 (series 9) [253] was installed and Windows Media Services was enabled. In this way the server side streaming application was deployed. This allows for Windows Media (WM) file streaming, including the Multiple bit-rate (MBR) ones that QOAS will be tested against. On the client machine, Windows Media Player series 9 was installed constituting the client application for WM streaming.
6.3.2.3 Tested Approaches
During subjective testing three different approaches are assessed by the test participants with different motion content clips and background traffic variation: the streaming of multimedia clips based on QOAS-the adaptive scheme proposed in this thesis, the commercially available adaptive Windows Media (WM) Multiple bit-rate (MBR) solution, launched as part of the WM series 9 products and a non-adaptive streaming solution.
69 W in d o w s M ed ia , W eb S ite, M icro so ft, h ttp ://w w w .m ic roso ft.com /w indow s/vv indow sm ed ia/de fau lt.asp
223

Gabriel-Miro Muntcan - Ph.D. Thesis 6. Experimental Results
6.3.2.4 T est E n v iro n m en t
The test environment was determined according to the ITU-T R P.910 recommendations [63], The streamed multimedia clips are displayed on a Desktop PC 19 inches monitor situated in room with no natural light. The only source of light barely allows for the answer sheets to be filled in, it is localised and it does not reflect in the monitors nor disturb the subjects. The parameters for the monitor (brightness, luminance, hue etc.) have been set at average values. The viewing distance was set at 5 times the height of the picture, within the limits suggested by ITU-T R P.910 and should remain fixed for the duration of the testing. The audio component of the multimedia is played out by two 10 W Creative Cambridge SoundWorks SBS52 speakers which are the only source of sound in the testing room.
6.3.2.5 M ultim ed ia C lips
In order to perform the tests, multimedia clips were encoded from high quality DVD sources. The WM Producer was used to encode a multiple bitrate (MBR) stream that can adapt to five audiences at 2.0 Mb/s, 2.5 Mb/s, 3.0 Mb/s, 3.5 Mb/s and 4.0 Mb/s. For the QOAS-based system, five streams were MPEG-2 encoded at 2.0 Mb/s, 2.5 Mb/s, 3.0 Mb/s, 3.5 Mb/s and 4.0 Mb/s. This process was repeated for different movies with various motion content or types, maintaining constant the IBBP-pattern, the number of frames per GOP at 9 and the resolution at 320 x 240. 15 minutes long multimedia sequences were encoded from the following movies: Die Hard 1 - with very high motion content, Jurassic Park 3 with an average - high motion content, Don’t Say
A Word, with average - low motion content and Family Man with very little action in it. A cartoons movie was also encoded - Road To El Dorado. From these clips shorter sequences were used as source files for multimedia streaming.
Due to the fact the testing time for each subject has not to exceed 30 minutes according to the suggestion made by ITU-T R. P.910, the multimedia clips use for testing was limited to four, leaving aside the sequence from Jurassic Park 3. Since the subjects’ attention has a time limit, only 1 minute-long clips were used from each movie, for each test. This is unlike the ITU-T R P.910 recommendations that suggest using 1 0 s long sequences, but we support the opinion presented in [132] which states that such a short sequence is not enough to allow the subject both to accommodate with the particular movie content and to notice quality differences, especially if the quality varies in time for each sequence, not only between sequences.
2 2 4

Gabriel-Miro Muntean - Ph.D. Thesis 6. Experimental Results
6.3.2.6 T est M ethod
The chosen test method is a combination between the Absolute Category Rating (ACR) or Single Stimulus (SS) and the Degradation Category Rating (DCR) or Double Stimulus (DS), presented in detail in ITU-T R P.910 [63]. ACR involves the presentation of the multimedia sequences one at a time and the subject is asked to grade each of them separately on a given category scale. In this case the sequences with identical content would be streamed using different solutions one after the other, with short breaks for grading after each of them. DCR implies the fact that the test sequences are presented in pairs. The first stimulus presented is always the reference while the second sequence is the tested one. In our case this second sequence has the same content, but it is delivered using a different approach. The subject is asked to grade only the quality of the second multimedia clip.
Unfortunately in order to apply only the ACR test method, the implicit reference must be well known by all the assessors, and this cannot be expected in this case. If only the DCR method had been applied, the reference clips would have to be displayed too many times, the test would take too long, the subjects would become bored and the accuracy of the results would suffer. Therefore the ACR and DCR methods were combined and therefore a reference clip is shown first and then the multimedia sequences that have to be assessed. After each of them the subject is asked to grade its subjective quality on the given quality scale. The grading process should be very short in order to minimise the time passed since the viewer has seen the reference clip and also to minimise the total duration of the testing procedure.
6.3.2.7 G rad in g Scale
The multimedia quality could be graded on different scales such as, for example, a binary one (e.g. good/bad), a continuous graphical scale with no explicit labels (e.g. ranging between bad and excellent), or the quality scales for subjective testing suggested by ITU-T R P.910 with 5, 9 or 11 points. Since lately many systems, including commercial ones, have been rated on the 1-5 scale (see Table 6-33), which offers enough information in order to significantly assess the results being also simple to work with, this grading scale was selected for the perceptual tests, too. Apart from this, the quality metric Q used to objectively assess the quality of the streamed multimedia during the simulations uses the same 1-5 scale, allowing for a simple comparison between the simulation objective test results and these subjective test results.
225
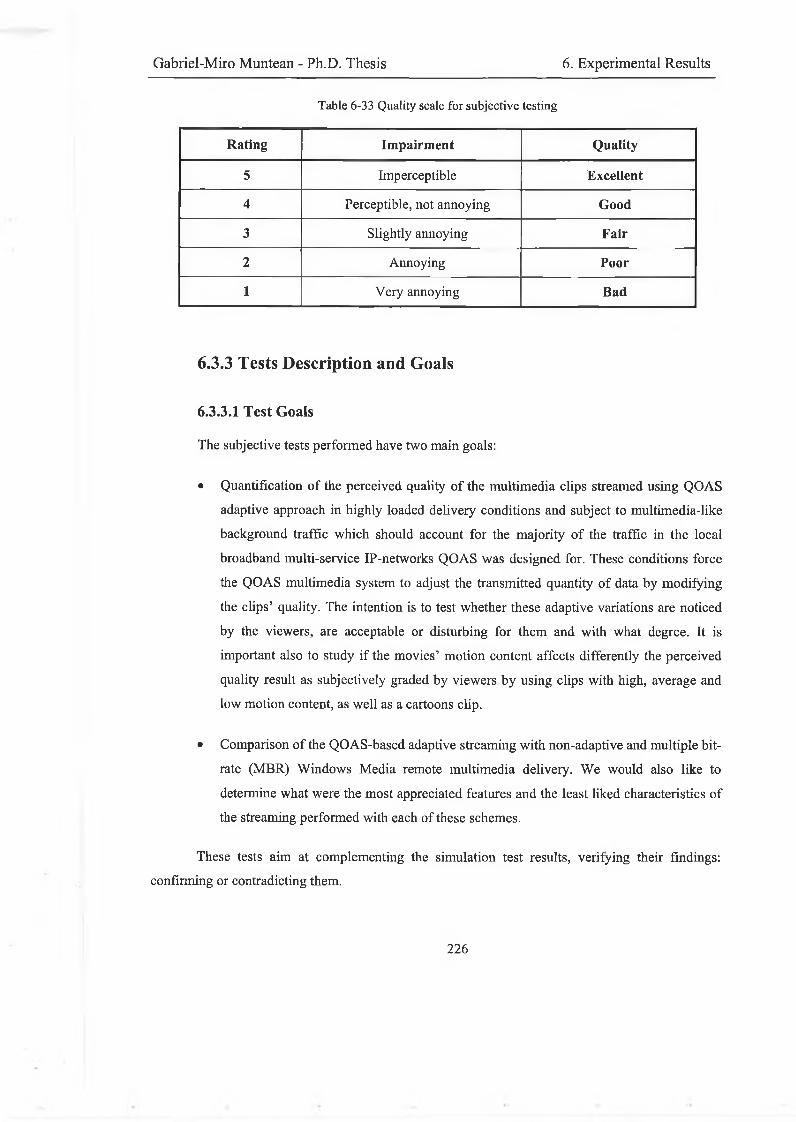
Gabriel-Miro Muntean - Ph.D. Thesis 6. Experimental Results
Table 6-33 Quality scale for subjective testing
Rating Impairment Quality
5 Imperceptible Excellent
4 Perceptible, not annoying Good
3 Slightly annoying Fair
2 Annoying Poor
1 Very annoying Bad
6.3.3 Tests Description and Goals
6.3.3.1 Test Goals
The subjective tests performed have two main goals:
• Quantification of the perceived quality of the multimedia clips streamed using QOAS adaptive approach in highly loaded delivery conditions and subject to multimedia-like background traffic which should account for the majority of the traffic in the local broadband multi-service IP-networks QOAS was designed for. These conditions force the QOAS multimedia system to adjust the transmitted quantity of data by modifying the clips’ quality. The intention is to test whether these adaptive variations are noticed by the viewers, are acceptable or disturbing for them and with what degree. It is important also to study if the movies’ motion content affects differently the perceived quality result as subjectively graded by viewers by using clips with high, average and low motion content, as well as a cartoons clip.
• Comparison of the QOAS-based adaptive streaming with non-adaptive and multiple bit- rate (MBR) Windows Media remote multimedia delivery. We would also like to determine what were the most appreciated features and the least liked characteristics of the streaming performed with each of these schemes.
These tests aim at complementing the simulation test results, verifying their findings: confirming or contradicting them.
226
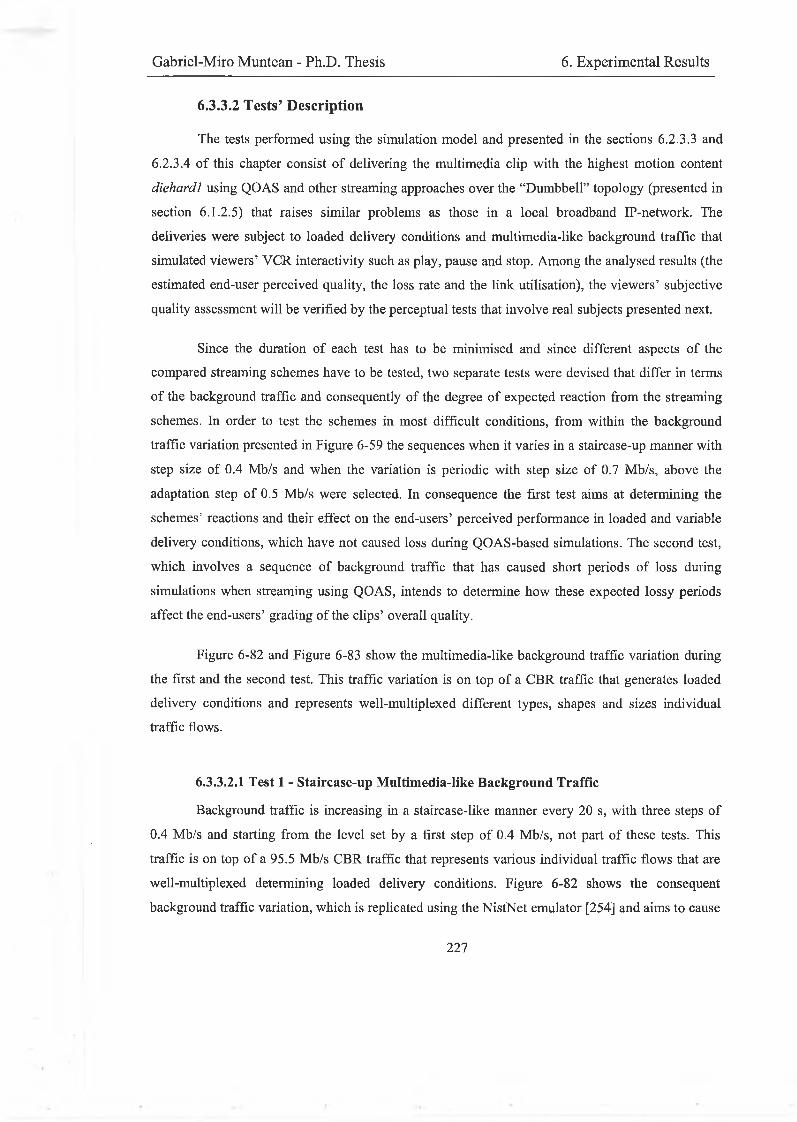
Gabriel-Miro Muntean - Ph.D. Thesis 6. Experimental Results
6.3.3.2 T ests’ D escrip tion
The tests performed using the simulation model and presented in the sections 6.2.3.3 and6.2.3.4 of this chapter consist of delivering the multimedia clip with the highest motion content diehardl using QOAS and other streaming approaches over the “Dumbbell” topology (presented in section 6.1.2.5) that raises similar problems as those in a local broadband IP-network. The deliveries were subject to loaded delivery conditions and multimedia-like background traffic that simulated viewers’ VCR interactivity such as play, pause and stop. Among the analysed results (the estimated end-user perceived quality, the loss rate and the link utilisation), the viewers’ subjective quality assessment will be verified by the perceptual tests that involve real subjects presented next.
Since the duration of each test has to be minimised and since different aspects of the compared streaming schemes have to be tested, two separate tests were devised that differ in terms of the background traffic and consequently of the degree of expected reaction from the streaming schemes. In order to test the schemes in most difficult conditions, from within the background traffic variation presented in Figure 6-59 the sequences when it varies in a staircase-up manner with step size of 0.4 Mb/s and when the variation is periodic with step size of 0.7 Mb/s, above the adaptation step of 0.5 Mb/s were selected. In consequence the first test aims at determining the schemes’ reactions and their effect on the end-users’ perceived performance in loaded and variable delivery conditions, which have not caused loss during QOAS-based simulations. The second test, which involves a sequence of background traffic that has caused short periods of loss during simulations when streaming using QOAS, intends to determine how these expected lossy periods affect the end-users’ grading of the clips’ overall quality.
Figure 6-82 and Figure 6-83 show the multimedia-like background traffic variation during the first and the second test. This traffic variation is on top of a CBR traffic that generates loaded delivery conditions and represents well-multiplexed different types, shapes and sizes individual traffic flows.
6.3.3.2.1 Test 1 - Staircase-up Multimedia-like Background Traffic
Background traffic is increasing in a staircase-like manner every 20 s, with three steps of 0.4 Mb/s and starting from the level set by a first step of 0.4 Mb/s, not part of these tests. This traffic is on top of a 95.5 Mb/s CBR traffic that represents various individual traffic flows that are well-multiplexed determining loaded delivery conditions. Figure 6-82 shows the consequent background traffic variation, which is replicated using the NistNet emulator [254] and aims to cause
2 2 7
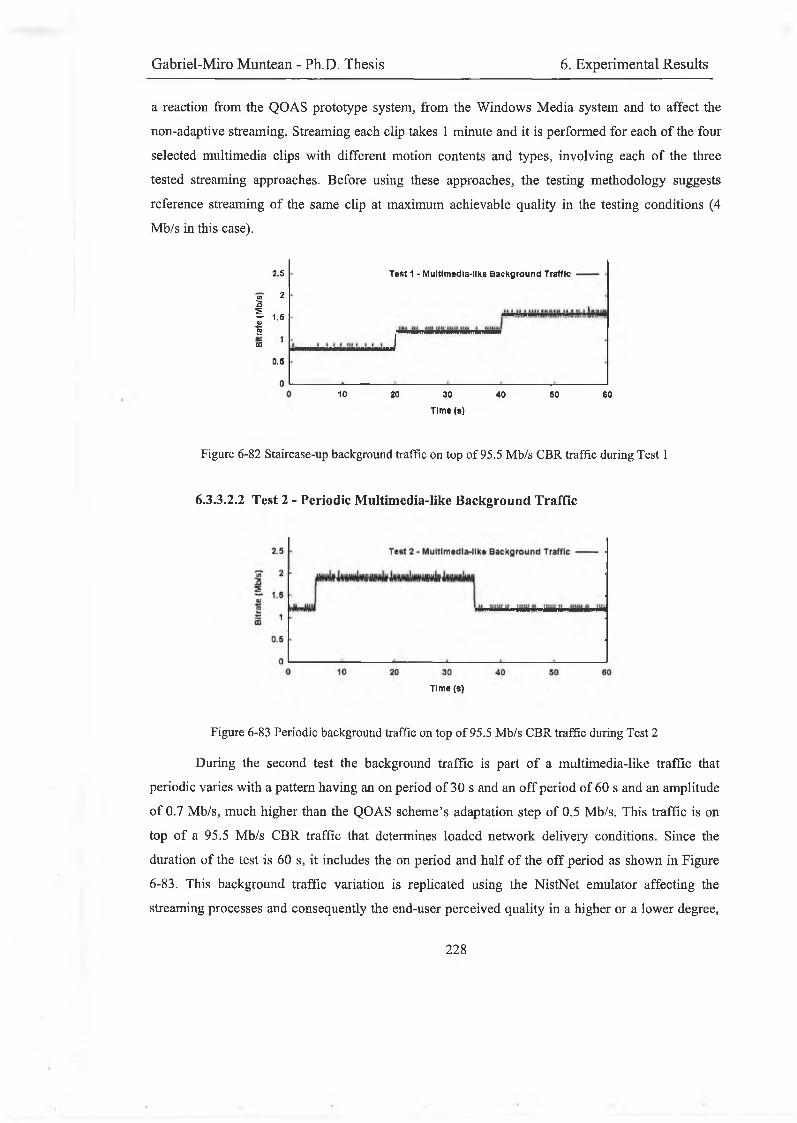
Gabriel-Miro Muntean - Ph.D. Thesis 6. Experimental Results
a reaction from the QOAS prototype system, from the Windows Media system and to affect the non-adaptive streaming. Streaming each clip takes 1 minute and it is performed for each of the four selected multimedia clips with different motion contents and types, involving each of the three tested streaming approaches. Before using these approaches, the testing methodology suggests reference streaming of the same clip at maximum achievable quality in the testing conditions (4 Mb/s in this case).
Tesi 1 - Multlmedla-llke Background Traffic2.5
to 235
¥ 1.5§
15
0.5
010 20 30
Time (s)
40 60 60
Figure 6-82 Staircase-up background traffic on top o f 95.5 Mb/s CBR traffic during Test 1
6.3.3.2.2 Test 2 - Periodic Multimedia-like Background Traffic
Time (s)
Figure 6-83 Periodic background traffic on top of 95.5 Mb/s CBR traffic during Test 2
During the second test the background traffic is part of a multimedia-like traffic that periodic varies with a pattern having an on period of 30 s and an off period of 60 s and an amplitude of 0.7 Mb/s, much higher than the QOAS scheme’s adaptation step of 0.5 Mb/s. This traffic is on top of a 95.5 Mb/s CBR traffic that determines loaded network delivery conditions. Since the duration of the test is 60 s, it includes the on period and half of the off period as shown in Figure 6-83. This background traffic variation is replicated using the NistNet emulator affecting the streaming processes and consequently the end-user perceived quality in a higher or a lower degree,
228
Gabricl-Miro Muntcan - Ph.D. Thesis 6. Experimental Results
depending on the scheme’s capability to adjust to these variations. All three tested approaches (QOAS, WM MBR and non-adaptive) are used for streaming and all four selected movie clips are streamed. As in the first test type, reference streaming is required for each clip at maximum achievable quality (4 Mb/s in this case) in existing setup conditions.
6.3.3.2.3 Test Phases
Each of the two test types consists of four phases that each involves a different clip from the four movies with different motion content taken into consideration and presented in section 6.3.2.4. In order not to bias the viewers’ decision regarding a movie type or another, the order in which these clips were shown was randomised. For each multimedia clip, first the reference streaming is performed at the highest quality taken into consideration (4.0 Mb/s) and the delivery is not subject to any background traffic that might interfere with its quality as seen by the remote viewer. Then each of the three streaming approaches is employed for delivering the clip to the remote viewer and after each of them, the subject is asked to grade its quality and to highlight the quality-related feature he/she liked the most and the one that he/she disliked the most. The order in which these approaches were used with the same clip was also randomised not to affect the obtained results.
6.3.3.2.4 Test Considerations
In order to ensure good testing results, it is very significant to include a training phase
prior to starting the test sequence. In this training phase the test operators have to explain what is the goal of these tests and what it is required from each participant. More detailed information about this phase is given in Appendix C.
Since the subjects’ visual acuity greatly differ and some of the participants may suffer from visual impairments that may affect their assessment of the streamed multimedia clips’ quality, prior to testing the viewers should be screened for normal visual acuity or corrected-to-normal acuity and for normal colour vision. The results of these findings can be used during the results’ analysis.
Participants’ boredom or fatigue have an important impact on the multimedia clips’ quality assessment as well as on the accuracy of the answers. Therefore the participation to testing should be voluntary, so the subjects could leave at any time.
Although the QOAS adaptation does not interfere with the audio component (we have considered that it takes only a small fraction of the bandwidth in comparison to the video
229
Gabriel-Miro Muntean - Ph.D. Thesis 6. Experimental Results
component), since the quality of any multimedia sequence is influenced also by the associated sound (e.g. audio and video must be appropriately synchronized), during testing the clips are streamed with their soundtracks.
During testing the participants are asked to indicate whether they have liked some characteristics related to the quality of the multimedia streaming such as continuity, audio/video synchronisation, clarity etc. They are also asked to mark any defects they noticed and they have disliked during streaming such as tiling, jerkiness, de-synchronisation etc.
A sample of a test questionnaire is presented in Appendix C.
6.3.4 Tests Results
6.3.4.1 Test 1 - Staircase-up Multimedia-like Background Traffic
The subjective Test 1 has involved 42 subjects with ages between 18 and 48, with various experience related to multimedia streaming (i.e. 22 - familiar, 19 - not familiar and 1 - expert), 19 of which wearing glasses or contact lenses and none with other visual impairments that may affect their perception of the multimedia quality. The Test 1 results are presented in the next tables as follows. Table 6-34 presents statistics related to the average subjects’ perceived quality when the four multimedia sequences named Die Hard 1, Don’t Say a Word, Family Man and Road to El
Dorado were streamed in the background traffic conditions mentioned in section 6.3.3.2.I. Table 6-35 presents the test results related to the participants’ most appreciated of the clips’ quality characteristics such as continuity, quality stability, image clarity and media synchronisation in all the tested situations during Test 1. The figures in the table represent the percentage of the subjects that have appreciated the most the associated multimedia stream characteristic. Table 6-36 presents the percentage of the participants that have mostly disliked certain multimedia streaming related features indicated in the table such as jerkiness, quality variation, blurring, tiling and media de- synchronisation. The results are presented for all the tests performed, including all the streaming schemes and involving all the multimedia clips taken into account.
2 3 0
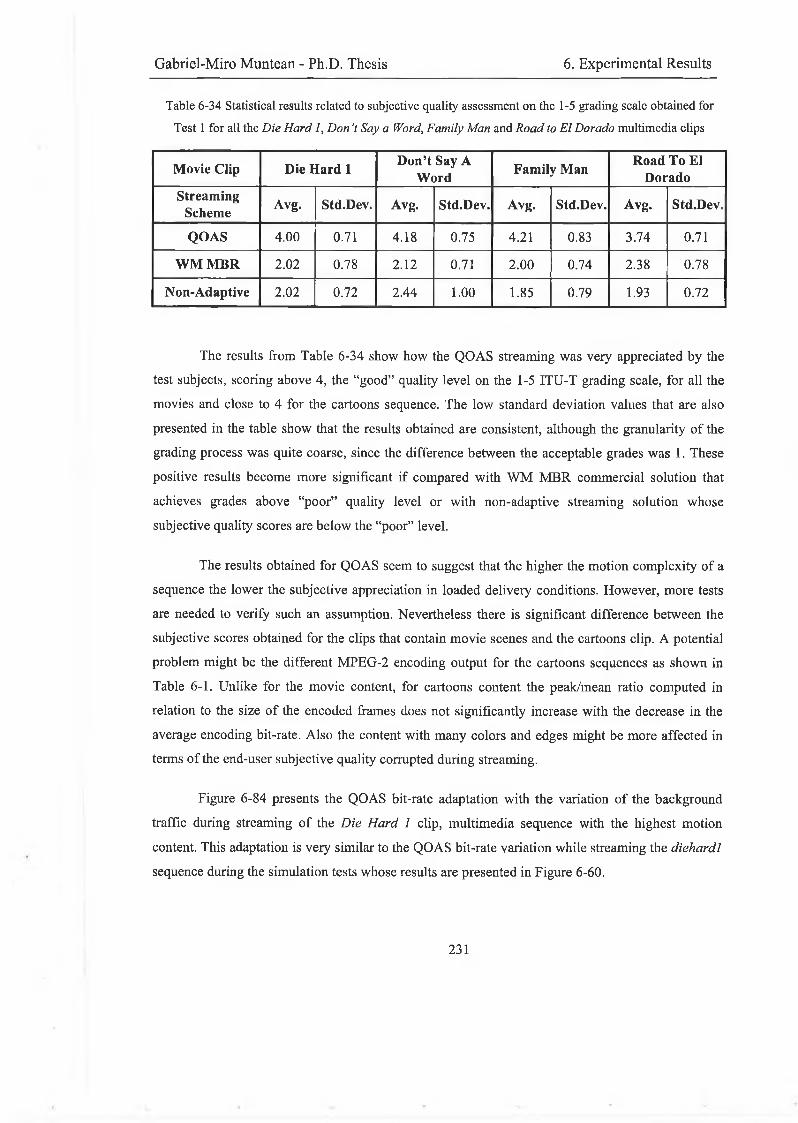
Gabriel-Miro Muntean - Ph.D. Thesis 6. Experimental Results
Table 6-34 Statistical results related to subjective quality assessment on the 1-5 grading scale obtained for
Test 1 for all the Die Hard 1, Don 7 Say a Word, Family Man and Road to El Dorado multimedia clips
Movie Clip Die Hard 1 Don’t Say A Word Family Man
Road To El Dorado
StreamingScheme Avg. Std.Dev. Avg. Std.Dev. Avg. Std.Dev. Avg. Std.Dev.
QOAS 4.00 0.71 4.18 0.75 4.21 0.83 3.74 0.71
WM MBR 2.02 0.78 2.12 0.71 2.00 0.74 2.38 0.78
Non-Adaptive 2.02 0.72 2.44 1.00 1.85 0.79 1.93 0.72
The results from Table 6-34 show how the QOAS streaming was very appreciated by the test subjects, scoring above 4, the “good” quality level on the 1-5 ITU-T grading scale, for all the movies and close to 4 for the cartoons sequence. The low standard deviation values that are also presented in the table show that the results obtained are consistent, although the granularity of the grading process was quite coarse, since the difference between the acceptable grades was 1. These positive results become more significant if compared with WM MBR commercial solution that achieves grades above “poor” quality level or with non-adaptive streaming solution whose subjective quality scores are below the “poor” level.
The results obtained for QOAS seem to suggest that the higher the motion complexity of a sequence the lower the subjective appreciation in loaded delivery conditions. However, more tests are needed to verify such an assumption. Nevertheless there is significant difference between the subjective scores obtained for the clips that contain movie scenes and the cartoons clip. A potential problem might be the different MPEG-2 encoding output for the cartoons sequences as shown in Table 6-1. Unlike for the movie content, for cartoons content the peak/mean ratio computed in relation to the size of the encoded frames does not significantly increase with the decrease in the average encoding bit-rate. Also the content with many colors and edges might be more affected in terms of the end-user subjective quality corrupted during streaming.
Figure 6-84 presents the QOAS bit-rate adaptation with the variation of the background traffic during streaming of the Die Hard 1 clip, multimedia sequence with the highest motion content. This adaptation is very similar to the QOAS bit-rate variation while streaming the diehardl sequence during the simulation tests whose results are presented in Figure 6-60.
231
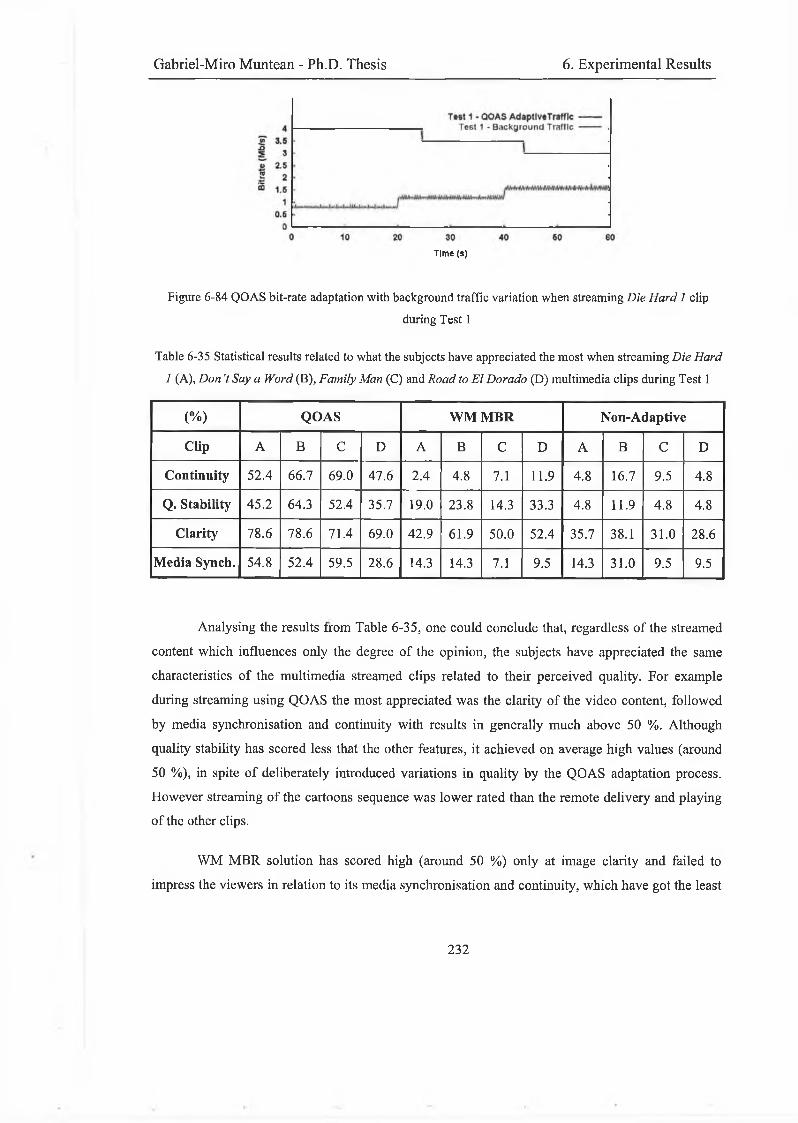
Gabriel-Miro Muntean - Ph.D. Thesis 6. Experimental Results
Time (s)
Figure 6-84 QOAS bit-rate adaptation with background traffic variation when streaming Dìe Hard 1 clip
during Test 1
Tabic 6-35 Statistical results related to what the subjects have appreciated the most when streaming Die Hard
1 (A), Don't Say a Word (B), Family Man (C) and Road to El Dorado (D) multimedia clips during Test 1
(%) QOAS WM MBR Non-Adaptive
Clip A B C D A B C D A B C D
Continuity 52.4 66.7 69.0 47.6 2.4 4.8 7.1 11.9 4.8 16.7 9.5 4.8
Q. Stability 45.2 64.3 52.4 35.7 19.0 23.8 14.3 33.3 4.8 11.9 4.8 4.8
Clarity 78.6 78.6 71.4 69.0 42.9 61.9 50.0 52.4 35.7 38.1 31.0 28.6
Media Synch. 54.8 52.4 59.5 28.6 14.3 14.3 7.1 9.5 14.3 31.0 9.5 9.5
Analysing the results from Table 6-35, one could conclude that, regardless of the streamed content which influences only the degree of the opinion, the subjects have appreciated the same characteristics of the multimedia streamed clips related to their perceived quality. For example during streaming using QOAS the most appreciated was the clarity of the video content, followed by media synchronisation and continuity with results in generally much above 50 %. Although quality stability has scored less that the other features, it achieved on average high values (around 50 %), in spite of deliberately introduced variations in quality by the QOAS adaptation process. However streaming of the cartoons sequence was lower rated than the remote delivery and playing of the other clips.
WM MBR solution has scored high (around 50 %) only at image clarity and failed to impress the viewers in relation to its media synchronisation and continuity, which have got the least
2 3 2
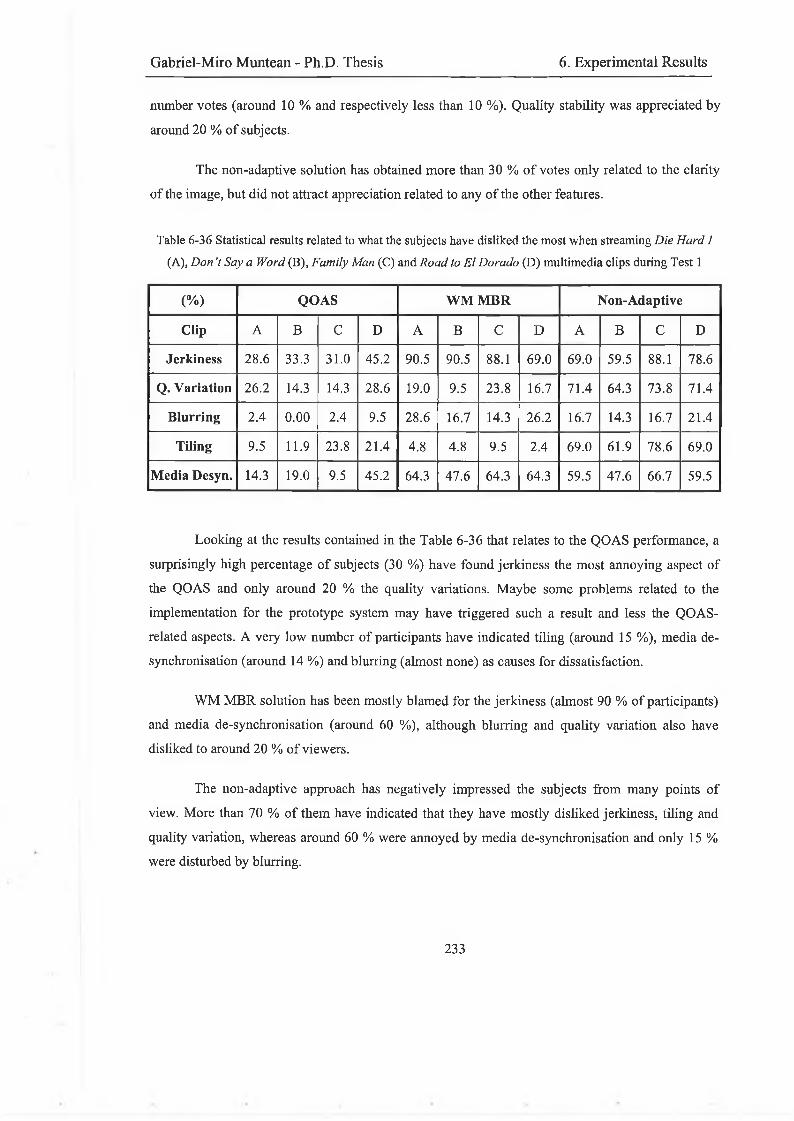
Gabriel-Miro Muntean - Ph.D. Thesis 6. Experimental Results
number votes (around 10 % and respectively less than 10 %). Quality stability was appreciated by around 20 % of subjects.
The non-adaptive solution has obtained more than 30 % of votes only related to the clarityof the image, but did not attract appreciation related to any of the other features.
Table 6-36 Statistical results related to what the subjects have disliked the most when streaming Die Hard 1
(A), D on’t Say a Word (B), Family Man (C) and Road to El Dorado (D) multimedia clips during Test 1
(%) QOAS WM MBR Non-Adaptive
Clip A B C D A B C D A B C D
Jerkiness 28.6 33.3 31.0 45.2 90.5 90.5 88.1 69.0 69.0 59.5 88.1 78.6
Q. Variation 26.2 14.3 14.3 28.6 19.0 9.5 23.8 16.7 71.4 64.3 73.8 71.4
Blurring 2.4 0.00 2.4 9.5 28.6 16.7 14.3 26.2 16.7 14.3 16.7 21.4
Tiling 9.5 11.9 23.8 21.4 4.8 4.8 9.5 2.4 69.0 61.9 78.6 69.0
Media Desyn. 14.3 19.0 9.5 45.2 64.3 47.6 64.3 64.3 59.5 47.6 66.7 59.5
Looking at the results contained in the Table 6-36 that relates to the QOAS performance, a surprisingly high percentage of subjects (30 %) have found jerkiness the most annoying aspect of the QOAS and only around 20 % the quality variations. Maybe some problems related to the implementation for the prototype system may have triggered such a result and less the QOAS- related aspects. A very low number of participants have indicated tiling (around 15 %), media de- synchronisation (around 14 %) and blurring (almost none) as causes for dissatisfaction.
WM MBR solution has been mostly blamed for the jerkiness (almost 90 % of participants) and media de-synchronisation (around 60 %), although blurring and quality variation also have disliked to around 20 % of viewers.
The non-adaptive approach has negatively impressed the subjects from many points of view. More than 70 % of them have indicated that they have mostly disliked jerkiness, tiling and quality variation, whereas around 60 % were annoyed by media de-synchronisation and only 15 % were disturbed by blurring.
2 3 3
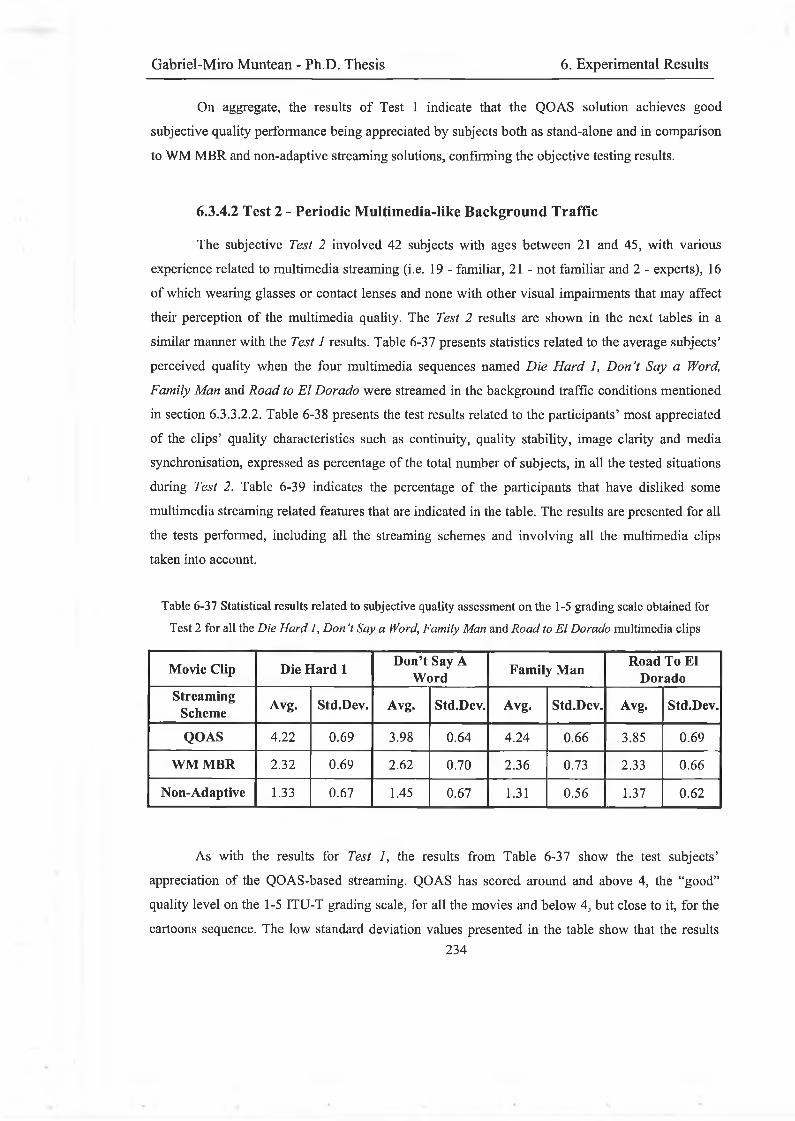
Gabriel-Miro Muntean - Ph.D. Thesis 6. Experimental Results
On aggregate, the results of Test 1 indicate that the QOAS solution achieves good subjective quality performance being appreciated by subjects both as stand-alone and in comparisonto WM MBR and non-adaptive streaming solutions, confirming the objective testing results.
6.3.4.2 Test 2 - Periodic Multimedia-like Background Traffic
The subjective Test 2 involved 42 subjects with ages between 21 and 45, with various experience related to multimedia streaming (i.e. 19 - familiar, 21 - not familiar and 2 - experts), 16 of which wearing glasses or contact lenses and none with other visual impairments that may affect their perception of the multimedia quality. The Test 2 results are shown in the next tables in a similar manner with the Test 1 results. Table 6-37 presents statistics related to the average subjects’ perceived quality when the four multimedia sequences named Die Hard 1, Don’t Say a Word, Family Man and Road to El Dorado were streamed in the background traffic conditions mentioned in section 6.3.3.2.2. Table 6-38 presents the test results related to the participants’ most appreciated of the clips’ quality characteristics such as continuity, quality stability, image clarity and media synchronisation, expressed as percentage of the total number of subjects, in all the tested situations during Test 2. Table 6-39 indicates the percentage of the participants that have disliked some multimedia streaming related features that are indicated in the table. The results are presented for all the tests performed, including all the streaming schemes and involving all the multimedia clips taken into account.
Table 6-37 Statistical results related to subjective quality assessment on the 1-5 grading scale obtained for
Test 2 for all the Die Hard 1, D on’t Say a Word, Family Man and Road to El Dorado multimedia clips
Movie Clip Die Hard 1Don’t Say A
Word Family ManRoad To El
DoradoStreaming
Scheme Avg. Std.Dev. Avg. Std.Dev. Avg. Std.Dev. Avg. Std.Dev.
QOAS 4.22 0.69 3.98 0.64 4.24 0.66 3.85 0.69
WM MBR 2.32 0.69 2.62 0.70 2.36 0.73 2.33 0.66
Non-Adaptive 1.33 0.67 1.45 0.67 1.31 0.56 1.37 0.62
As with the results for Test 1, the results from Table 6-37 show the test subjects’ appreciation of the QOAS-based streaming. QOAS has scored around and above 4, the “good” quality level on the 1-5 ITU-T grading scale, for all the movies and below 4, but close to it, for the cartoons sequence. The low standard deviation values presented in the table show that the results
234
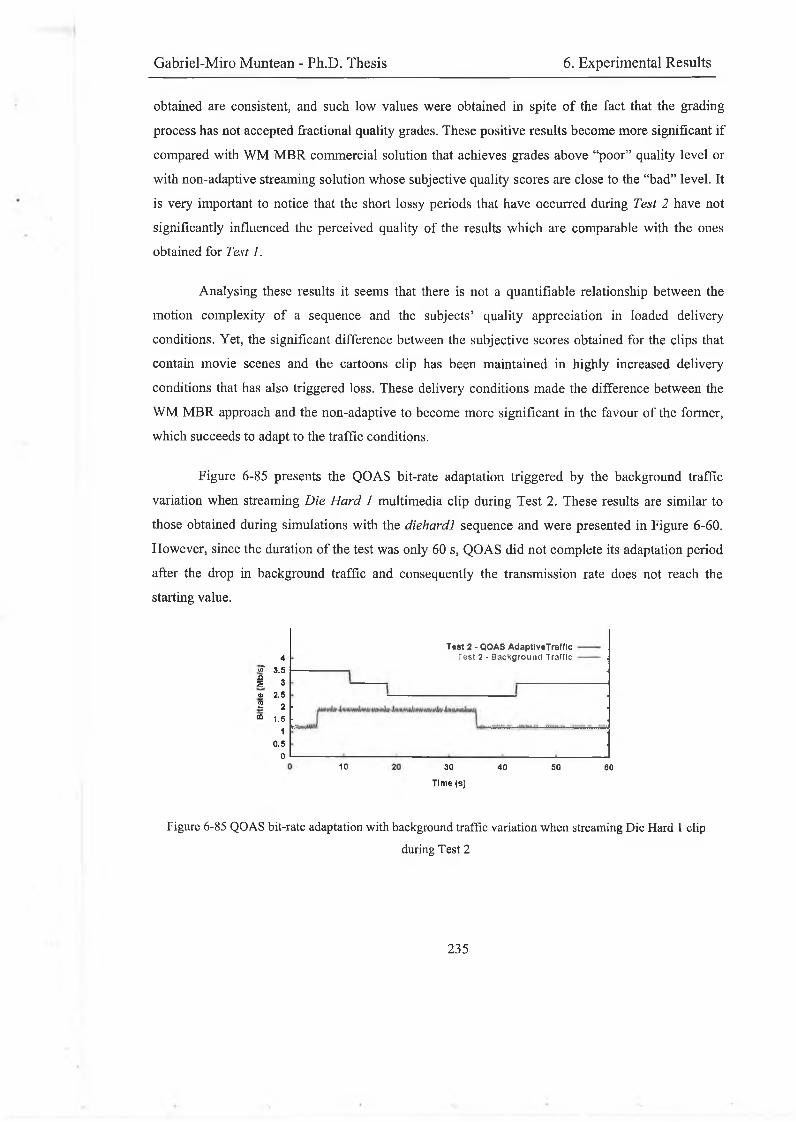
Gabriel-Miro Muntean - Ph.D. Thesis 6. Experimental Results
obtained are consistent, and such low values were obtained in spite of the fact that the grading process has not accepted fractional quality grades. These positive results become more significant if compared with WM MBR commercial solution that achieves grades above “poor” quality level or with non-adaptive streaming solution whose subjective quality scores are close to the “bad” level. It is very important to notice that the short lossy periods that have occurred during Test 2 have not significantly influenced the perceived quality of the results which are comparable with the ones obtained for Test 1.
Analysing these results it seems that there is not a quantifiable relationship between the motion complexity of a sequence and the subjects’ quality appreciation in loaded delivery conditions. Yet, the significant difference between the subjective scores obtained for the clips that contain movie scenes and the cartoons clip has been maintained in highly increased delivery conditions that has also triggered loss. These delivery conditions made the difference between the WM MBR approach and the non-adaptive to become more significant in the favour of the former, which succeeds to adapt to the traffic conditions.
Figure 6-85 presents the QOAS bit-rate adaptation triggered by the background traffic variation when streaming Die Hard 1 multimedia clip during Test 2. These results are similar to those obtained during simulations with the diehardl sequence and were presented in Figure 6-60. However, since the duration of the test was only 60 s, QOAS did not complete its adaptation period after the drop in background traffic and consequently the transmission rate does not reach the starting value.
4"vT 3.5i 34) 2.52 2CÛ 1.5
10.5
0
Test 2 - QOAS AdaptlveTrafflcTest 2 - Background Traffic
i.“.,.,Vi'
10 30
Time (s)
40 50 60
Figure 6-85 QOAS bit-rate adaptation with background traffic variation when streaming Die Hard 1 clip
during Test 2
235
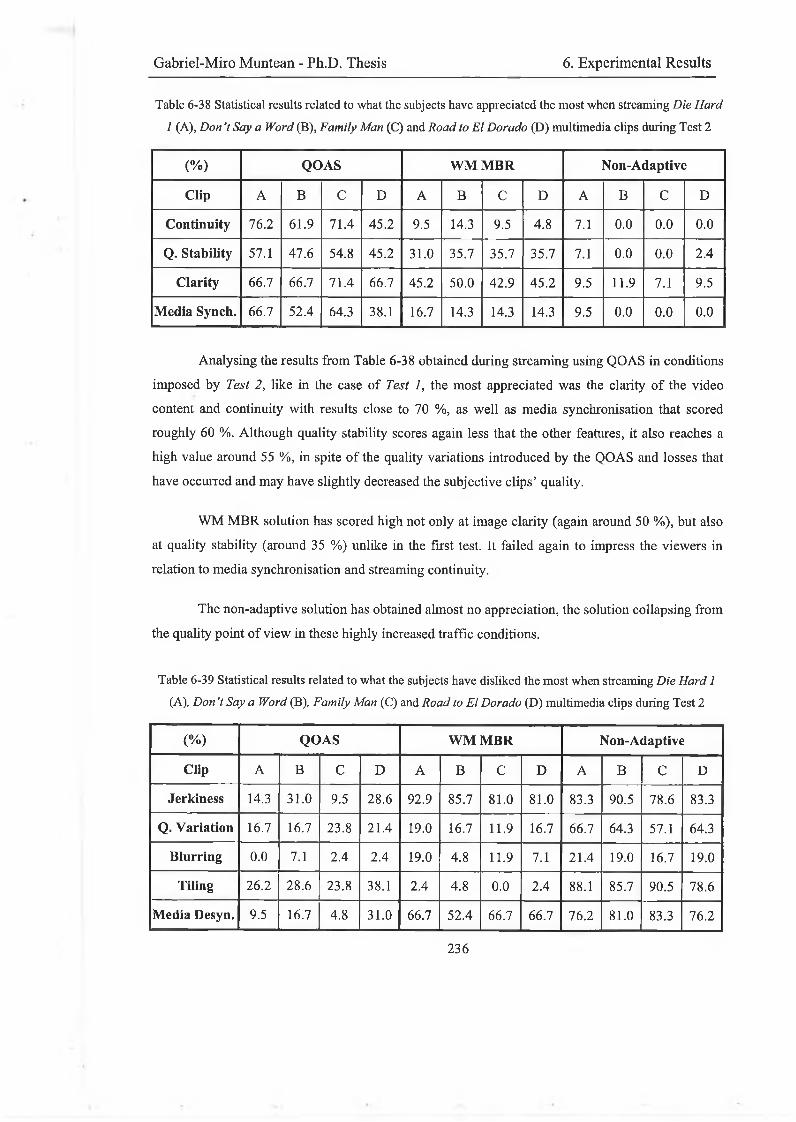
Gabriel-Miro Muntean - Ph.D. Thesis 6. Experimental Results
Table 6-38 Statistical results related to what the subjects have appreciated the most when streaming Die Hard 1 (A), Don7 Say a Word (B), Family Man (C) and Road to El Dorado (D) multimedia clips during Test 2
(%) QOAS WM MBR Non-Adaptive
Clip A B C D A B C D A B C D
Continuity 76.2 61.9 71.4 45.2 9.5 14.3 9.5 4.8 7.1 0.0 0.0 0.0
Q. Stability 57.1 47.6 54.8 45.2 31.0 35.7 35.7 35.7 7.1 0.0 0.0 2.4
Clarity 66.7 66.7 71.4 66.7 45.2 50.0 42.9 45.2 9.5 11.9 7.1 9.5
Media Synch. 66.7 52.4 64.3 38.1 16.7 14.3 14.3 14.3 9.5 0.0 0.0 0.0
Analysing the results from Table 6-38 obtained during streaming using QOAS in conditions imposed by Test 2, like in the case of Test 1, the most appreciated was the clarity of the video content and continuity with results close to 70 %, as well as media synchronisation that scored roughly 60 %. Although quality stability scores again less that the other features, it also reaches a high value around 55 %, in spite of the quality variations introduced by the QOAS and losses that have occurred and may have slightly decreased the subjective clips’ quality.
WM MBR solution has scored high not only at image clarity (again around 50 %), but also at quality stability (around 35 %) unlike in the first test. It failed again to impress the viewers in relation to media synchronisation and streaming continuity.
The non-adaptive solution has obtained almost no appreciation, the solution collapsing from the quality point of view in these highly increased traffic conditions.
Table 6-39 Statistical results related to what the subjects have disliked the most when streaming Die Hard 1 (A), Don 7 Say a Word (B), Family Man (C) and Road to El Dorado (D) multimedia clips during Test 2
(%) QOAS WM MBR Non-Adaptive
Clip A B C D A B C D A B C D
Jerkiness 14.3 31.0 9.5 28.6 92.9 85.7 81.0 81.0 83.3 90.5 78.6 83.3
Q. Variation 16.7 16.7 23.8 21.4 19.0 16.7 11.9 16.7 66.7 64.3 57.1 64.3
Blurring 0.0 7.1 2.4 2.4 19.0 4.8 11.9 7.1 21.4 19.0 16.7 19.0
Tiling 26.2 28.6 23.8 38.1 2.4 4.8 0.0 2.4 88.1 85.7 90.5 78.6
Media Desyn. 9.5 16.7 4.8 31.0 66.7 52.4 66.7 66.7 76.2 81.0 83.3 76.2
236

Gabriel-Miro Muntean - Ph.D. Thesis 6. Experimental Results
Table 6-39 indicates in relation to the QOAS performance that around 25 % of subjects have tiling the most disturbing, followed by quality variation (roughly 20 % of them) and jerkiness (~17 %). However in such difficult delivery condition the number of dissatisfied viewers is very low and this is in favour of the QO AS-based solution.
WM MBR solution has been again mostly blamed for the jerkiness (almost 85 % of participants) and media de-synchronisation (around 60 %), and less for blurring, quality variation and tiling, in this order.
The non-adaptive approach determined more than 80 % subjects to indicate that they have mostly disliked jerkiness, tiling and media de-synchronisation, although quality variation also scored more than 60 %.
These results show that QOAS solution has successfully adapted even to very difficult delivery conditions achieving good subjective quality performance appreciation. Test 2 confirms the results obtained by the first test relative to QOAS and in comparison to both WM MBR and non- adaptive streaming solutions, verifying also the objective testing results.
6.3.5 Comments
During the simulation tests the QOAS-based system has adapted switching the source of transmission from the 4.0 Mb/s stream to the 3.5 Mb/s and then to the 3.0 Mb/s one in the first test without experiencing any loss when transmitting diehard! sequence. It has also changed the transmission rate from 3.5 Mb/s to 3.0 Mb/s and 2.5 Mb/s and then back to 3.5 Mb/s during the background traffic variations as in the second test, experiencing short lossy periods. However it has maintained the average estimated end-user perceived quality above 4.0 (4.42 and 4.24 respectively). When similar conditions as in the simulation tests were emulated and the QOAS prototype system was tested it has also achieved subjective quality results above 4.0 for the same movie (4.00 and 4.22 respectively). These results confirm the objective testing results, in spite of some slight differences between the resulting values. However the test participants’ subjective quality assessment related to all the movie sequences streamed in different delivery conditions using QOAS was around “good” ITU-T quality level, a fact that confirms the good performance of QOAS and recommends it as a viable solution.
These conclusions about QOAS are also confirmed by the comparison with the non- adaptive streaming and with the Windows Media MBR adaptive solution. The former, as expected,
237
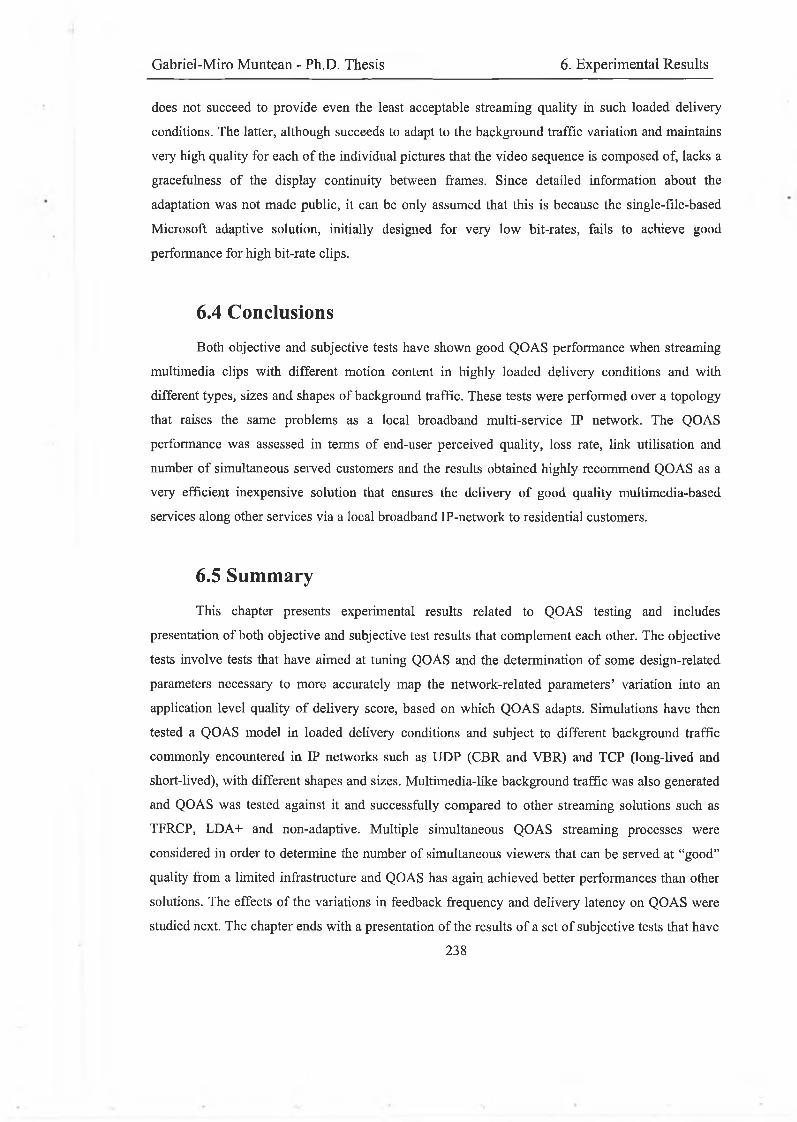
Gabriel-Miro Muntean - Ph.D. Thesis 6. Experimental Results
does not succeed to provide even the least acceptable streaming quality in such loaded delivery conditions. The latter, although succeeds to adapt to the background traffic variation and maintains very high quality for each of the individual pictures that the video sequence is composed of, lacks a gracefulness of the display continuity between frames. Since detailed information about the adaptation was not made public, it can be only assumed that this is because the single-file-based Microsoft adaptive solution, initially designed for very low bit-rates, fails to achieve good performance for high bit-rate clips.
6.4 ConclusionsBoth objective and subjective tests have shown good QOAS performance when streaming
multimedia clips with different motion content in highly loaded delivery conditions and with different types, sizes and shapes of background traffic. These tests were performed over a topology that raises the same problems as a local broadband multi-service IP network. The QOAS performance was assessed in terms of end-user perceived quality, loss rate, link utilisation and number of simultaneous served customers and the results obtained highly recommend QOAS as a very efficient inexpensive solution that ensures the delivery of good quality multimedia-based services along other services via a local broadband IP-network to residential customers.
6.5 Summary
This chapter presents experimental results related to QOAS testing and includes presentation of both objective and subjective test results that complement each other. The objective tests involve tests that have aimed at tuning QOAS and the determination of some design-related parameters necessary to more accurately map the network-related parameters’ variation into an application level quality of delivery score, based on which QOAS adapts. Simulations have then tested a QOAS model in loaded delivery conditions and subject to different background traffic commonly encountered in IP networks such as UDP (CBR and VBR) and TCP (long-lived and short-lived), with different shapes and sizes. Multimedia-like background traffic was also generated and QOAS was tested against it and successfully compared to other streaming solutions such as TFRCP, LDA+ and non-adaptive. Multiple simultaneous QOAS streaming processes were considered in order to determine the number of simultaneous viewers that can be served at “good” quality from a limited infrastructure and QOAS has again achieved better performances than other solutions. The effects of the variations in feedback frequency and delivery latency on QOAS were studied next. The chapter ends with a presentation of the results of a set of subjective tests that have
238

Gabriel-Miro Muntean - Ph.D. Thesis 6. Experimental Results
verified the results obtained by simulations. These have confirmed QOAS as a viable solution for streaming of high quality clips to local viewers, achieving very significant performance improvements over other solutions.
Gabriel-Miro Muntean - Ph.D. Thesis 7. Conclusions and Future Work
Chapt er VII
Co nc l us i o ns
Abstract
This chapter summarises the research reported in this thesis, highlights the significant
achievements o f the proposed Quality Oriented Adaptation Scheme (QOAS), presents the
contributions o f the research and underscores the benefits o f the proposed solution. Some future
work directions are suggested at the end.
7.1 Main AchievementsThis research aimed to find a solution for delivering high quality rich content multimedia-
based services that would both be attractive to customers and beneficial for the service providers. Since existing solutions involve high complexity, increased deployment costs, and/or a lack of concern for the end-user perceived quality, a Quality-Oriented Adaptation Scheme (QOAS) was proposed. Its aim is to provide good end-user perceived quality for very high rate multimedia-based services in highly loaded and variable delivery conditions. If used in local broadband multi-service IP networks, QOAS allows for serving a larger number of customers from the same network infrastructure while maintaining good end-user perceived quality, bringing significant benefits to service providers and network operators and helping to ensure the success of these services.
This thesis proposed and presented in detail the principles and the mechanisms behind
QOAS and analysed results o f various tests. The effects on QOAS performance o f increased
traffic o f different types, with various sizes and variation patterns as might be outputted by the other services delivered through the same infrastructure were assessed. The effects o f multimedia
like background traffic with different variations commonly expected due to the users’ VCR interactivity with multimedia services were also tested. Similarly the effects o f multiple
simultaneous QOAS-based streaming processes were analysed. All these effects on QOAS performance were assessed in terms of end-user perceived quality, loss rate, link utilisation and number of customers served from a limited infrastructure.
240
Gabriel-Miro Muntean - Ph.D. Thesis 7. Conclusions and Future Work
The results were compared with those o f an ideal adaptive scheme that uses all the available bandwidth not used by the background traffic at anytime in order to stream multimedia data, achieving 100 % utilisation and no-loss and with other proposed streaming solutions such as
the adaptive TFRCP and LDA+ schemes and a non-adaptive mechanism.
These tests involve instantiations of QOAS in both a simulation model and a prototype system and the test results show very significant performances of the QOAS adaptive multimedia streaming stand-alone and in comparison to the other streaming solutions, regardless of the implementation used.
In comparison to the ideal adaptive scheme the results are very impressive in relation to the end-user perceived quality when using QOAS in simulated heavy traffic conditions for streaming multimedia clips subject to background traffic of different types, shapes and variation patterns. This subjective quality is not only above the “good” perceptual level (4 on the ITU-T 1-5 scale), but also in almost all cases it is within 1% from the corresponding value estimated for the ideal adaptive scheme. Moreover QOAS does not experience the latter’s multiple variations with the bandwidth made available by the cross traffic that may disturb the viewers. QOAS streaming maintained loss rates of less than 0 .1% in all cases, despite the fact that the delivery network was fully loaded. The link utilisation also reaches very high levels, QOAS making use of more than 99.5% of the bandwidth resources in the large majority of tests and even in the remaining cases the available resources are less than 1.5% from being fully used.
QOAS has achieved very good results also in comparison to other proposed approaches
for streaming multimedia, such as adaptive TFRCP and LDA+ and a non-adaptive solution. For streaming in very heavy traffic conditions and subject to highly variable multimedia-like background traffic, QOAS has maintained the average end-user perceived quality above the “good” perceptual level, whereas for both adaptive schemes it was between the “fair” and the “good” subjective level and for the non-adaptive solution it was close to the “bad” level. The loss rate experienced by QOAS was very close to the ideal (0.015 %), whereas for the other tested adaptive schemes it exceeded 1 % and for the non-adaptive solution has even reached 13 %, severely affecting the quality of the delivery. The link utilisation was high for all the schemes, but QOAS has obtained the highest (99.93 %) after the non-adaptive solution whose 100 % link utilisation comes with a high price paid in end-user perceived quality. In terms of the number of customers served from a limited infrastructure, QOAS has also scored highly. For example, in order to maintain an average “good” perceptual quality level for all the streamed multimedia clips, 23% more clients could be served by using QOAS than by using TFRCP, 33% more clients than by using
241
Gabriel-Miro Muntean - Ph.D. Thesis 7. Conclusions and Future Work
LDA+, and 39% more users than by using the non-adaptive solution. If the goal is to maintain a “fair” average quality level for the clients, the benefit of using QOAS is 26% greater than TFRCP, 13% greater than LDA+, and 42% greater than the non-adaptive solution in terms on the number of simultaneous served customers.
In order to verify these very good results in terms of end-user perceived quality, extensive
subjective tests that have involved the QOAS prototype system were performed. These tests have used multimedia clips with different motion content and apart from QOAS also other streaming approaches such as Microsoft’s Windows Media (WM) Multiple bit-rate (MBR) adaptive
streaming solution and a non-adaptive scheme. When the background traffic was varied in a similar fashion to multimedia clips subject to VCR-like interactivity with customers, QOAS has achieved subjective quality results above 4, the “good” ITU-T perceptual quality level, for all the movies streamed and in spite of the severely loaded and highly variable delivery conditions. In similar conditions WM MBR has scored on average only between “poor” and “fair”, whereas the non-adaptive scheme has achieved on average between “bad” and “poor” on the same scale.
7.2 Novel Contributions
In this section the contributions made by the QOAS-related research are highlighted, making the solution original.
I) QOAS uses a novel client-located grading scheme that maps some network-related
parameters’ values, variation and variation patterns onto application-level QoS scores that describe the quality of the delivery. The Quality of Delivery Grading Scheme (QoDGS) monitors the packet loss, the packet delay and the delay jitter, which most seriously influence end-user perceived quality, as well as the end-user perceived quality as measured by a no-reference moving picture quality metric (Q). The three-stage QoDGS is based on both short-term and long-term evaluation of these monitored parameters’ variations. Short-term variations are important for learning quickly about transient effects, such as sudden traffic changes and for reacting as fast as possible to them. Long-term variations are monitored in order to track slow changes in the delivery environment (e.g. new users). Taking into account the relative differences in the importance of the monitored parameters in relation to the characteristics of the delivery architecture (by weighting their contributions), short-term (Q oD St) and long-term (QoDLT) grades are computed. These partial grades are then used to determine the application-level quality of delivery score (QoDsCOre)-
242
Gabriel-Miro Muntean - Ph.D. Thesis 7. Conclusions and Future Work
Unlike the other sender-driven adaptive approaches for streaming multimedia clips that collect delivery-related information such as loss rate, delay etc. at the clients and send it to the server for processing, QOAS bases its adaptation on a different concept. Its idea is that apart from the monitoring of all these delivery-related parameters QOAS also distributes the quality of delivery grading process among its clients. As consequence, the only feedback that is transmitted to the
server consists o f the client-computed QoD scores that estimate the current delivery conditions and suggest quality adjustment decisions to be made by the server. This has an effect in lowering the complexity of the computations to be performed at the server, in reducing the quantity of information sent across the network and in increasing the accuracy of the grading since the client - as the receiver - is in better position to assess the quality of the delivery than the sender.
II) The end-user perceived quality as estimated by a no-reference objective metric fo r
multimedia streaming is actively considered during the adaptation, as part of the QoDGS’s grading process. Since the goal of this adaptive scheme for streaming multimedia clips is to maximise the end-user perceived quality, it seems logical to conclude that by monitoring it during streaming and by taking it into account “in-service”, the effectiveness of the adaptation is increased and better results can be achieved in terms of the remote viewers’ perceived quality. This was shown by the results of the performed experimental tests, both objective and subjective.
III) QOAS’s tuning on an infrastructure that raises the same problems as a local broadband IP-network has produced very good results during the extensive testing sessions. Significant results are obtained in comparison to existing streaming solutions, adaptive or not, commercial or research- proposed in different delivery conditions. However, it is more significant that the QOAS’s
behaviour is very close to that o f an ideal adaptive scheme, which is unlikely to be ever built, in terms of estimated end-user perceived quality, loss rate and link utilisation when used for multimedia streaming in the presence of traffic of different types, sizes and variation patterns.
IV) QOAS allows for a significant increase in the number o f customers that can be
simultaneous served from an existing infrastructure while maintaining a good end-user
perceived quality for the multimedia-based services offered, even in comparison with other existing solutions for delivering multimedia, adaptive or not.
7.3 QOAS BenefitsDelivering multimedia streaming-related services by using QOAS has some significant
benefits that are mentioned next.
243

Gabriel-Miro Muntean - Ph.D. Thesis 7. Conclusions and Future Work
Simultaneous Access to Diverse Services
Both the service providers and the network operators on one hand and the customers on the other look forward to providing and having access to diverse services such as VoD, VoIP (IP telephony), high rate data transfers, etc. Unfortunately these services have different types and therefore various requirements that have to be accommodated by the same multi-service broadband IP-based infrastructure without interfering with each other. In this context the tests have shown that QOAS delivers multimedia-based services that gracefully adapt to traffic produced by other types of services and positively influences this traffic by reducing its share of bandwidth.
Increased Network Infrastructure Utilisation
In order to offer the best possible service quality at the lowest cost, service providers and network operators have to take full advantage of the existing network infrastructure. However, increasing the number of simultaneously served customers and the network utilisation decreases the quality of service in general. QOAS serves an increased number of customers from the same network infrastructure while maintaining a good quality level for the services provided.
Easy Scalability and Upgrade
The tremendous growth of the Internet and the fast evolution of the current cable TV services show that scalability is a significant problem for the designers and has to be taken into account. Another important problem, common to any engineering solution, is aging with the time and therefore updates are required from time to time. In relation to these problems, QOAS for delivering multimedia-based services to the residential users scores very well. The solution allows for more users to be added to the system at short notice and with no other investments apart from those related to their cable connection. Being a software solution, it also permits for upgrades to be made easily without any difficult problems to be overcome. In this context the QOAS’s client- located Quality of Delivery Grading Scheme (QoDGS) and Server Arbitration Scheme (SAS) can be replaced by new, improved versions, if they are developed.
Providing Personalised Services
The scalability issue may have another dimension apart from number: heterogeneity of customers. In order to be considered acceptable, any multimedia-based solution has to be able to satisfy customers with different expectations. Therefore QOAS implements a "one-to-one" relationship with the customer by providing personalised, interactive, on-demand services.
244
Gabriel-Miro Muntean - Ph.D. Thesis 7. Conclusions and Future Work
Independence from Distributed Ownership
Providing content for services, providing connectivity and transporting the selected service to the receivers are three activities that could be completely separated from the ownership and administration point of view. Three different companies could be respectively the program provider, the service provider and the network operator, each with different policies and security issues that may not overlap, making the co-operation difficult if necessary for providing good quality services (e.g. deployment of QoS enhancements into the network may not be acceptable for the network operator or the service provider). Therefore solutions such as QOAS that offer independence from the manner the distribution of services to the customers is managed are highly desirable.
7.4 Future Work
Although the performances of QOAS as a solution for streaming high quality multimedia clips over local broadband multi-service IP-networks are already very close to an ideal adaptive scheme, there are some aspects in relation to the applicability of the scheme or to its potential extension that could be further explored. Next this section presents some of them.
Use of Error Control Solutions in Conjunction with QOAS
The QOAS-based solution for streaming high quality multimedia-based services in highly loaded delivery conditions in the current form which was extensively designed and tested did not take into consideration any error control mechanism to work in conjunction with apart from certain error resilient encoding provided by the MPEG compression scheme. However some of these error control mechanisms such as those based on retransmissions and on forward error control (FEC) have been assessed and considered not suitable to be used in conjunction with QOAS since they require supplementary bandwidth, which is not available in the expected highly loaded delivery conditions. Some other error control solutions, including error concealment techniques, seem suitable to reduce the effects of eventual packet losses during multimedia streaming on the end-user perceived quality. As a direct consequence different target loss rates have to be set for QOAS (i.e. higher) that take into account the application of these error concealment methods. These target limits have to be determined after extensive testing, including subjective ones, which should aim at assessing the results of these error control mechanisms on the remote multimedia viewers. Also these tests have to determine which of these mechanisms are best suited for applicability and in what delivery conditions they are recommended.
245
Gabriel-Miro Muntean - Ph.D. Thesis 7. Conclusions and Future Work
QOAS Independence from the Encoding Scheme
QOAS uses for in-service estimation of end-user perceived quality the no-reference moving picture quality metric (Q), as part of its client-located Quality of Delivery Grading Scheme (QoDGS). Q, as a no-reference metric, makes use of some a-priory knowledge about the encoding scheme - MPEG and the effect packet loss has on the MPEG-encoded stream. Since QOAS uses Q, the current version of QOAS is highly dependent on the encoding scheme that may limit its applicability. In consequence further work, aiming at increasing the QOAS generality, may explore possibilities to either use a no-reference metric that is independent from the encoding scheme or a set of different no-reference metrics for a number of popular encoding schemes.
Scalability and Real-Life Testing
For any proposed solution it is significant to allow for scalability. QOAS was such designed that permits new users to be added to the multimedia delivery system with ease. Also the simulation tests performed have shown very good results in terms of consequent end-user perceived quality when new users are added, the QOAS-based system achieving much better performances than other tested streaming solution. However real-life testing may be necessary in order to fully assess how the viewers are affected if their number increases and this is a direction future work may take.
Live Content Streaming Testing
The tests that have already been performed have mainly focused on streaming of prerecorded multimedia clips, which are only a part of the multimedia-based services. Since QOAS allows also for real-time adaptation of live transmissions, further work may include real-life testing of live multimedia deliveries. They can be performed either using an encoding card capable of adaptively modifying the encoding process or multiple encoding cards that encode the same content in different quality versions at the same time. The first case uses QOAS only to command the adaptive measures to be taken, whereas in the second QOAS controls the adaptive streaming in similar fashion it does with the pre-recorded streams, switching the source of transmission between the existing ones.
QOAS Extension for Multicasting
QOAS was designed to allow for a “one-to-one” relationship with the customers to which it is meant to provide on-demand, personalised multimedia-based services as part of a multi-service set offered via local broadband IP-networks. Among these services an important position due to its
246
Gabriel-Miro Muntean - Ph.D. Thesis 7. Conclusions and Future Work
current popularity has broadcast TV. This popularity is explained mainly by the high attraction of the main news programs, the important live transmissions, the major talk shows or the best-known series and by the viewers’ routine-like daily and weekly schedule, which provides very much convenience for the customers. Although broadcast events can be replaced in an on-demand driven environment by multiple unicast deliveries of content to the viewers, it is a waste of resources to stream the same content over the same infrastructure multiple times. Therefore future work may take advantage of this common schedule for a number of viewers and propose solutions that would make use better of the shared resources. Using multicasting for such deliveries seems a good direction for research since although it introduces some overhead, if the number of simultaneous viewers is above a certain threshold, may achieve better performances. However this threshold, the architecture, the localisation of the customers and the complexity of the solution are very important and have to be taken into account in order to achieve good performances.
QOAS Extension for Low Bandwidth and/or W ireless Environments
QOAS was designed such as it currently targets very high bit-rate multimedia streaming over broadband wireline IP networks. However, many services are currently being delivered through much narrow bandwidth links and it is expected that some of them, including multimedia- based services, to complement the broadband related ones, offering to the users a rich set of heterogeneous services. Therefore QOAS may be extended to target lower bandwidth environments, including wireless ones that introduce supplementary challenges such as higher and less predictable loss rates, different encoding schemes such as MPEG-4, for instance and user mobility.
QOAS Extension with MPEG-4
A significant extension to QOAS could take into account the object-based structure of the MPEG-4 encoding solution for multimedia streams. For instance the different quality versions defined for the same multimedia content may not be totally exclusive as in the current solution, but more like complementing each other. The fine granularity scalability (FGS) or the progressive fine granularity scalability (PFGS) that were proposed for MPEG-4 can be used in order to transmit first a base layer (“must have”) and, if the delivery conditions permit, other enhancement layers that would increase the overall quality of the multimedia streams.
247

Gabriel-Miro Muntean - Ph.D. Thesis 7. Conclusions and Future Work
7.5 Summary
This last chapter presents first the conclusions drawn after the Quality-O riented Adaptation
Schem e (Q O A S) has been designed and tested. The results o f these tests, both objective and
subjective, are briefly summ arised and Q O A S ’s significant perform ances, stand-alone and in
com parison to other solutions, are listed indicating very important achievem ents. N ext the
contributions o f the research performed and presented in this thesis are listed and briefly
com m ented. The m ost important benefits o f the Q O A S-based solution for streaming m ultim edia are
also presented in this chapter, which ends with som e suggestion s for future work.
248
Gabriel-Miro Muntean - Ph.D. Thesis Appendix A
Ap pe nd i x A
De f i n i t i o n s for Te c h n i c a l Terms
Connectivity = a host A has “Type-P-Instantaneous-Unidirectional-Connectivity” to a host
B at time T if a type-P packet transmitted from A to B at time T will arrive at B. Bidirectional
connectivity refers to unidirectional connectivity from A to B and from B to A. [203]
One-way delay = the “Type-P-One-way-Delay” from host A to host B is dT at moment T if
the host A sent the first bit of a type-P packet to B at moment T and host B received it at moment
T+dT. The one-way delay is undefined (in fact, infinite) if the packet does not arrive at host B.[204]
One-way loss = the “Type-P-One-way-Packet-Loss” from host A to host B is 0 at moment
T if the host A sent the first bit of a type-P packet to B at moment T and host B received that packet. If host B did not receive that packet “Type-P-One-way-Packet-Loss” at moment T is 1. [210] Note:
In practice the one-way loss is measured over a period of time and is expressed as a percentage of the total number of packets sent.
Error propagation = the process of spreading of an error effect to a larger area, involving
parts that were not affected directly by the original error. [65] Note: The term is used in multimedia
streaming in relation with MPEG encoding and refers to the fact that an error that affects the
compressed data that corresponds to a reference frame will affect not only this frame, but also other
frames that use the reference frame data for decoding. [133]
Round-trip delay = the “Type-P-Round-trip-Delay” from host A to host B at moment T is
dT if host A sent the first bit of a type-P packet to B at time T, B received it and immediately sent
another type-P packet back to A that has received the last bit of that packet at time T+dT. The “Round-trip-Delay” from A to B at T is undefined (informally, infinite) if A sent the first bit of a
type-P packet to B at time T but either B did not receive the packet, B did not send a type-P packet
in response or A did not receive that response packet. [212]
249
Gabriel-Miro Muntean - Ph.D. Thesis Appendix A
Round-trip loss = the “Round-trip-Loss” between host A and host B is equal to the
percentage of the packets sent by host A to host B that were followed by received answer packets
by the host A from the total number of packets sent. Host B is supposed to receive the packets sent by host A and answer by sending other packets back to host A52.
One-way delay variation = the “One-way-IP-Packet-Delay-Variation” for two packets
sent from host A to host B, as the difference between the value of the One-way-delay for the second
packet at T2 and the value of the One-way-Delay for the first packet at Tl. T1 is the time at which A sent the first bit of the first packet, and T2 is the time at which A sent the first bit of the second packet. [213] Note: An alternate, but related, way of computing an estimate of delay variation
(jitter) is given in RFC 1889 [100], By taking the absolute values of the delay variation sequence (as
defined in [213]) and applying an exponential filter with parameter 1/16 the estimate is generated: j_new = 15/16* j_old + l/16*j_new.
Network congestion = a network situation when the traffic increases above a certain limit, the routers are not able to cope with the number of packets to be routed and they begin loosing them. If the traffic further increases, almost no packets are delivered. [215]
Loss pattern = refers to the manner the loss occurs. IETF IPPM Working Group [61] has
defined two loss pattern metrics: the “loss period” metric captures the frequency and length
(burstiness) of loss once it starts, and the “loss distance” metric captures the spacing between the loss periods. [216]
Packet reordering = refers to the process necessary to be performed in order to restore at the destination the order in which the packets were sent. In general packet order is not expected to
change during transmission from a host to another one, but there are cases when it does change. For
example when a single packet stream is sent from a host to another one between which there are
two paths, one with slightly longer transfer time, the packets traversing the longer path may arrive out-of-order. [220]
Bulk transport capacity = measures the network's ability to transfer significant quantities
of data with a single congestion-aware transport connection (e.g., TCP). The formal is: data_sent /
elapsed_time, where "data_sent" represents the unique "data" bits transferred (i.e., not including
header bits or emulated header bits). Note: The amount of data sent should only include the unique
number of bits transmitted (i.e. if a particular packet is retransmitted the data it contains should be counted only once). [223]
250

Gabriel-Miro Muntean - Ph.D. Thesis Appendix A
Available bandwidth = maximum end-to-end throughput given cross traffic load. It is a
metric that varies with the time, background traffic type and variation pattern, used in general as an
average over certain time interval. [255]
W ire time = historically the term was to loosely denote the time at which a packet appeared
on a link, without exactly specifying whether this refers to the first bit, the last bit, or some other
consideration. This informal definition makes a distinction between when the packet's propagation
delays begin and cease to be due to the network rather than the endpoint hosts. [62]
Clock offset = the difference between the time reported by the clock and the "true" time as
defined by the universal time clock at a particular moment. If the clock reports a time Tc and the true time is Tt, then the clock's offset is Tc - Tt. [62, 204]
Synchronized clocks = a pair of clocks that are “accurate” with respect to one another
(their relative offset is zero). Note: Clocks can be highly synchronized yet arbitrarily inaccurate in terms of how well they tell true time. For many measurements, synchronization between two clocks is more important than the accuracy of the clocks. [62, 204]
Clock accuracy = indicates how close the absolute value of the clock’s offset is to zero at a particular moment. Ideally this should be 0. [62, 204]
Clock resolution = the smallest unit by which the clock's time is updated. It gives a lower
bound on the clock's uncertainty. Resolution is defined in terms of seconds. However, resolution is
relative to the clock's reported time and not to true time, so for example a resolution of 10 ms only
means that the clock updates its notion of time in 0.01 second increments, not that this is the true
amount of time between updates. Note: Clocks can have very fine resolutions and yet be wildly inaccurate. [62, 204]
Clock skew = the frequency difference (first derivative of its offset with respect to true time) between the clock and true time at a particular moment. [62, 204]
Clock drift = the variation in skew exhibited by some real clocks (the second derivative of the clock's offset with respect to true time). [62]
Host = a computer capable (if all is working properly) of communicating using the IP protocols. Note: Includes routers. [154]
251

Gabriel-Miro Muntean - Ph.D. Thesis Appendix A
Link = the link-level abstraction of a “virtual direct connection” between two or more
hosts. Often thought of in terms of a single underlying physical connection. [154]
Router = a host that facilitates communication between other hosts by forwarding packets from one link to another. [154]
Path = the network-level abstraction of a “virtual link” from host A to host B. The Internet Protocol (IP) makes it appear to higher levels as though the host A has a direct connection to B.
This apparent direct connection is a “path.” The notion of “path” is a unidirectional concept. [154]
Route = a sequence of links and routers comprising a path. [154]
Router buffer size = the number of bits the router has available for buffering queued packets (the router is seen as a queueing server). [154]
Link bandwidth = a link's data-carrying capacity, measured in bits per second, where
“data” does not include those bits needed solely for link-layer headers. [154]
Link propagation time = the time difference in seconds between the moment when host A
on the link A-B begins sending one bit to host B and the moment when host B has received the bit.[154]
Motion vector = A two-dimensional vector used for motion compensation that provides an
offset from the coordinate position in the current picture or field to the coordinates in a reference frame or reference field. [75, 76]
Mutex object = A mutual exclusion object that allows multiple threads to synchronise access to a shared resource. A mutex has two states: locked and unlocked. Once a mutex has been
locked by a thread, other threads attempting to lock it will block. When the locking thread unlocks (releases) the mutex, one of the blocked threads will acquire (lock) it and proceed.
252

Gabriel-Miro Muntean - Ph.D. Thesis Appendix B
A p p e n d i x B
MPEG 1 and MPEG 2 En c o d i n g
Schemes
B.l MPEG 1 and MPEG 2 Video
The MPEG video compression algorithm is based on the fact that the human eye is more sensitive to brightness changes than chromatic ones. Therefore, in order to achieve compression, the image data is divided into one luminance and two chrominance components, the latter of a smaller
size. After this lossy step the compression method used is Discrete Cosine Transform (DCT) and
then quantisation (Q). These reduce the high spatial frequency components from the image based on
the observation that the human viewer is more sensitive to the reconstruction errors of low
frequency components. The quantisation is meant to reduce the precision of the DCT-coefflcients
according to the required image quality. The higher the Q factor, the lower quality of the image will
be obtained after decompression. A zig-zag scan arranges the low frequency coefficients to the
beginning of the stream. The upper left comer coefficient represents the mean value of the block
and is encoded using the difference from the previous block (DPCM). Since most of the high
frequency coefficients are zero after the quantisation, run length encoding (RLE) is used for further
compression. The final step in the compression process is to minimize the entropy using Huffman
(or arithmetic) coding. The frame encoded in this way is called I-frame (intra frame) because the encoding process uses no information about other frames. A description diagram of the encoding process is presented in Figure B-l.
253
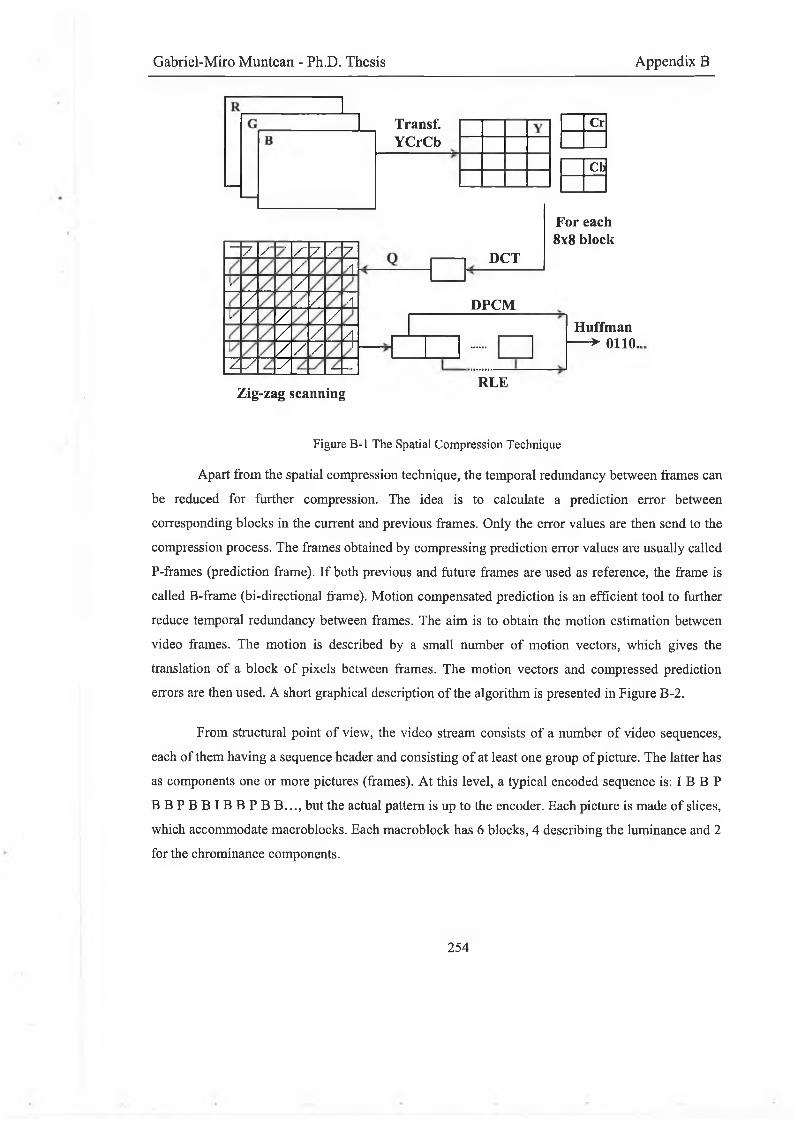
Gabriel-Miro Muntean - Ph.D. Thesis Appendix B
/ / ■/- 7 / 7/ ■1
, // , / -I
1 / / // / A
! / / /Ay y
Zig-zag scanning
T ransí,YCrCb
DCT
D PC M
RLE
Cr
Cb
For each 8x8 block
H uffm an — ► 0110 .,
Figure B-l The Spatial Compression Technique
Apart from the spatial compression technique, the temporal redundancy between frames can be reduced for further compression. The idea is to calculate a prediction error between
corresponding blocks in the current and previous frames. Only the error values are then send to the
compression process. The frames obtained by compressing prediction error values are usually called
P-frames (prediction frame). If both previous and future frames are used as reference, the frame is
called B-frame (bi-directional frame). Motion compensated prediction is an efficient tool to further reduce temporal redundancy between frames. The aim is to obtain the motion estimation between
video frames. The motion is described by a small number of motion vectors, which gives the
translation of a block of pixels between frames. The motion vectors and compressed prediction errors are then used. A short graphical description of the algorithm is presented in Figure B-2.
From structural point of view, the video stream consists of a number of video sequences,
each of them having a sequence header and consisting of at least one group of picture. The latter has as components one or more pictures (frames). At this level, a typical encoded sequence is: I B B P
B B P B B I B B P B B . . . , but the actual pattern is up to the encoder. Each picture is made of slices,
which accommodate macroblocks. Each macroblock has 6 blocks, 4 describing the luminance and 2 for the chrominance components.
254
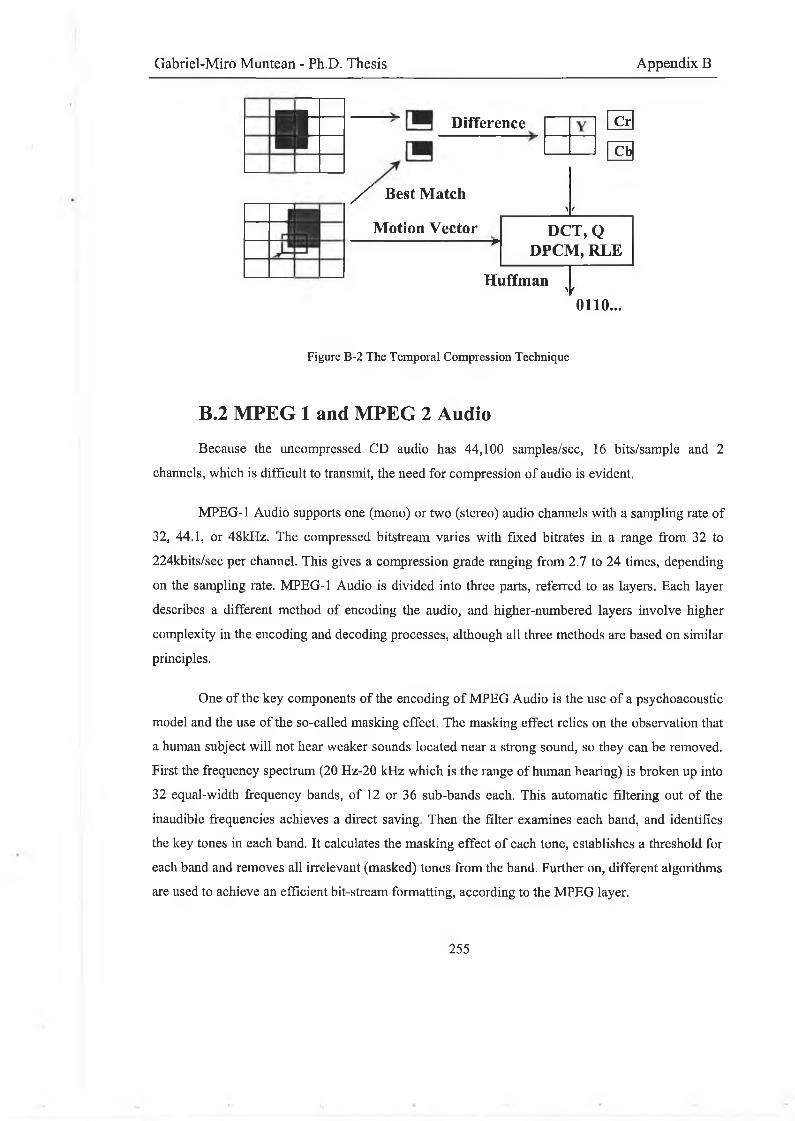
Gabriel-Miro Muntean - Ph.D. Thesis Appendix B
■ _t D ifference Cr
Cb
/ ^ B e s t M atch>f
M otion V ector D C T , QP
D PC M , RLE
H uffm an >f
0110...
Figure B-2 The Temporal Compression Technique
B.2 MPEG 1 and MPEG 2 AudioBecause the uncompressed CD audio has 44,100 samples/sec, 16 bits/sample and 2
channels, which is difficult to transmit, the need for compression of audio is evident.
MPEG-1 Audio supports one (mono) or two (stereo) audio channels with a sampling rate of
32, 44.1, or 48kHz. The compressed bitstream varies with fixed bitrates in a range from 32 to
224kbits/sec per channel. This gives a compression grade ranging from 2.7 to 24 times, depending
on the sampling rate. MPEG-1 Audio is divided into three parts, referred to as layers. Each layer
describes a different method of encoding the audio, and higher-numbered layers involve higher
complexity in the encoding and decoding processes, although all three methods are based on similar principles.
One of the key components of the encoding of MPEG Audio is the use of a psychoacoustic model and the use of the so-called masking effect. The masking effect relies on the observation that
a human subject will not hear weaker sounds located near a strong sound, so they can be removed. First the frequency spectrum (20 Hz-20 kHz which is the range of human hearing) is broken up into
32 equal-width frequency bands, of 12 or 36 sub-bands each. This automatic filtering out of the
inaudible frequencies achieves a direct saving. Then the filter examines each band, and identifies
the key tones in each band. It calculates the masking effect of each tone, establishes a threshold for
each band and removes all irrelevant (masked) tones from the band. Further on, different algorithms are used to achieve an efficient bit-stream formatting, according to the MPEG layer.
255
Gabriel-Miro Muntean - Ph.D. Thesis Appendix B
The Layer I algorithm is the simplest one and is best suited for bit rates above 128kbits/sec
per channel. 384 audio samples are coded into every frame. Layer II is a bit more complex and
improves the compression rate by coding data in larger groups. Layer II use 1152 samples/frame,
which is the same as in Layer III and is targeted for bit rates around 128 kbits/s per channel. Layer
III is the most complex but offers the best audio quality, particularly for bit rates around 64 kbits/s per channel.
MPEG-2 Audio extends the MPEG-1 standard with a set of additional features. The big
difference is the support for multichannel and the multilingual support. It supports up to five high fidelity audio channels and one low frequency enhancement channel. This is perfectly suited for
digital movies where you want surround sounds. The standard also has support for up to seven additional commentary channels. Another feature is the additional support for lower, compressed
bitrates down to 8kbits/sec. MPEG-2 also introduces support for 16, 22.05 and 24kHz. The
commentary channels are allowed to have a sampling rate that is half the high fidelity channel.
All MPEG Audio frames start with a 32-bit header. The header consists of an ID flag, a
layer flag, an error protection flag, a bitrate index, a sampling frequency index, a mode flag, and
other less important data (such as copyright, etc.). After the header the encoded data is placed in a format, which depends on the specific layer.
B.3 MPEG -1 Systems and MPEG 2 Program
The MPEG Systems stream combines one or more streams of video and audio as well as other data, into a single stream suitable for storage or transmission. The syntactical and semantic
rules imposed by the standard enable correct synchronization and playback.
The basic principle of MPEG-1 Systems coding is the use of time stamps which specify the
decoding and display time of audio and video and the time of reception of the multiplexed coded
data at the decoder. This allows for a great degree of flexibility in decoder design, the number of
streams, multiplex packet lengths, video picture rates, audio sample rates, coded data rates, digital storage medium or network performance. It also provides flexibility in selecting which entity is the
master time base, while guaranteeing that synchronization and buffer management are maintained.
Variable data rate operation is supported. A reference model of a decoder system is specified which
provides limits for the ranges of parameters available to encoders and provides requirements for decoders.
256

Gabriel-Miro Muntean - Ph.D. Thesis Appendix B
The stream consists of a continuous sequence of elementary stream packets (known as
“pack”-s). Each pack includes information regarding the clock reference and the stream rate. A
System header follows and then one or more Packet blocks. Apart from packet data, each has a
presentation time stamp, which helps the decoder in its playing process and a stream ID which
indicates whose stream the packet belongs to.
The MPEG-2 Program stream is similar to the MPEG-1 Systems standard. It includes
extensions to support new and future applications. Both are built on a common Packetized
Elementary Stream packet structure, facilitating common video and audio decoder implementations and stream type conversions
257

Gabriel-Miro Muntean - Ph.D. Thesis Appendix C
A p p e n d i x C
Doc ume n t s for Sub j e c t i v e Tes t i ngPersonal Information Page
Record No:
Gender: a) male b) female
Age:
Do you use glasses/contact lenses: a) yes b) no
Are you long/short sighted: a) long sighted b) short sighted c) no
Do you have other visual conditions that may affect your perception of movies (e.g. color blindness, glare):
a) yes b) no
How familiar are you with multimedia streaming:
a) I work in this domain
b) I am familiar
c) I am not familiar
Dou you rent DVDs/tapes: a) often b) sometimes c) never
Do you go to cinema/theatre: a) often b) sometimes c) never
Would you like to watch movies via Video on Demand streaming to your home (e.g. via cable TV):
a) yes b) no
Name (optional*):
E-niail/phone no. (optional*):_______ __________________________________________________
* Fill the optional fields if you want to take part in the draw for prizes. This allows us to contact you.
DisclaimerThe information collected will be kept separately from the perceptual test results and it will not be made public under any form. The name and e-mail address are collected only to allow us to deliver the prizes after the draw.
258

Gabriel-Miro Muntean - Ph.D. Thesis Appendix C
Questionnaire
Record No:
Test Type:
Directions
Could you kindly answer the following questions about the last sequence shown?A) Grade the perceived quality of the streamed multimedia clip on the 1 (the worst quality) to 5
(the best) subjective scale presented in the following table.B) State what you liked about the clip shown (e.g clarity, continuity etc.).C) State what you disliked about the clip shown (e.g blurriness, discontinuity etc.).
Quality scale for subjective testing (ITU-T R P.910)
Rating Quality Impairment5 Excellent Imperceptible
4 Good Perceptible, not annoying
3 Fair Slightly annoying
2 Poor Annoying
1 Bad Very annoying
Example of Answer Sheet
Phase No:
A) Grade the perceived quality of the streamed multimedia clip:
Clip Code: Grade:
B) State what you have appreciated at the clip shown (please indicate others if any):
Continuity: Quality Stability:
Clarity: Media Synchronisation:
C) State what you have disliked at the clip shown (please indicate others if any):
Jerkiness: Quality Variation: Bluring:
Tiling: Media Desynchronisation:
259

Gabriel-Miro Muntean - Ph.D. Thesis Appendix C
Answer Sheet
Phase No:
Clip Code: ______________
A) Grade the perceived quality of the streamed multimedia clip:
Grade:
B) State what you have appreciated at the clip shown (please indicate others if any):
Continuity: Quality Stability:
Clarity: Media Synchronisation:
C) State what you have disliked at the clip shown (please indicate others if any):
Jerkiness: Quality Variation: Bluring:
Tiling: Media Desynchronisation:
260

Gabriel-Miro Muntean - Ph.D. Thesis Appendix C
Clip Code: ____________
A) Grade the perceived quality of the streamed multimedia clip:
Grade:
B) State what you have appreciated at the clip shown (please indicate others i f any):
Continuity: Quality Stability:
Clarity: Media Synchronisation:
C) State what you have disliked at the clip shown (please indicate others if any):
Jerkiness: Quality Variation: Bluring:
Tiling: Media Desynchronisation:
261
Gabriel-Miro Muntean - Ph.D. Thesis Appendix C
Test Instructions
Welcome MessageWelcome to the perceptual testing session organised by the Performance Engineering
Laboratory, Dublin City University.
Test ObjectivesWe have proposed a novel approach for multimedia streaming and we want to test it and
compare it to other approaches. These subjective tests you take part in aim at quantifying the perceived quality of different multimedia clips, streamed using various approaches.
DisclaimerPlease fill in the personal information page. The information collected will be kept separately
from the perceptual test results and will never be made public in any form. Your name and e-mail address are collected only to allow us to deliver the prizes after the draw.
Test DirectionsThe test consists of four phases. In each phase you will be first shown a high quality clip that
gives you a reference for your judgement. Next you will be shown a series of multimedia clips and you will be asked to grade their quality on the indicated 1-5 scale. The grading is done immediately after the clip has ended. You are not allowed to change the screen position, the distance from the screen or to turn the speakers louder since they are fixed for all the test subjects. Once the test has started you are not allowed to pause it or to stop it or to ask questions. However if you feel bored or tired, you can leave the testing room anytime.
ExamplePhase [X]This is the reference clip for the [X]-th phase:[Clip streaming]The [Y]-th multimedia clip is shown next. Immediately after finishing it please answer the
questions.[Clip streaming]
Please grade its quality and answer the questions.[Grading & Answering],
Our test has ended. Could we have your forms, please?[Collection of all the forms]Thank you for your kind participation.
QuestionnaireCould you kindly answer the following questions about the last sequence shown?
A) Grade the perceived quality of the streamed multimedia clip on the 1 (the worst quality) to 5 (the best) subjective scale presented in the given table.B) State what you liked about the clip shown (e.g clarity, continuity etc.)C) State what you disliked about the clip shown (e.g blurriness, discontinuity etc).
262
Gabriel-Miro Muntean - Ph.D. Thesis Publications
List of P u b l i c a t i o n sGabriel-Miro Muntean, Philip Perry, Liam Murphy, “A New Adaptive Multimedia Streaming System for All-IP Multi-Service Networks”, accepted, IEEE Transactions on Broadcasting, 2003
Gabriel-Miro Muntean, Liam Murphy, “Adaptive Pre-recorded Multimedia Streaming”,Proceedings of IEEE GLOBECOM 2002, Taipei, Taiwan, November 2002
Gabriel-Miro Muntean, Liam Murphy, “Adaptive Traffic-Based Techniques For LiveMultimedia Streaming”, Proceedings of the 9lh IEEE International Conference on Telecommunication ICT’2002, Beijing, China, June 2002
Gabriel-Miro Muntean, Liam Murphy, “An Adaptive Mechanism For Pre-recorded Multimedia Streaming Based On Traffic Conditions“, Proceedings of the 11th W3C World Wide Web Conference, Honolulu, Hawaii, USA, May 2002
Gabriel-Miro Muntean, Liam Murphy, “Feedback Controlled Traffic Shaping for Multimedia Transmissions in a Real-Time Client-Server System”, Lecture Notes in Computer Science 2093, Springer-Verlag, 2001, Vol. II, pp. 540-548, ISSN 0302-9743
Gabriel-Miro Muntean, Liam Murphy, “A Novel Feedback Controlled Multimedia Transmission Scheme”, Proceedings of the 8th IEEE International Conference on Telecommunication, Bucharest, Romania, June 2001, Vol. Ill, pp. 123-128
Gabriel-Miro Muntean, Liam Murphy, “Experimental Results for a Feedback-Controlled Multimedia Transmission System”, Proceedings of the 17th IEE UK Teletraffic Sysmposium 2001, Dublin, Ireland, May 2001, pp. 15/1-15/6
Gabriel-Miro Muntean, Liam Murphy, “Some Software Issues of a Real-Time MultimediaNetworking System”, Transactions on Automatic Control and Control Science, Vol. 45, No. 59/111, pp. 35-40, Romania, 2000, ISSN 1224-600X
Gabriel-Miro Muntean, Liam Murphy, “An Object Oriented Prototype System for Feedback Controlled Multimedia Networking”, The Irish Signals and Systems Conference 2000, University College of Dublin, Ireland, June 2000, pp. 173-180
AwardsBest Student Poster Paper Award - The 11th W3C World Wide Web Conference, Honolulu, Hawaii, USA, May 2002, for “An Adaptive Mechanism For Pre-recorded Multimedia Streaming Based On Traffic Conditions”
Best Paper Award - The 8th IEEE International Conference on Telecommunication, Bucharest, Romania, June 2001, for “A Novel Feedback Controlled Multimedia Transmission Scheme”
263
Gabriel-Miro Muntean - Ph.D. Thesis References
Re f e r e nc e s
[1] Lance Harper, “Building the Next Generation Digital Video Network”, White Paper, Cisco Systems, July 2003, http://www.webtorials.com/main/resource/papers/cisco/paper28.htm
[2] John Horrobin, “Delivering MPEG-2 Video Services over a Multiservice IP Network”, Cisco Systems, White Paper, http://www.webtorials.com/main/resource/papers/cisco/paperlO.htm
[3] S. Dravida, D. Gupta, S. Nanda, K. Rege, J. Strombosky, M. Tandon, “Broadband Access over Cable for Next-Generation Services: A Distributed Switch Architecture”, IEEE Communications Magazine, vol. 40, no. 8, August, 2002, pp. 116-124
[4] Jan Hein Bakkers, “European Broadband Market Predictions and Preliminary Analysis 2002- 2003”, IDC, January 2003, http://www.idc.com/getdoc.jhtml?containerId=BT5 IK
[5] Sage Research, “Customers at the Gate: Mounting Demand for Broadband-enabled Services”, February 2002, http://www.sageresearch.com/broadband.pdf
[6] Jitendra Padhye, Jim Kurose, Don Towsley, Rajeev Koodli, “A Model Based TCP Friendly Rate Control Protocol”, Proceedings International Workshop on Network and Operating System Support for Digital Audio and Video - NOSSDAV, 1999
[7] Dorgham Sisalem, A. Wolisz, “LDA+ TCP-Friendly Adaptation: A Measurement and Comparison Study”, Proceedings International Workshop on Network and Operating System Support for Digital Audio and Video - NOSSDAV, 2000
[8] Committee on Broadband Last Mile Technology, National Research Council, “Broadband: Bringing Home the Bits”, National Academy Press, USA, 2002
[9] Fred Dawson, "Market for Fiber in the Loop Picks up Steam", XChange Web, Virgo Publishing Inc., 2002, http://www.xchangemag.com/webextra/231webxl.html
[10] John Horrobin, "Motivations for Distributing Digital Video Over IP Networks", Cisco, October 17, 2001, http://www.cisco.com
[11] Laura Parker, “Building a Multiservice Platform for the Future”, Cisco Systems, White Paper, 2003, http://www.webtorials.com/main/resource/papers/cisco/paperl6.htm
[12] Peter Merriman, "Broadband entertainment over DSL: the business imperative", Alcatel Telecommunications Review, October 1, 2002,http://www.alcatel.com/doctypes/articlepaperlibrary/pdf/ATR2002Q2/us/MerrimanGBp.pdf
264
Gabriel-Miro Muntean - Ph.D. Thesis References
[13] Emmanuel L. Abram-Profeta, Kang G. Shin, “Scheduling Video Programs in Near Video- on-Demand Systems”, Proceedings of ACM Multimedia 97, Seattle, USA, 1997, http://www.acm.org/sigmm/MM97/papers/profeta/NVoD_article ACM.html
[14] Jon Postel, “Internet Protocol”, RFC 760, January 1980, http://www.ietf.org/rfc/rfc760.txt
[15] ITU-T Recommendation E.800, “Terms and Definitions Related to Quality of Service and Network Performance Including Dependability”, August 1994
[16] ISO/IEC 10746-2, “Information Technology - Open Distributed Processing - Reference Model: Foundations”, International Standards Organisation, 1996
[17] Eric S. Crawley, Raj Nair, Bala Rajagopalan, Hal Sandick, “A Framework for QoS-based Routing in the Internet”, RFC 2386, http://www.ietf.org/rfc/rfc2386.txt
[18] Cisco Systems, “Internetworking Technology Handbook”, 2003, http://www.cisco.com/univercd/cc/td/doc/cisintwk/ito_doc/qos.pdf
[19] Microsoft, “Quality of Service”, Technical White Paper, September 1999, http://www.microsoft.com/windows2000/docs/QoSOver.doc
[20] ITU-T Recommendation X.902, “Information Technology - Open Distributed Processing - Reference Model: Foundations”, November 1995
[21] ITU-T Recommendation X.641, “Information technology - Quality of service: Framework”, December 1997
[22] ISO/IEC 13236, “Information technology - Quality of service: Framework”, International Standards Organisation, December 1997
[23] Wolfgang Effelsberg, Ralf Steinmetz, “Video Compression Techniques”, Heidelberg, Germany, dpunkt-Verlag, 1998
[24] Daniel O. Awduche, Joe Malcolm, Johnson Agogbua, Mike O'Dell, Jim McManus “Requirements for Traffic Engineering Over MPLS”, RFC 2702, http://www.ietf.org/rfc/rfc2702.txt
[25] ISO/IEC 15802-3 “Information technology - Telecommunications and information exchange between systems - Local and metropolitan area networks - Common specifications - Part 3: Media Access Control (MAC) Bridges”, International Standards Organisation, 1998
[26] IEEE, "Information technology - Telecommunications and information exchange between systems - Local and metropolitan area networks - Common specifications - Part 3: Media Access Control (MAC) Bridges: Revision (Incorporating IEEE 802. Ip: Traffic Class Expediting and Dynamic Multicast Filtering)”, IEEE P802.1D/D17, May 1998
[27] ITU-T Recommendation Y.1541, “Quality of Service (QoS) Classes for IP Networks”, December 2000
265
Gabriel-Miro Muntean - Ph.D. Thesis References
[28] Bob Braden, David Clark, Scott Shenker, “Integrated Services in the Internet Architecture: an Overview”, RFC 1633, June 1994, http://www.ietf.org/rfc/rfcl633.txt
[29] Scott Shenker, Craig Partridge, Roch Guerin, “Specification of Guaranteed Quality of Service”, RFC 2212, September 1997, http://www.ietf.org/rfc/rfc2212.txt
[30] John Wroclawski, “Specification of the Controlled-Load Network Element Service”, RFC 2211, September 1997, http://www.ietf.org/rfc/rfc2211.txt
[31] Bob Braden et. al, “Resource ReSerVation Protocol (RSVP) - Version 1 Functional Specification”, RFC 2205, September 1997, http://www.ietf.org/rfc/rfc2205.txt
[32] Allison Mankin et. al, “Resource ReSerVation Protocol (RSVP) Version 1 Applicability Statement Some Guidelines on Deployment”, RFC 2208, September 1997, http://www.ietf.org/rfc/rfc2208.txt
[33] Steven Blake et. al, “An Architecture for Differentiated Services”, RFC 2475, December 1998, http://www.ietf.org/rfc/rfc2475.txt
[34] Kathleen Nichols, Steven Blake, Fred Baker, David L. Black “Definition of the Differentiated Services Field (DS Field) in the IPv4 and IPv6 Headers”, RFC 2474, December 1998, http://www.ietf.org/rfc/rfc2474.txt
[35] Van Jacobson, Kathleen Nichols, Kedamath Poduri, “An Expedited Forwarding PHB”, RFC 2598, June 1999, http://www.ietf.org/rfc/rfc2598.txt
[36] Juha Heinanen, Fred Baker, Walter Weiss, John Wroclawski, “Assured Forwarding PHB Group”, RFC 2597, June 1999, http://www.ietf.org/rfc/rfc2597.txt
[37] Eric C. Rosen, Arun Viswanathan, Ross Callon “MPLS Architecture” RFC 3031, January 2001, http://www.ietf.org/rfc/rfc3031 .txt
[38] Ashley Stephenson, “QoS: The IP Solution”, White Paper, Lucent, December 1999, http://www.lucent.com/livelink/139988_Whitepaper.pdf
[39] Mohamed El-Darieby, Dorina C. Petriu, and Jerome Rolia, “A Hierarchical Distributed Protocol for MPLS path creation", Proc. of the 7th IEEE International Symposium on Computers and Communications, pp. 920-926, Taormina, Italy, July 2002
[40] Andrew T. Campbell, “A Quality of Service Architecture”, Ph.D. Thesis, Lancaster University, England, UK, January 1996
[41] Andrew T. Campbell, Geoff Coulson and David Hutchison, “A Suggested QoS Architecture for Multimedia Communications”, ISO/IEC JTC1/SC21/WG1 N1201, International Standards Organisation, UK, November, 1992 and Internal Report MPG-92-37, Department of Computing, Lancaster University, UK, 1992
266
Gabriel-Miro Muntean - Ph.D. Thesis References
[42] Andrew T. Campbell, Geoff Coulson and David Hutchison, “A Quality of Service Architecture”, ACM Computer Communications Review, Vol. 24, No. 2, April 1994
[43] David Hutchison, Andreas Mauthe and Nicholas Yeadon, Quality-of-service Architecture: Monitoring and Control of Multimedia Communications”, IEEE Electronics and Communication Engineering Journal, Vol. 9, No. 3, 1997, pp. 100-106
[44] Andrew Campell, Geoff Coulson, Francisco Garcia, and David Hutchison, “A Continuous Media Transport and Orchestration Service”, Proceedings of SIGCOMM'92, Baltimore, USA, August 1992, pp. 99-110
[45] Tricha Anjali, Caterina Scoglio, L. C. Chen, Ian F. Akyildiz and George Uhl, “ABEst: an Available Bandwidth Estimator within an Autonomous System," Proceedings of IEEE Globecom 2002, Taipei, Taiwan, November 2002
[46] Chris Sluman, “Quality of Service in Distributed Systems”, BSI/IST21 /-/1/5:33, British Standards Institution, UK, October 1991
[47] Anindo Banerjea, Domenico Ferrrari, Bruce A. Mah, Mark Moran, Dinesh C. Verma, Hui Zhang, “The Tenet Real-time Protocol Suite: Design, Implementation, and Experiences”, IEEE/ACM Transactions on Networking, Vol. 4, No. 1, February 1996, pp. 1-10
[48] Lars C. Wolf, Ralf G. Herrtwich, “The System Architecture of the Heidelberg Transport System”, ACM Operating System Review, Vol. 28, No. 2, April 1994
[49] Bernd Wolflnger, Mark Moran, "A Continuous Media Data Transport Service and Protocol for Real-Time Communication in High Speed Networks," Proc. NOSSDAV'91, Heidelberg, Germany, November 1991
[50] Carsten Vogt, Lars C. Wolf, Ralf G. Herrtwich and Hartmut Wittig, “HeiRAT - Quality-of- Service Management for Distributed Multimedia Systems”, Multimedia Systems Journal, Vol. 6, No. 3, pp. 152-166, 1998
[51] Aurel A. Lazar, Shailendra K. Bhonsle and Koon-Seng S. Lim, “A Binding Architecture for Multimedia Networks”, Journal of Parallel and Distributed Computing, Vol. 30, No. 2, 1995, pp. 204-216
[52] Klara Nahrstedt, Jonathan Smith, “Design, Implementation and Experiences of the OMEGA End Point Architecture”, Technical Report MS-CIS-95-22, University of Pensylvania, May 1995, http://citeseer.nj.nec.com/nahrstedt95design.html
[53] TINA, http://www.tinac.com/about/principles_of_tinac.htm
[54] Brian Field, Taieb F. Znati and Daniel Mosse, “NU-NET: A Framework For A Versatile Network Architecture To Support Real-Time Communication Performance Guarantees”, Proceedings of INFOCOM’95, 1995
267
Gabriel-Miro Muntean - Ph.D. Thesis References
[55] Deming Chen, Regis Colwell, Herschel Gelman, Panos K. Chrysanthis, Daniel Mosse, “A Framework for Experimenting with QoS for Multimedia Services”, Proceedings Conference on Multimedia Computing and Networking, 1996
[56] Omotunde Adebayo, John Neilson, Dorina C. Petriu, “A Performance Study of Client/Broker/Server Systems”, Proceedings of IBM Centre for Advanced Studies Conference - CASCON'97, pp.l 16-130, Toronto, November 1997
[57] Constant Gbaguidi, Oliver Verscheure and Jean-Pierre Hubaux, “A New Flexible and Modular QoS Mapping Framework based on Psychophysics”, IFIP/IEEE Conference on the Management of Multimedia Networks and Services (MMNS), Montreal, Canada, July 1997
[58] Cristina Aurrecoechea, Andrew Cambell, and Linda Hauw, “A Survey of QoS Architectures, “Multimedia Systems Journal”, May 1998, Vol. 6, No. 3, pp. 138-15
[59] Dapeng Wu, Yiwei Thomas Hou, Wenwu Zhu, Ya-Qin Zhang, Jon. M. Peha, “Streaming Video over the Internet: Approaches and Directions”, IEEE Transactions On Circuits and Systems for Video Technology, Vol. 11, No. 3, 2001, pp. 282-300
[60] Xin Wang, H. Schulzrinne, "Comparison of Adaptive Internet Multimedia Applications", IEICE Trans, on Communications, Vol. E82-B/6, June 1999, pp. 806 - 818
[61] IETF IP Performance Metrics (IPPM) Working Group (WG), http://www.ietf.org/html.charters/ippm-charter.html
[62] Vem Paxson, Guy Aimes, Jamshid Mahdavi, and Matt Mathis, “Framework for IP Performance Metrics", RFC 2330, May 1998, http://www.faqs.org/rfcs/rfc2330.html
[63] ITU-T Recommendation P.910, “Subjective Video Quality Assessment Methods for Multimedia Applications”, September 1999
[64] ITU-T Recommendation P.800, “Methods for Subjective Determination of Transmission Quality”, August 1996
[65] Vasudev Bhaskaran, Konstantinos Konstantinides, “Image and Video Compression Standards - Algorithms and Architectures”, Kluwer Academic Publishers, USA, 1997
[66] Jorma J. Rissanen and Glen G. Langdon, “Arithmetic Coding”, IBM Journal of Research and Development, Vol. 23, No. 2, March 1979, pp. 149-162
[67] ITU-T Recommendation T.81, “Information technology - Digital compression and coding of continuous-tone still images - Requirements and guidelines”, September 1992
[68] ISO/IEC 10918-1, “Information technology - Digital compression and coding of continuous- tone still images - Requirements and guidelines”, International Standards Organisation, 1994
[69] ITU-T Recommendation T.800, “Information technology - JPEG 2000 image coding system: Core coding system”, August 2002
268

Gabriel-Miro Muntean - Ph.D. Thesis References
[70] ISO/IEC 15444-1, “Information technology - JPEG 2000 image coding system: Core coding system”, International Standards Organisation, December 2000
[71] ISO/IEC 15444-3, “Information technology - JPEG 2000 image coding system: Motion JPEG 2000”, International Standards Organisation, July 2002
[72] ISO/IEC Moving Pictures Expert Group (MPEG),http://www.chiariglione.org/mpeg/index.htm
[73] ISO/IEC International Standard 11172, “MPEG-1 - Coding of Moving Pictures & Associated Audio for Digital Storage Media up to 1.5 Mbits/s”, November 1993
[74] ISO/IEC International Standard 13818, “MPEG-2 - Generic Coding of Moving Pictures and Associated Audio Information”, November 1994
[75] ITU-T Recommendation H.262, “Information technology - Generic coding of moving pictures and associated audio information: Video”, February 2000
[76] ISO/IEC 14496 “Information technology - Coding of audio-visual objects”, International Standards Organisation, 2001
[77] W. Li, “Streaming Video Profile in MPEG-4”, IEEE Transaction on Circuits and Systems for Video Technology, Vol. 11, No. 2, February 2001
[78] F. Wu, S. Li, Y.-Q. Zhang, “A Framework for Efficient Progressive Fine Granularity Scalable Video Coding”, IEEE Transaction on Circuits and Systems for Video Technology, Vol. 11, No. 2, February 2001
[79] ITU-T Recommendation H.320, “Narrow-band visual telephone systems and terminal equipment”, May 1999
[80] ITU-T Recommendation H.261, “Video codec for audiovisual services at p x 64 Kb/s”, March 1993
[81] ITU-T Recommendation H.263, “Video coding for low bit rate communication”, Feb. 1998
[82] ITU-T Recommendation H.264 and ISO/IEC 11496-10, “Advanced Video Coding”, Final Committee Draft, Document JVT-E022, September 2002
[83] ITU-T Recommendation G.711, “Pulse code modulation (PCM) of voice frequencies”, November 1988
[84] ITU-T Recommendation G.722, “7 kHz audio-coding within 64 kbit/s”, November 1988
[85] ITU-T Recommendation G.728, “Coding of speech at 16 kbit/s using low-delay code excited linear prediction”, September 1992
269
Gabriel-Miro Muntean - Ph.D. Thesis References
[86] Jorg Widmer, Robert Denda, Martin Mauve, “A Survey on TCP-Friendly Congestion Control”, IEEE Network Magazine, Special Issue: Control of Best Effort Traffic, May/June 2001
[87] Supratnik Bhattacharyya, Don Towsley, Jim Kurose, “The Loss Path Multiplicity Problem in Multicast Congestion Control”, Proceedings of IEEE INFOCOM, New York, USA, 1999, Vol. 2, pp. 856-863
[88] S. Jamaloddin Golestani, Krishan Sabnani, “Fundamental Observations on Multicast Congestion Control in the Internet”, Proceedings of IEEE INFOCOM, New York, USA, 1999, Vol. 2, pp. 990-1000
[89] Sally Floyd, Kevin Fall, “Promoting the Use of End-to-end Congestion Control in the Internet”, IEEE/ACM Transactions on Networking, Vol. 7, No. 4, August 1999, pp. 458-472
[90] Reza Rejaie, Mark Handley, and Deborah Estrin, “Layered Quality Adaptation for Internet Video Streaming”, IEEE Journal on Selected Areas of Communications (JSAC), Special Issue on Internet QOS, 2000
[91] Dapeng Wu, Yiwei Thomas Hou, Ya-Qin Zhang, “Transporting Real-time Video over the Internet: Challenges and Approaches”, Proceedings of the IEEE, Vol. 88, No. 12, December 2000
[92] H. Kanakia, P. Mishra, A. Reibman “An Adaptive Congestion Control Scheme For Realtime Packet Video Transport”, Proceedings of ACM SIGCOMM, San Francisco, California, USA, September, 1993, pp. 20-31
[93] S. Jacobs, Alexandras Eleftheriadis, “Streaming Video Using Dynamic Rate Shaping and TCP Congestion Control”, Journal of Visual Communication and Image Representation, Vol. 9, No. 3, September 1998, pp. 221-222
[94] S. Jacobs, Alexandros Eleftheriadis, “Real-time Dynamic Shaping and Control for Internet Video Applications”, Workshop on Multimedia Signal Processing, Princeton, USA, June 1997
[95] Alexandros Eleftheriadis, S. Penjan, D. Anastassiou, “Constrained and General Dynamic Rate Shaping of Compressed Digital Video”, Proceedings of IEEE International Conference on Image Processing, Washington, USA, October 1995
[96] Jean C. Bolot, T. Turletti, “A Rate Control Mechanism for Packet Video in the Internet”, Proceedings of INFOCOM, Toronto, Canada, June, 1994, pp. 1216-1223
[97] Jean C. Bolot, T. Turletti, “Adaptive Error Control for Packet Video in the Internet”, Proceedings of ICIP, Lausanne, Switzerland, September 16-19, 1996
[98] Jean C. Bolot, T. Turletti, I. Wakeman, “Scalable Feedback Control for Multicast Video Distribution in the Internet'”, Proceedings of ACM/SIGCOMM, Vol. 24, No. 4, London, UK, October 1994, pp. 58-67
270
Gabriel-Miro Muntean - Ph.D. Thesis References
[99] Dorgham Sisalem, Henning Schulzrinne, “The Loss-Delay Adjustment Algorithm: A TCP- friendly Adaptation Scheme”, Proceedings International Workshop on Network and Operating System Support for Digital Audio and Video - NOSSDAV, Cambridge, England, July 1998
[100] Henning Schulzrinne, S. Casner, R. Frederick, V. Jacobson,: "RTP: A Transport Protocol for Real-Time Applications", RFC1889, January 1996, http://www.ietf.org/rfc/rfcl889.txt
[101] Jitendra Padhye, Victor Firoiu, Don Towsley, Jim Kurose, “Modeling TCP Throughput: A Simple Model and its Empirical Validation”, Proceedings of ACM SIGCOMM, Vancouver, Canada, October 1998
[102] Ingo Busse, Bernd Deffner, Henning Schulzrinne, “Dynamic QoS Control of Multimedia Applications based on RTP”, Computer Communications Journal, Vol. 19, No. 1, January 1996
[103] Reza Rejaie, Mark Handley and Deborah Estrin, “RAP: An End-to-end Rate-based Congestion Control Mechanism for Realtime Streams in the Internet”, Proceedings of INFOCOM, March 1999
[104] Reza Rejaie, Mark Handley and Deborah Estrin, “Quality Adaptation for Unicast Audio and Video”, Proceedings of ACM SIGCOMM, September 1999
[105] Sally Floyd, Mark Handley, Jitendra Padhye, Jorg Widmer, “Equation-based Congestion Control for Unicast Applications”, ACM SIGCOMM, August 2000
[106] Hay der Radha, Yingwei Chen, Kavitha Parthasarathy and Robert Cohen, “Scalable Internet Video using MPEG-4”, Signal Processing: Image Communication, Vol. 15, 1999, pp. 95-126
[107] Seongho Cho, Heekyoung Woo and Jong-won Lee, “ATFRC: Adaptive TCP Friendly Rate Control Protocol”, Lecturer Notes in Computer Science, Springer-Verlag Heidelberg, Germany, No. 2662, 2003
[108] Charles Krasic, Jonathan Walpole and Wu-Chi Feng, “Quality-Adaptive Media Streaming by Priority Drop”, Proceedings International Workshop on Network and Operating System Support for Digital Audio and Video - NOSSDAV, USA, 2003
[109] Thierri Turletti, C. Huitema, "Videoconferencing in the Internet”, IEEE/ACM Transactions on Networking Journal, June 1996, pp. 340-351
[110] Jean C. Bolot, Thierry Turletti, “Experience with Rate Control Mechanisms for Packet Video in the Internet'”, ACM SIGCOMM Computer Communication Review, Vol. 28, No 1, January 1998, pp. 4-15
[111] Steve McCanne, Van Jacobson and Martin Vetterli, “Receiver-Driven Layered Multicast”, Proceedings of the ACM SIGCOMM'96, Stanford, California, USA, August 1996, pp. 117-130
[112] A. Legout, E. W. Biersack, “Pathological Behaviors for RLM and RLC”, Proceedings International Workshop on Network and Operating System Support for Digital Audio and Video - NOSSDAV, 2000
271
Gabriel-Miro Muntean - Ph.D. Thesis References
[113] Lorenzo Vicisano, Jon Crowcroft, and Luigi Rizzo, “TCP-like Congestion Control for Layered Multicast Data Transfer”, Proc. of IEEE INFOCOM, vol. 3, pp. 996-1003, March 1998
[114] John Byers, Michael Frumin, Gavin Horn, Michael Luby, Michael Mitzenmacher, Alex Roetter and William Shaver, “FLID-DL: Congestion Control for Layered Multicast,” Proceedings International Workshop on Networked Group Communication (NGC 2000), November 2000
[115] John Byers, Michael Luby, Michael Mitzenmacher and A. Rege, “A Digital Fountain Approach to Reliable Distribution of Bulk Data”, Proc. of ACM SIGCOMM, September 1998
[116] X. Li, S. Paul and M. H. Ammar, “Layered video multicast with retransmissions (LVMR): Evaluation of Hierarchical Rate Control”, Proc. IEEE INFOCOM, vol. 3, pp. 1062-1072, March 1998
[117] Dorgham Sisalem and A. Wolisz, “MLDA: A TCP-friendly Congestion Control Framework for Heterogeneous Multicast Environments,” Proceedings of the International Workshop on Quality of Service (IWQoS), June 2000
[118] Injong Rhee, Volkan Ozdemir, and Yung Yi, “TEAR: TCP Emulation At Receivers - Flow Control for Multimedia Streaming”, Technical Report, Department of Computer Science, NCSU, April 2000, http://www.csc.ncsu.edu/faculty/rhee/export/tear_page/
[119] S. Y. Cheung, M. Ammar, X. Li, “On the Use of Destination Set Grouping to Improve Fairness in Multicast Video Distribution”, Proc. of IEEE INFOCOM, March 1996, pp. 553-560
[120] Q. Guo, Q. Zhang, W. Zhu, Y.-Q. Zhang, “Sender Adaptive and Receiver-Driven Video Multicasting”, IEEE Symposium on Circuits and Systems, Sydney, Australia, May 2001
[121] Nicholas Yeadon, Francisco Garcia, David Hutchison and Doug Shepherd, “Filters: QoS Support Mechanisms for Multipeer Communications”, IEEE Journal on Selected Areas in Communications, Vol. 14, No. 7, September 1996, pp. 1245-1262
[122] Nicholas Yeadon,, “QoS Filtering For Multimedia Communications”, Ph.D. Thesis, Cpomputing Department, Lancaster University, UK, May 1996
[123] Andreas Mauthe, Francisco Garcia, David Hutchison, Nicholas Yeadon, “QoS Filtering and Resource Reservation in an Internet Environment”, Multimedia Tools and Applications, Vol. 13, Kluwer Academic Publishers, Netherlands, 2001, p. 285-306
[124] E. Amir, S. McCanne and H. Zhang, “An Application Level Video Gateway”, Proceedings of ACM Multimedia '95, San Francisco, November 1995
[125] I. Kouvelas, V. Hardman and J. Crowcroft, “Network Adaptive Continuous Media Applications Through Self Organised Transcoding”, Proc. International Workshop on Network and Operating System Support for Digital Audio and Video - NOSSDAV, Cambridge, UK, 1998
272
Gabriel-Miro Muntean - Ph.D. Thesis References
[126] T. Shanableh and M. Ghanbari M., “Heterogeneous Video Transcoding to Lower Spatio- Temporal Resolutions and Different Encoding Formats, IEEE Transactions on Multimedia, Vol. 2, pp. 101-110, June 2000
[127] J. Youn, J. Xin and M.-T. Sun, “Fast Video Transcoding Architectures for Networked Multimedia Applications”, Proceedings of the IEEE ISCAS, Geneva, Switzerland, Vol. 4, pp. 25- 28, May 2000
[128] Zhijun Lei, Nicolas D. Georganas, “Rate Adaptation Transcoding for Precoded Video Streams”, Proceedings of ACM Multimedia Conference, Juan Les Pins, France, 2002
[129] Limin Wang, Ajay Luthra and Bob Eifrig, “Rate Control for MPEG Transcoders”, IEEE Transaction on Circuits and Systems for Video Technology, Vol. 11, No. 2, February 2001
[130] M. Yuen and H. R. Wu, “A Survey of Hybrid MC/DPCM/DCT Video Coding Distortions”, Signal Processing Journal, Vol. 70, No. 3, 1998, pp. 247-278
[131] ANSI Tl.801.02, “Digital Transport of Video T eleconferencing/Video Telephony Signals - Performance Terms, Definitions and Examples”, American National Standards Institute (ANSI), Alliance for Telecommunications Industry Solutions, 1996
[132] Dimitrios Miras, “Network QoS Needs of Advanced Internet Applications - A Survey, Intemet2 QoS Working Group, 2002,http://qos.intemet2.edu/wg/apps/fellowship/Docs/Intemet2AppsQoSNeeds.pdf
[133] Oliver Verscheure, Pascal Frossard, Maher Hamdi, “User-Oriented QoS Analysis in MPEG-2 Video Delivery”, Journal of Real-Time Imaging, vol. 5, no. 5, October 1999
[134] Stefan Winkler, “Vision Models and Quality Metrics for Image Processing Applications”, Ph.D. Thesis, Swiss Federal Institute of Technology, Lausanne, Switzerland, 2000
[135] Christian J. van den Branden Lambrecht, “Perceptual Models and Architectures for Video Coding Applications, Ph.D. Thesis, L'Ecole Polytechnique Federale de Lausanne (EPFL), Lausanne, Switzerland, 1996
[136] Pascal Frossard, “Robust and Multiresolution Video Delivery: From H.26x to Matching Pursuit Based Technologies”, Ph.D. Thesis, L'Ecole Polytechnique Federale de Lausanne (EPFL), Lausanne, Switzerland, 2001
[137] Stefan Winkler, Animesh Sharma, David McNally, “Perceptual Video Quality and Blockiness Metrics for Multimedia Streaming Applications”, Proceedings of the International Symposium on Wireless Personal Multimedia Communications, Aalborg, Denmark, September 2001, pp. 553-556
[138] “Video Quality Metrix - Frequently Asked Questions”, Samoff Web Site, http://www.samoff.com/products_services/video_vision/jndmetrix/documents/vqm_faq.asp
273
Gabriel-Miro Muntean - Ph.D. Thesis References
[139] The Video Quality Experts Group (VQEG), Final Report, April 2000, http://www.its.bldrdoc.gov/vqeg/pdf/final_report_aprilOO.pdf
[140] Mike Knee, “The Picture Appraisal Rating (PAR) - a single-ended picture quality measure for MPEG-2”, White Paper, Snell & Wilcox, January 2000, http://www.snellwilcox.com/products/mosalina/content/downloads/parpaper.pdf
[141] Mosalina, MPEG-2 Analyzer and Quality Control Tool, Mosalina Brochure, Snell & Wilcox http://www.snellwilcox.com/products/mosalina/content/downloads/mosabrochure.pdf
[142] “A Guide to Maintaining Video Quality of Service for Digital Television Programs”, White Paper, Tektronix, 2000, http://www.broadcastpapers.com/tvtran/25W_14000_0.pdf
[143] “Pixelmetrix and KDD Media to jointly market VP Series Picture Quality Analyzer “, Pixelmetrix Press Release http://www.pixelmetrix.com/rel/press%20release/lkdd.pdf
[144] Stefan Winkler “A Perceptual Distortion Metric for Digital Color Video”, Proceedings of Human Vision and Electronic Imaging SPIE, Vol. 3644, San Jose, USA, January 1999
[145] Andrew B. Watson, J. Hu, and J. F. III. McGowan, “Digital Video Quality Metric Based on Human Vision,” Journal of Electronic Imaging, Vol. 10, No. 1, pp. 20-29, 2001
[146] Andrew B. Watson, “Method and Apparatus for Evaluating the Visual Quality of Processed Digital Video Sequences”, U.S. Patent No. 6,493,023, December 2002
[147] A.P. Hekstra et. al, “PVQM - A Perceptual Video Quality Measure”, Journal of Signal Processing: Image Communication, Vol. 17, No. 10, 2002, pp. 781-798
[148] ITU-T R. P.861, “Objective Quality Measurement of Telephone-band (300 - 3400 Hz) Speech Codecs”, February 1996
[149] Stephen Wolf and Margaret H. Pinson, “In-Service Video Quality Measurement System Utilizing an Arbitrary Bandwidth Ancillary Data Channel”, U.S. Patent No. 6,496,221, Dec. 2002
[150] Arthur A. Webster et al., “An Objective Video Quality Assessment System Based on Human Perception” SPIE Human Vision, Visual Processing, and Digital Display IV, Vol. 1913, February 1993, San Jose, USA, pp. 15-26
[151] Christian J. van den Branden Lambrecht, Oliver Verscheure, “Perceptual Quality Measure Using a Spatio-Temporal Model of the Human Visual System”, Proceedings of the SPIE, Vol. 2668, San Jose, USA, February 1996, pp. 450-461
[152] Christian J. van den Branden Lambrecht, “Color Moving Pictures Quality Metric”, Proceedings of International Conference on Image Processing ICIP'96, vol. 1, Lausanne, Switzerland, September 16-19, 1996, pp. 885-888
[153] ITU-R BT.500, “Methodology for the Subjective Assessment of the Quality of Television Pictures”
274
Gabriel-Miro Muntean - Ph.D. Thesis References
[154] Vem Paxson, “Measurements and Analysis of End-to-End Internet Dynamics”, Ph.D. Dissertation, U.C. Berkeley, 1997, ftp://ftp.ee.lbl.gov/papers/vp-thesis/dis.ps.gz
[155] Colin Perkins, Orion Hodson, Vicky Hardman, “A Survey of Packet-Loss Recovery Techniques for Streaming Audio”, IEEE Network Magazine, Vol. 12, Sept./Oct. 1998, pp. 40-48
[156] Joohee Kim, Russell M. Mersereau, and Yucel Altunbasak, “Error-Resilient Image and Video Transmission Over the Internet Using Unequal Error Protection”, IEEE Transactions on Image Processing, Vol. 12, No. 2, February 2003, pp. 121-131
[157] Wai-tian Tan and Avideh Zakhor, ’’Multicast Transmission of Scalable Video using Receiver-driven Hierarchical FEC “, in Packet Video Workshop, New York, USA, April 1999
[158] Jean C. Bolot and Thierry Turletti, “Adaptive Error Control for Packet Video in the Internet”, Proceedings of IEEE International Conference on Image Processing (ICIP), Lausanne, Switzerland, September 1996, pp. 25-28
[159] Bert J. Dempsey, Jorg Liebeherr, Alfred C. Weaver, “On Retransmission-Based Error Control for Continuous Media Traffic in Packet-Switching”, Computer Networks and ISDN Systems, Vol. 28, No. 5, 1996, pp. 719-736
[160] Xue Li, Sanjoy Paul, Mostafa Ammar, “Layered Video Multicast with Retransmissions (LVMR): Evaluation of Hierarchical Rate Control”, Proc. of the International Workshop on Network and Operating System Support for Digital Audio and Video - NOSSDAV, 1997, pp. 161-172
[161] Dapeng Wu, Yiwei Thomas Hou, Bo Li, Member, Wenwu Zhu, Ya-Qin Zhang and H. Jonathan Chao, “An End-to-End Approach for Optimal Mode Selection in Internet Video Communication: Theory and Application”, IEEE Journal on Selected Areas in Communications (JSAC), Special Issue on Error-Resilient Image and Video Transmission, Vol. 18, No. 6, June 2000, pp. 977-995
[162] Rui Zhang, Shankar L. Regunathan, and Kenneth Rose Video Coding with Optimal Inter/Intra-Mode Switching for Packet Loss Resilience, IEEE Journal on Selected Areas in Communications (JSAC), Special Issue on Error-Resilient Image and Video Transmission, Vol. 18, No. 6, June 2000, pp. 966-976
[163] Doo-Man Chung and Yao Wang, "Multiple Description Image Coding Using Signal Decomposition and Reconstruction Based on Lapped Orthogonal Transforms," IEEE Trans, on Circuits and Systems for Video Technology, Vol. 9, No. 6, September 1999, pp. 895-908
[164] Jae-Young Pyun, Jae-Jeon Shim, Sung-Jea Ko, and Sang Hyun Park, “Packet Loss Resilience for Video Stream over the Internet”, IEEE Transactions on Consumer Electronics, pp. 556-561, August 2002
[165] Jon Postel, "User Datagram Protocol," RFC 768, August 1980, http://www.ietf.org/rfc/rfc768.txt
275
Gabriel-Miro Muntean - Ph.D. Thesis References
[166] Jon Postel, “Transmission Control Protocol”, RFC 793, September 1981, http ://www.ietf.org/rfc/rfc793 .txt
[167] Henning Schulzrinne, A. Rao, R. Lanphier, "Real Time Streaming Protocol (RTSP)", RFC2326, April 1998, http://www.ietf.org/rfc/rfc2326.txt
[168] J. Rosenberg, H. Schulzrinne, G. Camarillo, A. Johnston, J. Peterson, R. Sparks, M. Handley, and E. Schooler, “SIP: Session Initiation Protocol”, RFC 3261, June 2002, http://www.ietf.org/rfc/rfc3261 .txt
[169] Michael Rabinovich and Oliver Spatscheck, “Web Caching and Replication”, Addison Wesley Publishing House, USA, 2002
[170] Markus Hofmann, T. S. Eugene Ng, Katherine Guo, Sanjoy Paul and Hui Zhang, “Caching Techniques for Streaming Multimedia Over the Internet”, Technical Report BL011345-990409- 04TM, Bell Laboratories, April 1999, http://citeseer.nj.nec.com/hofmannOOcaching.html
[171] Subhabrata Sen, Jennifer Rexford, and Don Towsley, “Proxy Prefix Caching for Multimedia Streams,” Proceedings of the IEEE INFOCOM’99, New York, USA, March 1999, p p .1310-1319
[172] Sung-Ju Lee, Wei-Ying Ma and Bo Shen, “An Interactive Video Delivery and Caching System Using Video Summarization”, Computer Communications Journal, Vol. 25, No. 4, March 2002, pp. 424-435
[173] Reza Rejaie, Haobo Yu, Mark Handley, Deborah Estrin, “Multimedia Proxy Caching Mechanism for Quality Adaptive Streaming Applications in the Internet”, Proceedings of IEEE INFOCOM, Tel-Aviv, Israel, March 2000
[174] Soam Acharya and Brian Smith, “MiddleMan: A Video Caching Proxy Server”, Proceedings of the International Workshop on Network and Operating System Support for Digital Audio and Video NOSSDAV, Chapel Hill, USA, June 2000
[175] Jia Wang, “A Survey of Web Caching Schemes for the Internet”, ACM Computer Communication Review, Vol. 29, No. 5, October 1999, pp. 36-46
[176] Reza Rejaie, “An End-to-End Architecture for Quality Adaptive Streaming Applications in the Internet”, Ph.D. Thesis, Computer Science Department, University of Southern California, September 1999
[177] Greg Barish and Katia Obraczka, “World Wide Web Caching: Trends and Techniques”, IEEE Communications Magazine, Internet Technology Series, May 2000
[178] Anawat Chankhunthod, Peter B. Danzig, Chuck Neerdaels, Michael F. Schwartz, Kurt J. Worrell, “A Hierarchical Internet Object Cache”, Proceedings of the USENIX Technical Conference, January 1996
276
Gabriel-Miro Muntean - Ph.D. Thesis References
[179] Dean Povey, John Harrison, “A Distributed Internet Cache”, Proceedings Proceedings of the Australasian Computer Science Conference, February 1997
[180] Pablo Rodriguez, Christian Spanner, Ernst W. Biersack, “Web Caching Architectures: Hierarchical and Distributed Caching”, Proc. of the International Web Caching Workshop, 1999
[181] Duane Wessels, K. Claffy, “Internet Cache Protocol (ICP), version 2”, RFC 2186, September 1997, http://www.ietf.org/rfc/rfc2186.txt
[182] Wallapak Tavanapong, Minh Ttran, Junyu Zhou, Srikanth Krishnamohan, “Video Caching Network for On-Demand Video Streaming”, Proc. of IEEE GLOBECOM, Taipei, Taiwan, 2002
[183] Michael Rabinovich, Jeff Chase and Syam Gadde, “Not All Hits are Created Equal: Cooperative Proxy Caching over a Wide-area Network”, Computer Networks and ISDN Systems, Vol. 30, No. 22/23, November 1998, pp. 2253-2259
[184] Kirk L. Johnson, John F. Carr, Mark S. Day and M. Frans Kaashoek, “The Measured Performance of Content Distribution Networks”, Computer Communications Journal, Vol. 24, No. 2, February 2001, pp. 202-206
[185] Balachander Krishnamurthy, Craig Wills and Yin Zhang, “On the Use and Performance of Content Distribution Networks”, Proceedings of SIGCOMM IMW, California, USA, November 2001,pp. 169-182
[186] Stefan Saroiu, Krishna P. Gummadi, Richard J. Dunn, Steven D. Gribble, Henry M. Levy, “An Analysis of Internet Content Delivery Systems”, Proceedings of the Fifth Symposium on Operating Systems Design and Implementation, Boston, December 2002
[187] Reza Rejaie and Antonio Ortega, “PALS: Peer-to-peer Adaptive Layered Streaming”, Proceedings of NOSSDAV 2003
[188] Harmonic Inc., “Network and Access Architecture for On-Demand Cable Television”, Cable Telecommunication Engineering Journal, Vol. 24, No. 1, March 2002
[189] S.-H. Gary Chan, Fouad A. Tobagi, “Providing Distributed On-Demand Video Services Using Multicasting and Local Caching”, Proceedings of IEEE Multimedia Applications, Services and Technologies, Vancouver, Canada, June 1999
[190] Jack Y. B. Lee, “On a Unified Architecture for Video-on-Demand Services”, IEEE Transactions in Multimedia, Vol. 4, No. 1, March 2002, pp. 38-47
[191] Scott A. Barnett and Garry J. Anido, "A Cost Comparison of Distributed and Centralized Approaches to Video-on-Demand", IEEE Journal of Selected Areas in Communications, Vol. 14, No.6, August 1996, pp. 1173-1183
[192] Eric Wing Ming Wong and Sammy Chi Hung Chan, “Performance Modeling of Video-on- Demand Systems in Broadband Networks”, IEEE Transactions on Circuits and Video Technology, Vol. 11, No. 7, July 2001
277
Gabriel-Miro Muntean - Ph.D. Thesis References
[193] Juan Segarra and Vicent Chovi, “Distribution of Video-on-Demand in ResidentialNetworks”, Lecture Notes in Computer Science, Vol. 2158, Springer-Verlag, 2001, pp. 50-61
[194] R. J. Green, Sandra I. Woolley, N. W. Gamham and K. P. Jones, “Quality-of-Service Management for Broadband Residential Video Services”, IEE Electronics and Communication Engineering Journal Vol. 13, No. 16, December 2001, pp. 265-275
[195] L. Zhang, L. Zheng, K. S. Ngee, "Effect of Delay and Delay Jitter on Voice/Video over IP", Computer Communications, vol. 25, no. 9, June 2002, pp. 863-873
[196] Olivier Verscheure, Pascal Frossard and Maher Hamdi, “MPEG-2 Video Services over Packet Networks: Joint Effect of Encoding Rate and Data Loss on User-Oriented QoS”, Proceedings NOSSDAV 98, Cambridge, UK, July 1998, pp. 257-264
[197] Reza Rejaie, "An End-to-End Architecture for Quality Adaptive Streaming Applications in the Internet", Ph.D. Thesis, University of Southern California, December 1999
[198] Baochun Li, Klara Nahrstedt, “A Control-Based Middleware Framework for Quality of Service Adaptations”, IEEE Journal of Selected Areas in Communications, Vol. 17, No. 9, September 1999, pp. 1632-1650
[199] Dapeng Wu, Yiwei Thomas Hou, Wenwu Zhu, Hung-Ju Lee, Tihao Chiang, Ya-Qin Zhang,H. Jonathan Chao, “On End-To-End Architecture For Transporting MPEG4 Video Over The Internet”, IEEE Transactions On Circuits And Systems For Video Technology, Vol. 10, No. 6, September 2000
[200] Joan L. Mitchell, William B. Pennebaker, Chad E. Fogg and Didier J. LeGall, “MPEG Video Compression Standard”, Chapman & Hall, USA, 1996
[201] Didier LeGall, "MPEG: A Video Compression Standard for Multimedia Applications" Communications of the ACM, Vol 34, No 4, April, 1991, pp. 46-58
[202] M. F. Alam, M. Atiquzzaman, M. A. Karim, "Traffic Shaping for MPEG Video Transmission Over The Next Generation Internet", Computer Communications Journal, No. 23, 2000, pp. 1336-1348
[203] Jamshid Mahdavi and Vem Paxson, “IPPM Metrics for Measuring Connectivity”, RFC 2678, September 1999
[204] Guy Aimes, Sunil Kalidindi, and Matthew Zekauskas, “A One-way Delay Metric for IPPM”, RFC 2679, September 1999, http://www.faqs.org/rfcs/rfc2679.html
[205] Jean C. Bolot., “Characterizing End-to-End Packet Delay and Loss Behavior in the Internet," Journal of High Speed Networks, Vol. 2, No. 3, December 1993, pp. 305-323
[206] Kimberly Claffy, George Polyzos and Hans-Wener Braun, "Measurement Considerations for Assessing Unidirectional Latencies", Internetworking: Research and Experience, Vol. 4, No. 3, September 1993, pp. 121-132
278
Gabriel-Miro Muntean - Ph.D. Thesis References
[207] Vem Paxson, "End-to-end Internet Packet Dynamics", IEEE/ACM Transactions on Networking, Vol. 7, No. 3, 1999, pp. 277-292
[208] ITU-T Recommendation G.l 14, “One-way transmission time”, May 2000
[209] Manish Jain, and Constantinos Dovrolis, "End-to-end Available Bandwidth: Measurement Methodology, Dynamics and Relation with TCP Throughput," Proc. of ACM SIGCOMM 2002
[210] Guy Aimes, Sunil Kalidindi, and Matthew Zekauskas “A One-way Packet Loss Metric for IP Performance Metrics (IPPM)”, RFC 2680, September 1999, http://www.faqs.org/rfcs/rfc2680.html
[211] Nick Feamster, "Adaptive Delivery of Real-Time Streaming Video", M. Eng. Thesis, Massachusetts Institute of Technology, May, 2001, http://nms.lcs.mit.edu/papers/feamster- thesis.pdf
[212] Guy Aimes, Sunil Kalidindi, and Matthew Zekauskas “A Round-trip Delay Metric for IP Performance Metrics (IPPM)”, RFC 2681, September 1999, http://www.faqs.org/rfcs/rfc2681 .html
[213] Carlo Demichelis, Philip Chimento, “IP Packet Delay Variation Metric for IP Performance Metrics”, RFC 3393, November 2002, http://www.faqs.org/rfcs/rfc3393.html
[214] Van Jacobson, Kathleen Nichols and Kedamath Poduri, “An Expedited Forwarding PHB”, RFC 2598, June 1999
[215] Andrew S. Tanenbaum, “Computer Networks”, Third Edition, Prentice-Hall, USA, 1996
[216] Rajeev Koodli, Rayadurgam Ravikanth, “One-way Loss Pattern Sample Metrics”, RFC 3357, August 2002, http://www.faqs.org/rfcs/rfc3357.html
[217] Jean C. Bolot and Andre Vega Garcia, “The Case for FEC-based Error Control for Packet Audio in the Internet", ACM Multimedia Systems, 1997, http://citeseer.nj.nec.com/bolot97case.html
[218] Michael S. Borella, Debbie Swider, Suleyman Uludag, Gregory B. Brewster, “Internet Packet Loss: Measurement and Implications for End-to-End QoS”, Proceedings of International Conference on Parallel Processing, August 1998, http://citeseer.nj.nec.com/borella98intemet.html
[219] Mark Handley, “An Examination of MBONE Performance”, Technical Report, USC/ISI, ISI/RR-97-450, July 1997, http://citeseer.nj.nec.com/handley97examination.html
[220] Maya Yajnik, Jim Kurose and Don Towsley, “Packet Loss Correlation in the MBONE Multicast Network”, Proceedings of IEEE Global Internet, London, UK, November 1996, http://citeseer.nj.nec.com/article/yajnik96packet.html
[221] Marco Media, A. Carpani, R. Lo Cigno, “Measuring IP and TCP Behavior on Edge Nodes”, Proceedings IEEE Globecom 2002, Taipei, Taiwan, November 2002
279
Gabriel-Miro Muntean - Ph.D. Thesis References
[222] Jon C. R. Bennett, Craig Partridge, and Nicholas Shectman, “Packet Reordering is Not Pathological Network Behavior”, IEEE/ACM Trans, on Networking, Vol. 7, No. 6, Dec. 1999
[223] Matt Mathis, Mark Allman, “Framework for Defining Empirical Bulk Transfer Capacity Metrics”, RFC 3148, July 2001, http://www.faqs.org/rfcs/rfc3148.html
[224] Mark Allman, “Measuring End-to-end Bulk Transfer Capacity”, Proceedings of the ACM SIGCOMM Internet Measurement Workshop, San Francisco, USA, November 2001
[225] Robert L. Carter and Mark E. Crovella, “Measuring Bottleneck Link Speed in Packet- Switched Networks”, Journal of Performance Evaluation, Vol. 27&28, 1996, pp. 297-318
[226] Srinivasan Keshav, “A Control-theoretic Approach to Flow Control”, Proceedings of ACM SIGCOMM 1991, September 1991
[227] Tricha Anjali, Caterina Scoglio, Ian F. Akyildiz, George Uhl, Agatino Sciuto, Jeffrey A. Smith, “Available Bandwidth Measurement in IP Networks”, Internet Draft, http://www.ietf.org/intemet-drafts/draft-anjali-ippm-avail-band-measurement-00.txt
[228] Michael Lombardi, “Computer Time Synchronization”, White Paper, National Institute of Standards and Technology, USA, Physics Laboratory, Time and Frequency Division, http://www.boulder.nist.gov/timefreq/service/pdf/computertime.pdf
[229] T. Yamashita, S. Ono, “Synchronizing Clock Frequency With A High Speed Digital Network”, IEICE Technical Report, CPSY94-119, March, 1995
[230] David L. Mills, “Network Time Protocol (Version 3) Specification, Implementation and Analysis”, RFC 1305, March, 1992, http://www.ietf.org/rfc/rfcl305.txt
[231] MCK Communications, MCK Voice Quality Testing - White Paper, September 2002, http://www.mck.com/solutions_products/white_papers_primers
[232] Donald L. Stone, Kevin Jeffay, “An Empirical Study Of Delay Jitter Management Policies”, Multimedia Systems Journal, Vol. 2, No. 6, January 1995, pp 267-279
[233] W. Richard Stevens, “TCP/IP Illustrated Volume 1: the Protocols”, Addison-Wesley, 1994
[234]M. E. Van Valkenburg, “Analog Filter Design”, Oxford University Press, New York, USA, 1982
[235] Wenyu Jiang, Henning Schulzrinne, “QoS Measurement of Internet Real Time Multimedia Services”, Technical Report CUCS-015-99, Department of Computer Science, Columbia University, December 1999, http://www.cs.columbia.edu/~hgs/papers/Jian9912_QoS.pdf
[236] Michael S. Borella, Debbie Swider, Suleyman Uludag, Gregory B. Brewster, “Internet Packet Loss: Measurement and Implications for End-to-End QoS”, Proceedings of the International Conference on Parallel Processing, Minneapolis, USA, August 1998, pp. 3-15, http://www.xnet.cOm/~cathmike/MSB/Pubs/icpp98.ps.Z
280
Gabriel-Miro Muntean - Ph.D. Thesis References
[237] ITU-T Recommendation H.225.0, “Call Signalling Protocols and Media Stream Packetization for Packet-based Multimedia Communication Systems”, November 2000
[238] Hellosoft, Real Time Protocol (RTP), White Paper, http://www.hellosoft.com/resources/documents/rtp.pdf
[239] ITU-T H.323, “Packet-based multimedia communications systems”, November 2000
[240] George Ghinea, J. P. Thomas, “QoS Impact on User Perception and Understanding of Multimedia Video Clips”, Proc. o f ACM Multimedia, Bristol, United Kingdom, 1998
[241] Colin Perkins, Orion Hodson, and Vicky Hardman, “A Survey of Packet-loss Recovery Techniques for Streaming Audio”, IEEE Network Magazine, September/October 1998
[242] Sandeep Bajaj, Lee Breslau, Deborah Estrin, Kevin Fall, Sally Floyd, Padma Haidar, Mark Handley, Ahmed Helmy, John Heidemann, Polly Huang, Satish Kumar, Steven McCanne, Reza Rejaie, Puneet Sharma, Kannan Varadhan, Ya Xu, Haobo Yu, and Daniel Zappala, “Improving Simulation for Network Research”, Technical Report 99-702b, University of Southern California, March 1999, http://www.isi.edu/~johnh/PAPERS/Bajaj99a.pdf
[243] “Programmer's Reference”, MVR-D2000 Amber Development Kit, version 3.20, Canopus Corporation, USA, 2000
[244] Kate Gregory, “Special Edition Using Visual C++ 6.0”, Que Publishing House, USA, 1998
[245] Roger Jennings and Peter Hipson, "Database Developer's Guide with Visual C++ 4", Sams- Macmillan Publishing House, 1996
[246] The Network Simulator - ns-2, http://www.isi.edu/nsnam/ns/
[247] “OTcl - MIT Object Tel”, Massachusetts Institute of Technology, September 1995, ftp://ftp.tns.lcs.mit.edu/pub/otcl/README.html
[248] Kevin Fall, Kannan Varadhan, “The ns Manual (formerly ns Notes and Documentation)”, VINT Project, http://www.isi.edu/nsnam/ns/ns-documentation.html
[249] Jae Chung and Mark Claypool, “NS by Example”, Worchester Polytechnic Institute, http://nile.wpi.edu/NS
[250] Marc Greis, “Tutorial for the Network Simulator - NS” VINT Project, http ://w ww. isi. edu/nsnam/ns/tutorial/index. html
[251] Balachander Krishnamurthy, Craig Wills and Yin Zhang, “On the use and performance of content distribution networks”, Proceedings o f the ACM SIGCOMM Internet Measurement Workshop, San Francisco, November 2001
281

Gabriel-Miro Muntean - Ph.D. Thesis References
[252] Balachander Krishnamurthy, Craig Wills, and Yin Zhang. “Preliminary measurements on the effect of server adaptation for web content delivery”, Technical Report TD-59VNB8, AT&T Labs and Research, April 2002, http://www.research.att.com/Vyzhang/papers/spinach-td02.pdf[253] Jordi Ribas-Corbera, “Windows Media 9 Series - A Platform to Deliver Compressed Audio and Video for Internet and Broadcast Applications”, EBU Technical Review, January 2003, http://www.ebu.ch/trev_293-ribas.pdf
[254] NIST Net, http://snad.ncsl.nist.gov/itg/nistnet
[255] Manish Jain, Constantinos Dovrolis, “End-to-End Available Bandwidth: Measurement Methodology, Dynamics, and Relation with TCP Throughput”, ACM SIGCOMM, Pittsburgh, USA, August 2002
282
Related Documents