Dual window method for processing spectroscopic optical coherence tomography signals with simultaneously high spectral and temporal resolution Francisco Robles 1, 2 , Robert N. Graf 2 , and Adam Wax 2 1 Department of Medical Physics, Duke University, Durham, NC 27708 2 Department of Biomedical Engineering and the Fitzpatrick Institute for Photonics Duke University, Durham, NC 27708 [email protected] Abstract: Current methods for analysis of spectroscopic optical coherence tomography (SOCT) signals suffer from an inherent tradeoff between time (depth) and frequency (wavelength) resolution. Here, we present a dual window (DW) method for reconstructing time frequency distributions (TFDs) that applies two orthogonal Gaussian windows that independently determine the spectral and temporal resolution. The effectiveness of the method is demonstrated in simulations and in processing of measured OCT signals that contain fields which vary in time and frequency. The DW method yields TFDs that maintain high spectral and temporal resolution and are free from the artifacts and limitations commonly observed with other processing methods. ©2009 Optical Society of America OCIS codes: (120.3180) Interferometry; (290.1350) Backscattering; (110.4500) Optical Coherence Tomography References and Links 1. D. Huang, E. A. Swanson, C. P. Lin, J. S. Schuman, W. G. Stinson, W. Chang, M. R. Hee, T. Flotte, K. Gregory, C. A. Puliafito, and J. G. Fujimoto, "Optical Coherence Tomography," Science 254, 1178-1181 (1991). 2. U. Morgner, W. Drexler, F. X. Kartner, X. D. Li, C. Pitris, E. P. Ippen, and J. G. Fujimoto, "Spectroscopic optical coherence tomography," Opt. Lett. 25, 111-113 (2000). 3. J. F. deBoer, T. E. Milner, M. J. C. vanGemert, and J. S. Nelson, "Two-dimensional birefringence imaging in biological tissue by polarization-sensitive optical coherence tomography," Opt. Lett. 22, 934-936 (1997). 4. J. A. Izatt, M. D. Kulkami, S. Yazdanfar, J. K. Barton, and A. J. Welch, "In vivo bidirectional color Doppler flow imaging of picoliter blood volumes using optical coherence tomograghy," Opt. Lett. 22, 1439-1441 (1997). 5. Y. H. Zhao, Z. P. Chen, C. Saxer, S. H. Xiang, J. F. de Boer, and J. S. Nelson, "Phase-resolved optical coherence tomography and optical Doppler tomography for imaging blood flow in human skin with fast scanning speed and high velocity sensitivity," Opt. Lett. 25, 114-116 (2000). 6. C. Y. Xu, C. Vinegoni, T. S. Ralston, W. Luo, W. Tan, and S. A. Boppart, "Spectroscopic spectral-domain optical coherence microscopy," Opt. Lett. 31, 1079-1081 (2006). 7. A. Wax, C. H. Yang, and J. A. Izatt, "Fourier-domain low-coherence interferometry for light-scattering spectroscopy," Opt. Lett. 28, 1230-1232 (2003). 8. R. N. Graf and A. Wax, "Nuclear morphology measurements using Fourier domain low coherence interferometry," Opt. Express 13, 4693-4698 (2005). 9. M. Bayram and R. G. Baraniuk, "Multiple window time-frequency analysis," Proceedings of the IEEE-Sp International Symposium on Time-Frequency and Time-Scale Analysis 535, 173-176 (1996). 10. D. J. Thomson, "Spectrum Estimation and Harmonic-Analysis," Proceedings of the IEEE 70, 1055-1096 (1982). 11. C. Y. Xu, F. Kamalabadi, and S. A. Boppart, "Comparative performance analysis of time-frequency distributions for spectroscopic optical coherence tomography," Appl. Opt. 44, 1813-1822 (2005). 12. R. N. Graf and A. Wax, "Temporal coherence and time-frequency distributions in spectroscopic optical coherence tomography," J. Opt. Soc. Am. A 24, 2186-2195 (2007). 13. L. Cohen, "Time Frequency-Distributions - a Review," Proc. IEEE 77, 941-981 (1989). #107201 - $15.00 USD Received 6 Feb 2009; revised 19 Mar 2009; accepted 6 Apr 2009; published 9 Apr 2009 (C) 2009 OSA 13 April 2009 / Vol. 17, No. 8 / OPTICS EXPRESS 6799

Welcome message from author
This document is posted to help you gain knowledge. Please leave a comment to let me know what you think about it! Share it to your friends and learn new things together.
Transcript
Dual window method for processing spectroscopic optical coherence tomography signals with simultaneously high spectral and
temporal resolution
Francisco Robles 1, 2
, Robert N. Graf 2, and Adam Wax
2
1Department of Medical Physics, Duke University, Durham, NC 27708 2Department of Biomedical Engineering and the Fitzpatrick Institute for Photonics
Duke University, Durham, NC 27708 [email protected]
Abstract: Current methods for analysis of spectroscopic optical coherence tomography (SOCT) signals suffer from an inherent tradeoff between time (depth) and frequency (wavelength) resolution. Here, we present a dual window (DW) method for reconstructing time frequency distributions (TFDs) that applies two orthogonal Gaussian windows that independently determine the spectral and temporal resolution. The effectiveness of the method is demonstrated in simulations and in processing of measured OCT signals that contain fields which vary in time and frequency. The DW method yields TFDs that maintain high spectral and temporal resolution and are free from the artifacts and limitations commonly observed with other processing methods.
©2009 Optical Society of America
OCIS codes: (120.3180) Interferometry; (290.1350) Backscattering; (110.4500) Optical Coherence Tomography
References and Links
1. D. Huang, E. A. Swanson, C. P. Lin, J. S. Schuman, W. G. Stinson, W. Chang, M. R. Hee, T. Flotte, K. Gregory, C. A. Puliafito, and J. G. Fujimoto, "Optical Coherence Tomography," Science 254, 1178-1181 (1991).
2. U. Morgner, W. Drexler, F. X. Kartner, X. D. Li, C. Pitris, E. P. Ippen, and J. G. Fujimoto, "Spectroscopic optical coherence tomography," Opt. Lett. 25, 111-113 (2000).
3. J. F. deBoer, T. E. Milner, M. J. C. vanGemert, and J. S. Nelson, "Two-dimensional birefringence imaging in biological tissue by polarization-sensitive optical coherence tomography," Opt. Lett. 22, 934-936 (1997).
4. J. A. Izatt, M. D. Kulkami, S. Yazdanfar, J. K. Barton, and A. J. Welch, "In vivo bidirectional color Doppler flow imaging of picoliter blood volumes using optical coherence tomograghy," Opt. Lett. 22, 1439-1441 (1997).
5. Y. H. Zhao, Z. P. Chen, C. Saxer, S. H. Xiang, J. F. de Boer, and J. S. Nelson, "Phase-resolved optical coherence tomography and optical Doppler tomography for imaging blood flow in human skin with fast scanning speed and high velocity sensitivity," Opt. Lett. 25, 114-116 (2000).
6. C. Y. Xu, C. Vinegoni, T. S. Ralston, W. Luo, W. Tan, and S. A. Boppart, "Spectroscopic spectral-domain optical coherence microscopy," Opt. Lett. 31, 1079-1081 (2006).
7. A. Wax, C. H. Yang, and J. A. Izatt, "Fourier-domain low-coherence interferometry for light-scattering spectroscopy," Opt. Lett. 28, 1230-1232 (2003).
8. R. N. Graf and A. Wax, "Nuclear morphology measurements using Fourier domain low coherence interferometry," Opt. Express 13, 4693-4698 (2005).
9. M. Bayram and R. G. Baraniuk, "Multiple window time-frequency analysis," Proceedings of the IEEE-Sp International Symposium on Time-Frequency and Time-Scale Analysis 535, 173-176 (1996).
10. D. J. Thomson, "Spectrum Estimation and Harmonic-Analysis," Proceedings of the IEEE 70, 1055-1096 (1982).
11. C. Y. Xu, F. Kamalabadi, and S. A. Boppart, "Comparative performance analysis of time-frequency distributions for spectroscopic optical coherence tomography," Appl. Opt. 44, 1813-1822 (2005).
12. R. N. Graf and A. Wax, "Temporal coherence and time-frequency distributions in spectroscopic optical coherence tomography," J. Opt. Soc. Am. A 24, 2186-2195 (2007).
13. L. Cohen, "Time Frequency-Distributions - a Review," Proc. IEEE 77, 941-981 (1989).
#107201 - $15.00 USD Received 6 Feb 2009; revised 19 Mar 2009; accepted 6 Apr 2009; published 9 Apr 2009
(C) 2009 OSA 13 April 2009 / Vol. 17, No. 8 / OPTICS EXPRESS 6799
14. K. F. Lee, F. Reil, S. Bali, A. Wax, and J. E. Thomas, "Heterodyne measurement of Wigner distributions for classical optical fields," Opt. Lett. 24, 1370-1372 (1999)
15. R. N. Graf, W. J. Brown, and A. Wax, "Parallel frequency domain optical coherence tomography scatter-mode imaging of the hamster cheek pouch using a thermal light source," Opt. Lett. 33, 1285-1287 (2008).
16. F. H. White and K. Gohari, "Cellular and Nuclear Volumetric Alterations during Differentiation of Normal Hamster-Cheek Pouch Epithelium," Arch. Dermatol. Res. 273, 307-318 (1982).
17. A. Knuttel and M. Boehlau-Godau, "Spatially confined and temporally resolved refractive index and scattering evaluation in human skin performed with optical coherence tomography," J. Biomed. Opt. 5, 83- 92 (2000).
18. H. Ding, J. Lu, K. Jacobs, and X. Hu, “Determination of refractive indices of porcine skin tissues and Intralipid at eight wavelengths between 325 and 1557 nm,” J. Opt. Soc. Am. A. 22, 1151-1157 (2005).
19. V. Tuchin, “Tissue optics: light scattering methods and instruments for medical diagnosis,” SPIE (2000). 20. T. Hillman and D. Sampson, “The effect of water dispersion and absorption on axial resolution in ultrahigh-
resolution optical coherence tomography,” Opt. Express 13, 1860-1874 (2005).
1. Introduction
Optical coherence tomography (OCT) has been established as an excellent technique for cross-sectional imaging of biological samples with high resolution, speed, and sensitivity [1]. In recent years, several specialized extensions of OCT have been developed in order to gain functional information about probed samples [2-5]. One such extension which seeks to analyze depth-resolved spectroscopic information about experimental samples is known as spectroscopic OCT (SOCT) when applied as an imaging technique [2, 6] and Fourier domain low coherence interferometry (fLCI) when applied as an analysis method [7, 8]. Because the spectral scattering and absorption properties of a biological sample vary depending on its molecular makeup, SOCT obtains increased contrast and functional information by spatially mapping spectral characteristics onto coherence gated images.
In order to generate depth resolved spectroscopic information from data collected in a single domain, SOCT typically employs a short time Fourier transform (STFT) or a continuous wavelet transform (CWT). The resulting depth-wavelength distributions are analogous to time-frequency distributions (TFDs) which have been analyzed extensively in the signal processing literature [9, 10], but only recently analyzed in the context of SOCT [11, 12]. Graf and Wax used the Wigner TFD from Cohen’s class of functions [13] to show that temporal coherence information contained in the Wigner TFD cross-terms can be utilized to gain structural knowledge of samples via SOCT signals [12]. However, TFDs generated by the STFT are severely limited by the relationship between time and frequency which results in an inherent tradeoff between time (depth) resolution and frequency (wavelength) resolution.
Work in the fields of signal processing and quantum physics have paved the way for a new SOCT processing technique that ameliorates the detrimental effects of the time-frequency resolution tradeoff. Thomson, for example, developed a method particularly well suited for stationary Gaussian signals using orthogonal windows as means for estimating weighted averages for spectral approximations to achieve high-resolution spectral information [10]. Later, Bayram and Baraniuk expanded on Thomson’s method by implementing two Hermite-function-based windows to provide a robust analysis of the time-varying spectrum of non-stationary signals, which are pertinent to fields such as radar, sonar, acoustics, biology, and geophysics [9]. More recently, Lee et al [14] showed that using multiple windows simultaneously can avoid a similar resolution tradeoff in measurement of the position and momentum of a light field.
In this paper we introduce the dual window (DW) method for processing SOCT signals. Unlike radar, sonar, etc., the spectral analysis of SOCT is inherently restricted to signals that are quasi-stationary, with a frequency content that does not vary sharply in time as a chirped signal would. Instead, the DW method is applied here to detecting modulation of OCT signals due to scattering or absorption; thus posing a well-conditioned problem for the DW method. The technique allows the reconstruction of the Wigner TFD of an SOCT signal using two orthogonal windows which independently determine spectral and temporal resolution, avoiding the time-frequency resolution tradeoff that limits current SOCT signal processing.
#107201 - $15.00 USD Received 6 Feb 2009; revised 19 Mar 2009; accepted 6 Apr 2009; published 9 Apr 2009
(C) 2009 OSA 13 April 2009 / Vol. 17, No. 8 / OPTICS EXPRESS 6800
Simulations and experimental results from scattering and absorption phantoms are presented to justify the capabilities of the approach.
2. Theory
The DW method is based on calculating two separate STFTs and then combining the results. The first STFT uses a broad spectral Gaussian window to obtain high temporal/depth resolution while the second STFT uses a narrow spectral window to generate high spectroscopic resolution. The two resulting TFDs are then multiplied together to obtain a single TFD with simultaneously high spectral and temporal resolutions.
To understand what the DW method is revealing, let us consider the FDOCT signal
)cos()()(2)()()(*
dkkEkEkIkIkI SRSR ⋅⋅++= , (1)
where I(k) is the total detected intensity, IR and IS are the intensities of the reference and sample fields, respectively, and d is a constant optical path difference between the sample and
reference arms. The STFT of the cross correlation term, ( )dkEE SR ⋅⋅cos2 * can be expressed
as
κκκκ κκ
′⋅⋅⋅′⋅′′= ⋅′−−′−
∫ deedEEzkSziu
k
SR
2
2
2
)(
* )cos()()(2),( . (2)
Note that u, the width or standard deviation of the Gaussian window, must be chosen carefully in order to obtain acceptable spectral or temporal resolution. If, for example, u is chosen to be the same order of magnitude as the bandwidth of the source, then the STFT produces a TFD that has good temporal/depth resolution, but poor spectral resolution. On the other hand, if u is chosen to be much smaller than the bandwidth of the source, then the STFT generates a TFD with good spectral resolution, but poor temporal resolution. The DW method, however, can avoid this resolution tradeoff.
Consider the TFDs resulting from two STFTs, S1 and S2, generated by a narrow spectral window and a wide spectral window, respectively. Assuming that the reference field in Eq. (1) is slowly varying over the frequencies of interest, the processed signal is given by
( ) ( )zkSzkSzkDW ,,),( 21
∗⋅=
)cos()cos()()(4 2121
* dkdkkEkE SS ⋅⋅⋅= ∫∫
2 21 2
2 21 2
( ) ( )
( )2 21 2
k k k k
i k k za be e e dk dk
− − − −− −× ⋅ ⋅ , (3)
where a and b are independent parameters that set the widths of the windows, and b >> a. In order to obtain a more insightful form of the processed signal, consider a coordinate change such that
Ω=k1 + k2
2, q = k1 − k2, k1 = Ω+
q
2, and k2 = Ω−
q
2, (4)
where the Jacobian of the transform is unity. Thus, the processed signal DW can be written as
⋅
−Ω
⋅
+Ω⋅−Ω+Ω= ∫∫ dq
dqq
Eq
EzkDW SS2
cos2
cos)2
()2
(4),( *
2 2
2 2
( ) ( )2 2
2 2
q qk k
iqza be e e d dq
− Ω+ − − Ω− −
−× ⋅ ⋅ Ω . (5)
#107201 - $15.00 USD Received 6 Feb 2009; revised 19 Mar 2009; accepted 6 Apr 2009; published 9 Apr 2009
(C) 2009 OSA 13 April 2009 / Vol. 17, No. 8 / OPTICS EXPRESS 6801
The term
−Ω
+Ω22
* qE
qE SS from Eq. (5) can be expressed in terms of a Wigner
TFD by utilizing the ambiguity function [12, 13]:
* ( ) ( ) ( , )2 2
iq
S S S
q qE E W e dζζ ζ−Ω+ Ω− = Ω ⋅∫ , (6)
where WS (Ω,ζ ) is the Wigner TFD of the sample field in the new coordinate system. After substituting Eq. (6) into Eq. (5) and simplifying, the processed signal yields
( , ) 4 ( , ) cos(2 ) cos( )iq
SDW k z W e d d q dζζ ζ−= ⋅ Ω ⋅ ⋅ Ω ⋅ ⋅∫∫∫
2
2 2 2
1 1 ( )( )
2 2 2
q q kk
iqza b be e d dq
Ω− − Ω− + ⋅ + + − × ⋅ Ω . (7)
By integrating Eq. (7) with respect to q and assuming a is small compared to b, such that
a2/b
2 << 1, the DW signal simplifies to
2
2 22
2( )
2( )( , ) 4 ( , ) cos(2 )
k
d z abS
DW k z b W e e d d dζπ ζ ζ
Ω−−
− + += Ω ⋅ Ω ⋅ ⋅ Ω∫∫ . (8)
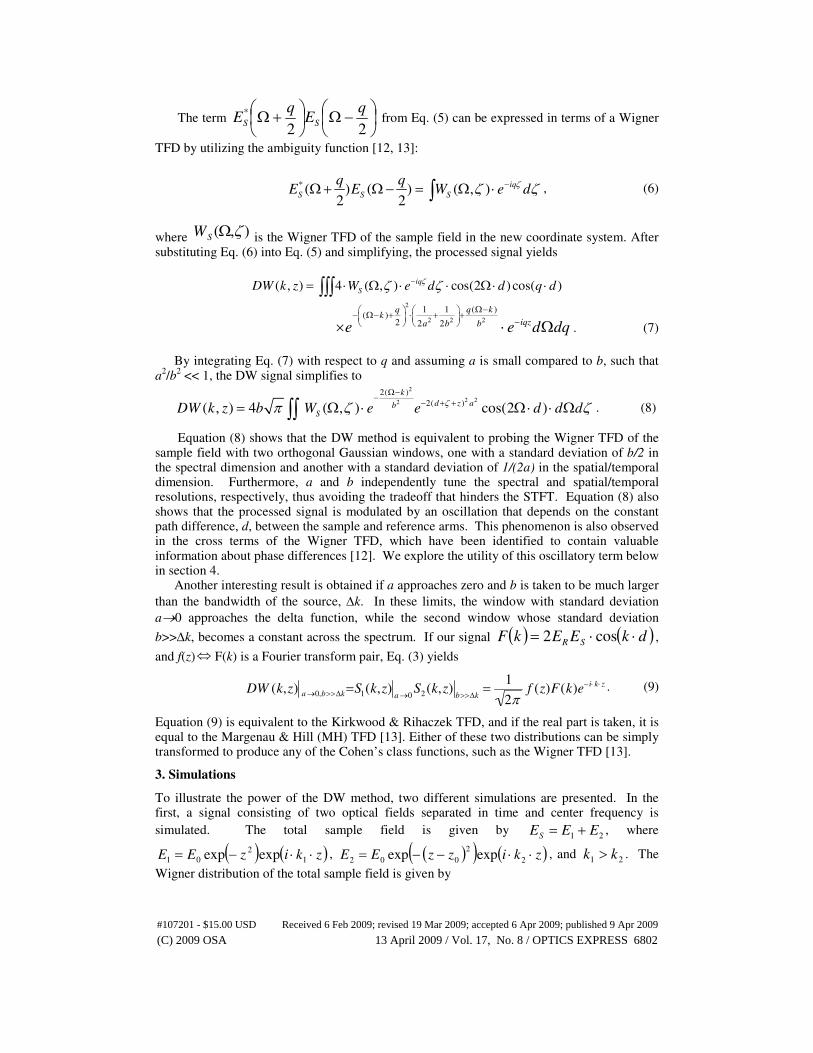
Equation (8) shows that the DW method is equivalent to probing the Wigner TFD of the sample field with two orthogonal Gaussian windows, one with a standard deviation of b/2 in the spectral dimension and another with a standard deviation of 1/(2a) in the spatial/temporal dimension. Furthermore, a and b independently tune the spectral and spatial/temporal resolutions, respectively, thus avoiding the tradeoff that hinders the STFT. Equation (8) also shows that the processed signal is modulated by an oscillation that depends on the constant path difference, d, between the sample and reference arms. This phenomenon is also observed in the cross terms of the Wigner TFD, which have been identified to contain valuable information about phase differences [12]. We explore the utility of this oscillatory term below in section 4.
Another interesting result is obtained if a approaches zero and b is taken to be much larger
than the bandwidth of the source, ∆k. In these limits, the window with standard deviation
a→0 approaches the delta function, while the second window whose standard deviation
b>>∆k, becomes a constant across the spectrum. If our signal ( ) ( )dkEEkF SR ⋅⋅= cos2 ,
and f(z)⇔ F(k) is a Fourier transform pair, Eq. (3) yields
DW (k,z) a→0,b>>∆k=S1(k,z)a→0
S2(k,z)b>>∆k
=1
2πf (z)F(k)e−i⋅k⋅ z . (9)
Equation (9) is equivalent to the Kirkwood & Rihaczek TFD, and if the real part is taken, it is equal to the Margenau & Hill (MH) TFD [13]. Either of these two distributions can be simply transformed to produce any of the Cohen’s class functions, such as the Wigner TFD [13].
3. Simulations
To illustrate the power of the DW method, two different simulations are presented. In the first, a signal consisting of two optical fields separated in time and center frequency is
simulated. The total sample field is given by 21 EEES += , where
( ) ( )zkizEE ⋅⋅−= 1
2
01 expexp , ( )( ) ( )zkizzEE ⋅⋅−−= 2
2
002 expexp , and 21 kk > . The
Wigner distribution of the total sample field is given by
#107201 - $15.00 USD Received 6 Feb 2009; revised 19 Mar 2009; accepted 6 Apr 2009; published 9 Apr 2009
(C) 2009 OSA 13 April 2009 / Vol. 17, No. 8 / OPTICS EXPRESS 6802

W (k,z) =1
2πES
*∫ (z −ζ2
)ES (z +ζ2
)e ikζdζ , (10)
and the MH distribution of the total sample field is given by
MH(k,z) = Re1
2πE S (k)E S (z)e
−ikz , (11)
where E S(k)⇔ ES (z) is a Fourier transform pair. Figure 1 illustrates the resulting TFDs.
Fig. 1. (a). Ideal TFD with E1 centered at z0 = 5 and k1 = 13 and E2 centered at z0 = 0 and k2 = 26. (b). Wigner TFD. (c). MH TFD. (d). Dual Window method.
The ideal TFD, shown in Fig. 1(a), is produced by treating each pulse as an individual
field and superimposing their respective TFDs onto one map. However, this can only be obtained with prior knowledge of the individual fields. The ideal TFD in Fig. 1(a) contains two pulses with Gaussian shapes in both the temporal and spectral dimensions. The pulses are well separated in each dimension. Figures 1(b)-1(d) show different TFDs that can be generated from a single mixed field. The Wigner distribution, shown in Fig. 1(b), reveals the two Gaussian pulses along with an additional cross term that appears between them. The cross term contains modulations in each dimension which, in some cases, reveal important information about the temporal phase differences [12]. More often, however, these cross terms are viewed as undesirable artifacts as they yield non-zero values at times/depths and frequencies that do not exist in the field. Moreover, as more components are added to the field, the cross terms may interfere with the local signals. The MH distribution, shown in Fig. 1(c), contains four pulses. In addition to the two pulses comprising the signal field, the MH TFD also contains two artifact pulses known as ‘reflections in time’ [13]. As is the case with the Wigner distribution, these artifacts yield non-zero intensities at times and frequencies that should contain no signal.
#107201 - $15.00 USD Received 6 Feb 2009; revised 19 Mar 2009; accepted 6 Apr 2009; published 9 Apr 2009
(C) 2009 OSA 13 April 2009 / Vol. 17, No. 8 / OPTICS EXPRESS 6803

The TFD generated using the DW method is presented in Fig. 1(d). The TFD is generated by simply computing the product of two STFTs processed with wide and narrow spectral windows respectively. In Fig. 1(d) the cross terms that are present in the Wigner and MH distributions are completely eliminated as a result of the use of two orthogonal windows.
The second simulation models a SOCT signal from a Michelson interferometer with an experimental sample containing two distinct reflecting surfaces. The first sample surface reflects the entire Gaussian spectrum of the source while the second sample surface absorbs the high frequency portion (upper half) of the source spectrum. This simulation is analogous to the absorbing phantom experiment discussed below in Section 5.1. In the scenario of this simulation, i.e. a SOCT system, neither the Wigner nor the MH distributions can be constructed because the detected signal is the intensity of the field and therefore the phase information is lost. Thus, we reconstruct the TFDs via the STFT and the DW method.
Fig. 2. (a). Ideal TFD with simulated source bandwidth of ∆k = 35 length-1 units. (b). Narrow spectral window STFT with standard deviation = 2 length-1 units. (c). Wide spectral window STFT with standard deviation = 45 length -1 units. (d). Double window method using the two windows used in (b) and (c). (e). Time marginals (depth profile) of (a), (b), and (d). (f). Spectral profile at t = 4.5 in (a), (c), and (d).
Figure 2(a) shows the ideal TFD of the simulated signal while Figs. 2(b) and 2(c) show the
TFDs generated by the STFT using narrow and wide spectral windows, respectively. In each case, the effects of the time-frequency resolution tradeoff are obvious. The TFD generated with the wide spectral window suffers from degraded temporal resolution while the TFD generated with the narrow spectral window suffers from degraded spectral resolution. As Xu et al. showed, the STFT window can be optimized for specific applications, but regardless of the window size, a resolution tradeoff must be made [11]. Figure 2(d) shows the TFD generated using the DW method which computes the product of the TFDs shown in Figs. 2(b) and 2(c). Figure 2(e) shows the time marginals computed from Figs. 2(b)-2(d) which demonstrate that the DW method resolves the two sample surfaces with a resolution comparable to that of the ideal case, whereas the narrow spectral window STFT does not. Figure 2(f) shows the spectral profile of the rear surface reflection in Figs. 2(b)-2(d)
#107201 - $15.00 USD Received 6 Feb 2009; revised 19 Mar 2009; accepted 6 Apr 2009; published 9 Apr 2009
(C) 2009 OSA 13 April 2009 / Vol. 17, No. 8 / OPTICS EXPRESS 6804

illustrating that the DW method maintains higher spectral fidelity than the wide spectral window STFT. Note that the DW method is able to accurately portray the absorbed wavenumbers, while the wide spectral window STFT reveals no absorption information. The DW frequency profile also reveals the same spectral modulation that is seen in the narrow window STFT and that is characteristic of the Wigner TFD. This modulation results from cross correlations between field components that overlap in time and is analyzed further in section 4.
4. Local oscillations
It has been shown previously that temporal coherence information from Wigner TFD cross-terms can be utilized to gain structural knowledge of samples via the SOCT signal [12]. However, these cross terms are typically viewed as undesirable artifacts as they yield non-zero values at times/depths and frequencies that do not actually exist in the field.
Equation (8) shows that signals processed by the DW method are modulated by a cosine term whose frequency depends on the constant path difference, d, between the sample and reference arms. This is the same phenomenon that is observed in the cross terms of the Wigner TFD, and these oscillations can be used to gain valuable information about phase differences.
Fig. 3. (a). TFD of simulation 2 generated by the DW processing method. (b). Spectral profile corresponding to the dashed red line in (a). (c). Correlation plot with peak corresponding to sample spacing distance of 1.5 units.
Figure 3(b) shows the frequency profile from the front reflecting surface of the sample in
simulation 2 (Fig. 2). This frequency spectrum is taken from depth 3 of the TFD shown in Fig. 3(a) which was generated by the DW method. The spectral modulation that is present can be further processed to reveal structural information about the simulated experimental sample. Fourier transforming the spectrum from Fig. 3(b) generates the correlation plot shown in Fig. 3(c) which exhibits a clear correlation peak corresponding to a physical distance of 1.5. This distance agrees with the 1.5 unit spacing of the surfaces in the simulated sample, thus providing additional information about the structure of the sample.
5. Experimental results
5.1 Absorption phantom experiments
Experiments were performed using the white light parallel frequency domain OCT (pfdOCT) system previously described by Graf et al. in [15]. To evaluate the ability of the DW processing method to generate TFDs with simultaneously high spectral and temporal resolution, we constructed an absorption phantom consisting of a glass wedge filled with an absorbing dye as shown in Fig. 4(a). Figure 4(b) shows a pfdOCT scan of the absorption phantom with the two inner glass surfaces clearly visible. Note that the signal from the rear
#107201 - $15.00 USD Received 6 Feb 2009; revised 19 Mar 2009; accepted 6 Apr 2009; published 9 Apr 2009
(C) 2009 OSA 13 April 2009 / Vol. 17, No. 8 / OPTICS EXPRESS 6805
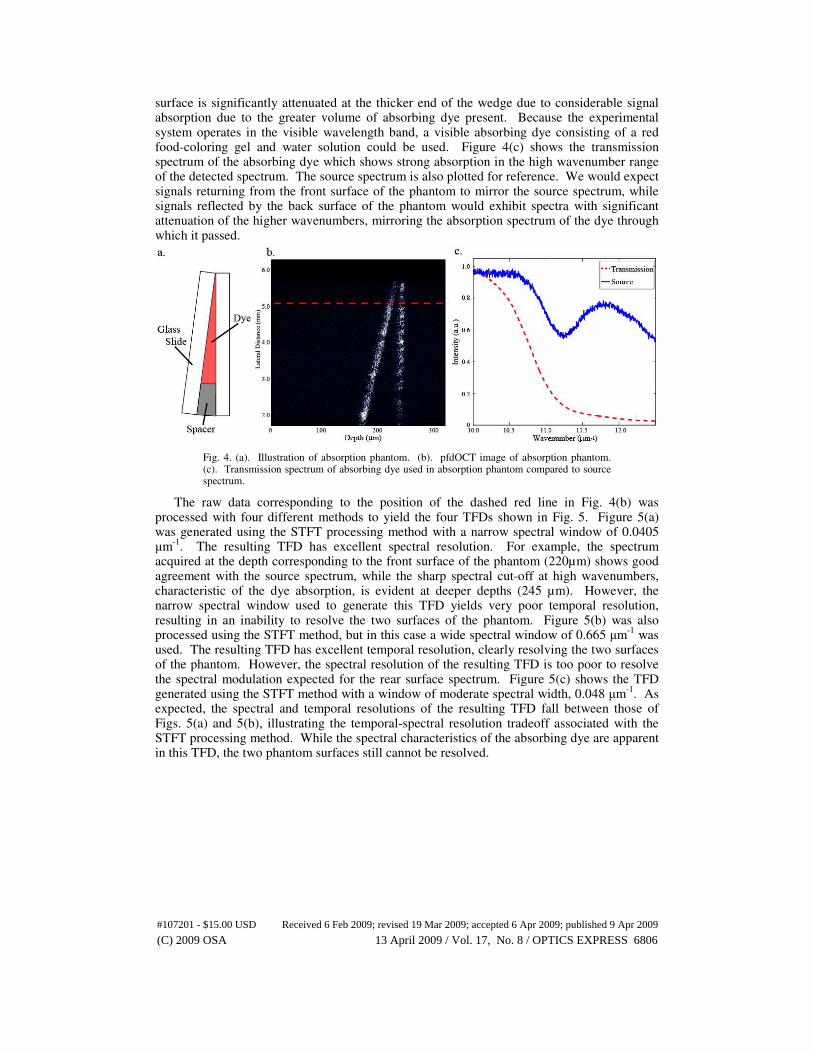
surface is significantly attenuated at the thicker end of the wedge due to considerable signal absorption due to the greater volume of absorbing dye present. Because the experimental system operates in the visible wavelength band, a visible absorbing dye consisting of a red food-coloring gel and water solution could be used. Figure 4(c) shows the transmission spectrum of the absorbing dye which shows strong absorption in the high wavenumber range of the detected spectrum. The source spectrum is also plotted for reference. We would expect signals returning from the front surface of the phantom to mirror the source spectrum, while signals reflected by the back surface of the phantom would exhibit spectra with significant attenuation of the higher wavenumbers, mirroring the absorption spectrum of the dye through which it passed.
Fig. 4. (a). Illustration of absorption phantom. (b). pfdOCT image of absorption phantom. (c). Transmission spectrum of absorbing dye used in absorption phantom compared to source spectrum.
The raw data corresponding to the position of the dashed red line in Fig. 4(b) was processed with four different methods to yield the four TFDs shown in Fig. 5. Figure 5(a) was generated using the STFT processing method with a narrow spectral window of 0.0405 µm
-1. The resulting TFD has excellent spectral resolution. For example, the spectrum
acquired at the depth corresponding to the front surface of the phantom (220µm) shows good agreement with the source spectrum, while the sharp spectral cut-off at high wavenumbers, characteristic of the dye absorption, is evident at deeper depths (245 µm). However, the narrow spectral window used to generate this TFD yields very poor temporal resolution, resulting in an inability to resolve the two surfaces of the phantom. Figure 5(b) was also processed using the STFT method, but in this case a wide spectral window of 0.665 µm
-1 was
used. The resulting TFD has excellent temporal resolution, clearly resolving the two surfaces of the phantom. However, the spectral resolution of the resulting TFD is too poor to resolve the spectral modulation expected for the rear surface spectrum. Figure 5(c) shows the TFD generated using the STFT method with a window of moderate spectral width, 0.048 µm
-1. As
expected, the spectral and temporal resolutions of the resulting TFD fall between those of Figs. 5(a) and 5(b), illustrating the temporal-spectral resolution tradeoff associated with the STFT processing method. While the spectral characteristics of the absorbing dye are apparent in this TFD, the two phantom surfaces still cannot be resolved.
#107201 - $15.00 USD Received 6 Feb 2009; revised 19 Mar 2009; accepted 6 Apr 2009; published 9 Apr 2009
(C) 2009 OSA 13 April 2009 / Vol. 17, No. 8 / OPTICS EXPRESS 6806
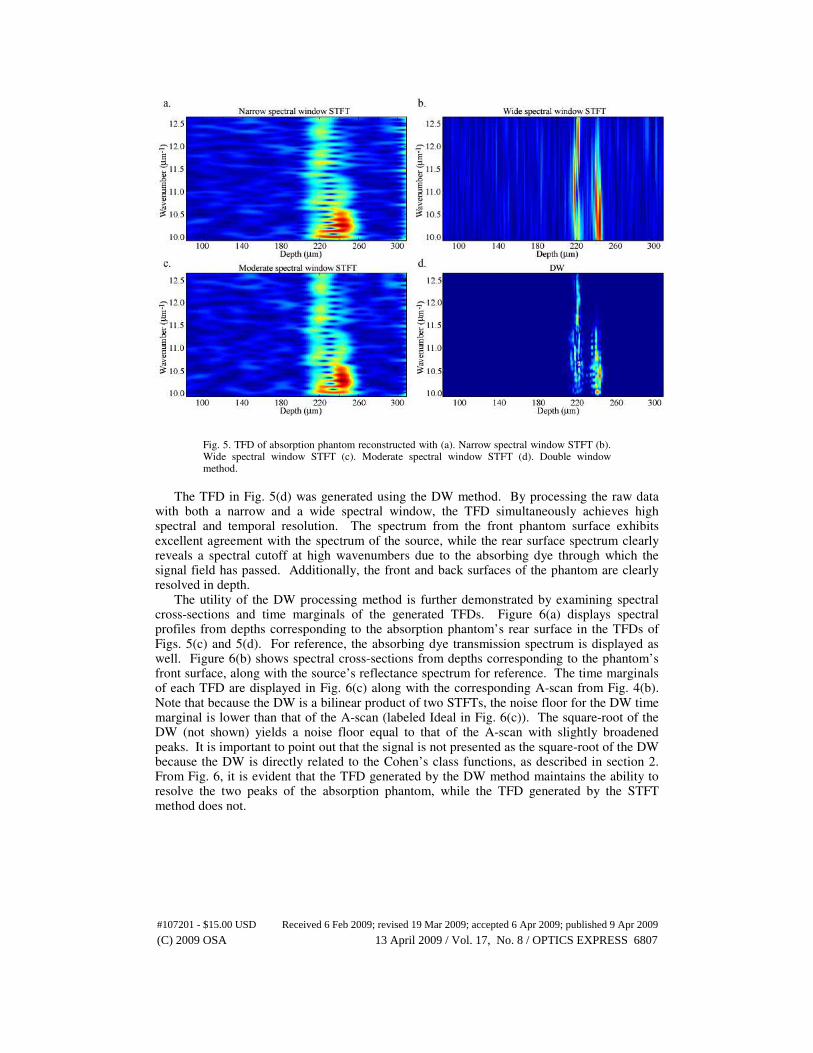
Fig. 5. TFD of absorption phantom reconstructed with (a). Narrow spectral window STFT (b). Wide spectral window STFT (c). Moderate spectral window STFT (d). Double window method.
The TFD in Fig. 5(d) was generated using the DW method. By processing the raw data
with both a narrow and a wide spectral window, the TFD simultaneously achieves high spectral and temporal resolution. The spectrum from the front phantom surface exhibits excellent agreement with the spectrum of the source, while the rear surface spectrum clearly reveals a spectral cutoff at high wavenumbers due to the absorbing dye through which the signal field has passed. Additionally, the front and back surfaces of the phantom are clearly resolved in depth.
The utility of the DW processing method is further demonstrated by examining spectral cross-sections and time marginals of the generated TFDs. Figure 6(a) displays spectral profiles from depths corresponding to the absorption phantom’s rear surface in the TFDs of Figs. 5(c) and 5(d). For reference, the absorbing dye transmission spectrum is displayed as well. Figure 6(b) shows spectral cross-sections from depths corresponding to the phantom’s front surface, along with the source’s reflectance spectrum for reference. The time marginals of each TFD are displayed in Fig. 6(c) along with the corresponding A-scan from Fig. 4(b). Note that because the DW is a bilinear product of two STFTs, the noise floor for the DW time marginal is lower than that of the A-scan (labeled Ideal in Fig. 6(c)). The square-root of the DW (not shown) yields a noise floor equal to that of the A-scan with slightly broadened peaks. It is important to point out that the signal is not presented as the square-root of the DW because the DW is directly related to the Cohen’s class functions, as described in section 2. From Fig. 6, it is evident that the TFD generated by the DW method maintains the ability to resolve the two peaks of the absorption phantom, while the TFD generated by the STFT method does not.
#107201 - $15.00 USD Received 6 Feb 2009; revised 19 Mar 2009; accepted 6 Apr 2009; published 9 Apr 2009
(C) 2009 OSA 13 April 2009 / Vol. 17, No. 8 / OPTICS EXPRESS 6807
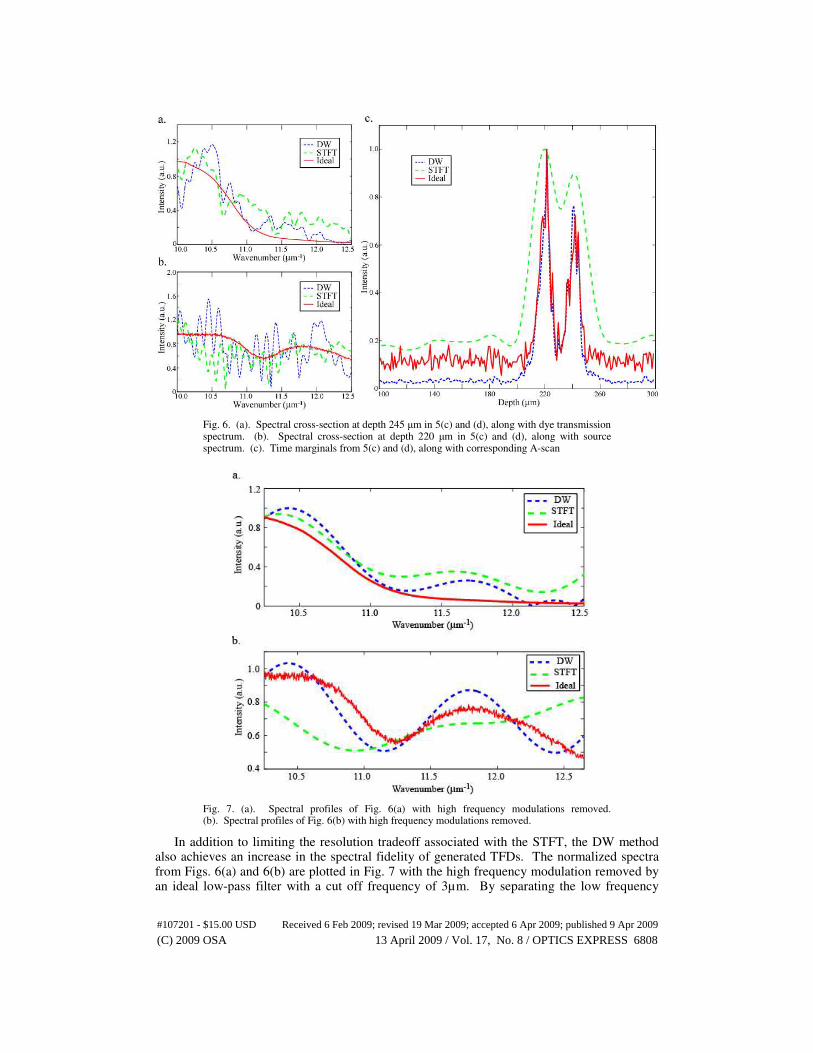
Fig. 6. (a). Spectral cross-section at depth 245 µm in 5(c) and (d), along with dye transmission spectrum. (b). Spectral cross-section at depth 220 µm in 5(c) and (d), along with source spectrum. (c). Time marginals from 5(c) and (d), along with corresponding A-scan
Fig. 7. (a). Spectral profiles of Fig. 6(a) with high frequency modulations removed. (b). Spectral profiles of Fig. 6(b) with high frequency modulations removed.
In addition to limiting the resolution tradeoff associated with the STFT, the DW method also achieves an increase in the spectral fidelity of generated TFDs. The normalized spectra from Figs. 6(a) and 6(b) are plotted in Fig. 7 with the high frequency modulation removed by an ideal low-pass filter with a cut off frequency of 3µm. By separating the low frequency
#107201 - $15.00 USD Received 6 Feb 2009; revised 19 Mar 2009; accepted 6 Apr 2009; published 9 Apr 2009
(C) 2009 OSA 13 April 2009 / Vol. 17, No. 8 / OPTICS EXPRESS 6808
content from the high frequency local oscillations, we can assess the fidelity with which each processing method recreates the ideal spectrum. Chi-squared values for each processing method were calculated to assess goodness-of-fit. Table 1 summarizes the chi-squared values. For both the rear surface spectra in Fig. 7(a) and the front surface spectra in Fig. 7(b), the chi-squared values associated with DW method are lower than those of the STFT indicating that the DW processing method recreates the ideal signal with greater spectral fidelity. In addition, we calculated the goodness of fit for the square of the STFT to account for the fact that the DW method produces a bi-linear distribution. The DW method is also seen to produce superior spectral fidelity than the STFT squared.
Table 1. Chi-squared calculations
DW STFT STFT
2
Rear surface spectrum
0.0980 0.1329 0.1245
Front surface spectrum
0.0248 0.0317 0.0305
As with the simulated SOCT signals, the local oscillations seen in the TFD obtained from
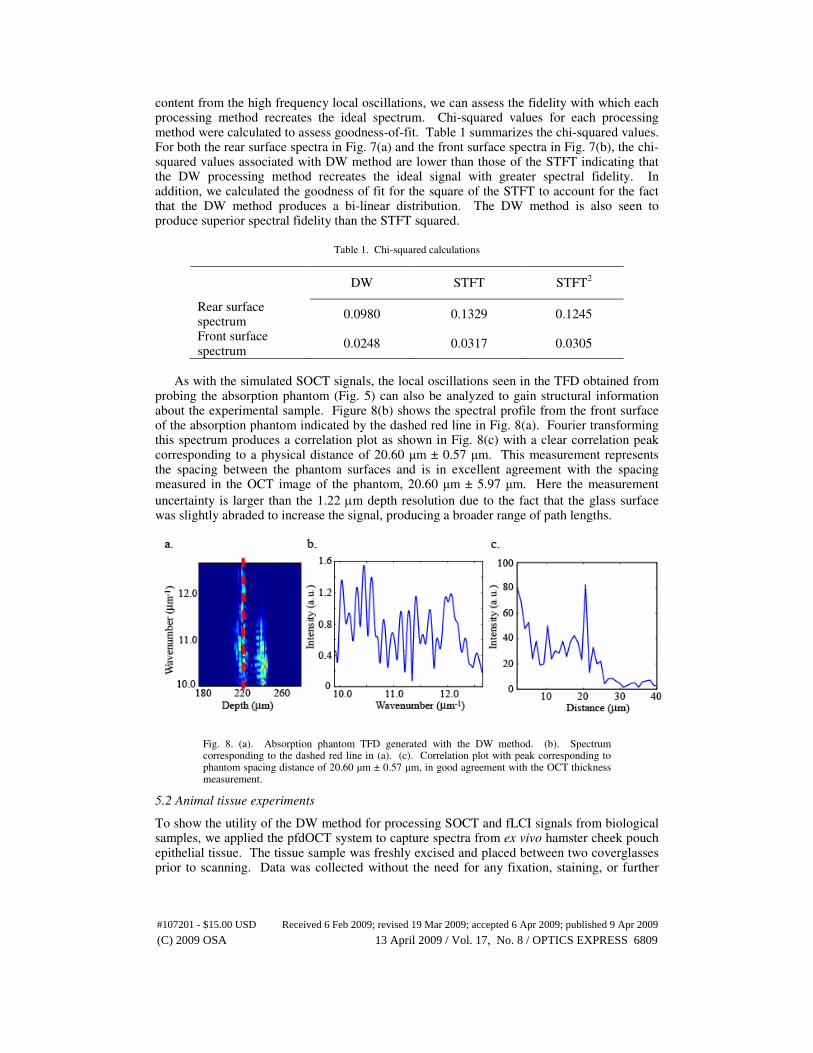
probing the absorption phantom (Fig. 5) can also be analyzed to gain structural information about the experimental sample. Figure 8(b) shows the spectral profile from the front surface of the absorption phantom indicated by the dashed red line in Fig. 8(a). Fourier transforming this spectrum produces a correlation plot as shown in Fig. 8(c) with a clear correlation peak corresponding to a physical distance of 20.60 µm ± 0.57 µm. This measurement represents the spacing between the phantom surfaces and is in excellent agreement with the spacing measured in the OCT image of the phantom, 20.60 µm ± 5.97 µm. Here the measurement
uncertainty is larger than the 1.22 µm depth resolution due to the fact that the glass surface was slightly abraded to increase the signal, producing a broader range of path lengths.
Fig. 8. (a). Absorption phantom TFD generated with the DW method. (b). Spectrum corresponding to the dashed red line in (a). (c). Correlation plot with peak corresponding to phantom spacing distance of 20.60 µm ± 0.57 µm, in good agreement with the OCT thickness measurement.
5.2 Animal tissue experiments
To show the utility of the DW method for processing SOCT and fLCI signals from biological samples, we applied the pfdOCT system to capture spectra from ex vivo hamster cheek pouch epithelial tissue. The tissue sample was freshly excised and placed between two coverglasses prior to scanning. Data was collected without the need for any fixation, staining, or further
#107201 - $15.00 USD Received 6 Feb 2009; revised 19 Mar 2009; accepted 6 Apr 2009; published 9 Apr 2009
(C) 2009 OSA 13 April 2009 / Vol. 17, No. 8 / OPTICS EXPRESS 6809

preparation of the tissue. The raw data was processed using the DW method and resulted in the TFD shown in Fig. 9(b).
Fig. 9. (a). Histopathology of hamster cheek pouch used for experiments in section 5.2 with basal layer depth indicated. (b). TFD from hamster cheek pouch tissue generated with the DW method. Basal layer indicated by red dashed box. (c). Average spectrum from a 15.45 µm depth segment corresponding to the basal tissue layer (red box in part (b)). (d). Correlation plot with peak corresponding to scatterer diameter of 4.94 µm.
The generated TFD can be used to identify spectral modulation due to scattering within the sample, specifically to assess nuclear morphology in situ based on scattering signatures. In epithelial tissues, the majority of nuclear scattering occurs in the basal layer, approximately 40 µm beneath the tissue surface, as determined by histopathological analysis and shown in Fig. 9(a). The corresponding depth of the TFD in Fig. 9(b), which was scaled by n ≈ 1.38 to account for the approximate index of refraction [17, 18], was selected and the spectra from a 15.45 µm depth segment was averaged in order to increase the signal-to-noise ratio. The averaged spectrum was first fit by a power-law and the residual spectrum is shown in Fig. 9(c). The local oscillations present in this signal contain valuable structural information about the scatterers in the tissue. Graf and Wax have previously shown that these local oscillations can be used to quantitatively determine nuclear morphology by analyzing the Fourier transform of the spectrum, producing a plot of the depthwise correlation function [8]. Similar to the processing applied in the simulated example (Fig. 3(c)) and the experimental results (Fig. 8(c)), Fourier transforming the spectrum from Fig. 9(c) yields the correlation plot shown in Fig. 9(d). This plot shows a clear correlation peak corresponding to the distance between
#107201 - $15.00 USD Received 6 Feb 2009; revised 19 Mar 2009; accepted 6 Apr 2009; published 9 Apr 2009
(C) 2009 OSA 13 April 2009 / Vol. 17, No. 8 / OPTICS EXPRESS 6810

the light scattered from the front and back surfaces of the nuclei, i.e. the nuclear diameter. The correlation distance measurement in Fig, 9(d) has been scaled by a factor of 2 n, to account for the round trip path through the nucleus and assuming an index of refraction for the nucleaus, n = 1.395 [19]. The diameter of 4.94 µm corresponds nicely with the nuclear diameter expected for the basal tissue layer of hamster cheek pouch epithelium [16] when measurements are adjusted to account for fLCI’s measurement of the minor axis of cell nuclei [8].
There are three key reasons that we are confident that the correlation peak represents nuclear diameter as opposed to the separation between nuclei. First, the front and back surfaces of each nucleus provides two scattering surfaces which are relatively aligned in the axial direction. On the other hand, the alignment between different nuclei is not as well ordered making them less likely to yield oscillations in the spatially averaged spectrum. Second, we expect that the distances between nuclei would have a much larger variation than the measured diameters of single nuclei. Thus, the separation between nuclei would yield a broad distribution of distances, and not the very narrow correlation peak seen in the correlation plot. Third, we have recently completed an animal study examining the correlation peak as a function of tissue health. We find that the correlation peak moves to longer distances for dysplastic tissue but remains smaller for healthy tissues, consistent with the nuclear enlargement seen for dysplastic tissues. If the correlation plot was measuring nucleus-to-nucleus distances, we would expect this parameter to decrease due to the increase in nucleus-to-cytoplasmic ratio observed in dysplasia.
6. Summary
We have introduced the DW method for processing SOCT signals which can simultaneously maintain high spectral and temporal resolution. Moreover, the nature of SOCT signals provides a well-conditioned and optimal problem for the DW method, even though we expect that this approach may break down for signals with sharply varying frequency content, such as those due to a chirped pulse. Chirped pulses are caused by dispersion; thus, tissue components and exogenous agents which induce significant degrees of dispersion may limit the application of the DW method. However, this tissue dispersion is already known to degrade depth resolution by up to an order of magnitude with an uncompensated ultra high resolution OCT system and at large imaging depths (above 1mm) [20].
We have shown that the DW method probes the Wigner TFD of the signal field with two orthogonal windows that independently determine spectral and temporal resolution and thus avoids the resolution tradeoff that hinders traditional SOCT processing methods. In addition, we have shown that local oscillations contained in the TFDs generated by the DW method contain valuable information about the structure of experimental samples. By comparing the performance of the DW and STFT processing methods in analyzing SOCT signals from an absorption phantom, we have shown that the DW method recovers TFDs with superior fidelity while simultaneously maintaining high spectral and temporal resolution. We have also shown the utility of the DW method for processing SOCT and fLCI signals from biological samples to gain morphological information about scatterers.
Since its introduction, SOCT has held promise for gaining spatial and functional knowledge of a biological sample by mapping spectral information onto depth resolved images. Unfortunately, traditional SOCT processing methods such as the STFT and CWT have been limited by an inherent tradeoff between spectroscopic and depth resolution. This time-frequency tradeoff greatly reduces the utility of the analysis by degrading either the depth or spectral resolution to the point that important features cannot be accurately reconstructed. We expect that by avoiding this tradeoff, the DW processing method will enable new directions in SOCT and depth resolved spectroscopy.
#107201 - $15.00 USD Received 6 Feb 2009; revised 19 Mar 2009; accepted 6 Apr 2009; published 9 Apr 2009
(C) 2009 OSA 13 April 2009 / Vol. 17, No. 8 / OPTICS EXPRESS 6811

Acknowledgments
We gratefully acknowledge Xiaoxin Chen for providing the animal tissue used in this work. This research has been supported by grants from the National Institutes of Health (NCI R21-CA120128) and the National Science Foundation (BES 03-48204).
#107201 - $15.00 USD Received 6 Feb 2009; revised 19 Mar 2009; accepted 6 Apr 2009; published 9 Apr 2009
(C) 2009 OSA 13 April 2009 / Vol. 17, No. 8 / OPTICS EXPRESS 6812
Related Documents


![[Coherence] coherence 모니터링 v 1.0](https://static.cupdf.com/doc/110x72/54c1fc894a79599f448b456b/coherence-coherence-v-10.jpg)