DTE ENERGY SPIN OF DT MIDSTREAM JUNE 9, 2021

Welcome message from author
This document is posted to help you gain knowledge. Please leave a comment to let me know what you think about it! Share it to your friends and learn new things together.
Transcript
DTE ENERGY SP IN OF DT MIDSTREAM
J U N E 9 , 2 0 2 1
Safe harbor statement
2
The information contained herein is as of the date of this document. DTE Energy expressly disclaims any current intention to update any forward-looking statements contained in this document as a result of new
information or future events or developments. Words such as “anticipate,” “believe,” “expect,” “may,” “could,” “would,” “projected,” “aspiration,” “plans”, “target” and “goals” signify forward-looking statements.
Forward-looking statements are not guarantees of future results and conditions but rather are subject to various assumptions, risks and uncertainties. This document contains forward-looking statements about DTE
Energy’s and DT Midstream’s financial results and estimates of future prospects, and actual results may differ materially. This document contains forward-looking statements about DTE Energy’s intent to spin-off DT
Midstream and DTE Energy’s preliminary strategic, operational and financial considerations related thereto. The statements with respect to the separation transaction are preliminary in nature and subject to change
as additional information becomes available. The separation transaction will be subject to the satisfaction or waiver of a number of conditions, and there is no assurance that such separation transaction will in fact
occur. Many factors impact forward-looking statements including, but not limited to, the following: risks related to the spin-off of DT Midstream, including that the process of exploring the transaction and potentially
completing the transaction could disrupt or adversely affect the consolidated or separate businesses, results of operations and financial condition, that the transaction may not achieve some or all of any anticipated
benefits with respect to either business, and that the transaction may not be completed in accordance with DTE Energy’s expected plans or anticipated timelines, or at all; the duration and impact of the COVID-19
pandemic on DTE Energy and customers, impact of regulation by the EPA, the EGLE, the FERC, the MPSC, the NRC, and for DTE Energy, the CFTC and CARB, as well as other applicable governmental proceedings and
regulations, including any associated impact on rate structures; the amount and timing of cost recovery allowed as a result of regulatory proceedings, related appeals, or new legislation, including legislative
amendments and retail access programs; economic conditions and population changes in our geographic area resulting in changes in demand, customer conservation, and thefts of electricity and, for DTE Energy,
natural gas; the operational failure of electric or gas distribution systems or infrastructure; impact of volatility of prices in the oil and gas markets on DTE Energy’s gas storage and pipelines operations and the volatility
in the short-term natural gas storage markets impacting third-party storage revenues related to DTE Energy; impact of volatility in prices in the international steel markets on DTE Energy’s power and industrial projects
operations; the risk of a major safety incident; environmental issues, laws, regulations, and the increasing costs of remediation and compliance, including actual and potential new federal and state requirements; the
cost of protecting assets against, or damage due to, cyber incidents and terrorism; health, safety, financial, environmental, and regulatory risks associated with ownership and operation of nuclear facilities; volatility in
commodity markets, deviations in weather, and related risks impacting the results of DTE Energy’s energy trading operations; changes in the cost and availability of coal and other raw materials, purchased power, and
natural gas; advances in technology that produce power, store power or reduce power consumption; changes in the financial condition of significant customers and strategic partners; the potential for losses on
investments, including nuclear decommissioning and benefit plan assets and the related increases in future expense and contributions; access to capital markets and the results of other financing efforts which can be
affected by credit agency ratings; instability in capital markets which could impact availability of short and long-term financing; the timing and extent of changes in interest rates; the level of borrowings; the potential for
increased costs or delays in completion of significant capital projects; changes in, and application of, federal, state, and local tax laws and their interpretations, including the Internal Revenue Code, regulations, rulings,
court proceedings, and audits; the effects of weather and other natural phenomena on operations and sales to customers, and purchases from suppliers; unplanned outages; employee relations and the impact of
collective bargaining agreements; the availability, cost, coverage, and terms of insurance and stability of insurance providers; cost reduction efforts and the maximization of plant and distribution system performance;
the effects of competition; changes in and application of accounting standards and financial reporting regulations; changes in federal or state laws and their interpretation with respect to regulation, energy policy, and
other business issues; contract disputes, binding arbitration, litigation, and related appeals; and the risks discussed in DTE Energy’s public filings with the Securities and Exchange Commission. New factors emerge
from time to time. We cannot predict what factors may arise or how such factors may cause results to differ materially from those contained in any forward-looking statement. Any forward-looking statements speak
only as of the date on which such statements are made. We undertake no obligation to update any forward-looking statement to reflect events or circumstances after the date on which such statement is made or to
reflect the occurrence of unanticipated events. This document should also be read in conjunction with the Forward-Looking Statements section of the joint DTE Energy and DTE Electric 2020 Form 10-K and 2021 Form
10-Q (which sections are incorporated by reference herein), and in conjunction with other SEC reports filed by DTE Energy and DTE Electric.
Introduction
DTE Energy
DT Midstream
Appendix
3
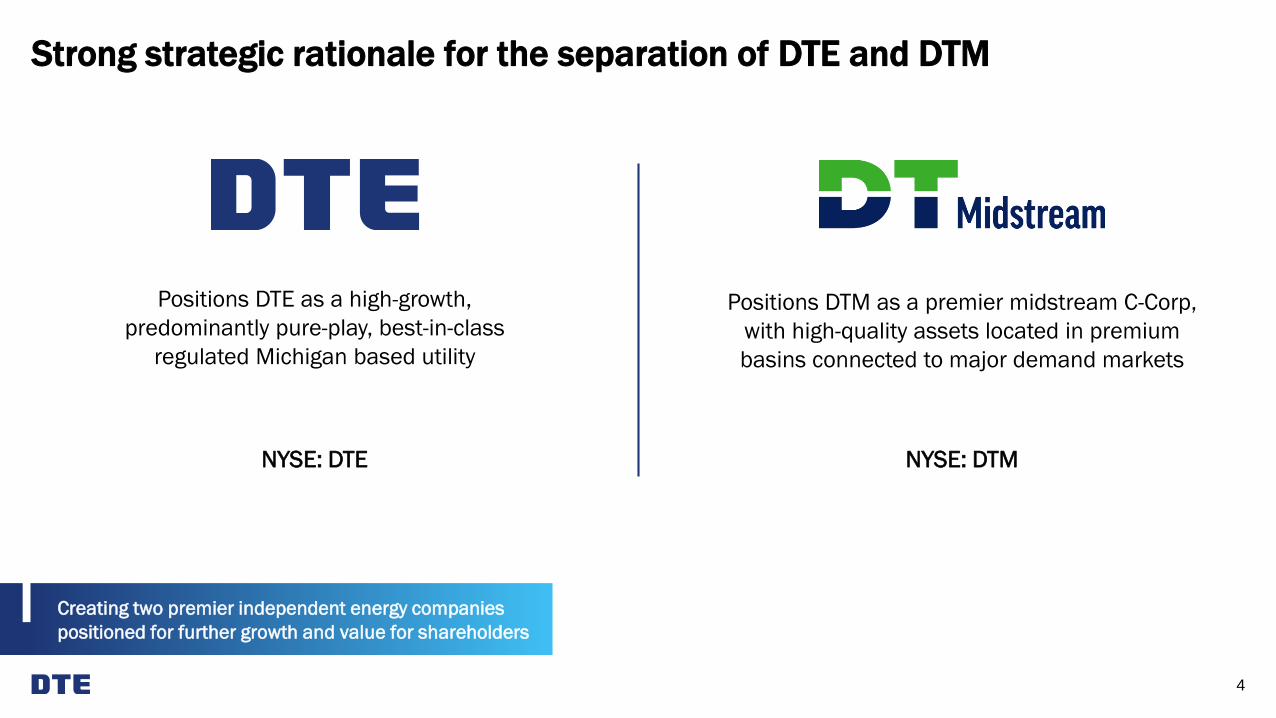
Strong strategic rationale for the separation of DTE and DTM
4
Positions DTE as a high-growth,
predominantly pure-play, best-in-class
regulated Michigan based utility
Positions DTM as a premier midstream C-Corp,
with high-quality assets located in premium
basins connected to major demand markets
NYSE: DTMNYSE: DTE
Creating two premier independent energy companies
positioned for further growth and value for shareholders
1. Annualized dividend is the current consolidated pre-spin version of DTE; the spin is currently expected to occur mid-year 2021 and any post-spin guidance is subject to final Board approval and will be provided later in the process
2. Subject to final Board approval
3. Reasonable proxy for combined annualized dividend - calculated using current disclosures; additional disclosures are expected to occur mid-year 2021 and any post-spin dividend guidance is subject to final Board approval and will be
provided later in the process
5
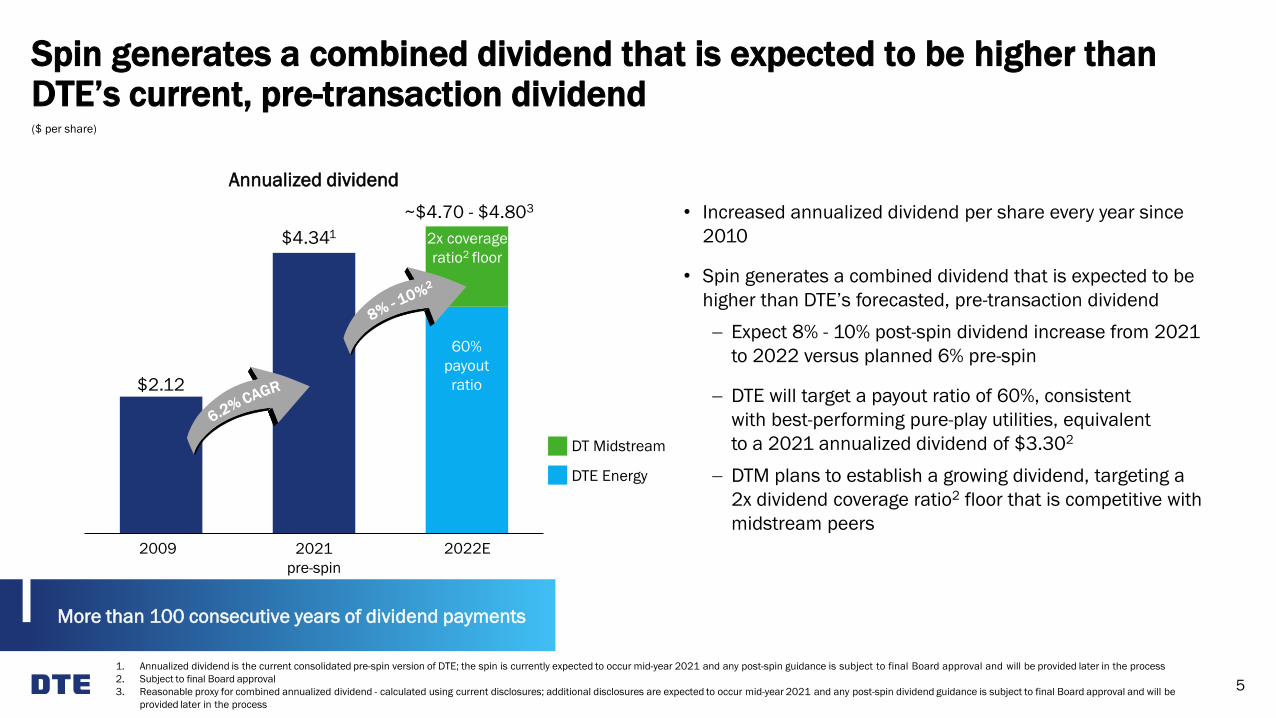
Spin generates a combined dividend that is expected to be higher than DTE’s current, pre-transaction dividend
Annualized dividend
$2.12
• Increased annualized dividend per share every year since
2010
• Spin generates a combined dividend that is expected to be
higher than DTE’s forecasted, pre-transaction dividend
− Expect 8% - 10% post-spin dividend increase from 2021
to 2022 versus planned 6% pre-spin
− DTE will target a payout ratio of 60%, consistent
with best-performing pure-play utilities, equivalent
to a 2021 annualized dividend of $3.302
− DTM plans to establish a growing dividend, targeting a
2x dividend coverage ratio2 floor that is competitive with
midstream peers
More than 100 consecutive years of dividend payments
2009 2021
pre-spin
2022E
($ per share)
~$4.70 - $4.803
DT Midstream
DTE Energy
2x coverage
ratio2 floor
$4.341
60%
payout
ratio
Introduction
DTE Energy
DT Midstream
Appendix
6
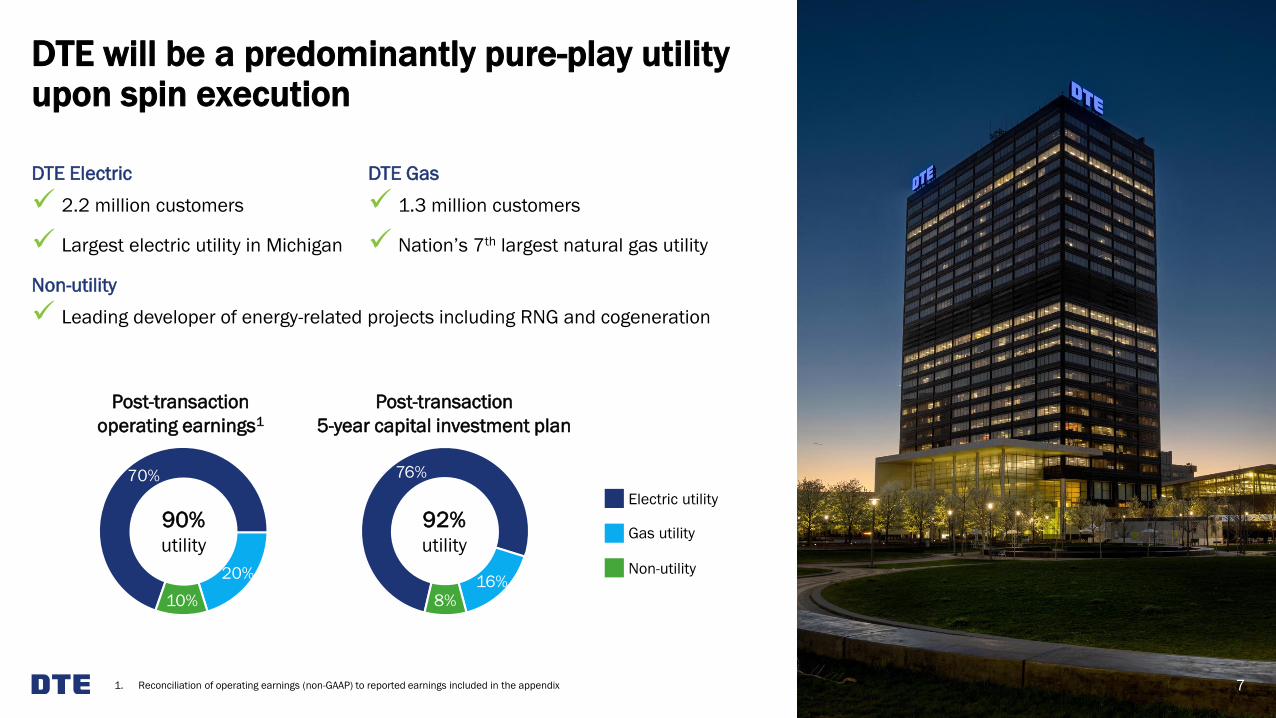
DTE Electric
✓ 2.2 million customers
✓ Largest electric utility in Michigan
Non-utility
✓ Leading developer of energy-related projects including RNG and cogeneration
DTE will be a predominantly pure-play utility upon spin execution
7
DTE Gas
✓ 1.3 million customers
✓ Nation’s 7th largest natural gas utility
70%
20%
10%
76%
16%8%
Post-transaction
operating earnings1
Post-transaction
5-year capital investment plan
Gas utility
Non-utility
Electric utility
1. Reconciliation of operating earnings (non-GAAP) to reported earnings included in the appendix
90%utility
92%utility
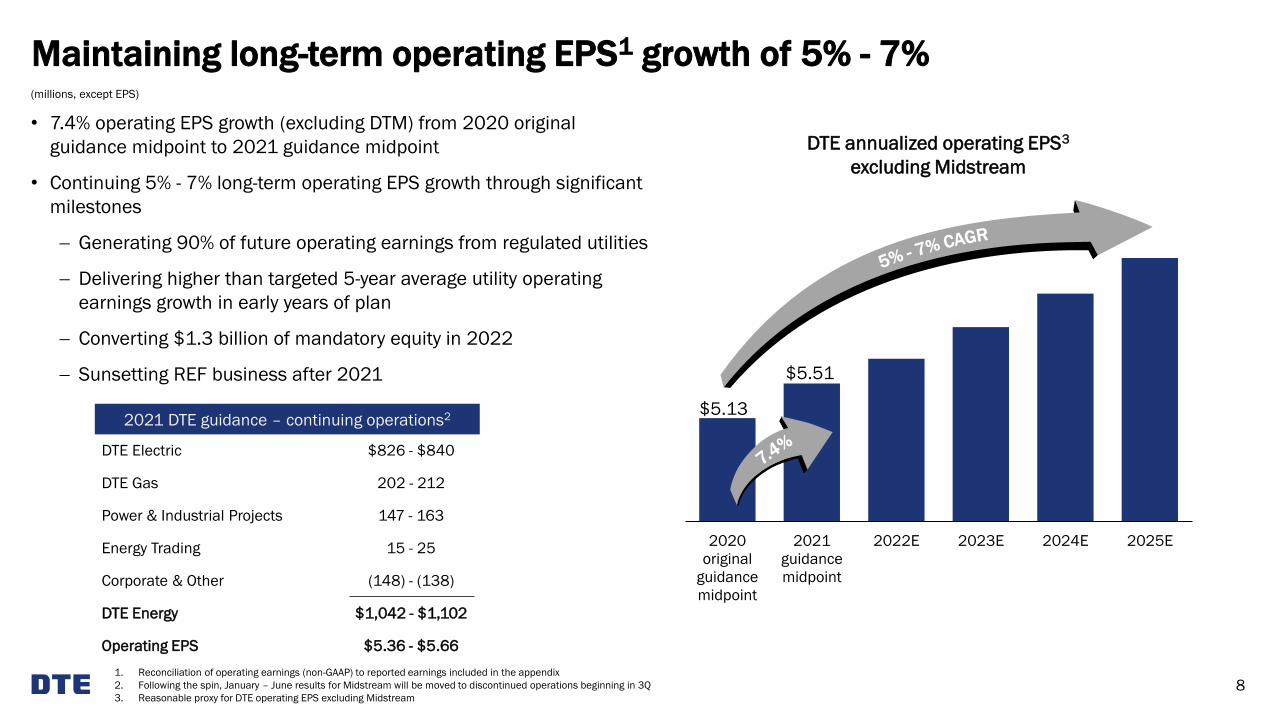
Maintaining long-term operating EPS1 growth of 5% - 7%
8
2020
original
guidance
midpoint
2021
guidance
midpoint
2022E 2023E 2024E 2025E
DTE annualized operating EPS3
excluding Midstream
• 7.4% operating EPS growth (excluding DTM) from 2020 original
guidance midpoint to 2021 guidance midpoint
• Continuing 5% - 7% long-term operating EPS growth through significant
milestones
− Generating 90% of future operating earnings from regulated utilities
− Delivering higher than targeted 5-year average utility operating
earnings growth in early years of plan
− Converting $1.3 billion of mandatory equity in 2022
− Sunsetting REF business after 2021
$5.13
$5.51
1. Reconciliation of operating earnings (non-GAAP) to reported earnings included in the appendix
2. Following the spin, January – June results for Midstream will be moved to discontinued operations beginning in 3Q
3. Reasonable proxy for DTE operating EPS excluding Midstream
2021 DTE guidance
DTE Electric $826 - $840
DTE Gas 202 - 212
Power & Industrial Projects 147 - 163
Energy Trading 15 - 25
Corporate & Other (148) - (138)
DTE Energy $1,042 - $1,102
Operating EPS $5.36 - $5.66
2021 DTE guidance – continuing operations2
(millions, except EPS)
Introduction
DTE Energy
DT Midstream
Appendix
9
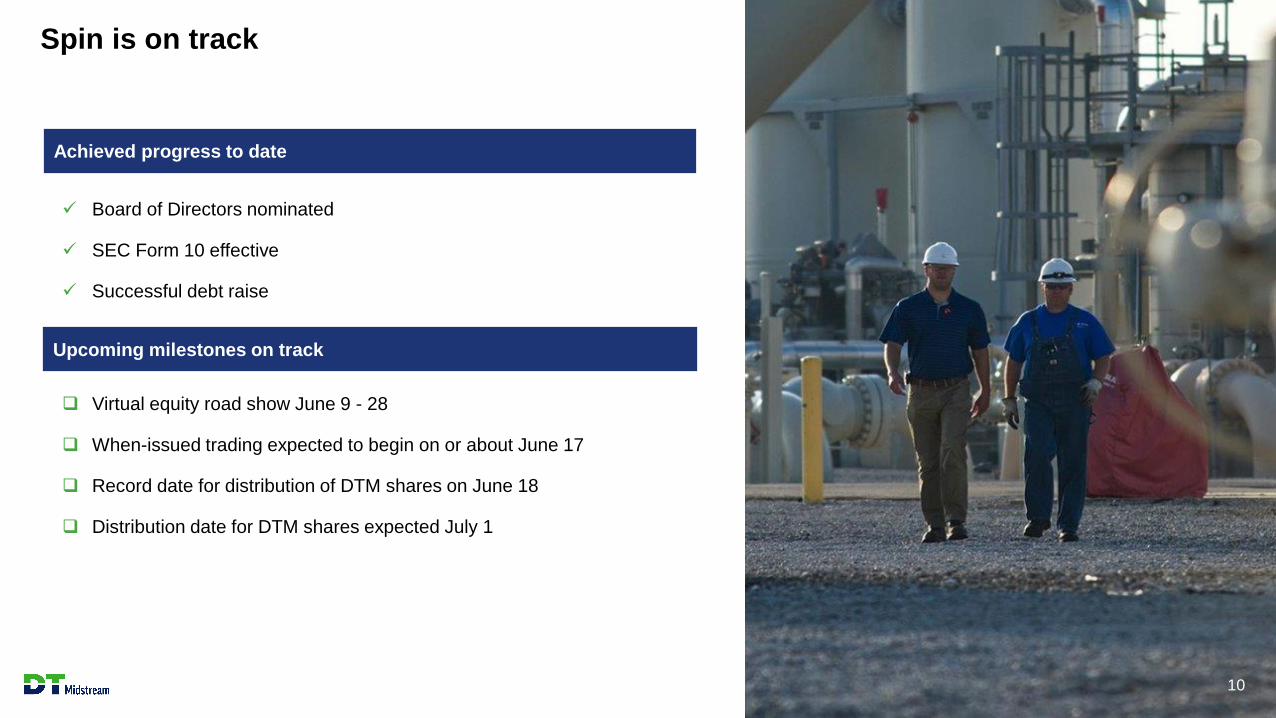
❑ Virtual equity road show June 9 - 28
❑ When-issued trading expected to begin on or about June 17
❑ Record date for distribution of DTM shares on June 18
❑ Distribution date for DTM shares expected July 1
✓ Board of Directors nominated
✓ SEC Form 10 effective
✓ Successful debt raise
Spin is on track
10
Achieved progress to date
Upcoming milestones on track
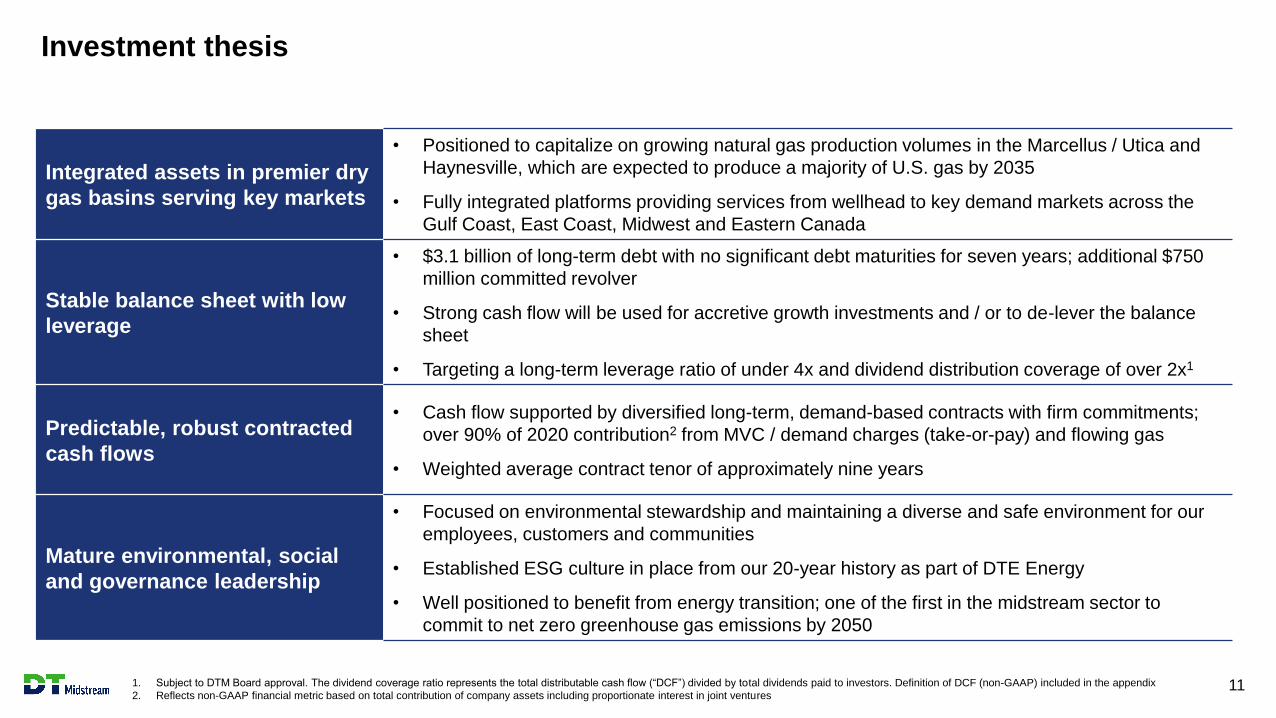
Investment thesis
11
Integrated assets in premier dry
gas basins serving key markets
• Positioned to capitalize on growing natural gas production volumes in the Marcellus / Utica and
Haynesville, which are expected to produce a majority of U.S. gas by 2035
• Fully integrated platforms providing services from wellhead to key demand markets across the
Gulf Coast, East Coast, Midwest and Eastern Canada
Stable balance sheet with low
leverage
• $3.1 billion of long-term debt with no significant debt maturities for seven years; additional $750
million committed revolver
• Strong cash flow will be used for accretive growth investments and / or to de-lever the balance
sheet
• Targeting a long-term leverage ratio of under 4x and dividend distribution coverage of over 2x1
Predictable, robust contracted
cash flows
• Cash flow supported by diversified long-term, demand-based contracts with firm commitments;
over 90% of 2020 contribution2 from MVC / demand charges (take-or-pay) and flowing gas
• Weighted average contract tenor of approximately nine years
Mature environmental, social
and governance leadership
• Focused on environmental stewardship and maintaining a diverse and safe environment for our
employees, customers and communities
• Established ESG culture in place from our 20-year history as part of DTE Energy
• Well positioned to benefit from energy transition; one of the first in the midstream sector to
commit to net zero greenhouse gas emissions by 2050
1. Subject to DTM Board approval. The dividend coverage ratio represents the total distributable cash flow (“DCF”) divided by total dividends paid to investors. Definition of DCF (non-GAAP) included in the appendix
2. Reflects non-GAAP financial metric based on total contribution of company assets including proportionate interest in joint ventures
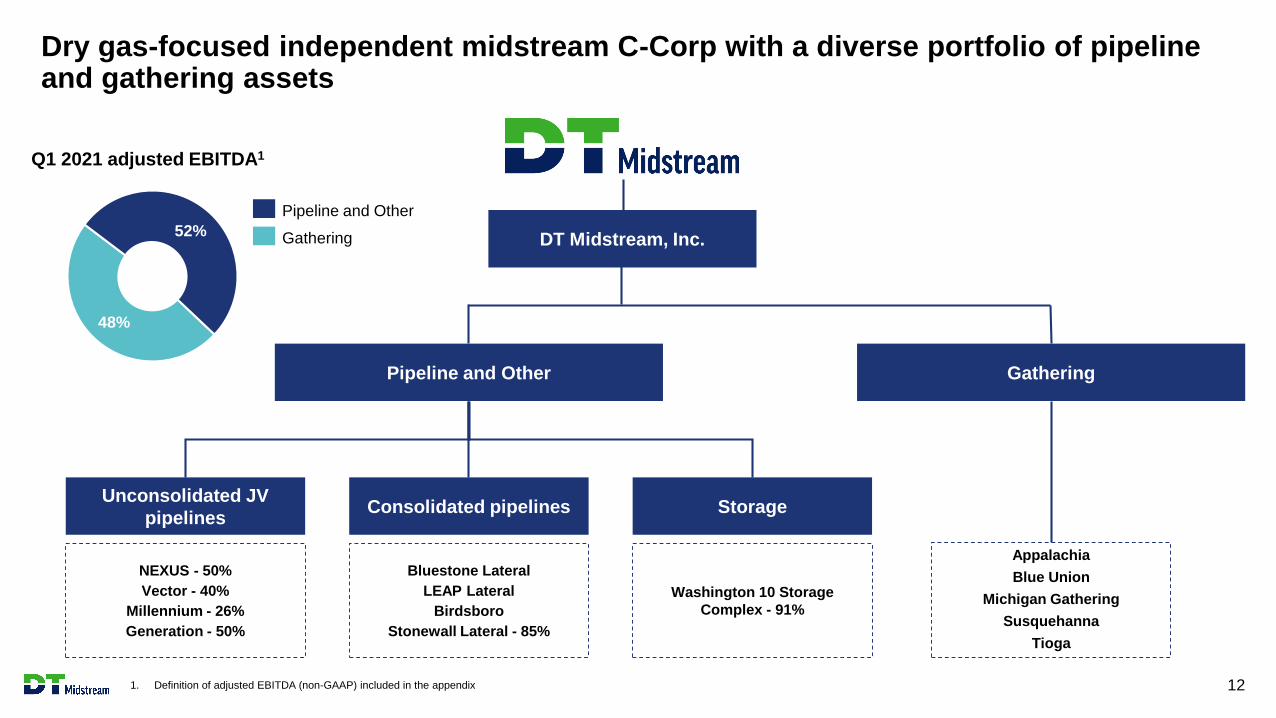
Dry gas-focused independent midstream C-Corp with a diverse portfolio of pipeline and gathering assets
1. Definition of adjusted EBITDA (non-GAAP) included in the appendix 12
Pipeline and Other Gathering
Unconsolidated JV
pipelinesConsolidated pipelines Storage
NEXUS - 50%
Vector - 40%
Millennium - 26%
Generation - 50%
Bluestone Lateral
LEAP Lateral
Birdsboro
Stonewall Lateral - 85%
Washington 10 Storage
Complex - 91%
Appalachia
Blue Union
Michigan Gathering
Susquehanna
Tioga
DT Midstream, Inc.
Q1 2021 adjusted EBITDA1
48%
52%
Pipeline and Other
Gathering
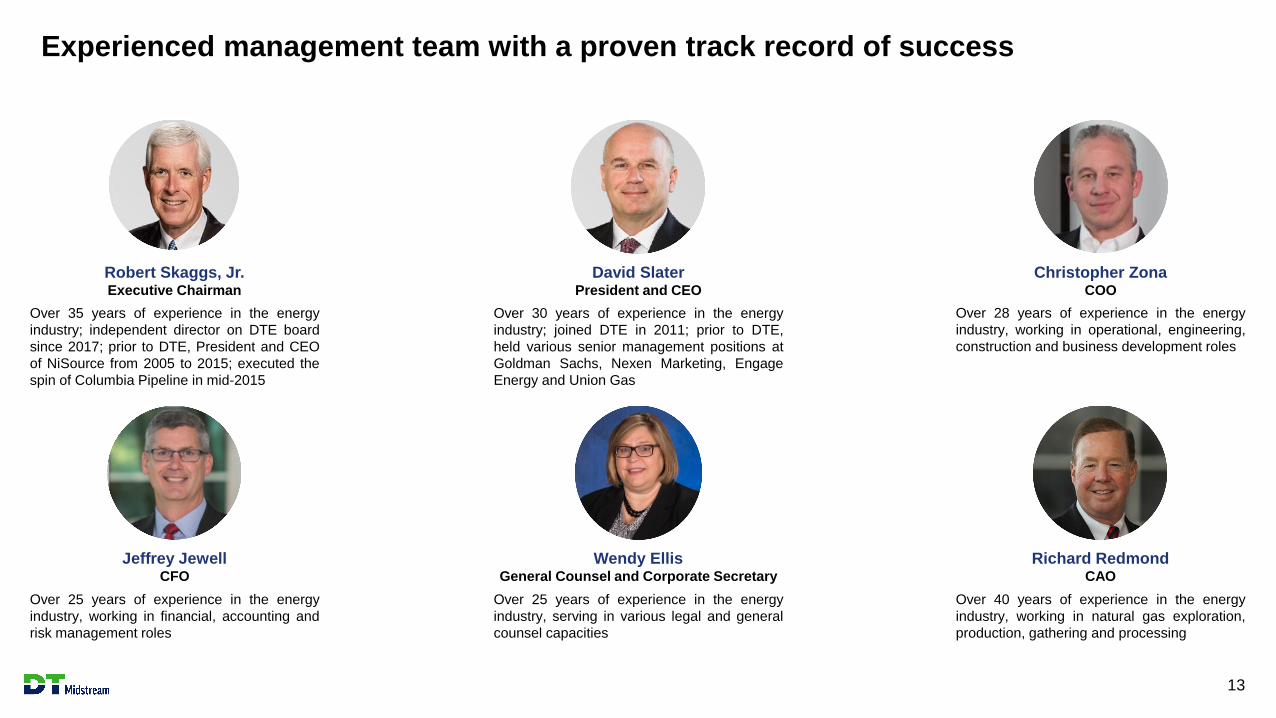
Experienced management team with a proven track record of success
13
Robert Skaggs, Jr.Executive Chairman
Over 35 years of experience in the energy
industry; independent director on DTE board
since 2017; prior to DTE, President and CEO
of NiSource from 2005 to 2015; executed the
spin of Columbia Pipeline in mid-2015
Jeffrey JewellCFO
Wendy EllisGeneral Counsel and Corporate Secretary
Richard RedmondCAO
Over 30 years of experience in the energy
industry; joined DTE in 2011; prior to DTE,
held various senior management positions at
Goldman Sachs, Nexen Marketing, Engage
Energy and Union Gas
Over 28 years of experience in the energy
industry, working in operational, engineering,
construction and business development roles
Over 25 years of experience in the energy
industry, serving in various legal and general
counsel capacities
Over 40 years of experience in the energy
industry, working in natural gas exploration,
production, gathering and processing
Over 25 years of experience in the energy
industry, working in financial, accounting and
risk management roles
David SlaterPresident and CEO
Christopher ZonaCOO
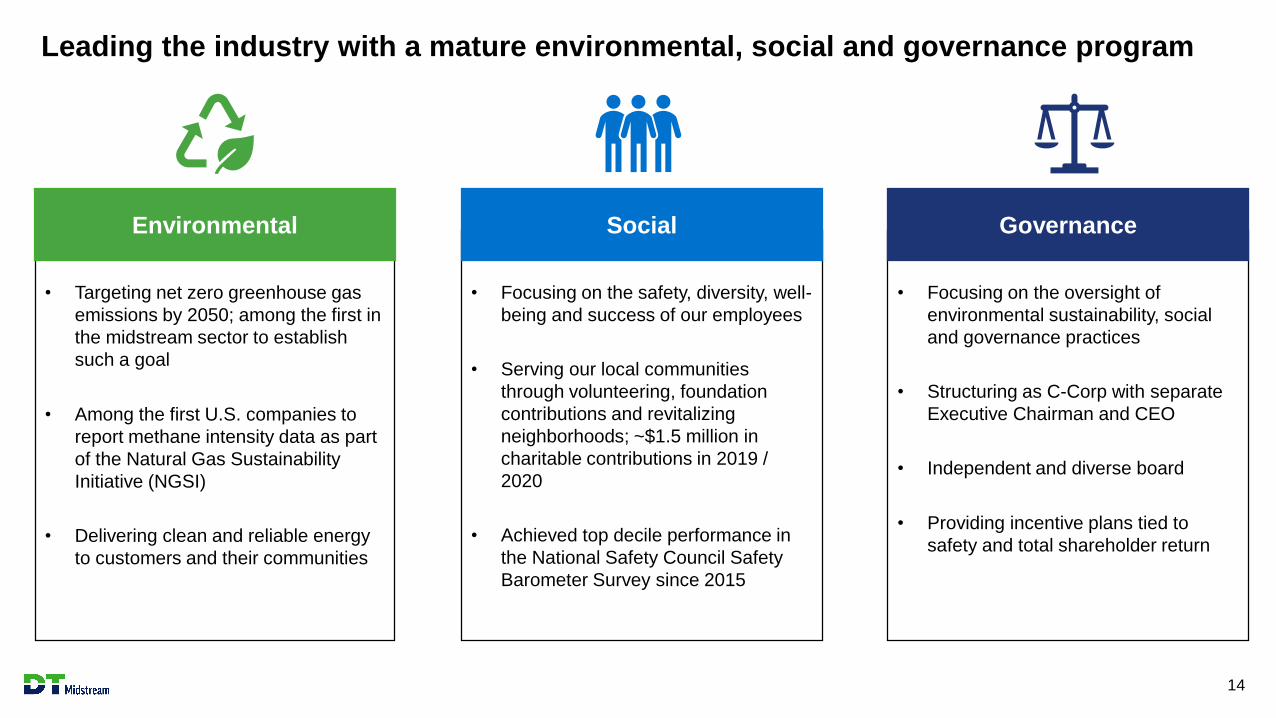
• Targeting net zero greenhouse gas
emissions by 2050; among the first in
the midstream sector to establish
such a goal
• Among the first U.S. companies to
report methane intensity data as part
of the Natural Gas Sustainability
Initiative (NGSI)
• Delivering clean and reliable energy
to customers and their communities
Environmental
Leading the industry with a mature environmental, social and governance program
14
• Focusing on the safety, diversity, well-
being and success of our employees
• Serving our local communities
through volunteering, foundation
contributions and revitalizing
neighborhoods; ~$1.5 million in
charitable contributions in 2019 /
2020
• Achieved top decile performance in
the National Safety Council Safety
Barometer Survey since 2015
Social
• Focusing on the oversight of
environmental sustainability, social
and governance practices
• Structuring as C-Corp with separate
Executive Chairman and CEO
• Independent and diverse board
• Providing incentive plans tied to
safety and total shareholder return
Governance
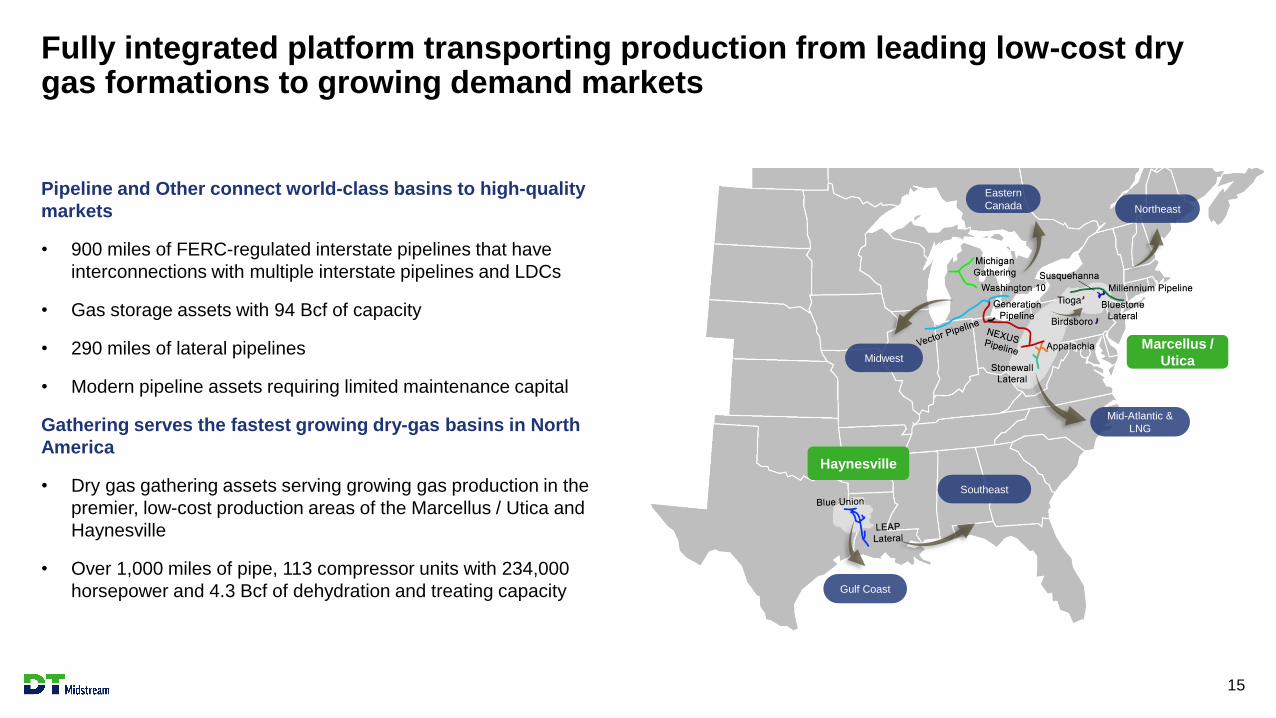
Fully integrated platform transporting production from leading low-cost dry gas formations to growing demand markets
15
Pipeline and Other connect world-class basins to high-quality
markets
• 900 miles of FERC-regulated interstate pipelines that have
interconnections with multiple interstate pipelines and LDCs
• Gas storage assets with 94 Bcf of capacity
• 290 miles of lateral pipelines
• Modern pipeline assets requiring limited maintenance capital
Gathering serves the fastest growing dry-gas basins in North
America
• Dry gas gathering assets serving growing gas production in the
premier, low-cost production areas of the Marcellus / Utica and
Haynesville
• Over 1,000 miles of pipe, 113 compressor units with 234,000
horsepower and 4.3 Bcf of dehydration and treating capacity
Mid-Atlantic &
LNG
Eastern
Canada Northeast
Midwest
Southeast
Gulf Coast
Haynesville
Marcellus /
Utica
65%
29%
6%
40%
17%
36%
7%
48%
52%
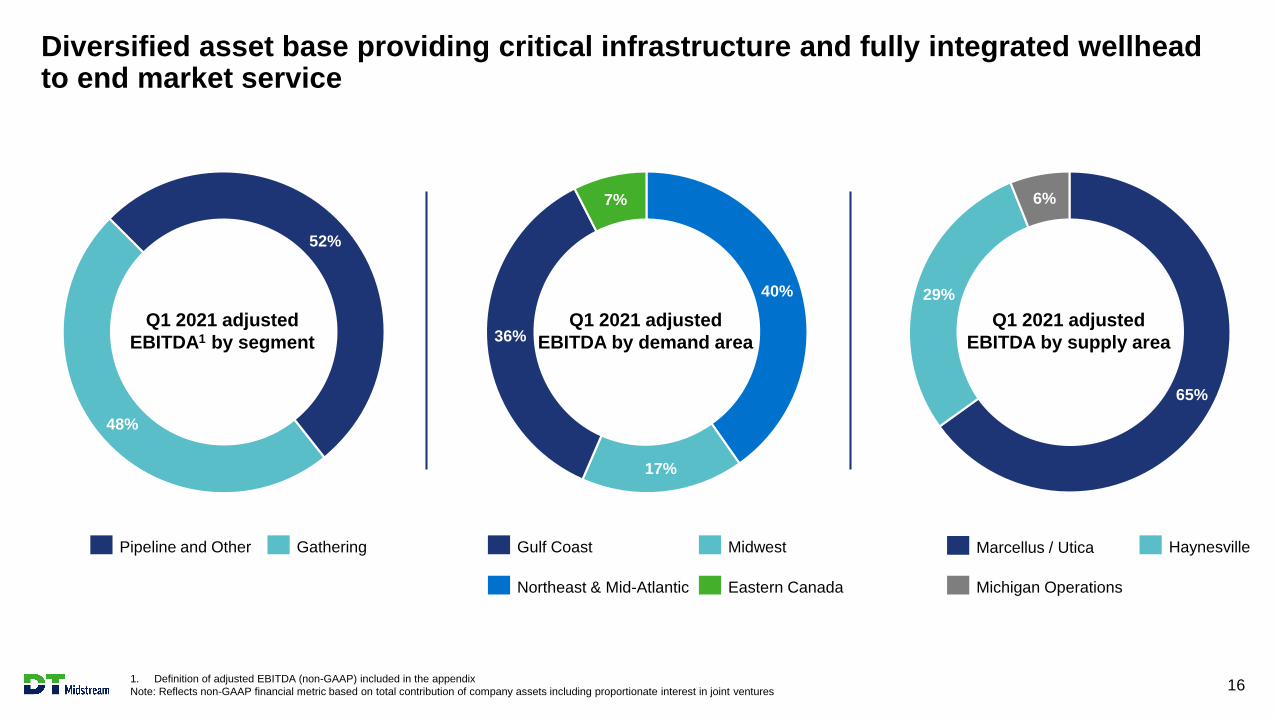
Diversified asset base providing critical infrastructure and fully integrated wellhead to end market service
1. Definition of adjusted EBITDA (non-GAAP) included in the appendix
Note: Reflects non-GAAP financial metric based on total contribution of company assets including proportionate interest in joint ventures 16
Q1 2021 adjusted
EBITDA by demand area
Q1 2021 adjusted
EBITDA1 by segment
Q1 2021 adjusted
EBITDA by supply area
Pipeline and Other Gathering Gulf Coast Midwest
Northeast & Mid-Atlantic Eastern Canada
Marcellus / Utica Haynesville
Michigan Operations
Pipeline and Other Gathering
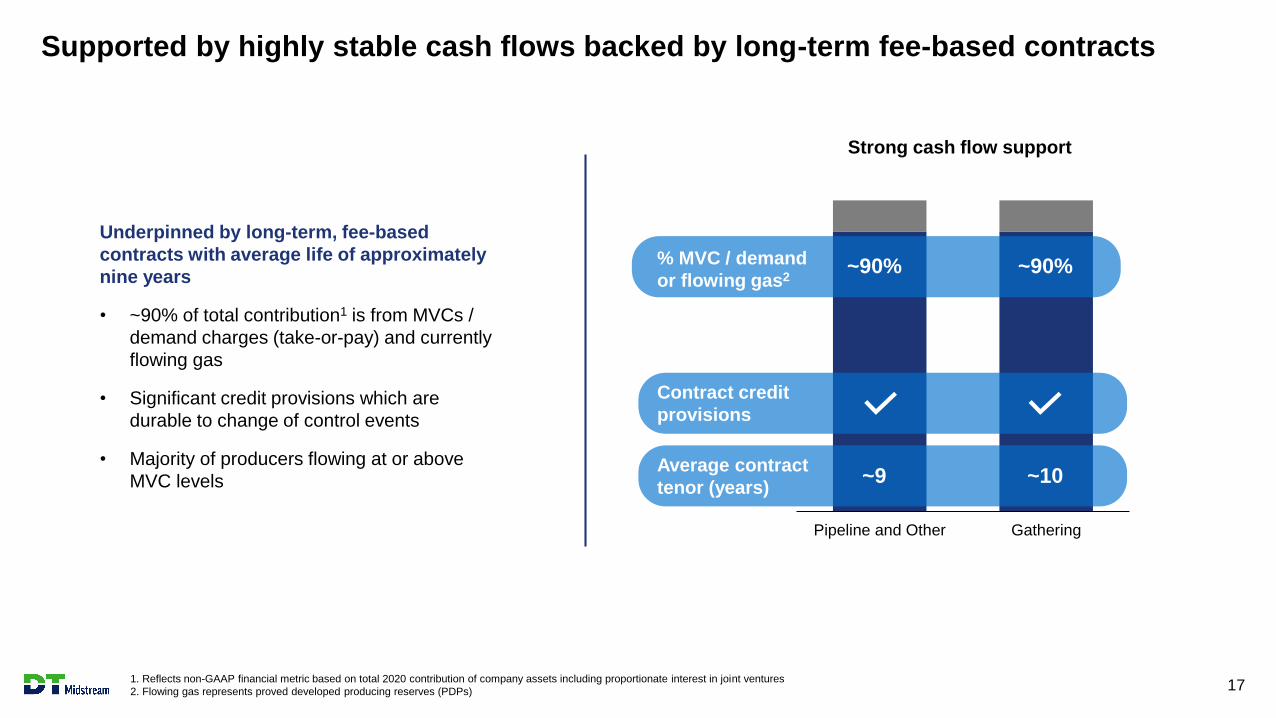
Supported by highly stable cash flows backed by long-term fee-based contracts
1. Reflects non-GAAP financial metric based on total 2020 contribution of company assets including proportionate interest in joint ventures
2. Flowing gas represents proved developed producing reserves (PDPs) 17
Underpinned by long-term, fee-based
contracts with average life of approximately
nine years
• ~90% of total contribution1 is from MVCs /
demand charges (take-or-pay) and currently
flowing gas
• Significant credit provisions which are
durable to change of control events
• Majority of producers flowing at or above
MVC levelsAverage contract
tenor (years)
Contract credit
provisions
Strong cash flow support
~9 ~10
~90% ~90%% MVC / demand
or flowing gas2
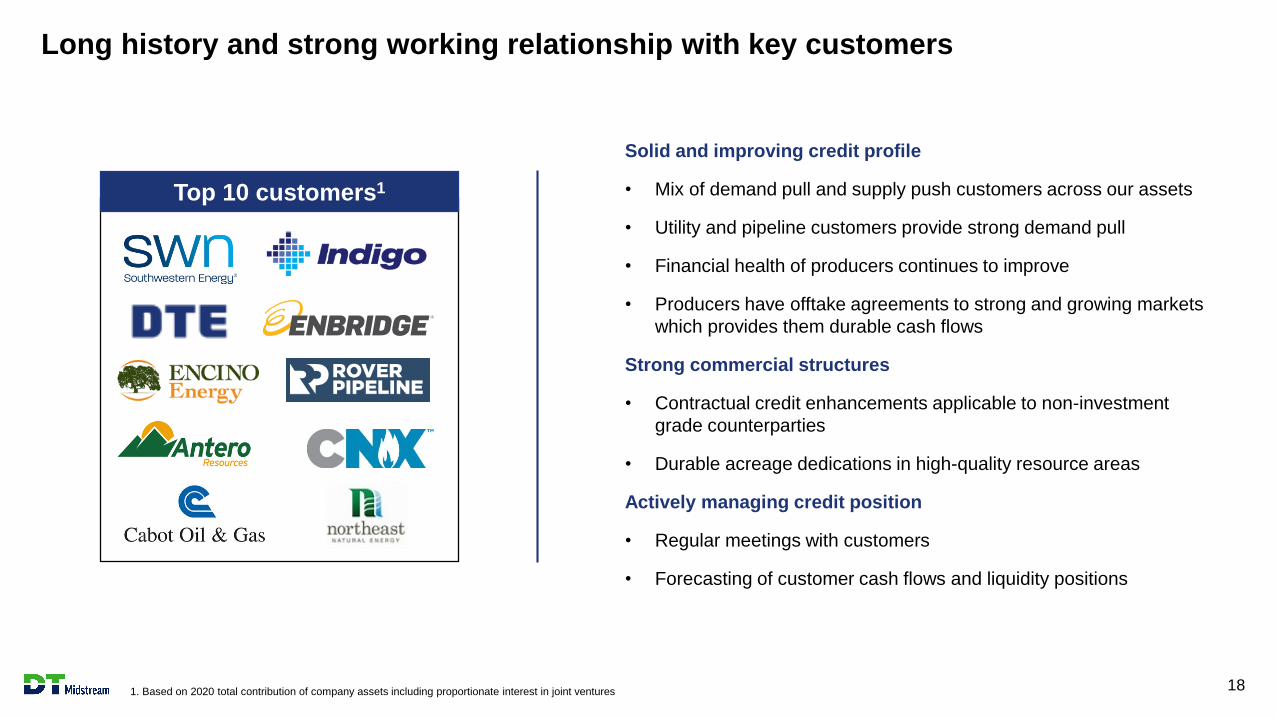
Long history and strong working relationship with key customers
1. Based on 2020 total contribution of company assets including proportionate interest in joint ventures 18
DTM op 10 customers
Top 10 customers1
Solid and improving credit profile
• Mix of demand pull and supply push customers across our assets
• Utility and pipeline customers provide strong demand pull
• Financial health of producers continues to improve
• Producers have offtake agreements to strong and growing markets
which provides them durable cash flows
Strong commercial structures
• Contractual credit enhancements applicable to non-investment
grade counterparties
• Durable acreage dedications in high-quality resource areas
Actively managing credit position
• Regular meetings with customers
• Forecasting of customer cash flows and liquidity positions
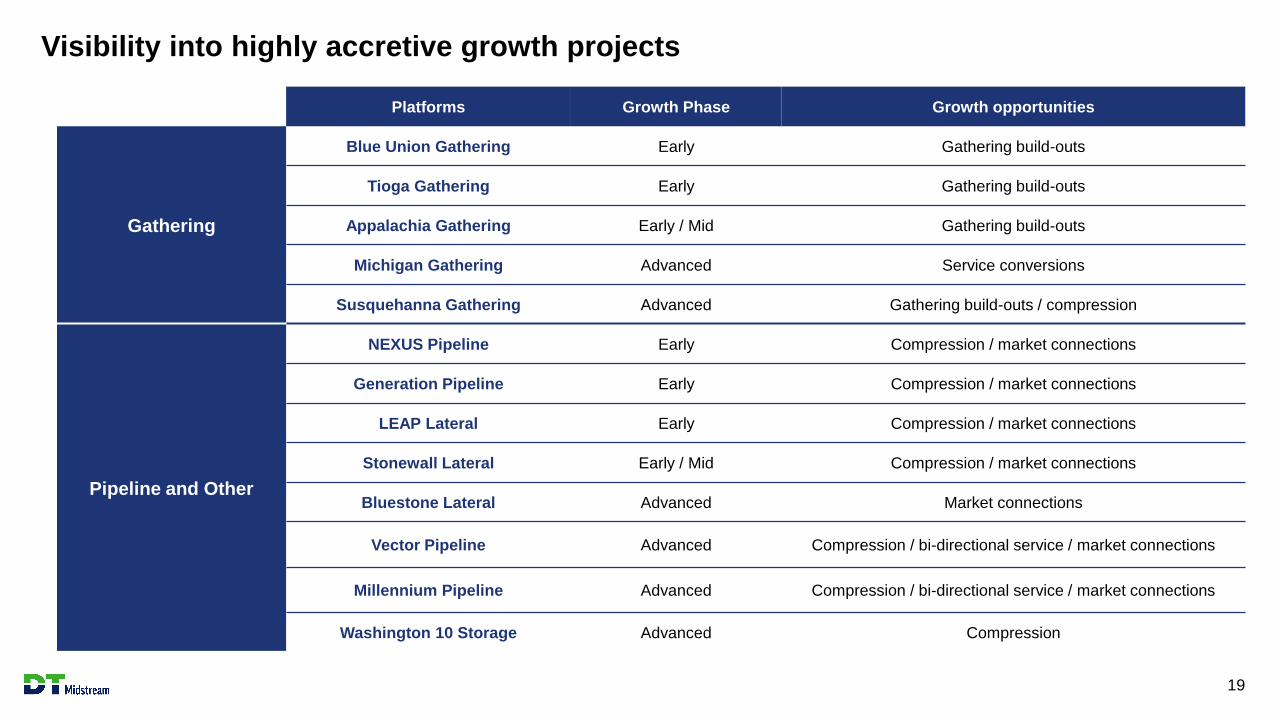
Visibility into highly accretive growth projects
19
Platforms Growth Phase Growth opportunities
Gathering
Blue Union Gathering Early Gathering build-outs
Tioga Gathering Early Gathering build-outs
Appalachia Gathering Early / Mid Gathering build-outs
Michigan Gathering Advanced Service conversions
Susquehanna Gathering Advanced Gathering build-outs / compression
Pipeline and Other
NEXUS Pipeline Early Compression / market connections
Generation Pipeline Early Compression / market connections
LEAP Lateral Early Compression / market connections
Stonewall Lateral Early / Mid Compression / market connections
Bluestone Lateral Advanced Market connections
Vector Pipeline Advanced Compression / bi-directional service / market connections
Millennium Pipeline Advanced Compression / bi-directional service / market connections
Washington 10 Storage Advanced Compression
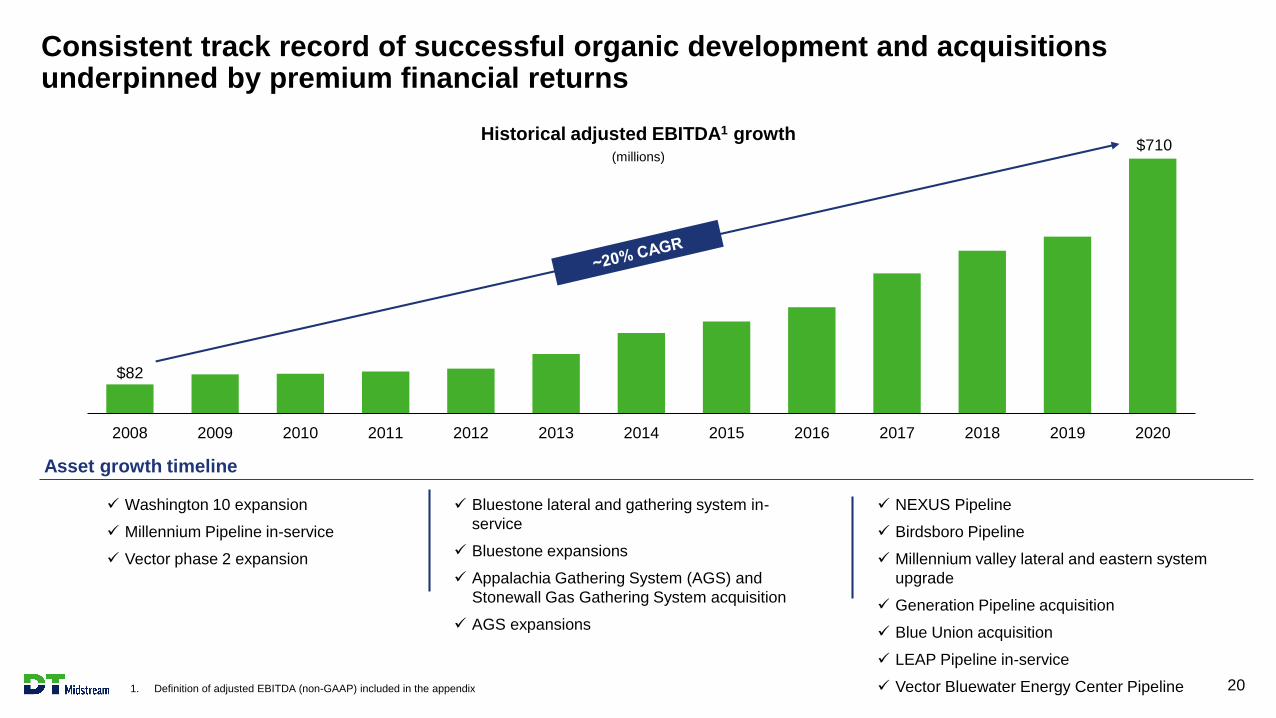
Consistent track record of successful organic development and acquisitions underpinned by premium financial returns
1. Definition of adjusted EBITDA (non-GAAP) included in the appendix 20
$82
$710
2008 2009 2010 2011 2012 2013 2014 2015 2016 2017 2018 2019 2020
✓ Washington 10 expansion
✓ Millennium Pipeline in-service
✓ Vector phase 2 expansion
✓ Bluestone lateral and gathering system in-
service
✓ Bluestone expansions
✓ Appalachia Gathering System (AGS) and
Stonewall Gas Gathering System acquisition
✓ AGS expansions
✓ NEXUS Pipeline
✓ Birdsboro Pipeline
✓ Millennium valley lateral and eastern system
upgrade
✓ Generation Pipeline acquisition
✓ Blue Union acquisition
✓ LEAP Pipeline in-service
✓ Vector Bluewater Energy Center Pipeline
Historical adjusted EBITDA1 growth(millions)
Asset growth timeline
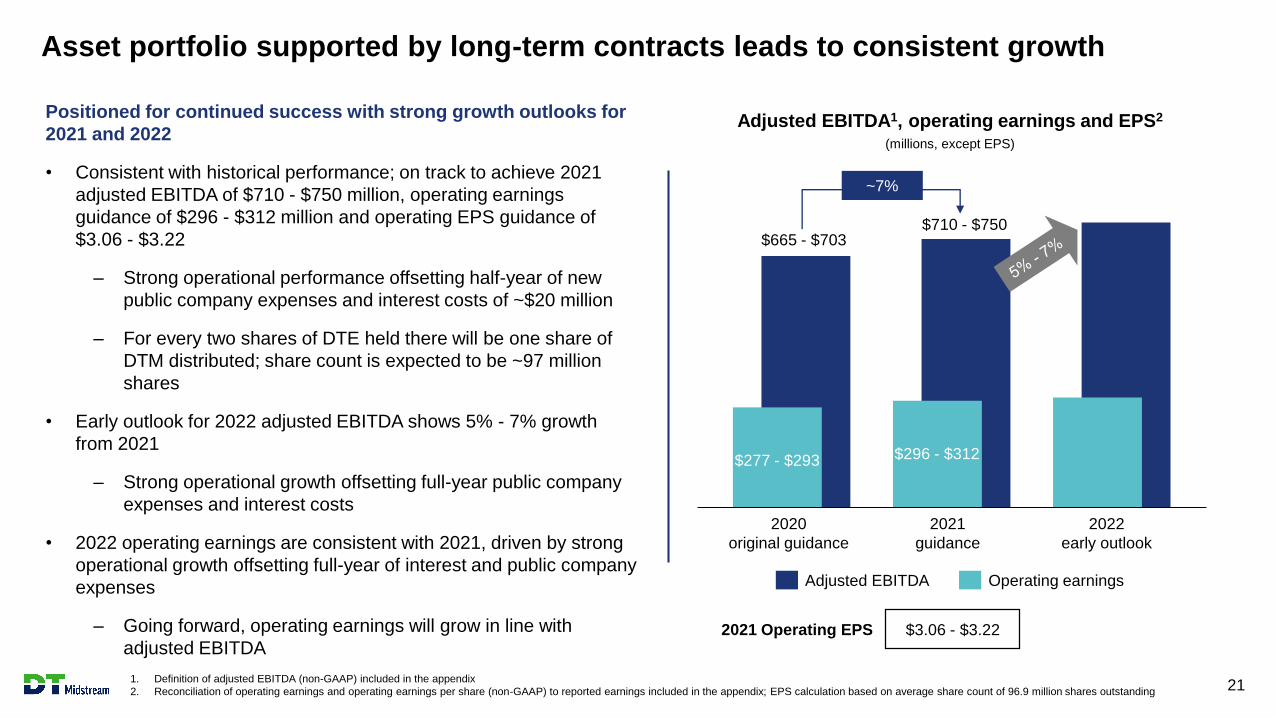
Asset portfolio supported by long-term contracts leads to consistent growth
1. Definition of adjusted EBITDA (non-GAAP) included in the appendix
2. Reconciliation of operating earnings and operating earnings per share (non-GAAP) to reported earnings included in the appendix; EPS calculation based on average share count of 96.9 million shares outstanding 21
Adjusted EBITDA Operating earnings
Adjusted EBITDA1, operating earnings and EPS2
(millions, except EPS)
Positioned for continued success with strong growth outlooks for
2021 and 2022
• Consistent with historical performance; on track to achieve 2021
adjusted EBITDA of $710 - $750 million, operating earnings
guidance of $296 - $312 million and operating EPS guidance of
$3.06 - $3.22
– Strong operational performance offsetting half-year of new
public company expenses and interest costs of ~$20 million
– For every two shares of DTE held there will be one share of
DTM distributed; share count is expected to be ~97 million
shares
• Early outlook for 2022 adjusted EBITDA shows 5% - 7% growth
from 2021
– Strong operational growth offsetting full-year public company
expenses and interest costs
• 2022 operating earnings are consistent with 2021, driven by strong
operational growth offsetting full-year of interest and public company
expenses
– Going forward, operating earnings will grow in line with
adjusted EBITDA$3.06 - $3.222021 Operating EPS
$710 - $750$665 - $703
$296 - $312$277 - $293
~7%
2020
original guidance
2021
guidance
2022
early outlook
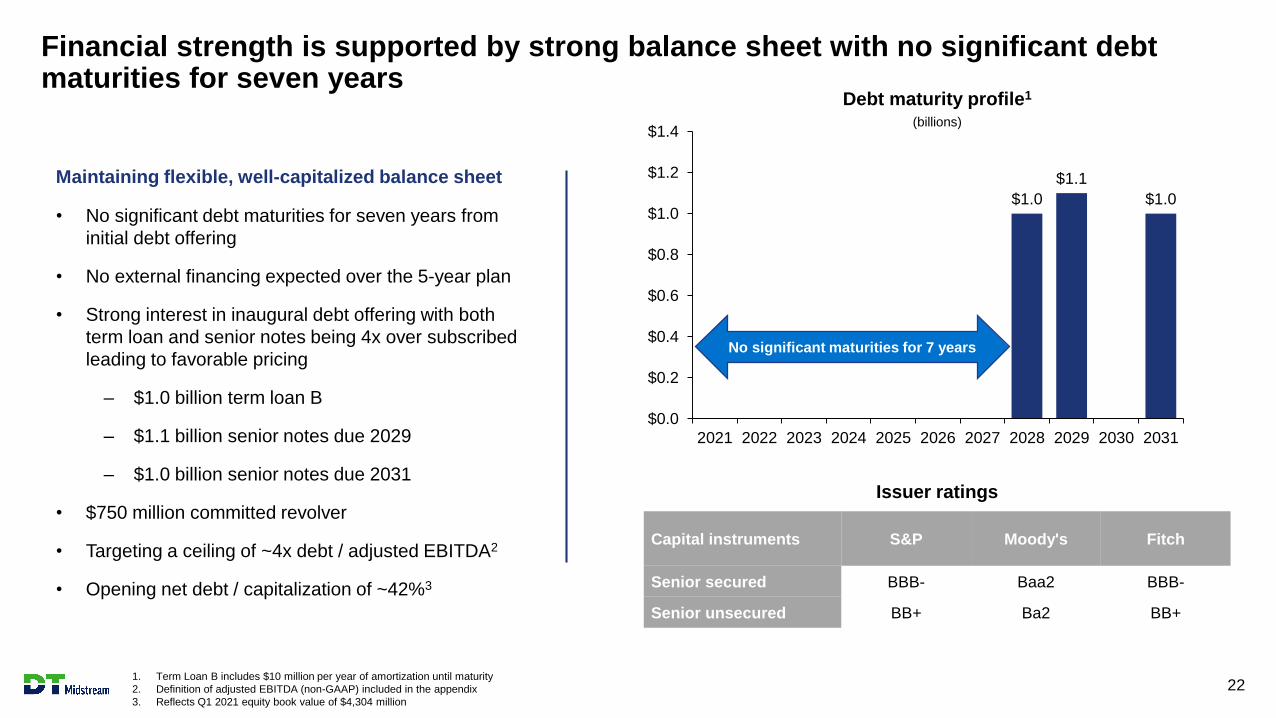
Financial strength is supported by strong balance sheet with no significant debt maturities for seven years
221. Term Loan B includes $10 million per year of amortization until maturity
2. Definition of adjusted EBITDA (non-GAAP) included in the appendix
3. Reflects Q1 2021 equity book value of $4,304 million
Maintaining flexible, well-capitalized balance sheet
• No significant debt maturities for seven years from
initial debt offering
• No external financing expected over the 5-year plan
• Strong interest in inaugural debt offering with both
term loan and senior notes being 4x over subscribed
leading to favorable pricing
– $1.0 billion term loan B
– $1.1 billion senior notes due 2029
– $1.0 billion senior notes due 2031
• $750 million committed revolver
• Targeting a ceiling of ~4x debt / adjusted EBITDA2
• Opening net debt / capitalization of ~42%3
Capital instruments S&P Moody's Fitch
Senior secured BBB- Baa2 BBB-
Senior unsecured BB+ Ba2 BB+
$1.0
$1.1
$1.0
$0.0
$0.2
$0.4
$0.6
$0.8
$1.0
$1.2
$1.4
2021 2022 2023 2024 2025 2026 2027 2028 2029 2030 2031
Debt maturity profile1
(billions)
No significant maturities for 7 years
Issuer ratings
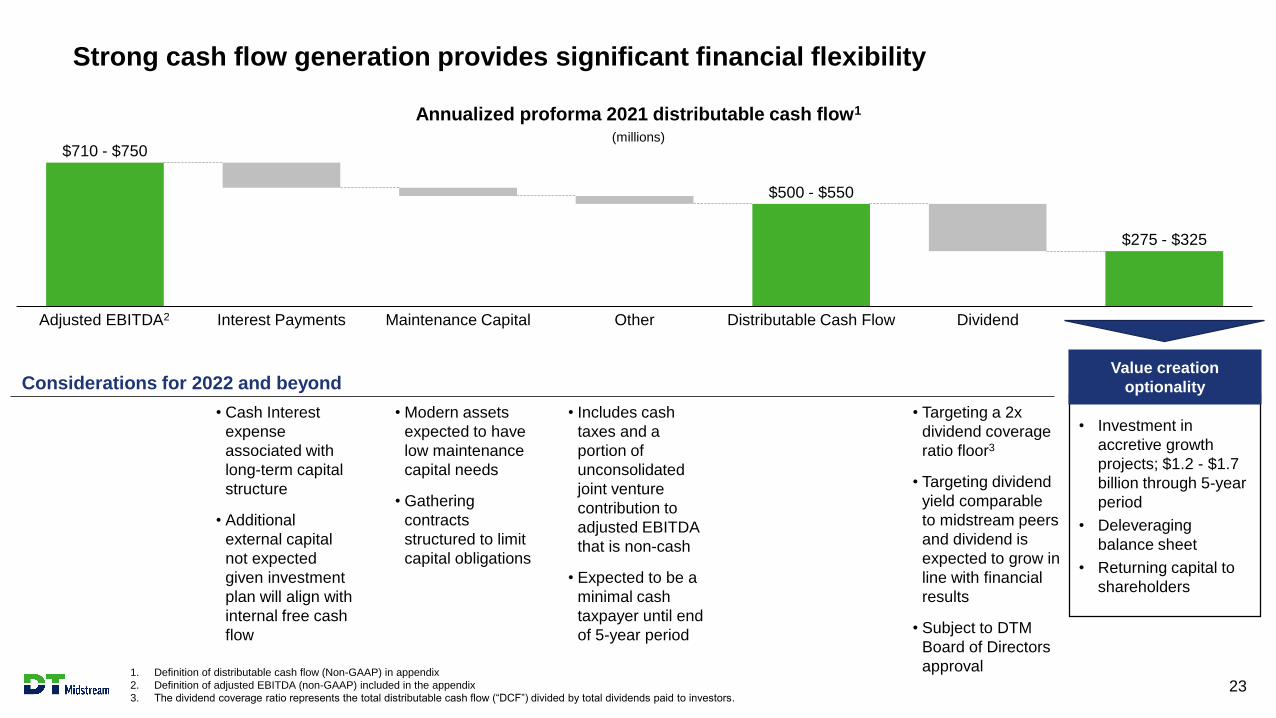
Strong cash flow generation provides significant financial flexibility
23
Annualized proforma 2021 distributable cash flow1
(millions)
• Modern assets
expected to have
low maintenance
capital needs
• Gathering
contracts
structured to limit
capital obligations
• Cash Interest
expense
associated with
long-term capital
structure
• Additional
external capital
not expected
given investment
plan will align with
internal free cash
flow
Considerations for 2022 and beyond
• Investment in
accretive growth
projects; $1.2 - $1.7
billion through 5-year
period
• Deleveraging
balance sheet
• Returning capital to
shareholders
Value creation
optionality
1. Definition of distributable cash flow (Non-GAAP) in appendix
2. Definition of adjusted EBITDA (non-GAAP) included in the appendix
3. The dividend coverage ratio represents the total distributable cash flow (“DCF”) divided by total dividends paid to investors.
• Includes cash
taxes and a
portion of
unconsolidated
joint venture
contribution to
adjusted EBITDA
that is non-cash
• Expected to be a
minimal cash
taxpayer until end
of 5-year period
Interest PaymentsAdjusted EBITDA2 Maintenance Capital Dividend
$275 - $325
Distributable Cash FlowOther
$500 - $550
$710 - $750
• Targeting a 2x
dividend coverage
ratio floor3
• Targeting dividend
yield comparable
to midstream peers
and dividend is
expected to grow in
line with financial
results
• Subject to DTM
Board of Directors
approval
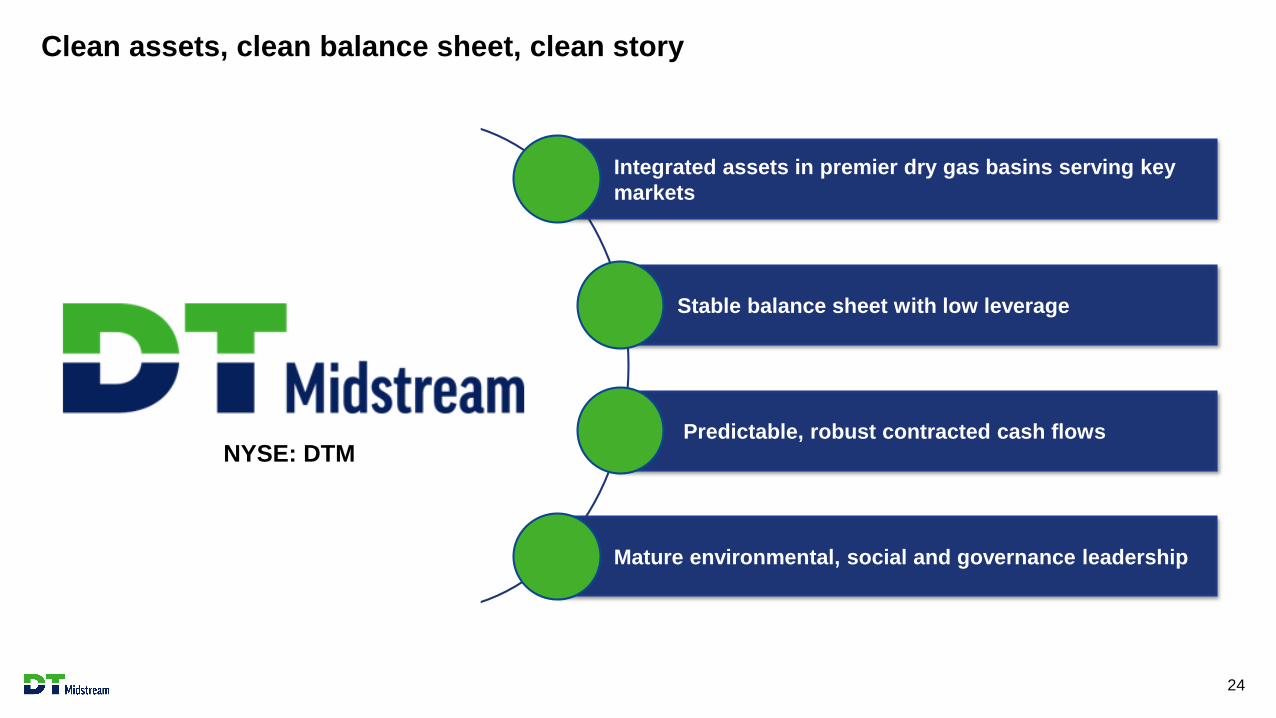
Integrated assets in premier dry gas basins serving key
markets
Stable balance sheet with low leverage
Predictable, robust contracted cash flows
Mature environmental, social and governance leadership
Clean assets, clean balance sheet, clean story
24
NYSE: DTM
25
Introduction
DTE Energy
DT Midstream
Appendix
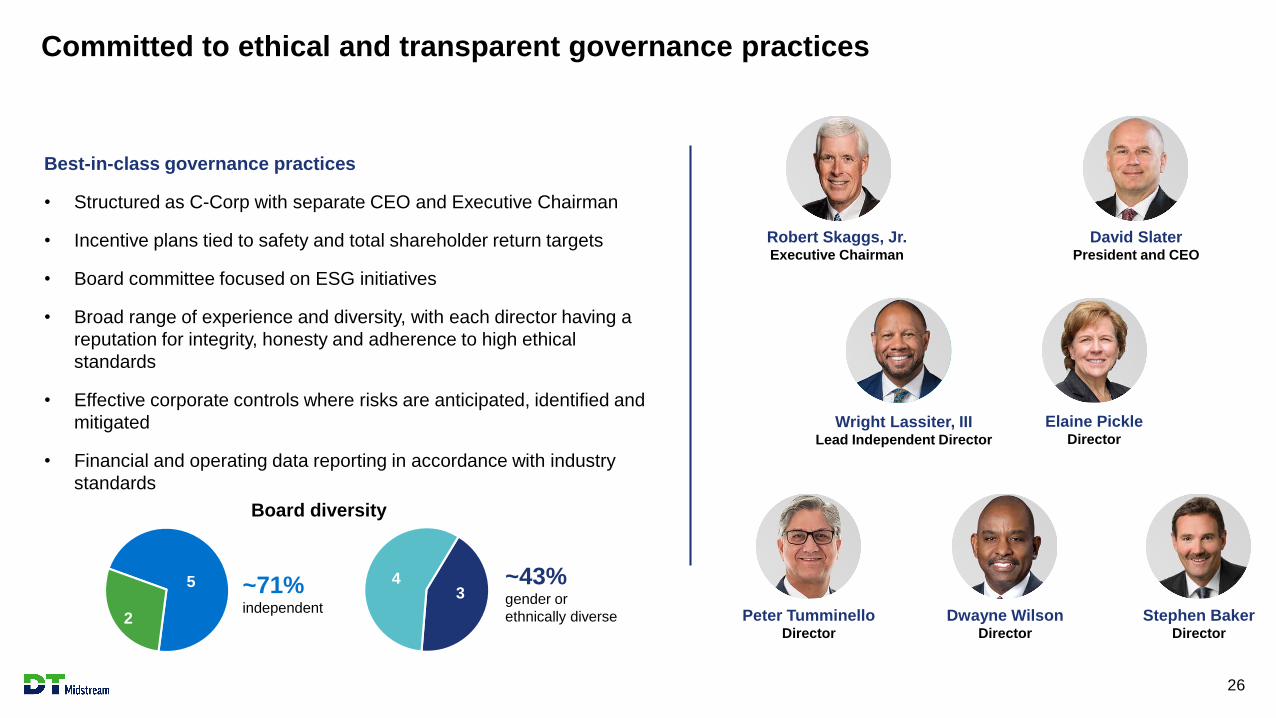
~71% independent
Committed to ethical and transparent governance practices
26
Best-in-class governance practices
• Structured as C-Corp with separate CEO and Executive Chairman
• Incentive plans tied to safety and total shareholder return targets
• Board committee focused on ESG initiatives
• Broad range of experience and diversity, with each director having a
reputation for integrity, honesty and adherence to high ethical
standards
• Effective corporate controls where risks are anticipated, identified and
mitigated
• Financial and operating data reporting in accordance with industry
standards
Robert Skaggs, Jr.Executive Chairman
David SlaterPresident and CEO
Wright Lassiter, IIILead Independent Director
Elaine PickleDirector
Peter TumminelloDirector
Dwayne WilsonDirector
Stephen BakerDirector
5
2
34
Board diversity
~43% gender or
ethnically diverse
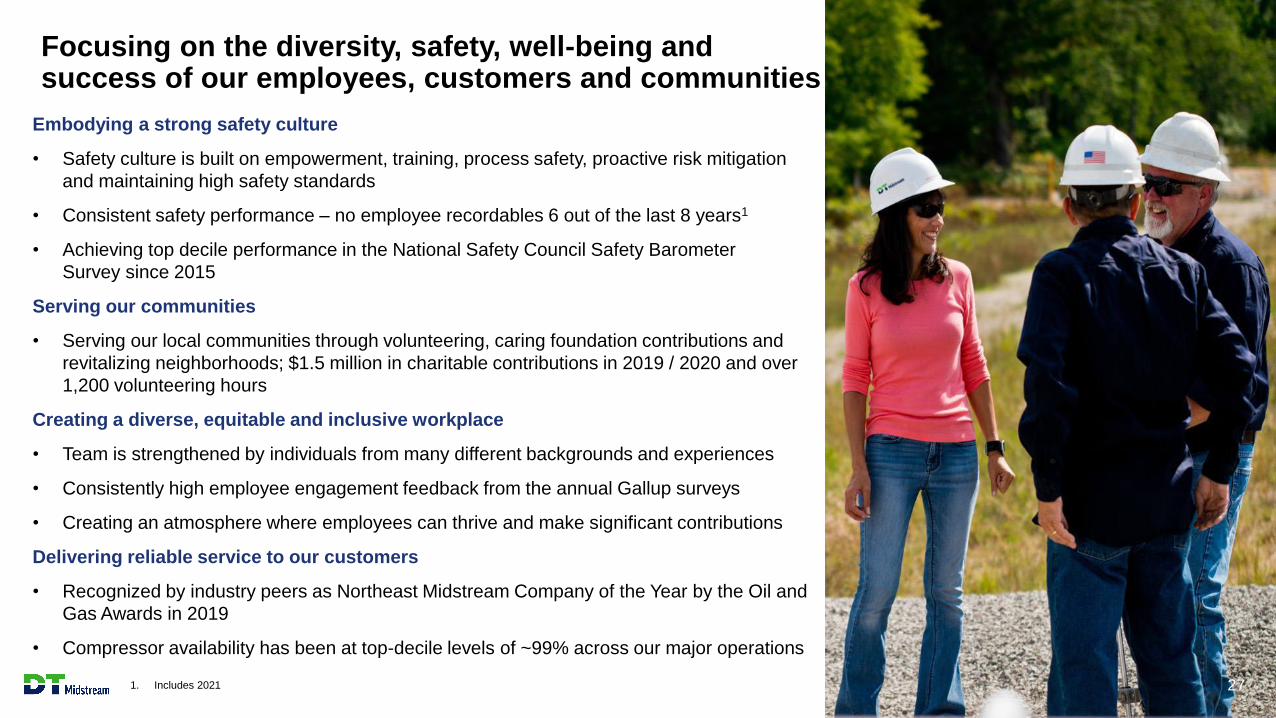
Focusing on the diversity, safety, well-being and success of our employees, customers and communities
27
Embodying a strong safety culture
• Safety culture is built on empowerment, training, process safety, proactive risk mitigation
and maintaining high safety standards
• Consistent safety performance – no employee recordables 6 out of the last 8 years1
• Achieving top decile performance in the National Safety Council Safety Barometer
Survey since 2015
Serving our communities
• Serving our local communities through volunteering, caring foundation contributions and
revitalizing neighborhoods; $1.5 million in charitable contributions in 2019 / 2020 and over
1,200 volunteering hours
Creating a diverse, equitable and inclusive workplace
• Team is strengthened by individuals from many different backgrounds and experiences
• Consistently high employee engagement feedback from the annual Gallup surveys
• Creating an atmosphere where employees can thrive and make significant contributions
Delivering reliable service to our customers
• Recognized by industry peers as Northeast Midstream Company of the Year by the Oil and
Gas Awards in 2019
• Compressor availability has been at top-decile levels of ~99% across our major operations
1. Includes 2021
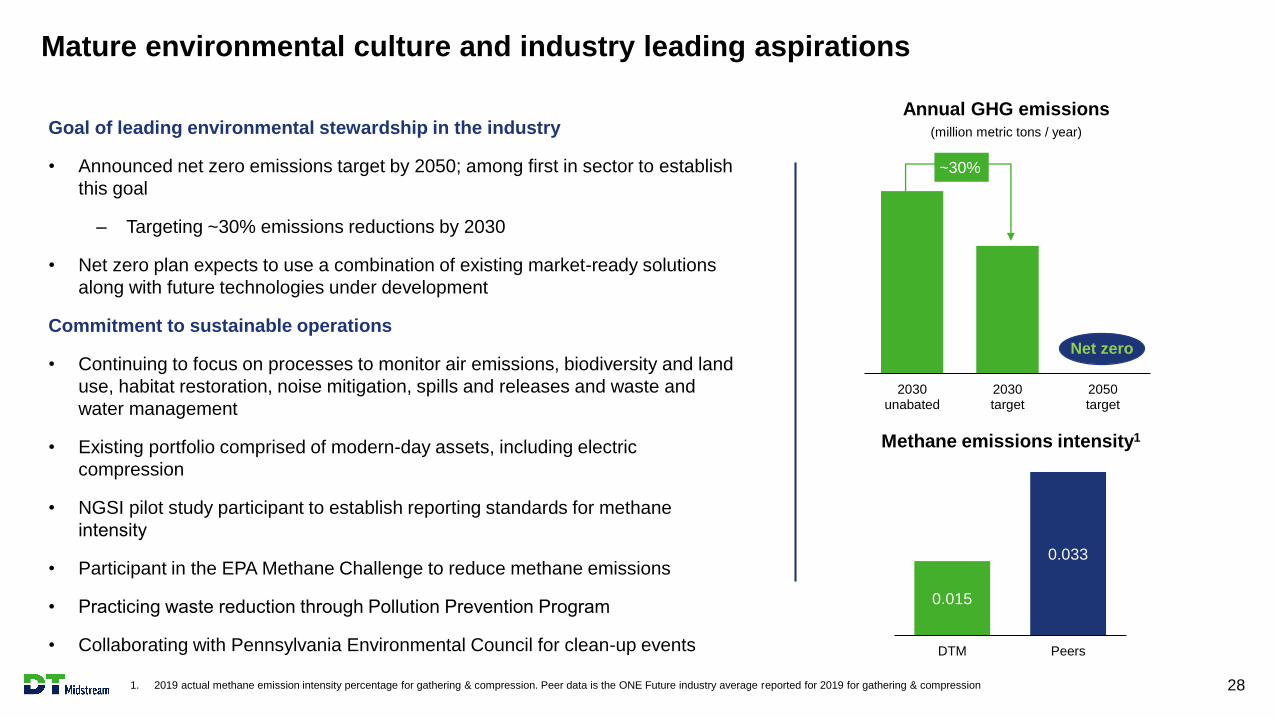
Goal of leading environmental stewardship in the industry
• Announced net zero emissions target by 2050; among first in sector to establish
this goal
– Targeting ~30% emissions reductions by 2030
• Net zero plan expects to use a combination of existing market-ready solutions
along with future technologies under development
Commitment to sustainable operations
• Continuing to focus on processes to monitor air emissions, biodiversity and land
use, habitat restoration, noise mitigation, spills and releases and waste and
water management
• Existing portfolio comprised of modern-day assets, including electric
compression
• NGSI pilot study participant to establish reporting standards for methane
intensity
• Participant in the EPA Methane Challenge to reduce methane emissions
• Practicing waste reduction through Pollution Prevention Program
• Collaborating with Pennsylvania Environmental Council for clean-up events
2030unabated
2030target
2050target
Mature environmental culture and industry leading aspirations
1. 2019 actual methane emission intensity percentage for gathering & compression. Peer data is the ONE Future industry average reported for 2019 for gathering & compression 28
~30%
0.015
0.033
DTM Peers
Methane emissions intensity1
Net zero
Annual GHG emissions(million metric tons / year)
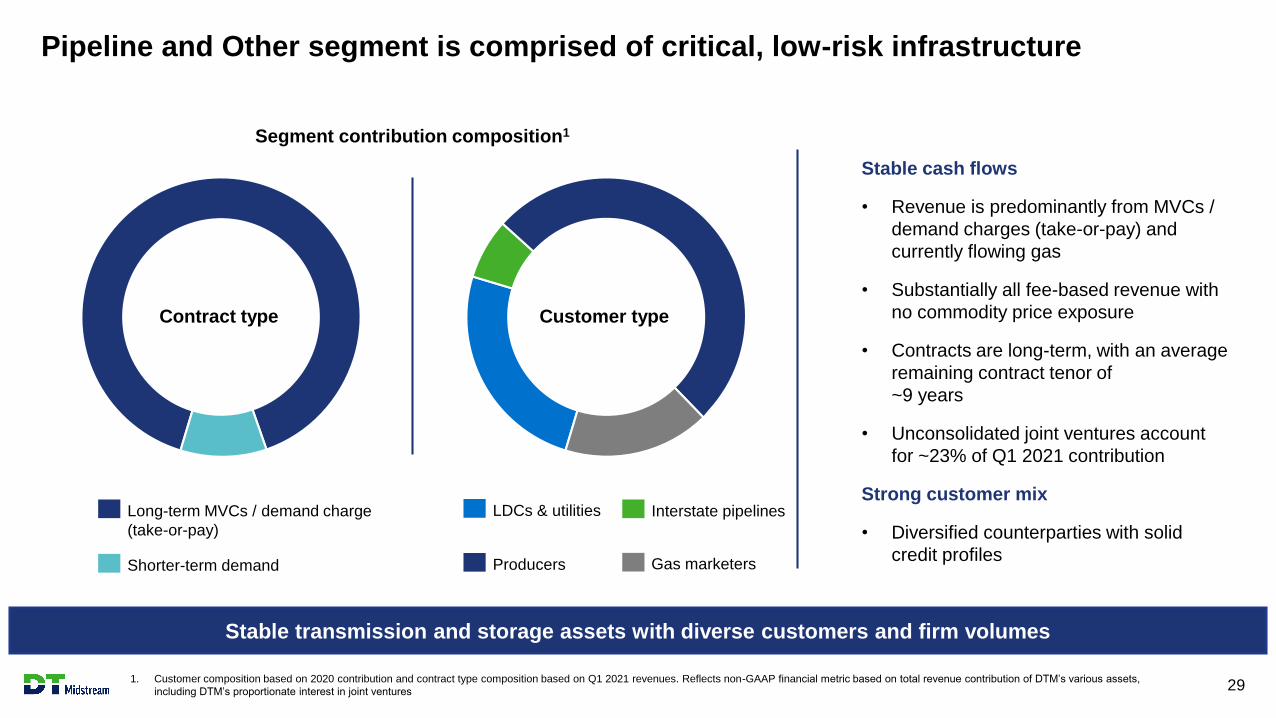
Pipeline and Other segment is comprised of critical, low-risk infrastructure
1. Customer composition based on 2020 contribution and contract type composition based on Q1 2021 revenues. Reflects non-GAAP financial metric based on total revenue contribution of DTM’s various assets,
including DTM’s proportionate interest in joint ventures 29
Stable cash flows
• Revenue is predominantly from MVCs /
demand charges (take-or-pay) and
currently flowing gas
• Substantially all fee-based revenue with
no commodity price exposure
• Contracts are long-term, with an average
remaining contract tenor of
~9 years
• Unconsolidated joint ventures account
for ~23% of Q1 2021 contribution
Strong customer mix
• Diversified counterparties with solid
credit profiles
Stable transmission and storage assets with diverse customers and firm volumes
Producers
Interstate pipelinesLDCs & utilities
Gas marketers
Long-term MVCs / demand charge
(take-or-pay)
Shorter-term demand
Contract type Customer type
Segment contribution composition1
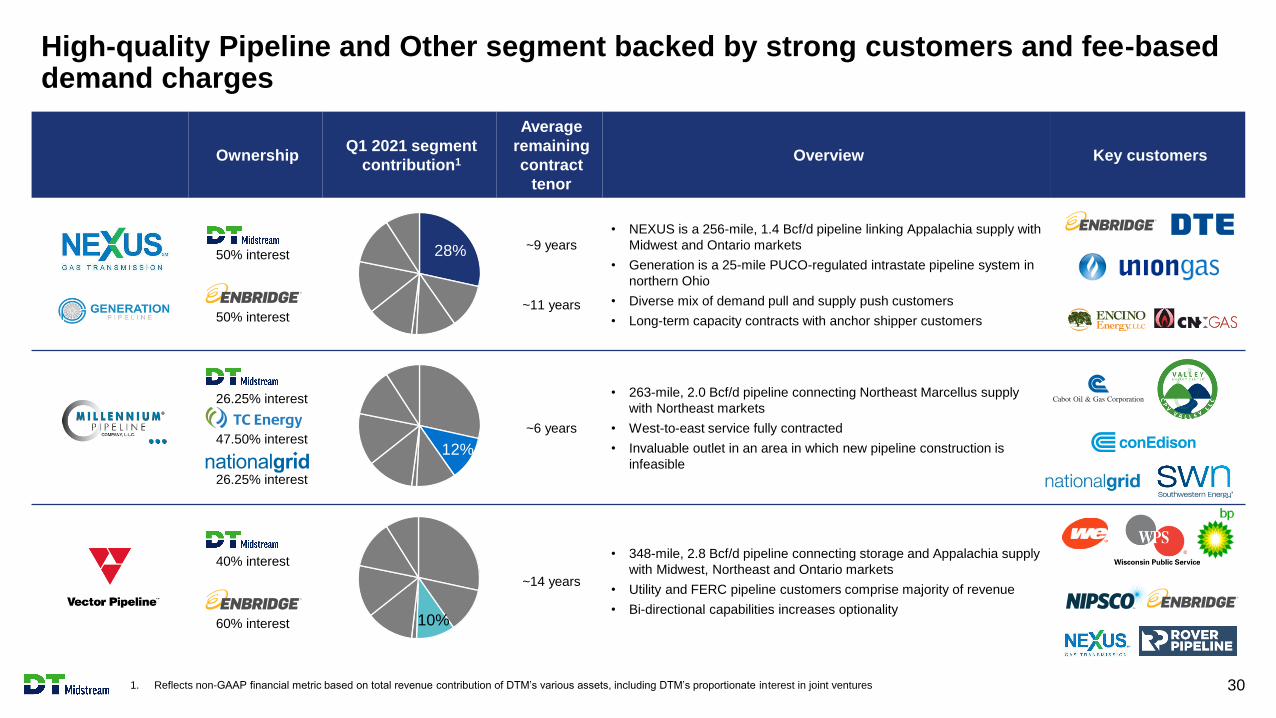
High-quality Pipeline and Other segment backed by strong customers and fee-based demand charges
1. Reflects non-GAAP financial metric based on total revenue contribution of DTM’s various assets, including DTM’s proportionate interest in joint ventures 30
OwnershipQ1 2021 segment
contribution1
Average
remaining
contract
tenor
Overview Key customers
50% interest
50% interest
~9 years
~11 years
• NEXUS is a 256-mile, 1.4 Bcf/d pipeline linking Appalachia supply with
Midwest and Ontario markets
• Generation is a 25-mile PUCO-regulated intrastate pipeline system in
northern Ohio
• Diverse mix of demand pull and supply push customers
• Long-term capacity contracts with anchor shipper customers
26.25% interest
47.50% interest
26.25% interest
~6 years
• 263-mile, 2.0 Bcf/d pipeline connecting Northeast Marcellus supply
with Northeast markets
• West-to-east service fully contracted
• Invaluable outlet in an area in which new pipeline construction is
infeasible
40% interest
60% interest
~14 years
• 348-mile, 2.8 Bcf/d pipeline connecting storage and Appalachia supply
with Midwest, Northeast and Ontario markets
• Utility and FERC pipeline customers comprise majority of revenue
• Bi-directional capabilities increases optionality
28%
12%
10%
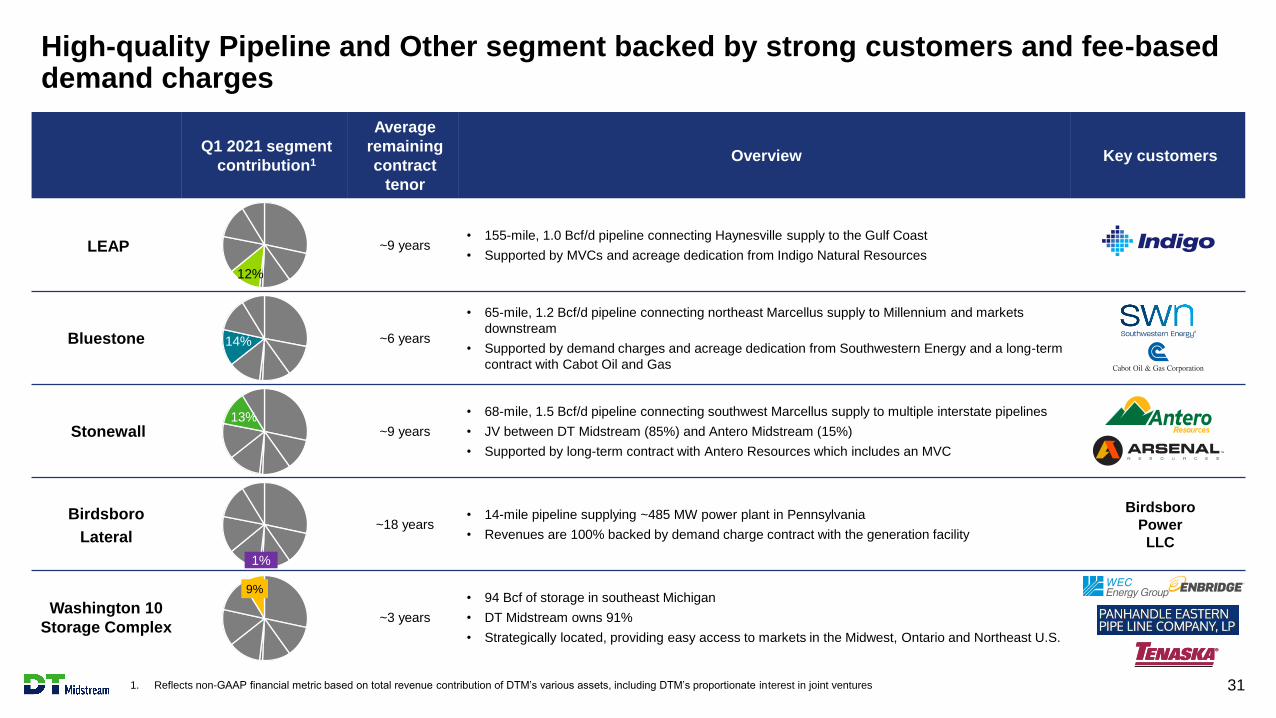
High-quality Pipeline and Other segment backed by strong customers and fee-based demand charges
1. Reflects non-GAAP financial metric based on total revenue contribution of DTM’s various assets, including DTM’s proportionate interest in joint ventures 31
Q1 2021 segment
contribution1
Average
remaining
contract
tenor
Overview Key customers
LEAP ~9 years• 155-mile, 1.0 Bcf/d pipeline connecting Haynesville supply to the Gulf Coast
• Supported by MVCs and acreage dedication from Indigo Natural Resources
Bluestone ~6 years
• 65-mile, 1.2 Bcf/d pipeline connecting northeast Marcellus supply to Millennium and markets
downstream
• Supported by demand charges and acreage dedication from Southwestern Energy and a long-term
contract with Cabot Oil and Gas
Stonewall ~9 years
• 68-mile, 1.5 Bcf/d pipeline connecting southwest Marcellus supply to multiple interstate pipelines
• JV between DT Midstream (85%) and Antero Midstream (15%)
• Supported by long-term contract with Antero Resources which includes an MVC
Birdsboro
Lateral~18 years
• 14-mile pipeline supplying ~485 MW power plant in Pennsylvania
• Revenues are 100% backed by demand charge contract with the generation facility
Washington 10
Storage Complex~3 years
• 94 Bcf of storage in southeast Michigan
• DT Midstream owns 91%
• Strategically located, providing easy access to markets in the Midwest, Ontario and Northeast U.S.
Birdsboro
Power
LLC
12%
14%
13%
1%
9%
New slide
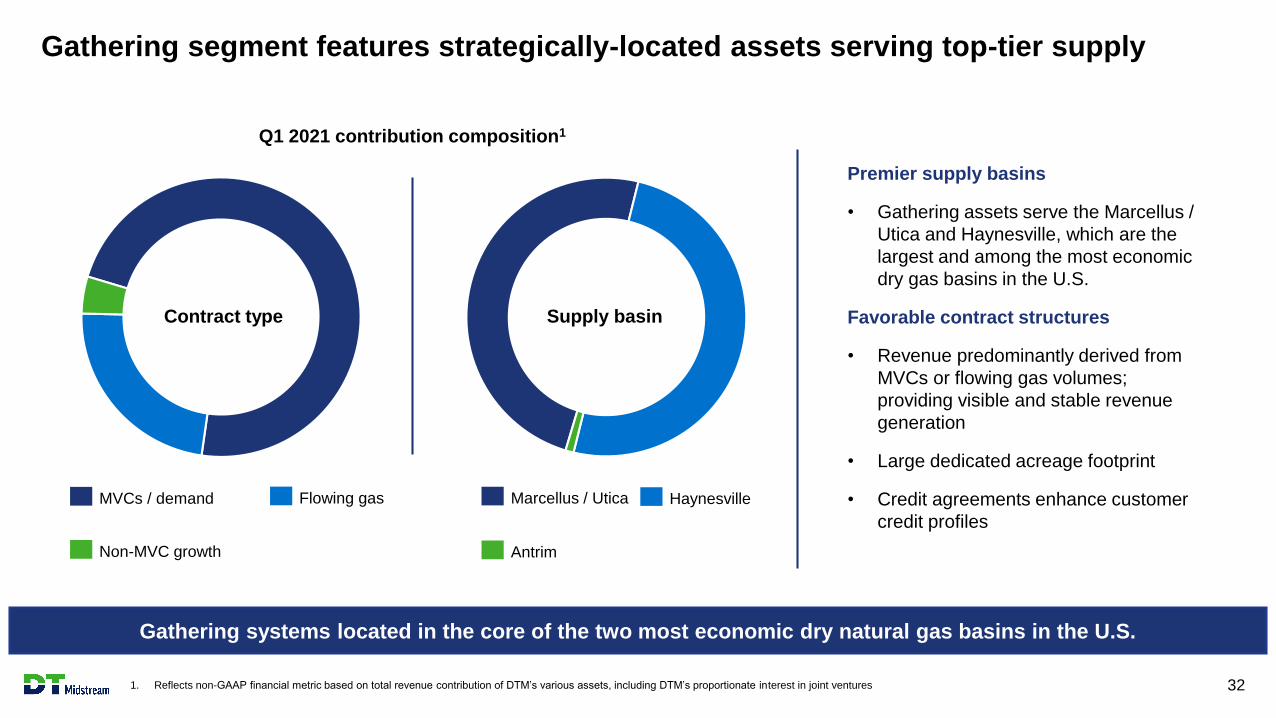
Gathering segment features strategically-located assets serving top-tier supply
1. Reflects non-GAAP financial metric based on total revenue contribution of DTM’s various assets, including DTM’s proportionate interest in joint ventures 32
Gathering systems located in the core of the two most economic dry natural gas basins in the U.S.
Antrim
HaynesvilleMarcellus / Utica
Non-MVC growth
Flowing gasMVCs / demand
Premier supply basins
• Gathering assets serve the Marcellus /
Utica and Haynesville, which are the
largest and among the most economic
dry gas basins in the U.S.
Favorable contract structures
• Revenue predominantly derived from
MVCs or flowing gas volumes;
providing visible and stable revenue
generation
• Large dedicated acreage footprint
• Credit agreements enhance customer
credit profiles
Contract type Supply basin
Q1 2021 contribution composition1
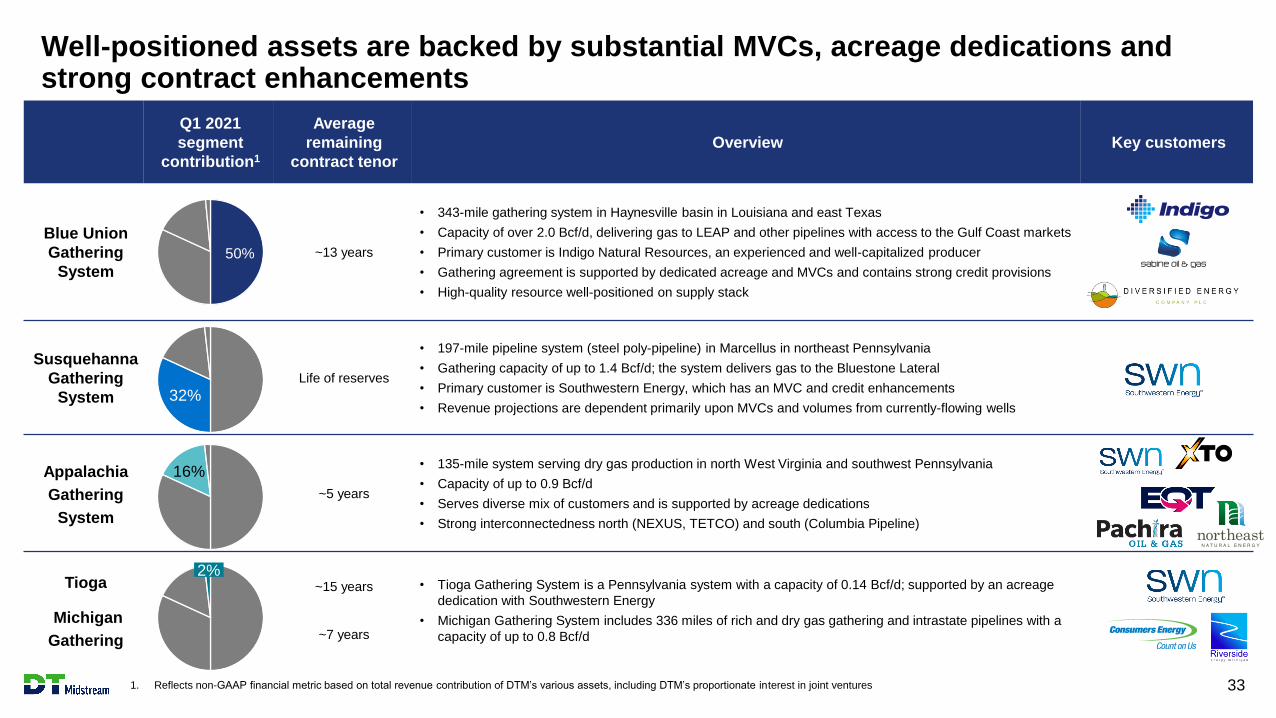
Q1 2021
segment
contribution1
Average
remaining
contract tenor
Overview Key customers
Blue Union
Gathering
System
~13 years
• 343-mile gathering system in Haynesville basin in Louisiana and east Texas
• Capacity of over 2.0 Bcf/d, delivering gas to LEAP and other pipelines with access to the Gulf Coast markets
• Primary customer is Indigo Natural Resources, an experienced and well-capitalized producer
• Gathering agreement is supported by dedicated acreage and MVCs and contains strong credit provisions
• High-quality resource well-positioned on supply stack
Susquehanna
Gathering
System
Life of reserves
• 197-mile pipeline system (steel poly-pipeline) in Marcellus in northeast Pennsylvania
• Gathering capacity of up to 1.4 Bcf/d; the system delivers gas to the Bluestone Lateral
• Primary customer is Southwestern Energy, which has an MVC and credit enhancements
• Revenue projections are dependent primarily upon MVCs and volumes from currently-flowing wells
Appalachia
Gathering
System
~5 years
• 135-mile system serving dry gas production in north West Virginia and southwest Pennsylvania
• Capacity of up to 0.9 Bcf/d
• Serves diverse mix of customers and is supported by acreage dedications
• Strong interconnectedness north (NEXUS, TETCO) and south (Columbia Pipeline)
Tioga
Michigan
Gathering
~15 years
~7 years
• Tioga Gathering System is a Pennsylvania system with a capacity of 0.14 Bcf/d; supported by an acreage
dedication with Southwestern Energy
• Michigan Gathering System includes 336 miles of rich and dry gas gathering and intrastate pipelines with a
capacity of up to 0.8 Bcf/d
2%
50%
16%
32%
Well-positioned assets are backed by substantial MVCs, acreage dedications and strong contract enhancements
1. Reflects non-GAAP financial metric based on total revenue contribution of DTM’s various assets, including DTM’s proportionate interest in joint ventures 33
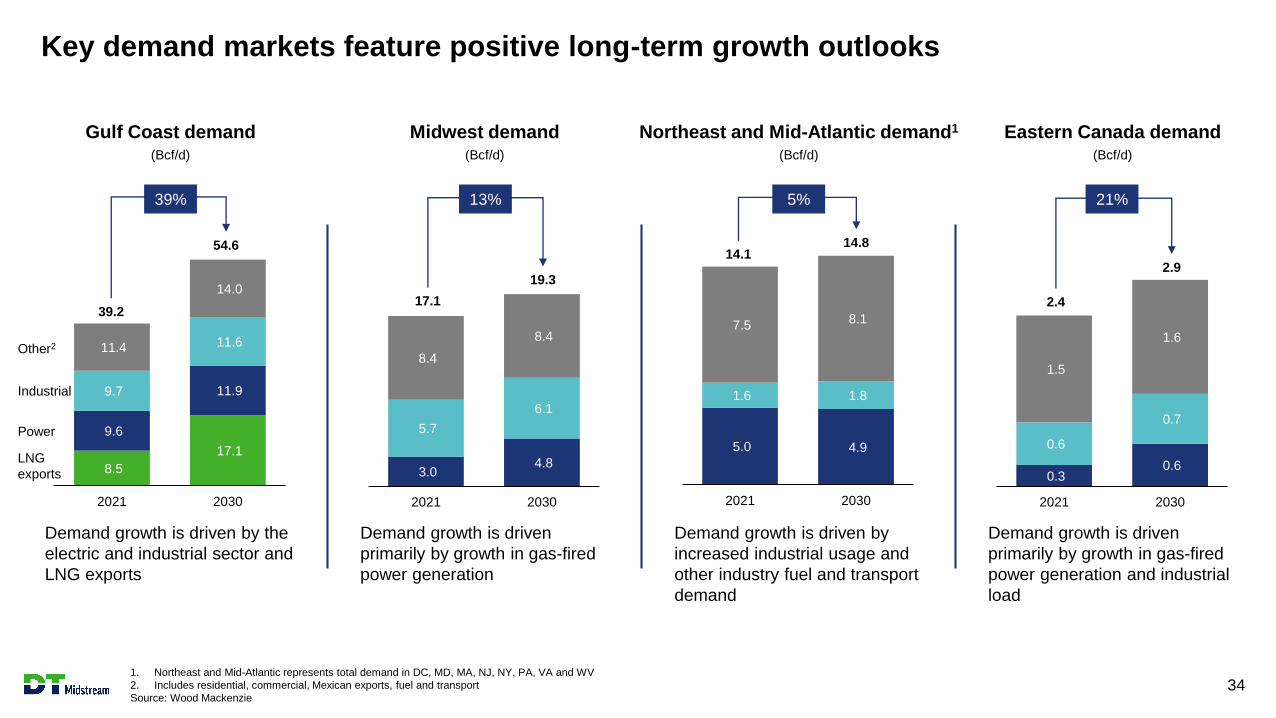
Key demand markets feature positive long-term growth outlooks
1. Northeast and Mid-Atlantic represents total demand in DC, MD, MA, NJ, NY, PA, VA and WV
2. Includes residential, commercial, Mexican exports, fuel and transport
Source: Wood Mackenzie34
Demand growth is driven by the
electric and industrial sector and
LNG exports
Demand growth is driven
primarily by growth in gas-fired
power generation
Demand growth is driven by
increased industrial usage and
other industry fuel and transport
demand
Demand growth is driven
primarily by growth in gas-fired
power generation and industrial
load
8.5
17.1
9.6
11.9 9.7
11.6 11.4
14.0
2021 2030
3.0 4.8
5.7
6.1
8.4
8.4
2021 2030
5.0 4.9
1.6 1.8
7.5 8.1
2021 2030
0.3 0.6
0.6
0.7
1.5
1.6
2021 2030
39.2
54.6
39%
17.1
19.3
14.114.8
2.4
2.9
Power
LNG
exports
Industrial
Other2
Gulf Coast demand(Bcf/d)
Midwest demand(Bcf/d)
Northeast and Mid-Atlantic demand1
(Bcf/d)
Eastern Canada demand(Bcf/d)
13% 5% 21%
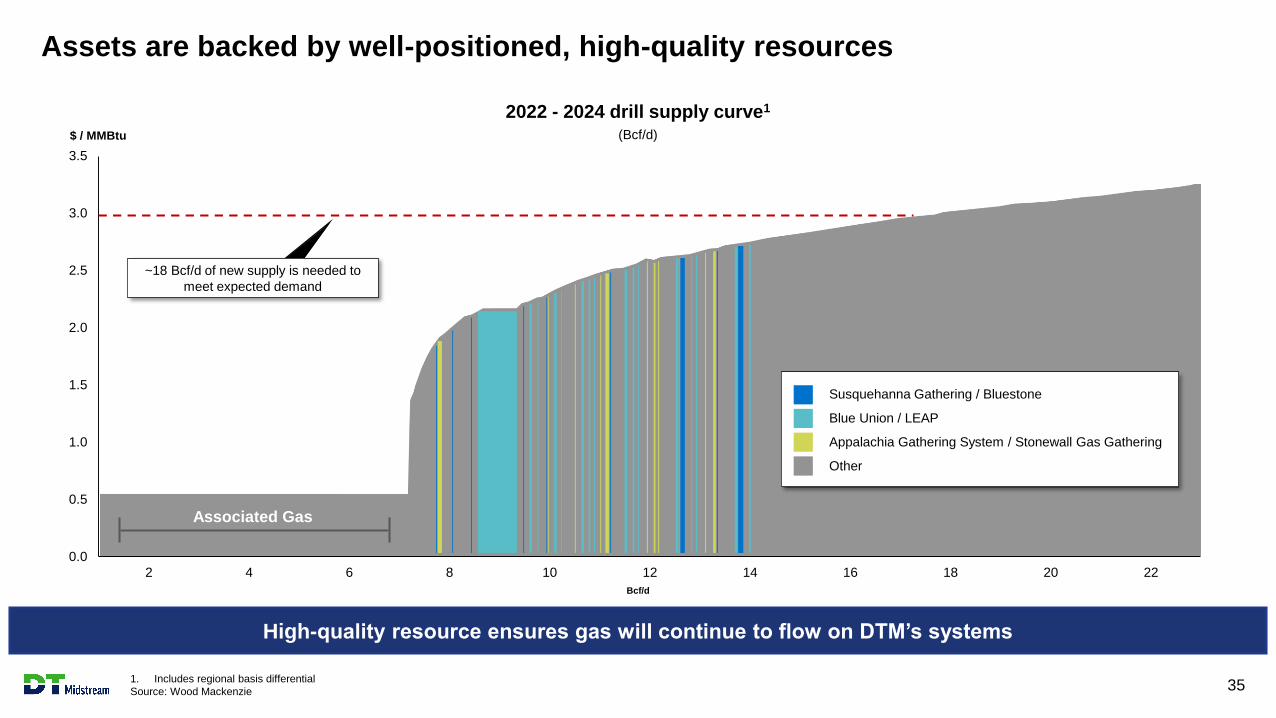
Assets are backed by well-positioned, high-quality resources
1. Includes regional basis differential
Source: Wood Mackenzie 35
0.0
0.5
1.0
1.5
2.0
2.5
3.0
3.5
2 4 6 8 10 12 14 16 18 20 22
~18 Bcf/d of new supply is needed to
meet expected demand
$ / MMBtu
High-quality resource ensures gas will continue to flow on DTM’s systems
Susquehanna Gathering / Bluestone
Blue Union / LEAP
Appalachia Gathering System / Stonewall Gas Gathering
Other
2022 - 2024 drill supply curve1
(Bcf/d)
Bcf/d
Associated Gas
Reconciliation of reported to operating earnings (non-GAAP)
36
Use of Operating Earnings Information – Operating earnings exclude non-recurring items, certain mark-to-market adjustments and discontinued operations. DTE Energy
management believes that operating earnings provide a more meaningful representation of the company’s earnings from ongoing operations and uses operating earnings as the
primary performance measurement for external communications with analysts and investors. Internally, DTE Energy uses operating earnings to measure performance against
budget and to report to the Board of Directors.
In this presentation, DTE Energy provides guidance for future period operating earnings. It is likely that certain items that impact the company’s future period reported results will be
excluded from operating results. A reconciliation to the comparable future period reported earnings is not provided because it is not possible to provide a reliable forecast of specific
line items (i.e. future non-recurring items, certain mark-to-market adjustments and discontinued operations). These items may fluctuate significantly from period to period and may
have a significant impact on reported earnings.
Adjusted EBITDA and distributable cash flow (DCF) are non-GAAP measures
37
New slide
Adjusted EBITDA is defined as GAAP net income attributable to DT Midstream before expenses for interest, taxes, depreciation and amortization, further adjusted to include our
proportional share of net income from our equity method investees (excluding taxes, depreciation and amortization), and to exclude certain items we consider non-routine. We believe
Adjusted EBITDA is useful to us and external users of our financial statements in understanding our operating results and the ongoing performance of our underlying business
because it allows our management and investors to have a better understanding of our actual operating performance unaffected by the impact of interest, taxes, depreciation,
amortization and non-routine charges noted in the table below. We believe the presentation of Adjusted EBITDA is meaningful to investors because it is frequently used by analysts,
investors and other interested parties in our industry to evaluate a company’s operating performance without regard to items excluded from the calculation of such measure, which
can vary substantially from company to company depending on accounting methods, book value of assets, capital structure and the method by which assets were acquired, among
other factors. We use Adjusted EBITDA to assess our performance by reportable segment and as a basis for strategic planning and forecasting.
Distributable Cash Flow (DCF) is calculated by deducting earnings from equity method investees, depreciation and amortization attributable to noncontrolling interests, cash interest
expense, maintenance capital investment (as defined below), and cash taxes from, and adding interest expense, income tax expense, depreciation and amortization, certain items we
consider non-routine and dividends and distributions from equity method investees to, Net Income Attributable to DT Midstream. Maintenance capital investment is defined as the
total capital expenditures used to maintain or preserve assets or fulfill contractual obligations that do not generate incremental earnings. We believe DCF is a meaningful performance
measurement because it is useful to us and external users of our financial statements in estimating the ability of our assets to generate cash earnings after servicing our debt, paying
cash taxes and making maintenance capital investments, which could be used for discretionary purposes such as common stock dividends, retirement of debt or expansion capital
expenditures.
Adjusted EBITDA and DCF are not measures calculated in accordance with GAAP and should be viewed as a supplement to and not a substitute for the results of operations
presented in accordance with GAAP. There are significant limitations to using Adjusted EBITDA and DCF as a measure of performance, including the inability to analyze the effect of
certain recurring and non-recurring items that materially affect our net income or loss. Additionally, because Adjusted EBITDA and DCF exclude some, but not all, items that affect net
income and are defined differently by different companies in our industry, Adjusted EBITDA and DCF do not intend to represent net income attributable to DT Midstream, the most
comparable GAAP measure, as an indicator of operating performance and are not necessarily comparable to similarly titled measures reported by other companies.
Reconciliation of net income attributable to DT Midstream to Adjusted EBITDA or DCF as projected for full-year 2021 is not provided. We do not forecast net income as we cannot,
without unreasonable efforts, estimate or predict with certainty the components of net income. These components, net of tax, may include, but are not limited to, impairments of
assets and other charges, divesture costs, acquisition costs, or changes in accounting principles. All of these components could significantly impact such financial measures. At this
time, management is not able to estimate the aggregate impact, if any, of these items on future period reported earnings. Accordingly, we are not able to provide a corresponding
GAAP equivalent for Adjusted EBITDA or DCF.
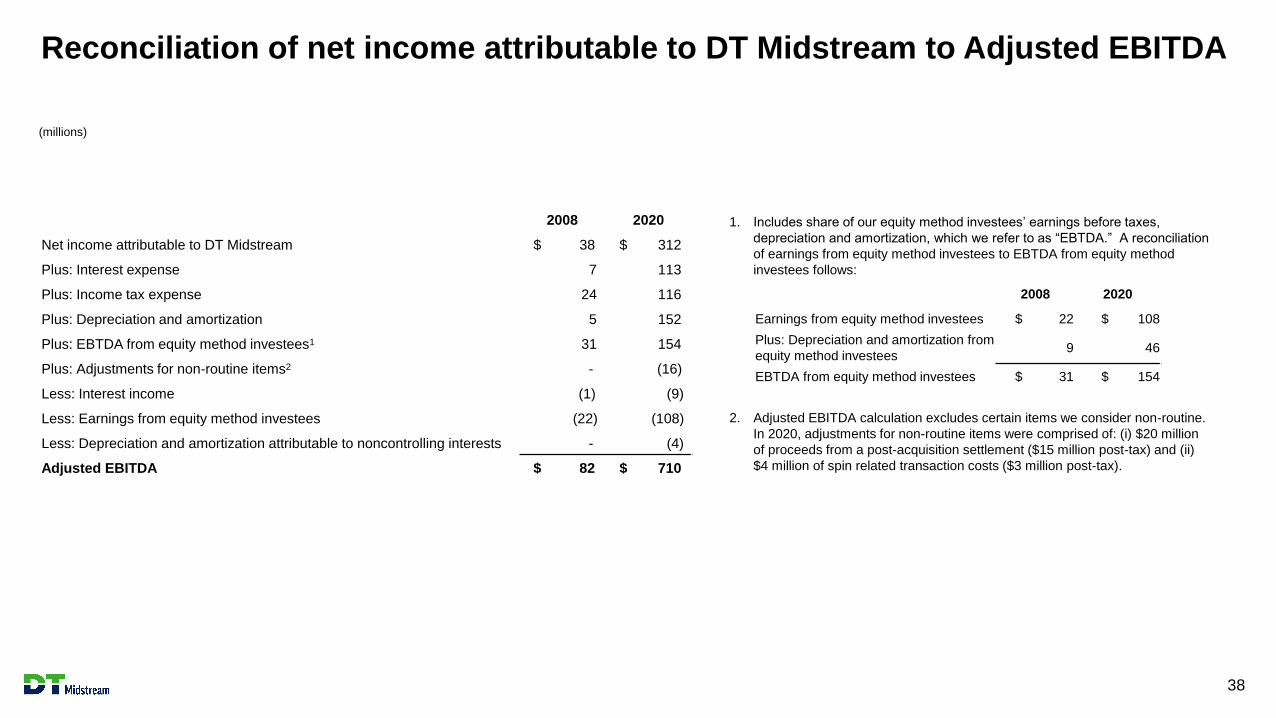
Reconciliation of net income attributable to DT Midstream to Adjusted EBITDA
38
New slide
(millions)
2008 2020
Net income attributable to DT Midstream $ 38 $ 312
Plus: Interest expense 7 113
Plus: Income tax expense 24 116
Plus: Depreciation and amortization 5 152
Plus: EBTDA from equity method investees1 31 154
Plus: Adjustments for non-routine items2 - (16)
Less: Interest income (1) (9)
Less: Earnings from equity method investees (22) (108)
Less: Depreciation and amortization attributable to noncontrolling interests - (4)
Adjusted EBITDA $ 82 $ 710
1. Includes share of our equity method investees’ earnings before taxes,
depreciation and amortization, which we refer to as “EBTDA.” A reconciliation
of earnings from equity method investees to EBTDA from equity method
investees follows:
2008 2020
Earnings from equity method investees $ 22 $ 108
Plus: Depreciation and amortization from
equity method investees9 46
EBTDA from equity method investees $ 31 $ 154
2. Adjusted EBITDA calculation excludes certain items we consider non-routine.
In 2020, adjustments for non-routine items were comprised of: (i) $20 million
of proceeds from a post-acquisition settlement ($15 million post-tax) and (ii)
$4 million of spin related transaction costs ($3 million post-tax).
DT Midstream Safe Harbor Statement
39
New slide
This presentation contains statements which, to the extent they are not statements of historical or present fact, constitute “forward-looking statements” under the securities laws. These forward-looking statements
are intended to provide management’s current expectations or plans for our future operating and financial performance, business prospects, outcomes of regulatory proceedings, market conditions, and other
matters, based on what we believe to be reasonable assumptions and on information currently available to us.
Forward-looking statements can be identified by the use of words such as “believe,” “expect,” “expectations,” “plans,” “intends,” “continues,” “forecasts,” “goals,” “strategy,” “prospects,” “estimate,” “project,”
“scheduled,” “target,” “anticipate,” “could,” “may,” “might,” “will,” “should,” “see,” “guidance,” “outlook,” “confident” and other words of similar meaning. The absence of such words, expressions or statements,
however, does not mean that the statements are not forward-looking. In particular, express or implied statements relating to future earnings, cash flow, results of operations, uses of cash, tax rates and other
measures of financial performance, future actions, conditions or events, potential future plans, strategies or transactions of DT Midstream, the Spin-Off, including the expected timing of completion of the Spin-Off
and estimated costs associated with the Spin-Off, and other statements that are not historical facts, are forward-looking statements.
Forward-looking statements are not guarantees of future results and conditions, but rather are subject to numerous assumptions, risks, and uncertainties that may cause actual future results to be materially
different from those contemplated, projected, estimated, or budgeted. Many of the factors that will determine these results are beyond our ability to control or accurately predict. Such assumptions, risks,
uncertainties and other factors include, but are not limited to, the following: changes in general economic conditions; competitive conditions in our industry; changes in the long-term supply of, demand for and
price of natural gas and related products; actions taken by third-party operators, processors, transporters and gatherers; changes in expected production from Indigo Natural Resources, LLC and/or its affiliates,
Southwestern Energy Company and/or its affiliates, Antero Resources Corporation and/or its affiliates and other third parties in our areas of operation; demand for natural gas gathering, transmission, storage,
transportation and water services; our ability to retain or replace existing customers or volumes due to declining demand or increased competition; the availability and price of natural gas to the consumer
compared to the price of alternative and competing fuels; development and rate of adoption of and competition from alternative energy sources; our ability to successfully implement our business plan; our ability
to complete organic growth projects on time and on budget and the ability of such assets to operate as designed; our ability to successfully identify, evaluate and timely complete acquisitions the ability of the
acquired assets to operate at expected levels; the price and availability of debt and equity financing; restrictions in our existing and any future credit facilities; energy efficiency and technology trends; operating
hazards and other risks incidental to gathering, storing and transporting natural gas; natural disasters, adverse weather conditions, power shortages, casualty losses, epidemics, pandemics (such as COVID-19)
and other matters beyond our control; interest rates; labor relations; the ability of our customers and other counterparties to perform under their contracts with us, including as a result of financial distress or
bankruptcy; constraints on our ability to perform our obligations under our contracts, whether as a result of non-performance by third parties, including our customers or counterparties, market constraints, third-
party constraints, legal constraints (including governmental orders and guidance), or other factors; changes in the availability and cost of capital; changes in tax status; the effects of environmental, health and
safety, and other government regulations and of current or pending legislation; changes in our tariff rates required by the Federal Energy Regulatory Commission, the Michigan Public Service Commission or any
other regulatory agency; changes in insurance markets impacting costs and the level and types of coverage available; the timing and extent of changes in commodity prices; the suspension, reduction or
termination of our customers’ obligations under our commercial agreements; disruptions due to equipment interruption or failure at our facilities, or third-party facilities on which our business is dependent;
information technology risks, including cybersecurity breaches and other disruptions or failures of our information systems; the effects of future litigation; the qualification of the Spin-Off as a tax-free Distribution;
our ability to achieve the benefits that we expect to achieve as an independent publicly traded company; and our dependence on DTE Energy to provide us with certain services following the Spin-Off.
The above list of factors is not exhaustive. Other factors described herein, as well as factors that are unknown or unpredictable, could also cause actual future results to be materially different from those
contained in any forward-looking statement. For additional information on factors that may affect our forward-looking statements, including those associated with COVID-19, see the discussion under the section
entitled “Risk Factors” in our registration statement on Form 10 and any other reports filed with the SEC. Given the uncertainties and risk factors that could cause our actual results to differ materially from those
contained in any forward-looking statement, you should not put undue reliance on any forward-looking statements.
Any forward-looking statements speak only as of the date on which such statements are made. We are under no obligation to, and expressly disclaim any obligation to, update or alter our forward-looking
statements, whether as a result of new information, subsequent events, changes in assumptions or otherwise, unless required by law.
Related Documents