June 2012 Detroit Transportation Corporation Noise Abatement And Ride Quality Study Project No: MI‐80‐0004 DTC: Project Manager Cornelius Henry Transit Specialist

Welcome message from author
This document is posted to help you gain knowledge. Please leave a comment to let me know what you think about it! Share it to your friends and learn new things together.
Transcript

June 2012
Detroit Transportation Corporation
Noise Abatement
And
Ride Quality Study
Project No: MI‐80‐0004 DTC: Project Manager Cornelius Henry Transit Specialist

Detroit Transportation Corporation: Noise Abatement and Ride Quality Study 2
Acknowledgment(s) DTC Staff: Barbara Hansen, General Manager Ernest Latham, Maintenance Mgr. Mark Simmons, Maintenance Tech. Richard Luckey, Maintenance Tech. Roderick Mc Cartha, Maintenance Tech. Zola Hayes, Maintenance Tech. Robert Cantalini, Safety Manager James Colunga, Engineer Jordan Medeiros, Engineer Ophelia Robinson, Exec. Administrative Asst. PB Staff: Gordon Martyn Loram Staff: Lindsey Langton John Petucilli

Detroit Transportation Corporation: Noise Abatement and Ride Quality Study 3
Detroit Transportation Corporation
Table of Content Page #
Executive Summary 1 ‐ 35
Study Methodology 36
Car Noise Assessment 36 – 37
Rail Grinding Project (Loram) 37 – 46
Factors Affecting Ride Quality 46 – 47
Surface Condition 47‐48
Corrugation Measurement 48 – 57
Prediction Model (Linear Regression Model)
58 – 65
Noise and Vibration Testing Report 68
Preventive Rail grinding and Noise Abatement Plan 70
Recommendation and Conclusion 72
DTC Rail Grinding Program 74 ‐ 113
Appendices
A. Rail Measurement Post CAT System Wide
B. Simple Linear Regression Noise Prediction Model
C. Defiance DPM Noise and Vibration Measurement Report

Detroit Transportation Corporation: Noise Abatement and Ride Quality Study 4
1.0 Executive Summary 2.0 Study Methodology 2.1 Study Objective 2.2 General Study Approach 2.3 Instrumentation Understanding and Overview 3.0 In Car Noise Abatement 3.1 Measurement Location 3.2 Measurement Instrumentation 3.3 Measurement Process 3.4 Data Collection and Results 3.5 Noise Measurement Results 3.6 Results and Comparison to Standards 3.7 Conclusions and Recommendations 4.0 Rail Grinding Project 4.1 General System Descriptions 4.2 Rail / Wheel Condition 4.3 DTC 2005 Rail Grind 4.4 Pre‐Grind Condition 4.5 DTC Project Objective 4.6 Rail Grinding Process 4.7 Corrugation Measurement 4.8 Post Grind Rail Profile 4.9 Conclusion and Recommendations

Detroit Transportation Corporation: Noise Abatement and Ride Quality Study 5
5.0 Factors Affecting Ride Quality 5.1 Construction of Variables Affecting Ride Quality 5.2 General Assessment and Scoring of Variables 5.3 Conclusion and Recommendations 6.0 Surface Condition 6.1 Measurement and Instrumentation 6.2 Measurement Process 6.3 Measurement Locations 6.4 Conclusion and Recommendations 7.0 Corrugation Measurement 7.1 General Description of Approach using Corrugation Analysis Trolley (CAT) 7.2 Measurement Instrumentation 7.3 Measurement Process 7.4 Data Collection and Results 7.5 CAT Measurement Results 7.6 Result and Comparison to Standards 8.0 Corrugation and Noise Reduction Model – Simple Linear Regression 8.1 General Description of Model 8.2 Objective of Statistical Model 8.3 Data Collection and Results, Descriptive Statistical Testing and Parameters 8.4 Conclusion and Recommendations 9.0 Noise and Vibration Testing 9.1 General Study Objective 9.2 Instrumentation and Test Procedures 9.3 Statistical Results

Detroit Transportation Corporation: Noise Abatement and Ride Quality Study 6
9.4 Results Plots 9.5 Equipment List 10.0 DTC Rail Graining Program General Program Description Truck Alignment Types Noise Measurement and Instrumentation Data Collection Rail Inspection and Corrective Measures
Rail Corrugation Inspection and Correction Visual Inspection Rail Corrugation Measurement Surface Measurement Recommended Rail Grinding Maintenance Plan Required Resources Recommended Schedule: DTC Grinding Recommended Schedule: Major Grinding Conclusion and Recommendations

Detroit Transportation Corporation: Noise Abatement and Ride Quality Study 7
Appendices A. Rail Measurement Post CAT System Wide B. DTC Statistical Analysis and Noise Corrugation Prediction Model C. Defiance DPM Noise and Vibration Measurement Report

Detroit Transportation Corporation: Noise Abatement and Ride Quality Study 8
References 1) UTDC TECHNICAL REPORT DPM RAIL GRINDING MAINTENANCE MANUAL REVISED NOVEMBER 15,
1989
2) LORAM DPM POST RAIL GRINDING REPORT DECEMBER 2010
3) INTERNATIONAL STANDARDS‐ISO3095 REPORT; RAILWAY APPLICATIONS‐ACOUSTICS‐MEASUREMENT OF NOISE EMITTED BY RAILWAY BOUND VEHICLES
4) INNOTRACK GUIDELINE D4.5.5‐GUIDELINES FOR MANAGEMENT OF RAIL GRINDING‐2006
5) RAIL MEASUREMENT PRODUCTS FOR RAIL CORRUGATION‐LONGTITUDINAL PROFILES‐2007
6) RAIL CORRUGATION: CHARACTERISTICS, CAUSES AND TREATMENTS, SI.GRASSIE PHD. MAY 2009
7) BEST PRACTICES‐AREMA COMMITTEE #4, SUB COMMITTEE #9‐2000
8) DTC MAINTENANCE DEPARTMENT – RAIL GRINDING PROGRAM, PAST PRACTICES AND EXPERIENCES
9) ATS CONSULTING 2010
10) SL GRASSIE AND J. KALOUSEK “RAIL CORRUGATION: CHARACTERISTICS, CAUSES, AND TREATMENTS” JOURNAL OF RAIL AND RAPID TRANSIT, PROC OF I MECH ENG, 1993 201F, 57‐68
11) SL GRASSIE, “RAIL CORRUGATION: CHARACTERISTICS, CAUSES, AND TREATMENTS”, JOURNAL OF RAIL AND RAPID TRANSIT PROC OF I MECH E.2009 223F, 581 – 596
12) SOCIETY OF ACOUSTICAL ENGINEERING (1998) FUNDAMENTALS OF NOISE AND VIBRATION: FRANK FAHY AND JOHN WALKER
13) TRANSIT NOISE AND VIBRATION IMPACT ASSESSMENT MAY 2006: FEDERAL TRANSIT ADMINISTRATION

Detroit Transportation Corporation: Noise Abatement and Ride Quality Study 9
Definitions A‐Weighting: A standard filter used to alter the sensitivity of a sound level
meter with respect to frequency so that the instrument is less sensitive at low and high frequencies where the human ear is less sensitive. Also is expressed as dBA.
Accelerometer: A transducer that converts vibration motion to an electrical
signal proportional to the acceleration of that motion. Ambient: The pre‐project background noise or vibration level. Amplitude: Difference between the extremes of an oscillating signal. Alignment: The horizontal location of a railroad or transit system as
described by curved and tangent track. Automated Guideway Transit (AGT): Guided steel wheel or rubber tired transit passenger vehicle
operating singly or in multi‐car trains with a fully automated system on fixed guideways along an exclusive right‐of‐way.
Consist: The total number and type of cars, locomotives, or transit
vehicles in a train‐set. Corrugated Rail: A rough condition of alternating ridges and grooves which
develop on the rail head in service. Decibel: The standard unit of measurement for sound pressure levels
and vibration level. Technically a decibel is the unit of level which denotes the ratio between two quantities that are proportional to power; the number of decibels is 10 times the logarithm of this ratio. Also written as dB.
Equivalent Level: The level of steady sound which, in a stated time period and a
stated location, has the same sound energy as the time varying sound. Also written as Leq.
Flange: The vertical projection along the inner rim of a wheel that
serves, together with the corresponding projection of the mating wheel of a wheel set to keep the wheel set on the track.
Frequency: The number of times that a periodically occurring quality
repeats itself in a specified period. With reference to noise a vibration signals, the number of cycles per second.
Frequency Spectrum: Distribution of frequency components of a noise or vibration
signal.

Detroit Transportation Corporation: Noise Abatement and Ride Quality Study 10
Radius of Curvature: A measure of severity of a curve in a track structure based on the length of the radius of a circle that would be formed if the curves were continued.
Root Mean Square (RMS): The square root of a mean‐square value of an oscillating
waveform is obtained by squaring the value of amplitude and each instant of time and then averaging the values.
Sound Exposure Level: The level of sound accumulated over a given time interval or
event. Technically, the sound exposure level is the level of the time integrated mean square a weighted sound for a stated time interval or event with a reference time of one (1) second.

Detroit Transportation Corporation: Noise Abatement and Ride Quality Study 11
Executive Summary The Detroit People Mover system opened in 1987 for revenue service. Since that time, most of the track and rail cars have experienced over 13 million miles of travel collectively. Individual cars of course, have experienced much less travel but still have significant miles approximately 1.3 million miles per rail car. E.S.1 Study of Methodology Summary (see figure1)
Identify factors affecting ride quality
Identify factors (variables) that DTC staff is working with consultant(s) can measure and collect baseline data
Establish methodology for instrumentation and data collection
Establish quality control procedures for data integrity
Collect and analyze data; establish baseline data base
Perform statistical testing and analysis where appropriate
Construct a regression model for predicting corrugation removal and associated dba levels
Detroit Transportation Corporation: Noise Abatement and Ride Quality Study 12
Noise Abatement And
Ride Quality Study
Identify Factors Affecting Ride Quality
Literature Research
Identify Factors (Variables) that can be measured with
Minimum Difficulty
Select In‐Vehicle as well as Component Factors for
Testing
Establish Specification
Procedure for Data
Collection
Compare with FTA Process
for Noise Evaluation
Compare with APTA
Standards for Noise
Evaluation
Compare with NVH Research and Methods
(Noise, Vibration, Harshness)
Establish Methodology for
Instrumentation and Data
Collection
Establish Quality Control
Procedure for Data
Integrity
Analyze Data; Establish
Baseline Data Base
Construct and Test
Regression Model for
Predicting Corrugation
Removal and Associated
dBA levels
Figure 1 Study Methodology
Flow Chart Noise Abatement & Ride Quality Study
Step 1 Step 2 Step 3 Step 4 Step 4a Step 4b
Detroit Transportation Corporation: Noise Abatement and Ride Quality Study 13
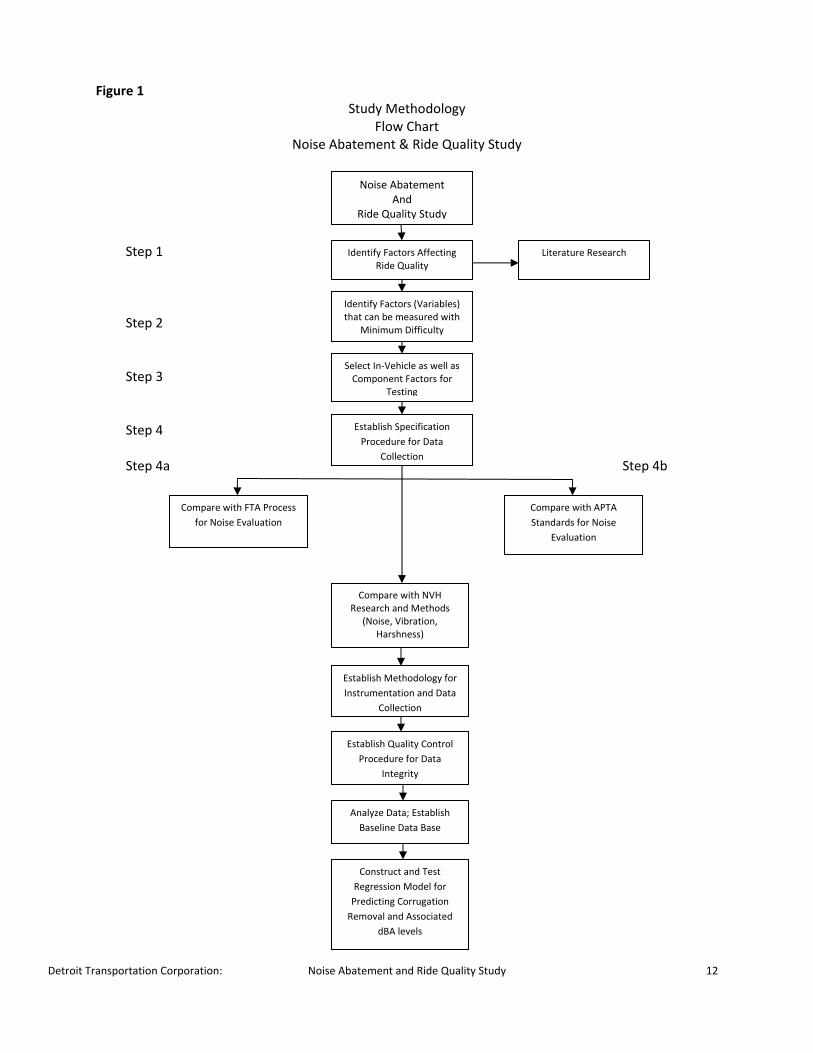
E.S.2 Car Noise Assessment During the course of the year 2010, noise data was collected on every rail car in the DTC system. The noise levels inside the vehicles measured from a maximum of 100 dBA for several seconds on some portion of the track. The mean dBA system level was measured at 85.52. DTC staff also performed some statistical test in particular a Box Plot analysis to measure the difference in mean noise values between rail cars within the group. The results indicated that the noise inside the cars approaching the stations showed little variance except at Fort and Cass, Joe Louis Arena, and Time Square stations. E.S.3 Rail Grinding Project DTC undertook this project in October of 2010. The primary object was to reduce the noise levels by removing corrugation. The other prescribed objectives were as follows:
Evaluate the existing profile standard and develop a grinding program to restore proper wheel/rail interface.
Document rail profiles with mini‐prof device, for use in grind planning and to serve as a benchmark for future rail maintenance.
Restore rail/wheel interface by removing the minimum amount of metal, so that the rail life can be extended to maximum levels.
The Detroit People Mover system is a transit system in downtown Detroit that consist of 2.9 miles of elevated track. The system includes 35 curves ranging from 115’ to 3000’ radii. The Rail is 115 RE standard except that which was replaced in 2008. There are six 6) curve sections P(6), P(10), P(13), P(21),P(24), P(29) that were replaced due to rail head wear. Table 1 shows track section and general location of the replaced rail
Table 1
DTC 2008 Rail ReplacementCurve ID# Track Section Station Area
P6 298 Cadillac Center
P10 338 Grand Circus Park
P13 354 Times Square
P21 006 Cobo Hall
P24 094 Joe Louis Arena
P29 170 Financial

Detroit Transportation Corporation: Noise Abatement and Ride Quality Study 14
The Grinding Equipment due to close tolerance of the DTC guideway requires a specifically configured grinder to be used. The grinder is composed of a power car and two grinding carts. Prior to developing the Rail Grinding Plan, the DTC staff in conjunction with Loram the consultant performed a general assessment of the wheel/rail condition. The following areas were identified:
Visible corrugation in some areas.
Possible truck noise on sharper curves
Various levels of wheel wear throughout fleet.
Some degree of curve wear on older high rails.
Areas of irregular band width and position.
The template used to measure the rail profile is shown in figure 2. Figure 2

Detroit Transportation Corporation: Noise Abatement and Ride Quality Study 15
Collect Pre‐Grind Measurements, which
included Mini‐prof Profiles, Rail Hardness, Condition
Photos, and Corrugation Data
Electric Bar Gauge Templates from NRC
Determine Grind Increments for Half of the System, Based on Pre‐Grind Mini‐Prof Profiles
and Corrugation Data
Evaluate the Existing Profile Standard, and Develop a Grinding Program that will Restore Proper Wheel/Rail
Interface
Collect Pre‐Grind Measurements, which
included Mini‐prof Profiles, Rail Hardness, Condition
Photos, and Corrugation Data
Document Rail Profiles with Mini‐Prof Device for use in
Grinding Planning and to Serve as Benchmark for Future Rail
Maintenance
Restore Rail/Wheel Interface Removing the Minimum
Amount of Metal, to Extend Rail Life to Maximum Level
Quality Control Inspections/Safety
Certification Checklist
DTC Final Approval and Acceptance
Figure 3: A general description of the rail grinding process is shown in figure 3.
General Overview Of Rail Grinding Process

Detroit Transportation Corporation: Noise Abatement and Ride Quality Study 16
E.S.4 Factors Affecting Ride Quality DTC engineers and maintenance staff identified factors (variables) affecting noise level and general ride quality. The assessment (subjective) determined that there are fourteen (14) major areas that affect ride quality and in‐vehicle noise level.
A. Wheel Profile B. Rail Profile C. Truck Suspension D. HVAC System E. Car body Structure F. Rail Corrugation G. Rail Spacing H. Wheel Spacing I. Rail Wheel Hardness J. Vehicle Speed K. Wheel and Rail Profile L. Rail Profile and Truck Suspension M. Wheel Profile and Truck Suspension N. Hunting
DTC using the drill down method further detailed within these major categories specific sub component measures that contribute to noise and decreased ride quality. A scoring / rating system utilized internally by DTC staff to determine noise impact and ease of implementation, was developed and implemented. Impacts were defined as follows:
Hi Impact: This variable has a significant impact on noise heard by the receiver.
Medium Impact: This variable may have a significant impact on the noise heard.
Low Impact: This variable does not have a significant impact on noise heard. Ease of implementation as follows:
High Ease: This variable is ease or low cost to implement.
Medium Ease: This variable may have some difficulty generally has medium cost.
Low Ease: This variable has significant difficulty or high comparative cost to implement. The average scores for each variable are shown in Figure 4. The major areas that DTC staff determined to have general highest impact or simply the biggest “bang” for the dollar in reducing noise was in descending order
1. Rail Corrugation 2. Rail Profile 3. Vehicle Speed 4. Wheel Profile

Detroit Transportation Corporation: Noise Abatement and Ride Quality Study 17
Figure 4

Detroit Transportation Corporation: Noise Abatement and Ride Quality Study 18
However, in some cases the process in which noise travels, and is magnified acoustically requires that some variables need to be analyzed as pairs. This will allow the analyst to begin to understand and assess the noise and ride quality impact. E.S.5 Surface Condition The DTC rail grinding process included surface finish specification of 10 microns or less over a specified distance. The grinding stones used to remove the rail material leave circular abrasions in the rail head. The abrasions are called grinding signatures. Pronounced grinding signatures will produce a howling effect from the vehicle wheels. Elimination of this howling effect required a surface finish Ra (average roughness of 10 microns or less. This was specified in the rail grinding contract. The measurer’s device used for this level of precision was a MAHR P 51 surface measuring instrument E.S.6 Rail Corrugation Measurement Rail corrugation is defined as the interaction of dynamic force between rail and wheel (and truck) that lead to surface wear on the rail and wheels creating an imperfection in both. See Figure 5 The formation of corrugation seems to be more prominent in curves than along tangent track; however this was not the case at DTC. The amplitude of these forces is potentially increased by:
Flange friction at high rail
Misalignment of wheel sets in truck
Rail support stiffness variation
Slip between wheel and rail due to difference in wheel diameter between wheels of same wheel set
Existing corrugation
Truck steering As a result of these forces modulation of resonance frequency (track and wheel set), the following frequency modulation factors occur:
Low (frequency anti‐resonance (i.e. non‐suspended) mass bouncing on track spring
Axle tension mode
Axle bending /wheel lateral mode The real impact of the congregated forces track/wheel and rail car produces at least two recognized forms of rail corrugation: general
Soft track with booted sleeper and resilient under sleeper pads leads to short wavelengths
Track with guard rail can lead to short wavelengths corresponding with lateral wheel set resonance (lateral wear)
Research has indicated that under normal wear conditions corrugation amplitude growth is moderate; estimated range of growth is 0.05 MM (microns) in 1 year time (SL. Grassie‐2009). The DTC system is comprised of a mixture of simple hard wear corrugation and excessive corrugation. Simple wear corrugation creates a weak pattern mainly on the lower rail (highest axel load) with a wavelength that corresponds to one of the track/wheel sets resonances:

Detroit Transportation Corporation: Noise Abatement and Ride Quality Study 19
Stiff track leads to long wavelengths Soft track without sleepers (soft rail fixation systems) leads to short wavelengths and soft rail
(with curve replacement in 2008 with hardened rail (on some DTC curves). The measuring of rail corrugation and acoustic roughness was performed using the Corrugation Analysis Trolley (CAT). In the case of the rail grinding at DTC; post corrugation measurements were taken two days after rail grinding. The CAT as it is commonly referred to was initially developed at Cambridge University In the 1970’s, and was later used by British Rail Research to measure acoustic roughness for prediction of wheel/rail noise.

Detroit Transportation Corporation: Noise Abatement and Ride Quality Study 20
Figure 5 Model of Wheel / Rail
Rolling Noise Generation (DJT, 1991)
DJ THOMPSON MODEL
Noise from Rail
Wheel Roughness Rail Corrugation
Σ
Contact Filter
Roughness Input
Wheel/Rail Interaction
Rail Receptance Contact Receptance
Wheel Receptance
Wheel Response Rail Receptance
Wheel Vibration Rail Vibration
Wheel Radiation Wheel Radiation
Noise from Wheel
Σ
Noise Prorogation In Car
Wayside

Detroit Transportation Corporation: Noise Abatement and Ride Quality Study 21
E.S.8 Noise and Corrugation Prediction Model DTC staff tested and developed a regression model to determine the associated relationship between noise (sound levels) and corrugation metal removal associated with the DTC rail grinding project A simple regression model using the standard mathematical format equation. Regression Equation (y) = a + b(x) Slope (b) = (N ΣXY – (ΣX) (ΣY)/NΣX2‐(ΣX)2) Intercept (A) = (ΣY – Σb(ΣX)/N
Where X and Y are the variables b = the slope of the regression line. a – the intercept point of the regression line and Y axis N = Number of values or elements X – First score Y = Second score ΣXY = Sum of the product of First and Second scores ΣX = Sum of First score ΣY = Sum or Second scores ΣX2 = Sum of square first scores
The DTC regression model utilized software “Stat‐crunch” statistical analysis software to run DTC data points “Metal Removal” and “Noise Levels” post rail grind. The statistical model calculated the associated descriptive statistics for each associate Y and X values. The parameters associated with the population size of 367 is the number of track sections used in the analysis to represent the 2.9 mile elevated track mileage. Those descriptors are as follows:
Analysis of Variance measures
Standard error estimate
F test
MS (Mean Square)
DF (Degrees of Freedom)
An example of the predictive model and the predictive values shown in Figures 6, 6.1, 7, 7.1, 8, 8.1, 9, 9.1 The Predicted values are at the 95% confidence level (C.I.). The noise prediction values were generally with the range of 1 to 2 dBA’s at the 95% C.I. level which is more than satisfactory as a single prediction model E.S.9 Noise and Vibration Testing DTC contracted with Defiance Testing and Engineering to conduct noise and vibration testing to support the applied research.

Detroit Transportation Corporation: Noise Abatement and Ride Quality Study 22
Figure 6:
Simple linear regression results: Dependent Variable: VAR4 Independent Variable: VAR7 VAR4 = 79.99726 – 8.027459 VAR7 Sample size: 367 R (correlation coefficient) = ‐0.05 R‐sq = 0.0025044156 Estimate of error standard deviation: 6.0985675 Parameter estimates:
Parameter Estimate Std.Err. DF 95% L. Limit 9% U. LimitIntercept 79.99726 0.7453987 365 78.53144 81.46307
Slope ‐8.027459 8.385596 365 ‐24.517605 8.4626875
Analysis of variance table for regression model:
Source DF SS MS F‐stat P‐value Model 1 34.083485 34.083485 0.91640675 0.3391
Error 365 13575.272 37.192528
Total 366 13609.356
Predicted values:
X value Pred. Y s.e.(Pred.y) 95% C.I. for mean 95% P.I. for new
0.032 79.74038 0.5156583 (78.72635, 80.75442) (67.70485, 91.77592)

Detroit Transportation Corporation: Noise Abatement and Ride Quality Study 23
Figure 6.1

Detroit Transportation Corporation: Noise Abatement and Ride Quality Study 24
Figure 7 Simple linear regression results: Dependent Variable: VAR4 Independent Variable: VAR7 VAR4 = 79.99726 – 8.027459 VAR7 Sample size: 367 R (correlation coefficient) = ‐0.05 R‐sq = 0.0025044156 Estimate of error standard deviation: 6.0985675 Parameter estimates:
Parameter Estimate Std.Err. DF 95% L. Limit 9% U. Limit Intercept 79.99726 0.7453987 365 78.53144 81.46307
Slope ‐8.027459 8.385596 365 ‐24.517605 8.4626875
Analysis of variance table for regression model:
Source DF SS MS F‐stat P‐value Model 1 34.083485 34.083485 0.91640675 0.3391
Error 365 13575.272 37.192528
Total 366 13609.356
Predicted values:
X value Pred. Y s.e.(Pred.y) 95% C.I. for mean 95% P.I. for new
0.092 79.258736 0.33293125 (78.60403, 79.91344) (67.24814, 91.26933)

Detroit Transportation Corporation: Noise Abatement and Ride Quality Study 25
Figure 7.1

Detroit Transportation Corporation: Noise Abatement and Ride Quality Study 26
Figure 8 Simple linear regression results: Dependent Variable: VAR4 Independent Variable: VAR7 VAR4 = 79.99726 – 8.027459 VAR7 Sample size: 367 R (correlation coefficient) = ‐0.05 R‐sq = 0.0025044156 Estimate of error standard deviation: 6.0985675 Parameter estimates:
Parameter Estimate Std.Err. DF 95% L. Limit 9% U. Limit Intercept 79.99726 0.7453987 365 78.53144 81.46307
Slope ‐8.027459 8.385596 365 ‐24.517605 8.4626875
Analysis of variance table for regression model:
Source DF SS MS F‐stat P‐value Model 1 34.083485 34.083485 0.91640675 0.3391
Error 365 13575.272 37.192528
Total 366 13609.356
Predicted values:
X value Pred. Y s.e.(Pred.y) 95% C.I. for mean 95% P.I. for new
0.069 79.44337 0.33232844 (78.78985, 80.096886 (67.43293, 91.453896)

Detroit Transportation Corporation: Noise Abatement and Ride Quality Study 27
Figure 8.1

Detroit Transportation Corporation: Noise Abatement and Ride Quality Study 28
Figure 9 Simple linear regression results: Dependent Variable: VAR4 Independent Variable: VAR7 VAR4 = 79.99726 – 8.027459 VAR7 Sample size: 367 R (correlation coefficient) = ‐0.05 R‐sq = 0.0025044156 Estimate of error standard deviation: 6.0985675 Parameter estimates:
Parameter Estimate Std.Err. DF 95% L. Limit 9% U. Limit Intercept 79.99726 0.7453987 365 78.53144 81.46307
Slope ‐8.027459 8.385596 365 ‐24.517605 8.4626875
Analysis of variance table for regression model:
Source DF SS MS F‐stat P‐value Model 1 34.083485 34.083485 0.91640675 0.3391
Error 365 13575.272 37.192528
Total 366 13609.356
Predicted values:
X value Pred. Y s.e.(Pred.y) 95% C.I. for mean 95% P.I. for new
0.088 79.29084 0.32469878 (78.65233, 79.92936 (67.28112, 91.30057)

Detroit Transportation Corporation: Noise Abatement and Ride Quality Study 29
Figure 9.1

Detroit Transportation Corporation: Noise Abatement and Ride Quality Study 30
Defiance Noise and Vibration Testing The objective of this project was to instrument a People Mover car and perform noise and vibration measurements, noise levels inside of the car, and to measure the noise/acceleration/vibration between a rebuilt truck and used (old) one. INSTRUMENTATION AND TEST PROCEDURES Defiance instrumented a People Mover car and performed noise and vibration measurement from August 27 to 28, 2011 at Detroit Transportation Corporation’s facility in Detroit, MI. Defiance instrumented a People Mover car with total of 32 channels as per Table No. 2 Instrumentation Channel List. The front truck of the test car was a new one and the rear truck was an old one. LMS SCADAS Mobile system with Test. Lab software was utilized to collect and process noise and vibration data. Data acquisition sample rates were set to 52 KHz for microphones and 4,096 Hz for accelerations and forces. Data was collected in the following manner two laps of clockwise (Run 1 and Run 3) and two laps of counter‐clockwise (Run 2 and Run 4). The front end of the test car was connected to another car. Test car was in the front during counter‐clockwise test runs. All speakers and fans in the car were turned off during the test. Car was stopped at every station with the doors opened and closed. Statistical results are shown in Tables 3, 4

Detroit Transportation Corporation: Noise Abatement and Ride Quality Study 31
Table 2
People Mover Instrumentation Channel List
Channel No. Channel Description EU Positive Direction 1 Front Car Microphone Pa NA
2 Rear Car Microphone Pa NA
3 Front Truck LF Wheel Mnt Accel X g FWD
4 Front Truck LF Wheel Mnt Accel Y g Right
5 Front Truck LF Wheel Mnt Accel Z g Up
6 Front Truck RR Wheel Mnt Accel X g FWD
7 Front Truck RR Wheel Mnt Accel Y g Right
8 Front Truck RR Wheel Mnt Accel Z g Up
9 Front Truck Left Bolster Car Side Accel Z g Up
10 Front Truck Right Bolster Truck Side Accel Z g Up
11 Front Truck Right Bolster Car Side Accel Z g Up
12 Front Truck Right Bolster Truck Side Accel Z g Up
13 Front Truck Pivot Car Side Accel X g FWD
14 Front Truck Pivot Car Side Accel Y g Right
15 Front Truck Pivot Car Side Accel Z g Up
16 Rear Truck LF Wheel Mnt Accel X g FWD
17 Rear Truck LF Wheel Mnt Accel Y g Right
18 Rear Truck LF Wheel Mnt Accel Z g Up
19 Rear Truck RR Wheel Mnt Accel X g FWD
20 Rear Truck RR Wheel Mnt Accel Y g Right
21 Rear Truck RR Wheel Mnt Accel Z g Up
22 Rear Truck Left Bolster Car Side Accel Z g Up
23 Rear Truck Left Bolster Truck Side Accel Z g Up
24 Rear Truck Right Bolster Car Side Accel Z g Up
25 Rear Truck Right Bolster Truck Side Accel Z g Up
26 Rear Truck Pivot Car Side Accel X g FWD
27 Rear Truck Pivot Car Side Accel Y g Right
28 Rear Truck Pivot Car Side Accel Z g Up
29 Front Truck Long Link Load lbs Tension
30 Front Truck Short Link Load lbs Tension
31 Rear Truck Long Link Load lbs Tension
32 Rear Truck Short Link Load lbs Tension

Detroit Transportation Corporation: Noise Abatement and Ride Quality Study 32
Instrumentation and Set‐Up Photographs

Detroit Transportation Corporation: Noise Abatement and Ride Quality Study 33

Detroit Transportation Corporation: Noise Abatement and Ride Quality Study 34

Detroit Transportation Corporation: Noise Abatement and Ride Quality Study 35

Detroit Transportation Corporation: Noise Abatement and Ride Quality Study 36

Detroit Transportation Corporation: Noise Abatement and Ride Quality Study 37

Detroit Transportation Corporation: Noise Abatement and Ride Quality Study 38

Detroit Transportation Corporation: Noise Abatement and Ride Quality Study 39

Detroit Transportation Corporation: Noise Abatement and Ride Quality Study 40
Statistics for Run 1 and Run 2: Data by Direction Table 3

Detroit Transportation Corporation: Noise Abatement and Ride Quality Study 41
Table 4

Detroit Transportation Corporation: Noise Abatement and Ride Quality Study 42
The vibration testing data seems to suggest on a limited basis given that this is baseline data that direction of travel / or which truck is lead is impacted by more force. The results of the impact testing is indicated in the statistical tables 3, and 4. Since this is baseline data and there is no historical trend, the ability to draw inferential conclusions is limited and will require more testing. The data does suggests that when preventive maintenance is being scheduled that lead trucks on the rail cars need to get more attention to check for force / stress related components. The data also suggest a difference in lateral forces between new and old trucks. Inside vehicle noise registered on all four runs in the low 80’s on the tested vehicle. The frequency distributed based on 1/3 octave is shown in Figure 10 within a normal distribution curve 200 – 2000 Hz.
Conclusion and Recommendation The improvement of Ride Quality and continued Noise Abatement Reduction require that the following action items are implemented:
Major Rail Grinding is recommended every two years Noise data is collected at minimum of twice a month on at least 4 rail cars. Noise readings above
82dBA are noted. Rail inspection for corrugation is done at least once a month
Rail corrugation if found through visible inspection is noted by track section Rail corrugation is measured using the rail corrugation measuring device Block grinding at site location is done
Wheels are checked for irregularities during scheduled PM and/or a monthly basis Truck overhaul program must continue to reduce noise and provide good ride quality Lead trucks need to have special attention given due to substantial force applied to them
Resources manpower and expenditures need to focused in this area to manage noise and ride quality
DTC needs to establish a formal ride quality and noise abatement program within agency and assign that responsibility
DTC rail inspection work is done during daylight hours / Sunday mornings

Detroit Transportation Corporation: Noise Abatement and Ride Quality Study 43
Defiance Graph Figure 10

Detroit Transportation Corporation: Noise Abatement and Ride Quality Study 44
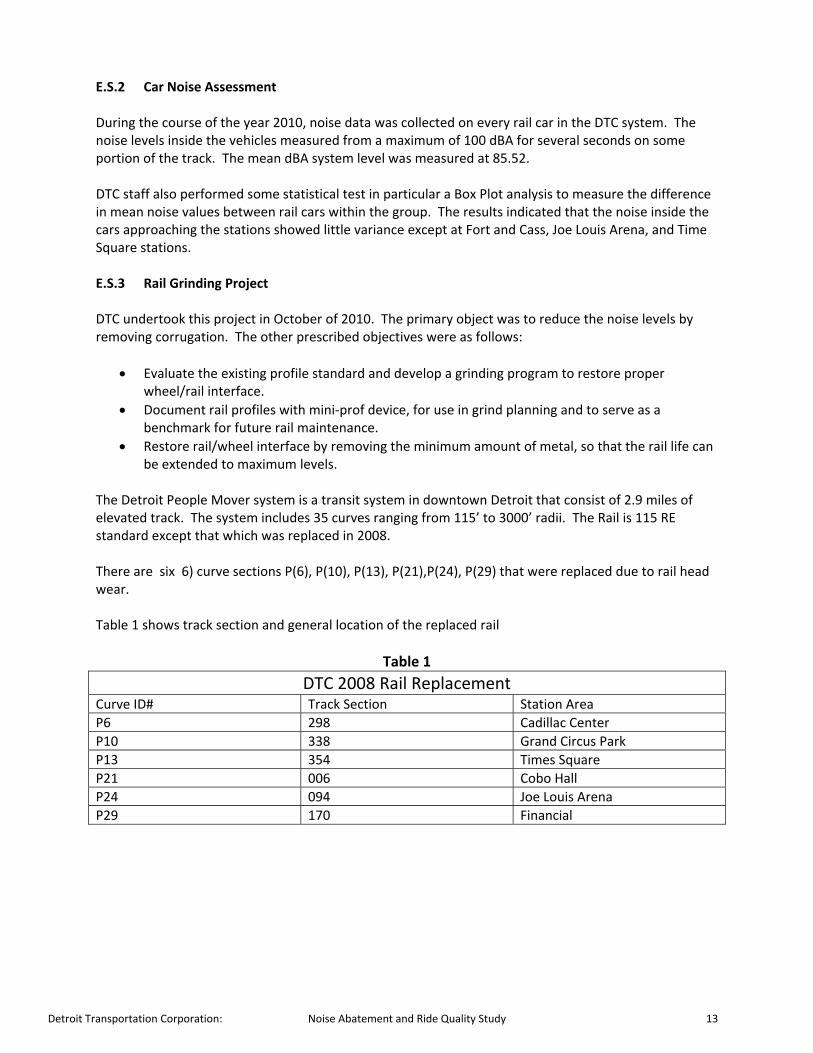
2.0 Study Methodology 2.1 Study Objective
The objective of the study was to develop an approach to evaluate key factors affecting the ride quality, noise levels, and the load forces affecting a rebuilt truck and an old one.
The study also was designed to construct and test a linear regression model to predict noise value based on metal removal from the track through the rail grinding process 2.2 General Study Approach
DTC staff was responsible for collecting noise data, and evaluating the data. The noise meter was calibrated to “A” weighting scale in DBA’ s. The staff developed a matrix of factors affecting noise and ride quality due to the large number of influential variable on those that could be easily measured by staff were focused on the study example being:
Rail Corrugation Rail / Wheel Interface Noise inside the rail cars Trucks and the noise vibration force generated by a rebuild one versus a new one.
The staff also as part of the data collection efforts designed and built a Rail Corrugation
Measuring Device to measure corrugation depth. 2.3 Instrumentation Understanding and Overview
Noise measurements the equipment used for measuring sound is an Extech model 4077736 digital sound meter measures noise (set up for slow averaged, A weighted. Meets type two standards 1.5 db accuracy, ANSI, and IEC 651.
The surface measurement instrument used to measure smoothness is a MAHR pocket surface measuring device. The device was calibrated and used to determine (average roughness) RA values in microns.
The subsequent instrumentation of the vehicle to gather vibration/force data was gathered through the placement of microphones / accelerometers on the trucks and microphones inside the vehicles. The noise level inside the vehicle was based as previously mentioned on the “A” weighted sound level using a single descriptor leg (equivalent sound level) constant sound that one would expect to occur at a specific time frame. The value does not include any weighted factors to penalize noise (sound) due to time of day it occurs or location such as the Community Noise Equivalent Level (CNEL) or the Day – Night average sound level (DNL).
3.0 In Car Noise Abatement DTC staff as part of its noise management program collects noise data on a regular basis. Generally, once or twice a month depending on the following:
Manpower availability

Detroit Transportation Corporation: Noise Abatement and Ride Quality Study 45
Visual inspection of rail that indicates that wear / corrugation is beginning to formulate
Observation – Antidotal information received regarding noise. 3.1 Measurement Location:
The measurement location for noise data collection is generally taken in the center / rear end location of the train with PA and HVAC systems turned off so the filtration process is not disturbed. DTC staff currently uses a noise meter and computer software program to collect the data.
3.2 Measurement Instrumentation:
The instrument used to collect the data is an Extech model 4077736 digital sound meter. This device will measure noise at a 1.5 db accuracy level and has been approved by ANSI, and IEC 651.
3.3 Measurement Process
The process is shown in Figure 11 below.

Detroit Transportation Corporation: Noise Abatement and Ride Quality Study 46
Figure 11 Noise Measurement Process
Vehicles Selected for Data Collection Sample at least (min.) 4 Cars
Data Collector Check Instrument, Turns off P/A, HVAC
Data Collector Selects Position – Center of Train to Start Collection
Data Collection; after Revenue Service is closed
Data Collector Completes at Least 1 Round Trip
Data Exported into Data Manager Software (Excel)
Greater than 82 dba prompts the following:
Visual Inspection of Rail
Rail Car Inspection Focus on Wheels, Trucks, Suspension, Etc.
Data Imported into Statistical Package for (Stat‐Crunch, Mini‐Tab) Analysis
Report Produced forward to Maintenance Manager for Review
Decision made Based on DTC
Noise Standards (82 dba) Inside Rail Car
OptionsDecision / To Correct / Reduce Noise is Implemented
Step 1 Step 2 Step 3 Step 4 Step 5 Step 6 Step 7 Step 8 Step 9 Step 10 Step 11

Detroit Transportation Corporation: Noise Abatement and Ride Quality Study 47
3.4 Data Collection and Results
DTC staff reviews data initially for quality and accuracy by trend and variability analysis. The results are generally summaries. The emphasis is on data quality, and noise patterns. Histograms are displayed on the following pages showing the relative frequency of noise patterns.
3.5 Noise Measurement Results The result of noise collected during the month of September 2011 is displayed in Table 5
for the following rail cars:
DV 03 DV 04 DV 05 DV 09 DV 10 DV 11
Table 5
Noise Data – September 23, 2011
Vehicle Maximum Level (Leq)
DV 03 84.7
DV 04 81.1
DV 05 83.1
DV 09 81
DV 10 85.1
DV 11 81.6 dba

Detroit Transportation Corporation: Noise Abatement and Ride Quality Study 48
DV03 Summary Statistics
Frequency Table Results for var8‐dv3:
Column n Mean Variance Std. Dev. Std. Err Median Range Min Max Q1 Q3
Var1‐dv3 1039 62.77594 103.77594 10.186288 0.31601533 63.9 38.6 46.1 84.7 52.2 71.6
Var8dv3 Frequency Relative Frequency
80 1 0.05263158
80.1 1 0.05263158
80.2 1 0.05263158
80.4 1 0.05263158
80.5 1 0.05263158
80.7 1 0.05263158
80.8 2 0.10526316
81 1 0.05263158
81.1 1 0.05263158
81.5 1 0.05263158
81.7 1 0.05263158
81.9 2 0.10526316
82 2 0.10526316
83.1 1 0.05263158
83.8 1 0.05263158
84.7 1 0.05263158

Detroit Transportation Corporation: Noise Abatement and Ride Quality Study 49
DV 04 Summary Statistics
Frequency Table Results for var8‐dv4:
Column n Mean Variance Std. Dev. Std. Err Median Range Min Max Q1 Q3
Var1‐dv4 920 64.53978 79.29295 8.8483305 0.2917208 66.5 34 47.1 81.1 56.4 72
Var8dv4 Frequency Relative Frequency
80.2 1 0.2
80.4 1 0.2
80.5 1 0.2
81.1 2 0.4

Detroit Transportation Corporation: Noise Abatement and Ride Quality Study 50
DV 05 Summary Statistics
Frequency Table Results for var2‐dv5
Column n Mean Variance Std. Dev. Std. Err Median Range Min Max Q1 Q3
Var1‐dv5 1012 63.19516 78.47569 8.858651 0.2784693 65.15 35.4 47.7 83.1 55.1 70.55
Var8dv4 Frequency Relative Frequency
80.6 1 0.33333334
81.5 1 0.33333334
83.1 1 0.33333334

Detroit Transportation Corporation: Noise Abatement and Ride Quality Study 51
DV 09 Summary Statistics
Frequency Table Results for var2‐dv9:
Column n Mean Variance Std. Dev. Std. Err Median Range Min Max Q1 Q3
Var1‐dv9 1027 63.67186 82.0868 9.060177 0.2827167 64.8 32.6 48.4 81 54.5 71.6
Var8dv4 Frequency Relative Frequency
80 1 0.16666667
80.1 1 0.16666667
80.3 2 0.33333334
80.5 1 0.16666667
81 1 0.16666667

Detroit Transportation Corporation: Noise Abatement and Ride Quality Study 52
DV 10 Summary Statistics
Frequency Table Results for var11‐dv10:
Column n Mean Variance Std. Dev. Std. Err Median Range Min Max Q1 Q3
Var1‐dv10 897 65.06756 85.2055 9.230682 0.30820352 66.5 38.3 46.8 85.1 57.3 72.9
Var8dv4 Frequency Relative Frequency
80 1 0.0625
80.2 3 0.1875
80.6 1 0.0625
80.7 1 0.0625
80.8 1 0.0625
80.9 1 0.0625
81 1 0.0625
81.1 2 0.125
81.9 1 0.0625
82.3 1 0.0625
82.5 1 0.0625
83 1 0.0625
85.1 1 0.0625

Detroit Transportation Corporation: Noise Abatement and Ride Quality Study 53
DV 11 Summary Statistics
Frequency Table Results for var8‐dv11:
Column n Mean Variance Std. Dev. Std. Err Median Range Min Max Q1 Q3
Var1‐dv11 901 64.04794 72.601074 8.520626 0.28386322 65.3 34.3 47.3 81.6 57.3 70.8
Var8dv4 Frequency Relative Frequency
80 1 0.125
80.2 2 0.25
80.4 1 0.125
80.5 1 0.125
80.6 1 0.125
81.5 1 0.125
81.6 1 0.125

Detroit Transportation Corporation: Noise Abatement and Ride Quality Study 54
3.6 Results and Comparison to Standards The DTC standard for in‐car vehicle noise is between 82 – 84 dBA. The November 2010 post rail grind noise levels system average was measured at 79.35 dBA’s. The results of September 2011 noise count indicate a system wide average of 82.77 dBA’s which is within the DTC standard.
3.7 Conclusion and Recommendations The conclusion is that the noise levels since the major rail grind have on the average increased 3.42 dBA system wide. The human ear‐acoustics can notice sound level changes in this range. . However, tonal frequency is still the key. Therefore the recommendation is to continue to collect noise data at least twice a month and measure against DTC standard, and reduce noise levels that exceed standard.
4.0 Rail Grinding Project 2010
4.1 General System Descriptions
The People Mover is a rail distribution system that operates in downtown Detroit, 2.9 miles of elevated guideway. The system has been operating since 1987, and serves 2 million trips per year.
4.2 Rail / Wheel Condition The Loram team investigated the general relationship between rail and wheel (interface). These conditions were cited.
Some levels of visible corrugation in certain areas
Possible truck noise on sharp curves
Some degree of curve wear on older high rails
Areas of irregular running band width and position
Areas of two point wheel contact bands 4.3 Conclusion and Recommendations
The conclusions and recommendations are from the consultant report (Loram 2010 – DTC Rail Grinding Summary Report). Those are as follows:
General Comments:
Based on rail shape and corrugation, as well as negative feedback on noise levels throughout various section of the system, the grind cycle should probably be contracted somewhat from the existing 5 year schedule. This will greatly reduce the metal removal requirements in terms of rail shape and corrugation reduction, in turn extending asset rail life. Grinding in a corrective manner requires the removal of three times or more metal over a similar period of time. This is due to the fact that rail anomalies tend to regress in a non‐linear but accelerated fashion.
Defined templates are necessary to provide proper wheel/rail interface as well as to make the grinding process as efficient as possible.
The rail templates need to be addressed to accommodate the various levels of wheel wear evident on the DPM rolling stock.

Detroit Transportation Corporation: Noise Abatement and Ride Quality Study 55
Maintaining the system in a more timely manner will allow for grinding from expansion joints to expansion joint which will eliminate set downs creating a more transition free rail surface. The levels of corrugation will be at less variant levels which will also promote more station to station grinding.
Recommendations:
The grinding process is much more beneficial when applied at the appropriate time. It would be prudent to do some interim data collection prior to the next grind to assess the system and allow for a more suitable grind schedule. This should include both rail profile and corrugation data. Due to the precarious template situation, it is important to monitor rail profile degradation to help in defining suitable templates. These full system measurements are recommended on an annual basis.
The most important consideration foron the DPM appears to be the control of corrugation. For this reason the grind cycles should be determined predominately by the evidence and growth of corrugation throughout the system. Once this cycle is determined it will be easier to generate defined rail templates that a) do not over shape the rail, and b) provide suitable relief so as to not generate poor wheel/rail interface between grind cycles.
There are two options in regards to template creation at this time. DPM can provide the NRC with wheel profiles which include each wheel that is being used on the system at any given time. Because of the limited number of wheel sets, this should be a relatively painless process. Since the more worn of the wheel sets are removed from service and turned to a new wheel shape in a fairly systematic manner, the spectrum of wheel wear should be somewhat consistent over any period of time. This should allow templates to be created that will be suitable for the entire fleet and proved for a suitable wheel/rail interface. The second option would be utilize the current post grind rail profiles to serve as the standard going forward. It would entail taking all the similar geometry templates and generating an average template for each.
5.0 Factors Affecting Ride Quality 5.1 Construction of variables affecting ride quality and noise abatement.
DTC staff: Engineering and Maintenance developed a list of variables affecting ride quality based on literature reviews and 24 years of urban rail transit experiences. The variables are displayed in Figure 7 Thirty‐five variables were isolated as contributors; however given staff, data and research limitations, these could not be modeled and tested. However, the identification and grouping of variables did allow DTC to focus on several areas that were identified in previous studies and work efforts to reduce levels The average score for each variable is a function of ease of implementation, significance to noise levels, and measurement capability. The scores were subjective but based on experience and research derived from “best practice” methods. The rating of points is a simple equivalency scale with the highest score indicating the most significant factor(s) believed to be a contributor to acoustic noise levels inside the rail cars.

Detroit Transportation Corporation: Noise Abatement and Ride Quality Study 56
5.2 Conclusion and Recommendations
The conclusion reached by staff was that DTC with limited staff, and resources should focus primarily on removing rail corrugations, improve rail/wheel geometry, rebuilt trucks, and improve suspension to reduce the noise. The recommendation is to continue to investigate as many factors as possible over the next years to improve the ride quality. The formalization of “Ride Quality and Noise Abatement Program” is recommended.
6.0 Surface Condition 6.1 Measurements and Instrumentation The instrument used was a “MAHR Pocket Surf P51” to measure the average surface roughness (RA) over a given distance. 6.2 Measurement Process
The gauge was calibrated and post‐grind measurements were taken every 150 feet on the left and right rail to determine if the RA values exceeded 10 microns as specified in DTC rail grinding specifications. The data collected by Engineering and Maintenance staff on all sections of the track did not exceed 10 microns. The highest readings was 9.948 at track section274 coming out of curve P3.
The process of where to measure was determined by duplicating and sampling post‐grind locations. This was done by DTC staff to determine if specification tolerances were being met by the contractor Loram.
6.3 Measurement Location The locations are shown by track section in Table 6 6.4 Conclusion and Recommendations The surface post‐grind measurements all met expectations, specifications, and desired outcome.

Detroit Transportation Corporation: Noise Abatement and Ride Quality Study 57
Figure 7

Detroit Transportation Corporation: Noise Abatement and Ride Quality Study 58
MDOT Noise Analysis 1 micron (m)= 1 x10⁻⁶ m = 39.37 x 10⁻⁶ in TS LR RR
StationTrack
Section
Pre-GrindS. P. L.(dBA)
Post-GrindS. P. L.(dBA)
Variance(dBA)
Pre-GrindCat
(m)
Post-GrindCat
(m)Variance(m)
Pre-GrindSurface
(m)
Post-GrindSurface
(m)Variance(m)
TrackSection TS LR RR
TS 367 92 90.8 -1.2 0.104 0.104 0.0 367 367 0.344 0.927TS 366 90.5 88.2 -2.3 0.104 0.104 L R 0.0 366TS 365 88.7 85.5 -3.2 0.104 0.104 0.0 365TS 364 82.3 80.4 -1.9 0.104 0.104 0.0 364TS 363 84 78.5 -5.5 0.104 0.104 0.0 363
TS 362 86 84.5 -1.5 0.104 0.104 0.0 362 362 1.187 0.763 362 1.187 0.763TS 361 83.1 79.7 -3.4 0.104 0.104 0.0 361 357 0.33 0.232TS 360 83.1 79 -4.1 0.104 0.104 0.0 360 352 0.333 0.225TS 359 82.5 78.8 -3.7 0.104 0.104 0.0 359 348 3.35 0.427TS 358 85 84.5 -0.5 0.077 0.077 0.0 358 348 5.3 4.95TS 357 86.1 79.7 -6.4 0.077 0.077 0.33 0.232 -0.1 357 357 0.33 0.232 345 3.2 1.6TS 356 84 79 -5.0 0.077 0.077 0.0 356 342 6.69 0.4TS 355 83 78.8 -4.2 0.077 0.077 0.0 355 339 4.282 5.49TS 354 83.1 77.9 -5.2 0.077 0.077 0.0 354 336 3.89 0.294TS 353 82.3 79.2 -3.1 0.077 0.077 0.0 353 333 2.55 7.036TS 352 80 78.3 -1.7 0.077 0.077 0.333 0.225 -0.1 352 352 0.333 0.225 329 5.073 2.891TS 351 81 78.1 -2.9 0.178 0.178 0.0 351 329 5.073 1.191TS 350 79.1 75.2 -3.9 0.178 0.178 0.0 350 329 1.002 2.35TS 349 76.2 74.2 -2.0 0.178 0.178 0.0 349 324 1.619 3.278TS 348 76.2 73.2 -3.0 0.178 0.178 5.3 4.95 -0.4 348 324 1.619 3.278GC 347 93 92.4 -0.6 0.039 0.039 0.0 347 319 2.11 2.442GC 346 87 85.3 -1.7 0.039 0.039 0.0 346 314 3.014 0.423GC 345 83 73.6 -9.4 0.039 0.039 3.2 1.6 -1.6 345 309 2.563 1.582GC 344 79 73.9 -5.1 0.122 0.122 0.0 344 304 6.93 2.999GC 343 79 73.9 -5.1 0.122 0.122 0.0 343 299 2.903 4.31GC 342 76 72.4 -3.6 0.122 0.122 6.69 0.4 -6.3 342 294 0.908 0.827GC 341 76 72.1 -3.9 0.122 0.122 0.0 341 289 3.648 2.892GC 340 73.5 72.5 -1.0 0.093 0.093 0.0 340 284 1.579 2.166GC 339 73 72.5 -0.5 0.093 0.093 4.282 5.49 1.2 339 279 3.525 3.26GC 338 74 72.6 -1.4 0.093 0.093 0.0 338 274 6.948 8.887GC 337 76 74.5 -1.5 0.093 0.093 0.0 337 274 2.98 1.05GC 336 78 77.8 -0.2 0.093 0.093 3.89 0.294 -3.6 336 263 0.53 0.03GC 335 78 77.3 -0.7 0.046 0.046 0.0 335 253 0.54 0.626GC 334 79 76 -3.0 0.046 0.046 0.0 334 243 0.43 2.334GC 333 74 72.6 -1.4 0.046 0.046 2.55 7.036 4.5 333 233 4.637 2.367GC 332 77 73 -4.0 0.101 0.101 0.0 332 225 1.37 2.45GC 331 73 73 0.0 0.101 0.101 0.0 331 215 2.444 1.444GC 330 74 74 0.0 0.101 0.101 0.0 330 210 0.703 0.194GC 329 79.3 79.3 0.0 0.101 0.101 5.073 2.891 -2.2 329 205 1.354 0.763GC 328 93.9 92.9 -1.0 0.076 0.076 0.0 328 200 0.789 0.402BW 327 94 92.9 -1.1 0.076 0.076 0.0 327 196 0.309 0.656BW 326 88 86.2 -1.8 0.076 0.076 0.0 326 193 1.331 0.857BW 325 91 89.7 -1.3 0.076 0.076 0.0 325 190 4.362 0.297
Table 6
TS=Times Square GT=Greektowk AR=Joe Louis Area GC=Grand Circus Park BT=Bricktown CH=COCO Hall BW=Broadway RC=Renaissance Center FIN=Financial District CC=Cadillac Center MI=Michigan
Figure 6

Detroit Transportation Corporation: Noise Abatement and Ride Quality Study 59
MDOT Noise Analysis 1 micron (m)= 1 x10⁻⁶ m = 39.37 x 10⁻⁶ in TS LR RR
StationTrack
Section
Pre-GrindS. P. L.(dBA)
Post-GrindS. P. L.(dBA)
Variance(dBA)
Pre-GrindCat
(m)
Post-GrindCat
(m)Variance(m)
Pre-GrindSurface
(m)
Post-GrindSurface
(m)Variance(m)
TrackSection TS LR RR
BW 324 83.8 81.8 -2.0 0.076 0.076 1.619 3.278 1.7 324 190 0.943BW 323 84 81.7 -2.3 0.076 0.076 0.0 323 187 3.278 3.789BW 322 80 79 -1.0 0.049 0.049 0.0 322 173 2.279 1.944BW 321 82 80.5 -1.5 0.049 0.049 0.0 321 171 1.738 0.898BW 320 83 76.4 -6.6 0.049 0.049 0.0 320 167 1.991 1.757BW 319 82 78.7 -3.3 0.049 0.049 2.11 2.442 0.3 319 163 4.655 0.792BW 318 82 82 0.0 0.049 0.049 0.0 318 155 0.245 0.551BW 317 81 79.6 -1.4 0.049 0.049 0.0 317 150 0.335 0.406BW 316 78 76.5 -1.5 0.049 0.049 0.0 316 145 0.485 0.334BW 315 77 75.7 -1.3 0.049 0.049 0.0 315 140 0.366 0.898BW 314 79 76.8 -2.2 0.058 0.058 3.014 0.423 -2.6 314 135 0.305 0.499BW 313 77 75.7 -1.3 0.058 0.058 0.0 313 130 0.484 0.85BW 312 79 74.1 -4.9 0.058 0.058 0.0 312 125 0.423 0.225BW 311 78 72.6 -5.4 0.058 0.058 0.0 311 115 4.743 0.78BW 310 85 80.5 -4.5 0.11 0.110 0.0 310 110 2.917 1.048BW 309 92 89.3 -2.7 0.11 0.110 2.563 1.582 -1.0 309 105 0.267 0.67BW 308 91 90.4 -0.6 0.11 0.110 0.0 308 100 1.24 0.359BW 307 73 71.9 -1.1 0.11 0.110 0.0 307 94 0.757 2.292BW 306 73 71.9 -1.1 0.11 0.110 0.0 306 90 2.62 1.32BW 305 74 72.3 -1.7 0.11 0.110 0.0 305 86 0.242 2.13BW 304 75 71.8 -3.2 0.11 0.110 6.93 2.99 -3.9 304 83 1.06 0.275CC 303 72 71.9 -0.1 0.11 0.110 0.0 303 80 0.237 0.456CC 302 73 72 -1.0 0.062 0.062 0.0 302 74 0.32 0.208CC 301 74 71.9 -2.1 0.062 0.062 0.0 301 71 4.16 0.506CC 300 79 76.4 -2.6 0.0492 0.049 0.0 300 68 5.58 0.49CC 299 80 78 -2.0 0.0492 0.049 2.903 4.31 1.4 299 65 5.41 0.918CC 298 83 77.3 -5.7 0.0492 0.049 0.0 298 62 11.5 0.348CC 297 75 72.4 -2.6 0.0492 0.049 0.0 297 46 2.777 3.34CC 296 75 73.5 -1.5 0.0492 0.049 0.0 296 43 2.89 3.044CC 295 76 73.2 -2.8 0.108 0.108 0.0 295 40 1.275 3.464CC 294 82 78 -4.0 0.108 0.108 0.908 0.827 -0.1 294 37 1.731 2.398CC 293 82 78.7 -3.3 0.108 0.108 0.0 293 34 0.764 2.914CC 292 88 86.6 -1.4 0.12 0.120 0.0 292 31 0.888 1.473CC 291 89 87.5 -1.5 0.12 0.120 0.0 291 29 3.038 1.238CC 290 81 79.4 -1.6 0.12 0.120 0.0 290 26 0.886 2.442CC 289 86 82.2 -3.8 0.12 0.120 3.648 2.892 -0.8 289 26 0.939 2.938CC 288 84 81.2 -2.8 0.089 0.089 0.0 288 23 0.489 1.018CC 287 86 83.7 -2.3 0.089 0.089 0.0 287 19 1.694 0.646CC 286 89 86.6 -2.4 0.089 0.089 0.0 286 14 1.12 2.524CC 285 90 87.1 -2.9 0.089 0.089 0.0 285 9 1.346 1.078
TS=Times Square GT=Greektowk AR=Joe Louis Area GC=Grand Circus Park BT=Bricktown CH=COCO Hall BW=Broadway RC=Renaissance Center FIN=Financial District CC=Cadillac Center MI=Michigan

Detroit Transportation Corporation: Noise Abatement and Ride Quality Study 60
MDOT Noise Analysis 1 micron (m)= 1 x10⁻⁶ m = 39.37 x 10⁻⁶ in TS LR RR
StationTrack
Section
Pre-GrindS. P. L.(dBA)
Post-GrindS. P. L.(dBA)
Variance(dBA)
Pre-GrindCat
(m)
Post-GrindCat
(m)Variance(m)
Pre-GrindSurface
(m)
Post-GrindSurface
(m)Variance(m)
TrackSection TS LR RR
CC 284 84 79.4 -4.6 0.098 0.098 1.579 2.166 0.6 284CC 283 88 83.2 -4.8 0.098 0.098 0.0 283CC 282 89 84 -5.0 0.088 0.088 0.0 282CC 281 86 83.9 -2.1 0.088 0.088 0.0 281CC 280 85 82.3 -2.7 0.088 0.088 0.0 280CC 279 89 89 0.0 0.088 0.088 3.525 3.26 -0.3 279CC 278 87 85.5 -1.5 0.088 0.088 0.0 278CC 277 85 83.2 -1.8 0.088 0.088 0.0 277CC 276 80 77.8 -2.2 0.088 0.088 0.0 276CC 275 81 79 -2.0 0.088 0.088 0.0 275CC 274 83 79.2 -3.8 0.203 0.203 6.948 8.887 1.9 274CC 273 83 79.9 -3.1 0.203 0.203 0.0 273CC 272 82 77.5 -4.5 0.203 0.203 0.0 272CC 271 82 80 -2.0 0.203 0.203 0.0 271CC 270 80 77.5 -2.5 0.203 0.203 0.0 270GT 269 83 75.1 -7.9 0.203 0.203 0.0 269GT 268 83 72.2 -10.8 0.203 0.203 0.0 268GT 267 80 71.8 -8.2 0.203 0.203 0.0 267GT 266 85 79.5 -5.5 0.203 0.203 0.0 266GT 265 94 91.3 -2.7 0.141 0.141 0.0 265GT 264 90 89.1 -0.9 0.141 0.141 0.0 264GT 263 80 76.1 -3.9 0.164 0.164 0.53 0.03 -0.5 263GT 262 79 71.9 -7.1 0.164 0.164 0.0 262GT 261 76 71.9 -4.1 0.164 0.164 0.0 261GT 260 76 71.8 -4.2 0.164 0.164 0.0 260GT 259 75 72.1 -2.9 0.164 0.164 0.0 259GT 258 75 72.1 -2.9 0.092 0.092 0.0 258GT 257 75 72 -3.0 0.092 0.092 0.0 257GT 256 76.1 71.9 -4.2 0.092 0.092 0.0 256BT 255 77 72.3 -4.7 0.092 0.092 0.0 255BT 254 82 76.4 -5.6 0.092 0.092 0.0 254BT 253 84 78.5 -5.5 0.092 0.092 0.54 0.626 0.1 253BT 252 83 78.2 -4.8 0.092 0.092 0.0 252BT 251 76 71.7 -4.3 0.092 0.092 0.0 251BT 250 84 80.9 -3.1 0.092 0.092 0.0 250BT 249 77 72 -5.0 0.092 0.092 0.0 249BT 248 83 80 -3.0 0.092 0.092 0.0 248BT 247 77 72 -5.0 0.092 0.092 0.0 247BT 246 82 76.4 -5.6 0.092 0.092 0.0 246BT 245 77 75.5 -1.5 0.092 0.092 0.0 245BT 244 77 75.5 -1.5 0.092 0.092 0.0 244BT 243 79 75 -4.0 0.092 0.092 0.43 2.334 1.9 243BT 242 83 78.6 -4.4 0.092 0.092 0.0 242BT 241 89 85 -4.0 0.092 0.092 0.0 241BT 240 82 76.9 -5.1 0.092 0.092 0.0 240BT 239 80 76.7 -3.3 0.084 0.084 0.0 239BT 238 84 81.4 -2.6 0.072 0.072 0.0 238BT 237 80 77.5 -2.5 0.072 0.072 0.0 237BT 236 83 80.3 -2.7 0.072 0.072 0.0 236BT 235 83 83.8 0.8 0.072 0.072 0.0 235BT 234 84 80.5 -3.5 0.072 0.072 0.0 234BT 233 80 77.5 -2.5 0.106 0.106 4.637 2.367 -2.3 233BT 232 81 76.6 -4.4 0.106 0.106 0.0 232
TS=Times Square GT=Greektowk AR=Joe Louis Area GC=Grand Circus Park BT=Bricktown CH=COCO Hall BW=Broadway RC=Renaissance Center FIN=Financial District CC=Cadillac Center MI=Michigan

Detroit Transportation Corporation: Noise Abatement and Ride Quality Study 61
MDOT Noise Analysis 1 micron (m)= 1 x10⁻⁶ m = 39.37 x 10⁻⁶ in TS LR RR
StationTrack
Section
Pre-GrindS. P. L.(dBA)
Post-GrindS. P. L.(dBA)
Variance(dBA)
Pre-GrindCat
(m)
Post-GrindCat
(m)Variance(m)
Pre-GrindSurface
(m)
Post-GrindSurface
(m)Variance(m)
TrackSection TS LR RR
BT 231 88 86.4 -1.6 0.106 0.106 0.0 231BT 230 85 82 -3.0 0.115 0.115 0.0 230BT 229 84 76 -8.0 0.115 0.115 0.0 229BT 228 83 71.9 -11.1 0.115 0.115 0.0 228BT 227 83 77.8 -5.2 0.115 0.115 0.0 227BT 226 76 72 -4.0 0.115 0.115 0.0 226RC 225 75 72 -3.0 0.115 0.115 1.37 2.45 1.1 225RC 224 77 72.1 -4.9 0.115 0.115 0.0 224RC 223 75 72 -3.0 0.115 0.115 0.0 223RC 222 82 77.8 -4.2 0.075 0.075 0.0 222RC 221 84 82.2 -1.8 0.075 0.075 0.0 221RC 220 86 83 -3.0 0.075 0.075 0.0 220RC 219 74 72.1 -1.9 0.075 0.075 0.0 219RC 218 75 71.9 -3.1 0.075 0.075 0.0 218RC 217 76 72.4 -3.6 0.075 0.075 0.0 217RC 216 75 73.6 -1.4 0.075 0.075 0.0 216RC 215 77 75.6 -1.4 0.075 0.075 2.444 1.444 -1.0 215RC 214 97 91.4 -5.6 0.113 0.113 0.0 214RC 213 85 82.5 -2.5 0.113 0.113 0.0 213RC 212 89 89.9 0.9 0.113 0.113 0.0 212RC 211 93 90.8 -2.2 0.085 0.085 0.0 211RC 210 89 86.4 -2.6 0.085 0.085 0.703 0.194 -0.5 210RC 209 93 90.5 -2.5 0.085 0.085 0.0 209ML 208 93 91.1 -1.9 0.085 0.085 0.0 208ML 207 89 87.7 -1.3 0.088 0.088 0.0 207ML 206 89 86.4 -2.6 0.088 0.088 0.0 206ML 205 93 87.7 -5.3 0.088 0.088 1.354 0.763 -0.6 205ML 204 87 85.1 -1.9 0.088 0.088 0.0 204ML 203 85 83.2 -1.8 0.088 0.088 0.0 203ML 202 85 81.6 -3.4 0.088 0.088 0.0 202ML 201 80 78.9 -1.1 0.069 0.069 0.0 201ML 200 82 78.8 -3.2 0.069 0.069 0.789 0.402 -0.4 200ML 199 82 79.3 -2.7 0.069 0.069 0.0 199ML 198 83 77.6 -5.4 0.069 0.069 0.0 198ML 197 80 76.8 -3.2 0.069 0.069 0.0 197ML 196 78 74.3 -3.7 0.069 0.069 0.309 0.656 0.3 196ML 195 76 73.2 -2.8 0.069 0.069 0.0 195ML 194 75 72.5 -2.5 0.069 0.069 0.0 194ML 193 75 72.1 -2.9 0.069 0.069 1.331 0.857 -0.5 193ML 192 75 72.6 -2.4 0.069 0.069 0.0 192ML 191 74 71.9 -2.1 0.069 0.069 0.0 191ML 190 74 71.5 -2.5 0.069 0.069 4.362 0.297 -4.1 190ML 189 74 71.8 -2.2 0.069 0.069 0.0 189ML 188 75 72.2 -2.8 0.069 0.069 0.0 188ML 187 75 71.4 -3.6 0.031 0.031 3.278 3.789 0.5 187ML 186 75 72.4 -2.6 0.031 0.031 0.0 186ML 185 74 71.1 -2.9 0.1 0.100 0.0 185ML 184 74 71.6 -2.4 0.1 0.100 0.0 184ML 183 74 72.9 -1.1 0.1 0.100 0.0 183ML 182 74 71.1 -2.9 0.1 0.100 0.0 182ML 181 75 71.2 -3.8 0.1 0.100 0.0 181ML 180 74 71.1 -2.9 0.1 0.100 0.0 180
TS=Times Square GT=Greektowk AR=Joe Louis Area GC=Grand Circus Park BT=Bricktown CH=COCO Hall BW=Broadway RC=Renaissance Center FIN=Financial District CC=Cadillac Center MI=Michigan

Detroit Transportation Corporation: Noise Abatement and Ride Quality Study 62
MDOT Noise Analysis 1 micron (m)= 1 x10⁻⁶ m = 39.37 x 10⁻⁶ in TS LR RR
StationTrack
Section
Pre-GrindS. P. L.(dBA)
Post-GrindS. P. L.(dBA)
Variance(dBA)
Pre-GrindCat
(m)
Post-GrindCat
(m)Variance(m)
Pre-GrindSurface
(m)
Post-GrindSurface
(m)Variance(m)
TrackSection TS LR RR
ML 179 74.1 71.1 -3.0 0.022 0.022 0.0 179ML 178 83 81.6 -1.4 0.022 0.022 0.0 178FIN 177 82 78.9 -3.1 0.022 0.022 0.0 177FIN 176 80 71.5 -8.5 0.022 0.022 0.0 176FIN 175 83 73.7 -9.3 0.059 0.059 0.0 175FIN 174 85 74.9 -10.1 0.059 0.059 0.0 174FIN 173 85 77.9 -7.1 0.059 0.059 2.279 1.944 -0.3 173FIN 172 98 89.5 -8.5 0.059 0.059 0.0 172FIN 171 97 85.1 -11.9 0.059 0.059 1.738 0.898 -0.8 171FIN 170 98 88.4 -9.6 0.059 0.059 0.0 170FIN 169 98 86.9 -11.1 0.059 0.059 0.0 169FIN 168 92 79.3 -12.7 0.059 0.059 0.0 168FIN 167 92 80.9 -11.1 0.025 0.025 1.991 1.757 -0.2 167FIN 166 92 79.3 -12.7 0.025 0.025 0.0 166FIN 165 92 80.9 -11.1 0.025 0.025 0.0 165FIN 164 88 75.9 -12.1 0.025 0.025 0.0 164FIN 163 85 77 -8.0 0.025 0.025 4.655 0.792 -3.9 163FIN 162 88 76.7 -11.3 0.025 0.025 0.0 162FIN 161 85 71.9 -13.1 0.025 0.025 0.0 161FIN 160 85 80.2 -4.8 0.045 0.045 0.0 160FIN 159 86 82.5 -3.5 0.045 0.045 0.0 159FIN 158 87 71.9 -15.1 0.045 0.045 0.0 158FIN 157 87 79.2 -7.8 0.045 0.045 0.0 157FIN 156 88 71.6 -16.4 0.045 0.045 0.0 156FIN 155 87 71.5 -15.5 0.045 0.045 0.245 0.551 0.3 155FIN 154 87 71.4 -15.6 0.044 0.044 0.0 154FIN 153 86 71.3 -14.7 0.044 0.044 0.0 153FIN 152 87 71 -16.0 0.044 0.044 0.0 152FIN 151 88 70.9 -17.1 0.044 0.044 0.0 151FIN 150 88 78.7 -9.3 0.044 0.044 0.335 0.406 0.1 150FIN 149 89 74 -15.0 0.044 0.044 0.0 149FIN 148 87 71.6 -15.4 0.044 0.044 0.0 148FIN 147 88 72.4 -15.6 0.044 0.044 0.0 147FIN 146 88 74.4 -13.6 0.044 0.044 0.0 146FIN 145 89 77.4 -11.6 0.044 0.044 0.485 0.334 -0.2 145FIN 144 95 87.6 -7.4 0.044 0.044 0.0 144FIN 143 98 87.5 -10.5 0.066 0.066 0.0 143FIN 142 98 89.3 -8.7 0.066 0.066 0.0 142FIN 141 98 87.5 -10.5 0.066 0.066 0.0 141FIN 140 98 89.3 -8.7 0.066 0.066 0.366 0.898 0.5 140FIN 139 99 82.9 -16.1 0.066 0.066 0.0 139FIN 138 92 81.7 -10.3 0.066 0.066 0.0 138FIN 137 92 81.6 -10.4 0.066 0.066 0.0 137FIN 136 92 81.6 -10.4 0.066 0.066 0.0 136FIN 135 92 78.4 -13.6 0.066 0.066 0.305 0.499 0.2 135FIN 134 92 80.2 -11.8 0.066 0.066 0.0 134FIN 133 92 84 -8.0 0.066 0.066 0.0 133FIN 132 92 80.2 -11.8 0.066 0.066 0.0 132FIN 131 92 80.4 -11.6 0.066 0.066 0.0 131FIN 130 92 78.5 -13.5 0.066 0.066 0.484 0.85 0.4 130
TS=Times Square GT=Greektowk AR=Joe Louis Area GC=Grand Circus Park BT=Bricktown CH=COCO Hall BW=Broadway RC=Renaissance Center FIN=Financial District CC=Cadillac Center MI=Michigan

Detroit Transportation Corporation: Noise Abatement and Ride Quality Study 63
MDOT Noise Analysis 1 micron (m)= 1 x10⁻⁶ m = 39.37 x 10⁻⁶ in TS LR RR
StationTrack
Section
Pre-GrindS. P. L.(dBA)
Post-GrindS. P. L.(dBA)
Variance(dBA)
Pre-GrindCat
(m)
Post-GrindCat
(m)Variance(m)
Pre-GrindSurface
(m)
Post-GrindSurface
(m)Variance(m)
TrackSection TS LR RR
FIN 129 92 80.3 -11.7 0.066 0.066 0.0 129FIN 128 94 85.8 -8.2 0.066 0.066 0.0 128FIN 127 94 81.3 -12.7 0.066 0.066 0.0 127FIN 126 94 81.2 -12.8 0.092 0.092 0.0 126FIN 125 94 80 -14.0 0.069 0.069 0.423 0.225 -0.2 125FIN 124 92 78.8 -13.2 0.069 0.069 0.0 124FIN 123 92 74.9 -17.1 0.069 0.069 0.0 123FIN 122 92 74.2 -17.8 0.049 0.049 0.0 122FIN 121 92 74.2 -17.8 0.049 0.049 0.0 121FIN 120 94 82.7 -11.3 0.049 0.049 0.0 120FIN 119 94 73.8 -20.2 0.049 0.049 0.0 119FIN 118 94 71.2 -22.8 0.049 0.049 0.0 118FIN 117 92 73.3 -18.7 0.049 0.049 0.0 117FIN 116 92 71.5 -20.5 0.049 0.049 0.0 116FIN 115 92 71.9 -20.1 0.049 0.049 4.743 0.78 -4.0 115FIN 114 92 71.5 -20.5 0.049 0.049 0.0 114FIN 113 94 71.2 -22.8 0.032 0.032 0.0 113FIN 112 92 79.7 -12.3 0.032 0.032 0.0 112FIN 111 92 80.2 -11.8 0.032 0.032 0.0 111FIN 110 92 78 -14.0 0.032 0.032 2.917 1.048 -1.9 110FIN 109 94 71.9 -22.1 0.158 0.158 0.0 109FIN 108 94 72.1 -21.9 0.158 0.158 0.0 108FIN 107 92 75.3 -16.7 0.158 0.158 0.0 107FIN 106 92 80.9 -11.1 0.158 0.158 0.0 106FIN 105 94 83.5 -10.5 0.158 0.158 0.267 0.67 0.4 105FIN 104 92 80.9 -11.1 0.158 0.158 0.0 104FIN 103 94 83.5 -10.5 0.158 0.158 0.0 103FIN 102 92 79.7 -12.3 0.158 0.158 0.0 102AR 101 92 80.2 -11.8 0.042 0.042 0.0 101AR 100 91 79.7 -11.3 0.042 0.042 1.24 0.359 -0.9 100AR 99 91 79.7 -11.3 0.042 0.042 0.0 99AR 98 91 80.2 -10.8 0.082 0.082 0.0 98AR 97 97 81.8 -15.2 0.082 0.082 0.0 97AR 96 92 87.8 -4.2 0.082 0.082 0.0 96AR 95 91 83.2 -7.8 0.082 0.082 0.0 95AR 94 96 83.2 -12.8 0.082 0.082 0.757 2.292 1.5 94AR 93 96 82.6 -13.4 0.082 0.082 0.0 93AR 92 96 85.6 -10.4 0.082 0.082 0.0 92AR 91 96 92.8 -3.2 0.082 0.082 0.0 91AR 90 97 93.3 -3.7 0.082 0.082 2.62 1.32 -1.3 90AR 89 92 85.3 -6.7 0.046 0.046 0.0 89AR 88 92 86.4 -5.6 0.046 0.046 0.0 88AR 87 97 88.3 -8.7 0.046 0.046 0.0 87AR 86 98 90.1 -7.9 0.046 0.046 0.242 2.13 1.9 86AR 85 98 87.3 -10.7 0.034 0.034 0.0 85AR 84 98 88.1 -9.9 0.034 0.034 0.0 84AR 83 98 88.3 -9.7 0.034 0.034 1.06 0.275 -0.8 83AR 82 96 80.5 -15.5 0.034 0.034 0.0 82AR 81 96 89.6 -6.4 0.06 0.060 0.0 81AR 80 96 86.4 -9.6 0.06 0.060 0.237 0.456 0.2 80AR 79 97 89.2 -7.8 0.06 0.060 0.0 79
TS=Times Square GT=Greektowk AR=Joe Louis Area GC=Grand Circus Park BT=Bricktown CH=COCO Hall BW=Broadway RC=Renaissance Center FIN=Financial District CC=Cadillac Center MI=Michigan

Detroit Transportation Corporation: Noise Abatement and Ride Quality Study 64
MDOT Noise Analysis 1 micron (m)= 1 x10⁻⁶ m = 39.37 x 10⁻⁶ in TS LR RR
StationTrack
Section
Pre-GrindS. P. L.(dBA)
Post-GrindS. P. L.(dBA)
Variance(dBA)
Pre-GrindCat
(m)
Post-GrindCat
(m)Variance(m)
Pre-GrindSurface
(m)
Post-GrindSurface
(m)Variance(m)
TrackSection TS LR RR
AR 78 97 85.8 -11.2 0.06 0.060 0.0 78AR 77 97 87.4 -9.6 0.06 0.060 0.0 77AR 76 95 88.2 -6.8 0.022 0.022 0.0 76AR 75 96 91.9 -4.1 0.022 0.022 0.0 75AR 74 98 95.4 -2.6 0.053 0.053 0.32 0.208 -0.1 74AR 73 98 93.1 -4.9 0.053 0.053 0.0 73AR 72 95 85.2 -9.8 0.053 0.053 0.0 72AR 71 95 87.3 -7.7 0.099 0.099 4.16 0.506 -3.7 71AR 70 94 87.9 -6.1 0.099 0.099 0.0 70AR 69 94 77.1 -16.9 0.099 0.099 0.0 69AR 68 94 76 -18.0 0.099 0.099 5.58 0.49 -5.1 68AR 67 92 81.4 -10.6 0.099 0.099 0.0 67AR 66 92 79.7 -12.3 0.048 0.048 0.0 66AR 65 92 88.2 -3.8 0.048 0.048 5.41 0.918 -4.5 65AR 64 95 88.2 -6.8 0.048 0.048 0.0 64CH 63 90 83.7 -6.3 0.048 0.048 0.0 63CH 62 89 81 -8.0 0.048 0.048 11.5 0.348 -11.2 62CH 61 90 77.8 -12.2 0.048 0.048 0.0 61CH 60 90 77.2 -12.8 0.048 0.048 0.0 60CH 59 90 77.2 -12.8 0.048 0.048 0.0 59CH 58 88 76.2 -11.8 0.048 0.048 0.0 58CH 57 89 76.2 -12.8 0.048 0.048 0.0 57CH 56 89 72.5 -16.5 0.058 0.058 0.0 56CH 55 88 71.6 -16.4 0.058 0.058 0.0 55CH 54 88 72.5 -15.5 0.053 0.053 0.0 54CH 53 87 71.4 -15.6 0.053 0.053 0.0 53CH 52 88 77.4 -10.6 0.058 0.053 -0.005 0.0 52CH 51 85 75.8 -9.2 0.053 0.053 0.0 51CH 50 85 77.3 -7.7 0.046 0.046 0.0 50FC 49 85 74.7 -10.3 0.046 0.046 0.0 49FC 48 83 72.1 -10.9 0.046 0.046 0.0 48FC 47 85 71.6 -13.4 0.046 0.046 2.77 3.34 0.6 47FC 46 83 71.4 -11.6 0.046 0.046 0.0 46FC 45 85 77.7 -7.3 0.046 0.046 0.0 45FC 44 85 79 -6.0 0.046 0.046 0.0 44FC 43 85 72.7 -12.3 0.046 0.046 2.89 3.044 0.2 43FC 42 88 88.5 0.5 0.046 0.046 0.0 42FC 41 92 87.1 -4.9 0.046 0.046 0.0 41FC 40 85 79.1 -5.9 0.046 0.046 1.275 3.464 2.2 40FC 39 85 82 -3.0 0.046 0.046 0.0 39FC 38 82 79.5 -2.5 0.073 0.073 0.0 38FC 37 88 87.7 -0.3 0.073 0.073 1.731 2.398 0.7 37FC 36 89 89.7 0.7 0.073 0.073 0.0 36FC 35 88 86.8 -1.2 0.073 0.073 0.0 35FC 34 90 89.8 -0.2 0.073 0.000 0.764 2.914 2.2 34FC 33 87 85.2 -1.8 0.073 0.073 0.0 33FC 32 85 82.9 -2.1 0.04 0.000 0.0 32MI 31 88 86 -2.0 0.04 0.000 0.888 1.473 0.6 31MI 30 85 80 -5.0 0.04 0.040 0.0 30MI 29 85 79.7 -5.3 0.015 0.073 3.038 1.238 -1.8 29MI 28 87 85.7 -1.3 0.15 0.150 0.0 28
TS=Times Square GT=Greektowk AR=Joe Louis Area GC=Grand Circus Park BT=Bricktown CH=COCO Hall BW=Broadway RC=Renaissance Center FIN=Financial District CC=Cadillac Center MI=Michigan

Detroit Transportation Corporation: Noise Abatement and Ride Quality Study 65
MDOT Noise Analysis 1 micron (m)= 1 x10⁻⁶ m = 39.37 x 10⁻⁶ in TS LR RR
StationTrack
Section
Pre-GrindS. P. L.(dBA)
Post-GrindS. P. L.(dBA)
Variance(dBA)
Pre-GrindCat
(m)
Post-GrindCat
(m)Variance(m)
Pre-GrindSurface
(m)
Post-GrindSurface
(m)Variance(m)
TrackSection TS LR RR
MI 27 92 91.3 -0.7 0.15 0.150 0.0 27MI 26 85 81.8 -3.2 0.15 0.150 0.939 2.938 2.0 26MI 25 89 89 0.0 0.035 0.035 0.0 25MI 24 85 80.1 -4.9 0.035 0.035 0.0 24MI 23 87 84 -3.0 0.035 0.035 0.489 1.018 0.5 23MI 22 90 89.1 -0.9 0.113 0.113 0.0 22MI 21 85 80.1 -4.9 0.113 0.113 0.0 21MI 20 95 93.2 -1.8 0.113 0.113 0.0 20MI 19 95 87.1 -7.9 0.113 0.113 1.694 0.646 -1.0 19MI 18 95 91.8 -3.2 0.113 0.113 0.0 18MI 17 85 82.7 -2.3 0.077 0.077 0.0 17MI 16 85 83 -2.0 0.077 0.077 0.0 16MI 15 84 81.6 -2.4 0.077 0.077 0.0 15MI 14 87 83 -4.0 0.077 0.077 1.12 2.524 1.4 14MI 13 85 80 -5.0 0.077 0.077 0.0 13MI 12 85 74.2 -10.8 0.077 0.077 0.0 12TS 11 75 72.9 -2.1 0.077 0.077 0.0 11TS 10 76.4 72.4 -4.0 0.097 0.097 0.0 10TS 9 73 72 -1.0 0.097 0.097 1.346 1.078 -0.3 9TS 8 74 72.9 -1.1 0.097 0.097 0.0 8TS 7 75.1 72.3 -2.8 0.097 0.097 0.0 7TS 6 83.2 78.4 -4.8 0.097 0.097 0.0 6TS 5 83 77.2 -5.8 0.097 0.097 0.0 5TS 4 85 76.7 -8.3 0.104 0.104 0.0 4TS 3 77 74.2 -2.8 0.104 0.104 0.0 3TS 2 79.2 75.2 -4.0 0.104 0.104 0.0 2TS 1 84 79.8 -4.2 0.104 0.104 0.0 1
TS=Times Square GT=Greektowk AR=Joe Louis Area GC=Grand Circus Park BT=Bricktown CH=COCO Hall BW=Broadway RC=Renaissance Center FIN=Financial District CC=Cadillac Center MI=Michigan

Detroit Transportation Corporation: Noise Abatement and Ride Quality Study 66
7.0 Corrugation Measurement 7.1 General description of approach using Corrugation Analysis Trolley (CAT)
The (CAT) is an extremely accurate measuring tool that is used to measure both rail corrugation and so‐called acoustic roughness. The device can be used and carried by a single person: the equipment weighs about 20Kg and can be carried by a single person. The device has been used in some form since the 1990’s and has been incorporated into engineering documents such as standards criteria document EN 13231‐3:2006. The CAT device used in the DTC corrugation analysis by Loram displayed readings based on 1/3 octave in the 1—300mm wavelength.
7.2 Measurement Instrumentation
The CAT instrument charters position, wavelength frequency, and exceeding levels greater than 5%. The CAT stores raw profile data from which measurement statistics are derived. The CAT stores rail profile data at intervals of 1mm or 2mm, and with precision of 0.01 microns.
7.3 Measurement Process
The data was collected on the entire 2.9 loop from expansion joint to expansion joint files were made for the whole loop. Stationary measurements were identified and classified from beginning to end use basic nomenclature STA 00.00.
7.4 CAT Measurements Results
Data was collected during September and October 2010 to determine the corrugation levels on the DTC track, the entire loop was measured 2.9 miles. An example of the data sheets are displayed in Figures 10, 11 on the next several pages. The measurement and pattern definition of rail corrugation has been defined by “ATS” consultants as a pattern of sinusoidal grooves in the rail ATS consultants 2010 – Abstract Pg. 4
Rail corrugation causes “howling” noise at 75dBA or higher in 1/3 octave band in the frequency range of 1000‐1750 Hz. This noise is extremely annoying. An example is shown in Figures 12, 13
7.5 Results and Comparison to Standards
The results of post‐corrugation measures clearly shows that most of the corrugation was removed and after “touch‐up” which is the fine tuning process used after the initial grind. All areas along the rail met the DTC grinding specification of 5% exception of 4 microns for the distance of 30 to 100.
An exception of note is curve P11 high and low rail near Grand Circus Park which due to difficulty in determining initial profile the grinding did not meet specification and had a high exceedence rate.

Detroit Transportation Corporation: Noise Abatement and Ride Quality Study 67
\ cannot

Detroit Transportation Corporation: Noise Abatement and Ride Quality Study 68

Detroit Transportation Corporation: Noise Abatement and Ride Quality Study 69
Figure 10

Detroit Transportation Corporation: Noise Abatement and Ride Quality Study 70
Figure 11

Detroit Transportation Corporation: Noise Abatement and Ride Quality Study 71
Figure 12

Detroit Transportation Corporation: Noise Abatement and Ride Quality Study 72
Figure 13

Detroit Transportation Corporation: Noise Abatement and Ride Quality Study 73
8.0 Corrugation and Noise Reduction Model The DTC staff as part of its literature research on noise predictions models cited several reference abstracts. The specific abstract paper is a collection of European based urban rail passenger models reviewed by Leevween van J.A. Hans‐dgmr Consulting Engineer Abstract” Railway Noise Prediction Model, as comparison the paper reviewed models from the following countries:
Austria
Denmark
France
Germany
The Netherlands
Norway
Sweden
Switzerland
United Kingdom
Most of these noise prediction models are usually developed by railway institutes or consultants.
The general model used in the aforementioned countries is in the form of: Lp = Lw + ΣΔ propagation factors., where Lp is the calculated noise level, Lw is the sound power level of the source and ΣΔ propagation factors is the summation of the total of all attenuation due to propagation.
The construction of this model into two parts source description, such as type of train, tracks and speeds. The second part addresses the second part of this type of model attenuations, such as geometrical spreading, air absorption, ground absorption, sound level due to reflections and meteorological affects.
DTC staff used this basic framework and constructed a simple linear regression model section. DTC revenue service track is divided into 367 track sections. The regression model prediction values were based on N = 1 and 1 degree of freedom so as to narrow the prediction level to individual track section where it was possible. The starting point of the analysis is track section 367, the prediction model results are at the 95% confidence level designed to estimate and predict noise levels based on corrugation metal removal plots from the “DTC Rail Grinding Project 2010”.
The DTC Model: Lp = [Cr + K constant speed] Y = [Δ + b(x)] simple regression equation Lp = Calculated noise level Cr = Corrugation removed depth in microns
The DTC model used noise and corrugation removal data by track section, an example of model predictions are shown in Figures 14 & 15

Detroit Transportation Corporation: Noise Abatement and Ride Quality Study 74
Figure 14 Simple linear regression results: Dependent Variable: VAR4 Independent Variable: VAR7 VAR4 = 79.99726 – 8.027459 VAR7 Sample size: 367 R (correlation coefficient) = ‐0.05 R‐sq = 0.0025044156 Estimate of error standard deviation: 6.0985675 Parameter estimates:
Parameter Estimate Std.Err. DF 95% L. Limit 9% U. Limit Intercept 79.99726 0.7453987 365 78.53144 81.46307
Slope ‐8.027459 8.385596 365 ‐24.517605 8.4626875
Analysis of variance table for regression model:
Source DF SS MS F‐stat P‐value Model 1 34.083485 34.083485 0.91640675 0.3391
Error 365 13575.272 37.192528
Total 366 13609.356
Predicted values:
X value Pred. Y s.e.(Pred.y) 95% C.I. for mean 95% P.I. for new
0.042 79.8601 0.45265893 (78.76985, 80.650256 (67.63438, 91.88584)

Detroit Transportation Corporation: Noise Abatement and Ride Quality Study 75
Figure 15

Detroit Transportation Corporation: Noise Abatement and Ride Quality Study 76
The Y values (predicted) for noise levels based on corrugated metal removal plots are within 1 – 2 dBA for mean values over a given area of track. Simply put, if the corrugation removed is .42 microns and the profile is correct, noise levels on DTC vehicles is within + or – 2dA. The Noise Abatement Process is shown in Figure 16, and the Predicted Values for the system are shown in Figure 17
8.2 Objective of Statistical Model
The primary objective of the statistical prediction model is two‐fold. The first being to forecast noise levels based on corrugation levels, second to assist DTC maintenance in controlling noise levels inside the vehicle and wayside noise as well. This objective was clearly met based on the results of prediction model.
8.3 Data Collections and Results; Statistical Testing and Parameters
The results of 367 track section and the prediction model are included as part of the text. The data in Table 6 mean predicted noise value vs. post‐grind noise mean values.
8.4 Conclusion and Recommendation
The linear regression model works well for noise predictions based on metal plot removal. However, if more actual casualty is required based on parameters influencing noise all equivalent sound pressure levels, and influence of attenuation, then a more robust multiple regression model and a much more complex data set is required.
The fact that noise which is primarily attributed to corrugation can be predicted with confidence makes this a useful tool in managing noise abatement and increasing the rail life.
9.0 Noise and Vibration Testing
DTC hired Defiance Testing and Engineering to perform noise and vibration test on a People Mover car and to measure the noise/acceleration/vibration between a rebuild truck and a used one. This was successfully accomplished and the results are included in the final report submitted to DTC titled “Detroit People Mover Noise and Vibration Measurement Report No. 106145‐000. This report primary intent was to provide a baseline set of data to be used as the reference for any additional noise and vibration testing to be conducted on People Mover cars. The complete report is provided for MDOT as part of the overall study effort. (See Appendix “C”)
10.0 DTC Rail Grinding Program
DTC Maintenance and Engineering staff updated the “UTDC Technical Report DPM Rail Grinding Maintenance Manual Revised November 15, 1989”. The updated manual includes additional measuring techniques to include new and approved methods to reduce noise and ultimately extend the life of the rail. The subject areas covered in the document include the following: Rail Corrugation Inspection and Correction Visual Inspection

Detroit Transportation Corporation: Noise Abatement and Ride Quality Study 77
Rail Corrugation Measurement Surface Measurement Recommended Rail Grinding Maintenance Required Resources Recommended Schedule: DTC Grinding Recommended Schedule: Major Grinding Conclusion and Recommendations
Figure 16
Noise Abatement Process
Step 1 Step 2 Step 3 Step 4 Step 5
DTC Noise / Data Collection
Compare Noise Levels with Standards
Track Sections that Exceed Standards
Perform Visual Inspection for Corrugation
Perform Corrugation Measurements
Select and Perform Grinding

Detroit Transportation Corporation: Noise Abatement and Ride Quality Study 78
Figure 17 Predicted (y) values (dBA)
79.66 79.79
79.37 79.64
79.21 79.46
79.62 79.19
79.41 79.21
79.67 79.29
78.79 78.36
79.09 78.86
79.51 78.68
79.82 79.25
79.2 79.49
79.33 79.28
79.62 79.6
79.72 79.53
79.6 79.38
79.25 79.68
79.44
79.82 79.305
79.52
79.01
79.41455
79.305
79.41455
*79.35978 79.35
*Note: System Wide Noise Prediction Mean (y) Value
DTC Post‐Grinding Noise Value System Wide Mean

Detroit Transportation Corporation: Noise Abatement and Ride Quality Study 79
Recommendation and Conclusion
The improvement of ride quality and continued noise abatement reduction requires that the following action items are implemented:
Major Rail Grinding is recommended every two years Noise data is collected at a minimum of twice a month on at least four (4) rail
cars. Noise readings above 82dBA are noted. Rail inspection for corrugation is done at least once a month Rail corrugation, if found through visible inspection, is noted by track section Rail corrugation is measured using the rail corrugation measuring device Block grinding at site location is done Wheels are checked for irregularities during scheduled PM and/or a monthly basis Truck overhaul program must continue to reduce noise and provide good ride
quality Lead trucks needs to have special attention given due to substantial force applied
to them Resources, manpower, and expenditures need to focused in this area DTC needs to establish a formal ride quality and noise abatement program within
agency and assign that responsibility

Detroit Transportation Corporation: Noise Abatement and Ride Quality Study 80
Detroit Transportation Corporation
Rail Grinding Program
Date: March 2012
Prepared by: Maintenance, Planning and Engineering

Detroit Transportation Corporation: Noise Abatement and Ride Quality Study 81
DTC Technical Report
1.0 Introduction 2.0 Track Alignment Types 3.0 Noise Measurements 3.1 Instrumentation 3.2 Data Collection 3.2.1 Set Up 3.2.2 Measurements 3.3.3 Calibration 4.0 Rail Inspection and Corrective Measures 4.1. Rail Corrugation Inspection and Correction 4.1.1. Visual Inspection 4.1.2. Rail Corrugation Measurement 4.1.3. Surface Measurements 4.1.4. Block Grinding Rail Corrugation 4.1.5. Belt Grinding Rail Corrugation 4.2 Rail Profile Inspection and Correction 4.2.1. Tangent Rail 4.2.2. Medium Curve 4.2.3. Sharp Curve 4.3. Gauge Corner Shelling 4.4. Maintenance of Fixed Frogs 5.0 Recommended Rail Grinding Maintenance Plan 5.1. Required Resources 5.2. Recommended Schedule: DTC Grinding 5.3. Recommended Schedule: Major Grinding 6.0. Planning for Line Rail Adjustments 7.0. Cobo Hall APPENDIX A A.1 Block Grinder Preparation A.2 Block Grinder Operation APPENDIX B B.1 Belt Grinder Preparation B2 Belt Grinder Operation
REFERENCES

Detroit Transportation Corporation: Noise Abatement and Ride Quality Study 82
1.0 INTRODUCTION
The Detroit People Mover (DPM) is a downtown rail distribution system approximately 2.9 miles
long that operates on an elevated guide way. The system includes 35 curves with radii ranging
from 115’ to 3,000’. The rail is standard 115RE throughout the system.
The specified noise level for the DPM system is 80‐dBA max. This level can be maintained with
the present vehicle and track system provided that the wheel and rail are in very good
condition. However, the age of the vehicles and the condition of the track may make it difficult
to achieve.
This manual provides a procedure and planning guide for proper maintenance of the rail surface
in the whole system (mainline and special track work). It is divided in two parts:
Sections 2 to 5: GRINDING PROCEDURES – describing how to inspect and grind rail.
Sections 6 to 8: RECOMMENDED PLAN – recommending how often inspection and grinding should be carried out.
The general principles in grinding procedure are:
1) Monitor rail surface condition using interior car noise measurement. Supplement this
with visual inspection for rail corrugation and profile deviation. A rail profile gauge is provided for profile inspection.
2) Correction of rail corrugation in mainline track is to be done with the following
Block grinder
Belt grinder
Specialized vendor equipment
3) Correction of rail profile in the whole system is to be done with contracted grinding vendors,
The general principles in grinding planning are:
1) Frequent maintenance at regular intervals is to be used to prevent serious rail condition deterioration.
Detroit Transportation Corporation: Noise Abatement and Ride Quality Study 83
2.0 TRACK ALIGNMENT TYPES
For the purpose of rail grinding maintenance, the system track alignment is divided into three types as shown in Table 1. The first type is tangent rack or straight track, the second type is curved track, which has a constant radius, and the third type is the spiral track, which provides the transition between tangent and curved track. The spiral is divided into two parts, Part 1 to be treated as tangent. Part 2 to be treated as curve. Rules are described below as follows:
Expansion joints are treated as tangent.
Straight switch blades are treated as tangent.
Curved switch blades are treated as medium curves.
Moveable frog is treated as tangent when the nose is sent for straight through traffic; and treated as medium curve when set for turnout traffic.
All curves in MCF are treated as tangent.
Fixed frogs are treated as tangent.

Detroit Transportation Corporation: Noise Abatement and Ride Quality Study 84
TABLE 1: TRACK ALIGNMENT TYPES FOR RAIL GRINDING MAINTENANCE PLANNING
Type of Curve Curve Numbers Curve RADII
(ft./m)
Sharp*** 6, 7, 10, 13, 21, 24, 29 25
11, 12, 14, 35
5*
1, 2, 3
23, 24,34
33* 9
32 4*
17*
27
115.0/35.1 116
140.0/42.7
145.7/44.4
150.0/45.7
160.0/48.8
163.7/49.9
175.0/53.3
200.0/61.0
202.8/61.8
220.6/67.2
250.0/76.2
Medium 15, 18*
19*, 20*
22, 23, 26
30*
31*
300.0/91.4
330.0/100.6
500.0/152.4
560.6/170.9
558.4/170.2
Tangent** 8, 16, 28
36
1000.0/304.8
3000.0/914.4
* Double Spirals ** All curves greater than 800 ft. radius are considered tangent *** The sharp curves note in bold were replaced in 2008 and have the stock profile. All other mainline rail has the NRC profile as of 2005.

Detroit Transportation Corporation: Noise Abatement and Ride Quality Study 85
3.0 NOISE MEASUREMENTS
Interior vehicle noise measurements are used to identify track locations of higher noise that is deemed unacceptable. This data can be compared to the normal, “quiet” system noise to determine when the noise begins to increase over a given section of track. Based on this data, corrective rail maintenance can be implemented as required.
3.1 INSTRUMENTATION
The required data are interior noise level (slow averaged, A weighted). The required equipment is listed in Table 2. A photo is shown in Figure 1.
TABLE 2: NOISE MEASUREMENT INSTRUMENTION
Equipment Function
EXTECH MODEL 4077736 DIGITAL SOUND METER
Measure noise (set up for slow averaged, A weighted).Meets type two standards 1.5 db accuracy
ANSI,AND IEC 651

Detroit Transportation Corporation: Noise Abatement and Ride Quality Study 86
3.2 DATA COLLECTION
3.2.1 Set‐Up
Before measurement check the following:
1) Rail is dry (no rain, ice or snow), air temperature is at lest 4°F above the dew point (available from DPM Control).
2) Test vehicle has been in service for at least 2 hours.
3) Test vehicle is empty except for test personnel.
4) Doors locked all radios off, P.A. breaker shut off (Notify DPM Control).
5) Noise meter mounted 4 ft. above floor at car center.
All equipment listed in Table 2 are hooked up and calibrated (see 3.2.3. for calibration details).
3.2.2 Measurement
1) Run vehicle in automatic mode. 2) Label chart with date, time, temperature, dew point, vehicle number and position (leading
or trailing), starting track position. 3) Start recording; maintain silence, note any abnormal external noise on chart, note stations. 4) Stop after two complete circuits. 5) Remove equipment, return vehicle to revenue service (notify DPM Control).
3.2.3 Calibration
Prior to each test measurement, calibrate the noise meter and chart recorder. To calibrate the noise meter, select the fast averaging time, 70 to 130 dBA ranges and connect the calibrator signal to the microphone. Adjust the meter calibration screw so that its screen indicates 93.8 dBA.

Detroit Transportation Corporation: Noise Abatement and Ride Quality Study 87
Figure 1: Noise Recorder

Detroit Transportation Corporation: Noise Abatement and Ride Quality Study 88

Detroit Transportation Corporation: Noise Abatement and Ride Quality Study 89

Detroit Transportation Corporation: Noise Abatement and Ride Quality Study 90

Detroit Transportation Corporation: Noise Abatement and Ride Quality Study 91

Detroit Transportation Corporation: Noise Abatement and Ride Quality Study 92
4.0. RAIL INSPECTION AND CORRECTIVE MEASURES
Rail inspection is carried out over areas of persistent high noise to detect early development of rail corrugation and profile deterioration in order to correct the problems. The inspection for rail profile deterioration is to be done with a set of wheel profile templates. These are mounted on a long bar and represent a wheel set. It is called ‘Rail Profile Gauge’. The templates normally provided on this gauge describe the specific rail profile conditions required and the grinding angle to produce such conditions by belt grinding. For the inspection of the high rail in sharp curves where the profile accuracy is critical for good vehicle performance, an additional template is provided. It describes the exact contour, which is required for the high rail gauge corner. Note that one template has a slot to allow for the setting up of wheel profile back to back distance to 54 13/32” (1382 mm) as shown in Figures 2 through 11.

Detroit Transportation Corporation: Noise Abatement and Ride Quality Study 93
Figure 2

Detroit Transportation Corporation: Noise Abatement and Ride Quality Study 94
Figure 3

Detroit Transportation Corporation: Noise Abatement and Ride Quality Study 95
Figure 4

Detroit Transportation Corporation: Noise Abatement and Ride Quality Study 96
Figure 5

Detroit Transportation Corporation: Noise Abatement and Ride Quality Study 97
Figure 6

Detroit Transportation Corporation: Noise Abatement and Ride Quality Study 98
Figure 7

Detroit Transportation Corporation: Noise Abatement and Ride Quality Study 99
Figure 8

Detroit Transportation Corporation: Noise Abatement and Ride Quality Study 100
Figure 9
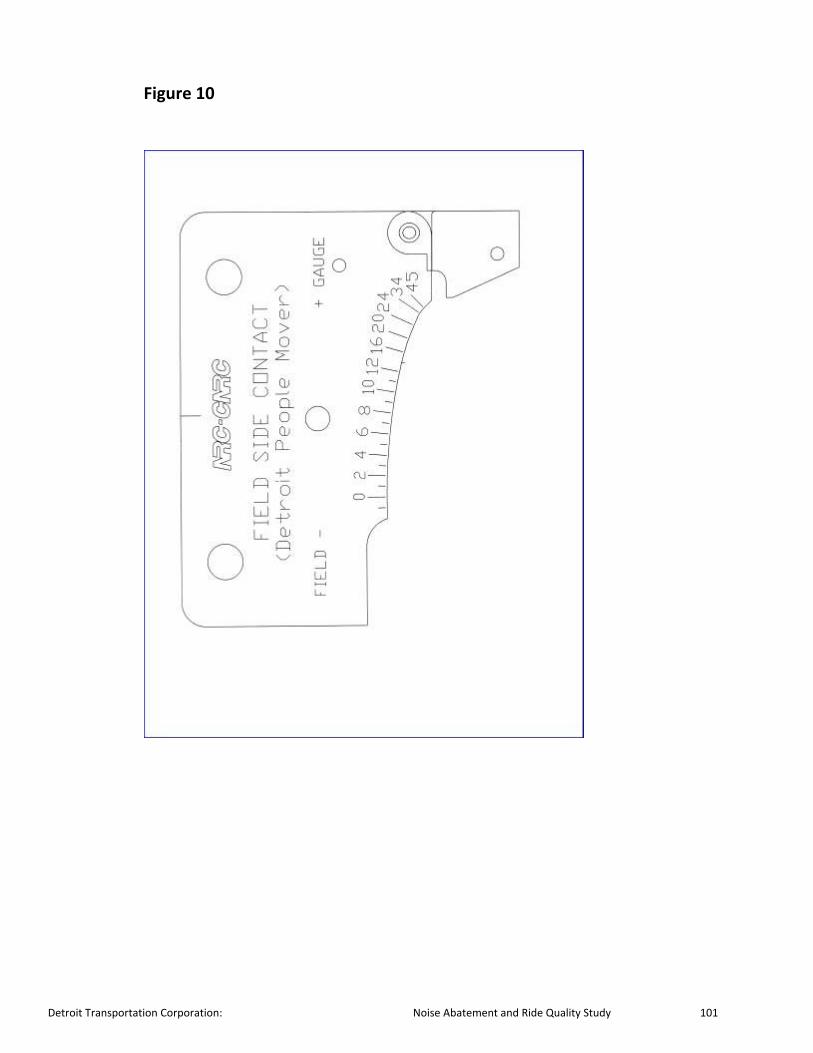
Detroit Transportation Corporation: Noise Abatement and Ride Quality Study 101
Figure 10

Detroit Transportation Corporation: Noise Abatement and Ride Quality Study 102
Figure 11 This gauge now represents the normal positioning of a wheel set in tangent track. Visually inspect the contact band between the templates and rails. A flashlight or feeler gauge (0.005”) may be used to better determine the position of the contact band. If and/or when the contact band is achieved in the zone marked ‘MIN 5/8” CONTACT BAND REQ’D’, check the width of the contact band. If it is less than 5/8”, read the contact angle indicated on the template at the center of the contact band. Set the belt grinder at this angle. Grind one pass at a time with rail profile inspection in between to determine when the grinding has just increased the contact width to minimum 5/8”. Stop belt grinding when such width is achieved.

Detroit Transportation Corporation: Noise Abatement and Ride Quality Study 103
4.1. RAIL CORRUGATION INSPECTION AND CORRECTION
4.1.1 Visual Inspection
Use the noise chart as a guide to locate the high noise areas. Visual inspection should be
performed during daylight hours, if possible, if not a strong flashlight or headlight of the rail
grinder is acceptable. Look along the rail length at eye‐level at about two feet from the rail
surface. Rail corrugation, if it exists, will appear as a uniform wavy pattern on the rail surface.
Rail Corrugation If rail corrugation exists at 4 microns or greater, remove it with block grinding. According to steps indicated in Section 6. The procedure for the operation of the block grinder procedure is given in Appendix A. Caution: If more than 125 passes have to be used to remove rail corrugation, the rail profile may be distorted; after 125 passes recheck the rail profile with the rail profile gauge. The belt grinder is used to correct the rail profile. Use the procedure for rail profile inspection and belt grinding to check and correct the ground rail profile as necessary. Since rail surface after any belt grinding is not smooth, apply 50 passes of block grinding after any belt grinding to complete the task.

Detroit Transportation Corporation: Noise Abatement and Ride Quality Study 104
4.1.2 Rail Corrugation Measurements DTC staff, after visual inspection of rail corrugation exists, will measure the displacement with the corrugation measuring device. These measurements are taken at least three times an over a length of 50 feet intervals for tangent track and 25 feet intervals for spiral and curves and subsequently averaged.
4.1.3 Surface Measurements DTC purchased a surface finishing measuring instrument to measure the roughness of the post grind surface. The smoothness of the surface affects the noise /vibration and wavelength frequency. RA (average roughness) values were calculated and measured after the rail grinding. The data range average –measured in microns was left rail measured 2.29773 microns, right rail 1.680924. DTC Rail Corrugation Measuring Device

Detroit Transportation Corporation: Noise Abatement and Ride Quality Study 105

Detroit Transportation Corporation: Noise Abatement and Ride Quality Study 106
Surface Measuring Device
4.1.4 Block Grinding Rail Corrugation If rail corrugation exists, remove it with block grinding. According to steps indicated in Section 6. The procedure for the operation of the block grinder procedure is given in Appendix A. Caution: If more than 125 passes have to be used to remove rail corrugation, the rail profile may be distorted; after 125 passes recheck the rail profile with the rail profile gauge, the belt grinder is used to correct the rail profile. Use the procedure for ail profile inspection and belt grinding to check and correct the ground rail profile as necessary. Since rail surface after any belt grinding is not smooth, apply 50 passes of block grinding after any belt grinding to complete the task. After grinding is completed, check the rail surface with the measurement gauge.
4.1.5 Belt Grinding Rail Corrugation
125 block grinding passes my not be sufficient to completely remove severe corrugations and achieve acceptable noise levels. If not the following rail corrugation removal procedure using belt grinding may be used.

Detroit Transportation Corporation: Noise Abatement and Ride Quality Study 107
Tangent Rail These angles must be checked and adjusted as needed to ensure that the corrugation field is removed. After the removal process is completed the following actions must take place.
‐Surface Measurement recorded ‐Profile checked ‐Block grinding
Medium Curve
Rail Angle (to gauge) Number of Passes
Low Rail (Only if Corrugated) 15° 4 passes
10° 4 passes
5° 4 passes
High Rail (Only if Corrugated 20° 2 passes
15° 2 passes
8° 2 passes
0° 6 passes
These angles must be checked and adjusted as needed to ensure that the corrugation field is removed. After the removal process is completed the following actions must take place.
‐Surface Measurement recorded ‐Profile checked ‐Block grinding
Sharp Curve
Rail Angle (to gauge) Number of Passes
Low Rail (Only if Corrugated) 15° 6 passes
10° 6 passes
5° 6 passes
High Rail (Only if Corrugated) 20° 2 passes
15° 2 passes
8° 2 passes
0° 4 passes
Rail Approx Angle* (to gauge)
Number of Passes
Both 15° 4 passes
10° 4 passes
5° 4 passes

Detroit Transportation Corporation: Noise Abatement and Ride Quality Study 108
These angles must be checked and adjusted as needed to ensure that the corrugation field is removed. After the removal process is completed the following actions must take place.
‐Surface Measurement recorded ‐Profile checked ‐Block grinding
4.2. RAIL PROFILE INSPECTION AND CORRECTION
4.2.1 Tangent Rail Install the ‘’ templates on the Rail Profile Gauge. Details of these templates are shown in Figure 12 & 13. Turn the ‘Rail Stop’, so that the
Figure 12: Tangent Rail CPC Template

Detroit Transportation Corporation: Noise Abatement and Ride Quality Study 109
Figure 13
The rail templates are as follows
Note: The inspection between grinds may indicate belt angle adjustment required. Remove grinding debris off the rail. Apply 50 passes of block grinding over the belt grinding area to complete the task. (See Appendix A) If and/or when the contact band is achieved in the zone marked ‘MIN 5/8” CONTACT BAND REQ’D’, check the width of the contact band. If it is less then 5/8”, read the contact angle indicated on the template at the center of the contact band. Set the belt grinder at this angle. Grind one pass at a time with rail profile inspection in between to determine when the grinding has just increased the contact width to minimum 5/8”. Stop grinding when such width is achieved. Note: The inspection between grinds may indicate belt angle adjustment requirement. Remove grinding debris off rail heads. Apply 50 passes of Block grinding over the belt grind area to complete the task. (See the Appendix A).

Detroit Transportation Corporation: Noise Abatement and Ride Quality Study 110
4.3 GAUGE CORNER SHELLING
If a rail gauge corner exhibits shelling (small flakes of metal falling off the rail surface), belt grind the affected rail at 45 degrees to gauge. Visually inspect the rail after each pass until the shillings have just been completely removed.
4.4 MAINTENANCE OF FIXED FROG All frogs in the MCF area are fixed frogs. The procedures for maintenance grinding of the fixed frogs are described below: Inspect and Correct Vertical Height
1) Place a 12 inch straight edge at positions as shown on drawing no. 122C 660 442, Sheet 1 of 2 (the straight edge to span between wing rail). Measure gap between straight edge and top of frog nose. Grind (or built up by welding edge if necessary to achieve specified dimensions.
2) Place a 4 inch straight edge along the length of the frog as a guide to achieve a smooth
transition between grinding.
Caution: When grinding, grind a little at a time and make frequent measurements to avoid over‐grinding.
Inspect and Correct Transverse Profile
1) Using the tangent templates place the rail profile gauge at positions “A” and “B” as shown on drawing no. 122C 660 442, sheet 2 of 2. Grind the frog nose corners if necessary to conform to the wheel template profile as indicated on the drawing.
2) It may be necessary to build up the frog nose corners by welding. The angles on the
template can be used as guide to select the grinding angle. Use a 4 inch straight edge as a guide to achieve a smooth transition in profile along the length of the frog.
5.0 RECOMMENDED RAIL GRINDING MAINTENANCE PLAN
5.1 REQUIRED RESOURCES The resources to conduct this plan include both equipment and manpower as follows:
a) One block grinding cart, one belt grinder, one set of noise measurement
instrumentation, and the rail profile gauge (with 3 templates). b) Grinding crew of 2 men, 9 nights per 4 week period. Noise technician, 4 hours per week
(16 hours per 4 week period). Man hour requirement is pending on results of system noise measurements and inspection.

Detroit Transportation Corporation: Noise Abatement and Ride Quality Study 111
5.2 RECOMMENDED SCHEDULE: DTC GRINDING The recommended rail grinding schedule consists of a four‐week routine, which is repeated. The first three weeks activities include noise measurements and block grinding as described below:
1) Measure noise monthly and save files on the Maintenance laptop once every two weeks
2) Review the noise data and determine the required actions as follows:
dBA Action
Up to 80 dBA No action
81 to 84 dBA Block grind 50 passes
85 to 88 dBA Block grind 75 passes
More than 88 dBA Block grind 100 passes
Accord higher priority to areas having highest noise level. Note: These noise levels are average of all measurement results. If noise level in a curve is below 80 dBA in one lap and above it in another lap perform a third lap to indicate the actual condition. Inspect the rail profile first (see Section 4.2) to determine whether the rail profile is incorrect and belt grinding correction is needed.
3) When the block grinding areas include special track work such as expansion joints, and
the noise level over the special track work remains high after grinding, grind the special track work again during the following week. Use the criteria above to determine the required grinding passes.
4) If the block grinding areas include freshly belt‐ground areas, extend the block grinding
one track section beyond the belt‐ground track length. This one extra track section is needed to blend the ground and ungrounded area together. During the fourth week, besides the above activities, carry out visual track inspection. This inspection is to be applied to areas where persistent high noise has been recorded over the last three weeks, even though block grinding has been applied. The inspection procedure is given in Section 4. If there is an area where rail corrugations still remain after 125 passes of block grinding or more, apply the belt grinding procedure described in Section 4.1.5

Detroit Transportation Corporation: Noise Abatement and Ride Quality Study 112
5.3 RECOMMEND SCHEDULE: MAJOR GRINDING Based on the depth of Rail Corrugation and Noise levels DTC should contract for these services at a minimum of at least once every 2‐3 years. This will extend rail life and reduce corrugation and noise levels in the system.
6.0 PLANNING FOR LIM RAIL ADJUSTMENT During inspection, measure the LIM rail height with respect to the T.O.R. The measured height of the LIM rail should be within + 1/8” (3 mm) – 0” (0 mm). If the actual LIM rail height exceeds the limits, the LIM rail must be adjusted according to the existing measurements. The current LIM rail height is nominally adjusted to be level with the top of rail (T.O.R.). After long‐term grinding of any given track section, the LIM gap will decrease as the height of the T.O.R. becomes lower due to grinding and wear. The rate of change of LIM gap is estimated to be 0.00025” (0.006 mm) per pass of belt grinding and 0.000025” (0.0006 mm) per pass of block grinding. Thus, based on the amount of grinding of any section of track, a schedule for inspection of the LIM rail height can be prepared as follows: For any given track section: Change in T.O.R. (in) = number of passes of belt grinding X 0.00025 + number of passes of block grinding X 0.000025. The LIM rail should be inspected when the change in height of the T.O.R. exceeds 0.040”ng procedure to bring its height with + 1/16” (1.00 mm) – 0” (0 mm). Note: Switch closure rails must also be inspected during inspection of adjacent LIM rails to ensure that the closure rail T.O.R. is level with the running rail T.O.R. + 1/16” (1mm). If not, grind the closure rail according to the following sequence:
Passes Degrees to Gauge
6 passes At 15 degrees to gauge
6 passes At 10 degrees to gauge
6 passes At 5 degrees to gauge
10 passes At 0 degrees to gauge
Repeat this sequence if necessary until the closure rail T.O.R. is level with the running rail T.O.R.
7.0 COBO HALL This section of guideway within Cobo Hall consists of tangent track, a 115 ft/ (35 m) radius curve, an expansion joint and a 500 ft. (152 m) radius curve. Each of these features is maintained according to the appropriate sections of this manual.

Detroit Transportation Corporation: Noise Abatement and Ride Quality Study 113
Special attention can be provided as follows:
1) Include the Cobo Hall area in any track inspection, if possible. Ensure that the 115 ft. curve and expansion joint are inspected at least once every 4 weeks.
2) As soon as noise level in the Cobo Hall area exceeds 80 dBA, rail grinding must be carried out on a priority basis.

Detroit Transportation Corporation: Noise Abatement and Ride Quality Study
APPENDIX A
BLOCK GRINDING

Detroit Transportation Corporation: Noise Abatement and Ride Quality Study 115
A.1 BLOCK GRINDER PREPARATION
1) Water cocks on grinding cart must be wide open to provide adequate block cleaning. 2) Air bag pressure set at 75 psi. Use nitrogen air tanks. 3) Use Norton 23A 1430 BV grinding block or equivalent. Need 3 blocks per side. 4) Set stone carrier angle permanently at 0° (i.e., vertical). 5) Set stone carrier laterally so that the clamping bolts slide in the slots of the carrier frame. 6) Set the block height between the bottom of the stone and top of rail head at ¼”. If
adjustment is required, follow these steps:
Loosen side stone clamping bolt and allow the stones to drop onto the rail head.
Set the block height above the rail at ¼” using a spacer and tighten the stone clamping assembly and the vertical stone retaining rod nuts.
Re‐install vertical stone retaining rods ensuring snug fit against top of grinding stones. Torque rod nuts to 18 ft. lb. Secure locking nut against the bottom rod nut.
7) Test move the blocks up and down a few times to ensure no binding.

Detroit Transportation Corporation: Noise Abatement and Ride Quality Study 116
A.2 BLOCK GRINDER OPERATION
1. Check to ensure that the 2‐car consist used to pull the block grinder cart has good brakes and PCU.
2. Set markers to help identify the correct starting and stopping location. (Refer to Figure 1,
Section 1 for rules). Do not grind outside markers. 3. Run at 15 mph in tangent track, 10 mph in curves and 5 mph in MCF. 4. If stones are new or when switching from one type of track to another (i.e., tangent to
curve; left‐hand to right‐hand curves), apply 20 passes over and above the normal grinding requirement to wear the stone to the rail contour.
5. Leave all water valves fully open. Check to ensure water is available at all times during
grinding. 6. Grind one type of track at a time. 7. Use push/pull mode. 8. Ensure that the gap between the bottom of the stones and the top of the rail head does not
exceed 1 ½” during grinding to avoid damage to the air bag. 9. If a section of track is too short to grind with a continuously reversing block down motion
and there is a possibility of overheating the LIM, then the distance travelled should be lengthened and the blocks raised at each end of the curved or tangent track section.
10. When stopping grinding train to reverse direction, use LIM breaking until the grinding train
has decelerated to approximately 2 mph and then apply disc brakes. This will prevent flat spots from forming on the wheels.
11. After Block grinding is completed perform the following
12. Perform Surface Measurement testing and record readings
13. Conduct Corrugation Measurement testing and note readings
14. Verify LIM rail height and adjust to specification as needed.
15. Conduct noise test and evaluate readings.

Detroit Transportation Corporation: Noise Abatement and Ride Quality Study 117
APPENDIX B
BELT GRINDING

Detroit Transportation Corporation: Noise Abatement and Ride Quality Study 118
B.1 BELT GRINDER PREPARATION
Ensure grinder brake is in good order.
Use Norton System E backing “NOV‐ZON” E864 4” x 132” Plyweld Belt – Grit Z‐36‐Y.
Check to ensure all grinding functions are operable (such as cross‐feeds, down pressure, etc.).
B.2 BELT GRINDER OPERATION
Set markers to correctly identify start and stop positions during grinding. Refer to Figure 1, Section 1 for rules. Do not grind past markers.
Grind at 2 to 3 miles per hour.
Grinding wheel speed must be between 1500‐1550 rpm at 2000 rpm engine revolution.
Downward pressure is required for engaging the grinder wheel to the rail head. This pressure should be set at 400 psi ± [add minus sign under the plus sign] when the angle setting is greater than 12°, the pressure should be set at 275 psi ±25 psi/ These are recommended downward pressure settings; however, field adjustments could be required, depending on grinding conditions.
Grinding back pressure is created due to the friction between the grinding wheel and the rail head during the grinding process. This pressure is not to exceed 2,000 psi by using the manual override hand levers.
Belts should be changed after every 30 minutes of actual grinding. In order to get maximum belt life, use the manual cross‐feed levers to move the belt back and forth across the contact surface. Special care must be exercised in curved track to ensure that grinding wheel makes continuous contact with the rail head.
After grinding operation is completed, clean the rail head of all metal shavings.
Perform Surface Measurement testing and record readings
Conduct Corrugation Measurement testing and note readings
Verify LIM rail height and adjust to specification as needed.
Conduct noise test and evaluate readings

Detroit Transportation Corporation: Noise Abatement and Ride Quality Study 119
REFERENCES: 1) UTDC TECHNICAL REPORT DPM RAIL GRINDING MAINTENACE MANUAL REVISED NOVEMBER 15,
1989 2) LORAM DPM POST RAIL GRINDING REPORT DECEMBER 2010 3) INTERNATIONAL STANARDS‐ISO3095 REPORT; RAILWAY APPLICATIONS‐ACOUSTICS‐
MEASUREMENT OF NOISE EMITTED BY RAILWAY BOUND VEHICLES. 4) INNOTRACK GUIDELINE D4.5.5‐GUIDELI9NES FOR THE MANAGEMENT OF RAIL GRINDING‐2006 5) RAIL MEASUREMENT PRODUCTS FOR RAIL CORRUGATION‐LONGTITUDINAL PROFILES‐2007 6) RAIL CORRUGATION: CHARACTERISTICS, CAUSES AND TREATMENTS, SI.GRASSIE PHD, MAY 2009 7) BEST PRACTICES‐ AREM COMMITTEE #4, SUB COMMITTEE#9‐2000 8) DTC MAINTENACE DEPARTMENT‐RAIL GRINDING PROGRAM, PAST PRACTICES AND EXPERIENCES.
9) ATS CONSULTING 2010
10) SLGRASSIE,”and J.KALOUSEK ”RAIL CORRUGATION CHARACTERISTICS, CAUSES and TREATMENTS”
JOURNAL of RAIL and RAPID TRANSIT, PROC OF MECH E 1993 201F, 57‐68.
11) SLGRASSIE,”RAIL CORRUGATION:CHARACTERISTICS, CAUSES, and TREATMENTS”,JOURNAL of RAIL and RAPID TRANSIT, PROC of MECH E.2009 223F, 581‐596
12) SOCIETY of ACOUSTICAL ENGINEERING (1998) FUNDAMENTALS OF NOISE and VIBRATION: FRANK FAHY and JOHN WALKER.
13) TRANSIT NOISE and VIBRATION IMPACT ASSESSMENT MAY2006: FEDERAL TRANSIT ADMINISTRATION.
Related Documents