DSP HOW-TO GUIDE Getting Started with Code Composer Studio V3.3 for TMS320F2812

Welcome message from author
This document is posted to help you gain knowledge. Please leave a comment to let me know what you think about it! Share it to your friends and learn new things together.
Transcript
DSP HOW-TO GUIDE
Getting Started with Code
Composer Studio V3.3 for
TMS320F2812
Join the Technical Community Today!
http://www.pantechsolutions.net
Contents at a Glance
1. Introduction of Code Composer Studio ...................... 3
2. Launching The Code Composer Studio 3.3 .................. 4
3. Setting Up The Target ................................................ 4
4. Creating a New Project .............................................. 6
5. Build a Project ......................................................... 13
6. Connecting the Target ............................................. 14
7. Load the Project ...................................................... 16
8. Go Main .................................................................. 17
9. BreakPoints ............................................................. 18
10. Source Stepping ...................................................... 20
11. Watch Window ....................................................... 21
12. Output Window ...................................................... 24
13. Help ........................................................................ 24
Join the Technical Community Today!
http://www.pantechsolutions.net
1. Introduction of Code Composer Studio
Code Composer Studio Integrated Design Environment for
the C2000 Family of Texas Instruments Digital Signal Processors.
Simply, Code Composer Studio is the environment for project
development for all tools needed to build an application for the
C2000-Family.
The objective of this module is to understand the basic
functions of the Code Composer Studio 3.3, how to create and
debug a project in CCS 3.3 for TMS320F2812/F28335 kit. This
following section will introduces some of the basic features and
functions in Code Composer Studio so you can create and build
simple projects. Experienced users can proceed to the following
sections for more in-depth explanations of Code Composer
Studio’s various features.
Finally, you will able to work the TYRO-TMS320F2812/TYRO
TMS320F28335 kit with CCS 3.3
Join the Technical Community Today!
http://www.pantechsolutions.net
2. Launching The Code Composer Studio 3.3
click this icon shown on your desktop. To launch Code
Composer Studio IDE for the first time, configure Code Composer
Studio for a specific target.
3. Setting Up The Target
To create a system configuration using a standard configuration
file:
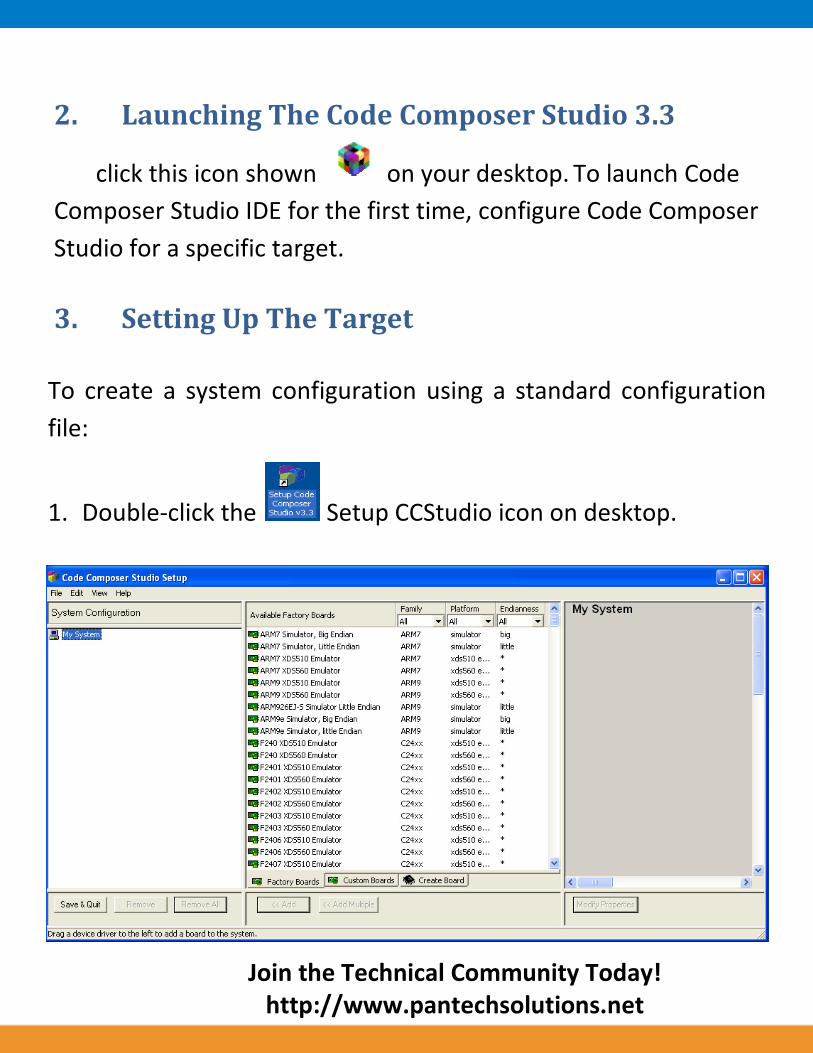
1. Double-click the Setup CCStudio icon on desktop.
Join the Technical Community Today!
http://www.pantechsolutions.net
The System Configuration dialog box appears.
2. From the list of Available Factory Boards, select the standard
configuration that matches your system. Your list of available
boards will differ depending on your installation. Determine if
one of the available configurations matches your system.
Example:
If our Target present at available factory boards, then
follow these steps.
In Family, Select C28xx.
In platform, Select XDS 100 USB Emulator.
In Endianness, Select little. Then Select F2812 XDS100
USB Emulator.
3. Click the Add button to import your selection to the system
configuration currently being created. The configuration you
selected now displays under the My System icon in the System
Configuration pane of the Setup window.
Join the Technical Community Today!
http://www.pantechsolutions.net
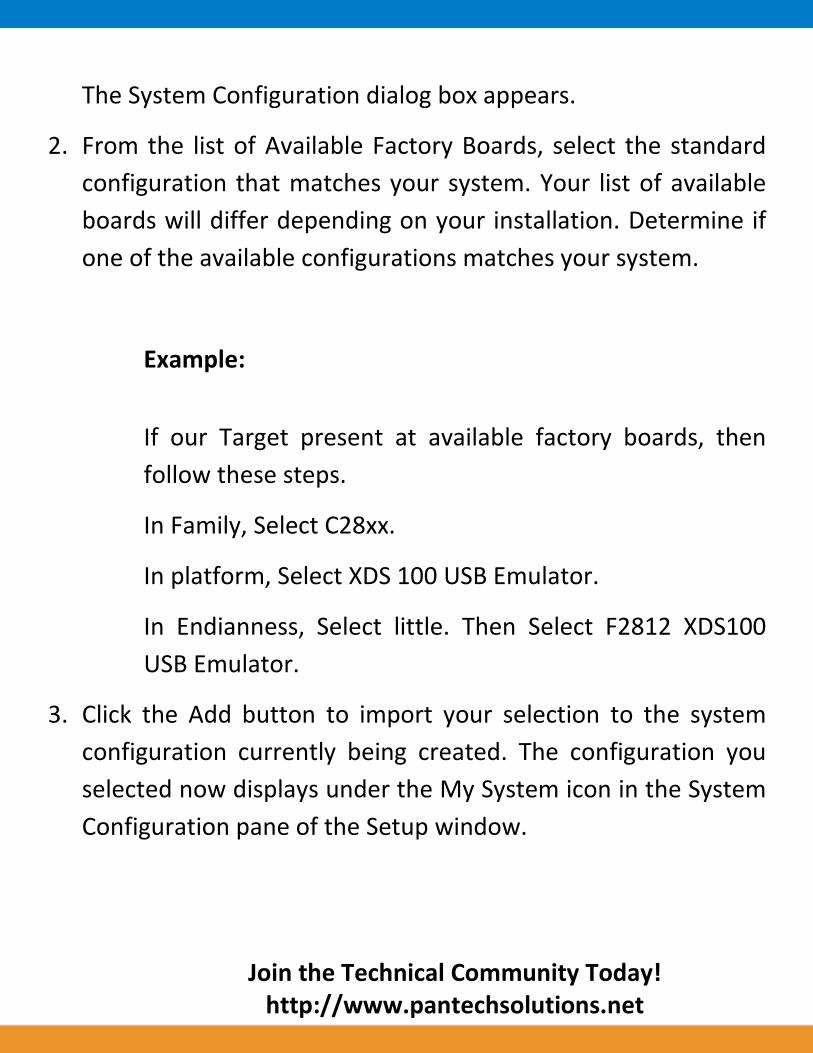
4. Click the Save & Quit button to save the configuration.
5. Click the Yes button to start the Code Composer Studio IDE with
your configuration. You can now start a project.
4. Creating a New Project
To create a working project, follow these steps:
1. If you installed Code Composer Studio in C:\CCStudio_v3.3,
create a folder called practice in the
C:\CCStudio_v3.3\myprojects folder or use your any other
location .
Join the Technical Community Today!
http://www.pantechsolutions.net
Note:
There is no default configuration, you must set a configuration
before starting Code Composer Studio. See Chapter 2.1 for
more about Code Composer Studio configurations.
2. Launch Code Composer Studio. See Chapter 2
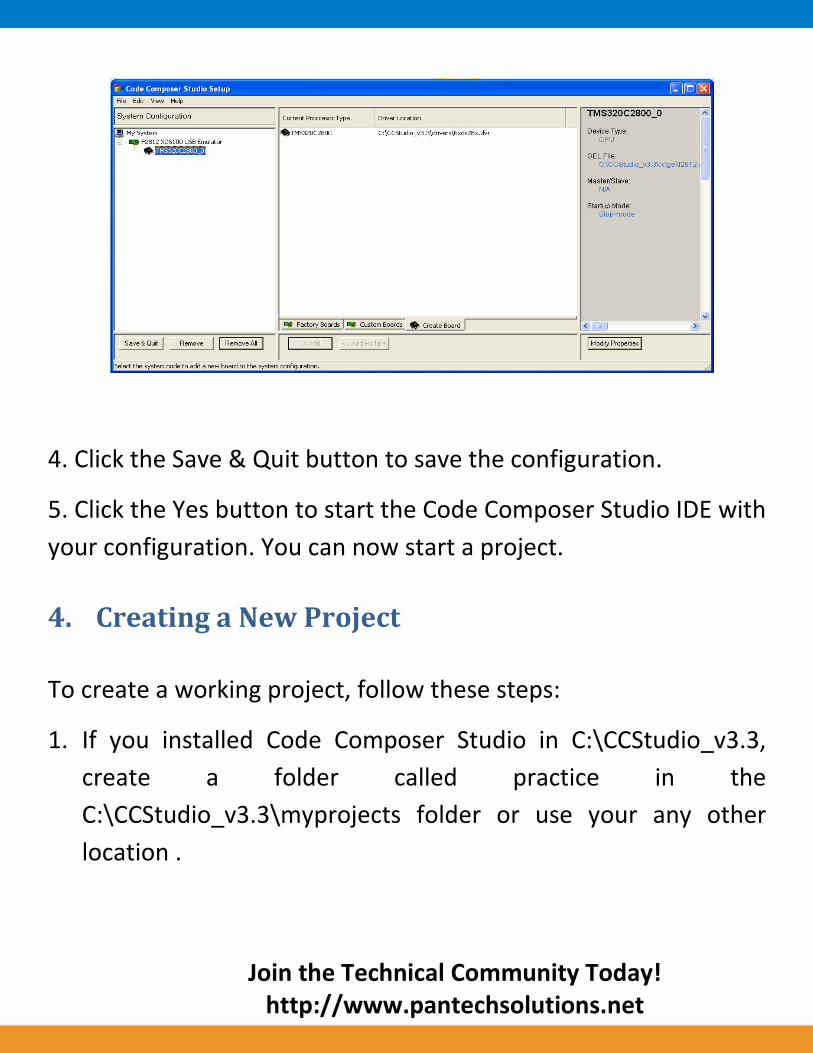
3. From the CCStudio Project menu, choose New.
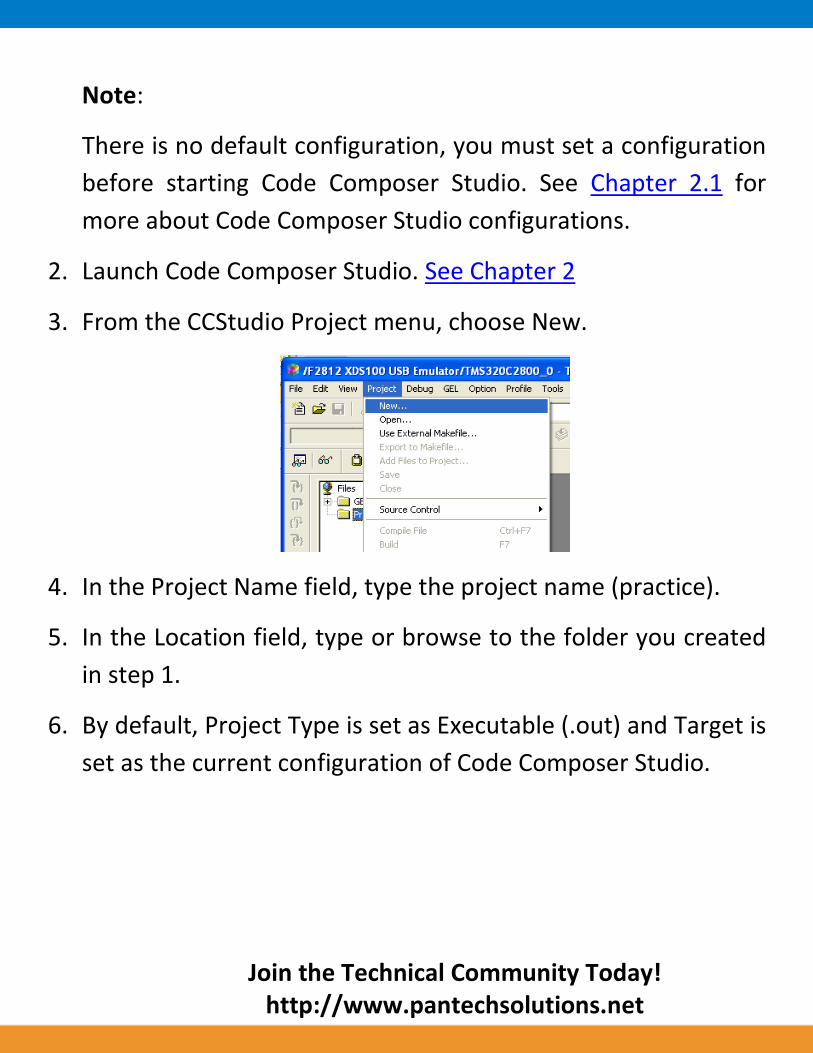
4. In the Project Name field, type the project name (practice).
5. In the Location field, type or browse to the folder you created
in step 1.
6. By default, Project Type is set as Executable (.out) and Target is
set as the current configuration of Code Composer Studio.
Join the Technical Community Today!
http://www.pantechsolutions.net
7. Click Finish. Code Composer Studio creates a project file called
practice.pjt. This file stores your project settings and references
the various files used by your project.
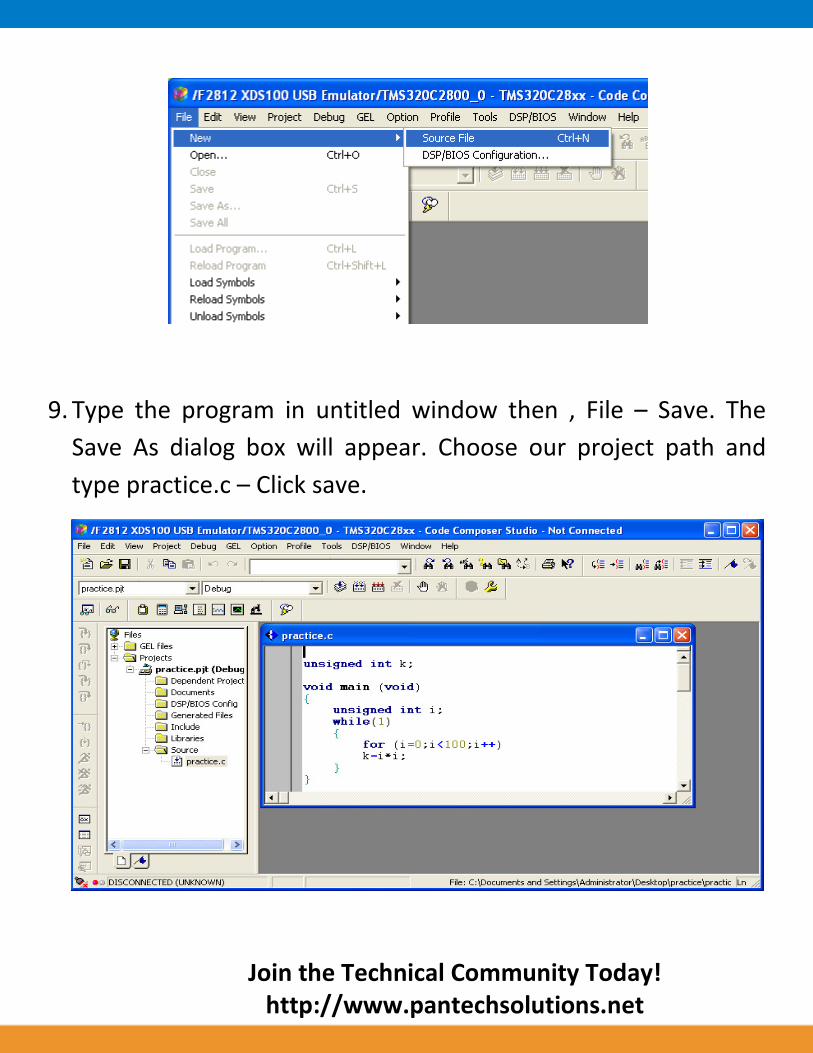
8. From the CCStudio File menu, choose New – Source File.
Join the Technical Community Today!
http://www.pantechsolutions.net
9. Type the program in untitled window then , File – Save. The
Save As dialog box will appear. Choose our project path and
type practice.c – Click save.
Join the Technical Community Today!
http://www.pantechsolutions.net
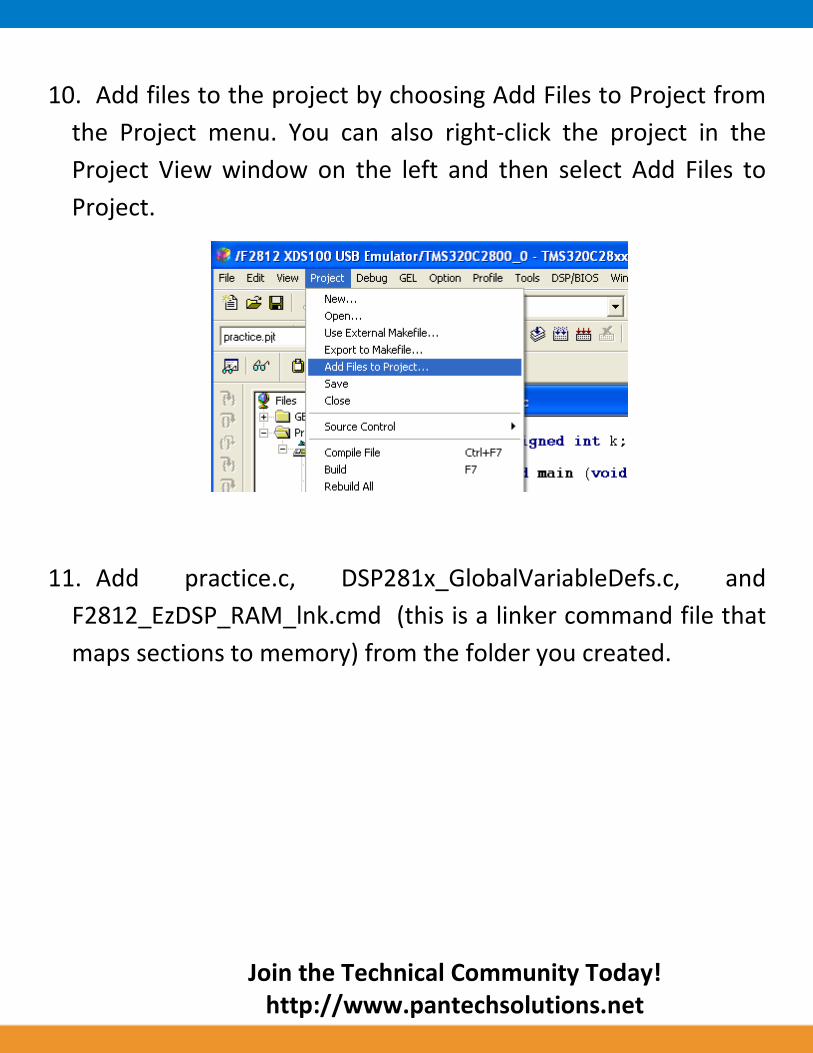
10. Add files to the project by choosing Add Files to Project from
the Project menu. You can also right-click the project in the
Project View window on the left and then select Add Files to
Project.
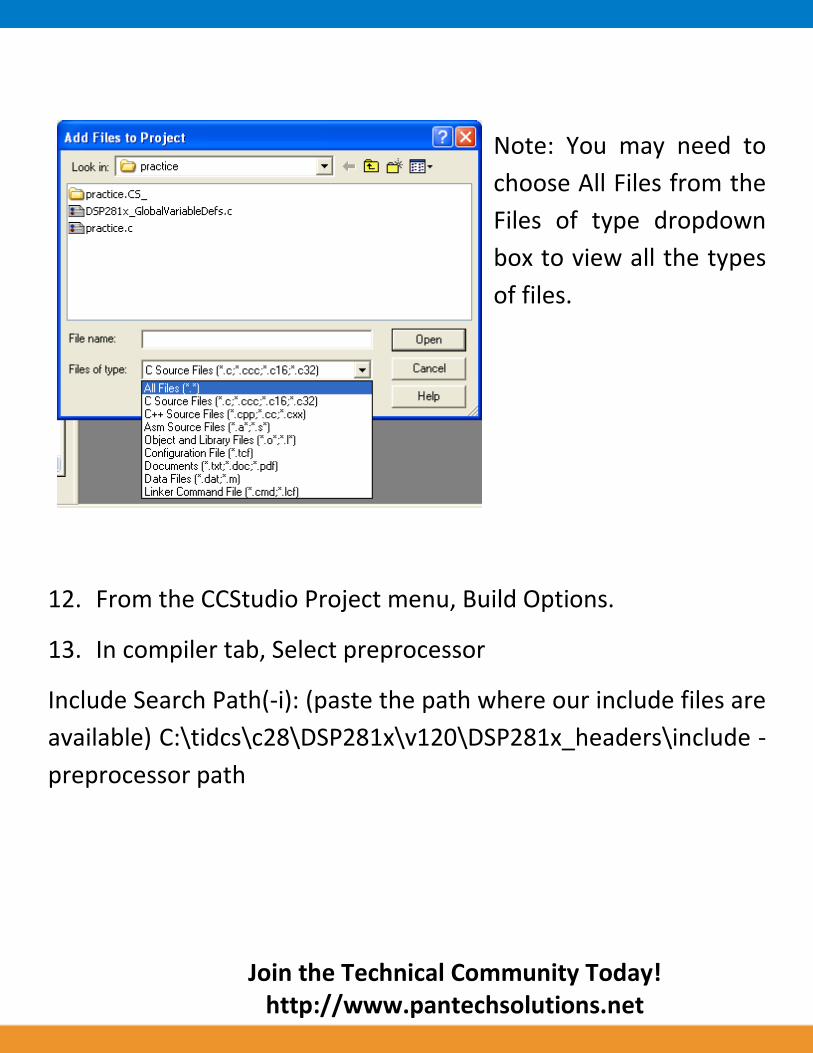
11. Add practice.c, DSP281x_GlobalVariableDefs.c, and
F2812_EzDSP_RAM_lnk.cmd (this is a linker command file that
maps sections to memory) from the folder you created.
Join the Technical Community Today!
http://www.pantechsolutions.net
Note: You may need to
choose All Files from the
Files of type dropdown
box to view all the types
of files.
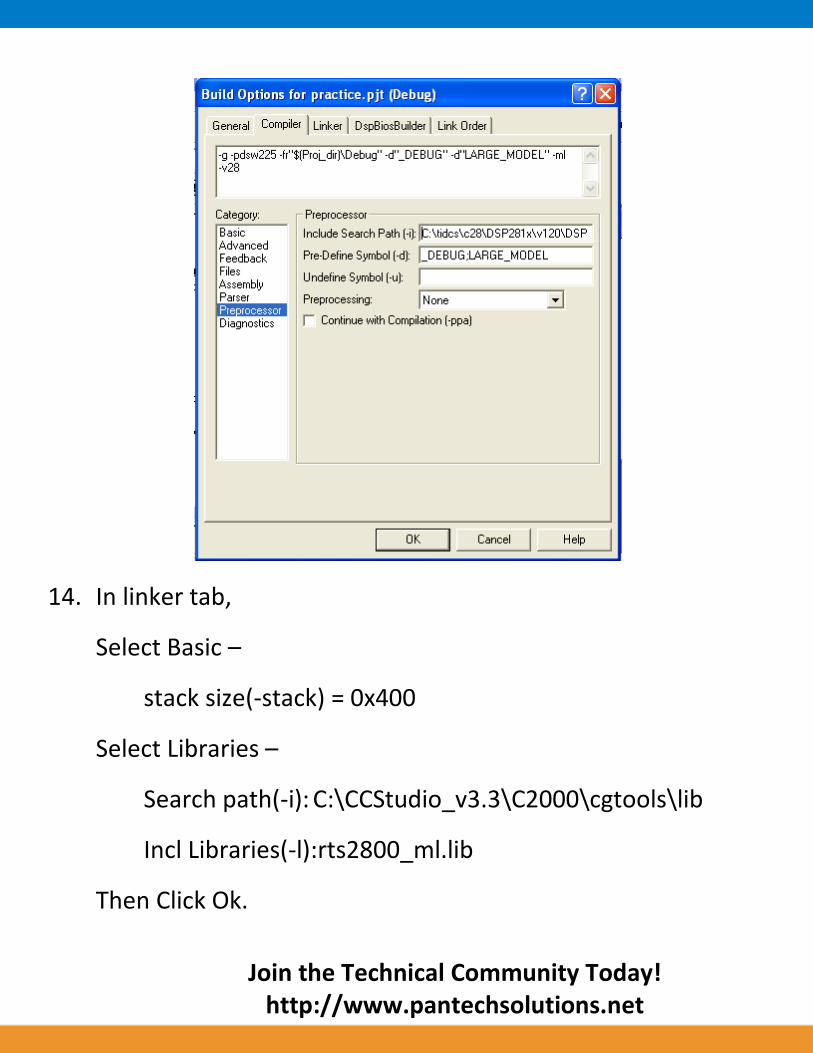
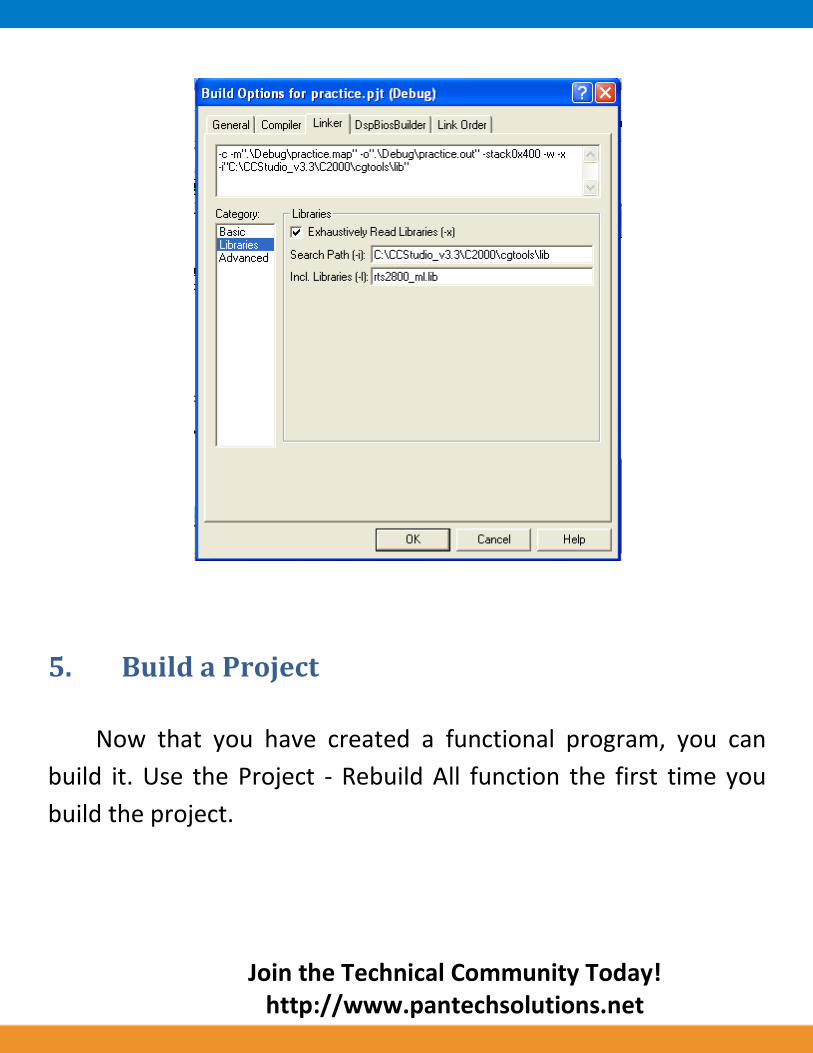
12. From the CCStudio Project menu, Build Options.
13. In compiler tab, Select preprocessor
Include Search Path(-i): (paste the path where our include files are
available) C:\tidcs\c28\DSP281x\v120\DSP281x_headers\include -
preprocessor path
Join the Technical Community Today!
http://www.pantechsolutions.net
14. In linker tab,
Select Basic –
stack size(-stack) = 0x400
Select Libraries –
Search path(-i): C:\CCStudio_v3.3\C2000\cgtools\lib
Incl Libraries(-l):rts2800_ml.lib
Then Click Ok.
Join the Technical Community Today!
http://www.pantechsolutions.net
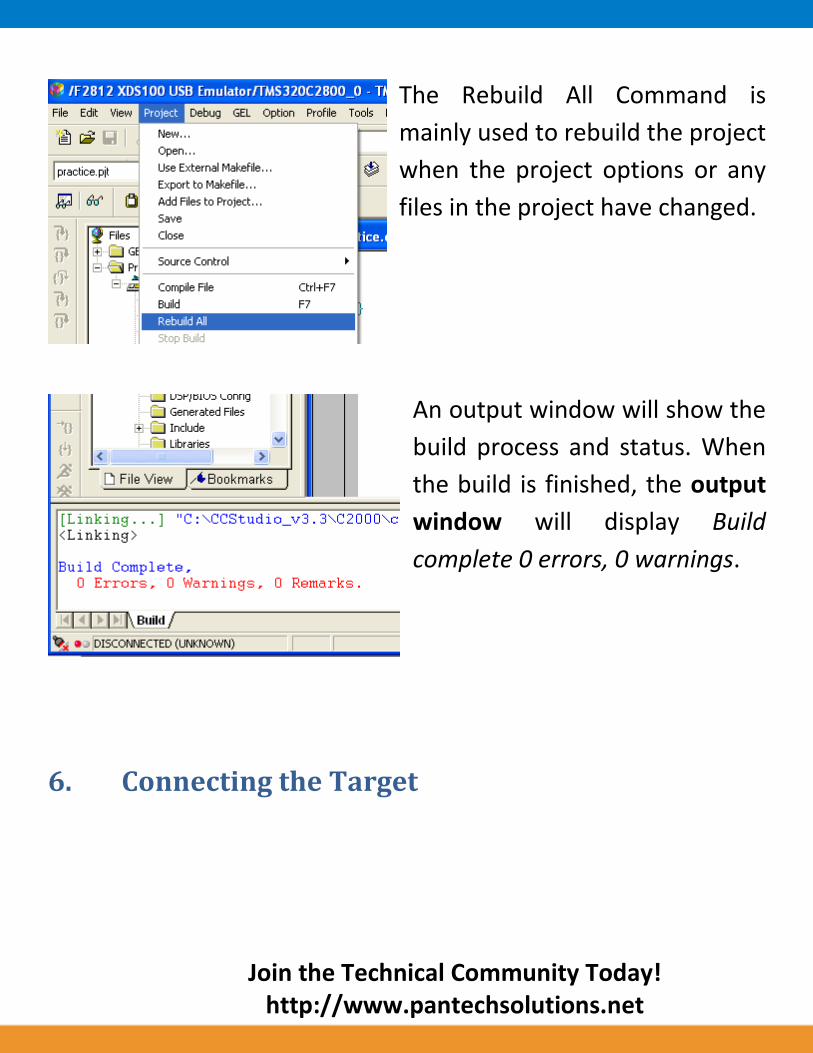
5. Build a Project
Now that you have created a functional program, you can
build it. Use the Project - Rebuild All function the first time you
build the project.
Join the Technical Community Today!
http://www.pantechsolutions.net
The Rebuild All Command is
mainly used to rebuild the project
when the project options or any
files in the project have changed.
An output window will show the
build process and status. When
the build is finished, the output
window will display Build
complete 0 errors, 0 warnings.
6. Connecting the Target
Join the Technical Community Today!
http://www.pantechsolutions.net
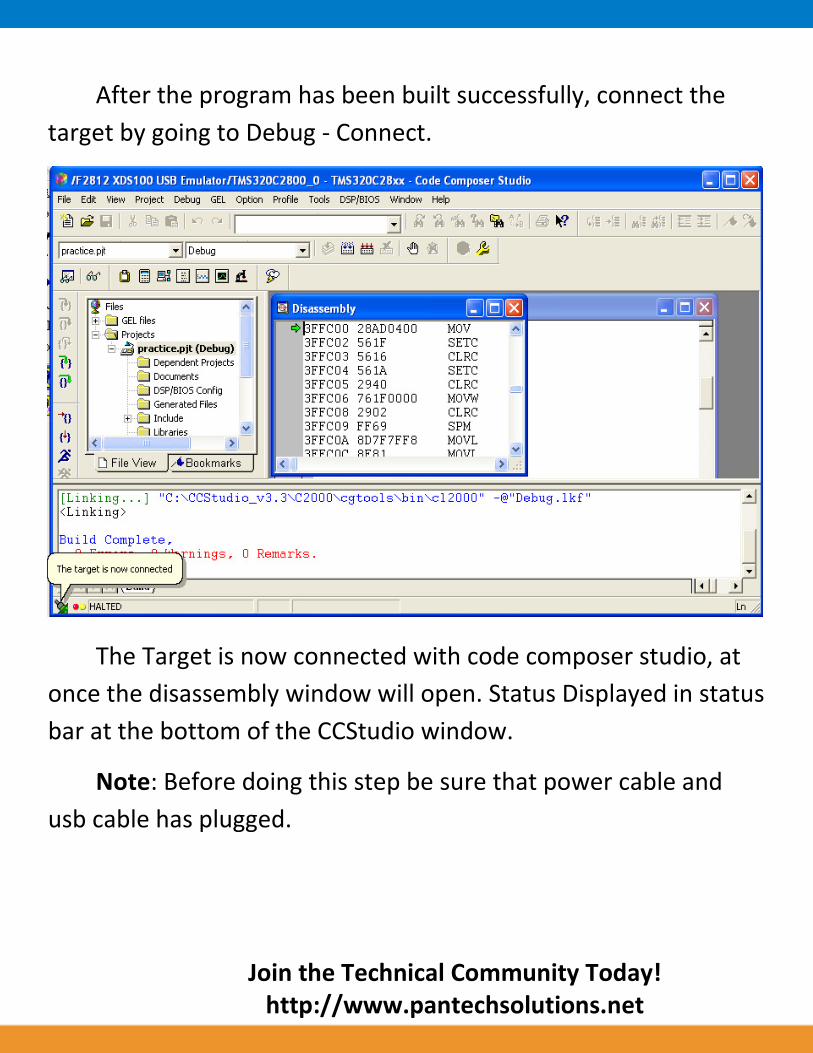
After the program has been built successfully, connect the
target by going to Debug - Connect.
The Target is now connected with code composer studio, at
once the disassembly window will open. Status Displayed in status
bar at the bottom of the CCStudio window.
Note: Before doing this step be sure that power cable and
usb cable has plugged.
Join the Technical Community Today!
http://www.pantechsolutions.net
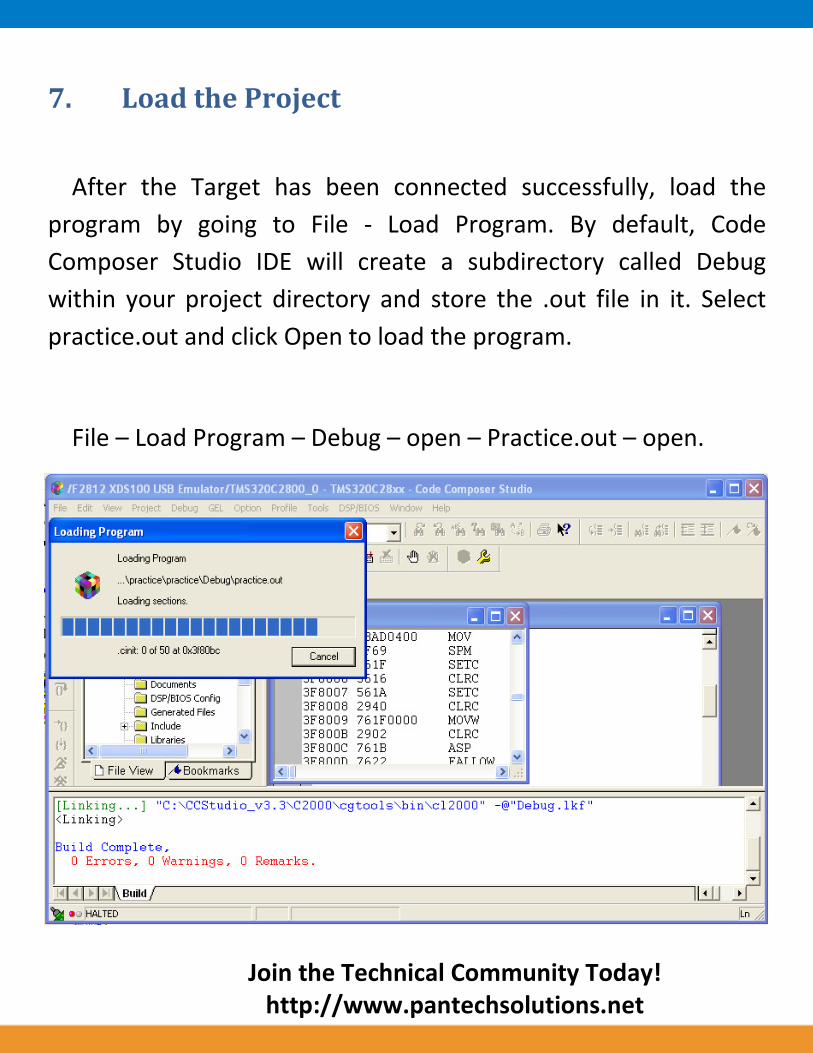
7. Load the Project
After the Target has been connected successfully, load the
program by going to File - Load Program. By default, Code
Composer Studio IDE will create a subdirectory called Debug
within your project directory and store the .out file in it. Select
practice.out and click Open to load the program.
File – Load Program – Debug – open – Practice.out – open.
Join the Technical Community Today!
http://www.pantechsolutions.net
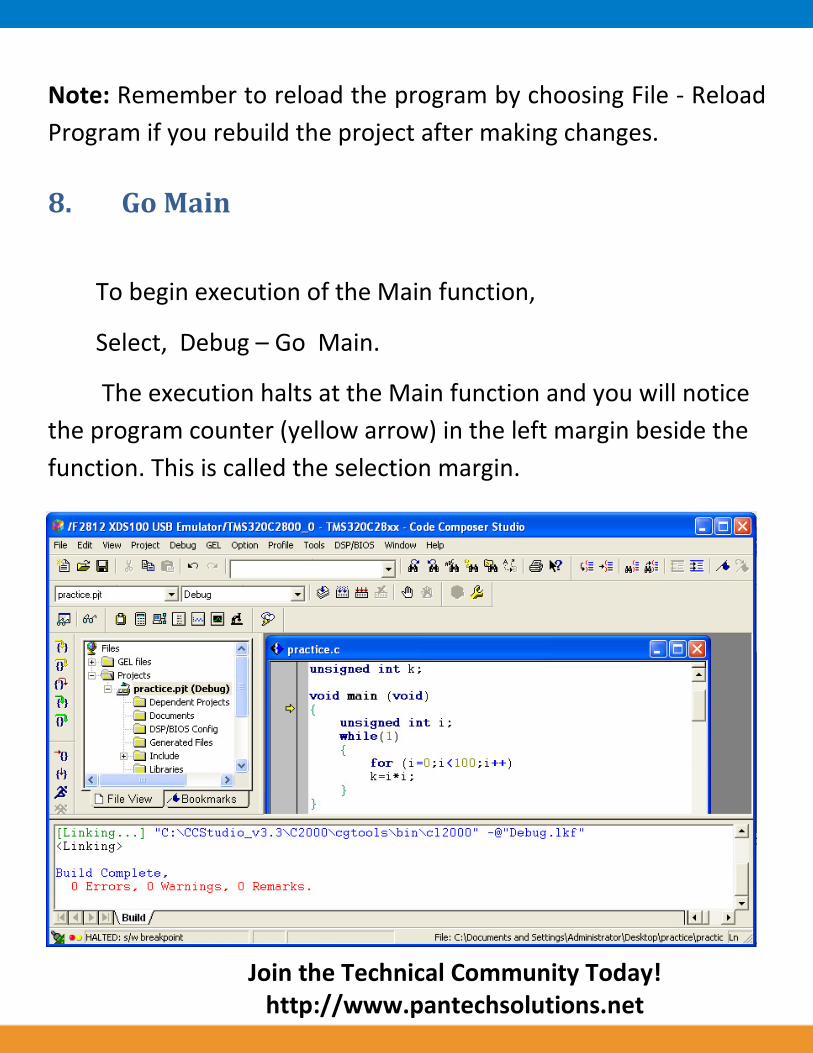
Note: Remember to reload the program by choosing File - Reload
Program if you rebuild the project after making changes.
8. Go Main
To begin execution of the Main function,
Select, Debug – Go Main.
The execution halts at the Main function and you will notice
the program counter (yellow arrow) in the left margin beside the
function. This is called the selection margin.
Join the Technical Community Today!
http://www.pantechsolutions.net
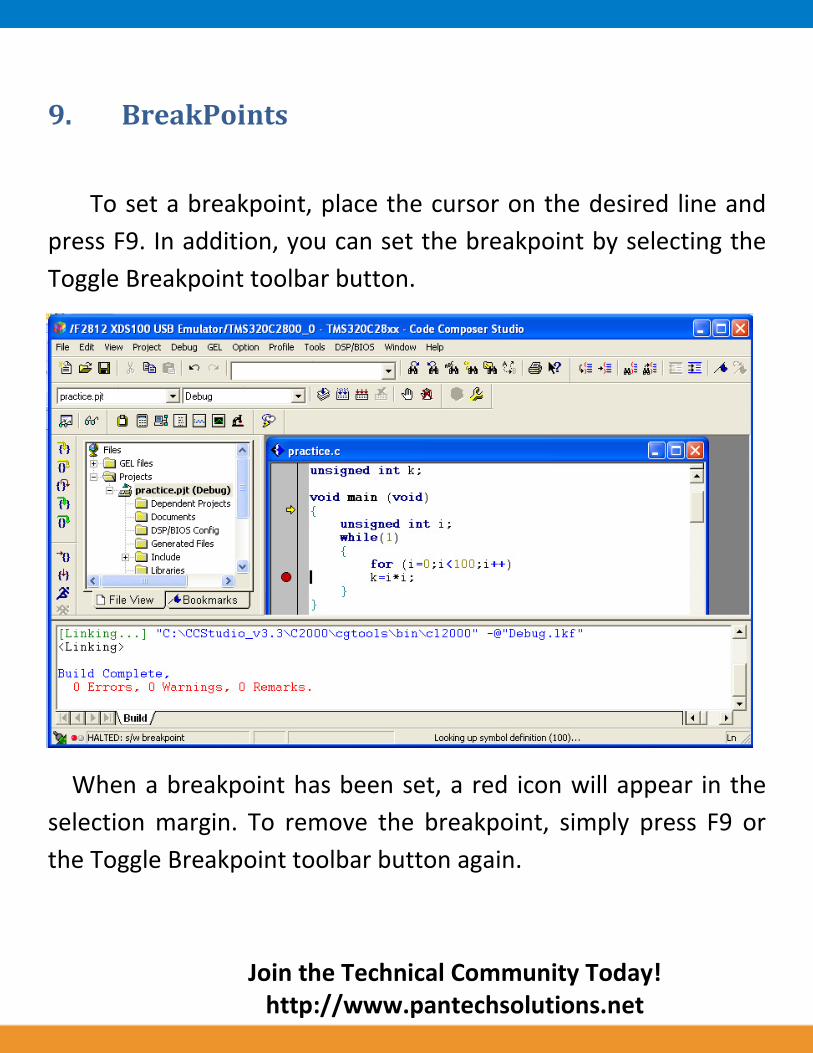
9. BreakPoints
To set a breakpoint, place the cursor on the desired line and
press F9. In addition, you can set the breakpoint by selecting the
Toggle Breakpoint toolbar button.
When a breakpoint has been set, a red icon will appear in the
selection margin. To remove the breakpoint, simply press F9 or
the Toggle Breakpoint toolbar button again.
Join the Technical Community Today!
http://www.pantechsolutions.net
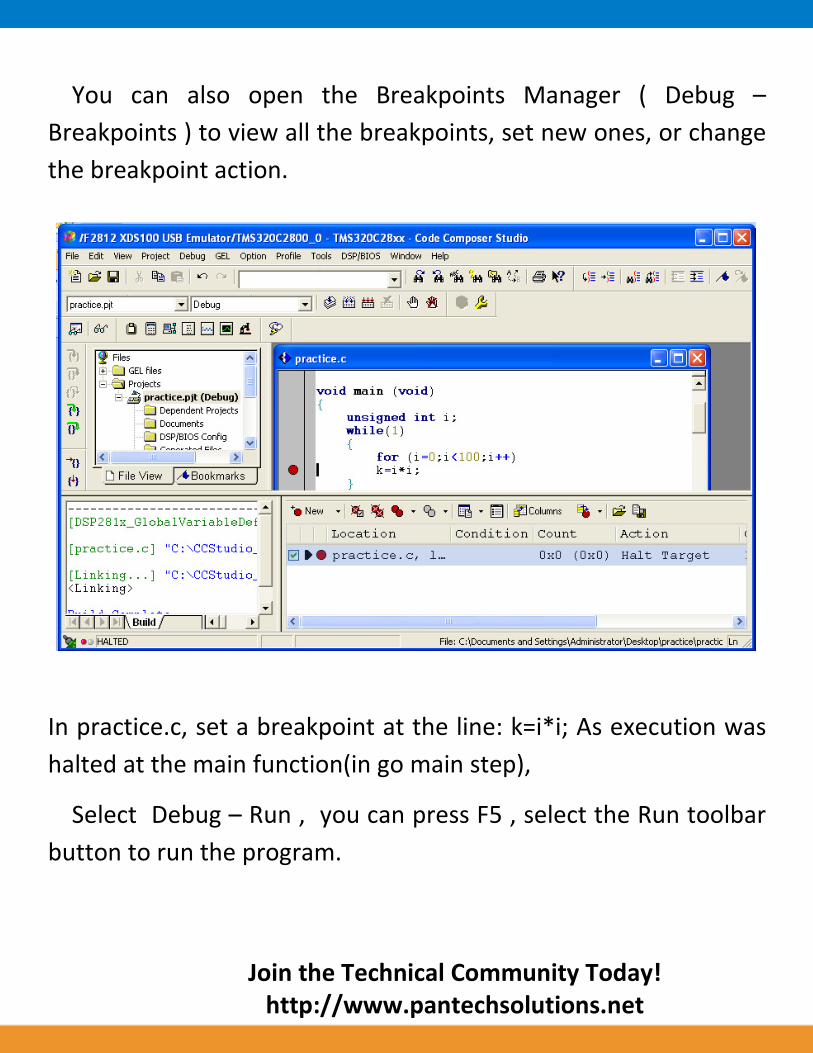
You can also open the Breakpoints Manager ( Debug –
Breakpoints ) to view all the breakpoints, set new ones, or change
the breakpoint action.
In practice.c, set a breakpoint at the line: k=i*i; As execution was
halted at the main function(in go main step),
Select Debug – Run , you can press F5 , select the Run toolbar
button to run the program.
Join the Technical Community Today!
http://www.pantechsolutions.net
Once execution reaches the breakpoint, it halts, as displayed in
the status bar at the bottom of the CCStudio window.
After reached the breakpoint, it halts later you give run or
Single stepping. Now we will see the source stepping to run
further.
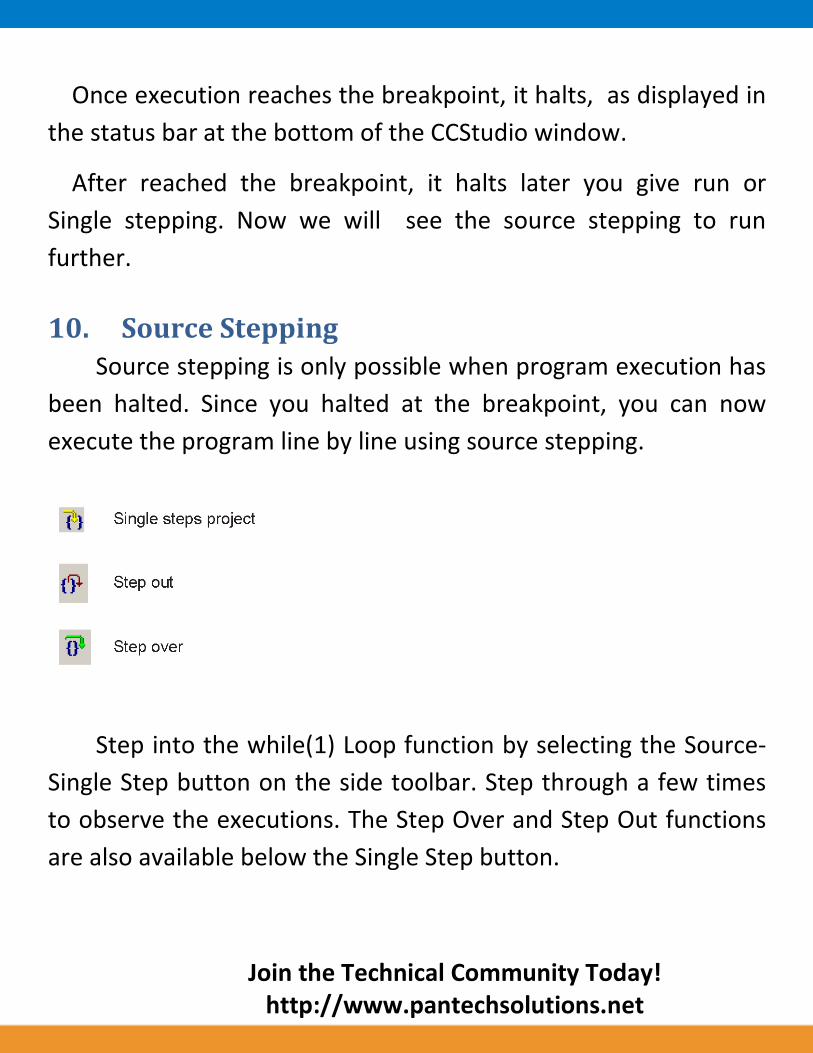
10. Source Stepping
Source stepping is only possible when program execution has
been halted. Since you halted at the breakpoint, you can now
execute the program line by line using source stepping.
Step into the while(1) Loop function by selecting the Source-
Single Step button on the side toolbar. Step through a few times
to observe the executions. The Step Over and Step Out functions
are also available below the Single Step button.
Join the Technical Community Today!
http://www.pantechsolutions.net
Assembly stepping is also available. Whereas source stepping
steps through the lines of code, assembly stepping steps through
the assembly instructions.
Now we will see something about Watch Window, later we
follow the execution of above example program, then we
understand about breakpoints , source stepping and watch
window together.
11. Watch Window
In the debugging process, you should view the value of the
variables to ensure that the function executes properly. Variables
can be viewed in the watch window when the CPU has been
halted.
The watch window can be opened by selecting View – Watch
Window. The Watch Locals tab shows all the relevant variables in
the current execution. Once the program reached breakpoint
then , it halts.
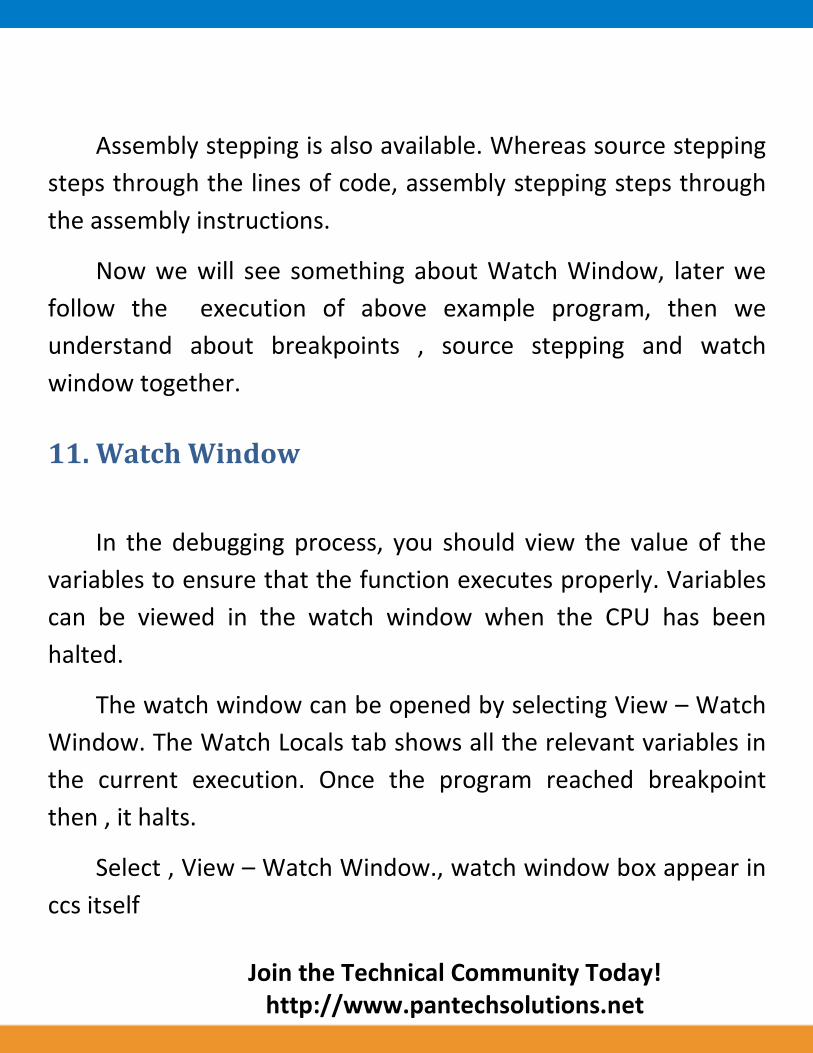
Select , View – Watch Window., watch window box appear in
ccs itself
Join the Technical Community Today!
http://www.pantechsolutions.net
As you continue to Step Into the while loop, the values of the
variables change through each execution.
Example: As per our previous discussion, program execution
reached breakpoint then it halts, we opened the watch window to
viewing the varibles. Now the value of k is zero, then follow the
below steps to understand breakpoint, source stepping and watch
window.
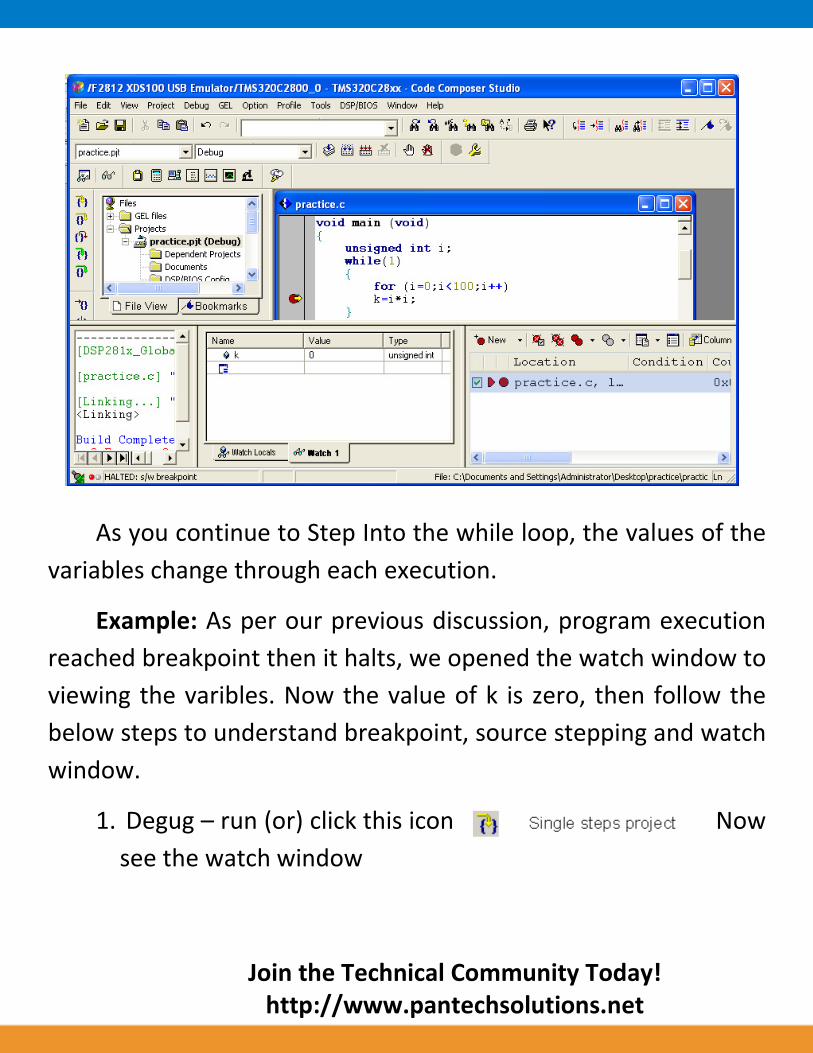
1. Degug – run (or) click this icon Now
see the watch window
Join the Technical Community Today!
http://www.pantechsolutions.net
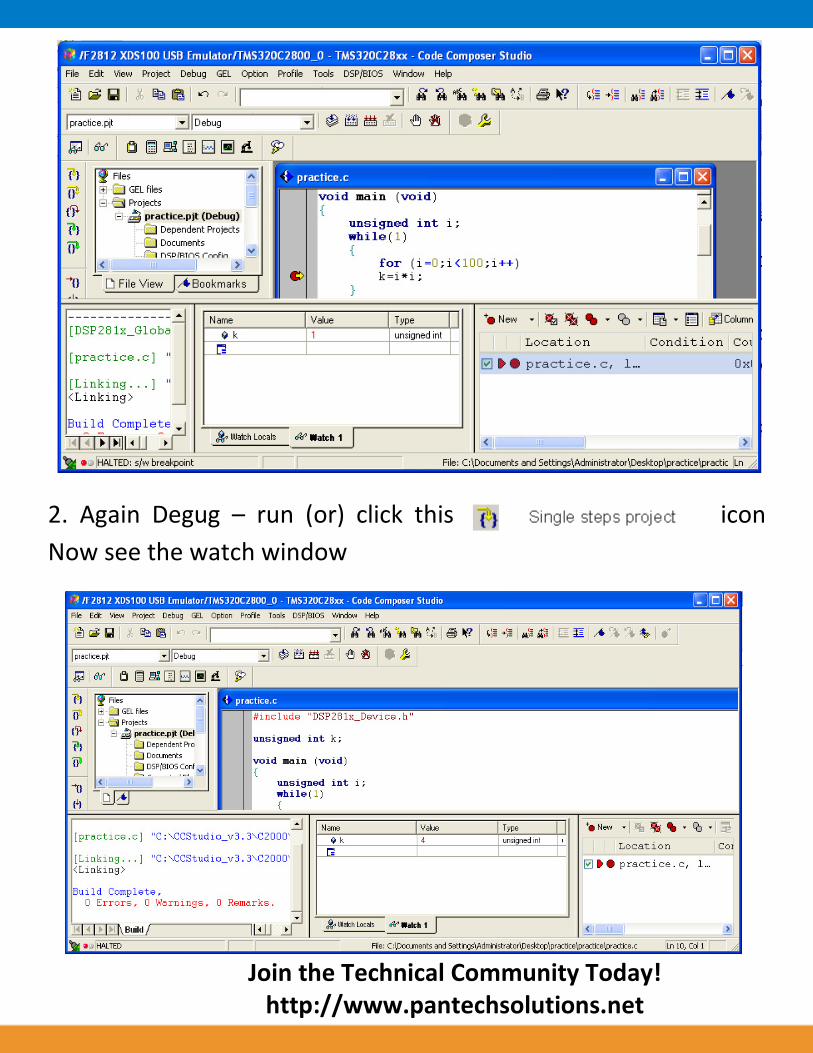
2. Again Degug – run (or) click this icon
Now see the watch window
Join the Technical Community Today!
http://www.pantechsolutions.net
In addition, you can view the values of specific variables by
hovering the mouse pointer over the variable or by placing the
variables in the Watch1 tab.
12. Output Window
The Output window is located at the bottom of the screen by
default. It can also be accessed by View – Output Window. By
default, the printf function displays the same Output window,
showing information such as the contents of Stdout and the build
log. See Output window image in chapter 5
13. Help
Code Composer Studio provides many help tools through the
Help menu. Select Help Contents to search by contents. Select
Help Tutorial to access tutorials to guide you through the Code
Composer Studio development process.
Select Help Web Resources to obtain the most current help
topics and other guidance. User manuals are PDF files that
provide information on specific features or processes. You can
access updates and a number of optional plug-ins through Help
Update Advisor.

Join the Technical Community Today!
http://www.pantechsolutions.net
Pantech solutions creates information packed technical
documents like this one every month. And our website is a rich
and trusted resource used by a vibrant online community of
more than 1,00,000 members from organization of all shapes
and sizes.
Did you enjoy the read?

Join the Technical Community Today!
http://www.pantechsolutions.net
What do we sell?
Our products range from Various Microcontroller
development boards, DSP Boards, FPGA/CPLD boards,
Communication Kits, Power electronics, Basic electronics,
Robotics, Sensors, Electronic components and much more . Our
goal is to make finding the parts and information you need
easier and affordable so you can create awesome projects and
training from Basic to Cutting edge technology.
Related Documents


![DSP Loudspeaker User Guide - Meridian Audio209].pdf · Meridian DSP Loudspeaker User Guide Subtitle Off ... DSP allows sophisticated processing to be performed ... 210mm x 900mm x](https://static.cupdf.com/doc/110x72/5b1560267f8b9a1a398c0804/dsp-loudspeaker-user-guide-meridian-209pdf-meridian-dsp-loudspeaker-user.jpg)


