Real-time flood extent maps based on social media Arnejan van Loenen Dirk Eilander Patricia Trambauer Jurjen Wagemaker (FloodTags.com) Email: [email protected]

Welcome message from author
This document is posted to help you gain knowledge. Please leave a comment to let me know what you think about it! Share it to your friends and learn new things together.
Transcript

Real-time flood extent maps
based on social media
Arnejan van Loenen
Dirk Eilander
Patricia Trambauer
Jurjen Wagemaker (FloodTags.com)
Email: [email protected]


Pilot area: Jakarta
3
Frequent floods in
Jakarta
Feb 9th-11th 2015
• > 728 000 tweets
• peak 900 tweets/minute
• 2200 incl. water depth
• ~ 900 tweets (40%)
location
• For comparison: 10-20
water level gauges (not
all functioning)
“15.31 #Flood in Cipinang
Melayu where the water
level reaches up to +/ - 2m”

Flood observations in the “Twitter cloud”
Data integration platform: Delft-FEWS
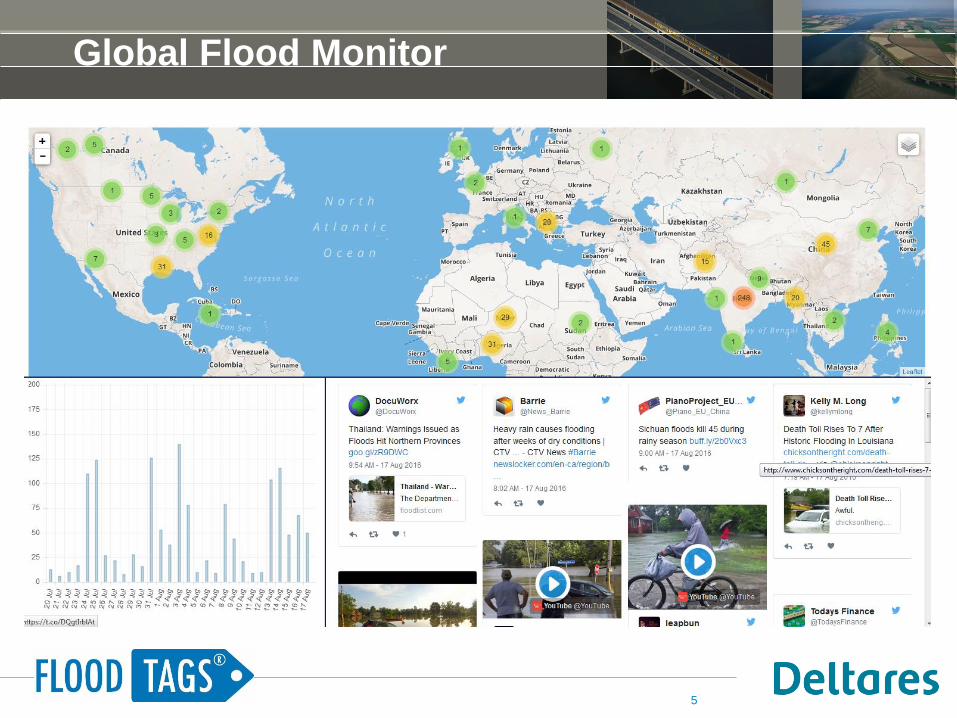
Global Flood Monitor
5

Contents
• What social media can add to flood disaster management
• How to find the useful information
• Real-time flood mapping
• There is some uncertainty though

Information sources during floods
Telemetry CCTV
Rain radar Remote Sensing

Potential use of social media
8
-Finding flood prone areas
-validating hydrodynamic
models
- Currently flooded areas
- People in need
- Evacuation routes
Flood forecasting
Flood prevention
Disaster management
Disaster recovery - Flood Impact analysis

How to find the useful information
9

Is it a flood prone area?
Method 1: Height Above Nearest Drainage (HAND)
The HAND model normalizes topography according to the local
relative heights found along the drainage network
10

Is it a flood prone area?
Method 2: Slope
11

Is it a flood prone area?
12
• HAND (<3.5m) & Slope (<0.2 m-1) match well with flood
areas from MODISlance archive
• Uncertainty in threshold derived from bootstrapping HAND
and Slope flood areas
• Could be used to improve geo-location tweets

What is heavy rain?
13
90th percentile
99th percentile
Local hourly precipitation Accumulated daily precipitation

Contextual validation method
Static maps Dynamic maps
Weighted average taken as
Proxy for probability of flood

Real-time flood mapping
15
• Twitter Data
5 Min resolution
Water depth
Location
• February 5th 2014
Peak 250/5
minutes

Probabilistic approach
16
P = 0.3
P = 0.5
P = 0.2
x
x
x

Results 10 Feb 2015
17

York floods 2015: deterministic approach
29 m
0 m0 5 102.5 Km

Generate flood plane
19
• Group observations by flowpath
• Interpolate water levels on reach
! Observation0 3 61.5 Km
29 m
0 m0 5 102.5 Km

York floods, 2015
20
[1]
[3]
[5]
[2]
[6]
[9]
[11]
[10]
[8]
[7]
[4]
0 1 20.5 Km
Recorded Flood Extent
Mapped Water depth (m)
5 m 0 m
[4][1]
[3]
[5]
[2]
[6]
[9]
[11]
[10]
[8]
[7]
0 0.1 0.20.05 Km
Recorded Flood Extent
Mapped Water depth (m)
5 m 0 m

Uncertainty analysis
Uncertainty due to:
• Locational errors
• Elevation errors
• Water depth error
• Total uncertainty
21
[1] [2]
[3]
[4]
[5]
!
!
!!
!
!
!
!
!
!
!
!
!!
!
!
!
!
!
!
!
!!
!
!
!
!
!
!
!!
!
!
!
!!
!
!
!
!
!
!
!
!
!
!
!
!
!
!
!
!
!
!
!
!!
!
!
!
!
!
! !!
!!
!
!
!
!
!
!
!
!
! Validation Points
Mapped Water Depth
5 m 0 m
0 5 102.5 Km
Percentage Flooded
100% 50% 0%
0 5 102.5 Km
Percentage Flooded
100% 50% 0%
0 5 102.5 Km
Percentage Flooded
100% 50% 0%
0 5 102.5 Km
Percentage Flooded
100% 50% 0%
0 5 102.5 Km
Flood probability

Concluding
• There is a lot of useful information out there
• The information is real-time and (partly) publicly available
• The challenge is filtering out the useful data; real-time hydrological
data and tools can help
• Uncertainty in flood mapping due to location and observation error
• Quality of flood mapping increases by using hydrological
characteristics
• Useful flood maps can be generated using a low number of
observations
• Photos contain a lot of useful information

Questions?
Ideas for further development and possible
applications in projects are also welcome!
[email protected] +31(0)88335 8525
[email protected] +31(0)88335 7672
Related Documents