Javier García Alba*, J.F. Bárcena, A. García , B. Pérez-Díaz, P. Núñez, S. Castanedo, R. Medina ENVIRONMENTAL HYDRAULICS INSTITUTE “IHCANTABRIA”. UNIVERSIDAD DE CANTABRIA IMPACT OF DREDGING PROCESSES IN TURBIDITY OF SEMI- ENCLOSED WATER BODIES: APPLICATION TO BAY OF CARTAGENA DE INDIAS (COLOMBIA)

Welcome message from author
This document is posted to help you gain knowledge. Please leave a comment to let me know what you think about it! Share it to your friends and learn new things together.
Transcript
Javier García Alba*, J.F. Bárcena, A. García , B. Pérez-Díaz, P. Núñez, S. Castanedo, R. Medina
ENVIRONMENTAL HYDRAULICS INSTITUTE “IHCANTABRIA”. UNIVERSIDAD DE CANTABRIA
IMPACT OF DREDGING PROCESSES IN TURBIDITY OF SEMI-
ENCLOSED WATER BODIES: APPLICATION TO BAY OF
CARTAGENA DE INDIAS (COLOMBIA)
1. Why is this study necessary? 2. Starting data and scenarios 3. Turbidity analysis 4. Acknowledgements
Index
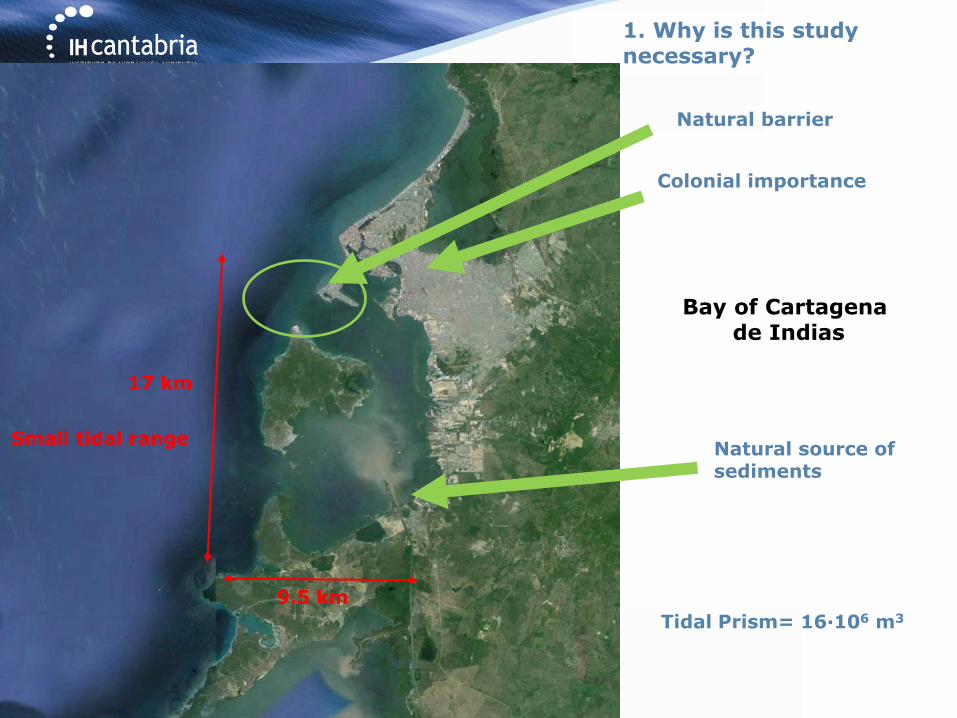
1. Why is this study necessary?
Colonial importance
Bay of Cartagena de Indias
Natural barrier
Natural source of sediments
17 km
9.5 km
Small tidal range
Tidal Prism= 16·106 m3
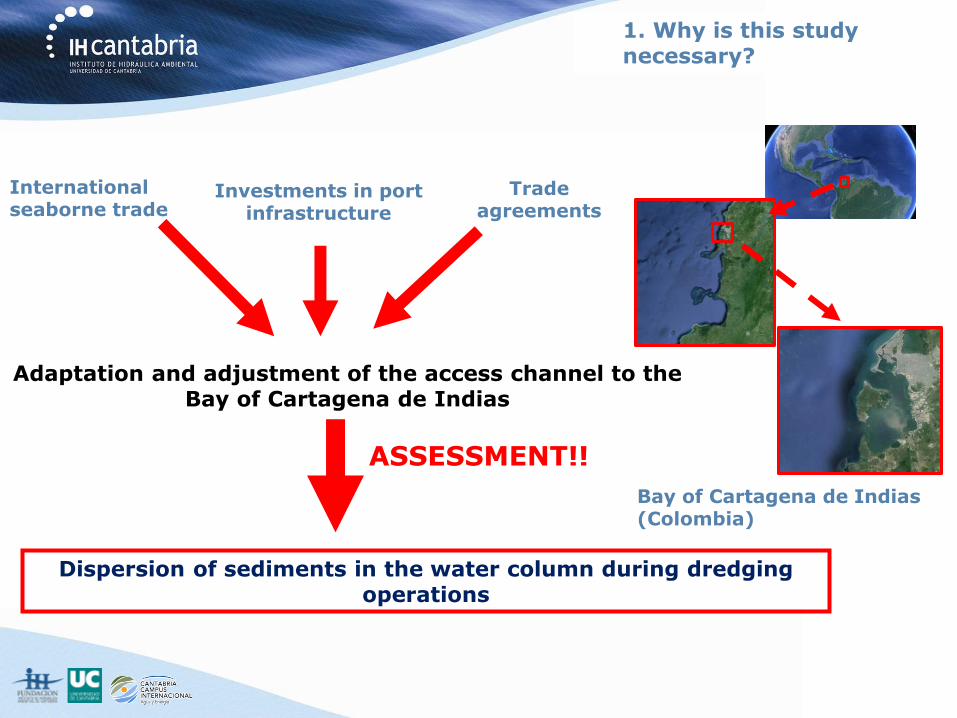
International seaborne trade
Adaptation and adjustment of the access channel to the Bay of Cartagena de Indias
Investments in port infrastructure
Trade agreements
Dispersion of sediments in the water column during dredging operations
Bay of Cartagena de Indias (Colombia)
ASSESSMENT!!
1. Why is this study necessary?
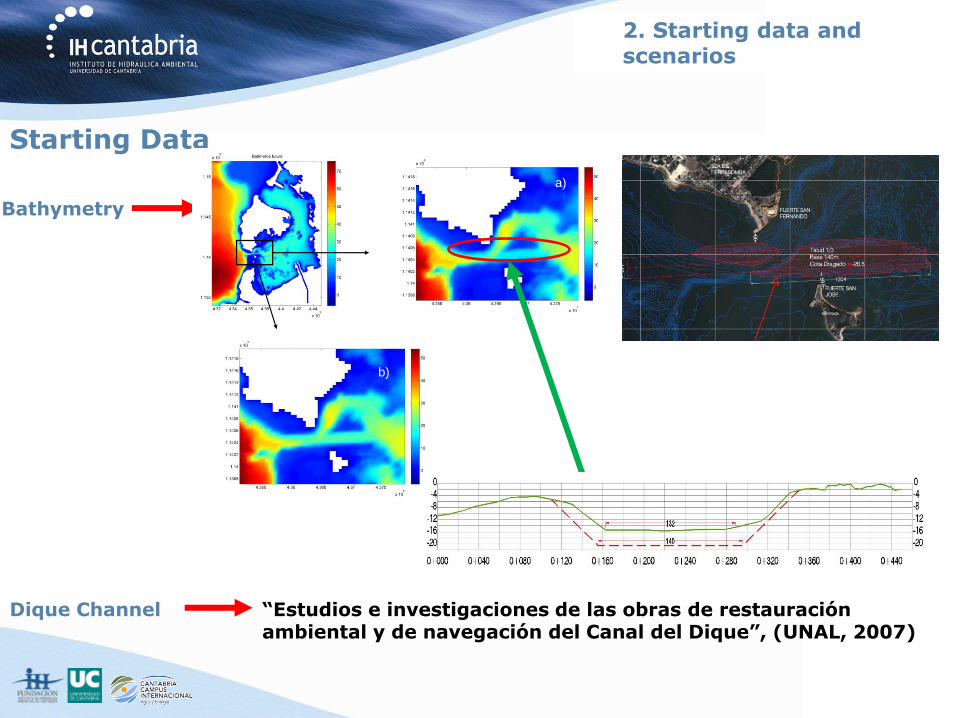
2. Starting data and scenarios
Bathymetry
Starting Data
a)
b)
Dique Channel “Estudios e investigaciones de las obras de restauración ambiental y de navegación del Canal del Dique”, (UNAL, 2007)
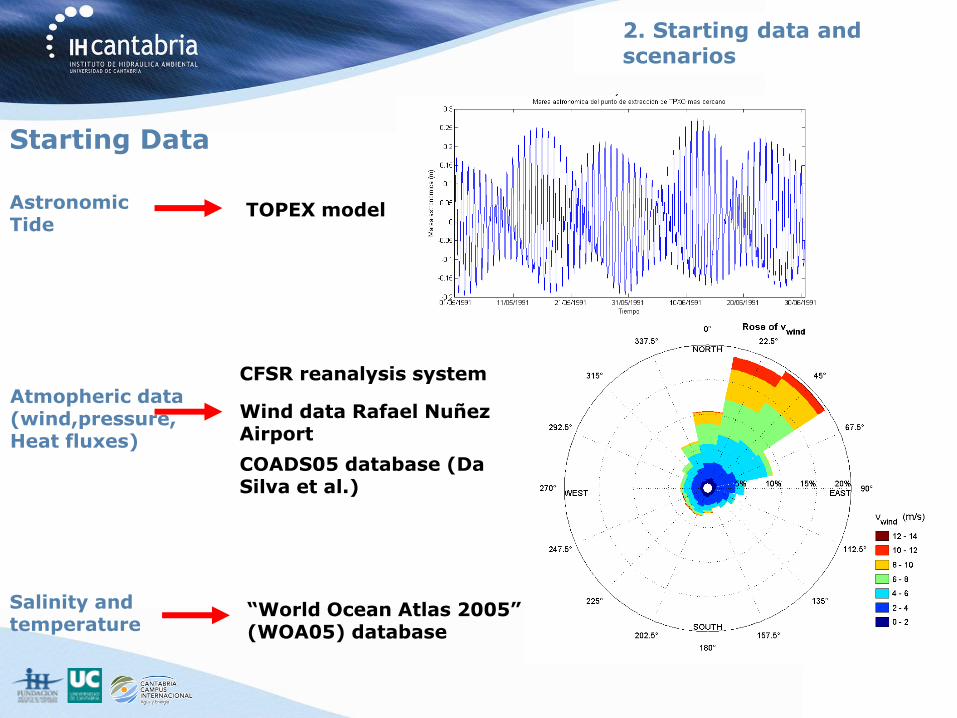
CFSR reanalysis system Atmopheric data (wind,pressure, Heat fluxes)
Salinity and temperature
Wind data Rafael Nuñez Airport
COADS05 database (Da Silva et al.)
“World Ocean Atlas 2005” (WOA05) database
Astronomic Tide
a)
b)
a)
b)
TOPEX model
2. Starting data and scenarios
Starting Data
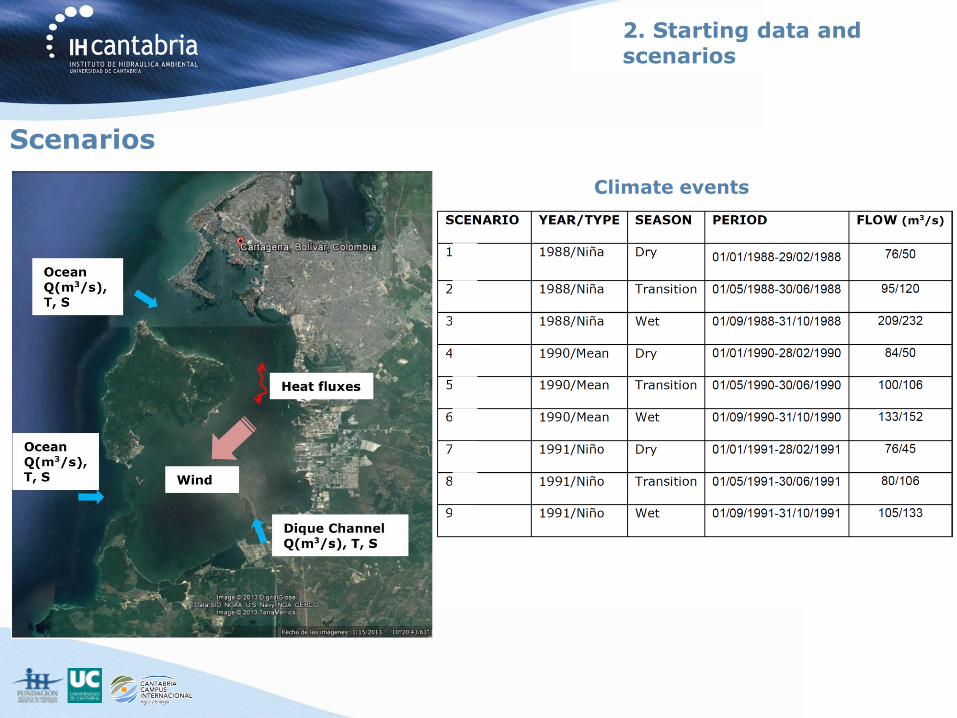
Scenarios
Climate events
2. Starting data and scenarios
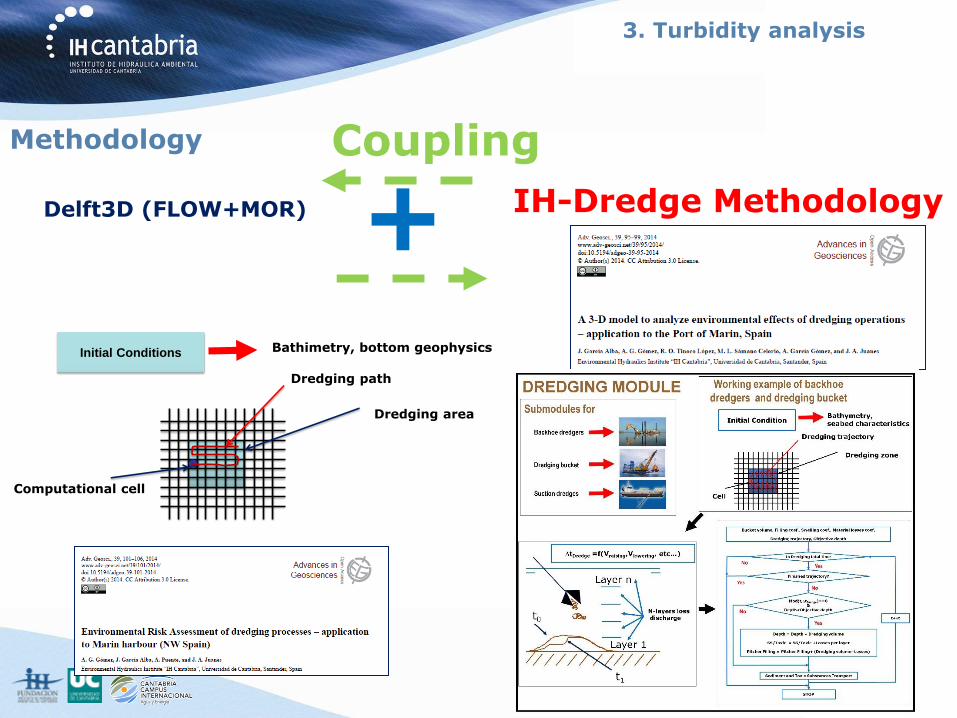
IH-Dredge Methodology + Delft3D (FLOW+MOR)
Coupling
3. Turbidity analysis
Methodology
Initial Conditions
Computational cell
Dredging path
Bathimetry, bottom geophysics
4. Módulos de dragado
Dredging area
Draga de succión en marcha
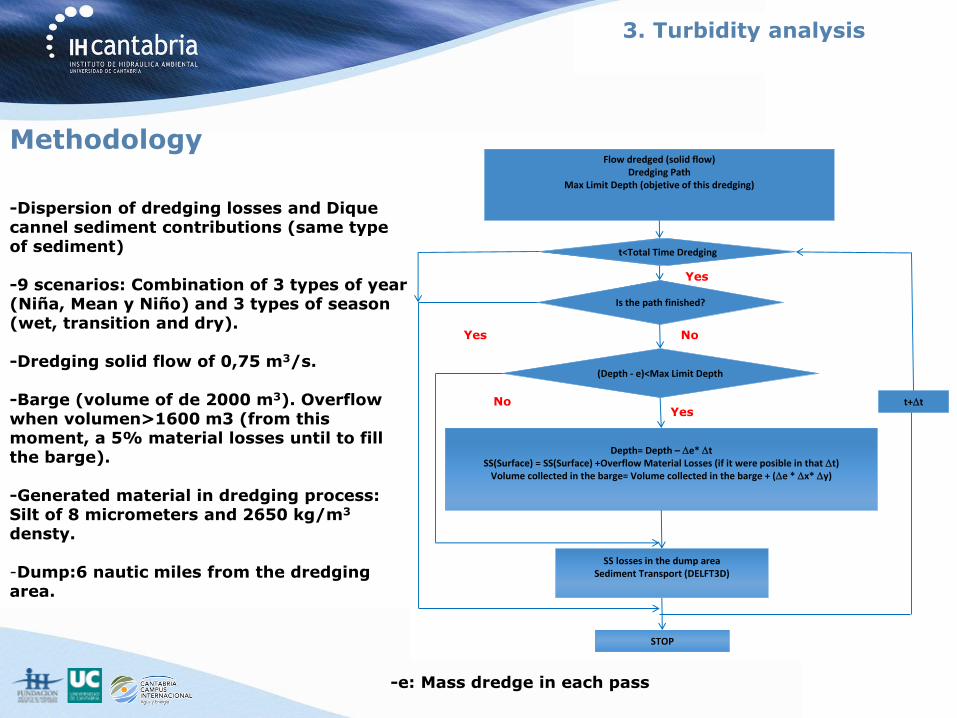
-Dispersion of dredging losses and Dique cannel sediment contributions (same type of sediment) -9 scenarios: Combination of 3 types of year (Niña, Mean y Niño) and 3 types of season (wet, transition and dry). -Dredging solid flow of 0,75 m3/s. -Barge (volume of de 2000 m3). Overflow when volumen>1600 m3 (from this moment, a 5% material losses until to fill the barge). -Generated material in dredging process: Silt of 8 micrometers and 2650 kg/m3 densty. -Dump:6 nautic miles from the dredging area.
3. Turbidity analysis
Methodology Flow dredged (solid flow)
Dredging PathMax Limit Depth (objetive of this dredging)
Depth= Depth – e* tSS(Surface) = SS(Surface) +Overflow Material Losses (if it were posible in that t)
Volume collected in the barge= Volume collected in the barge + (e * x* y)
STOP
Trayec.Terminada?
YesNo
NoYes
t<Tiempo Total Dragado
Yes
t+t
SS losses in the dump areaSediment Transport (DELFT3D)
Is the path finished?
t<Total Time Dredging
(Depth - e)<Max Limit Depth
-e: Mass dredge in each pass

Instantenaous concentration
Spatial distribution of SS concentration provided by material losses (kg/m3) during the dredging process in the surface layer. Scenario: year 1990 (Mean year)- Transition season
t = 1 h t = 150 h
t = 300 h t = 430 h
3. Turbidity analysis
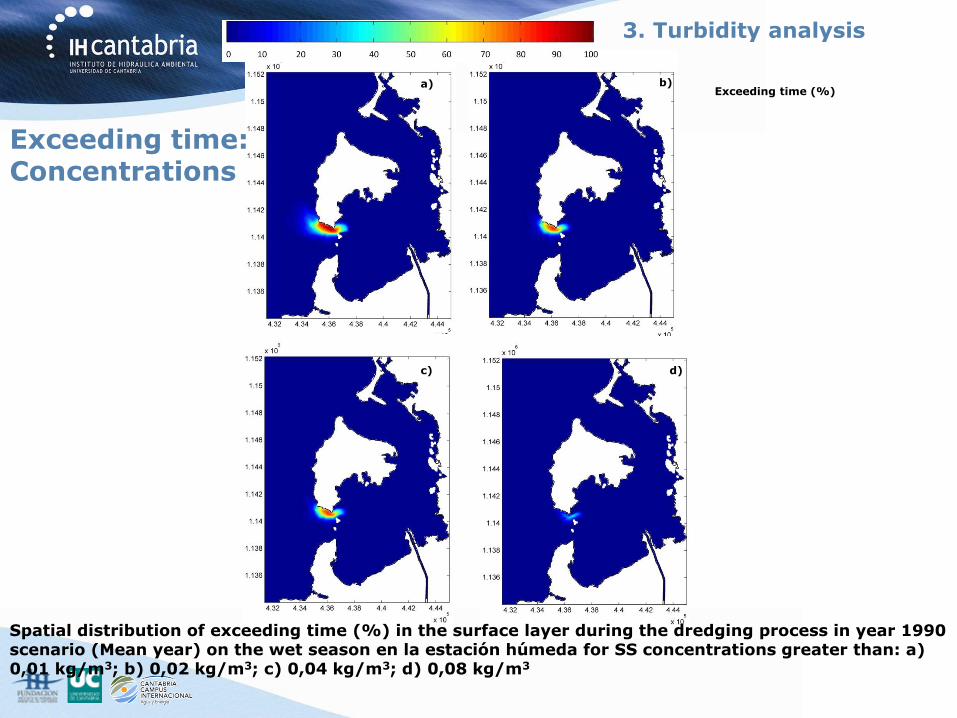
Spatial distribution of exceeding time (%) in the surface layer during the dredging process in year 1990 scenario (Mean year) on the wet season en la estación húmeda for SS concentrations greater than: a) 0,01 kg/m3; b) 0,02 kg/m3; c) 0,04 kg/m3; d) 0,08 kg/m3
Exceeding time (%) a) b)
c) d)
Exceeding time: Concentrations
3. Turbidity analysis
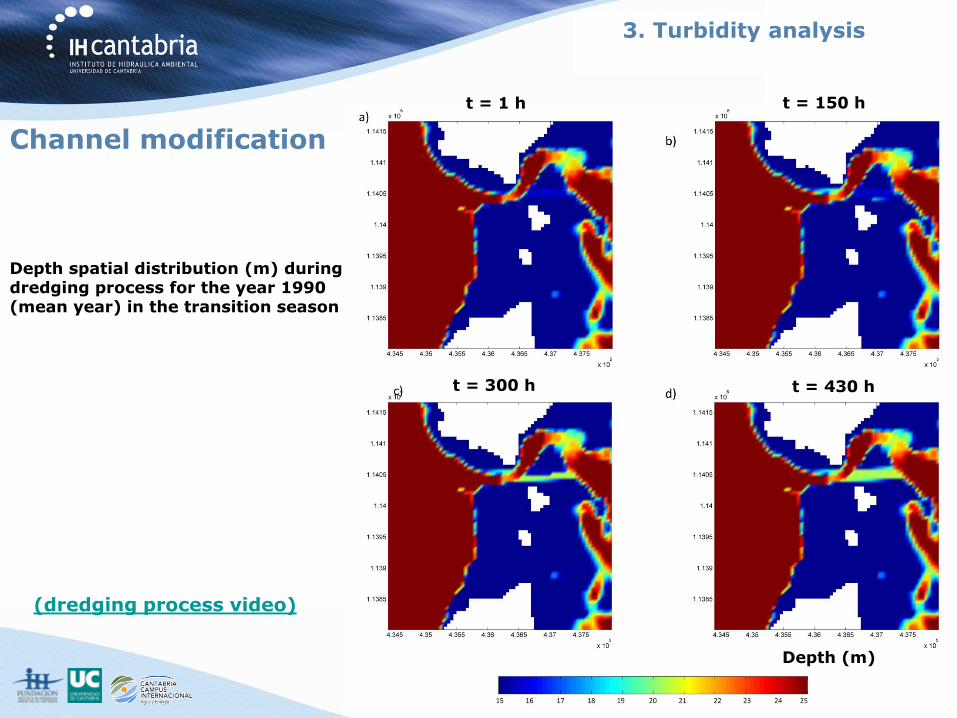
Channel modification
Depth spatial distribution (m) during dredging process for the year 1990 (mean year) in the transition season
(dredging process video)
t = 1 h t = 150 h
t = 300 h t = 430 h
3. Turbidity analysis
Depth (m)
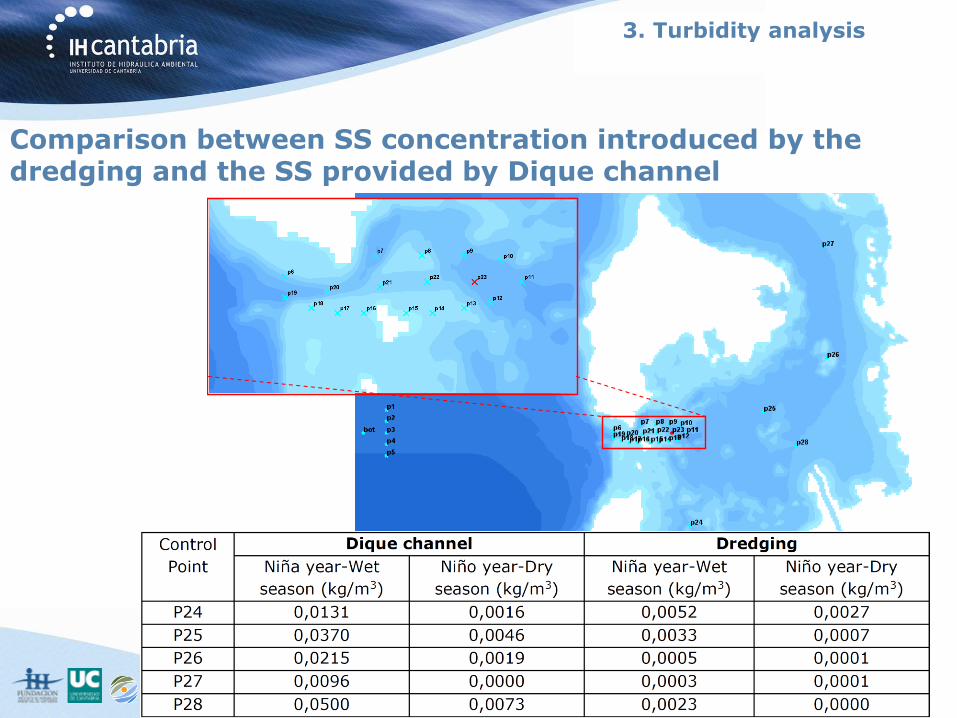
Comparison between SS concentration introduced by the dredging and the SS provided by Dique channel
3. Turbidity analysis
Conclusions -In the area to be dredged, the average SS concentration in the surface layer has values ranging from 0.048 kg/m3 (Niña year – wet season) to 0,074 kg/m3 ( Niño year –transition season). -In the dredging area, the maximum value of the temporal average concentration is between 0,123 kg/m3 (Niña year-wet season and Mean year-dry season) and 0.178 kg/m3 (Niño year-transition season). -Exceeding time of concentrations >0.02 kg/m3 is similar for all scenarios, whereas the related area to the exceeding time of concentrations > 0.01 kg/m3, is bigger for scenarios on the dry season due to hydrodynamic fenomena in the channel (higher outflow in that zone). -The discharge into the dump area has a very localized dispersion not reaching the dredging area or inside the bay. -Dredging material losses affect a localized area in the dredging zone. While the dredge is working the SS concentration in this area due to its losses are greater than the concentration provide by Dique channel. During Niña year the SS concentration coming from Dique channel is much greater than the sediment contribution of the dredging process. On the dry season it is lightly smaller.
3. Turbidity analysis
4. Acknowledgements
Acknowledgements
-Aqua & Terra Consultores Asociados S.A.S. -Plan Nacional de I+D+i (2013) del Ministerio de Ciencia e Innovación (Proyecto CTM2012-32538). -CFSR (Climate Forecast System Reanalysis, The National Centers for Environmental Prediction NCEP). -Rafael Nuñez Airport (wind data).
-“World Ocean Atlas 2005” (WOA05) database. -COADS05 database. -TOPEX/Poseidon System.

Javier García Alba*, J.F. Bárcena, A. García , B. Pérez-Díaz, P. Núñez, S. Castanedo, R. Medina
ENVIRONMENTAL HYDRAULICS INSTITUTE “IHCANTABRIA”. UNIVERSIDAD DE CANTABRIA
IMPACT OF DREDGING PROCESSES IN TURBIDITY OF SEMI-
ENCLOSED WATER BODIES: APPLICATION TO BAY OF
CARTAGENA DE INDIAS (COLOMBIA)
Related Documents