Drug-related mortality among newly-released offenders Home Office Online Report 16/03 Social Survey Division, Office for National Statistics National Addiction Centre, Institute of Psychiatry The views expressed in this report are those of the authors, not necessarily those of the Home Office (nor do they reflect Government policy).

Welcome message from author
This document is posted to help you gain knowledge. Please leave a comment to let me know what you think about it! Share it to your friends and learn new things together.
Transcript

Drug-related mortalityamong newly-releasedoffenders
Home Office Online Report 16/03
Social Survey Division, Office for National StatisticsNational Addiction Centre, Institute of Psychiatry
The views expressed in this report are those of the authors, not necessarily those of the Home Office (nor do theyreflect Government policy).

DRUG-RELATED MORTALITY AMONG NEWLY-RELEASED OFFENDERS
Report of a research project carried out by the Office for National Statisticsand the National Addiction Centre on behalf of the Home Office
Nicola SingletonElizabeth PendrySocial Survey Division,Office for National Statistics
Colin TaylorMichael FarrellJohn MarsdenNational Addiction Centre,Institute of Psychiatry

Acknowledgements
We would like to acknowledge those people who contributed to the survey and the productionof this report. Thanks are due to staff at the Home Office and the Prison Service, in particularRachel Higgs and Keith Rogers who provided us with the prison records and dealt sopromptly and efficiently with our queries and Arun Sondhi in the Drug & Alcohol ResearchProgramme (DARP) for comments and advice on the content of this report.
Thanks are also due to ONS staff for their assistance: especially to Kerry Bond of the NationalHealth Service Central Registrar (NHSCR, Registration Division) for assistance with thematching of prisoners to the NHSCR, to Lin Shane and Rosemary Coward (Vital events andMorbidity Processing, Administrative Sources and Geography Division) for re-coding of ICD9codes to ICD10, to Allan Baker (Mortality, Health and Care Division) for the provision of thenational mortality data and advice on the Drug Poisoning Database and coding of deaths, andto Pat Riach (Medical Research and Confidentiality, Health and Care Division) for theprovision of coroners’ texts.
We were also assisted by Theresa Johnston at the Scottish Office who provided deathcertificates for deaths occurring in Scotland.
Nicola Singleton, Elizabeth Pendry, Colin Taylor, Michael Farrell and John Marsden.

contentsAcknowledgements
Executive summary.................................................................................................................... 1
1 Introduction ......................................................................................................................... 6
2 Method................................................................................................................................ 8
Preparation of the Module A dataset...................................................................................... 8
Module A sample characteristics............................................................................................ 9
Preparation of the Module B dataset.................................................................................... 11
Analysis of Module B............................................................................................................ 12
3 Mortality rates ................................................................................................................... 13
Recorded deaths .................................................................................................................. 13
Mortality rates ....................................................................................................................... 14
Extent of increased risk of death immediately post-release................................................. 16
Factors associated with mortality rates ................................................................................ 16
4 Causes and circumstances of deaths............................................................................... 21
Underlying causes of death.................................................................................................. 21
Time since release from prison ............................................................................................ 23
Types of drugs involved in drug-related deaths ................................................................... 24
Settings in which drug-related deaths occurred ................................................................... 27
Alcohol.................................................................................................................................. 28
Associated illnesses ............................................................................................................. 29
Accidental versus suicidal intent………………………………………………………………... 29
5 Risk factors for drug-related mortality............................................................................... 31
Socio-demographic and personal characteristics (Table B1, Appendix B; Table C1,
Appendix C).......................................................................................................................... 32
Offence and sentence characteristics (Table B2, Appendix B; Table C2, Appendix C)
……………………………………………………………………………………………….35
Substance use (Table B3, Appendix B; Table C3, Appendix C).......................................... 37
Mental state (Table B4, Appendix B; Table C4, Appendix C) .............................................. 39
Final logistic regression model ............................................................................................. 43
6 Discussion......................................................................................................................... 46
7 Recommendations............................................................................................................ 51
References............................................................................................................................... 54
Appendix A: Statistical techniques used in the analysis for this report................................... 57
Appendix B: Characteristics of those dying from drug-related causes, from other causes and
those who were still alive (Module B) ...................................................................................... 59
Appendix C: Prevalence of drug-related death by risk factors ............................................... 65
Glossary……………………………………………………………………………………………….75

1
Executive summary
There is considerable concern about rates of drug-related mortality in the United Kingdom.Studies have suggested that recently released offenders are a group at high risk of dying fromdrug-related causes. To obtain more information about the extent and nature of drug-relatedmortality among newly-released prisoners in England and Wales, the Home Officecommissioned the Office for National Statistics to undertake a research project incollaboration with the National Addiction Centre.
Mortality rates
• Module A deals with 6,674 discharges occurring in June 1999 and 6,736 in December1999. Of these 13,410 discharges, 972 could not be traced on the National HealthService Central Register resulting in a final sample size of 12,438.
• In the time period covered by the study, 79 drug-related deaths and 58 deaths from othercauses were recorded among study members in Module A. The definition of drug-relateddeath used in this study is that used for the Office for National Statistics Drug-RelatedPoisoning Deaths Database.
• There was a high rate of death in the immediate post-release period. There were 13deaths in the first week after release (55 deaths per thousand per annum), six in thesecond week (25 deaths per thousand per annum) and three-four per week in the thirdand fourth weeks (15 deaths per thousand per annum). After this the rate of deathdeclined to a steady rate of about two deaths per week (between 5 and 10 deaths perthousand per annum).
• The decline in the mortality rate after discharge for all causes was largely due to thedecline in the drug-related mortality rate. The drug-related mortality rate decreased from50 per thousand per annum in the first week after release to 17 per thousand per annumin the second week and then to about four or five per thousand per annum thereafter. Thehighest rate for mortality from other causes was observed four weeks after discharge andwas just over ten per thousand. It then dropped slightly to between two and four perthousand.
• Over the study period 137 deaths were recorded among the people in the sample,whereas in a sample of the general population matched for age and gender only 23 wouldbe expected. In the week following release, prisoners in the sample were about 40 timesmore likely to die than a member of the general population. Most of this excess (90%)was associated with drug-related causes.
• A measure of the extent of excess mortality specifically associated with the immediatepost-release period is obtained by comparing the excess mortality ratio for the first weekpost-release with that for the period three months or more after release, when mortalityrates remained constant. The drug-related component of the excess mortality ratio for thefirst week post-release was 12.5 times greater than that for the period three months toone year post-release and in the second week was 4.2 times greater.
• The age of the prisoner at the time of release was significantly associated with the risk ofdeath from both drug-related and other causes. There was a higher than expectednumber of deaths in all age groups compared to the general population but the differencewas greatest for prisoners aged 25 to 39 years old at the time of release. In this age

group there were about 11 times as many deaths as expected and about two-thirds of thisexcess mortality was due to drug-related causes.
• Two groups of main offence had significantly higher rates of drug-related mortality. Thesewere theft (which included robbery, burglary and fraud) and property/other crimes. Bothgroups had three times higher odds of drug-related mortality after release.
Causes and circumstances of death
• The 56 non-drug-related deaths for which a cause could be ascertained were classifiedas either acute or chronic. Overall, 16 were classified as chronic and 40 as acute, withmany, if not most, in some way related to the lifestyle and pattern of drug and alcoholconsumption. In this population, a significant number of non-drug-related deaths werethe result of motor vehicle accidents, alcohol-related deaths and suicides reflecting thehigh risk lifestyle of this population.
• A large proportion of the cohort had additional spells in prison during the follow-up period.It is apparent that a significant proportion of those dying a comparatively long time aftertheir index release from prison had died immediately after a more recent release fromprison. This is most marked in the case of drug-related deaths. A fifth of this group haddied within two weeks of their index release but almost a third had died within two weeksof their last release from prison.
• Of the 79 drug-related deaths just over half (53 per cent) were recorded as involving asingle drug only. A single drug with alcohol was recorded in 13 per cent of cases, mixeddrugs without alcohol in 19 per cent and mixed drugs with alcohol in 14 per cent of cases(in 71 per cent of cases heroin or morphine were specifically mentioned either by thecoroner or in the toxicology report).
• Information about where death occurred was available for just under half the drug-relateddeath cases. A large proportion of deaths occurred in residential settings suggesting thatit is possible that family members or friends may have observed the deterioration.
• There were a number of deaths where the underlying cause of death was specificallyalcohol-related and others where alcohol was mentioned as a contributory factor. In totalamongst all deaths, 11 deaths were classified as alcohol-related and alcohol was found tobe a contributory factor or found present in the body of a further 23 cases (21 of thesewere drug-related deaths).
• Amongst the drug-related deaths in the sample there was only one instance of a coronerconsidering that a deliberate suicide had occurred, although suicides were recordedamongst the non-drug-related deaths.
Risk factors for drug-related mortality
• Module B involved the linking of data from the ONS Psychiatric Morbidity amongPrisoners Survey (PMP) carried out in 1997 with data on releases and deaths. A sampleof 3,142 was obtained from the PMP and 2,649 of these prisoners had been released intothe community in England or Wales. Of these 2,649, 103 could not be traced on theNational Health Service Central Register and one case was later found to have died incustody and was excluded, resulting in a final sample size of 2,545.

3
• There have been 25 drug-related deaths and 21 deaths from other causes recorded tostudy members in Module B. The results of the analyses in this section are thereforebased on very small numbers so should be interpreted with caution.
Socio-demographic and personal characteristics
• Those in the Module B sample dying from drug-related causes were most likely to bemale, white and aged under 30. The majority had left school at 16 years of age, had noqualifications and had been living off crime before the prison term when they wereinterviewed. They were also mostly single at the time of interview and had been livingwith other adults in rented, self-contained accommodation before the prison term whenthey were interviewed.
Offence and prison sentence factors
• Compared with the survey population as a whole, people in Module B who had died fromdrug-related causes were:
− more likely to have been imprisoned for a sex offence− less likely to have served between six and 11 months− less likely to have been imprisoned in a Category C or Female Training prison or an
Open or Category D prison.
Substance use
• A range of factors relating to substance use and dependence were considered in theanalysis of the survey data. Compared with the survey population as a whole, people whohad died from drug-related causes were more likely to have:− injected drugs− used illicit tranquillisers− used drugs in the month before the prison term in which they were interviewed− been dependent upon opiates and stimulants in the year before the prison term
when they were interviewed− experienced an accidental overdose in the past− had treatment for drug problems during the prison term when they were interviewed− had treatment for drug problems in the year before the prison term when they were
interviewed− been prescribed methadone during the prison term they were serving when
interviewed.
Mental state
• A number of factors indicative of respondents’ mental state were also considered.Compared with the survey population as a whole, people who had died from drug-relatedcauses were more likely to have:
− been assessed as having antisocial and other types of personality disorder and lesslikely to have non-antisocial types of personality disorder only
− been receiving medication acting on the Central Nervous System (CNS) at the timeof interview
− had suicidal thoughts between one week and one year before the interview

− ever experienced three or more stressful life events− been victimised during the prison term they were serving when they were
interviewed.
Multivariate analyses
• Multiple logistic regression analysis was used to try to identify the factors that wereindependently associated with the likelihood of dying from drug-related causes taking intoaccount all the other factors shown above to be associated with drug-related mortality.
• The personal and socio-demographic factors identified in this way were employmentstatus (living off crime or being economically inactive increased risk), marital status (beingseparated, divorced or widowed or being single increased risk) and having a smallprimary support group. Prisoners who were taken into Local Authority Care duringchildhood had a lower risk of drug-related death.
• The most important prison-related factor was offence type (those held for sex offenceshad a higher risk of drug-related death).
• Having a history of using tranquillisers illicitly, use of drugs in the month beforeimprisonment and not using drugs in the prison term in which they were interviewed wereassociated with a significantly increased risk of mortality from drug-related causes.
• Other factors which entered the model but for which the differences between groups didnot reach statistical significance were the length of the prison term in which they wereinterviewed, having a history of accidental overdose, being in receipt of medication actingon the CNS at the time of interview, and the number of stressful life events.
Discussion
• This study is the first of its kind to empirically estimate the drug-related mortality riskamong all sentenced prisoners in the early phase of release from prison in England andWales. The most striking conclusion from this study is the very high rates of drug-relatedmortality in the first two weeks after release from prison. The effect is very strong andconfirms findings from previous smaller-scale studies.
• This study confirms that released prisoners have a much higher risk of death than peoplein the general population. This is consistent with a broader body of knowledge indicatingthat individuals with a high level of drug involvement, high level of drug dependence, useof injected drugs, use of tranquillisers, and lower levels of social support and of economicand social functioning are at greater risk. It also indicates that those who are in prison fora medium period of time are also at greater risk.
• As well as showing a high risk for early drug-related deaths, this study shows that thepost-release population is at high risk from non-drug-related death also and that theneeds from a social, mental and physical perspective of prisoners on release are verysubstantial.
• A high proportion of individuals returning to the community from prison who have useddrugs immediately prior to entry will return to drug use. It is clear that this return to usewith altered tolerance to opiates, alcohol and benzodiazepines presents a major hazard inthe first week.
5
• Some of the data from Module B of this study relating to use of health services wouldappear to indicate that many of those at risk are being identified and worked with to somedegree. There is a need to see if the process of risk identification and linkage forthroughcare planning and post-release support could be developed in a manner thatwould assist in reducing the levels of risk exposure on release. The present findings haveimplications for the operation of drug misuse treatment interventions within the criminaljustice system. The operation of Counselling, Assessment, Referral, Advice andThroughcare (CARAT) initiatives should be reviewed in particular so that the prisonrelease arrangements (throughcare) for inmates with known drug misuse arestrengthened.
• There is clear evidence from other studies that drug substitution treatment for those withchronic opioid dependence reduces the risk of death. Consideration should be given toensuring that opioid dependent individuals on release from prison have fast track accessto community based treatment services and in particular to methadone maintenancetreatment. Some of the data presented here seems to indicate that brief and intermittentprison based treatment does not play an effective role in reducing drug-related death risk.
Recommendations
• General education and awareness-raising about the risk of drug-related death in theimmediate post-release period as a result of the consumption of drugs and alcohol shouldbe made available to all prisoners as part of their release preparation.
• It is recommended that links to community based services be improved. Individuals athigher risk of drug-related death should be identified and linked into ongoing care withcommunity-based services immediately on release from prison as part of acomprehensive and integrated approach to treatment in prison and the community. Allprisoners on release should have priority access to community based drug services in thefirst month of release because of increased overdose risk and overall vulnerability torelapse during this period.
• Consideration should be given to the establishment of pilot studies to investigate thefeasibility of providing a methadone maintenance programme within prisons forindividuals with long-standing opioid dependence (recognising that some methadoneprescribing initiatives in prison have already been implemented).
• It is recommended that consideration should be given to developing a pilot project toinvestigate the use of naltrexone, which should include an evaluation of the likely impacton overdose risk and mortality.
• It is recommended that potential use of naloxone should also be further explored.
• It is suggested that the rates obtained in this study could be used as the basis for target-setting for the reduction in post-release drug-related mortality. Further research on thistopic is also recommended to establish the relative risk of drug-related mortality amongsub-groups not covered in this study, such as women prisoners and remand prisoners,and for the consideration of possible regional variation.

1 Introduction
There is considerable concern about rates of drug-related mortality in the UK. A number ofsmall-scale studies in different countries have suggested that recently released offenders area group that have especially high rates (Harding-Pink, 1990; Seaman et al., 1998; Seymour etal., 2000). To obtain more information about the extent and nature of drug-related mortalityamong newly-released prisoners in England and Wales and associated risk factors, the HomeOffice commissioned the Office for National Statistics to undertake a research project incollaboration with the National Addiction Centre. The main aims of the research, as given inthe project specification, were to:
• Estimate the drug-related mortality rates of prisoners recently released from prison inEngland and Wales.
• Determine how these rates differ from other populations.
• Determine the causes and circumstances of death (e.g. overdose, poisoning, suicideetc.).
• Determine the risk factors amongst this group.
• Determine how long drug-using ex-prisoners are at risk following release.
• Provide recommendations for future interventions at the prison-community interface.
There were two parts to the project. Module A involved the flagging on the National HealthService Central Register (NHSCR) of a large cohort of released prisoners identifiedretrospectively through the Inmate Information System in order to identify deaths among thisgroup (see Chapter 2). The size of the cohort was chosen so that it would provide goodestimates of mortality rates immediately post-release and the profile of these rates in relationto time from release. The large size of the cohort yields a large number of drug-relateddeaths, hence this module has also been used as the source of data on causes andcircumstances surrounding these deaths among newly released prisoners. However, this partof the study relates only to sentenced prisoners and information on possible associated riskfactors is limited to data available from the release extract and does not include any detailsabout history of drug use. Module B involved the linkage of data from the 1997 ONS Surveyof Psychiatric Morbidity among Prisoners (Singleton et al., 1998) to data on deaths from theNHSCR and coroners’ records to provide information about risk factors pre-release and theirrelationship to mortality among released prisoners, male and female, both remand andsentenced.
It has long been noted that opiate dependent prisoners on release from prison are vulnerableto drug overdoses and other adverse events (Stöver, 2001). The aim of this study was toattempt to establish an empirical basis for this observation and to quantify the size of theadditional risk of death in the early period after release from prison among the sentencedprison population as a whole.
Prisoners are a vulnerable population with high levels of substance dependence and otherforms of social and psychiatric morbidity. Mortality is most likely to be significantly reducedduring the period of imprisonment, due to reduced alcohol and drug use and reducedexposure to the risks of ordinary daily life. After release, mortality is increased substantiallycompared to the general aged-matched population (Harding-Pink, 1990). The specific issue of

7
concern in this study is whether mortality is particularly elevated in the immediate post releaseperiod. This might be due to involvement in a wide range of potentially risky activities in theimmediate post-release period, in reaction to the restriction of activities during the period ofimprisonment. It might also be due to alteration in tolerance to drugs of dependence, inparticular opiates, but also other depressant drugs such as alcohol and benzodiazepines mayplay a significant part.
Official statistics report that there were more than 2,900 drug-related deaths identified inEngland and Wales in 1999 (Office for National Statistics, 2001). These figures includedeaths resulting from the consumption of all types of drugs, including paracetamol and anti-depressants, and suicides as well as accidental deaths. From longitudinal studies of heroinaddicts in different countries it is estimated that the annual mortality is between one and twoper cent, which is approximately 14 to 16 times the expected mortality rate for this broadlyyoung age group (Oppenheimer et al., 1994; Darke and Zador, 1996; Hser et al., 2001).
Immediate or almost immediate deaths can arise as a direct effect of a drug consumed. Thiscan be an accident due to an underestimate of the strength of the drug or a lack of knowledgeabout dose effects, or due to a deliberate overdose as part of a suicide act. Often it can bevery difficult to distinguish between accidental and deliberate overdoses. Frequently also adeath can occur from other causes, such as road accidents, falls or violent incidents, wherethe deceased is known to be a drug user or opiates are identified as part of a forensictoxicology screen. In such cases, determining whether the death was drug-related can bedifficult and coroners may vary considerably in their methods of classifying such deaths.
Drug overdose is one of the most frequent causes of death amongst the drug usingpopulation in the UK (Ghodse et al., 1998; Frischer et al., 1993; Powis et al., 1999; Strang etal., 1999a). Neeleman and Farrell (1997) noted a striking nine-fold increase in opioid-relateddeaths in the period between 1974 and 1992 in England and Wales. Around 60 per cent ofregular heroin users have experienced a non-fatal overdose at some point (Darke and Zador,1996; Darke et al., 1996), with the risk of overdose increased for opiate users who have alsoconsumed other central nervous system depressants, such as alcohol, benzodiazepines orother opioids (Gossop et al., 1996; Powis et al., 1999; Strang et al., 1999a; Strang et al.,1999b; Darke and Ross, 1999).
There are complex issues around the classification of drug-related deaths that were wellreviewed in the recent Advisory Council on the Misuse of Drugs (ACMD) report “ReducingDrug Related Deaths” (2000). There are a range of approaches to the categorisation of drug-related deaths. This report will adhere to the standard ONS classification system.
2 Method
Two datasets were constructed for the project. Firstly, data on deaths were obtained for alarge cohort of prisoners selected from the release extracts from the Prison Service InmatesInformation System for June and December 1999 (Module A). Secondly, for Module B, datesof release and death data were added to data collected on the ONS survey of psychiatricmorbidity among prisoners which was carried out in 1997.
Ethical approval for the research was obtained from the Prisons Health Research EthicsCommittee. Particular attention was paid to the procedures to be adopted for maintainingconfidentiality of the data throughout the project.
Preparation of the module A dataset
The sample was drawn from a list, provided by the Prison Service from their InmateInformation System, of all sentenced prisoners who had been discharged from prison in Juneand December 1999. The Inmate Information System is a database which contains extractsfrom the Local Inmates Database System (LIDS), which is the administrative system used inall prisons to record inmate details. The sample for this study was taken from a routine listingobtained from this database, the monthly release extract, which contains information on allsentenced prisoners released from custody throughout each month. This list included detailsof the prison term and of the offence committed. Prisoners who had been deported orrepatriated, who had transferred out of England or Wales, had transferred to hospital or haddied in custody were excluded from the list, leaving a total of 7,416 eligible cases in the Junesampling frame and 8,988 in the December frame. The list for each month was then orderedby age and a systematic sample drawn using different sampling fractions for each month. Thesampling fractions were selected with the aim of providing a sample of approximately 6,000prisoners in each month flagged on the NHS Central Register (NHSCR). The expectedmatching rate on the NHSCR was 88 per cent which meant that approximately 6,800 caseswould be needed in each month to provide a matched sample of 6,000 per month.1 Toachieve this, the sampling fractions used were nine in ten and three in four for June andDecember respectively. This yielded a sample of 13,410 cases: 6,674 from June 1999 and6,736 from December 1999.
Deaths were defined as being drug-related according to the National Statistics definition (seeChristophersen et al., 1998), which is used by ONS to compile a database of drug-relatedpoisoning deaths in England and Wales. Under this definition, drug-related deaths are deathswith an underlying cause of death with the International Classification of Diseases, NinthRevision (ICD-9) codes shown in Figure 2.1.
1 It was necessary to restrict the sample size for financial reasons. A charge is made for each person flagged on the NHSCR and for each death for which
information is obtained.

9
This definition includes only deaths directly caused by drugs (e.g. poisoning, overdoses) anddoes not include deaths caused indirectly by drugs (e.g. a drug user killed whilst driving underthe influence of drugs, a drug user dying from AIDS). This is because it is generally the directcause of death (e.g. road traffic accident, HIV infection) that is selected by the coroner as theunderlying cause of death. While, the National Statistics definition has been criticised forexcluding some deaths caused indirectly by drugs and including others, such as poisoningsby ‘over the counter’ medications, which may not be related to illicit drug-use (ACMD, 2000),other definitions have different drawbacks and omissions. The advantage of the ONSdefinition was that it was unambiguously defined, required information from death notificationsonly and hence could be applied to all cases in the study, and there was comparable nationaldata available.
A file was created to provide an indication of the frequency and extent to which members ofthe sample experienced additional prison terms following their index discharge in June orDecember 1999. This file showed the number of completed terms for each prisoner and thelength of each repeat term. It was created from release extract files which were obtainedfrom the Prison Service showing all the discharges from June 1999 until January 2001. Allpossible matches were made provisionally from the release extracts with cases in the sample,based on name and date of birth. All the possible matches were examined in more detail todetermine which could be considered ‘true’ matches. In general, cases where there wasmore than one discrepancy between the sample case and the release file case were excludedas not being true matches.
Module A sample characteristics
As noted above, this report deals with 6,674 discharges of sentenced prisoners occurring inJune 1999 and 6,736 in December 1999. Of these 13,410 discharges, 972 could not betraced on the NHSCR so that the final number of releases included in the study was 12,438.
Figure 2.1 International Classification of Diseases, Ninth Revision (ICD-9) codesused to define drug-related deaths
Underlying cause ofdeath code (ICD-9) Description
292 drug psychoses
304 drug dependence
305.2 – 305.9 non dependent abuse of drugs
E850-E858 accidental poisoning by drugs,medicaments and biologicals
E950.0-E950.5 suicide and self-inflicted poisoningby solid or liquid substances
E980.0 – E980.5 poisoning by solid or liquid substances, undetermined whether accidentally or purposely inflicted
E962.0 assault by poisoning – drugs and medicaments

Table 2.1 Total number of discharged prisoners traced and the number of observationdays in the study to 31 January 2001, by gender of discharged person
Numberdischarged
Number ofobservation days
Women 883 445,087
Men 11,555 5,822,747
Total 12,438 6,267,834
For purposes of reporting death rates, the study period is deemed to end in January 2001,giving a total number of observed person-days2 on which to base mortality rate calculations of6,267,834 (Table 2.1).
Within the total sample, there are 11,555 men and 883 women, a ratio of 13:1; a similar ratioholds for the number of observed person-days on which the death rate calculations arebased. This is not a sufficient number of women for death rates to be reliably reported formen and women separately.
Table 2.2 Gender and age at index discharge of study members in 5-year age bands
Age at indexdischarge
Women Men Total
15 – 19 113 (13%) 1,786 (15%) 1,899 (15%)20 – 24 219 (25%) 2,955 (26%) 3,174 (25%)25 – 29 199 (23%) 2,386 (21%) 2,585 (21%)30 – 34 153 (17%) 1,839 (16%) 1,992 (16%)35 – 39 90 (10%) 1,107 (10%) 1,197 (10%)40 – 44 42 (5%) 650 (6%) 692 (6%)45 – 49 28 (3%) 374 (3%) 402 (3%)50 – 54 30 (3%) 235 (2%) 265 (2%)55 – 59 6 (1%) 121 (1%) 127 (1%)60 – 64 3 (0%) 62 (1%) 65 (1%)65 – 69 0 27 (0%) 27 (0%)70 – 74 0 7 (0%) 7 (0%)75 – 79 0 3 (0%) 3 (0%)
80+ 0 2 (0%) 2 (0%)Total no. in
sample883 11,554 12,437*
*The age of one male discharged prisoner is unknown
Table 2.2 shows the distribution of age at discharge within the sample. Well over half of thesample was aged less than 30, with a quarter of the sample being aged 20 to 25 years. Therewas no significant difference in the age distribution between men and women.
2 The total, for all study members, of all days over which they were followed up, which is obtained by summing the number of days from release to date of deathor to 31 January 2001 for all individuals.

11
Some study members will have experienced repeated terms of incarceration during the studyperiod which will have had an impact on their risk of death. The Prison Service database isbased around prison episodes rather than individuals and so it is difficult to obtain informationon repeat prison terms for the large numbers of individuals in a sample of this size.Computerised listings of information were only available on discharges from prison and not onentry into prison. As a result it was possible to obtain details of additional terms ofimprisonment started and completed within the study period but not on repeat terms ofincarceration begun but not completed by the end of the study period. Identification of theserepeat terms of imprisonment was carried out by matching names and dates of birth from thesample file with those on subsequent release extracts. Therefore, if there are errors orvariation in the way these were entered into the Local Inmates Database System (LIDS), e.g.miskeying a date of birth or using a different form of a name, then a repeat term would bemissed. In addition, for people in the sample who died, a manual search of the Prison ServiceInmate Information System was conducted to obtain information on the most recent date ofrelease from prison. However, as these data were not available for the whole sample, thisinformation is not included here but is considered in the section on causes and circumstancesof death. The figures given here, therefore, will be under-estimates of the true number ofrepeat terms of imprisonment experienced by this cohort of offenders.
Over the follow-up period, at least two terms of incarceration (including the index term) werebegun and completed by 2,379 study members (19% of the sample), with 559 of thesecompleting three or more terms of imprisonment (maximum 13 terms). However, the aim ofthis study is to identify mortality rates for a cohort of prisoners released at a particular point intime. While the likelihood of repeated terms of imprisonment and subsequent releases maybe a factor increasing the risk of death of a proportion of the sample during the study period,the calculations of death rates must be based on the index discharge on the basis of whicheach individual was selected. Hence the mortality rates reported here are based upon thetotal time at risk of death after the index discharge and the total number of recorded deaths.No account is taken of whether the at-risk time or the deaths were at liberty or in asubsequent incarceration.
Preparation of the Module B dataset
Module B involved the linking of data from the ONS Psychiatric Morbidity among PrisonersSurvey (PMP) carried out in 1997 (Singleton et al., 1998) with data on releases and deaths.The PMP survey was carried out in all 131 prisons in England and Wales during 1997. Itinvolved personal interviews using a structured questionnaire which contained questionscovering employment and education, general health, access to health services and treatmentfor mental health problems as well as standard assessment instruments for assessing mentalhealth. The following sampling fractions were used: 1 in 34 male sentenced prisoners (1:50in the final four weeks of the survey); 1 in 8 men on remand and 1 in 3 of all women prisoners.A response rate of 88 per cent was achieved resulting in a sample of 3,142 prisoners.
Release dates for the prisoners who had taken part in the PMP survey were obtained fromthe Prison Service. Of these, 2,649 had been released into the community in England andWales (the remainder had either not been released yet or had been deported or repatriated,transferred out of England or Wales, transferred to hospital or died in custody).
Details of these 2,649 cases were sent to be flagged on the NHSCR. As with Module A, themajority of cases sent for flagging were matched with the register entries through automaticmatching. Where cases could not be matched automatically, operator matching was usedand this identified a number of cases with more than one possible match. Where there wasmore than one possible match, additional data was obtained from the PMP survey data orfrom the Prison Service to help identify which, if any, was the true match.

Out of 2,649 cases, 2,546 cases were successfully matched and flagged on the NHSCR(96%). One case was later found to have died in custody and was excluded, leaving a finalsample size of 2,545.
Details of any deaths that had been registered were sent to the research team. Oncereceived, details of the death and whether it was drug- or alcohol-related were entered intothe database with the prisoner’s details and interview data. We were notified of 46 deaths (25drug-related and 21 from other causes) by the NHSCR during the study period.
Analysis of Module B
The data were weighted for the different sampling fractions used in the PMP survey butweighting for non-response was not carried out as non-response was very low and there wasonly very limited information about non-responders on which to base any weighting.
Tables were run on the weighted data to look at the mental health and other characteristics(at the time of the survey in 1997) of those who had later died from drug-related causes andto investigate the prevalence of these risk factors in the prison population at that time. Testsfor significance of differences were carried out, since the small size of the sample of drug-related deaths means that quite large apparent differences could occur by chance.
Multiple logistic regression modelling was used to identify risk factors that appeared to beindependently related to risk of death from drug-related causes in the sample. The dependentvariable used in the logistic regression was drug-related death versus alive or death fromother causes. Logistic regression analysis is explained in more detail in Appendix A whichalso includes more information on the statistical procedures used in the analysis of theModule A dataset.

13
3 Mortality Rates
Recorded deaths
The Module A dataset was used for the calculation of mortality rates described in this section.Notification of deaths that occurred up to the end of January 2001 and were sent to theauthors before 31 July 2001 have been included in the study. The number of recorded deathsto study members is shown in Table 3.1.
Table 3.1 Number of recorded deaths to study members, by gender
Drug-related deathSurvived
Yes No
Total
Women 874 7 2 883
Men 11,427 72 56 11,555
Total 12,301 79 58 12,438
A total of 28 of these recorded 137 deaths are known to have occurred after discharge from afurther term of incarceration beyond the index discharge. However, as noted above, the timeto death used in the subsequent analysis here is the time from the index discharge that led totheir inclusion in the study cohort. The higher ratio of drug-related deaths amongst womenthat can be seen in Table 3.1 is unreliable, being based on a small number of events, and isnot statistically significantly different from the lower ratio amongst men.
There are sometimes extensive delays in recording a death. These delays are generallygreater in the case of drug-related deaths. Drug-related deaths are usually the subject of aninquest and this can result in delays of up to a year or more in final registration of the death.The mean delay in registering drug-related deaths included in this study was 132 dayscompared with 80 days for deaths from other causes (note that in five cases the date ofregistration of the death was not known).
The reporting of the bulk (75%) of deaths that were drug-related was delayed by no morethan 176 days (about 6 months) and for the deaths from other causes by no more than 108days (3½ months). At the time of carrying out the analysis for this report, the time since indexdischarge was about 25 months (750 days) for the June cohort and 19 months (570 days) forthe December cohort. Therefore, if the length of delay in recording deaths reported above istypical, it is likely that all the deaths occurring within seven months of index discharge willhave been included in the analysis, as will the majority of the deaths recorded over the first 12months of the study. However, there may be a few deaths that occurred towards the end ofthe study period that were unrecorded at the time of the analysis.

Mortality rates
The period-specific death rates and the overall death rates for both drug-related causes andother causes of death in the study cohort are shown in Table 3.2.
The mortality rates for the year after release from prison were 5.2 per thousand per annum formortality from drug-related causes and 3.8 per thousand for other causes. To allowcomparison between the mortality rates at different time periods post-release, the period-specific mortality rates are presented in the table as the per annum equivalent rate perthousand population. It can be seen that the period-specific mortality rates from all causesdeclines rapidly as length of time after discharge increases, from 55 deaths per thousand perannum during the first week after discharge to approximately a half of this figure (25 perthousand per annum) during the second week after discharge. It then approximately halvesagain to 15 per thousand during weeks three and four after discharge but thereafter the ratevaries between five and ten per thousand for the remainder of the first year after discharge.
Table 3.2 Numbers of observed deaths and equivalent death rate per annum by drug-related and non-drug causes and by weeks after discharge
Number of observed deaths Equivalent death rate per annum(per 1,000)
Weeks afterdischarge(grouped) Drug-
relatedNon-drug
All causes Drug-related
Non-drug All causes
Up to 1 12 1 13 50.4 4.2 54.6
1 up to 2 4 2 6 16.8 8.4 25.2
2 up to 4 2 5 7 4.2 10.5 14.7
4 up to 8 5 2 7 5.3 2.1 7.4
8 up to 13 4 3 7 3.4 2.5 5.9
13 up to 26 15 13 28 4.9 4.2 9.1
26 up to 52 22 21 43 3.6 3.4 7.0
Total to 1 yr 64 47 111 5.2 3.8 9.0
>= 1 year 15 11 26 3.1 2.3 5.4
Total 79 58 137 4.6 3.4 8.0
The fall in the rate of mortality is extremely marked in the drug-related mortality rates but isbarely detectable in mortality from other causes. The drug-related mortality rate decreasesfrom 50 per thousand per annum in the first week after release to 17 per thousand in thesecond week and then drops to five per thousand or below thereafter (Table 3.2 and Figure3.1). The highest rates for mortality from other causes were observed in the first four weeksafter discharge. The highest rate was 10.5 per thousand per annum which occurred in theperiod two to four weeks after discharge. After this the non drug-related mortality rate droppedto between two and four per thousand per annum, much the same as the drug-relatedmortality rate.

15
Table 3.3 Excess mortality among newly-released prisoners compared with (a) thegeneral population and (b) excess mortality 13 to 52 weeks post-release by cause ofdeath
No. ofdeaths
(a) Excess mortality ratio(compared with general population)
(b) Immediate excessmortality (compared with
13 to 52 weeks post-release)
Weeks afterdischarge(grouped)
Observeddeaths
Expecteddeaths
All causes Drug-relatedcauses
Non-drugcauses
Drug-relatedcauses
Non-drugcauses
Up to 1 13 0.3 40.2 37.1 3.1 12.5 1.1
>1 to 2 6 0.3 18.6 12.4 6.2 4.2 2.3
>2 to 4 7 0.6 10.8 3.1 7.7 1.0 2.8
>4 to 8 7 1.3 5.4 3.9 1.6 1.3 0.6
>8 to 13 7 1.6 4.3 2.5 1.9 0.8 0.7
>13 to 26 28 4.2 6.7 3.6 3.1
>26 to 52 43 8.3 5.2 2.6 2.51.0 1.0
Total up to 1 yr 111 16.7 6.6 3.8 2.8
>52 to 104 26 6.4 4.0 2.3 1.7
Total 137 23.1 5.9 3.4 2.5
To show how mortality rates among newly-released prisoners compare with rates among thegeneral population, the expected numbers of deaths for different time periods post-releasehave been calculated for an equivalent general population sample, matched for gender, ageand observation period, based on deaths in 1999 among the general population of Englandand Wales. Comparison of the number of observed deaths with the expected number givesthe excess mortality ratio, which is shown in Table 3.3. Over the study period as a whole, 137deaths were recorded among the people in the sample, whereas in a sample of the generalpopulation matched for age and gender only 23 would be expected. This gives an excessmortality ratio of about 5.9, of which 3.4 is due to drug-related deaths.
In the week immediately following release, prisoners in this sample were about 40 times morelikely to die than a member of the general population. Most of this excess mortality (over 90per cent) was associated with drug-related causes. The excess mortality ratio declinedsteeply after the first week, reaching a plateau from about four weeks after discharge at aboutfive times the expected mortality. From this time onwards about half the excess mortalityamong the released prisoners was due to drug-related causes (Figure 3.1).

Extent of increased risk of death immediately post-release
Recently released prisoners are a group of individuals who have very high-risk lifestyles and,as shown above, have higher mortality rates from both drug-related and non-drug-relatedcauses than the general population. However, it is also apparent from the data presentedabove that the period immediately post-release is one of particularly high risk of death andone of the aims of this research project was to identify the extent to which the risk isincreased at this time and for how long the period of elevated risk extends.
However, the mortality rates among released prisoners will vary if there are changes to thecomposition of the population, in particular if there are changes to the proportion of drug usersand, most importantly, injecting drug users in the population. A comparison of the excessmortality ratios (compared with the general population) in the immediate post-release periodwith that related to later periods (3 months to a year post-release) provides a measure of theexcess mortality associated with the period immediately after release that is independent ofthe age, sex and drug use profile of the population. As shown in Table 3.3, with respect to thedrug-related component, excess mortality up to week 1 is 12.5 times greater than that beyondthree months and in the second week post-release is 4.2 times greater. For other time periodsand for non-drug-related deaths the excess mortality ratios are not significantly different fromthose for the period three months to one year post-release.
Factors associated with mortality rates
The release extract used to obtain the Module A sample upon which these mortality rateshave been calculated, contained only limited information on factors that might be associatedwith risk of death post-release. The association of the few available factors with mortalityrates is considered below.
Figure 3.1 Excess mortality ratio for different time periods post-release by cause of death
05
1015202530354045
Up to 11 up to 2
2 up to 44 up to 8
8 up to 13
13 up to 26
26 up to 52>=52
Total
Time since release (weeks)
Exce
ss m
orta
lity
ratio
Drug-related deaths Not drug-related

17
Age at release
The age of the prisoner at the time of release was significantly associated with risk of deathfrom both drug-related and other causes. People aged 25 and over had a higher relative riskof death from drug-related causes compared to those aged less than 20, while people aged40 and over had a higher risk of death from causes that were not drug-related.
However, since older people might be expected to have higher risk of death than youngerpeople, the association between age at the time of release and risk of death from drug-relatedand other causes in the period of the study was also investigated by looking at the excessmortality in comparison to the general population. Table 3.4 shows that there was a greaterthan expected number of deaths in all age groups but that the difference was greatest forprisoners aged 25 to 39 years at the time of release. In this age group there were more than10 times as many deaths as expected and about two-thirds of this excess mortality was dueto drug-related causes. By contrast, those aged less than 20 or aged 40 and over had lowerexcess mortality ratios than the others in the sample and the excess deaths are due to othercauses rather than drug-related causes.
Table 3.4 Excess mortality among newly-released prisoners compared with the generalpopulation by age at time of release and cause of death
All causes Drug-relatedcauses
Non-drugcauses
Age at timeof release(grouped)
No. insample
Observeddeaths
Expecteddeaths
ExcessMortality
Ratio
ExcessMortality
Ratio
ExcessMortality
Ratio
<20 years 1,899 6 1.7 3.5 1.2 2.3
20 to 24 3,174 19 3.8 5.0 3.7 1.3
25 to 29 2,585 33 3.0 11.0 8.0 3.0
30 to 39 3,189 48 4.6 10.5 6.8 3.7
40+ years 1,590 31 10.1 3.1 0.8 2.3
Total 12,437* 137 23.2 5.9 3.4 2.5
* The age of one prisoner was not known
Ethnicity
The release extract from which the Module A sample was drawn contains information on therecorded ethnic origin of the released prisoners. In this sample (from which people who weredeported at the end of their sentence had been excluded), the majority were classed as‘White’ with only 11.8 per cent from other ethnic groups and only six deaths recorded amongthis ‘Other’ group. Released prisoners who were classed as ‘White’ had a significantly greaterrisk of death in the study period compared with those in the ‘Other’ group. The odds of a drug-related death for released prisoners in the ‘White’ category was more than three times greaterthan for those in the ‘Other’ group (OR 3.4; 95%CI 1.1-10.8). This increased risk wasessentially unchanged when differences in age are taken into account. Mortality from othercauses was also higher among the ‘White’ group but to a lesser degree and the differencewas not statistically significant.

Type of offence
The main offence for which the prisoner had been imprisoned is also available from therelease extract. The numbers of deaths occurring post-release according to the type of mainoffence for which the prisoner had been held is shown in Table 3.5. The two groups withsignificantly higher rates of drug-related mortality, in comparison with people in the categoryviolence against the person, were acquisitive offences (which includes robbery, theft, fraud,burglary, forgery and handling stolen goods) and property/other crimes (including arson,criminal damage, drunkenness, begging, prostitution, immigration and other specified crimes).Both these groups had three times greater odds of dying from drug-related causes afterrelease (OR 3.2, 95% CI 1.3-8.1 for acquisitive offences and OR 3.2, 95% CI 1.1-9.0 forproperty/other crimes) compared to the group convicted of violent offences. These elevatedodds remained after controlling for age at release.
Table 3.5 Mortality by type of offence
No. of deathsOffence group
Drug-related Other causes
Total no. insample
Violence against the person 5 8 1,714
Sex offences 0 5 315
Acquisitive offences* 49 18 5,281
Drug offences 2 5 903
Motoring offences 4 12 1,888
Property/other** 12 9 1,315
Offence not recorded 0 0 281* theft, robbery, burglary, forgery, handling stolen goods and fraud
** arson, criminal damage, drunkenness, begging, immigration-related offences, prostitution
Discharge type, sentence length and length of prison term
Over half the prisoners in the sample (56 per cent) were discharged under the automaticrelease category, a further 19 per cent were conditional releases and 16 per cent were HomeCurfew Detention releases (conditional or unconditional). No significant differentials inmortality were observed between these categories. The remaining nine per cent werereleased under a variety of categories resulting in too few cases to yield any reliableinformation on differential mortality rates.
Although there was an apparent reduced risk of drug-related mortality associated with havingreceived a prison sentence of longer than one year, this was not statistically significant. Ingeneral, no significant differences in observed mortality rates were found to be associatedwith varying sentence lengths.
Information was also available on the actual length of time spent in prison which can be quitedifferent from sentence length. There was a higher than expected number of deaths from bothdrug-related and other causes of death among all groups of prisoners released after servingsix months or less and drug-related causes were responsible for approaching two-thirds ofthis excess mortality. Among those who had served between six months and one year there

19
was only a slight excess mortality from drug-related causes, while among those who hadserved over a year most of the excess mortality was from non-drug-related causes.
Table 3.6 Mortality and excess mortality in relation to time actually served thissentence
Drug-related causes Non drug-related causesTime actuallyserved
No. insample✝
No. ofexpecteddeaths
Observeddeaths
Excessmortality
Siglevel✝✝
Observeddeaths
Excessmortality
Siglevel✝✝
Up to 2 weeks 1,225 2.5 10 4.1 8 3.3>2 wks to 1 mth 1,433 2.5 11 4.4 * 5 2.0>1 to 1½ months 1,529 2.5 6 2.4 6 2.4>1½ to 2 months 1,203 2.0 8 4.0 3 1.5>2 to 3 months 1,569 2.6 14 5.4 ** 10 3.8>3 to 6 months 1,613 2.7 15 5.7 ** 6 2.3>6 to 12 months 1,672 3.2 6 1.9 3 0.9 *>12 months 2,192 5.1 9 1.7 --- 17 3.3 ---* p<0.05, ** p<0.01✝ Two (surviving) inmates are omitted from the table due to lack of information✝✝ Significance level for excess mortality for period served compared with those serving in excess of 12months
Rates of drug-related mortality were significantly associated with the length of time actuallyserved (Table 3.6). Excess mortality from drug-related causes was highest among those whohad been imprisoned for between two and six months, and was significantly greater than forthose who had served over one year (p<0.01). The excess drug-related mortality amongthose who had served less than one month was also significantly greater than for those whohad spent more than a year in prison prior to release (p<0.05). In contrast, excess mortalityfrom non-drug-related causes did not vary significantly between groups, with the exception ofthose who served between six months and one year for whom the mortality rate was nohigher than expected.
Seasonal variation in mortality
It is possible that mortality rates among newly-released prisoners might vary at different timesof the year. For example, there might be a higher rate of drug and alcohol-related mortalityaround Christmas leading to more deaths immediately post-release among the Decembersample. To investigate this and the extent to which this might have affected the results of thestudy, mortality rates were calculated separately for the June and December release cohortsand are shown in Table 3.7. In both cohorts the pattern of very high death rates in the weekafter release followed by a decline to a plateau is clearly seen and any differences betweenthe rates for the two months are not statistically significant.
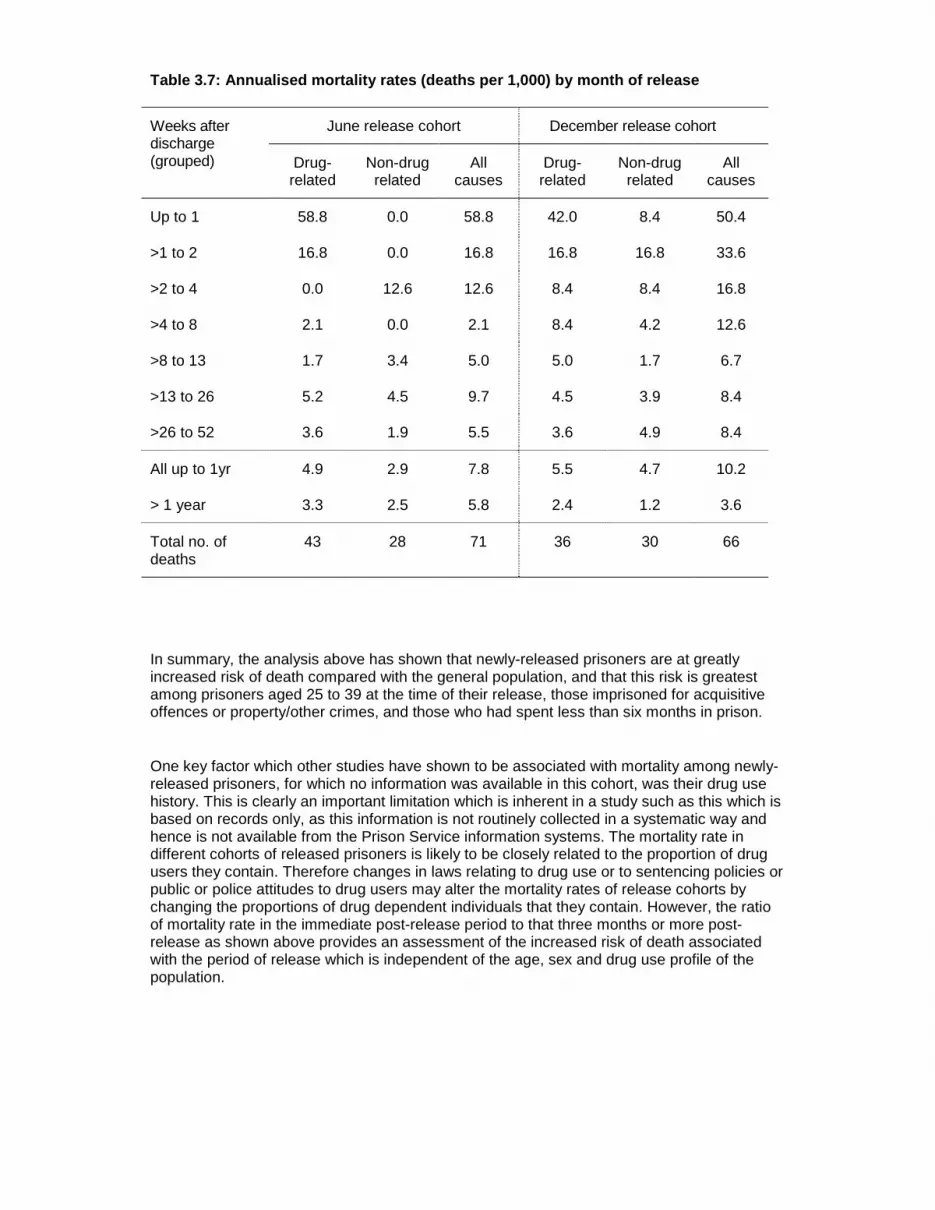
Table 3.7: Annualised mortality rates (deaths per 1,000) by month of release
June release cohort December release cohortWeeks afterdischarge(grouped) Drug-
relatedNon-drugrelated
Allcauses
Drug-related
Non-drugrelated
Allcauses
Up to 1 58.8 0.0 58.8 42.0 8.4 50.4
>1 to 2 16.8 0.0 16.8 16.8 16.8 33.6
>2 to 4 0.0 12.6 12.6 8.4 8.4 16.8
>4 to 8 2.1 0.0 2.1 8.4 4.2 12.6
>8 to 13 1.7 3.4 5.0 5.0 1.7 6.7
>13 to 26 5.2 4.5 9.7 4.5 3.9 8.4
>26 to 52 3.6 1.9 5.5 3.6 4.9 8.4
All up to 1yr 4.9 2.9 7.8 5.5 4.7 10.2
> 1 year 3.3 2.5 5.8 2.4 1.2 3.6
Total no. ofdeaths
43 28 71 36 30 66
In summary, the analysis above has shown that newly-released prisoners are at greatlyincreased risk of death compared with the general population, and that this risk is greatestamong prisoners aged 25 to 39 at the time of their release, those imprisoned for acquisitiveoffences or property/other crimes, and those who had spent less than six months in prison.
One key factor which other studies have shown to be associated with mortality among newly-released prisoners, for which no information was available in this cohort, was their drug usehistory. This is clearly an important limitation which is inherent in a study such as this which isbased on records only, as this information is not routinely collected in a systematic way andhence is not available from the Prison Service information systems. The mortality rate indifferent cohorts of released prisoners is likely to be closely related to the proportion of drugusers they contain. Therefore changes in laws relating to drug use or to sentencing policies orpublic or police attitudes to drug users may alter the mortality rates of release cohorts bychanging the proportions of drug dependent individuals that they contain. However, the ratioof mortality rate in the immediate post-release period to that three months or more post-release as shown above provides an assessment of the increased risk of death associatedwith the period of release which is independent of the age, sex and drug use profile of thepopulation.

21
4 Causes And Circumstances Of Deaths
Information on the cause of death as recorded on the death certificate was available from theNHS Central Register for all deaths as part of the flagging process. This provides informationon all the causes of death given in section I of the Cause of Death section of the certificateand an underlying cause of death given in section II. In cases where an external underlyingcause of death is given (ICD-9 codes beginning with E), a secondary cause of death is givenas well. The written text relating to cause of death on the certificate is coded by staff in theRegistration Division of ONS according to the ICD-9 classification of diseases and it is thesecodes which have been used in this analysis. In some cases some additional information wasavailable from Part V of the Coroner’s Certificate after Inquest, giving greater detail of thecauses and circumstances surrounding the death, such as the location of death, backgroundinformation on history of drug use and a description of the sequence of events leading up tothe death. However, the completion of this section is compulsory only for deaths by accidentor misadventure so there was often no information available, hence the tables in this part ofthe report often include a large ‘unknown’ category. In cases where there was no informationabout the death beyond cause of death, additional information was sought from the coroner,such as toxicology and post-mortem reports if available. However, this is a slow process andreports were not always available, so there are still a significant proportion of cases for whichno information was available about the circumstances of death.
The deaths are grouped into drug-related and other cause of death given on the certificate.The range of underlying causes is shown in Table 4.1 below.
Overall, the range of deaths and the descriptions of the deaths add illuminating informationbeyond the raw death statistics. Some of it provides a vivid picture of the loneliness andisolation of some of these individuals in their final hours of life:
“The deceased was found dead in unused garage which is used by drug takers. He wassurrounded by tin foil, needles etc. as used by drug abusers. Nothing is known about Mr X .Unable to trace a G.P. He was released from prison on 11.8.00 (15 days before death). Theyhave no record of an address for him.”
For the purpose of understanding and clarification we provide a qualitative description andoverview of the deaths as reported from the coroners. The level of information available fromthe coroners is very varied so only limited conclusions should be drawn from this.
Underlying causes of death
Of the deaths recorded in the study period 79 were categorised as drug-related, 11 asalcohol-related and 47 from other causes. Some of these deaths highlight the difficulties inthe classification process: where a death is recorded as bronchopneumonia and opiates arealso present, or in other instances where a major road traffic accident occurs and thedeceased is reported as having multiple injuries but toxicology reports the presence ofmorphine, alcohol and benzodiazepines, or in another instance where the deceased was apedestrian walking on a motorway. One death among the non-drug-related deaths had asecondary cause of death of heroin poisoning but is classified as non-drug-related becausethe underlying cause of death was given as E988.8 (Injury by unspecified means,

undetermined whether accidentally or purposely inflicted), which is not one of the ICD-9codes included as drug-related according to the ONS definition.
Table 4.1 Underlying cause of death by type of death
Type of deathICD-9code
Cause of deathDrug-related
Othercauses
All causes
140-239 Neoplasm - 2 (3%) 2 (1%)
240-279 Endocrine, nutritional, and metabolicdiseases and immunity disorders
- 1 (2%) 1 (1%)
304 Drug dependence 31 (39%) - 31 (23%)
305.2-305.9
Non-dependent abuse of drugs(excluding alcohol)
19 (24%) - 19 (14%)
290–303,305.0, 306-319
Mental disorders (excluding drug-related causes above)
- 2 (3%) 2 (1%)
320-389 Diseases of the nervous system andsense organs
- 1 (2%) 1 (1%)
390-459 Diseases of the circulatory system - 12 (21%) 12 (9%)
460-519 Diseases of the respiratory system - 6 (10%) 6 (4%)
520-579 Diseases of the digestive system - 5 (9%) 5 (4%)
780-799 Signs, symptoms and ill-definedconditions
- 2 (3%) 2 (1%)
E850-E858 Accidental poisoning by drugsmedicaments and biological
23 (29%) - 23 (17%)
E950.0-E950.5
Suicide or self-inflicted poisoning –drug-related
1 (1%) - 1 (1%)
E980.0-E980.5
Poisoning undetermined whetheraccidentally or purposefully inflicted –drug-related
5 (6%) - 5 (4%)
Other external causes of injury orpoisoning not already included above
- 27 (47%) 27 (20%)
TOTAL 79 58 137
The main ICD-9 categories of underlying cause of death obtained from the death registrationsare shown in Table 13. For non-drug-related deaths the most important categories areexternal causes of injury other than the categories used to define drug-related deaths (47%)and diseases of the circulatory system (21% of non-drug-related deaths). When consideringthe underlying cause of non-drug-related deaths, it is possible to broadly categorise these 58deaths, on the limited information available, as either acute or chronic disorders. Chronicdisorders are chronic lung conditions, ischaemic heart disease, malignancies and otherchronic conditions. Acute disorders include suicides, homicides, road traffic accidents andother acute conditions such as brain haemorrhages, asthma, epilepsy, gastro-intestinalbleeds. Overall it is calculated that 16 were chronic disorders and 40 were acute disorders,with many, if not most, in some way related to the lifestyle and pattern of drug and alcoholconsumption (in two cases cause of death could not be ascertained).

23
There were 13 deaths categorised as either suicide or with an open verdict (six of which weredrug-related), and one death (not drug-related) for which no verdict was given on thecoroner’s certificate but the circumstances suggested suicide. There were four deaths fromstabbings or related traumatic injuries and one death from multiple injuries with a verdict ofunlawful killing. There were seven road traffic accidents either as driver, passenger orpedestrian and one caused by a fall down some stairs. It is clear that, in this population, asignificant number of non drug-related deaths were the result of motor vehicle accidents,alcohol-related deaths and suicides reflecting the high risk lifestyle of this population.
Time since release from prison
It is suggested that the period immediately following release from prison is one of high risk ofdeath for drug users because they may have lost their tolerance for drugs during the period ofrelative abstinence or reduced intake in prison. Immediately after release a dose of a drugthat might have been tolerated before prison may be fatal. For the calculation of mortalityrates above, the time to death from the index release was used in the analysis as the authorswere interested in identifying the risk of death for a cohort of prisoners over the year fromrelease, regardless of where that time was spent. However, we know that quite a largeproportion of the cohort had additional spells in prison during that follow up period and, whenconsidering the time since release from prison as a causative factor or a circumstancesurrounding a death, it is more appropriate to consider the length of time since the mostrecent release. Information was obtained on the most recent release from prison from thePrison Service Inmate Information System for all the people in the cohort who had died. Thedata on this are shown in Table 4.2.
The high level of mortality risk in the period immediately post-release is shown quite clearly,as it is apparent that a significant proportion of those dying a comparatively long time aftertheir index release from prison had died immediately after a more recent release from prison.This is most marked in the case of drug-related deaths. Among this group, a fifth (20 per cent)had died within two weeks of their index release but almost a third (30 per cent) had diedwithin two weeks of their last release from prison. In contrast, among deaths from othercauses, 5 per cent occurred within two weeks of their index release and 7 per cent within twoweeks of their last release.

Table 4.2 Deaths occurring at different times post-release based on (a) time from indexrelease and (b) time since most recent release from prison by cause of death
(a) Time from index releaseNo. (%) of deaths
(b) Time from most recent releaseNo. (%) of deaths
Weeksafterrelease(grouped) Drug-related Non-drug
relatedAll causes Drug-related Non-drug
relatedAll causes
Up to 1 12 (15%) 1 (2%) 13 (9%) 18 (23%) 2 (3%) 20 (15%)
>1 to 2 4 (5%) 2 (3%) 6 (4%) 6 (8%) 2 (3%) 8 (6%)
>2 to 4 2 (3%) 5 (9%) 7 (5%) 4 (5%) 5 (9%) 9 (7%)
>4 to 8 5 (6%) 2 (3%) 7 (5%) 7 (9%) 2 (3%) 9 (7%)
>8 to 13 4 (5%) 3 (5%) 7 (5%) 5 (6%) 4 (7%) 9 (7%)
>13 to 26 15 (19%) 13 (22%) 28 (20%) 19 (24%) 15 (26%) 34 (25%)
>26 to 52 22 (28%) 21 (36%) 43 (31%) 13 (16%) 18 (31%) 31 (23%)
Total < 1 yr 64 (81%) 47 (81%) 111 (81%) 72 (91%) 48 (83%) 120 (88%)
>= 1 year 15 (19%) 11 (19%) 26 (19%) 7 (9%) 10 (17%) 17 (12%)
Total 79 58 137 79 58 137
Types of drugs involved in drug-related deaths
Information on the types of drugs involved in the drug-related deaths among the sample wasobtained mainly from the information recorded on the death certificate and this variedconsiderably in the level of detail provided. For example, one case just stated ‘mixed drugoverdose’ while others listed in detail the individual drugs found at post-mortem. In somecases toxicology and post-mortem reports have been obtained which have given more detailon the types of drugs involved and whether or not alcohol was also present in significantamounts. Of the 79 drug-related deaths, just over half (53 per cent) were recorded asinvolving a single drug only, a single drug with alcohol was recorded in 13 per cent of cases,mixed drugs without alcohol in 19 per cent and mixed drug and alcohol in 14 per cent ofcases (there was also one case in which death was apparently not associated with a recentepisode of drug use but rather to the consequences of a history of intravenous drug use).
The number of cases in which different individual drugs were mentioned is shown in Table4.3. Opiates, in particular heroin or morphine,3 were by far the most frequently mentioneddrugs. In 71 per cent of cases heroin or morphine were specifically mentioned either by thecoroner or in toxicology reports. Methadone was implicated in ten overdose deaths (13%). Insix of these it was the sole toxic drug and typically the coroners suggested that more than theprescribed amount had been consumed:
3 Once ingested, heroin is broken down into morphine in the body so the two drugs are indistinguishable after consumption.

25
“It was alleged that the deceased was a heroin addict and when he came to the bailhostel in ….. he went to the ….. drug addiction centre. He was not assessed as heshould have been and was prescribed methadone. This was administered to himunder the control of the staff and the over-dosage did not come from his prescribeddrugs. The inference is that methadone was obtained the day before. He was lastseen alive at 11 am on the day he died and was found at 5.40pm.”
Table 4.3 Frequency with which different drugs were mentioned in reports of drug-related deaths
Type of drug No. (%) of cases*
Heroin/morphine 56 (71%)
Methadone 10 (13%)
Opiate-based analgesics 5 (6%)
Unspecified opiate 7 (9%)
Any opiate 69 (87%)
Cocaine 6 (8%)
Benzodiazepine 9 (11%)
Tricyclic anti-depressants 5 (6%)
Other named drug 3 (4%)
Unspecified drugs 8 (10%)
Total no. of cases 79* In many cases more than one type of drug was mentioned
Opiate-based analgesics were mentioned in five cases (four dihydrocodeine, onedextropropoxyphene), while opiates of unspecified type were mentioned in seven cases.Compared with drug-related deaths as a whole, there seems to be a larger proportion ofdeaths involving heroin or morphine and a somewhat smaller proportion involvingopiate/opioid analgesics. For example, Ghodse et al. (2001) found that heroin/morphine wasimplicated in 43 per cent of the drug-related deaths occurring in 2000 that were reported tothem and opiate/opioid analgesics were implicated in 31 per cent, while heroin or morphinewere mentioned in 754 (26 per cent) of the 2,943 deaths included on the ONS database ofdeaths from drug-related poisoning for 1999 (Office for National Statistics, 2001).
Other types of drugs were mentioned less frequently. Benzodiazepines were mentioned innine cases, tricyclic anti-depressants in five cases, while three cases mentioned other nameddrugs that did not occur elsewhere and in eight cases (ten per cent) ‘other drugs’ or ‘mixeddrugs’ were mentioned but the types were not specified.
One UK study (Gossop et al, 2002) showed risk (odds ratios) for mortality from opioids almostdoubled for every additional drug used. Specific drug use factors which were associated withincreased risk of death by drug overdose included regular (weekly or more frequent) use ofnon-prescribed benzodiazepines and amphetamines, and drinking above recommendedlimits.

Table 4.4 No. of deaths associated with different drug combinations (percentage oftotal drug-related deaths in parentheses)
Drugs or drug combinations identifiedDrugsalone
Drugs +alcohol
Heroin/morphine 34 (43%) 7 (9%)
Methadone 4 (5%) 2 (3%)
Opiate-based painkillers 1 (1%) -
Opiates unspecified 2 (3%) 1 (1%)
Single drugs
Tricyclic antidepressants 1 (1%) -
More than one opioid 2 (3%) 1 (1%)
Opioid(s) + benzodiazepines 1 (1%) 3 (4%)
Opioid(s) + cocaine 3 (4%) -
Opioid(s) + one other type of drug 1 (1%) -
Two other types of drugs - 1 (1%)
Opioid(s) + benzodiazepines + other 2 (3%) 3 (4%)
Opioid(s) + two other types of drug 1 (1%) 1 (1%)
Multipledrugs
Unspecified mixture of drugs 5 (6%) 2 (3%)
Total* 57 (72%) 21 (27%)
*In one case the death was not directly linked to an episode of use.
In this sample, only one drug was mentioned in 53 per cent of the cases of drug-related deathwhich were linked to a particular episode of drug use, a single drug with alcohol wasmentioned in 13 per cent of cases, mixed drugs alone in 19 per cent of cases and mixeddrugs plus alcohol in 14 per cent of deaths. However, it should be noted that in some casescoroners only put the drug considered primarily responsible for death on the certificate,whereas toxicology reports often mention other drugs as well. As toxicology reports have notbeen obtained for all cases, the figures given here should be regarded as a minimumestimate of the contribution of poly-drug use to mortality.
Table 4.4 shows the various drug combinations present at time of death as reported by thecoroners. In those cases where only one drug type was mentioned, heroin (or morphine) wasthe most common drug reported, either alone (34 cases) or alone with alcohol (7 cases).Methadone was next most frequently mentioned, in four cases alone and in two cases withalcohol, followed by unspecified opiates.
Overall there were 26 cases where it appeared that more than one type of drug was involved.However, in seven of these cases there was no information on the specific types of drugimplicated in the drug-related death and all that was available from the coroner’s certificatewas a comment such as “mixed drugs” or “illicit drugs”. In the 19 cases for which more detail

27
was available, the majority of cases (18 in all) involved opioids; either a mixture of differenttypes of opioid, or one or more opioids in combination with other types of drugs, mainlybenzodiazepines and, to a lesser extent, cocaine and tricyclic antidepressants. If opioids areconsidered as a single type of drug, then in nine cases, two different types of drug werementioned, while in seven cases at least three types of drugs were recorded. Alcohol wasalso present in 11 of the 26 cases where a mixture of drugs was involved.
Mortality from heroin overdoses is more commonly reported in injecting drug users comparedto non-injecting drug users, and it is assumed that the intravenous administration of a bolus ofunknown dosage is potentially riskier because of the rapid rise in blood level before correctiveaction or resuscitation action can be taken. There were reports of at least one person foundwith a needle in their arm and more frequent reports of people being found with injectingmaterial in close proximity. However, information of any kind on route of drug use wasavailable in only 13 cases, of which in 11 cases it appeared that injecting drugs was involved.
Settings in which drug-related deaths occurred
There is a body of work (Darke and Zador, 1996) that relates the risk of accidental overdoseto taking drugs (specifically, injecting) not in excessive quantities or at unusual purity levelsbut in unusual circumstances or settings. Information on the setting in which the deathsoccurred was often not provided on the coroner’s certificate. For the drug-related deaths,information about where death occurred was available in just under half the cases (38, 48%),so the results presented here must be interpreted with caution. In addition, one cannotdetermine from these data whether circumstances surrounding a death are unusual or not,however Table 4.5 shows the information available on the settings in which deaths occurred.
The commonest place for drug-related deaths to occur was in the deceased’s own home.Among those drug-related deaths for which information about the setting was available, abouta third (13 cases) occurred in their own home and a similar proportion in other people’shomes or other unspecified indoor location (12 cases), which in several instances wasprobably a squat or similar place where drug addicts go regularly to obtain or take drugs. Justover a quarter died in a hostel, street or public place (10 cases). The place of death for thosecategorised as the street or a public place ranged from a drain outlet to a station or hoteltoilet. This proportion dying in their own or another person’s home is similar to that reportedby Ghodse et al. (2001) for drug-related deaths occurring in 2000 reported to the NationalProgramme on Substance Abuse Deaths, among which 62 per cent occurred at a definedresidential address.
Table 17: Settings in which drug-related deaths occurred
Setting of death No. of cases
Own home 13
Other’s home/unspecified indoor 12
Hostel (local authority or probation) 6
In street/public place 4
Hospital 3
No information available 41
Total 79

In studies of drug-related deaths, most of which involve poly-drug use, usually a process ofdeterioration over a number of hours is reported with gradually increased intoxication,deepening of sleep with heavy snoring and finally respiratory arrest. Therefore, it has beensuggested (ACMD, 2000) that there may be an opportunity for intervention at the lateintoxication phase in a significant number of fatalities. The data from this study does notprovide an assessment of the proportion of people who were with other people during theperiod preceding death and in which case intervention might have been possible to preventdeath. However, there were some cases in which there are descriptions from the coroners’text of circumstances which suggested that other people were present at least some of thetime.
While it is not known how many were alone and how many were in the company of others alarge proportion of deaths occur in a residential setting, so it is possible that family membersor friends may have observed the deterioration. If this is the case, then further education forfamily members in the recognition and management of overdose may prevent some deaths.
Alcohol
The tendency for alcohol to potentiate the effect of other drugs makes it an important andfrequent concomitant drug in overdose deaths. As shown in Table 4.4 above, it was noted tobe present in 27 per cent of the drug-related deaths in this sample. However, there were alsoa number of deaths for which the underlying cause was specifically alcohol-related (e.g. E860Accidental poisoning by alcohol or 571.0 Alcoholic fatty liver) and others where it wasmentioned as a contributory factor:
“In the early hours of 10 November 2000 at his home … when asleep after takingdrink he set himself on fire with a burning cigarette.”
In other cases alcohol was mentioned as being present in the body in elevated amountseither in the coroner’s comments or in toxicology reports. In total amongst all deaths, 11deaths were classified as alcohol-related and alcohol was found to be a contributory factor orfound in the body in a further 23 cases (21 of these were classified as drug-related and twofrom other causes) (Table 4.6). In general, where alcohol is shown as a cause along withother drugs the main underlying cause is ascribed to the drug rather than alcohol althoughattribution of cause is often difficult.
Table 4.6 Number (%) of deaths in which alcohol was involved by cause of death
Degree of alcoholinvolvement
Drug-related deaths Other causes All causes
Alcohol-related - 11 (19%) 11 (8%)
Alcohol involved 21 (27%) 2 (3%) 23 (17%)
No known alcoholinvolvement 58 (73%) 45 (78%) 103 (75%)
Total deaths 79 58 137
It is likely also, for those with a history of alcohol abuse or dependence, that there issubstantial loss of tolerance during the period of incarceration and that a return to previousdrinking patterns is associated with periods of gross intoxication in the early phase afterrelease. Unfortunately, the inconsistent way in which the information on the presence of

29
alcohol as a contributory factor is available in the survey means that the authors cannotinvestigate this possibility.
Associated illnesses
Although deaths designated as drug-related usually result from an overdose of the drugconcerned, use of drugs can result in death from illness resulting from chronic drugconsumption. Deaths in which HIV or Hepatitis C are given as a cause are examples ofdeaths that arise from blood-borne viruses usually as a result of injecting drug use, andcirrhosis of the liver may arise as a long term complication of hepatitis or separately due tochronic heavy alcohol consumption or alcohol dependence. Deaths for which such causes aregiven as the underlying cause of death do not usually fit the definition of drug-related deathbeing used, however they may be mentioned on the death certificate among the causes ofdeath or in the details from post-mortem. In this sample, hepatitis C was mentioned in fivecases, all of them drug-related deaths.
Often, in descriptions on the death registration documentation, the recorder has attempted tospecify the mechanism of death due to a range of complications, the commonest being avariety of ways to describe respiratory depression as a result of drug toxicity. In other casesrespiratory infection or other forms of acute or chronic illness are combined with the use ofthese drugs of dependence.
Accidental versus suicidal intent
Whether a death is accidental or not is usually determined from circumstances surroundingthe overdose. Most coroners’ comments on the deaths in the present study were confined tonoting primarily that there was an overdose, only occasionally noting additionally that itappeared to be accidental. For example,
“The deceased a heroin abuser having been released from prison on 16th October2000 was straightaway back to his addiction by 17 October and on 18 October havingdied through injection on that morning at sometime before 3.30pm at …. in the city of….. after further injection in the company of other similar addicts with the intent tosatisfy his abuse rather than take his own life.”
Amongst the drug-related deaths in the sample there was only one instance of a coronerconsidering that a deliberate suicide had occurred and five cases where an open verdict wasrecorded, while three suicides and five open verdicts were recorded amongst the non-drug-related deaths. The coroner wrote of the only recorded anti-depressant overdose:
“Self-administered overdose – clear cry for help (called police about it).”
In the data for this study there was a preponderance of straightforward, single opioidoverdoses (41/79 deaths) among the drug-related deaths (although as mentioned above,some of these might have involved other drugs or alcohol not mentioned by the coroner).These were slightly more likely to occur in the first 14 days after release from prison (16/24deaths in the two weeks after release as opposed to 25/54 in the remainder of the year)(Table 4.7). One coroner’s comment recorded that the opiate appeared to be of no greaterpurity than usual, but in general no such information is available.

Table 4.7 Relationship of type of drugs used and time to death after most recentrelease from prison
Time since releaseTypes of drugsmentioned <= 2 weeks > 2 weeks Total
Any opioid alone 16 25 41
Other drug alone 0 1 1
Any single opioid +alcohol
4 6 10
Another drug + alcohol 0 0 0
Mixed drugs alone 3 12 15
Mixed drugs + alcohol 1 10 11
Total 24 54 78*
*One case was not linked to a specific episode of drug use
It is noteworthy that only one of the drug-related deaths was considered to be suicide, allother cases leaving no note and looking clearly as if an unexpected event had occurred. Bycontrast in the non-drug-related deaths, two of the suicides used hanging or ligature (as didtwo of the open verdicts), with one case of carbon monoxide poisoning. Previous work(Vingoe et al., 1999; Darke & Ross, 2001) suggests that drug dependent individualscommitting suicide have a preference for more violent suicide methods than overdosemethods.

31
5 Risk Factors For Drug-Related MortalityTo examine the risk factors associated with drug-related mortality amongst ex-prisoners in theimmediate post-release period, a longitudinal study would ideally be carried out. However,such studies are extremely resource intensive in both time and monetary terms and areparticularly difficult given the extreme mobility of the population. Such a study was beyond thescope of this project but, as an alternative, survey data from a representative sample ofprisoners collected as part of a separate study have been analysed to provide someindication of possible risk factors for drug-related mortality. This chapter examines thecharacteristics of the Module B prisoners who have died from drug-related causes since beingreleased from prison after being interviewed for the 1997 Survey of Psychiatric Morbidityamong Prisoners in England and Wales. This survey covered all prisons in England andWales and involved interviews with a random sample of about 3,200 prisoners representingall types of prisoner: remand and sentenced, male and female. In this module, out of the sub-group of 2,545 of these prisoners, who had been released at some time and remained inGreat Britain, notifications were received of 25 drug-related deaths and 21 deaths from othercauses.
There are a number of important limitations to the approach adopted which should be bornein mind when considering the results in this chapter , which arise from the use of a datasetoriginally collected for a completely different purpose. Firstly, due to the relatively smallnumber of deaths that occurred in the sample within the study period, analyses looking atdifferent times after release from prison or at different types of prisoner (e.g. male or female)were not possible. The small number of deaths also means that the results in this section arebased on very small sample sizes and so could be very unstable. They should be interpretedwith care, as an additional death could alter the findings considerably. Another limitation ofthe dataset is that the information on risk factors for the survey relates to varying times pre-release and some of the factors, e.g. mental health state or experience of drug use in prison,may have altered by the time of release. In addition, it should be noted that the risk factordata relate to the prison term in which the prisoner was interviewed and not necessarily theterm after which they died.
Data are presented describing the characteristics of those who died from drug-related causesand indicating, where appropriate, the differences from the population as a whole. Onlystatistically significant differences are reported, unless indicated otherwise. The tables areshown in Appendix B. The characteristics are considered under four broad headings: socio-demographic and personal characteristics; offence and prison sentence factors; substanceuse; and mental state.
Tables showing the prevalence of deaths from drug-related causes and from other causes bysocio-demographic and personal characteristics, offence and sentence factors, substanceuse and mental state are also shown in Appendix C.
Multiple logistic regression modelling was then used to identify risk factors that appear to beindependently related to risk of death from drug-related causes in this sample. These factorsmight be used to identify prisoners at particular risk of death following discharge. The logisticregression analysis that was carried out considered the possible risk factors under thesesame broad headings separately, i.e. socio-demographic and personal characteristics;offence and prison sentence factors; substance use; and mental state. The association of theoffence and prison sentence factors with drug-related death was then considered after firstadjusting for the socio-demographic and personal characteristics. Similarly, the association ofthe mental state factors with drug-related death was investigated after adjusting for thesubstance use factors. The final model that was produced showed the association of the

substance use and mental state factors with the risk of drug-related death having adjusted forthe socio-demographic and personal characteristics and the offence and prison sentencesfactors first.
Socio-demographic and personal characteristics (Table B1, Appendix B;Table C1, Appendix C)
Personal characteristics
The majority of the prison population are male. Therefore, unsurprisingly, the majority (96 percent) of those dying from drug-related causes were male.
Those dying from drug-related causes were most likely to be aged under 30: 48 per cent wereaged between 21 and 29 and 24 per cent between 16 and 20. These proportions are slightlyhigher than the proportions of the prison population as a whole in these age groups althoughthe differences in proportions did not reach statistical significance. In the prison population asa whole, 44 per cent were aged between 21 and 29 and 20 per cenr between 16 and 20.Although they made up only 85 per cent of the prison population, all those dying from drug-related deaths had given their ethnic group as ‘White’.
Prisoners were also asked if they had been taken into Local Authority care as a child andwhether they had spent any time up to the age of 16 in an institution, such as a children’shome, borstal or young offenders’ institution. Only eight per cent of those with a drug-relateddeath had been taken into Local Authority care as a child, although a larger proportion (19 percent) of those with a drug-related death had been institutionalised as a child. Theseproportions are significantly lower than the proportion of the prison population as a whole whohad been taken into Local Authority care or had been institutionalised as a child: 28 per centof the prison population had been taken into Local Authority care and 36 per cent had lived inan institution. Those taken into Local Authority care or who had lived in an institution madeup a larger proportion of those dying from other causes.
Education and employment before prison term
It was found that 54 per cent of those with a drug-related death had left school at 16 years ofage and that 62 per cent had no qualifications. None of those who had left school at 17 orabove and none of those with A level or higher qualifications had died from drug-relatedcauses. In the prison population as a whole, 9 per cent and 13 per cent respectively had leftschool at 17 or above and had A level or higher qualifications.
For questions on employment a ‘living off crime’ category was added to the usual working,unemployed and looking for work, and economically inactive categories. Almost half (46 percent) of those who had died from drug-related causes had been living off crime before theprison term when they were interviewed, compared to 18 per cent of the prison population asa whole. Only 12 per cent of those who had died from drug-related causes had been working,compared to 39 per cent of the prison population as a whole, and only 15 per cent had beenunemployed and looking for work.

33
Marital status and living arrangements
Prisoners were asked what they considered their marital status to be at the time of theinterview. Due to small numbers, the widowed, divorced and separated categories werecombined. Single prisoners represented 65 per cent of those dying from drug-related causesand those who were divorced, separated or widowed, 23 per cent. Only 12 per cent of thosewho had died from drug-related causes were married or cohabiting at the time of interviewcompared to 41 per cent of the prison population as a whole.
Respondents were also asked with whom they were living before they came to prison andwhat type of accommodation they had lived in. More than half (60 per cent) of drug-relateddeaths were among those who had been living only with other adults before the term whenthey were interviewed and 28 per cent among those living alone. Only 12 per cent of drug-related deaths were people who had been living with their children before the prison termwhen they were interviewed. This compared to 31 per cent of the prison population as awhole.
More than half (52 per cent) of those who had died from drug-related causes had been livingin rented, self-contained accommodation before the prison term when they were interviewed,whilst 24 per cent had been living with their parents, other relatives or with friends. None ofthose who had owned their accommodation before they came to prison or had lived in abedsit or rooms with shared amenities had had a drug-related death. However, in the prisonpopulation as a whole 13 per cent had lived in owned accommodation and six per cent in abedsit or room with shared amenities.
Social support
Almost all (97 per cent) of the prisoners had contact with people from outside the prisonduring the prison term when they were interviewed whether it was in the form of letters, visitsor telephone calls. All of those who had died from drug-related causes had had contact withpeople from outside prison during their prison term. The majority (69 per cent) of those dyingfrom drug-related causes had had contact with family and friends whilst 27 per cent had hadcontact only with friends.
Questions were also asked to assess the extent of the prisoners’ social network. Closefriends and relatives form an individual’s ‘primary support group’. Previous research hassuggested that adults with a primary support group of three people or fewer are at thegreatest risk of suffering psychiatric morbidity (Brugha et al., 1993). The questions used hadbeen asked on other ONS surveys of psychiatric morbidity and focused on the number ofpeople the prisoner felt close to. The questions were amended slightly to refer to everyonethe individual was acquainted to rather than just friends and family. This was done to reflectthe fact that for some prisoners the most important form of support might be from peoplewithin the prison system who might not be regarded as family or friends.
Questions to assess the prisoners’ perceived level of social support were also asked. Thesequestions were originally used in the 1987 Health and Lifestyles Survey (Health PromotionResearch Trust, 1987) and have also been used in other ONS surveys of psychiatricmorbidity. Again the frame of reference for the questions was broadened from family andfriends to ‘everyone you know (including those here at the prison as well as thoseelsewhere)’.

Those with the smallest primary support group size and those who had a moderate lack ofperceived social support at the time of interview represented the largest proportion of drug-related deaths: 35 per cent of drug-related deaths were among those with a primary supportgroup of zero to three people and 42 per cent among those who felt a moderate lack ofsupport.
Multiple logistic regression – socio-demographic and personal characteristics
When all the socio-demographic factors were entered into a logistic regression analysis, fourmain factors were found to be significantly and independently associated with drug-relateddeath (Table 5.1). These were employment before the prison term when they wereinterviewed, marital status at the time of interview, whether the prisoner was taken into LocalAuthority care as a child and the size of their primary support group at the time of interview.
The factor with the strongest association to drug-related death was employment status. Theodds of dying from drug-related causes for people who were living off the proceeds of crimebefore the prison term were ten times those for people who were working. The economicallyinactive were also significantly more likely to have died from drug-related causes than thosewho were working – their odds of dying from drug-related causes were four times those ofpeople who were working.
Table 5.1 Multiple logistic regression – socio-demographic and personalcharacteristics
Socio Demographic and Personal Characteristics Adjusted OddsRatio
95% Confidence Interval
Employment status Working 1.0before prison term Unemployed 2.3 0.5 10.4
Living off crime 9.8 ** 2.7 35.6Economically inactive 4.4 * 1.1 17.1
Marital status at time of Married/cohabiting 1.0interview Single 4.2 * 1.2 14.3
Separated/divorced/widowed
8.3 ** 2.0 33.7
Taken in Local Authority Yes 0.1 ** 0.03 0.6care as a child No 1.0
Primary support group 0 to 3 2.9 * 1.2 7.1size 4 to 8 0.9 0.3 2.5
9+ 1.0
*p<0.05, **p<0.01
Compared with prisoners who were married or cohabiting, the odds of a drug-related deathwere increased eight-fold among those who were divorced, separated or widowed at the timeof interview and quadrupled for those who were single.
Prisoners with the smallest primary support group at the time of interview had almost threetimes greater odds of a drug-related death after release than those with the largest supportgroup size.

35
Finally, it was found that those who had been taken into Local Authority care as a child hadlower odds of a drug-related death. Those who had been taken into care were significantlyless likely to have had a drug-related death than those who had not been taken into care.
Offence and sentence characteristics (Table B2, Appendix B; Table C2,Appendix C)
Prisoners were asked how many times they had been in prison before for other offences (i.e.not the current one). Those who had ten or more previous prison terms had the smallestproportion of drug-related deaths (12 per cent).
Details of offence for which the prisoner had been imprisoned at the time of interview werecollected from prison records and prisoners categorised according to their main offence. Themain offence may not be the most serious or only offence for which the prisoner was beingheld. The largest proportion of drug-related deaths was among those who had beenimprisoned for an acquisitive offence (39 per cent). However, 23 per cent of drug-relateddeaths were among sex offenders, who made up only six per cent of prisoners. Offencesincluded in the sex offence category are shown in the Glossary.
Extra data on the release date of the prisoner were obtained from Prison Service records andthe length of time the prisoner actually served was calculated. Almost half (46 per cent) ofthose dying from drug-related causes had served, for the term they were serving wheninterviewed, between one and two years. The smallest proportion (4 per cent) of drug-relateddeaths was found among those who had served between six and eleven months. Thiscompares to 20 per cent of the population as a whole who had served this length of time.
More than half (54 per cent) of drug-related deaths were among those who were in a Localprison at the time of interview and just over 23 per cent among those in Young OffendersInstitutes. Only 15 per cent of drug-related deaths were among those in a Closed Category Cor Female Training prison and none among those who had been held in an Open or CategoryD prison. This compares to 31 per cent of the population as a whole who were in a ClosedCategory C or Female Training prison and 8 per cent in an Open or Category D prison.
Multiple logistic regression - offence and sentence factors
Only the main offence was found to be significantly and independently associated with drug-related death when the sentence and offence factors were entered into a logistic regressionanalysis (Table 5.2).

Table 5.2 Multiple logistic regression – prison sentence factors
Offence and Prison Sentence factors Adjusted OddsRatio
95% Confidence Interval
Offence type Violent/Other/not known 1.0Sex offence 8.0 ** 2.5 26.3Acquisitive 1.0 0.4 2.7Drug offence 1.0 0.2 4.3
Type of prison Local prison 1.0Dispersal/Category Btrainer
1.8 0.4 8.0
Category C or Femaletrainer
0.3 0.1 1.1
Open or Category D 0.1 0.01 4.3Young Offenders’Institute
1.1 0.4 3.2
Time served for term when <3 month 1.0interviewed 3 to 5 months 2.6 0.7 9.9
6 to 11 months 0.2 0.0 1.81 year but not 2 years 1.9 0.6 6.42 years or more 0.4 0.1 1.9
*p<0.05, **p<0/01
Those imprisoned at the time of interview for sex offences had eight times greater odds ofhaving a drug-related death than those who had committed violent, ‘other’ or unknown crimes.A logistic regression analysis was run entering the significant factors from the socio-demographic and personal characteristics model first, followed by all the offence andsentence factors. In this way, the effect of the offence and sentence factors can be seenadjusted for the socio-demographic and personal characteristics. When the model was run, itwas found that having been imprisoned for a sex offence remained significantly associatedwith drug-related death, with the odds ratio increasing very slightly from 8.0 to 8.3 (Table 5.3).The type of prison no longer remained in the model.
Table 5.3: Multiple logistic regression – prison sentence factors adjusted for socio-demographic and personal characteristics
Offence and Prison Sentence factors AdjustedOdds Ratio
95% ConfidenceInterval
Offence type Violent/Other/not known 1.0Sex offence 8.3 ** 2.1 32.1Acquisitive 0.8 0.3 2.1Drug offence 0.6 0.1 3.0
Time served for term when <3 month 1.0interviewed 3 to 5 months 2.5 0.6 10.1
6 to 11 months 0.2 0.02 1.81 year but not 2 years 1.2 0.4 4.12 years or more 0.3 0.1 1.3
*p<0.05, **p<0/01

37
Substance use (Table B3, Appendix B; Table C3, Appendix C)
As noted above, when looking at substance use factors, particularly dependence status,accidental overdose and drug treatment, it should be noted that respondents’ status withregard to these factors could have changed between the time of interview and the releasefrom prison immediately preceding death.
Use of drugs
Respondents were asked if they had ever used any of a range of illicit drugs. If they had usedthe most common and addictive of these, cannabis, heroin, non-prescribed methadone,amphetamines, crack and cocaine, they were then asked a series of questions about the useof each of these drugs in the period preceding the prison term in which they were interviewed.They were also asked if they had ever injected drugs. Prisoners were then asked about theirdrug use in prison.
At the time of interview, the majority (83 per cent) of prisoners had used drugs at some time intheir life. Over half (57 per cent) had taken drugs but not injected and 26 per cent hadinjected drugs. However, 58 per cent of those dying from drug-related causes had injecteddrugs at some time in their life while none of them reported having never used drugs at thetime of interview.
Looking at the type of drugs used it was found that 77 per cent of those dying from drug-related causes had used illicit tranquillisers at some point up until the time of interview. Thiscompares to only 30 per cent of the prison population as a whole who had used illicittranquillisers. As mentioned in the chapter on causes and circumstances of death, poly-druguse has been identified as a factor in drug-related deaths. Tranquillisers depress therespiratory system and, used in conjunction with opiates which also suppress the respiratorysystem, are often implicated in drug-related death.
Prisoners were also asked about whether they had used drugs in the month or year beforethe prison term they were serving when interviewed. It was found that 85 per cent of drug-related deaths were among those who had used drugs in the month before the prison termthey were serving when interviewed. Looking at the sample as a whole, only 57 per cent hadused drugs in the month before the prison term when they were interviewed.
When looking at drug-use in prison, it was found that more than half (54 per cent) of thosewho had died from drug-related causes had not used drugs during the prison term they wereserving when interviewed. However, 55 per cent of the population as a whole had also notused drugs during the prison term they were serving when interviewed.
Drug dependence
Drug dependence was assessed using five questions asking about drug use in the yearbefore coming to prison. Respondents who had taken cannabis, heroin, cocaine, crack,amphetamines or non-prescribed methadone were asked, for each drug, whether they hadused it everyday for two weeks or more, whether they had felt they needed it or weredependent on it, whether they had tried to cut down but could not, whether they had neededlarger amounts to get the same effect, or whether they had suffered withdrawal symptomsfrom stopping or cutting down. For drugs other than cannabis a positive response to any

statement was used to indicate drug dependence. At least two positive responses wereneeded for cannabis users to be classified as dependent.
Those dying from drug-related causes were likely to have been dependent on opiates andstimulants or on stimulants alone in the year before the prison term when they wereinterviewed. It was found that 40 per cent of those dying from drug-related causes had beendependent on opiates and stimulants whilst a further 20 per cent had been dependent onstimulants only. Only 12 per cent of the sample as a whole had been dependent on opiatesand stimulants in the year before their prison term. More than half (52 per cent) of the samplehad not been dependent on any drug in the year before their prison term and only 9 per centhad been dependent on cannabis. However, only 28 per cent of drug-related deaths wereamong those assessed as having no dependence in the year before the prison term in whichthey were interviewed and none were assessed as dependent on cannabis alone.
Previous accidental over-doses
Although only 23 per cent of the sample as a whole had accidentally over-dosed up to thedate of interview it was found that 62 per cent of those who later died from drug-relatedcauses had done so.
Drug treatment
Among prisoners who died of drug-related causes, 44 per cent had received treatment fordrug use during the prison term in which they were interviewed and 44 per cent had neverreceived it or had received it more than a year before the prison term when they wereinterviewed. By comparison, only 16 per cent of the prison population as a whole hadreceived treatment during their prison term whilst 73 per cent had never received it or hadreceived it more than year before the prison term when they were interviewed.
The majority of prisoners (89 per cent) had never been prescribed methadone up to the timeof interview or had been prescribed it more than a year before the prison term when theywere interviewed. Only six per cent had been prescribed it in the year before their prison termand five per cent during the prison term in which they were interviewed. However, eight percent of drug-related deaths were among those who had been prescribed methadone duringtheir prison term.
Other substance use
The Alcohol Use Disorders Identification Test (AUDIT) (Babor et al. 1992) was used to assessalcohol misuse (i.e. hazardous or harmful drinking) among prisoners in the year before theprison term when they were interviewed. A score of eight or above on the AUDIT is indicativeof hazardous drinking. Those having drug-related deaths were most likely to have beenextremely hazardous drinkers scoring 16 or more on the AUDIT scale (46 per cent).
The majority of prisoners in the sample (over 80 per cent) were smokers. As might beexpected since smoking was so common, it was found that all of those who had died weresmokers at the time of interview and that those with a drug-related death were more likely tobe smokers than the population as a whole.

39
Multiple logistic regression (drug use)
When the drug use factors were entered into a logistic regression analysis three factors werefound to be significantly and independently associated with drug-related death (Table 5.4).
The first was whether the prisoner had ever used illicit tranquillisers (up to the time ofinterview). The odds of having a drug-related death were five times greater for those who hadused illicit tranquillisers than for those who had not. Secondly, having accidentally overdosedin the past almost tripled the odds of having a drug-related death. It was also found that thosewho had used drugs in the prison term when they were interviewed were significantly lesslikely to die from drug-related causes than those who had not used drugs during their prisonterm. Those who had not used drugs in their prison term were more than three times as likelyto have a drug-related death as those who had used drugs in their prison term once the otherfactors had been taken into account.
Table 5.4 Multiple logistic regression (drug use)
Drug Use Adjusted OddsRatio
95% ConfidenceInterval
Ever used illicit Yes 5.1 ** 1.8 14.7tranquillisers No 1.0
Ever accidentally Yes 2.8 * 1.2 6.7over-dosed No 1.0
Used drugs in prison No 1.0term when interviewed Yes 0.3 ** 0.1 0.7
Used drugs before Never used/used >1 yr before 1.0the prison term in Used 1 to 12 months before 0.8 0.1 7.3which interviewed Used in month before 3.4 0.7 17.1
When last received drugtreatment
Never/>year before currentprison term 1.0In year before current prisonterm 0.5 0.1 1.9In prison (this term) 2.4 1.0 5.8
*p<0.05, **p<0/01
Mental state (Table B4, Appendix B; Table C4, Appendix C)
Mental disorders
The survey used lay interviewers to administer the self-completion (screening) questionnaireof the Structured Clinical Interview for DSM-IV (SCID-II) (First et al., 1997) to identifyprisoners with a personality disorder and two categories were omitted (depressive andpassive aggressive disorders). More discussion on the use of this questionnaire can be foundin Singleton et al. (1998). Prisoners were then categorised as having no personality disorder,an antisocial personality disorder only, an antisocial personality disorder and anotherpersonality disorder and another personality disorder only.

The highest proportion of drug-related deaths (65 per cent) was found among prisoners whowere suffering from an antisocial and another personality disorder at the time of interview. Inthe prison population as a whole only 38 per cent had an antisocial and other personalitydisorder at the time of interview. The smallest proportion of drug-related deaths (4 per cent)was found among those who were suffering from another disorder only. This compares to 16per cent of the prison population as a whole.
Neurotic disorders in the week prior to interview were assessed in the lay interviews using therevised version of the Clinical Interview Schedule (CIS-R) (Lewis et al., 1992). Again, detailsabout the use of this instrument and the scale can be found in Singleton et al. (1998). Thosescoring 12 or more are considered to have significant psychiatric morbidity.
In this sample as a whole, 43 per cent of prisoners were found to have scored 12 or more onthe CIS-R scale, including 28 per cent who had scored 18 or more. Looking at drug-relateddeaths, 42 per cent of prisoners who had died from drug-related causes had scored 18 ormore on the CIS-R scale at the time of interview. The proportion of those who had died fromother causes who had scored 18 or more on the CIS-R scale at the time of interview was alsohigh, at 44 per cent.
Data from lay interviews was used to classify respondents into those with probable psychosisand those without (see Singleton et al., 1998). As this classification was not based on aclinical assessment some degree of error is likely. Just five per cent of prisoners wereclassified as ‘probably psychotic’ at the time of interview. However, 19 per cent of drug-related deaths and 17 per cent of deaths from other causes were found among those in thisgroup. The differences in these proportions, however, were not statistically significant.
Treatment for mental health problems
Prisoners were asked whether they were taking any medication which acts on the centralnervous system (CNS medication), for example, hypnotics, anxiolytics (sedatives andsleeping pills) and anti-depressants, analgesics or drugs used in psychoses and relateddisorders. Just over 42 per cent of those dying from drug-related causes were taking CNSmedication at the time of the interview compared with 20 per cent of the population as awhole.
Information on help or treatment received for ‘a mental, nervous or emotional problem’ in theyear before coming to prison was obtained from prisoners who had been in prison for lessthan two years. Only 18 per cent of the prison population had received help for a mentaldisorder before the prison term they were serving when interviewed. However, 32 per cent ofthose with a drug-related death and 28 per cent of those who had died from other causes haddone so. The difference in these proportions, however, was not statistically significant.
Suicidal thoughts and deliberate self-harm
Respondents were asked “Have you ever thought of taking your life, even though you wouldnot actually do it?". If they answered yes, they were asked when this was. It was found that12 per cent of those dying from drug-related causes had had suicidal thoughts in the weekbefore interview, 40 per cent had had them in the year before interview, and 40 per cent hadnever had suicidal thoughts up until the time of interview. By comparison, only 18 per cent ofthe prison population as a whole had suicidal thoughts in the year before interview and 62 percent had never had them up to the time of interview.

41
Stressful life events
Prisoners were shown cards with lists of 15 stressful life events and were asked if they hadsuffered any of these at any time of their life (see Glossary). All but four of the events weredrawn from the List of Threatening Experience (Brugha et al., 1985). The list covers eventswhich are common and which are likely to be rated as highly (psychologically) threatening.Four additional events were added because they were felt to be common in the prisonpopulation and may have a negative impact on a person’s mental health. The list does notinclude all common stressful events. For example, moving house and having a baby areexcluded as although stressful these are not generally threatening. If the prisoner reportedthat they had suffered any of these events they were asked how recently this had occurred.
Just over a third (35 per cent) of drug-related deaths were among those who had reportedthat they had had a stressful life event in the six months before the interview. All of those whohad had a drug-related death had reported that they had suffered more than three of theevents listed on the cards, compared with 76 per cent of the prison population.
Victimisation in the prison term was asked about separately. Again prisoners were shown acard, this time listing a range of acts of victimisation. They were asked if they had sufferedany of the forms of victimisation on the card during the prison term they were serving whenthey were interviewed. Items on the list included being threatened with violence, havingbelongings stolen, being a victim of actual violence, receiving unwanted sexual attention andforced sexual attention. Almost three-quarters (73 per cent) of those who had died from drug-related causes reported that they had suffered victimisation during the prison term when theywere interviewed compared to 42 per cent of the prison population as a whole.
Multiple logistic regression (mental state)
Three of the mental state factors were significantly and independently associated with drug-related death. These were suicidal thoughts, taking CNS medication and victimisation inprison (Table 5.5).
Having had suicidal thoughts between one week and a year before the interview increasedthe odds of having a drug-related death three-fold compared to those who had not had anysuicidal thoughts up to the time of the interview. The second significant factor was whetherthe prisoner was taking CNS medication at the time of interview. Taking CNS medicationmore than doubled the odds of dying from drug-related causes compared with those who hadnot been taking any. Finally, those who had been victimised during the prison term they wereserving when interviewed were three times as likely to have suffered a drug-related death asthose who had not once the other factors had been taken into account.

Table 5.5: Multiple logistic regression (mental state)
Mental State Adjusted OddsRatio
95% Confidence Interval
Any personality disorder No disorder 1.0at time of interview Antisocial disorder only 0.9 0.2 3.7
Antisocial disorder andanother disorder
1.4 0.4 4.7
Other disorder only 0.2 0.03 1.9
Neurosis – CIS-R score 0 to 5 1.06 to 11 0.3 0.1 1.112 to 17 0.2 0.1 1.018+ 0.3 0.1 1.0
Suicidal thoughts at time In past week 3.2 0.7 14.7of interview In past year (excl. past week) 2.9 * 1.0 8.3
In lifetime (excl. past year) 0.6 0.1 2.8Never 1.0
Taking CNS medication No 1.0at time of interview Yes 2.6 * 1.1 5.9
Number of stressful life <3 1.0events 3 or more 11.5 0.6 224.2
Suffered victimisation in No 1.0prison term wheninterviewed
Yes 3.0 * 1.2 7.3
*p<0.05, **p<0/01
Another logistic regression analysis was run controlling for the significant drug misuse factorsfirst, before entering all the mental state factors.
When the drug use factors were adjusted for, it was found that only the association betweendrug-related death and victimisation in the prison term when interviewed remained significant(Table 5.6). The odds ratio relating to victimisation increased slightly from three to 3.3.
The strength of the association between taking CNS medication at the time of interview anddrug-related mortality was reduced slightly and the difference between those takingmedication and those who were not was no longer significant. However, the odds of thosewith a CIS-R score between six and 11 or 12 and 17 having a drug-related death weresignificantly lower than for those who had scored between zero and five after substance usefactors were taken into account. Personality disorder was not retained in the model once theadjustment for drug use factors had been made.

43
Table 5.6: Multiple logistic regression – mental state adjusting for drug use
Adjusted for Drug UseMental State Adjusted
OddsRatio
95% ConfidenceInterval
0 to 5 1.06 to 11 0.3 * 0.1 1.012 to 17 0.2 * 0.0 0.9
Neurosis – CIS-R score
18+ 0.4 0.1 1.2
In past week 2.5 0.5 11.7In past year (excl. past week) 2.3 0.8 6.7In lifetime (excl. past year) 0.4 0.1 2.2
Suicidal thoughts at time ofinterview
Never 1.0
No 1.0Taking CNS medication attime of interview Yes 2.3 0.9 5.6
<3 1.0Number of stressful lifeevents 3 or more 6.8 0.3 132.0
No 1.0Suffered victimisation inprison term in whichinterviewed
Yes 3.3 * 1.3 8.3
*p<0.05, **p<0/01
Final logistic regression model
A final logistic regression analysis was run (Table 5.7). Factors found to be significantlyassociated with drug-related death from the earlier logistic regression analyses were enteredinto the model. The socio-demographic and personal characteristics, and offence andsentence factors were entered first, followed by the drug use and mental state factors. Thismeant that the effect of drug use and mental state could be looked at having adjusted for thebackground and sentence and offence factors.
In this final model, 12 factors were retained. Eight of these factors remained statisticallysignificant, five of them background factors and three of them drug use factors.
In this final model, those living off crime before the prison term when they were interviewedwere 11 times more likely to have died from drug-related causes as those who were workingbefore their prison term, once the other factors had been taken into account.
Those who were separated, divorced or widowed at the time of interview were alsosignificantly more likely to have had a drug-related death than those who were married orcohabiting at the time of interview. Being taken into Local Authority care was alsosignificantly associated with drug-related death appearing to have a protective effect, withthose who had not been taken into care having ten times greater odds of a drug-related deaththan those who had been taken into care.
Those with the smallest support group size at the time of interview were significantly morelikely to have a drug-related death than those with the largest, and the odds of their having a

drug-related death were nearly four times higher than for those who had a support group ofnine or more.
Offence type also remained significant, with the odds of those imprisoned for a sexual offenceat the time of interview having a drug-related death being just over 67 times that for thosewho had committed a violent, other or unknown offence.
After adjusting for the background factors, it was found that three substance misuse factorsremained significant. Those who had used illicit tranquillisers were over six times as likely tohave had a drug-related death as those who had not used illicit tranquillisers. Use of drugs inthe prison term when they were interviewed was also significant, with those who had useddrugs in their prison term being less likely to have died from drug-related causes than thosewho had not used drugs in their prison term. Use of drugs in the month before the currentprison term became strongly associated with the chance of a drug-related death oncebackground factors were taken into account, with an adjusted odds ratio of 66.7 comparedwith those who had never used drugs or used them over a year before coming to prison.

45
Table 5.7 Final logistic regression model – drug use and mental state adjusted forsocio-demographic and personal characteristics and offence and prison sentencefactors
Socio-demographic and Personal Characteristics and Offence andPrison Sentence factors
Adjusted OddsRatio
95% ConfidenceInterval
Employment status Working 1.0before prison term Unemployed 2.8 0.4 17.8
Living off crime 11.3 ** 2.0 62.4Economically inactive 4.4 0.8 22.8
Marital status at time of Married/cohabiting 1.0interview Single 3.5 0.9 13.1
Separated/divorced/ widowed 6.2 * 1.2 32.1
Taken in Local Authority Yes 0.1 ** 0.03 0.5care as a child No 1.0
Primary support group 0 to 3 3.8 * 1.2 11.8size 4 to 8 1.1 0.3 3.8
9+ 1.0
Offence type Violent/Other/not known 1.0Sex offence 67.4 ** 9.8 464.2Acquisitive 0.5 0.2 1.6Drug offence 0.4 0.1 2.2
Time served for term when <3 month 1.0interviewed 3 to 5 months 5.4 1.0 30.1
6 to 11 months 0.5 0.1 6.31 year but not 2 years 4.5 1.0 20.22 years or more 0.8 0.1 4.6
Drug use and mental state – adjusted for aboveEver used illicit Yes 6.1 ** 1.9 19.8tranquillisers No 1.0
Ever accidentally Yes 2.3 0.9 6.2overdosed No 1.0
Used drugs before Never used/used >1 yr before 1.0the prison term in Used in 1 to 12 months before 10.8 0.7 171.6which interviewed Used in month before 66.7 ** 5.8 769.1
Used drugs in prison No 1.0in term when interviewed Yes 0.2 ** 0.1 0.5
Taking CNS medication at No 1.0time of interview Yes 2.6 1.0 6.8
Number of stressful life <3 1.0events 3 or more 9.0 0.4 185.7
*p<0.05, **p<0.01

6 Discussion
The project aims were to :
• estimate the drug-related mortality rates of prisoners recently released from prison inEngland and Wales
• determine how these rates differ from other populations
• determine the causes and circumstances of death (e.g. overdose, poisoning, suicide etc.)
• determine the risk factors amongst this group
• determine how long drug-using ex-prisoners are at risk following release
• provide recommendations for future interventions at the prison-community interface
This study is the first of its kind to empirically estimate the drug-related mortality risk amongall sentenced prisoners in the early phase of release from prison in England and Wales.There is a marked increase in risk compared with the general population in the immediateperiod after release from prison for drug-related deaths. There is a substantially elevateddeath rate from drug-related deaths in the first week and the rates continue to be elevated butlevel off from about one month post-release. The rates of non-drug-related deaths are highalso but are consistent across time.
The most striking conclusion from this study is the very high rate of drug-related mortality inthe first two weeks after release from prison. Overall the mortality rate for the year afterdischarge is nine per thousand. However, it can be seen that the period-specific mortalityrate from all causes declines rapidly as length of time after discharge increases: from 55deaths per thousand per annum during the first week after discharge to approximately onehalf this figure (25 per thousand per annum) during the second week after discharge and thenhalf again (to 15 per thousand per annum) during weeks three and four after discharge.Thereafter the rate varies around a lower figure of between five and ten per thousand for theremainder of the first year after discharge. The increased risk of death in this early periodimmediately after release was almost entirely due to drug-related mortality, which wasresponsible for over 90 per cent of the deaths the first week after release and 67 per cent ofdeaths in the second week.
The effect is very strong and confirms reports of such risk from studies looking at specific sub-groups of the prison population, such as injecting drug users. Information was not availableon the drug use history of the members of the cohort on which the mortality rate calculationswere based to allow a calculation of the relative risk of mortality after controlling for thesefactors. However, the relative risk of death in the immediate post-release period compared tothe overall mortality rate shows that the excess drug-related mortality in the week immediatelypost-release within this cohort was 12.5 times that between three months and one year. Thisratio between excess mortality rates in the first few weeks to rates for later periods, whenmortality rates reach a plateau, provides a measure of the increased risk associated with the

47
immediate post-release period and should be independent of the age, sex and drug-useprofile of the population.
This study chose two separate months in the year, but there is only slight variation betweenthese two months. The authors conclude that these provide a reasonable picture for the year.It is possible to argue that two atypical months were recorded and that a thorough check of alltwelve months would be different. The authors doubt this, as two months were picked wellapart with one in summer and the other in winter and no significant differences were foundbetween mortality rates between the two samples. The hypothesis is that a further study thatsampled across a broader period would obtain similar findings.
This study also confirmed that released prisoners have a much higher risk of death thanpeople in the general population. Over an entire year after release, prisoners in this samplewere seven times more likely to die than people of the same age and sex in the generalpopulation. Over half of this increased mortality was due to drug-related deaths. Thisincreased level of risk was most marked in the week immediately after release whenprisoners in this sample were 40 times more likely to die than the general population. Withinthis time period the excess mortality was almost entirely due to drug-related deaths.
Direct comparison of the mortality rates reported here with other studies is not possible due todifferences in the samples used. For example, Seaman et al. (1998) looked at a sample ofinjecting drug-users recently released from prison and Harding-Pink’s Swiss study (1990) onlyincluded deaths which required a medico-legal examination. In contrast this study included allsentenced prisoners regardless of drug use history and information was collected on alldeaths regardless of cause. However, Harding-Pink (1990) found overall mortality ratesamong released offenders in the first year after release from prison over four times the age-adjusted rate in the general population of Switzerland. She also found that the majority ofthese deaths were due to drug-poisoning and there was a clustering of deaths within the firstfew weeks after release from prison. Seymour et al. (2000), in their study of drug-relateddeaths in the Strathclyde region of Scotland, found that recently released prisoners were athigh risk of dying from drug misuse, making up 13 per cent of all drug-related deaths between1990 and 1997 and found that over half (62 per cent) of the drug-related deaths occurringwithin one month of release from prison took place within one week of release.
As well as showing a high risk for early drug-related deaths this study shows that the postrelease population are at high risk from non drug-related death also and that the needs from asocial, mental and physical perspective of prisoners on release are very substantial.
The mental health needs of prisoners were well outlined in the Survey of Psychiatric Morbidityamong Prisoners (Singleton et al., 1998). This presented a picture of individuals with highrates of early developmental disruption, family discord, high rates of alcohol and drugdependence and current psychiatric morbidity. In the context of these high rates of social andpsychiatric morbidity, the elevated mortality rates are consistent with the sort of elevated ratesreported in cohorts of dependent heroin users. The key difference is the high rate in theimmediate release period that falls sharply in the first few weeks of release. This additionalrisk is added to an already highly vulnerable and morbid population in a manner that presentsa significant social and policy challenge. It would be unreasonable to expect that mortality ofdrug dependent individuals returning to their homes should be less than drug dependentindividuals living in the community, however the level of additional mortality indicates thatthere is a window of very high risk that has received only limited attention to date.
The challenge of responding to such a risk period is considerable. There are clearly nosimple solutions to such a complex problem. However the results from this type of researchshould be used to raise levels of awareness of staff, prisoners and family to behaviour in high

risk periods with the aim of modifying identifiable risks. It should also be recognised that,unless there is effective enhanced treatment within prisons and effective referral toappropriate treatment and support upon release, any increase in the use of detention for drugusers is likely to lead to increases in drug-related mortality. Thus there is the potential fordirect conflict between policies aimed at reducing drug-related mortality and those intended toreduce crime through increased use of detention for frequent offenders, a large proportion ofwhom are drug-dependent.
The analysis provides data from two sources. One source is the actual mortality ratesestimated from cohorts representing two release periods and calculated on a week by weekbasis from date of discharge from prison. The second part is based on the tracking ofindividuals interviewed in the Psychiatric Morbidity among Prisoners Survey, where it hasbeen possible to determine mortality among those who have been released. This analysisprovides broader information about the characteristics of those who have died with somedetailed measures of their background social and personal characteristics and the influenceof these characteristics on the risk of death. This sample does not allow us to determinewhether these characteristics influence the death rates in the immediate release period. Itdoes however allow comparison between drug-related deaths and other types of death. In thisway it provides a valuable background of information and characteristics to amplify thestriking mortality rates reported. Sampling issues mean that it is not possible to report onmales and females separately.
This work is consistent with a broader body of knowledge (Darke and Zador, 1996; White andIrvine, 1999) in indicating that individuals with a high level of drug involvement, high level ofdrug dependence, use of injected drugs, use of tranquillisers, and lower levels of socialsupport, economic and social functioning are at greater risk. It also appears to indicate thatthose who are in prison for a medium period of time are also at greater risk. It is possible tospeculate on how many of these factors might be mediated, but overall it would be preferableto consider if such material could be used to profile a range of risk factors that could stimulatestaff to target information and awareness raising as part of pre-release planning.
Some of the data such as use of health services would appear to indicate that many of thoseat risk are being identified and worked with to some degree. There is a need to see if theprocess of risk identification and linkage for throughcare planning and post release supportcould be developed in a manner that would assist in reducing the levels of risk exposure onrelease.
The data from the two different modules give conflicting results with respect to the associationbetween being held for sex offending and drug-related mortality. The two datasets coverdifferent populations and time periods. Some of the study period covered a time when therewas mass media focus on the release of sex offenders into the community, and the authorswonder whether this has had a distorting effect on overall mortality rates among sexoffenders. This can only be explored through further studies at a different time.
There was no strong effect for psychiatric morbidity, or suicidal thinking or self-harmbehaviour when other socio-demographic factors were controlled for in logistic regressionmodelling. However, it is worth noting that before controlling for these factors neuroticdisorder, possible psychosis, suicidal thinking and previous self-harm were higher in thegroups of drug-related deaths. This suggests that the apparent effect of these factors isexplained by their association with the other risk factors that were identified as significantlyassociated with risk of drug-related death. Many of the individuals have very limited socialsupport networks and died in lonely isolated circumstances. Having a restricted social supportnetwork of less than three people was associated with increased rates of drug-related deaths.

49
The data presented here suggests that a number of factors are responsible for this increasedmortality. In the first instance the alteration in tolerance, i.e. reduced tolerance to opiates as aresult of imprisonment and restricted access to heroin and other opiates, places opiatedependent individuals at risk when they return to their communities. In addition the reductionin tolerance to alcohol and other psychoactive drugs adds to the risk of altered opioidtolerance if other drugs are consumed in combination with heroin or other opioids.
While suicides were reported, these were mainly by other methods and not drug-related andlook distinctly different. A pattern of poly-drug and alcohol use was common but by no meansdominant as a mode of death.
The key issue that arises and requires further exploration and consideration is: Are thesedeaths preventable? The authors would suggest that the bulk of these deaths that are classedas drug-related are unlikely to have been covert suicides. However it was also noted thatraised levels of psychiatric and social morbidity are associated before other socio-demographic features are controlled for. Overall there are a range of factors that appear toput some individuals at considerable risk, a combination of baseline serious drug involvement,poor social support and poly-drug involvement with low baseline education and socialfunctioning and major levels of criminal justice involvement. This would seem to indicate thatthe most vulnerable and deprived section of the community and of the prison community carrythe largest morbidity and mortality burden and a broad and integrated approach to tacklingthis will be required.
Overall this is a highly morbid population and the opioid dependent population as reported inthe National Treatment and Outcome Research (NTORS) study have a high mortality rate(Gossop et al., 2002). However, this additional mortality and the accidental nature of thedeaths leave open the opportunity for further consideration of approaches to attempt toreduce this risk.
In the first instance a number of prisons have put together information leaflets andeducational programmes that inform inmates of the risks resulting from altered tolerance todrugs should they revert to drug use on release (for example, the leaflet “Getting Out…OfYour Head”). There is a need to ensure that all individuals who may be vulnerable haveaccess to or are provided with this information as part of a release information pack.
There is clear evidence that drug substitution treatment for those with chronic opioiddependence reduces the risk of death. Consideration should be given to ensuring that opioiddependent individuals on release from prison have fast track access to community-basedtreatment services and, in particular, to methadone maintenance treatment. Some of the datahere seems to indicate that brief and intermittent prison-based treatment does not play aneffective role in reducing drug-related death risk, paradoxically ongoing use of drugs in prisonappears to reduce risk of death. We would interpret this data with caution, as a high overalllevel of drug involvement, before and within prison, indicates a high level of dependence andassociated problems likely to increase the risk of death. There may be a sub-group for whomcontinued use in prison is associated with continued tolerance to a range of drugs that isprotective when the individual returns to drug use on release. However, this can only bespeculated upon and requires some broader consideration to determine the best way tointerpret this complex data set.
More recently as part of a response to addict deaths in the community, some treatmentsettings have begun to prescribe naloxone (the opioid antagonist) to those who areconsidered to be considerably at risk. The aim of this is to provide the means for individuals tobe able to reverse any major overdose. While some individuals become unconsciousimmediately, it is reported that a significant number of overdose deaths are associated with a

gradual reduction in consciousness. While recognising that such an approach requires furthercareful evaluation, consideration should be given to conducting a pilot study of naloxonesupply to chronic opioid dependent individuals in association with training on the use and themanagement of opioid overdose.
As discussed in Chapter 4 on the causes and circumstances surrounding the deaths of newlyreleased prisoners, it is not known how many were alone and how many were in the companyof others when they died but, since a large proportion of deaths occur in a residential setting,it is possible that family members or friends may have observed the deterioration. If this is thecase, then further education for family members in the recognition and management ofoverdose may prevent some deaths. Firstly family members need to be better able torecognise the symptoms of significant overdose such as slow deep breathing, snoring andlack of responsiveness to painful stimuli. In addition families could benefit from learning aboutthe positions that reduce the risk of aspirating vomitus.
Some people have recommended that knowledge of first aid procedures such as mouth tomouth respiration and cardiac resuscitation could also save lives. Probably the mostimportant aspect of this would be to train families to use emergency ambulance services assoon as serious concern about level of consciousness arises. Early use of emergencyservices is more likely to save lives.
The present findings have implications for the operation of drug misuse treatmentinterventions within the criminal justice system. The operation of CARAT initiatives should bereviewed in particular so that the prison release arrangements (throughcare) for inmates withknown drug misuse problems are strengthened. Once individuals are at liberty in thecommunity many of the reported deaths may not be readily preventable, but further workshould be done to examine the immediate support arrangements that are in place. This workshould look at the care pathways that individuals follow i.e. CARAT treatment in prison andthen continuing treatment support in the community. This should also involve probation andcommunity treatment agencies in relation to CARAT referral and throughcare arrangements.Further work to review the screening procedures that CARAT teams use to identify and workwith high-risk drug using inmates should also be undertaken.
In addition, the prison is but one facility where individuals are returned to the community aftera period free from opiates. Drug-free therapeutic communities and in-patient detoxificationunits are also settings where people are discharged after detoxification. There would bebenefit from a study of these units to see whether there is a similar level of elevated risk ondischarge from these units. Given the possibility that individuals with more severe problemsenter such units, its possible that the risk would be even greater than that of prison release.
The overall recommendation is that a broad and concerted approach needs to be taken whichinvolves a comprehensive and holistic response to a very complex problem. It is wellrecognised that much of the prison population is vulnerable, economically, socially, physicallyand mentally. Those who are poly-drug involved with low levels of educational and socialattainment have additional challenges to contend with. Well run prison rehabilitationprogrammes are a potentially very important route or pathway of rehabilitation for some ofthese individuals. However, a major challenge is that it is widely accepted that the majority ofindividuals returning to the community from prison who have used immediately prior to entrywill return to drug use. It is clear that this return to use with altered tolerance to opiates,alcohol and benzodiazepines present a major hazard in the first week. An obvious high profileongoing campaign to highlight the scale of the risk and the need for caution and the option forconsideration of seeking other longer term rehabilitation should be developed further.

51
7 RecommendationsRecommendation 1: General education and awareness-raising of the risk of drug-relateddeath in the immediate post-release period as a result of the consumption of drugs andalcohol should be made available to all prisoners as part of their release preparation.
Overall the determining factor in early release drug-related deaths would appear to be alteredtolerance to opioid type drugs. Approaches to the reduction in drug-related deaths in the earlyrelease period require the development of approaches that increase the awareness of risk ofoverdose at the early stage of relapse to drug use in the early phase after release fromprison.
Many drug users view such deaths as a recognised hazard of heroin and other drug use.There is a need to promote risk awareness and approaches to risk reduction in thispopulation. Overall it is estimated that up to one-third of prisoners have a history of heroin useor dependence. Some of these on release will not relapse to drug use but the majority arepredicted to resume heroin use at some stage after release. Also use of other substancessuch as alcohol and tranquillisers are important co-factors in overdose risk and overdosefatality. It is likely that release is associated with heavy drinking episodes, which may betriggers to use of other drugs, and the combination lends greater risk of overdose.
Therefore the main recommendation is that this problem is sufficiently large that it becomes asubject of general education and awareness-raising for all prisoners as part of releasepreparation. All prisoners need to be made aware that heavy consumption of alcohol andother drugs, in particular minor tranquillisers and opioid-type drugs, can result in non-fatal andalso in fatal overdose. All prisoners should be issued with an overdose prevention card thatcontains information on ways to avoid overdose stated in a clear and non-judgementalfashion. A range of audio-visual educational material should be available to highlight andeducate prisoners and prison staff about the issues of changing tolerance to drugs and drugoverdose on release from prison.
Recommendation 2: Individuals at higher risk of drug-related death should be identified andlinked into ongoing care with community-based services immediately on release from prisonas part of a comprehensive and integrated approach to treatment in prison and thecommunity.
In general it is recognised that those who relapse to drug use who are poly-drug and alcoholdependent, who are homeless and are socially isolated are at greater risk of drug-relateddeath. As part of a comprehensive and integrated approach to treatment in prison andtreatment in the community, it is recommended that such individuals should be identified andthat part of throughcare planning should include linking such individuals into ongoing carewith community-based services on immediate release from prison. Ideally such individuals,wherever possible, should be linked into relevant local services as part of release planning.This would need to include a broad range of services, including housing and other relevantsocial supports, and should be considered in conjunction with other approaches to tacklesocial exclusion. In many settings and for many individuals such through-care planning will beproblematic because of a range of individual circumstances. It is the authors’recommendation that all prisoners on release should have priority access to community-based drug services in the first month of release because of increased overdose risk andoverall vulnerability to relapse during this period.

The CARAT scheme (Counselling, Assessment, Referral, Advice and Throughcare) shouldhave a role in any such programme. It was started in 1999 and so is unlikely to have hadmuch impact on the drug-related mortality in this study. Rates of mortality in subsequentyears might provide some evidence of the effectiveness of this programme.
Recommendation 3: Consideration should be given to the establishment of a pilot study toinvestigate the feasibility of providing a methadone maintenance programme within prisonsfor individuals with long-standing opioid dependence.
In addition, there is the issue of individuals who have been on methadone for long periods oftime before incarceration. There is good evidence that being in methadone treatment reducesthe risk of overdose-related death but does not eliminate such risk. Consideration needs to begiven to the continuation of methadone for individuals with long-standing opioid dependencewho are imprisoned. In particular long-standing opioid dependence with associated poly-drugdependence requires ongoing management within the prison setting and appropriate referralas part of pre-release planning. There are clearly difficult logistic issues in making methadonemaintenance treatment available in prison and also in developing appropriate capacity incommunity-based treatment programmes as part of a longer-term strategy to reduce drug-related deaths. However, the possibility of a pilot project to develop and evaluate ways ofproviding a methadone maintenance treatment programme for opiate-dependent peopleentering prison for remand or short sentence terms should be considered.
Recommendation 4: Consideration should be given to whether it would be appropriate todevelop a pilot project to investigate the use of naltrexone, which should include an evaluationof the likely impact on overdose risk and mortality.
Naltrexone is an opioid receptor blocking agent that has been suggested could be used as amedication to prevent relapse to heroin use. Since the return to previous patterns of heroinuse after a period of abstinence in prison appears to be an important factor in the high drug-related mortality rates among newly-released prisoners reported here, consideration shouldbe given to developing pilot programmes for the use of naltrexone and this should include anevaluation of such an intervention on overdose risk and overdose mortality.
Recommendation 5: The potential for pilot programmes aimed at making naloxone morewidely available in the community should also be considered.
It appears from the death notifications reviewed in this study that other people may have beenpresent when a number of the drug-related deaths occurred. It is possible that the use ofnaloxone could have prevented deaths in some cases. Strang (1999) has proposed that theprovision of naloxone may also be a significant tool in reducing opioid-related mortality in thewider community. Consideration should be given to piloting the provision of naloxone as partof an overall strategy to prevent drug-related deaths among prisoners. In the absence of fullerexploration in the community setting, such an approach is likely to be controversial and wouldneed to be done as part of some experimental evaluation study that could be conducted in amanner that would provide usable data. It is the authors view that a controlled study would berequired but a randomised study would probably not be feasible before other studies on therole of naloxone have been conducted in the community.
Recommendation 6: The authors suggest that the rates obtained in this study should be usedas the basis for target-setting for the reduction in post-release drug-related mortality. Furtherresearch on this topic is also recommended to establish the relative risk of drug-relatedmortality among sub-groups not covered in this study, such as women prisoners and remandprisoners, and for the consideration of possible regional variation.

53
This study has covered a limited period of time and there is confidence that the results arerobust for the study period. However the authors would recommend that further research onthis topic be conducted and that targets be set for the reduction in post release drug-relatedmortality as an achievable target. Any change to the composition of the prison population withrespect to the proportion of prisoners who are drug-dependent and injecting drug users islikely to affect the overall drug-related mortality rate, regardless of the effectiveness anyprogrammes put in place to try and reduce such mortality. Therefore any consideration ofchange over time would need to take this possibility into account. Information on the level ofdrug dependence among prisoners at different times may be available from sources such assurveys or reception health screening but the reliability of the data is likely to be variable.However, if the key target is the reduction of mortality in the immediate post-release period,then the relative risk of dying in this period compared with a later period could be used tomonitor effectiveness, irrespective of the overall mortality rate, thus overcoming this problem.
It should be possible to significantly reduce post-release drug-related mortality, but overallmortality among individuals who are heroin dependent has run between one to two per cent instudies conducted over three decades. It is therefore unlikely that mortality would beeliminated, but a target of significant reduction is consistent with overall targets for reducingdrug-related mortality.
It is the study’s estimate that drug-related mortality after release from prison makes adisproportionate contribution to overall drug-related mortality and impacting on mortalityassociated with release is likely to make a significant impact on overall drug-related mortality.
This research project focused on obtaining mortality rates and information on causes andcircumstances of death from a cohort of all sentenced prisoners as resources were limited.Additional areas for research which should be considered for the future include: establishingthe relative risk of drug-related mortality among sub-groups not covered in this study, such aswomen prisoners and remand prisoners; consideration of possible regional variation andvariation in rates between particular prisons; and the investigation of risk factors for mortalityamong drug-using prisoners rather than the prison population as a whole.
In summary a range of approaches are possible, from a broad and comprehensivepsychoeducational and awareness raising strategy to more pilot-style projects of improvinglinks to community based services, to expanding pharmacotherapy options for themanagement of opioid dependence and for the prevention of relapse and also for the reversalof opioid overdose. All approaches should be subject to appropriate and pragmaticevaluation.

8 ReferencesAdvisory Council on the Misuse of Drugs (2000) Reducing Drug Related Deaths. London: TheStationery Office.
Babor TF, de la Fuente JR, Saunders J and Grant M (1992) AUDIT The Alcohol UseDisorders Identification Test: Guidelines for use in primary health care, World HealthOrganisation: Geneva.
Brugha TS, Bebbington P, Tennant C and Hurry J (1985) The List of ThreateningExperiences: a subject of 12 life event categories with considerable long term contextualthreat, Psychological Medicine, 15, 189-194.
Brugha TS, Wing JK, Brewin CR, MacCarthy B and Lesage A (1993) The relationship ofsocial network deficits in social functioning in long-term psychiatric disorders, SocialPsychiatry and Psychiatric Epidemiology, 28, 218-224.
Christophersen O, Rooney C and Kelly S (1998) Drug-related mortality: methods and trends.Population Trends, 93, 29-37.
Darke S, Ross J and Hall W (1996) Overdose amongst heroin users in Sydney: I. Prevalanceand correlates of non-fatal overdose. Addiction, 91, 405-411.
Darke S, and Ross J (1999) Heroin-related deaths in South Western Sydney, Australia, 1992-96. Drug and Alcohol Review, 18(1):39-45.
Darke S and Zador D (1996) Fatal heroin overdose: a review. Addiction. 91: 1765-72.
Darke S and Ross J (2001) The relationship between suicide and heroin overdose amongmethadone maintenance patients in Sydney, Australia. Addiction, 96(10): 1443-53.
First MB, Gibbon M, Spitzer RL, William JBW and Benjamin L (1997) Structured ClinicalInterview for DSM-IV Axis II Personality Disorders, American Psychiatric Press: Washington.
Frischer M, Bloor M, Goldberg D, Clark J, Green S and McKeganey N (1993) Mortality amonginjecting drug users: a critical reappraisal. Journal of Epidemiology and Community Health,47:59-63.
Ghodse AH, Oyefeso A, Webb L, Pollard M and Corkery J (2001) Drug-related Deaths asReported by Coroners in England and Wales. Annual Review 2000 and np-SAD SurveillanceReport, No 7.
Ghodse AH, Oyefeso A and Kilpatrick B (1998) Mortality of drug addicts in the UnitedKingdom 1967-1993. International Journal of Epidemiology, 27:473-478.

55
Gossop M, Griffiths P, Powis B, Williamson S and Strang J (1996) Frequency of non-fatalheroin overdose: survey of heroin users recruited in non-clinical settings. British MedicalJournal, 313:402.
Gossop M, Stewart D, Treacy S and Marsden J (2002) A prospective study of mortalityamong drug misusers during a 4 year period after seeking treatment. Addiction, 97, 39-47.
Harding-Pink D (1990) Mortality following release from prison, Medicine, Science and theLaw, 30, 12-16.
Health Promotion Research Trust (1987) The Health and Lifestyles Survey.
Hser Y, Hoffman V, Grella C and Anglin D (2001) A 33 year follow-up of narcotics addicts,Archive of General Psychiatry, 58: 503-508.
Lewis G, Pelosi A, Araya RC and Dunne G (1992) Measuring psychiatric disorder in thecommunity: a standardized assessment for use by lay interviewers, Psychological Medicine,22, 465-486.
Neeleman J and Farrell M (1997) Fatal methadone and heroin overdoses: time trends inEngland and Wales. Journal of Epidemiology and Community Health, 51: 435-437.
Office for National Statistics (2001). Deaths related to drug poisoning: England and Wales,1995 to 99. Health Statistics Quarterly 09: 70-72.
Oppenheimer E, Tobutt C, Taylor C and Andrew T (1994) Death and survival in a cohort ofheroin addicts from London clinics: A 22-year follow-up. Addiction, 89:1299-1308.
Powis B, Strang J, Griffiths P, Taylor C, Williamson S, Fountain J and Gossop M (1999) Self-reported overdose among injecting drug users in London: extent and nature of the problem.Addiction, 94(4):471-478.
Seaman SR, Brettle RP and Gore SM (1998) Mortality from overdose among injecting drugusers recently released from prison: database linkage study, British Medical Journal 316,426-428.
Seymour A, Oliver JS and Black M (2000) Drug-related deaths among recently releasedprisoners in the Strathclyde region of Scotland, Journal of Forensic Science, 45(3), 649-654.
Singleton N, Meltzer H, Gatward R, Coid J and Deasy D (1998) Psychiatric Morbidity amongPrisoners in England and Wales, TSO: London.
Stöver H (2001) Study on Assistance to Drug Users in Prisons, European Monitoring Centrefor Drugs and Drug Addiction.

Strang J, Griffiths P, Powis B, Fountain J, Williamson S and Gossop M (1999a) Which drugscause overdose among opiate misusers? Study of personal and witnessed overdoses. Drugand Alcohol Review, 18:253-261.
Strang J, Griffiths P, Powis B, Fountain J, Williamson S and Gossop M (1999b) Which drugscause overdose among opiate misusers? Study of personal and witnessed overdoses. Drugand Alcohol Review. 1999. 18: 253-261.
Strang J (1999) Take-home naloxone: The next steps [Letter]. Addiction. 1999, February 94,207.
Vingoe L, Welch S, Farrell M and Strang J (1999) Heroin overdose among a treatmentsample of injecting drug misusers: accident or suicidal behaviour? Journal of Substance Use4(1): 88-99.
White JM and Irvine RJ (1999) Mechanisms of fatal opioid overdose. Addiction, 94(7):961-972.

57
Appendix A: Statistical techniques used in the analysis for this report
Mortality rate calculations
Calculations of observed mortality rates have been made allowing for different lengths of theperiods of observation in the study using the Stata 6.0 procedure for Poisson regression, aswere their statistical significance levels. Poisson regression is a generalised form of simple(least squares estimation) regression that uses weighting of the observations (i) to allow fordifferent exposure periods of different individuals within the overall study period, and (ii) toallow rates (for mortality etc.) to be broken down as ratios, not as the sum of differentialfactors.
Excess mortality ratios have been calculated by comparison with general population mortalityrates matched for age and gender with the prison sample. The population mortality rates arebased on those observed for England and Wales 1997/8, but adjusted for increased accuracy(using a colog-log survival model) to remove chance fluctuations that arise in the observedrates. Over the study period as a whole, 137 deaths were recorded among the people in thesample, whereas in a sample of the general population matched for age and gender only 23would be expected. This gives an excess mortality ratio of about 5.9 (i.e. the prison samplemortality (137) divided by the general population mortality matched for age and gender (23)).
Risk factors relating to mortality have been calculated as odds ratios, which show thenumbers of deaths associated with the risk group in relation to the number of deaths in aspecified base-line comparison group. The odds ratios have been adjusted where necessaryto allow for the effects of other identified risk factors.
Multiple logistic regression
Multiple logistic regression estimates the relationship of a dichotomous dependent variable, inthis case drug-related death, and a risk factor while controlling for the confounding effects ofother risk factors in the analysis. A backward likelihood ratio method was used to identify thesignificant risk factors.
Logistic regression produces an estimate of the odds of a death occurring in an individual in aparticular category compared with individuals in a reference category for that risk factor. Theodds, for example, of drug-related death for those living off crime before coming to prison aredefined as the ratio of the probability of death for those living off crime compared with theprobability for those who were working. The Adjusted Odds Ratio (OR) controls for thepossible confounding effects of the other risk factors in the model i.e. age, sex, time in prison.For example Table 4.7 (Chapter 4) shows those living off crime were ten times as likely tohave had a drug-related death compared with those in the reference category of ‘working’(adjusted odds ratio = 9.8).
To determine whether the increased odds of having a characteristic are due to chance ratherthan having a particular characteristic, one must consult the confidence interval associatedwith the odds ratio. The confidence intervals around the odds ratios indicate that the ‘true’(i.e. the population) odds ratio is 95 per cent likely to lie between these two values. If theconfidence interval does not include 1 then the odds ratio is likely to be significantly differentfrom that of the reference category.

Significance
It is stated in the report that some differences or odds ratios are ‘significant’. Asterisks in thetables show where the differences are significant. Statistical significance indicates that it isunlikely that a difference or odds ratio of this magnitude would be found due to chance alone.Specifically, the likelihood that the difference or odds ratio shows an effect simply by chanceis less than 5 per cent where p<0.05 (indicated by one asterisk) or less than 1 per cent wherep<0.01 (indicated by two asterisks). This is conventionally assumed to be infrequent enoughto discount chance as an explanation for the finding.

59
Appendix B: Characteristics of those dying from drug-related causes, from othercauses and those who were still alive (Module B)Table B1: Socio-demographic and personal characteristics
Drug relateddeath
Other death Alive All
% % % %
Personal CharacteristicsSex Male 96 94 96 96
Female 4 6 4 4
Age group 16 to 20 24 17 20 2021 to 29 48 17 44 4430 to 39 12 50 24 2440+ 16 17 12 12
Ethnic group White 100 * 89 85 85Black 0 * 0 10 10Other 0 * 11 5 5
Taken in to Local Authority Yes 8 * 61 28 28care as a child No 92 * 39 73 73
Lived in an institution as Yes 19 * 67 36 36a child No 81 * 33 64 64
Education and EmploymentAge left school 13 or less 4 11 8 8
14 or 15 42 50 41 4116 years 54 39 42 4317 years or older 0 * 0 9 9
Educational qualifications A level or higher 0 * 39 13 13GCSE/O level 31 39 25 25Other qualifications 8 0 14 14No qualifications 62 22 48 48
Employment status Working 12 19 39 39before prison term Unemployed 15 25 22 22
Living off crime 46 * 19 17 18Economically inactive 27 38 21 21
Base (unweighted) 25 21 2,499 2,545*difference in proportion (drug-related death and prison population) p<0.05

Table B1 (continued) socio-demographic and personal characteristics
Drug relateddeath
Other death Alive All
% % % %
Marital Status and Living ArrangementsMarital status at time of interview Married/cohabiting 12 * 56 41 41
Single 65 33 49 49Separated/divorced/widowed
23 11 10 10
Who lived with before Lived alone 28 6 18 18prison term Lived with other adults
only60 56 49 49
Lived with children 12 * 39 31 31Other 0 * 0 1 1
Accommodation type before Owned 0 * 22 13 13prison term Rented, self-contained 52 67 49 49
Bedsit/sharedamenities
0 * 0 6 6
Hostel/temporary 8 0 4 4With parents/relatives/friends
24 6 21 21
Other 16 6 8 8
Social SupportAny contact from outside prison Yes 100 * 94 97 97(phone/letter/visits) No 0 * 6 3 3
External contact from: Friends and family 69 56 75 75Family only 27 22 17 17Friends only 4 17 5 5No-one 0 * 6 3 3
Primary support group 0 to 3 35 21 16 17size 4 to 8 23 32 28 28
9+ 42 47 56 56
Perceived social support Severe lack 27 56 25 26Moderate lack 42 6 33 33No lack 31 39 41 41
Base (unweighted) 25 21 2,499 2,545*difference in proportion (drug-related death and prison population) p<0.05

61
Table B2 Offence and prison sentence characteristics
Drug relateddeath
Other death Alive All
% % % %
Number of previous None 24 16 37 36prison terms 1 16 11 18 18
2 to 4 24 32 24 245 to 9 24 26 16 1610 or more 12 16 6 6
Main offence Violent/other/ notknown
31 44 36 36
Sex offence 23 * 0 6 6Acquisitive 39 56 42 42Drug offence 8 0 16 16
Sentence length – prison service Remand 19 22 19 19definition Short 23 11 22 22
Medium 31 11 29 29Long 27 56 30 30
Time served for prison term when < 3 months 15 5 14 14interviewed 3-5 months 19 5 9 9
6-11 months 4 * 11 20 201 year but not 2 years 46 26 28 292 years or more 15 53 29 29
Prison type – when interviewed Local prison 54 21 40 40Dispersal/Category Btrainer
8 26 5 6
Category C or femaletrainer
15 * 37 31 31
Open or Category D 0 * 0 8 8Young Offenders’Institute (all types)
23 16 16 16
Base (unweighted) 25 21 2,499 2,545*difference in proportion (drug-related death and prison population) p<0.05
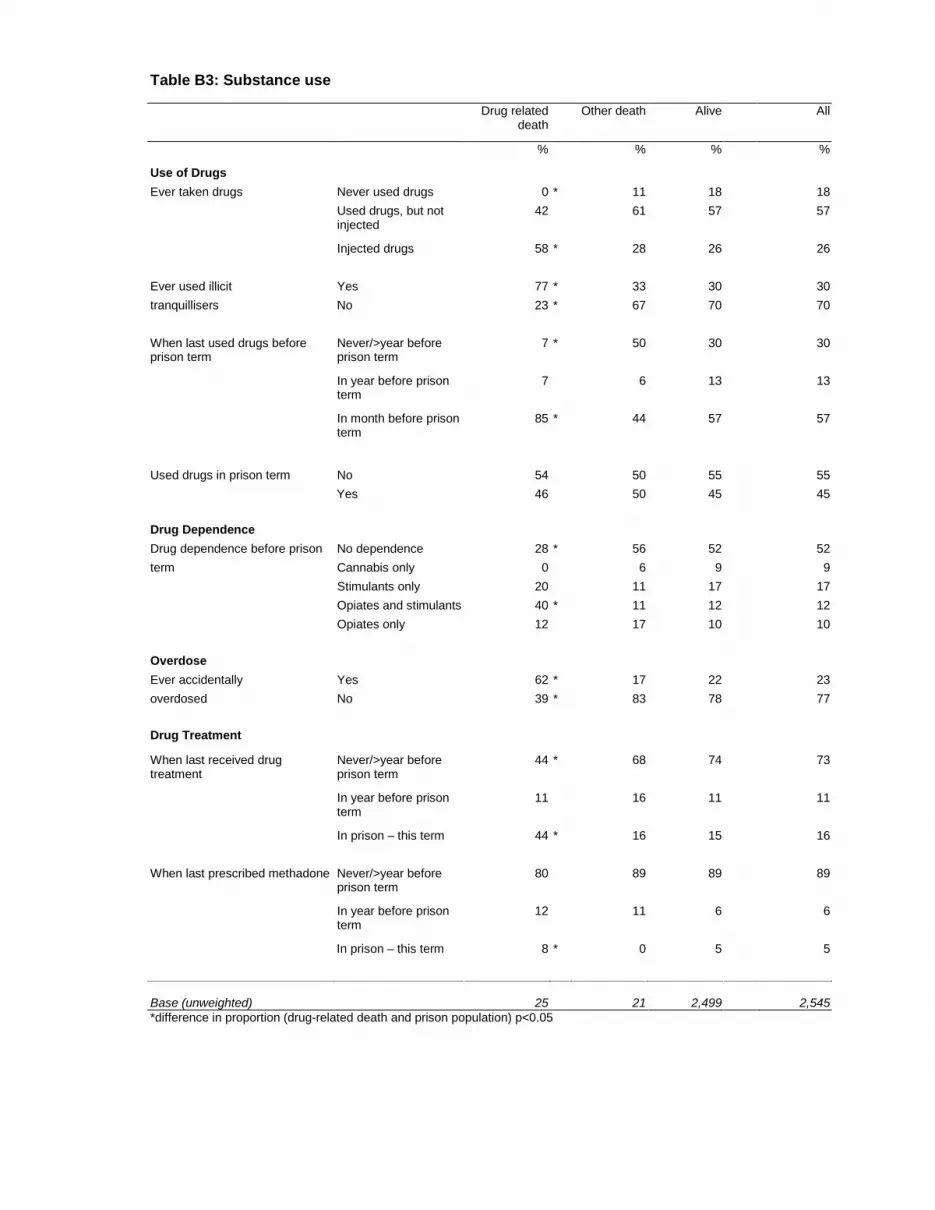
Table B3: Substance use
Drug relateddeath
Other death Alive All
% % % %
Use of DrugsEver taken drugs Never used drugs 0 * 11 18 18
Used drugs, but notinjected
42 61 57 57
Injected drugs 58 * 28 26 26
Ever used illicit Yes 77 * 33 30 30tranquillisers No 23 * 67 70 70
When last used drugs beforeprison term
Never/>year beforeprison term
7 * 50 30 30
In year before prisonterm
7 6 13 13
In month before prisonterm
85 * 44 57 57
Used drugs in prison term No 54 50 55 55Yes 46 50 45 45
Drug DependenceDrug dependence before prison No dependence 28 * 56 52 52term Cannabis only 0 6 9 9
Stimulants only 20 11 17 17Opiates and stimulants 40 * 11 12 12Opiates only 12 17 10 10
OverdoseEver accidentally Yes 62 * 17 22 23overdosed No 39 * 83 78 77
Drug Treatment
When last received drugtreatment
Never/>year beforeprison term
44 * 68 74 73
In year before prisonterm
11 16 11 11
In prison – this term 44 * 16 15 16
When last prescribed methadone Never/>year beforeprison term
80 89 89 89
In year before prisonterm
12 11 6 6
In prison – this term 8 * 0 5 5
Base (unweighted) 25 21 2,499 2,545*difference in proportion (drug-related death and prison population) p<0.05

63
Table B3 (continued) Substance use
Drug relateddeath
Other death Alive All
% % % %
Smoker at time of interview Non smoker 0 * 0 19 19Smoker 100 * 100 81 81
Drinking – AUDIT score 0 to 7 31 28 38 388 to 15 23 6 33 3216+ 46 67 29 30
Base (unweighted) 25 21 2,499 2,545*difference in proportion (drug-related death and prison population) p<0.05

Table B4 Mental state
Drug relateddeath
Other death Alive All
% % % %
Mental DisordersAny personality disorder at time No disorder 15 6 25 25of interview Antisocial disorder
only15 11 22 22
Antisocial disorder andanother disorder
65 * 67 37 38
Other disorder only 4 * 17 17 16
Neurosis – CIS-R score 0 to 5 35 28 34 346 to 11 12 17 22 2212 to 17 12 11 15 1518+ 42 44 28 28
Psychosis Unlikely psychotic 82 83 95 95(lay interview) Probably psychotic 19 17 5 5
TreatmentTaking CNS medication at the No 58 * 67 81 81time of interview Yes 42 * 33 19 20
Any help received before Yes 32 28 18 18prison term for mental disorder No 60 28 72 72
In prison>=2 years 8 44 10 10
Suicidal Thoughts and Deliberate Self-harmHas had suicidal In past week 12 6 5 6thoughts In past year (excl. past
week)40 * 28 18 18
In lifetime (excl. pastyear)
8 6 14 14
Never 40 * 61 63 62
Ever self-harmed Yes 12 0 6 6No 89 100 94 94
Stressful Life events % % % %
Had stressful life event Yes 35 28 25 25in last 6 months No 65 72 75 75
Number of stressful life <3 0 * 0 25 24events 3 or more 100 * 100 76 76
Suffered victimisation Yes 73 * 53 41 42in prison term No 27 * 47 59 59
Base (unweighted) 25 21 2,499 2,545*difference in proportion (drug-related death and prison population) p<0.05

Appendix C Prevalence of drug-related death by risk factors
Table C1 Socio-demographic and personal characteristics
Personal Characteristics
Sex Age group Ethnic GroupMale Female 16-20 21-29 30-39 40+ White Black Other
% % % % % % % % %Drug-related death 1 0.9 1.2 1.1 0.5 1.3 1.2 0 0Other death 0.7 0.9 0.6 0.3 1.5 1 0.7 0 1.5Alive 98.3 98.2 98.2 98.7 98 97.8 98.1 100 98.5
Base (unweighted) 1,920 625 541 1,079 627 298 2,108 287 150
Taken into Local Authoritycare as child
Lived in an institution as achild
Yes No Yes No% % % %
Drug-related death 0.3 1.3 0.5 1.3Other death 1.6 0.4 1.3 0.4Alive 98.1 98.3 98.1 98.3
Base (unweighted) 745 1,791 933 1,612

Table C1 (continued) Socio-demographic and personal characteristics
Education and employment before prison termAge left school Educational qualifications
13 or under 14 or 15 16 17 or older A level orhigher
GCSE/O level Otherqualifications
Noqualifications
% % % % % % % %Drug-related death 0.5 1 1.3 0 0 1.3 0.6 1.3Other death 1 0.9 0.6 0 2.1 1.1 0 0.3Alive 98.5 98.1 98.1 100 97.9 97.6 99.4 98.4
Base (unweighted) 198 1,050 1,082 214 297 612 368 1,263
Employment status before prison termWorking Unemployed Living off
crimeEconomically
inactive% % % %
Drug-related death 0.3 0.7 2.7 1.3Other death 0.3 0.7 0.7 1.1Alive 99.4 98.6 96.6 97.6
Base (unweighted) 869 549 411 675

67
Table C1 (continued) Socio-demographic and personal characteristics
Marital Status and Living ArrangementsMarital status when interviewed Who lived with before prison term
Married/cohabiting
Single Separated/divorced/widowed
Alone With otheradults only
With children Other
% % % % % % %Drug-related death 0.3 1.4 2.4 1.5 1.2 0.4 0Other death 1 0.5 0.8 0.2 0.8 0.9 0Alive 98.8 98.1 96.9 98.3 98 98.7 100
Base (unweighted) 1,014 1,228 286 467 1,226 805 47
Accommodation typeOwned Rented, self-
containedBedsit/Shared
amenities
Hostel/temporary
With parents/friend/
relatives
Other
% % % % % %Drug-related death 0 1 0 1.8 1.1 2.1Other death 1.3 1 0 0 0.2 0.5Alive 98.8 98 100 98.2 98.7 97.4
Base (unweighted) 273 1,299 147 112 504 210

Table C1 (continued) Socio-demographic and personal characteristics
Social Contact
Any contact from outsideprison
External contact from: Primary support group size
Yes No Friends andfamily
Family only Friends only No-one 0 to 3 4 to 8 9+
% % % % % % % % %Drug-related death 1.1 0 0.9 1.6 0.8 0 2.1 0.8 0.8Other death 0.7 1.3 0.5 0.9 2.3 1.3 1 0.8 0.6Alive 98.3 98.7 98.5 97.4 96.9 98.7 96.9 98.3 98.6
Base (unweighted) 2,450 93 1,860 434 156 93 462 783 1,300
Perceived social supportSevere lack Moderate lack No lack
% % %Drug-related death 1.1 1.3 0.8Other death 1.6 0.1 0.7Alive 97.4 98.6 98.6
Base (unweighted) 660 839 1,024

69
Table C2 Offence and prison sentence factors
Number of Previous Prison terms Main OffenceNone 1 2 to 4 5 to 9 10 or more Violent/other/
not knownSex offence Acquisitive Drug offence
% % % % % % % % %Drug-related death 0.7 0.9 1 1.5 1.9 0.9 3.9 0.9 0.5Other death 0.3 0.4 1 1.2 1.9 0.9 0 0.9 0Alive 99 98.7 98 97.3 96.2 98.3 96.1 98.1 99.5
Base (unweighted) 975 438 569 392 166 918 108 1,075 444
Sentence length Time served for prison term when interviewedRemand Short Medium Long <3 months 3 to 5 months 6 to 11 months 1 year but not
2 years2 years or more
% % % % % % % % %Drug-related death 1 1.1 1.1 0.9 1.1 2.2 0.2 1.6 0.5Other death 0.8 0.4 0.3 1.3 0.3 0.4 0.4 0.7 1.3Alive 98.1 98.5 98.6 97.7 98.6 97.4 99.4 97.7 98.1
Base (unweighted) 1,155 407 449 517 434 304 570 669 568
Prison type – at time of interview
Local prison Dispersal/Category B
trainer
Female orCategory C
trainer
Open orCategory D
YoungOffenders’Institute
% % % % %Drug-related death 1.4 1.4 0.5 0 1.5Other death 0.4 3.5 0.9 0 0.7Alive 98.2 95.1 98.6 100 97.8
Base (unweighted) 1,366 92 554 210 323

Table C3 Substance use
Use of DrugsDrug use ever Last used drugs Use of illicit tranquillisers
Never useddrugs
Used drugs,but notinjected
Injected drugs Never/>yearbefore current
prison term
In year beforecurrent prison
term
In monthbefore current
prison term
Yes No
% % % % % % % %Drug-related death 0 0.8 2.3 0.3 0.6 1.6 2.6 0.3Other death 0.4 0.8 0.8 1.2 0.3 0.6 0.8 0.7Alive 99.6 98.5 97 98.6 99.1 97.9 96.6 99
Base (unweighted) 449 1,364 730 754 366 1,423 804 1,741
Drug use in prison termwhen interviewedNo Yes% %
Drug-related death 1 1.1Other death 0.6 0.8Alive 98.4 98.2
Base (unweighted) 1,487 1,043

71
Table C3 (Continued) Substance use
Dependence and Over-doseDependence on drugs in year before prison term Ever accidentally overdosed
Nodependence
Cannabisonly
Stimulantsonly
Opiates andStimulants
Opiates only Yes No
% % % % % % %Drug-related death 0.5 0 1.1 3.3 1.2 2.8 0.5Other death 0.8 0.4 0.5 0.7 1.2 0.5 0.8Alive 98.7 99.6 98.4 96.1 97.6 96.7 98.7
Base (unweighted) 1,249 207 414 382 293 620 1,919
Drug TreatmentEver received treatment for drugs Ever prescribed methadone
Never In year beforecurrent prison
term
In prison –this term
Never/>1 yrbefore current
prison term
In year beforecurrent prison
term
In prison –this term
% % % % % %Drug-related death 0.6 1.1 3 0.9 2 1.5Other death 0.7 1.1 0.8 0.7 1.3 0Alive 98.7 97.9 96.2 98.4 96.7 98.5
Base (unweighted) 1,817 344 381 2,175 193 174

Table C3 (Continued) Substance use
Drinking and SmokingDrinking – AUDIT score Smoker at time of interview
0-7 8 to 15 16+ Non smoker Smoker% % % % %
Drug-related death 0.8 0.7 1.6 0 1.3Other death 0.5 0.1 1.6 0 0.9Alive 98.7 99.2 96.8 100 97.8
Base (unweighted) 1,129 707 709 406 2,107

73
Table C4 Mental state
Mental DisordersPersonality Disorder at time of interview CIS-R Score
No disorder Antisocialdisorder only
Antisocialdisorder and
anotherdisorder
Otherdisorder only
0 to 5 6 to 11 12 to 17 18+
% % % % % % % %Drug-related death 0.6 0.7 1.8 0.2 1 0.5 0.8 1.5Other death 0.2 0.4 1.3 0.7 0.6 0.5 0.5 1.1Alive 99.2 98.9 97 99 98.4 98.9 98.7 97.3
Base (unweighted) 552 465 998 530 700 510 405 930
PsychosisUnlikely
psychoticProbablypsychotic
% %Drug-related death 0.9 3.8Other death 0.6 2.3Alive 98.5 93.8
Base (unweighted) 2,353 192

Table C4 (continued) Mental state
TreatmentCNS medication Help for mental disorder before prison
No Yes Yes No In prison>=2years
% % % % %Drug-related death 0.7 2.2 1.8 0.8 0.8Other death 0.6 1.2 1.1 0.3 3Alive 98.7 96.6 97.1 98.9 96.2
Base (unweighted) 1,845 700 601 1,771 173
Suicidal Thoughts and Deliberate Self-harmSuicidal thoughts Deliberate self-harm
In past week In past year(excl. past
week)
In lifetime(excl. past
year)
Never Yes No
% % % % % %Drug-related death 2.2 2.2 0.5 0.6 1.9 1Other death 0.7 1.1 0.3 0.7 0 0.8Alive 97.1 96.7 99.2 98.7 98.1 98.3
Base (unweighted) 227 540 352 1,423 155 2,389
Stressful Life EventsStressful life events Number of stressful life
eventsVictimisation in prison term
Yes No 0-2 3 or more Yes No% % % % % %
Drug-related death 1.4 0.9 0 1.3 1.8 0.5Other death 0.8 0.7 0 0.9 0.9 0.6Alive 97.8 98.4 100 97.7 97.3 98.9
Base (unweighted) 743 1,802 604 1,941 1,015 1530

75
GLOSSARY
Drug-related death
Deaths were classed as drug-related if the underlying cause of death was coded to any of thefollowing ICD-9 codes:
Underlying cause ofdeath code (ICD-9) Description
292 drug psychoses
304 drug dependence
305.2 – 305.9 non dependent abuse of drugs
E850-E858 accidental poisoning by drugs,medicaments and biologicals
E950.0-E950.5 suicide and self-inflicted poisoningby solid or liquid substances
E980.0 – E980.5 poisoning by solid or liquid substances, undetermined whether accidentally or purposely inflicted
E962.0 assault by poisoning – drugs and medicaments
Property/other crimes
Arson
Criminal damage
Drunkenness
Begging
Prostitution
Immigration offences
Other specified crimes
Acquisitive offences
Robbery
Theft
Fraud
Burglary
Forgery
Handling stolen goods

Sexual offences
Buggery
Indecency between males
Rape
Indecent assault
Gross indecency/indecent assault of child
Unlawful sexual intercourse
Incest
Abduction
Bigamy
Indecent exposure
Other sexual offences
Stressful life events
Prisoners were asked whether they had experienced any of the following 15 events:
1. Bullying
2. Violence at work
3. Violence in the home
4. Sexual abuse
5. Serious life-threatening illness/injury
6. Separation due to marital difficulties or the breakdown of a steady relationship
7. Death of husband, wife (or partner) or a child
8. Death of a parent or brother/sister
9. Death of a close family friend or other relative you were close to
10. Stillbirth of a baby
11. Being expelled from school
12. Being sacked or made redundant
13. Running away from home
14. Being homeless
15. Serious money problems
All but four of the events (events 1, 11, 13 and 14) were drawn from the List of Threatening
Experience (Brugha et al., 1985).

Produced by the Research Development and Statistics Directorate, Home Office
This document is available only in Adobe Portable Document Format (PDF) through the RDSwebsite
Home OfficeResearch, Development and Statistics DirectorateCommunication Development UnitRoom 27550 Queen Anne’s GateLondon SW1H 9AT
Tel: 020 7273 2084 (answerphone outside of office hours)Fax: 020 7222 0211Email: [email protected]
ISBN 1 84082 993 1 Crown copyright 2003
Related Documents


