Dipartimento di Scienze Economiche Facoltà di Economia Via S. Faustino 74/b 25122 BRESCIA e-mail: [email protected] Drug Pricing in a Regulated Market Stefano Capri and Rosella Levaggi Address for Correspondence: Prof. Rosella Levaggi Dipartimento di Scienze Economiche Università di Brescia Via S. Faustino 74/b 25122 BRESCIA [ITALY] ISIS Research, Milano. Dipartimento di Scienze Economiche, Università di Brescia.

Welcome message from author
This document is posted to help you gain knowledge. Please leave a comment to let me know what you think about it! Share it to your friends and learn new things together.
Transcript

�
Dipartimento di Scienze Economiche
Facoltà di Economia Via S. Faustino 74/b
25122 BRESCIA
e-mail: [email protected]
Drug Pricing in a Regulated Market
Stefano Capri� and Rosella Levaggi�
Address for Correspondence: Prof. Rosella Levaggi Dipartimento di Scienze Economiche Università di Brescia Via S. Faustino 74/b 25122 BRESCIA [ITALY]
� ISIS Research, Milano. � Dipartimento di Scienze Economiche, Università di Brescia.

2
Drug Pricing in a Regulated Market
Abstract In this article we analyse the problem of determining the price for new drugs in a market where a stringent budget constraint on public expenditure exists and we suggest an innovative methodology to set their prices. The market is characterised by asymmetry of information and a high proportion of investment in R&D, an element that has to be taken into account because it is only through research that it is possible to obtain better drugs. Our proposed method allows to set the price of new drugs in different market contexts, i.e. where less effective alternatives are already sold or in new markets. We also propose a unified methodology to evaluate the social value of drugs in different markets through the definition of a function of the cost per QALY that society is willing to pay. Keywords: Drug value, price setting, public health care expenditure

3
1. Introduction
When a market can work according to the rules set out for perfect competition there is no need for
regulation because a first best allocation of resources, where consumers maximise their utility and
firms their profits, is reached automatically. Prices on these markets reflect the marginal benefit
from consumption and the equilibrium is found at a point where the marginal cost of production is
equal to marginal utility of consumption. This condition also implies zero profit for the firms and
cost minimisation. The markets for drugs is not a perfect competitive structure for several reasons:
• on the consumption side, the demand does not reflect the marginal benefit of consumers. The
demand for drugs is usually made by a doctor who acts as an agent for his patients hence the
demand might reflect also his preferences; furthermore if the patient has an insurance coverage,
the price he pays is lower than the market price;
• on the production side, drugs have a high proportion of cost in R&D hence the price is usually
much higher than their cost of production.
In reviewing the different regulation policies applied to the drug market we can find at least five
categories of restrictions:
• patent restrictions on commercialisation of the new drug which allows the company to sell new
drugs in a regime of monopoly;
• restrictions on their price ranging from the Italian case where the price and its increase must be
authorised by a government agency to the less restrictive Australian rule to reimburse the
consumer with the price of the cheapest alternative;
• restrictions on the drugs that can be sold, i.e. before a new drug can be put on the market, its use
must be approved on the basis of its effectiveness in controlled clinical trials1;
• Restrictions on the reimbursement scheme. In most countries once a drug is approved to be sold
on the market, its cost is not necessarily met by the State. In some cases the reimbursement
scheme depends on the special circumstances of the patients while in other systems drugs are
classified in different categories according to their importance2;
• budget limits on the purchase or prescription of drugs such as the indicative prescribing amount
set up in Britain for GP's or the double budget procedures in Italy3.
�
1 The rules to be followed to allow new drugs to be sold are not uniform. The most important schemes are described in Capri et al. (2001). 2 In Italy, for example, there are different groups: A whose cost is fully covered by public expenditure, B which consists of prescribed medicines for which the patient must make a 50% copayment, and C that includes drugs for which the consumer has to make a full payment. For a detailed presentation see Levaggi and Capri (1999) cap.7

4
In this article we would like to present the problems for a benevolent regulator who has to set the price
for new drugs in a market where a stringent budget constraint exists. The market is characterised by
asymmetry of information and a high proportion of investment in R&D, an element that need to be
taken into account because it is only through research that it is possible to obtain more effective drugs.
In the field of public economics the literature has recently proposed new models to determine a
socially optimal price in the presence of monopoly and asymmetry of information4. Laffont and Tirole
(1993), for example, set up a framework to examine regulation in several environments from the point
of view of a benevolent regulator who wants to maximise the welfare of his community. In the case of
regulatory policy, the three elements that need to be taken into account are consumer’s surplus, the
profit of the firm and the cost of public funds needed to enforce the regulation5.
These models proposed are however not suitable for the pharmaceutical industry because in this
market both costs and consumers' surplus are difficult to be measured.
In this article we propose an innovative method based on the evaluation of the social value of each
drug. Our analysis stems from the Gravelle (1998) model, but is innovative in many aspects. The
article will be organised as follows: in section two we present the models suggested by the literature to
deal with regulation in the drug market, in section three we present our novel approach and finally in
section four we draw the conclusions of our analysis.
2. The models suggested by the literature
The market for drugs is a typical example of a non-competitive market where a first best allocation
of resources cannot be reached. In this market, in fact, the producer is not a price-taker and can set a
price higher than the marginal cost of the product he is selling6 and government intervention is
needed to correct for this market failure. Several models have been proposed to correct this market
failure, but most schemes fail to reach their objectives because they are based on the assumption
that the costs of the regulated industry can be observed7.
Loeb and Magat (1979) suggest a regulation mechanism to overcome the problem related to the
asymmetry of information on the cost side of the pharmaceutical industry. They propose to use a
system based on the evaluation of the consumer’s surplus: the firm producing an innovative drug is
given a subsidy that is equal to the total consumer surplus generated by the new product. In this case,
3 See Levaggi (1998) for a description of the system. 4. See Laffont and Tirole (1993) and Armstrong et al.(1994). 5 The latter element should be weighted by their shadow price, i.e. the opportunity cost of using funds in this environment. 6 See Tirole (1988) for a complete exposition. 7 See Tirole (1988). Some economists have proposed innovative models that take account of asymmetry of information
5
the firm will sell its product at a price equal to its marginal cost, but the total profit of the firm is
increased by the subsidy. The mechanism automatically secures that the firm pursues a cost
minimisation strategy. This approach is not easily implemented because the demand for new drugs is
difficult to measure, and this information is necessary to evaluate the amount of the subsidy. Gravelle
(1998) summarises the shortfalls of this approach as follows:
• pharmaceuticals needs relevant investments in R&D that is usually a sunk cost for the industry;
• on the research side competition is quite high and it is often necessary to grant patents before the
exploitation of the new drug ;
• the promotion of a new drug plays an important role in its market success; an optimal incentive
scheme ought to take account of this aspect as well;
• the new products might be a substitute for other less effective drugs already available. The actual
improvement needs to be certified in a rigorous way;
• the demand for a drug does not reflect patient’s benefit or willingness to pay since it derives from
an agency relationship between the patient and his doctor.
Gravelle suggests to use a different method, EPV (Ex Post Value of reimbursement), which is based
on the social value of the new drug and is not measured using demand as in a standard microeconomic
approach. The incentive scheme foresees the payment of a lump sum to the firm only if the new drug
is actually sold on the market and a matching subsidy paid on each unit of product sold. The
distinction between the lump sum and the matching grant element is important to give the firm an
optimal incentive to invest and promote the new drug; from the point of view of the optimal quantity
to be sold it is only necessary that the total subsidy is equal to the marginal social evaluation of the
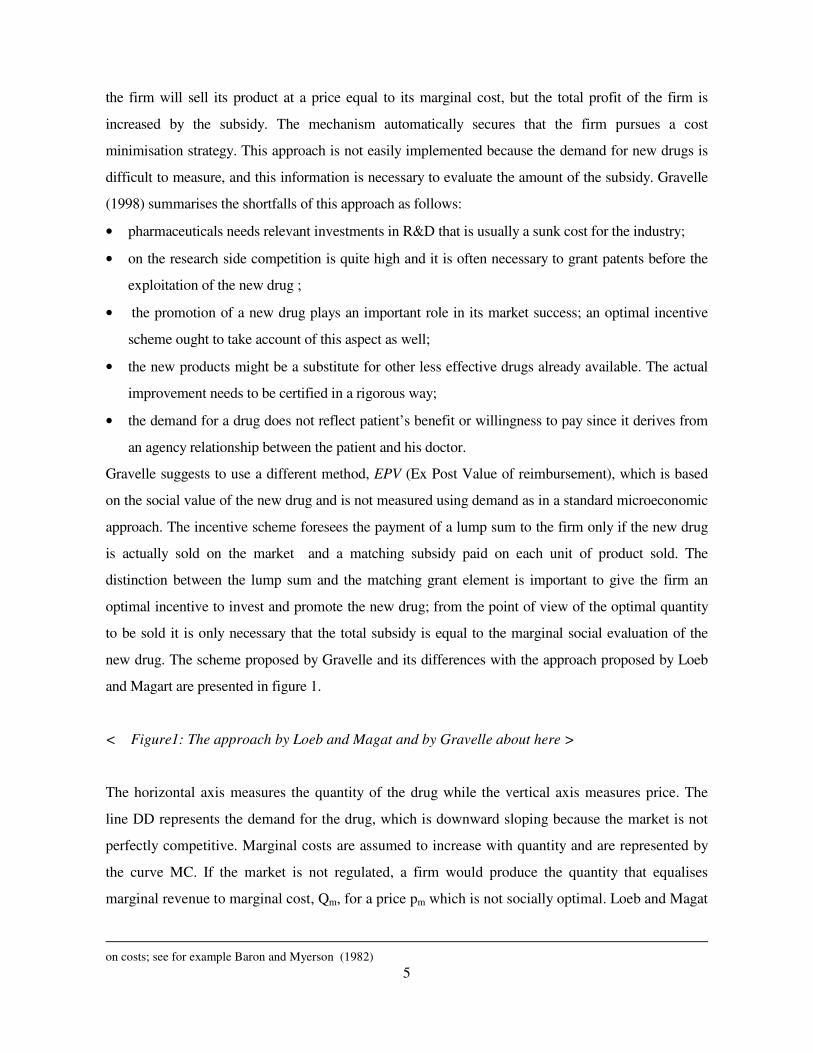
new drug. The scheme proposed by Gravelle and its differences with the approach proposed by Loeb
and Magart are presented in figure 1.
< Figure1: The approach by Loeb and Magat and by Gravelle about here >
The horizontal axis measures the quantity of the drug while the vertical axis measures price. The
line DD represents the demand for the drug, which is downward sloping because the market is not
perfectly competitive. Marginal costs are assumed to increase with quantity and are represented by
the curve MC. If the market is not regulated, a firm would produce the quantity that equalises
marginal revenue to marginal cost, Qm, for a price pm which is not socially optimal. Loeb and Magat
on costs; see for example Baron and Myerson (1982)
6
propose to subsidise the firm to make it produce the quantity Ql at the price pl. This is done by
supplying the firm with the lump sum subsidy plDF. Gravelle (1998) notes that in this market the
social benefit of the drug8 might be higher than the willingness to pay of the consumer; in the case
presented in figure 1 the average social benefit of the drug, BM, is greater than the willingness to
pay of consumers (). The optimal social quantity to produce is the one for which marginal social
benefits are equal to marginal cost. This point is represented by (Qg, pg ) hence the subsidy to the
firm ought to be p-pg. The extra profit granted to the firm gives, according to Gravelle, the
incentive to an optimal investment in promotion and R&D.
This mechanism can be successfully applied both in systems where drugs are fully paid by the State
and in contexts where they are financed through copayment from the patient.
However, the implementation of this scheme is difficult because the marginal benefit function for
the use of a new drug cannot be readily estimated. In a public health care system that is dominated
by the public supply the social value of a new drug can be defined using indirect methods as it will
be shown in the following section.
3. A method to determine the maximum allowable price for a new drug
The social benefit of a drug can be readily transformed into its money value through different
procedures, the most important being cost-benefit analysis, but this method can be successfully used
only if the price of a drug has already been defined. The problems for the regulator in the drug
market is very complicated: in the short-run he has to ensure that the price of new drug is similar to
the alternatives already sold on the market and that the benefits/price ratio is as uniform as possible
across drugs; in the long run a method has to be devised to balance the need to pass onto the
consumer the benefits of innovation and the profit to be secured to the pharmaceutical industry in
order to support research in new drugs9.
In our article we will propose an innovative procedure for the following cases:
• price setting for an innovative drug on a market where other alternatives are already sold;
• price setting for an innovative drug on a market where there are no alternatives;
• price realignment for all the drugs on the market.
The first two cases are short-run problem while the last procedure is related to price setting in the
8 The difference might arise from the nature of impure public good of drugs and from the value that society attaches to research 9 See Benzi (1998)

7
long-run.
In our analysis we focus on the methods to be used to set the price in a market where public
regulation imposes a stringent budget constraint on the use of new drugs. In the conclusions we will
show how our methodology can be easily applied to a market where such a stringent constraint does
not exist.
3.1 Price setting for an innovative drug on a market where other drugs are sold
In this market price setting is more simple; in the short run in fact it is possible to use the total cost
of the less effective drug as a proxy for the social evaluation of the therapeutic properties of that
specific treatment10.
In this case, the elements that should be taken into account to determine the price of the new drug
fall into two main categories:
• the effectiveness of the news drug measured in terms of QALY’s or in any other equivalent
measure; its compliance; its side effects and the value that society attaches to the research in new
drugs. The latter element needs to be kept separated from the commercial use of the patent.
Society as a whole has an interest in promoting research since this is the most effective way to
increase the probability of new discoveries;
• the cost savings that can be achieved through the use of the drug. In this category we can include
the decrease in direct medical cost associated with the use of the new treatment which, for
example, might not need to be used with other drugs and also the savings deriving from less days
of hospitalisation, the decrease in indirect medical costs such as social community care. It could
also be included in this category indirect economic cost saving deriving, for example, from
losing less working days.
To present our methodology, we start with a very simple model; we consider a market where one
drug, F1, producing only one characteristic - approximated by the number of QALY11 gained - S at
rate β112
, is sold for a price pF1. We define a therapeutic unit as QF1 which is equal to the quantity of
F1 that is needed for the drug to be effective. In the short run, a fixed budget constraint R is set for
the purchase of F1. This budget constraint implicitly defines the number of patients that can be
treated. The price of the innovative drug can be determined as follows:
10 This system is implicitly used in countries such as Australia where the less costly alternative is reimbursed. In some countries such as Italy the principle is that a drug with the same effectiveness, same posology and method of administration should be sold at the same price. 11 QALY stands for Quality Adjusted Life Years. This measure is discussed at length in Williams (1992) 12 The production in terms of restored health has to be linked to the units of therapy that can be bought, as it will be

8
1. definition of quantity that can be purchased given the specific budget constraint: 1
*1
FpR
F = .
2. Definition of the number of patients, PAT, that can be treated given that QF1 is the number of
doses that are necessary for a treatment: 1
*1
FQF
PAT = 13.
Once the number of patients has been identified, we can define the total amount of S that can be
obtained with drug F1 as follows: PATS 1* β= and the price of a single treatment
as:111 * FFQ QPP = .
The parameter β reflects the effectiveness of the drug to restore patient's health and it is affected by
different factors such as the probability of success of the therapy and its effectiveness.
In this market a new drug, F2, is introduced which produces S at rate β2>β1. The increased
productivity for β2 can be determined by a greater effectiveness of the new drug, by a higher
probability of success or by both factors.
In the short run we suggest a very simple procedure to set the price for F2; we argue that its
maximum price should be set to the level that leaves society indifferent to buy the old or the new
drug. Society is indifferent between the two alternatives if their supply allows to get to the same
level S* of characteristics.
Given the assumption of a higher productivity of the new drug, we can obtain the same level of S
treating a smaller number of patients (Number Needed to Treat NNT):
2
*
2 βS
NNTF =
The price for each treatment will then be equal to PQF2 = R/NNTF2 while the price of the each unit of
F2 depends on the number of units that are necessary for each treatment, i.e. 22
*2 * FF NNTQF = and the
price should be equal to:
*2
2 FR
PF =
This method can be made more realistic by including the costs associated with the use of the drug. In
our analysis we will use only the direct medical costs cF1 and are assumed to be proportional to the use
of the drug and to the number of patients treated. With this new assumption, the total budget constraint
shown in this paragraph. 13 The effectiveness of a drug depends from the specific characteristics of the patients and by its the recommended use. With QF1 we define the recommended use, i.e. the course of therapy that is necessary for the drug to be effective. The actual effectiveness depends on the specific characteristics of the patients and this is an element that can be observed

9
for the use of drug F1 is:
PATcRR FT 1+ =
where RT is the total cost for the use of drug F1.
Let us now consider the introduction on this market of F2 whose indirect costs are equal to cF2 and
whose effectiveness is equal to β2 .The procedure to evaluate the cost is similar to the one presented
above; first of all it is necessary to consider the number of patients that ought to be treated with the
new drug to get the same level of S*:
2
*
2 βS
NNTF =
Once the number of patients has been determined, we can find the maximum price of each treatment
as follows:
222
FT
Q cNNT
RP
F−=
and from this equation we obtain the price of the drug with the information on the number of units that
are necessary for each treatment:
*2
22 F
PP FQ
F =
If the cost for the use of the new drug is lower than for those existing on the market, it is possible to
shift a part of the budget used for the supplementary cost to finance the purchase of the drug. This
might be a shortcoming of the model since the application of this procedure depends on the sources
of finance; on the budget setting procedures ; on the type of costs considered.
If the direct costs considered in cF1 are the purchase of other drugs, the procedure is correct since the
increased budget for the purchase of F2 is compensated by the reduction of the expenses for other
drugs. If the cost considered derives partly from other drugs and partly from hospital or community
care, the problem is more complicated especially in a public health care system. If the costs for
supplying health care are partly borne by the State and partly by the consumers, it might be correct
to weight the savings with the opportunity cost of the funds; this element does not substantially
change the results presented above, it just makes the solution more complicated from an applied
point of view since it is necessary to evaluate this shadow cost and use it to weight the cost savings.
The example presented in table 1 might be useful to illustrate the methodology. In the short run a
budget of 1000 units is set to buy F1 that produces S at a rate equal to β1= 3. Given a price of 4, 250
only in statistical, average terms.

10
units can be bought; each treatment needs 10 units hence the number of patients treated is 25 and the
total number of QALY produced is 75 . For each patient treated, there is an extra cost of 20 so that the
total budget RT is equal to 1500. In the table we consider two cases: the first one in which the total
budget constraint for the drug includes supplementary costs and a second case in which these costs are
not considered in setting the price to compare the difference in the results.
The new drug that is introduced on the market produces S at a higher rate and presents a lower
direct cost. With the new drug it is possible to reach 75 QALYs treating less patients as shown by
the lower value of NNT2 and the price for F2 can then be higher. If the costs associated with each
treatment are not considered, there is a saving from the total budget RT equal to 143.75. This saving
is due to the joint effect of the 10% reduction in the cost of each treatment and from the reduction in
the number of patients that is necessary to treat to get the same level of QALY gained.
<Table1: Price setting for a drug in a market where already exists a competitor about here >
The problem considered here is rather different from the approach used by the traditional literature on
innovative drug 14 where the price is set and the consumer ought to choose which drug to buy. In our
case we have to define the price of the new drug and for this reason the solution proposed differs form
the standard literature.
The pricing procedure presented above can be easily extended to the case in which many
characteristics determine the social value of a drug. In this case, the maximum price of the new drug is
determined with reference to the level of utility enjoyed by society with the old drug . The procedure to
follow is illustrated for the case in which the social welfare function is linear in the characteristics of
the drug and for a market where a cost cF1 is associated with the treatment of each patient. This
assumption allows to obtain a neat algebraic formulation, but it does not alter the results of the
analysis. The social welfare function is then defined over the characteristics of the drug and can be
written as:
21 )1( =SW SSMax αα −+
where α is the relative weight attached to each characteristic of the drug and S1 and S2 are two
characteristics of the drug which are important to determine its social value.
With a fixed public expenditure budget constraint R and a price equal to pF1 it is possible to buy *
1F doses of drug which, given the productivity levels β1 and β3 and the number of doses per each
14 See, for example, Zweifel and Breyer (1997)

11
treatment allows to treat a specific number of patients (PAT) so that society can reach the following
index of utility:
PATPAT
SS
31*
21*
)1( = SW
)1( = SW
βααβαα
−+
−+
In this market a new drug F2 is introduced. Its production in terms of characteristics is equal to β2 and
β4 respectively while the price for each treatment is equal to cF2. We can now determine the number of
patients to treat, NNTF2 which are necessary to get the same result. From the previous equation we can
write that:
42
*
)1(2 βααβ −+= SW
NNTF
The price of the new treatment will then be equal to:
22
2FQ c
NNTRT
P −=
22
2FQ c
NNTR
P −=
and from this equation we obtain the price of the drug as:
2
2
2
F
QF D
PP =
An example is now presented to clarify the methodology. Table 2 presents the introduction of a new
drug with two characteristics in a market where a drug was already sold. In the example we consider
two alternative cases, the first one in which there is a cost of 20 for each course of treatment an the
alternative case in which there is a 10% reduction in the cost associated with the use of the drug. The
evaluation of the price of the drug is done using α equal to 0,4 which means that the first characteristic
has a relatively lower weight.
As we can note, F2 is more productive in terms of both characteristics and for this reason it can be
granted a higher price. However, the new drug requires a longer treatment; if we do not consider
associated costs its unit price will slightly less than for the drug already on the market. When
indirect costs are internalised F2 has a higher price since all the cost savings can be taken into
account. It is then interesting and important to remark that the consideration of the cost to be
included in the analysis is quite important for the results to be obtained.
<Table2: Price setting in a market where more than one characteristic is considered about here >
12
The price setting procedure described has important consequences for the market for drugs. If the
evaluation of the new drug is done on the basis of one characteristic, it is reasonable to assume that
only one of the two drugs, and usually the most effective, will be sold after the introduction of the
innovative product. If the characteristics on which the price is set are more than one, both drugs can
coexists according to the rules set out by the literature on innovative drugs15.
3.2 Price setting for drugs where there are no other alternatives on the market
If a new drug is sold on market where there are no alternative, i.e. this drug is used for the treatment of
an ailment for which there was no known remedy, we can think to set its price in a way to equalise the
average cost per QALY in other sectors of the drug market.
In the short run we can determine the number of patients that can be treated and hence the budget
constraint in terms of the resources that were used up to that moment for the care of that type of
patients, even if a beneficial treatment was not on offer. In most cases, in fact the use of palliative care
or the "doing nothing" option have costs that, in the short run, can be directed to the purchase of the
innovative drug.
The cost per QALY in each section of the market can be defined as the ratio of the budget to the total
QALY gained; for the first example in the previous section cost per QALY is defined as:
*SR
CQALY =
and a comparison of this cost for drugs already sold allows to determine the average cost per QALY,
QALYC that in the short run could be used as a reference to set the price of the innovative drug.
The technical conditions relating to the new drug allows to define the number of equivalent units of
the new drug that are necessary to gain one QALY. If we assume that the new treatment produces
QALY at a rate β5 and that each treatment requires QF3 doses of drug, the price of each unit of the drug
can be written as16:
3
3
5
F
QALYF Q
CP
β=
while the price for a therapy QF3 is equal to:
15 See, for example, Zweifel and Breyer(14) and Levaggi and Capri (4) cap. 7 16 The following formula can be easily obtained from equations (1) to (3) on the assumption that S* =1, i.e. only one QALY is gained.

13
53βQALYQF CP =
The number of patients can instead be determined on the basis of the budget that is saved from the cost
of unproductive (in terms of QALY) techniques that were previously used to take care of the patients
with that specific disease. If the cost of production for the new drug is higher than the cost per QALY
in other markets, it is possible to grant the innovator the higher price (the so-called premium price),
but this decision ought to be taken using considerations outside the model presented here.
3.3 Price realignment
In the long run the price of the different drugs needs to be revised and realigned. The need for this
revisions stems from several considerations:
• the need to pass onto the patients the benefits of R&D. When the new drug is introduced on the
market, its price ought to be allow the firm to have a good return on its investment in research. In
the long run, however, we can think that part of the benefits from the innovation should be
allocated to the consumer by lowering the cost per QALY gained using the drug;
• drugs in different markets receive different prices per QALY. This might be the result of market
conditions, costs and innovation, but it could also mean that the degree of inertia in the past has
created this inequalities that ought to be reduced.
The methodology we propose can be summarised as follows:
• evaluation of the cost per QALY in terms of the utility enjoyed by society;
• comparison with the actual cost of the drug;
• comparison with the actual cost per QALY.
As concerns the first step we propose to define the cost per QALY that society is willing to pay for
each drug as follows:
)(* QALYgnb
ta
CQALY ++=
where a and b are two parameters, t is the number of years the drug has been on sale, n is the number
of competitors on the market considered and g(QALY) is a function of the number of QALY gained
using that drug. The objective of this formula is to give an incentive to innovation in sectors where
there are few competitors and to introduce new drug. The payment is made up of a lump sum that
depends on the number of years the drug has been on the market and on the number of alternatives that
can be used. The first parameter allows to pass onto the consumer part of the benefits of the

14
innovation. Other things being equal, in fact, the cost per QALY of the drug is inversely related to the
number of years the drug has been sold. The second part of the lump sum is related to the need to
promote research in areas where drugs have few alternatives in order to increase the probability of
diseases to be cured. Finally the last part of the formula is related to the effectiveness of the drug in
terms of number of QALY that can be gained using the formula. The functional form chosen for g(.)
determines this relationship. In general terms we can think that the first derivative of g will be positive
will the second derivative might be positive up to a certain level of QALY to become negative after
this ceiling has been reached. In diagrammatic terms we can express this relationship as follows:
<Figure 2: Cost per QALY gained. About here >
On the horizontal axis we measure the number of QALY gained while on the vertical axis we
measure the allowed cost per QALY. The quantity k measures the lump-sum element, i.e nb
ta +
while the curve kG represents society evaluation of the number of QALY gained for each treatment.
Using this procedure it is possible to define the cost per QALY in different contexts and compare
the gains that can be obtained in different markets for drugs.
Having obtained the theoretical cost per QALY, we can compare this reference value with the actual
cost of production. If this cost is higher than the evaluation of society, the Government can still
decide to introduce the new drug and allow the higher cost. This might be done using considerations
relating to the importance of the innovation or the characteristics of the market in which it is
introduced17.
Finally, if the actual cost per QALY of a drug is different from the evaluation presented above, it is
possible to devise a form of realignment which allows in a set period of time to align its price to the
average on the market. This might be done comparing the actual cost per QALY and the theoretical
one and to set a path to make the two of them equal.
4. Conclusions
In this paper we have proposed a methodology for setting the price for drugs in a public health care
market. The market is characterised by asymmetry of information and a high proportion of investment
in R&D. Our method allows to:
• set a price for an innovative drug on a market where other alternatives are already sold;

15
• set a price for an innovative drug on a market where there are no alternatives;
• align prices for all the drugs on the market.
In the short run, our methodology propose to fix a price that allows to keep consumers’ welfare a
the pre-existing level and to satisfy the constraint of a fixed budget constraint. In the long run, a
realignment procedure can be devised using a pricing formula that takes account of the QALY
gained using the new drug, of the degree of innovation of the product and of its market conditions.
This method might also be used to set prices in a private market. In this latter case the difference
between the short run (price setting for a new drug during the year) and the long-run (price
realignement) is in the evaluation of, n, the number of competitors. For the short run, n should be
evaluated without the new drug, i.e. n should be equal to the number of pre-existing drugs so that
during the year the price for the competitors is not altered by the presence of an innovator and the
innovator receives the same lump-sum as the his competitors.
An important area that the paper leaves unexplored is the actual determination of the parameters of
the cost per QALY function. In this area several alternative are possible and their setting depends on
the objective function of the regulator. The important contribution of our paper is in setting a
common methodology which allows to compare drugs in different markets and that, in the long run,
should be able to reduce the differences in prices that do not depend from specific characteristics of
the drug.
17 This is the case of drugs introduced in markets where there are no alternatives or for the so-called orphan drugs.
16
References Armstrong, M, S. Cowan and J. Vickers (1994) Regulatory Reform, MIT Press, Cambridge, MA Baron, D. P. and R.B. Myerson (1982) Regulating a monopolist with unknown costs, Econometrica, 50(4):911-30 Benzi, G. (1998) New European pharmaceutical system and “drug value”. The European Union Review 3:51-66. Capri S, L. Terranova, F. L, Merlo et al., (and the members of GISF (Italian Group for Pharmacoeconomic Studies) (2001) Guidelines for Economic Evaluations in Italy Recommendations from the Italian Group of Pharmacoeconomic Studies, Drug Information Journal, vol. 35 (in press). Gravelle, H. (1998) Ex post value reimbursement for pharmaceuticals, Medical Decision Making, 18 suppl:S27-S38 Laffont, J.J. and J. Tirole (1993) A Theory of Incentives in Procurement and Regulation, The MIT Press, Cambridge, MA Levaggi, R. (1998) Allocazione di risorse e asimmetria informativa: il caso della spesa farmaceutica, Rivista di Diritto Finanziario e Scienza delle Finanze, 57(1):155-172 Levaggi, R. e S. Capri (1999) Economia Sanitaria, Franco Angeli, Milano Loeb, M. e W.A. Magat (1979) A decentralised method for utility regulation, Journal of Law and Economics, 22:299-404 Tirole J. (1988) The theory of industrial organisation, MIT Press, Cambridge, MA Williams, A. and P. Kind (1992) The present state of play about QUALYs in A. Hopkins (ed) Measures of the quality of life, London: Royal College of Physicians, 21-34 Zweifel, P. e F. Breyer (1997) Health Economics, Oxford University Press, Oxford.

17
Table1: Price setting for a drug in a market where already exists a competitor.
Market before the introduction of the new product
Costs not considered Costs considered
R 1000 1000 S* 75 75 β1 3 3 PF1 4 4
*1F 250 250
Q1 10 10 PAT 25 25 PQ1 40 40 CF1 20 20 RT 1500 1500 Drug value for F2 β2 4 4 NNTF2 18.75 18,75 QF2 10 10
*2F 187,5 187,5
pF2 5,333 6,1 PQF2 53,33 61 R 1000 1143,75 CF2 19 19 RT 1356,25 1500

18
Table2: Price setting in a market where more than one characteristic is considered
Market before introduction of New product
Costs not considered Costs considered
R 1000 1000 S1 75 75 S2 125 125 α 0,4 0,4 SW* 105 105 β1 3 3 β3 5 5 PF1 4 4
*1F 250 250
QF1 10 10 PAT 25 25 PQF1 40 40 CF1 20 20 RT 1500 1500 Drug value for F2 S1 42 42 S2 147 147 β2 2 2 β4 7 7 CC 105 105 NNTF2 21 21 QF2 10 10
*2F 210 210
PF2 4.761 5.342 PQF2 47.61 53.42 CF2 19 19 R 1000 1122 RT 1378 1500

19
Figure1: The approach by Loeb and Magart and by Gravelle

20
Figure 2: Cost per QALY gained.

�
Dipartimento di Scienze Economiche
Facoltà di Economia Via S. Faustino 74/b
25122 BRESCIA
e-mail: [email protected]
Brescia, 27th June 2001 Editor-in-Chief, Prof. Thomas W. Teal Drug Information Journal 501 Office Center Drive, Suite 450 Ft. Washington, PA 19034-3211 USA Dear Prof. Teal I am sending you herewith enclosed three copies of the article Pricing policies the pharmaceutical sector that I would like to be considered for publication in the Drug Information Journal I am looking forward to hear from you. Best wishes, Prof. Rosella Levaggi
Related Documents