DRIVING PSM PERFORMANCE BEYOND KPI METRICS Stewart W. Behie, Manager Safety & Process Risk Occidental Oil and Gas Corporation Corporate HES Risk Engineering Group December 12, 2018 Purdue Process Safety and Assurance Center (P2SAC) Purdue University, West Lafayette, Indiana

Welcome message from author
This document is posted to help you gain knowledge. Please leave a comment to let me know what you think about it! Share it to your friends and learn new things together.
Transcript
DRIVING PSM PERFORMANCE BEYOND KPI METRICS
Stewart W. Behie, Manager Safety & Process Risk
Occidental Oil and Gas Corporation
Corporate HES Risk Engineering Group
December 12, 2018
Purdue Process Safety and Assurance Center (P2SAC)
Purdue University, West Lafayette, Indiana

Remembering the world’s Process Safety Guru
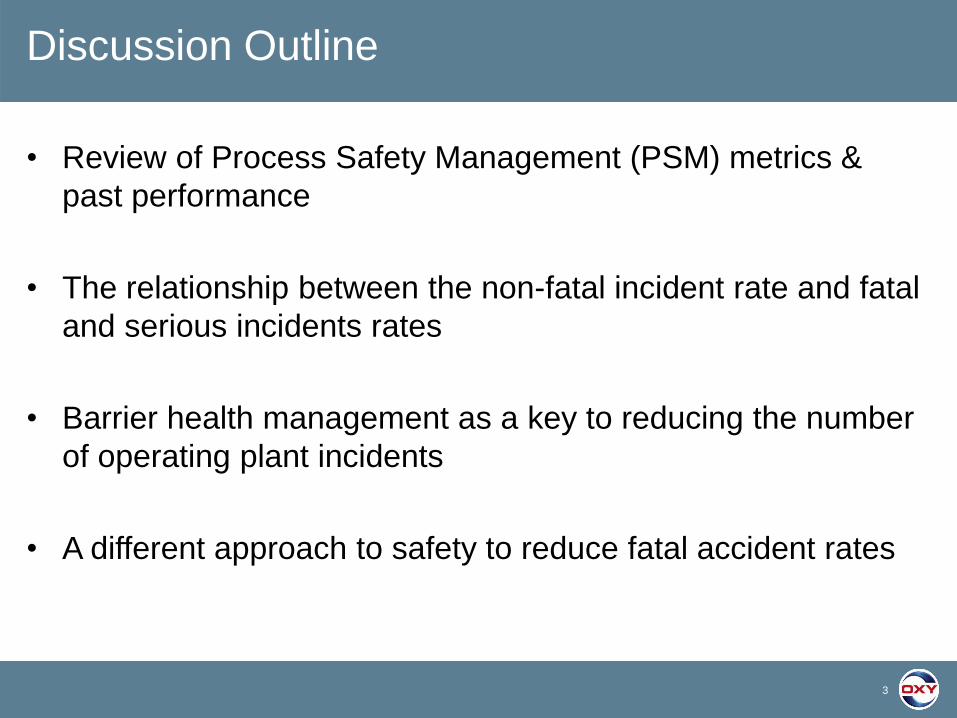
• Review of Process Safety Management (PSM) metrics &
past performance
• The relationship between the non-fatal incident rate and fatal
and serious incidents rates
• Barrier health management as a key to reducing the number
of operating plant incidents
• A different approach to safety to reduce fatal accident rates
3
Discussion Outline

4
Process Safety Indicators Pyramid (IOGP, Report 456, November 2018; API 754, April 2016)
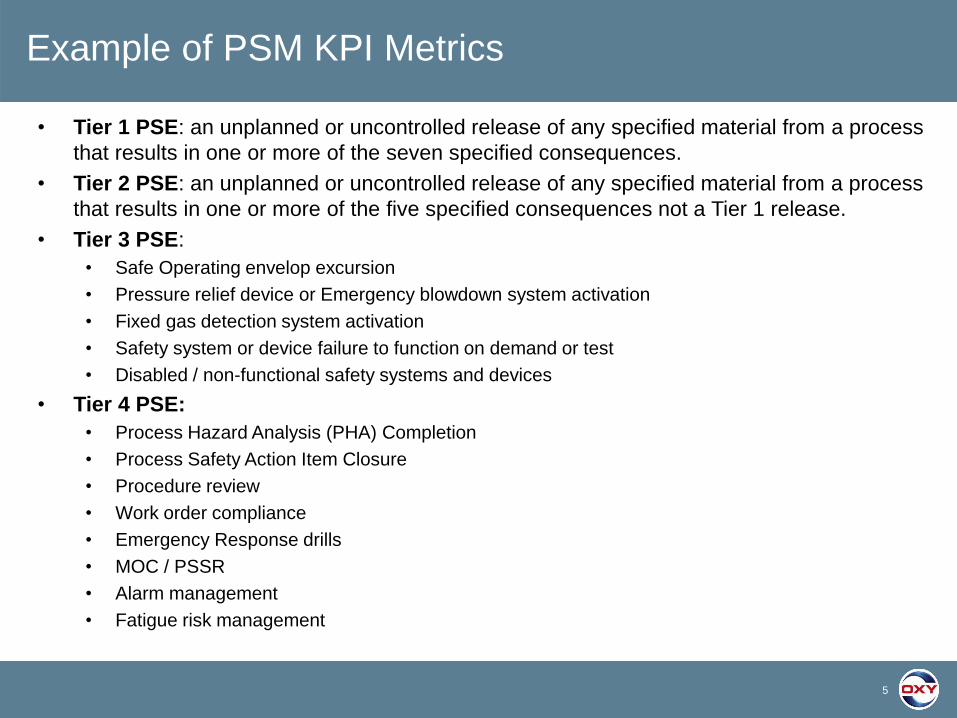
• Tier 1 PSE: an unplanned or uncontrolled release of any specified material from a process
that results in one or more of the seven specified consequences.
• Tier 2 PSE: an unplanned or uncontrolled release of any specified material from a process
that results in one or more of the five specified consequences not a Tier 1 release.
• Tier 3 PSE:
• Safe Operating envelop excursion
• Pressure relief device or Emergency blowdown system activation
• Fixed gas detection system activation
• Safety system or device failure to function on demand or test
• Disabled / non-functional safety systems and devices
• Tier 4 PSE:
• Process Hazard Analysis (PHA) Completion
• Process Safety Action Item Closure
• Procedure review
• Work order compliance
• Emergency Response drills
• MOC / PSSR
• Alarm management
• Fatigue risk management
5
Example of PSM KPI Metrics
6
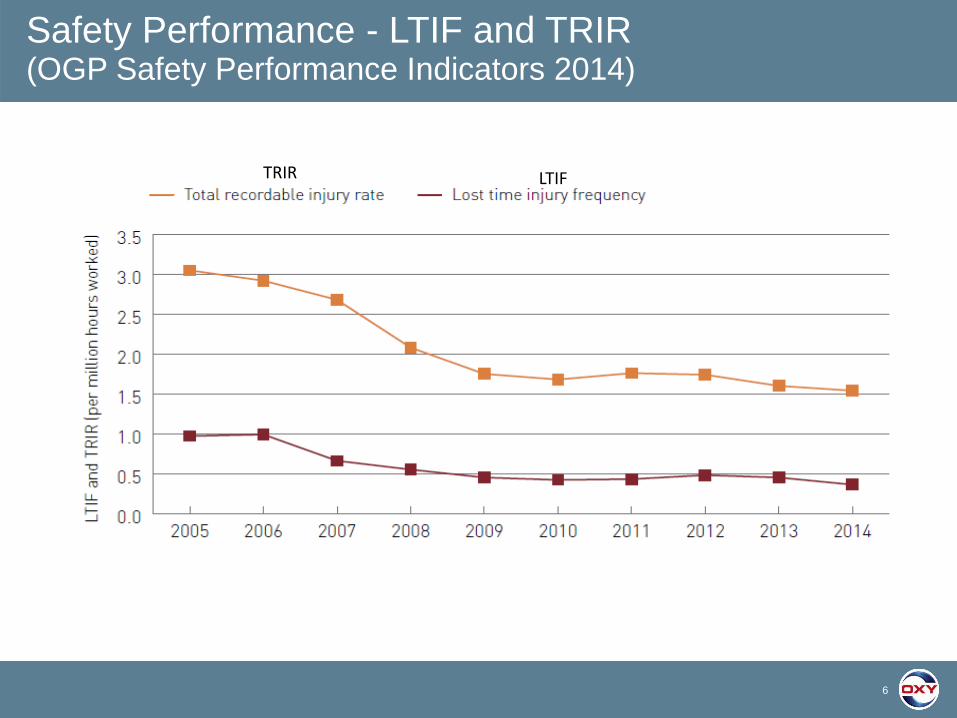
Safety Performance - LTIF and TRIR (OGP Safety Performance Indicators 2014)
TRIR LTIF
7
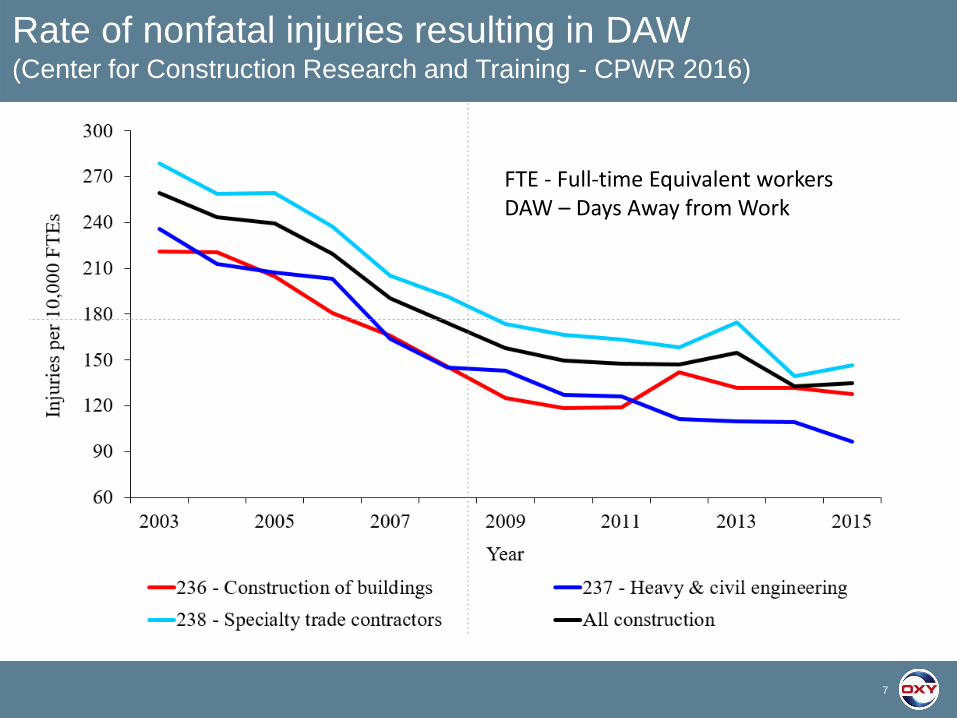
Rate of nonfatal injuries resulting in DAW(Center for Construction Research and Training - CPWR 2016)
FTE - Full-time Equivalent workers DAW – Days Away from Work
8
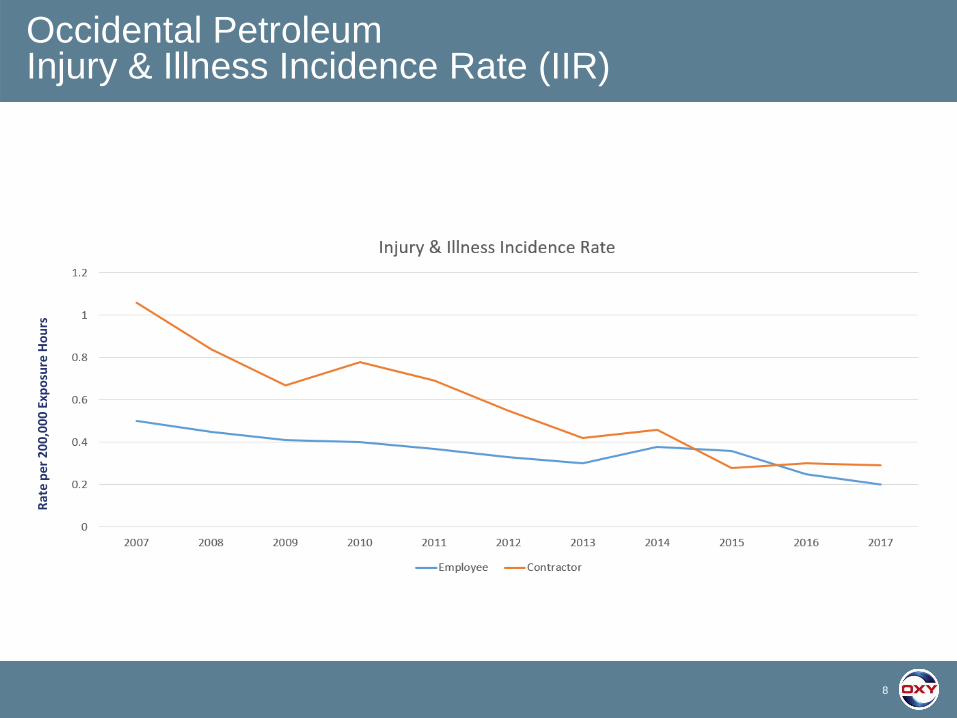
Occidental PetroleumInjury & Illness Incidence Rate (IIR)
Rat
e p
er 2
00
,00
0 E
xpo
sure
Ho
urs
9
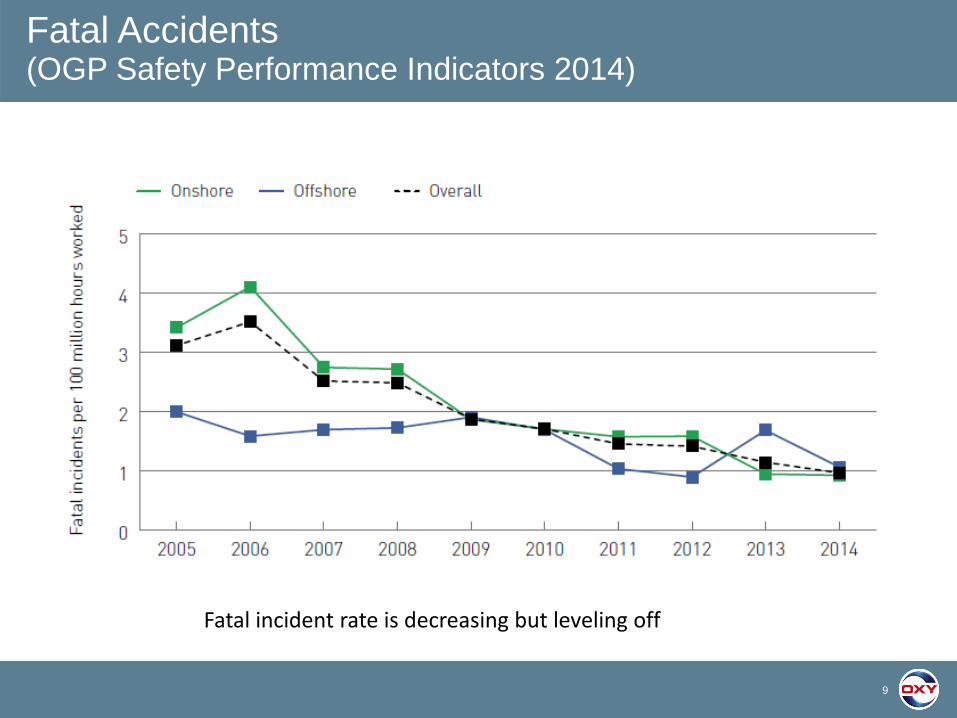
Fatal Accidents(OGP Safety Performance Indicators 2014)
Fatal incident rate is decreasing but leveling off
11
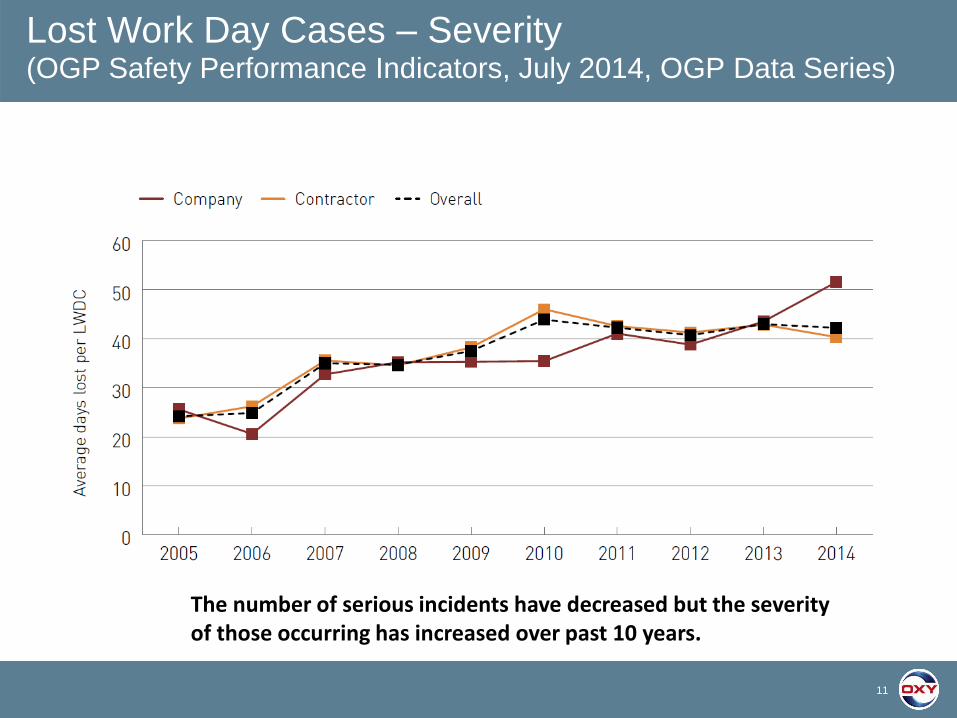
Lost Work Day Cases – Severity(OGP Safety Performance Indicators, July 2014, OGP Data Series)
The number of serious incidents have decreased but the severity of those occurring has increased over past 10 years.
12
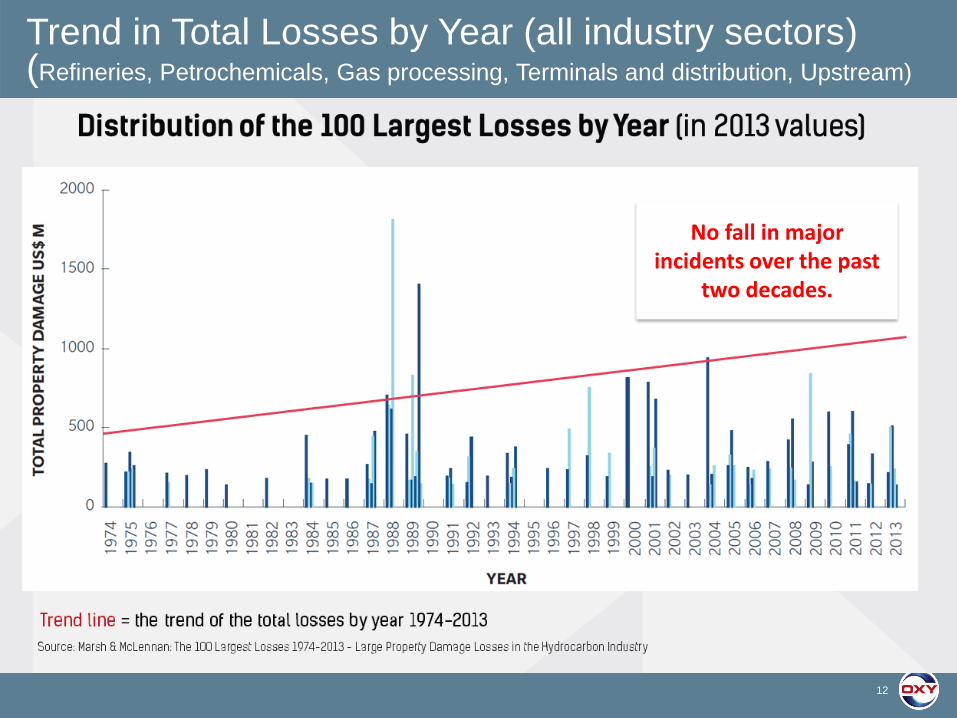
Trend in Total Losses by Year (all industry sectors)(Refineries, Petrochemicals, Gas processing, Terminals and distribution, Upstream)
No fall in major incidents over the past
two decades.
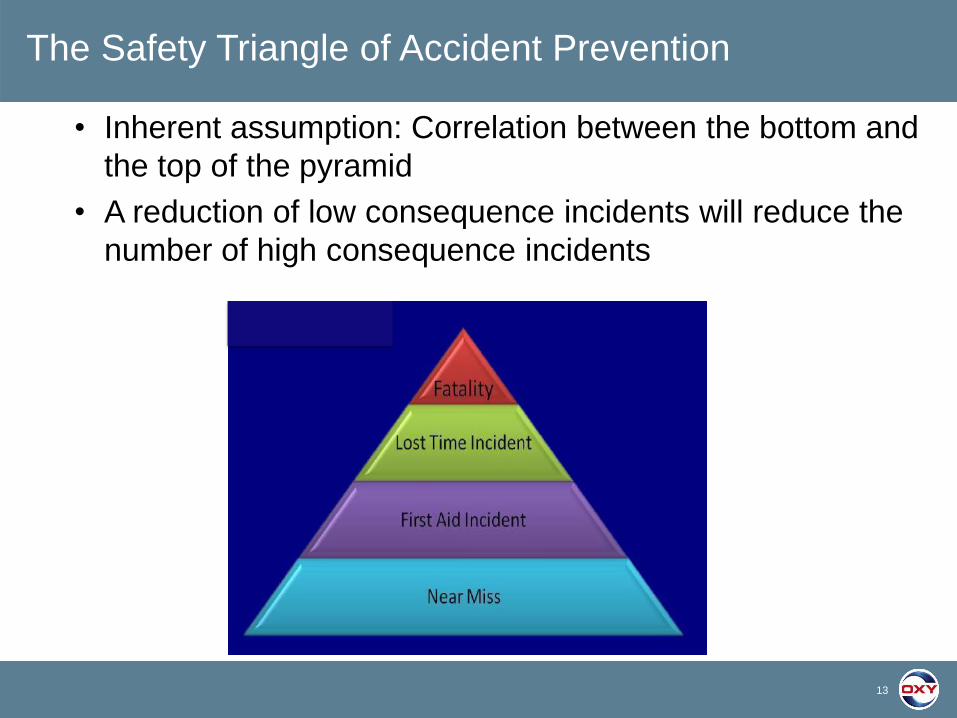
• Inherent assumption: Correlation between the bottom and
the top of the pyramid
• A reduction of low consequence incidents will reduce the
number of high consequence incidents
13
The Safety Triangle of Accident Prevention

14
Is this a Dangerous Assumption?
Are the root causes of low and high consequence
incidents very different?
15
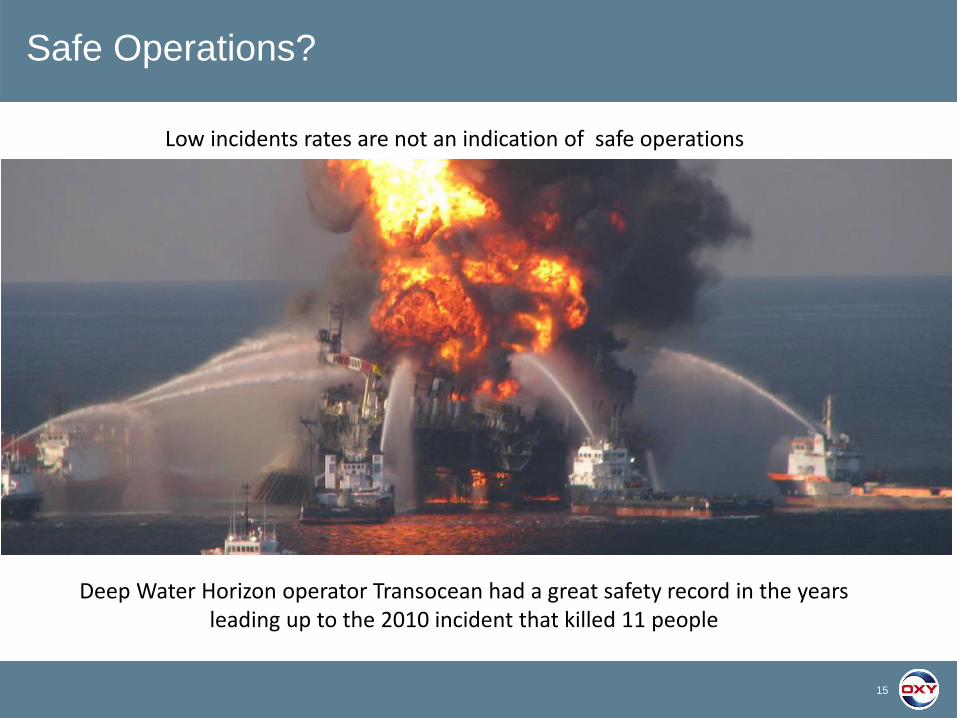
Safe Operations?
Low incidents rates are not an indication of safe operations
Deep Water Horizon operator Transocean had a great safety record in the years leading up to the 2010 incident that killed 11 people

16
The Nature of Fatal Accidents
• Anomalies / outliers
• Do not follow a pattern that can be identified, predicted &
prevented
• Cannot be prevented by reducing non-fatal incidents
• Not a failure of prevention systems
• Are a failure of preparation and recovery mechanisms
• Reduction requires a different focus to overall safety
management
17
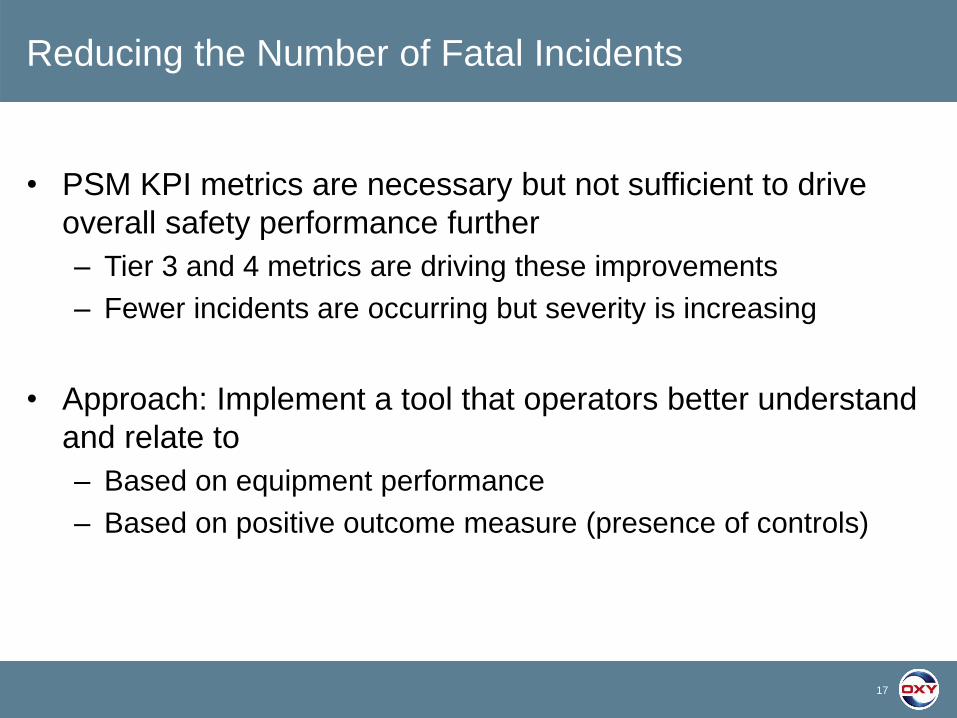
Reducing the Number of Fatal Incidents
• PSM KPI metrics are necessary but not sufficient to drive
overall safety performance further
– Tier 3 and 4 metrics are driving these improvements
– Fewer incidents are occurring but severity is increasing
• Approach: Implement a tool that operators better understand
and relate to
– Based on equipment performance
– Based on positive outcome measure (presence of controls)
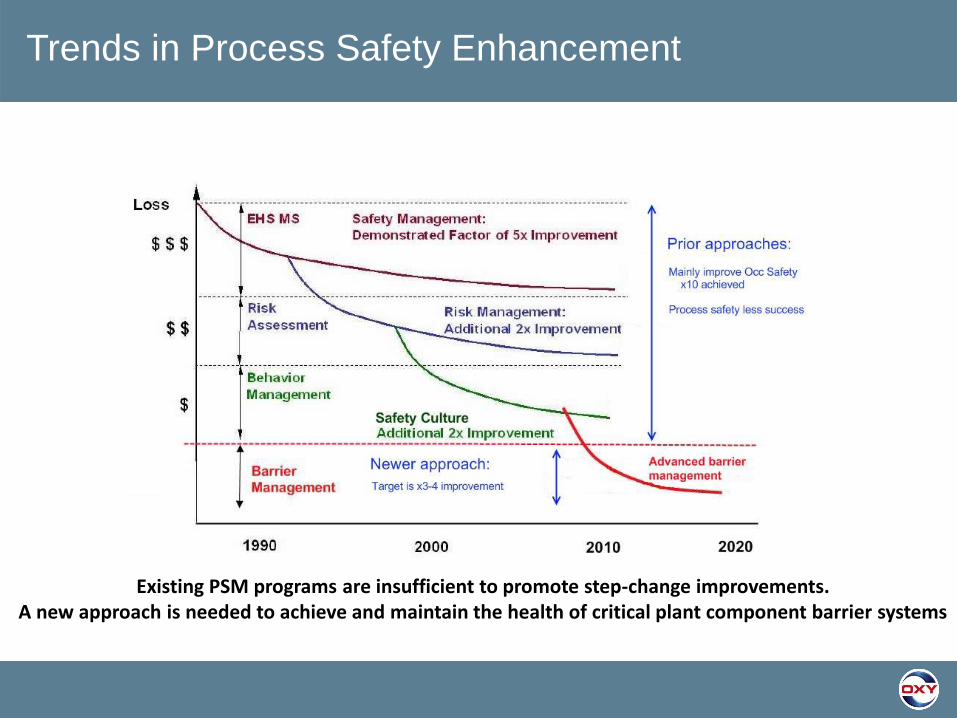
Trends in Process Safety Enhancement
Existing PSM programs are insufficient to promote step-change improvements. A new approach is needed to achieve and maintain the health of critical plant component barrier systems
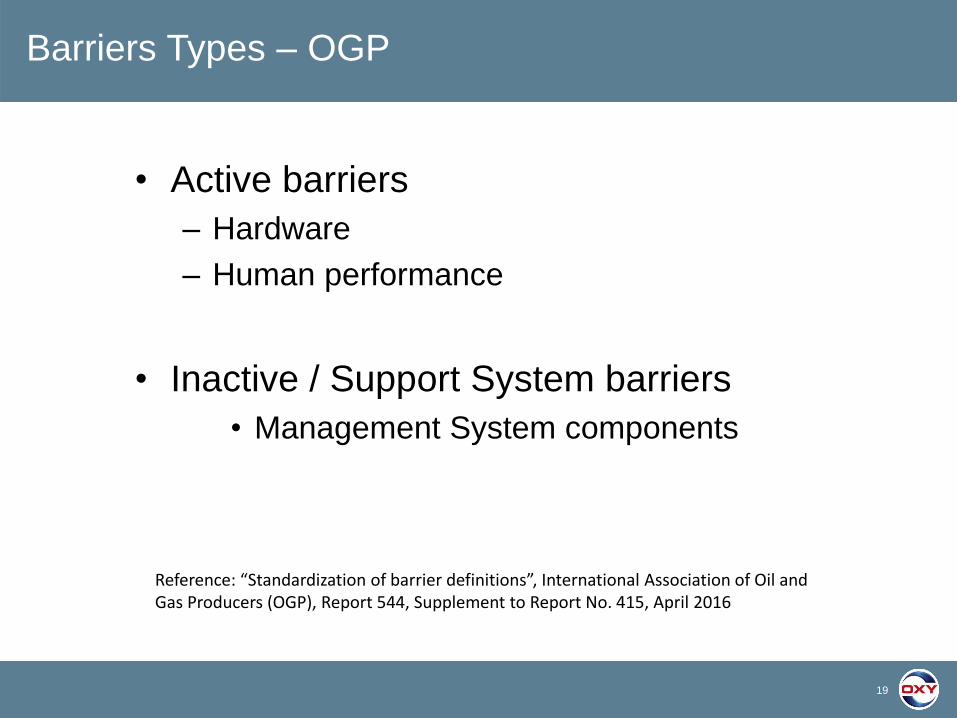
• Active barriers
– Hardware
– Human performance
• Inactive / Support System barriers
• Management System components
19
Barriers Types – OGP
Reference: “Standardization of barrier definitions”, International Association of Oil and Gas Producers (OGP), Report 544, Supplement to Report No. 415, April 2016

20
Hardware Barriers – OGP Definitions
Reference: “Standardization of barrier definitions”, International Association of Oil and Gas Producers (OGP), Report 544, Supplement to Report No. 415, April 2016
21
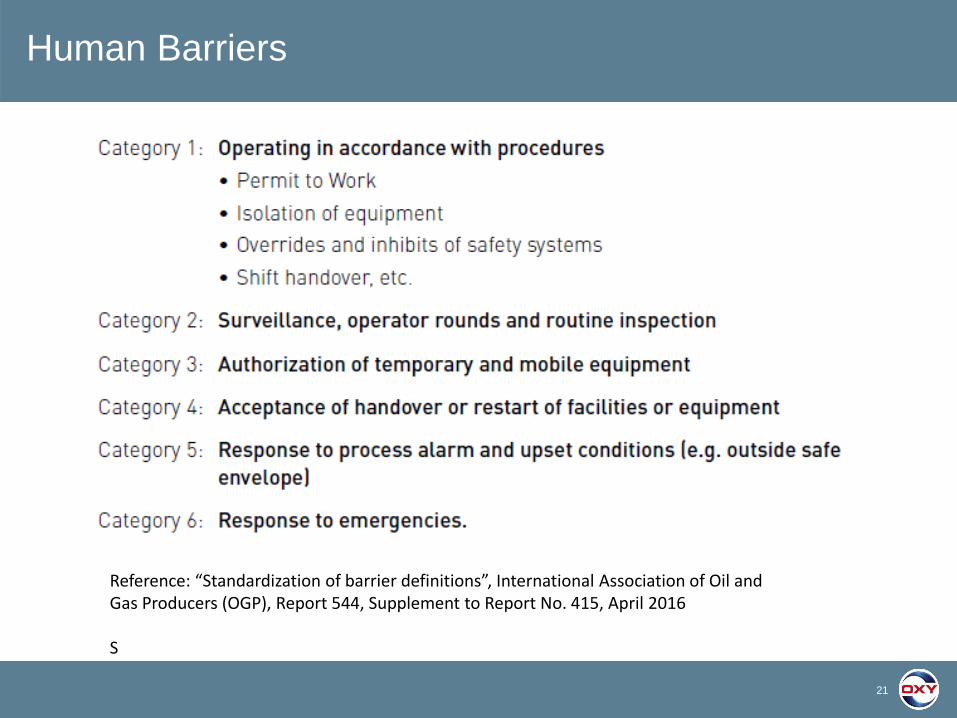
Human Barriers
Reference: “Standardization of barrier definitions”, International Association of Oil and Gas Producers (OGP), Report 544, Supplement to Report No. 415, April 2016
S

22
Management System Barriers
Reference: “Standardization of barrier definitions”, International Association of Oil and Gas Producers (OGP), Report 544, Supplement to Report No. 415, April 2016
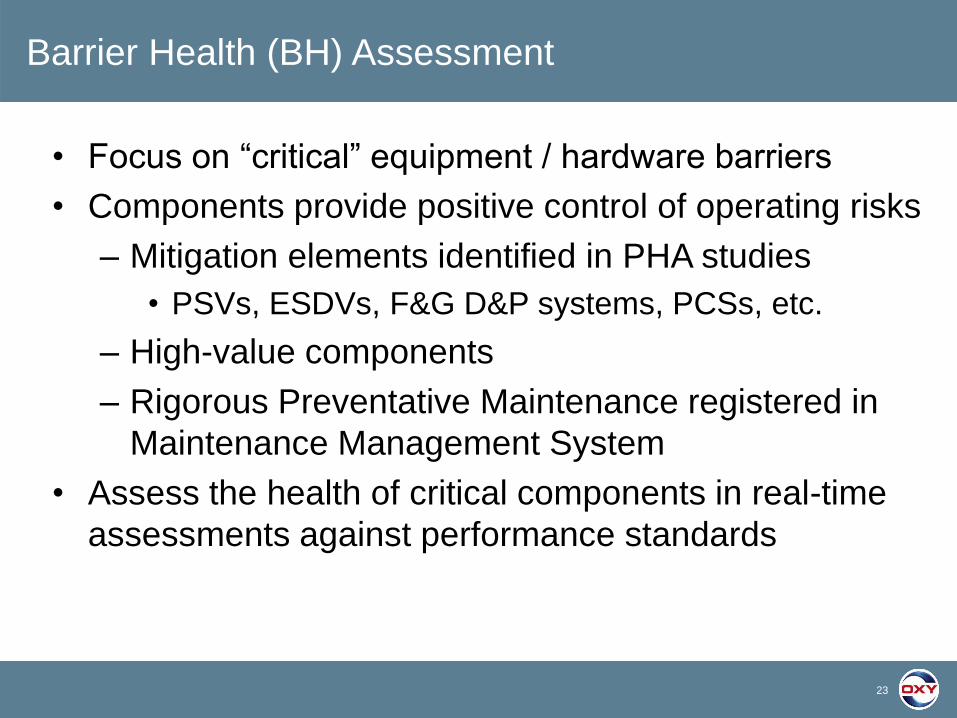
• Focus on “critical” equipment / hardware barriers
• Components provide positive control of operating risks
– Mitigation elements identified in PHA studies
• PSVs, ESDVs, F&G D&P systems, PCSs, etc.
– High-value components
– Rigorous Preventative Maintenance registered in
Maintenance Management System
• Assess the health of critical components in real-time
assessments against performance standards
23
Barrier Health (BH) Assessment

• Real time BH models have been developed and
are in place in a number of operating facilities
• Consultant advanced models in place
– RiskPoynt
– Petrotechnics
• Adopt OGP hardware barrier categories
• In-house development at Oxy
24
Hardware Barrier Health Models

Simultaneous area-level view allows operations to view the barrier condition and include permit and isolation information from external permit systems.
Advantage – a clear view of operations hazards with information that is collected daily and stored for future reference.
RiskPoynt - Operations Display
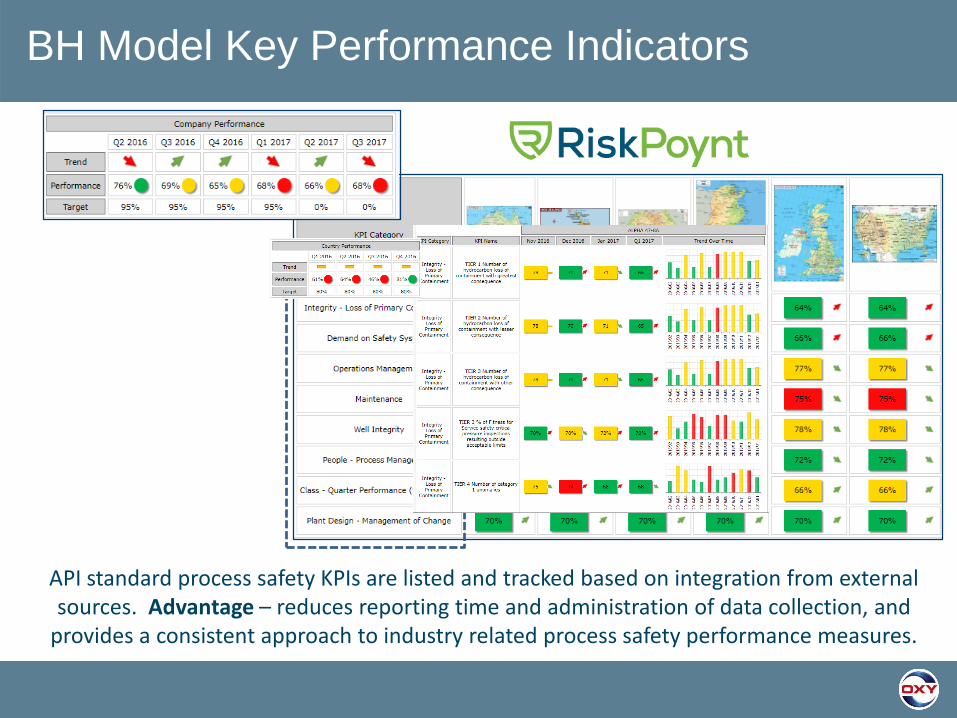
API standard process safety KPIs are listed and tracked based on integration from external sources. Advantage – reduces reporting time and administration of data collection, and
provides a consistent approach to industry related process safety performance measures.
BH Model Key Performance Indicators

Mapping systems data to barriers
27
Petrotechnics Barrier Health Model(mapping systems data to barriers)
Mapping work activities
to barriers
• Focus at the plant level
• Full engagement of O&M staff
• Near real time assessment of barriers health
against performance standards
• Focus on managing consequences
• Allows work execution plans to be optimized
• Management access to output
28
Barrier Health Models
Balancing prevention, execution and recovery to reduce
chances of serious incidents
– Implement a bottom-up approach
– Engage and empower of plant staff
– Focus on consequence (not hazard) management
Combine “Stop work” authority with “do not start” work
authority
Ensure that all the safeguards are in place to “fail safely”
Focus on identifying and maintaining controls
Rigorous risk management focused at the work site
29
Safety Differently

• PSM KPIs have driven improvements in non-fatal and fatal
incident rates
• Number of incidents has decreased but the severity of
those occurring has increased
• Barrier Health models offer the potential to further reduce
number and costs of incidents
• Different focus on safety is needed to help reduce the
number of fatal incidents
30
Conclusions

1. “Stepping Out of the Triangle and into the Field”, Jae Teakle, Tanya Lughermo, Tom
Mannion, Richard Biddle (Chevron), presented at the SPE International Conference on
Health, Safety and Environment in Oil and Gas Exploration and Production, 11-13
September, Perth, Australia 2012
2. “The Human Factor, Process Safety and Culture”, SPE Technical Report, March 2014
3. “Assuring an Adequate Safety Culture”, Ken Arnold, Major Projects, Internal Presentation,
Occidental Oil and Gas, 2017
4. “National Commission on the BP Deepwater Horizon Oil Spill and Offshore Drilling, Report
to the President, January 2011
5. “Buckets to Disaster: Guidance to Improve the Outcome of Critical Technical Decisions”,
Behie, Mannan et al, presented at the 20th International PSM Symposium, Mary Kay
O’Connor Process Safety Center, Texas A&M University, October 2017
6. “A Guide to selecting Appropriate Tools to Improve HES Culture”, International Association
of Oil and Gas Producers (OGP), Report No. 435, March 2010
7. “Safety Management and Safety Culture, The Long, Hard and Winding Road”, Prof.
Patrick Hudson, Center for Safety Research, Leiden University, Netherlands
8. “Process safety – Leading Key performance Indicators”, International Association of Oil
and Gas Producers (OGP), Report 556, Supplement to Report No. 456, July 2016
31
References
9. “Standardization of barrier definitions”, International Association of Oil and Gas Producers
(OGP), Report 544, Supplement to Report No. 415, April 2016
10. “Workplace Fatalities, Failure to Predict”, Todd Conklin, 2017.
11. “The danger of losing situational awareness”, Sidney Dekker, Cognition, Technology &
Work, Volume 17, Number 2, 2015.
12. “Becoming the Worlds Safest Company, Tesla’s Journey”, Laurie Muse Shelby, EHS Vice
President, Tesla, Inc., Keynote Address at the MKOPSC International Symposium, October
2018
13. “The Compelling case for change”, Tim Fleming, GM HSE, Laing O’Rourke, October 2017
14. “The Largest Losses 1978 – 2107, Large Property Damage Losses in the Hydrocarbon
Industry”, 25th Edition, Marsh & McLennan, March 2018
15. “Process Safety - Recommended practice on Key Performance Indicators”, International
Association of Oil and Gas Producers (OGP), Report 456, November 2018.
32
References

33
The End
Thank you for your attention
Questions?

34
Measuring the Positives
References

35
Active Barriers
Reference: “Process Safety – Leading key performance indicators”, International Association of Oil and Gas Producers (OGP), Report 556, Supplement to Report No. 456, July 2016

36
Plant Risk Sources

37
Reduce FAR Need to See Safety Differently
Sidney Dekker, Oil and Gas Safety in a Post-Truth World, May 2018
38
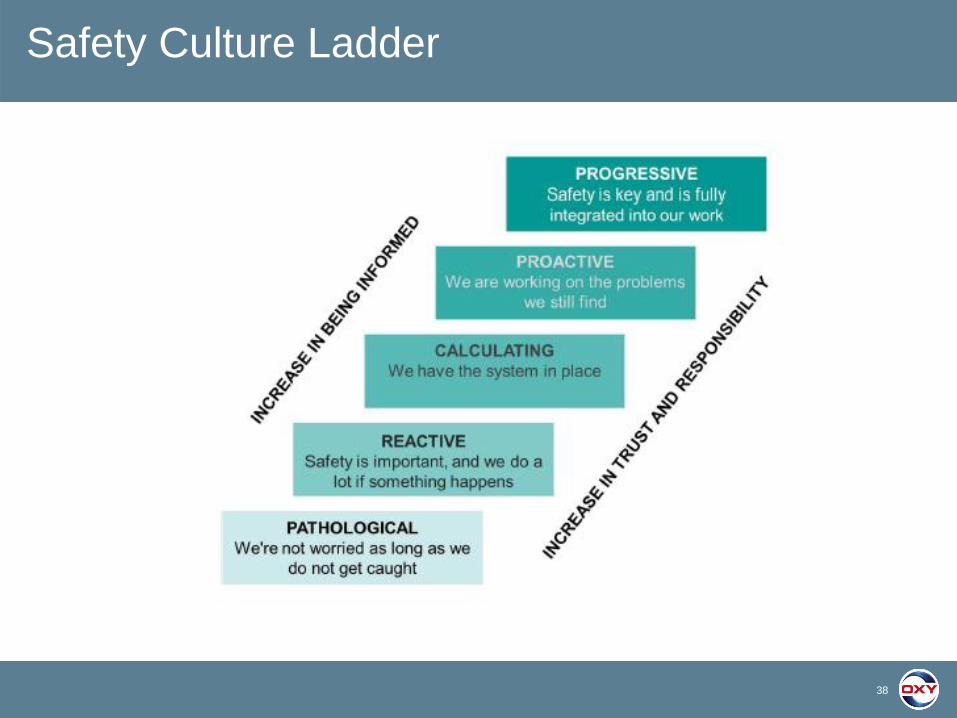
Safety Culture Ladder
Related Documents