Benchmarking Regulatory Affairs Staffing & Performance Excellence in Medical Devices Best Practices, LLC Strategic Benchmarking Research & Analysis February 2015 Page | 1

Driving Performance Excellence in the Regulatory Affairs Function at Medical Device Companies: Budget, Staffing & Responsibilities
Jan 23, 2017
Welcome message from author
This document is posted to help you gain knowledge. Please leave a comment to let me know what you think about it! Share it to your friends and learn new things together.
Transcript
Benchmarking Regulatory Affairs
Staffing & Performance Excellence
in Medical Devices
Best Practices, LLC Strategic Benchmarking Research & Analysis
February 2015 Page | 1
Page | 2
Executive Summary 3-10
Research Overview 3-6
Regulatory Landscape: Executive Summary 7-10
Detailed Research Findings 11-87
Regulatory Structure & Management 11-33
Regulatory Submissions & Functional Trends Benchmark Analysis 34-50
Investment & Staffing Efficiency Benchmarks 51-62
Roles & Responsibility Benchmarks 63--74
Regulatory Outsourcing & Offshoring Benchmarks 75-87
Benchmark Profile 88-94
About Best Practices, LLC 95
Table of Contents

Page | 3
Field Research & Insight Development:
Best Practices, LLC recruited Regulatory Vice
Presidents and Executives at 32 leading medical
device companies to share quality data
and regulatory insights regarding current and future
trends influencing Regulatory Affairs.
Medical Device Companies wish to
inform and deepen their understanding of
the critical drivers of Regulatory
performance excellence including:
• Staffing & structure
• Submissions & functional trends
• Roles & responsibilities
• Regulatory offshoring & outsourcing trends
Research Objectives:
Business Objective:
This study:
Maps regulatory performance benchmarks to deepen understanding of high performance boundaries
Identifies key performance indicators for regulatory budget, staffing, submissions trends,
management factors, critical regulatory roles, responsibilities and offshoring / outsourcing trends, and
Spotlights current and future trends shaping the Medical Device Regulatory Affairs function.
Regulatory Affairs leaders in the Medical Device industry seek to understand optimal resourcing and staffing levels to balance
corporate efficiency with effectiveness of regulatory systems. Best Practices, LLC conducted this study to establish evidence-
based benchmarks describing performance levels, approaches and boundaries -- as well as to capture forward-looking insights
about high-performance in the Regulatory Affairs function at medical device companies.
Research Objectives & Methodology
Page | 4
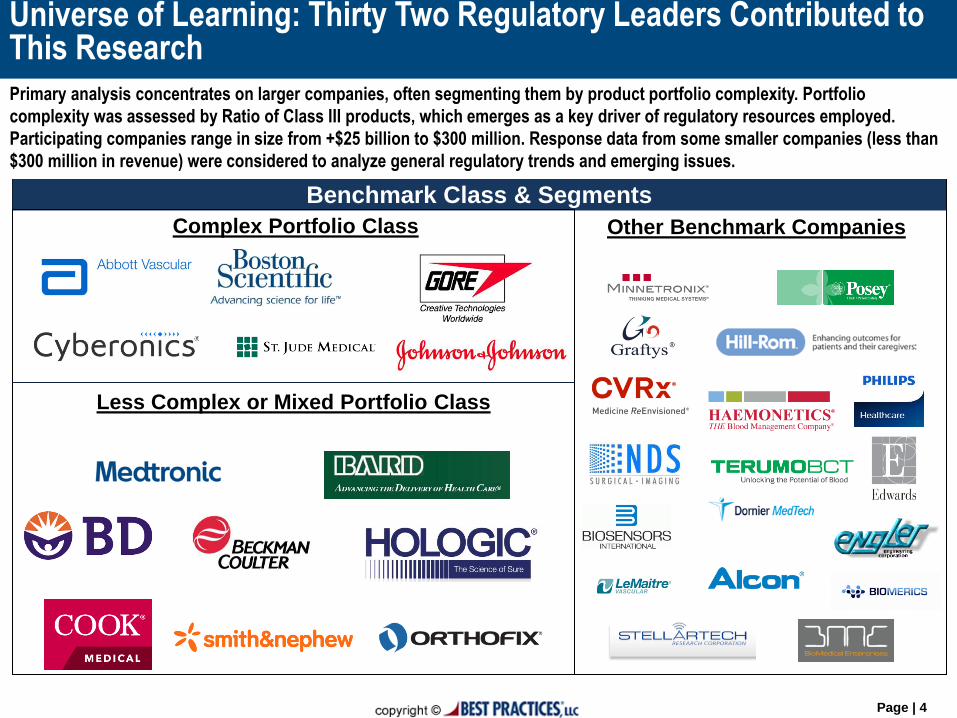
Benchmark Class & Segments
Complex Portfolio Class
Less Complex or Mixed Portfolio Class
Other Benchmark Companies
Universe of Learning: Thirty Two Regulatory Leaders Contributed to This Research
Primary analysis concentrates on larger companies, often segmenting them by product portfolio complexity. Portfolio
complexity was assessed by Ratio of Class III products, which emerges as a key driver of regulatory resources employed.
Participating companies range in size from +$25 billion to $300 million. Response data from some smaller companies (less than
$300 million in revenue) were considered to analyze general regulatory trends and emerging issues.
Page | 5
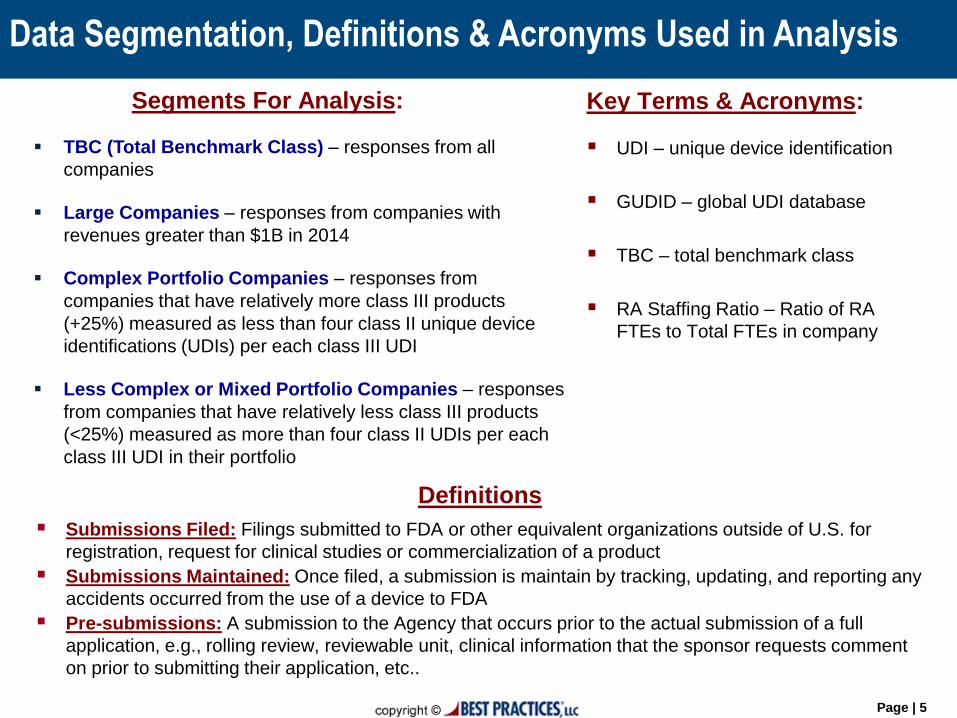
Segments For Analysis:
TBC (Total Benchmark Class) – responses from all
companies
Large Companies – responses from companies with
revenues greater than $1B in 2014
Complex Portfolio Companies – responses from
companies that have relatively more class III products
(+25%) measured as less than four class II unique device
identifications (UDIs) per each class III UDI
Less Complex or Mixed Portfolio Companies – responses
from companies that have relatively less class III products
(<25%) measured as more than four class II UDIs per each
class III UDI in their portfolio
Key Terms & Acronyms:
UDI – unique device identification
GUDID – global UDI database
TBC – total benchmark class
RA Staffing Ratio – Ratio of RA
FTEs to Total FTEs in company
Data Segmentation, Definitions & Acronyms Used in Analysis
Definitions
Submissions Filed: Filings submitted to FDA or other equivalent organizations outside of U.S. for
registration, request for clinical studies or commercialization of a product
Submissions Maintained: Once filed, a submission is maintain by tracking, updating, and reporting any
accidents occurred from the use of a device to FDA
Pre-submissions: A submission to the Agency that occurs prior to the actual submission of a full
application, e.g., rolling review, reviewable unit, clinical information that the sponsor requests comment
on prior to submitting their application, etc..
Page | 6
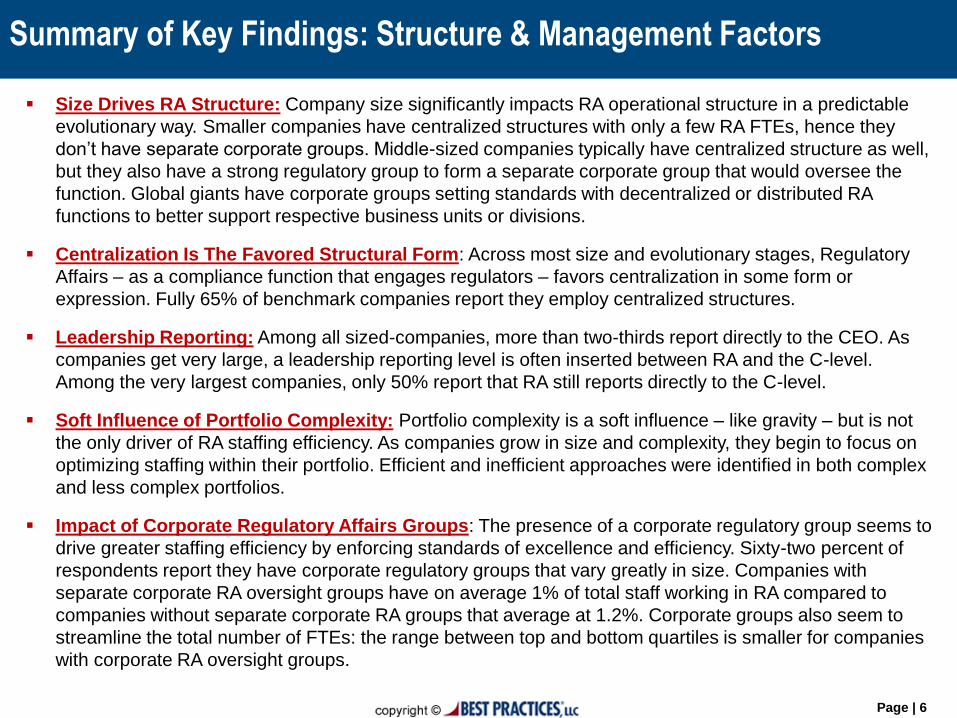
Summary of Key Findings: Structure & Management Factors
Size Drives RA Structure: Company size significantly impacts RA operational structure in a predictable
evolutionary way. Smaller companies have centralized structures with only a few RA FTEs, hence they
don’t have separate corporate groups. Middle-sized companies typically have centralized structure as well,
but they also have a strong regulatory group to form a separate corporate group that would oversee the
function. Global giants have corporate groups setting standards with decentralized or distributed RA
functions to better support respective business units or divisions.
Centralization Is The Favored Structural Form: Across most size and evolutionary stages, Regulatory
Affairs – as a compliance function that engages regulators – favors centralization in some form or
expression. Fully 65% of benchmark companies report they employ centralized structures.
Leadership Reporting: Among all sized-companies, more than two-thirds report directly to the CEO. As
companies get very large, a leadership reporting level is often inserted between RA and the C-level.
Among the very largest companies, only 50% report that RA still reports directly to the C-level.
Soft Influence of Portfolio Complexity: Portfolio complexity is a soft influence – like gravity – but is not
the only driver of RA staffing efficiency. As companies grow in size and complexity, they begin to focus on
optimizing staffing within their portfolio. Efficient and inefficient approaches were identified in both complex
and less complex portfolios.
Impact of Corporate Regulatory Affairs Groups: The presence of a corporate regulatory group seems to
drive greater staffing efficiency by enforcing standards of excellence and efficiency. Sixty-two percent of
respondents report they have corporate regulatory groups that vary greatly in size. Companies with
separate corporate RA oversight groups have on average 1% of total staff working in RA compared to
companies without separate corporate RA groups that average at 1.2%. Corporate groups also seem to
streamline the total number of FTEs: the range between top and bottom quartiles is smaller for companies
with corporate RA oversight groups.
Page | 7
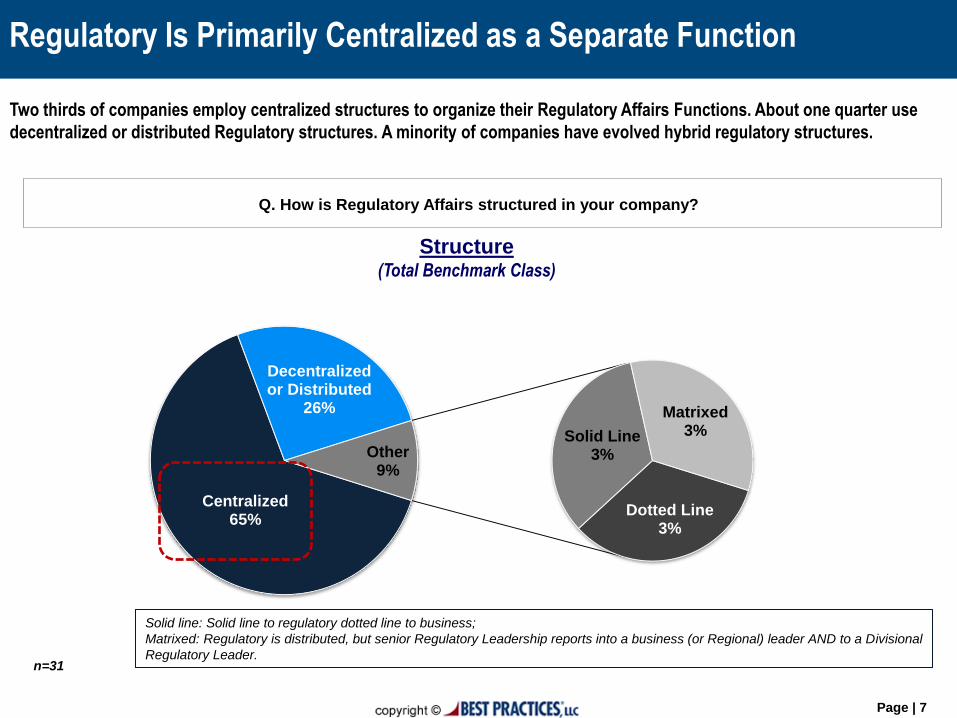
Q. How is Regulatory Affairs structured in your company?
n=31
Structure (Total Benchmark Class)
Centralized 65%
Decentralized or Distributed
26%
Dotted Line 3%
Solid Line 3%
Matrixed 3%
Other 9%
Solid line: Solid line to regulatory dotted line to business;
Matrixed: Regulatory is distributed, but senior Regulatory Leadership reports into a business (or Regional) leader AND to a Divisional
Regulatory Leader.
Regulatory Is Primarily Centralized as a Separate Function
Two thirds of companies employ centralized structures to organize their Regulatory Affairs Functions. About one quarter use
decentralized or distributed Regulatory structures. A minority of companies have evolved hybrid regulatory structures.
Page | 8
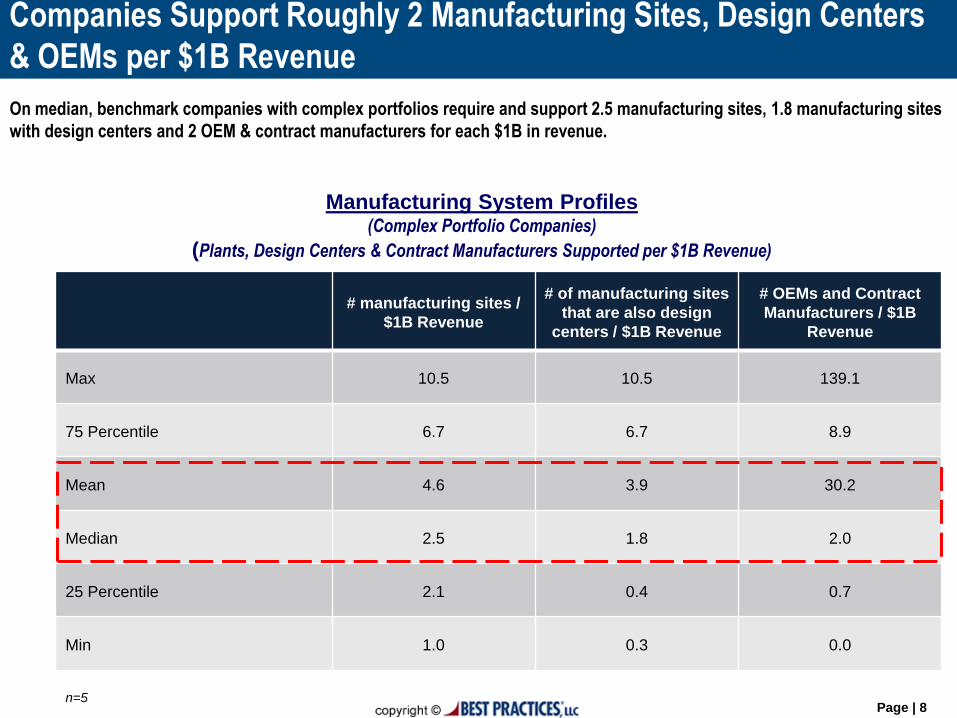
# manufacturing sites /
$1B Revenue
# of manufacturing sites
that are also design
centers / $1B Revenue
# OEMs and Contract
Manufacturers / $1B
Revenue
Max 10.5 10.5 139.1
75 Percentile 6.7 6.7 8.9
Mean 4.6 3.9 30.2
Median 2.5 1.8 2.0
25 Percentile 2.1 0.4 0.7
Min 1.0 0.3 0.0
Manufacturing System Profiles (Complex Portfolio Companies)
(Plants, Design Centers & Contract Manufacturers Supported per $1B Revenue)
Companies Support Roughly 2 Manufacturing Sites, Design Centers
& OEMs per $1B Revenue
On median, benchmark companies with complex portfolios require and support 2.5 manufacturing sites, 1.8 manufacturing sites
with design centers and 2 OEM & contract manufacturers for each $1B in revenue.
n=5
Page | 9
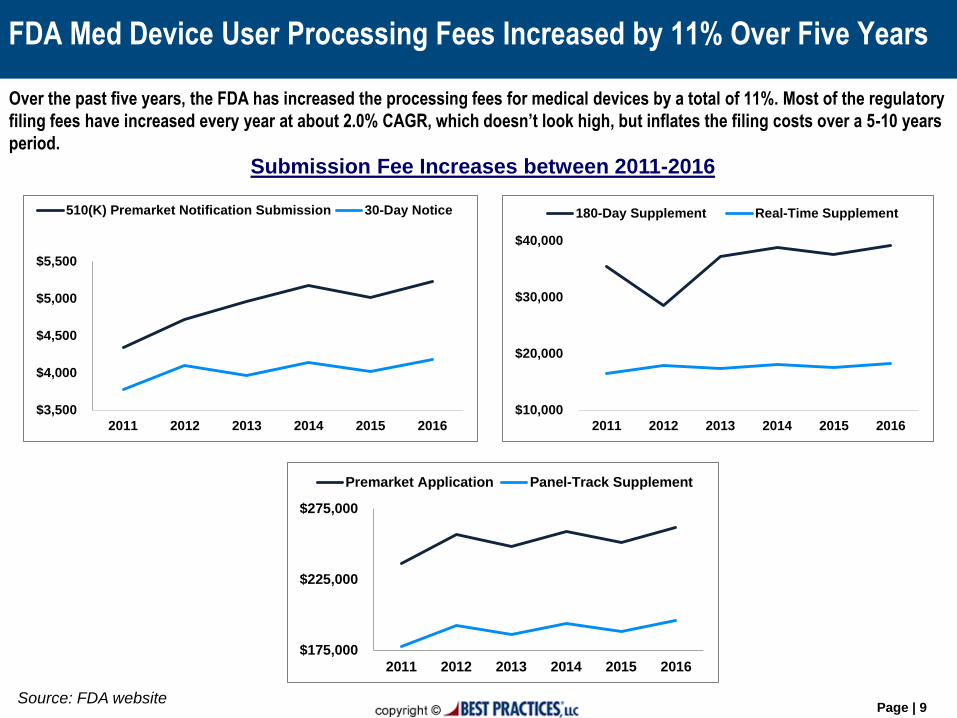
$175,000
$225,000
$275,000
2011 2012 2013 2014 2015 2016
Premarket Application Panel-Track Supplement
$10,000
$20,000
$30,000
$40,000
2011 2012 2013 2014 2015 2016
180-Day Supplement Real-Time Supplement
$3,500
$4,000
$4,500
$5,000
$5,500
2011 2012 2013 2014 2015 2016
510(K) Premarket Notification Submission 30-Day Notice
Over the past five years, the FDA has increased the processing fees for medical devices by a total of 11%. Most of the regulatory
filing fees have increased every year at about 2.0% CAGR, which doesn’t look high, but inflates the filing costs over a 5-10 years
period.
FDA Med Device User Processing Fees Increased by 11% Over Five Years
Submission Fee Increases between 2011-2016
Source: FDA website
Page | 10
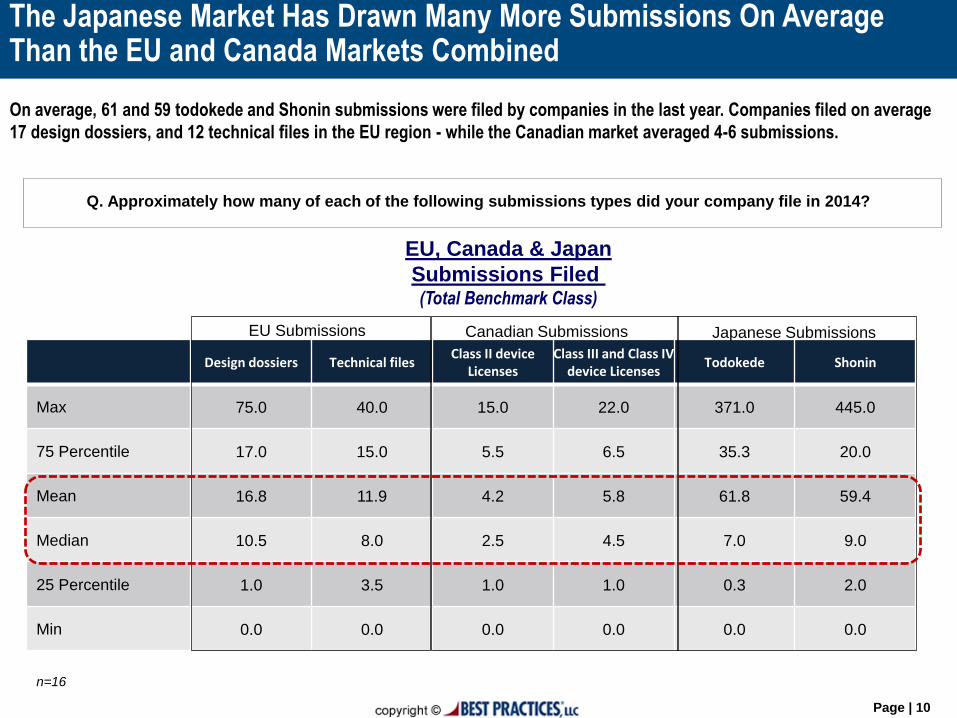
Q. Approximately how many of each of the following submissions types did your company file in 2014?
n=16
EU, Canada & Japan
Submissions Filed (Total Benchmark Class)
The Japanese Market Has Drawn Many More Submissions On Average Than the EU and Canada Markets Combined
On average, 61 and 59 todokede and Shonin submissions were filed by companies in the last year. Companies filed on average
17 design dossiers, and 12 technical files in the EU region - while the Canadian market averaged 4-6 submissions.
Design dossiers Technical files Class II device
Licenses Class III and Class IV
device Licenses Todokede Shonin
Max 75.0 40.0 15.0 22.0 371.0 445.0
75 Percentile 17.0 15.0 5.5 6.5 35.3 20.0
Mean 16.8 11.9 4.2 5.8 61.8 59.4
Median 10.5 8.0 2.5 4.5 7.0 9.0
25 Percentile 1.0 3.5 1.0 1.0 0.3 2.0
Min 0.0 0.0 0.0 0.0 0.0 0.0
EU Submissions Canadian Submissions Japanese Submissions
Page | 11
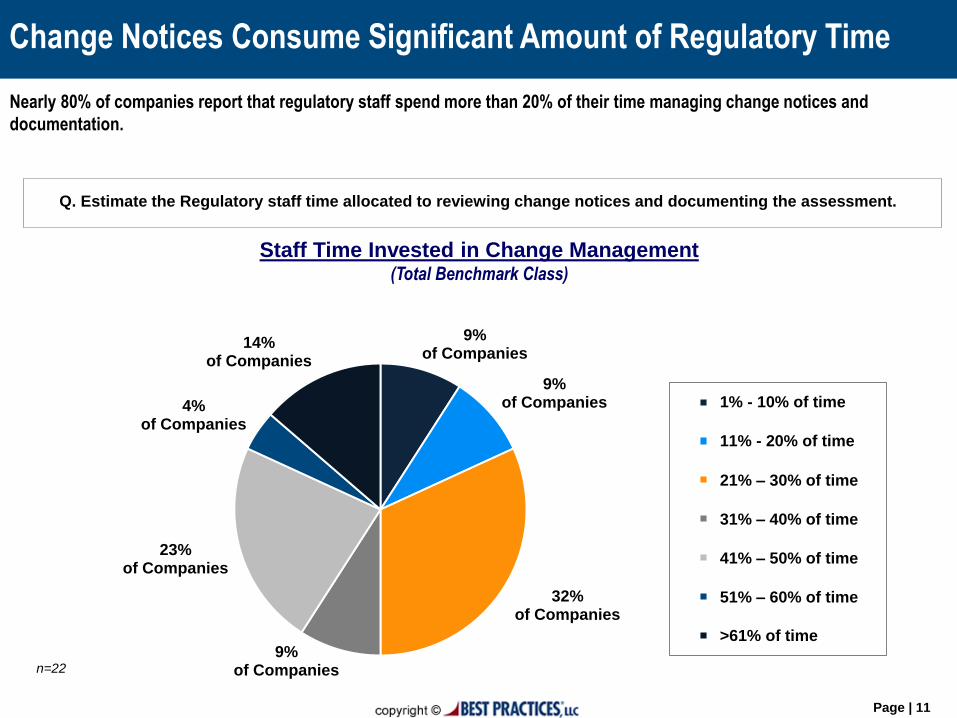
Q. Estimate the Regulatory staff time allocated to reviewing change notices and documenting the assessment.
n=22
Staff Time Invested in Change Management (Total Benchmark Class)
Change Notices Consume Significant Amount of Regulatory Time
Nearly 80% of companies report that regulatory staff spend more than 20% of their time managing change notices and
documentation.
9% of Companies
9% of Companies
32% of Companies
9% of Companies
23% of Companies
4% of Companies
14% of Companies
1% - 10% of time
11% - 20% of time
21% – 30% of time
31% – 40% of time
41% – 50% of time
51% – 60% of time
>61% of time

Page | 12
Best Practices®, LLC is an internationally recognized thought leader in the field of best practice
benchmarking®. We are a research, consulting, benchmark database, publishing and advisory firm that
conducts work based on the simple yet profound principle that organizations can chart a course to superior
economic performance by leveraging the best business practices, operating tactics and winning strategies of
world-class companies.
6350 Quadrangle Drive, Suite 200
Chapel Hill, NC 27517
(Phone): 919-403-0251
www.best-in-class.com
Learn More About Our Company:
Related Documents