DRIVING ORGANIZATIONAL CHANGE The Next Generation Project Management Office

Welcome message from author
This document is posted to help you gain knowledge. Please leave a comment to let me know what you think about it! Share it to your friends and learn new things together.
Transcript
DRIVING ORGANIZATIONAL CHANGE The Next Generation Project Management Office
www.apqc.org
WHO IS APQC?
APQC is a member-based nonprofit and one of the leading proponents of benchmarking and best practice business research. Working with more than 500 organizations worldwide in all industries, APQC focuses on providing organizations with the information they need to work smarter, faster, and with confidence. Every day we uncover the processes and practices that push organizations from good to great. Visit us at www.apqc.org and learn how you can make best practices your practices.
www.apqc.org
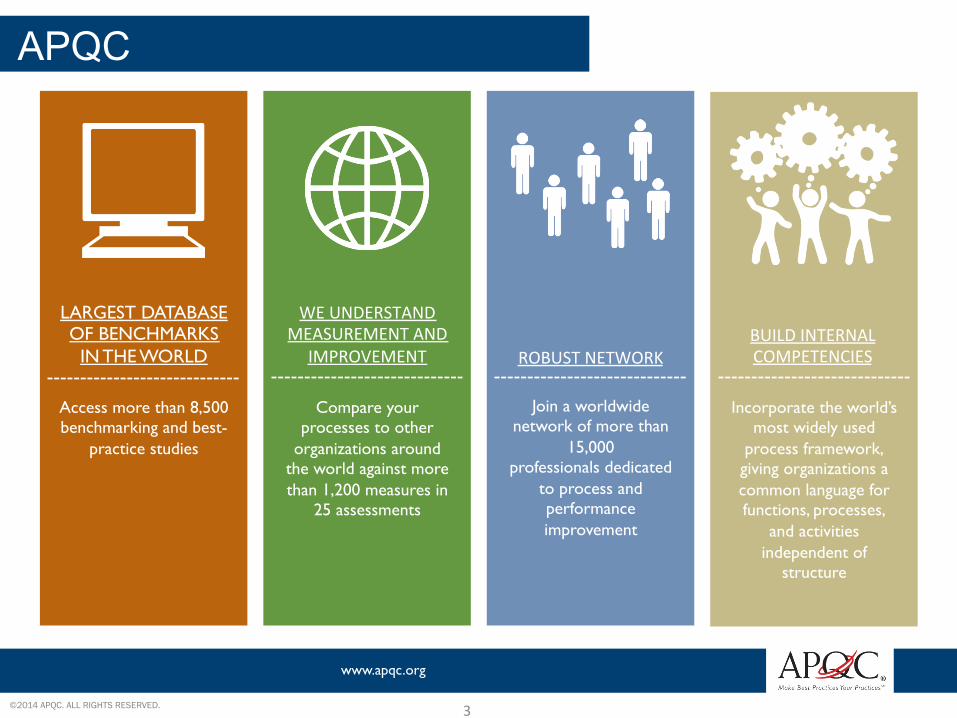
LARGEST DATABASE OF BENCHMARKS
IN THE WORLD
WE UNDERSTAND MEASUREMENT AND
IMPROVEMENT ROBUST NETWORK BUILD INTERNAL COMPETENCIES
Access more than 8,500 benchmarking and best-
practice studies
Compare your processes to other
organizations around the world against more than 1,200 measures in
25 assessments
Join a worldwide network of more than
15,000 professionals dedicated
to process and performance improvement
Incorporate the world’s most widely used
process framework, giving organizations a common language for functions, processes,
and activities independent of
structure
©2014 APQC. ALL RIGHTS RESERVED.
APQC
3

www.apqc.org
o Demographics o Common PMO characteristics
§ Governance models § KPIs § Responsibilities § Skill competencies and gaps
o Comparison of PMOs in large and small organizations
o Factors driving PMO’s support of strategic and transformational change initiatives
5
www.apqc.org
©2014 APQC. ALL RIGHTS RESERVED.
DEMOGRAPHICS
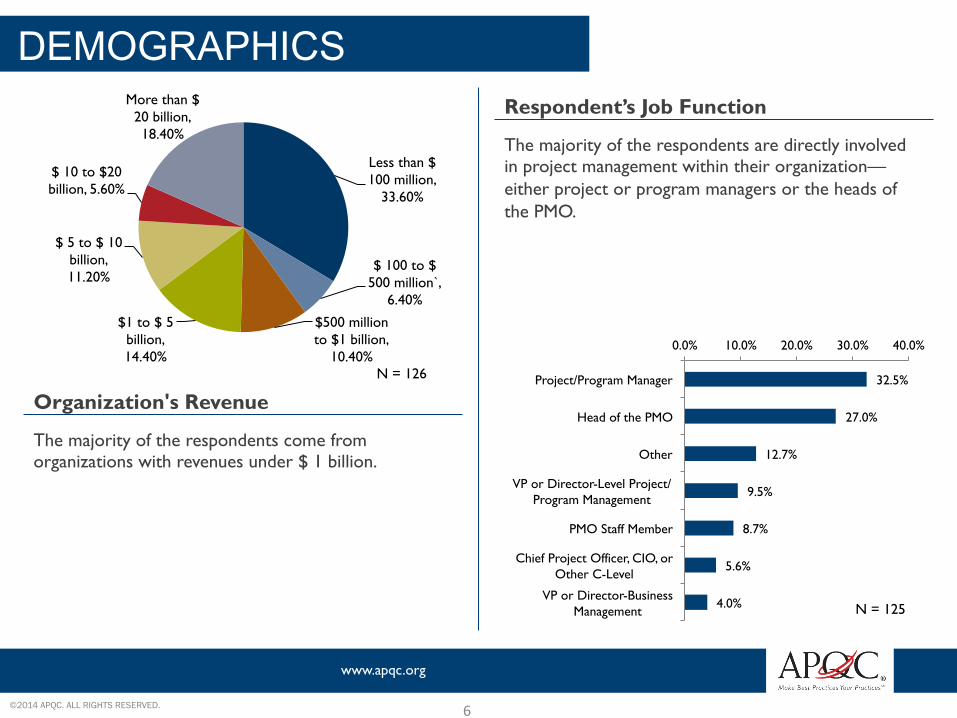
Organization's Revenue
6
32.5%
27.0%
12.7%
9.5%
8.7%
5.6%
4.0%
0.0% 10.0% 20.0% 30.0% 40.0%
Project/Program Manager
Head of the PMO
Other
VP or Director-Level Project/Program Management
PMO Staff Member
Chief Project Officer, CIO, or Other C-Level
VP or Director-Business Management
The majority of the respondents come from organizations with revenues under $ 1 billion.
Less than $ 100 million,
33.60%
$ 100 to $ 500 million`,
6.40%
$500 million to $1 billion,
10.40%
$1 to $ 5 billion, 14.40%
$ 5 to $ 10 billion, 11.20%
$ 10 to $20 billion, 5.60%
More than $ 20 billion, 18.40%
Respondent’s Job Function
The majority of the respondents are directly involved in project management within their organization—either project or program managers or the heads of the PMO.
N = 126
N = 125
PMO TRENDS
7
www.apqc.org
©2014 APQC. ALL RIGHTS RESERVED.
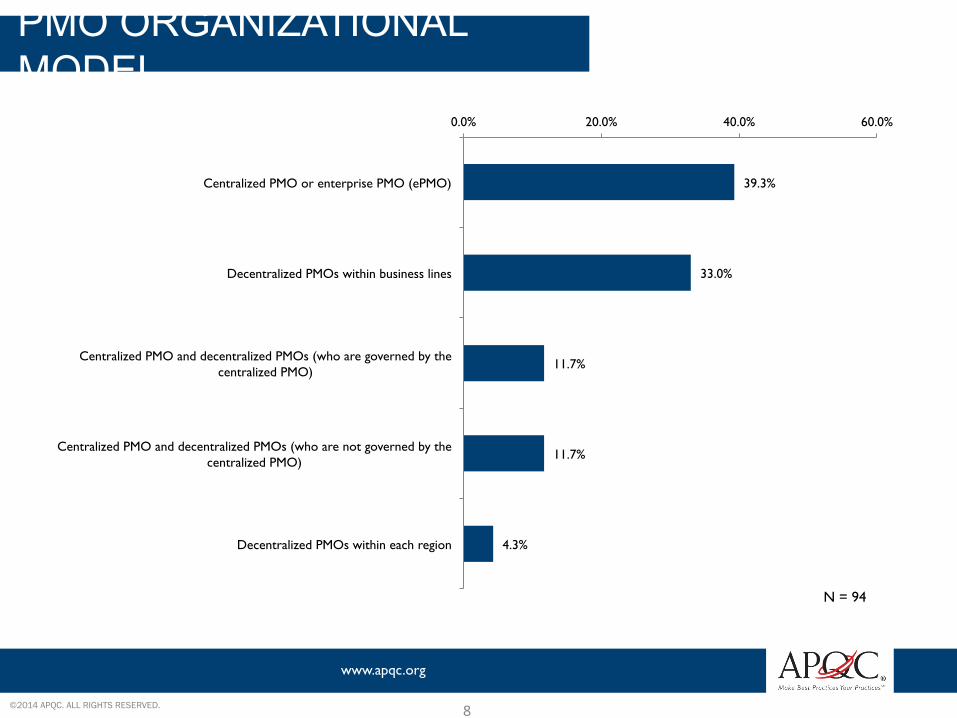
PMO ORGANIZATIONAL MODEL
39.3%
33.0%
11.7%
11.7%
4.3%
0.0% 20.0% 40.0% 60.0%
Centralized PMO or enterprise PMO (ePMO)
Decentralized PMOs within business lines
Centralized PMO and decentralized PMOs (who are governed by the centralized PMO)
Centralized PMO and decentralized PMOs (who are not governed by the centralized PMO)
Decentralized PMOs within each region
8
N = 94
www.apqc.org
©2014 APQC. ALL RIGHTS RESERVED.
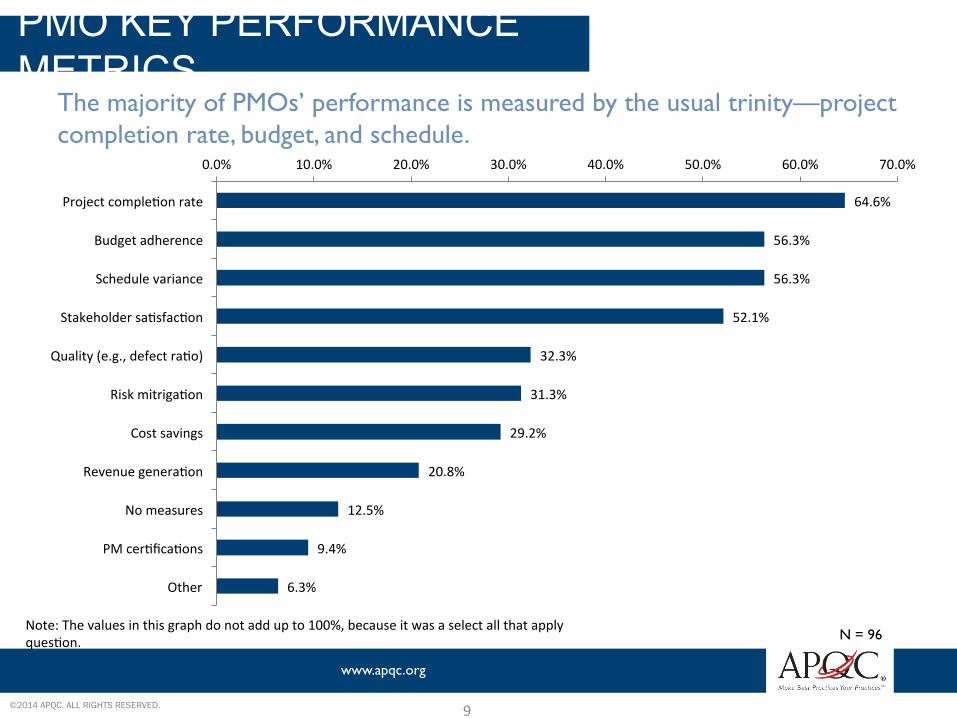
PMO KEY PERFORMANCE METRICS
64.6%
56.3%
56.3%
52.1%
32.3%
31.3%
29.2%
20.8%
12.5%
9.4%
6.3%
0.0% 10.0% 20.0% 30.0% 40.0% 50.0% 60.0% 70.0%
Project compleIon rate
Budget adherence
Schedule variance
Stakeholder saIsfacIon
Quality (e.g., defect raIo)
Risk mitrigaIon
Cost savings
Revenue generaIon
No measures
PM cerIficaIons
Other
9
The majority of PMOs’ performance is measured by the usual trinity—project completion rate, budget, and schedule.
N = 96 Note: The values in this graph do not add up to 100%, because it was a select all that apply quesIon.
www.apqc.org
©2014 APQC. ALL RIGHTS RESERVED.
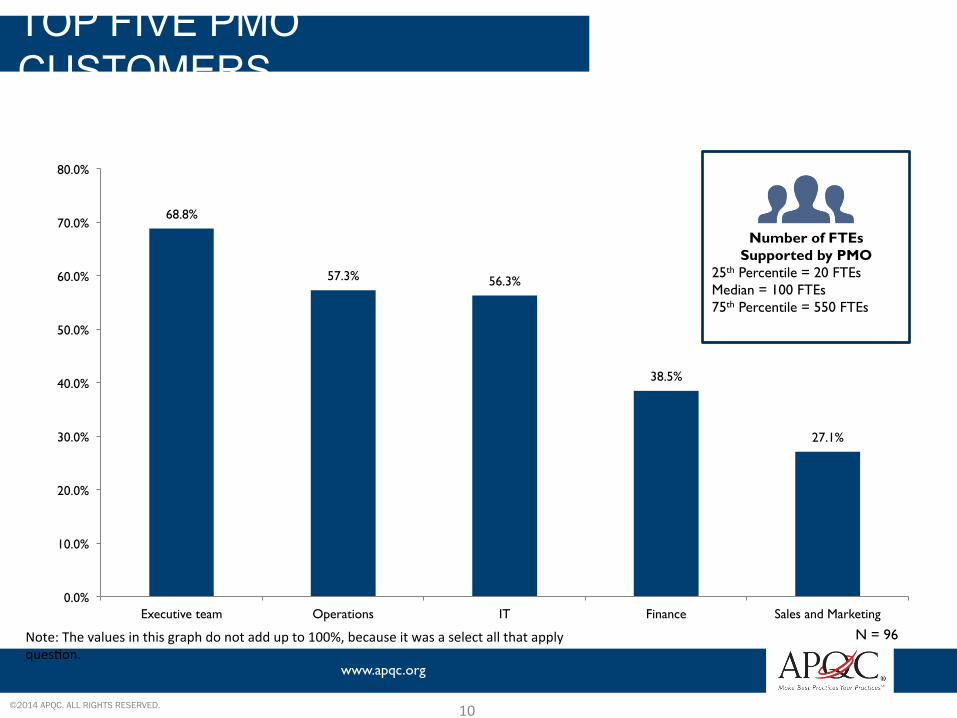
TOP FIVE PMO CUSTOMERS
68.8%
57.3% 56.3%
38.5%
27.1%
0.0%
10.0%
20.0%
30.0%
40.0%
50.0%
60.0%
70.0%
80.0%
Executive team Operations IT Finance Sales and Marketing
10
N = 96
Number of FTEs Supported by PMO
25th Percentile = 20 FTEs Median = 100 FTEs 75th Percentile = 550 FTEs
Note: The values in this graph do not add up to 100%, because it was a select all that apply quesIon.
www.apqc.org
©2014 APQC. ALL RIGHTS RESERVED.
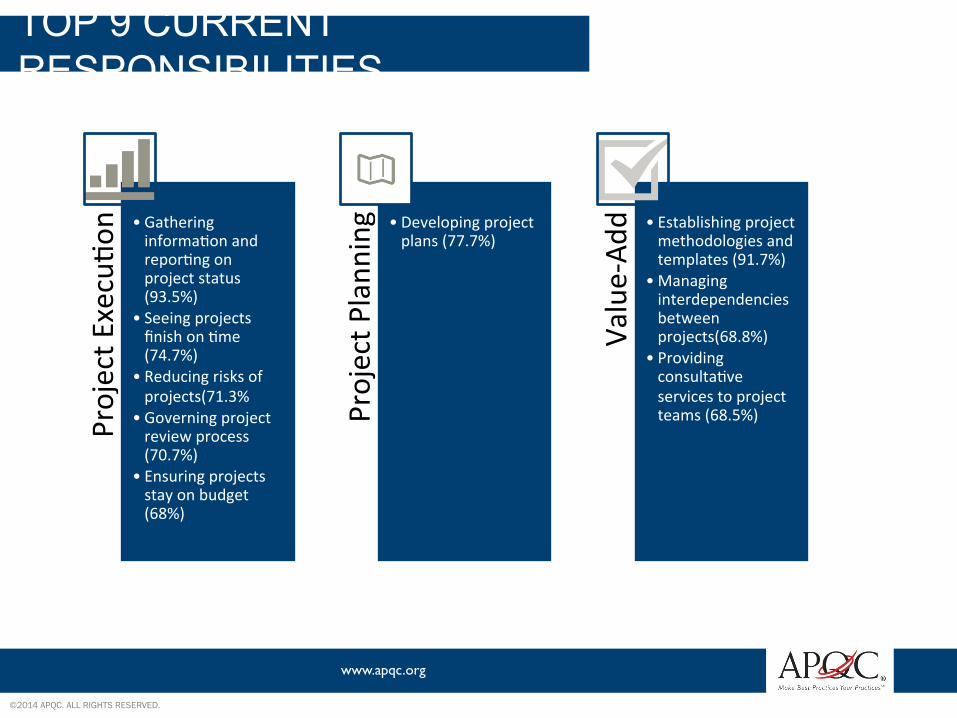
TOP 9 CURRENT RESPONSIBILITIES
Project ExecuIo
n • Gathering informaIon and reporIng on project status (93.5%)
• Seeing projects finish on Ime (74.7%)
• Reducing risks of projects(71.3%
• Governing project review process (70.7%)
• Ensuring projects stay on budget (68%)
Project P
lann
ing
• Developing project plans (77.7%)
Value-‐Ad
d • Establishing project methodologies and templates (91.7%)
• Managing interdependencies between projects(68.8%)
• Providing consultaIve services to project teams (68.5%)
www.apqc.org
©2014 APQC. ALL RIGHTS RESERVED.
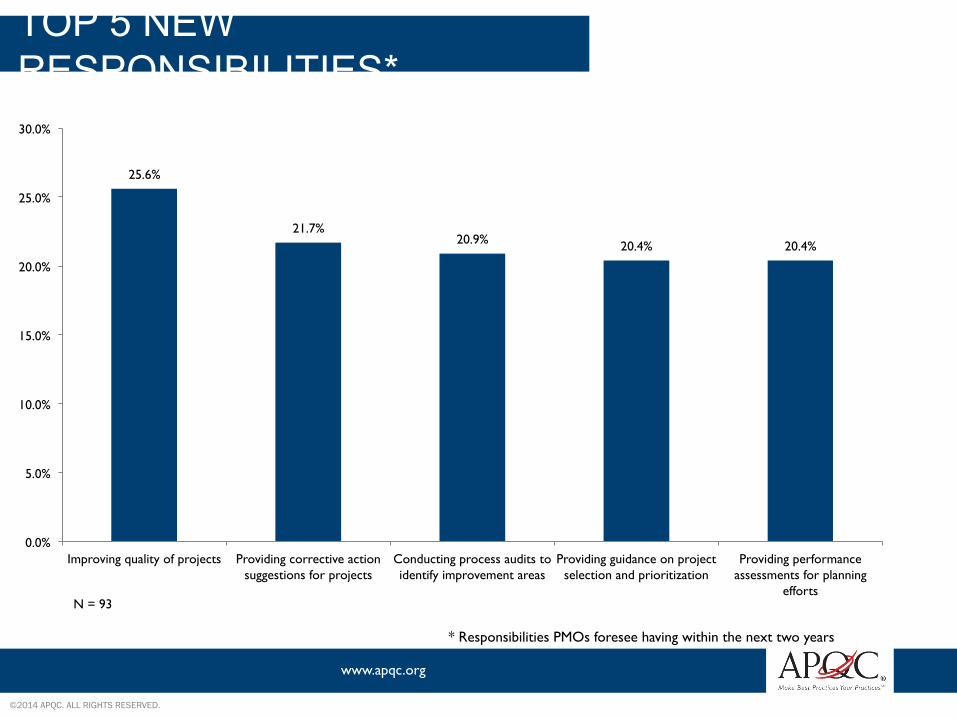
TOP 5 NEW RESPONSIBILITIES*
25.6%
21.7% 20.9% 20.4% 20.4%
0.0%
5.0%
10.0%
15.0%
20.0%
25.0%
30.0%
Improving quality of projects Providing corrective action suggestions for projects
Conducting process audits to identify improvement areas
Providing guidance on project selection and prioritization
Providing performance assessments for planning
efforts N = 93
* Responsibilities PMOs foresee having within the next two years
www.apqc.org
©2014 APQC. ALL RIGHTS RESERVED.
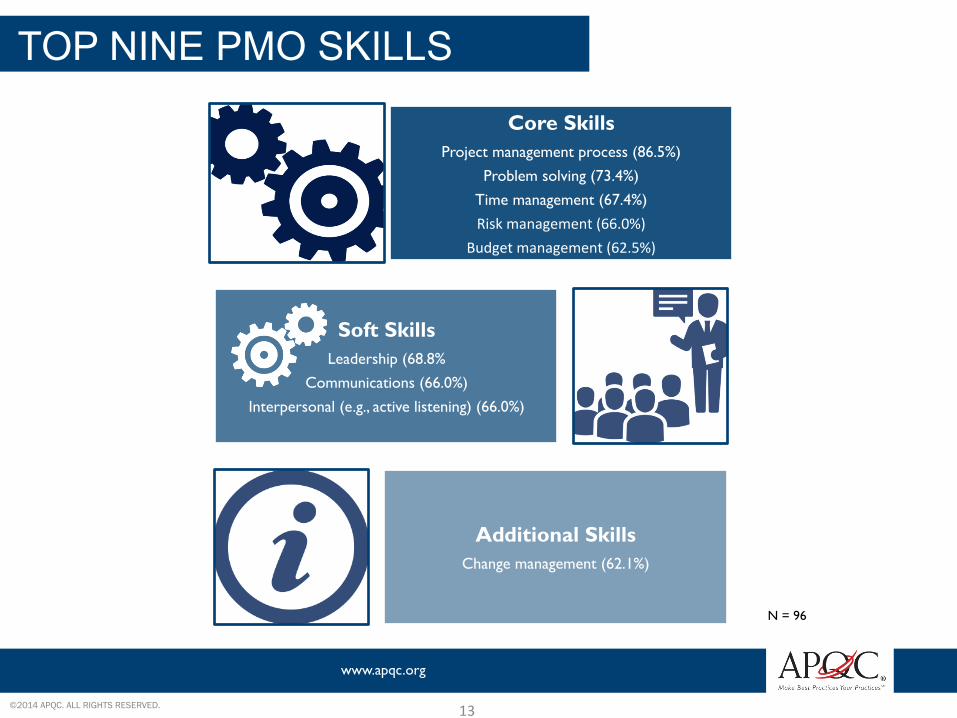
TOP NINE PMO SKILLS
13
Core Skills Project management process (86.5%)
Problem solving (73.4%) Time management (67.4%) Risk management (66.0%)
Budget management (62.5%)
Soft Skills Leadership (68.8%
Communications (66.0%) Interpersonal (e.g., active listening) (66.0%)
Additional Skills Change management (62.1%)
N = 96
www.apqc.org
©2014 APQC. ALL RIGHTS RESERVED.
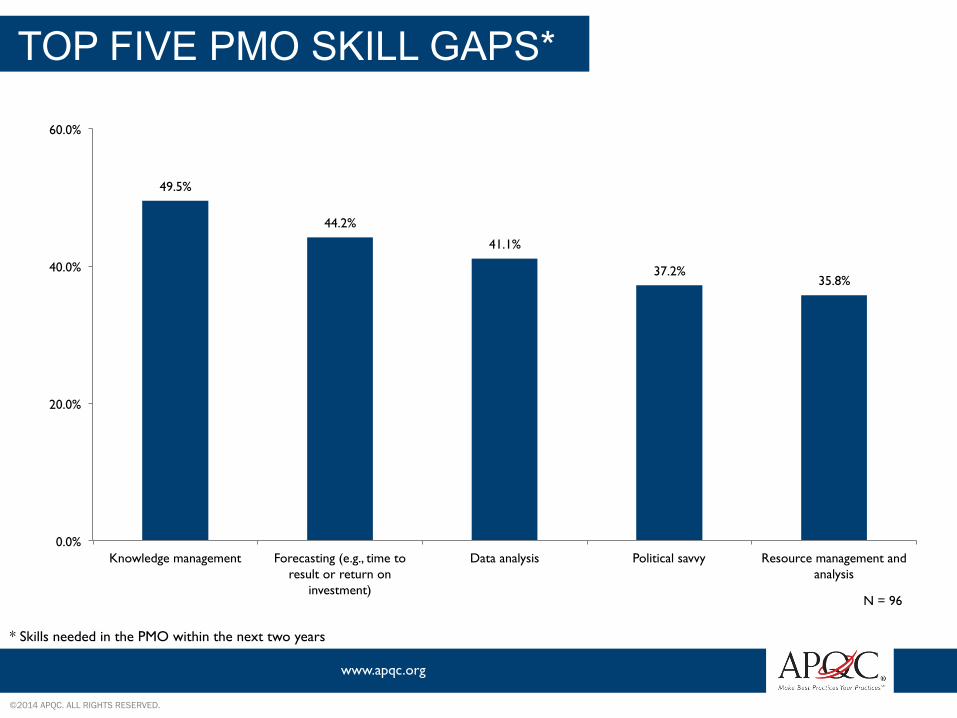
TOP FIVE PMO SKILL GAPS*
49.5%
44.2%
41.1%
37.2% 35.8%
0.0%
20.0%
40.0%
60.0%
Knowledge management Forecasting (e.g., time to result or return on
investment)
Data analysis Political savvy Resource management and analysis
N = 96
* Skills needed in the PMO within the next two years
TALE OF TWO PMOS
15
www.apqc.org
©2014 APQC. ALL RIGHTS RESERVED.
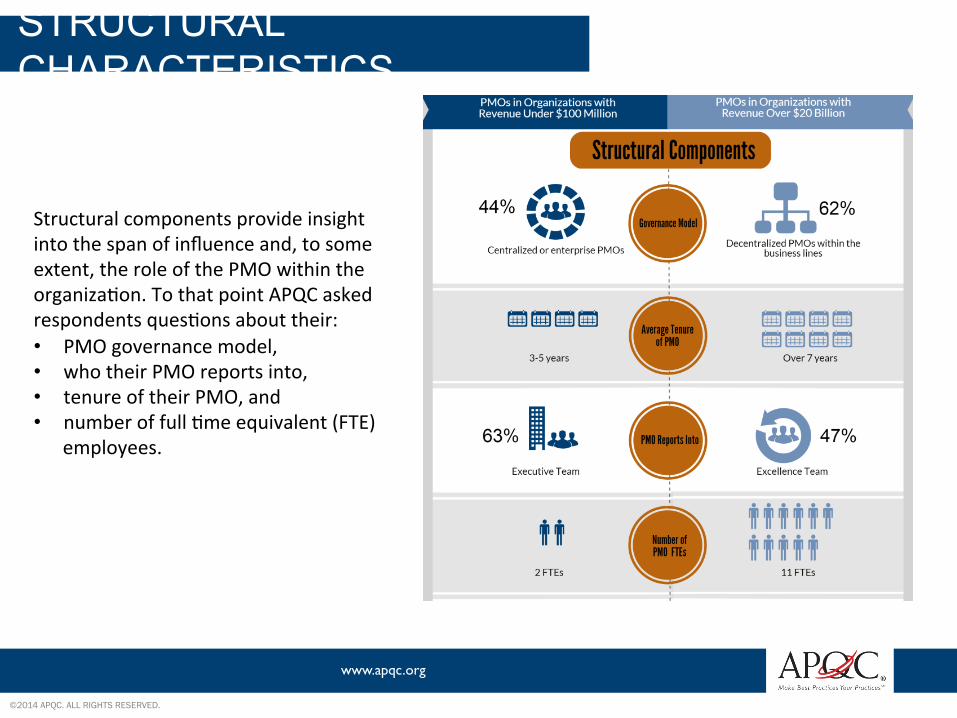
STRUCTURAL CHARACTERISTICS
Structural components provide insight into the span of influence and, to some extent, the role of the PMO within the organizaIon. To that point APQC asked respondents quesIons about their: • PMO governance model, • who their PMO reports into, • tenure of their PMO, and • number of full Ime equivalent (FTE)
employees.
www.apqc.org
©2014 APQC. ALL RIGHTS RESERVED.
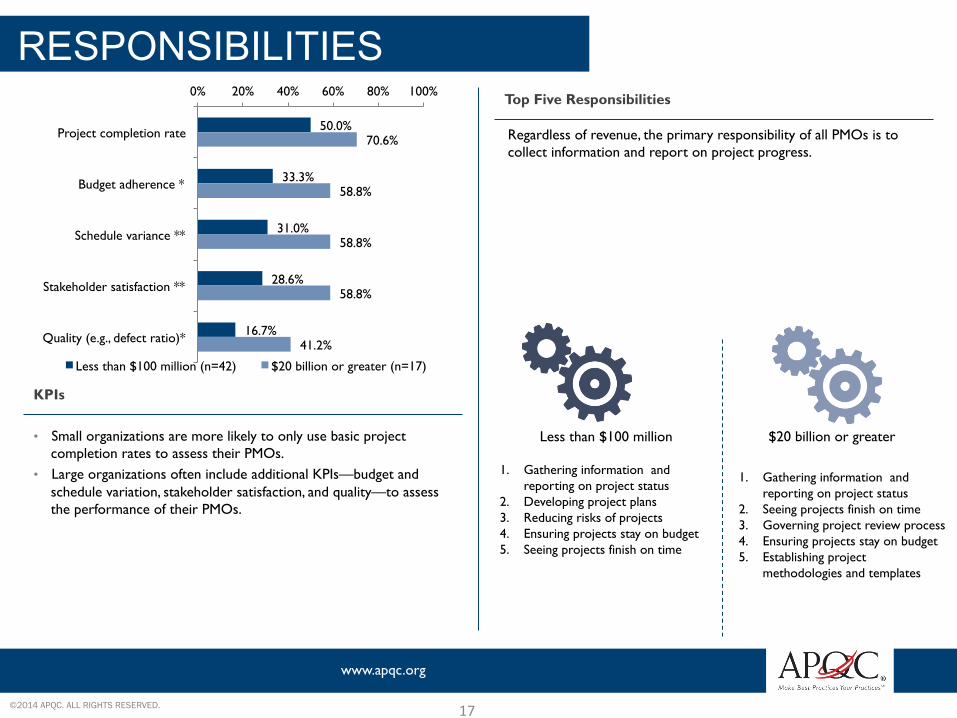
RESPONSIBILITIES
KPIs
17
Top Five Responsibilities
50.0%
33.3%
31.0%
28.6%
16.7%
70.6%
58.8%
58.8%
58.8%
41.2%
0% 20% 40% 60% 80% 100%
Project completion rate
Budget adherence *
Schedule variance **
Stakeholder satisfaction **
Quality (e.g., defect ratio)*
Less than $100 million (n=42) $20 billion or greater (n=17)
1. Gathering information and
reporting on project status 2. Developing project plans 3. Reducing risks of projects 4. Ensuring projects stay on budget 5. Seeing projects finish on time
1. Gathering information and reporting on project status
2. Seeing projects finish on time 3. Governing project review process 4. Ensuring projects stay on budget 5. Establishing project
methodologies and templates
Less than $100 million $20 billion or greater
Regardless of revenue, the primary responsibility of all PMOs is to collect information and report on project progress.
• Small organizations are more likely to only use basic project completion rates to assess their PMOs.
• Large organizations often include additional KPIs—budget and schedule variation, stakeholder satisfaction, and quality—to assess the performance of their PMOs.
www.apqc.org
©2014 APQC. ALL RIGHTS RESERVED.
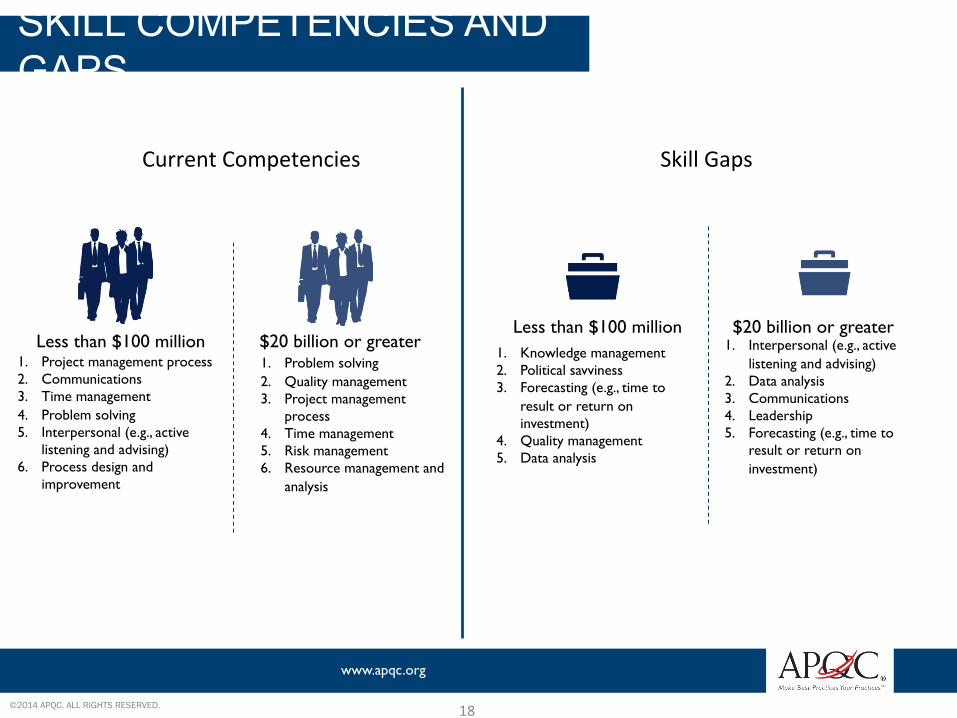
SKILL COMPETENCIES AND GAPS
18
1. Project management process 2. Communications 3. Time management 4. Problem solving 5. Interpersonal (e.g., active
listening and advising) 6. Process design and
improvement
1. Problem solving 2. Quality management 3. Project management
process 4. Time management 5. Risk management 6. Resource management and
analysis
Less than $100 million $20 billion or greater 1. Knowledge management 2. Political savviness 3. Forecasting (e.g., time to
result or return on investment))
4. Quality management 5. Data analysis
1. Interpersonal (e.g., active listening and advising)
2. Data analysis 3. Communications 4. Leadership 5. Forecasting (e.g., time to
result or return on investment)
Less than $100 million $20 billion or greater
Current Competencies Skill Gaps
SUPPORTING STRATEGIC AND TRANSFORMATIONAL CHANGE
www.apqc.org
©2014 APQC. ALL RIGHTS RESERVED.
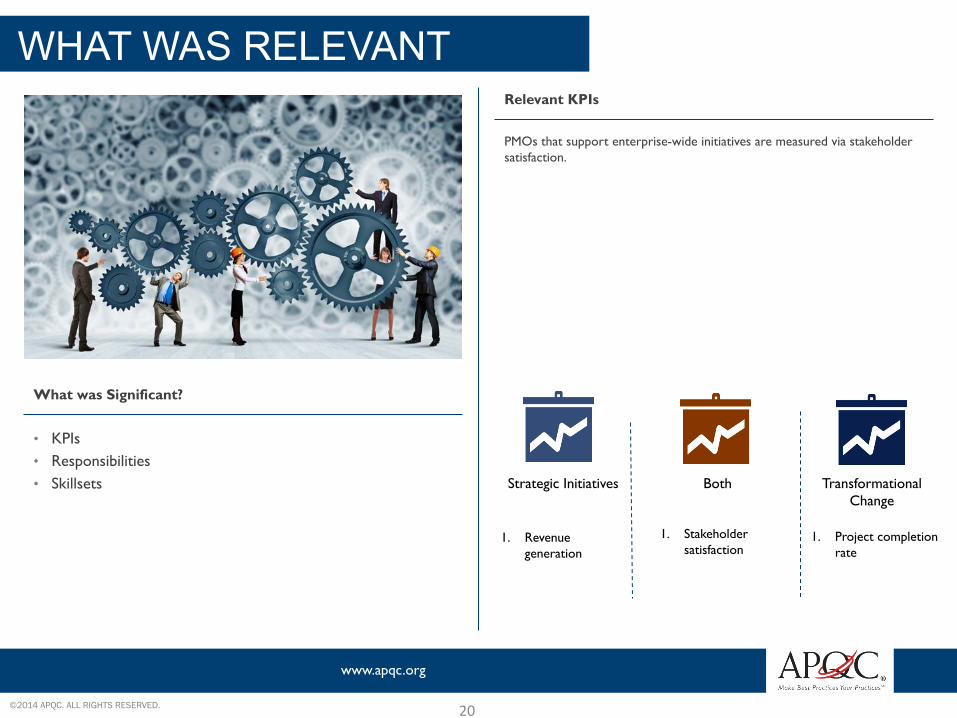
WHAT WAS RELEVANT
What was Significant?
20
• KPIs • Responsibilities • Skillsets
Relevant KPIs
PMOs that support enterprise-wide initiatives are measured via stakeholder satisfaction.
1. Revenue generation
1. Stakeholder
satisfaction
1. Project completion rate
Strategic Initiatives Both Transformational Change
www.apqc.org
©2014 APQC. ALL RIGHTS RESERVED.
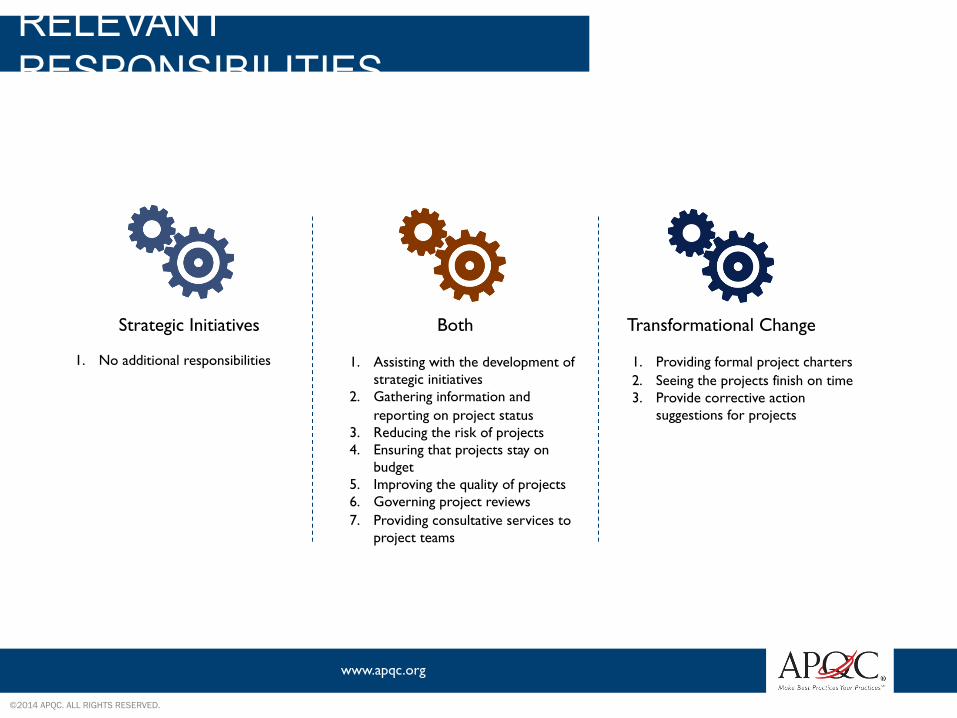
RELEVANT RESPONSIBILITIES
1. No additional responsibilities
1. Assisting with the development of
strategic initiatives 2. Gathering information and
reporting on project status 3. Reducing the risk of projects 4. Ensuring that projects stay on
budget 5. Improving the quality of projects 6. Governing project reviews 7. Providing consultative services to
project teams
1. Providing formal project charters 2. Seeing the projects finish on time 3. Provide corrective action
suggestions for projects
Strategic Initiatives Both Transformational Change
www.apqc.org
©2014 APQC. ALL RIGHTS RESERVED.
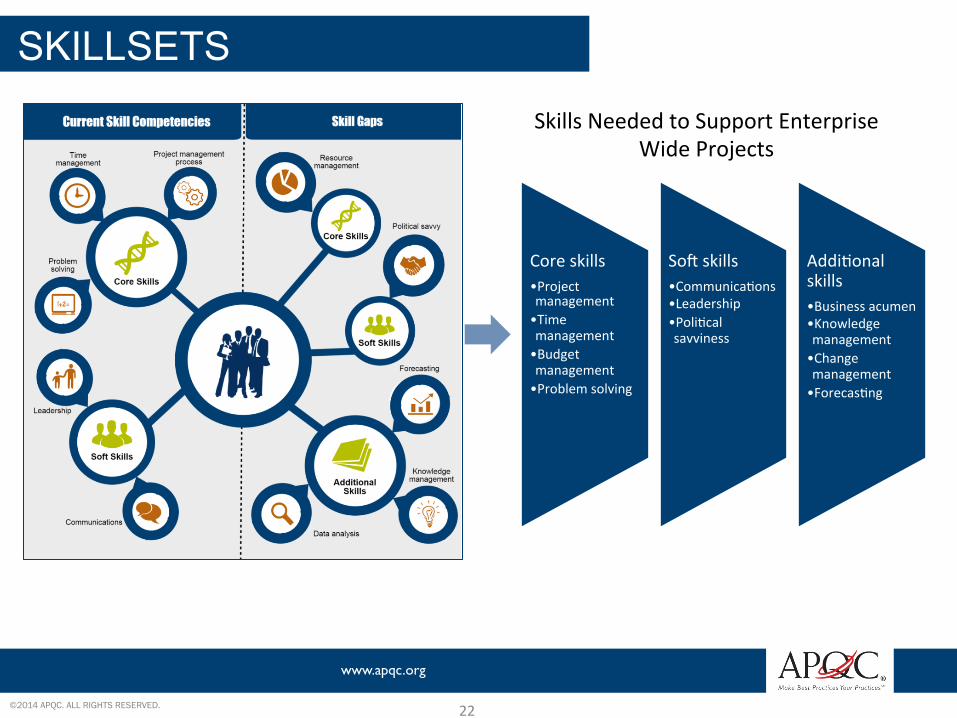
SKILLSETS
22
Core skills • Project management • Time management • Budget management • Problem solving
Sof skills • CommunicaIons • Leadership • PoliIcal savviness
AddiIonal skills • Business acumen • Knowledge management • Change management • ForecasIng
Skills Needed to Support Enterprise Wide Projects

QUESTIONS
23
www.apqc.org
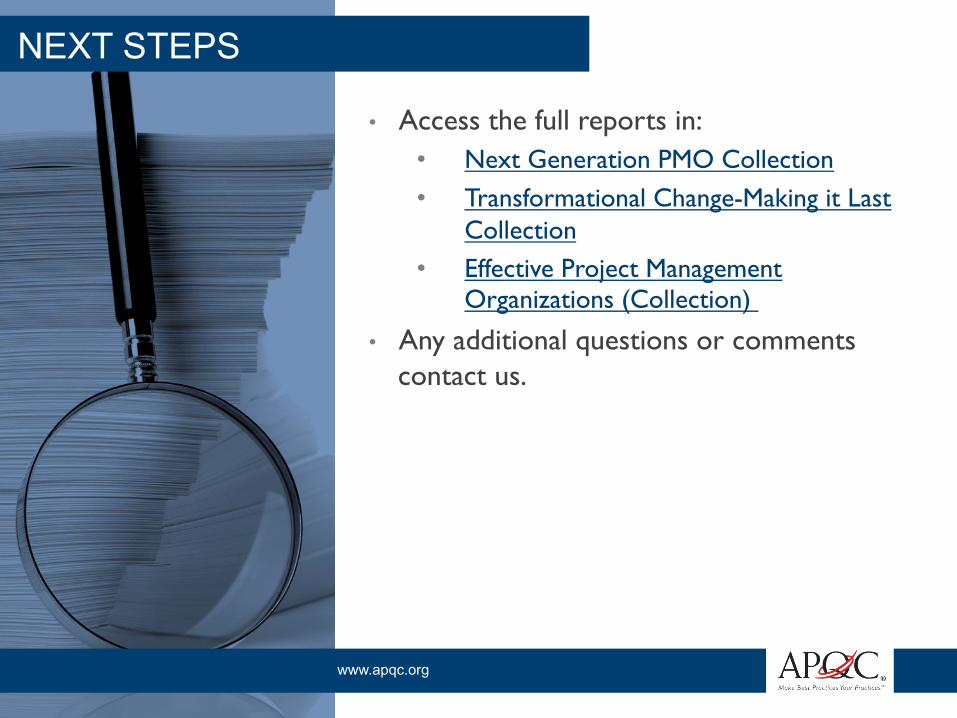
NEXT STEPS
• Access the full reports in: • Next Generation PMO Collection • Transformational Change-Making it Last
Collection • Effective Project Management
Organizations (Collection)
• Any additional questions or comments contact us.
www.apqc.org 123 N. Post Oak | Houston, TX | 77024
25
Related Documents


![Driving organizational change in healthcare [Webcast]](https://static.cupdf.com/doc/110x72/58ed9c371a28abd9608b459f/driving-organizational-change-in-healthcare-webcast.jpg)
