Nogueira Reis, P. & Augusto, M. (2019) Drivers to Equity Valuation: Perpetuities or Annuities Approach? An Application to the main European Stock Markets. Journal of Business, Universidad del Pacífico (Lima, Peru) Vol.11(1): 27-48 27 Drivers to Equity Valuation: Perpetuities or Annuities Approach? An Application to the main European Stock Markets Pedro M. Nogueira Reis [email protected] Escola Superior de Tecnologia e Gestão de Viseu, Portugal Mário António Gomes Augusto [email protected] Universidade de Coimbra, Portugal Abstract Academics and practitioners have been applying equity valuation methods mainly based on discount cash flow models, residual income models, or dividend discount models combined with balance sheet and income statement multiples of market comparables to analyse share price, provide price targets for investors, or even as a basis for transactions such as mergers and acquisitions (M&A). Most of these methods rely on mathematical deductions of growing or constant perpetuities or near perpetuities (such as annuities) to attain market values. However, it is of the utmost relevance for valuation to verify how the theoretical models relate with real values, and what their relationship is with companies’ past age. Beyond stating a non-linear relationship for valuation models and ascertain important valuation drivers, using a sample of more than 3,400 European companies with cross section data, this paper contributes to the improvement of valuation model’s effectiveness by inducing non-explicit period valuation modifications to long-term annuities and perpetuities, considering class age intervals. This paper’s originality is supported by the study of the relationship of past company age with predicted annuities, the proof of non-compliance of perpetuity-based valuation models, and the contribution of new value drivers for valuation purposes. Keywords: annuity, perpetuity, equity valuation, DCF, RIM, DDM. https://doi.org/10.21678/jb.2019.986 Paper received 12/11/2018 paper accepted 15/04/2019 Nogueira Reis, P. & Augusto, M. (2019) Drivers to Equity Valuation: Perpetuities or Annuities Approach? An Application to the main European Stock Markets. Journal of Business, Universidad del Pacífico (Lima, Peru) Vol.11(1): 27-48 Editor in Chief: Prof. Dr. Luis Camilo Ortigueira-Sánchez

Welcome message from author
This document is posted to help you gain knowledge. Please leave a comment to let me know what you think about it! Share it to your friends and learn new things together.
Transcript
Nogueira Reis, P. & Augusto, M. (2019) Drivers to Equity Valuation: Perpetuities or Annuities Approach? An Application to the main European Stock Markets. Journal of Business, Universidad del Pacífico (Lima, Peru) Vol.11(1): 27-48
27
Drivers to Equity Valuation: Perpetuities or Annuities Approach? An Application to the main European Stock
Markets
Pedro M. Nogueira Reis [email protected]
Escola Superior de Tecnologia e Gestão de Viseu, Portugal
Mário António Gomes Augusto [email protected]
Universidade de Coimbra, Portugal
Abstract
Academics and practitioners have been applying equity valuation methods mainly based on discount cash flow models, residual income models, or dividend discount models combined with balance sheet and income statement multiples of market comparables to analyse share price, provide price targets for investors, or even as a basis for transactions such as mergers and acquisitions (M&A). Most of these methods rely on mathematical deductions of growing or constant perpetuities or near perpetuities (such as annuities) to attain market values. However, it is of the utmost relevance for valuation to verify how the theoretical models relate with real values, and what their relationship is with companies’ past age. Beyond stating a non-linear relationship for valuation models and ascertain important valuation drivers, using a sample of more than 3,400 European companies with cross section data, this paper contributes to the improvement of valuation model’s effectiveness by inducing non-explicit period valuation modifications to long-term annuities and perpetuities, considering class age intervals. This paper’s originality is supported by the study of the relationship of past company age with predicted annuities, the proof of non-compliance of perpetuity-based valuation models, and the contribution of new value drivers for valuation purposes.
Keywords: annuity, perpetuity, equity valuation, DCF, RIM, DDM.
https://doi.org/10.21678/jb.2019.986 Paper received 12/11/2018 paper accepted 15/04/2019
Nogueira Reis, P. & Augusto, M. (2019) Drivers to Equity Valuation: Perpetuities or Annuities Approach? An Application to the main European Stock Markets. Journal of Business, Universidad del Pacífico (Lima, Peru) Vol.11(1): 27-48
Editor in Chief: Prof. Dr. Luis Camilo Ortigueira-Sánchez
Nogueira Reis, P. & Augusto, M. (2019) Drivers to Equity Valuation: Perpetuities or Annuities Approach? An Application to the main European Stock Markets. Journal of Business, Universidad del Pacífico (Lima, Peru) Vol.11(1): 27-48
28
Introduction
The most common valuation models include the dividend discount model (DDM), based on
Gordon and Shapiro’s (1956) premises (with growth or no growth); the discount cash flow
model (DCF), discounting free cash flow, equity cash flow or capital cash flow; and residual
income models (RI). The difficulty associated with the prediction models is how to deal with
uncertainty related with free cash flows (FCF), earnings, or dividends alongside the discount
rate. Several models use annuities, constant growth perpetuities, no-growth perpetuities, two-
stage growth periods, three-stage growth periods, flows with probability of occurrence, and
cyclical flows treated with a function of SEN(x). For instance, Arnold and North (2011) deal
with cyclical terminal values where individual cycles can be implemented for each component
account of the FCF with different lengths or different numbers of phases allowing several
estimation values with the Monte Carlo simulation technique.
The Gordon-Shapiro model has been commonly used to calculate terminal values in corporate
valuation over long periods, mainly dividends. This formula was later adapted to deal with FCF
by Copeland et al. (2000). Considering the terminal value’s high sensitivity to the growth
parameter, Friedl and Schwetzler (2011) argue that the use of the Gordon-Shapiro model
leads to correct results when applied to free cash flows using nominal and real input
parameters, but they recognize that the model can lead to errors when used with net income
rather than cash flows due to unclear relationships between growth, earnings, and returns.
Elsner and Krumholz (2013) state that the commonly used valuation formula for perpetuities
is no longer suitable for estimating unbiased terminal values because the estimated cost of
capital gives rise to a standard error and to biases in firm values, so they correct the no-growth
perpetuity formula in order to incorporate adjusted log cost of capital based on three variables:
estimated cost of capital, variance, and sample size. They find that without a correction, firm
values are systematically biased and on average, overstated. The constant growth dividend
formula, with the numerator of the equation dividends created by Gordon and Shapiro (1956)
and developed by Copeland et al. (2000), established an accounting-driven equity valuation
model as part of an analytical approach to company strategy. The value driver, adapted from
Koller et al. (2010), to company valuation, is:
.
(1)
Nogueira Reis, P. & Augusto, M. (2019) Drivers to Equity Valuation: Perpetuities or Annuities Approach? An Application to the main European Stock Markets. Journal of Business, Universidad del Pacífico (Lima, Peru) Vol.11(1): 27-48
29
Where NOPAT is the net operating profit less adjusted taxes, g is the NOPAT growth in
perpetuity, RONIC is the return on new invested capital, Wacc is the weighted average cost
of capital, and Netdebt is the initial finance debt including leases and pension funds burden,
less any cash available or other securities. In this paper we propose that any financial asset
of a target company should be valued separately in terms of market value and included in the
valuation. The equation underlies the economic-profit approach, equivalent to the DCF
approach but with accounting values. The perpetual growth terminal value also is presented
as a form of a plain perpetuity of flows, FCF/WACC, or applied to dividends as dividend/equity
required return. This could be applied even for an earnings model, or RI, as we can observe:
.
(2)
with Re the required equity return rate.
In this paper we initially apply DCF, DDM, and RI models through an annuity considering a
firm’s past age and also a perpetuity approach to those attributes, comparing the results with
real values and hence obtaining factual expressions in line with our sample. This will lead to
non-linear adjusted models as well as adjusted predicted perpetuity value expressions
according to company-age intervals, which we will compare with traditional valuation
terminologies. Afterwards, we verify the main drivers of fundamental valuation, concluding that
earnings, free cash flow, dividends, PER, volatility, and cost of capital are the most important
inducers of company value. These findings will contribute to academia since we look at
traditional models from a different perspective, providing evidence that the simple perpetual
approach to terminal value is inadequate in valuation, as too is the perpetual growth approach.
We also show that there may not be a link between a company’s past age and future value,
computed by an annuity that is a function of former company age. Our sample is built upon
2017 data from the Reuters Datastream, considering more than 3,400 listed companies from
the main indexes in five European countries. Apart from this section, this paper presents the
background in the next section, then the research design (sample, data, and methodology)
are. Thereafter, the results and conclusions are set out in a systematic way.
Nogueira Reis, P. & Augusto, M. (2019) Drivers to Equity Valuation: Perpetuities or Annuities Approach? An Application to the main European Stock Markets. Journal of Business, Universidad del Pacífico (Lima, Peru) Vol.11(1): 27-48
30
Background Bancel and Mittoo (2014) show that the most popular valuation methods are the relative
valuation (comparables or multiples, 80% of users), DCF models using free cashflow to firm
(80%), and the DDM (20%, the least utilized). Most executives use two or three valuation
methods combined to obtain a company’s value. The most popular multiples used are firm
value/EBITDA, price earnings ratio (PER), firm value/EBIT, price-book ratio and firm
value/sales (in this rank order). Considering the required rate of return, Bancel and Mittoo
(2014) reach the conclusion that valuation experts use one of the following: “a risk free rate
plus an intuitive risk premium”; “the return on equity that the shareholders require”; “a range
between 8% and 12% considering the operational risk and the financial risk”; “15%”; “the risk
free rate plus the estimated risk (country, industry and firm)”; “the same risk premium for all
firms”; “qualitative estimated rate based on industry business risk and stock volatility and
liquidity”; or “the historical implicit cost of equity as charged by the market”(Bancel & Mittoo,
2014: 109). The major advantages of current valuation models are the comparison between
firm valuations, and the main difficulty is in providing a correct discount rate. Finance theory
has developed a simple valuation framework that requires the estimation of only a few
parameters, but the implementation is challenging because the theory provides little direction
about how to guess these parameters, and thus practitioners are forced to make their own
estimates with subjective views, possibly biasing the results. The discount rate is an important
driver on firm valuation and therefore interest rate uncertainty reduces the valuation of
investment projects and thus the valuation company (Ballestra, Pacelli, & Radi, 2018).
A combination of methods is often applied by practitioners, whereby multiples such as price
earnings (P/E) are used to confirm the valuation compared to its pairs. Sahoo and Rajib (2013)
find that P/E multiples of comparable firms, selected from a company sample based on the
parameters, industry, revenue characteristics, book value, and return on net worth, positively
influence the price of a company, as in the case of an IPO. A lower estimation power of the
comparable company’s P/E approach suggests that the valuation function is not restricted to
comparable peer-group average P/E, and an adjustment of other fundamentals helps to
improve valuation accuracy.
In valuation, despite the macro environment and other systematic risk factors, company-
specific factors are still predominant in explaining cross-sectional differences in valuation,
while country and industry factors boost their explanatory power, according to Foster et al.
(2012). They find that company-specific financial statement factors were the most important
group, as compared with the country- or industry-specific factors, in explaining cross-sectional
Nogueira Reis, P. & Augusto, M. (2019) Drivers to Equity Valuation: Perpetuities or Annuities Approach? An Application to the main European Stock Markets. Journal of Business, Universidad del Pacífico (Lima, Peru) Vol.11(1): 27-48
31
differences in three equity valuation ratios: the price revenue multiple, the price earnings
multiple, and the price equity book value multiple.
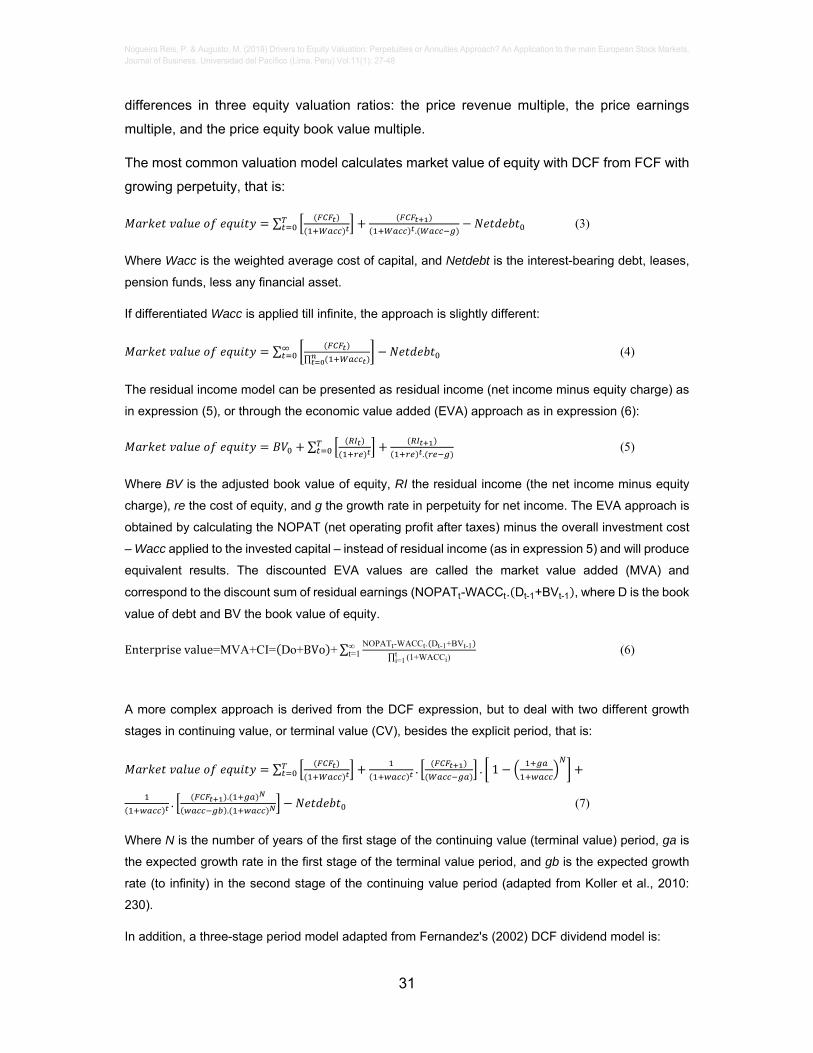
The most common valuation model calculates market value of equity with DCF from FCF with
growing perpetuity, that is:
∑.
(3)
Where Wacc is the weighted average cost of capital, and Netdebt is the interest-bearing debt, leases,
pension funds, less any financial asset.
If differentiated Wacc is applied till infinite, the approach is slightly different:
∑∏
(4)
The residual income model can be presented as residual income (net income minus equity charge) as
in expression (5), or through the economic value added (EVA) approach as in expression (6):
∑.
(5)
Where BV is the adjusted book value of equity, RI the residual income (the net income minus equity
charge), re the cost of equity, and g the growth rate in perpetuity for net income. The EVA approach is
obtained by calculating the NOPAT (net operating profit after taxes) minus the overall investment cost
– Wacc applied to the invested capital – instead of residual income (as in expression 5) and will produce
equivalent results. The discounted EVA values are called the market value added (MVA) and
correspond to the discount sum of residual earnings (NOPATt-WACCt. Dt-1+BVt-1 , where D is the book
value of debt and BV the book value of equity.
Enterprisevalue=MVA+CI= Do+BVo +∑NOPATt-WACCt. Dt-1+BVt-1
∏ (1+WACCiti=1 )
∞t=1 (6)
A more complex approach is derived from the DCF expression, but to deal with two different growth
stages in continuing value, or terminal value (CV), besides the explicit period, that is:
∑ . . 1
..
. (7)
Where N is the number of years of the first stage of the continuing value (terminal value) period, ga is
the expected growth rate in the first stage of the terminal value period, and gb is the expected growth
rate (to infinity) in the second stage of the continuing value period (adapted from Koller et al., 2010:
230).
In addition, a three-stage period model adapted from Fernandez's (2002) DCF dividend model is:
Nogueira Reis, P. & Augusto, M. (2019) Drivers to Equity Valuation: Perpetuities or Annuities Approach? An Application to the main European Stock Markets. Journal of Business, Universidad del Pacífico (Lima, Peru) Vol.11(1): 27-48
32
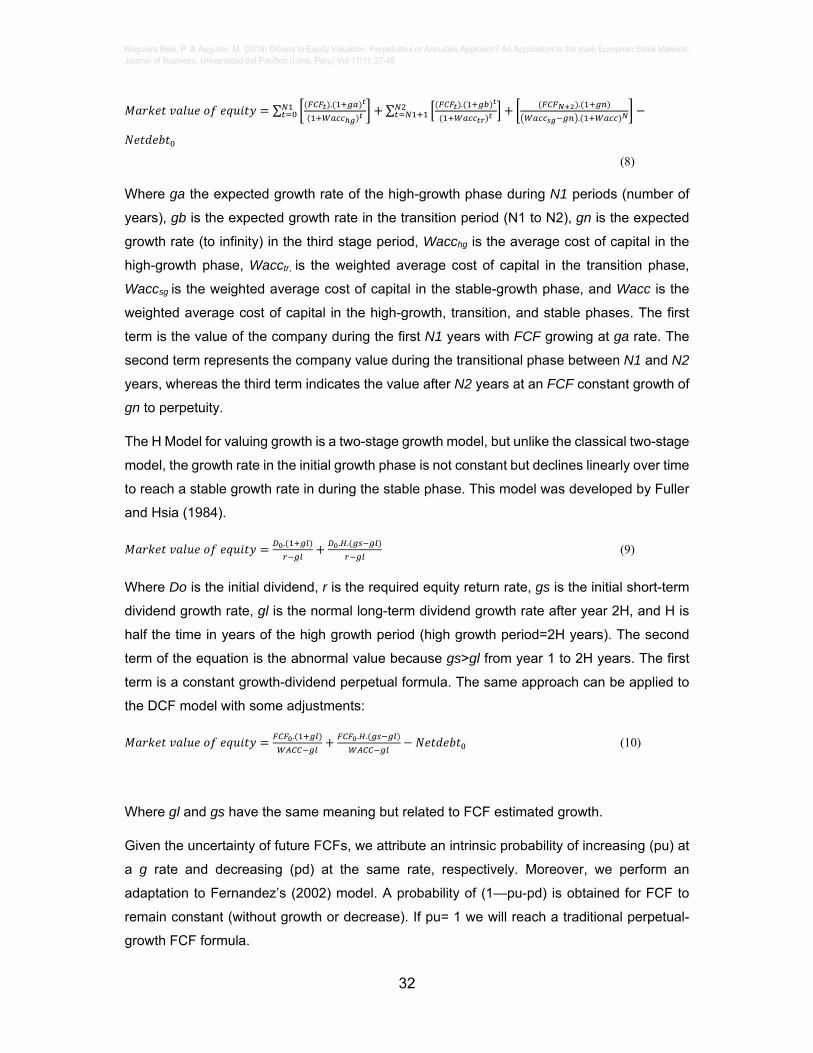
∑ . ∑ . .
.
(8)
Where ga the expected growth rate of the high-growth phase during N1 periods (number of
years), gb is the expected growth rate in the transition period (N1 to N2), gn is the expected
growth rate (to infinity) in the third stage period, Wacchg is the average cost of capital in the
high-growth phase, Wacctr, is the weighted average cost of capital in the transition phase,
Waccsg is the weighted average cost of capital in the stable-growth phase, and Wacc is the
weighted average cost of capital in the high-growth, transition, and stable phases. The first
term is the value of the company during the first N1 years with FCF growing at ga rate. The
second term represents the company value during the transitional phase between N1 and N2
years, whereas the third term indicates the value after N2 years at an FCF constant growth of
gn to perpetuity.
The H Model for valuing growth is a two-stage growth model, but unlike the classical two-stage
model, the growth rate in the initial growth phase is not constant but declines linearly over time
to reach a stable growth rate in during the stable phase. This model was developed by Fuller
and Hsia (1984).
. . .
(9)
Where Do is the initial dividend, r is the required equity return rate, gs is the initial short-term
dividend growth rate, gl is the normal long-term dividend growth rate after year 2H, and H is
half the time in years of the high growth period (high growth period=2H years). The second
term of the equation is the abnormal value because gs>gl from year 1 to 2H years. The first
term is a constant growth-dividend perpetual formula. The same approach can be applied to
the DCF model with some adjustments:
. . . (10)
Where gl and gs have the same meaning but related to FCF estimated growth.
Given the uncertainty of future FCFs, we attribute an intrinsic probability of increasing (pu) at
a g rate and decreasing (pd) at the same rate, respectively. Moreover, we perform an
adaptation to Fernandez’s (2002) model. A probability of (1—pu-pd) is obtained for FCF to
remain constant (without growth or decrease). If pu= 1 we will reach a traditional perpetual-
growth FCF formula.
Nogueira Reis, P. & Augusto, M. (2019) Drivers to Equity Valuation: Perpetuities or Annuities Approach? An Application to the main European Stock Markets. Journal of Business, Universidad del Pacífico (Lima, Peru) Vol.11(1): 27-48
33
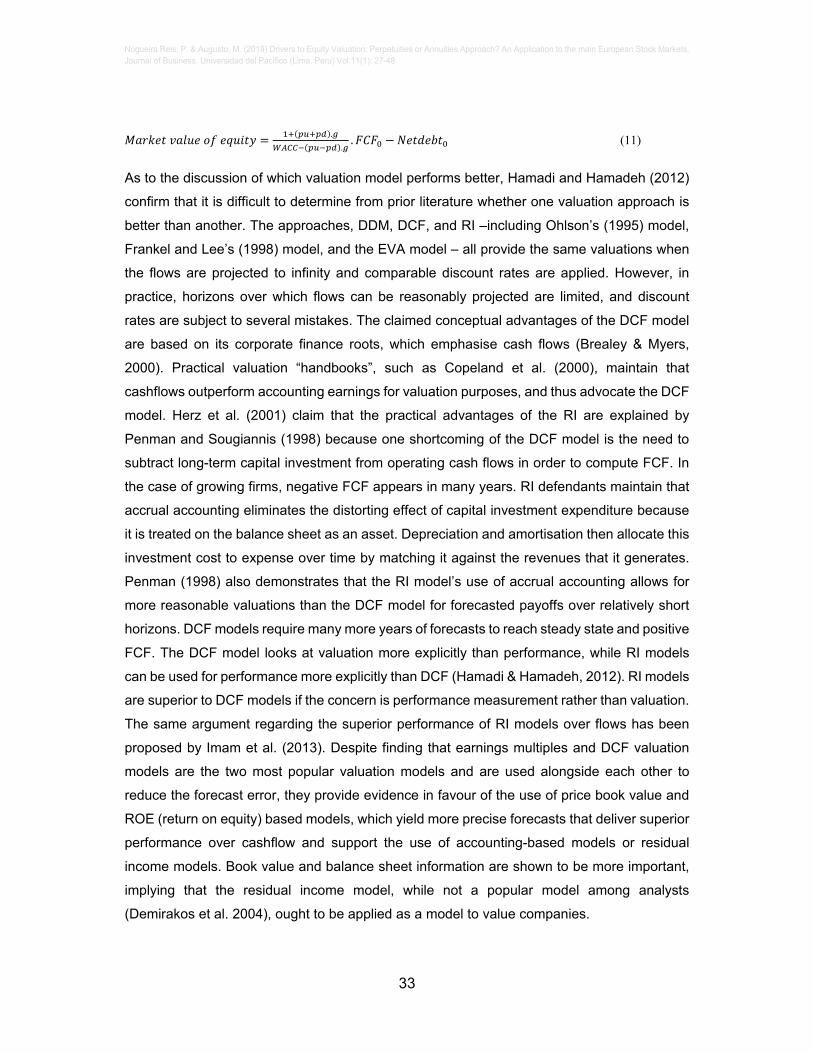
.
.. (11)
As to the discussion of which valuation model performs better, Hamadi and Hamadeh (2012)
confirm that it is difficult to determine from prior literature whether one valuation approach is
better than another. The approaches, DDM, DCF, and RI –including Ohlson’s (1995) model,
Frankel and Lee’s (1998) model, and the EVA model – all provide the same valuations when
the flows are projected to infinity and comparable discount rates are applied. However, in
practice, horizons over which flows can be reasonably projected are limited, and discount
rates are subject to several mistakes. The claimed conceptual advantages of the DCF model
are based on its corporate finance roots, which emphasise cash flows (Brealey & Myers,
2000). Practical valuation “handbooks”, such as Copeland et al. (2000), maintain that
cashflows outperform accounting earnings for valuation purposes, and thus advocate the DCF
model. Herz et al. (2001) claim that the practical advantages of the RI are explained by
Penman and Sougiannis (1998) because one shortcoming of the DCF model is the need to
subtract long-term capital investment from operating cash flows in order to compute FCF. In
the case of growing firms, negative FCF appears in many years. RI defendants maintain that
accrual accounting eliminates the distorting effect of capital investment expenditure because
it is treated on the balance sheet as an asset. Depreciation and amortisation then allocate this
investment cost to expense over time by matching it against the revenues that it generates.
Penman (1998) also demonstrates that the RI model’s use of accrual accounting allows for
more reasonable valuations than the DCF model for forecasted payoffs over relatively short
horizons. DCF models require many more years of forecasts to reach steady state and positive
FCF. The DCF model looks at valuation more explicitly than performance, while RI models
can be used for performance more explicitly than DCF (Hamadi & Hamadeh, 2012). RI models
are superior to DCF models if the concern is performance measurement rather than valuation.
The same argument regarding the superior performance of RI models over flows has been
proposed by Imam et al. (2013). Despite finding that earnings multiples and DCF valuation
models are the two most popular valuation models and are used alongside each other to
reduce the forecast error, they provide evidence in favour of the use of price book value and
ROE (return on equity) based models, which yield more precise forecasts that deliver superior
performance over cashflow and support the use of accounting-based models or residual
income models. Book value and balance sheet information are shown to be more important,
implying that the residual income model, while not a popular model among analysts
(Demirakos et al. 2004), ought to be applied as a model to value companies.
Nogueira Reis, P. & Augusto, M. (2019) Drivers to Equity Valuation: Perpetuities or Annuities Approach? An Application to the main European Stock Markets. Journal of Business, Universidad del Pacífico (Lima, Peru) Vol.11(1): 27-48
34
One of the main drivers of valuation models is the discount rate, which values the risk
associated with flows or payoffs. The tension between expected payoffs and their risk is at the
core of valuation (Penman, 2011). Risk associated with flows or earnings is incorporated in
the discount rate and growth rate for the future and is very difficult to estimate. The discount
and growth rates are closely related, as the risk that determines the discount rate is due to the
uncertainty about growth (Penman, 2011). The discount rate uses the cost of equity for risk,
usually derived from the well-known capital asset pricing model (CAPM). However, problems
have been studied and reported in academia; namely, the incorrect assumption that returns
follow the bell-shaped normal distribution whereas current practice has shown that actual
distributions have “fat tails”. Betas are estimated ex-ante but should be a prediction. In periods
of strong crises, all assets move together and thus diversification fails to prevent risk.
Furthermore, estimating the market risk premium is a very theoretical task (Penman, 2011).
Considering CAPM, Garcia et al. (2010) indicate that several adjustments to the CAPM have
been suggested by academics and practitioners, based mainly on modifying the discount rate
to deal with country risk for valuation of companies in emerging markets. This procedure is
wrong according to the authors, considering that the only risk is the non-diversifiable risk, and
adding country risk, which could be diversifiable, is a mistake. They propose a more precise
estimation of cashflows rather than adjustments of the discount rate. Arbitrage pricing theory
(APT), an alternative to attaining cost of equity as a discount rate, is a multifactor asset pricing
model that has more risk factors for the market portfolio. Meanwhile, estimation of additional
betas for the supplementary risk exposures along with risk premiums are required, and
presumably are time varying.
Penman (2011) proposes that the cost of capital from the asset pricing models introduces
uncertainty to the valuation, exacerbating risk and uncertainty. The author provides a set of
returns associated with alternative growth outcomes demonstrating to investors uncertain
about growth that they should be careful about the risk of paying excessively for growth.
Penman (2011) calculates the cost of equity not as a required rate of return but an internal
rate of return for a given forecast of forward earnings and growth.
Many questions have been raised about Gordon and Shapiro’s (1956) approach, mainly with
regard to its inability to cope with inflation. For instance, Bradley and Jarrell (2008) derived a
valuation model that explicitly incorporates replacement investments. The authors concluded
that the Gordon-Shapiro value driver model (VDM) produces biased results in the presence of
inflation, and these conclusions are underlined by Ritter and Warr (2002). On the opposite
side, others, such as Friedl and Schwetzler (2011) and O’Hanlon and Peasnell (2004), stand
up for the model even in the presence of inflation. Meitner (2013) indicates that the Gordon-
Nogueira Reis, P. & Augusto, M. (2019) Drivers to Equity Valuation: Perpetuities or Annuities Approach? An Application to the main European Stock Markets. Journal of Business, Universidad del Pacífico (Lima, Peru) Vol.11(1): 27-48
35
Shapiro constant dividend growth formula, also known as the VDM, has some severe
deficiencies that affect its applicability to valuation. The author argues that the VDM requires
an idealized academic environment with no historical inflation volatility, historical corporate
investment activity, and a single depreciation method applied for all assets, criteria that
according to Meitner (2013), are not met in real life. Meitner contends that the fault lies in the
VDM’s reliance on book rates of return rather than on economic rates of return, as well as the
model’s inability to deal properly with assets with infinite life, such as goodwill or land. The
work of Meitner (2013) underlines the limits of the role of accounting in equity valuation.
Considering the errors in valuation when using DCF models, Green et al. (2016) indicate that
analysts make a median of three theory-related and/or execution errors and four questionable
economic judgments per DCF. After correcting these major errors, the authors conclude on a
change in the analysts’ mean valuations and target prices of between -2 and +14 % per error.
According to the authors, analysts misunderstand certain aspects of how to value equity,
applying errors about future interest rates, future in-perpetuity revenue, and FCF growth rates,
as well as errors related with expected rates of return. They show that the outcome of those
errors is potentially biased price targets for the shares covered.
When relating cash flow risk in younger and older companies. Chi et al. (2017) propose that
positive cash flow volatility measured by Tobin’s Q varies with firm size and investment
opportunities, but the correlation across market segments decreases risk (cash flow volatility)
because of the diversification effect of investing in more market segments. As a firm invests
in its growth opportunities, book value increases, getting closer to its market value, reducing
the multiple price to book value valuation, or Tobin’s Q. Younger and smaller firms have
greater performance volatility and a higher firm valuation. Chi et al. (2017), using a theoretical
model show that as a firm grows older and larger, both its cash flow volatility and Tobin’s Q
decrease. They state that the positive association between cash flow volatility and Tobin’s Q
is more pronounced for firms that are young (small), have greater growth opportunities, and
have higher cash-flow correlation across segments.
Negative book value and market value have also been addressed when studying firm value;
the findings of Jan & Ou (2011) show that market prices in negative-book-value firms are
higher than in positive-book-value firms, and the correlation between market value and book
value for negative-book-value firms is negative. Their results indicate that R&D accumulated
over time contributes to the increasing trend of negative-book-value occurrences, but also
plays an important role in the market valuation of firms that simultaneously report negative
earnings and negative book value.
Nogueira Reis, P. & Augusto, M. (2019) Drivers to Equity Valuation: Perpetuities or Annuities Approach? An Application to the main European Stock Markets. Journal of Business, Universidad del Pacífico (Lima, Peru) Vol.11(1): 27-48
36
None of the valuation models presented take into consideration market discounts value for
firms that engage in related parties’ transactions. Kohlbeck & Mayhew (2010) suggest that
related-party firms have significantly lower valuations and marginally lower subsequent returns
than non-related-party firms. In addition, the models do not include any liquidity discount,
control stake discount, and often do not consider any non-operating assets that can bring
value and cash to the company, or any long-term financial assets, which should be valued
separately and treated and valued as a single asset. Enterprise value obtained from DCF
using FCF should be deducted by net debt, which represents long- and short-term interest-
bearing debt, including leases, bank facilities, or any government debt to be repaid and
pension funds liabilities, deducted for available cash over working capital needs and short-
term securities.
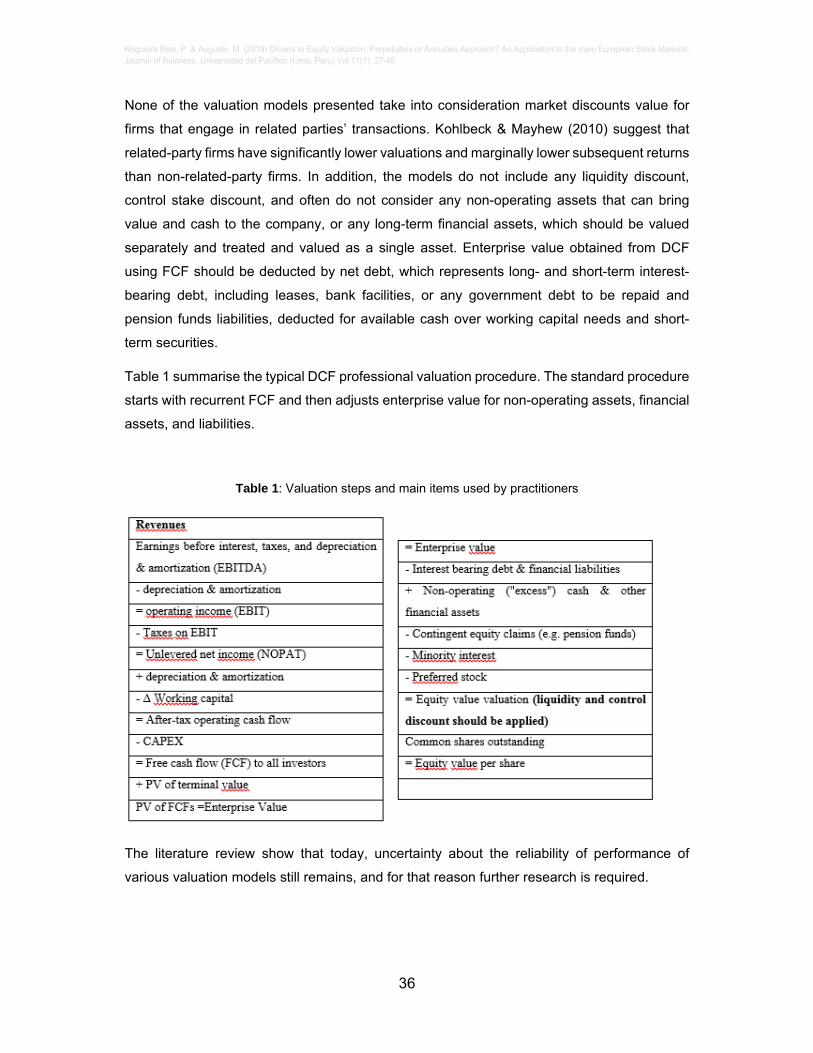
Table 1 summarise the typical DCF professional valuation procedure. The standard procedure
starts with recurrent FCF and then adjusts enterprise value for non-operating assets, financial
assets, and liabilities.
Table 1: Valuation steps and main items used by practitioners
The literature review show that today, uncertainty about the reliability of performance of
various valuation models still remains, and for that reason further research is required.
Nogueira Reis, P. & Augusto, M. (2019) Drivers to Equity Valuation: Perpetuities or Annuities Approach? An Application to the main European Stock Markets. Journal of Business, Universidad del Pacífico (Lima, Peru) Vol.11(1): 27-48
37
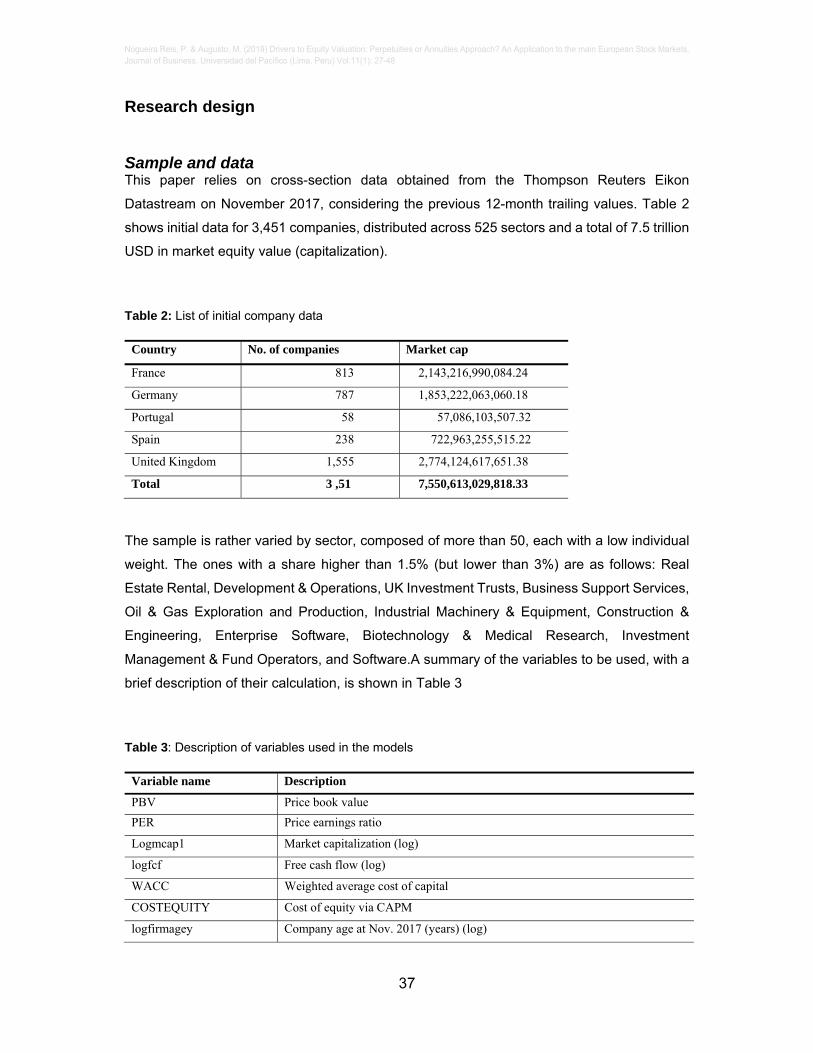
Research design Sample and data This paper relies on cross-section data obtained from the Thompson Reuters Eikon
Datastream on November 2017, considering the previous 12-month trailing values. Table 2
shows initial data for 3,451 companies, distributed across 525 sectors and a total of 7.5 trillion
USD in market equity value (capitalization).
Table 2: List of initial company data
Country No. of companies Market cap
France 813 2,143,216,990,084.24
Germany 787 1,853,222,063,060.18
Portugal 58 57,086,103,507.32
Spain 238 722,963,255,515.22
United Kingdom 1,555 2,774,124,617,651.38
Total 3 ,51 7,550,613,029,818.33
The sample is rather varied by sector, composed of more than 50, each with a low individual
weight. The ones with a share higher than 1.5% (but lower than 3%) are as follows: Real
Estate Rental, Development & Operations, UK Investment Trusts, Business Support Services,
Oil & Gas Exploration and Production, Industrial Machinery & Equipment, Construction &
Engineering, Enterprise Software, Biotechnology & Medical Research, Investment
Management & Fund Operators, and Software.A summary of the variables to be used, with a
brief description of their calculation, is shown in Table 3
Table 3: Description of variables used in the models
Variable name Description
PBV Price book value
PER Price earnings ratio
Logmcap1 Market capitalization (log)
logfcf Free cash flow (log)
WACC Weighted average cost of capital
COSTEQUITY Cost of equity via CAPM
logfirmagey Company age at Nov. 2017 (years) (log)
Nogueira Reis, P. & Augusto, M. (2019) Drivers to Equity Valuation: Perpetuities or Annuities Approach? An Application to the main European Stock Markets. Journal of Business, Universidad del Pacífico (Lima, Peru) Vol.11(1): 27-48
38
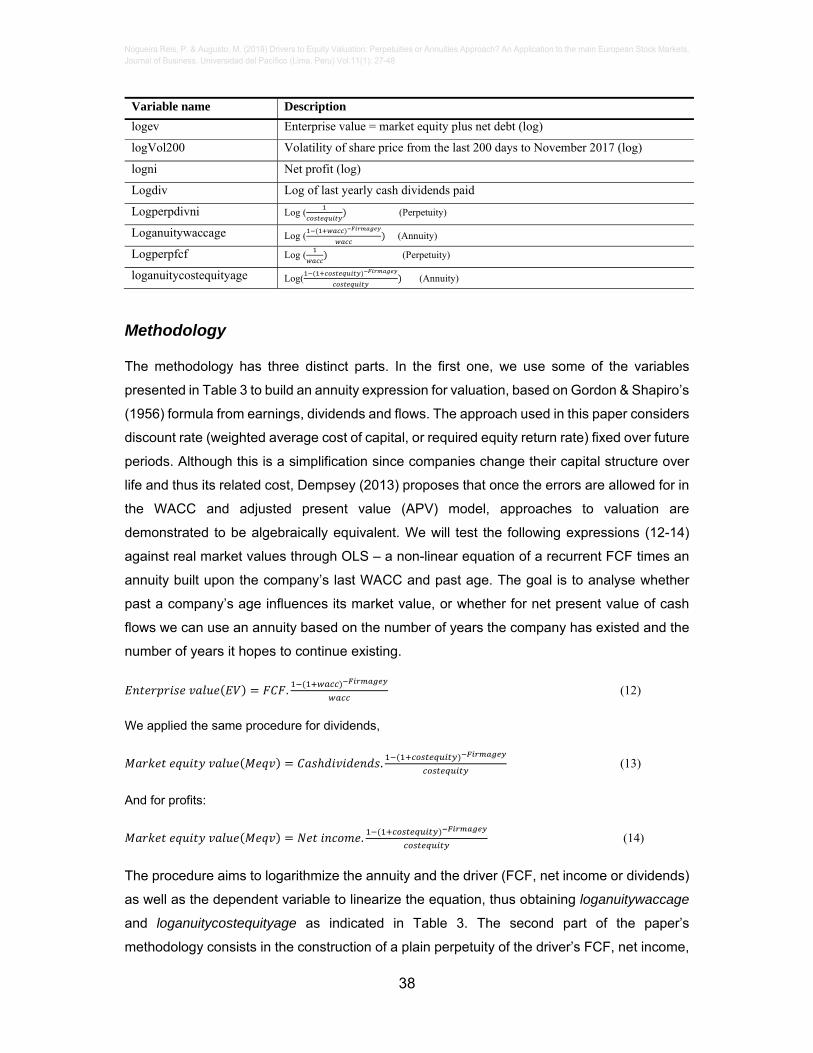
Variable name Description
logev Enterprise value = market equity plus net debt (log)
logVol200 Volatility of share price from the last 200 days to November 2017 (log)
logni Net profit (log)
Logdiv Log of last yearly cash dividends paid
Logperpdivni Log ( (Perpetuity)
Loganuitywaccage Log ( (Annuity)
Logperpfcf Log ( (Perpetuity)
loganuitycostequityage Log( (Annuity)
Methodology The methodology has three distinct parts. In the first one, we use some of the variables
presented in Table 3 to build an annuity expression for valuation, based on Gordon & Shapiro’s
(1956) formula from earnings, dividends and flows. The approach used in this paper considers
discount rate (weighted average cost of capital, or required equity return rate) fixed over future
periods. Although this is a simplification since companies change their capital structure over
life and thus its related cost, Dempsey (2013) proposes that once the errors are allowed for in
the WACC and adjusted present value (APV) model, approaches to valuation are
demonstrated to be algebraically equivalent. We will test the following expressions (12-14)
against real market values through OLS – a non-linear equation of a recurrent FCF times an
annuity built upon the company’s last WACC and past age. The goal is to analyse whether
past a company’s age influences its market value, or whether for net present value of cash
flows we can use an annuity based on the number of years the company has existed and the
number of years it hopes to continue existing.
. (12)
We applied the same procedure for dividends,
. (13)
And for profits:
. (14)
The procedure aims to logarithmize the annuity and the driver (FCF, net income or dividends)
as well as the dependent variable to linearize the equation, thus obtaining loganuitywaccage
and loganuitycostequityage as indicated in Table 3. The second part of the paper’s
methodology consists in the construction of a plain perpetuity of the driver’s FCF, net income,
Nogueira Reis, P. & Augusto, M. (2019) Drivers to Equity Valuation: Perpetuities or Annuities Approach? An Application to the main European Stock Markets. Journal of Business, Universidad del Pacífico (Lima, Peru) Vol.11(1): 27-48
39
and dividends due with the respective discount rate. Considering the non-linearity of the
expression (15), again, the log was applied to the driver and to the simple perpetuity, obtaining
logperpdivni and logperpfcf built as indicated in Table 3. OLS is used in log variables to force
the “noconstant”1 option, to find real parameters.
The objective allows us to test whether the relationships expressed through mathematical
approaches that are used in valuation were applied in real scenarios, and, if so, what the
differences are with respect to real values.
As an example, for FCF:
. (15)
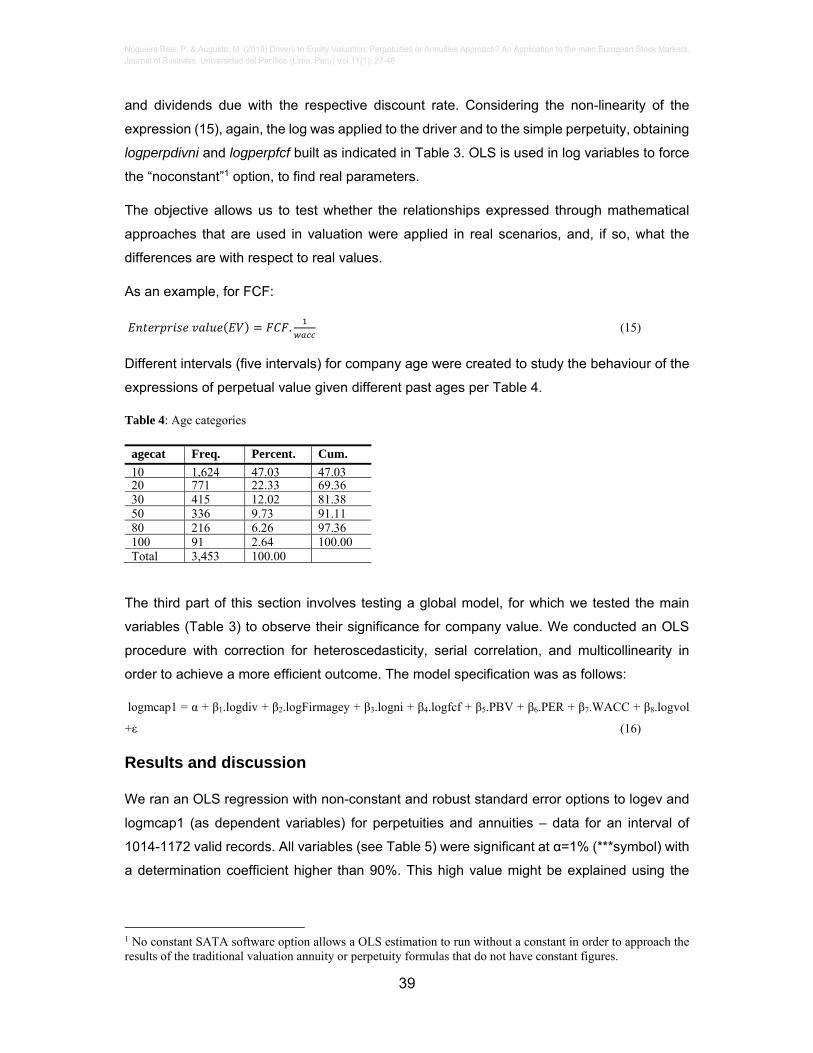
Different intervals (five intervals) for company age were created to study the behaviour of the
expressions of perpetual value given different past ages per Table 4.
Table 4: Age categories
agecat Freq. Percent. Cum.
10 1,624 47.03 47.0320 771 22.33 69.3630 415 12.02 81.3850 336 9.73 91.1180 216 6.26 97.36100 91 2.64 100.00Total 3,453 100.00
The third part of this section involves testing a global model, for which we tested the main
variables (Table 3) to observe their significance for company value. We conducted an OLS
procedure with correction for heteroscedasticity, serial correlation, and multicollinearity in
order to achieve a more efficient outcome. The model specification was as follows:
logmcap1 = α + β1.logdiv + β2.logFirmagey + β3.logni + β4.logfcf + β5.PBV + β6.PER + β7.WACC + β8.logvol
+ε (16)
Results and discussion
We ran an OLS regression with non-constant and robust standard error options to logev and
logmcap1 (as dependent variables) for perpetuities and annuities – data for an interval of
1014-1172 valid records. All variables (see Table 5) were significant at α=1% (***symbol) with
a determination coefficient higher than 90%. This high value might be explained using the
1 No constant SATA software option allows a OLS estimation to run without a constant in order to approach the results of the traditional valuation annuity or perpetuity formulas that do not have constant figures.
Nogueira Reis, P. & Augusto, M. (2019) Drivers to Equity Valuation: Perpetuities or Annuities Approach? An Application to the main European Stock Markets. Journal of Business, Universidad del Pacífico (Lima, Peru) Vol.11(1): 27-48
40
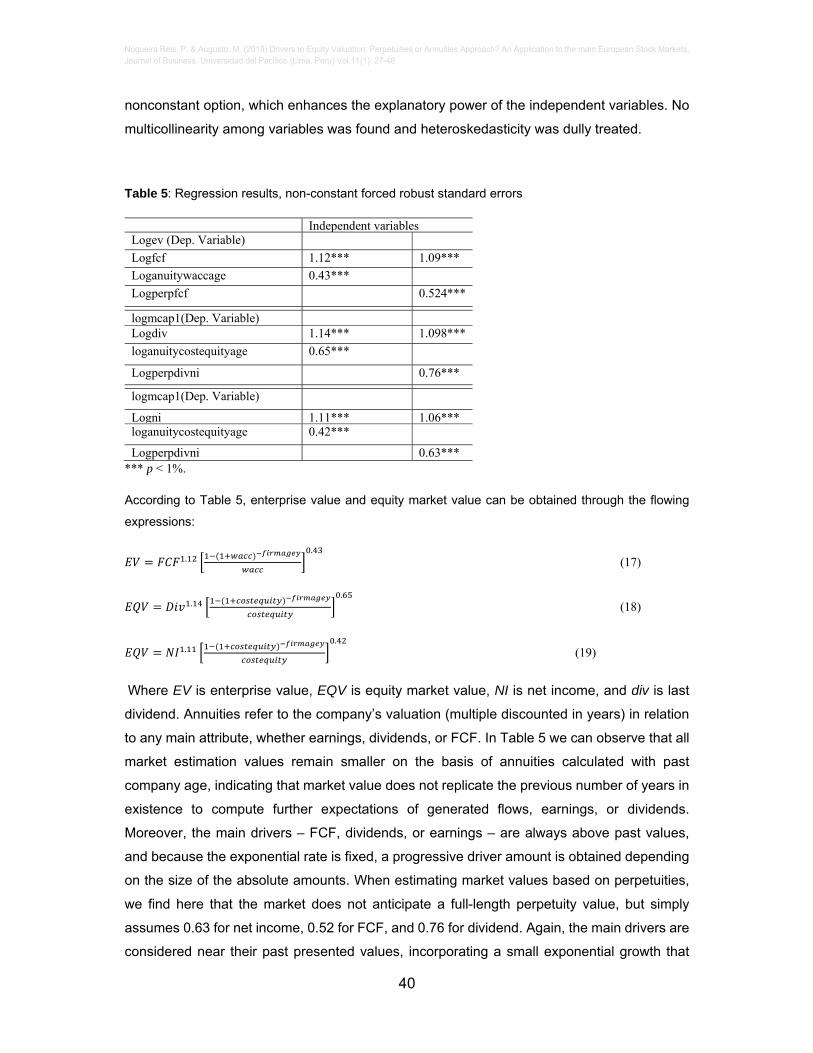
nonconstant option, which enhances the explanatory power of the independent variables. No
multicollinearity among variables was found and heteroskedasticity was dully treated.
Table 5: Regression results, non-constant forced robust standard errors
Independent variablesLogev (Dep. Variable)
Logfcf 1.12*** 1.09***
Loganuitywaccage 0.43***
Logperpfcf 0.524***
logmcap1(Dep. Variable)
Logdiv 1.14*** 1.098***
loganuitycostequityage 0.65***
Logperpdivni 0.76***
logmcap1(Dep. Variable)
Logni 1.11*** 1.06***loganuitycostequityage 0.42***
Logperpdivni 0.63*** *** p < 1%.
According to Table 5, enterprise value and equity market value can be obtained through the flowing
expressions:
..
(17)
..
(18)
..
(19)
Where EV is enterprise value, EQV is equity market value, NI is net income, and div is last
dividend. Annuities refer to the company’s valuation (multiple discounted in years) in relation
to any main attribute, whether earnings, dividends, or FCF. In Table 5 we can observe that all
market estimation values remain smaller on the basis of annuities calculated with past
company age, indicating that market value does not replicate the previous number of years in
existence to compute further expectations of generated flows, earnings, or dividends.
Moreover, the main drivers – FCF, dividends, or earnings – are always above past values,
and because the exponential rate is fixed, a progressive driver amount is obtained depending
on the size of the absolute amounts. When estimating market values based on perpetuities,
we find here that the market does not anticipate a full-length perpetuity value, but simply
assumes 0.63 for net income, 0.52 for FCF, and 0.76 for dividend. Again, the main drivers are
considered near their past presented values, incorporating a small exponential growth that
Nogueira Reis, P. & Augusto, M. (2019) Drivers to Equity Valuation: Perpetuities or Annuities Approach? An Application to the main European Stock Markets. Journal of Business, Universidad del Pacífico (Lima, Peru) Vol.11(1): 27-48
41
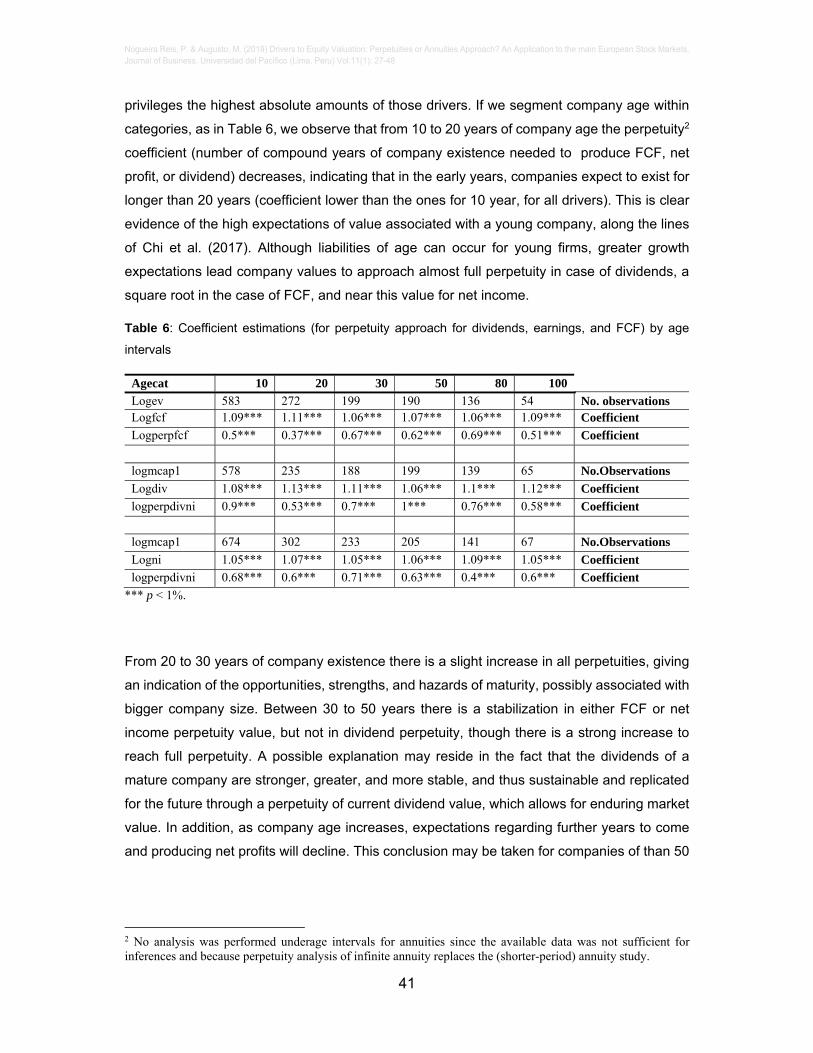
privileges the highest absolute amounts of those drivers. If we segment company age within
categories, as in Table 6, we observe that from 10 to 20 years of company age the perpetuity2
coefficient (number of compound years of company existence needed to produce FCF, net
profit, or dividend) decreases, indicating that in the early years, companies expect to exist for
longer than 20 years (coefficient lower than the ones for 10 year, for all drivers). This is clear
evidence of the high expectations of value associated with a young company, along the lines
of Chi et al. (2017). Although liabilities of age can occur for young firms, greater growth
expectations lead company values to approach almost full perpetuity in case of dividends, a
square root in the case of FCF, and near this value for net income.
Table 6: Coefficient estimations (for perpetuity approach for dividends, earnings, and FCF) by age
intervals
Agecat 10 20 30 50 80 100
Logev 583 272 199 190 136 54 No. observations Logfcf 1.09*** 1.11*** 1.06*** 1.07*** 1.06*** 1.09*** Coefficient
Logperpfcf 0.5*** 0.37*** 0.67*** 0.62*** 0.69*** 0.51*** Coefficient
logmcap1 578 235 188 199 139 65 No.Observations
Logdiv 1.08*** 1.13*** 1.11*** 1.06*** 1.1*** 1.12*** Coefficient
logperpdivni 0.9*** 0.53*** 0.7*** 1*** 0.76*** 0.58*** Coefficient
logmcap1 674 302 233 205 141 67 No.Observations
Logni 1.05*** 1.07*** 1.05*** 1.06*** 1.09*** 1.05*** Coefficient
logperpdivni 0.68*** 0.6*** 0.71*** 0.63*** 0.4*** 0.6*** Coefficient
*** p < 1%.
From 20 to 30 years of company existence there is a slight increase in all perpetuities, giving
an indication of the opportunities, strengths, and hazards of maturity, possibly associated with
bigger company size. Between 30 to 50 years there is a stabilization in either FCF or net
income perpetuity value, but not in dividend perpetuity, though there is a strong increase to
reach full perpetuity. A possible explanation may reside in the fact that the dividends of a
mature company are stronger, greater, and more stable, and thus sustainable and replicated
for the future through a perpetuity of current dividend value, which allows for enduring market
value. In addition, as company age increases, expectations regarding further years to come
and producing net profits will decline. This conclusion may be taken for companies of than 50
2 No analysis was performed underage intervals for annuities since the available data was not sufficient for inferences and because perpetuity analysis of infinite annuity replaces the (shorter-period) annuity study.
Nogueira Reis, P. & Augusto, M. (2019) Drivers to Equity Valuation: Perpetuities or Annuities Approach? An Application to the main European Stock Markets. Journal of Business, Universidad del Pacífico (Lima, Peru) Vol.11(1): 27-48
42
years of age whereby the perpetuities for all drivers fall sharply, as their valuation does not
support perpetuities considering the years these companies have already existed.
The market does not value companies in full perpetuity, with the exception of companies
between 30 to 50 years of age in the case of dividends. Nevertheless, in the early years of
existence it seems that all drivers give a partial perpetuity valuation that decreases up to 20
years. Companies with aged between 10 and 20 years are valued at a rather low proportion
of a perpetuity. The market does not anticipate a longer generation of flows, results, or
dividends. However, after that age, perpetuities behave differently: the dividend reaches its
peak and decrease through to 100 years, whereas the other two drivers perform similarly,
remaining in a perpetuity coefficient range of between 0.4 and 0.7.
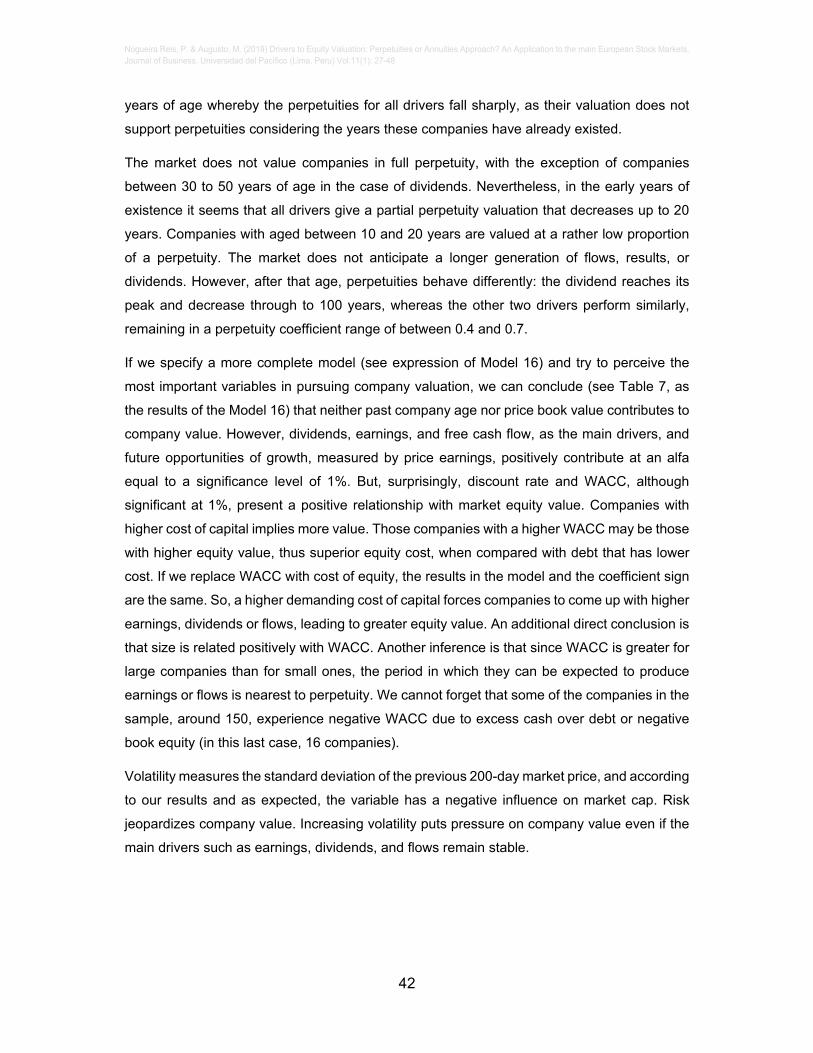
If we specify a more complete model (see expression of Model 16) and try to perceive the
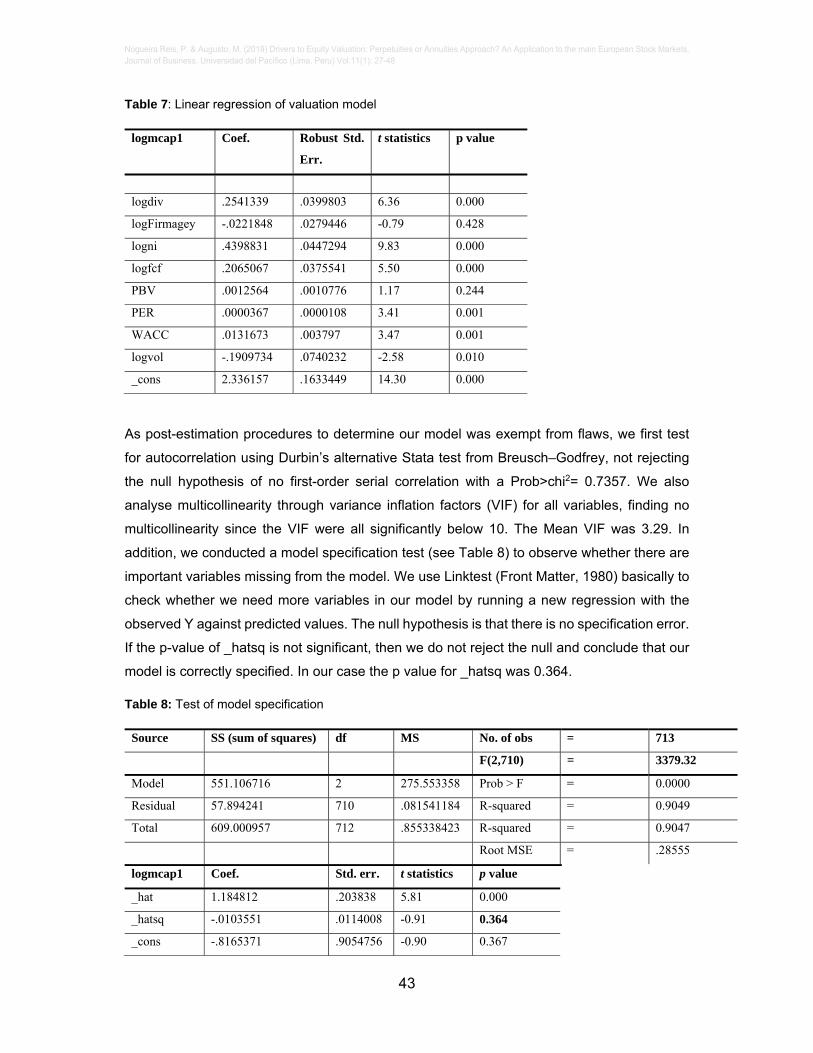
most important variables in pursuing company valuation, we can conclude (see Table 7, as
the results of the Model 16) that neither past company age nor price book value contributes to
company value. However, dividends, earnings, and free cash flow, as the main drivers, and
future opportunities of growth, measured by price earnings, positively contribute at an alfa
equal to a significance level of 1%. But, surprisingly, discount rate and WACC, although
significant at 1%, present a positive relationship with market equity value. Companies with
higher cost of capital implies more value. Those companies with a higher WACC may be those
with higher equity value, thus superior equity cost, when compared with debt that has lower
cost. If we replace WACC with cost of equity, the results in the model and the coefficient sign
are the same. So, a higher demanding cost of capital forces companies to come up with higher
earnings, dividends or flows, leading to greater equity value. An additional direct conclusion is
that size is related positively with WACC. Another inference is that since WACC is greater for
large companies than for small ones, the period in which they can be expected to produce
earnings or flows is nearest to perpetuity. We cannot forget that some of the companies in the
sample, around 150, experience negative WACC due to excess cash over debt or negative
book equity (in this last case, 16 companies).
Volatility measures the standard deviation of the previous 200-day market price, and according
to our results and as expected, the variable has a negative influence on market cap. Risk
jeopardizes company value. Increasing volatility puts pressure on company value even if the
main drivers such as earnings, dividends, and flows remain stable.
Nogueira Reis, P. & Augusto, M. (2019) Drivers to Equity Valuation: Perpetuities or Annuities Approach? An Application to the main European Stock Markets. Journal of Business, Universidad del Pacífico (Lima, Peru) Vol.11(1): 27-48
43
Table 7: Linear regression of valuation model
logmcap1 Coef. Robust Std.
Err.
t statistics p value
logdiv .2541339 .0399803 6.36 0.000
logFirmagey -.0221848 .0279446 -0.79 0.428
logni .4398831 .0447294 9.83 0.000
logfcf .2065067 .0375541 5.50 0.000
PBV .0012564 .0010776 1.17 0.244
PER .0000367 .0000108 3.41 0.001
WACC .0131673 .003797 3.47 0.001
logvol -.1909734 .0740232 -2.58 0.010
_cons 2.336157 .1633449 14.30 0.000
As post-estimation procedures to determine our model was exempt from flaws, we first test
for autocorrelation using Durbin’s alternative Stata test from Breusch–Godfrey, not rejecting
the null hypothesis of no first-order serial correlation with a Prob>chi2= 0.7357. We also
analyse multicollinearity through variance inflation factors (VIF) for all variables, finding no
multicollinearity since the VIF were all significantly below 10. The Mean VIF was 3.29. In
addition, we conducted a model specification test (see Table 8) to observe whether there are
important variables missing from the model. We use Linktest (Front Matter, 1980) basically to
check whether we need more variables in our model by running a new regression with the
observed Y against predicted values. The null hypothesis is that there is no specification error.
If the p-value of _hatsq is not significant, then we do not reject the null and conclude that our
model is correctly specified. In our case the p value for _hatsq was 0.364.
Table 8: Test of model specification
Source SS (sum of squares) df MS No. of obs = 713
F(2,710) = 3379.32
Model 551.106716 2 275.553358 Prob > F = 0.0000
Residual 57.894241 710 .081541184 R-squared = 0.9049
Total 609.000957 712 .855338423 R-squared = 0.9047
Root MSE = .28555
logmcap1 Coef. Std. err. t statistics p value
_hat 1.184812 .203838 5.81 0.000
_hatsq -.0103551 .0114008 -0.91 0.364
_cons -.8165371 .9054756 -0.90 0.367
Nogueira Reis, P. & Augusto, M. (2019) Drivers to Equity Valuation: Perpetuities or Annuities Approach? An Application to the main European Stock Markets. Journal of Business, Universidad del Pacífico (Lima, Peru) Vol.11(1): 27-48
44
Conclusions
Traditional variables commonly considered for evaluation by academics and professionals, such as dividends, flows and earnings, are confirmed to be the most important for inducing company value. Also, cost of capital is a driver that pushes value further, as it is positively correlated with company value. As the WACC method always uses market values of debt and equity to determine weights, potential errors may occur with this computation (Mitra, 2011). WACC is a cost but also a demand rate. Fernandez (2010) argues that WACC is neither a cost nor a required return: it is a weighted average of a cost and a required return. According to the author, referring to WACC as the “cost of capital” may be misleading because it is not a cost. In the present paper we compute WACC using the traditional formula, whereas a high percentage equity market value related to its enterprise value presents a higher cost of equity and thus a bigger average cost of capital. So, it is not uncommon for reduced leveraged companies to show a higher equity cost and greater equity value. It should be recalled that this paper uses the latest available historical WACC cost and not a prospective one, as well as a single WACC rate per company, regardless of the fact of several divisions and thus several WACC coexisting within a company (see Krüger et al., 2015). If future WACC tend to increase, the traditional view, that actual equity market value will be reduced through a higher discount rate, still holds. For our sample, in a cross-section view, larger WACC is associated positively with bigger company market caps. Risk, measured by volatility, reduces company value. Hussainey et al. (2015) also conclude that dividend yield, a value risk measure, was found to be negatively related to share price volatility. Allayannis and Weston (2003) have previously showed empirical evidence that cash flow volatility is negatively valued by investors. Huang (2009) states that historical cashflow volatility is negatively related to future returns cross-sectionally, and thus jeopardizes company value. After controlling for systematic risk, Mitra (2016) finds that higher earning quality is associated with lower company-specific return volatility.
Company past age does not appear to be significant in explaining company value in our cross-section data. Despite the studies of Reis and Augusto (2013, 2014a, 2014b), which negatively relate company age with value using panel data, past age does not seem to influence the annuity value-driver formulas to appraise company equity market value. Coad et al. (2015) find that age influences performance, and thus greater value is achieved through intermediating mechanisms such as routinization, accumulated reputation, and organizational rigidity. The authors of this paper found a positive connection between PER and market cap. PER is a future expectation of growth ratio. Firms with a greater PER are related to greater value. Mathilda (2012) has found that PER has a negative influence, while PBV has no effect on stock returns, and nor do PER and PBV simultaneously. Jatmiko (2015) states that none of these variables are statistically proven to have a relationship with the return (and consequently value). These analyses are based on panel data that are different to that applied in this paper, in which we use a cross section data sample. Similar to our results Ou and Sepe (2002) find that analysts' forecast-based measure of “earnings persistence” dominates historical earnings variance in explaining cross-sectional variations in the value-relevance of future earnings, and in this sense PER ratio. Arslan and Zaman (2014) also underline our results even in the presence of a panel data approach, indicating that their study reveals that the price earnings ratio has a significant positive impact on stock prices (market cap). An identical conclusion was reached by Bhargava and Malhotra (2006), who concluded that an increase in the price-earnings ratio brings an increase in stock prices. Fernandez (2013) contends that PER depends on the variations in interest rates beyond the control of the company and other factors inherent to the company such as risk, growth, and the return on its investments. The author observes that PER increases, ceteris paribus, if interest rates fall; and if a company’s risk decreases, then net profit increases.
This paper addresses the practical application of annuities or perpetuities in valuation models. Our conclusion is that annuities that use FCF, dividends, or earnings based on past company
Nogueira Reis, P. & Augusto, M. (2019) Drivers to Equity Valuation: Perpetuities or Annuities Approach? An Application to the main European Stock Markets. Journal of Business, Universidad del Pacífico (Lima, Peru) Vol.11(1): 27-48
45
age as an expectation of future duration, does not imply that actual market value discounts a full number of years for which a company has already existed. In fact, past company existence is not a good indicator for future company existence, as also verified in our full model (see Table 7). Applying a perpetuity over FCF, earnings, or dividends driver discounted by the respective required rate of return does not seem to be the best way, as the model shows, as market company value does not support a complete full-time perpetuity but instead partial perpetuities (longer annuities). If we break up age into different intervals, additional features can be derived from the analysis. Basically, a perpetuity or annuity is the discounted years (as a duration) that needs to be applied to a driver in order to obtain the market value. But what appears to be a pattern is the fact that in the interval up to 50 years of company age, the full perpetuity is reached for the dividend, showing the maturity of the companies and a stable predicted flow as the dividend. The market values companies with long maturity, relying on stable dividends. Conversely, neither earnings nor free cash flow contributes to a full perpetuity company valuation in either frame age. Instead, the coefficient ranges from 0.4 to 0.6, approximately. During a company’s early existence (up to ten years), we find that valuations are greater, although far from the full perpetuity that Chi et al. (2017) detect. So, the non-constant method of applying full perpetuities for valuation, or even perpetual with growth valuation – used as a terminal value in most valuation models – does not seem consistent with market values since no market value appears to be near full perpetuity, unless in the aforementioned case of dividends in a 50-year mature stage. Thus, the results for dividends are in keeping with the Gordon-Shapiro formula, in terms of the proxy to obtain a more accurate market value for mature companies in the range of 30 to 50 years of age. Our results confirm those of the defenders of the value driver formula, Friedl and Schwetzler (2011) and O’Hanlon and Peasnell (2004), and go against the conclusions of Bradley and Jarrell (2008), and Ritter and Warr (2002).
This paper also confirms that the three most important approaches to the DCF, DDM and earnings valuation model, should not apply perpetuities but in its place annuities, but not related with past age.
References
Allayannis, G., & Weston, J. P. (2003). Earnings volatility, cash flow volatility, and firm value. Working Paper, University of Virginia, Charlottesville, VA, 22906(September). https://doi.org/10.1.1.200.7766
Arnold, T. O. M., & North, D. S. (2011). Long-Run Business Cycles, 86–96.
Arslan, M., & Zaman, R. (2014). Impact of Dividend Yield and Price Earnings Ratio on Stock Returns: A Study Non-Financial listed Firms of Pakistan. Research Journal of Finance and Accounting, 5(19), 2222–2847.
Ballestra, L. V., Pacelli, G., & Radi, D. (2018). Valuing investment projects under interest rate risk : empirical evidence from European firms. Applied Economics, 49(56), 5662–5672.
Bancel, F., & Mittoo, U. R. (2014). The Gap between Theory and Practice of Firm Valuation : Survey of European Valuation Experts. Journal of Applied Corporate Finance, 26(4), 106–117.
Bhargava, V., & Malhotra, D. K. (2006). Do Price-Earnings Ratios Drive Stock Values? Journal of Portfolio Management, 33(1), 86–92.
Bradley, M., & Jarrell, G. A. (2008). Expected Inflation and the Constant‐Growth Valuation Model. Journal of Applied Corporate Finance, 20(2), 66-78.
Brealey, R. A. & Myers, S. C. (2000). Principles of corporate finance. Irwin/Mcgraw-hill.
Nogueira Reis, P. & Augusto, M. (2019) Drivers to Equity Valuation: Perpetuities or Annuities Approach? An Application to the main European Stock Markets. Journal of Business, Universidad del Pacífico (Lima, Peru) Vol.11(1): 27-48
46
Chi, J. D., Su, X., Chang, S., Coles, J., Durguner, S., Eckbo, B. E., & Harford, J. (2017). The Dynamics of Performance Volatility and Firm Valuation, 52(1), 111–142.
Coad, A., Holm, J. R., Krafft, J., & Quatraro, F. (2015). Firm age and performance. Journal of Evolutionary Economics, 28(1), 1-11.
Koller, T., Goedhart, M., & Wessels, D. (2010). Valuation: measuring and managing the value of companies (Vol. 499). John Wiley and sons.
Copeland, T. E.; Koller, T. & Murrin, J. (2000). Valuation: Measuring and Managing the Value of Companies. Mckinsey company Inc.
Demirakos, E. G., Strong, N. C., & Walker, M. (2004). What valuation models do analysts use? Accounting Horizons, 18(4), 221–240.
Dempsey, M. (2013). Consistent cash flow valuation with tax‐deductible debt: A clarification. European Financial Management, 19(4), 830-836.
Elsner, S. & Krumholz, H. (2013). Corporate valuation using imprecise cost of capital. Journal of Business Economics, 83, 985–1014.
Fernandez, P. (2002). Valuation methods and shareholder value creation. Academic Press.
Fernandez, P. (2010). WACC: Definition, Misconceptions, and Errors. Business Valuation Review, 29(4), 138–144.
Fernandez, P. (2013). Price to Earnings Ratio, Value to Book Ratio and Growth. SSRN Electronic Journal, 27. https://doi.org/10.2139/ssrn.2212373
Foster, G., Kasznik, R., & Sidhu, B. K. (2012). International equity valuation: The relative importance of country and industry factors versus company‐specific financial reporting information. Accounting & Finance, 52(3), 767-814.
Frankel, R., Lee, C. M. C.. (1998). Accounting Valuation, Market Expectations, and Cross-Sectional Stock Returns. Journal of Accounting Economics, 25, 283–319.
Friedl, G., & Schwetzler, B. (2011). Terminal value, accounting numbers and inflation. Journal of Applied Corporate Finance, 23(2), 104–112.
Front Matter. (1980). Journal of the Royal Statistical Society. Series C (Applied Statistics), 29(1). Retrieved from http://www.jstor.org/stable/2346401.
Fuller, R.J. and Hsia, C. (1984). “A simplified common stock valuation model”, Financial Analysts Journal, 40(5), 49-56.
Gordon, M. J., & Shapiro, E. (1956). Capital equipment analysis: the required rate of profit. Management science, 3(1), 102-110.
Green, J., Hand, J. R., & Zhang, X. F. (2016). Errors and questionable judgments in analysts’ DCF models. Review of Accounting Studies, 21(2), 596-632.
Hamadi, H., & Hamadeh, M. (2012). Equity valuation: a comparison between the discounted cash flow models and the residual, 6(2), 104–116.
Herz, H., Iannaconi, T. E., Maines, L. A., Palepu, K., Ryan, S.T., Schipper, K., Schrand, C.M., Skinner, D.J., Vincent, L. (2001). Equity Valuation Models and Measuring Goodwill Impairment, Accounting Horizons,15(2),161-70.
Huang, A. G. (2009). The cross section of cashflow volatility and expected stock returns. Journal of Empirical Finance, 16(3), 409–429.
Nogueira Reis, P. & Augusto, M. (2019) Drivers to Equity Valuation: Perpetuities or Annuities Approach? An Application to the main European Stock Markets. Journal of Business, Universidad del Pacífico (Lima, Peru) Vol.11(1): 27-48
47
Hussainey, K., Oscar Mgbame, C., & Chijoke‐Mgbame, A. M. (2015). Dividend policy and share price volatility. Investment Management and Financial Innovations, 12(1), 57–68.
Imam, S., Chan, J., & Shah, S. Z. A. (2013). Equity valuation models and target price accuracy in Europe: Evidence from equity reports. International Review of Financial Analysis, 28, 9-19.
Jan, C. L., & Ou, J. A. (2011). Negative-book-value firms and their valuation. Accounting horizons, 26(1), 91-110.
Jatmiko, D. P. (2015). The relationship between return, price to earnings ratio, price to book value ratio, size and beta in different data period. Investment Management and Financial Innovations, 12(1), 47–59.
Kohlbeck, M., & Mayhew, B. W. (2010). Valuation of firms that disclose related party transactions. Journal of Accounting and Public Policy, 29(2), 115–137.
Krüger, P., landier, a., & Thesmar, D. (2015). The WACC Fallacy: The Real Effects of Using a Unique Discount Rate. The Journal of Finance, 70(3), 1253–1285.
Mathilda, M. (2012). Pengaruh price earnings ratio dan price to book value terhadap return saham indeks LQ 45. Jurnal Akuntansi, 4(1), 1–21.
Meitner, M. (2013). Multi-period Asset Lifetimes and Accounting-based Equity Valuation: Take Care with Constant-growth Terminal Value Models! Abacus, 49(3), 340–366.
Mitra, R. K. (2016). The association between earnings quality and firm-specific return volatility. Review of Accounting and Finance, 15(3), 294–316.
Mitra, S. K. (2011). Revisiting WACC. Global Journal of Management and Business Research, 11(11), 89–96.
O’hanlon, J., & Peasnell, K. (2004). Residual income valuation: Are inflation adjustments necessary?. Review of Accounting Studies, 9(4), 375-398.
Ohlson, J. A. (1995). Earnings, book values, and dividends in equity valuation. Contemporary accounting research, 11(2), 661-687.
Ou, J. A., & Sepe, J. F. (2002). Analysts earnings forecasts and the roles of earnings and book value in equity valuation. Journal of Business Finance and Accounting, 29(3–4), 287–316.
Penman, S. (2011). Accounting for Risk and Return in Equity Valuation Morgan. Applied Corporate Finance, 23(2), 50–58.
Penman, S. H. (1998). A synthesis of equity valuation techniques and the terminal calculation for the dividend discount model. Review of Accounting Studies, 2(4), 303-323.
Penman, S. H., & Sougiannis, T. (1998). A comparison of dividend, cash flow, and earnings apporaches to equity valuation. Contemporary Accounting Research, 15(3), 343–383.
Reis, P.N. & Augusto, M.G. (2013). Determinants of Terminal Value in the Evaluation of Companies: A Panel Data Approach to the Context of European Companies. International Research Journal of Finance and Economics, 138(117), 9-118.
Reis, P.N. & Augusto, M.G. (2014a). Determinants of Firm Terminal Value: The Perspective of North American and European Financial Analysts. International Business & Economics Research Journal, 4(13), 793-808.
Reis, P.N. & Augusto, M.G. (2014b). What Is a Firm’s Life Expectancy? Empirical Evidence in the Context of Portuguese Companies. Journal of Business Valuation and Economic Loss Analysis, 1(10), 45-55.

Nogueira Reis, P. & Augusto, M. (2019) Drivers to Equity Valuation: Perpetuities or Annuities Approach? An Application to the main European Stock Markets. Journal of Business, Universidad del Pacífico (Lima, Peru) Vol.11(1): 27-48
48
Ritter, J. & Warr, R. (2002). The Decline of Inflation and the Bull Market of 1982–1999, Journal of Financial and Quantitative Analysis, 37(1), 29–61.
Sahoo, S., & Rajib, P. (2013). Comparable company’s P/E multiple and IPO valuation: an empirical investigation for Indian IPOs. Decision, 40(1-2), 27-46.
Related Documents