Ciencias Marinas (2010), 36(2): 147–159 147 C M INTRODUCTION Mangroves are found worldwide in protected sites such as bays and coastal lagoons, as well as in low energy locations exposed to the open sea, where they form a well-defined fringe of vegetation along the coasts in tropical and subtro- pical regions (Lugo and Snedaker 1974, Trejo-Torres et al. INTRODUCCIÓN Los manglares se encuentran alrededor del mundo en sitios protegidos como bahías y lagunas costeras, así como en sitios de baja energía expuestos a mar abierto, donde forman una franja de vegetación bien definida a lo largo de las costas de las regiones tropicales y subtropicales (Lugo y Snedaker Drivers of mangrove deforestation in Mahahual-Xcalak, Quintana Roo, southeast Mexico Agentes de deforestación de manglar en Mahahual-Xcalak, Quintana Roo, sureste de México M Hirales-Cota 1 * a , J Espinoza-Avalos 1 , B Schmook 1 , A Ruiz-Luna 2 , R Ramos-Reyes 3 1 El Colegio de la Frontera Sur, Unidad Chetumal, Avenida Centenario km 5.5, Colonia Pacto Obrero, Chetumal, CP 77014, Quintana Roo, México. * E-mail: [email protected] 2 Centro de Investigación en Alimentación y Desarrollo A.C. Av. Sábalo-Cerritos s/n, Estero del Yugo, Mazatlán, CP 82000, Sinaloa, México. 3 El Colegio de la Frontera Sur, Unidad Villahermosa, Carretera Villahermosa-Reforma km 15.5, Ranchería Guineo sección II, Villahermosa, CP 86280, Tabasco, México. a Current address: Sociedad de Historia Natural Niparajá, AC, Revolución de 1910 #430, E.V. Guerrero y Colegio Militar, Col. Esterito, La Paz, CP 23020, Baja California Sur, México. ABSTRACT. Mangroves occur in coastal areas and are therefore vulnerable to anthropogenic disturbance and exhibit high rates of deforestation. Mexico is among the countries with the highest degree of mangrove deforestation in America; however, precise data on national mangrove coverage in Mexico is incomplete, making it impossible to accurately ascertain the rate of mangrove loss over time. Precise information is necessary to assess changes at local and regional scales to detect the magnitude, trends, and drivers of the transformation. This study aimed to estimate the loss of mangrove cover in the area of Mahahual-Xcalak (Quintana Roo, Mexico) between 1995 and 2007, to calculate the annual deforestation rate and to identify the drivers of deforestation. Landsat TM and ETM+ images from 1995 and 2007 were used to estimate the loss of mangrove cover using a multitemporal analysis. Semi-structured interviews with local residents of Mahahual and Xcalak were undertaken to identify and validate the drivers of deforestation. The image analysis for the 12-year period showed that 1070 ha of mangrove forest have been lost, with an annual deforestation rate of 0.85%—a relatively high value compared with other mangrove regions in Mexico. The main factor that has triggered the reduction of mangrove coverage is the expansion of anthropogenic land uses (e.g., settlements and roads). This study concludes that conservation and rehabilitation programs need to be implemented so that the Mahahual-Xcalak mangrove environment can continue to provide key ecosystem services. Key words: mangroves, drivers of deforestation, deforestation rate, Mexican Caribbean, Landsat imagery. RESUMEN. Debido a su localización en la zona costera, los manglares son vulnerables a disturbios antropogénicos y presentan tasas de deforestación altas. México está entre los países con mayor grado de deforestación de manglar en América; sin embargo, faltan datos precisos de la cobertura nacional de manglar, haciendo imposible estimar con exactitud la tasa de pérdida de manglar en el paso del tiempo. Se necesita obtener información precisa para evaluar los cambios en las escalas local y regional, y así detectar la magnitud, tendencias y agentes de la transformación del manglar. Por lo tanto, los objetivos de este estudio son estimar la pérdida de cobertura de manglar en la zona Mahahual- Xcalak (Quintana Roo, México) entre 1995 y 2007, calcular la tasa de deforestación anual e identificar los agentes de deforestación. Para estimar la pérdida de cobertura de manglar se hizo un análisis multitemporal usando imágenes satelitales Landsat TM y ETM+ de 1995 y 2007. Para identificar y validar los agentes de deforestación se llevaron a cabo entrevistas semiestructuradas a residentes locales de Mahahual y Xcalak. El análisis de las imágenes por el periodo de 12 años demostró que se han perdido 1070 ha de bosque de manglar, con una tasa anual de deforestación de 0.85%, tasa relativamente alta en comparación con otras regiones de México. El principal factor que ha disparado la disminución de la cobertura de manglar es la expansión de los usos antropogénicos del suelo (e.g., la construcción de poblados y caminos). Este estudio concluye que para segurar que los manglares de Mahahual-Xacalak continúen proporcionando servicios ambientales claves, se necesita la implementación de programas dirigidos a su conservación y rehabilitación. Palabras clave: manglares, agentes de deforestación, tasa de deforestación, Caribe Mexicano, imágenes Landsat.

Welcome message from author
This document is posted to help you gain knowledge. Please leave a comment to let me know what you think about it! Share it to your friends and learn new things together.
Transcript

Ciencias Marinas (2010), 36(2): 147–159
147
CM
INTRODUCTION
Mangroves are found worldwide in protected sites such asbays and coastal lagoons, as well as in low energy locationsexposed to the open sea, where they form a well-definedfringe of vegetation along the coasts in tropical and subtro-pical regions (Lugo and Snedaker 1974, Trejo-Torres et al.
INTRODUCCIÓN
Los manglares se encuentran alrededor del mundo ensitios protegidos como bahías y lagunas costeras, así como ensitios de baja energía expuestos a mar abierto, donde formanuna franja de vegetación bien definida a lo largo de las costasde las regiones tropicales y subtropicales (Lugo y Snedaker
Drivers of mangrove deforestation in Mahahual-Xcalak, Quintana Roo, southeast Mexico
Agentes de deforestación de manglar en Mahahual-Xcalak, Quintana Roo, sureste de México
M Hirales-Cota1*a, J Espinoza-Avalos1, B Schmook1, A Ruiz-Luna2, R Ramos-Reyes3
1 El Colegio de la Frontera Sur, Unidad Chetumal, Avenida Centenario km 5.5, Colonia Pacto Obrero, Chetumal, CP 77014, Quintana Roo, México. * E-mail: [email protected]
2 Centro de Investigación en Alimentación y Desarrollo A.C. Av. Sábalo-Cerritos s/n, Estero del Yugo, Mazatlán, CP 82000, Sinaloa, México.
3 El Colegio de la Frontera Sur, Unidad Villahermosa, Carretera Villahermosa-Reforma km 15.5, Ranchería Guineo sección II, Villahermosa, CP 86280, Tabasco, México.
a Current address: Sociedad de Historia Natural Niparajá, AC, Revolución de 1910 #430, E.V. Guerrero y Colegio Militar, Col. Esterito, La Paz, CP 23020, Baja California Sur, México.
ABSTRACT. Mangroves occur in coastal areas and are therefore vulnerable to anthropogenic disturbance and exhibit high rates ofdeforestation. Mexico is among the countries with the highest degree of mangrove deforestation in America; however, precise data on nationalmangrove coverage in Mexico is incomplete, making it impossible to accurately ascertain the rate of mangrove loss over time. Preciseinformation is necessary to assess changes at local and regional scales to detect the magnitude, trends, and drivers of the transformation. Thisstudy aimed to estimate the loss of mangrove cover in the area of Mahahual-Xcalak (Quintana Roo, Mexico) between 1995 and 2007, tocalculate the annual deforestation rate and to identify the drivers of deforestation. Landsat TM and ETM+ images from 1995 and 2007 wereused to estimate the loss of mangrove cover using a multitemporal analysis. Semi-structured interviews with local residents of Mahahual andXcalak were undertaken to identify and validate the drivers of deforestation. The image analysis for the 12-year period showed that 1070 ha ofmangrove forest have been lost, with an annual deforestation rate of 0.85%—a relatively high value compared with other mangrove regions inMexico. The main factor that has triggered the reduction of mangrove coverage is the expansion of anthropogenic land uses (e.g., settlementsand roads). This study concludes that conservation and rehabilitation programs need to be implemented so that the Mahahual-Xcalak mangroveenvironment can continue to provide key ecosystem services.
Key words: mangroves, drivers of deforestation, deforestation rate, Mexican Caribbean, Landsat imagery.
RESUMEN. Debido a su localización en la zona costera, los manglares son vulnerables a disturbios antropogénicos y presentan tasas dedeforestación altas. México está entre los países con mayor grado de deforestación de manglar en América; sin embargo, faltan datos precisosde la cobertura nacional de manglar, haciendo imposible estimar con exactitud la tasa de pérdida de manglar en el paso del tiempo. Se necesitaobtener información precisa para evaluar los cambios en las escalas local y regional, y así detectar la magnitud, tendencias y agentes de latransformación del manglar. Por lo tanto, los objetivos de este estudio son estimar la pérdida de cobertura de manglar en la zona Mahahual-Xcalak (Quintana Roo, México) entre 1995 y 2007, calcular la tasa de deforestación anual e identificar los agentes de deforestación. Paraestimar la pérdida de cobertura de manglar se hizo un análisis multitemporal usando imágenes satelitales Landsat TM y ETM+ de 1995 y 2007.Para identificar y validar los agentes de deforestación se llevaron a cabo entrevistas semiestructuradas a residentes locales de Mahahual yXcalak. El análisis de las imágenes por el periodo de 12 años demostró que se han perdido 1070 ha de bosque de manglar, con una tasa anual dedeforestación de 0.85%, tasa relativamente alta en comparación con otras regiones de México. El principal factor que ha disparado ladisminución de la cobertura de manglar es la expansión de los usos antropogénicos del suelo (e.g., la construcción de poblados y caminos). Esteestudio concluye que para segurar que los manglares de Mahahual-Xacalak continúen proporcionando servicios ambientales claves, se necesitala implementación de programas dirigidos a su conservación y rehabilitación.
Palabras clave: manglares, agentes de deforestación, tasa de deforestación, Caribe Mexicano, imágenes Landsat.

Ciencias Marinas, Vol. 36, No. 2, 2010
148
1993). Because of this, mangroves are vulnerable to naturaldisturbances like hurricanes and storms (Smith et al. 1994),and they are also exposed to anthropogenic disturbanceagents such as urbanization, road construction, pollution,tourism, and aquaculture (Ellison and Fearnsworth 1996,Valiela et al. 2001).
The lack of appreciation for the ecological, economic,and social importance of this vegetation has promoteddevelopment activities that are leading to the loss of theecosystem services they provide, such as preventing soil andbeach erosion, providing habitat for wildlife, protecting thecoastline from storm surges, waves and floods, and enablingrecreational opportunities (UNEP-WCMC 2006). Moreover,while it is claimed that mangroves are rapidly disappearingwith an annual loss of 1% to 2% worldwide (Duke et al.2007), there are few studies on this issue at a local scale,especially in countries such as Mexico, where, even thoughthey are protected by law, mangroves have been threatenedby the rapid development of the coastal areas in the lastdecades.
Precise data on national mangrove coverage for Mexico isincomplete, making it impossible to ascertain accurately therate of mangrove loss over time or to evaluate the majorthreats they are facing (Ruiz-Luna et al. 2008, CONABIO2008). Mexico is considered among the countries with thehighest degree of mangrove deforestation in North andCentral America (Yáñez-Arancibia and Lara-Domínguez1999, FAO 2007, Ruiz-Luna et al. 2008), with an estimatedannual loss of between 1% and 2.5% (INE 2005). However,this cannot be confirmed just based on the contrastingnational statistics, and it is necessary to assess changes atlocal and regional scales to detect the magnitude, trends, anddrivers of the transformation.
In this regard, based on the growing tourism and urbandevelopment along the Caribbean coast of Mexico, aresearcher from the National Autonomous University ofMexico (cited by López-Portillo and Ezcurra 2002)suggested that the annual rate of mangrove loss is higher inthis part of the country than in the Mexican Pacific and Gulfof Mexico. Mangrove deforestation in the area of theMexican Caribbean has been detected mainly in the northernpart of the state of Quintana Roo (Peréz-Villegas andCarrazal 2000), but tourism and urban development in thesouthern part have increased in localities such as theMahahual-Xcalak coastal area, affecting the coastal ecosys-tems, like the mangrove forests, as well as the benefits andenvironmental services they provide.
Considering these factors and the sparse and incompleteinformation for the Yucatan Peninsula and the MexicanCaribbean, it is necessary to have a baseline for futuresustainable mangrove management. This study aimed toestimate the recent extent and loss in mangrove cover in theMahahual-Xcalak area between 1995 and 2007, by calcula-ting the annual deforestation rate and identify the drivers ofdeforestation.
1974, Trejo-Torres et al. 1993). Debido a su ubicación, losmanglares son vulnerables a agentes de disturbio naturalescomo los huracanes y tormentas (Smith et al. 1994), ytambién están expuestos a agentes de disturbio antropogé-nicos como la urbanización, la construcción de carreteras, lacontaminación, el turismo y la acuacultura (Ellison yFearnsworth 1996, Valiela et al. 2001).
La falta de un reconocimiento cabal de la importanciaecológica, económica y social de los manglares, ha fomen-tado que actividades antropogénicas estén llevando a lapérdida de los servicios ambientales que estos ecosistemasproveen, como prevenir la erosión del suelo y las playas,proveer hábitat a fauna silvestre, proteger la línea de costa detormentas, oleaje e inundaciones, y permitir actividadesrecreativas (UNEP-WCMC 2006). Aunque en general se hadocumentado que los manglares del mundo están desapare-ciendo rápidamente con una pérdida anual de 1% a 2% (Dukeet al. 2007), hay pocos estudios en este ámbito a escala local,especialmente en países como México, donde a pesar de estarprotegidos por la ley, los manglares han sido amenazados porel desarrollo acelerado de las últimas décadas en las zonascosteras.
En México hay una carencia de datos precisos en lacobertura nacional de manglar, por consecuencia es impo-sible conocer con certeza la tasa de pérdida de manglares a lolargo de los años y evaluar las principales amenazas a las quese enfrentan (Ruiz-Luna et al. 2008, CONABIO 2008).México es uno de los países con más altos niveles de defores-tación de manglar en la región de América del Norte yAmérica Central (Yáñez-Arancibia y Lara-Domínguez 1999,FAO 2007, Ruiz-Luna et al. 2008), con una tasa de pérdidaanual estimada entre 1% y 2.5% (INE 2005). Sin embargo, loanterior no puede ser válido contrastando estadísticas nacio-nales y por tanto es necesario evaluar los cambios en lasescalas local y regional para detectar la magnitud, la tenden-cia y los agentes de la transformación de los manglares.
En ese sentido, y basándose en el crecimiento urbano yturístico en la zona costera del Caribe Mexicano, un investi-gador de la Universidad Nacional Autónoma de México(citado por López-Portillo y Ezcurra 2002) sugirió que la tasaanual de pérdida de manglar en esta zona es más alta que enel Pacífico Mexicano y el Golfo de México. La deforestaciónde manglar en la zona del Caribe mexicano ha sido registradaprincipalmente para la parte norte del estado de QuintanaRoo (Peréz-Villegas y Carrazal 2000), pero en lugares comola zona costera Mahahual-Xcalak, al sur del estado, reciente-mente se ha incrementado el desarrollo turístico y urbano,afectando a los ecosistemas costeros como los bosques demanglar y a los beneficios y servicios ambientales que estosproveen.
Considerando los factores mencionados, así como lainformación escasa e incompleta para la península deYucatán y el Caribe mexicano, es necesario tener una líneabase para el futuro manejo sustentable del manglar. En este

Hirales-Cota et al.: Drivers of mangrove deforestation in southeast Mexico
149
MATERIAL AND METHODS
Study area
The Mahahual-Xcalak area is located in the municipalityof Othón P. Blanco, in the southern part of the state ofQuintana Roo, Mexico (18º15–18º45N , 87º40–87º55W;fig. 1). Like other parts of the Mexican Caribbean, it has seenrapid tourism development that has led to the environmentalmodification of mangroves and other coastal environments(Arriaga-Cabrera et al. 1998).
The study area includes much of the Protected NaturalArea Xcalak National Reef Park, a declared Ramsar site(Camarena-Luhrs 2003, CONANP 2004). In addition, it fallswithin Sian Ka’an-Xcalak, considered a priority mangrovesite because of its biological relevance and the need toundertake immediate ecological rehabilitation in the area(CONABIO 2008).
estudio se estima la extensión actual y la pérdida de lacobertura de manglar en la zona Mahahual-Xcalak entre 1995y 2007, calculando la tasa de deforestación anual e identifi-cando los agentes de deforestación.
MATERIALES Y MÉTODOS
Área de estudio
El área Mahahual-Xcalak está localizada al sur del estadode Quintana Roo, en el Municipio de Othón P. Blanco, entrelas coordenadas 18º15–18º45 N y 87º40–87º55 O (fig. 1).Igual que otras partes del Caribe mexicano, presenta un desa-rrollo turístico acelerado que ha llevado a la modificaciónambiental de los manglares y otros ambientes costeros(Arriaga-Cabrera et al. 1998).
El área de estudio incluye gran parte del Área NaturalProtegida Parque Nacional Arrecifes de Xcalak, consideradaun sitio Ramsar (Camarena-Luhrs 2003, CONANP 2004).Además, está ubicada dentro del sitio prioritario de manglarSian Ka’an-Xcalak, determinado por su relevancia biológicay por tener necesidad de una inmediata rehabilitación ecoló-gica (CONABIO 2008).
Varios ecosistemas coexisten con los manglares en el áreade estudio, como los arrecifes de coral, los ceibadales, laslagunas costeras, las playas, la vegetación de duna costera ylas selvas (Sánchez-Sánchez et al. 1991, CONANP 2004).De acuerdo a la clasificación de Lugo y Snedaker (1974),los tipos de manglar encontrados en la zona son manglarenano, ribereño, de franja, de cuenca y de isla. Las especiesde mangle presentes son: Rhizophora mangle (L.) (manglerojo), Laguncularia racemosa (L.) Gaertn. f. (mangleblanco), Avicennia germinans (L.) Stearn (mangle negro) yConocarpus erectus (L.) (mangle botoncillo).
Respecto a la población humana, hay poblaciones de bajadensidad en el área, incluyendo Mahahual y Xcalak, con unnúmero total de residentes de 252 y 282, respectivamente(INEGI 2005). Mahahual fue fundado a principios de 1990 ysu población se incrementó en un 89% a partir del año 2000.La población de Xcalak se ha mantenido estable desde 1980(INEGI 2000, 2005). Actualmente, la principal actividadeconómica promovida por el gobierno en la zona es elturismo, lo cual está cambiando rápidamente el paisaje local,transformando ecosistemas como los bosques de manglar ydañando ambientes marinos, con el aumento de la infraes-tructura turística (caminos, cuartos de hospedaje y puertos).Además de las fuentes antropogénicas de degradación, elmanglar de la zona de estudio está expuesto a agentes dedisturbio naturales, como las tormentas y los huracanes, queson frecuentes en las temporadas de lluvia, de junio anoviembre (Vidal-Zepeda 2005). El huracán más reciente queafectó el área de estudio fue Dean (21 de agosto de 2007), elcual dañó severamente a los bosques de manglar cercanos ala localidad de Mahahual.
Figure 1. Study area on the Caribbean coast of Mexico(Mahahual-Xcalak area, Quintana Roo). Figura 1. Área de estudio, en la costa caribeña de México(zona de Mahahual-Xcalak, Quintana Roo).
Xcalak
Mahahual
87°36'W87°45'W87°54'W88°3'W
18°4
5'N
18°3
6'N
18°2
7'N
18°1
8'N
18°9
'N
Chetumal Bay
Caribbean Sea
0 105 km
N
87°30'W90°0'W92°30'W
QuintanaRoo
Car
ibbe
an S
eaGulf ofMexico
Peninsula of YucatanN
20°0
0'N

Ciencias Marinas, Vol. 36, No. 2, 2010
150
Several ecosystems coexist with mangroves in the studyarea, including coral reefs, seagrass meadows, coastallagoons, beaches, coastal dune vegetation, and rainforests(Sánchez-Sánchez et al. 1991, CONANP 2004). Accordingto the mangrove classification proposed by Lugo andSnedaker (1974), the types of mangrove forests found inthe area are dwarf, riverine, fringe, basin, and overwash.The species found in the area are: Rhizophora mangle (L.)(red mangrove), Laguncularia racemosa (L.) Gaertn. f.(white mangrove), Avicennia germinans (L.) Stearn (blackmangrove), and Conocarpus erectus (L.) (buttonwoodmangrove).
Regarding the human population, low-density settlementsare found in the area, including Mahahual and Xcalak, whichhave a resident population of 252 and 282, respectively(INEGI 2005). Mahahual was founded in the early 1990s andits population has grown by 89% since 2000. The populationof Xcalak has remained stable since 1980 (INEGI 2000,2005). Tourism is currently the main economic activity. It ispromoted by the government and is rapidly changing thelocal landscape, transforming ecosystems like mangroveforests, and damaging marine environments due to the build-ing of tourism infrastructure (roads, rooms, harbors). In addi-tion to anthropogenic degradation, mangroves in the studyarea are exposed to natural disturbance agents, such as stormsand hurricanes, which are common in the rainy season, fromJune to November (Vidal-Zepeda 2005). The most recenthurricane to hit the study area was Dean (21 August 2007),and it severely damaged the mangrove forests nearMahahual.
Deforestation rate
To estimate the loss of mangrove cover in the study area,a multitemporal analysis was carried out using two Landsatimages (path 19, row 47), one collected in 1995 by theThematic Mapper (TM) and the other in 2007 by theEnhanced Thematic Mapper-Plus (ETM+) sensors. Althoughhigh resolution images are now available (Satellite Pourl’Observation de la Terre [SPOT], IKONOS, Quickbird), wechose Landsat scenes because they provide the longest recordof usable satellite imagery for comparisons, particularly forpixel to pixel analysis. The two images were geometricallycorrected and projected to UTM 16 N (WGS84), and maskedto a polygon of the study area, using ERDAS Imagine 9.1software.
The windowed images were classified using a standardsupervised method, with the maximum likelihood decisionrule. To classify the 1995 image, calibration training siteswere obtained with the aid of vegetation and land use mapsobtained from the Mexican National Institute of Statistics,Geography, and Informatics (INEGI), scale 1:250,000 (seriesII, 1998–2000), and ground data that was collected in 1995with a Trimble GeoExplorer Global Positioning System(GPS, 50-cm typical position accuracy) by the Costa Maya
Tasa de deforestación
Para estimar la pérdida de cobertura del manglar en elárea de estudio, se llevó a cabo un análisis multitemporalusando dos imágenes Landsat (path 19, row 47); una fuetomada en 1995 con el sensor Thematic Mapper (TM) y laotra en 2007 con el sensor Enhanced Thematic Mapper-Plus(ETM+). Aunque existen imágenes de alta resolución(Satellite Pour l’Observation de la Terre [SPOT], IKONOS,Quickbird), nosotros escogimos las del sensor Landsat, yaque estas tienen el registro temporal más grande de imágenesde satélite que puede usarse para hacer comparaciones, parti-cularmente para análisis de pixel a pixel. Las imágenesfueron corregidas geométricamente y proyectadas a UTM16 N (WGS84), y de ellas se extrajo el polígono del área deestudio, usando el software ERDAS Imagine 9.1.
Los cortes extraídos de las imágenes fueron clasificadosusando el método supervisado, con la regla de decisión‘máxima verosimilitud’. Para clasificar la imagen de 1995,los sitios de entrenamiento fueron obtenidos con la ayuda deuna carta de uso de suelo y vegetación (escala 1:250,000)tomada del Instituto Nacional de Estadística y Geografía(INEGI; serie II, 1998–2000), y datos obtenidos en tierra en1995 a través del Programa de Ordenamiento EcológicoTerritorial de Costa Maya, con un Sistema de Posiciona-miento Global (SPG) Trimble Geo Explorer (exactitud típicade 50 cm). Para la clasificación de la imagen de 2007, lossitios de entrenamiento fueron extraídos de imágenes de altaresolución (SPOT 5, de enero 2006, e IKONOS-2, deseptiembre 2006) que cubrían el 70% del área de estudio, loanterior basado en la experiencia en campo de los autores.Adicionalmente, se usaron datos de campo obtenidos en 2005y 2007 por la Secretaría de Marina (SEMAR) con un SPGGarmin (exactitud típica de 15 m).
Las clases de cobertura terrestre que se identificaronen las imágenes Landsat fueron: manglar, otra vegetación(bosque tropical caducifolio y vegetación de duna costera),otros usos de suelo (caminos y suelo desnudo), pueblos(asentamientos humanos), agua y manglar dañado por elhuracán Dean (MDHD). La clase MDHD representa áreasdonde el manglar fue afectado por el huracán pero quepermanecía vivo y, al igual que la clase pueblos, fue digitali-zada en la imagen de 2007 después de interpretación visual.Después de la clasificación de las imágenes, se aplicó unfiltro ‘de mayoría’ (3 × 3 pixeles) para disminuir el efectode pixeles aislados de algunas clases de cobertura en lasimágenes clasificadas.
La exactitud de la clasificación de la imagen de 2007 seobtuvo calculando la exactitud total y un estimado del coefi-ciente Kappa (^κ), descrito por Congalton y Green (1999),usando un grupo de datos de referencia. La evaluación de laexactitud fue calculada usando 288 puntos de referencia entierra seleccionados al azar. Los sitios más accesibles(49) fueron visitados y el resto de los sitios (239) fueronverificados en imágenes Quickbird (DigitalGlobe) del 13 de

Hirales-Cota et al.: Drivers of mangrove deforestation in southeast Mexico
151
Territorial Ecological Ordering Program. For the 2007 imageclassification, training sites were extracted, based on theauthors’ field experience, from high resolution images(SPOT 5 from January 2006 and IKONOS-2 from September2006) that covered 70% of the study area. In addition, grounddata were collected with a Garmin GPS (15-m typical posi-tion accuracy) in 2005 and 2007 by the Navy Ministry(SEMAR).
The land cover classes identified in both Landsat imageswere: mangroves, other vegetation (tropical dry forest,coastal dune vegetation), other land uses (roads, exposedsoils), villages (human settlements), water, and mangrovesdamaged by Hurricane Dean (MDHD). The MDHD classrepresents areas where mangrove stands were disturbed bythe hurricane but remained alive and, like villages, it wasdigitized on the 2007 image after visual image interpretation.Once the classification was done, a majority filter (3 × 3pixels) was applied to reduce the speckled pattern effect ofsome land cover classes in the classified image.
The accuracy of the 2007 final classification was assessedby calculating the overall accuracy and an estimate of theKappa coefficient (^κ ), as described by Congalton and Green(1999), using a set of reference data. The accuracy assess-ments was calculated using 288 randomly-selected groundreference points. The more accessible sites (49) were visitedand the remaining sites (239) were verified based on theQuickbird (DigitalGlobe) images recorded on 13 February2007 using the Google Earth Pro software. Regarding thequality of the reference data for the 1995 image, it was notpossible to assess the accuracy for this output but consideringthat the classification process was the same for the two satel-lite scenes, we presumed an error level similar to that for the2007 output.
A further multitemporal post-classification analysis wasdone to determine the magnitude and direction of land coverchanges (Mas 1999, Lu et al. 2004). The analysis produced achange detection matrix with all land cover class combina-tions from the 1995 and 2007 maps and a thematic map withthe resulting land use and land cover changes, providing avisual depiction of changes from one class to another.
Finally, an average estimate of the deforestation rate (r)was obtained using the formula provided by FAO (1996) thatexpresses the annual change in mangrove cover at the begin-ning of each year. To visualize it as percentage, the resultingvalue must be multiplied by 100. The formula provided byFAO (1996) is expressed as follows:
where r is the rate of change, A1 is the mangrove area attime 1, A2 is the mangrove area at time 2, and t is the periodof time analyzed (years).
r 1 1A1 A2–
A1------------------–
1 t–=
febrero de 2007, usando el programa Google Earth Pro.Respecto a la calidad de los datos de referencia para laimagen de 1995, no fue posible evaluar la exactitud de suclasificación, pero considerando que el proceso de clasifica-ción fue el mismo para las escenas satelitales, supusimos queel nivel de error fue similar al resultado del 2007.
Posteriormente, se llevó a cabo un análisis multitemporalpost-clasificatorio para determinar la magnitud y dirección delos cambios de cobertura de suelo (Mas 1999, Lu et al. 2004).Este análisis produjo una matriz de detección de cambio contodas las combinaciones de las clases de cobertura de suelode los mapas de 1995 y 2007, y un mapa temático con losresultados de los cambios de uso de suelo y de cobertura,proporcionando una representación visual de los cambios deuna clase a otra.
Finalmente, se obtuvo una estimación promedio de la tasade deforestación (r) del manglar, por medio de la fórmulapropuesta por la FAO (1996), que expresa el cambio anual enla cobertura de manglar al inicio de cada año. Para expresarlaen porcentaje, el valor resultante debe ser multiplicado por100. La fórmula propuesta por la FAO (1996) se expresacomo:
donde r es la tasa de cambio, A1 es la superficie de manglaren la fecha 1, A2 es la superficie de manglar en la fecha 2 y tes el periodo de tiempo analizado (años).
Agentes de deforestación de manglar
Se realizaron 56 entrevistas semi-estructuradas (conte-niendo preguntas abiertas y cerradas) en Mahahual (n = 29) yen Xcalak (n = 27) a residentes locales, para conocer cómoperciben los agentes que afectan el manglar. Debido altamaño de la población, aproximadamente el 10% de los resi-dentes locales fueron entrevistados en ambas localidades, yparticiparon 11 mujeres y 45 hombres, con 49 años de edadpromedio (intervalo de 22 a 77 años). Para obtener informa-ción que coincidiera lo más posible con el periodo de estudio(1995 a 2007), las personas seleccionadas para entrevistartenían al menos 10 años de residencia en la zona de estudio.La técnica de muestreo utilizada siguió el enfoque Bola denieve, el cual consiste en entrevistar a un informante clavequien provea nombre de otras personas con el criterioestablecido, y así sucesivamente se va obtenido la lista de lasposibles personas a entrevistar (Berg 1963, De Vaus 2002).Adicionalmente, se realizaron visitas de campo a los sitiosde manglares dañados para identificar los agentes de defo-restación y complementar la información obtenida de lasentrevistas.
r 1 1A1 A2–
A1------------------–
1 t–=

Ciencias Marinas, Vol. 36, No. 2, 2010
152
Drivers of mangrove deforestation
To determine how the local residents perceive the agentsaffecting mangroves, 56 semi-structured interviews (contain-ing open-ended and closed questions) were conducted inMahahual (n = 29) and Xcalak (n = 27). Due to the popula-tion size, approximately 10% of locals were interviewed inboth localities. By gender, 11 women and 45 men, averaging49 years of age (ranging from 22 to 77), participated in thisphase of the study. To obtain information that coincided withthe study period (1995–2007), the people selected for inter-views had to have been living in the area for at least 10 years.The sampling technique employed the Snowball approach,interviewing first a key informant who then provided namesof other people who met the interview criteria, and these inturn provided more names and so on (Berg 1963, De Vaus2002). Additionally, field visits to damaged mangrove siteswere conducted to identify drivers of deforestation in order tocomplement the information obtained from interviews.
A chi-square test was used to analyze differences in thefrequency of drivers of deforestation between the villages.The test was performed with Statistica 6.0 (StatSoft 1998).
RESULTS
Mangrove deforestation rate
The final classification output for 2007 produced valuesof 85% and 0.79 for the overall accuracy and Kappa coeffi-cient estimate, respectively. The observed overall accuracyfulfills the standards for an overall accuracy assessment(Anderson et al. 1976, Strahler et al. 2006). The resultingKappa coefficient also suggests a good map classification,considering that ^κ = 1 indicates full accordance between themap and reality (Chuvieco 2002). In addition, the ^κ valuefrom our analysis is within the “almost perfect” agreementbetween the map and reality with regards to the value rangeproposed by Landis and Koch (1977). Hence, we assumedthat the results from both classifications satisfactorilyexplained the spatial distribution of the selected classes bydate (fig. 2), even when some detected changes were clearlycommission errors (misclassification of one class overanother). These areas were corrected to have a better assess-ment for the 2007 mangrove cover and to estimate a morereliable annual deforestation rate, taking into account theMDHD surface (920 ha), which only had structural damagebut did not disappear as an ecosystem. After this correction,the 2007 mangrove cover was around 6620 ha, contrastingwith 7690 ha in 1995, and the final estimate for mangroveloss was approximately 1070 ha. With these benchmarkresults, the average annual deforestation rate was 0.85%,though it is recognized that mangrove loss was not nece-ssarily linear in time.
Though the study focused on the loss of mangrove cover,the change detection matrix at landscape level showed that
Para conocer si había diferencias entre las localidades,respecto a la frecuencia de cada agente de disturbio, se aplicóla prueba Chi-cuadrada de Pearson. La prueba estadística sehizo con el software Statistica 6.0 (StatSoft 1998).
RESULTADOS
Tasa de deforestación del manglar
La exactitud total y el coeficiente Kappa obtenidos para laclasificación de 2007 fueron 85% y 0.79, respectivamente.La exactitud total observada satisface los valores estándaresde una evaluación de exactitud total (Strahler et al. 2006).El coeficiente Kappa calculado también sugiere una buenaclasificación de la imagen, considerando que un valor de^κ = 1 indica un acuerdo pleno entre el mapa y la realidad(Chuvieco 2002). Adicionalmente, el valor de ^κ obtenido denuestro análisis está en el rango de concordancia “casiperfecta” entre el mapa y la realidad, con respescto al inter-valo de valores propuesto por Landis y Koch (1977). Consi-derando lo anterior, suponemos que los resultados de ambasclasificaciones explican satisfactoriamente la distribuciónespacial de las clases de cobertura seleccionadas por fecha(fig. 2), incluso cuando algunos cambios detectados clara-mente son errores de comisión (clasificación errónea de unaclase en otra). Las áreas fueron corregidas para una mejorevaluación de la cobertura de manglar de 2007 y para estimaruna tasa anual de deforestación confiable, tomando en cuentala superficie del MDHD (920 ha), la cual solo tuvo dañosestructurales pero no desapareció como ecosistema. Despuésde esta corrección, la extensión de manglar en 2007 fue dealrededor de 6620 ha, contrastando con las 7690 ha en 1995,con una estimación final de pérdida de aproximadamente1070 ha. Con estos resultados como punto de referencia, latasa de deforestación anual promedio fue de 0.85%, aunquese reconoce que la pérdida de manglar no fue necesariamentelineal en el tiempo.
Aunque el estudio se enfocó en la pérdida de cobertura demanglar, en el nivel de paisaje la matriz de detección decambio mostró que las clases agua y otra vegetación mantu-vieron un alto grado de estabilidad (>80%), con crecimientosen la superficie de agua (tabla 1). También, la clase otros usosde suelo incrementó cerca del 40% de su extensión original,principalmente a las clases otra vegetación y manglar. Elporcentaje de cambio entre MDHD y manglar fue 12%. Engeneral, el cambio total representó alrededor del 25% delpaisaje analizado, y los principales usos de suelo y loscambios de cobertura terrestre se muestran en la figura 3.
Agentes de deforestación de manglar
La percepción de reducción en la superficie de manglarfue mayor entre los habitantes entrevistados de Mahahual quelos de Xcalak (χ2 = 5.91; g.l. = 1; P < 0.05). El 76% de losentrevistados de Mahahual mencionaron que han notado

Hirales-Cota et al.: Drivers of mangrove deforestation in southeast Mexico
153
the water and other vegetation classes maintained a highdegree of stability (>80%), with increased water surface(table 1). Also, the other land uses class increased above 40%of its original extent, mainly onto the other vegetation andmangrove classes. The percentage of change between theMDHD and mangrove classes was 12%. In general, there wasan overall change representing around 25% of the analyzedlandscape, and the main land use and land cover changes areshown in figure 3.
Drivers of mangrove deforestation
The loss of mangrove cover was perceived as higher bythe residents of Mahahual than by those of Xcalak (χ2 = 5.91;d.f. = 1; P < 0.05). Thus, 76% of the Mahahual residentsinterviewed noticed losses of mangrove area, in contrast to30% from Xcalak. Nine drivers of mangrove deforestationwere identified from the interviews (table 2), though therewas no consensus on the local perception about mangrovedisturbances since 8 interviewees from Mahahual and 18from Xcalak did not mention drivers of deforestation. Theresidents interviewed claimed that the deforested mangrove
pérdida de manglar, mientras que entre los de Xcalak el 30%dijo notar pérdida. A partir de las entrevistas, fueron identifi-cados 9 agentes de deforestación de manglar (tabla 2),aunque no hubo un consenso en la percepción local, ya que8 personas entrevistadas de Mahahual y 18 de Xcalak nomencionaron agentes de deforestación. Los entrevistados deambas localidades mencionaron que los sitios donde se haperdido manglar se ubican a lo largo del camino costero ydetrás de los poblados.
Los agentes de deforestación más frecuentementemencionados fueron la construcción de caminos y la tala parala construcción de casas (tabla 2). En contraste, durante lasvisitas a la zona de estudio se observó que los principalesagentes de disturbio para el manglar fueron: límites de pro-piedad (líneas angostas trazadas dentro de la zona de manglarpara delimitar propiedades privadas), tala para la construc-ción de hoteles, construcción de caminos y el impacto delhuracán Dean (fig. 4).
Comparando entre localidades, el número de agentesmencionados por los entrevistados fue mayor en Mahahualque en Xcalak. Los agentes contaminación, delimitación depredios, extracción de leña e interrupción de flujos de agua,
Figure 2. Land cover classes for the Mahahual-Xcalak area in 1995 and 2007. Note the increase in cover corresponding to other landuses (mainly roads) and villages. Figura 2. Clases de cobertura terrestre de la zona Mahahual-Xcalak en 1995 y 2007. Nótese el aumento de cobertura en las clases otrosusos de suelo (principalmente caminos) y pueblos.
Land cover classes
WaterOther land usesMangrove
Mangrove by Hurricane Deandamaged
Other vegetation
Villages
Quintana Roo State
87°30' W90°0'W92°30'W
QuintanaRoo
Car
ibbe
an S
eaGulf ofMexico
Peninsula of YucatanN
20°0
0'N
87°44'W87°52'W
18°4
0'N
18°3
2'N
18°2
4'N
18°1
6'N
Land cover classes in 1995 Land cover classes in 2007
1: 370 502
N N
Xcalak
Mahahual
Caribbean Sea
87°44'W87°52'W
1: 370 502Xcalak
Caribbean Sea
Mahahual

Ciencias Marinas, Vol. 36, No. 2, 2010
154
sites were generally located on the road running along thecoast and behind towns.
The most frequently mentioned drivers of mangrove losswere road construction and clear cutting to build houses(table 2). In contrast, the field work in the study area indi-cated that the main drivers of mangrove deforestation were:delineation of property boundaries (narrow lines traced insidethe mangrove zone to mark out private properties), clearcutting to build hotels, road construction, and the impact ofHurricane Dean (fig. 4).
Comparison between localities indicated that more typesof drivers of mangrove deforestation were mentioned by thelocal residents of Mahahual than by those of Xcalak. Somedrivers were mentioned only by the Mahahual residents, suchas pollution, property boundaries, firewood extraction, andthe disruption of waterways. As mentioned, road constructionwas quoted more frequently in Mahahual than in Xcalak(χ2 = 13.2; d.f. = 1; P < 0.05), but in general there were nosignificant differences between the perception of the otherdrivers (table 2).
DISCUSSION
The thematic map output from the satellite imagery clas-sification showed accuracies that fulfill the standards foraccuracy assessments (Chuvieco 2002, Strahler et al. 2006),with ^κ values indicating high agreement between the mapand reality, which is classified as “almost perfect” accordingto the scale proposed by Landis and Koch (1977). Similarstudies that include mangrove cover have calculated overallaccuracies from 78% to 92% and ^κ values from 0.69 to 0.90(Alonso-Pérez et al. 2003; Hernández-Cornejo et al. 2005;Berlanga-Robles and Ruiz-Luna 2006, 2007).
fueron mencionados únicamente en Mahahual. El agentedeforestación para construcción de caminos fue significa-tivamente más mencionado en Mahahual que en Xcalak(2 = 13.2; g.l. = 1; P < 0.05), pero en general no hubo dife-rencias significativas entre la percepción de los otros agentes(tabla 2).
DISCUSIÓN
Lo mapas temáticos resultantes de la clasificación deimágenes tuvieron exactitudes que cumplen con los están-dares de las evaluaciones de exactitud (Chuvieco 2002,Strahler et al. 2006), con un valor de ^κ indicando un altoacuerdo entre el mapa y la realidad, el cual es clasificadocomo “casi perfecto” de acuerdo con la escala propuesta porLandis y Koch (1977). Trabajos similares que abordan eltema de cobertura de manglar han obtenido exactitudes tota-les de 78% a 92% y valores de ^κ de 0.69 a 0.90 (Alonso-Pérez et al. 2003, Hernández-Cornejo et al. 2005, Berlanga-Robles y Ruiz-Luna 2006, 2007).
Las inexactitudes son, en su mayoría, atribuidas a la hete-rogeneidad de hábitat en el área de estudio, donde una mezclade suelo inundable, manglar chaparro y disperso, así comovariaciones en la profundidad y características del agua,impiden la identificación exacta de clases en las imágenesLandsat de 30 m de resolución espacial. Esas limitantespodrían llevar a errores de clasificación de sitios de manglar,como lo ha documentado Díaz-Gallegos y Acosta-Velázquez(2009), pero algunos de estos errores pueden ser detectados ycorregidos para obtener un producto final mejor.
Diferentes métodos para estudiar manglares medianteel uso de imágenes Landsat han sido aplicados en México,así como en latitudes tropicales similares, obteniendo altos
Table 1. Landscape change detection matrix in the Mahahual-Xcalak area. Land cover classes: (1) mangroves, (2) other vegetation,(3) other land uses, (4) water, (5) villages, and (6) mangroves damaged by Hurricane Dean. Figures in hectares (rounded to the nearest ten).Underlined figures are considered errors in the image classifications that affected the mangrove cover calculated for 2007.Tabla 1. Matriz de detección de cambio en la zona Mahahual-Xcalak. Clases de cobertura terrestre: (1) manglar, (2) otra vegetación,(3) otros usos de suelo, (4) agua, (5) pueblos y (6) manglar dañado por el huracán Dean. Cifras en hectáreas (redondeado a la decena máscercana). Las cifras subrayadas son consideradas errores en la clasificación de las imágenes que afectan la cobertura de manglar estimadaen 2007.
2007 1995 Total in 2007
Class 1 2 3 4 5 6
1 4980 470 110 40 0 0 5600
2 450 7870 600 0 0 0 8920
3 650 1070 690 110 10 0 2530
4 770 50 20 1710 0 0 2550
5 10 90 30 0 30 0 160
6 830 50 30 0 0 0 910
Total in 1995 7690 9600 1480 1860 40 0 20670
Location stability 64.8 82.0 46.6 91.9 75.0 n.d.
Residence stability –37.3 –7.6 41.5 27.1 75.0 n.d.

Hirales-Cota et al.: Drivers of mangrove deforestation in southeast Mexico
155
87°30'W90°0'W92°30'W
QuintanaRoo
Car
ibbe
an S
eaGulf ofMexico
Peninsula of YucatanN
20°0
0'N
5 0 52.5 km
Mangrove cover without changes
Mangrove to other land uses
Mangrove to villages
Mangrove to mangrove damaged by Hurricane Dean
Other land cover changes
Land cover without changes
Land use and land cover changesfrom 1995 to 2007
N
87°44'W87°52'W
18°4
0'N
18°3
2'N
18°2
4'N
18°1
6'N
Xcalak
Mahahual
Caribbean Sea
Figure 3. Main land use and land cover changes in the Mahahual-Xcalak area. Figura 3. Principales cambios de usos y cobertura de suelos en la zona Mahahual-Xcalak.
Table 2. Number of times that drivers of mangrove deforestation were mentioned by the residents of Mahahual and Xcalak. Mahahual,n = 29; Xcalak, n = 27; d.f. = 1; n.s. = statistically not significant. Tabla 2. Número de veces que los agentes de deforestación del manglar fueron mencionados por residentes de Mahahual y Xcalak.Mahahual n = 29, Xcalak n = 27, g.l. = 1, n.s. = no significativo.
Drivers of mangrove deforestation Mahahual Xcalak 2 P
Road building 14 1 13.20 <0.05
Deforestation to build houses 7 4 0.56 n.s.
Hurricane impact 5 3 0.30 n.s.
Deforestation to build hotels 3 2 0.09 n.s.
Pollution 3 0 2.75 n.s.
Hydrology disruption 3 0 2.75 n.s.
Private land delimitation 2 0 1.80 n.s.
Firewood extraction 1 0 0.88 n.s.
Deforestation to provide access to beaches 0 1 1.17 n.s.
Ciencias Marinas, Vol. 36, No. 2, 2010
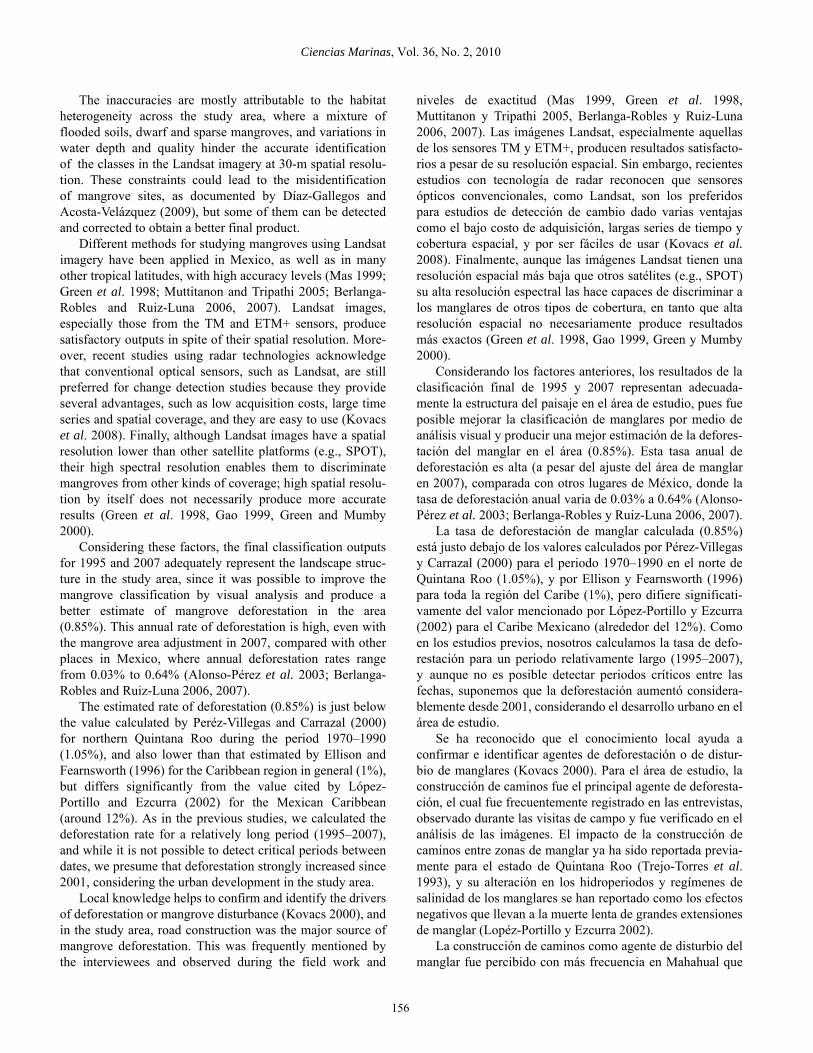
156
The inaccuracies are mostly attributable to the habitatheterogeneity across the study area, where a mixture offlooded soils, dwarf and sparse mangroves, and variations inwater depth and quality hinder the accurate identificationof the classes in the Landsat imagery at 30-m spatial resolu-tion. These constraints could lead to the misidentificationof mangrove sites, as documented by Díaz-Gallegos andAcosta-Velázquez (2009), but some of them can be detectedand corrected to obtain a better final product.
Different methods for studying mangroves using Landsatimagery have been applied in Mexico, as well as in manyother tropical latitudes, with high accuracy levels (Mas 1999;Green et al. 1998; Muttitanon and Tripathi 2005; Berlanga-Robles and Ruiz-Luna 2006, 2007). Landsat images,especially those from the TM and ETM+ sensors, producesatisfactory outputs in spite of their spatial resolution. More-over, recent studies using radar technologies acknowledgethat conventional optical sensors, such as Landsat, are stillpreferred for change detection studies because they provideseveral advantages, such as low acquisition costs, large timeseries and spatial coverage, and they are easy to use (Kovacset al. 2008). Finally, although Landsat images have a spatialresolution lower than other satellite platforms (e.g., SPOT),their high spectral resolution enables them to discriminatemangroves from other kinds of coverage; high spatial resolu-tion by itself does not necessarily produce more accurateresults (Green et al. 1998, Gao 1999, Green and Mumby2000).
Considering these factors, the final classification outputsfor 1995 and 2007 adequately represent the landscape struc-ture in the study area, since it was possible to improve themangrove classification by visual analysis and produce abetter estimate of mangrove deforestation in the area(0.85%). This annual rate of deforestation is high, even withthe mangrove area adjustment in 2007, compared with otherplaces in Mexico, where annual deforestation rates rangefrom 0.03% to 0.64% (Alonso-Pérez et al. 2003; Berlanga-Robles and Ruiz-Luna 2006, 2007).
The estimated rate of deforestation (0.85%) is just belowthe value calculated by Peréz-Villegas and Carrazal (2000)for northern Quintana Roo during the period 1970–1990(1.05%), and also lower than that estimated by Ellison andFearnsworth (1996) for the Caribbean region in general (1%),but differs significantly from the value cited by López-Portillo and Ezcurra (2002) for the Mexican Caribbean(around 12%). As in the previous studies, we calculated thedeforestation rate for a relatively long period (1995–2007),and while it is not possible to detect critical periods betweendates, we presume that deforestation strongly increased since2001, considering the urban development in the study area.
Local knowledge helps to confirm and identify the driversof deforestation or mangrove disturbance (Kovacs 2000), andin the study area, road construction was the major source ofmangrove deforestation. This was frequently mentioned bythe interviewees and observed during the field work and
niveles de exactitud (Mas 1999, Green et al. 1998,Muttitanon y Tripathi 2005, Berlanga-Robles y Ruiz-Luna2006, 2007). Las imágenes Landsat, especialmente aquellasde los sensores TM y ETM+, producen resultados satisfacto-rios a pesar de su resolución espacial. Sin embargo, recientesestudios con tecnología de radar reconocen que sensoresópticos convencionales, como Landsat, son los preferidospara estudios de detección de cambio dado varias ventajascomo el bajo costo de adquisición, largas series de tiempo ycobertura espacial, y por ser fáciles de usar (Kovacs et al.2008). Finalmente, aunque las imágenes Landsat tienen unaresolución espacial más baja que otros satélites (e.g., SPOT)su alta resolución espectral las hace capaces de discriminar alos manglares de otros tipos de cobertura, en tanto que altaresolución espacial no necesariamente produce resultadosmás exactos (Green et al. 1998, Gao 1999, Green y Mumby2000).
Considerando los factores anteriores, los resultados de laclasificación final de 1995 y 2007 representan adecuada-mente la estructura del paisaje en el área de estudio, pues fueposible mejorar la clasificación de manglares por medio deanálisis visual y producir una mejor estimación de la defores-tación del manglar en el área (0.85%). Esta tasa anual dedeforestación es alta (a pesar del ajuste del área de manglaren 2007), comparada con otros lugares de México, donde latasa de deforestación anual varia de 0.03% a 0.64% (Alonso-Pérez et al. 2003; Berlanga-Robles y Ruiz-Luna 2006, 2007).
La tasa de deforestación de manglar calculada (0.85%)está justo debajo de los valores calculados por Pérez-Villegasy Carrazal (2000) para el periodo 1970–1990 en el norte deQuintana Roo (1.05%), y por Ellison y Fearnsworth (1996)para toda la región del Caribe (1%), pero difiere significati-vamente del valor mencionado por López-Portillo y Ezcurra(2002) para el Caribe Mexicano (alrededor del 12%). Comoen los estudios previos, nosotros calculamos la tasa de defo-restación para un periodo relativamente largo (1995–2007),y aunque no es posible detectar periodos críticos entre lasfechas, suponemos que la deforestación aumentó considera-blemente desde 2001, considerando el desarrollo urbano en elárea de estudio.
Se ha reconocido que el conocimiento local ayuda aconfirmar e identificar agentes de deforestación o de distur-bio de manglares (Kovacs 2000). Para el área de estudio, laconstrucción de caminos fue el principal agente de deforesta-ción, el cual fue frecuentemente registrado en las entrevistas,observado durante las visitas de campo y fue verificado en elanálisis de las imágenes. El impacto de la construcción decaminos entre zonas de manglar ya ha sido reportada previa-mente para el estado de Quintana Roo (Trejo-Torres et al.1993), y su alteración en los hidroperiodos y regímenes desalinidad de los manglares se han reportado como los efectosnegativos que llevan a la muerte lenta de grandes extensionesde manglar (Lopéz-Portillo y Ezcurra 2002).
La construcción de caminos como agente de disturbio delmanglar fue percibido con más frecuencia en Mahahual que

Hirales-Cota et al.: Drivers of mangrove deforestation in southeast Mexico
157
validation by image analysis. The impact of the constructionof roads across mangrove areas in Quintana Roo has beenreported previously (Trejo-Torres et al. 1993), and the disrup-tion of hydroperiods and salinity regimens has been docu-mented as a negative effect leading to the slow decadence oflarge areas of mangroves (López-Portillo and Ezcurra 2002).
Road construction as a deforestation driver was morecommonly recognized by the Mahahual residents than by theXcalak residents, probably because Mahahual has seen anincrease in infrastructure and because some months prior tothe beginning of this study a new road was constructedbehind this village; a recent experience undoubtedly fresh inthe minds of these residents. In addition to road construction,the delimitation of private property has a similar impact asthat of roads on mangrove forests, increasing fragmentationas well as decreasing area (Pérez-Villegas and Carrazal 2000,Díaz-Gallegos and Acosta-Velázquez 2009).
en Xcalak, probablemente porque en Mahahual ha habido unincremento en la infraestructura y porque unos meses antesde realizar las entrevistas se había construido un camino quecruzó áreas de manglar detrás de este pueblo, experiencia queindudablemente estaba fresca en las mentes de las personasde Mahahual. Aunado a la construcción de caminos, la deli-mitación de propiedades privadas tiene un impacto similar alde los caminos en los bosques manglar, incrementando lafragmentación y disminuyendo su área (Pérez-Villegas yCarrazal 2000, Diaz-Gallegos y Acosta-Velázquez 2009).
Otro agente de deforestación importante en la zona esel desmonte de área de manglar para construir hoteles yviviendas como consecuencia del crecimiento de actividadesturísticas en la zona, especialmente en Mahahual. La pobla-ción de Mahahual creció un 89% en el periodo 2000–2005dado el inicio de operaciones de muelle de cruceros turísticosen 2001 y la expectativa del desarrollo local llevó a un
a b
c d
Figure 4. Drivers of mangrove deforestation observed in the study area: (a) private land delimitation, (b) deforestation to build hotels,(c) building of roads, and (d) impact of Hurricane Dean.Figura 4. Agentes de deforestación de manglar en el área de estudio: (a) delimitación de propiedades privadas, (b) deforestación paraconstruir hoteles, (c) construcción de caminos y (d) impacto del huracán Dean.
Ciencias Marinas, Vol. 36, No. 2, 2010
158
Another important driver of deforestation is the clearanceof mangrove areas to build houses and hotel infrastructure asa consequence of the growth of tourism in the area, especiallyin Mahahual. The Mahahual population grew by 89% from2000 to 2005 when a cruise ship dock began operating in2001 and the expectations of local development led toincreased immigration and, consequently, greater construc-tion to provide housing and accommodation for immigrantsand tourists.
In conclusion, this study demonstrates that mangrovedeforestation in the Mahahual-Xcalak area is reaching levelssimilar to those recorded for northern Quintana Roo, wheretourism and urban development pressure are much higher. Itis also remarkable that the mangrove deforestation rates inthis area are higher in comparison to other Mexican regions,particularly the Pacific. The results of our interviews andchange analysis indicate that the main deforestation driversare related to the development of tourism facilities, ratherthan merely to population growth.
It is clear that the ecosystem services provided bymangroves, including those related to tourism (with implica-tions for the regional economy), can be lost if the current rateof deforestation continues. To avoid and reduce the impact ofdeforestation agents, it is necessary to conduct research onthe damages caused by anthropogenic and natural factors inorder to propose and apply conservation and rehabilitationprograms, and thus maintain the integrity of the mangrovesand other coastal ecosystems, such as coral reefs, whileachieving sustainable development in the Mahahual-Xcalakarea.
ACKNOWLEDGEMENTS
The authors thank PADI Foundation and My Community,Our Earth (MyCOE) for funding this project. We also thankSEMAR, the Costa Maya Territorial Ecological OrderingProgram, the GeoEye Foundation, and the Quintana RooDepartment of Urban Development and the Environment(SEDUMA) for the information and imagery provided.Thanks to Xcalak National Reef Park (CONANP) and CostaMaya Coastal Development Research Station (EIMCCM) forproviding accommodation. Special thanks to AM RamírezM, FD López M, and R Herrera P for their assistance in thefield, as well as to the residents of Mahahual and Xcalak fortheir valuable cooperation, and Z Christman, G Islebe, andAJ Navarrete for their valuable comments to early drafts ofthe paper.
REFERENCES
Alonso-Pérez F, Ruiz-Luna A, Turner J, Berlanga-Robles CA,Mitchelson-Jacob G. 2003. Land cover changes and impact ofshrimp aquaculture on the landscape in the Ceuta coastal lagoonsystem, Sinaloa, Mexico. Ocean Coast. Manage. 46: 583–600.
Anderson RJ, Hardy EE, Roach TJ, Witmer ER. 1976. A land useand land cover classification system for use with remote sensordata. US Geological Survey, Washington, DC, 28 pp.
aumento en la inmigración de personas, lo cual trajo consigola necesidad de edificar construcciones para viviendas y paradar servicios a los inmigrantes y turistas.
En conclusión, este estudio demuestra que la deforesta-ción de manglar en la zona Mahahual-Xcalak está alcanzadoniveles similares a aquellos registrados para el norte deQuintana Roo, donde el desarrollo urbano y turístico esmucho más alto. También, es notable que la tasa de deforesta-ción en el área de estudio es más alta comparada con otrasregiones de México, particularmente del Pacífico. Los resul-tados de nuestras entrevistas y del análisis de cambiosindican que los principales agentes de deforestación estánrelacionados al desarrollo de instalaciones turísticas, más queal crecimiento poblacional.
Es claro que los servicios ambientales que el manglarprovee, incluyendo aquellos ofrecidos a turistas (con implica-ciones para la economía regional), pueden perderse si la tasade deforestación actual continua. Para evitar y reducir losimpactos de los agentes de deforestación, es necesario llevara cabo estudios acerca de los daños derivados de causas natu-rales y antropogénicas para proponer y aplicar programas deconservación y rehabilitación, que permitan mantener laintegridad de los manglares con otros ecosistemas costeros,como los arrecifes coralinos, con la finalidad de lograr undesarrollo sustentable en la zona Mahahual-Xcalak.
AGRADECIMIENTOS
Los autores agradecen a la Fundación PADI y a MyCommunity, Our Earth (MyCOE) el financiamiento a esteproyecto. También agradecen a SEMAR, al Programa deOrdenamiento Ecológico Territorial de Costa Maya, laFundación GeoEYE y SEDUMA (Secretaría de DesarrolloUrbano y Medio Ambiente del estado de Quintana Roo) elhaber proporcionado imágenes satelitales e información aeste estudio. Gracias al personal del Parque NacionalArrecifes de Xcalak (CONANP) y de la Estación de investi-gación para el Manejo Costero Costa Maya (EIMCCM)por proporcionar alojamiento. Un agradecimiento especialpara AM Ramírez M, FD López M y R Herrera P por laayuda en los viajes de campo, también a las personas de lazona Mahahual-Xcalak por su valiosa cooperación y a ZChristman , G Islebe y AJ Navarrete por sus valiosos comen-tarios a las versiones de este trabajo durante su desarrollo.
Arriaga-Cabrera L, Vázquez-Domínguez E, González-Cano J,Jiménez-Rosenberg R, Muñoz-López E, Aguilar Sierra V. 1998.Regiones Prioritarias Marinas de México. Comisión Nacionalpara el Conocimiento y Uso de la Biodiversidad, México DF,198 pp.
Berg S. 1963. Random contact processes, snowball sampling andfactorial series distributions. J. Appl. Probab. 20: 31–46.
Berlanga-Robles CA, Ruiz-Luna A. 2006. Evaluación de loscambios en el paisaje del sistema estuarino de San Blas, Nayarit,México, por medio del análisis de imágenes de satélite LandsatMSS. Cienc. Mar. 32: 523–538.

Hirales-Cota et al.: Drivers of mangrove deforestation in southeast Mexico
159
Berlanga-Robles CA, Ruiz-Luna A. 2007. Análisis de las tendenciasde cambio del bosque de manglar del sistema lagunar Teacapán-Agua Brava, México. Una aproximación con el uso de imágenesde satélite LANSAT. Univ. Cienc. 23: 29–46.
Camarena-Luhrs T. 2003. Ficha informativa de los humedales deRamsar (FIR), Parque Nacional Arrecifes de Xcalak. ComisiónNacional de Áreas Natural Protegidas, SEMARNAT, México,23 pp.
Chuvieco SE. 2002. Teledetección Ambiental. Ariel SA, Barcelona,592 pp.
CONABIO. 2008. Manglares de México. Comisión Nacional para elConocimiento y Uso de la Biodiversidad, México DF, 35 pp.
CONANP, Comisión Nacional de Áreas Natural Protegidas. 2004.Programa de manejo parque nacional Arrecifes de Xcalak. JarasImpresores, México DF, 162 pp.
Congalton GR, Green K. 1999. Assessing the Accuracy of RemoteSensed Data: Principles and Practices. Lewis, Florida, 137 pp.
De Vaus DA. 2002. Surveys in Social Research. Allen and Unwin,St. Leonards, NSW, Australia, 369 pp.
Díaz-Gallegos JR, Acosta-Velázquez J. 2009. Tendencias en latransformación del uso de suelo y la vegetación aledaña. In:Espinoza-Avalos J, Islebe GA, Hernández-Arana HA (eds.), ElSistema Ecológico de la Bahía de Chetumal/Corozal: CostaOccidental del Mar Caribe. El Colegio de la Frontera Sur(ECOSUR), Chetumal, México pp. 226–237.
Duke NC, Meynecke JO, Dittmann S, Ellison AM, Anger K, BergerU, Cannicci S, Diele K, Ewel KC, Field CD, Koedam N, LeeSY, Marchand C, Nordhaus I, Dahdouh-Guebas F. 2007. Aworld without mangroves? Science 317: 41–42.
Ellison MA, Fearnsworth JE. 1996. Anthropogenic disturbance ofCaribbean mangrove ecosystems: Past impacts, present trends,and future predictions. Biotropica 28: 549–565.
FAO. 1996. Forest Resources Assessment 1990. Survey of tropicalforest cover and study of change processes. FAO, Rome, 152 pp.
FAO. 2007. Mangroves of North and Central America 1980–2005:Country reports. Forest Resources Assessment Working PaperNo. 137, Rome. Http://www.fao.org/forestry/home/en/.
Gao J. 1999. A comparative study on spatial and spectral resolutionsof satellite data in mapping mangrove forests. Int. J. RemoteSens. 22: 2823–2833.
Green EP, Mumby PJ. 2000. Mapping mangroves. In: Green EP,Mumby PJ, Edwards AJ, Clark CD (eds.), Remote SensingHandbook for Tropical Coastal Management. CoastalManagement Sourcebooks 3, UNESCO, Paris, 316 pp.
Green EP, Clark CD, Mumby PJ, Edwards AJ, Ellis AC. 1998.Remote sensing techniques for mangrove mapping. Int. J.Remote Sens. 19: 935–956.
Hernández-Cornejo R, Koedam N, Ruiz-Luna A, Troell M,Dahdouh-Guebas F. 2005. Remote sensing and ethnobotanicalassessment of the mangrove forest changes in the Navachiste-San Ignacio-Macapule lagoon complex, Sinaloa, Mexico. Ecol.Soc. 10: 16, http://www.ecologyandsociety.org/vol10/iss1/art16.
INE, Insituto Nacional de Ecología. 2005. Evaluación preliminar delas tasas de pérdida de superficie de manglar en México.SEMARNAT-INE, México, DF, 21 pp.
INEGI. 2000. Censo Nacional de Población y Vivienda 2000.Instituto Nacional de Estadística, Geografía e Informática,México, DF, http://www.inegi.org.mx/est/contenidos/Proyectos/ccpv/cpv 2000/ default.aspx.
INEGI. 2005. Conteo 2005. Instituto Nacional de Estadística,Geografía e Informática, México, DF, http://www.inegi.org.mx/est/contenidos/proyectos/ccpv/cpv2005/Default.aspx.
Kovacs JM. 2000. Perceptions of environmental change in a tropicalcoastal wetland. Land Degrad. Develop. 11: 209–220.
Kovacs JM, Zhang C, Flores-Verdugo F. 2008. Mapping thecondition of mangroves of the Mexican Pacific using C-bandENVISAT ASAR and Landsat optical data. Cienc. Mar. 34:407–418.
Landis JR, Koch GG. 1977. The measurement of observeragreement for categorical data. Biometrics 33: 159–174.
López-Portillo J, Ezcurra E. 2002. Los manglares de México: Unarevisión. Maderas y Bosques, núm. esp.: 27–51.
Lu D, Mausel P, Brondizio E, Moran E. 2004. Change detectiontechniques. Int. J. Remote Sens. 25: 2365–2407.
Lugo EA, Snedaker CS. 1974. The ecology of mangroves. Annu.Rev. Ecol. Syst. 5: 39-64.
Mas JF. 1999. Monitoring land-cover changes: A comparison ofchange detection techniques. Int. J. Remote Sens. 20: 139–152.
Muttitanon W, Tripathi NK. 2005. Land use/land cover changes inthe coastal zone of Ban Don Bay, Thailand, using Landsat 5 TMdata. Int. J. Remote Sens. 26: 2311–2323.
Peréz-Villegas G, Carrazal E. 2000. El desarrollo turístico enCancún, Quintana Roo y sus consecuencias sobre la cubiertavegetal. Invest. Geogr. 43: 145–166.
Ruiz-Luna A, Acosta-Velázquez J, Berlanga-Robles CA. 2008. Onthe reliability of the data of the extent of mangroves: A casestudy in Mexico. Ocean Coast. Manage. 51: 342–351.
Sánchez-Sánchez O, Cabrera-Cano EF, Torres-Pech AT, Herrera-Escudero P, Serralta-Peraza P, Gómez-Varela CS. 1991.Vegetación. In: Camarena-Luhrs T, Salazar-Vallejo SI (eds.),Estudios Ecológicos Preliminares de la Zona Sur de QuintanaRoo. Centro de Investigaciones de Quintana Roo (CIQRO),Quintana Roo, México, pp. 231–248.
Smith TJ, Robbleeh MB, Wanles R, Doyle TW. 1994. Mangroves,hurricanes, and lightning strikes. BioScience 44: 256–262.
StatSoft. 1998. STATISTICA for Windows, Computer ProgramManual. StatSoft, Inc., Tulsa, http://www.statsoft.com/.
Strahler A, Boschetti L, Foody GM, Field MA, Hansen MC, HeroldM, Mayaux P, Morisette JT, Stehman SV, Woodcock C. 2006.Global land cover validation: Recommendations for evaluationand accuracy assessment of global land cover maps. Report ofCommittee of Earth Observation Satellites (CEOS), WorkingGroup on Calibration and Validation (WGCV), Italy, 51 pp.
Trejo-Torres JC, Durán R, Olmsted I. 1993. Manglares de laPenínsula de Yucatán. In: Salazar-Vallejo S, González NE (eds.),Biodiversidad Marina y Costera de México. CONABIO-CIQRO, México, pp. 660–672.
UNEP-WCMC. 2006. In the front line: Shoreline protection andother ecosystem services from mangroves and coral reefs. TheUnited Nations Environment Programme World ConservationMonitoring Centre, Cambridge, UK, 33 pp.
Valiela I, Bowen JL, York JK. 2001. Mangrove forests: One of theWorld’s threatened major tropical environments. BioScience 51:807–815.
Vidal-Zepeda R. 2005. Región 11, Península de Yucatán. In: Vidal-Zepeda R (eds.), Las Regiones Climáticas de México.Universidad Nacional Autónoma de México (UNAM), MéxicoDF, pp. 189–210.
Yáñez-Arancibia A, Lara-Domínguez AL. 1999. Los manglares deÁmerica Latina en la encrucijada. In: Yañez-Arancibia A, Lara-Domínguez AL (eds.), Ecosistemas de Manglar en AméricaTropical. INENOAA-UICN, Beaufort, USA, pp. 9–16.
Received October 2009;accepted April, 2010.
Related Documents