Giving the power of the graph to the user TechInMotionSF @ Quid Joey Hobbs

{Drinks & Data} with Joey Hobbs
Jul 18, 2015
Welcome message from author
This document is posted to help you gain knowledge. Please leave a comment to let me know what you think about it! Share it to your friends and learn new things together.
Transcript

Giving the power of the graph to the user
TechInMotionSF @ Quid Joey Hobbs

Inside and out, Quid is all about the graph

I’ll be talking about…
• An overview of graphs
• What Quid does differently, in graph terms
• A demonstration using Quid

What is a graph?
• A graph is not a chart
• A set of things (nodes or vertices)
• A set of links which connect these things (edges)

A simple example
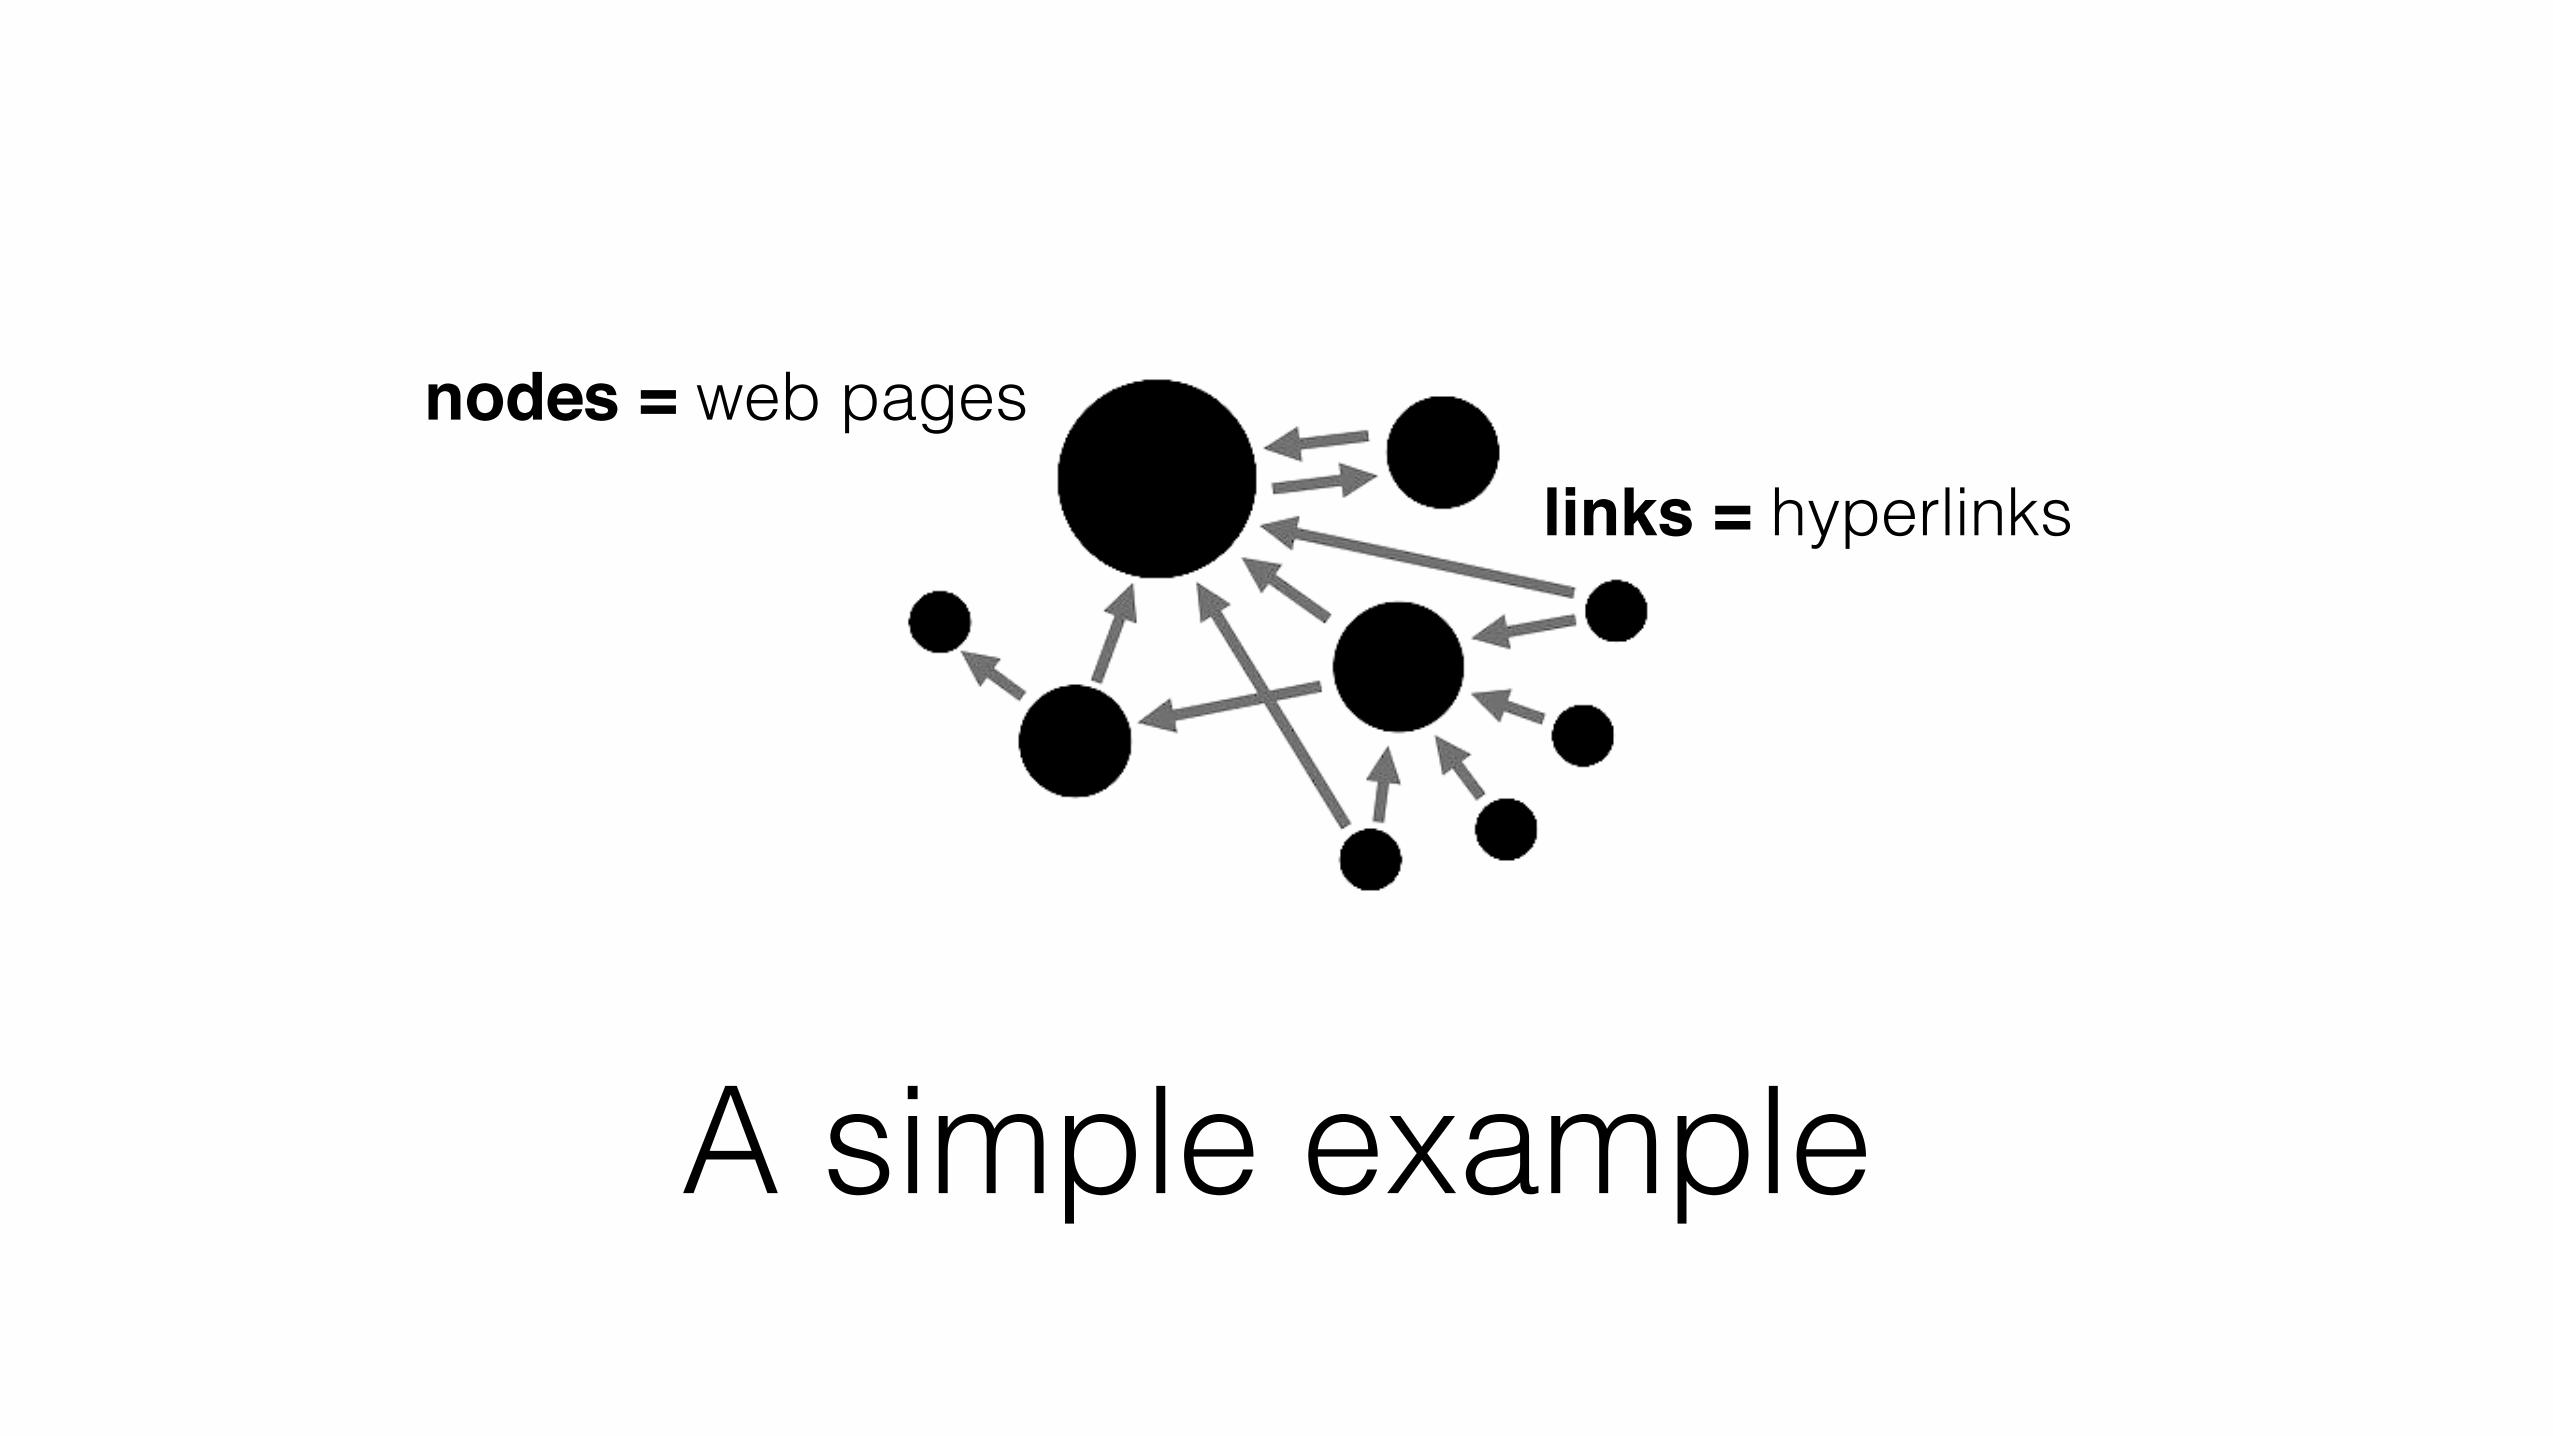
A simple example
nodes = web pageslinks = hyperlinks

The result

Facebook’s Social Graph


• Graphs are often used, but not often exposed
!
• The graph structure itself contains a lot of information
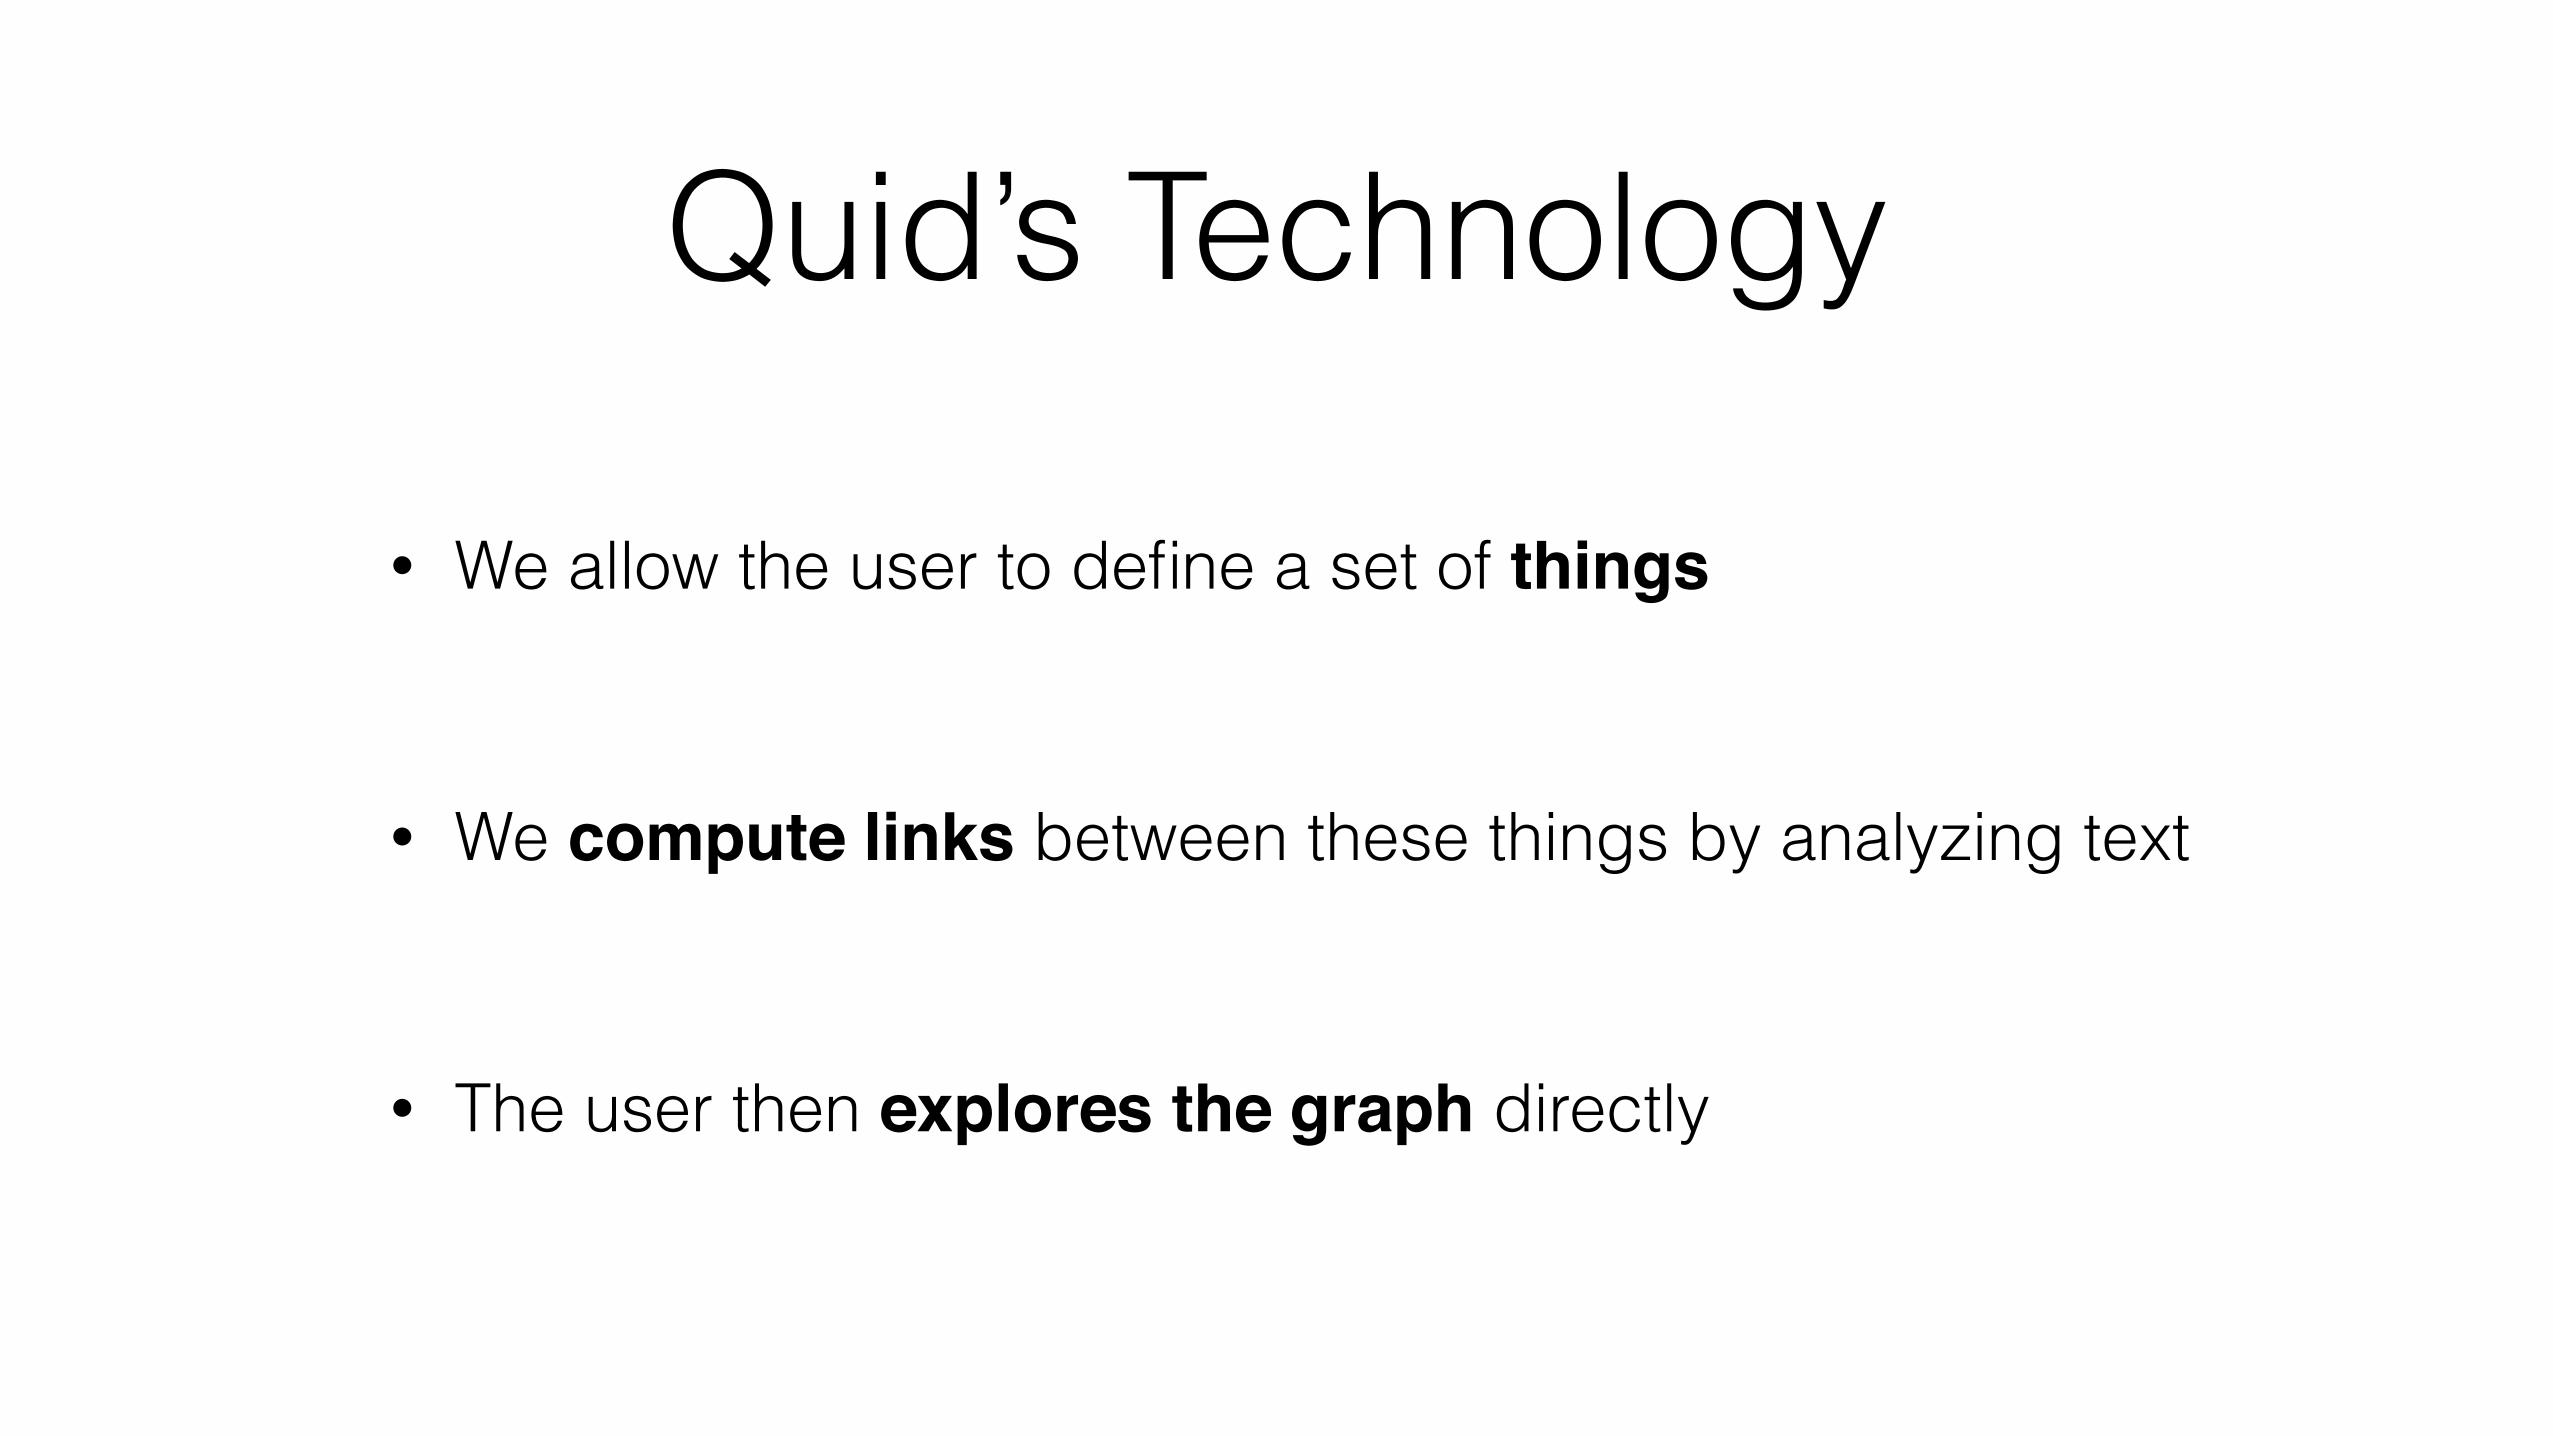
• We allow the user to define a set of things!
!
• We compute links between these things by analyzing text!
!
• The user then explores the graph directly
Quid’s Technology
Demo: what does the data visualization technology landscape look like?
Thank you for listening
Related Documents