WaterAid India 2005 Coverage, Financing and Emerging Concerns Status in India and Sanitation Drinking Water

Welcome message from author
This document is posted to help you gain knowledge. Please leave a comment to let me know what you think about it! Share it to your friends and learn new things together.
Transcript
WaterAid India 2005
Coverage, Financing and Emerging Concerns
Status in Indiaand Sanitation
Drinking Water


WaterAid India 2005
Coverage, Financing and Emerging Concerns
Status in India
Drinking Waterand Sanitation

First print: 2005, 1500 copiesSecond reprint edition: 2006; 1500 copies
© WaterAid India, 2005
Any part of this publication may be translated or reprinted with due acknowledgement to WaterAid, India
Published byWaterAid India1st Floor, Nursery School BuildingC-3, Nelson Mandela MargVasant Kunj,New Delhi - 110070Tel: 0091-11-46084400Fax: 0091-11-46084411Email: [email protected]
Design and Printing New Concept Information Systems Pvt. Ltd.New Delhi -110 076Tel : 91-11-26972748, 26973246
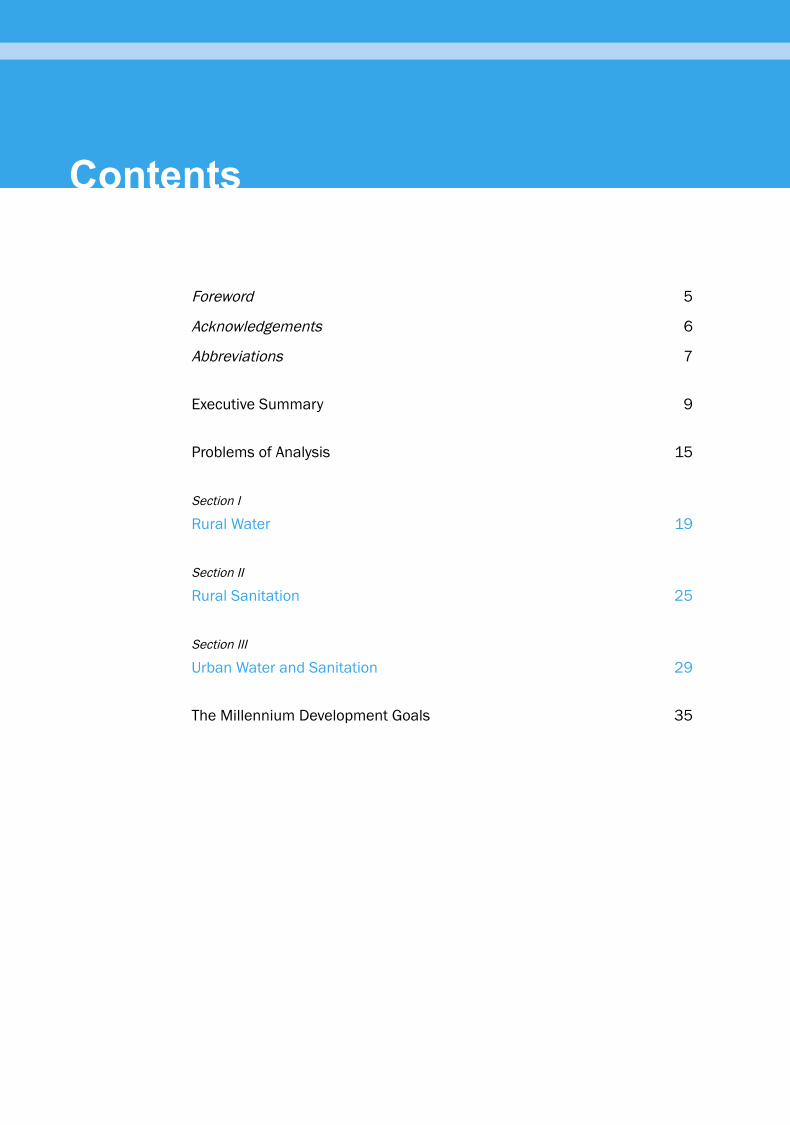
Foreword 5
Acknowledgements 6
Abbreviations 7
Executive Summary 9
Problems of Analysis 15
Section I
Rural Water 19
Section II
Rural Sanitation 25
Section III
Urban Water and Sanitation 29
The Millennium Development Goals 35
Contents


ForewordDespite massive outlays for drinking water and sanitation in India, access to safe drinking water remains a challenge. Institutional challenges in rural and urban drinking water and sanitation remain a major hurdle. These include addressing leakages in official spending, monitoring of progress and creating linkages between different agencies.
The failure of increased coverage and access may also be a combined result of ineffective programmes and policies as well as worsening livelihoods of the poorest communities on the one hand and the elite capturing resources and capital on the other. Failure in addressing resource sustainability and in achieving the desired behavioural change goals, needs to be reassessed from this point of view instead of relying upon a one-sided target driven approach.
Drinking water is an issue that evokes strong response in the electoral political discourse of the country, where election promises have drinking water as a top priority. But sanitation is largely missing in the political agenda. Despite increasing allocation of financial resources, specially for drinking water, there are serious concerns around sustainability of resources (water points and infrastructure developed) and investments made in the drinking water sector.
There are concerns on groundwater and surface water sustainability, with emerging concerns of inequity in access that is both intra-rural and rural-urban. The crisis has become intense over the past decade affecting both rural and urban sectors. With two-thirds of India being drought prone, increasing demands on available water from intensive agriculture and industry and increasing levels of groundwater and surface water pollution, drinking water availability is emerging as a constraint in many places. Access and delivery of safe drinking water varies from state to state and even within a state. Making projections of future demand and supply and investments required, depends on the definition of coverage and the choice of technology adopted. There have been no large scale independent reviews of the status of water and sanitation in India since the mid 1990s when the mid term review of the Ninth Plan highlighted serious concerns around the official data on coverage. Estimates of financial gaps for the sector suffer from limitations of data on existing status, priorities of the assessing agencies – whether these are financial institutions, GoI or World Bank – the technology choice under consideration and what is understood as minimum requirements for the sector.
Effectiveness of financial spending in the rural drinking water sector is a major cause of concern along with the poor progress in rural sanitation. There is a lack of continuous and regular monitoring of the status on the ground in terms of equitable access and affordability and a lack of long term planning at a disaggregated level of say, a district or a block in the rural areas. The entire process of Sector Reform for rural drinking water and sanitation is a top down process from the Centre to the States, with the State and District level Water and Sanitation Missions remaining ineffective and ill staffed. The role of NGOs and civil society is inadequately defined in decentralised programmes and projects. There is only administrative decentralisation without sufficient political decentralisation giving PRIs the limited role of project implementation. The situation is worse in the urban water and sanitation where credible estimates of coverage and access and financing requirements, are absent. Decentralisation is virtually meaningless for urban areas of India where a Municipality Ward as the minimum unit of decentralised planning has hundreds of thousands of population and a multiplicity of urban bodies to deal with.
This Paper by WaterAid India is an assessment of the drinking water and sanitation situation in the country in terms of coverage and financing gaps, if any, keeping the targets of the Millennium Development Goals as a benchmark for this assessment. Released on the World Water Day 2005, it is hoped that this work will facilitate a prioritisation of actions needed to address critical gaps in the water and sanitation sector in India.
Dr N C Saxena
Foreword
5

Drinking Water and Sanitation Status in IndiaWaterAid India 2005
6
AcknowledgementAcknowledgementsThis desk review of water and sanitation coverage and financing in India would not have been possible without the extensive published work of the Government of India, The UN, The World Bank and various NGOs. Paul Roberts working with WaterAid India led this work.
We are grateful to Mr. Paul Deverill, Mr. S Sundar and Mr. Raj Kumar Daw at UNICEF, Prof. Amitabh Kundu of the Jawaharlal Nehru University, Prof. D B Gupta of NCAER, Mr. Ramender Singh and his team from the Delhi based NGO Kislay, Mr. K. Mazumdar, Mr. Mark Ellery at WSP, Ms. Kathleen Shordt at IRC, Mr. A. Vaidyanathan at MIDS, Ms. Sheela Patel of SPARC and Dr. N C Saxena. Ms. Belinda Calaguas, Mr. Ravi Narayanan, Mr. David Redhouse, Mr. Anand Sekhar, Ms. Mamita Bora Thakkar, Mr. Roger Fitzgerald and other colleagues at WaterAid provided inputs for this paper.
This report is being released on the occasion of World Water Day 2005 with the expectation that it will contribute to addressing the drinking water and sanitation concerns of India. This report presents an overview and WaterAid hopes to publish similar studies in forthcoming years in different states of India in collaboration with its partners and various stakeholders.
Depinder S Kapur Country Representative WaterAid India
Abbreviations
7
ARWSP – Accelerated Rural Drinking Water Supply Programme
bn – billion
CBOs – Community Based Organisations
DDWS – Department of Drinking Water Supply
EGCIP – Expert Group Committee on Infrastructure Privatisation
GoI – Government of India
IEC – Information, Education & Communication
JMP – Joint Monitoring Programme of WHO and UNICEF
Lpcd – Litres per capita per day
MDGs – Millennium Development Goals
mn – million
MoUD – Ministry of Urban Development
NCAER – National Centre for Applied Economic Research
NSS – National Sample Survey
O&M – Operation and Maintenance
PEO – Planning Evaluation Office (part of GoI Planning Department)
PRIs – Panchayati Raj Institutions (local government institutions in India)
RGNDWM – Rajiv Gandhi National Drinking Water Mission (part of the DDWS)
Rs – Rupees
SHGs – Self-help groups
ULB – Urban Local Bodies
WAI – WaterAid India
WATSAN – Water and Sanitation
WC – Water Closet
AbbreviationsAbbreviations


Executive Summary
9
This Paper is an assessment of the drinking water and sanitation situation in the country in terms of coverage and financing gaps if any, keeping the targets of the Millennium Development Goals as a benchmark for our assessment. WaterAid India has in this Paper tried to highlight the emerging concerns and recommendations for public policy.
Rural water coverage as per the Department of Drinking Water Supply (DDWS) stands at 94% of rural habitations in early 2004. This means that India is more than on course to meet the MDG target of 70.5% of habitations ‘fully covered’ by 2015. Smaller studies have highlighted a large number of non-functional or unusable water sources, primarily a result of falling ground water levels leading to insufficient yield, increasing problems of water quality or poor maintenance leading to defunct infrastructure. There is a difference between the number of habitations considered ‘fully covered’ and the number with coverage plus use plus sustainability.
Huge financial resources have been earmarked for the rural drinking water sector in the Tenth Five-Year Plan even with 94% of habitations considered fully covered. It is hard to understand that if officially 95% of the rural population is fully covered with drinking water, what is the need to allocate massive outlays for the rest of the target population? Effectiveness of government spending in rural drinking water is emerging as a major concern. Despite huge financial allocations committed under the Tenth Plan, it looks unlikely that India will reach the MDG targets for rural water and sanitation. There is
still a lack of clarity about whether public monies are being spent in a pro poor and sustainable manner. The increasing financial outlays for the rural water sector in India do not reflect the true status on the ground. Rural drinking water sector financing in India is already a major political issue and will continue to be so in the years to come.
Rural sanitation. Table 1 shows that in year 2000, just 15% of the rural population were covered. This level needs to rise to 53% by 2015 to meet the MDG target and would require some 21 mn people per year gaining access to and utilising basic, hygienic, sanitation between 2000-15 (around 7.5 mn people per year gained access to a latrine between 1990-2000). Even if such a task was theoretically possible, there appears to be insufficient resource allocation to the sector to achieve this. The sanitation coverage situation in rural areas is poor. In 2000, coverage stood at around 15% of the rural population. An additional 53% would need to be covered by 2015 to meet the MDG target, a huge challenge. There appears to be a shortfall of some Rs 287 bn (US$6.4 bn) in the financing needed between 2002-15 to reach the MDG target for rural sanitation. Progress has been so slow over the last ten years and coverage remains so poor, that it looks extremely unlikely that India will reach the MDG target in 2015.
The MDG targets for urban water and sanitation in India will not be met without large investments in the sewerage, wastewater and solid waste disposal
Table 1 Statistics to watchCoverage (% and Millions of people served / to be
served in 2015)No. of people
to reach each year
Finance gap
2002-15 MDG1990 2000 2015 MDG
Rural Water 41%
260 mn
94%? 70.5%
583 mn
13 mn No gap
Probably
Rural Sanitation6%
38 mn
15% 53%
438 mn 21 mn
Rs 533 bn
Or $11.8 bn
Urban Water55%
155 mn
95%? 77.5%
309 mn6 mn Potential gap
Rs 1,000 bn
Or $22 bnUrban Sanitation44%
94 mn
61%? 72%
287 mn8 mn
Executive SummaryExecutive Summary
US $1 = Indian Rs 45
Drinking Water and Sanitation Status in IndiaWaterAid India 2005
10
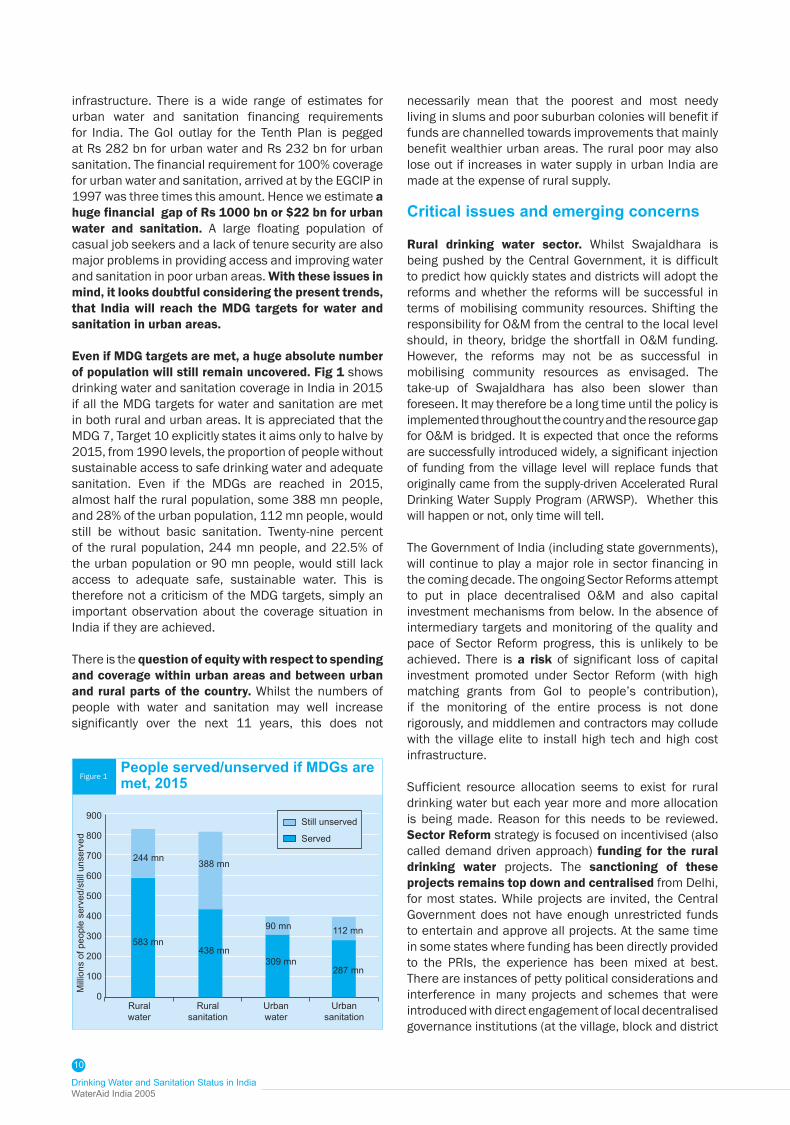
necessarily mean that the poorest and most needy living in slums and poor suburban colonies will benefit if funds are channelled towards improvements that mainly benefit wealthier urban areas. The rural poor may also lose out if increases in water supply in urban India are made at the expense of rural supply.
Critical issues and emerging concerns
Rural drinking water sector. Whilst Swajaldhara is being pushed by the Central Government, it is difficult to predict how quickly states and districts will adopt the reforms and whether the reforms will be successful in terms of mobilising community resources. Shifting the responsibility for O&M from the central to the local level should, in theory, bridge the shortfall in O&M funding. However, the reforms may not be as successful in mobilising community resources as envisaged. The take-up of Swajaldhara has also been slower than foreseen. It may therefore be a long time until the policy is implemented throughout the country and the resource gap for O&M is bridged. It is expected that once the reforms are successfully introduced widely, a significant injection of funding from the village level will replace funds that originally came from the supply-driven Accelerated Rural Drinking Water Supply Program (ARWSP). Whether this will happen or not, only time will tell.
The Government of India (including state governments), will continue to play a major role in sector financing in the coming decade. The ongoing Sector Reforms attempt to put in place decentralised O&M and also capital investment mechanisms from below. In the absence of intermediary targets and monitoring of the quality and pace of Sector Reform progress, this is unlikely to be achieved. There is a risk of significant loss of capital investment promoted under Sector Reform (with high matching grants from GoI to people’s contribution), if the monitoring of the entire process is not done rigorously, and middlemen and contractors may collude with the village elite to install high tech and high cost infrastructure.
Sufficient resource allocation seems to exist for rural drinking water but each year more and more allocation is being made. Reason for this needs to be reviewed. Sector Reform strategy is focused on incentivised (also called demand driven approach) funding for the rural drinking water projects. The sanctioning of these projects remains top down and centralised from Delhi, for most states. While projects are invited, the Central Government does not have enough unrestricted funds to entertain and approve all projects. At the same time in some states where funding has been directly provided to the PRIs, the experience has been mixed at best. There are instances of petty political considerations and interference in many projects and schemes that were introduced with direct engagement of local decentralised governance institutions (at the village, block and district
infrastructure. There is a wide range of estimates for urban water and sanitation financing requirements for India. The GoI outlay for the Tenth Plan is pegged at Rs 282 bn for urban water and Rs 232 bn for urban sanitation. The financial requirement for 100% coverage for urban water and sanitation, arrived at by the EGCIP in 1997 was three times this amount. Hence we estimate a huge financial gap of Rs 1000 bn or $22 bn for urban water and sanitation. A large floating population of casual job seekers and a lack of tenure security are also major problems in providing access and improving water and sanitation in poor urban areas. With these issues in mind, it looks doubtful considering the present trends, that India will reach the MDG targets for water and sanitation in urban areas.
Even if MDG targets are met, a huge absolute number of population will still remain uncovered. Fig 1 shows drinking water and sanitation coverage in India in 2015 if all the MDG targets for water and sanitation are met in both rural and urban areas. It is appreciated that the MDG 7, Target 10 explicitly states it aims only to halve by 2015, from 1990 levels, the proportion of people without sustainable access to safe drinking water and adequate sanitation. Even if the MDGs are reached in 2015, almost half the rural population, some 388 mn people, and 28% of the urban population, 112 mn people, would still be without basic sanitation. Twenty-nine percent of the rural population, 244 mn people, and 22.5% of the urban population or 90 mn people, would still lack access to adequate safe, sustainable water. This is therefore not a criticism of the MDG targets, simply an important observation about the coverage situation in India if they are achieved.
There is the question of equity with respect to spending and coverage within urban areas and between urban and rural parts of the country. Whilst the numbers of people with water and sanitation may well increase significantly over the next 11 years, this does not
900
800
700
600
500
400
300
200
100
0
Mill
ions
of p
eopl
e se
rved
/stil
l uns
erve
d
Rural water
Rural sanitation
Urban water
Urban sanitation
438 mn309 mn
287 mn
112 mn
People served/unserved if MDGs are met, 2015
Still unserved
Served
90 mn
Figure 1
583 mn
244 mn 388 mn
Executive Summary
11
levels) in many states in India, leading to not only project failures but also in some instances a victimisation of honest government staff working in the state run Public Health and Engineering Departments. Parallel government programmes and schemes in operation from the same ministry and several other schemes from other government departments and projects, are undermining each other.
Urban water and sanitation sector. The GoI is trying to put in place new legal mechanisms to ensure that the town and city municipalities can raise private sector funding, without any negative interference from the state governments under whose jurisdiction they are. This change has to deal with the federal political and administrative structures of governance and the transition will take time. For a city like Delhi, water availability is not an issue but inequity in supply to different areas within the city and the cornering of most of the available water for the richer and elite residential areas is.1 In this scenario, the issues are more complex than simply a lack of political will or increasing tariffs to recover O&M costs. If inequity in water supply is going to remain as before, why should the poorer communities pay for improved infrastructure for a city water supply. Hence not only will the financing requirements for sewerage systems, wastewater treatment and solid waste management be much higher than requirements merely for the provision of disposal of excreta, but the question of equity and cross subsidisation needs to be addressed while estimating the increased financing for urban water and sanitation. In the case of private investments in urban water and sanitation, there is an emerging concern around high cost and wasteful private individual household investments in urban water and sanitation to supplement the failure of the public infrastructure to deliver. Projections about financing of urban water and sanitation infrastructure should take into account this factor.
Sustainability of financial arrangements
The financial estimates for urban water and sanitation suffer from the lack of consistent data collection at GoI. Estimates for financial requirements from the banks and financial institutions suffer from the myopic outlook that sees drinking water as a purely economic good and are based on technological solutions, high cost infrastructure and easy to collect pricing mechanisms. The growing bankruptcy of public finances in smaller towns is a major issue of concern for future planning and sustainability of existing infrastructure. The increasing cost of electricity and water charges, besides O&M, is a major cause of worry for low-cost community managed infrastructure that has been built as NGO models in the last decade. The increasing tendency of sub national governments to opt for loans for high cost infrastructure from financial institutions – is further weakening public finances and governance. The loan giving financial
institutions are not doing enough to provide space for public discussion and information sharing around new projects. Incomplete decentralisation under the Sector Reforms programme in India – more administrative than political and financial, coupled with unequal resource ownership and political power, is a major cause of concern for institutional sustainability.
Role of the government in the sector
It is becoming difficult for the government to fund, monitor and manage the rural drinking water infrastructure in India, the way the current programmes are structured and with the worsening environment of public finances. The Central Government is keen to withdraw from its current perceived responsibility of providing for drinking water in rural India and take on more of a facilitator’s role. In addition to the task of managing, the cost of operations and maintenance of existing investments has become so huge and the state governments finances so bankrupt, that the state governments too want to pass this on to a third agency or to the people. There is a popular perception of withdrawal of the state from its welfare commitments, including economic and social development. Drinking water has become a very emotive political issue in rural areas and any elected representative is forced to make concessions for augmenting drinking water supplies in his/her constituency.
Para-state agencies involved in running and managing drinking water programmes in the states are not ready to give up their roles and powers. Both the state and the central governments therefore wish to use Sector Reforms to downsize these agencies. There is hence a tussle at different levels with the state government agencies, on restructuring the roles and blocking the implementation of Sector Reforms. The net result is that there is sometimes resistance to Sector Reforms and sometimes through the backdoor the old system gets back in and nothing much changes on the ground for the funding mechanism.
People’s expectations and demands for improvement in water supply have also increased over the last decades. Hence, drinking water investments continue to be made by the government, irrespective of the norms prescribed under Sector Reform schemes for government and people’s cost contributions. It is becoming difficult for any political party to take a hard stand on the issue of decentralised, sustainable and people-managed drinking water system in rural areas. These factors together combine to pose major hurdles on the uptake of the Sector Reform programme.2
1 From a recent WaterAidIndia study - Profiling the “Informal City” of Delhi. 2004.
2 This was discussed in a recent Study presented in the WSP-DFID review workshop in Delhi (in August 2004), on the Sector Reform progress in Andhra Pradesh.

Drinking Water and Sanitation Status in IndiaWaterAid India 2005
12
Understanding the nature of private investment and its operations in the water and sanitation sector
Water being a state level subject and nearly two thirds of India being drought prone and semi-arid, during times of drought, large scale unregulated private investments in drinking water and sanitation at the individual household level and a multiplicity of small and large private contractors has resulted in competing self interests that are not always beneficial for meeting the drinking water and resource sustainability as well. In urban areas, people are making huge investments in extracting water and building their own sanitation disposal systems. In urban slums provision of basic services is linked to political power and patronage and not the sustainability, access, quality and equity of the resource provision. The unorganised private sector, which is operational on a large scale in many small Indian towns and cities, has developed a vested interest in providing drinking water, with little interest in either resource sustainability or efficiency of water use. Water trains are now running almost every year for a couple of months in Rajasthan.
Recommendations
This desk review by WaterAid India of the complex water and sanitation scenario of India, proposes the following major recommendations for public policy, programmes and renewed focus of all other stakeholders.
1. Improving the quality, regularity and reliability of statistics of drinking water and sanitation
Arriving at a common definition of coverage and its assessment, is required for all national level surveys. Functionality of the improved source, usage and water quality have to be included in these norms, otherwise there is no point in claiming 99.6% coverage for rural drinking water at the national level. Similarly for rural sanitation and urban water and sanitation statistics.
There is a need for consistency in the methodology of estimating coverage, among the various estimates for rural drinking water emanating from NSS, Census and the DDWS. There is also a need for regular, independent studies to assess coverage.
There is large gap in the reliability of urban water and sanitation coverage and the financial requirements. Unlike the rural water and sanitation statistics for which DDWS is the nodal agency within Ministry of Rural Development and conducts frequent surveys, the urban water and sanitation coverage is not undertaken by a single agency on a regular basis.
2. Monitoring of water quality, access and affordability of drinking water should become a key consideration of national and state level agencies
Effective monitoring of access, quantity and quality of water and sanitation, is a key consideration for India. Given the large investments and big programmes and schemes including the current thrust of Sector Reforms, absence of good quality of monitoring on the ground is a big lacuna. Monitoring of parameters of health and hygiene, status of other complimentary services like electricity and delivery charges, social aspects of access for the marginalised and poor communities, programmes and schemes, subsidies and campaigns, interface between different agencies, etc. – is not being done or is being done piece meal by different agencies.
Besides the government, other civil society organisations and the private sector should also pool their information and ideas together to monitor and assess the water and sanitation status on a regular basis. While only the government will have the means to undertake large sample surveys on a regular basis, the knowledge and information with the NGOs and the sector needs expansion INGOs should be pooled together and shared widely in the public domain.
At the district level, the Collector should be made in charge of supervising progress on rural sanitation. The existing state level water and sanitation mission’s role should be strengthened for civil society participation and citizens’ forums to be engaged in planning and monitoring of progress in the rural (block and district level forums) and urban (city forums and ward level monitoring) settings.
At the national level, given the size of the country and the complexity of the situation, regional and national level bodies that monitor the progress of water and sanitation coverage and financing requirements should be constituted with sufficient participation of civil society and NGOs for both rural and urban water and sanitation.
Community level monitoring systems for water availability, changes in ground water levels, water quality and water usage – these are also required for supporting higher level planning and monitoring.
3. Effectiveness of public spending and realistic estimates of sector financing from a bottom up approach to assessment of finances for the sector
Irrespective of Sector Reforms or no reforms, effective financial allocation for new investments and operations

Executive Summary
13
and maintenance, not the quantum of available finance for rural water supply, is an emerging concern. However, an estimation of financial requirements is based on the reliability of the existing status of coverage and the technology options.
Having officially achieved 94% coverage in rural drinking water supply in 2004 it is difficult to understand why financial allocations requested by DDWS for rural drinking water coverage in the Tenth Plan (2002-07) were projected at a massive Rs 404 bn, against the Ninth Plan (1997-2002) expenditure of Rs 167 bn. Similarly estimates for urban water and sanitation infrastructure show an extreme variation depending upon the source (EGCIP estimates vs NIUA estimates).
Bottlenecks in timely release of grants of various government schemes and the coordination of funding support of various INGOs and NGOs, is a major concern for effective financial management in the sector.
Estimates of financing requirements need to have a bottom up approach from the village, block and district levels, for different levels of service provision and technology options. Merely announcing new schemes with a demand driven approach will not help. This task has to be decentralised and appropriate manpower and financial resources provided for doing this. For urban water and sanitation financing, different Indian towns and cities can have different options and the government can take up the major cost of providing urban infrastructure for large metros and towns, given that some of the Municipalities like Delhi have budgets larger than many smaller states of India and there is little transparency in information sharing or public debate on the budget allocations.
Financial requirements for increased sanitation coverage in rural India need to be determined based on a disaggregated analysis for the finance required from the government (as subsidy or as incentive) and from the people, for the different components of hardware and software (community awareness and motivation and for health and hygiene).
Alternative financing estimates for the water and sanitation sector are required and this exercise should be coordinated to the extent possible with all the stakeholders for a 5 to 7 year estimate for the sector.
A review of subsidies is required. Rationalisation should not be misunderstood as across the board reduction of subsidy. The experience of different agencies working in different contexts needs to be pooled together and different approaches to effective use of subsidies needs to be tried out.
4. Effective Policy, administrative and legal action needed to secure the sustainability of safe drinking waterpoints
Given the increasing unsustainability of rural drinking water schemes, there is a need to identify waterpoints exclusively for drinking water needs of the rural community and incorporate this into the legal and administrative framework of rural governance so that these waterpoints are considered a common property resource and any threat to its sustainability is countered by administrative action. If this is not done, merely increasing funding will not solve the problem of increasing water distress.
Longer term planning for urban drinking water needs and for safe disposal of liquid and solid wastes, is required. The current discourse on right to drinking water and priority for drinking water in the national and state level water policies, is not matched with the reality of budget allocation and projects on the ground. Water basin level approach to planning is being proposed in most state and national budgets planning.
Strengthening regulation for safe drinking water provision is also required, for the service providers to be regulated with stringent regulations for public health and safety.
5. Making a case for improved and equitable water and sanitation for urban poor
Given the increasing urbanisation trend in India, high vulnerability of urban livelihoods and insecurity, the higher financial allocations or resource mobilisation for some cities and not others and the inequity in distribution and access to water and sanitation facilities within a city – all these provide the moral imperative to include urban water and sanitation as a developmental goal for India for the coming decades.
Since different cities in India have a different economic status, there is a potential for exploring different options for delivery of water and sanitation to the urban poor in India. Potential for free minimum drinking water alongwith a slab based water tariff that cross subsidises lower consumption levels is also possible. Community managed urban toilet complexes can be another priority in place of contractor managed toilets in urban slums. It is a moral imperative to deal with the agony of a lack of access to toilets in urban slums that impinge upon not only a large majority of urban population but also some of the poorest and most vulnerable, including women and children, lower castes and classes. To translate this into a priority for urban administrative bodies and municipal councillors requires coordinated action and public outcry.
Drinking Water and Sanitation Status in IndiaWaterAid India 2005
14
Whatever be the options, the process of arriving at the options is an empowering one when it is done in a democratic, participatory and transparent manner.
6. Need for special focus on rural sanitation
The past approach and record of rural sanitation has not been very encouraging. The involvement of NGOs in campaigning for sanitation and hygiene promotion should be encouraged by the government.
PRIs are being identified as the nodal implementation agencies for sanitation, without sufficient focus on the capacity and constraints of PRIs. There is much that needs to be improved in the TSC programme of GoI. The TSC guidelines could be made more effective by identifying credible organisations to lead the TSCs.
Improvements in TSC include removing anomalies in the district administrative set up which includes setting up fully staffed State Water and Sanitation Missions, giving priority to appointment of best staff and filling all vacant posts, better planning, better coordination between the various departments of health, education and PHED, encouraging low-cost sanitation options and capacity building of government staff to appreciate low-cost sanitation options, timely sanction disbursements of grants and honorariums to the volunteers.
Identifying factors that impinge on low achievement of rural sanitation, including material factors like lack of water and behaviour change issues, need immediate attention.
Problems of Analysis
15
Background and PurposeThis paper aims to set out the water and sanitation (WATSAN) situation in India, assessing both the coverage and financing situation. Related issues of effective, equitable and sustainable delivery of water and sanitation have been taken up in this review. The first section of this paper deals with rural water, the second with rural sanitation, the third with WATSAN in urban India and the fourth sets out the concluding comments. Whilst reviewing the coverage and financing issues surrounding the WATSAN sector in India we have assessed coverage levels and estimated how many more people need to be reached in order to meet the MDG targets. We have then assessed whether the costs of reaching the targets are likely to be met with planned spending in the sector. Whilst the scope of the paper has not allowed for detailed analysis of specific policies, we do hope to have brought a fresh perspective on the extent of the provision of water and sanitation in India and highlighted issues related to ensuring its effective, equitable and sustainable delivery.
This paper is not intended to be a critique of the work of any organisation nor is it an evaluation of a particular project.
Methodology This Paper is based on a desk review of literature on the subject, studies and work experience of WaterAid India
and interaction with experts in this field over a period of three months.
In order to assess the coverage and use WAI has relied on data from the DDWS, the decadal Census of India and UNICEF/WHO/Planning Commission assessments, which are based on numerous Government of India (GoI) sample surveys. We have also used data from the PEO, World Bank and from WaterAid’s own studies. Unfortunately in the drinking water and sanitation sector, the multiplicity of government ministries dealing separately with rural and urban planning, multiplicity of national level surveys not using a uniform methodology for assessing coverage and a lack of independent studies at a sufficiently representative scale – adds to the problem of an assessment of the situation on the ground. A major effort in the review by WaterAid India has therefore been to place in perspective all the assessments made by the major agencies engaged in the drinking water and sanitation sector in India and to then draw out the critical issues and emerging concerns from as best an analysis as possible. The most significant sources for this review are the DDWS, RGNDWM, Planning Commission, Census and NSS, UNICEF 2002 Assessment Report and the World Bank water sector reports. Different sources of information have been sought and analysed in this review. Against each set of statistics a footnote has been added noting the source. Whilst figures from WAI’s own reports in states in the south have been mentioned, the
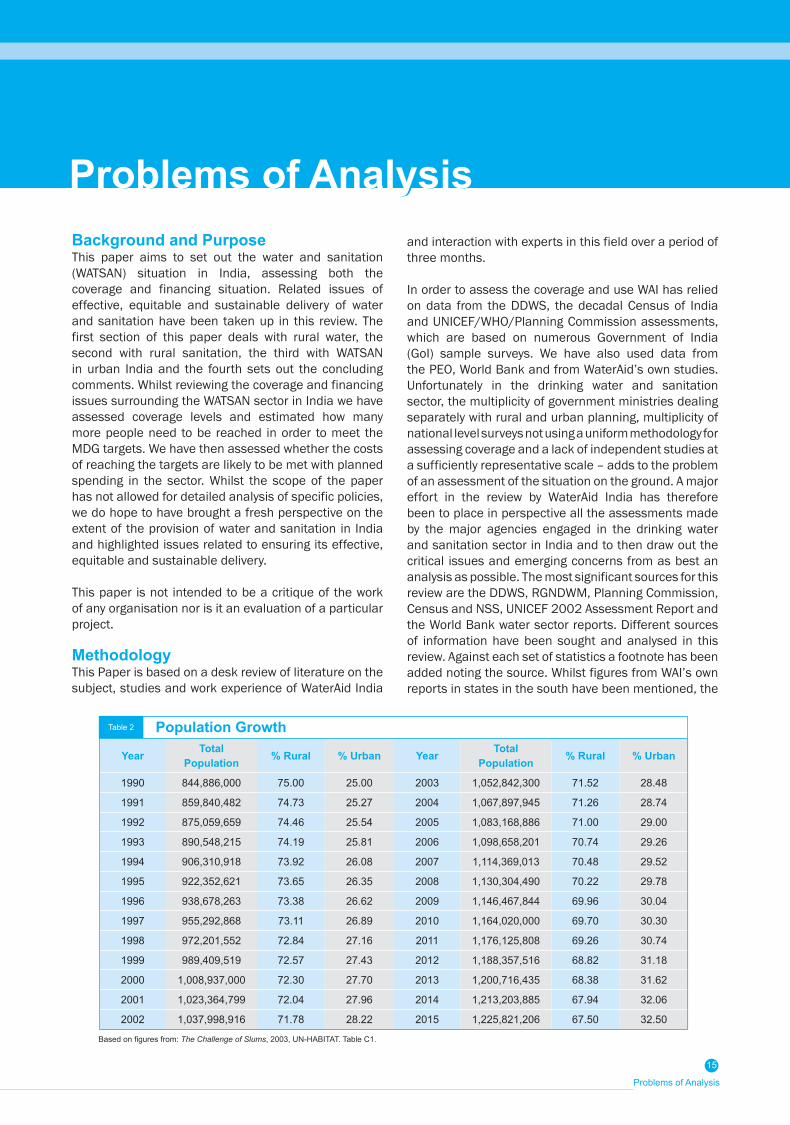
Year Total Population % Rural % Urban Year Total
Population % Rural % Urban
1990 844,886,000 75.00 25.00 2003 1,052,842,300 71.52 28.48
1991 859,840,482 74.73 25.27 2004 1,067,897,945 71.26 28.74
1992 875,059,659 74.46 25.54 2005 1,083,168,886 71.00 29.00
1993 890,548,215 74.19 25.81 2006 1,098,658,201 70.74 29.26
1994 906,310,918 73.92 26.08 2007 1,114,369,013 70.48 29.52
1995 922,352,621 73.65 26.35 2008 1,130,304,490 70.22 29.78
1996 938,678,263 73.38 26.62 2009 1,146,467,844 69.96 30.04
1997 955,292,868 73.11 26.89 2010 1,164,020,000 69.70 30.30
1998 972,201,552 72.84 27.16 2011 1,176,125,808 69.26 30.74
1999 989,409,519 72.57 27.43 2012 1,188,357,516 68.82 31.18
2000 1,008,937,000 72.30 27.70 2013 1,200,716,435 68.38 31.62
2001 1,023,364,799 72.04 27.96 2014 1,213,203,885 67.94 32.06
2002 1,037,998,916 71.78 28.22 2015 1,225,821,206 67.50 32.50
Based on figures from: The Challenge of Slums, 2003, UN-HABITAT. Table C1.
Problems of AnalysisProblems of Analysis
Table 2 Population Growth
Drinking Water and Sanitation Status in IndiaWaterAid India 2005
16
findings have not been extrapolated up to the national level. It was felt this would be inaccurate given the small sample sizes.
Figures 1-5 of this paper are based on estimations of India’s population and urbanisation rate from 1990-2015. To avoid using more than one source of information we used statistics from UN-HABITAT, which give figures on both population and urbanisation for the entire period of 1990-2015. The figures used are given in Table 2.
ConstraintsA desk review of coverage and financing gaps at the national level for a large country like India with varying resource status and development levels has its limitations. There are few sources of information besides the national level government surveys and it is not possible to extrapolate small regional or state level studies to predict national level trends with accuracy. Data also often conflicts in its assessment of the state of the drinking water and sanitation sector in India. WAI was particularly constrained by the lack of information relating to the urban sector (including urban slums) in both coverage and financing. Working within these limitations, WAI has been able to identify a few key considerations in making a more meaningful assessment of coverage and financing for water and sanitation. This has been highlighted in the concluding section of this paper.
WAI is also aware that it is difficult to predict future demand for water and sanitation and the financing requirements needed until 2015, on the basis of projected population increases and prevailing cost estimates in the absence of forecasts of economic growth and distribution of incomes and welfare in India. The demand, technology and financing (which in turn is influenced by the choice of technology) as well as the resource status may change significantly as a result of a change in economic growth and per capita real incomes. Nevertheless, whilst it is acknowledged that an India-wide desk review will never be an exact science, it is hoped WAI has provided a broad picture of the current water and sanitation situation and highlighted the difficulties associated with reaching the MDG targets.
FinancingSector Reforms are changing the way water and sanitation (WATSAN) is provided and financed in India. Local communities will decide on the technology they require and rather than being wholly financed from the government, significant contributions towards WATSAN projects will come from the community level. Trying to assess how quickly Sector Reform will be adopted throughout India and the likely impacts on financing is very difficult, which makes assessing financing for the MDG target year in 2015 difficult.
It has not been possible to find separate public and private capital investment trends in urban and rural water and sanitation in the past or the likely investments in the future, except for the estimates of the Expert Group Committee on Infrastructure Privatisation.
A Definition of ‘Coverage’The MDG Goal Seven, Target 10 aims to: halve by 2015, from 1990 levels, the proportion of people without sustainable access to safe drinking water and to halve by 2015 the proportion of people without basic sanitation. However, there is a certain degree of ambiguity over the meaning of the term ‘sustainable access to safe drinking water’ and ‘basic sanitation’ and no internationally agreed definitions.
Differences in assessments of the progress India is making towards the MDG targets are often a reflection of different organisations using different sets of criteria by which to measure progress. This also tends to lead to differing assessments in the financing required to reach the MDG targets. WAI believes that progress towards the MDG targets needs to account for both ‘coverage’ and ‘use’. It is imperative that households are not only provided with sanitary latrines and safe waterpoints but they also need to use them for health benefits to be realised.
Figures released by the DDWS show that in the first quarter of 2004, 94% of rural habitations were considered ‘fully covered’ with enough, safe drinking water. However, the DDWS also notes that at any given time approximately 15% of government waterpoints fail to function effectively. Moreover, this figure of 94% is only an assessment of government waterpoints and does not take into account the number of people still using potentially unsafe private wells. Whilst 94% of rural habitations may well be fully covered with safe government waterpoints this is not the same as saying that 94% of habitations have access to functioning safe sources and are only using these safe water sources. For these reasons it is possible to measure progress towards the MDG targets, in accordance with WAI’s own definition of coverage, only using figures released by the DDWS.
Statistics for urban WATSAN and rural sanitation were taken from a UNICEF/WHO sponsored study in conjunction with the Planning Commission of India, entitled: India Assessment 2002, Water Supply and Sanitation. Based on a linear regression of various sample surveys, these figures measure the percentage of households taking their drinking water from protected sources in rural and urban India. However, these figures do not take into account the seasonality of water supply or water quality. For urban and rural sanitation, the figures measure the percentage of households with a toilet but do not measure the sanitary condition of the toilets, usage or hygiene practices. Given the large and

Problems of Analysis
17
growing problem of water shortages in summer months, water pollution and the number of latrines that are in an unsanitary state or are simply left unused, it is also not possible to measure progress towards the MDG targets, in accordance with WAI’s own definition of coverage, only using these figures.
For these reasons this paper has cited studies that have taken into account more of the above issues. This paper has also stressed the need to examine what exactly the various ‘coverage’ and ‘access’ statistics actually measure. In doing so, we hope to have brought a fresh perspective on India’s progress towards the MDG targets.
A more rigorous measurement of water progress towards the MDG targets could be that in addition to the GoI water coverage criteria3 we have the following:1) Access to at least 40 litres4 of water per person per
day in rural areas, 135lpcd in urban areas.2) Within 1.6 kms of the home or with 100 m elevation
in hilly areas.3) One handpump to serve no more than 250 people.4) Enough water is available every day of the year.5) From a protected source, such as a household
connection, public standpipe, safe borehole (not irrigation pumps), protected well or spring, and rainwater collection. Unimproved sources include vendors, tanker trucks, and unprotected wells and springs and bottled water.5
6) Free from harmful pollutants and high levels of salinity.6
7) Water points are functional (WAI’s experience shows that community-based maintenance systems are the best ways to keep water sources in good condition and fix them in case of break down).
8) No other source of drinking water is used that does not fit the above criteria.
Similarly for assessing sanitation coverage:1) Technology must be used that can dispose of
faeces in an environmentally safe way. Whilst there are many latrine types in India and each latrine or latrine block needs to be appropriate to the local environment they should all dispose of faeces in a sanitary and safe way. Faeces should not soil or come into contact with humans, flies, or animals nor must it pollute water sources. For example, a pour flush, single pit latrine would be considered sanitary but a service latrine would not.
2) There should be no problems identified with the latrine, such as: foul smells, flies/mosquitoes, flooding during rainy season, insufficient water for hygienic use, lack of privacy for women.
3) The latrine must actually be used. Moreover, if we are measuring per household, then all members of the household should use only a sanitary latrine and not practice open defecation.
4) The latrine must be located within a reasonable distance from users’ homes.
5) Use of the latrine must also be accompanied with hygienic practices such as hand-washing with a cleaning agent, such as soap, after use.
3 The GoI is in the process of relaxing the norms for rural water supply. The relaxed norms stipulate that once every habitation in the state has a safe drinking water source providing 40 lpcd, State Governments may provide (if demanded by the ben-eficiaries) up to: 55 lpcd of safe drinking water; one source for every 150 persons; no specific limit for isolated SC/ST habitations, ensuring one safe source for vulnerable communities, irrespective of their population in the habitation; one source within 0.5 km in the plains and 50 metres difference in the hills. Beneficiaries of the relaxed norms must be willing to share no less than 20% of the capital and 100% of O&M costs of the higher service.
4 As per GoI norms, 40 litres are divided into: 3 for drinking; 5 for cooking; 15 for bath-ing; 7 for washing utensils & house; and 10 for ablution.
5 Bottled drinking water is not considered a satisfactory source because of its ex-tremely high unit costs and therefore is normally not an option for poorer people. If they are forced to use bottled water, consumption is usually low.
6 A source is said to be safe if it is free from physical, chemical bacteriological and biological contamination and conforms to the drinking water quality standards prescribed by the BIS.

Drinking Water and Sanitation Status in IndiaWaterAid India 2005
18

Section I Rural Water
19
The increase in the number of people covered by drinking water in rural areas is a notable achievement and reflection of the significant investments by the Government of India (GoI) over the last decade. The eradication of Guinea worm disease is also something to be lauded. GoI has also taken the decision to upscale sector reforms principles across the country which will hopefully go a long way to achieving the sustainability of sources. Figure 2 shows the progress India is making towards the MDG target according to figures released by the DDWS.
The DDWS figures shown in Figure 2, based on information from state governments, show that 94% of rural habitations – some 720 mn people – were considered ‘fully covered’ in April 2004.7 Enormous progress has been made between 1994 and 2004 with some 39 mn people gaining fully covered status each year. The apparent fall in coverage from 1990 to 1994 can be explained by a change from measuring just ‘physical coverage’ of villages in 1990 to measuring whether habitations are fully covered, partially covered or not covered from 1994 onwards.8
Figure 2 paints a rosy picture of water provision in rural India. Whilst the DDWS does not look on course to achieve its aim of 100% of habitations being ‘fully covered’ in 2004, this target does look likely to be achieved in the next few years. Only if full coverage
Rural Watermeans installing handpumps in all habitations of India and not the functionality and adequacy and safety of the water pumped out.
The RGNDWM reports that rural habitations covered increased from 56% in 1985 to 95% in 2004. This increase is attributed to the implementation of ARWSP, SRP and Swajaldhara. The allocation of funds under ARWSP increased substantially from about Rs 3 bn in 2000 to Rs 31.48 bn in 2004. The mission also states that of the 1.42 mn rural habitations in the country, all but 8,686 habitations had been covered with water supply. During the period 1999 to 2005, 100,000 schemes with a total outlay of Rs 27.10 mn was sanctioned in 67 Sector Reform districts and 409 Swajaldhara districts. Community contribution to the programme was calculated at Rs 1.82 bn.
Statistics released by the DDWS only measure access to government waterpoints but they do not take into account the number of people still using potentially unsafe private wells. Utter Pradesh (with a million out of the 3.5 mn handpumps in India) and Bihar are considered 100% ‘fully covered’ yet large numbers of people in these states suffer from water-related diseases as people still draw dirty water from private shallow wells. In Madhya Pradesh between 1998–2003, there has been an increase of 92% in diarrhoeal diseases (including gastroenteritis, cholera and dysentery), 3.2% in jaundice cases and of 162% meningitis cases.9 Whilst 94% of rural habitations may well be fully covered with safe government waterpoints this is not the same as saying that 94% of the population only use safe waterpoints as they may also be using their unsafe private wells.10 If we take a definition of fully covered that also assesses usage, coverage is likely to be lower than in Figure 2.
Furthermore, DDWS figures are based on 1991, and more recently, 2001 Census assessments of the number of habitations in India. The number of habitations increases from year to year due to population growth and displacement caused by natural disasters. As new
Section I
7 See: www.ddws.nic.in/ARWSP_Reports/state_hab.asp8 Habitations are defined by DDWS: includes hamlets, settlements and other
habitations as per the revenue classification of a village9 Water and Sanitation in Madhya Pradesh, WaterAid India, 200510 RGNDWM quoted in The Recommendations for the Tenth Plan Working Group on
Rural Drinking Water Supply and Sanitation, 2001, DDWS. Also mentioned: there are 3.5 mn handpumps and more than 116,000 piped water schemes as of 2001.
800
700
600
500
400
300
200
100
0
Mill
ions
of p
eopl
e 'fu
lly c
over
ed'
1985
Rural Water Coverage
1990 2000 2005 20101995
Percentage of habitations/no. people ‘fully covered’
DDWS problem ofslippage @ 15%
74%/469 mn*
49%/328 mn
67%/466 mn
87%/639 mn
94%/717 mn
79%/601 mn
72%/543 mn
* physical coverage’ as per Eighth Five-Year Plan
Sources: 1994 - GoI quoted in Rural Water Supply and Sanitation, World Bank, 1999; 1997 - Working Group on the Tenth Five-Year Plan, Table 2.2.1; 2001 - Working Group on the Tenth Five-Year Plan, chapter 1; 2004 - www.ddws.nic.in
Figure 2
Drinking Water and Sanitation Status in IndiaWaterAid India 2005
20
habitations are only measured every decade, in the years preceding a census coverage statistics will not take into account these new habitations which are likely to have poor water (and sanitation) facilities.11 In this way, the percentage of ‘fully covered’ habitations may be lower than in Figure 2, especially in the few years prior to a census.
There is also the issue of pressure on handpumps. Under the DDWS norms, each handpump should serve 250 people. The norms also stipulate that everyone should have access to 40lpcd in rural areas. Mark II handpumps can discharge around 12 litres per minute. For a community of 250 people, the handpump would need to work continuously for 13 hours 53 mins every day to ensure an output of 40 lpcd. When a community grows to 251 people a new handpump, according to a very strict interpretation of the guidelines, should be installed. However, if this is not the case and the population increased to, say, 400 before a new handpump was installed the pressure on the existing sole pump increases significantly. For a population of 400, one pump would need to be continuously used for over 22 hours each day to ensure 40lpcd, which is somewhat infeasible.12 If this situation is occurring but state governments are still reporting such habitations as fully covered to the DDWS, coverage would be lower than in Figure 2.
Some of these issues – but not all - have been recognised by the Central Government under the term ‘slippage’. Slippage refers to ‘fully covered’ habitations slipping into the ‘partially covered’ category, and ‘partially covered’ habitations slipping to ‘not covered’, due to problems of source functionality, water quality and the emergence of new habitations. The Working Group on the Tenth Five-Year Plan said that slippage affected around 15% of habitations in rural India. This has been shown in Figure 2.13
It is reasonable to assume that at any given point in time a certain percentage of sources will be non functional. For example, the source could be waiting for a mechanic to come and fix a small fault that has rendered it unusable. If this is the case in most of the slippage habitations then slippage will not be much of a problem so long as the fault is dealt with speedily. The key factor is cause of the ‘slip’. No statistics have been released which break the cause of slippage down into: source non-functionality (in which case the length of time for which the source is non-functional will be important); water quality problems; or as a result of new habitations arising without a safe source. Furthermore, if non-functionality is a result of sources having reached the end of their working lives rather than having broken down, then the sources will need replacing, not just fixing. It is therefore difficult to ascertain whether ‘slippage’ is a serious or a relatively minor problem.
It is pertinent to also raise the question of how states calculate their coverage levels. Are states measuring coverage by simply increasing the number of habitations ‘fully covered’ year on year in accordance with the number of new waterpoints installed without subtracting the number of points that have reached the end of their working lives or which have become permanently unusable? Bihar, Chhattisgarh, Madhya Pradesh, Orissa, Tamil Nadu, Tripura, Uttar Pradesh, Daman and Diu, Delhi, Pondicherry and Chandigarh all claim 100% of habitations ‘fully covered’ for rural water in 2004, even though in many of these states serious water problems are frequently reported. Perhaps it is the case that, in the words of the Tenth Five-Year Plan document: “reliable data on the ground reality of rural water supply is lacking.”14
Whilst Figure 2 shows India making good progress on coverage, the recognised problem of slippage could be much greater than the estimated 15%. Moreover, in addition to slippage, there is the problem of the continued use of unsafe sources to account for. These problems could well mean that coverage is much worse than that shown in Figure 2. Small-scale surveys lend weight to such a conclusion.
A Planning Evaluation Organisation (PEO) study by the Planning Commission in 1996-97 showed a large discrepancy between official coverage levels and the study’s findings:
“Eighty-seven villages in 16 states were studied…Although in the selected villages the number of people who had access to drinking water from government sources had increased from 69% to 81% between 1986 and 1996, serious problems were noted by the PEO, despite the fact the definition of ‘providing’ water is very liberal: the source needs to be within 1.6 km; one HP for every 250 people; and 40 lcpd is taken as ‘fully covered’.
Nineteen of the 29 districts reported the problem of frequent water scarcity. Of the 87 villages 40% complained of shortages during summer months. Thirty percent of people reported that the water supply was not dependable. There were frequent breakdowns due to power shortages in the case of piped water supply and damage to the pipelines led to leakages and contamination. For handpumps the quality of construction was not satisfactory in
11 Mid-term Review of the Ninth Five-Year Plan, DDWS, 2000, p.8. 12 The Sector Reforms principles provide communities with the opportunity to demand
more water resources at a cost sharing of 20% capital costs (after 40lcpd) and 100% maintenance costs.
13 Given the small proportion of habitations that fall into the PC and NC categories, we have assumed that slippage is from FC habitations.
14 Tenth Five-Year Plan, GoI, p.601.
Section I Rural Water
21
47% of cases and there were frequent mechanical failures.
Agencies complained of the untimely release of funds and shortages of staff…for instance in Bijnore (UP) 11 mechanics looked after 4000 handpumps… in only 28% of cases routine maintenance activities of oiling etc., was undertaken. Eighty seven percent of districts reported breakdowns during the year, out of which only in 43% of cases were repairs undertaken. Often spares were unavailable and funds were inadequate.”15
The PEO study also quotes two other studies A study by ORG conducted in 1998 in eight districts
of Madhya Pradesh also highlighted serious problems:
“…nearly 30% of HP villages and 88% of piped water supply villages had to be reduced from the status of fully covered to partially covered. Improper repairs and non-maintenance of pumps resulted in frequent breakdowns rendering the water supply system non-functional…Moreover, there was no adequate data to suggest whether the covered habitations got 40 lpcd as per the norms or much less.”
A study by Samtek Consultants in 1998 in four districts of Bihar noted:
“Fifty-five percent of households faced scarcity of water for 1-2 months and 16% for more than three months. During the non-scarcity period, 52% of households received only up to 20 litres of water. Even those villages which are reported by the State Government as ‘fully covered’ are facing problems of getting safe and adequate water. The frequency of breakdowns of hamdpumps was very high and 40% of households reported that their handpumps had stopped functioning once in the last 3 months. There are only one or two technicians on average for a block and they seldom visit the interior parts...As a result a large number of defunct handpumps remain unattended to for a long time.”16
The results of a WaterAid India (WAI) study in Tamil Nadu and Andhra Pradesh in 2001 also concludes that there is a significant difference between statistics released by the state governments and the proportion of people with water as per the suggested coverage norms as outlined in ‘Problems of Analysis’ (pages 16-17 of this report). The WAI study found that whilst the state government claimed a coverage rate of 32% for the study area, the coverage level as measured against the criteria of more stringent coverage used by WAI was around 15%, as water sources that had been assumed to be functional were in reality non-functional because of poor (or no) maintenance, ground water depletion/falling groundwater levels or poor water quality.
The serious problem of operation and maintenance (O&M) that these studies have pointed to is unlikely to have improved in recent years. A lack of prioritisation and funds for O&M certainly seems to be a major explanatory factor of why water sources have been deteriorating into a state of disrepair. The total estimated cost for O&M of the 3.5 mn GoI handpumps and 100,000 piped water supply schemes is around Rs 20 bn per year. Under ARWSP guidelines, 15% of total funds are allocated for O&M. With an outlay of Rs 404 bn for the five years of the Tenth Plan, the average yearly total available for O&M would be Rs 12 bn, leaving a shortfall of some Rs 8 bn per year. Furthermore, it has been reported that in practice much less is available for O&M than even this.17
Falling groundwater levels in dryland areas may also lead to many existing functional sources (i.e. working handpumps and piped water schemes based on groundwater) becoming non-functional and requiring large capital investments.18 Competing claims from industrial and agriculture use in many parts of India are also emerging as problems. Unregulated groundwater extraction for agriculture and industrial use is emerging as a major threat to resource sustainability, threatening drinking water supplies. Contamination of groundwater through unregulated mining, the use of chemical fertilisers and salinity ingress in coastal areas is becoming alarming. A GoI evaluation survey in 1999 noted that 142,000 habitations consume water that
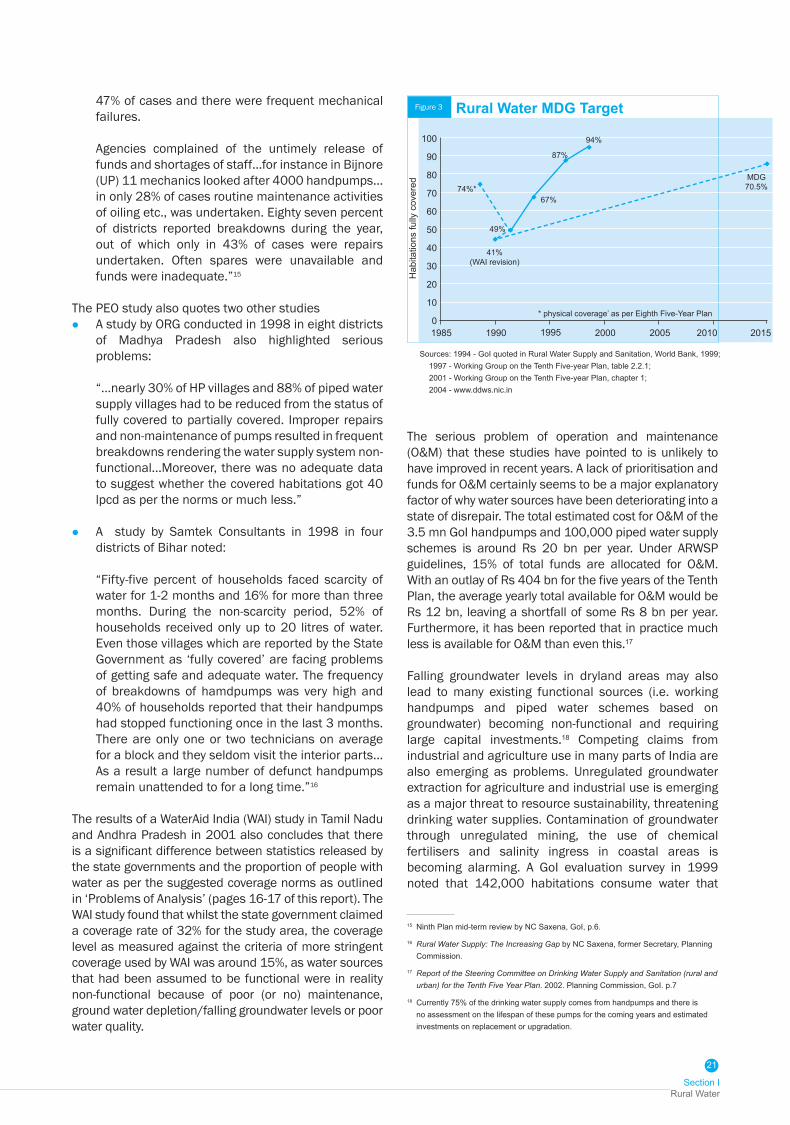
Sources: 1994 - GoI quoted in Rural Water Supply and Sanitation, World Bank, 1999; 1997 - Working Group on the Tenth Five-year Plan, table 2.2.1; 2001 - Working Group on the Tenth Five-year Plan, chapter 1; 2004 - www.ddws.nic.in
15 Ninth Plan mid-term review by NC Saxena, GoI, p.6.
16 Rural Water Supply: The Increasing Gap by NC Saxena, former Secretary, Planning Commission.
17 Report of the Steering Committee on Drinking Water Supply and Sanitation (rural and urban) for the Tenth Five Year Plan. 2002. Planning Commission, GoI. p.7
18 Currently 75% of the drinking water supply comes from handpumps and there is no assessment on the lifespan of these pumps for the coming years and estimated investments on replacement or upgradation.
Figure 3
100
90
80
70
60
50
40
30
20
10
0
Hab
itatio
ns fu
lly c
over
ed
1985
Rural Water MDG Target
1990 2000 2005 20101995
74%*
94%
* physical coverage’ as per Eighth Five-Year Plan
87%
67%
49%
41%(WAI revision)
MDG70.5%
2015
Drinking Water and Sanitation Status in IndiaWaterAid India 2005
22
has excessive quantities of fluoride, iron, nitrate, arsenic and/or salinity.19 Problem villages have gone up to more than 200,000 in 2004 and habitations with problems of inadequate water availability are stated at another 300,000.20 In Jharkhand and Chhattisgarh, uranium pollution is now coming on to the horizon as a water quality problem as has mercury pollution in West Bengal.
In the absence of recent surveys to verify coverage levels, it is difficult to build up an accurate national level perspective on coverage, especially if coverage is defined by the norms set out in ‘Problems of Analysis’ (pages 16-17 of this report). The Census of India does measure water (and sanitation) hardware but does not assess many of the soft elements of provision, for instance the seasonality of supply or functionality or use of the source. UNICEF/WHO/Planning Commission also arrive at estimates of water supply coverage and use based on a linear regression of various GoI sample surveys. These estimates do not however assess the seasonality of supply, the functionality of infrastructure or water quality issues.21
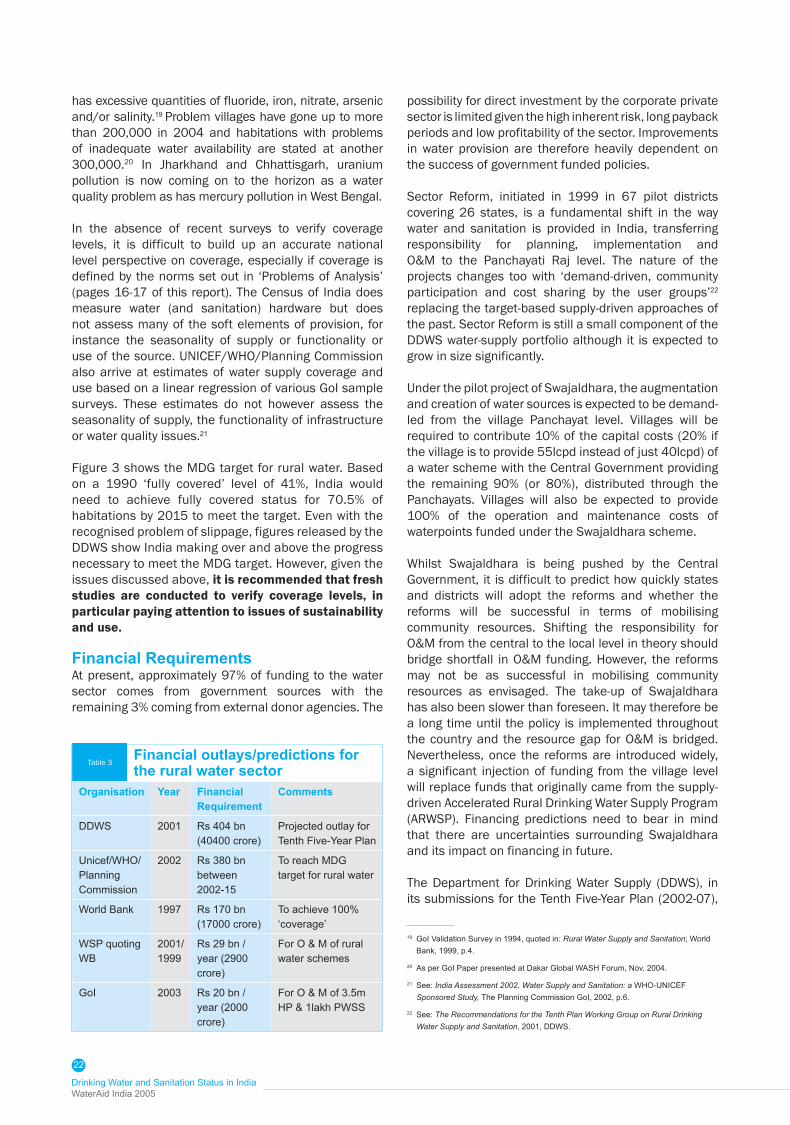
Figure 3 shows the MDG target for rural water. Based on a 1990 ‘fully covered’ level of 41%, India would need to achieve fully covered status for 70.5% of habitations by 2015 to meet the target. Even with the recognised problem of slippage, figures released by the DDWS show India making over and above the progress necessary to meet the MDG target. However, given the issues discussed above, it is recommended that fresh studies are conducted to verify coverage levels, in particular paying attention to issues of sustainability and use.
Financial RequirementsAt present, approximately 97% of funding to the water sector comes from government sources with the remaining 3% coming from external donor agencies. The
possibility for direct investment by the corporate private sector is limited given the high inherent risk, long payback periods and low profitability of the sector. Improvements in water provision are therefore heavily dependent on the success of government funded policies.
Sector Reform, initiated in 1999 in 67 pilot districts covering 26 states, is a fundamental shift in the way water and sanitation is provided in India, transferring responsibility for planning, implementation and O&M to the Panchayati Raj level. The nature of the projects changes too with ‘demand-driven, community participation and cost sharing by the user groups’22 replacing the target-based supply-driven approaches of the past. Sector Reform is still a small component of the DDWS water-supply portfolio although it is expected to grow in size significantly.
Under the pilot project of Swajaldhara, the augmentation and creation of water sources is expected to be demand-led from the village Panchayat level. Villages will be required to contribute 10% of the capital costs (20% if the village is to provide 55lcpd instead of just 40lcpd) of a water scheme with the Central Government providing the remaining 90% (or 80%), distributed through the Panchayats. Villages will also be expected to provide 100% of the operation and maintenance costs of waterpoints funded under the Swajaldhara scheme.
Whilst Swajaldhara is being pushed by the Central Government, it is difficult to predict how quickly states and districts will adopt the reforms and whether the reforms will be successful in terms of mobilising community resources. Shifting the responsibility for O&M from the central to the local level in theory should bridge shortfall in O&M funding. However, the reforms may not be as successful in mobilising community resources as envisaged. The take-up of Swajaldhara has also been slower than foreseen. It may therefore be a long time until the policy is implemented throughout the country and the resource gap for O&M is bridged. Nevertheless, once the reforms are introduced widely, a significant injection of funding from the village level will replace funds that originally came from the supply-driven Accelerated Rural Drinking Water Supply Program (ARWSP). Financing predictions need to bear in mind that there are uncertainties surrounding Swajaldhara and its impact on financing in future.
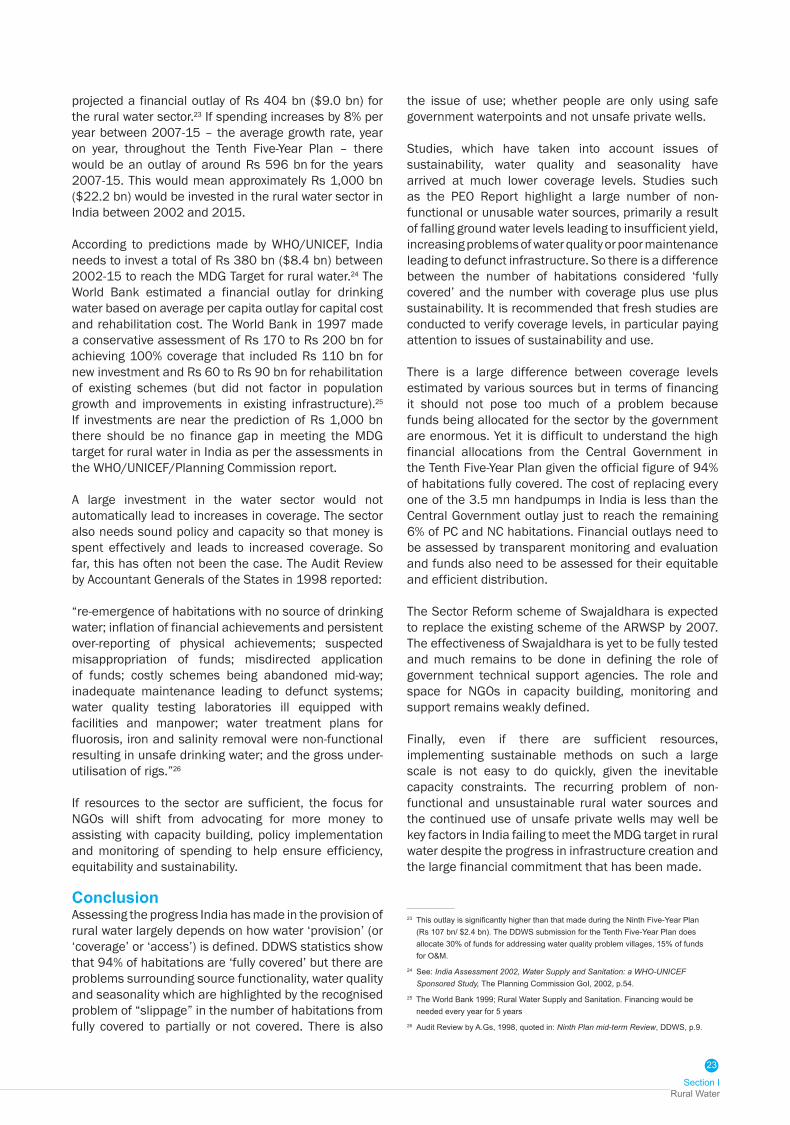
The Department for Drinking Water Supply (DDWS), in its submissions for the Tenth Five-Year Plan (2002-07),
Table 3Financial outlays/predictions for the rural water sector
Organisation Year Financial Requirement
Comments
DDWS 2001 Rs 404 bn (40400 crore)
Projected outlay for Tenth Five-Year Plan
Unicef/WHO/Planning Commission
2002 Rs 380 bn between 2002-15
To reach MDG target for rural water
World Bank 1997 Rs 170 bn (17000 crore)
To achieve 100% ‘coverage’
WSP quoting WB
2001/ 1999
Rs 29 bn / year (2900 crore)
For O & M of rural water schemes
GoI 2003 Rs 20 bn / year (2000 crore)
For O & M of 3.5m HP & 1lakh PWSS
19 GoI Validation Survey in 1994, quoted in: Rural Water Supply and Sanitation; World Bank, 1999, p.4.
20 As per GoI Paper presented at Dakar Global WASH Forum, Nov. 2004.
21 See: India Assessment 2002, Water Supply and Sanitation: a WHO-UNICEF Sponsored Study, The Planning Commission GoI, 2002, p.6.
22 See: The Recommendations for the Tenth Plan Working Group on Rural Drinking Water Supply and Sanitation, 2001, DDWS.
Section I Rural Water
23
projected a financial outlay of Rs 404 bn ($9.0 bn) for the rural water sector.23 If spending increases by 8% per year between 2007-15 – the average growth rate, year on year, throughout the Tenth Five-Year Plan – there would be an outlay of around Rs 596 bn for the years 2007-15. This would mean approximately Rs 1,000 bn ($22.2 bn) would be invested in the rural water sector in India between 2002 and 2015.
According to predictions made by WHO/UNICEF, India needs to invest a total of Rs 380 bn ($8.4 bn) between 2002-15 to reach the MDG Target for rural water.24 The World Bank estimated a financial outlay for drinking water based on average per capita outlay for capital cost and rehabilitation cost. The World Bank in 1997 made a conservative assessment of Rs 170 to Rs 200 bn for achieving 100% coverage that included Rs 110 bn for new investment and Rs 60 to Rs 90 bn for rehabilitation of existing schemes (but did not factor in population growth and improvements in existing infrastructure).25 If investments are near the prediction of Rs 1,000 bn there should be no finance gap in meeting the MDG target for rural water in India as per the assessments in the WHO/UNICEF/Planning Commission report. A large investment in the water sector would not automatically lead to increases in coverage. The sector also needs sound policy and capacity so that money is spent effectively and leads to increased coverage. So far, this has often not been the case. The Audit Review by Accountant Generals of the States in 1998 reported:
“re-emergence of habitations with no source of drinking water; inflation of financial achievements and persistent over-reporting of physical achievements; suspected misappropriation of funds; misdirected application of funds; costly schemes being abandoned mid-way; inadequate maintenance leading to defunct systems; water quality testing laboratories ill equipped with facilities and manpower; water treatment plans for fluorosis, iron and salinity removal were non-functional resulting in unsafe drinking water; and the gross under-utilisation of rigs.”26
If resources to the sector are sufficient, the focus for NGOs will shift from advocating for more money to assisting with capacity building, policy implementation and monitoring of spending to help ensure efficiency, equitability and sustainability.
ConclusionAssessing the progress India has made in the provision of rural water largely depends on how water ‘provision’ (or ‘coverage’ or ‘access’) is defined. DDWS statistics show that 94% of habitations are ‘fully covered’ but there are problems surrounding source functionality, water quality and seasonality which are highlighted by the recognised problem of “slippage” in the number of habitations from fully covered to partially or not covered. There is also
the issue of use; whether people are only using safe government waterpoints and not unsafe private wells.
Studies, which have taken into account issues of sustainability, water quality and seasonality have arrived at much lower coverage levels. Studies such as the PEO Report highlight a large number of non-functional or unusable water sources, primarily a result of falling ground water levels leading to insufficient yield, increasing problems of water quality or poor maintenance leading to defunct infrastructure. So there is a difference between the number of habitations considered ‘fully covered’ and the number with coverage plus use plus sustainability. It is recommended that fresh studies are conducted to verify coverage levels, in particular paying attention to issues of sustainability and use.
There is a large difference between coverage levels estimated by various sources but in terms of financing it should not pose too much of a problem because funds being allocated for the sector by the government are enormous. Yet it is difficult to understand the high financial allocations from the Central Government in the Tenth Five-Year Plan given the official figure of 94% of habitations fully covered. The cost of replacing every one of the 3.5 mn handpumps in India is less than the Central Government outlay just to reach the remaining 6% of PC and NC habitations. Financial outlays need to be assessed by transparent monitoring and evaluation and funds also need to be assessed for their equitable and efficient distribution.
The Sector Reform scheme of Swajaldhara is expected to replace the existing scheme of the ARWSP by 2007. The effectiveness of Swajaldhara is yet to be fully tested and much remains to be done in defining the role of government technical support agencies. The role and space for NGOs in capacity building, monitoring and support remains weakly defined.
Finally, even if there are sufficient resources, implementing sustainable methods on such a large scale is not easy to do quickly, given the inevitable capacity constraints. The recurring problem of non-functional and unsustainable rural water sources and the continued use of unsafe private wells may well be key factors in India failing to meet the MDG target in rural water despite the progress in infrastructure creation and the large financial commitment that has been made.
23 This outlay is significantly higher than that made during the Ninth Five-Year Plan (Rs 107 bn/ $2.4 bn). The DDWS submission for the Tenth Five-Year Plan does allocate 30% of funds for addressing water quality problem villages, 15% of funds for O&M.
24 See: India Assessment 2002, Water Supply and Sanitation: a WHO-UNICEF Sponsored Study, The Planning Commission GoI, 2002, p.54.
25 The World Bank 1999; Rural Water Supply and Sanitation. Financing would be needed every year for 5 years
26 Audit Review by A.Gs, 1998, quoted in: Ninth Plan mid-term Review, DDWS, p.9.

Section II Rural Sanitation
25
Sanitation programmes in India have traditionally relied heavily on high levels of subsidies for latrine construction. This approach has been criticised for failing to motivate and sustain higher levels of sanitation coverage which also grew very slowly between 1990-2000. The high subsidy approach has now changed with the introduction of the Total Sanitation Campaign (TSC) in 1999. The TSC reform principles are demand-driven and community-led. The concept of sanitation, which was previously limited to the disposal of human excreta by cess pools, open ditches, pit latrines, bucket system, has now been expanded to include liquid and solid waste disposal, food hygiene, personal, domestic as well as environmental hygiene.27 The GoI has reported rapid growth in coverage levels in the last five years as a result of the TSC, which has now been implemented in 426 districts across the country.28 DDWS estimates that 9.45 mn latrines were constructed for rural households under the CRSP up to the end of the Ninth Plan.
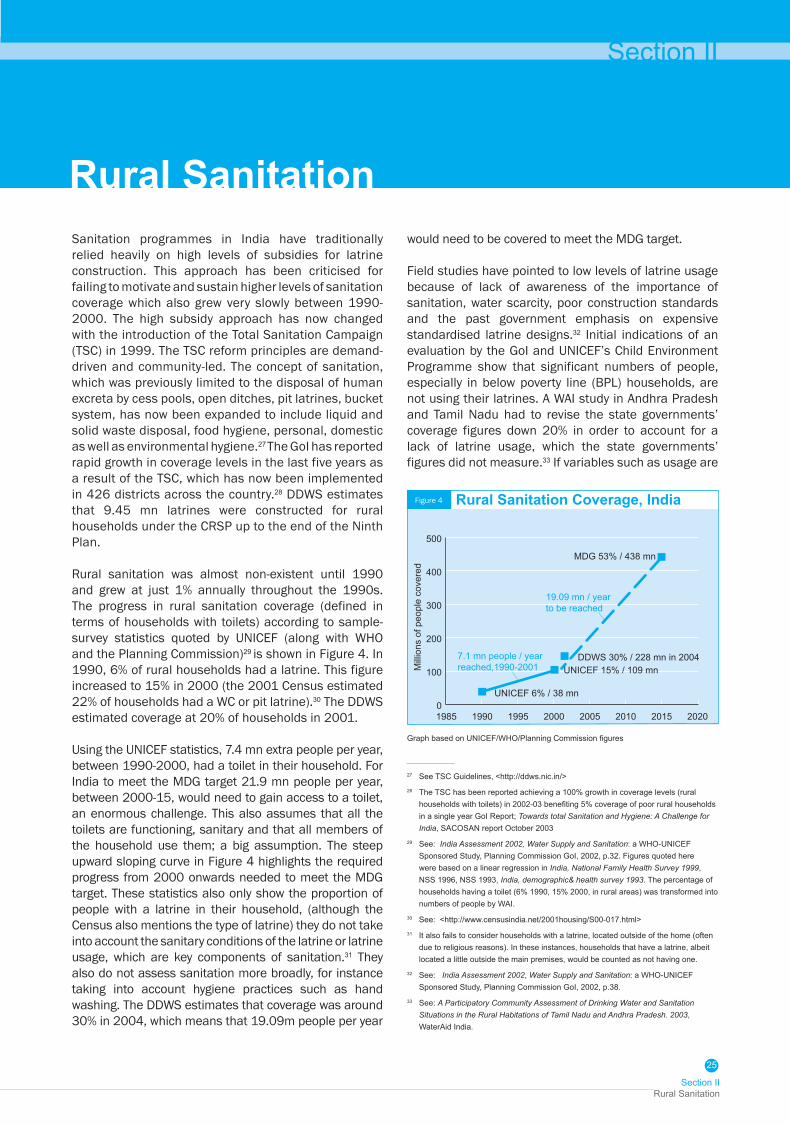
Rural sanitation was almost non-existent until 1990 and grew at just 1% annually throughout the 1990s. The progress in rural sanitation coverage (defined in terms of households with toilets) according to sample-survey statistics quoted by UNICEF (along with WHO and the Planning Commission)29 is shown in Figure 4. In 1990, 6% of rural households had a latrine. This figure increased to 15% in 2000 (the 2001 Census estimated 22% of households had a WC or pit latrine).30 The DDWS estimated coverage at 20% of households in 2001.
Using the UNICEF statistics, 7.4 mn extra people per year, between 1990-2000, had a toilet in their household. For India to meet the MDG target 21.9 mn people per year, between 2000-15, would need to gain access to a toilet, an enormous challenge. This also assumes that all the toilets are functioning, sanitary and that all members of the household use them; a big assumption. The steep upward sloping curve in Figure 4 highlights the required progress from 2000 onwards needed to meet the MDG target. These statistics also only show the proportion of people with a latrine in their household, (although the Census also mentions the type of latrine) they do not take into account the sanitary conditions of the latrine or latrine usage, which are key components of sanitation.31 They also do not assess sanitation more broadly, for instance taking into account hygiene practices such as hand washing. The DDWS estimates that coverage was around 30% in 2004, which means that 19.09m people per year
Rural Sanitationwould need to be covered to meet the MDG target.
Field studies have pointed to low levels of latrine usage because of lack of awareness of the importance of sanitation, water scarcity, poor construction standards and the past government emphasis on expensive standardised latrine designs.32 Initial indications of an evaluation by the GoI and UNICEF’s Child Environment Programme show that significant numbers of people, especially in below poverty line (BPL) households, are not using their latrines. A WAI study in Andhra Pradesh and Tamil Nadu had to revise the state governments’ coverage figures down 20% in order to account for a lack of latrine usage, which the state governments’ figures did not measure.33 If variables such as usage are
Section II
0
100
200
300
400
500
Mill
ions
of p
eopl
e co
vere
d
UNICEF 6% / 38 mn
7.1 mn people / year reached,1990-2001
19.09 mn / year to be reached
UNICEF 15% / 109 mnDDWS 30% / 228 mn in 2004
MDG 53% / 438 mn
1985 1990 1995 2000 2005 2010 2015 2020
Figure 4 Rural Sanitation Coverage, India
27 See TSC Guidelines, <http://ddws.nic.in/>28 The TSC has been reported achieving a 100% growth in coverage levels (rural
households with toilets) in 2002-03 benefiting 5% coverage of poor rural households in a single year GoI Report; Towards total Sanitation and Hygiene: A Challenge for India, SACOSAN report October 2003
29 See: India Assessment 2002, Water Supply and Sanitation: a WHO-UNICEF Sponsored Study, Planning Commission GoI, 2002, p.32. Figures quoted here were based on a linear regression in India, National Family Health Survey 1999, NSS 1996, NSS 1993, India, demographic& health survey 1993. The percentage of households having a toilet (6% 1990, 15% 2000, in rural areas) was transformed into numbers of people by WAI.
30 See: <http://www.censusindia.net/2001housing/S00-017.html>31 It also fails to consider households with a latrine, located outside of the home (often
due to religious reasons). In these instances, households that have a latrine, albeit located a little outside the main premises, would be counted as not having one.
32 See: India Assessment 2002, Water Supply and Sanitation: a WHO-UNICEF Sponsored Study, Planning Commission GoI, 2002, p.38.
33 See: A Participatory Community Assessment of Drinking Water and Sanitation Situations in the Rural Habitations of Tamil Nadu and Andhra Pradesh. 2003, WaterAid India.
Graph based on UNICEF/WHO/Planning Commission figures
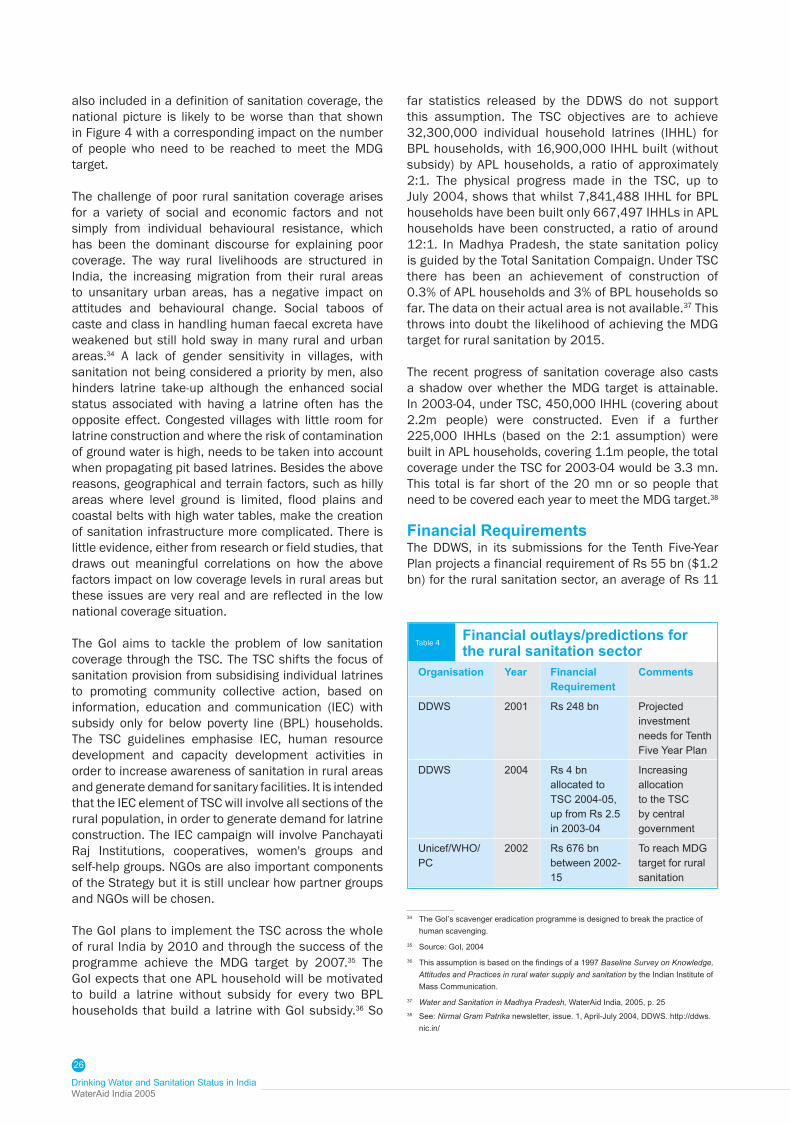
Drinking Water and Sanitation Status in IndiaWaterAid India 2005
26
also included in a definition of sanitation coverage, the national picture is likely to be worse than that shown in Figure 4 with a corresponding impact on the number of people who need to be reached to meet the MDG target.
The challenge of poor rural sanitation coverage arises for a variety of social and economic factors and not simply from individual behavioural resistance, which has been the dominant discourse for explaining poor coverage. The way rural livelihoods are structured in India, the increasing migration from their rural areas to unsanitary urban areas, has a negative impact on attitudes and behavioural change. Social taboos of caste and class in handling human faecal excreta have weakened but still hold sway in many rural and urban areas.34 A lack of gender sensitivity in villages, with sanitation not being considered a priority by men, also hinders latrine take-up although the enhanced social status associated with having a latrine often has the opposite effect. Congested villages with little room for latrine construction and where the risk of contamination of ground water is high, needs to be taken into account when propagating pit based latrines. Besides the above reasons, geographical and terrain factors, such as hilly areas where level ground is limited, flood plains and coastal belts with high water tables, make the creation of sanitation infrastructure more complicated. There is little evidence, either from research or field studies, that draws out meaningful correlations on how the above factors impact on low coverage levels in rural areas but these issues are very real and are reflected in the low national coverage situation.
The GoI aims to tackle the problem of low sanitation coverage through the TSC. The TSC shifts the focus of sanitation provision from subsidising individual latrines to promoting community collective action, based on information, education and communication (IEC) with subsidy only for below poverty line (BPL) households. The TSC guidelines emphasise IEC, human resource development and capacity development activities in order to increase awareness of sanitation in rural areas and generate demand for sanitary facilities. It is intended that the IEC element of TSC will involve all sections of the rural population, in order to generate demand for latrine construction. The IEC campaign will involve Panchayati Raj Institutions, cooperatives, women's groups and self-help groups. NGOs are also important components of the Strategy but it is still unclear how partner groups and NGOs will be chosen.
The GoI plans to implement the TSC across the whole of rural India by 2010 and through the success of the programme achieve the MDG target by 2007.35 The GoI expects that one APL household will be motivated to build a latrine without subsidy for every two BPL households that build a latrine with GoI subsidy.36 So
far statistics released by the DDWS do not support this assumption. The TSC objectives are to achieve 32,300,000 individual household latrines (IHHL) for BPL households, with 16,900,000 IHHL built (without subsidy) by APL households, a ratio of approximately 2:1. The physical progress made in the TSC, up to July 2004, shows that whilst 7,841,488 IHHL for BPL households have been built only 667,497 IHHLs in APL households have been constructed, a ratio of around 12:1. In Madhya Pradesh, the state sanitation policy is guided by the Total Sanitation Compaign. Under TSC there has been an achievement of construction of 0.3% of APL households and 3% of BPL households so far. The data on their actual area is not available.37 This throws into doubt the likelihood of achieving the MDG target for rural sanitation by 2015.
The recent progress of sanitation coverage also casts a shadow over whether the MDG target is attainable. In 2003-04, under TSC, 450,000 IHHL (covering about 2.2m people) were constructed. Even if a further 225,000 IHHLs (based on the 2:1 assumption) were built in APL households, covering 1.1m people, the total coverage under the TSC for 2003-04 would be 3.3 mn. This total is far short of the 20 mn or so people that need to be covered each year to meet the MDG target.38
Financial RequirementsThe DDWS, in its submissions for the Tenth Five-Year Plan projects a financial requirement of Rs 55 bn ($1.2 bn) for the rural sanitation sector, an average of Rs 11
34 The GoI’s scavenger eradication programme is designed to break the practice of human scavenging.
35 Source: GoI, 200436 This assumption is based on the findings of a 1997 Baseline Survey on Knowledge,
Attitudes and Practices in rural water supply and sanitation by the Indian Institute of Mass Communication.
37 Water and Sanitation in Madhya Pradesh, WaterAid India, 2005, p. 2538 See: Nirmal Gram Patrika newsletter, issue. 1, April-July 2004, DDWS. http://ddws.
nic.in/
Table 4Financial outlays/predictions for the rural sanitation sector
Organisation Year Financial Requirement
Comments
DDWS 2001 Rs 248 bn Projected investment needs for Tenth Five Year Plan
DDWS
2004 Rs 4 bn allocated to TSC 2004-05, up from Rs 2.5 in 2003-04
Increasing allocation to the TSC by central government
Unicef/WHO/PC
2002 Rs 676 bn between 2002-15
To reach MDG target for rural sanitation

Section II Rural Sanitation
27
bn per year.39 An outlay of Rs 34 bn ($718 mn) has also been provided under the Total Sanitation Campaign since its initiation in 1999 but as of September 2003, the total spending has been less than 9%. The TSC has allocated Rs 12.5 mn per district for information education and communication (IEC) and Rs 4 mn for start up activities.40
DDWS reports that 10 mn households had been covered with latrines leading to an increase in rural sanitation coverage from 22% in 2001 to 30% in 2004. In addition to this, 1,15,000 school toilets, 3800 sanitary complexes and 17,000 anganwadi toilets had also been constructed. A total outlay of Rs 41.38 bn was projected (in the DDWS report submitted at the Global WASH Forum at Dakar, Senegal in November 2004). According to predictions made by UNICEF and WHO, India needs to invest approximately Rs 676 bn ($15.0 bn) between 2002-15 to reach the MDG Target for rural sanitation, some Rs 52 bn per year.41 If investments in sanitation are of the order of Rs 11 bn per year there could be a shortfall in funding for the MDG target of some Rs 41 bn per year (not considering funds from TSC).
Financing options for rural sanitation need to consider leveraging funds from local financial institutions including rural banks, micro-credit and self-help groups. The issue of sanitary material supplies is also crucial and the role of the small scale private sector in ensuring this supply on a sustainable basis needs to be addressed. Long-term projections of financing requirements for rural sanitation therefore need to be based on alternative scenarios of people’s own contributions. In WAI’s experience, the use of SHGs and micro-credit play a positive, integral role in sanitation projects.
The allocations made under the Total Sanitation Campaign for IEC, start up activities, training and visits need to be reviewed to assess whether they are adequate and what is the best institutional mechanism for utilising them. The incentive schemes for rural sanitation (for 100% open defecation free villages) that have been introduced under the Nirmal Gram Puraskar Schemes need to be monitored closely for assessing whether the claims are sustained and the incentives are effective in achieving results over a longer time period. Unlike drinking water which receives significant funds from states, sanitation continues to be funded in a big way from central funds which makes states dependent on the Central Government for sanitation provision. Higher financial commitment from the states giving a higher priority to sanitation in state plans would reduce this dependency. For BPL IHHL construction, 60% of the costs are borne by the Central Government, 20% by the state and 20% by the user.
ConclusionPoor rural sanitation coverage is explained by a variety of social and economic factors, not simply individual behavioural resistance which has been the dominant discourse in the past. The way rural livelihoods are structured in India, with increasing migration from rural areas to unsanitary urban areas has a negative impact on attitudes and behaviour. Social taboos of caste and class in handling human faeces are resilient. A lack of gender sensitivity with sanitation not being considered a priority by men, congested villages with little room for construction and geographical and terrain factors can also hinder latrine take-up. The enhanced social status from latrine ownership tends to have the opposite effect but not in every instance. These issues are real and play a part in explaining low sanitation coverage in rural India. Hygiene promotion is another area of concern, which is often inadequately addressed in the drive to increase coverage and latrine numbers.
The challenges in meeting the MDG target are money and time. There will be a shortfall in financing to meet the MDG target by 2015 unless spending between 2007-15 is proportionately much higher than government commitments for 2002-07. The financing situation could be improved if the demand driven approach of Sector Reforms is successful in unleashing people’s own financial contributions for rural sanitation, but so far the amount of money being spent on TSC is still low relative to predictions of the amount of money required to meet the MDG target.
Even if spending was not an issue the MDG target still looks unlikely to be reached unless progress under the TSC increases dramatically. So far, too few latrines have been built to cover the 20 mn people who need to be reached each year to meet the MDG target. The issues of latrine usage and hygiene also need to be considered, although TSC is much more likely to tackle these problems given its focus on IEC and community participation. The MDG target for rural sanitation looks unlikely to be met in India because of insufficient time in which to increase sustainable sanitation coverage on such a vast scale.
39 To achieve a coverage level of 35% by 2007.40 GoI Report for SACOSAN October 2003.41 See: India Assessment 2002, Water Supply and Sanitation: a WHO-UNICEF
Sponsored Study, The Planning Commission GoI, 2002, p.54. As WAI did not have the breakdown or the methods by which this result was arrived at, WAI just quoted this figure as it stands.

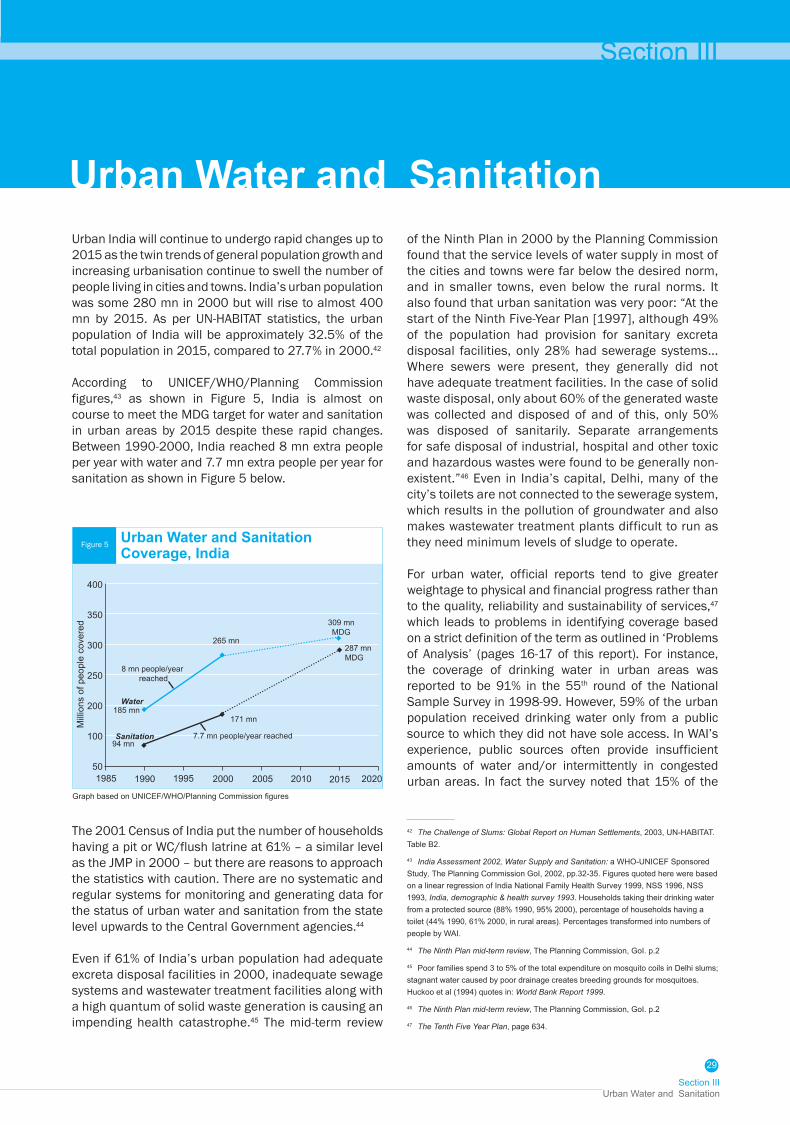
Section III Urban Water and Sanitation
29
Urban India will continue to undergo rapid changes up to 2015 as the twin trends of general population growth and increasing urbanisation continue to swell the number of people living in cities and towns. India’s urban population was some 280 mn in 2000 but will rise to almost 400 mn by 2015. As per UN-HABITAT statistics, the urban population of India will be approximately 32.5% of the total population in 2015, compared to 27.7% in 2000.42
According to UNICEF/WHO/Planning Commission figures,43 as shown in Figure 5, India is almost on course to meet the MDG target for water and sanitation in urban areas by 2015 despite these rapid changes. Between 1990-2000, India reached 8 mn extra people per year with water and 7.7 mn extra people per year for sanitation as shown in Figure 5 below.
Urban Water and Sanitationof the Ninth Plan in 2000 by the Planning Commission found that the service levels of water supply in most of the cities and towns were far below the desired norm, and in smaller towns, even below the rural norms. It also found that urban sanitation was very poor: “At the start of the Ninth Five-Year Plan [1997], although 49% of the population had provision for sanitary excreta disposal facilities, only 28% had sewerage systems... Where sewers were present, they generally did not have adequate treatment facilities. In the case of solid waste disposal, only about 60% of the generated waste was collected and disposed of and of this, only 50% was disposed of sanitarily. Separate arrangements for safe disposal of industrial, hospital and other toxic and hazardous wastes were found to be generally non-existent.”46 Even in India’s capital, Delhi, many of the city’s toilets are not connected to the sewerage system, which results in the pollution of groundwater and also makes wastewater treatment plants difficult to run as they need minimum levels of sludge to operate.
For urban water, official reports tend to give greater weightage to physical and financial progress rather than to the quality, reliability and sustainability of services,47 which leads to problems in identifying coverage based on a strict definition of the term as outlined in ‘Problems of Analysis’ (pages 16-17 of this report). For instance, the coverage of drinking water in urban areas was reported to be 91% in the 55th round of the National Sample Survey in 1998-99. However, 59% of the urban population received drinking water only from a public source to which they did not have sole access. In WAI’s experience, public sources often provide insufficient amounts of water and/or intermittently in congested urban areas. In fact the survey noted that 15% of the
Section III
42 The Challenge of Slums: Global Report on Human Settlements, 2003, UN-HABITAT. Table B2.
43 India Assessment 2002, Water Supply and Sanitation: a WHO-UNICEF Sponsored Study, The Planning Commission GoI, 2002, pp.32-35. Figures quoted here were based on a linear regression of India National Family Health Survey 1999, NSS 1996, NSS 1993, India, demographic & health survey 1993. Households taking their drinking water from a protected source (88% 1990, 95% 2000), percentage of households having a toilet (44% 1990, 61% 2000, in rural areas). Percentages transformed into numbers of people by WAI.
44 The Ninth Plan mid-term review, The Planning Commission, GoI. p.2
45 Poor families spend 3 to 5% of the total expenditure on mosquito coils in Delhi slums; stagnant water caused by poor drainage creates breeding grounds for mosquitoes. Huckoo et al (1994) quotes in: World Bank Report 1999.
46 The Ninth Plan mid-term review, The Planning Commission, GoI. p.2
47 The Tenth Five Year Plan, page 634.
The 2001 Census of India put the number of households having a pit or WC/flush latrine at 61% – a similar level as the JMP in 2000 – but there are reasons to approach the statistics with caution. There are no systematic and regular systems for monitoring and generating data for the status of urban water and sanitation from the state level upwards to the Central Government agencies.44
Even if 61% of India’s urban population had adequate excreta disposal facilities in 2000, inadequate sewage systems and wastewater treatment facilities along with a high quantum of solid waste generation is causing an impending health catastrophe.45 The mid-term review
Figure 5
400
350
300
250
200
100
50
Mill
ions
of p
eopl
e co
vere
d
1985
Urban Water and Sanitation Coverage, India
1990 2005 2010 20201995
Graph based on UNICEF/WHO/Planning Commission figures
Water
309 mnMDG
Sanitation
185 mn
8 mn people/year reached
7.7 mn people/year reached
171 mn
265 mn
94 mn
2000 2015
287 mn MDG

Drinking Water and Sanitation Status in IndiaWaterAid India 2005
30
urban households did not get sufficient water from their principal water source in April, May and June.48 It is therefore hard to believe that 88% of the urban population of India had access to safe and adequate drinking water in 1990.
The urban slum population of India is severely under reported as per official estimates. Even though slum populations are valued as vote banks, the enumeration for ‘informal settlements’ usually excludes them in the total headcount for urban population. There are many categories/classifications of urban poor settlements in India including authorised and unauthorised slums, resettled slums and Jhuggi Jhopdi clusters. Urban poor living in slum like conditions could constitute at least 50% of the Indian urban population. It is fair to assume that only 50% of the urban slum population have adequate access to safe water. The revised water line in Figure 6 adjusting for a higher urban slum population of India than the official statistics, WAI believes that only 155 mn out of the 280 mn urban population or 55% of urban population had access to safe and adequate drinking water in 1990, as against the official estimate of 88% coverage.
Moreover, urban water access/coverage is often calculated by measuring the total water available in an urban area and dividing this by the total population. This provides an unsatisfactory assessment of coverage, as there is inequity in the distribution of water in Indian cities. Whilst wealthier parts of town receive huge quantities of water poorer areas go dry, yet the average supply per capita looks good. Poor quality, regular shortages in supply (which in turn leads to contamination), weak infrastructure and high leakages (as high as 25-50%) are also major problems confronting the provision of urban drinking water.
In Tamil Nadu, WAI found that coverage statistics often do not take into account the large numbers of unserved
people living in slums and therefore over estimate the proportion of urban people ‘covered’. In Thiruchirapalli, whilst only 10% of people in urban areas did not have access to enough safe, sustainable water, the figure for slum areas was around 90%. In Delhi, NGOs estimate that just 30-40% of the slum population has adequate drinking water.49 The issue of effective coverage for slum populations in urban areas of India is particularly difficult as it is often linked to the tenure status of settlements (authorised vs. unauthorised, legal vs. illegal) and large floating populations. This makes investments in sanitation infrastructure problematic. The poor coverage situation in poorer areas is also often a reflection of poor and disadvantaged people being excluded from participation in water and sanitation decision-making.
In a study done by WAI for Madhya Pradesh, it was found that 93% of towns in the state have less than 70 lcpd of water as against a minimum supply norm of 135 lcpd. The data related to supply of water indicated that only 63% of the urban centres receive water daily, while 28% towns receive water supply once in two days and 9% towns once in two or more days. Similarly on sanitation, the study found that only 76% of the urban households in the state have the facility of being connected to either a closed or an open drain. The districts in the Bundelkhand region, namely, Damoh, Chhatarpur, Panna, Satna, and Rewa; and districts in the southern tribal belt namely, Shahdol, Sidhi, and Umaria have a high proportion (more than 35%) of households which are not connected with drains for the disposal of waste water.50
There have been innovative experiments in sanitation infrastructure and service provision in some urban slums by NGOs and government. SPARC and WaterAid India have demonstrated the concept of community managed slum sanitation programmes in Mumbai and Thiruchirapalli. Recently, with the engagement of the Pune Municipal Commissioner, this work was taken up on a large scale in Pune Municipality. The cities of Hyderabad and Bangalore have also witnessed innovative successes. The Hyderabad Municipal Corporation relied on increased tax collection for spending on water and sanitation. However the Pune Municipal Commissioner (R. Gaikwad) did not follow this route and was able to spend forty times the annual outlay for urban sanitation by drawing on sources of funding other than increasing taxes on civic services. The Infosys sponsored model in Bangalore demonstrated a sustainable pilot project where high quality public toilets in commercial areas cross subsidise toilets in slums. However, to what
48 Quoted from: The Tenth Five Year Plan.
49 Discussion with staff of KISLAY, a Delhi based NGO
50 Water and Sanitation in Madhya Pradesh, WaterAid India, 2005
Figure 6
400
350
300
250
200
100
50
Mill
ions
of p
eopl
e co
vere
d
Revised Urban Water & Sanitation Coverage and MDG targets for India
1990 2005 20101995
Graph based on UNICEF/WHO/Planning Commission figures
Water
MDG target 309 mn
Sanitation
155 mn
6 mn/year target
8 mn/year target
94 mn
2000 2015
MDG target 286 mn
1985
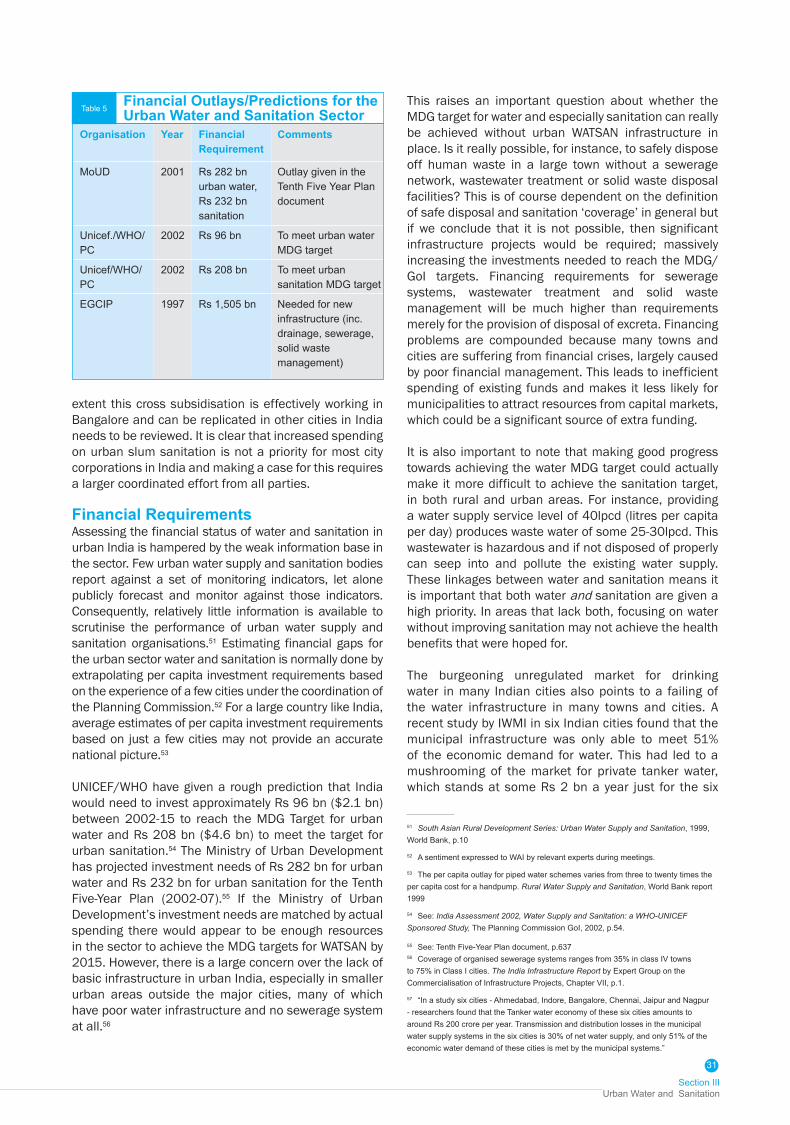
Section III Urban Water and Sanitation
31
Table 5
extent this cross subsidisation is effectively working in Bangalore and can be replicated in other cities in India needs to be reviewed. It is clear that increased spending on urban slum sanitation is not a priority for most city corporations in India and making a case for this requires a larger coordinated effort from all parties.
Financial Requirements Assessing the financial status of water and sanitation in urban India is hampered by the weak information base in the sector. Few urban water supply and sanitation bodies report against a set of monitoring indicators, let alone publicly forecast and monitor against those indicators. Consequently, relatively little information is available to scrutinise the performance of urban water supply and sanitation organisations.51 Estimating financial gaps for the urban sector water and sanitation is normally done by extrapolating per capita investment requirements based on the experience of a few cities under the coordination of the Planning Commission.52 For a large country like India, average estimates of per capita investment requirements based on just a few cities may not provide an accurate national picture.53
UNICEF/WHO have given a rough prediction that India would need to invest approximately Rs 96 bn ($2.1 bn) between 2002-15 to reach the MDG Target for urban water and Rs 208 bn ($4.6 bn) to meet the target for urban sanitation.54 The Ministry of Urban Development has projected investment needs of Rs 282 bn for urban water and Rs 232 bn for urban sanitation for the Tenth Five-Year Plan (2002-07).55 If the Ministry of Urban Development’s investment needs are matched by actual spending there would appear to be enough resources in the sector to achieve the MDG targets for WATSAN by 2015. However, there is a large concern over the lack of basic infrastructure in urban India, especially in smaller urban areas outside the major cities, many of which have poor water infrastructure and no sewerage system at all.56
This raises an important question about whether the MDG target for water and especially sanitation can really be achieved without urban WATSAN infrastructure in place. Is it really possible, for instance, to safely dispose off human waste in a large town without a sewerage network, wastewater treatment or solid waste disposal facilities? This is of course dependent on the definition of safe disposal and sanitation ‘coverage’ in general but if we conclude that it is not possible, then significant infrastructure projects would be required; massively increasing the investments needed to reach the MDG/GoI targets. Financing requirements for sewerage systems, wastewater treatment and solid waste management will be much higher than requirements merely for the provision of disposal of excreta. Financing problems are compounded because many towns and cities are suffering from financial crises, largely caused by poor financial management. This leads to inefficient spending of existing funds and makes it less likely for municipalities to attract resources from capital markets, which could be a significant source of extra funding.
It is also important to note that making good progress towards achieving the water MDG target could actually make it more difficult to achieve the sanitation target, in both rural and urban areas. For instance, providing a water supply service level of 40lpcd (litres per capita per day) produces waste water of some 25-30lpcd. This wastewater is hazardous and if not disposed of properly can seep into and pollute the existing water supply. These linkages between water and sanitation means it is important that both water and sanitation are given a high priority. In areas that lack both, focusing on water without improving sanitation may not achieve the health benefits that were hoped for.
The burgeoning unregulated market for drinking water in many Indian cities also points to a failing of the water infrastructure in many towns and cities. A recent study by IWMI in six Indian cities found that the municipal infrastructure was only able to meet 51% of the economic demand for water. This had led to a mushrooming of the market for private tanker water, which stands at some Rs 2 bn a year just for the six
Organisation Year Financial Requirement
Comments
MoUD 2001 Rs 282 bn urban water, Rs 232 bn sanitation
Outlay given in the Tenth Five Year Plan document
Unicef./WHO/PC
2002 Rs 96 bn To meet urban water MDG target
Unicef/WHO/PC
2002 Rs 208 bn To meet urban sanitation MDG target
EGCIP 1997 Rs 1,505 bn Needed for new infrastructure (inc. drainage, sewerage, solid waste management)
51 South Asian Rural Development Series: Urban Water Supply and Sanitation, 1999, World Bank, p.10
52 A sentiment expressed to WAI by relevant experts during meetings.
53 The per capita outlay for piped water schemes varies from three to twenty times the per capita cost for a handpump. Rural Water Supply and Sanitation, World Bank report 1999
54 See: India Assessment 2002, Water Supply and Sanitation: a WHO-UNICEF Sponsored Study, The Planning Commission GoI, 2002, p.54.
55 See: Tenth Five-Year Plan document, p.637 56 Coverage of organised sewerage systems ranges from 35% in class IV towns to 75% in Class I cities. The India Infrastructure Report by Expert Group on the Commercialisation of Infrastructure Projects, Chapter VII, p.1.
57 “In a study six cities - Ahmedabad, Indore, Bangalore, Chennai, Jaipur and Nagpur - researchers found that the Tanker water economy of these six cities amounts to around Rs 200 crore per year. Transmission and distribution losses in the municipal water supply systems in the six cities is 30% of net water supply, and only 51% of the economic water demand of these cities is met by the municipal systems.”
Financial Outlays/Predictions for the Urban Water and Sanitation Sector

Drinking Water and Sanitation Status in IndiaWaterAid India 2005
32
cities.57 This private service, by its very nature, will only supply water to those who can afford the relatively high market price for tanker water. This is particularly worrying in cities such as Chennai, where private tanker operators are buying up water discharged by large borewells in neighbouring agricultural areas and selling the water to the wealthier denizens of the city. This process reduces the options of the municipal authorities to increase the municipal water supply and whilst augmenting the supply to richer inhabitants it does nothing for the poor.
Some estimates of financial requirements are high because they include the cost of potentially huge water and sanitation infrastructure improvements. For instance, for the Ninth Five-Year Plan the National Institute for Urban Affairs (NIUA) put investment needs for urban water and sanitation at Rs 34 bn per annum, whereas the Ninth Plan Working Group put the requirement at Rs 108 bn per annum and the Expert Group Committee on Infrastructure Privatisation (EGCIP) put the requirement at an enormous Rs 301 bn per annum for each of the five years of the Ninth Plan period.58
Given the number of urban cities and the size of India’s urban population coupled with the poor state of urban infrastructure for water and sanitation, the financial requirements to meet the MDG target could be much higher than previously envisaged, leaving an enormous shortfall in financing for the sector.59
In recent years, the Central Government, a number of state governments and several urban local bodies have embarked upon various reforms that would facilitate a sustainable development of urban infrastructure.60 These include: Decentralisation and empowerment of local bodies Fiscal incentives for urban reforms by the Central
Government Legal and financial reforms initiated at State level Management and other reforms carried out by
urban local bodies
The Government has set up two incentive funds for urban reforms at state and municipal levels - the Urban Reform Incentive Fund (URIF) and the City Challenge Fund (CCF). The URIF has been set up to provide reform-linked assistance to the states in the country so as to incentivise and accelerate the process of urban reforms identified by the Government of India from time to time (Government of India, 2004). States are required to sign a Memorandum of Agreement (MOA) with the Central Government. The Ministry of Urban Development and Poverty Alleviation, GOI, has also developed a Model Municipal Act and advised all the state governments in the country to modify their Municipal Acts on the lines suggested in the Model Act. The Model Act has provisions that will enable the urban local bodies to leverage funds, introduce improved
accounting systems and private sector participation in the development of urban infrastructure and delivery of services. Thus, state municipal acts modified on the lines of the Model Act would provide the necessary legal environment for carrying out the various types of reforms at the municipal level and effective functioning of ULBs.
Despite the above changes and small incentives of Rs 5 bn, will the MDG target for urban water, and especially sanitation be achieved? Financing problems are compounded because many towns and cities are suffering from financial crises, largely caused by the dwindling revenues of most city corporations over the years on account of reduced taxation for commercial and industrial sectors and the increasing outlays on city infrastructure without the involvement of the poorest people of the cities in deciding financial allocations and taxation. Inequity in access to urban drinking water supply is evident in most Indian cities where institutions like the Army Cantonment Boards and elite residential areas pay a much lower charge for water supplied by civic authorities. For a city like Delhi, water availability is not an issue but inequity in supply to different areas within the city and the cornering of most of the available water for the richer and elite residential areas is. In this scenario, the issues are more complex than simply a lack of political will or increasing tariffs to recover O&M costs. If inequity in water supply is going to remain as before, why should the poorer communities pay for improved infrastructure for a city water supply. Hence not only will the financing requirements for sewerage systems, wastewater treatment and solid waste management be much higher than requirements merely for the provision of disposal of excreta, but the question of equity and cross subsidisation needs to be addressed while estimating the increased financing for urban water and sanitation.
The current inequity in service provision in urban areas shows that the progress India is making towards the MDG targets is not necessarily being done in a particularly pro-poor way. Whilst progress in coverage levels has increased in the last decade those living in slum areas are predominantly still affected by very poor water and sanitation facilities. The revised water line in Figure 5 takes into account what the coverage level would look like if inequity in water provision was better taken into account in the statistics. This line assumes
58 South Asian Rural Development Series: Urban Water Supply and Sanitation, 1999, World Bank, p.12
59 We have not assessed the investments already made or projected in the private sector (micro and unregulated as well as large formal corporate investments) but these could be significant.
60 Municipal reforms for Sustainable urban Infrastructure development in India; Delhi Feb 2004 ; Vinod Tiwari, Director NIUA

Section III Urban Water and Sanitation
33
that out of the 21% of India’s urban population living in slums, 90% have inadequate water supply. If this assumption is correct – and small scale surveys suggest it is – then India would not be on course to meet the MDG target.
ConclusionWhilst large resource outlays have been made in the Tenth Plan, whether these are sufficient for investing in urban infrastructure for both water and sanitation to meet the MDG Targets needs more scrutiny. Moreover, urban sector reforms – outlining the regulatory mechanism and powers of utility service providers, norms for subsidy and cost recovery, laws and legislation – is yet to be implemented across the country, although some pilot projects have been initiated. This makes the planning process uncertain and financial assessments difficult. However, depending on whether the cost of large scale infrastructure improvements are taken into consideration or not largely influences whether there is a finance gap in meeting the MDG targets in urban areas.
It is important to note that even if there is a large financial outlay for urban areas and all of this outlay is matched by actual spending it does not guarantee that those with the worst WATSAN provision will enjoy substantially improved coverage by 2015. Inequity in public spending in towns and cities – and the resultant difference in coverage levels between poor and
wealthy areas – will remain a major issue. A break-up of resource outlays for maintenance and new physical infrastructure in different socio-economic parts of urban areas is required for an informed public debate about the equity of public spending. It is also important to look at equity between urban and rural areas, as there is a temptation for large towns and state capitals to corner large spending outlays and public subsidies and transport surface water and/or mine ground water from afar to satisfy their needs, which can be at the expense of the water needs of rural areas and smaller towns.61
Whether or not India will reach the MDG and the GoI targets for water and sanitation again depends on the criteria by which coverage is measured. For instance: can basic sanitation be ensured in urban areas (especially high density slums) without the basic sewerage infrastructure in place? Can safe, sustainable water be provided to urban areas that do not have adequate sanitation facilities? If we conclude that the answer to such questions is essentially ‘yes’ then it may look like India is broadly on target to meet the water and sanitation MDGs. If the answer to such questions is negative, significant infrastructure enhancements would be needed in many parts of the country (plus the sector capacity to implement them), massively increasing the investments needed to reach the MDG/GoI targets as well as creating a less optimistic assessment of the present coverage situation.
61 There are numerous instances of metros, state capitals and large cities securing heavily subsidised water from rural areas, creating scarcity problems in the rural areas from where the water is taken. Transparency in this process is required to ensure public scrutiny can take place regarding this issue.

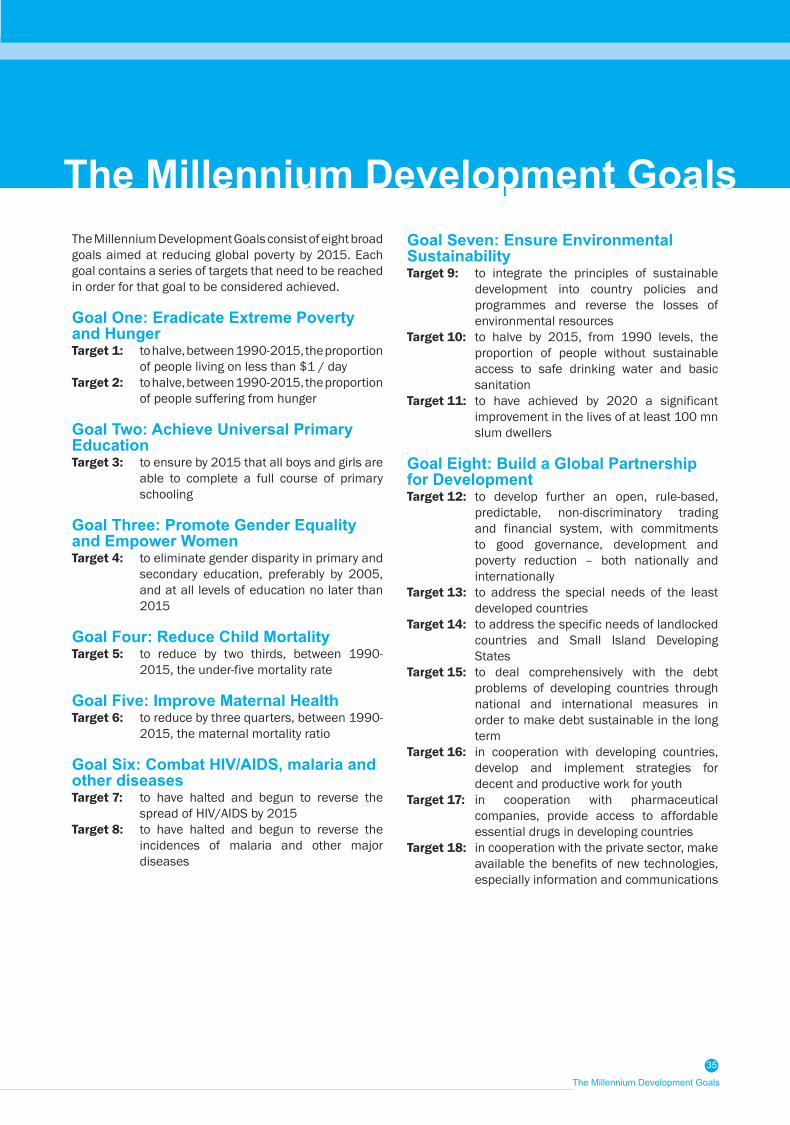
The Millennium Development Goals
35
The Millennium Development Goals consist of eight broad goals aimed at reducing global poverty by 2015. Each goal contains a series of targets that need to be reached in order for that goal to be considered achieved.
Goal One: Eradicate Extreme Poverty and HungerTarget 1: to halve, between 1990-2015, the proportion
of people living on less than $1 / dayTarget 2: to halve, between 1990-2015, the proportion
of people suffering from hunger
Goal Two: Achieve Universal Primary EducationTarget 3: to ensure by 2015 that all boys and girls are
able to complete a full course of primary schooling
Goal Three: Promote Gender Equality and Empower WomenTarget 4: to eliminate gender disparity in primary and
secondary education, preferably by 2005, and at all levels of education no later than 2015
Goal Four: Reduce Child MortalityTarget 5: to reduce by two thirds, between 1990-
2015, the under-five mortality rate
Goal Five: Improve Maternal HealthTarget 6: to reduce by three quarters, between 1990-
2015, the maternal mortality ratio
Goal Six: Combat HIV/AIDS, malaria and other diseasesTarget 7: to have halted and begun to reverse the
spread of HIV/AIDS by 2015Target 8: to have halted and begun to reverse the
incidences of malaria and other major diseases
Goal Seven: Ensure Environmental SustainabilityTarget 9: to integrate the principles of sustainable
development into country policies and programmes and reverse the losses of environmental resources
Target 10: to halve by 2015, from 1990 levels, the proportion of people without sustainable access to safe drinking water and basic sanitation
Target 11: to have achieved by 2020 a significant improvement in the lives of at least 100 mn slum dwellers
Goal Eight: Build a Global Partnership for DevelopmentTarget 12: to develop further an open, rule-based,
predictable, non-discriminatory trading and financial system, with commitments to good governance, development and poverty reduction – both nationally and internationally
Target 13: to address the special needs of the least developed countries
Target 14: to address the specific needs of landlocked countries and Small Island Developing States
Target 15: to deal comprehensively with the debt problems of developing countries through national and international measures in order to make debt sustainable in the long term
Target 16: in cooperation with developing countries, develop and implement strategies for decent and productive work for youth
Target 17: in cooperation with pharmaceutical companies, provide access to affordable essential drugs in developing countries
Target 18: in cooperation with the private sector, make available the benefits of new technologies, especially information and communications
The Millennium Development GoalsThe Millennium Development Goals

Water
A Profile of the State, Institutions and Policy Environment
and SanitationMadhya Pradesh
in
WaterAid India 2005
Recent Reports
WaterAid – water for lifeThe international NGOdedicated exclusively tothe provision of safedomestic water, sanitationand hygiene education tothe world’s poorest people.
WaterAid – Water for AllWaterAid is an International NGO, established in 1981, in response to the United Nations declaration of the Water and Sanitation Decade, 1980–90, to enable better access of poor communities to adequate, safe water. WaterAid remains the UK’s only major charity dedicated exclusively to the provision of safe domestic water, sanitation and hygiene education to the world’s poorest people. WaterAid works in 15 countries across Asia and Africa, through local organisations and communities, helping them set up low cost, sustainable projects using appropriate technology that can be managed by the community itself. WaterAid also seeks to influence the water and sanitation policies of other key organisations, such as governments, to secure and protect the right of poor people to safe, affordable water and sanitation services.
WaterAid in IndiaWaterAid began working in India in the latter part of the 1980s with a few small projects and has since grown in strength and coverage. Today, WaterAid works in more than 10 states with two regional offices in Bhopal and Bhubaneshwar, in partnership with local NGOs and government departments and ministries that seek assistance in the specific areas of rural and urban water supply, sanitation and hygiene promotion. Community sustained improvement in drinking water and sanitation has been WaterAid’s watchword in all its programmes.
Different models of community participation and management, of both rural and urban water supply and sanitation, alternate delivery mechanisms, school hygiene promotion programmes, water conservation and recharge measures have been demonstrated to the sector. These projects have a strong partnering component with state governments and departments and have proved to be the inspiration behind successful replications in other states. A vast array of publications, including training manuals for development workers, issue sheets and concept papers for advocacy initiatives and IEC material have been jointly developed with NGO partners and are in wide circulation.
WaterAid has participated in collaborative initiatives with the government and other agencies including the Water Supply and Sanitation Collaborative Council (WSSCC), the Water and Sanitation Programme (WSP) of the World Bank, UNICEF and DFID. Alliances are important for core programming concerns of rural and urban programming for water and sanitation, Integrated Water Resources Management and Networking with a range of government departments and government organisations, at the national and regional levels in India. WaterAid India is committed to making its own contribution to the MDG challenge and is open to exploring ways of partnering with all stakeholders for achieving water and sanitation for all.
Regional Office EastPlot No. 1266,Bhoinagar, Unit 9,Bhubaneswar - 751022OrissaTelefax: 0674-2382262
Regional Office WestE7/846 Arera ColonyBhopal - 462016Madhya PradeshTelefax: 0755-4294724
Regional Office SouthRajat ResidencyGitanjali Paradise#102, 1st Floor, Rahat BaghNagavarpalya, Bangalore-560093KarnatakaTelefax: 080-25240704
WaterAidRegional Offices
Published byWaterAid India1st Floor, Nursery School BuildingC-3, Nelson Mandela MargVasant Kunj,New Delhi - 110070Tel: 0091-11-46084400Fax: 0091-11-46084411Email: [email protected]
Related Documents