Chapter 4: Selection of water source and treatment Contents 4.1 Introduction 1 4.2 Identifying potential sources 1 4.2.1 Quantity, reliability, access 1 4.3 Barriers to the transmission of micro-organisms 4 4.3.1 Protection of water catchments 5 4.3.2 Storage and pretreatment 6 4.3.3 Coagulation and filtration 7 4.3.4 Disinfection and inactivation 7 4.4 Evaluating the sources 8 4.4.1 Where to sample 8 4.4.2 When to sample and how often 10 4.4.3 What to sample for 11 4.4.4 Effect of recycling washwater 19 4.5 Selecting appropriate treatment processes 19 4.5.1 Intakes 19 4.5.2 Treatment selection 21 References 25 List of tables Table 4.1: Source water quality 2 Table 4.2: Performance that can be achieved by effective barriers to contamination 6 Table 4.3: Effect of impoundment on mean concentrations of some determinands during fairly dry summer/autumn periods 9 Table 4.4: Summary of sources that may provide significant chemical contaminants of concern (COCs) to freshwater environments in New Zealand 1 13 Table 4.5: Prioritising chemical monitoring in drinking-water using limited information 15

drinking-water-guidelines-ch-4-selection-water-source-treatment-jan14.docx
Dec 21, 2015
Welcome message from author
This document is posted to help you gain knowledge. Please leave a comment to let me know what you think about it! Share it to your friends and learn new things together.
Transcript

Chapter 4: Selection of water source and treatment
Contents4.1 Introduction 1
4.2 Identifying potential sources 14.2.1 Quantity, reliability, access 1
4.3 Barriers to the transmission of micro-organisms 44.3.1 Protection of water catchments 54.3.2 Storage and pretreatment 64.3.3 Coagulation and filtration 74.3.4 Disinfection and inactivation 7
4.4 Evaluating the sources 84.4.1 Where to sample 84.4.2 When to sample and how often 104.4.3 What to sample for 114.4.4 Effect of recycling washwater 19
4.5 Selecting appropriate treatment processes 194.5.1 Intakes 194.5.2 Treatment selection 21
References 25
List of tables
Table 4.1: Source water quality 2Table 4.2: Performance that can be achieved by effective barriers to
contamination 6Table 4.3: Effect of impoundment on mean concentrations of some
determinands during fairly dry summer/autumn periods 9Table 4.4: Summary of sources that may provide significant chemical
contaminants of concern (COCs) to freshwater environments in New Zealand1 13
Table 4.5: Prioritising chemical monitoring in drinking-water using limited information 15
Table 4.6: Treatment options for typical low colour source waters 24Table 4.7: Treatment options for source waters with colour that also needs to
be removed 24Table 4.8: Treatment options for other types of source waters 24Table 4.9: Options for waters that only require disinfection 25

List of figures
Figure 4.1: Confidence limits on a 95th percentile estimate 11Figure 4.2: Micro-organism size and treatability 23
Note
In December 2013, legislation changed the term ‘public health risk management plan’ to ‘water safety plan’. Any reference within this text to ‘public health risk management plan’ has been changed to reflect the new legislation. No other
changes have been made to this document.

4.1 IntroductionChapter 3: Source Waters discusses general issues relating to the quality of natural fresh water systems, ie, surface water and groundwater, and measures that can be taken to protect or enhance their quality.
In a sense, this chapter converts these natural waters into prospective raw or source waters, ie, water systems that are being considered for processing into drinking-water. It discusses some of the information that is needed in the planning stages of developing a new water supply, and the barriers that can be used to protect public health. The chapter finishes with a summary of matching water treatment processes with raw water quality.
A major consideration when designing a water supply scheme is the nature of the source water that is to be used. Questions that arise include:
is it in reasonable proximity to the area to be supplied?
is the flow sufficient, or will an impoundment be needed?
is there an indication of the downstream minimum flow requirement?
how variable is the quality, day-to-day, or seasonally?
what is the worst water quality the treatment plant will have to cope with?
will the quality of its waters pose special concerns for the efficacy of treatment? For example, might such variations cause non-compliance with the DWSNZ, impairment of desired plant performance? Or excessive treatment costs?
is the catchment or recharge area vulnerable to contamination (now or in the future) eg, from geothermal areas, mining activities, urban and agricultural pollutants: faecal microbes, sediment, fertilisers and pesticides?
what management techniques are available to mitigate contamination and how might their efficacy vary with soil type and topography, for example?
Some of the broader aspects are covered in Chapter 3, and those more specifically related to water supply, in this chapter. Rainwater is covered in Chapter 19: Small and Individual Supplies.
4.2 Identifying potential sources4.2.1 Quantity, reliability, access
A variety of sources are used for the purpose of water supply, ranging in size from those needed by single households (see Chapter 19) to supplies needed for large cities. Each kind of supply can be characterised according to its raw water quality (Table 4.1) and there are some rules of thumb that can be applied with regard to the necessary levels of treatment for each source-type:
the widely-accepted minimum treatment for a non-secure groundwater source is disinfection
the widely accepted minimum treatment for a surface water source is filtration followed by disinfection. This minimum level should also be applied to a groundwater source that is under the direct influence of surface water, which includes all springs.
Guidelines for Drinking-water Quality Management for New Zealand 2013 1Chapter 4: Selection of water source and treatment – January 2014


Table 4.1: Source water quality
Raw water source Microbiological quality Chemical quality Aesthetic quality
Roof water Sometimes poor Usually good, subject to air, roof and paint contaminants
Soft/corrosive so could contain some metals
Unconfined aquifer Often poor Can be high in nitrate and ammonium
Variable, can be turbid, discoloured, soft/corrosive. Can be high in iron or manganese
Confined aquifer Usually good Usually good. Can be high in carbon dioxide and ammonium
Variable. Can be hard or soft/corrosive and high in iron or manganese. Usually low turbidity
River or stream.Controlled or few human/animal impacts
Good to poor Usually good Usually good but turbid and discoloured under flood conditions
River or stream.High human and/or animal impacts
Poor. Higher protozoal risk
Often poor Good to poor. Turbid and discoloured under flood conditions
Lake/reservoir.Controlled or few human/animal impacts
Usually good. May contain algae
Usually good Usually good. May have iron and manganese in deep water. May be coloured water from bush catchments
Lake/reservoir.High human and/or animal impacts
Often poor. Higher protozoal risk
Good to poor Usually good, may not be good if prone to algae blooms. May have iron/manganese in deep water
The treatment required to produce safe drinking-water depends on the raw water source that is used. Some natural purification occurs in surface waters as a result of dilution, storage time, sunlight exposure, and associated physical and biological processes. With groundwater, natural purification may occur by infiltration of rainfall through soil and percolation through underlying porous materials such as sand, gravel and joints or fractures in bedrock. Effective treatment should be provided to ensure safety and consistency in the quality of drinking-water (MoE 2001).
Rivers and streams
It is critically important when assessing a possible source of water supply to ensure that the resource has an adequate quantity at all times, so that a reliable source of supply is assured. For flowing waters (rivers and streams) it is important to have a good understanding of the flow regime, see Chapter 3: Source Waters, section 3.3) and have a long enough record of stream flows to provide useful summary statistics. This includes mean annual seven-day minimum flow, mean discharge, and mean annual flood, and to generate a flow-duration curve expressing the proportion of time during which the flow of a stream is equal to or greater than given amounts, regardless of chronological order. Flow measurement is discussed in the Hydrologists’ Field Manual (DSIR 1988).
Specific discharge, or flow per unit area of catchment (L/s/km2) when multiplied by the catchment area gives the mean annual flow. Also of interest are extreme low flows, such as the 20-year seven-day minimum flow, and flood flows. These data are provided by continuous level recording calibrated by field gaugings of the river in question over a sufficient period. In cases where level and flow-gauging data have not been collected it is possible to estimate flow regimes by applying measured relationships between rainfall and runoff from gauged basins to ungauged basins within the same region (Duncan and Woods 2004). An easier way
Guidelines for Drinking-water Quality Management for New Zealand 2013 3Chapter 4: Selection of water source and treatment – January 2014

to get mean flows and mean annual low flows for third and higher order streams throughout New Zealand is to use the River Ecosystem Classification database that is available from the NIWA website for the Freshwater Fish Database (via online services). The NZFFD Assistant software is available for Windows users to download as a compressed zip file.The regional council should be contacted early in the assessment of a new source to check on water flows (likely minimum flow requirements and the volume available for allocation) and trends in land use patterns.
Rivers used for drinking-water supply are generally accessible to the public as well as having private lands draining to them. This means that water quality is variable and not easily controlled and that such waters are unprotected from illegal activities and major pollution events (eg, spills from tanker accidents, discharges of urban, farm and factory wastes). Monitoring programmes are needed to determine when river sources may be unacceptable for treatment and to determine the quality of influent water prior to treatment. They should provide an understanding of average water quality, changing water quality conditions and the magnitude and frequency of extreme water quality occurrences. Monthly sampling is commonly chosen for river monitoring networks because it provides useful information about average or characteristic water quality, and changes in water quality. Results can be used for trend analysis after sufficient data have been collected (at least five years, or 50–100 data sets) (Ward et al 1990). Some targeted sampling may be needed too, to cover special events such as flood and drought.
Lakes and reservoirs
The volume of a lake (or reservoir) is the product of its surface area and its average depth. Catchment size and rainfall determine the flow of water into a lake and thereby influence flushing and supply of water. Storage in lakes and reservoirs is usually expressed in terms of lake level that is measured with a permanent and well-surveyed staff gauge, often to within 1 mm (Hoare and Spigel 1987). Assuming that the lake area varies negligibly with level over the operating range, then available lake volume is proportional to level. The level of a lake is thus controlled by the difference between its inflows and outflows, as defined below (Hoare and Spigel 1987):
surface inflow rate: Qin
groundwater inflow rate: Gin
precipitation rate on lake surface per unit area Poutflow rate from surface outlet: Qoutflow rate to groundwater: Gout
evaporation rate from lake surface per unit area: Elake area: Alevel: L
in which case:
Qin + Gin + (PA) = Q + Gout + (EA) + AdL/dt
dL/dt is the rate of change in water level, with time. One of the advantages of lake storage is that because outflow rate can only increase by means of an increase in lake level, which absorbs a large proportion of the inflow, outflow rate in response to a storm varies much less markedly than the inflow rate. In other words, in-lake

storage has a smoothing effect on outflows in response to storm events. The corollary of this is that when lake levels falls below the spill level, outflow ceases.
It is possible to isolate water storage reservoirs from public access or to prohibit activities like swimming and other forms of contact recreation so that water quality is maintained at a high level. In cases where there is some public ownership of catchment land (eg, Hays Creek, Auckland) control of water quality is not as tight and some additional monitoring may be required to detect incidents that adversely affect the capacity for treatment to be effective. Bimonthly sampling is considered an appropriate frequency that will enable trends to be detected in lakes and reservoirs as well as yielding general water quality information (Ward et al 1990).
Springs and groundwater sources
Supply of groundwater and springs is dependent on surface waters that supply them and there is often a considerable time lag between changes in the supply (quantity) and quality of surface water and the emergent groundwater being used downstream. Hydraulic changes travel through an aquifer as a pressure wave moving much faster than the groundwater and its constituents. This is particularly so for deep aquifers and groundwater such as those used to supply Christchurch, and for spring waters emerging in the Lake Taupo catchment. In order to have a dependable supply it is necessary to understand these relationships between surface water hydrology and the resulting groundwater resource.
Emergent groundwater and springs water may be affected by surface contamination that is some distance removed from the point of supply and thus, may not be apparent. Shallow groundwater is particularly prone to this sort of contamination, where there are intensive land-use activities in the areas that recharge the groundwater or feed springs. Recent conversions to dairy farms in the Waitaki River valley rely on the relatively clean river water from the Waitaki River to flood-irrigate pasture for dairy farming and are causing some deterioration of shallow groundwater in the area through drainage of polluted surface water. Irrigation of freely-draining soils is a well known mechanism for introducing surface contaminants to shallow groundwater and is thought to be the main mechanism for nitrate contamination in the Waikato and other parts of New Zealand (Selvarajah et al 1994). Recent irrigation trends in Canterbury, with subsequent intensification of agricultural activities, are increasing the risk of groundwater contamination and uncertain effects on the quantities of some groundwater resources (PCE 2004).
Changes in groundwater quality and quantity are much more gradual than for surface waters and, accordingly, quarterly monitoring should be carried out (ie, at three-month intervals) to provide useful information for water quality time-trend analysis when sufficient data has been collected. At a rate of four samples/site/year it will be many years before sufficient information has been collected for trend analysis, with the consequence that degradation of a groundwater may only be detected well after contamination has occurred (Ward et al 1990). Thus, it may be prudent to monitor surface sources of groundwater and their catchments (eg, for major changes in land use), as well. Water quality data for major New Zealand aquifers collected for the National Groundwater Monitoring Programme is available from the Institute of Geological and Nuclear Sciences.
Guidelines for Drinking-water Quality Management for New Zealand 2013 5Chapter 4: Selection of water source and treatment – January 2014

Risk management issues related to new supplies are addressed in the MoH water safety plan guide Ref: S2: Development of New Supplies.
4.3 Barriers to the transmission of micro-organisms
New Zealand waters generally do not contain chemicals that pose a threat to public health when used for drinking-water supplies. The main concern is the risk of disease by the transmission of micro-organisms, see Chapter 5: Microbiological Quality.
Although disinfectants are available that can inactivate nearly all micro-organisms, it has long been an accepted public health concept that the greater the number of barriers employed, the safer the water for drinking.
WHO (2004a) stated in section 1.1.1:
Securing the microbial safety of drinking-water supplies is based on the use of multiple barriers, from catchment to consumer, to prevent the contamination of drinking-water or to reduce contamination to levels not injurious to health. Safety is increased if multiple barriers are in place, including protection of water resources, proper selection and operation of a series of treatment steps, and management of distribution systems (piped or otherwise), to maintain and protect treated water quality. The preferred strategy is a management approach that places the primary emphasis on preventing or reducing the entry of pathogens into water sources and reducing reliance on treatment processes for removal of pathogens.
Traditionally, the barriers have included (WHO 2004c):
protection of source water (water used for drinking-water should originate from the highest quality source possible)
coagulation, flocculation and sedimentation
filtration
disinfection
protection of the distribution system.
See WHO (2003) for a thorough discussion on the protection of water quality. This book contains the following chapters:
Chapter 1: Safe drinking water: an ongoing challenge
Chapter 2: Introducing parameters for the assessment of drinking water quality
Chapter 3: Assessment of risk
Chapter 4: Catchment characterisation and source water quality
Chapter 5: Treatment efficiency
Chapter 6: Monitoring the quality of drinking-water during storage and distribution
Chapter 7: Surveillance and investigation of contamination incidents and waterborne outbreaks

Chapter 8: Analytical methods for microbiological water quality testing.
4.3.1 Protection of water catchments
Drinking-water should not contain any micro-organisms capable of causing disease. All micro-organisms can enter water supplies at any stage of the collection and distribution cycle. Any micro-organisms that reach the water source are reduced in number by natural processes such as storage, settlement and natural solar ultraviolet light. If it can be avoided, sources from which drinking-waters are drawn should not receive faecal contamination, which is likely to contain pathogenic micro-organisms.
Natural processes are insufficient to ensure sterile water for public distribution. Production of microbiologically safe water involves an intense programme of protection, treatment and monitoring that is based largely on the improvement of nature’s already established processes. A reasonable combination of the following measures should be in place for all modern urban water supplies:
the original water source should ideally be protected from contamination by human or animal faeces and the catchment should be protected, see Chapter 3: Source Waters, section 3.5.1
the water can be stored to allow settlement and die-off of micro-organisms.
Table 4.2 indicates the percentage removal of faecal coliform bacteria as a result of the processes indicated. Care must be taken to see percentage removal in context where the actual numbers of bacteria may be up to 106/mL. Monitoring for microbiological quality is simply a check that barriers are working and should not be regarded as a replacement for removal of any of the barriers.
Table 4.2: Performance that can be achieved by effective barriers to contamination
Process Removal of faecal indicator bacteria Reference
Protection of catchment Variable Medema et al (2003); Collins (2005)
Artificial impoundments(3–4 weeks’ storage)
Variable Medema et al (2003)
Coagulation and sedimentation 40–90 percent Medema et al (2003)
Filtration 99–99.9 percent Stanfield et al (2003) a
Chemical disinfection b >99% with sufficient C.t values c Stanfield et al (2003) a
UV disinfection >99%, depends on dose d Stanfield et al (1999) a
a) Stanfield et al (2003) state these removals for bacteria.
b) Chlorine/chloramine/chlorine dioxide/ozone.
c) This does not necessarily apply to protozoan cysts.
d) Doses of 400 J/m2 will reduce vegetative bacteria by 4 to 8 logs (Stanfield et al 1999).
Faecal material from humans and animals is the most likely source of waterborne pathogens. Humans and domestic animals should be excluded from water supply catchments wherever possible, particularly if the water treatment process does not include flocculation, sedimentation, filtration and disinfection. Section 3.3 discusses the control of surface water quality.
Chapter 3: Source Waters discusses mitigation of pollutants and catchment protection in a broader sense, see section 3.5.
Guidelines for Drinking-water Quality Management for New Zealand 2013 7Chapter 4: Selection of water source and treatment – January 2014

4.3.2 Storage and pretreatment
Most pathogenic micro-organisms do not survive long in stored water and significant die-off will occur, typically more than 90 percent removal of faecal indicator bacteria after a week of two’s storage. See Chapter 12: Pretreatment Processes, section 12.3.2: Off-river Storage for further information, including some information re reduction times for selected micro-organisms. Retention of water in artificial storage systems such as lakes or dams will allow the suspended material (inorganic and organic, including pathogens) to settle as the specific gravity is marginally greater than that of water. In addition, pathogenic micro-organisms do not usually grow outside the host as the optimum growth conditions do not prevail. Competition for nutrients from the normal aquatic flora, predation by native protozoans, and most particularly inactivation by solar ultraviolet radiation, are important pathogen-removing processes.
The removal of solids by settlement helps remove micro-organisms that are adsorbed to the solids. This clarification of water will facilitate solar ultraviolet inactivation and subsequent disinfection. Where it is not possible to store the bulk of water for sufficient time, pre-disinfection can be used as an alternative to storage to reduce numbers of potential pathogens. However, prechlorination of water at this stage requires higher levels of chlorine and may produce hazardous by-products.
4.3.3 Coagulation and filtration
Assistance of natural processes by the addition of a chemical coagulant or flocculant to aggregate bacteria and other particles, followed by sedimentation and filtration through graded sand, can remove up to 80–90 percent of suspended solids. Chemicals such as alum, PAC, iron compounds, and polyelectrolytes may be used to promote aggregation of microbes and other suspended particles, see Chapter 13. Further, activated carbon may be used to remove (by adsorption) some taste and odour causing compounds and other organic molecules.
It is essential that the removal of micro-organisms and other particulate matter should be as complete as possible before disinfection such that the need for high disinfectant doses (and the cost of disinfection) is reduced. This will also limit the production of disinfection by-products.
If the colour and turbidity are not high, effective water treatment can be achieved by using filtration without chemical coagulation. Chapter 14 covers diatomaceous earth, slow sand, cartridge, bag and membrane filtration processes.
4.3.4 Disinfection and inactivation
Pathogenic micro-organisms in all water supplies need to be disinfected (inactivated) or removed, except in groundwaters that comply with the bacterial requirements in section 4.5 of the DWSNZ. Disinfection processes are discussed in Chapter 15.
Water suppliers must assume that all surface waters contain E. coli (which indicates the probability of pathogenic bacteria and viruses being present) and

protozoal (oo)cysts, and treat the water accordingly. A discharge that increases the number of E. coli may increase the risk to public health but not necessarily increase the cost of disinfection – usually the dose will be the same whether there is 1 E. coli per 100 mL, or (say) 1000 per 100 mL. However, a discharge that increases the number of protozoal (oo)cysts in the source water may cause the required number of log credits to increase, and hence the cost of treatment.
Disinfection can and should inactivate all types of pathogenic, indicator and other micro-organisms. However, by definition disinfection does not usually inactivate every last cell (or (oo)cyst, spore or virion) of micro-organisms that are present. Rather disinfection reduces concentrations to acceptable levels for which disease risk is very low (but not zero, Gerba et al 2003). Note that the term inactivate is used to recognise that disinfecting agents do not (usually) destroy micro-organisms completely, but merely render them incapable of infection and growth (Stanfield et al 2003). Microbes are usually still recognisable microscopically after disinfection, despite being inactivated.
The commonest disinfectant used in water supply is still chlorine, as the gas or hypochlorite, but other chemical disinfectants such as chloramine, chlorine dioxide, and ozone are also used (Stanfield et al 2003). Ozone is particularly popular in Europe, apparently because toxic organochlorine byproducts are not produced with this disinfectant, and because many supplies sourced from rivers contain organic substances that can be destroyed by ozone. Ultraviolet radiation (usually by exposure to lamps emitting most energy at 254 nm) is a powerful disinfecting agent, and is becoming increasingly popular in New Zealand and elsewhere, particularly for inactivating protozoa, again in part because organochlorine byproducts are avoided. See Chapter 15. There is increasing interest in natural solar disinfection (SODIS) of water, particularly in developing countries and situations (eg, disaster zones) where infrastructure for water disinfection is unavailable or has been damaged, but sunlight is abundant (eg, McGuigan 1998; WHO 2009, 2011a).
The quality of the water prior to disinfection is important because it can greatly influence the efficiency (and cost) of disinfection (Sobsey 1989). Both organic matter and suspended particles (indexed by turbidity measurement) need to be reduced to low concentrations prior to disinfection. Organic matter will increase the consumption of chemical (oxidising) disinfectants and therefore the cost. Organic matter also strongly absorbs UV radiation, so reducing the effective dose to micro-organisms. Turbidity will reduce the efficiency of both chemical and ultraviolet disinfection. The pH of water is important for the effectiveness of some forms of disinfection, notably that with chlorine.
A number of micro-organisms such as Cryptosporidium and Giardia, and the cyanobacteria, are resistant to typical chlorination doses and can penetrate some filtration processes.
The maintenance of a satisfactory level of disinfectant throughout the distribution system is often important, allowing the disinfection process to continue beyond the treatment plant, and to protect against any minor accidental contamination, and helps limit regrowth (biofilms). The lack of a residual is often cited as an important disadvantage of using UV irradiation as the sole disinfectant, which is therefore
Guidelines for Drinking-water Quality Management for New Zealand 2013 9Chapter 4: Selection of water source and treatment – January 2014

best suited to smaller water supplies for which reticulation is in good condition with excellent safeguards in place to avoid accidental contamination.
4.4 Evaluating the sources4.4.1 Where to sample
This section discusses the evaluation of potential raw water sources, not source water monitoring which is discussed in Chapter 8: Protozoa Compliance, section 8.2, and not sampling techniques which is dealt with in Chapter 17.
A series of sample sites needs to be assessed when evaluating potential new sources. These should become apparent after conducting a sanitary survey of the catchment.
River systems
Samples should be collected from potential intake sites and from tributaries that may impact on water quality in the main stream at or near the intake. If the intake is in the lower reaches, it may be necessary to determine the distance that saline water extends up the river, particularly during periods of low river flow that coincide with spring tides and/or long periods of onshore wind. Also, samples should be taken close to the point at which the intake would be located, and not necessarily in the middle of the river (eg, from a bridge). This is because upstream tributary inflows can hug the riverbanks for some distance downstream (Rutherford 1994), and so a sample taken from midstream will not necessarily be representative of the quality of the water that would be taken. Sampling from each side and the middle will indicate the degree of mixing, which in large rivers and sluggish rivers, may be minimal.
Lakes and reservoirs
Samples should be collected at different depths for at least a year to determine whether the water body stratifies, and if it does, to measure the quality of the lower waters.
Ideally a dam should be built a few years before the water treatment plant is designed. This allows the composition of the impounded water to settle down and gives time to assess its treatment needs correctly. The water quality of a stream can be quite different after impoundment, to the extent that different types of treatment may be required or desired.
Otherwise, there may be a similar catchment nearby where the effects of impoundment can be studied, with the hope that it will give an indication of the probable raw water quality.
The changes that can occur when impounding a stream (see Table 4.3 for some typical values) include:
after heavy rain, suspended solids can rise to very high levels in stream water, and remain high for a day or two. Suspended solids entering a reservoir are diluted, so do not reach the same high levels, but may remain elevated for
weeks. If the flood water is much colder than the reservoir water it may plunge to an intermediate depth
stream phytoplankton are mainly attached to pebbles (epiphytic or benthic). In a reservoir the phytoplankton are free-swimming or floating species (planktonic), and these can reach much higher population densities. Nutrient levels in a reservoir can be higher too, because most nutrients are associated with run-off, which in a stream, passes with the flood flow, but these nutrients may be retained in an impoundment
natural organic matter (commonly measured as UV absorbance at 254 nm after membrane filtration) leaches from the soil during and after rain. In a stream this mostly passes down with (or very soon after) the fresh or flood. However, much of it is retained in an impoundment
reservoir surface water temperature in summer can reach several degrees higher than stream water flowing through a bush catchment, and stay warmer during early winter
summer stratification and deoxygenation usually occur in impoundments, giving rise to elevated concentrations of iron, manganese, ammonia, carbon dioxide and hydrogen sulphide, mainly in the deeper water
the reservoir water will usually be dirtier for the first few years due to scouring of the cleared slopes, and due to the high deoxygenation rates of the newly flooded bottom sediments.
Table 4.3: Effect of impoundment on mean concentrations of some determinands during fairly dry summer/autumn periods
Determinand, ‘typical values’ Flowing stream Impounded water (surface) Impounded water (deeper)
Temperature, °C 14 19 11
pH 7.4 7.1* 6.2
Turbidity, NTU 2 5 10
Total phosphorus, mg/L P 0.005 0.02 0.2
Iron, mg/L 0.1 0.3 10
Manganese, mg/L 0.01 0.05 2
Silica, mg/L Sio2 18 13 15
Alkalinity, mg/L Caco3 18 13 25
UV abs254, 10 mm, filtered 0.03 0.09 0.15
Colour, Hazen units 5 25 30
Based on Ogilvie 1983.
* Can reach pH 8 during the afternoon if algal content high.
Groundwater
The well should be pump-tested, screened and developed before making decisions about any water treatment requirements. Samples need to be collected without any aeration, filling the sample bottle carefully to the top, and allowing several bottle volumes to run through so all air is displaced; a BOD bottle with its tapered lid is ideal for tests that are affected by aeration, including the carbon dioxide calculation. Measure the pH as soon as possible. Faulty sampling can cause a groundwater with a pH of 6.5 with 40 mg/L of carbon dioxide to lose all its carbon
Guidelines for Drinking-water Quality Management for New Zealand 2013 11Chapter 4: Selection of water source and treatment – January 2014

dioxide and end up with a pH of about 7.4. This will result in the selection of a completely inappropriate treatment process.
There are several good references to sampling techniques for groundwater. A recent book is by Sundaram et al (2009). See Sinton (1986) for an earlier publication.
Deep confined groundwaters usually display a fairly consistent chemical composition, whereas the composition of shallow unconfined groundwaters can vary markedly throughout a year; see Chapter 3: Source Waters, section 3.2.
4.4.2 When to sample and how often
An objective of sampling a prospective water source is to discover the degree of contamination that may:
regularly be present
occasionally be present.
Sampling should cover at least a year so that seasonal effects and irregular events can be assessed. Water treatment plants usually have to be designed to treat the worst quality raw water. The usual (regular) water quality is discovered best by random sampling in time. However, the sampling programme should be designed to include an assessment of the impact of climatic events such as drought and different rain intensities. That way, any otherwise unforeseen patterns of quality variation may be picked up. See Chapter 9 for discussion related to cyanobacteria.
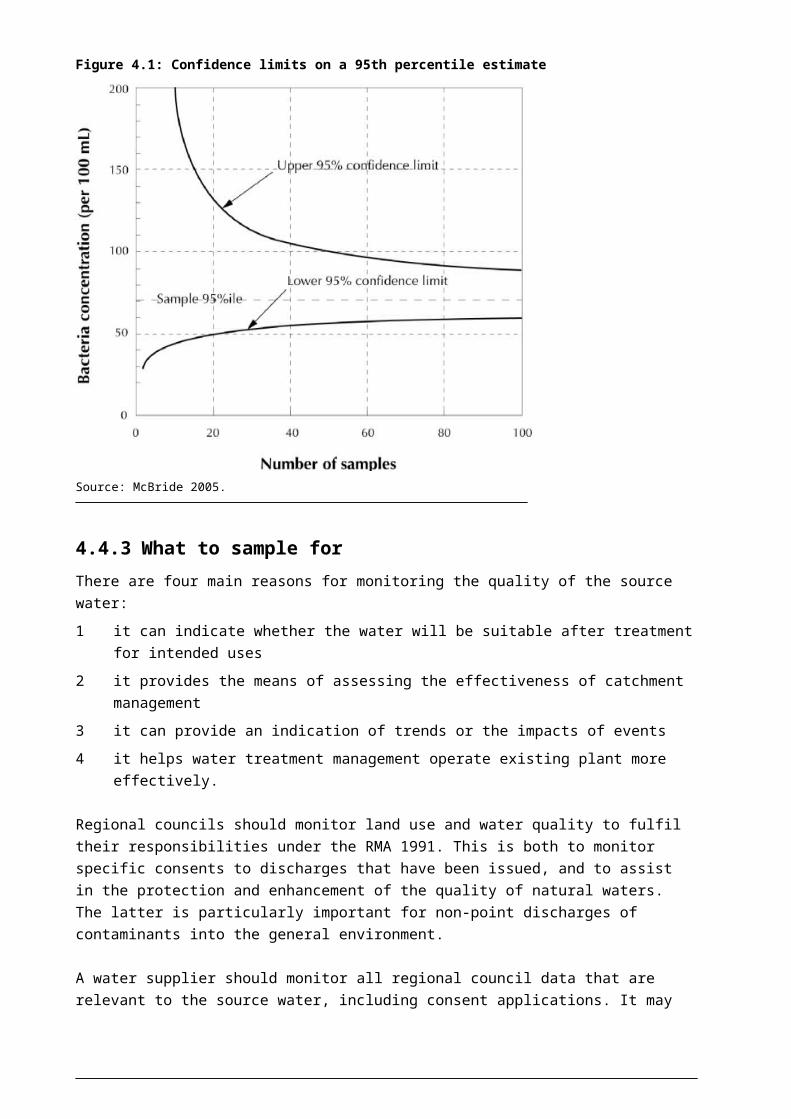
In order to pick out extremes in data, a productive approach is to seek to estimate 95 percentiles of the water quality variable with reasonable confidence. As a broad generalisation, more than 50 samples are desirable to achieve this. This is shown in Figure 4.1; once one takes beyond about 50 samples, the width of the confidence interval decreases very slowly.

Figure 4.1: Confidence limits on a 95th percentile estimate
Source: McBride 2005.
4.4.3 What to sample for
There are four main reasons for monitoring the quality of the source water:
1 it can indicate whether the water will be suitable after treatment for intended uses
2 it provides the means of assessing the effectiveness of catchment management
3 it can provide an indication of trends or the impacts of events
4 it helps water treatment management operate existing plant more effectively.
Regional councils should monitor land use and water quality to fulfil their responsibilities under the RMA 1991. This is both to monitor specific consents to discharges that have been issued, and to assist in the protection and enhancement of the quality of natural waters. The latter is particularly important for non-point discharges of contaminants into the general environment.
A water supplier should monitor all regional council data that are relevant to the source water, including consent applications. It may also be appropriate to commission other water quality monitoring which will assist in the protection of the source.
Until 1995, the Institute of Environmental Science and Research Ltd (ESR) monitored many source waters and drinking-waters on a three- to five-year surveillance cycle for inorganic and physical determinands, pesticides and trace organics under contract to the Ministry of Health. This source water monitoring no longer occurs.
Guidelines for Drinking-water Quality Management for New Zealand 2013 13Chapter 4: Selection of water source and treatment – January 2014

Protozoa monitoring is discussed in Chapter 8: Protozoa Compliance, section 8.2 Source Water. Monitoring other micro-organisms is discussed in section 4.3: Barriers to the transmission of micro-organisms. Generally speaking, unless the water is a secure bore water, all waters contain micro-organisms that need to be inactivated or removed. The disinfectant dose is normally determined by the disinfectant demand of the water (after treatment), not the number of micro-organisms present. A combination of the two is required for protozoal inactivation.
Risk-based approach
The DWSNZ include MAVs for 115 chemical determinands that may be present in waters and potentially represent a significant health concern to human consumers. This list contains a wide range of chemicals representing natural and anthropogenic sources, ie, may be found in source waters. A few of them are produced in disinfection processes or could enter the water from treatment chemicals or materials used in the distribution system or plumbing; these are discussed in Chapter 10: Chemical Compliance and Chapter 15: Treatment Processes: Disinfection.
Many of the determinands will not be present in a given water source so procedures are required to prioritise analytical assessments. A risk management approach provides a basis for a decision support framework to prioritise a chemical assessment programme.
The three main criteria for identifying specific determinands of concern to public health in any particular setting are:
high probability of consumer exposure from drinking-water
significant hazard to health
interference in the treatment process.
Chemicals judged to be more likely to occur and to be highly hazardous to human health should be given greater priority for risk management than those judged less likely to occur in the drinking-water and to have lower health hazards. This can be addressed in the water safety plan.
The period of exposure should also be considered, because health effects caused by chemicals in drinking-water generally result from long-term exposure. Few chemicals in NZ drinking-water have been shown to cause acute health problems in the short term, except through intentional or accidental contamination on a large scale. In such instances, the water frequently (but not always) becomes undrinkable due to unacceptable taste, odour or appearance (WHO 2004a).
Risk management strategies for chemicals in drinking-water should also take into account the broader context. For example, if drinking-water is not the main route of exposure for a chemical, then controlling levels in water supplies may have little impact on public health (WHO 2004b).
A recent World Health Organization publication (WHO 2004b) provides guidance on a risk-based approach, and detailed background information on chemical contaminants derived from a wide range of sources. A key component of a risk-based approach is to generate a list of potential contaminants that might be in the
source water, based on knowledge about the natural mineralogy, anthropogenic activities and hydraulic processes (eg, rainfall, catchment size, groundwater contribution) operating in the catchment. Integration of this information provides a robust approach to categorising the likely importance of contaminants of concern.
New Zealand has a number of major landscape-scale activities that may contribute significantly to downstream contaminants. Table 4.4 provides an overview of some sources and activities that may give rise to contaminants. This provides a risk-based approach to assess potential contaminants that may occur in a water supply. The objective of this tabulation is to provide an indication of sources that may require greater consideration in New Zealand compared with the generic WHO (2004b) listings. Some of these activities are conducted on a wide scale (eg, pest control for possums, forestry spraying), others may have cumulative risks from a large number of small or diffuse inputs (eg, agricultural ponds), while others may be regional (eg, geothermal, mining).
Table 4.4: Summary of sources that may provide significant chemical contaminants of concern (COCs) to freshwater environments in New Zealand1
Source Contaminants of concern Comment
Agriculture Ammonia, nitrate, modern pesticides, Zn, Cu, F, cyanotoxins, DDT, dieldrin
Cd and F input from fertiliser; Zn from application for facial eczema; Cu from horticultural spraying; DDT and dieldrin from legacy use of pesticides; cyanotoxins from blue-green algal growth in agricultural oxidation ponds
Forestry Cu, Cr, As, fungicides, PCP Cu from forestry Dothistroma spraying; Cu, Cr, As and PCP from old timber treatment sites
Geothermal Hg, B, As, F, Li Geothermal (and some hydrothermal) region input to surface and groundwaters
Pest control 1080, brodifacoum Used widely for possum and rat control
Mining Gold mining: Cu, Cr, AsCoal mining: B, Hg, Cd
Legacy mining inputs. New Zealand coal is high in B in some areas
Aquaculture Hg, antibiotics Hg is derived from use of some fish meal. Antibiotics added to many feeds
Domestic oxidation ponds
Ammonia, nitrate, various, cyanotoxins
Microcystin from blue-green algal growth in oxidation ponds
Mineralogy As, Hg Parts of New Zealand have mineralised areas with natural leaching of As and Hg to receiving waters
1 See also Hickey 1995, 2000; Smith 1986; Lentz et al 1998.
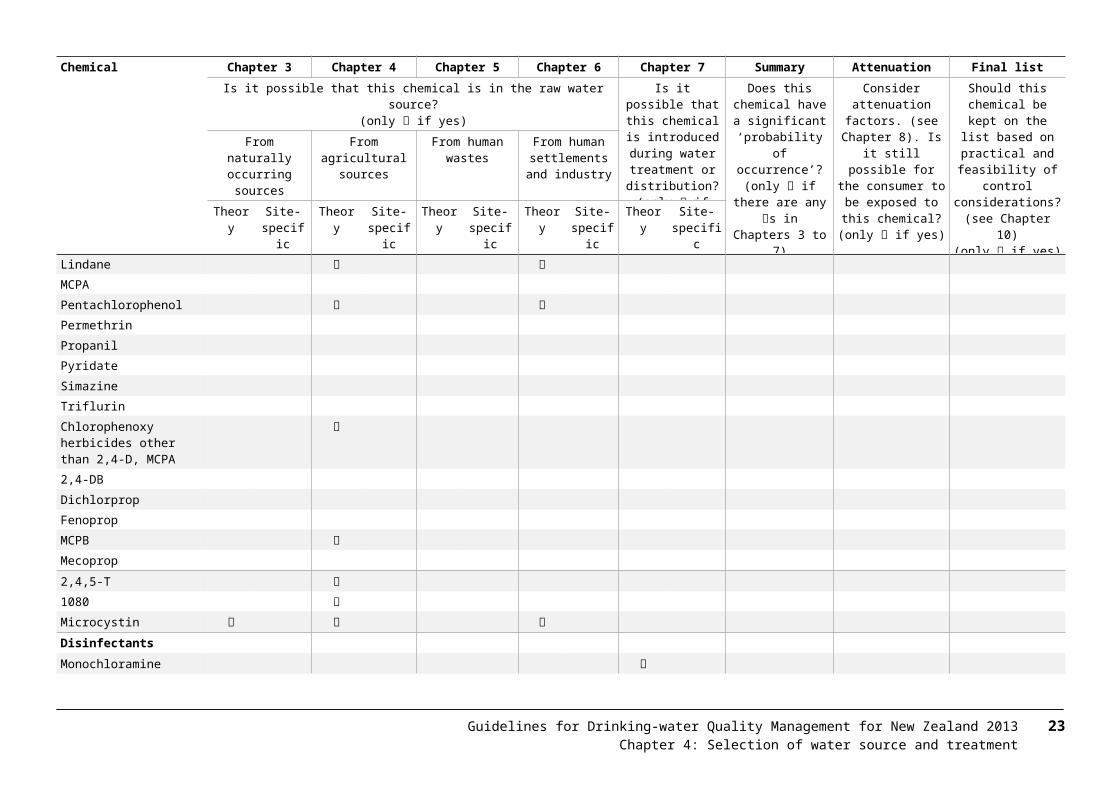
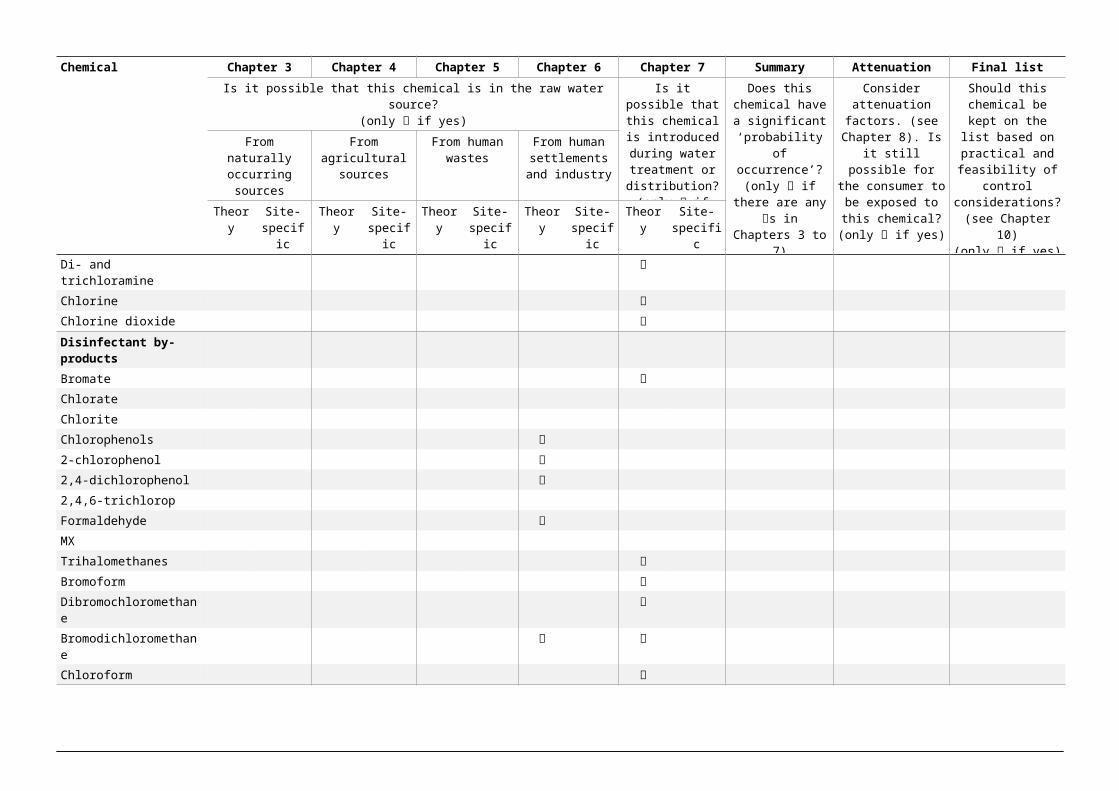
The risk-based procedure then involves listing the potential contaminant contributions followed by the hazard assessment. Table 4.5 illustrates an assessment procedure for an integrated catchment approach. The contaminants illustrated in this table are those likely to be of relevance in the New Zealand environment. There may be a range of site-specific contaminants in some water sources. This approach provides a decision-support basis for monitoring and surveillance of contaminants. The listing process is designed to be relatively exhaustive in drawing information from a range of sources to compile the database. The subsequent procedure involves risk ranking to eliminate contaminants that would not be expected to be present in significant quantities in the catchment. For completeness, Table 4.5 includes determinands that may enter the water during and after treatment.
Guidelines for Drinking-water Quality Management for New Zealand 2013 15Chapter 4: Selection of water source and treatment – January 2014
There is no national database available in New Zealand that provides information on point source and diffuse source contaminants or natural water concentrations. Rather, data must be gathered from a wide range of sources. Information for contaminants from a wide range of discharges is contained in a range of publications (eg, Hickey 1995, 2000; Smith 1986; Lentz et al 1998). Wilcock (1989), Wilcock and Close (1990) reviewed pesticide use, together with a risk-based assessment (Wilcock 1993). The pesticide use data has more recently been updated (Holland and Rahman 1999).
Most New Zealand water suppliers find that they do not need to monitor their source waters for chemical determinands of health significance. Some aesthetic determinands are measured regularly. And some determinands can impair the performance of the treatment process. Generally, the only raw water monitoring recommended to be conducted on site are those determinands that water treatment plant operators can do something about. These depend on the treatment process being used (Chapters 12–15) and the likelihood of them being a nuisance in the treatment process. Some problems that are fairly common are:
colour (or UV absorbance) and turbidity affect coagulation processes
natural organic matter and bromide may lead to disinfection by-products
silt and debris from floods can challenge the solids loading of the treatment plant
a change in raw water pH can require a pH adjustment either at the coagulation or final stage
low alkalinity, often during and after heavy rain, may prevent sufficient floc to form in the coagulation process
free carbon dioxide in bore water can cause metallic corrosion
iron, and particularly manganese, can be difficult to remove during treatment
algae can block filters, and cause taste and odour problems
an increase in the ammonia concentration can increase the chlorine demand
an increase in the colour or UV absorbance (or decrease in UVT) can affect the UV disinfection efficacy
low temperatures can affect treatment rates
C.t values are temperature dependant.

Table 4.5: Prioritising chemical monitoring in drinking-water using limited information
Chemical Chapter 3 Chapter 4 Chapter 5 Chapter 6 Chapter 7 Summary Attenuation Final list
Is it possible that this chemical is in the raw water source?(only if yes)
Is it possible that this chemical is
introduced during water treatment or
distribution?(only if yes)
Does this chemical have a
significant ‘probability of occurrence’?
(only if there are any s in
Chapters 3 to 7)
Consider attenuation factors.
(see Chapter 8). Is it still possible for the
consumer to be exposed to this
chemical?(only if yes)
Should this chemical be kept on
the list based on practical and
feasibility of control considerations?(see Chapter 10)
(only if yes)
From naturally occurring sources
From agricultural sources
From human wastes
From human settlements and
industry
Theory Site-specific
Theory Site-specific
Theory Site-specific
Theory Site-specific
Theory Site-specific
Inorganic constituents
Antimony
Arsenic
Barium
Beryllium
Boron
Cadmium
Chromium
Copper
Cyanide
Fluoride
Lead
Manganese
Mercury (total)
Molybdenum
Nickel
Nitrate (as NO3-)
Nitrite (as NO2-)
Selenium
Organic constituents
Aromatic hydrocarbons
Benzene
Toluene
Xylenes
Ethylbenzene
Benzo[a]pyrene
Guidelines for Drinking-water Quality Management for New Zealand 2013 17Chapter 4: Selection of water source and treatment

Chemical Chapter 3 Chapter 4 Chapter 5 Chapter 6 Chapter 7 Summary Attenuation Final list
Is it possible that this chemical is in the raw water source?(only if yes)
Is it possible that this chemical is
introduced during water treatment or
distribution?(only if yes)
Does this chemical have a
significant ‘probability of occurrence’?
(only if there are any s in
Chapters 3 to 7)
Consider attenuation factors.
(see Chapter 8). Is it still possible for the
consumer to be exposed to this
chemical?(only if yes)
Should this chemical be kept on
the list based on practical and
feasibility of control considerations?(see Chapter 10)
(only if yes)
From naturally occurring sources
From agricultural sources
From human wastes
From human settlements and
industry
Theory Site-specific
Theory Site-specific
Theory Site-specific
Theory Site-specific
Theory Site-specific
Pesticides
Alachlor
Aldicarb
Aldrin/dieldrin
Atrazine
Carbofuran
Chlordane
DDT
1,2-dibromo
3-chloropropane
2,4-D √
Heptachlor and
Heptachlor epoxide
Hexachlorobenzene
Lindane
MCPA
Pentachlorophenol
Permethrin
Propanil
Pyridate
Simazine
Triflurin
Chlorophenoxy herbicides other than 2,4-D, MCPA
2,4-DB
Dichlorprop
Fenoprop
MCPB
Mecoprop

Chemical Chapter 3 Chapter 4 Chapter 5 Chapter 6 Chapter 7 Summary Attenuation Final list
Is it possible that this chemical is in the raw water source?(only if yes)
Is it possible that this chemical is
introduced during water treatment or
distribution?(only if yes)
Does this chemical have a
significant ‘probability of occurrence’?
(only if there are any s in
Chapters 3 to 7)
Consider attenuation factors.
(see Chapter 8). Is it still possible for the
consumer to be exposed to this
chemical?(only if yes)
Should this chemical be kept on
the list based on practical and
feasibility of control considerations?(see Chapter 10)
(only if yes)
From naturally occurring sources
From agricultural sources
From human wastes
From human settlements and
industry
Theory Site-specific
Theory Site-specific
Theory Site-specific
Theory Site-specific
Theory Site-specific
2,4,5-T
1080
Microcystin
Disinfectants
Monochloramine
Di- and trichloramine
Chlorine
Chlorine dioxide
Disinfectant by-products
Bromate
Chlorate
Chlorite
Chlorophenols
2-chlorophenol
2,4-dichlorophenol
2,4,6-trichlorop
Formaldehyde
MX
Trihalomethanes
Bromoform
Dibromochloromethane
Bromodichloromethane
Chloroform
Guidelines for Drinking-water Quality Management for New Zealand 2013 19Chapter 4: Selection of water source and treatment

Chemical Chapter 3 Chapter 4 Chapter 5 Chapter 6 Chapter 7 Summary Attenuation Final list
Is it possible that this chemical is in the raw water source?(only if yes)
Is it possible that this chemical is
introduced during water treatment or
distribution?(only if yes)
Does this chemical have a
significant ‘probability of occurrence’?
(only if there are any s in
Chapters 3 to 7)
Consider attenuation factors.
(see Chapter 8). Is it still possible for the
consumer to be exposed to this
chemical?(only if yes)
Should this chemical be kept on
the list based on practical and
feasibility of control considerations?(see Chapter 10)
(only if yes)
From naturally occurring sources
From agricultural sources
From human wastes
From human settlements and
industry
Theory Site-specific
Theory Site-specific
Theory Site-specific
Theory Site-specific
Theory Site-specific
Chemicals that may give rise to consumer complaints
Inorganic constituents
Aluminium
Ammonia
Chloride
Copper
Hydrogen sulphide
Iron
Manganese
Sodium
Sulphate
Zinc
Organic constituents)
Synthetic detergents
Disinfectants and disinfectant by-products
Chlorine
Chloramine
2-chlorophenol
2,4-dichlorophenol
2,4,6-trichlorophenol
Chemicals not of health significance
Asbestos
Source: Derived from WHO 2004b.
Upgrade this table following the WHO protocol – see Figure 1 (WHO 2004b).

4.4.4 Effect of recycling washwater
The effect of recycling wastewater from the sedimentation process and filter backwash can modify the composition of the source water, especially if the return is not continuous, so care is needed when collecting raw water samples, ie, the raw water is really source water plus recycle. Sedimentation tank wastes are usually thickened and dewatered, with only the supernatant being returned. These practices can save 1–4 percent of the flow.
The recycled water may contain high pathogen densities (the main concern being pathogenic protozoa) that challenge the filter and result in breakthrough unless certain precautions are taken. The USEPA found of the 12 waterborne cryptosporidiosis outbreaks that have occurred at drinking water systems since 1984, three were linked to contaminated drinking-water from water utilities where recycle practices were identified as a possible cause. This resulted in their Filter Backwash Recycle Rule (USEPA 2002).
Section 5.2.1.3 of the DWSNZ outlines the recycling conditions that need to be followed in order avoid an increase in the protozoal log removal requirement.
The UKWIR (2000) developed a water treatment guidance manual that addresses recycling of spent filter backwash water. The UKWIR recognised the risk posed by concentrated suspensions of Cryptosporidium oocysts in spent filter backwash. UKWIR developed the following guidelines to prevent passing oocysts into finished water:
backwash water should be settled to achieve a treatment objective of greater than 90 percent solids removal before recycling
recycle flows should be at less than 10 percent of raw water flow and continuous rather than intermittent
continuous monitoring of the recycle stream with online turbidimeters should be conducted
jar tests should be conducted on plant influent containing both recycle streams and raw water to properly determine coagulant demand
polymers should be considered to assist coagulation if high floc shear or poor settling occurs
the recycle of liquids from dewatering processes should be minimised, particularly when quality is unsuitable for recycling.
Raw waters with a high natural organic matter content may cause recycling problems due to formation of increased levels of disinfection by-products. Trihalomethane formation potential products can increase by over 100-fold between the raw water and recycled water.
Another potential health concern, particularly if water from sludge treatment systems is returned, is the possibly high level of monomer resulting from the use of polyelectrolyte. Section 8.2.1.2 of the DWSNZ shows how to address this problem.
Risk management issues related to recycling are covered in the MoH water safety plan guide Ref: P4.4: Pre-treatment Processes – Waste Liquor Reintroduction.
Guidelines for Drinking-water Quality Management for New Zealand 2013 21Chapter 4: Selection of water source and treatment – January 2014

4.5 Selecting appropriate treatment processes
4.5.1 Intakes
The intake or point of abstraction of a drinking-water supply may be from a bore, spring, infiltration gallery, lake, reservoir, stream, or river. Careful design and maintenance of the abstraction process can prevent significant problems in subsequent treatment processes. Design issues include the adequate testing and development of bores, provision for backflushing infiltration galleries, the use of fine screens to prevent particulate materials entering the process, and the use of presettling processes to keep silts and sands out of pumps and filters and, where required, for avoidance of the use of high turbidity water after storms. The degree of any pretreatment needed will depend on the subsequent treatment processes. Pretreatment processes are discussed in Chapter 12.
Design of bore abstraction systems should consider potential yields and how to enhance these; changes in water quality with time; the potential for easy removal of the pump, and possibly the screen, for maintenance and cleaning and inspection of the casing.
Specifications for well drilling work should ensure that rigs and equipment are thoroughly steam cleaned between jobs to minimise the potential for transfer of iron and manganese fixing bacteria between different locations. If infestations of these bacteria occur, regular treatment of the bore with acid and chlorine washes may control the problem. Specifications should also include the logging of the drillings, and the supply of the bore logs to the water supplier. See Chapter 3: Source Waters, section 3.2 Groundwater for further information.
River intakes must be sited so that they:
are above the minimum water level (a weir may need to be constructed on small rivers)
do not accumulate debris
do not block with gravel
are not on fish migratory paths
are preferably upstream of or on the opposite bank from discharges or dirty tributaries
and if that is not possible, they are far enough downstream for the discharge to be fully mixed.
There must be adequate redundancy of intake pumps to guard against the event of breakdowns, and must be sited above maximum flood level. Failure to supply water to the plant inlet can have serious repercussions on the treatment plant and is crucial to the whole supply system.
Valve selection for reservoirs is important. The top valve must be high enough to draw the required flow of upper (epilimnion) water while the water level is nearly full. A lower valve is needed so oxygenated water can still be abstracted during dry or high use periods; this means high dams may require several valves. If there is an insufficient number of valves, anaerobic water may have to be abstracted when
the water level is too low for the top valve to operate. Anaerobic water can contain very high concentrations of iron and manganese. Anaerobic water can also have elevated ammonia and sulphide levels, which may challenge the chlorination equipment.
Risk management issues related to intakes are addressed in:
MoH water safety plan guide Ref: P1.1: Surface Water Abstraction – Rivers, Streams and Infiltration Galleries, and in
MoH water safety plan guide Ref: P1.2: Surface Water Abstraction – Lakes and Reservoirs.
4.5.2 Treatment selection
General
For any particular source water, there will usually be several treatment options that can produce drinking-water that complies with the DWSNZ. What is successful overseas may not always be appropriate for New Zealand. The treatment process is selected after assessing the catchment and its water quality; see previous sections of this Chapter and Chapter 3: Source Waters. Procedures for handling quality issues not addressed by the treatment process should be covered in the water safety plan.
New Zealand surface water sources are often influenced by the steep topography of the land, both in terms of quantity and quality, and the short in-river travel distances. Overlaying this are sudden weather changes with significant rainfall. Unstable catchments can result in rapid changes in turbidity or solids loadings in the source water, often with equally rapid clearing of these conditions. Most of New Zealand is not subject to prolonged drought, freezing or spring snowmelt.
Community populations in New Zealand are somewhat different from those in more densely populated countries. Our relatively small population and large per capita land area means that our water supplies are often widely spaced, serving small or very small populations. A lot of the overseas technical papers and studies tend to deal with the larger plants. Often these are not relevant to most of our water suppliers. In New Zealand there are:
14 communities providing drinking-water to >50,000 people
58 communities providing drinking-water to 5000–50,000
213 communities providing drinking-water to 500–5000
1702 communities providing drinking-water to <500.
Over 96 percent of New Zealand communities have a population of less than 5000. Our large communities are not large by overseas standards. Drinking-water for populations less than 500 is discussed further in Chapter 19: Small, Individual and Tankered Supplies.
Information regarding protection of catchments, pre-treatment, and storage is covered in more detail in section 4.3. Other data can often be obtained from regional councils or locally in terms of water levels or flows, and past flood events.
Guidelines for Drinking-water Quality Management for New Zealand 2013 23Chapter 4: Selection of water source and treatment – January 2014
The information and data required by the design or process engineer to help identify and select treatment plant components and configurations are discussed in section 4.2: Identifying potential sources, ie, potential water quantity, reliability and continuity, and from section 4.4: Evaluating the sources.
Pre-selection process
The traditional approach to treatment plant design includes obtaining:
hydrological data
rainfall and other relevant climate data
historical raw water quality
information about land use that can affect water quality (sanitary survey)
results of monitoring water treatment in the same or similar catchments
assessment of potential water treatment processes.
Ideally the pre-selection and planning process will allow time for pilot plant studies to test the preferred treatment processes, allowing cost reductions in the final plant by not having to incorporate as many contingencies in the design. Some advantages in including a pilot plant stage were discussed in Couper and Fullerton (1995).
Other planning issues that must be considered are:
expected design life
intake site selection
population projections, ie, proposed and future plant capacity
long term (or other) security of the catchment or water source
planning and resource allocation/management issues, including plant waste disposal.
Due to rapid changes or extremes in raw water quality some water supplies use more than one source. Examples include Gisborne (upland sources and Waipaoa River), and Wellington’s Kaitoke supply (river water or pond storage). This offers the option to switch from a source that becomes difficult to treat, to a cleaner source, either fully or by mixing the two. Two sources may be needed when the main source is affected by drought or when the abstraction rate is controlled by an in-stream minimum flow, eg, Waikanae.
If the difficult treatment situations are expected to be short-lived, there may be advantages in relying on increasing the volume of stored treated water.
Selection options
Figure 4.2 shows the size of some micro-organisms and the suitability of various treatment processes for removing them. The size of viruses and small bacteria show why disinfection is so important.
As well as the traditional assessment of the source water and catchment, the DWSNZ now require some water supplies to monitor Cryptosporidium, in order to

determine the source water protozoal risk category, refer section 5.2.1 of DWSNZ, and Chapter 8: Protozoa Compliance, section 8.2 of the Guidelines.
Chapter 8: Protozoa Compliance, section 8.3 discusses the cumulative log credit approach to the removal or inactivation of protozoa, and discusses the log credits that different treatment processes can be awarded. This is illustrated with some examples, showing different approaches for achieving 3 and 4 log removals.
As well as source water quality, costs have a major bearing on the choice of treatment process. Processes such as diatomaceous earth, bag and cartridge filtration usually require less capital to install than coagulation/filtration plant and membrane filtration so tend to be used more often in the smaller water supplies. Conventional coagulation/filtration plants usually have lower operating costs so tend to be used by the larger water suppliers. Costs are not discussed in these Guidelines.
The treatment processes chosen for protozoal compliance must also be suitable for dealing with other impurities, as covered in the following discussion. Generally, for most source waters, the water treatment process is still selected on basic issues such as colour and turbidity. Whether a source water needs 3 or 4 log removals for protozoal compliance, usually dictates the selection of disinfectant or its dose, or the turbidity required from the filters. If a source water is required to achieve 4 log removals, it may be necessary to include an additional treatment process, over and above the amount of treatment that just colour and turbidity would require.
Guidelines for Drinking-water Quality Management for New Zealand 2013 25Chapter 4: Selection of water source and treatment – January 2014
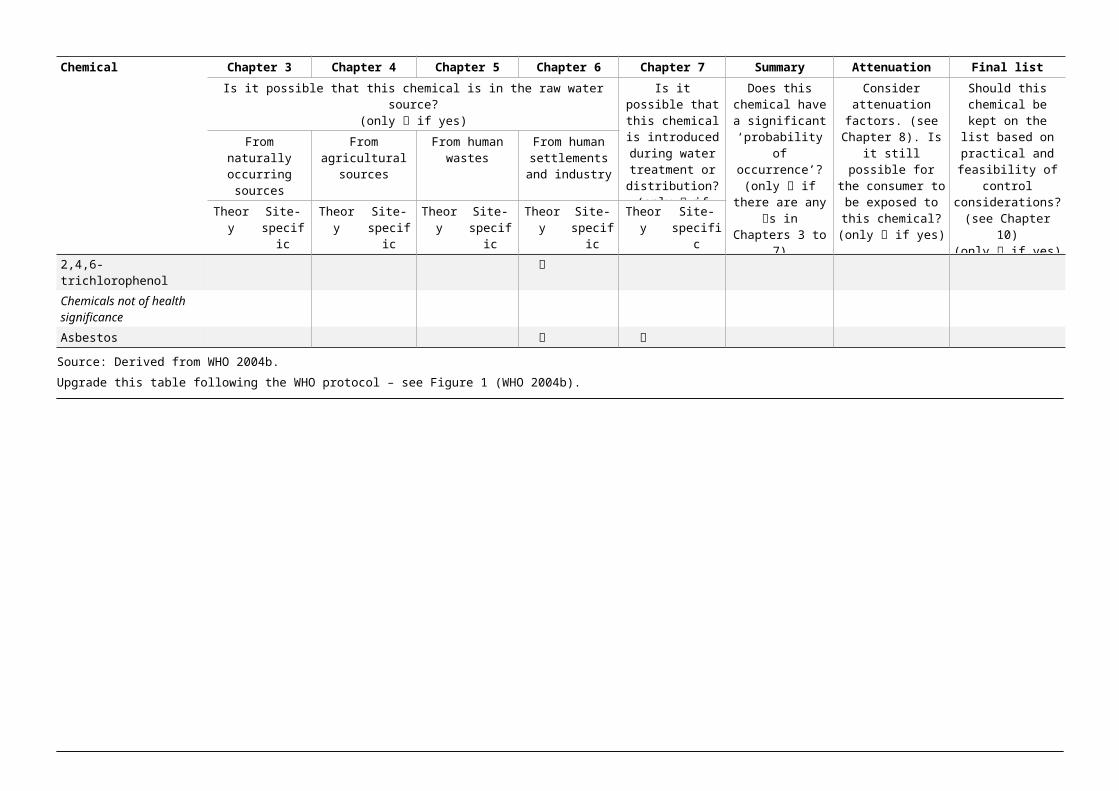
Figure 4.2: Micro-organism size and treatability
This section concentrates on the options for the treatment of determinands other than protozoa. Chapter 8 discusses the treatment requirements needed in order to comply with protozoa compliance. Chapters 12–15 describe operational aspects of the treatment processes in more detail. Chapter 3 in AWWA (1990) gives a guide to the selection of water treatment processes.
All water sources other than secure bore water need some form of disinfection. Chlorine is still the most frequently used disinfectant in New Zealand water supplies. At reasonable doses, it is effective against most bacteria and viruses. The selection of disinfectant will be dependant on the approach adopted in order to satisfy protozoa compliance, and whether it has been decided to maintain a chlorine residual in the distribution system. See Chapter 15: Disinfection, Table 15.3 for a summary of the efficacy of different disinfectants.
Tables 4.6–4.8 only offer guidance; they are not meant to be part of a design manual. The tables attempt to match potential treatment processes with raw water quality. In some cases the raw water quality may be such that a combination of processes is needed.
For individual supplies, refer to Chapter 19, Table 19.2: Contaminants and treatment methods, and Table 19.3: Point-of-use devices and their effectiveness against various contaminants.

Table 4.6: Treatment options for typical low colour source waters
Treatment options Filteringnon-securebore water
Removingcarbon dioxidefrom bore water
Removing ironor manganeseex bore water
Filtering surface water without much
colour (note 3)
Cartridge Yes Yes
Aeration Yes (note 1) Yes (note 2)
Aeration, coagulation and filtration
Yes Yes
Aeration plus oxidation and/or pH increase
Yes Yes
Diatomaceous earth filtration
Yes Yes
Slow sand filter Yes
Membrane filtration (MF) Yes
1 Check that sodium hydroxide or hydrated lime is not needed too.
2 Check amount of iron and manganese removed by aeration alone: oxidation and/or pH adjustment may be needed.
3 If the turbidity is low enough, disinfection may be the only treatment needed. Ozone may lower the colour.
Table 4.7: Treatment options for source waters with colour that also needs to be removed
Treatment options Surface water with low
particulate matter
Waters with high or a large range of
turbidities
Surface water with large
numbers of algae (note 1)
Lowland rivers below industry or
intense agriculture
Slow sand filter Yes
Coagulation, direct filtration Yes
Coagulation, sedimentation, filtration
Yes Yes Yes (note 2)
Coagulation, DAF, filtration Yes Yes Yes (note 2)
Coagulation preceded by microstrainer
Yes
Membrane filtration (MF) Yes Yes (note 3) Yes (note 3) Yes (note 3)
Coagulation or MF plus activated carbon
Yes Yes
Coagulation or MF plus ozone Yes
1 There could be seasonal variation.
2 Pretreatment may be essential, eg, bankside or off-river storage.
3 Coagulation may be needed at times.
Table 4.8: Treatment options for other types of source waters
Treatment options Groundwater with high ammonia concentrate
Groundwater with geothermal
material
Waters with low colour but glacial
flour
Hard water
Aeration At high pH
Aeration plus oxidation and/or pH increase
Yes Possibly
Diatomaceous earth filtration Possibly
Slow sand filter Possibly
Guidelines for Drinking-water Quality Management for New Zealand 2013 27Chapter 4: Selection of water source and treatment – January 2014
Membrane filtration (MF) Yes
Coagulation and sand filtration Possibly Yes
Softening Possibly Yes
Note: Groundwaters containing geothermal water may need specific guidance.
Table 4.9: Options for waters that only require disinfection
Disinfectant Bacterial compliance Protozoal compliance Residual in the distribution system
Chlorine Yes Yes
Chloramine Yes Yes
Chlorine dioxide Yes Yes Yes
Ozone Yes Yes
UV light Yes Yes
Note that nanofiltration and reverse osmosis systems can also remove bacteria and protozoa.
The DWSNZ do not include any compliance criteria for viruses. All of the above disinfection processes (except chloramine) inactivate most viruses.
Risk management issues related to design and operation are covered in the MoH water safety plan guide Ref: Ref: P11: Treatment Processes – Plant Construction and Operation.
USEPA (2007) is a useful manual covering many aspects of water treatment.
ReferencesAWWA. 1990. Water Quality and Treatment (4th edition). Published for American Water Works Association by McGraw-Hill Inc.
Collins R, McLeod M, Donnison A, et al. 2005. Surface Runoff and Riparian Management III. NIWA Client Report 2005-054 to the Ministry of Agriculture and Forestry, Wellington. This document can be accessed from http://maxa.maf.govt.nz/mafnet/publications/techpapers/06-02/page-04.htm
Couper SJ, Fullerton RW. 1995. Pilot Plant Trials: Seeking the most cost-effective solution. Annual Conference, New Zealand Water and Wastes Association.
DSIR. 1988. Hydrologists’ Field Manual. Hydrology Centre Publication No. 15. Christchurch. (Now NIWA.)
Duncan M, Woods R. 2004. Flow regimes. In J Harding, P Mosley, C Pearson, et al (eds) Freshwaters of New Zealand, pp 7.1–7.14. Christchurch: New Zealand Hydrological Society and New Zealand Limnological Society, Caxton Press.
Gerba CP, Nwachuku N, Riley KR. 2003. Disinfection resistance of waterborne pathogens on the United States EPA’s contaminant candidate list. Journal of Water Supply Research and Technology 52: 81–94.
Hickey CW. 1995. Ecotoxicity in New Zealand. Australian Journal of Ecotoxicology 1: 43–50.
Hickey CW. 2000. Ecotoxicology: laboratory and field approaches. In KC Collier, M Winterbourn (eds) New Zealand Stream Invertebrates: Ecology and Implications for Management, pp. 313–43. Christchurch: New Zealand Limnological Society.
Hoare RA, Spigel RH. 1987. Water balances, mechanics and thermal properties. In WN Vant (ed) Lake Managers Handbook, pp 41–58, Water and Soil Miscellaneous Publication No. 103. Wellington: Ministry of Works and Development.
Holland P, Rahman A. 1999. Review of Trends in Agricultural Pesticide Use in New Zealand. MAF Policy Technical Paper 99/11. 54 pp. See http://www.maf.govt.nz/mafnet/rural-nz/sustainable-resource-use/resource-management/pesticide-use-trends/PesticideTrends.PDF or http://citeseerx.ist.psu.edu/viewdoc/download?doi=10.1.1.62.1461&rep=rep1&type=pdf.
Lentz M, Kennedy P, Jones P, et al. 1998. Review of Environmental Performance Indicators for Toxic Contaminants in the Environment: Air, water and land. Environmental performance indicators. Technical Paper No. 37 Toxic. Wellington: Ministry for the Environment. 105+ pp. http://www.mfe.govt.nz/publications/air/epi-toxic-review-oct98.html
McBride GB. 2005. Using Statistical Methods for Water Quality Management: Issues, options and solutions. New York: Wiley.
McGuigan KG, Joyce TM, Conroy RM, et al. 1998. Solar disinfection of drinking water contained in transparent plastic bottles: Characterising the bacterial inactivation process. Journal of Applied Microbiology 84: 1138–48.
Medema GJ, Shaw S, Waite M, et al. 2003. Chapter 4. Catchment characterisation and source water quality, pp 111–58. In Assessing Microbial Safety of Drinking Water. OECD, World Health Organization.
MoE. 2001. Drinking Water treatment 2001. Ontario, Canada: Ministry of the Environment.
Note: The New Zealand Ministry of Health’s Guides for drinking-water supplies can be accessed as Word documents on the Ministry of Health website: www.health.govt.nz/watersafetyplans
MoH water safety plan guide Ref: S2. Development of New Supplies. Wellington: Ministry of Health.
MoH water safety plan guide Ref: P1.1. Surface Water Abstraction – Rivers, Streams and Infiltration Galleries. Wellington: Ministry of Health.
MoH water safety plan guide Ref: P1.2. Surface Water Abstraction – Lakes and Reservoirs. Wellington: Ministry of Health.
MoH water safety plan guide Ref: P4.4. Pre-treatment Processes – Waste Liquor Reintroduction. Wellington: Ministry of Health.
MoH water safety plan guide Ref: Ref: P11. Treatment Processes – Plant Construction and Operation. Wellington: Ministry of Health.
Ogilvie D. 1983. Changes in Water Quality after Impoundment. Paper presented at the XVth Pacific Science Congress: Changes in Freshwater Ecosystems.
PCE. 2004. Growing for Food. Wellington: Parliamentary Commissioner for the Environment.
Guidelines for Drinking-water Quality Management for New Zealand 2013 29Chapter 4: Selection of water source and treatment – January 2014
Rutherford JC. 1994. River Mixing. New York: Wiley.
Selvarajah, N, Maggs GR, Crush JR, et al. 1994. Nitrate in groundwater in the Waikato region. In LD Currie, P Loganathan (eds) The Efficient Use of Fertilisers in a Changing Environment: Reconciling productivity with sustainability, pp 160–185. Occasional report no. 7. Palmerston North: Fertiliser and Lime Research Centre, Massey University.
Sinton L. 1986. A Guide to Groundwater Sampling Techniques. National Water and Soil Conservation Authority, Water and Soil Miscellaneous Publication No. 99.
Smith DG. 1986. Heavy metals in the New Zealand aquatic environment: a review. Water and Soil Miscellaneous Publication No. 100. Wellington: Ministry of Works and Development, 108 pp.
Sobsey MD. 1989. Inactivation of health-related micro-organisms in water by disinfection processes. Water Science and Technology 21: 179–95.
Stanfield G, Le Chevallier M, Snozzi M. 2003. Chapter 5. Treatment efficiency, pp 159–178. In Assessing Microbial Safety of Drinking Water. OECD: World Health Organization.
Sundaram B, Feitz A, Caritat P de, et al. 2009. Groundwater Sampling and Analysis – A Field Guide. Commonwealth of Australia, Geoscience Australia, Record 2009/27, 95 pp. https://www.ga.gov.au/products/servlet/controller?event=GEOCAT_DETAILS&catno=68901
UKWIR. 2000. Guidance Manual Supporting the Water Treatment Recommendations from the Badenoch Group of Experts on Cryptosporidium (2nd edition). Report No. 00/DW/06/10. London: UK Water Industry Research Limited.
USEPA. 2002. Filter Backwash Recycling Rule, Technical Guidance Manual. Office of Ground Water and Drinking Water, EPA 816-R-02-014. 178 pp. http://www.epa.gov/ogwdw/mdbp/pdf/filterbackwash/fbrr_techguidance.pdf or go to http://water.epa.gov/lawsregs/rulesregs/sdwa/mdbp/index.cfm
USEPA. 2007. Simultaneous Compliance Guidance Manual for the Long Term 2 and Stage 2 DBP Rules. EPA 815-R-07-017. 462 pp. http://www.epa.gov/ogwdw/disinfection/stage2/pdfs/guide_st2_pws_simultaneous-compliance.pdf
Ward RC, Loftis JC, McBride GB. 1990. Design of Water Quality Monitoring Systems. New York, NY: Van Norstrand Reinhold. 231 pp.
Wilcock RJ. 1989. Patterns of Pesticide Use in New Zealand. Part 1: North Island 1985–1988. Water Quality Centre Publication No. 15. Hamilton: DSIR.
Wilcock RJ, Close ME. 1990. Patterns of Pesticide Use in New Zealand. Part 2: South Island1986–1989. Water Quality Centre Publication No. 16. Hamilton: DSIR.
Wilcock RJ. 1993. Application of land-use data and screening tests for evaluating pesticide runoff toxicity. Environmental Management 17(3): 365–71.
WHO. 2003. Assessing Microbial Safety of Drinking-water: Improving approaches and methods. Published on behalf of the World Health Organization and the Organisation for Economic Co-operation and Development by IWA Publishing, London. Available at: http://www.who.int/water_sanitation_health/dwq/9241546301/en/index.html

WHO. 2004a. Guidelines for Drinking-water Quality 2004 (3rd ed). Geneva: World Health Organization. Available at: www.who.int/water_sanitation_health/dwq/gdwq3/en/print.html see also the addenda
WHO. 2004b. Chemical Safety of Drinking-water: assessing priorities for risk management. Geneva: World Health Organization. See http://www.who.int/water_sanitation_health/dwq/cmp/en/
WHO. 2004c. Water Treatment and Pathogen Control: Process efficiency in achieving safe drinking water. Published on behalf of WHO by IWA Publishing. Available at: http://www.who.int/water_sanitation_health/dwq/9241562552/en/index.html
WHO. 2009. Scaling Up Household Water Treatment Among Low-Income Populations. WHO/HSE/WSH/09.02. Geneva: World Health Organization. http://www.who.int/household_water/research/household_water_treatment/en/index.html
WHO. 2011. Guidelines for Drinking-water Quality 2011 (4th ed). Geneva: World Health Organization. Available at: http://www.who.int/water_sanitation_health/publications/2011/dwq_guidelines/en/index.html
WHO. 2011a. Evaluating Household Water Treatment Options: Health-based targets and microbiological performance specifications. 68 pp. http://www.who.int/water_sanitation_health/publications/2011/evaluating_water_treatment.pdf
Guidelines for Drinking-water Quality Management for New Zealand 2013 31Chapter 4: Selection of water source and treatment – January 2014
Related Documents