DRAWING INFERENCES FROM GROUP DATA: Construc)ng 2 nd level models, working with ROIs, and avoiding sta)s)cal circularity

Welcome message from author
This document is posted to help you gain knowledge. Please leave a comment to let me know what you think about it! Share it to your friends and learn new things together.
Transcript
DRAWINGINFERENCESFROMGROUPDATA:Construc)ng2ndlevelmodels,workingwithROIs,
andavoidingsta)s)calcircularity

Soyouhavegroupdata…Whatnow?
¨ Whole-brainvoxelwiseanalysis¤ ConstrucJngappropriate2ndlevelmodels
n Characterizingwithin-subject(repeatedmeasures)effects
n Characterizingbetween-subject(group)effects
n Usingcovariatesatthe2ndlevel
¨ Region-of-interest(ROI)analysis¤ ChoosingyourROIs¤ Avoiding“voodoo”
n a.k.a.inferenJalcircularity;non-independenceerrors

Workingwithrepeatedmeasuresdata
¨ YouhavedatafromagroupofsubjectsandyouwanttolookforacJvitychangesacrosscondiJons
¨ Thesimplestapproachistocreatecontrastimagesforeachsubjectandthenconductaone-samplet-testacrosssubjects
¨ ContrastimagesaresimplyweightedlinearcombinaJonsofcondiJon-specificbetaimages
¤ e.g.,CondA-CondB:[1-1]
¤ ReferredtoasCOPEimagesinFSLand.conimagesinSPM

Workingwithrepeatedmeasuresdata
¨ ContrastswithmorethantwocondiJons:
¤ CondAandCondBvs.CondC:[11-2]
n NOTE:IfCondA&Bhavevastlydifferent#’softrials,itmaybebecertorunanewGLMthatcombinesthesecondiJons,oralternaJvelyyoucouldweighteachcondiJonbythe#oftrials
¤ (CondA–CondB)vs.(CondC–CondD):[1-1-11]
n TheinteracJonterm!
¨ Nullhypothesis:
¤ acrosssubjectmeanofcontrastvariable=0

Workingwithrepeatedmeasuresdata
¨ Probingforparametriceffectswithlinearcontrastcoefficients
¤ 3condiJons:[-101]
¤ 4condiJons:[-3-113]
¤ 5condiJons:[-2-1012]
¤ 6condiJons:[-5-3-1135]
¨ Canalsoprobefor2ndorder(quadraJc)and3rdorder(cubic)effects
¨ Anysetofcontrastcoefficientscanwork,solongastheysumtozero
¤ WriteyourcontrastcoefficientsasposiJvenumbersandthensubtractthemeanfromeachnumber
¤ Butnotethatcustomcontrastsmightnotbeorthogonaltoeachother

Example:MappinglinearandquadraJccontrasts

Example:Mappingcustomcontrasts
Todd&Marois(2004)Nature

AlternaJveapproach:Separatepairwisetests
Chenetal.(2013)AJNRAmJNeuroradiol

AlternaJveapproach:Separatepairwisetests
Chenetal.(2013)AJNRAmJNeuroradiol

Workingwithrepeatedmeasuresdata
¨ Probingforparametriceffectswithlinearcontrastcoefficients
¤ 3condiJons:[-101]
¤ 4condiJons:[-3-113]
¤ 5condiJons:[-2-1012]
¤ 6condiJons:[-5-3-1135]
¨ Canalsoprobefor2ndorder(quadraJc)and3rdorder(cubic)effects
¨ Anysetofcontrastcoefficientscanwork,solongastheysumtozero
¤ WriteyourcontrastcoefficientsasposiJvenumbersandthensubtractthemeanfromeachnumber
¤ Butnotethatcustomcontrastsmightnotbeorthogonaltoeachother

Theone-samplet-test(inFSL)
TheimagesinpucedintoEV1canbe:Ø thebetaesJmatesfromasinglecondiJonØ thedifferencebetweentwocondiJonsØ anylinearcontrastbetweencondiJons
Take-homepoint:Aone-samplet-testcanaccomplishalot!

AnalternaJve(slightlymoreinvolved)waytotestforadifferencebetween2condiJons
¨ FSLrepresentaJonof2ndlevelmodelforpairedt-test
8subjects2condiJons(A&B)

Whythetwoapproachesareequivalent
PLoSBiology(2015)

WhatifonesubjectismissingdatafromagivencondiJon?
¨ RelaJvelycommonsituaJontobefacedwith¤ E.g.,AnalysisofCorrectvs.Incorrecttrials
n subjectmayhavenoincorrecttrials
¨ PotenJalsoluJons:¤ Analysiscanberunomipngthatsubject’sdata
¤ Or,analysiscanberunasanunpairedt-test(essenJallyconsideringthetwocondiJonsastwoseparategroupsofsubjects)n MoreconservaJve,butmaysomeJmesbeuseful,especiallyifmulJplesubjectsaremissingdata

Between-subjectmodels
¨ Wehavetwogroupsofsubjects(e.g.,9paJentsand7controls)withpotenJallydifferentcross-subjectvariance.¤ Two-SampleT-Test(equalvariancenotassumed)
¨ SpecifytwogroupmembershipssothatFSL’sFEATesJmateseachgroup'scross-subjectvarianceseparately.¤ SPM’sdefaultisalsotoassumeunequalvariance
¨ WewanttotestwhetherornotacJvitybetweenthetwogroupsisequivalentforagivencondiJon

Two-sampleunpairedt-test

Howabouttwogroupswithtwocondi)ons?
¨ E.g.,Comparingthemagnitudeofpre-vs.post-trainingacJvaJonchangesinpaJentsandcontrols¤ Within-subjectfactor:pre-vs.post-training¤ Across-subjectfactor:paJentsvs.controls
¨ Oneeasy-to-implementapproach:¤ FirstcomputeA-Bdifferenceimageforeachsubject¤ Thenperformsimpletwo-sample(unpaired)t-testtofindgroupdifferencesn i.e.,groupxcondiJoninteracJon
¨ ThisbasicapproachcangeneralizetoanylinearcombinaAonofrepeatedmeasuresfactors

Howabouttwogroupswithtwocondi)ons?
¨ AnalternaJveapproach(slightlymoreinvolved):

SpecificaJonofmorecomplexgroup-levelmodelscangettrickyinFSL
¨ SeeFSLFEATuserguideforexamplesofmulJ-factorANOVAmodels
¨ hCp://fsl.fmrib.ox.ac.uk/fsl/fslwiki/FEAT/UserGuide

Introducingcovariatesintoyourmodels
¨ Singlegroupwithcovariate¤ Youhaveasinglegroupofsubjectsandyoualsohavemeasuredage.YouwouldliketoseeifthereisanageeffectonbrainacJvity.
n Whatwouldthemodellooklike?
n Whatcontrastswouldyouspecifyfortheageeffect?

Use age Use demeaned age
• Both models will give exactly the same result for C2, but C1 will be different.
Singlegroupwithcovariate
SlidefromJeaneCeMumford

Simulateddata
Takehome:MeancenteringisonlynecessaryifyouwantyourPEofcolumnof1stobetheoverallmean
SlidefromJeaneCeMumford

TwogroupswithaconJnuouscovariate
¨ Wehavetwogroupsandaconfoundingcovariate(e.g.,depressionscore).
¨ OurprimaryinterestisinthedifferenceofmeanbrainacJvaJonbetweenthetwogroups.
¨ Wewanttomakesurethisdifferencewasn’tduetobetweengroupdifferencesindepression.
¨ Whatshouldthemodellooklike?
SlidefromJeaneCeMumford

¨ Okaytodemeantheconfoundingmeasureacrossallsubjects
¤ Butonlynecessaryifyouintendtolookateachgroupvs.baseline(e.g.,[100])
¨ ButdoNOTdemeantheconfoundingmeasurewithingroup
¤ Thiscouldremoveanyconfoundingeffectthemeasuremighthave
TwogroupswithaconJnuouscovariate
SlidefromJeaneCeMumford

Whyyoushouldn’tdemeanwithingroup
¨ Whatifthisiswhatyourdatalooklike?¤ ApparentdifferenceinmeansisclearlyduetorangeofXsampled,notthegroupmembership
SlidefromJeaneCeMumfordFormorediscussionofissuessurroundingmean-centering:hCp://mumford.fmripower.org/mean_centering/

FormoreinformaJononmean-centering
hCp://mumfordbrainstats.tumblr.com

TesJngtheinteracJon
¨ WhatifyouwanttotestwhethertherelaJonshipbetweenbrainacJvityanddepressionscorediffersbetweenyourgroups?¤ mean-centeringisnotnecessaryhere
010-1SlidefromJeaneCeMumford

2ndlevelanalysesinSPM

2ndlevelanalysesinSPM

2ndlevelanalysesinSPM

2ndlevelanalysesinSPM

2ndlevelanalysesinSPM

2ndlevelanalysesinSPM

AlternaJvestovoxelwiseanalysis
¨ ConvenJonalfMRIstaJsJcscomputeonestaJsJcalcomparisonpervoxel.¤ Advantage:candiscovereffectsanywhereinbrain.¤ Disadvantage:lowstaJsJcalpowerduetomulJplecomparisons.
¨ SmallVolumeCorrecAon:OnlyruntestsonasmallproporJonofvoxels(byreducingthesearchspace,allowsformorelenientvoxel-levelstats)
¨ Region-of-interest:PooldataacrossaregionforsinglestaJsJcaltest.
SVC ROI SPM
Example: how many comparisons on this slice?
• Voxelwise: 1600
• SVC: 57
• ROI: 1
SlidefromChrisRorden

WhyuseROIs?
¨ ConvenientwaytoalleviatethemulJplecomparisonsproblemsthatariseinwhole-brainanalyses¤ ShouldsAlladjuststatsfor#ofROIstested!
¨ Allowsformorehypothesis-drivenanalyses¤ ExploringtheenJredatasetcanbeunwieldyandsomeJmesleadstounfocusedandhighly-speculaJvepapers
¤ ROIresultsareeasiertopresentanddiscuss
¤ HemodynamicJmecourseplotscanbeinformaJve
¤ ROIsdon’trequiresubjectstoacJvatetheexactsamevoxeln ButanROI-onlyanalysisisvulnerabletoTypeIIerrors!

Region-of-interestanalysis
¨ ChoosingtherightROI(s)¤ Anatomically-defined
n Atlas-based(e.g.,AALatlas)

Region-of-interestanalysis
¨ ChoosingtherightROI(s)¤ Anatomically-defined
n AutomatedsegmentaJon-based(e.g.,Freesurfer)

Region-of-interestanalysis
¨ ChoosingtherightROI(s)¤ Anatomically-defined
n AutomatedsegmentaJon-based(e.g.,Freesurfer)

Region-of-interestanalysis
¨ ChoosingtherightROI(s)¤ Anatomically-defined
n Hand-tracedusinganatomicallandmarks

Region-of-interestanalysis
¨ ChoosingtherightROI(s)¤ Anatomically-defined
n Coordinate-based(e.g.,basedonapreviousstudy)

Region-of-interestanalysis
¨ ChoosingtherightROI(s)¤ Anatomically-defined
n Coordinate-based(e.g.,basedonapreviousstudy)

Region-of-interestanalysis
¨ ChoosingtherightROI(s)¤ Anatomically-defined
n Coordinate-based(e.g.,basedonameta-analysis)

Region-of-interestanalysis
¨ ChoosingtherightROI(s)¤ Anatomically-defined
n Network-based
!

Region-of-interestanalysis
¨ ChoosingtherightROI(s)¤ Anatomically-defined
n Network-based
Poweretal.(2013)CurrOpinNeurobio

Region-of-interestanalysis
¨ ChoosingtherightROI(s)¤ Anatomically-defined
n Network-based
Gordonetal.(2014)CerebralCortex

Region-of-interestanalysis
¨ ChoosingtherightROI(s)¤ Anatomically-defined
n Network-based
Gordonetal.(2014)CerebralCortex

Region-of-interestanalysis
¨ ChoosingtherightROI(s)¤ FuncAonally-defined
n BasedonaparJcularacJvaJoneffectinyourdatan ROI-definingcontrastneedstobeorthogonaltostaJsJcaltestsconductedonextracteddata
n Independent“localizer”taskscanbeusefulhere
n AVOIDDOUBLE-DIPPINGATALLCOSTS!

Isthisokay?
Ø IdenAfyaclusterthatshowsabovesignificantacJvityforbothCatsandDogs(viaconjunc)onanalysis)
Ø TestwhetherthisregionshowssignificantacJvityforDogs>Snakes
Ø TestwhetherthisregionshowssignificantacJvityforHorses>Snakes
Ø IdenAfyaclusterthatshowsCats>Dogseffect
Ø TestwhetherthisregionshowssignificantacJvityforCats>Snakes
Ø TestwhetherthisregionshowssignificantacJvityforSnakes>Dogs
Ø TestwhetherthisregionshowssignificantacJvityforDogs>Snakes

Isthisokay?
Ø IdenAfyaclusterthatshowssignificanteffectofsJmulustypeinone-wayANOVA(F-test)thatincludesalltaskcondiJons(Cats,Dogs,Snakes,Horses)
Ø TestwhetherthisregionshowssignificantacJvityforCats>Dogs
Ø TestwhetherthisregionshowssignificantacJvityfor(Cats&Dogs&Horses)>Snakes

Isthisokay?
StrongMemory
ModerateMemory
WeakMemory
***
StrongMemory
ModerateMemory
WeakMemory
*
*
IdenJfyROIsbasedon2contrasts:StrongMemory>WeakMemoryStrongMemory>ModerateMemory
Okaytolookatplotstomakesurethatnothingweirdisgoingon,buteffectsizeswillbeinflatedandsignificancebracketsarehighlymisleading

Isthisokay?
StrongMemory
ModerateMemory
WeakMemory
***
StrongMemory
ModerateMemory
WeakMemory
*
*
IdenJfyROIsbasedonanatomicalboundaries
NotappropriatetodrawanyconclusionsaboutthesetworegionsshowingdissociableprofilesofacJvityunlessyoudirectlytestforaregionxcondiJoninteracJon

The“implied”interacJon
Nieuwenhuisetal.(2011)NatureNeuroscience

The“implied”interacJon
Nieuwenhuisetal.(2011)NatureNeuroscience

The“implied”interacJon
Nieuwenhuisetal.(2011)NatureNeuroscience
¨ “…theerrorofcomparingsignificancelevelsisespeciallycommonintheneuroimagingliterature,inwhichresultsaretypicallypresentedincolor-codedstaJsJcalmapsindicaJngthesignificancelevelofaparJcularcontrastforeach(visible)voxel.
¨ Avisualcomparisonbetweenmapsfortwogroupsmighttempttheresearchertostate,forexample,that“thehippocampuswassignificantlyacJvatedinyoungeradults,butnotinolderadults”.
¨ However,theimpliedclaimisthatthehippocampusisacJvatedmorestronglyinyoungeradultsthaninolderadults,andsuchaclaimrequiresadirectstaJsJcalcomparisonoftheeffects.
¨ Similarly,claimsaboutdifferencesinacJvaJonacrossbrainregionsmustbesupportedbyasignificantinteracJonbetweenbrainregionandthefactorunderlyingthecontrastofinterest.”

ROIdefiniJonisaffectedbynoise
SlidefromNikoKriegeskorte
true region
overfitted ROI
RO
I-ave
rage
ac
tivat
ion
overestimated effect
independent ROI

Baker, Hutchison, & Kanwisher
(2007)
High selectivity from pure
noise. SlidefromEdVul
ROIdefiniJonisaffectedbynoise

VoodoocorrelaJons
EdVul

VoodoocorrelaJons
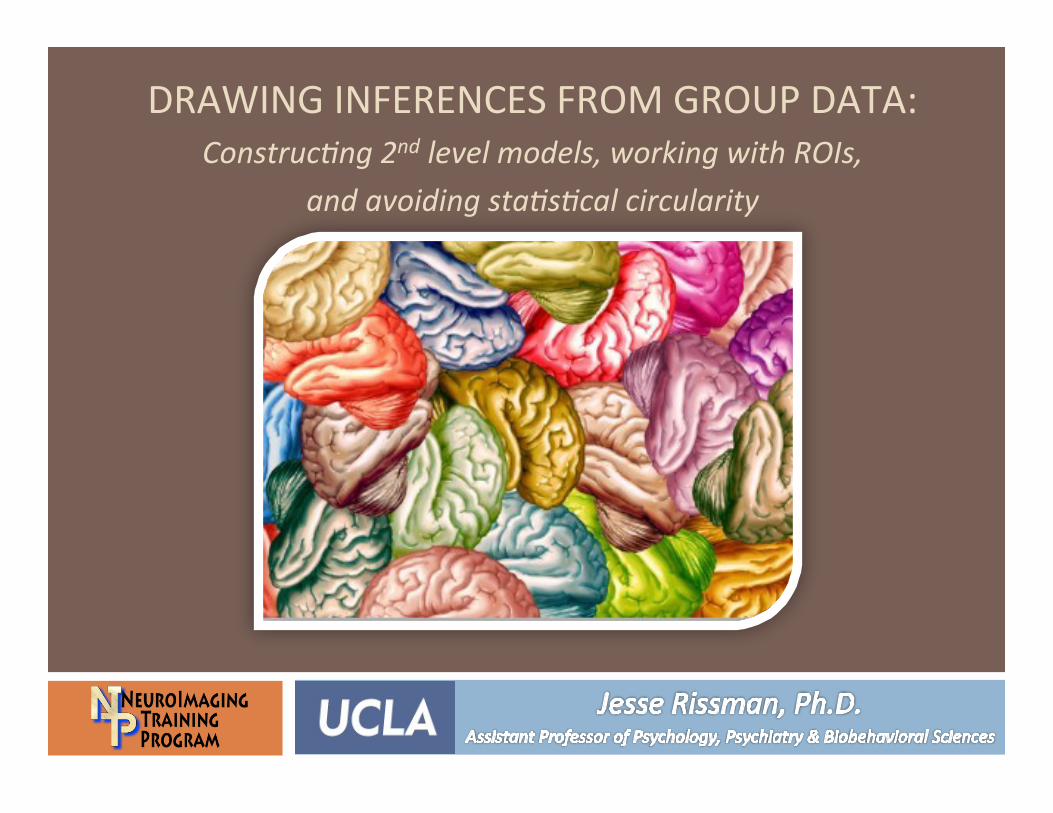
VoodooPuzzlinglyhighcorrelaJons

VoodoocorrelaJons
r = 0.82
Neuralcorrelatesofhumanvirtuejudgment
r = -0.83

VoodoocorrelaJons
Thisfigureistherealdata

VoodoocorrelaJons
“Tosumup,then,weareledtoconcludethatadisturbinglylarge,andquite
prominent,segmentoffMRIresearchonemoJon,personality,andsocialcogniJon
isusingseriouslydefecJveresearchmethodsandproducingaprofusionofnumbersthatshouldnotbebelieved.Althoughwehavefocusedhereon
studiesrelaJngtoemoJon,personality,andsocialcogniJon,wesuspectthatthequesJonableanalysismethodsdiscussedherearealsowidespreadinotherfields
thatusefMRItostudyindividualdifferences,suchascogniJve
neuroscience,clinicalneuroscience,andneurogeneJcs.”
Vuletal.(2009)

ToavoidselecJonbias,wecan...
...performanonselecAveanalysisOR...makesurethatselecJonandresultsstaJsJcsareindependentunderthenullhypothesis,becausetheyareeither:¨ inherentlyindependent¨ orcomputedonindependentdata
¤ e.g.,separatestudy;funcAonallocalizer;cross-validaAon
e.g.independentcontrasts
e.g.whole-brainmapping(noROIanalysis)
SlidefromNikoKriegeskorte

FormoreinformaJon…
¨ PuzzlinglyHighCorrelaAonsinfMRIStudiesofEmoAon,Personality,andSocialCogniAon.Vul,E.,HarrisC.,Winkielman,P.,&Pashler,H.(2009)PerspecJvesonPsychologicalScience,4,274-290.[FormerlyJtled:VoodooCorrelaJonsinSocialNeuroscience].
¨ Circularanalysisinsystemsneuroscience–thedangersofdoubledipping.KriegeskorteN,SimmonsWK,BellgowanPSF,BakerCI.(2009)NatureNeuroscience12(5):535-40.
¨ Everythingyouneverwantedtoknowaboutcircularanalysis,butwereafraidtoask.KriegeskorteN,LindquistMA,NicholsTE,PoldrackRA,VulE.(2010)JCerebBloodFlowMetab.30(9):1551-7.
¨ Voodooandcircularityerrors.Vul,E.andPashler,H.(2012).NeuroImage,62,945-948.
Related Documents