Tweed-New Haven Airport: Master Plan Update An Economic Evaluation-Phase 1 DRAFT By Fred Carstensen, Director William Lott, Director of Research Stan McMillen, Manager, Research Projects Bobur Alimov, Research Assistant Na Li Dawson, Research Assistant Ed Zolnik, Research Assistant November 23, 1999 CONNECTICUT CENTER FOR ECONOMIC ANALYSISª Department of Economics, U-63 University of Connecticut 341 Mansfield Road Storrs, CT 06269-1063 Voice: 860-486-0485 Fax: 860-486-4463

Welcome message from author
This document is posted to help you gain knowledge. Please leave a comment to let me know what you think about it! Share it to your friends and learn new things together.
Transcript

Tweed-New Haven Airport: Master Plan Update
An Economic Evaluation-Phase 1
DRAFT
By
Fred Carstensen, DirectorWilliam Lott, Director of Research
Stan McMillen, Manager, Research ProjectsBobur Alimov, Research AssistantNa Li Dawson, Research Assistant
Ed Zolnik, Research Assistant
November 23, 1999
CONNECTICUT CENTER FOR ECONOMIC ANALYSISDepartment of Economics, U-63
University of Connecticut341 Mansfield Road
Storrs, CT 06269-1063Voice: 860-486-0485 Fax: 860-486-4463

TWEED-NEW HAVEN AIRPORT: MASTER PLAN UPDATE_______________________
Page: i
- EXECUTIVE SUMMARY -
Project Overview
As an integral part of the update of the Master Plan for Tweed-New Haven Airport, the
Connecticut Center for Economic Analysis (CCEA) performed an economic impact analysis of the
Airport. The analysis considers two scenarios, (a) a status quo forecast and (b) a no-constraint
forecast. The latter forecast assumes that the Airport will be modernized to accommodate new
regional jet service. The no-constraint forecast was further divided into a low-growth alternative
and a high-growth alternative for commercial traffic. The analysis shows that the total economic
impact of Tweed-New Haven Airport ranges from $63,783,485 for the status quo forecast to
$327,238,964 for the high-growth alternative by 2019.
CCEA was further charged to study the question of whether the Airport had had an adverse impact
on property vales in the neighborhoods surrounding the Airport. The Center studied over 700
residential real estate transactions in the neighborhood surrounding the Airport over the years
1967 to 1999. The analysis found no statistically significant difference in the changes in value of
residences within the runway protection zones and those outside of them over the period. The
sample was further divided into properties within the 65db noise contour and those outside. Again,
no statistically significant differences in price growth between the two groups was uncovered.
Overview of CCEA
The Connecticut Center for Economic Analysis (CCEA) at the University of Connecticut, maintains
several regional economic models and through its Forecasting and Analysis Group performs
economic impact and policy analysis for a variety of development projects and initiatives
throughout Connecticut. For example, CCEA has prepared analyses on the following:
• Groton-New London Submarine Base Closing
• Igor Sikorsky Memorial Airport, Bridgeport
• The Bridgeport Casino proposal
• Connecticut Tourism
• Structured Tax Credits

TWEED-NEW HAVEN AIRPORT: MASTER PLAN UPDATE_______________________
Page: ii
• Property tax regimes in Naugatuck, Waterbury, and Hartford
Among other projects, CCEA is currently preparing the economic impact analysis of the
consequences of rail and highway infrastructure improvements in New Haven, including a new
State Street Station, new parking facilities, the Church Street Bridge, and, improved schedules and
trains for Metro-North, Shore Line East and Amtrak.
Airport Master Plan Update
The Tweed-New Haven Regional Airport Master Plan Update has three phases:
Ø Phase 1 - Development of a Scope of Work
Ø Phase 2 - Inventory, Forecasts, Airport Role, and Initial Screening
Ø Phase 3 - Alternatives Analysis, Environmental Assessment, Financial Plan, Airport Layout
Plans
Phase 1 is now completed; Phase 2 is presently being prepared. There are two elements of the
forecasts of aviation demand being developed in Phase 2: scheduled air service market analysis
and general aviation activity. Simat, Helliesen & Eichner, Inc. (SH&E) prepared the draft
scheduled service market analysis using two scenarios: base case/status quo, and no-constraint.
Within the no-constraint scenario, SH&E developed two separate forecasts: a low and high range.
These three scheduled service forecasts encompass the reasonable range of potential scheduled
passenger activity at Tweed-New Haven Regional Airport between the years 2000-2019.
The two scenarios and the range of forecasts provide the initial basis for developing conceptual
facility requirements and alternatives that will be considered in the Airport Master Plan Update.
The scheduled service forecast scenarios will be combined with general aviation forecasts (which
will be prepared as part of Phase 2) to present a complete picture of potential aviation demand at
Tweed-New Haven Regional Airport. CCEA used FAA’s current Terminal Area Forecast (TAF)
for Tweed-New Haven Airport to identify future general aviation activity (see Appendix 2). The

TWEED-NEW HAVEN AIRPORT: MASTER PLAN UPDATE_______________________
Page: iii
FAA’s TAF will be also be used in development of forecasts for general aviation activity in Phase
2 of the Master Plan Update.
The Market Assessment and Economic Impact Sub-committee met on August 12, 1999, to review
the methodology used in preparing the economic impact analysis. The CCEA economic impact
analysis serves as one tool for evaluating impacts of the forecast scenarios, particularly in Task 6,
Initial Screening.
In the course of the Airport Master Plan Update, CCEA will use two different models to measure
potential economic impacts:
• Regional Input-Output Modeling System (RIMS) II
• Regional Economic Models, Inc. (REMI)
CCEA first ran the RIMS model, which is presented here, based on the scenarios presented in the
scheduled service market analysis. As noted above, FAA has long used RIMS as their standard
airport economic impact model. However, RIMS utilizes a limited number of variables compared
to REMI, and has less capacity to assess the impact of various policy decisions, decisions which
REMI can evaluate. Moreover, REMI is a dynamic model, which makes it a more sophisticated
tool when looking at long-term impacts. As a dynamic economic model, REMI requires more data
than is presently available, particularly for development and construction costs of any future
airport facilities. As a result, CCEA can only complete a REMI analysis in Phase 3 of the Master
Plan Update. CCEA developed a RIMS analysis in this phase of the Master Plan Update because
of its comparability with FAA assessments at other airports and to provide an initial measure of
the economic impacts of the various forecast ranges. However, this first analysis includes only
forecasts for commercial activity; it assumes that there is no growth in general aviation.
Regional Industrial Multiplier System (RIMS) II
The Bureau of Economic Analysis (BEA) of the U.S. Department of Commerce originally
developed the RIMS model in the 1970s. It built RIMS on the basis of the Department of

TWEED-NEW HAVEN AIRPORT: MASTER PLAN UPDATE_______________________
Page: iv
Commerce input-output (I-O) table of the national economy. It breaks out almost 500 separate U.S.
industries, including airports (see Appendix 1 for an overview of the RIMS methodology). As
noted above, FAA adopted RIMS as its standard technique for measuring the economic impacts of
airports. RIMS measures the economic impact of each industry by accounting for three elements of
potential economic impacts:
Ø direct: employment, payroll, revenue generated by services and goods sold on the airport
Ø indirect: what the users and employees of the airport spend off-airport (in the local and
regional economy in hotels, restaurants, etc.) as a result of their using or being
employed on the airport
Ø induced: the money generated by direct and indirect impacts (described above) is used
throughout the regional economy to buy even more goods and services not
associated with the airport, which otherwise would not have been available
One of the key elements of the RIMS program is identification of an appropriate multiplier that
accounts for induced economic benefits.
Results of RIMS II Analysis
As the following tables reveal, the RIMS analysis shows a positive economic benefit for the
region for each of the forecast scenarios. The table presents economic benefits in terms of
transportation benefits (based on the cost savings of using Tweed-New Haven Airport versus other
airports), as well as direct economic benefits. In addition, the economic impact per capita within
New Haven County increases as passenger enplanements increase under the no-constraint
scenario.
Transportation Benefit of Tweed-New Haven Airport to Tweed-New Haven market area under
different scenarios
(1999 dollars)
Base Case Low No-Constraint High No-Constraint

TWEED-NEW HAVEN AIRPORT: MASTER PLAN UPDATE_______________________
Page: v
1999 $2,637,937 $2,637,937 $2,637,937
2009 $5,209,284 $8,412,880 $19,617,164
2019 $6,467,635 $10,608,664 $25,091,634
Economic Benefit of Tweed-New Haven Airport to Tweed-New Haven market area under
different scenarios
(1999 dollars)
Base Case
Direct Impact Indirect Impact Induced Impact Economic Benefit
1999 $4,371,092 $6,722,758 $8,320,387 $19,414,237
2009 $9,936,566 $15,419,702 $19,017,201 $44,373,469
2019 $12,660,106 $20,091,809 $24,563,936 $57,315,850
Low No-Constraint
Direct Impact Indirect Impact Induced Impact Economic Benefit
1999 $4,371,092 $6,722,758 $8,320,387 $19,414,237
2009 $16,870,360 $27,564,749 $33,326,331 $77,761,440
2019 $21,622,963 $37,149,573 $44,079,402 $102,851,938
High No-Constraint
Direct Impact Indirect Impact Induced Impact Economic Benefit
1999 $4,371,092 $6,722,758 $8,320,387 $19,414,237
2009 $41,120,954 $84,062,507 $93,887,596 $219,071,056
2019 $52,969,958 $119,685,659 $129,491,713 $302,147,331
By the year 2019, the analysis projects transportation benefits range from $6,467,635 under the
base case scenario, to a high of $25,091,634 under the no-constraint scenario. Economic benefits
TWEED-NEW HAVEN AIRPORT: MASTER PLAN UPDATE_______________________
Page: vi
to range from a low of $57,315,850 under the base case scenario, to a high of $302,147,331 under
the no-constraint scenario in the year 2019.
The second part of the current study seeks to assess the impact of the airport on residential real
estate values in the adjacent neighborhoods. An analysis of about 700 real estate sales in the target
area over the past 32 years (1967-1999) found that there is no statistically significant difference
between the price growth of houses in the runway protection zones (RPZs) or within the 65db
noise contour, and, the price growth of houses outside the RPZs or outside the 65db noise contour.

TWEED-NEW HAVEN AIRPORT: MASTER PLAN UPDATE_______________________
Page: vii
Table of Contents
Executive Summary Pages i to vi
Table of Contents vii
Section 1.1: Economic Analysis 1
Introduction 1
Transportation Benefits 2
Economic Benefits 3
Total Economic Benefit 7
Section 1.2 Airport Operating and Maintenance Costs 9
Section 2: Property Value Analysis 12
Comparative Sales in Target Zone and Statistical Analysis 12
Section 3: Conclusions 17
Bibliography 18
Appendix 1: RIMS II Description and Methodology 19
Appendix 2: FAA Terminal Area Forecast 24
Appendix 3: Calculation of Transportation Benefit 25
Appendix 4: Historical Sales Data of Residential Properties in the Target Zone 26
Appendix 5: Target Zone and Clear Zone Maps 31
Appendix 6: Reading List of Property Value-Related Articles 33
Appendix 7: Statistical Analysis 35

TWEED-NEW HAVEN AIRPORT: MASTER PLAN UPDATE__________________________________
Page: 1
Section 1.1: Economic Analysis
Introduction
The goal of this report is to provide assistance in analyzing the economic benefit of Tweed-New Haven Airport.
This analysis provides in turn information that helps frame the discussions of the Technical Advisory Committee
about the current and future role of Tweed-New Haven Airport.
This report analyzes the economic impact of two forecast scenarios for Tweed-New Haven Airport that Simat,
Helliesen & Eichner, Inc. (SH&E), present in their draft report “Master Plan Update Market Analysis and
Forecasts 2000-2019.” The no-constraint scenario requires improvements that would permit the Airport to
accommodate newer aircraft now being used for regional air travel. These innovations would encourage airlines
offering regional travel to increase scheduled flights at Tweed Airport. The modernization would also permit
housing of and utilization by more and larger general aviation aircraft. Both the updating itself and the increased
air traffic it would encourage will have an economic impact on the Tweed-New Haven market area in particular
and the State of Connecticut in general.
To analyze the economic impact of the forecast scenarios, the analysis follows the standard procedures that the
Federal Aviation Administration recommends in its economic impact evaluation report1 and utilizes the SH&E
market analysis. That analysis considers two scenarios: a base case scenario that assumes air service patterns
will not dramatically change from those seen today; a no-constraint scenario, which includes high and low range
forecasts, assumes that Tweed-New Haven Airport will make necessary physical improvements to accommodate
increased traffic. It also assumes no growth in general aviation.
The focus of the first section of this report is to estimate the economic benefits of Tweed-New Haven Airport
under each of those three forecast scenarios. Those benefits in each case are the sum of the transportation and
economic benefits that are calculated separately.
The transportation benefit is the value of the service that the Airport brings to its surrounding area: time saved
and costs avoided by travelers who otherwise would use other airports such as Bradley International, La
Guardia, White Plains, and T.F. Green in Providence. This does not include, however, consideration of the
1 See FAA report “Measuring the regional economic significance of the airports”, DOT/FAA/PP/87-1.
TWEED-NEW HAVEN AIRPORT: MASTER PLAN UPDATE__________________________________
Page: 2
degree to which people choose to travel at all or use alternative means of transportation because of such costs.
The economic benefit is the regional economic activity, employment, and payroll that can be attributed to the
operation of Tweed-New Haven Airport. But, critically, this does not incorporate the economic benefit of
outlays for capital improvements, nor any change in general aviation activity. Thus the analysis calculates these
benefits in a highly conservative fashion.
Transportation Benefits
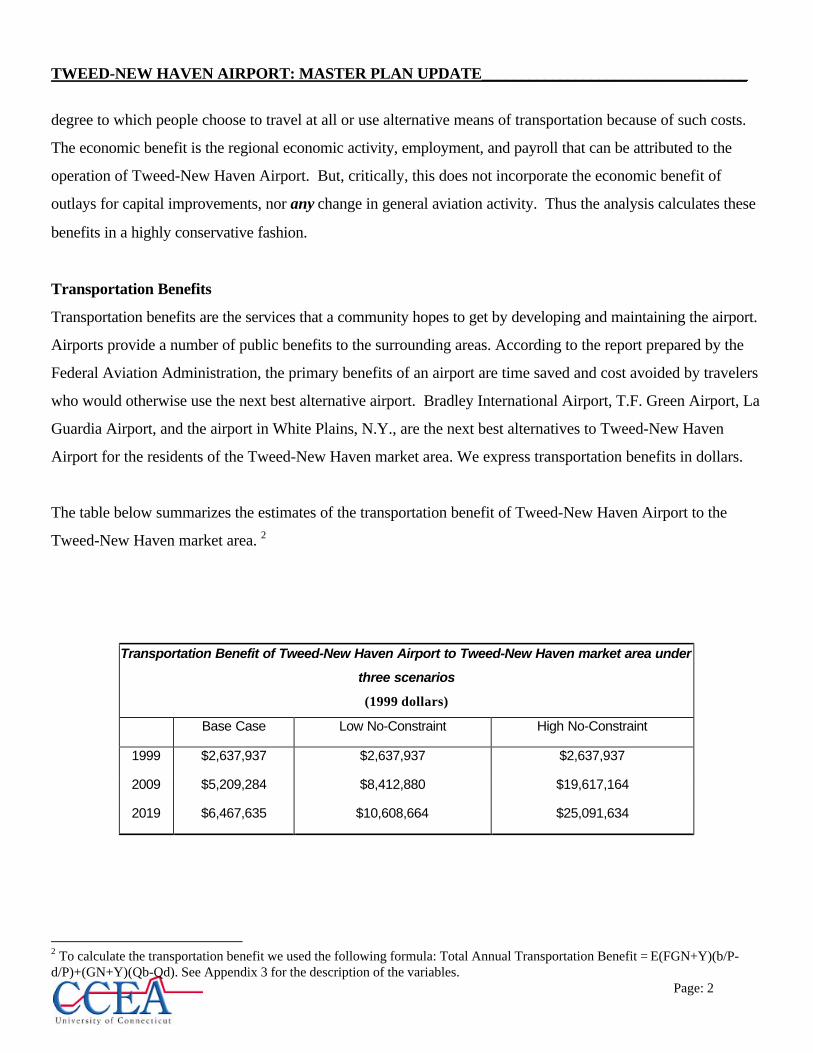
Transportation benefits are the services that a community hopes to get by developing and maintaining the airport.
Airports provide a number of public benefits to the surrounding areas. According to the report prepared by the
Federal Aviation Administration, the primary benefits of an airport are time saved and cost avoided by travelers
who would otherwise use the next best alternative airport. Bradley International Airport, T.F. Green Airport, La
Guardia Airport, and the airport in White Plains, N.Y., are the next best alternatives to Tweed-New Haven
Airport for the residents of the Tweed-New Haven market area. We express transportation benefits in dollars.
The table below summarizes the estimates of the transportation benefit of Tweed-New Haven Airport to the
Tweed-New Haven market area. 2
Transportation Benefit of Tweed-New Haven Airport to Tweed-New Haven market area under
three scenarios
(1999 dollars)
Base Case Low No-Constraint High No-Constraint
1999 $2,637,937 $2,637,937 $2,637,937
2009 $5,209,284 $8,412,880 $19,617,164
2019 $6,467,635 $10,608,664 $25,091,634
2 To calculate the transportation benefit we used the following formula: Total Annual Transportation Benefit = E(FGN+Y)(b/P-d/P)+(GN+Y)(Qb-Qd). See Appendix 3 for the description of the variables.

TWEED-NEW HAVEN AIRPORT: MASTER PLAN UPDATE__________________________________
Page: 3
The results show a great difference in the transportation benefits of Tweed-New Haven Airport that result from
the three forecast scenarios. First, just the existence of the Airport provides 24 minutes of saved time per
traveler in the Tweed-New Haven market area. Second, even under the base case scenario, the airport brings
$52 of transportation benefit (in 1999 dollars) per person to the market area in 2019. The low no-constraint
and high no-constraint scenarios generate much greater the per capita benefits. Under the low no-constraint
scenario the per capita transportation benefit equals $86. Under the high no-constraint scenario, the
transportation benefit is even higher, at $204 per capita. The estimation of the transportation benefits of
increased commercial service at Tweed-New Haven Airport highlight that as the level of service increases, the
per capita transportation benefits increase as well.
Economic Benefits
Economic benefits measure the importance of aviation as an industry, in terms of the employment it provides and
the goods and services it consumes. While the transportation benefit is typically seen as the primary motive for
airport development, economic benefit refers to broad impacts that airports have on regional economies and is
critical to appreciating the full value of airport development. Economic benefits fall into three categories: direct,
indirect, and induced impacts.
Direct impacts refer to the effects of economic activities of the airport and all airport-related facilities. Some
direct impacts (e.g., airport employment) occur on site; others (local production of goods and services for use at
the airport) occur off site. The distinguishing feature of a direct impact is that it is an immediate consequence of
airport economic activity. Simply put, direct impacts represent economic activities that would not have occurred
in the absence of the airport. CCEA captures the direct impact of Tweed-New Haven Airport by estimating the
total annual payroll of all businesses that relate to airport operations.
Indirect impacts flow from off-site economic activities, such as services that travel agencies, hotels, restaurants,
and retail establishments and that are attributable to the airport. The largest component of indirect impacts is
visitor expenditures. Indirect impacts differ from direct impacts in that they originate entirely off site. Even so,
indirect impacts are economic activities that would not have occurred in the absence of the Airport. That’s why
it would be desirable to consider only visitors and not the total annual passengers, as the latter include local
residents. However, this data is almost impossible to obtain. That’s why the impacts of expenditures of tourists
and other visitors using the airport may be overstated, especially for regions that are easily accessible

TWEED-NEW HAVEN AIRPORT: MASTER PLAN UPDATE__________________________________
Page: 4
from other airports or by other means of transportation.3 However, we attempted to solve this problem by
applying appropriate coefficients provided by the FAA to the annual number of arriving passengers and
measuring indirect impacts by following FAA-recommended procedure.4
Induced impacts are the multiplier effects of the direct and indirect impacts. These refer to the increase in main
economic variables that result from successive rounds of spending that direct and indirect impacts generate. For
example, most of the income earned by employees of the airport is spent locally. Some of this spending becomes
an income to local employees in service areas, and they spend part of their income locally as well. Each
successive round of spending creates additional income. We calculate induced impacts of Tweed-New Haven
Airport by using FAA-recommended multipliers from the RIMS II model. The multipliers are applied to both
direct and indirect impacts of the airport. Finally, the total economic benefit of the airport is simply the sum of
the direct, indirect, and induced impacts.
The direct benefits are the sum of compensation benefits and other sources of value-added. The compensation
benefit was obtained by multiplying the average airport annual payroll per employee by the estimated number of
airport employees. The latter number was derived from two relationships: one between the number of
commercial passengers and airport employment, and one between the number of based aircraft and airport
employment.5 Therefore, we considered general aviation and commercial aviation at Tweed-New Haven
Airport. Information provided by airport management and confirmed with the figures obtained from the FAA
provided the basis for determining average annual payroll expenditure per employee. The other sources of
value-added were estimated using figures from the latest version of IMPLAN. For the State of Connecticut, the
other sources of value-added in the air transportation industry are 53.8% of compensation benefit.
Indirect impact equals estimated expenditures by visitors. The SH&E forecast provided estimates of the number
of arriving passengers. The FAA report provides the numbers for the estimated expenditures per visitor.6 CCEA
adjusted them properly for inflation, size of the airport, and the population of the Tweed-New Haven market
area.
3 See FAA report DOT/FAA/PP/87-1, pp. 16-17.4 For details see FAA report DOT/FAA/PP/87-1, pp. 19-22.5 Total airport employment = 650.5*passengers (millions) + number of based aircraft / 7.2. This formula was generated based onthe information provided by the FAA in its report DOT/FAA/PP/87-1.6 See table 3-1, p. 21 in the FAA report DOT/FAA/PP/87-1.
TWEED-NEW HAVEN AIRPORT: MASTER PLAN UPDATE__________________________________
Page: 5
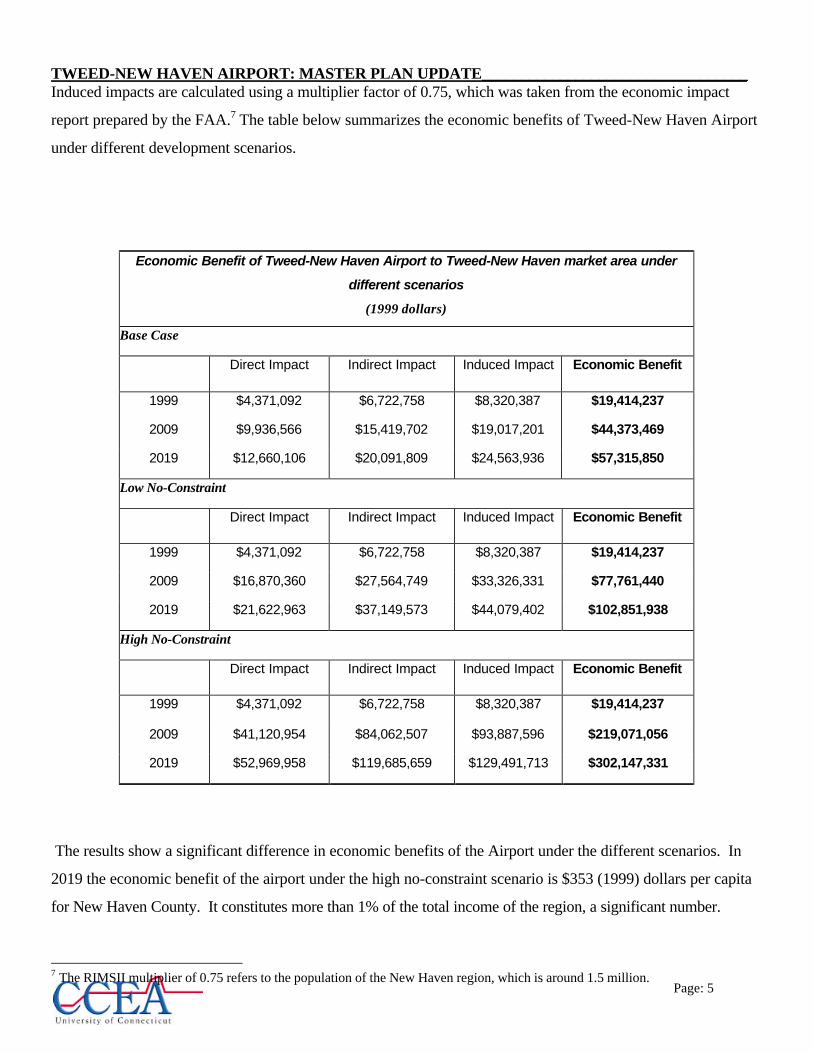
Induced impacts are calculated using a multiplier factor of 0.75, which was taken from the economic impact
report prepared by the FAA.7 The table below summarizes the economic benefits of Tweed-New Haven Airport
under different development scenarios.
Economic Benefit of Tweed-New Haven Airport to Tweed-New Haven market area under
different scenarios
(1999 dollars)
Base Case
Direct Impact Indirect Impact Induced Impact Economic Benefit
1999 $4,371,092 $6,722,758 $8,320,387 $19,414,237
2009 $9,936,566 $15,419,702 $19,017,201 $44,373,469
2019 $12,660,106 $20,091,809 $24,563,936 $57,315,850
Low No-Constraint
Direct Impact Indirect Impact Induced Impact Economic Benefit
1999 $4,371,092 $6,722,758 $8,320,387 $19,414,237
2009 $16,870,360 $27,564,749 $33,326,331 $77,761,440
2019 $21,622,963 $37,149,573 $44,079,402 $102,851,938
High No-Constraint
Direct Impact Indirect Impact Induced Impact Economic Benefit
1999 $4,371,092 $6,722,758 $8,320,387 $19,414,237
2009 $41,120,954 $84,062,507 $93,887,596 $219,071,056
2019 $52,969,958 $119,685,659 $129,491,713 $302,147,331
The results show a significant difference in economic benefits of the Airport under the different scenarios. In
2019 the economic benefit of the airport under the high no-constraint scenario is $353 (1999) dollars per capita
for New Haven County. It constitutes more than 1% of the total income of the region, a significant number.
7 The RIMSII multiplier of 0.75 refers to the population of the New Haven region, which is around 1.5 million.

TWEED-NEW HAVEN AIRPORT: MASTER PLAN UPDATE__________________________________
Page: 6
On the other hand, under the base scenario, the total economic benefit of Tweed-New Haven Airport is $67 per
capita for New Haven County, still an impressive number, but obviously smaller than the one that emerges under
the no-constraint scenarios.
Total Economic Benefit
The results show the benefits of increased service at Tweed-New Haven Airport. Under both forecast no-
constraint ranges, the Airport could generate significantly increased income for the region. Increased direct
impacts suggested by the results refer to increased airport employment. Increased indirect impacts constitute
an increase in employment in businesses related to airport operations. In addition, the increased volume of
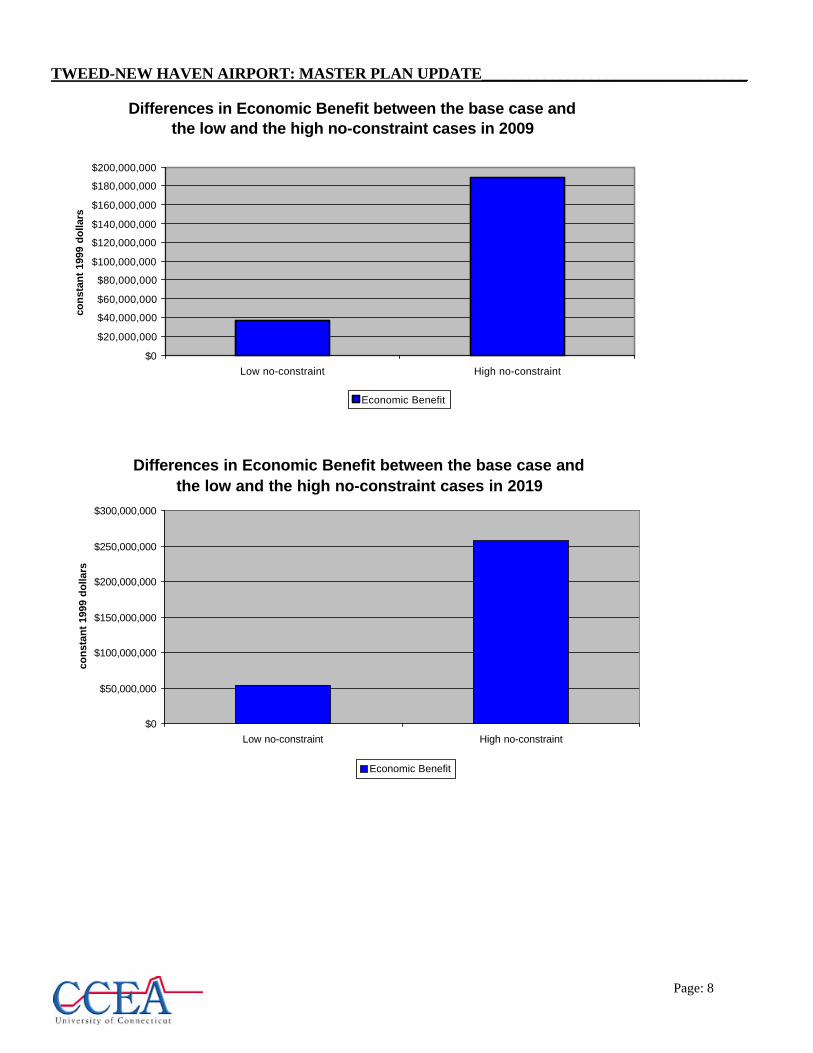
commercial air traffic would induce a significant amount of income in the region. The charts and the table
presented below summarize the total impact (transportation plus economic) of Tweed-New Haven Airport under
different forecast scenarios. Development of the high no-constraint scenario compared to the base case scenario
would generate an additional $189 million per year for the region in ten years, and an additional $263 million
per year by 2019 in 1999 dollars.
Tweed New Haven Airport Total Economic Impact on Tweed-New Haven market area(1999 dollars)
Base Case Low No-Constraint High No-Constraint
1999 $22,052,174 $22,052,174 $22,052,174
2009 $49,582,753 $86,174,320 $238,688,220
2019 $63,783,485 $113,460,602 $327,238,964

TWEED-NEW HAVEN AIRPORT: MASTER PLAN UPDATE__________________________________
Page: 7
$0
$50,000,000
$100,000,000
$150,000,000
$200,000,000
$250,000,000
con
stan
t 19
99 d
olla
rs
Base Case Low No Constraint High No Constraint
Scenarios
Total Economic Impact of Tweed-New Haven Airport on Tweed-New Haven market area in 2009 under different
forecast scenarios
Transportation Benefit Economic Benefit
$0
$50,000,000
$100,000,000
$150,000,000
$200,000,000
$250,000,000
$300,000,000
$350,000,000
con
stan
t 19
99 d
olla
rs
Base Case Low No Constraint High No Constraint
Scenarios
Total Economic Impact of Tweed-New Haven Airport on Tweed-New Haven market area in 2019 under different
forecast scenarios
Transportation Benefit Economic Benefit
TWEED-NEW HAVEN AIRPORT: MASTER PLAN UPDATE__________________________________
Page: 8
Differences in Economic Benefit between the base case and the low and the high no-constraint cases in 2009
$0
$20,000,000
$40,000,000
$60,000,000
$80,000,000
$100,000,000
$120,000,000
$140,000,000
$160,000,000
$180,000,000
$200,000,000
Low no-constraint High no-constraint
con
stan
t 19
99 d
olla
rs
Economic Benefit
Differences in Economic Benefit between the base case and the low and the high no-constraint cases in 2019
$0
$50,000,000
$100,000,000
$150,000,000
$200,000,000
$250,000,000
$300,000,000
Low no-constraint High no-constraint
con
stan
t 19
99 d
olla
rs
Economic Benefit
TWEED-NEW HAVEN AIRPORT: MASTER PLAN UPDATE__________________________________
Page: 9
Section 1.2 Airport Operating and Maintenance Costs
While the preceding economic impact analysis identified the benefits generated by the airport, we must recognize
that there are costs associated with operating and maintaining the airport, as well as costs for capital
improvements. This section presents an overview of those costs, as well as the funding sources that support
those expenses.
The City of New Haven owns Tweed-New Haven Regional Airport. The Airport Authority, which operates the
Airport, has leased out operation of the Airport to American Port Services (Amport), which is responsible for
the day-to-day operation and maintenance of the Airport.
The operating and maintenance (O&M) expenses, for the fiscal year 1999-2000 are $2,149,300, and, are
categorized as follows:
Airport Operating and Maintenance Expenses
Airport Authority Administration
Marketing and Air Service Development
Depreciation and Reserve
Legal and audit
Improvements reserve
Management
AMPORT Fees, personnel salaries and benefits
Non-Personnel
Administration
Insurance
Maintenance
Utilities
Under existing regulations, the Federal Aviation Administration (FAA) does not support airport O&M costs,
except for the radio navigation aids such as the on-airport VOR and localizer transmitters, the approach light
system, and automated weather observation station.

TWEED-NEW HAVEN AIRPORT: MASTER PLAN UPDATE__________________________________
Page: 10
However, there are a number of revenue sources which offset O&M expenses. Total revenue generated in FY
1999-2000 equals $2,163,590. The single largest source of revenue ($1.2 million) is generated through a
subsidy from the City of New Haven and the State of Connecticut, each contributing $600,000. The various
sources of revenue are shown below:
Airport Revenues
Carry-over into FY 99-00
Subsidy
City of New Haven
State of Connecticut
Concessions/Fees
Investment interest
Fuel flowage fee
Land rental
Landing/Ramp parking fees
Automobile parking revenue
Office & counter rental
Rental car concessions
Telephone concessions
Terminal building advertising
Vending/coffee machine
Miscellaneous commercial revenue
One of the stated goals of the Airport Authority is to increase revenues from other sources to eventually eliminate
subsidies from the City and the State. Under the state legislation that was enacted creating the Airport Authority,
both the city and state subsidy will be available for only a limited time frame.

TWEED-NEW HAVEN AIRPORT: MASTER PLAN UPDATE__________________________________
Page: 11
Airport Capital Improvement Program (ACIP)
The other expense associated with the Airport is the Airport Capital Improvement Program (ACIP). The ACIP
identifies projects to be undertaken at the Airport, the estimated cost for each project, and the potential funding
sources for each project. The ACIP is typically prepared for a five-year period, and provides detailed
information for each of the five years. In addition to identifying projects that will be undertaken by the airport,
the FAA and the Connecticut DOT consider the ACIP when developing their own capital improvement program.
The current ACIP for Tweed-New Haven Airport covers the period between FY 1999-2004, and estimates that
total capital improvement costs will equal $18,044,843 over the five-year period. Of that amount, it is projected
that the Airport will pay for $1,907,121 (10.6%), $1,241,363 (6.9%) will be paid by ConnDOT, and
$14,896,359 (82.5%) will be paid by FAA.
Both ConnDOT and FAA issue grants (not loans) to the Airport for capital improvements. As a result, the money
is not paid back to the state or FAA, however, the airport signs grant assurances before accepting the grant. The
grant assurance legally encumbers the Airport authority to comply with federal and state regulations, including a
commitment to keep the airport open, operating, and available for public use for a period of at least twenty years
from the date of accepting the grant.

TWEED-NEW HAVEN AIRPORT: MASTER PLAN UPDATE__________________________________
Page: 12
Section 2: Property Value Analysis
The Tweed-New Haven Airport Authority requested a study of the market value of properties adjacent to
Tweed-New Haven Airport. The purpose of the study is to find out whether historically Tweed-New Haven
Airport systematically and adversely affected the value of property in the vicinity of the airport.
This study employs a well-established method for estimating the fair market value of properties, namely, the
comparable sales approach. The data set includes sales data for approximately 700 single-family houses
between 1967 and 1999 (see Appendix 4).8 The analysis compares sale prices for properties within the runway
protection zones (RPZs) to the sale prices of properties outside the RPZs but within the study area (that is, within
the target zone, see Appendix 5). The shaded properties in Appendix 4 are the ones within the RPZs. This
analysis did not find any systematic differentiation in the market value of properties within the RPZs compared to
properties outside the RPZs but within the target zone. Interestingly, properties outside the RPZs did rise in
value somewhat faster than those inside between 1967 and 1979, but then rose at a lower rate during the 1980s,
when jet service began at Tweed-New Haven. During the 1990s, there was no clear difference in the rate of
change in values. Thus, over the entire period, there is no statistically significant difference between the change
in property values within the RFZ and those outside of it as determined using a non-parametric Rank Sum test.
These three subperiods were selected because they represent distinctly different economic regimes. The first
period (1967 to 1979) was one of high and volatile inflation that affected mortgages and interest-sensitive
investment. The 1980s saw the return to stable and lower inflation and sustained economic growth, culminating
in the highest real estate values in Connecticut history. The third period began as in 1981 and 1982 with a
recession, but saw a long and steady recovery and real estate price growth along with historically low inflation
and mortgage rates in the mid-1990s.
Tweed-New Haven Airport started operation in 1931. During two periods in 1967 and 1975, commercial jets
operated at Tweed-New Haven Airport. Air Wisconsin scheduled jet service into Tweed in 1985. There has
long been a question of whether Tweed-New Haven Airport has adversely impacted the market value of
residential properties around the airport. While there are numerous studies on property values around airports

TWEED-NEW HAVEN AIRPORT: MASTER PLAN UPDATE__________________________________
Page: 13
(see Appendix 6 for a reference list of these studies9), this issue can be understood from a simple economic
principle, namely the capitalization of property value in market price.
Suppose the assertion that Tweed-New Haven Airport has caused the adjacent residential properties’ values to
go down is true. The airport has been in its current location for almost 70 years. Scheduled jet service started as
early as 1967, adding to general aviation activity that already existed. We may reasonably assume that anyone
purchasing property in the vicinity of the airport after 1967 did so knowing that there was an airport close by,
one that accommodated commercial jet service. It is also reasonable to assume that they knew that airport traffic
might impact the use and enjoyment of their property, and therefore, they would only be willing to pay a lower
price for that property than for similar property located further from the airport. Purchasers thus were implicitly
compensated through purchasing the property at a lower price. Almost 70 years after the Airport was built, and
more than 30 years after scheduled jet service began at Tweed, the capitalization of residential properties around
the airport should have occurred some time ago. This economic logic is consistent with the sales price trend we
observe in the historical data: the analysis finds the operations of Tweed-New Haven Airport since 1967 have
had no systematic impacts on the values of surrounding residential properties. This conclusion is based on
comparing the average sales price growth rates of properties inside and outside the RPZs and within the target
area. We looked at three time periods: 1967 to 1979; 1980 to 1989; and, 1990 to the present. There is no
statistically significant difference (at the 1% level) between sales price growth rates of properties in either area
in any period. In other words, the economic rate of return to investing in property in the RPZs compared to
investing in property within the target area but outside the RPZs is essentially the same. Appendix 4 describes
the statistical method used to test the significance of the difference of the sales price growth rates, and, contains
the summary data used in the calculations.
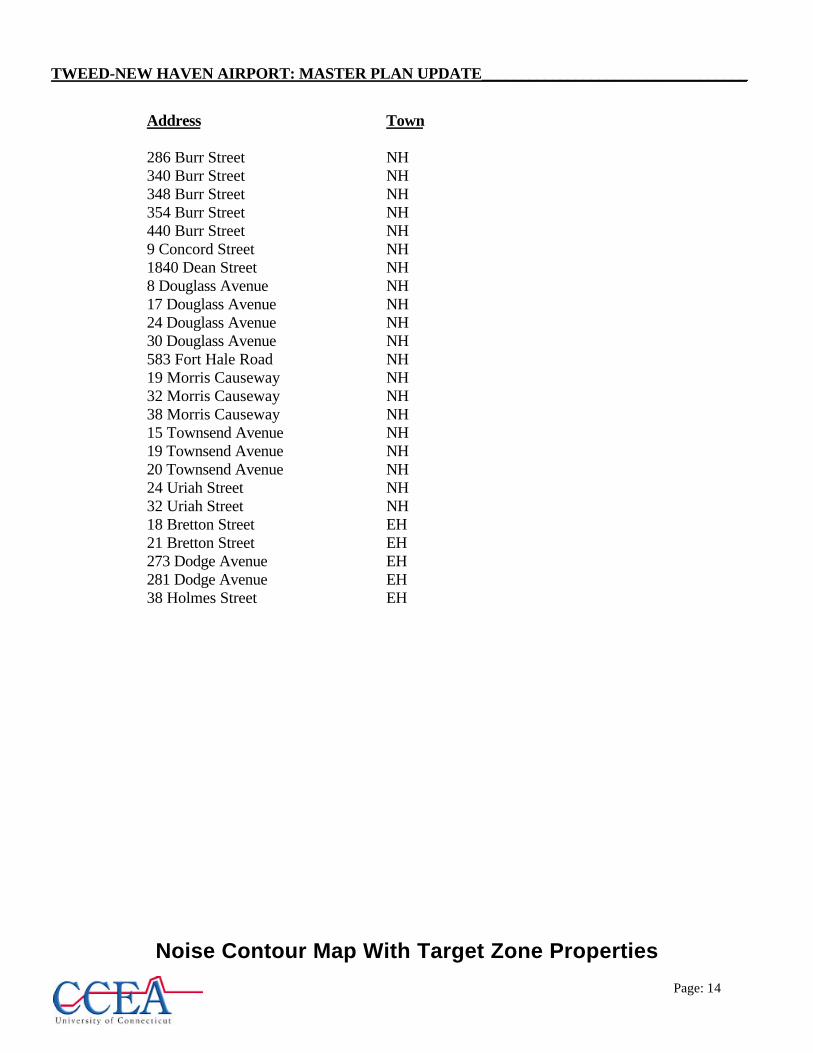
In order to further qualify housing price growth, we identified 25 properties located within the 65db noise
contour zone around Tweed-New Haven Airport listed in the following table. All properties used in this portion
of the study appear in the map following the table.
8 We are grateful to Mr. John Leary of Leary Counseling and Valuation, Inc. for providing detailed sales data between the period of1967-1986 within the study area. His data was used as evidence in 1985 court case of Melillo v. City of New Haven and wasapproved by the court to be the appropriate evidence (Aircraft Owners and Pilots Association Magazine, October 1999).9 We once again would like to express our gratitude to Mr. John Leary for providing part of this list to us.
TWEED-NEW HAVEN AIRPORT: MASTER PLAN UPDATE__________________________________
Page: 14
Address Town
286 Burr Street NH340 Burr Street NH348 Burr Street NH354 Burr Street NH440 Burr Street NH9 Concord Street NH1840 Dean Street NH8 Douglass Avenue NH17 Douglass Avenue NH24 Douglass Avenue NH30 Douglass Avenue NH583 Fort Hale Road NH19 Morris Causeway NH32 Morris Causeway NH38 Morris Causeway NH15 Townsend Avenue NH19 Townsend Avenue NH20 Townsend Avenue NH24 Uriah Street NH32 Uriah Street NH18 Bretton Street EH21 Bretton Street EH273 Dodge Avenue EH281 Dodge Avenue EH38 Holmes Street EH
Noise Contour Map With Target Zone Properties

TWEED-NEW HAVEN AIRPORT: MASTER PLAN UPDATE__________________________________
Page: 15
Note: Red dots denote New Haven properties and blue dots indicate East Haven properties; squares areproperties within the 65db contour.
Due to the limited number of properties inside the 65db noise contour, a statistical test based on the means of
those properties inside and outside the contour as above is not reliable. We use Ordinary Least Squares to
estimate the impact of property location, that is inside and outside of the 65db noise contour, on the properties’
sales price growth rate. We find no significant impact of housing location on the sales price growth rate. The
model is a simple linear regression model written as:
P = β0 + β1zone + β267next + β367twice + β480same + β580next + β690same + ε,
where P stands for housing price growth rate. The zone variable has value of 1 if the property is inside the 65db
contour and 0 otherwise. Each categorical variable controls for the different sales scenarios described in
Appendix 7. For example, “67next” has the value of 1 if the property was first sold in the period 1967-1979 and
resold again in the period 1980-1989, and 0 otherwise. “67twice” means that the property was first sold in the
period 1967-1979 and resold in 1990 or later. “80same” indicates whether the property was first sold and resold

TWEED-NEW HAVEN AIRPORT: MASTER PLAN UPDATE__________________________________
Page: 16
during 1980-1989 (1 if true, 0 otherwise). The other categorical variables have comparable definitions. The
categorical variable “67same” is omitted to avoid the statistical problem of multicollinearity.
The data set has 321 properties. Regression results are presented in the following table. The F-statistic for the
regression indicates that the model is significant at the customary 5% level. We conclude that the coefficient of
the zone categorical variable is not significantly different from zero. In other words, whether the property is
located inside or outside of the 65db noise contour makes no significant difference in terms of rate of return to
the investment.
Regression Results
ANOVA
df F Significance FRegression 6 2.520196932 0.02135217Residual 315Total 321
Coefficients Standard Error t Statistics P-valueIntercept 0.080995264 0.009647659 8.395328077 1.599E-15Zone -0.002353131 0.017035464 -0.138131297 0.890224967next 0.008562362 0.01847391 0.463484019 0.643337567twice -0.028005724 0.023733973 -1.179984665 0.238896780same 0.016035501 0.013380018 1.198466338 0.231636480next -0.032039232 0.020651841 -1.551398368 0.121810390same -0.031338473 0.014389094 -2.177932356 0.0301526
TWEED-NEW HAVEN AIRPORT: MASTER PLAN UPDATE__________________________________
Page: 17
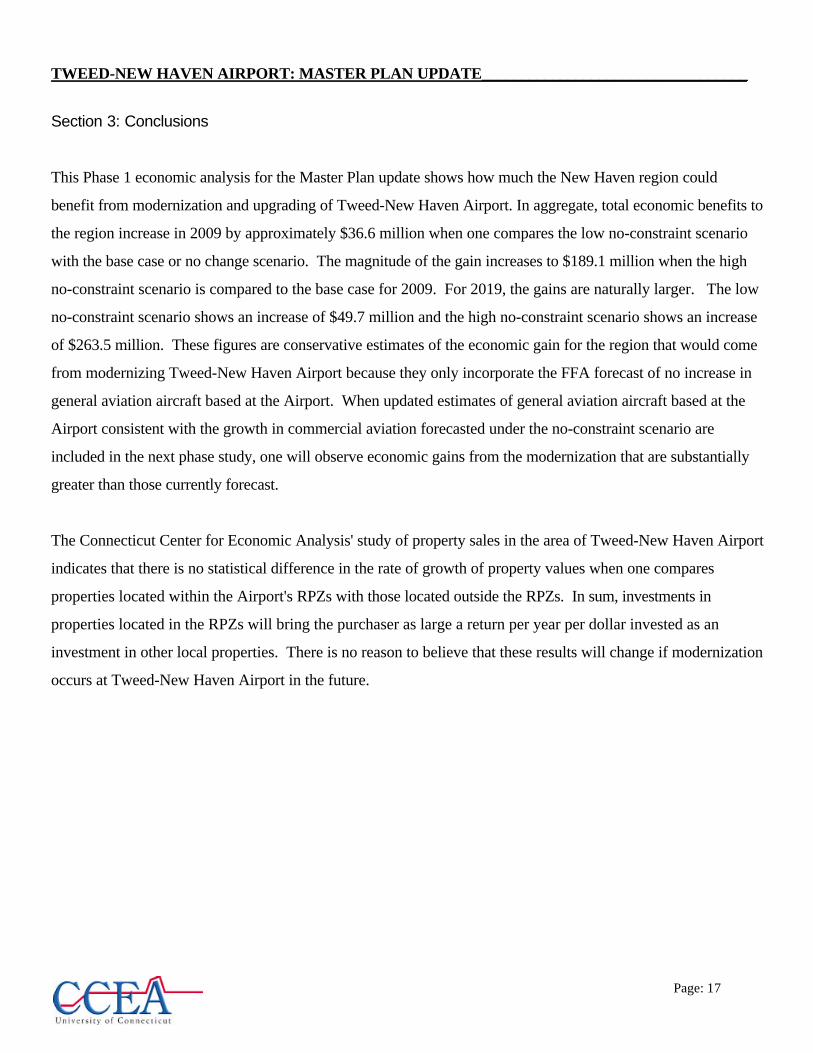
Section 3: Conclusions
This Phase 1 economic analysis for the Master Plan update shows how much the New Haven region could
benefit from modernization and upgrading of Tweed-New Haven Airport. In aggregate, total economic benefits to
the region increase in 2009 by approximately $36.6 million when one compares the low no-constraint scenario
with the base case or no change scenario. The magnitude of the gain increases to $189.1 million when the high
no-constraint scenario is compared to the base case for 2009. For 2019, the gains are naturally larger. The low
no-constraint scenario shows an increase of $49.7 million and the high no-constraint scenario shows an increase
of $263.5 million. These figures are conservative estimates of the economic gain for the region that would come
from modernizing Tweed-New Haven Airport because they only incorporate the FFA forecast of no increase in
general aviation aircraft based at the Airport. When updated estimates of general aviation aircraft based at the
Airport consistent with the growth in commercial aviation forecasted under the no-constraint scenario are
included in the next phase study, one will observe economic gains from the modernization that are substantially
greater than those currently forecast.
The Connecticut Center for Economic Analysis' study of property sales in the area of Tweed-New Haven Airport
indicates that there is no statistical difference in the rate of growth of property values when one compares
properties located within the Airport's RPZs with those located outside the RPZs. In sum, investments in
properties located in the RPZs will bring the purchaser as large a return per year per dollar invested as an
investment in other local properties. There is no reason to believe that these results will change if modernization
occurs at Tweed-New Haven Airport in the future.

TWEED-NEW HAVEN AIRPORT: MASTER PLAN UPDATE__________________________________
Page: 18
Bibliography
Hamburg, M. (1974), Basic Statistics: A Modern Approach, Harcourt Brace Jovanovich, Inc. New York.
“Measuring the regional economic significance of the airports”, DOT/FAA/PP/87-1.
“The Airport Wins One”, Aircraft Owners and Pilots Association Magazine, October 1999.
TWEED-NEW HAVEN AIRPORT: MASTER PLAN UPDATE__________________________________
Page: 19
APPENDIX 1
REGIONAL INDUSTRIAL MULTIPLIER SYSTEM II
This appendix describes the RIMS II multipliers, describes the manner in which they are used, and presents a sample set ofcalculations for determining regional impacts.10 RIMS II multipliers are intended to show the total regional effects onindustrial output, personal earnings and employment for any county or group of contiguous counties in the United Statesresulting from any industry activity. Industry descriptions are defined according to the 1977 Bureau of Economic Analysis(BEA) national input-output tables. Induced impacts for any airport-related businesses can be estimated by applying theRIMS II multipliers to activities within the air transportation industrial sector.
RIMS II multipliers are given in three tables: total output multipliers, earnings multipliers, and employment multipliers. Inaddition, BEA will also provide a household direct coefficient table upon request. The total output multiplier table is used tocompute the total impact of a change in demand. These multipliers identify the demands placed on a particular region fromthe future growth of a business activity. The earnings multipliers measure the impacts on earnings (income) andemployment. The employment multipliers are used in calculating the total number of jobs created by final changes indemand. Of the three sets of multipliers, the earnings multipliers are the most suitable for estimating the economic impactsof a particular business activity. The direct coefficient table can be used to determine sales of a particular regional industrywhen airport expenditures are the only available information.
Each aviation business related to a targeted airport is assigned a Standard Industrial Classification code. The aviation-relatedbusiness is identified with a corresponding RIMS II code number. Table A-1 presents business activities that are most likelyencountered in aviation—related economic studies. These activities can be matched with corresponding RIMS II codenumbers. The RIMS II code number will identify the specific multiplier factor to be applied to the affected business.
The RIMS II model uses sales by aviation businesses to estimate the final demand at targeted airports. Business activitiesare evaluated and defined according to their level of economic consequences to the targeted airport. These activities aregrouped into direct and indirect impacts. Business information gathered at each airport includes:
1. magnitude of sales2. size of purchase3. identity of purchase4. number of employees5. size of payroll
In general, sales should be multiplied by RIMS II multipliers to determine economic impacts. However, if data are lackingfor some specific types of business activity, other information, such as expenditures, payroll earnings and number ofemployees can be used. The following calculations illustrate the RIMS II methods of computing economic impacts fromdata on airport sales, payroll and employment.
10 Much of this discussion is drawn from Douglas S. McLeod, Recommended Regional Economic Impact Procedures for AviationRelated Projects, Draft Report for Presentation to the Transportation Research Board Annual Meeting, January, 1987 (15).
TWEED-NEW HAVEN AIRPORT: MASTER PLAN UPDATE__________________________________
Page: 20
Table A-1AVIATION RIMS II CODE NUMBERS
Business RIMS II Number
AIRPORT MANAGEMENT Administration 650500 Construction 110400AIRLINES 650500
FIXED-BASED OPERATORSAircraft Servicing 650500Aircraft Rental 720300Aerial Spraying 010100
FEDERAL FACILITIESAir National Guard 780400Air Traffic Control 650500Airport Mail Facilities 650500Airways Facilities 650500Armed Forces 780400Customs Patrol 650500Forestry Service 040000Weather Service 730300
ONSITE AVIATION-RELATEDAdvertising 730300Aircraft Manufacturing 600100Aircraft Sales (retail) 690200Airport Parking 750000Airport Security 650100Airport Terminal Services 650500Auto Rental 750001Auxiliary Aircraft Parts Manufacturing 600400Aviation School 770402Avionics Manufacturing 620100Avionics Repair 730300Barber Shops 720200Book Stores 690200Building Maintenance and Cleaning 730100Coin-Operated Amusement 760200Drinking Places 740000Drug Stores 690200Engine and Propeller Manufacturing 610700Fire Departments 790300Flight Insurance 700500Flying Clubs 770400

TWEED-NEW HAVEN AIRPORT: MASTER PLAN UPDATE__________________________________
Page: 21
Table A-1 (cont.)
AVIATION RIMS II CODE NUMBERS
Business
Flying InstructionsFood ServicesFreight ForwardingGift ShopsHotels / MotelsNews DealersPersonnel Supply ServicesPolice DepartmentRepair ShopsRestaurantsTaxi ServiceTobacco ShopsTravel Agents
RIMS II Number
770403690100650701690200720100690200730100790300730300740000650100650100
650702

TWEED-NEW HAVEN AIRPORT: MASTER PLAN UPDATE_________________
Page: 22
1. Applying the RIMS II Approach to Sales Data
I. AssumptionsA. Business — Fixed based operator (from survey)B. RIMS II Code Number - 650500 (from A-1)C. Sales - $100,000 (from survey)D. RIMS II earnings multiplier for code number 650500 - 0.6131 (from
RIMS XI tables)
II. Earnings Impact CalculationsSales times earnings multiplier$100,00 x 0.6131 = $61,310
2. Applying the RIMS II Approach to Payroll Data
I. AssumptionsA. Business - Engine and propeller manufacturer (from survey)B. RIMS II Code Number - 610700 (from Table A-1)C. Sales - None provided (from survey)D. Payroll - $300,000 (from survey)E. RIMS II earnings multiplier for code number 610700 - 0.7120 (from
RIMS II tables)
II. Earnings Impact CalculationsA. Obtain direct coefficient household multiplier for applicable RIMS code
number (610700) - 0.3676 (from RIMS II tables).B. Calculate economic base multiplier by dividing RIMS IX earnings
multiplier (0.7120) by direct coefficient household multiplier (0.3676) =1.9369.
C. Determine earnings by multiplying payroll by economic base multiplier.$300,00 x 1.9369 = $581,070
3. Applying the RIMS II Approach to Employment Data
I. AssumptionsA. Business - Aerial sprayer (from survey)B. RIMS II Code Number - 010100 (from Table A-1)C. Sales - None provided (from survey)D. Employees - 3 (estimated from airport manager)E. RIMS II earnings multiplier for code number 010100 - 0.5662 (from
RIMS II tables)
II. Earnings Impact Calculations
A. Obtain direct coefficient household multiplier for applicable RIMS codenumber (010100) — 0.2619 (from RIMS II tables).
B. Calculate economic base multiplier by dividing RIMS II earnings multiplier(0.5662) by direct coefficient household multiplier (0.2619) = 2.1619.

TWEED-NEW HAVEN AIRPORT: MASTER PLAN UPDATE_________________
Page: 23
C. Obtain average earnings per job - $15,000 (from SIC number, RIMS IIcode number and county).
D. Determine payroll by multiplying the estimated number of employees (3)times the average earnings per job ($15,000) = $45,000.
E. Determine earnings by multiplying payroll by economic base multiplier$45,000 x 2.1619 = $97,286.

TWEED-NEW HAVEN AIRPORT: MASTER PLAN UPDATE_____________________________________________________
Page: 24
APPENDIX 2
FAA TERMINAL AREA FORECAST
REGION STATE: ANE-CT LOCID: HVNCITY: NEW HAVEN AIRPORT: TWEED-NEW HAVEN
AIRCRAFT OPERATIONS
Enplanements Itinerant Operations Local Operations
Year Air ComruuterTotal Air AT & GA Military Total GA Military Total Total Total Inst.Ops. Based AircraftCarrierCarrier Comm. OPS
1990 53 43347 43400 4 8491 32812 151 41458 53402 430 53832 95290 13716 841991 33539 54492 88031 1033 9357 32034 148 42572 46685 806 47491 90063 14588 981992 66586 71604 138190 2387 10080 29492 172 42131 33161 997 34158 76289 16876 961993 62827 63196 126023 1943 8947 29482 183 40555 27988 210 28198 68753 15131 961994 58224 72203 130427 1677 9015 27041 192 37925 25374 131 25505 63430 15239 961995 56111 59183 115294 1792 9428 29025 351 40596 21766 108 21874 62470 15826 841996 22655 72313 94968 819 11225 28049 392 40485 27025 118 27143 67628 16273 881997 0 70766 70766 0 11181 30523 173 41877 30818 172 30990 72867 15523 70
*1998 0 73163 73163 0 11559 30886 173 42618 31118 172 31290 73908 15932 70*1999 0 75560 75560 0 11702 31245 173 43120 31414 172 31586 74706 16119 70*2000 0 77957 77957 0 11835 31659 173 43667 31759 172 31931 75598 16306 70*2001 0 80353 80353 0 11960 32079 173 44212 32109 172 32281 76493 16485 70*2002 0 82750 82750 0 12077 32506 173 44756 32465 172 32637 77393 16659 70*2003 0 85147 85147 0 12186 32826 173 45185 32720 172 32892 78077 16807 70*2004 0 87544 87544 0 12288 33177 173 45638 33002 172 33174 78812 16955 70*2005 0 89941 89941 0 12382 33531 173 4608633287 172 33459 79545 17094 70*2006 0 92338 92338 0 12469 33884 173 46526 33569 172 33741 80267 17228 70*2007 0 94734 94734 0 12549 34236 173 46958 33849 172 34021 80979 17354 70*2008 0 97131 97131 0 12623 34589 173 47385 34129 172 34301 81686 17475 70*2009 0 99528 99528 0 12806 34940 173 47919 34407 172 34579 82498 17698 70*2010 0 101925 101925 0 12984 35277 173 48434 34673 172 34845 83279 17914 70*2011 0 104322 104322 0 13157 35600 173 48930 34928 172 35100 84030 18124 70*2012 0 106719 106719 0 13326 35910 173 49409 35172 172 35344 84753 18327 70*2013 0 109116 109116 0 13490 36207 173 49870 35405 172 35577 85447 18524 70*2014 0 111512 111512 0 13649 36491 173 50313 35628 172 35800 86113 18714 70*2015 0 113909 113909 0 13804 36763 173 50740 35841 172 36013 86753 18899 70

TWEED-NEW HAVEN AIRPORT: MASTER PLAN UPDATE_________________
Page: 25
APPENDIX 3
CALCULATION OF THE TRANSPORTATION BENEFIT
The transportation benefit of Tweed-New Haven Airport is calculated by the following
formula:
Total Annual Transportation Benefit = E(FGN+Y)(b/P-d/P)+(GN+Y)(Qb-Qd)
where
G Itinerant operations per based aircraft per year. They are different underdifferent scenarios.
N = 72 Number of based aircraft at Tweed New Haven airport. We obtain thisinformation from the airport’s website. The different scenarios assume thesame number of based aircraft.
d = 17.7 Ground access distance to Tweed-New Haven airport, in miles. Wecalculate this number by developing a comprehensive weighted average thatconsidered not only geographical coordinates of the airport’s surroundingtowns, but also the towns’ income and population.
b = 35.6 Ground access distance to the next best alternative airport, in miles. Thenext best alternative airports are different across the towns depending ontheir geographical location. We calculate this number by using theweighted average model mentioned above.
E = 30 Passenger time values, in dollars per hour. This number is a typical valuesuggested by the Advisory Circular.
F = 2.5 Number of passengers per trip per general aviation aircraft. This variableis also a typical variable from the Advisory Circular by FAA.
P = 45 Car speed, in miles per hour. This number is suggested by the AdvisoryCircular by FAA.
Q = 0.39 Car costs, including amortization, in dollars per mile. This value is alsosuggested by the Advisory Circular by FAA.
Y Annual passengers in commercial service. The figures are different foreach year under different scenarios. They are obtained from the forecastdeveloped by SH&E.

TWEED-NEW HAVEN AIRPORT: MASTER PLAN UPDATE_________________
Page: 26
APPENDIX 4: Historical Sales Data of Residential Properties in the Target Zone

TWEED-NEW HAVEN AIRPORT: MASTER PLAN UPDATE_________________
Page: 32
Appendix 5: Target Zone with Runway Protection Zones Map
TWEED-NEW HAVEN AIRPORT: MASTER PLAN UPDATE_________________
Page: 32
Tweed - New Haven Airport
##
#
##
#
#
#
#
#
#
#
#
#
#
#
#
#
##
## #
#
#
###
##
#
#
#
#
#
#
###
#
#
#
#
#
#
#
#
#
##
#
#
#
#
#
#
#
#
#
##
#
#
#
##
#
#
#
#
#
#
#
#
##
#
#
#
#
#
#
#
#
#
#
#
#
#
#
#
#
#
#
#
#
#
#
#
#
#
#
#
#
##
#
#
#
#
#
#
#
#
#
#
#
##
##
#
#
##
#
#
#
#
#
#
#
#
#
#
#
#
#
#
#
#
#
#
#
#
#
#
#
#
#
##
#
#
#
#
#
#
#
#
#
##
#
#
#
#
#
#
#
#
#
#
#
#
#
#
#
#
##
#
#
#
#
#
#
#
#
#
#
#
#
#
#
#
#
#
#
#
#
#
#
#
#
#
#
#
#
#
%
%%%
%
%
%
% %%%
%
%%
%
%
%%
%%
%%
%%
%
%%
75
75
70
65
Town Boundary - New HavenTown Boundary - East HavenStreets - New HavenStreets - East Haven
# Residences - New Haven# Residences - East Haven% Residences (>\= 65 Decibels) - New Haven% Residences (>\= 65 Decibels) - East Haven
Scale 1 : 2,000 Feet
TWEED-NEW HAVEN AIRPORT: MASTER PLAN UPDATE_________________
Page: 33
APPENDIX 6
REFERENCES ON PROPERTY VALUES AND AIRPORTS
Baxter, William F. and Lilian R. Altree, “Legal Aspects of Airport Noise”, Journal of
Law and Economics, 1972, v15(1), pp. 1-114.
Borins, Sandford F., “Meiszkowski and Saper’s Estimate of the Effects of Airport Noise
on Property Values: A Comment”, Journal of Urban Economics, 1981, v9(1), pp.
125-128.
Conger, G. M. (1968), “Noise Damage”, The Appraisal Journal, April.
Dankert, T. M. (1985), “Liability for Noise When There is No Taking”, Legal News,
February.
Feitelson, Eran I., Robert E. Hurd and Richard R. Mudge “ The Impact of Airport Noise
on Willingness to Pay for Residences”, TR, 1997, v1 (1, Sep.), pp. 1-14.
Guler, Kemal, Charles R. Plott and Quang H. Vuong “A Stud of Zero-Out Action:
Experimental Analysis of a Process of Allocating Private Rights to the Use of
Public Property”, Caltech Social Science Working paper:650, 1987.
Hall, T. H. and W. Beaton (1965), “A Factor Formula for Valuation of Avigation
Easements”, The Appraisal Journal, January.
Haar, C. M. (1968), “Airport Noise and the Urban Dweller: A Proposed Solution”, The
Appraisal Journal, October.
Howard, J. H. (1954), “Valuation of an Avigation Easement”, The Appraisal Journal,
July.
Hyde, J. V. (1977), “Notes and Comments”, The Appraisal Journal, April.
Ingram, D. (1972), “The Effect on Value of Noise Factors”, The Appraisal Journal, July.
Jackson, R. “Airport Noise and Congestion: A Peak Loan Pricing Solution”, Applied
Economics, 1971, v3(3), pp. 197-204.
Levesque, Terrence J., “Modelling the Effects of Airport Noise on Residential Housing
Markets: A Case Study of Winnipeg International Airport”, Journal of Transport
Economics and Policy, 1994, v28(2), pp. 1989-210.
Mieszkowski, Peter and Arthur M. Saper, “An Estimate of the Effects of Airport Noise on
Property Values”, Journal of Urban Economics, 1978, v5(4), pp. 425-440.
TWEED-NEW HAVEN AIRPORT: MASTER PLAN UPDATE_________________
Page: 34
Nelson, Jon P., “ Airport, Noise, Location, Rent, and the Market for residential
Amenities”, Journal of Environmental Economics and Management, 1979, v6(4),
pp. 320-331.
O’Byrne, Patricia Habuda, Jon P. Nelson and Joseph J. Seneca, “ Housing Values, Census
Estimates, Disequilibrium, and the Environmental Cost of Airport Noise: A Case
Study of Atlanta”, Journal of Environmental Economics and Management, 1985,
v12(2), pp. 169-178.
Pennington, G., N. Topham and R. Ward, “Aircraft Noise and Residential Property values
Adjacent to Manchester International Airport”, Journal of Transport Economics
and Policy, 1990, v24(1), pp. 49-60.
Randall, W. (1954), “Appraise of Damages Caused by Proximity to Jet Airport”, The
Appraisal Journal, January.
Sackman, J. L. (1969), “Proximity Damages”, The Appraisal Journal, April.
Spaeth, R. L. (1972), “Measuring the Cost of Airport Noise: Formulas and Pitfalls”, The
Appraisal Journal, July.
Strunck, J. E. (1963), “Avigational Easements – Case Studies”, The Appraisal Journal,
April.
Tomkins, J., N. Topham, N. Twomey, J., and R. Ward, (1998), “Noise versus access: the
impact of an airport on urban property market,” Urban Studies, February, v35 n2
243-259.
Walther, H. O. (1954), “The Impact of Municipal Airports on the Market Value of Real
Estate in the Adjacent Areas”, The Appraisal Journal, January.
Walther, H. O. (1959), “Effect of Jet Airports on Market Value of Vicinage Real Estate”,
The Appraisal Journal, October.
West, R J. (1988), “Statistical Inference: An Avigation Easement Analysis”, Real Estate
Issues, 13(1), Spring/Summer.
Uyeno, Dean, Stanley W. Hamilton and Andrew J.G. Biggs, “Density of residential Land
Use and the Impact of Airport Noise”, Journal of Transport Economics and
Policy, 1993, v27(1), pp. 3-18.

TWEED-NEW HAVEN AIRPORT: MASTER PLAN UPDATE_________________
Page: 35
APPENDIX 7
MANN-WHITNEY U-TEST RESULT SUMMARY
The Mann-Whitney U-Test (Rank Sum Test) is a useful non-parametric technique to test
whether two independent samples have been drawn from the same population.11 In this
study, the two samples are the sales prices of residential properties inside the RPZ and
those outside the RPZ.
We divide the study period into three sub-periods, 1967-1979, 1980-1989 and 1990-1999.
For the first period 1967-1979, there are three different scenarios. Some properties are
first sold within this period and re-sold again within this period. Some properties are first
sold in this period but not sold again until the 1980s. The last scenario is the properties
first sold between 1967-1979 and not re-sold until the 1990s. We separate these three
scenarios in conducting the Rank Sum Test. For the same reason, there are two scenarios
within 1980-1989 period and one scenario within 1990-1999 time period. Table 1
summarizes the test statistics (all are significant at the 1% level).
Table 1: Summary of Rank Sum Test Statistics
1967-1979U-statistics µU σU z-score
Scenario 1: 421 434.5 81.18 -0.17Scenario 2: 91 84 28.98 0.24Scenario 3: 49 94 28.54 -1.16
1980-1989U-statistics µU σU z-score
Scenario 1: 98 65 18.62 1.77Scenario 2: 40 54 16.97 -0.82
1990-1999U-statistics µU σU z-score13 7.5 4.61 1.19
11 See Hamburg, M. (1974), Basic Statistics: A Modern Approach, Harcourt Brace Jovanovich, Inc.
Related Documents