Ver. 2006.Oct.06 Draft Report of Pre-validation and Inter-laboratory Validation For Stably Transfected Transcriptional Activation (TA) Assay to Detect Estrogenic Activity - The Human Estrogen Receptor Alpha Mediated Reporter Gene Assay Using hER-HeLa-9903 Cell Line - Ver.2006.Oct.06 Masahiro Takeyoshi, Ph.D. Chemicals Evaluation and Research Institute (CERI), Japan

Welcome message from author
This document is posted to help you gain knowledge. Please leave a comment to let me know what you think about it! Share it to your friends and learn new things together.
Transcript

Ver. 2006.Oct.06
Draft Report of
Pre-validation and Inter-laboratory Validation
For Stably Transfected Transcriptional Activation (TA) Assay
to Detect Estrogenic Activity
- The Human Estrogen Receptor Alpha Mediated Reporter Gene Assay Using hER-HeLa-9903 Cell Line -
Ver.2006.Oct.06
Masahiro Takeyoshi, Ph.D.
Chemicals Evaluation and Research Institute (CERI), Japan

Ver. 2006.Oct.06
i
TABLE OF CONTENTS
0. ACRONYMS 1
1. SUMMARY ASSESSMENT 3
2. INTRODUCTION 5
3. OBJECTIVES 7
4. VALIDATION DESIGN 8
5. TEST METHOD USED 11
5.1 Test protocol ................................................................................................................ 11
5.1.1 Cell line (stable clone: hERα-carrying HeLa cells) ............................................. 13 5.1.2 Medium (support protocols Nos. 1-4, APPENDIX 2 and APPENDIX 3)............ 14 5.1.3 Chemical exposure to cells.................................................................................... 14 5.1.4 Reagent for stably transfected TA assays and detection instrument (support
protocol No. 5, APPENDIX 3) ............................................................................... 16 5.1.5 Test chemical ........................................................................................................ 17
5.2 Data Recording and Analyses ..................................................................................... 23
6. RESULTS 26
6.1 Stability of response of hER-HeLa-9903 cell line....................................................... 26
6.2 Relevance of the assay system..................................................................................... 27
6.3 Overview assessment of the stably transfected TA assay using hER-HeLa-9903 ..... 30
6.4 Supplemental information that supports the performance of the assay test system
for detection of estrogenic activity .............................................................................. 33
6.5 Inter-laboratory reproducibility (reliability) and protocol transferability................ 37
7. DISCUSSION 45

Ver. 2006.Oct.06
ii
7.1 Limitations of the assay, and further validation considerations................................ 50
7.1.1 Function of this test method and application of a prediction model. .................. 50 7.1.2 Detection of anti-estrogenic activity..................................................................... 50 7.1.3 Non-receptor mediated luminescence signals ...................................................... 50 7.1.4 Metabolic capability and TA assays..................................................................... 51
8. CONCLUSIONS 51
9. RECOMMENDATIONS 52
10. ACKNOWLEDGMENTS 53
11. REFERENCES 53
APPENDIX 1 LIST OF PARTICIPATING LABORATORIES 57
APPENDIX 2 STANDARD OPERATING PROCEDURE (SOP) FOR DETECTION OF
ESTROGENIC ACTIVITY USING THE REPORTER GENE ASSAY 59
APPENDIX 3 PROTOCOL USED FOR THE INTER-LABORATORY VALIDATION
STUDY 71
APPENDIX 4 CONSIDERATION OF THE EDGE EFFECTS ON ASSAY SYSTEM 87
APPENDIX 5 STANDARD PROTOCOLS FOR DETECTING OF ANTI-ESTROGENIC
ACTIVITY USING THE REPORTER GENE ASSAY 95
APPENDIX 6 INDEPENDENT STSTISTICAL ANALYSES FOR INTER-LABORATORY
VALIDATION STUDY …………………………………………………………….……………107
APPENDIX 7 REPORT OF THE PRELIMINARY VALIDATION ASSESSMENT
PANEL OF THE ‘JAPANESE MULTI-LABORATORIES VALIDATION STUDY OF A
STABLY TRANSFECTED ER ALPHA MEDIATED REPORTER GENE ASSAY IN
JAPAN’ ……………………………………….…………………………………………….141
APPENDIX 8 THE SUMMARY OF QUERIES FROM PVAP AND CORRESPONDING
ANSWERS ……………………………………………………………………………………...185

Ver. 2006.Oct.06
1
0. ACRONYMS
AR Androgen Receptor
BPA Bisphenol A
CERI Chemicals Evaluation and Research Institute (Japan)
CV Coefficient of Variation
DCC-FBS Dextran-Coated Charcoal-treated Fetal Bovine Serum
DIP Data Interpretation Procedure
DMSO Dimethylsulfoxide
E2 17β-Estradiol
EC European Commission
EC50 The molar concentration of a compound which produces 50% of the
maximum possible response for that compound
ECVAM European Centre for the Validation of Alternative Methods
EDCs Endocrine Disrupting Chemicals
EDTA (OECD) Task Force on Endocrine Disruptor Testing and Assessment
EMEM Eagle’s Minimum Essential Medium
ER Estrogen Receptor
ERE Estrogen Responsive Element
EU European Union
GD 34 OECD Guidance Document 34 “Guidance document on the validation
and international acceptance of new or updated test methods for hazard
assessment”
GLP Good Laboratory Practice
ICCVAM Interagency Coordinating Committee on the Validation of Alternative
Methods (U.S.)
JaCVAM Japanese Centre for the Validation of Alternative Methods

Ver. 2006.Oct.06
2
NICEATM National Toxicology Program (NTP) Interagency Centre for the Evaluation
of Alternative Toxicological Methods (U.S.)
NIEHS National Institute of Environment and Health Sciences (U.S.)
NIHS National Institute of Health Sciences (Japan)
NP Nonylphenol
OECD Organisation for Economic Co-operation and Development
PC50/PC10 The concentration of chemical estimated to cause 50% or 10%, respectively,
of activity of the positive control response on a plate by plate basis.
PM Prediction Model
PVAP The Preliminary Validation Assessment Panel of the 'Japanese
multi-laboratories validation study of a stably transfected ER alpha mediated
reporter gene assay in Japan'
QA Quality Assurance
SD Standard Deviation
SE Standard Error
SOP Standard Operating Procedure
SPSF Standard Project Submission Form
TA Transcriptional Activation
TS Testosterone
US EPA United Sates Environmental Protection Agency
VMG Validation Management Group
VMG-NA Validation Management Group for Non –Animal Testing
WNT (OECD) Working Group of the National Coordinators for the Test Guidelines
Programme

Ver. 2006.Oct.06
3
1. SUMMARY ASSESSMENT
1 Numerous chemicals found in the environment, as well as some synthetic chemicals may
disrupt the endocrine functions of wildlife and humans. At the present time, there is global
concern regarding endocrine disruption effects resulting from chemical exposure,
particularly those mediated by the estrogen receptor (ER).
2 Some in vitro assays, such as the transcriptional activation (TA) assays and receptor
binding assays, have been proposed and incorporated into the “OECD Conceptual
Framework for the Testing and Assessment of Endocrine Disrupting Chemicals” as “Level
2” in vitro assays to provide mechanistic information for prioritization purposes.
3 Several in vitro TA and receptor binding assay methods are currently at, or will soon begin
validation at national, European and international levels, but are not yet close to
completion and full assessment of their validation status. Although the need is urgent, at
the present time there are no in vitro screening assays for estrogenic activity that have
been peer reviewed for potential test guideline development, to enable use for OECD
regulatory purposes.
4 Recognizing this urgency, Japan has made an extensive effort to establish and
domestically validate a new in vitro pre-screening procedure, the Stably Transfected
Transcriptional Activation (TA) Assay using the hER-HeLa-9903 cell line for detecting
the estrogenic activity of chemicals mediated by the human estrogen receptor α (hERα)
for a level 2 screening test in the OECD Conceptual Framework for the Testing and
Assessment of endocrine disrupting chemicals (EDCs).
5 Under the agreement of the 1st OECD validation management group for non-animal
testing (VMG-NA) meeting that Japan would take lead in this assay, validation work on
the hERα mediated stably transfected TA assay conducted in Japan consisted of both
pre-validation and inter-laboratory validation. The pre-validation work was conducted in
the Chemicals Evaluation and Research Institute (CERI), Japan and the inter-laboratory
validation study was conducted within four Japanese domestic laboratories upon the
initiative of CERI.
6 The overall goal of the validation efforts for the stably transfected TA assay using
hER-HeLa-9903 cell line as reported herein is to develop and validate a test method and
protocol that will support the development of test guidelines for the detection of chemicals
potentially possessing estrogenic activity through hERα.

Ver. 2006.Oct.06
4
7 In the pre-validation study, the mean Log10[EC50 (M)] for 17β estradiol (E2), the positive
reference chemical, in 13 runs showed acceptable and normal variation observed for such
assays.
8 As for the results of the inter-laboratory validation study, statistical analysis using nine
coded test chemicals revealed that the reproducibility within four participating laboratories
of this assay system appeared to have acceptably low between-lab variation. The results
showed that the test system is highly reliable and that the test protocol used in this study is
adequately transferable for practical use.
9 Log10[EC50 (M)] obtained with the proposed assay system showed high consistency with
the data obtained by the ER-CALUX, HELN-ERα and LUMI-CELLTM assay systems at.
R2=0.987 (n=8), R2=0.937 (n=7) and R2=0.922 (n=7), respectively. Moreover, Log10[EC50
(M)] values obtained in the proposed stably transfected TA assay for several known
estrogenic positive chemicals are consistent and correlate well with those listed in
ICCVAM report (2003) R2=0.802 (n=20).
10 The results obtained by the stably transfected TA assay and the information given in the
ICCVAM report (2003) were compared with regard to 46 chemicals. The collected
information listed in the ICCVAM report is based on several different in vitro assay
systems to detect estrogenic activities, and the assay performance parameters for the
stably transfected TA assay, concordance, sensitivity and specificity, were 80%, 79% and
82%, respectively.
11 So as to provide supplemental information, the results obtained from the receptor binding
assay using hERα and the stably transfected TA assay were compared with regard to 48
chemicals. The concordance, sensitivity and specificity, were 77%, 71% and 83%,
respectively.
12 Furthermore, as a part of supplemental information, the results obtained by the
uterotrophic assay and the stably transfected TA assay were also compared with regard to
48 chemicals, and the concordance, sensitivity and specificity, were 90%, 91% and 88%,
respectively.
13 The comparative results between the endpoints of the stably transfected ER TA assay and
data provided in the ICCVAM report (2003), ER binding assays and the immature rat
uterotrophic assay indicate high concordance and therefore suggest that the outcomes of

Ver. 2006.Oct.06
5
the stably transfected ER TA assay can provide reliable information about the biological
effect of chemicals mediated by ER-ligand interactions.
14 Accordingly, the overall assay performance of the stably transfected TA assay system
using hER-HeLa-9903 was deemed satisfactory for practical use, and in accordance with
OECD Guidance Document No.34 (GD 34).
15 A Japanese human ERα mediated stably transfected TA assay system using
hER-HeLa-9903 cell line is well-established and has been shown to be a well-validated
assay for the development of an OECD test guideline for the detection of chemicals
possessing potential estrogenic activity mediated through hERα. The assay is a therefore a
promising method to use in the prescreening process of an endocrine disruptor screening
strategy.
2. INTRODUCTION
16 A number of chemicals found in the environment, as well as some synthetic chemicals,
may disrupt the endocrine functions of wildlife and humans. At the present time, there is
global concern regarding endocrine disruption effects resulting from chemical exposure,
particularly those mediated by the ER. To ensure chemical safety, an effective screening
method for chemicals to detect endocrine modulating potencies has been sought by
regulatory agencies in several countries, including the United States Environment
Protection Agency (US-EPA), Japan and Europe (EDSTAC, 1998; OECD, 2001, ECB,
2006). The US-EPA developed a chemical screening and testing program consisting of a
tiered system to evaluate the endocrine disrupting effects of chemicals (Earl-Gray L. Jr.,
1998). In this program, the hormone receptor mediated reporter gene assay system is
proposed for pre-screening and the Tier 1 screening battery.
17 The endocrine disrupter testing and assessment task force (EDTA) was established in
1997 as a special activity under the OECD test guideline program: (1) to investigate
regulatory requirements and needs in member countries for endocrine disrupting
chemicals (EDCs); (2) to try to develop harmonized assessment practices in member
countries for EDCs; and (3) to develop test guidelines for EDCs. Under the EDTA’s
supervision, the validation management groups for mammalian (VMG-mammalian) and
for ecotoxicity (VMG-eco) tests were established in 1999 and 2001, respectively.
18 The 6th EDTA meeting held in Tokyo in 2002 confirmed the urgent need for cost-efficient

Ver. 2006.Oct.06
6
and quick screening test methods not requiring animals, and therefore agreed to establish
the validation management groups for non-animal testing (VMG-NA). The OECD
conceptual framework for testing and assessment of potential endocrine disrupting
chemicals from both new and existing substances, including such different chemical
sectors as pharmaceuticals, industrial chemicals and pesticides, was also agreed upon at
this meeting (OECD, 2002). This framework is not a testing scheme but rather a toolbox
that contains various tests, each of which can contribute information about detecting the
hazards of endocrine disruption. Within this toolbox framework, there are five levels, each
level corresponding to a different level of biological complexity.
19 Some in vitro assays, such as the transcriptional activation (TA) and receptor binding
assays, have been proposed and incorporated into the “OECD Conceptual Framework for
the Testing and Assessment of Endocrine Disrupting Chemicals” as “Level 2” in vitro
assays to provide mechanistic information for prioritization purposes.
20 A main mechanism of action of hormones is via binding with their specific receptors after
secretion from endocrine glands. Hormone receptors are distributed in the cell-membrane
or inner-nucleus. The action of hydrophilic ligands, such as growth hormone and insulin,
are known to be mediated through membrane receptors, and the hydrophobic ligands,
such as steroid and thyroid hormones, act through nuclear receptors after penetration into
the nucleus.
21 Nuclear receptors, such as steroid hormone receptors and thyroid hormone receptors, are
known to be one of the main effector sites of endocrine disruptors, and the signal
transduction through these nuclear receptors would be a starting point for the harmful
effects of endocrine disruptors. The estrogen receptor is well characterized and well
known as a major mediator of estrogenic effects. Estrogenic effects may be observed at
very low concentrations; therefore a highly sensitive assay method is necessary for hazard
assessment.
22 Nuclear receptors play important roles in the regulation of target gene expression. In this
regard, the reporter gene assay technique that has long been used to evaluate specific gene
expression would be applicable for evaluation of the hormonal activities of chemicals.
23 Generally, transcription regulatory sequences are located either upstream or downstream
of the structural gene. Expression of the hormone responsive gene is regulated through the
binding of receptors with their ligands; the hormonal activity will be presented by
transcriptional activation induced by the binding of receptor-ligand complex to the

Ver. 2006.Oct.06
7
cis-region of the target gene.
24 In reporter gene assays, a reporter gene, which is not expressed in host cells such as a
firefly luciferase gene or a β-galactosidase gene, is used to visualize the gene expression
induced by receptor-ligand interaction.
25 Thus, the reporter gene assay technique may be suitable for detecting the hormonal
activities of chemicals because this technique has long been used to detect the enhancers
and promoter activity of genes. The reporter gene assay system may also provide a
powerful tool for screening endocrine disrupting chemicals (Takeyoshi et al., 2002;
Yamasaki et al., 2002).
26 Several in vitro TA and ER binding assay methods are currently or will soon begin
validation at national, European and international levels, but are not yet close to
completion and full assessment of their validation status. Although the need is urgent, at
the present time there are no in vitro screening assays for estrogenic activity that have
been peer reviewed for potential test guideline development, to enable use for OECD
regulatory purposes.
27 Recognizing this urgency, Japan has made an extensive effort to establish and
domestically validate a new in vitro pre-screening procedure, the Stably Transfected
Transcriptional Activation (TA) Assay using hER-HeLa-9903 cell line for detecting the
estrogenic activity of chemicals for a level 2 screening test in the OECD Conceptual
Framework for the Testing and Assessment of EDCs under the agreement of the 1st OECD
VMG-NA meeting that Japan would take lead in this assay.
28 Japan endorses the OECD Guidance Document 34 (GD 34), and this validation report
therefore adheres to the internationally agreed OECD guidance on validation and
international acceptance of new or updated test methods for hazard assessment.
3. OBJECTIVES
29 The overall goal of the validation efforts for the stably transfected TA assay using
hER-HeLa-9903 cell line as reported herein is to develop and validate a test method and
protocol that will support the development of test guidelines for the detection of chemicals
potentially possessing estrogenic activity through hERα.

Ver. 2006.Oct.06
8
30 The data obtained from TA assays are typically analyzed to derive the EC50 value as a
biological parameter. This parameter (EC50) is calculated by applying an appropriate
model equation, such as a logistic equation. For the use of such model equations to
calculate the EC50 value, the full-dose response curve is required. However, the full-dose
response curve cannot always be obtained, due to the solubility of a test chemical in the
assay media or the cytotoxicity of a test chemical. In such cases, the quantitative
evaluation of the test chemical through use of the EC50 is not possible. The quantitative
explanation is important for providing information about the strength of the potential
activity of a test chemical. Therefore, such new reliable and relevant parameters other
than EC50 were also investigated within this validation work.
31 This study report will provide information on: (1) reliability; (2) relevance; (3)
transferability of a protocol; (4) identification of the acceptable variations of protocols; (5)
limitations of the test method; and (6) possible reliable and relevant parameters other than
the EC50.
4. VALIDATION DESIGN
32 The work of validating the stably transfected TA assay using hER-HeLa-9903 cell line to
detect estrogenic activity consisted of both pre-validation and inter-laboratory validations.
The pre-validation work was conducted at the Chemicals Evaluation and Research
Institute (CERI), Japan, and the domestic inter-laboratory validation study was conducted
by four Japanese laboratories, including CERI, on the initiative of CERI. All the processes
of the validation work were financially supported by the Ministry of Economy Trade and
Industry (METI) and the Ministry of Health Labor and Welfare (MHLW), Japan.
33 The overall validation design is shown in Fig. 1. This approach is also presented in Fig. 2,
which shows how the assessment process of the relevance and reliability of a test method
can be undertaken in a stepwise, yet flexible, manner while still providing the information
necessary to address the 1996 Solna criteria and principles for validation.

Ver. 2006.Oct.06
9
Fig. 1 Validation Design Scheme According to GD 34 Specified Requirements
Fig. 2 Assessment Process of the Relevance and Reliability of New or Significantly
Revised Testing Methods for Hazard Characterization Specified in GD 34
Ver. 2006.Oct.06
10
34 The pre-validation study of stably transfected TA assays using hER-HeLa-9903 cell line
conducted by CERI was designed to identify both the reliability and relevance of the
testing system. In order to demonstrate the relevance, the test results obtained were
compared to the published data that used other stably transfected cell lines (ERα-CALUX,
HELN-ERα, LUMI-CELLTM) to detect estrogenic activity (Sonneveld et al; 2006; Escade
et al, 2006; Jefferson et al, 2002). Also, further comparisons were made with the results
available in the ICCVAM list of Recommended Substances for Validation of In Vitro
Estrogen Receptor Transcriptional Activation Assays (ICCVAM, 2003). Furthermore, to
provide supportive information demonstrating the ability to detect estrogenic activity, the
results obtained from the relevant assays (receptor binding assay using hERα and
uterotorophic assay) were compared to those obtained using the proposed assay system.
35 The inter-laboratory validation study was planned by CERI and conducted at CERI’s
initiative with three other participating laboratories (APPENDIX 1). Before starting the
inter-laboratory study, the laboratory, the assay skills, and implementation structures of
each laboratory were assessed by laboratory inspections and audits conducted on an
independent basis by the CERI supervised study director and Quality Assurance (QA)
manager, under the standard GLP organizational structure as shown in Fig. 3.
36 Although the pre-validation study was conducted without GLP compliance, the
inter-laboratory validation study was conducted with GLP compliance and managed by
CERI’s QA audit system.
Management
Study Director
Quality Assurance unit
Material Storage unit
GLP committee
Animal Experiment Section
Gene Analysis Section
Chemical Analysis section
Participating laboratory 2
Participating laboratory 3
Participating laboratory 4
・・・・
CERI
OtherParticipatinglaboratories
Quality Assurance Manager
(Participating laboratory 1)
Fig. 3 Organization Schema of CERI GLP System Employed for the Inter-laboratory
Validation Study.

Ver. 2006.Oct.06
11
37 The inter-laboratory validation study of the stably transfected TA assay using
hER-HeLa-9903 cell line was designed to:
• Assess the intra- and inter-laboratory variability and reproducibility of the protocol
among the investigated endpoints;
• Assess the relevance of the proposed test method to detect a range of estrogenic
activity;
• Identify acceptable variations of the test protocol;
• Identify limitations of the test method; and
• Provide possible reliable and relevant parameters other than the EC50.
38 In order to assess both the reliability of the assay protocol and the protocol transferability,
the inter-laboratory validation study consisted of assays repeated three times using nine
coded test chemicals with or without estrogenic activity and one reference chemical
(17β-Estradiol, E2), in each laboratory. Assay data were gathered in CERI and were
analyzed with regard to reproducibility of the analytical parameters calculated as EC50,
PC50 and PC10. These PC50 and PC10 values are defined as the concentration of
chemical estimated to cause 50% or 10%, respectively, of an activity in the positive
control response. The details of PC50 and PC10 are described in the section entitled “Data
Recording and Analyses (p.23)”.
5. TEST METHOD USED
5.1 Test protocol
39 The standard operating procedure (SOP) used for the pre-validation study and the protocol
used for inter-laboratory validation study are attached in APPENDIX 2 and APPENDIX 3,
respectively. The support protocols for the preparation of mediums, reconstitution of
frozen stock cells, propagation, preparation of frozen stock, preparation of assay plates
and chemiluminescence detection are included in the Appendices. The assay methodology
used in the pre-validation study was substantially identical to that of the inter-laboratory
validation study. The summary of the protocols is shown in Table 1.

Ver. 2006.Oct.06
12
Table 1 Summary of the protocol
Factors
Cell line hERα-HeLa-9903 stable cell line
Cell medium Eagle’s Minimum Essential Medium (EMEM) without phenol red with 10%
dextran-coated charcoal-treated fetal bovine serum (DCC-FBS)
Vehicle Dimethylsulfoxide (DMSO)
Vehicle control 0.1% of DMSO as final concentration
(six-wells for pre-validations and three-wells for inter-laboratory validations)
Final concentration of vehicle 0.1%
Positive control for calculation of PC10
or PC50 values *
100 pM of 17β-Estradiol (E2) in six-wells for pre-validations
1 nM of E2 in three-wells for inter-laboratory validations
Positive control for dose response curve 17β-Estradiol (E2); 0.1 pM, 1 pM, 10 pM, 100 pM, 1 nM, 10 nM and 100 nM
Number of test chemicals within
pre-validation
22 chemicals for preliminary assessment.
48 chemicals for comparison with receptor binding assays*
48 chemicals for comparison with uterotrophic assays*
46 chemicals for comparison with data listed as ICCVAM reference chemicals
*: Not the same set of chemicals
Number of test chemicals within
inter-laboratory validations
9 coded test chemicals and one positive reference chemical (E2)
Number of assays per chemical Three-runs of each chemical (in triplicate) on separate days for the
inter-laboratory validation study
Concentrations tested Test Chemicals: 10 pM, 100 pM, 1 nM, 10 nM, 100 nM, 1 µM and 10 µM
Cell density 104 cells/well
Incubation time with test chemicals 20-24 hours
40 The original protocol used for inter-laboratory validation was designed for use with a
Glo-type luciferase assay reagent (Steady Glo luciferase reagent, Promega). However, to
avoid the variation of results originating from the sensitivity of the luminometer used for
the assay, the original protocol was amended to allow use of two types of assay reagents,
both Glo-type and Flash-type reagents. The combined use of a luciferase reagent and a
luminometer at each participating laboratory is tabulated in Table 2.

Ver. 2006.Oct.06
13
Table 2 The Combined Use of a Luciferase Reagent and a Luminometer at Each
Participating Laboratory in Inter-laboratory Validation Study
Name of Participating Lab. Luminometer Type of Luciferase Reagent
CERI Lumister [BMG] Flash [Promega] (Promega, E1500)
Sumitomo Top-count [Packard] Glo [Promega] (Promega, E2510)
Otsuka Pharm. ARVO [PerkinElmer] Flash [Promega] (Promega, E1500)
Kaneka Top-count [Packard] Glo [Promega] (Promega, E2510)
5.1.1 Cell line (stable clone: hERα-carrying HeLa cells)
41 hER-HeLa-9903 cell line is an estrogen responsive stable transformant derived from a
HeLa cell line. This cell line was established by Sumitomo Chemical Co. as follows:
human cervical tumor cells (HeLa; ATCC No. CCL-2) purchased from ATCC through
Dai-Nippon Pharmaceutical Company (Osaka, Japan) were stably transfected with both
plasmids human ERα expression vector and a firefly luciferase reporter vector bearing
five tandem repeats of estrogen-responsive element (ERE) driven by a mouse
metallothionein promoter TATA element. A vitellogenin ERE was selected because of its
high reactivity to estrogen in the preliminary experiments.
Enhancer (ERE) 5'-TCGACAAAGTCAGGTCACAGTGACCTGATCAAG-3'
Promoter 5'-GATCTCGACTATAAAGAGGGCAGGCTGTCCTCTAAGCGTCACCACGACTTCA-3'
42 The human ERα expression vector was generated by insertion of a RT-PCR amplified
full-length of human ERα cDNA (Genbank Accession No. 47621M), with an efficient
Kozak's translation initiator sequence, from a commercial human ovary mRNA (Clontech,
Palo Alto, CA), into the blunting site of a pRc/RSV vector (Invitrogen, San Diego, CA).
43 Functional ERα, ERβ, AR, TRα and TRβ could not be detected in the host cell (HeLa;
ATCC No. CCL-2), when tested by mock transfection assays with each hormone
responsive reporter construct. Further, the established cell line, hER-HeLa-9903, was
confirmed to be free of any mycoplasma infection.
44 The hER-HeLa-9903 cell line was obtained from Sumitomo Chemical Co., Ltd. and then
distributed to each participating laboratory.
45 This cell line is available from the Owner, Sumitomo Chemical Co., Ltd. under the
independent contract.

Ver. 2006.Oct.06
14
5.1.2 Medium (support protocols Nos. 1-4, APPENDIX 2 and APPENDIX 3)
46 Eagle’s Minimum Essential Medium without phenol red (EMEM, Nissui Pharmaceutical
Co.), supplemented with a 10% dextran-coated-charcoal (DCC)-treated fetal bovine serum
(DCC-FBS) was used for both the propagation and the assay. This DCC-FBS was
prepared at CERI, and was subsequently provided to each participating laboratory for the
inter-laboratory validation study.
5.1.3 Chemical exposure to cells
5.1.3-.1) For pre-validations (support protocol No. 5, APPENDIX 2)
47 Each test chemical used for this pre-validation study was dissolved in dimethysulfoxide
(DMSO) at 10 mM as a stock solution. The final concentration of DMSO in the assay
medium was 0.1%, which did not affect the cells.
48 The ranges of test concentrations of the test chemical were 10 µM, 1 µM, 100 nM, 10 nM,
1 nM, 100 pM, and 10 pM (10-11-10-5M). The ranges of test concentrations of 1 µM, 100
nM, 10 nM, 1 nM, 100 pM, 10 pM and 1 pM (10-12-10-6M) were only used for the initial
test to demonstrate the stability of the test system.
49 In order to prepare the desired concentrations of test chemicals, the 10 mM of stock
solution was first serially diluted in common ratios of 10 with DMSO to obtain 1 mM,
100 µM, 10 µM, 10 µM, 1 µM, 100 nM and 10 nM. Then, these diluted samples in
DMSO were further diluted with serum-free EMEM to prepare three-fold concentrations
of the desired test concentrations (1.5 µL of DMSO soln. in 500 µL of serum-free EMEM).
Lastly, the desired test concentrations in quadruplicate were prepared by adding 50 µL of
each sample solution to each well of the assay plates, containing 1x10⁴ cells/well/100 µL
as illustrated in the assignment table (Table 3).
50 Positive control wells (n=6) treated with a natural ligand (100 pM of E2) and vehicle
control wells (n=6) treated with DMSO (0.1%) alone were prepared on every assay plate.
51 After adding the chemicals, the assay plates were incubated in a CO2 incubator for 20-24
hours to induce the reporter gene products.
52 Cytotoxicity evaluation was conducted by examining baseline induction. If a substance

Ver. 2006.Oct.06
15
induced decreased luciferase activity below baseline, the substance was considered to be
cytotoxic.
Table 3 Plate Dose Assignment Table: Pre-validation Study
Chemical 1 Chemical 2 Chemical 3 1 2 3 4 5 6 7 8 9 10 11 12
A 10 µM → → → → → → → → → → → B 1 µM → → → → → → → → → → → C 100 nM → → → → → → → → → → → D 10 nM → → → → → → → → → → → E 1 nM → → → → → → → → → → → F 100 pM → → → → → → → → → → → G 10 pM → → → → → → → → → → → H VC → → → → → PC → → → → →
VC: Vehicle control (DMSO at 0.1%); PC: Positive control (100 pM of E2)
5.1.3-.2) For inter-laboratory validations (support protocol No. 5, APPENDIX 3)
53 The stock solutions of test chemicals were prepared at CERI, where they were coded and
then provided to each participating laboratory.
54 The 10 mM of stock solutions at each participating laboratory were serially diluted in
common ratios of 10 with DMSO to obtain 1 mM, 100 µM, 10 µM, 10 µM, 1 µM and 100
nM. Further diluted chemical solutions with serum-free EMEM were prepared to obtain
final concentrations of 10 µM, 1 µM, 100 nM, 10 nM, 1 nM, 100 pM, and 10 pM
(10-11-10-5M) for the test chemicals in the assay plate in triplicate in the same manner as
shown for the pre-validation.
55 On the basis of sensitivity of the assay system, the concentration range to be tested was set
at 10-11-10-5M. The assay system can detect estrogenic activity of well-known weak
estrogenic chemicals in this concentration range, such as bisphenol A (BPA) and
nonylphenol. This fixed-concentration strategy could allow the assay to achieve
high-throughput assay performance as a screening test method for providing mechanistic
information, which would be placed at level 2 in the OECD conceptual framework.
56 A full dose response range of E2 was assigned in all assay plates to monitor the accuracy
of chemical dilution procedure in the inter-laboratory study.
57 In the inter-laboratory validation study, an analysis of each triplicate, for each
concentration of a test chemical, was employed to achieve the high-throughput assay

Ver. 2006.Oct.06
16
format.
58 Positive control wells (n=3) treated with a natural ligand (1 nM of E2) and vehicle control
wells (n=3) treated with DMSO alone, were prepared on every assay plate.
59 After adding the chemicals, the assay plates were incubated in a CO2 incubator for 20-24
hours to induce the reporter gene products.
60 The test chemicals and the vehicle and positive control substances were all assigned to the
assay wells in accordance with the assignment table for inter-laboratory validation study
(Table 4).
61 In some assay systems using microtiter plates, the consideration of an edge effect would
be necessary before starting assays because of differences between wells located on the
edge and the center of the assay plate, with regard to the evaporative loss of medium and
efficacy of gas exchange, etc. In cases that such edge effects would be expected, 36 wells
on the edge of a 96-well plate should not be used for the assay. However, following an
independent assessment, it was confirmed that the assay system using hER-HeLa-9903
cell line did not show any edge effects that would affect the assay results for practical use
(APPENDIX 4).
Table 4 Plate Dose Assignment Table: Inter-laboratory Validation Study
Chemical 1 Chemical 2 Chemical 3 E2 1 2 3 4 5 6 7 8 9 10 11 12
A 10 µM → → → → → → → → 100 nM → → B 1 µM → → → → → → → → 10 nM → → C 100 nM → → → → → → → → 1 nM → → D 10 nM → → → → → → → → 100 pM → → E 1 nM → → → → → → → → 10 pM → → F 100 pM → → → → → → → → 1 pM → → G 10 pM → → → → → → → → 0.1 pM → → H VC → → BL → → → → → PC → →
VC: Vehicle control (DMSO); BL: Blank; PC: Positive control (1 nM E2)
5.1.4 Reagent for stably transfected TA assays and detection instrument (support protocol
No. 5, APPENDIX 3)
62 A standard luciferase assay system (Promega, E1500) was used in the pre-validation study
conducted at CERI. One of two types of commercial luciferase assay reagents, the
standard luciferase assay system (Promega, E1500) or Steady-Glo Luciferase Assay

Ver. 2006.Oct.06
17
System (Promega, E2520), was used for measuring luciferase activity in each laboratory
as the preliminary test before the inter-laboratory validation study.
63 The type of luciferase assay reagent used for each inter-laboratory validation study was
dependent upon the sensitivity of the luminometer used at that particular participating
laboratory. Selection of the assay reagent was determined by the results of a preliminary
test that confirmed the assay conditions at each participating laboratory.
5.1.5 Test chemical
5.1.5-.1) Dose selection
64 The test concentration range employed in this assay was determined based upon the
sensitivity of the assay, whilst also ensuring that there were no problems with solubility
and cytotoxicity.
65 As described above, on the basis of sensitivity of the assay system, the concentration
range at 10-11-10-5M can detect estrogenic activity of well-known weak estrogenic
chemicals in this concentration range, such as bisphenol A (BPA) and nonylphenol (NP),
allowing the high-throughput assay performance as a screening test method for providing
mechanistic information.
5.1.5-.2) Selection of test chemicals
For pre-validation
66 To examine the stability of the assay system as a part of the pre-validation study, three
chemicals, an endogenous estrogen (17β-estradiol; E2), a weak estrogen, bisphenol A
(BPA) and negative substance in the range 10-11M-10-6M, testosterone (TS), were tested a
total of 13 times in repeated tests.
67 To demonstrate the performance of the assay system in detecting estrogenic activity, 22
chemicals (Table 5) were selected from a chemical list that provided median EC50 values
as determined by using different assay systems, such as the mammalian reporter gene
assay, the mammalian cell-proliferation assay, or the yeast reporter gene assay in the
ICCVAM report (ICCVAM, 2003). Some chemicals in this list were excluded on the basis
of unavailability, or due to regulatory restrictions, such as the substances under emission
control by Japanese Law concerning the Evaluation of Chemical Substances and
Regulation of their Manufacture, etc. (Law No. 117, 1973, as last amended by Law No.49,

Ver. 2006.Oct.06
18
2003).
Table 5 Chemicals Used for the Quantitative Comparison
(selected from ICCVAM list (ICCVAM, 2003)) Chemical Cas No. Manufacturer Lot. No Purity
Ethynyl Estradiol 57-63-6 Wako KSN3933 98%Diethylstilbestrol 56-53-1 Wako 7488C N.S.17α-Estradiol 57-91-0 Wako ELJ1532 97%17β-Estradiol 50-28-2 Wako ACL1188 >97%Estrone 53-16-7 Wako TPN4558 98%Zearalenone 17924-92-4 Sigma 50K4014 99.7%17α-Methyltestosterone 58-18-4 Wako TPE6748 97%β-Zearalenol 71030-11-0 Sigma 40K4092 >90%Coumestrol 479-13-0 Fluka 400248 95%Estriol 50-27-1 Wako DLM3617 98%4-tert-Octylphenol 140-66-9 Wako 09802JQ 99%Genistein 446-72-0 Wako NNP1712 98%4-Nonylphenol 84852-15-3 TCI FGE01 98%Testosterone,19-Nor 434-22-0 Sigma 108H0648 >99%Daidzein 486-66-8 Wako HC-1408 97%Phloretin 60-82-2 Sigma 99H7000 99.6%Levonorogestrel 797-63-7 Sigma 30K0711 99%Bisphenol A 80-05-7 TCI GF01 >99%Naringenin 480-41-1 Aldrich 14722PG N.S.Methoxychlor 72-43-5 Wako YWL9207 >97%Progesterone 57-83-0 Sigma 98H0893 99%Atrazine 1912-24-9 Wako MSF9593 >98%
Aldrich : Aldrich Chemical Co., Inc. (Sigma-Aldrich corp.)Fluka : Fluka Chemie AG (Sigma-Aldrich corp.)Sigma : Sigma Chemical Co. (Sigma-Aldrich corp.)TCI : Tokyo Kasei Kogyo Co., Ltd.Wako : Wako Pure Chemical Industries, Ltd.N.S. : not specified
68 In order to evaluate the relevance and to provide the mechanism of action by the proposed
stably transfected TA assay, 46 chemicals selected from the ICCVAM list, which provides
both positive and negative estrogenic information (ICCVAM, 2003), were tested (Table
6).
69 The results obtained by applying the same protocols as the pre-validation study were
compared as supplemental information to the results obtained from a receptor binding
assay using recombinant hERα, and the uterotrophic assay. The 48 chemicals in Table 7
used for this comparison with the receptor binding were selected from the US EPA’s core
chemical list, proposed at the March 2002 Endocrine Disruptor Methods Validation
Subcommittee meeting (EDMVS, 2002). The 48 chemicals for which uterotrophic assay
data had already been tested were used for this comparison (Table 8). It should be noted
that the range of chemicals used for the comparison with the binding assay and immature
rat uterotrophic assay were not identical but differed according to data availability.

Ver. 2006.Oct.06
19
70 The receptor binding assay was performed as follows: a solution (10 µL, final conc. 0.2
nM) of approximately 10 nM of recombinant human estrogen receptor ligand binding
domain fused with glutathione S-transferase, expressed in E. coli, was dissolved in
Tris-HCl (pH 7.4, 70 µL) containing 1 mM EDTA, 1 mM EGTA, 1 mM NaVO3, 10%
glycerol, 10 mg/ml γ-globulin, 0.5 mM phenylmethylsulfonyl fluoride, and 0.2 mM
leupeptin. After adding the sample solution (10 µL) of each chemical and 5 nM
[2,4,6,7,16,17-3H] of 17β-estradiol (10 µL), the solution was incubated for 1 h at 25°C.
Free radioligand was removed by incubation with 0.2% activated charcoal and 0.02%
dextran in PBS (pH 7.4) for 10 min at 4°C followed by filtration. Chemicals were tested
in the concentration range of 10-11-10-4M. The data were fitted to Hill’s equation by using
the GraphPad Prism computer program, and IC50 values were calculated. Then relative
binding affinity (RBA) to the 17β-estradiol was calculated. Any chemicals possessing
RBA values were defined as positive chemicals in the receptor binding assays.
71 For the immature rat uterotrophic assays, chemicals were dissolved in olive oil and
injected subcutaneously into the back of immature (19-day-old) female rats; each group
consisted of six rats that were injected once a day for three consecutive days. A vehicle
control group was injected solely with olive oil, and a positive control group was injected
with ethynyl estradiol (EE). The dose levels were determined based on the results of a
preliminary range finding study. The dosing volume was 2 mL/kg of body weight.
Animals were sacrificed by exsanguinations under deep ether anesthesia approximately 24
hours after the final dosing, and their uteri were carefully dissected, free of adhering fat
and mesentery, and weighed. The blotted weight changes in the uterus from the test group
after giving chemicals to immature female rats for three days were compared with those
of the vehicle control group. When there was a statistically significant difference from the
control group determined by the two-tailed Student's t test, the change in the uterus was
judged positive.
Ver. 2006.Oct.06
20
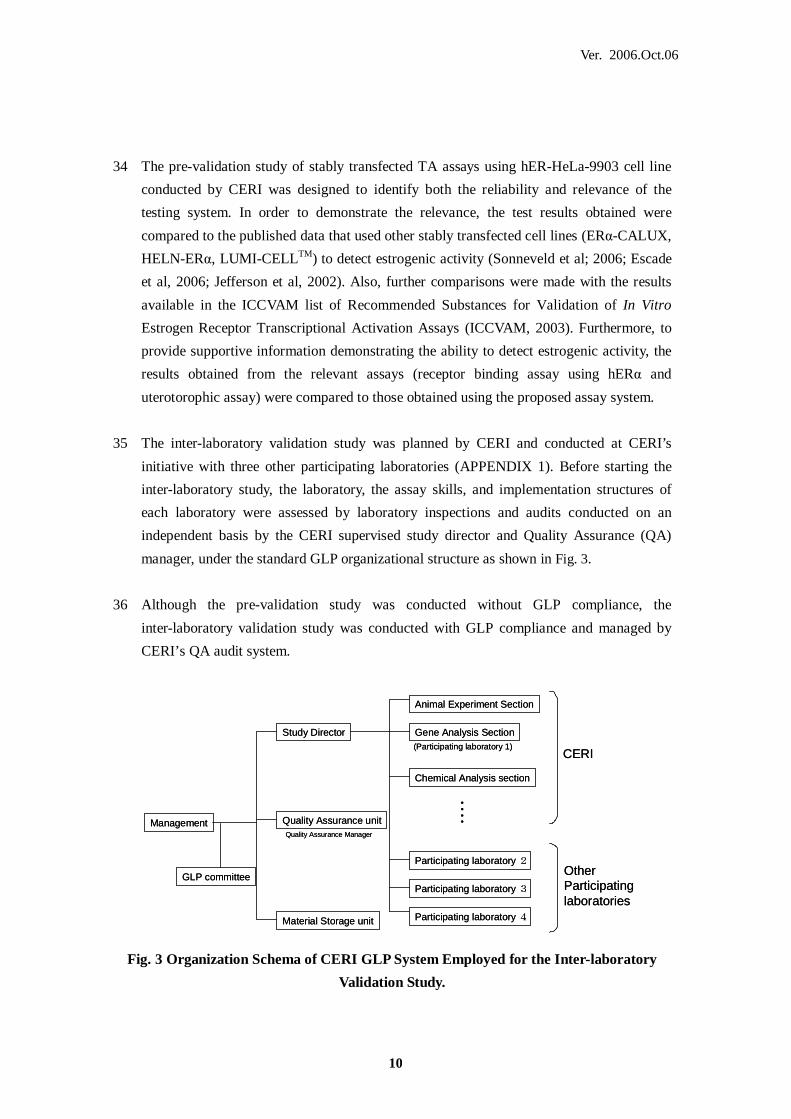
Table 6 Selected Chemicals Used to Examine the Concordance Between the Stably
Transfected TA Assay and the Data Reported in the ICCVAM Report (2003)
Chemical CAS No. Manufacturer Lot. No. Purity 17α-Ethinyl estradiol 57-63-6 Wako KSN3933 98% Diethylstilbestrol 56-53-1 Wako 7488C N.S. 17α-Estradiol 57-91-0 Wako ELJ1532 97% 17β-Estradiol 50-28-2 Wako ACL1188 >97% Zearalenone 17924-92-4 Sigma 50K4014 N.S. Estrone 53-16-7 Wako TPN4558 98% Methyl testosterone 58-18-4 Wako TPE6748 97% Coumestrol 479-13-0 Fluka 400248 <95% Genistein 446-72-0 Wako NNP1712 98% p- n-Nonylphenol 104-40-5 Wako N.S. Bisphenol B 77-40-7 TCI FIC01 N.S. Daidzein 486-66-8 Wako HC-1408 97% 4-Cumylphenol 599-64-4 Wako PAK1144 98% Bisphenol A 80-05-7 TCI GF01 >99% p,p’ -Methoxychlor 72-43-5 Wako YWL9207 >97% Apigenin 520-36-5 Aldrich 00902BU N.S. Tamoxifen 10540-29-1 ICN 4636C N.S. Kepone (Chlordecone) 143-50-0 Wako 99% Butylbenzyl phthalate 85-68-7 Wako KSJ8408 99% Kaempferol 520-18-3 Wako ELK6128 95% 4-tert- Octylphenol 140-66-9 Wako YWE9213 97% Atrazine 1912-24-9 Wako MSF9593 >98% Progesterone 57-83-0 Sigma 98H0893 99% Testosterone 58-22-0 Wako ACG5233 >97% Corticosterone 50-22-6 Sigma 128H0744 95% Phenobarbital 57-30-7 Wako ACE1373 98.00% Vinclozolin 50471-44-8 Wako HCQ9724 99% Cyproterone acetate 427-51-0 Sigma 65H0687 N.S. Flutamide 13311-84-7 Sigma 87H1511 98 Linuron 330-55-2 Dr.Ehrensofter 70226 100% Mifepristone 84371-65-3 Sigma 19H0828 98% Procymidone 32809-16-8 Wako HCH9638 99% Clomiphene citrate 50-41-9 Sigma 28 0308 N.S. Ethyl paraben 120-47-8 Wako ELH6061 99% Norethynodrel 68-23-5 Sigma 88F0192 N.S. 4-Androstenedione 63-05-8 Sigma 116H0463 98% 2-sec- Butylphenol 89-72-5 Wako KSR1873 98% Diethylhexyl phthalate 117-81-7 Wako ELE1799 97% Morin 480-16-0 Fluka 404144 N.S. Phenolphthalin 81-90-3 Wako ELP7131 N.S. Haloperidol 52-86-8 ICN 85689 90% Ketoconazole 65277-42-1 Wako 78353 N.S. Reserpine 50-55-5 RBI SNV-494A 97.5% Spironolactone 52-01-7 Sigma 41K1534 97% L-Thyroxine 51-48-9 TCI GF01 98% 17β-Trenbolone 10161-33-8 Sigma aldrich 024K0877 >98%
Aldrich : Aldrich Chemical Co., Inc. (Sigma-Aldrich corp.)Fluka : Fluka Chemie AG (Sigma-Aldrich corp.)ICN : ICN Biomedicals, Inc.Kanto : Kanto Chemical Co,. Inc.Sigma : Sigma Chemical Co. (Sigma-Aldrich corp.)RBI : SIGMA-RBITCI : Tokyo Kasei Kogyo Co., Ltd.Wako : Wako Pure Chemical Industries, Ltd.N.S. : not specified

Ver. 2006.Oct.06
21
Table 7 Chemicals Used to Examine the Concordance between the Stably Transfected TA
Assay and Receptor Binding Assays
Chemical CAS No. Manufacturer Lot. No. Purity
Ethynyl estradiol 57-63-6 Wako KSN3933 98%17β-Estradiol 50-28-2 Wako ACL1188 >97% Hexestrol 84-16-2 Wako LDQ2218 N.S.Estrone 53-16-7 Wako TPN4558 98%17α-Estradiol 57-91-0 Wako ELJ1532 97%Norethynodrel 68-23-5 Sigma 88F0192 N.S.Coumestrol 479-13-0 Fluka 400248 <95%Genistein 446-72-0 Wako NNP1712 98%4-tert- Octylphenol 140-66-9 Wako YWE9213 97%Daidzein 486-66-8 Wako HC-1408 97%Nonylphenol (mixture) 25154-52-3 Aldrich 00504CU N.S.Bisphenol B 77-40-7 TCI FIC01 N.S.Testosterone propionate 57-85-2 Sigma 98H0566 N.S.Bisphenol A 80-05-7 TCI GF01 >99%5α-Dihydrotestosterone 521-18-6 Wako TPJ4827 95%Kaempferol 520-18-3 Wako ELK6128 95%4-alpha-Cumylphenol 599-64-4 Wako PAK1144 98%17α-Methyltestosterone 58-18-4 Wako TPE6748 97%Morin 480-16-0 Fluka 404144 N.S.Vinclozolin 50471-44-8 Wako HCQ9724 99%Testosterone 58-22-0 Wako ACG5233 >97%Tamoxifen 10540-29-1 ICN 4636C N.S.Clomiphene citrate 50-41-9 Sigma 28 0308 N.S.di(2-Ethylhexyl)phthalate 117-81-7 Wako ELE1799 97%RU-486 84371-65-3 Sigma 19H0828 98%Methoxychlor 72-43-5 Wako YWL9207 >97%Fenarimol 60168-88-9 Kanto 707S7109 97%para-sec -butylphenol 99-71-8 TCI FHF01 >98%Dibutyl phthalate 84-74-2 Wako for Anal. of Phthalic Acid Esters
Phenolphthalin 81-90-3 Wako ELP7131 N.S.Cyproterone acetate 427-51-0 Sigma 65H0687 N.S.Ethyl p -Hydroxybenzoate 120-47-8 Wako ELH6061 99%2,4,5-Trichlorophenoxyacetic acid 93-76-5 Wako HCL9884 98.7%p,p' -DDE 72-55-9 Wako YWG9700 99%Ketoconazol 65277-42-1 Wako 78353 N.S.Androstenedione 63-05-8 Sigma 116H0463 98%Progesterone 57-83-0 Sigma 98H0893 99%Haloperidol 52-86-8 ICN 85689 90%Medroxyprogesterone 520-85-4 Sigma 59H0579 N.S.Spironolactone 52-01-7 Sigma 41K1534 97%L-thyroxine 51-48-9 TCI GF01 98%Reserpine 50-55-5 RBI SNV-494A 97.5%Corticosterone 50-22-6 Sigma 128H0744 95%Phenobarbital 50-06-6 Maruishi 8603 N.S.Linuron = Lorox 330-55-2 Dr.Ehrensofter 70226 100%Procymidon 32809-16-8 Wako HCH9638 99%Atrazine 1912-24-9 Wako MSF9593 >98%Flutamide 13311-84-7 Sigma 87H1511 98Aldrich : Aldrich Chemical Co., Inc. (Sigma-Aldrich corp.)Fluka : Fluka Chemie AG (Sigma-Aldrich corp.)ICN : ICN Biomedicals, Inc.Kanto : Kanto Chemical Co,. Inc.N.S. : not specified
Maruishi : Maruishi Pharmaceutical. Co., Ltd.Sigma : Sigma Chemical Co. (Sigma-Aldrich corp.)RBI : SIGMA-RBITCI : Tokyo Kasei Kogyo Co., Ltd.Wako : Wako Pure Chemical Industries, Ltd.

Ver. 2006.Oct.06
22
Table 8 Chemicals Used to Examine the Concordance between the Stably Transfected TA
Assay and Immature Rat Uterotrophic Assays
Chemical Name Cas No. Manufacture Lot No. PurityEthynyl Estradiol 57-63-6 Wako KSN3933 >97%Equilin 474-86-2 Sigma 97H1529 100%Estrone 53-16-7 Wako TPN4558 98%17α-Estradiol 57-91-0 Wako ACL1188 >97%Zearalenone 17924-92-4 Sigma 50K4014 N.S.4-(1-Adamantyl)phenol 29799-07-3 Aldrich 11608MR 97%2,2-bis(4-Hydroxyphenyl)-4-methyl-n-pentane 6807-17-6 Wako PTM1337 100%Genistein 446-72-0 Wako NNP1712 98%Norethrindrone 68-22-4 Wako DWM4647 100%4-tert -Octylphenol 140-66-9 Wako 09802JQ 99%4,4'-(Hexafluoroisopropylidene)diphenol 1478-61-1 Aldrich 05328PI 97%Daidzein 486-66-8 Wako HC-1408 97%Nonylphenol (mixture) 25154-52-3 Kanto 109281 97%Bisphenol B 77-40-7 TCI FIC01 100%4,4'-Thiobisphenol 2664-63-3 TCI JC01 100%Testosterone enanthate 315-37-7 Wako KSL4869 100%Bisphenol A 80-05-7 TCI GF01 >99%2,2',4,4'-Tetrahydroxybenzophenone 131-55-5 Wako ELN6605 98%2,4,4'-Trihydroxybenzophenone 1470-79-7 Aldrich 04417JN 95%p -Dodecyl-phenol 104-43-8 Kanto 209D2209 N.S.5α-Dihydrotestosterone 521-18-6 Wako TPJ4827 95%4-Hydroxyazobenzene 1689-82-3 Wako LDM7343 96%4-Cyclohexylphenol 1131-60-8 TCI FIJ01 100%4-α-Cumylphenol 599-64-4 Wako PAK1144 98%4,4'-Dihydroxybenzophenone 611-99-4 Wako LDR1808 99%4-Hydroxybenzophenone 1137-42-4 Aldrich 04419CO 98%3,3,3',3'-Tetramethyl-1,1'-spirobisindane-5,5',6,6'-tetrol 77-08-7 TCI GG01 99%p -(tert- Pentyl)phenol 80-46-6 Wako ELF1567 100%4-(Phenylmethyl)phenol 101-53-1 TCI FHG01 100%17α-Methyltestosterone 58-18-4 Wako ELG7538 100%4-n -Amylphenol 14938-35-3 TCI FIF01 99%4,4'-(Octahydro-4,7-methano-5H-inden-5-ylidene)bisphenol 1943-97-1 ACROS A008394601 100%Levonorogestrel 797-63-7 Sigma 30K0711 99%Methoxychlor 72-43-5 Wako YWL9207 >97%4-n -Octylphenol 1806-26-4 Wako JSL9944 99%Diphenyl-p -Phenylenediamine 74-31-7 Wako ELH7269 97%4,4'-Dimethoxybenzophenone 90-96-0 TCI FIH01 100%Dicyclohexyl phthalate 84-61-7 Wako RIG9061 100%Diethyl phthalate 84-66-2 Wako ELH6895 99%di-n -Butyl phthalate 84-74-2 Wako ACE7193 N.S.di(2-Ethylhexyl)adipate 103-23-1 Wako LDR4958 100%p-n -Nonylphenol 104-40-5 TCI 10425 99%di(2-Ethylhexyl)phthalate 117-81-7 Wako ELH6895 99%Benzophenone 119-61-9 Wako HCM9879 100%Tributyltin chloride 1461-22-9 Wako LDN5508 98%Octachlorostyrene 29082-74-4 Kanto 106121 100%Hematoxylin 517-28-2 Sigma 99H3645 N.S.4,4'-Dimethoxytriphenylmethane 7500-76-7 ERC 1040701 100%Aldrich : Aldrich Chemical Co., Inc. (Sigma-Aldrich corp.)Fluka : Fluka Chemie AG (Sigma-Aldrich corp.)ICN : ICN Biomedicals, Inc.Kanto : Kanto Chemical Co,. Inc.N.S. : not specified
Sigma : Sigma Chemical Co. (Sigma-Aldrich corp.)RBI : SIGMA-RBITCI : Tokyo Kasei Kogyo Co., Ltd.Wako : Wako Pure Chemical Industries, Ltd.

Ver. 2006.Oct.06
23
For inter-laboratory validations
72 For the inter-laboratory validation study in order to evaluate the protocol transferability
among laboratories and to evaluate the relevance of the assay system, nine test chemicals
including six positive chemicals that exhibit a wide range of strength of estrogenic activity
and three presumed negatives within the test concentration range from 10-11-10-5M were
selected (Table 9).
73 Moreover, the full dose response range of E2 was measured in all assay plates to monitor
the accuracy of chemical dilution procedure, and to evaluate reproducibility of positive
control responses at the participating laboratories.
Table 9 Chemicals Used for Inter-laboratory Validation Study
Chemical CAS No. Manufacturer Lot. No. Purity
17β-Estradiol 50-28-2 Wako ACK5754 99%
17α-Estradiol 57-91-0 Wako ELJ1532 97% ,HPLC ,for Biochem.
Genistein 446-72-0 Wako VIR1711 98%
4-tert-Octylphenol 140-66-9 Wako YWE9213 97% ,cGC ,for Environment Anal.
Bisphenol A 80-05-7 TCI GF01 >99%
p-tert-Pentylphenol 80-46-6 Wako KSQ2664 97% ,GC
17α-Methyltestosterone 58-18-4 Wako TPE6748 97% ,HPLC ,for Biochem.
Hematoxylin 517-28-2 Wako LDK7723 N.S.
Diethylhexyl phthalate 117-81-7 Wako ELE1799 97% ,GC
Benzophenone 119-61-9 Wako RLH9114 99% ,cGC ,for Environment Anal.
TCI : Tokyo Kasei Kogyo Co., Ltd.Wako : Wako Pure Chemical Industries, Ltd.N.S. : not specified
5.1.5-.3) Test chemical supply
74 All chemicals used in the studies were obtained from a domestic distributor. For the
inter-laboratory validation study, 10 mM solutions of test chemicals in dimethylsulfoxide
(DMSO) were prepared by CERI, and they were then coded and distributed to the
participating laboratories.
5.2 Data Recording and Analyses
75 The luminescence signal data as read by a luminometer were processed, and the average
for the vehicle control (V.C.) wells was calculated. Positive control data below a fold

Ver. 2006.Oct.06
24
induction threshold of 4, was not observed. The value for each test well was divided by
the average value of the V.C. wells in order to obtain individual relative transcriptional
activities. Then the average transcriptional activity was calculated for each concentration
of the test chemical.
76 If Hill’s logistic equation is applicable to dose response data, EC50 was calculated by
following equation:
Y=Bottom + (Top-Bottom)/(1+10^((LogEC50-X)*HillSlope))
where X is the logarithmic concentration of the test chemical, Y is the
response, and Y starts at the Bottom and goes to the Top with a sigmoid
shape.
Data were analyzed using the commercial software Prism, version 3.00
(Graphpad Software Inc.), and the EC50 value (the concentration producing a
50% peak response) was calculated by applying a logistic equation.
77 Furthermore, the PC50 and PC10 values were also calculated. These PC50 and PC10
values were defined as the test chemical concentrations estimated to elicit either a 10% or
a 50% transcription activity when compared with the positive control (PC) response of
100 pM or 1 nM of 17β-estradiol (E2) for pre-validation and inter-lab validation,
respectively, in each assay plate. Each PC value was calculated by a simple linear
regression using two variable data points in the transcription activity (Fig. 4).
Fig. 4 Definition of PC50 and PC10 Values
78 A common spreadsheet prepared by CERI was provided to all participating laboratories
and used throughout all the studies.

Ver. 2006.Oct.06
25
Example of the excel spread sheet for processing raw data (Prepared by CERI)
NC_Ave 967NC_SD 117
Raw - NC_Ave 6285.67 6273.67 7181.67 7564.67 7732.67 7642.67 6801.67 6947.67 6994.67 5925.67 5535.67 6389.671447.67 2188.67 4319.67 7183.67 6853.67 6840.67 4901.67 3412.67 3548.67 7265.67 5936.67 6382.67273.667 785.667 1257.67 3575.67 3472.67 3467.67 1623.67 1240.67 911.667 6786.67 6998.67 6374.67205.667 600.667 457.667 548.667 479.667 505.667 418.667 269.667 284.667 5823.67 6396.67 6161.67246.667 20.6667 179.667 19.6667 98.6667 128.667 -35.333 -104.33 5.66667 2870.67 2817.67 2810.67-96.333 109.667 52.6667 69.6667 -100.33 -131.33 -21.333 -49.333 12.6667 408.667 391.667 459.667-6.3333 50.6667 106.667 -1.3333 -57.333 -155.33 39.6667 -95.333 0.66667 -21.333 89.6667 169.6679.66667 111.667 -121.33 10.6667 -135.33 -158.33 -258.33 -23.333 -159.33 6449.67 6191.67 6306.67
PC_Ave 6316Relative transcriptional activity Transcriptional activity of PC = (PC_Ave + NC_Ave)/NC_Ave 7.53
= (Raw - NC_Ave)/PC_Ave 0.9952 0.9933 1.1371 1.1977 1.2243 1.2100 1.0769 1.1000 1.1075 0.9382 0.8765 1.01170.2292 0.3465 0.6839 1.1374 1.0851 1.0831 0.7761 0.5403 0.5619 1.1504 0.9399 1.01060.0433 0.1244 0.1991 0.5661 0.5498 0.5490 0.2571 0.1964 0.1443 1.0745 1.1081 1.00930.0326 0.0951 0.0725 0.0869 0.0759 0.0801 0.0663 0.0427 0.0451 0.9220 1.0128 0.97560.0391 0.0033 0.0284 0.0031 0.0156 0.0204 -0.0056 -0.0165 0.0009 0.4545 0.4461 0.4450
-0.0153 0.0174 0.0083 0.0110 -0.0159 -0.0208 -0.0034 -0.0078 0.0020 0.0647 0.0620 0.0728-0.0010 0.0080 0.0169 -0.0002 -0.0091 -0.0246 0.0063 -0.0151 0.0001 -0.0034 0.0142 0.02690.0015 0.0177 -0.0192 0.0017 -0.0214 -0.0251 -0.0409 -0.0037 -0.0252 1.0212 0.9803 0.9985
25 29 33 37
Concentration (M) Ave SD Rank Ave SD Rank Ave SD Rank Concentration (M) Ave SD Rank1.E-05 1.0419 0.0825 1 1.2107 0.0133 1 1.0948 0.0159 1 1.E-07 0.9421 0.0677 41.E-06 0.4199 0.2361 2 1.1019 0.0308 2 0.6261 0.1303 2 1.E-08 1.0336 0.1071 21.E-07 0.1223 0.0779 3 0.5550 0.0097 3 0.1993 0.0564 3 1.E-09 1.0640 0.0502 11.E-08 0.0667 0.0317 4 0.0810 0.0055 4 0.0514 0.0130 4 1.E-10 0.9701 0.0456 31.E-09 0.0236 0.0184 5 0.0130 0.0089 5 -0.0071 0.0088 7 1.E-11 0.4485 0.0052 51.E-10 0.0035 0.0168 7 -0.0085 0.0171 6 -0.0031 0.0049 6 1.E-12 0.0665 0.0056 61.E-11 0.0080 0.0089 6 -0.0113 0.0123 7 -0.0029 0.0110 5 1.E-13 0.0126 0.0152 7
Max 1.0419 1.2107 1.0948 1.0640Max - Value(1.E-11 M) 1.0339 1.2220 1.0977 1.0514
PC50 or PC10 PC50、 PC10 PC50、 PC10 PC50、 PC10 PC50、 PC10PC50 ####### ####### ####### #######PC10 ####### ####### ####### #######
For PC10 calculation 25 29 33 37
log [Concentration (M)] ((Raw - NC_Ave)/PC_Ave)- Value(1.E-11 M) log [Concentration (M)]-5 1.0339>=10%PC × 1.2220>=10%PC × 1.0977>=10%PC × -7 0.9295>=10%PC ×-6 0.4119>=10%PC × 1.1132>=10%PC × 0.6290>=10%PC × -8 1.0211>=10%PC ×-7 0.1143>=10%PC ####### 0.5663>=10%PC ####### 0.2022>=10%PC ####### -9 1.0514>=10%PC ×-8 0.0587 <10%PC × 0.0923 <10%PC × 0.0543 <10%PC × -10 0.9576>=10%PC ×
0 0 0 0
0 0 0 0
0.0
0.5
1.0
1.5
2.0
1.E-11 1.E-09 1.E-07 1.E-05
25
0.0
0.5
1.0
1.5
2.0
1.E-11 1.E-09 1.E-07 1.E-05
29
0.0
0.5
1.0
1.5
2.0
1.E-11 1.E-09 1.E-07 1.E-05
33
0.0
0.5
1.0
1.5
2.0
1.E-13 1.E-11 1.E-09 1.E-07
37
79 Two-by-two table analyses were performed to evaluate accuracy (concordance)
([a+d]/[a+b+c+d]), sensitivity (a/[a+c]), and specificity (d/[b+d]) of the proposed stably
transfected TA assay system, by comparing it with a reference assay method, because
there is no “gold standard” test method that could be compared with this assay.

Ver. 2006.Oct.06
26
New Test Outcome
Positive Negative Total
Positive a c a+c
Negative b d b+d
Reference Test
Classification
Total a+b c+d a+b+c+d
80 In order to examine the concordance of the outcomes of the proposed assay system with
the results listed in the ICCVAM Recommended Substances for Validation of In Vitro ER
TA Agonism Assays, two-by-two table analysis was conducted upon 46 selected
chemicals.
81 The performance of the assay system using hER-HeLa-9903 cells was evaluated using a
two-by-two table analysis with reference data obtained from either a receptor binding
assay or an immature rat uterotrophic assay; both of these assay types were conducted at
CERI.
6. RESULTS
6.1 Stability of response of hER-HeLa-9903 cell line
82 The reliability of the assay system using hER-HeLa-9903 cells line was evaluated by
analyzing the reproducibility of the test systems’ biological responses to E2 as a potent
estrogen, to TS, and to BPA. The assays for these three chemicals were repeated 13 times
over a four-month period. The duration of the test was decided upon pursuant to the
longest subculture period from one stock tube of the cell line.
83 The individual response curves for transcriptional activity for the 13 assays (Fig. 5) and
the changes in the positive control (100 pM of E2) response during the study period (Fig.
6) are shown.
84 E2 produced a typical sigmoidal response in all 13 experiments. The maximum
transcriptional activities induced by E2 were from 4.77 to 15.4-fold (Fig. 5). No increase
or decrease of time-dependent tendencies was observed with regard to the positive control
responses (Fig. 6). The mean Log10[EC50 (M)] ± Standard deviation (SD) for E2 was
-11.17 ± 0.25 (n=13) and the 95% confidential interval ranged from -11.02 to -11.32. The
95% confidential interval for E2 was within acceptable and normal variation observed for
such assays.

Ver. 2006.Oct.06
27
85 When the raw numbers were assessed in, a range of log10[PC50 (M)] of E2 as measured in
13 experiments, the narrow range was evident (from -10.87 to -11.58), despite the
extensively wide range of assay concentrations (10-12-10-6M).
86 The precise EC50 values of the other two chemicals, BPA and TS, could not be calculated
because these chemicals did not demonstrate a complete sigmoidal dose response curve
over the concentration range tested (10-12-10-6M).
E2
-13 -12 -11 -10 -9 -8 -7 -6 -50
5
10
15
20
Concentration (10nM)
Tran
scri
ptio
nal a
ctiv
ity
(Fo
ld i
ndu
ced
)
TS
-13 -12 -11 -10 -9 -8 -7 -6 -50
5
10
15
20
Concentration (10nM)
Tran
scri
ptio
nal a
ctiv
ity
(Fo
ld i
ndu
ced
)
BPA
-13 -12 -11 -10 -9 -8 -7 -6 -50
5
10
15
20
Concentration (10nM)
Tran
scri
ptio
nal a
ctiv
ity
(Fo
ld i
ndu
ced
)
Fig. 5 Individual Dose-response Curves for 17β-estradiol (E2), Testosterone (TS) and
Bisphenol A (BPA) in 13 Assays –Transcriptional Activity
9/5 9/12 9/13 9/20 9/22 9/29 10/24 10/27 11/2 11/15 11/29 12/14 12/220
10
20
Date
Tran
scri
ptio
nal a
ctiv
ity
(Fol
d in
duce
d)
Fig. 6 Changes in the Positive control (100 pM of E2) Response during the Study Period
6.2 Relevance of the assay system
87 The fact that there is no “gold standard” data that can be used to evaluate the relevance of
the proposed stably transfected TA assay should be taken into consideration; i.e., no
validated assay to detect estrogenic activity is currently available. One possible approach
to demonstrate the capacity of any transfected TA assay system for detecting estrogenic
activity of chemicals is to compare the results with available data collected from other
assays that are designed to detect estrogenic activity.

Ver. 2006.Oct.06
28
88 The EC50s for 22 selected chemicals (as shown in Table 10), the relationships between
logEC50s obtained from the proposed assay, and the median logEC50s referred to the
ICCVAM report (2003) which are derived from EC50 values from different assay systems
(including the mammalian reporter-gene assay, the mammalian cell-proliferation assay,
and the yeast reporter-gene assay), and of which any are expected to detect estrogenic
activity, are shown in Fig. 8.
89 Note that for 17α-methyltestosterone, genistein, phloretin and naringenin, the PC50 values
are shown in place of the EC50 values in Table 10 because the response curves of those
chemicals did not exhibit sigmoidal responses, and the EC50 values of these chemicals
could not be calculated using Hill’s logistic equation.
90 With regard to levonorogestrel and methoxychlor, neither the EC50 nor the PC50 value
could be calculated because the response curves were incomplete and did not show more
than 50% of PC response (see the response curve shown below in Fig. 7). Thus, the EC50
values were considered to be over 10-5 M. However, the PC50 values for these two
chemicals appeared to be around 10-5 M, judging from the appearance of the curves.
-11 -10 -9 -8 -7 -6 -50.0
0.5
1.0 LevonorogestrelMethoxychlor
Concentration (10nM)
Rel
ativ
e po
tenc
y(v
s 10
0pM
E2)
Fig. 7 Dose response curves of levonorogestrel and methoxychlor
91 For accurate calculations of EC50 values with Hill’s equation, at least four data points
containing the basal response and the saturated response are required. The dose response
curve of the two chemicals discussed above, levonorogestrel and methoxychlor, did not
appear to reach the saturated response. Moreover, most of the weak estrogenic compounds
that elicit transcriptional activity over 10-6M would show a similar dose response curve to
these two compounds.
92 In this regard, the PC50 value is regarded as a relative E2 estrogenic activity value that is
Ver. 2006.Oct.06
29
normalized by E2. This parameter can be obtained with only two data points. The PC50
values can also be calculated in cases of weak estrogenic compounds as the relative
estrogenic activity to the natural estrogen.
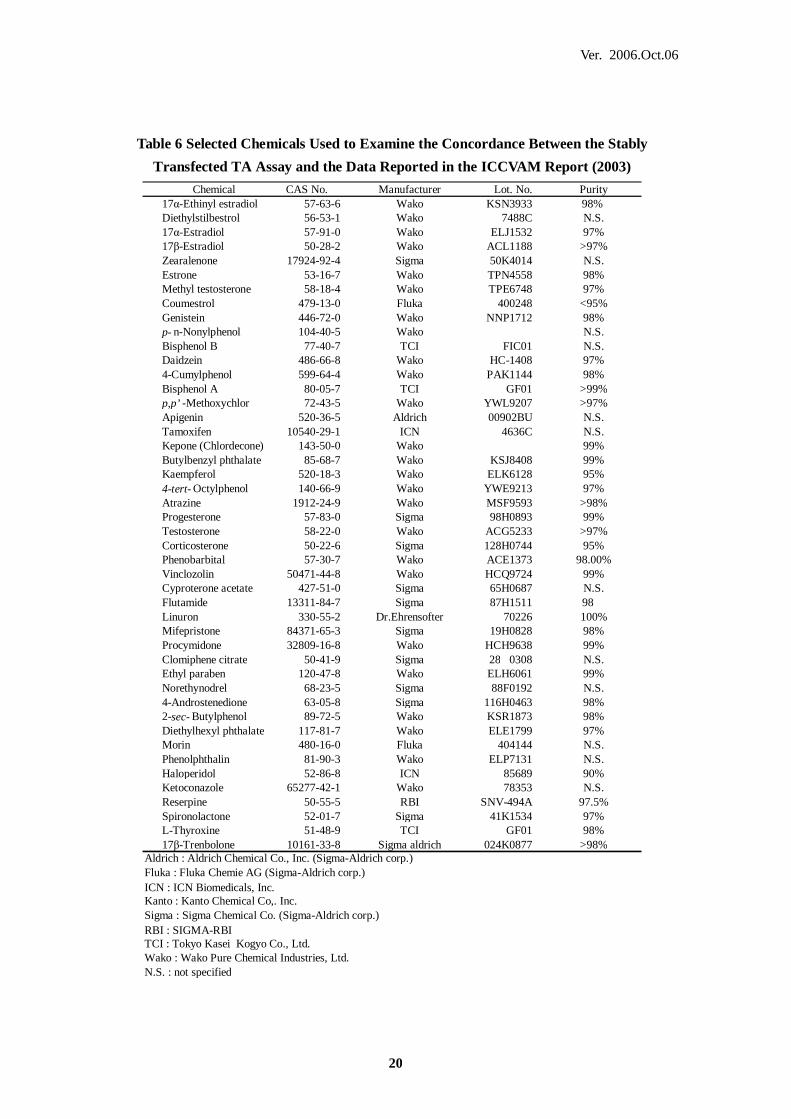
93 Log10[EC50 (M)] values obtained in the proposed stably transfected TA assay for several
known chemicals listed in ICCVAM report (2003) correlate well with the values reported
by ICCVAM (2003). As shown in Fig. 8-1, the correlation coefficient between the
Log10[EC50 (M)]of proposed test outcomes and that of original data was successful
(R2=0.802, n=20).
94 Although available data are limited, Log10[EC50 (M)] obtained from the stably transfected
TA assay using the hER-HeLa-9903 cell line showed high consistency with the data
obtained by the ER-CALUX and HELN-ERα cell systems. As shown in Fig. 8-2, the
correlation coefficient between the Log10[EC50 (M)] of the proposed test outcomes and
that reported in other ER/TA assay systems were R2= 0.987 (vs. ERα-CALUX , n=8), R2=
0.938 (vs. HELN-ERα cell system , n=7) and R2= 0.922 (vs. LUMI-CERLTM , n=7).
95 As for the regression formula for each individual assay system, the slopes of the formula
against ERα CALUX and LUMI-CELL™ were nearly 1.0 (0.956 for ERα-CALUX, 1.01
for LUMI-CELL™), however that for HELN-ERα cell systems was 0.712.
Table 10 EC50 Values Obtained from the Stably Transfected TA Assay using
HeLa-hER-9903 and the Median EC50 Values Reported in the Other Assays for Detection of Estrogenic Activity
Reference* ERα-CALUX# HELN-ERα¶ LUMI-CELL™ $Ethynyl Estradiol 5.68E-12 1.10E-11 7.94E-12 8.00E-12 NADiethylstilbestrol 2.40E-11 1.89E-11 3.98E-11 N.A. 1.83E-1117α-Estradiol 6.04E-10 4.60E-11 1.58E-09 N.A. NA17β-Estradiol 8.17E-12 1.00E-10 1.58E-11 1.70E-11 8.44E-12Estriol 1.91E-11 7.10E-10 1.26E-10 1.60E-10 NAEstrone 4.89E-10 3.20E-09 1.00E-09 6.60E-10 NAZearalenone 9.05E-10 3.43E-09 N.A. N.A. 1.66E-0917α-Methyltestosterone ( 4.11E-06 ) 1.08E-08 N.A. N.A. NABeta-Zearalenol 4.79E-09 1.50E-08 N.A. N.A. NACoumestrol 6.05E-08 1.50E-08 N.A. 1.60E-08 1.94E-084-tert -Octylphenol 1.01E-07 5.00E-08 N.A. N.A. NAGenistein ( 2.45E-08 ) 6.20E-08 5.01E-08 3.80E-08 7.03E-074-Nonylphenol 4.91E-07 9.45E-08 N.A. N.A. NATestosterone,19-Nor 5.91E-08 2.12E-07 2.00E-07 N.A. NADaidzein 4.99E-06 2.90E-07 N.A. 1.50E-07 2.05E-06Phloretin ( 4.95E-06 ) 3.00E-07 N.A. N.A. NALevonorogestrel (ca. 1.00E-05 ) 3.30E-07 N.A. N.A. NABisphenol A 4.55E-07 3.99E-07 N.A. N.A. NANaringenin ( 1.48E-06 ) 1.00E-06 N.A. N.A. 4.48E-06Methoxychlor (ca. 1.00E-05 ) 8.85E-06 7.94E-06 N.A. NAProgesterone - - - N.A. NAAtrazine - - N.A. N.A. NA§: The EC values in the parenthesis indicates PC50 value instead of EC50, because the response curve was a non-sigmoidal one.*: quoted from ICCVAM (2003).#: quoted from Sonneveld et al. (2006).¶: quoted from Escande et al. (2006).$: calculated from the values as ug/mL units published in Jefferson et al. (2002)-: Negative responseN.A.: Not available
EC50(M)Chemical Name
HeLa-hER-9903§

Ver. 2006.Oct.06
30
-12 -11 -10 -9 -8 -7 -6 -5 -4-12
-11
-10
-9
-8
-7
-6
-5
-4R2=0.802y=0.69 x - 2.55
HeLa-9903 log[EC50]
Ref
eren
ce lo
g[E
C50
]
Fig. 8-1 The Relationship between LogEC50s and Median Log EC50s in the ICCVAM Report (2003)
-12 -11 -10 -9 -8 -7 -6 -5-12
-11
-10
-9
-8
-7
-6
-5y=0.956x-0.0704R2=0.987
HeLa-9903 log[EC50]
ER
-CA
LU
X l
og
[EC
50]
-12 -11 -10 -9 -8 -7 -6 -5-12
-11
-10
-9
-8
-7
-6
-5y=0.712x-2.63R2=0.937
HeLa-9903 log[EC50]
HE
LN
lo
gE
C50
]
-12 -11 -10 -9 -8 -7 -6 -5-12
-11
-10
-9
-8
-7
-6
-5y=1.01x+0.253R2=0.922
HeLa-9903 log[EC50]
LU
MI-
CE
LL
TM
log
[EC
50]
Fig. 8-2 The Relationship of LogEC50s between the Data Obtained in Proposed TA Assay System and the Other ER/TA Assay System using ERα-CALUX, HELN-ERα or
LUMI-CELLTM Assay Systems
6.3 Overview assessment of the stably transfected TA assay using hER-HeLa-9903
96 The positive/negative result outcomes reported as the PC50 of the stably transfected TA
assay using hER-HeLa-9903 cell line were compared with 46 chemicals recommended by
ICCVAM for appraising the performance of new assay results (ICCVAM, 2003). The
Ver. 2006.Oct.06
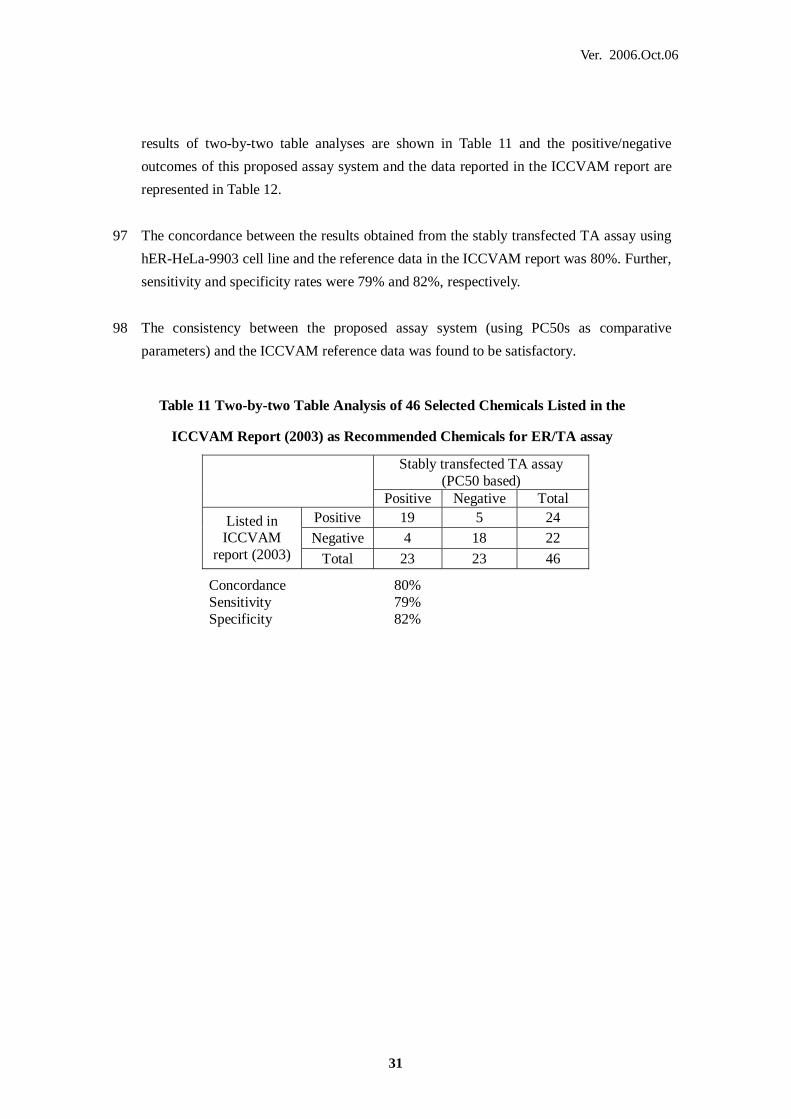
31
results of two-by-two table analyses are shown in Table 11 and the positive/negative
outcomes of this proposed assay system and the data reported in the ICCVAM report are
represented in Table 12.
97 The concordance between the results obtained from the stably transfected TA assay using
hER-HeLa-9903 cell line and the reference data in the ICCVAM report was 80%. Further,
sensitivity and specificity rates were 79% and 82%, respectively.
98 The consistency between the proposed assay system (using PC50s as comparative
parameters) and the ICCVAM reference data was found to be satisfactory.
Table 11 Two-by-two Table Analysis of 46 Selected Chemicals Listed in the
ICCVAM Report (2003) as Recommended Chemicals for ER/TA assay
Stably transfected TA assay (PC50 based)
Positive Negative Total Positive 19 5 24 Negative 4 18 22
Listed in ICCVAM
report (2003) Total 23 23 46
Concordance 80% Sensitivity 79% Specificity 82%

Ver. 2006.Oct.06
32
Table 12 The Positive/negative Outcomes from the hERα Mediated Proposed Stably
Transfected TA Assay (PC50 based) and the Data Reported in ICCVAM Report (2003)
Chemical name ICCVAM PC50 17α-Ethinyl estradiol 57-63-6 P (2/2) P Diethylstilbestrol 56-53-1 P (8/8) P 17α-Estradiol 57-91-0 P (2/2) P 17β-Estradiol 50-28-2 P (77/77) P Zearalenone 17924-92-4 P (8/8) P Estrone 53-16-7 P (3/3) P Methyl testosterone 58-18-4 P (2/2) P Coumestrol 479-13-0 P (8/8) P Genistein 446-72-0 P (11/11) P p- n-Nonylphenol 104-40-5 P (4/4) N Bisphenol B 77-40-7 P (2/2) P Daidzein 486-66-8 P (5/5) P 4-Cumylphenol 599-64-4 P (2/2) P Bisphenol A 80-05-7 P (15/15) P p,p’ -Methoxychlor 72-43-5 P (12/13) -
Apigenin 520-36-5 P (6/6) P Tamoxifen 10540-29-1 P (5/7) -
Kepone (Chlordecone) 143-50-0 P (4/6) P Butylbenzyl phthalate 85-68-7 P (3/4) P Kaempferol 520-18-3 P (2/2) P 4-tert- Octylphenol 140-66-9 P (2/3) P Atrazine 1912-24-9 N (3/3) N Progesterone 57-83-0 N (2/2) N Testosterone 58-22-0 N (2/2) P Corticosterone 50-22-6 N (1/1) N Phenobarbital 57-30-7 N (1/1) N Vinclozolin 50471-44-8 N (1/1) P Cyproterone acetate 427-51-0 N (1/1) N Flutamide 13311-84-7 N (1/1) N Linuron 330-55-2 N (1/1) N Mifepristone 84371-65-3 N (1/1) N Procymidone 32809-16-8 N (1/1) N Clomiphene citrate 50-41-9 P -
Ethyl paraben 120-47-8 P -
Norethynodrel 68-23-5 P P 4-Androstenedione 63-05-8 N -
2-sec- Butylphenol 89-72-5 N N Diethylhexyl phthalate 117-81-7 N N Morin 480-16-0 N P Phenolphthalin 81-90-3 N N Haloperidol 52-86-8 N N Ketoconazole 65277-42-1 N N Reserpine 50-55-5 N N Spironolactone 52-01-7 N N L-Thyroxine 51-48-9 N -
17β-Trenbolone 10161-33-8 N P
CAS
P: Positive, N: Negative, -: the response was not reached to PC50 value but responded enough
to calculate PC10 value. These chemicals are regarded as negatives in two-by-two analysis.
Ver. 2006.Oct.06
33
6.4 Supplemental information that supports the performance of the assay test system for
detection of estrogenic activity
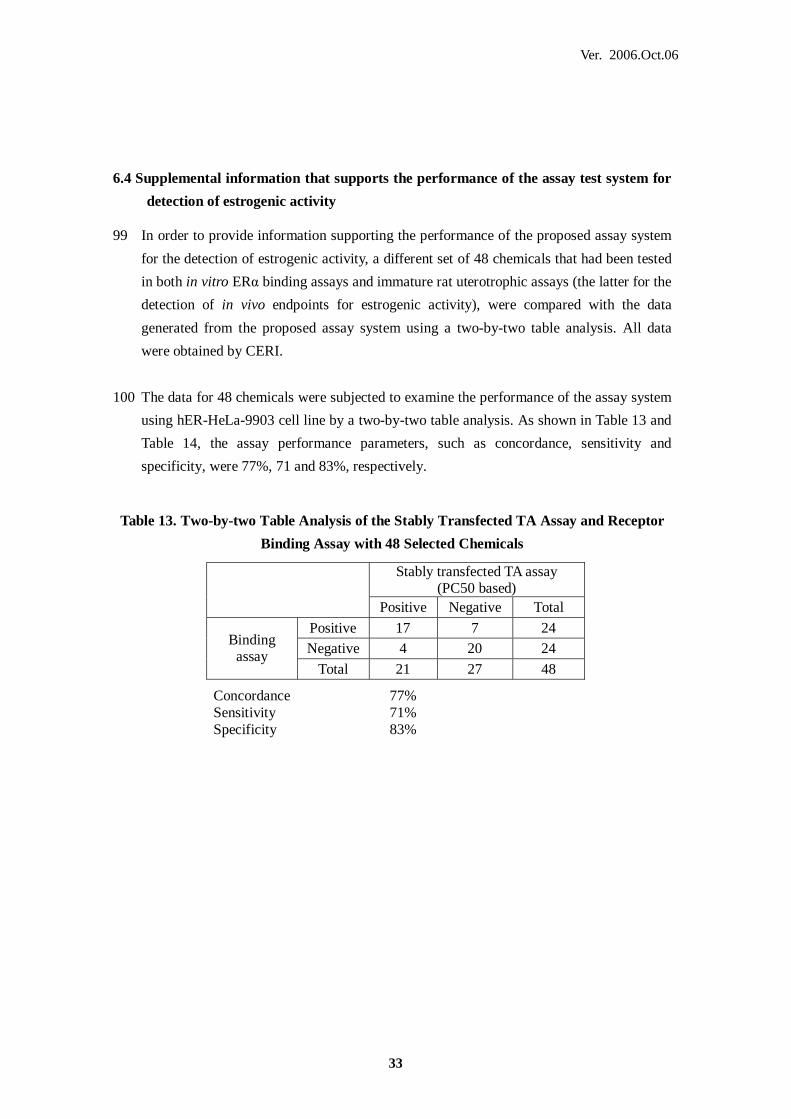
99 In order to provide information supporting the performance of the proposed assay system
for the detection of estrogenic activity, a different set of 48 chemicals that had been tested
in both in vitro ERα binding assays and immature rat uterotrophic assays (the latter for the
detection of in vivo endpoints for estrogenic activity), were compared with the data
generated from the proposed assay system using a two-by-two table analysis. All data
were obtained by CERI.
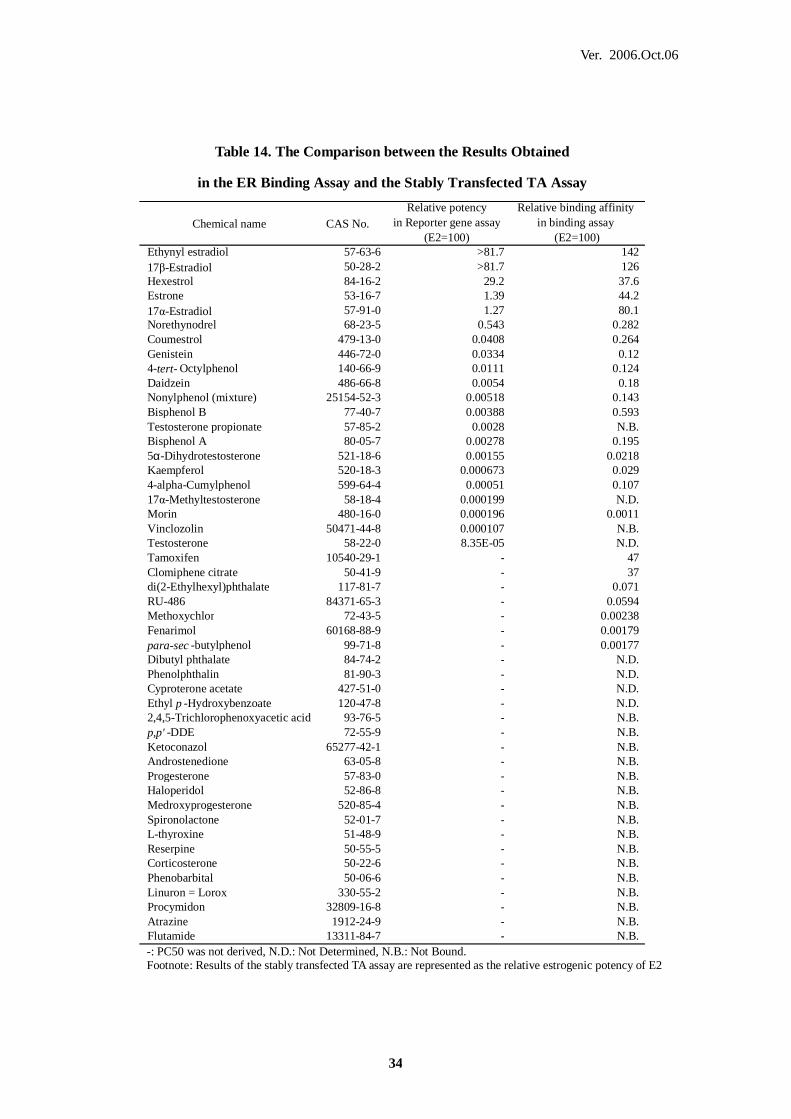
100 The data for 48 chemicals were subjected to examine the performance of the assay system
using hER-HeLa-9903 cell line by a two-by-two table analysis. As shown in Table 13 and
Table 14, the assay performance parameters, such as concordance, sensitivity and
specificity, were 77%, 71 and 83%, respectively.
Table 13. Two-by-two Table Analysis of the Stably Transfected TA Assay and Receptor
Binding Assay with 48 Selected Chemicals
Stably transfected TA assay (PC50 based)
Positive Negative Total
Positive 17 7 24 Negative 4 20 24
Binding assay
Total 21 27 48
Concordance 77% Sensitivity 71% Specificity 83%
Ver. 2006.Oct.06
34
Table 14. The Comparison between the Results Obtained
in the ER Binding Assay and the Stably Transfected TA Assay
Chemical name CAS No.Relative potency
in Reporter gene assay(E2=100)
Relative binding affinityin binding assay
(E2=100)Ethynyl estradiol 57-63-6 >81.7 14217β-Estradiol 50-28-2 >81.7 126Hexestrol 84-16-2 29.2 37.6Estrone 53-16-7 1.39 44.217α-Estradiol 57-91-0 1.27 80.1Norethynodrel 68-23-5 0.543 0.282Coumestrol 479-13-0 0.0408 0.264Genistein 446-72-0 0.0334 0.124-tert- Octylphenol 140-66-9 0.0111 0.124Daidzein 486-66-8 0.0054 0.18Nonylphenol (mixture) 25154-52-3 0.00518 0.143Bisphenol B 77-40-7 0.00388 0.593Testosterone propionate 57-85-2 0.0028 N.B.Bisphenol A 80-05-7 0.00278 0.1955α-Dihydrotestosterone 521-18-6 0.00155 0.0218Kaempferol 520-18-3 0.000673 0.0294-alpha-Cumylphenol 599-64-4 0.00051 0.10717α-Methyltestosterone 58-18-4 0.000199 N.D.Morin 480-16-0 0.000196 0.0011Vinclozolin 50471-44-8 0.000107 N.B.Testosterone 58-22-0 8.35E-05 N.D.Tamoxifen 10540-29-1 - 47Clomiphene citrate 50-41-9 - 37di(2-Ethylhexyl)phthalate 117-81-7 - 0.071RU-486 84371-65-3 - 0.0594Methoxychlor 72-43-5 - 0.00238Fenarimol 60168-88-9 - 0.00179para-sec -butylphenol 99-71-8 - 0.00177Dibutyl phthalate 84-74-2 - N.D.Phenolphthalin 81-90-3 - N.D.Cyproterone acetate 427-51-0 - N.D.Ethyl p -Hydroxybenzoate 120-47-8 - N.D.2,4,5-Trichlorophenoxyacetic acid 93-76-5 - N.B.p,p' -DDE 72-55-9 - N.B.Ketoconazol 65277-42-1 - N.B.Androstenedione 63-05-8 - N.B.Progesterone 57-83-0 - N.B.Haloperidol 52-86-8 - N.B.Medroxyprogesterone 520-85-4 - N.B.Spironolactone 52-01-7 - N.B.L-thyroxine 51-48-9 - N.B.Reserpine 50-55-5 - N.B.Corticosterone 50-22-6 - N.B.Phenobarbital 50-06-6 - N.B.Linuron = Lorox 330-55-2 - N.B.Procymidon 32809-16-8 - N.B.Atrazine 1912-24-9 - N.B.Flutamide 13311-84-7 - N.B. -: PC50 was not derived, N.D.: Not Determined, N.B.: Not Bound. Footnote: Results of the stably transfected TA assay are represented as the relative estrogenic potency of E2

Ver. 2006.Oct.06
35
101 The PC50 based positive/negative outcomes of 48 chemicals from the stably transfected
TA assay using hER-HeLa-9903 cell line and from an immature rat uterotrophic assay
were compared and the results of two-by-two table analysis are shown in Table 15. The
original data is shown in Table 16.
102 The concordance between the results obtained from the stably transfected TA assay using
hER-HeLa-9903 cell line and the immature rat uterotrophic assay was 90%. Further,
sensitivity and specificity were 91% and 88%, respectively.
103 Although the proposed stably transfected TA assay system shows good concordance with
other in vitro and in vivo ER screening tests, it is important to caution that the TA assay is
not a one to one alternative replacement method for any other existing in vivo test
methods, but is a stand-alone screening test method for prioritizing or grouping substances
in general categories of potential modes of action, and can be used in the OECD
Conceptual Framework for the Testing and Assessment of Endocrine Disrupting
Chemicals (adopted by OECD/EDTA 6).
Table 15 Two-by-two Table Analysis of the Stably Transfected TA Assay and the
Immature Rat Uterotrophic Assay with 48 Selected Chemicals Stably transfected TA assay
Positive Negative Total
Positive 29 3 32 Negative 2 14 16
Uterotrophic assay
Total 31 17 48
Concordance 90% Sensitivity 91% Specificity 88%

Ver. 2006.Oct.06
36
Table 16 A Comparison of the hERα Mediated Proposed Stably Transfected TA Assay
and the Immature Rat Uterotrophic Assay
PC10 PC50Ethynyl Estradiol 57-63-6 >10 >10 P P PEquilin 474-86-2 >10 75 P P PEstrone 53-16-7 30 588 P P P17α-Estradiol 57-91-0 72 644 P P PZearalenone 17924-92-4 24 644 P P P4-(1-Adamantyl)phenol 29799-07-3 1248 18594 P P P2,2-bis(4-Hydroxyphenyl)-4-methyl-n-pentane 6807-17-6 1892 19903 P P PGenistein 446-72-0 2242 24459 P P PNorethrindrone 68-22-4 1006 49474 P P P4-tert -Octylphenol 140-66-9 1846 73676 P P P4,4'-(Hexafluoroisopropylidene)diphenol 1478-61-1 6906 80249 P P PDaidzein 486-66-8 17606 151271 P P NNonylphenol (mixture) 25154-52-3 11530 157618 P P PBisphenol B 77-40-7 23576 210679 P P P4,4'-Thiobisphenol 2664-63-3 20087 213679 P P PTestosterone enanthate 315-37-7 17140 270712 P P PBisphenol A 80-05-7 20157 294271 P P P2,2',4,4'-Tetrahydroxybenzophenone 131-55-5 106427 328223 P P P2,4,4'-Trihydroxybenzophenone 1470-79-7 43765 374950 P P Pp -Dodecyl-phenol 104-43-8 23645 410096 P P P5α-Dihydrotestosterone 521-18-6 104122 527786 P P P4-Hydroxyazobenzene 1689-82-3 164424 1082903 P P P4-Cyclohexylphenol 1131-60-8 64256 1507661 P P P4-α-Cumylphenol 599-64-4 149373 1600708 P P P4,4'-Dihydroxybenzophenone 611-99-4 124213 1648224 P P P4-Hydroxybenzophenone 1137-42-4 1096217 2596825 P P P3,3,3',3'-Tetramethyl-1,1'-spirobisindane-5,5',6,6'-tetrol 77-08-7 143472 3156712 P P Np -(tert- Pentyl)phenol 80-46-6 401969 3456682 P P P4-(Phenylmethyl)phenol 101-53-1 1198024 4073138 P P P17α-Methyltestosterone 58-18-4 173235 4109650 P P P4-n -Amylphenol 14938-35-3 177639 4615960 P P P4,4'-(Octahydro-4,7-methano-5H-inden-5-ylidene)bisphenol1943-97-1 37162 - P N PLevonorogestrel 797-63-7 104707 - P N PMethoxychlor 72-43-5 1228849 - P N N4-n -Octylphenol 1806-26-4 1255876 - P N NDiphenyl-p -Phenylenediamine 74-31-7 2300407 - P N P4,4'-Dimethoxybenzophenone 90-96-0 2497084 - P N NDicyclohexyl phthalate 84-61-7 2527731 - P N NDiethyl phthalate 84-66-2 4461009 - P N Ndi-n -Butyl phthalate 84-74-2 8505555 - P N Ndi(2-Ethylhexyl)adipate 103-23-1 - - N N Np-n -Nonylphenol 104-40-5 - - N N Ndi(2-Ethylhexyl)phthalate 117-81-7 - - N N NBenzophenone 119-61-9 - - N N NTributyltin chloride 1461-22-9 - - N N NOctachlorostyrene 29082-74-4 - - N N NHematoxylin 517-28-2 - - N N N4,4'-Dimethoxytriphenylmethane 7500-76-7 - - N N N
Reporter geneChemical Name CAS PC10(pM) PC50 (pM) Uterotrophic assay
*: All data concerning the stably transfected TA assay and immature rat uterotrophic assay were determined in the Hita laboratory,
CERI-Japan. -: Could not be determined. P: Positive, N: Negative Positive/Negative based decision of stably transfected TA assay was made based on the PC50 values. Positive/Negative based decision for the uterotrophic assay was made when positive response was observed in agonist tests.

Ver. 2006.Oct.06
37
6.5 Inter-laboratory reproducibility (reliability) and protocol transferability.
104 For the inter-laboratory validation study, assays were performed three times on separate
days with nine coded test chemicals and one positive control substance, E2. The
reproducibility of E2 responses are shown in Table 17 using four different parameters,
log10[PC10 (M)], log10[PC50 (M)] and log10[EC50 (M)].
105 The mean Log10[PC50 (M)], Log10[PC10 (M)], and Log10[EC50 (M)] measured in a same
day at each participating laboratory ranged from -10.46 to -11.28, from -11.71 to -12.33
and from -10.36 to -11.19, respectively. These data demonstrated the high reproducibility
of the assay system with regard to the positive control (E2) responses.
106 Log10[PC50 (M)], Log10[PC10 (M)] and Log10[EC50 (M)] values obtained for nine test
chemicals and positive control substance, E2, in three separate experiments are shown in
Table 18, Table 19 and Table 20. Except for the EC50 values of 17α-Methyltestosterone, all
the assay results showed high reproducibility within all parameters at any of the
participating laboratories. Although there were differences in the luciferase detection
system used, i.e., reagents and luminometer, the outputs obtained from each laboratory
were consistent.
107 The EC50 value for 17α-Methyltestosterone could not always. The reason for this was due
to the incomplete dose response curve given by 17α-Methyltestosterone, similar to the
cases were mentioned in section 6.2. However it was possible to calculate PC50 values for
17α-Methyltestosterone for all experiments conducted in each participating laboratory
with one exception at one laboratory, with high reproducibility (See Table 18 and Table 19).
Consequently it can be concluded that there is a great advantage to using PC values as an
assay parameter.
108 As for the parameters used to evaluate the assay results, the PC50 value is capable of
making a sharp distinction between estrogenic compounds and non-estrogenic compounds.
PC10 can also distinguish positive compounds; however, positive responses were noted in
some experiments with regard to presumed negative chemicals, Hematoxylin,
Diethylhexyl phthalate and Benzophenone. Similar positive results have also been
reported in the literature, but have been negative in other reports, the latter in some cases
may depend on the cut off of 10 -5M (Blair et al., 2000; ICCVAM, 2003; Suzuki et al.,
2005; Yamasaki et al., 2002).

Ver. 2006.Oct.06
38
Table 17 The Reproducibility of the Assay System with a Positive Control Substance,
17β-Estradiol
Data Mean SE SD Data Mean SE SD1-1 -11.91 -10.69 -10.791-2 -11.89 -10.69 -10.761-3 -11.73 -10.52 -10.582-1 -12.42 -10.98 -11.012-2 -12.65 -11.22 -11.132-3 -11.91 -10.90 -10.933-1 -11.98 -11.11 -11.173-2 -12.41 -11.36 -11.153-3 -12.41 -11.37 -11.251-1 -11.74 -11.06 -11.121-2 >-13.00 -10.83 -10.481-3 >-13.00 -11.59 -11.492-1 -12.01 -10.51 -10.512-2 -11.62 -10.54 -10.462-3 -11.50 -10.50 -10.463-1 -12.12 -11.05 -10.933-2 -11.82 -10.77 -10.713-3 -11.87 -10.63 -10.551-1 -11.58 -10.44 -10.411-2 -11.56 -10.48 -10.37
-2-1 -11.09 -10.38 -10.312-2 -11.58 -10.43 -10.29
-3-1 -11.84 -10.55 -10.693-2 -11.64 -10.75 -10.703-3 -11.95 -10.90 -10.811-1 -12.61 -11.08 -11.041-2 >-13.00 -11.04 -11.061-3 -11.80 -10.71 -10.632-1 -11.88 -10.65 -10.632-2 -12.23 -10.51 -10.472-3 -11.85 -10.56 -10.573-1 -11.66 -10.48 -10.383-2 -11.72 -10.37 -10.263-3 -11.75 -10.52 -10.43
MAX -11.09 * -11.71 * 0.22 * 0.38 * -10.37 -10.46 * 0.12 * 0.20 * -10.26 -10.36 * 0.14 * 0.24 *MIN -12.65 * -12.33 * 0.02 * 0.04 * -11.59 -11.28 * 0.01 * 0.01 * -11.49 -11.19 * 0.00 * 0.01 *Ave. -11.89 * -11.95 * 0.11 * 0.20 * -10.77 -10.82 * 0.06 * 0.10 * -10.72 -10.81 * 0.05 * 0.08 *
*excepted shaded region
0.02
0.10
0.12
0.03 0.02
0.06
0.10
0.08
0.01
0.01
0.01
0.02
-11.71
0.02
-10.73 0.07
0.01
0.04
-10.30
0.03
-11.02
-10.73
0.01
0.01
0.01
-10.39
0.01
0.01
0.00
Log10 [ EC50(M) ]
0.01
-11.03 0.17
-10.63
0.14-11.28
0.10
Log10 [ PC50(M) ]
-10.63
0.40-12.20
-10.87-10.89
-11.00
-10.46
-10.73
-10.71
-10.40
0.11
-11.19 0.05
-11.02
0.07
0.06
0.03
-10.94
-10.46
-10.57
0.04
0.04
0.20
0.01
0.01
0.17
0.03
0.10
-10.36 0.09
-10.91 0.240.14
0.05
0.05
0.07
0.08
0.09
Test Substance
-10.55 0.08
37
38
39
0.02
Test vialNo.
Laboratory
otsuka
-11.81
sumitomo
40
17β-Estradiol
Total
kaneka
Trial
ceri
Log10 [ PC10 (M) ]Data Mean SE SD
0.57
-11.99 0.12 0.21
-11.57 0.01 0.01
-11.34 0.24
-11.74 - -
-11.71 0.15 0.27
-11.94 0.09 0.16
-12.27 0.14 0.25
0.06 0.10
-12.33 0.22
-11.84
0.38
0.16
0.04
0.34
-: Data were excluded because the assay was conducted on separate days (one of three runs conducted by Otsuka
pharm.)
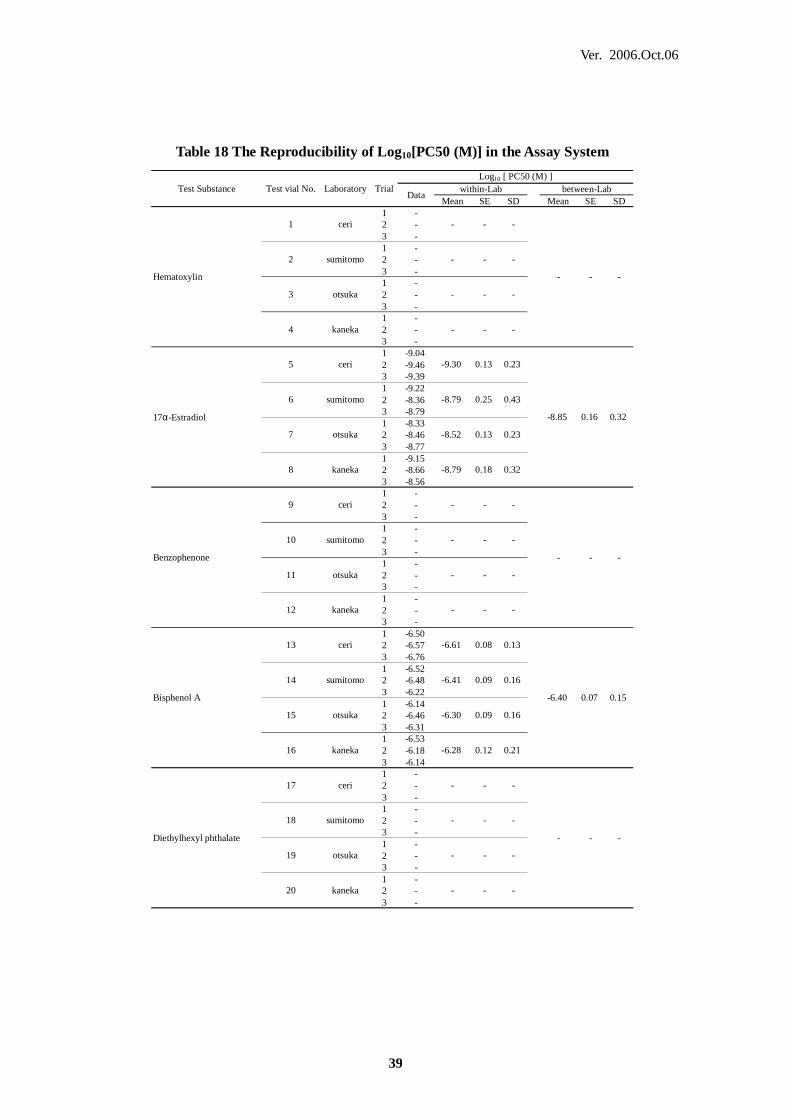
Ver. 2006.Oct.06
39
Table 18 The Reproducibility of Log10[PC50 (M)] in the Assay System
Mean SE SD Mean SE SD1 -2 -3 -1 -2 -3 -1 -2 -3 -1 -2 -3 -1 -9.042 -9.463 -9.391 -9.222 -8.363 -8.791 -8.332 -8.463 -8.771 -9.152 -8.663 -8.561 -2 -3 -1 -2 -3 -1 -2 -3 -1 -2 -3 -1 -6.502 -6.573 -6.761 -6.522 -6.483 -6.221 -6.142 -6.463 -6.311 -6.532 -6.183 -6.141 -2 -3 -1 -2 -3 -1 -2 -3 -1 -2 -3 -
otsuka
20 kaneka
12 kaneka
sumitomo
15 otsuka
otsuka
8 kaneka
sumitomo
3 otsuka
4 kaneka
1 ceri
2 sumitomo
Test Substance Test vial No. Laboratory TrialLog10 [ PC50 (M) ]
within-Lab between-Lab
Hematoxylin
- -
- -
Data
-
- -
- -
- -
-
-
-
-
17α-Estradiol
-9.30 0.23
-8.79 0.32
5 ceri
6 sumitomo
7
0.32
-8.79 0.43
-8.52 0.23
0.13
0.25
0.13
0.18
Benzophenone
- -
- -
9 ceri
10
11 otsuka
-
- -
- -
-
-
-
-
Bisphenol A
-6.61 0.13
-6.28 0.21
13 ceri
14
16 kaneka
0.15
-6.41 0.16
-6.30 0.160.09
0.08
0.09
0.12
Diethylhexyl phthalate
- -
- -
17 ceri
18 sumitomo
19
-
- -
- -
-
-
-
-
--
0.16
-
0.07-6.40
-
-8.85

Ver. 2006.Oct.06
40
Table 18 – continued
1 -6.772 -7.663 -7.781 -7.422 -6.893 -6.991 -7.232 -7.273 -7.541 -7.522 -7.073 -6.971 -5.752 -5.873 -5.901 -5.492 -5.103 -5.351 -5.732 -3 -5.501 -5.602 -5.513 -5.311 -6.852 -7.123 -7.511 -6.672 -6.683 -6.481 -6.892 -6.823 -6.701 -6.722 -6.803 -6.751 -6.082 -6.303 -6.791 -5.912 -5.823 -5.771 -5.892 -5.873 -6.061 -6.002 -5.893 -5.991 -10.632 -11.033 -11.281 -10.632 -10.893 -11.001 -10.462 -10.403 -10.731 -10.942 -10.573 -10.46
MAX 0.32 0.55 0.16 0.32MIN 0.02 0.04 0.07 0.14Ave. 0.12 0.21 0.11 0.22
39 otsuka
40 kaneka
37 ceri
38 sumitomo
35
kaneka
33 ceri
34 sumitomo
otsuka
32 kaneka
otsuka
24 kaneka
sumitomo
27 otsuka
sumitomo
-10.66
17β-Estradiol
-10.98
-10.84
-10.53
Genistein
-7.40 0.55
-7.18 0.29
21 ceri
22
23 otsuka
0.14
-7.10 0.28
-7.35 0.17
0.32
0.16
0.10
0.17
0.07
17α-Methyltestosterone
-5.84 0.08
-5.47 0.15
25 ceri
26
28 kaneka
0.22
-5.31 0.20
-5.62 0.16
0.11
0.05
0.11
0.08
0.11
4-tert-Octylphenol
-7.16 0.33
-6.76 0.04
29 ceri
30 sumitomo
31
0.23
-6.61 0.11
-6.80 0.100.06
0.19
0.07
0.02
0.12
p-tert-pentylphenol
-6.39 0.36
-5.96 0.06
-5.83 0.07
-5.94 0.10
36
0.20
-6.03 0.24
0.10
0.12
-10.75
0.21
-5.56
-7.26
-6.83
0.25
0.33
0.11
0.10
0.19
0.18
0.19
0.06
0.03
0.15
0.04

Ver. 2006.Oct.06
41
Table 19 The Reproducibility of Log10[PC10 (M)] in the Assay System
1 -2 -3 -8.121 -2 -3 -1 -2 -3 -1 -2 -3 -1 -10.492 -10.693 -9.981 -10.472 -9.843 -9.841 -9.652 -9.333 -9.851 -10.062 -9.833 -9.641 -2 -3 -1 -2 -3 -1 -2 -3 -1 -7.612 -3 -1 -7.772 -7.513 -7.921 -7.732 -7.283 -6.881 -10.202 -7.083 -6.821 -10.812 -6.973 -6.921 -2 -3 -1 -2 -5.493 -1 -2 -3 -1 -2 -3 -
Log10 [ PC10 (M) ]
DataMean SE SD Mean SE
between-LabSD
0.17
-8.12
-9.97
-7.61
-7.82
-
0.20
-
Laboratory Trial
-
- -
-
- -
-
0.21
-
-10.05
-
-7.30
-
within-Lab
- -
-
-8.12
-
-
0.33
-10.39
-9.61
-9.84
0.37
-
-
-
-7.61
- -
0.41
-7.73
-8.04
-8.23
0.12
-5.49
-5.49 -
-
-
-
-
0.21 0.36
0.15 0.26
0.12 0.21
- -
-
-
-
-
0.21
sumitomo
otsuka
kaneka
16
17
0.2514
15
0.43
12
13
otsuka
kaneka
ceri
sumitomo10
11 otsuka
8
9
1.09 1.88
6
7
sumitomo
kaneka
ceri
sumitomo
otsuka
1
2
3
4
1.29 2.23kaneka
ceri
Test Substance
ceri
sumitomo
otsuka
kaneka
ceri
Test vial No.
-
-
- -
Diethylhexyl phthalate
-
18
19
20 -
Bisphenol A
Benzophenone
17α-Estradiol
5
Hematoxylin

Ver. 2006.Oct.06
42
Table 19- continued. 1 -7.182 -8.403 -8.701 -8.702 -7.843 -7.841 -7.942 -7.943 -7.991 -8.922 -8.053 -7.951 -7.662 -7.403 -8.061 -7.442 -6.323 -6.581 -7.062 -6.743 -7.401 -7.592 -7.453 -7.171 -7.902 -7.963 -8.511 -9.672 -7.653 -7.991 -7.962 -7.843 -7.841 -7.852 -8.073 -7.891 -7.542 -7.673 -7.961 -9.792 -6.703 -6.861 -7.422 -7.343 -7.511 -7.462 -6.973 -7.401 -11.842 -12.333 -12.271 -11.742 -11.713 -11.941 -11.572 -11.353 -11.811 -12.202 -11.993 -11.71
MAX 1.29 2.23 0.20 0.41MIN 0.01 0.03 0.07 0.14Ave. 0.29 0.50 0.14 0.29
0.12
0.12
0.13
0.20
0.07
-11.58
-11.97
-12.14
0.250.14
-11.80
0.15
-8.12 0.14
-8.09 0.46
-8.31
-7.41
-6.78
-7.06
-7.24
0.19
0.40
-7.71 0.33
-7.93
-8.44
-8.09 0.25
-8.12
-7.88
0.19
0.24
-7.72
0.24
-7.78
-7.55
0.12
-11.87
-7.43
-7.28
0.05
37
35
36
33
34
ceri
sumitomo
otsuka
kaneka
ceri
sumitomo
otsuka
kaneka
26
ceri
sumitomo
otsuka
kaneka
27
28
otsuka
23
24
otsuka
kaneka
ceri
sumitomo
25
kaneka
ceri
sumitomo
p-tert-pentylphenol
30
31
32
4-tert-Octylphenol
29
17α-Methyltestosterone
22 0.29
0.31
Genistein
0.50
21
-8.13
-7.96
0.80
0.01 0.03
0.54
0.34 0.59
0.19 0.33
0.12 0.22
17β-Estradiol
38
39
40
0.34
0.62
0.12
1.08
0.04 0.07
0.07
0.21
1.00 1.74
0.09
0.16 0.27
0.26
0.07 0.13
0.13 0.23

Ver. 2006.Oct.06
43
Table 20 The Reproducibility of Log10[EC50 (M)] in the Assay System
Mean SE SD Mean SE SD1 -9.022 -9.373 -9.371 -2 -8.833 -8.821 -8.482 -8.573 -8.881 -9.042 -8.693 -8.841 -6.252 -6.223 -6.461 -2 -5.993 -5.991 -6.002 -6.183 -6.031 -6.152 -5.973 -5.981 -5.952 -5.333 -5.881 -2 -5.273 -5.961 -5.002 -5.243 2.521 -5.212 -4.823 -5.511 -2 -3 -6.061 -5.732 -5.633 0.411 -5.532 -5.953 -5.591 -2 -3 -
0.35
-6.06 - -
- - -
-4.77
-3.65 2.03 3.51
-5.69 0.13 0.23
0.74 1.49
-5.62 0.34 0.49
-2.57 2.55 4.41
-5.18
-5.72
-6.31 0.08 0.13
-5.99
-6.07 0.06 0.10
-6.03 0.06 0.10
0.13 0.26
-8.82 0.01 0.01
-8.64 0.12 0.21
-8.85 0.17
-9.25 0.12 0.20
-8.89
intra-Lab inter-Lab
0.92 1.30-5.13
-6.10 0.07 0.14
0.20
0.10
0.00 0.00
0.20 0.34
17α-Methyltestosterone
25 ceri
28 kaneka
26 sumitomo
27 otsuka
Genistein
21 ceri
24 kaneka
22 sumitomo
23 otsuka
Bisphenol A
13 ceri
16 kaneka
14 sumitomo
15 otsuka
alpha-Estradiol
5 ceri
8 kaneka
6 sumitomo
7 otsuka
Log10 [EC50(M)]
DataTest Substance Test vial No. Laboratory Trial

Ver. 2006.Oct.06
44
Table 20-continued
Mean SE SD Mean SE SD1 -6.932 -6.933 -7.391 -6.252 -6.363 -6.201 -6.802 -7.063 -6.701 -6.582 -6.693 -6.751 -5.922 -5.903 -6.801 0.812 -5.613 -5.881 -5.712 -6.183 -5.981 -5.552 -5.843 -5.801 -10.692 -10.973 -11.121 -11.032 -10.483 -10.731 -10.392 -10.343 -10.721 -10.822 -10.473 -10.32
MAX * -10.43 - - - - - -MIN * 0.00 0.00 0.07 0.14Ave. * 0.37 0.64 0.39 0.71* Excepting for Hematoxylin, Benzophenone and Diethylhexyl phthalate
inter-LabTest Substance Test vial No. Laboratory TrialLog10 [EC50(M)]
Dataintra-Lab
0.20
-10.75 0.16 0.28
-10.48 0.12 0.21
-10.53 0.15 0.26
1.22
-3.56 2.19 3.78
-5.95 0.14 0.23
-5.73
-6.21 0.30
0.61
0.16
-5.36
-10.67 0.10
-7.08 0.15 0.27
0.52
-6.27 0.05 0.08
-10.92 0.13 0.22
-6.85 0.11 0.19
-6.67 0.05 0.08
0.09
-6.72 0.17 0.34
17β-Estradiol
37 ceri
40 kaneka
38 sumitomo
39 otsuka
p-tert-pentylphenol
33 ceri
36 kaneka
34 sumitomo
35 otsuka
4-tert-Octylphenol
29 ceri
32 kaneka
30 sumitomo
31 otsuka
109 An independent statistical assessment of the inter-laboratory reproducibility (reliability)
and protocol transferability components of the validation of the assay was conducted 1).
110 In addition the results from individual runs as well as overall variability
(within-laboratory or between-laboratory) were similarly independently assessed. A
summary of overall between-laboratory standard deviation (SD) estimates for positives
are presented in Table 21. The full report is available in Appendix 6.
1) These analyses were conducted by Dr Yutaka Aoki, ASPH Fellow at the US EPA.

Ver. 2006.Oct.06
45
Table 21 Summary of Overall Between-laboratory SD of LogPC10 and LogPC50
Chemical Log10[PC10 (M)] Log10[PC50 (M)] 17α-Estradiol 0.31 0.29 Bisphenol A 0.29 0.27 Genistein 0.31 0.15 17α-Methyltestosterone 0.21 0.21 4-tert-Octylphenol 0.15 0.18 p-tert-Pentylphenol 0.30 0.08 17β-Estradiol 0.21 0.24
0.25 0.20 Arithmetic mean
0.26* 0.20*
* For all chemicals other than 17β-Estradiol
111 Overall between-laboratory SD of 0.25 means that a future parameter estimate from a
laboratory drawn from a universe of laboratories like the four laboratories in the
inter-laboratory study is expected to fall in the range between 0.33 times the true value
and 3.1 times the true value (0.33 = 1/3.1 = 10-1.95*0.25) with a probability of 95%. The SDs
of Log10[PC10 (M)] and Log10[PC50 (M)] were in the range of the minimum and
maximum ratios to the true value of 0.25 and 4.0, respectively. The additional independent
statistical analysis (Appendix 6) concluded that the level of variability of this assay
seemed satisfactorily low for the intended use of the assay.
112 These results clearly demonstrate the high reproducibility, technical transferability and
strength of the stably transfected TA assay system using hER-HeLa-9903 cell line.
7. DISCUSSION
113 Numerous chemicals found in the environment, as well as some synthetic chemicals may
disrupt the endocrine functions of wildlife and humans. At the present time, there is global
concern regarding endocrine disruption effects resulting from chemical exposure,
particularly those mediated by the ER. To ensure the safety of chemicals, an effective
procedure for screening chemicals for endocrine modulating activity has been pursued by
regulatory agencies in several countries, including the United States Environment
Protection Agency (US-EPA), Japan and Europe.
114 The endocrine disrupter testing and assessment task force (EDTA) was established in
1997 and the OECD conceptual framework for testing and assessment of potential
endocrine disrupting chemicals from both new and existing substances was agreed upon at
the 6th EDTA meeting (OECD, 2002). This framework is not a testing scheme but rather a

Ver. 2006.Oct.06
46
toolbox that contains various tests, each of which can contribute information about
detecting the hazards of endocrine disruption. Within this toolbox framework, there are
five levels, each level corresponding to a different level of biological complexity. Some
in vitro assays, such as the transcriptional activation (TA) assays and receptor binding
assays, have been proposed and incorporated as “Level 2” in vitro assays to provide
mechanistic information for prioritization purposes.
115 In the US, the US-EPA developed a chemical screening and testing program consisting of
a tiered system to evaluate the endocrine disrupting effects of chemicals (Earl-Gray L. Jr.,
1998). In this program, the hormone receptor mediated reporter gene assay system is
proposed for pre-screening and the Tier 1 screening battery. Within the European Union
(EU), the development and validation of internationally agreed test methods to assess
endocrine disruption in people and wildlife is part of the European Community Strategy
on Endocrine Disrupting Substances (COM (99) 706), both within the OECD and as part
of the development of an appropriate EU testing strategy. The EC Registration, Evaluation
and Authorisation of CHemicals ‘REACH’ programme is expected to enter into force in
2007 (EDSTAC, 1998; ECB, 2006). In Europe, several in vitro TA assays are currently
being validated within the EU integrated project ReProTect, and receptor binding assays
internationally, with the US, Japan and Europe, under the OECD umbrella.
116 In order to develop and validate a test protocol to support the development of test
guidelines for the detection of chemicals possessing the potential estrogenic activity
through human estrogen receptor α (hERα), we conducted a series of validation tests for
the hERα mediated stably transfected TA assay established in Japan under the agreement
of the 1st OECD VMG-NA meeting that Japan would take lead in this assay.
117 Validation work on the hERα mediated stably transfected TA assay using a stable clone
consisted of both pre-validation and inter-laboratory validation. The pre-validation work
was conducted in the Chemicals Evaluation and Research Institute (CERI), Japan and the
inter-laboratory validation study was conducted within four Japanese domestic
laboratories upon the initiative of CERI.
118 Under the pre-validation study, the stability of the responses to E2, BPA and TS were
measured in the range from 10-12 to 10-6M. E2 produced a typical sigmoidal response in
all 13 experiments and the mean Log10[EC50 (M)] ± SD for E2 was -11.17 ± 0.25 and the
95% confidential interval ranged from -11.02 to -11.32. The 95% confidential interval for
E2 was within acceptable and normal variation observed for such assays. The precise
EC50 values of the other two chemicals, BPA and TS, could not be calculated because
Ver. 2006.Oct.06
47
these chemicals could not show complete sigmoidal dose response over the concentration
range tested.
119 As for the results of the inter-laboratory validation study, statistical analysis revealed that
the reproducibility within four participating laboratories of this assay system appeared to
have acceptably low between-laboratory variation (in-house analysis and Appendix 6). The
results showed that the test system has highly reliable and that the test protocol used in this
study is adequately transferable for practical use.
120 The additional independent statistical analysis (Appendix 6), recommends that with respect
to the endpoint parameter to be used for this assay system, Hill equation-based nonlinear
regression be used for estimating PC10 values, because it has an advantage over linear
interpolation, in terms of accuracy and precision. However, for practical purposes, the
authors do not agree for the following reasons:
i) As the linear regression based PC values can achieve high-throughput performance
and as this type of assay will require high-throughput performance to screen a vast
number of chemicals for prioritization, before the implementation of higher level
tests, and the linear regression based PC10 is easy to apply for batch-processing in
spread sheet of Microsoft Excel.
ii) The calculation of Hill equation-based PC values requires at least 4 data points
although linear regression-based PC values requires only 2 data points. Accordingly
it would not be possible to calculate the Hill equation-based PC value for putative
weak estrogens that can induce transactivation only at the highest concentration.
iii) The application of Hill equation-based PC values would be employed after
consideration of the purpose of this assay, the applicability to batch-processing and
the applicability to weak estrogens. With regards to the estimation of PC50, both the
linear regression-based and the Hill equation-based can provide similar results.
121 Log10[EC50 (M)] obtained with the proposed assay system showed high consistency with
the data obtained by the ERα-CALUX, HELN-ERα and LUMI-CELLTM assay systems at.
R2=0.987 (n=8), R2=0.937 (n=7) and R2=0.922 (n=7) respectively. (Sonneveld et al, 2006;
Escade et al, 2006; Jefferson et al., 2002). Moreover, the correlation coefficient between
log10[EC50 (M)] obtained from the stably transfected TA assay using hER-HeLa-9903 cell
line and logEC50s in the ICCVAM report (2003) was successful (R2=0.802, n=20). As for
the regression formula for each individual assay system, the slopes of the formula against
ERα-CALUX and LUMI-CELL™ were nearly 1.0 (0.956 for ERα-CALUX, 1.01 for
LUMI-CELL™), however the slope for HELN-ERα cell systems was 0.712. These results
Ver. 2006.Oct.06
48
suggest that the assay system using hER-HeLa-9903 gives much the same EC50 values
with the assay systems using ERα-CALUX and LUMI-CELL™. On the same time, the
assay system using hER-HeLa-9903 tend to give slightly higher EC50 values for weak
estrogenic compounds compared with HELN-ERα cell systems. However the Speaman’s
correlation coefficient between both assay systems is 0.9643. Accordingly this trend gives
no problem to the assay system for the main purposes of this assay system; detection and
prioritizing of the estrogenic activity of chemicals.
122 The results obtained by the stably transfected TA assay and the information given in the
ICCVAM report (2003) were compared with regard to 46 chemicals. The information in
ICCVAM report (2003) was collected based on several different in vitro assay systems to
detect estrogenic activities, and the assay performance parameters for the stably
transfected TA assay, concordance, sensitivity and specificity, were 80%, 79% and 82%,
respectively.
123 So as to provide supplemental information, the results obtained from the receptor binding
assay using hERα and the stably transfected TA assay were compared with regard to 48
chemicals. The concordance, sensitivity and specificity, were 77%, 71% and 83%,
respectively.
124 Furthermore, as a part of supplemental information, the results obtained by the
uterotrophic assay and the stably transfected TA assay were also compared with regard to
48 chemicals, and the concordance, sensitivity and specificity, were 90%, 91% and 88%,
respectively.
125 The high concordance observed when comparing the endpoints of the stably transfected
TA ER assay and the other ER endpoints, including those provided in the ICCVAM report
(2003), the ER binding assay and the immature rat uterotrophic assay suggest that the
outcomes of the stably transfected TA assay can provide reliable information about the
biological effect of chemicals mediated by receptor-ligand interaction.
126 Accordingly, the overall assay performance of the stably transfected TA assay system
using the hER-HeLa-9903 cell line was deemed satisfactory for practical use, and in
accordance with GD 34 (See Table 22).
127 This validation report was completed with the kind assistance of the preliminary
validation assessment panel of the 'Japanese multi-laboratories validation study of a
stably transfected ER alpha mediated reporter gene assay in Japan' (PVAP). The

Ver. 2006.Oct.06
49
final report from PVAP can be found in Appendix 7. The summary of queries from PVAP
and corresponding answers are provided in Appendix 8.
Table 22 Checklist to Assess Whether the Validation Principles in OECD GD34 were Met, Partially Met, or Not Met by the Japanese Multi-laboratories Validation Study of the
Stably Transfected TA Assay.
Principles Met /Not met
Explanation and Justification
a) The rationale for the test method should be available. MET
The proposed test method is used to provide mechanistic information and used for the purposes of prioritizing or grouping substances that has a potential estrogenic activity mediated estrogen receptor alpha.
b) The relationship between the test method's endpoint(s) and the (biological) phenomenon of interest should be described. MET
The endpoint is a luciferase activity that is produced as a result of transcriptional activation of the reporter gene.
Stimulation of reporter gene expression in response to ER agonists, is thought to be mediated by direct binding where E2-liganded ER binds directly to estrogen responsive element (ERE) and interacts directly with coactivator proteins and components of the RNA polymerase II transcription initiation complex resulting in enhanced transcription.
c) A detailed protocol for the test method should be available. MET
This is provided in the draft report appendices. Further statistical discussions on data analysis and decision criteria are provided in paragraphs 3.11 and 4.10 and appendices 2 and 3.
d) The intra-, and inter-laboratory reproducibility of the test method should be demonstrated.
MET Demonstrated.
e) Demonstration of the test method's performance should be based on the testing of reference chemicals representative of the types of substances for which the test method will be used.
A sufficient number of the reference chemicals should have been tested under code to exclude bias.
NOT FULLY MET
Reference chemicals are necessary to establish the relevance and reliability of the proposed test and should include a minimum number of chemicals possessing expected range of response (strong, moderate, weak and negative).
Nine coded chemicals and one positive chemical, E2, (Table 9) possessing expected ranges of response were tested under the inter-laboratory validation, and relevance and reliability were demonstrated.
Data were collected at the lead laboratory for further comparison with 46 chemicals selected from the ICCVAM list, and these data give a strong indication of relevance of the proposed test method (paper in preparation).
f) The performance of the test method should have been evaluated in relation to relevant information from the species of concern, and existing relevant toxicity testing data.
MET
Relevant information obtained from the ICCVAM ED list, and results for selected chemicals were compared with this list. All data used for this comparison were produced at the lead laboratory.
Additionally a data comparison was conducted with the proposed test method and the hERα Binding assay (and data from the immature rat uterotrophic assay) with good concordance.
g) Ideally, all data supporting the validity of a test method should have been obtained in accordance with the principles of GLP.
NOT FULLY MET
The pre-validation and data collection for comparison with ICCVAM list or hERα binding assay were not conducted to GLP, but in the spirit of GLP. The inter laboratory validation however was conducted to GLP. While GLP is ideal, for practical purposes, the fact that components of this validation and data comparison was not always to GLP is considered acceptable.
h) All data supporting the assessment of the validity of the test method should be available for expert review. MET
A detailed test protocol is available, and data is available for independent review.
Benchmark: The responses of positive control (E2) and vehicle control (DMSO) wells in each assay plate act as a benchmark such that reproducible results can be obtained when generating PC10 and PC50 values normalized by the positive control response.

Ver. 2006.Oct.06
50
7.1 Limitations of the assay, and further validation considerations
7.1.1 Function of this test method and application of a prediction model.
128 The “Solna Principles”(1996) and GD34 specify that a series of reference chemicals must
be utilized to demonstrate the test method’s performance, but with flexibility appropriate
to the test method undergoing validation. Where an in vitro test method is intended as an
alternative method for in vivo testing, a prediction model can be defined to clarify the
limitations of the in vitro assay to predict the in vivo results representing current scientific
knowledge. The test method validated in this report addresses the generally accepted
nuclear receptor mediated mechanism of ERα activation only. It has not been directly
extrapolated to the complex in vivo estrogenic situation in the format of a prediction
model algorithm. However as part of the EDTA Conceptual Framework toolbox, users
might wish to develop this test method as an alternative for specified in vivo ERα
screening assays, by utilizing the test method to produce data for different purposes,
including the development of a prediction model.
7.1.2 Detection of anti-estrogenic activity
129 This validation effort only considered agonists. For screening and prioritization purposes,
ideally chemicals would also be assessed for antagonistic activity. The test method
described in this report can also address this need and preliminary data are available.
Although antagonists were not included in this validation effort, the antagonist protocol is
included in APPENDIX 5, together with data for three strong antagonists which so far
have been tested nine times by the CERI laboratory. Additional data for 250 chemicals
can be provided on request.
130 In the near future, the currently validated protocol could be updated and extended with the
optimization of the antagonist ERα TA assay, as and when such a protocol might be
supported and made available in a catch-up validation manner.
7.1.3 Non-receptor mediated luminescence signals
131 Non-receptor mediated luminescence signals have been reported at concentrations higher
than 1 µM of the phytoestrogens genistein, daidzein and biochanin A (Escade et al., 2006).
Escade et al. observed an over activation of the luciferase reporter gene in a stably
transfected ER HeLa cell line (HELN-ERα, HELN-ERβ and the parental HELN cell line).

Ver. 2006.Oct.06
51
This effect has also been previously reported for genistein (Kuiper et al., 1998), and
indicates that luciferase expression obtained at high concentrations of phytoestrogens
needs to be examined carefully in such stably transfected TA assay systems. However, this
effect has not been reported in the literature with respect to the ERα screening of
industrial chemicals, which is the intended regulatory use of this proposed test method.
7.1.4 Metabolic capability and TA assays
132 This ER TA assay method does not include metabolism considerations, beyond the
capacity to screen substances that are also metabolic products of parent compounds.
133 Metabolism is known to be a bottleneck in the development of in vitro tests for regulatory
purposes (Coecke et al 2006). For instance, we have conducted a study on 64 chemicals
using S9 mix and performed in a stably transfected TA assay and two potential problems
were observed to be associated with the use of S9. Trans-Stilbene was used as a reference
agonist because it needs to be hydroxylated to trans-4-hydroxystilbene and
trans-4,4’-dihydroxystilbene in order to be active. With the amounts of S9 required, E2 at
normally active concentrations was inactivated, while higher concentrations of E2 were
again more active with S9, than without. This is explained by an inversion of the
concentration response curve that has a maximum at about 100 pM. The second problem
that was encountered was the low reproducibility (unpublished data: Takeyoshi et al,
extract from the OECD draft Detailed Review Paper, “The use of metabolising systems
for in vitro testing of endocrine disruptors”, June 2006).
8. CONCLUSIONS
134 Results of the inter-laboratory validation study within four Japanese domestic laboratories
showed the high reproducibility of the assay system and good technical transferability of
the assay protocols.
135 One of the primary purposes of prescreening procedures, such as the stably transfected TA
assay and the receptor binding assay, is to prioritize chemicals for subsequent testing at
the higher screening stages. Accordingly, a high concordance and a low false negative rate
are required for prescreening procedures. Two-by-two table analytical comparison of the
results of the stably transfected TA assay with those of in vivo screening tests, such as the
uterotrophic assay, revealed that the stably transfected TA assay demonstrated a high
concordance and low false negative rate. These results suggested that the stably

Ver. 2006.Oct.06
52
transfected TA assay is a promising method to be utilized in the prescreening process of an
endocrine disruptor testing strategy.
136 The stably transfected TA assay system can be conducted with approximately 100
chemicals within a week at a relatively low cost (approximately $1,290, €1,700, ¥200,000
per chemical).
137 Moreover, the system employs an established cell line, so the system is compliant with the
3R policies, and it can furthermore contribute to the reduction of animals being tested for
regulatory purposes, with respect to ER mediated endocrine disruption, particularly with
respect to in vivo assays such as the uterotrophic assay.
138 A Japanese human ER mediated stably transfected TA assay system using
hER-HeLa-9903 is well-established and has been shown to be a well-validated assay for
development of an OECD test guideline for the detection of chemicals possessing
potential estrogenic activity through hERα. The assay is a therefore a promising method to
use in the prescreening process of an endocrine disruptor screening strategy.
9. RECOMMENDATIONS
139 Currently, there are many types of luciferase reagents and luminometers. To produce
reproducible results, a wide dynamic range of raw signal counts between positive and
negative (vehicle) control responses would be required. In our experience, the dynamic
range between positive and vehicle control responses depends upon the combination of
the luciferase reagent and the sensitivity of the luminometer used for the study.
Accordingly, any suitable combination of a luciferase assay reagent and luminometer
should be determined in the individual laboratory by preliminary testing with several
control compounds, such as E2, BPA, etc.
140 With regards to the parameters used for the study, historically the EC50 value has been
used for indicating the relative biological activity of chemicals. Calculation of EC50,
using Hill’s logistic equation, requires at least four data points and complete sigmoidal
dose response to estimate accurate and reproducible values. Some weak estrogens cannot
give complete sigmoidal dose responses in the stably transfected TA assay, and it is
difficult to obtain accurate EC50 values. In the case of these weak estrogens, PC10 and
PC50 values calculated using linear regression can be obtained with accuracy and
reproducibility. PC50 values can also provide the relative estrogenic potency and this

Ver. 2006.Oct.06
53
parameter reflects ER mediated biological effects from the results of comparative studies
with ER binding and/or immature rat uterotrophic assays. Moreover a high-throughput
assay design can be achieved by using PC values and fixed-dose format. Taking these
factors together, PC values are promising parameters for TA assays.
10. ACKNOWLEDGMENTS
All the processes of the validation work were supported by the Ministry of Economy, Trade
and Industry (METI), and the Ministry of Health, Labour and Welfare (MHLW), Japan. We
deeply appreciate these Japanese authorities and the four Japanese laboratories that participated
in the inter-laboratory validation studies: Hita Laboratory, CERI, the Environmental Health
Science Laboratory, Sumitomo Chemical Co. Ltd., EDC Analysis Center, Otsuka
Pharmaceutical Co. Ltd., and KANEKA Techno-Research Co., Ltd.
We are also deeply indebted to the colleagues who kindly joined in the informal preliminary
peer-review panel organized by the OECD Secretariat; Dr. Yumi Akahori (CERI), Dr Jun
Kanno (NIHS), Dr Hajime Kojima (JaCVAM), Prof. Daniel Dietrich (on behalf of ECVAM),
Dr. Susan Laws (US EPA), Mr. Gary Timms (US EPA), Dr. Yutaka Aoki (ASPH Fellow at US
EPA), Dr. Tim Schrader (Health Canada), Dr. Bill Stokes (NIEHS/NICEATM, ICCVAM), Dr.
Ray Tice (NIEHS/NICEATM, ICCVAM), Ms. Patricia Ceger (ILS. Inc./NICEATM, ICCVAM),
Dr. Frank Deal (ILS. Inc./NICEATM, ICCVAM), Dr Patric Amcoff (OECD Secretariat) and Dr.
Miriam Jacobs (OECD Secretariat and panel Chair).
We also gratefully acknowledge the award of a visiting scientist fellowship from the Japan
Food Hygiene Association to Dr Miriam Jacobs, to assist with the drafting of this report.
11. REFERENCES
Blair, R.M., Fang, H., Branham, W.S., Hass, B.S., Dial, S.L., Moland, C.L., Tong, W., Shi, L.,
Perkins, R. and Sheehan, D.M. (2000) The Estrogen Receptor Relative Binding Affinities of
188 Natural and Xenochemicals: Structural Diversity of Ligands. Toxicol. Sci. 54, 138-153.
Coecke, S., Ahr, H., Blaauboer, B.J., Bremer, S., Casati, S., Castell, J., Combes, R., Corvi, R.,
Crespi, C.L., Cunningham, M.L., Elaut, G., Eletti, B., Freidig, A., Gennari, A., Ghersi-Egea,
J.F., Guillouzo, A., Hartung, T., Hoet, P., Ingelman-Sundberg, M., Munn, S., Janssens, W.,
Ladstetter, B., Leahy, D., Long, A., Meneguz, A., Monshouwer, M., Morath, S., Nagelkerke,

Ver. 2006.Oct.06
54
F., Pelkonen, O., Ponti, J., Prieto, P., Richert, L., Sabbioni, E., Schaack, B., Steiling, W., Testai,
E., Vericat, J.A. and Worth, A. (2006) Metabolism: a bottleneck in in vitro toxicological test
development. The report and recommendations of ECVAM workshop 54. Altern. La.b Anim.
34, 49-84
ECB (European Chemical Bureau) [URL: http://ecb.jrc.it/ accessed 20.09.06.]
EDMVS (2002) Endocrine Disruptor Methods Validation Subcommittee (EDMVS) Third
Plenary Meeting March 25-27,
[URL: http://www.epa.gov/scipoly/oscpendo/meetings/mtg_032502.htm accessed 20.09.06.]
EDSTAC (1998) Endocrine Disruptor Screening and Testing Advisory Committee (EDSTAC)
Final report. [URL: http://www.epa.gov/scipoly/oscpendo/pubs/edspoverview/finalrpt.htm
accessed 20.09.06.]
Escande, A., Pillon, A., Servant, N., Cravedi, J.P., Larrea, F., Muhn, P., Nicolas, J.C., Cavailles,
V. and Balaguer, P. (2006) Evaluation of ligand selectivity using reporter cell lines stably
expressing estrogen receptor alpha or beta. Biochem. Pharmacol. 71, 1459-1469.
Gray, L.E. Jr. (1998) Tiered screening and testing strategy for xenoestrogens and antiandrogens.
Toxicol. Lett. 102-103, 677-680.
Hartung, T., Bremer, S., Casati, S., Coecke, S., Corvi, R., Fortaner, S., Gribaldo, L., Halder, M.,
Hoffmann, S., Roi, A.J., Prieto, P., Sabbioni, E., Scott, L., Worth, A., and Zuang, V. (2004) A
modular approach to the ECVAM principles on test validity. ATLA 32, 467-472.
ICCVAM (2003) ICCVAM Evaluation of In Vitro Test Methods for Detecting Potential
Endocrine Disruptors: Estrogen Receptor and Androgen Receptor Binding and Transcriptional
Activation Assays. [URL: http://iccvam.niehs.nih.gov/methods/endocrine.htm#fineval
accessed 22.09.06.]
Jefferson, W.N., Padilla-Banks, E., Clark, G. and Newbold (2002) Assessing estrogenic activity
of phytochemicals using transcriptional activation and immature mouse uterotrophic responses.
J. Chromat. B. 777, 179-189.
Kuiper, G.G., Lemmen, J.G., Carlsson, B., Corton, J.C., Safe, S.H., van der Saag, P.T., van der
Burg, B. and Gustafsson, J.A. (1998) Interaction of estrogenic chemicals and phytoestrogens

Ver. 2006.Oct.06
55
with estrogen receptor beta. Endocrinology 139, 4252-4263.
OECD (2001) OECD 3rd meeting of the validation management group for the screening and
testing of endocrine disrupters (mammalian effects). ENV/JM/TG/EDTA (2001). Paris: Joint
meeting of the chemicals committee and the working party on chemicals, pesticides and
biotechnology .
OECD (2002) OECD conceptual Framework for the Testing and Assessment of Endocrine
Disrupting Chemicals [URL: http://www.oecd.org/dataoecd/17/33/23652447.doc accessed
22.09.06.]
OECD (2006) OECD draft Detailed Review Paper, “The use of metabolising systems for in
vitro testing of endocrine disruptors”
Sonneveld, E., Riteco, J.A., Jansen, H.J., Pieterse, B., Brouwer, A., Schoonen, W.G. and van
der Burg, B. (2006) Comparison of in vitro and in vivo screening models for androgenic and
estrogenic activities. Toxicol. Sci. 89, 173-187.
Suzuki, T., Kitamura, S., Khota, R., Sugihara, K., Fujimoto, N. and Ohta, S. (2005) Estrogenic
and antiandrogenic activities of 17 benzophenone derivatives used as UV stabilizers and
sunscreens. Toxicol. Appl. Pharmacol. 203, 9-17.
Takeyoshi, M., Yamasaki, K., Sawaki, M., Nakai, M., Noda, S. and Takatsuki, M. (2002) The
efficacy of endocrine disruptor screening tests in detecting anti-estrogenic effects downstream
of receptor-ligand interactions. Toxicol. Lett. 126, 91-98.
Yamasaki, K., Takeyoshi, M., Yakabe, Y., Sawaki, M., Imatanaka, N., and Takatsuki, M.
(2002) Comparison of Reporter Gene Assay and Immature Rat Uterotrophic Assay of
Twenty-Three Chemicals. Toxicology. 170, 21-30.


Ver. 2006.Oct.06
57
APPENDIX 1 List of Participating Laboratories
Testing facility 1 (Coordination and enforcement of the study)
Hita laboratory
Chemicals Evaluation and Research Institute (CERI)
3-822, Ishii-machi, Hita-shi, Oita 8770061, Japan
Testing facility 2 (Enforcement of the study)
Environmental Health Science Laboratory,
Sumitomo Chemical Co., Ltd.
1-98, Kasugade-naka 3-chome, Konohana-ku,
Osaka 554-8558, Japan
Testing facility 3 (Enforcement of the study)
EDC Analysis Center, Otsuka Life Science Initiative,
Otsuka Pharmaceutical Co., Ltd.
224-18, Ebisuno Hiraishi, Kawauchi-cho, Tokushima
7710195, Japan
Testing facility 4 (Enforcement of the study)
KANEKA Techno-Research Co., Ltd.
1-8, Miyamae-cho, Takasago-cho, Takasago-shi,
Hyogo 6768688, Japan


59
APPENDIX 2 Standard operating procedure (SOP) for detection of estrogenic activity
using the reporter gene assay
STANDARD OPERATING PROCEDURE (SOP)
for detection of estrogenic activity using the reporter gene assay
Description: This document provides a methodology for detecting the estrogenic activity of
chemicals by the reporter gene assay technique using the hER-HeLa-9903 cell line.
Chemicals Evaluation and Research Institute
CERI-Japan
60
Materials and Methods
1. Test chemicals
Test chemicals should be dissolved in dimethylsulfoxide (DMSO) at a concentration of 10
mM.
2. Competitive substance
17β-Estradiol (E2)
3. Vehicle for chemical stock solutions
Dimethylsulfoxide (DMSO) should be used for the vehicle.
4. Materials
4.1 Cell lines
The hERα-HeLa-9903 stable cell line (Sumitomo Chemicals Co.) will be used for the assay.
4.2 Cell cultures (See support protocols No.1 – No. 4)
Cells should be maintained in Eagle’s Minimum Essential Medium (EMEM) without phenol
red, supplemented with a 10% dextran-coated-charcoal (DCC)-treated fetal bovine serum
(DCC-FBS), in a CO2 incubator (5% CO2) at 37˚C.
4.3 Preparation of chemicals
All chemicals are dissolved in DMSO at a concentration of 10 mM, and those solutions are
serially diluted with the same solvent at a common ratio of 1:10 in order to prepare stock
solutions with concentrations of 1 mM, 100 µM, 10 µM, 1 µM, 100 nM and 10 nM. In the case
of positive control substance (E2), stock solutions are prepared at concentrations of 100 µM,
10 µM, 1 µM, 100 nM, 10 nM, 1 nM and 100 pM.
4.4 Preparation of cells
Assay plates are prepared according to the support protocol No. 5.
4.5 Reagents for the luciferase assay
A commercial luciferase assay reagent, Steady-Glo Luciferase Assay System (Promega,
E2510 and its equivalents) or a standard luciferase assay system (Promega, E1500 and its
equivalents) are used in this study. A bottle of Luciferase Assay Substrate is dissolved with the
Luciferase Assay Buffer. The dissolved substrate should either be used immediately or stored
below -20 C.
When using the standard luciferase assay system, Cell Culture Lysis Reagent (Promega,

61
E1531) should be used before adding the substrate.
4.7 Chemical exposure
Each test chemical diluted in DMSO are added to the wells to achieve final
concentrations of 10 µM, 1 µM, 100 nM, 10 nM, 1 nM, 100 pM, and 10 pM (10-11-10-5M) for
testing in quadruplicate.
To achieve the above-described test conditions, each chemical stock solution should be
serially diluted in a common ratio of 1:10 with DMSO in order to obtain 10 µM, 10 µM, 1 µM,
100 nM, 10 nM and 1 nM working solutions. Exactly 1.5 µL of 10 mM chemical stock and 6
working solutions will dilute in serum-free EMEM (500 µL).
Then 50µL of the diluted test samples will be added to each well of the assay plate
according to the assignment table shown in Fig.1.
Positive control wells (n=6) treated with 100 pM of E2 and vehicle control wells (n=6)
treated with DMSO alone will be prepared on every assay plate. After adding the chemicals,
the assay plates will be incubated in a CO2 incubator for 20-24 hours to induce the reporter
gene products.
Fig.1 Typical assignment of the assay plate for the agonist assay Chemical 1 Chemical 2 Chemical 3 1 2 3 4 5 6 7 8 9 10 11 12
A 10 µM → → → → → → → → → → → B 1 µM → → → → → → → → → → → C 100 nM → → → → → → → → → → → D 10 nM → → → → → → → → → → → E 1 nM → → → → → → → → → → → F 100 pM → → → → → → → → → → → G 10 pM → → → → → → → → → → → H VC → → → → → PC → → → → →
VC: Vehicle control (DMSO at 0.1%); PC: Positive control (100 pM of E2)
4.8 Luciferase assay (See support protocol No. 6)
Luciferase activity will be measured with the luciferase assay reagent and a luminometer
according to the manufacturer’s instructions.
5. Analysis of data The luminescence signal data are processed, and the average for the negative control wells
were calculated. The integrated value for each test well is divided by the average integrated
value of the negative control wells to obtain individual relative transcriptional activity. Then
the average transcriptional activity is calculated for each concentration of the test chemical.
The PC50 and PC10 values are calculated for each test chemical. These PC values are defined
as the concentration of chemical estimated to cause 50% or 10%, respectively, of activity of the
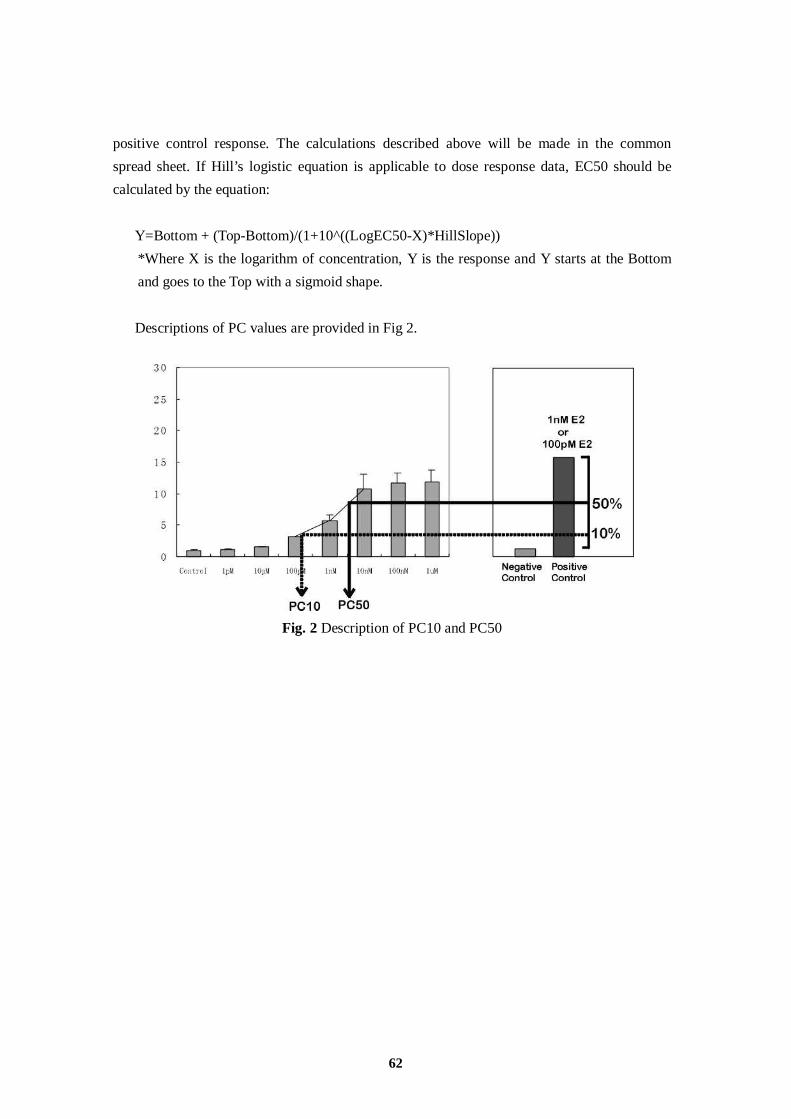
62
positive control response. The calculations described above will be made in the common
spread sheet. If Hill’s logistic equation is applicable to dose response data, EC50 should be
calculated by the equation:
Y=Bottom + (Top-Bottom)/(1+10^((LogEC50-X)*HillSlope))
*Where X is the logarithm of concentration, Y is the response and Y starts at the Bottom
and goes to the Top with a sigmoid shape.
Descriptions of PC values are provided in Fig 2.
Fig. 2 Description of PC10 and PC50

63
SUPPORT PROTOCOLS
No.1 Preparation of the medium
Reagents
Eagle’s Minimal Essential medium without neutral red (Nissui Pharmaceutical Co.)
10% Sodium bicarbonate (NaHCO3)
Dissolve 10 grams of NaHCO3 to a final volume of 100 mL with water. Next, the
solution should be sterilized using a vacuum-driven bottle-top sterilization filter unit
and stored at room temperature.
3% Glutamine
Dissolve 3 grams of glutamine to a final volume of 100 mL with water. Next, the
solution should be sterilized using vacuum-driven bottle-top sterilization filter unit.
Prepared 3% Glutamine should be stored in aliquots under -20°C.
Dextran-coated charcoal (DCC)-treated Fetal bovine serum (DCC-FBS)
Prepared and provided by CERI-Japan.
Preparation of EMEM*
Add the following reagents into a 1L conical glass flask and then add Milli-Q water to
bring the total volume to one liter:
・9.4 grams of pre-made powder medium
・18 mL 10% Sodium Bicarbonate
・3% Glutamine 12 mL
Preparation of 10%FBS-EMEM*
Add 56 mL of dextran-coated charcoal (DCC)-treated fetal bovine serum (DCC-FBS)
to 500 mL EMEM.
*EMEM and 10%FBS-EMEM should be stored in a refrigerator after being sterilized with a
vacuum-driven bottle-top sterilization filter unit.

64
SUPPORT PROTOCOLS
No. 2. Reconstitution of cells from the frozen stock
1. Remove the vial from the liquid nitrogen or freezer and immediately transfer it to a 37°C
water bath.
2. While holding the tip of the vial, gently agitate the vial.
3. When completely thawed, transfer the cell stock into 5mL pre-warmed 10%FBS-EMEM
in 15 a mL conical tube.
4. Centrifuge the tube at 1100 rpm (200-300 x g) for 5-min, then remove the supernatant
carefully.
5. Resuspend the cell with 10 mL of 10%FBS-EMEM and place it in a 90 mm culture dish.
6. Incubate the cells in a 5% CO2 incubator at 37°C.

65
SUPPORT PROTOCOLS
No. 3. Propagation
1. Remove the medium from the culture dish with a sterile pipette or sucker.
2. Rinse the cell with 5 mL of PBS.
3. Remove the PBS with a sterile pipette or sucker.
4. Add 2 mL of Trypsin-EDTA solution (0.25% Trypsin + 0.02%EDTA/PBS), enough to
coat the bottom of the culture dish, and then remove the excess.
5. Allow the Trypsin treated cells to stand for about 3-min. in a 5% CO2 incubator at 37°C.
(Monitor the cells under a microscope. The cells are beginning to detach when they appear
rounded.)
6. Tap the dish gently.
7. Wash with 5 mL of 10%FBS-EMEM to remove the adherent cells.
8. Count the number of cells.
9. Dilute the cell suspension with 10%FBS-EMEM to 0.4-1.0 x 10⁵ cells/mL.
10. Place 10 mL of cell suspension in a 90 mm culture dish.
11. Incubate the cells in a 5% CO2 incubator at 37°C.

66
SUPPORT PROTOCOLS
No. 4. Preparation of frozen stock
1. Remove the medium from the culture dish with a sterile pipette or sucker.
2. Rinse the cell with 5 mL of PBS.
3. Remove the PBS with a sterile pipette or sucker.
4. Add 2 mL of Trypsin-EDTA solution, enough to coat the bottom of the culture dish, and
then remove the excess.
5. Allow the Trypsin-treated cell to stand for about 3-min. in a 5% CO2 incubator at 37°C.
(Monitor the cells under a microscope. The cells are beginning to detach when they appear
rounded.)
6. Tap the dish gently.
7. Wash with 5 mL of 10%FBS-EMEM to remove the adherent cells.
8. Count the number of cells.
9. Centrifuge the tube at 1100 rpm (200-300 x g) for 5-min., and remove the supernatant
carefully.
10. Add Cell-Banker* (Juji Field Inc.) and resuspend the cell at a density of ca. 1 x 10⁴
cells/mL.
11. Make 1 mL aliquots of cell stock.
12. Freeze and store the cell stock below -80°C.**
*A conventional freeze medium (90% FBS/10% DMSO) can be used in place of Cell-Banker.
**Storage in liquid nitrogen would be preferable for long-term storage (more than 3 months).
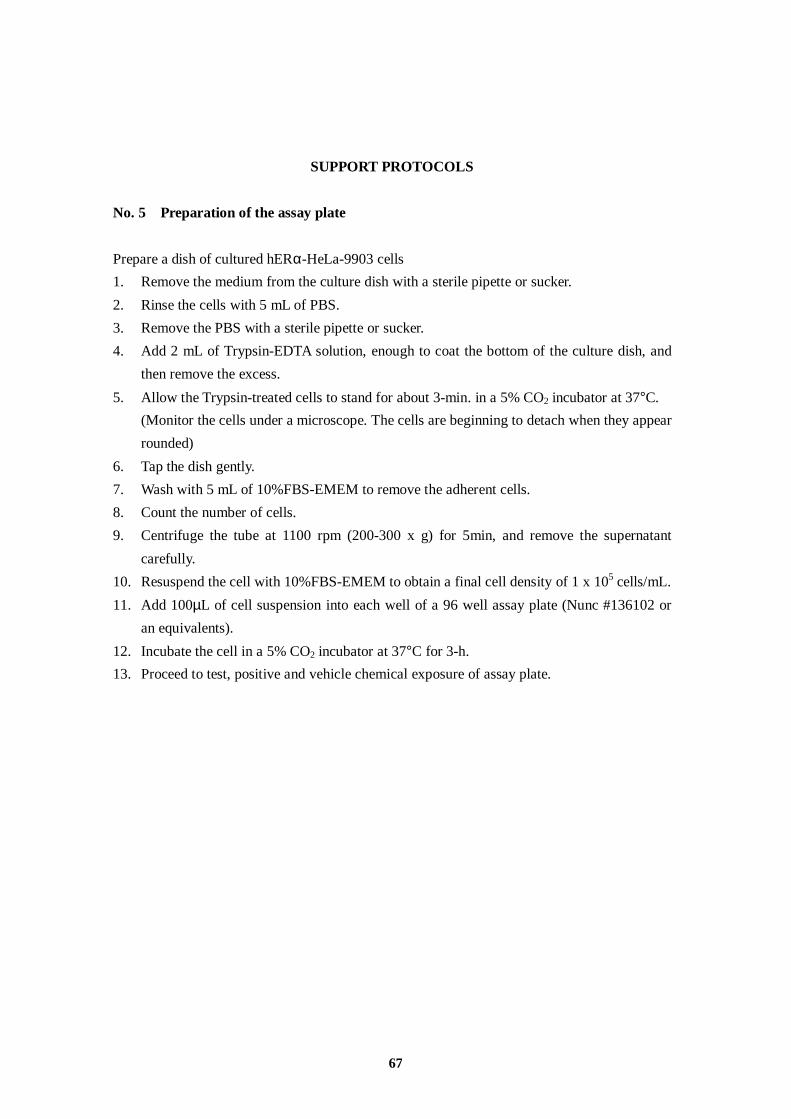
67
SUPPORT PROTOCOLS
No. 5 Preparation of the assay plate
Prepare a dish of cultured hERα-HeLa-9903 cells
1. Remove the medium from the culture dish with a sterile pipette or sucker.
2. Rinse the cells with 5 mL of PBS.
3. Remove the PBS with a sterile pipette or sucker.
4. Add 2 mL of Trypsin-EDTA solution, enough to coat the bottom of the culture dish, and
then remove the excess.
5. Allow the Trypsin-treated cells to stand for about 3-min. in a 5% CO2 incubator at 37°C.
(Monitor the cells under a microscope. The cells are beginning to detach when they appear
rounded)
6. Tap the dish gently.
7. Wash with 5 mL of 10%FBS-EMEM to remove the adherent cells.
8. Count the number of cells.
9. Centrifuge the tube at 1100 rpm (200-300 x g) for 5min, and remove the supernatant
carefully.
10. Resuspend the cell with 10%FBS-EMEM to obtain a final cell density of 1 x 10⁵ cells/mL.
11. Add 100µL of cell suspension into each well of a 96 well assay plate (Nunc #136102 or
an equivalents).
12. Incubate the cell in a 5% CO2 incubator at 37°C for 3-h.
13. Proceed to test, positive and vehicle chemical exposure of assay plate.

68
SUPPORT PROTOCOLS
No. 6-1. Chemiluminescence detection with a standard luciferase reagent
Reagents
Cell lysis reagent (4.5x): Dilute 10 mL of 5×Cell Culture Lysis Reagent (CCLR, #E1531) with
45 mL of distilled water.
Luciferase Assay Reagent: Add 1 vial105 mL of Luciferase Assay buffer (Promega, #E4550)
into a vial containing Luciferase Assay Substrate (Promega, #E4550),
and dissolve the substrate thoroughly. Store the substrate below -20°C
if necessary.
Chemiluminescence Detection
1. Flick and drain off the contents of the assay plate.
2. Add 100µL of PBS to the well to wash the plate.
3. Flick and drain off the contents of the assay plate.
4. Add 100µL of PBS to the well to wash the plate again.
5. Flick and drain off the contents of the assay plate.
6. Add 15 µL of Cell lysis reagent (4.5x) to the wells.
7. Incubate for 10-min. at room temperature.
8. Add 50 µL of Luciferase Assay Reagent to the wells.
9. Read the plates on a chemiluminescence plate reader.

69
SUPPORT PROTOCOLS
No. 6-2. Chemiluminescence detection with a luciferase reagent using the Steady-Glo
Luciferase Assay System
Reagents
Luciferase Assay Reagent: Add 1 vial (100 mL) of Luciferase Assay buffer into a vial
containing Luciferase Assay Substrate (Promega, #E2520), and
dissolve the substrate thoroughly. Store the substrate below -20°C if
necessary.
Chemiluminescence Detection
1. Remove 50µL of the assay medium from all wells of the assay plate.
2. Add 100µL of the Luciferase Assay Reagent to wells.
3. Allow to stand for 5-min.
4. Read the plates on a chemiluminescence plate reader.

71
APPENDIX 3 Protocol used for the inter-laboratory validation study
Study Code: R10-xxxx
Multi-lab validation study for the ERα mediated reporter gene assay
xx, 2005
Chemicals Evaluation and Research Institute
CERI-Japan

72
Multi-lab validation study for the ERα mediated reporter gene assay
Participating laboratories
Testing facility 1 (coordination and enforcement of the study)
Testing facility 2 (enforcement of the study)
Testing facility 3 (enforcement of the study)
Testing facility 4 (enforcement of the study)
Aim of the study: To appraise the reliability and reproducibility of the ERα mediated reporter
gene assay method by conducting the assays within multiple laboratories
utilizing the same test chemicals. The technical transferability will be also
evaluated in this study.
GLP This study will be conducted in compliance with the “OECD principle of
Good Laboratory Practice,” November 26, 1997.
Proposed study dates
Start Date
Completion Date

73
Persons concerned in the study
Study director
Person in charge of individual studies conducted by each laboratory
Testing facility 1:
Testing facility 2:
Testing facility 3:
Testing facility 4:
Quality Assurance Supervisor
Peer reviewers
(To be announced)

74
Materials and Methods
1. Test chemicals
The test chemicals to be used in this study are listed in Table 1. All chemicals will be coded
and provided by CERI as 10 mM solutions in dimethylsulfoxide (DMSO).
2. Positive control substance
2.1 Chemical name
17β-Estradiol (E2)
2.2 Lot No.
ACK5754 2.3 Manufacturer
Wako Pure Chemicals, Japan
2.4 Storage
To be stored at room temperature in a shading bottle.
3. Vehicle control (vehicle for chemical stock solutions)
3.1 Chemical name
Dimethylsulfoxide (DMSO)
3.2 Lot No.
PKF5322 3.3 Manufacturer
Wako Pure Chemicals, Japan
3.4 Storage
To be stored at room temperature
4. Materials
4.1 Test systems
The hERα-HeLa-9903 stable cell line system (Sumitomo Chemicals Co.) will be used for
the assay.
Each laboratory should conduct three series of assays with the nine test chemicals listed in
Table 1 on independent days.
4.2 Cell lines
hERα-HeLa-9903 will be provided by the Sumitomo Chemical Co. Ltd.
4.3 Cell culture (See support protocols No.1 – No. 4)

75
Cells should be maintained in Eagle’s Minimum Essential Medium (EMEM) without phenol
red, supplemented with a 10% dextran-coated-charcoal (DCC)-treated fetal bovine serum
(DCC-FBS), in a CO2 incubator (5% CO2) at 37˚C.
4.4 Preparation of chemicals
All test chemicals dissolved in DMSO at 10 mM will be serially diluted with the same
solvent at a common ratio of 1:10 in order to prepare concentrations of 1 mM, 100 µM, 10 µM,
1 µM, 100 nM and 10 nM in DMSO. In the case of positive control substance (E2), DMSO
solutions will be prepared at concentrations of 100 µM, 10 µM, 1 µM, 100 nM, 10 nM, 1 nM
and 100 pM.
4.5 Preparation of cells
Assay plates will be prepared according to support protocol No. 5.
4.6 Reagents for luciferase assay
A commercial luciferase assay reagent, Steady-Glo Luciferase Assay System (Promega,
E2510 and its equivalents) or a standard luciferase assay system (Promega, E1500 and its
equivalents) will be employed in this study. A bottle of Luciferase Assay Substrate is dissolved
with the Luciferase Assay Buffer. Dissolved substrate should either be used immediately or
stored below -20°C.
In cases where the standard luciferase assay system is used, Cell Culture Lysis Reagent
(Promega, E1531) should be used before adding the substrate.
4.7 Chemical exposure
Each test chemical diluted in DMSO will be added to the wells for final concentrations
of 10 µM, 1 µM, 100 nM, 10 nM, 1 nM, 100 pM, and 10 pM (10-11-10-5M) for the test
chemicals and 100 nM, 10 nM, 1 nM, 100 pM, 10 pM, 1 pM, 0.1 pM (10-13-10-7M) for the
positive control substance, in triplicate.
To achieve the above-described test conditions, each chemical stock solution provided
by CERI should be serially diluted in a common ratio of 1:10 with DMSO in order to obtain 10
µM, 10 µM, 1 µM, 100 nM, 10 nM and 1 nM working solutions. Exactly 1.5 µl of 10 mM
chemical stock and 6 working solutions will dilute in serum-free EMEM (500 µl).
Then 50µl of the diluted test samples will be added to each well of the assay plate
according to the assignment table shown below.
Positive control wells (n=3) treated with a natural ligand (1 nM of E2 for stable cell
assay) and vehicle control wells (n=3) treated with DMSO alone will be prepared on every
assay plate. Serial dilution of E2 will be tested in all assay plates to examine the reproducibility
of dose responses to E2. After adding the chemicals, the assay plates will be incubated in a

76
CO2 incubator for 20-24 hours to induce the reporter gene products.
Test chemicals, as well as negative and positive control substances, should all be assigned as
below.
Plate dose assignment of test chemicals in the assay plate
Test Chemical 1 Test Chemical 2 Test Chemical 3 PC (E2) 1 2 3 4 5 6 7 8 9 10 11 12 A 10 µM → → → → → → → → 100 nM → → B 1 µM → → → → → → → → 10 nM → → C 100 nM → → → → → → → → 1 nM → → D 10 nM → → → → → → → → 100 pM → → E 1 nM → → → → → → → → 10 pM → → F 100 pM → → → → → → → → 1 pM → → G 10 pM → → → → → → → → 0.1 pM → → H VC → → BL → → → → → PC → →
VC: Vehicle control (DMSO); BL: Blank; PC: Positive control (1 nM E2)
4.8 Luciferase assay (See support protocol No. 6)
Luciferase activity will be measured with the luciferase assay reagent and a luminometer
according to the manufacturer’s instructions.
4.9. While edge effects are not considered to affect the final data for practical purposes, this needs
to be monitored by individual laboratories.
5. Analysis of data The luminescence signal data will be processed, and the average for the vehicle control
wells will be calculated. The integrated value for each test well will be divided by the average
integrated value of the vehicle control wells to obtain individual relative transcriptional activity.
Then the average transcriptional activity will be calculated for each concentration of the test
chemical. The PC50 and PC10 values will be calculated for each test chemical. These PC
values are defined as the concentration of chemical estimated to cause 50% or 10%,
respectively, of activity of the positive control response. The calculations described above will
be made in the common spread sheet provided by CERI-Japan. If Hill’s logistic equation is
applicable to dose response data, EC50 should be calculated by the following equation:
Y=Bottom + (Top-Bottom)/(1+10^((LogEC50-X)*HillSlope))
* Where X is the logarithm of concentration, Y is the response and Y starts at the Bottom
and goes to the Top with a sigmoid shape.

77
Descriptions of PC values are shown in Fig. 2.
Fig. 2 Description of PC10 and PC50
6. Records
The records listed below should be retained at each laboratory.
Study protocol and its amendments
Amendments should be prepared if some modification is to be made regarding the original
protocol. In this case, approval of the amendment by CERI would be required.
Standard Operating Procedures (SOPs)
SOPs or instruction manuals should be prepared by each laboratory.
Chemicals
With regard to the test chemicals and the positive control substance supplied by CERI,
records of usage, storage, return and other related records should be retained at each
laboratory.
Cell
With regard to the cells, records of acquisition, propagation, storage, usage, passage
number of cells used for assay, and other related records should be retained at each laboratory.
Reagents
With regard to the reagents used in the assay, records of the manufacturer’s name, the lot

78
number, usage, and related records should be retained at each laboratory. In the case of
reagents made at the laboratory, the recipes and the records of preparation, storage, usage and
other related records should be retained at each laboratory.
Equipments
All equipment used in the study should have corresponding records of the manufacturer’s
name, usage, maintenance and periodical inspection at each laboratory.
Main study
All records with regard to the cells, reagents, equipment, dates of the assays performed,
researchers participating in the study, and other relevant records should be retained at each
laboratory.
Data
All raw data derived from the study and the records of processing of data should be retained
at each laboratory.
7. Inspection of the study
To assure GLP compliance, the lead quality assurance personnel would inspect the
operations in the study, including records and data, as the occasion demands. If
inappropriate cases are found, remedial actions would be required. All records related to the
inspection should be retained by CERI.
8. Evaluation of the results of multi-lab validation studies
All data obtained by each laboratory should be filled in the common spread sheets
provided by CERI, and will be collected at CERI. Then the reliability, reproducibility and
technical transferability of this assay method will be evaluated by CERI.
9. Reporting
The report will contain details of the test substances, methodology, results and
interpretation of data. A GLP statement and a Quality Assurance statement will be included
in the report.
10. Peer review
The final report will be prepared after completing peer review of this study and
related data by the external specialists.

79
Table 1 Candidate chemical list for multi-lab validation studies
Chemical CAS No. Manufacturer Lot. No. Purity
17β-Estradiol 50-28-2 Wako ACK5754 99%
17α-Estradiol 57-91-0 Wako ELJ1532 97% ,HPLC ,for Biochem.
Genistein 446-72-0 Wako VIR1711 98%
4-tert-Octylphenol 140-66-9 Wako YWE9213 97% ,cGC ,for Environment Anal.
Bisphenol A 80-05-7 TCI GF01 >99%
p-tert-Pentylphenol 80-46-6 Wako KSQ2664 97% ,GC
17α-Methyltestosterone 58-18-4 Wako TPE6748 97% ,HPLC ,for Biochem.
Hematoxylin 517-28-2 Wako LDK7723 N.S.
Diethylhexyl phthalate 117-81-7 Wako ELE1799 97% ,GC
Benzophenone 119-61-9 Wako RLH9114 99% ,cGC ,for Environment Anal.
TCI : Tokyo Kasei Kogyo Co., Ltd.Wako : Wako Pure Chemical Industries, Ltd.N.S. : not specified

80
6/8/2005
SUPPORT PROTOCOLS
No. 1. Preparation of the medium
Reagents
Eagle’s Minimal Essential medium without neutral red (Nissui Pharmaceutical Co.).
10% Sodium bicarbonate (NaHCO3)
Dissolve 10 grams of NaHCO3 to a final volume of 100 mL with water. Next, the
solution should be sterilized using a vacuum-driven bottle-top sterilization filter unit
and stored at room temperature.
3% Glutamine
Dissolve 3 grams of glutamine to a final volume of 100 mL with water. Next, the
solution should be sterilized using vacuum-driven bottle-top sterilization filter unit.
Prepared 3% Glutamine should be stored in aliquots under -20°C.
Dextran-coated charcoal (DCC)-treated Fetal bovine serum (DCC-FBS)
Prepared and provided by CERI-Japan.
Preparation of EMEM *
Add the following reagents into a 1L conical glass flask and then add sufficient
Milli-Q water to bring the total volume to one liter:
・9.4 grams of pre-made powder medium
・18 mL 10% Sodium Bicarbonate
・3% Glutamine 12 mL
Preparation of 10%FBS-EMEM *
Add 56 mL of dextran-coated charcoal (DCC)-treated fetal bovine serum
(DCC-FBS) to 500 mL EMEM.
* EMEM and 10%FBS-EMEM should be stored in a refrigerator after being sterilized with a
vacuum-driven bottle-top sterilization filter unit.
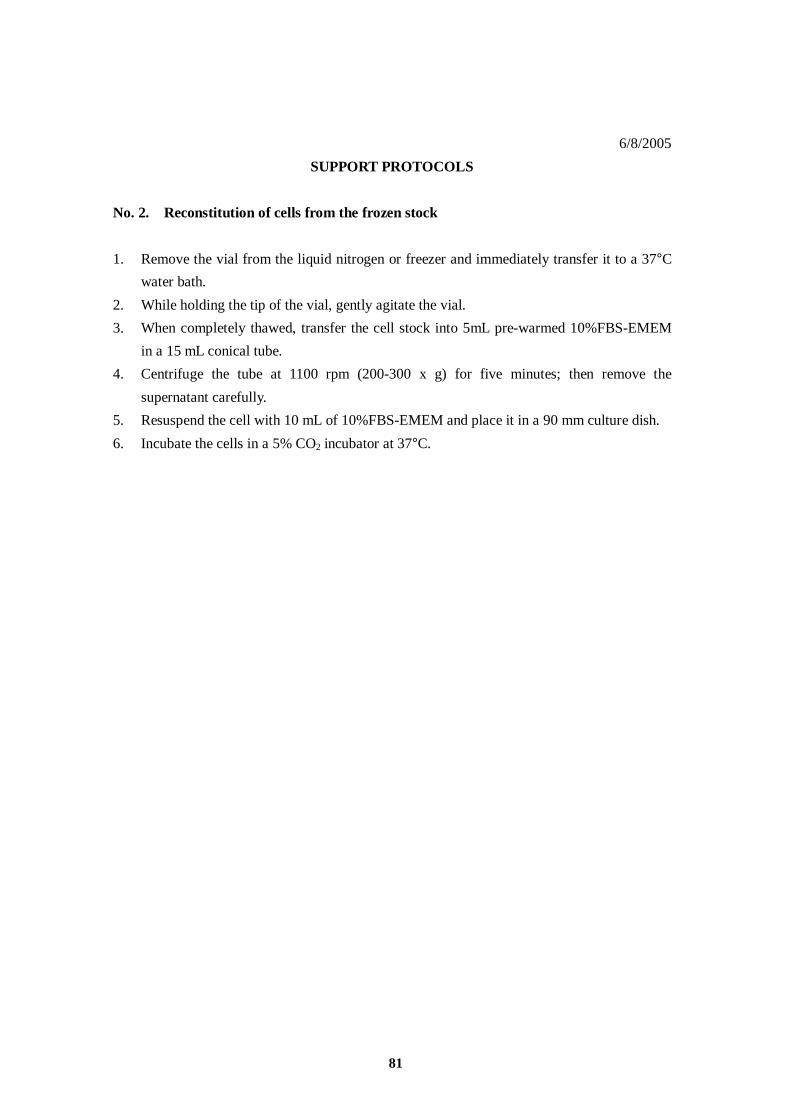
81
6/8/2005
SUPPORT PROTOCOLS
No. 2. Reconstitution of cells from the frozen stock
1. Remove the vial from the liquid nitrogen or freezer and immediately transfer it to a 37°C
water bath.
2. While holding the tip of the vial, gently agitate the vial.
3. When completely thawed, transfer the cell stock into 5mL pre-warmed 10%FBS-EMEM
in a 15 mL conical tube.
4. Centrifuge the tube at 1100 rpm (200-300 x g) for five minutes; then remove the
supernatant carefully.
5. Resuspend the cell with 10 mL of 10%FBS-EMEM and place it in a 90 mm culture dish.
6. Incubate the cells in a 5% CO2 incubator at 37°C.
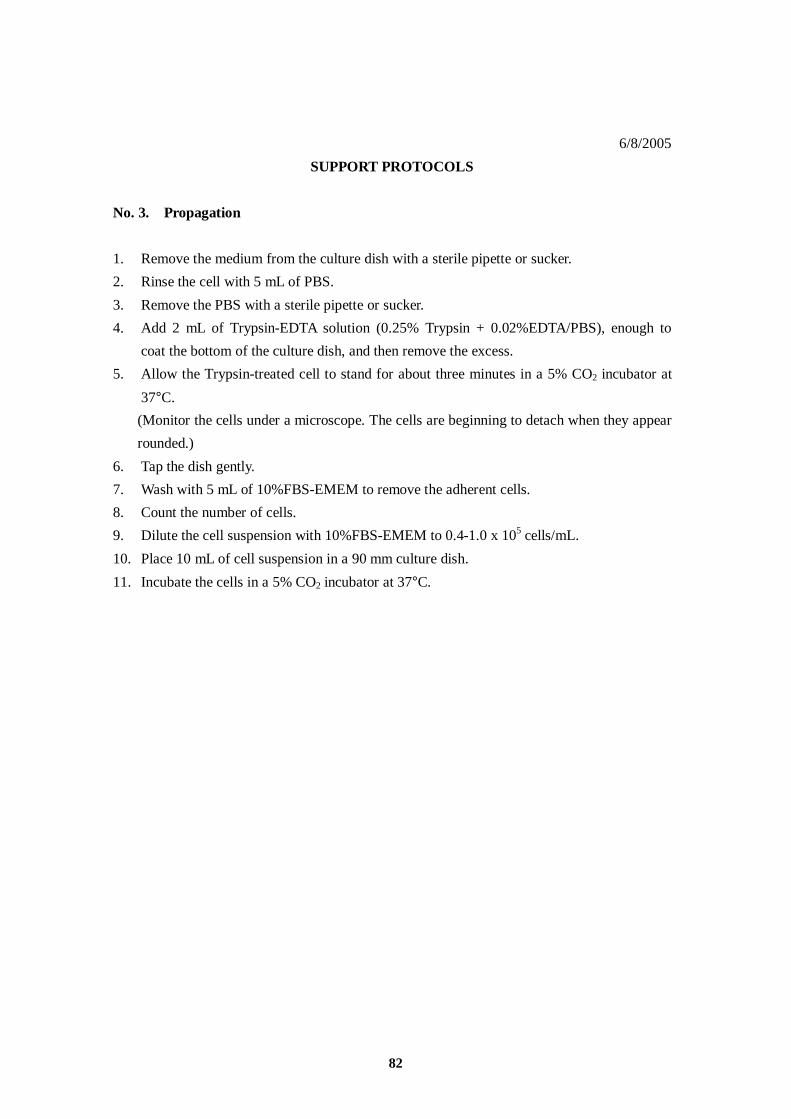
82
6/8/2005
SUPPORT PROTOCOLS
No. 3. Propagation
1. Remove the medium from the culture dish with a sterile pipette or sucker.
2. Rinse the cell with 5 mL of PBS.
3. Remove the PBS with a sterile pipette or sucker.
4. Add 2 mL of Trypsin-EDTA solution (0.25% Trypsin + 0.02%EDTA/PBS), enough to
coat the bottom of the culture dish, and then remove the excess.
5. Allow the Trypsin-treated cell to stand for about three minutes in a 5% CO2 incubator at
37°C.
(Monitor the cells under a microscope. The cells are beginning to detach when they appear
rounded.)
6. Tap the dish gently.
7. Wash with 5 mL of 10%FBS-EMEM to remove the adherent cells.
8. Count the number of cells.
9. Dilute the cell suspension with 10%FBS-EMEM to 0.4-1.0 x 10⁵ cells/mL.
10. Place 10 mL of cell suspension in a 90 mm culture dish.
11. Incubate the cells in a 5% CO2 incubator at 37°C.

83
6/8/2005
SUPPORT PROTOCOLS
No. 4. Preparation of frozen stock
1. Remove the medium from the culture dish with a sterile pipette or sucker.
2. Rinse the cell with 5 mL of PBS.
3. Remove the PBS with a sterile pipette or sucker.
4. Add 2 mL of Trypsin-EDTA solution, enough to coat the bottom of the culture dish, and
then remove the excess.
5. Allow the Trypsin-treated cell to stand for about three minutes in a 5% CO2 incubator at
37°C.
(Monitor the cells under a microscope. The cells are beginning to detach when they appear
rounded.)
6. Tap the dish gently.
7. Wash with 5 mL of 10%FBS-EMEM to remove the adherent cells.
8. Count the number of cells.
9. Centrifuge the tube at 1100 rpm (200-300 x g) for five minutes, and remove the
supernatant carefully.
10. Add Cell-Banker* (Juji Field Inc.) and resuspend the cell at a density of ca. 1 x 10⁴
cells/mL.
11. Make 1 mL aliquots of cell stock.
12. Freeze and store the cell stock below -80°C.**
* A conventional freeze medium (90% FBS/10% DMSO) can be used in place of Cell-Banker.
** Storage in liquid nitrogen would be preferable for long-term storage (more than three
months).
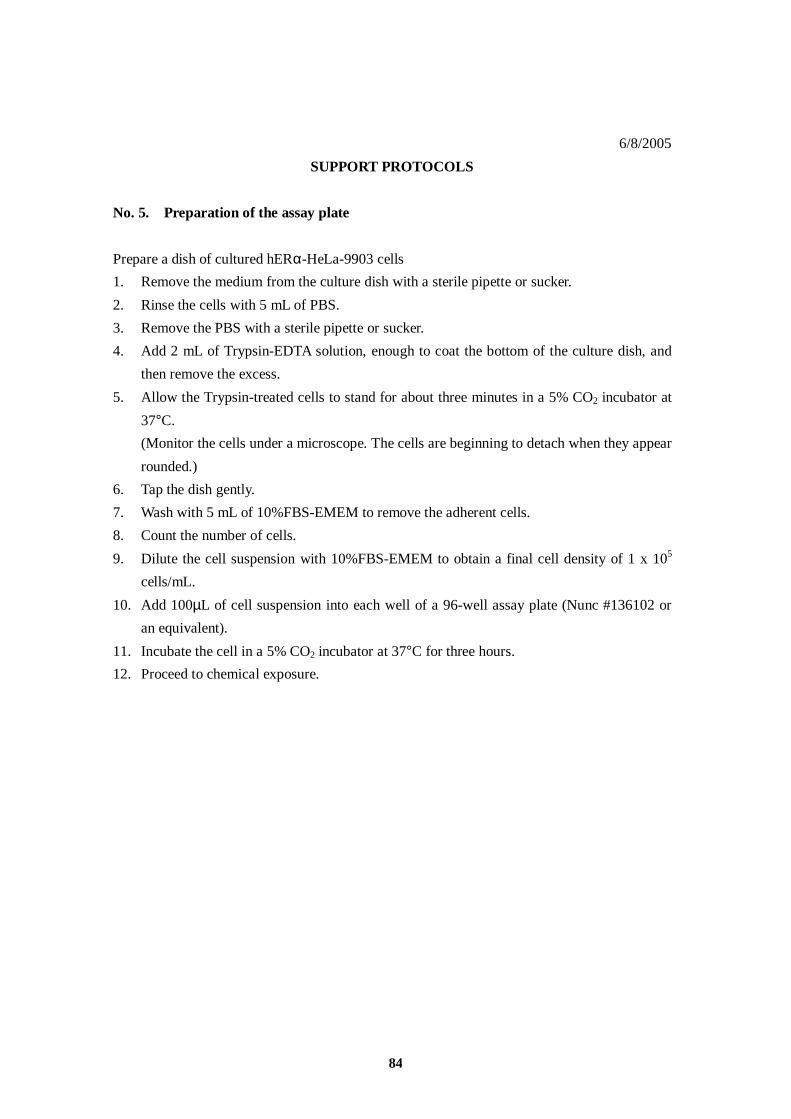
84
6/8/2005
SUPPORT PROTOCOLS
No. 5. Preparation of the assay plate
Prepare a dish of cultured hERα-HeLa-9903 cells
1. Remove the medium from the culture dish with a sterile pipette or sucker.
2. Rinse the cells with 5 mL of PBS.
3. Remove the PBS with a sterile pipette or sucker.
4. Add 2 mL of Trypsin-EDTA solution, enough to coat the bottom of the culture dish, and
then remove the excess.
5. Allow the Trypsin-treated cells to stand for about three minutes in a 5% CO2 incubator at
37°C.
(Monitor the cells under a microscope. The cells are beginning to detach when they appear
rounded.)
6. Tap the dish gently.
7. Wash with 5 mL of 10%FBS-EMEM to remove the adherent cells.
8. Count the number of cells.
9. Dilute the cell suspension with 10%FBS-EMEM to obtain a final cell density of 1 x 10⁵
cells/mL.
10. Add 100µL of cell suspension into each well of a 96-well assay plate (Nunc #136102 or
an equivalent).
11. Incubate the cell in a 5% CO2 incubator at 37°C for three hours.
12. Proceed to chemical exposure.
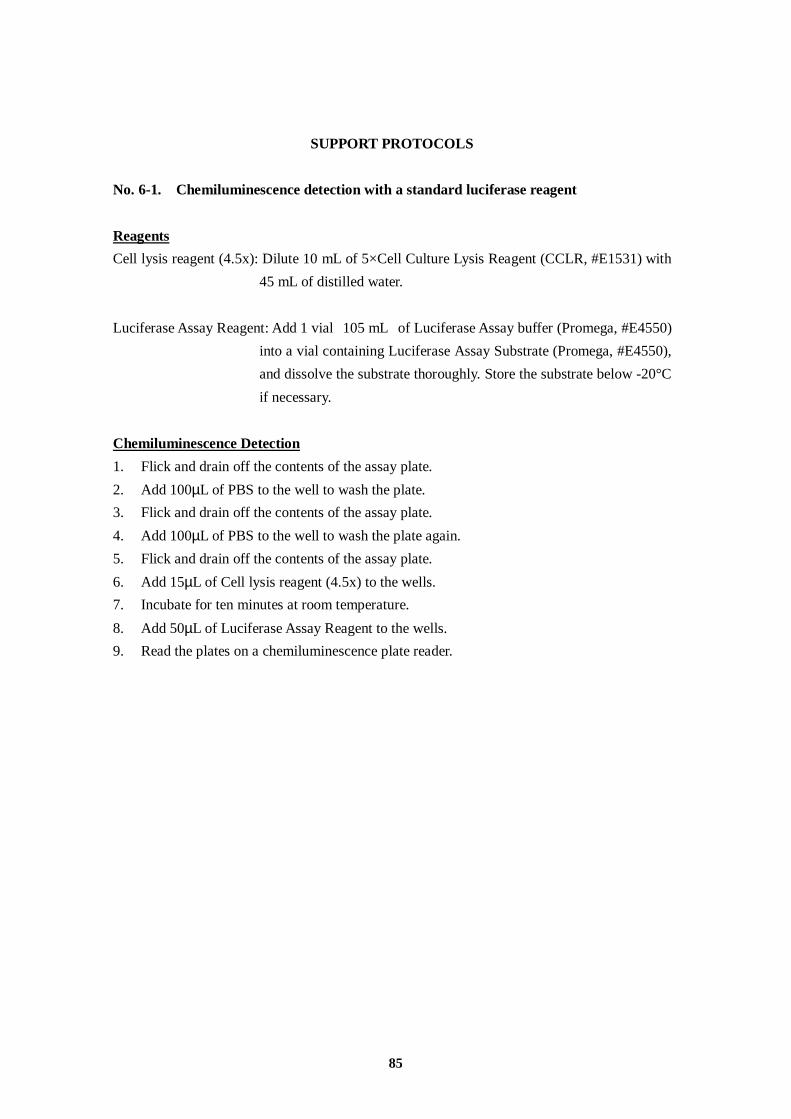
85
SUPPORT PROTOCOLS
No. 6-1. Chemiluminescence detection with a standard luciferase reagent
Reagents
Cell lysis reagent (4.5x): Dilute 10 mL of 5×Cell Culture Lysis Reagent (CCLR, #E1531) with
45 mL of distilled water.
Luciferase Assay Reagent: Add 1 vial105 mL of Luciferase Assay buffer (Promega, #E4550)
into a vial containing Luciferase Assay Substrate (Promega, #E4550),
and dissolve the substrate thoroughly. Store the substrate below -20°C
if necessary.
Chemiluminescence Detection
1. Flick and drain off the contents of the assay plate.
2. Add 100µL of PBS to the well to wash the plate.
3. Flick and drain off the contents of the assay plate.
4. Add 100µL of PBS to the well to wash the plate again.
5. Flick and drain off the contents of the assay plate.
6. Add 15µL of Cell lysis reagent (4.5x) to the wells.
7. Incubate for ten minutes at room temperature.
8. Add 50µL of Luciferase Assay Reagent to the wells.
9. Read the plates on a chemiluminescence plate reader.

86
SUPPORT PROTOCOLS
No. 6-2. Chemiluminescence detection with a luciferase reagent using the Steady-Glo
Luciferase Assay System
Reagents
Luciferase Assay Reagent: Add 1 vial100 mL of Luciferase Assay buffer into a vial
containing Luciferase Assay Substrate (Promega, #E2520), and
dissolve the substrate thoroughly. Store the substrate below -20°C if
necessary.
Chemiluminescence Detection
1. Remove 50µL of the assay medium from all wells of the assay plate.
2. Add 100µL of the Luciferase Assay Reagent to wells.
3. Allow to stand for five minutes.
4. Read the plates on a chemiluminescence plate reader.

87
APPENDIX 4 Consideration of the edge effects on assay system
Masahiro Takeyoshi, Ph.D
CERI, Japan
In some assay systems using microtiter plates, an edge effect could not be ignored
because of differences among wells located on the edge and center of the assay plate with
regard to the evaporative loss of medium and efficacy of gas exchange, etc. In the case that
clear edge effects would be expected, wells on edge should not be used for the assay. We have
conducted some experiments to ensure the edge effects on the assay system.
1) Experiment 1
-The distribution of luminescent intensity in a assay plate were examined by measuring
the chemiluminescence signal of all the wells on a assay plate stimulated with the positive
control substance, 100 pM of E2 or the vehicle (dimethylsulphoxide, DMSO, final
concentration at 0.1%). This experiment was conducted according to the SOP attached in
APPENDIX 3. For this experiment, two assay plates were prepared and each plate was
treated with 100pM of E2 or vehicle (DMSO) only.
Data obtained in this experiment were shown in Table 1-1 and 1-2 for the vehicle
treated and 100 pM of E2 treated plates, respectively, and distributions of the signals
summarized by A-H rows were shown in Figure 1.
To ensure the edge effect, we analyzed the results by Tukey’s multiple comparison test,
and no significant differences were noted between any combination of two rows within the
assay plate treated with 100pM of E2 (Table 2). There was no edge effect like tendency with
regard to the signals assessed by rows.
Table 1-1 The raw data of the luminescence intensity of each well in vehicle treated plate
1 2 3 4 5 6 7 8 9 10 11 12A 86365 79024 76496 83248 85988 81890 93131 88834 87276 78168 76700 80736B 80704 76268 70380 73748 81874 86122 84618 84650 76936 74563 68252 73993C 76433 72350 70490 74196 82125 81011 85254 82163 82506 76684 75183 81209D 79746 78694 76991 82612 81120 77509 81919 83770 85702 85205 77328 89445E 82808 84465 84151 88399 85713 78082 78306 84129 84610 87496 89380 93677F 84387 84591 87252 87566 81882 73293 77703 82392 82335 86526 87529 89918G 87802 83955 88155 86098 79307 80539 88630 82832 82424 86037 89282 98113H 91484 85855 90950 96438 83853 84340 94427 86673 88703 87121 94248 100445
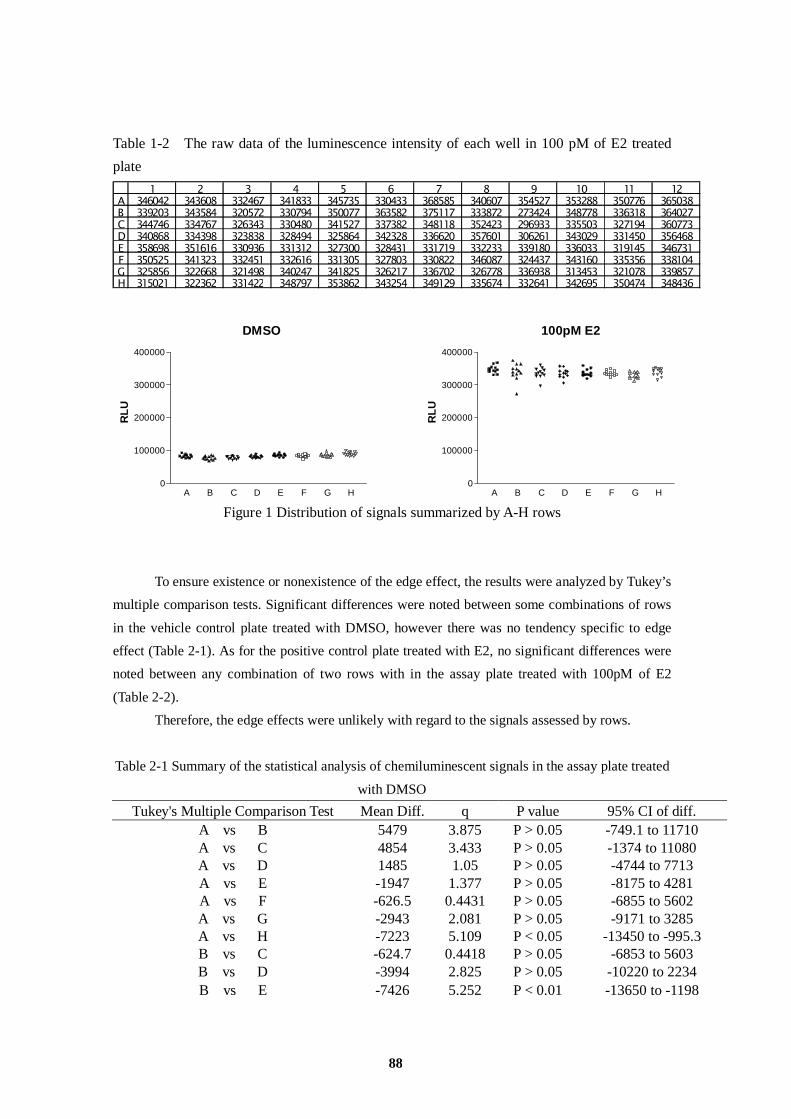
88
Table 1-2 The raw data of the luminescence intensity of each well in 100 pM of E2 treated
plate
1 2 3 4 5 6 7 8 9 10 11 12A 346042 343608 332467 341833 345735 330433 368585 340607 354527 353288 350776 365038B 339203 343584 320572 330794 350077 363582 375117 333872 273424 348778 336318 364027C 344746 334767 326343 330480 341527 337382 348118 352423 296933 335503 327194 360773D 340868 334398 323838 328494 325864 342328 336620 357601 306261 343029 331450 356468E 358698 351616 330936 331312 327300 328431 331719 332233 339180 336033 319145 346731F 350525 341323 332451 332616 331305 327803 330822 346087 324437 343160 335356 338104G 325856 322668 321498 340247 341825 326217 336702 326778 336938 313453 321078 339857H 315021 322362 331422 348797 353862 343254 349129 335674 332641 342695 350474 348436
DMSO
A B C D E F G H 0
100000
200000
300000
400000
RL
U
100pM E2
A B C D E F G H 0
100000
200000
300000
400000
RL
U
Figure 1 Distribution of signals summarized by A-H rows
To ensure existence or nonexistence of the edge effect, the results were analyzed by Tukey’s
multiple comparison tests. Significant differences were noted between some combinations of rows
in the vehicle control plate treated with DMSO, however there was no tendency specific to edge
effect (Table 2-1). As for the positive control plate treated with E2, no significant differences were
noted between any combination of two rows with in the assay plate treated with 100pM of E2
(Table 2-2).
Therefore, the edge effects were unlikely with regard to the signals assessed by rows.
Table 2-1 Summary of the statistical analysis of chemiluminescent signals in the assay plate treated
with DMSO
Tukey's Multiple Comparison Test Mean Diff. q P value 95% CI of diff. A vs B 5479 3.875 P > 0.05 -749.1 to 11710 A vs C 4854 3.433 P > 0.05 -1374 to 11080 A vs D 1485 1.05 P > 0.05 -4744 to 7713 A vs E -1947 1.377 P > 0.05 -8175 to 4281 A vs F -626.5 0.4431 P > 0.05 -6855 to 5602 A vs G -2943 2.081 P > 0.05 -9171 to 3285 A vs H -7223 5.109 P < 0.05 -13450 to -995.3 B vs C -624.7 0.4418 P > 0.05 -6853 to 5603 B vs D -3994 2.825 P > 0.05 -10220 to 2234 B vs E -7426 5.252 P < 0.01 -13650 to -1198

89
B vs F -6106 4.318 P > 0.05 -12330 to 122.6 B vs G -8422 5.956 P < 0.01 -14650 to -2194 B vs H -12700 8.983 P < 0.001 -18930 to -6474 C vs D -3370 2.383 P > 0.05 -9598 to 2858 C vs E -6801 4.81 P < 0.05 -13030 to -572.9 C vs F -5481 3.876 P > 0.05 -11710 to 747.2 C vs G -7798 5.515 P < 0.01 -14030 to -1569 C vs H -12080 8.542 P < 0.001 -18310 to -5850 D vs E -3431 2.427 P > 0.05 -9659 to 2797 D vs F -2111 1.493 P > 0.05 -8339 to 4117 D vs G -4428 3.131 P > 0.05 -10660 to 1800 D vs H -8708 6.158 P < 0.01 -14940 to -2480 E vs F 1320 0.9336 P > 0.05 -4908 to 7548 E vs G -996.5 0.7047 P > 0.05 -7225 to 5232 E vs H -5277 3.732 P > 0.05 -11500 to 951.3 F vs G -2317 1.638 P > 0.05 -8545 to 3911 F vs H -6597 4.665 P < 0.05 -12830 to -368.8 G vs H -4280 3.027 P > 0.05 -10510 to 1948
Table 2-2 Summary of the statistical analysis of chemiluminescent signals in the assay plate treated
with E2
Tukey's Multiple Comparison Test Mean Diff. q P value 95% CI of diff. A vs B 7799 1.854 P > 0.05 -10730 to 26320 A vs C 11400 2.71 P > 0.05 -7129 to 29920 A vs D 12140 2.887 P > 0.05 -6382 to 30670 A vs E 11630 2.766 P > 0.05 -6891 to 30160 A vs F 11580 2.753 P > 0.05 -6946 to 30100 A vs G 18320 4.355 P > 0.05 -206.6 to 36840 A vs H 8264 1.965 P > 0.05 -10260 to 26790 B vs C 3597 0.8551 P > 0.05 -14930 to 22120 B vs D 4344 1.033 P > 0.05 -14180 to 22870 B vs E 3835 0.9117 P > 0.05 -14690 to 22360 B vs F 3780 0.8987 P > 0.05 -14750 to 22310 B vs G 10520 2.501 P > 0.05 -8006 to 29040 B vs H 465.1 0.1106 P > 0.05 -18060 to 18990 C vs D 747.5 0.1777 P > 0.05 -17780 to 19270 C vs E 237.9 0.05657 P > 0.05 -18290 to 18760 C vs F 183.3 0.04359 P > 0.05 -18340 to 18710 C vs G 6923 1.646 P > 0.05 -11600 to 25450 C vs H -3132 0.7446 P > 0.05 -21660 to 15390 D vs E -509.6 0.1212 P > 0.05 -19030 to 18020 D vs F -564.2 0.1341 P > 0.05 -19090 to 17960 D vs G 6175 1.468 P > 0.05 -12350 to 24700 D vs H -3879 0.9223 P > 0.05 -22400 to 14650 E vs F -54.59 0.01298 P > 0.05 -18580 to 18470 E vs G 6685 1.589 P > 0.05 -11840 to 25210 E vs H -3369 0.8011 P > 0.05 -21890 to 15160 F vs G 6739 1.602 P > 0.05 -11790 to 25260

90
F vs H -3315 0.7881 P > 0.05 -21840 to 15210 G vs H -10050 2.391 P > 0.05 -28580 to 8471
2) Experiment 2
The differences in dose responsiveness of positive control substance (E2) in
concentration range of 10-13-10-7 M were tested twice. This experiment was also conducted
according to the SOP attached in APPENDIX 3. The plate format used for this experiment is as
shown below. PC50 values were calculated according to the SOP in APPENDIX 3. Data
obtained in this experiment were shown in Figure 2.
Edge Center Center Edge Series-1 Series-2 Series-3 Seris-4 1 2 3 4 5 6 7 8 9 10 11 12 A 100 nM → → → → → → → → → → → B 10 nM → → → → → → → → → → → C 1 nM → → → → → → → → → → → D 100 pM → → → → → → → → → → → E 10 pM → → → → → → → → → → → F 1 pM → → → → → → → → → → → G 0.1 pM → → → → → → → → → → → H VC → → → → → PC → → → → →
Edge Center1.0×10 -12
1.0×10 -11
PC
50 (
M)
Figure 2 Distribution of PC50 values assessed by their location on the assay plate
PC50 values of E2 located in edge and center of the plate were 3.04-5.21 pM and 3.07-4.44
pM, respectively. Moreover, statistical analysis revealed that there was no significant
difference between the assay area located in the edge and center of the assay plate (Unpaired
t-test).
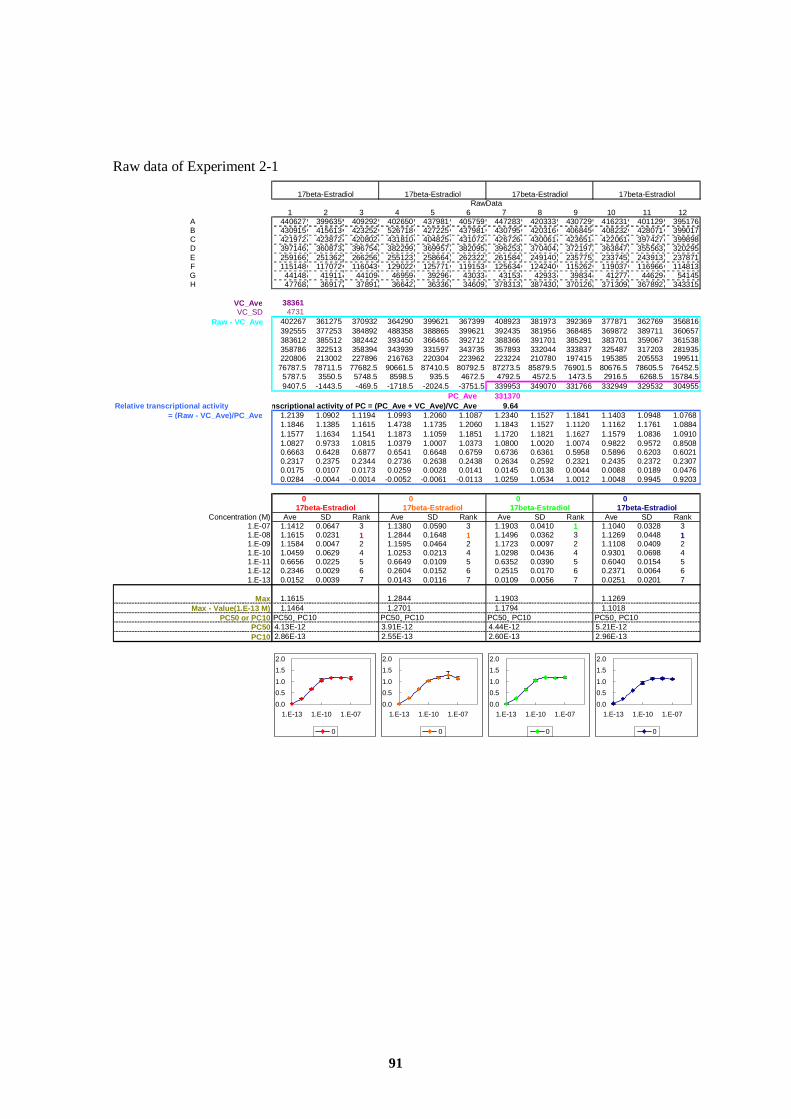
91
Raw data of Experiment 2-1
1 2 3 4 5 6 7 8 9 10 11 12A 440627 399635 409292 402650 437981 405759 447283 420333 430729 416231 401129 395176B 430915 415613 423252 526718 427225 437981 430795 420316 406845 408232 428071 399017C 421972 423872 420802 431810 404825 431072 426726 430061 423651 422061 397427 399898D 397146 360873 396754 382299 369957 382095 396253 370404 372197 363847 355563 320295E 259166 251362 266256 255123 258664 262322 261584 249140 235775 233745 243913 237871F 115148 117072 116043 129022 125771 119153 125634 124240 115262 119037 116966 114813G 44148 41911 44109 46959 39296 43033 43153 42933 39834 41277 44629 54145H 47768 36917 37891 36642 36336 34609 378313 387430 370126 371309 367892 343315
VC_Ave 38361VC_SD 4731
Raw - VC_Ave 402267 361275 370932 364290 399621 367399 408923 381973 392369 377871 362769 356816392555 377253 384892 488358 388865 399621 392435 381956 368485 369872 389711 360657383612 385512 382442 393450 366465 392712 388366 391701 385291 383701 359067 361538358786 322513 358394 343939 331597 343735 357893 332044 333837 325487 317203 281935220806 213002 227896 216763 220304 223962 223224 210780 197415 195385 205553 199511
76787.5 78711.5 77682.5 90661.5 87410.5 80792.5 87273.5 85879.5 76901.5 80676.5 78605.5 76452.55787.5 3550.5 5748.5 8598.5 935.5 4672.5 4792.5 4572.5 1473.5 2916.5 6268.5 15784.59407.5 -1443.5 -469.5 -1718.5 -2024.5 -3751.5 339953 349070 331766 332949 329532 304955
PC_Ave 331370Relative transcriptional activity anscriptional activity of PC = (PC_Ave + VC_Ave)/VC_Ave 9.64
= (Raw - VC_Ave)/PC_Ave 1.2139 1.0902 1.1194 1.0993 1.2060 1.1087 1.2340 1.1527 1.1841 1.1403 1.0948 1.07681.1846 1.1385 1.1615 1.4738 1.1735 1.2060 1.1843 1.1527 1.1120 1.1162 1.1761 1.08841.1577 1.1634 1.1541 1.1873 1.1059 1.1851 1.1720 1.1821 1.1627 1.1579 1.0836 1.09101.0827 0.9733 1.0815 1.0379 1.0007 1.0373 1.0800 1.0020 1.0074 0.9822 0.9572 0.85080.6663 0.6428 0.6877 0.6541 0.6648 0.6759 0.6736 0.6361 0.5958 0.5896 0.6203 0.60210.2317 0.2375 0.2344 0.2736 0.2638 0.2438 0.2634 0.2592 0.2321 0.2435 0.2372 0.23070.0175 0.0107 0.0173 0.0259 0.0028 0.0141 0.0145 0.0138 0.0044 0.0088 0.0189 0.04760.0284 -0.0044 -0.0014 -0.0052 -0.0061 -0.0113 1.0259 1.0534 1.0012 1.0048 0.9945 0.9203
0 0 0 0
Concentration (M) Ave SD Rank Ave SD Rank Ave SD Rank Ave SD Rank1.E-07 1.1412 0.0647 3 1.1380 0.0590 3 1.1903 0.0410 1 1.1040 0.0328 31.E-08 1.1615 0.0231 1 1.2844 0.1648 1 1.1496 0.0362 3 1.1269 0.0448 11.E-09 1.1584 0.0047 2 1.1595 0.0464 2 1.1723 0.0097 2 1.1108 0.0409 21.E-10 1.0459 0.0629 4 1.0253 0.0213 4 1.0298 0.0436 4 0.9301 0.0698 41.E-11 0.6656 0.0225 5 0.6649 0.0109 5 0.6352 0.0390 5 0.6040 0.0154 51.E-12 0.2346 0.0029 6 0.2604 0.0152 6 0.2515 0.0170 6 0.2371 0.0064 61.E-13 0.0152 0.0039 7 0.0143 0.0116 7 0.0109 0.0056 7 0.0251 0.0201 7
Max 1.1615 1.2844 1.1903 1.1269Max - Value(1.E-13 M) 1.1464 1.2701 1.1794 1.1018
PC50 or PC10 PC50、PC10 PC50、PC10 PC50、PC10 PC50、PC10PC50 4.13E-12 3.91E-12 4.44E-12 5.21E-12PC10 2.86E-13 2.55E-13 2.60E-13 2.96E-13
RawData
17beta-Estradiol 17beta-Estradiol 17beta-Estradiol 17beta-Estradiol
17beta-Estradiol 17beta-Estradiol 17beta-Estradiol 17beta-Estradiol
0.0
0.5
1.0
1.5
2.0
1.E-13 1.E-10 1.E-07
0
0.0
0.5
1.0
1.5
2.0
1.E-13 1.E-10 1.E-07
0
0.0
0.5
1.0
1.5
2.0
1.E-13 1.E-10 1.E-07
0
0.0
0.5
1.0
1.5
2.0
1.E-13 1.E-10 1.E-07
0

92
Raw data of Experiment 2-2
1 2 3 4 5 6 7 8 9 10 11 12A 417623 407102 427390 401056 415118 408177 415155 412447 399360 361752 338430 323728B 432525 399290 398332 405751 410344 408138 404195 401749 391344 383711 361148 325995C 435791 411232 419499 396024 416500 430491 417821 404350 398169 391703 364141 321396D 381765 386704 371174 368269 364571 383540 371594 375149 368177 355489 329860 305095E 272537 275576 276690 266649 271155 270315 276066 264992 259749 240602 243147 248553F 128551 123589 118179 136025 125818 120409 126409 116077 121630 117219 116420 100396G 26930 25690 27637 27880 23460 25588 28304 27643 24903 24602 27847 31158H 18160 16127 16017 16417 16017 17273 403967 389615 367452 375027 357732 364997
VC_Ave 16669VC_SD 871
Raw - VC_Ave 400955 390434 410722 384388 398450 391509 398487 395779 382692 345084 321762 307060415857 382622 381664 389083 393676 391470 387527 385081 374676 367043 344480 309327419123 394564 402831 379356 399832 413823 401153 387682 381501 375035 347473 304728365097 370036 354506 351601 347903 366872 354926 358481 351509 338821 313192 288427255869 258908 260022 249981 254487 253647 259398 248324 243081 223934 226479 231885111883 106921 101511 119357 109150 103741 109741 99408.5 104962 100551 99751.5 83727.5
10261.5 9021.5 10968.5 11211.5 6791.5 8919.5 11635.5 10974.5 8234.5 7933.5 11178.5 14489.51491.5 -541.5 -651.5 -251.5 -651.5 604.5 387299 372947 350784 358359 341064 348329
PC_Ave 359797Relative transcriptional activity anscriptional activity of PC = (PC_Ave + VC_Ave)/VC_Ave 22.59
= (Raw - VC_Ave)/PC_Ave 1.1144 1.0852 1.1415 1.0683 1.1074 1.0881 1.1075 1.1000 1.0636 0.9591 0.8943 0.85341.1558 1.0634 1.0608 1.0814 1.0942 1.0880 1.0771 1.0703 1.0414 1.0201 0.9574 0.85971.1649 1.0966 1.1196 1.0544 1.1113 1.1502 1.1149 1.0775 1.0603 1.0424 0.9657 0.84691.0147 1.0285 0.9853 0.9772 0.9669 1.0197 0.9865 0.9963 0.9770 0.9417 0.8705 0.80160.7111 0.7196 0.7227 0.6948 0.7073 0.7050 0.7210 0.6902 0.6756 0.6224 0.6295 0.64450.3110 0.2972 0.2821 0.3317 0.3034 0.2883 0.3050 0.2763 0.2917 0.2795 0.2772 0.23270.0285 0.0251 0.0305 0.0312 0.0189 0.0248 0.0323 0.0305 0.0229 0.0220 0.0311 0.04030.0041 -0.0015 -0.0018 -0.0007 -0.0018 0.0017 1.0764 1.0365 0.9749 0.9960 0.9479 0.9681
0 0 0 0
Concentration (M) Ave SD Rank Ave SD Rank Ave SD Rank Ave SD Rank1.E-07 1.1137 0.0282 2 1.0880 0.0195 2 1.0904 0.0235 1 0.9023 0.0533 31.E-08 1.0933 0.0541 3 1.0879 0.0064 3 1.0629 0.0190 3 0.9458 0.0808 21.E-09 1.1270 0.0347 1 1.1053 0.0482 1 1.0843 0.0279 2 0.9517 0.0985 11.E-10 1.0095 0.0221 4 0.9879 0.0279 4 0.9866 0.0097 4 0.8713 0.0700 41.E-11 0.7178 0.0060 5 0.7024 0.0067 5 0.6956 0.0232 5 0.6321 0.0113 51.E-12 0.2968 0.0144 6 0.3078 0.0220 6 0.2910 0.0144 6 0.2631 0.0264 61.E-13 0.0280 0.0027 7 0.0249 0.0061 7 0.0286 0.0050 7 0.0311 0.0091 7
Max 1.1270 1.1053 1.0904 0.9517Max - Value(1.E-13 M) 1.0990 1.0803 1.0618 0.9206
PC50 or PC10 PC50、PC10 PC50、PC10 PC50、PC10 PC50、PC10PC50 3.04E-12 3.07E-12 3.29E-12 4.38E-12PC10 2.36E-13 2.26E-13 2.40E-13 2.70E-13
RawData
17beta-Estradiol 17beta-Estradiol 17beta-Estradiol 17beta-Estradiol
17beta-Estradiol 17beta-Estradiol 17beta-Estradiol 17beta-Estradiol
0.0
0.5
1.0
1.5
2.0
1.E-13 1.E-10 1.E-07
0
0.0
0.5
1.0
1.5
2.0
1.E-13 1.E-10 1.E-07
0
0.0
0.5
1.0
1.5
2.0
1.E-13 1.E-10 1.E-07
0
0.0
0.5
1.0
1.5
2.0
1.E-13 1.E-10 1.E-07
0

93
3) Experiment 3
The edge effects at all participating laboratories of inter-lab validation study were
examined by analyzing the dose responsiveness of positive control substance (E2) prepared in
all assay plates, i.e. 9 plates. In this trial, three PC50 values were calculated using the data in
each single column (10, 11, or 12) for each assay plate (Table 3). Then PC50 obtained for each
column were statistically compared by Tukey’s multiple comparison tests for each participating
laboratories.
Consequently, the distributions of the PC50 values obtained for each column in all
participating laboratories showed much the same pattern, and the statistical analysis revealed that
no significant differences between any combinations of PC50 values for each columns (Figure 3).
CERI
10 11 121.0×10 -12
1.0×10 -11
1.0×10 -1
1.0×10 -09
Column
PC
50 (
M)
Sumitomo
10 11 121.0×10 -12
1.0×10 -11
1.0×10 -1
1.0×10 -09
Column
PC
50 (
M)
Kaneka
10 11 121.0×10 -12
1.0×10 -11
1.0×10 -1
1.0×10 -09
Column
PC
50 (
M)
Otsuka
10 11 121.0×10 -12
1.0×10 -11
1.0×10 -1
1.0×10 -09
Column
PC
50 (
M)
Figure 3 Distribution of PC values obtained for each column (10, 11 or 12)

94
Table 3 PC50 values calculated for each column of the assay plates of inter-lab validation study
Plate 10 11 12 10 11 12 10 11 12 10 11 121 1.67E-11 2.24E-11 2.20E-11 8.39E-12 1.18E-11 6.74E-12 6.41E-12 9.30E-12 9.84E-12 3.76E-11 4.04E-11 3.16E-11
Trial 1 2 2.89E-11 1.34E-11 2.34E-11 3.96E-11 2.38E-11 3.20E-11 8.94E-12 7.27E-12 1.12E-11 4.30E-11 3.18E-11 2.73E-113 2.74E-11 2.96E-11 3.40E-11 3.35E-12 1.00E-11 2.97E-11 2.25E-11 2.09E-11 1.68E-11 3.01E-11 5.03E-11 3.92E-111 9.19E-12 1.01E-11 1.22E-11 2.52E-11 1.03E-11 1.08E-11 2.00E-11 2.12E-11 2.61E-11 4.32E-11 4.28E-11 4.05E-11
Trial 2 2 4.89E-12 5.56E-12 8.86E-12 2.88E-11 2.77E-11 2.95E-11 2.88E-11 3.06E-11 3.35E-11 3.07E-11 2.74E-11 3.52E-113 1.25E-11 1.24E-11 1.27E-11 8.11E-12 2.05E-11 2.21E-11 2.78E-11 2.75E-11 2.75E-11 3.15E-11 3.22E-11 1.07E-101 5.96E-12 5.75E-12 1.70E-11 2.86E-12 3.01E-12 1.96E-12 3.65E-11 3.31E-11 3.03E-11 3.40E-11 2.59E-11 2.65E-11
Trial 3 2 3.61E-12 4.02E-12 6.32E-12 4.73E-11 2.24E-11 3.32E-11 4.49E-11 3.93E-11 4.33E-11 2.18E-11 1.89E-11 1.34E-113 4.40E-12 3.49E-12 5.20E-12 2.48E-11 1.84E-11 2.76E-11 2.48E-11 3.01E-11 3.78E-11 1.48E-11 1.43E-11 9.90E-12
Mean 1.26E-11 1.19E-11 1.58E-11 2.09E-11 1.64E-11 2.15E-11 2.45E-11 2.44E-11 2.63E-11 3.18E-11 3.15E-11 3.68E-11SD 9.79E-12 8.95E-12 9.37E-12 1.62E-11 8.05E-12 1.19E-11 1.21E-11 1.07E-11 1.16E-11 9.26E-12 1.15E-11 2.84E-11
CERI Sumitomo Kaneka Otsuka
Conclusions:
Based on the results of experiment 1, 2 and 3, there are no significant edge effects with
regard to the chemilumiscent signals induced by positive control substance (E2) within
laboratory and inter-laboratories. As for the PC50 values calculated from four independent
assay area of the assay plate, statistical analysis showed no significant difference between two
test areas located in the both side (column 1-3 and column 10-12) and other two test areas
located in the center (column 4-6 and column 7-9) of the assay plate. Moreover the
distributions of the PC50 values for E2 obtained for each column (10, 11 or 12) in all
participating laboratories showed much the same pattern, and the statistical analysis revealed
that no significant differences between any combinations of PC50 values for each row.
These results suggest that there is no edge effect that would affect the results for
practical purposes.
95
APPENDIX 5 Standard protocols for detecting of anti-estrogenic activity using the
reporter gene assay
STANDARD PROTOCOLS
for detection of anti-estrogenic activity using the reporter gene assay
Description: This document provides a methodology for detecting the anti-estrogenic activity of
chemicals by the reporter gene assay technique using the hER-HeLa-9903 cell line.
Chemicals Evaluation and Research Institute
CERI-Japan
96
Materials and Methods
1. Test chemicals
Test chemicals should be dissolved in dimethylsulfoxide (DMSO) at a concentration of 10
mM.
2. Competitive substance
17β-Estradiol (E2)
3. Vehicle for chemical stock solutions
Dimethylsulfoxide (DMSO) should be used for the vehicle.
4. Test system and operating procedures
4.1 Cell lines
The hERα-HeLa-9903 stable cell line (Sumitomo Chemicals Co.) will be used for the assay
and the 9903-control cell, which consistently expresses firefly luciferase by the RSV promoter
without stimulation, will be used for evaluating the cell-toxic effect of chemicals when an
anti-estrogenic like effect is observed.
4.2 Cell cultures (See support protocols No.1 – No. 4)
Cells should be maintained in Eagle’s Minimum Essential Medium (EMEM) without phenol
red, supplemented with a 10% dextran-coated-charcoal (DCC)-treated fetal bovine serum
(DCC-FBS), in a CO2 incubator (5% CO2) at 37˚C.
4.3 Preparation of chemicals
All chemicals will be dissolved in DMSO at a concentration of 10 mM, and those solutions
will be serially diluted with the same solvent at a common ratio of 1:10 in order to prepare
stock solutions with concentrations of 1 mM, 100 µM, 10 µM, 1 µM, 100 nM and 10 nM.
4.4 Preparation of cells
Assay plates will be prepared according to support protocol No. 5.
4.5 Reagents for the luciferase assay
A commercial luciferase assay reagent, Steady-Glo Luciferase Assay System (Promega,
E2510 and its equivalents) or a standard luciferase assay system (Promega, E1500 and its
equivalents) will be used in this study. A bottle of Luciferase Assay Substrate is dissolved with
the Luciferase Assay Buffer. The dissolved substrate should either be used immediately or
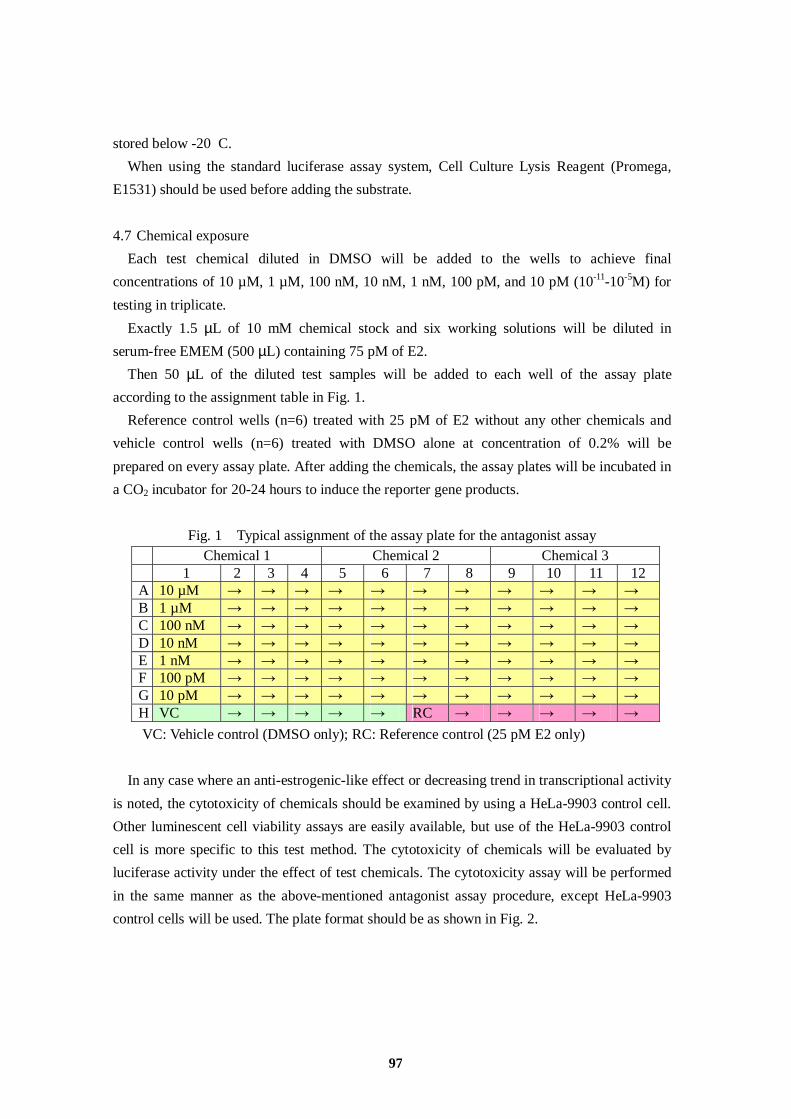
97
stored below -20C.
When using the standard luciferase assay system, Cell Culture Lysis Reagent (Promega,
E1531) should be used before adding the substrate.
4.7 Chemical exposure
Each test chemical diluted in DMSO will be added to the wells to achieve final
concentrations of 10 µM, 1 µM, 100 nM, 10 nM, 1 nM, 100 pM, and 10 pM (10-11-10-5M) for
testing in triplicate.
Exactly 1.5 µL of 10 mM chemical stock and six working solutions will be diluted in
serum-free EMEM (500 µL) containing 75 pM of E2.
Then 50 µL of the diluted test samples will be added to each well of the assay plate
according to the assignment table in Fig. 1.
Reference control wells (n=6) treated with 25 pM of E2 without any other chemicals and
vehicle control wells (n=6) treated with DMSO alone at concentration of 0.2% will be
prepared on every assay plate. After adding the chemicals, the assay plates will be incubated in
a CO2 incubator for 20-24 hours to induce the reporter gene products.
Fig. 1 Typical assignment of the assay plate for the antagonist assay Chemical 1 Chemical 2 Chemical 3 1 2 3 4 5 6 7 8 9 10 11 12 A 10 µM → → → → → → → → → → → B 1 µM → → → → → → → → → → → C 100 nM → → → → → → → → → → → D 10 nM → → → → → → → → → → → E 1 nM → → → → → → → → → → → F 100 pM → → → → → → → → → → → G 10 pM → → → → → → → → → → → H VC → → → → → RC → → → → →
VC: Vehicle control (DMSO only); RC: Reference control (25 pM E2 only)
In any case where an anti-estrogenic-like effect or decreasing trend in transcriptional activity
is noted, the cytotoxicity of chemicals should be examined by using a HeLa-9903 control cell.
Other luminescent cell viability assays are easily available, but use of the HeLa-9903 control
cell is more specific to this test method. The cytotoxicity of chemicals will be evaluated by
luciferase activity under the effect of test chemicals. The cytotoxicity assay will be performed
in the same manner as the above-mentioned antagonist assay procedure, except HeLa-9903
control cells will be used. The plate format should be as shown in Fig. 2.

98
Fig. 2 Typical assignment of the assay plate for the cytotoxicity 1 2 3 4 5 6 7 8 9 10 11 12 A 10 µM → → → → → → → → → → → B 1 µM → → → → → → → → → → → C 100 nM → → → → → → → → → → → D 10 nM → → → → → → → → → → → E 1 nM → → → → → → → → → → → F 100 pM → → → → → → → → → → → G 10 pM → → → → → → → → → → → H VC → → → → → → → → → → →
VC: Vehicle control (DMSO only)
4.8 Luciferase assay (See support protocol No. 6)
Luciferase activity will be measured with the luciferase assay reagent and a luminometer in
accordance with the manufacturer’s instructions.
5. Analysis of data The luminescence signal data will be processed, and the average for the vehicle control
wells will be calculated. The integrated value for each test well will be divided by the average
integrated value of the vehicle control wells in order to obtain individual relative
transcriptional activities. Then the average transcriptional activity will be calculated for each
concentration of the test chemical. Next the 50% inhibitory concentration against mean
transcriptional activity induced by the reference wells (25 pM of E2) will be calculated and
used for evaluating the anti-estrogenic activities of chemicals.
The above-described calculations will be made using commercial software with Hill’s
logistic equation showing below:
Y=Bottom + (Top-Bottom)/(1+10^((LogEC50-X)*HillSlope))
* Where X is the logarithm of concentration, Y is the response and Y starts at the Bottom
and goes to the Top with a sigmoid shape.
In the cytotoxicity test, the luminescence signal data will be also processed, and the average
of the vehicle control wells will be calculated. The integrated value for each test well will be
divided by the average integrated value of the vehicle control wells in order to obtain
individual relative transcriptional activities. When the transcriptional activities are reduced less
than 80% of the mean transcriptional activities of the vehicle control wells, the concentration
should be regarded as a cytotoxic concentration and thereby excluded for evaluation of any
anti-estrogenic effects.

99
SUPPORT PROTOCOLS
No. 1. Preparation of the medium
Reagents
Eagle’s Minimal Essential medium without neutral red (Nissui Pharmaceutical Co.).
10% Sodium Bicarbonate (NaHCO3)
Dissolve ten grams of NaHCO3 to a final volume of 100 mL with water. Next, the solution
should be sterilized using a vacuum-driven bottle-top sterilization filter unit and stored at
room temperature.
3% Glutamine
Dissolve three grams of glutamine to a final volume of 100 mL with water. Next, the
solution should be sterilized using a vacuum-driven bottle-top sterilization filter unit.
Prepared 3% Glutamine should be stored in aliquots lower than -20°C.
Dextran-coated charcoal (DCC)-treated fetal bovine serum (DCC-FBS)
Prepared and provided by CERI-Japan.
Preparation of EMEM *
Add the following reagents into a 1L conical glass flask and then add Milli-Q water to
bring the total volume to one liter:
・9.4 grams of pre-made powder medium
・18 mL of 10% Sodium Bicarbonate
・12 mL of 3% Glutamine
Preparation of EMEM containing 75pM of E2
Add 75nM of E2 to EMEM at a proportion of 1:1000 just prior to use.
Preparation of 10%FBS-EMEM *
Add 56 mL of dextran-coated charcoal (DCC)-treated fetal bovine serum
(DCC-FBS) to 500 mL EMEM. * Both EMEM and 10%FBS-EMEM should be stored in a refrigerator after being sterilized with a vacuum-driven bottle-top sterilization filter unit.

100
SUPPORT PROTOCOLS
No. 2. Reconstitution of cells from frozen stock
1. Remove the vial from the liquid nitrogen or the freezer and immediately transfer it to a
37°C water bath.
2. While holding the tip of the vial, gently agitate the vial.
3. When completely thawed, transfer the cell stock into 5 mL pre-warmed 10%FBS-EMEM
in a 15 mL conical tube.
4. Centrifuge the tube at 1100 rpm (200-300 x g) for five minutes, and remove the
supernatant carefully.
5. Resuspend the cell with 10 mL of 10%FBS-EMEM and place in a 90 mm culture dish.
6. Incubate the cells in a 5% CO2 incubator at 37°C.

101
SUPPORT PROTOCOLS
No. 3. Propagation
1. Remove the medium from the culture dish with a sterile pipette or sucker.
2. Rinse the cells with 5 mL of PBS.
3. Remove the PBS with a sterile pipette or sucker.
4. Add 2 mL of Trypsin-EDTA solution (0.25% Trypsin + 0.02%EDTA/PBS), enough to
coat the bottom of the culture dish, and then remove the excess.
5. Allow the Trypsin-treated cells to stand for about three minutes in a 5% CO2 incubator at
37°C.
6. (Monitor the cells under a microscope. The cells are beginning to detach when they appear
rounded.)
7. Tap the dish gently.
8. Wash with 5 mL of 10%FBS-EMEM to remove the adherent cells.
9. Count the number of cells.
10. Dilute the cell suspension with 10%FBS-EMEM to 0.4-1.0 x 10⁵ cells/mL.
11. Place 10 mL of cell suspension in a 90 mm culture dish.
12. Incubate the cells in a 5% CO2 incubator at 37°C.

102
SUPPORT PROTOCOLS
No. 4. Preparation of frozen stock
1. Remove the medium from the culture dish with a sterile pipette or sucker.
2. Rinse the cells with 5 mL of PBS.
3. Remove the PBS with a sterile pipette or sucker.
4. Add 2 mL of Trypsin-EDTA solution, enough to coat the bottom of the culture dish, and
then remove the excess.
5. Allow the Trypsin-treated cell to stand for about three minutes in a 5% CO2 incubator at
37°C.
6. (Monitor the cells under a microscope. The cells are beginning to detach when they appear
rounded.)
7. Tap the dish gently.
8. Wash with 5 mL of 10%FBS-EMEM to remove the adherent cells.
9. Count the number of cells.
10. Centrifuge the tube at 1100 rpm (200-300 x g) for five minutes, and remove the
supernatant carefully.
11. Add Cell-Banker* (Juji Field Inc.) and resuspend the cell at density of ca. 1 x 10⁴
cells/mL.
12. Make 1 mL aliquots of cell stock.
13. Freeze and store the cell stock below -80°C.**
* A conventional freeze medium (90% FBS/10% DMSO) can be used in place of Cell-Banker.
** Storage in liquid nitrogen would be preferable for long-term storage (longer than three
months).

103
5/2/2006
SUPPORT PROTOCOLS
No. 5 Preparation of the assay plate
Prepare a dish of cultured hERα-HeLa-9903 cells
1. Remove the medium from the culture dish with a sterile pipette or sucker.
2. Rinse the cells with 5 mL of PBS.
3. Remove the PBS with a sterile pipette or sucker.
4. Add 2 mL of Trypsin-EDTA solution, enough to coat the bottom of the culture dish, and
then remove the excess.
5. Allow the Trypsin-treated cell to stand for about three minutes in a 5% CO2 incubator at
37°C.
6. (Monitor the cells under microscope. The cells are beginning to detach when they appear
rounded.)
7. Tap the dish gently.
8. Wash with 5 mL of 10%FBS-EMEM to remove the adherent cells and transfer the cell
suspension to a centrifuge tube.
9. Count the number of cells.
10. Centrifuge the tube at 1100 rpm (200-300 x g) for five minutes, and remove the
supernatant carefully.
11. Resuspend the cell with 10%FBS-EMEM to obtain a final cell density of 1 x 10⁵ cells/mL.
12. Add 100 µL of cell suspension into each well of a 96-well assay plate (Nunc #136102 or
its equivalents).
13. Incubate the cells in a 5% CO2 incubator at 37°C for three hours.
14. Proceed to chemical exposure.

104
SUPPORT PROTOCOLS
No. 6-1. Chemiluminescence detection with a standard luciferase reagent
Reagents
Cell lysis reagent (4.5x): Dilute 10 mL of 5×Cell Culture Lysis Reagent (CCLR, #E1531) with
45 mL of distilled water.
Luciferase Assay Reagent: Add 1 vial105 mL of Luciferase Assay buffer (Promega, #E4550)
into a vial containing Luciferase Assay Substrate (Promega, #E4550),
and dissolve the substrate thoroughly. Store the substrate below -20°C
if necessary.
Chemiluminescence detection
1. Flick and drain off the contents of the assay plate.
2. Add 100 µL of PBS to the well to wash the plate.
3. Again flick and drain off the contents of the assay plate.
4. Add 100µL of PBS to the well to wash the plate again.
5. Again flick and drain off the contents of the assay plate.
6. Add 15 µL of cell lysis reagent (4.5x) to wells.
7. Incubate for ten minutes at room temperature.
8. Add 50µL of Luciferase Assay Reagent to wells.
9. Read the plates on a chemiluminescence plate reader.

105
SUPPORT PROTOCOLS
No. 6-2. Chemiluminescence detection with luciferase reagent using Steady-Glo
Luciferase Assay System
Reagents
Luciferase Assay Reagent: Add 1 vial (100 mL) of Luciferase Assay buffer into a vial
containing Luciferase Assay Substrate (Promega, #E2520), and
dissolve the substrate thoroughly. Store the substrate below -20°C if
necessary.
Chemiluminescence Detection
1. Remove 50 µL of assay medium from all wells of assay plate.
2. Add 100 µL of Luciferase Assay Reagent to the wells.
3. Allow to stand for five minutes.
4. Read plates on a Chemiluminescence plate reader.


107
Appendix 6. Independent statistical analyses for inter-laboratory validation study
SUMMARY
As part of the preliminary peer review, further independent statistical analyses were conducted to
examine inter-laboratory variability, and are provided in this appendix.
The statistical data analyses compare very favourably. In both cases, the assay demonstrated
acceptable overall within-lab variability as well as between-lab variability. However, while the
independent analyses are more complex and may yield greater precision, the precision does make a
sufficient difference to the more practical statistical method used by CERI. The CERI PC50
measure also has the added benefit in being able to be obtained with only two data points. The
PC50 values can also be calculated in cases of weak estrogenic compounds as the relative
estrogenic activity to the natural estrogen. For this reason the CERI method is the method of choice
as it is more accessible and user friendly for regulatory purposes.
INTRODUCTION
This appendix includes preliminary results of the additional analyses proposed and performed by a
member of the preliminary peer review panel. The analyses will be finalized in the future and so the
content of this appendix should be taken as provisional, interim results. Analytical strategies
employed in this appendix have been developed and used for the data from certain in vitro assays
other than the transfected ER gene reporter assay. As the attempt to adapt the strategies to the
present data set was made, it was realized some additional considerations specific to the transfected
ER gene reporter assay was necessary. Some tentative decisions were made based on these
considerations, but they are subject to further changes in the future.
A version of assay variability assessment is already included in the body of the report. Specifically,
overall within-lab and between-lab variability were estimated and interpreted. The additional
analyses herein were performed with similar underling goals in mind although employing
alternative methods at two levels: in generating run-specific estimates; and in further summarizing
these run-specific estimates for each lab (and further summarizing lab-specific estimates obtained
thereby across labs). As such, there are up to a total of four different combinations of methods
applied to each parameter of interest as summarized below (detailed explanation for each of these
procedures will be given later).
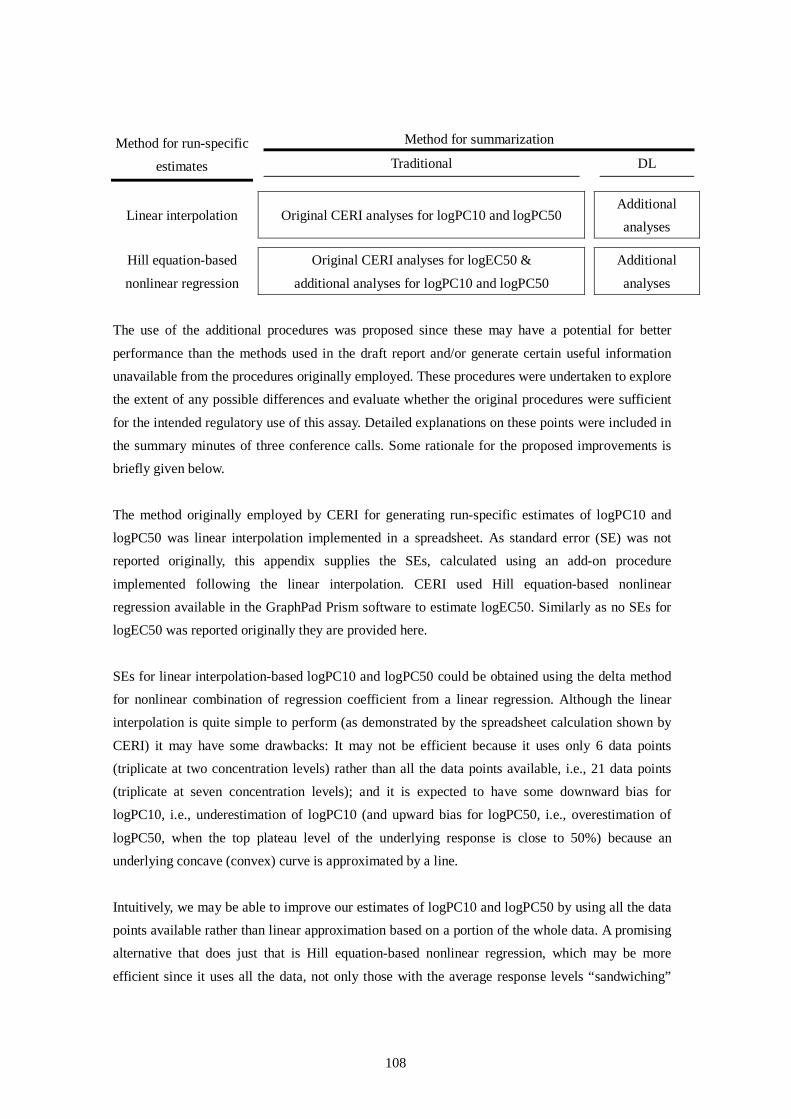
108
Method for summarization Method for run-specific
estimates Traditional DL
Linear interpolation Original CERI analyses for logPC10 and logPC50 Additional
analyses
Hill equation-based
nonlinear regression
Original CERI analyses for logEC50 &
additional analyses for logPC10 and logPC50
Additional
analyses
The use of the additional procedures was proposed since these may have a potential for better
performance than the methods used in the draft report and/or generate certain useful information
unavailable from the procedures originally employed. These procedures were undertaken to explore
the extent of any possible differences and evaluate whether the original procedures were sufficient
for the intended regulatory use of this assay. Detailed explanations on these points were included in
the summary minutes of three conference calls. Some rationale for the proposed improvements is
briefly given below.
The method originally employed by CERI for generating run-specific estimates of logPC10 and
logPC50 was linear interpolation implemented in a spreadsheet. As standard error (SE) was not
reported originally, this appendix supplies the SEs, calculated using an add-on procedure
implemented following the linear interpolation. CERI used Hill equation-based nonlinear
regression available in the GraphPad Prism software to estimate logEC50. Similarly as no SEs for
logEC50 was reported originally they are provided here.
SEs for linear interpolation-based logPC10 and logPC50 could be obtained using the delta method
for nonlinear combination of regression coefficient from a linear regression. Although the linear
interpolation is quite simple to perform (as demonstrated by the spreadsheet calculation shown by
CERI) it may have some drawbacks: It may not be efficient because it uses only 6 data points
(triplicate at two concentration levels) rather than all the data points available, i.e., 21 data points
(triplicate at seven concentration levels); and it is expected to have some downward bias for
logPC10, i.e., underestimation of logPC10 (and upward bias for logPC50, i.e., overestimation of
logPC50, when the top plateau level of the underlying response is close to 50%) because an
underlying concave (convex) curve is approximated by a line.
Intuitively, we may be able to improve our estimates of logPC10 and logPC50 by using all the data
points available rather than linear approximation based on a portion of the whole data. A promising
alternative that does just that is Hill equation-based nonlinear regression, which may be more
efficient since it uses all the data, not only those with the average response levels “sandwiching”

109
the specific levels of interest (i.e., 10% or 50%). It reflects the underlying biological model more
properly, thereby providing potentially more accurate logPC10 or logPC50. In CERI’s original
analysis logEC50 values already were estimated using a version of Hill equation-based nonlinear
regression. logPC50 and logEC50 differ from each other in that the former corresponds to
log10(concentration) that yields 50% of the response given by a standard compound at a
pre-specified concentration while the latter corresponds to log10(concentration) that yields 50% of
the response the maximum response level the test chemical produces. In this document log10 may
be expressed simply as “log”.
It was proposed that the DerSimonian-Laird (DL) random effects model be used as an alternative
procedure for summarizing the run-specific estimates for each lab (and further summarizing the
lab-specific estimates across labs). This procedure takes SE of individual run estimates into account
and provides not only estimates of the overall between-run (lab) variability but also estimates of
intrinsic between-run (lab) variability. The original analyses by CERI used what we call
“traditional” in this appendix.
To sum, several combinations of parameters of interest and analytical procedures are performed,
which are summarized below.
Method for summary
Traditional DL
Parameter of interest
Estimation
method for
individual run logPC10 logPC50 logEC50 logPC10 logPC50 logEC50
Linear
interpolation
Tables 17,
19
Tables 17,
18 N.A.
Tables 6.1,
6.2
Tables 6.1,
6.3 N.A.
Hill
equation-based
nonlinear
regression
Tables 6.4,
6.5
Tables 6.4,
6.6
Tables 17,
20, 6.4, 6.7
Tables 6.8,
6.9
Tables 6.8,
6.10
Tables 6.8,
6.11
Methods
As an alternative method for obtaining run-specific summary for logPC10 and logPC50, the use of
Hill equation-based nonlinear regression was proposed. A version of the equation with four
parameters, i.e., bottom, top, slope, and logPC10 (or logPC50), with a constraint of bottom = 0, was

110
initially proposed. The constraint of bottom = 0 seems justified since an appropriate blank value
was subtracted from all response values.
After some exploratory analyses of the CERI data, it was decided to include another constraint of
slope >= 0. This additional constraint keeps nonsensical logPC10 or logPC50 accompanied by a
negative slope from being reported. Other constraints may also be used to keep nonsensical fit
results from being generated, but in this preliminary analysis the constraint of slope >= 0 only was
imposed. For logEC50 estimation, no constraint for the two remaining parameters (top levels and
Hill slope) was imposed. It also was noticed that using a standard set of initial values for the three
parameters resulted in failure to converge. Changing the initial value for logPC10 to log(the
minimum concentration) achieved convergence in certain runs.
For estimation of logEC50, 4-parameter Hill equation-based nonlinear regression was used. Again,
a constraint of slope >= 0 was imposed while no constraint for the other parameters were used.
Hill equation-based nonlinear regression occasionally generated rather imprecise logPC10 or
logEC50. Estimates of these with SE (estimate) > 1 were excluded from further analyses. This
cutoff is arbitrary. It represents a high degree of uncertainty and corresponds approximately to
180-fold difference between the upper and lower limits of PC10 (or EC50), which were obtained by
exponentiating corresponding 95% confidence limits for logPC10 (or logEC50).
The proposed alternative method for summarizing run(lab)-specific estimates was
DerSimonian-Laird random effects model. This generates, in addition to the estimate of overall
between-variability, an estimate of intrinsic between-variability. In general, the overall (total)
variability consists of two components: intrinsic between variability and overall within variability.
That is, the following relationships hold:2)
Overall (total) within-lab variability = Overall (total) between-run variability = intrinsic between-run variability
+ overall within-run variability and
Overall (total) between-lab variability = intrinsic between-lab variability
+ overall within-lab variability
The complementary estimates of overall within-variability and intrinsic between-variability serve
2) The relationships hold in terms of variance under the assumption of independence between the underlying components for the two right-hand side terms.

111
certain practical purposes for a user of the assay.
In the traditional method, overall between-variability is estimated by obtaining SD of the point
estimates for which a mean is calculated. SE of the mean is SD/sqrt(the number of point estimates
summarized). In the DerSimonian-Laird (DL) random effects model, the overall
between-variability is estimated by combining the estimate of intrinsic between-variability and
estimates of within-variability. In the DL random effects model both SE of the mean and SD were
calculated such that they can be compared to the counterparts from the traditional method. In
addition, p-value for testing the null hypothesis of intrinsic between-variability = zero also was
obtained for the DL model. This p-value is labeled as “homogeneity p-value” in the tables. Since
the Q statistic-based test for these homogeneity p-value is known to be underpowered, a p-value
below 0.1~0.15 (as opposed to usual 0.05) may be taken as some evidence for existence of
non-zero intrinsic between-variability. In estimating overall between-variability, the traditional
method ignores SE of the estimates being summarized, thereby taking within-variability into
account only through apparent overall between-variability, which sometimes can be misleadingly
small. As such, the traditional method underestimates overall between-variability when the intrinsic
between-variability is small relative to within-variability. Other than this difference, the traditional
method and DL method are expected to yield comparable results in terms of overall
between-variability estimates, which is of our primary interest in an interlaboratory study.
For the present data, within the same run (i.e., experiment done on the same occasion) 17β-estradiol
was tested in up to three plates. This provided us with an opportunity to investigate relative
contribution of intrinsic between-plate variability and within-plate variability to overall
between-run variability. For Tables 4 and 8, within-run summary was estimated from within-plate
summary employing the same method used to the between-run, within-lab summary, i.e., either the
traditional method or DL random effects method.
Simultaneous modeling of mean of response and log(variance) of response was performed to
compare two methods of summarization using a heteroscedastic regression.
Stata statistical software (version 8) was used. A user-defined command “meta” was used for the
DerSimonian-Laird random effects model and “regh” for the heteroscedastic regression.

112
Results
Overall between-lab variability
The results for individual runs as well as overall variability (within-lab or between-lab) are
presented in Tables 6.1-11. These results based on the alternative procedures in general lead us to
the same conclusions as the ones based on the original combination of procedures, i.e., the linear
interpolation for run-specific summary and traditional method for between-run (lab) summary. That
is, the assay demonstrated acceptable overall within-lab variability as well as between-lab
variability. Overall between-lab SDs are estimated for each of the chemicals tested as follows using
Hill equation-based nonlinear regression and DerSimonian-Laird random effects model (extracted
from Tables 6.9 and 10). (The readers who wish to rely on results based on a combination of
procedures other than this can base their decisions on corresponding overall between-lab SD values
in Tables 17-20 in the body of the report or Tables 6.2, 3, 5, 6 in this appendix. Qualitative
conclusion would be similar to the ones presented above.)
Summary of overall between-lab SD estimates for presumed positives
Chemical logPC10 logPC50
17α-Estradiol 0.31 0.29
Bisphenol A 0.29 0.27
Genistein 0.31 0.15
17α-Methyltestosterone 0.21 0.21
4-tert-Octylphenol 0.15 0.18
p-tert-pentylphenol 0.30 0.08
17β-Estradiol 0.21 0.24
Arithmetic mean 0.25 0.20
Arithmetic mean* 0.26 0.20 * For all chemicals other than 17β-Estradiol
Overall between-lab SD of 0.25 means that a future parameter estimate from a lab drawn from a
universe of labs like the four labs in the interlaboratory study is expected to fall in the range
between 0.33 times the true value and 3.1 times the true value (0.33 = 1/3.1 = 10-1.95*0.25) with a
probability of 95%. The overall between-lab variability could be greater for some test chemicals.
The observed maximum was 0.31, and this corresponds to the minimum and maximum ratios to the
true value of 0.25 and 4.0, respectively. This level of variability seems satisfactorily low for the
intended use of the assay.
For the rest of this Appendix, foci will be given to logPC10 and logPC50. Interpretation of
logEC50 depends on the top plateau level of the observed curve, which can vary considerably
across chemicals. As such, logEC50 is not as readily interpretable as logPC10 or logPC50.

113
Table 6.1 Estimated logPC10, logPC50 and logEC50 and their SE for 17β-estradiol based on linear interpolation by run and within- and overall between-lab variation (DL random effects model)
TestvialNo. intrinsic homo- intrinsic homo- intrinsic homo- intrinsic
Esti- SDbtw- geneity SDbtw- geneity Esti- SDbtw- geneity SDbtw-mate plate p -value run p -value mate plate p -value run
1-1 -11.89 0.12 -10.69 0.101-2 -11.73 0.05 -10.52 0.031-3 -11.91 0.08 -10.69 0.042-1 -12.42 0.04 -10.98 0.042-2 -12.65 0.09 -11.22 0.062-3 -11.91 0.01 -10.90 0.033-1 -11.98 0.11 -11.11 0.103-2 -12.41 0.10 -11.36 0.063-3 -12.41 0.06 -11.37 0.041-1 -11.74 0.06 -11.06 0.071-2 -10.83 0.191-3 -11.59 0.052-1 -12.01 0.58 -10.51 0.052-2 -11.62 0.04 -10.54 0.022-3 -11.50 0.09 -10.50 0.073-1 -12.12 0.41 -11.05 0.263-2 -11.82 0.16 -10.77 0.093-3 -11.87 0.09 -10.63 0.041-1 -11.58 0.07 -10.44 0.031-2 -11.56 0.09 -10.48 0.051-32-1 -11.09 0.11 -10.38 0.032-2 -11.58 0.05 -10.43 0.062-33-1 -11.84 0.08 -10.55 0.053-2 -11.64 0.14 -10.75 0.043-3 -11.95 0.06 -10.90 0.121-1 -12.61 0.28 -11.08 0.061-2 -11.04 0.071-3 -11.80 0.04 -10.71 0.082-1 -11.88 0.12 -10.65 0.032-2 -12.23 0.38 -10.51 0.032-3 -11.85 0.09 -10.56 0.023-1 -11.66 0.08 -10.48 0.023-2 -11.72 0.08 -10.37 0.013-3 -11.75 0.06 -10.52 0.04
MAX -11.09 0.58 -11.35 0.56 0.53 -11.64 0.33 0.29 -10.37 0.26 -10.39 0.40 0.38 -10.48 0.37 0.36MIN -12.65 0.01 -12.32 0.06 0.00 -12.11 0.13 0.09 -11.59 0.01 -11.31 0.03 0.00 -10.99 0.09 0.08Ave. -11.87 0.14 -11.81 0.23 0.19 -11.70 0.20 0.17 -10.76 0.07 -10.72 0.15 0.13 -10.58 0.21 0.20
Log10[PC10(M)]
0.79
0.92
< 0.01
< 0.01
< 0.01
-11.64
0.12
< 0.01
< 0.01
0.60
0.71
0.09
0.09 0.10
< 0.010.18
-11.80 0.13
0.22
SD
-12.11 0.14 0.13 < 0.01
Mean SD
0.33
0.00
0.22
0.06 0.39 -11.72
0.08
0.39
0.14
0.20
Mean
0.29 < 0.01
0.14 0.12 0.75
-10.72 0.14 0.10 0.10
Total
kaneka
otsuka 0.35
0.12
0.07
39
0.56-12.16
Test Substance
-11.87
-11.72
40
17β
-Est
rad
iol
Laboratory Trial
ceri
-12.28
37
-11.82
-12.32
0.12
0.39
0.00
0.10
38
0.13
-11.57
-11.74
-11.60
-11.87
-11.35
sumitomo
0.06
-11.85
0.08
-11.02 0.36
< 0.01
-10.54 0.03 0.00
Log10[PC50(M)]
0.12 0.10 < 0.01
Mean SD
-10.62
0.37
-10.48 0.09 0.08
-10.71 0.21 0.18
-10.63 0.17 0.16
-10.99
-11.31 0.10 0.08 0.05
-11.18 0.40 0.38
0.53
0.00
0.00
Mean SD
0.00
0.34
-10.45 0.03 0.00 0.48
-10.39 0.04 0.00 0.46
-10.71 0.15 0.13 < 0.01
-10.95 0.19 0.17 < 0.01
-10.57 0.07 0.06 < 0.01
-10.45 0.08 0.08 < 0.01

114
Table 6.2 Estimated logPC10 and its SE based on linear interpolation by run and within- and between-lab variation (DL random effects model
intrinsic homogeneity intrinsic homogeneitySDbtw-runp -value SDbtw-run p -value
1 - -2 - -3 -8.12 0.301 - -2 - -3 - -1 - -2 - -3 - -1 - -2 - -3 - -1 -10.49 0.272 -10.69 0.273 -9.98 0.021 -10.47 0.102 -9.84 0.113 -9.84 0.061 -9.65 0.122 -9.33 0.103 -9.85 0.051 -10.06 0.092 -9.83 0.063 -9.64 0.061 - -2 - -3 - -1 - -2 - -3 - -1 - -2 - -3 - -1 -7.61 0.422 - -3 - -1 -7.77 0.122 -7.51 0.043 -7.92 0.181 -7.73 0.192 -7.28 0.303 -6.88 0.041 -10.20 0.552 -7.08 0.183 -6.82 0.091 -10.81 0.822 -6.97 0.073 -6.92 0.031 - -2 - -3 - -1 - -2 -5.49 0.203 - -1 - -2 - -3 - -1 - -2 - -3 - -
SD
0.30
-
-8.12 0.30
Mean SE
0.00 -
-9.90 0.13 0.18 0.10
0.30
0.25
-7.61 0.42 0.00 -0.42
-7.43 0.19 0.29 0.040.38
-5.49 0.20 0.00 -0.20
-8.12 0.30 0.00 -
- - - -
- - - --
- - - --
-10.33 0.26 0.39 < 0.010.45
-10.05 0.20 0.34 < 0.010.35
-9.62 0.17 0.28 < 0.010.30
-9.83 0.11 0.17 < 0.010.19
- - - --
- - - --
- - - --
-7.61 0.42 0.00 -0.42
-7.69 0.13 0.19 0.010.22
-7.28 0.31 0.50 < 0.010.54
-7.80 0.51 0.82 < 0.010.88
-7.10 0.17 0.24 < 0.010.30
- - - --
-5.49 0.20 0.00 -0.20
- - - --
- - - --
Bisphenol A
18
19
20
17
15
14
13
Test vial No.
Diethylhexyl phthalate
Benzophenone
Hematoxylin
alpha-Estradiol
5
Test Substance
4
12
10
sumitomo
otsuka
1
2
3
ceri
6
7
sumitomo
11 otsuka
8
9
kaneka
ceri
otsuka
kaneka
ceri
ceri
kaneka
sumitomo
16
sumitomo
otsuka
kaneka
sumitomo
otsuka
kaneka
ceri
Data SELaboratory Trial
Log10 [PC10(M) ]Within-lab Between-lab
Mean SE SD
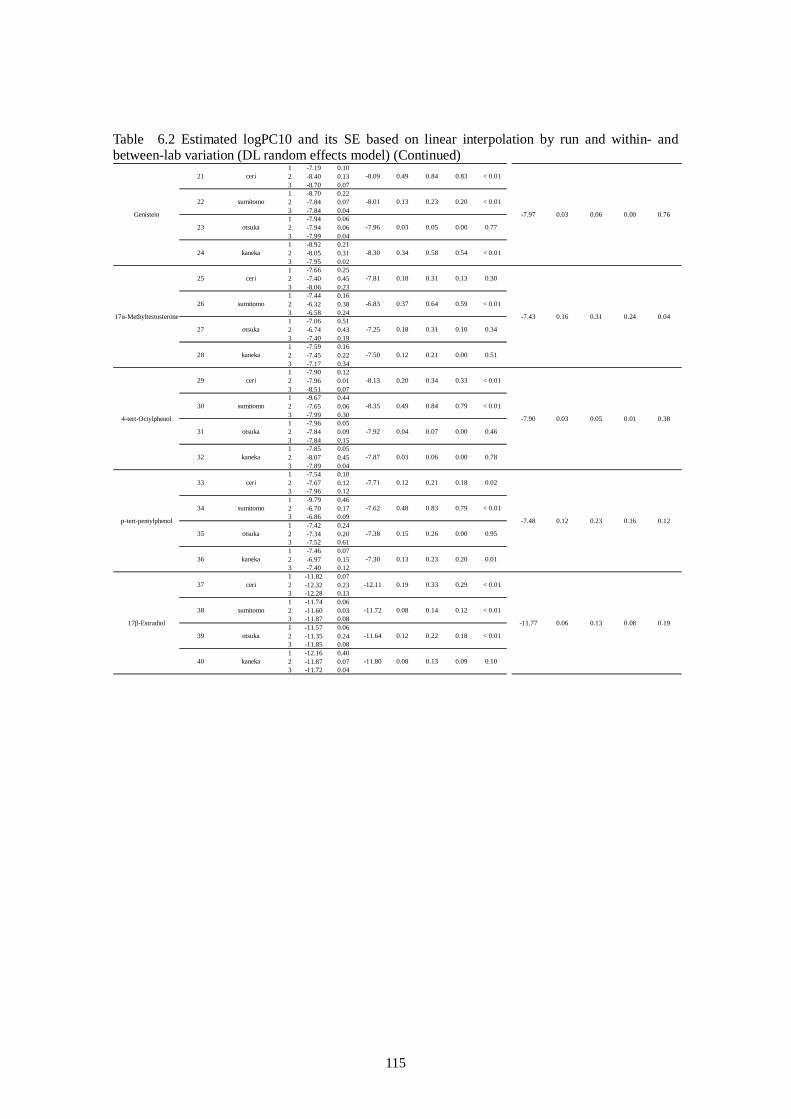
115
Table 6.2 Estimated logPC10 and its SE based on linear interpolation by run and within- and between-lab variation (DL random effects model) (Continued)
1 -7.19 0.102 -8.40 0.133 -8.70 0.071 -8.70 0.222 -7.84 0.073 -7.84 0.041 -7.94 0.062 -7.94 0.063 -7.99 0.041 -8.92 0.212 -8.05 0.313 -7.95 0.021 -7.66 0.252 -7.40 0.453 -8.06 0.231 -7.44 0.162 -6.32 0.383 -6.58 0.241 -7.06 0.512 -6.74 0.433 -7.40 0.191 -7.59 0.162 -7.45 0.223 -7.17 0.341 -7.90 0.122 -7.96 0.013 -8.51 0.071 -9.67 0.442 -7.65 0.063 -7.99 0.301 -7.96 0.052 -7.84 0.093 -7.84 0.151 -7.85 0.052 -8.07 0.453 -7.89 0.041 -7.54 0.102 -7.67 0.123 -7.96 0.121 -9.79 0.462 -6.70 0.173 -6.86 0.091 -7.42 0.242 -7.34 0.203 -7.52 0.611 -7.46 0.072 -6.97 0.153 -7.40 0.121 -11.82 0.072 -12.32 0.233 -12.28 0.131 -11.74 0.062 -11.60 0.033 -11.87 0.081 -11.57 0.062 -11.35 0.243 -11.85 0.081 -12.16 0.402 -11.87 0.073 -11.72 0.04
-7.97 0.03 0.00 0.760.06
-7.43 0.16 0.24 0.040.31
-7.90 0.03 0.01 0.380.05
-7.48 0.12 0.16 0.120.23
-11.77 0.06 0.08 0.190.13
-8.09 0.49 0.83 < 0.010.84
-8.01 0.13 0.20 < 0.010.23
-7.96 0.03 0.00 0.770.05
-8.30 0.34 0.54 < 0.010.58
-7.81 0.18 0.13 0.300.31
-6.83 0.37 0.59 < 0.010.64
-7.25 0.18 0.10 0.340.31
-7.50 0.12 0.00 0.510.21
-8.13 0.20 0.33 < 0.010.34
-8.35 0.49 0.79 < 0.010.84
-7.92 0.04 0.00 0.460.07
-7.87 0.03 0.00 0.780.06
0.79 < 0.010.83
-7.71 0.12 0.18 0.020.21
0.20 0.010.23
-7.38 0.15 0.00 0.950.26
0.12 < 0.010.14
-12.11 0.19 0.29 < 0.010.33
0.09 0.100.13
-11.64 0.12 0.18 < 0.010.22
Genistein
21
-11.80 0.08
-11.72 0.08
-7.30 0.13
-7.62 0.48
17β-Estradiol
38
39
40
37
17α-Methyltestosterone
22
p-tert-pentylphenol
30
31
32
4-tert-Octylphenol
29
35
36
33
34
ceri
sumitomo
otsuka
ceri
sumitomo
25 ceri
sumitomo26
23
24
27
28
otsuka
kaneka
kaneka
kaneka
ceri
sumitomo
otsuka
otsuka
kaneka
ceri
sumitomo
otsuka
kaneka

116
Table 6.3 Estimated logPC50 and its SE based on linear interpolation by run and within- and between-lab variation (DL random effects model)
intrinsic homogeneity intrinsic homogeneity
SDbtw-run p -value SDbtw-run p -value1 - -2 - -3 - -1 - -2 - -3 - -1 - -2 - -3 - -1 - -2 - -3 - -1 -9.04 0.102 -9.46 0.043 -9.39 0.021 -9.22 0.182 -8.63 0.083 -8.79 0.041 -8.33 0.072 -8.46 0.043 -8.77 0.131 -9.15 0.022 -8.66 0.053 -8.56 0.031 - -2 - -3 - -1 - -2 - -3 - -1 - -2 - -3 - -1 - -2 - -3 - -1 -6.50 0.022 -6.57 0.033 -6.76 0.081 -6.52 0.152 -6.48 0.123 -6.22 0.041 -6.14 0.082 -6.46 0.053 -6.31 0.081 -6.53 0.022 -6.18 0.063 -6.14 0.031 - -2 - -3 - -1 - -2 - -3 - -1 - -2 - -3 - -1 - -2 - -3 - -
- -
-
-
-
- -
0.14 0.02
0.03
< 0.01
< 0.01
0.09 0.17
- -
-
-
-
- -
0.46 < 0.01
< 0.01
< 0.01
< 0.01
0.24 0.48
- -
-
-
-
- -
SD SE SD
-
-
-
-
-
0.16
0.15
0.26
-6.41
< 0.01
-
-
-
-
0.38
-8.87
< 0.01
-
-
-
-
-
--
Mean SE MeanEstimate
Log10 [ PC50 (M) ]Within-lab Between-lab
SE
otsuka
otsuka
-
-
-
20 kaneka
12 kaneka
sumitomo
15 otsuka
18 sumitomo
8 kaneka
sumitomo
3 otsuka
4 kaneka
1 ceri
2 sumitomo
Test Substance Test vial No. Laboratory Trial
Hematoxylin
- -
- -
-- -
- -
alpha-Estradiol
-9.34 0.11
-8.79 0.38
5 ceri
6 sumitomo
7
-8.82 0.19
-8.49 0.16
0.06
0.11
0.09
0.22
Benzophenone
- -
- -
9 ceri
10
11 otsuka
-
-
-
Bisphenol A
-6.58
-6.31
0.15
-
-
-
-6.29 0.26
13 ceri
14
16 kaneka
-6.37 0.19
0.10
0.05
0.11
0.08
Diethylhexyl phthalate
- -
- -
17 ceri
19
- -
- -
-
-
-
-
-
0.10
-
0.07
0.17
-
-
0.17
0.14

117
Table 6.3 Estimated logPC50 and its SE based on linear interpolation by run and within- and between-lab variation (DL random effects model) (Continued)
1 -6.77 0.072 -7.66 0.013 -7.78 0.051 -7.42 0.152 -6.89 0.053 -6.99 0.031 -7.23 0.052 -7.27 0.053 -7.54 0.031 -7.52 0.002 -7.07 0.053 -6.97 0.021 -5.75 0.362 -5.87 0.143 -5.90 0.391 -5.49 0.152 -5.10 0.303 -5.35 0.111 -5.73 0.152 - -3 -5.50 0.161 -5.60 0.202 -5.51 0.183 -5.31 0.161 -6.85 0.072 -7.12 0.013 -7.51 0.031 -6.67 0.172 -6.68 0.083 -6.48 0.071 -6.89 0.042 -6.82 0.113 -6.70 0.061 -6.72 0.042 -6.80 0.043 -6.75 0.061 -6.08 0.122 -6.30 0.103 -6.79 0.081 -5.91 0.102 -5.82 0.113 -5.77 0.081 -5.89 0.192 -5.87 0.353 -6.06 0.131 -6.00 0.182 -5.89 0.093 -5.99 0.101 -10.98 0.112 -11.11 0.083 -11.14 0.061 -10.82 0.132 -10.64 0.043 -10.67 0.021 -10.54 0.062 -10.56 0.063 -10.60 0.031 -10.65 0.062 -10.55 0.043 -10.55 0.04
MAX 0.22 0.38 0.38 0.24 0.48 0.46MIN 0.02 0.03 0.00 0.07 0.14 0.11Ave. 0.10 0.17 0.12 0.11 0.22 0.19
0.17 < 0.01
0.39
0.66
0.32
0.09 0.18
0.11 0.04
0.54
0.72
0.72
0.07 0.14
0.11 < 0.01
0.10
0.04
0.37
0.07 0.14
0.17 < 0.01
0.47
0.31
0.50
0.10 0.20
0.16 0.07
< 0.01
< 0.01
< 0.01
0.11 0.21
0.00
0.00
0.02
-10.73
0.45
0.00
0.00
0.00
-5.95
< 0.01
0.10
0.10
0.00
-6.78
< 0.01
0.00
0.02
0.00
-5.56
0.95
0.12
0.18
0.38
-7.21
< 0.01
sumitomo
39 otsuka
35
kaneka
otsuka
33 ceri
34
otsuka
32 kaneka
sumitomo
24 kaneka
sumitomo
27 otsuka
sumitomo
-10.57
17β-Estradiol
-11.11
-10.67
-10.58
40 kaneka
37 ceri
38
Genistein
-7.41 0.37
-7.18 0.38
21 ceri
22
23 otsuka
-7.03 0.14
-7.35 0.19
0.21
0.08
0.11
0.22
17α-Methyltestosterone
-5.86 0.22
-5.45 0.18
25 ceri
26
28 kaneka
0.11
0.10
-5.38 0.14
-5.62 0.16
0.08
4-tert-Octylphenol
-7.16 0.27
-6.75 0.05
29 ceri
30 sumitomo
31
-6.59 0.14
-6.81 0.120.07
p-tert-pentylphenol
-6.39 0.38
-5.95 0.11
-5.82 0.09
-5.99 0.17
36
0.22
0.37
0.00
0.27
0.37
0.16
0.08
0.03
0.13
0.07 0.00
0.03
0.02
0.03
0.03
0.04
0.05
0.05
0.04
0.10
0.06

118
Table 6.4 Estimated logPC10, logPC50 and logEC50 and their SE for 17β-estradiol based on Hill equation-based nonlinear regression by run and within- and overall between-lab variation (traditional analysis)
Estimate Mean SE SD Estimate Mean SE SD HILLSLOPE R2 Estimate Mean SE1-1 -11.66 0.17 -10.74 0.08 1.07 0.99 -10.75 0.101-2 -11.56 0.20 -10.54 0.10 0.96 0.98 -10.57 0.131-3 -11.84 0.16 -10.73 0.08 1.04 0.99 -10.74 0.092-1 -11.80 0.24 -11.03 0.08 6.97 0.99 -10.98 0.022-2 -12.15 0.17 -11.22 0.07 1.55 0.99 -11.00 0.052-3 -11.68 0.14 -10.94 0.05 1.41 0.99 -10.91 0.053-1 -11.85 0.37 -11.10 0.13 1.32 0.96 -11.17 0.193-2 -11.99 0.26 -11.27 0.10 2.18 0.99 -11.04 0.103-3 -12.05 0.23 -11.31 0.10 1.62 0.99 -11.15 0.131-1 -11.17 0.02 -11.01 0.02 1.31 0.97 -11.12 0.141-2 -12.46 0.51 -11.02 0.21 1.05 0.96 -10.48 0.231-3 -13.23 0.37 -11.56 0.15 0.46 0.98 -11.49 0.542-1 -11.72 0.26 -10.50 0.12 0.83 0.98 -10.51 0.172-2 -11.37 0.23 -10.54 0.12 1.28 0.97 -10.46 0.162-3 -11.33 0.19 -10.47 0.09 0.96 0.99 -10.46 0.113-1 -12.23 0.28 -11.00 0.12 0.74 0.98 -10.93 0.193-2 -11.61 0.17 -10.81 0.08 1.32 0.99 -10.71 0.103-3 -11.61 0.11 -10.65 0.05 1.02 1.00 -10.55 0.061-1 -11.36 0.10 -10.42 0.05 1.03 1.00 -10.40 0.061-2 -11.30 0.15 -10.45 0.07 1.08 0.99 -10.37 0.091-3 - - - - 1.18 0.99 - -2-1 -11.02 0.21 -10.32 0.09 1.12 0.99 -10.42 0.102-2 -11.31 0.13 -10.38 0.06 1.06 0.99 -10.26 0.072-3 - - - - 0.72 0.98 - -3-1 -11.46 0.22 -10.61 0.13 1.22 0.97 -10.67 0.153-2 -11.30 0.15 -10.79 0.10 1.68 0.98 -10.71 0.123-3 -11.91 0.20 -10.91 0.09 0.96 0.99 -10.78 0.111-1 -11.89 0.19 -11.09 0.07 3.50 0.99 -10.97 0.401-2 -12.26 0.19 -11.15 0.08 1.64 1.00 -10.89 0.061-3 -11.53 0.11 -10.73 0.05 1.20 0.99 -10.60 0.072-1 -11.49 0.09 -10.68 0.05 1.28 1.00 -10.58 0.062-2 -11.65 0.18 -10.53 0.08 1.03 0.99 -10.36 0.102-3 -11.47 0.13 -10.58 0.07 1.27 0.99 -10.46 0.083-1 -11.40 0.14 -10.46 0.06 1.04 0.99 -10.35 0.083-2 -11.42 0.13 -10.33 0.05 1.02 1.00 -10.20 0.063-3 -11.48 0.08 -10.51 0.04 1.02 1.00 -10.40 0.05
MAX -11.02 0.51 -11.17 0.60 1.04 -10.32 0.21 -10.35 0.18 0.31 6.9700 1.0000 -10.20 0.54 -10.32 0.30MIN -13.23 0.02 -12.29 0.02 0.04 -11.56 0.02 -11.23 0.02 0.02 0.4600 0.9600 -11.49 0.02 -11.12 0.01Ave. -11.67 0.20 -11.63 0.20 0.34 -10.76 0.09 -10.73 0.08 0.14 1.5567 0.9869 -10.67 0.14 -10.64 0.10
-10.60 0.04 0.08
-10.43 0.05 0.09
-10.35 0.03 0.04
-10.77 0.09 0.15
-10.50 0.04
-10.82 0.10 0.17
-11.23 0.07 0.11
-11.19 0.18 0.31
-10.67 0.07 0.11
-11.07 0.08 0.14
Total
38 sumitomo
39 otsuka
37 ceri
0.14
Log10[EC50(M)]Log10[PC50(M)]
0.04 -10.32
0.10 -10.47
-10.73
1.04 -11.03
0.25
0.06
0.06
-11.54 0.0640 kaneka
-11.43 0.02
-11.89 0.21 0.36 -10.82 0.11-10.99 0.13 0.23
0.08
-11.56 0.18 0.31 -10.72
0.20
0.03
-10.34-11.17 0.14
-11.82 0.21 0.36
0.01-11.33 0.03 0.05 -10.39-10.43 0.02 0.02
-12.29 0.60
0.11
-11.47 0.12 0.21 0.02-10.480.02
-10.97 0.03
0.30
-11.12 0.04
Log10[PC10(M)]
-11.96 0.06 0.10
-11.69 0.08
Test Substance Test vial No. Laboratory
-10.69 0.06
17β-Estradiol
Trial
-11.88 0.14

119
Table 6.5 Estimated logPC10 and its SE based on Hill equation-based nonlinear regression by run and within- and overall between-lab variation (traditional analysis)
Mean SE SD Mean SE SD1 - -2 - -3 - -1 - -2 -4.18 0.973 - -1 - -2 - -3 - -1 - -2 - -3 - -1 -10.00 0.382 -10.17 0.333 -9.88 0.331 -10.69 0.582 -9.64 0.183 -9.67 0.111 -9.36 0.202 -9.17 0.183 -9.40 0.351 -9.89 0.122 -9.55 0.133 -9.30 0.241 - -2 - -3 - -1 - -2 - -3 - -1 - -2 - -3 - -1 -7.99 0.332 - -3 - -1 -7.37 0.082 -7.14 0.103 -7.41 0.171 -7.88 0.662 -7.14 0.233 -6.63 0.111 -6.83 0.282 -8.21 0.363 -6.16 0.011 -7.31 0.172 -7.02 0.153 -6.83 0.111 - -2 - -3 - -1 - -2 -5.33 0.153 -4.96 0.031 - -2 - -3 - -1 - -2 - -3 - -
-20 kaneka - -
-5.14 - -
18 sumitomo -5.14 0.18 0.26
19 otsuka
0.24
Diethylhexyl phthalate
17 ceri - - -
- - -
16 kaneka -7.05 0.14
-7.16 0.21 0.41
14 sumitomo -7.22 0.36 0.63
15 otsuka
-
Bisphenol A
13 ceri -7.31 0.08 0.14
-7.07 0.60 1.05
12 kaneka -7.99 -
-7.99 - -
10 sumitomo - - -
11 otsuka
0.30
Benzophenone
9 ceri - - -
- - -
8 kaneka -9.58 0.17
-9.73 0.11 0.22
6 sumitomo -10.00 0.34 0.60
7 otsuka
-
alpha-Estradiol
5 ceri -10.01 0.08 0.14
-9.31 0.07 0.12
4 kaneka - -
-
3 otsuka - - -
2 sumitomo -4.18 -
Hematoxylin
1 ceri - - -
-4.18 - -
Log10 [ PC10 (M) ]
Estimate SEintra-Lab inter-LabTest Substance Test vial No. Laboratory Trial

120
Table 6.5 Estimated logPC10 and its SE based on Hill equation-based nonlinear regression by run and within- and overall between-lab variation (traditional analysis) (Continued)
1 -7.05 0.222 -9.02 0.263 -9.22 0.271 -9.34 0.222 -7.99 0.243 -7.88 0.201 -8.29 0.382 -8.26 0.303 -8.98 0.261 -8.96 0.272 -8.35 0.223 -8.91 0.151 -7.86 0.502 -7.44 0.243 -7.72 0.431 -7.72 0.282 -6.15 0.373 -6.42 0.181 -7.32 0.292 -6.62 0.393 -7.54 0.291 -7.49 0.372 -7.53 0.303 -7.16 0.241 -7.67 0.132 -7.92 0.033 -8.23 0.161 -7.97 0.502 -7.55 0.183 -8.83 0.281 -7.81 0.092 -7.37 0.863 -7.57 0.131 -7.67 0.062 -9.56 0.433 -7.81 0.071 -7.46 0.192 -7.48 0.143 -7.77 0.121 -7.39 0.242 -6.12 0.023 -6.72 0.141 -7.70 0.292 -7.19 0.283 -7.30 0.231 -7.31 0.222 -6.95 0.193 -7.75 0.181 -11.69 0.082 -11.88 0.143 -11.96 0.061 -12.29 0.602 -11.47 0.123 -11.82 0.211 -11.33 0.032 -11.17 0.143 -11.56 0.181 -11.89 0.212 -11.54 0.063 -11.43 0.02
MAX 0.97 0.69 1.20 0.21 0.41MIN 0.01 0.07 0.12 0.06 0.12Ave. 0.24 0.25 0.44 0.15 0.29
0.2440 kaneka -11.62 0.14
-11.67 0.06 0.12
38 sumitomo -11.86 0.24 0.41
39 otsuka
0.40
17β-Estradiol
37 ceri -11.84 0.08 0.14
-11.35 0.11 0.19
36 kaneka -7.34 0.23
-7.26 0.10 0.20
34 sumitomo -6.74 0.37 0.64
35 otsuka
1.05
p-tert-pentylphenol
33 ceri -7.57 0.10 0.18
-7.40 0.15 0.27
32 kaneka -8.35 0.61
-8.00 0.19 0.38
30 sumitomo -8.11 0.38 0.65
31 otsuka
0.20
4-tert-Octylphenol
29 ceri -7.94 0.16 0.28
-7.58 0.13 0.22
28 kaneka -7.39 0.12
-7.25 0.15 0.30
26 sumitomo -6.76 0.48 0.84
27 otsuka
0.34
17α-Methyltestosterone
25 ceri -7.67 0.12 0.21
-7.16 0.28 0.48
24 kaneka -8.74 0.20
-8.52 0.20 0.40
22 sumitomo -8.40 0.47 0.81
23 otsuka
Genistein
21 ceri -8.43 0.69 1.20
-8.51 0.24 0.41

121
Table 6.6 Estimated logPC50 and its SE based on Hill equation-based nonlinear regression by run and within- and overall between-lab variation (traditional analysis)
Mean SE SD Mean SE SD1 - -2 - -3 - -1 - -2 - -3 - -1 - -2 - -3 - -1 - -2 - -3 - -1 -9.09 0.172 -9.48 0.213 -9.31 0.151 -9.06 0.252 -8.71 0.093 -8.83 0.051 -8.36 0.122 -8.47 0.113 -8.86 0.131 -9.12 0.042 -8.71 0.063 -8.73 0.201 - -2 - -3 - -1 - -2 - -3 - -1 - -2 - -3 - -1 - -2 - -3 - -1 -6.45 0.032 -6.48 0.053 -6.73 0.091 -6.38 0.192 -6.35 0.083 -6.11 0.021 -6.09 0.072 -6.35 0.053 -6.05 0.011 -6.46 0.072 -6.12 0.043 -6.09 0.031 - -2 - -3 - -1 - -2 - -3 - -1 - -2 - -3 - -1 - -2 - -3 - -
-20 kaneka - -
- - -
18 sumitomo - - -
19 otsuka
0.21
Diethylhexyl phthalate
17 ceri - - -
- - -
16 kaneka -6.22 0.12
-6.30 0.01 0.03
14 sumitomo -6.28 0.08 0.15
15 otsuka
-
Bisphenol A
13 ceri -6.55 0.09 0.16
-6.16 0.09 0.16
12 kaneka - -
- - -
10 sumitomo - - -
11 otsuka
0.23
Benzophenone
9 ceri - - -
- - -
8 kaneka -8.85 0.13
-8.90 0.02 0.04
6 sumitomo -8.87 0.10 0.18
7 otsuka
-
alpha-Estradiol
5 ceri -9.29 0.11 0.20
-8.57 0.15 0.26
4 kaneka - -
-
3 otsuka - - -
2 sumitomo - -
Hematoxylin
1 ceri - - -
- - -
Log10 [ PC50 (M) ]
Estimate SEintra-Lab inter-LabTest Substance Test vial No. Laboratory Trial

122
Table 6.6 Estimated logPC50 and its SE based on Hill equation-based nonlinear regression by run and within- and overall between-lab variation (traditional analysis) (Continued)
1 -6.53 0.112 -7.65 0.123 -7.77 0.121 -7.28 0.132 -6.78 0.083 -6.95 0.091 -7.10 0.162 -7.14 0.133 -7.40 0.261 -7.46 0.112 -7.00 0.083 -6.93 0.051 -5.72 0.242 -5.81 0.123 -5.84 0.211 -5.39 0.082 -5.74 0.123 -5.22 0.041 -5.60 0.082 -4.85 0.153 -5.39 0.081 -5.58 0.162 -5.41 0.083 -5.23 0.061 -6.90 0.052 -7.07 0.013 -7.46 0.081 -6.68 0.182 -6.61 0.073 -6.45 0.071 -6.92 0.042 -6.93 0.163 -6.74 0.071 -6.72 0.032 -6.83 0.053 -6.78 0.031 -6.07 0.082 -6.24 0.053 -6.83 0.051 -5.88 0.092 -5.96 0.023 -5.82 0.051 -5.88 0.132 -5.92 0.153 -6.02 0.091 -6.00 0.082 -5.90 0.073 -5.99 0.051 -10.67 0.072 -11.07 0.083 -11.23 0.071 -11.19 0.182 -10.50 0.023 -10.82 0.101 -10.43 0.022 -10.35 0.033 -10.77 0.091 -10.99 0.132 -10.60 0.043 -10.43 0.05
MAX 0.26 0.40 0.69 0.12 0.23MIN 0.01 0.03 0.06 0.01 0.03Ave. 0.09 0.13 0.22 0.05 0.11
0.2940 kaneka -10.67 0.17
-10.75 0.03 0.05
38 sumitomo -10.84 0.20 0.35
39 otsuka
0.06
17β-Estradiol
37 ceri -10.99 0.17 0.29
-10.52 0.13 0.22
36 kaneka -5.96 0.03
-6.04 0.08 0.16
34 sumitomo -5.89 0.04 0.07
35 otsuka
0.06
p-tert-pentylphenol
33 ceri -6.38 0.23 0.40
-5.94 0.04 0.07
32 kaneka -6.77 0.03
-6.84 0.05 0.10
30 sumitomo -6.58 0.07 0.12
31 otsuka
0.18
4-tert-Octylphenol
29 ceri -7.15 0.17 0.29
-6.87 0.06 0.11
28 kaneka -5.41 0.10
-5.48 0.07 0.14
26 sumitomo -5.45 0.15 0.26
27 otsuka
0.29
17α-Methyltestosterone
25 ceri -5.79 0.04 0.07
-5.28 0.22 0.39
24 kaneka -7.13 0.17
-7.17 0.12 0.23
22 sumitomo -7.00 0.15 0.26
23 otsuka
Genistein
21 ceri -7.32 0.40 0.69
-7.21 0.09 0.16

123
Table 6.7 Estimated logPC50 and its SE based on Hill equation-based nonlinear regression by run and within- and overall between-lab variation (DL random effects model)
Mean SE SD Mean SE SD1 - -2 - -3 - -1 - -2 - -3 -6.02 0.661 -4.23 0.032 -6.08 0.373 - -1 - -2 -8.89 0.153 - -1 -9.02 0.032 -9.37 0.333 -9.37 0.191 - -2 -8.83 0.103 -8.82 0.061 -8.48 0.142 -8.57 0.123 -8.88 0.161 -9.04 0.042 -8.69 0.083 -8.84 0.141 -4.37 0.042 -8.41 0.753 -7.69 0.611 - -2 - -3 - -1 -7.90 0.752 - -3 - -1 -7.44 0.362 -9.29 0.993 -7.72 0.361 -6.25 0.042 -6.22 0.033 -6.46 0.111 - -2 -5.99 0.103 -5.99 0.021 -6.00 0.082 -6.18 0.063 -6.03 0.041 -6.15 0.022 -5.97 0.053 -5.98 0.031 - -2 -9.00 0.023 - -1 -4.31 0.072 - -3 -4.27 0.041 - -2 - -3 - -1 -9.99 0.432 - -3 - -
3.05
-4.29 0.02 0.02
- - -
-9.99 -
-9.00
3.05
-8.15 0.58 1.00
-6.31 0.08 0.13
-
-5.99
0.50
-6.82 1.25 2.16
-
-6.07 0.06 0.10
-6.03 0.06 0.10
0.13 0.26
-8.82 0.01 0.01
-8.64 0.12 0.21
-8.85 0.17
-9.25 0.12 0.20
-8.89
intra-Lab inter-Lab
- - -
-6.69 1.96 1.96
-6.02
- - -
-7.90 - -
0.71
-6.10 0.07 0.14
-7.62
- -
0.10
0.00 0.00
-
-
-5.15 0.93 1.31
-8.89 -
Diethylhexyl phthalate
17 ceri
20 kaneka
18 sumitomo
19 otsuka
-7.76
Bisphenol A
13 ceri
16 kaneka
14 sumitomo
15 otsuka
Benzophenone
9 ceri
12 kaneka
10 sumitomo
11 otsuka
alpha-Estradiol
5 ceri
8 kaneka
6 sumitomo
7 otsuka
Hematoxylin
1 ceri
4 kaneka
2 sumitomo
3 otsuka
Log10 [EC50(M)]
Estimate SETest Substance Test vial No. Laboratory Trial

124
Table 6.7 Estimated logPC10 and its SE based on Hill equation-based nonlinear regression by run and within- and overall between-lab variation (DL random effects model) (Continued)
1 -5.95 0.052 -5.33 0.373 -5.88 0.281 - -2 -5.27 0.443 -5.96 0.121 -5.00 0.792 -5.24 0.463 2.52 0.661 -5.21 0.372 -4.82 0.543 -5.51 0.131 - -2 - -3 -6.06 0.481 -5.73 0.452 -5.63 0.973 0.41 0.881 -5.53 0.742 -5.95 0.683 -5.59 0.711 - -2 - -3 - -1 -6.93 0.062 -6.93 0.023 -7.39 0.091 -6.25 0.202 -6.36 0.113 -6.20 0.121 -6.80 0.052 -7.06 0.083 -6.70 0.081 -6.58 0.042 -6.69 0.063 -6.75 0.051 -5.92 0.252 -5.90 0.173 -6.80 0.071 0.81 0.782 -5.61 0.423 -5.88 0.101 -5.71 0.432 -6.18 0.303 -5.98 0.121 -5.55 0.452 -5.84 0.133 -5.80 0.171 -10.69 0.062 -10.97 0.033 -11.12 0.041 -11.03 0.302 -10.48 0.023 -10.73 0.111 -10.39 0.012 -10.34 0.083 -10.72 0.031 -10.82 0.112 -10.47 0.063 -10.32 0.06
MAX * -10.43 0.05 - - - - - -MIN * 0.01 0.00 0.00 0.07 0.14Ave. * 0.22 0.37 0.64 0.39 0.71* Excepting for Hematoxylin, Benzophenone and Diethylhexyl phthalate
0.20
-10.75 0.16 0.28
-10.48 0.12 0.21
-10.53 0.15 0.26
1.22
-3.56 2.19 3.78
-5.95 0.14 0.23
-5.73
-6.21 0.30
0.61
0.16
-5.36
-10.67 0.10
-7.08 0.15 0.27
0.52
-6.27 0.05 0.08
0.35
-6.06 - -
- - -
-4.77
-3.65 2.03 3.51
-5.69 0.13 0.23
0.74 1.49
-5.62 0.34 0.49
-2.57 2.55 4.41
-5.18
-5.72
-10.92 0.13 0.22
-6.85 0.11 0.19
-6.67 0.05 0.08
0.09
0.92 1.30
-6.72 0.17 0.34
-5.13
0.20
0.20 0.34
17β-Estradiol
37 ceri
40 kaneka
38 sumitomo
39 otsuka
p-tert-pentylphenol
33 ceri
36 kaneka
34 sumitomo
35 otsuka
4-tert-Octylphenol
29 ceri
32 kaneka
30 sumitomo
31 otsuka
17α-Methyltestosterone
25 ceri
28 kaneka
26 sumitomo
27 otsuka
Genistein
21 ceri
24 kaneka
22 sumitomo
23 otsuka

125
Table 6.8 Estimated logPC10, logPC50 and logEC50 and their SE for 17β-estradiol based on Hill equation-based nonlinear regression by run and within- and overall between-lab variation (DL random effects model)
TestvialNo. intrinsic homo- intrinsic homo- intrinsic homo- intrinsic homo- intrinsic homo- intrinsic homo-
Esti- SDbtw- geneity SDbtw- geneity Esti- SDbtw- geneity SDbtw- geneity Esti- SDbtw- geneity SDbtw- geneitymate SE plate p -value run p -value mate SE plate p -value run p -value mate SE plate p -value run p -value
1-1 -11.66 0.17 -10.74 0.08 -10.75 0.101-2 -11.56 0.20 -10.54 0.10 -10.57 0.131-3 -11.84 0.16 -10.73 0.08 -10.74 0.092-1 -11.80 0.24 -11.03 0.08 -10.98 0.022-2 -12.15 0.17 -11.22 0.07 -11.00 0.052-3 -11.68 0.14 -10.94 0.05 -10.91 0.053-1 -11.85 0.37 -11.10 0.13 -11.17 0.193-2 -11.99 0.26 -11.27 0.10 -11.04 0.103-3 -12.05 0.23 -11.31 0.10 -11.15 0.131-1 -11.17 0.02 -11.01 0.02 -11.12 0.141-2 -12.46 0.51 -11.02 0.21 -10.48 0.231-3 -13.23 0.37 -11.56 0.15 -11.49 0.542-1 -11.72 0.26 -10.50 0.12 -10.51 0.172-2 -11.37 0.23 -10.54 0.12 -10.46 0.162-3 -11.33 0.19 -10.47 0.09 -10.46 0.113-1 -12.23 0.28 -11.00 0.12 -10.93 0.193-2 -11.61 0.17 -10.81 0.08 -10.71 0.103-3 -11.61 0.11 -10.65 0.05 -10.55 0.061-1 -11.36 0.10 -10.42 0.05 -10.40 0.061-2 -11.30 0.15 -10.45 0.07 -10.37 0.091-32-1 -11.02 0.21 -10.32 0.09 -10.42 0.102-2 -11.31 0.13 -10.38 0.06 -10.26 0.072-33-1 -11.46 0.22 -10.61 0.13 -10.67 0.153-2 -11.30 0.15 -10.79 0.10 -10.71 0.123-3 -11.91 0.20 -10.91 0.09 -10.78 0.111-1 -11.89 0.19 -11.09 0.07 -10.97 0.401-2 -12.26 0.19 -11.15 0.08 -10.89 0.061-3 -11.53 0.11 -10.73 0.05 -10.60 0.072-1 -11.49 0.09 -10.68 0.05 -10.58 0.062-2 -11.65 0.18 -10.53 0.08 -10.36 0.102-3 -11.47 0.13 -10.58 0.07 -10.46 0.083-1 -11.40 0.14 -10.46 0.06 -10.35 0.083-2 -11.42 0.13 -10.33 0.05 -10.20 0.063-3 -11.48 0.08 -10.51 0.04 -10.40 0.05
MAX -11.02 0.51 -11.21 1.31 1.26 -11.34 0.24 0.14 -10.32 0.21 -10.37 0.32 0.29 -10.52 0.32 0.32 -10.20 0.54 -10.32 0.47 0.38 -10.48 0.21 0.19MIN -13.23 0.02 -12.25 0.11 0.00 -11.82 0.11 0.02 -11.56 0.02 -11.25 0.06 0.00 -11.00 0.18 0.17 -11.49 0.02 -11.09 0.03 0.00 -10.93 0.16 0.13Ave. -11.67 0.20 -11.62 0.41 0.30 -11.44 0.18 0.09 -10.76 0.09 -10.73 0.15 0.11 -10.61 0.25 0.23 -10.67 0.14 -10.62 0.18 0.11 -10.52 0.19 0.17
Log10[PC10(M)] Log10[PC50(M)] Log10 [ EC50(M) ]
Total
0.16
< 0.01
-10.50 0.180.08 0.10
0.09
0.23
-10.48 < 0.01
0.18
0.04
0.17 < 0.01
-10.77
0.11
-10.32 0.11
0.23 < 0.01
-10.64 0.19
0.08 0.03
0.05 0.220.07 0.19
-10.98 0.24
-10.43 0.10
-10.62 0.080.1140 kaneka
-11.87 0.39 0.36 < 0.01
-11.51 0.12 0.00
0.19 < 0.01-10.37 0.07 0.00 0.58
0.00 0.82
-10.48 0.210.07 0.20
0.00 0.82
0.17 < 0.01
-10.39 0.07
-10.32 0.11
-10.73 0.12
0.00 0.72
-10.52 0.18
0.09 0.15
0.02 0.36
-10.42 0.06
-10.79 0.14
0.1239 otsuka
-11.34 0.12 0.00 0.72
-11.21 0.20 0.11
0.13 0.10-10.50 0.11 0.00 0.88
0.38 0.04
-10.61 0.180.00 0.97
0.13 0.08
0.27 < 0.01
-10.94 0.47
-10.47 0.14
-10.68 0.17
0.29 < 0.01
-10.79 0.30
0.14 0.01
0.14 0.21
-11.19 0.32
-10.80 0.16
0.2438 sumitomo
-12.25 1.31 1.26 < 0.01
-11.43 0.22 0.00
0.15 < 0.01-11.06 0.15 0.14 < 0.01
0.00 0.51
-10.93 0.160.00 0.45
0.00 0.73
0.32 < 0.01
-10.71 0.10
-10.98 0.03
-11.09 0.12
0.06 0.22
-11.00 0.32
0.00 0.39
-11.51
0.51
0.15
SD
0.08 0.27
-10.68 0.10
-11.25 0.11
Within-run Within-lab
SDMeanSDMean
Within-lab
Mean SD Mean SD Mean SD Mean
Within-run Within-lab
17β-
Est
rad
iol
37 ceri
Within-runTest Substance LaboratoryTrial
-11.82
-11.59
-11.34
0.17 0.00
-11.87 0.28 0.21
-11.70
0.09
-11.99 0.27 0.00 0.90
0.46
-11.73 0.26 0.19 0.11
0.24
-11.54 0.32 0.26 0.05
0.71
-11.45 0.11 0.00 0.85

126
Table 6.9 Estimated logPC10 and its SE based on Hill equation-based nonlinear regression by run and within- and overall between-lab variation (DL random effects model)
intrinsic homogeneity intrinsic homogeneitySDbtw-runp -value SDbtw-run p -value *
1 - -2 - -3 - -1 - -2 -4.18 0.973 - -1 - -2 - -3 - -1 - -2 - -3 - -1 -10.00 0.382 -10.17 0.333 -9.88 0.331 -10.69 0.582 -9.64 0.183 -9.67 0.111 -9.36 0.202 -9.17 0.183 -9.40 0.351 -9.89 0.122 -9.55 0.133 -9.30 0.241 - -2 - -3 - -1 - -2 - -3 - -1 - -2 - -3 - -1 -7.99 0.332 - -3 - -1 -7.37 0.082 -7.14 0.103 -7.41 0.171 -7.88 0.662 -7.14 0.233 -6.63 0.111 -6.83 0.282 -8.21 0.363 -6.16 0.011 -7.31 0.172 -7.02 0.153 -6.83 0.111 - -2 - -3 - -1 - -2 -5.33 0.153 -4.96 0.031 - -2 - -3 - -1 - -2 - -3 - -
- -
-5.11 0.18
- -
-7.03 0.14
- -
-6.99 0.27
-7.02 0.56
-7.99 0.33
-7.30 0.09
- -
- -
-9.62 0.16
- -
-9.72 0.14
-9.27 0.12
- -
-10.01 0.20
-
-4.18 0.97
- -
Test Substance Test vial No. Laboratory Trial
Log10 [PC10(M) ]
Data SEWithin-lab Between-lab
4 kaneka
Mean SE SD Mean SE SD
-
0.97 0.00
- - -
- - -
- -
-
2 sumitomo 0.97 0.00 -
3 otsuka
-4.18 0.97
-
alpha-Estradiol
5 ceri
8 kaneka
0.72
Hematoxylin
1 ceri
0.34 0.00 0.83
0.28 0.23 0.03
0.22 0.00
-9.63 0.15 0.31 0.26
12 kaneka
< 0.01
6 sumitomo 0.25 0.15 0.21
7 otsuka
0.33 0.00
- - -
0.33 0.00 -
- -
-
10 sumitomo - - -
11 otsuka
-7.99 0.33
-
Bisphenol A
13 ceri
16 kaneka
< 0.01
Benzophenone
9 ceri
0.15 0.10 0.16
0.24 0.19 0.06
0.96 0.93
-7.18 0.09 0.17 0.07
20 kaneka
0.32
14 sumitomo 0.47 0.38 0.03
15 otsuka
0.18 0.00
- - -
- - -
- -
-
18 sumitomo 0.25 0.23 0.02
19 otsuka
-5.11 0.18
-
Diethylhexyl phthalate
17 ceri

127
Table 6.9 Estimated logPC10 and its SE based on Hill equation-based nonlinear regression by run and within- and overall between-lab variation (DL random effects model) (Continued)
1 -7.05 0.222 -9.02 0.263 -9.22 0.271 -9.34 0.222 -7.99 0.243 -7.88 0.201 -8.29 0.382 -8.26 0.303 -8.98 0.261 -8.96 0.272 -8.35 0.223 -8.91 0.151 -7.86 0.502 -7.44 0.243 -7.72 0.431 -7.72 0.282 -6.15 0.373 -6.42 0.181 -7.32 0.292 -6.62 0.393 -7.54 0.291 -7.49 0.372 -7.53 0.303 -7.16 0.241 -7.67 0.132 -7.92 0.033 -8.23 0.161 -7.97 0.502 -7.55 0.183 -8.83 0.281 -7.81 0.092 -7.37 0.863 -7.57 0.131 -7.67 0.062 -9.56 0.433 -7.81 0.071 -7.46 0.192 -7.48 0.143 -7.77 0.121 -7.39 0.242 -6.12 0.023 -6.72 0.141 -7.70 0.292 -7.19 0.283 -7.30 0.231 -7.31 0.222 -6.95 0.193 -7.75 0.181 -11.70 0.102 -11.87 0.163 -11.99 0.161 -12.25 0.752 -11.43 0.133 -11.73 0.151 -11.34 0.082 -11.21 0.143 -11.54 0.191 -11.87 0.232 -11.51 0.073 -11.45 0.06
MAX 0.97 1.26 1.24 # 0.97 0.97 0.26MIN 0.07 0.11 0.00 # 0.07 0.14 0.00Ave. 0.26 0.41 0.27 0.23 0.31 0.08* Heterogeneity p -value could not be calculated when summarizing just one estimate.
-11.51 0.07
-11.59 0.14
-11.34 0.07
-7.34 0.24
-11.82 0.09
-6.71 0.34
-7.38 0.15
-7.98 0.19
-7.60 0.11
-8.11 0.46
-7.72 0.08
-7.34 0.16
-7.92 0.12
-6.77 0.46
-7.22 0.25
-8.74 0.19
-7.56 0.19
-8.40 0.47
-8.55 0.26
-8.43 0.73
Genistein
21 ceri
24 kaneka
0.13
1.26 1.24 < 0.01
0.33 0.26 0.08
0.44 0.32
-8.64 0.14 0.29 0.00
28 kaneka
0.86
22 sumitomo 0.82 0.79 < 0.01
23 otsuka
0.22 0.02
0.33 0.00 0.69
0.29 0.00 0.56
0.43 0.29
0.39
26 sumitomo 0.80 0.75 < 0.01
27 otsuka
-7.36 0.11
0.16
4-tert-Octylphenol
29 ceri
32 kaneka
0.33
17α-Methyltestosterone
25 ceri
0.21 0.17 0.03
0.33 0.28 < 0.01
0.15 0.05
-7.83 0.07 0.14 0.05
36 kaneka
0.35
30 sumitomo 0.80 0.73 < 0.01
31 otsuka
0.29 0.21
0.19 0.12 0.18
0.42 0.37 < 0.01
0.26 0.00
0.07
34 sumitomo 0.58 0.56 < 0.01
35 otsuka
-7.36 0.14
0.41
17β-Estradiol
37 ceri
40 kaneka
0.36
p-tert-pentylphenol
33 ceri
0.21 0.19
0.15 0.08 0.27
0.11 0.07 0.19
0.12 0.02
< 0.01
38 sumitomo 0.24 0.14 0.21
39 otsuka
-11.56 0.11

128
Table 6.10 Estimated logPC50 and its SE based on Hill equation-based nonlinear regression by run and within- and overall between-lab variation (DL random effects model)
intrinsic homogeneity intrinsic homogeneitySDbtw-runp -value SDbtw-runp -value
1 - -2 - -3 - -1 - -2 - -3 - -1 - -2 - -3 - -1 - -2 - -3 - -1 -9.09 0.172 -9.48 0.213 -9.31 0.151 -9.06 0.252 -8.71 0.093 -8.83 0.051 -8.36 0.122 -8.47 0.113 -8.86 0.131 -9.12 0.042 -8.71 0.063 -8.73 0.201 - -2 - -3 - -1 - -2 - -3 - -1 - -2 - -3 - -1 - -2 - -3 - -1 -6.45 0.032 -6.48 0.053 -6.73 0.091 -6.38 0.192 -6.35 0.083 -6.11 0.021 -6.09 0.072 -6.35 0.053 -6.05 0.011 -6.46 0.072 -6.12 0.043 -6.09 0.031 - -2 - -3 - -1 - -2 - -3 - -1 - -2 - -3 - -1 - -2 - -3 - -
- - - -
- - - -
-
18 sumitomo - - - - -
19 otsuka
- - - -
- - - -
Diethylhexyl phthalate
17 ceri -
-
20 kaneka -
0.09 0.16 0.15 < 0.01
0.10 0.18 0.17 < 0.01
< 0.01
14 sumitomo -6.25 0.10 0.18 0.15 < 0.01
15 otsuka
-6.30 0.10 0.19 0.17
0.06 0.11 0.09 0.01
Bisphenol A
13 ceri -6.52
-6.16
16 kaneka -6.21
- - - -
- - - -
-
10 sumitomo - - - - -
11 otsuka
- - - -
- - - -
Benzophenone
9 ceri -
-
12 kaneka -
0.17 0.29 0.27 < 0.01
0.14 0.25 0.22 0.01
< 0.01
6 sumitomo -8.81 0.05 0.09 0.04 0.30
7 otsuka
-8.89 0.14 0.29 0.26
0.10 0.18 0.06 0.32
alpha-Estradiol
5 ceri -9.28
-8.56
8 kaneka -8.87
- - - -
- - - -
-
2 sumitomo - - - - -
3 otsuka
- - - -
- - - -
Hematoxylin
1 ceri -
-
4 kaneka -
Mean SE SD Mean SE SD
Log10 [ PC50 (M)]
Data SEWithin-lab Between-lab
Test Substance Test vial No. Laboratory Trial

129
Table 6.10 Estimated logPC50 and its SE based on Hill equation-based nonlinear regression by run and within- and overall between-lab variation (DL random effects model) (Continued)
1 -6.53 0.112 -7.65 0.123 -7.77 0.121 -7.28 0.132 -6.78 0.083 -6.95 0.091 -7.10 0.162 -7.14 0.133 -7.40 0.261 -7.46 0.112 -7.00 0.083 -6.93 0.051 -5.72 0.242 -5.81 0.123 -5.84 0.211 -5.39 0.082 -5.74 0.123 -5.22 0.041 -5.60 0.082 -4.85 0.153 -5.39 0.081 -5.58 0.162 -5.41 0.083 -5.23 0.061 -6.90 0.052 -7.07 0.013 -7.46 0.081 -6.68 0.182 -6.61 0.073 -6.45 0.071 -6.92 0.042 -6.93 0.163 -6.74 0.071 -6.72 0.032 -6.83 0.053 -6.78 0.031 -6.07 0.082 -6.24 0.053 -6.83 0.051 -5.88 0.092 -5.96 0.023 -5.82 0.051 -5.88 0.132 -5.92 0.153 -6.02 0.091 -6.00 0.082 -5.90 0.073 -5.99 0.051 -10.98 0.082 -11.08 0.053 -11.09 0.031 -10.82 0.102 -10.72 0.053 -10.75 0.031 -10.55 0.082 -10.58 0.073 -10.62 0.041 -10.67 0.082 -10.56 0.043 -10.54 0.03
MAX 0.41 0.71 0.70 0.14 0.29 0.26MIN 0.02 0.04 0.00 0.04 0.08 0.00Ave. 0.10 0.18 0.14 0.10 0.19 0.16
Genistein
21 ceri -7.32
-7.16
24 kaneka -7.11
0.41 0.71 0.70 < 0.01
-7.11 0.07 0.13 0.00 0.71
22 sumitomo -6.98 0.13 0.23 0.21 < 0.01
23 otsuka 0.10 0.16 0.00 0.60
0.14 0.24 0.23 < 0.01
17α-Methyltestosterone
25 ceri -5.80
-5.31
28 kaneka -5.37
0.10 0.17 0.00 0.92
-5.49 0.12 0.25 0.21 < 0.01
26 sumitomo -5.42 0.13 0.22 0.21 < 0.01
27 otsuka 0.17 0.30 0.28 < 0.01
0.09 0.16 0.13 0.05
4-tert-Octylphenol
29 ceri -7.13
-6.86
32 kaneka -6.77
0.11 0.18 0.18 < 0.01
-6.81 0.09 0.18 0.16 < 0.01
30 sumitomo -6.55 0.07 0.12 0.07 0.20
31 otsuka 0.07 0.12 0.09 0.06
0.03 0.05 0.04 0.10
p-tert-pentylphenol
33 ceri -6.38
-5.96
36 kaneka -5.97
0.23 0.40 0.40 < 0.01
-5.96 0.04 0.08 0.05 0.20
34 sumitomo -5.90 0.06 0.10 0.08 0.02
35 otsuka 0.07 0.11 0.00 0.61
0.03 0.06 0.00 0.49
17β-Estradiol
37 ceri -11.08
-10.60
40 kaneka -10.56
0.02 0.04 0.00 0.50
-10.75 0.12 0.24 0.24 < 0.01
38 sumitomo -10.75 0.02 0.04 0.00 0.61
39 otsuka 0.03 0.05 0.00 0.62
0.03 0.04 0.01 0.35

130
Table 6.11 Estimated logEC50 and its SE based on Hill equation-based nonlinear regression by run and within- and overall between-lab variation (DL random effects model)
intrinsic homogeneity intrinsic homogeneitySDbtw-runp -value SDbtw-run p -value
1 - -2 - -3 - -1 - -2 - -3 -6.02 0.661 -4.23 0.032 -6.08 0.373 - -1 - -2 -8.89 0.153 - -1 -9.02 0.032 -9.37 0.333 -9.37 0.191 - -2 -8.83 0.103 -8.82 0.061 -8.48 0.142 -8.57 0.123 -8.88 0.161 -9.04 0.042 -8.69 0.083 -8.84 0.141 -4.37 0.042 -8.41 0.753 -7.69 0.611 - -2 - -3 - -1 -7.90 0.752 - -3 - -1 -7.44 0.362 -9.29 0.993 -7.72 0.361 -6.25 0.042 -6.22 0.033 -6.46 0.111 - -2 -5.99 0.103 -5.99 0.021 -6.00 0.082 -6.18 0.063 -6.03 0.041 -6.15 0.022 -5.97 0.053 -5.98 0.031 - -2 -9.00 0.023 - -1 -4.31 0.072 - -3 -4.27 0.041 - -2 - -3 - -1 -9.99 0.432 - -3 - -
2.27 2.18
- - - --
-
-5.11 0.93
-6.02 0.66 0.66 0.00
< 0.01
-8.89 0.15 0.15 0.00 -
1.31 1.28
-9.17 0.14 0.25 0.19 0.10
-8.85 0.09 0.18
0.87
0.15
< 0.01
-8.63 0.11 0.19 0.13
-8.82 0.05 0.07 0.00
-8.86 0.13 0.23 0.21
-6.76 1.49 2.58 2.52
0.30 0.79
-
0.21
0.00
-
0.52
- - - -
-7.90 0.75 0.75 0.00
-7.75 0.34 0.59 0.35
-6.26 0.04 0.07 0.05
-6.78 1.31
0.12
-6.09 0.07
0.99
0.05
< 0.01
< 0.01
-7.74
Data SESD SDMean SE Mean SE
0.11
Log10 [EC50(M) ]Within-lab Between-lab
0.14 < 0.010.14
0.14 0.03
< 0.01
0.11
0.00
-4.28
-7.74 1.93
-9.00 0.02 0.02 0.00
-9.99 0.43 0.43
- - - -
< 0.01
0.03 0.05 0.00 0.67
3.34 3.33
-
-
-
18 sumitomo
Diethylhexyl phthalate
17 ceri
otsuka19
20 kaneka
Bisphenol A
13 ceri
otsuka
14 sumitomo
15
16 kaneka
-5.99
-6.04
0.00
-6.07 0.06 0.080.10
0.02 0.03
0.06
Benzophenone
9 ceri
otsuka11
12 kaneka
10 sumitomo
6 sumitomo
kaneka
alpha-Estradiol
5 ceri
otsuka7
8
2 sumitomo
3
Hematoxylin
1 ceri
otsuka
4 kaneka
Test Substance Test vial No. Laboratory Trial

131
Table 6.11 Estimated logEC50 and its SE based on Hill equation-based nonlinear regression by run and within- and overall between-lab variation (DL random effects model) (Continued)
1 -5.95 0.052 -5.33 0.373 -5.88 0.281 - -2 -5.27 0.443 -5.96 0.121 -5.00 0.792 -5.24 0.463 2.52 0.661 -5.21 0.372 -4.82 0.543 -5.51 0.131 - -2 - -3 -6.06 0.481 -5.73 0.452 -5.63 0.973 0.41 0.881 -5.53 0.742 -5.95 0.683 -5.59 0.711 - -2 - -3 - -1 -6.93 0.062 -6.93 0.023 -7.39 0.091 -6.25 0.202 -6.36 0.113 -6.20 0.121 -6.80 0.052 -7.06 0.083 -6.70 0.081 -6.58 0.042 -6.69 0.063 -6.75 0.051 -5.92 0.252 -5.90 0.173 -6.80 0.071 0.81 0.782 -5.61 0.423 -5.88 0.101 -5.71 0.432 -6.18 0.303 -5.98 0.121 -5.55 0.452 -5.84 0.133 -5.80 0.171 -10.71 0.062 -10.98 0.023 -11.09 0.071 -10.94 0.272 -10.47 0.083 -10.68 0.101 -10.39 0.052 -10.32 0.083 -10.73 0.071 -10.77 0.132 -10.48 0.063 -10.32 0.06
MAX * 0.97 2.55 4.42 4.37 0.31 0.53 0.29MIN * 0.02 0.02 0.03 0.00 0.07 0.14 0.00Ave. * 0.22 0.34 0.57 0.48 0.15 0.28 0.16* Excepting for Hematoxylin, Benzophenone and Diethylhexyl phthalate
0.00
-
0.00
3.26
17β-Estradiol
37 ceri
otsuka
40 kaneka
39
38 sumitomo
-10.93 0.09 0.16
-10.61
kaneka
0.23
-5.65
-5.74 0.32 0.45 0.37 0.13
-2.57
-5.44
0.34
-6.23 0.36 0.63 0.60 < 0.01
-5.87 0.14 0.24 0.16
0.23 0.08
2.55 4.42 4.37 < 0.01
0.13 0.22 0.04
0.17
p-tert-pentylphenol
33 ceri
35 otsuka
36 kaneka
34 sumitomo
-6.06 0.48 0.48
30 sumitomo
-3.68 1.93 3.35
- -
31
-7.06 0.10 0.17
0.16 0.15
-6.71 0.15 0.30 0.29 < 0.01
0.36
-
-5.80 0.31 0.53 0.00 0.46
< 0.01
0.90
4-tert-Octylphenol
29 ceri 0.18
otsuka
32
-6.29 0.07 0.13
-6.67
-5.70 0.41
26 sumitomo
27
< 0.01
< 0.01
0.71 0.00
0.58
-
0.03
17α-Methyltestosterone
25 ceri
otsuka
28 kaneka -
-6.85 0.09
-5.81 0.10
0.09 0.080.05
0.12
0.18 0.00 0.66
0.14 0.18
-3.69 1.34 2.32 2.27 < 0.01
-5.99 0.11
-5.91
Genistein
21 ceri
otsuka23
24
22 sumitomo
kaneka
0.22 0.19
0.15 < 0.01
0.18 0.00 0.83
0.23
0.16 < 0.01
-10.64 0.11
0.12 0.21 0.19
< 0.01
0.11 0.18 0.13 0.10
< 0.01
0.18-10.50 0.11
-10.48

132
Estimation of logPC10/50 (linear interpolation vs. Hill equation-based nonlinear regression)
The choice of estimation method for logPC10 made considerable difference in the logPC10
estimates (see Graph 6.1.A). logPC10 values based on linear interpolation tended to be much smaller
than those based on parametric estimation from Hill equation-based nonlinear regression. As
mentioned earlier, this was expected because the concave curvature likely present around the
response level of 10% was ignored in the linear interpolation. All linear interpolation-based logPC10
values for 17β-estradiol were smaller than the parametric counterparts. For other test compounds,
linear interpolation sometimes generated an estimate greater (more than one log10 unit in the most
extreme case) than the parametric method. Such overestimation is more problematic than
underestimation since overestimation of logPC10 actually means underestimation of the chemical’s
potential to induce estrogenic response. It is notable that these interpretations are based on the
assumption that the parametric logPC10 values are more accurate than the linear interpolation-based
counterparts. That is, our results actually does not provide any direct information as to whether a
linear interpolation-based estimate is biased downward or a parametric counterpart is biased upward
when the former is smaller than the latter.
Graph 6.1 Comparison between linear interpolation and Hill equation-based nonlinear regression: logPC10 and logPC50
-13
-12
-11
-10
-9-8
-7-6
-5Li
ne
ar
inte
rpo
latio
n-b
ase
d lo
gP
C1
0
-13 -12 -11 -10 -9 -8 -7 -6 -5Parametric logPC10
A: logPC10 for standard and all chemicals
-13
-12
-11
-10
-9-8
-7-6
-5Li
ne
ar
inte
rpo
latio
n-b
ase
d lo
gP
C5
0
-13 -12 -11 -10 -9 -8 -7 -6 -5Parametric logPC50
B: logPC50 for standard and all chemicals
Run-specific summaries for 17beta-estradiol were obtained using the DL random effects model. The diagonal line is y = x.
As can be seen in Graph 6.1.B, the choice of these two estimation methods made little difference for
the estimated logPC50 values. Results from the two methods are similar presumably because
underlying true curve has much lower level of curvature in the range where response is closer to the
midpoint of the entire curve. An exception was a point at the upper right hand corner, which was

133
noticeably above the y = x line, indicating the Hill equation-based estimate was greater than the
interpolation-based estimate. In general this kind of difference may arise when an underlying
response curve at around logPC50 is convex (i.e., the curve is reaching to its plateau). Graph 6.2
shows agreement of SE (parameter estimate for individual run) across the two analytical procedures
in absolute as well as logarithmic scales.
Graph 6.2 Comparison between linear interpolation and Hill equation-based nonlinear regression: SE(logPC10) and SE(logPC50) for individual run
0.0
0.2
0.4
0.6
0.8
1.0
SE
(Lin
ear
inte
rpol
atio
n-ba
sed
logP
C10
)
0.0 0.2 0.4 0.6 0.8 1.0SE(Parametric logPC10)
A: SE(logPC10), natural scale
0.0
0.2
0.4
0.6
0.8
1.0
SE
(Lin
ear
inte
rpol
atio
n-ba
sed
logP
C50
)
0.0 0.2 0.4 0.6 0.8 1.0SE(Parametric logPC50)
B: SE(logPC50), natural scale
0.00
10.
010.
11.
010
.0S
E(L
inea
r in
terp
olat
ion-
base
d lo
gPC
10)
0.0 0.0 0.1 1.0 10.0SE(Parametric logPC10)
A: SE(logPC10), Log10 scale
0.0
0.0
0.1
1.0
10.0
SE
(Lin
ear
inte
rpol
atio
n-ba
sed
logP
C50
)
0.0 0.0 0.1 1.0 10.0SE(Parametric logPC50)
B: SE(logPC50), Log10 scale
Run-specific summaries for 17beta-estradiol were obtained usingthe DL random effects model.
As mentioned earlier, there were some reasons to speculate that SE of linear interpolation-based
estimates of logPC10 and logPC50 could be greater than those from Hill equation-based nonlinear
regression. Contrary to this speculation, there was some evidence that linear interpolation resulted in
smaller SEs (Table 6.12).

134
Nonetheless, SE of logPC10 and logPC50 based on the linear interpolation varied more as seen by
greater SD of log(SE(estimate)) in Table 6.12 (logarithm of SEs are summarized since they were
right-skewed and log-transformation would make the resultant distribution more normal).
Table 6.12 Comparison between linear interpolation and nonlinear regression: analytical within-run
variability.
Variable Method Mean SD p-value for difference*
Linear interpolation -0.91 0.39 log(SE(logPC10) (N = 86) Nonlinear regression -0.72 0.31
5*10-6
Linear interpolation -1.18 0.37 log(SE(logPC50) (N = 83) Nonlinear regression -1.14 0.29
0.31
* Based on paired t-test ignoring within-lab and within-chemical correlation.
It is possible that SEs of the linear interpolation-based parameter estimates do not reflect the true level of variability in the estimates since SEs are calculated ignoring the uncertainly due to the probabilistic selection of data points used for the interpolation. The true level of variability could be greater than the expected level given the selected adjacent log(concentration)-response pairs. The Hill equation-based nonlinear regression used the whole data set without selection, introducing no uncertainty of this sort.
For the data sets on 17β-Estradiol from “Sumitomo” lab trials 1-2 and 1-3 and “Kaneka” lab trial 1-2,
attempts to estimate logPC10 using the interpolation method failed since the lowest
concentration-specific mean response was greater than 10%. The nonlinear regression, on the other
hand, successfully generated a logPC10 estimate for these data sets. These examples illustrate
another advantage of the nonlinear regression, i.e., its capacity to generate a logPC10 estimate for
the data set with the lowest concentration-specific mean response greater than 10% as long as the
data overall have a monotonously increasing pattern. This can be considered a cost saving feature
since additional experiments to be conducted using lower concentrations of the test chemical may be
omitted.
For other positive chemicals, failure to report either interpolation- or Hill equation-based logPC10
estimate did not occur. On the other hand, in some runs for negative chemicals the interpolation-
and/or Hill equation-based procedure reported logPC10. It may appear possible that random
fluctuation in response may be detected as monotonous increase by the linear interpolation. The
nonlinear regression is less susceptible to the consequence of such random fluctuation because the
rest of the data would tend to inform the absence of monotonous increase. Of note are data for
Diethylhexyl phthalate (a negative) from Sumitomo lab where logPC10 was reported for each of
three runs. A spurious gradient in background response across wells with increasing concentrations
may have resulted in this. Other than this, the frequency of reporting logPC10 for a negative
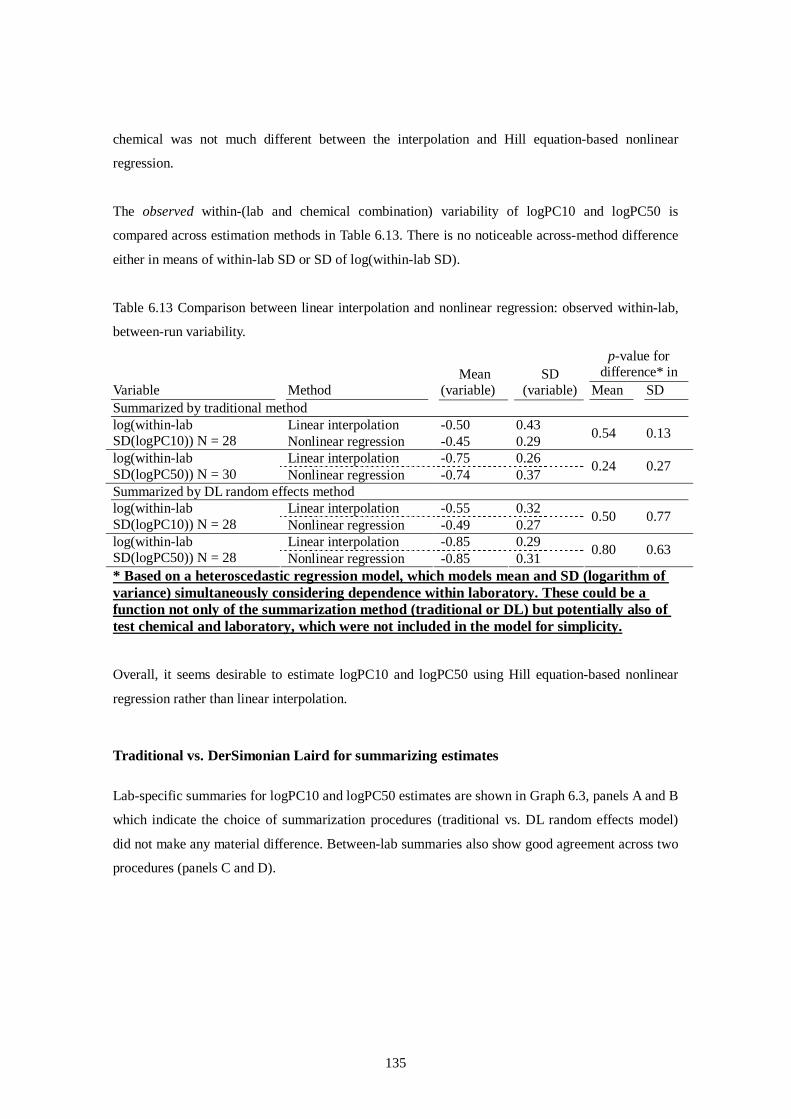
135
chemical was not much different between the interpolation and Hill equation-based nonlinear
regression.
The observed within-(lab and chemical combination) variability of logPC10 and logPC50 is
compared across estimation methods in Table 6.13. There is no noticeable across-method difference
either in means of within-lab SD or SD of log(within-lab SD).
Table 6.13 Comparison between linear interpolation and nonlinear regression: observed within-lab,
between-run variability.
p-value for difference* in
Variable Method Mean
(variable) SD
(variable) Mean SD Summarized by traditional method
Linear interpolation -0.50 0.43 log(within-lab SD(logPC10)) N = 28 Nonlinear regression -0.45 0.29
0.54 0.13
Linear interpolation -0.75 0.26 log(within-lab SD(logPC50)) N = 30 Nonlinear regression -0.74 0.37
0.24 0.27
Summarized by DL random effects method Linear interpolation -0.55 0.32 log(within-lab
SD(logPC10)) N = 28 Nonlinear regression -0.49 0.27 0.50 0.77
Linear interpolation -0.85 0.29 log(within-lab SD(logPC50)) N = 28 Nonlinear regression -0.85 0.31
0.80 0.63
* Based on a heteroscedastic regression model, which models mean and SD (logarithm of variance) simultaneously considering dependence within laboratory. These could be a function not only of the summarization method (traditional or DL) but potentially also of test chemical and laboratory, which were not included in the model for simplicity. Overall, it seems desirable to estimate logPC10 and logPC50 using Hill equation-based nonlinear
regression rather than linear interpolation.
Traditional vs. DerSimonian Laird for summarizing estimates
Lab-specific summaries for logPC10 and logPC50 estimates are shown in Graph 6.3, panels A and B
which indicate the choice of summarization procedures (traditional vs. DL random effects model)
did not make any material difference. Between-lab summaries also show good agreement across two
procedures (panels C and D).

136
Graph 6.3 Comparison of point estimates across summary methods (traditional vs. DL random effects model)
-13
-12
-11
-10
-9-8
-7-6
-5-4
Tra
ditio
nal s
umm
ary
of lo
gPC
10
-13 -12 -11 -10 -9 -8 -7 -6 -5 -4DL model-based summary of logPC10
A: Within-lab logPC10
-13
-12
-11
-10
-9-8
-7-6
-5-4
Tra
ditio
nal s
umm
ary
of lo
gPC
10
-13 -12 -11 -10 -9 -8 -7 -6 -5 -4DL model-based summary of logPC10
B: Within-lab logPC50
-13
-12
-11
-10
-9-8
-7-6
-5-4
Tra
ditio
nal s
umm
ary
of lo
gPC
10
-13 -12 -11 -10 -9 -8 -7 -6 -5 -4DL model-based summary of logPC10
C: Between-lab logPC10
-13
-12
-11
-10
-9-8
-7-6
-5-4
Tra
ditio
nal s
umm
ary
of lo
gPC
10
-13 -12 -11 -10 -9 -8 -7 -6 -5 -4DL model-based summary of logPC10
D: Between-lab logPC50
Diagonal line is y = x.

137
On the other hand, estimates of overall between-variability for logPC10 and logPC50 differed much
more across summarization procedures (Graph 6.4). (Please note that the use of within-lab SE and
between-lab SD are intentional: the former is the within-component of the latter on a common scale,
i.e., the square of the former plus the square of intrinsic between-lab SD equals the square of the
latter.)
Graph 6.4 Comparison of overall within-lab ( = between-run) and between-lab variability estimates for nonlinear regression-based logPC10 and logPC50 across summary methods (traditional vs. DL random effects model)
0.1
.2.3
.4.5
.6.7
.8
Tra
ditio
nal s
umm
ary
of lo
gPC
10
0 .1 .2 .3 .4 .5 .6 .7 .8DL model-based summary of logPC10
A: Within-lab SE(logPC10)
0.1
.2.3
.4.5
.6.7
.8
Tra
ditio
nal s
umm
ary
of lo
gPC
50
0 .1 .2 .3 .4 .5 .6 .7 .8DL model-based summary of logPC50
B: Within-lab SE(logPC50)
0.1
.2.3
.4.5
.6.7
.8T
radi
tiona
l sum
mar
y of
logP
C10
0 .1 .2 .3 .4 .5 .6 .7 .8DL model-based summary of logPC10
C: Between-lab SD(logPC10)
0.1
.2.3
.4.5
.6.7
.8T
radi
tiona
l sum
mar
y of
logP
C50
0 .1 .2 .3 .4 .5 .6 .7 .8DL model-based summary of logPC50
D: Between-lab SD(logPC50)
Diagonal line is y = x.

138
In order to examine whether estimates of overall between-run variability systematically differed
across summarization methods, its mean and spread were modeled by heteroscedastic regression. As
seen in Table 6.14, overall between-run variability for logPC10 were similar across summarization
methods. For logPC50, overall between-run variability was smaller and less variable when the DL
method was applied. Nonetheless, the magnitude of the difference was not substantial.
Table 6.14 Comparison between traditional method vs. DL random effects model: observed within-lab, between-run variability.
p-value for difference* in
Variable Summarization Method Mean (var-iable)
SD (var-iable)
Mean (variable)
SD (variable)
Linear interpolation Traditional -0.50 0.43 log(within-lab
SD(logPC10)) N = 28 DL random effects -0.55 0.33 0.43 0.003
Traditional -0.75 0.27 log(within-lab SD(logPC50)) N = 28 DL random effects -0.85 0.29
0.02 0.05
Nonlinear regression Traditional -0.46 0.29 log(within-lab
SD(logPC10)) N = 29 DL random effects -0.49 0.28 0.36 0.35
Traditional -0.74 0.27 log(within-lab SD(logPC50)) N = 28 DL random effects -0.85 0.31
<0.01 <0.01
* Based on a heteroscedastic regression model, which models mean and SD (logarithm of variance) simultaneously considering dependence within laboratory. These could be a function not only of the summarization method (traditional or DL) but potentially also of test chemical and laboratory, which were not included in the model for simplicity. Some simulation results performed to date (not shown) indicated that when intrinsic between-unit
variability is small relative to within-unit variability the traditional method tended to underestimate
the overall between-unit variability. Such tendency could be seen for the overall between-run
variability estimated for the current data as shown in Graph 6.5. This graph shows how the relative
size of the traditional method-based overall between-run variability compared to the DL-based
counterpart changed according to the size of the observed intrinsic between-run variability, which is
expressed in relation to the within-run variability. The vertical axis value of 1 means the traditional
overall between-run variability estimate was equal to the DL overall between-run variability. Small
horizontal axis values mean small intrinsic between-run variability in relation to within-run
variability. The horizontal axis value of zero means the intrinsic between-variability was estimated to
be zero. Note that in the panel A the vertical axis values at the horizontal axis value of zero are
mostly below 1, meaning the traditional overall between-run variability estimates were consistently
smaller than the DL counterparts. The aforementioned simulation indicated that the tendency for the
traditional method to underestimate overall between-unit variability diminishes rapidly as intrinsic
between-run variability increases proportionally, and the pattern seen in the panel A is consistent
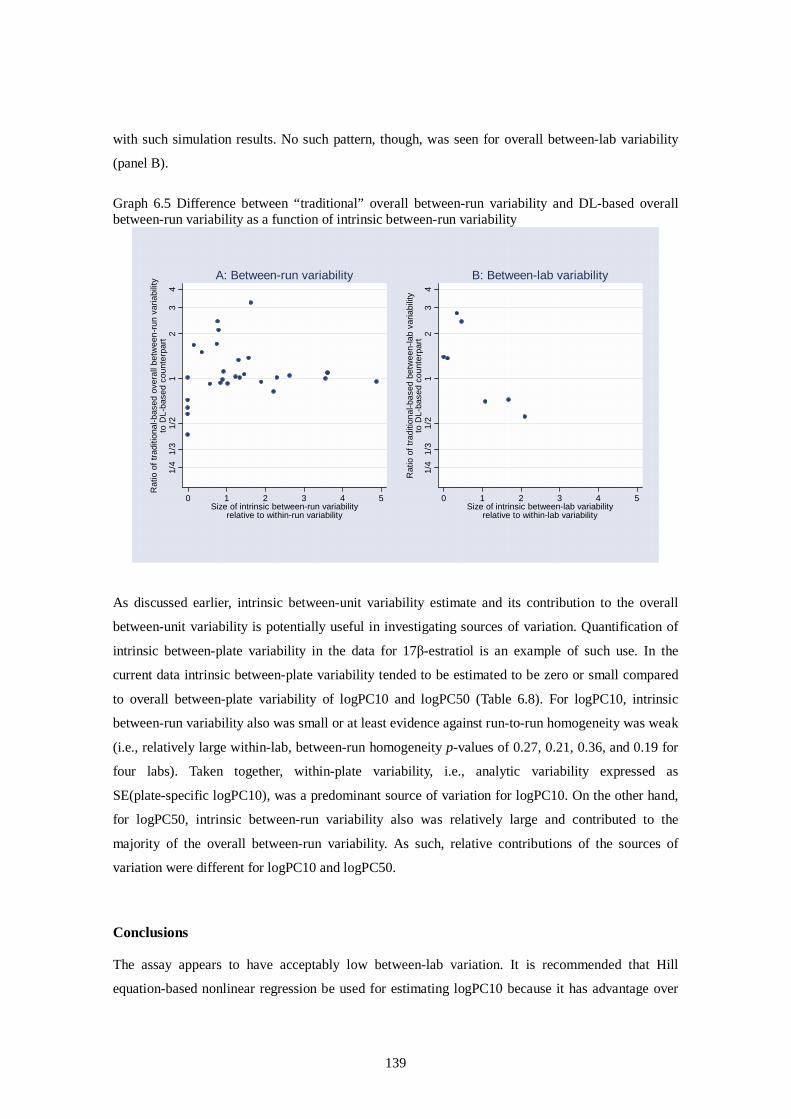
139
with such simulation results. No such pattern, though, was seen for overall between-lab variability
(panel B).
Graph 6.5 Difference between “traditional” overall between-run variability and DL-based overall between-run variability as a function of intrinsic between-run variability
1/4
1/3
1/2
12
34
Rat
io o
f tr
aditi
onal
-bas
ed o
vera
ll be
twee
n-ru
n va
riabi
lity
to D
L-ba
sed
coun
terp
art
0 1 2 3 4 5Size of intrinsic between-run variability
relative to within-run variability
A: Between-run variability
1/4
1/3
1/2
12
34
Rat
io o
f tr
aditi
onal
-bas
ed b
etw
een-
lab
varia
bilit
yto
DL-
base
d co
unte
rpar
t
0 1 2 3 4 5Size of intrinsic between-lab variability
relative to within-lab variability
B: Between-lab variability
As discussed earlier, intrinsic between-unit variability estimate and its contribution to the overall
between-unit variability is potentially useful in investigating sources of variation. Quantification of
intrinsic between-plate variability in the data for 17β-estratiol is an example of such use. In the
current data intrinsic between-plate variability tended to be estimated to be zero or small compared
to overall between-plate variability of logPC10 and logPC50 (Table 6.8). For logPC10, intrinsic
between-run variability also was small or at least evidence against run-to-run homogeneity was weak
(i.e., relatively large within-lab, between-run homogeneity p-values of 0.27, 0.21, 0.36, and 0.19 for
four labs). Taken together, within-plate variability, i.e., analytic variability expressed as
SE(plate-specific logPC10), was a predominant source of variation for logPC10. On the other hand,
for logPC50, intrinsic between-run variability also was relatively large and contributed to the
majority of the overall between-run variability. As such, relative contributions of the sources of
variation were different for logPC10 and logPC50.
Conclusions
The assay appears to have acceptably low between-lab variation. It is recommended that Hill
equation-based nonlinear regression be used for estimating logPC10 because it has advantage over

140
linear interpolation in terms of accuracy and precision. For logPC50, there is not much difference
between the two methods. While a thorough comparison of the CERI method vs. DL random effects
model based solely on this single data set cannot be made, minor, relatively unimportant drawbacks
of the CERI method were noted. For a full comparison, detailed analyses preferably based on
simulation would be necessary.
141
Appendix 7 Report of the preliminary validation assessment panel of the 'Japanese multi-laboratories validation study of a stably transfected ER alpha mediated reporter gene assay in Japan'
REPORT OF THE PRELIMINARY VALIDATION ASSESSMENT PANEL OF THE 'JAPANESE MULTI-LABORATORIES VALIDATION STUDY OF A STABLY
TRANSFECTED ER ALPHA MEDIATED REPORTER GENE ASSAY IN JAPAN'.
Final version 29 June 2006

142
ACCRONYMS
AR Androgen Receptor
CERI Chemicals Evaluation and Research Institute (Japan)
CV coefficient of variation
DIP Data interpretation procedure
ECVAM European Centre for the Validation of Alternative Methods
EDTA (OECD) Task Force on Endocrine Disruptor Testing and Assessment
ER Estrogen Receptor
ERE Estrogen Responsive Element
GD 34 Guidance Document 34
GLP Good Laboratory Practice
ICCVAM Interagency coordinating Committee on the Validation of Alternative Methods (US)
JaCVAM Japanese Centre for the Validation of Alternative Methods
NICEATM National Toxicology Program (NTP) Interagency Centre for the Evaluation of Alternative Toxicological Methods (US)
NIEHS National Institute of Environment and Health Sciences (US)
NIHS National Institute of Health Sciences (Japan)
PC 50/PC10 The concentration of chemical estimated to cause 50% or 10%, respectively, of activity of the positive control response on a plate by plate basis.
PM Prediction Model
QA Quality Assurance
SOP Standard Operating Procedure
SPSF Standard Project Submission Form
TA Transcriptional Activation
US EPA US Environmental Protection Agency
VMG-NA Validation Management Group for Non –Animal Testing

143
WNT (OECD) Working Group of the National Coordinators for the Test Guidelines Programme
1. INTRODUCTION AND BACKGROUND
1.1 At the present time, there is global concern regarding endocrine disruption effects, particulary mediated by the estrogen receptor (ER) resulting from chemical exposure. Several in vitro ER binding and transfected cell line assay methods are currently or imminently being (pre) validated at national, regional and international levels, but are some way away from completion and full assessment of their validation status.
1.2 A screening test method is a rapid, usually simple test performed for the purposes of prioritizing or grouping substances in general categories of potential modes of action (e.g., in vitro binding to the oestrogen receptor). The results from screening tests are generally used for preliminary decision making and to set priorities for additional and more complex tests. Although the results from screening tests, alone, may not be sufficient for risk assessment purposes, there may be circumstances where such results may be combined with other test results in a tiered testing approach to provide in the hazard/risk assessments (GD34).
1.3 Currently, no in vitro screening assay for ER activity that can be used for OECD regulatory purposes has been peer reviewed for potential test guideline development, although the need is urgent. Recognizing this urgency, Japan has made an extensive effort to establish and domestically validate a new in vitro pre-screening procedure, the hER-HeLa-9903 Estrogen Receptor (ER) Transcriptional Activation (TA) Test for detecting the estrogenic activity of chemicals for a level 2 screening test in the OECD Conceptual Framework for the Testing and Assessment of Endocrine Disrupting Chemicals.
1.4 The with-in Japan multi-laboratory validation process of Japanese ER TA Assay was completed as an activity of the Validation Management Group (Non -Animal)( VMG-NA) and the results were presented at the 3rd VMG-NA held in November 2005.
1.5 The assay is based on an estrogen reactive stable human cervical tumor cell line, hER-HeLa- 9903, which was developed by the Sumitomo Chemical Company in Japan. An initial test protocol of the assay system was developed and optimized by the Chemicals Evaluation and Research Institute (CERI). Using this optimized protocol, a pre-validation of the test system was conducted by CERI as an initial assessment exercise in order to identify the reliability, relevance and performance (accuracy) of the assay system. Following this first assessment, CERI, led an inter-laboratory validation involving four participating laboratories, all of which used coded chemicals under GLP compliance conditions. The data produced indicated good reproducibility and technical transference between laboratories. The data compared favourably and showed good concordance with that reported for the immature rat uterotrophic assay (80%) and summarised by ICCVAM (85%), (ICCVAM 2003), with an overall low false positive rate of 9%.

144
1.6 Following this presentation, the VMG-NA agreed to create a panel with the task of assisting the Japanese in assessing the readiness of the validation study for independent scientific peer review and supporting additional requirements that might be deemed necessary. The panel activities were informal and unofficial, as member countries did not make official nominations for panel membership, and the panel members participated on a voluntary basis.
1.7 Using GD 34 criteria as a basis, the primary tasks or charges of the panel were to assist the Japanese in a transparent manner in assessing whether there is sufficient information on the domestic validation to submit a report for scientific review, with the independent review procedure to be agreed by the Japanese. This report, which is based upon the three teleconference discussions of the panel held over six months, provides the first step in this process and will be made available to the VMG-NA. All the points and discussions documented herein were agreed by the panel during their preliminary validation assessment activities or charge. These teleconferences were conducted under the auspices of the individual expertise of the participants, and therefore the teleconference minutes and this report reflect their expert opinion, and not that of the organisations in which the experts are employed.
1.8 The report outlines the panel discussions, and each meeting is summarised in this report. Through the teleconference process the steps taken in the preliminary validation assessment are identified, and also included as appendices are the summary statements from participants. Subsequent activities include writing of a comprehensive validation report, or peer charge, using the preliminary validation assessment report as a basis. Following this next report the Japanese will decide how to go ahead with the formal peer review process. Routes for the organisation of independent peer review were identified and discussed at the 9th EDTA and 18th WNT via a contract house or by a member country competent authority, as follows: ‘The Secretariat drew the attention of the WNT on Document ENV/JM/TG(2006)5 including two examples of approaches proposed to address the peer review of validated methods: a proposal made by the United States and a proposal made by Japan. It proposed to initially address peer reviews on a case-by-case basis until experience is gained and after a certain time, possibly consider a more comprehensive guidance on the processes for peer review. The United States introduced Annex 1 of Document ENV/JM/TG(2006)5 , which does not apply to a specific assay. The Secretariat brought Information Document [INF.6] to the attention of the meeting, as a collation of comments received from members of the VMG-eco on the Annex 1 of Document ENV/JM/TG(2006)5. The WNT agreed that the document describes a plausible approach, but does not provide standard procedures.’ (Paragraph 36 of the Draft Summary record of the 18th meeting of the WNT, Bern Switzerland 16-18 May 2006.)
1.9 Should the assay be ultimately considered by the Japanese to be appropriate for submission to the OECD, the Japanese will be required to submit a SPSF to the OECD Secretariat for consideration by the WNT. On 1 June 2006, in response to queries from CERI, and discussions and recommendations at the 18th WNT with the Japanese National Coordinator and chair, the Secretariat recommended that the Japanese submit an SPSF soon, so that the project could be added to the rolling work plan.
Background information: What is a reporter gene assay?
1.10 The Reporter gene assay method is an in vitro tool that allows the identification of promoters and enhancers together with an assessment of the correlations between their activities and conformations by measurement of the reporter proteins that are expressed from reporter genes. The promoters and the enhancers, which are upstream of all protein coding regions on the genome, adjust the activity and enhancement of the expression of the proteins. Because the

145
reporter genes that code useful proteins that become indicators later in the target cells are artificially built downstream of the promoters and enhancers, reporter genes have become a focus of investigations. In the case of luciferase (a gene from the firefly), if a substrate is added to the cells expressing this enzyme, bioluminescence is observed so the expression from the reporter gene is detected visually and can also be measured quantitatively (See Figure 7-1).
1.11 Thus the reporter gene assay technique may be suitable for detecting hormonal activity of chemicals, because it has been used to detect enhancers and promoter activity of genes. The reporter gene assay system may also provide a powerful tool to screen for endocrine disrupting chemicals (Takeyoshi et al., 2002; Yamasaki et al., 2002, and has also been developed for use in other cell lines, e.g. CALUX (Sonneveld et al 2006).
1.12 The assay used for this validation study uses the human cervical tumor cells host cell line HeLa cell line with an inserted construct: Human ERα expression vector (full-length) with a firefly luciferase reporter construct bearing five tandem repeats of a vitellogenin estrogen-responsive element (ERE) driven by a mouse metallothionein promoter TATA element.
Figure 7-1. Diagram showing the principle of the reporter gene assay
11.1 1.13 Panel participants
The panel participants were proposed during and following the 3rd VMG-NA, on the basis of the organisation they represented at the VMG-NA, and for their specific expertise particularly in relation to statistical analyses, validation and /or receptor screening assays. The panel initially included the following experts:
1. Dr. Masahiro Takeyoshi (CERI) 2. Dr. Yumi Akahori (CERI) 3. Prof. Daniel Dietrich (on behalf of ECVAM) 4. Dr. Susan Laws (US EPA) 5. Mr. Gary Timm (US EPA) 6. Dr. Yutaka Aoki (ASPH Fellow at US EPA) 7. Dr.Tim Schrader (Health Canada) 8. Dr. Bill Stokes (NIEHS/NICEATM, ICCVAM) 9. Dr. Ray Tice (NIEHS/NICEATM, ICCVAM) 10. Ms. Patricia Ceger (ILS. Inc./NICEATM, ICCVAM) 11. Mr. Frank Deal (ILS. Inc./NICEATM, ICCVAM) 12. Dr. Miriam Jacobs (OECD call leader) There were alterations in participation of the panel activities: Following the first teleconference, 13. Dr. Jun Kanno (NIHS) and
Firefly luciferase gene
Hormone responsiveelement
Receptor
HormoneHormone
Detection of Detection of ChemiluminescenceChemiluminescence
Luciferase
HTS00021 / Estr adi ol , 17b
0
1
2
3
4
5
6
7
8
9
10
11
12
13
14
15
1uM100nM10nM1nM100pM10pM1pMCont r ol
17β-Estradiol
log [Conc.(M)]
C -12 -11 -10 -9 -8 -7 -6
15
10
5
0Inte
nsi
ty o
f lu
min
esce
nce
HTS00021 / Estr adi ol , 17b
0
1
2
3
4
5
6
7
8
9
10
11
12
13
14
15
1uM100nM10nM1nM100pM10pM1pMCont r ol
17β-Estradiol
log [Conc.(M)]
C -12 -11 -10 -9 -8 -7 -6
15
10
5
0
HTS00021 / Estr adi ol , 17b
0
1
2
3
4
5
6
7
8
9
10
11
12
13
14
15
1uM100nM10nM1nM100pM10pM1pMCont r ol
17β-Estradiol
log [Conc.(M)]
C -12 -11 -10 -9 -8 -7 -6
15
10
5
0Inte
nsi
ty o
f lu
min
esce
nce
Typical responsesin Reporter gene assay

146
14. Dr. Hajime Kojima (JaCVAM) were invited to join, to improve the Japanese representation and expertise. Although a panel member, Prof Bob Combes did not participate in any of the teleconferences, but did submit written comments at a later date. 1.14 Following the second teleconference it became apparent that the panel had become a little unbalanced with respect to numbers of persons with validation expertise representing different bodies. The Secretariat therefore recommended that the numbers of such persons for each of the different participating bodies, during the teleconferences, is reduced and/or maintained at two persons to improve the balance in representation across the participating bodies and improve manageability of the teleconference.
1.15 Further consultation with experts outside the panel was sought where panel members felt it useful. Dr Ray Tice requested further consultation on statistical matters from the Statistical expert consultant to ICCVAM, Dr. Joe Haseman. The ECVAM computational toxicology and statistical expert Dr. Sebastian Hoffman was also consulted. Dr. Jean-Claude Nicholas was consulted with respect to the possibility of induction of non receptor mediated effects that might be observed at higher concentrations that might impact upon and increase the chemical luminescence.
Steps undertaken during preliminary validation assessment process
1.16 The steps taken during the preliminary validation assessment at the request of the panel included (in chronological order):
• Teleconference 2
i. CERI conducted a comparison of the draft report submission with the guidelines provided in the OECD Guidance Document 34 and ICCVAM Evaluation of In Vitro Test Methods for Detecting Potential Endocrine Disruptors (NIH Pub. No. 03-4503) and stated their rationale for deviations from these guidelines.
ii. CERI provided further information on cell line characterisation, methods of cytotoxicity evaluation and ER alpha antagonist TA testing (See also appendix 7-1).
iii. CERI provided raw fold induction data for the positive controls and for the chemicals assessed under the (pre) validation stage from data generated by the CERI laboratory. The provision of such data from the other laboratories was not possible. The panel required this information to assess the extent of the variation in fold induction over time.
iv. Dr. Yutaka Aoki (US EPA) provided information on proposed methods for between- and within-variation estimation to the whole group (Appendix 7-2) and consulted directly with CERI on how to proceed.
v. CERI conducted an internal audit of data transcribed.
vi. CERI provided raw data on edge effects from the CERI laboratory.

147
• Teleconference 3
vii. CERI submitted the antagonist assay protocol (SOP) and raw data for consideration by the panel. (See appendix 7-1).
viii. For the negative substances used, information and justification was provided by CERI on solubility and the maximum concentration used.
ix. Data analysis proposal from Dr Yutaka Aoki and subsequent discussion from and response to NICEATM consultant statistician Dr Joe Haseman, and Dr Sebastian Hoffman (ECVAM). (Appendix 7-3)
x. Assistance from Dr Aoki to CERI in conducting statistical estimations of between- and within-run (laboratory) variation (provisionally in June 2006).

148
TELECONFERENCE SUMMARIES
2. THE FIRST TELECONFERENCE WAS HELD ON 6 FEBRUARY 2006.
The meeting opened with a presentation from CERI summarising the validation of the reporter gene assay using the hER-HeLa-9903 cell line to detect estrogenic activity. During the presentation there were a number of queries, to which the following clarifications were given:
2.1 Coefficients of variation (CV) analysis to evaluate intra- and inter-laboratory reproducibility were based on log EC50 values, not EC50 values.
2.2 Requests were made for clarification as to the nature of the PC50 and PC10 values, how they are calculated, why there was no CV for the PC10 of 17β estradiol (E2), and whether PC50 and PC10 values were calculated within or across experiments. The PC50 and PC10 values are defined as the concentration of chemical estimated to cause 50% or 10%, respectively, of activity of the positive control response on a plate by plate basis. This measure is not the same as % maximum induction of the positive control, and is not the same as an EC50. It was not always possible to calculate EC50 values. 100pM E2 was the single positive control for both PC50 and PC10 values. No CV could be calculated for the PC10 of E2 due to the fact that the lowest concentration tested was 10-12 M, at which concentration ERα activation was still high. CERI did not try to increase the concentration of the chemicals for which an EC50 could not be obtained at a dose range from 10pM to 10µM, to obtain an EC50 value.
2.3 When selecting substances from the ICCVAM List of Reference Substances, CERI excluded substances that had excessive cost or limited commercial availability.
2.4 During prevalidation testing, a historical database was established using three substances, E2, bisphenol A (positive) and methyl testosterone (negative) which were tested 13 times over a four month period.
2.5 The first phase of the inter-laboratory testing study used two substances, E2 and bisphenol A to determine assay transferability. In this phase, it was determined that the sensitivity of the luminometer could be a limiting factor in a laboratory’s ability to duplicate the results of other laboratories. This problem was overcome by the use of a more sensitive luminescence system in some of the participating laboratories.
2.6 Of the 10 substances used in the inter-laboratory validation phase, seven were selected because they were positive in the uterotrophic assay and three were selected because they were negative. 10 chemicals were tested to keep within the cytotoxicity and solubility range for each chemical. Of the 46 substances used by CERI to examine concordance between CERI uterotrophic and ICCVAM data, 10 compounds were problematic in terms of cytotoxicity or limited solubility. Further discussion as to the nature of PC10 and PC50 values ensued.
2.7 In general practice, substances are determined to be positive by CERI based on their PC50 values, with a substance being considered positive if a PC50 could be calculated. However, for the examination of concordance between CERI and ICCVAM data, CERI considered substances to be positive if a PC10 could be calculated for that substance. Concern was expressed that the PC10 value could give rise to many false positives. Potential metabolism issues also need to be addressed with respect to the metabolism of substances such that they do not reach the cellular target.

149
2.8 Participants requested that CERI send additional copies of raw data for this assay for examination. Raw data spreadsheets were sent out to the original panel of participants, prior to the meeting and to ICCVAM subsequently. Additional raw data was required to assess fold activation/induction, so as to clarify the variation of fold induction and enable comparison with fold induction data from comparable assays. Assessment of this data was favourable, and the variation observed was considered acceptable by the panel.
2.9 The following questions were asked regarding the calculation of PC10 and PC50 values:
i. Why is only one concentration (100 pM) used for the calculation of PC10 and PC50
values?.
ii. Might it be more statistically valid to use at least three concentrations (for instance, 10 pM, 100 pM and 1 nM) for this calculation? This would define a range of acceptability which could include historical and concurrent data which one could use to tease out performance criteria.
2.10 The comment from the participating statistician was that a single point would probably be sufficient for making this evaluation, but that ideally, this single concentration should be run in several additional wells, to stabilise the titrations and thus improve precision of the calculation. Also, an option worth considering is to introduce a relative index comparing a test chemical to a standard. In this approach one would calculate a ratio of (PC10 for the standard) to (PC10 for the test chemical) utilizing the data concurrently obtained for the standard. Similar to this ratio is relative binding affinity (RBA), which is already in use for receptor binding assays. Intuitively the use of relative index of this sort would result in more efficient cancellation of day-to-day (batch-to-batch) variation common to the standard and test chemical. Appendix 7-1 includes the statistical evaluation advice and discussion provided to the Panel by Dr Yutaka Aoki.
2.11 Additional questions were raised regarding the table from the presentation showing five to 15-fold induction of 100 pM E2 over a four-month period:
i. Are the hER-HeLa-9903 cells stable for longer than the four-month period used by CERI?
ii. Why is there so much variability in fold induction?
iii. Is there a risk of “false positives” showing up when the induction is 15 fold that would not appear when the induction was five fold?
iv. Are there upper and lower limit “cut-offs” for fold induction?
In response, CERI stated that the cells are stable for longer than the four month period, but that they do not use the cells longer than this period. The lower cut-off for induction is five fold for 100 pM E2, but there is no upper limit of induction used as a cut-off. 2.12 This led to the question of controlling for cell number. In particular, it was asked whether knowledge of cell number would allow for normalisation of induction. The conclusion was that although this could be done, it would not necessarily prove to be of any use. Luciferase reporter gene systems normally have varied degrees of response (i.e., varying fold inductions) that are not related to cell number in a linear fashion (i.e., on some days, the cells just respond better than on other days). In particular, there should not be any risk of seeing an

150
increase in “false positives” on days where there is a higher than usual induction because what usually happens in these cases is that the response is elevated for all cells. However, it was also decided that this issue would require additional thought and consideration.
2.13 Information on the test cell line characterisation was requested. As a cervical carcinoma cell line it is possible that there may be intrinsic metabolism occurring via for example P450, other receptors such as the Progesterone receptor and the Pregnane X receptor and cellular transporters such as Pgp.
2.14 Cytotoxicity evaluation was conducted by examining baseline induction. If a substance causes luciferase activity to fall below baseline, the substance is considered to be cytotoxic. The panel were concerned that this method was open to confounding, because if a substance is an antagonist, it could suppress luciferase activity below basal levels, without killing cells. A request was made for CERI to provide more information on this issue and QA controls generally (see paragraphs 3. 7 and 4.11).
2.15 It was recommended that CERI compare their submission to the guidelines in the OECD Guidance Document 34 and ICCVAM Evaluation of In Vitro Test Methods for Detecting Potential Endocrine Disruptors (NIH Pub. No. 03-4503).
3. THE SECOND TELECONFERENCE MEETING WAS HELD ON 17 MARCH 2006.
3.1 This meeting opened with a presentation from CERI summarising where the validation principles in OECD GD34 were met, partially met, or not met (Table 7-3.1) and whether the validation principles from the Minimum Standard Procedure recommended by ICCVAM were met, partially met, or not met ( Appendix 7-4, Table 7-4.1). Table 7-3.2 gives the 10 core coded compounds tested in the inter- laboratory testing phase of the validation study.

151
Table 7-3.1. Checklist to assess whether the validation principles in OECD GD34 were met, partially met, or not met by the Japanese multi-laboratories validation study of a stably transfected ER alpha mediated reporter gene assay in Japan.
Principles Met/Not met
Explanation and Justification
a) The rationale for the test method should be available.
MET
The proposed test method is used to provide mechanistic information and used for the purposes of prioritizing or grouping substances that has a potential estrogenic activity mediated estrogen receptor alpha.
b) The relationship between the test method's endpoint(s) and the (biological) phenomenon of interest should be described.
MET
The endpoint is a luciferase activity that is produced as a result of transcriptional activation of the reporter gene. Stimulation of reporter gene expression in response to ER agonists, is thought to be mediated by direct binding where E2-liganded ER binds directly to estrogen responsive element (ERE) and interacts directly with coactivator proteins and components of the RNA polymerase II transcription initiation complex resulting in enhanced transcription.
c) A detailed protocol for the test method should be available.
MET
This is provided in the draft report appendices. Further statistical discussions on data analysis and decision criteria are provided in paragraphs 3.11 and 4.10 and appendices 2 and 3.
d) The intra-, and inter-laboratory reproducibility of the test method should be demonstrated.
MET
Demonstrated.
e) Demonstration of the test method's performance should be based on the testing of reference chemicals representative of the types of substances for which the test method will be used. A sufficient number of the reference chemicals should have been tested under code to exclude bias.
NOT FULLY MET
Reference chemicals are necessary to establish the relevance and reliability of the proposed test and should include a minimum number of chemicals possessing expected range of response (strong, moderate, weak and negative). There was not consensus that this requirement was met. A minority view expressed concerns that the requirements specified by the ICCVAM ED to test 78 specified chemicals were not met. This opinion was attached as appendix 7-1 in the summary of the third teleconference and is attached to this report as appendix 4. 10 coded chemicals (Table 7-3.2) possessing expected ranges of response were tested under the inter-laboratory validation, and relevance and reliability were demonstrated. However while a sufficient number of chemicals were not tested in all participating laboratories, according to ICCVAM recommendations, data were collected at the lead laboratory for further comparison with 46 chemicals selected from the ICCVAM list, and these data give a strong indication of relevance of the proposed test method.

152
While the ICCVAM list of 78 chemicals does span a broad range of chemical classes and, for that reason, may be useful for identifying the limitations of the assay it also states that EC50 and IC50 data area available for 18 (23%) and 10 (13%) of these 78 recommended substances for agonism and antagonism, respectively. Qualitative data are available for 27 (35%) and 10 (13%) of these 78 recommended substances for agonism and antagonism, respectively. Thus, there is incomplete information regarding how all 78 of the recommended substances will respond in in vitro ER TA agonism and antagonism assays utilizing mammalian cell reporter gene systems. In which case testing only 10 of the 78 substances in multiple laboratories and the remainder in the lead laboratory is not a significant flaw in this validation effort. The limitations of the assay can be adequately determined by testing the remainder of the 78 chemicals in one or more laboratory/s. This could be considered to be consistent with ECVAM's proposed modular approach to validation (Hartung et al 2004), where core, better characterised coded sets of chemicals are tested in all participating laboratories, but further chemicals being tested for the prediction model are split or staggered between the three different laboratories. Such an approach is intended to improve the efficiency, reduce costs and speed up the validation process to meet pressing European and international regulatory requirements.
f) The performance of the test method should have been evaluated in relation to relevant information from the species of concern, and existing relevant toxicity testing data.
MET Relevant information obtained from the ICCVAM ED list, and results for selected chemicals were compared with this list. All data used for this comparison were produced at the lead laboratory. Additionally a data comparison was conducted with the proposed test method and the hERalpha Binding assay (and data from the immature rat uterotrophic assay) with good concordance.
g) Ideally, all data supporting the validity of a test method should have been obtained in accordance with the principles of GLP.
NOT FULLY MET
The pre-validation and data collection for comparison with ICCVAM list or hERalpha binding assay were not conducted to GLP. However the inter laboratory validation was conducted to GLP. There was consensus from the panel that although GLP is ideal, for practical purposes, the fact that components of this validation and data comparison was not always to GLP was acceptable.

153
h) All data supporting the assessment of the validity of the test method should be available for expert review.
MET A detailed test protocol is available, and data is available for independent review (including that prepared by this pre-peer review). Benchmark: The responses of positive control (E2) and vehicle control (DMSO) wells in each assay plate act as a benchmark such that reproducible results can be obtained when generating PC10 and PC50 values normalized by the positive control response.

154
Table 7-3.2. The 10 coded chemicals possessing expected ranges of response tested under the inter-laboratory validation. Chemical Name CAS Category Chemical Class
17b-Estradiol 50-28-2 Strong ER and AR agonist; AR antagonist
Steroid, phenolic, Estrene
17a-Estradiol 57-91-0 ER agonist Steroid, phenolic, Estrene
Genistein 446-72-0 Weak ER agonist and antagonist
Flavonoid; Isoflavone; Phenol
Bisphenol A 80-05-7 ER agonist Diphenylalkane; Bisphenol; Phenol
17a-Methyltestosterone 58-18-4 ER and AR agonist Steroid, non-phenolic; Androstene
4-tert-Octylphenol 140-66-9 ER agonist Alkylphenol; Phenol
p-tert-Pentylphenol 80-46-6 Alkylphenol; Phenol
Hematoxylin 517-28-2 Negative
Di(2-ethylhexyl)phthalate 117-81-7 Negative. ER binder Phthalate
Benzophenone 119-61-9 Negative Benzophenone 3.2 Cell line Characterization -hER-HeLa-9903. The host cell line was checked for the following nuclear receptors, Estrogen Receptors α and β (ERα, ERβ respectively), Thyroid Receptors α and β (TRα and TRβ respectively) and the Androgen Receptor (AR). This was confirmed by a mock transfection assay with each hormone responsive reporter construct. No mycoplasma infection was detected.
3.3 It was emphasised that although there might be further applications, the assay was primarily designed to provide mechanistic information. There was also concern expressed by CERI with respect to the number of chemicals tested, and whether these were sufficient or not, and that the triplicate tests were not always repeated for the same chemicals.
3.4 Discussion began first with concerns regarding the number of chemicals tested. For statistical purposes it was recommended that in order to a get good grasp of assay reliability for each class of chemicals, a minimum of three chemicals is required for each class. Also that ‘difficult’ chemicals should be included (but were not), to address for example, solubility and cytotoxicity responses. A total of 10 chemicals were tested, therefore with 2 to 3 chemicals for each class of chemicals for 4 classes. Dr. Akahori pointed out that 5 chemicals classified as "weak" were tested and so were 3 "negatives." While for these particular classes the number of chemicals satisfies the minimum requirement, for the remaining classes, the chemical class-specific information on reliability is somewhat limited. It is therefore suggested that the best course of action at this point is to assess the repeatability of each chemical class by obtaining the chemical class-specific estimation of between- and within-laboratory variations, and examining any statistical evidence that they differ across chemical classes. If they do not, then estimate the variations common to all applicable chemical classes, assuming the true levels of variations are comparable across chemical classes. Before doing this, the intra (within-lab) and inter (between-lab) laboratory variations require reassessment as currently they are overestimated in the draft report.
3.5 The use of the concordance, sensitivity and specificity. It was recommended that sensitivity and specificity be the primary endpoints, and that the use of concordance as a summary measure of the sensitivity and specificity should be avoided unless a caveat is included stating that here the term concordance is used to mean the weighted average of

155
sensitivity and specificity, with weights being the prevalence of the substances being evaluated for sensitivity and specificity, and that prevalence is not a well defined concept in this example. The reason for this is that here true positives and true negatives have been chosen arbitrarily, so prevalence does not have real meaning. As such, the concordance here is a function of an arbitrary number (prevalence). Sensitivity and specificity values are far more accurate terms to use, as they are not influenced by an arbitrary level of prevalence.
3.6 Maximum concentrations that can be realistically tested in this test method. ICCVAM’s expert panel recommend a maximum concentration of 1mM which is extremely high for cellular systems, and it was agreed that for practicality, one does not really need such a high response if a full dose response curve is obtained at a lower dose, or depending upon the reasons for conducting the assay or if practical reasons such as solubility/cytotoxicity preclude it. However it was agreed that for substances that tested negative in the assay (where negative is defined as no observed transcription), information and or justification should be provided on solubility and the maximum concentration used. This is because in some instances, higher concentrations have been shown to be positive in other cellular assay systems. This should therefore help explain where negative data is discordant with that published in the literature (as seen with nonylphenol for example, which is positive at higher concentrations) and identify limitations of the test, or possibly the literature. Further testing with the antagonist ICI 182 780 which is used to inhibit effects seen, would be useful to verify the ER alpha mediated mechanism.
3.7 Cytoxicity. Questions were raised about the cytotoxicity tests, and whether the control cells were the same as those used for assay purposes. It was explained that the same basal cell line had been used to develop both the ER responsive cell line and that used to evaluate cytotoxicity, and that the cytotoxicity test was not conducted at the same time as the ER test. Concern was expressed with respect to reproducibility of the cytotoxicity assay is when conducted at a different time and using a different (but related) cell line. Cytotoxicity was further discussed during the third teleconference, see paragraphs 2. 15, 4.11. ).
3.8 From the summary information provided on the ERα antagonist TA assay (also see appendix 7-1 for the SOP), it was noted that the vehicle and positive controls were placed on the far edge of the plate. The question was therefore raised about assessment of edge effects, by dosing test plates with all vehicle controls and another with all positive controls to assess any variation for both controls. CERI informed the participants that the plate layout was different for the ERα agonist TA assay. CERI confirmed that they had assessed edge effects and it was not a concern, however this was discussed further at the final teleconference, see paragraph 5.6.
3.9 GLP. Although preferable, GLP and GCCP were not considered to be an issue of major concern, so long as the laboratory practice was clear and transparent. However an internal audit was requested, such that all data transcription is double checked by an additional operator (as with QA in GLP), to ensure error reduction.
3.10 Discussion with respect to the Prediction Model (PM) and the Data Interpretation Procedure (DIP). The applicability of the Prediction Model (PM) concept, that is the relevance of the assay to the applicability domain(s) of the chemical universe that the test can be applied to, was not planned for this domestic validation at the outset, and does not appear to be possible on the basis of the chemicals selected for testing in this reporter gene assay domestic validation. This may have implications for similar reporter gene assays that may be taken forward for validation assessment at the OECD level. While GD 34 is the OECD validation guidance for the panel, concern was expressed at setting a precedent that did not comply with the more stringent PM validation requirements considered by both ICCVAM and ECVAM to be an essential
156
component of a successful formal validation exercise. Relevance with respect to the DIP, can however be established on the mechanistic knowledge of the broadly-defined "estrogenic effects", as proposed by CERI, although the panel felt that some supplemental analyses on relevance based on comparison of this assay to other "semi-gold standard" assays would be useful, particulary with reference to sensitivity and specificity.
3.11 Issues regarding log EC50 were presented for information and discussion, see appendix 7-2. It was agreed that there was a need to continue the discussion on the potential usefulness of logPC10 and logPC50 over logEC50, relative potency measures and definition of a positive chemical based on these or other measures including a traditional LOAEL. Preliminary suggestions on the best approach for the relative induction potency, is to use difference between logPC10 for estradiol and logPC10 for a test chemical, which is similar to logIC50-based RBA for the estrogen receptor (ER). Further statistical concerns included the size of error bars and classification of positives and magnitude of response. CERI confirmed a positive to be a PC10 value (three fold increase above vehicle control). It was agreed that this required further exploration, to achieve consensus on an agreed statistical uniformity/consistency with particular respect to reporter gene assays (beyond this study) between countries and individual regulatory bodies, and that this might be the sole subject of a future teleconference.
4. THE THIRD TELECONFERENCE MEETING HELD ON 19 MAY 2006.
4.1 This meeting opened with update from Secretariat on the 9th EDTA and 18th WNT regarding the activities of this panel and the preparation of the preliminary validation assessment report. This was followed by an Update from CERI regarding outstanding action points from second teleconference.
4.2 For the negative substances used in the validation study, information and justification on solubility and the maximum concentration used was provided, See Table 7-4.1.
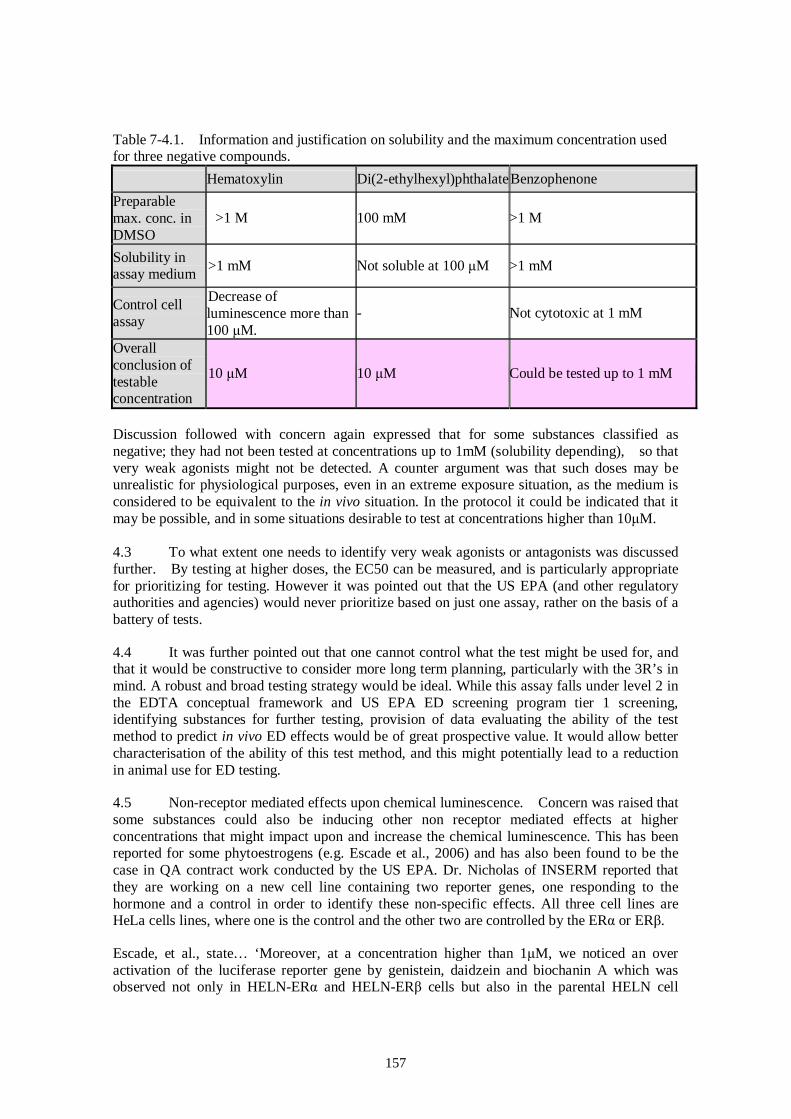
157
Table 7-4.1. Information and justification on solubility and the maximum concentration used for three negative compounds.
Hematoxylin Di(2-ethylhexyl)phthalate Benzophenone
Preparable max. conc. in DMSO
>1 M 100 mM >1 M
Solubility in assay medium
>1 mM Not soluble at 100 µM >1 mM
Control cell assay
Decrease of luminescence more than 100 µM.
- Not cytotoxic at 1 mM
Overall conclusion of testable concentration
10 µM 10 µM Could be tested up to 1 mM
Discussion followed with concern again expressed that for some substances classified as negative; they had not been tested at concentrations up to 1mM (solubility depending), so that very weak agonists might not be detected. A counter argument was that such doses may be unrealistic for physiological purposes, even in an extreme exposure situation, as the medium is considered to be equivalent to the in vivo situation. In the protocol it could be indicated that it may be possible, and in some situations desirable to test at concentrations higher than 10µM. 4.3 To what extent one needs to identify very weak agonists or antagonists was discussed further. By testing at higher doses, the EC50 can be measured, and is particularly appropriate for prioritizing for testing. However it was pointed out that the US EPA (and other regulatory authorities and agencies) would never prioritize based on just one assay, rather on the basis of a battery of tests.
4.4 It was further pointed out that one cannot control what the test might be used for, and that it would be constructive to consider more long term planning, particularly with the 3R’s in mind. A robust and broad testing strategy would be ideal. While this assay falls under level 2 in the EDTA conceptual framework and US EPA ED screening program tier 1 screening, identifying substances for further testing, provision of data evaluating the ability of the test method to predict in vivo ED effects would be of great prospective value. It would allow better characterisation of the ability of this test method, and this might potentially lead to a reduction in animal use for ED testing.
4.5 Non-receptor mediated effects upon chemical luminescence. Concern was raised that some substances could also be inducing other non receptor mediated effects at higher concentrations that might impact upon and increase the chemical luminescence. This has been reported for some phytoestrogens (e.g. Escade et al., 2006) and has also been found to be the case in QA contract work conducted by the US EPA. Dr. Nicholas of INSERM reported that they are working on a new cell line containing two reporter genes, one responding to the hormone and a control in order to identify these non-specific effects. All three cell lines are HeLa cells lines, where one is the control and the other two are controlled by the ERα or ERβ.
Escade, et al., state… ‘Moreover, at a concentration higher than 1µM, we noticed an over activation of the luciferase reporter gene by genistein, daidzein and biochanin A which was observed not only in HELN-ERα and HELN-ERβ cells but also in the parental HELN cell
158
line….This effect, which was previously reported for genistein (Kuiper, et al., 1998), indicated that luciferase expression obtained at high concentrations of phytoestrogens needs to be examined carefully.’ 4.6 Edge effects. CERI provided CERI laboratory data on edge effects (assessed by tested a single concentration of estradiol in all 96 wells) conducted after the 2nd teleconference. CERI considered that there was no edge effect affecting the final results. Data from the other participating laboratories was not available. This was discussed further as follows;
At the edge of the plate the wells may suffer from humidity effects and evaporative loss, and the conditions of incubation at the CERI lab are the same as that generally found in other laboratories. Dr Yutaka Aoki assessed the data and noted higher signals by 3.5% among the edge wells, compared with the inner wells, although it was agreed with CERI that these differences were likely to be trivial, and unlikely to affect the final result. For this reason it would be preferable to document the overall CV, and even conduct a formal analysis to see that these results do not affect the final data. It was agreed that as long as the CV for the whole plate is small, say less than 10%, in a plate with common positive control in all well on one hand, and with clear dose response in a plate with test chemical(s) and standard on the other, then the edge effects could be considered not to affect the final data for practical purposes, and that this should be clearly stated in the protocol and monitored by individual laboratories. Further, there can be a number of plate effects one might usefully consider, for example:
• There can be effects due to cell respiration and metabolism that can be affected by the buffering capacity of the medium and cell number in each well, such that the greater the cell density required by a protocol, the more unhealthy or depleted the cells in central wells might be due to limited gas exchange, compared to those at the edge.
• Optical differences in position of the different wells of the plates can affect the luminosity readings by a plate reader (as well as observation by the naked eye).
• Stacking of plates: effects on cell metabolism have been observed in plates at the bottom of the pile of stacked plates when a large number, i.e. more than 5 plates have been stacked on top of one another in the incubator in some cells.
• Over spraying of ethanol before placing plates in the incubator.
4.7 Provision of antagonist data. CERI provided the SOP (appendix 7-1) and presented antagonist data on three substances tested nine times each in-house. It was noted that a concurrent positive control was not included in these experiments. The Secretariat reminded the conference call participants that the focus of the validation effort was on the agonist assay and that more antagonist testing data existed. These data are currently available on the CERI website in Japanese; CERI offered to prepare and make these data available to the panel and for independent scientific review. Although there was no assessment of interlaboratory reproducibility for the antagonist assay, CERI indicated that as the assay is almost identical to the agonist protocol, extrapolation might be possible by consideration of that validated protocol.
4.8 Concern was expressed that from a regulatory standpoint not having the antagonist data would mean that a substance that was negative for agonist activity would need to be tested in, for example, a binding assay to demonstrate that the substance was not an antagonist. A compromise was suggested such that at a later time point the currently validated protocol could be updated and extended in a catch-up manner, with the validated antagonist protocol as and

159
when such a protocol might be supported and made available (within a year or so). However for the present, the progression of this test should continue, as other similar assays are not so close to being validated and independently scientifically reviewed. It was generally preferred that there is no delay with moving the assay forward now. However, provision of the range of antagonist data in the report for independent peer review submission, which shows that the antagonist assay is working well, would be of great value to the reviewers.
4.9 Internal audit of data transcribed. This was done according to GLP; one error was identified in Table 13, which has now been corrected. A modified Table 13 will be attached in the final report for independent scientific review.
4.10 Statistical data analyses: Proposed methods for estimation of between- and within-run (laboratory) variation. Agreement on future plans on the revision of and addition to the analysis. Dr Yutaka Aoki (US EPA) gave a presentation with a focus particulary on a weighted average approach for assessing between- and within-run (laboratory) variation and the calculation of standard deviation (SD), with a view to refine the estimates of the various sources of variability that contribute to differences in response. Two macros were also included for the panel participants to experiment with. Appendices 2 and 3 provide information on this approach and further discussion which is presently ongoing.
4.11 Cytotoxicity queries: Provision of the criteria for when cytotoxicity is evaluated and how the data are interpreted, together with the provision of such data with respect to the reproducibility of the cytotoxicity assay when conducted at a different time and using a different (but related) cell line (see paragraph 4.7). CERI explained that generally, when the cell viability is below 80% of the solvent control, the test concentration is regarded as a cytotoxic concentration and the data at that concentration is excluded from the antagonist data analysis. CERI does not have data on the reproducibility of the cytotoxicity assay at this point.
5. DISCUSSION
5.1 Overall, the feeling from the Japanese participants for the domestic validation of this ERα reporter gene assay is that they consider that the current status of the assay is sufficient to be taken forward for official independent scientific peer review with respect to pre-screening for ERα mediated ED effects. This recommendation was therefore made to the WNT meeting in May 2006, and endorsed by the ED Task Force and WNT. With the assistance of the Secretariat, the Japanese are therefore now preparing a report for submission for independent scientific peer review.
5.2 Queries with respect to protocol optimisation, chemical selection, data analyses with sufficient statistical power for the assay, and relatively minor and non essential questions regarding inter (or between) laboratory assessment of making up the chemicals in stock solution have or are in the process of being addressed as far as reasonably possible. From a retrospective point of view, taking the validation data generated together with the extensive data set conducted by CERI in-house using this assay (which is generally in concordance with that from other published ERα mediated in vitro assays), the majority view was that this assay was robust. The minority view (Dr Tice, Dr Stokes and Prof. Combes) was attached as an appendix to the Summary of teleconference 3 and is presented in this report as appendix 7-4.
160
References
Current Status of Test Methods for Detecting Endocrine Disruptors: In Vitro Estrogen Receptor Transcriptional Activation Assays, The National Toxicology Program (NTP), Interagency Center for the Evaluation of Alternative Toxicological Methods (NICEATM), National Institute of Environmental Health Sciences (NIEHS), 2002.
Earl-Gray L Jr. (1998) Tiered screening and testing strategy for xenoestrogens and antiandrogens. Toxicology Letters 102-103:677-680
Endocrine Disruptor Screening and Testing Advisory Committee (EDSTAC) (1998) Final report.
URL: http://www.epa.gov/scipoly/oscpendo/history/finalrpt.htm
Escande, A., et al. (2006) Evaluation of ligand selectivity using reporter cell lines stably expressing estrogen receptor alpha or beta. Biochem. Pharmacol. May 14; 71(10):1459-69. Epub 2006 Mar 22.
Hartung et al., (2004) A modular approach to the ECVAM Principles on test validity. ATLA 32, 467-472.
ICCVAM (May 2003) Evaluation of In Vitro Test Methods for Detecting Potential Endocrine Disruptors: Estrogen Receptor and Androgen Receptor Binding and Transcriptional Activation Assays NIH Publication No. 03-4503). URL: http://iccvam.niehs.nih.gov/methods/endodocs/edfinrpt/edfinrpt.pdf
Kuiper, et al., (1998) Interaction of estrogenic chemicals and phytoestrogens with estrogen receptor beta. Endocrinol 139: 4252-4263.
OECD conceptual Framework for the Testing and Assessment of Endocrine Disrupting Chemicals URL: http://www.oecd.org/dataoecd/17/33/23652447.doc
Organization of Economic Cooperation and Development. OECD. 2001. 3rd meeting of the validation management group for the screening and testing of endocrine disrupters (mammalian effects). ENV/JM/TG/EDTA (2001). Paris: Joint meeting of the chemicals committee and the working party on chemicals, pesticides and biotechnology .2001.
Sonneveld E, Riteco JA, Jansen HJ, Pieterse B, Brouwer A, Schoonen WG, van der Burg B. (2006) Comparison of in vitro and in vivo screening models for androgenic and estrogenic activities. Toxicol. Sci. Jan;89(1):173-87.
Takeyoshi,M., Yamasaki,K., Sawaki,M., Nakai,M., Noda,S. and Takatsuki,M. (2002) The efficacy of endocrine disruptor screening tests in detecting anti-estrogenic effects downstream of receptor-ligand interactions. Toxicol. Lett. 126, 91-98.
Yamasaki, K.; Takeyoshi, M.; Yakabe, Y.; Sawaki, M.; Imatanaka, N.; and Takatsuki, M. (2002) Comparison of Reporter Gene Assay and Immature Rat Uterotrophic Assay of Twenty-Three Chemicals. Toxicology. 170 (1-2), 21-30.

161
Appendix 7-1
Detection of anti-estrogenic activity using reporter gene assay Description: This document provides a methodology for detecting anti-estrogenic activity of
chemicals by reporter gene assay technique using hER-HeLa-9903 cell line.
Materials and methods
1. Test chemicals Test chemicals should be dissolved in dimethylsulfoxide (DMSO) at a concentration of 10
mM. 2. Competitive substance
17β-Estradiol (E2) 3. Vehicle for chemical stock solutions
Dimethylsulfoxide (DMSO) should be used for the vehicle. 4. Test system and operating procedures 4.1 Cell lines
hERα-HeLa-9903 stable cell line (Sumitomo Chemicals Co.) will be used for the assay and 9903-control cell which consistently express firefly luciferase by the RSV promoter without stimulation will be used for evaluating cell-toxic effect of chemicals when anti-estrogenic like effect is observed. 4.2 Cell culture (See support protocols No.1 – No. 4)
Cells should be maintained in Eagle’s Minimum Essential Medium (EMEM) without phenol red, supplemented with 10% dextran-coated-charcoal (DCC)-treated fetal bovine serum (DCC-FBS), in a CO2 incubator (5% CO2) at 37˚C. 4.3 Preparation of chemicals
All chemicals will be dissolved in DMSO at a concentration of 10 mM, and the solutions will be serially diluted with the same solvent at a common ratio of 1:10 to prepare stock solutions with concentrations of 1 mM, 100 µM, 10 µM, 1 µM, 100 nM and 10 nM.
4.4 Preparation of cells
Assay plate will be prepared according to the support protocol No.5 4.5 Reagents for luciferase assay
Commercial luciferase assay reagent, Steady-Glo Luciferase Assay System (Promega, E2510 and its equivalents) or standard luciferase assay system (Promega, E1500 and its equivalents) will be used in this study. A bottle of Luciferase Assay Substrate is dissolved with the Luciferase Assay Buffer. Dissolved substrate should be used immediately or stored below -20C.
In the case of using the standard luciferase assay system, Cell Culture Lysis Reagent (Promega, E1531) should be used before adding the substrate. 4.7 Chemical exposure
Each test chemical diluted in DMSO will be added to the wells to final concentrations of 10 µM, 1 µM, 100 nM, 10 nM, 1 nM, 100 pM, and 10 pM (10-11-10-5M) for test in triplicate.
Exact 1.5 µl of 10 mM chemical stock and 6 working solutions will be diluted in serum-free EMEM (500 µl) containing 75 pM of E2.
Then 50 µl of the diluted test samples will be added to each well of assay plate according
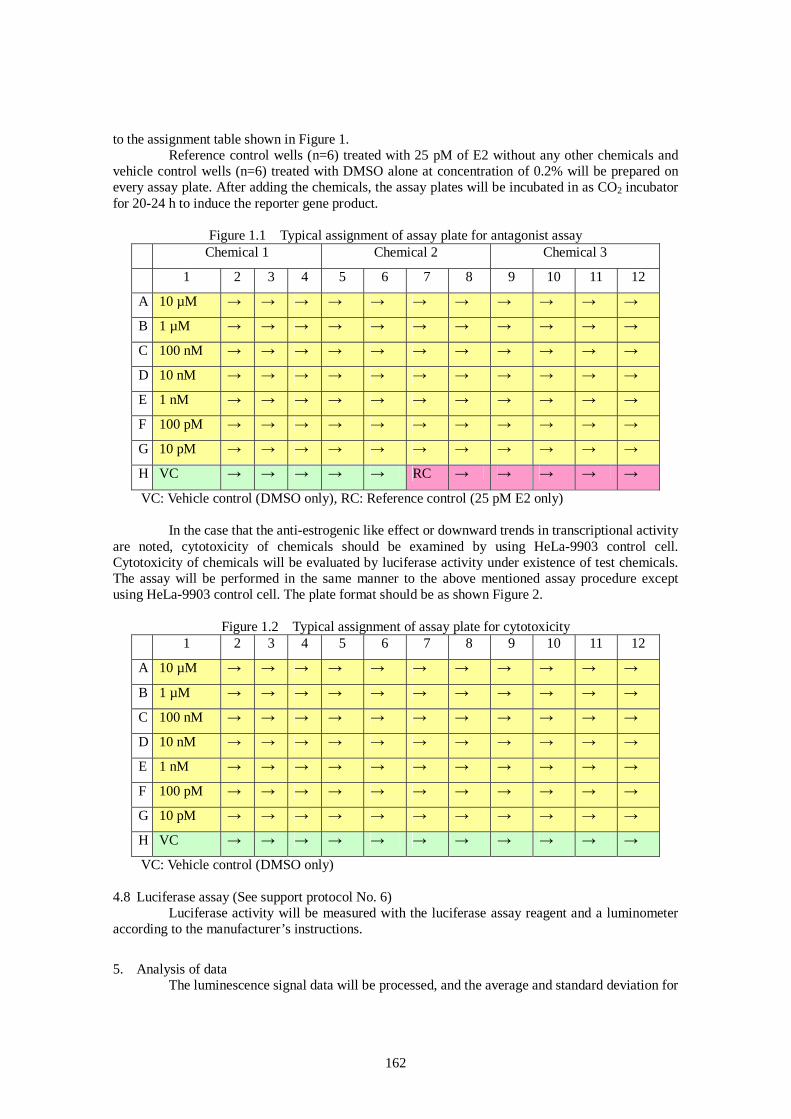
162
to the assignment table shown in Figure 1. Reference control wells (n=6) treated with 25 pM of E2 without any other chemicals and
vehicle control wells (n=6) treated with DMSO alone at concentration of 0.2% will be prepared on every assay plate. After adding the chemicals, the assay plates will be incubated in as CO2 incubator for 20-24 h to induce the reporter gene product.
Figure 1.1 Typical assignment of assay plate for antagonist assay
Chemical 1 Chemical 2 Chemical 3
1 2 3 4 5 6 7 8 9 10 11 12
A 10 µM → → → → → → → → → → →
B 1 µM → → → → → → → → → → →
C 100 nM → → → → → → → → → → →
D 10 nM → → → → → → → → → → →
E 1 nM → → → → → → → → → → →
F 100 pM → → → → → → → → → → →
G 10 pM → → → → → → → → → → →
H VC → → → → → RC → → → → →
VC: Vehicle control (DMSO only), RC: Reference control (25 pM E2 only)
In the case that the anti-estrogenic like effect or downward trends in transcriptional activity are noted, cytotoxicity of chemicals should be examined by using HeLa-9903 control cell. Cytotoxicity of chemicals will be evaluated by luciferase activity under existence of test chemicals. The assay will be performed in the same manner to the above mentioned assay procedure except using HeLa-9903 control cell. The plate format should be as shown Figure 2.
Figure 1.2 Typical assignment of assay plate for cytotoxicity
1 2 3 4 5 6 7 8 9 10 11 12
A 10 µM → → → → → → → → → → →
B 1 µM → → → → → → → → → → →
C 100 nM → → → → → → → → → → →
D 10 nM → → → → → → → → → → →
E 1 nM → → → → → → → → → → →
F 100 pM → → → → → → → → → → →
G 10 pM → → → → → → → → → → →
H VC → → → → → → → → → → →
VC: Vehicle control (DMSO only) 4.8 Luciferase assay (See support protocol No. 6)
Luciferase activity will be measured with the luciferase assay reagent and a luminometer according to the manufacturer’s instructions.
5. Analysis of data The luminescence signal data will be processed, and the average and standard deviation for
163
the vehicle control wells will be calculated. The integrated value for each test well will be divided by the average integrated value of the vehicle control wells to obtain individual relative transcriptional activity. Then the average transcriptional activity will be calculated for each concentration of the test chemical. Then 50% inhibitory concentration against mean transcriptional activity induced by reference wells (25 pM of E2), will be calculated, and used for evaluating anti-estrogenic activity of chemicals.
Calculation described above will be made by the commercial software with the Hill’s logistic equation showing below;
Y=Bottom + (Top-Bottom)/(1+10^((LogEC50-X)*HillSlope)) *Where, X is the logarithm of concentration. Y is the response and Y starts at Bottom and goes to Top with a sigmoid shape.
In the cytotoxicity test, the luminescence signal data will be also processed, and the average of vehicle control wells will be calculated. The integrated value for each test well will be divided by the average integrated value of the vehicle control wells to obtain individual relative transcriptional activity. When transcriptional activity are reduced less than 80% of the mean transcriptional activity of vehicle control wells, the concentration should be regarded as cytotoxic concentration and excluded for evaluation of anti-estrogenic effect.

164
6/8/2005
SUPPORT PROTOCOLS
No.1 Preparation of medium
Reagents
• Eagle’s Minimal Essential medium without Neutral red (Nissui Pharmaceutical Co.)
• 10% Sodium bicarbonate (NaHCO3)
Dissolve 10 grams of NaHCO3 to a final volume of 100 mL with water. Then the solution
should be sterilized using vacuum-driven bottle-top sterilization filter unit and stored in
room temperature.
• 3% Glutamine
Dissolve 3 grams of glutamine to a final volume of 100 mL with water. Then the solution
should be sterilized using vacuum-driven bottle-top sterilization filter unit. Prepared 3%
Glutamine should be stored in aliquots under -20°C.
• Dextran-corted charcoal (DCC)-treated Fetal bovine serum (DCC-FBS)
Prepared and provided by CERI-Japan.
Preparation of EMEM*
Add following reagent into a 1-L conical glass flask and then make to 1 liter with Milli-Q water.
・9.4 grams of pre-made powder medium
・18 mL of 10% Sodium bicarbonate
・12 mL of 3% Glutamine
Preparation of EMEM containing 75pM of E2
Add 75nM E2 to EMEM at proportion of 1:1000 just prior to use.
Preparation of 10%FBS-EMEM*
Add 56 mL of dextran-corted charcoal (DCC)-treated Fetal bovine serum (DCC-FBS) to
500mL EMEM.
*EMEM and 10%FBS-EMEM should be stored in a refrigerator after sterilized with
vacuum-driven bottle-top sterilization filter unit.

165
6/8/2005 SUPPORT PROTOCOLS
No. 2. Reconstitute of cell from the frozen stock
1. Remove vial from Liquid Nitrogen or freezer and immediately transfer to 37°C water bath. 2. While holding the tip of the vial, gently agitate the vial. 3. When completely thawed, transfer the cell stock into 5 mL pre-warmed 10%FBS-EMEM in 15
mL conical tube. 4. Centrifuge the tube at 1100 rpm (200-300 x g) for 5min, and remove the supernatant carefully. 5. Resuspend the cell with 10 mL of 10%FBS-EMEM and place to 90 mm culture dish. 6. Incubate the cell in 5% CO2 incubator at 37°C.

166
6/8/2005 SUPPORT PROTOCOLS
No. 3. Propagation
1. Remove the medium from the culture dish with sterile pipette or sucker. 2. Rinse the cell with 5 mL of PBS. 3. Remove PBS with sterile pipette or sucker. 4. Add 2 mL of Trypsin-EDTA solution (0.25% Trypsin + 0.02%EDTA/PBS) to cover the bottom
of the culture dish and then remove the excess. 5. Allow to stand Trypsin treated cell for ca. 3 min in 5% CO2 incubator at 37°C.
(Monitor cells under microscope. Cells are beginning to detach when they appear rounded) 6. Tap the dish gently. 7. Wash to remove the adherent cells with 5 mL of 10%FBS-EMEM. 8. Count cell number. 9. Dilute the cell suspension with 10%FBS-EMEM to 0.4-1.0 x 10⁵ cells/mL. 10. Place 10 mL of cell suspension to 90 mm culture dish. 11. Incubate the cell in 5% CO2 incubator at 37°C.

167
6/8/2005 SUPPORT PROTOCOLS
No. 4. Preparation of frozen stock
1. Remove the medium from the culture dish with sterile pipette or sucker. 2. Rinse the cell with 5 mL of PBS. 3. Remove PBS with sterile pipette or sucker. 4. Add 2 mL of Trypsin-EDTA solution to cover the bottom of the culture dish and then remove
the excess. 5. Allow to stand Trypsin treated cell for ca. 3 min in 5% CO2 incubator at 37°C.
(Monitor cells under microscope. Cells are beginning to detach when they appear rounded) 6. Tap the dish gently. 7. Wash to remove the adherent cells with 5 mL of 10%FBS-EMEM. 8. Count cell number. 9. Centrifuge the tube at 1100 rpm (200-300 x g) for 5min, and remove the supernatant carefully. 10. Add Cell-Banker* (Juji Field Inc.) and resuspend the cell at density of ca 1 x 10⁴ cells/mL. 11. Make 1 mL aliquots of cell stock. 12. Freeze and store the cell stock below -80°C**. *Conventional freeze medium (90% FBS/10% DMSO) can be used in place of Cell-Banker. **Storage in liquid nitrogen would be preferable for long-term storage (more than 3 months).

168
5/2/2006 SUPPORT PROTOCOLS
No. 5 Preparation of assay plate
Prepare a dish of cultured hERα-HeLa-9903 cell 1. Remove the medium from the culture dish with sterile pipette or sucker. 2. Rinse the cell with 5 mL of PBS. 3. Remove PBS with sterile pipette or sucker. 4. Add 2 mL of Trypsin-EDTA solution to cover the bottom of the culture dish and then remove
the excess. 5. Allow to stand Trypsin treated cell for ca. 3 min in 5% CO2 incubator at 37°C. (Monitor cells under microscope. Cells are beginning to detach when they appear rounded) 6. Tap the dish gently. 7. Wash to remove the adherent cells with 5 mL of 10%FBS-EMEM and transfer the cell
suspension to a centrifuge tube. 8. Count cell number. 9. Centrifuge the tube at 1100 rpm (200-300 x g) for 5min, and remove the supernatant carefully. 10. Resuspend the cell with 10%FBS-EMEM to obtain a final cell density of 1 x 10⁵ cells/mL. 11. Add 100 µL of cell suspension into each well of 96 well assay plate (Nunc #136102 or
equivalents). 12. Incubate the cell in 5% CO2 incubator at 37°C for 3h 13. Proceed to chemical exposure.

169
SUPPORT PROTOCOLS
No. 6-1. Chemiluminescence Detection with standard luciferase reagent
Reagents Cell lysis reagent (4.5x): Dilute 10 mL of 5×Cell Culture Lysis Reagent (CCLR, #E1531) with 45
mL of distilled water. Luciferase Assay Reagent: Add 1 vial105 mL of Luciferase Assay buffer (Promega, #E4550) into
a vial containing Luciferase Assay Substrate (Promega, #E4550), and dissolve the substrate thoroughly. Store the substrate below -20°C if necessary.
Chemiluminescence Detection 1. Flick and drain off the contents of the assay plate. 2. Add 100 µl of PBS to the well to wash the plate. 3. Flick and drain off the contents of the assay plate. 4. Add 100µl of PBS to the well to wash the plate again. 5. Flick and drain off the contents of the assay plate. 6. Add 15 µL of Cell lysis reagent (4.5x) to wells. 7. Incubate for 10 min at room temperature. 8. Add 50µL of Luciferase Assay Reagent to wells. 9. Read plates on a Chemiluminescence plate reader.
170
SUPPORT PROTOCOLS
No. 6-2. Chemiluminescence Detection with luciferase reagent using Steady-Glo Luciferase Assay System
Reagents Luciferase Assay Reagent: Add 1 vial (100 mL) of Luciferase Assay buffer into a vial containing
Luciferase Assay Substrate (Promega, #E2520), and dissolve the substrate thoroughly. Store the substrate below -20°C if necessary.
Chemiluminescence Detection 1. Remove 50 µL of assay medium from all wells of assay plate. 2. Add 100 µL of Luciferase Assay Reagent to wells. 3. Allowed to stand for 5 min. 4. Read plates on a Chemiluminescence plate reader
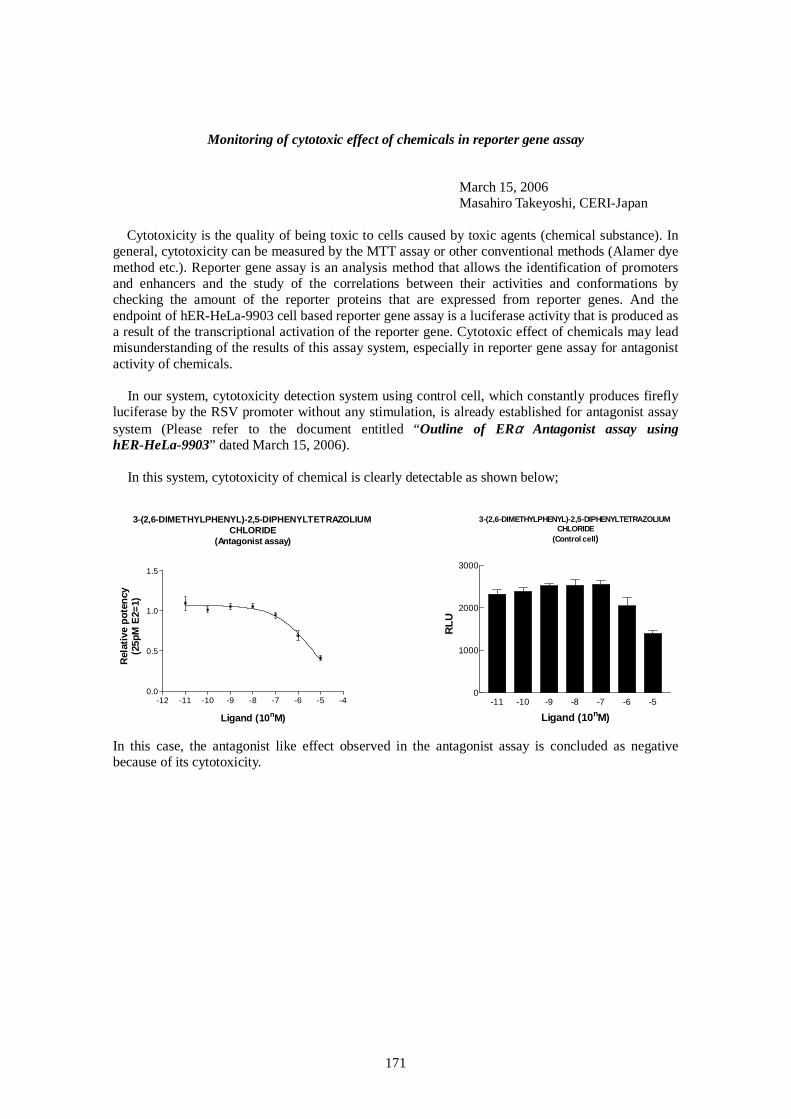
171
Monitoring of cytotoxic effect of chemicals in reporter gene assay
March 15, 2006 Masahiro Takeyoshi, CERI-Japan
Cytotoxicity is the quality of being toxic to cells caused by toxic agents (chemical substance). In
general, cytotoxicity can be measured by the MTT assay or other conventional methods (Alamer dye method etc.). Reporter gene assay is an analysis method that allows the identification of promoters and enhancers and the study of the correlations between their activities and conformations by checking the amount of the reporter proteins that are expressed from reporter genes. And the endpoint of hER-HeLa-9903 cell based reporter gene assay is a luciferase activity that is produced as a result of the transcriptional activation of the reporter gene. Cytotoxic effect of chemicals may lead misunderstanding of the results of this assay system, especially in reporter gene assay for antagonist activity of chemicals.
In our system, cytotoxicity detection system using control cell, which constantly produces firefly luciferase by the RSV promoter without any stimulation, is already established for antagonist assay system (Please refer to the document entitled “Outline of ERα Antagonist assay using hER-HeLa-9903” dated March 15, 2006).
In this system, cytotoxicity of chemical is clearly detectable as shown below;
3-(2,6-DIMETHYLPHENYL)-2,5-DIPHENYLTETRAZOLIUMCHLORIDE
(Antagonist assay)
-12 -11 -10 -9 -8 -7 -6 -5 -40.0
0.5
1.0
1.5
Ligand (10nM)
Rel
ativ
e p
oten
cy(2
5pM
E2=
1)
3-(2,6-DIMETHYLPHENYL)-2,5-DIPHENYLTETRAZOLIUMCHLORIDE
(Control cell)
-11 -10 -9 -8 -7 -6 -50
1000
2000
3000
Ligand (10nM)
RL
U
In this case, the antagonist like effect observed in the antagonist assay is concluded as negative because of its cytotoxicity.

172
The cytotoxic effect of chemical also causes reduction of basic transcriptional activity in agonist assay (See below).
REDUCTION OF BASIC TA ACTIVITY IN AGONIST ASSAYWITH
3-(2,6-DIMETHYLPHENYL)-2,5-DIPHENYLTETRAZOLIUMCHLORIDE
-12 -11 -10 -9 -8 -7 -6 -5 -4300
400
500
600
Ligand (10nM)
RL
U
3-(2,6-DIMETHYLPHENYL)-2,5-DIPHENYLTETRAZOLIUMCHLORIDE
(Control cell)
-11 -10 -9 -8 -7 -6 -50
1000
2000
3000
Ligand (10nM)
RLU
This result indicates that monitoring of basic TA activity in agonist assay can provide the cytotoxic effects of chemical. In some laboratory, MTT assay may be employed for monitoring cytotoxic effect of chemicals. MTT assay is a general experimental technique for measuring cellular proliferation (cell growth). In this assay, the amount of yellow MTT (3-(4,5-Dimethylthiazol-2-yl)-2,5-diphenyltetrazolium bromide) oxidised to purple formazan is measured spectrophotometrically. This oxidation takes place when mitochondrial reductase enzymes are active, and thus conversion is directly related to the number of viable cells, another way of saying it is related to the number of cells possessing active mitochondrial reductase enzymes. However, an endpoint of the reporter gene assay is luciferase activity resulting from the transcriptional activation, and is not a mitochondrial reductase activity. For this reason, clear discrepancy is noted between the cytotoxicity measured by MTT and that monitored by luciferase activity. Figures below shows cytotoxic effects of tripropyl-tin measured by both two methods.
MTT assay
-12 -11 -10 -9 -8 -7 -6 -5 -40.0
0.1
0.2
0.3
0.4
Chemical (10nM)
A57
0-64
0nm
Firefly luciferase
-12 -11 -10 -9 -8 -7 -6 -5 -40
2500
5000
7500
10000
Chemical (10nM)
RL
U
Although the transcriptional activity measured by luciferase, this means cytotoxic effect on cellular transcriptional activity, was definitely reduced at least 10-8M of tri-propyl tin, no effect was noted in MTT assay at the same concentration (10-8M of tri-propyl tin). This suggests that cytotoxicity in the reporter gene assay should be monitored with luciferase activity of control cell or basic transcriptional activity of agonist assay rather than MTT assay.

173
Appendix 7-2
See Appendix 6 in the validation report

174
Appendix 7-3
Subject: FW: Statistical approach for intra- and interlaboratory variability ------ Forwarded Message From: <[email protected]> Date: Thu, 25 May 2006 10:56:50 -0400 To: "Deal, Frank H (NIH/NIEHS) [C]" <[email protected]> Cc: "Tice, Raymond (NIH/NIEHS) [E]" <[email protected]>, "Ceger, Patricia (NIH/NIEHS) [C]" <[email protected]>, "Blackard, Brad (NIH/NIEHS) [C]" <[email protected]>, "Charles, Jeffrey (NIH/NIEHS) [C]" <[email protected]> Conversation: Statistical approach for intra- and interlaboratory variability Subject: Re: Statistical approach for intra- and interlaboratory variability Frank- I have examined Dr. Aoki’s PowerPoint slides, and I believe I understand his concerns. The examples used to illustrate his concerns involve data from four labs with three runs per lab. These 12 data points (logPC50s) are apparently each based on estimates from a Hill equation analysis. However, regardless of how the estimates are obtained, each of the logPC50s is an estimate and has an associated SE of the estimate. One of Dr. Aoki’s objections is that these standard errors associated with the estimation process are typically ignored in the data evaluation process. For example, the typical approach for computing the mean response for each lab is to simply average the three runs. Dr. Aoki prefers instead a weighted average approach that weights each estimate inversely with the associated variability (i.e., the less variable estimate gets weighted more heavily in the averaging process). In my opinion, this is a reasonable option, and I suspect that a statistical purist would likely prefer the weighted average approach to the unweighted average. However, it could also be argued that since each run was carried out under identical conditions, the runs should be given equal weight, regardless of variability. Thus, I disagree with Dr. Aoki that it is ‘naïve’ and ‘inappropriate’ to work with unweighted means, which provide unbiased estimates of the underlying parameter and typically are similar to the weighted means in any case. For example, in one of Dr. Aoki’s examples, the unweighted mean is -6.94; the weighted mean is -6.93. I suspect that this is typical of what would be found in practice, especially since there are ’validity check’ safeguards built in that will minimize the likelihood that the underlying variability estimates will differ greatly from run to run. From a practical point of view, it is unlikely in our area of application that the choice of weighted vs. unweighted means will have any noticeable impact on the overall interpretation of a study. I note also that in Dr. Aoki’s Slide 6, the lab and run columns are mislabelled and should be reversed. A second related concern of Dr. Aoki is the calculation of an SD. For example, the variation in response among the three runs at a given lab in theory represents two distinct sources of variability: (i) the variability associated with the estimation process itself; and (ii) the additional variability that might be due to factors that are different from run to run. The SD that is normally calculated does not distinguish between these two sources of variability, but Dr. Aoki feels that this distinction is important and that by subtracting out (i) and focusing strictly on (ii), one obtains better ‘estimates’.

175
Better estimates of what? I agree that his approach provides better estimates of Source of Variability (ii), but I would argue that the primary variability of interest is the actual observed variability among runs, which reflects both (i) and (ii). It should not matter if this variability is due entirely to the estimation process (as was the case in three of the four labs in his example) or if both (i) and (ii) contribute to this variability. The end result is what matters. Similar comments apply when combining the lab means to produce an overall average. Once again, one could either use a weighted average (-7.15 in Dr. Aoki’s example) or an unweighted average (-7.13). Generally, the two will agree very closely. The variability observed among the lab means is due to a combination of three sources of variability: (i) and (ii) as noted above and (iii) additional variability introduced by factors that differ among labs. Here again, Dr. Aoki recommends ‘subtracting out’ (i) and (ii) to obtain a ‘pure’ estimate of (iii). I would once again argue that it is the overall variability that is important, regardless of the contribution of the three individual components. Although weighted versus unweighted means will very likely have little or no impact on the final interpretation of a study, the same may not be true for an evaluation of variability. In Dr. Aoki’s ‘fake data’ example, he concludes that the much better SD’s are essentially all zero. What does this mean from the standpoint of assessing the reproducibility of the assay? I worry that a naive investigator may assume that this means that the assay is extremely reproducible (after all, it has zero SD’s), but this may not be the case at all. It may simply mean that the variability associated with the estimation process is so great that it can totally account for the overall variability in response observed among runs and among labs. The magnitude of this variability may or may not be cause for concern, but I still would argue that quantifying the specific sources of the variability is not nearly as important as evaluating the magnitude of the resulting variability itself, as assessed in the ‘traditional’ (and not ‘inappropriate’) way. Dr. Aoki states in Slide 15 that the statistical programs used to produce the Hill equation estimates of the logEC50 do not provide associated SE estimates, but I do not believe that this is the case. Doesn’t Prism produce them routinely? If so, then this information can be used in the manner suggested by Dr. Aoki. Importantly, in the final analysis, one must decide if the purpose of these studies is to refine our estimates of the various sources of variability that contribute to differences in response, or is it to determine whether or not an assay has acceptable reproducibility. Dr. Aoki’s presentation focuses on the former, but in my opinion, the latter should be our goal. Thus, if I am trying to determine whether or not an assay is acceptably reproducible, I would want to focus on the observed variability in the actual EC50 estimates across and within labs regardless of the factors that contributed to the variability. For example, suppose I observed a coefficient of variation of 50%, that in normal circumstances would be unacceptable. However, using Dr. Aoki’s approach, it is not this variability that is important, but the relative contribution of the factors that produced it. This high variability might be due to the estimation process, differences among runs, differences among labs, or a combination of these three factors. In my opinion, quantifying these sources of variability and determining which is the primary contributor should not be our focus. For example, one extreme possibility is that the Hill equation model fit is so poor (and the resulting SE’s of the estimated EC50’s so high) that Source of Variability (i) can account for essentially all the variability in response, and as a result all the better estimate SD’s computed by Dr. Aoki for Sources of Variability (ii) and (iii) are close to zero. Would Dr. Aoki consider such an assay to have acceptable reproducibility since the estimated SD’s are all close to zero? I would not.

176
If assessing the individual components contributing to the overall variability is viewed as a critical matter, then you could carry out a nested ANOVA to examine quantitatively the relative effects of variability among labs and variability among runs within labs on the overall response (e.g., the logEC50). I could find nothing in Dr. Aoki’s presentation to suggest how his approach could be used in a real world setting to determine whether or not an assay had acceptable reproducibility. One exercise that would be of interest would be to take a real world example and assess whether or not the assay has acceptable reproducibility in the usual way (considering CV’s, etc.), and then ask Dr. Aoki and his colleagues to take the same data and make a similar ‘bottom line’ judgment based on his more complex assessment of weighted means, extracting sources of variability, etc. I strongly suspect that the same conclusion will be reached after considerably more work. As a general rule, if a new complex statistical procedure is proposed to replace a ‘less rigorous’ one, then it should be demonstrated empirically how the old method fails and the advantages of the new approach in terms of the goal of the study, which in this case is accessing whether or not the assay has acceptable reproducibility. Until this is done, and concrete examples can be presented demonstrating the superiority of this more complex data assessment process, I see no need to make major changes in what is currently done. Regarding Appendix 2, I strongly agree with Dr. Aoki that it makes no sense to calculate a CV based on log-transformed data. Surely, no one is recommending this (are they?). If so, this should be abandoned, and I agree with Dr. Aoki that the measure of variability to use in this case is the SD, not the CV. I further agree with his assertion that ‘In general, CV is a good measure of variation where SD of a variable increases (linearly) with the mean of the variable. ’ Dr. Aoki then states that ‘there seems to be no reason to believe that the SD increases with the mean’. It is unclear if he is referring to the SD associated with the log transformed data (in which case I agree with him) or the untransformed data (in which case I disagree). For example, toxic compounds with very low EC50’s may have three runs with estimated EC50 values of (e.g.) 0.01, 0.03, and 0.05, while a non-toxic compound may have EC50 values of 1000, 3000, and 5000, In such cases, the SD’s of the EC50’s are quite different, but the SD’s of the log transformed data are identical. This is what generally happens in practice. Thus, in terms of the EC50 I would use CV; in terms of the logEC50 I would use SD. I suspect that Dr. Aoki would agree with this. Joe Haseman 5-25-06 ------ End of Forwarded Message
June 20, 2006 Yutaka Aoki, ASPH Fellow at USEPA
[email protected] I share with Dr. Haseman the view that our primary goal is to evaluate whether the overall variability of the parameter estimate of scientific/regulatory interest from the assay is acceptably low. In the case of the transcriptional activation studies, for example, we are interested in whether the overall variability of the logPC10 across laboratories is acceptably low. In addition to this goal, it is often useful to have the capacity to evaluate the contributions of various sources of variability. In such cases it makes sense to have an estimate of intrinsic between-unit variability, not only overall (total) between-unit variability. (Please note that in my presentation I used the term “true between-run (lab)

177
variation” to refer to what I am calling “intrinsic between-run (lab) variation” in this document.) In general, the overall (total) variability consists of two components: intrinsic between variability and overall within variability. That is, the following relationships hold:3
Overall (total) within-lab variability = Overall (total) between-run variability = intrinsic between-run variability
+ overall within-run variability and
Overall (total) between-lab variability = intrinsic between-lab variability
+ overall within-lab variability Please note that the term “between-run (lab) variability” appears on both sides of the equations with different descriptors (“overall” vs. “intrinsic”). Hence there are two alternative interpretations for the term “between-lab variability,” which appears in various assay validation guidelines as a standard component to be estimated in interlaboratory studies. I took the between-lab variation to mean intrinsic, not overall, variability, and applied the general, widely-used procedure for its estimation (i.e., the DerSimonian Laird random effects model). However, I realized from Dr. Haseman’s comments that the term “between-lab variability” could be taken to mean “overall between-lab variability”. What Dr. Haseman calls the “traditional procedure” is the natural procedure that ensues from this interpretation. Using one of these interpretations results in preference for a particular kind of between-lab variability estimate, the “overall” or “intrinsic”. There are a few potential uses for the complementary pair of estimates of intrinsic between-unit variability and within-unit variability as opposed to a single estimate of overall (total) between-unit variability alone. For instance, the pair of variability estimates are useful at a pre-validation stage when one is trying to identify specific sources of variation as a target of variability reduction. High variability in radioactive count measurement, for example, would tend to increase within-run variation, not intrinsic between-run variation. Inappropriate preparation of a stock standard solution for each run, from which appropriate serial dilution can be made reliably, would result in increase in intrinsic between-run variation, not in within-run variation. For an instance of post-validation use of the complementary variability estimates, suppose the overall between-lab variability for an assay has been found to be unacceptably high under a specified design and we would like to know how much an increase in the number of runs (or, rarely, labs) might reduce the variability to the desired level. Only with the estimates of intrinsic between-lab variability and overall within-lab variability (which is a function of the number of runs), would easy calculation of the necessary number of runs be possible. As an additional benefit, the proposed procedure gives rise to a good estimator of overall variability, which in certain circumstances performs considerably better than the counterpart for the traditional method: the latter underestimates overall variability when intrinsic between-unit variation is small compared to within-unit variability. This difference arises because the two procedures handle standard errors (SEs) of estimates differently: our proposed procedure takes SEs of estimates (either run-specific summaries or lab-specific summaries that are to be further summarized) into account while the traditional method ignores them. The advantage of the proposed procedure was clearly noted in simulations I performed. In the case of the transcriptional activation data, for example, the overall between-laboratory variability would be more accurately estimated by the new procedure if the variability within each lab were large relative to the variability between labs. Underestimation of the overall variability is problematic since it gives a false sense of reproducibility to the user.
3 The relationships hold in terms of variance under the assumption of independence between the underlying components for the two right-hand side terms.

178
When deriving estimates of overall variability, which both Dr. Haseman and I regard as the most relevant variability measures, I obtain an estimate of intrinsic between-variability, and then combine it with within-variability estimates. This is done by taking into account the experimental design (i.e., how many runs and laboratories are actually used). Although the new procedure may be more difficult to grasp conceptually than the traditional method of estimating overall variability, it is quite simple to implement. We consider the computational cost associated with our proposed procedure small, and particularly so when compared to potential benefits we gain by using it. It is likely this response lacks the level of details that some readers would desire. I omitted many details for the sake of simplicity, but I am happy to provide more detailed information or answer questions upon request.

179
Appendix 7-4 Table 7-4.1 Summary of criteria that were not met according to ICCVAM Minimum Standard
Procedures (ICCVAM 2003)
Minimum Standard Procedure Met/
Not Met Explanation and Justification
The stability of the test substances should be demonstrated prior to testing. In the absence of stability information, the stock solution should be prepared fresh prior to use.
NOT MET but resolvable
retrospectively
The stabilities of test substances were not confirmed, however empirically stable substances were used. The stock solution was not freshly prepared. Under the inter-laboratory validation, the stock solution was prepared at the lead laboratory and then distributed to the participating laboratories. All stock solutions were stored at -20C at each laboratory. The capabilities of the participating laboratories to make up stock solutions accurately were assumed, and the lead laboratory did not consider it necessary to include this as part of the validation process at the time. Should it be absolutely necessary for the purposes of the independent peer review, the participating laboratories could be requested to make up the stock solutions individually and then be subsequently assessed.
Studies should be performed in compliance with GLP guidelines.
NOT FULLY MET
The pre-validation was not to GLP, the inter-laboratory validation was under GLP, and the data collection for comparison with the ICCVAM list and hERa binding assay was not to GLP standards.
In a validation study, repeat studies would be conducted to evaluate intra-laboratory repeatability and reproducibility. In contrast, in screening studies, repeat studies are not conducted, except to clarify equivocal results.
NOT FULLY MET
The pre-validation and inter-laboratory validation was repeated but the data collection for comparison with ICCVAM list or hERa binding assay was not always repeated.
It should be noted that major deviation from the ICCVAM and ECVAM validation requirements could mean that the assay may not be considered by these validation bodies as correctly and formally validated for regulatory use.

180
Comments received from Drs Bill Stokes and Ray Tice (NICEATM) on Studies Conducted by CERI to Support the Validation of the hER-HeLa-9903 Estrogen
Receptor (ER) Transcriptional Activation (TA) Test Method
Our comments are based on information CERI has provided in their report entitled, “Draft Pre-Validation and Inter-Laboratory Validation Report of the Human Estrogen Receptor Mediated Reporter Gene Assay”, and other supporting materials, including those used to present information that CERI has provided at the request of the OECD Preliminary Validation Assessment Panel. Our assessment of the provided information is based on relevant information provided in Section VII of OECD Guidance Document No. 34, which recommends and defines the components of a new test method submission. Our assessment of the hER-HeLa-9903 ER TA test method protocol is based on the minimum procedural standards (we now call these essential test method components) recommended by ICCVAM4 and based on the deliberations of an ICCVAM international expert panel on ER and androgen receptor binding and TA assays that met in May of 2002. Our evaluation of the substances used to evaluate the accuracy and reliability of the hER-HeLa-9903 ER TA test method is based on the ICCVAM list of recommended reference substances for ER binding or TA test methods5. Our comments are organized under the major headings in Section VII of OECD Guidance Document No. 34 as follows: Introduction and Rationale for the Proposed Test Method Reports and supporting materials address the rationale for the CERI ER TA test method, as specified in this section of the Guidance Document, but discussions regarding the specific limitations of the test method could be usefully expanded. Test Method Protocol Components A test method protocol has been provided, as specified in this section of the Guidance Document, but this is the protocol that was used for the experiments that involved multiple laboratories only. It is stated in the text that the in-house protocol was similar but the protocol followed throughout and any modifications and the rationale for those modifications needs to be included. For example, in the interlaboratory study, estradiol was tested over multiple concentrations but in the in-house studies, it was tested at only a single concentration. The rational for this difference should be provided. In addition, in terms of the test method protocol, the highest concentration of substance tested was 10 µM, not the 1 mM recommended by the ICCVAM international expert panel and ICCVAM (see footnote 1). We appreciate that not all substances can be tested up to this concentration (due to solubility or excessive cytotoxicity) but the purpose for using this limit dose is to detect even very weak ER agonists or antagonists. Thus, at least some of the substances classified as negative by CERI have not been adequately tested (this was demonstrated in the data set provided by CERI for the last conference call) while others may have been adequately tested if solubility or cytotoxicity
4 “ICCVAM Evaluation of In Vitro Test Methods For Detecting Potential Endocrine Disruptors: Estrogen Receptor and Androgen Receptor Binding and Transcriptional Activation Assays” (available at http://iccvam.niehs.nih.gov/methods/endocrine.htm). 5 “ICCVAM Evaluation of In Vitro Test Methods For Detecting Potential Endocrine Disruptors: Estrogen Receptor and Androgen Receptor Binding and Transcriptional Activation Assays” and the 2006 Addendum to this report (available at http://iccvam.niehs.nih.gov/methods/endocrine.htm).

181
data can be provided to support the highest concentration tested. There seems to be a lack of information in regard to the rationale/justification, criteria for use, and reliability for the cytotoxicity evaluation, which were conducted using the same basal cell line but with a different plasmid construct as a separate experiment. From verbal discussions, it appears that CERI does not feel a cytotoxicity evaluation is needed for the agonist tests. This issue needs to be formally discussed in their submission. For use as a screening assay for ER or AR activity, it is critical that a TA test method evaluate for antagonist as well as agonist activity. Except for the intralaboratory repeat testing of three substances, an evaluation of the ability of the CERI ER TA test method to identify ER antagonists has not been provided. Furthermore, the antagonist protocol used in the testing of these three substances had no concurrent positive control, and did not use a reference standard with a full dose response curve as is done in the CERI agonist protocol. We appreciate the desire to move ahead with the agonist version of the test method independent of the antagonist version but wish to point out that a negative ER agonist study is virtually worthless without knowing whether or not the test substance binds to the ER and/or demonstrates antagonist activity. We do not agree with CERI’s premise, stated in the most recent OECD teleconference, that the antagonist protocol is similar enough to the agonist protocol to be considered as validated in the same manner. We urge that the current ER antagonist protocol be modified to include appropriate positive controls and that further validation studies using this protocol be completed before peer review. The protocol needs to include a discussion about potential “edging effects”, and how to identify if the outside wells on the 96-well plate can be used because such effects are not detected under the experimental conditions used by a specific laboratory. Characterisation and Selection of Substances Used for Validation of the Proposed Test Method To facilitate validation of ER TA assay, ICCVAM compiled a list of 78 recommended reference substances. ICCVAM recommends that these substances be tested in a phased manner, with a minimum of 53 substances being tested across at least three laboratories. The remaining 25 substances are recommended for testing once in one laboratory or divided among two or more laboratories. Our evaluation of the data submitted indicates that CERI tested a total of 56 substances, although only 10 were tested across multiple laboratories. Seven of these 10 substances are on the ICCVAM list and the remaining three have similar ER activities to other ICCVAM substances recommended for interlaboratory testing and could be considered as replacements for these. Therefore, to meet ICCVAM recommendations, 43 additional substances from the ICCVAM recommended list or their equivalents would require further interlaboratory testing. CERI tested 12 of the remaining 25 substances on the ICCVAM list that do not require interlaboratory testing at least once, leaving an additional 13 substances from the list or their equivalents that would require further testing. Also, substances are not classified according to product class and only the 10 substances tested across multiple laboratories are classified by chemical class. These 10 substances represent 6 chemical classes compared to the 15 chemical classes represented by those substances recommended for interlaboratory testing by ICVAM (a total of 22 chemical classes are represented by the ICCVAM recommended list of 78).

182
In Vivo Reference Data Used to Assess the Accuracy of the Proposed Test Method The comparison of experimentally derived results from ER TA agonist and immature rat uterotrophic studies conducted at CERI using 50 substances adequately supports the accuracy of the proposed ER TA agonist test method. Testing all 78 reference substances would not only allow for a better characterization of the reliability and comparative sensitivity of the CERI test method versus other Tier 1 assays but also increase the likelihood that in vitro tests might be developed that could be used to reduce animal use in endocrine disruptor (ED) testing. Test Method Data and Results Results and data from prevalidation and interlaboratory studies conducted by CERI to support the validation of their hER-HeLa-9903 ER TA agonist assay have been provided, but much of this was not provided in the CERI draft validation report but rather at the request from the OECD preliminary validation assessment panel. It is assumed that the requested results and data will be included as appropriate in the appendices of the final validation report from CERI. Test Method Relevance (Accuracy) Because this test method is to be used as a Tier 1 screening assay (at least in the United States), there is no need for an evaluation of the ability of the test method to predict in vivo endocrine disruptor effects. However, such data are welcome and would allow better characterization of the ability of in vitro test methods such as this to reduce animal use in ED testing. The comparison of CERI derived ER TA results with ICCVAM published ER TA results for 46 substances is appropriate. Test Method Reliability (Repeatability/Reproducibility) In terms of intra- and inter-laboratory reproducibility, 10 substances (two strongly active positives, four moderately active positives, one weakly active positive, and three negatives) were tested three times in each of three laboratories. All tests were conducted using stock solutions provided by CERI (i.e., the full test method protocol was not evaluated). Furthermore, substances that posed potential problems in testing due to their physico-chemical characteristics (i.e., poor solubility) or because they were overtly cytotoxic were not tested. Thus, this is not an adequate evaluation of the intra- or inter-interlaboratory reproducibility of this test method. In its international evaluation of another ER TA test method, NICEATM/ICCVAM is proposing 12 substances to evaluate intralaboratory reproducibility in three labs (testing 3 times in each lab) and another 41 substances to be tested once in each of three labs to adequately evaluate interlaboratory reproducibility. These substances cover the range of anticipated agonist and antagonist responses, include a wide variety of chemical classes, and include substances with varied physico-chemical properties and cytotoxicity properties. Also, in their interlaboratory evaluation, the reference substance, estradiol, was tested over its complete concentration response range. In contrast, for other substances, CERI tested estradiol at a single concentration. The former is recommended by the ICCVAM International ED Expert Panel and by ICCVAM for all experiments. Test Method Data Quality Interlaboratory studies testing 10 substances were conducted using GLP guidelines, but none of the

183
pre-validation studies were conducted in this manner. At the last OECD preliminary validation assessment panel teleconference, CERI representatives indicated that a data audit has been recently conducted on the prevalidation studies and stated that non-compliance with GLP guidelines had no impact on data quality. We recommend that a specific discussion regarding data quality and non-compliance be included in the CERI report. Animal Welfare Considerations (Refinement, Reduction and Replacement) Our evaluation of the validation report and supporting materials indicate that specific discussions on how the proposed test method will refine, reduce, or replace animal use if used in a battery of tests to detect potential endocrine disruptors were not provided. Practical Considerations We recommend the inclusion of considerations such as the cost and time required to conduct the assay and report results. Considering the concerns about “edging effects”, we also recommend expanding the discussion of necessary equipment and supplies, and the required level of training, expertise and demonstrated proficiency needed by study personnel. Late Comments received on 3 June 2006 from Prof. Combes (member of the panel, but did not
participate in the teleconferences or discussions prior to 3 June 2006). Dear All, Thanks for all the summaries which I have now had a chance to read in some detail, although I am afraid that I still have not had the opportunity to look at all the raw data. My impression is that there has been an awful lot of work done on this assay and those involved deserve congratulations for their efforts and for getting us to the stage we are at. Having said that, I have several overall concerns about the readiness of the work that has been done for peer review, since I am unsure as to the ability of the interlaboratory validation study to transparently and unequivocally demonstrate reliability and relevance of the assay for its stated purpose. In this regard, I share many of the concerns that have been raised in the NICEATM comments raised during the last teleconference as presented in Appendix 1 of the latest set of minutes. Due to the large amount of information and data, I am unclear as to exactly where we are now and welcome the suggestion that there should be an overall report. This could well serve as the document for eventual peer review, but this decision should not be taken until we have all seen the document and agreed on its status. The last thing we would want is for the peer review report to be controversial (as indeed is the report for the Uterotrophic assay) as this would undermine the validation process and give the assay a bad name, when it could all be avoided by being less hasty and ensuring that the validation study is as good as possible. I personally remain unconvinced that the stuies are ready yet for peer review for the following main reasons:

184
1. the raw data are not as transparent as they should be 2. there is a need to agree on how the data are transformed and statistically analyzed (personally I prefer the presentation of straightforward error bars) 3. it appears to me that the validation has only been performed in Japan, when for it should be assessed in other countries (this is no criticism of Japanese laboratories, merely it is necessary to ensure that reliability extends to other countries 4. there have been claims for the deviation of the studies from accepted OECD, ECVAM and ICCVAM validation criteria - these need to be discussed in more detail. With regard to other matters, I think that it would be good to have more detail concerning what was discussed in relation to the assay at the recent WNT meeting. In addition, I am unhappy with the vagueness of what is stated regarding the potential arrangements for peer reviewing the assay, as stated in the minutes of the last teleconference. A peer review of a validation study should not be contracted out to a laboratory, for goodness sake! I am also very concerned that the OECD might be asked to organise a peer review, in view of the debacle over the review of the uterotrophic assay. Peer review of new in vitro methods should be left to those with experience and authority with undertaking them in conjunction with relevant legislative authorities; namely ICCVAM and the ECVAM Scientific Advisory Committee. In fact, my suggestion would be for a joint peer review organised by ECVAM, ICCVAM and the newly-formed JACVAM. This would be an excellent opportunity to initiate a world-wide peer review study and to capitalise on the existence of these centres. However, I re-iterate that no peer review should be undertaken until it can be ensured that the validation study meets all the necessary criteria. I apologise if I seem rather over-critical, but I am not trying to be - I am very impressed by the work achieved on the assay, but I think we should be cautious in going too fast and losing the opportunity to build on the excellent foundation that we have. I am as keen as anyone to see these types of assays on the books to augment and eventually replace the in vivo methods. But we must get it right, ensure it meets international criteria, and check that everything is independent and transparent. I hope all this helps, with best wishes, Bob Combes

185
Appendix 8 Summary of queries from PVAP and corresponding answers
No. Queries from PVAP Corresponding answers i. CERI conducted a comparison of the draft report submission with the
guidelines provided in the OECD Guidance Document 34 and ICCVAM Evaluation of In Vitro Test Methods for Detecting Potential Endocrine Disruptors (NIH Pub. No. 03-4503) and stated their rationale for deviations from these guidelines.
See Table 7-3.2 in appendix 7
ii. CERI provided further information on cell line characterisation, methods of cytotoxicity evaluation and ER alpha antagonist TA testing
・ Cell line characterization See Paragraph 3.2 in appendix 7 ・ Method of cytotoxicity evaluation See Paragraph 3.7 and 4.11 in appendix 7 ・ ER alpha antagonist TA testing See Paragraph 4.7 in appendix 7
iii. CERI provided raw fold induction data for the positive controls and for the chemicals assessed under the (pre) validation stage from data generated by the CERI laboratory. The provision of such data from the other laboratories was not possible. The panel required this information to assess the extent of the variation in fold induction over time.
The raw fold induction data was provided.
iv. Dr. Yutaka Aoki (US EPA) provided information on proposed methods for between- and within-variation estimation to the whole group (Appendix 7-2) and consulted directly with CERI on how to proceed.
See Appendix 7-2
v. CERI conducted an internal audit of data transcribed. See Paragraph 4.10 in appendix 7 vi. CERI provided raw data on edge effects from the CERI laboratory. See Paragraph 4.6 in appendix 7
vii. CERI submitted the antagonist assay protocol (SOP) and raw data for consideration by the panel. (See appendix 7-1).
See Appendix7-1
viii. For the negative substances used, information and justification was provided by CERI on solubility and the maximum concentration used.
See Paragraph 4.2 in appendix 7
ix. Data analysis proposal from Dr Yutaka Aoki and subsequent discussion from and response to NICEATM consultant statistician Dr Joe Haseman, and Dr Sebastian Hoffman (ECVAM). (Appendix 7-3)
See Appendix 3
x. Assistance from Dr Aoki to CERI in conducting statistical estimations of between- and within-run (laboratory) variation (provisionally in June 2006).
See Appendix 6 “Independent statistical analyses for inter-laboratory validation study” in the validation report
Related Documents