DRAFT REPORT – October 2016 Prepared by Kimley-Horn and Associates, Inc. in association with Wilson & Company, Inc. and Gordley Design Group, Inc. YMPO 2018-2041 UPDATE Regional Transportation Plan

Welcome message from author
This document is posted to help you gain knowledge. Please leave a comment to let me know what you think about it! Share it to your friends and learn new things together.
Transcript

DRAFT REPORT – October 2016
Prepared by Kimley-Horn and Associates, Inc. in association with Wilson & Company, Inc. and Gordley Design Group, Inc.
YMPO2018-2041 UPDATE
Regional Transportation Plan

Letter from the Chairman of the YMPO Executive Board
– RUSSELL "RUSS" CLARK Board of Supervisors, Yuma County
Letter from the YMPO Executive Director
– Executive Director, YMPO

TA
BL
E O
F C
ON
TE
NT
S
This report has been prepared in cooperation with, and financed in part by, the U.S. Department of Transportation – Federal Highway Administration (FHWA), the Federal Transit Administration (FTA), and the Arizona Department of Transportation (ADOT). The contents of this report do not necessarily reflect the views of ADOT, FTA, or FHWA. This report does not constitute a standard, specification, or regulation.
This is not a legal document. Although much care was taken to ensure the accuracy of information presented in this document, YMPO does not guarantee the accuracy of this information. D
ISC
LA
IME
R1. Introduction ............................................................................................. 2
YMPO Region ............................................................................................................................ 2YMPO’s Members ..................................................................................................................... 4YMPO’s Focus .......................................................................................................................... 4YMPO’s Mission ....................................................................................................................... 4YMPO Regional Transportation Plan ...................................................................................... 5The Planning Process .............................................................................................................. 5Fixing America’s Surface Transportation Act (FAST Act) ...................................................... 5
2. Performance-Based Planning: a Cornerstone of the YMPO Regional Plan 8What is Performance-Based Planning? ................................................................................... 8Why is Performance-Based Planning Important? .................................................................. 8Nationwide Significance of Performance-Based Planning .................................................... 8Goals, Objectives, Performance Measures, and Targets ....................................................... 9
3. Public Involvement ................................................................................ 20
4. Growth Trends in the Region ................................................................. 28Overview ................................................................................................................................. 28Economic Development Trends ............................................................................................. 47Trade and Tourism .................................................................................................................. 49What is a Foreign Trade Zone? ............................................................................................... 50
5. Roadway System ..................................................................................... 54Roadways ................................................................................................................................ 54Safety........................................................................................................................................71Bridges and Grade Separations ..............................................................................................74
6. Transportation Alternatives ................................................................... 78Intelligent Transportation Systems (ITS) ............................................................................... 78Travel Demand Management (TDM) ..................................................................................... 81Transit ...................................................................................................................................... 83Non-Motorized Transportation .............................................................................................. 90Aviation .................................................................................................................................. 105Congestion Management ..................................................................................................... 108Transportation Security .........................................................................................................110
7. Freight.................................................................................................. 114Border Infrastructure ............................................................................................................121Inland Ports, Warehousing, and Distribution Centers .........................................................124

LIS
T O
F F
IGU
RE
S Figure 1.1 – YMPO Region Focus Area .......................................................................................... 2
Figure 1.2 – YMPO’s Location in Relation to International Trade Routes ................................... 3
Figure 1.3 – The Regional Transportation Planning Process ........................................................ 5
Figure 2.1 – National Highway System Routes .............................................................................11
Figure 4.1 – 2015 Dwelling Unit Density ...................................................................................... 31
Figure 4.2 – 2041 Dwelling Unit Density ...................................................................................... 33
Figure 4.3 – 2015 Employment Density ....................................................................................... 39
Figure 4.4 – Current and Future Employment ..............................................................................41
Figure 4.5 – 2041 Employment Density ....................................................................................... 43
Figure 4.6 – YMPO Region Land Ownership ............................................................................... 46
Figure 4.7 – Future Growth and Redevelopment Areas ............................................................. 46
Figure 4.8 – YMPO’s Location in Relation to International Trade Routes ................................. 49
Figure 4.9 – Foreign Trade Zones ................................................................................................. 50
Figure 4.10 – Greater Yuma Economic Development Website ....................................................51
Figure 5.1 – Current Regional Roadway Network Functional Classifications ........................... 55
Figure 5.2 – Regionally Significant Routes .................................................................................. 57
Figure 5.3 – 2015 Regional Roadway Network Number of Through Lanes ............................... 59
Figure 5.4 – 2015 Traffic Volumes .................................................................................................61
Figure 5.5 – Level of Service – Highway ...................................................................................... 63
Figure 5.6 – 2041 Baseline Regional Roadway Network Number of Through Lanes ............... 65
Figure 5.7 – 2041 Traffic Volumes ................................................................................................ 67
Figure 5.8 – Roadways with LOS E or LOS F in 2041 Baseline Condition ................................ 69
Figure 5.9 – Crashes by Jurisdiction, 2004-2013 ......................................................................... 72
Figure 5.10 – HSIP Corridors in the YMPO Region ...................................................................... 73
Figure 6.1 – YCAT Bus System Map ............................................................................................. 85
Figure 6.2 – Existing Bicycle Facilities in the YMPO Region ...................................................... 93
Figure 6.3 – Sidewalk Deficiencies ............................................................................................... 95
Figure 6.4 – Proposed Bicycle Network ......................................................................................101
Figure 6.5 – Elements of the Congestion Management Process ............................................. 108
Figure 7.1 – Existing Truck Routes ...............................................................................................116
Figure 7.2 – Buildout Truck Routing Plan ...................................................................................117
Figure 7.3 – National Highway Freight Network in Arizona ......................................................118

LIS
T O
F T
AB
LE
S Table 2.1 – Roadway and Bridge Objectives, Performance Measures and Current Conditions 13
Table 2.2 – Roadway Safety Objectives, Performance Measures and Current Conditions.......13
Table 2.3 – Vehicle Mobility Objectives, Performance Measures and Current Conditions .......14
Table 2.4 – Bicycle Mobility Objectives, Performance Measures and Current Conditions .......14
Table 2.5 – Transit Mobility Objectives, Performance Measures and Current Conditions ........15
Table 2.6 – Freight Movement and Economic Vitality Objectives, Performance Measures and Current Conditions ......................................................................................................16
Table 2.7 – Environmental Sustainability Objectives, Performance Measures and Current Conditions ....................................................................................................................16
Table 2.8 – Aviation Objectives, Performance Measures and Current Conditions ....................17
Table 2.9 – Border Crossings Objectives, Performance Measures and Current Conditions .....18
Table 2.10 – Tourism Objectives, Performance Measures and Current Conditions ...................18
Table 3.1 – Public Meetings ......................................................................................................... 22
Table 4.1 – 2000-2015 Yuma County Population ....................................................................... 29
Table 4.2 – Yuma County 2015 Employment ............................................................................... 35
Table 4.3 – Top Ten Employers in the YMPO Region .................................................................. 37
Table 5.1 Crashes by Jurisdiction, 2004-2013 ............................................................................. 72
Table 5.2 – Bridges and Bridge Classifications in the YMPO Region ......................................... 75
Table 7.1 – Top Ten Road Segments with the Highest Percent Trucks, Based on 2015 Traffic Count Data ................................................................................................................115
Table 7.2 – Top Ten Locations with the Highest Number of Trucks, Based on 2015 Traffic Count Data ................................................................................................................115
Table 7.3 – Arizona-Sonora Border Master Plan Recommendations ........................................123
LIS
T O
F A
CR
ON
YM
S A
ACA ...................Arizona Commerce Authority
ACIP ... Airport Capital Improvement Program
ACS ................ American Community Surveys
ADA ................Americans with Disabilities Act
ADEM ............. Arizona Division of Emergency Management
ADOA ...........................Arizona Department of Administration
ADOT ...........................Arizona Department of Transportation
AIDA ........ Arizona International Development Authority
AIP ...................Airport Improvement Program
AMPO ...Association of Metropolitan Planning Organizations
APTS ............Advanced Public Transportation Systems
ASASP ....Arizona State Airports System Plan
AWC ......................... Arizona Western College
C
Caltrans .................... California Department of Transportation
CBI .............Coordinated Border Infrastructure
CBP ......(U.S.) Customs and Border Protection
CCTV ...................... Closed-Circuit Televisions
CEAs .......................... Critical Emphasis Areas
CMAQ ................... Congestion Mitigation and Air Quality
CMP ........... Congestion Management Process
CMS ...........Congestion Management System
D
DCC ................. Defense Contractors Complex
DMS ......................... Dynamic Message Signs
DOTs ..(State) Departments of Transportation
DPS .... (Arizona) Department of Public Safety
E
EA .........................Environmental Assessment
EDA ............................Economic Development Administration
EDC ......................................Every Day Counts
EPA ... (U.S.) Environmental Protection Agency
F
FAA ...............Federal Aviation Administration
FAST-ACT ................ Fixing America's Surface Transportation Act
FEMA ......... Federal Emergency Management Authority
FHWA ...........Federal Highway Administration
FMS .................Freeway Management System
FRA................Federal Railroad Administration
FTA .................. Federal Transit Administration
FTZ .................................... Foreign Trade Zone
G
GA ..........................................General Aviation
GIS ............. Geographic Information Systems
GSA ............. General Services Administration
GYEDC ......................Greater Yuma Economic Development Corporation
H
HSIP .................Highway Safety Improvement Program
HSM ...........................Highway Safety Manual
HUD ....... (Department of) Housing and Urban Development
HURF ................. Highway User Revenue Fund
I

LIS
T O
F A
CR
ON
YM
S
IMC ... Implementation Monitoring Committee
ITS ............ Intelligent Transportation Systems
J
JARC ........Job Access and Reverse Commute
JSF ..................................... Joint Strike Fighter
K
Kimley-Horn ......Kimley-Horn and Associates, Inc.
KYF2 ......Know Your Farmer, Know Your Food
L
LAX ............ Los Angeles International Airport
LOS ......................................... Level of Service
M
MAP-21 ......Moving Ahead for Progress in the 21st Century
MCAS-Yuma .............Marine Corps Air Station Yuma
MPD ..................Multimodal Planning Division
MPO ........Metropolitan Planning Organization
N
NADB ..... North American Development Bank
NAFTA .................. North American Free Trade Agreement
NASA ........... National Aeronautics and Space Administration
NAU ..................... Northern Arizona University
NHPP ..............National Highway Performance Program
NHS .........................National Highway System
NPIAS ........National Plan of Integrated Airport Systems
P
PFCs ...................... Passenger Facility Charges
POE ...............................................Port of Entry
PSHIA ..........Phoenix Sky Harbor International Airport
Q
QR ...........................................Quick Response
R
RHC ......................Railway-Highway Crossings
RRIF ....... Rail Rehabilitation and Improvement Financing
RSA ........................ Road Safety Assessments
RSR ................... Regionally Significant Routes
RTP .....................Regional Transportation Plan
RV ..................................... Recreational Vehicle
S
SASP .....................State Aviation System Plan
SBA .......(U.S.) Small Business Administration
SEA ................. Systems Engineering Analysis
SETIF............................Safety Enforcement and Transportation Infrastructure Fund
SOV ...........................Single-Occupant Vehicle
SR ....................................................State Route
SRTS .............................Safe Routes to School
STEP ..........State Trade and Export Promotion
STP ...............Surface Transportation Program
STRAHNET .......... Strategic Highway Network
T
TAC ..................Technical Advisory Committee
TAP ........Transportation Alternatives Program
TDM .............................. Travel Demand Model
TE .....................Transportation Enhancements
TIFIA ........... Transportation Infrastructure and Innovation Act

LIS
T O
F A
CR
ON
YM
S
TIGER .....................Transportation Investment Generating Economic Recovery
TIP ..............Transportation Improvement Plan
TMA .......... Transportation Management Area
TOC ..........................Traffic Operations Center
TTP ...................Tribal Transportation Program
U
UA ...................................University of Arizona
UAS ......................... Unmanned Aerial System
UPRR ............................. Union Pacific Railroad
USDA .............U.S. Department of Agriculture
USDOT .....U.S. Department of Transportation
W
WACOG ................ Western Arizona Council of Governments
Y
YCAA ............ Yuma County Airport Authority
YCAT ......................Yuma County Area Transit
YCIPTA ........ Yuma County Intergovernmental Public Transportation Authority
YIA......................... Yuma International Airport
YMPO ................. Yuma Metropolitan Planning Organization
YPG .............................Yuma Proving Grounds

AC
KN
OW
LE
DG
EM
EN
TS
Russell "Russ" Clark - CHAIRMAN
Board of Supervisors, Yuma County
Cecilia McCollough - TREASURER
Mayor, Town of Wellton
Jacob Miller - MEMBER
Council Member, City of Yuma
Greg Ferguson - MEMBER
Supervisor, Yuma County
Maria Ramos - MEMBER
Council Member, City of San Luis
Gary Knight - VICE CHAIRMAN
Council Member, City of Yuma
J. Deal Begay, Jr. - MEMBER
Vice Chairman, Cocopah Indian Tribe
Jose Yepez - MEMBER
Council Member, City of Somerton
Paul Patane - MEMBER
Yuma District Engineer, ADOT
William "Bill" Craft - MEMBER
Deputy Mayor, City of Yuma
YMPO Executive Board
John Starkey - CHAIRMAN
Zoning Administrator, City of San Luis
Roger Patterson - MEMBER
County Engineer, Yuma County
Maggie Castro - MEMBER
Planning Section Manager, Yuma County
Joshua Scott - MEMBER
City Engineer, City of Yuma
Omar Heredia - MEMBER
Planner, Cocopah Indian Tribe
Jennifer Albers - MEMBER
Principal Planner, City of Yuma
Mark Hoffman - MEMBER
Senior Planner, ADOT
Joel Olea - MEMBER
Director of Public Works, City of Yuma
Samuel Palacios - MEMBER
Public Works Director, City of Somerton
Joseph Grant - MEMBER
Public Works Director, Town of Wellton
YMPO Technical Advisory Committee (TAC) and Regional Transportation Plan TAC
YMPO Staff
Executive Director
Charles GutierrezSenior Planner Manager
Brian BradyIT/Web Design
Melissa RamosAdministrative Assistant

Introduction
Chapter 1

YMPO 2018-2041 Regional Transportation Plan Update
INT
RO
DU
CT
ION
2
I N T R O D U C T I O NYMPO RegionThe Yuma Metropolitan Planning Organi-zation (YMPO) is a nonprofit metropolitan planning organization (MPO) for the Yuma region, located in southwestern Arizona. YMPO is designated as a bi-state MPO because the region includes the commu-nity of Winterhaven in Imperial County, California and all of Yuma County, Arizona. The focus area of the YMPO region is shown in Figure 1.1. Yuma’s geography and location as the best spot for crossing the Colorado River promote the YMPO region as a natural and historical transpor-tation hub, which continues today. Con-nections to Arizona and California are provided by I-8 and US 95. State Route (SR) 195 is a limited access state highway that enhances the movement of goods and freight between the San Luis Port of Entry (POE) for commercial vehicles (San Luis POE II) and I-8.
(Source: Kimley-Horn)
Figure 1.1 – YMPO Region Focus Area(Source: Kimley-Horn)
Yuma
Somerton
San Luis
Wellton

YMPO 2018-2041 Regional Transportation Plan Update
INT
RO
DU
CT
ION
3
Figure 1.2 – YMPO’s Location in Relation to International Trade Routes (Source: YMPO)
An International HubThe YMPO region is an important hub internationally. Figure 1.2 shows the relationship of national and international trade routes to the YMPO region. International trade connections between the United States, Mexico, and Canada present significant opportunities for the YMPO region with the passage of the North American Free Trade Agreement (NAFTA) and the develop-ment of international transportation and trade corridors. The City of San Luis Rio Colorado, in Mexico, immediately south of the YMPO region, shares strong binational, cultural, and historical ties with the region. YMPO actively participates in trade corridor planning and supporting freight initiatives.
San Luis II Port of Entry(Source: Google)

YMPO 2018-2041 Regional Transportation Plan Update
INT
RO
DU
CT
ION
4
YMPO’s MembersYMPO member jurisdictions include the City of Yuma, Yuma County, the Cocopah Indian Tribe, the Town of Wellton, the cities of Somerton and San Luis, and the Arizona Department of Trans-portation (ADOT). These member jurisdictions constitute the voting members of YMPO. There are also a number of ex officio representatives of different public agencies that work with the YMPO Executive Board and Technical Advisory Committee (TAC). The current ex officio agen-cies are the Federal Highway Administration (FHWA), Federal Transit Administration (FTA), Envi-ronmental Protection Agency (EPA), California Department of Transportation (Caltrans), Yuma County Intergovernmental Public Transportation Authority (YCIPTA), Quechan Indian Tribe, the community of Winterhaven, and Imperial County.
YMPO’s Focus YMPO’s focus is “Local Governments and Citizens Working Together.” This focus informs all of YMPO’s work efforts, as well as its concept of service, responding to service and information requests by local jurisdictions and citizens.
YMPO’s Mission YMPO’s mission is to strive to attain and balance multimodal transportation-related needs with finite resources in the YMPO region, while promoting a safe environment and enhancing the quality of life in the community.
YMPO’s Focus:Local Governments and Citizens Working Together
Public Meeting for the YMPO 2018-2041 Regional Transportation Plan(Source: Kimley-Horn)
PLACEHOLDER
YMPO 2018-2041 Regional Transportation Plan Update
INT
RO
DU
CT
ION
5
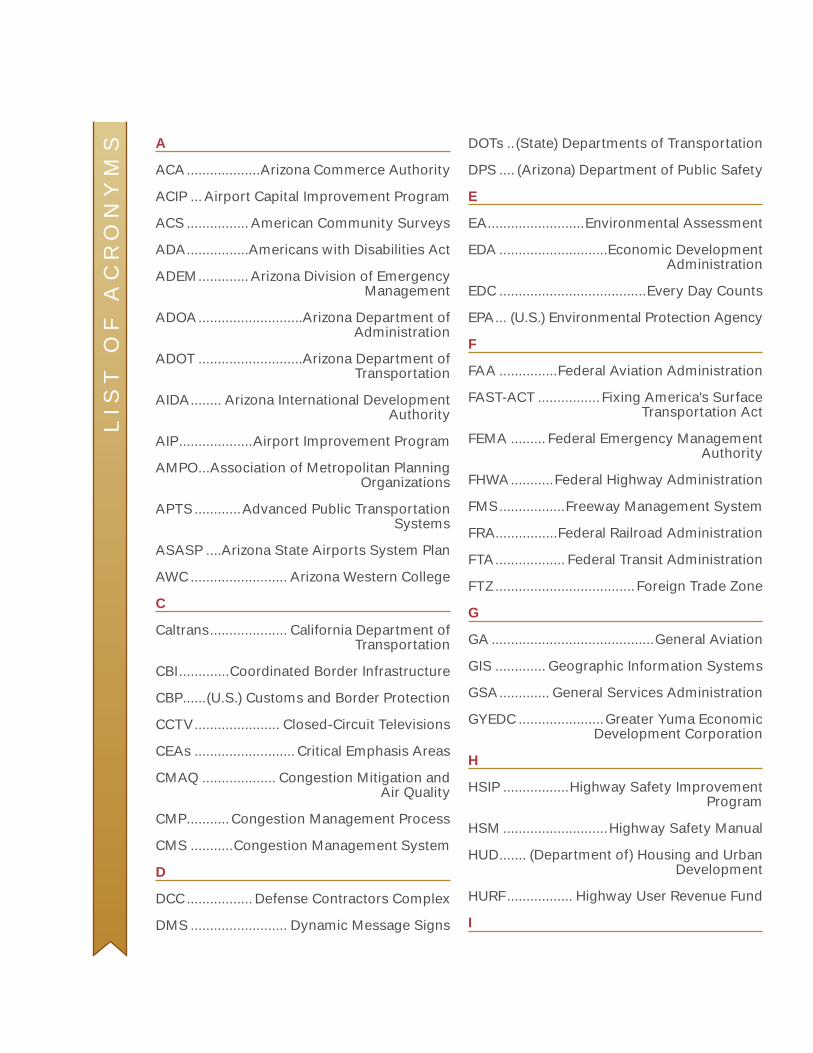
YMPO Regional Transportation Plan The YMPO 2018-2041 Regional Transportation Plan (RTP) is a 24-year, multimodal plan developed by YMPO in conjunction with YMPO member jurisdictions. It addresses the regional transporta-tion system and is updated every four years to meet federal funding requirements and address changing community needs.
The Planning Process The YMPO RTP represents a collaborative effort to establish a vision for the region’s transportation system. The RTP was developed based on direction from the Technical Advisory Committee (TAC) public and stakeholder input. The RTP planning process provides answers to four key questions, as illustrated in Figure 1.3.
1. Where are we now? The RTP summarizes current trans-portation system conditions.
2. Where do we want to go? The RTP establishes trans-portation system goals and objectives.
3. What will it take to get us there? The RTP provides rec-ommendations for each mode of transportation.
4. How do we allocate our resources? The RTP presents an investment strategy for how limited resources will be expended for transportation improvements.
TT an por ion Need
Land Use and Econo yy
e e a e e o ????Where are we now?Where are we now?
TTransporttatition NNeeddTTransporttatition NNeeddCommunity GoalsCommunity GoalsCommunity Goals
Land Use and EconomyyLand Use and EconomyyEnvironmentEnvironment
Goals
Where do we want to go?????Where do we want to go?Where do we want to go?
OutreachOOuttrea hchOOuttrea hchGoalsGoals
Performance MeasuresPerformance MeasuresPerformance Measures
Bi yclePedestrian
Frei htAviation
g ?????What will it take to get us there?What will it take to get us there?
RoRoadadwawayyRoRoadadwawayyBicyycleBicyycle
Pedestrian Pedestrian
TransitTrTranansisittTrTranansisittFreighg tFreighg tAAv a oAviationAviation
Cos s a esFunding Strategy
o dodo e aa oocacatete ouu esesouou ccees?????How do we allocate our resources?How do we allocate our resources?
PrioritizationPrPrioiorirititizazatitiononPrPrioiorirititizazatitiononCost EstimatesCost EstimatesCost Estimates
Funding StrategyFunding Strategy
Figure 1.3 – The Regional Transportation Planning Process(Source: Kimley-Horn)
Fixing America’s Surface Transportation Act (FAST Act)On December 4, 2015, President Obama signed into law the Fixing America’s Surface Trans-portation Act, or “FAST Act.” This law provides long-term funding for surface transportation and increases federal fund-ing by 11 percent over five years. The law makes changes and reforms to many programs including streamlining the approval process for new transpor-tation projects, providing new safety tools, and establishing new pro-grams to advance freight projects.
This RTP is prepared in accordance
with the FAST Act
requirements
Performance-Based Planning: A Cornerstone of the YMPO Regional Plan
Chapter 2

YMPO 2018-2041 Regional Transportation Plan Update
PE
RF
OR
MA
NC
E-B
AS
ED
PL
AN
NIN
G
8
P E R F O R M A N C E - B A S E D P L A N N I N G : A C O R N E R S T O N E O F T H E Y M P O R E G I O N A L P L A NWhat is Performance-Based Planning?Performance-based planning helps translate a long-range vision into a set of goals, objectives, and performance criteria that can be used to guide investment decisions.
Performance-based planning involves the following steps:
1. Developing goals and objectives – Goals are broad statements that describe what will be achieved. Objectives are specific and mea-surable statements to achieve the goals. Goals and objectives were determined in collaboration with the RTP TAC.
2. Identifying performance mea-sures – Performance measures are metrics used to assess progress towards meeting an objective.
3. Establishing performance targets – Targets are measures of performance. 4. Allocating resources – This step involves determining the specific approaches that will be
used to achieve the targets.5. Measuring and reporting results – This step involves measuring progress on a regular
basis.
Why is Performance-Based Planning Important? The region sets goals and specific targets for tracking progress to provide a way to define suc-cess and measure achievements.
Nationwide Significance of Performance-Based PlanningMoving Ahead for Progress in the 21st Century (MAP-21), the federal highway funding authoriza-tion signed into law on July 6, 2012, promotes a performance-based, multimodal transportation program to address the many challenges facing the U.S. transportation system.
These challenges include improving safety, maintaining infrastructure conditions, reducing traffic congestion, improving efficiency of the system and freight movement, protecting the environ-ment, and reducing delays in project delivery. The FAST Act, signed into law on December 4, 2015, maintained this performance-based approach to transportation planning.

YMPO 2018-2041 Regional Transportation Plan Update
PE
RF
OR
MA
NC
E-B
AS
ED
PL
AN
NIN
G
9
MAP-21 and the subsequent FAST Act outline funding and procedural requirements for multi-modal transportation planning in metropolitan areas and states. They require MPOs and states to develop transportation plans and transportation improvement programs through a performance-driven, outcome-based approach to planning.
Goals, Objectives, Performance Measures, and TargetsBuilding on the goals that were developed in the previous 2037 YMPO Regional Transportation Plan, the YMPO has developed goals, objectives, performance measures, and targets in 10 areas. These goal areas are:
1. Road and Bridge Condition – Maintain the highway infrastructure (e.g., pavement and bridges) in good repair.
2. Roadway Safety – Reduce the number of fatality and serious injury crashes on all public roads.
3. Vehicle Mobility – Improve efficiency and reduce travel time and congestion in the region by providing new roadway connections, widening existing roads, or implementing new tech-nologies to improve traffic flow efficiency.
4. Bicycle Mobility – Provide more bicycle infrastructure region-wide (e.g. bicycle lanes, striped shoulders, and shared use paths).
5. Transit Mobility – Provide more transit options and service regionwide, particularly to transit-dependent populations.
6. Freight Movement and Economic Vitality – Improve the region’s freight networks and strengthen the ability of the region to access national and international trade markets.
7. Environmental Sustainability – Protect and enhance the natural environment through im-proving air quality, levels of ozone, and levels of particulates.
8. Aviation - Increase air traffic operations, a major economic force in the region. 9. Border Crossings – Improve cross-border travel in the region.10. Tourism – Enhance the economy of the region by increasing tourism.
Some performance measures refer to roads on the National Highway System, which consists of roadways important to the nation's economy, defense, and mobility. National Highway System routes in the region are:
Interstate 8 – on the Interstate system South 4th Avenue, I-8 - 32nd Street and 32nd Street, 4th Avenue - Avenue 5E (Business 8) US 95 SR 195 Avenue 3E, US 95 - Yuma Marine Corps Air Station
A map of these routes is provided in Figure 2.1.
For each goal area, a description of the objectives, performance measures and current condition is provided. In future RTPs reporting will be shown for each measure to show clear progress on each goal.

YMPO 2018-2041 Regional Transportation Plan Update 11
PE
RF
OR
MA
NC
E-B
AS
ED
PL
AN
NIN
G
£95
§̈¦8
Ca l i
f or n
i a
Ca l i
f or n
i aA
r iz o n a
Ar i
z o n a
M e x i c oM e x i c o
Ave
I
Ave
H
Ave
G
Ave
F
Ave
E
Ave
D
Ave
C
Ave
B
Ave
A
Ave
1E
Ave
2E
Ave
3E
Ave
4E
Ave
5E
Ave
6E
Ave
7E
Ave
8E
Ave
9E
Ave
10E
Fortu
na R
d
Ave
12E
Ave
13E
Ave
14E
Ave
15E
Ave
19E
Ave
20E
Ave
21E
Ave
18E
Ave
J
Co 25th St
Co 24th St
Co 22nd St
Juan Sanchez Blvd / Co 23rd St
Co 21st St
Co 20th St
Co 19th St
Co 18th St
Co 17th St
Co 16th St
Co 15th St
Co 14th St
Co 13th St
Co 12th St
Co 11th St
Co 10th St
Co 9th St
Co 8th St
Co 7st St
Co 6th St
Ave
16E
Ave
22E
Ave
23E
Ave
24E
Ave
25E
Ave
26E
Ave
27E
Ave
29E
Ave
30E
Ave
31E
Ave
32E
Ave
33E
Ave
34E
Ave
35E
Ave
36E
Ave
37E
Ave
38E
Ave
39E
Ave
28E
Imperial Dam Rd
Martinez Lake Rd
San Luis
Somerton
Yuma
Wellton
Gila River
Colorado River
Ave
16E
£95
£95
?ï
?ï
Coconino
Pima
Mohave
Gila
Pinal
Yavapai
Maricopa
Cochise
La Paz
Graham
Apa
che
Nav
ajo
Gre
enle
e
Santa CruzYMPO
Yuma
Municipality/Tribal LandNational Highway System Routes
² 0 2 41
Miles
Figure 2.1 – National Highway System Routes(Source: USDOT)
YMPO 2018-2041 Regional Transportation Plan Update
PE
RF
OR
MA
NC
E-B
AS
ED
PL
AN
NIN
G
13
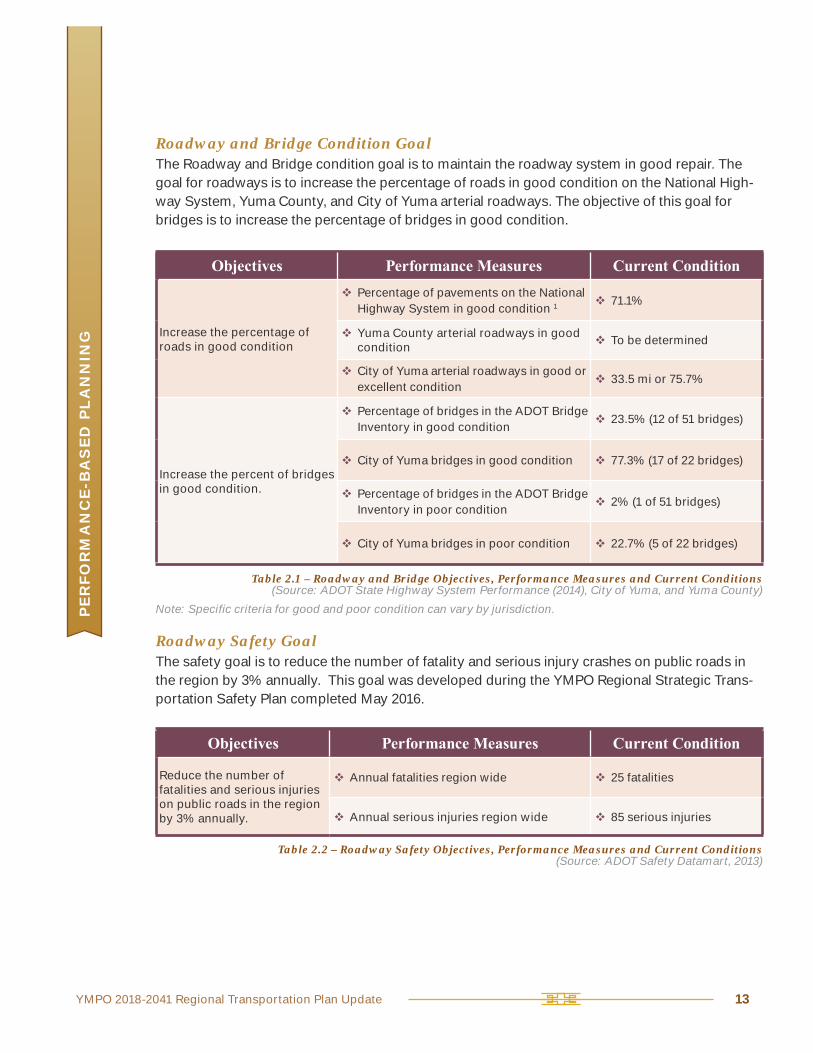
Roadway and Bridge Condition Goal The Roadway and Bridge condition goal is to maintain the roadway system in good repair. The goal for roadways is to increase the percentage of roads in good condition on the National High-way System, Yuma County, and City of Yuma arterial roadways. The objective of this goal for bridges is to increase the percentage of bridges in good condition.
Roadway Safety Goal The safety goal is to reduce the number of fatality and serious injury crashes on public roads in the region by 3% annually. This goal was developed during the YMPO Regional Strategic Trans-portation Safety Plan completed May 2016.
Objectives Performance Measures Current Condition
Increase the percentage of roads in good condition
Percentage of pavements on the National Highway System in good condition 1
71.1%
Yuma County arterial roadways in good condition
To be determined
City of Yuma arterial roadways in good or excellent condition
33.5 mi or 75.7%
Increase the percent of bridges in good condition.
Percentage of bridges in the ADOT Bridge Inventory in good condition
23.5% (12 of 51 bridges)
City of Yuma bridges in good condition 77.3% (17 of 22 bridges)
Percentage of bridges in the ADOT Bridge Inventory in poor condition
2% (1 of 51 bridges)
City of Yuma bridges in poor condition 22.7% (5 of 22 bridges)
Objectives Performance Measures Current Condition
Reduce the number of fatalities and serious injuries on public roads in the region by 3% annually.
Annual fatalities region wide 25 fatalities
Annual serious injuries region wide 85 serious injuries
Table 2.1 – Roadway and Bridge Objectives, Performance Measures and Current Conditions(Source: ADOT State Highway System Performance (2014), City of Yuma, and Yuma County)
Table 2.2 – Roadway Safety Objectives, Performance Measures and Current Conditions(Source: ADOT Safety Datamart, 2013)
Note: Specific criteria for good and poor condition can vary by jurisdiction.

YMPO 2018-2041 Regional Transportation Plan Update
PE
RF
OR
MA
NC
E-B
AS
ED
PL
AN
NIN
G
14
Vehicle Mobility Goal The vehicle mobility goal is to reduce delays and congestion in the region through roadway improvements. One objective for this goal is to reduce the annual hours of delay on major col-lectors and arterials in the region. Another objective is to reduce vehicle miles of travel on major collector and arterial routes in the region. The third objective is to reduce roadway segment miles with unacceptable levels of service (LOS) in the region. These data are obtained from the YMPO travel demand model.
Bicycle Mobility Goal The bicycle mobility goal is focused on providing more facilities for bicyclists regionwide. The objective of this goal is to increase the percentage of roads with bicycle lanes or paved striped shoulders which can be used by bicyclists.
Objectives Performance Measures Current Condition
Reduce annual hours of delay on major arterials and collectors
Annual hours of vehicle travel 33.2 million hours
Reduce vehicle miles of travel on major arterials and collectors
Annual vehicle miles of travel 1448 million vehicle miles
Reduce roadway segment miles with unacceptable LOS (LOS E or F) on major arterials and collectors
Miles of roadway segments that perform at LOS E or LOS F during peak periods
0 segments
Objectives Performance Measures Current Condition
Increase percentage of roads with bicycle lanes or paved striped shoulders
City of Yuma miles of bike lanes 12.4 miles
Table 2.3 – Vehicle Mobility Objectives, Performance Measures and Current Conditions(Source: 2015 YMPO travel demand model data)
Table 2.4 – Bicycle Mobility Objectives, Performance Measures and Current Conditions(Source: City of Yuma)

YMPO 2018-2041 Regional Transportation Plan Update
PE
RF
OR
MA
NC
E-B
AS
ED
PL
AN
NIN
G
15
Transit Mobility Goal The focus of the transit mobility goal is to provide increased transit service for the general public including seniors and individuals with disabilities. One objective is to increase annual transit rid-ership on the Yuma County Area Transit (YCAT) system. The other objectives were developed as part of the 2015 Yuma Regional Transportation Coordination Plan in consultation with community transit providers. These objectives included:
Involving more groups in the YMPO Regional Mobility Committee Marketing the Enhanced Mobility of Seniors and Individuals with Disabilities (FTA 5310 Pro-gram) to the public, as measured by voluntary transit service provider reports. Working to meet unmet transportation needs within Yuma County, as measured by trans-portation funding in the region.
Objectives Performance Measures Current Condition
Increase annual transit ridership on YCAT system
Annual YCAT transit ridership
209,400 passenger trips (2014 fixed route service)
1,477 passenger trips (2014 demand response service)
Involve more groups in the YMPO Regional Mobility Committee
Number of participating agencies in the Regional Mobility Committee
16 agencies
Market the Enhanced Mobility of Seniors and Individuals with Disabilities- FTA 5310 Program to the public
Number of trips provided 332,259 trips (reported by 3 agencies)
Work to meet unmet transportation needs within Yuma County
Transportation funding $4,218,676 (2011)
Table 2.5 – Transit Mobility Objectives, Performance Measures and Current Conditions(Source: 2015 Yuma Regional Transportation Coordination Plan and the National Transit Database)

YMPO 2018-2041 Regional Transportation Plan Update
PE
RF
OR
MA
NC
E-B
AS
ED
PL
AN
NIN
G
16
Freight Movement and Economic Vitality Goal Yuma’s strategic location on state and interstate routes make improving the efficiency of the regional freight network vital in supporting Yuma’s economy. This objective is measured by decreasing the number of miles of key freight routes that operate poorly during peak periods.
Environmental Sustainability GoalThe objective of the environmental sustainability goal is to improve regional air quality, measured by levels of particulates 10 micrometers or less in diameter (PM10), and ozone levels.
Objectives Performance Measures Current Condition
Improve the efficiency and effectiveness of the regional freight network and facilities to take advantage of desirable market access conditions
Decrease the number of miles of I-8, SR 195, and US 95 that perform at LOS E or F during peak periods.
0 miles
Objectives Performance Measures Current Condition
Improve regional air quality Air quality reporting measures: Level of PM10 and ozone
PM10 = 7805.19 tons/year (2014)
Ozone = 0.077ppm* 2012-2014 average
Table 2.6 – Freight Movement and Economic Vitality Objectives, Performance Measures and Current Conditions(Source: YMPO travel demand model, 2015)
Table 2.7 – Environmental Sustainability Objectives, Performance Measures and Current Conditions(Source: YMPO 2014 Air Quality Conformity Analysis and ADEQ Annual Ambient Air Assessment Report)

YMPO 2018-2041 Regional Transportation Plan Update
PE
RF
OR
MA
NC
E-B
AS
ED
PL
AN
NIN
G
17
Aviation GoalAviation activity is an important contributor to the local economy and should be increased. Activ-ity is measured through reporting on annual aircraft operations for military aircraft operations, general aviation, and commercial services. Note: Data on Yuma Proving Ground operations are not available.
Objectives Performance Measures Current Condition
Contribute to the economy of the region by increasing the level of aviation activity
Military aircraft operations
Rolle Field: 100 operations
Somerton Airport: 0 operations
Yuma Marine Corps Air Station / Yuma International: 109,158 operations
General Aviation local operations – Those operating in the local traffic pattern or within a 20-mile radius of the airport
Rolle Field: 0 operations
Somerton Airport: 0 operations
Yuma Marine Corps Air Station / Yuma International: 45,981 operations
General aviation itinerant operations - Those general aviation operations (excluding commuter or air taxi) not qualifying as local.
Rolle Field: 0 operations
Somerton Airport: 50 operations
Yuma Marine Corps Air Station / Yuma International: 13,546 operations
Commercial services – scheduled operations by certified carriers or interstate carriers
Rolle Field: 3,000 operations
Somerton Airport: 4,000 operations
Yuma Marine Corps Air Station / Yuma International: 18,814 operations
Table 2.8 – Aviation Objectives, Performance Measures and Current Conditions(Source: Federal Aviation Administration Airport Facilities Data)

YMPO 2018-2041 Regional Transportation Plan Update
PE
RF
OR
MA
NC
E-B
AS
ED
PL
AN
NIN
G
18
Border Crossings Goal The City of San Luis, within the YMPO region, is at the border with San Luis Rio Colorado, Sonora and California. San Luis is the second busiest border crossing point in Arizona and is served by the San Luis Port of Entry and San Luis II, a Commercial Port of Entry. This goal is to improve cross-border travel for all modes of transportation as measured by commercial truck crossings, personal vehicle crossings, and pedestrian crossings.
Tourism Goals The YMPO region is located at a crossroads where Arizona, California, and Mexico meet, making tourism an important industry in the region. This goal is to increase the level of tourism as mea-sured by the estimated travel spending in Yuma County, reported by the Yuma Visitor’s Bureau.
Objectives Performance Measures Current Condition
Improve the accessibility and efficiency of cross-border travel for all modes of travel
Number of commercial truck crossings
33,712 trucks
Number of personal vehicle crossings
3,106,744 vehicles
Number of pedestrian crossings 2,351,506 persons
Objectives Performance Measures Current Condition
Increase the level of tourism in the region, which will in turn increase tourism related jobs and spending
Annual travel spending in Yuma County
$664.7M
Table 2.9 – Border Crossings Objectives, Performance Measures and Current Conditions(Source: Bureau of Transportation Statistics, 2015 Data)
Table 2.10 – Tourism Objectives, Performance Measures and Current Conditions(Source: Yuma Visitors Bureau - 2014 Data)

Growth Trends in the Region
Chapter 4

YMPO 2018-2041 Regional Transportation Plan Update
GR
OW
TH
TR
EN
DS
IN
TH
E R
EG
ION
28
G R O W T H T R E N D S I N T H E R E G I O NOverviewMany land use characteristics affect travel behav-ior. Where people live, work, attend school, go shopping, and travel affect transportation needs and choices. This chapter discusses growth trends in land use, population, and employment. It also discusses economic development initiatives that may influence travel in the region.
Regionally and nationally there is emphasis on providing integrated multimodal transportation systems with walkable, mixed use neighborhoods. For example, in 2015 an improvement project was com-pleted in downtown San Luis to revitalize Main Street, improve the circulation of traffic, enhance pedestrian safety, and improve access to downtown businesses. This project made it easier for vehicle, pedestrian, and bicycle traffic to travel in the downtown area.
Using transpor-tation to promote healthy and sustainable communi-ties also promotes reduced motor vehicle use, air quality improvements, less highway congestion, and improved safety. The ability of YMPO member juris-dictions to work together to develop the 2018-2041 RTP advances the concept of a seamless regional mobility system, which is critical to regional and global competitiveness. This regional coordination is also a key way to leverage limited funds.
(Source: Kimley-Horn)
Land use and transportation have a reciprocal relationship and must be balanced
to achieve vibrant communities
Land Use Transportation
YMPO 2018-2041 Regional Transportation Plan Update
GR
OW
TH
TR
EN
DS
IN
TH
E R
EG
ION
29
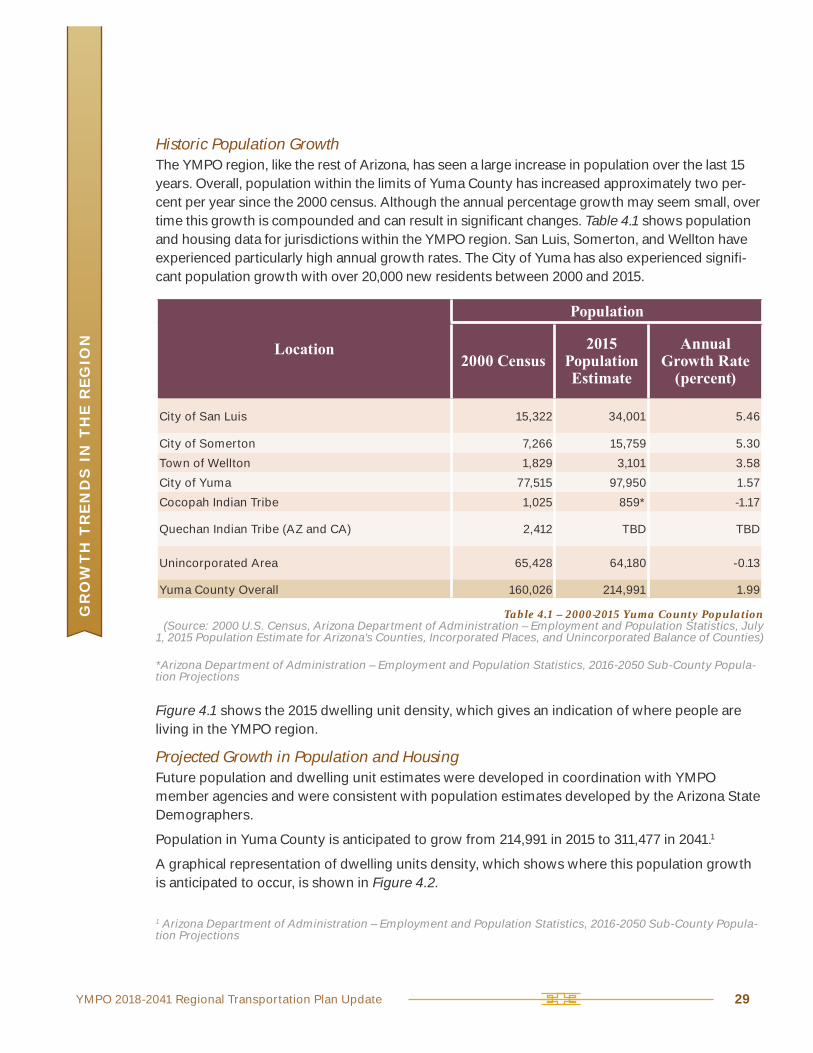
Historic Population GrowthThe YMPO region, like the rest of Arizona, has seen a large increase in population over the last 15 years. Overall, population within the limits of Yuma County has increased approximately two per-cent per year since the 2000 census. Although the annual percentage growth may seem small, over time this growth is compounded and can result in significant changes. Table 4.1 shows population and housing data for jurisdictions within the YMPO region. San Luis, Somerton, and Wellton have experienced particularly high annual growth rates. The City of Yuma has also experienced signifi-cant population growth with over 20,000 new residents between 2000 and 2015.
Location
Population
2000 Census 2015
PopulationEstimate
Annual Growth Rate
(percent)
City of San Luis 15,322 34,001 5.46
City of Somerton 7,266 15,759 5.30
Town of Wellton 1,829 3,101 3.58
City of Yuma 77,515 97,950 1.57
Cocopah Indian Tribe 1,025 859* -1.17
Quechan Indian Tribe (AZ and CA) 2,412 TBD TBD
Unincorporated Area 65,428 64,180 -0.13
Yuma County Overall 160,026 214,991 1.99
Table 4.1 – 2000-2015 Yuma County Population (Source: 2000 U.S. Census, Arizona Department of Administration – Employment and Population Statistics, July
1, 2015 Population Estimate for Arizona's Counties, Incorporated Places, and Unincorporated Balance of Counties)
*Arizona Department of Administration – Employment and Population Statistics, 2016-2050 Sub-County Popula-tion Projections
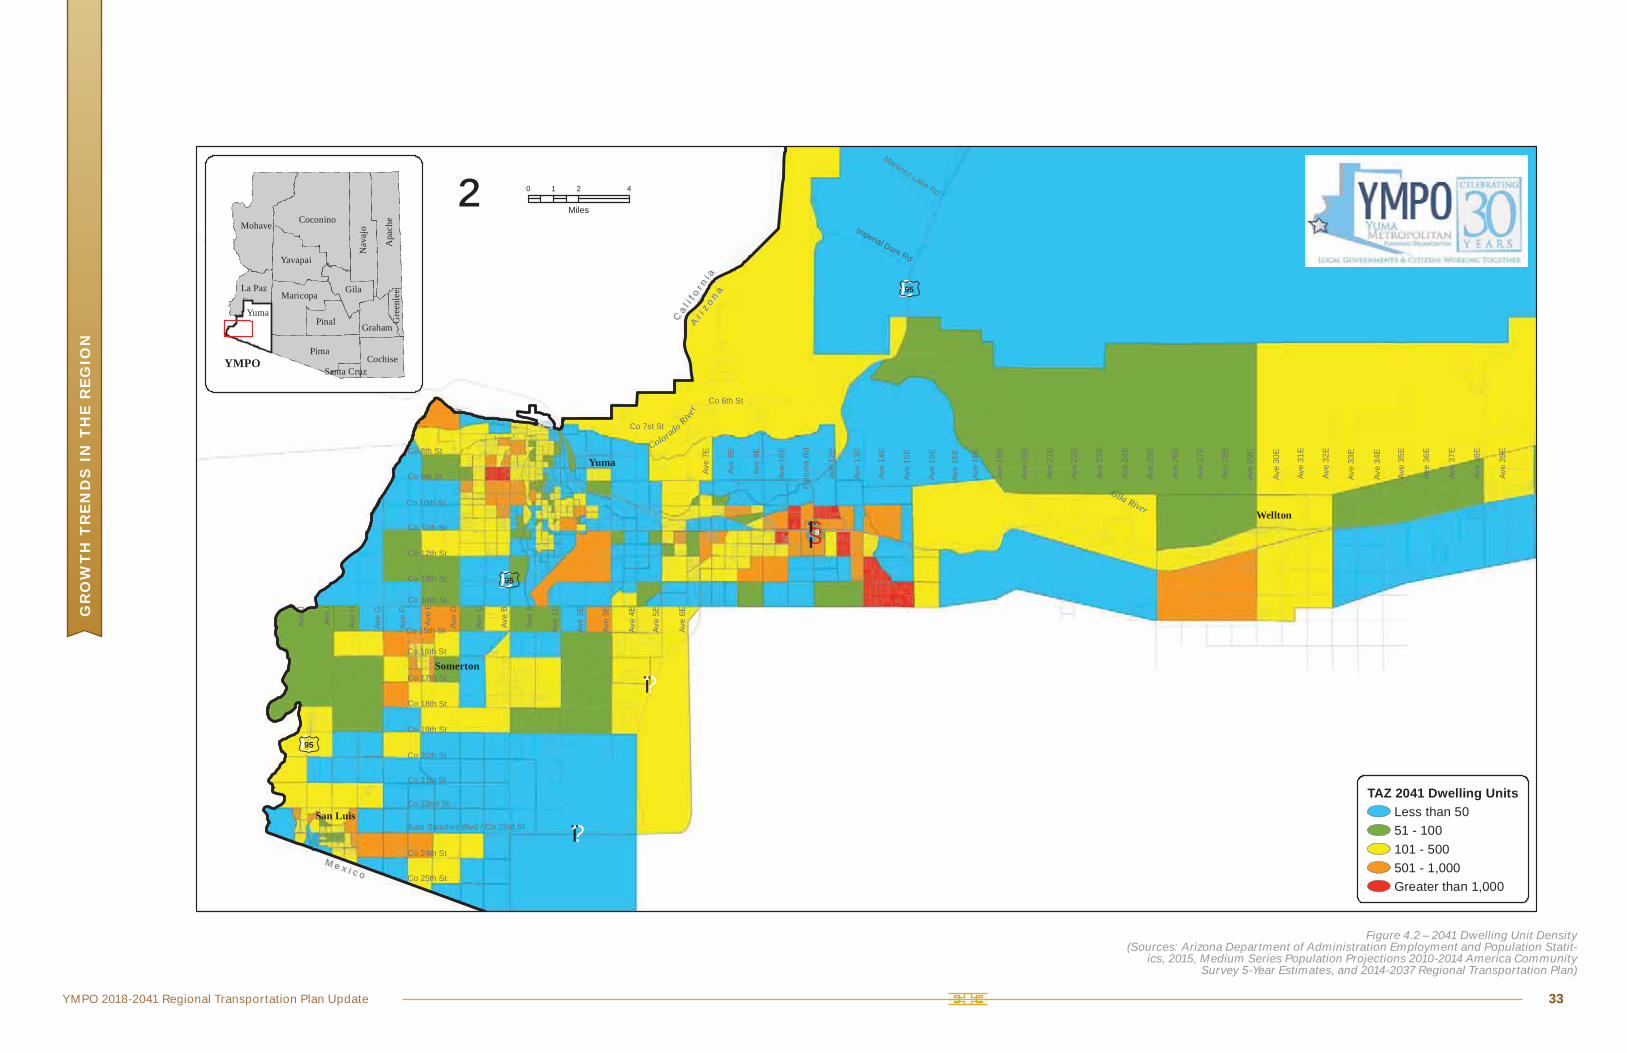
Figure 4.1 shows the 2015 dwelling unit density, which gives an indication of where people are living in the YMPO region.
Projected Growth in Population and Housing Future population and dwelling unit estimates were developed in coordination with YMPO member agencies and were consistent with population estimates developed by the Arizona State Demographers.
Population in Yuma County is anticipated to grow from 214,991 in 2015 to 311,477 in 2041.1
A graphical representation of dwelling units density, which shows where this population growth is anticipated to occur, is shown in Figure 4.2.
1 Arizona Department of Administration – Employment and Population Statistics, 2016-2050 Sub-County Popula-tion Projections

YMPO 2018-2041 Regional Transportation Plan Update 31
GR
OW
TH
TR
EN
DS
IN
TH
E R
EG
ION
£95
§̈¦8
Ca l i
f or n
i a
Ca l i
f or n
i aA r i
z o n a
A r iz o n a
M e x i c oM e x i c o
Ave
I
Ave
H
Ave
G
Ave
F
Ave
E
Ave
D
Ave
C
Ave
B
Ave
A
Ave
1E
Ave
2E
Ave
3E
Ave
4E
Ave
5E
Ave
6E
Ave
7E
Ave
8E
Ave
9E
Ave
10E
Fortu
na R
d
Ave
12E
Ave
13E
Ave
14E
Ave
15E
Ave
19E
Ave
20E
Ave
21E
Ave
18E
Ave
J
Co 25th St
Co 24th St
Co 22nd St
Juan Sanchez Blvd / Co 23rd St
Co 21st St
Co 20th St
Co 19th St
Co 18th St
Co 17th St
Co 16th St
Co 15th St
Co 14th St
Co 13th St
Co 12th St
Co 11th St
Co 10th St
Co 9th St
Co 8th St
Co 7st St
Co 6th St
Ave
16E
Ave
22E
Ave
23E
Ave
24E
Ave
25E
Ave
26E
Ave
27E
Ave
29E
Ave
30E
Ave
31E
Ave
32E
Ave
33E
Ave
34E
Ave
35E
Ave
36E
Ave
37E
Ave
38E
Ave
39E
Ave
28E
Imperial Dam Rd
Martinez Lake Rd
San Luis
Somerton
Yuma
Wellton
Gila River
Colorado River
Ave
16E
£95
£95
?ï
?ï
Coconino
Pima
Mohave
Gila
Pinal
Yavapai
Maricopa
Cochise
La Paz
Graham
Apac
he
Nava
jo
Gree
nlee
Santa CruzYMPO
Yuma
TAZ 2015 Dwelling UnitsLess than 5051 - 100101 - 500501 - 1,000Greater than 1,000
² 0 2 41
Miles
Figure 4.1 – 2015 Dwelling Unit Density(Sources: Arizona Department of Administration Employment and Population
Statitics, 2015, Medium Series Population Projections 2010-2014 America Com-munity Survey 5-Year Estimates, and 2014-2037 Regional Transportation Plan)
YMPO 2018-2041 Regional Transportation Plan Update 33
GR
OW
TH
TR
EN
DS
IN
TH
E R
EG
ION
£95
§̈¦8
Ca l i
f or n
i a
Ca l i
f or n
i aA r i
z o n a
A r iz o n a
M e x i c oM e x i c o
Ave
I
Ave
H
Ave
G
Ave
F
Ave
E
Ave
D
Ave
C
Ave
B
Ave
A
Ave
1E
Ave
2E
Ave
3E
Ave
4E
Ave
5E
Ave
6E
Ave
7E
Ave
8E
Ave
9E
Ave
10E
Fortu
na R
d
Ave
12E
Ave
13E
Ave
14E
Ave
15E
Ave
19E
Ave
20E
Ave
21E
Ave
18E
Ave
J
Co 25th St
Co 24th St
Co 22nd St
Juan Sanchez Blvd / Co 23rd St
Co 21st St
Co 20th St
Co 19th St
Co 18th St
Co 17th St
Co 16th St
Co 15th St
Co 14th St
Co 13th St
Co 12th St
Co 11th St
Co 10th St
Co 9th St
Co 8th St
Co 7st St
Co 6th St
Ave
16E
Ave
22E
Ave
23E
Ave
24E
Ave
25E
Ave
26E
Ave
27E
Ave
29E
Ave
30E
Ave
31E
Ave
32E
Ave
33E
Ave
34E
Ave
35E
Ave
36E
Ave
37E
Ave
38E
Ave
39E
Ave
28E
Imperial Dam Rd
Martinez Lake Rd
San Luis
Somerton
Yuma
Wellton
Gila River
Colorado River
Ave
16E
£95
£95
?ï
?ï
Coconino
Pima
Mohave
Gila
Pinal
Yavapai
Maricopa
Cochise
La Paz
Graham
Apac
he
Nava
jo
Gree
nlee
Santa CruzYMPO
Yuma
TAZ 2041 Dwelling UnitsLess than 5051 - 100101 - 500501 - 1,000Greater than 1,000
² 0 2 41
Miles
Figure 4.2 – 2041 Dwelling Unit Density(Sources: Arizona Department of Administration Employment and Population Statit-
ics, 2015, Medium Series Population Projections 2010-2014 America Community Survey 5-Year Estimates, and 2014-2037 Regional Transportation Plan)

YMPO 2018-2041 Regional Transportation Plan Update
GR
OW
TH
TR
EN
DS
IN
TH
E R
EG
ION
35
Employment The three main contributors to the region’s growth and economy are the agricultural, military, and tourism industries. Employment data from the 2015 census is shown in Table 4.2.
Area 2015 Employment
City of San Luis 6,367
City of Somerton 1,922
Town of Wellton 1,169
City of Yuma 43,955
Cocopah Indian Tribe 925
Other Unincorporated Areas 17,954
Yuma County Overall 72,292
Table 4.2 – Yuma County 2015 Employment(Source: Arizona Department of Administration – Employment and Population Statistics and MAG AZ-SMART
land use suballocation tool)
The regional economy has a diverse foundation with two major defense facilities, a regional/inter-state medical facility, a retail and hospitality sector that hosts more than 80,000 winter visitors annually (Yuma Sun, 2012), a $3.2 billion high-tech agribusiness industry, and a growing industrial sector.

YMPO 2018-2041 Regional Transportation Plan Update
GR
OW
TH
TR
EN
DS
IN
TH
E R
EG
ION
37
Table 4.3 shows the top 10 employers in the YMPO region.
Employer Activity Employees
#1 US Army Proving Ground (YPG) Military 2319
#2 Yuma Regional Medical Center HealthCare 2080
#3 Yuma Elementary School District Government 1700
#4 Wal-Mart Stores Retail 1394
#5 City of Yuma Government 1388
#6 Yuma County Government 1350
#7 US Marine Corps Air Station (MCAS) Military 1350
#8 Bose Corporation Manufacturing 1300
#9 US Border Patrol Government 920
#10 ACT, Advanced Call Center Technologies Call Center 814
Table 4.3 – Top Ten Employers in the YMPO Region(Source: Yuma County Chamber of Commerce)
Figure 4.3 illustrates the 2015 distribution of employment in the YMPO TDM developed for use in preparing the 2018-2041 RTP.

YMPO 2018-2041 Regional Transportation Plan Update 39
GR
OW
TH
TR
EN
DS
IN
TH
E R
EG
ION
£95
§̈¦8
Ca l i
f or n
i a
Ca l i
f or n
i aA r i
z o n a
A r iz o n a
M e x i c oM e x i c o
Ave
I
Ave
H
Ave
G
Ave
F
Ave
E
Ave
D
Ave
C
Ave
B
Ave
A
Ave
1E
Ave
2E
Ave
3E
Ave
4E
Ave
5E
Ave
6E
Ave
7E
Ave
8E
Ave
9E
Ave
10E
Fortu
na R
d
Ave
12E
Ave
13E
Ave
14E
Ave
15E
Ave
19E
Ave
20E
Ave
21E
Ave
18E
Ave
J
Co 25th St
Co 24th St
Co 22nd St
Juan Sanchez Blvd / Co 23rd St
Co 21st St
Co 20th St
Co 19th St
Co 18th St
Co 17th St
Co 16th St
Co 15th St
Co 14th St
Co 13th St
Co 12th St
Co 11th St
Co 10th St
Co 9th St
Co 8th St
Co 7st St
Co 6th St
Ave
16E
Ave
22E
Ave
23E
Ave
24E
Ave
25E
Ave
26E
Ave
27E
Ave
29E
Ave
30E
Ave
31E
Ave
32E
Ave
33E
Ave
34E
Ave
35E
Ave
36E
Ave
37E
Ave
38E
Ave
39E
Ave
28E
Imperial Dam Rd
Martinez Lake Rd
San Luis
Somerton
Yuma
Wellton
Gila River
Colorado River
Ave
16E
£95
£95
?ï
?ï
Coconino
Pima
Mohave
Gila
Pinal
Yavapai
Maricopa
Cochise
La Paz
Graham
Apac
he
Nava
jo
Gree
nlee
Santa CruzYMPO
Yuma
TAZ 2015 mployeesLess than 100101 - 500501 - 1,0001,001 - 1,5001,501 - 2,500Greater than 2,500
² 0 2 41
Miles
Figure 4.3 – 2015 Employment Density(Sources: Arizona Department of Administration Employment and Population Statit-
ics, 2015, Medium Series Population Projections 2010-2014 America Community Survey 5-Year Estimates, and 2014-2037 Regional Transportation Plan)

YMPO 2018-2041 Regional Transportation Plan Update
GR
OW
TH
TR
EN
DS
IN
TH
E R
EG
ION
41
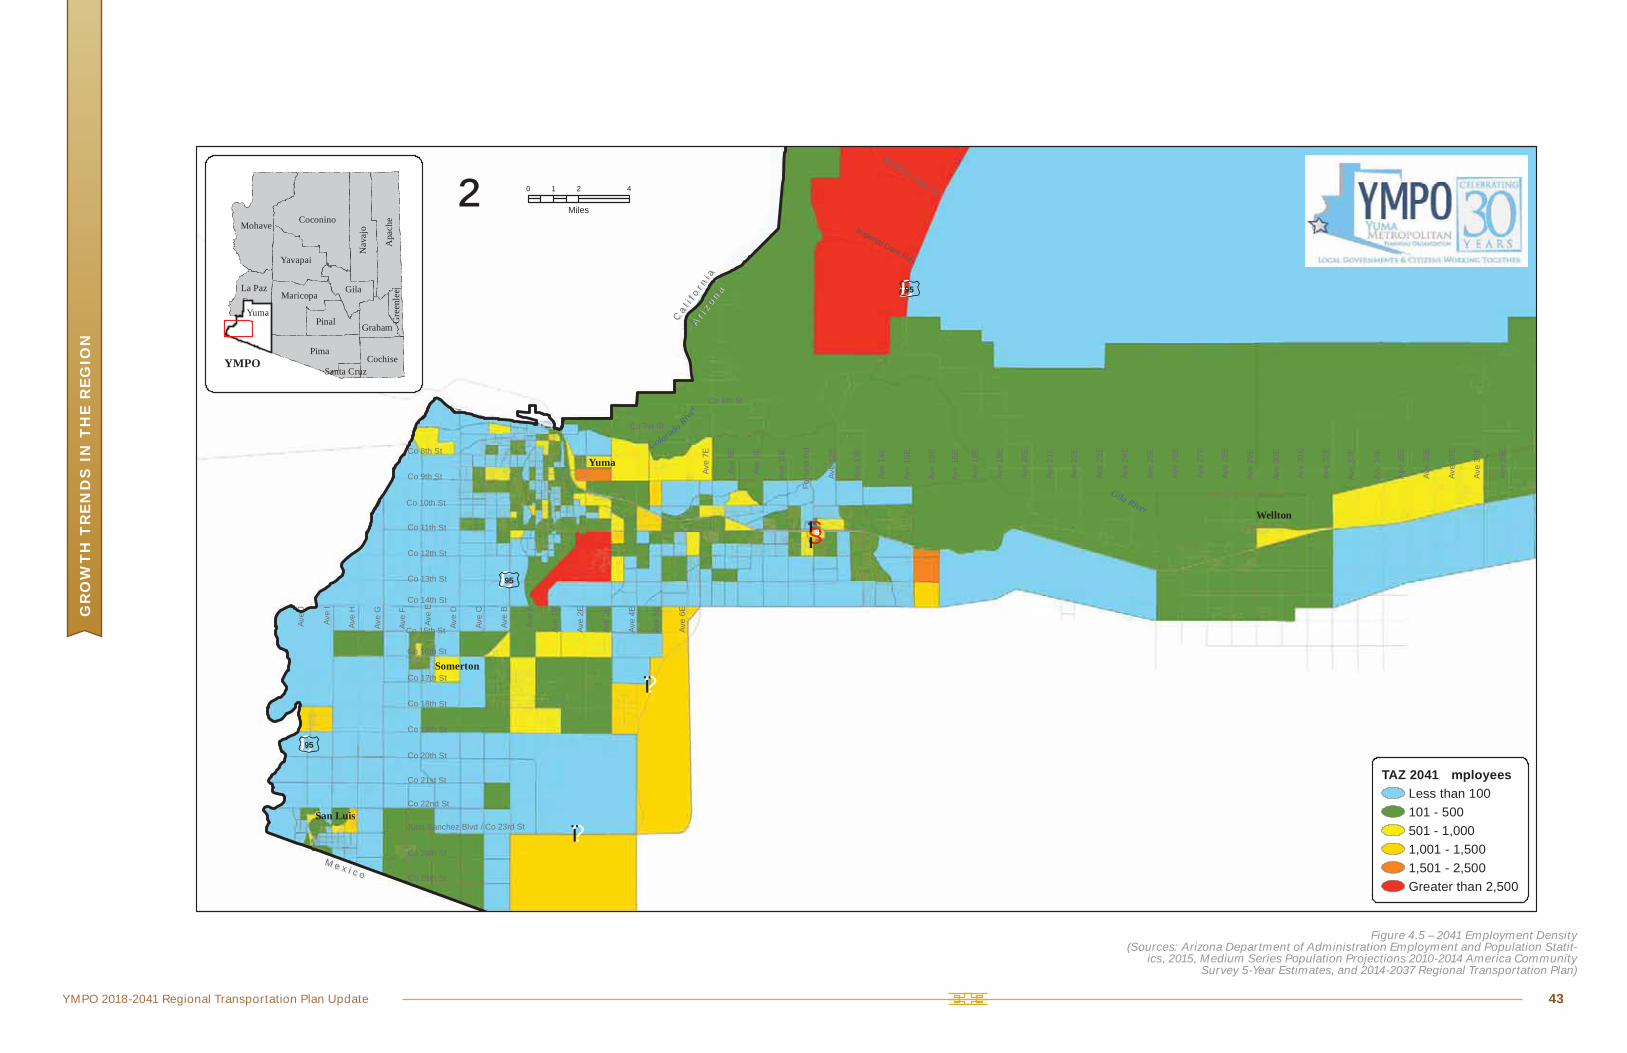
Future Employment
The total number of jobs in the region is estimated to grow from approximately 72,292 employ-ees in 2015 to 113,187 in 2041. As additional jobs are created in the region, the need for new and improved roadways, bikeways, sidewalks, and additional transit services will increase. A compari-son of current and projected future employment is shown in Figure 4.4.
A graphical representation of projeted employment density in 2041 is provided in Figure 4.5.
Yuma Proving Ground (Source: Kimley-Horn)
PLACEHOLDER
2015 2018 2021 2031 2041
Current and Future Employment (number of employees)
120,000
100,000
80,000
60,000
40,000
20,000
0.0
72,292 77,12582,037
97,965
113,187
Figure 4.4 – Current and Future Employment(Source: Kimley-Horn)
YMPO 2018-2041 Regional Transportation Plan Update 43
GR
OW
TH
TR
EN
DS
IN
TH
E R
EG
ION
£95
§̈¦8
Ca l i
f or n
i a
Ca l i
f or n
i aA r i
z o n a
A r iz o n a
M e x i c oM e x i c o
Ave
I
Ave
H
Ave
G
Ave
F
Ave
E
Ave
D
Ave
C
Ave
B
Ave
A
Ave
1E
Ave
2E
Ave
3E
Ave
4E
Ave
5E
Ave
6E
Ave
7E
Ave
8E
Ave
9E
Ave
10E
Fortu
na R
d
Ave
12E
Ave
13E
Ave
14E
Ave
15E
Ave
19E
Ave
20E
Ave
21E
Ave
18E
Ave
J
Co 25th St
Co 24th St
Co 22nd St
Juan Sanchez Blvd / Co 23rd St
Co 21st St
Co 20th St
Co 19th St
Co 18th St
Co 17th St
Co 16th St
Co 15th St
Co 14th St
Co 13th St
Co 12th St
Co 11th St
Co 10th St
Co 9th St
Co 8th St
Co 7st St
Co 6th St
Ave
16E
Ave
22E
Ave
23E
Ave
24E
Ave
25E
Ave
26E
Ave
27E
Ave
29E
Ave
30E
Ave
31E
Ave
32E
Ave
33E
Ave
34E
Ave
35E
Ave
36E
Ave
37E
Ave
38E
Ave
39E
Ave
28E
Imperial Dam Rd
Martinez Lake Rd
San Luis
Somerton
Yuma
Wellton
Gila River
Colorado River
Ave
16E
£95
£95
?ï
?ï
Coconino
Pima
Mohave
Gila
Pinal
Yavapai
Maricopa
Cochise
La Paz
Graham
Apac
he
Nava
jo
Gree
nlee
Santa CruzYMPO
Yuma
TAZ 2041 mployeesLess than 100101 - 500501 - 1,0001,001 - 1,5001,501 - 2,500Greater than 2,500
² 0 2 41
Miles
Figure 4.5 – 2041 Employment Density(Sources: Arizona Department of Administration Employment and Population Statit-
ics, 2015, Medium Series Population Projections 2010-2014 America Community Survey 5-Year Estimates, and 2014-2037 Regional Transportation Plan)

YMPO 2018-2041 Regional Transportation Plan Update
GR
OW
TH
TR
EN
DS
IN
TH
E R
EG
ION
45
Community DevelopmentCurrent land use categories are designated and defined by individual jurisdictions. These land use designations do not necessarily correspond to existing land uses but rather indicate how the agency intends the land to be used. Land ownership in the YMPO region influences land use and is shown in Figure 4.6.
Each jurisdiction in the YMPO region has a plan for growth and development. Future growth and redevelopment areas are summarized in Figure 4.7.

YMPO 2018-2041 Regional Transportation Plan Update
GR
OW
TH
TR
EN
DS
IN
TH
E R
EG
ION
46
Figure 4.6 – YMPO Region Land Ownership
(Source: ADOT, ASLD)
Figure 4.7 – Future Growth and Redevelopment Areas(Source: YMPO)
To Be Updated

YMPO 2018-2041 Regional Transportation Plan Update
GR
OW
TH
TR
EN
DS
IN
TH
E R
EG
ION
47
Economic Development TrendsOverview
Economic Development and Transportation LinkagesThe full benefit of a region's investment in transportation goes well beyond improvements in trans-portation system performance and safety. Other benefits and costs must be given consideration, such as accessibility to markets, market area expansion, intermodal connectivity, system expansion and maintenance, and in the case of the YMPO region, enhancing cross-border trade opportunities. If people and goods cannot effectively be moved to and from population and employment centers or between markets, the regional economy may not meet its full potential. Thus, the economic stability and growth of the region are dependent on a dynamic, evolving transportation system capable of supporting the interactions of myriad supply and demand channels.
Vibrant Local CommunitiesJurisdictions within the YMPO region, prominent stakeholders, and business organizations sup-port plans for growth and development. There is an understanding that the regional transporta-tion system is critical to the overall economic health of individual jurisdictions and the region as a whole. Regional leadership recognizes there is great value to the integration of multimodal transportation investments alongside efforts to increase labor market access and reduce conges-tion for all modes of travel. Recent and planned transportation improvements associated with economic development for the YMPO member jurisdictions are discussed below.
Yuma County – Yuma County experienced expansive growth in recent years, which required improvements to the regional roadway network. Growth of the Foothills area increased congestion on I-8 frontage roads, resulting in plans to accommodate travel in the area while protecting the functionality of this key regional freeway. Efforts to improve access to the Mexican border stimulated
improvements to US 95 and resulted in the development of SR 195, which connects San Luis to I-8. Projected growth of residential, commercial, and mixed-use developments will require additional planning and evaluation of the regional roadway network.
City of Yuma – The City of Yuma will remain the central focus of regional eco-nomic growth, therefore, Yuma identified major growth areas and subareas of the City to be targeted for improvements and redevelopment. Transportation system improvements will be an integral part of the orchestration of new redevelopment and development actions. Development of a multimodal transportation center in
the downtown area is key to support and enhance mobility and accessibility in the redevelop-ment areas. In addition, new multimodal linkages will be established to accommodate the planned Estancia development and its integration with the City’s transportation network.
City of San Luis – The City of San Luis, in response to rapid growth during the past decade, moved forward with improvements to US 95 (Main Street) and Juan Sanchez Boulevard to improve access to San Luis POE I in the downtown area. Activity also focused on improving the efficiency of cross-border movements, which are critical to the local and regional economy. Actions have included
development of San Luis POE II five miles east of San Luis POE I. San Luis POE II improvements

YMPO 2018-2041 Regional Transportation Plan Update
GR
OW
TH
TR
EN
DS
IN
TH
E R
EG
ION
48
expedited both private and commercial crossings, reduced costs to shippers, and reduced time delays for workers. Residential growth and accompanying retail activity will require planning and evaluation of the City’s transportation system linkages and modal options.
City of Somerton – The City of Somerton adopted a downtown redevelopment plan to accommodate a dynamic, mixed-use growth center that will be suffi-ciently flexible to support more robust social and economic interactions in response to regional growth. The recent narrowing of US 95 through downtown Somerton is reflective of the City's priority on promoting downtown development.
Town of Wellton – Although the Town of Wellton expects to retain its rural, agri-cultural character in the near future, the Town has identified a long-term transpor-tation network that will support not only expanding residential development, but also additional commercial and industrial activity. Town plans anticipate available parcels adjacent to the Union Pacific Railroad (UPRR) freight corridor and major roadways, particularly I-8, to become prominent attractions for economic growth.
Cocopah Indian Tribe – The Cocopah Indian Tribe has three reservation areas: the North Reservation, the East Reservation, and the West Reservation. The Cocopah Reservation comprises approximately 6,500 acres. The Cocopah Indian Tribe has developed a 20-Year Long-Range Transportation Plan for all three reservation areas and completed a more detailed transportation plan for the East
Reservation area under a grant from the ADOT. These plans identify transportation improvements that will support planned economic development. Current key economic activities include the Cocopah Casino, Cocopah Resort and Conference Center, Cocopah Rio Colorado Golf Course, Cocopah Recreation Vehicle and Golf Resort, Cocopah Museum, Cocopah Speedway, and the Wild River Family Entertainment Center.
YMPO 2018-2041 Regional Transportation Plan Update
GR
OW
TH
TR
EN
DS
IN
TH
E R
EG
ION
49
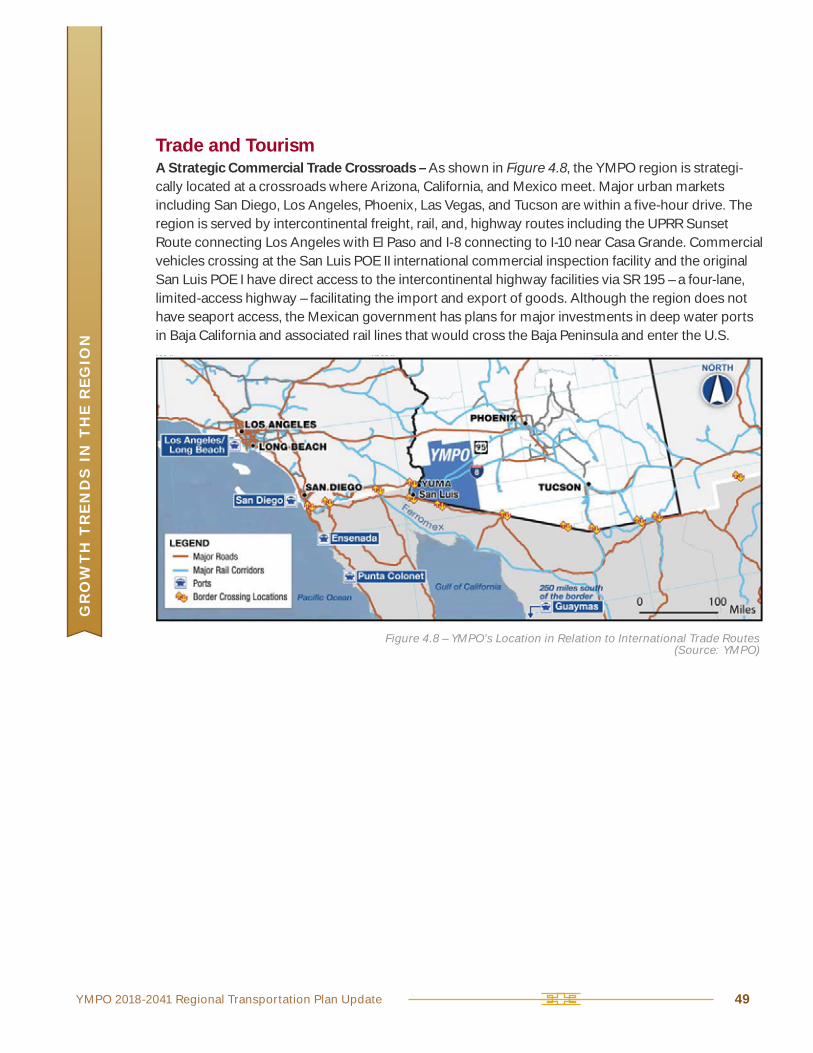
Trade and TourismA Strategic Commercial Trade Crossroads – As shown in Figure 4.8, the YMPO region is strategi-cally located at a crossroads where Arizona, California, and Mexico meet. Major urban markets including San Diego, Los Angeles, Phoenix, Las Vegas, and Tucson are within a five-hour drive. The region is served by intercontinental freight, rail, and, highway routes including the UPRR Sunset Route connecting Los Angeles with El Paso and I-8 connecting to I-10 near Casa Grande. Commercial vehicles crossing at the San Luis POE II international commercial inspection facility and the original San Luis POE I have direct access to the intercontinental highway facilities via SR 195 – a four-lane, limited-access highway – facilitating the import and export of goods. Although the region does not have seaport access, the Mexican government has plans for major investments in deep water ports in Baja California and associated rail lines that would cross the Baja Peninsula and enter the U.S.
Figure 4.8 – YMPO’s Location in Relation to International Trade Routes (Source: YMPO)

YMPO 2018-2041 Regional Transportation Plan Update
GR
OW
TH
TR
EN
DS
IN
TH
E R
EG
ION
50
Foreign Trade Zones (FTZs) – Due to the unique crossroads location of the YMPO region, four sites in the region have been granted designation as FTZs, as shown in Figure 4.9. The FTZs per-mit U.S.-based companies to be competitive in the global marketplace through deferral, reduc-tion, or elimination of customs duties for merchandise and material brought in to the FTZ. Mer-chandise can be admitted to the sites duty-free for storage, repacking, displaying, or assembly as part of a larger product, or introduced into a manufacturing process.
San Luis POE II and Interna-tional Trade – A significant contributor to promoting regional trade is the San Luis POE II, constructed in 2010. This port provides efficient processing of com-mercial vehicles only and improvements to SR 195 (Juan Sanchez Boulevard/Araby Road), which have increased access between the border crossing and I-8. Moving the bulk of com-mercial vehicle crossings to San Luis POE II has reduced congestion at San Luis POE I, however, congestion continues to be an issue for cross-border traffic, espe-cially during the produce harvest seasons. What is a Foreign Trade Zone?
A Foreign Trade Zone (FTZ) is a designated geographic area considered to be officially outside of U.S. Customs territory.
Source: Yuma County Foreign Trade Zone #219 http://www.yumaftz.com/index.html
Figure 4.9 – Foreign Trade Zones(Source: www.yumaftz.com/ftz219sites.html)

YMPO 2018-2041 Regional Transportation Plan Update
GR
OW
TH
TR
EN
DS
IN
TH
E R
EG
ION
51
Other Emerging Trade Opportunities – Anticipating the need for industrial and commercial space, the GYEDC has created an interactive website for information about available commercial space and buildings: www.greateryumaprospector.com, shown in Figure 4.10. The YMPO region is also home to the San Luis Price Center, which is an 84,000 square foot building near San Luis POE I. The building, owned by the City, is available for lease.
Bicycle Tourism on the Rise – Arizona is recognized as a great place for bicycling. The League of American Bicyclists ranks Arizona as No. 19 in its annual state rankings (May 2015). While communities in the YMPO region have not yet achieved designation as a Bicycle Friendly Community, several of the communities support and sponsor bicy-cling events. These events encourage participation by winter visitors and provide incentives to improve the bicycling environment. Bicy-cling events also draw ven-dors from within and out-side the YMPO region. The events highlight the best qualities and characteristics of the region, particularly the favorable winter climate.
San Luis POE I Improvements – San Luis POE I is a primary crossing for day workers who are employed throughout the YMPO region. The GSA, which operates the international POEs, is planning improvements at San Luis POE I to improve and enhance the crossing experience for private vehicles, pedestrians, bicycles, and transit. These improvements will also aid in making the San Luis POE I crossing more attrac-tive for tourists as the congested conditions and resulting delays will be improved.
Figure 4.10 – Greater Yuma Economic Development Website(Source: Excerpt from Greater Yuma Economic Development Corporation
Interactive website, http://www.greateryumaprospector.com/)

YMPO 2018-2041 Regional Transportation Plan Update
GR
OW
TH
TR
EN
DS
IN
TH
E R
EG
ION
52
Winter Climate Attracts Tourism – The tourism dynamic of the region relies heavily on the exceptional winter climate, although attractions in the region are not strictly limited to the winter season. In response to tourist activity, the region has developed more than 23,000 recreational vehicle (RV) spaces and nearly 4,000 hotel rooms. Thus, at the height of the winter visitor sea-son, the region’s population swells by more than 80,000 people (Yuma Sun, 2012). These individuals join the “locals” in dining, golfing, shopping, and taking trips to Algodones and other cities in Mexico. Tourists may also indulge in hiking, tubing, balloon rides, bird watching, water sports, the Dove Hunt, and recreational riding in the Imperial Sand Dunes Recreation Area.
Agritourism – Agriculture supports an important aspect of the region’s tourist trade by providing the foundation for annual events such as Field to Feast, Lettuce Days, and the Dove Hunt. The region has been able to capitalize on these events and increase regional tourism. To take advan-tage of the influx of winter visitors and other tourists, the region has also developed several tourism venues such as Historic Downtown Yuma, Pivot Point Interpretative Plaza (commemorat-ing the first crossing of the Colorado River by a train), Yuma Territorial Prison, and the Yuma Quar-termaster Depot.
(Source: Kimley-Horn)
rmaster Depot.
(Source: www.visityuma.com/ climate.html)
Weather AveragesLow High Rain
Jan 41°F 68°F .45”
Apr 52°F 86°F .15”
Jul 76°F 106°F .31”
Oct 58°F 89°F .31"

Roadway System
Chapter 5

YMPO 2018-2041 Regional Transportation Plan Update
RO
AD
WA
Y S
YS
TE
M
54
R O A D W AY S Y S T E MRoadwaysOverviewRoadways are a central focus of the 2018-2041 RTP. The condition of the roadway system is critical to the eco-nomic wellbeing of the region.
Functional Roadway ClassificationThe YMPO regional roadway network is based on a mile grid arterial system of roadways with differing functional classifications. Roadways are functionally classified or grouped according to the character of traffic service (mobility versus access) they are intended to provide. These classifications are used in transportation system planning, roadway design, and determining eligibility for federal roadway improvement funds. The current federal functional classification of roads in the YMPO region is shown in Figure 5.1. To access federal funding, roads have to be federally functionally classified as an arterial or collector street. Local streets are not eligible for federal funding.
Regionally Significant Route (RSR)Figure 5.2 shows RSRs including I-8, US 95, SR 195, and Business 8 (32nd Street and 4th Avenue). I-8 and Avenue 3E between I-8 and MCAS-Yuma are designated as a part of the Strategic Highway Network (STRAHNET), which is a system of roadways to accommodate military needs such as emergency mobilization or the movement of armor, ammunition, food, and other commodities.
Current Lanes and Traffic VolumesFigure 5.3 shows the current number of through lanes on major roadways in the region. Figure 5.4 shows 2015 average annual daily traffic volumes for select roadway segments derived from traffic volume data maintained by YMPO. YMPO staff conducts an extensive traffic counting program each year and monitors trends in traffic volumes. Traffic volumes vary between the winter and summer months because the agricultural season peaks during the winter and because the YMPO region is host to a large number of winter visitors. Higher percentage traffic volume increases occur in areas with these visitors, such as Wellton and the Foothills area east of the City of Yuma. YMPO staff is in the process of creating a Freight Corridor mapping system which will assist in assessing need and justification for improvements to the most important freight routes.
Mobility vs. Access Relationship(Source: FHWA)
Proportion of Service
(Source: Kimley-Horn)
YMPO conducts bi-annual traffic counts at 198 count stations and conducts an additional 165 sites on a two-year rotation

YMPO 2018-2041 Regional Transportation Plan Update 55
RO
AD
WA
Y S
YS
TE
M
£95
§̈¦8
Ca l i
f or n
i a
Ca l i
f or n
i aA r i
z o n a
A r iz o n a
M e x i c oM e x i c o
Ave
I
Ave
H
Ave
G
Ave
F
Ave
E
Ave
D
Ave
C
Ave
B
Ave
A
Ave
1E
Ave
2E
Ave
3E
Ave
4E
Ave
5E
Ave
6E
Ave
7E
Ave
8E
Ave
9E
Ave
10E
Fortu
na R
d
Ave
12E
Ave
13E
Ave
14E
Ave
15E
Ave
19E
Ave
20E
Ave
21E
Ave
18E
Ave
J
Co 25th St
Co 24th St
Co 22nd St
Juan Sanchez Blvd / Co 23rd St
Co 21st St
Co 20th St
Co 19th St
Co 18th St
Co 17th St
Co 16th St
Co 15th St
Co 14th St
Co 13th St
Co 12th St
Co 11th St
Co 10th St
Co 9th St
Co 8th St
Co 7st St
Co 6th St
Ave
16E
Ave
22E
Ave
23E
Ave
24E
Ave
25E
Ave
26E
Ave
27E
Ave
29E
Ave
30E
Ave
31E
Ave
32E
Ave
33 E
Ave
34 E
Ave
35E
Ave
36E
Ave
37E
Ave
38E
Ave
39E
Ave
28E
Imperial Dam Rd
Martinez Lake Rd
San Luis
Somerton
Yuma
Wellton
Gila River
Colorado River
Ave
17E
£95
£95
?ï
?ï
Coconino
Pima
Mohave
Gila
Pinal
Yavapai
Maricopa
Cochise
La Paz
Graham
Apac
he
Nava
jo
Gree
nlee
Santa CruzYMPO
Yuma
²
Municipality/Tribal Landun tional lassi i ation
InterstateFreeway
rincipal ArterialMinor ArterialMa or CollectorMinor Collector
0 2 41
Miles
Figure 5.1 – Current Regional Roadway Network Functional Classifications (Source: ADOT, YMPO)
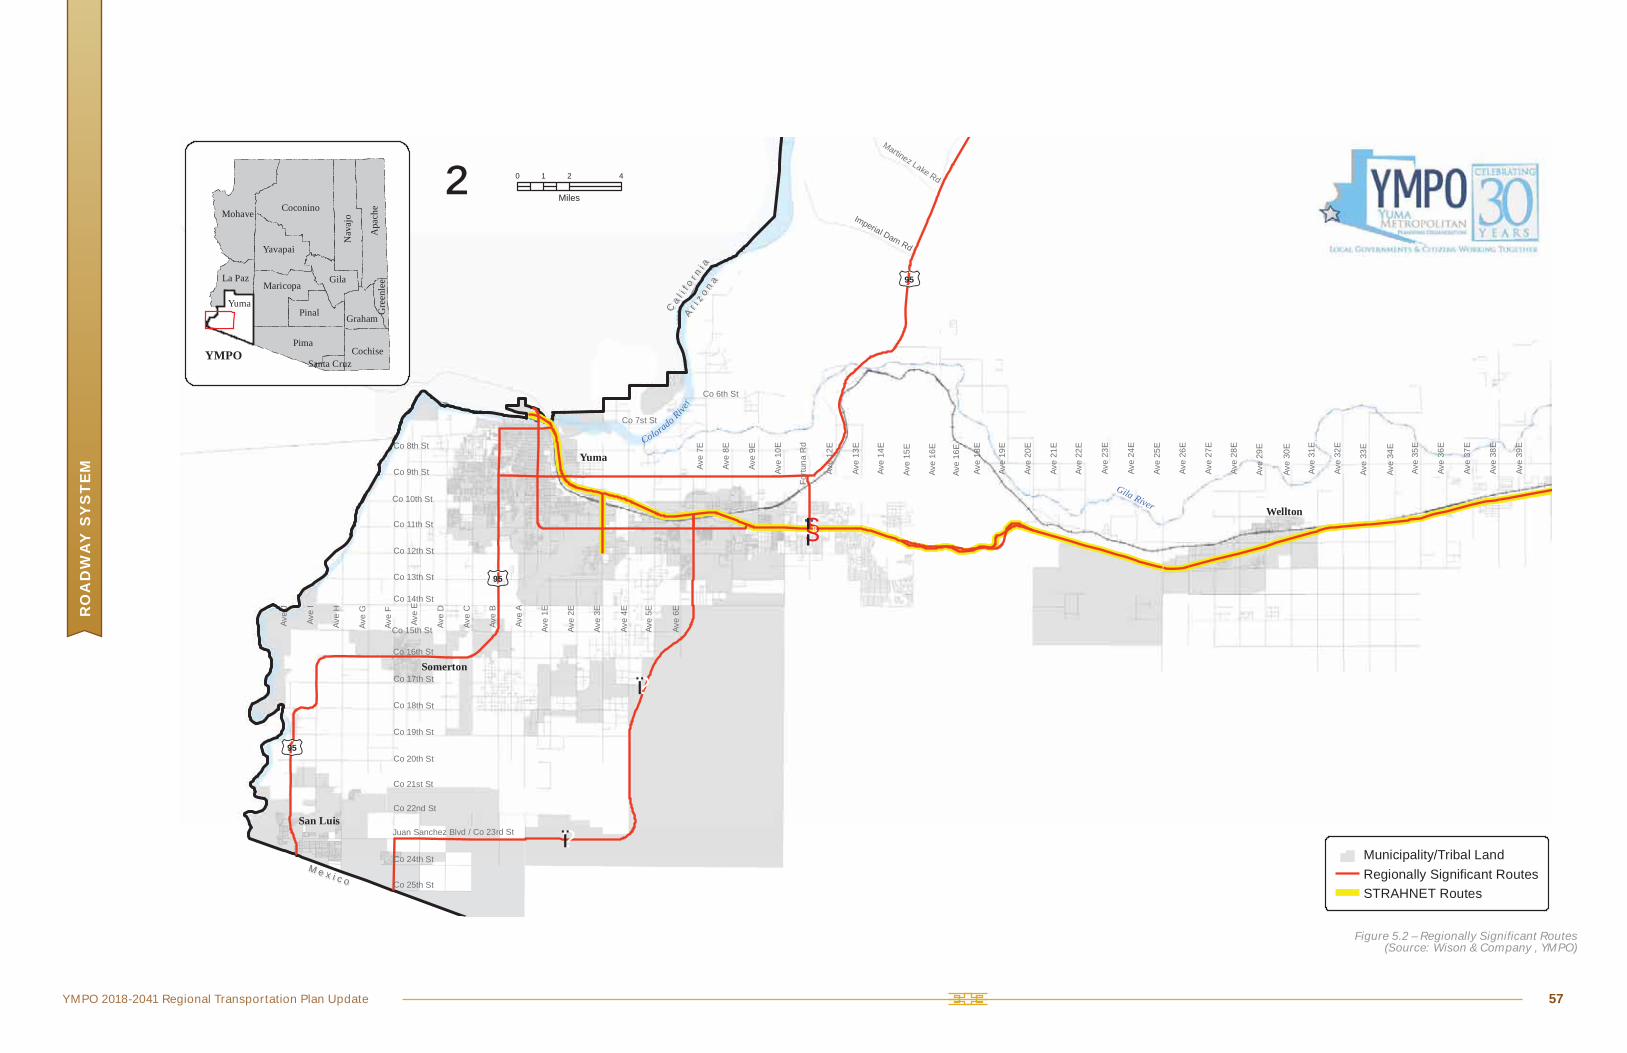
YMPO 2018-2041 Regional Transportation Plan Update 57
RO
AD
WA
Y S
YS
TE
M
£95
§̈¦8
Ca l i
f or n
i a
Ca l i
f or n
i aA r i
z o n a
A r iz o n a
M e x i c oM e x i c o
Ave
I
Ave
H
Ave
G
Ave
F
Ave
E
Ave
D
Ave
C
Ave
B
Ave
A
Ave
1E
Ave
2E
Ave
3E
Ave
4E
Ave
5E
Ave
6E
Ave
7E
Ave
8E
Ave
9E
Ave
10E
Fortu
na R
d
Ave
12E
Ave
13E
Ave
14E
Ave
15E
Ave
19E
Ave
20E
Ave
21E
Ave
18E
Ave
J
Co 25th St
Co 24th St
Co 22nd St
Juan Sanchez Blvd / Co 23rd St
Co 21st St
Co 20th St
Co 19th St
Co 18th St
Co 17th St
Co 16th St
Co 15th St
Co 14th St
Co 13th St
Co 12th St
Co 11th St
Co 10th St
Co 9th St
Co 8th St
Co 7st St
Co 6th St
Ave
16E
Ave
22E
Ave
23E
Ave
24E
Ave
25E
Ave
26E
Ave
27E
Ave
29E
Ave
30E
Ave
31E
Ave
32E
Ave
33E
Ave
34E
Ave
35E
Ave
36E
Ave
37E
Ave
38E
Ave
39E
Ave
28E
Imperial Dam Rd
Martinez Lake Rd
San Luis
Somerton
Yuma
Wellton
Gila River
Colorado River
Ave
16E
£95
£95
?ï
?ï
Coconino
Pima
Mohave
Gila
Pinal
Yavapai
Maricopa
Cochise
La Paz
Graham
Apac
he
Nava
jo
Gree
nlee
Santa CruzYMPO
Yuma
Municipality/Tribal LandRegionally Significant RoutesSTRAHNET Routes
² 0 2 41
Miles
Figure 5.2 – Regionally Significant Routes(Source: Wison & Company , YMPO)
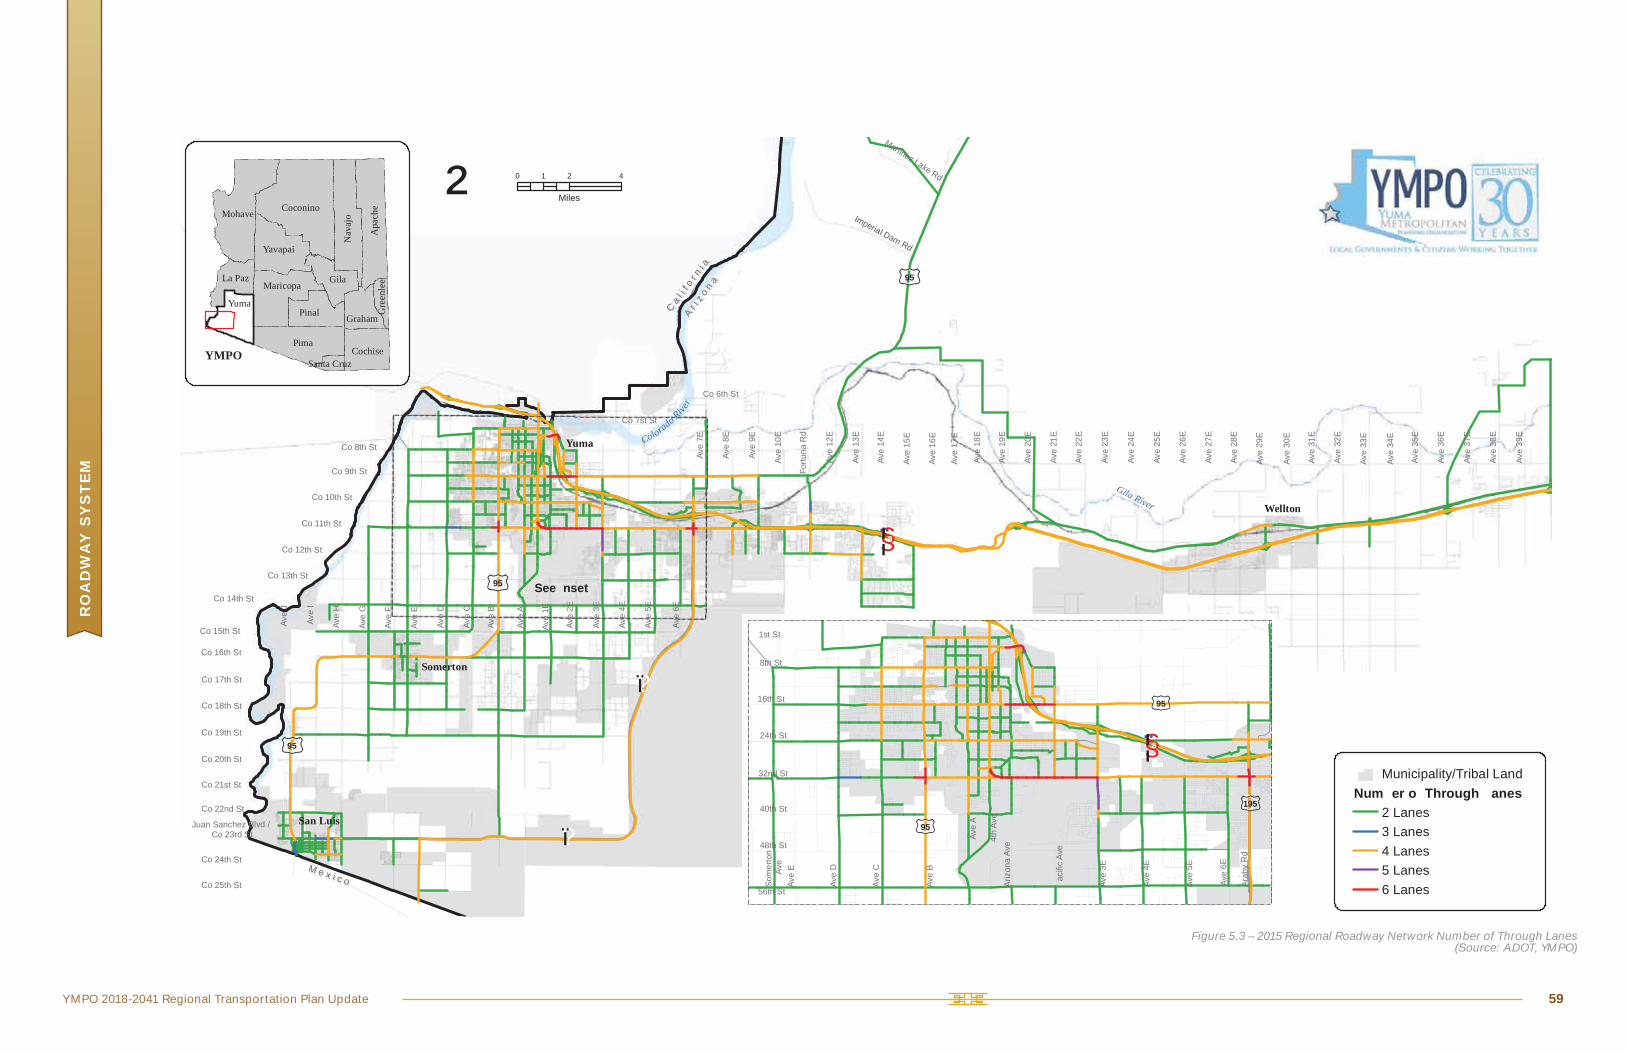
YMPO 2018-2041 Regional Transportation Plan Update 59
RO
AD
WA
Y S
YS
TE
M
£95
§̈¦8
Ca l i
f or n
i a
Ca l i
f or n
i aA r i
z o n a
A r iz o n a
M e x i c oM e x i c o
Ave
I
Ave
H
Ave
G
Ave
F
Ave
E
Ave
D
Ave
C
Ave
6E
Ave
7E
Ave
8E
Ave
9E
Ave
10E
Fortu
na R
d
Ave
12E
Ave
13E
Ave
14E
Ave
15E
Ave
19E
Ave
20E
Ave
21E
Ave
18E
Ave
J
Co 25th St
Co 24th St
Co 22nd St
Juan Sanchez Blvd / Co 23rd St
Co 21st St
Co 20th St
Co 19th St
Co 18th St
Co 17th St
Co 16th St
Co 15th St
Co 14th St
Co 13th St
Co 12th St
Co 11th St
Co 10th St
Co 9th St
Co 8th St
Co 7st St
Co 6th St
Ave
16E
Ave
22E
Ave
23E
Ave
24E
Ave
25E
Ave
26E
Ave
27E
Ave
29E
Ave
30E
Ave
31E
Ave
32E
Ave
33E
Ave
34E
Ave
35E
Ave
36E
Ave
37E
Ave
38E
Ave
39E
Ave
28E
Imperial Dam Rd
Martinez Lake Rd
San Luis
Somerton
Yuma
Wellton
Gila River
Colorado River
See nset
Ave
17E
£95
£95
?ï
?ï
Ave
B
Ave
A
Ave
1E
Ave
2E
Ave
3E
Ave
4E
Ave
5E
Coconino
Pima
Mohave
Gila
Pinal
Yavapai
Maricopa
Cochise
La Paz
Graham
Apac
he
Nava
jo
Gree
nlee
Santa CruzYMPO
Yuma
² 0 2 41
Miles
56th St
48th St
40th St
32nd St
24th St
16th St
8th St
Som
erto
n Av
eAv
e E
Ave
D
Ave
C
Ave
B
Ave
A
4th
Ave
Arizo
na A
ve
acific
Ave
Ave
3E
Ave
4E
Ave
5E
Ave
6E
Arab
y Rd
£95
£195
§̈¦8
1st St
£95 4
Municipality/Tribal LandNum er o Through anes
2 Lanes3 Lanes4 Lanes5 Lanes6 Lanes
Figure 5.3 – 2015 Regional Roadway Network Number of Through Lanes(Source: ADOT, YMPO)

YMPO 2018-2041 Regional Transportation Plan Update 61
RO
AD
WA
Y S
YS
TE
M
£95
§̈¦8
Ca l i
f or n
i a
Ca l i
f or n
i aA r i
z o n a
A r iz o n a
M e x i c oM e x i c o
Ave
I
Ave
H
Ave
G
Ave
F
Ave
E
Ave
D
Ave
C
Ave
6E
Ave
7E
Ave
8E
Ave
9E
Ave
10E
Fortu
na R
d
Ave
12E
Ave
13E
Ave
14E
Ave
15E
Ave
19E
Ave
20E
Ave
21E
Ave
18E
Ave
J
Co 25th St
Co 24th St
Co 22nd St
Juan Sanchez Blvd / Co 23rd St
Co 21st St
Co 20th St
Co 19th St
Co 18th St
Co 17th St
Co 16th St
Co 15th St
Co 14th St
Co 13th St
Co 12th St
Co 11th St
Co 10th St
Co 9th St
Co 8th St
Co 7st St
Co 6th St
Ave
16E
Ave
22E
Ave
23E
Ave
24E
Ave
25E
Ave
26E
Ave
27E
Ave
29E
Ave
30E
Ave
31E
Ave
32E
Ave
33E
Ave
34E
Ave
35E
Ave
36E
Ave
37E
Ave
38E
Ave
39E
Ave
28E
Imperial Dam Rd
Martinez Lake Rd
San Luis
Somerton
Yuma
Wellton
Gila River
Colorado River
See nset
Ave
17E
£95
£95
?ï
?ï
Ave
B
Ave
A
Ave
1E
Ave
2E
Ave
3E
Ave
4E
Ave
5E
1
9 1
149
2
2
00
5
5
242 1
5
0
11
1
44
4 4
142
4
2 0 4
95
1 2
5 5
58
2 2
4
108
144 5
5
5
5
0
0
1 8
2
28 2
40
8
41
4 2 9
1
1
21 5
9
1
0 9
84
0 91
118
224
5
9 2 5
2 15 5
4
2
1
0
124 8
14
142
2
1
1
19
8
2
19 8
41
28
0 1
4 9
14
110
4 4 21 9
2 41
118
4
21 5
0
51
0
0
28
2
4 8204
18
2
12
0 1
0
19 1
151
51
18
8 95 0 9
112
21
1
48
1
0 1
4 8
14
1 05
1 2
2
1
14
215
52
14
8 2
0
58
0 58
8 2
0 8
5
01
14 9
5
22
5 5
9
5
15
1 4
59
14
5
12
05
4 2
11 8
15
4
9
14
2
21
109
4 4
21
1 4
5
44
58
5
5
4
48
24
02
0 2
24 1
2
1
10 5
4 5
2
11 9
1
9
52
9
0 5
1
4
0 5
08
0
5
0 8
5
5 9
1
1
5
0
510 0 8
4
4 1
12
44
0
18
8 2
22
0 8 2
4
5
8
4
22
5
8
0
11 9
92
2 9
4
5
1
124
9 8
5
9
0
21
14
1
0
1
59
1
101 8
0
55
4
0 8
0
4
4 8
4
4
0
1
4 5
9 9
040
0 1 1
8
19
4
0
1 954
8 4
4 9
8 1
54
12 9
92
49
0
5
1 8
4
2
14
125
1 9
29
1
0
0 5
2 8
4
8
9
0 2
09
4 9
4
00
1 4
0 5
58
0
2 8
1
8
1 1
4
12 1
1
1 5
11
1 9
2
04
15
0
9
05
2 9
8
2
0
10
0
1 411
10 2
5
1
0
8
0 4
11
0
09
4
1 2
0 2
0 1
Coconino
Pima
Mohave
Gila
Pinal
Yavapai
Maricopa
Cochise
La Paz
Graham
Apac
he
Nava
jo
Gree
nlee
Santa CruzYMPO
Yuma
² 0 2 41
Miles
56th St
48th St
40th St
32nd St
24th St
16th St
8th St
Som
erto
n Av
eAv
e E
Ave
D
Ave
C
Ave
B
Ave
A
4th
Ave
Arizo
na A
ve
acific
Ave
Ave
3E
Ave
4E
Ave
5E
Ave
6E
Arab
y Rd
£95
£195
§̈¦8
1st St
£95 4
1
1
2 424
8
101
85
0
8
5
25
8 9 0
9
22
8
0
24
01
1 1
4
5
142
1
4
95
210
8
182
4
02
12 1
144 5
5
02
84
1 2
5
0
4
04
08
9
01
4
24
04
5
01
20 9
0
0
2 1
08
2
84
1
1 8
1
2
2
8
5
1224 1
2 92 4
1
21 5
0 4
2
1
9
1
0 9
18
1
4
2 1
9 9
5 5
12
41
15
1
14 1 2
14
2
511921
0
28
08
222
4
28
0 1
4 9
29 5 0 9
98
5
0
19
112
4 4
9
1
48
4
21 5
21 8
11
2
1
14
58
21
1
52
19
0
198
4
4 8
2 22
1
19 1
04
2
5
5
5
05
0 9
4 0 1 42
5 1
8 5
0 10
1 2
1
1 4
21
109
1 1
1 2
215
5
58
1
1 5
11
18
1
8 2
2
0 8
14 9
9
5 2
48
15
15
24
1 4
14
2
154 2
2
2 1
9
02
22 9
8
22 2
1 4
12
2
5 1
4
0 2
24 1
09
5
10 5
1
4 5
2
5 28
1
4
28
9
08
0 5
2
0 5
2 4
4
0 8
1
8 0
92
0
1
10
4 1
5
4
4
5
1
28 5
5
1 21 8
9 4
4
5
1 1
1
9 2
5 1
5 4
8 4
14
1 8
22
1
1
9
8
4 9
1 4
1
0
8
28
Municipality/Tribal Land
99 9M 2015
Average Annual Daily Traffic in thousands
Figure 5.4 – 2015 Traffic Volumes(Source: ADOT, YMPO)

YMPO 2018-2041 Regional Transportation Plan Update
RO
AD
WA
Y S
YS
TE
M
63
Current Roadway Network PerformanceLOS rates the performance of the roadway network in terms of the degree of congestion using letters A through F, similar to school report card grades as shown in Figure 5.5. LOS is defined by the Highway Capacity Manual (HCM) and is described below:
LOS A: Free flow. Traffic flows freely at the posted speed limit. Incidents or vehicle breakdowns have mini-mal impact on others. LOS A generally occurs late at night in urban areas and frequently in rural areas.
LOS B: Reasonably free flow. LOS A speeds are main-tained, maneuverability within the traffic stream is slightly restricted. Motorists have a high level of physi-cal and psychological comfort.
LOS C: Stable flow, at or near free flow. Motorists’ abil-ity to maneuver between lanes is noticeably restricted and requires more driver awareness. Roads remain uncongested but are approaching capacity. Minor inci-dents begin to lead to traffic delays behind the incident. This is the target LOS for most rural highways.
LOS D: Approaching unstable flow. Speeds are decreased and motorist freedom to maneuver is more limited. Examples are a busy shopping corridor in the middle of a weekday or a major arterial during commut-ing hours. This is the target LOS for most urban streets, as attaining LOS C would be cost-prohibitive.
LOS E: Unstable flow, operating at capacity. Flow becomes irregular and speed varies rapidly as ability to maneuver diminishes. Vehicles rarely reach the speed limit. Any incident or disruption to traffic flow, such as crashes or merging ramp traffic or lane changes, leads to congestion.
LOS F: Every vehicle moves in lockstep with the vehicle in front of it and slowing is required. Travel time cannot be predicted because demand is greater than capacity. LOS F is a traffic jam.
Currently there are no roadways in the YMPO region that operate at LOS E or LOS F (unaccept-able levels) based on 2015 traffic volume data.
Level of Service – Highway
A
B
C
D
E
F
Figure 5.5 – Level of Service – Highway(Source: Colorado Department of
Transportation, FHWA)

YMPO 2018-2041 Regional Transportation Plan Update
RO
AD
WA
Y S
YS
TE
M
64
Future Roadway Network PerformanceYMPO's Travel Demand Model (TDM) was utilized to project future regional travel patterns through the year 2041. The number of dwelling units and number of employees in the year 2041 were projected based on anticipated land use changes. A 2041 baseline roadway network was developed by updating the current roadway network to account for improvements that are already programmed and funded for construction based on available project programming docu-ments from the YMPO member agencies. The 2041 baseline network does not include improve-ments for which funding has not yet been committed and programmed. Figure 5.6 shows the 2041 baseline roadway network in terms of the number of through lanes and Figure 5.7 shows projected 2041 average annual daily traffic volumes per TDM outputs. Figure 5.8 shows which roadways in the YMPO region operate at LOS E or LOS F based on the 2041 baseline traffic vol-ume data.
Regional Needs and ProjectsBy 2041, if no improvements are made except those projects already programmed for construc-tion, it is anticipated there will be approximately 28 miles of roadway segments not operating at an acceptable LOS. Based on input from YMPO member jurisdictions there are other roadway system needs in addition to reducing congestion, such as reclassification of roadways, address-ing roadway network discontinuities, addressing pavement surface deterioration, and adding facilities and amenities for pedestrians, bicyclists, and transit riders. To improve the LOS of the regional roadway network and address other related priorities of the YMPO member jurisdictions, the following types of roadway network improvements are needed:
Reclassifying roadway segments to better reflect current or projected roadway functionality Widening roadways or intersections to increase the number of through lanes or turn lanes Paving dirt roads to eliminate discontinuities in the paved roadway network and to improve travel time and air quality
Providing traffic signalization or refined traffic signal timing to improve intersection operations Constructing new or improved bridges to separate traffic from intersecting vehicles, trains, canals, rivers, or washes Constructing new or improved roadway and pedestrian facilities in the vicinity of POEs to facilitate the efficient movement of people and goods Rehabilitating pavement surfaces to protect investments made in roadway infrastructure Implementing roadway or intersection safety improvements Providing facilities for alternate modes of travel such as walking, bicycling, or riding transit Providing other traveler amenities such as rest areas and landscaping

YMPO 2018-2041 Regional Transportation Plan Update 65
RO
AD
WA
Y S
YS
TE
M
£95
§̈¦8
Ca l i
f or n
i a
Ca l i
f or n
i aA r i
z o n a
A r iz o n a
M e x i c oM e x i c o
Ave
I
Ave
H
Ave
G
Ave
F
Ave
E
Ave
D
Ave
C
Ave
6E
Ave
7E
Ave
8E
Ave
9E
Ave
10E
Fortu
na R
d
Ave
12E
Ave
13E
Ave
14E
Ave
15E
Ave
19E
Ave
20E
Ave
21E
Ave
18E
Ave
J
Co 25th St
Co 24th St
Co 22nd St
Juan Sanchez Blvd / Co 23rd St
Co 21st St
Co 20th St
Co 19th St
Co 18th St
Co 17th St
Co 16th St
Co 15th St
Co 14th St
Co 13th St
Co 12th St
Co 11th St
Co 10th St
Co 9th St
Co 8th St
Co 7st St
Co 6th St
Ave
16E
Ave
22E
Ave
23E
Ave
24E
Ave
25E
Ave
26E
Ave
27E
Ave
29E
Ave
30E
Ave
31E
Ave
32E
Ave
33E
Ave
34E
Ave
35E
Ave
36E
Ave
37E
Ave
38E
Ave
39E
Ave
28E
Imperial Dam Rd
Martinez Lake Rd
San Luis
Somerton
Yuma
Wellton
Gila River
Colorado River
See nset
Ave
17E
£95
£95
?ï
?ï
Ave
B
Ave
A
Ave
1E
Ave
2E
Ave
3E
Ave
4E
Ave
5E
Coconino
Pima
Mohave
Gila
Pinal
Yavapai
Maricopa
Cochise
La Paz
Graham
Apac
he
Nava
jo
Gree
nlee
Santa CruzYMPO
Yuma
² 0 2 41
Miles
56th St
48th St
40th St
32nd St
24th St
16th St
8th St
Som
erto
n Av
eAv
e E
Ave
D
Ave
C
Ave
B
Ave
A
4th
Ave
Arizo
na A
ve
acific
Ave
Ave
3E
Ave
4E
Ave
5E
Ave
6E
Arab
y Rd
£95
£195
§̈¦8
1st St
£95 4
Municipality/Tribal LandNum er o Through anes
2 Lanes3 Lanes4 Lanes5 Lanes6 Lanes
Figure 5.6 – 2041 Baseline Regional Roadway Network Number of Through Lanes(Source: Wilson & Company, YMPO)

YMPO 2018-2041 Regional Transportation Plan Update 67
RO
AD
WA
Y S
YS
TE
M
£95
§̈¦8
Ca l i
f or n
i a
Ca l i
f or n
i aA r i
z o n a
A r iz o n a
M e x i c oM e x i c o
Ave
I
Ave
H
Ave
G
Ave
F
Ave
E
Ave
D
Ave
C
Ave
6E
Ave
7E
Ave
8E
Ave
9E
Ave
10E
Fortu
na R
d
Ave
12E
Ave
13E
Ave
14E
Ave
15E
Ave
19E
Ave
20E
Ave
21E
Ave
18E
Ave
J
Co 25th St
Co 24th St
Co 22nd St
Juan Sanchez Blvd / Co 23rd St
Co 21st St
Co 20th St
Co 19th St
Co 18th St
Co 17th St
Co 16th St
Co 15th St
Co 14th St
Co 13th St
Co 12th St
Co 11th St
Co 10th St
Co 9th St
Co 8th St
Co 7st St
Co 6th St
Ave
16E
Ave
22E
Ave
23E
Ave
24E
Ave
25E
Ave
26E
Ave
27E
Ave
29E
Ave
30E
Ave
31E
Ave
32E
Ave
33E
Ave
34E
Ave
35E
Ave
36E
Ave
37E
Ave
38E
Ave
39E
Ave
28E
Imperial Dam Rd
Martinez Lake Rd
San Luis
Somerton
Yuma
Wellton
Gila River
Colorado River
See nset
Ave
17E
£95
£95
?ï
?ï
Ave
B
Ave
A
Ave
1E
Ave
2E
Ave
3E
Ave
4E
Ave
5E
04
181
8
2
1 4111
241
01
1
198
4
119
525
2 9 0
5
1
4
9 4
14
1
20
58
50
4 9
8
5 08
22
80
5
9
21 9
52
09
94
18 2
41
1 910 1
85
4 1
59
102
25 1
5
11
1
1 2
1
11
105
42 2
8
9
2
8 4
2
0
8 2 5
92 14
2 1
158
10
2 5
0 514
2 9
92
2 5
15
5
4 1
5
15
0
0
85
0
4
1 49
2
111
1 8 20
8
1
8 5
1
5
19 9
4 4
5
4
5
9 4
25
1
118
24 5
1
94
1 59
20
22
11 1
118
240 24
1
08
9
2 2
28
2 8
82
24 285
2
0
54
1 1
5
8 2
2 22
12
44
5
2 9
88
2
8
88 15 2
4
1 2
2
414
15 1
28
1
5 8
10
5
12
128
18
18
189
18
10
0 9
1 2 9 1
4
5
11
1
1
4 9
9
1
2
5
185
0
51
9
5
5
58
15 5
1 44 1
114
8 4
8
9
5 88
28 4
5
4 4
18
12
5
9 9
94
29 8
201
211
29
1 5
0
8
9
144
5
0
42
4 9
2
9 2
8
10 4
2
2 4
21 1
2
10
2
1
1
9 5
10 5
14
49
49
1
8
24 88
20
4
0
8
4
11 2
209
199
4 5
2
08
5
5 9
81
10
19
241
0 9
5
11 210
1
81
1 49
1
1
1 8
111
2
25 8
5 2
18 2
192
2
1
8
14
44
2
8
21
8 1
9
2
5
24
0
2
9
0
15
2424
5
0
0 9
105
0 8
1 8
198
0
0
08
18
4
2
0 2
Coconino
Pima
Mohave
Gila
Pinal
Yavapai
Maricopa
Cochise
La Paz
Graham
Apac
he
Nava
jo
Gree
nlee
Santa CruzYMPO
Yuma
² 0 2 41
Miles
56th St
48th St
40th St
32nd St
24th St
16th St
8th St
Som
erto
n Av
eAv
e E
Ave
D
Ave
C
Ave
B
Ave
A
4th
Ave
Arizo
na A
ve
acific
Ave
Ave
3E
Ave
4E
Ave
5E
Ave
6E
Arab
y Rd
£95
£195
§̈¦8
1st St
£95 4
5
8
20
111 1 4
8
241
8
1 4
59
111
1
01
24 9
52
4
195
5
0
9
1
2 9
4 8
1
2
5
2
9
4
20
10
22
5
45
22
8
5
25
8
2 8
8 9
4 2
4
2
9
12
10 10
94
18
0
258
11
0 259
4
15 2
10 4
9 8
9
1
2 5
229
8
2 4
1 9
1
10 1
0
222
2 4
05
21
92
2 2
0 5
81
92
4
2
9
2
8 4
1
40 5
4
0
4
2
8
2 1
8
10
2 5
24
5
5
25
0 5
1
99
202
2
1
2
229
19 9
9
10 8
41 2
8
25 2
9
225
2
85
9
0
28 8
54 2 8
0
4
8 50
4 4
4
2 211
1
12 1
4 91
8
2
10
20
1
8
8
11 1
2
24
2 2
5
2
28
202
414
2 8
24 2
28 89
8 2
04
19
28
0 4
9
29
2 9
8
4 5
8 8
5
1
5 8
9
12
5
88
5 48
5 8
9
49
5
8 89
51
58
0 9
9 1
58
0 2
11
81 81
1144 9
2
1
12 4
04
94
8
144
5
18
9
8
28 4
29 8
4
9 4
2
55
12
9 2
8
2 4
10
19 21
81
4
204
2
19
19
11 21
1
2
9
28
Municipality/Tribal Land
99 9M 2041
Average Annual Daily Traffic in thousands
Figure 5.7 – 2041 Traffic Volumes(Source: Wilson & Company, YMPO)

YMPO 2018-2041 Regional Transportation Plan Update 69
RO
AD
WA
Y S
YS
TE
M
£95 §̈¦8
Ca l i
f or n
i a
Ca l i
f or n
i aA r i
z o n a
A r iz o n a
M e x i c oM e x i c o
Ave
I
Ave
H
Ave
G
Ave
F
Ave
E
Ave
D
Ave
C
Ave
B
Ave
A
Ave
1E
Ave
2E
Ave
3E
Ave
4E
Ave
5E
Ave
6E
Ave
7E
Ave
8E
Ave
9E
Ave
10E
Fortu
na R
d
Ave
12E
Ave
13E
Ave
14E
Ave
15E
Ave
19E
Ave
20E
Ave
21E
Ave
18E
Ave
J
Co 25th St
Co 24th St
Co 22nd St
Juan Sanchez Blvd / Co 23rd St
Co 21st St
Co 20th St
Co 19th St
Co 18th St
Co 17th St
Co 16th St
Co 15th St
Co 14th St
Co 13th St
Co 12th St
Co 11th St
Co 10th St
Co 9th St
Co 8th St
Co 7st St
Co 6th St
Ave
16E
Ave
22E
Ave
23E
Ave
24E
Ave
25E
Ave
26E
Ave
27E
Ave
29E
Ave
30E
Ave
31E
Ave
32E
Ave
33E
Ave
34E
Ave
35E
Ave
36E
Ave
37E
Ave
38E
Ave
39E
Ave
28E
Imperial Dam Rd
Martinez Lake Rd
San Luis
Somerton
Yuma
Wellton
Gila River
Colorado River
Ave
17E
£95
£95
?ï
?ï
See nset
Coconino
Pima
Mohave
Gila
Pinal
Yavapai
Maricopa
Cochise
La Paz
Graham
Apac
he
Nava
jo
Gree
nlee
Santa CruzYMPO
Yuma
Municipality/Tribal Land2041 e el o Ser i e
L S FL S EL S A - D
² 0 2 41
Miles
48th St
40th St
32nd St
24th St
16th St
8th St
Ave
E
Ave
D
Ave
C
Ave
B
Ave
A
4th
Ave
Arizo
na A
ve
acific
Ave
Ave
4E
Ave
6E
Arab
y Rd
Ave
3E
Ave
5E
£95
§̈¦8
1st St
Figure 5.8 – Roadways with LOS E or LOS F in 2041 Baseline Condition (Source: Wilson & Company, YMPO)

YMPO 2018-2041 Regional Transportation Plan Update
RO
AD
WA
Y S
YS
TE
M
71
SafetyOverview
Highway Safety – A Regional and National PriorityThe YMPO has been proactive in addressing transpor-tation safety in the region and in May, 2016 completed the YMPO Regional Strategic Transportation Safety Plan to reduce the risk of death and serious injury to all transportation users in the YMPO region. The plan resulted in a strategy to incorporate safety enhance-ments in projects, improve safety via traffic opera-tions and ITS solutions, and monitor and report on system performance and program effectiveness.
The plan was developed in recognition of the safety emphasis areas (shown to the right) that were devel-oped in the statewide Arizona 2014 Strategic Highway Safety Plan. The top five emphasis areas are consid-ered to be the top focus statewide due to the high contribution to fatalities and serious injuries statewide.
Priority projects were identified and information was assembled to assist jurisdictions in justifying these projects for funding.
YMPO Region Safety Vision and Goal Input from the YMPO TAC, as well as professionals from other engineering, planning, manage-ment, law enforcement, public safety, education, and community agencies in the YMPO region developed the following safety vision and regional goal for traffic safety:
Arizona 2014 Strategic Highway Safety Plan Emphasis Areas
Speeding and Aggressive Driving Impaired Driving Occupant Protection Motorcycles Distracted Driving Roadway Infrastructure and Operations Age-related Heavy Vehicles/Buses/Transit Non-motorized Users Natural Risks Traffic Incident Management Interjurisdictional
The safety vision:“No More Deaths, No More Injuries – Know More.”
The regional goal for traffic safety:“Reduce the number of fatalities and serious injuries
in the region by 3% annually.”

YMPO 2018-2041 Regional Transportation Plan Update
RO
AD
WA
Y S
YS
TE
M
72
Regional Safety Performance Crash data over a ten year period from 2004 to 2013 was analyzed to identify safety concerns for the entire YMPO region. The crash data was used to identify trends and issues in order to iden-tify a list of potential safety projects for the region.
Table 5.1 shows the percent of total crashes, incapacitating injury crashes, and fatal crashes in the region for the 10-year period.
Table 5.1 Crashes by Jurisdiction, 2004-2013(Source: YMPO Regional Strategic Transportation Safety Plan, May 2016)
Agency Total Crashes % of Total Crashes
Incapacitating Injury Crashes
% of Incapacitating
Injury Crashes
Fatal Crashes
% of Fatal Crashes
Yuma 19,225 67% 545 57% 74 32%
Yuma County
8,163 28% 391 41% 148 64%
San Luis 996 3% 8 0.8% 6 2.6%
Somer-ton
234 0.8% 6 0.6% 4 1.7%
Wellton 60 0.2% 4 0.4% 1 0.4%
Total 28,680 100% 954 100% 233 100%
A further review of data indicated that rear end crashes were the most frequent type of crash in the region, however single vehicle crashes were the most frequent fatal crash type (see Figure 5.9.)
Single Vehicle
Angle Left Turn Rear End Head OnSideswipe
Same Direction
Rear to Side Pedestrian Bicyclist
# of Total Crashes and Serious Crashes per Collision Manner
Tota
l
Sev
ere
10,000
9,000
8,000
7,000
6,000
5,000
4,000
3,000
2,000
1,000
0
450
400
350
300
250
200
150
100
50
0
Total Severe Crashes
Figure 5.9 – Crashes by Jurisdiction, 2004-2013(Source: YMPO Regional Strategic Transportation Safety Plan, May 2016)

YMPO 2018-2041 Regional Transportation Plan Update
RO
AD
WA
Y S
YS
TE
M
73
The goal of the crash data analysis was to determine locations that would benefit from a safety improvement. Highway Safety Improvement Program (HSIP) federal funding is a critical source for local governments to install and upgrade traffic safety countermeasures and strategies. To improve the odds of receiving federal funds high priority intersections and segments were combined to high-light 12 rural and six urban corridors in the region, shown in Figure 5.10. The corridors were selected based on the number of crashes on relevant segments and intersections, especially fatal and incapaci-tating injury crashes. TAC members reviewed the corridors and provided input on existing conditions and safety concerns and provided suggestions for alternative or additional corridors.
These corridors and intersections will be the focus of safety improvements over time. Specific proj-ects were developed to address these safety needs.
Figure 5.10 – HSIP Corridors in the YMPO Region(Source: YMPO Regional Strategic Transportation Safety Plan, May 2016)

YMPO 2018-2041 Regional Transportation Plan Update
RO
AD
WA
Y S
YS
TE
M
74
How Regional Safety is Incorporated into the Regional Transportation PlanSafety concerns should be considered on every project in the region. Safety is being included in the RTP in the following ways:
Consider safety a criteria in project programming .
Give high priority to projects that address YMPO Regional Strategic Transportation Safety Plan Emphasis Areas .
Give high priority to locations experiencing fatal and serious injury crashes. Promote systematic safety improvements in projects like rumble strips, shoulders, bike
lanes, sidewalks, and lighting. Recommend conducting Safety Assessments (RSA) during the project design stage and during evaluation of high priority locations.
Bridges and Grade SeparationsBridges have played an important role in the Yuma region’s history. In 1870 the Southern Pacific Railroad bridged the Colorado River near today’s Yuma Crossing National Heritage area, which was created to tell the story of the crossing at “Pivot Point.” It includes the history of the rail, rope ferry, and bridge crossings. The Ocean-to-Ocean Highway Bridge on Old Highway 80 was built in 1914 and was the first vehicle bridge across the Colorado River.
Bridges and grade-separated structures are a major transportation asset in the YMPO region. ADOT maintains inventories for all bridges and grade-separation structures on the state high-ways. YMPO member jurisdictions have agreements with ADOT to maintain bridge inventories for bridges on local and county roads. ADOT bridge inventories document the location, year of construction, bridge type, and physical dimensions of the bridge and roadway. Each bridge and grade-separation structure has a sufficiency rating indicative of bridge sufficiency to remain in service. Bridge sufficiency is expressed as a percentage in which 100 percent represents an
(Source: Kimley-Horn)
When constructed in 1914, the Ocean-to-Ocean Highway Bridge was the first and only vehicular traffic bridge over the lower Colorado River for
1,200 miles.
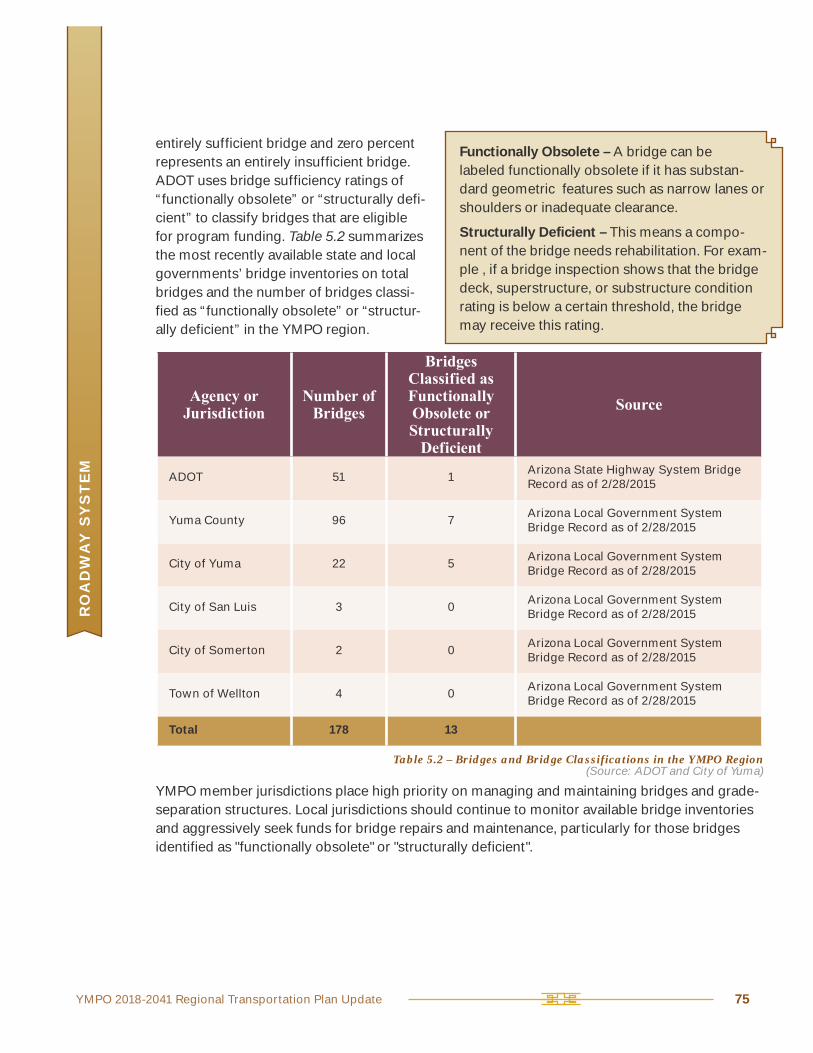
YMPO 2018-2041 Regional Transportation Plan Update
RO
AD
WA
Y S
YS
TE
M
75
entirely sufficient bridge and zero percent represents an entirely insufficient bridge. ADOT uses bridge sufficiency ratings of “functionally obsolete” or “structurally defi-cient” to classify bridges that are eligible for program funding. Table 5.2 summarizes the most recently available state and local governments’ bridge inventories on total bridges and the number of bridges classi-fied as “functionally obsolete” or “structur-ally deficient” in the YMPO region.
Agency or Jurisdiction
Number of Bridges
Bridges Classified as Functionally Obsolete or Structurally
Deficient
Source
ADOT 51 1Arizona State Highway System Bridge Record as of 2/28/2015
Yuma County 96 7Arizona Local Government System Bridge Record as of 2/28/2015
City of Yuma 22 5Arizona Local Government System Bridge Record as of 2/28/2015
City of San Luis 3 0Arizona Local Government System Bridge Record as of 2/28/2015
City of Somerton 2 0Arizona Local Government System Bridge Record as of 2/28/2015
Town of Wellton 4 0Arizona Local Government System Bridge Record as of 2/28/2015
Total 178 13
Table 5.2 – Bridges and Bridge Classifications in the YMPO Region(Source: ADOT and City of Yuma)
YMPO member jurisdictions place high priority on managing and maintaining bridges and grade-separation structures. Local jurisdictions should continue to monitor available bridge inventories and aggressively seek funds for bridge repairs and maintenance, particularly for those bridges identified as "functionally obsolete" or "structurally deficient".
Functionally Obsolete – A bridge can be labeled functionally obsolete if it has substan-dard geometric features such as narrow lanes or shoulders or inadequate clearance.
Structurally Deficient – This means a compo-nent of the bridge needs rehabilitation. For exam-ple , if a bridge inspection shows that the bridge deck, superstructure, or substructure condition rating is below a certain threshold, the bridge may receive this rating.

Transportation Alternatives
Chapter 6

YMPO 2018-2041 Regional Transportation Plan Update
TR
AN
SP
OR
TA
TIO
N A
LTE
RN
AT
IVE
S
78
T R A N S P O R TAT I O N A LT E R N AT I V E SIntelligent Transportation Systems (ITS)OverviewITS uses traffic and traveler information to integrate all components of a traditional transportation system into an interconnected network. ITS uses technologies, communications, and management strategies to increase the safety and efficiency of the surface transportation system.
ITS in the YMPO RegionTraditional ITS devices that are used by YMPO member jurisdictions include traffic signals, traf-fic detection, and communications between signals to a centralized location for management and operations. Signal preemption for emergency vehicles and highway-rail equipment are also utilized in the YMPO region. The current focus of local jurisdictions is to manage the arterial street system to maximize the safety and efficiency of the arterial transportation system. An ITS inven-tory for the YMPO region includes over 100 ITS devices.
In the City of Yuma signals are centrally operated by a signal system housed at the City of Yuma Traffic Operations Center (TOC). Signals along 4th Avenue and 16th Street are coordinated to maximize progression and reduce travel time along the corridors. The City is responsible for maintenance and operation of City intersections as well as Yuma County and Somerton intersections. There are cur-rently no Closed Circuit Television (CCTV) cameras at signalized intersections in the YMPO urbanized area, although camera functionality has been included in the development of the City’s centrally controlled system. Traffic detection for City-operated signals is by intersection loop systems.
ADOT utilizes a package of ITS strategies commonly referred to as a Freeway Management Sys-tem (FMS). The FMS provides surveillance, incident management, travel time displays, and traveler advisory functions throughout the state. All FMS operations are centrally coordinated from the ADOT TOC in Phoenix. The TOC also serves as a statewide emergency coordination center during freeway emergencies. ADOT operates one Dynamic Message Sign (DMS) in Yuma County on I-8 eastbound around Avenue 10E. The DMS is used by ADOT to provide traveler information such as construction alerts, lane restrictions, and general public service announcements.
(Source: Kimley-Horn)

YMPO 2018-2041 Regional Transportation Plan Update
TR
AN
SP
OR
TA
TIO
N A
LTE
RN
AT
IVE
S
79
ADOT also provides traveler information via the internet at www.az511.com. This 511 traveler information service provides traveler information in Sonora, Mexico and wait times at San Luis POE I. This website is heavily utilized by local television and radio traffic reporters, as well as members of the public, to obtain freeway condition information.
ITS at POEsThere are four POEs in the YMPO region: two in Yuma supporting I-8 state-to-state travel and two in San Luis supporting international travel. There are only a few existing ITS devices associated with screening and processing (e.g., cameras, signals, signs) at the state POEs, while the interna-tional POEs have a more widespread deployment of ITS devices.
(Source: ADOT)

YMPO 2018-2041 Regional Transportation Plan Update
TR
AN
SP
OR
TA
TIO
N A
LTE
RN
AT
IVE
S
80
Statewide ITS ArchitectureUSDOT Rule 940 stipulates that all federally funded regional ITS projects or projects that include ITS components must be consistent with a regional ITS architecture and must include a Systems Engineering Analysis (SEA). In order to be compliant with Rule 940, YMPO was involved in the development of the Arizona Statewide ITS Architecture completed in February 2013. YCIPTA was also involved in the development of a regional ITS architecture regarding existing and planned transit ITS functions. The Arizona Statewide ITS Architecture provides a common framework for planning, defining, and integrating ITS. Local agencies can use the ITS architecture information to better define planned ITS projects, thus ensuring regional compatibility and better integration in the future.
Needs, Projects, and Estimates
Arterial ITS ProgramTraffic signal synchronization/coordination along major transportation corridors should be com-pleted on an every-other-year basis to ensure traffic efficiency is maximized along the corridor and travel times are efficient. DMS and CCTV cameras do not exist along roadways in the YMPO region and should be a planned investment as an ITS-specific project or included as part of future intersection improvements. The YMPO region could benefit from investing in arterial DMS to provide traveler information to the local traveling public, such as closures and restrictions, special event messages, and travel times. CCTV cameras can provide surveillance capabilities for moni-toring incidents and congestion levels.
An ITS plan should be developed for the YMPO region to document existing conditions and needs, as well as establish the long-term ITS strategies and processes that would benefit the region. A regional ITS plan should include ITS-related infrastructure, operational processes, and agreements that will support the future expansion and use of ITS devices and systems in the region. Arterial components should be the focus of the ITS plan, although coordination and inte-gration with ADOT’s plans for state-owned facilities in the YMPO region are necessary.
Freeway Management SystemEnhancements to ADOT’s FMS system in the YMPO region along I-8 would benefit interstate trav-elers and commercial vehicle operations. Inclusion of some CCTV surveillance of I-8 and coordi-nation with the City of Yuma TOC would support integrated corridor management when I-8 expe-riences closures or restrictions that force traffic onto the arterial network. Additional DMS along I-8 westbound and eastbound would provide traveler information to the public when closures or restrictions cause delays. Shared control of future Caltrans DMS close to the state line should be considered for incidents that may affect state line accessibility.
The Arizona Statewide ITS Architecture provides a common framework for planning, defining, and
integrating ITS.

YMPO 2018-2041 Regional Transportation Plan Update
TR
AN
SP
OR
TA
TIO
N A
LTE
RN
AT
IVE
S
81
Travel Demand Management (TDM)Overview
Single Occupant Vehicle (SOV) Use is IncreasingAccording to the American Community Surveys (ACS) conducted by the U. S. Census Bureau, the number of workers in Yuma County that drive alone to and from work has been steadily increasing over the past several years, up from an estimated 77 percent in 2007 to 85 percent in 2015.
TDM is aimed at decreasing the num-ber of SOVs that travel on the road-ways, particularly during periods of peak congestion. This can be achieved through the implementation of policies and strategies that replace vehicle trips with another mode of travel such as transit, carpooling or vanpooling, bicycling, or walking. The key to successful TDM is providing incentives and convenient access to alternate travel mode.
YCAT Vanpool Vanpooling can be a great option for larger groups of commuters. YCAT Vanpool provides clearly marked vans to qualifying groups of 7-15 commut-ers, driven by one of the vanpool members. Passengers share the cost of operating the van by paying a monthly fee to the primary driver. The fee cov-ers gas, insurance, and vehicle mainte-nance. YCIPTA provides a $300 subsidy to vans on a first come, first served basis through their contractor vRide. Further information about the program is provided on the YCIPTA website, www.ycipta.org/vanpool.html.
2007 2009 2011 2015
Travel Mode to Work
90%
80%
70%
60%
50%
40%
30%
20%
10%
0%
Single Occupant
Carpool
Public Transportation
(Source: Commuting Characteristics, U.S. Census Bureau ACS, 2007,2009,2011, 2015)
(Source: YCIPTA)

YMPO 2018-2041 Regional Transportation Plan Update
TR
AN
SP
OR
TA
TIO
N A
LTE
RN
AT
IVE
S
82
Regional Needs and Projects
More Travel Mode ChoicesTransportation alternatives to the SOV should be provided through investments in bicycle, transit, and pedestrian amenities throughout the YMPO region. The current YCIPTA 10-Year Capital Plan includes $39,000 to install bus shelters, signs, information posts, poles, benches, trash cans, and other passenger enhancements. Bicycle and pedestrian improvements should be incorporated into road widening and intersection projects.
Intelligent Transportation Systems (ITS) for Public TransportationAdvanced technology-based ITS applications in public transportation can serve as incentives to increas use of transit for work and non-work trips, thereby reducing the demand for SOVs.
Programs and Strategies to Reduce SOVsPrograms and strategies to deter SOV use should be considered by regional and local levels of governments and by employers. Examples of strategies and programs include:
Parking pricing strategies to encourage other modes of travel. Employer programs to encourage carpooling or transit use through employee reimbursement and by providing vanpool services or vehicles.
Employer incentive programs to encourage alternative work hour options to reduce travel during peak periods of congestion.
Marketing CampaignsDeveloping printed and electronic messages can inform the public of available alternate travel mode options and encourage their use.
(Source: http://www.parkingsign-corner.com/reforcarpopa.html)

YMPO 2018-2041 Regional Transportation Plan Update
TR
AN
SP
OR
TA
TIO
N A
LTE
RN
AT
IVE
S
83
TransitOverview YCIPTA was formed in 2010 to administer, plan, operate, and maintain public transit services throughout Yuma County. YCIPTA members include Yuma County, the cities of Yuma, San Luis, Somerton, and the Town of Wellton.
YCIPTA is in the process of developing a YCAT Community Transit Committee to help form com-munity partnerships and provide a communication link between the residents of the service area and the YCIPTA Board of Directors.
Transit service is provided by the YCAT, which includes fixed route vanpool and YCAT OnCall demand-response bus service throughout the YMPO region. YCAT also serves the unincorpo-rated communities of Gadsden, Fortuna Foothills, and Ligurta.
Fixed Route Service – YCAT provides transit services Monday through Friday from 5:30 a.m. to 8:30 p.m. with limited evening service from Arizona Western College, University of Arizona, and Northern Arizona University, as well as other limited Yuma County and eastern Imperial County destinations. Weekend service is Saturday between 9:30 a.m. and 6:30 p.m. YCAT operates nine routes as well as a special night service called the NightCAT. A route map is provided in Figure 6.1 and are available at www.ycipta.org.
YCAT OnCall Paratransit – YCAT OnCall is a demand response transportation service that pro-vides door to door transportation for individuals who, because of a disability, are not able to utilize a fixed route bus service.
YCAT Vanpool Program – YCAT Vanpool provides clearly marked vans to qualifying groups of 7-15 commuters to be driven by one of the vanpool members. Passengers share the cost of oper-ating the van by paying a monthly fee to the primary driver. The fee covers gas, insurance, and vehicle maintenance. YCIPTA provides a $300 subsidy to vans on a first come, first served basis through their contractor vRide. Further information about the program is provided on the YCIPTA website, www.ycipta.org/vanpool.html.

YMPO 2018-2041 Regional Transportation Plan Update 85
TR
AN
SP
OR
TA
TIO
N A
LTE
RN
AT
IVE
S
21
YCAT RIDER’S GUIDE
20
YCAT RIDER’S GUIDE
YCAT SYSTEM MAP For more detailed information, see individual route maps.
NightCAT – MONDAY THRU FRIDAY ONLYArizona Western
College /Northern Arizona
University Univ. of Arizona
ARRIVE
YumaInternational
AirportApproximateDEPARTURE
DropoffPassengers
7:45 — Until 8:459:45 10:30 Until 10:45
NightCATThis service will pick up passengers at the following locations with advance reservations. Tomake a reservation call (928) 783-2235 prior to 6:00 PM on the day of travel.■ Downtown Yuma Transit Center■ Yuma Regional Medical Center (24th St. / Avenue A – Westbound)■ Yuma Palms Regional Center (Castle Dome Ave. at Yuma Palms Pkwy.)■ West Yuma Transfer Hub■ Cocopah Casino ■ Paradise Casino■ Quechan Casino Resort■ San Luis (Main Str. / Factor Warehouse – Northbound and ACCT on San Luis Plaza Dr.) ■ Somerton (Main St. / State Avenue – Southbound).
Regular bus fare applies. To check status of bus after 6:00 PM, call (928) 539-7076 ext 240.
PM times are in boldface type.
Schedules are subject to changewithout notice.
Times are approximate and mayvary depending on trafficconditions, weather and otherconditions.
Figure 6.1 – YCAT Bus System Map(Source: YCIPTA)

YMPO 2018-2041 Regional Transportation Plan Update
TR
AN
SP
OR
TA
TIO
N A
LTE
RN
AT
IVE
S
87
Transit System EnhancementsSpecial features of the YCAT transit system that make it more convenient to take the bus include:
CatTRAX System – Bus riders can text or call to find out when the next bus is coming to their stop. This system uses satellite technology and advanced computer models to track buses. This system, which initially operated one route, now covers all YCAT routes.
(Source: YCIPTA)

YMPO 2018-2041 Regional Transportation Plan Update
TR
AN
SP
OR
TA
TIO
N A
LTE
RN
AT
IVE
S
88
YCATPass – An all-in-one electronic transit card that keeps track of any passes and cash value that a rider loads onto it, while applying all applicable fares, discounts, and transfer rules. This lets the transit patron customize the card for his or her transit needs.
Passenger amenities – New bus shelters and benches were installed at 36 locations in 2014 and bus stop standards were developed. Over 175 locations throughout the YCAT service area now have infoposts installed to tell passengers when the bus will arrive at their stop.
Greyhound Connect – In 2014 YCIPTA partnered with Greyhound Lines to implement “Grey-hound Connect.” YCAT Yellow Route 95 now connects to Greyhound's network of more than 3,800 destinations via the Yuma Greyhound Bus stop. Other locations on Yellow Route 95 include San Luis, Gadsden, Somerton, Cocopah Casino, the West Yuma Transfer Hub, and the Downtown Yuma Transit Center.
Lifeline Transit Pass Program – In 2014 YCIPTA received funding to start a new lifeline transit pass program for low income residents. The program provides discounted passes for passen-gers meeting income eligibility guidelines.
SARA Rides – Since 2012 YCIPTA has been working with the Saguaro Foundation and Yuma Met-ropolitan Planning Organization (YMPO) to implement SARA Rides - a mobility management "one call, one click" transportation center where Yuma County residents can get information regarding transportation options and services from one source.
YMPO and ADOT have provided funding to help start SARA Rides and as a result a new schedul-ing, reservations, and dispatching system was purchased to facilitate the coordination of vehicles from all public and non-profit transportation providers, reducing the cost of transportation ser-vices for these sensitive populations.
Planning for the FutureIn 2014 a Short-Range Transit Plan (Fiscal Year 2013-2014 to Fiscal Year 2018-2019) was created to guide the development of the transit system. YCIPTA also has a 10-Year Capital Plan that provides long range planning through Fiscal Year 2020-2021. Future transit plans included in the 10-Year Capital Plan are detailed below.
Multimodal Transit CenterA multimodal facility in the downtown area is planned to incorporate Amtrak’s cross-country rail services, Greyhound’s regional intercity bus lines, and YCAT's local bus services. The cur-rent YCIPTA 10-Year Capital Plan includes $9.8 million for the multimodal transit center. Phase I includes exterior and first floor renovations and roof/HVAC upgrades. Phase II will renovate the second and third floors and will be based on the City of Yuma identifying a private developer.
Operations and Maintenance FacilityA new bus maintenance facility is needed to replace the leased facility, accommodate more buses, and provide more cost-effective maintenance. The current YCIPTA 10-Year Capital Plan includes $1.0 million for a new bus maintenance facility.

YMPO 2018-2041 Regional Transportation Plan Update
TR
AN
SP
OR
TA
TIO
N A
LTE
RN
AT
IVE
S
89
Park-and-Ride LotsPark-and-ride lots are needed to encourage transit use in outlying areas. The current YCIPTA 10-Year Capital Plan includes a park-and-ride lot at the County Sheriff’s station in Fortuna Foothills near the intersection of South Foothills Boulevard and South Frontage Road.
Passenger AmenitiesPassenger amenities will encourage people to ride the bus. The current YCIPTA 10-Year Capital Plan includes installation of bus shelters, signs, information posts, poles, benches, trash cans, and other passenger enhancements.
Fleet ReplacementThe transit fleet will need to be replaced as it ages. The current YCIPTA 10-Year Capital Plan includes funding for bus fleet and support vehicle replacements.
Bus TurnoutsBus turnouts are needed to reduce congestion on the street system. The current YCIPTA 10-Year Capital Plan includes funds to construct bus bays and turnouts in Yuma County.

YMPO 2018-2041 Regional Transportation Plan Update
TR
AN
SP
OR
TA
TIO
N A
LTE
RN
AT
IVE
S
90
Non-Motorized TransportationOverview
Bicycle Facilities – A Growing Regional SystemArizona is recognized as a great place for bicycling. The League of American Bicyclists ranks Ari-zona as No. 19 in its annual state rankings (May 2015). Furthermore, ten Arizona communities are designated by the League as a Bicycle Friendly Community: Tempe, Tucson, and Scottsdale are gold; Mesa, Sedona, and Flagstaff are silver.
While communities in the YMPO region have not yet achieved designation as a Bicycle Friendly Community, bicycle and pedestrian accommodation and safety is of high importance.
City of Yuma – Most of the region’s existing bicycle and pedestrian facilities are located in the City of Yuma. According to the City of Yuma Transportation Master Plan (October 2014), there are slightly more than 36 miles of bicycle facili-ties in the City comprised of bike routes, lanes, paths, and multi-use paths. There are 12.4 miles of designated bike lanes. While a stand-alone pedestrian plan has not been developed, separated multi-use paths provide ideal pedestrian facilities.
City of San Luis – As part of the San Luis Streets Improvement project new dedicated bicycle lanes were installed on US 95 (Main Street) and First Avenue.
(Source: Kimley-Horn)

YMPO 2018-2041 Regional Transportation Plan Update
TR
AN
SP
OR
TA
TIO
N A
LTE
RN
AT
IVE
S
91
City of Somerton – According to the Somerton Comprehensive Transportation Plan, there are three existing multi-use path segments in Somerton. Two are on Main Street, one is on County 16½ Street, and several shared-use pathways are on Caesar Chavez Avenue and the Somerton Canal. The Somerton Shared-Use Pathway and Trails System Master Plan recommends addi-tional multi-use paths. The Somerton General Plan includes policies that promote the construc-tion of bicycle facilities and routes on new collectors or arterials.
Town of Wellton – Wellton does not have designated bicycle facilities, but there are paved shoul-ders and a multi-use path on Old Highway 80 through downtown Wellton that can be utilized by bicyclists. Bicycle facility improvement projects and Complete Streets cross-sections that include a multi-use lane are recommended in the Wellton Transportation Long-Range Plan.
Existing designated bicycle facilities in the region are shown in Figure 6.2. The existing regional bicycle network has many gaps and discontinuities. There are few bicycle amenities such as bike racks or lockers in the region, however, transit buses are equipped with bicycle racks and bicycles can be brought on the bus at the bus operator’s discretion.
Pedestrian Facilities Expand Travel Choices
Sidewalks exist in urbanized parts of the region, but there are many gaps and discontinuities. In rural areas, sidewalks generally do not exist. Most of the sidewalks and sidewalk ramps are acces-sible by pedestrians with disabilities, particularly those facilities constructed since 1990.
City of Yuma – The Yuma General Plan indicates that “the City shall plan, design, and operate all transportation facilities to enable safe and convenient access for all users, including motorists, pedestrians, bicyclists and transit riders.” As part of the City of Yuma Master Transportation Plan (October, 2014), 12 strategic roadway corridors were reviewed and evaluated to identify deficien-cies related to pedestrian mobility:
1. 4th Avenue from Colorado River to 32nd Street 2. 4th Avenue Extension from 32nd Street to 40th Street3. Arizona Avenue from 10th Street to 32nd Street 4. Pacific Avenue from 8th Street to 32nd Street 5. Avenue A from 1st Street to 32nd Street 6. Avenue 3 E from US-95/County 9th Street to 32nd Street 7. 1st Street from 4th Avenue to Avenue B8. 8th Street from 4th Avenue to Avenue B 9. US-95/ 16th Street from Arizona Avenue to Engler Avenue 10. 24th Street from Avenue A to Pacific Avenue 11. 32nd Street from Avenue B to Avenue 3 E 12. 40th Street from Avenue 3 E to Avenue 10 E.
A field review of these corridors indicated that 26 miles of additional sidewalks would be required to provide continuous pedestrian facilities. An Americans with Disabilities review of these corri-dors was also undertaken and it was recommended that a transition plan for non-compliant drive-ways and intersections be deveolped. Locations of sidewalk deficiencies within these corridors are shown in Figure 6.3.

YMPO 2018-2041 Regional Transportation Plan Update 93
TR
AN
SP
OR
TA
TIO
N A
LTE
RN
AT
IVE
S
Figure 6.2 – Existing Bicycle Facilities in the YMPO Region(Source: YMPO, City of Yuma, City of Somerton)
XX
X
£95
§̈¦8
Ca l i
f or n
i a
Ca l i
f or n
i aA r i
z o n a
A r iz o n a
M e x i c oM e x i c o
Ave
I
Ave
H
Ave
G
Ave
F
Ave
E
Ave
D
Ave
C
Ave
B
Ave
A
Ave
1E
Ave
2E
Ave
3E
Ave
4E
Ave
5E
Ave
6E
Ave
7E
Ave
8E
Ave
9E
Ave
10E
Fortu
na R
d
Ave
12E
Ave
13E
Ave
14E
Ave
15E
Ave
19E
Ave
20E
Ave
21E
Ave
18E
Ave
J
Co 25th St
Co 24th St
Co 22nd St
Juan Sanchez Blvd / Co 23rd St
Co 21st St
Co 20th St
Co 19th St
Co 18th St
Co 17th St
Co 16th St
Co 15th St
Co 14th St
Co 13th St
Co 12th St
Co 11th St
Co 10th St
Co 9th St
Co 8th St
Co 7st St
Co 6th St
Ave
16E
Ave
22E
Ave
23E
Ave
24E
Ave
25E
Ave
26E
Ave
27E
Ave
29E
Ave
30E
Ave
31E
Ave
32E
Ave
33E
Ave
34E
Ave
35E
Ave
36E
Ave
37E
Ave
38E
Ave
39E
Ave
28E
Imperial Dam Rd
Martinez Lake Rd
San Luis
Somerton
Yuma
Wellton
Gila River
Colorado River
Ave
17E
£95
£95
?ï
?ï
See Inset
Coconino
Pima
Mohave
Gila
Pinal
Yavapai
Maricopa
Cochise
La Paz
Graham
Apac
he
Nava
jo
Gree
nlee
Santa CruzYMPO
Yuma
²
Municipality/Tribal LandExisting Bicycle Facilities
Bike LaneMulti-Use PathBike PathBike Route
X Bicycle Crossing
0 2 41
Miles
XX
X
§̈¦8
32nd St
24th St
16th St
8th St
Ave
B
Ave
C
Ave
D
Ave
A
Arizo
na A
ve
Pacif
ic Av
e
Ave
3E
1st St
£95

YMPO 2018-2041 Regional Transportation Plan Update 95
TR
AN
SP
OR
TA
TIO
N A
LTE
RN
AT
IVE
S
£95
§̈¦8
Ca l i
f or n
i a
Ca l i
f or n
i aA r i
z o n a
A r iz o n a
M e x i c oM e x i c o
Ave
I
Ave
H
Ave
G
Ave
F
Ave
E
Ave
D
Ave
C
Ave
B
Ave
A
Ave
1E
Ave
2E
Ave
3E
Ave
4E
Ave
5E
Ave
6E
Ave
7E
Ave
8E
Ave
9E
Ave
10E
Fortu
na R
d
Ave
12E
Ave
13E
Ave
14E
Ave
15E
Ave
19E
Ave
20E
Ave
21E
Ave
18E
Ave
J
Co 25th St
Co 24th St
Co 22nd St
Juan Sanchez Blvd / Co 23rd St
Co 21st St
Co 20th St
Co 19th St
Co 18th St
Co 17th St
Co 16th St
Co 15th St
Co 14th St
Co 13th St
Co 12th St
Co 11th St
Co 10th St
Co 9th St
Co 8th St
Co 7st St
Co 6th St
Ave
16E
Ave
22E
Ave
23E
Ave
24E
Ave
25E
Ave
26E
Ave
27E
Ave
29E
Ave
30E
Ave
31E
Ave
32E
Ave
33E
Ave
34E
Ave
35E
Ave
36E
Ave
37E
Ave
38E
Ave
39E
Ave
28E
Imperial Dam Rd
Martinez Lake Rd
San Luis
Somerton
Yuma
Wellton
Gila River
Colorado River
Ave
17E
£95
£95
?ï
?ï
See Inset
Coconino
Pima
Mohave
Gila
Pinal
Yavapai
Maricopa
Cochise
La Paz
Graham
Apac
he
Nava
jo
Gree
nlee
Santa CruzYMPO
Yuma
²
Municipality/Tribal LandSidewalk Deficiencies
0 2 41
Miles
§̈¦8
Ave
B
32nd St
Ave
A
Arizo
na A
ve
Pacif
ic Av
e
Ave
3E
1st St
£95
Ave
4E
Ave
5E
Ave
6E ?ï
Ave
7E
Ave
8E
Ave
9E
Ave
10E
Co 12th St
24th St
16th St
8th St
Figure 6.3 – Sidewalk Deficiencies(Source: Wilson & Company)

YMPO 2018-2041 Regional Transportation Plan Update
TR
AN
SP
OR
TA
TIO
N A
LTE
RN
AT
IVE
S
98
City of San Luis – Over two mil-lion pedestrians annually cross the U.S./Mexico border at San Luis POE I, giving the downtown area of the City of San Luis the highest level of pedestrian activ-ity in the region.
In 2015, the San Luis Street Improvement project was com-pleted, which included pedes-trian improvements.
The project included rerouting San Luis Port of Entry traffic away from the busy business district, which has significant pedes-trian and bicycle traffic. Port of entry traffic was moved to two local roads that were converted to one-way streets in an effort to relieve some of the traffic congestion and enhance safety.
By rerouting vehicle traffic from the San Luis Port of Entry away from Main Street, access to busi-nesses along Main Street was improved to better accommodate pedestrians and bicyclists. It also allowed for additional parking, benches, new pavement, pavement striping, and landscaping.
ADOT installed the first pedestrian-activated signalized crosswalk in Yuma County, located at the intersection of US 95 (Main Street) and Urtuzuastegui Street. This special type of traffic light, known as the Pedestrian Hybrid Beacon, is a system of indicator lights and signs that controls vehicle traffic to assist pedestrians in safely crossing a major street or highway at a marked cross-walk that does not have a standard traffic signal.
The San Luis General Plan includes policies that promote the installation of new pedestrian facili-ties such as sidewalks, overpasses, pedestrian signals at major intersections, improved curb cuts at cross-walks, and pedestrian refugee areas.
City of Somerton – Sidewalks exist along most roadways in the developed portions of the City of Somerton. Per the Somerton General Plan, all new road construction within the City is required to provide sidewalks and ADA-accessible ramps. The City also has a retrofit program in place to gradually install sidewalks on all older roadways within the City.
Town of Wellton – The Town of Wellton has sidewalks along only a few of its roadway segments. The Town has identified a need for pedestrian facilities such as sidewalks that connect activity centers. The Town has developed pedestrian facility, improvement project recommendations, and Complete Streets cross-sections that include sidewalks in the Wellton Transportation Long Range Plan.
Yuma County – Yuma County has subdivision regulations that require sidewalks in all new devel-opments.
Cocopah Indian Tribe – The Cocopah Indian Tribe has indicated it would like to see more side-walks implemented to encourage more physical activity and provide a safer traveling environ-ment for pedestrians.
(Source: Kimley-Horn)

YMPO 2018-2041 Regional Transportation Plan Update
TR
AN
SP
OR
TA
TIO
N A
LTE
RN
AT
IVE
S
99
YMPO Region Trails and Paths Provide a Regional Asset for RecreationWhile trails and paths can be used as connecting routes to other transportation facilities, they are most often used for recreational purposes. Trails generally are not paved while paths generally are paved. Trails and paths are typically multi-use, meaning they are open to various non-motor-ized travelers such as pedestrians, hikers, bicyclists, and equestrians. Existing trails and paths in the YMPO region are generally located along canals or rivers or in hilly areas. The locations of the trails and paths generally align with the aforementioned bicycle paths (see Figure 6.2).
Regional Needs and ProjectsBicycle Facilities – The Yuma Bicycle Facilities Master Plan (2009) (see Table 5.1) identifies a proposed network of bike lanes, bike paths, shared-use paths, and crossings to create a network that connects to schools and activity centers to encourage bicyclists of all ages and abilities to routinely use bicycling to get to and from work, school, and other activities. This plan has been updated through guidance from City of Yuma bicycle planners and public input. Proposed bicycle facilities include bike lanes, shared-use paths, and shared-use trails. These proposed bicycle facilities, along with bicycle facilities proposed in approved plans for Wellton, Somerton, and San Luis, are shown in Figure 6.4.
ey arally
ile trails and paths can be used as connecting routes to other transportation facilities, they aroe paved. Trails and paths are typically multi-use, meaning they are open to various non-motord travelers such as pedestrians, hikers, bicyclists, and equestrians. Existing trails and paths in
e YMPO region are generally located along canals or rivers or in hilly areas. The locations of thi
i l N d d P j t(Source: Kimley-Horn)
(Source: Kimley-Horn)
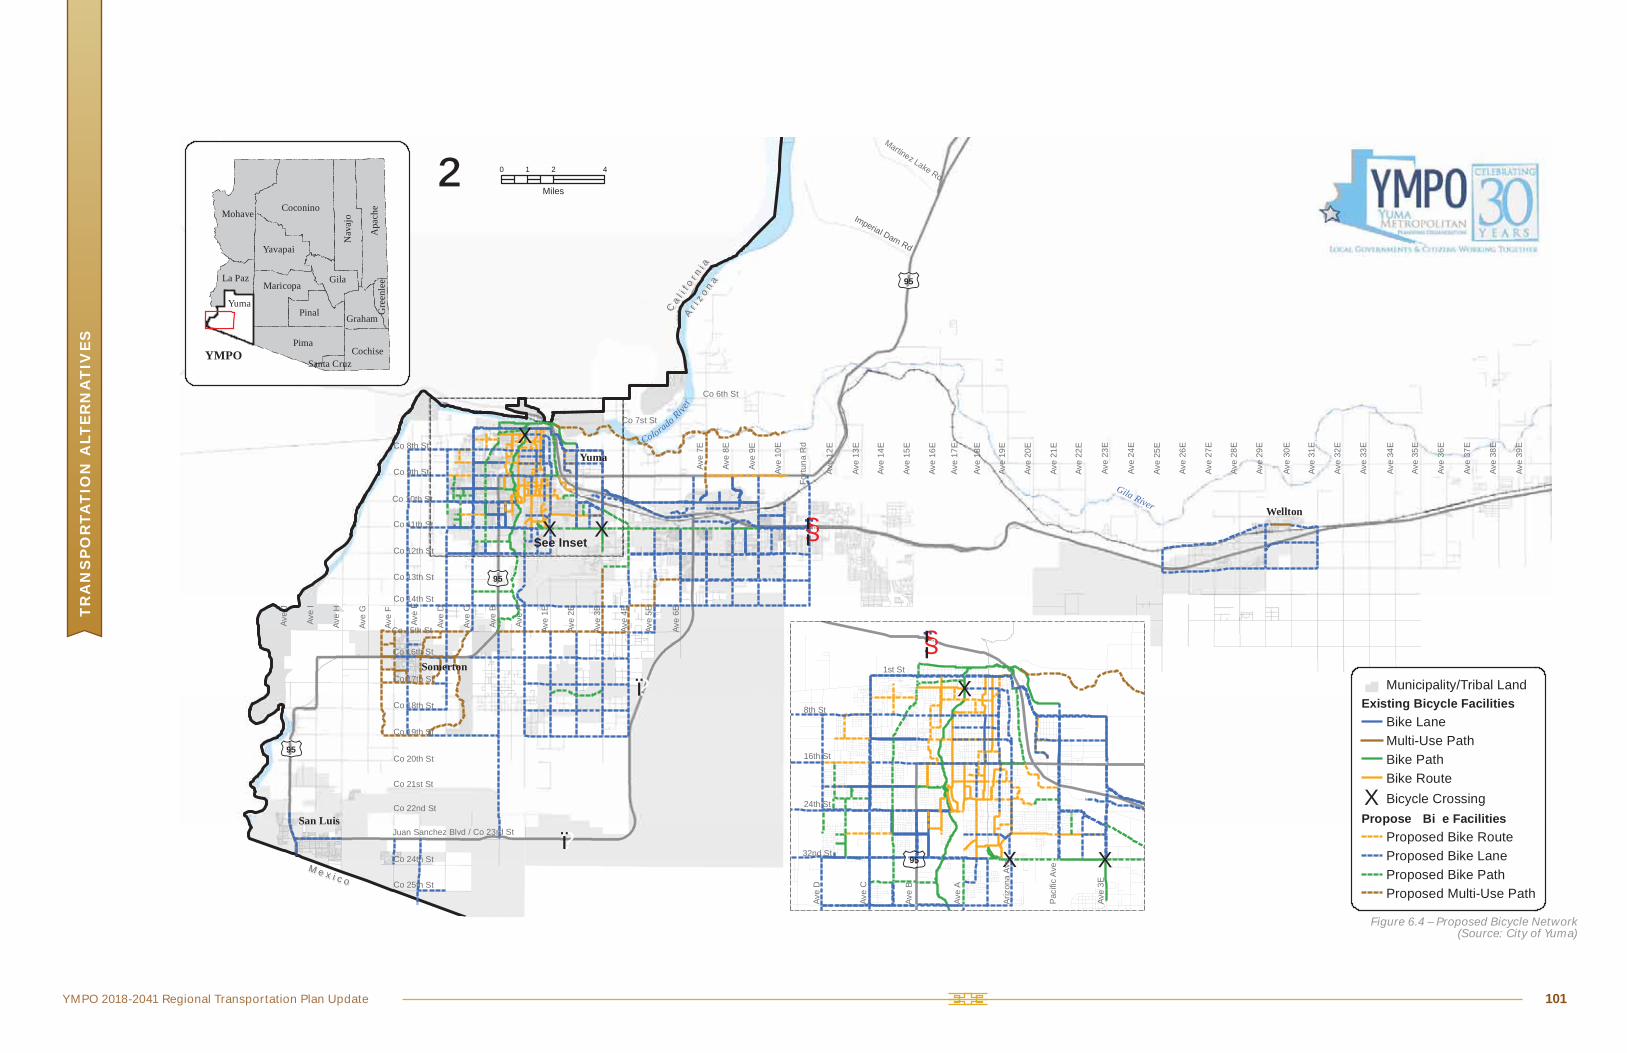
YMPO 2018-2041 Regional Transportation Plan Update 101
TR
AN
SP
OR
TA
TIO
N A
LTE
RN
AT
IVE
S
Figure 6.4 – Proposed Bicycle Network(Source: City of Yuma)
XX
X
£95
§̈¦8
Ca l i
f or n
i a
Ca l i
f or n
i aA r i
z o n a
A r iz o n a
M e x i c oM e x i c o
Ave
I
Ave
H
Ave
G
Ave
F
Ave
E
Ave
D
Ave
C
Ave
B
Ave
A
Ave
1E
Ave
2E
Ave
3E
Ave
4E
Ave
5E
Ave
6E
Ave
7E
Ave
8E
Ave
9E
Ave
10E
Fortu
na R
d
Ave
12E
Ave
13E
Ave
14E
Ave
15E
Ave
19E
Ave
20E
Ave
21E
Ave
18E
Ave
J
Co 25th St
Co 24th St
Co 22nd St
Juan Sanchez Blvd / Co 23rd St
Co 21st St
Co 20th St
Co 19th St
Co 18th St
Co 17th St
Co 16th St
Co 15th St
Co 14th St
Co 13th St
Co 12th St
Co 11th St
Co 10th St
Co 9th St
Co 8th St
Co 7st St
Co 6th St
Ave
16E
Ave
22E
Ave
23E
Ave
24E
Ave
25E
Ave
26E
Ave
27E
Ave
29E
Ave
30E
Ave
31E
Ave
32E
Ave
33E
Ave
34E
Ave
35E
Ave
36E
Ave
37E
Ave
38E
Ave
39E
Ave
28E
Imperial Dam Rd
Martinez Lake Rd
San Luis
Somerton
Yuma
Wellton
Gila River
Colorado River
Ave
17E
£95
£95
?ï
?ï
See Inset
Coconino
Pima
Mohave
Gila
Pinal
Yavapai
Maricopa
Cochise
La Paz
Graham
Apac
he
Nava
jo
Gree
nlee
Santa CruzYMPO
Yuma
²
Municipality/Tribal LandExisting Bicycle Facilities
Bike LaneMulti-Use PathBike PathBike Route
X Bicycle CrossingPropose Bi e Facilities
Proposed Bike RouteProposed Bike LaneProposed Bike PathProposed Multi-Use Path
0 2 41
Miles
XX
X
§̈¦8
32nd St
24th St
16th St
8th St
Ave
B
Ave
C
Ave
D
Ave
A
Arizo
na A
ve
Pacif
ic Av
e
Ave
3E
1st St
£95

YMPO 2018-2041 Regional Transportation Plan Update
TR
AN
SP
OR
TA
TIO
N A
LTE
RN
AT
IVE
S
103
Pedestrian ImprovementsThe ADOT Pedestrian Safety Action Plan identified three segments in Yuma as high priority loca-tions to improve pedestrian safety. These segments were selected based on a high number of motor-vehicle pedestrian crashes. The ADOT Pedestrian Safety Action Plan (2009) recommends that improvements be made to these segments including pedestrian crossings and median ref-uge islands. The segments and estimated cost of improvements are:
US 95, Avenue 2E - Avenue 3E (Estimated Cost: $1.5 million) 4th Avenue, 1st Street - 32nd Street (Estimated Cost: $5.5 million) US 95, 4th Avenue - Redondo Center Drive (Estimated Cost: $1.3 million)
This plan is currently being updated.
Regional Plan and Policy RecommendationsIn addition to expanding the bicycle network, it is proposed that YMPO serve as a leader to instill a “bicycle culture” throughout the region. A city and region with a strong “bicycle culture” has a well-developed bicycle infrastructure (e.g. separated bike lanes, facilities to improve convenience of bicycling, bicycle racks). A region with a “bicycle culture” will have a significant portion of the population bicycling to and from work or for other utilitarian purposes. The following policy rec-ommendations should be considered by YMPO and its member jurisdictions.
1. Develop a Regional Bicycle and Pedestrian Facilities Plan – The Yuma Bicycle Facilities Mas-ter Plan presents a cohesive network within the City of Yuma. A comprehensive bicycle and pedestrian plan should be developed that incorporates the communities of San Luis, Somer-ton, Wellton, Winterhaven, CA, and Yuma County. The Yuma Regional Bicycle and Pedestrian Plan should provide for facilities within communities and facilities that connect communities. The plan should include an extensive education and outreach campaign.
2. Develop a Regional Complete Streets Policy – Complete Streets are designed and operated to enable safe access and use by all users (bicyclists, pedestrians, motorists, and public transit users of all ages and ranges of ability). Complete Streets make it easy to cross the street, walk to shopping, and bicycle to work. By adopting a Complete Streets policy, com-munities direct their transportation planners and engineers to routinely design and operate the entire right-of-way to enable safe access for all users.
3. Regional Bicycle and Pedestrian Advisory Committee – Form a regional bicycle and pedestrian advisory committee that would oversee activities such as:
Develope a regional bicycle and pedestrian facilities plan.
The City of Yuma is expected to establish a bicycle and pedestrian commission. The commission will help raise the prominence of bicycling and walking in the City of Yuma. Consideration should be given to establishing a regional bicycle and pedestrian advisory committee with representation from all YMPO member jurisdictions.
YMPO 2018-2041 Regional Transportation Plan Update
TR
AN
SP
OR
TA
TIO
N A
LTE
RN
AT
IVE
S
104
Develop and implement a regional bicycle and pedestrian safety awareness campaign. Distribute bicycle and pedestrian safety education booklets. Host bicycle and pedestrian facility design workshops for local agency staff. Encourage employers to be bicycle friendly – provide bike racks, showers, and benefits for bicycle commuters. Collaborate with local jurisdictions, companies, schools, and health organizations to pro-mote bicycling and walking as a healthy alternative to driving. Host bicycle and walking events such as Walk to School Day and Cyclovia bicycle rides. Encourage cities and towns to pursue and implement bicycle- and pedestrian-friendly policies. Collaborate with local law enforcement to better enforce traffic laws that relate to bicycles and pedestrians. These include the three-foot law when passing a bicyclist and yielding to pedestrians at a crosswalk. Collaborate with and encourage local bicycle advocacy organizations.
4. Bicycle Friendly Region – Submit for designation as a Bicycle Friendly Region by the League of American Bicyclists; enact the policies and implement the infrastructure requisite for this designation. Develop an action plan to improve bicycling in Yuma based on feedback pro-vided by the League of American Bicyclists.
5. Walk Friendly Communities Assessment – Develop an action plan to improve walkability in the YMPO region based on feedback from an assessment tool. Submit for designation as a Walk Friendly Community offered by the University of North Carolina Highway Safety Research Center.

YMPO 2018-2041 Regional Transportation Plan Update
TR
AN
SP
OR
TA
TIO
N A
LTE
RN
AT
IVE
S
105
AviationOverview
Improvements at Yuma International Airport and Rolle Field There are two public-use airports in the YMPO region: Yuma Interna-tional Airport (YIA) and Rolle Field. YIA operates in conjunction with the Marine Corps Air Station Yuma, which is referred to as MCAS-Yuma. Rolle Field is a general aviation (GA) airport located near San Luis that formerly operated as an auxiliary airfield for the Army during World War II. Both airports are oper-ated by the Yuma County Airport Authority (YCAA).
The YCAA embarked on several improvements to YIA and Rolle Field. These improvements include taxiway and apron improvements at YIA, as well as expansion of and improvements to the Defense Contractor Complex. Improvements that have been made at Rolle Field include a complete rehabili-tation of one of the runways, construction of a hangar, aircraft parking apron, and security fencing. In 2015 an Airport Master Plan was completed for Rolle Field. The plan was developed with the objectives to:
Preserve public and private investments Reflect community goals and objectives Take advantage of the current trends towards unmanned aircraft systems (UAS) Maintain safety Preserve safety Strengthen the economy
Yuma International Airport (Source: Yuma County Airport Authority)
Rolle Field(Source: Yuma County Airport Authority)

YMPO 2018-2041 Regional Transportation Plan Update
TR
AN
SP
OR
TA
TIO
N A
LTE
RN
AT
IVE
S
106
In addition to these two public-use airports, Somerton Airport is a private GA airport in the region located near Somerton. This airport has three runways of gravel and/or dirt composition, as well as hangar facilities, fuel service, flight training offices, and a pilot lounge. Due to its structure as a private airport, pilots are required to sign a waiver prior to landing and are encouraged to contact the airport prior to operating there.
Commercial Aviation Increases Over the Long-TermThe YMPO region currently has commercial air service provided by two airlines. US Airways cur-rently provides nonstop service to Phoenix Sky Harbor International Airport (PSHIA) and United Airlines provides nonstop service to Los Angeles International Airport (LAX). Overall, total pas-senger traffic has increased since 2001. The airport recorded a total of 150,092 passengers in 2012 compared to 94,396 passengers in 2001. However, passenger traffic has declined slightly year by year from 2010, falling from nearly 165,000 passengers in 2010 to 159,894 passengers in 2011. US Airways currently accounts for the majority of passenger traffic, carrying approximately 72 percent of passengers in 2012.
Partnering to Support Military Aviation The YMPO region is deeply rooted in military aviation and in providing military support. The region has recently seen increased interest from operators of UAS vehicles. YIA is currently partnering with several agencies including the Defense Contractors Complex (DCC), YPG, and MCAS-Yuma to be one of the Federal Aviation Administration’s (FAA) test ranges for integration of UAS vehicles safely into the national airspace system. The airport master plan addresses how Rolle Field can act as a viable alternative for operating and testing UAS vehicles.
Space Technology Testing In 2009 a newly completed hangar at the DCC—the Pappy Boy-ington Hangar—was leased for use by the National Aeronautics and Space Administration (NASA) and one of their consulting partners. The facility has been serving as a base for NASA as it conducts testing for the parachute assembly system for the Orion space capsule program. The hangar is used for preparation by the NASA team prior to conducting air drop tests at YPG.
MCAS-Yuma: An Operational Base for the F-35MCAS-Yuma is involved with the F-35 Joint Strike Fighter (JSF) program and will become an operational base for the F-35. Over $400 million in improvement projects have been implemented at MCAS-Yuma to prepare for the F-35 JSF jets. MCAS-Yuma is expected to house five F-35 squadrons of 16 planes each and a test squadron of eight planes.
Yuma Proving Ground (YPG)YPG is a large Army installation located in northern Yuma County where nearly every piece of combat equipment is tested. The testing includes significant aviation activity, encompassing heli-
MCAS-Yuma; Slated to Become an Operational Base for the F-35 JSF
(Source: Scott Youmans [public domain]. https://www.marines.mil)

YMPO 2018-2041 Regional Transportation Plan Update
TR
AN
SP
OR
TA
TIO
N A
LTE
RN
AT
IVE
S
107
copter and fixed-wing developmental testing, aircraft parachute drops, and UAS vehicle testing.
Airport Master Plans Set the Vision and Goals for Aviation in the RegionThe most recent YIA Master Plan update was completed in 2009 and was intended to cover a planning horizon of 20 years. The following are some of the goals and objectives identified for the airport master plan effort at the beginning of the process.
Develop a plan to ensure a workable agreement between the YCAA and the U.S. Marine Corps. MCAS-Yuma has an important role in the City’s economy and the collective resources offered by YCAA and MCAS-Yuma should be managed collaboratively. Develop a plan that identifies the best long-term facilities for civil aviation activity including reasonably-priced GA facilities, economic development, and passenger amenities within the terminal building. Enhance the relationship and partnership between the YCAA and the U.S. Marine Corps. Consider global and specific issues such as airfield inspections and hours of operation for the airport traffic control tower. Provide strategies for accommodating future terminal needs, including expansion of pas-senger holding areas and public parking needs during peak activity or heightened security threats.
The ADOT Aeronautics Division completed a comprehensive update to the Arizona State Airports System Plan (ASASP) in 2008. At the beginning of the planning process an airport system vision was established, which led to the development of airport system goals. The ASASP vision is to provide an airport system that accommodates demand, supports economic and transportation needs, and maximizes funding resources.
The recommended Rolle Field Master Plan Concept includes the following enhancements:
Extension of Runway 17-35 to the north and south Addition of full length parallel Taxiway A GA terminal / Administration building Apron enhancement Additional storage hangers UAS support vehicle parking UAS Launch and Recovery Site Additional storage hangers and training and meeting rooms
Regional Needs and ProjectsRegional aviation projects are based on information in the 2017-2021 ADOT Five Year Construc-tion Program.
Yuma International Airport 2017-2021 ImprovementsThere are two taxiway pavement preservation projects estimated to cost $182,319.
Rolle Field 2017-2021 ImprovementsThere are two pavement preservation projects for a runway and taxiway estimated to cost $92,900.

YMPO 2018-2041 Regional Transportation Plan Update
TR
AN
SP
OR
TA
TIO
N A
LTE
RN
AT
IVE
S
108
Congestion ManagementOverview
Regional Traffic Congestion Can Vary SeasonallyTraffic congestion, as measured by traditional traffic analysis techniques, is not a significant problem today in the YMPO region compared to many larger metropolitan areas. Congestion that takes place during the daily com-mute-to-work period (known as recurring congestion) occurs on the north and south I-8 frontage roads, in urbanized commercial areas in the City of Yuma, and at San Luis POE I. What traditional traffic techniques do not fully recognize is the dramatic increases in traffic during the agricultural produce season and during the influx of winter visitors, which cause traffic volumes in some areas to increase by 33 percent over average conditions. With the projected increase in population and economic activity in the region, congestion levels will increase significantly unless steps are taken to plan and implement a multimodal transportation plan to combat congestion with transportation choices that reduce the region’s reliance on SOV use. Congestion relief is a principal regional objective of this RTP.
Congestion Management Process (CMP) – The YMPO region does not currently have a CMP because although the mini-mum population threshold of 200,000 in the urbanized area has been met (the 2015 estimated population for the urban-ized area was 214,991), the region has not been defined as a Transportation Management Area (TMA). When both of these criteria are met, a CMP will be required as part of the regional transpor-tation planning process. It is estimated that criteria for establishing a CMP will be met within the next several years. The proactive development of a CMP can offer valuable input to congestion relief strategies as the region prepares for becoming a TMA, though it is not yet required.
(Source: Kimley-Horn)
The proactive development of a CMP can offer valuable input to congestion relief strategies as the
region prepares to become a TMA.
Figure 6.5 – Elements of the Congestion Management Process(Source: FHWA Congestion Management Handbook)

YMPO 2018-2041 Regional Transportation Plan Update
TR
AN
SP
OR
TA
TIO
N A
LTE
RN
AT
IVE
S
109
The CMP shown in Figure 6.5, which has evolved from what was previously known as the Con-gestion Management System (CMS), is a systematic approach, collaboratively developed and implemented throughout a metropolitan region, that provides for the safe and effective man-agement and operation of new and existing transportation facilities through the use of demand reduction and operational management strategies.
To prepare for a CMP for the YMPO region CMP models from across the country are available in publications prepared by FHWA, FTA, and the Association of Metropolitan Planning Organizations (AMPO). The FHWA CMP Guidebook defines the steps for developing a CMP process model. The process model is not intended to serve as a step-by-step approach, but is intended to convey the general flow of the approach, building on regional objectives to develop and implement strategies and evaluate their effectiveness.
Regional Needs and Projects
Congestion Management Steering CommitteeYMPO should establish a steering committee to monitor the development of a region-wide CMP and the development of projects and strategies. Because projects are most often implemented by YMPO member jurisdictions, oversight by a steering committee can be valuable to relay informa-tion on the CMP process during project development and performance assessment. A goal of the committee should be to achieve regional consistency between planned and programmed proj-ects and project development, particularly for projects that will add capacity to roadways.
Congestion Management Process (CMP)The steering committee recommended above should oversee research leading to the develop-ment and evaluation of CMP model alternatives and the development of the CMP itself. A pro-active CMP should be collaboratively developed and implemented by YMPO and its member jurisdictions to add a new dimension to the traditional approach to congestion management and operate new and existing transportation facilities through the use of demand reduction and operational management strategies.

YMPO 2018-2041 Regional Transportation Plan Update
TR
AN
SP
OR
TA
TIO
N A
LTE
RN
AT
IVE
S
110
Transportation SecurityOverviewThe security of the transportation system is a national and regional priority. Sep-tember 11, 2001 changed many Ameri-cans' perspective about homeland safety and security. When one considers the amount of hazardous materials, chemi-cals, and flammable products that are transported on the nation’s infrastructure each day, it is easy to recognize the need for security measures along highways and bridges. The security of America's infrastructure including critical trans-portation assets such as bridges, POEs, airports, and primary highways, has become an important consideration during the development of new transportation projects.
Security PlanningThe YMPO region has developed plans to mitigate adverse impacts from hazardous natural or man-made events. In 2004 and 2005, Yuma County and the incorporated cities and towns in Yuma County initially participated in a multi-jurisdictional mitigation planning process. YMPO member jurisdictions developed Multi-Hazard Mitigation Plans for Yuma County, San Louis, Somerton, Wellton, and the City of Yuma.
The Federal Emergency Management Authority (FEMA) approved these plans between 2005 and 2006. In 2010 a five-year update was completed and the plans were consolidated into one overall plan called the Yuma County Multi-Jurisdictional Hazard Mitigation Plan. This consolidated plan provides information on potential hazards including descriptions, history, probability and mag-nitude, vulnerability, sources, and profile maps. The hazards evaluated include transportation crashes, drought, earthquakes, flooding, severe wind, and wildfire.
In 2013 the State of Arizona Hazard Mitigation Plan was developed, which included the assessment of Yuma County.
Transportation System CrashesThe Yuma County Multi-Jurisdictional Hazard Mitigation Plan notes that Yuma County residents have been exposed to several train derailments, multiple car crashes due to dense fog and blow-ing dust, and numerous airplane crashes. Most of the airplane crashes have been military planes associated with either MCAS-Yuma or YPG.
Transportation security addresses the protection
of transportation infrastructure related to
hazardous events. Security must be considered early in the planning of new transportation projects.

YMPO 2018-2041 Regional Transportation Plan Update
TR
AN
SP
OR
TA
TIO
N A
LTE
RN
AT
IVE
S
111
Regional Needs and Projects
Transportation Infrastructure PlanningPlanning for transportation security should be part of the regional transportation planning pro-cess. The degree to which transportation security should be considered and resources expended is dependent upon the nature of the project.
Is the proposed project in a primarily rural area? Does the proposed project cross a state border? Will the proposed project be in close proximity to urbanized areas? Will the proposed project become a major thoroughfare subject to heavy truck traffic and hazardous materials?
Is the proposed project a critical piece of infrastructure (e.g., bridges across navigable waters, rest areas, POEs)? Is there other nearby infrastructure (e.g., power plants, refining facilities, etc.)? Could the proposed project affect or mitigate hazards identified in the Yuma County Multi-jurisdictional Hazard Mitigation Plan?
The majority of needed roadway system improvements are located near I-8, the UPRR, the Colo-rado River, the border with California, the international border, MCAS-Yuma, YIA, highly urban-ized areas, and agricultural areas, which warrant a security risk assessment as part of project development. Coordination with the Arizona Division of Emergency Management (ADEM) and Yuma County Office of Emergency Management should be considered.
Transportation Security/Incident Management Working GroupA transportation security/incident management working group should be established to provide transportation security input on new projects. This working group can also enhance collabora-tion and coordination between traditional transportation infrastructure providers (e.g., regional, county, tribal, and local entities) and emergency responders. The working group should coordi-nate with YMPO and member jurisdictions to establish organizational responsibilities, available transportation resources, and procedures for preparing for, responding to, and recovering from incidents that impact the residents of the YMPO region. The working group should solicit input from key emergency management and response stakeholders including the Yuma County Office of Emergency Management, Yuma County Sheriff’s Office, ADEM, Arizona Department of Public Safety (DPS), and FHWA.
Transportation Security Education and TrainingYMPO should conduct transportation security education and training exercises and workshops using local and national experts.
Intelligent Transportation System (ITS) IntegrationThe YMPO region’s ITS infrastructure is an integral part of transportation security. Current and future transportation and transit ITS components should consider video surveillance, CCTV, DMS, mobility assistance patrols, vehicle detectors, transit vehicle tracking, in-vehicle naviga-tion, integrated radio systems, and automated vehicle location. These traffic monitoring, incident detection, and response systems can be utilized to improve the security of the regional transpor-tation system.

Freight
Chapter 7
YMPO 2018-2041 Regional Transportation Plan Update
FR
EIG
HT
114
F R E I G H TYuma's location on the border of four states, Arizona, California, Sonora, Mexico and Baja, Mex-ico) and two countries, United States and Mexico, makes it a natural transportation hub. There are over 52 million consumers within a one-day truck haul in the east and west directions via Interstate 8 or the north and south directions via US Highway 95, according to the Greater Yuma Economic Development Corporation. Freight movement is critical to the Yuma economy and supports many key sectors of the economy, such as agriculture, Maquila operations, and indus-trial manufacturing.
Truck Freight Major commercial and industrial trucking activity is limited to designated truck routes, which are built to standards accommodating heavy vehicles. Existing truck routes in the Yuma area are shown in Figure 7.1.
The figure shows designated commercial truck routes and overweight truck routes. Key truck routes include I-8, US 95, SR 195, 8th Street, 16th Street, 4th Avenue, and 32nd Street. An over-weight truck route is located on SR-195 between E. 32nd Street and east of San Luis. ADOT permits for travel on this route can be purchased, which increases the weight limits for commer-cial trucks from 80,000 pounds to 90,800 pounds. The fee for this permit is shared with the State Highway Fund (50%), Yuma County (25%), and San Luis (25%). This permit allows produce from Mexico to be unloaded into warehouses located in the commercial zone of the Arizona Interna-tional Port of Entry, which is defined by a 25-mile radius from the Arizona-Mexico border. While the routes used by overweight trucks are approved by local jurisdiction, ADOT imlements the permitting process that legally allows trucks to use these corridors.
As part of the City of Yuma Transportation Master Plan (2014) a Buildout Truck Routing Plan was developed for the community, which is shown in Figure 7.2. A focus for the plan was to facilitate the efficient movement of trucks and minimize excessive wear on local streets.
YMPO Truck Count Program YMPO conducts an extensive traffic count program twice a year at approximately 188 locations in the region. They have been proactive in including classification counts as part of the traffic counts and have identified routes that have the highest percentage of truck volumes and the highest number of trucks traveling on the road system.
Table 7.1 shows the top 10 locations with the highest percentage of truck traffic and Table 7.2 shows the top 10 locations with the highest number of trucks. 16th Street west of Avenue C appears on both tables, as does the 4th Avenue extension south of 32nd Street. A number of seg-ments of 16th Street appear to have high levels of truck traffic.

YMPO 2018-2041 Regional Transportation Plan Update
FR
EIG
HT
115
Road Location Percent TrucksAvenue E South of Juan Sanchez
Boulevard24%
Ave 3 1/2 E South of 32nd Street 24%
Gila Ridge Road East of Ave 3E 23%
16th Street West of Avenue C 22%
4th Avenue North of 40th Street 18%
County 19th Street West of Avenue 3E 16%
4th Ave Extension South of 32nd Street 15%
Dome Valley Road North of Old US 80 14%
Avenue 3E South of Palo Verde 13%
Gila Ridge Road West of Araby Road 12%
Table 7.1 – Top Ten Road Segments with the Highest Percent Trucks, Based on 2015 Traffic Count Data (Source: Yuma Metropolitan Planning Organization)
Street Location Number of Trucks 16th Street West of Avenue C 1734
16th Street East of Arizona Avenue 1539
4th Avenue South of 16th St 1423
Avenue B South of 20th St 1387
16th Street West of Ave A 1378
32nd Street East of Fortuna Avenue 1343
16th Street West of Pacific Avenue 1291
B-8 East of Ave 3E 1279
4th Ave Extension South of 32nd St 1254
Pacific Avenue South of 24th St 1243
Table 7.2 – Top Ten Locations with the Highest Number of Trucks, Based on 2015 Traffic Count Data (Source: Yuma Metropolitan Planning Organization)

YMPO 2018-2041 Regional Transportation Plan Update
FR
EIG
HT
116
Figure 7.1 – Existing Truck Routes(Source: City of Yuma Transportation Master Plan (2014) Wilson and Company)

YMPO 2018-2041 Regional Transportation Plan Update
FR
EIG
HT
117
Figure 7.2 – Buildout Truck Routing Plan (Source: City of Yuma Transportation Master Plan (2014) Wilson and Company
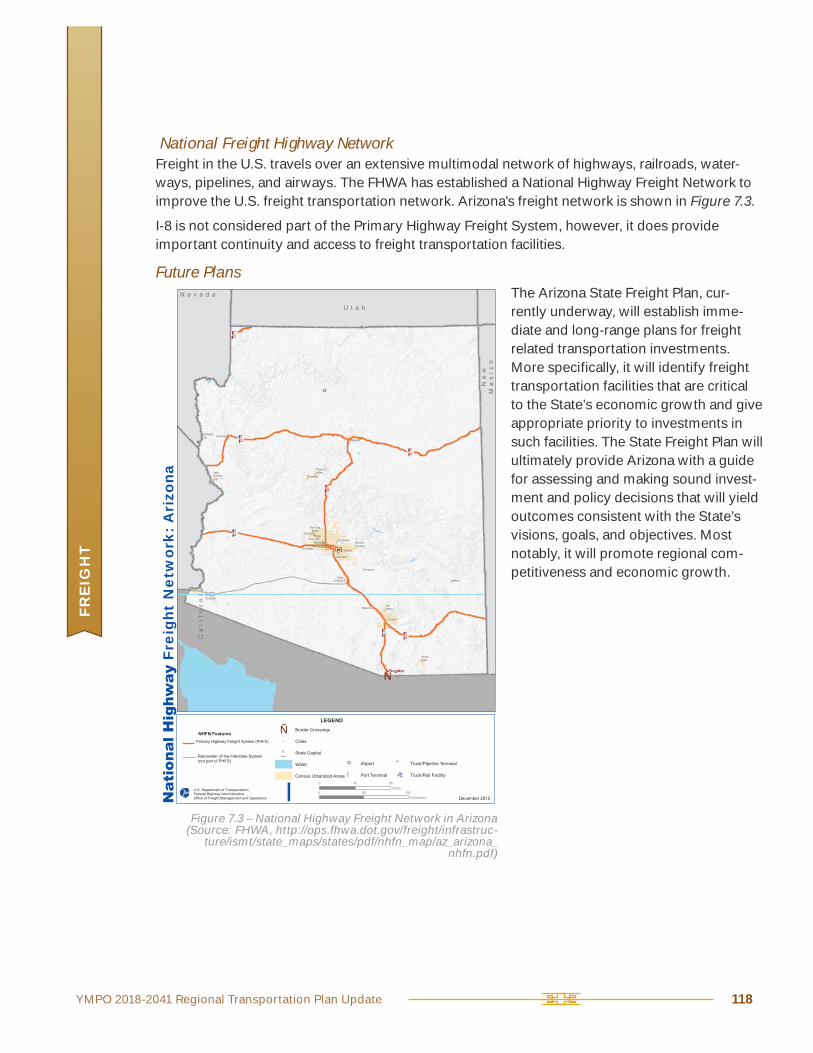
YMPO 2018-2041 Regional Transportation Plan Update
FR
EIG
HT
118
National Freight Highway Network Freight in the U.S. travels over an extensive multimodal network of highways, railroads, water-ways, pipelines, and airways. The FHWA has established a National Highway Freight Network to improve the U.S. freight transportation network. Arizona's freight network is shown in Figure 7.3.
I-8 is not considered part of the Primary Highway Freight System, however, it does provide important continuity and access to freight transportation facilities.
Future Plans The Arizona State Freight Plan, cur-rently underway, will establish imme-diate and long-range plans for freight related transportation investments. More specifically, it will identify freight transportation facilities that are critical to the State’s economic growth and give appropriate priority to investments in such facilities. The State Freight Plan will ultimately provide Arizona with a guide for assessing and making sound invest-ment and policy decisions that will yield outcomes consistent with the State’s visions, goals, and objectives. Most notably, it will promote regional com-petitiveness and economic growth.
o
_̂
Ñ
Ca
l if
or
ni a
N e v a d a
Ne
wM
ex
ico
U t a h
KingmanFlagstaff
LakeHavasuCity
PrescottValley
Prescott
Sun CityWest
Surprise
Sun CityPeoria
GlendaleScottsdale
Goodyear AvondaleApacheJunction
Gilbert
Chandler
Yuma
FortunaFoothills
Florence
CasaGrande Safford
MaranaOroValley
Tucson
SierraVista
BullheadCity
£60
§̈¦17
§̈¦10§̈¦19
§̈¦15
§̈¦40
§̈¦40
§̈¦10
Nogales
Frei
ght
Net
wor
k: A
rizo
na
I0 40 80
Miles0 80 160
Kilometers
U.S. Department of Transportation, Federal Highway Administration, Office of Freight Management and Operations
Ñ Border Crossings
Cities
_̂ State Capital
Water
Census Urbanized Areas
LEGEND
o
Airport
Î Port Terminal
" Truck/Pipeline Terminal
Æò Truck/Rail Facility
FN Features
Remainder of the Interstate System(not part of P )
ber 2015
Figure 7.3 – National Highway Freight Network in Arizona (Source: FHWA, http://ops.fhwa.dot.gov/freight/infrastruc-
ture/ismt/state_maps/states/pdf/nhfn_map/az_arizona_nhfn.pdf)

YMPO 2018-2041 Regional Transportation Plan Update
FR
EIG
HT
119
Air FreightAir Freight at Public Airports – The two public airports in the YMPO region provide limited freight service. Yuma International Airport (YIA) has an air cargo ramp and FedEx provides air freight services there. Though limited with respect to air freight services, YIA is experiencing a change in functions and roles as it addresses the needs of MCAS-Yuma, YPG, and the nation’s space development program. Available information indicates that the following activi-
ties are underway: deployment of more stringent security measures, upgrade of communication capabilities, construction of U.S. Customs and Border Protection (CBP), increased availability of hangars to customers involved in aviation and space testing programs, and development of a Defense Contractors Complex (DCC) for use by military contractors. As military- and space-related activities increase at YIA, the demand for expanded air freight capability will also increase.
Rolle Field
Rolle Field is a general aviation airport located approximately two miles north of the San Luis II Commercial Port of Entry. In 2015 an Airport Master Plan was completed for the airport. The vision for the airport, in part, is that the development of Rolle Field will contribute to the economic development of the City of San Luis as it grows with the expansion of the new Port of Entry at San Luis II. Rolle Field is also uniquely positioned to participate in the testing and development of unmanned aircraft as an extension of the YIA DCC.
Rail FreightUPRR – UPRR is the sole rail freight provider in the YMPO region. The UPRR Sunset Route between Los Angeles and El Paso ties in with rail corridors extending east to Jackson-ville, Florida and north to Chicago, Illinois. UPRR operates up to 70 trains per day on the Sunset Route and the ongoing double tracking of the line will allow the company to operate more than 100 trains per day.
UPRR Wellton Branch – The Arizona State Rail Plan (2011) included a recommendation to investigate reopening the UPRR Wellton Branch between the Phoenix metropolitan area and the Town of Wellton. Currently, approximately 80 miles of the line is out of service and the entire line would need to be rehabilitated in order for it to be reactivated.
(Source: www.up.com)

YMPO 2018-2041 Regional Transportation Plan Update
FR
EIG
HT
120
Regional Needs and Projects
Regional Freight Framework StudyImproved integration of regional air, rail, and truck freight services and facilities is needed to meet current and future freight demands. A regional freight framework study should be conducted to establish a framework for regional freight processing, services, and facilities for manufactur-ers and commercial (retail and wholesale) enterprises. The study should address issues such as regional preferences for a location of a Colorado River UPRR rail crossing to accommodate UPRR double tracking, an assessment of regional costs and benefits of reopening the UPRR Wellton Branch, and an assessment of regional costs and benefits of being part of the national freight highway network.
Yuma County Rail Corridor Study RecommendationsThe recommendations developed by the Yuma County Rail Corridor Study should be advanced, including the creation of a steering committee to engage appropriate federal (U.S. and Mexico) and state (Arizona and Sonora) agencies in pursuing improved rail connectivity in the region and with Mexico.

YMPO 2018-2041 Regional Transportation Plan Update
FR
EIG
HT
121
Border Infrastructure Overview
International POEs in the RegionThe YMPO region is currently served by two international POEs. Combined, the two POEs repre-sent the second highest level of border crossing activity in the state of Arizona. About 30 percent are passenger vehicles and pedestrian crossings and 11 percent are commercial vehicle cross-ings. Historically, POEs in the YMPO region account for approximately five percent of the value of all goods crossing the Arizona-Sonora border.
San Luis POE I was constructed in 1930 and later expanded in 1984 and 1991. It is located in the downtown commercial center in the City of San Luis at the terminus of Main Street (US 95). San Luis POE I provides cross-border patrol (CBP) inspection of passenger vehicles, bicycles, and pedestrians. Vehicular congestion exists along US 95 as a result of CBP inspection protocols for southbound vehicles exiting to Mexico. Congestion at the San Luis POE I increases during the agricultural produce season. A reconstruction of the San Luis POE I is planned, which will improve pedestrian processing pace and reduce wait times for cross-border travelers entering the U.S. in a safe manner consistent with security measures in place by agencies operating the LPOE. In 2014 almost 2.29 million pedestrians used this border crossing. This proposed project would not change either the ingress or egress points to the LPOE. Pedestrians coming into the US from Mexico would, upon leaving the new processing building, utilize the existing sidewalks leading north to Urtuzuastegui Street.
ADOT completed a San Luis Street Improvement project to improve traffic and pedestrian mobility through the San Luis LPOE, to reduce conflicts between motorists, bicyclists and pedestrians, to improve drainage in the project area, and to enhance and revitalize the business district on Main Street. The project included:
Constructing two roundabouts: D Street at US 95 and Urtuzuastegui Street at US 95 Converting Archibald Street (SB) and 1st Avenue (NB) to one way streets Reconfiguring NB traffic from the LPOE directly to 1st Avenue with accessibility to US 95 from the Urtuzuastegui Street (EB and WB) Converting US 95 from a 5 lane facility between the planned Urtuzuastegui Street mini-roundabout and D Street roundabout into a two-lane local road Constructing a transition road from the F St/US 95 intersection, which is north of the D Street roundabout, west to Archibald Street New construction, reconstruction and widening Archibald Street from a two lane street to a three lane one-way SB facility from F Street to Urtuzuastegui Street Constructing an additional EB lane on Urtuzuastegui Street from Archibald Street to the LPOE Providing amenities on US 95 to accommodate pedestrian and bicycle traffic
(Source: Kimley-Horn)

YMPO 2018-2041 Regional Transportation Plan Update
FR
EIG
HT
122
San Luis POE II is a new facility located approximately five miles east of San Luis POE I at the terminus of Avenue E. It provides commercial vehicle inspection and direct access to SR 195. San Luis POE II was designed with the potential for expansion to accommodate up to 650 commercial vehicles per day, as well as the potential to add facilities for passenger vehicles, pedestrians, and bicyclists.
Arizona-Sonora Border Master PlanADOT, in cooperation with the State of Sonora, Mexico and numerous bi-national federal, state, and local stakeholders, completed the Arizona-Sonora Border Master Plan (2013), which identified and ranked a series of POE, multimodal infrastructure, and rail projects that would enhance travel across the border.
Regional Needs and Projects
Arizona-Sonora Border Master Plan RecommendationsA number of projects evaluated during the Arizona-Sonora Border Master Plan were among the necessary capital improvement projects that have been completed or are in planning and design. Highly ranked projects recommended in the Arizona-Sonora Border Master Plan are shown in Table 7.3.
As described previously, improvements to the POE I are currently being planned.
Evaluation of Arizona POE Projects Overall RankPOE Project Description Out of 17
San Luis I - SENTRI Primary Booth Project 1
San Luis I - Pedestrian Pop-Out Project #1 (Reconfiguration in place) 2
San Luis I - Pedestrian Pop-Out Project #2 (Expansion) 3
San Luis II - POV/Pedestrian Processing Facility 4
San Luis I - Outbound Technology Project 6
San Luis I - SENTRI Secondary Inspection Area 8
San Luis I - Expansion and Modernization 9
San Luis I - Outbound Inspection Infrastructure 10
San Luis I - Primary Booth Replacement Project 11
San Luis II - New Rail POE 16
Evaluation of Multimodal Infrastructure Projects Overall RankFacility Project Description/Extent Proposed Improvement Out of 108
Archibald St and First Ave
C St to Urtuzuastegui StConvert to one-way couplet and construct bus pullouts
1
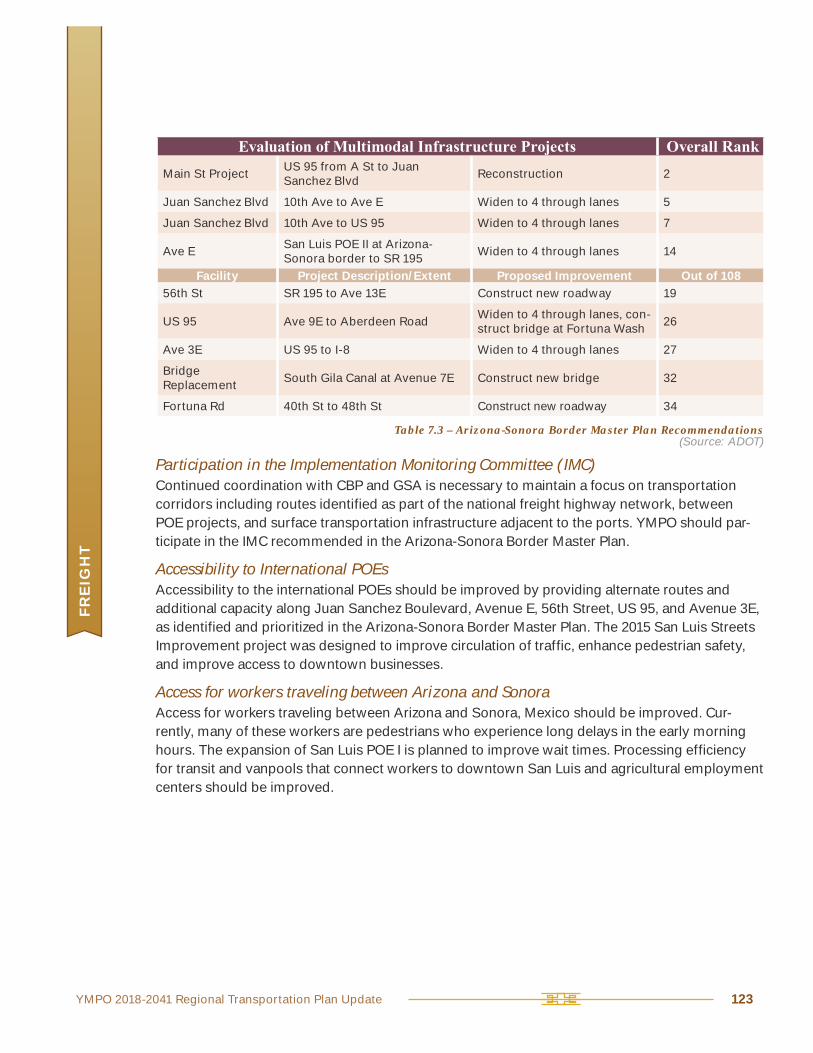
YMPO 2018-2041 Regional Transportation Plan Update
FR
EIG
HT
123
Evaluation of Multimodal Infrastructure Projects Overall RankMain St Project
US 95 from A St to Juan Sanchez Blvd
Reconstruction 2
Juan Sanchez Blvd 10th Ave to Ave E Widen to 4 through lanes 5
Juan Sanchez Blvd 10th Ave to US 95 Widen to 4 through lanes 7
Ave ESan Luis POE II at Arizona-Sonora border to SR 195
Widen to 4 through lanes 14
Facility Project Description/Extent Proposed Improvement Out of 10856th St SR 195 to Ave 13E Construct new roadway 19
US 95 Ave 9E to Aberdeen RoadWiden to 4 through lanes, con-struct bridge at Fortuna Wash
26
Ave 3E US 95 to I-8 Widen to 4 through lanes 27
Bridge Replacement
South Gila Canal at Avenue 7E Construct new bridge 32
Fortuna Rd 40th St to 48th St Construct new roadway 34
Table 7.3 – Arizona-Sonora Border Master Plan Recommendations(Source: ADOT)
Participation in the Implementation Monitoring Committee (IMC)Continued coordination with CBP and GSA is necessary to maintain a focus on transportation corridors including routes identified as part of the national freight highway network, between POE projects, and surface transportation infrastructure adjacent to the ports. YMPO should par-ticipate in the IMC recommended in the Arizona-Sonora Border Master Plan.
Accessibility to International POEsAccessibility to the international POEs should be improved by providing alternate routes and additional capacity along Juan Sanchez Boulevard, Avenue E, 56th Street, US 95, and Avenue 3E, as identified and prioritized in the Arizona-Sonora Border Master Plan. The 2015 San Luis Streets Improvement project was designed to improve circulation of traffic, enhance pedestrian safety, and improve access to downtown businesses.
Access for workers traveling between Arizona and SonoraAccess for workers traveling between Arizona and Sonora, Mexico should be improved. Cur-rently, many of these workers are pedestrians who experience long delays in the early morning hours. The expansion of San Luis POE I is planned to improve wait times. Processing efficiency for transit and vanpools that connect workers to downtown San Luis and agricultural employment centers should be improved.

YMPO 2018-2041 Regional Transportation Plan Update
FR
EIG
HT
124
Inland Ports, Warehousing, and Distribution CentersOverviewThe concept of inland ports stems from processing and capacity constraints at the Pacific coast ports in Southern California. Coastal ports are limited in their ability to classify and store com-modities destined for inland locations. Private and public sector planners in the YMPO region have viewed this situation as an opportunity to develop inland ports that will streamline the sup-ply chain by integrating rail and truck freight services with warehousing and distribution services.
Key elements of the general economic activity in the region are warehousing functions and distribution to markets. Historically, major industries in the YMPO region have been manufactur-ing-, fabrication-, and agriculture-related activities. Recently, the area has been the beneficiary of numerous newly constructed agricultural processing plants. Produce is shipped to these facilities from the fields and is then processed, packaged, and stored for market distribution. The YMPO region has been identified as a prime location for long-term development of agricultural based processing and other industrial activities. It has a well-developed transportation system including I-8, the UPRR Sunset Route, and YIA.
Industrial and commerce centers are typically located near major transportation facilities. The YMPO region is strategically located at the crossroads of California, Arizona, and Sonora, Mexico. This location puts the region within a one-day truck haul of over 50 million consumers via I-8 and US 95. The dual POEs in San Luis provide incentives for the development of distribution centers to support warehouse storage of export and import goods. Seventeen major trucking companies are located in the YMPO region and the North American Free Trade Agreement (NAFTA) is becoming the vehicle for the nternational trade envisioned. Land ports open the door for future goods movement between Arizona and Sonora and will increase demand for an even more dynamic warehouse/distribution logistics formula for the YMPO region.
Modal Integration and AccessKey requirements for the development of inland ports are the modal integration of rail and truck freight service and access to the interstate highway system for truck shipments. The UPRR Sun-
Port of Long Beach, California (Source: http://en.wikipedia.org/wiki/Intermodal_freight_transport)

YMPO 2018-2041 Regional Transportation Plan Update
FR
EIG
HT
125
set Route passes through the YMPO region and links 23 states in the western U.S. with links to railroads serving the eastern U.S. and Canada. In addition, UPRR is the only railroad serving six international gateways to Mexico, made possible by operating agreements with Ferromex. UPRR is in the process of double-tracking the Sunset Route, which will increase freight capacity and access to the YMPO region. Connections with major ports and freight transfer points in Los Ange-les and El Paso provide an ideal opportunity for investments to advance the concept of an inland port with associated warehouseing and distribution centers.
The Yuma County Rail Corridor StudyThe Yuma County Rail Corridor Study has advanced the inland port concept in the YMPO region through recommendations for improving rail access and the evaluation of methods for maximiz-ing import and export options, particularly with Mexico. This study involved the investigation of alternatives for creating an industrial park on the UPRR Sunset Route and a linkage of the UPRR Sunset Route with Ferromex in Mexico. The study also identified ways to improve rail freight service and access in the YMPO region and evaluated methods for supporting economic devel-opment through improvements to freight handling and movement.
Regional Needs and Projects
Site Selection and Land PlanningThe Yuma County Rail Corridor Study has identified two potential sites for an inland port facility. Additional work is needed to evaluate potential industrial sites and identify requirements for road access, site infrastructure, and accommodation of rail freight infrastructure and services. New zoning or rezoning may be necessary.
Yuma County Rail Corridor Study RecommendationsThe recommendations of the Yuma County Rail Corridor Study should be implemented as appropriate and include assessment of the economic costs and benefits of constructing a rail line to access an industrial park in San Luis, assessment of the economic costs and benefits of constructing a rail spur to an industrial park in Wellton, and evaluation of developing a rail linkage with Ferromex in Mexico.
NAFTA/CANAMEX Support ElementsCollaboration and cooperation with Sonora industrial and commercial entities should continue in order to identify transportation and facility needs that will support expansion of the warehous-ing and distribution functions in the YMPO region. Partnerships with USDOT, ADOT, and Caltrans should be expanded with respect to master planning of border area transportation facilities.
Commercial and Industrial Site DevelopmentGYEDC, a GIS-based website, provides a one-stop source for corporate site selection data, eco-nomic/demographic research results, and quality of life information for prospective businesses. GYEDC has developed a dynamic, interactive website can examine the location and attributes of commercial and industrial sites in the YMPO region. GYEDC offers a portal to the YMPO region’s business activity available to interested individuals and corporations around the world. Actions to maintain and update this site with appropriately located sites will yield benefits beyond the tradi-tional practice of industrial development.
Related Documents