damon connolly dennis rodoni vice president supervisor district 4 kathrin sears supervisor district 3 director eric lucan city of novato alternate judy arnold director supervisor district 5 stephanie moulton-peters city of mill valley director kate colin 2nd vice president city of san rafael katie rice supervisor district 2 director president supervisor district 1 711 grand ave, #110 san rafael, ca 94901 ph: 415.226.0855 fax: 415.226.0856 marintransit.org November 18, 2019 Honorable Board of Directors Marin County Transit District 3501 Civic Center Drive San Rafael, CA 94903 SUBJECT: Draft FY 2020-2029 Marin Transit Short Range Transit Plan Dear Board Members: RECOMMENDATION: Set public hearing on Draft Short Range Transit Plan for Monday, January 6, 2020 at 10 a.m. SUMMARY: Staff have developed a Draft FY 2019/20 – FY 2028/29 Short Range Transit Plan (SRTP) for public review and comment. The SRTP provides the District with a framework for service and capital planning and provides necessary financial planning input for the Metropolitan Transportation Commission (MTC) and the Transportation Authority of Marin (TAM). The SRTP update satisfies the goals of the Measure A and Measure AA transportation sales tax expenditure plan. Measure A and Measure AA call for an update to this document every two years. The SRTP summarizes Marin Transit accomplishments since the approval of the previous update in 2017 and sets out activities and programs for the next ten years. The document is organized into five chapters: System Overview, Goals/Targets & Performance, Service Plan, Capital Plan, and Financial Plan. Marin Transit significantly expanded local fixed route services in 2016 (+19%). Since then, staff have made incremental changes to address underperforming route segments. Fixed route service levels are planned to remain constant throughout the ten-year horizon though staff is considering several minor service changes to enhance service performance and efficiency. Since the last SRTP, there have been significant changes in Marin Transit’s local and State operations funding, and Marin Transit continues to be in a strong financial position. The major revenue changes are sales tax revenue extends through the entire plan period at a lower annual amount, particularly for capital projects and there is increased state funding for operations and capital projects. Item 8

Welcome message from author
This document is posted to help you gain knowledge. Please leave a comment to let me know what you think about it! Share it to your friends and learn new things together.
Transcript
damon connolly
dennis rodonivice presidentsupervisor district 4
kathrin sears
supervisor district 3director
eric lucan
city of novatoalternate
judy arnolddirectorsupervisor district 5
stephanie moulton-peters
city of mill valleydirector
kate colin2nd vice presidentcity of san rafael
katie rice
supervisor district 2director
presidentsupervisor district 1
711 grand ave, #110san rafael, ca 94901
ph: 415.226.0855fax: 415.226.0856marintransit.org
November 18, 2019
Honorable Board of Directors Marin County Transit District 3501 Civic Center Drive San Rafael, CA 94903
SUBJECT: Draft FY 2020-2029 Marin Transit Short Range Transit Plan
Dear Board Members:
RECOMMENDATION: Set public hearing on Draft Short Range Transit Plan for Monday, January 6, 2020 at 10 a.m.
SUMMARY: Staff have developed a Draft FY 2019/20 – FY 2028/29 Short Range Transit Plan (SRTP) for public review and comment. The SRTP provides the District with a framework for service and capital planning and provides necessary financial planning input for the Metropolitan Transportation Commission (MTC) and the Transportation Authority of Marin (TAM). The SRTP update satisfies the goals of the Measure A and Measure AA transportation sales tax expenditure plan. Measure A and Measure AA call for an update to this document every two years.
The SRTP summarizes Marin Transit accomplishments since the approval of the previous update in 2017 and sets out activities and programs for the next ten years. The document is organized into five chapters: System Overview, Goals/Targets & Performance, Service Plan, Capital Plan, and Financial Plan.
Marin Transit significantly expanded local fixed route services in 2016 (+19%). Since then, staff have made incremental changes to address underperforming route segments. Fixed route service levels are planned to remain constant throughout the ten-year horizon though staff is considering several minor service changes to enhance service performance and efficiency.
Since the last SRTP, there have been significant changes in Marin Transit’s local and State operations funding, and Marin Transit continues to be in a strong financial position. The major revenue changes are sales tax revenue extends through the entire plan period at a lower annual amount, particularly for capital projects and there is increased state funding for operations and capital projects.
Item 8

2
Aside from service updates, the plan does update other elements of the plan. These include: Rider profile and customer satisfaction ratings from the most recent systemwide
onboard survey; Demographic profiles based on most recent census information; Assessment of paratransit usage, and the results of internal modeling to estimate
future demand and shifts between paratransit and other mobility management programs;
The District’s goals and performance targets to quantify the performance of the system and the District’s ability to meet the goals of Measure A and Measure AA;
The Service plan reflects recommendations from the 2016 Marin Access Strategic Plan and Recommendations Study;
The Capital plan outlines Marin Transit’s fleet replacement and expansion schedule, and includes plans for bus stop and facility improvements; and
The Financial plan reflects anticipated District revenues and expenditures and discusses future fare and eligibility policies.
At MTC’s request, Marin Transit will submit the Draft SRTP for their review and comment later this month. The draft plan is available for download from the Transit District’s web site at www.marintransit.org. Digital copies are also available for distribution free of charge and in hard copy format by contacting Marin Transit staff at [email protected] or by calling (415) 226-0855. Staff requests that your Board set a public hearing at the January 6, 2020 Marin Transit Board Meeting to receive any public comment. Following setting of the public hearing, staff will open an online comment portal for the public to submit comments. This portal will be in addition to taking comments by mail, phone, or in-person at the public hearing. Staff will present a summary of all comments to your Board at the January 6, 2020 meeting in advance of the public hearing. With direction from your Board, staff will present the revised final draft of the plan for adoption at the February 2020 meeting. The SRTP is a planning document that illustrates the future direction of the District. Any plan recommendation that requires future Board action will be developed as a separate task with the appropriate amount of outreach and public notification and, if needed, a budget adjustment request. Board approval of the SRTP indicates acceptance of District goals and targets to measure service performance and the long-range strategic vision for service, capital, and financial planning. FISCAL/STAFFING IMPACT: There is no fiscal impact associated with this item. Respectfully submitted,
Aida Banihashemi Planning Manager Attachment - Draft Marin Transit Short Range Transit Plan for FY 2019/20 – FY 2028/29
Item 8

M A R I N T R A N S I T
2020-2029 Short Range Transit Plan
DRAFT | November 2019Item 8
MARIN TRANSIT | 2020–2029 SHORT RANGE TRANSIT PLAN
i
Title Page
Item 8

MARIN TRANSIT | 2020–2029 SHORT RANGE TRANSIT PLAN
ii
Acknowledgements
Board of Directors
Damon Connolly, Supervisor District 1 Katie Rice, Supervisor District 2 Kathrin Sears, Supervisor District 3 Dennis Rodoni, Supervisor District 4 Judy Arnold, Supervisor District 5 Stephanie Moulton-Peters, City of Mill Valley Kate Colin, City of San Rafael Eric Lucan, City of Novato (alternate) Approved by Marin Transit Board of Directors on February 3, 2020 Approved by Transportation Authority of Marin Board of Directors on MM DD, YYYY
Prepared by Marin Transit staff
Federal transportation statutes require that the Metropolitan Transportation Commission (MTC), in partnership with state and local agencies, develop and periodically update a long-range Regional Transportation Plan (RTP), and a Transportation Improvement Program (TIP) that implements the RTP by programming federal funds to transportation projects contained in the RTP. In order to effectively execute these planning and programming responsibilities, MTC requires that each transit operator in its region that receives federal funding through the TIP, prepare, adopt and submit to MTC a Short Range Transit Plan (SRTP).
The preparation of this report has been funded in part by a grant from the U.S. Department of Transportation (DOT) through section 5303 of the Federal Transit Act. The contents of this SRTP reflect the views of Marin Transit, and not necessarily those of the Federal Transit Administration (FTA) or MTC. Marin Transit is solely responsible for the accuracy of the information presented in this SRTP.
Item 8
MARIN TRANSIT | 2020–2029 SHORT RANGE TRANSIT PLAN
iii
Contents Chapter 1: System Overview .......................................................................................................................................... 1-1
District History ............................................................................................................................................................ 1-1
Planning History and Studies .................................................................................................................................... 1-1
District Structure ......................................................................................................................................................... 1-7
Marin County School Coordination......................................................................................................................... 1-9
Regional Coordination ............................................................................................................................................ 1-11
Service Area Profile and Demographics .............................................................................................................. 1-13
Transit Rider Market Assessment ......................................................................................................................... 1-16
Marin Transit Services ............................................................................................................................................. 1-22
Connecting Regional Services ................................................................................................................................ 1-49
Other Marin County Services ................................................................................................................................ 1-51
Fare Structure ........................................................................................................................................................... 1-51
Fleet Inventory ......................................................................................................................................................... 1-59
Facilities Overview ................................................................................................................................................... 1-60
Chapter 2: Goals, Targets, and Performance .............................................................................................................. 2-1
Systemwide Performance ........................................................................................................................................... 2-2
Corridor-Level Performance ..................................................................................................................................... 2-8
Route-Level Performance ....................................................................................................................................... 2-10
District Level Performance .................................................................................................................................... 2-16
Chapter 3: Service Plan ................................................................................................................................................... 3-1
Planned Service Levels ............................................................................................................................................... 3-7
Unfunded Service Needs ........................................................................................................................................ 3-26
Chapter 4: Capital Plan .................................................................................................................................................... 4-1
Vehicles ......................................................................................................................................................................... 4-5
Bus Stop and Corridor Improvements ................................................................................................................. 4-13
Administrative and Operations Facilities ............................................................................................................. 4-14
Technology and Other Capital Needs .................................................................................................................. 4-15
Chapter 5: Financial Plan ................................................................................................................................................ 5-1
Operating Budget ........................................................................................................................................................ 5-1
Appendix A: Route Profiles .......................................................................................................................................... A-1
Appendix B: Fare and Eligibility Analysis .................................................................................................................. B-1
Appendix C: Unfunded Service Needs Assessment ................................................................................................. C-1
Item 8
MARIN TRANSIT | 2020–2029 SHORT RANGE TRANSIT PLAN
iv
Appendix D: Fleet Inventory ....................................................................................................................................... D-1
Appendix E: Title VI Program ..................................................................................................................................... E-1
Appendix F: Operating Revenue ................................................................................................................................... F-1
Appendix G: Zero Emission Fleet Replacement Plan ............................................................................................. G-1
Appendix H: Public Comments .................................................................................................................................. H-1
Figures
Figure 1-1: District Structure ......................................................................................................................................... 1-8 Figure 1-2: Supervisors and District Boundaries ........................................................................................................ 1-9 Figure 1-3: Transit Propensity .................................................................................................................................... 1-19 Figure 1-4: Employment Density ............................................................................................................................... 1-20 Figure 1-5: Origins and Destinations ......................................................................................................................... 1-21 Figure 1-6: Route Structure ......................................................................................................................................... 1-28 Figure 1-7: Existing Service Frequencies .................................................................................................................. 1-30 Figure 1-8: Express Connections ............................................................................................................................... 1-31 Figure 1-9: Paratransit Trip Origins and Destinations ............................................................................................ 1-42 Figure 1-10: Novato Dial-A-Ride Origins and Destinations ................................................................................. 1-46 Figure 1-11: Clipper Usage Trends by Typology (% of Riders Using Clipper for Fare Payment)(1) ............... 1-59 Figure 1-12: Bus Stop Signs ........................................................................................................................................ 1-62 Figure 1-13: Rider Panel Information........................................................................................................................ 1-62 Figure 2-1: Total Marin Transit Passenger Trips ........................................................................................................ 2-4 Figure 2-2: FY 2017/18 Productivity by Route and Typology .............................................................................. 2-12 Figure 2-3: FY 2017/18 Passenger Subsidy by Route and Typology ................................................................... 2-13 Figure 3-1: Local Fixed Route Service Summary (FY 2011/12 – FY 2017/18) ................................................ 3-13 Figure 3-2: Recreational Service Summary (FY 2011/12 – FY 2017/18) ........................................................... 3-16 Figure 3-3: Rural Service Summary (FY 2011/12 – FY 2017/18) ........................................................................ 3-17 Figure 3-4: Supplemental Service Summary (FY 2011/12 – FY 2017/18) ......................................................... 3-18 Figure 3-5: Dial-A-Ride Service Summary (FY 2011/12 – FY 2017/18) ............................................................ 3-20 Figure 3-6: Estimated Paratransit and Mobility Management Program Growth ............................................... 3-24 Figure 4-1: 10-Year Capital Expenditures By Type .................................................................................................... 4-1 Figure 4-2: 10-Year Capital Expenditures by Year ..................................................................................................... 4-2 Figure 5-1: Projected Operations Revenues and Expenditures................................................................................ 5-2 Figure 5-2: District Reserve Level ................................................................................................................................. 5-3 Figure 5-3: 10-Year Operations Expenses by Type ................................................................................................... 5-4 Figure 5-4: 10-Year Operations Revenue by Type ..................................................................................................... 5-6 Figure 5-5: Transit's Share of Measure A (Actual and Projected Receipts by Fiscal Year ................................... 5-8
Tables
Table 1-1: Estimated Population, Size and Densities of Marin County Cities and Unincorporated Area ..... 1-14 Table 1-2: Demographic Overview of Marin County ............................................................................................. 1-15 Table 1-3: Demographic Overview of Transit Riders in Marin County .............................................................. 1-16 Table 1-4: Summary of Service Provider Contracts ................................................................................................ 1-22 Table 1-5: Fixed Route Service Organization........................................................................................................... 1-23
Item 8
MARIN TRANSIT | 2020–2029 SHORT RANGE TRANSIT PLAN
v
Table 1-6: Summary of Fixed-Route Typologies ..................................................................................................... 1-27 Table 1-7: Marin Fixed Route Transit Routes .......................................................................................................... 1-33 Table 1-8: Yellow Bus Funding .................................................................................................................................. 1-34 Table 1-9: Marin Access Programs ............................................................................................................................ 1-37 Table 1-10: Paratransit Trips and Vehicle Hours .................................................................................................... 1-41 Table 1-11: Volunteer Driver Program Data ........................................................................................................... 1-44 Table 1-12: Senior Shopping Shuttles ........................................................................................................................ 1-47 Table 1-13: Current Fare Structure ............................................................................................................................ 1-53 Table 1-14: Muir Woods Shuttle Fares ...................................................................................................................... 1-55 Table 1-15: Fixed Route Payment Type (percent of Riders Using) ...................................................................... 1-56 Table 1-16: Fare Media Usage (Total passenger trips where media was used / % of total media type) ........ 1-57 Table 1-17: Youth Pass Distribution ......................................................................................................................... 1-58 Table 1-18: Maintenance Facilities by Contractor ................................................................................................... 1-60 Table 1-19: Bus Stops by Type and Jurisdiction ...................................................................................................... 1-61 Table 1-20: Bus Stop Amenities Guidelines ............................................................................................................. 1-62 Table 2-1: Fixed-Route Program Historic Performance ........................................................................................... 2-2 Table 2-2: Yellow Bus Program Historic Performance ............................................................................................. 2-3 Table 2-3: Marin Access Program Historic Performance ......................................................................................... 2-3 Table 2-4: Priority Transit Corridors ............................................................................................................................ 2-8 Table 2-5: Productivity Goals by Typology .............................................................................................................. 2-10 Table 2-6: Cost Effectiveness Goals by Typology .................................................................................................. 2-11 Table 2-7: FY 2017/18 Performance by Route ....................................................................................................... 2-14 Table 2-8: Outside Grant Funding by Fiscal Year................................................................................................... 2-17 Table 2-9: System Performance Objectives, Measures and Actual Performance ............................................... 2-20 Table 3-1: Planned Revenue Hours by Service Type and Route Typology ............................................................ 3-9 Table 3-2: Planned Service Miles by Service Type and Route Typology ............................................................. 3-10 Table 3-3: Service Expansion Projects ...................................................................................................................... 3-27 Table 4-1: Capital Funding and Improvement Plan ................................................................................................... 4-4 Table 4-2: Vehicle Summary by Type and Service ..................................................................................................... 4-5 Table 4-3: ICT Zero Emission Purchase Requirements Timeline ........................................................................... 4-6 Table 4-4: Availability of Zero Emission Vehicle Equivalents ................................................................................. 4-6 Table 4-5: Fixed Route Vehicles By Fuel Type ........................................................................................................... 4-7 Table 4-6: Fixed Route Vehicle Types .......................................................................................................................... 4-8 Table 4-7: Vehicle Service Life Guidance .................................................................................................................... 4-9 Table 4-8: Fixed Route Vehicle Summary ................................................................................................................... 4-9 Table 4-9: Local Transit Bus Replacement Schedule .............................................................................................. 4-10 Table 4-10: Demand Response Vehicle Summary .................................................................................................. 4-11 Table 4-11: Paratransit & Dial-A Ride Vehicle Replacement and Expansions Schedule.................................. 4-12 Table 5-1: Service Contract Summary .......................................................................................................................... 5-4 Table 5-2: 10-Year Financial Projections ..................................................................................................................... 5-5 Table 5-3: Local Sales Tax Allocation Percentages for Local Transit .................................................................... 5-7 Table 5-4: STA Funding Categories .............................................................................................................................. 5-9 Table 5-5: Summary of Proposed Fare Changes ..................................................................................................... 5-12 Table 5-6: Operations Revenue Detail ...................................................................................................................... 5-13
Item 8

MARIN TRANSIT | 2020–2029 SHORT RANGE TRANSIT PLAN Chapter 1: System Overview
1-1
Chapter 1: System Overview
District History
The Marin County Transit District (Marin Transit) was formed by a vote of the people of Marin County in 1964 to provide local transit service within Marin County. Marin Transit does not own any facilities and does not employ its own drivers. Instead, Marin Transit contracts with Golden Gate Transit, Marin Airporter, MV Transportation, and Whistlestop to operate local bus and paratransit services.
Prior to late 2003, Marin County’s transit district primarily managed and administered the contract for local and regional paratransit serving eligible seniors and disabled individuals. Marin Transit was historically a “pass through” agency providing funds for local services managed by Golden Gate Transit. With the 2003 service restructuring, Marin Transit began to take responsibility for planning, outreach, oversight, and management of local fixed route transit services throughout the county.
In 2004, Marin County voters approved a ½ cent transportation sales tax increase. Measure A provided a dedicated funding source for local public transit under a 20-year expenditure plan. This new funding enabled the District to pay for local big bus fixed route services, pay for and expand the rural Stagecoach service, and introduce the community shuttle program. Marin voters renewed the local ½ cent sales tax (Measure AA) for an additional 30 years in November 2018.
Marin County initiated the Muir Woods Shuttle in 2005 as a demonstration project. Marin Transit took over responsibility for the program in 2009. The Shuttle has significantly reduced transportation impacts on the National Monument and surrounding areas. The program is managed and funded under a formal partnership between the District and the National Park Service.
Marin Transit has also taken an active role in planning, managing, and recently funding various home to school transportation services for K-12 students in Marin County. The District adds Supplemental Service to the regular fixed route services on school days and partners with most school districts to support or directly provide yellow school bus services. A partnership with the College of Marin enables all enrolled students to ride the local services for free.
The District has added staff commensurate with its increased responsibilities and measured growth in services and functions. Prior to Measure A approval, Marin Transit had one full-time and one part-time employee. With the stability of Measure A, the number of full-time employees grew from 1.5 to 3.5 in 2006 and 5 employees in 2008. As of 2019, the District has 15 full-time employees.
Planning History and Studies
Measure A Expenditure Plan 2004
The Measure A Expenditure Plan provided a framework for the use of the Measure A ½ cent sales tax devoted to transportation improvements within Marin County. Fifty-five percent of this funding is designated for Strategy 1 of the plan to provide a seamless local bus transit system that improves mobility and meets community needs. There are four specific sub-strategies under Strategy 1 with accompanying service goals:
Item 8

MARIN TRANSIT | 2020–2029 SHORT RANGE TRANSIT PLAN Chapter 1: System Overview
1-2
Maintain and expand local bus transit service • Provide transit service every 15 minutes in the following corridors:
Highway 101 throughout Marin County connecting to San Francisco San Rafael-College of Marin via Andersen/Sir Francis Drake San Rafael-San Anselmo via Red Hill/4th Street San Rafael Transit Center – Civic Center and Northgate Mall.
• Provide transit service every 30 minutes in the following corridors: Sausalito to Marin City and the Toll Plaza via Bridgeway Mill Valley on Miller Avenue and East Blithedale Corte Madera and Larkspur via Tamalpais/Magnolia and Sir Francis Drake San Anselmo to Fairfax via Sir Francis Drake and Red Hill Road San Rafael via Lincoln to Civic Center, Merrydale, and on to Kaiser Hospital Novato service in the Hamilton area, in the Ignacio area east of Palmer and S. Novato
Boulevard Corridor service from Novato to the San Rafael Transit Center with connection to College
of Marin • Provide accessible neighborhood scaled shuttles using small buses in the following communities:
Novato Mill Valley Sausalito Belvedere and Tiburon San Rafael Ross Valley West Marin (maintain and expand Stagecoach service)
• Restore night service and ferry connector shuttles as demand requires • Provide flexible services for hillier or less populated areas with transit demand • Provide enhanced school bus service using creative transportation solutions
Maintain and improve the rural bus transit system • Develop a seven-day a week operation • Develop a north and south route service
Maintain and expand transit service and program for those with special needs • Maintain and expand transportation services for seniors and the disabled • Continue and extend paratransit service to all of Marin County • Develop new shared ride, wheelchair accessible taxi services that augments paratransit services • Expand group transportation and shuttle services focused on seniors • Provide discounted fares for very low-income seniors and person with disabilities, as well as the
lowest income members of our community • Provide discounted transit passes to youth
Invest in bus transit facilities for a clean and efficient transit system • Transit hubs in Novato and Southern Marin
Item 8

MARIN TRANSIT | 2020–2029 SHORT RANGE TRANSIT PLAN Chapter 1: System Overview
1-3
• Clean fuel vehicles • Bus stop amenities (bike racks, shelters, benches, etc.) • Bike racks on buses • Accurate signage and real-time information
The Expenditure Plan requires Marin Transit to develop and maintain a Short Range Transit Plan responsive to the changing transit needs of the county.
Measure AA Expenditure Plan 2018
The Measure AA Expenditure Plan defines how the extension of the 1/2-cent transportation sales tax will fund essential transportation needs in Marin. These include local street and road maintenance, Safe Routes to Schools programs, high quality local transit service, and highway and interchange improvements.
Marin voters approved the 2018 Marin County Transportation Sales Tax Renewal Expenditure Plan by a 76.7% margin in November 2018. This extends the ½- cent transportation sales tax for another 20 years through 2039. The goal of the Measure AA Expenditure Plan is to reduce congestion and greenhouse gas emissions, maintain and improve local transportation infrastructure, and provide high quality transportation options for people of all ages who live, work, and travel in Marin County.
Fifty-five percent of Measure AA funding is designated for Category 4 of the plan that calls for efficient and effective local transit services to reduce congestion and meet community needs, including services to schools and specialized service for seniors and persons with disabilities. Under this category, the sales tax enables Marin County to:
• Preserve existing transit service and provide a robust local public transit system dedicated to delivering workers and students to their jobs and schools.
• Maintain and expand rural and recreational bus services such as the Muir Woods Shuttle and the West Marin Stagecoach.
• Maintain and expand transit services and paratransit services for Marin’s seniors, persons with disabilities, and those with special needs.
• Dedicate funds for yellow school bus and other school transit services to provide matching funds for alternative fuel buses, such as all-electric buses, and plan for alternatives to traditional transit services.
Invest in bus transit facilities Short Range Transit Plans FY 2006-2015, FY 2009-2018, FY 2010-2019, FY 2012-2021, FY 2016-2025, FY 2018-2027
Marin Transit released its first Short Range Transit Plan in March 2006. This document:
• Developed a detailed understanding of the existing local service network; • Refined standards for productivity and mobility that ensure sales tax funds and other funding
resources are spent in the most efficient and cost-effective manner; • Used current and projected travel demand, land use, and demographics in the county to identify
service gaps and appropriate service levels in a constrained financial environment; • Developed supporting capital, marketing, and administrative plans; • Involved the public in deciding the transit future for Marin County; and
Item 8
MARIN TRANSIT | 2020–2029 SHORT RANGE TRANSIT PLAN Chapter 1: System Overview
1-4
• Developed polices to evaluate services and make adjustments over time.
The implementation of many of the objectives outlined in the March 2006 Short Range Transit Plan are described in subsequent SRTP updates released in 2009, 2010, and 2011. In 2012, Marin Transit completed a comprehensive update of the SRTP that introduced service typology definitions and tiered performance standards based on these assignments. In the 2015 SRTP, Marin Transit described a proposal for major fixed route service changes and restructuring that was implemented in June 2016. The Board adopted the most SRTP in December 2017.
Strategic Marketing Plan 2008
The Strategic Marketing Plan provided Marin Transit with recommended short-, medium-, and long-term strategies for passenger information materials, bus stop signage, and an advertising campaign. The effort started with a marketing baseline inventory and identification of the District’s market research needs. The consultant conducted stakeholder interviews and two sets of focus groups with current and potential riders. In addition to the strategies, the plan provided a budget with cost estimates for each aspect of the plan and an implementation timeline.
Marin Transit Systemwide Onboard Survey 2008, 2012, 2017
The District completed a 2008 onboard survey and summary report to ascertain rider satisfaction, develop a comprehensive understanding of how Marin Transit riders use the service, and record rider demographics for future planning efforts. All Marin Transit’s services were surveyed and resulted in 2,947 completed questionnaires. Marin Transit conducted an updated onboard survey in 2012 as part of its Countywide Transit Needs Assessment Study with 3,408 completed rider surveys.
In Spring 2017, the Metropolitan Transportation Commission (MTC) conducted an onboard survey as part of its Regional Onboard Survey Program. This survey was conducted by in-person interviewers using tablet computers unlike prior efforts that used traditional paper survey instruments. This method is more resource intensive and results in a smaller sample size and results in more accurate and complete data. All routes except Supplemental School services and the Muir Woods Shuttle were surveyed and provided 1,216 completed surveys.
Enhanced Taxi Services for Social Service Transportation and Public Transit Programs in Marin County 2008
In partnership with Marin County’s Department of Health and Human Services, Marin Transit identified strategies for enhanced taxi services for social service and public paratransit programs for Marin residents. MTC funded this project as a case study for other counties in the region.
Central and Southern Marin Transit Study 2009
Marin Transit worked with the Transportation Authority of Marin (TAM) on a Central and Southern Marin Transit Study. This project developed an incremental program of feasible and fundable improvements to U.S. 101-oriented trunk line bus service and identified opportunities for transit feeder service for ferry and regional commute bus services. An early premise of the study was the idea of locating a potential large transit hub serving Central and Southern Marin. Subsequent travel demand and transit service analysis concluded that a program of local transit infrastructure investment distributed at multiple sites on all the study corridors
Item 8
MARIN TRANSIT | 2020–2029 SHORT RANGE TRANSIT PLAN Chapter 1: System Overview
1-5
will yield more effective mobility benefits. The study introduced the concept of multimodal “green-hubs” at these sites to facilitate safe and efficient connectivity and community-oriented mobility. This is reflected in the options considered in the evaluation process and in the study’s final recommendations.
West Marin Transit Needs Assessment 2009
Marin Transit conducted a community-based transportation study to understand the transit needs specific to West Marin residents, employees, and visitors. Two rounds of public meetings were held at various locations, and community input significantly shaped the final strategies and recommendations. Highlights included recommendations to increase service on the Stagecoach routes, improve connections to Marin Airporter and Sausalito Ferry services, improve bus stops, and enhance bicycle carrying capacity on transit vehicles.
South Novato Transit Hub Study 2010
Marin Transit developed a strategic plan to improve bus patron access and transfers in Novato in partnership with the City of Novato and Golden Gate Transit. The plan identified three transit stops in Novato for upgrade: the downtown transit stop at Redwood and Grant, stops near the Rowland Boulevard and Highway 101 interchange, and stops near the Ignacio/Bel Marin Keys and Highway 101 interchange. These stops provide opportunities for passengers to transfer between regional-local and local-local bus routes within Novato and increased the efficiency of transit operations. The study identified improvements that target these locations and require minimal changes to bus operations or to adjacent land use. Improvements at the two locations along Highway 101 were completed in 2014. The District completed its largest construction project to date in September 2017 when it opened a downtown transfer facility that combined adjacent stops into one location.
Marin Senior Transportation Action and Implementation Plan 2010
Marin Transit co-sponsored the Marin Senior Mobility Action and Implementation Plan with Marin County’s Health and Human Services Division on Aging and Adult Services. The plan identified measures that the County and transportation agencies can take to support the mobility of Marin’s growing older population. The study supports efforts to keep older people safe and connected to their communities, as problems related to aging make it harder for them to get around. The Existing Conditions Report considered current and future demographics, described the state of senior transportation, presented examples of best practices, reported on outreach activities conducted as part of this project, and identified transportation gaps. The Action and Implementation Plan detailed strategies to meet the transportation needs of older adults based on the project’s research and stakeholder outreach efforts.
Novato Transit Needs Assessment 2011
Partnering with the City of Novato, Marin Transit conducted a Novato Transit Needs Assessment to evaluate transit services, identify new and emerging mobility needs not met by current transit service options, and craft practical strategies to meet these needs. This study included an extensive public outreach program of meetings, onboard and community surveys, and various tabling events. A series of short- and mid-term recommendations were developed. These included restructuring local bus routes to enhance service, better marketing of transit service, targeted bus stop improvements, and a transition plan for a community shuttle program to increase coverage using smaller vehicles.
Item 8
MARIN TRANSIT | 2020–2029 SHORT RANGE TRANSIT PLAN Chapter 1: System Overview
1-6
In March 2012, Marin Transit implemented several Phase 1 recommendations. Service-related changes included consolidating Routes 51 and 52 and extending Route 49. These changes increased local service frequencies to every 30 minutes, increased service for early morning and late evening travel, and added weekend service to areas where it had not been available. The District produced a Novato-specific transit rider guide that highlighted the service changes and combined all transit options in one brochure. Many of the Phase 2 recommendations were completed in 2013 and 2014, including adding a new shuttle network and capital improvements at major bus stops.
Tiburon Transit Needs Assessment 2012
Marin Transit completed its third community-based transit needs assessment study in the Tiburon Peninsula in 2012. As with similar efforts, this study conducted extensive outreach and analyzed performance data to develop transit service enhancements. The recommended service plan was largely implemented in August 2013 and included a new Route 219/219f shuttle and expanded Route 119 services to Redwood High School.
Countywide Transit Market Assessment Study 2012
The Countywide Transit Market Assessment (CTMA) evaluated how Marin fixed route transit service was provided relative the characteristics of existing transit markets. This study forecasted how these markets may shift or change in the future and identified recommendations to restructure or improve transit services. The assessment drew on a comprehensive onboard survey (2012), 2010 US Census data, and ride check data collected between 2010 and 2012. Recommendations focused on improvements to the fixed routes structure to better serve current markets and were largely implemented in June 2016.
Coordinated Countywide Student Transportation Study 2015
Marin Transit conducted a Coordinated Countywide School Transportation Study in partnership with TAM and the Marin County Office of Education. This study identified options to relieve roadway congestion, encourage use of healthy mobility options, and improve coordination of resources dedicated to student access to school. The study evaluated all current program offerings for opportunities to achieve proposed service goals especially reducing traffic congestion. These include the role of yellow bus transportation programs, public transit services, and Safe Routes to Schools (SR2S) programs. The report identified recommendations and action items to advance home to school transportation services based on stakeholder participation and the initial inventory of existing programs.
Marin Transit held a Board workshop in December 2015 to review the study results and recommendations. Following the workshop, the Board formed an Ad Hoc Committee on Student Transportation to advance the strategic planning phase of the study and develop a five-year implementation plan.
The study concluded that K – 8 students are most appropriately transported in yellow buses as opposed to transit buses. The Ad Hoc Committee on Student Transportation supported the transition of two elementary schools (St. Hilary School and the Cove School) from Supplemental service to yellow bus service. These actions directly achieved the second goal of the study to “Develop a Transition Plan to better match service models to student needs.” Additionally, the Ad Hoc Committee advised staff on developing a formula to distribute Measure AA funds to existing yellow bus programs in Marin County. In January 2019, the Marin Transit Board approved the allocation of $600,000 annually for three years to five yellow bus programs in Marin. Through these two actions, the Ad Hoc Committee on Student Transportation advanced the goals of the Coordinated Countywide School Transportation Study.
Item 8

MARIN TRANSIT | 2020–2029 SHORT RANGE TRANSIT PLAN Chapter 1: System Overview
1-7
Marin Access Strategic Analysis and Recommendations 2016
In 2015, Marin Transit initiated a comprehensive study of Marin Access programs to identify performance trends and lessons learned. The study provides an in-depth overview of Marin Access programs and riders and the market forces that influence current and future demand. The study identifies opportunities and constraints for Marin Access services and ten recommended strategies. Staff developed an action plan in 2016 with eight priority initiatives. Since 2016, staff have made progress on these initiatives:
• Implementing the Marin Mobility Innovation Incubator and awarding funding to support rider education about technology options;
• Implementing a same-day accessible pilot service; and • Procuring additional software solutions to improve the user experience for paratransit eligible clients.
Staff will conduct further analysis to evaluate the ongoing performance of Marin Access programs.
District Structure
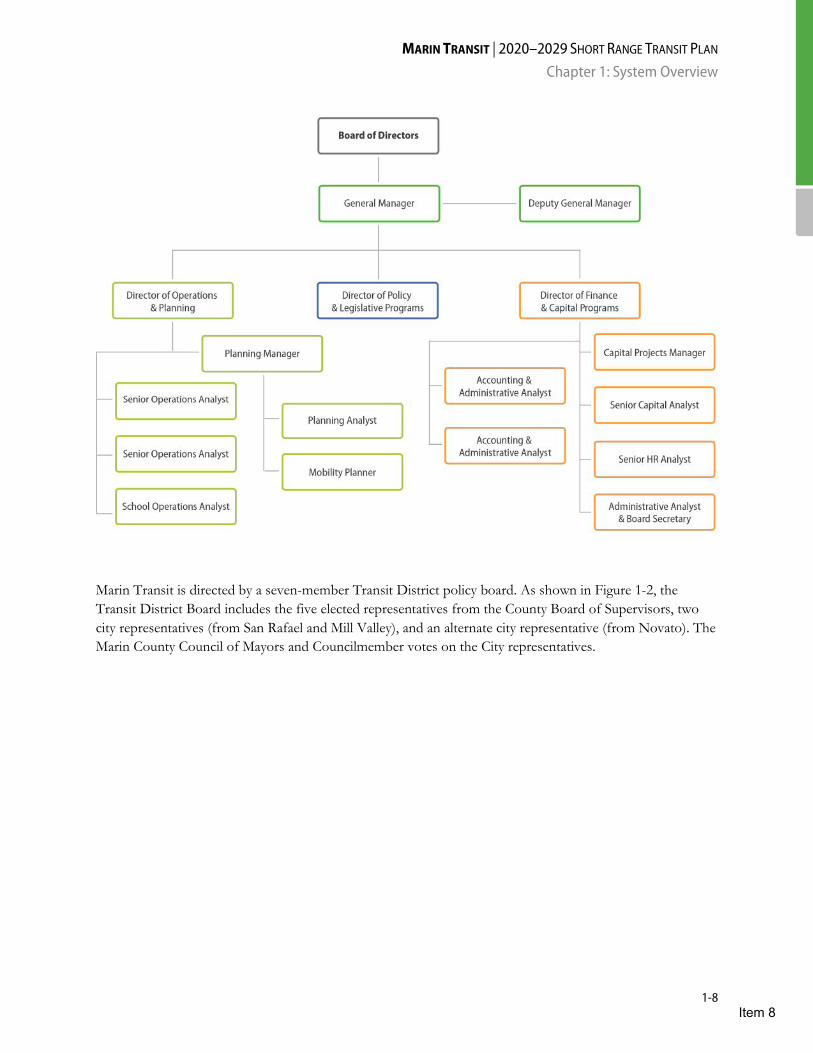
Marin Transit hired its first dedicated General Manager in June 2008. Three Director level positions report directly to the General Manager. These are the Director of Operations and Planning, the Director of Policy and Legislative Programs, and the Director of Finance and Capital Programs. The Director of Operations and Planning oversees three positions that support the operation oversight functions and a Planning Manager who oversees two Planning Analysts that support planning efforts of District provided services and programs.
The Director of Finance and Capital Programs oversees two Accounting and Grants Analysts, a Capital Projects Manager, Capital Analyst, and an Administrative Analyst. The Director of Policy and Legislative Programs oversees compliance with federal requirements, develops intergovernmental policies and initiatives, and serves as Marin Transit’s Civil Rights Officer. The District’s structure is shown in Figure 1-1.
Figure 1-1: District Structure
Item 8
MARIN TRANSIT | 2020–2029 SHORT RANGE TRANSIT PLAN Chapter 1: System Overview
1-8
Marin Transit is directed by a seven-member Transit District policy board. As shown in Figure 1-2, the Transit District Board includes the five elected representatives from the County Board of Supervisors, two city representatives (from San Rafael and Mill Valley), and an alternate city representative (from Novato). The Marin County Council of Mayors and Councilmember votes on the City representatives.
Item 8
MARIN TRANSIT | 2020–2029 SHORT RANGE TRANSIT PLAN Chapter 1: System Overview
1-9
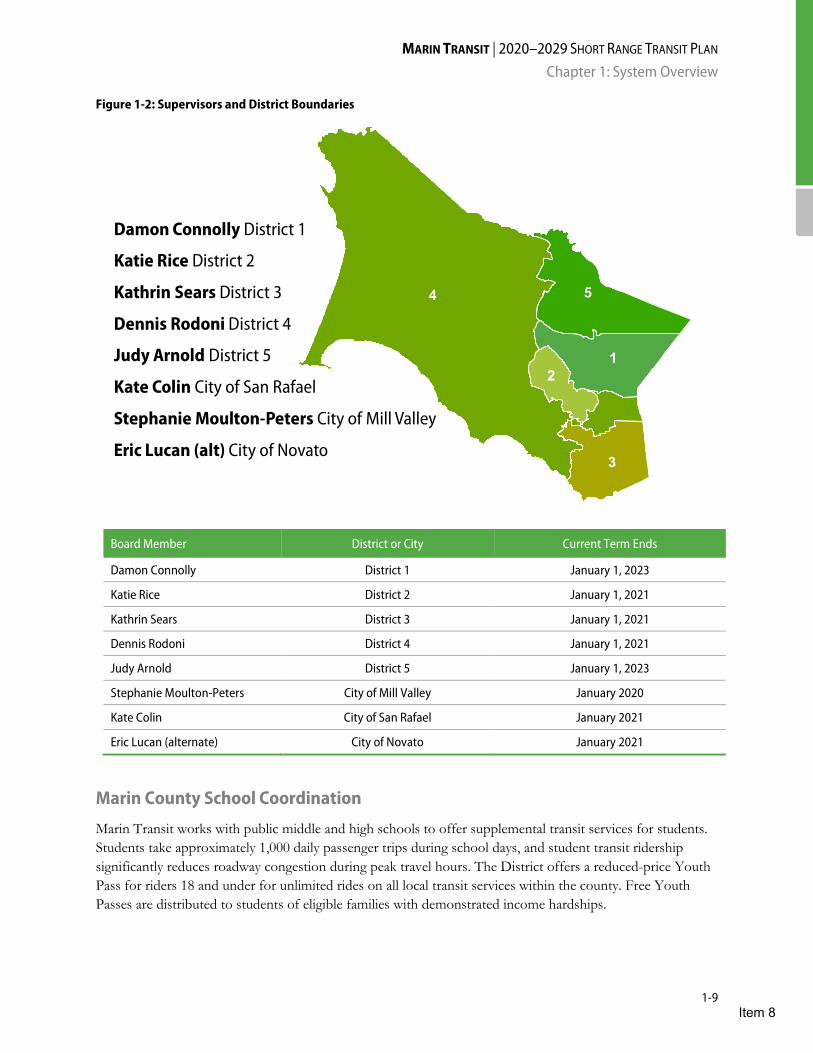
Figure 1-2: Supervisors and District Boundaries
Board Member District or City Current Term Ends
Damon Connolly District 1 January 1, 2023
Katie Rice District 2 January 1, 2021
Kathrin Sears District 3 January 1, 2021
Dennis Rodoni District 4 January 1, 2021
Judy Arnold District 5 January 1, 2023
Stephanie Moulton-Peters City of Mill Valley January 2020
Kate Colin City of San Rafael January 2021
Eric Lucan (alternate) City of Novato January 2021
Marin County School Coordination
Marin Transit works with public middle and high schools to offer supplemental transit services for students. Students take approximately 1,000 daily passenger trips during school days, and student transit ridership significantly reduces roadway congestion during peak travel hours. The District offers a reduced-price Youth Pass for riders 18 and under for unlimited rides on all local transit services within the county. Free Youth Passes are distributed to students of eligible families with demonstrated income hardships.
Damon Connolly District 1
Katie Rice District 2
Kathrin Sears District 3
Dennis Rodoni District 4
Judy Arnold District 5
Kate Colin City of San Rafael
Stephanie Moulton-Peters City of Mill Valley
Eric Lucan (alt) City of Novato
Item 8
MARIN TRANSIT | 2020–2029 SHORT RANGE TRANSIT PLAN Chapter 1: System Overview
1-10
Many of Marin’s school districts predict decreasing enrollment in the coming years. Marin Transit is exploring innovative ways to partner with individual schools and the Transportation Authority of Marin’s (TAM) Safe Routes to School (SR2S) program to support sustainable transportation options for students, such as yellow school bus programs. Examples of how schools work with Marin Transit to achieve efficiencies and ensure reliable service include:
• Designate a school coordinator or district coordinator as the primary point person for transit services. This person is responsible for informing parents and students on transit service options and registering students for Marin Transit’s Youth Pass Program.
• Distribute and promote Marin Transit’s Youth Pass. Assigned school coordinators collect payments or eligibility forms for free passes and provide this information to Marin Transit each semester. Coordinators receive a login password for Marin Transit’s integrated data management system to access transit information and record Youth Pass sales and free pass distribution.
• Provide School Calendars and Bell Schedules. Before teachers leave at the end the school year, the school provides Marin Transit and the bus operator with calendars and bell schedules for the upcoming school year. This provides adequate time for scheduling school transportation services.
• Coordinate Planning Assistance. Schools work with Marin Transit to plan for anticipated demands and geographic distribution of student populations. Information desired from schools and school districts include annual enrollment projections and student home origins.
• Participate in Safe Routes to School meetings. Marin Transit staff regularly attend SR2S meetings for school districts across the county to advocate for bus use as a component of SR2S, brainstorm ways to encourage students to ride, and ensure bus stops and pathways to stops are safe.
• Provide operational support for yellow bus programs. Marin County’s school districts no longer have dedicated funding or internal expertise to manage yellow school bus programs. As a means of traffic congestion relief, cities and school districts are working together to provide home to school transportation with yellow school bus programs. These partnerships raise funds and may contract with Marin Transit to provide planning expertise, contractor oversight, and customer service support.
• Distribute Measure AA funds to support existing yellow bus programs. There is no dedicated funding for regular yellow school bus programs in Marin County. In 2019, Marin Transit began distributing $600,000 annually for three years to support operation of five existing yellow bus programs in Marin. After eligible programs meet specific threshold criteria, Marin Transit determines the amount of funding that each program receives based on a formula.
School districts making programmatic changes in school boundaries, grade level distribution, or staggering of bell times are encouraged to include Marin Transit in their discussions to determine impacts on current or future transit services and the most efficient way to provide these services. Due to limited financial resources, the District cannot guarantee additional service to a school or school district that makes these types of changes if they will lead to operational inefficiencies.
Item 8
MARIN TRANSIT | 2020–2029 SHORT RANGE TRANSIT PLAN Chapter 1: System Overview
1-11
Marin Transit and the College of Marin also have a partnership to offer all registered students unlimited access to the local transit network. The partnership also provides enhanced services to the Kentfield campus on school days – Route 122.
Regional Coordination
Metropolitan Transportation Commission (MTC)
MTC is the transportation planning, coordinating, and financing agency for the nine-county San Francisco Bay Area. As the regional transportation planning agency and the metropolitan planning organization, MTC is also responsible for the Regional Transportation Plan that serves as a blueprint for transit and transportation investments in the Bay Area.
Marin Transit actively participates in several regional transit programs and on various committees.
511 Program The 511 Program is a phone and online resource that provides access to Bay Area transportation information. This service provides up-to-the minute information on all modes of travel including traffic, transit, and bicycling. Marin Transit participates in the 511 Program and provides up-to-date schedules, routes, and fare information. In 2014, Marin Transit joined the 511 real-time transit information system that provides real-time arrival predictions.
Clipper Program Clipper is the Bay Area’s universal fare media available for use on all public transit systems throughout the region. Golden Gate Transit (GGT) was one of the first agencies to adopt the system in 2006. Marin Transit contracts with GGT for a significant portion of its services, and Clipper has been available on these routes from the beginning. The District deployed Clipper on the remaining Marin Transit fixed route services in 2014. Since Clipper does not include any of the District’s passes or pass programs, Marin Transit continues to offer paper pass options to its riders. In 2019, the Clipper program initiated systemwide upgrades and enhancements that are expected to take approximately four years to complete. The District plans to transition to an independent operator within the Clipper when this process concludes.
Committees Marin Transit staff actively participate in regional committees organized by MTC. These include: Policy Advisory Council, Transit Finance Working Group, 511 Transit Technical Advisory Committee, Clipper Technical Advisory Committee, Regional Transit Rider Survey Working Group, Paratransit Technical Advisory Committee, and Bay Area Partnership Accessibility Committee.
Community-Based Transportation Plans (CBTP) & Station Area Planning Marin Transit continues to participate as a partner, stakeholder, and member of the Technical Advisory Committees for Marin County CBTP studies. These include: the Canal in San Rafael - 2007, Marin City - 2009 with 2015 update, and Novato - 2015. District staff has participated as technical members of three station area plans for SMART. These include stations in downtown San Rafael, adjacent to the County Civic Center in north San Rafael, and Larkspur. These collaborative efforts have identified important transit needs for potential regional grant opportunities.
Item 8
MARIN TRANSIT | 2020–2029 SHORT RANGE TRANSIT PLAN Chapter 1: System Overview
1-12
Resolutions The MTC Board of Commissioners has passed a series of resolutions that guide the coordinated regional development for transit services. These include:
• MTC Resolution No. 3434 (Regional Transit Expansion Program): There are no expansion projects specific to Marin Transit. SMART is the only Marin County project.
• MTC Resolution No. 4140 (Transit Capital Priorities Program for FY 2014/15 & FY 2015/16): This resolution includes the regional policies and procedures that guide the programing of FTA Section 5307 Urbanized funds to Bay Area Operators. The funds are primarily available for capital replacements of vehicle and equipment. The resolution also provides guidance for 5307 funds available for ADA paratransit operations as ADA set aside funds. Marin Transit’s SRTP assumes continued availability of 5307 funding for these purposes.
• MTC Resolution No. 3866 (MTC Transit Coordination Implementation Plan): The Transit Coordination Implementation Plan promotes coordinated fares and schedules among the Bay Area Transit Operators. Marin Transit shares data with the 511 schedule-based and real-time programs. The San Rafael Transit Center is part of the Regional Transit Hub Signage Program, and Marin Transit participated in developing and updating this signage. Marin Transit fully implemented Clipper on all local services in 2014. In Spring 2017, the District worked with MTC to conduct an onboard passenger survey as part of MTC’s Cooperative Demographic and Travel Pattern Transit Rider Survey Program. The District participates in coordination of all services as outlined in Resolution No. 3055.
• MTC Resolution No. 4060 (MTC Transit Sustainability Project): Marin Transit acknowledges and supports the Transit Sustainability Project recommendations and works closely with North Bay operators and SMART to coordinate planning and fare policies. District staff regularly participate in monthly North Bay Transit Technical Advisory Committee meetings and collaborate with planning staff from these agencies.
Golden Gate Transit
Marin Transit and Golden Gate Bridge Highway and Transportation District (Golden Gate Transit) work together to ensure coordination in providing Marin County with a quality regional and local transit system. Golden Gate Transit is Marin Transit’s primary contractor for local transit service and long-time partner. Planning, operations, and customer service staff meet regularly to discuss coordination of current and planned transit operations. Marin Transit supports a single customer service department staffed by Golden Gate Transit. The two agencies agree on formulas for sharing certain costs and TDA and STA revenues as detailed in the Marin Transit/Golden Gate Transit Intergovernmental Agreement. Under a separate agreement, Marin Transit manages the paratransit service contract on behalf of Golden Gate Transit.
Sonoma Marin Area Rail Transit (SMART)
When fully constructed, SMART will provide commuter rail service along a 70-mile corridor in Sonoma and Marin Counties. The voter-approved project will include a companion bicycle-pedestrian pathway along the corridor between Cloverdale and Larkspur. The Initial Operating Segment (IOS) of the project opened on Friday, August 25, 2017, and includes rail service between the Santa Rosa Airport and Downtown San Rafael.
Item 8
MARIN TRANSIT | 2020–2029 SHORT RANGE TRANSIT PLAN Chapter 1: System Overview
1-13
Bus connections currently link the Airport station to Cloverdale and the Downtown San Rafael station to Larkspur. In July 2017, SMART began to construct the rail extension to Larkspur that includes 2.2 miles of track connecting San Rafael and the terminal station in Larkspur Landing. SMART expects to initiate train service to Larkspur and open a new station in Downtown Novato in late 2019. Marin Transit and SMART staff meet regularly to coordinate planning efforts to ensure that transit users will experience a seamless network.
National Park Service (NPS)
The US Department of the Interior National Park Service (NPS) and Marin Transit partner to provide the Muir Woods Shuttle, a seasonal tourist-oriented transit service to Muir Woods National Monument. NPS and Marin Transit meet regularly to explore opportunities to improve services and expand service to other areas in Marin. Marin Transit oversees operation of the Shuttle, and the National Park Service provides financial, planning, and operations support for the program.
To manage Muir Woods visitation levels and parking demand, NPS implemented a new reservation system in January 2018. This system requires visitors to purchase park entrance tickets in advance and reserve a parking space or Shuttle seats. The reservation system has alleviated capacity issues on the Shuttle experienced in previous seasons by making arrival patterns more predictable.
The District is working with NPS to adapt new elements of the Shuttle program to support the new reservation model.
Transportation Authority of Marin (TAM)
TAM is the Congestion Management Agency and the transportation sales tax authority for Marin County. TAM administers the ½ cent transportation sales tax (Measure A) initially approved in 2004 and renewed in November 2018 as Measure AA. The expenditure plan designates 55 percent of Measure AA funds for transit service. Marin Transit and TAM closely coordinate on financial matters under the Measure AA funding categories and on capital investments for inclusion in the Regional Transportation Plan.
North Bay Transit Operators
Marin Transit meets regularly with three transit providers in Sonoma County, Santa Rosa City Bus, Petaluma Transit, and Sonoma County Transit, and Sonoma County’s congestion management authority (SCTA). Discussions provide updates on local and regional transit and transportation programs and identify opportunities for coordination and joint procurements.
Service Area Profile and Demographics
There are eleven incorporated cities and towns within Marin County. Table 1-1 presents and compares the population of cities in the county for the years 2000, 2010, and 2017. This data represents the total population and is not limited to bus riders.
Item 8

MARIN TRANSIT | 2020–2029 SHORT RANGE TRANSIT PLAN Chapter 1: System Overview
1-14
Table 1-1: Estimated Population, Size and Densities of Marin County Cities and Unincorporated Area
City Population Size Density
2000(1) 2010(2) 2017(3) % Change (2010-2017) (mi2) (pop/mi2) (emp/mi2)(4) (HH/acre)(3)
Belvedere 2,125 2,068 2,126 2.80% 0.5 3,984 688 2.88
Corte Madera 9,100 9,253 9,864 6.60% 4.4 2,925 1,353 1.34
Fairfax 7,319 7,441 7,598 2.10% 2.2 3,376 600 2.44
Larkspur 12,014 11,926 12,396 3.94% 3.0 3,939 2,004 3.07
Mill Valley 13,600 13,903 14,355 3.25% 4.8 2,919 1,060 1.91
Novato 47,630 51,904 55,980 7.85% 27.4 1,891 713 1.22
Ross 2,329 2,415 2,543 5.30% 1.6 1,441 288 0.75
San Anselmo 12,378 12,336 12,580 1.97% 2.7 4,608 1,009 3.03
San Rafael 56,063 57,713 59,070 2.35% 16.5 3,504 2,055 2.16
Sausalito 7,330 7,061 7,141 1.13% 1.8 3,987 2,857 3.32
Tiburon 8,666 8,962 9,165 2.26% 4.4 2,015 399 1.37
Unincorporated County
68,735 67,934 68,137 0.29% 450.5 152 24 0.09
Marin County Total 247,289 252,916 260,955 3.12% 519.8 485 179 0.31
Sources: (1) U.S. Census Bureau, 2000 Census; (2) U.S. Census Bureau, 2010 Census; (3) U.S. Census Bureau, 2013-2017 American Community Survey; (4) U.S. Census Bureau, LEHD Origin-Destination Employment Statistics, 2014
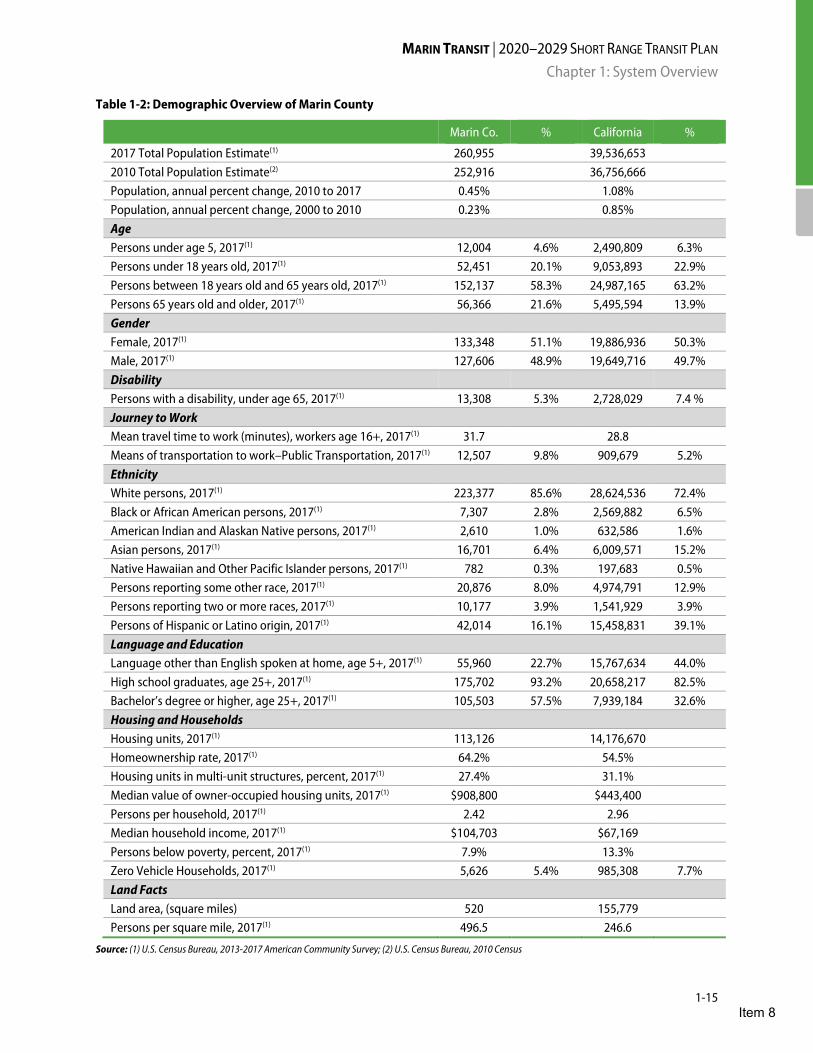
Table 1-2 compares current demographic and population data for Marin County using U.S. Census Bureau estimates from the 2000 and 2010 decennial census and the 2013-2017 American Community Survey. This data includes a summary of the total population of the County and State.
Table 1-3 presents key demographic data for local fixed route, rural services, and paratransit service and compare this data to the demographics of Marin. The comparison highlights significant differences in transit riders from the average Marin County resident in income and race. Compared to Marin County’s population as a whole, Marin Transit local riders have significantly lower income levels and a smaller proportion of riders identify themselves as Caucasian/White. About 35 percent of Marin Transit local riders earn less than $25,000 a year. Most Marin residents (63%) earn $75,000 or more, at the other end of the range.
Item 8
MARIN TRANSIT | 2020–2029 SHORT RANGE TRANSIT PLAN Chapter 1: System Overview
1-15
Table 1-2: Demographic Overview of Marin County
Marin Co. % California %
2017 Total Population Estimate(1) 260,955 39,536,653 2010 Total Population Estimate(2) 252,916 36,756,666 Population, annual percent change, 2010 to 2017 0.45% 1.08% Population, annual percent change, 2000 to 2010 0.23% 0.85% Age Persons under age 5, 2017(1) 12,004 4.6% 2,490,809 6.3% Persons under 18 years old, 2017(1) 52,451 20.1% 9,053,893 22.9% Persons between 18 years old and 65 years old, 2017(1) 152,137 58.3% 24,987,165 63.2% Persons 65 years old and older, 2017(1) 56,366 21.6% 5,495,594 13.9% Gender Female, 2017(1) 133,348 51.1% 19,886,936 50.3% Male, 2017(1) 127,606 48.9% 19,649,716 49.7% Disability Persons with a disability, under age 65, 2017(1) 13,308 5.3% 2,728,029 7.4 % Journey to Work Mean travel time to work (minutes), workers age 16+, 2017(1) 31.7 28.8 Means of transportation to work–Public Transportation, 2017(1) 12,507 9.8% 909,679 5.2% Ethnicity White persons, 2017(1) 223,377 85.6% 28,624,536 72.4% Black or African American persons, 2017(1) 7,307 2.8% 2,569,882 6.5% American Indian and Alaskan Native persons, 2017(1) 2,610 1.0% 632,586 1.6% Asian persons, 2017(1) 16,701 6.4% 6,009,571 15.2% Native Hawaiian and Other Pacific Islander persons, 2017(1) 782 0.3% 197,683 0.5% Persons reporting some other race, 2017(1) 20,876 8.0% 4,974,791 12.9% Persons reporting two or more races, 2017(1) 10,177 3.9% 1,541,929 3.9% Persons of Hispanic or Latino origin, 2017(1) 42,014 16.1% 15,458,831 39.1% Language and Education Language other than English spoken at home, age 5+, 2017(1) 55,960 22.7% 15,767,634 44.0% High school graduates, age 25+, 2017(1) 175,702 93.2% 20,658,217 82.5% Bachelor’s degree or higher, age 25+, 2017(1) 105,503 57.5% 7,939,184 32.6% Housing and Households Housing units, 2017(1) 113,126 14,176,670 Homeownership rate, 2017(1) 64.2% 54.5% Housing units in multi-unit structures, percent, 2017(1) 27.4% 31.1% Median value of owner-occupied housing units, 2017(1) $908,800 $443,400 Persons per household, 2017(1) 2.42 2.96 Median household income, 2017(1) $104,703 $67,169 Persons below poverty, percent, 2017(1) 7.9% 13.3% Zero Vehicle Households, 2017(1) 5,626 5.4% 985,308 7.7% Land Facts Land area, (square miles) 520 155,779 Persons per square mile, 2017(1) 496.5 246.6
Source: (1) U.S. Census Bureau, 2013-2017 American Community Survey; (2) U.S. Census Bureau, 2010 Census
Item 8

MARIN TRANSIT | 2020–2029 SHORT RANGE TRANSIT PLAN Chapter 1: System Overview
1-16
Table 1-3: Demographic Overview of Transit Riders in Marin County
Category Transit Rider (Onboard Survey Results)
Marin County %(1) 2005 2008 2012 2017(2)
Age
Persons under 18 years old 18% 25% 21% 11% 20%
Persons between 18 and 65 years old 78% 70% 72% 80% 60%
Persons 65 years old and older 4% 5% 7% 9% 20%
Gender
Female 48% 46% 49% 44% 51%
Male 52% 54% 51% 56% 49%
Household Income
Under $25,000 51% 61% 57% 35% 12%
$25,000 to $49,999 28% 18% 20% 24% 13%
$50,000 to $74,999 10% 8% 7% 12% 12%
$75,000 or more 10% 13% 16% 29% 63%
Race
Hispanic n/a 49% 43% 52% 16%
Caucasian/White n/a 36% 39% 29% 72%
African American n/a 9% 7% 7% 2%
Asian n/a 8% 5% 5% 6%
Other n/a 5% 6% 7% 4%
Source: (1) U.S. Census Bureau, 2013-2017 American Community Survey, (2) 2017 onboard survey did not include Supplemental school routes that were included in previous survey efforts.
Transit Rider Market Assessment
Marin Transit conducted a passenger survey in Spring 2017 to better understand the demographic characteristics and transit travel patterns of our passengers.
“Typical” Characteristics of Local Transit Riders
Marin Transit staff drew the following conclusions in comparing passenger demographics from the onboard survey and U.S. Census data from Marin County:
• The strongest indicator of transit usage is number of workers per household. Survey respondents who said there were three or more working persons in their homes accounted for over one-third of responses (37 percent), compared to just five percent of county residents. Note that in some cases multiple members of a household may have responded. Census data is reports data based on the number of households and not individuals.
Item 8
MARIN TRANSIT | 2020–2029 SHORT RANGE TRANSIT PLAN Chapter 1: System Overview
1-17
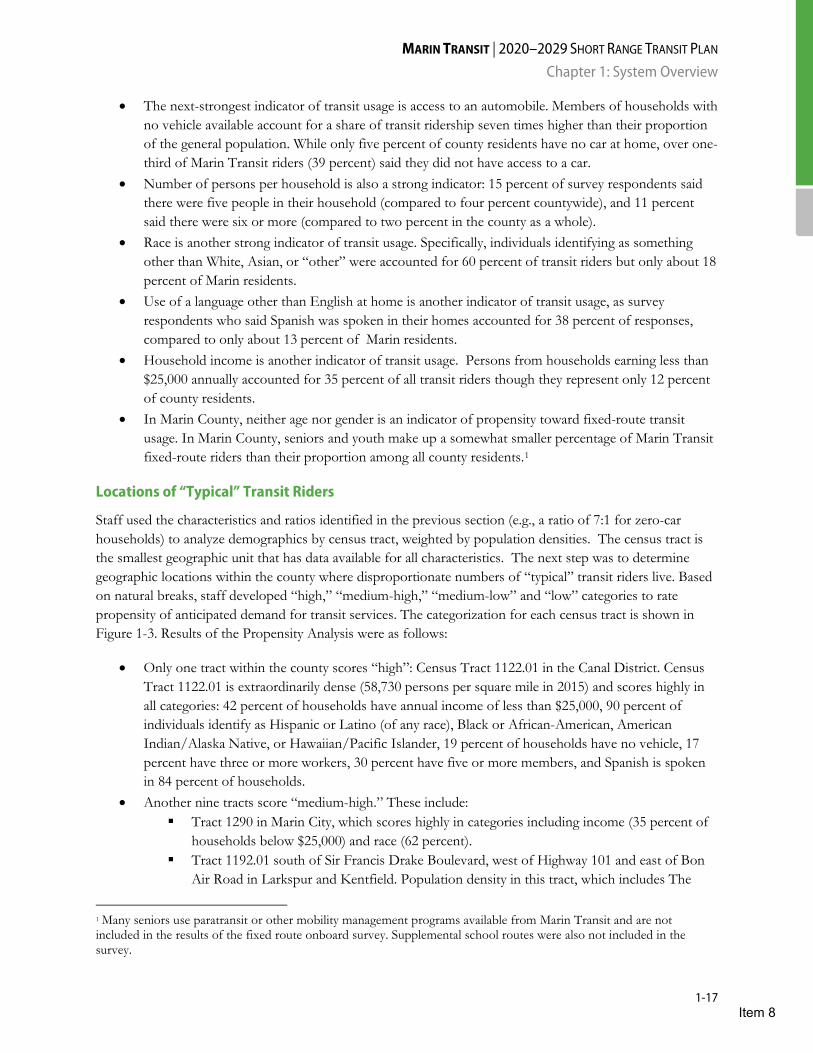
• The next-strongest indicator of transit usage is access to an automobile. Members of households with no vehicle available account for a share of transit ridership seven times higher than their proportion of the general population. While only five percent of county residents have no car at home, over one-third of Marin Transit riders (39 percent) said they did not have access to a car.
• Number of persons per household is also a strong indicator: 15 percent of survey respondents said there were five people in their household (compared to four percent countywide), and 11 percent said there were six or more (compared to two percent in the county as a whole).
• Race is another strong indicator of transit usage. Specifically, individuals identifying as something other than White, Asian, or “other” were accounted for 60 percent of transit riders but only about 18 percent of Marin residents.
• Use of a language other than English at home is another indicator of transit usage, as survey respondents who said Spanish was spoken in their homes accounted for 38 percent of responses, compared to only about 13 percent of Marin residents.
• Household income is another indicator of transit usage. Persons from households earning less than $25,000 annually accounted for 35 percent of all transit riders though they represent only 12 percent of county residents.
• In Marin County, neither age nor gender is an indicator of propensity toward fixed-route transit usage. In Marin County, seniors and youth make up a somewhat smaller percentage of Marin Transit fixed-route riders than their proportion among all county residents.1
Locations of “Typical” Transit Riders
Staff used the characteristics and ratios identified in the previous section (e.g., a ratio of 7:1 for zero-car households) to analyze demographics by census tract, weighted by population densities. The census tract is the smallest geographic unit that has data available for all characteristics. The next step was to determine geographic locations within the county where disproportionate numbers of “typical” transit riders live. Based on natural breaks, staff developed “high,” “medium-high,” “medium-low” and “low” categories to rate propensity of anticipated demand for transit services. The categorization for each census tract is shown in Figure 1-3. Results of the Propensity Analysis were as follows:
• Only one tract within the county scores “high”: Census Tract 1122.01 in the Canal District. Census Tract 1122.01 is extraordinarily dense (58,730 persons per square mile in 2015) and scores highly in all categories: 42 percent of households have annual income of less than $25,000, 90 percent of individuals identify as Hispanic or Latino (of any race), Black or African-American, American Indian/Alaska Native, or Hawaiian/Pacific Islander, 19 percent of households have no vehicle, 17 percent have three or more workers, 30 percent have five or more members, and Spanish is spoken in 84 percent of households.
• Another nine tracts score “medium-high.” These include: Tract 1290 in Marin City, which scores highly in categories including income (35 percent of
households below $25,000) and race (62 percent). Tract 1192.01 south of Sir Francis Drake Boulevard, west of Highway 101 and east of Bon
Air Road in Larkspur and Kentfield. Population density in this tract, which includes The
1 Many seniors use paratransit or other mobility management programs available from Marin Transit and are not included in the results of the fixed route onboard survey. Supplemental school routes were also not included in the survey.
Item 8
MARIN TRANSIT | 2020–2029 SHORT RANGE TRANSIT PLAN Chapter 1: System Overview
1-18
Tamalpais apartments for seniors, is the main contributor to its high score at 9,797 persons per square mile.
Tracts 1122.02, 1121, 1110, and 1090.01 in the Canal District and downtown and southern portions of San Rafael.
Tracts 1022.02, 1022.03, and 1041.02 in downtown and central Novato • Another 14 tracts score “medium-low.” These are clustered in Novato, in central Marin in San Rafael
and San Anselmo, and in southern Marin in Corte Madera, Tam Junction, Strawberry, and Sausalito. • The remainder of the county scored “low” in the analysis.
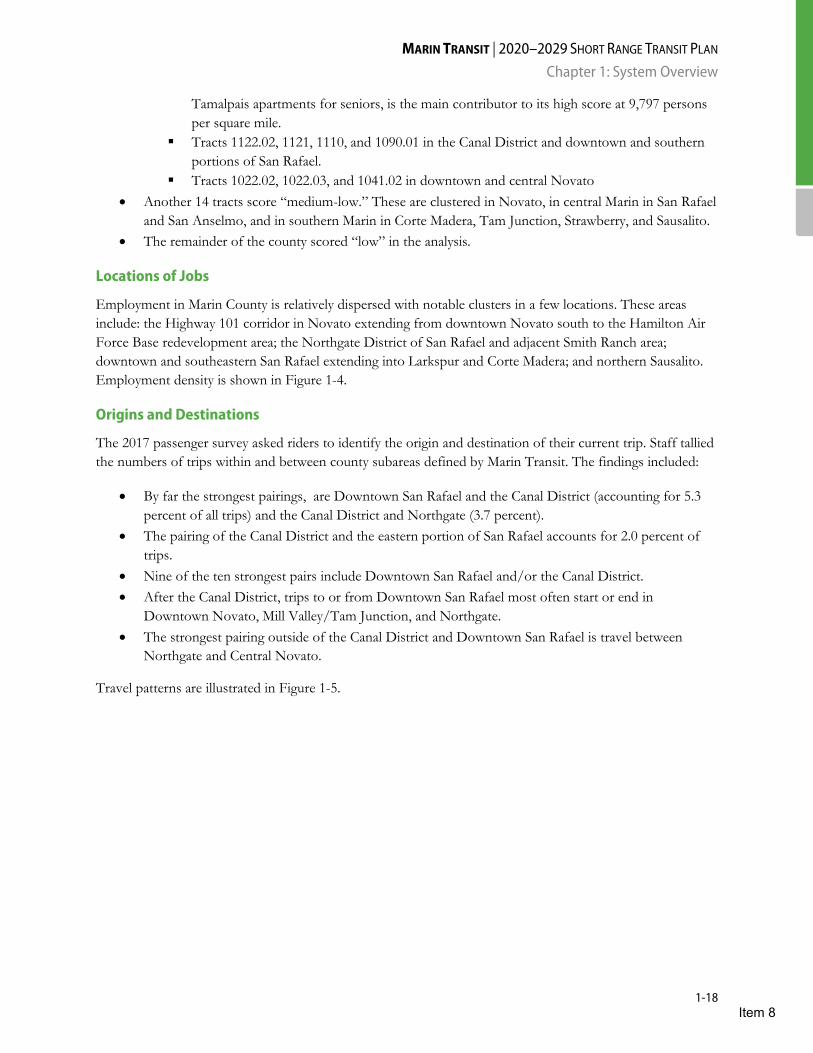
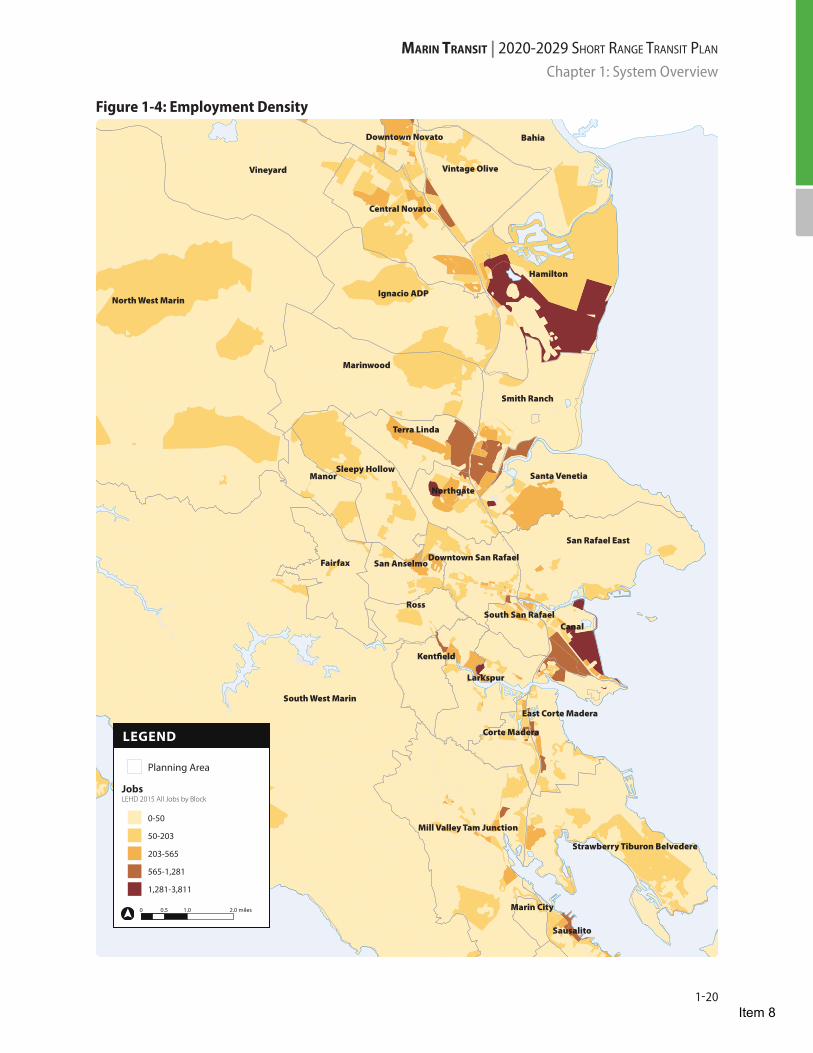
Locations of Jobs
Employment in Marin County is relatively dispersed with notable clusters in a few locations. These areas include: the Highway 101 corridor in Novato extending from downtown Novato south to the Hamilton Air Force Base redevelopment area; the Northgate District of San Rafael and adjacent Smith Ranch area; downtown and southeastern San Rafael extending into Larkspur and Corte Madera; and northern Sausalito. Employment density is shown in Figure 1-4.
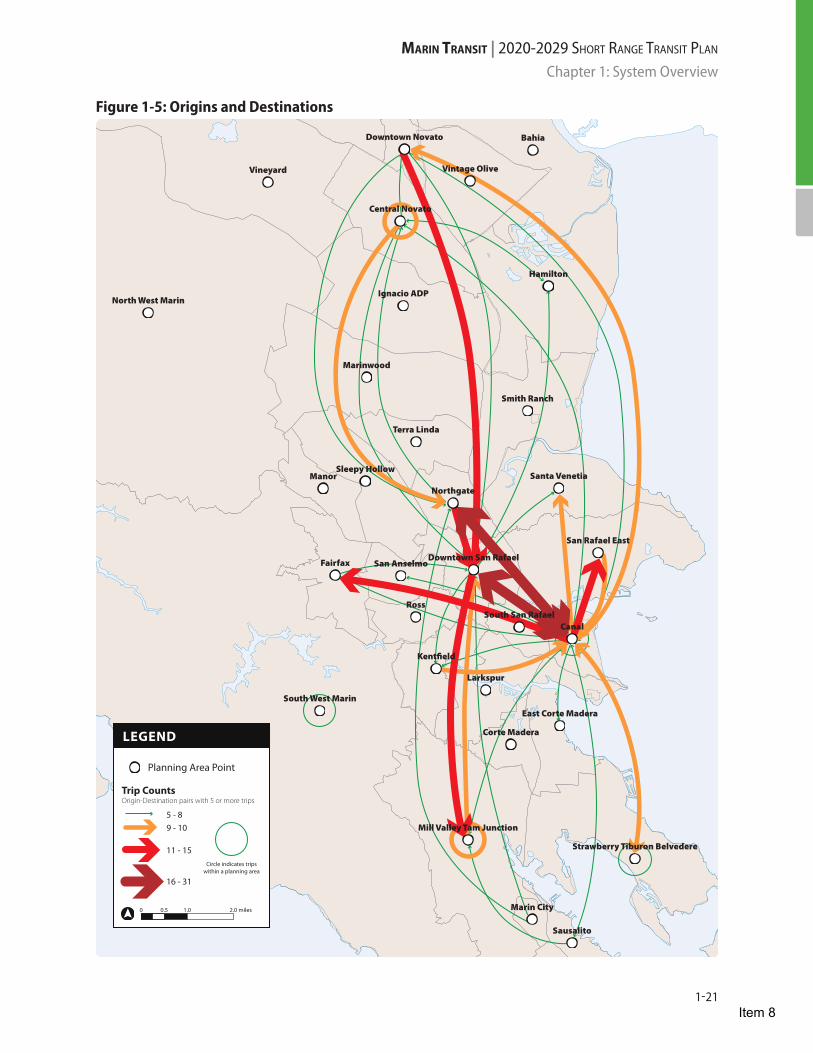
Origins and Destinations
The 2017 passenger survey asked riders to identify the origin and destination of their current trip. Staff tallied the numbers of trips within and between county subareas defined by Marin Transit. The findings included:
• By far the strongest pairings, are Downtown San Rafael and the Canal District (accounting for 5.3 percent of all trips) and the Canal District and Northgate (3.7 percent).
• The pairing of the Canal District and the eastern portion of San Rafael accounts for 2.0 percent of trips.
• Nine of the ten strongest pairs include Downtown San Rafael and/or the Canal District. • After the Canal District, trips to or from Downtown San Rafael most often start or end in
Downtown Novato, Mill Valley/Tam Junction, and Northgate. • The strongest pairing outside of the Canal District and Downtown San Rafael is travel between
Northgate and Central Novato.
Travel patterns are illustrated in Figure 1-5.
Item 8

Ross
Manor
Canal
Bahia
Fairfax
Vineyard
Larkspur
Hamilton
Sausalito
San Marin
Northgate
Marinwood
Kent�eld
Marin City
Terra Linda
Smith Ranch
San Anselmo
Ignacio ADP
Corte Madera
Vintage Olive
Sleepy HollowSanta Venetia
Central Novato
San Rafael East
Downtown Novato
South West Marin
South San Rafael
North West Marin
East Corte Madera
Downtown San Rafael
Mill Valley Tam Junction
Strawberry Tiburon Belvedere
LEGEND
0 0.5 1.0 2.0 miles
Planning Area Point
Transit Propensity Indexby Census Tract
Low
Medium-Low
Medium-High
High
Marin TransiT | 2020-2029 Short range tranSit Plan
1-19
Chapter 1: System Overview
Figure 1-3: Transit Propensity
Item 8
Ross
Manor
Canal
Bahia
Fairfax
Vineyard
Larkspur
Hamilton
Sausalito
San Marin
Northgate
Marinwood
Kent�eld
Marin City
Terra Linda
Smith Ranch
San Anselmo
Ignacio ADP
Corte Madera
Vintage Olive
Sleepy HollowSanta Venetia
Central Novato
San Rafael East
Downtown Novato
South West Marin
South San Rafael
North West Marin
East Corte Madera
Downtown San Rafael
Mill Valley Tam Junction
Strawberry Tiburon Belvedere
LEGEND
0 0.5 1.0 2.0 miles
Planning Area
JobsLEHD 2015 All Jobs by Block
0-50
50-203
203-565
565-1,281
1,281-3,811
Marin TransiT | 2020-2029 Short range tranSit Plan
1-20
Chapter 1: System Overview
Figure 1-4: Employment Density
Item 8
Ross
Manor
Canal
Bahia
Fairfax
Vineyard
Larkspur
Hamilton
Sausalito
San Marin
Northgate
Marinwood
Kent�eld
Marin City
Terra Linda
Smith Ranch
San Anselmo
Ignacio ADP
Corte Madera
Vintage Olive
Sleepy HollowSanta Venetia
Central Novato
San Rafael East
Downtown Novato
South West Marin
South San Rafael
North West Marin
East Corte Madera
Downtown San Rafael
Mill Valley Tam Junction
Strawberry Tiburon Belvedere
LEGEND
0 0.5 1.0 2.0 miles
Planning Area Point
Trip CountsOrigin-Destination pairs with 5 or more trips
5 - 89 - 10
11 - 15
16 - 31
Circle indicates tripswithin a planning area
Marin TransiT | 2020-2029 Short range tranSit Plan
1-21
Chapter 1: System Overview
Figure 1-5: Origins and Destinations
Item 8

MARIN TRANSIT | 2020–2029 SHORT RANGE TRANSIT PLAN Chapter 1: System Overview
1-22
Marin Transit Services
Marin Transit does not directly operate any of its services and instead provides them through contracts with multiple service providers. Table 1-4 summarizes the various contracts, the contracted organizations, and the terms of these contracts.
Table 1-4: Summary of Service Provider Contracts
Contract Type Services Provided Contractor Current Term FY 2018/19 Operating Expenses
Inter-governmental Agreement
Local Fixed Route and Customer Service
Golden Gate Transit
Jul 1, 2015 – Jun 30, 2020
(option years thru Jun 30, 2022) $8.9 million
Competitively Bid Local Fixed Route and Community Shuttles
Marin Airporter Jul 1, 2018 – Jun 30, 2021
(option years thru Jun 30, 2023) $5.7 million
Competitively Bid Local Fixed Route, Rural, and Seasonal Services, Catch-A-Ride
MV Transportation
July 1,2018 – Jun 30, 2021
(option years thru Jun 30, 2023) $3.8 million
Competitively Bid Local Paratransit, Novato Dial-A-Ride, and Rural Dial-A-Ride
Whistlestop Transportation
Jan 1, 2016 – Jun 30, 2020
(option years thru Jun 30, 2022) $4.7 million
Competitively Bid Travel Navigator Program, VDP
Whistlestop Transportation
May 16, 2016 – Jun 30, 2019 (option years thru June 30, 2022)
$363,000
Competitively Bid Yellow Bus Michael’s Transportation Services
Jul 1, 2018 – Jun 30, 2021
(option years thru June 30, 2023) $619,000
The following sections provide a brief overview of all transit services offered by Marin Transit and other providers within Marin County.
Fixed Route Services
Marin Transit provides a total of 29 fixed route transit services within Marin. Over three million trips were made on the local fixed route network in FY 2017/18.
Services are organized within the District based the typology of the service. The typology defines the function of that route and its intended market. There are seven typologies: Local Trunkline, Local Basic, Local Connector, Supplemental School, Rural, Recreational, and Partnership. Table 1-5 below shows a breakdown of each route by contractor and typology.
Item 8
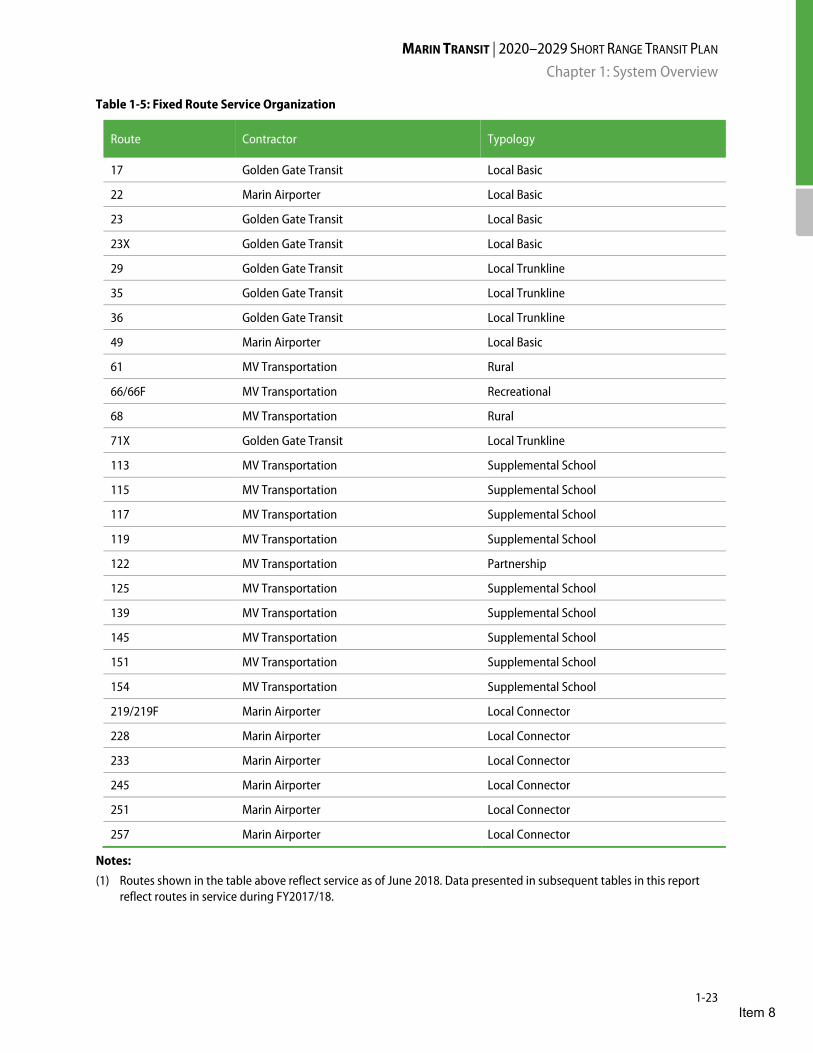
MARIN TRANSIT | 2020–2029 SHORT RANGE TRANSIT PLAN Chapter 1: System Overview
1-23
Table 1-5: Fixed Route Service Organization
Route Contractor Typology
17 Golden Gate Transit Local Basic
22 Marin Airporter Local Basic
23 Golden Gate Transit Local Basic
23X Golden Gate Transit Local Basic
29 Golden Gate Transit Local Trunkline
35 Golden Gate Transit Local Trunkline
36 Golden Gate Transit Local Trunkline
49 Marin Airporter Local Basic
61 MV Transportation Rural
66/66F MV Transportation Recreational
68 MV Transportation Rural
71X Golden Gate Transit Local Trunkline
113 MV Transportation Supplemental School
115 MV Transportation Supplemental School
117 MV Transportation Supplemental School
119 MV Transportation Supplemental School
122 MV Transportation Partnership
125 MV Transportation Supplemental School
139 MV Transportation Supplemental School
145 MV Transportation Supplemental School
151 MV Transportation Supplemental School
154 MV Transportation Supplemental School
219/219F Marin Airporter Local Connector
228 Marin Airporter Local Connector
233 Marin Airporter Local Connector
245 Marin Airporter Local Connector
251 Marin Airporter Local Connector
257 Marin Airporter Local Connector
Notes: (1) Routes shown in the table above reflect service as of June 2018. Data presented in subsequent tables in this report
reflect routes in service during FY2017/18.
Item 8

MARIN TRANSIT | 2020–2029 SHORT RANGE TRANSIT PLAN Chapter 1: System Overview
1-24
Fixed Route Typologies Approval of a local transportation sales tax measure in 2004 marked a turning point for local transit service in Marin County. This created a dedicated source of local funding and enabled Marin Transit to develop a service plan tailored to the needs of local transit riders. Historically, local transit service in Marin County was a byproduct of the Golden Gate Transit commute service. That service focused on commute trips into San Francisco across the Golden Gate Bridge during the peak commute hours, operated with coach-style vehicles. Marin Transit has focused planning efforts on developing a local transit system and route typologies that reflect the markets they are intended to serve.
Marin Transit developed the typologies with extensive community outreach to obtain public and rider preferences for transit services. This input was complemented by a comprehensive performance assessment using quantitative analysis tools. These include GIS analysis of annual ride-check data, farebox transfer data, and origin-destination passenger information. The effort transformed the previous “one size fits all” Golden Gate Transit service delivery model, and generated a series of route typologies and mobility management options unique to local transit markets. The resulting typologies have enabled the District to “right-size” transit service to the various markets within Marin and maximize operating resources. The typologies are consistent with the service definitions the regional MPO (MTC) suggested and guide the District’s decisions on fleet assignment, frequency and span of service, performance thresholds, and focusing capital investments to facilitate transfer activity.
Marin Transit assigned to all Marin Transit routes to seven unique route typologies. These typologies are described below, and Table 1-6 summarizes the different attributes of each typology.
/// Local Trunkline Local Trunkline services operate along the highest ridership corridors and often serve the areas of the county with the highest population or employment densities. These routes provide the backbone for the transit network and connect with Local Basic and Local Connector services at key transfer locations. Along Highway 101, Trunkline services supplement the Golden Gate Transit regional services that continue to San Francisco and Sonoma Counties.
Local Trunkline services include Routes 35, 36, and 71X. All routes use heavy-duty transit vehicles that accommodate up to two wheelchairs and three bicycles. The current fleet is a mix of low-floor 40’ and 60’ articulated, low-floor vehicles. In 2020, the District plans to replace all 60’ articulated vehicles with 40’ vehicles.
/// Local Basic Local Basic services operate along many of the county’s arterial corridors that have transit-supportive land use patterns. This type of service provides more extensive coverage than the Local Trunkline services while balancing frequency and speed. Routes provide direct connections between major destinations beyond the Highway 101 corridor and transfer opportunities with Local Trunkline and Local Connector services.
All Local Basic routes use heavy-duty transit vehicles that accommodate up to two wheelchairs and three bicycles. The current fleet is a mix of 35’ and 40’ low-flow vehicles.
Item 8

MARIN TRANSIT | 2020–2029 SHORT RANGE TRANSIT PLAN Chapter 1: System Overview
1-25
/// Local Connector Local Connector services operate in lower density areas with less supportive transit land use patterns or where larger bus capacity is not warranted. These services rely on good transfer opportunities to the Local Trunkline and Local Basic services for travel outside the community.
The connector routes are operated in a 24’ shuttle type cutaway vehicles on behalf of Marin Transit by Marin Airporter, under a five-year contract that expires on June 30, 2021. All shuttle vehicles carry up to two wheelchairs and two bicycles.
/// Supplemental School Supplemental School services address the transportation needs of students, primarily in middle and high school, within the County. These services offer additional capacity alongside other Marin Transit routes during school bell times and on school days only. These routes provide direct connections between major student destinations and are not designed for transfer opportunities.
Supplemental School routes use heavy-duty transit vehicles that accommodate up to two wheelchairs and two bicycles.
/// Rural Rural services provide connections between West Marin and the eastern part of the county on the West Marin Stagecoach. These routes provide community mobility and regional connections to the Highway 101 corridor. The Stage routes also serve a significant recreational and tourist market, particularly during summer and on weekends, and help reduce congestion in the rural areas. Major recreational and tourist destinations include Point Reyes National Seashore, Mt. Tamalpais State Park, Samuel P. Taylor State Park, and Stinson Beach.
Topography is challenging on these routes, and there are specific fleet attributes required to deliver these services. Flag stops are permitted along the western, rural portion of the routes at any location where it is safe for the driver to pull over.
Two routes (Route 61 and Route 68) are operated by MV Transportation under contract to Marin Transit. The North Route (“Route 68”) begins at the San Rafael Transit Center and terminates at Inverness via Sir Francis Drake and the Shoreline Highway. Major stops include San Anselmo, Fairfax, Woodacre, San Geronimo, Samuel P. Taylor Park, Point Reyes, and Inverness Park. The South Route (“Route 61”) begins in Marin City on weekdays and in Sausalito on weekends and holidays and terminates in Bolinas. Major stops include Marin City, Manzanita Park and Ride, Tamalpais Junction, Pantoll Ranger Station, and Stinson Beach.
All rural vehicles carry up to two wheelchairs and two bicycles. ADA eligible riders may schedule deviated pickup and drop-offs within three-quarters of a mile of the fixed route using the Stagecoach service. Reservations are required for this service. On weekends on the South Route 61, ADA trips are assigned to paratransit services provided by Whistlestop Wheels.
/// Recreational Recreational services support recreation or tourist-based travel within the county. Major attractions include the Muir Woods National Monument within the Golden Gate National Recreation Area. These services strictly focus on reducing congestion related to recreational travel. They operate seasonally depending on
Item 8
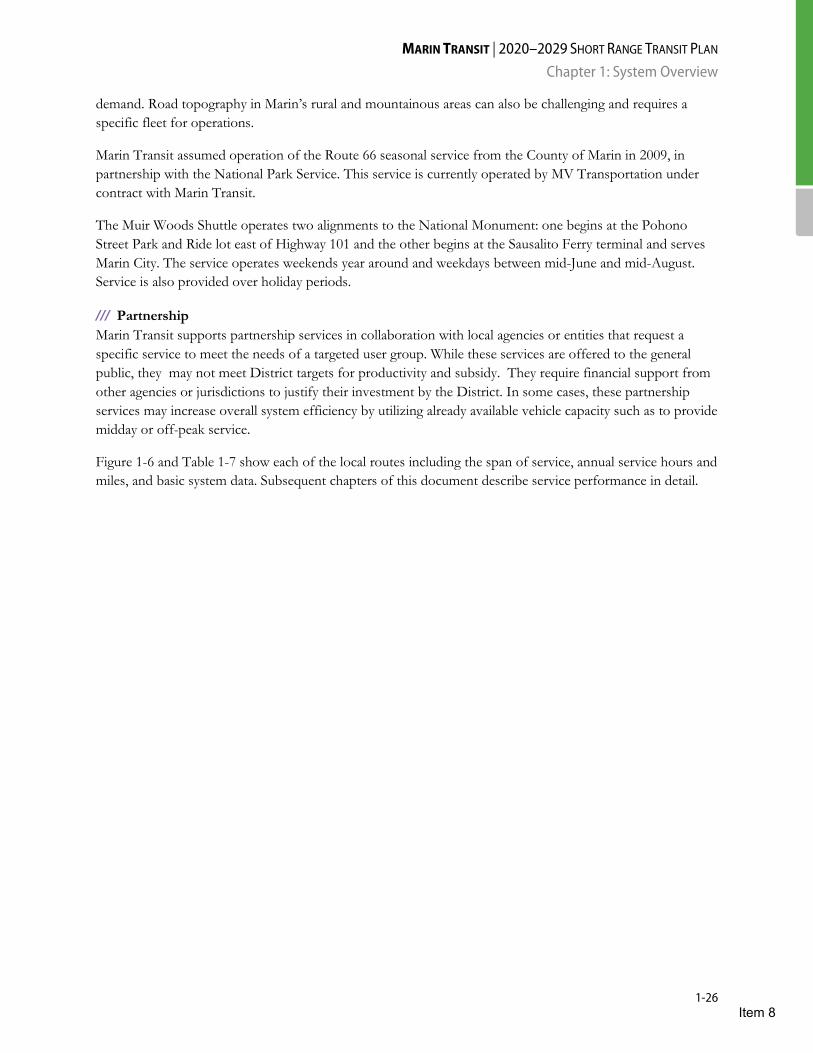
MARIN TRANSIT | 2020–2029 SHORT RANGE TRANSIT PLAN Chapter 1: System Overview
1-26
demand. Road topography in Marin’s rural and mountainous areas can also be challenging and requires a specific fleet for operations.
Marin Transit assumed operation of the Route 66 seasonal service from the County of Marin in 2009, in partnership with the National Park Service. This service is currently operated by MV Transportation under contract with Marin Transit.
The Muir Woods Shuttle operates two alignments to the National Monument: one begins at the Pohono Street Park and Ride lot east of Highway 101 and the other begins at the Sausalito Ferry terminal and serves Marin City. The service operates weekends year around and weekdays between mid-June and mid-August. Service is also provided over holiday periods.
/// Partnership Marin Transit supports partnership services in collaboration with local agencies or entities that request a specific service to meet the needs of a targeted user group. While these services are offered to the general public, they may not meet District targets for productivity and subsidy. They require financial support from other agencies or jurisdictions to justify their investment by the District. In some cases, these partnership services may increase overall system efficiency by utilizing already available vehicle capacity such as to provide midday or off-peak service.
Figure 1-6 and Table 1-7 show each of the local routes including the span of service, annual service hours and miles, and basic system data. Subsequent chapters of this document describe service performance in detail.
Item 8
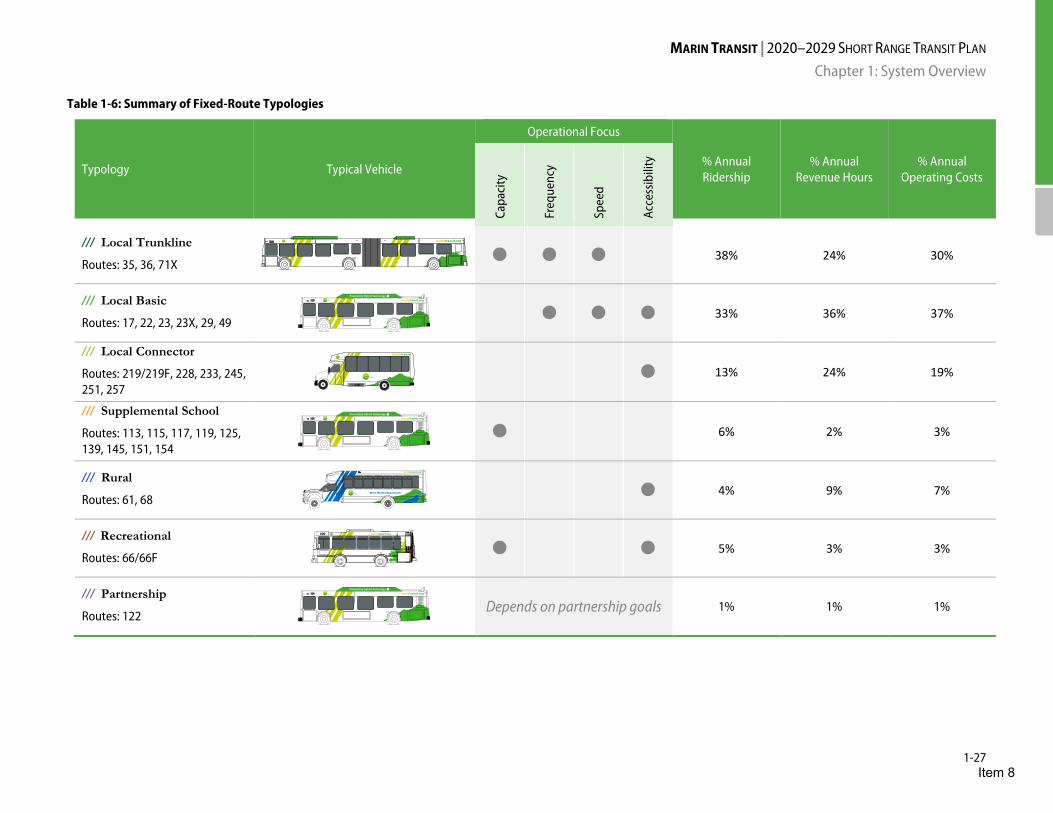
MARIN TRANSIT | 2020–2029 SHORT RANGE TRANSIT PLAN Chapter 1: System Overview
1-27
Table 1-6: Summary of Fixed-Route Typologies
Typology Typical Vehicle
Operational Focus
% Annual Ridership
% Annual Revenue Hours
% Annual Operating Costs
Capa
city
Freq
uenc
y
Spee
d
Acce
ssib
ility
/// Local Trunkline
Routes: 35, 36, 71X ● ● ● 38% 24% 30%
/// Local Basic
Routes: 17, 22, 23, 23X, 29, 49 ● ● ● 33% 36% 37%
/// Local Connector
Routes: 219/219F, 228, 233, 245, 251, 257
● 13% 24% 19%
/// Supplemental School
Routes: 113, 115, 117, 119, 125, 139, 145, 151, 154
● 6% 2% 3%
/// Rural
Routes: 61, 68 ● 4% 9% 7%
/// Recreational
Routes: 66/66F ● ● 5% 3% 3%
/// Partnership
Routes: 122 Depends on partnership goals 1% 1% 1%
Item 8
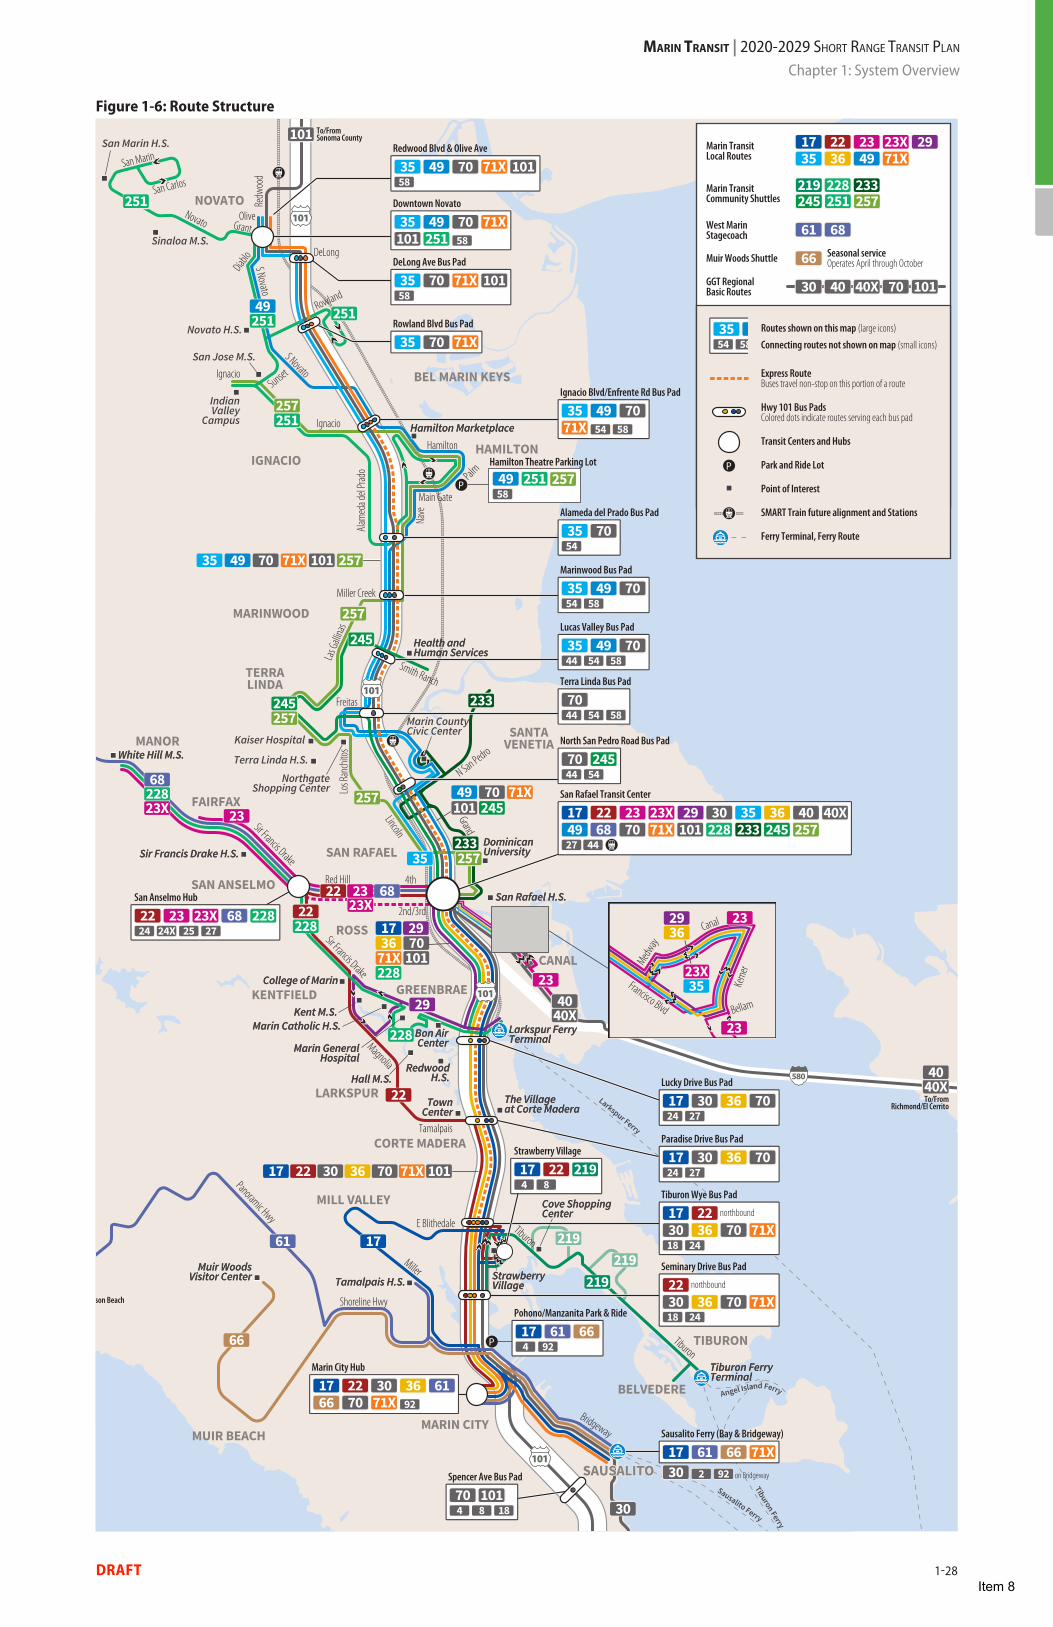
101 To/FromSonoma County
To/FromInverness
To/FromBolinas, Stinson Beach
To/FromSan Francisco
NorthgateShopping Center
Marin CountyCivic Center
Kaiser Hospital
Terra Linda H.S.
IndianValley
Campus
San Marin H.S.
San Jose M.S.
Sinaloa M.S.
Novato H.S.
Sir Francis Drake H.S.Sir Francis Drake H.S.
College of MarinCollege of Marin
Kent M.S.Kent M.S.
White Hill M.S.White Hill M.S.
Dominican UniversityDominican University
Health andHuman ServicesHealth andHuman Services
San Rafael H.S.San Rafael H.S.
Marin Catholic H.S.Marin Catholic H.S.
Marin GeneralHospital
Marin GeneralHospital
Bon AirCenter
Bon AirCenter
Hall M.S.Hall M.S.Redwood
H.S.Redwood
H.S.
The Villageat Corte MaderaThe Villageat Corte MaderaTown
CenterTown
Center
Tiburon FerryTerminalTiburon FerryTerminal
Tamalpais H.S.Tamalpais H.S.
Cove ShoppingCenterCove ShoppingCenter
StrawberryVillageStrawberryVillage
Muir WoodsVisitor Center
Muir WoodsVisitor Center
Hamilton MarketplaceHamilton Marketplace
Larkspur FerryTerminalLarkspur FerryTerminal
228
70
10171X70
257
257
257
257
228
228
228
22
22
22
22
35
10171X
40X
40X
219
219219
3629
29
17
10171X7030
1017030
3617
61
66
17
68
68
23X
23X
23
23
23
245
245
4935
49
233
233
257
257
24510171X7049
251
251 251
251
30
40
40
SANTAVENETIA
SAN RAFAEL
SAN ANSELMO
FAIRFAX
MANOR
ROSS
KENTFIELD GREENBRAE
CANAL
LARKSPUR
CORTE MADERA
MILL VALLEY
MUIR BEACH
BELVEDERE
TIBURON
MARIN CITY
TERRALINDA
HAMILTON
BEL MARIN KEYS
NOVATO
IGNACIO
MARINWOOD
251 25749Hamilton Theatre Parking Lot
58
P
P
Larkspur Ferry
Sausalito Ferry
Tiburon Ferry
Angel Island Ferry
23Canal
Kerne
r
Bellam
Francisco Blvd
Medway
36
35
29
23X
23
Las Ga
llinas
GrandSir Francis Drake
Lincoln
Sir Francis DrakeMagnolia
101
101
101
101
Red Hill
Freitas
Los R
anch
itos
4th
2nd/3rd
Tamalpais
E Blithedale
Shoreline Hwy
Panoramic Hwy
Tiburon
Bridgeway
Tiburon
Miller
Novato
S Novato
Redw
ood
S Novato
Rowland
GrantDiab
lo
Olive
San Marin
San Carlos
SunsetIgnacio
DeLong
Ignacio
Alame
da de
l Prad
o
Nave
Hamilton
Main Gate
Palm
Miller Creek
Smith Ranch
N San Pedro
580
Downtown Novato
35 49 70 71X101 251 58
Ignacio Blvd/Enfrente Rd Bus Pad
35 49 7071X 54 58
Alameda del Prado Bus Pad
35 7054
Marinwood Bus Pad
35 49 7054 58
San Anselmo Hub
22 23 68 22823X24 24X 25 27
Lucas Valley Bus Pad
35 49 7044 54 58
Terra Linda Bus Pad
7044 54 58
North San Pedro Road Bus Pad
70 24544 54
San Rafael Transit Center
17 22 23 23X 35 36 4040X
2949
3070 71X 101 228 233 24568 257
40X
27 44
DeLong Ave Bus Pad
35 70 71X 10158
Rowland Blvd Bus Pad
35 70 71X
Lucky Drive Bus Pad
17 30 36 7024 27
Paradise Drive Bus Pad
17 30 36 7024 27
Tiburon Wye Bus Pad
22 northbound
3017
36 70 71X18 24
36 70
Seminary Drive Bus Pad
2230 71X18 24
northbound
2271X
36 6170
Marin City Hub
1770
3066 92
17 6661Pohono/Manzanita Park & Ride
17924
Sausalito Ferry (Bay & Bridgeway)
17 6130
66 71X2 92 on BridgewaySpencer Ave Bus Pad
70 1014 8 18
Redwood Blvd & Olive Ave
35 49 70 71X 10158
Strawberry Village
17 22 2194 8
P
1736 71X493522 2923X23
6861
66
30 70 10140 40X
Marin Transit Local Routes
Marin Transit Community Shuttles
West Marin Stagecoach
Muir Woods Shuttle Seasonal service Operates April through October
GGT Regional Basic Routes
Routes shown on this map (large icons)
Connecting routes not shown on map (small icons)
257251228 233
245219
35 7054 58
Express Route Buses travel non-stop on this portion of a route
Hwy 101 Bus PadsColored dots indicate routes serving each bus pad
Transit Centers and Hubs
Park and Ride Lot
Point of Interest
SMART Train future alignment and Stations
Ferry Terminal, Ferry Route
To/FromRichmond/El Cerrito
DRAFT
Marin TransiT | 2020-2029 Short range tranSit Plan
Chapter 1: System Overview
1-28
Figure 1-6: Route Structure
Item 8

MARIN TRANSIT | 2020–2029 SHORT RANGE TRANSIT PLAN Chapter 1: System Overview
1-29
Service Structure Providing effective and efficient transportation poses challenges in a suburban environment such as Marin County. As resources for transit are limited, these challenges require the District to identify the right balance between coverage and service levels (frequency/coverage). Spreading service over a larger geography creates reduced service levels overall that are not attractive to many riders. Concentrating service in a few select corridors makes them inaccessible for many residents.
The District’s most recent service changes in 2016 were a step toward increasing service levels while minimizing any reduction in coverage. These improvements focused on select east-west and north-south corridors where travel demand and congestion were highest. The goal was to transition these corridors from a 15/30-minute peak and 30/60-minute off-peak frequency to a 15-minute daily service level. Figure 1-7 shows these high frequency corridors.
In addition to increased service frequencies in these corridors, the District focused its most recent service improvements on reducing transit travel time. There are limited opportunities for travel time advantages over single occupant automobiles in Marin. Limited stop or express services reduce passenger travel time along these corridors. Figure 1-8 shows these service areas.
Table 1-7 provides a comprehensive summary of service levels and ridership by route.
Item 8

Richardson Bay
Bolinas Bay
Tomales Bay
Bodega Bay
San Pablo Bay
San Rafael Bay
Marin CountyCivic Center
Northgate Mall
Kaiser Hospital
Health & Human Services
Dominican University
Vintage Oaks
Indian Valley Campus
Pacheco Plaza
Marin General
College of Marin
Larkspur FerryTerminal
The Villageat Corte Madera
Town Center
Tiburon FerryTerminal
Sausalito FerryTerminal
Strawberry Village
MANOR
STINSON BEACH
SAN GERONIMO
MILL VALLEY
SAUSALITOMARIN CITY
TIBURON
SAN ANSELMO
KENTFIELD
FAIRFAX
SAN RAFAEL
NOVATO
CANAL
HAMILTON
IGNACIO
TERRA LINDA
CORTE MADERA
LARKSPUR
LEGEND
0 0.5 1.0 2.0 miles
Transfer Point
Peak Frequency
Every 15 minutes
Every 30 minutes
Every 60 minutes or more
Point of Interest
Marin TransiT | 2020-2029 Short range tranSit Plan
DRAFT 1-30
Chapter 1: System Overview
Figure 1-7: Existing Service Frequencies
Item 8

Richardson Bay
Bolinas Bay
Tomales Bay
Bodega Bay
San Pablo Bay
San Rafael Bay
Marin CountyCivic Center
Northgate Mall
Kaiser Hospital
Health & Human Services
Dominican University
Vintage Oaks
Indian Valley Campus
Pacheco Plaza
Marin General
College of Marin
Larkspur FerryTerminal
The Villageat Corte Madera
Town Center
Tiburon FerryTerminal
Sausalito FerryTerminal
Strawberry Village
MANOR
STINSON BEACH
SAN GERONIMO
MILL VALLEY
SAUSALITOMARIN CITY
TIBURON
SAN ANSELMO
KENTFIELD
FAIRFAX
SAN RAFAEL
NOVATO
CANAL
HAMILTON
IGNACIO
TERRA LINDA
CORTE MADERA
LARKSPUR
LEGEND
0 0.5 1.0 2.0 miles
Transfer Point
Express Routes
All local stops served
Route does not stop
Regular local service only
Point of Interest
Marin TransiT | 2020-2029 Short range tranSit Plan
DRAFT 1-31
Chapter 1: System Overview
Figure 1-8: Express Connections
Item 8

MARIN TRANSIT | 2020–2029 SHORT RANGE TRANSIT PLAN Chapter 1: System Overview
1-32
Table 1-7: Marin Fixed Route Transit Routes
Route Days of
Operation
Service Span(1) Frequency Annual Ridership(2)
Annual Rev Hrs(2) (3) Weekdays Weekends Weekdays Weekends
Local Trunkline
35 Canal - San Rafael - Novato Daily 5:08a - 2:25a 5:08a - 2:25a 30 min 30 min 665,936 23,006
36 Canal - San Rafael - Marin City Daily 6:23a - 8:10p 7:18a - 6:40p 30 min 30 min 361,490 13,700
71X Highway 101 Corridor Weekdays 6:10a – 7:08p - 30 min/60 min - 115,745 7,405
Local Basic
17 Sausalito - Mill Valley - San Rafael Daily 5:30a - 11:25p 6:30a - 11:25p 30/60 min 60 min 250,651 14,885
22 San Rafael - Marin City Daily 6:00a - 10:55p 7:00a - 9:55p 30/60 min 60 min 207,816 17,906
23 Fairfax - San Rafael - Canal Daily 5:51a - 10:46p 7:06a - 9:53p 60 min 60 min 196,569 11,070
23X Manor - Fairfax - San Rafael - Canal Weekdays 6:01a - 7:25p - 60/- min - 52,463 3,407
29 Marin General - San Rafael - Canal Weekdays 6:34a – 6:55p - 60/- min - 40,315 3,299
49 San Rafael - Downtown Novato Daily 6:11a - 9:01p 7:15a - 10:55p 30/60 min 60 min 244,988 14,842
Local Connector
219 Tiburon - Strawberry Daily 6:18a – 9:00p 7:43a - 7:58p 30 min 30 min 51,072 6,484
228 San Rafael - San Anselmo - Fairfax Daily 6:30a - 8:25p 6:42a - 7:25p 60 min 60 min 78,027 10,124
233 Santa Venetia - San Rafael Daily 6:24a - 7:28p 7:24a - 5:55p 60 min 60 min 43,943 4,359
245 San Rafael - Kaiser - Smith Ranch Rd Daily 7:00a - 6:55p 7:00a - 6:55p 60 min 60 min 51,096( 4,347
251 Novato Local Daily 6:35a - 8:56p 8:01a - 8:54p 60 min 60 min 98,028 9,596
257 San Rafael - Hamilton - Ignacio Weekdays 6:01a - 10:25p - 60 min - 65,515 7,639
Item 8

MARIN TRANSIT | 2020–2029 SHORT RANGE TRANSIT PLAN Chapter 1: System Overview
1-33
Table 1-7: Marin Fixed Route Transit Routes (continued)
Route Days of
Operation
Service Span(1) Frequency Annual Ridership(2)
Annual Rev Hrs(2) (3) Weekdays Weekends Weekdays Weekends
Supplemental
113 Corte Madera - Redwood HS School Days 7:16a - 3:37p - 4 trips - 16,449 346
115 Sausalito - Mill Valley - Tiburon School Days 7:20a - 2:59p - 3 trips - 9,495 344
117 Corte Madera - Hall MS School Days 7:41a - 3:54p - 3 trips - 23,647 457
119 Tiburon - Redwood HS School Days 7:04a - 3:37p - 4 trips - 30,850 592
125 San Anselmo - Drake HS - Lagunitas School Days 7:05a – 5:10p - 4 trips - 11,798 597
139 Lucas Valley - Terra Linda HS School Days 7:02a - 4:25p - 2trips - 4,852 320
145 San Rafael - Terra Linda HS School Days 7:20a - 4:10p - 2-3 trips - 18,475 253
151 San Jose MS - Novato HS - San Marin HS School Days 6:59 - 4:18p - 6-8 trips - 44,574 782
154 Novato - Sinaloa MS School Days 7:33a – 3:22p - 2 trips - 12,168 351
Stagecoach
61 Sausalito - Marin City - Stinson Beach - Bolinas
Daily 6:55a - 8:00p 8:20a - 10:05p 3-5 hours 60-120 min 36,010 5,535
68 San Rafael - Fairfax - Pt. Reyes Station - Inverness
Daily 6:16a - 10:40p 7:16a - 11:55p 60-120 min 60-120 min 82,745 10,656
Recreational
66/66F Sausalito - Marin City - Muir Woods Seasonal(4) 8:45a - 6:55p 8:35a - 7:55p 30 min 10/20 min 163,916 5,930
Partnership
122 San Rafael - College of Marin School Days 8:15a - 3:10p - 30 min - 22,969 2,012
Notes: (1) Service span for local and school routes based on 2018-2019 operations. (2) Annual figures based on FY 2017/18 data. (3) Annual hours of service for school routes are shown, although annual number of trips provided is used to complete productivity calculations. (4) The Muir Woods Shuttle (Route 66/66F) operates weekends and holidays from April through October and daily from mid-June through mid-August, as well as during select winter holiday periods.
Item 8

MARIN TRANSIT | 2020–2029 SHORT RANGE TRANSIT PLAN Chapter 1: System Overview
1-34
Yellow Bus
Many Marin County school districts no longer provide yellow bus services for home to school transportation unless required to do so by the State of California. Recently, cities and towns have partnered with local school districts to revive yellow bus programs as a means of traffic congestion relief. In southern Marin, students in the Mill Valley School District, Reed Union School District, and Ross Valley School District are offered yellow bus service through funding partnerships with local cities and towns. Marin Transit provides varying levels of support to each of these programs based on their needs.
Measure AA Funding Distribution The Marin Transit Board established an ad hoc school transportation committee in 2016. The committee met 13 times in two years to discuss school transportation needs and Marin Transit’s role in providing home to school bus service. Guidance from this task force ultimately resulted in Board approval to distribute $600,000 of Measure AA funds to five existing regular home to school yellow bus programs in Marin County. Programs were selected based on threshold criteria. The distribution of funds in FY 2019/20 was based on a formula that takes a percentage subsidy of a program’s one-way pass price and multiplies it by the number of one-way passes that program distributed in FY 2017/18. This amount is the base amount and remains set for three years, beginning in FY 2019/20. The base amount will be adjusted annually for Marin County sales tax growth. Marin Transit may also adjust the base amount if a program reduces its service level by more than 20 percent.
Table 1-8 below shows the approved “Yellow Bus Funding Allocation” recipients, formula factors, and resulting annual fund distribution.
Table 1-8: Yellow Bus Funding Allocations (FY 2017/18 Base Year Data Used for FY 2019/20 Distribution)
Mill
Valley SD
Reed Union SD
& Cove School
Ross Valley SD
San Rafael SD
Miller Creek SD
Total Calculation
One Way Pass Price
(a) $337.50 $295.00 $375.00 $237.50 $199.50 annual price, 50% of round trip
Subsidy per pass
(b) $118.13 $103.25 $131.25 $83.13 $69.83 35% of one-way
pass price [0.35 x (a)]
One Way Passes Distributed
(c) 214 1,316 1,013 2,792 605 5,940 School year 2017-2018 source data
Funding for FY 2019/20 allocation
$25,279 $135,877 $132,956 $232,085 $42,244 $568,441 35% of pass price
for every pass distributed [(b) x (c)]
Ross Valley School District In the 2005/06 school year, Marin Transit’s began to providing transportation to Ross Valley School District, and particularly White Hill Middle School. Prior to this, Ross Valley School District contracted directly with Golden Gate Transit (GGBHTD) to provide service on routes 123 (San Anselmo to White Hill) and 127
Item 8

MARIN TRANSIT | 2020–2029 SHORT RANGE TRANSIT PLAN Chapter 1: System Overview
1-35
(Sleepy Hollow to White Hill). In 2005 GGBHTD determined that all local public transit services should originate with Marin Transit, including three routes provided by GGBHTD under contract with school districts. These included the two previously mentioned RVSD routes and one route to Larkspur School District. Marin Transit agreed to integrate the GGBHTD contract routes into their supplemental school services. The District eliminated unproductive school service on other Marin Transit routes to provide financial support for the three routes serving RSVD and Larkspur School District.
Although responsibility for the service to RVSD transitioned to Marin Transit in 2005/06, operation of the service continued to be provided by GGBHTD under contract with Marin Transit until the 2015/16 school year when service was shifted as required by the intergovernmental agreement between GGBHTD and Marin Transit in place at that time. At the end of the 2014/15 school year Marin Transit, was providing 2,160 hours of supplemental school service to the Ross Valley School District (RVSD) through its agreement with GGBHTD primarily to White Hill School. This service required 12 dedicated vehicles in the afternoon. Marin Transit determined that the RVSD service was most suitably provided under a traditional “yellow bus” contract, given the equipment requirements and the dedicated nature of the service.
In 2015 Marin Transit awarded a one-year contract with two option years to Michael’s Transportation to provide a six-yellow bus service to the Ross Valley School District. Marin Transit exercised both option years to continue the service through Spring 2018. In January 2018, Marin Transit issued a Request for Proposals for yellow bus contractors to provide the service beginning on July 1, 2018. Michael’s Transportation was the sole respondent, and Marin Transit awarded the operator with a second three-year contract with two option years.
Marin Transit shifted its annual subsidy contribution of $175,000 in local funding from supplemental school service to yellow bus service in FY 15/16. The District continued that subsidy level in each subsequent year until it introduced the FY 2019/20 Measure AA funding formula. The County of Marin and the Towns of San Anselmo and Fairfax have also participated in funding the yellow bus service. The Ross Valley School District program continues to serve nearly 1,000 daily riders, approximately 500 students, relieving congestion on the heavily traveled Sir Francis Drake corridor.
Marin Transit handles all logistics of the RSVD program. These include contract management, website development, pass sales and production, customer service, and daily monitoring of the buses via GPS technology. Staff at White Hill Middle School and Hidden Valley Elementary School support the program by distributing passes and managing student loading on the afternoon buses.
Mill Valley School District In September 2015, the City of Mill Valley developed a Traffic and Congestion Reduction Advisory Task Force. This task force initiated a two-year yellow school bus program pilot for the Mill Valley School District (MVSD) funded by contributions from MVSD, the City of Mill Valley, and Marin County. These contributions cover approximately half of the cost of the program. The remaining program costs are paid for through student pass sales.
Marin Transit initially provided planning support with routing and scheduling design. Once the program was approved, MVSD contracted Marin Transit to provide on-going operational support including website development, pass sales/production/distribution, contractor management, customer service and daily bus monitoring via GPS technology.
Item 8

MARIN TRANSIT | 2020–2029 SHORT RANGE TRANSIT PLAN Chapter 1: System Overview
1-36
The Program sold over 250 one-way bus passes in the first year. On average, 140 daily riders or approximately 70 students took the bus daily to three schools: Mill Valley Middle School, Edna Maguire Elementary, and Strawberry Point Elementary. In the following two years, bus pass sales declined each year with 175 annual one-way passes sold in the 2018/19 academic year.
Marin Transit will continue to provide operational support for the program through Spring 2020. The future of the program beyond the extended pilot is undetermined.
Reed Union School District In April 2016, the Town of Tiburon, the City of Belvedere and Reed Union School District (RUSD) voted to form the Tiburon Peninsula Traffic Relief Joint Powers Agency (JPA). The purpose of the JPA is to coordinate efforts to reduce school-related congestion on Tiburon Boulevard. The JPA contracted with First Student through 2023 to provide yellow bus service to the Cove School in the Larkspur-Corte Madera School District and Reed Elementary, Bel Aire Elementary, and Del Mar Middle School. Seven buses run 26 routes each day and transport 900 riders or approximately 450 students to and from school.
In 2016, the JPA contracted with Marin Transit to provide operational support. Marin Transit supports the program through contractor management, route planning, and real-time communications to parents regarding service disruptions. The JPA also employs a part-time program manager to manage the website and handle pass sales/production/distribution and most customer service issues.
In providing ongoing operational support, Marin Transit monitors the GPS location of the buses. The JPA amended its contract with First Student to include the use of a parent-friendly app called “First View.” With the First View app, parents receive bus stop arrival predictions and notifications of service delays. Marin Transit supported the initial data set up and continues to support the app with schedule and stop updates as needed. First Student staff handle all app-related customer service issues.
Marin Access
To complement traditional fixed-route transit, Marin Transit provides a suite of programs that serve older adults, persons with disabilities, and other Marin residents who cannot or choose not to drive. Specialized services for these populations are offered through a family of programs that fall under the umbrella of Marin Access. These programs generally fall into two categories: Transportation Information and Enrollment and Transportation Services. Table 1-99 describes each Marin Access program and outlines their intended purpose, rider eligibility requirements, and any fares associated with the service.
Item 8
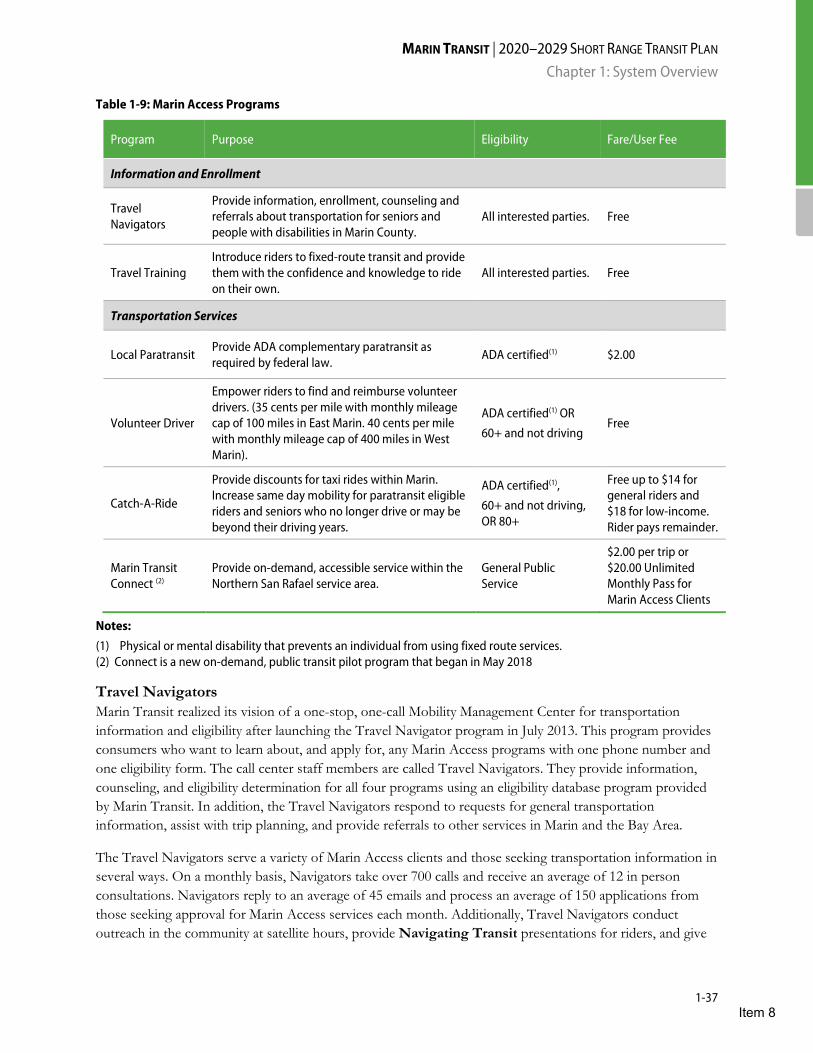
MARIN TRANSIT | 2020–2029 SHORT RANGE TRANSIT PLAN Chapter 1: System Overview
1-37
Table 1-9: Marin Access Programs
Program Purpose Eligibility Fare/User Fee
Information and Enrollment
Travel Navigators
Provide information, enrollment, counseling and referrals about transportation for seniors and people with disabilities in Marin County.
All interested parties. Free
Travel Training Introduce riders to fixed-route transit and provide them with the confidence and knowledge to ride on their own.
All interested parties. Free
Transportation Services
Local Paratransit Provide ADA complementary paratransit as required by federal law.
ADA certified(1) $2.00
Volunteer Driver
Empower riders to find and reimburse volunteer drivers. (35 cents per mile with monthly mileage cap of 100 miles in East Marin. 40 cents per mile with monthly mileage cap of 400 miles in West Marin).
ADA certified(1) OR
60+ and not driving Free
Catch-A-Ride
Provide discounts for taxi rides within Marin. Increase same day mobility for paratransit eligible riders and seniors who no longer drive or may be beyond their driving years.
ADA certified(1),
60+ and not driving, OR 80+
Free up to $14 for general riders and $18 for low-income. Rider pays remainder.
Marin Transit Connect (2)
Provide on-demand, accessible service within the Northern San Rafael service area.
General Public Service
$2.00 per trip or $20.00 Unlimited Monthly Pass for Marin Access Clients
Notes: (1) Physical or mental disability that prevents an individual from using fixed route services. (2) Connect is a new on-demand, public transit pilot program that began in May 2018
Travel Navigators Marin Transit realized its vision of a one-stop, one-call Mobility Management Center for transportation information and eligibility after launching the Travel Navigator program in July 2013. This program provides consumers who want to learn about, and apply for, any Marin Access programs with one phone number and one eligibility form. The call center staff members are called Travel Navigators. They provide information, counseling, and eligibility determination for all four programs using an eligibility database program provided by Marin Transit. In addition, the Travel Navigators respond to requests for general transportation information, assist with trip planning, and provide referrals to other services in Marin and the Bay Area.
The Travel Navigators serve a variety of Marin Access clients and those seeking transportation information in several ways. On a monthly basis, Navigators take over 700 calls and receive an average of 12 in person consultations. Navigators reply to an average of 45 emails and process an average of 150 applications from those seeking approval for Marin Access services each month. Additionally, Travel Navigators conduct outreach in the community at satellite hours, provide Navigating Transit presentations for riders, and give
Item 8
MARIN TRANSIT | 2020–2029 SHORT RANGE TRANSIT PLAN Chapter 1: System Overview
1-38
presentations to community partner staff. In FY 2017/18, the Navigators staffed more than 50 events across Marin County.
Service Area and Hours: Travel Navigators are available from 8:00 AM to 5:00 PM, Monday through Friday over the phone or on a walk-in basis at the Whistlestop Senior Center building at 930 Tamalpais Avenue in San Rafael. The Whistlestop Travel Navigator office at is located directly across the street from the San Rafael Transit Center and is accessible via Marin Transit local and Golden Gate regional fixed route transit services. In March 2017, Marin Transit began to expand the Travel Navigator presence to include satellite hours at locations in Marin City, Novato, West Marin, and the Canal district of San Rafael.
Travel Navigators focus on transportation solutions for seniors and people with disabilities within Marin and assist with trip planning that extends beyond Marin and into surrounding counties.
Reservations and Scheduling: The core mission of the Travel Navigators is to provide information and to assist with trip planning, not directly reserving or scheduling trips.
Costs to the Rider: Clients are not charged for any assistance provided by the Travel Navigators. The Travel Navigator phone number has a local 415 area code number.
Travel Training To promote independence through mobility, Marin Transit has several travel training options for Marin residents who want to learn about their choices for getting around without driving. Expanded education and outreach on transportation alternatives include community group presentations on navigating transit and individualized travel training.
Group presentations: Navigating Transit is a free one-hour presentation and discussion on alternatives to driving for older adults in Marin. This presentation is tailored to riders or staff of community partners that serve older adults or people with disabilities. A Marin Transit representative presents extensive information on riding the bus and ferry including trip planning, tips for riding, and fare options for older adults. It also discusses transportation alternatives available to Marin’s older adults. These include volunteer driver programs, Marin Catch-A-Ride, Marin Transit Connect, and Marin Access paratransit.
The presentation provides a clear picture of the transportation options available to older adults. Different programs can meet different needs, and the presenters encourage riders to use these programs in conjunction with other programs. Throughout the presentation, participants are welcome to ask questions. The trainers discuss materials related to each program and make them made available to take home.
Individualized travel training: Marin Transit offers individualized travel training to Marin’s older adults. These “transit tours” consist of a Marin Transit representative who plans a trip for an individual or group on an actual transit route. These trips usually take about three hours and are tailored to the route the individual or group requesting a “tour” will be traveling.
Tech Tips for Transportation: Marin Transit partners with a local non-profit to provide a hands-on, two-session class that demonstrate and teach participants how to use technology to find information on their transportation options. All class participants practice use of the tools on the Marin Transit website such as the trip planner and program finder. Each session is two hours. Participants are encouraged to contact Travel Navigators to enroll in the Marin Access programs applicable to their needs.
Item 8
MARIN TRANSIT | 2020–2029 SHORT RANGE TRANSIT PLAN Chapter 1: System Overview
1-39
Eligibility: The group presentations focus primarily on services for older adults and are available to all interested parties. Individualized travel training orients older adults to public transit and can be adapted for other groups. Tech Tips for Transportation classes are open to the general public, though recruitment focuses on older adults and/or their caregivers or family members. Service Area and Hours: Travel training is conducted in Marin County typically during regular business hours, Monday through Friday. Reservations and Scheduling: To schedule a group presentation or individual training, the interested party may call a Travel Navigator or directly contact Marin Transit to speak with the appropriate representative. Costs to the Rider: Marin Transit does not charge or collect any fees for any travel training services. Tech Tips for Transportation classes may require a nominal fee that varies by location.
Local Paratransit Paratransit service mandated by the Americans with Disabilities Act (ADA) is curb-to-curb service for individuals unable to use fixed route transit services due to a disability. Marin Access Paratransit Service is the primary paratransit service in Marin County. Marin Transit contracts with Whistlestop Wheels to provide local and regional paratransit for individuals that meet the eligibility requirements for service under the ADA. Marin Access Paratransit is a door-to-door service. Marin Access provides regional paratransit on behalf of Golden Gate Transit. The ADA sets specific criteria that every public transit operator must meet in providing paratransit service that complements the local fixed route system during the hours of operation. Marin Access Paratransit provides services as mandated under the ADA and additional service outside of the ADA-required service area.
Eligibility: Paratransit service riders must be certified as ADA eligible. The ADA bases eligibility on whether an applicant has a cognitive or physical disability that makes it impossible to travel independently using accessible fixed route service.
Service Area and Hours: Paratransit service complements fixed-route transit service and offers a comparable trip for those unable use the fixed route network. This service is provided within three-quarters of a mile from a fixed route during the hours the fixed route service operates.
In addition to complementary paratransit service, Marin Access provides service to trip origins and destinations beyond the mandated three-quarters of a mile radius required under the ADA on a stand-by basis. This is called “extended service.” Since the 2006 Short Range Transit Plan, Marin Transit grandfathered areas into the mandated service boundary including portions of Lucas Valley.
Marin Transit strives to fulfill all requested paratransit trips within Marin County. In FY 2017/18, Marin Transit served 1,070 local paratransit trips beyond the ADA mandate as stand-by trips. These non-mandated trips are 0.9% of the trips provided. For trips in the extended service area, Marin Access takes reservations on a stand-by basis.
Fare: The $2.00 fare for ADA-mandated service is equal to the basic adult fare for local transit service. In the ADA regulation, the fare for mandated paratransit can be twice the amount of the regular fixed route fare. In Marin the current maximum fare under the ADA would be $4.00. Marin Transit requires a fifty-cent surcharge to the base ADA fare for trips that begin or end in the “extended” service area. Service in the
Item 8
MARIN TRANSIT | 2020–2029 SHORT RANGE TRANSIT PLAN Chapter 1: System Overview
1-40
extended area is defined as more than three-quarters of a mile from a local route operating at the time of the requested trip. The fare for non-mandated trips is $2.50, and the ADA does not set a maximum fare for non-mandated trips.
Fares are collected as cash or a ticket. Whistlestop Wheels sells and distribute ticket booklets with 10 tickets each. Paratransit passengers who qualify as low income receive free two ticket booklets on a quarterly basis. In FY2017/18, the low-income scholarship program distributed 1,264 free ticket booklets to 190 unduplicated clients.
Reservations and Scheduling: In addition to accepting reservations one day in advance as required, Marin Access Paratransit takes reservations up to seven days in advance and accepts a limited quantity of subscription rides. These are also known as standing orders and are reserved for clients with recurring trips to the same location at the same time from week to week. These may be regular trips to work, a day program, or medical appointments. ADA regulations specifically permits both practices. Though neither is required, they are common among paratransit operators.
Marin Transit has a policy of no denials, and all ride requests within the service area made before 5:00 pm the previous day should be fulfilled.
In the spirit of the ADA, Marin Access operates paratransit as an efficient shared ride van service. Multiple riders may get on and off the van during another rider’s trip. Schedulers receive and confirm reservation requests and enters them into a scheduling software called Trapeze PASS. Using PASS, call center and dispatching staff create daily routes that most efficiently serve the client reservations.
When a rider schedules a trip, he or she is given a 30-minute pick-up window for when they can expect their vehicle to arrive.
Marin Transit began to update the Trapeze PASS scheduling software in 2017, in part to enhance the user experience. Staff developed and implemented tools to assist riders and their families or caretakers to schedule and monitor upcoming trips. The Marin Access Passenger Portal enables riders or their delegates (friends, family, caretakers, or staff at facilities or adult day programs) to easily book trips online and manage their trips outside of the traditional phone-based scheduling system. Marin Access Alerts provides notifications to riders or delegates regarding upcoming trips via phone, text, or email. The alerts include scheduling and cancellation notifications as well as notice when the vehicle assigned to their trip is ten minutes away from arrival. These tools were implemented in Summer 2019 after an extensive testing and refinement period to ensure that they were easy for all riders to use and understand.
Passenger Assistance: Drivers assist passengers between the vehicle and the front door of their origin or destination if the driver can maintain visual contact of the vehicle. This “door-to-door” service is optional under the ADA, which requires agencies to provide “curb-to-curb” service. For curb-to-curb service, drivers assist passengers with boarding and alighting the vehicles.
Item 8

MARIN TRANSIT | 2020–2029 SHORT RANGE TRANSIT PLAN Chapter 1: System Overview
1-41
Table 1-10: Paratransit Trips and Vehicle Hours
Passenger Trips(1) Revenue Hours Passengers per Hour Annual % Change in
Passengers
FY 2000/01 70,293 37,930 1.85
FY 2001/02 76,122 37,769 2.02 +8.3%
FY 2002/03 76,609 37,812 2.03 +0.6%
FY 2003/04 83,764 38,820 2.16 +9.3%
FY 2004/05 83,961 39,197 2.14 +0.2%
FY 2005/06 86,465 39,458 2.19 +3.0%
FY 2006/07 91,628 41,966 2.18 +6.0%
FY 2007/08 94,813 43,292 2.19 +3.5%
FY 2008/09 99,690 47,460 2.10 +5.1%
FY 2009/10 105,669 48,321 2.19 +6.0%
FY 2010/11 111,250 51,087 2.18 +5.3%
FY 2011/12 113,592 46,897 2.42 +2.1%
FY 2012/13 120,169 59,589 2.02 +5.8%
FY 2013/14 126,403 55,648(2) 2.27 +5.2%
FY 2014/15 132,680 58,388 2.27 +5.0%
FY 2015/16 124,764 56,461 2.21 -6.0%
FY 2016/17 119,673 53,011 2.26 -4.1%
FY 2017/18 123,131 59,385 2.07 +2.1%
Notes: (1) Totals through FY 2012/13 exclude attendants and companions of ADA-eligible rides.(2) Revenue hours starting from FY 2013/14 reflect a switch in the calculation methodology to be more consistent with
the National Transit Database reporting
Demand for paratransit is generally dispersed throughout the county. Figure 1-9 shows one year’s worth of paratransit origin and destination points.
Item 8
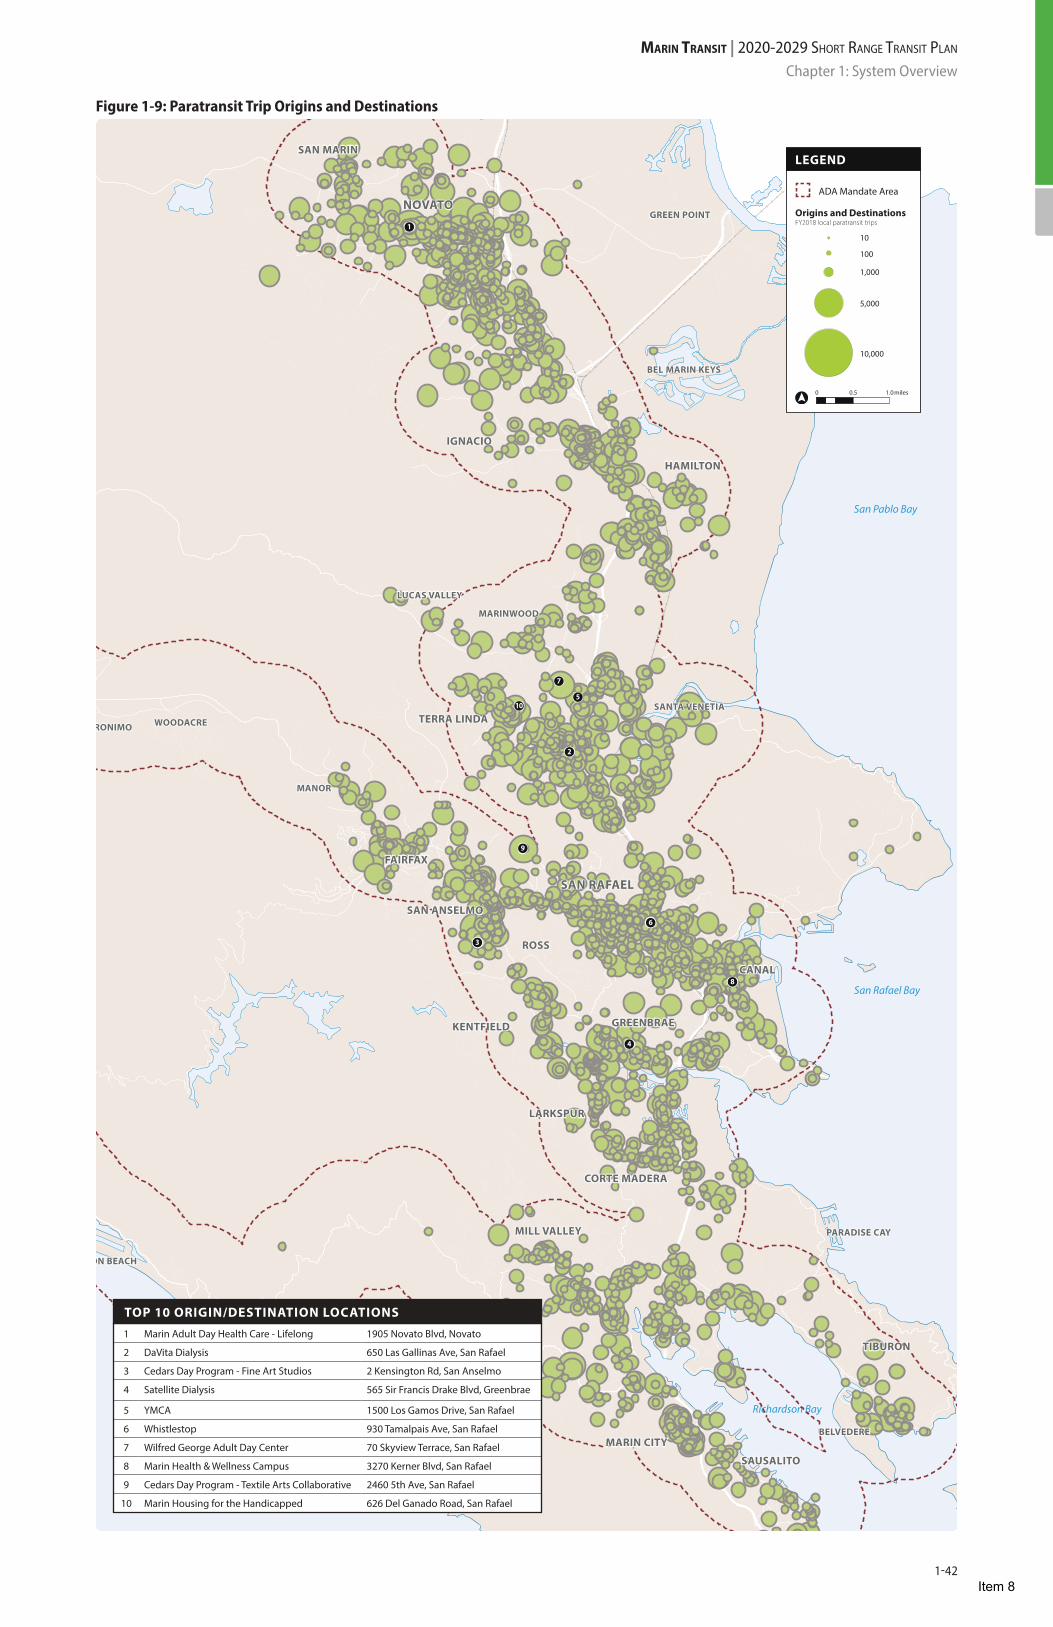
Richardson Bay
Bolinas Bay
Tomales Bay
Bodega Bay
San Pablo Bay
San Rafael Bay
1
10
7
5
2
6
3
4
9
8
PARADISE CAY
MANOR
MARINWOOD
GREEN POINT
BEL MARIN KEYS
LUCAS VALLEY
MUIR BEACH
STINSON BEACH
BOLINAS
WOODACRESAN GERONIMO
FOREST KNOLLS
LAGUNITAS
NICASIO
OLEMA
POINT REYES STATION
INVERNESS PARK
INVERNESS
BELVEDERE
SANTA VENETIA
GREENBRAE
CORTE MADERA
LARKSPUR
MILL VALLEY
SAUSALITO
MARIN CITY
TIBURON
ROSS
SAN ANSELMO
KENTFIELD
FAIRFAX
TERRA LINDA
HAMILTON
IGNACIO
SAN MARIN
CANAL
SAN RAFAEL
NOVATO
LEGEND
0 0.5 1.0miles
Origins and DestinationsFY2018 local paratransit trips
10
100
1,000
5,000
10,000
ADA Mandate Area
Marin TransiT | 2020-2029 Short range tranSit Plan
Chapter 1: System Overview
1-42
Figure 1-9: Paratransit Trip Origins and Destinations
1 Marin Adult Day Health Care - Lifelong 1905 Novato Blvd, Novato
2 DaVita Dialysis 650 Las Gallinas Ave, San Rafael
3 Cedars Day Program - Fine Art Studios 2 Kensington Rd, San Anselmo
4 Satellite Dialysis 565 Sir Francis Drake Blvd, Greenbrae
5 YMCA 1500 Los Gamos Drive, San Rafael
6 Whistlestop 930 Tamalpais Ave, San Rafael
7 Wilfred George Adult Day Center 70 Skyview Terrace, San Rafael
8 Marin Health & Wellness Campus 3270 Kerner Blvd, San Rafael
9 Cedars Day Program - Textile Arts Collaborative 2460 5th Ave, San Rafael
10 Marin Housing for the Handicapped 626 Del Ganado Road, San Rafael
TOP 10 ORIGIN/DESTINATION LOCATIONS
Item 8
MARIN TRANSIT | 2020–2029 SHORT RANGE TRANSIT PLAN Chapter 1: System Overview
1-43
Volunteer Driver Volunteer driver programs are a low-cost alternative to traditional demand-response services. Elements of a volunteer driver program include scheduling, recruitment, volunteer screening, addressing liability concerns, and mileage reimbursement. Different models incorporate some or all these elements. Volunteer driver programs are traditionally hosted by community-based organizations that specialize in serving seniors or adults with disabilities. Marin Transit administers two non-traditional volunteer driver programs (STAR and TRIP) and has spearheaded multiple efforts to support traditional community-based volunteer driver programs.
STAR and TRIPtrans: Since 2011, Marin Access has administered and supported two non-traditional volunteer driver programs based on the TRIP (Transportation Reimbursement and Information Program) model. The TRIP model was developed by the Independent Living Partnership of Riverside County, California. Under this model, riders recruit their own drivers and reimburse them for mileage costs using funds from the sponsoring agency in this case Marin Transit.
In East Marin, the program is known as STAR and reimburses riders 35 cents per mile up to 100 miles per month. In West Marin, the program is known as TRIPtrans, or more commonly, TRIP, and reimburses riders 40 cents per mile up to 400 miles per month. TRIP in West Marin is slightly different than STAR. West Marin Senior Services occasionally recruits and vets volunteer drivers and matches them with riders who need assistance.
STAR and TRIP are available to adults 60 and over who no longer drive or need assistance and adults under 60 who are ADA eligible. The Travel Navigators are responsible for enrolling and providing reimbursement to riders in the STAR and TRIP programs.
Item 8
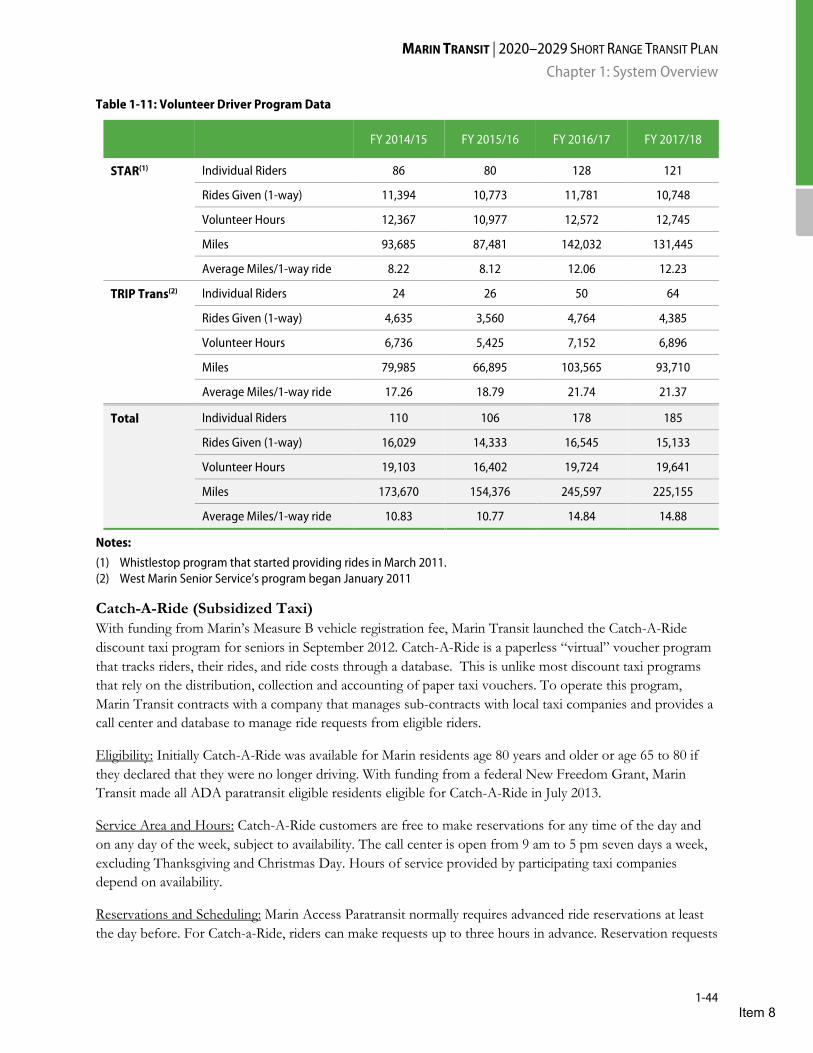
MARIN TRANSIT | 2020–2029 SHORT RANGE TRANSIT PLAN Chapter 1: System Overview
1-44
Table 1-11: Volunteer Driver Program Data
FY 2014/15 FY 2015/16 FY 2016/17 FY 2017/18
STAR(1) Individual Riders 86 80 128 121
Rides Given (1-way) 11,394 10,773 11,781 10,748
Volunteer Hours 12,367 10,977 12,572 12,745
Miles 93,685 87,481 142,032 131,445
Average Miles/1-way ride 8.22 8.12 12.06 12.23
TRIP Trans(2) Individual Riders 24 26 50 64
Rides Given (1-way) 4,635 3,560 4,764 4,385
Volunteer Hours 6,736 5,425 7,152 6,896
Miles 79,985 66,895 103,565 93,710
Average Miles/1-way ride 17.26 18.79 21.74 21.37
Total Individual Riders 110 106 178 185
Rides Given (1-way) 16,029 14,333 16,545 15,133
Volunteer Hours 19,103 16,402 19,724 19,641
Miles 173,670 154,376 245,597 225,155
Average Miles/1-way ride 10.83 10.77 14.84 14.88
Notes: (1) Whistlestop program that started providing rides in March 2011. (2) West Marin Senior Service’s program began January 2011
Catch-A-Ride (Subsidized Taxi) With funding from Marin’s Measure B vehicle registration fee, Marin Transit launched the Catch-A-Ride discount taxi program for seniors in September 2012. Catch-A-Ride is a paperless “virtual” voucher program that tracks riders, their rides, and ride costs through a database. This is unlike most discount taxi programs that rely on the distribution, collection and accounting of paper taxi vouchers. To operate this program, Marin Transit contracts with a company that manages sub-contracts with local taxi companies and provides a call center and database to manage ride requests from eligible riders.
Eligibility: Initially Catch-A-Ride was available for Marin residents age 80 years and older or age 65 to 80 if they declared that they were no longer driving. With funding from a federal New Freedom Grant, Marin Transit made all ADA paratransit eligible residents eligible for Catch-A-Ride in July 2013.
Service Area and Hours: Catch-A-Ride customers are free to make reservations for any time of the day and on any day of the week, subject to availability. The call center is open from 9 am to 5 pm seven days a week, excluding Thanksgiving and Christmas Day. Hours of service provided by participating taxi companies depend on availability.
Reservations and Scheduling: Marin Access Paratransit normally requires advanced ride reservations at least the day before. For Catch-a-Ride, riders can make requests up to three hours in advance. Reservation requests
Item 8

MARIN TRANSIT | 2020–2029 SHORT RANGE TRANSIT PLAN Chapter 1: System Overview
1-45
are made by calling the Catch-A-Ride number. Once the Catch-A-Ride scheduler confirms a ride with the taxi provider, the scheduler notifies clients of their confirmed ride by phone when the request is made or shortly after.
Costs to the Rider: Eligible rider can receive up to eight one-way taxi rides per month at a $14 per ride discount for general riders or $18 for low-income riders. Costs for each trip are set over the phone when the rider makes their reservation. The call taker establishes the trip mileage by entering the origin and destination in Google Maps. The fare is determined using a drop ($3.50) and a per mile rate ($4.00) for each taxi company. The passenger is responsible for paying the taxi driver any costs beyond the Marin Access-subsidized fare of $14 or $18.
In FY 2017/18, Marin Catch-A-Ride carried over 3,000 registered riders and provided an average of 1,200 to 1,300 one-way discounted taxi rides each month.
Other Marin Transit Services
Novato Dial-A-Ride
The Novato Dial-A-Ride (DAR) service is a general public transit service that provides a flexible route, demand responsive service within Novato. This DAR is primarily used by seniors, students, and persons with disabilities traveling within Novato. Figure 1-10 maps the density of DAR origins and destinations. This service started in August 2009.
The Dial-A-Ride provides curb-to-curb pick-up and drop-off service. All trips must start and end within the City of Novato, and everyone is welcome to use the service. Rides are scheduled by calling the reservation number up to seven days in advance. The Novato DAR vehicle can carry two bicycles. This service is operated under the Marin Access paratransit contract.
In August 2013, Marin Transit started dedicated service to Novato Human Needs and Margaret Todd Senior Center to accommodate high ridership demands to these locations on specific days at specific times. On Tuesdays, the service is offered to Novato Human Needs between the hours of 1:00 PM to 3:00 PM to provide access to the weekly food bank. On Wednesdays, from 11:00 AM to 2:00 PM, Dial-A-Ride serves Margaret Todd Senior Center for weekly senior lunch and farmer’s market events.
Item 8

Richardson Bay
Bolinas Bay
Tomales Bay
Bodega Bay
San Pablo Bay
San Rafael Bay
GREEN POINT
BEL MARIN KEYS
HAMILTON
IGNACIO
SAN MARIN
NOVATO
LEGEND
0 0.5 1.0miles
Origins and DestinationsFY2018 trips
1
10
50
100
1,000
Service Area
Marin TransiT | 2020-2029 Short range tranSit Plan
Chapter 1: System Overview
1-46
Figure 1-10: Novato Dial-A-Ride Origins and Destinations
Item 8
MARIN TRANSIT | 2020–2029 SHORT RANGE TRANSIT PLAN Chapter 1: System Overview
1-47
Rural Dial-A-Ride Marin Transit operates two general public, demand response services in West Marin. These services connect rural communities to shopping destinations in Novato and Petaluma. Riders schedule their rides by calling the reservation number up to seven days in advance. The West Marin DAR services are also operated under the Marin Access paratransit contract.
The Dillon Beach/Tomales DAR provides curb-to-curb pick-up and drop-off service between Dillon Beach, Tomales, and Petaluma and only operates on Wednesdays. Eastbound pick-ups and westbound drop-offs are available within Dillon Beach and Tomales, as well as within ¾ mile of Tomales-Petaluma Road or Dillon Beach Road. Westbound pick-ups and eastbound drop-offs are available within Petaluma city limits.
The Point Reyes DAR provides passengers curb-to-curb pick-up and drop-off service between Point Reyes Station and Novato only on the second Monday of each month. Eastbound pick-ups and westbound drop-offs are available within ¾ mile of the existing bus stop in Point Reyes Station. Service is provided to shopping destinations in Novato, including the Vintage Oaks Shopping Center, Trader Joe’s, and the Novato Fair Shopping Center.
Senior Shopping Shuttles Marin Transit operates several senior shopping shuttles through its paratransit contract. These shuttles operate as one round trip each week from one of three senior housing facilities in Marin to provide access to grocery shopping. The three locations served are Marin Valley Mobile Country Club (Novato), Rotary Manor (San Rafael), and Martinelli House (San Rafael). Table 1-12 below shows a summary of these services.
Table 1-12: Senior Shopping Shuttles
Shopper Shuttle Destinations Days of Operation Hours of Operation
Marin Valley Shopper Marin Valley Mobile Country Club in Novato to Vintage Oaks, Safeway and Grocery Outlet Wednesdays 11:00 AM - 1:00 PM
Rotary Manor Shopper Montecito Shopping Center, United Market, and Red Hill Shopping Center in San Rafael
Thursdays 11:00 AM – 1:00 PM
Martinelli House Shopper
Montecito Shopping Center and United Market in San Rafael
Fridays 11:45 AM – 1:00 PM
Marin Transit Connect
Staff have taken a proactive approach to determine how Marin Transit can best adapt to and leverage the changing landscape in transportation and emerging mobility services. In 2016, staff completed a Strategic Analysis for Marin Access programs that provided guidance for developing new programs and improving current services for older adults and ADA customers.
Marin Transit’s 2016 and 2018 Short Range Transit Plans recognized that mobility services are in the midst of radical changes and that public transit needs to respond and take advantage of these services to reduce congestion and transport transit-dependent populations. The 2018 SRTP anticipated a partnership to support on-demand mobility within that plan’s first year. Alongside private and non-profit partners, the District pursued a partnership with the private sector to increase and expand mobility.
Item 8
MARIN TRANSIT | 2020–2029 SHORT RANGE TRANSIT PLAN Chapter 1: System Overview
1-48
Marin Transit staff received 5310 funding to operate accessible same-day service above and beyond ADA-mandated paratransit. The Board authorized the District to purchase four accessible vans and approved an agency-operated on-demand pilot program to begin in late Spring 2018.
The Marin Transit Connect pilot program was developed in partnership with VIA, a mobility technology vendor. Testing began in May 2018, and full revenue service began July 1, 2018. The Connect service is operated by the District’s paratransit contractor, Whistlestop Wheels.
The service is operated in a roughly four-square mile service area of Northern San Rafael as shown in next page. Staff selected this area for a number of reasons: a mix of employment, residential, educational, and other activity centers; a high level of transit connections with Marin Transit local bus service, Golden Gate Transit regional bus service, and SMART commuter rail; and a high concentration of Marin Access trip activity. Marin Transit deliberately designed the Connect to compliment the public transit network and test how the service interacts with other transit services.
Connect is an on-demand, fully accessible general public transit service designed to provide accessible same-day service to those with disabilities and to increase first/last mile commuter connections to major employers. In contrast to the District’s existing fixed route or demand responsive services, the Connect service offers the ability to request and manage a trip within a smartphone app. Connect is the only Marin Transit program that enables riders to pay for their trip within an app.
To use the service, riders download the Marin Transit Connect app powered by VIA from the iTunes App Store or Google Play Store. Once they register, riders can request a trip from any location to any location within the service area. Riders who do not have access to a smartphone can call the Marin Access Travel Navigators to set up an account and schedule rides. Connect provides riders with an estimated time of arrival in the app. Customers without a smartphone receive updates if they have a mobile phone with SMS messaging.
For much of the pilot, service hours of Connect were weekdays from 6:20 AM until 7:00 PM and an accessible vehicle was always in service. Marin Transit adjusted service hours and vehicle supply over the course of the pilot to respond to demand.
The base fare for the pilot service was $4.00 per trip, per rider. In addition to the regular fare, riders could purchase a monthly pass for $40.00 for unlimited rides over a 30-day period. Marin Access clients received a 50 percent discount on the base fare, and Marin Access offered clients a $20 monthly pass for $20 per month. Requested rides to or from transit stops in the service area received a 50 percent discount to encourage transit usage.
The Connect is still a new service and is continuously evolving. The District is conducting an evaluation process to assess the program’s performance throughout the first year. The evaluation study will develop benchmarks and performance metrics based on the Connect’s unique characteristics. As part of the pilot evaluation, staff conducted a survey after the first six months of the pilot in November 2018. Based on the findings, staff recommended that the Board extend the pilot period. The Board of Directors approved extending the pilot program through June 2020, with additional testing for changes to the fare structure and service area.
Item 8

MARIN TRANSIT | 2020–2029 SHORT RANGE TRANSIT PLAN Chapter 1: System Overview
1-49
Connect Service Map
Connecting Regional Services
Golden Gate Transit
Marin Transit’s local transit network is connected throughout the county to Golden Gate Transit regional service. The two systems complement each other and maximize the services available to Marin County residents. Marin Transit designed its local service is to make timed connections to the regional network in Marin City, San Rafael, and Novato and, to a lesser extent, in San Anselmo and Strawberry.
Item 8

MARIN TRANSIT | 2020–2029 SHORT RANGE TRANSIT PLAN Chapter 1: System Overview
1-50
Regional Basic Services A significant amount of local travel is completed on Golden Gate Transit’s basic regional services. Approximately 500,000 or 18 percent of regional trips have both an origin and destination within Marin County. Approximately 77 percent of these riders use Routes 30, 70, and 101 that operate along the Highway 101 corridor. Along with local routes 17, 35, 36, 49, and 71X, these corridor services are designed to encourage interdependence of travel along Marin’s primary transportation corridor to provide maximum mobility for local and regional transit markets.
Golden Gate Transit provides three intercounty basic services to Marin County that connect with Marin Transit’s local service:
• Routes 40/40X – Operates as a link between San Rafael, Richmond and El Cerrito and funded by the MTC with Regional Measure 2 funds
• Routes 30, 70, and 101 – Operate along the Highway 101 corridor within Marin County and extend beyond the county line. These routes are referred to as “trunk line” or “corridor service” as they are the backbone to the Bridge District’s route structure. The combination of regional Routes 30/70/101 and local Routes 35/36/71 maintains 15-minute service along the 101-corridor during most of the day.
o Route 30 serves San Rafael, Marin City, and Sausalito and continues to San Francisco.
o Route 70 provides all-day service between Novato and San Francisco, serving all major transfer centers and freeway bus pads.
o Route 101 provides express service between Santa Rosa and San Francisco. This route serves all stops within San Francisco and Sonoma County and operates express within Marin County. In Marin, Route 101 provides connections to local services at the San Rafael Transit Center and the four northernmost stops in Downtown Novato.
Most of Marin Transit’s fixed route system schedules are designed to provide timed connections with the Highway 101 trunk line services at the San Rafael Transit Center.
Ferry Feeder Services In 2013, Golden Gate Transit re-established ferry feeder service timed to the Larkspur Ferry service. Route 25 or “The Wave” operates weekdays between the Ross Valley and the Larkspur Ferry terminal along Sir Francis Drake. Eighteen trips are designed to meet arriving or departing ferries and offer free rides to transferring ferry patrons. These consist of eight eastbound in the morning and ten westbound in the evening. Those not transferring to or from the ferry can also use the service and pay the local fare.
In September 2017, Golden Gate Transit started a ferry connector service between Downtown San Rafael and the Larkspur Ferry Terminal in partnership with SMART. Nine weekday and six weekend connections are provided between the train and ferry in each direction. Golden Gate Transit expects to discontinue The Wave when SMART begins rail service to Larkspur Landing.
Item 8

MARIN TRANSIT | 2020–2029 SHORT RANGE TRANSIT PLAN Chapter 1: System Overview
1-51
Sonoma County Transit
Sonoma County Transit provides local and intercity fixed route bus service within Sonoma County. These services complement the local fixed route services provided by Santa Rosa City Bus, Petaluma Transit, and Healdsburg Transit. Sonoma County Transit Route 38 provides a direct connection to the San Rafael Transit Center from the Town of Sonoma and areas north including Boyes Hot Springs, Agua Caliente, Glen Ellen, and Kenwood. Route 38 operates one southbound weekday trip that arrives in San Rafael at 7:07 AM and one northbound weekday trip that leaves San Rafael at 6:26 PM.
Sonoma Marin Area Rail Transit (SMART)
Passenger service on phase one of the new commuter rail service began on Friday, August 25, 2017. The train offers weekday, peak-hour, bidirectional service every 30-60 minutes. Limited service is also provided during the midday and on weekends. Train schedules are aligned with the San Rafael Transit Center pulse operation, offering timed connections for rail patrons transferring to or from buses at that location.
In July 2017, SMART began to construct its rail extension to Larkspur. The extension to Larkspur includes 2.2 miles of track connecting San Rafael and Larkspur, a terminal station in Larkspur Landing, and three bridges. It utilizes the recently rehabilitated Cal Park Tunnel that provides a bicycle/pedestrian connection to Larkspur from San Rafael. SMART train service to Larkspur is projected to begin in late 2019. The extension to Larkspur will coincide with service to second station in Downtown Novato and increased weekday service frequency.
Other Services in Marin County
Hamilton Shuttle
The Hamilton residential development in Novato supports a community shuttle to ease congestion and meet transportation demand management requirements. The shuttle is funded through developer and homeowner’s association fees and runs weekdays during commute hours (5:30 to 8:45 am and 4:20 to 7:00 pm). The shuttle has timed stops along a designated loop. Each trip begins or ends at a Park & Ride or bus stop location so riders can catch fixed-route public transit. This shuttle service is free and open to the public.
Fare Structure
Marin Transit’s fare policies are designed to meet the following objectives:
• Maintain subsidy by service type standards; • Offer fare media that encourages ridership, supports operational efficiencies, and simplifies fare
payment; and • Keep Marin Transit’s fares in line with peer systems in the Bay Area.
In the 2006 SRTP, Marin Transit’s cash fare of $2.00 was identified as among the highest of peer agencies. To bring fares in line with other agencies, Marin Transit has not increased local fares for over 15 years. As part of the 2016 and 2018 SRTP, Marin Transit evaluated its fare structure and proposed recommendations for future fare changes. Staff have further refined these fare policy recommendations, and these are described in Appendix B of this SRTP.
Item 8

MARIN TRANSIT | 2020–2029 SHORT RANGE TRANSIT PLAN Chapter 1: System Overview
1-52
Fixed Route
Passengers have a variety of options for paying Marin Transit fares as described below and summarized in Table 1-13.
• Cash: Coin and bills (up to $20) are accepted using GFI Odyssey Validating fare boxes. Discounts are available for youth, seniors, and persons with disabilities. For discounted cash fare, passengers must show proper identification. Youth may show their student ID card. Seniors may show an ID card that indicates their age. Persons with disabilities may show a DMV Disabled Placard ID, RTC Discount Card, Medicare Card, or ID card for persons with disabilities from another transit service. Personal service assistants are eligible for 50% off the adult cash fare only when accompanying a person with disabilities who has an attendant logo on his/her RTC Discount Card.
Change cards are issued to passengers who overpay the fare by more than $1.00. Change cards have no cash value and can be used for future travel on Marin Transit or Golden Gate Transit. For transfers, passengers must advise the bus driver of their final destination to receive a transfer card.
• Daily/Weekly/Monthly Passes: In July 2009, Marin Transit introduced passes that provide unlimited rides on Marin Transit and Golden Gate Transit routes within Marin County during the applicable time period. Day, week, and monthly passes are magnetic stripe passes validated by the farebox.
Day passes are purchased on-board transit vehicles and are valid for the day of travel. Weekly and monthly passes are activated at first use and good for 7 or 31 days. Weekly and monthly passes can be purchased online, by phone by calling toll-free 511, or at the Customer Service Center at the San Rafael Transit Center.
• Clipper: Clipper® is a stored value, fare-payment card that is accepted on all public transit services in the San Francisco Bay Area, including Marin Transit, Golden Gate Transit, and SMART services. Clipper® patrons receive a 10% discount on adult fares on Marin Transit local services. Transfer arrangements with Golden Gate Transit and SMART are embedded in the integrated Clipper fare table.
• Marin Transit Youth Pass: Marin Transit’s Youth Transit Pass offers youth ages 5-18 unlimited travel on all local routes. Validation stickers are distributed through local schools and attached to a student’s picture ID card that student use as a flash pass. The transit pass is not valid on Golden Gate regional routes.
The Youth Transit Pass costs students $175 per six-month period. Students who wish to pay for a year-long pass at the beginning of the school year may do so at a further discounted annual price of $325. The program also enables students whose families meet income requirements similar to the free and reduced-price lunch programs to participate in the program free of charge.
• College of Marin Pass: In the fall of 2015, Marin Transit, in partnership with the College of Marin (COM) began a new program that enables registered students to use their COM ID card to ride any local Marin Transit service. Like the Youth Pass program, validation stickers are distributed to
Item 8
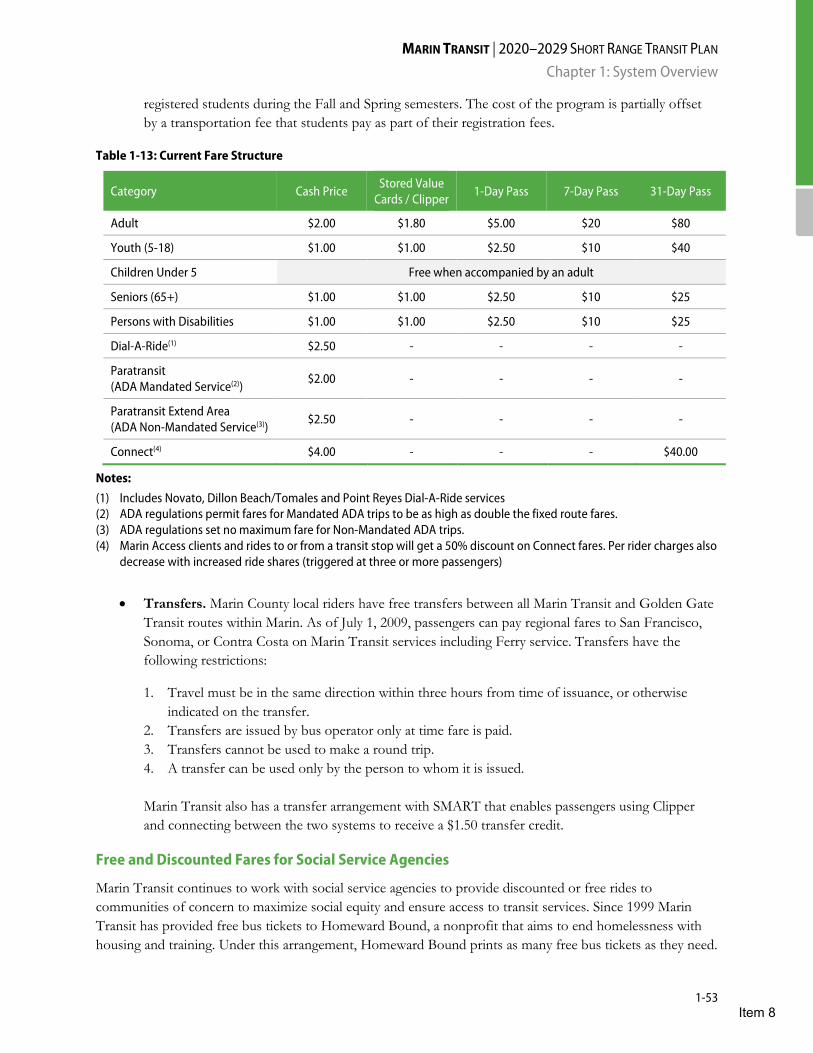
MARIN TRANSIT | 2020–2029 SHORT RANGE TRANSIT PLAN Chapter 1: System Overview
1-53
registered students during the Fall and Spring semesters. The cost of the program is partially offset by a transportation fee that students pay as part of their registration fees.
Table 1-13: Current Fare Structure
Category Cash Price Stored Value
Cards / Clipper 1-Day Pass 7-Day Pass 31-Day Pass
Adult $2.00 $1.80 $5.00 $20 $80
Youth (5-18) $1.00 $1.00 $2.50 $10 $40
Children Under 5 Free when accompanied by an adult
Seniors (65+) $1.00 $1.00 $2.50 $10 $25
Persons with Disabilities $1.00 $1.00 $2.50 $10 $25
Dial-A-Ride(1) $2.50 - - - -
Paratransit (ADA Mandated Service(2))
$2.00 - - - -
Paratransit Extend Area (ADA Non-Mandated Service(3))
$2.50 - - - -
Connect(4) $4.00 - - - $40.00
Notes: (1) Includes Novato, Dillon Beach/Tomales and Point Reyes Dial-A-Ride services (2) ADA regulations permit fares for Mandated ADA trips to be as high as double the fixed route fares. (3) ADA regulations set no maximum fare for Non-Mandated ADA trips. (4) Marin Access clients and rides to or from a transit stop will get a 50% discount on Connect fares. Per rider charges also
decrease with increased ride shares (triggered at three or more passengers)
• Transfers. Marin County local riders have free transfers between all Marin Transit and Golden Gate Transit routes within Marin. As of July 1, 2009, passengers can pay regional fares to San Francisco, Sonoma, or Contra Costa on Marin Transit services including Ferry service. Transfers have the following restrictions:
1. Travel must be in the same direction within three hours from time of issuance, or otherwise indicated on the transfer.
2. Transfers are issued by bus operator only at time fare is paid. 3. Transfers cannot be used to make a round trip. 4. A transfer can be used only by the person to whom it is issued.
Marin Transit also has a transfer arrangement with SMART that enables passengers using Clipper and connecting between the two systems to receive a $1.50 transfer credit.
Free and Discounted Fares for Social Service Agencies
Marin Transit continues to work with social service agencies to provide discounted or free rides to communities of concern to maximize social equity and ensure access to transit services. Since 1999 Marin Transit has provided free bus tickets to Homeward Bound, a nonprofit that aims to end homelessness with housing and training. Under this arrangement, Homeward Bound prints as many free bus tickets as they need.
Item 8

MARIN TRANSIT | 2020–2029 SHORT RANGE TRANSIT PLAN Chapter 1: System Overview
1-54
Homeward Bound staff distributes the tickets to clients daily, and often hand them out at the shelters the night before a client will need to take the bus for transportation to an appointment or job.
Under a separate program, Golden Gate Transit sells $2.00 tickets to approximately 20 Social Service agencies throughout Marin. These agencies distribute the tickets to their clients for use on all Marin Transit routes and local trips on Golden Gate Transit routes. No discount is offered for these tickets. As of July 2017, participating agencies are:
• St Vincent de Paul • Marin General
Hospital • Health & Human
Service • Health & Human
Service (CalWorks) • Health & Human
Service (Hope) • Community Mental
Health • Marin Services For
Women
• Buckelew • Community Action
Marin • Community Action
Marin (ACASA) • BARC • General Assistance • Marin Sheriff • Marin Aids • Ritter House • Novato Human Needs • West Marin Services
• Southern Marin Intern Project
• Center Point • Lucas Valley
Community Church • Marin Pregnancy Clinic • Marin HHS(Spahr
Center) • Marin County
Probation • Marin County Public
Defender’s Office
Marin Transit also has an arrangement with the Department of Health and Human Services to provide a bulk discount of 25 percent on their purchase of adult monthly passes.
Muir Woods Shuttle
To relieve parking and congestion issues at Muir Woods National Park, the National Park Service and Marin Transit provide a shuttle service as an alternative to driving and parking. The Muir Woods Shuttle began as a demonstration project in 2005. The service was originally a partnership of the National Park Service, County of Marin, and Golden Gate Transit. In 2009, responsibility for the Shuttle shifted to Marin Transit under a funding agreement with the National Park Service.
In 2017, National Park Services implemented a new web-based parking and transit ticketing system for Muir Woods to better manage visitation and parking demand. Under the new system, visitors are required to purchase their parking reservation and can pre-purchase shuttle tickets for a specific window of time.
The round-trip adult fare is $3.00 per person. No fare is charged for youth ages 15 and younger, seniors with a Lifetime NPS Pass, and disabled individuals with a Federal Lands Access Pass. One-way fares are not available. In previous years, passengers transferring from another local Marin Transit route had the option of purchasing a Day Pass for use on the Shuttle. This option is no longer available under the online reservation system. The reservation system has alleviated capacity issues on the Shuttle experienced in previous seasons by making arrival patterns more predictable. The pricing structure of $8 for a parking reservation and $3 for a Shuttle seat reservation provides an incentive to take the Shuttle. Table 1-14 shows the current Muir Woods Shuttle fares.
Item 8

MARIN TRANSIT | 2020–2029 SHORT RANGE TRANSIT PLAN Chapter 1: System Overview
1-55
Table 1-14: Muir Woods Shuttle Fares
Muir Woods Fare Category Current Fare (Round Trip)
Adult $3.00
Youth (15-18) $3.00
Youth (under 15) Free
Senior/Disabled (without NPS Pass) $3.00
Senior/Disabled and up to three party members (with NPS or FLA Pass) Free
Mobility Management Programs
Marin Access Paratransit The one-way fare for travel within the paratransit service area in Marin County is $2.00, payable at time of boarding. Marin Access Paratransit riders can pre-pay for rides by purchasing a 10-ticket booklet for $20. Drivers do not sell ticket booklets or carry change.
The one-way fare is $2.50 for trips within Marin County that are outside the service area. These are considered “extended” trips (see Figure 1-9 for Service Area).
Though a local trip, a “will-call” trip occurs when the passenger is not ready for his/her scheduled pick-up and calls to have Marin Access send out a second vehicle. These are also subject to the $2.50 fare.
Marin Transit offers a Low-Income Fare Assistance Program for seniors and persons with disabilities who need financial assistance. This program provides a fare subsidy for ADA eligible paratransit riders who are current recipients of Supplemental Security Income (SSI), and is funded by Marin County’s Measure B vehicle registration fee. Qualifying riders receive 20 free one-way rides over a 90-day period.
Catch-A-Ride Marin Catch-A-Ride provides a discounted fare for eligible Marin residents for riding on taxis and other licensed vehicles within Marin County. Marin Transit pays the first $14 of each one-way ride for up to eight rides per month. For low-income riders, Marin Transit will pay $18 for each one-way ride. Riders only pay to cover the value of the ride when it exceeds the amount Marin Transit contributes.
How Riders Pay
Table 1-15 provides a breakdown of how local transit riders pay for their fare on fixed route services. Until FY 2013/14, the Clipper fare card was only available on the Local Fixed Routes services and not on the Community Shuttle or Stagecoach services.
Item 8

MARIN TRANSIT | 2020–2029 SHORT RANGE TRANSIT PLAN Chapter 1: System Overview
1-56
Table 1-15: Fixed Route Payment Type (percent of Riders Using)
Payment Type FY 2012/13 FY 2013/14 FY 2014/15 FY 2015/16 FY 2016/17 FY 2017/18
Cash 48% 46% 46% 45% 45% 44%
Clipper 11% 13% 13% 10% 10% 11%
Passes(1) 16% 18% 19% 23% 25% 26%
Complimentary(1) 4% 4% 6% 6% 7% 6%
Transfer 21% 19% 16% 16% 13% 12%
Total 100% 100% 100% 100% 100% 100%
Notes: (1) The Month Pass, Week Pass, and Day Pass, all available for Adult, Youth, and Senior rates, and the Youth Pass and
College of Marin pass (2) Children ages 4 and under, employees, ferry transfers, Homeward Bound passes, and other free tickets
Fare Media Usage
Table 1-16 provides information on fare media products and their use. Aside from the School Youth Pass and College of Marin Pass, the most utilized fare product is the senior/disabled monthly pass. This is followed by the adult weekly pass and adult monthly pass. Use of all these products has grown significantly since their release in 2008. Marin Transit eliminated its $18 and $36 value cards due to declining sales and Clipper’s availability on all fixed route services. The Clipper card provides the same discount on local travel for adults as the stored value cards did.
Item 8
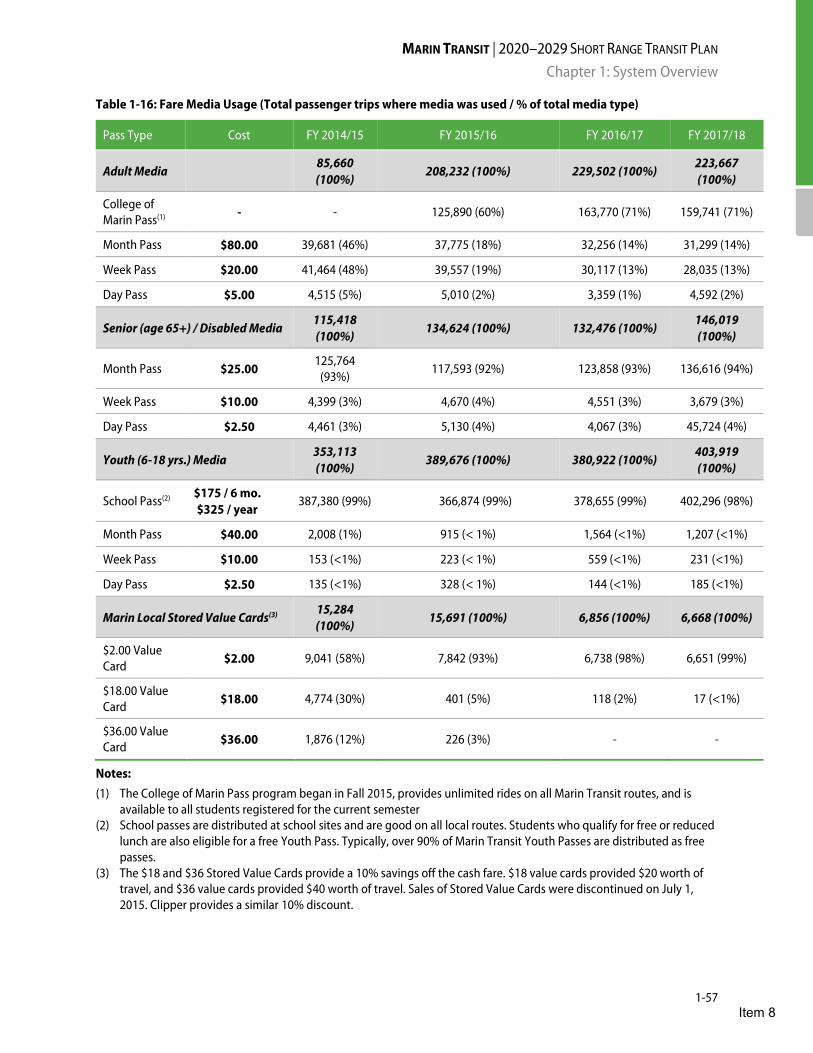
MARIN TRANSIT | 2020–2029 SHORT RANGE TRANSIT PLAN Chapter 1: System Overview
1-57
Table 1-16: Fare Media Usage (Total passenger trips where media was used / % of total media type)
Pass Type Cost FY 2014/15 FY 2015/16 FY 2016/17 FY 2017/18
Adult Media 85,660 (100%)
208,232 (100%) 229,502 (100%) 223,667 (100%)
College of Marin Pass(1) - - 125,890 (60%) 163,770 (71%) 159,741 (71%)
Month Pass $80.00 39,681 (46%) 37,775 (18%) 32,256 (14%) 31,299 (14%)
Week Pass $20.00 41,464 (48%) 39,557 (19%) 30,117 (13%) 28,035 (13%)
Day Pass $5.00 4,515 (5%) 5,010 (2%) 3,359 (1%) 4,592 (2%)
Senior (age 65+) / Disabled Media 115,418 (100%)
134,624 (100%) 132,476 (100%) 146,019 (100%)
Month Pass $25.00 125,764
(93%) 117,593 (92%) 123,858 (93%) 136,616 (94%)
Week Pass $10.00 4,399 (3%) 4,670 (4%) 4,551 (3%) 3,679 (3%)
Day Pass $2.50 4,461 (3%) 5,130 (4%) 4,067 (3%) 45,724 (4%)
Youth (6-18 yrs.) Media 353,113 (100%)
389,676 (100%) 380,922 (100%) 403,919 (100%)
School Pass(2) $175 / 6 mo. $325 / year
387,380 (99%) 366,874 (99%) 378,655 (99%) 402,296 (98%)
Month Pass $40.00 2,008 (1%) 915 (< 1%) 1,564 (<1%) 1,207 (<1%)
Week Pass $10.00 153 (<1%) 223 (< 1%) 559 (<1%) 231 (<1%)
Day Pass $2.50 135 (<1%) 328 (< 1%) 144 (<1%) 185 (<1%)
Marin Local Stored Value Cards(3) 15,284 (100%)
15,691 (100%) 6,856 (100%) 6,668 (100%)
$2.00 Value Card $2.00 9,041 (58%) 7,842 (93%) 6,738 (98%) 6,651 (99%)
$18.00 Value Card $18.00 4,774 (30%) 401 (5%) 118 (2%) 17 (<1%)
$36.00 Value Card $36.00 1,876 (12%) 226 (3%) - -
Notes: (1) The College of Marin Pass program began in Fall 2015, provides unlimited rides on all Marin Transit routes, and is
available to all students registered for the current semester (2) School passes are distributed at school sites and are good on all local routes. Students who qualify for free or reduced
lunch are also eligible for a free Youth Pass. Typically, over 90% of Marin Transit Youth Passes are distributed as free passes.
(3) The $18 and $36 Stored Value Cards provide a 10% savings off the cash fare. $18 value cards provided $20 worth of travel, and $36 value cards provided $40 worth of travel. Sales of Stored Value Cards were discontinued on July 1, 2015. Clipper provides a similar 10% discount.
Item 8
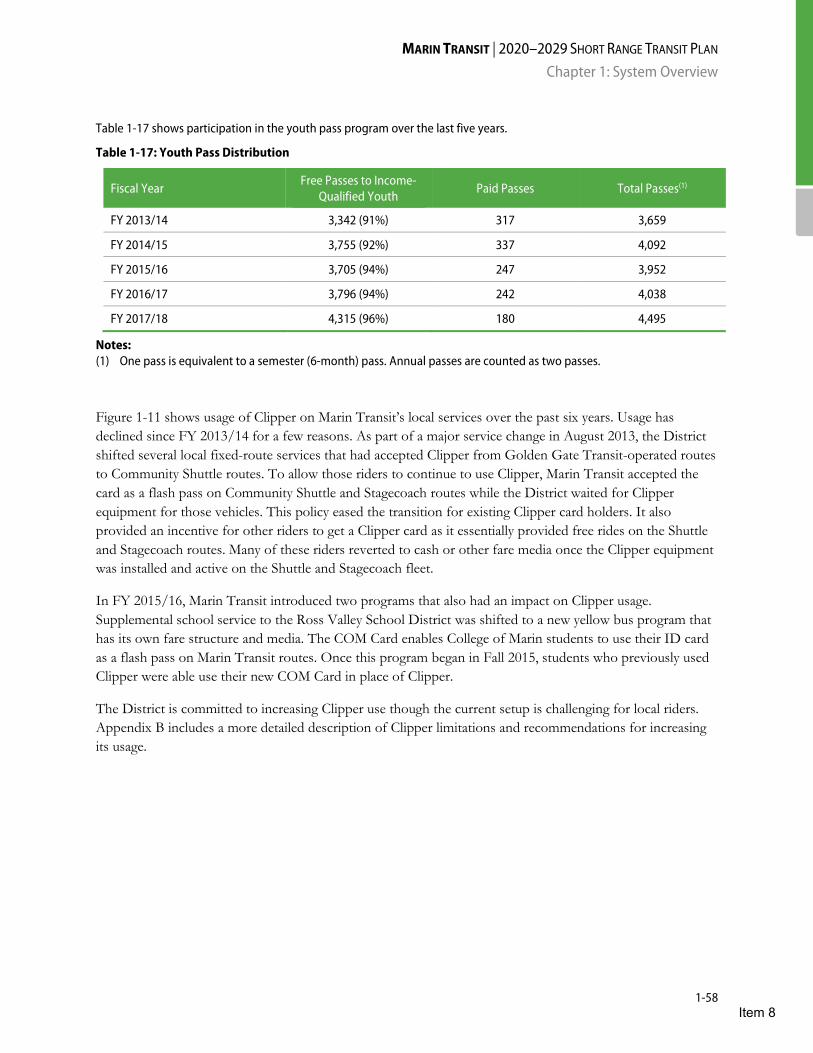
MARIN TRANSIT | 2020–2029 SHORT RANGE TRANSIT PLAN Chapter 1: System Overview
1-58
Table 1-17 shows participation in the youth pass program over the last five years.
Table 1-17: Youth Pass Distribution
Fiscal Year Free Passes to Income-
Qualified Youth Paid Passes Total Passes(1)
FY 2013/14 3,342 (91%) 317 3,659
FY 2014/15 3,755 (92%) 337 4,092
FY 2015/16 3,705 (94%) 247 3,952
FY 2016/17 3,796 (94%) 242 4,038
FY 2017/18 4,315 (96%) 180 4,495
Notes: (1) One pass is equivalent to a semester (6-month) pass. Annual passes are counted as two passes.
Figure 1-11 shows usage of Clipper on Marin Transit’s local services over the past six years. Usage has declined since FY 2013/14 for a few reasons. As part of a major service change in August 2013, the District shifted several local fixed-route services that had accepted Clipper from Golden Gate Transit-operated routes to Community Shuttle routes. To allow those riders to continue to use Clipper, Marin Transit accepted the card as a flash pass on Community Shuttle and Stagecoach routes while the District waited for Clipper equipment for those vehicles. This policy eased the transition for existing Clipper card holders. It also provided an incentive for other riders to get a Clipper card as it essentially provided free rides on the Shuttle and Stagecoach routes. Many of these riders reverted to cash or other fare media once the Clipper equipment was installed and active on the Shuttle and Stagecoach fleet.
In FY 2015/16, Marin Transit introduced two programs that also had an impact on Clipper usage. Supplemental school service to the Ross Valley School District was shifted to a new yellow bus program that has its own fare structure and media. The COM Card enables College of Marin students to use their ID card as a flash pass on Marin Transit routes. Once this program began in Fall 2015, students who previously used Clipper were able use their new COM Card in place of Clipper.
The District is committed to increasing Clipper use though the current setup is challenging for local riders. Appendix B includes a more detailed description of Clipper limitations and recommendations for increasing its usage.
Item 8
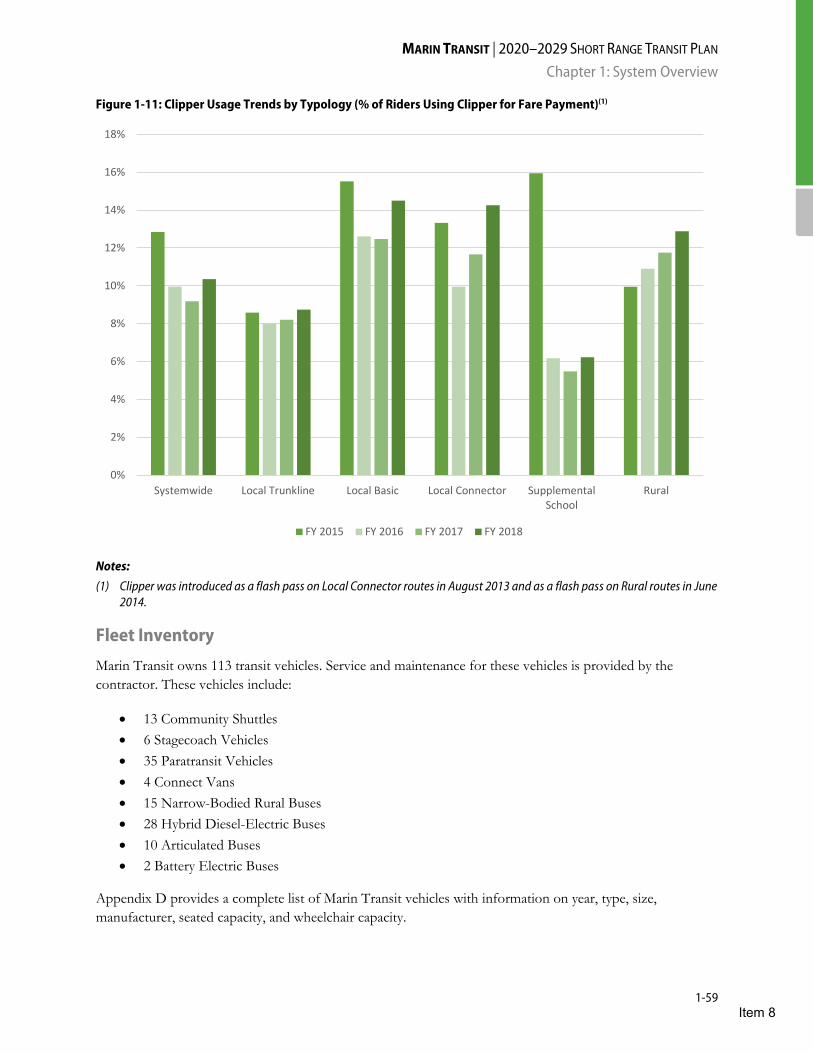
MARIN TRANSIT | 2020–2029 SHORT RANGE TRANSIT PLAN Chapter 1: System Overview
1-59
Figure 1-11: Clipper Usage Trends by Typology (% of Riders Using Clipper for Fare Payment)(1)
Notes: (1) Clipper was introduced as a flash pass on Local Connector routes in August 2013 and as a flash pass on Rural routes in June
2014.
Fleet Inventory
Marin Transit owns 113 transit vehicles. Service and maintenance for these vehicles is provided by the contractor. These vehicles include:
• 13 Community Shuttles • 6 Stagecoach Vehicles • 35 Paratransit Vehicles • 4 Connect Vans • 15 Narrow-Bodied Rural Buses • 28 Hybrid Diesel-Electric Buses • 10 Articulated Buses • 2 Battery Electric Buses
Appendix D provides a complete list of Marin Transit vehicles with information on year, type, size, manufacturer, seated capacity, and wheelchair capacity.
0%
2%
4%
6%
8%
10%
12%
14%
16%
18%
Systemwide Local Trunkline Local Basic Local Connector SupplementalSchool
Rural
FY 2015 FY 2016 FY 2017 FY 2018
Item 8
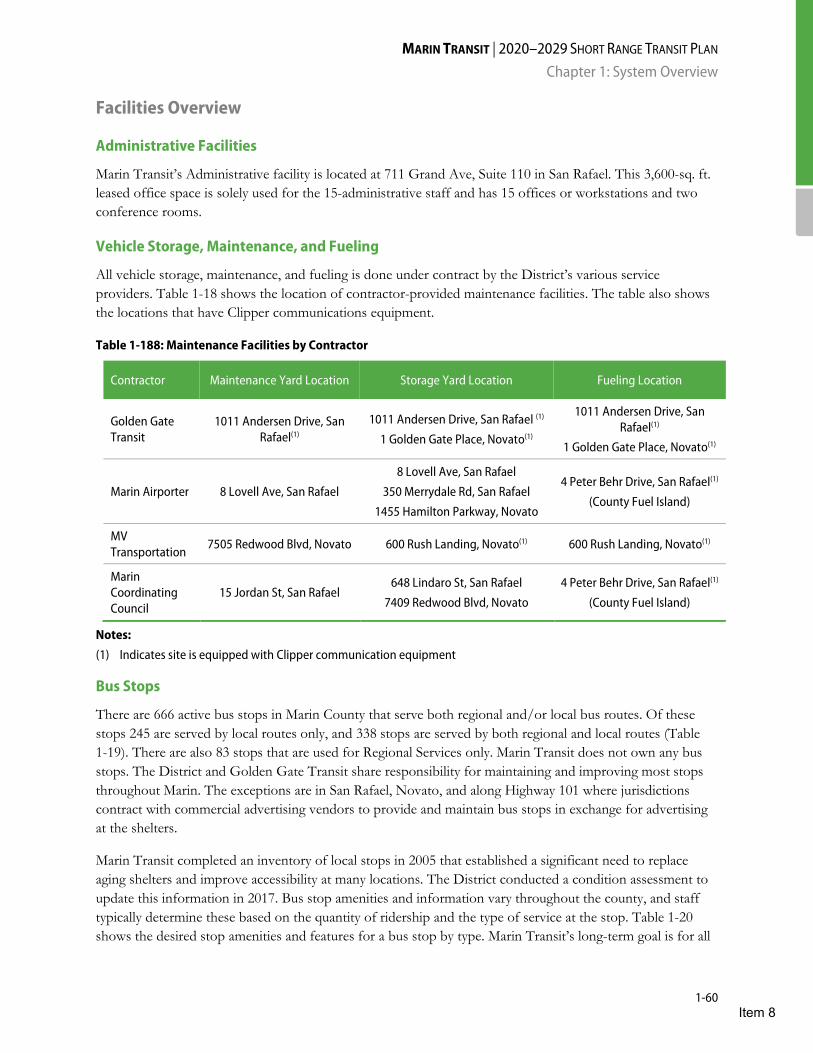
MARIN TRANSIT | 2020–2029 SHORT RANGE TRANSIT PLAN Chapter 1: System Overview
1-60
Facilities Overview
Administrative Facilities
Marin Transit’s Administrative facility is located at 711 Grand Ave, Suite 110 in San Rafael. This 3,600-sq. ft. leased office space is solely used for the 15-administrative staff and has 15 offices or workstations and two conference rooms.
Vehicle Storage, Maintenance, and Fueling
All vehicle storage, maintenance, and fueling is done under contract by the District’s various service providers. Table 1-18 shows the location of contractor-provided maintenance facilities. The table also shows the locations that have Clipper communications equipment.
Table 1-188: Maintenance Facilities by Contractor
Contractor Maintenance Yard Location Storage Yard Location Fueling Location
Golden Gate Transit
1011 Andersen Drive, San Rafael(1)
1011 Andersen Drive, San Rafael (1)
1 Golden Gate Place, Novato(1)
1011 Andersen Drive, San Rafael(1)
1 Golden Gate Place, Novato(1)
Marin Airporter 8 Lovell Ave, San Rafael
8 Lovell Ave, San Rafael
350 Merrydale Rd, San Rafael
1455 Hamilton Parkway, Novato
4 Peter Behr Drive, San Rafael(1)
(County Fuel Island)
MV Transportation
7505 Redwood Blvd, Novato 600 Rush Landing, Novato(1) 600 Rush Landing, Novato(1)
Marin Coordinating Council
15 Jordan St, San Rafael 648 Lindaro St, San Rafael
7409 Redwood Blvd, Novato
4 Peter Behr Drive, San Rafael(1)
(County Fuel Island)
Notes: (1) Indicates site is equipped with Clipper communication equipment
Bus Stops
There are 666 active bus stops in Marin County that serve both regional and/or local bus routes. Of these stops 245 are served by local routes only, and 338 stops are served by both regional and local routes (Table 1-19). There are also 83 stops that are used for Regional Services only. Marin Transit does not own any bus stops. The District and Golden Gate Transit share responsibility for maintaining and improving most stops throughout Marin. The exceptions are in San Rafael, Novato, and along Highway 101 where jurisdictions contract with commercial advertising vendors to provide and maintain bus stops in exchange for advertising at the shelters.
Marin Transit completed an inventory of local stops in 2005 that established a significant need to replace aging shelters and improve accessibility at many locations. The District conducted a condition assessment to update this information in 2017. Bus stop amenities and information vary throughout the county, and staff typically determine these based on the quantity of ridership and the type of service at the stop. Table 1-20 shows the desired stop amenities and features for a bus stop by type. Marin Transit’s long-term goal is for all
Item 8
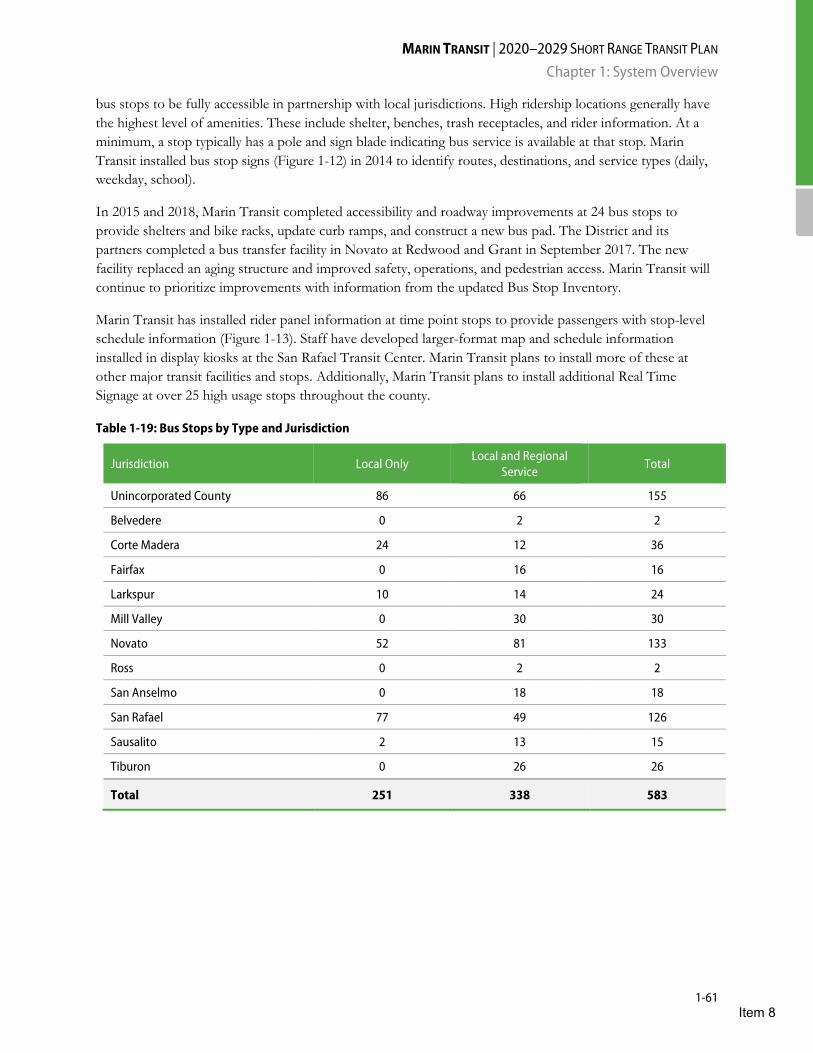
MARIN TRANSIT | 2020–2029 SHORT RANGE TRANSIT PLAN Chapter 1: System Overview
1-61
bus stops to be fully accessible in partnership with local jurisdictions. High ridership locations generally have the highest level of amenities. These include shelter, benches, trash receptacles, and rider information. At a minimum, a stop typically has a pole and sign blade indicating bus service is available at that stop. Marin Transit installed bus stop signs (Figure 1-12) in 2014 to identify routes, destinations, and service types (daily, weekday, school).
In 2015 and 2018, Marin Transit completed accessibility and roadway improvements at 24 bus stops to provide shelters and bike racks, update curb ramps, and construct a new bus pad. The District and its partners completed a bus transfer facility in Novato at Redwood and Grant in September 2017. The new facility replaced an aging structure and improved safety, operations, and pedestrian access. Marin Transit will continue to prioritize improvements with information from the updated Bus Stop Inventory.
Marin Transit has installed rider panel information at time point stops to provide passengers with stop-level schedule information (Figure 1-13). Staff have developed larger-format map and schedule information installed in display kiosks at the San Rafael Transit Center. Marin Transit plans to install more of these at other major transit facilities and stops. Additionally, Marin Transit plans to install additional Real Time Signage at over 25 high usage stops throughout the county.
Table 1-19: Bus Stops by Type and Jurisdiction
Jurisdiction Local Only Local and Regional
Service Total
Unincorporated County 86 66 155
Belvedere 0 2 2
Corte Madera 24 12 36
Fairfax 0 16 16
Larkspur 10 14 24
Mill Valley 0 30 30
Novato 52 81 133
Ross 0 2 2
San Anselmo 0 18 18
San Rafael 77 49 126
Sausalito 2 13 15
Tiburon 0 26 26
Total 251 338 583
Item 8
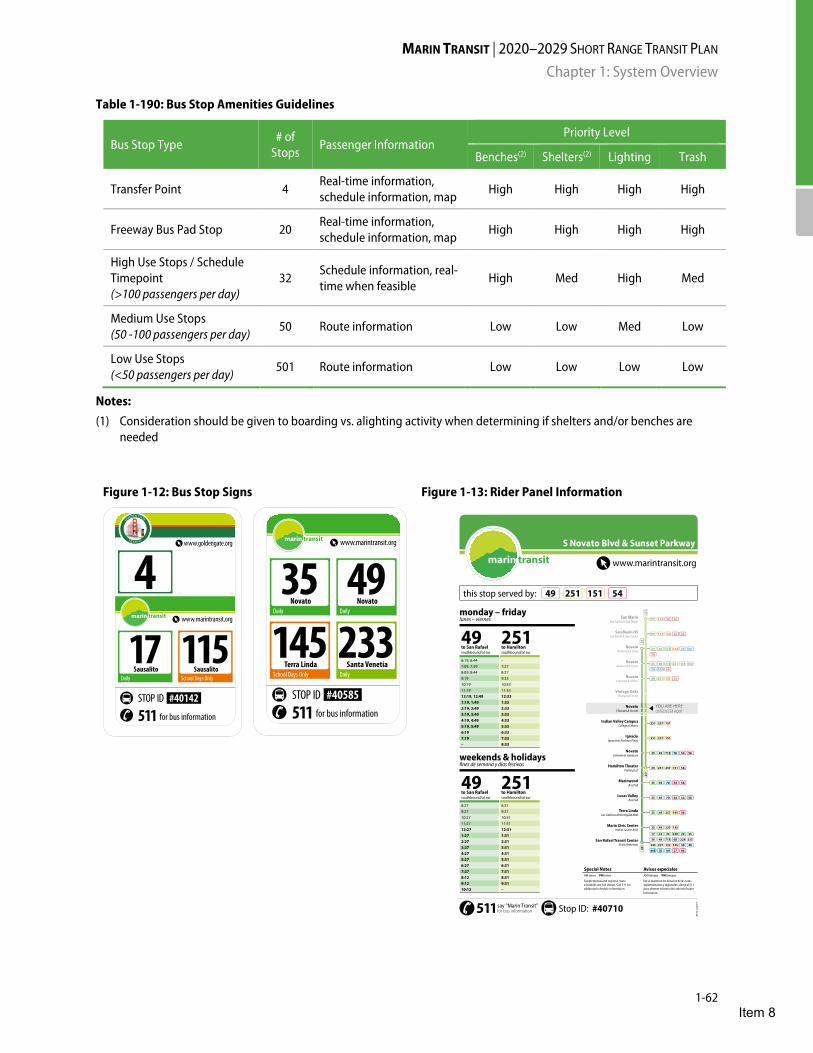
MARIN TRANSIT | 2020–2029 SHORT RANGE TRANSIT PLAN Chapter 1: System Overview
1-62
Table 1-190: Bus Stop Amenities Guidelines
Bus Stop Type # of
Stops Passenger Information
Priority Level
Benches(2) Shelters(2) Lighting Trash
Transfer Point 4 Real-time information, schedule information, map High High High High
Freeway Bus Pad Stop 20 Real-time information, schedule information, map
High High High High
High Use Stops / Schedule Timepoint (>100 passengers per day)
32 Schedule information, real-time when feasible
High Med High Med
Medium Use Stops (50 -100 passengers per day)
50 Route information Low Low Med Low
Low Use Stops (<50 passengers per day)
501 Route information Low Low Low Low
Notes: (1) Consideration should be given to boarding vs. alighting activity when determining if shelters and/or benches are
needed
Figure 1-12: Bus Stop Signs Figure 1-13: Rider Panel Information
www.goldengate.org
www.marintransit.org
STOP ID
511 for bus information
#40142
17Daily
SausalitoSchool Days Only
115Sausalito
4www.marintransit.org
STOP ID
511 for bus information
#40585
145School Days Only
Terra LindaDaily
233Santa Venetia
35Daily
NovatoDaily
49Novato
Special Notes Avisos especialesAM times PM times AM tiempos PM tiempos
No se muestran los horarios de las rutassuplementarios y regionales. Llame al 511para obtener información adicional sobrelos horarios.
Supplemental and regional routeschedules are not shown. Call 511 foradditional schedule information.
49to San Rafaelsouthbound/al sur
251to Hamiltonsouthbound/al sur
6:19, 6:44 –7:09, 7:39 7:278:09, 8:44 8:279:19 9:3310:19 10:3311:19 11:3312:19, 12:49 12:331:19, 1:49 1:332:19, 2:49 2:333:19, 3:49 3:334:19, 4:49 4:335:19, 5:49 5:336:19 6:337:19 7:33– 8:33
monday – fridaylunes – viernes
weekends & holidays
49to San Rafaelsouthbound/al sur
251to Hamiltonsouthbound/al sur
8:27 8:319:27 9:3110:27 10:3111:27 11:3112:27 12:311:27 1:312:27 2:313:27 3:314:27 4:315:27 5:316:27 6:317:27 7:318:12 8:319:12 9:3110:12 –
17 22 23 23X 29 35
36 49 71X 68 228
245 122 145 30 40
40X 70
233
257
101 27 44
49 251 151 54
251 154 54 56
251 151 154
35 49 71X 154 70 101
58
35 49 71X 70 54 58
251 257 151
251 257
35 49 70 44 54 58
YOU ARE HEREUSTED ESTÁ AQUÍ
this stop served by: 49 151251 54
35 49 71X 251 151 154
70 101 58
49 251 151 54
49 251 257 151 58
35 49 70 54 58
35 49 257 145 38
35 49 233 145
San Rafael Transit Center3rd & Hetherton
49
MarinwoodBus Pad
Lucas ValleyBus Pad
NovatoRedwood & Grant
Terra LindaLas Gallinas at Northgate Mall
Marin Civic CenterHall of Justice Arch
NovatoEnfrente & Salvatore
NovatoRedwood & Olive
Hamilton TheaterParking Lot
NovatoS Novato & Sunset
NovatoS Novato & Arthur
49
IgnacioIgnacio at Pacheco Plaza
Indian Valley CampusCollege of Marin
Vintage OaksShopping Center
San Marin HSSan Marin & San Carlos
San MarinSan Carlos & San Marin
251
251
151
54 56
251 154 54 56
251 151 154
35 49 71X 154 70 101
58
35 49 71X 251 151 154
70 101 58
49 251 151 54
49
NovatoRedwood & Grant
NovatoRedwood & Olive
NovatoS Novato & Arthur
Vintage OaksShopping Center
San Marin HSSan Marin & San Carlos
San MarinSan Carlos & San Marin
251
54 56
www.marintransit.org
Stop ID:511say "Marin Transit"for bus information #40710
S Novato Blvd & Sunset Parkway
Item 8
MARIN TRANSIT | 2020–2029 SHORT RANGE TRANSIT PLAN Chapter 1: System Overview
1-63
Park-and-Ride
Marin Transit does not own or maintain any park-and-ride lots. Many local routes serve the 15 park-and-ride facilities in Marin County that other transit operators or Caltrans own and maintain. For the Muir Woods Shuttle, Marin Transit has a cooperative agreement with the County of Marin, Caltrans, and the Shoreline Office Complex in Mill Valley for shared use of parking at the Pohono Park–and-Ride lot.
Item 8
MARIN TRANSIT | 2020–2029 SHORT RANGE TRANSIT PLAN Chapter 2: Goals, Targets, and Performance
2-1
Chapter 2: Goals, Targets, and Performance
This chapter outlines goals, identifies targets, and evaluates Marin Transit’s performance at four different levels: systemwide operations, by priority transit corridor, route-level performance, and as a District. This performance monitoring program measures the success of the local transit system using readily available data that the District collects and analyzes. Marin Transit established performance standards and objectives in the 2006 Short Range Transit Plan to reflect local Measure A transportation sales tax goals and the District’s mission to operate, maintain, and improve local transit service. Marin Transit has updated these goals in subsequent SRTP efforts, and they continue to reflect the goals in the Measure A and Measure AA Expenditure Plan.
Marin Transit has updated its Goals and Targets to reflect ever-changing service needs and updates to District policies. The most current goals are presented below.
1) Systemwide Performance: a. Relieves congestion and provides mobility as measured in total ridership; b. Ensures high levels of customer satisfaction with services; c. Provides accessible and reliable transit services with Marin County; d. Ensures services are provided in a reliable manner; e. Provides service levels to prevent overcrowding; f. Promotes environmental justice based on demographic analysis; and g. Meets cost efficiency standards based on cost per revenue hour.
2) Corridor-Level Performance a. Provides adequate service frequency in priority transit corridors; b. Provides adequate span of service in priority transit corridors; and c. Provides competitive travel times to promote transit usage.
3) Route-Level Performance: a. Meets service typology productivity standards based on passengers per hour; b. Meets service typology cost effectiveness standards based on subsidy per passenger trip; and c. Establish funding agreements for Partnership services.
4) District Performance: a. Attracts outside funding sources, including federal and state revenue, as well as discretionary grants
and other local funds; b. Operates the system in a manner that encourages public involvement and participation; and c. Maintains a capital plan to minimize air quality issues and provide quality amenities and vehicles.
Since the last SRTP, staff have developed a corridor-based category and transferred some of the route-level performance goals to that category. This change better reflects the structure of the District’s fixed-route service network and the priorities in the original Measure A Expenditure Plan. In addition, the District added a goal (3c) for a new typology of service and updated performance targets for 1c and 1f. These updates reflect a more accurate methodology for measuring availability of service and consistency with the District’s Title VI plan. Table 2-9 presents a comprehensive review of performance measures and actual performance.
Item 8
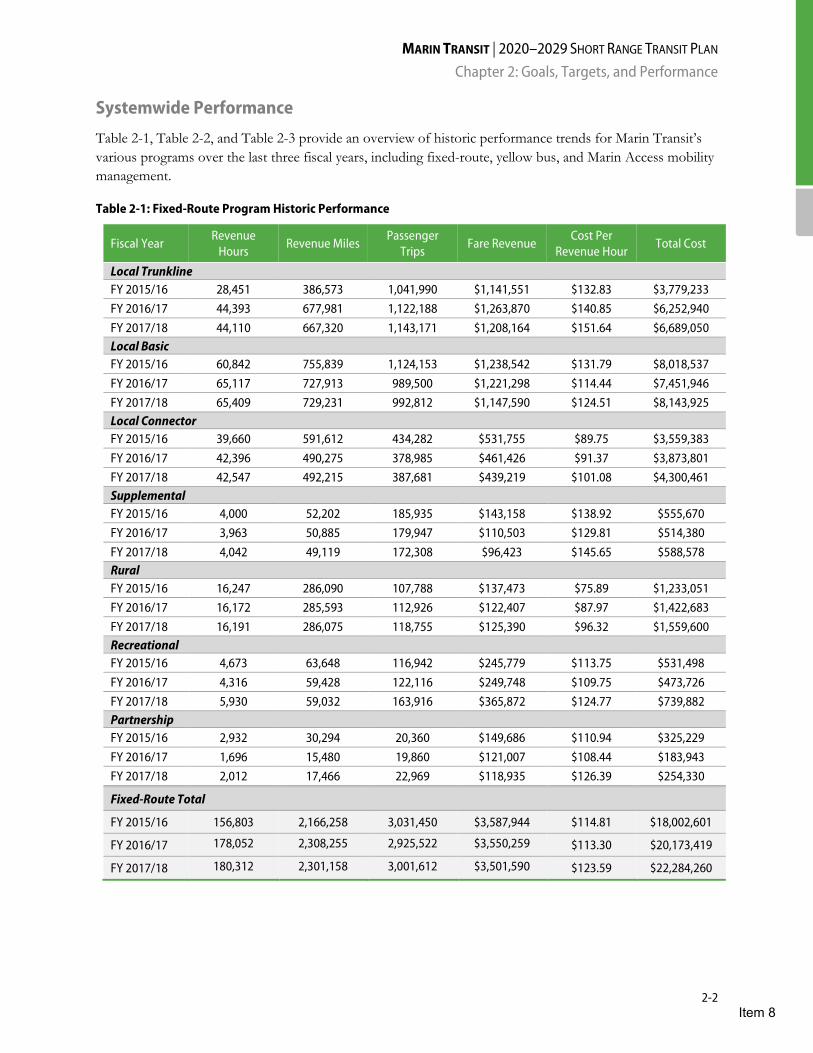
MARIN TRANSIT | 2020–2029 SHORT RANGE TRANSIT PLAN Chapter 2: Goals, Targets, and Performance
2-2
Systemwide Performance
Table 2-1, Table 2-2, and Table 2-3 provide an overview of historic performance trends for Marin Transit’s various programs over the last three fiscal years, including fixed-route, yellow bus, and Marin Access mobility management.
Table 2-1: Fixed-Route Program Historic Performance
Fiscal Year Revenue Hours Revenue Miles Passenger
Trips Fare Revenue Cost Per Revenue Hour Total Cost
Local Trunkline FY 2015/16 28,451 386,573 1,041,990 $1,141,551 $132.83 $3,779,233 FY 2016/17 44,393 677,981 1,122,188 $1,263,870 $140.85 $6,252,940 FY 2017/18 44,110 667,320 1,143,171 $1,208,164 $151.64 $6,689,050 Local Basic FY 2015/16 60,842 755,839 1,124,153 $1,238,542 $131.79 $8,018,537 FY 2016/17 65,117 727,913 989,500 $1,221,298 $114.44 $7,451,946 FY 2017/18 65,409 729,231 992,812 $1,147,590 $124.51 $8,143,925 Local Connector FY 2015/16 39,660 591,612 434,282 $531,755 $89.75 $3,559,383 FY 2016/17 42,396 490,275 378,985 $461,426 $91.37 $3,873,801 FY 2017/18 42,547 492,215 387,681 $439,219 $101.08 $4,300,461 Supplemental FY 2015/16 4,000 52,202 185,935 $143,158 $138.92 $555,670 FY 2016/17 3,963 50,885 179,947 $110,503 $129.81 $514,380 FY 2017/18 4,042 49,119 172,308 $96,423 $145.65 $588,578 Rural FY 2015/16 16,247 286,090 107,788 $137,473 $75.89 $1,233,051 FY 2016/17 16,172 285,593 112,926 $122,407 $87.97 $1,422,683 FY 2017/18 16,191 286,075 118,755 $125,390 $96.32 $1,559,600 Recreational FY 2015/16 4,673 63,648 116,942 $245,779 $113.75 $531,498 FY 2016/17 4,316 59,428 122,116 $249,748 $109.75 $473,726 FY 2017/18 5,930 59,032 163,916 $365,872 $124.77 $739,882 Partnership FY 2015/16 2,932 30,294 20,360 $149,686 $110.94 $325,229 FY 2016/17 1,696 15,480 19,860 $121,007 $108.44 $183,943 FY 2017/18 2,012 17,466 22,969 $118,935 $126.39 $254,330
Fixed-Route Total
FY 2015/16 156,803 2,166,258 3,031,450 $3,587,944 $114.81 $18,002,601
FY 2016/17 178,052 2,308,255 2,925,522 $3,550,259 $113.30 $20,173,419
FY 2017/18 180,312 2,301,158 3,001,612 $3,501,590 $123.59 $22,284,260
Item 8
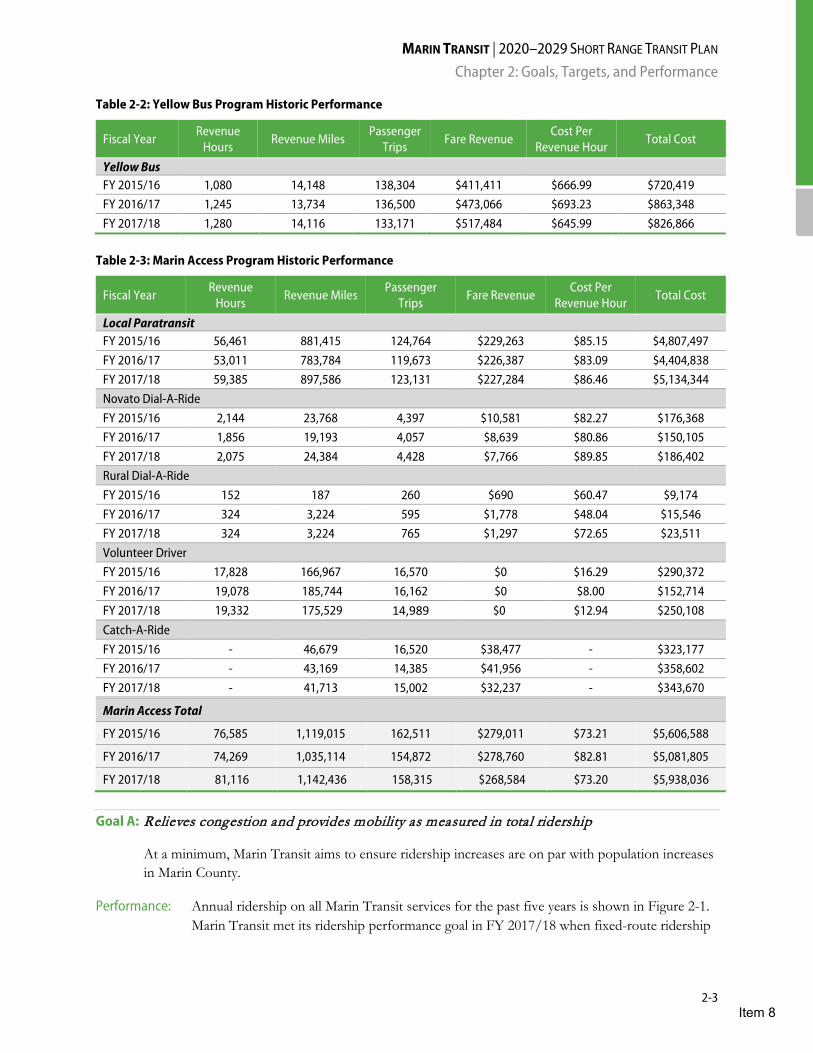
MARIN TRANSIT | 2020–2029 SHORT RANGE TRANSIT PLAN Chapter 2: Goals, Targets, and Performance
2-3
Table 2-2: Yellow Bus Program Historic Performance
Fiscal Year Revenue Hours Revenue Miles Passenger
Trips Fare Revenue Cost Per Revenue Hour Total Cost
Yellow Bus FY 2015/16 1,080 14,148 138,304 $411,411 $666.99 $720,419 FY 2016/17 1,245 13,734 136,500 $473,066 $693.23 $863,348 FY 2017/18 1,280 14,116 133,171 $517,484 $645.99 $826,866
Table 2-3: Marin Access Program Historic Performance
Fiscal Year Revenue Hours Revenue Miles Passenger
Trips Fare Revenue Cost Per Revenue Hour Total Cost
Local Paratransit FY 2015/16 56,461 881,415 124,764 $229,263 $85.15 $4,807,497 FY 2016/17 53,011 783,784 119,673 $226,387 $83.09 $4,404,838 FY 2017/18 59,385 897,586 123,131 $227,284 $86.46 $5,134,344 Novato Dial-A-Ride FY 2015/16 2,144 23,768 4,397 $10,581 $82.27 $176,368 FY 2016/17 1,856 19,193 4,057 $8,639 $80.86 $150,105 FY 2017/18 2,075 24,384 4,428 $7,766 $89.85 $186,402 Rural Dial-A-Ride FY 2015/16 152 187 260 $690 $60.47 $9,174 FY 2016/17 324 3,224 595 $1,778 $48.04 $15,546 FY 2017/18 324 3,224 765 $1,297 $72.65 $23,511 Volunteer Driver FY 2015/16 17,828 166,967 16,570 $0 $16.29 $290,372 FY 2016/17 19,078 185,744 16,162 $0 $8.00 $152,714 FY 2017/18 19,332 175,529 14,989 $0 $12.94 $250,108 Catch-A-Ride FY 2015/16 - 46,679 16,520 $38,477 - $323,177 FY 2016/17 - 43,169 14,385 $41,956 - $358,602 FY 2017/18 - 41,713 15,002 $32,237 - $343,670
Marin Access Total
FY 2015/16 76,585 1,119,015 162,511 $279,011 $73.21 $5,606,588
FY 2016/17 74,269 1,035,114 154,872 $278,760 $82.81 $5,081,805
FY 2017/18 81,116 1,142,436 158,315 $268,584 $73.20 $5,938,036
Goal A: Relieves congestion and provides mobility as measured in total ridership
At a minimum, Marin Transit aims to ensure ridership increases are on par with population increases in Marin County.
Performance: Annual ridership on all Marin Transit services for the past five years is shown in Figure 2-1. Marin Transit met its ridership performance goal in FY 2017/18 when fixed-route ridership
Item 8
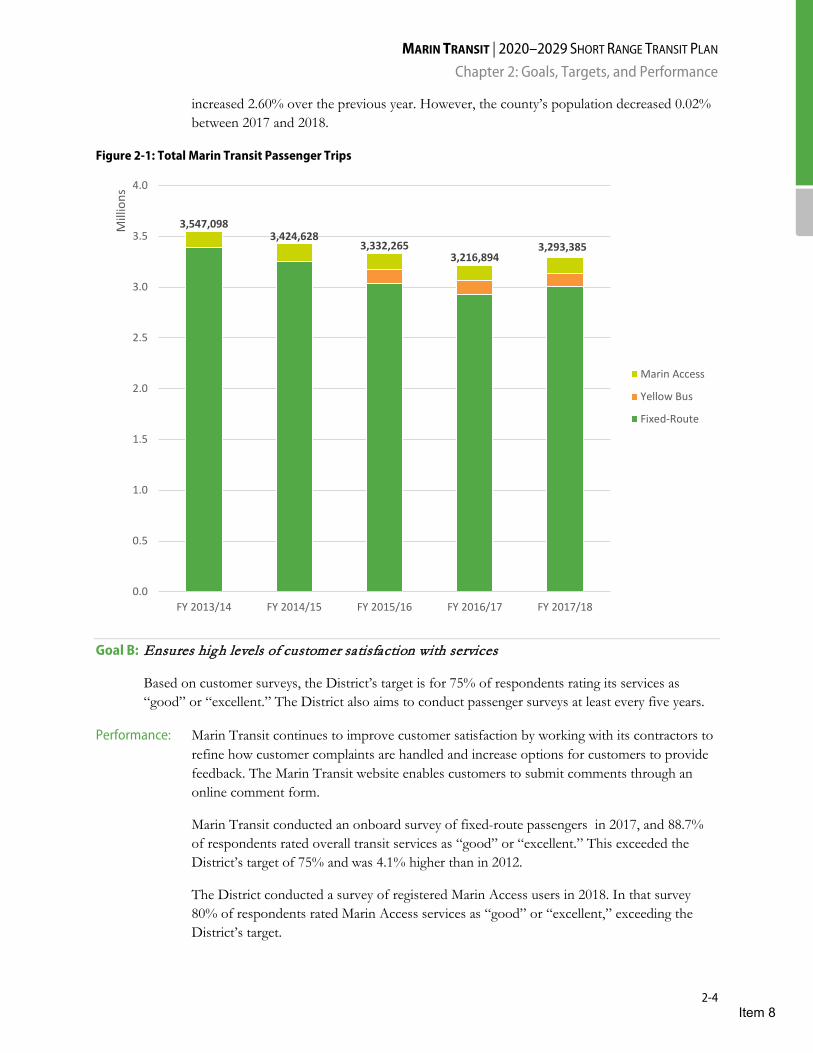
MARIN TRANSIT | 2020–2029 SHORT RANGE TRANSIT PLAN Chapter 2: Goals, Targets, and Performance
2-4
increased 2.60% over the previous year. However, the county’s population decreased 0.02% between 2017 and 2018.
Figure 2-1: Total Marin Transit Passenger Trips
Goal B: Ensures high levels of customer satisfaction with services
Based on customer surveys, the District’s target is for 75% of respondents rating its services as “good” or “excellent.” The District also aims to conduct passenger surveys at least every five years.
Performance: Marin Transit continues to improve customer satisfaction by working with its contractors to refine how customer complaints are handled and increase options for customers to provide feedback. The Marin Transit website enables customers to submit comments through an online comment form.
Marin Transit conducted an onboard survey of fixed-route passengers in 2017, and 88.7% of respondents rated overall transit services as “good” or “excellent.” This exceeded the District’s target of 75% and was 4.1% higher than in 2012.
The District conducted a survey of registered Marin Access users in 2018. In that survey 80% of respondents rated Marin Access services as “good” or “excellent,” exceeding the District’s target.
3,547,0983,424,628
3,332,2653,216,894
3,293,385
0.0
0.5
1.0
1.5
2.0
2.5
3.0
3.5
4.0
FY 2013/14 FY 2014/15 FY 2015/16 FY 2016/17 FY 2017/18
Mill
ions
Marin Access
Yellow Bus
Fixed-Route
Item 8
MARIN TRANSIT | 2020–2029 SHORT RANGE TRANSIT PLAN Chapter 2: Goals, Targets, and Performance
2-5
Goal C: Provides accessible transit services within Marin County
Marin Transit’s goal is to provide transit service to major origins and activity centers within the county. This goal includes providing transit within ½ mile of 85% of all county residents, 80% of jobs, and 90% of large multifamily housing developments, as well as ensuring that 90% and 75% of middle and high schools are within ½ mile and ¼ mile, respectively, of transit service or are served by a yellow bus program.
Performance: According to 2015 Census data, about 82.5% of Marin County residents are within ½ mile of an active transit stop. Based on 2014 Longitudinal Employer-Household Dynamics (LEHD) data, about 81.6% of all jobs within the county are within ½ mile of transit. About 87.9% of large multifamily housing units (defined as having 40 units or more) are served by transit. Of public and private schools serving grades seven and higher, 86.2% are within ¼ mile and 98.3% are within ½ mile of transit or are served by yellow bus.
Goal D: Ensures services are provided in a reliable manner
To ensure reliable services, the District aims to have a 90% on-time performance target at major stops and transfer hubs and an 80% on-time performance target at minor timepoint stops for fixed-route operations. The District also aims to have less than 1% of fixed-route trips missed or removed from the daily schedule. For paratransit services, the on-time performance target is that at least 90% of all paratransit trips arrive within the 30-minute pick-up window.
Performance: Based on data from manual observations and the District’s automated vehicle tracking system where available, on-time performance for major stops and transfer hubs in FY 2016/17 was 82.2%. This is below the 90% target. On-time performance for minor timepoint stops was 79.6%, also below the District’s target. Since the major service changes in June 2016, the District has continued to work with its contractors to identify on-time performance issues and adjust schedules as needed.
In FY 2017/18, a total of 357 or 0.17% of the 209,850 trips were missed or cancelled. This met the District’s target of less than 1%. In FY 2017/18, 86.3% of all paratransit trips arrived within the 30-minute pick-up window and did not meet the target of 90%.
Goal E: Provides service levels to prevent overcrowding
Marin Transit aims to minimize the number of overloaded trips and overcrowding. The system-wide goal is an average maximum load factor for local service that does not to exceed 1.25, as measured by a ratio of total passengers to seats on board the vehicles. This equates to a maximum of approximately 10 standees on a 40’ vehicle and 15 standees on a 60’ articulated vehicle.
Performance: Marin Transit works closely with its contractors to ensure passengers are not left behind due to overcrowding or overloaded vehicles. In particular, staff monitors overcrowding on routes to and from the Canal area of San Rafael, routes that provide service along Highway 101, routes that provide supplemental school service, Muir Woods Shuttle trips, and West Marin Stagecoach routes that provide weekend summer service.
Item 8
MARIN TRANSIT | 2020–2029 SHORT RANGE TRANSIT PLAN Chapter 2: Goals, Targets, and Performance
2-6
Marin Transit provides frequent bus service using articulated buses in the Canal area of San Rafael to minimize overcrowding and ensure passengers wait no longer than 15 minutes for the next bus during peak periods. Shadow or back-up buses are deployed on the Muir Woods Shuttle to accommodate peaks in demand based on weather and traffic.
Average load factors and overcrowded trips were determined based on passenger mile sampling data collected for NTD reporting. A total of 307 trips were sampled in FY 2016/17. Using the capacity of the vehicle used for each trip, systemwide average load factor was 0.28. This indicates that on most trips there is adequate seating capacity and typically no standees. Of the 307 trips sampled, there were five trips that had load factors greater than 1.0 and carried standees, and only one trip with a load factor greater than 1.25.
Policies are also in place to prevent overcrowding. On most vehicles, capacity is limited to 10 standees in addition to the seating capacity. Drivers may allow additional standees if deemed safe. Standees are sometimes limited or prohibited on supplemental school routes, particularly for routes serving younger children. Due to the conditions of the roadway, standees are not permitted on the Muir Woods Shuttle.
Goal F: Promotes environmental justice based on demographic analysis
Marin Transit has additional coverage goals to provide transit services within ½ mile of 85% of seniors, 90% of zero-car households, 90% of minority populations, and 90% of all low-income households.
Performance: Based on 2015 US Census data, approximately 74.0% of seniors reside within ½ mile of a fixed-route transit stop. Most of the areas with senior populations not served by transit are in Novato and the Peacock Gap areas. Marin Access programs, such as Volunteer Driver and Catch-A-Ride, provide additional mobility options for seniors including those who live beyond ½ mile of existing fixed-route transit service.
Approximately 88.3% of zero-car households and 86.1% of minority populations are served by transit. Minority populations are defined as those who identify themselves as American Indian or Alaska Native, Asian, Black or African American, Hispanic or Latin, and/or Native Hawaiian or Other Pacific Islander.
Low-income households are defined as households earning less than $50,000 annually. Based on 2015 Census data, about 83.0% of low-income households are located within ½ mile of transit service.
This analysis does not include supplemental school services, demand-response services such as the Novato Dial-A-Ride, or other transit service providers that may serve census blocks located more than a half mile from Marin Transit bus routes.
Goal G: Meets cost efficiency standards based on cost per revenue hour
The District monitors cost efficiency in terms of operating cost per revenue hour. Currently, performance targets are $135 per hour for fixed-route and $98 per hour for demand response
Item 8

MARIN TRANSIT | 2020–2029 SHORT RANGE TRANSIT PLAN Chapter 2: Goals, Targets, and Performance
2-7
programs. These targets are based on a peer review conducted in 2011 and increase annually based on a 3% escalation.
Performance For fixed-route services, the goal of $135 per hour is a system wide target merging all fixed-route programs. In FY 2017/18, the fixed route hourly rate average was $124. This is a 3% decrease compared to FY 2015/16. This trend has continued over the past six years and is due in part to renegotiated service contracts, shifts in service between programs, and new contract rates.
Operating costs per revenue hour for demand response services also declined over the last fiscal year. In FY 2017/18, the demand response hourly rate average was $87 per hour, about 5% lower than FY 2015/16. Much of the decline was due to a new operating contract with lower rates that went into effect on January 1, 2016.
Item 8
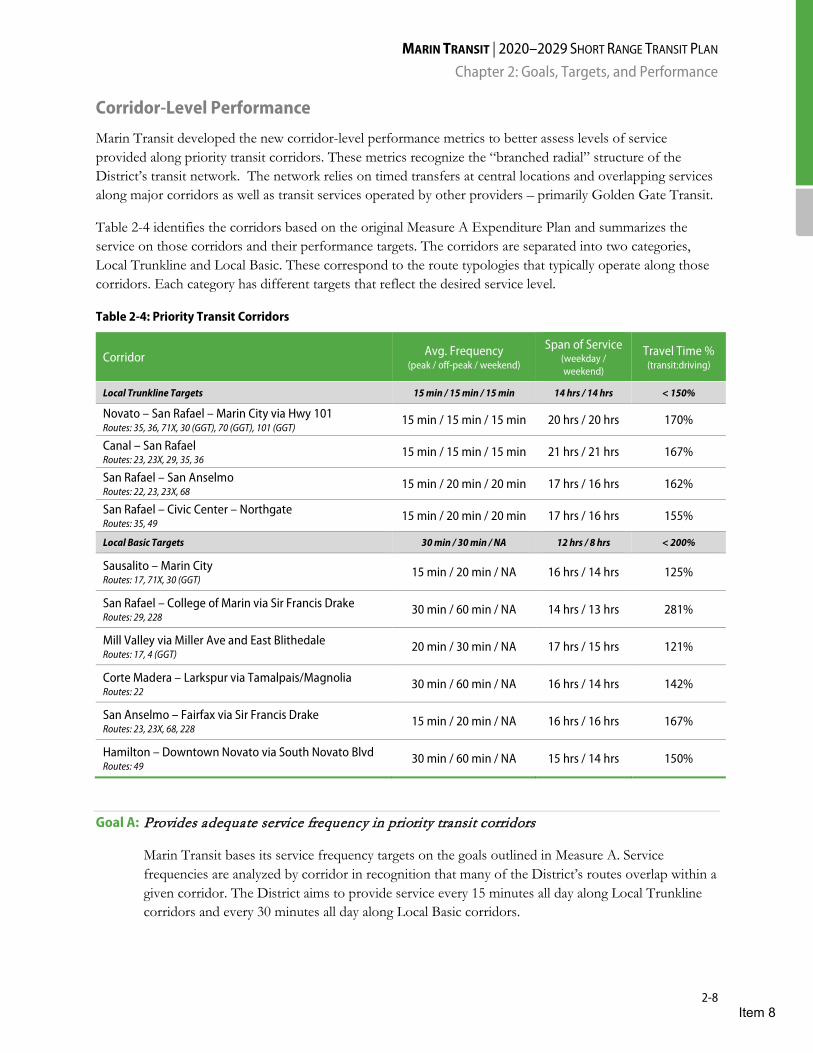
MARIN TRANSIT | 2020–2029 SHORT RANGE TRANSIT PLAN Chapter 2: Goals, Targets, and Performance
2-8
Corridor-Level Performance
Marin Transit developed the new corridor-level performance metrics to better assess levels of service provided along priority transit corridors. These metrics recognize the “branched radial” structure of the District’s transit network. The network relies on timed transfers at central locations and overlapping services along major corridors as well as transit services operated by other providers – primarily Golden Gate Transit.
Table 2-4 identifies the corridors based on the original Measure A Expenditure Plan and summarizes the service on those corridors and their performance targets. The corridors are separated into two categories, Local Trunkline and Local Basic. These correspond to the route typologies that typically operate along those corridors. Each category has different targets that reflect the desired service level.
Table 2-4: Priority Transit Corridors
Corridor Avg. Frequency (peak / off-peak / weekend)
Span of Service (weekday / weekend)
Travel Time % (transit:driving)
Local Trunkline Targets 15 min / 15 min / 15 min 14 hrs / 14 hrs < 150%
Novato – San Rafael – Marin City via Hwy 101 Routes: 35, 36, 71X, 30 (GGT), 70 (GGT), 101 (GGT) 15 min / 15 min / 15 min 20 hrs / 20 hrs 170%
Canal – San Rafael Routes: 23, 23X, 29, 35, 36 15 min / 15 min / 15 min 21 hrs / 21 hrs 167%
San Rafael – San Anselmo Routes: 22, 23, 23X, 68 15 min / 20 min / 20 min 17 hrs / 16 hrs 162%
San Rafael – Civic Center – Northgate Routes: 35, 49 15 min / 20 min / 20 min 17 hrs / 16 hrs 155%
Local Basic Targets 30 min / 30 min / NA 12 hrs / 8 hrs < 200%
Sausalito – Marin City Routes: 17, 71X, 30 (GGT) 15 min / 20 min / NA 16 hrs / 14 hrs 125%
San Rafael – College of Marin via Sir Francis Drake Routes: 29, 228 30 min / 60 min / NA 14 hrs / 13 hrs 281%
Mill Valley via Miller Ave and East Blithedale Routes: 17, 4 (GGT) 20 min / 30 min / NA 17 hrs / 15 hrs 121%
Corte Madera – Larkspur via Tamalpais/Magnolia Routes: 22 30 min / 60 min / NA 16 hrs / 14 hrs 142%
San Anselmo – Fairfax via Sir Francis Drake Routes: 23, 23X, 68, 228 15 min / 20 min / NA 16 hrs / 16 hrs 167%
Hamilton – Downtown Novato via South Novato Blvd Routes: 49 30 min / 60 min / NA 15 hrs / 14 hrs 150%
Goal A: Provides adequate service frequency in priority transit corridors
Marin Transit bases its service frequency targets on the goals outlined in Measure A. Service frequencies are analyzed by corridor in recognition that many of the District’s routes overlap within a given corridor. The District aims to provide service every 15 minutes all day along Local Trunkline corridors and every 30 minutes all day along Local Basic corridors.
Item 8
MARIN TRANSIT | 2020–2029 SHORT RANGE TRANSIT PLAN Chapter 2: Goals, Targets, and Performance
2-9
Performance: Average service frequency goals were met for two of the four Local Trunkline corridors and for three of the six Local Basic corridors. All the corridors met their peak frequency targets.
Goal B: Provides adequate span of service in priority transit corridors
Span of service targets have been developed for the two corridor types. The District aims to provide a span of service of 14 hours daily along Local Trunkline corridors. Along Local Basic corridors, the span of service target is 12 hours on weekdays and 8 hours on weekends.
Performance: Span of service goals were met for all four Local Trunkline corridors. All six of the Local Basic corridors also met both the weekday and weekend targets.
Goal C: Provides competitive travel times to promote transit usage
To promote transit use, Marin Transit aims to provide travel times competitive with the automobile. Based on non-congested conditions, scheduled transit travel times along Local Trunkline corridors should be no more than 150% longer than the equivalent auto travel times. For Local Basic corridors, transit travel times should be no more than 200% longer.
Performance: None of the four Local Trunkline corridors met the travel time target. Five of the six Local Basic corridors did meet the target. The San Rafael – College of Marin via Sir Francis Drake corridor has the longest transit travel time compared to auto travel. The routes that operate along this corridor, Routes 29 and 228, deviate to serve other locations including Larkspur Landing and Marin General, which increases travel time. Route 122 provides an express connection between San Rafael and College of Marin though operates via San Anselmo.
Item 8

MARIN TRANSIT | 2020–2029 SHORT RANGE TRANSIT PLAN Chapter 2: Goals, Targets, and Performance
2-10
Route-Level Performance
Table 2-7 shows route-level performance grouped by service typology for all Marin Transit services operated in FY 2015/16. This analysis reflects the transit network prior to the major service change implemented in June 2016.
Goal A: Meets service typology productivity standards based on passengers per hour/trip
The District has specified productivity goals measured by passengers per hour or trip and based on service typologies, as shown in Table 2-5.
Table 2-5: Productivity Goals by Typology
Typology Routes Productivity Target (minimum)
Local Trunkline 35, 36, 71X 20 passengers/ REVENUE HOUR
Local Basic 17, 22, 23, 23X, 29, 49 18 passengers/ REVENUE HOUR
Local Connector 219, 228, 233, 245, 251, 257 8 passengers/ REVENUE HOUR
Supplemental 113, 115, 117, 119, 125, 139, 145, 151, 154 20 passengers/TRIP
Rural 61, 68 6 passengers/ REVENUE HOUR
Recreational 66 25 passengers/ REVENUE HOUR
Demand Response Paratransit, Novato DAR, Dillon Beach/Tomales DAR, Point Reyes DAR
2 passengers/ REVENUE HOUR
Performance: Figure 2-2 shows the productivity of each route for FY 2017/18 compared to the service
standard. All fixed routes except Local Basic routes collectively met their unlinked passenger per hour goals. Twelve of these routes did not meet their productivity targets. These include: Routes 17, 22, 23, 23X, 29, 49, 71X, 115, 125, 139, 219 and 228. In the previous fiscal year, fourteen routes did not meet this target. Route 35 was the most productive local fixed-route service excluding supplemental, and carried an average of 28.9 passengers per hour.
Of the nine Supplemental routes, six met the productivity target of 20 passengers per trip. Route 151 (Hamilton – San Jose MS – Novato HS - San Marin HS) was the best performing supplemental route with 34.7 passengers per trip.
Stagecoach Routes 61 and 68 both met their productivity goal of 6 passengers per hour. Recreational Route 66 (Muir Woods Shuttle) also met its productivity goal of 25 passengers per hour.
Local Paratransit, the Dillon Beach/Tomales Dial-A-Ride, Pt Reyes Dial-A-Ride, and Novato Dial-A-Ride met the demand response productivity target of 2 passengers per hour.
Goal B: Meets service typology cost effectiveness standards based on subsidy per trip
The District has specified cost-effectiveness goals. These are measured by average subsidy per passenger and based on service typologies, as shown in Figure 2-3.
Item 8
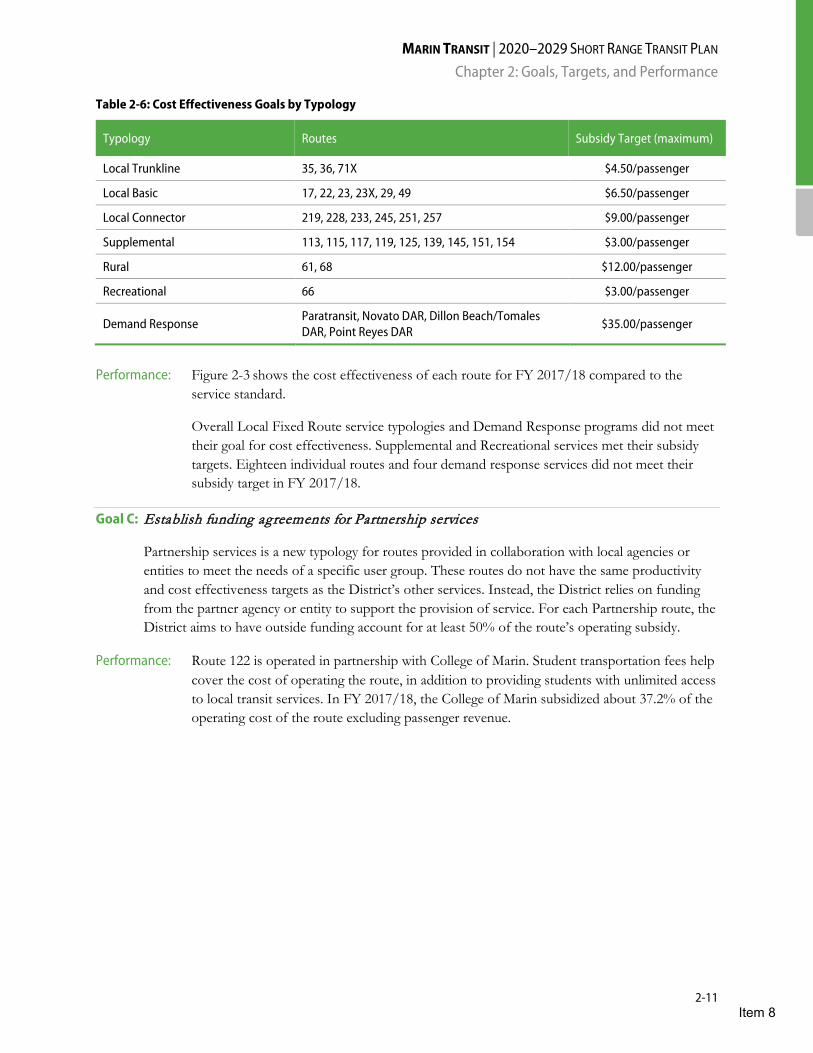
MARIN TRANSIT | 2020–2029 SHORT RANGE TRANSIT PLAN Chapter 2: Goals, Targets, and Performance
2-11
Table 2-6: Cost Effectiveness Goals by Typology
Typology Routes Subsidy Target (maximum)
Local Trunkline 35, 36, 71X $4.50/passenger
Local Basic 17, 22, 23, 23X, 29, 49 $6.50/passenger
Local Connector 219, 228, 233, 245, 251, 257 $9.00/passenger
Supplemental 113, 115, 117, 119, 125, 139, 145, 151, 154 $3.00/passenger
Rural 61, 68 $12.00/passenger
Recreational 66 $3.00/passenger
Demand Response Paratransit, Novato DAR, Dillon Beach/Tomales DAR, Point Reyes DAR
$35.00/passenger
Performance: Figure 2-3 shows the cost effectiveness of each route for FY 2017/18 compared to the
service standard.
Overall Local Fixed Route service typologies and Demand Response programs did not meet their goal for cost effectiveness. Supplemental and Recreational services met their subsidy targets. Eighteen individual routes and four demand response services did not meet their subsidy target in FY 2017/18.
Goal C: Establish funding agreements for Partnership services
Partnership services is a new typology for routes provided in collaboration with local agencies or entities to meet the needs of a specific user group. These routes do not have the same productivity and cost effectiveness targets as the District’s other services. Instead, the District relies on funding from the partner agency or entity to support the provision of service. For each Partnership route, the District aims to have outside funding account for at least 50% of the route’s operating subsidy.
Performance: Route 122 is operated in partnership with College of Marin. Student transportation fees help cover the cost of operating the route, in addition to providing students with unlimited access to local transit services. In FY 2017/18, the College of Marin subsidized about 37.2% of the operating cost of the route excluding passenger revenue.
Item 8
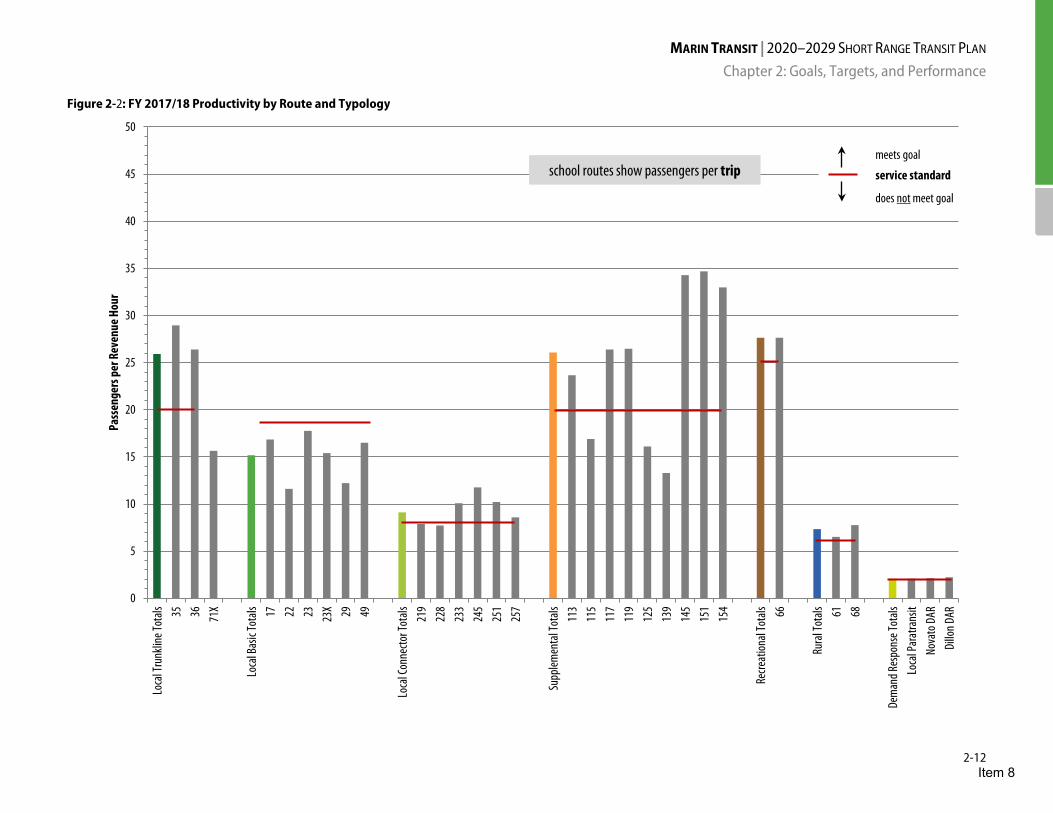
MARIN TRANSIT | 2020–2029 SHORT RANGE TRANSIT PLAN Chapter 2: Goals, Targets, and Performance
2-12
Figure 2-2: FY 2017/18 Productivity by Route and Typology
0
5
10
15
20
25
30
35
40
45
50
Loca
l Tru
nklin
e Tot
als 35 36 71X
Loca
l Bas
ic To
tals 17 22 23 23X 29 49
Loca
l Con
necto
r Tot
als 219
228
233
245
251
257
Supp
lemen
tal T
otals 11
311
511
711
912
513
914
515
115
4
Recre
ation
al To
tals 66
Rura
l Tot
als 61 68
Dem
and R
espo
nse T
otals
Loca
l Par
atra
nsit
Nova
to D
ARDi
llon D
AR
Pass
enge
rs p
er R
even
ue H
our
meets goal
service standard
does not meet goal
school routes show passengers per trip
Item 8
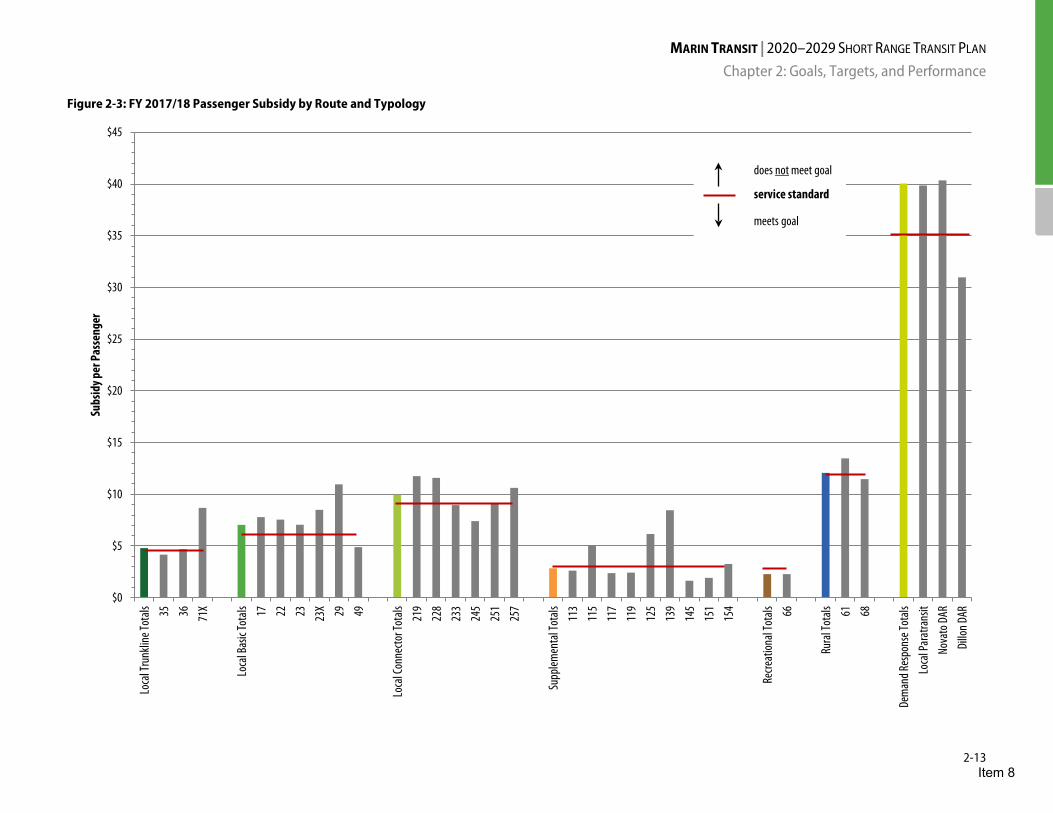
MARIN TRANSIT | 2020–2029 SHORT RANGE TRANSIT PLAN Chapter 2: Goals, Targets, and Performance
2-13
Figure 2-3: FY 2017/18 Passenger Subsidy by Route and Typology
$0
$5
$10
$15
$20
$25
$30
$35
$40
$45Lo
cal T
runk
line T
otals 35 36 71
X
Loca
l Bas
ic To
tals 17 22 23 23X 29 49
Loca
l Con
necto
r Tot
als 219
228
233
245
251
257
Supp
lemen
tal T
otals 11
311
511
711
912
513
914
515
115
4
Recre
ation
al To
tals 66
Rura
l Tot
als 61 68
Dem
and R
espo
nse T
otals
Loca
l Par
atra
nsit
Nova
to D
ARDi
llon D
AR
Subs
idy p
er P
asse
nger
does not meet goal
service standard
meets goal
Item 8
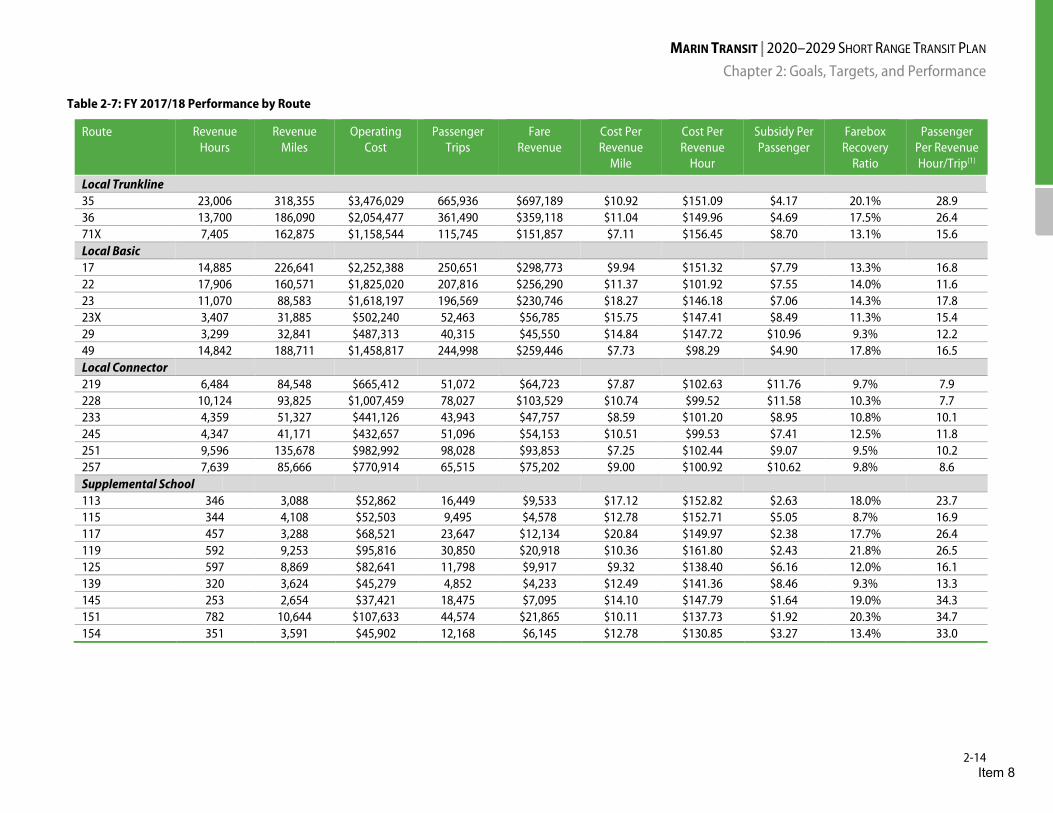
MARIN TRANSIT | 2020–2029 SHORT RANGE TRANSIT PLAN Chapter 2: Goals, Targets, and Performance
2-14
Table 2-7: FY 2017/18 Performance by Route
Route Revenue Hours
Revenue Miles
Operating Cost
Passenger Trips
Fare Revenue
Cost Per Revenue
Mile
Cost Per Revenue
Hour
Subsidy Per Passenger
Farebox Recovery
Ratio
Passenger Per Revenue Hour/Trip(1)
Local Trunkline 35 23,006 318,355 $3,476,029 665,936 $697,189 $10.92 $151.09 $4.17 20.1% 28.9 36 13,700 186,090 $2,054,477 361,490 $359,118 $11.04 $149.96 $4.69 17.5% 26.4 71X 7,405 162,875 $1,158,544 115,745 $151,857 $7.11 $156.45 $8.70 13.1% 15.6 Local Basic 17 14,885 226,641 $2,252,388 250,651 $298,773 $9.94 $151.32 $7.79 13.3% 16.8 22 17,906 160,571 $1,825,020 207,816 $256,290 $11.37 $101.92 $7.55 14.0% 11.6 23 11,070 88,583 $1,618,197 196,569 $230,746 $18.27 $146.18 $7.06 14.3% 17.8 23X 3,407 31,885 $502,240 52,463 $56,785 $15.75 $147.41 $8.49 11.3% 15.4 29 3,299 32,841 $487,313 40,315 $45,550 $14.84 $147.72 $10.96 9.3% 12.2 49 14,842 188,711 $1,458,817 244,998 $259,446 $7.73 $98.29 $4.90 17.8% 16.5 Local Connector 219 6,484 84,548 $665,412 51,072 $64,723 $7.87 $102.63 $11.76 9.7% 7.9 228 10,124 93,825 $1,007,459 78,027 $103,529 $10.74 $99.52 $11.58 10.3% 7.7 233 4,359 51,327 $441,126 43,943 $47,757 $8.59 $101.20 $8.95 10.8% 10.1 245 4,347 41,171 $432,657 51,096 $54,153 $10.51 $99.53 $7.41 12.5% 11.8 251 9,596 135,678 $982,992 98,028 $93,853 $7.25 $102.44 $9.07 9.5% 10.2 257 7,639 85,666 $770,914 65,515 $75,202 $9.00 $100.92 $10.62 9.8% 8.6 Supplemental School
113 346 3,088 $52,862 16,449 $9,533 $17.12 $152.82 $2.63 18.0% 23.7 115 344 4,108 $52,503 9,495 $4,578 $12.78 $152.71 $5.05 8.7% 16.9 117 457 3,288 $68,521 23,647 $12,134 $20.84 $149.97 $2.38 17.7% 26.4 119 592 9,253 $95,816 30,850 $20,918 $10.36 $161.80 $2.43 21.8% 26.5 125 597 8,869 $82,641 11,798 $9,917 $9.32 $138.40 $6.16 12.0% 16.1 139 320 3,624 $45,279 4,852 $4,233 $12.49 $141.36 $8.46 9.3% 13.3 145 253 2,654 $37,421 18,475 $7,095 $14.10 $147.79 $1.64 19.0% 34.3 151 782 10,644 $107,633 44,574 $21,865 $10.11 $137.73 $1.92 20.3% 34.7 154 351 3,591 $45,902 12,168 $6,145 $12.78 $130.85 $3.27 13.4% 33.0
Item 8
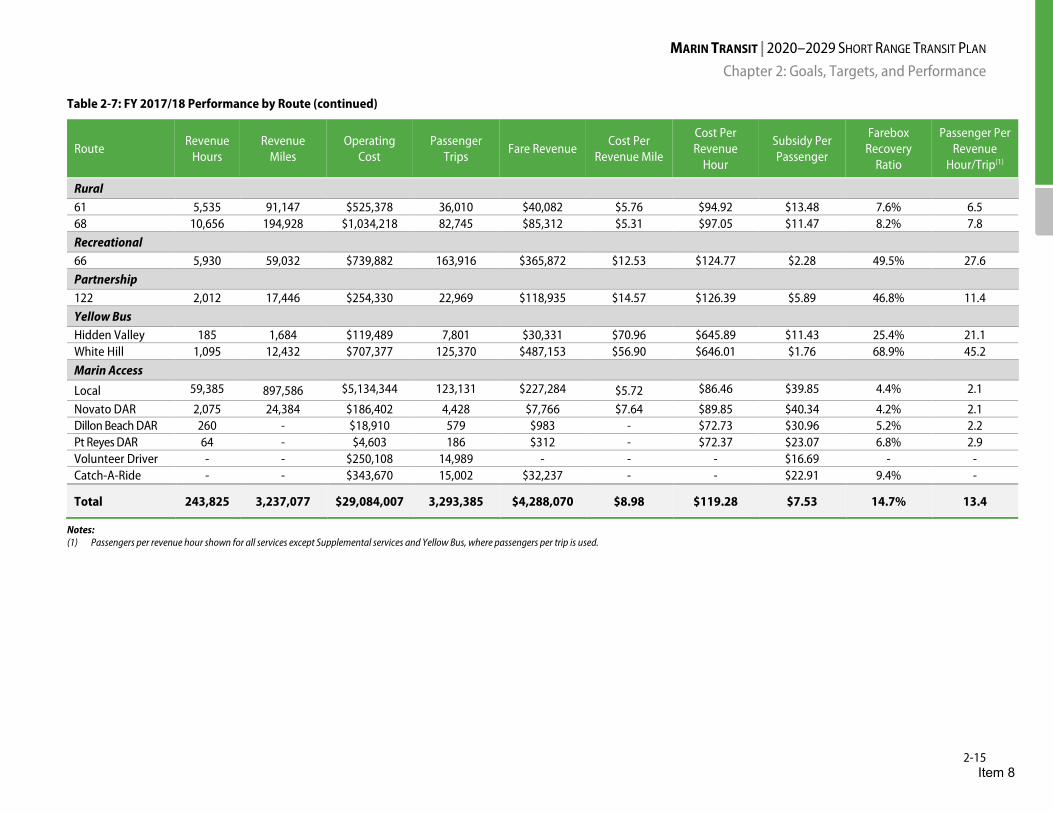
MARIN TRANSIT | 2020–2029 SHORT RANGE TRANSIT PLAN Chapter 2: Goals, Targets, and Performance
2-15
Table 2-7: FY 2017/18 Performance by Route (continued)
Route Revenue Hours
Revenue Miles
Operating Cost
Passenger Trips Fare Revenue Cost Per
Revenue Mile
Cost Per Revenue
Hour
Subsidy Per Passenger
Farebox Recovery
Ratio
Passenger Per Revenue
Hour/Trip(1)
Rural 61 5,535 91,147 $525,378 36,010 $40,082 $5.76 $94.92 $13.48 7.6% 6.5 68 10,656 194,928 $1,034,218 82,745 $85,312 $5.31 $97.05 $11.47 8.2% 7.8 Recreational 66 5,930 59,032 $739,882 163,916 $365,872 $12.53 $124.77 $2.28 49.5% 27.6 Partnership 122 2,012 17,446 $254,330 22,969 $118,935 $14.57 $126.39 $5.89 46.8% 11.4 Yellow Bus Hidden Valley 185 1,684 $119,489 7,801 $30,331 $70.96 $645.89 $11.43 25.4% 21.1 White Hill 1,095 12,432 $707,377 125,370 $487,153 $56.90 $646.01 $1.76 68.9% 45.2 Marin Access Local 59,385 897,586 $5,134,344 123,131 $227,284 $5.72 $86.46 $39.85 4.4% 2.1
Novato DAR 2,075 24,384 $186,402 4,428 $7,766 $7.64 $89.85 $40.34 4.2% 2.1 Dillon Beach DAR 260 - $18,910 579 $983 - $72.73 $30.96 5.2% 2.2 Pt Reyes DAR 64 - $4,603 186 $312 - $72.37 $23.07 6.8% 2.9 Volunteer Driver - - $250,108 14,989 - - - $16.69 - - Catch-A-Ride - - $343,670 15,002 $32,237 - - $22.91 9.4% -
Total 243,825 3,237,077 $29,084,007 3,293,385 $4,288,070 $8.98 $119.28 $7.53 14.7% 13.4
Notes: (1) Passengers per revenue hour shown for all services except Supplemental services and Yellow Bus, where passengers per trip is used.
Item 8

MARIN TRANSIT | 2020–2029 SHORT RANGE TRANSIT PLAN Chapter 2: Goals, Targets, and Performance
2-16
District Level Performance
District level performance goals are aimed at organizational achievements that are not directly linked to the service Marin Transit provides.
Goal A: Attracts outside funding sources, including federal, state, and toll revenue, as well as other local funds
Marin Transit uses local Measure A funds as the local match for state and federal grant sources and to pay for administrative costs associated with securing grant funding. As Marin Transit has increased staff, the District has been able to implement more programs and secure additional grant funding. Marin Transit’s goal is to maintain 5% of its budget as discretionary grant funded.
Performance: In FY 2017/18, the District was able to secure 5% of its budget from outside discretionary funding sources as shown in Table 2-8.
Item 8

MARIN TRANSIT | 2020–2029 SHORT RANGE TRANSIT PLAN Chapter 2: Goals, Targets, and Performance
2-17
Table 2-8: Outside Grant Funding by Fiscal Year
Fund Source FY 2018/19 Actual
FY 2019/20 Budget
Formula Grants
State - Transportation Development Act (Fixed Route Operations) $5,109,399 $5,836,446
State - State Transit Assistance (Population Based - Fixed Route Operations) $1,140,266 $1,274,541
State - State Transit Assistance (Population Based - Paratransit Operations) $103,372 $60,000
State - State Transit Assistance (Revenue Based - Fixed Route Operations) $598,064 $650,000
FTA 5307 (Vehicles, Equipment and facility) $1,747,540 $8,821,701
FTA 5311 (Rural funding) $215,088 $213,885
FTA 5307 ADA Set Aside $715,573 $687,028
Total Formula Grant Funds $9,629,302 $17,543,601
Discretionary Grants
State - State Transit Assistance (Population Based - Lifeline Operations of Route 257) $0 $391,151
State - LCTOP (Operations of Route 23x) $335,795 $0
State - Proposition 1B Bond Fund - PTMISEA (Novato Downtown Bus Facility Improvement)
$179,592 $0
FTA 5309 (State of Good Repair - Bus Stop Improvements) $418,378 $0
FTA 5310 (Mobility Management - Regional Discretionary Grant) $486,487 $437,500
National Park Service Grant (Muir Woods Shuttle, Fort Baker) $323,371 $452,570
FTA 5320 Paul Sarbanes Transit in the Parks (Muir Woods Shuttle) $56,856 $151,494
FTA 5339 (Bus and Bus Facilities - Facility) $0 $4,400,000
FTA 5316 (Job Access Reverse Commute – Mobility Management Technology) $60,938 $0
Total Discretionary Grant Funds $1,861,417 $5,832,715
Marin Transit Budget $34,150,824 $55,151,045
% of Total Budget 5% 11%
Item 8

MARIN TRANSIT | 2020–2029 SHORT RANGE TRANSIT PLAN Chapter 2: Goals, Targets, and Performance
2-18
Goal B: Operates the system in a manner that encourages public involvement and participation
Marin Transit is committed to encouraging public participation in the local transit planning and monitoring process. The District aims to provide multiple channels for obtaining customer feedback in English and Spanish, and holds all public meetings in accessible locations served by transit. Marin Transit staff participate in passenger and community advisory committees for additional opportunities to discuss issues with riders and the public.
Performance: Marin Transit conducted its fourth system wide passenger survey in the Spring 2017 and will conduct passenger surveys at least every five years. In addition to the comprehensive system wide onboard surveys, Marin Transit has conducted passenger surveys on various routes to obtain feedback on proposed or recently implemented service changes. The District also started annual mail surveys to all Marin Access clients in 2015 to solicit rider feedback and identify program improvements.
Marin Transit holds various public meetings in local communities to gather feedback on the system and communicate directly with bus passengers. In addition to more traditional meeting formats, Marin Transit has taken a “hands on” approach to solicit public feedback and communicate with riders. This includes participating in local community events and providing staff in the field. Examples include outreach campaigns associated with the June 2016 service changes and the Redwood and Grant Transit Improvement Project. The primary goal is to connect with riders while they use the service and encourage community and stakeholder participation.
The Marin Mobility Consortium was developed as stakeholder advisory group in 2010 to identify and pursue new transportation options for Marin’s senior, disabled, and low-income residents. Marin Transit staff act as chair of the consortium, which has over 60 active members. Consortium meetings are held quarterly, and a steering committee and focused workgroups hold additional meetings.
Marin Transit staffs the Marin County Paratransit Coordinating Council to facilitate discussion and maintain accessibility of transit services for those unable to ride fixed-route transit, as defined under the Americans with Disabilities Act. Marin Transit also participates in Golden Gate Transit’s Accessibility and Bus Passenger Advisory Committees to hear from general public riders and riders with disabilities regarding accessibility issues on the fixed route bus system.
Marin Transit updated its Public Participation Plan as part of its 2017-2020 Title VI Program, adopted in July 2017. The plan provides a framework for gathering input from riders, the public, and other stakeholders. The outline of the District’s Title VI Program is provided in Appendix E. In Spring 2020, Marin Transit will revise the entire Title VI Program including the Public Participation Plan.
Goal C: Maintains a capital plan to minimize air quality issues and provide quality amenities and vehicles
Item 8
MARIN TRANSIT | 2020–2029 SHORT RANGE TRANSIT PLAN Chapter 2: Goals, Targets, and Performance
2-19
Performance: Marin Transit’s capital plan is described in Chapter 4 and includes programs to improve bus stops and purchase new hybrid and electric vehicles.
Item 8
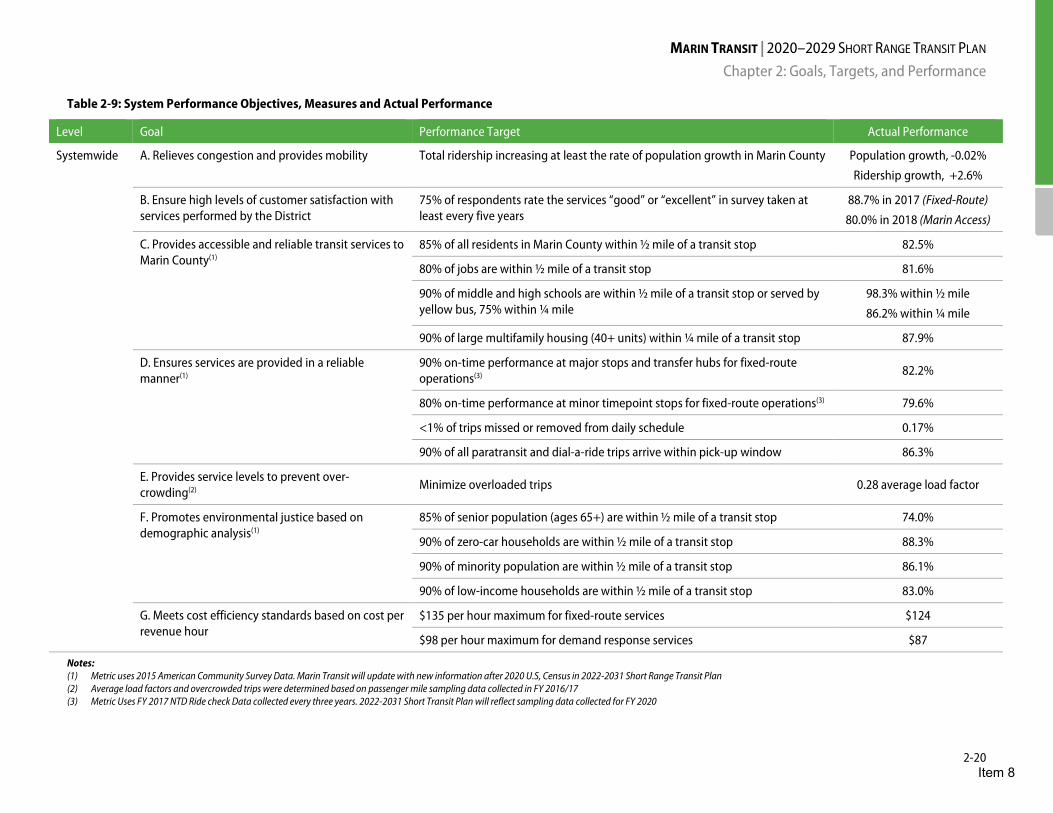
MARIN TRANSIT | 2020–2029 SHORT RANGE TRANSIT PLAN Chapter 2: Goals, Targets, and Performance
2-20
Table 2-9: System Performance Objectives, Measures and Actual Performance
Level Goal Performance Target Actual Performance
Systemwide A. Relieves congestion and provides mobility Total ridership increasing at least the rate of population growth in Marin County Population growth, -0.02%
Ridership growth, +2.6%
B. Ensure high levels of customer satisfaction with services performed by the District
75% of respondents rate the services “good” or “excellent” in survey taken at least every five years
88.7% in 2017 (Fixed-Route)
80.0% in 2018 (Marin Access)
C. Provides accessible and reliable transit services to Marin County(1)
85% of all residents in Marin County within ½ mile of a transit stop 82.5%
80% of jobs are within ½ mile of a transit stop 81.6%
90% of middle and high schools are within ½ mile of a transit stop or served by yellow bus, 75% within ¼ mile
98.3% within ½ mile
86.2% within ¼ mile
90% of large multifamily housing (40+ units) within ¼ mile of a transit stop 87.9%
D. Ensures services are provided in a reliable manner(1)
90% on-time performance at major stops and transfer hubs for fixed-route operations(3)
82.2%
80% on-time performance at minor timepoint stops for fixed-route operations(3) 79.6%
<1% of trips missed or removed from daily schedule 0.17%
90% of all paratransit and dial-a-ride trips arrive within pick-up window 86.3%
E. Provides service levels to prevent over-crowding(2)
Minimize overloaded trips 0.28 average load factor
F. Promotes environmental justice based on demographic analysis(1)
85% of senior population (ages 65+) are within ½ mile of a transit stop 74.0%
90% of zero-car households are within ½ mile of a transit stop 88.3%
90% of minority population are within ½ mile of a transit stop 86.1%
90% of low-income households are within ½ mile of a transit stop 83.0%
G. Meets cost efficiency standards based on cost per revenue hour
$135 per hour maximum for fixed-route services $124
$98 per hour maximum for demand response services $87
Notes: (1) Metric uses 2015 American Community Survey Data. Marin Transit will update with new information after 2020 U.S, Census in 2022-2031 Short Range Transit Plan (2) Average load factors and overcrowded trips were determined based on passenger mile sampling data collected in FY 2016/17 (3) Metric Uses FY 2017 NTD Ride check Data collected every three years. 2022-2031 Short Transit Plan will reflect sampling data collected for FY 2020
Item 8
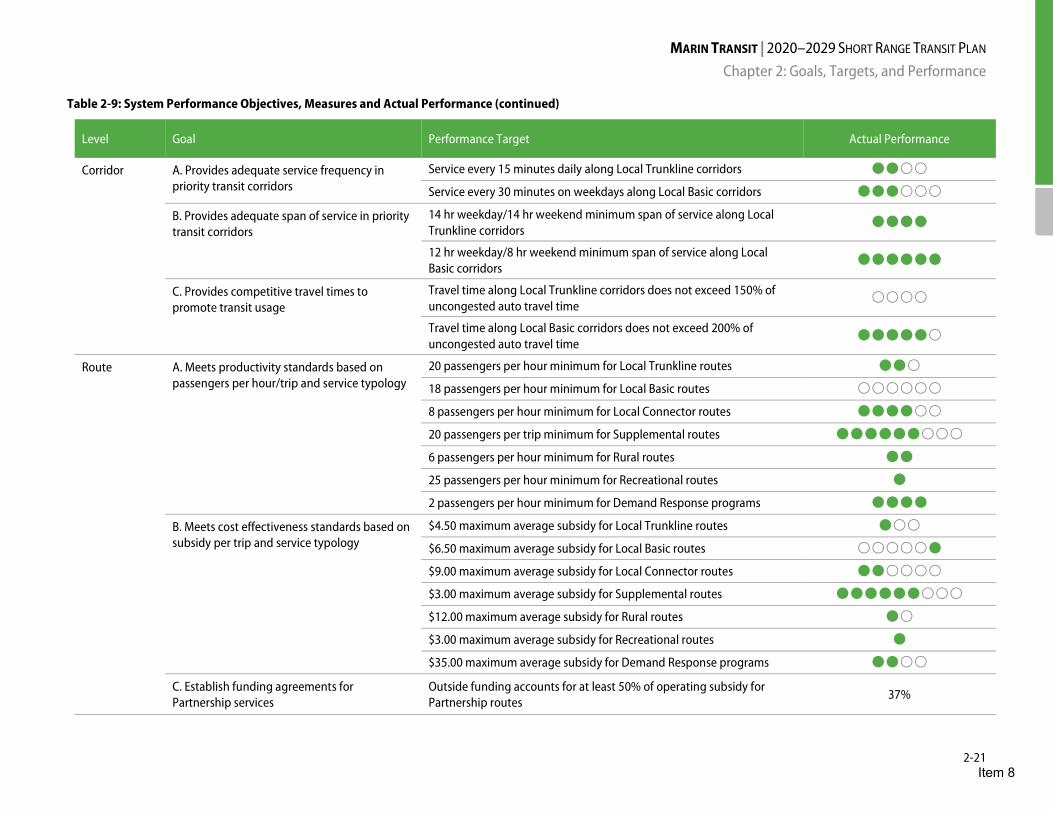
MARIN TRANSIT | 2020–2029 SHORT RANGE TRANSIT PLAN Chapter 2: Goals, Targets, and Performance
2-21
Table 2-9: System Performance Objectives, Measures and Actual Performance (continued)
Level Goal Performance Target Actual Performance
Corridor A. Provides adequate service frequency in priority transit corridors
Service every 15 minutes daily along Local Trunkline corridors Service every 30 minutes on weekdays along Local Basic corridors
B. Provides adequate span of service in priority transit corridors
14 hr weekday/14 hr weekend minimum span of service along Local Trunkline corridors
12 hr weekday/8 hr weekend minimum span of service along Local Basic corridors
C. Provides competitive travel times to promote transit usage
Travel time along Local Trunkline corridors does not exceed 150% of uncongested auto travel time
Travel time along Local Basic corridors does not exceed 200% of uncongested auto travel time
Route
A. Meets productivity standards based on passengers per hour/trip and service typology
20 passengers per hour minimum for Local Trunkline routes
18 passengers per hour minimum for Local Basic routes
8 passengers per hour minimum for Local Connector routes
20 passengers per trip minimum for Supplemental routes
6 passengers per hour minimum for Rural routes
25 passengers per hour minimum for Recreational routes
2 passengers per hour minimum for Demand Response programs
B. Meets cost effectiveness standards based on subsidy per trip and service typology
$4.50 maximum average subsidy for Local Trunkline routes
$6.50 maximum average subsidy for Local Basic routes
$9.00 maximum average subsidy for Local Connector routes
$3.00 maximum average subsidy for Supplemental routes
$12.00 maximum average subsidy for Rural routes
$3.00 maximum average subsidy for Recreational routes
$35.00 maximum average subsidy for Demand Response programs
C. Establish funding agreements for Partnership services
Outside funding accounts for at least 50% of operating subsidy for Partnership routes
37%
Item 8

MARIN TRANSIT | 2020–2029 SHORT RANGE TRANSIT PLAN Chapter 2: Goals, Targets, and Performance
2-22
Table 2-9: System Performance Objectives, Measures and Actual Performance (continued)
Level Goal Performance Target Actual Performance
District A. Attracts outside funding sources, including federal, state and toll revenue, as well as other local funds
Grants account for 5% of the Marin Transit Budget (excludes STA and TDA) 11%
B. Operate the system in manner that encourages public involvement and participation
Provide channels for customer feedback in English and Spanish Passenger surveys, public meetings, community events, stakeholder advisory groups, comment cards, email, phone
calls; Updated Public Participation Plan adopted July 2017 (see
Appendix E)
All meetings to be held in accessible locations that are served by transit (within ¼ mile)
Meeting locations include Novato City Hall, Hannah Gallery (Marin City), Pickleweed (Canal), Marin
Transit Offices, Whistlestop, Marin County Civic Center
Participation in passenger and community advisory committees Marin Access Paratransit Coordinating Council, Marin
Mobility Consortium, Bus Passenger Advisory Committee,
Advisory Committee on Accessibility
C. Maintain a capital plan to minimize air quality issues and provide quality amenities and vehicles
Capital Plan includes programs to improve bus stops and purchase new hybrid and electric vehicles
(see Chapter 4)
Item 8

MARIN TRANSIT | 2020–2029 SHORT RANGE TRANSIT PLAN Chapter 3: Service Plan
3-1
Chapter 3: Service Plan
The SRTP Service plan anticipates future transit service levels using projected revenue hours and revenue miles over the next ten years. The planned service levels show very little growth in fixed route service and slight growth in senior and ADA programs. The Service plan provides for Marin Transit to test new senior/ADA demand response programs in the first three years. The plan estimates that service levels will return to historic growth levels in the fourth year. These service levels support a balanced budget and enable the District to maintain Board-adopted reserve levels throughout the ten-year plan.
In developing this Service plan, staff acknowledges a number of challenges and opportunities. Challenges include:
• Lack of permanent operations and maintenance facilities; • Attracting and retaining labor, including drivers and maintenance staff; • Supporting transportation for special needs populations; and • Defining transit’s priority within the county’s transportation hierarchy.
To respond to these challenges, Marin Transit has:
• Benefited from an extension to the local transportation sales tax (Measure A/AA) for an additional 30 years;
• Continued to diversify the District's planning and operations to better match service levels to demand;
• Controlled costs through competitive bidding; • Leveraged regional transit expansion activities; • Provided congestion relief through student transportation services, and • Evaluated potential private sector partnerships to increase and expand mobility.
Marin Transit will explore opportunities related to future improvements in regional transit, student transportation, and other alternative transportation options. The next section describes the District’s challenges and opportunities in more detail.
Challenge: Lack of Permanent Facilities Limits Program Growth; Financial and Operational Stability
Marin Transit relies on its service providers to identify and secure property for storing and maintaining the equipment required to deliver local transit services. In Marin County, it is challenging to find and expensive to lease these types of facilities. Marin Transit conducted surveys of current and potential service providers for all types of service including local bus, paratransit, and yellow school bus service. These service providers identified the need to secure a facility as the most significant factor in determining their interest in bidding on Marin Transit services, ability to provide the service, and proposed pricing.
The District has been actively working to identify and secure funding and locate a suitable maintenance and/or parking facility location site. In Fall 2016, Marin Transit received a $4.4 million grant from the Federal Transit Administration to purchase land and pave, fence, and light the site for bus storage. In addition to
Item 8
MARIN TRANSIT | 2020–2029 SHORT RANGE TRANSIT PLAN Chapter 3: Service Plan
3-2
Marin Transit’s Capital reserve funds, the federal grant provides a head start for the District in identifying and developing an operations and maintenance facility.
In June 2015, the Board authorized the General Manager to obtain assistance from a real estate broker and pursue available properties. The Board formed an ad-hoc committee that has met intermittently to help staff evaluate and select a site. To date, the District has not been succeeded in identifying a site that meets operational needs and that the local jurisdiction supports. Efforts have proven to be challenging due to the lack of sizable parcels zoned for industrial use.
Challenge: Attracting and Retaining Labor to Support Services
The strength of the economy has led to challenges for many transit agencies nationwide, and the impacts are heightened in the Bay Area. In August 2019, Marin County’s unemployment rate was 2.4%. This is the third lowest in the State of California where the overall unemployment rate was 4.2%. Marin County’s current median home price is approximately $1.2 million, placing the county in the top three in the state of California. Coupled with high housing costs, changes in the labor market creates very challenging conditions for recruiting local labor for entry-level bus operator and maintenance positions. Higher-level positions are also challenging to retain. Commute conditions into Marin County are affected by limited highway facilities, the effectiveness of regional transit connections, and bridges that are susceptible to congestion and traffic accidents.
Aside from increased marketing and recruiting for these positions, the District actively works with its contractors to identify wage increases and incentives to attract and retain qualified employees. In November 2017, the Marin Transit Board voluntarily elected to increase contract costs to allow driver and operations staff wages to increase. Marin Transit rebid the local, rural, and seasonal contracts in 2018 to encourage bidders to make staff wages and benefits competitive in Marin County to improve retention and minimize turnover. These strategies ensure reliable and quality service and have increased the cost of operations by more than projected inflation rates.
Challenge: Providing Cost-Effective Transportation for Special Needs Populations
Marin County has an ongoing responsibility and commitment to its senior, disabled, and low-income residents. These populations often have the greatest need for transportation services that typically require the highest amount of subsidy. Marin’s senior population continues to rise, and the number of low-income residents increases with economic inequality. The District’s surveys of local transit and Marin Access riders showed that 57% and 50% of riders earn less than $25,000 per year, respectively. Population trends indicate over one-third of the county’s population will be over the age of 60 by 2030.
Marin Transit will always need to provide highly personal and higher subsidy programs to meet the needs of riders who depend on public transportation to maintain independence and a high quality of life. Over 25% of Marin Access survey respondents stated that without Marin Access they would not travel. For financial, logistical, or personal reasons, many riders do not have other viable mobility options. For example, private sector innovations such as Transportation Network Companies (TNCs) and commuter shuttles increase mobility for some. However, they do not reach a significant portion of those who rely on Marin Access programs. Compared to the general population, Marin Access riders earn significantly less, are less likely to own a smartphone, and may require wheelchair-accessible vehicles that these emerging services do not currently provide.
Item 8
MARIN TRANSIT | 2020–2029 SHORT RANGE TRANSIT PLAN Chapter 3: Service Plan
3-3
Marin Transit is committed to supporting these riders and factors the costs of the services they require into program planning. The District will consider how to keep this population informed and involved in the decision-making process. Marin Transit will work to ensure enough funding is available to meet mandated paratransit service demand and efficiently use any additional paratransit funds to continue to meet most of the demand for non-mandated trips.
Challenge: Transit’s Priority in Marin County’s Transportation Hierarchy
Local transit use in Marin ranks high compared to most other counties in the Bay Area. Compared to neighboring North Bay counties, the number of Marin bus riders is over three times higher per capita than in Sonoma and Solano Counties and over four times higher than in Napa County1. At the same time, Marin County does not support many of the key incentives for using transit through cost and travel-time saving that other communities have established.
Countywide, 95% of all households in Marin own vehicles. Despite this level of auto ownership, there are potential financial incentives that promote alternative transportation options for select trips. The most common are parking fees and congestion pricing tolls. Few locations and employment sites in Marin charge nominal or market rate fees for parking. Pricing and other parking policies can be developed as incentives for transit use.
Travel time savings is another area where transit in Marin County has limited advantage over other travel options. There is limited roadway infrastructure and limited support for transit preferential treatments such as signal priority and queue jump lanes. Carpool lanes on Highway 101 have very limited hours of operation. Recent efforts to expand these hours of operation have not been supported locally. Most transit routes operate on the busiest and often most congested roadways, and the services become less attractive for passengers due to slow speeds and long ride times.
The District will continue to lobby for roadway enhancements and preferential treatments for transit from jurisdictions that plan, own, invest in, and/or operate these facilities. These include cities and towns, the County, the Transportation Authority of Marin (TAM), and Caltrans. This issue is especially relevant as the District works with Golden Gate Transit and the City of San Rafael to relocate the San Rafael Transit Center. The rapidly developing transportation technology landscape and physical roadway capacity constraints will likely force roadway owners to rethink how they manage roadways and curb space if congestion relief is a priority.
Challenge: Keeping Pace in a Rapidly Changing Transportation Environment
In recent years, technology has transformed the transportation industry and this trend is continuing. Advances in smartphone technology have given users greater access to real-time information, dynamic trip planning, shared-ride services, and integrated payment options. These devices have fueled the growth of Transportation Network Companies (TNCs) such as Uber and Lyft and in other ride share options such as bike share and scooter share. These private sector offerings compete to develop a base of users who ultimately subscribes to a company for all their mobility needs.
1 Bus riders include all operators within each county: Marin Transit and Golden Gate Transit (Marin); Sonoma County Transit, Santa Rosa CityBus, and Petaluma Transit (Sonoma); VINE (Napa); SolTrans, FAST, Vacaville City Coach, Dixon Readi-Ride, and Rio Vista Breeze (Solano). Within Marin County, approximately half of all bus riders use Marin Transit services.
Item 8

MARIN TRANSIT | 2020–2029 SHORT RANGE TRANSIT PLAN Chapter 3: Service Plan
3-4
The automotive industry focused on two major trends: electrification and autonomous vehicles. Transportation electrification will assist with reducing greenhouse gas emissions and dependence on fossil fuels. Autonomous vehicles may increase safety and enhance independence for those who cannot drive. They also offer opportunities to rethink auto ownership including how we house, store, or park vehicles and the land-use impacts of these shifts.
The challenge for the District is to understand how transit fits into these future transportation environments and how to leverage technology advancements to improve transit services. Marin Transit’s recent efforts to advanced services through technology include:
• Full electrification of two heavy duty buses. These vehicles were put into service in 2018, and staff continue to monitor their performance to understand whether the technology is scalable for Marin’s operation.
• Maintaining and disseminating transit information for app developers to use in trip planning apps. The District offers these data feeds through the developers’ page on its website.
• Piloting Marin Transit Connect to offer transit riders the ability to request and book real-time mobility services in Northern San Rafael through a smartphone app. The Connect is the first time the District has offered integrated fare payment within the app, thus reducing the need for cash transactions. As this program continues to grow, the District will monitor costs and benefits closely to determine whether Connect supports or diverts resources from other transit services.
Neither Marin Transit or the public transit industry as a whole are in a position to invest in software development or other advances toward electrification. The District relies on the private sector to bring these advances to market and partner with the public sector to implement. A primary challenge with this model is the procurement process required to purchase these technologies or engage with the private sector. Often it is hard for the public sector to define the specific scope of services because it is unclear what is available or under development. Terms related to duration of agreements become challenging since the technology advances so quickly, and future needs are difficult to predict. In some cases, the private sector needs the transit agency to test and development emerging technologies and this does not fit in well with traditional contract and procurement policies. These are a few of the hurdles to fostering successful implementation and procurement of rapidly changing technologies.
Opportunity: Funding Certainty of Future Revenues (Measure A/AA)
The District has taken measures to control expenditures and expand service primarily through procuring new operations contracts and diversifying the types of service offered. Since passage of Measure A in 2004, the average cost per hour of fixed route service and demand response services has increased 19% and 10%, respectively. That is an annual growth of approximately 1.2 % per year for fixed route and 0.5% per year for demand response services.
The previous Short Range Transit Plan showed a future ten-year financial outlook anticipating that the Measure A local transportation sales tax expires. Measure A designated 55% of the revenues to provision of local transit and is the source of 40% of Marin Transit’s operating revenues. Without this source of local transportation funding, the District estimated that it would need to dramatically reduce services. To balance expenses and revenues, Marin Transit estimated that it would eliminate over half of all local fixed route service, all non-mandated senior/ADA programs, and all District-supported yellow school bus transportation.
Item 8
MARIN TRANSIT | 2020–2029 SHORT RANGE TRANSIT PLAN Chapter 3: Service Plan
3-5
Fortunately, Marin voters approved a 30-year extension of this local transportation sales tax as Measure AA in November 2018. This approval retained over half of the measure for transit services and gave the District financially stability for the foreseeable future. Long-term financial stability enables the District to better plan and deliver local transit services without significant impacts on service levels or uncertainties about capital expenditures.
Opportunity: Diversification of Services
Marin Transit has done a lot to prepare for the changing demographics of the county and anticipate the needs of its riders. The District’s Marin Access Mobility Management Program is one of the more developed programs of this kind in the Bay Area. Marin Access identifies and provides mobility options for senior and ADA-eligible populations and is supported by Measure A, Measure B, and various grant opportunities. These programs will continue to grow and mature to address the need for paratransit services. They will also provide more attractive mobility options that can be operated at a lower cost to serve a wider population, including the significant number of seniors who are healthy and active. The Mobility Management Program coordinates resources, volunteers, and social service organizations to develop and support these services in Marin.
Advances in the fixed-route program have positioned the District to respond to the need for additional mobility options. The District has applied service typologies to the range of services it offers based on their purpose. The continued growth and expansion of local connector services or “community shuttles” responds to input from community-based planning efforts and has a stronger appeal to senior riders. In providing community fixed route services and travel training, Marin Transit is working towards minimizing dependence on more expensive paratransit services.
The District has also responded to the specific needs of younger students who lack home to school transportation services in Marin County. Marin Transit has helped establish and expand yellow school bus programs by partnering with school districts. These services provide needed transportation services for many students and reduce roadway congestion during peak travel hours. The District is a very rare example of a public transportation agency that continues to diversify its offerings based on the needs of the community.
Opportunity: Controlling Costs Through Competitive Procurement
Marin County relies solely on its contractors to provide the operational and maintenance support for its services. Five different contractors operate the District’s fixed route, yellow bus, and demand response services. Other entities, such as the taxi industry and local non-profits, provide additional services and support transportation programs that Marin Transit subsidizes.
Since the 2004 voter approval of Measure A, the District has been able to control its costs through competitive procurement for service providers. In the first full year of operation after Measure A, the District paid an average of $113 per hour for fixed route service and $67 per hour for demand response service. Since that time, all but one of Marin Transit’s operations contracts has had at least two competitive bidding cycles. The exception is local service operated GGBHTD. Over ten years later, the District pays an average of $130 per hour for fixed route (+15%) and $74 per hour for demand response services (+10%).
Item 8
MARIN TRANSIT | 2020–2029 SHORT RANGE TRANSIT PLAN Chapter 3: Service Plan
3-6
Opportunity: Regional Transit Expansion and New Non-Motorized Program Synergies
Marin Transit will continue to strengthen mobility options and seek opportunities for increased ridership. The new SMART passenger rail service offers a high capacity transit option for Sonoma and Marin County residents. Golden Gate Transit bus and ferry service connections to San Francisco and the East Bay continue to adapt to provide Marin residents with a more attractive transportation alternative to these highly desired work and entertainment markets.
The Transportation Authority of Marin (TAM), the county’s Congestion Management Agency, is developing permanent and pilot projects that support alternative transportation. These include a guaranteed ride home program, countywide bike share pilot, potential car-sharing opportunities, and a first/last mile on-demand rideshare pilot program. Local transit serves a key role in facilitating connections within the county and to regional transit services.
Opportunity: Congestion Relief through Student Transportation Services
Students have always been a core ridership market in Marin County, with an estimated one in four trips taken by this demographic. These trips occur on regular fixed route and supplemental transit services. In recent years, the District has taken a more active role in providing, managing, and funding yellow school bus services on behalf of school districts. Marin Transit oversees yellow bus operations for three school districts that transport over 1,200 students each day.
The growth in yellow school bus programs reflects their success in attracting new riders and reducing congestion on local and regional roadways. There is increased interest from cities and towns throughout the county in partnering with schools and Marin Transit to explore opportunities to move students out of cars and onto buses.
Opportunity: Partnering with Private Sector to Increase and Enhance Mobility
Mobility services are undergoing radical changes. Transportation Network Companies (TNCs) such as Uber and Lyft leverage technology to connect passengers with drivers, and major technology and automotive companies are racing to develop autonomous vehicles. Within the life of this plan, it is likely that autonomous vehicles will be commercially available and operate on local roadways in Marin County.
Staff participates in ongoing discussions with the private sector to understand and identify opportunities for partnership that will improve local transit offerings and serve the mobility needs of all Marin residents. Launched after the previous SRTP, Marin Transit Connect supports on-demand mobility for all riders and offers a smartphone app to request, book, and manage trips.
New technologies will reshape the transportation sector and provide additional options for travel and car-free lifestyles. However, these technologies may have little to offer in terms of congestion relief. Marin County has limited options to increase roadway capacity and adding capacity may induce additional traffic. There are opportunities for public transit to further reduce congestion. These include high capacity transit service in congested corridors and private sector partnerships that encourage affordable and reliable connections to public transit.
The District and roadway operators can work together to investigate options to increase transit priority and reduce transit travel times in congested corridors, making transit more attractive for choice riders. A
Item 8
MARIN TRANSIT | 2020–2029 SHORT RANGE TRANSIT PLAN Chapter 3: Service Plan
3-7
combination of low transit fares and tolls, congestion pricing, or parking fees will also make driving more expensive and provide further incentives to take transit.
Planned Service Levels
The District plans service levels based on projected financial resources to minimize the need to significantly reduce service. Current revenue projections indicate improved economic conditions for transit. However, the District has had to reduce service to maintain financial stability in the past. Previous Marin Transit SRTPs planned for service level reductions to reflect declines in local Measure A, State, and Federal revenues and address fixed increases of operating contract costs. These planned reductions played out in a series of fixed route service cuts beginning in March 2010. The first was a 5.5% reduction or 6,690 revenue hours followed by a 1.9% reduction or 2,150 revenue hours in March 2012.
In addition to service cuts, Marin Transit focused on reducing operating costs. Except for Golden Gate Transit-operated local service, the District competitively bid contracted operations and succeeded in lowering their costs. The District renegotiated the interagency agreement with Golden Gate Transit in 2012. Historically, this agreement has represented the largest share of Marin Transit services at the highest cost. A new agreement with GGBHTD took effect July 1, 2012. This new agreement:
• Reduced the contract rate; • Shifted the cost structure to a cost per revenue hour; • Reduced the annual escalation rate from 5% to 2.7%; • Shifted lower productivity routes to the District’s shuttle service program; and • Modified the payment structure for capital costs.
Under the 2012 terms, Marin Transit was able to implement the Service plan in the previous Short Range Transit Plan, increase local service hours by 11%, replenish the District’s Emergency Contingency Reserves, and delay the need to spend reserve funds in the future.
In 2015, the District executed a new intergovernmental agreement with GGBHTD that extends through 2020 with an option to extend to 2022. The 2015 agreement provides additional cost savings, flexibility in the number of annual contracted hours, and more financial clarity. Also, in 2015, the District rebid the Marin Access Paratransit services and was able to reduce operating costs associated with that program. Coupled with other financial efficiency measures, these service agreements led the District to expand fixed route service by nearly 20% in 2016.
Since the 2016 expansion, District planners have focused on monitoring fixed route service and reallocating or eliminating unproductive service. While some of these cuts have reduced hours, the District added runtime to other routes to account for increasing congestion. These added hours offset the service cuts and result in a minimal change in service levels over the past two to three years.
The only service expansion of since the last SRTP was in May 2018 when the District launched its first on-demand transit service, Marin Transit Connect. This service expanded demand response hours by 15% in FY 2019 compared to the previous year.
Marin Transit continues to investigate new revenue to support ongoing increases in operating costs. These include raising passenger fares, applying for available grant funds, and identifying scheduling and operational
Item 8

MARIN TRANSIT | 2020–2029 SHORT RANGE TRANSIT PLAN Chapter 3: Service Plan
3-8
efficiencies that lead to cost-neutral service improvements. The local initiative program outlined in the 2006 Short Range Transit Plan was designed to provide matching funds to local communities that propose to develop new service. The District suspended this program in FY 2009/10 to minimize the impact of reduced funding availability on service levels. Marin Transit may expand partnership opportunities if operational efficiencies can be achieved, new revenues are identified, vehicle expansion is achieved, or the District secures a maintenance facility. Partnerships services will be required to meet District performance criteria.
The ten-year plan projects that operational expenses will outpace revenues in year three, District finances will remain stable over the ten years and support current and planned service levels. Table 3-1 shows the projected annual service levels by revenue hours, or buses for yellow bus service, and Table 3-2 provides projections for annual revenue miles. The narrative following the tables describes the assumptions for these service levels by program type.
Item 8
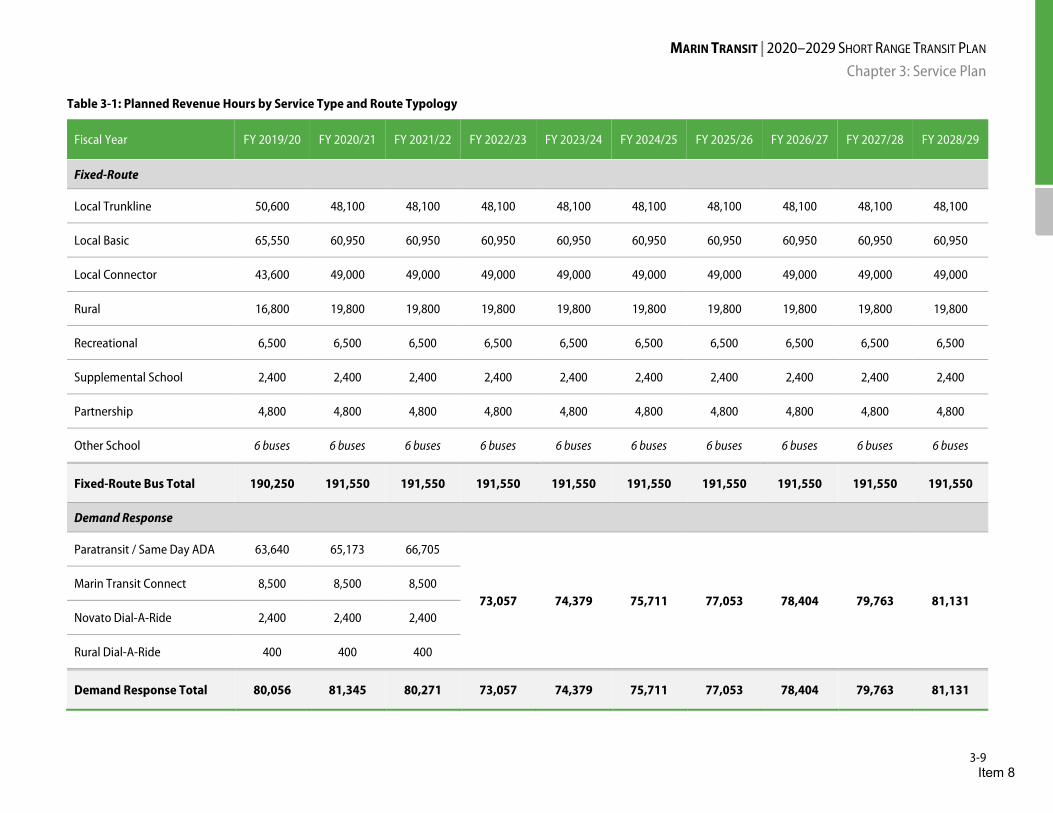
MARIN TRANSIT | 2020–2029 SHORT RANGE TRANSIT PLAN Chapter 3: Service Plan
3-9
Table 3-1: Planned Revenue Hours by Service Type and Route Typology
Fiscal Year FY 2019/20 FY 2020/21 FY 2021/22 FY 2022/23 FY 2023/24 FY 2024/25 FY 2025/26 FY 2026/27 FY 2027/28 FY 2028/29
Fixed-Route
Local Trunkline 50,600 48,100 48,100 48,100 48,100 48,100 48,100 48,100 48,100 48,100
Local Basic 65,550 60,950 60,950 60,950 60,950 60,950 60,950 60,950 60,950 60,950
Local Connector 43,600 49,000 49,000 49,000 49,000 49,000 49,000 49,000 49,000 49,000
Rural 16,800 19,800 19,800 19,800 19,800 19,800 19,800 19,800 19,800 19,800
Recreational 6,500 6,500 6,500 6,500 6,500 6,500 6,500 6,500 6,500 6,500
Supplemental School 2,400 2,400 2,400 2,400 2,400 2,400 2,400 2,400 2,400 2,400
Partnership 4,800 4,800 4,800 4,800 4,800 4,800 4,800 4,800 4,800 4,800
Other School 6 buses 6 buses 6 buses 6 buses 6 buses 6 buses 6 buses 6 buses 6 buses 6 buses
Fixed-Route Bus Total 190,250 191,550 191,550 191,550 191,550 191,550 191,550 191,550 191,550 191,550
Demand Response
Paratransit / Same Day ADA 63,640 65,173 66,705
73,057 74,379 75,711 77,053 78,404 79,763 81,131 Marin Transit Connect 8,500 8,500 8,500
Novato Dial-A-Ride 2,400 2,400 2,400
Rural Dial-A-Ride 400 400 400
Demand Response Total 80,056 81,345 80,271 73,057 74,379 75,711 77,053 78,404 79,763 81,131
Item 8
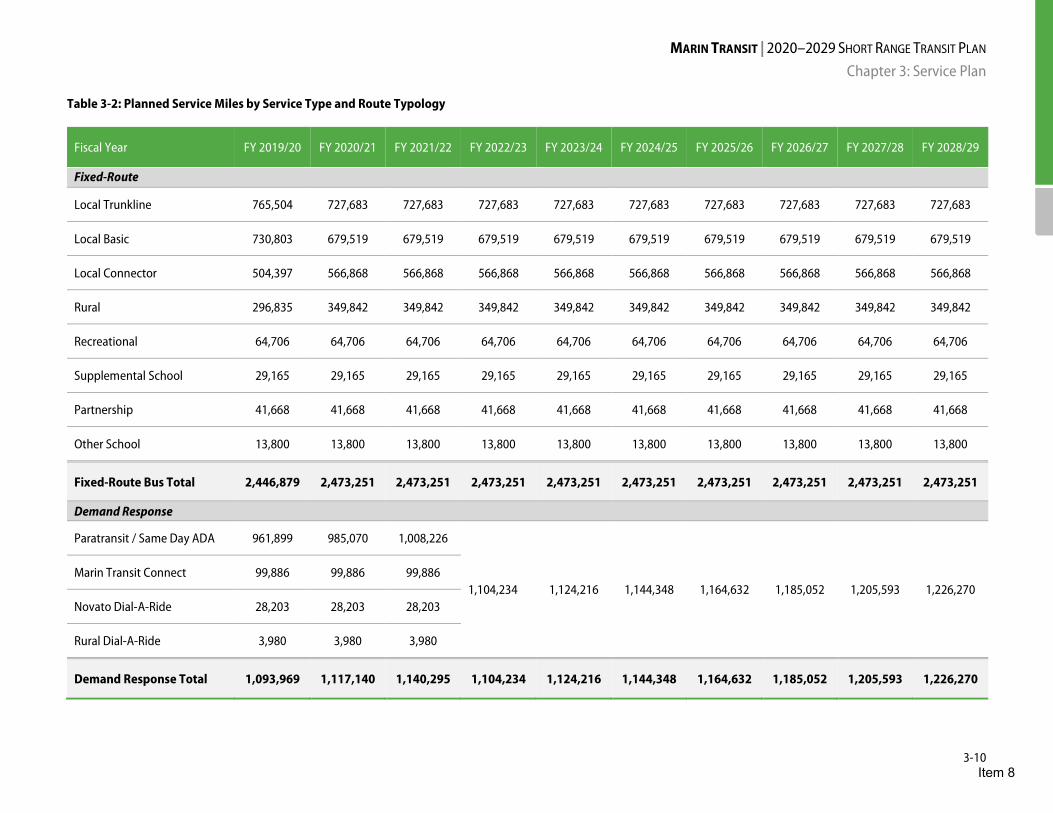
MARIN TRANSIT | 2020–2029 SHORT RANGE TRANSIT PLAN Chapter 3: Service Plan
3-10
Table 3-2: Planned Service Miles by Service Type and Route Typology
Fiscal Year FY 2019/20 FY 2020/21 FY 2021/22 FY 2022/23 FY 2023/24 FY 2024/25 FY 2025/26 FY 2026/27 FY 2027/28 FY 2028/29
Fixed-Route
Local Trunkline 765,504 727,683 727,683 727,683 727,683 727,683 727,683 727,683 727,683 727,683
Local Basic 730,803 679,519 679,519 679,519 679,519 679,519 679,519 679,519 679,519 679,519
Local Connector 504,397 566,868 566,868 566,868 566,868 566,868 566,868 566,868 566,868 566,868
Rural 296,835 349,842 349,842 349,842 349,842 349,842 349,842 349,842 349,842 349,842
Recreational 64,706 64,706 64,706 64,706 64,706 64,706 64,706 64,706 64,706 64,706
Supplemental School 29,165 29,165 29,165 29,165 29,165 29,165 29,165 29,165 29,165 29,165
Partnership 41,668 41,668 41,668 41,668 41,668 41,668 41,668 41,668 41,668 41,668
Other School 13,800 13,800 13,800 13,800 13,800 13,800 13,800 13,800 13,800 13,800
Fixed-Route Bus Total 2,446,879 2,473,251 2,473,251 2,473,251 2,473,251 2,473,251 2,473,251 2,473,251 2,473,251 2,473,251
Demand Response
Paratransit / Same Day ADA 961,899 985,070 1,008,226
1,104,234 1,124,216 1,144,348 1,164,632 1,185,052 1,205,593 1,226,270 Marin Transit Connect 99,886 99,886 99,886
Novato Dial-A-Ride 28,203 28,203 28,203
Rural Dial-A-Ride 3,980 3,980 3,980
Demand Response Total 1,093,969 1,117,140 1,140,295 1,104,234 1,124,216 1,144,348 1,164,632 1,185,052 1,205,593 1,226,270
Item 8
MARIN TRANSIT | 2020–2029 SHORT RANGE TRANSIT PLAN Chapter 3: Service Plan
3-11
Fixed Route
Since FY 2011/12, Marin Transit has undertaken three sizable service changes. These changes altered the structure of Marin local fixed route services and expanded service levels by over 30%:
1. March 2012 North Marin County Restructuring. Marin Transit restructured service in Novato and Northern Marin based on Phase 1 recommendations from the Novato Transit Needs Assessment Study. This restructuring eliminated duplication in regional and local services and reduced annual service levels by 2,150 hours. The restructuring resulted in expanded local service hours and frequencies within Novato.
2. August 2013 Service Changes. Marin Transit reallocated services between its contractors and expanded service by 11% on local routes in Novato and Tiburon. These changes resulted from the Tiburon and Novato Transit Needs Assessments and renegotiation of the interagency agreement with GGBHTD. Changes included adding shuttle service in Novato and Tiburon, extending Route 23 to the Canal and Target, and expanding evening services throughout the county. Marin Transit staff monitored the performance of the August 2013 changes, which led to additional modifications in Tiburon in June 2014.
3. June 2016 Service Changes. Marin Transit expanded service by nearly 20% on local fixed route services. These changes were based on the Countywide Transit Market Assessment, the previous Short Range Transit Plan-funded service assessment, and new operations agreements in 2015. The 2016 service increases focused on four areas: service frequency, more direct service, faster service, and increased efficiency. Staff continue to monitor the impact of these changes.
Since 2016, the District has implemented a service of service reductions to eliminate unproductive service and improve productivity (passengers per revenue hour). Due to the need to account for congestion, the District has increased revenue time on some routes without necessarily expanding service. Overall growth since 2016 has been minimal.
Local Fixed Route The Local Fixed Route program categorizes routes within three Marin Transit service typologies (Local Trunkline, Local Basic, and Local Connectors). These represent 59% of total service hours forecasted over the next ten years. Figure 3-1 summarizes annual revenue hours on these services over the past seven years. The plan assumes service levels will remain relatively constant throughout the plan horizon.
Underperforming Routes Marin Transit regularly monitors services to ensure they are performing efficiently and effectively and carry out the transit goals in Measure A. Staff make ongoing incremental changes to schedules to address underperformance or poor reliability. More significant service changes are needed to address routes that do not meet their performance targets over an extended period. The following summarizes the District’s underperforming routes based on FY 2018/19 data:
• Routes currently not meeting productivity targets (passengers per hour): Route 17, Route 22, Route 23/23X, Route 29, Route 49, Route 71X, Route 219, and Route 228
Item 8
MARIN TRANSIT | 2020–2029 SHORT RANGE TRANSIT PLAN Chapter 3: Service Plan
3-12
• Routes currently not meeting cost effectiveness targets: (subsidy per passenger): Route 17, Route 22, Route 23, Route 23X, Route 29, Route 36, Route 71X, Route 219, Route 228, Route 233, and Route 257
Item 8
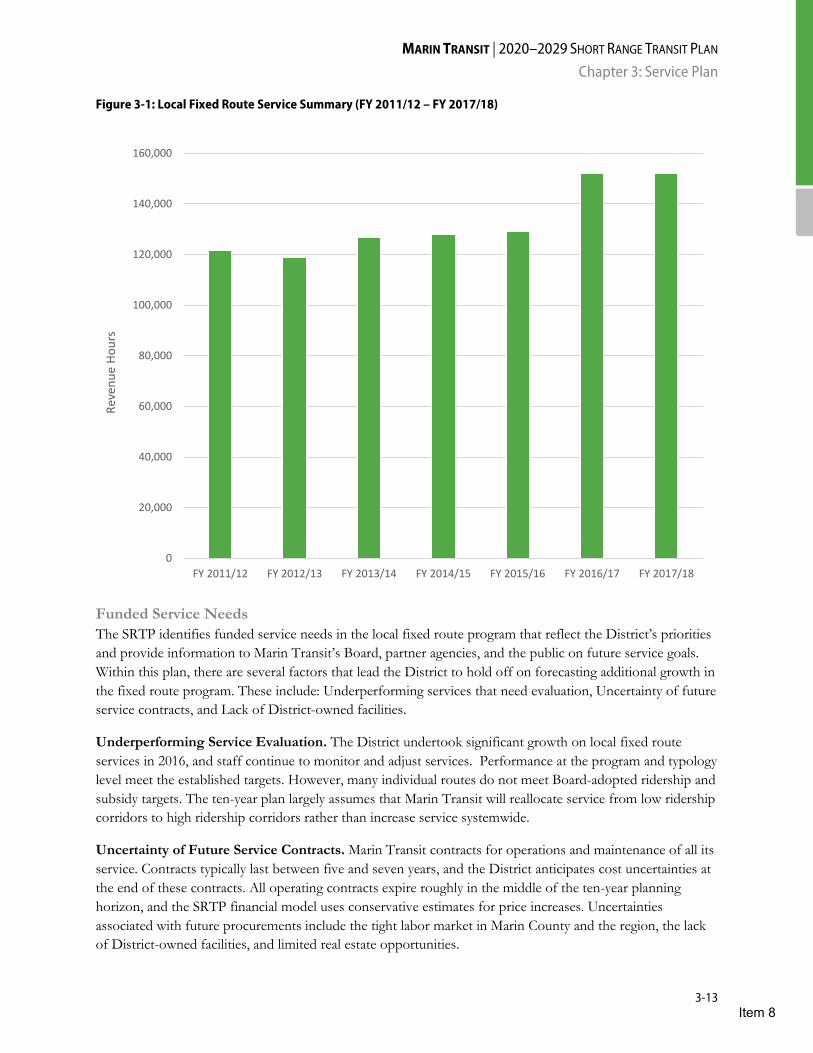
MARIN TRANSIT | 2020–2029 SHORT RANGE TRANSIT PLAN Chapter 3: Service Plan
3-13
Figure 3-1: Local Fixed Route Service Summary (FY 2011/12 – FY 2017/18)
Funded Service Needs The SRTP identifies funded service needs in the local fixed route program that reflect the District’s priorities and provide information to Marin Transit’s Board, partner agencies, and the public on future service goals. Within this plan, there are several factors that lead the District to hold off on forecasting additional growth in the fixed route program. These include: Underperforming services that need evaluation, Uncertainty of future service contracts, and Lack of District-owned facilities.
Underperforming Service Evaluation. The District undertook significant growth on local fixed route services in 2016, and staff continue to monitor and adjust services. Performance at the program and typology level meet the established targets. However, many individual routes do not meet Board-adopted ridership and subsidy targets. The ten-year plan largely assumes that Marin Transit will reallocate service from low ridership corridors to high ridership corridors rather than increase service systemwide.
Uncertainty of Future Service Contracts. Marin Transit contracts for operations and maintenance of all its service. Contracts typically last between five and seven years, and the District anticipates cost uncertainties at the end of these contracts. All operating contracts expire roughly in the middle of the ten-year planning horizon, and the SRTP financial model uses conservative estimates for price increases. Uncertainties associated with future procurements include the tight labor market in Marin County and the region, the lack of District-owned facilities, and limited real estate opportunities.
0
20,000
40,000
60,000
80,000
100,000
120,000
140,000
160,000
FY 2011/12 FY 2012/13 FY 2013/14 FY 2014/15 FY 2015/16 FY 2016/17 FY 2017/18
Reve
nue
Hour
s
Item 8
MARIN TRANSIT | 2020–2029 SHORT RANGE TRANSIT PLAN Chapter 3: Service Plan
3-14
Lack of District-Owned Facilities. The District does not own maintenance or transit vehicle parking facilities. Despite federal grant funds and local Capital reserve funding, the District has been unable to locate and secure a suitable property. A Marin Transit-owned facility will reduce operations costs and provide stability for ongoing operations. Future service expansion will require additional vehicles and drivers and will be challenging and costly without a Marin Transit facility. The District will not consider significantly expanding service until it has established a location and secured funding to develop a facility.
Staff have identified candidate improvements to the fixed route network for possible implementation in the first two years of the plan. These include:
Increase service on routes serving the Canal to provide comparable seating capacity for the transition of articulated buses to standard 40’ coaches. Staff expects this change to be implemented in March of 2020 and it will impact Routes 23x, 29, and 35. This change will provide service frequencies every 8-10 minutes within the Canal during weekday peak hours. Current frequencies are every 15 minutes using articulated buses.
Reallocate hours from underperforming routes or route segments to increase frequencies on higher ridership routes or create potential new routes. Staff expects to reduce service on Route 22 and Route 35 between Northgate and Novato. Staff expects to add weekend service and make changes within Novato on Route 257 and changes to Route 23 (Fairfax to Canal). Staff is also considering a new route to serve the San Rafael-Northgate-Kaiser corridor. Targeted improvements will increase service frequencies to every 8-10 minutes in the corridors between Downtown San Rafael and San Anselmo and Downtown San Rafael to Northgate/Civic Center along 4th Street.
Reassign route segments among routes that serve the same corridors, and establish new bus stops to increase route efficiency and reduce travel times for riders. The two most problematic areas staff will focus on are Routes 17 and 22 stops near Strawberry Village and the San Anselmo Hub. Staff is also considering reassigning service to Strawberry from Route 17 to Route 36. To address congestion at the San Anselmo Hub, staff is planning an alternative stop along Sir Francis Drake south of the hub and relocating Routes 22, 122 and westbound 228 service to that stop.
Explore new shuttle services to support on-demand ridership markets served by the Novato Dial-A-Ride. Staff will conduct a detailed assessment of Novato Dial-A-Ride (DAR) to consider whether changes are needed to the DAR and/or local Routes 251 and 257 to better meet demand. Staff will also explore a new service to the Marin Community Clinic on Redwood Blvd.
Improve connections to Regional High Capacity Transit Networks (SMART and Golden Gate Ferry Services). SMART plans to increase service frequency and will open two new stops at Larkspur and Downtown Novato in the next three to six months. Marin Transit plans to extend Route 49 to connect to the San Marin/Northern Novato SMART station starting in December 2019. Additional service frequency to/from the San Rafael Transit Center will increase the quantity and quality of connections with the new SMART schedules. Staff will consider other changes to the fixed route network to facilitate connections without impacting existing ridership markets. Staff is exploring Route 29 changes to connect Downtown Larkspur to the Larkspur Landing Ferry and the SMART station. For service at the Civic Center station, staff will evaluate shuttle Routes 245 and 257 for modifications that may serve the station and connect to employment markets in Terra Linda. For the Hamilton Station, staff will evaluate potential modifications to Routes 251 and 257 to serve the
Item 8
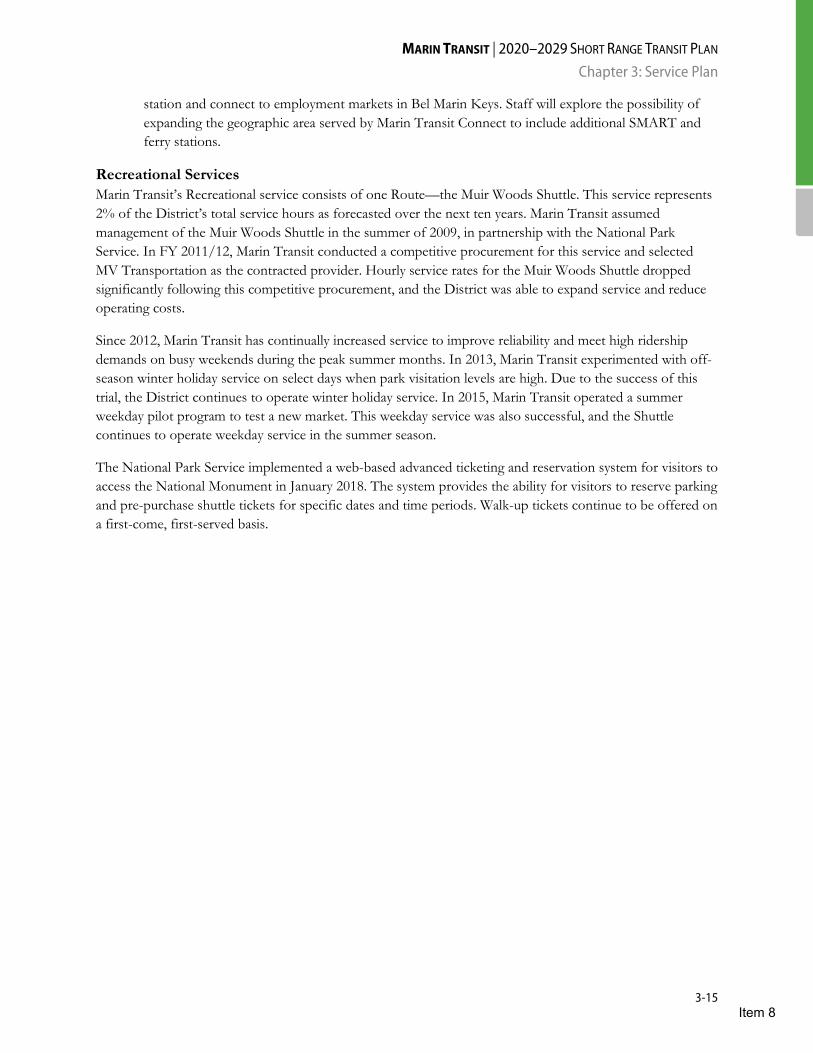
MARIN TRANSIT | 2020–2029 SHORT RANGE TRANSIT PLAN Chapter 3: Service Plan
3-15
station and connect to employment markets in Bel Marin Keys. Staff will explore the possibility of expanding the geographic area served by Marin Transit Connect to include additional SMART and ferry stations.
Recreational Services Marin Transit’s Recreational service consists of one Route—the Muir Woods Shuttle. This service represents 2% of the District’s total service hours as forecasted over the next ten years. Marin Transit assumed management of the Muir Woods Shuttle in the summer of 2009, in partnership with the National Park Service. In FY 2011/12, Marin Transit conducted a competitive procurement for this service and selected MV Transportation as the contracted provider. Hourly service rates for the Muir Woods Shuttle dropped significantly following this competitive procurement, and the District was able to expand service and reduce operating costs.
Since 2012, Marin Transit has continually increased service to improve reliability and meet high ridership demands on busy weekends during the peak summer months. In 2013, Marin Transit experimented with off-season winter holiday service on select days when park visitation levels are high. Due to the success of this trial, the District continues to operate winter holiday service. In 2015, Marin Transit operated a summer weekday pilot program to test a new market. This weekday service was also successful, and the Shuttle continues to operate weekday service in the summer season.
The National Park Service implemented a web-based advanced ticketing and reservation system for visitors to access the National Monument in January 2018. The system provides the ability for visitors to reserve parking and pre-purchase shuttle tickets for specific dates and time periods. Walk-up tickets continue to be offered on a first-come, first-served basis.
Item 8
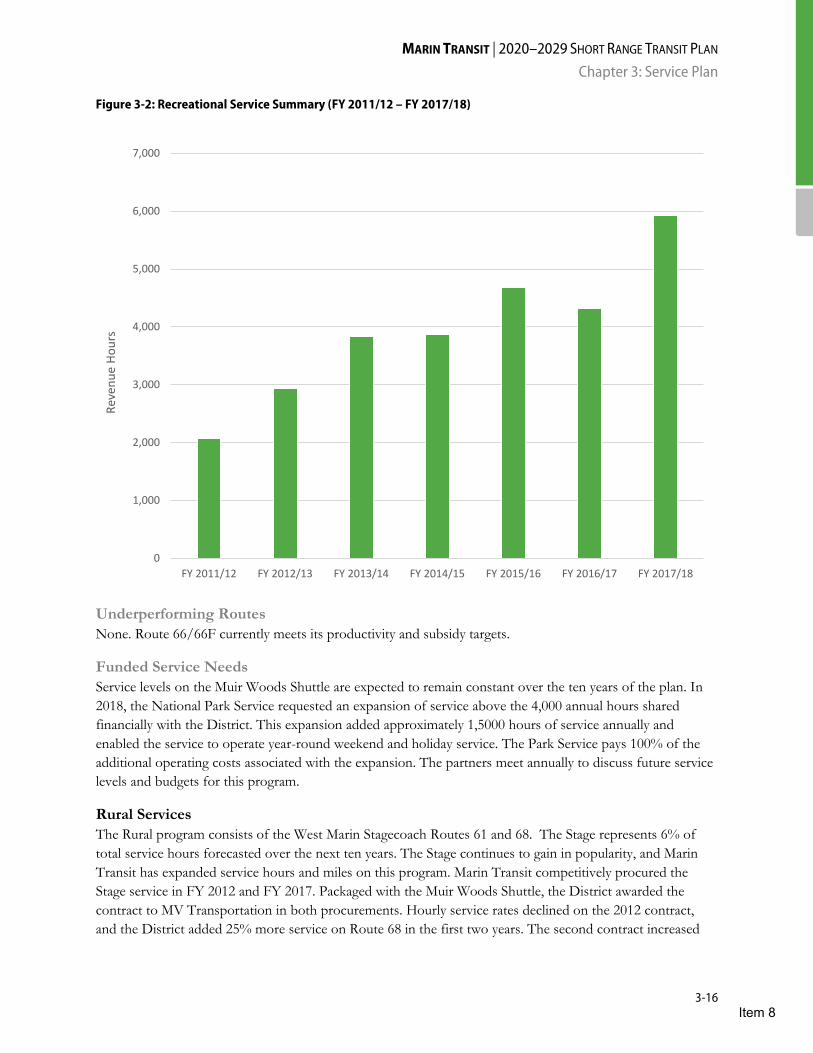
MARIN TRANSIT | 2020–2029 SHORT RANGE TRANSIT PLAN Chapter 3: Service Plan
3-16
Figure 3-2: Recreational Service Summary (FY 2011/12 – FY 2017/18)
Underperforming Routes None. Route 66/66F currently meets its productivity and subsidy targets.
Funded Service Needs Service levels on the Muir Woods Shuttle are expected to remain constant over the ten years of the plan. In 2018, the National Park Service requested an expansion of service above the 4,000 annual hours shared financially with the District. This expansion added approximately 1,5000 hours of service annually and enabled the service to operate year-round weekend and holiday service. The Park Service pays 100% of the additional operating costs associated with the expansion. The partners meet annually to discuss future service levels and budgets for this program.
Rural Services The Rural program consists of the West Marin Stagecoach Routes 61 and 68. The Stage represents 6% of total service hours forecasted over the next ten years. The Stage continues to gain in popularity, and Marin Transit has expanded service hours and miles on this program. Marin Transit competitively procured the Stage service in FY 2012 and FY 2017. Packaged with the Muir Woods Shuttle, the District awarded the contract to MV Transportation in both procurements. Hourly service rates declined on the 2012 contract, and the District added 25% more service on Route 68 in the first two years. The second contract increased
0
1,000
2,000
3,000
4,000
5,000
6,000
7,000
FY 2011/12 FY 2012/13 FY 2013/14 FY 2014/15 FY 2015/16 FY 2016/17 FY 2017/18
Reve
nue
Hour
s
Item 8
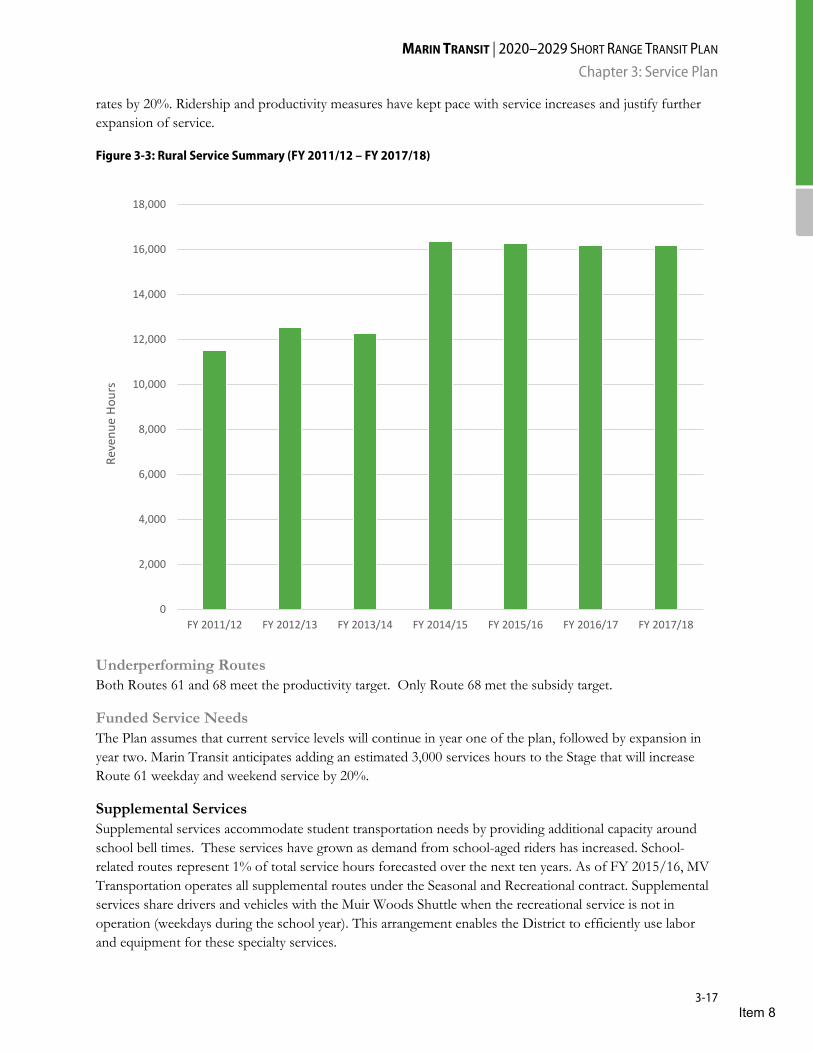
MARIN TRANSIT | 2020–2029 SHORT RANGE TRANSIT PLAN Chapter 3: Service Plan
3-17
rates by 20%. Ridership and productivity measures have kept pace with service increases and justify further expansion of service.
Figure 3-3: Rural Service Summary (FY 2011/12 – FY 2017/18)
Underperforming Routes Both Routes 61 and 68 meet the productivity target. Only Route 68 met the subsidy target.
Funded Service Needs The Plan assumes that current service levels will continue in year one of the plan, followed by expansion in year two. Marin Transit anticipates adding an estimated 3,000 services hours to the Stage that will increase Route 61 weekday and weekend service by 20%.
Supplemental Services Supplemental services accommodate student transportation needs by providing additional capacity around school bell times. These services have grown as demand from school-aged riders has increased. School-related routes represent 1% of total service hours forecasted over the next ten years. As of FY 2015/16, MV Transportation operates all supplemental routes under the Seasonal and Recreational contract. Supplemental services share drivers and vehicles with the Muir Woods Shuttle when the recreational service is not in operation (weekdays during the school year). This arrangement enables the District to efficiently use labor and equipment for these specialty services.
0
2,000
4,000
6,000
8,000
10,000
12,000
14,000
16,000
18,000
FY 2011/12 FY 2012/13 FY 2013/14 FY 2014/15 FY 2015/16 FY 2016/17 FY 2017/18
Reve
nue
Hour
s
Item 8
MARIN TRANSIT | 2020–2029 SHORT RANGE TRANSIT PLAN Chapter 3: Service Plan
3-18
In December 2015, the District completed a comprehensive study to determine future K-12 school transportation needs. The recommendations focused on how to support and expand yellow school bus service for K-8 students and supplemental transit resources for the high schools. Marin Transit has implemented the following recommendations in recent years:
• Transitioned Supplemental service in the Ross Valley to yellow school bus service. An estimated 2,000 annual revenue hours of public transit service on Routes 23, 126, and 127 were transitioned to six yellow buses operating 17 morning and afternoon trips every school day in FY 2015/16. An estimated 450 passenger trips per day are provided on these services, and ridership increased slightly.
• Added a new Supplemental service to Terra Linda High School in FY 2015/16. Approximately 200 hours of revenue service were added, serving an estimated 90 students per day.
• Transitioned the Cove School and St. Hilary School Supplemental services to yellow bus. These resources were further invested in increasing service to Redwood High School to accommodate overcrowding.
• Added a new Supplemental service to serve Novato High School in August 2019. Approximately 500 hours of revenue service were added to serve an estimated 100 students per day.
Figure 3-4: Supplemental Service Summary (FY 2011/12 – FY 2017/18)
0
1,000
2,000
3,000
4,000
5,000
6,000
FY 2011/12 FY 2012/13 FY 2013/14 FY 2014/15 FY 2015/16 FY 2016/17 FY 2017/18
Reve
nue
Hour
s
Item 8

MARIN TRANSIT | 2020–2029 SHORT RANGE TRANSIT PLAN Chapter 3: Service Plan
3-19
Underperforming Routes • Routes not meeting productivity targets (passengers per trip): Route 115, Route 117, Route 125, and
Route 139 • Routes not meeting cost effectiveness targets: (subsidy per passenger): Route 115, Route 125, Route
139, and Route 154
Funded Service Needs The Plan does not include growth in revenue hours for the Supplemental program during the ten-year plan. The District will continue to work with school districts to better coordinate bell times to increase efficiency and serve additional students.
Partnership The Partnership typology is a new typology that currently consist of Route 122, an express service to College of Marin’s Kentfield campus. This service represents 1% of the District’s total service hours over the next ten years. Service levels are dependent on funding from College of Marin through student transportation fees, and this funding is expected to remain consistent for the duration of the plan.
Underperforming Routes Due to the unique nature of Partnership services, Marin Transit does not measure performance based on the same productivity and cost effectiveness targets as other fixed-route services. The District established a target for outside funding to account for at least 50% of a partnership route’s operating subsidy. In FY 2015/16, Route 122 did not meet this target, with 48.9% of the service’s net cost contributed by College of Marin. In the Fall 2017 semester, the District adjusted schedules for the Route 122 to cancel low-ridership trips and better align the service with the June 2016 systemwide changes. With reduced operating costs, the transportation fees collected by College of Marin for FY 2016/17 cover approximately 58% of the net cost.
Funded Service Needs The Plan assumes that current service levels will continue over the ten-year plan.
Dial-A-Ride The District operates two types of general public Dial-A-Ride services that serve rural and low-density areas of county. Collectively, these programs represent 1% of total service hours forecasted over the next ten years
The Novato Dial-A-Ride program is expected to remain at current service levels through the first three years of the plan. In year four, the District expects to reconsider how demand response services is structured and the plan projects that these service hours will be combined with other demand response services. Marin Transit will make decisions regarding the future of the Novato Dial-A-Ride utilizing lessons from the Connect program and staff review of DAR performance.
Dial-A-Ride is a valuable transit option in Novato for those who need to access destinations further away from fixed route services. The program has evolved as the District has expanded fixed route options and identified high demand locations. However, productivity and subsidy rates continue to demonstrate that this model of service is costly to provide on a per passenger basis and does not achieve high productivity (passengers per revenue hour).
Rural Dial-A-Ride routes serve Dillon Beach/Tomales and Point Reyes Station and connect to services in Petaluma and Novato, respectively. Service to Dillon Beach and Tomales is operated weekly, and service to
Item 8

MARIN TRANSIT | 2020–2029 SHORT RANGE TRANSIT PLAN Chapter 3: Service Plan
3-20
Point Reyes Station is provided twice per month. A total of 400 annual service hours are allocated to these routes.
Underperforming Routes • All routes met their current productivity target. • Routes not meeting cost-effectiveness targets (subsidy per passenger): Novato Dial-A-Ride
Funded Service Needs During the first three years of the plan, Marin Transit does not anticipate growth in revenue hours for any of the Dial-A-Ride programs. The plan assumes these programs will be integrated into other demand response program offerings based on an evaluation of pilot projects and other similar services. After this assessment, staff may consider expanding or restructuring programs to better serve Novato.
Figure 3-5: Dial-A-Ride Service Summary (FY 2011/12 – FY 2017/18)
Marin Access
Historically, local paratransit has been the primary means of transportation for Marin County’s ADA and senior populations. Marin Transit established the Marin Access Mobility Management Center in 2010 to combine paratransit enrollment with information and referrals for other transportation services for seniors, persons with disabilities, and low-income residents. In subsequent years, Marin Transit has introduced travel training, countywide volunteer driver programs, and a subsidized taxi program under the “Marin Access”
0
500
1,000
1,500
2,000
2,500
FY 2011/12 FY 2012/13 FY 2013/14 FY 2014/15 FY 2015/16 FY 2016/17 FY 2017/18
Reve
nue
Hour
s
Item 8
MARIN TRANSIT | 2020–2029 SHORT RANGE TRANSIT PLAN Chapter 3: Service Plan
3-21
umbrella. The goal of these programs is to provide for continued growth and mobility options for senior and ADA residents while respecting budget and resource limitations. Marin Access programs serve over 2,000 Marin residents and provide over 150,000 trips every year.
In 2015, the District initiated a detailed assessment of Marin Access programs to identify performance trends and lessons learned before deciding whether to expand or introduce new offerings. The study presented a comprehensive analysis of Marin Transit’s senior mobility programs under Marin Access and recommended future improvements. The study’s findings have informed Marin Transit’s decisions regarding programs that serve a rapidly growing senior population with limited resources.
The study recommendations emphasize the need to provide a more seamless experience for current program users and new travel options that leverage technological advances. They acknowledge the increased use of the internet and smart phones. The study underscored the importance of programs that serve active, healthy seniors and those with a higher level of transportation needs.
The District identified and acted on initiatives to support current and projected service levels on these programs. Remaining actions will require future Board approval. These include options to contain costs while meeting future mobility demands.
• Maximize the use of electronic scheduling software. In late 2016, Marin Transit released a Request for Proposals for a comprehensive demand response scheduling software package and associated hardware for operation of Marin Access Paratransit and mobility management programs. After a competitive procurement, the District awarded a contract to Trapeze, the District’s incumbent scheduling and dispatch software provider for paratransit service. In FY 2019/20, Marin Transit will upgrade its Trapeze software to consolidate the functionalities of three different software suites (Trapeze, Microsoft Access, and Assisted Rides) into one central software package. This will increase the efficiency of the call and dispatch center and provide additional ways for Marin Access riders and their support teams to view, schedule, update, and pay for trips.
• Provide more robust paratransit service to areas outside of the ADA-mandated geographic service area. As mandated under the ADA, paratransit service extends within ¾ of a mile from existing transit routes to provide service that complements fixed route transit. This geographic boundary may appear arbitrary to riders, particularly when only part of a neighborhood or street is served. The current service area also presents a challenge for a growing number of residents who are eligible for paratransit. They may need to travel to a local destination outside of the mandated service area or do not live directly within the service area. These clients have a disability that prevents them from walking/rolling to or riding accessible public transportation. It is difficult for them to find appropriate or affordable options to bridge the first or last mile to access the mandated service area. In 2018, the District expanded the boundaries of the non-mandated paratransit service area to serve residents who would otherwise be isolated. Staff will develop fare and scheduling policies for this extended service area to minimize any unintended consequences for ADA-mandated paratransit service.
• Develop a more robust, accessible same-day service. Marin Access is a family of services that provides a menu of services consistent with rider demand and need. Current travel trends show a strong demand for short trips that could be served more efficiently while increasing mobility for many Marin Access clients. In 2018 Marin Transit launched the Connect as a fully accessible, on-
Item 8
MARIN TRANSIT | 2020–2029 SHORT RANGE TRANSIT PLAN Chapter 3: Service Plan
3-22
demand service that does not require advance reservation. Staff developed the pilot program for older adults to access the service and those with disabilities who need additional support in the reservation process or at the time of the ride. To meet these needs, the District:
o Provides a call-in option for non-smartphone users; o Utilize drivers from the paratransit contract operating the service; o Provides wheelchair accessible vehicles; o Accepts credit cards or cash; and o Provides a door-to-door option for those with limited mobility.
• Evaluate Fare Policies and Eligibility Criteria for Marin Access Programs. Marin Transit
charges a flat $2.00 fare for ADA-mandated paratransit services and $2.50 for non-mandated paratransit trips countywide. The Catch-A-Ride program pays qualified users for the first $14.00 for each trip, for up to eight trips per month. Marin Transit has reviewed and compared ridership trends on the Catch-A-Ride and paratransit programs. The results indicate a need to make the out-of-pocket user costs for the two programs comparable to enable clients to select the program that best serves their needs.
Eligibility requirements differ for nearly all Marin Access programs. This creates confusion for the user. Many Marin Access clients also rely on services that Marin Transit does not operate. These have their own requirements and eligibility thresholds. Marin Transit needs to establish a consistent and easy to understand eligibility process for Marin Access programs. The District is proposing changes to Marin Access eligibility thresholds jointly with potential fare policy changes. The proposal also considers eligibility requirements established by other service providers in Marin and the Bay Area. Appendix B outlines these proposed changes.
• Pursue effective partnerships to test and support innovative modes and services. Marin Transit has taken the lead to coordinate and provide transportation for seniors and ADA-paratransit eligible individuals. For paratransit services to remain stable, these client populations need to be able to choose additional transportation options. In the past, the District’s gap grant program has provided seed funding for new services. These include a Shopper Shuttle in West Marin and a grassroots Volunteer Driver program in Sausalito. Based on findings from the Marin Access Strategic Analysis & Recommendations study, the District refocused its gap grant funding to solicit new, innovative, and wide-ranging proposals. The newly branded “Innovation Incubator” cultivates projects that do not duplicate Marin Access program offerings, test new and innovative practices, and will be sustainable without District support. Through the Innovation Incubator, the District will continue to expand partnerships to ensure new services are well coordinated and sustainable.
• “Establish a wider audience” One of the biggest challenges for many people seeking transportation assistance is to know their available options and how to utilize them. The Travel Navigator program serves as a resource for riders, family members, friends, or caregivers to get assistance without having to piece together information from multiple sources. Additionally, the travel training program provides an orientation for riders to Marin Transit’s most flexible service—the local fixed route bus. The Travel Navigator and travel training programs will need to extend their reach into the community, physically through satellite hours at locations throughout Marin and visibly through consistent and accessible marketing and outreach.
Item 8
MARIN TRANSIT | 2020–2029 SHORT RANGE TRANSIT PLAN Chapter 3: Service Plan
3-23
Support new and expanded volunteer driver programs within the county. In Fall 2016, staff conducted a survey and a workshop with community-based volunteer driver programs in Marin. The purpose of the outreach was to determine how Marin Transit can best support new and expanded volunteer driver programs. Based on the results, the District plans to establish a resource center for these programs that will operate under the Marin Access umbrella to support and train community-based volunteer drivers. Marin Transit-sponsored volunteer driver programs provided nearly 15,000 rides in FY 2017/18. Yet the District recognizes that these programs do not attract and retain a broad selection of volunteers or serve the widest range of needs. To foster this low-cost and high-impact transportation solution, the resource center will encourage and support organizations with significant member ties and diverse missions to develop and manage future volunteer driver programs. Marin Transit and resource center staff will:
Develop training materials and resource toolkits for volunteer drivers and volunteer driver programs and make them available online, in print, and potentially in person. Training materials cover such topics as assisting clients with special needs and how to navigate common destinations;
Evaluate Assisted Rides, the volunteer driver software Marin Transit provides to several volunteer driver programs. Consider how to improve this software or procure new software to meet the needs of volunteer driver programs of all sizes;
Work with volunteer driver programs to develop and conduct a survey of current volunteer drivers and potential volunteers to help volunteer driver programs gather data and insights;
Conduct an assessment to estimate the cost of capital and operating needs for all volunteer driver programs including hardware, liability insurance, vehicles, marketing, etc.; and
Conduct ongoing workshops and/or webinars to assist local volunteer driver programs with developing content, skills, and/or enhanced programs.
As demand for Marin Access services increase, the District must allocate a higher percentage of the budget to support these programs. Marin Transit anticipates a 22% growth in ridership on paratransit services over the next ten years. It is unclear what the best service model will be in the future. The District does not specifically allocate hours to an individual program after year three of the plan. The strategy is to test and learn from new offerings in the initial three years, and then make recommendations for future services. Staff envision that these recommendations will be featured in the District’s next SRTP in two years. Figure 3-6 shows a projection for how the District anticipates the relative growth Marin Access in the future.
Item 8
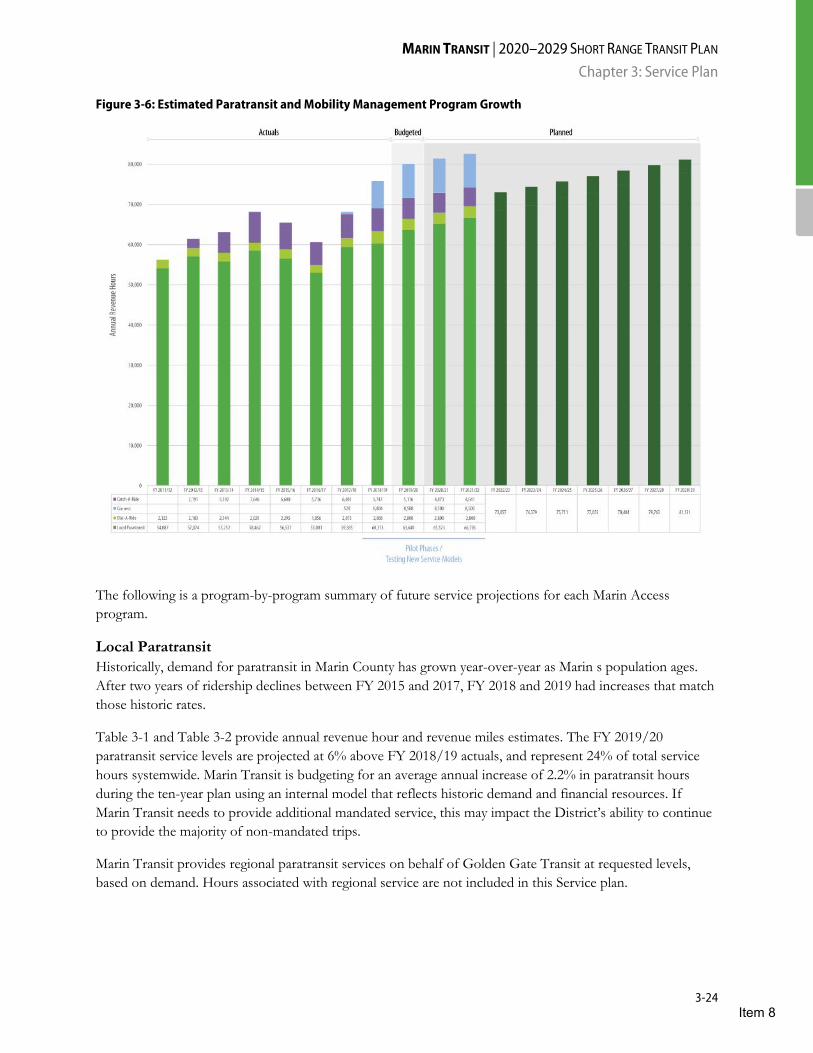
MARIN TRANSIT | 2020–2029 SHORT RANGE TRANSIT PLAN Chapter 3: Service Plan
3-24
Figure 3-6: Estimated Paratransit and Mobility Management Program Growth
The following is a program-by-program summary of future service projections for each Marin Access program.
Local Paratransit Historically, demand for paratransit in Marin County has grown year-over-year as Marin s population ages. After two years of ridership declines between FY 2015 and 2017, FY 2018 and 2019 had increases that match those historic rates.
Table 3-1 and Table 3-2 provide annual revenue hour and revenue miles estimates. The FY 2019/20 paratransit service levels are projected at 6% above FY 2018/19 actuals, and represent 24% of total service hours systemwide. Marin Transit is budgeting for an average annual increase of 2.2% in paratransit hours during the ten-year plan using an internal model that reflects historic demand and financial resources. If Marin Transit needs to provide additional mandated service, this may impact the District’s ability to continue to provide the majority of non-mandated trips.
Marin Transit provides regional paratransit services on behalf of Golden Gate Transit at requested levels, based on demand. Hours associated with regional service are not included in this Service plan.
Item 8
MARIN TRANSIT | 2020–2029 SHORT RANGE TRANSIT PLAN Chapter 3: Service Plan
3-25
Catch-A-Ride Catch-A-Ride is projected to maintain similar service levels during the first three years of the plan. Beginning in year four, Marin Transit anticipates pooling these resources with other demand response programs. While staff is uncertain how these services will be configured in year four, they will be designed to meet the needs of current Catch-A-Ride users.
Connect Marin Transit Connect is still in its pilot stage. The District has allocated additional resource to support this program in the first three years of the plan. As with all other Demand Response programs, the future of this service is unclear after year three. Staff will consider the future of Connect after further analysis.
Volunteer Driver The STAR and TRIP Volunteer Driver reimbursement programs are available in the urbanized and rural parts of the county. Trips supported by these programs have increased steady steadily since their inception in 2012, and they provide approximately 15,000 trips annually. The plan estimates ridership on these Marin Transit sponsored programs will continue at current levels throughout the ten years and identifies funding. The plan also provides for future increases in per-mile reimbursements and operation of a volunteer driver program resource center.
School Bus Support
Marin Transit supports school service through several different programs, as outlined in the Countywide School Transportation Coordinated Study. A Board workshop in December 2015 reviewed the study results and recommendations. The Board formed an Ad Hoc Committee on Student Transportation to advance the strategic planning phase from the study and develop a five-year implementation plan. Advancing the plan will focus resources on two distinct services:
• Supplemental School Service. As identified in the Coordinated Study, this service is most appropriate for high school students. With Board support, Marin Transit is working to provide more service for high schools where demand is high and there is an urgent need for additional buses. To redirect transit resources to high school services, staff is working on specific actions such as transitioning K-8 transportation services to Yellow Bus. This is a more appropriate service for primary and middle school students.
• Yellow Bus Service. School districts no longer receive dedicated funding for home to school transportation services for the general student population. Cities concerned about traffic congestion are partnering with school districts to revive yellow bus programs. School districts typically lack in-house expertise in route planning and contractor management. Marin school districts have contracted with Marin Transit to provide this operational support. The Tiburon Peninsula Traffic Relief Joint Powers Authority (JPA) provides yellow bus service for the Reed Union School District and the Cove School in the Larkspur-Corte Madera School District. The JPA and the Mill Valley School District executed contracts with Marin Transit in 2016. These partnerships are a model that Marin Transit can replicate with school districts across the county to support and expand yellow bus services. In one case, Marin Transit directly contracts with a yellow bus service provider to provide yellow bus service to two campuses in Ross Valley (White Hill Middle School, Hidden Valley Elementary
Item 8
MARIN TRANSIT | 2020–2029 SHORT RANGE TRANSIT PLAN Chapter 3: Service Plan
3-26
School, and Ross Valley Charter at the WHMS campus). This model presents long-term challenges, and Marin Transit is investigating opportunities to transition this service to the operational support model described above. Staff worked with stakeholders for the Ross Valley program to develop a formal group dedicated to the success of the Ross Valley yellow bus program. This led to the development of the Ross Valley Yellow Bus Transportation Services Joint Exercise of Powers Agreement (JEPA), which went into effect on January 1, 2019. JEPA members form a joint committee that includes representatives from the Town of San Anselmo, Town of Fairfax, County of Marin, and Ross Valley School District. The purpose of the committee is to provide enhanced public oversight and transparency for the yellow bus program operated by Marin Transit and serving Ross Valley public schools. The joint committee will provide policy guidance and advice to Marin Transit.
• Yellow Bus Funding Support. As mentioned above, there is no dedicated funding for regular home to school yellow bus programs. In 2019, Marin Transit will begin to distribute $600,000 annually for three years to support the operation of five existing yellow bus programs. Eligible programs had to meet specific threshold criteria. Marin Transit will be distributed individual program funding based on a formula. The formula takes a percentage subsidy of the program’s one-way pass price and multiplies it by the number of one-way passes it distributed in FY 2017/18. In the first round of the allocation, the subsidy will be 35 percent of the one-way pass price. Marin Transit will reassess this percentage in future funding cycles.
Supplemental and Yellow Bus services account for just two percent of all service hours in the ten-year plan, and the plan assumes no future growth in total hours during the first eight years. The ability to increase service will be based largely on achieving efficiencies through better coordination of school bell times Operating costs associated with these services are affected by the financial instability created by the lack of dedicated parking and maintenance facilities.
Unfunded Service Needs
There are limited financial resources available for transit services within the ten years of this SRTP. The District has developed recommendations for service improvements and unfunded expansion opportunities (expansion needs) beyond the District’s financial means. These changes are needed to achieve many of the goals of the Measure A Expenditure Plan to create a transit network that provides sustainable mobility options while reducing roadway congestion.
The District evaluates unfunded expansion opportunities using the Measure A Expenditure Plan performance criteria for transit investments. These criteria are:
• Fill gap in the bus transit network • Meets productivity standards (passengers per hour) • Meets cost-effectiveness standards (subsidy per passenger) • Relieves congestion (total ridership) • Provides seamless connections (to regional service) • Eliminates "pass ups" (overcrowding on routes) • Protomes environnemental justice (demographic analysis)
Item 8

MARIN TRANSIT | 2020–2029 SHORT RANGE TRANSIT PLAN Chapter 3: Service Plan
3-27
• Attracts outside funding (federal, state, toll, other local)
Staff have identified a total of 21 expansion services in the unfunded needs assessment and assigned them to seven categories. Table 3-3 provides a summary of the expansion project in no particular order and a brief description. These are described in detail in Appendix C.
Table 3-3: Service Expansion Projects
Route / Service Area Description
Expand and Enhance Shuttle Services
New Shuttle: Mill Valley New circulator shuttle in Mill Valley
New Shuttle: Sausalito New circulator shuttle in Sausalito
New Shuttle: East Corte Madera New circulator shuttle between E. Corte Madera and Larkspur Landing
Expand Shuttle: Tiburon Evenings (219) Expanded evening service for employees and patrons
Expand Shuttle: Novato Evenings (251) Expanded evening service for residents
Expand Shuttle: Novato Hamilton (251 or 257) Deviate Route 251 or 257 to serve Bolling Circle areas of Hamilton
Expand and Enhance K-12 School Bus Services
Yellow Bus Expansion Phase 1 Kentfield and Larkspur-Corte Madera School Districts
Yellow Bus Expansion Phase 2 Reed Union, Mill Valley, Ross Valley, San Rafael Elementary & Dixie School Districts
Yellow Bus Expansion Phase 3 Novato School District
Expand Supplemental Transit Program Tamalpais Union, San Rafael High, and Novato High Districts
Enhance Service Frequency in Transit Corridors
San Rafael – San Anselmo Corridor Expand off peak and weekend frequency from 20 minutes to 15 minutes
San Rafael – Civic Center Corridor Expand off peak and weekend frequency from 20 minutes to 15 minutes
Hamilton –Downtown Novato Corridor Expand off peak and weekend frequency from 60 minutes to 30 minutes
Provide Limited Stop or Express Services
Mill Valley Express (Route 17x) New weekday peak only express service connecting Downtown San Rafael to Mill Valley
Expand Rural and Recreational Services
Provide new service between Golden Gate Bridge and West Marin
New route connecting the Golden Gate Bridge to Muir Woods and West Marin
Provide expanded service to Muir Woods Provide a new Muir Woods route that serves Larkspur Landing
Provide and Support Flexible First/Last Mile Services
Novato connector services Services to better connect rail and bus in Novato
Item 8
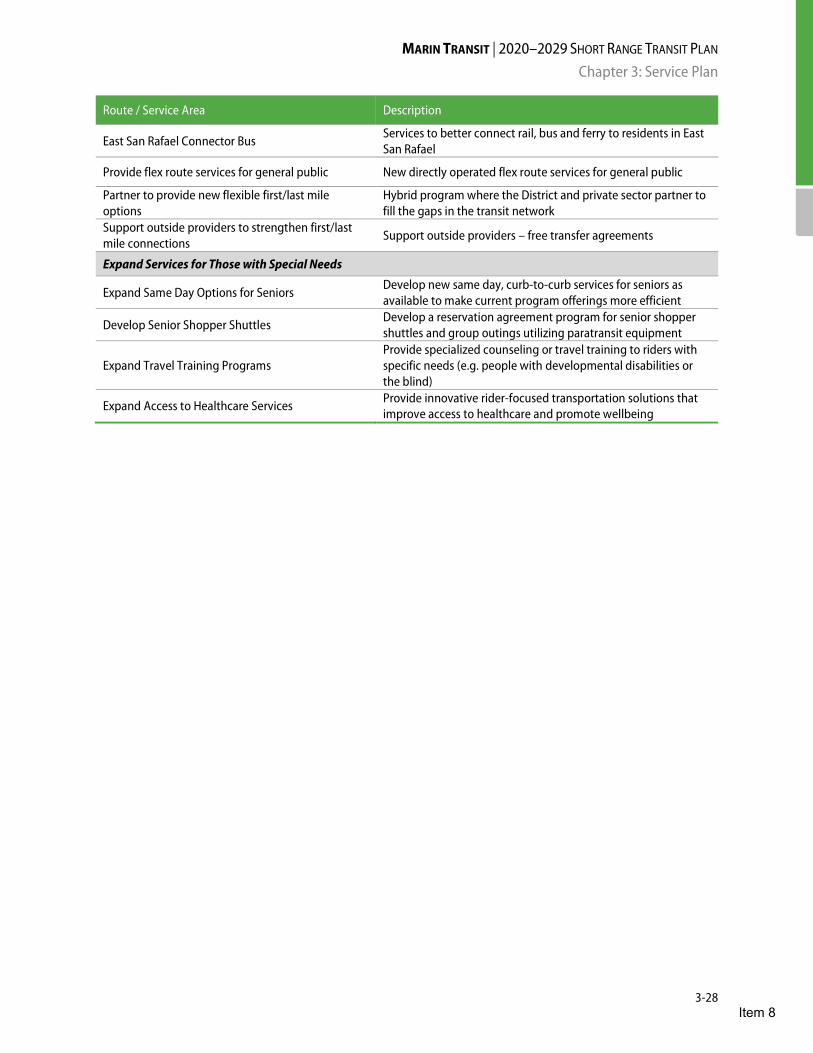
MARIN TRANSIT | 2020–2029 SHORT RANGE TRANSIT PLAN Chapter 3: Service Plan
3-28
Route / Service Area Description
East San Rafael Connector Bus Services to better connect rail, bus and ferry to residents in East San Rafael
Provide flex route services for general public New directly operated flex route services for general public
Partner to provide new flexible first/last mile options
Hybrid program where the District and private sector partner to fill the gaps in the transit network
Support outside providers to strengthen first/last mile connections
Support outside providers – free transfer agreements
Expand Services for Those with Special Needs
Expand Same Day Options for Seniors Develop new same day, curb-to-curb services for seniors as available to make current program offerings more efficient
Develop Senior Shopper Shuttles Develop a reservation agreement program for senior shopper shuttles and group outings utilizing paratransit equipment
Expand Travel Training Programs Provide specialized counseling or travel training to riders with specific needs (e.g. people with developmental disabilities or the blind)
Expand Access to Healthcare Services Provide innovative rider-focused transportation solutions that improve access to healthcare and promote wellbeing
Item 8
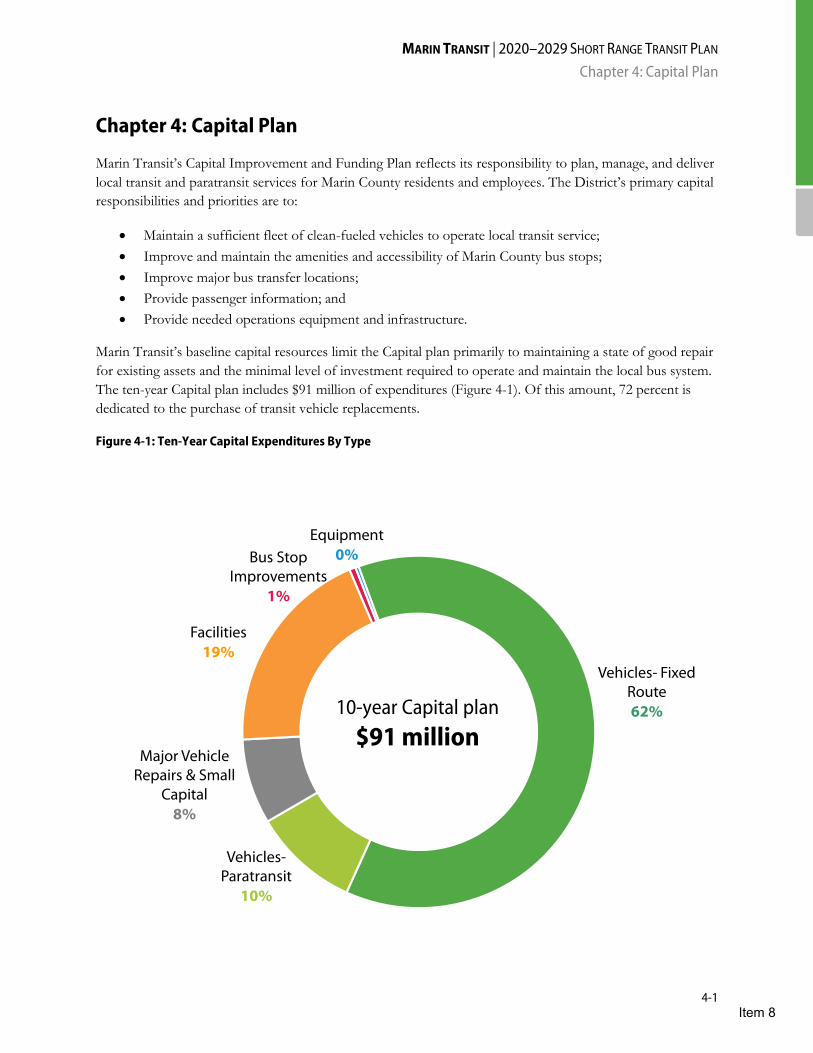
MARIN TRANSIT | 2020–2029 SHORT RANGE TRANSIT PLAN Chapter 4: Capital Plan
4-1
Chapter 4: Capital Plan
Marin Transit’s Capital Improvement and Funding Plan reflects its responsibility to plan, manage, and deliver local transit and paratransit services for Marin County residents and employees. The District’s primary capital responsibilities and priorities are to:
• Maintain a sufficient fleet of clean-fueled vehicles to operate local transit service; • Improve and maintain the amenities and accessibility of Marin County bus stops; • Improve major bus transfer locations; • Provide passenger information; and • Provide needed operations equipment and infrastructure.
Marin Transit’s baseline capital resources limit the Capital plan primarily to maintaining a state of good repair for existing assets and the minimal level of investment required to operate and maintain the local bus system. The ten-year Capital plan includes $91 million of expenditures (Figure 4-1). Of this amount, 72 percent is dedicated to the purchase of transit vehicle replacements.
Figure 4-1: Ten-Year Capital Expenditures By Type
Vehicles- Fixed Route62%
Vehicles-Paratransit
10%
Major Vehicle Repairs & Small
Capital8%
Facilities19%
Bus Stop Improvements
1%
Equipment0%
10-year Capital plan$91 million
Item 8
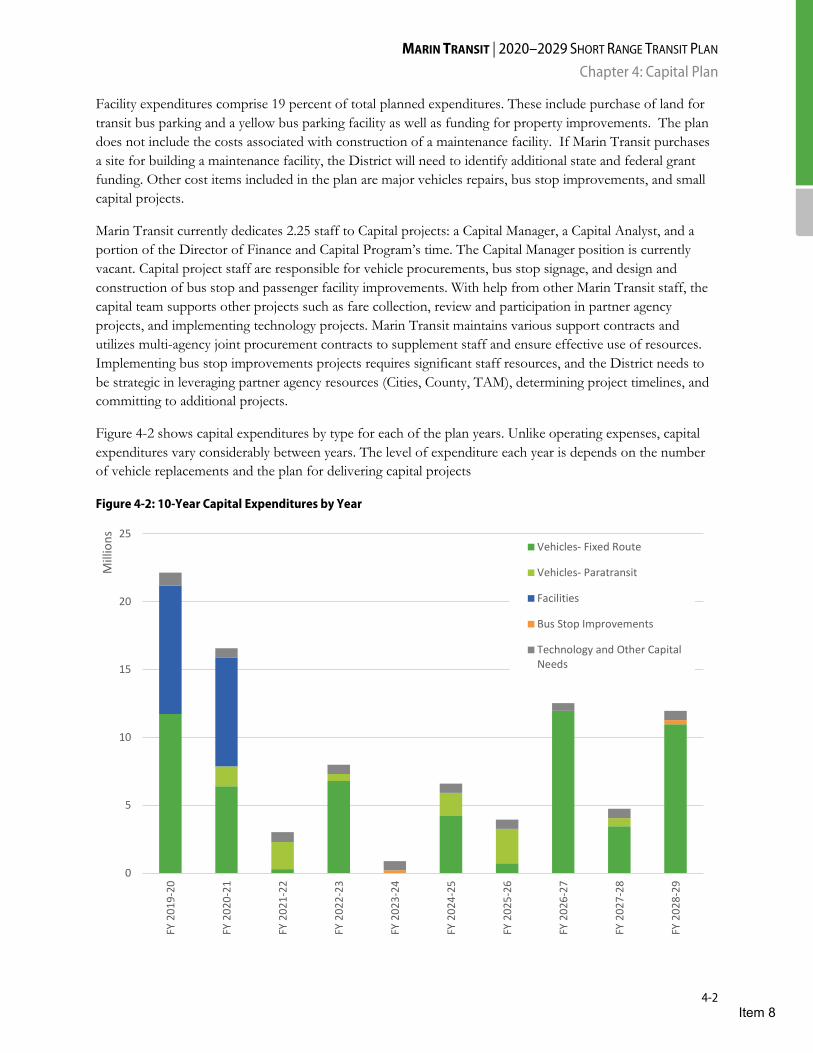
MARIN TRANSIT | 2020–2029 SHORT RANGE TRANSIT PLAN Chapter 4: Capital Plan
4-2
Facility expenditures comprise 19 percent of total planned expenditures. These include purchase of land for transit bus parking and a yellow bus parking facility as well as funding for property improvements. The plan does not include the costs associated with construction of a maintenance facility. If Marin Transit purchases a site for building a maintenance facility, the District will need to identify additional state and federal grant funding. Other cost items included in the plan are major vehicles repairs, bus stop improvements, and small capital projects.
Marin Transit currently dedicates 2.25 staff to Capital projects: a Capital Manager, a Capital Analyst, and a portion of the Director of Finance and Capital Program’s time. The Capital Manager position is currently vacant. Capital project staff are responsible for vehicle procurements, bus stop signage, and design and construction of bus stop and passenger facility improvements. With help from other Marin Transit staff, the capital team supports other projects such as fare collection, review and participation in partner agency projects, and implementing technology projects. Marin Transit maintains various support contracts and utilizes multi-agency joint procurement contracts to supplement staff and ensure effective use of resources. Implementing bus stop improvements projects requires significant staff resources, and the District needs to be strategic in leveraging partner agency resources (Cities, County, TAM), determining project timelines, and committing to additional projects.
Figure 4-2 shows capital expenditures by type for each of the plan years. Unlike operating expenses, capital expenditures vary considerably between years. The level of expenditure each year is depends on the number of vehicle replacements and the plan for delivering capital projects
Figure 4-2: 10-Year Capital Expenditures by Year
0
5
10
15
20
25
FY 2
019-
20
FY 2
020-
21
FY 2
021-
22
FY 2
022-
23
FY 2
023-
24
FY 2
024-
25
FY 2
025-
26
FY 2
026-
27
FY 2
027-
28
FY 2
028-
29
Mill
ions Vehicles- Fixed Route
Vehicles- Paratransit
Facilities
Bus Stop Improvements
Technology and Other CapitalNeeds
Item 8

MARIN TRANSIT | 2020–2029 SHORT RANGE TRANSIT PLAN Chapter 4: Capital Plan
4-3
Capital Funding
TAM allocates four percent of Measure AA transportation sales tax funds for Marin Transit to invest in bus transit facilities (Strategy 1.4). This is currently about $900,000 per year, down from $1.5 million per year under Measure A. This funding is critical to Marin Transit’s ability to provide matching grant funds. Under Measure A, the percentage allocation was six percent. There is also less overall funding for Marin Transit in the new measure, and the District projects a 41% decline in capital funding. This leads to less flexibility for projects such as Bus Stop Improvements and requires Marin Transit to use $1.1 million dollars in Capital Reserves for vehicle replacements over the ten years of this SRTP. In addition, Marin Transit anticipates expending $11 million in reserve funds on future maintenance and parking facilities.
Some increases in funding sources will offset a portion of the loss in Measure A/AA. These include State Transit Assistance – State of Good Repair funds and State Cap and Trade Funding – Low Carbon Transit Operations Program (LCTOP) funding. Marin Transit will use funding from both sources as a local match for vehicle replacements. State Transit Assistance funding has increased with the passage of Senate Bill 1 Transportation Funding (SB-1) in 2018. Marin Transit receives about $250,000 under the SB-1 formula to maintain and repair assets. Cap and Trade Funding through the Low Carbon Transit Operations Program (LCTOP) provides another source of funds for the purchase of all-electric vehicle replacements.
These sources are only a fraction of what is needed to maintain and improve the capital assets required to support local bus services. The Metropolitan Transportation Commission (MTC) programs Federal Transit Administration (FTA) Section 5307 Urbanized Area Formula funds that provide 82 percent of funding for vehicle replacement projects. Competitive federal grant programs can provide additional funding for vehicles and bus stop improvement projects.
Marin Transit’s vehicle replacement costs are estimated to be $65.4 million over the next ten years. The District expects most of this funding ($51.5 million) to come from FTA Section 5307 funds through MTC’s Transit Capital Priorities program. The remaining $13.9 million will need to come from state and local funding sources.
Marin Transit recently finished a $1.6 million FTA Section 5309 State of Good Repair grant for bus stop improvement projects and a federal Paul S. Sarbanes Transit in the Parks grant to improve bus stops that serve Muir Woods National Monument. Marin Transit will need to seek additional grant funds to plan for and construct the District’s capital needs, including bus stop and passenger facility improvement projects.
Item 8
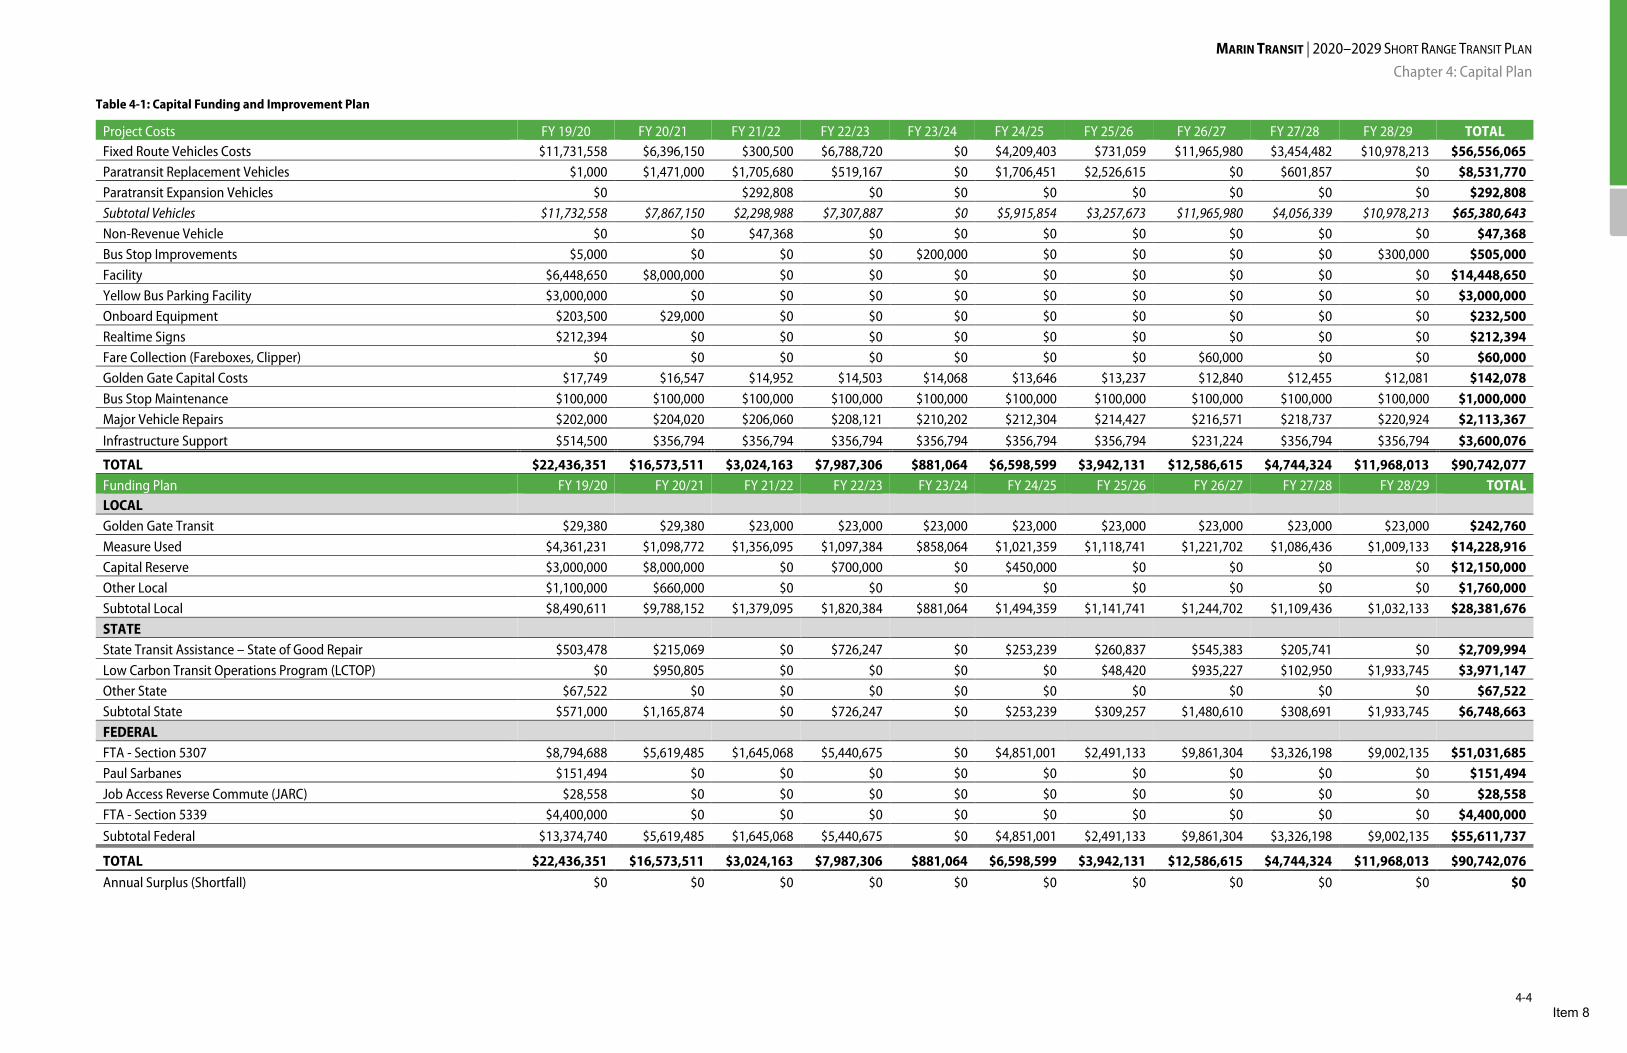
MARIN TRANSIT | 2020–2029 SHORT RANGE TRANSIT PLAN Chapter 4: Capital Plan
4-4
Table 4-1: Capital Funding and Improvement Plan
Project Costs FY 19/20 FY 20/21 FY 21/22 FY 22/23 FY 23/24 FY 24/25 FY 25/26 FY 26/27 FY 27/28 FY 28/29 TOTAL Fixed Route Vehicles Costs $11,731,558 $6,396,150 $300,500 $6,788,720 $0 $4,209,403 $731,059 $11,965,980 $3,454,482 $10,978,213 $56,556,065 Paratransit Replacement Vehicles $1,000 $1,471,000 $1,705,680 $519,167 $0 $1,706,451 $2,526,615 $0 $601,857 $0 $8,531,770 Paratransit Expansion Vehicles $0 $292,808 $0 $0 $0 $0 $0 $0 $0 $292,808 Subtotal Vehicles $11,732,558 $7,867,150 $2,298,988 $7,307,887 $0 $5,915,854 $3,257,673 $11,965,980 $4,056,339 $10,978,213 $65,380,643 Non-Revenue Vehicle $0 $0 $47,368 $0 $0 $0 $0 $0 $0 $0 $47,368 Bus Stop Improvements $5,000 $0 $0 $0 $200,000 $0 $0 $0 $0 $300,000 $505,000 Facility $6,448,650 $8,000,000 $0 $0 $0 $0 $0 $0 $0 $0 $14,448,650 Yellow Bus Parking Facility $3,000,000 $0 $0 $0 $0 $0 $0 $0 $0 $0 $3,000,000 Onboard Equipment $203,500 $29,000 $0 $0 $0 $0 $0 $0 $0 $0 $232,500 Realtime Signs $212,394 $0 $0 $0 $0 $0 $0 $0 $0 $0 $212,394 Fare Collection (Fareboxes, Clipper) $0 $0 $0 $0 $0 $0 $0 $60,000 $0 $0 $60,000 Golden Gate Capital Costs $17,749 $16,547 $14,952 $14,503 $14,068 $13,646 $13,237 $12,840 $12,455 $12,081 $142,078 Bus Stop Maintenance $100,000 $100,000 $100,000 $100,000 $100,000 $100,000 $100,000 $100,000 $100,000 $100,000 $1,000,000 Major Vehicle Repairs $202,000 $204,020 $206,060 $208,121 $210,202 $212,304 $214,427 $216,571 $218,737 $220,924 $2,113,367 Infrastructure Support $514,500 $356,794 $356,794 $356,794 $356,794 $356,794 $356,794 $231,224 $356,794 $356,794 $3,600,076
TOTAL $22,436,351 $16,573,511 $3,024,163 $7,987,306 $881,064 $6,598,599 $3,942,131 $12,586,615 $4,744,324 $11,968,013 $90,742,077 Funding Plan FY 19/20 FY 20/21 FY 21/22 FY 22/23 FY 23/24 FY 24/25 FY 25/26 FY 26/27 FY 27/28 FY 28/29 TOTAL LOCAL Golden Gate Transit $29,380 $29,380 $23,000 $23,000 $23,000 $23,000 $23,000 $23,000 $23,000 $23,000 $242,760 Measure Used $4,361,231 $1,098,772 $1,356,095 $1,097,384 $858,064 $1,021,359 $1,118,741 $1,221,702 $1,086,436 $1,009,133 $14,228,916 Capital Reserve $3,000,000 $8,000,000 $0 $700,000 $0 $450,000 $0 $0 $0 $0 $12,150,000 Other Local $1,100,000 $660,000 $0 $0 $0 $0 $0 $0 $0 $0 $1,760,000 Subtotal Local $8,490,611 $9,788,152 $1,379,095 $1,820,384 $881,064 $1,494,359 $1,141,741 $1,244,702 $1,109,436 $1,032,133 $28,381,676 STATE State Transit Assistance – State of Good Repair $503,478 $215,069 $0 $726,247 $0 $253,239 $260,837 $545,383 $205,741 $0 $2,709,994 Low Carbon Transit Operations Program (LCTOP) $0 $950,805 $0 $0 $0 $0 $48,420 $935,227 $102,950 $1,933,745 $3,971,147 Other State $67,522 $0 $0 $0 $0 $0 $0 $0 $0 $0 $67,522 Subtotal State $571,000 $1,165,874 $0 $726,247 $0 $253,239 $309,257 $1,480,610 $308,691 $1,933,745 $6,748,663 FEDERAL FTA - Section 5307 $8,794,688 $5,619,485 $1,645,068 $5,440,675 $0 $4,851,001 $2,491,133 $9,861,304 $3,326,198 $9,002,135 $51,031,685 Paul Sarbanes $151,494 $0 $0 $0 $0 $0 $0 $0 $0 $0 $151,494 Job Access Reverse Commute (JARC) $28,558 $0 $0 $0 $0 $0 $0 $0 $0 $0 $28,558 FTA - Section 5339 $4,400,000 $0 $0 $0 $0 $0 $0 $0 $0 $0 $4,400,000 Subtotal Federal $13,374,740 $5,619,485 $1,645,068 $5,440,675 $0 $4,851,001 $2,491,133 $9,861,304 $3,326,198 $9,002,135 $55,611,737
TOTAL $22,436,351 $16,573,511 $3,024,163 $7,987,306 $881,064 $6,598,599 $3,942,131 $12,586,615 $4,744,324 $11,968,013 $90,742,076 Annual Surplus (Shortfall) $0 $0 $0 $0 $0 $0 $0 $0 $0 $0 $0
Item 8
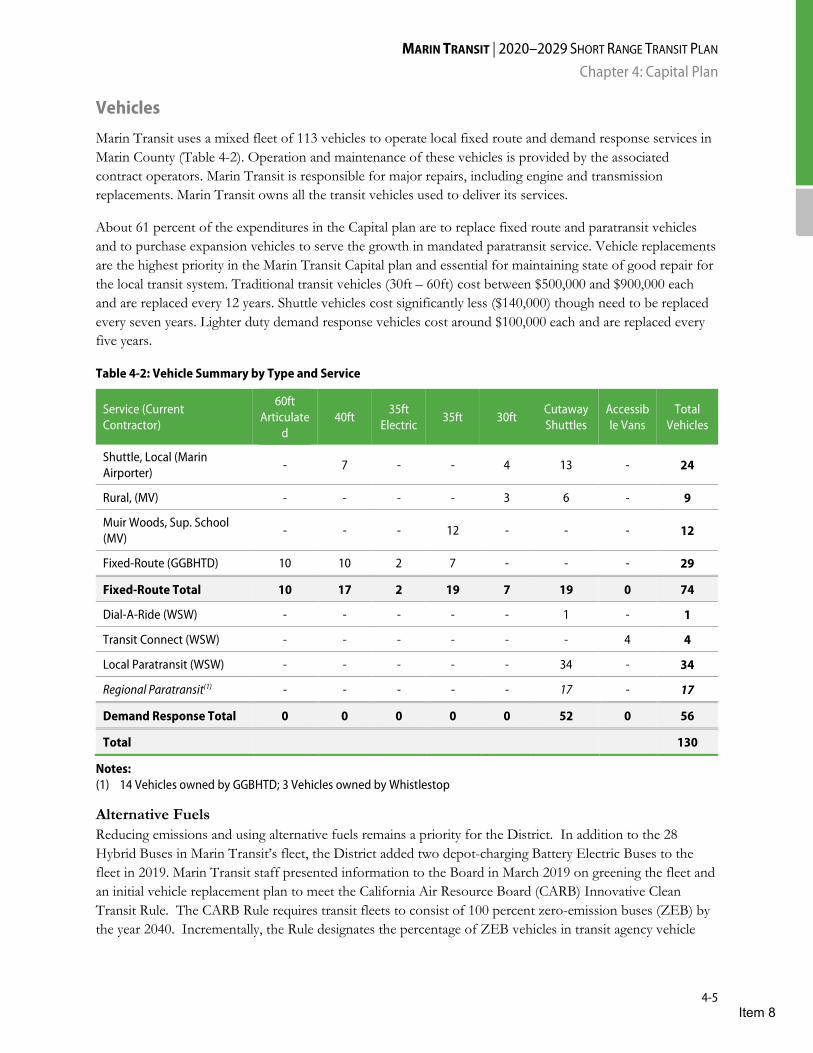
MARIN TRANSIT | 2020–2029 SHORT RANGE TRANSIT PLAN Chapter 4: Capital Plan
4-5
Vehicles
Marin Transit uses a mixed fleet of 113 vehicles to operate local fixed route and demand response services in Marin County (Table 4-2). Operation and maintenance of these vehicles is provided by the associated contract operators. Marin Transit is responsible for major repairs, including engine and transmission replacements. Marin Transit owns all the transit vehicles used to deliver its services.
About 61 percent of the expenditures in the Capital plan are to replace fixed route and paratransit vehicles and to purchase expansion vehicles to serve the growth in mandated paratransit service. Vehicle replacements are the highest priority in the Marin Transit Capital plan and essential for maintaining state of good repair for the local transit system. Traditional transit vehicles (30ft – 60ft) cost between $500,000 and $900,000 each and are replaced every 12 years. Shuttle vehicles cost significantly less ($140,000) though need to be replaced every seven years. Lighter duty demand response vehicles cost around $100,000 each and are replaced every five years.
Table 4-2: Vehicle Summary by Type and Service
Service (Current Contractor)
60ft Articulate
d 40ft 35ft
Electric 35ft 30ft Cutaway
Shuttles Accessible Vans
Total Vehicles
Shuttle, Local (Marin Airporter)
- 7 - - 4 13 - 24
Rural, (MV) - - - - 3 6 - 9
Muir Woods, Sup. School (MV)
- - - 12 - - - 12
Fixed-Route (GGBHTD) 10 10 2 7 - - - 29
Fixed-Route Total 10 17 2 19 7 19 0 74
Dial-A-Ride (WSW) - - - - - 1 - 1
Transit Connect (WSW) - - - - - - 4 4
Local Paratransit (WSW) - - - - - 34 - 34
Regional Paratransit(1) - - - - - 17 - 17
Demand Response Total 0 0 0 0 0 52 0 56
Total 130
Notes: (1) 14 Vehicles owned by GGBHTD; 3 Vehicles owned by Whistlestop
Alternative Fuels Reducing emissions and using alternative fuels remains a priority for the District. In addition to the 28 Hybrid Buses in Marin Transit’s fleet, the District added two depot-charging Battery Electric Buses to the fleet in 2019. Marin Transit staff presented information to the Board in March 2019 on greening the fleet and an initial vehicle replacement plan to meet the California Air Resource Board (CARB) Innovative Clean Transit Rule. The CARB Rule requires transit fleets to consist of 100 percent zero-emission buses (ZEB) by the year 2040. Incrementally, the Rule designates the percentage of ZEB vehicles in transit agency vehicle
Item 8

MARIN TRANSIT | 2020–2029 SHORT RANGE TRANSIT PLAN Chapter 4: Capital Plan
4-6
purchase orders for small and large agencies. Table 4-3 below shows the timeline for these requirements and the number of vehicles the District plans to replace each year.
Table 4-3: ICT Zero Emission Purchase Requirements Timeline
Year Percentage of Purchase Required
to be Zero Emissions Buses
Marin Transit Vehicle Purchases
Planned # of Replacements # Zero Emission Bus Purchases
Required 2026
25% of Purchase
7 5
2027 - 0
2028 11 8
2029 100% of Purchase 10 10
Marin Transit’s current fixed route fleet is shown in Table 4-4. The District plans to meet or exceed these requirements, if possible. Staff will evaluate each vehicle purchase to determine whether a percentage of or the entire purchase can be converted to a Zero-Emission vehicle. A summary table of the Fixed Route Fleet Transition Plan is included in Table 4-9 below, and the full plan is provided in Appendix G. The base plan assumes the District will convert its standard size bus fleet to Battery Electric Buses first, since the technology is readily available. Staff anticipates that the vehicles that will be converted last will be the narrow-bodied vehicles that deliver Marin Transit’s rural services. The steep terrain and windy roads make this fleet the most challenging vehicle type to convert given the current limitations and range of electric buses. The District expects the technology will improve or new solutions will be available by 2030 when it will begin to convert the rural fleet.
Table 4-4: Availability of Zero Emission Vehicle Equivalents
Vehicle Type # in MT
Fleet Fuel Type
Approved Zero Emission
Equivalent?
Vehicle Life
(yrs.) Notes
30ft, 35ft, 40ft Low Floor Bus
30 Renewable
Diesel (Hybrid) Yes (FCEB and
BEB) 12
All District-owned Vehicles are Hybrid Buses
60ft Articulated Bus
10 Renewable
Diesel Yes (BEB) 12 Upcoming replacement in FY2019/20
30ft / 35ft XHF (narrow) Bus
15 Diesel1 No 12 Narrow buses needed for rural roads, challenging topography - a unique vehicle type not available with alternative fuel
Shuttles / Stagecoach Cutaways
19 Gasoline No 7 Manufacturers have not identified a cost-effective means to build this size of vehicle due to low vehicle costs and short lifespan
Paratransit Cutaways
35 Gasoline No 5 Manufacturers have not identified a cost-effective means to build this size vehicle due to low vehicle cost and short lifespan
When a Zero-Emission vehicle purchase is not possible, Marin Transit will continue to purchase hybrid and alternative fuel vehicles as funds are available. Staff developed cost estimates based on MTC’s regional
Item 8
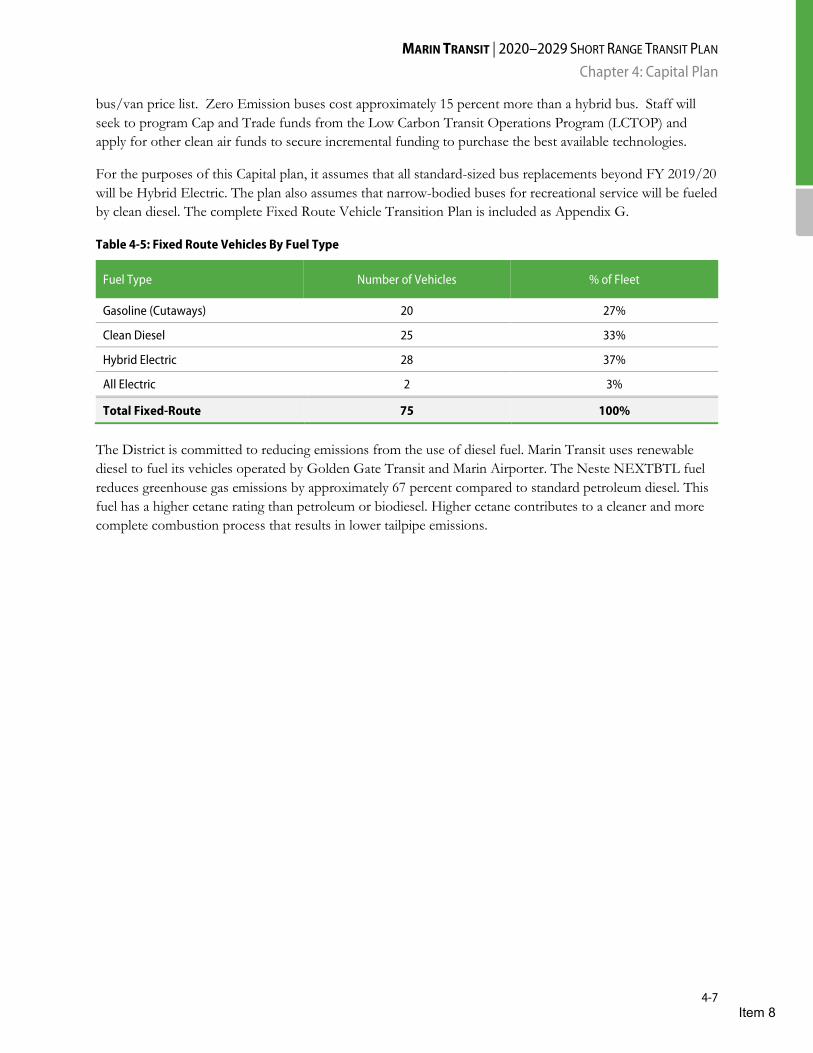
MARIN TRANSIT | 2020–2029 SHORT RANGE TRANSIT PLAN Chapter 4: Capital Plan
4-7
bus/van price list. Zero Emission buses cost approximately 15 percent more than a hybrid bus. Staff will seek to program Cap and Trade funds from the Low Carbon Transit Operations Program (LCTOP) and apply for other clean air funds to secure incremental funding to purchase the best available technologies.
For the purposes of this Capital plan, it assumes that all standard-sized bus replacements beyond FY 2019/20 will be Hybrid Electric. The plan also assumes that narrow-bodied buses for recreational service will be fueled by clean diesel. The complete Fixed Route Vehicle Transition Plan is included as Appendix G.
Table 4-5: Fixed Route Vehicles By Fuel Type
Fuel Type Number of Vehicles % of Fleet
Gasoline (Cutaways) 20 27%
Clean Diesel 25 33%
Hybrid Electric 28 37%
All Electric 2 3%
Total Fixed-Route 75 100%
The District is committed to reducing emissions from the use of diesel fuel. Marin Transit uses renewable diesel to fuel its vehicles operated by Golden Gate Transit and Marin Airporter. The Neste NEXTBTL fuel reduces greenhouse gas emissions by approximately 67 percent compared to standard petroleum diesel. This fuel has a higher cetane rating than petroleum or biodiesel. Higher cetane contributes to a cleaner and more complete combustion process that results in lower tailpipe emissions.
Item 8
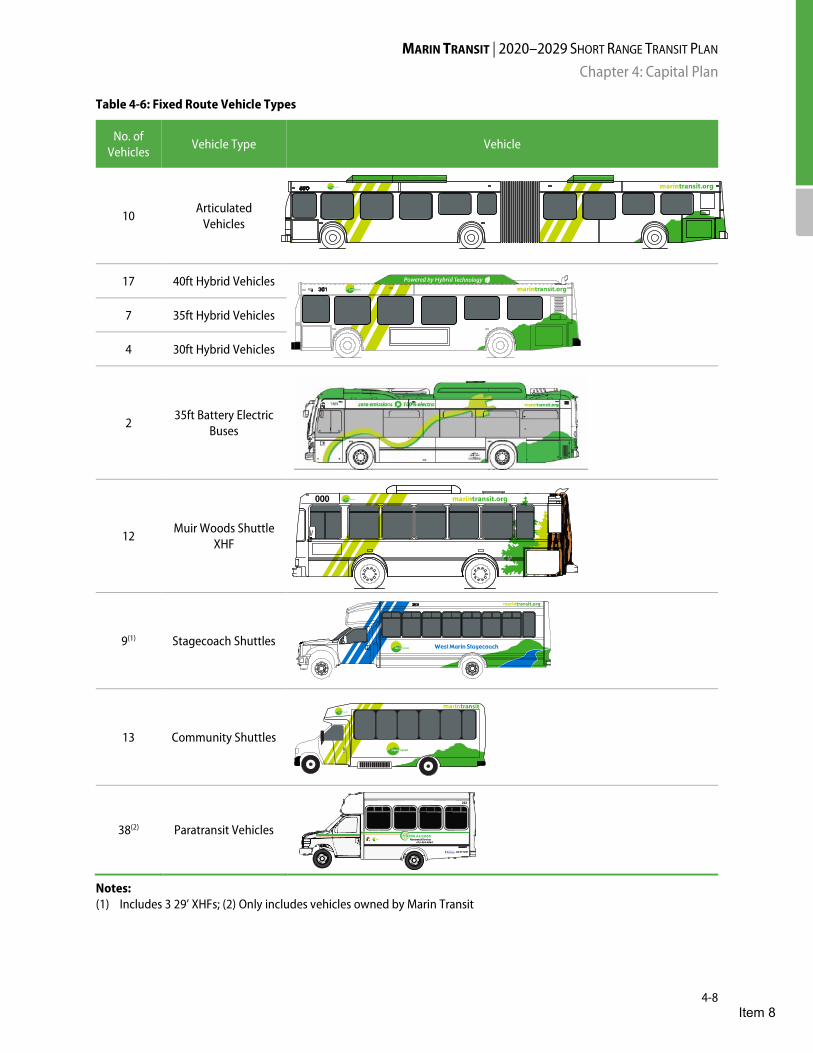
MARIN TRANSIT | 2020–2029 SHORT RANGE TRANSIT PLAN Chapter 4: Capital Plan
4-8
Table 4-6: Fixed Route Vehicle Types
No. of Vehicles Vehicle Type Vehicle
10 Articulated
Vehicles
17 40ft Hybrid Vehicles
7 35ft Hybrid Vehicles
4 30ft Hybrid Vehicles
2 35ft Battery Electric
Buses
12 Muir Woods Shuttle
XHF
9(1) Stagecoach Shuttles
13 Community Shuttles
38(2) Paratransit Vehicles
Notes: (1) Includes 3 29’ XHFs; (2) Only includes vehicles owned by Marin Transit
415-454-0964
202
CA 471291
Item 8

MARIN TRANSIT | 2020–2029 SHORT RANGE TRANSIT PLAN Chapter 4: Capital Plan
4-9
Table 4-7: Vehicle Service Life Guidance
Asset Class (1) Service Life
35’-40’ heavy duty and articulated transit bus 12 years or 500,000 miles
30’ heavy duty transit bus 10 years or 350,000 miles
30’ medium-duty transit bus 7 years or 200,000 miles
25’-35’ light-duty transit bus 5 years or 150,000 miles
Other vehicles (e.g., small buses, regular and specialized vans) 4 years or 100,000 miles
Note: (1) A heavy-duty transit bus is manufactured as a bus for urban and/or high passenger volume utilization. A medium-
duty bus is manufactured for a lighter duty cycle.
Local Fixed Route Vehicles
The local fixed route program requires an estimated 74 vehicles to operate service and maintain an adequate spare ratio. The District deploys these vehicles to delivery different services under multiple service contracts, as shown in Table 4-2. The Capital plan assumes a replacement schedule in accordance with the service life for each vehicle type in Marin Transit’s Fixed Asset Management policy (FA-01) corresponding to federal and regional guidelines and policies (Table 4-7).
Table 4-8 and Table 4-9 provide a summary of the replacement schedule for local transit buses. A full vehicle inventory is provided in Appendix D.
Table 4-8: Fixed Route Vehicle Summary
Marin Transit
Owned Contractor
Owned/Leased Total
FY 2019/20 Vehicles 72 72
Replacement (FY2019/20 – FY 2028/29)(1) 83 - 83
Expansion (FY2019/20 – FY 2028/29) - - -
Retirement (currently retired active) 1 - 0
FY 2028/29 Vehicles 77 - 77
Note: (1) Ten 60-foot Articulated Buses will be replaced in a seat for seat replacement with fifteen 40-foot buses
Item 8

MARIN TRANSIT | 2020–2029 SHORT RANGE TRANSIT PLAN Chapter 4: Capital Plan
4-10
Table 4-9: Local Transit Bus Replacement Schedule
Fiscal Year (In-service)
Replacements
Total Cost
Local Share Vehicle Type Seating
Capacity Service(1)
FY 2019/20 4 $1,600,000 $1,094,880
29ft XHF
(upgrade) 22 SG
11 $8,940,000 $1,609,200 40ft 34 LB
FY 2020/21
9 $1,032,000 $185,760 24ft 20 SH
2 $850,000 $153,000 35ft XHF 37 MW
4 $4,351,320 $1,614,816 40ft Electric 40 LB
FY 2022/23
7 $5,584,578 $1,005,224 35ft hybrid 32 LB
2 $874,182 $599,281 29ft XHF
(upgrade) 22 SG
1 $140,962 $25,373 24ft 20 SH
FY 2024/25 8 $4,197,241 $755503 35ft XHF 37 MW
FY 2025/26 1 $154,033 $27,826 24ft 20 SH
1 $269,557 $48,420 24ft Electric 20 SH
FY 2026/27 7 $6,770,277 $1,218,650 40ft hybrid 40 LB
4 $5,195,704 $935,227 30ft electric 30 LB
FY 2027/28
2 $571,947 $102,950 24ft Electric 20 SH
7 $1,143,893 $205,900 24 ft 20 SH
1 $592,215 $107,215 35ft 34 MW
2 $1,146,427 $205,741 29ft 22 SG
FY 2028/29 10 $10,743,028 $1,976,078 40ft Electric 40 LB
Note: (1) Service Types: LB – Big Bus, SH- Shuttle, SG- Rural Stagecoach, MW- Seasonal Muir Woods and School
Expansion Needs When considering service expansion, vehicles are often a constraint on the amount of service the District can add. Expansion vehicles are a low priority in the regional Capital plan, and typically do not receive federal funds. Local, state, or discretionary grants are required to expand fleets. The Capital plan does not include any expansion vehicles for the local fixed route program, and this is consistent with the current service plan. However, Marin Transit will replace its ten 60ft Articulated buses with 15-40ft standard sized transit buses to provide a seat for seat replacement.
Item 8

MARIN TRANSIT | 2020–2029 SHORT RANGE TRANSIT PLAN Chapter 4: Capital Plan
4-11
Marin Transit relies on one retired active vehicle to support operations. Retired active vehicles are vehicles that are beyond their FTA-determined useful life that the District keeps available for service, while adding their official replacements to the fleet. The District intends to replace these retired active vehicles as expansion vehicles, if funding becomes available.
Demand Response Vehicles
Marin Transit has 56 vehicles available for local and regional demand response services. To provide an adequate number of spare vehicles, the District uses a maximum of approximately 42 vehicles in peak service. Marin Transit owns 35 vehicles, GGBHTD owns 14, and the contractor provides another three vehicles to support the operations. The three contractor-owned vehicles will be replaced in late 2019. Four of the District’s vehicles are accessible vans used exclusively in Marin Transit’s Connect Program and another vehicle is assigned to the Dial-A-Ride program.
Based on the contract with Marin Transit, GGBHTD has committed to providing all vehicles for the regional paratransit service and a proportion of vehicles for the local paratransit service based on their share of Marin County fixed route trips (currently about 25 percent).
Expansion Needs Marin Transit anticipates increasing demand for paratransit service. To keep pace with the growth in ADA-mandated paratransit, the Capital plan includes the purchase of five additional vehicles. These vehicles are funded 100 percent with Measure A capital funds.
Historically, Marin Transit has also relied on keeping demand response vehicles in service after their replacement due date to ensure adequate numbers of vehicles are available.
Table 4-10: Demand Response Vehicle Summary
Dial-A -Ride
(Marin Transit)
Accessible Vans
(Marin Transit)
Paratransit Cutaways
(Marin Transit)
Contractor Owned
Paratransit
GGBHTD (Paratransit)
Total
FY 2019/20 Vehicles 1 4(1) 34(2) 3 14 56
Planned Disposals 2 8 110 3 51 174
Replacement (FY2019/20 – FY 2028/29)
2 8 110 - 51 174
Expansion (FY2019/20 – FY 2028/29) - - 5 - - 5
FY 2028/29 Vehicles 1 4 39 0 17 61
Notes: (1) Vehicles used in Marin Transit Connect program (2) Includes one retired active vehicle
Item 8

MARIN TRANSIT | 2020–2029 SHORT RANGE TRANSIT PLAN Chapter 4: Capital Plan
4-12
Table 4-11: Paratransit & Dial-A Ride Vehicle Replacement and Expansions Schedule
Fiscal Year Qty.
Replacements (R) / Expansion (E)
Total Cost Local Share
Vehicle Type
Seating Capacity
Wheelchair Capacity
Program(1)
FY 2019/20 17 (R) GGT owned NA Cutaways 8 2 RPT/LPT
FY 2020/21 16 (R) $1,740,787 $313,342 Cutaways 8 2 LPT
FY 2021/22 15 (R) $1,456,821 $262,228 Cutaways 8 2 LPT
FY 2022/23
3 (R) $356,663 $64,199 Cutaways 8 2 LPT
3 (E) $356,663 $356,663 Cutaways 8 2 LPT
2(R) $119,150 $21,447 Vans 6 2 CT
FY 2023/24 16 (R) GGT owned NA Cutaways 8 2 RPT/LPT
FY 2024/25 16 (R) $2,018,049 $363,249 Cutaways 8 2 LPT
FY 2025/26 15 (R) $1,948,679 $350,762 Cutaways 8 2 LPT
2 (E) $259,842 $259,842 Cutaways 8 2 LPT
FY 2026/27 0 - - - - - -
FY 2027/28 4 (R) $601,857 $108,334 Vans 6 2 CT
FY 2028/29 0 - - - - - -
Note: (1) Service Types: LPT – Local Paratransit, RPT – Regional Paratransit, CT –Connect
Electric Vehicle Pilot
Marin Transit placed an order for two 35-foot BYD Battery-Electric Buses with seating for 32 passengers, delivered in FY 2019. Golden Gate Transit operates and maintains these vehicles as a pilot project. The two all-electric buses provide an opportunity for the District and GGBHTD to test the new technology and better understand the advantages and challenges in operating an all-electric fleet. The agencies are gathering data regarding fuel costs, operational advantages. and limitations that will guide future bus purchases. Marin Transit purchased the vehicles with a combination of Federal Section 5307, Measure A, and a Bay Area Air Quality Management District grant. TAM allocated $75,000 through Measure B towards the vehicle purchase and to install charging stations at Golden Gate Transit’s yard where the buses are parked overnight.
Yellow School Buses (unfunded)
Marin Transit has operated yellow school bus service under contract for four years and will investigate purchasing its own school service vehicles. Investment in new, District-owned vehicles will improve service reliability and reduce ongoing operations costs. Direct ownership of the yellow bus fleet will also expand the number of potential service providers that will bid on new contracts, and support service expansion as demand increases.
Item 8
MARIN TRANSIT | 2020–2029 SHORT RANGE TRANSIT PLAN Chapter 4: Capital Plan
4-13
Bus Stop and Corridor Improvements
Bus Stop Improvements
Marin Transit is committed to improving local bus stops in Marin County to address accessibility and provision of shelters, signage (both eye level and bus stop flags), and other stop amenities. The District continues to work with local jurisdictions to ensure that all bus stops are accessible, according to the Americans with Disabilities Act (ADA).
Since 2012, Marin Transit has addressed prioritized bus stop needs by providing new shelters, benches, signage, roadway repair, and accessibility improvements. Marin Transit received a $1.6 million Federal State of Good Repair grant and applied these funds to replace all bus stop signs throughout the county, add bus stop amenities and accessibility improvements at 23 locations, and fund other minor upgrades to stops in West Marin and San Rafael. Staff gained valuable experience from that process. These projects are resource intensive due to the unique nature of each bus stop and the jurisdictions where they are located.
Marin Transit continues to plan for a future phase of bus stop improvements. In 2017, the District initiated an update to the 2005 bus stop inventory to reflect recent improvements, better quantify needs, and prioritize stop improvements. Through same contract, the District initiated preliminary design work for 25 stops throughout Marin County. Staff will use these designs plans to apply for funding for a new Bus Stop Improvements project.
In 2019, the District initiated a procurement for Real-Time Information signs at high-usage bus stops. Signs placed at select stops will provide real time data feeds for Golden Gate Transit and Marin Transit routes. For shared stops, this will eliminate passenger confusion when there is information sign data from only one of the transit agencies. A Lifeline grant will fund the first installations in San Rafael and Novato. Staff will identify funding sources to install additional signs at targeted bus stops.
Major Improvements at Transfer Locations
Marin Transit has a vested interest in improving major transfer locations to facilitate transfers between services, improve operations, and attract riders. Since 2010, Marin Transit has worked with its partners to build new facilities in Marin City and Downtown Novato and is currently working on relocating and constructing a new intermodal transfer station in Downtown San Rafael. SMART operation in the current San Rafael Transit Center highly constrains bus operations. Caltrans, local jurisdictions, and partner agencies have recently completed secondary transfer locations such as SMART stations, Highway 101 interchanges stops, Downtown Fairfax, and Strawberry Village.
Major Transit Corridor Improvements (unfunded)
Recent Marin Transit service changes added new limited stop or express bus services to reduce travel time to major destinations. These services target major travel corridors such as Highway 101, Sir Francis Drake Blvd., 4th Street/Miracle Mile, and areas in the Canal. Travel time savings for transit can also be achieved through capital infrastructure investments in these corridors. Such investments include traffic signal priority, transit queue jump lanes, and bus stop bulb-outs. These features speed up transit operations, improve safety, and make transit more competitive with automobile travel.
Item 8
MARIN TRANSIT | 2020–2029 SHORT RANGE TRANSIT PLAN Chapter 4: Capital Plan
4-14
The District actively participates in countywide efforts to study the benefits of infrastructure investments in key transit corridors. Recent efforts include: the Sir Francis Drake Boulevard Rehabilitation Project; US101/East Blithedale Ave-Tiburon Blvd Interchange Pedestrian and Bicycle Access Planning Study; Fairfax-San Rafael Transit Corridor Feasibility Study; and Caltrans Ramp Metering. The District partners with TAM, the County of Marin, GGBHTD, City of Larkspur, City of San Rafael, Town of Ross, Town of San Anselmo, and Caltrans. Increasing transit ridership can significantly expand capacity in these congested corridors or “person throughput,” and Marin Transit will continue to lobby for these transit priority enhancements.
Administrative and Operations Facilities
Bus Operations and Maintenance Facilities
Marin Transit provides contractors with the vehicles to operate its service and relies on them to provide maintenance and storage facilities. There are four maintenance yards, eight storage yards, and four fueling locations that support District operations. Marin Transit is seeking to lease or purchase its own facility to increase competition for contracted services, reduce long term risks and uncertainties, and consolidate existing facilities. Space needs include contract operations and maintenance services for fixed and paratransit vehicles, with infrastructure that will accommodate the transition to mostly all-electric buses. Marin Transit anticipates that the facility design will utilize solar power and meet minimum level LEED certification for environmental sustainability.
FTA awarded the District a $4.4 million 5339 Bus Facilities grant to purchase land, with a $1.1 million local match, for a total of $5.5 million. The District has also budgeted $950,000 in Measure A and $8 million in reserves towards construction of a new facility. Additional funds will be needed to construct the facility, purchase equipment, and acquire furnishings.
Yellow Bus Parking and Maintenance Facilities
The Capital plan includes a project to purchase land for yellow bus parking. The yellow bus program is operated by contractors with facilities outside the county. Historically, the District has secured temporary parking for vehicles on Marin County property. After June 2019, this leasing arrangement will no longer be available. Parking for the yellow bus service is critical to control operation costs. Parking is major constraint as the District prepares to initiate a procurement for this service and evaluates options for future expansion. A District-owned parking facility within the county will increase contractor interest in bidding on the work, increase service reliability, and ultimately reduce ongoing operations costs.
Marin County has a very limited number of sites that are appropriate for this use. The District will work with its partners to look for a site that can park the most vehicles. A site where contractor can also maintain the vehicles will further reduce operations costs. The District needs to purchase property that can accommodate 15 buses for the school programs currently in operation. Marin Transit expects that more school districts will be interested in offering yellow school bus service. Marin Transit needs to secure a long-term parking facility within the county that can accommodate 24 buses to ensure sustainable growth and cost stability for the yellow bus program. As outlined in the Coordinated Countywide Student Transportation Study, the final growth phase will include service for nine school districts and require parking for 70 yellow buses.
Item 8

MARIN TRANSIT | 2020–2029 SHORT RANGE TRANSIT PLAN Chapter 4: Capital Plan
4-15
Zero Emission Bus Infrastructure (unfunded)
The Capital plan includes vehicle costs for upgrading buses to zero emission. It does not include the costs for the associated infrastructure to support these vehicles. These costs will be determined by Marin Transit’s ability to purchase right of way to install charging infrastructure or the willingness and ability of Marin Transit’s operations contractors to install charging infrastructure. Marin Transit will need to secure additional funding for Zero Emission Bus infrastructure before purchasing any vehicles.
Staff Offices
Marin Transit leases staff offices at 711 Grand Avenue in San Rafael. The current lease extends through 2023. If the District purchase a bus operations and maintenance facility, staff will consider possible cost savings and operational efficiencies from co-locating staff offices with operations.
Technology and Other Capital Needs
Most of the remaining capital expenditures consist of communications equipment, fare collection, and major vehicles repairs. Staff time not charged directly to capital projects is included in the infrastructure support costs.
Real-Time Signs
Marin Transit installed an AVL system on the Shuttle and Rural programs in 2011 to provide real-time bus arrival information for passengers and expanded the system to all Marin Transit services in 2016. Information is available online and on limited real-time signs at stops across the county. Marin Transit recently awarded a contract to expand real-time signs to at least 25 locations countywide. This project will provide integrated Marin Transit and GGBHTD prediction data at high ridership stops and transfer points.
Fare Collection
As discussed in the Service plan, Marin Transit’s fare structure is embedded into GGBHTD regional zone-based system. This embedded flat fare within a zone-based system requires complicated programming and results in limitations for both Marin Transit and GGBHTD. Marin Transit intends to transition to a transfer agreement with GGBHTD that will be similar to the District’s transfer fare structure with SMART.
Marin Transit supports the Clipper regional fare payment card deployed on all its local bus services. To accelerate Clipper use, Marin Transit deployed Clipper within the design and function of GGBHTD’s regional system. Under this structure, Clipper cannot support Marin Transit’s pass products and requires passengers to tag on and tag off the bus to pay the correct fare. If passengers fail to tag off, Clipper charges them the maximum regional fare up to $7.00. The potential for incurring the maximum fare instead of the $2.00 flat fare is too high of a risk for low-income riders and a deterrent to using Clipper.
Marin Transit worked with MTC and the Clipper program to develop a change order in the Clipper software design. The change order would enable the District to become an independent operator in the system and achieve the goals outlined in previous SRTP efforts. Due to a combination of cost and the Clipper 2.0 program under development, the District decided to delay this change order until Clipper 2.0 is completed in 2023. The completion of Clipper 2.0 will provide Clipper independence at no added cost to the District.
Item 8
MARIN TRANSIT | 2020–2029 SHORT RANGE TRANSIT PLAN Chapter 4: Capital Plan
4-16
Marin Transit uses a highly sophisticated Genfare (GFI) validating farebox for cash fares and magnetic fare payment cards on the fixed route system. Marin Transit will continue to maintain this system until a new Clipper system supports monthly and weekly passes. With this change, the District will either reprogram the GFI fareboxes or consider a simplified farebox solution.
Paratransit clients pay their fares in cash to the driver. In 2016, Marin Transit installed non-validating fareboxes in paratransit vehicles to increase security. The District is implementing a pre-paid electronic option for paratransit fares through its Trapeze software upgrade, expected to be available in early 2020.
Capital Contribution to Contractor
Under the operations contract effective July 1, 2015, Marin Transit’s annual capital contribution to GGBHTD was reduced significantly. This payment is for the depreciation of the local share of assets purchased prior to 2006. The District budgets payments for major vehicle repairs or significant capital expenditures for all operations contracts under Major Vehicle Repairs and Infrastructure Support categories.
Bus Stop Maintenance
Measure A funds support ongoing maintenance contracts to clean and repair Marin Transit local bus stops. The majority of bus stop maintenance is done by GGBHTD or by local jurisdictions (City of Novato and San Rafael) under advertising agreements.
Major Vehicle Repairs
Vehicle service and minor maintenance is provided by the associated contract operators. Marin Transit is responsible for major repairs, including engine and transmission replacements. Under the previous contract with GGBHTD, Marin Transit paid for major vehicle repairs through its Capital Contribution. Marin Transit now directly pays for these repairs, and the District’s associated budget category anticipates this.
Infrastructure Support
Infrastructure support consists of Marin Transit staff time for capital programs that is not directly billed to projects and low value capital assets and other equipment.
Item 8
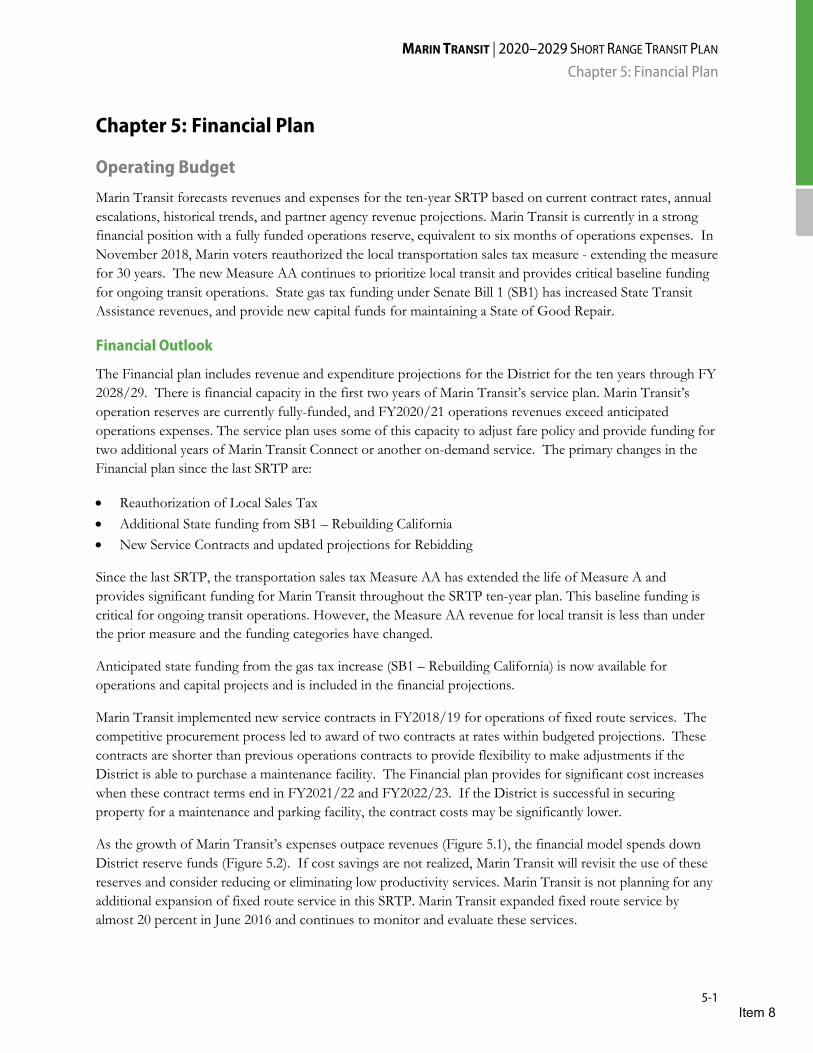
MARIN TRANSIT | 2020–2029 SHORT RANGE TRANSIT PLAN Chapter 5: Financial Plan
5-1
Chapter 5: Financial Plan
Operating Budget
Marin Transit forecasts revenues and expenses for the ten-year SRTP based on current contract rates, annual escalations, historical trends, and partner agency revenue projections. Marin Transit is currently in a strong financial position with a fully funded operations reserve, equivalent to six months of operations expenses. In November 2018, Marin voters reauthorized the local transportation sales tax measure - extending the measure for 30 years. The new Measure AA continues to prioritize local transit and provides critical baseline funding for ongoing transit operations. State gas tax funding under Senate Bill 1 (SB1) has increased State Transit Assistance revenues, and provide new capital funds for maintaining a State of Good Repair.
Financial Outlook
The Financial plan includes revenue and expenditure projections for the District for the ten years through FY 2028/29. There is financial capacity in the first two years of Marin Transit’s service plan. Marin Transit’s operation reserves are currently fully-funded, and FY2020/21 operations revenues exceed anticipated operations expenses. The service plan uses some of this capacity to adjust fare policy and provide funding for two additional years of Marin Transit Connect or another on-demand service. The primary changes in the Financial plan since the last SRTP are:
• Reauthorization of Local Sales Tax • Additional State funding from SB1 – Rebuilding California • New Service Contracts and updated projections for Rebidding
Since the last SRTP, the transportation sales tax Measure AA has extended the life of Measure A and provides significant funding for Marin Transit throughout the SRTP ten-year plan. This baseline funding is critical for ongoing transit operations. However, the Measure AA revenue for local transit is less than under the prior measure and the funding categories have changed.
Anticipated state funding from the gas tax increase (SB1 – Rebuilding California) is now available for operations and capital projects and is included in the financial projections.
Marin Transit implemented new service contracts in FY2018/19 for operations of fixed route services. The competitive procurement process led to award of two contracts at rates within budgeted projections. These contracts are shorter than previous operations contracts to provide flexibility to make adjustments if the District is able to purchase a maintenance facility. The Financial plan provides for significant cost increases when these contract terms end in FY2021/22 and FY2022/23. If the District is successful in securing property for a maintenance and parking facility, the contract costs may be significantly lower.
As the growth of Marin Transit’s expenses outpace revenues (Figure 5.1), the financial model spends down District reserve funds (Figure 5.2). If cost savings are not realized, Marin Transit will revisit the use of these reserves and consider reducing or eliminating low productivity services. Marin Transit is not planning for any additional expansion of fixed route service in this SRTP. Marin Transit expanded fixed route service by almost 20 percent in June 2016 and continues to monitor and evaluate these services.
Item 8
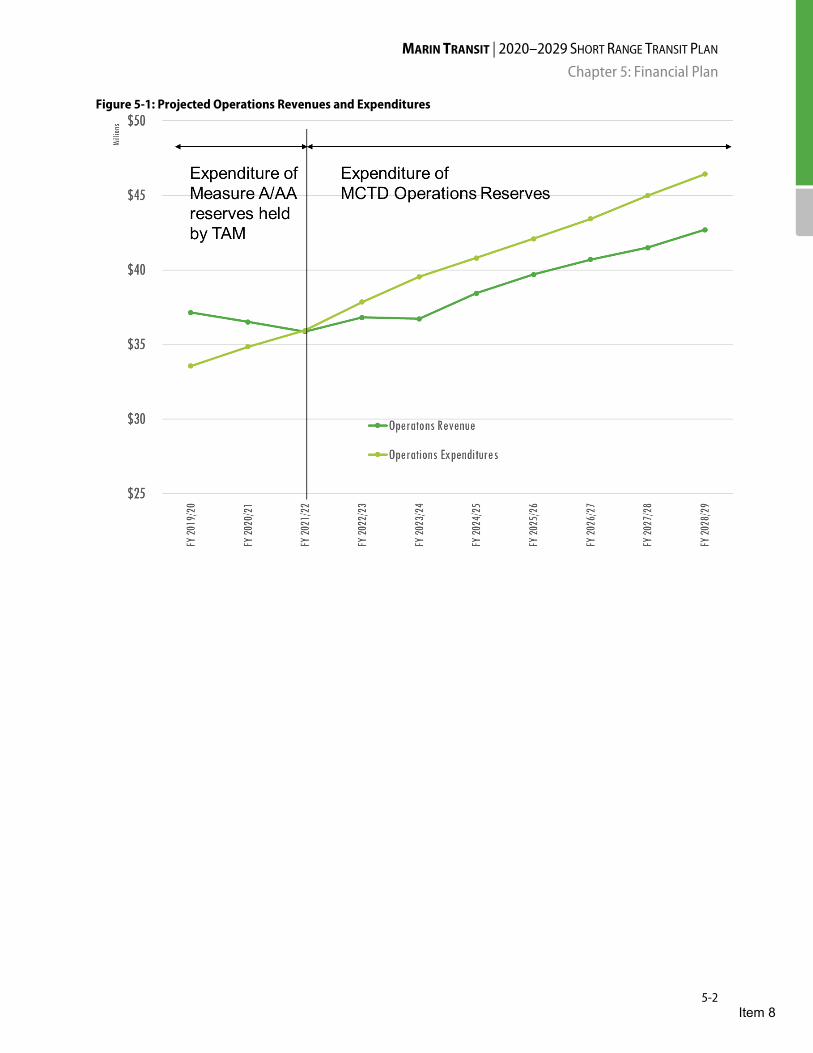
MARIN TRANSIT | 2020–2029 SHORT RANGE TRANSIT PLAN Chapter 5: Financial Plan
5-2
Figure 5-1: Projected Operations Revenues and Expenditures
Item 8

MARIN TRANSIT | 2020–2029 SHORT RANGE TRANSIT PLAN Chapter 5: Financial Plan
5-3
Figure 5-2: District Reserve Level for Service Plan Assumptions and Contract Rate Increase Assumptions
Operations Expenses
Marin Transit relies on contract operators to delivery its service, and the majority of operation expenses are tied to large contracts (Table 5-1). The operations contracts are the majority of the District’s expenses (77%, Figure 5-3). As such, service contract rates significantly affect the District’s long-term financial outlook.
The District’s four major contracts are with Golden Gate Bridge Highway & Transportation District, Marin Airporter, MV Transportation, and Whistlestop. Golden Gate Transit operates 43 percent of Marin Transit’s fixed route service through an intergovernmental agreement, down from 60 percent in FY 2014/15. This agreement is comprehensive in scope and includes operating and maintenance requirements, revenue apportionment, vehicle purchase terms, and a capital contribution. Marin Transit competitively procures the remainder of its services through a request for proposal (RFP) process to ensure high quality service and competitive rates.
Marin Transit will need to rebid or renegotiate all service contracts in years three and four of the SRTP plan period. Current contracts include annual rate escalations of 2.7%- 3%. The Financial plan projects eight percent cost increases associated with new contracts that will outpace projected revenue growth. Some contract hourly rates may not increase if the District is able to secure an operations and maintenance facility.
The ten-year summary of operating expenditures and revenues are shown in Table 5-2.
Item 8
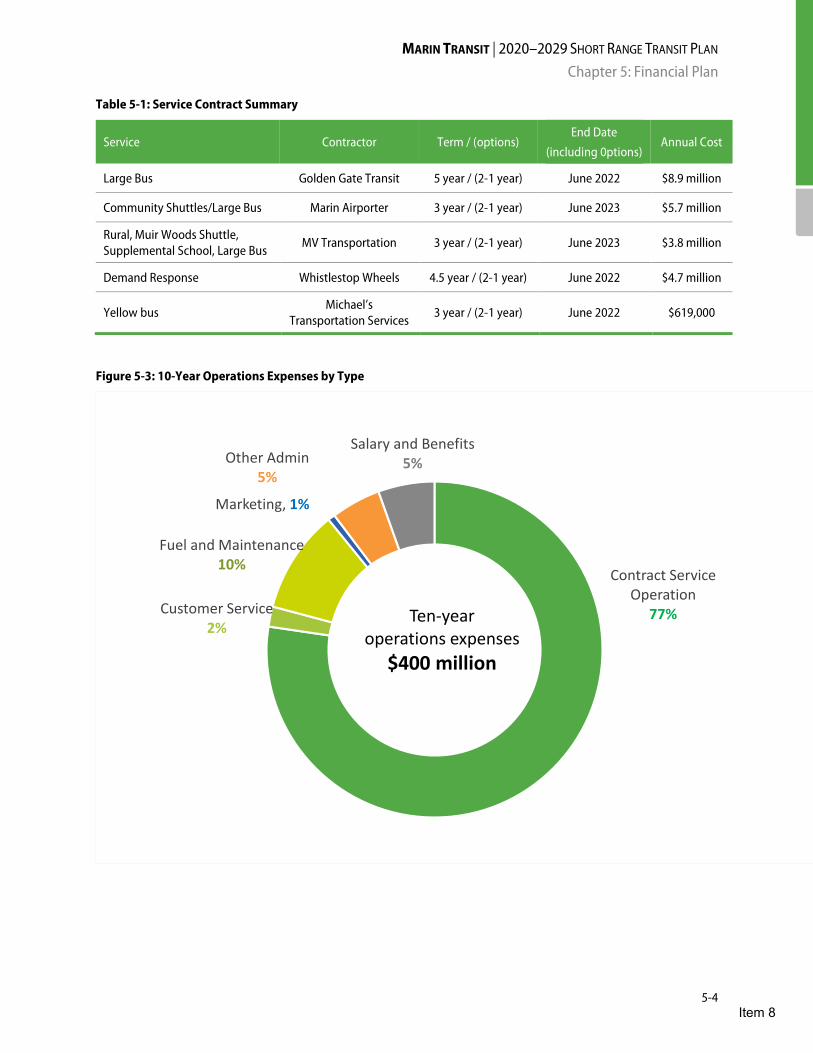
MARIN TRANSIT | 2020–2029 SHORT RANGE TRANSIT PLAN Chapter 5: Financial Plan
5-4
Table 5-1: Service Contract Summary
Service Contractor Term / (options) End Date
(including 0ptions) Annual Cost
Large Bus Golden Gate Transit 5 year / (2-1 year) June 2022 $8.9 million
Community Shuttles/Large Bus Marin Airporter 3 year / (2-1 year) June 2023 $5.7 million
Rural, Muir Woods Shuttle, Supplemental School, Large Bus
MV Transportation 3 year / (2-1 year) June 2023 $3.8 million
Demand Response Whistlestop Wheels 4.5 year / (2-1 year) June 2022 $4.7 million
Yellow bus Michael’s
Transportation Services 3 year / (2-1 year) June 2022 $619,000
Figure 5-3: 10-Year Operations Expenses by Type
Contract Service Operation
77%Customer Service2%
Fuel and Maintenance10%
Marketing, 1%
Other Admin5%
Salary and Benefits5%
Ten-year operations expenses
$400 million
Item 8

MARIN TRANSIT | 2020–2029 SHORT RANGE TRANSIT PLAN Chapter 5: Financial Plan
5-5
Table 5-2: 10-Year Financial Projections – Expenses by Program
Table 5-3: 10-Year Financial Projections- Expenses by Category
Fiscal Year FY 2019/20 FY 2020/21 FY 2021/22 FY 2022/23 FY 2023/24 FY 2024/25 FY 2025/26 FY 2026/27 FY 2027/28 FY 2028/29 10-year Total
Fixed Route Operations
Hours 190,250 191,550 191,550 191,550 191,550 191,550 191,550 191,550 191,550 191,550 1,914,200 Rate $128.97 $134.10 $138.16 $146.17 $152.99 $157.37 $161.89 $166.52 $172.19 $177.14 $153.57 Subtotal Expense $24,537,195 $25,687,773 $26,464,100 $27,999,767 $29,304,363 $30,144,755 $31,009,230 $31,897,683 $32,982,890 $33,930,649 $293,958,404
Demand Response
Hours 80,056 81,345 80,271 73,057 74,379 7,511 77,053 78,404 79,763 81,131 712,970
Rate $84.49 $83.88 $88.02 $100.64 $102.92 $1,061.41 $107.78 $110.36 $113.05 $115.86 $110.82 Subtotal Expense $6,764,327 $6,823,608 $7,065,674 $7,352,648 $7,655,262 $7,972,276 $8,304,443 $8,652,554 $9,017,450 $9,400,019 $79,008,262
Yellow Bus Service 6 buses 6 buses 6 buses 6 buses 6 buses 6 buses 6 buses 6 buses 6 buses 6 buses
Subtotal Expense $925,328 $937,004 $965,989 $995,844 $1,026,634 $1,058,391 $1,091,144 $1,124,926 $1,159,769 $1,195,707 $10,480,738
Other Agency Expenses (Pass Through)
Intercounty Paratransit on behalf of GGBHTD
Hours 8,500 8,755 9,018 9,288 9,567 9,854 10,149 10,454 10,768 11,091 97,443 Expense $940,018 $982,043 $1,024,084 $1,070,975 $1,120,227 $1,171,967 $1,226,330 $1,283,459 $1,343,503 $1,406,623 $11,569,228
Grants to External Yellow Bus Programs $405,485 $414,487 $423,688 $433,094 $442,709 $452,449 $462,402 $472,575 $482,972 $482,972 $4,472,833 Subtotal Expenses $1,345,503 $1,396,529 $1,447,773 $1,504,069 $1,562,936 $1,624,415 $1,688,732 $1,756,034 $1,826,475 $1,889,595 $16,042,062
Total Revenues $37,159,021 $36,528,936 $35,875,652 $36,817,222 $36,726,238 $38,441,766 $39,702,062 $40,712,863 $41,502,384 $44,290,248 $387,756,391 Total Expenses $33,572,354 $34,844,915 $35,943,535 $37,852,328 $39,549,195 $40,799,838 $42,093,547 $43,431,193 $44,986,585 $46,415,9701 $399,489,459 Annual Surplus/Deficit $3,586,667 $1,684,021 ($67,884) ($1,035,106) ($2,822,957) ($2,358,072) ($2,391,485) ($2,718,330) ($3,484,201) ($2,125,722) Cumulative Surplus/Deficit $16,010,802 $17,694,822 $17,626,939 $16,591,833 $13,768,877 $11,410,805 $9,019,320 $6,300,990 $2,816,789 $691,067 Note: 1) Includes expenditure of capital reserve funds for operations
Fiscal Year FY 2019/20 FY 2020/21 FY 2021/22 FY 2022/23 FY 2023/24 FY 2024/25 FY 2025/26 FY 2026/27 FY 2027/28 FY 2028/29 10-year Total
Contract Service Operation 25,631,104 26,494,073 27,269,791 28,903,417 30,315,983 31,270,130 32,256,855 33,277,378 34,332,967 35,424,943 305,176,640
Fuel and Maintenance 2,967,148 3,210,117 3,365,383 3,468,754 3,576,410 3,688,595 3,805,564 3,927,595 4,054,985 4,188,050 36,252,601 Communications 195,456 200,139 206,837 213,001 218,179 225,443 232,169 237,891 245,772 253,111 2,227,998 Customer Service 651,950 674,129 697,089 720,859 745,469 770,949 797,331 824,649 852,935 882,226 7,617,586 Other Operations 122,289 125,358 128,519 131,774 135,127 138,581 142,139 145,803 149,577 153,464 1,372,632 Marketing 246,808 252,917 260,415 267,957 275,905 283,907 292,334 300,823 309,758 318,763 2,809,587 Salary and Benefits 2,275,580 2,365,406 2,451,548 2,540,881 2,633,526 2,729,607 2,829,254 2,932,600 3,039,786 3,150,955 26,949,143
Administration 420,529 441,648 455,510 469,175 483,250 497,748 512,682 528,065 712,385 733,757 5,254,749 Equipment 14,750 9,800 9,800 9,800 9,800 9,800 9,800 9,800 9,800 9,800 102,950 Software 137,834 141,969 146,228 150,614 155,133 159,787 164,580 169,518 174,603 179,842 1,580,107 Grants 405,485 414,487 423,688 433,094 442,709 452,449 462,402 472,575 482,972 482,972 4,472,833 Consulting 503,421 514,873 528,729 543,001 557,701 572,842 588,438 604,501 621,046 638,087 5,672,640 Total Expenses 33,572,354 34,844,915 35,943,535 37,852,328 39,549,195 40,799,838 42,093,549 43,431,197 44,986,585 46,415,970 399,489,465
Item 8
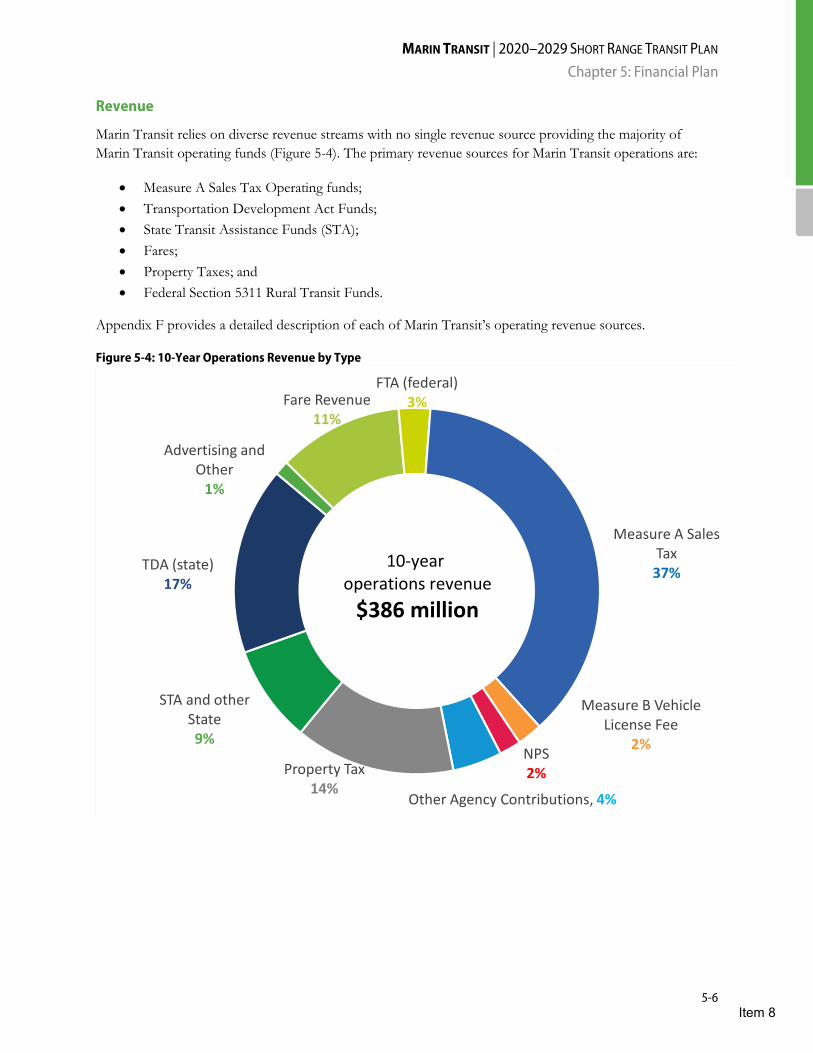
MARIN TRANSIT | 2020–2029 SHORT RANGE TRANSIT PLAN Chapter 5: Financial Plan
5-6
Revenue
Marin Transit relies on diverse revenue streams with no single revenue source providing the majority of Marin Transit operating funds (Figure 5-4). The primary revenue sources for Marin Transit operations are:
• Measure A Sales Tax Operating funds; • Transportation Development Act Funds; • State Transit Assistance Funds (STA); • Fares; • Property Taxes; and • Federal Section 5311 Rural Transit Funds.
Appendix F provides a detailed description of each of Marin Transit’s operating revenue sources.
Figure 5-4: 10-Year Operations Revenue by Type
Advertising and Other
1%
Fare Revenue11%
FTA (federal)3%
Measure A Sales Tax37%
Measure B Vehicle License Fee
2%NPS2%
Other Agency Contributions, 4%
Property Tax14%
STA and other State9%
TDA (state)17%
10-year operations revenue
$386 million
Item 8
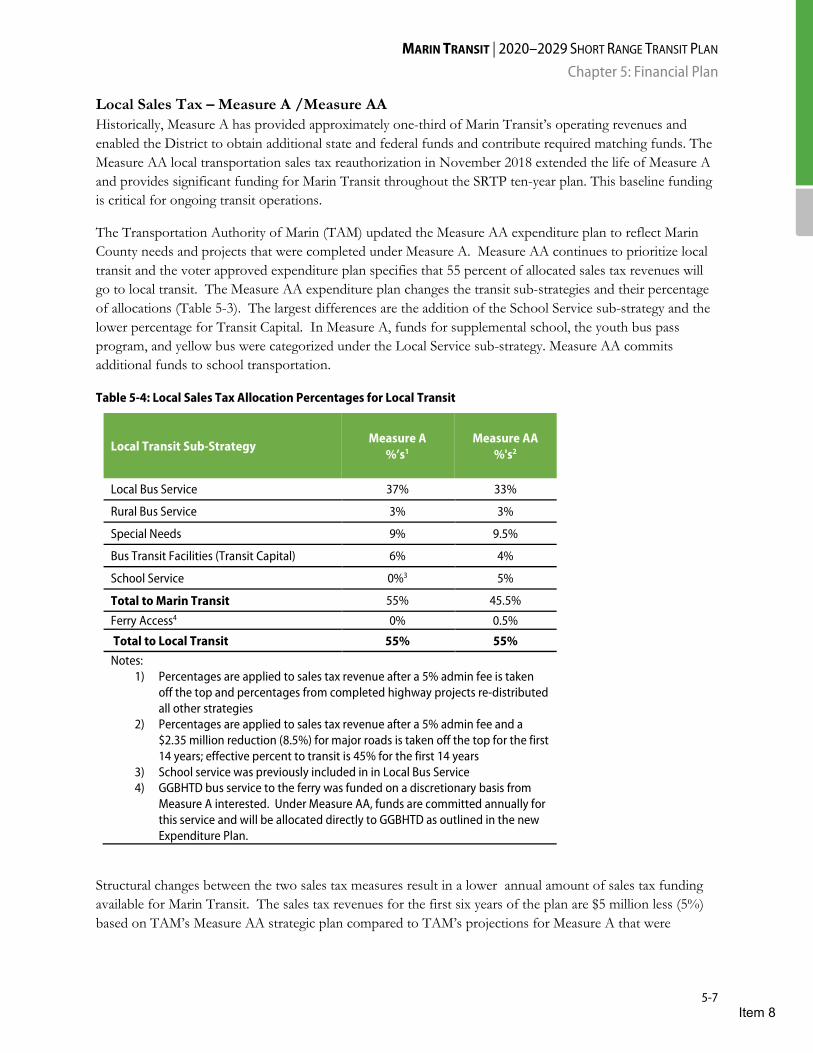
MARIN TRANSIT | 2020–2029 SHORT RANGE TRANSIT PLAN Chapter 5: Financial Plan
5-7
Local Sales Tax – Measure A /Measure AA Historically, Measure A has provided approximately one-third of Marin Transit’s operating revenues and enabled the District to obtain additional state and federal funds and contribute required matching funds. The Measure AA local transportation sales tax reauthorization in November 2018 extended the life of Measure A and provides significant funding for Marin Transit throughout the SRTP ten-year plan. This baseline funding is critical for ongoing transit operations.
The Transportation Authority of Marin (TAM) updated the Measure AA expenditure plan to reflect Marin County needs and projects that were completed under Measure A. Measure AA continues to prioritize local transit and the voter approved expenditure plan specifies that 55 percent of allocated sales tax revenues will go to local transit. The Measure AA expenditure plan changes the transit sub-strategies and their percentage of allocations (Table 5-3). The largest differences are the addition of the School Service sub-strategy and the lower percentage for Transit Capital. In Measure A, funds for supplemental school, the youth bus pass program, and yellow bus were categorized under the Local Service sub-strategy. Measure AA commits additional funds to school transportation.
Table 5-4: Local Sales Tax Allocation Percentages for Local Transit
Local Transit Sub-Strategy Measure A %’s1
Measure AA %'s2
Local Bus Service 37% 33%
Rural Bus Service 3% 3%
Special Needs 9% 9.5%
Bus Transit Facilities (Transit Capital) 6% 4%
School Service 0%3 5%
Total to Marin Transit 55% 45.5%
Ferry Access4 0% 0.5%
Total to Local Transit 55% 55% Notes:
1) Percentages are applied to sales tax revenue after a 5% admin fee is taken off the top and percentages from completed highway projects re-distributed all other strategies
2) Percentages are applied to sales tax revenue after a 5% admin fee and a $2.35 million reduction (8.5%) for major roads is taken off the top for the first 14 years; effective percent to transit is 45% for the first 14 years
3) School service was previously included in in Local Bus Service 4) GGBHTD bus service to the ferry was funded on a discretionary basis from
Measure A interested. Under Measure AA, funds are committed annually for this service and will be allocated directly to GGBHTD as outlined in the new Expenditure Plan.
Structural changes between the two sales tax measures result in a lower annual amount of sales tax funding available for Marin Transit. The sales tax revenues for the first six years of the plan are $5 million less (5%) based on TAM’s Measure AA strategic plan compared to TAM’s projections for Measure A that were
Item 8
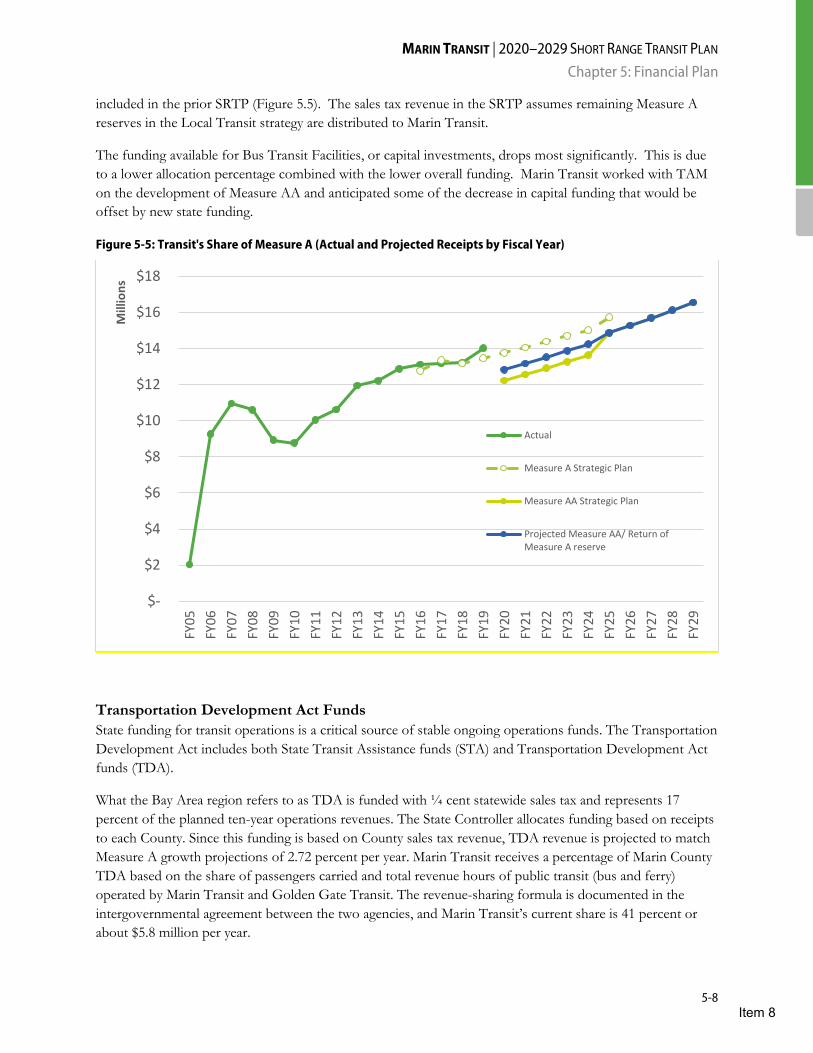
MARIN TRANSIT | 2020–2029 SHORT RANGE TRANSIT PLAN Chapter 5: Financial Plan
5-8
included in the prior SRTP (Figure 5.5). The sales tax revenue in the SRTP assumes remaining Measure A reserves in the Local Transit strategy are distributed to Marin Transit.
The funding available for Bus Transit Facilities, or capital investments, drops most significantly. This is due to a lower allocation percentage combined with the lower overall funding. Marin Transit worked with TAM on the development of Measure AA and anticipated some of the decrease in capital funding that would be offset by new state funding.
Figure 5-5: Transit's Share of Measure A (Actual and Projected Receipts by Fiscal Year)
Transportation Development Act Funds State funding for transit operations is a critical source of stable ongoing operations funds. The Transportation Development Act includes both State Transit Assistance funds (STA) and Transportation Development Act funds (TDA).
What the Bay Area region refers to as TDA is funded with ¼ cent statewide sales tax and represents 17 percent of the planned ten-year operations revenues. The State Controller allocates funding based on receipts to each County. Since this funding is based on County sales tax revenue, TDA revenue is projected to match Measure A growth projections of 2.72 percent per year. Marin Transit receives a percentage of Marin County TDA based on the share of passengers carried and total revenue hours of public transit (bus and ferry) operated by Marin Transit and Golden Gate Transit. The revenue-sharing formula is documented in the intergovernmental agreement between the two agencies, and Marin Transit’s current share is 41 percent or about $5.8 million per year.
$-
$2
$4
$6
$8
$10
$12
$14
$16
$18
FY05
FY06
FY07
FY08
FY09
FY10
FY11
FY12
FY13
FY14
FY15
FY16
FY17
FY18
FY19
FY20
FY21
FY22
FY23
FY24
FY25
FY26
FY27
FY28
FY29
Mill
ions
Actual
Measure A Strategic Plan
Measure AA Strategic Plan
Projected Measure AA/ Return ofMeasure A reserve
Item 8
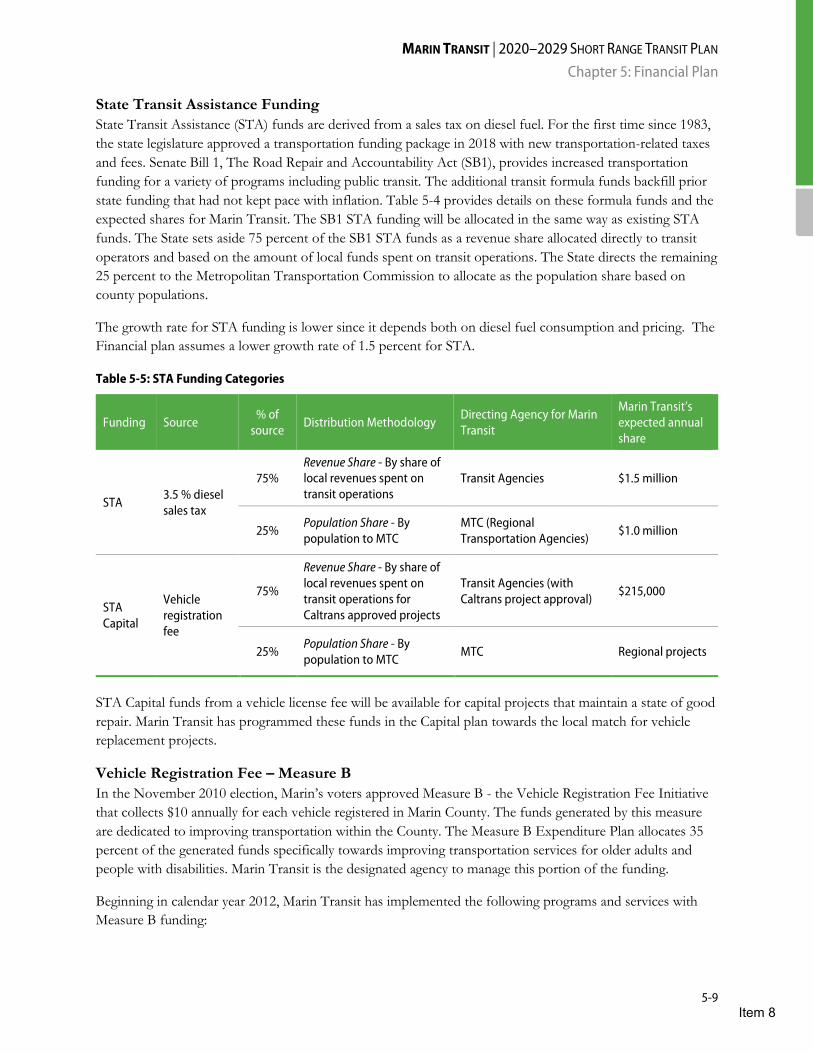
MARIN TRANSIT | 2020–2029 SHORT RANGE TRANSIT PLAN Chapter 5: Financial Plan
5-9
State Transit Assistance Funding State Transit Assistance (STA) funds are derived from a sales tax on diesel fuel. For the first time since 1983, the state legislature approved a transportation funding package in 2018 with new transportation-related taxes and fees. Senate Bill 1, The Road Repair and Accountability Act (SB1), provides increased transportation funding for a variety of programs including public transit. The additional transit formula funds backfill prior state funding that had not kept pace with inflation. Table 5-4 provides details on these formula funds and the expected shares for Marin Transit. The SB1 STA funding will be allocated in the same way as existing STA funds. The State sets aside 75 percent of the SB1 STA funds as a revenue share allocated directly to transit operators and based on the amount of local funds spent on transit operations. The State directs the remaining 25 percent to the Metropolitan Transportation Commission to allocate as the population share based on county populations.
The growth rate for STA funding is lower since it depends both on diesel fuel consumption and pricing. The Financial plan assumes a lower growth rate of 1.5 percent for STA.
Table 5-5: STA Funding Categories
Funding Source % of
source Distribution Methodology
Directing Agency for Marin Transit
Marin Transit’s expected annual share
STA 3.5 % diesel sales tax
75% Revenue Share - By share of local revenues spent on transit operations
Transit Agencies $1.5 million
25% Population Share - By population to MTC
MTC (Regional Transportation Agencies)
$1.0 million
STA Capital
Vehicle registration fee
75%
Revenue Share - By share of local revenues spent on transit operations for Caltrans approved projects
Transit Agencies (with Caltrans project approval)
$215,000
25% Population Share - By population to MTC
MTC Regional projects
STA Capital funds from a vehicle license fee will be available for capital projects that maintain a state of good repair. Marin Transit has programmed these funds in the Capital plan towards the local match for vehicle replacement projects.
Vehicle Registration Fee – Measure B In the November 2010 election, Marin’s voters approved Measure B - the Vehicle Registration Fee Initiative that collects $10 annually for each vehicle registered in Marin County. The funds generated by this measure are dedicated to improving transportation within the County. The Measure B Expenditure Plan allocates 35 percent of the generated funds specifically towards improving transportation services for older adults and people with disabilities. Marin Transit is the designated agency to manage this portion of the funding.
Beginning in calendar year 2012, Marin Transit has implemented the following programs and services with Measure B funding:
Item 8
MARIN TRANSIT | 2020–2029 SHORT RANGE TRANSIT PLAN Chapter 5: Financial Plan
5-10
• Ongoing funding for Volunteer Driver Programs that assist older adults and ADA-eligible residents.
• Same-day accessible service – This is includes funding for the Catch A Ride program and Marin Transit connect that provide on demand
• A low-income scholarship program to assist SSI-eligible ADA paratransit riders with paying paratransit fares.
• A “Gap Grant” program reformulated as an Incubator Program. This program provides small competitive grants to Marin-based organizations that need financial and technical assistance to develop transportation programs serving seniors or persons with disabilities. In April 2017, Marin Transit issued the first call for Incubator proposals, asking applicants to focus on specific initiatives and priorities outlined by the District. In previous years, the District approved small grants to assist with a rural senior shuttle program, transportation to an adult day health care program, and management software for a volunteer driver program.
• Supplemental funding for Marin Transit to address increasing demand for ADA paratransit services.
• Mobility Management and Travel Navigator staffing to help with program development and outreach and expand Marin Transit’s travel training efforts.
Fares In FY 2023/24, Marin Transit is forecasting a fare increase of $0.25 on all services. This would raise fares to a $2.25 adult fare and $1.25 reduced fare, and staff projects that the new fare will increase fare revenue by ten percent. Board action and a Title VI analysis will be required prior to implementing any fare increases.
Paratransit fares are projected to increase at approximately the same rate as the amount of service (4%). The plan assumes that paratransit fares will increase in two phases reflected in the Financial Plan: phase 1 effective July FY 2020/21 and phase 2 in FY 2023/24. These increases will bring the paratransit fare to the industry standard of twice the adult fare. This is equivalent to a $4.00 paratransit fare, based on current fixed route fares.
Marin Transit is in the process of updating the eligibility thresholds for low-income fare assistance (LIFA), and anticipates that this will increase the number of eligible riders. LIFA eligible riders will also receive free access to the District’s Fixed Route services.
Appendix B of the SRTP includes a comprehensive analysis of Marin Transit’s Fare Policy, Program Eligibility, and Low-Income Fare Assistance and makes the recommendations described in Table 5 4. These recommendations are included in the fare revenue projections.
Item 8

MARIN TRANSIT | 2020–2029 SHORT RANGE TRANSIT PLAN Chapter 5: Financial Plan
5-11
Table 5-6: Summary of Proposed Fare Changes
Program Current Proposed Phase 1 (July 1, 2020)
Proposed Phase 2 (July 1, 2023)
Adult Adult Cash Fare $2.00 No change No change Adult Clipper Single Ride $1.80 No change No change Adult 1-Day Pass $5.00 No change No change Adult 7-Day Pass $20.00 Eliminate No change Adult 31-Day Pass $80.00 $40.00 No change Seniors 65+ / Persons with Disabilities S/D Cash Fare $1.00 No change No change S/D Clipper Single Ride $1.00 No change No change S/D 1-Day Pass $2.50 No change No change S/D 7-Day Pass $10.00 Eliminate No change S/D 31-Day Pass $25.00 $20.00 No change Youth Ages 5 - 18 Youth Cash Fare $1.00 No change No change Youth Clipper Single Ride $1.00 No change No change Youth 1-Day Pass $2.50 No change No change Youth 7-Day Pass $10.00 Eliminate No change Youth 31-Day Pass $40.00 Eliminate No change 6 Month Youth Pass $175.00 Eliminate No change Annual Youth Pass $325.00 No change No change Annual Youth Pass - low income Free No change No change Marin Access Novato Dial-A-Ride $2.00/$1.00 $4.00/$2.00 No change Rural Dial-A-Ride $2.50 $4.00/$2.00 No change Paratransit - Mandated $2.00 $3.00 $4.00 Paratransit - Extended $2.50 $3.00 $4.00
Catch A Ride Free up to $14.00/$18.00 Limit of 8 trips/month (1)
$4.00 + 100% of fare above $18.00
Limit of 10 trips/month
$5.00 + 100% of fare above $19.00
Limit of 10 trips/ month
Volunteer Driver No Fare - Driver
reimbursement $.35/mile or $.40/mile West Marin
No Fare - increase driver reimbursement
to $0.60/mile No change
Property Tax Marin Transit receives 0.05 percent of County property tax, or about $4.00 million per year, directly from Marin County. Property tax grown at 5-8 percent in the last few years after declining or almost no growth for four years (FY 2008/09 – FY 2011/12). Due to a potential slowing of the economy, the SRTP projects an average of three percent property tax growth over the ten-year plan.
FTA Section 5311 Federal Section 5311 Rural Transit Funds are less than one percent of Marin Transit’s total revenues. Yet they are a significant revenue source (20%) for operating rural services that tend to have lower productivity. These
Item 8
MARIN TRANSIT | 2020–2029 SHORT RANGE TRANSIT PLAN Chapter 5: Financial Plan
5-12
funds depend on the federal transportation bill and annual appropriations. Based on prior year trends, the District projects 5311 funding will grow by three percent per year.
Paratransit Contribution Marin Transit and GGBHTD share responsibility for local paratransit in Marin County. Historically, Marin Transit has ensured that both agencies meet this responsibility. In this arrangement, GGBHTD has contributed its share of funding to Marin Transit. This relationship is expected to continue, and GGBHTD is projected to contribute funding for 25 percent of the mandated local paratransit operations costs to complement its regional fixed route services.
Marin Transit also contracts for regional paratransit services on behalf of GGBHTD, which pays 100 percent of that cost. This relationship is expected to continue, and the associated costs and revenues are included in the Financial plan.
Item 8
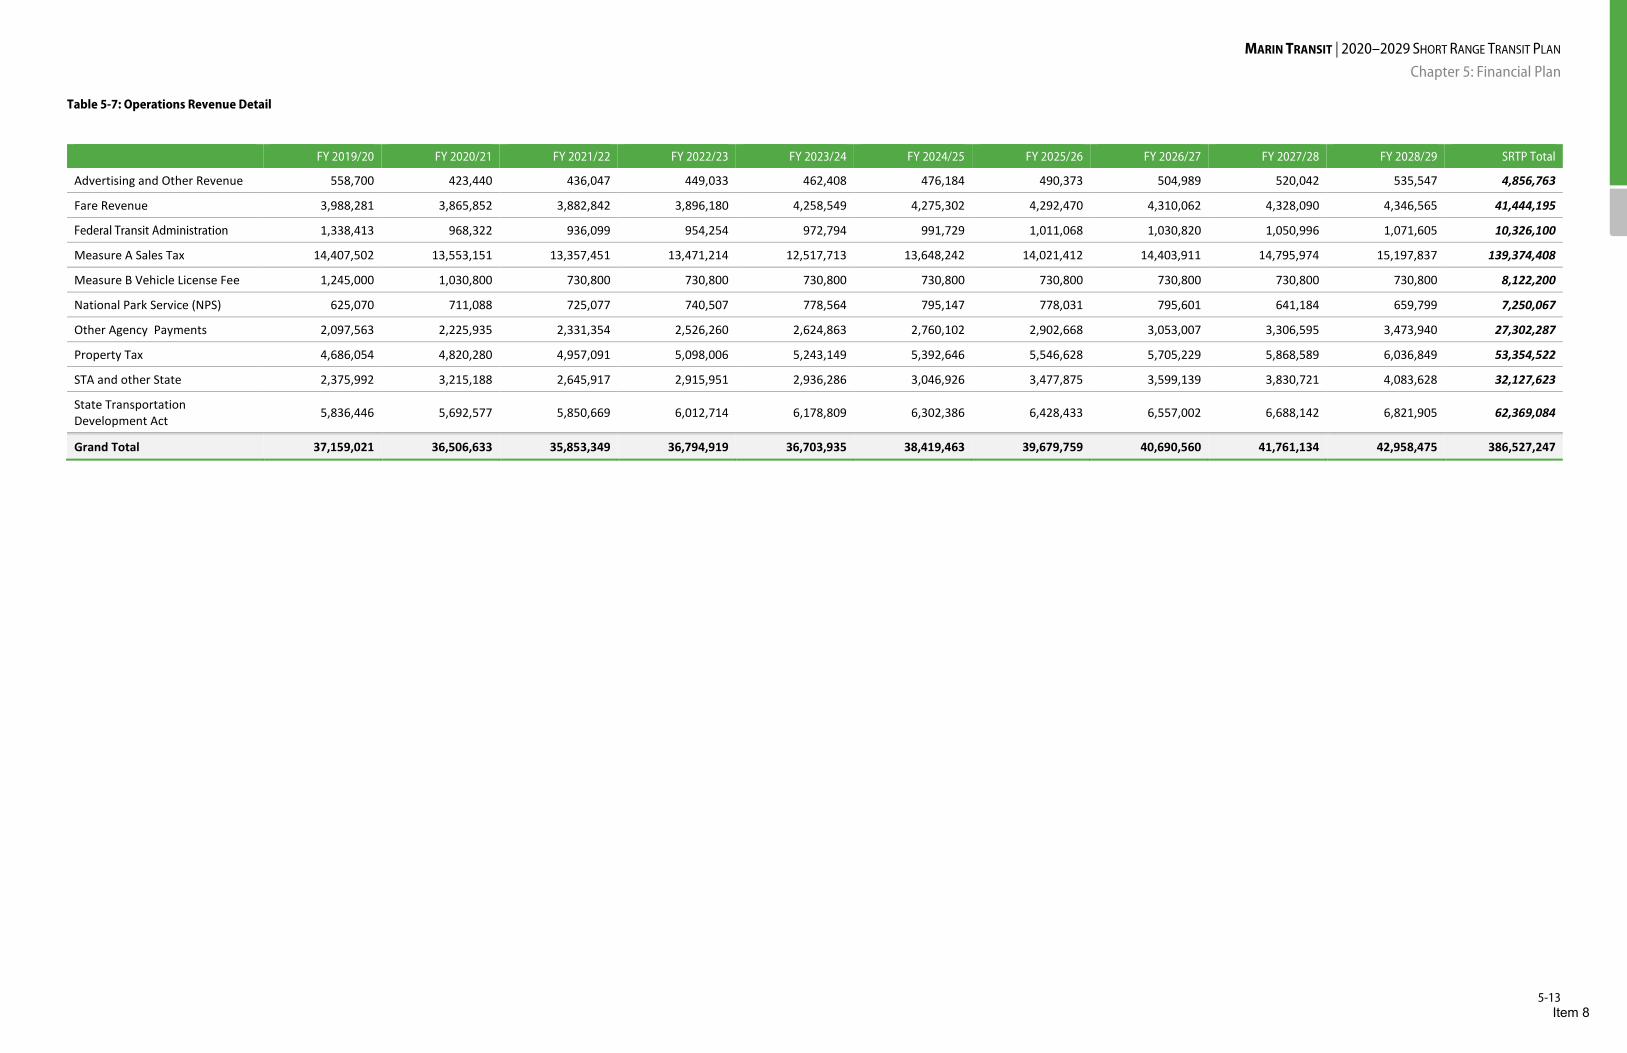
MARIN TRANSIT | 2020–2029 SHORT RANGE TRANSIT PLAN Chapter 5: Financial Plan
5-13
Table 5-7: Operations Revenue Detail
FY 2019/20 FY 2020/21 FY 2021/22 FY 2022/23 FY 2023/24 FY 2024/25 FY 2025/26 FY 2026/27 FY 2027/28 FY 2028/29 SRTP Total
Advertising and Other Revenue 558,700 423,440 436,047 449,033 462,408 476,184 490,373 504,989 520,042 535,547 4,856,763
Fare Revenue 3,988,281 3,865,852 3,882,842 3,896,180 4,258,549 4,275,302 4,292,470 4,310,062 4,328,090 4,346,565 41,444,195
Federal Transit Administration 1,338,413 968,322 936,099 954,254 972,794 991,729 1,011,068 1,030,820 1,050,996 1,071,605 10,326,100
Measure A Sales Tax 14,407,502 13,553,151 13,357,451 13,471,214 12,517,713 13,648,242 14,021,412 14,403,911 14,795,974 15,197,837 139,374,408
Measure B Vehicle License Fee 1,245,000 1,030,800 730,800 730,800 730,800 730,800 730,800 730,800 730,800 730,800 8,122,200
National Park Service (NPS) 625,070 711,088 725,077 740,507 778,564 795,147 778,031 795,601 641,184 659,799 7,250,067
Other Agency Payments 2,097,563 2,225,935 2,331,354 2,526,260 2,624,863 2,760,102 2,902,668 3,053,007 3,306,595 3,473,940 27,302,287
Property Tax 4,686,054 4,820,280 4,957,091 5,098,006 5,243,149 5,392,646 5,546,628 5,705,229 5,868,589 6,036,849 53,354,522
STA and other State 2,375,992 3,215,188 2,645,917 2,915,951 2,936,286 3,046,926 3,477,875 3,599,139 3,830,721 4,083,628 32,127,623
State Transportation Development Act
5,836,446 5,692,577 5,850,669 6,012,714 6,178,809 6,302,386 6,428,433 6,557,002 6,688,142 6,821,905 62,369,084
Grand Total 37,159,021 36,506,633 35,853,349 36,794,919 36,703,935 38,419,463 39,679,759 40,690,560 41,761,134 42,958,475 386,527,247
Item 8
DRAFT | November 2019
M A R I N T R A N S I T
2020-2029 Short Range Transit Plan: Appendices
Item 8
Item 8

17Local Basic
Days of Service: Wkdy, Sa, SuAvg Freq (Wkdy Peak): 30 min
Avg Freq (Wkdy Non-Peak): 60 minAvg Freq (Wked): 60 min
FY 2017 Farebox Recovery: 15%% transfer (to route): 25%
% Clipper usage: 16%
Annual Avg Monthly Avg Daily Annual Avg Monthly Avg Daily Annual Avg Monthly Avg DailyWeekday 194,263 5,396 257 11,496 319 15 177,386 4,927 234 Saturday 27,564 766 174 1,541 43 10 24,621 684 156 Sunday 26,171 727 145 1,720 48 10 27,378 761 152 Total 247,998 6,889 226 14,757 410 13 229,385 6,372 209
Annual Avg Monthly Avg Daily Annual Avg Monthly Avg Daily Annual Avg Monthly Avg DailyWeekday $1,617,108 $44,920 $2,136 $247,041 $6,862 $326 $1,370,067 $38,057 $1,810Saturday $217,536 $6,043 $1,377 $36,894 $1,025 $234 $180,642 $5,018 $1,143Sunday $242,142 $6,726 $1,345 $35,826 $995 $199 $206,316 $5,731 $1,146Total $2,076,786 $57,689 $1,897 $319,761 $8,882 $292 $1,757,025 $48,806 $1,605
Passengers per Revenue Hour
Subsidy per Passenger
Cost per Revenue Hour
Farebox Recovery
Weekday 16.9 $7.05 $140.67 15.3%Saturday 17.9 $6.55 $141.17 17.0%Sunday 15.2 $7.88 $140.78 14.8%Total 16.8 $7.08 $140.73 15.4%
Passengers Revenue Hours Operating CostsPassenger
RevenueOperating Subsidy
Passengers per Revenue Hour
Subsidy per Passenger
Cost per Revenue Hour
Farebox Recovery
FY 2016 280,486 15,330 $2,041,616 $302,337 $1,739,279 18.3 $6.20 $133.17 14.8%FY 2017 247,998 14,757 $2,076,786 $319,761 $1,757,025 16.8 $7.08 $140.73 15.4%FY 2018 250,651 14,885 $2,252,338 $298,773 $1,953,565 16.8 $7.79 $151.32 13.3%
Histo
ric Tr
ends
FY 20
17/1
8 DAT
A
Passengers Revenue Hours Revenue Miles
Operating Costs Passenger Revenue Operating Subsidy
301,136 280,486
247,998 250,651
0
50,000
100,000
150,000
200,000
250,000
300,000
350,000
FY 2015 FY 2016 FY 2017 FY 2018
Passengers
15,167
15,330
14,757 14,885
14,400
14,600
14,800
15,000
15,200
15,400
FY 2015 FY 2016 FY 2017 FY 2018
Revenue Hours
$2,108,822
$2,041,616 $2,076,786
$2,252,338
$1,900,000$1,950,000$2,000,000$2,050,000$2,100,000$2,150,000$2,200,000$2,250,000$2,300,000
FY 2015 FY 2016 FY 2017 FY 2018
Operating Costs
19.9 18.3 16.8 16.8
0.0
5.0
10.0
15.0
20.0
25.0
30.0
FY 2015 FY 2016 FY 2017 FY 2018
Passengers per Revenue Hour
$5.87 $6.20 $7.08 $7.79
$0.00$2.00$4.00$6.00$8.00
$10.00$12.00$14.00
FY 2015 FY 2016 FY 2017 FY 2018
Subsidy per Passenger
$139.04 $133.17 $140.73 $151.32
$0
$50
$100
$150
$200
FY 2015 FY 2016 FY 2017 FY 2018
Cost per Revenue Hour
Item 8

22Local Basic
Days of Service: Wkdy, Sa, SuAvg Freq (Wkdy Peak): 30 min
Avg Freq (Wkdy Non-Peak): 60 minAvg Freq (Wked): 60 min
FY 2017 Farebox Recovery: 17%% transfer (to route): 10%
% Clipper usage: 11%
Annual Avg Monthly Avg Daily Annual Avg Monthly Avg Daily Annual Avg Monthly Avg DailyWeekday 184,918 5,137 244 14,244 396 19 126,319 3,509 167 Saturday 16,752 465 106 1,537 43 10 16,232 451 103 Sunday 14,088 391 78 1,773 49 10 18,729 520 104 Total 215,758 5,993 197 17,553 488 16 161,280 4,480 147
Annual Avg Monthly Avg Daily Annual Avg Monthly Avg Daily Annual Avg Monthly Avg DailyWeekday $1,312,992 $36,472 $1,734 $232,926 $6,470 $308 $1,080,066 $30,002 $1,427Saturday $142,334 $3,954 $901 $21,235 $590 $134 $121,099 $3,364 $766Sunday $163,993 $4,555 $911 $18,898 $525 $105 $145,095 $4,030 $806Total $1,619,319 $44,981 $1,479 $273,059 $7,585 $249 $1,346,260 $37,396 $1,229
Passengers per Revenue Hour
Subsidy per Passenger
Cost per Revenue Hour
Farebox Recovery
Weekday 13.0 $5.84 $92.18 17.7%Saturday 10.9 $7.23 $92.63 14.9%Sunday 7.9 $10.30 $92.51 11.5%Total 12.3 $6.24 $92.25 16.9%
Passengers Revenue Hours Operating CostsPassenger
RevenueOperating Subsidy
Passengers per Revenue Hour
Subsidy per Passenger
Cost per Revenue Hour
Farebox Recovery
FY 2016 243,635 14,872 $1,971,172 $259,453 $1,711,719 16.4 $7.03 $132.55 13.2%FY 2017 215,758 17,553 $1,619,319 $273,059 $1,346,260 12.3 $6.24 $92.25 16.9%FY 2018 207,816 17,906 $1,825,020 $256,290 $1,568,730 11.6 $7.55 $101.92 14.0%
Histo
ric Tr
ends
FY 20
17/1
8 DAT
A
Passengers Revenue Hours Revenue Miles
Operating Costs Passenger Revenue Operating Subsidy
281,761 249,148 243,635
215,758 207,816
0
50,000
100,000
150,000
200,000
250,000
300,000
FY 2014 FY 2015 FY 2016 FY 2017 FY 2018
Passengers
15,083 14,777 14,872 17,553 17,906
0
5,000
10,000
15,000
20,000
FY 2014 FY 2015 FY 2016 FY 2017 FY 2018
Revenue Hours$2,220,145
$2,054,433 $1,971,172
$1,619,319 $1,825,020
$0
$500,000
$1,000,000
$1,500,000
$2,000,000
$2,500,000
FY 2014 FY 2015 FY 2016 FY 2017 FY 2018
Operating Costs
18.7 16.9 16.4
12.3 11.6
0.0
5.0
10.0
15.0
20.0
25.0
30.0
FY 2014 FY 2015 FY 2016 FY 2017 FY 2018
Passengers per Revenue Hour
$6.67 $7.07 $7.03 $6.24 $7.55
$0.00$2.00$4.00$6.00$8.00
$10.00$12.00$14.00
FY 2014 FY 2015 FY 2016 FY 2017 FY 2018
Subsidy per Passenger
$147.20 $139.03 $132.55
$92.25 $101.92
$0
$50
$100
$150
$200
FY 2014 FY 2015 FY 2016 FY 2017 FY 2018
Cost per Revenue Hour
Item 8

23Local Basic
Days of Service: Wkdy, Sa, SuAvg Freq (Wkdy Peak): 60 min
Avg Freq (Wkdy Non-Peak): 60 minAvg Freq (Wked): 60 min
FY 2017 Farebox Recovery: 16%% transfer (to route): 24%
% Clipper usage: 12%
Annual Avg Monthly Avg Daily Annual Avg Monthly Avg Daily Annual Avg Monthly Avg DailyWeekday 145,707 4,047 192 8,042 223 11 64,277 1,785 85 Saturday 28,305 786 179 1,434 40 9 11,466 319 73 Sunday 25,138 698 140 1,589 44 9 12,750 354 71 Total 199,150 5,532 182 11,065 307 10 88,492 2,458 81
Annual Avg Monthly Avg Daily Annual Avg Monthly Avg Daily Annual Avg Monthly Avg DailyWeekday $1,096,892 $30,469 $1,449 $179,427 $4,984 $237 $917,465 $25,485 $1,212Saturday $195,468 $5,430 $1,237 $35,226 $979 $223 $160,242 $4,451 $1,014Sunday $216,299 $6,008 $1,202 $32,255 $896 $179 $184,044 $5,112 $1,022Total $1,508,659 $41,907 $1,378 $246,908 $6,859 $225 $1,261,751 $35,049 $1,152
Passengers per Revenue Hour
Subsidy per Passenger
Cost per Revenue Hour
Farebox Recovery
Weekday 18.1 $6.30 $136.40 16.4%Saturday 19.7 $5.66 $136.29 18.0%Sunday 15.8 $7.32 $136.12 14.9%Total 18.0 $6.34 $136.35 16.4%
Passengers Revenue Hours Operating CostsPassenger
RevenueOperating Subsidy
Passengers per Revenue Hour
Subsidy per Passenger
Cost per Revenue Hour
Farebox Recovery
FY 2016 268,218 13,154 $1,703,216 $308,138 $1,395,078 20.4 $5.20 $129.48 18.1%FY 2017 199,150 11,065 $1,508,659 $246,908 $1,261,751 18.0 $6.34 $136.35 16.4%FY 2018 196,569 11,070 $1,618,197 $230,746 $1,387,451 17.8 $7.06 $146.18 14.3%
Histo
ric Tr
ends
FY 20
17/1
8 DAT
A
Passengers Revenue Hours Revenue Miles
Operating Costs Passenger Revenue Operating Subsidy
268,218
199,150 196,569
0
50,000
100,000
150,000
200,000
250,000
300,000
FY 2016 FY 2017 FY 2018
Passengers13,154
11,065 11,070
10,000
10,500
11,000
11,500
12,000
12,500
13,000
13,500
FY 2016 FY 2017 FY 2018
Revenue Hours$1,703,216
$1,508,659
$1,618,197
$1,400,000
$1,450,000
$1,500,000
$1,550,000
$1,600,000
$1,650,000
$1,700,000
$1,750,000
FY 2016 FY 2017 FY 2018
Operating Costs
20.4
18.0 17.8
16.0
17.0
18.0
19.0
20.0
21.0
FY 2016 FY 2017 FY 2018
Passengers per Revenue Hour
$5.20 $6.34 $7.06
$0.00$2.00$4.00$6.00$8.00
$10.00$12.00$14.00
FY 2016 FY 2017 FY 2018
Subsidy per Passenger
$129.48 $136.35 $146.18
$0
$50
$100
$150
$200
FY 2016 FY 2017 FY 2018
Cost per Revenue Hour
Item 8
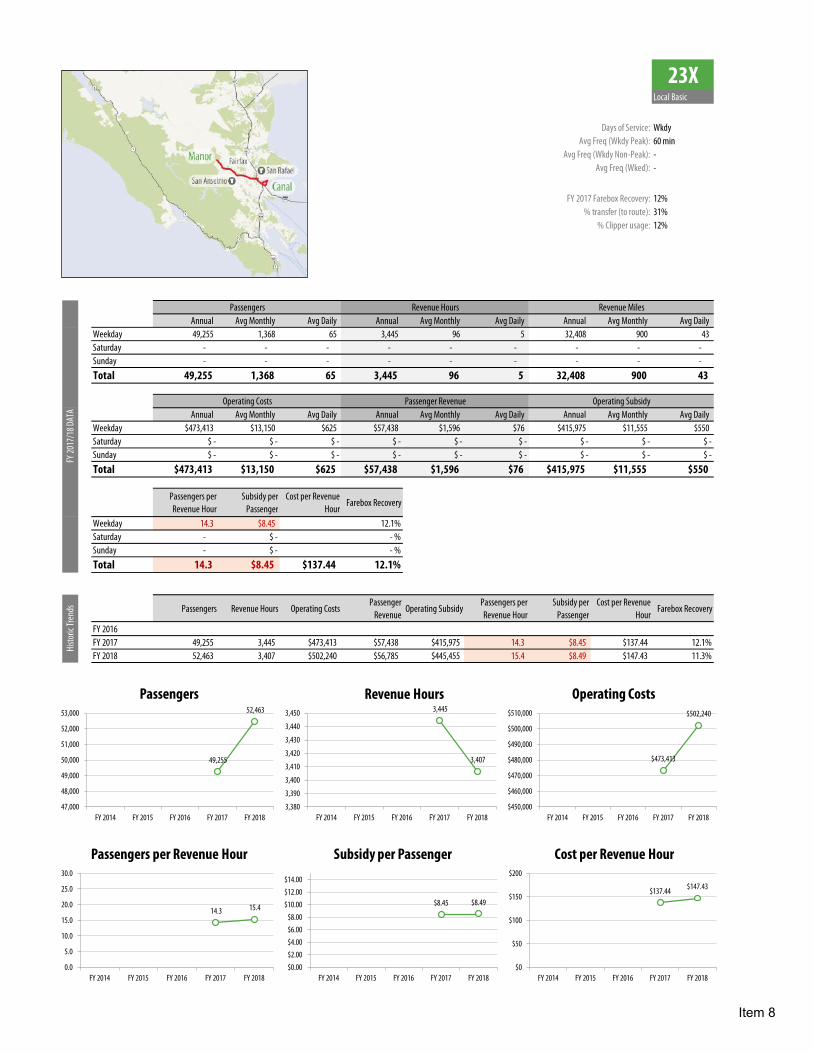
23XLocal Basic
Days of Service: WkdyAvg Freq (Wkdy Peak): 60 min
Avg Freq (Wkdy Non-Peak): -Avg Freq (Wked): -
FY 2017 Farebox Recovery: 12%% transfer (to route): 31%
% Clipper usage: 12%
Annual Avg Monthly Avg Daily Annual Avg Monthly Avg Daily Annual Avg Monthly Avg DailyWeekday 49,255 1,368 65 3,445 96 5 32,408 900 43 Saturday - - - - - - - - - Sunday - - - - - - - - - Total 49,255 1,368 65 3,445 96 5 32,408 900 43
Annual Avg Monthly Avg Daily Annual Avg Monthly Avg Daily Annual Avg Monthly Avg DailyWeekday $473,413 $13,150 $625 $57,438 $1,596 $76 $415,975 $11,555 $550Saturday $ - $ - $ - $ - $ - $ - $ - $ - $ -Sunday $ - $ - $ - $ - $ - $ - $ - $ - $ -Total $473,413 $13,150 $625 $57,438 $1,596 $76 $415,975 $11,555 $550
Passengers per Revenue Hour
Subsidy per Passenger
Cost per Revenue Hour
Farebox Recovery
Weekday 14.3 $8.45 $137.44 12.1%Saturday - $ - $ - - %Sunday - $ - $ - - %Total 14.3 $8.45 $137.44 12.1%
Passengers Revenue Hours Operating CostsPassenger
RevenueOperating Subsidy
Passengers per Revenue Hour
Subsidy per Passenger
Cost per Revenue Hour
Farebox Recovery
FY 2016FY 2017 49,255 3,445 $473,413 $57,438 $415,975 14.3 $8.45 $137.44 12.1%FY 2018 52,463 3,407 $502,240 $56,785 $445,455 15.4 $8.49 $147.43 11.3%
Histo
ric Tr
ends
FY 20
17/1
8 DAT
A
Passengers Revenue Hours Revenue Miles
Operating Costs Passenger Revenue Operating Subsidy
49,255
52,463
47,000
48,000
49,000
50,000
51,000
52,000
53,000
FY 2014 FY 2015 FY 2016 FY 2017 FY 2018
Passengers3,445
3,407
3,380
3,390
3,400
3,410
3,420
3,430
3,440
3,450
FY 2014 FY 2015 FY 2016 FY 2017 FY 2018
Revenue Hours
$473,413
$502,240
$450,000
$460,000
$470,000
$480,000
$490,000
$500,000
$510,000
FY 2014 FY 2015 FY 2016 FY 2017 FY 2018
Operating Costs
14.3 15.4
0.0
5.0
10.0
15.0
20.0
25.0
30.0
FY 2014 FY 2015 FY 2016 FY 2017 FY 2018
Passengers per Revenue Hour
$8.45 $8.49
$0.00$2.00$4.00$6.00$8.00
$10.00$12.00$14.00
FY 2014 FY 2015 FY 2016 FY 2017 FY 2018
Subsidy per Passenger
$137.44 $147.43
$0
$50
$100
$150
$200
FY 2014 FY 2015 FY 2016 FY 2017 FY 2018
Cost per Revenue Hour
Item 8

29Local Basic
Days of Service: WkdyAvg Freq (Wkdy Peak): 60 min
Avg Freq (Wkdy Non-Peak): -Avg Freq (Wked): -
FY 2017 Farebox Recovery: 10%% transfer (to route): 26%
% Clipper usage: 12%
Annual Avg Monthly Avg Daily Annual Avg Monthly Avg Daily Annual Avg Monthly Avg DailyWeekday 40,103 1,114 53 3,707 103 5 37,048 1,029 49 Saturday - - - - - - - - - Sunday - - - - - - - - - Total 40,103 1,114 53 3,707 103 5 37,048 1,029 49
Annual Avg Monthly Avg Daily Annual Avg Monthly Avg Daily Annual Avg Monthly Avg DailyWeekday $509,475 $14,152 $673 $49,634 $1,379 $66 $459,841 $12,773 $607Saturday $ - $ - $ - $ - $ - $ - $ - $ - $ -Sunday $ - $ - $ - $ - $ - $ - $ - $ - $ -Total $509,475 $14,152 $673 $49,634 $1,379 $66 $459,841 $12,773 $607
Passengers per Revenue Hour
Subsidy per Passenger
Cost per Revenue Hour
Farebox Recovery
Weekday 10.8 $11.47 $137.45 9.7%Saturday - $ - $ - - %Sunday - $ - $ - - %Total 10.8 $11.47 $137.45 9.7%
Passengers Revenue Hours Operating CostsPassenger
RevenueOperating Subsidy
Passengers per Revenue Hour
Subsidy per Passenger
Cost per Revenue Hour
Farebox Recovery
FY 2016 181,786 10,502 $1,378,760 $219,997 $1,158,763 17.3 $6.37 $131.29 16.0%FY 2017 40,103 3,707 $509,475 $49,634 $459,841 10.8 $11.47 $137.45 9.7%FY 2018 40,315 3,299 $487,313 $45,550 $441,763 12.2 $10.96 $147.71 9.3%
Histo
ric Tr
ends
FY 20
17/1
8 DAT
A
Passengers Revenue Hours Revenue Miles
Operating Costs Passenger Revenue Operating Subsidy
225,998 203,632
181,786
40,103 40,315
0
50,000
100,000
150,000
200,000
250,000
FY 2014 FY 2015 FY 2016 FY 2017 FY 2018
Passengers10,927 10,795 10,502
3,707 3,299
0
2,000
4,000
6,000
8,000
10,000
12,000
FY 2014 FY 2015 FY 2016 FY 2017 FY 2018
Revenue Hours
$1,607,795 $1,500,887 $1,378,760
$509,475 $487,313
$0
$500,000
$1,000,000
$1,500,000
$2,000,000
FY 2014 FY 2015 FY 2016 FY 2017 FY 2018
Operating Costs
20.7 18.9 17.3
10.8 12.2
0.0
5.0
10.0
15.0
20.0
25.0
30.0
FY 2014 FY 2015 FY 2016 FY 2017 FY 2018
Passengers per Revenue Hour
$5.93 $6.23 $6.37
$11.47 $10.96
$0.00$2.00$4.00$6.00$8.00
$10.00$12.00$14.00
FY 2014 FY 2015 FY 2016 FY 2017 FY 2018
Subsidy per Passenger
$147.14 $139.04 $131.29 $137.45 $147.71
$0
$50
$100
$150
$200
FY 2014 FY 2015 FY 2016 FY 2017 FY 2018
Cost per Revenue Hour
Item 8

35Local Trunkline
Days of Service: Wkdy, Sa, SuAvg Freq (Wkdy Peak): 30 min
Avg Freq (Wkdy Non-Peak): 30 minAvg Freq (Wked): 30 min
FY 2017 Farebox Recovery: 23%% transfer (to route): 17%
% Clipper usage: 8%
Annual Avg Monthly Avg Daily Annual Avg Monthly Avg Daily Annual Avg Monthly Avg DailyWeekday 492,328 13,676 650 16,909 470 22 224,421 6,234 296 Saturday 84,453 2,346 535 2,860 79 18 43,336 1,204 274 Sunday 82,088 2,280 456 3,284 91 18 50,021 1,389 278 Total 658,869 18,302 602 23,052 640 21 317,778 8,827 290
Annual Avg Monthly Avg Daily Annual Avg Monthly Avg Daily Annual Avg Monthly Avg DailyWeekday $2,367,217 $65,756 $3,127 $533,190 $14,811 $704 $1,834,027 $50,945 $2,423Saturday $403,729 $11,215 $2,555 $97,853 $2,718 $619 $305,876 $8,497 $1,936Sunday $463,362 $12,871 $2,574 $98,732 $2,743 $549 $364,630 $10,129 $2,026Total $3,234,308 $89,842 $2,954 $729,775 $20,272 $666 $2,504,533 $69,570 $2,287
Passengers per Revenue Hour
Subsidy per Passenger
Cost per Revenue Hour
Farebox Recovery
Weekday 29.1 $3.73 $140.00 22.5%Saturday 29.5 $3.62 $141.18 24.2%Sunday 25.0 $4.44 $141.11 21.3%Total 28.6 $3.80 $140.30 22.6%
Passengers Revenue Hours Operating CostsPassenger
RevenueOperating Subsidy
Passengers per Revenue Hour
Subsidy per Passenger
Cost per Revenue Hour
Farebox Recovery
FY 2016 472,718 9,300 $1,202,986 $544,109 $658,877 50.8 $1.39 $129.35 45.2%FY 2017 658,869 23,052 $3,234,308 $729,775 $2,504,533 28.6 $3.80 $140.30 22.6%FY 2018 665,936 23,006 $3,476,029 $697,189 $2,778,840 28.9 $4.17 $151.09 20.1%
Histo
ric Tr
ends
FY 20
17/1
8 DAT
A
Passengers Revenue Hours Revenue Miles
Operating Costs Passenger Revenue Operating Subsidy
574,669
476,489 472,718
658,869 665,936
0
100,000
200,000
300,000
400,000
500,000
600,000
700,000
FY 2014 FY 2015 FY 2016 FY 2017 FY 2018
Passengers
8,644 8,544 9,300
23,052 23,006
0
5,000
10,000
15,000
20,000
25,000
FY 2014 FY 2015 FY 2016 FY 2017 FY 2018
Revenue Hours
$1,271,601 $1,187,694 $1,202,986
$3,234,308 $3,476,029
$0$500,000
$1,000,000$1,500,000$2,000,000$2,500,000$3,000,000$3,500,000$4,000,000
FY 2014 FY 2015 FY 2016 FY 2017 FY 2018
Operating Costs
66.5 55.8
50.8
28.6 28.9
0.010.020.030.040.050.060.070.080.0
FY 2014 FY 2015 FY 2016 FY 2017 FY 2018
Passengers per Revenue Hour
$1.20 $1.52 $1.39
$3.80 $4.17
$0.00
$2.00
$4.00
$6.00
$8.00
$10.00
FY 2014 FY 2015 FY 2016 FY 2017 FY 2018
Subsidy per Passenger
$147.10 $139.01 $129.35 $140.30 $151.09
$0
$50
$100
$150
$200
FY 2014 FY 2015 FY 2016 FY 2017 FY 2018
Cost per Revenue Hour
Item 8
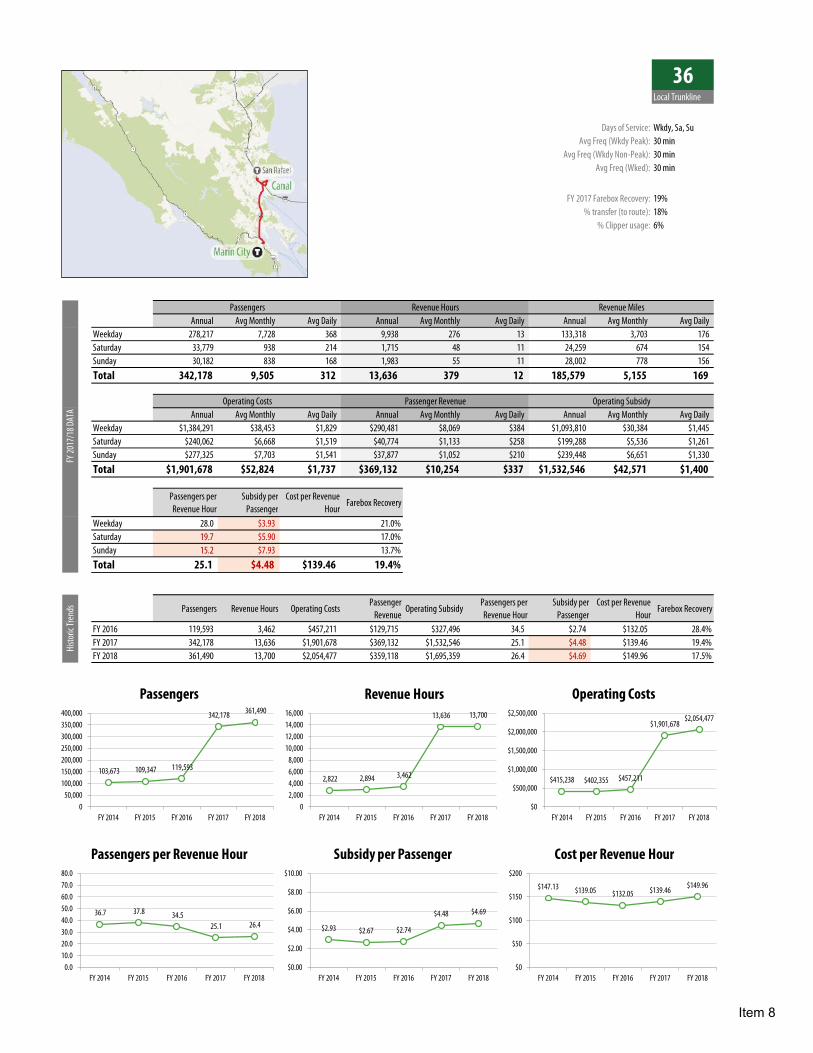
36Local Trunkline
Days of Service: Wkdy, Sa, SuAvg Freq (Wkdy Peak): 30 min
Avg Freq (Wkdy Non-Peak): 30 minAvg Freq (Wked): 30 min
FY 2017 Farebox Recovery: 19%% transfer (to route): 18%
% Clipper usage: 6%
Annual Avg Monthly Avg Daily Annual Avg Monthly Avg Daily Annual Avg Monthly Avg DailyWeekday 278,217 7,728 368 9,938 276 13 133,318 3,703 176 Saturday 33,779 938 214 1,715 48 11 24,259 674 154 Sunday 30,182 838 168 1,983 55 11 28,002 778 156 Total 342,178 9,505 312 13,636 379 12 185,579 5,155 169
Annual Avg Monthly Avg Daily Annual Avg Monthly Avg Daily Annual Avg Monthly Avg DailyWeekday $1,384,291 $38,453 $1,829 $290,481 $8,069 $384 $1,093,810 $30,384 $1,445Saturday $240,062 $6,668 $1,519 $40,774 $1,133 $258 $199,288 $5,536 $1,261Sunday $277,325 $7,703 $1,541 $37,877 $1,052 $210 $239,448 $6,651 $1,330Total $1,901,678 $52,824 $1,737 $369,132 $10,254 $337 $1,532,546 $42,571 $1,400
Passengers per Revenue Hour
Subsidy per Passenger
Cost per Revenue Hour
Farebox Recovery
Weekday 28.0 $3.93 $139.30 21.0%Saturday 19.7 $5.90 $139.99 17.0%Sunday 15.2 $7.93 $139.84 13.7%Total 25.1 $4.48 $139.46 19.4%
Passengers Revenue Hours Operating CostsPassenger
RevenueOperating Subsidy
Passengers per Revenue Hour
Subsidy per Passenger
Cost per Revenue Hour
Farebox Recovery
FY 2016 119,593 3,462 $457,211 $129,715 $327,496 34.5 $2.74 $132.05 28.4%FY 2017 342,178 13,636 $1,901,678 $369,132 $1,532,546 25.1 $4.48 $139.46 19.4%FY 2018 361,490 13,700 $2,054,477 $359,118 $1,695,359 26.4 $4.69 $149.96 17.5%
Histo
ric Tr
ends
FY 20
17/1
8 DAT
A
Passengers Revenue Hours Revenue Miles
Operating Costs Passenger Revenue Operating Subsidy
103,673 109,347 119,593
342,178 361,490
050,000
100,000150,000200,000250,000300,000350,000400,000
FY 2014 FY 2015 FY 2016 FY 2017 FY 2018
Passengers
2,822 2,894 3,462
13,636 13,700
02,0004,0006,0008,000
10,00012,00014,00016,000
FY 2014 FY 2015 FY 2016 FY 2017 FY 2018
Revenue Hours
$415,238 $402,355 $457,211
$1,901,678 $2,054,477
$0
$500,000
$1,000,000
$1,500,000
$2,000,000
$2,500,000
FY 2014 FY 2015 FY 2016 FY 2017 FY 2018
Operating Costs
36.7 37.8 34.5 25.1 26.4
0.010.020.030.040.050.060.070.080.0
FY 2014 FY 2015 FY 2016 FY 2017 FY 2018
Passengers per Revenue Hour
$2.93 $2.67 $2.74
$4.48 $4.69
$0.00
$2.00
$4.00
$6.00
$8.00
$10.00
FY 2014 FY 2015 FY 2016 FY 2017 FY 2018
Subsidy per Passenger
$147.13 $139.05 $132.05 $139.46 $149.96
$0
$50
$100
$150
$200
FY 2014 FY 2015 FY 2016 FY 2017 FY 2018
Cost per Revenue Hour
Item 8

49Local Basic
Days of Service: Wkdy, Sa, SuAvg Freq (Wkdy Peak): 30 min
Avg Freq (Wkdy Non-Peak): 60 minAvg Freq (Wked): 60 min
FY 2017 Farebox Recovery: 22%% transfer (to route): 9%
% Clipper usage: 11%
Annual Avg Monthly Avg Daily Annual Avg Monthly Avg Daily Annual Avg Monthly Avg DailyWeekday 201,564 5,599 266 11,313 314 15 139,528 3,876 184 Saturday 18,489 514 117 1,517 42 10 18,370 510 116 Sunday 17,183 477 95 1,761 49 10 21,402 595 119 Total 237,236 6,590 217 14,590 405 13 179,300 4,981 164
Annual Avg Monthly Avg Daily Annual Avg Monthly Avg Daily Annual Avg Monthly Avg DailyWeekday $978,903 $27,192 $1,293 $230,134 $6,393 $304 $748,769 $20,799 $989Saturday $131,907 $3,664 $835 $22,520 $626 $143 $109,387 $3,039 $692Sunday $153,484 $4,263 $853 $21,844 $607 $121 $131,640 $3,657 $731Total $1,264,294 $35,119 $1,155 $274,498 $7,625 $251 $989,796 $27,494 $904
Passengers per Revenue Hour
Subsidy per Passenger
Cost per Revenue Hour
Farebox Recovery
Weekday 17.8 $3.71 $86.53 23.5%Saturday 12.2 $5.92 $86.98 17.1%Sunday 9.8 $7.66 $87.18 14.2%Total 16.3 $4.17 $86.65 21.7%
Passengers Revenue Hours Operating CostsPassenger
RevenueOperating Subsidy
Passengers per Revenue Hour
Subsidy per Passenger
Cost per Revenue Hour
Farebox Recovery
FY 2016 147,480 6,795 $900,804 $146,345 $754,459 21.7 $5.12 $132.57 16.2%FY 2017 237,236 14,590 $1,264,294 $274,498 $989,796 16.3 $4.17 $86.65 21.7%FY 2018 244,998 14,841 $1,458,817 $259,446 $1,199,371 16.5 $4.90 $98.29 17.8%
Histo
ric Tr
ends
FY 20
17/1
8 DAT
A
Passengers Revenue Hours Revenue Miles
Operating Costs Passenger Revenue Operating Subsidy
152,259 144,262 147,480
237,236 244,998
0
50,000
100,000
150,000
200,000
250,000
300,000
FY 2014 FY 2015 FY 2016 FY 2017 FY 2018
Passengers
6,440 6,349 6,795
14,590 14,841
02,0004,0006,0008,000
10,00012,00014,00016,000
FY 2014 FY 2015 FY 2016 FY 2017 FY 2018
Revenue Hours
$948,702 $882,801 $900,804
$1,264,294 $1,458,817
$0$200,000$400,000$600,000$800,000
$1,000,000$1,200,000$1,400,000$1,600,000
FY 2014 FY 2015 FY 2016 FY 2017 FY 2018
Operating Costs
23.6 22.7 21.7
16.3 16.5
0.0
5.0
10.0
15.0
20.0
25.0
30.0
FY 2014 FY 2015 FY 2016 FY 2017 FY 2018
Passengers per Revenue Hour
$5.07 $5.02 $5.12 $4.17 $4.90
$0.00$2.00$4.00$6.00$8.00
$10.00$12.00$14.00
FY 2014 FY 2015 FY 2016 FY 2017 FY 2018
Subsidy per Passenger
$147.32 $139.05 $132.57
$86.65 $98.29
$0
$50
$100
$150
$200
FY 2014 FY 2015 FY 2016 FY 2017 FY 2018
Cost per Revenue Hour
Item 8

61Rural
Days of Service: Wkdy, Sa, SuAvg Freq (Wkdy Peak): 8 trips
Avg Freq (Wkdy Non-Peak): -Avg Freq (Wked): 16 trips
FY 2017 Farebox Recovery: 8%% transfer (to route): 7%
% Clipper usage: 11%
Annual Avg Monthly Avg Daily Annual Avg Monthly Avg Daily Annual Avg Monthly Avg DailyWeekday 17,166 477 23 2,631 73 4 45,398 1,261 60 Saturday 9,922 276 64 1,319 37 9 20,810 578 135 Sunday 9,240 257 49 1,542 43 8 24,457 679 129 Total 36,328 1,009 33 5,492 153 5 90,665 2,518 83
Annual Avg Monthly Avg Daily Annual Avg Monthly Avg Daily Annual Avg Monthly Avg DailyWeekday $229,650 $6,379 $306 $17,691 $491 $24 $211,959 $5,888 $282Saturday $113,378 $3,149 $736 $11,622 $323 $75 $101,756 $2,827 $661Sunday $132,750 $3,688 $699 $10,646 $296 $56 $122,104 $3,392 $643Total $475,778 $13,216 $435 $39,959 $1,110 $36 $435,819 $12,106 $398
Passengers per Revenue Hour
Subsidy per Passenger
Cost per Revenue Hour
Farebox Recovery
Weekday 6.5 $12.35 $87.30 7.7%Saturday 7.5 $10.26 $85.98 10.3%Sunday 6.0 $13.21 $86.07 8.0%Total 6.6 $12.00 $86.63 8.4%
Passengers Revenue Hours Operating CostsPassenger
RevenueOperating Subsidy
Passengers per Revenue Hour
Subsidy per Passenger
Cost per Revenue Hour
Farebox Recovery
FY 2016 37,276 5,475 $408,987 $48,421 $360,566 6.8 $9.67 $74.70 11.8%FY 2017 36,328 5,492 $475,778 $39,959 $435,819 6.6 $12.00 $86.63 8.4%FY 2018 36,010 5,535 $525,378 $40,082 $485,296 6.5 $13.48 $94.92 7.6%
Histo
ric Tr
ends
FY 20
17/1
8 DAT
A
Passengers Revenue Hours Revenue Miles
Operating Costs Passenger Revenue Operating Subsidy
33,386
39,478
37,276 36,328 36,010
30,000
32,000
34,000
36,000
38,000
40,000
FY 2014 FY 2015 FY 2016 FY 2017 FY 2018
Passengers
5,056
5,379 5,475 5,492 5,535
4,8004,9005,0005,1005,2005,3005,4005,5005,600
FY 2014 FY 2015 FY 2016 FY 2017 FY 2018
Revenue Hours
$390,358 $417,539 $408,987 $475,778
$525,378
$0
$100,000
$200,000
$300,000
$400,000
$500,000
$600,000
FY 2014 FY 2015 FY 2016 FY 2017 FY 2018
Operating Costs
6.6 7.3 6.8 6.6 6.5
0.0
2.0
4.0
6.0
8.0
10.0
FY 2014 FY 2015 FY 2016 FY 2017 FY 2018
Passengers per Revenue Hour
$10.45 $9.40 $9.67
$12.00 $13.48
$0.00$2.00$4.00$6.00$8.00
$10.00$12.00$14.00
FY 2014 FY 2015 FY 2016 FY 2017 FY 2018
Subsidy per Passenger
$77.21 $77.62 $74.70 $86.63 $94.92
$0
$50
$100
$150
$200
FY 2014 FY 2015 FY 2016 FY 2017 FY 2018
Cost per Revenue Hour
Item 8
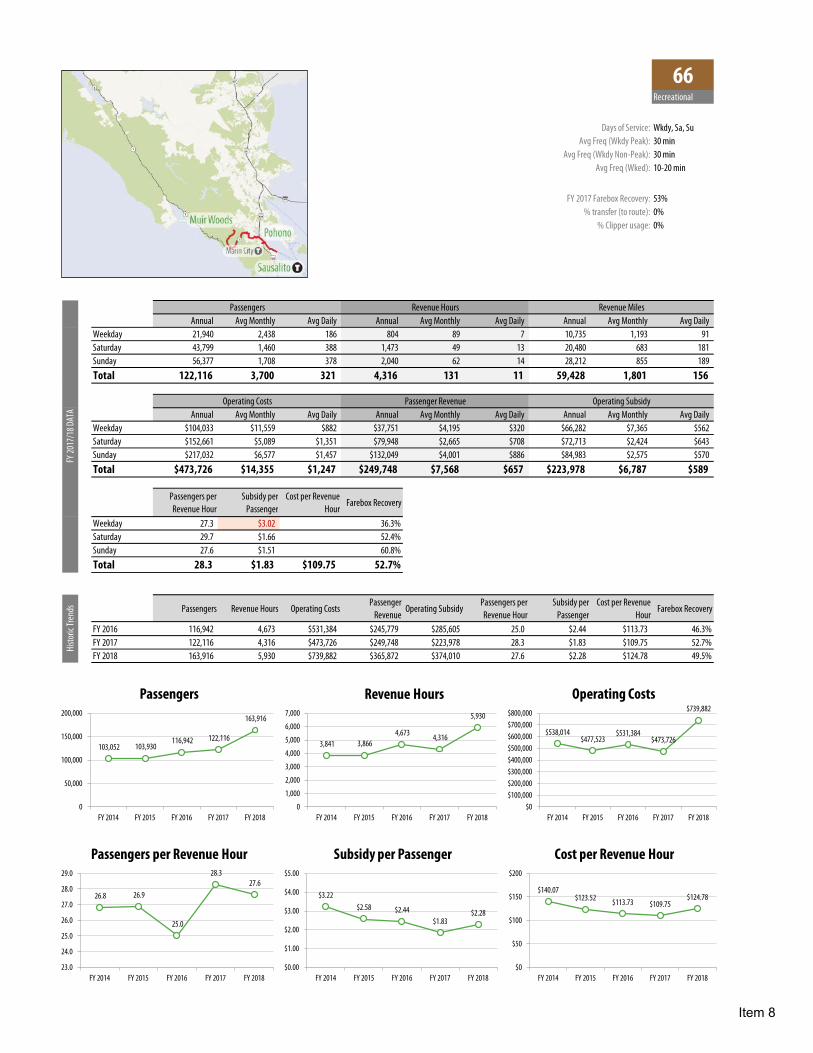
66Recreational
Days of Service: Wkdy, Sa, SuAvg Freq (Wkdy Peak): 30 min
Avg Freq (Wkdy Non-Peak): 30 minAvg Freq (Wked): 10-20 min
FY 2017 Farebox Recovery: 53%% transfer (to route): 0%
% Clipper usage: 0%
Annual Avg Monthly Avg Daily Annual Avg Monthly Avg Daily Annual Avg Monthly Avg DailyWeekday 21,940 2,438 186 804 89 7 10,735 1,193 91 Saturday 43,799 1,460 388 1,473 49 13 20,480 683 181 Sunday 56,377 1,708 378 2,040 62 14 28,212 855 189 Total 122,116 3,700 321 4,316 131 11 59,428 1,801 156
Annual Avg Monthly Avg Daily Annual Avg Monthly Avg Daily Annual Avg Monthly Avg DailyWeekday $104,033 $11,559 $882 $37,751 $4,195 $320 $66,282 $7,365 $562Saturday $152,661 $5,089 $1,351 $79,948 $2,665 $708 $72,713 $2,424 $643Sunday $217,032 $6,577 $1,457 $132,049 $4,001 $886 $84,983 $2,575 $570Total $473,726 $14,355 $1,247 $249,748 $7,568 $657 $223,978 $6,787 $589
Passengers per Revenue Hour
Subsidy per Passenger
Cost per Revenue Hour
Farebox Recovery
Weekday 27.3 $3.02 $129.44 36.3%Saturday 29.7 $1.66 $103.67 52.4%Sunday 27.6 $1.51 $106.38 60.8%Total 28.3 $1.83 $109.75 52.7%
Passengers Revenue Hours Operating CostsPassenger
RevenueOperating Subsidy
Passengers per Revenue Hour
Subsidy per Passenger
Cost per Revenue Hour
Farebox Recovery
FY 2016 116,942 4,673 $531,384 $245,779 $285,605 25.0 $2.44 $113.73 46.3%FY 2017 122,116 4,316 $473,726 $249,748 $223,978 28.3 $1.83 $109.75 52.7%FY 2018 163,916 5,930 $739,882 $365,872 $374,010 27.6 $2.28 $124.78 49.5%
Histo
ric Tr
ends
FY 20
17/1
8 DAT
A
Passengers Revenue Hours Revenue Miles
Operating Costs Passenger Revenue Operating Subsidy
103,052 103,930 116,942 122,116
163,916
0
50,000
100,000
150,000
200,000
FY 2014 FY 2015 FY 2016 FY 2017 FY 2018
Passengers
3,841 3,866 4,673 4,316
5,930
0
1,000
2,000
3,000
4,000
5,000
6,000
7,000
FY 2014 FY 2015 FY 2016 FY 2017 FY 2018
Revenue Hours
$538,014 $477,523
$531,384 $473,726
$739,882
$0$100,000$200,000$300,000$400,000$500,000$600,000$700,000$800,000
FY 2014 FY 2015 FY 2016 FY 2017 FY 2018
Operating Costs
26.8 26.9
25.0
28.3 27.6
23.0
24.0
25.0
26.0
27.0
28.0
29.0
FY 2014 FY 2015 FY 2016 FY 2017 FY 2018
Passengers per Revenue Hour
$3.22 $2.58 $2.44
$1.83 $2.28
$0.00
$1.00
$2.00
$3.00
$4.00
$5.00
FY 2014 FY 2015 FY 2016 FY 2017 FY 2018
Subsidy per Passenger
$140.07 $123.52 $113.73 $109.75
$124.78
$0
$50
$100
$150
$200
FY 2014 FY 2015 FY 2016 FY 2017 FY 2018
Cost per Revenue Hour
Item 8

68Rural
Days of Service: Wkdy, Sa, SuAvg Freq (Wkdy Peak): 60 min
Avg Freq (Wkdy Non-Peak): 120 minAvg Freq (Wked): 60-120 min
FY 2017 Farebox Recovery: 9%% transfer (to route): 13%
% Clipper usage: 12%
Annual Avg Monthly Avg Daily Annual Avg Monthly Avg Daily Annual Avg Monthly Avg DailyWeekday 59,903 1,664 80 7,282 202 10 133,167 3,699 177 Saturday 8,410 234 55 1,492 41 10 27,123 753 176 Sunday 8,285 230 44 1,907 53 10 34,638 962 182 Total 76,598 2,128 70 10,680 297 10 194,928 5,415 178
Annual Avg Monthly Avg Daily Annual Avg Monthly Avg Daily Annual Avg Monthly Avg DailyWeekday $645,737 $17,937 $860 $64,332 $1,787 $86 $581,405 $16,150 $774Saturday $131,882 $3,663 $856 $9,260 $257 $60 $122,622 $3,406 $796Sunday $169,286 $4,702 $891 $8,856 $246 $47 $160,430 $4,456 $844Total $946,905 $26,303 $865 $82,448 $2,290 $75 $864,457 $24,013 $789
Passengers per Revenue Hour
Subsidy per Passenger
Cost per Revenue Hour
Farebox Recovery
Weekday 8.2 $9.71 $88.68 10.0%Saturday 5.6 $14.58 $88.41 7.0%Sunday 4.3 $19.36 $88.79 5.2%Total 7.2 $11.29 $88.66 8.7%
`Passengers Revenue Hours Operating Costs
Passenger Revenue
Operating SubsidyPassengers per Revenue Hour
Subsidy per Passenger
Cost per Revenue Hour
Farebox Recovery
FY 2016 70,292 10,611 $811,978 $88,808 $723,170 6.6 $10.29 $76.52 10.9%FY 2017 76,598 10,680 $946,905 $82,448 $864,457 7.2 $11.29 $88.66 8.7%FY 2018 82,745 10,656 $1,034,218 $85,312 $948,906 7.8 $11.47 $97.06 8.2%
Histo
ric Tr
ends
FY 20
17/1
8 DAT
A
Passengers Revenue Hours Revenue Miles
Operating Costs Passenger Revenue Operating Subsidy
56,988 65,866 70,292
76,598 82,745
0
20,000
40,000
60,000
80,000
100,000
FY 2014 FY 2015 FY 2016 FY 2017 FY 2018
Passengers
7,185
10,589 10,611 10,680 10,656
0
2,000
4,000
6,000
8,000
10,000
12,000
FY 2014 FY 2015 FY 2016 FY 2017 FY 2018
Revenue Hours
$571,618
$848,305 $811,978 $946,905
$1,034,218
$0
$200,000
$400,000
$600,000
$800,000
$1,000,000
$1,200,000
FY 2014 FY 2015 FY 2016 FY 2017 FY 2018
Operating Costs
7.9
6.2 6.6 7.2
7.8
0.0
2.0
4.0
6.0
8.0
10.0
FY 2014 FY 2015 FY 2016 FY 2017 FY 2018
Passengers per Revenue Hour
$8.85
$11.65 $10.29
$11.29 $11.47
$0.00$2.00$4.00$6.00$8.00
$10.00$12.00$14.00
FY 2014 FY 2015 FY 2016 FY 2017 FY 2018
Subsidy per Passenger
$79.55 $80.11 $76.52 $88.66 $97.06
$0
$50
$100
$150
$200
FY 2014 FY 2015 FY 2016 FY 2017 FY 2018
Cost per Revenue Hour
Item 8
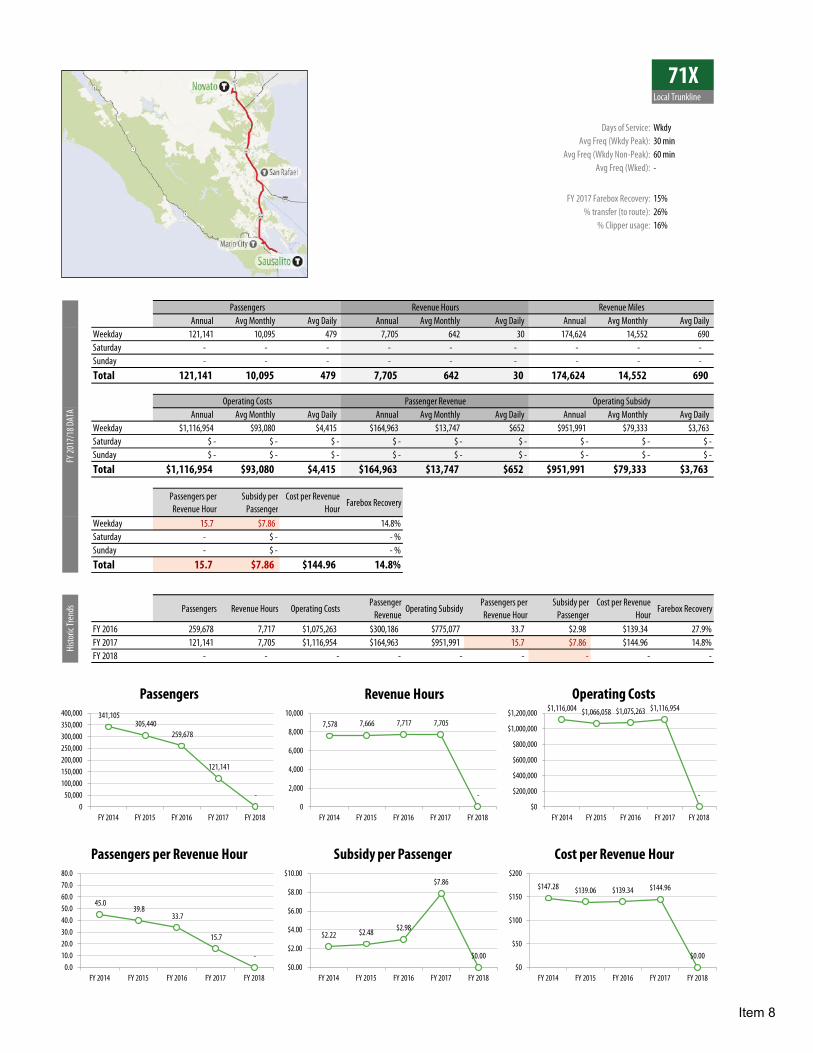
71XLocal Trunkline
Days of Service: WkdyAvg Freq (Wkdy Peak): 30 min
Avg Freq (Wkdy Non-Peak): 60 minAvg Freq (Wked): -
FY 2017 Farebox Recovery: 15%% transfer (to route): 26%
% Clipper usage: 16%
Annual Avg Monthly Avg Daily Annual Avg Monthly Avg Daily Annual Avg Monthly Avg DailyWeekday 121,141 10,095 479 7,705 642 30 174,624 14,552 690 Saturday - - - - - - - - - Sunday - - - - - - - - - Total 121,141 10,095 479 7,705 642 30 174,624 14,552 690
Annual Avg Monthly Avg Daily Annual Avg Monthly Avg Daily Annual Avg Monthly Avg DailyWeekday $1,116,954 $93,080 $4,415 $164,963 $13,747 $652 $951,991 $79,333 $3,763Saturday $ - $ - $ - $ - $ - $ - $ - $ - $ -Sunday $ - $ - $ - $ - $ - $ - $ - $ - $ -Total $1,116,954 $93,080 $4,415 $164,963 $13,747 $652 $951,991 $79,333 $3,763
Passengers per Revenue Hour
Subsidy per Passenger
Cost per Revenue Hour
Farebox Recovery
Weekday 15.7 $7.86 $144.96 14.8%Saturday - $ - $ - - %Sunday - $ - $ - - %Total 15.7 $7.86 $144.96 14.8%
Passengers Revenue Hours Operating CostsPassenger
RevenueOperating Subsidy
Passengers per Revenue Hour
Subsidy per Passenger
Cost per Revenue Hour
Farebox Recovery
FY 2016 259,678 7,717 $1,075,263 $300,186 $775,077 33.7 $2.98 $139.34 27.9%FY 2017 121,141 7,705 $1,116,954 $164,963 $951,991 15.7 $7.86 $144.96 14.8%FY 2018 - - - - - - - - -
Histo
ric Tr
ends
FY 20
17/1
8 DAT
A
Passengers Revenue Hours Revenue Miles
Operating Costs Passenger Revenue Operating Subsidy
341,105 305,440
259,678
121,141
-0
50,000100,000150,000200,000250,000300,000350,000400,000
FY 2014 FY 2015 FY 2016 FY 2017 FY 2018
Passengers
7,578 7,666 7,717 7,705
-0
2,000
4,000
6,000
8,000
10,000
FY 2014 FY 2015 FY 2016 FY 2017 FY 2018
Revenue Hours$1,116,004 $1,066,058 $1,075,263 $1,116,954
-$0
$200,000
$400,000
$600,000
$800,000
$1,000,000
$1,200,000
FY 2014 FY 2015 FY 2016 FY 2017 FY 2018
Operating Costs
45.0 39.8
33.7
15.7
-0.0
10.020.030.040.050.060.070.080.0
FY 2014 FY 2015 FY 2016 FY 2017 FY 2018
Passengers per Revenue Hour
$2.22 $2.48 $2.98
$7.86
$0.00 $0.00
$2.00
$4.00
$6.00
$8.00
$10.00
FY 2014 FY 2015 FY 2016 FY 2017 FY 2018
Subsidy per Passenger
$147.28 $139.06 $139.34 $144.96
$0.00 $0
$50
$100
$150
$200
FY 2014 FY 2015 FY 2016 FY 2017 FY 2018
Cost per Revenue Hour
Item 8
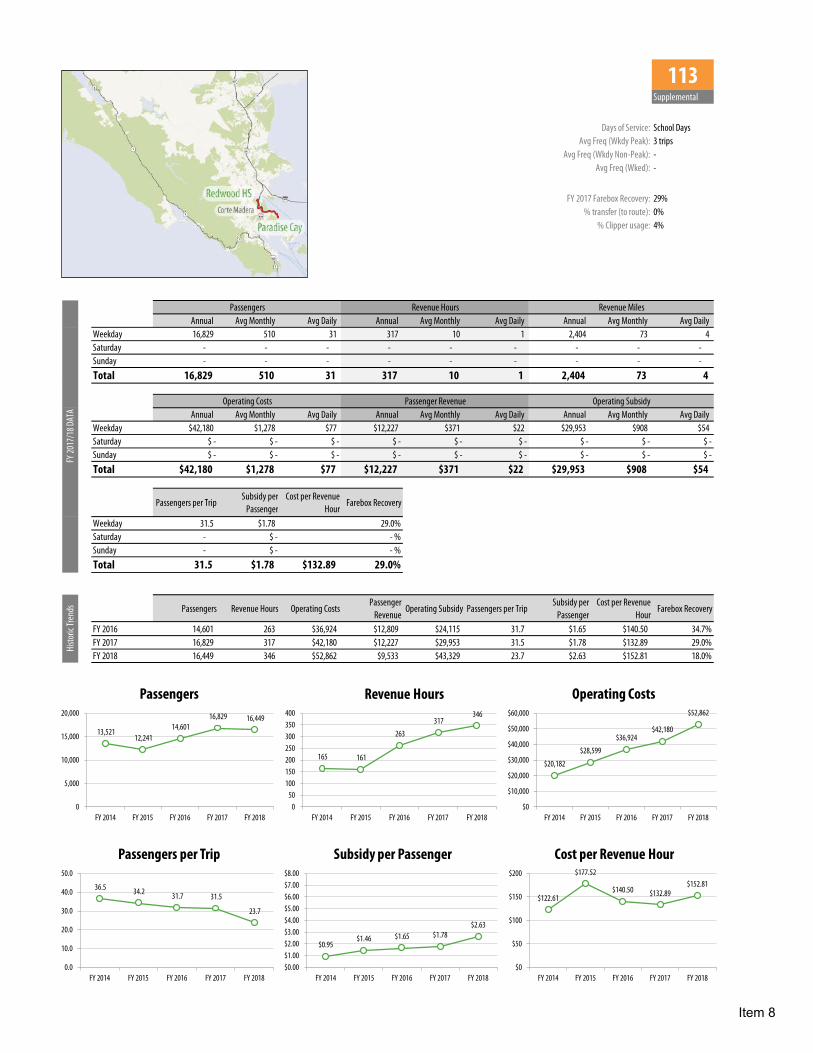
113Supplemental
Days of Service: School DaysAvg Freq (Wkdy Peak): 3 trips
Avg Freq (Wkdy Non-Peak): -Avg Freq (Wked): -
FY 2017 Farebox Recovery: 29%% transfer (to route): 0%
% Clipper usage: 4%
Annual Avg Monthly Avg Daily Annual Avg Monthly Avg Daily Annual Avg Monthly Avg DailyWeekday 16,829 510 31 317 10 1 2,404 73 4 Saturday - - - - - - - - - Sunday - - - - - - - - - Total 16,829 510 31 317 10 1 2,404 73 4
Annual Avg Monthly Avg Daily Annual Avg Monthly Avg Daily Annual Avg Monthly Avg DailyWeekday $42,180 $1,278 $77 $12,227 $371 $22 $29,953 $908 $54Saturday $ - $ - $ - $ - $ - $ - $ - $ - $ -Sunday $ - $ - $ - $ - $ - $ - $ - $ - $ -Total $42,180 $1,278 $77 $12,227 $371 $22 $29,953 $908 $54
Passengers per TripSubsidy per
PassengerCost per Revenue
HourFarebox Recovery
Weekday 31.5 $1.78 $132.89 29.0%Saturday - $ - $ - - %Sunday - $ - $ - - %Total 31.5 $1.78 $132.89 29.0%
Passengers Revenue Hours Operating CostsPassenger
RevenueOperating Subsidy Passengers per Trip
Subsidy per Passenger
Cost per Revenue Hour
Farebox Recovery
FY 2016 14,601 263 $36,924 $12,809 $24,115 31.7 $1.65 $140.50 34.7%FY 2017 16,829 317 $42,180 $12,227 $29,953 31.5 $1.78 $132.89 29.0%FY 2018 16,449 346 $52,862 $9,533 $43,329 23.7 $2.63 $152.81 18.0%
Histo
ric Tr
ends
FY 20
17/1
8 DAT
A
Passengers Revenue Hours Revenue Miles
Operating Costs Passenger Revenue Operating Subsidy
13,521 12,241
14,601 16,829 16,449
0
5,000
10,000
15,000
20,000
FY 2014 FY 2015 FY 2016 FY 2017 FY 2018
Passengers
165 161
263
317 346
050
100150200250300350400
FY 2014 FY 2015 FY 2016 FY 2017 FY 2018
Revenue Hours
$20,182
$28,599
$36,924 $42,180
$52,862
$0
$10,000
$20,000
$30,000
$40,000
$50,000
$60,000
FY 2014 FY 2015 FY 2016 FY 2017 FY 2018
Operating Costs
36.5 34.2 31.7 31.5
23.7
0.0
10.0
20.0
30.0
40.0
50.0
FY 2014 FY 2015 FY 2016 FY 2017 FY 2018
Passengers per Trip
$0.95 $1.46 $1.65 $1.78
$2.63
$0.00$1.00$2.00$3.00$4.00$5.00$6.00$7.00$8.00
FY 2014 FY 2015 FY 2016 FY 2017 FY 2018
Subsidy per Passenger
$122.61
$177.52
$140.50 $132.89 $152.81
$0
$50
$100
$150
$200
FY 2014 FY 2015 FY 2016 FY 2017 FY 2018
Cost per Revenue Hour
Item 8

115Supplemental
Days of Service: School DaysAvg Freq (Wkdy Peak): 5 trips
Avg Freq (Wkdy Non-Peak): -Avg Freq (Wked): -
FY 2017 Farebox Recovery: 11%% transfer (to route): 0%
% Clipper usage: 7%
Annual Avg Monthly Avg Daily Annual Avg Monthly Avg Daily Annual Avg Monthly Avg DailyWeekday 14,021 425 24 637 19 1 6,963 211 12 Saturday - - - - - - - - - Sunday - - - - - - - - - Total 14,021 425 24 637 19 1 6,963 211 12
Annual Avg Monthly Avg Daily Annual Avg Monthly Avg Daily Annual Avg Monthly Avg DailyWeekday $87,534 $2,653 $152 $9,504 $288 $17 $78,030 $2,365 $136Saturday $ - $ - $ - $ - $ - $ - $ - $ - $ -Sunday $ - $ - $ - $ - $ - $ - $ - $ - $ -Total $87,534 $2,653 $152 $9,504 $288 $17 $78,030 $2,365 $136
Passengers per TripSubsidy per
PassengerCost per Revenue
HourFarebox Recovery
Weekday 18.5 $5.57 $137.44 10.9%Saturday - $ - $ - - %Sunday - $ - $ - - %Total 18.5 $5.57 $137.44 10.9%
Passengers Revenue Hours Operating CostsPassenger
RevenueOperating Subsidy Passengers per Trip
Subsidy per Passenger
Cost per Revenue Hour
Farebox Recovery
FY 2016 16,366 559 $82,403 $12,638 $69,765 16.8 $4.26 $147.54 15.3%FY 2017 14,021 637 $87,534 $9,504 $78,030 18.5 $5.57 $137.44 10.9%FY 2018 9,495 344 $52,503 $4,578 $47,925 16.9 $5.05 $152.73 8.7%
Histo
ric Tr
ends
FY 20
17/1
8 DAT
A
Passengers Revenue Hours Revenue Miles
Operating Costs Passenger Revenue Operating Subsidy
21,488
16,366 14,021
9,495
0
5,000
10,000
15,000
20,000
25,000
FY 2014 FY 2015 FY 2016 FY 2017 FY 2018
Passengers
775
559 637
344
0
200
400
600
800
1,000
FY 2014 FY 2015 FY 2016 FY 2017 FY 2018
Revenue Hours$131,168
$82,403 $87,534
$52,503
$0
$20,000
$40,000
$60,000
$80,000
$100,000
$120,000
$140,000
FY 2014 FY 2015 FY 2016 FY 2017 FY 2018
Operating Costs
22.1 16.8 18.5 16.9
0.0
10.0
20.0
30.0
40.0
50.0
FY 2014 FY 2015 FY 2016 FY 2017 FY 2018
Passengers per Trip
$5.23 $4.26
$5.57 $5.05
$0.00$1.00$2.00$3.00$4.00$5.00$6.00$7.00$8.00
FY 2014 FY 2015 FY 2016 FY 2017 FY 2018
Subsidy per Passenger$169.18
$147.54 $137.44 $152.73
$0
$50
$100
$150
$200
FY 2014 FY 2015 FY 2016 FY 2017 FY 2018
Cost per Revenue Hour
Item 8

117Supplemental
Days of Service: School DaysAvg Freq (Wkdy Peak): 6 trips
Avg Freq (Wkdy Non-Peak): -Avg Freq (Wked): -
FY 2017 Farebox Recovery: 21%% transfer (to route): 0%
% Clipper usage: 2%
Annual Avg Monthly Avg Daily Annual Avg Monthly Avg Daily Annual Avg Monthly Avg DailyWeekday 34,820 1,055 64 640 19 1 4,753 144 9 Saturday - - - - - - - - - Sunday - - - - - - - - - Total 34,820 1,055 64 640 19 1 4,753 144 9
Annual Avg Monthly Avg Daily Annual Avg Monthly Avg Daily Annual Avg Monthly Avg DailyWeekday $81,509 $2,470 $149 $17,140 $519 $31 $64,369 $1,951 $117Saturday $ - $ - $ - $ - $ - $ - $ - $ - $ -Sunday $ - $ - $ - $ - $ - $ - $ - $ - $ -Total $81,509 $2,470 $149 $17,140 $519 $31 $64,369 $1,951 $117
Passengers per TripSubsidy per
PassengerCost per Revenue
HourFarebox Recovery
Weekday 28.4 $1.85 $127.32 21.0%Saturday - $ - $ - - %Sunday - $ - $ - - %Total 28.4 $1.85 $127.32 21.0%
Passengers Revenue Hours Operating CostsPassenger
RevenueOperating Subsidy Passengers per Trip
Subsidy per Passenger
Cost per Revenue Hour
Farebox Recovery
FY 2016 33,705 552 $77,694 $23,478 $54,216 26.9 $1.61 $140.75 30.2%FY 2017 34,820 640 $81,509 $17,140 $64,369 28.4 $1.85 $127.32 21.0%FY 2018 23,647 457 $68,521 $12,134 $56,387 26.4 $2.38 $150.03 17.7%
Histo
ric Tr
ends
FY 20
17/1
8 DAT
A
Passengers Revenue Hours Revenue Miles
Operating Costs Passenger Revenue Operating Subsidy
34,496
50,008
33,705 34,820
23,647
0
10,000
20,000
30,000
40,000
50,000
60,000
FY 2014 FY 2015 FY 2016 FY 2017 FY 2018
Passengers
341
509 552
640
457
0
100
200
300
400
500
600
700
FY 2014 FY 2015 FY 2016 FY 2017 FY 2018
Revenue Hours
$41,796
$77,168 $77,694 $81,509 $68,521
$0
$20,000
$40,000
$60,000
$80,000
$100,000
FY 2014 FY 2015 FY 2016 FY 2017 FY 2018
Operating Costs
40.6 39.9
26.9 28.4 26.4
0.0
10.0
20.0
30.0
40.0
50.0
FY 2014 FY 2015 FY 2016 FY 2017 FY 2018
Passengers per Trip
($0.28) ($0.01)
$1.61 $1.85 $2.38
-$2.00
-$1.00
$0.00
$1.00
$2.00
$3.00
$4.00
$5.00
$6.00
FY 2014 FY 2015 FY 2016 FY 2017 FY 2018
Subsidy per Passenger
$122.53
$151.58 $140.75
$127.32
$150.03
$0$20$40$60$80
$100$120$140$160
FY 2014 FY 2015 FY 2016 FY 2017 FY 2018
Cost per Revenue Hour
Item 8
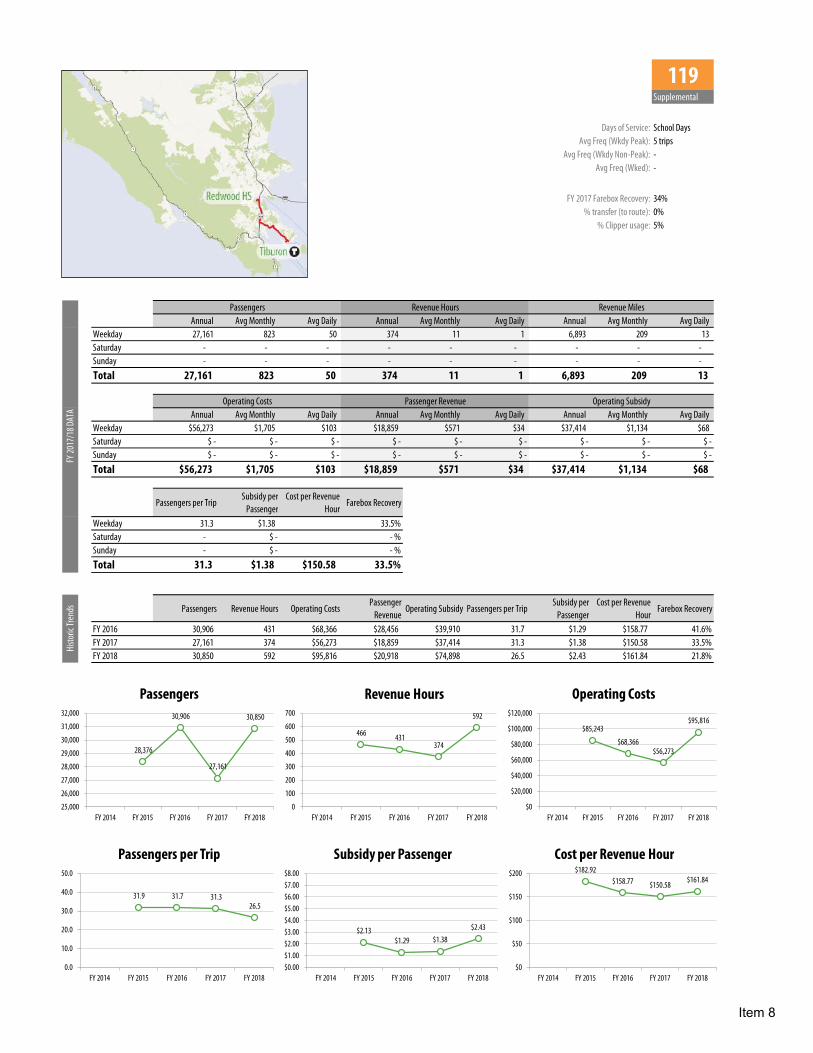
119Supplemental
Days of Service: School DaysAvg Freq (Wkdy Peak): 5 trips
Avg Freq (Wkdy Non-Peak): -Avg Freq (Wked): -
FY 2017 Farebox Recovery: 34%% transfer (to route): 0%
% Clipper usage: 5%
Annual Avg Monthly Avg Daily Annual Avg Monthly Avg Daily Annual Avg Monthly Avg DailyWeekday 27,161 823 50 374 11 1 6,893 209 13 Saturday - - - - - - - - - Sunday - - - - - - - - - Total 27,161 823 50 374 11 1 6,893 209 13
Annual Avg Monthly Avg Daily Annual Avg Monthly Avg Daily Annual Avg Monthly Avg DailyWeekday $56,273 $1,705 $103 $18,859 $571 $34 $37,414 $1,134 $68Saturday $ - $ - $ - $ - $ - $ - $ - $ - $ -Sunday $ - $ - $ - $ - $ - $ - $ - $ - $ -Total $56,273 $1,705 $103 $18,859 $571 $34 $37,414 $1,134 $68
Passengers per TripSubsidy per
PassengerCost per Revenue
HourFarebox Recovery
Weekday 31.3 $1.38 $150.58 33.5%Saturday - $ - $ - - %Sunday - $ - $ - - %Total 31.3 $1.38 $150.58 33.5%
Passengers Revenue Hours Operating CostsPassenger
RevenueOperating Subsidy Passengers per Trip
Subsidy per Passenger
Cost per Revenue Hour
Farebox Recovery
FY 2016 30,906 431 $68,366 $28,456 $39,910 31.7 $1.29 $158.77 41.6%FY 2017 27,161 374 $56,273 $18,859 $37,414 31.3 $1.38 $150.58 33.5%FY 2018 30,850 592 $95,816 $20,918 $74,898 26.5 $2.43 $161.84 21.8%
Histo
ric Tr
ends
FY 20
17/1
8 DAT
A
Passengers Revenue Hours Revenue Miles
Operating Costs Passenger Revenue Operating Subsidy
28,376
30,906
27,161
30,850
25,000
26,000
27,000
28,000
29,000
30,000
31,000
32,000
FY 2014 FY 2015 FY 2016 FY 2017 FY 2018
Passengers
466 431 374
592
0
100
200
300
400
500
600
700
FY 2014 FY 2015 FY 2016 FY 2017 FY 2018
Revenue Hours
$85,243
$68,366 $56,273
$95,816
$0
$20,000
$40,000
$60,000
$80,000
$100,000
$120,000
FY 2014 FY 2015 FY 2016 FY 2017 FY 2018
Operating Costs
31.9 31.7 31.3 26.5
0.0
10.0
20.0
30.0
40.0
50.0
FY 2014 FY 2015 FY 2016 FY 2017 FY 2018
Passengers per Trip
$2.13 $1.29 $1.38
$2.43
$0.00$1.00$2.00$3.00$4.00$5.00$6.00$7.00$8.00
FY 2014 FY 2015 FY 2016 FY 2017 FY 2018
Subsidy per Passenger$182.92
$158.77 $150.58 $161.84
$0
$50
$100
$150
$200
FY 2014 FY 2015 FY 2016 FY 2017 FY 2018
Cost per Revenue Hour
Item 8
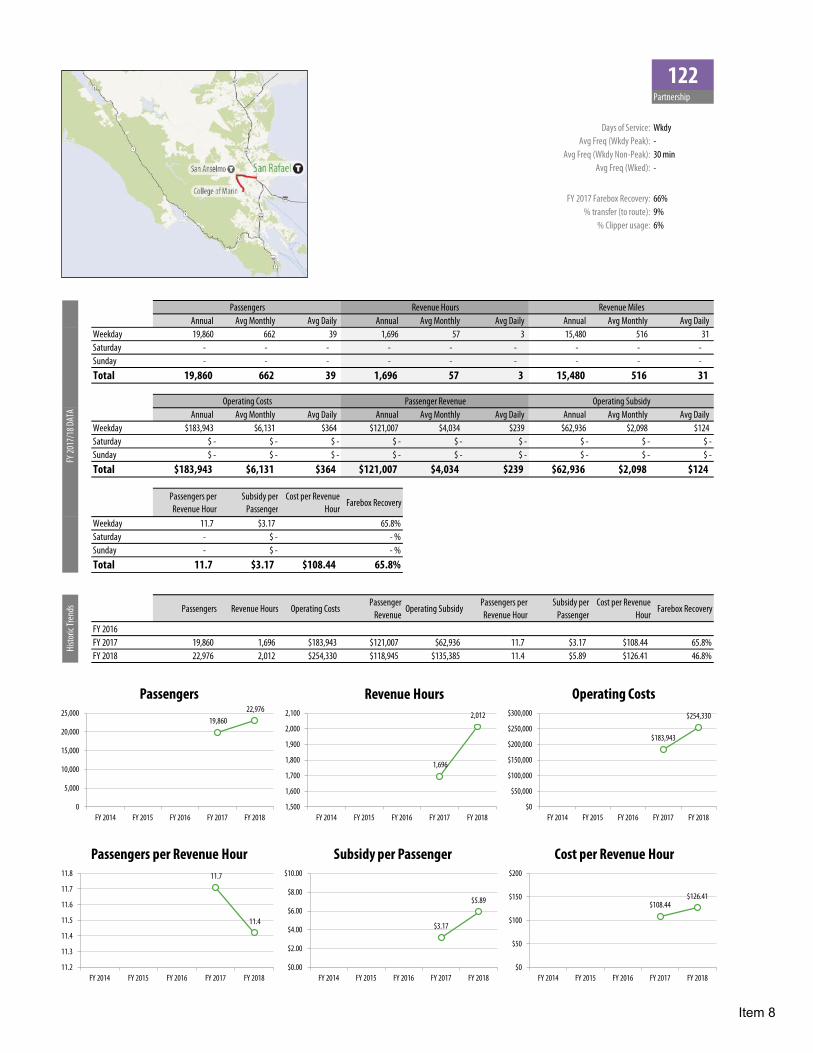
122Partnership
Days of Service: WkdyAvg Freq (Wkdy Peak): -
Avg Freq (Wkdy Non-Peak): 30 minAvg Freq (Wked): -
FY 2017 Farebox Recovery: 66%% transfer (to route): 9%
% Clipper usage: 6%
Annual Avg Monthly Avg Daily Annual Avg Monthly Avg Daily Annual Avg Monthly Avg DailyWeekday 19,860 662 39 1,696 57 3 15,480 516 31 Saturday - - - - - - - - - Sunday - - - - - - - - - Total 19,860 662 39 1,696 57 3 15,480 516 31
Annual Avg Monthly Avg Daily Annual Avg Monthly Avg Daily Annual Avg Monthly Avg DailyWeekday $183,943 $6,131 $364 $121,007 $4,034 $239 $62,936 $2,098 $124Saturday $ - $ - $ - $ - $ - $ - $ - $ - $ -Sunday $ - $ - $ - $ - $ - $ - $ - $ - $ -Total $183,943 $6,131 $364 $121,007 $4,034 $239 $62,936 $2,098 $124
Passengers per Revenue Hour
Subsidy per Passenger
Cost per Revenue Hour
Farebox Recovery
Weekday 11.7 $3.17 $108.44 65.8%Saturday - $ - $ - - %Sunday - $ - $ - - %Total 11.7 $3.17 $108.44 65.8%
Passengers Revenue Hours Operating CostsPassenger
RevenueOperating Subsidy
Passengers per Revenue Hour
Subsidy per Passenger
Cost per Revenue Hour
Farebox Recovery
FY 2016FY 2017 19,860 1,696 $183,943 $121,007 $62,936 11.7 $3.17 $108.44 65.8%FY 2018 22,976 2,012 $254,330 $118,945 $135,385 11.4 $5.89 $126.41 46.8%
Histo
ric Tr
ends
FY 20
17/1
8 DAT
A
Passengers Revenue Hours Revenue Miles
Operating Costs Passenger Revenue Operating Subsidy
19,860 22,976
0
5,000
10,000
15,000
20,000
25,000
FY 2014 FY 2015 FY 2016 FY 2017 FY 2018
Passengers
1,696
2,012
1,500
1,600
1,700
1,800
1,900
2,000
2,100
FY 2014 FY 2015 FY 2016 FY 2017 FY 2018
Revenue Hours
$183,943
$254,330
$0
$50,000
$100,000
$150,000
$200,000
$250,000
$300,000
FY 2014 FY 2015 FY 2016 FY 2017 FY 2018
Operating Costs
11.7
11.4
11.2
11.3
11.4
11.5
11.6
11.7
11.8
FY 2014 FY 2015 FY 2016 FY 2017 FY 2018
Passengers per Revenue Hour
$3.17
$5.89
$0.00
$2.00
$4.00
$6.00
$8.00
$10.00
FY 2014 FY 2015 FY 2016 FY 2017 FY 2018
Subsidy per Passenger
$108.44 $126.41
$0
$50
$100
$150
$200
FY 2014 FY 2015 FY 2016 FY 2017 FY 2018
Cost per Revenue Hour
Item 8
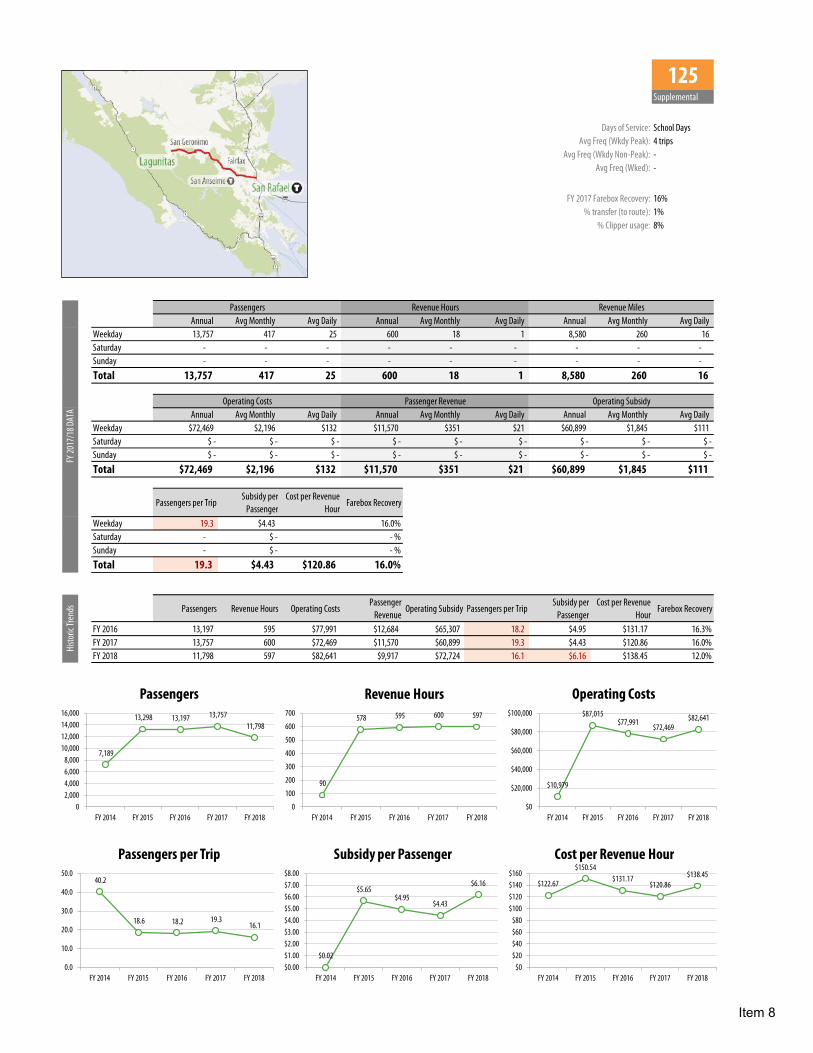
125Supplemental
Days of Service: School DaysAvg Freq (Wkdy Peak): 4 trips
Avg Freq (Wkdy Non-Peak): -Avg Freq (Wked): -
FY 2017 Farebox Recovery: 16%% transfer (to route): 1%
% Clipper usage: 8%
Annual Avg Monthly Avg Daily Annual Avg Monthly Avg Daily Annual Avg Monthly Avg DailyWeekday 13,757 417 25 600 18 1 8,580 260 16 Saturday - - - - - - - - - Sunday - - - - - - - - - Total 13,757 417 25 600 18 1 8,580 260 16
Annual Avg Monthly Avg Daily Annual Avg Monthly Avg Daily Annual Avg Monthly Avg DailyWeekday $72,469 $2,196 $132 $11,570 $351 $21 $60,899 $1,845 $111Saturday $ - $ - $ - $ - $ - $ - $ - $ - $ -Sunday $ - $ - $ - $ - $ - $ - $ - $ - $ -Total $72,469 $2,196 $132 $11,570 $351 $21 $60,899 $1,845 $111
Passengers per TripSubsidy per
PassengerCost per Revenue
HourFarebox Recovery
Weekday 19.3 $4.43 $120.86 16.0%Saturday - $ - $ - - %Sunday - $ - $ - - %Total 19.3 $4.43 $120.86 16.0%
Passengers Revenue Hours Operating CostsPassenger
RevenueOperating Subsidy Passengers per Trip
Subsidy per Passenger
Cost per Revenue Hour
Farebox Recovery
FY 2016 13,197 595 $77,991 $12,684 $65,307 18.2 $4.95 $131.17 16.3%FY 2017 13,757 600 $72,469 $11,570 $60,899 19.3 $4.43 $120.86 16.0%FY 2018 11,798 597 $82,641 $9,917 $72,724 16.1 $6.16 $138.45 12.0%
Histo
ric Tr
ends
FY 20
17/1
8 DAT
A
Passengers Revenue Hours Revenue Miles
Operating Costs Passenger Revenue Operating Subsidy
7,189
13,298 13,197 13,757 11,798
02,0004,0006,0008,000
10,00012,00014,00016,000
FY 2014 FY 2015 FY 2016 FY 2017 FY 2018
Passengers
90
578 595 600 597
0
100
200
300
400
500
600
700
FY 2014 FY 2015 FY 2016 FY 2017 FY 2018
Revenue Hours
$10,979
$87,015 $77,991
$72,469 $82,641
$0
$20,000
$40,000
$60,000
$80,000
$100,000
FY 2014 FY 2015 FY 2016 FY 2017 FY 2018
Operating Costs
40.2
18.6 18.2 19.3 16.1
0.0
10.0
20.0
30.0
40.0
50.0
FY 2014 FY 2015 FY 2016 FY 2017 FY 2018
Passengers per Trip
$0.02
$5.65 $4.95
$4.43
$6.16
$0.00$1.00$2.00$3.00$4.00$5.00$6.00$7.00$8.00
FY 2014 FY 2015 FY 2016 FY 2017 FY 2018
Subsidy per Passenger
$122.67
$150.54 $131.17
$120.86 $138.45
$0$20$40$60$80
$100$120$140$160
FY 2014 FY 2015 FY 2016 FY 2017 FY 2018
Cost per Revenue Hour
Item 8

139Supplemental
Days of Service: School DaysAvg Freq (Wkdy Peak): 2 trips
Avg Freq (Wkdy Non-Peak): -Avg Freq (Wked): -
FY 2017 Farebox Recovery: 20%% transfer (to route): 0%
% Clipper usage: 24%
Annual Avg Monthly Avg Daily Annual Avg Monthly Avg Daily Annual Avg Monthly Avg DailyWeekday 6,414 194 12 253 8 0 4,127 125 8 Saturday - - - - - - - - - Sunday - - - - - - - - - Total 6,414 194 12 253 8 0 4,127 125 8
Annual Avg Monthly Avg Daily Annual Avg Monthly Avg Daily Annual Avg Monthly Avg DailyWeekday $33,182 $1,006 $61 $6,635 $201 $12 $26,547 $804 $48Saturday $ - $ - $ - $ - $ - $ - $ - $ - $ -Sunday $ - $ - $ - $ - $ - $ - $ - $ - $ -Total $33,182 $1,006 $61 $6,635 $201 $12 $26,547 $804 $48
Passengers per TripSubsidy per
PassengerCost per Revenue
HourFarebox Recovery
Weekday 17.9 $4.14 $131.10 20.0%Saturday - $ - $ - - %Sunday - $ - $ - - %Total 17.9 $4.14 $131.10 20.0%
Passengers Revenue Hours Operating CostsPassenger
RevenueOperating Subsidy Passengers per Trip
Subsidy per Passenger
Cost per Revenue Hour
Farebox Recovery
FY 2016 6,391 315 $43,776 $6,241 $37,535 16.0 $5.87 $138.80 14.3%FY 2017 6,414 253 $33,182 $6,635 $26,547 17.9 $4.14 $131.10 20.0%FY 2018 4,852 320 $45,279 $4,233 $41,046 13.3 $8.46 $141.47 9.3%
Histo
ric Tr
ends
FY 20
17/1
8 DAT
A
Passengers Revenue Hours Revenue Miles
Operating Costs Passenger Revenue Operating Subsidy
4,026
5,906 6,391 6,414
4,852
0
1,000
2,000
3,000
4,000
5,000
6,000
7,000
FY 2014 FY 2015 FY 2016 FY 2017 FY 2018
Passengers
227 225
315
253
320
0
50
100
150
200
250
300
350
FY 2014 FY 2015 FY 2016 FY 2017 FY 2018
Revenue Hours
$27,734
$36,437
$43,776
$33,182
$45,279
$0
$10,000
$20,000
$30,000
$40,000
$50,000
FY 2014 FY 2015 FY 2016 FY 2017 FY 2018
Operating Costs
11.1 16.4 16.0 17.9
13.3
0.0
10.0
20.0
30.0
40.0
50.0
FY 2014 FY 2015 FY 2016 FY 2017 FY 2018
Passengers per Trip
$6.28 $5.28
$5.87
$4.14
$0.00$1.00$2.00$3.00$4.00$5.00$6.00$7.00$8.00
FY 2014 FY 2015 FY 2016 FY 2017 FY 2018
Subsidy per Passenger
$122.39
$161.73 $138.80 $131.10 $141.47
$0
$50
$100
$150
$200
FY 2014 FY 2015 FY 2016 FY 2017 FY 2018
Cost per Revenue Hour
Item 8

145Supplemental
Days of Service: School DaysAvg Freq (Wkdy Peak): 2-3 trips
Avg Freq (Wkdy Non-Peak): -Avg Freq (Wked): -
FY 2017 Farebox Recovery: 29%% transfer (to route): 5%
% Clipper usage: 2%
Annual Avg Monthly Avg Daily Annual Avg Monthly Avg Daily Annual Avg Monthly Avg DailyWeekday 16,406 497 30 191 6 0 2,175 66 4 Saturday - - - - - - - - - Sunday - - - - - - - - - Total 16,406 497 30 191 6 0 2,175 66 4
Annual Avg Monthly Avg Daily Annual Avg Monthly Avg Daily Annual Avg Monthly Avg DailyWeekday $25,426 $770 $46 $7,258 $220 $13 $18,168 $551 $33Saturday $ - $ - $ - $ - $ - $ - $ - $ - $ -Sunday $ - $ - $ - $ - $ - $ - $ - $ - $ -Total $25,426 $770 $46 $7,258 $220 $13 $18,168 $551 $33
Passengers per TripSubsidy per
PassengerCost per Revenue
HourFarebox Recovery
Weekday 37.2 $1.11 $133.47 28.5%Saturday - $ - $ - - %Sunday - $ - $ - - %Total 37.2 $1.11 $133.47 28.5%
Passengers Revenue Hours Operating CostsPassenger
RevenueOperating Subsidy Passengers per Trip
Subsidy per Passenger
Cost per Revenue Hour
Farebox Recovery
FY 2016 10,268 167 $21,672 $6,341 $15,331 39.6 $1.49 $129.93 29.3%FY 2017 16,406 191 $25,426 $7,258 $18,168 37.2 $1.11 $133.47 28.5%FY 2018 18,475 253 $37,421 $7,095 $30,326 34.3 $1.64 $147.82 19.0%
Histo
ric Tr
ends
FY 20
17/1
8 DAT
A
Passengers Revenue Hours Revenue Miles
Operating Costs Passenger Revenue Operating Subsidy
10,268
16,406 18,475
0
5,000
10,000
15,000
20,000
FY 2014 FY 2015 FY 2016 FY 2017 FY 2018
Passengers
167 191
253
0
50
100
150
200
250
300
FY 2014 FY 2015 FY 2016 FY 2017 FY 2018
Revenue Hours
$21,672 $25,426
$37,421
$0$5,000
$10,000$15,000$20,000$25,000$30,000$35,000$40,000
FY 2014 FY 2015 FY 2016 FY 2017 FY 2018
Operating Costs
39.6 37.2 34.3
0.0
10.0
20.0
30.0
40.0
50.0
FY 2014 FY 2015 FY 2016 FY 2017 FY 2018
Passengers per Trip
$1.49 $1.11 $1.64
$0.00$1.00$2.00$3.00$4.00$5.00$6.00$7.00$8.00
FY 2014 FY 2015 FY 2016 FY 2017 FY 2018
Subsidy per Passenger
$129.93 $133.47 $147.82
$0
$50
$100
$150
$200
FY 2014 FY 2015 FY 2016 FY 2017 FY 2018
Cost per Revenue Hour
Item 8

151Supplemental
Days of Service: School DaysAvg Freq (Wkdy Peak): 4-5 trips
Avg Freq (Wkdy Non-Peak): -Avg Freq (Wked): -
FY 2017 Farebox Recovery: 25%% transfer (to route): 1%
% Clipper usage: 4%
Annual Avg Monthly Avg Daily Annual Avg Monthly Avg Daily Annual Avg Monthly Avg DailyWeekday 36,801 1,115 67 594 18 1 10,649 323 19 Saturday - - - - - - - - - Sunday - - - - - - - - - Total 36,801 1,115 67 594 18 1 10,649 323 19
Annual Avg Monthly Avg Daily Annual Avg Monthly Avg Daily Annual Avg Monthly Avg DailyWeekday $73,842 $2,238 $134 $18,463 $559 $33 $55,379 $1,678 $100Saturday $ - $ - $ - $ - $ - $ - $ - $ - $ -Sunday $ - $ - $ - $ - $ - $ - $ - $ - $ -Total $73,842 $2,238 $134 $18,463 $559 $33 $55,379 $1,678 $100
Passengers per TripSubsidy per
PassengerCost per Revenue
HourFarebox Recovery
Weekday 42.8 $1.50 $124.42 25.0%Saturday - $ - $ - - %Sunday - $ - $ - - %Total 42.8 $1.50 $124.42 25.0%
Passengers Revenue Hours Operating CostsPassenger
RevenueOperating Subsidy Passengers per Trip
Subsidy per Passenger
Cost per Revenue Hour
Farebox Recovery
FY 2016 42,643 759 $100,712 $25,851 $74,861 45.6 $1.76 $132.67 25.7%FY 2017 36,801 594 $73,842 $18,463 $55,379 42.8 $1.50 $124.42 25.0%FY 2018 44,574 781 $107,633 $21,865 $85,768 34.7 $1.92 $137.75 20.3%
Histo
ric Tr
ends
FY 20
17/1
8 DAT
A
Passengers Revenue Hours Revenue Miles
Operating Costs Passenger Revenue Operating Subsidy
39,309 42,643
36,801
44,574
0
10,000
20,000
30,000
40,000
50,000
FY 2014 FY 2015 FY 2016 FY 2017 FY 2018
Passengers911
759
594
781
0
200
400
600
800
1,000
FY 2014 FY 2015 FY 2016 FY 2017 FY 2018
Revenue Hours$134,174
$100,712
$73,842
$107,633
$0$20,000$40,000$60,000$80,000
$100,000$120,000$140,000$160,000
FY 2014 FY 2015 FY 2016 FY 2017 FY 2018
Operating Costs
31.5
45.6 42.8
34.7
0.0
10.0
20.0
30.0
40.0
50.0
FY 2014 FY 2015 FY 2016 FY 2017 FY 2018
Passengers per Trip
$2.54 $1.76 $1.50 $1.92
$0.00$1.00$2.00$3.00$4.00$5.00$6.00$7.00$8.00
FY 2014 FY 2015 FY 2016 FY 2017 FY 2018
Subsidy per Passenger$147.22
$132.67
$124.42
$137.75
$110$115$120$125$130$135$140$145$150
FY 2014 FY 2015 FY 2016 FY 2017 FY 2018
Cost per Revenue Hour
Item 8

154Supplemental
Days of Service: School DaysAvg Freq (Wkdy Peak): 3 trips
Avg Freq (Wkdy Non-Peak): -Avg Freq (Wked): -
FY 2017 Farebox Recovery: 21%% transfer (to route): 0%
% Clipper usage: 5%
Annual Avg Monthly Avg Daily Annual Avg Monthly Avg Daily Annual Avg Monthly Avg DailyWeekday 13,738 416 25 358 11 1 4,342 132 8 Saturday - - - - - - - - - Sunday - - - - - - - - - Total 13,738 416 25 358 11 1 4,342 132 8
Annual Avg Monthly Avg Daily Annual Avg Monthly Avg Daily Annual Avg Monthly Avg DailyWeekday $41,965 $1,272 $76 $8,847 $268 $16 $33,118 $1,004 $60Saturday $ - $ - $ - $ - $ - $ - $ - $ - $ -Sunday $ - $ - $ - $ - $ - $ - $ - $ - $ -Total $41,965 $1,272 $76 $8,847 $268 $16 $33,118 $1,004 $60
Passengers per TripSubsidy per
PassengerCost per Revenue
HourFarebox Recovery
Weekday 25.5 $2.41 $117.29 21.1%Saturday - $ - $ - - %Sunday - $ - $ - - %Total 25.5 $2.41 $117.29 21.1%
Passengers Revenue Hours Operating CostsPassenger
RevenueOperating Subsidy Passengers per Trip
Subsidy per Passenger
Cost per Revenue Hour
Farebox Recovery
FY 2016 17,858 360 $46,133 $14,660 $31,473 31.1 $1.76 $128.08 31.8%FY 2017 13,738 358 $41,965 $8,847 $33,118 25.5 $2.41 $117.29 21.1%FY 2018 12,168 351 $45,902 $6,145 $39,757 33.0 $3.27 $130.83 13.4%
Histo
ric Tr
ends
FY 20
17/1
8 DAT
A
Passengers Revenue Hours Revenue Miles
Operating Costs Passenger Revenue Operating Subsidy
15,376 17,858
13,738 12,168
0
5,000
10,000
15,000
20,000
FY 2014 FY 2015 FY 2016 FY 2017 FY 2018
Passengers
293
360 358 351
050
100150200250300350400
FY 2014 FY 2015 FY 2016 FY 2017 FY 2018
Revenue Hours
$42,604
$46,133
$41,965
$45,902
$39,000$40,000$41,000$42,000$43,000$44,000$45,000$46,000$47,000
FY 2014 FY 2015 FY 2016 FY 2017 FY 2018
Operating Costs
38.8
31.1 25.5
33.0
0.0
10.0
20.0
30.0
40.0
50.0
FY 2014 FY 2015 FY 2016 FY 2017 FY 2018
Passengers per Trip
$1.91 $1.76 $2.41
$3.27
$0.00$1.00$2.00$3.00$4.00$5.00$6.00$7.00$8.00
FY 2014 FY 2015 FY 2016 FY 2017 FY 2018
Subsidy per Passenger$145.41
$128.08 $117.29
$130.83
$0$20$40$60$80
$100$120$140$160
FY 2014 FY 2015 FY 2016 FY 2017 FY 2018
Cost per Revenue Hour
Item 8
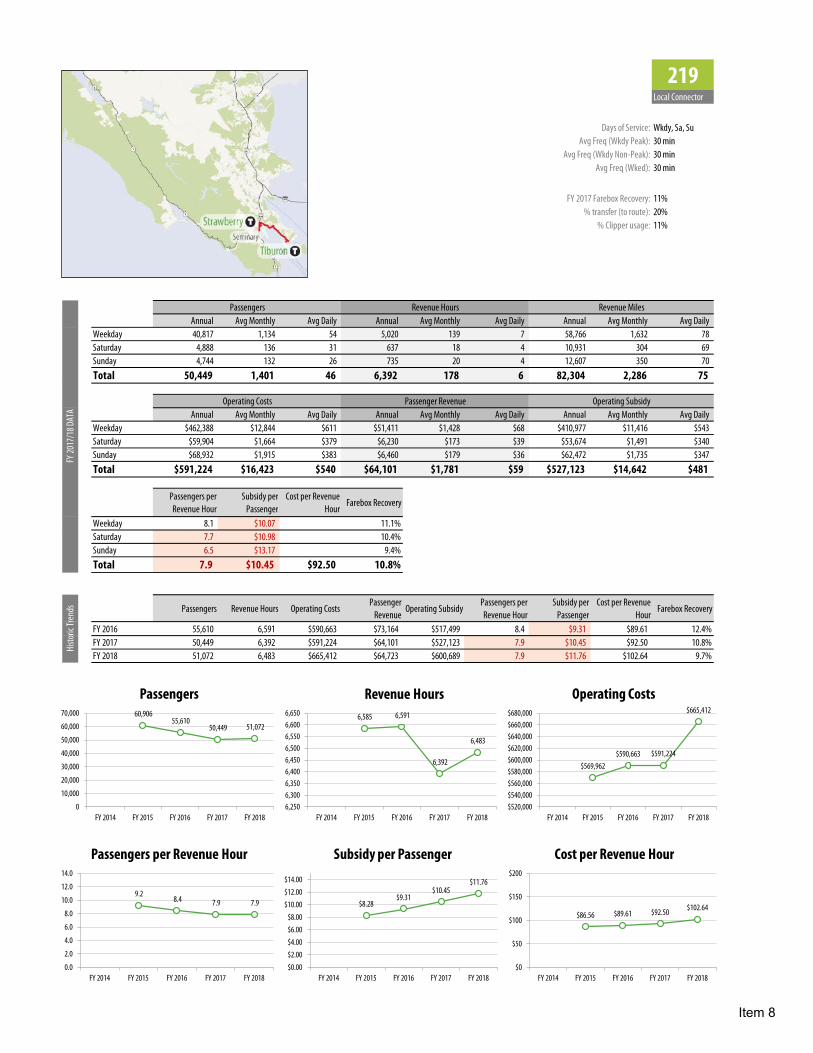
219Local Connector
Days of Service: Wkdy, Sa, SuAvg Freq (Wkdy Peak): 30 min
Avg Freq (Wkdy Non-Peak): 30 minAvg Freq (Wked): 30 min
FY 2017 Farebox Recovery: 11%% transfer (to route): 20%
% Clipper usage: 11%
Annual Avg Monthly Avg Daily Annual Avg Monthly Avg Daily Annual Avg Monthly Avg DailyWeekday 40,817 1,134 54 5,020 139 7 58,766 1,632 78 Saturday 4,888 136 31 637 18 4 10,931 304 69 Sunday 4,744 132 26 735 20 4 12,607 350 70 Total 50,449 1,401 46 6,392 178 6 82,304 2,286 75
Annual Avg Monthly Avg Daily Annual Avg Monthly Avg Daily Annual Avg Monthly Avg DailyWeekday $462,388 $12,844 $611 $51,411 $1,428 $68 $410,977 $11,416 $543Saturday $59,904 $1,664 $379 $6,230 $173 $39 $53,674 $1,491 $340Sunday $68,932 $1,915 $383 $6,460 $179 $36 $62,472 $1,735 $347Total $591,224 $16,423 $540 $64,101 $1,781 $59 $527,123 $14,642 $481
Passengers per Revenue Hour
Subsidy per Passenger
Cost per Revenue Hour
Farebox Recovery
Weekday 8.1 $10.07 $92.12 11.1%Saturday 7.7 $10.98 $94.01 10.4%Sunday 6.5 $13.17 $93.81 9.4%Total 7.9 $10.45 $92.50 10.8%
Passengers Revenue Hours Operating CostsPassenger
RevenueOperating Subsidy
Passengers per Revenue Hour
Subsidy per Passenger
Cost per Revenue Hour
Farebox Recovery
FY 2016 55,610 6,591 $590,663 $73,164 $517,499 8.4 $9.31 $89.61 12.4%FY 2017 50,449 6,392 $591,224 $64,101 $527,123 7.9 $10.45 $92.50 10.8%FY 2018 51,072 6,483 $665,412 $64,723 $600,689 7.9 $11.76 $102.64 9.7%
Histo
ric Tr
ends
FY 20
17/1
8 DAT
A
Passengers Revenue Hours Revenue Miles
Operating Costs Passenger Revenue Operating Subsidy
60,906 55,610
50,449 51,072
0
10,000
20,000
30,000
40,000
50,000
60,000
70,000
FY 2014 FY 2015 FY 2016 FY 2017 FY 2018
Passengers6,585 6,591
6,392
6,483
6,2506,3006,3506,4006,4506,5006,5506,6006,650
FY 2014 FY 2015 FY 2016 FY 2017 FY 2018
Revenue Hours
$569,962 $590,663 $591,224
$665,412
$520,000$540,000$560,000$580,000$600,000$620,000$640,000$660,000$680,000
FY 2014 FY 2015 FY 2016 FY 2017 FY 2018
Operating Costs
9.2 8.4 7.9 7.9
0.0
2.0
4.0
6.0
8.0
10.0
12.0
14.0
FY 2014 FY 2015 FY 2016 FY 2017 FY 2018
Passengers per Revenue Hour
$8.28 $9.31
$10.45 $11.76
$0.00$2.00$4.00$6.00$8.00
$10.00$12.00$14.00
FY 2014 FY 2015 FY 2016 FY 2017 FY 2018
Subsidy per Passenger
$86.56 $89.61 $92.50 $102.64
$0
$50
$100
$150
$200
FY 2014 FY 2015 FY 2016 FY 2017 FY 2018
Cost per Revenue Hour
Item 8
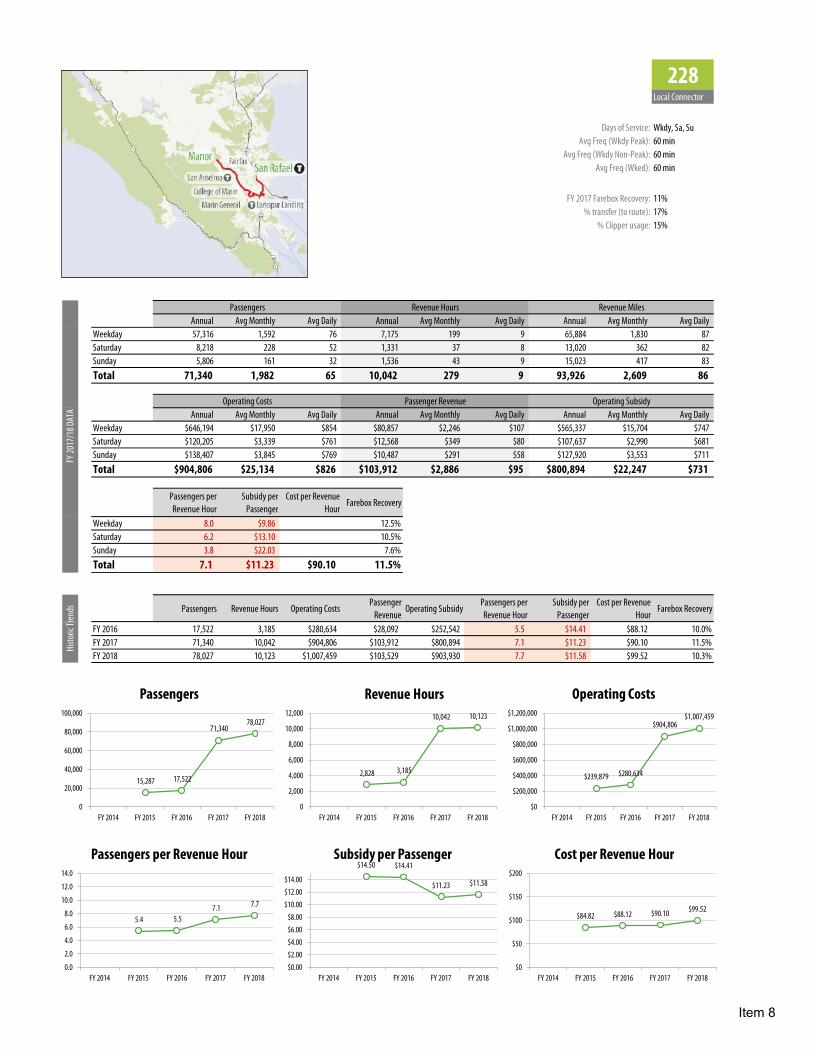
228Local Connector
Days of Service: Wkdy, Sa, SuAvg Freq (Wkdy Peak): 60 min
Avg Freq (Wkdy Non-Peak): 60 minAvg Freq (Wked): 60 min
FY 2017 Farebox Recovery: 11%% transfer (to route): 17%
% Clipper usage: 15%
Annual Avg Monthly Avg Daily Annual Avg Monthly Avg Daily Annual Avg Monthly Avg DailyWeekday 57,316 1,592 76 7,175 199 9 65,884 1,830 87 Saturday 8,218 228 52 1,331 37 8 13,020 362 82 Sunday 5,806 161 32 1,536 43 9 15,023 417 83 Total 71,340 1,982 65 10,042 279 9 93,926 2,609 86
Annual Avg Monthly Avg Daily Annual Avg Monthly Avg Daily Annual Avg Monthly Avg DailyWeekday $646,194 $17,950 $854 $80,857 $2,246 $107 $565,337 $15,704 $747Saturday $120,205 $3,339 $761 $12,568 $349 $80 $107,637 $2,990 $681Sunday $138,407 $3,845 $769 $10,487 $291 $58 $127,920 $3,553 $711Total $904,806 $25,134 $826 $103,912 $2,886 $95 $800,894 $22,247 $731
Passengers per Revenue Hour
Subsidy per Passenger
Cost per Revenue Hour
Farebox Recovery
Weekday 8.0 $9.86 $90.06 12.5%Saturday 6.2 $13.10 $90.30 10.5%Sunday 3.8 $22.03 $90.11 7.6%Total 7.1 $11.23 $90.10 11.5%
Passengers Revenue Hours Operating CostsPassenger
RevenueOperating Subsidy
Passengers per Revenue Hour
Subsidy per Passenger
Cost per Revenue Hour
Farebox Recovery
FY 2016 17,522 3,185 $280,634 $28,092 $252,542 5.5 $14.41 $88.12 10.0%FY 2017 71,340 10,042 $904,806 $103,912 $800,894 7.1 $11.23 $90.10 11.5%FY 2018 78,027 10,123 $1,007,459 $103,529 $903,930 7.7 $11.58 $99.52 10.3%
Histo
ric Tr
ends
FY 20
17/1
8 DAT
A
Passengers Revenue Hours Revenue Miles
Operating Costs Passenger Revenue Operating Subsidy
15,287 17,522
71,340 78,027
0
20,000
40,000
60,000
80,000
100,000
FY 2014 FY 2015 FY 2016 FY 2017 FY 2018
Passengers
2,828 3,185
10,042 10,123
0
2,000
4,000
6,000
8,000
10,000
12,000
FY 2014 FY 2015 FY 2016 FY 2017 FY 2018
Revenue Hours
$239,879 $280,634
$904,806 $1,007,459
$0
$200,000
$400,000
$600,000
$800,000
$1,000,000
$1,200,000
FY 2014 FY 2015 FY 2016 FY 2017 FY 2018
Operating Costs
5.4 5.5 7.1 7.7
0.0
2.0
4.0
6.0
8.0
10.0
12.0
14.0
FY 2014 FY 2015 FY 2016 FY 2017 FY 2018
Passengers per Revenue Hour$14.50 $14.41
$11.23 $11.58
$0.00$2.00$4.00$6.00$8.00
$10.00$12.00$14.00
FY 2014 FY 2015 FY 2016 FY 2017 FY 2018
Subsidy per Passenger
$84.82 $88.12 $90.10 $99.52
$0
$50
$100
$150
$200
FY 2014 FY 2015 FY 2016 FY 2017 FY 2018
Cost per Revenue Hour
Item 8
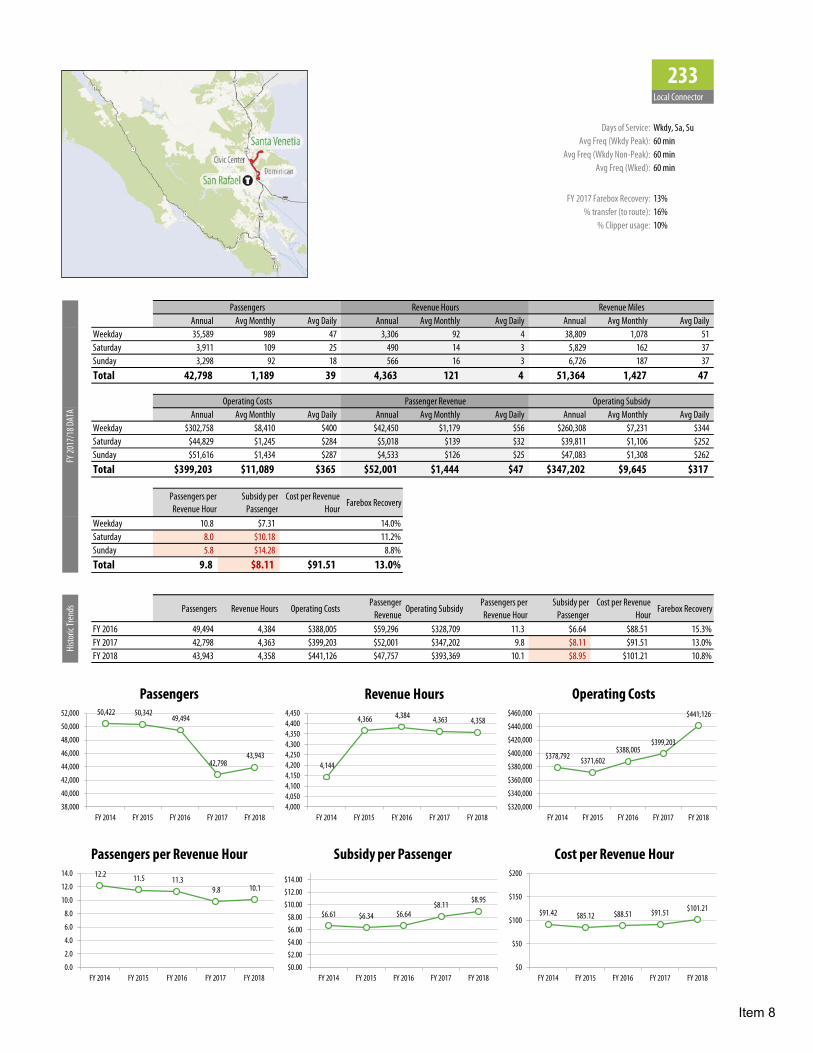
233Local Connector
Days of Service: Wkdy, Sa, SuAvg Freq (Wkdy Peak): 60 min
Avg Freq (Wkdy Non-Peak): 60 minAvg Freq (Wked): 60 min
FY 2017 Farebox Recovery: 13%% transfer (to route): 16%
% Clipper usage: 10%
Annual Avg Monthly Avg Daily Annual Avg Monthly Avg Daily Annual Avg Monthly Avg DailyWeekday 35,589 989 47 3,306 92 4 38,809 1,078 51 Saturday 3,911 109 25 490 14 3 5,829 162 37 Sunday 3,298 92 18 566 16 3 6,726 187 37 Total 42,798 1,189 39 4,363 121 4 51,364 1,427 47
Annual Avg Monthly Avg Daily Annual Avg Monthly Avg Daily Annual Avg Monthly Avg DailyWeekday $302,758 $8,410 $400 $42,450 $1,179 $56 $260,308 $7,231 $344Saturday $44,829 $1,245 $284 $5,018 $139 $32 $39,811 $1,106 $252Sunday $51,616 $1,434 $287 $4,533 $126 $25 $47,083 $1,308 $262Total $399,203 $11,089 $365 $52,001 $1,444 $47 $347,202 $9,645 $317
Passengers per Revenue Hour
Subsidy per Passenger
Cost per Revenue Hour
Farebox Recovery
Weekday 10.8 $7.31 $91.58 14.0%Saturday 8.0 $10.18 $91.41 11.2%Sunday 5.8 $14.28 $91.18 8.8%Total 9.8 $8.11 $91.51 13.0%
Passengers Revenue Hours Operating CostsPassenger
RevenueOperating Subsidy
Passengers per Revenue Hour
Subsidy per Passenger
Cost per Revenue Hour
Farebox Recovery
FY 2016 49,494 4,384 $388,005 $59,296 $328,709 11.3 $6.64 $88.51 15.3%FY 2017 42,798 4,363 $399,203 $52,001 $347,202 9.8 $8.11 $91.51 13.0%FY 2018 43,943 4,358 $441,126 $47,757 $393,369 10.1 $8.95 $101.21 10.8%
Histo
ric Tr
ends
FY 20
17/1
8 DAT
A
Passengers Revenue Hours Revenue Miles
Operating Costs Passenger Revenue Operating Subsidy
50,422 50,342 49,494
42,798 43,943
38,000
40,000
42,000
44,000
46,000
48,000
50,000
52,000
FY 2014 FY 2015 FY 2016 FY 2017 FY 2018
Passengers
4,144
4,366 4,384 4,363 4,358
4,0004,0504,1004,1504,2004,2504,3004,3504,4004,450
FY 2014 FY 2015 FY 2016 FY 2017 FY 2018
Revenue Hours
$378,792 $371,602 $388,005
$399,203
$441,126
$320,000
$340,000
$360,000
$380,000
$400,000
$420,000
$440,000
$460,000
FY 2014 FY 2015 FY 2016 FY 2017 FY 2018
Operating Costs
12.2 11.5 11.3 9.8 10.1
0.0
2.0
4.0
6.0
8.0
10.0
12.0
14.0
FY 2014 FY 2015 FY 2016 FY 2017 FY 2018
Passengers per Revenue Hour
$6.61 $6.34 $6.64 $8.11
$8.95
$0.00$2.00$4.00$6.00$8.00
$10.00$12.00$14.00
FY 2014 FY 2015 FY 2016 FY 2017 FY 2018
Subsidy per Passenger
$91.42 $85.12 $88.51 $91.51 $101.21
$0
$50
$100
$150
$200
FY 2014 FY 2015 FY 2016 FY 2017 FY 2018
Cost per Revenue Hour
Item 8
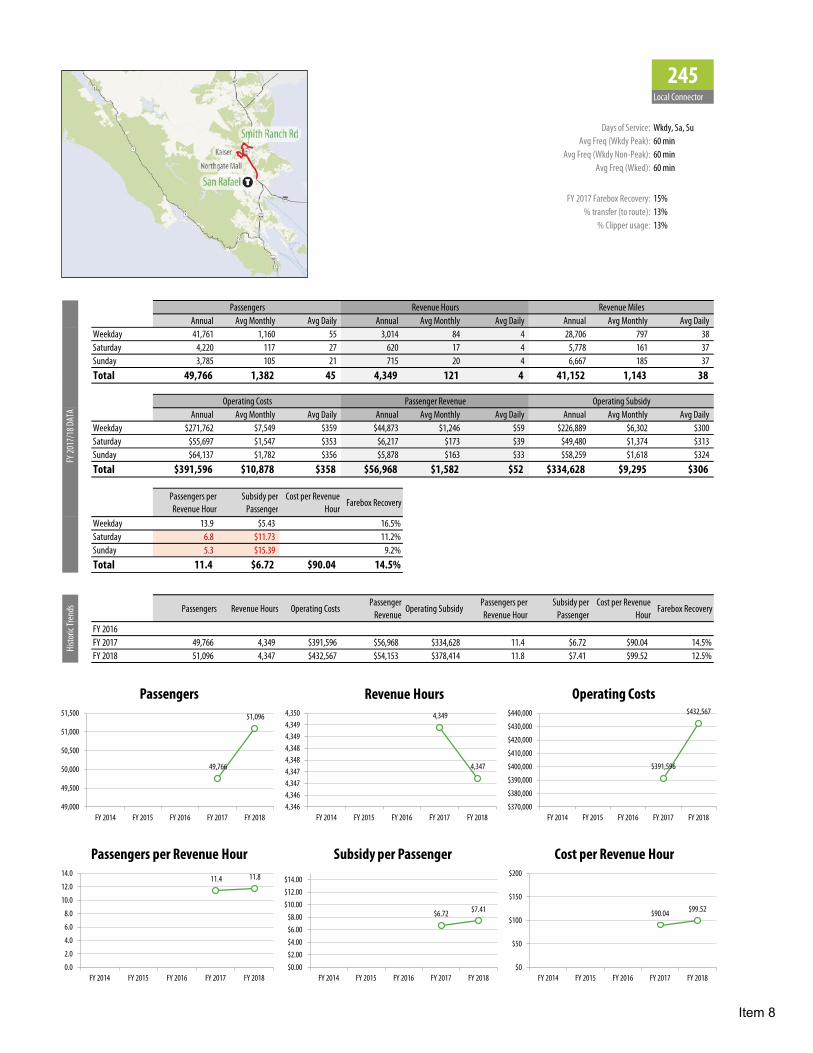
245Local Connector
Days of Service: Wkdy, Sa, SuAvg Freq (Wkdy Peak): 60 min
Avg Freq (Wkdy Non-Peak): 60 minAvg Freq (Wked): 60 min
FY 2017 Farebox Recovery: 15%% transfer (to route): 13%
% Clipper usage: 13%
Annual Avg Monthly Avg Daily Annual Avg Monthly Avg Daily Annual Avg Monthly Avg DailyWeekday 41,761 1,160 55 3,014 84 4 28,706 797 38 Saturday 4,220 117 27 620 17 4 5,778 161 37 Sunday 3,785 105 21 715 20 4 6,667 185 37 Total 49,766 1,382 45 4,349 121 4 41,152 1,143 38
Annual Avg Monthly Avg Daily Annual Avg Monthly Avg Daily Annual Avg Monthly Avg DailyWeekday $271,762 $7,549 $359 $44,873 $1,246 $59 $226,889 $6,302 $300Saturday $55,697 $1,547 $353 $6,217 $173 $39 $49,480 $1,374 $313Sunday $64,137 $1,782 $356 $5,878 $163 $33 $58,259 $1,618 $324Total $391,596 $10,878 $358 $56,968 $1,582 $52 $334,628 $9,295 $306
Passengers per Revenue Hour
Subsidy per Passenger
Cost per Revenue Hour
Farebox Recovery
Weekday 13.9 $5.43 $90.16 16.5%Saturday 6.8 $11.73 $89.88 11.2%Sunday 5.3 $15.39 $89.70 9.2%Total 11.4 $6.72 $90.04 14.5%
Passengers Revenue Hours Operating CostsPassenger
RevenueOperating Subsidy
Passengers per Revenue Hour
Subsidy per Passenger
Cost per Revenue Hour
Farebox Recovery
FY 2016FY 2017 49,766 4,349 $391,596 $56,968 $334,628 11.4 $6.72 $90.04 14.5%FY 2018 51,096 4,347 $432,567 $54,153 $378,414 11.8 $7.41 $99.52 12.5%
Histo
ric Tr
ends
FY 20
17/1
8 DAT
A
Passengers Revenue Hours Revenue Miles
Operating Costs Passenger Revenue Operating Subsidy
49,766
51,096
49,000
49,500
50,000
50,500
51,000
51,500
FY 2014 FY 2015 FY 2016 FY 2017 FY 2018
Passengers4,349
4,347
4,3464,3464,3474,3474,3484,3484,3494,3494,350
FY 2014 FY 2015 FY 2016 FY 2017 FY 2018
Revenue Hours
$391,596
$432,567
$370,000
$380,000
$390,000
$400,000
$410,000
$420,000
$430,000
$440,000
FY 2014 FY 2015 FY 2016 FY 2017 FY 2018
Operating Costs
11.4 11.8
0.0
2.0
4.0
6.0
8.0
10.0
12.0
14.0
FY 2014 FY 2015 FY 2016 FY 2017 FY 2018
Passengers per Revenue Hour
$6.72 $7.41
$0.00$2.00$4.00$6.00$8.00
$10.00$12.00$14.00
FY 2014 FY 2015 FY 2016 FY 2017 FY 2018
Subsidy per Passenger
$90.04 $99.52
$0
$50
$100
$150
$200
FY 2014 FY 2015 FY 2016 FY 2017 FY 2018
Cost per Revenue Hour
Item 8
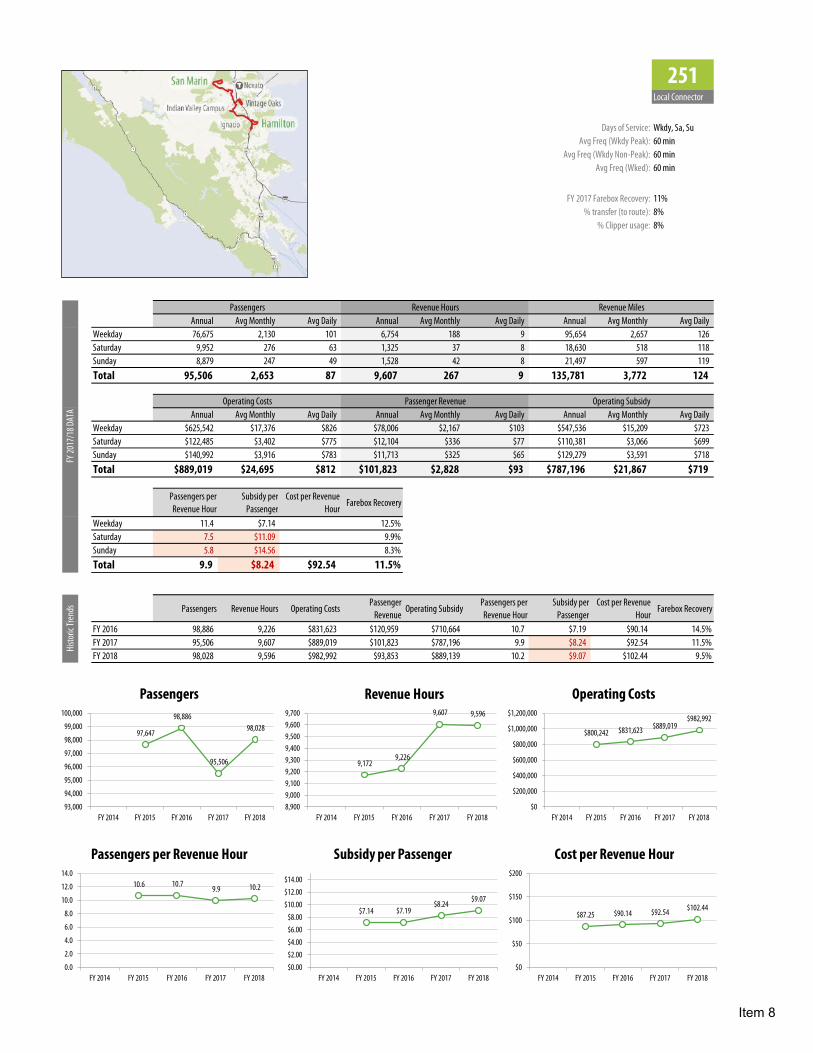
251Local Connector
Days of Service: Wkdy, Sa, SuAvg Freq (Wkdy Peak): 60 min
Avg Freq (Wkdy Non-Peak): 60 minAvg Freq (Wked): 60 min
FY 2017 Farebox Recovery: 11%% transfer (to route): 8%
% Clipper usage: 8%
Annual Avg Monthly Avg Daily Annual Avg Monthly Avg Daily Annual Avg Monthly Avg DailyWeekday 76,675 2,130 101 6,754 188 9 95,654 2,657 126 Saturday 9,952 276 63 1,325 37 8 18,630 518 118 Sunday 8,879 247 49 1,528 42 8 21,497 597 119 Total 95,506 2,653 87 9,607 267 9 135,781 3,772 124
Annual Avg Monthly Avg Daily Annual Avg Monthly Avg Daily Annual Avg Monthly Avg DailyWeekday $625,542 $17,376 $826 $78,006 $2,167 $103 $547,536 $15,209 $723Saturday $122,485 $3,402 $775 $12,104 $336 $77 $110,381 $3,066 $699Sunday $140,992 $3,916 $783 $11,713 $325 $65 $129,279 $3,591 $718Total $889,019 $24,695 $812 $101,823 $2,828 $93 $787,196 $21,867 $719
Passengers per Revenue Hour
Subsidy per Passenger
Cost per Revenue Hour
Farebox Recovery
Weekday 11.4 $7.14 $92.62 12.5%Saturday 7.5 $11.09 $92.46 9.9%Sunday 5.8 $14.56 $92.25 8.3%Total 9.9 $8.24 $92.54 11.5%
Passengers Revenue Hours Operating CostsPassenger
RevenueOperating Subsidy
Passengers per Revenue Hour
Subsidy per Passenger
Cost per Revenue Hour
Farebox Recovery
FY 2016 98,886 9,226 $831,623 $120,959 $710,664 10.7 $7.19 $90.14 14.5%FY 2017 95,506 9,607 $889,019 $101,823 $787,196 9.9 $8.24 $92.54 11.5%FY 2018 98,028 9,596 $982,992 $93,853 $889,139 10.2 $9.07 $102.44 9.5%
Histo
ric Tr
ends
FY 20
17/1
8 DAT
A
Passengers Revenue Hours Revenue Miles
Operating Costs Passenger Revenue Operating Subsidy
97,647
98,886
95,506
98,028
93,000
94,000
95,000
96,000
97,000
98,000
99,000
100,000
FY 2014 FY 2015 FY 2016 FY 2017 FY 2018
Passengers
9,172 9,226
9,607 9,596
8,9009,0009,1009,2009,3009,4009,5009,6009,700
FY 2014 FY 2015 FY 2016 FY 2017 FY 2018
Revenue Hours
$800,242 $831,623 $889,019 $982,992
$0
$200,000
$400,000
$600,000
$800,000
$1,000,000
$1,200,000
FY 2014 FY 2015 FY 2016 FY 2017 FY 2018
Operating Costs
10.6 10.7 9.9 10.2
0.0
2.0
4.0
6.0
8.0
10.0
12.0
14.0
FY 2014 FY 2015 FY 2016 FY 2017 FY 2018
Passengers per Revenue Hour
$7.14 $7.19 $8.24
$9.07
$0.00$2.00$4.00$6.00$8.00
$10.00$12.00$14.00
FY 2014 FY 2015 FY 2016 FY 2017 FY 2018
Subsidy per Passenger
$87.25 $90.14 $92.54 $102.44
$0
$50
$100
$150
$200
FY 2014 FY 2015 FY 2016 FY 2017 FY 2018
Cost per Revenue Hour
Item 8

257Local Connector
Days of Service: WkdyAvg Freq (Wkdy Peak): 60 min
Avg Freq (Wkdy Non-Peak): 60 minAvg Freq (Wked): -
FY 2017 Farebox Recovery: 12%% transfer (to route): 6%
% Clipper usage: 13%
Annual Avg Monthly Avg Daily Annual Avg Monthly Avg Daily Annual Avg Monthly Avg DailyWeekday 69,126 1,920 91 7,643 212 10 85,748 2,382 113 Saturday - - - - - - - - - Sunday - - - - - - - - - Total 69,126 1,920 91 7,643 212 10 85,748 2,382 113
Annual Avg Monthly Avg Daily Annual Avg Monthly Avg Daily Annual Avg Monthly Avg DailyWeekday $697,953 $19,388 $922 $82,621 $2,295 $109 $615,332 $17,093 $813Saturday $ - $ - $ - $ - $ - $ - $ - $ - $ -Sunday $ - $ - $ - $ - $ - $ - $ - $ - $ -Total $697,953 $19,388 $922 $82,621 $2,295 $109 $615,332 $17,093 $813
Passengers per Revenue Hour
Subsidy per Passenger
Cost per Revenue Hour
Farebox Recovery
Weekday 9.0 $8.90 $91.32 11.8%Saturday - $ - $ - - %Sunday - $ - $ - - %Total 9.0 $8.90 $91.32 11.8%
Passengers Revenue Hours Operating CostsPassenger
RevenueOperating Subsidy
Passengers per Revenue Hour
Subsidy per Passenger
Cost per Revenue Hour
Farebox Recovery
FY 2016 71,429 6,414 $575,805 $83,288 $492,517 11.1 $6.90 $89.77 14.5%FY 2017 69,126 7,643 $697,953 $82,621 $615,332 9.0 $8.90 $91.32 11.8%FY 2018 65,515 7,639 $770,914 $75,202 $695,712 8.6 $10.62 $100.92 9.8%
Histo
ric Tr
ends
FY 20
17/1
8 DAT
A
Passengers Revenue Hours Revenue Miles
Operating Costs Passenger Revenue Operating Subsidy
68,515
69,984
71,429
69,126
65,515
62,000
64,000
66,000
68,000
70,000
72,000
FY 2014 FY 2015 FY 2016 FY 2017 FY 2018
Passengers
5,965 6,289 6,414 7,643 7,639
0
2,000
4,000
6,000
8,000
10,000
FY 2014 FY 2015 FY 2016 FY 2017 FY 2018
Revenue Hours
$555,608 $546,363 $575,805 $697,953
$770,914
$0
$200,000
$400,000
$600,000
$800,000
$1,000,000
FY 2014 FY 2015 FY 2016 FY 2017 FY 2018
Operating Costs
11.5 11.1 11.1
9.0 8.6
0.0
2.0
4.0
6.0
8.0
10.0
12.0
14.0
FY 2014 FY 2015 FY 2016 FY 2017 FY 2018
Passengers per Revenue Hour
$7.21 $6.76 $6.90 $8.90
$10.62
$0.00$2.00$4.00$6.00$8.00
$10.00$12.00$14.00
FY 2014 FY 2015 FY 2016 FY 2017 FY 2018
Subsidy per Passenger
$93.15 $86.87 $89.77 $91.32 $100.92
$0
$50
$100
$150
$200
FY 2014 FY 2015 FY 2016 FY 2017 FY 2018
Cost per Revenue Hour
Item 8
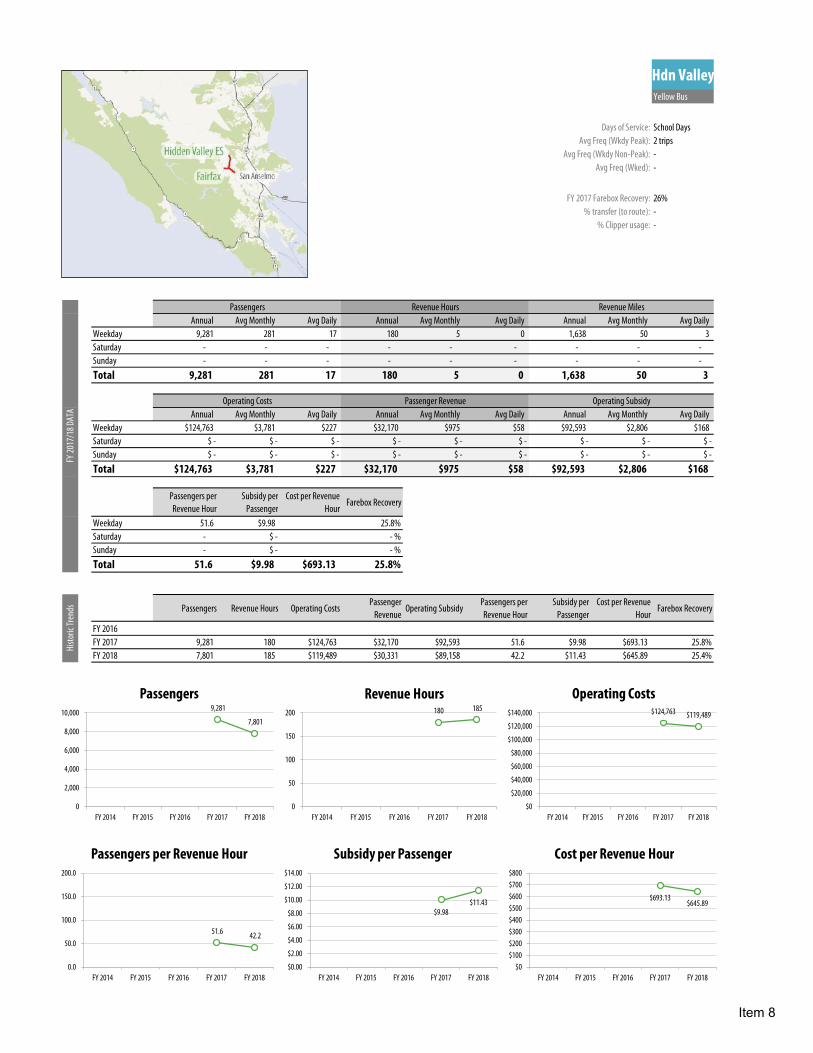
Hdn ValleyYellow Bus
Days of Service: School DaysAvg Freq (Wkdy Peak): 2 trips
Avg Freq (Wkdy Non-Peak): -Avg Freq (Wked): -
FY 2017 Farebox Recovery: 26%% transfer (to route): -
% Clipper usage: -
Annual Avg Monthly Avg Daily Annual Avg Monthly Avg Daily Annual Avg Monthly Avg DailyWeekday 9,281 281 17 180 5 0 1,638 50 3 Saturday - - - - - - - - - Sunday - - - - - - - - - Total 9,281 281 17 180 5 0 1,638 50 3
Annual Avg Monthly Avg Daily Annual Avg Monthly Avg Daily Annual Avg Monthly Avg DailyWeekday $124,763 $3,781 $227 $32,170 $975 $58 $92,593 $2,806 $168Saturday $ - $ - $ - $ - $ - $ - $ - $ - $ -Sunday $ - $ - $ - $ - $ - $ - $ - $ - $ -Total $124,763 $3,781 $227 $32,170 $975 $58 $92,593 $2,806 $168
Passengers per Revenue Hour
Subsidy per Passenger
Cost per Revenue Hour
Farebox Recovery
Weekday 51.6 $9.98 $693.13 25.8%Saturday - $ - $ - - %Sunday - $ - $ - - %Total 51.6 $9.98 $693.13 25.8%
Passengers Revenue Hours Operating CostsPassenger
RevenueOperating Subsidy
Passengers per Revenue Hour
Subsidy per Passenger
Cost per Revenue Hour
Farebox Recovery
FY 2016FY 2017 9,281 180 $124,763 $32,170 $92,593 51.6 $9.98 $693.13 25.8%FY 2018 7,801 185 $119,489 $30,331 $89,158 42.2 $11.43 $645.89 25.4%
Histo
ric Tr
ends
FY 20
17/1
8 DAT
A
Passengers Revenue Hours Revenue Miles
Operating Costs Passenger Revenue Operating Subsidy
9,281
7,801
0
2,000
4,000
6,000
8,000
10,000
FY 2014 FY 2015 FY 2016 FY 2017 FY 2018
Passengers180 185
0
50
100
150
200
FY 2014 FY 2015 FY 2016 FY 2017 FY 2018
Revenue Hours$124,763 $119,489
$0
$20,000
$40,000
$60,000
$80,000
$100,000
$120,000
$140,000
FY 2014 FY 2015 FY 2016 FY 2017 FY 2018
Operating Costs
51.6 42.2
0.0
50.0
100.0
150.0
200.0
FY 2014 FY 2015 FY 2016 FY 2017 FY 2018
Passengers per Revenue Hour
$9.98 $11.43
$0.00
$2.00
$4.00
$6.00
$8.00
$10.00
$12.00
$14.00
FY 2014 FY 2015 FY 2016 FY 2017 FY 2018
Subsidy per Passenger
$693.13 $645.89
$0$100$200$300$400$500$600$700$800
FY 2014 FY 2015 FY 2016 FY 2017 FY 2018
Cost per Revenue Hour
Item 8
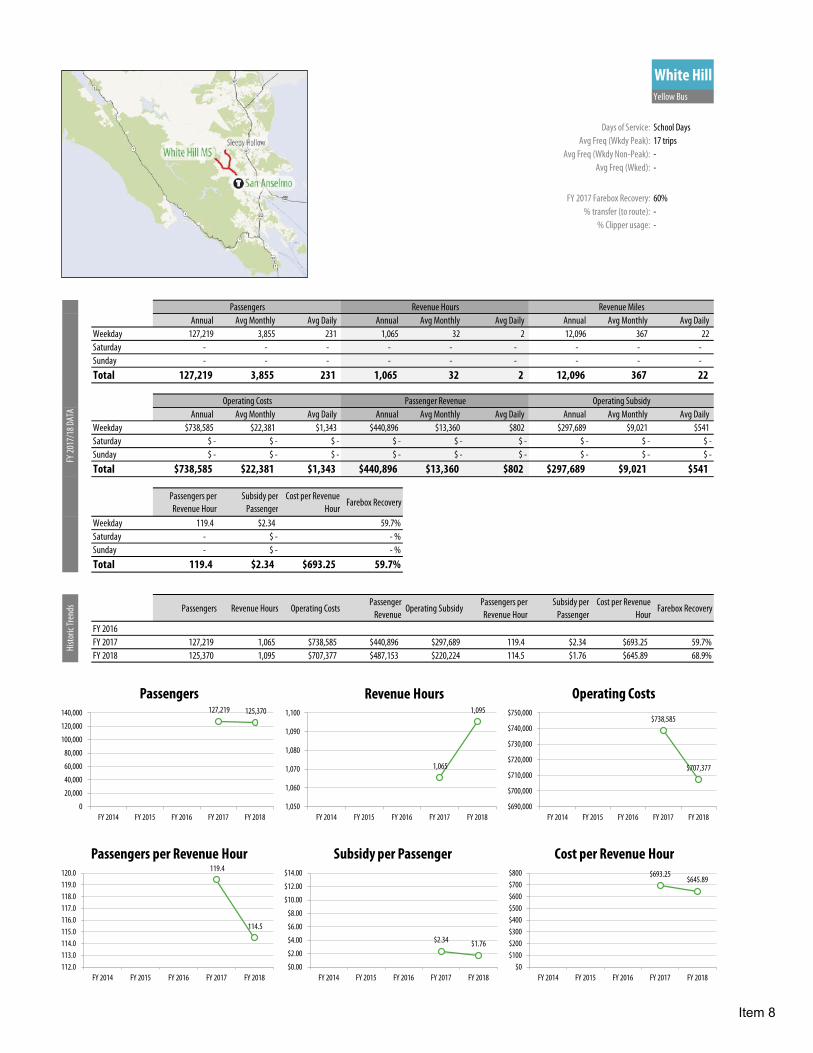
White HillYellow Bus
Days of Service: School DaysAvg Freq (Wkdy Peak): 17 trips
Avg Freq (Wkdy Non-Peak): -Avg Freq (Wked): -
FY 2017 Farebox Recovery: 60%% transfer (to route): -
% Clipper usage: -
Annual Avg Monthly Avg Daily Annual Avg Monthly Avg Daily Annual Avg Monthly Avg DailyWeekday 127,219 3,855 231 1,065 32 2 12,096 367 22 Saturday - - - - - - - - - Sunday - - - - - - - - - Total 127,219 3,855 231 1,065 32 2 12,096 367 22
Annual Avg Monthly Avg Daily Annual Avg Monthly Avg Daily Annual Avg Monthly Avg DailyWeekday $738,585 $22,381 $1,343 $440,896 $13,360 $802 $297,689 $9,021 $541Saturday $ - $ - $ - $ - $ - $ - $ - $ - $ -Sunday $ - $ - $ - $ - $ - $ - $ - $ - $ -Total $738,585 $22,381 $1,343 $440,896 $13,360 $802 $297,689 $9,021 $541
Passengers per Revenue Hour
Subsidy per Passenger
Cost per Revenue Hour
Farebox Recovery
Weekday 119.4 $2.34 $693.25 59.7%Saturday - $ - $ - - %Sunday - $ - $ - - %Total 119.4 $2.34 $693.25 59.7%
Passengers Revenue Hours Operating CostsPassenger
RevenueOperating Subsidy
Passengers per Revenue Hour
Subsidy per Passenger
Cost per Revenue Hour
Farebox Recovery
FY 2016FY 2017 127,219 1,065 $738,585 $440,896 $297,689 119.4 $2.34 $693.25 59.7%FY 2018 125,370 1,095 $707,377 $487,153 $220,224 114.5 $1.76 $645.89 68.9%
Histo
ric Tr
ends
FY 20
17/1
8 DAT
A
Passengers Revenue Hours Revenue Miles
Operating Costs Passenger Revenue Operating Subsidy
127,219 125,370
0
20,000
40,000
60,000
80,000
100,000
120,000
140,000
FY 2014 FY 2015 FY 2016 FY 2017 FY 2018
Passengers
1,065
1,095
1,050
1,060
1,070
1,080
1,090
1,100
FY 2014 FY 2015 FY 2016 FY 2017 FY 2018
Revenue Hours
$738,585
$707,377
$690,000
$700,000
$710,000
$720,000
$730,000
$740,000
$750,000
FY 2014 FY 2015 FY 2016 FY 2017 FY 2018
Operating Costs
119.4
114.5
112.0113.0114.0115.0116.0117.0118.0119.0120.0
FY 2014 FY 2015 FY 2016 FY 2017 FY 2018
Passengers per Revenue Hour
$2.34 $1.76
$0.00
$2.00
$4.00
$6.00
$8.00
$10.00
$12.00
$14.00
FY 2014 FY 2015 FY 2016 FY 2017 FY 2018
Subsidy per Passenger$693.25
$645.89
$0$100$200$300$400$500$600$700$800
FY 2014 FY 2015 FY 2016 FY 2017 FY 2018
Cost per Revenue Hour
Item 8
MARIN TRANSIT | FARE POLICY, PROGRAM ELIGIBILITY AND LIFA
B-1
Appendix B: Fare and Eligibility Analysis
Background
The Marin Transit 2016 and 2018 Short Range Transit Plans took an in-depth look at Marin Transit’s fare policy, and proposed changes to the structure and fare prices in response to the following policy goals:
Maintain cost effectiveness targets by service typology; Offer fare media that encourages ridership and simplifies payment; Keep Marin Transit fares in line with peer agencies; Provide non-cash options to support operational efficiency; and Maximize social equity by providing mobility for all within the county
In 2016, the District released the Marin Access Strategic Analysis and Recommendations report which provides an in-depth overview of Marin Access programs and riders and the market forces that influence current and future demand. The study examined how Marin Access services are being utilized, what aspects of the programs are well-performing, and what changes in policy or programs will improve the rider experience and enhance mobility management in the county. This study identified opportunities and constraints to improve Marin Access fare and eligibility policies and recommended the following strategies:
Reevaluate fare policies to optimize public subsidy, achieve sustainable programs, ensure fares are equitable and maintain a safety net for low-income individuals, and create pricing that manages consumer demand for services
Reassess eligibility thresholds to achieve consistency and equity across all Marin Access and Marin Transit programs
Staff revisited previous recommendations on fares and eligibility criteria for Marin Access program and the Low-Income Fare Assistance (LIFA) that is offered to seniors and those with disabilities.
A comprehensive review of fares and eligibility thresholds together has not been completed to date. With the addition of new programs such as Connect, upgraded technology expected to come online in 2020 such as the ability to pay fares via an online “wallet,” and growing needs in the community, revisiting the fares and eligibility policies were deemed necessary.
As part of the SRTP 2020-2029, staff conducted a comprehensive evaluation of fare pricing, policies, and program eligibility standards to develop updates to fare policy that will benefit riders and increase the financial sustainability of Marin Transit programs. Staff also conducted a survey of riders in November and December 2018 to inform these efforts, better understand why riders use certain payment methods, and identify possible incentives to achieve fare proposal goals.
The following Appendix reflects these updates and changes.
Guidelines for Setting Fares and Eligibility Standards
As a result of evaluating fare pricing, policies, and program eligibility standards, staff identified the following challenges and established fare policy and eligibility goals that guided the recommended policy changes.
Item 8
MARIN TRANSIT | FARE POLICY, PROGRAM ELIGIBILITY AND LIFA
B-2
Key Considerations and Challenges
Marin Transit has not increased its Fixed Route and Paratransit fares since 2004. Fare revenues in Demand Response programs do not keep pace with increasing operations costs and
do not meet current financial performance targets. Marin Transit’s ADA Paratransit fare is the second lowest among peer agencies in the Bay Area. Some fares do not reflect the premium features offered across various services and programs. For
example, the fare for some curb to curb, non-ADA demand response services is lower than the Fixed Route fare.
Marin Transit cannot independently change its fares within the Clipper system as its fare table in Clipper is shared with Golden Gate Transit. Until Clipper independence is reached, all changes to local fares must be agreed upon by both agencies.
Even though the fare for local trips is $2, Clipper users on local routes are required to tag-on/tag-off. This continues to be an obstacle for attracting local passengers to use Clipper. When a passenger forgets to tag off on exiting a Marin Transit bus, they are charged a higher regional fare.
Eligibility criteria to receive low-income fare assistance is inconsistent across services and programs. This has led to rider and community partner confusion.
Rider Survey
In 2018, Marin Transit staff conducted a survey of riders as part of a larger agency effort to simplify its fare structure. The goal of the survey was to better understand why use certain payment methods and identify possible incentives to achieve goals of the fare proposal. The survey also intended to identify level of rider’s awareness of different fare media options, determine willingness to shift away from cash to period passes and Clipper, and gauge rider’s interest in mobile ticketing.
The fare payment survey was administered online and on-board in both English and Spanish. A total of 535 responses were received with 301 responses coming from onboard riders and 234 responses online. About 17 percent of riders responded in Spanish, and 25 percent of onboard surveys were completed in Spanish. Over 85 percent of all respondents identified themselves as transit riders.
In summary, cash was overwhelmingly perceived as an easy and convenient way to pay. Common theme in survey responses included:
Lack of knowledge on Clipper and passes, Cash being known as the only fare payment method, and Financial challenges with affording a prepaid fare payment option
The survey results also confirmed that over a quarter of cash users will be willing to consider using passes if they were less expensive, while more than 60% of cash users were not aware of the 10% Clipper discount. Additionally, over 25% of cash users indicated concerns of being overcharged when paying by Clipper.
Lastly, about 67% of surveyed riders responded they were interested in mobile ticketing. Of those riders, 41% currently pay with cash, 40% percent pay with Clipper, and 19% percent use a pass product.
The results of the survey confirmed that while there are opportunities to shift away from cash to support operational efficiencies, cash may remain as the preferred method of fare payment for about 19% of the riders who indicated that they will not consider using any other fare media.
Item 8

MARIN TRANSIT | FARE POLICY, PROGRAM ELIGIBILITY AND LIFA
B-3
Staff also concluded that pass and Clipper usage can be incentivized through pricing adjustments, and considering the limited level of riders knowledge on some of the fare products, a focused marketing and education on fares is recommended to reinforce the impact of the policy updates and lead to riders behavioral changes in fare payment.
Fare and Eligibility Policy Goals
The 2020-2029 SRTP recommendations for fare policy and eligibility standards are targeted at the following goals:
Simplify senior/ADA program eligibility; Encourage pass and Clipper usage over cash payment to streamline and improve operations; Offer fare media that incentivizes ridership and simplifies payment; Keep fares and subsidy levels commensurate with the services offered across programs; Adjust fare assistance programs to maximize social equity and provide mobility options for all Marin
residents; Maintain cost effectiveness targets by service typology; and Keep Marin Transit fare policies consistent with regional efforts to coordinate and integrate transit
agencies fares.
The proposed policy changes fall into the following three categories:
Fare policies; Low-income fare assistance (LIFA) for older adults and those with disabilities; and Program eligibility for demand response programs.
Due to the interrelationship between these policies, staff considered changes to these three areas concurrently.
Fare Policy
The 2018 Short Range Transit Plan described recommendations for system-wide changes to fare pricing and structure. Staff are using the 2018 SRTP update as a guide for the updated fare policy changes. Staff continue to carefully weigh potential recommendations and guidelines to ensure they are consistent with regional goals and facilitate transfers with our partner transit agencies.
The 2018 SRTP recommended fixed route changes to Clipper pricing and youth fares. Staff did not recommend any major changes to fixed route fares due to the following factors:
Marin Transit and Golden Gate Transit are embedded within the Clipper regional fare system, and changes related to fare structure cannot be achieved independently within the Clipper environment. Golden Gate Transit declined to support proposed changes to youth fares.
Regional efforts are underway by MTC and San Francisco Planning and Urban Research (SPUR) to simplify fares and improve coordination within the region. Recommendations for significant changes to fixed routes fares should follow guidance from the region and additional coordination with our partner transit agencies.
Item 8

MARIN TRANSIT | FARE POLICY, PROGRAM ELIGIBILITY AND LIFA
B-4
Marin Transit will be designated as an independent operator under Clipper 2.0, which is expected to occur by 2023. Staff recommends postponing fixed route fare changes to when the District has control over its fare pricing, while remaining consistent with any future regional guidance.
The proposed eligibility and fare policy changes fall into two main categories are shown in Table B-1:
Adjust pricing and structure of Fixed Route Fare Media (passes) Implement a phased update for fare structure and pricing of Marin Access/ Paratransit programs
Fixed Route Fare Media Changes
7-day Passes:
Proposed Change:
Eliminate the 7-day Pass for all fare categories, including Adult/Senior/Youth
The following are expected impacts of these changes:
Eliminate the administrative burden associated with providing weekly passes that are currently underutilized.
Minimal impact on current pass users. This is due to very low usage of this pass (below one percent). Lowering monthly pass prices will be provide a new cost-effective option.
Monthly Passes:
Proposed Changes:
Reduce Adults Monthly Pass prices to $40 (-50% compared to current $80 pass price) Reduce Senior Monthly Pass price to $20 (-25% compared to current $25 pass price)
The following are expected impacts of these changes:
Make monthly passes a more attractive option to encourage pass usage over cash fare payments. Provide additional discount for regular riders who rely on public transit. Encourage additional usage of the services.
Demand Response Program Fares and Fare Policy
Dial-a-Ride (DAR) Fares
Proposed Changes:
Increase DAR fare to $4.00 for the general public (from $2.00 to $4.00 for the Novato DAR and from $2.50 to $4.00 for Rural DAR).
Increase Senior/ADA DAR fare from $1.00 to $2.00.
The following are expected impacts of these changes:
Fare pricing to align with the premium aspects of DAR services compared to Fixed-Route (i.e. on-demand curb-to-curb pick-up and drop-off services).
Item 8

MARIN TRANSIT | FARE POLICY, PROGRAM ELIGIBILITY AND LIFA
B-5
DAR pricing to support operational efficiencies and cost performance targets. Higher DAR fares will be an incentive for the general public to use Fixed Route services over DAR
where possible. This will free up additional capacity for Senior/ADA riders and alleviate current capacity issues.
ADA Paratransit Fares
Proposed Changes:
Increase all paratransit program fares to $3.00 in Phase 1, effective July 1, 2020. This equates to a 50% increase in the fare for current mandated paratransit and a 20% increase compared to the current extended, or non-mandated, service area for paratransit services.
Increase all paratransit fares to $4.00 in Phase 2, effective July 1, 2023.
The following are expected impacts of these changes:
A competitive pricing structure will encourage riders to use Fixed Route services or other Marin Access programs over ADA Paratransit services, where possible.
Fare pricing will keep pace with growing paratransit operations costs and help meet District’s performance targets.
Staff proposes increased eligibility thresholds and additional fare assistance subsidy levels for the Low-Income Fare Assistance Program to alleviate or eliminate the impact of fare increase on low-income riders.
Catch-A-Ride (CAR) Fare Structure
Proposed Changes:
Adjust CAR fare structure to require an initial $4.00 fare from rider to activate the subsidy of $14 per trip, effective July 1, 2020. The rider will pay 100 percent of the trip cost beyond $18. The subsidy per trip level will remain the same as currently provided for CAR riders that are not income eligible. Increase the limit of allowable subsidized trips from eight to ten trips per month. This is 25 percent more trips compared to the current program.
Adjust CAR base fare from $4.00 to $5.00, effective July 1, 2023. All other fare rules stay the same. The rider will pay 100 percent of the trip cost beyond $19.
The following are expected impacts of these changes:
The initial $4 contribution encourages use of Fixed Route services over CAR where possible Increased fare revenue will allow program to continue to meet District’s performance targets Riders will have an additional two CAR trips per month to support increased trip making
Volunteer Driver Reimbursement Subsidy
Proposed Changes:
Increase volunteer driver mileage reimbursement to $0.60/mile. This will be a 70% mileage reimbursement increase for STAR and 50% mileage reimbursement increase for TRIP compared to current rates.
Item 8
MARIN TRANSIT | FARE POLICY, PROGRAM ELIGIBILITY AND LIFA
B-6
The following are expected impacts of these changes:
Higher mileage reimbursements will increase the incentives for volunteer drivers to participate in the program
Increased incentives will encourage riders take more trips using the Volunteer Driver Programs, which are more cost-effective than paratransit or other Marin Access services
Provides additional support for Senior/ADA riders to ask for and receive ride assistance
Item 8

MARIN TRANSIT | FARE POLICY, PROGRAM ELIGIBILITY AND LIFA
B-7
Table B-1: Proposed Fare Changes
Note: (1) Qualified low-income riders get an additional $4.00 in subsidy per ride or free rides up to $18.00.
Program Current Proposed Phase 1 (July 1, 2020)
Proposed Phase 2 (July 1, 2023)
Adult
Adult Cash Fare $2.00 No change No change
Adult Clipper Single Ride $1.80 No change No change
Adult 1-Day Pass $5.00 No change No change
Adult 7-Day Pass $20.00 Eliminate No change
Adult 31-Day Pass $80.00 $40.00 No change
Seniors 65+ / Persons with Disabilities
S/D Cash Fare $1.00 No change No change
S/D Clipper Single Ride $1.00 No change No change
S/D 1-Day Pass $2.50 No change No change
S/D 7-Day Pass $10.00 Eliminate No change
S/D 31-Day Pass $25.00 $20.00 No change
Youth Ages 5 - 18
Youth Cash Fare $1.00 No change No change
Youth Clipper Single Ride $1.00 No change No change
Youth 1-Day Pass $2.50 No change No change
Youth 7-Day Pass $10.00 Eliminate No change
Youth 31-Day Pass $40.00 Eliminate No change
6 Month Youth Pass $175.00 Eliminate No change
Annual Youth Pass $325.00 No change No change
Annual Youth Pass - low income Free No change No change
Marin Access
Novato Dial-A-Ride $2.00/$1.00 $4.00/$2.00 No change
Rural Dial-A-Ride $2.50 $4.00/$2.00 No change
Paratransit - Mandated $2.00 $3.00 $4.00
Paratransit - Extended $2.50 $3.00 $4.00
Catch A Ride Free up to $14.00/$18.00 (1)
Limit of 8 trips/month
$4.00 + 100% of fare above $18.00
Limit of 10 trips/month
$5.00 + 100% of fare above $19.00
Limit of 10 trips/ month
Volunteer Driver No Fare - Driver reimbursement $.35/mile or
$.40/mile West Marin
No Fare - increase driver reimbursement to
$0.60/mile
No change
Item 8

MARIN TRANSIT | FARE POLICY, PROGRAM ELIGIBILITY AND LIFA
B-8
Low-Income Fare Assistance
Low-Income Fare Scholarship program provides fare assistance to Paratransit and Catch-A-Ride passengers who qualify as low income. Income qualified paratransit riders receive up to $40 per quarter to use for local paratransit rides or 80 rides per year. In terms of eligibility, all ADA eligible clients who are recipients of Supplemental Security Income (SSI) will be eligible to receive Paratransit low-income scholarship. Income eligibility for Catch-A-Ride service is determined based on Elder Economic Index and is self-reported. Eligible low-income riders receive an additional $4 subsidy per trip on Catch-A-Ride.
Under current policy, fare assistance eligibility varies across these programs, and the scholarship is limited to Catch-A-Ride and Paratransit services. Additionally, the documentation required to demonstrate eligibility is inconsistent and varies across transportation services. Income disclosure in multiple instances has been a burden for many applicants, and staff believe that this requirement has prevented access to fare assistance. Staff proposes to consolidate eligibility for both programs to simplify the application process and provide a higher financial safety net for older adults and those with disabilities in financial need.
The proposed changes to low-income fare assistance program fall into two categories: eligibility and application process, and financial assistance, as listed in the following sections. Table B-2 presents a summary of current and proposed changes to the fare assistance program.
Eligibility and Application Process
Consolidate eligibility criteria for fare assistance and make it applicable to all programs. Consistent eligibility standard improves operations, and District’s ability to serve those with financial need.
Registered Medi-Cal participants or riders with income at or below the current Elder Economic Index that correlates with their living situation will be eligible.
Medi-Cal eligibility will be verified by the Travel Navigator team via County of Marin. Income-based eligibility for non-Medi-Cal participants will be assessed based on the applicant’s income documentation.
LIFA will be offered to all eligible applicants across Marin Access programs during the program eligibility determination process. The LIFA application and determination process can be consolidated with program eligibility, while one will not hold up the process for the other.
LIFA eligibility will require annual renewal at the start of each calendar year. Those that qualify based on Medi-Cal eligibility will be renewed through coordination between the Travel Navigator department and the County of Marin. Those that qualify based on income will be required to provide updated income documentation each calendar year. Clients will communicate with the Travel Navigator to renew their eligibility.
Financial Assistance
Fare Assistance Credit: All low-income riders eligible for LIFA will receive $20 in credit each month in phase 1 (effective
July 1, 2020), and $25 in phase 2 (effective July 1, 2023). The LIFA credit can be used toward the
Item 8
MARIN TRANSIT | FARE POLICY, PROGRAM ELIGIBILITY AND LIFA
B-9
base fare of all Marin Access program including Paratransit, Catch-A-Ride, Dial-A-Ride and Connect. LIFA credit cannot be applied to the balance of trip over $18 in Catch-A-Ride service.
LIFA credit is applied for all eligible clients on a monthly basis, to a maximum of $240 in credit per year. The LIFA credit will not roll over annually and is reset at the start of each calendar year. The unused credit will expire at the end of each calendar year and has no cash value.
LIFA credit cannot be applied to trips for companions and will not be reimbursed in the event of no-shows of same day cancellations. Incidents out of the rider’s control will be reviewed on a case by case basis.
Fixed Route Pass:
All LIFA eligible riders will be eligible to receive free access to Fixed Route services. Eligible clients will have to opt in to receiving the fixed route pass. Opting in includes completing a fixed route pass request form, review of a short video designed to orient the applicant on to how to use the pass and more generally how to use fixed route service, review and signature of a certification form stating that they understand the policies for use, and a usable photo that will be affixed to their Marin Access badge. Transportation to and from Marin Access orientation sessions is the responsibility of the applicant. Alternatively, applicants can use the Marin Transit website to complete the opt in process or attend a Marin Access orientation session offered on a bi-weekly basis.
All eligible clients will receive a Marin Access badge that includes their name, Marin Access ID number, and photos that comply with the following requirements:
o Must be current and show the applicants face in a clearly visible fashion; o Travel Navigators will assess the usability of photos provided; and o Photos will also be uploaded to the platform used for scheduling and routing to improve
ability to detect fraudulent use of services.
The fixed route pass will be renewed annually with the period of validity signified by a sticker that will be attached to the badge indicating the current year
Clients can replace a lost Marin Access Badge only once annually at a cost of $20. Clients who lose their badge must fill out a lost badge form and return it to the Travel Navigators. The client will need to pick up all replacement badges to verify their identity and can make alternative arrangements on a case by case basis with approval from Marin Transit staff.
The following are expected impacts of these changes:
The new low-income eligibility threshold will significantly increase the number of riders eligible to receive LIFA fare assistance and offset any proposed increases in fares;
A streamlined application process for Medi-Cal participants and options for documenting income will remove the burden of duplicated paperwork for riders to obtain and/or demonstrate to demonstrate LIFA eligibility;
Replacing ticket booklets with ride credits in riders’ accounts will eliminate administrative work and reduce management costs; and
All potential LIFA eligible riders will be able to opt into multiple programs without the need for separate applications.
Item 8
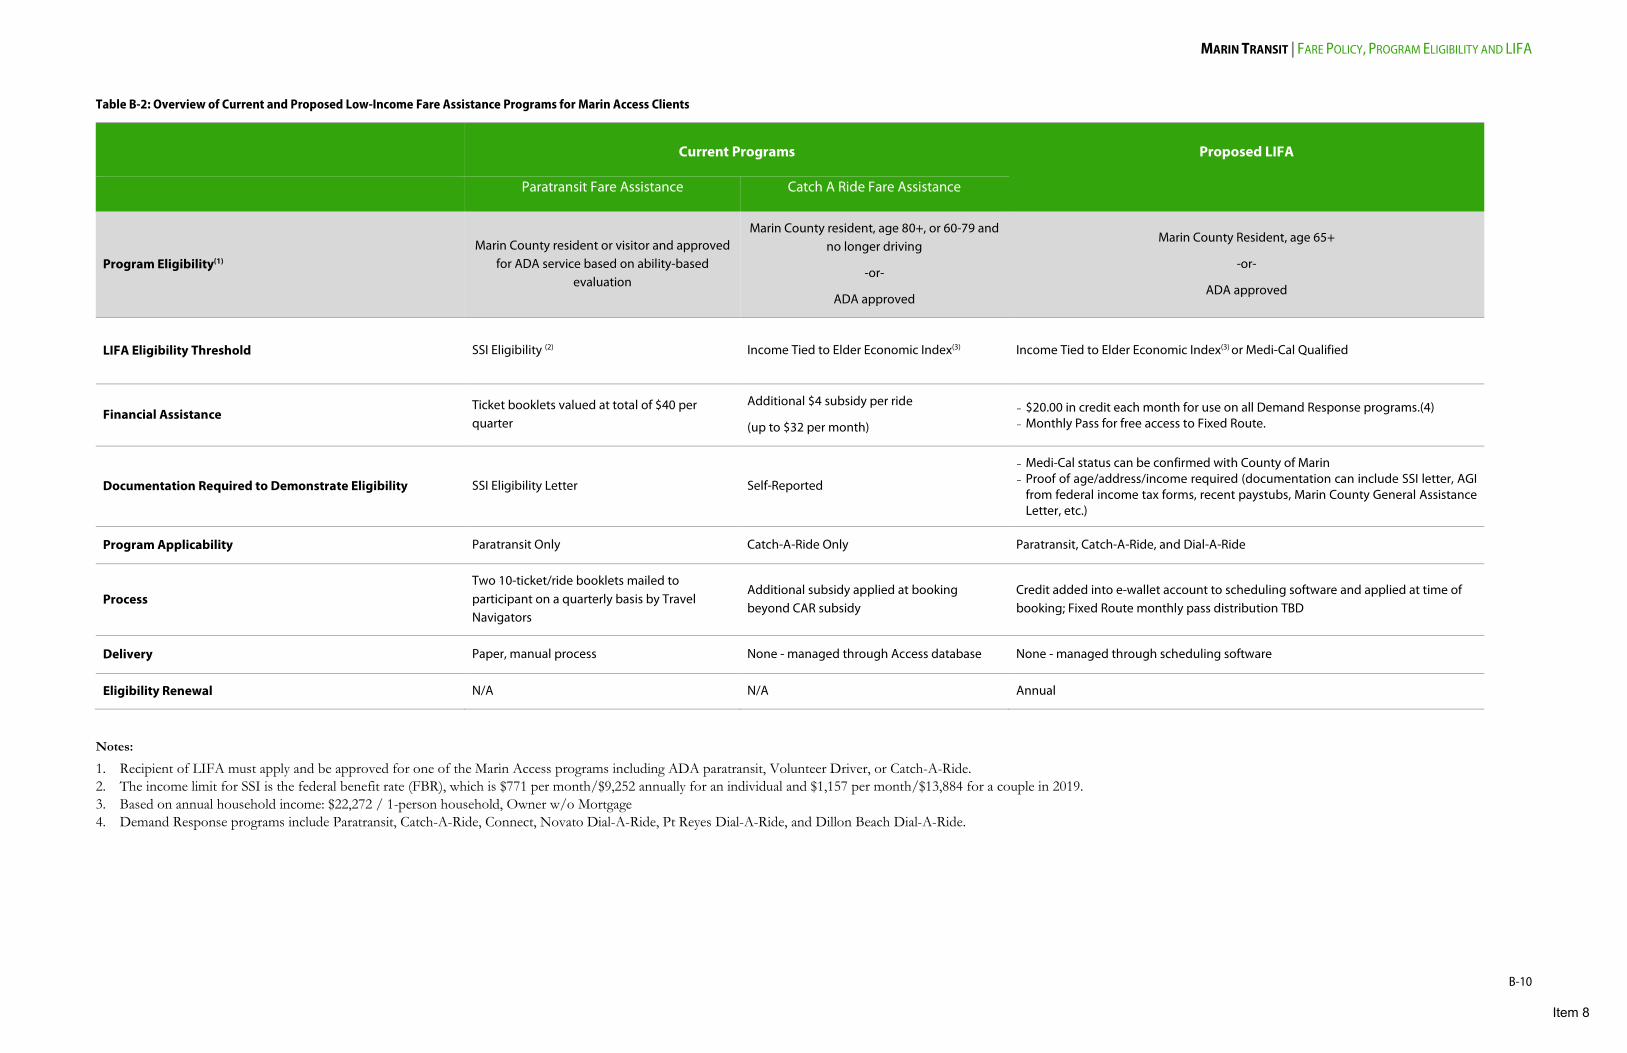
MARIN TRANSIT | FARE POLICY, PROGRAM ELIGIBILITY AND LIFA
B-10
Table B-2: Overview of Current and Proposed Low-Income Fare Assistance Programs for Marin Access Clients
Notes:
1. Recipient of LIFA must apply and be approved for one of the Marin Access programs including ADA paratransit, Volunteer Driver, or Catch-A-Ride. 2. The income limit for SSI is the federal benefit rate (FBR), which is $771 per month/$9,252 annually for an individual and $1,157 per month/$13,884 for a couple in 2019. 3. Based on annual household income: $22,272 / 1-person household, Owner w/o Mortgage 4. Demand Response programs include Paratransit, Catch-A-Ride, Connect, Novato Dial-A-Ride, Pt Reyes Dial-A-Ride, and Dillon Beach Dial-A-Ride.
Current Programs
Proposed LIFA
Paratransit Fare Assistance Catch A Ride Fare Assistance
Program Eligibility(1) Marin County resident or visitor and approved
for ADA service based on ability-based evaluation
Marin County resident, age 80+, or 60-79 and no longer driving
-or-
ADA approved
Marin County Resident, age 65+
-or-
ADA approved
LIFA Eligibility Threshold SSI Eligibility (2) Income Tied to Elder Economic Index(3) Income Tied to Elder Economic Index(3) or Medi-Cal Qualified
Financial Assistance Ticket booklets valued at total of $40 per quarter
Additional $4 subsidy per ride
(up to $32 per month)
- $20.00 in credit each month for use on all Demand Response programs.(4) - Monthly Pass for free access to Fixed Route.
Documentation Required to Demonstrate Eligibility SSI Eligibility Letter Self-Reported
- Medi-Cal status can be confirmed with County of Marin - Proof of age/address/income required (documentation can include SSI letter, AGI
from federal income tax forms, recent paystubs, Marin County General Assistance Letter, etc.)
Program Applicability Paratransit Only Catch-A-Ride Only Paratransit, Catch-A-Ride, and Dial-A-Ride
Process Two 10-ticket/ride booklets mailed to participant on a quarterly basis by Travel Navigators
Additional subsidy applied at booking beyond CAR subsidy
Credit added into e-wallet account to scheduling software and applied at time of booking; Fixed Route monthly pass distribution TBD
Delivery Paper, manual process None - managed through Access database None - managed through scheduling software
Eligibility Renewal N/A N/A Annual
Item 8
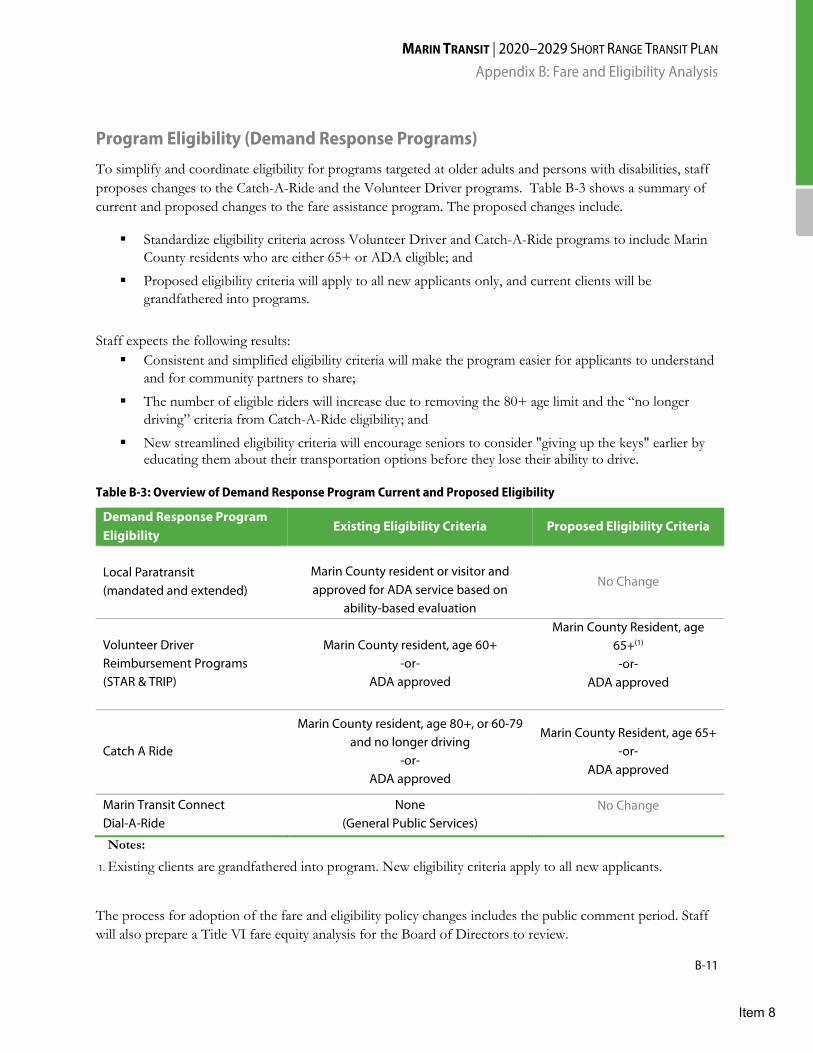
MARIN TRANSIT | 2020–2029 SHORT RANGE TRANSIT PLAN Appendix B: Fare and Eligibility Analysis
B-11
Program Eligibility (Demand Response Programs)
To simplify and coordinate eligibility for programs targeted at older adults and persons with disabilities, staff proposes changes to the Catch-A-Ride and the Volunteer Driver programs. Table B-3 shows a summary of current and proposed changes to the fare assistance program. The proposed changes include.
Standardize eligibility criteria across Volunteer Driver and Catch-A-Ride programs to include Marin County residents who are either 65+ or ADA eligible; and
Proposed eligibility criteria will apply to all new applicants only, and current clients will be grandfathered into programs.
Staff expects the following results: Consistent and simplified eligibility criteria will make the program easier for applicants to understand
and for community partners to share;
The number of eligible riders will increase due to removing the 80+ age limit and the “no longer driving” criteria from Catch-A-Ride eligibility; and
New streamlined eligibility criteria will encourage seniors to consider "giving up the keys" earlier by educating them about their transportation options before they lose their ability to drive.
Table B-3: Overview of Demand Response Program Current and Proposed Eligibility
Demand Response Program Eligibility
Existing Eligibility Criteria Proposed Eligibility Criteria
Local Paratransit (mandated and extended)
Marin County resident or visitor and approved for ADA service based on
ability-based evaluation
No Change
Volunteer Driver Reimbursement Programs (STAR & TRIP)
Marin County resident, age 60+ -or-
ADA approved
Marin County Resident, age 65+(1) -or-
ADA approved
Catch A Ride
Marin County resident, age 80+, or 60-79 and no longer driving
-or- ADA approved
Marin County Resident, age 65+ -or-
ADA approved
Marin Transit Connect Dial-A-Ride
None (General Public Services)
No Change
Notes:
1. Existing clients are grandfathered into program. New eligibility criteria apply to all new applicants.
The process for adoption of the fare and eligibility policy changes includes the public comment period. Staff will also prepare a Title VI fare equity analysis for the Board of Directors to review.
Item 8

MARIN TRANSIT | 2020–2029 SHORT RANGE TRANSIT PLAN Appendix C: Unfunded Service Needs Assessment
C-1
Appendix C: Unfunded Service Needs Assessment
Appendix C captures a number of local transit expansion service needs Marin Transit has identified based on the following:
• Input from riders (Bus Passenger Advisory Committee, comment cards, driver feedback, etc.) • Input from Stakeholders (Partner agencies, local cities and towns, etc.) • Current and previous planning studies • Changes in transportation market conditions • Changes in demographics
The expansion services described in this appendix illustrate the opportunities the District will pursue if financial resources are available. These services are additive to the service levels assumed in the District’s Service plan (see Chapter 3). The improvements further the objective in Strategy #1 of the Measure A Expenditure Plan:
Develop a seamless local bus transit system that improves mobility and serves community needs, including special transit for seniors and the disabled
Staff evaluated expansion projects based on an estimate of their ability to score well in an assessment based on the performance criteria in the Measure A Expenditure Plan for transit investment. These criteria include:
• Fills a gap in the bus transit network • Meets productivity standards (passengers per hour) • Meets cost effectiveness standards (subsidy per passenger) • Relieves congestion (total ridership) • Provides seamless connections (to regional service) • Eliminates "pass ups" (overcrowding on routes) • Promotes environmental justice (demographic analysis) • Attracts outside funding (federal, state, toll, other local)
To estimate performance under these criteria, District staff performed a qualitative assessment. Scores were given based on three tiers: High ( ) - likely supports goal, Medium ( ) - potentially supports goal, and Low ( ) – questionable whether the service will support goal. These ratings are estimates of the project’s ability to achieve the goal.
+++ + ++
Item 8

MARIN TRANSIT | 2020–2029 SHORT RANGE TRANSIT PLAN Appendix C: Unfunded Service Needs Assessment
C-2
Table C-1: Measure A Bus Transit Investments Evaluation Criteria Ratings Summary
Measure A Goal High Rating
Medium Rating
Low Rating
Fill gap in the bus transit network
Provides service to an area currently not served by any public transit service
Provides service to an area with limited public transit service
Provides additional service to an area already served well by public transit
Meets productivity standards (passengers per hour)
Productivity expected to greatly exceed standard
Productivity expected to regularly meet standard
Ability to meet productivity standard is questioned
Meets cost effectiveness standards (subsidy per passenger)
Cost effectiveness expected to greatly exceed standard
Cost effectiveness expected to regularly meet standard
Ability to meet cost effectiveness standard is questioned
Relieves congestion
(total ridership)
Ridership potential is great and has potential to significantly reduce vehicle
trips
Ridership potential is strong and may reduce select vehicle trips
Ridership potential is questionable and may not impact congestion relief
Provides seamless connections (to regional service)
Service is available and timed to meet regional services including bus, rail, and
ferry
Service is available but not timed specifically to meet regional services
including bus, rail, and ferry
Service is not available nor timed to meet regional services including bus, rail and
ferry
Eliminates "pass ups" (overcrowding on routes)
Service is offered on the same route/corridor, during the same times
when current overcrowding conditions regularly occurs
Service is offered on similar routes/corridors and during the same times when potential overcrowding
conditions can occur
Service does not address any potential overcrowding conditions on services
Promotes environmental justice (demographic analysis)
The service is offered to serve populations that demonstrate the greatest need for
the service
The service is offered equitably based on who it serves and its cost
The service is offered to a specific population that does not demonstrate
strong need based on their demographics
Attracts outside funding (federal, state, toll, other local)
Service relies on less than 25% of Measure A to implement and operate
Service relies on 25-50% of Measure A to implement and operate
Service requires at least 50% of Measure A to implement and operate
+++ + + +
Item 8
MARIN TRANSIT | 2020–2029 SHORT RANGE TRANSIT PLAN Appendix C: Unfunded Service Needs Assessment
C-3
The District will not prioritize or implement expansion projects in a sequential order simply based on their qualitative ratings. This assessment demonstrates the trade-offs between projects and highlights their strengths and weaknesses. Implementing any of these services will require the District to consider cost and other factors.
Staff identified a total of 21 expansion services in the unfunded needs assessment and assigned them to seven categories. In no particular order, these include:
• Expand and Enhance Shuttle Services • Expand and Enhance K-12 School Bus Services • Enhance Service Frequency in Transit Corridors • Provide Limited Stop or Express Services • Expand Rural and Recreational Services • Provide and Support Flexible First and Last Mile Services • Expand Services for Those with Special Needs
At the end of this appendix, Table C-10 and Table C-11 summarize each expansion service by rating, cost, ability to implement, and relative priority within the unfunded list. Some of these ratings are speculative as many of these projects require additional study and analysis.
The following is a brief narrative of each expansion category that outlines the expansion need, summarizes how the service is expected to perform under the evaluation criteria, estimates costs, and identifies opportunities for funding or partnerships.
Expand and Enhance Shuttle Services
Overview
Marin Transit has continued to expand shuttle services since the passage of Measure A. Shuttles provide a cost-effective fixed-route transit option for the areas of the county with lower ridership demands. The initial three shuttle routes launched in 2006 operated just under 5,000 annual revenue hours. Currently, the District operates over 35,000 annual hours of shuttle service on six routes. Ridership has grown from approximately 25,000 annual passenger trips to nearly 400,000 annual passenger trips.
The Measure A Expenditure Plan identified Mill Valley and Sausalito as candidates for shuttle service that currently do not have shuttle service. The Expenditure Plan envisioned locally designed shuttle services termed the “Millie” and the “Sally” for these communities. Although shuttle services have not developed in these communities, local and regional services in these areas provide some of the county’s highest transit service levels. Any new shuttle services in these communities will likely be coupled with a decrease in local big bus or regional transit services.
Marin Transit’s original 2006 Short Range Transit Plan called for a new shuttle route to replace a legacy Golden Gate Transit service in East Corte Madera and Larkspur. Marin Transit met this need by implementing Route 221 in 2007. Due to low ridership, the District eliminated this route in 2010. This left a service void for residents of Corte Madera east of Highway 101. Recent requests for service to these residential areas have reinstated the need to reconsider shuttle service, coupled with growth in retail services in the area, the SMART extension to Larkspur, and increased parking issues at Larkspur Ferry.
Item 8
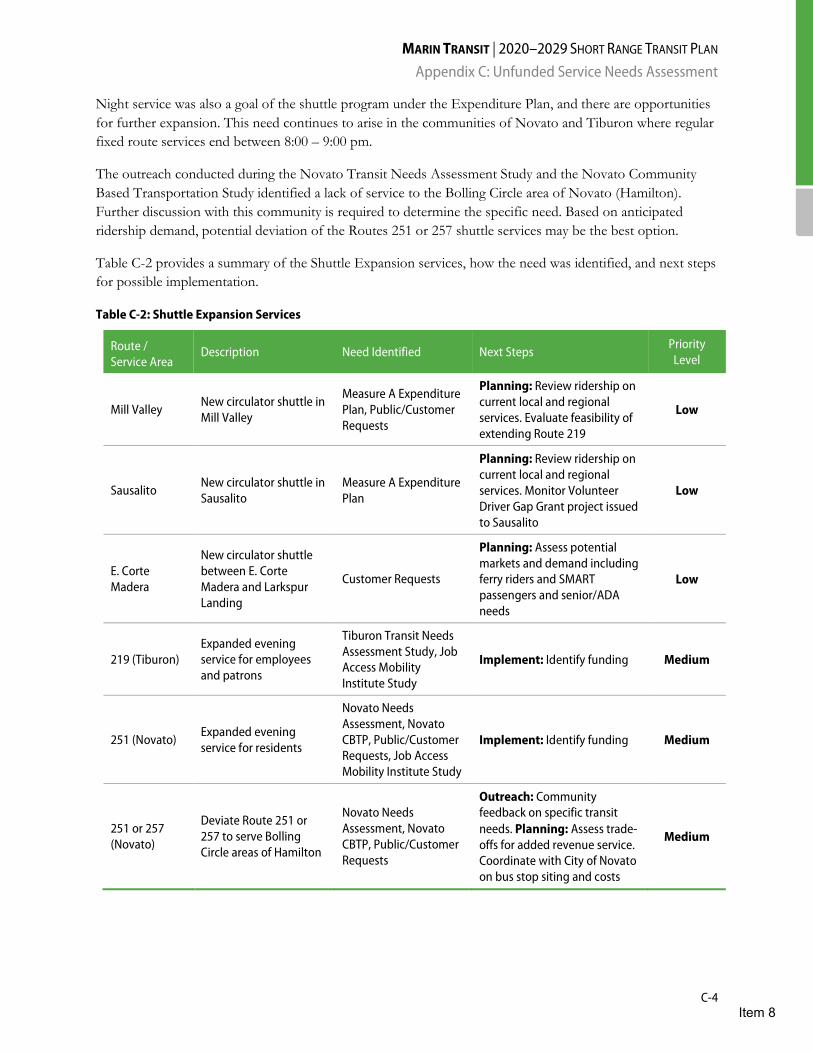
MARIN TRANSIT | 2020–2029 SHORT RANGE TRANSIT PLAN Appendix C: Unfunded Service Needs Assessment
C-4
Night service was also a goal of the shuttle program under the Expenditure Plan, and there are opportunities for further expansion. This need continues to arise in the communities of Novato and Tiburon where regular fixed route services end between 8:00 – 9:00 pm.
The outreach conducted during the Novato Transit Needs Assessment Study and the Novato Community Based Transportation Study identified a lack of service to the Bolling Circle area of Novato (Hamilton). Further discussion with this community is required to determine the specific need. Based on anticipated ridership demand, potential deviation of the Routes 251 or 257 shuttle services may be the best option.
Table C-2 provides a summary of the Shuttle Expansion services, how the need was identified, and next steps for possible implementation.
Table C-2: Shuttle Expansion Services
Route / Service Area
Description Need Identified Next Steps Priority Level
Mill Valley New circulator shuttle in Mill Valley
Measure A Expenditure Plan, Public/Customer Requests
Planning: Review ridership on current local and regional services. Evaluate feasibility of extending Route 219
Low
Sausalito New circulator shuttle in Sausalito
Measure A Expenditure Plan
Planning: Review ridership on current local and regional services. Monitor Volunteer Driver Gap Grant project issued to Sausalito
Low
E. Corte Madera
New circulator shuttle between E. Corte Madera and Larkspur Landing
Customer Requests
Planning: Assess potential markets and demand including ferry riders and SMART passengers and senior/ADA needs
Low
219 (Tiburon) Expanded evening service for employees and patrons
Tiburon Transit Needs Assessment Study, Job Access Mobility Institute Study
Implement: Identify funding Medium
251 (Novato) Expanded evening service for residents
Novato Needs Assessment, Novato CBTP, Public/Customer Requests, Job Access Mobility Institute Study
Implement: Identify funding Medium
251 or 257 (Novato)
Deviate Route 251 or 257 to serve Bolling Circle areas of Hamilton
Novato Needs Assessment, Novato CBTP, Public/Customer Requests
Outreach: Community feedback on specific transit needs. Planning: Assess trade-offs for added revenue service. Coordinate with City of Novato on bus stop siting and costs
Medium
Item 8
MARIN TRANSIT | 2020–2029 SHORT RANGE TRANSIT PLAN Appendix C: Unfunded Service Needs Assessment
C-5
Performance Criteria Ratings
Shuttle expansion projects tend to rate highest in filling a gap in the transit network that occurs due to low ridership demands. They may also score favorably in meeting productivity and cost-effectiveness standards due to lower operating costs. Any future shuttle projects in Mill Valley and Sausalito will overlap or duplicate current local and regional fixed route services. Staff assumes some reduction in service levels on existing routes will be necessary to achieve productivity and cost-effectiveness targets. Based on current riders of evening trips on local fixed-route services, added service will most benefit low-income riders who rely heavily on the transit service for mobility.
Cost Estimates or Considerations
The District’s current shuttle operating cost is approximately $90 per revenue hour including fuel. This equates to approximately $350,000 per year for a short 30-minute runtime for a route that operates every 60 minutes on weekdays only and $850,000 for a 60-minute runtime for a route that operates every 60 minutes daily. Although operating costs are lower than most other fixed route services, average farebox recovery on shuttle program routes is only 12%, and average passenger subsidy is $9.00 per trip. Assuming Measure A accounts for 40% of all operating costs, each shuttle passenger trip is supported by $3.60 of Measure A sales tax funding.
Opportunities for Funding / Partnerships
Shuttle routes primarily serve riders traveling within localized areas. There are opportunities to partner with local cities/towns, major employers, or Downtown Business Districts to subsidize the costs of shuttle services. Night service in Tiburon will directly support employees and patrons of local business. Shuttles in Sausalito and Mill Valley could perform similar roles. Novato service expansion projects may be eligible for MTC Lifeline or similar funding.
Marin Transit’s original 2006 SRTP identified a fixed route shuttle service type titled “Local Initiative Service.” The service was envisioned as relying on partnerships between local jurisdictions, agencies, or private employers and Marin Transit, with each providing half the cost of operation. These services would respond to a localized need and be unlikely to meet the District’s performance targets. Under the program, the District determines subsidy levels based on the actual performance of the service. To date, there are no examples where these services were developed. However, Marin Transit may refer to this model to implement the identified unfunded shuttle needs.
Expand and Enhance K-12 School Services
Overview
As in much of California, the delivery of school transportation in Marin County has evolved significantly since approval of Proposition 13 and as demographic trends lead to changes in bus ridership. There is a substantial financial commitment required to operate and manage a full-service school transportation program. This has led many school districts to seek a broad range of alternatives to provide student access to school. These include expanded use of Marin Transit supplemental school service, shared use of contractual mechanisms such as that used by Marin Pupil Transportation Authority, fee for service offerings, and active promotion of alternatives through programs like Safe Routes to School (SR2S).
Item 8
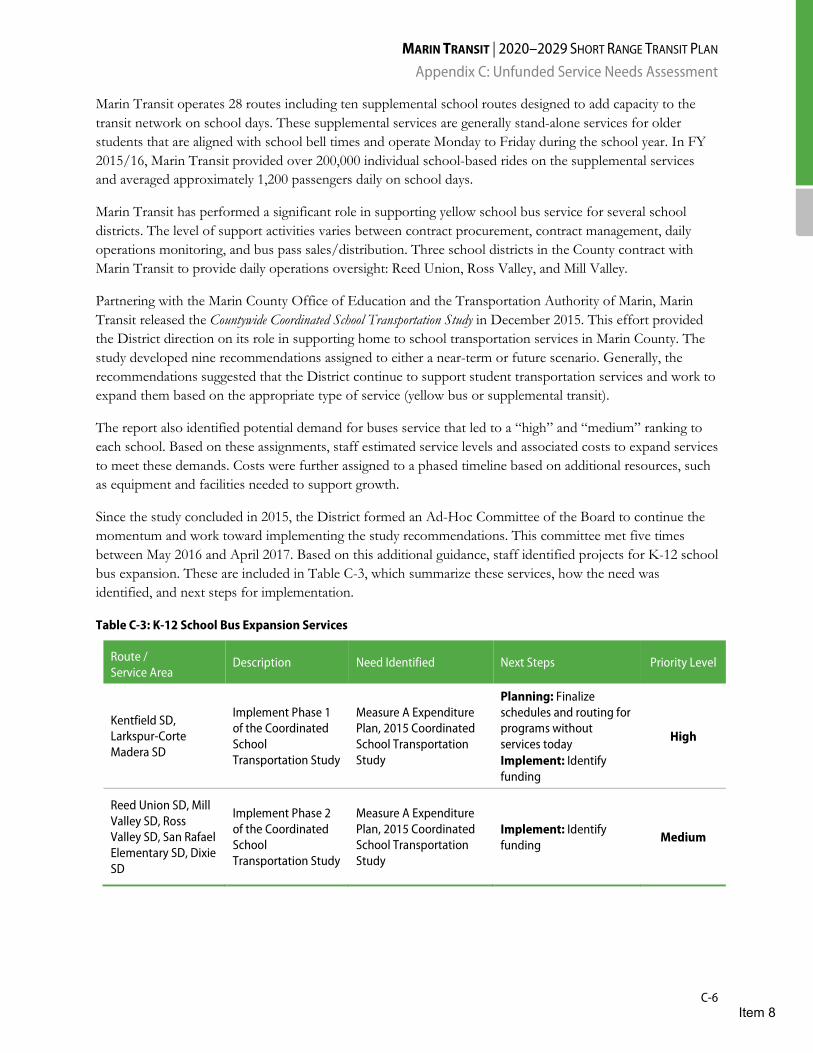
MARIN TRANSIT | 2020–2029 SHORT RANGE TRANSIT PLAN Appendix C: Unfunded Service Needs Assessment
C-6
Marin Transit operates 28 routes including ten supplemental school routes designed to add capacity to the transit network on school days. These supplemental services are generally stand-alone services for older students that are aligned with school bell times and operate Monday to Friday during the school year. In FY 2015/16, Marin Transit provided over 200,000 individual school-based rides on the supplemental services and averaged approximately 1,200 passengers daily on school days.
Marin Transit has performed a significant role in supporting yellow school bus service for several school districts. The level of support activities varies between contract procurement, contract management, daily operations monitoring, and bus pass sales/distribution. Three school districts in the County contract with Marin Transit to provide daily operations oversight: Reed Union, Ross Valley, and Mill Valley.
Partnering with the Marin County Office of Education and the Transportation Authority of Marin, Marin Transit released the Countywide Coordinated School Transportation Study in December 2015. This effort provided the District direction on its role in supporting home to school transportation services in Marin County. The study developed nine recommendations assigned to either a near-term or future scenario. Generally, the recommendations suggested that the District continue to support student transportation services and work to expand them based on the appropriate type of service (yellow bus or supplemental transit).
The report also identified potential demand for buses service that led to a “high” and “medium” ranking to each school. Based on these assignments, staff estimated service levels and associated costs to expand services to meet these demands. Costs were further assigned to a phased timeline based on additional resources, such as equipment and facilities needed to support growth.
Since the study concluded in 2015, the District formed an Ad-Hoc Committee of the Board to continue the momentum and work toward implementing the study recommendations. This committee met five times between May 2016 and April 2017. Based on this additional guidance, staff identified projects for K-12 school bus expansion. These are included in Table C-3, which summarize these services, how the need was identified, and next steps for implementation.
Table C-3: K-12 School Bus Expansion Services
Route / Service Area
Description Need Identified Next Steps Priority Level
Kentfield SD, Larkspur-Corte Madera SD
Implement Phase 1 of the Coordinated School Transportation Study
Measure A Expenditure Plan, 2015 Coordinated School Transportation Study
Planning: Finalize schedules and routing for programs without services today Implement: Identify funding
High
Reed Union SD, Mill Valley SD, Ross Valley SD, San Rafael Elementary SD, Dixie SD
Implement Phase 2 of the Coordinated School Transportation Study
Measure A Expenditure Plan, 2015 Coordinated School Transportation Study
Implement: Identify funding Medium
Item 8
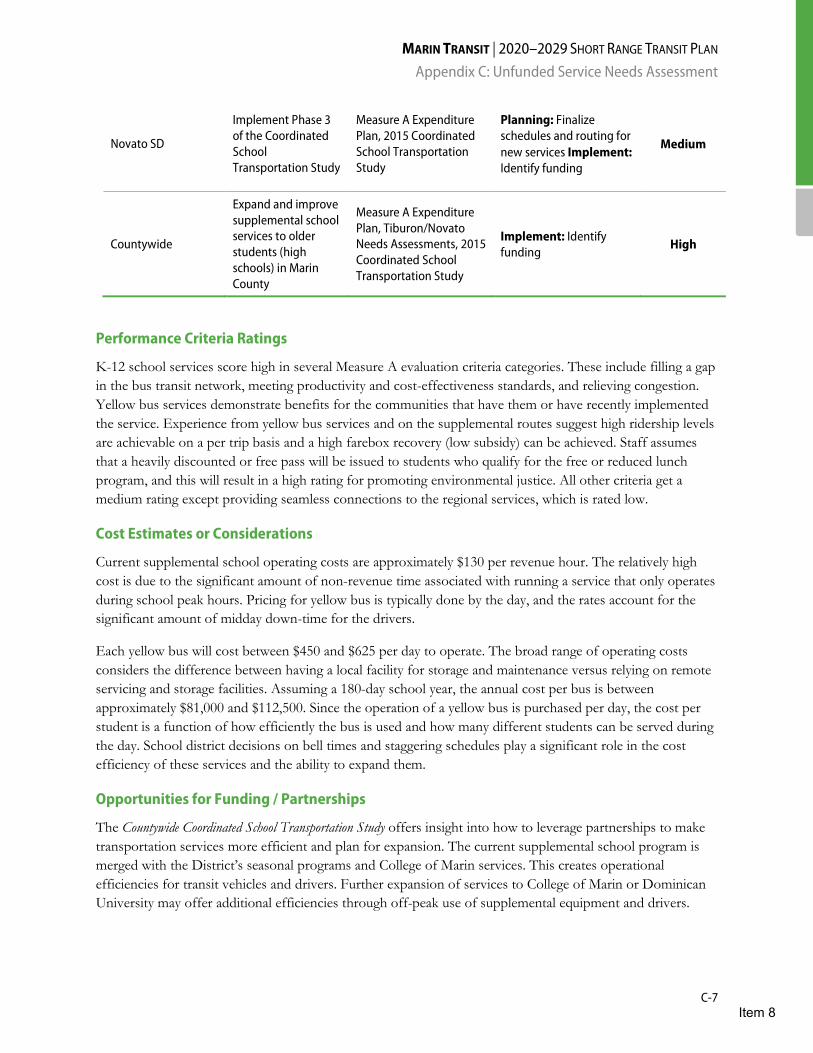
MARIN TRANSIT | 2020–2029 SHORT RANGE TRANSIT PLAN Appendix C: Unfunded Service Needs Assessment
C-7
Novato SD
Implement Phase 3 of the Coordinated School Transportation Study
Measure A Expenditure Plan, 2015 Coordinated School Transportation Study
Planning: Finalize schedules and routing for new services Implement: Identify funding
Medium
Countywide
Expand and improve supplemental school services to older students (high schools) in Marin County
Measure A Expenditure Plan, Tiburon/Novato Needs Assessments, 2015 Coordinated School Transportation Study
Implement: Identify funding High
Performance Criteria Ratings
K-12 school services score high in several Measure A evaluation criteria categories. These include filling a gap in the bus transit network, meeting productivity and cost-effectiveness standards, and relieving congestion. Yellow bus services demonstrate benefits for the communities that have them or have recently implemented the service. Experience from yellow bus services and on the supplemental routes suggest high ridership levels are achievable on a per trip basis and a high farebox recovery (low subsidy) can be achieved. Staff assumes that a heavily discounted or free pass will be issued to students who qualify for the free or reduced lunch program, and this will result in a high rating for promoting environmental justice. All other criteria get a medium rating except providing seamless connections to the regional services, which is rated low.
Cost Estimates or Considerations
Current supplemental school operating costs are approximately $130 per revenue hour. The relatively high cost is due to the significant amount of non-revenue time associated with running a service that only operates during school peak hours. Pricing for yellow bus is typically done by the day, and the rates account for the significant amount of midday down-time for the drivers.
Each yellow bus will cost between $450 and $625 per day to operate. The broad range of operating costs considers the difference between having a local facility for storage and maintenance versus relying on remote servicing and storage facilities. Assuming a 180-day school year, the annual cost per bus is between approximately $81,000 and $112,500. Since the operation of a yellow bus is purchased per day, the cost per student is a function of how efficiently the bus is used and how many different students can be served during the day. School district decisions on bell times and staggering schedules play a significant role in the cost efficiency of these services and the ability to expand them.
Opportunities for Funding / Partnerships
The Countywide Coordinated School Transportation Study offers insight into how to leverage partnerships to make transportation services more efficient and plan for expansion. The current supplemental school program is merged with the District’s seasonal programs and College of Marin services. This creates operational efficiencies for transit vehicles and drivers. Further expansion of services to College of Marin or Dominican University may offer additional efficiencies through off-peak use of supplemental equipment and drivers.
Item 8
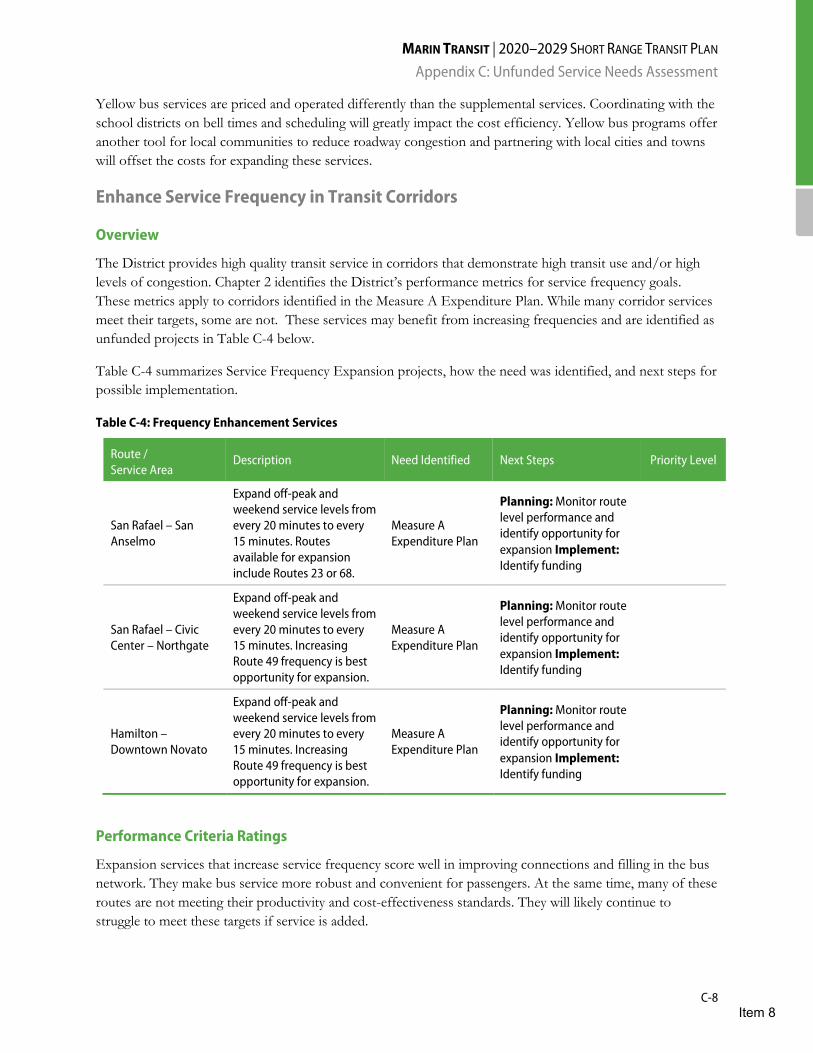
MARIN TRANSIT | 2020–2029 SHORT RANGE TRANSIT PLAN Appendix C: Unfunded Service Needs Assessment
C-8
Yellow bus services are priced and operated differently than the supplemental services. Coordinating with the school districts on bell times and scheduling will greatly impact the cost efficiency. Yellow bus programs offer another tool for local communities to reduce roadway congestion and partnering with local cities and towns will offset the costs for expanding these services.
Enhance Service Frequency in Transit Corridors
Overview
The District provides high quality transit service in corridors that demonstrate high transit use and/or high levels of congestion. Chapter 2 identifies the District’s performance metrics for service frequency goals. These metrics apply to corridors identified in the Measure A Expenditure Plan. While many corridor services meet their targets, some are not. These services may benefit from increasing frequencies and are identified as unfunded projects in Table C-4 below.
Table C-4 summarizes Service Frequency Expansion projects, how the need was identified, and next steps for possible implementation.
Table C-4: Frequency Enhancement Services
Route / Service Area
Description Need Identified Next Steps Priority Level
San Rafael – San Anselmo
Expand off-peak and weekend service levels from every 20 minutes to every 15 minutes. Routes available for expansion include Routes 23 or 68.
Measure A Expenditure Plan
Planning: Monitor route level performance and identify opportunity for expansion Implement: Identify funding
San Rafael – Civic Center – Northgate
Expand off-peak and weekend service levels from every 20 minutes to every 15 minutes. Increasing Route 49 frequency is best opportunity for expansion.
Measure A Expenditure Plan
Planning: Monitor route level performance and identify opportunity for expansion Implement: Identify funding
Hamilton – Downtown Novato
Expand off-peak and weekend service levels from every 20 minutes to every 15 minutes. Increasing Route 49 frequency is best opportunity for expansion.
Measure A Expenditure Plan
Planning: Monitor route level performance and identify opportunity for expansion Implement: Identify funding
Performance Criteria Ratings
Expansion services that increase service frequency score well in improving connections and filling in the bus network. They make bus service more robust and convenient for passengers. At the same time, many of these routes are not meeting their productivity and cost-effectiveness standards. They will likely continue to struggle to meet these targets if service is added.
Item 8
MARIN TRANSIT | 2020–2029 SHORT RANGE TRANSIT PLAN Appendix C: Unfunded Service Needs Assessment
C-9
Cost Estimates or Considerations
Based on current Marin Transit operations, expanding frequency will cost approximately $115 per revenue hour of service. Each of these identified frequency enhancements requires an investment of approximately 2,000 hours or close to $230,000 annually.
Opportunity for Funding / Partnerships
Expanding service frequencies on the existing transit network has limited opportunities to attract outside funding or partnerships. The best opportunity to fund these expansion services may be to reallocate revenues to concentrate resources in the most traveled and heavily used transit corridors. Canceling lower ridership coverage-based transit services could enable the District to reinvest resources.
Provide Limited Stop or Express Services
Overview
The focus of local transit services is to increase mobility for Marin County residents. Local transit trips are shorter in length than regional bus and ferry trips. The operating characteristics of local transit balances service speed with accessibility and can result in long travel times for some trips.
Goal C under the SRTP Corridor-Level performance measures calls for providing competitive travel times to promote transit use. Perhaps the most sensitive market to travel times are commuters who rely on the service daily and oftentimes transfer to another local or regional service to complete their trip. This market may increase with the introduction of SMART.
In June 2016, Marin Transit implemented Routes 71x and 23x to test how express services perform in a corridor already served by local routes. Route 71x provided an 18% travel time savings over other services in the Highway 101 corridor by removing the bus pad stops in San Rafael, Larkspur, and Corte Madera. Express Route 23x significantly decreases end-to-end travel times in the Fairfax to San Rafael corridor that is also served by Route 23.
The District has identified one other expansion project to achieve travel time savings in the Mill Valley to San Rafael corridor. An express service along Route 17 can achieve travel time savings for current riders and attract new riders to this route. In addition, Route 17 could be designed to provide a convenient link to future SMART services for southern Marin County residents traveling north.
The current deviation of Route 17 to Strawberry Village increases travel times for many riders traveling to Mill Valley. The ongoing study of the East Blithedale / Tiburon Blvd interchange is assessing improvements to pedestrian and bicycle circulation, with a focus on how these users connect to transit services. The study results will be evaluated in concert with express bus options for Mill Valley and other areas of southern Marin County.
Table C-5 provides a summary of the Limited Stop or Express Expansion services, how the District identified the need, and next steps for possible implementation.
Item 8
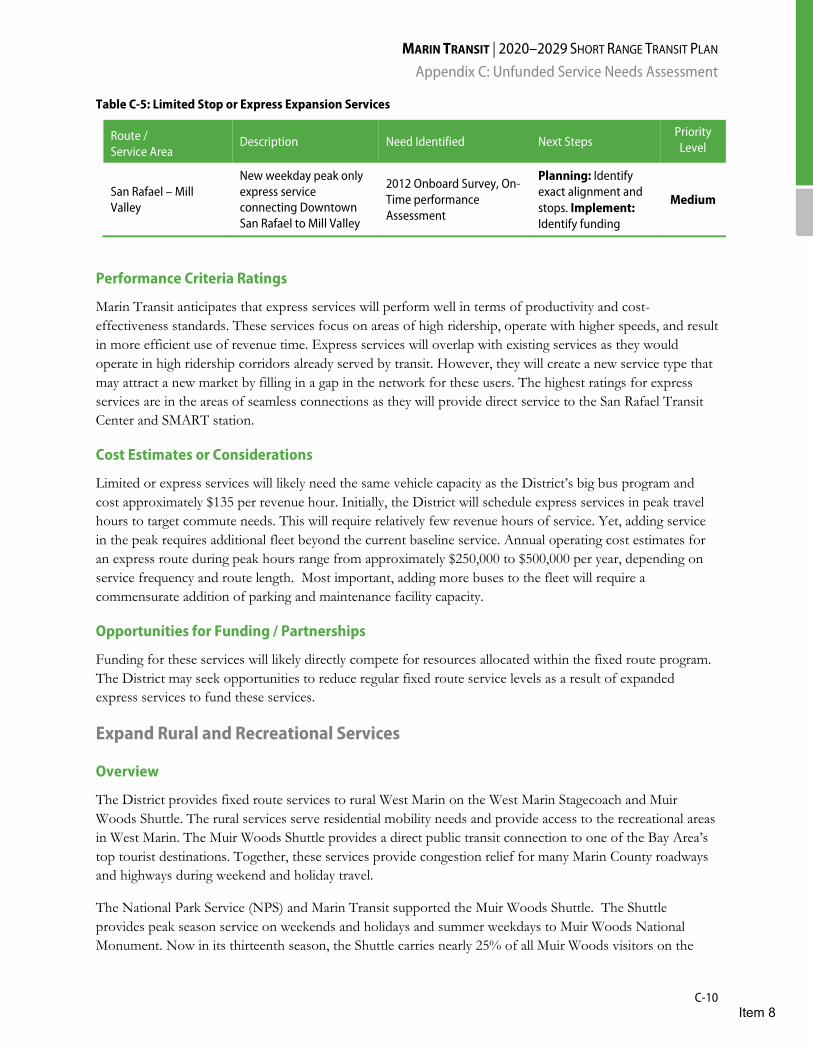
MARIN TRANSIT | 2020–2029 SHORT RANGE TRANSIT PLAN Appendix C: Unfunded Service Needs Assessment
C-10
Table C-5: Limited Stop or Express Expansion Services
Route / Service Area
Description Need Identified Next Steps Priority Level
San Rafael – Mill Valley
New weekday peak only express service connecting Downtown San Rafael to Mill Valley
2012 Onboard Survey, On-Time performance Assessment
Planning: Identify exact alignment and stops. Implement: Identify funding
Medium
Performance Criteria Ratings
Marin Transit anticipates that express services will perform well in terms of productivity and cost-effectiveness standards. These services focus on areas of high ridership, operate with higher speeds, and result in more efficient use of revenue time. Express services will overlap with existing services as they would operate in high ridership corridors already served by transit. However, they will create a new service type that may attract a new market by filling in a gap in the network for these users. The highest ratings for express services are in the areas of seamless connections as they will provide direct service to the San Rafael Transit Center and SMART station.
Cost Estimates or Considerations
Limited or express services will likely need the same vehicle capacity as the District’s big bus program and cost approximately $135 per revenue hour. Initially, the District will schedule express services in peak travel hours to target commute needs. This will require relatively few revenue hours of service. Yet, adding service in the peak requires additional fleet beyond the current baseline service. Annual operating cost estimates for an express route during peak hours range from approximately $250,000 to $500,000 per year, depending on service frequency and route length. Most important, adding more buses to the fleet will require a commensurate addition of parking and maintenance facility capacity.
Opportunities for Funding / Partnerships
Funding for these services will likely directly compete for resources allocated within the fixed route program. The District may seek opportunities to reduce regular fixed route service levels as a result of expanded express services to fund these services.
Expand Rural and Recreational Services
Overview
The District provides fixed route services to rural West Marin on the West Marin Stagecoach and Muir Woods Shuttle. The rural services serve residential mobility needs and provide access to the recreational areas in West Marin. The Muir Woods Shuttle provides a direct public transit connection to one of the Bay Area’s top tourist destinations. Together, these services provide congestion relief for many Marin County roadways and highways during weekend and holiday travel.
The National Park Service (NPS) and Marin Transit supported the Muir Woods Shuttle. The Shuttle provides peak season service on weekends and holidays and summer weekdays to Muir Woods National Monument. Now in its thirteenth season, the Shuttle carries nearly 25% of all Muir Woods visitors on the
Item 8
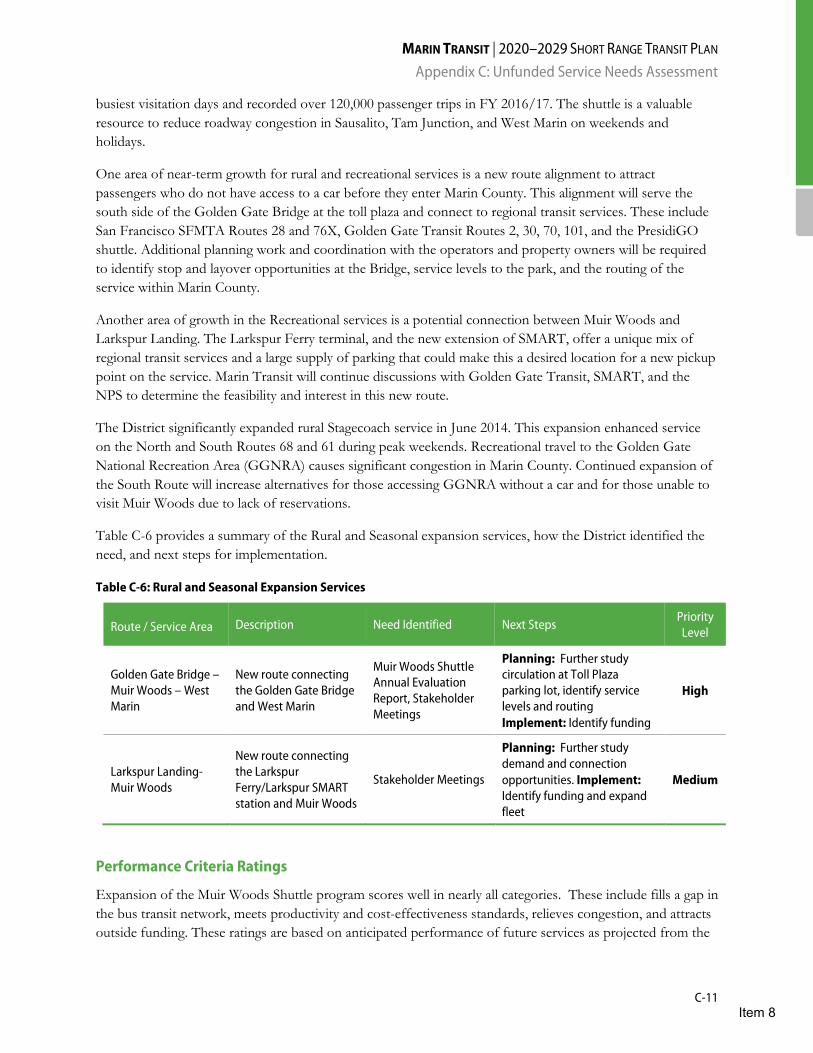
MARIN TRANSIT | 2020–2029 SHORT RANGE TRANSIT PLAN Appendix C: Unfunded Service Needs Assessment
C-11
busiest visitation days and recorded over 120,000 passenger trips in FY 2016/17. The shuttle is a valuable resource to reduce roadway congestion in Sausalito, Tam Junction, and West Marin on weekends and holidays.
One area of near-term growth for rural and recreational services is a new route alignment to attract passengers who do not have access to a car before they enter Marin County. This alignment will serve the south side of the Golden Gate Bridge at the toll plaza and connect to regional transit services. These include San Francisco SFMTA Routes 28 and 76X, Golden Gate Transit Routes 2, 30, 70, 101, and the PresidiGO shuttle. Additional planning work and coordination with the operators and property owners will be required to identify stop and layover opportunities at the Bridge, service levels to the park, and the routing of the service within Marin County.
Another area of growth in the Recreational services is a potential connection between Muir Woods and Larkspur Landing. The Larkspur Ferry terminal, and the new extension of SMART, offer a unique mix of regional transit services and a large supply of parking that could make this a desired location for a new pickup point on the service. Marin Transit will continue discussions with Golden Gate Transit, SMART, and the NPS to determine the feasibility and interest in this new route.
The District significantly expanded rural Stagecoach service in June 2014. This expansion enhanced service on the North and South Routes 68 and 61 during peak weekends. Recreational travel to the Golden Gate National Recreation Area (GGNRA) causes significant congestion in Marin County. Continued expansion of the South Route will increase alternatives for those accessing GGNRA without a car and for those unable to visit Muir Woods due to lack of reservations.
Table C-6 provides a summary of the Rural and Seasonal expansion services, how the District identified the need, and next steps for implementation.
Table C-6: Rural and Seasonal Expansion Services
Route / Service Area Description Need Identified Next Steps Priority Level
Golden Gate Bridge – Muir Woods – West Marin
New route connecting the Golden Gate Bridge and West Marin
Muir Woods Shuttle Annual Evaluation Report, Stakeholder Meetings
Planning: Further study circulation at Toll Plaza parking lot, identify service levels and routing Implement: Identify funding
High
Larkspur Landing-Muir Woods
New route connecting the Larkspur Ferry/Larkspur SMART station and Muir Woods
Stakeholder Meetings
Planning: Further study demand and connection opportunities. Implement: Identify funding and expand fleet
Medium
Performance Criteria Ratings
Expansion of the Muir Woods Shuttle program scores well in nearly all categories. These include fills a gap in the bus transit network, meets productivity and cost-effectiveness standards, relieves congestion, and attracts outside funding. These ratings are based on anticipated performance of future services as projected from the
Item 8
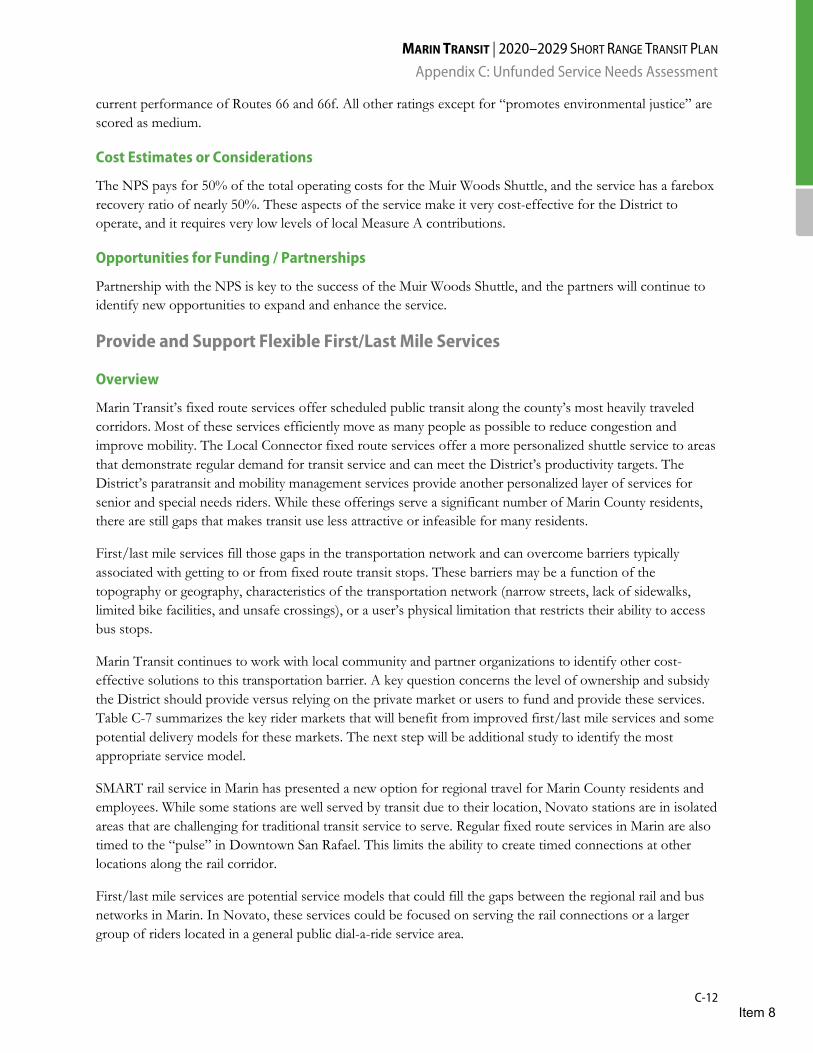
MARIN TRANSIT | 2020–2029 SHORT RANGE TRANSIT PLAN Appendix C: Unfunded Service Needs Assessment
C-12
current performance of Routes 66 and 66f. All other ratings except for “promotes environmental justice” are scored as medium.
Cost Estimates or Considerations
The NPS pays for 50% of the total operating costs for the Muir Woods Shuttle, and the service has a farebox recovery ratio of nearly 50%. These aspects of the service make it very cost-effective for the District to operate, and it requires very low levels of local Measure A contributions.
Opportunities for Funding / Partnerships
Partnership with the NPS is key to the success of the Muir Woods Shuttle, and the partners will continue to identify new opportunities to expand and enhance the service.
Provide and Support Flexible First/Last Mile Services
Overview
Marin Transit’s fixed route services offer scheduled public transit along the county’s most heavily traveled corridors. Most of these services efficiently move as many people as possible to reduce congestion and improve mobility. The Local Connector fixed route services offer a more personalized shuttle service to areas that demonstrate regular demand for transit service and can meet the District’s productivity targets. The District’s paratransit and mobility management services provide another personalized layer of services for senior and special needs riders. While these offerings serve a significant number of Marin County residents, there are still gaps that makes transit use less attractive or infeasible for many residents.
First/last mile services fill those gaps in the transportation network and can overcome barriers typically associated with getting to or from fixed route transit stops. These barriers may be a function of the topography or geography, characteristics of the transportation network (narrow streets, lack of sidewalks, limited bike facilities, and unsafe crossings), or a user’s physical limitation that restricts their ability to access bus stops.
Marin Transit continues to work with local community and partner organizations to identify other cost-effective solutions to this transportation barrier. A key question concerns the level of ownership and subsidy the District should provide versus relying on the private market or users to fund and provide these services. Table C-7 summarizes the key rider markets that will benefit from improved first/last mile services and some potential delivery models for these markets. The next step will be additional study to identify the most appropriate service model.
SMART rail service in Marin has presented a new option for regional travel for Marin County residents and employees. While some stations are well served by transit due to their location, Novato stations are in isolated areas that are challenging for traditional transit service to serve. Regular fixed route services in Marin are also timed to the “pulse” in Downtown San Rafael. This limits the ability to create timed connections at other locations along the rail corridor.
First/last mile services are potential service models that could fill the gaps between the regional rail and bus networks in Marin. In Novato, these services could be focused on serving the rail connections or a larger group of riders located in a general public dial-a-ride service area.
Item 8
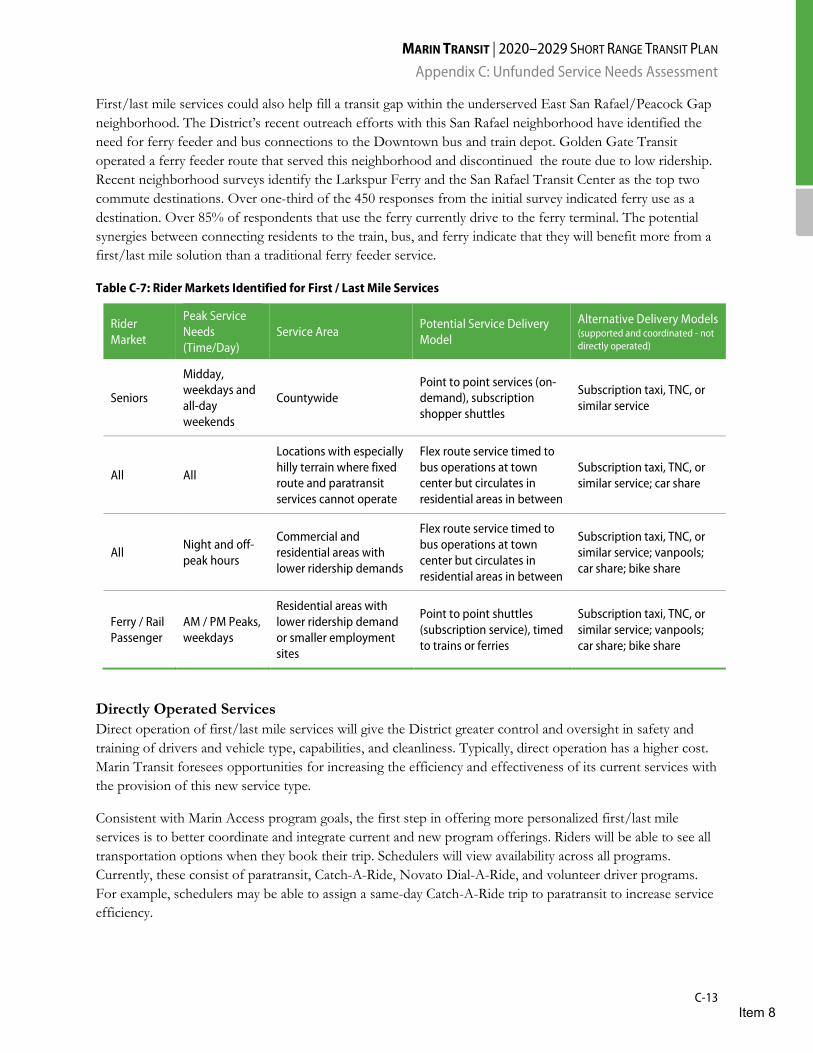
MARIN TRANSIT | 2020–2029 SHORT RANGE TRANSIT PLAN Appendix C: Unfunded Service Needs Assessment
C-13
First/last mile services could also help fill a transit gap within the underserved East San Rafael/Peacock Gap neighborhood. The District’s recent outreach efforts with this San Rafael neighborhood have identified the need for ferry feeder and bus connections to the Downtown bus and train depot. Golden Gate Transit operated a ferry feeder route that served this neighborhood and discontinued the route due to low ridership. Recent neighborhood surveys identify the Larkspur Ferry and the San Rafael Transit Center as the top two commute destinations. Over one-third of the 450 responses from the initial survey indicated ferry use as a destination. Over 85% of respondents that use the ferry currently drive to the ferry terminal. The potential synergies between connecting residents to the train, bus, and ferry indicate that they will benefit more from a first/last mile solution than a traditional ferry feeder service.
Table C-7: Rider Markets Identified for First / Last Mile Services
Rider Market
Peak Service Needs (Time/Day)
Service Area Potential Service Delivery Model
Alternative Delivery Models (supported and coordinated - not directly operated)
Seniors
Midday, weekdays and all-day weekends
Countywide Point to point services (on-demand), subscription shopper shuttles
Subscription taxi, TNC, or similar service
All All
Locations with especially hilly terrain where fixed route and paratransit services cannot operate
Flex route service timed to bus operations at town center but circulates in residential areas in between
Subscription taxi, TNC, or similar service; car share
All Night and off-peak hours
Commercial and residential areas with lower ridership demands
Flex route service timed to bus operations at town center but circulates in residential areas in between
Subscription taxi, TNC, or similar service; vanpools; car share; bike share
Ferry / Rail Passenger
AM / PM Peaks, weekdays
Residential areas with lower ridership demand or smaller employment sites
Point to point shuttles (subscription service), timed to trains or ferries
Subscription taxi, TNC, or similar service; vanpools; car share; bike share
Directly Operated Services Direct operation of first/last mile services will give the District greater control and oversight in safety and training of drivers and vehicle type, capabilities, and cleanliness. Typically, direct operation has a higher cost. Marin Transit foresees opportunities for increasing the efficiency and effectiveness of its current services with the provision of this new service type.
Consistent with Marin Access program goals, the first step in offering more personalized first/last mile services is to better coordinate and integrate current and new program offerings. Riders will be able to see all transportation options when they book their trip. Schedulers will view availability across all programs. Currently, these consist of paratransit, Catch-A-Ride, Novato Dial-A-Ride, and volunteer driver programs. For example, schedulers may be able to assign a same-day Catch-A-Ride trip to paratransit to increase service efficiency.
Item 8

MARIN TRANSIT | 2020–2029 SHORT RANGE TRANSIT PLAN Appendix C: Unfunded Service Needs Assessment
C-14
There may be limited opportunities for greater efficiency and economies of scale in integrating these programs. The District should evaluate a new service model that will operate as a flex route service that can be adapted to community needs and the areas served. Marin Transit’s diverse offerings of fixed route services provide riders with transit services based on a timetable for regular service. Flex routes offer solutions to address additional mobility needs. The District should evaluate a smaller vehicle type based on capacity needs of the service and ability to decrease costs.
Supported and Coordinated Services The taxi industry is a potential partner for supporting and coordinating first and last mile services. Recent advances in technology and smart phone access have spurred a new transportation market. Transportation Network Companies (TNCs) such as Uber and Lyft offer new opportunities for first and last mile transportation in addition to other shared-ride (Chariot, Sidecar, Lyft Line, Uberpool, etc.) or car-share companies (ZipCar, Getaround, etc.). These services are widely available in urbanized areas and much less so in suburban areas such as Marin County.
The District’s recent Catch-A-Ride partnership with the taxi industry is one model for brokering trips for seniors and ADA riders. In Marin County, the ability to expand these programs through the taxi providers is limited. Marin Transit should explore additional opportunities to support and coordinate with private or non-profit providers that require a lower per passenger subsidy levels than the Catch-A-Ride program. One option is to offer free transfers to fixed route services from taxis, transportation network company (TNC) services, or other approved providers. This will reduce the need for the District to provide these services directly and offer riders an incentive to use fixed-route transit. Since first/last mile connections are relatively short distance, the out-of-pocket costs will be minimal. The total cost of the trip will be more attractive as the transit portion provided as free. Encouraging this behavior will also create incentives for these outside providers and strengthen the market for and availability of services for Marin residents.
Marin Transit will also continue to partner with the Transportation Authority of Marin (TAM) on their countywide transportation demand management (TDM) strategies. The District will monitor TAM’s current discount ride program for first and last mile services to and from the SMART stations in partnership with Lyft. Future co-location of car share and bike share stations at key transit facilities will offer alternative travel options in areas where fixed route services are not financially or physically feasible. Partnering to support vanpooling is another option to increase access to and from transit stops.
The District could pursue a hybrid arrangement where Marin Transit provides the vehicle, maintenance, and driver training. The service could be provided through either the Volunteer Driver program, an organization that benefits from the service, or individuals who pool together for a shared ride. There may be additional opportunities to use the same vehicle outside service hours, for example, in a car share program to support other countywide mobility goals.
Driverless Technology Marin Transit will also need to consider a future with driverless cars and how they will impact public transit. Many automakers already offer autopilot functionality. There are still many technology and regulatory hurdles to overcome.
While autonomous vehicles offer many opportunities for mobility, their impact on congestion is unclear. There are few opportunities in Marin for additional infrastructure enhancements that will increase roadway capacity. In a future with autonomous vehicles, public transit’s role may be to focus on moving travelers on
Item 8

MARIN TRANSIT | 2020–2029 SHORT RANGE TRANSIT PLAN Appendix C: Unfunded Service Needs Assessment
C-15
capacity-constrained corridors. Along with high quality transit service on congestion corridors, autonomous vehicles could fill the need for first and last mile connections.
Table C-8 provides a summary of the First and Last Mile expansion services, how the District identified the need, and next steps for implementation.
Table C-8: First and Last Mile Expansion Services
Route / Service Area
Description Need Identified Next Steps Priority Level
Novato Local Connectors
SMART connector services to the two Novato stations
2015 MTC SMART Integration Study
Planning: Identify potential transfer demand and best way to support these needs
Medium
East San Rafael Connector Bus
Peak hour feeder bus to connect East San Rafael to Larkspur Ferry via San Rafael Transit Center / SMART station
2016/2017 Community Survey and Outreach
Planning: Map routing and cost estimates Implement: Secure funding
Medium
Countywide New directly operated flex route services for general public
Measure A Expenditure Plan, Tiburon/Novato/West Marin Needs Assessments
Planning: Further study to identify potential markets and subsidy levels
High
Countywide
Partner with outside providers to develop complementary services in areas with transit gaps
2016 SRTP Planning: Further study to identify potential markets and subsidy levels
High
Countywide Support outside providers - free transfer agreements
Measure A Expenditure Plan, Tiburon/Novato Needs Assessments
Planning: Further study to identify opportunities. Talk with outside providers and explore how the process will function
Medium
Performance Criteria Ratings
First and last mile services score highest in filling gaps in the bus transit network and providing seamless connections. The focus of these services is on cost-effective opportunities to achieve these goals. These services will be explored as part of the District’s upcoming planning process.
Since the program is still not well-defined, it is challenging for staff to score the other performance criteria. The ability to achieve high productivity or subsidy goals is questionable. These programs will not target large populations, yet they rely on heavy passenger loads. The metrics may also be challenging to quantify if the service increases the efficiency of other local services or significantly reduces the District’s reliance on outside providers, such as TNCs, over whom the District does not have oversight.
Item 8

MARIN TRANSIT | 2020–2029 SHORT RANGE TRANSIT PLAN Appendix C: Unfunded Service Needs Assessment
C-16
Cost Estimates or Considerations
Due to the personalized nature of these services, the cost per passenger is likely going to be high. The level of District investment and subsidy levels is determined by the decision to directly contract to operate service versus relying on outside providers. There may be opportunities to leverage available resources by integrating and better coordinating Marin Transit’s current programs, even if the District contracts directly for the operation. The District may not have a net increase in costs with this type of implementation if they increase the number of passengers served and reduce per passenger subsidies. Relying on and creating incentives for outside service providers such as taxis to support the District’s goals could also be a cost-effective way to implement this type of service without directly operating it.
Opportunities for Funding / Partnerships
The District should focus on partnership opportunities to develop first and last mile services and consider the ever-changing environment of mobility options. The District’s partnership with Whistlestop for Volunteer Driver programs offers an opportunity to leverage low-cost resources to help fill gaps in the transportation network. The District’s partnerships with the taxi industry may lead to future win-win opportunities that enable the District to expand mobility for seniors while strengthening the network of taxi services. Other potential partnership opportunities with TNCs could offers similar win-win arrangements.
The District will continue to work with TAM to ensure TDM programs are well-integrated with public transit and residents who choose a car-free lifestyle have a wide range of mobility options. This includes providing a “safety net” for transportation when one option fails or is not feasible for a specific trip. TDM programs support service to public transit and can address the first and last mile challenges identified across the county.
Expand Services for Those with Special Needs
Overview
While Marin County’s population experiences slow-to-little growth, the number of older adults is rapidly increasing. The number of senior residents – those over the age of 65 – in Marin has almost doubled since the year 2000 and is projected to increase an additional 41 percent in the next ten years. An aging population has a significant impact on transportation and transportation needs. As residents may need or want to shift their travel behavior to non-driving modes, cost-effective and convenient options will help keep this population active, healthy, and engaged within our community.
Marin Access programs serve a subset of seniors and people with disabilities who depend on public transportation to maintain their independence and a high quality of life. Marin Transit will always need to provide a high-touch, high-subsidy program to meet the needs of these riders. Any new offerings should be developed in coordination with agencies and organizations that also support this population. Coordinated planning will reduce costs, prevent service duplication, and provide riders and caregivers with the best possible service.
Table C-9 provides a summary of the Special Needs expansion services, how the District identified the need, and next steps for implementation.
Item 8
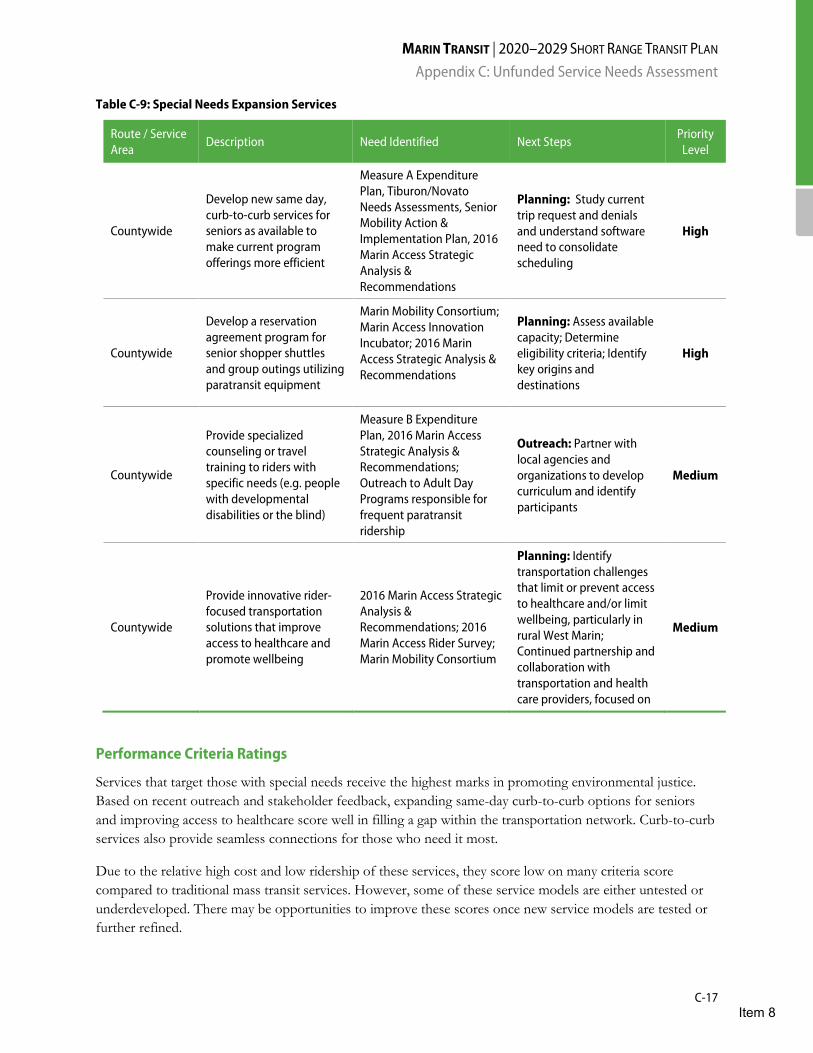
MARIN TRANSIT | 2020–2029 SHORT RANGE TRANSIT PLAN Appendix C: Unfunded Service Needs Assessment
C-17
Table C-9: Special Needs Expansion Services
Route / Service Area
Description Need Identified Next Steps Priority Level
Countywide
Develop new same day, curb-to-curb services for seniors as available to make current program offerings more efficient
Measure A Expenditure Plan, Tiburon/Novato Needs Assessments, Senior Mobility Action & Implementation Plan, 2016 Marin Access Strategic Analysis & Recommendations
Planning: Study current trip request and denials and understand software need to consolidate scheduling
High
Countywide
Develop a reservation agreement program for senior shopper shuttles and group outings utilizing paratransit equipment
Marin Mobility Consortium; Marin Access Innovation Incubator; 2016 Marin Access Strategic Analysis & Recommendations
Planning: Assess available capacity; Determine eligibility criteria; Identify key origins and destinations
High
Countywide
Provide specialized counseling or travel training to riders with specific needs (e.g. people with developmental disabilities or the blind)
Measure B Expenditure Plan, 2016 Marin Access Strategic Analysis & Recommendations; Outreach to Adult Day Programs responsible for frequent paratransit ridership
Outreach: Partner with local agencies and organizations to develop curriculum and identify participants
Medium
Countywide
Provide innovative rider-focused transportation solutions that improve access to healthcare and promote wellbeing
2016 Marin Access Strategic Analysis & Recommendations; 2016 Marin Access Rider Survey; Marin Mobility Consortium
Planning: Identify transportation challenges that limit or prevent access to healthcare and/or limit wellbeing, particularly in rural West Marin; Continued partnership and collaboration with transportation and health care providers, focused on
Medium
Performance Criteria Ratings
Services that target those with special needs receive the highest marks in promoting environmental justice. Based on recent outreach and stakeholder feedback, expanding same-day curb-to-curb options for seniors and improving access to healthcare score well in filling a gap within the transportation network. Curb-to-curb services also provide seamless connections for those who need it most.
Due to the relative high cost and low ridership of these services, they score low on many criteria score compared to traditional mass transit services. However, some of these service models are either untested or underdeveloped. There may be opportunities to improve these scores once new service models are tested or further refined.
Item 8

MARIN TRANSIT | 2020–2029 SHORT RANGE TRANSIT PLAN Appendix C: Unfunded Service Needs Assessment
C-18
Cost Estimates or Considerations
Although services for those with special needs tend to have high subsidy levels, the total amount of expected service is lower than other expansion projects. Cost estimates assume the continuation of other Marin Access supportive service and that expansion services will enhance these offerings.
Opportunities for Funding / Partnerships
The District is exploring creative options to fund these services. These include:
• Partnering with private transportation companies seeking to test new models; • Group shopping/recreational shuttles through paratransit contract; • Travel training partnerships; and • National Center for Mobility Management/Rides to Wellness funding.
Marin Transit recognizes that demand for these services is not typically focused on peak hour travel times. There may be opportunities to reuse program resources during the off-peak hours to provide operational and financial efficiencies.
Expansion Scoring and Priorities
Table C-10 summarizes all unfunded service improvements and organizes them by priority level. Priorities are assigned based on the evaluation ratings and ease of implementation. Overall service ratings are calculated based on an equal weighting of all Measure A criteria. Funding was not a factor in assigning priority. Many of these projects could be achieved with outside funding, partnerships, or discretionary grant funds.
The priority assignments are based on the District’s needs and assume current services levels and programs. Staff will revisit this list and the priority assignments annually and update them to reflect future needs for local transit service.
Table C-11 provides a summary of the project rating in each of the evaluation criteria, an estimate of annual operating costs and Measure A contribution, and an assessment of the ease of implementation. The cost is an estimate of the annual operating costs to Marin Transit. Each dollar sign ($) represents approximately $50,000 per year of added operating cost. The darker portions of the “$” indicate the portion of the financial support that will likely come from local Measure A funds or its replacement.
Item 8

MARIN TRANSIT | 2020–2029 SHORT RANGE TRANSIT PLAN Appendix C: Unfunded Service Needs Assessment
C-19
Table C-10: Expansion Services by Priority
High Priority, Not Ready Project (Ratings = High, Not Ready to Implement)
Yellow Bus Expansion: Kentfield & Larkspur-Corte Madera School Districts
Yellow Bus Expansion: Reed Union, Mill Valley, Ross Valley, San Rafael Elementary, & Dixie School Districts
Expand Supplemental Transit: Tamalpais Union, San Rafael, Novato School Districts
Provide new service between Golden Gate Bridge and West Marin
Medium Priority Projects, Ready Projects (Rating = Medium, Ready to Implement)
Expand Shuttle: Tiburon Evenings (219)
Expand Shuttle: Novato Evenings (251)
Expand Shuttle: Novato Hamilton (251 or 257)
Expand Fixed Frequency in San Rafael – San Anselmo Corridor
Expand Fixed Route Frequency in San Rafael – Civic Center Corridor
Expand Fixed Route Frequency in Hamilton –Downtown Novato Corridor
Mill Valley Express (Route 17x)
Medium Priority Projects, Not Ready Projects (Rating = Medium, Not Ready to Implement)
Yellow Bus Expansion: Novato School District
New route connecting the Larkspur Ferry/SMART station and Muir Woods
Novato connector services
East San Rafael Connector Bus
Provide flex route services for general public
Partner to provide new flexible first/last mile options
Support outside providers to strengthen first/last mile connections
Expand same day curb-to-curb options for seniors
Provide innovative rider-focused transportation solutions that improve access to healthcare and promote wellbeing
Low Priority Projects, Not Ready Projects (Rating = Low, Ready to Implement)
Develop a reservation agreement for senior shopper shuttles and group outings
Provide specialized counseling or travel training to riders with specific needs
Expand Shuttle: New circulator shuttle between E. Corte Madera and Larkspur Landing
Low Priority Projects, Not Ready Projects (Rating = Low, Not Ready to Implement)
New Shuttle: Mill Valley
New Shuttle: Sausalito
Item 8
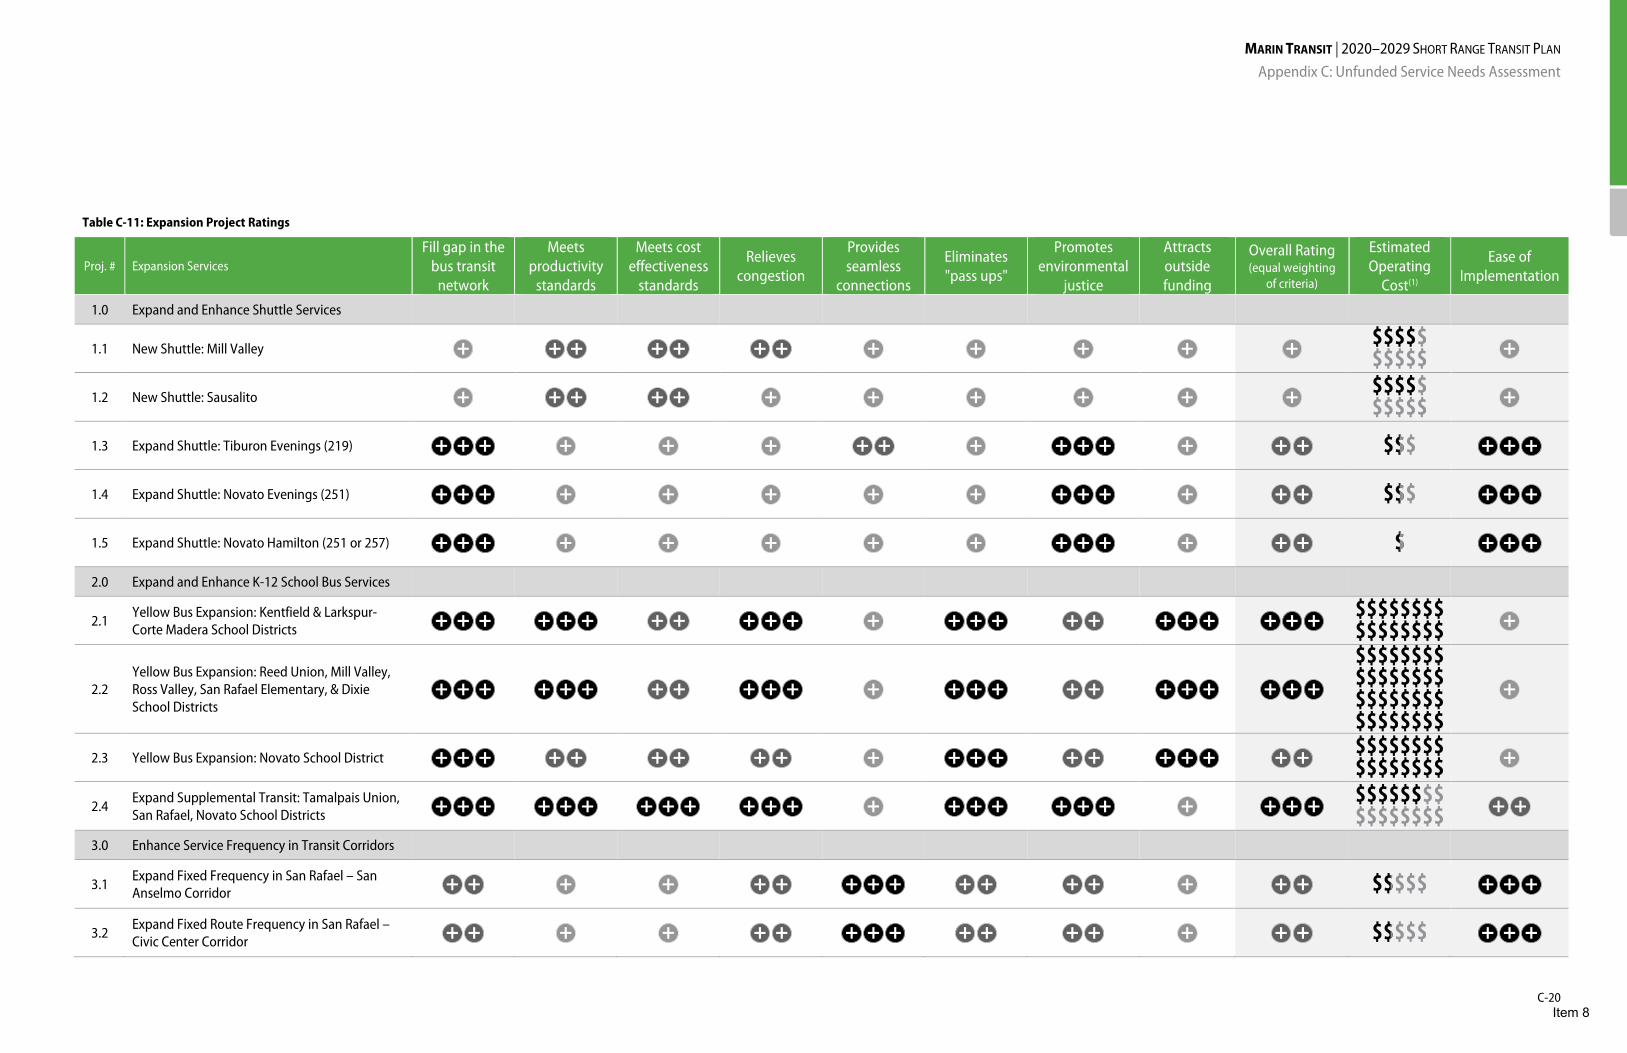
MARIN TRANSIT | 2020–2029 SHORT RANGE TRANSIT PLAN Appendix C: Unfunded Service Needs Assessment
C-20
Proj. # Expansion Services Fill gap in the
bus transit network
Meets productivity
standards
Meets cost effectiveness
standards
Relieves congestion
Provides seamless
connections
Eliminates "pass ups"
Promotes environmental
justice
Attracts outside funding
Overall Rating (equal weighting
of criteria)
Estimated Operating
Cost(1)
Ease of Implementation
1.0 Expand and Enhance Shuttle Services
1.1 New Shuttle: Mill Valley
1.2 New Shuttle: Sausalito
1.3 Expand Shuttle: Tiburon Evenings (219)
1.4 Expand Shuttle: Novato Evenings (251)
1.5 Expand Shuttle: Novato Hamilton (251 or 257)
2.0 Expand and Enhance K-12 School Bus Services
2.1 Yellow Bus Expansion: Kentfield & Larkspur-Corte Madera School Districts
2.2 Yellow Bus Expansion: Reed Union, Mill Valley, Ross Valley, San Rafael Elementary, & Dixie School Districts
2.3 Yellow Bus Expansion: Novato School District
2.4 Expand Supplemental Transit: Tamalpais Union, San Rafael, Novato School Districts
3.0 Enhance Service Frequency in Transit Corridors
3.1 Expand Fixed Frequency in San Rafael – San Anselmo Corridor
3.2 Expand Fixed Route Frequency in San Rafael – Civic Center Corridor
+ + + + + + + + + + + + +
+ + + + + + + + + + + +
+++ + + + + + + +++ + + + +++
+++ + + + + + +++ + + + +++
+++ + + + + + +++ + + + +++
+++ +++ + + +++ + +++ + + +++ +++ +
+++ +++ + + +++ + +++ + + +++ +++ +
+++ + + + + + + + +++ + + +++ + + +
+++ +++ +++ +++ + +++ +++ + +++ + +
+ + + + + + +++ + + + + + + + +++
+ + + + + + +++ + + + + + + + +++
Table C-11: Expansion Project Ratings
Item 8
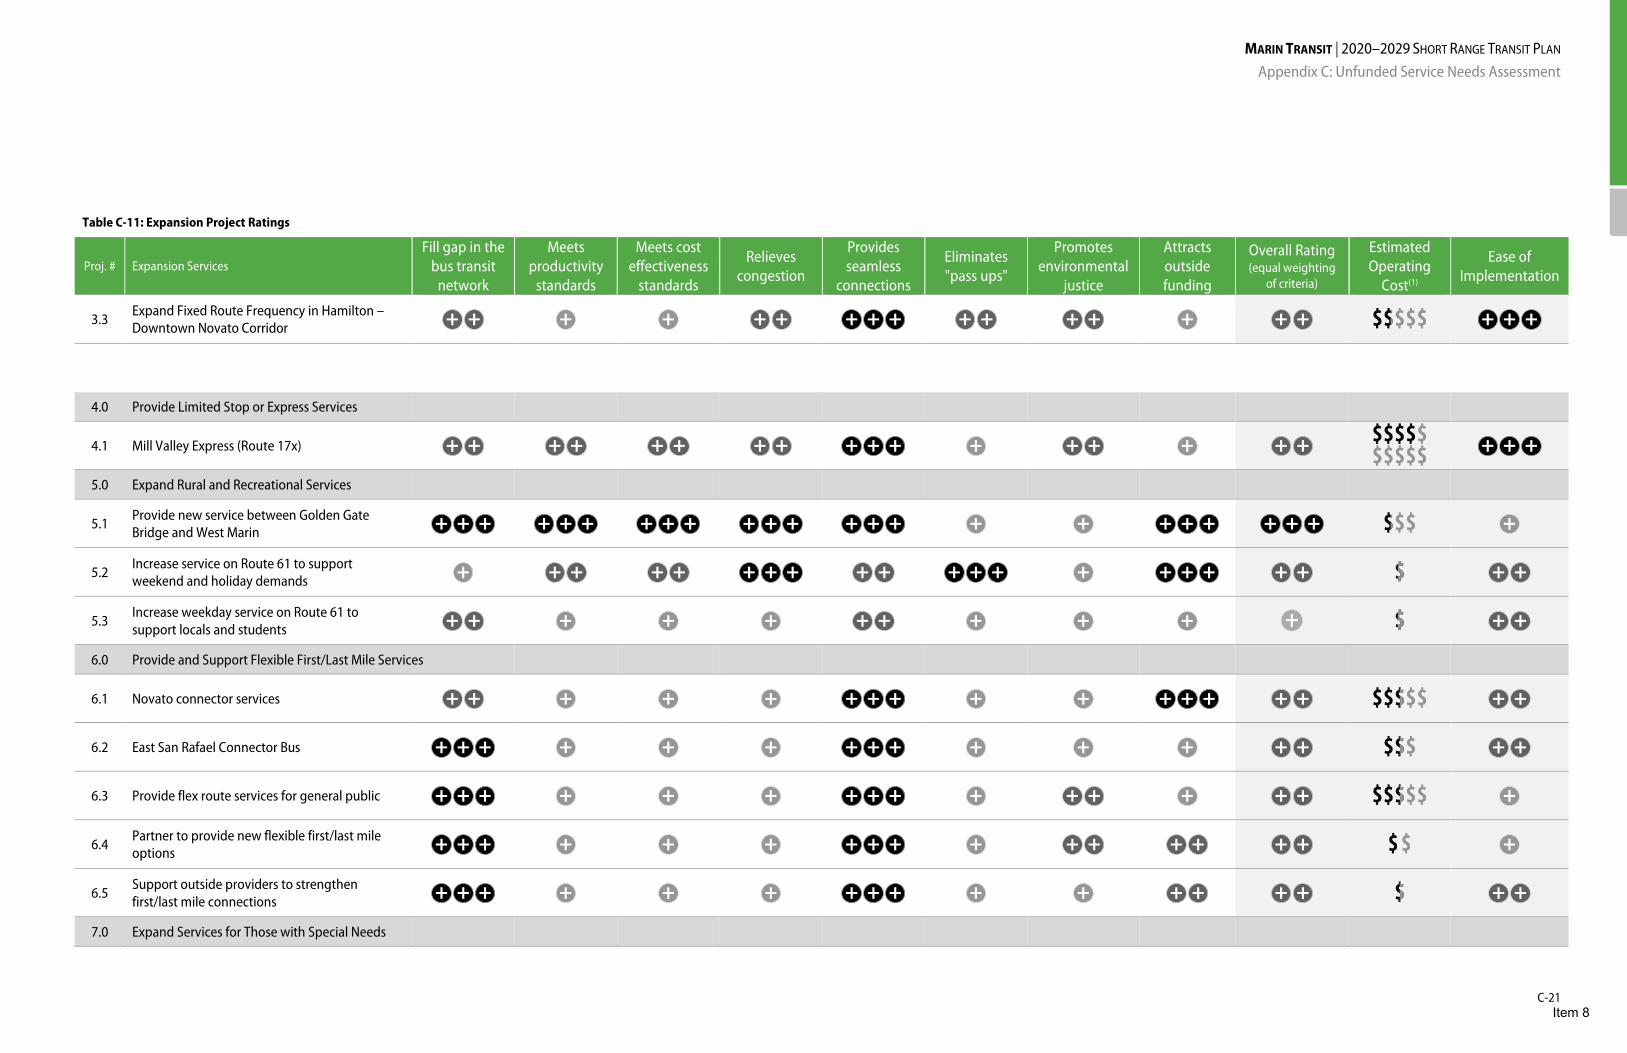
MARIN TRANSIT | 2020–2029 SHORT RANGE TRANSIT PLAN Appendix C: Unfunded Service Needs Assessment
C-21
Proj. # Expansion Services Fill gap in the
bus transit network
Meets productivity
standards
Meets cost effectiveness
standards
Relieves congestion
Provides seamless
connections
Eliminates "pass ups"
Promotes environmental
justice
Attracts outside funding
Overall Rating (equal weighting
of criteria)
Estimated Operating
Cost(1)
Ease of Implementation
3.3 Expand Fixed Route Frequency in Hamilton –Downtown Novato Corridor
4.0 Provide Limited Stop or Express Services
4.1 Mill Valley Express (Route 17x)
5.0 Expand Rural and Recreational Services
5.1 Provide new service between Golden Gate Bridge and West Marin
5.2 Increase service on Route 61 to support weekend and holiday demands
5.3 Increase weekday service on Route 61 to support locals and students
6.0 Provide and Support Flexible First/Last Mile Services
6.1 Novato connector services
6.2 East San Rafael Connector Bus
6.3 Provide flex route services for general public
6.4 Partner to provide new flexible first/last mile options
6.5 Support outside providers to strengthen first/last mile connections
7.0 Expand Services for Those with Special Needs
+ + + + + + +++ + + + + + + + +++
+ + + + + + + + +++ + + + + + + +++
+++ +++ +++ +++ +++ + + +++ +++ +
+ + + + + +++ + + +++ + +++ + + + +
+ + + + + + + + + + + +
+ + + + + +++ + + +++ + + + +
+++ + + + +++ + + + + + + +
+++ + + + +++ + + + + + + +
+++ + + + +++ + + + + + + + +
+++ + + + +++ + + + + + + + +
Table C-11: Expansion Project Ratings
Item 8
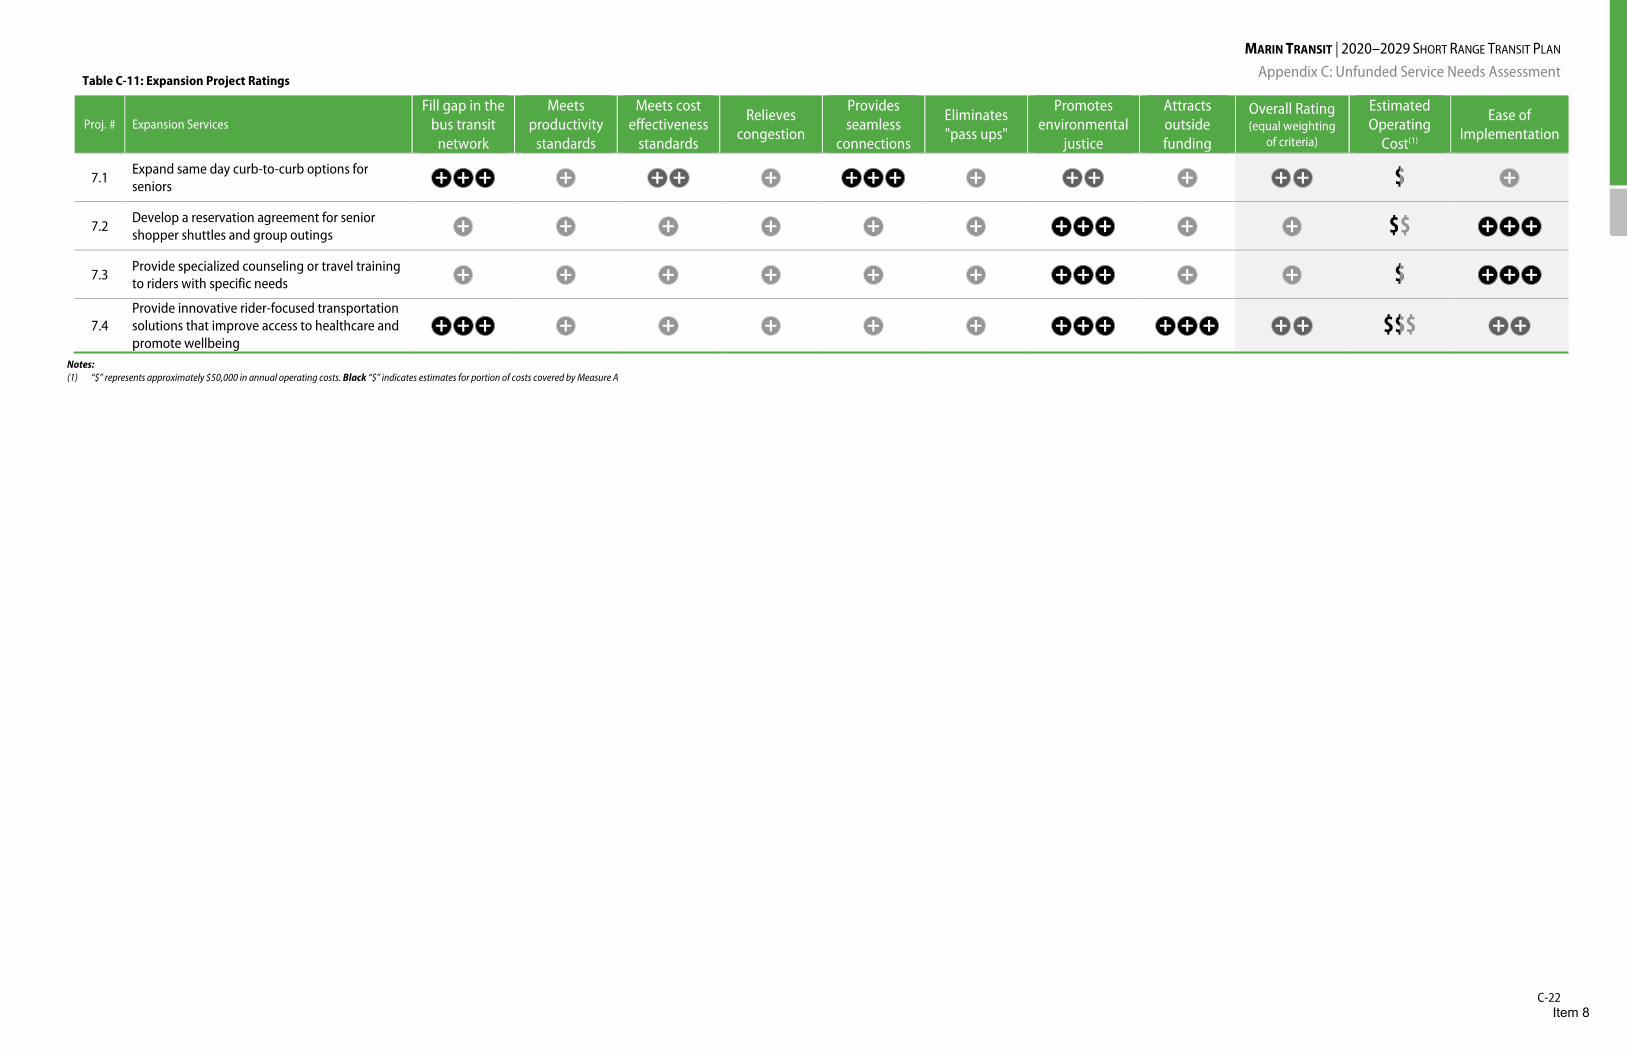
MARIN TRANSIT | 2020–2029 SHORT RANGE TRANSIT PLAN Appendix C: Unfunded Service Needs Assessment
C-22
Proj. # Expansion Services Fill gap in the
bus transit network
Meets productivity
standards
Meets cost effectiveness
standards
Relieves congestion
Provides seamless
connections
Eliminates "pass ups"
Promotes environmental
justice
Attracts outside funding
Overall Rating (equal weighting
of criteria)
Estimated Operating
Cost(1)
Ease of Implementation
7.1 Expand same day curb-to-curb options for seniors
7.2 Develop a reservation agreement for senior shopper shuttles and group outings
7.3 Provide specialized counseling or travel training to riders with specific needs
7.4 Provide innovative rider-focused transportation solutions that improve access to healthcare and promote wellbeing
Notes: (1) “$” represents approximately $50,000 in annual operating costs. Black “$” indicates estimates for portion of costs covered by Measure A
+++ + + + + +++ + + + + + + +
+ + + + + + +++ + + +++
+ + + + + + +++ + + +++
+++ + + + + + +++ +++ + + + +
Table C-11: Expansion Project Ratings
Item 8
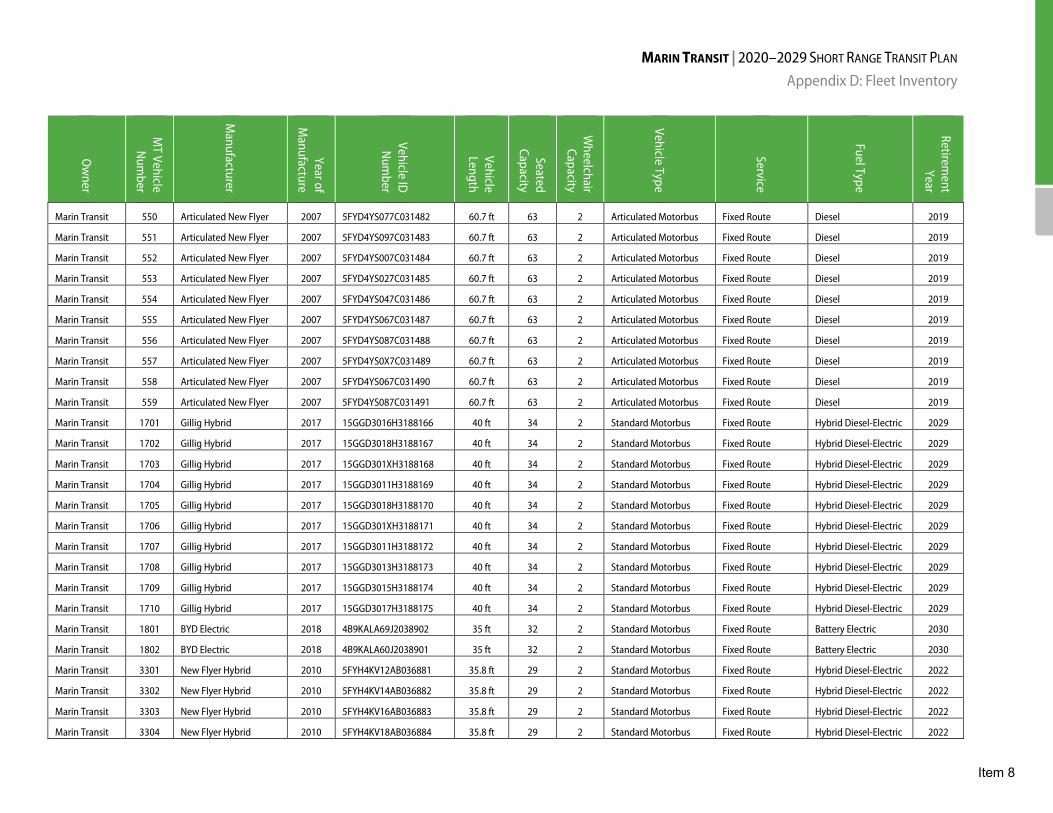
MARIN TRANSIT | 2020–2029 SHORT RANGE TRANSIT PLAN Appendix D: Fleet Inventory
Ow
ner
MT Vehicle N
umber
Manufacturer
Year of M
anufacture
Vehicle ID
Num
ber
Vehicle Length
Seated Capacity
Wheelchair Capacity
Vehicle Type
Service
Fuel Type
Retirement
Year
Marin Transit 550 Articulated New Flyer 2007 5FYD4YS077C031482 60.7 ft 63 2 Articulated Motorbus Fixed Route Diesel 2019
Marin Transit 551 Articulated New Flyer 2007 5FYD4YS097C031483 60.7 ft 63 2 Articulated Motorbus Fixed Route Diesel 2019
Marin Transit 552 Articulated New Flyer 2007 5FYD4YS007C031484 60.7 ft 63 2 Articulated Motorbus Fixed Route Diesel 2019
Marin Transit 553 Articulated New Flyer 2007 5FYD4YS027C031485 60.7 ft 63 2 Articulated Motorbus Fixed Route Diesel 2019
Marin Transit 554 Articulated New Flyer 2007 5FYD4YS047C031486 60.7 ft 63 2 Articulated Motorbus Fixed Route Diesel 2019
Marin Transit 555 Articulated New Flyer 2007 5FYD4YS067C031487 60.7 ft 63 2 Articulated Motorbus Fixed Route Diesel 2019
Marin Transit 556 Articulated New Flyer 2007 5FYD4YS087C031488 60.7 ft 63 2 Articulated Motorbus Fixed Route Diesel 2019
Marin Transit 557 Articulated New Flyer 2007 5FYD4YS0X7C031489 60.7 ft 63 2 Articulated Motorbus Fixed Route Diesel 2019
Marin Transit 558 Articulated New Flyer 2007 5FYD4YS067C031490 60.7 ft 63 2 Articulated Motorbus Fixed Route Diesel 2019
Marin Transit 559 Articulated New Flyer 2007 5FYD4YS087C031491 60.7 ft 63 2 Articulated Motorbus Fixed Route Diesel 2019
Marin Transit 1701 Gillig Hybrid 2017 15GGD3016H3188166 40 ft 34 2 Standard Motorbus Fixed Route Hybrid Diesel-Electric 2029
Marin Transit 1702 Gillig Hybrid 2017 15GGD3018H3188167 40 ft 34 2 Standard Motorbus Fixed Route Hybrid Diesel-Electric 2029
Marin Transit 1703 Gillig Hybrid 2017 15GGD301XH3188168 40 ft 34 2 Standard Motorbus Fixed Route Hybrid Diesel-Electric 2029
Marin Transit 1704 Gillig Hybrid 2017 15GGD3011H3188169 40 ft 34 2 Standard Motorbus Fixed Route Hybrid Diesel-Electric 2029
Marin Transit 1705 Gillig Hybrid 2017 15GGD3018H3188170 40 ft 34 2 Standard Motorbus Fixed Route Hybrid Diesel-Electric 2029
Marin Transit 1706 Gillig Hybrid 2017 15GGD301XH3188171 40 ft 34 2 Standard Motorbus Fixed Route Hybrid Diesel-Electric 2029
Marin Transit 1707 Gillig Hybrid 2017 15GGD3011H3188172 40 ft 34 2 Standard Motorbus Fixed Route Hybrid Diesel-Electric 2029
Marin Transit 1708 Gillig Hybrid 2017 15GGD3013H3188173 40 ft 34 2 Standard Motorbus Fixed Route Hybrid Diesel-Electric 2029
Marin Transit 1709 Gillig Hybrid 2017 15GGD3015H3188174 40 ft 34 2 Standard Motorbus Fixed Route Hybrid Diesel-Electric 2029
Marin Transit 1710 Gillig Hybrid 2017 15GGD3017H3188175 40 ft 34 2 Standard Motorbus Fixed Route Hybrid Diesel-Electric 2029
Marin Transit 1801 BYD Electric 2018 4B9KALA69J2038902 35 ft 32 2 Standard Motorbus Fixed Route Battery Electric 2030
Marin Transit 1802 BYD Electric 2018 4B9KALA60J2038901 35 ft 32 2 Standard Motorbus Fixed Route Battery Electric 2030
Marin Transit 3301 New Flyer Hybrid 2010 5FYH4KV12AB036881 35.8 ft 29 2 Standard Motorbus Fixed Route Hybrid Diesel-Electric 2022
Marin Transit 3302 New Flyer Hybrid 2010 5FYH4KV14AB036882 35.8 ft 29 2 Standard Motorbus Fixed Route Hybrid Diesel-Electric 2022
Marin Transit 3303 New Flyer Hybrid 2010 5FYH4KV16AB036883 35.8 ft 29 2 Standard Motorbus Fixed Route Hybrid Diesel-Electric 2022
Marin Transit 3304 New Flyer Hybrid 2010 5FYH4KV18AB036884 35.8 ft 29 2 Standard Motorbus Fixed Route Hybrid Diesel-Electric 2022
Item 8
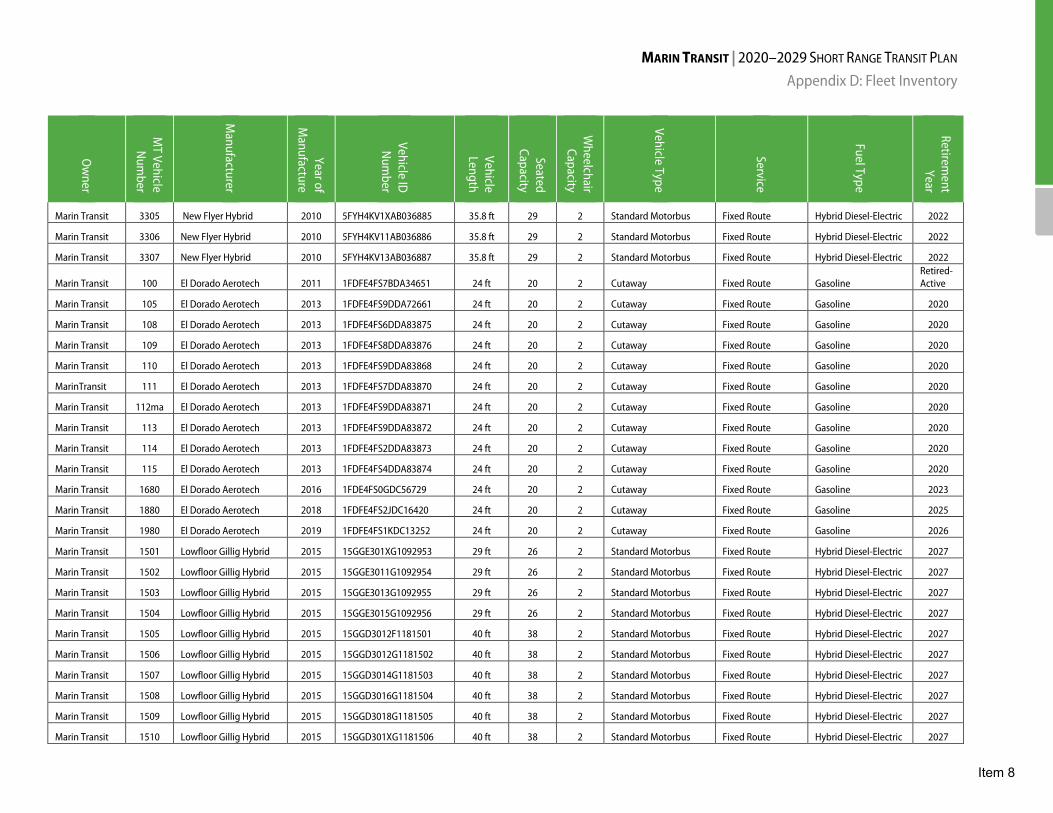
MARIN TRANSIT | 2020–2029 SHORT RANGE TRANSIT PLAN Appendix D: Fleet Inventory
Ow
ner
MT Vehicle N
umber
Manufacturer
Year of M
anufacture
Vehicle ID
Num
ber
Vehicle Length
Seated Capacity
Wheelchair Capacity
Vehicle Type
Service
Fuel Type
Retirement
Year
Marin Transit 3305 New Flyer Hybrid 2010 5FYH4KV1XAB036885 35.8 ft 29 2 Standard Motorbus Fixed Route Hybrid Diesel-Electric 2022
Marin Transit 3306 New Flyer Hybrid 2010 5FYH4KV11AB036886 35.8 ft 29 2 Standard Motorbus Fixed Route Hybrid Diesel-Electric 2022
Marin Transit 3307 New Flyer Hybrid 2010 5FYH4KV13AB036887 35.8 ft 29 2 Standard Motorbus Fixed Route Hybrid Diesel-Electric 2022
Marin Transit 100 El Dorado Aerotech 2011 1FDFE4FS7BDA34651 24 ft 20 2 Cutaway Fixed Route Gasoline Retired-Active
Marin Transit 105 El Dorado Aerotech 2013 1FDFE4FS9DDA72661 24 ft 20 2 Cutaway Fixed Route Gasoline 2020
Marin Transit 108 El Dorado Aerotech 2013 1FDFE4FS6DDA83875 24 ft 20 2 Cutaway Fixed Route Gasoline 2020
Marin Transit 109 El Dorado Aerotech 2013 1FDFE4FS8DDA83876 24 ft 20 2 Cutaway Fixed Route Gasoline 2020
Marin Transit 110 El Dorado Aerotech 2013 1FDFE4FS9DDA83868 24 ft 20 2 Cutaway Fixed Route Gasoline 2020
MarinTransit 111 El Dorado Aerotech 2013 1FDFE4FS7DDA83870 24 ft 20 2 Cutaway Fixed Route Gasoline 2020
Marin Transit 112ma El Dorado Aerotech 2013 1FDFE4FS9DDA83871 24 ft 20 2 Cutaway Fixed Route Gasoline 2020
Marin Transit 113 El Dorado Aerotech 2013 1FDFE4FS9DDA83872 24 ft 20 2 Cutaway Fixed Route Gasoline 2020
Marin Transit 114 El Dorado Aerotech 2013 1FDFE4FS2DDA83873 24 ft 20 2 Cutaway Fixed Route Gasoline 2020
Marin Transit 115 El Dorado Aerotech 2013 1FDFE4FS4DDA83874 24 ft 20 2 Cutaway Fixed Route Gasoline 2020
Marin Transit 1680 El Dorado Aerotech 2016 1FDE4FS0GDC56729 24 ft 20 2 Cutaway Fixed Route Gasoline 2023
Marin Transit 1880 El Dorado Aerotech 2018 1FDFE4FS2JDC16420 24 ft 20 2 Cutaway Fixed Route Gasoline 2025
Marin Transit 1980 El Dorado Aerotech 2019 1FDFE4FS1KDC13252 24 ft 20 2 Cutaway Fixed Route Gasoline 2026
Marin Transit 1501 Lowfloor Gillig Hybrid 2015 15GGE301XG1092953 29 ft 26 2 Standard Motorbus Fixed Route Hybrid Diesel-Electric 2027
Marin Transit 1502 Lowfloor Gillig Hybrid 2015 15GGE3011G1092954 29 ft 26 2 Standard Motorbus Fixed Route Hybrid Diesel-Electric 2027
Marin Transit 1503 Lowfloor Gillig Hybrid 2015 15GGE3013G1092955 29 ft 26 2 Standard Motorbus Fixed Route Hybrid Diesel-Electric 2027
Marin Transit 1504 Lowfloor Gillig Hybrid 2015 15GGE3015G1092956 29 ft 26 2 Standard Motorbus Fixed Route Hybrid Diesel-Electric 2027
Marin Transit 1505 Lowfloor Gillig Hybrid 2015 15GGD3012F1181501 40 ft 38 2 Standard Motorbus Fixed Route Hybrid Diesel-Electric 2027
Marin Transit 1506 Lowfloor Gillig Hybrid 2015 15GGD3012G1181502 40 ft 38 2 Standard Motorbus Fixed Route Hybrid Diesel-Electric 2027
Marin Transit 1507 Lowfloor Gillig Hybrid 2015 15GGD3014G1181503 40 ft 38 2 Standard Motorbus Fixed Route Hybrid Diesel-Electric 2027
Marin Transit 1508 Lowfloor Gillig Hybrid 2015 15GGD3016G1181504 40 ft 38 2 Standard Motorbus Fixed Route Hybrid Diesel-Electric 2027
Marin Transit 1509 Lowfloor Gillig Hybrid 2015 15GGD3018G1181505 40 ft 38 2 Standard Motorbus Fixed Route Hybrid Diesel-Electric 2027
Marin Transit 1510 Lowfloor Gillig Hybrid 2015 15GGD301XG1181506 40 ft 38 2 Standard Motorbus Fixed Route Hybrid Diesel-Electric 2027
Item 8

MARIN TRANSIT | 2020–2029 SHORT RANGE TRANSIT PLAN Appendix D: Fleet Inventory
Ow
ner
MT Vehicle N
umber
Manufacturer
Year of M
anufacture
Vehicle ID
Num
ber
Vehicle Length
Seated Capacity
Wheelchair Capacity
Vehicle Type
Service
Fuel Type
Retirement
Year
Marin Transit 1511 Lowfloor Gillig Hybrid 2015 15GGD3011G1181507 40 ft 38 2 Standard Motorbus Fixed Route Hybrid Diesel-Electric 2027
Caltrans 618 El Dorado Aero Elite 270 2012 1FDAF5GY1BED06704 27 ft 22 2 Cutaway Fixed Route Gasoline 2019
Caltrans 619 El Dorado Aero Elite 270 2012 1FDAF5GY2BEC98984 27 ft 22 2 Cutaway Fixed Route Gasoline 2019
Caltrans 620 El Dorado Aero Elite 270 2012 1FDAF5GY4BEC64917 27 ft 22 2 Cutaway Fixed Route Gasoline 2019
Caltrans 1136 El Dorado Aero Elite 320 2012 1FDAF5GY3CEA34206 32 ft 30 2 Cutaway Fixed Route Gasoline 2019
Marin Transit 1560 El Dorado Aero Elite 270 2015 1FDAF5GY4FED20196 27 ft 22 2 Cutaway Fixed Route Gasoline 2022
Marin Transit 1561 El Dorado Aero Elite 270 2015 1FDAF5GY6FED46248 27 ft 22 2 Cutaway Fixed Route Gasoline 2022
Marin Transit 301MV El Dorado 29' XHF 2015 1N9HBAC60FC084220 29 ft 29 2 Standard Motorbus Fixed Route Diesel 2027
Marin Transit 1760 El Dorado 29' XHF 2017 1N9HBAC65HC084098 29 ft 29 2 Standard Motorbus Fixed Route Diesel 2029
Marin Transit 1761 El Dorado 29' XHF 2017 1N9HBAC67HC084099 29 ft 29 2 Standard Motorbus Fixed Route Diesel 2029
Marin Transit 1860 El Dorado 35' XHF 2018 1N9HEAC65JC084231 35 ft 41 2 Standard Motorbus Fixed Route Diesel 2030
Marin Transit 1861 El Dorado 35' XHF 2018 1N9HEAC67JC084232 35 ft 41 2 Standard Motorbus Fixed Route Diesel 2030
Marin Transit 3060 El Dorado 35' XHF 2008 1N9HEACL48C084169 35 ft 37 2 Standard Motorbus Fixed Route Diesel 2020
Marin Transit 3061 El Dorado 35' XHF 2008 1N9HEACL08C084170 35 ft 37 2 Standard Motorbus Fixed Route Diesel 2020
Marin Transit 3062 El Dorado 35' XHF 2011 1N9HEACL2BC084226 35 ft 37 2 Standard Motorbus Fixed Route Diesel 2023
Marin Transit 3063 El Dorado 35' XHF 2011 1N9HEACL4BC084227 35 ft 37 2 Standard Motorbus Fixed Route Diesel 2023
Marin Transit 3064 El Dorado 35' XHF 2011 1N9HEACL6BC084228 35 ft 37 2 Standard Motorbus Fixed Route Diesel 2023
Marin Transit 3065 El Dorado 35' XHF 2012 1N9HEACL2DC084066 35 ft 37 2 Standard Motorbus Fixed Route Diesel 2024
Marin Transit 3066 El Dorado 35' XHF 2012 1N9HEACL4DC084067 35 ft 37 2 Standard Motorbus Fixed Route Diesel 2024
Marin Transit 3067 El Dorado 35' XHF 2012 1N9HEACL6DC084068 35 ft 37 2 Standard Motorbus Fixed Route Diesel 2024
Marin Transit 3068 El Dorado 35' XHF 2012 1N9HEACL8DC084069 35 ft 37 2 Standard Motorbus Fixed Route Diesel 2024
Marin Transit 3069 El Dorado 35' XHF 2012 1N9HEACL4DC084070 35 ft 37 2 Standard Motorbus Fixed Route Diesel 2024
Marin Transit 1860 El Dorado 35' XHF 2018 1N9HEAC65JC084231 35 ft 37 2 Standard Motorbus Fixed Route Diesel 2030
Marin Transit 1861 El Dorado 35' XHF 2018 1N9HEAC67JC084232 35ft 37 2 Standard Motorbus Fixed Route Diesel 2030
Marin Transit 1870 Mobile Information Kiosk 2018 1FDUF5GT1HEE86051 - 0 0 Other Other Gasoline 2033
Marin Transit 308 Starcraft 2009 1FD3E35L68DB57261 22 ft 8 3 Cutaway Demand Response Gasoline Retired Active
Item 8

MARIN TRANSIT | 2020–2029 SHORT RANGE TRANSIT PLAN Appendix D: Fleet Inventory
Ow
ner
MT Vehicle N
umber
Manufacturer
Year of M
anufacture
Vehicle ID
Num
ber
Vehicle Length
Seated Capacity
Wheelchair Capacity
Vehicle Type
Service
Fuel Type
Retirement
Year
Marin Transit 701 Starcraft Ford Class A 2015 1FDEE3FL9FDA12259 20 ft 8 3 Cutaway Demand Response Gasoline 2020
Marin Transit 702 Starcraft Ford Class A 2015 1FDEE3FL3FDA12263 20 ft 8 3 Cutaway Demand Response Gasoline 2020
Marin Transit 703 Starcraft Ford Class A 2015 1FDEE3FLXFDA12258 20 ft 8 3 Cutaway Demand Response Gasoline 2020
Marin Transit 704 Starcraft Ford Class A 2015 1FDEE3FL5FDA12264 20 ft 8 3 Cutaway Demand Response Gasoline 2020
Marin Transit 705 Starcraft Ford Class A 2015 1FDEE3FL4FDA12269 20 ft 8 3 Cutaway Demand Response Gasoline 2020
Marin Transit 706 Starcraft Ford Class A 2015 1FDEE3FL4FDA12272 20 ft 8 3 Cutaway Demand Response Gasoline 2020
Marin Transit 707 Starcraft Ford Class A 2015 1FDEE3FL9FDA12266 20 ft 8 3 Cutaway Demand Response Gasoline 2020
Marin Transit 708 Starcraft Ford Class A 2015 1FDEE3EFLFDA12260 20 ft 8 3 Cutaway Demand Response Gasoline 2020
Marin Transit 709 Starcraft Ford Class A 2015 1FDEE3FL7FDA12265 20 ft 8 3 Cutaway Demand Response Gasoline 2020
Marin Transit 710 Starcraft Ford Class A 2015 1FDEE3FL9GDC07284 20 ft 8 3 Cutaway Demand Response Gasoline 2020
Marin Transit 711 Starcraft Ford Class A 2015 1FDEE3FL6GDC07291 20 ft 8 3 Cutaway Demand Response Gasoline 2020
Marin Transit 712 Starcraft Ford Class A 2015 1FDEE3FL8GDC07289 20 ft 8 3 Cutaway Demand Response Gasoline 2020
Marin Transit 713 Starcraft Ford Class A 2015 1FDEE3FL6GDC07288 20 ft 8 3 Cutaway Demand Response Gasoline 2020
Marin Transit 714 Starcraft Ford Class A 2015 1FDEE3FL8GDC07292 20 ft 8 3 Cutaway Demand Response Gasoline 2020
Marin Transit 715 Starcraft Ford Class A 2015 1FDEE3FL4GDC07290 20 ft 8 3 Cutaway Demand Response Gasoline 2020
Marin Transit 716 Starcraft Ford Class A 2015 1FDEE3FL4GDC07287 20 ft 8 3 Cutaway Demand Response Gasoline 2020
Marin Transit 717 Starcraft Ford Class A 2015 1FDEE3FL5GDC07282 20 ft 8 3 Cutaway Demand Response Gasoline 2020
Marin Transit 718 Starcraft Ford Class A 2015 1FDEE3FL3GDC07281 20 ft 8 3 Cutaway Demand Response Gasoline 2020
Marin Transit 719 Starcraft Ford Class A 2015 1FDEE3FL2GDC07286 20 ft 8 3 Cutaway Demand Response Gasoline 2020
Marin Transit 720 Starcraft Ford Class A 2015 1FDEE3FL1GDC07280 20 ft 8 3 Cutaway Demand Response Gasoline 2020
Marin Transit 721 Starcraft Ford Class A 2015 1FDEE3FL0GDC07285 20 ft 8 3 Cutaway Demand Response Gasoline 2020
Marin Transit 722 Starcraft Ford Class A 2015 1FDEE3FL7GDC07283 20 ft 8 3 Cutaway Demand Response Gasoline 2020
Marin Transit 723 Starcraft Ford Class A 2015 1FDEE3FL1GDC07294 20 ft 8 3 Cutaway Demand Response Gasoline 2020
Marin Transit 724 Starcraft Ford Class A 2015 1FDEE3FLXGDC07293 20 ft 8 3 Cutaway Demand Response Gasoline 2020
Marin Transit 801 Starcraft Ford Class B 2015 1FDEE4FLOFDA25638 22 ft 12 3 Cutaway Demand Response Gasoline 2020
Marin Transit 802 Starcraft Ford Class B 2015 1FDEE4FL9FDA25640 22 ft 12 3 Cutaway Demand Response Gasoline 2020
Marin Transit 803 Starcraft Ford Class B 2015 1FDEE4FL7FDA25636 22 ft 12 3 Cutaway Demand Response Gasoline 2020
Item 8

MARIN TRANSIT | 2020–2029 SHORT RANGE TRANSIT PLAN Appendix D: Fleet Inventory
Ow
ner
MT Vehicle N
umber
Manufacturer
Year of M
anufacture
Vehicle ID
Num
ber
Vehicle Length
Seated Capacity
Wheelchair Capacity
Vehicle Type
Service
Fuel Type
Retirement
Year
Marin Transit 804 Starcraft Ford Class B 2015 1FDEE4FL0FDA25641 22 ft 12 3 Cutaway Demand Response Gasoline 2020
Marin Transit 805 Starcraft Ford Class B 2015 1FDEE4FL9FDA25637 22 ft 12 3 Cutaway Demand Response Gasoline 2020
Marin Transit 806 Starcraft Ford Class B 2015 1FDEE3FL9FDA25635 22 ft 12 3 Cutaway Demand Response Gasoline 2020
Marin Transit 807 Starcraft Ford Class B 2015 1FDEE3FL9FDA25639 22 ft 12 3 Cutaway Demand Response Gasoline 2020
Marin Transit 808 Starcraft Ford Class B 2018 1FDEE3FS2JDC16505 24 ft 12 3 Cutaway Demand Response Gasoline 2023
Marin Transit 809 Starcraft Ford Class B 2018 1FDEE3FS9JDC16503 24 ft 12 3 Cutaway Demand Response Gasoline 2023
Marin Transit 810 Starcraft Ford Class B 2018 1FDEE3FS8JDC14466 24 ft 12 3 Cutaway Demand Response Gasoline 2023
Marin Transit 1830 Ford Transit Van 2017 1FBZX2CMXJKA11854 22 ft 6 Van Demand Response Gasoline 2022
Marin Transit 1831 Ford Transit Van 2017 1FBZX2CM9HKA50865 22 ft 6 Van Demand Response Gasoline 2022
Marin Transit 1832 Ford Transit Van 2017 1FBZX2CM8HKA77068 22 ft 6 Van Demand Response Gasoline 2022
Marin Transit 1833 Ford Transit Van 2017 1FBZX2CM7HKB38961 22 ft 6 Van Demand Response Gasoline 2022 Golden Gate Transit 501 El Dorado 2013 1FDEE3FL6DDA45187 22 ft 8 3 Cutaway Demand Response Gasoline 2018 Golden Gate Transit 502 El Dorado 2013 1FDEE3FLXDDA39960 22 ft 8 3 Cutaway Demand Response Gasoline 2018 Golden Gate Transit 503 El Dorado 2013 1FDEE3FL1DDA39961 22 ft 8 3 Cutaway Demand Response Gasoline 2018 Golden Gate Transit 504 El Dorado 2013 1FDEE3FL3DDA39962 22 ft 8 3 Cutaway Demand Response Gasoline 2018 Golden Gate Transit 505 El Dorado 2013 1FDEE3FL9DDA89121 22 ft 8 3 Cutaway Demand Response Gasoline 2018 Golden Gate Transit 506 El Dorado 2013 1FDEE3FL0DDA89122 22 ft 8 3 Cutaway Demand Response Gasoline 2018 Golden Gate Transit 507 El Dorado 2013 1FDEE3FL2DDA89123 22 ft 8 3 Cutaway Demand Response Gasoline 2018 Golden Gate Transit 508 El Dorado 2013 1FDEE3FL4DDA89124 22 ft 8 3 Cutaway Demand Response Gasoline 2018 Golden Gate Transit 509 El Dorado 2013 1FDEE3FL6DDA89125 22 ft 8 3 Cutaway Demand Response Gasoline 2018 Golden Gate Transit 510 El Dorado 2013 1FDEE3FLODDB06033 22 ft 8 3 Cutaway Demand Response Gasoline 2018 Golden Gate Transit 511 El Dorado 2013 1FDEE3FL6DDB06036 22 ft 8 3 Cutaway Demand Response Gasoline 2018 Golden Gate Transit 512 El Dorado 2013 1FDEE3FL8DDB06037 22 ft 8 3 Cutaway Demand Response Gasoline 2018
Item 8
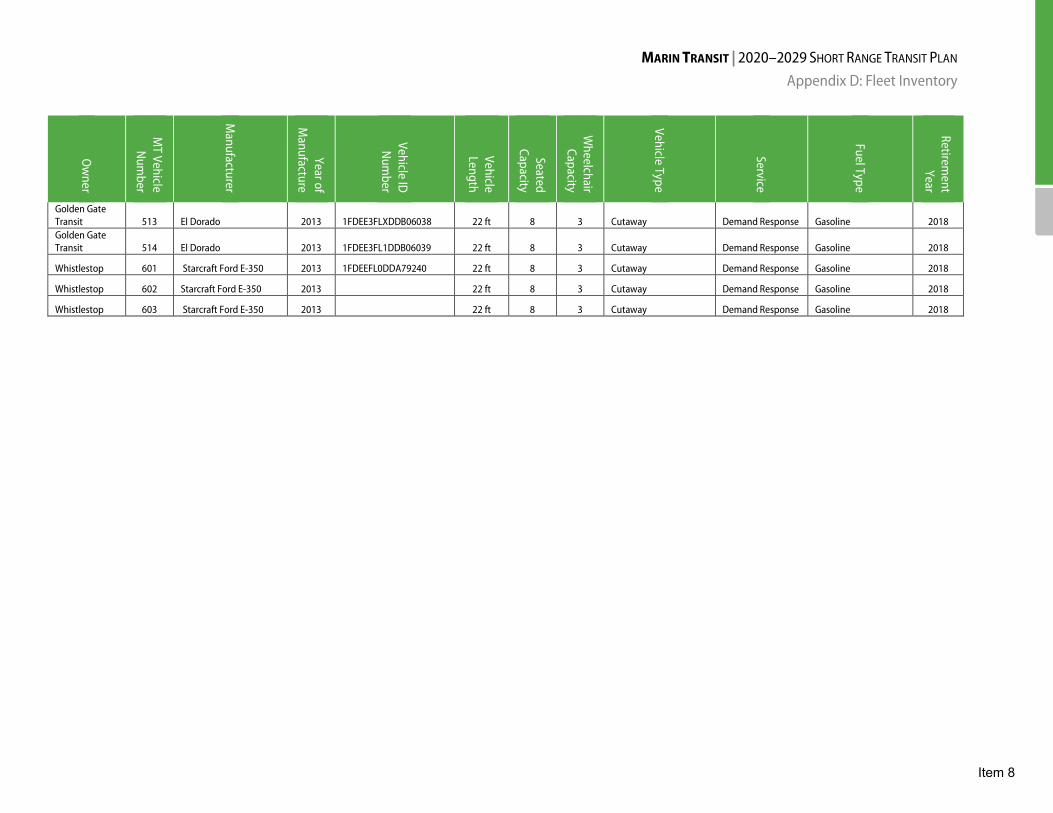
MARIN TRANSIT | 2020–2029 SHORT RANGE TRANSIT PLAN Appendix D: Fleet Inventory
Ow
ner
MT Vehicle N
umber
Manufacturer
Year of M
anufacture
Vehicle ID
Num
ber
Vehicle Length
Seated Capacity
Wheelchair Capacity
Vehicle Type
Service
Fuel Type
Retirement
Year
Golden Gate Transit 513 El Dorado 2013 1FDEE3FLXDDB06038 22 ft 8 3 Cutaway Demand Response Gasoline 2018 Golden Gate Transit 514 El Dorado 2013 1FDEE3FL1DDB06039 22 ft 8 3 Cutaway Demand Response Gasoline 2018
Whistlestop 601 Starcraft Ford E-350 2013 1FDEEFL0DDA79240 22 ft 8 3 Cutaway Demand Response Gasoline 2018
Whistlestop 602 Starcraft Ford E-350 2013 22 ft 8 3 Cutaway Demand Response Gasoline 2018
Whistlestop 603 Starcraft Ford E-350 2013 22 ft 8 3 Cutaway Demand Response Gasoline 2018
Item 8

MARIN TRANSIT | 2020–2029 SHORT RANGE TRANSIT PLAN Appendix E: Title VI Program
E-1
Appendix E: Title VI Program
Marin Transit’s Title VI Program is available for download at:
http://marintransit.org/titlevi.html
This plan was approved by the Marin Transit Board of Directors on July 24, 2017 and is updated every three years. Below is the Plan’s Table of Contents that shows the outline and structure of the document.
Marin County Transit District Federal Title VI Civil Rights Program for 2017-2020 to comply with FTA Circular C 4702.1B issued October 2012 ........................................................................................ 1
Marin Transit Title VI Complaint Procedures ................................................................................................ 3
Marin Transit Title VI Complaint Form .......................................................................................................... 5
List of Transit-Related Title VI Investigations, Complaints, and Lawsuits ................................................ 8
Marin Transit Public Participation Plan ............................................................................................... 9
Introduction ........................................................................................................................................................ 10
Developing Plans to Engage the Public ......................................................................................................... 10
Characteristics of Marin Local Transit Riders ............................................................................................... 11
Marin Transit Methods for Public Outreach and Participation ................................................................. 12
Project Open Houses, Workshops, and Community Meetings ................................................................. 14
Website Support ................................................................................................................................................. 15
Media Relations and Non-English Speaking Residents ............................................................................... 15
Community Events ............................................................................................................................................ 16
Community Organizations ............................................................................................................................... 16
Flexible Public Participation Opportunities .................................................................................................. 16
Translation Assistance ....................................................................................................................................... 16
Multilingual Information Materials ................................................................................................................. 17
Presentations and Visual Aids .......................................................................................................................... 17
Street Level and On Board the Bus Outreach .............................................................................................. 17
Social Media ........................................................................................................................................................ 17
Community Advisory Groups and Focus Groups ....................................................................................... 18
Public Notices and Legal Notices ................................................................................................................... 18
Community-Based Organizations and Contractor Outreach ..................................................................... 18
Email Communication ...................................................................................................................................... 18
Board of Directors’ Meetings ........................................................................................................................... 18
Passenger Advisory Groups ............................................................................................................................. 19
Item 8
MARIN TRANSIT | 2020–2029 SHORT RANGE TRANSIT PLAN Appendix E: Title VI Program
E-2
Mobility Management Travel Training Programs ......................................................................................... 19
Metropolitan Transportation Commission (MTC) / Public Participation Plan ...................................... 19
Public Participation in Major Service and Fare Changes .................................................................... 20
Legal Publication of Notice and Additional Outreach on Public Hearings ............................................. 20
Identifying Lessons Learned ............................................................................................................................ 21
Keeping the Public Participation Plan Up-to-Date ...................................................................................... 22
Marin Access Mobility Management Goals and Activities Regarding Outreach to Riders, Stakeholders, and Community Organizations ............................................................................................... 23
APPENDIX A - Marin Transit Public Participation Plan and Summary of Results for Proposed Major Service Changes for June 2016 ............................................................................................................ 26
APPENDIX B – Community Input on Outreach Strategies ..................................................................... 30
APPENDIX C – Marin Transit Public Outreach Activities by Type of Service Change ...................... 31
Marin Transit Language Assistance Plan - Improving Access to Transit Services for Persons with Limited English Proficiency in Marin County .................................................................................... 34
1. Introduction .................................................................................................................................................... 35
2. Plan Summary ................................................................................................................................................ 35
3. Marin Transit’s Service Area and Demographics ..................................................................................... 35
4. LEP Four Factor Analysis ............................................................................................................................ 37
6. Building on Marin Transit’s Inclusive Coordinated Transportation Partnership to Reach Spanish- and Vietnamese-Speaking Senior & Disabled Residents ............................................................................. 55
7. Contact Information ..................................................................................................................................... 56
Attachment 1 - Marin Transit Passenger Survey 2017 - Results from Selected Questions ................... 57
Membership of Non-Elected Committees and Councils .................................................................... 60
Description of Marin Transit Monitoring of Subrecipients for Compliance with Title VI ................. 60
Title VI Equity Analysis of Marin Transit Constructed Facilities ...................................................... 60
Setting System-wide Service Standards and Policies ............................................................................ 61
Demographic and Service Profile Maps and Charts ............................................................................ 65
Demographic Ridership and Travel Patterns, Collected by Surveys................................................... 75
Demographics and Travel Patterns of Marin Transit Riders .............................................................. 78
Results of Marin Transit’s System Monitoring Program and Report.................................................. 83
Public Engagement Process for Developing Policies for Major Service Changes, Disparate Impact, and Disproportionate Burden .............................................................................................................. 90
Marin Transit Title VI Civil Rights Policies on Major Service Changes, Disparate Impact, and Disproportionate Burden ...................................................................................................................... 91
Marin Transit Policy on Major Service Changes ........................................................................................... 91
Item 8

MARIN TRANSIT | 2020–2029 SHORT RANGE TRANSIT PLAN Appendix E: Title VI Program
E-3
Marin Transit Policies on Disparate Impact and Disproportionate Burden ............................................ 95
Results of Service and/or Fare Equity Analyses Conducted ............................................................... 98
Title VI Fare Equity Analysis for Change to Youth Fare Category and Elimination of Stored Value Cards .................................................................................................................................................................... 99
Title VI Service Equity Analysis of West Marin Stagecoach Route 68 Expansion ............................... 109
Title VI Service Equity Analysis of Proposed Major Service Changes to Marin Local Bus and Community Shuttle Routes for June 2016 ................................................................................................... 114
Programa de Derechos Civiles para 2017-2020 de Marin County Transit District conforme al Título VI Federal para cumplir con el Comunicado C 4702.1B de la FTA emitido en octubre de 2012 ....... 147
Declaración de la Política conforme al Título VI de Marin Transit – Aviso al Público ....................... 148
Procedimientos de Queja conforme al Título VI de Marin Transit ........................................................ 149
Formulario de Queja conforme al Título VI de Marin Transit ................................................................ 151
Item 8
MARIN TRANSIT | 2020–2029 SHORT RANGE TRANSIT PLAN Appendix F: Operating Revenue
F-1
Appendix F: Operating Revenue
Item 8

MARIN TRANSIT | 2020–2029 SHORT RANGE TRANSIT PLAN Appendix F: Operating Revenue
F-2
Source
% of Operations
Budget
FY2020 Funding (Millions)
Projected Growth
Description Notes
LOCA
L
Fares 11% $4.1 0% Farebox revenue Cash fares, pass sales, clipper usage, youth pass sales; no growth except with fare increase in FY2022
Measure A/Measure AA
39% $14.4 2.7% 1/2 cent County Sales Tax
Under Measure AA District receives 54.5% of revenues generated by this tax after administrative other costs - 33% for local operations, 3% for rural operations, 9.5% for special services, 4% for capital and 5% for school service
Measure B 3% $1.2 0.0% Marin County $10 Vehicle License Fee
Marin Transit receives 35% for specialized senior and paratransit programs
Property Tax 12% $4.6 3.0% Marin County Property Tax Dedicated tax allocated directly to Marin Transit
Other 7% $2.5 3.0% Fee for Service, Advertising, Interest etc.
Includes GGBHTD payments for the regional paratransit and a contribution towards local paratransit; Also includes interest and advertising revenue.
STAT
E
TDA 14% $5.8 2.7% State Local Transportation Fund (LTF) - Transportation Development Act Funding; 1/4-cent statewide sales tax
Statewide allocated based on population; Marin County share is split under terms within GGT operations contract based on passengers and hours; Marin Transit received 38% in FY18
STA Population 6%
$1.3 1.5% State Transportation Development Act Funding, from state sales tax on diesel fuel
Distributed to Marin County Cities based on population, Marin Transit's share is split under terms within GGT operations contract based on passengers and hours; Marin Transit received 38.5% in FY20
STA Revenue $1.6 1.5% Distributed by the State to Transit Agencies based on annually reported local revenue expended on transit service.
STA Lifeline <1% $0.4 - MTC Program using multiple funding sources including Transit STA
Depending on the cycle this has been distributed by formula or by a competitive grant process administered by the Transportation Authority of Marin
Item 8
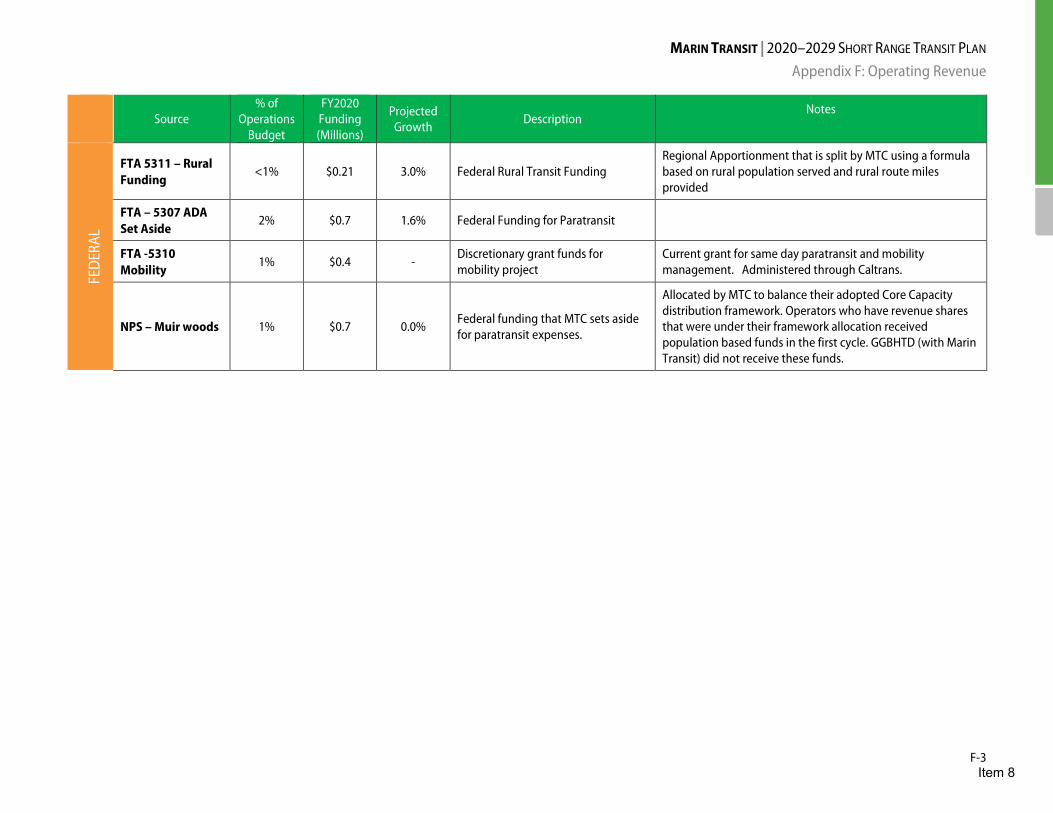
MARIN TRANSIT | 2020–2029 SHORT RANGE TRANSIT PLAN Appendix F: Operating Revenue
F-3
Source % of
Operations Budget
FY2020 Funding (Millions)
Projected Growth
Description Notes
FED
ERAL
FTA 5311 – Rural Funding
<1% $0.21 3.0% Federal Rural Transit Funding Regional Apportionment that is split by MTC using a formula based on rural population served and rural route miles provided
FTA – 5307 ADA Set Aside
2% $0.7 1.6% Federal Funding for Paratransit
FTA -5310 Mobility
1% $0.4 - Discretionary grant funds for mobility project
Current grant for same day paratransit and mobility management. Administered through Caltrans.
NPS – Muir woods 1% $0.7 0.0% Federal funding that MTC sets aside for paratransit expenses.
Allocated by MTC to balance their adopted Core Capacity distribution framework. Operators who have revenue shares that were under their framework allocation received population based funds in the first cycle. GGBHTD (with Marin Transit) did not receive these funds.
Item 8
MARIN TRANSIT | 2020–2029 SHORT RANGE TRANSIT PLAN Appendix F: Operating Revenue
F-4
Item 8
MARIN TRANSIT | 2020–2029 SHORT RANGE TRANSIT PLAN Appendix G: Zero Emission Fleet Replacement Plan
Appendix G: Zero Emission Fleet Replacement Plan
Marin Transit’s first Battery Electric Bus went into revenue service at the end of February, and staff is collecting information on range, fueling costs, and capabilities. Based on initial results, the range will not be sufficient for the majority of service blocks (the distance a bus drives in one day) without additional charging. Given the rapid pace of technological change and new electric buses in the pipeline, staff expects that the range for the next generation of zero-emission buses will increase. For purposes of the Fleet Replacement Plan, staff assumed the following availability for all-electric vehicles:
• An FTA-approved cutaway bus will be available in 2025; • An FTA-approved narrow body bus will be available in 2030; • The range of in-depot charged buses will increase from about 125 miles to 300 miles by 2027;
and • Over the next five years, there will not be a significant infusion of capital funding for Marin
Transit to construct infrastructure improvements that support in-route vehicle charging or hydrogen fueling stations.
To plan for technological uncertainty, Marin Transit staff has developed the following recommendations:
1) Develop a base plan that assumes the zero-emission technology is available to meet the minimum ICT requirements, without significant changes to routing or requiring in-route charging infrastructure;
2) Identify decision points that will allow time for developing route changes or infrastructure projects, if required; and
3) Identify decision points purchasing additional zero-emission vehicles if technology exceeds expectations and/or there is significant additional capital to pursue in-route charging or other mitigations to deploy zero-emission buses.
To meet the replacement plan goals, Marin Transit first anticipates the feasibility of converting the standard bus fleet to electric buses. The narrow-bodied vehicles needed for rural and recreational services have vehicle work blocks of over 300 miles on steep, hilly terrain. This makes them the most challenging to convert. Marin Transit plans to start to replace those vehicles with zero-emission technology in FY 2031 to allow more time for the technology to improve. Marin Transit will be able to modify the procurements planned for FY 2024 and FY 2027 should a suitable zero emission vehicle type become available earlier. In addition to the draft replacement plan in Table G-1 below, staff have provided a more detailed chart of the plan in Table G-2.
Item 8
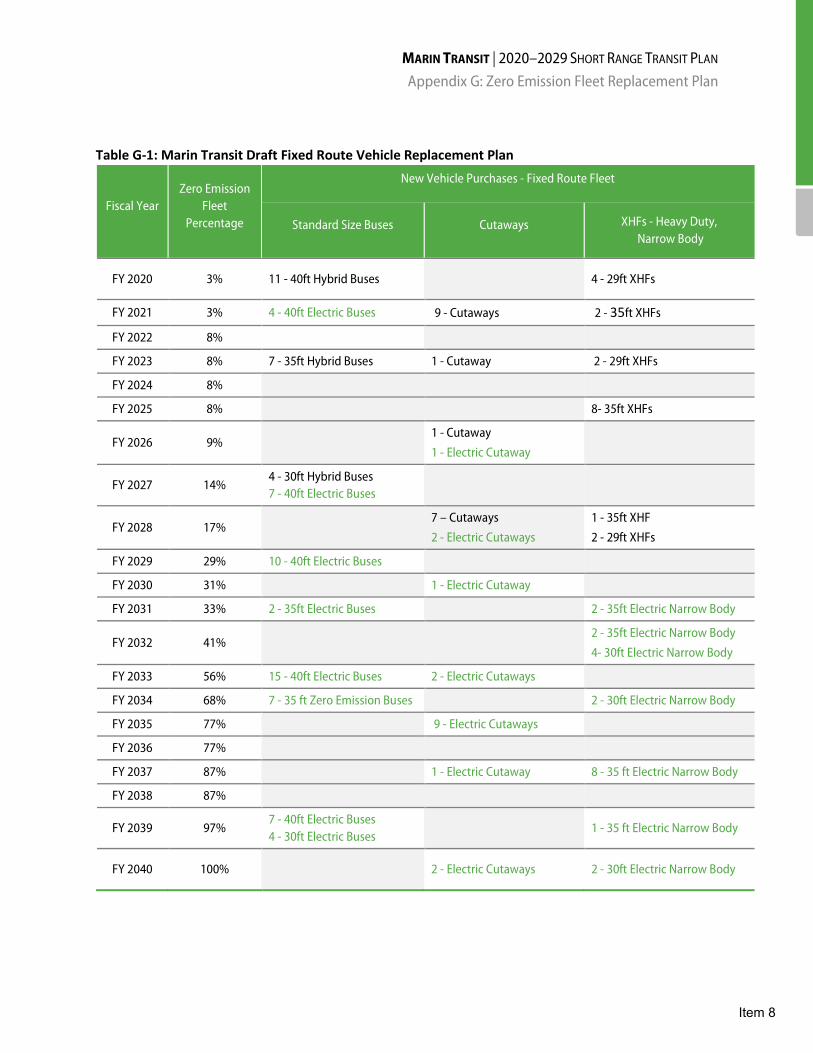
MARIN TRANSIT | 2020–2029 SHORT RANGE TRANSIT PLAN Appendix G: Zero Emission Fleet Replacement Plan
Table G-1: Marin Transit Draft Fixed Route Vehicle Replacement Plan
Fiscal Year Zero Emission
Fleet Percentage
New Vehicle Purchases - Fixed Route Fleet
Standard Size Buses Cutaways XHFs - Heavy Duty, Narrow Body
FY 2020 3% 11 - 40ft Hybrid Buses 4 - 29ft XHFs
FY 2021 3% 4 - 40ft Electric Buses 9 - Cutaways 2 - 35ft XHFs
FY 2022 8%
FY 2023 8% 7 - 35ft Hybrid Buses 1 - Cutaway 2 - 29ft XHFs
FY 2024 8%
FY 2025 8% 8- 35ft XHFs
FY 2026 9% 1 - Cutaway 1 - Electric Cutaway
FY 2027 14% 4 - 30ft Hybrid Buses 7 - 40ft Electric Buses
FY 2028 17% 7 – Cutaways 2 - Electric Cutaways
1 - 35ft XHF 2 - 29ft XHFs
FY 2029 29% 10 - 40ft Electric Buses
FY 2030 31% 1 - Electric Cutaway
FY 2031 33% 2 - 35ft Electric Buses 2 - 35ft Electric Narrow Body
FY 2032 41% 2 - 35ft Electric Narrow Body 4- 30ft Electric Narrow Body
FY 2033 56% 15 - 40ft Electric Buses 2 - Electric Cutaways
FY 2034 68% 7 - 35 ft Zero Emission Buses 2 - 30ft Electric Narrow Body
FY 2035 77% 9 - Electric Cutaways
FY 2036 77%
FY 2037 87% 1 - Electric Cutaway 8 - 35 ft Electric Narrow Body
FY 2038 87%
FY 2039 97% 7 - 40ft Electric Buses 4 - 30ft Electric Buses
1 - 35 ft Electric Narrow Body
FY 2040 100% 2 - Electric Cutaways 2 - 30ft Electric Narrow Body
Item 8

MARIN TRANSIT | 2020–2029 SHORT RANGE TRANSIT PLAN Appendix G: Zero Emission Fleet Replacement Plan
Decision Points and Next Steps
Staff have identified points in the next ten years when Marin Transit will decide whether to make increase its investments in Zero Emission Buses earlier or make other decisions regarding the future of the zero-emission fleet.
2020 – Procurement and In-service Plan for FY 2021 Electric Vehicles - By the end of 2019, Marin Transit needs a procurement and in-service plan for the four electric vehicles to be purchased in FY 2021. This plan will include vehicle selection, an operations plan, associated operations contractor agreements, and a plan for infrastructure and power delivery.
2024 – Initial Infrastructure Plan - Marin Transit will complete an initial infrastructure plan that will allow three years for implementation and construction before delivery of seven electric vehicles in FY 2027 and ten electric vehicles in FY 2029. The District is currently working to purchase a facility that would accommodate electric vehicle infrastructure. If the District has not yet purchased a facility, the plan will include alternatives. These may include hydrogen fuel cell buses, if the fueling is available, or consolidating electric vehicles with contractors that are able to install electrical infrastructure on their properties.
2025 – Confirm Vehicle Types for FY 2027 Procurement – Marin Transit will evaluate the battery range of available zero-emission vehicles. The District will also evaluate the status of its infrastructure and power delivery capabilities to determine whether it is possible increase the percentage of zero-emission buses in the FY 2027 procurement. At this time, the FY 2027 procurement is planned to consist of seven 40-foot electric and four 30-foot hybrid buses.
2025 – Determine if a zero-emission cutaway bus is available – Marin Transit’s first planned replacement of a cutaway (shuttle) with zero-emission technology is planned for FY 2026 to provide additional time for testing and development of a federally-approved vehicle. In addition, a price of the technology needs to go down for purchase of these vehicles to be cost effective over the shorter vehicle life (seven years). If no federally approved vehicle is available, CARB will exempt agencies from the requirement. Until a zero-emission alternative is available, the District will evaluate replacement of its shuttles with a standard size battery electric buses or replacing with standard gasoline vehicles
2027 – Confirm Vehicle Types for FY 2029 Procurement - Determine whether battery range has improved enough to deliver the District’s existing service profile. If not, the FY 2029 procurement allows time for Marin Transit to evaluate purchasing additional vehicles, cutting or re-designing service to match vehicle constraints, and/or negotiating with jurisdictions to install opportunity charging at strategic locations throughout the county.
2028 – Confirm Vehicle Types for FY 2031 Procurement of Narrow-Bodied Vehicles - Decide whether there is a zero-emission bus capable of operating on the West Marin Stage and Muir Woods Shuttle services. If not, Marin Transit will have to consider cutting these programs. If a narrow-bodied vehicle is available and the range is the only concern, the District will evaluate purchasing additional vehicles to provide the service and/or whether installing opportunity charging along the routes is feasible,
Item 8

MARIN TRANSIT | 2020–2029 SHORT RANGE TRANSIT PLAN Appendix G: Zero Emission Fleet Replacement Plan
2029 – Update Initial Infrastructure Plan – Based on the current fleet status and the state of zero-emissions bus technology, Marin Transit will update the infrastructure plan in advance of the FY 2032 procurements that will bring the District’s fleet to over 50 percent electric.
Electric bus technology is evolving rapidly. Marin Transit values the benefits of zero-emission buses. The District will recommend investments that take advantage of proven technologies while closely monitoring new developments. Marin Transit needs to be flexible as it develops the quickest, most reliable path toward a sustainable and completely zero-emission fleet. Staff will explore technology options as each of decision points nears and will evaluate the best investments that will move the District toward a battery electric fleet at a faster pace than the current vehicle replacement plan.
Item 8
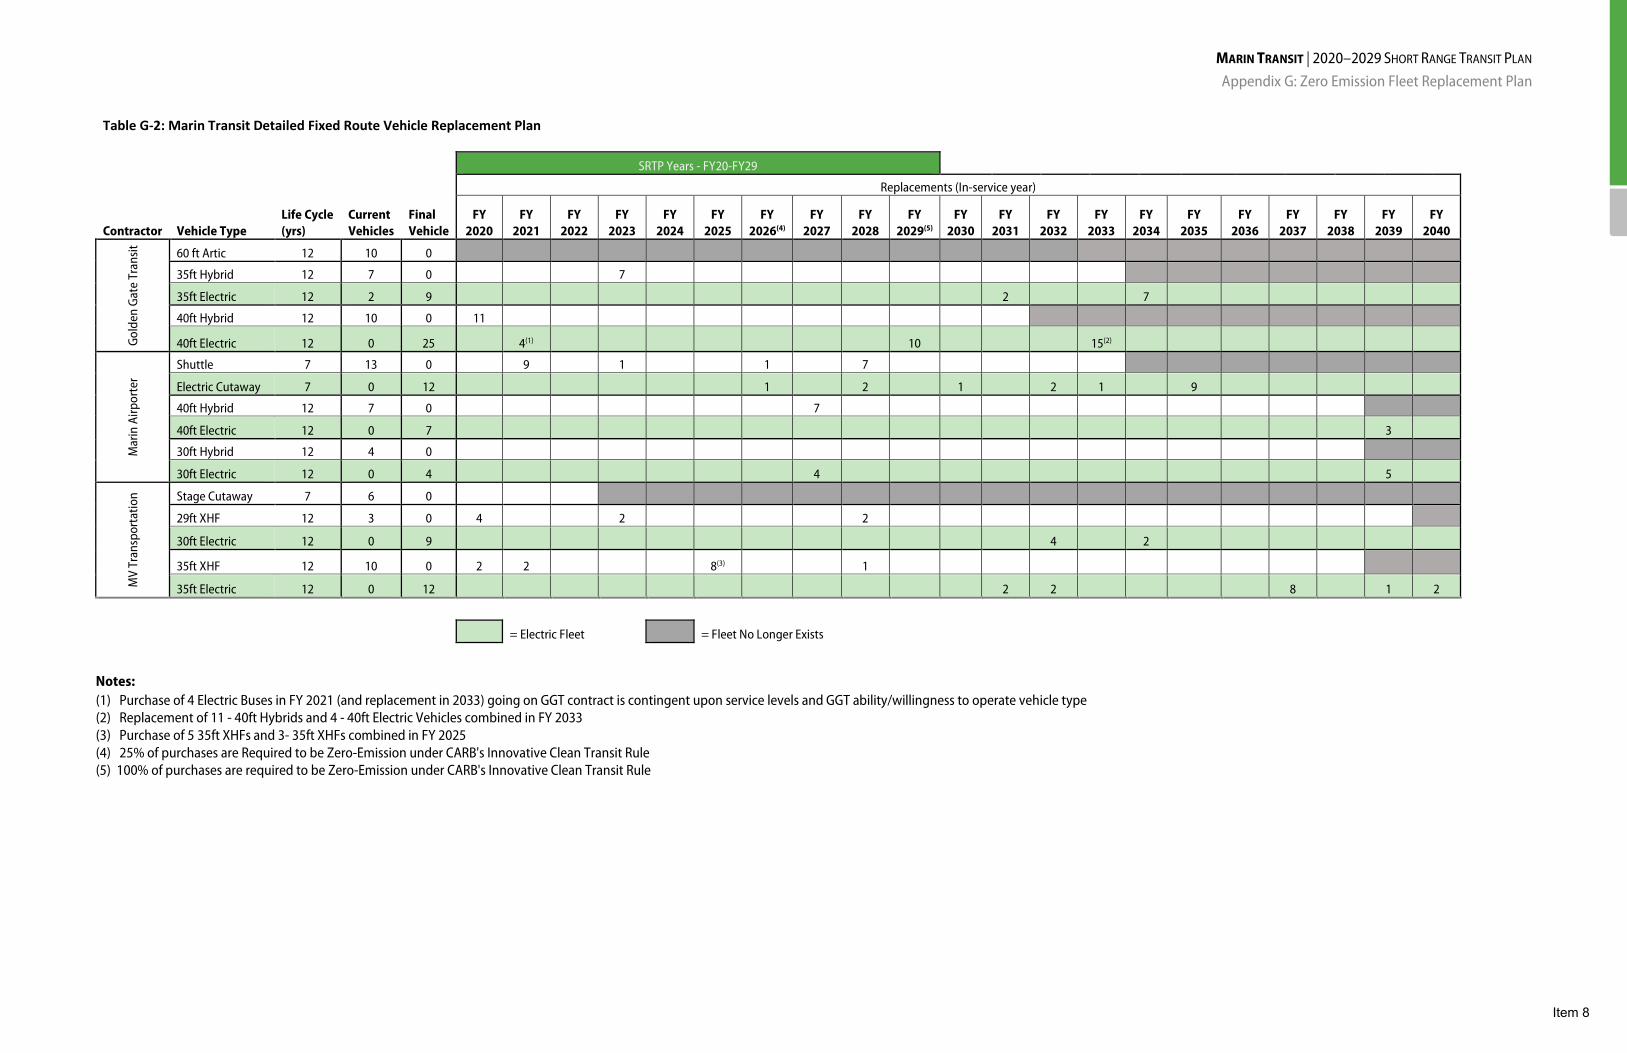
MARIN TRANSIT | 2020–2029 SHORT RANGE TRANSIT PLAN Appendix G: Zero Emission Fleet Replacement Plan
Table G-2: Marin Transit Detailed Fixed Route Vehicle Replacement Plan
SRTP Years - FY20-FY29
Replacements (In-service year)
Contractor Vehicle Type Life Cycle (yrs)
Current Vehicles
Final Vehicle
FY 2020
FY 2021
FY 2022
FY 2023
FY 2024
FY 2025
FY 2026(4)
FY 2027
FY 2028
FY 2029(5)
FY 2030
FY 2031
FY 2032
FY 2033
FY 2034
FY 2035
FY 2036
FY 2037
FY 2038
FY 2039
FY 2040
Gold
en G
ate
Tran
sit
60 ft Artic 12 10 0 35ft Hybrid 12 7 0 7 35ft Electric 12 2 9 2 7 40ft Hybrid 12 10 0 11
40ft Electric 12 0 25 4(1) 10 15(2)
Mar
in A
irpor
ter
Shuttle 7 13 0 9 1 1 7 Electric Cutaway 7 0 12 1 2 1 2 1 9 40ft Hybrid 12 7 0 7 40ft Electric 12 0 7 3 30ft Hybrid 12 4 0 30ft Electric 12 0 4 4 5
MV
Tran
spor
tatio
n Stage Cutaway 7 6 0 29ft XHF 12 3 0 4 2 2 30ft Electric 12 0 9 4 2
35ft XHF 12 10 0 2 2 8(3) 1
35ft Electric 12 0 12 2 2 8 1 2
= Electric Fleet = Fleet No Longer Exists
Notes: (1) Purchase of 4 Electric Buses in FY 2021 (and replacement in 2033) going on GGT contract is contingent upon service levels and GGT ability/willingness to operate vehicle type (2) Replacement of 11 - 40ft Hybrids and 4 - 40ft Electric Vehicles combined in FY 2033 (3) Purchase of 5 35ft XHFs and 3- 35ft XHFs combined in FY 2025 (4) 25% of purchases are Required to be Zero-Emission under CARB's Innovative Clean Transit Rule (5) 100% of purchases are required to be Zero-Emission under CARB's Innovative Clean Transit Rule
Item 8
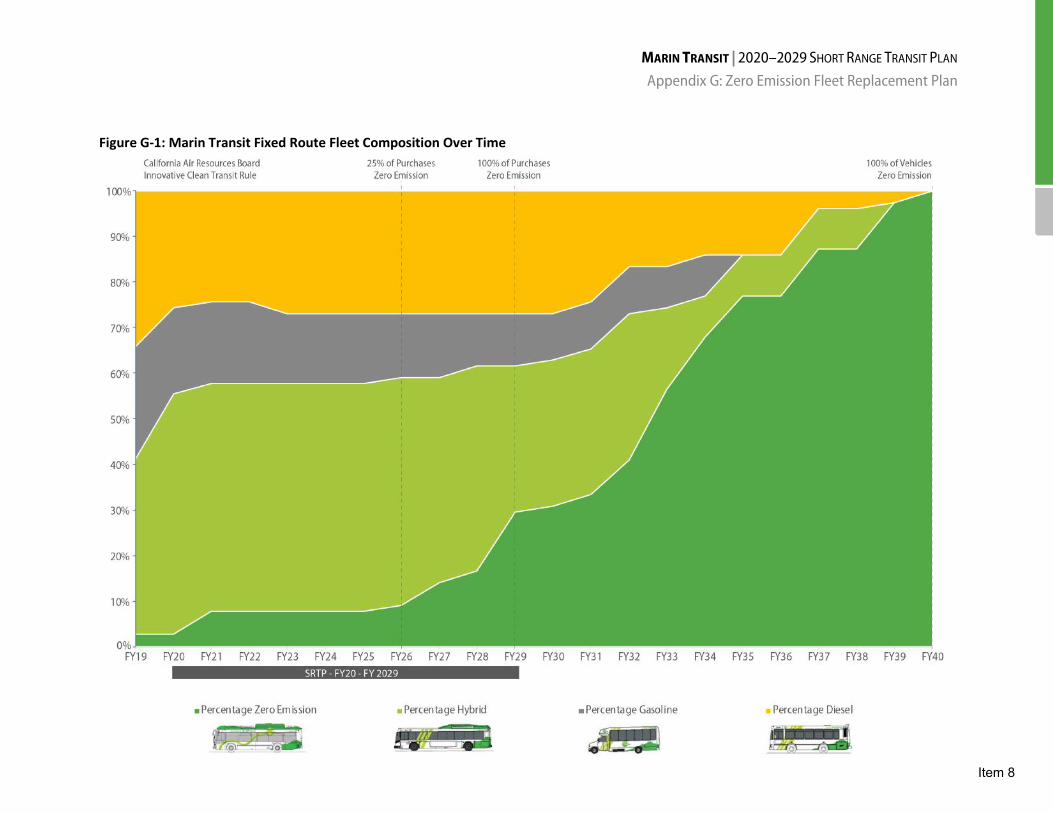
MARIN TRANSIT | 2020–2029 SHORT RANGE TRANSIT PLAN Appendix G: Zero Emission Fleet Replacement Plan
Figure G-1: Marin Transit Fixed Route Fleet Composition Over Time
Item 8
Related Documents