Honourable Mayor: Cllr. TD. Buthelezi Acting Municipal Manager: Mr.RN Hlongwa Private Bag X76 Ulundi 3838 Tel: 035 8745500 Email: [email protected] ZULULAND DISTRICT MUNICIPALITY DRAFT ANNUAL REPORT ASSESSMENT REPORT FOR THE 2017/2018 FINANCIAL YEAR

Welcome message from author
This document is posted to help you gain knowledge. Please leave a comment to let me know what you think about it! Share it to your friends and learn new things together.
Transcript

Honourable Mayor: Cllr. TD. Buthelezi Acting Municipal Manager: Mr.RN Hlongwa Private Bag X76 Ulundi 3838 Tel: 035 8745500 Email: [email protected]
ZULULAND DISTRICT MUNICIPALITY DRAFT ANNUAL REPORT ASSESSMENT REPORT FOR THE 2017/2018 FINANCIAL YEAR

1
TABLE OF CONTENTS 1. ABOUT THIS ANNUAL REPORT ........................................................................................................................................... 4 2. FOREWORDS ...................................................................................................................................................................... 4 2.1. MESSAGE FROM THE HONOURABLE MAYOR .................................................................................................................... 4 2.2. STATEMENT BY THE ACCOUNTING OFFICER ...................................................................................................................... 6 3. CHAPTER 1 –PROFILE OF THE ZULULAND DISTRICT MUNICIPALITY ..................................................................................... 8 3.1. MUNICIPAL FUNCTIONS .................................................................................................................................................... 8 3.2. DEMOGRAPHIC PROFILE .................................................................................................................................................... 9 3.3. SOCIO PROFILE ................................................................................................................................................................. 11 3.4. IMPACT OF HIV/AIDS ....................................................................................................................................................... 11 4. THE ZULULAND DISTRICT ECONOMY ................................................................................................................................ 12 4.1. INFRASTRUCTURE PROFILE .............................................................................................................................................. 12 Human Settlements .................................................................................................................................................................. 12 Municipal District Roads .......................................................................................................................................................... 14 Rail Transportation ................................................................................................................................................................... 16 Civil Aviation ............................................................................................................................................................................. 16 4.2. OVERALL KEY CHALLENGES LIST .................................................................................................................................. 16 5. CHAPTER 2 – GOVERNANCE, COMPLIANCE AND RISK MANAGEMENT ............................................................................. 18 5.1. POLITICAL GOVERNANCE ................................................................................................................................................. 18 5.2. POLITICAL GOVERNANCE ................................................................................................................................................. 18 Portfolio Committees ............................................................................................................................................................... 18 5.3. ADMINISTRATIVE GOVERNANCE ..................................................................................................................................... 19 Human Resources ..................................................................................................................................................................... 19 Organizational Personnel Related Expenditure ........................................................................................................................ 20 Employment and Vacancies ..................................................................................................................................................... 22 Senior Manager Appointments ................................................................................................................................................ 22 Performance Rewards .............................................................................................................................................................. 22 Job Evaluations ......................................................................................................................................................................... 23 Employment Changes ............................................................................................................................................................... 23 Employment Equity .................................................................................................................................................................. 24 Leave Utilization and Trends .................................................................................................................................................... 24 Labour Relations ....................................................................................................................................................................... 24 Skills Development & Capacity Building ................................................................................................................................... 24 Financial Policies ...................................................................................................................................................................... 25 Other Policies ........................................................................................................................................................................... 27 5.4. PERFORMANCE MANAGEMENT ...................................................................................................................................... 28 5.5. AUDITING AND OVERSIGHT ............................................................................................................................................. 28 Internal Audit ........................................................................................................................................................................... 29 Audit and Performance Management Committee ................................................................................................................... 29 Oversight Committee ............................................................................................................................................................... 30 5.6. RISK MANAGEMENT ........................................................................................................................................................ 30 5.7. ANTI-CORRUPTION AND FRAUD ...................................................................................................................................... 30 5.8. CODE OF CONDUCT ......................................................................................................................................................... 31 5.9. SUPPLY CHAIN MANAGEMENT ........................................................................................................................................ 31 5.10. INTERGOVERNMENTAL RELATIONS ................................................................................................................................. 31 5.11. PUBLIC ACCOUNTABILITY AND PARTICIPATION............................................................................................................... 32 6. CHAPTER 3 – STRATEGIC PRIORITIES ................................................................................................................................ 33
2
7. CHAPTER 4 – SERVICE DELIVERY PERFORMANCE ANALYSIS FOR THE FINANCIAL YEAR 2017/2018................................... 44 7.1. INFRASTRUCTURE & SERVICE DELIVERY PERFORMANCE ................................................................................................. 44 Water Provision ........................................................................................................................................................................ 44 Backlog Analysis ....................................................................................................................................................................... 45 Key Challenges.......................................................................................................................................................................... 49 7.2. WASTE WATER (SANITATION) PROVISION ................................................................................................................................. 49 Backlog ..................................................................................................................................................................................... 50 Projects Implemented for Year Under Review .......................................................................................................................... 50 Key Challenges.......................................................................................................................................................................... 51 7.3. MUNICIPAL DISTRICT AIRPORTS .............................................................................................................................................. 51 Projects Implemented for Year Under Review .......................................................................................................................... 51 Challenges ................................................................................................................................................................................ 51 7.4. DISASTER MANAGEMENT ....................................................................................................................................................... 52 Projects Implemented for Year Under Review .......................................................................................................................... 52 Challenges ................................................................................................................................................................................ 52 7.5. LOCAL ECONOMIC DEVELOPMENT PERFORMANCE ........................................................................................................ 53 Projects Implemented for Year Under Review .......................................................................................................................... 53 Challenges ................................................................................................................................................................................ 54 7.6. SOCIAL DEVELOPMENT (COMMUNITY & SOCIAL SERVICES, CHILD CARE; AGED CARE; SOCIAL PROGRAMMES), HEALTH INSPECTION; FOOD AND ABBATOIR LICENSING AND INSPECTION; ETC ........................................................................................ 54 Annual Women’s Summit ......................................................................................................................................................... 54 Community Economic Development Projects ........................................................................................................................... 54 Quality of life programmes ...................................................................................................................................................... 54 Youth Development .................................................................................................................................................................. 55 Youth Summits ......................................................................................................................................................................... 55 Youth Skills Development Programmes .................................................................................................................................... 55 Princess Mandisi Health Care Centre ....................................................................................................................................... 56 SPORT DEVELOPMENT PROGRAMME ...................................................................................................................................... 57 MUNICIPAL HEALTH SERVICES ................................................................................................................................................. 58 7.7. DEMOCRACY AND GOVERNANCE PERFORMANCE .......................................................................................................... 59 7.8. INSTITUTIONAL TRANSFORMATION PERFORMANCE ...................................................................................................... 59 7.9. SPATIAL AND ENVIRONMENTAL MANAGEMENT PERFORMANCE ................................................................................... 59 Development Planning Shared Services ................................................................................................................................... 59 Joint Municipal Planning Tribunal ............................................................................................................................................ 60 7.10. PERFORMANCE AGAINST GOVERNMENT LED PROGRAMMES ........................................................................................ 60 FREE BASIC SERVICES AND INDIGENT SUPPORT ....................................................................................................................... 60 EXPANDED PUBLIC WORKS PROGRAMME (EPWP) .................................................................................................................. 60 BACK TO BASICS ....................................................................................................................................................................... 61 8. CHAPTER 5 – OVERVIEW OF FINANCIAL PERFORMANCE .................................................................................................. 63 8.1. STATEMENT OF FINANCIAL PERFORMANCE .................................................................................................................... 63 INCOME .................................................................................................................................................................................... 63 SCHEDULE OF CONDITIONAL GRANTS RECEIVED ..................................................................................................................... 63 CASH BALANCE ......................................................................................................................................................................... 63 CASH COVERAGE ...................................................................................................................................................................... 63 EXPENDITURE ........................................................................................................................................................................... 64 LIQUIDITY MANAGEMENT ........................................................................................................................................................ 65 CURRENT RATIO ....................................................................................................................................................................... 65 CASH/COST COVERAGE RATIO ................................................................................................................................................. 65 CURRENT DEBTORS COLLECTION RATE .................................................................................................................................... 65 ASSET MANAGEMENT .............................................................................................................................................................. 65 CASHFLOW MANAGEMENT AND INVESTMENTS ..................................................................................................................... 65

3
MSCOA ..................................................................................................................................................................................... 65 ASSESSMENT BY THE ACCOUNTING OFFICER ON AREARS ON MUNICIPAL TAXES AND SERVICE CHARGES ............................ 66 LONG TERM CONTRACTS AND PUBLIC PRIVATE PARTNERSHIPS ............................................................................................. 66 REVENUE COLLECTION PERFORMANCE BY VOTE AND BY SOURCE.......................................................................................... 67 REVENUE COLLECTION PERFORMANCE BY SOURCE ................................................................................................................ 67 9. CHAPTER 6 – APPENDICES .................................................................................................................................................. A A. APPROVED ANNUAL FINANCIAL STATEMENTS ...................................................................................................................... A B. REPORT AND OPINION OF THE AUDITOR GENERAL ............................................................................................................... B C. AUDIT ACTION PLAN .............................................................................................................................................................. C D. ANNUAL PERFORMANCE REPORT .......................................................................................................................................... D E. STATEMENT OF RESPONSIBILITY AND CONFIRMATION OF ACCURACY.................................................................................. E F. REPORT OF THE AUDIT COMMITTEE ...................................................................................................................................... D G. LONG TERM CONTRACTS ....................................................................................................................................................... E H. CAPITAL EXPENDITURE PROJECT REPORT AT 30 JUNE 2018 ................................................................................................................ F

4
1. ABOUT THIS ANNUAL REPORT Every municipality and every municipal entity must for each financial year prepare an annual report in accordance with this Chapter. The council of a municipality must within nine months after the end of a financial year deal with the annual report of the municipality and of any municipal entity under the municipality’s sole or shared control in accordance with section 129. The purpose of an annual report is: (a) to provide a record of the activities of the municipality or municipal entity during the financial year to which the report relates; (b) to provide a report on performance against the budget of the municipality or municipal entity for that financial year; and (c) to promote accountability to the local community for the decisions made throughout the year by the municipality or municipal entity. This Annual Report is therefore a reflection or record of activities and performance that demonstrates the state of the Zululand District Municipality as of 30 June 2018. 2. FOREWORDS 2.1. MESSAGE FROM THE HONOURABLE MAYOR As the financial year 2017/2018 has come to a close I wish to commend the efforts and dedication of our law makers the Honourable Councillors, Members of the Executive Committee. I also wish to applaud the dedication and commitment of ZDM Management and Staff during the financial year of 2017/2018. I appreciate the opportunity given to me to lead Zululand District Municipality and intend to fulfil the responsibility placed on my shoulders with integrity and excellence. As I continue with my duties I remain highly aware that this is a position of service. Our focus as ZDM has not moved an inch since I took over as the Mayor in November 2017. Our mandate remains to provide clean water and sanitary services to the residents of the District. In our efforts to achieve this, the District has launched a number of projects from the start of the financial year in July 2017 which aims to provide these essential services to our residents. During the 2017/2018 financial year, the Integrated Development Plan served as a strategic guide for the Municipality as well as other interdepartmental and sustained programmes of action of Council. This Municipality managed to deliver services and implement its programmes in terms of the Council approved budget which was implemented according to the IDP. Various milestones were achieved. As a Water Service Authority several communities received water and sanitation thus further reducing the backlog in each of the local municipalities in Zululand. Community Engagements to account to the citizens of Zululand took place in the form of IDP, LED, Disaster Road Shows in the five local municipalities. The SALGA Games were also held successfuly.


6
2.2. STATEMENT BY THE ACCOUNTING OFFICER Institutional governance and administration The financial year has been a period of change. Firstly, the municipality managed to stabilise as far as the top management uncertainty was concerned. All head of departments were in place. However, the political wing has seen a replacement of the Mayor half yearly. Turn of events saw the vacancy of the municipal manager being prolonged, changing hands of acting municipal managers through out the period. Under those turbulences the organisation emerged as survived the storm. All necessary compliances were met. Without a doubt that would have an impact on an audit outcome. The municipality regressed from unqualified to qualified audit. Service delivery The municipality continued to deliver on its mandate. As per the projects identified on the IDP the budget managed to fulfil the allocation of funding on prioritised projects. All grants funds were 100% spent at financial year end without rollover application. Water reticulation continued to lead the programs. We note the difficulty in the provision of sanitation due to the unresolved challenges of bid objections. This put the municipality on the backfoot on sanitation backlog eradication. Local Economic Development Another key priority to the municipality is the eradication of poverty in the district. A frog-leap has been taken to re-establish the Zululand agency. This has been seen as the vehicle to the realisation of the aspirations of Radical Socio- economic transformation (RASET). Given the high unemployment rate, communities still need to take advantage of the market opportunities unlocked by RASET. The goals of the municipality are hindered by the limited resources due to its nature. The municipality is rural. No other viable source of income exists. Most of the funding is grant funded. That limits the ability to generate own revenue. Poverty prevails such that water distribution is regarded as free to most communities. That has got a negative impact on the balance sheet of the municipality. The council is yet to consider steps in introducing the fixed tariff charge for water provision. Financial viability Under the prevailing conditions, books were closed with a surplus which was transferred to the municipal reserves. It is however noted that the surplus is not necessarily cash backed. That is most difficult state of affairs of this municipality. The current ratio is not favourable. Past transactions have caused the inability to settle all creditors. Major efforts were made to reduce this burden by ensuring that at least all small creditors are settled. The balance is still owed to the Department of water and Sanitation as well as Water Services South Africa. This has a negative implication to the future grants. Changes to our business model is envisaged to turn this situation around. Social and community

8
3. CHAPTER 1 –PROFILE OF THE ZULULAND DISTRICT MUNICIPALITY 3.1. MUNICIPAL FUNCTIONS The Zululand District Municipality is a Category C municipality administered under a collective executive system. According to Section 84. ( 1 ) A district municipality has the following functions and powers: (a) Integrated development planning for the district municipality as a whole including a framework for integrated development plans for the local municipalities within the area of the district municipality taking into account the integrated development plans of those local municipalities. (b) Bulk supply of water that affects a significant proportion of municipalities in the district. (c) Bulk supply of electricity that affects a significant proportion of municipalities in the district. (d) Bulk sewage purification works and main sewage disposal that affects a significant proportion of municipalities in the district. (e) Solid waste disposal sites serving the area of the district municipality as a whole. (f) Municipal roads which form an integral part of a road transport system for the area of the district municipality as a whole. (g) Regulation of passenger transport services. (h) Municipal airports serving the area of the district municipality as a whole. (i) Municipal health services serving the area of the district municipality as a whole. (j) Fire fighting services serving the area of the district municipality as a whole. (k) The establishment, conduct and control of fresh produce markets and abattoirs serving the area of the district municipality as a whole. (l) The establishment, conduct and control of cemeteries and crematoria serving the district as a whole. (m) Promotion of local tourism for the area of the district municipality. (n) Municipal public works relating to any of the above functions or any other functions assigned to the district municipality. (o) The receipt, allocation and if applicable the distribution of grants made to the district municipality. (p) The imposition and collection of taxes, levies and duties as related to the above functions or as may be assigned to the district municipality in terms of national legislation.

9
3.2. DEMOGRAPHIC PROFILE A combination of sources have been used to interpret the statistics relating to the demographic statistics. These are StatsSA Census 2011, Census Community Survey 2016 and Global Insight 2015. Figure 1: Zululand district population 2011-2016 analysis
According to Census 2016 figures, Zululand District experienced an increase in its total population figures from 803 575 in 2011, to 892 310 in 2016. Most of the district’s population in 2016 resided in Abaqulusi (241 196), Nongoma (211 892) and Ulundi (205 762) local municipalities. The smallest population is recorded as 89 615 for eDumbe. In terms of percentage contribution, Abaqulusi contributes the highest percentage (27.5%) towards Zululand’s population, followed by Nongoma and Ulundi with 23.8% and 23.1%, respectively.
According to census, the population in the Zululand District Municipality grew by 1.45% in 2011 from 803,535 to 892,310 in 2016. Between 2011 and 2016, the Zululand growth rate rose from 1.2% to 1.4% which is on par with its neighbouring districts. The Zululand District Municipality contributes 22% to the provinces population.
89 615 143 845 241 196 211 892 205 762892 310
0100 000200 000300 000400 000500 000600 000700 000800 000900 0001 000 000
eDumbe Phongola Abaqulusi Nongoma Ulundi Zululand20112016
803575892310
740000760000780000800000820000840000860000880000900000
2011 201622%
78% ZululandKZN
10
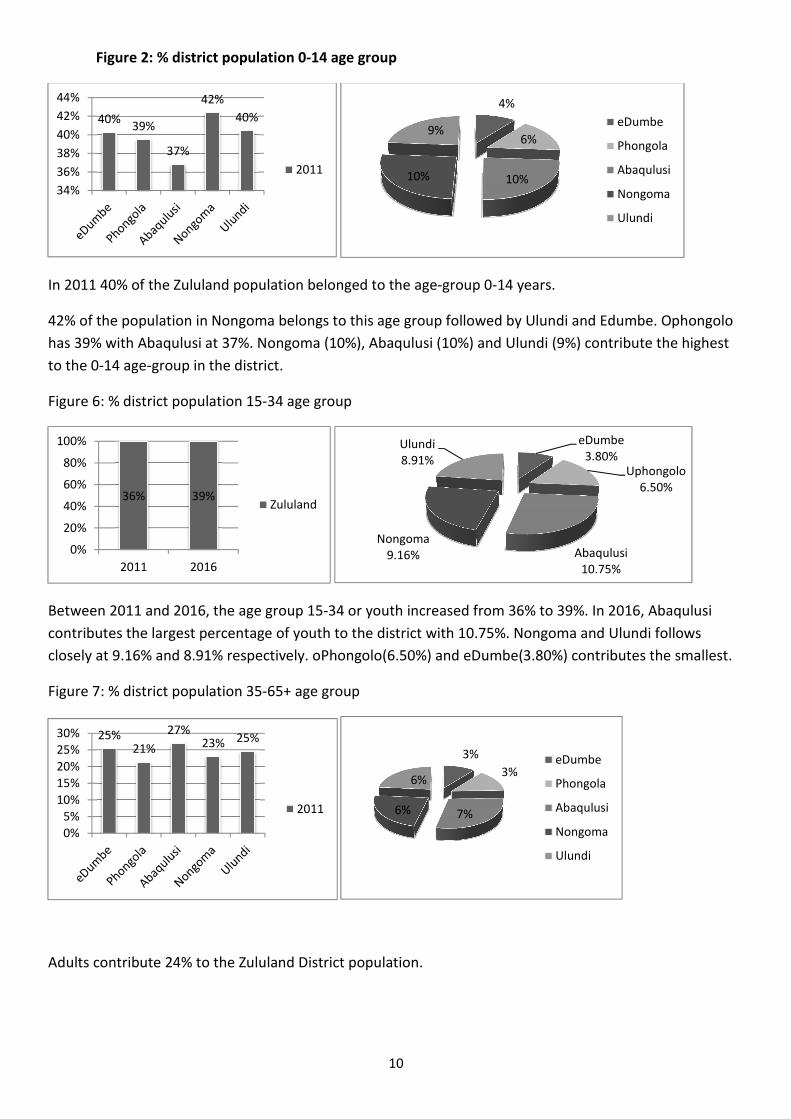
Figure 2: % district population 0-14 age group
In 2011 40% of the Zululand population belonged to the age-group 0-14 years. 42% of the population in Nongoma belongs to this age group followed by Ulundi and Edumbe. Ophongolo has 39% with Abaqulusi at 37%. Nongoma (10%), Abaqulusi (10%) and Ulundi (9%) contribute the highest to the 0-14 age-group in the district. Figure 6: % district population 15-34 age group
Between 2011 and 2016, the age group 15-34 or youth increased from 36% to 39%. In 2016, Abaqulusi contributes the largest percentage of youth to the district with 10.75%. Nongoma and Ulundi follows closely at 9.16% and 8.91% respectively. oPhongolo(6.50%) and eDumbe(3.80%) contributes the smallest. Figure 7: % district population 35-65+ age group
Adults contribute 24% to the Zululand District population.
40% 39% 37% 42% 40%34%36%38%40%42%44%
20114% 6%10%10%9% eDumbePhongolaAbaqulusiNongomaUlundi
36% 39%0%20%40%60%80%100%2011 2016
ZululandeDumbe3.80% Uphongolo6.50%
Abaqulusi10.75%Nongoma9.16%Ulundi8.91%
25% 21% 27% 23% 25%0%5%10%15%20%25%30%
2011 3% 3%7%6%6% eDumbePhongolaAbaqulusiNongomaUlundi

11
27% of Abaqulusi’s population is adults followed by eDumbe and Ulundi at 25%. Nongoma contributes 23% and oPhongolo 21% respectively. Abaqulusi (7%), Nongoma (6%) and Ulundi (6%) contribute the most to the district population in terms of this age group. 3.3. SOCIO PROFILE Zululand general labour indicators 2016Error! Not a valid link. Source: Global Insight, 2016 A total population of 596 680 in Zululand is considered economically active (ages of 15-64). Abaqulusi has the largest economically active population at 165 020. Ulundi and Nongoma follow with economically active populations of 138 977 and 136 603 respectively. On the same scale Abaqulusi has the largest unemployment rate at 30.5% followed by eDumbe (25.7%); Ulundi(22.7%). The lowest unemployment rate is recorded by Nongoma at 17.6%. The labour force participation rate in Zululand is 31.6% compared to a provincial average of 48.4% According to the KZN Provincial Treasury KZN Multiple Deprivation Index in 2011 Zululand have relatively lower levels of deprivation than most other municipalities within the province. Of the five local municipalities, eDumbe and uPhongolo are classified as having the highest levels of deprivation. The table below demonstrates population living below the poverty line in Zululand. Table 2: Zululand general labour indicators 2011 vs 2016
Source: Global Insight, 2017 313 212 (Community Survey 2016) people live below the poverty line in Zululand as compared to 321 881(Census 2011) which is a mere reduction of 8669. 3.4. IMPACT OF HIV/AIDS A comparison between 2001 and 2011 HIV/AIDS statistics for the district shows a worsening of the situation, with figures reflecting an increase in both the HIV/AIDS prevalence rate and HIV/AIDS related deaths in Zululand over the period.
050 000100 000150 000200 000250 000300 000350 000
eDumbe Phongola Abaqulusi Nongoma Ulundi Zululand
People living below the poverty line20112016

12
The high prevalence of HIV/AIDS poses a severe developmental challenge the district, as HIV/AIDS inhibits economic growth by reducing the availability of human capital. The labour force shrinks as more people fall sick and/or die, resulting in a young labour force that lacks experience, subsequently leading to reduced productivity and a smaller skilled population. In overall terms, the Zululand District made a limited contribution to the economy of KwaZulu-Natal in 2011, i.e. contributing only 3.0 % to the provincial economy at a growth rate of 1.4%. 4. THE ZULULAND DISTRICT ECONOMY Sector 2006 2011 2015 Agriculture 8.30% 9.80% 9.70% Mining 9.80% 9.00% 10.30% Manufacturing 6.60% 6.30% 6.00% Electricity 5.80% 5.50% 5.10% Construction 3.60% 3.60% 3.60% Trade 10.60% 10.50% 10.50% Transport 7.90% 8.10% 8.30% Finance 11.40% 12.10% 12.10% Community services 28.70% 28.10% 27.60% The community sector contributed 27.60% to the district GVA in 2015. Manufacturing, which is the highest economic contributor in the province made a comparatively smaller contribution to the District economy (6.0%). Despite the District being largely dependent on the sector for employment, agriculture only made a 9.70% contribution to the district economy. In 2015, agriculture, mining, trade and accommodation, and general government sectors made larger contributions than in other areas of the province. Key areas of concern are the significant gaps between the percentage of working age population, employment and the large numbers of not economically active residents, indicating high dependency levels. Abaqulusi and Ulundi Local Municipalities provide the largest number of formal and informal jobs within the district economy. However, it is important to note that none of the local municipalities are able to provide sufficient jobs for the working age population. The figure below depicts the share of each local municipality in total employment (formal and informal) for Zululand. Abaqulusi hosts the largest proportion of the population that are employed (41309) followed by Ulundi (20983). eDumbe contributes the lowest towards district employment levels (11478 of the total employed in the district). 4.1. INFRASTRUCTURE PROFILE Human Settlements According to the Census Community Survey there are 178,516 households across the Zululand District Municipality. This is less than 10% of total households in the whole of KwaZulu Natal.

13
About 32.3 % (57,702) of these dwellings in the Zululand District Municipality are classified as traditional. 53.8% (96,091) of the households in the Zululand District Municipality are headed by women which is 10% higher than the rate in KZN.
The majority of the households are in the area of Abaqulusi (51,472) followed by Ulundi (38,553), Nongoma (36,409), oPhongolo (34,667) and eDumbe (16,107). The table 40 below provides a summary of the status of access in respect of water and sanitation within the Zululand District and its five constituent local municipalities. Table 1: Status of Service Delivery within the Zululand District Municipality – 2016 Municipality Water Sanitation Electricity 2011 2016 2011 2016 2011 2016 Households serviced Households serviced Households serviced Households serviced Households serviced Households serviced Abaqulusi 30 604 37 418 25 590 27 200 31 223 11 709 eDumbe 10 400 10 738 11 570 11 221 10 127 41 400 Nongoma 9 435 7 518 12 088 17 106 21 851 23 256 Ulundi 18 513 23 283 20 988 12 808 25 825 25 825 uPhongolo 15 026 24 791 12 334 10 674 21 004 87 185 Source: Statistics SA, Community Survey 2016 Between 2011 and 2016, more than 9000 households received access to water. During the same period, more than 1600 households received access to sanitation. Improvement percentages in water access were found oPhongolo, Abaqulusi and Ulundi while vast improvement for sanitation is recorded in Nongoma and Abaqulusi. On access to electricity Nongoma recorded the most improvement. Municipality Total Households No of H/H electrified (2016) No of H/H Backlog % Backlog per LM
16 107 28 750 43 52734 03135 076
17415 34667 514723640938553
0 10 000 20 000 30 000 40 000 50 000 60 000eDumbePhongolaAbaqulusiNongomaUlundi20162011

14
Abaqulusi 51472 11709 39763 77% eDumbe 17415 4140 13275 76% oPhongolo 34667 8718 25949 75% Nongoma 36409 23256 13153 36% Ulundi 38553 25825 12728 33% Total 178516 73648 104868 59% At an average cost of R22,000 per household to provide electricity to a rural household the approximate capital cost required to eradicate the backlog per local municipality can be seen in the table below: Municipality HH Backlog Budget (mill) @ R22,000 per HH Abaqulusi 11709 257 598 000 eDumbe 13275 292 050 000 Nongoma 13153 289 366 000 Ulundi 12728 280 016 000 oPhongolo 25949 570 878 000 Total 76814 1 689 908 000 Municipal District Roads Zululand District Municipality has developed a district road asset management system to capture and maintain information on the length and condition of the road network and its associated furniture per local municipality. Material Paved (Tarred) Blocks Concrete Unpaved (Gravel) Length (KM) 370.89 11.71 0.62 2017.85 According to the RRAMS 2016, the district municipality a total road network of 2030km. Of that total 370.89km are paved, 11 km is surfaced with blocks and 0.62 km with concrete. A total of 2017km is unsurfaced. Municipality Extent(KM) 0 Years 1-3 Years 4 Years 5+ Abaqulusi 145.52 88.93 3.5 0.12 7.45 eDumbe 34.3 68.11 20.55 0.55 10.79 oPhongolo 39.9 65.28 11.96 1.36 21.4 Nongoma 10.82 70.41 23.39 0 6.2 Ulundi 89.18 59.12 7.57 0.95 32.36 Source: RRAMS 2016 Abaqulusi has the longest road network of which 88km has a remaining life of 0 year followed by Nongoma (70km), eDumbe (68km) and oPhongolo (65km). There is an urgent need for the implementation of road rehabilitation programmes in these municipalities.

15
The table above shows the extent of network that is no longer feasible for rehabilitation but must resurfaced. According to the table below a significant capital cost investment is required for the Zululand municipality to resurface the road network over a 5 year period. Municipality Year 1 Year 2 Year 3 Year 4 Year 5 Abaqulusi R 129 450 200 R 9 330 500 R 9 135 700 R 5 666 800 R 4 840 500 eDumbe R 23 870 800 R 7 767 400 R 490 200 R 209 600 R 115 200 oPhongolo R 19 226 900 R 4 966 900 R 3 128 000 R 4 223 500 R 4 161 700 Nongoma R 10 419 400 R 37 700 R 53 600 R 191 100 R 41 300 Ulundi R 40 772 800 R 4 694 800 R 2 045 100 R 5 255 200 R 1 934 800 Zululand R 223 740 100 R 26 797 300 R 14 852 600 R 15 546 200 R 11 093 500 Abaqulusi and Ulundi are in the greatest need of capital investment to repair roads infrastructure.
Municipality Year 1 Year 2 Year 3 Year 4 Year 5 Abaqulusi R 17 546 800 R 1 336 600 R 0 R 0 R 0 eDumbe R 2 369 300 R 1 308 700 R 0 R 0 R 0 oPhongolo R 4 218 800 R 1 070 200 R 0 R 0 R 0 Nongoma R 87 500 R 614 000 R 0 R 0 R 0 Ulundi R 5 205 700 R 1 731 000 R 0 R 0 R 0 Zululand R 29 428 100 R 6 060 500 R 0 R 0 R 0
01020304050Year 1 Year 2 Year 3 Year 4 Year 5Length_Proposed Resurfacing
Road Network Resurfacing NeedsAbaqulusi eDumbe oPhongolo Nongoma Ulundi
020406080100Year 1 Year 2 Year 3 Year 4 Year 5Length_Proposed Rehab
Proposed Network Rehabilitation NeedsAbaqulusi eDumbe oPhongolo Nongoma Ulundi

16
In terms of rehabilitation of roads Abaqulusi is under the most need to rehabilitate their road infrastructure followed by Ulundi and eDumbe. The diagrams and tables above point to oPhongolo and Nongoma municipality as having lesser extent of infrastructure but also in need of capital investment to resurface and or rehabilitate their road network which will lead to improved access by surrounding and different segments of the surrounding and external communities, potential investors and tourism.Better road will also benefit the economy of all Zululand towns in terms of exploiting their competitive advantages. Rail Transportation The most important rail link in the Zululand District is the coal line from Mpumalanga through Vryheid to the Richards Bay Coal Terminal from where the product is exported. The line runs from Witbank through Piet Retief, Paul Pietersburg, Vryheid East, Ulundi to Richards Bay. Although initially designed to convey 21 million tons of coal exports per annum, the route was upgraded in 1989, and in 1997 it conveyed 62 million tons of coal to Richards Bay. The Coal Line Study, conducted in 1999 found that there is approximately 17 general freight trains on the line, transporting 30 000 tons of goods to Richards Bay, including fero-chrome, granite, chrome, steel and timber. Although most of the freight is loaded north of Zululand substantial amounts of timber is loaded in the eDumbe and Vryheid areas. Civil Aviation The District has two airports of note, viz. the Ulundi Airport and the Vryheid Airport. However, due to a discontinuation of scheduled flights to Vryheid in the mid-1980s, the Vryheid airport is no longer licensed, and the municipal parks department maintains the airport. The ownership of the Ulundi airport was transferred from the Office of the Premier to the Zululand District Municipality in April 2007. For the next three years the KwaZulu-Natal provincial government provided financial assistance to the District Municipality to subsidise the cost of operations at the airport, and allow for the training of District Municipality staff to operate the facility, the re-laying of the main runway, upgrading of fire and rescue equipment, and the installation of all-weather navigational instruments. Clearance was obtained from the Civil Aviation Authority for commercial flights to be resumed, in recognition of the vital role the airport has to play in local development. The airport then commenced with the handling of commercial flights on a daily basis between Virginia Airport in Durban to Ulundi, and flights to Oribi Airport in Pietermaritzburg in 2012, with a view to stimulating both business and tourism growth in the district. 4.2. OVERALL KEY CHALLENGES LIST • Maintain functionality of Council structures • Maintenance of EDMS system (collaborator) thereby ensuring accurate record keeping. • Ongoing support to the LED sub-forums to continue functioning. • Maintenance and continual improvement of GIS system. • Ensure continued compliance with legal financial requirements.

17
• Improve vertical and horizontal alignment thereby ensuring coordinated service delivery by all spheres of government. • Prioritization of needs of marginalized groups. • Formulation and compliance with Risk Management Framework and Strategy. • Maintain functionality of IDP organizational arrangements internally and externally. • To further diversify the district’s economy. • Ongoing support of tourism initiatives. • Harness agri-processing opportunities in the district, notably venison production, leather processing and traditional medicines. • Foster timber product ion opportunities. • Improve rural road network to ensure improve linkages between settlements, rural nodes and municipal centres. • Harness opportunities relating to small scale mining. • Ensure indigent policy remains updated and relevant. • Ensuring ongoing monitoring of water balance in rural areas. • Commit and implement approved MIG business plans for roll-out of water and sanitation services in the district. • Ensure disaster management forums remain functional. • Redress disparities between levels of services and development in the urban and rural areas. • Improve access to formal waste disposal system. • Provision of adequate land to cater for anticipated required burial space. • Ongoing efforts to clarity the responsibilities between Local and District Municipality as well as the Department of Transport in respect of road maintenance and construction. • Improve the limited capacity of the electricity network in the southern portions of the District. • Improve functionality of Council oversight committee in particular. • LLF (Local Labour Forum) to meet more regularly. • Risk reduction strategies and actions to be defined and implemented. • Seek clarification in respect of the land reform programme roll-out/implementation.

18
5. CHAPTER 2 – GOVERNANCE, COMPLIANCE AND RISK MANAGEMENT 5.1. POLITICAL GOVERNANCE
The figure above shows the Executive Committee of the Zululand District Municipality during the period under review 5.2. POLITICAL GOVERNANCE Portfolio Committees DESCRIPTION DATE Finance and Budgeting; Community and Social Development, LED and Tourism Portfolio Committee 07/11/2017/; 22/01/2018;25/01/2018;20/03/2018 Capex and Water Provision Portfolio Committee 21/09/2017; 05/12/2017; 22/02/2018; 03/05/2018 Planning and GIS Portfolio Committee 20/09/2017; 07/03/2018; 20/03/2018; 23/05/2018 Corporate, Disaster, Health and Safety Portfolio Committee 02/10/2017; 21/02/2018 Municipal Public Accounts Committee 26/07/2017; 30/11/2017; 25/01/2018; 14/02/2018; 19/04/2018; 07/06/2018 COUNCIL AND EXCO MEETINGS DATE EXCO 28/07/2017; 24/08/2017;03/10/2017; 30/11/2017;23/01/2018; 27/02/2018;08/03/2018;22/03/2018; 25/03/2018; 14/05/2018
19
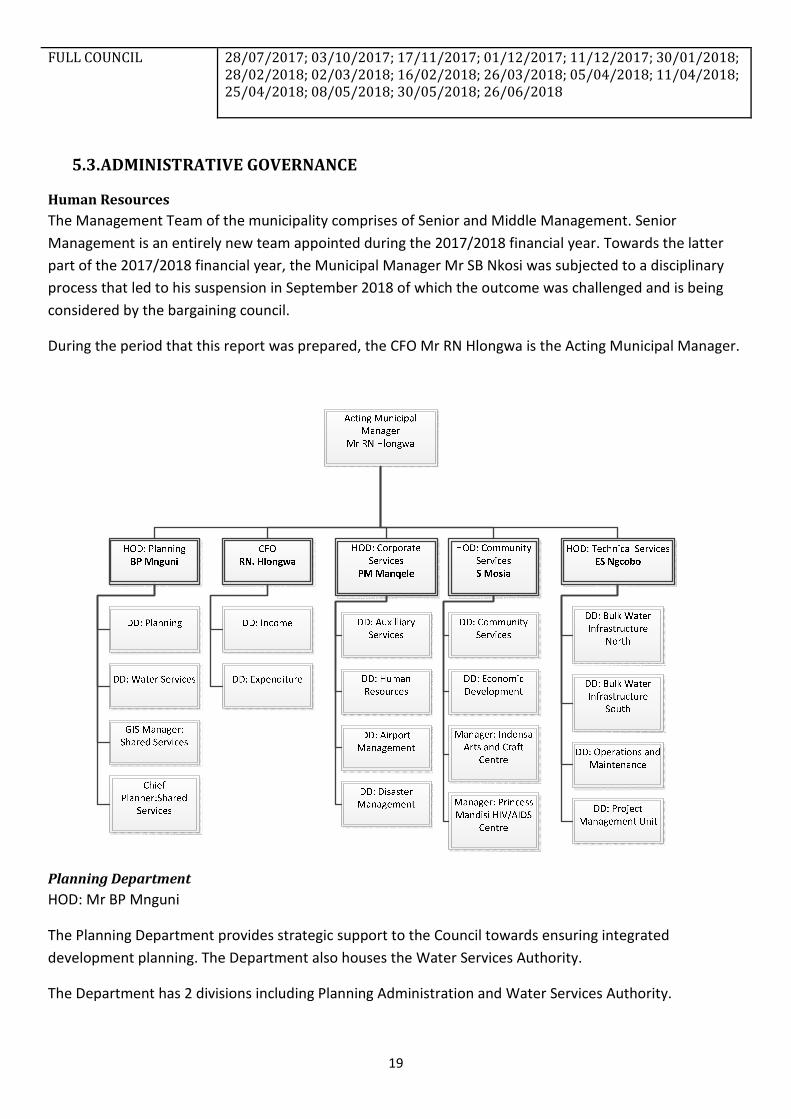
FULL COUNCIL 28/07/2017; 03/10/2017; 17/11/2017; 01/12/2017; 11/12/2017; 30/01/2018; 28/02/2018; 02/03/2018; 16/02/2018; 26/03/2018; 05/04/2018; 11/04/2018; 25/04/2018; 08/05/2018; 30/05/2018; 26/06/2018 5.3. ADMINISTRATIVE GOVERNANCE Human Resources The Management Team of the municipality comprises of Senior and Middle Management. Senior Management is an entirely new team appointed during the 2017/2018 financial year. Towards the latter part of the 2017/2018 financial year, the Municipal Manager Mr SB Nkosi was subjected to a disciplinary process that led to his suspension in September 2018 of which the outcome was challenged and is being considered by the bargaining council. During the period that this report was prepared, the CFO Mr RN Hlongwa is the Acting Municipal Manager.
Planning Department HOD: Mr BP Mnguni The Planning Department provides strategic support to the Council towards ensuring integrated development planning. The Department also houses the Water Services Authority. The Department has 2 divisions including Planning Administration and Water Services Authority.

20
Budget & Treasury Office CFO: Mr RN Hlongwa The Budget & Treasury Office applies Municipal financial management practice which involves managing a range of interrelated components such as Planning and budgeting, revenue, cash and expenditure management, procurement, asset management, reporting and oversight. Each component contributes to ensuring that expenditure is effective and efficient and that municipalities can be held accountable. This department has 2 divisions including Income and Expenditure. Expenditure includes Supply Chain Management. Corporate Services Department HOD: Mr PM Manqele The Corporate Services department provides an integrated administrative support service to the municipality focusing on institutional development, administration, management and governance. The Department has 4 divisions including Auxilliary Services, Human Resources, District Airport Management and Disaster Management. Community Services Department HOD: Mr S Mosia The Department promotes the district economic and social development as well as developing the people’s quality of life in an inclusive and sustainable manner. The Department has 6 divisions including social development, Youth, Gender & Disabled, HIV/AIDS, Arts and Craft, Local Economic Development and Municipal Health Services Technical Services HOD: Mr ES Ngcobo The Technical Services Department is a Water Services Provider for its area of jurisdiction. Focus is aimed at Water and Sanitation Services which are provided through the implementation of Regional Water Supply Schemes Programme (RWSS), Rudimentary Water Supply Schemes (Interim) and Sanitation (VIP Toilet) Programme and Emergency Relief. The Department has 3 divisions including the Project Management Unit (PMU), Bulk Management as well as Operations and Maintenance. Organizational Personnel Related Expenditure The following tables summarises the final audited personnel related expenditure by programme and by salary bands. In particular, it provides an indication of the following: • amount spent on personnel • amount spent on salaries, allowances and medical aid.
21
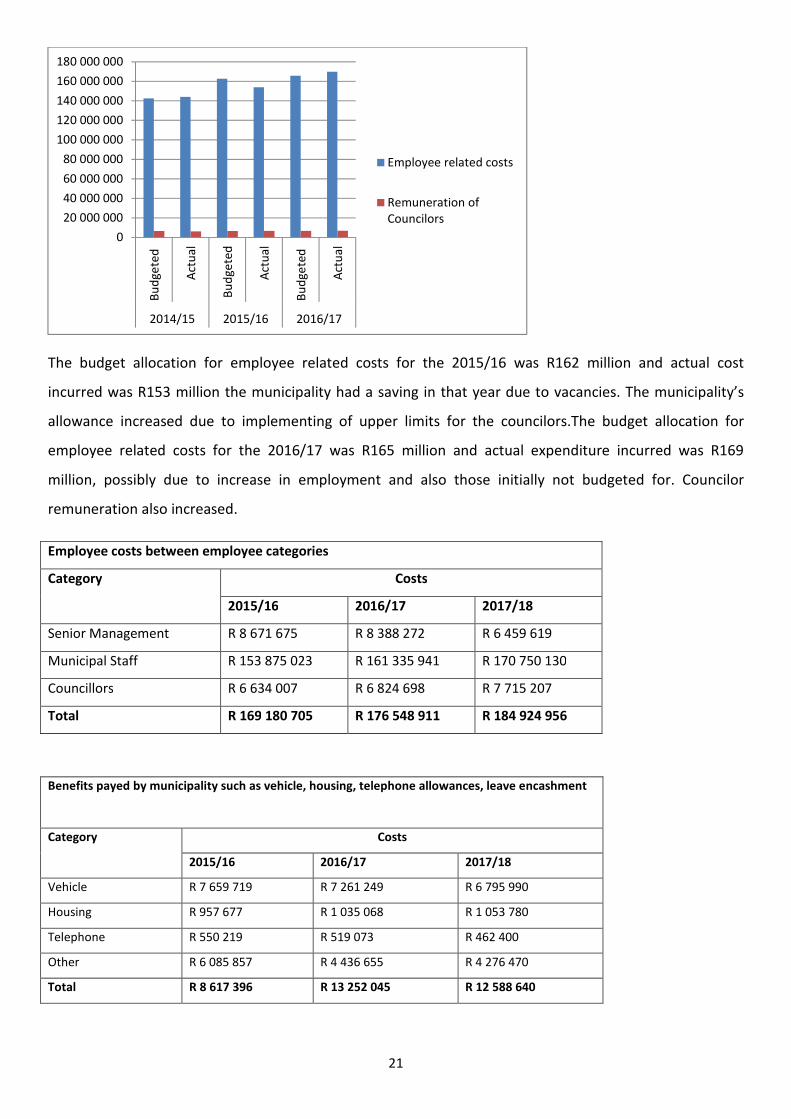
The budget allocation for employee related costs for the 2015/16 was R162 million and actual cost incurred was R153 million the municipality had a saving in that year due to vacancies. The municipality’s allowance increased due to implementing of upper limits for the councilors.The budget allocation for employee related costs for the 2016/17 was R165 million and actual expenditure incurred was R169 million, possibly due to increase in employment and also those initially not budgeted for. Councilor remuneration also increased. Employee costs between employee categories Category Costs 2015/16 2016/17 2017/18 Senior Management R 8 671 675 R 8 388 272 R 6 459 619 Municipal Staff R 153 875 023 R 161 335 941 R 170 750 130 Councillors R 6 634 007 R 6 824 698 R 7 715 207 Total R 169 180 705 R 176 548 911 R 184 924 956 Benefits payed by municipality such as vehicle, housing, telephone allowances, leave encashment Category Costs 2015/16 2016/17 2017/18 Vehicle R 7 659 719 R 7 261 249 R 6 795 990 Housing R 957 677 R 1 035 068 R 1 053 780 Telephone R 550 219 R 519 073 R 462 400 Other R 6 085 857 R 4 436 655 R 4 276 470 Total R 8 617 396 R 13 252 045 R 12 588 640
020 000 00040 000 00060 000 00080 000 000100 000 000120 000 000140 000 000160 000 000180 000 000Budgeted Actual Budgeted Actual Budgeted Actual2014/15 2015/16 2016/17
Employee related costsRemuneration ofCouncilors

22
Based on the three collective SALGBC agreements, salary increases have been factored into the budget. The employees related costs also include overtime, homeowner allowances and medical aid and performance bonuses that are paid to Senior Management. The costs also increased the costs of employee costs in the past three years. The costs associated with the Councilors allowance is determined by the Minister of Cooperative Governance and Traditional Affairs in accordance with the Remuneration of the Public Office Act, 1998 (Act 20 of 1998). Employment and Vacancies The following summary indicates the number of posts on the establishment, the number of employees and the vacancy rate. Number of posts and vacancies per department Department 2015/16 2016/17 2017/18 No. of Posts No. of Vacancies No. of Posts No. of Vacancies No. of Posts No. of Vacancies Finance 53 0 52 6 57 1 Technical 368 5 366 8 374 21 Planning 21 3 18 3 21 0 Community 58 0 56 2 58 1 Corporate 64 0 65 4 65 3 Senior Manager Appointments All Senior Managers reporting to the Municipal Manager are appointed. Signing of Performance Agreements All Senior Managers reporting to the Municipal Manager signed performance agreements for the 2017/2018 financial year in July 2017. The Performance Agreements were forwarded to the MEC: COGTA by 22 September 2017. Performance Rewards Employee Bonus Paid 2014/15 2015/16 2016/17 MM 174 826 192 443 171 060 CFO 124 535 156 008 120 006 HOD Planning 113 213 132 007 120 006 HOD Corporate 101 892 120 006 120 006 HOD Community 101 892 120 006 120 006 HOD Technical 101 892 120 006 120 006 Total 718 250 840 476 771 090
23
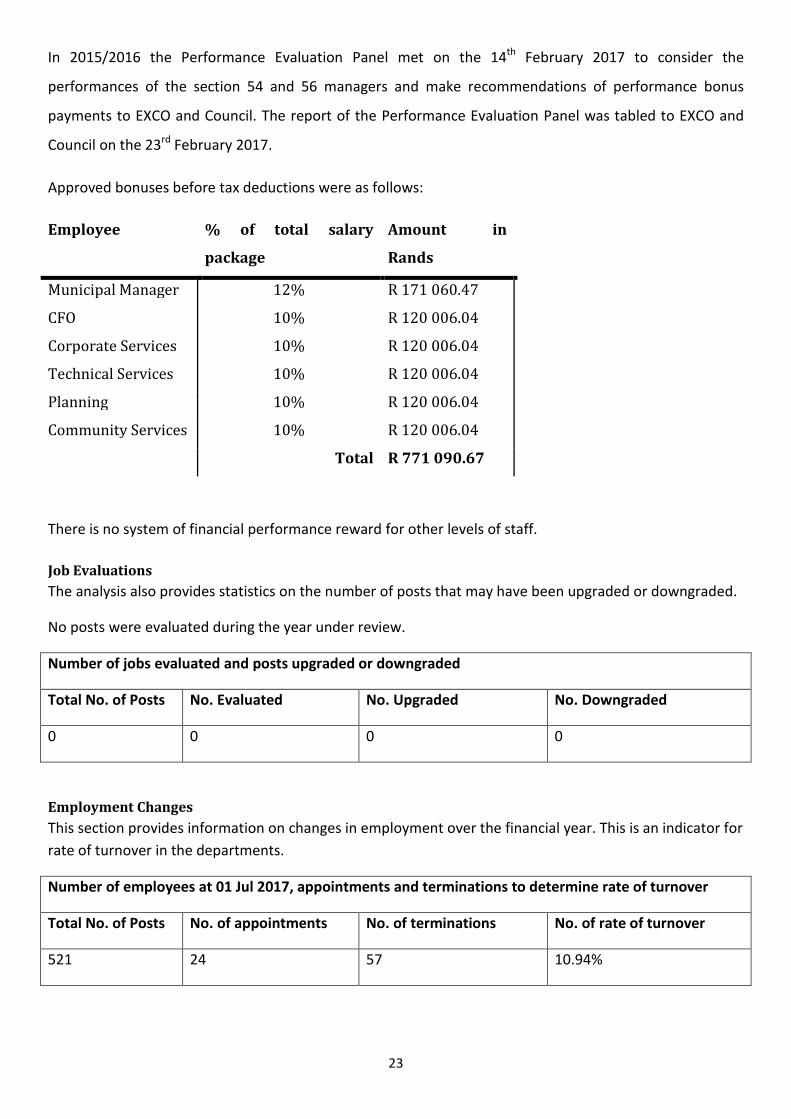
In 2015/2016 the Performance Evaluation Panel met on the 14th February 2017 to consider the performances of the section 54 and 56 managers and make recommendations of performance bonus payments to EXCO and Council. The report of the Performance Evaluation Panel was tabled to EXCO and Council on the 23rd February 2017. Approved bonuses before tax deductions were as follows: Employee % of total salary package Amount in Rands Municipal Manager 12% R 171 060.47 CFO 10% R 120 006.04 Corporate Services 10% R 120 006.04 Technical Services 10% R 120 006.04 Planning 10% R 120 006.04 Community Services 10% R 120 006.04 Total R 771 090.67 There is no system of financial performance reward for other levels of staff. Job Evaluations The analysis also provides statistics on the number of posts that may have been upgraded or downgraded. No posts were evaluated during the year under review. Number of jobs evaluated and posts upgraded or downgraded Total No. of Posts No. Evaluated No. Upgraded No. Downgraded 0 0 0 0 Employment Changes This section provides information on changes in employment over the financial year. This is an indicator for rate of turnover in the departments. Number of employees at 01 Jul 2017, appointments and terminations to determine rate of turnover Total No. of Posts No. of appointments No. of terminations No. of rate of turnover 521 24 57 10.94%

24
Employment Equity Occupational Levels (Number for all employees, including people with disabilities) Type Male Female Foreign Nationals Total A C I W A C I W Male Female Top management 4 0 0 0 0 0 0 0 0 0 4 Senior management 9 0 0 1 5 1 0 0 0 0 16 Professionally qualified and experienced specialists and mid-management 53 0 0 2 37 1 0 1 0 0 94 Leave Utilization and Trends Sick and annual leave per employee category; determine state of accrued leave Annual Leave Sick Leave Accrued leave 15/16 16/17 17/18 15/16 16/17 17/18 15/16 16/17 17/18 5322.4 5324.9 6160 3008.5 2974 2830.05 278.50 183.1 134.2 Labour Relations Disciplinary issues (nature of issue) Pending Concluded Suspensions 15/16 16/17 17/18 15/16 16/17 17/18 15/16 16/17 17/18 Na Na Na Na Na Na Na Na Na Na Skills Development & Capacity Building Number of employees who were trained as well as expenditure Department 2015/16 2016/17 2017/18 No. Trained Total Expenditure No. Trained Total Expenditure No. Trained Total Expenditure Councillors 24
R 2 561 650 22
R 907 063 25
R 1 208 444 Finance 12 3 17 Technical 158 143 120 Planning 3 1 5 Corporate 17 17 29 Community 4 4 13

25
Much of the training provided was towards technical services employees which is by far the largest employer in the municipality due to the water service provision. Corporate services employees, councillors, finance and community were the least trained in terms of numbers. The budget allocation for 2017/18 was higher than in 2016/17 but lesser than in 2015/16. Financial Policies Name of policy Description Last review Next review Human Resources Policies To provide a standard policy for all human resources related matters of all employees. May 2008 May 2019 Vehicle Policy To set out standard rules on how to use Council vehicles. May 2008 NA Supply Chain Management Policy To provide a policy framework within which the Accounting Officer & CFO can institute supply chain management system of highest possible ethical standard.
May 2008 NA Occupational Health & Safety Policy To ensure that heath and safety of all ZDM Employees and its community is prioritised. May 2008 NA Policy on the use of & Application of Information Technology The ancillary objective of this policy is to provide guidance to all current and future users of the computerised network.
May 2008 NA Draft Banking & Investment Policy The investment policy of the municipality is aimed at gaining the optimal return on investments, without incurring undue risks, during those periods when cash revenues are not needed for capital or operational purposes.
May 2017 NA Fixed Asset Management Policy To guide and manage the movable or immovable assets that are owned by or under the control of the municipality
May 2017 NA Cash Management Fund & Reserves This policy aims to set standards and guidelines towards ensuring financial viability over both the short and long term and includes funding as well as reservesrequirements.
May 2017 NA

26
Name of policy Description Last review Next review It also ensures the operating and capital budgets of Council are appropriately funded and reserves are maintained at the required levels. Insurance Policy This insurance policy is aimed at ensuring that all assets, Councillors, employees and third parties are insured economically and adequately at all times. May 2017 NA
ICT Policy The policy provides guidelines for introducing and maintaining ICT in a controlled and informed manner, while addressing the key elements of control and security. May 2017 NA
Management & Disposal of Asset Policy The purpose of the Asset Disposal Policy is to provide a framework for the disposal of the municipality’s assets that are not needed to provide the minimum level of basic municipal services and that are surplus to the municipality’s requirements.
May 2017 NA
Risk Management Policy The policy intends to guide the municipality in identifying, outsourcing, mitigating or managing strategic or operational risk in its mandated functions. May 2017 NA
Subsistence & Travelling Allowance Policy This policy sets basis for payment of subsistence and travel allowance for such official travelling. May 2017 NA Supply Chain Management Policy The supply chain management policy provides for an effective system of strategic and operational procurement of goods and services according to law and standards.
NA NA

27
Name of policy Description Last review Next review Credit Control Policy This policy serves to document the key elements of Credit Control and Debt Collection to be applied and monitored. May 2017 NA
Indigent Policy The Indigent Policy is intended to guide the national initiative to improve the lives of indigents and to improve access to Free Basic services. It provides a high level framework to guide the national initiative to improve the lives of theindigent.
May 2017 NA
Other Policies Name of Policy Date adopted Next Review 1 Affirmative Action 28 May 2017 NA 2 Attraction and Retention 28 May 2017 NA 3 Code of Conduct for employees 28 May 2017 NA 4 Delegations, Authorisation & Responsibility 28 May 2017 NA 5 Disciplinary Code and Procedures 28 May 2017 NA 6 Essential Services 28 May 2017 NA 7 Employee Assistance / Wellness 28 May 2017 NA 8 Employment Equity 28 May 2017 NA 9 Exit Management 28 May 2017 NA 10 Grievance Procedures 28 May 2017 NA 11 HIV/Aids 28 May 2017 NA 12 Human Resource and Development 28 May 2017 NA 13 Information Communications Technology 28 May 2017 NA 14 Job Evaluation Guided by SALGA NA 15 Leave 28 May 2017 NA 16 Occupational Health and Safety 28 May 2017 NA 17 Official Housing 28 May 2017 NA 18 Official Journeys 28 May 2017 NA 19 Official transport to attend Funerals 28 May 2017 NA 20 Official Working Hours and Overtime 28 May 2017 NA 21 Organisational Rights 28 May 2017 NA 22 Payroll Deductions 28 May 2017 NA 23 Performance Management and Development 28 May 2017 NA 24 Recruitment, Selection and Appointments 28 May 2017 NA 25 Remuneration Scales and Allowances 28 May 2017 NA 26 Resettlement 28 May 2017 NA

28
27 Sexual Harassment 28 May 2017 NA 28 Skills Development 28 May 2017 NA 29 Smoking 28 May 2017 NA 30 Special Skills 28 May 2017 NA 31 Uniforms and Protective Clothing 28 May 2017 NA 32 Water Use Policy 28 May 2017 NA 5.4. PERFORMANCE MANAGEMENT The Municipal Systems Act requires municipalities to develop a performance management system that is suitable for their own circumstances. Performance Management is located in the Planning Department. Performance-based management is a systematic approach to improving performance, via an ongoing process of establishing strategic performance objectives; measuring performance; collecting, analyzing, reviewing, and reporting performance data; and using that data to drive performance improvement. The performance management system or framework must describe how the municipality’s cycle and processes of performance planning, monitoring, measurement, review and reporting will happen and be organised and managed, while determining the roles of different role-players. The PMS Framework 2017-2022 was adopted by Council on the 28th March 2017. Performance Review and monitoring takes place in October, January, April and August every financial year. Legislation makes provision for performance reporting to be tabled to Council at least twice in a financial year. See Internal and Audit&Performance Management Committee below. As at 30 June 2018, performance evaluation applies to section 54 and 56 managers and does not cascade to other levels of employees. 5.5. AUDITING AND OVERSIGHT In its annual audits, the Auditor-General of South Africa examines financial and non-financial information of the municipality to determine: • Fair representation and absence of material misstatements in the financial statements • Reliable and credible performance information for purposes of reporting on pre-determined performance objectives • Compliance with all legislation governing financial matters There are 3 categories of audit outcomes. These include clean audit, Unqualified Audit, Disclaimer. For the 2015/2016 financial year the ZDM received a clean audit. In 2016/2017 the municipality received an unqualified audit with matters of emphasis. The regress was due to lax in monitoring controls as well as irregular expenditure as a result of non-compliance with legislation. In the 2017/2018 financial year the municipality received a Qualified Audit Opinion. Two factors that led to the qualified opinion include:

29
Revenue from exchange transactions • insufficient and appropriate audit evidence that management had properly accounted for all revenue from service charges, receivables and related impairments due to inadequate internal control in the billing process Water Losses • insufficient appropriate audit evidence for the disclosed water losses stated at R7,21 million in the note 59 to the financial statements (See Appendices for the full Audit Report) With regards to auditing there are 3 structures namely: • Internal Audit • Audit and Performance Management Committee • Council Internal Audit Internal Audit is outsourced to PriceWaterHouse Coopers. The audit commences every quarter to produce a report which is tabled to the Audit and Performance Management Committee. The Internal Audit is guided by the Internal Audit Charter and Audit Plan which are tabled to the Audit and Performance Management Committee. The Audit Plan (which is raisk based) and Audit Charter for the 2017/2018 financial year was tabled to the Audit Committee in August 2017. Audit and Performance Management Committee The Zululand District Municipality has an established Audit and Audit Performance Management Committee in accordance with section 166 of the Municipal Finance Management Act, Act no 56 of 2003 (MFMA) and section 14(2)(c) of the Local Government Municipal Planning and Performance Regulations, 2001 (Regulations). Consideration has also been given to section 14(2)(c) of the Regulations and MFMA Circular No. 65 issued by the National Treasury in November 2012 as well as the recommendations contained in the King Report on Governance for South Africa 2016 (King IV). The Audit and Performance Management Committee, consisting of independent, external members listed below, is required to meet at least 4 times per annum as per the Audit Committee Charter, although additional meetings may be called as the need arises. Members of the Audit and Performance Committee are as follows: Member Designation Qualifications Attended Mr P Mntambo (Chairperson) External Bcompt, Project Management, Forensic, Investigation & MBA 6/6 Mr MC Ndwandwe External Bcom 6/6 Mr MS Ngcobo Internal NDIP Town & Regional Planning 6/6
30
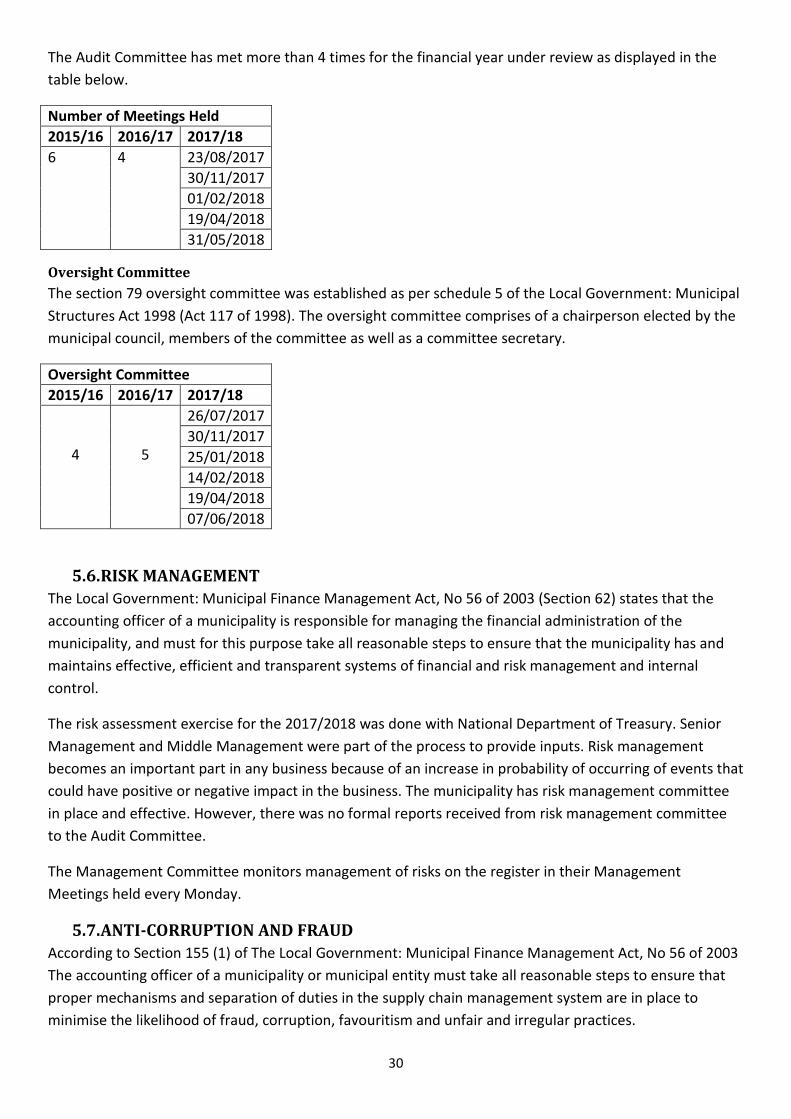
The Audit Committee has met more than 4 times for the financial year under review as displayed in the table below. Number of Meetings Held 2015/16 2016/17 2017/18 6 4
23/08/2017 30/11/2017 01/02/2018 19/04/2018 31/05/2018 Oversight Committee The section 79 oversight committee was established as per schedule 5 of the Local Government: Municipal Structures Act 1998 (Act 117 of 1998). The oversight committee comprises of a chairperson elected by the municipal council, members of the committee as well as a committee secretary. Oversight Committee 2015/16 2016/17 2017/18 4 5
26/07/2017 30/11/2017 25/01/2018 14/02/2018 19/04/2018 07/06/2018 5.6. RISK MANAGEMENT The Local Government: Municipal Finance Management Act, No 56 of 2003 (Section 62) states that the accounting officer of a municipality is responsible for managing the financial administration of the municipality, and must for this purpose take all reasonable steps to ensure that the municipality has and maintains effective, efficient and transparent systems of financial and risk management and internal control. The risk assessment exercise for the 2017/2018 was done with National Department of Treasury. Senior Management and Middle Management were part of the process to provide inputs. Risk management becomes an important part in any business because of an increase in probability of occurring of events that could have positive or negative impact in the business. The municipality has risk management committee in place and effective. However, there was no formal reports received from risk management committee to the Audit Committee. The Management Committee monitors management of risks on the register in their Management Meetings held every Monday. 5.7. ANTI-CORRUPTION AND FRAUD According to Section 155 (1) of The Local Government: Municipal Finance Management Act, No 56 of 2003 The accounting officer of a municipality or municipal entity must take all reasonable steps to ensure that proper mechanisms and separation of duties in the supply chain management system are in place to minimise the likelihood of fraud, corruption, favouritism and unfair and irregular practices.

31
It is noted that a Fraud Prevention Strategy is in place and a Code of Conduct for Municipal staff and its Councillors in terms of the Municipal Systems Act was applied by the Municipality. It must be stated, however, that fraud is very difficult to detect at any given time and level. 5.8. CODE OF CONDUCT Section 112 of The Local Government: Municipal Finance Management Act, No 56 of 2003 requires that a supply chain management policy must make provision for compulsory disclosure of any conflicts of interests prospective contractors may have in specific tenders and the exclusion of such prospective contractors from those tenders or bids. See Anti-Corruption and Fraud 5.9. SUPPLY CHAIN MANAGEMENT Description Number Total Value Tenders Awarded Not available Not available Quotations Awarded Not available Not available Deviations Not available R20 995 858.20 The Council had developed and approved its Supply Chain Management (SCM) Policy that is in line with Municipal Supply Chain Management (SCM) Regulations as issued by national Treasury. In an endeavour to ensure compliance and standardisation of the SCM Policy all amendments are submitted to Council for approval. The SCM Unit is centralised and reporting to the office of the Chief Financial Officer as required by regulation 7(1) of Municipal Supply Chain Management Regulations. Section 115 of the MFMA that deals with segregation of duties is complied with. The audit committee noted weaknesses of the SCM unit in that most of the quotations and tenders did not follow the normal process when procuring goods and services of the municipality. Many of the goods and services were purchased via deviations cirmventing the normal process. The total irregular expenditure of the municipality has increased to more than R300million. 5.10. INTERGOVERNMENTAL RELATIONS Intergovernmental Relations (IGR) in South African context concern the interaction of the different spheres of government. The Constitution declares that government is comprised of National, Provincial and Local spheres of government which are distinctive, interdependent and interrelated. According to the Constitution of the Republic of South Africa, Act, No.108 of 1996, Section 41 (2), an Act of Parliament must establish or provide structures and institutions to promote and facilitate Intergovernmental Relations and provide for appropriate mechanisms and procedures to facilitate settlement of Intergovernmental disputes. The table below demonstrates the number of times that the different segments of IGR met during the financial year under review: Name of Forum No. of Meetings (2017/2018) Mayors Forum 01 MMs Forum 01 CFOs Forum 01 Corporate Services Forum 01 Technical Services Forum 01 Planning & Development Forum 00

32
5.11. PUBLIC ACCOUNTABILITY AND PARTICIPATION The Municipality held izimbizo (public meetings) with each of its 7 clusters. The izimbizo are held firstly in November and these are the Integrated Development Plan (IDP) izimbizo and the public participates in shaping the IDP for the following year and makes the Municipality’s political and administrative governance structure aware of challenges faced at ward level and highlight challenges regarding infrastructure and other projects taking place in their communities even those being facilitated by another organ of state. Thereafter the izimbizo are held in April when the Draft Budget has been submitted to the Council. The community has an opportunity to engage with the Municipality regarding which projects have been funded for the following financial year and the planned projects for the next 3 years based on the budget submitted. The comments received at these meetings are taken into account when the Final IDP and Budget are submitted to Council for adoption. IDP, LED and Disaster Management Roadshows 2017 Date Municipality Venue 17/10/2017 Nongoma Mlokothwa Sportsground 18/10/2017 uPhongolo Dingukwazi Sportsground 15/11/2017 eDumbe Mangosuthu Sportsground 22/11/2017 Abaqulusi eMondlo Sportsground 19/11/2017 Ulundi Dalton, kwaGoje Sportsfield IDP, LED and Disaster Management Roadshows 2018 Date Municipality Venue 02/05/2018 uPhongolo Waterbas Sportsfield 04/05/2018 Abaqulusi Clifdale Sportsfield 09/05/2018 eDumbe Ophuzane Sportsfield 11/05/2018 Ulundi Okhukho, Emathayini 26/05/2018 Nongoma Emabhanoyini, Emcebo Website Publications 2017/2018 Publication Date Uploaded Integrated Development Plan 31-May-18 Budget 31-May-18 Performance Agreements 31-Jul-18 SDBIP 31-Jul-18 Annual Report 31-Mar-18 Water Services Development Plan 31-Mar-18

33
6. CHAPTER 3 – STRATEGIC PRIORITIES KEY PERFORMANCE AREA: INFRASTRUCTURE AND SERVICES FOCUS AREA: WATER&SANITATION GOAL: TO PROGRESSIVELY PROVIDE A COST EFFECTIVE, RELIABLE WATER AND SANITATION SERVICES AT A GOOD QUALITY TO ALL POTENTIAL CONSUMERS IN THE DISTRICT OBJECTIVE STRATEGY Maintaining an updated Water Services Development Plan Review 2017/18 WSDP Implement 2016/17 WSDP To provide cost effective water and sanitation (including free basic water and sanitation services) Provide Free Basic Water and sanitation Establish base-line costs of water production To provide for the Operations and Maintenance of water and sanitation projects Maintaining an updated water loss strategy Implement Water Loss Strategy Institutional Development&structuring for water loss Investigate&Implement information systems to pick up water leaks To improve on the quality of water delivered Implement Water Quality Strategy Improving quality of ground water delivered to communities through partnerships i.e. mines Rehabilitation&Refurbishment of water treatment works & infrastructure to improve quality of surface water To establish capital investment needed(including personnel) for waste water collection and treatment facilities to meet the water quality standards (blue drop & green drop) To facilitate labour intensive construction through water and sanitation projects implementation Implement the EPWP To provide effective Customer Care Improving communication and efficiency of response to technical concerns reported Maintaining updated bylaws Review and implement legislated water policies & Bylaws To effectively utilise grant allocation for water and sanitation Implement WSDP To deliver and regulate water services in a structured manner To effectively regulate and monitor WSP's and Water Services Intermediaries Prioritising and installing infrastructure in areas of economic opportunity Prioritising and installing infrastructure in areas of economic opportunity Identify methods to reduce presurre off the water systems due to increased levels of development Identify methods to reduce presurre off the water systems due to increased levels of development Ensuring universal access to water&sanitation (target funding agencies or adopt once off area specific interventions) Ensuring universal access to water&sanitation (target funding agencies or adopt once off area specific interventions) Investigate&implement billing to previously unbilled areas(by means of reasonable flat rate) Investigate&implement billing to previously unbilled areas(by means of reasonable flat rate)

34
Investigate&Implement energy efficiency measures at water sector systems(plants, boreholes) and households to reduce operating costs ( i.e.ESKOM) Investigate&Implement energy efficiency measures at water sector systems(plants, boreholes) and households to reduce operating costs ( i.e.ESKOM) Managing infrastructure capital assets to minimize the total cost of owning and operating these assets while delivering the desired service levels Managing infrastructure capital assets to minimize the total cost of owning and operating these assets while delivering the desired service levels Effectively regulating and monitoring WSP's and Water Services Intermediaries Effectively regulating and monitoring WSP's and Water Services Intermediaries Enteprise Development by increasing the local infrastructure skills pool by empowering local engineers& contractors Enteprise Development by increasing the local infrastructure skills pool by empowering local engineers& contractors KEY PERFORMANCE AREA: INFRASTRUCTURE AND SERVICES FOCUS AREA: MUNICIPAL DISTRICT AIRPORTS GOAL: TO VIABLY OPERATE & MAINTAIN A REGIONAL AIRPORT THAT CONTRIBUTES TO THE GROWTH & DEVELOPMENT OF THE DISTRICT OBJECTIVE STRATEGY To ensure development of airport infrastructure Review Airport Implementation Plan Implement current activities as identified in the Reviewed Airport Implementation Plan To operate the airport as a catalyst for economic growth To operate the airport as a catalyst for economic growth Investigating PPP activities as a mechanism to manage the airport efficiently Investigating PPP activities as a mechanism to manage the airport efficiently Maintenance of Airport infrastructure Maintenance of Airport infrastructure KEY PERFORMANCE AREA: INFRASTRUCTURE AND SERVICES FOCUS AREA: MUNICIPAL DISTRICT ROADS GOAL: TO FACILITATE THE PROVISION OF A WELL-DEVELOPED DISTRICT ROAD NETWORK OBJECTIVE STRATEGY To establish the status quo of roads within the Municipal Area and to take responsibility of the assigned district roads To develop a Rural Road Asset Management System and ensure that it is maintained Continuously collecting and interpreting of road condition data Development and review of an Integrated Public Transport Plan Development and review of an Integrated Public Transport Plan Collection, interpretation and maintenance of public transport infrastructure data Collection, interpretation and maintenance of public transport infrastructure data

35
KEY PERFORMANCE AREA: INFRASTRUCTURE AND SERVICES FOCUS AREA: REGULATION OF PASSENGER TRANSPORT SERVICES GOAL: TO FACILITATE THE REGULATION OF PASSENGER TRANSPORT SERVICES OBJECTIVE STRATEGY To clarify the DM's role in the Regulation of Passenger Transport Services Development of an Integrated Public Transport Plan Constantly monitor and actively improve efficiency of operations Ensuring compliance with relevant legislation, policies and frameworks KEY PERFORMANCE AREA: INFRASTRUCTURE AND SERVICES FOCUS AREA: FIRE FIGHTING GOAL: TO PLAN, CO-ORDINATE AND REGULATE FIRE FIGHTING SERVICES IN THE DISTRICT OBJECTIVE STRATEGY Regulation and co-ordination of Fire Fighting Services Secure funds to prepare ZDM Fire Fighting Bylaws KEY PERFORMANCE AREA: INFRASTRUCTURE AND SERVICES FOCUS AREA: DISASTER MANAGEMENT GOAL: TO DEAL WITH DISASTERS EFFICIENTLY & EFFECTIVELY IN THE DISTRICT OBJECTIVE STRATEGY To review and facilitate the district Disaster Management plan To review and implement the District Disaster Management Plan To create awareness of hazards and disasters To prepare Disasters and Hazards Awareness Strategy Ensuring compliance with relevant legislation, policies and frameworks Ensuring compliance with relevant legislation, policies and frameworks Review and adjust capacity of the Disaster Management Unit in relation to demand Review and adjust capacity of the Disaster Management Unit in relation to demand To reduce deployment times of disaster management equipment to disaster prone areas To reduce deployment times of disaster management equipment to disaster prone areas KEY PERFORMANCE AREA: INFRASTRUCTURE AND SERVICES FOCUS AREA: SOLID WASTE GOAL: TO FACILITATE THE EFFECTIVE AND EFFICIENT REMOVAL OF SOLID WASTE OBJECTIVE STRATEGY To facilitate co-ordinated regional solid waste Investigate Feasibility of Regional Solid Waste

36
management management Develop Integrated Waste Management Strategy Investigate feasibility of regional solid waste sites KEY PERFORMANCE AREA: INFRASTRUCTURE AND SERVICES FOCUS AREA: MUNICIPAL HEALTH SERVICES GOAL: TO FACILITATE THE EFFECTIVE AND EFFICIENT MUNICIPAL HEALTH SERVICE ACROSS THE DISTRICT OBJECTIVE STRATEGY To deliver an effective environmental municipal health service Prepare Plan for effective and efficient Municipal Environmental Health Services Develop a Municipal Environmental Health Strategy To incorporate municipal health staff into the municipal organogram KEY PERFORMANCE AREA: INFRASTRUCTURE AND SERVICES FOCUS AREA: REGIONAL FRESH PRODUCE MARKETS GOAL: INVESTIGATE THE FEASIBLITY OF FRESH PRODUCE MARKETS AND ABATTOIRS OBJECTIVE STRATEGY To establish co-ordinated and efficient regional fresh produce infrastructure where feasible Investigate Feasibility of regional Fresh Produce Markets and Abattoirs KEY PERFORMANCE AREA: INFRASTRUCTURE AND SERVICES FOCUS AREA: DISTRICT CEMETERIES GOAL: TO ENSURE THAT SUFFICIENT BURIAL SPACE IS AVAILABLE WITHIN THE DISTRICT OBJECTIVE STRATEGY To establish co-ordinated and efficient regional burial infrastructure where feasible Investigate the feasibility of a Regional Cemetery Site/s KEY PERFORMANCE AREA: ECONOMIC, AGRICULTURE AND TOURISM FOCUS AREA: DISTRICT TOURISM GOAL: TO PROMOTE TOURISM IN THE DISTRICT OBJECTIVE STRATEGY To create effective Tourism structures and have effective institutional arrangements in place. Regulary review Tourism section resources Revive Tourism Forum Strengthen TKZN linkages

37
Review/update Tourism Sector Plan To update/maintain the Zululand Tourism Database To ensure tourists/ potential tourists are aware of our product To update/implement themes/packages website upgrading brochure distribution To train and build capacity of employees Safety and Signage Investigate needs and allocate resources To develop and promote Tourism Infrastructure Develop/improve the following tourism routes Implement Tourism Portfolio Project To manage Tourism Hub Development KEY PERFORMANCE AREA: ECONOMIC, AGRICULTURE AND TOURISM FOCUS AREA: DISTRICT TOURISM GOAL: TO HAVE EFFECTIVE INSTITUTIONAL ARRANGEMENTS IN PLACE OBJECTIVE STRATEGY Review Tourism Sector Plan Review Tourism Sector Plan Maintain the Zululand Tourism Database as the main tourism information portal Maintain the Zululand Tourism Database as the main tourism information portal Revive the Tourism Forum as a main consultative structure Revive the Tourism Forum as a main consultative structure KEY PERFORMANCE AREA: ECONOMIC, AGRICULTURE AND TOURISM FOCUS AREA: DISTRICT TOURISM GOAL: TO MAINTAIN A STRONG MARKETING CAMPAIGN OF THE REGIONAL TOURISM PRODUCTS OBJECTIVE STRATEGY Develop and review the Zululand District Municipality investment &marketing strategy Develop and review the Zululand District Municipality investment &marketing strategy Develop marketing skills amoung existing staff/add new marketing capacity to staff contingent Develop marketing skills amoung existing staff/add new marketing capacity to staff contingent Constantly monitor and actively improve efficiency of operations Constantly monitor and actively improve efficiency of operations To support the maximisation of tourism opportunities To support the maximisation of tourism opportunities KEY PERFORMANCE AREA: ECONOMIC, AGRICULTURE AND TOURISM FOCUS AREA: DISTRICT TOURISM GOAL: TO SUPPORT THE MAXIMISATION OF TOURISM OPPORTUNITIES OBJECTIVE STRATEGY Identification of new tourism opportunities&potential Pursue the Zulu Heritage Route (Emakhosi Valley Heritage Route)

38
KEY PERFORMANCE AREA: ECONOMIC, AGRICULTURE AND TOURISM FOCUS AREA: LOCAL ECONOMIC DEVELOPMENT (LED) GOAL: TO IMPROVE THE ECONOMY OF THE DISTRICT, THROUGH THE CREATION OF JOB OPPORTUNITIES AND ADDITIONAL ECONOMIC ACTIVITIES OBJECTIVE STRATEGY Establishing LED Institutions and Processes Review LED Plan To change the attitudes of local stakeholders in the economy with spesific focus on local buying, local investment, welcoming new investment, co-operation in implementation of economic development and entrepreneurship Promote economic development through use of the regional radio station Conduct grass roots capacity building and awareness programmes Sensitize the community about LED To establish a solid foundation for economic development within the district be addressing key socio-economic issues to allow communities to effectively participate in the district economy Provide assistance with home-based HIV/AIDS care Youth entrepreneurship development Provide support to the informal sector To raise specifically the investment profile of the district through a multi-pronged public relations and marketing programme Develop Marketing Plan To market product development Establish Development Agency To improve access within the district and access between the district and neighbouring areas Prepare and implement a roads upgrading programme in co-operation with DoT and the LMs Upgrade road signage Investigate the feasibility of a privatised "highway patrol" Focus on achieving visible delivery with regard to local economic development Implement budgeted Tourism Development Projects KEY PERFORMANCE AREA: SOCIAL DEVELOPMENT FOCUS AREA: HIV/AIDS GOAL: TO REDUCE THE IMPACT OF HIV/AIDS OBJECTIVE STRATEGY To create HIV/AIDS awareness and education Review HIV/Aids Plan Implement HIV/AIDS awareness and education campaigns Developing and review Zululand HIV strategy

39
Ensuring compliance with relevant legislation, policies and frameworks The dispensing of HIV/AIDS must be in line with National Government Policy Providing & equipping adequate testing and treatment centres to communities Providing & equipping adequate testing and treatment centres to communities To train&build capacity of employees To train&build capacity of employees KEY PERFORMANCE AREA: SOCIAL DEVELOPMENT FOCUS AREA: YOUTH & GENDER GOAL: TO DEVELOP AND EMPOWER YOUTH, WOMAN, PEOPLE LIVING WITH DISABILITY, THE ELDERLY, WIDOWS AND ORPHANS OBJECTIVE STRATEGY To strategically plan development and empowerment initiatives for youth and gender Review the Youth, Gender and People living with Disabilities Plan Identify and implement projects focussed on youth development Identify and implement projects focussed on the development of women To promote early childhood development Development of education infrastructure based on received community needs To promote sports development within the district Identify and implement sporting events within the district KEY PERFORMANCE AREA: SOCIAL DEVELOPMENT FOCUS AREA: YOUTH & GENDER GOAL: ORPHANS, ELDERLY&DISABLED OBJECTIVE STRATEGY Maintaining an updated Orphans, Elderly&disabled strategy Maintaining an updated Orphans, Elderly&disabled strategy Identification, providing & equipping adequate orphans&elderly support centres at strategic locations Identification, providing & equipping adequate orphans&elderly support centres at strategic locations Modifying existing municipal run community facilities to accommodate physically challenged Modifying existing municipal run community facilities to accommodate physically challenged Co-ordinating, monitoring provision of support services to orphans&elderly across the district Co-ordinating, monitoring provision of support services to orphans&elderly across the district To promote the development of people living with Disabilities Identify and implement Disability programme To contribute towards addressing the needs of the elderly within the district Identify and implement projects focussed on the needs of the elderly To contribute towards addressing the needs of widows and orphans within the district Identify and implement projects focussed on the needs of widows and orphans

40
KEY PERFORMANCE AREA: SOCIAL DEVELOPMENT FOCUS AREA: EARLY CHILDHOOD DEVELOPMENT GOAL: TO SUPPORT DEVELOPMENT OF EDUCATION INFRASTRUCTURE AT LOWER GRADES OBJECTIVE STRATEGY Maintaining an updated Early Childhood Infrastructure development strategy Maintaining an updated Early Childhood Infrastructure development strategy KEY PERFORMANCE AREA: SOCIAL DEVELOPMENT FOCUS AREA: COMMUNITY DEVELOPMENT GOAL: THE SOCIAL UPLIFTMENT OF THE COMMUNITIES IN ZDM OBJECTIVE STRATEGY To reduce poverty by implementing Community Development Projects To investigate new & review existing social upliftment programs To identify and implement poverty alleviation projects through the Poverty Alleviation Fund To promote arts and culture Identify and implement arts and culture projects Investigating community skills levels for participation in the local economy Investigating community skills levels for participation in the local economy KEY PERFORMANCE AREA: INSTITUTIONAL TRANSFORMATION & DEVELOPMENT FOCUS AREA: EMPLOYMENT EQUITY GOAL: TO TRANSFORM THE ORGANISATION TO COMPLY WITH THE EMPLOYMENT EQUITY ACT OBJECTIVE STRATEGY To comply with Employment Equity Legislation To implement budgeted activities in the Employment Equity Plan KEY PERFORMANCE AREA: INSTITUTIONAL TRANSFORMATION & DEVELOPMENT FOCUS AREA: ICT & GIS GOAL: TO ENSURE THAT THE MUNICIPALITY REMAINS UP-TO-DATE WITH THE LATEST COMPUTER TECHNOLOGY AND PROGRAMMES TO ENABLE EFFECTIVE AND EFFICIENT SERVICE DELIVERY OBJECTIVE STRATEGY To constantly update and maintain the Municipality's computer and software assets to conform to market and industry requirements To constantly update and maintain the Municipality's computer and software assets to conform to market and industry requirements
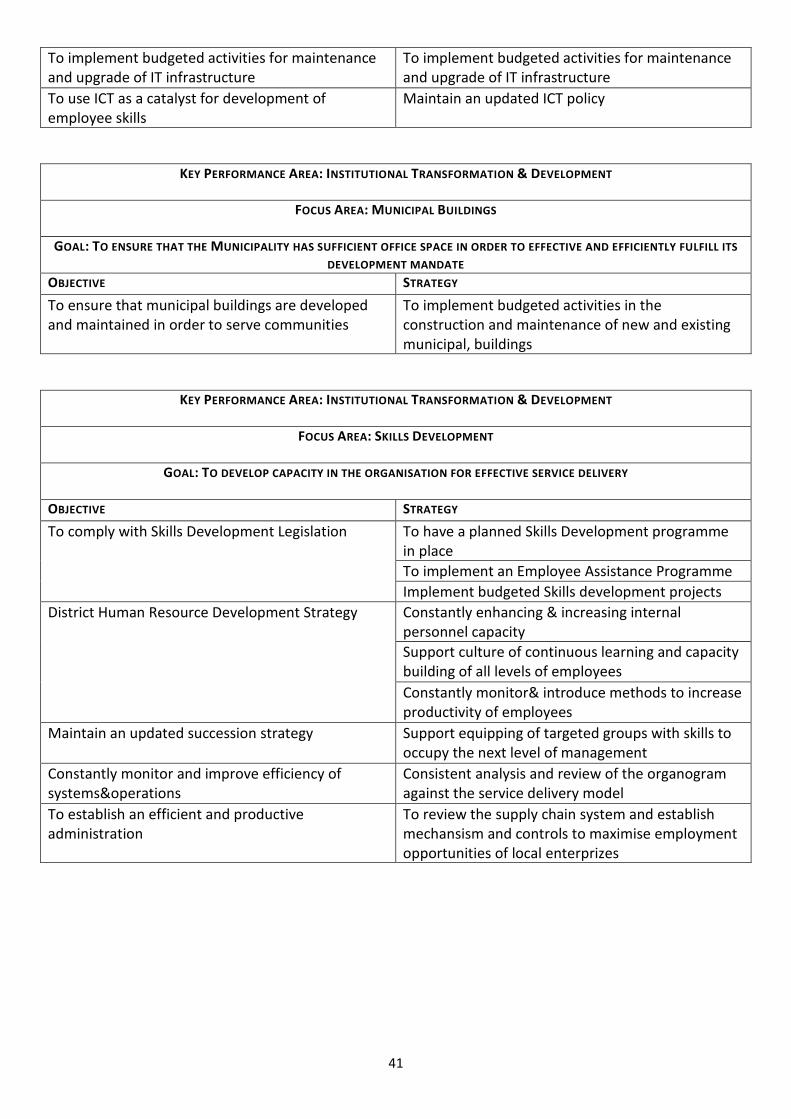
41
To implement budgeted activities for maintenance and upgrade of IT infrastructure To implement budgeted activities for maintenance and upgrade of IT infrastructure To use ICT as a catalyst for development of employee skills Maintain an updated ICT policy KEY PERFORMANCE AREA: INSTITUTIONAL TRANSFORMATION & DEVELOPMENT FOCUS AREA: MUNICIPAL BUILDINGS GOAL: TO ENSURE THAT THE MUNICIPALITY HAS SUFFICIENT OFFICE SPACE IN ORDER TO EFFECTIVE AND EFFICIENTLY FULFILL ITS DEVELOPMENT MANDATE OBJECTIVE STRATEGY To ensure that municipal buildings are developed and maintained in order to serve communities To implement budgeted activities in the construction and maintenance of new and existing municipal, buildings KEY PERFORMANCE AREA: INSTITUTIONAL TRANSFORMATION & DEVELOPMENT FOCUS AREA: SKILLS DEVELOPMENT GOAL: TO DEVELOP CAPACITY IN THE ORGANISATION FOR EFFECTIVE SERVICE DELIVERY OBJECTIVE STRATEGY To comply with Skills Development Legislation To have a planned Skills Development programme in place To implement an Employee Assistance Programme Implement budgeted Skills development projects District Human Resource Development Strategy Constantly enhancing & increasing internal personnel capacity Support culture of continuous learning and capacity building of all levels of employees Constantly monitor& introduce methods to increase productivity of employees Maintain an updated succession strategy Support equipping of targeted groups with skills to occupy the next level of management Constantly monitor and improve efficiency of systems&operations Consistent analysis and review of the organogram against the service delivery model To establish an efficient and productive administration To review the supply chain system and establish mechansism and controls to maximise employment opportunities of local enterprizes

42
KEY PERFORMANCE AREA: FINANCIAL MANAGEMENT FOCUS AREA: SOUND FINANCIAL MANAGEMENT GOAL: TO PROMOTE GOOD FINANCIAL PRACTICES OBJECTIVE STRATEGY To improve revenue collection Implement current credit control and debt collection policy and bylaws & Review same policy and bylaws To complete and submit accurate annual financial statements within the specified time period Prepare a schedule of all reconciliations to be performed To process payments in time Develop an invoice tracking system To complete and submit accurate annual financial statements within the specified time period Prepare a time schedule of all reconciliations to be performed to prepare AFS timely (in compliance with MFMA) To complete a budget within the specified time period Develop a budget time table in line with the IDP Process Plan To have an effective Auditing Function Develop an internal Audit plan Regular Review and implemention of risk register Ensure effective Audit Committee function To develop a Financial Plan (i.e. Budget Process and Time Table) Review and implement the current Financial Plan KEY PERFORMANCE AREA: FINANCIAL MANAGEMENT FOCUS AREA: SOUND FINANCIAL MANAGEMENT GOAL: TO BE A FINANCIALLY VIABLE MUNICIPALITY OBJECTIVE STRATEGY To increase the cost coverage ratio Review and implement the investment policy Implement the SCM policy to obtain cost effective methods of reducing fixed operating expenditure To increase the debt coverage ratio To Increase the revenue base of the municipality To provide sufficient cash resources Review and implement the current SDBIP To keep a minimum cash balance to cover average monthly expenditure Maintenance of the investment register on a monthly basis To report timely and accurately Development of a reporting framework and adherence to the MFMA reporting checklist To align Capital Programme and IDP Review and implement the current financial plan KEY PERFORMANCE AREA: DEMOCRACY & GOVERNANCE FOCUS AREA: COMPLIANCE, CLEAN AND SOUND ADMINISTRATION GOAL: TO PROMOTE GOOD GOVERNANCE, ACCOUNTABILITY & TRANSPARENCY

43
OBJECTIVE STRATEGY Policies & bylaws Review and implement current policies and bylaws Municipal Audit To implement budgeted activities for Municipal Auditing To review and improve public participation mechanisms To implement budgeted activities for community participation Development and maintenance of an updated communication strategy Ensure the effective and efficient marketing of the Municipal Area to attract investment To implement budgeted activities for marketing OPMS Review and Implement the Municipality's OPMS Maintain an updated performance management system to monitor service delivery performance KEY PERFORMANCE AREA: DEMOCRACY & GOVERNANCE FOCUS AREA: COMPLIANCE, CLEAN AND SOUND ADMINISTRATION GOAL: TO MANAGE RISK TO THE MUNICIPALITY EFFECTIVELY AND EFFICIENTLY OBJECTIVE STRATEGY To operate the organisation at a minimum risk level Review Municipal Risk Register To identify, document, classify, benchmark and improve standard operating procedures KEY PERFORMANCE AREA: DEMOCRACY & GOVERNANCE FOCUS AREA: COMPLIANCE, CLEAN AND SOUND ADMINISTRATION GOAL: TO ENSURE EFFECTIVE ADMINISTRATIVE PRACTICES OBJECTIVE STRATEGY To ensure effective administrative practices To identify, document, classify, benchmark and improve standard operating procedures Ensure compliance with legislation, policies and frameworks Ensure compliance with legislation, policies and frameworks KEY PERFORMANCE AREA: DEMOCRACY & GOVERNANCE FOCUS AREA: INTEGRATED & CO-ORDINATED DEVELOPMENT GOAL: TO CONTINUOUSLY PROMOTE INTEGRATED & CO-ORDINATED PLANNING AND DEVELOPMENT WITHIN THE DISTRICT OBJECTIVE STRATEGY To promote integrated development planning (including the spatial reflection thereof) in an environmentally responsible manner Review IDP Review ZDM Infrastructure Plan

44
To promote effective and efficient Shared Services To implement budgeted activities for Shared Services To promote good IGR To implement budgeted activities for IGR 7. CHAPTER 4 – SERVICE DELIVERY PERFORMANCE ANALYSIS FOR THE FINANCIAL YEAR 2017/2018 Overall the performance of the Zululand District Municipality improved from 83% to 88% between the 2016/17 and 2017/18 financial year.
The performance was audited by PricewaterHouse Coopers in July and August 2018. The Annual Performance Report was tabled to the Audit Committee on the 24th August 2018. The performance of the 2017/18 will be used to adapt the strategic plan and monitoring and evaluation framework of the Zululand District Municipality for the 2018/2019 financial year as well as the strategic direction for the 2019/2020 financial year. 7.1. INFRASTRUCTURE & SERVICE DELIVERY PERFORMANCE Water Provision Each regional scheme footprint has a sustainable water source from where infrastructure is progressively being rolled out to all households within the supply area. The supply footprints have been identified in such a way that water can be provided to all households within the area in a sustainable manner and at the lowest possible cost (R/kl).
Zululand District Municipality Annual Performance Targets 2016/2017Achieved 83%Not achieved 17%Zululand District Municipality Annual Performance Targets 2017/2018
Achieved 88%Not Achieved12%

45
Backlog Analysis For the period under review the Water Services Development Plan identified 183,177 households. 1,078 of these households are farmhouses. 31,225 households had none or inadequate access to water. 14,320 households are receiving the rudimentary level of service but which is less than RDP level of service. 29,517 households are receiving communal standpipes which is equal to RDP level of service 82,792 households are receiving yard connections which are higher than the RDP level of service. 52,036 of these households are located in the rural areas. The balance of 30,716 are located in urban areas.
Backlog The backlog is defined by households receiving less than RDP level of services. If one looks at the table above, this is a combination of none + rudimentary. Therefore for the period under review the water backlog in Zululand was 57,358 households. For households receiving none or inadequate level of service the backlog was reduced between 15/16 and 16/17 financial years. However the backlog rose in 17/18 due to an increase in the number of households. In terms of households receiving less than RDP level of service, the backlog rose again in 17/18 due to an increase in households. For yard connections the backlog increased between 15/16 and 16/17 but was reduced in 17/18. This points to an increase in the installation of yard connections. Projects Implemented for Year Under Review
38706 31225 32883 17853 14320 24475 27125 29517 39089 74170 82792 526050100002000030000400005000060000700008000090000
15/16 16/17 17/18 15/16 16/17 17/18 15/16 16/17 17/18 15/16 16/17 17/18none rudimentary (<RDP) communal standpipes(=RDP) yard connections (>RDP)
Water Backlog Trends

46
According to the PMU report, approximately 140 water projects with a total value of R132, 887,691.56 were constructed in the whole district for the period under review. These projects include bulk, reticulation and stand alone schemes. ZDM has the following levels of service: Regional schemes Intermediate Stand-Alone Schemes Rudimentary Water Supply Schemes Rural Sanitation Roll-Outs(New Infrastructure and Phase 3 Replacement Programme) Key projects implemented are as follows: uSuthu Regional Water Scheme This is the largest scheme in the district and contains the largest percentage of backlogs. It covers the area of Nongoma and parts of Ceza. The following projects are implemented under the Municipal Infrastructure Grant Programme: SCOPE OF WORK PROJECT ALLOCATION (2017/18) EXPENDITURE % Gravity main to soshamase an dreticulation at Delini and soshamase R 4 046 056 100% Construction of reticulation line, bulk line standtaps and chambers Ophalule village R 7 268 481 95% (cashflow management) Construction of reticulation line at Lindizwe village R 3 623 542 100% Construction of reticulation line at Esikhaleni village R 2 420 853 100% Construction of reticulation line at Nongoma south phase 1 R 2 937 431 100% Construction of reticulation line at Nongoma south phase 3 R 5 006 518 100% Construction of reticulation line at KwaMinya and Soshamase R 5 873 556 90% (completion delayed due to hardrock) Construction of reservoirs and fencing at Amaphiva R 3 177 794 0% (Site establishment) Construction of reticulation line and house connections at Amphiva R 4 021 457 0% (Site establishment) Reticulation Xolo B R 2 403 482 100%

47
Simdlangentsha West Simdlangentsha West consists of rural areas east of Paulpietersburg Town. SCOPE OF WORK PROJECT ALLOCATION EXPENDITURE PROG % Frischgewaard WTW-construction of a water treatment works -civils works R 64 503 171.00 R 0.95 0.95 Frischgewaard WTW-Installation of mechanical and Electrical equipment R 21 845 676.22 R 0.50 0.5 Mandlakazi The second largest scheme in the district covers Nongoma and presents second largest backlogs. SCOPE OF WORK PROJECT ALLOCATION EXPENDITURE % PROG % Bulk Rising Main from R1 to R6 R 10 762 888.88 100% 10179143 Construction of reservoir R12(sikhulile) R 2 848 783.93 100% 1610589.3 Construction of Electrical and Mechanical works - Reservoir Chambers - refurbishment of R3 , R5 & R6 Reservoirs(Nsimbini) R 3 177 365.11 100% 1098795.62 Construction of R3 , R4 & R6 Reservoirs(Dayeni,Sisuthu,Qhudebe) R 4 835 484.39 100% 441470 Construction of Reservoirs 7 Refurbishment of R7 Reservoirs(Odizima, kwasaku,Kwadayeni, okhalweni) R 2 739 730.96 100% 254263 Construction of R7 pumpstation(okhalweni) R 3 700 113.86 100% 332527 Construction of 2 reservoirs and refurshment of 4 reservoirs(ezimfabeni-250kl & 100kl) R 2 900 906.23 100% 392573 Construction of water treatment works R 32 013 030.50 100% 18910257.25 Construction of Weir B and Reservoirs Phase 1 R 9 944 140.09 100% 4778688.05 Construction of pipeline 01- Weir to WTW R 2 302 352.00 100% 2089314.74 Construction of pipeline 06- Reservoir Dg to Ea R 10 762 888.88 100% 2183430.42 Simdlangentsha Central SCOPE OF WORK PROJECT ALLOCATION EXPENDITURE PROG % The construction of bulk pipeline from Mozane Weir to Ombimini Reservoir R 12 719 970.19 R 554 852 80%

48
Simdlangentsha East SCOPE OF WORK PROJECT ALLOCATED COST EXPENDITURE % PROG % Construction of water reticulation pipeline, installations of water meters, construction of 1ML reservoir and refurbishment of existing pumpstation. R 13 498 486.10 R 1 397 448.72 0.3 Rudimentary South SCOPE OF WORK PROJECT ALLOCATED COST EXPENDITURE % PROG % Drilling 24 Boreholes in (Enkwalini,KwaShoba,Ndulinde,Kwavilikazi,Mvunyane,Sivule,St Paul,KwaHennie,Matshekazi,Sangweni,Nyosi,sgubudu,Gluckstad,Makhukhula,Moreson,Mboloba,Mvunyane,Khipinyawo,Kwagaqa,Mapayipini,Matshekazi,Mandunduwe)
R 4 139 993.22 R 3 716 295.27 100% Equiping of borehole, installation of 2x JoJo tanks and pipeline connection to existing line at the (Engilandi )area. R 1 359 761.55 R 1 359 761.55 100% Refurbishment of 3 reservoirs, installation of meter chambers and construction of a pumpstation(Eziduleni) R 971 139.57 R 816 076.74 100% Connection to spring, reticulation pipeline and 9x community stand taps.(Hlanzeni) R 1 472 220.43 R 407 786.61 100% Equipping of borehole, installation of 2x JoJo tanks and reticulation pipeline of the (Bethal) area. R 1 820 563.48 R 891 766.51 100% The following projects are implemented under the Regional Bulk Infrastructure Grant Programme: SCOPE OF WORK APPROVED PROJECT COSTS PROG % Usuthu Water Works R 12 204 237.74 100% Construction of Mandlakazi Phase Water Treatment Works R 105 011 313.59 95% Construction of Intermediate Pumpstation (WTW to Command Reservoir Upgrade to 10Ml/day) R 17 012 966.81 100% Mandlakazi RWSS: Bulk Gavity lines R 32 126 632.37 100% Holinyoka and Lindizwe Pump Station R 21 131 767.32 100% Usuthu Pump Station M and Reservoir BST 0.6ml) and Reservoir M1 and M2 (3ML Each) R 29 711 453.91 100%

49
SCOPE OF WORK APPROVED PROJECT COSTS PROG % Usuthu WPW Pump Station R 74 211 587.00 100% Gravity main from Res G towards White City R 5 136 325.06 85% Mahashini pump station Mechanical installations R 10 915 759.00 95% Nongoma Bulk 7Ml and Reservoir B R 38 894 595.29 100% Completion of Holinyoka and Lindizwe Pumpstation R 18 650 148.98 100% Completion of Concrete Reservoir 7ML with Access roads and Usuthu Reservoir B R 38 966 918.39 100% Nyokeni Self Build 100% Nongoma Reservoirs and Access Roads 100% Usuthu Water Purification Works R 233 243 554.47 100% Key Challenges It has been discovered that the ZDM historically ficused a lot on the bulk programmes but not enough on reticulation. During and after the drought it was discovered that a lot of the schemes did not have water. The ZDM is now focusing on ensuring that all schemes are functional by drilling boreholes to feed these schemes at strategic locations and this is paying huge dividends. The ZDM invests a lot towards construction of bulk pipelines and reticulation and sanitation to ensure that all its citizens have access to a quality yet affordable level of service. But there are several challenges we face. The biggest challenge of them all is that the municipality is not collecting revenue. Approximately 65% of the Zululand District Municipality population is indigent (they cannot afford to pay for the services rendered to them). But they are not registered on the Municipality’s database. Much of the approximate 35% who are able to afford are not paying. The municipality has appointed Debt collectors to assist in recovering long outstanding debt. The demand on the water and sanitation infrastructure network in the ZDM is always increasing. A study was done in 2014 and business plans were submitted to various funding institutions to upgrade identified water treatment works particularly in Ulundi and Ophongolo. A business plan was also submitted for funding of a dam in the uSuthu area which would enable the municipality to manage water reserves. The protracted drought played a significant role in slowing down service delivery and amplified the backlog particularly in deep rural areas which were already vulnerable. 7.2. Waste Water (Sanitation) Provision Sanitation in the rural areas is being provided in the form of dry-pit VIP toilets and the strategy is to implement these simultaneously with the roll-out of water services. This ensures a more effective impact with health and hygiene awareness training.

50
Backlog
Projects Implemented for Year Under Review In terms of sanitation 13 projects were implemented across the district with an accumulative total of R17,285,650.06. The projects are pre-cast concrete VIP type. Key Projects implemented are as follows: SCOPE OF WORK PROJECT ALLOCATION EXPENDITURE % PROG % The Installation Of ± 59 Pre-Cast Concrete Vip Toilet Units At Mafindose R 513 274.61 R 255 147.32 100% The Installation Of ± 73 Pre-Cast Concrete Vip Toilet Units At Bongaspoort R 600 165.33 R 227 363.74 100% The Installation Of ± 114 Pre-Cast Concrete Vip Toilet Units At Nkosientsha R 854 631.00 R 456 727.95 100% The Installation Of ± 115 Pre-Cast Concrete Vip Toilet Units At Kwambhulu R 860 837.47 R 396 093.31 100% The Installation Of ± 42 Pre-Cast Concrete Vip Toilet Units At Cotlands R 407 764.47 R 22 478.83 100% The Installation Of ± 330 Pre-Cast Concrete Vip Toilet Units At Gumbi Trust (Mvokweni) R 2 195 230.57 R 416 287.32 89% The Installation Of ± 325 Pre-Cast Concrete Vip Toilet Units At Gaqa R 2 164 198.18 R 556 438.83 84% The Installation Of ± 224 Pre-Cast Concrete Vip Toilet Units At Tholakele R 1 537 343.75 R 76 765.53 95% The Installation Of ± 21 Pre-Cast Concrete Vip Toilet Units At Obivane Spot R 277 428.40 R 19 295.93 100% The Installation Of ± 102 Pre-Cast Concrete Vip Toilet Units At Khuthuza R 780 153.24 R 115 822.03 100% The Installation Of ± 115 Pre-Cast Concrete Vip Toilet Units At Nkongolwane R 860 837.47 R 515 669.46 100% The Installation Of ± 396 Pre-Cast Concrete Vip Toilet Units At Mvuzini R 2 604 858.22 R 1 243 374.05 100% The Installation Of ± 369 Pre-Cast Concrete Vip Toilet Units At Kwamachanca R 2 437 283.28 R 526 634.70 100%
56757 31071 38077 69475 94909 1150481364 1364 2611 30258 30258 27511020000400006000080000100000120000140000
15/16 16/17 17/18 15/16 16/17 17/18 15/16 16/17 17/18 15/16 16/17 17/18none VIP septik tank waterborne sewerage
Sanitation Backlog Trends

51
The Installation Of ± 517 Pre-Cast Concrete Vip Toilet Units At Nceceni R 3 355 842.24 R 909 018.43 100% The Installation Of ± 144 Pre-Cast Concrete Vip Toilet Units At Mbilane R 1 040 825.38 R 323 685.71 100% Key Challenges Provision of sanitation services stagnated towards the end of the financial year under review due to litigation over the intention to award the sanitation contract. This contract involves the insatallation of VIP units around Nongoma, Ulundi and Phongola. The longer this process continues will severly hamper the ability of the municipality to deliver services to its communities. 7.3. Municipal District Airports The Zululand district has two airports, Ulundi Airport (Prince Mangosuthu Buthelezi Airport) and Vryheid Airport. The Ulundi Airport has daily flights to Pietermaritzburg, and is envisaged to alleviate the high traffic volumes on the roads leading to Ulundi and particular the accidents on these roads.
The District has managed to maintain the Airport Operations compliant to all relevant SACAA Regulations including pertinent ICAO and SA-CATS requirements with airport infrastructure that is required to operate the facility in its designated category of operation, in a safe and legal manner as per ICAO Annex 14, SA CAA Regulations / CATS including Refuelling Services and flight operations by Federal Air. Projects Implemented for Year Under Review A service provider has been outsourced in the 2017/2018 financial year to assist in strategic review and propose various methods including partnering with the private to operate the airport viably. General refurbishment and maintenance was done to the airport to keep the basic facilities functioning and up to a good standard. Challenges Operating the airport viably at the current moment is not practical. Incoming revenue is also not adequate to conduct preventative maintenance of the strong infrastructure and facilities of the airport. Both of these activities are putting a lot of pressure on the municipal finances which must be prioritised to address the community’s basic needs. The municipality would also like gto manage the airport at the highest possible category but this is not possible if the airport does not generate revenue and infrastructure is not maintained. The increasing levels of development around the airport precinct on tribal land is also a challenge to maintain the national and international safety standards of airports as well as pilot landing and take-off guidelines.

52
7.4. Disaster Management The disaster risk management function and DMC in the municipality resort under the Corporate Services Department of the Zululand District Municipality. The Municipal Disaster Offices are also located in the Protection Services Departments under Corporate Services. Projects Implemented for Year Under Review The Disaster Management policy was developed. The framework and sector plan will be reviewed in the following months of the new financial year. Three Fire Fighters are working Day shift; one Fire Officer and two Fire Fighters are working night shift. During the weekends one shift remain standby and during the public holidays both teams remain on standby, one shift are standby during the day and the other shift are standby at night. Zululand District Municipality has two utility trucks that were granted by COGTA that are used in case of any disaster related incidents. Zululand District has also bought the following equipment for the status of readiness: • Mini Fire engine with 2000L Water tank and 400L Foam capacity, • 2 x 500l Skid units, • 2 x 600L Fire fighting trailers and Rapid Response vehicle with Jaws of Life. There is one Disaster Utility truck that is placed in the Northern part of Zululand to be utilized by the three Municipalities (uPhongolo, e’Dumbe and AbaQulusi). According to the assessments conducted, a number of people were affected. It is also being indicated that major damages were reported where structures collapsed and rooves were blown off by strong winds. Assessments had been conducted; assistance was provided and relief material was distributed to the victims although it was insufficient. Housing rehabilitation; repair and reconstruction is required. Number of disasters that took place can be classified as follows: MUNICIPALITY NO OF INCIDENTS NO OF HOUSEHOLDS AFFECTED STRUCTURES TOTALY DESTROYED STRUCTURES PARTIAL DESTROYED NUMBER OF PEOPLE AFFECTED FATALITIES INJURIES
Abaqulusi 595 573 183 568 4834 4 3 Edumbe 132 132 131 102 1400 4 4 uPhongolo 632 613 612 941 4379 10 79 Nongoma 180 180 122 122 1492 4 2 Ulundi 236 236 214 170 1546 3 0 TOTAL 1775 1734 1262 1903 13651 25 88 Relief material (Blankets, plastic sheet and tents) were provided to the victims although house rehabilitation is still required to assist the victims. Challenges The biggest challenge is limited Financial Resources to cater for required back -up systems and maintenance service plans needed to strengthen Disaster Management Section.

53
Resources to develop a Disaster Centre are non existent. The MIG allocation of the municipality is used optimally towards eradication of water and sanitation. 7.5. LOCAL ECONOMIC DEVELOPMENT PERFORMANCE Projects Implemented for Year Under Review District Growth and Development Summit The District Growth and Development Summit was held on the 18th June 2018. Four commissions were established to deliberate on the above key focus areas. ZDM and its Local Municipalities top management especially HOD’s were deployed equally in each of the four commissions. The four commissions, discussed within the context of the PGDS principles, were structured as follows: - 1) Tourism Arts Culture and Heritage 2) Infrastructure and Spatial Development Framework 3) Agriculture Land Reform and Mining 4) Broader Socioeconomic Development The resolutions were integrated into the District Growth and Development Plan 2035 which will be tabled to Council for adoption. Business Breakfast Meeting
Honourable Mayor Cllr TD Buthelezi hosted a breakfast meeting comprising of local business people, industry champions and government sector on the 09th April 2018 where he encouraged the business sector to invest in the communities of Zululand. Cllr Buthelezi further presented that all construction projects would be labour intensive and focus on developing local SMMEs and contractors through the Sethembe Programme. Agricultural Programme Local Municipality Seedlings Seeds No. Co-ops Hectares Yield (tons) Abaqulusi Cabbage 5000 25kg x 80 80 60Ha approx. 6 tons Onions 5000 - - - on vegetables Beetroots 5000 - - - Approx. 60 tons Spinach 5000 - - - Maize Dumbe Cabba ge 5000 25kg x 95 95 65Ha approx. 70 tons Onions 5000 - - - Maize Beetroot 5000 - - - 8 tons vegetables Spinach 5000 - - - -

54
Local Municipality Seedlings Seeds No. Co-ops Hectares Yield (tons) Ulundi Cabbage 5000 25kg x 120 98 120Ha approx. 110 tons Onions 5000 - - - Maize Spinach 5000 - - - Vegetables 8 Beetroot 5000 - - - - Nongoma Cabbage 5000 25kg x 80 75 30Ha 80 tons maize Onions 5000 - - - 5 tons vegetables Spinach 5000 - - - - Beetroot 5000 - - - - Phongolo Cabbage 6000 25kg x 100 95 126Ha 48 tons maize Onions 6000 - - - 6 tons vegetables Spinach 6000 - - - - Beetroot 6000 - - - - Challenges The Municipality has several projects with completed Business Plans that have potential for job creation and attracting tourism into the District , however no investment or partnerships have been secured. Although sector department participation in IGR has been good, participation from local municipalities is not at an exemplary level and this will be addressed with the local municipalities in the upcoming financial year. 7.6. SOCIAL DEVELOPMENT (COMMUNITY & SOCIAL SERVICES, CHILD CARE; AGED CARE; SOCIAL PROGRAMMES), HEALTH INSPECTION; FOOD AND ABBATOIR LICENSING AND INSPECTION; ETC Annual Women’s Summit The aim of the Women’s summit is to empower women citizens through sharing of developmental information among delegates. This is a forum where women share information and enter into dialogues on issues pertaining to their holistic development. The themes for discussion cover business opportunities, self-help programmes/projects, and education on gender-based violence, women’s health, HIV/AIDS, family welfare, and Local Economic Development (LED) initiatives, etc. Community Economic Development Projects Through the Local Economic Development section, women and men are encouraged to form cooperatives in order to enable them to access assistance or information to start small scale farming and other types of business. They also get assisted with tractors by Amakhosi and the ZDM LED section to plough community gardens and fields. They are furthermore subsidised with seeds and fertilizers; those who are interested in poultry farming are assisted with feeds and chicks for starters. There is also a myriad of projects that communities are helped with to start making concrete blocks, clothing and catering businesses. Quality of life programmes A Quality of Life Forum has been formed with representation from local municipal forums such as Gender, Disability, Senior Citizens and Children. The Quality of Life also benefits in the similar manner as mentioned above.

55
Youth Development ZDM established a Zululand Youth Council which is a youth body that assists the municipality in designing and implementing of relevant youth programmes. A Youth Affairs Officer is designated personnel whose duty is to lead and advise the municipality on youth matters and work with the Youth Council to uplift the youth of the District. Youth Summits The Annual Youth Summit is held for young citizens to share information on available youth programmes within and outside the municipality. At these sessions information is imparted by the senior officials of the government and private sector with the aim of improving lives of young people in Zululand. This becomes a forum for interaction among the youth, the municipality, youth business funders and youth development agencies. Youth Skills Development Programmes Indonsa Arts & Craft Centre is based in Ulundi and it is one of best operating community art centres in KwaZulu-Natal. It is funded by the Zululand District Municipality in conjunction with the provincial Department of Arts and Culture. The Centres has grown from strength to strength assisting the young people to acquire business skills in fashion designing, music (instruments) and visual arts. Courses offered are for duration of six months and admission is free. Skills courses are specifically targeting young people who complete matric but lack funds to further their studies at tertiary institutions and also assist those that have academic qualifications but are unemployed so that their opportunities to get for employed are improved. Through the Centre, an annual Art Festival/Competition called ‘Umbele Wethu’ is held in all the five municipalities under the Zululand District Municipality and a big District final event in which the youth compete in all genres of music, dance, drama and visual arts.
Participants win money prizes in order to encourage them to advance their talents into careers. The music winners are assisted with free recording of their music at the Indonsa Art Centre studio. Quite a number of the musician that were trained at Indonsa and those that were picked from Umbele Wethu have grown to become professional musicians During the FY under review 178 have been trained in Visual Arts and graphic designing of which 13 are self-employed. 218 in Fashion Design, 63 groups individuals underwent skilling in Music and instruments,

56
±4620 school learners in one day training program in visual arts. One major challenge is that the capacity of the Centre is inadequate to meet the demands of the communities of ZDM. Princess Mandisi Health Care Centre Princess Mandisi Health Care Centre is a brainchild of the Municipality; the Council initiated and built this centre because of the commitment to ensure that all citizens of Zululand lead a healthy lifestyle. This municipality believes in developing communities holistically because it cares about people’s health and welfare. Through this Centre the ZDM wants to continually reduce the high HIV infection rate in Zululand. The following services are offered: • Voluntary counselling and Testing (VCT) • Health Education to youth in schools and out of school • On-going counselling for the infected and affected • Community HIV and AIDS awareness ZDM has forged partnership with NGOs. The NGOs work in conjunction with the municipal staff in all the 5 local municipalities in Zululand. These are continued means of strengthening proper coordination in the District. Care And Support Programmes There is an active support group which meets every month at the Centre. This is the platform where PLWHA (people living with HIV and AIDS) share their fears, challenges and other problems relating to stigma and discrimination. The centre has a vegetable garden to assist local needy households especially the child headed. We have 14 people working in that 2 hectare garden. Lovelife Programme The partnership between ZDM and the Love Life Trust keeps growing. This partnership was lobbied by the Hon. Mayor with an intention of improving the quality of healthy lifestyle for young people in Zululand. Youth is employed at the centre to implement the ‘Make Your Move’ campaign at schools which is the concept of educating young people to assist them to make informed decisions and to eradicate teenage pregnancy. Aids Councils ZDM HIV and AIDS Unit successfully established functional Ward Aids Committees (WAC); all 89 ZDM wards have their WAC established. All Local Municipalities have functional Local AIDS Councils who report to the District Aids Council on a quarterly basis.

57
SPORT DEVELOPMENT PROGRAMME Sports Development is one of the community’s activities that cuts across racial, gender and culture. It promotes development, personal discipline, leadership, team work skills and entertainment through sporting activities. It also contributes to the development and empowerment of local communities and encourages interest of learning and gaining more skills. Salga Games A minimum of 450 youth participate in the SALGA games in 15 sport codes every year. Mayoral Cup Games
The Mayoral Cup Games provide opportunities to expose the participants to the competition environment and even expose our talented players to the people who scout sport talent. Every year there are young people who get invited by National Football Division and Professional Soccer League teams for tests. Zululand District Municipality held a very successful and developmental Mayoral Cup Games. Mayoral Cup Games provide an opportunity for the players within Zululand District Municipality to expose their talents that might be developed into careers. 3 500 young people from the five local municipalities under the District of Zululand participated. The mayoral cup provides participants with sport development opportunities through the high level of competition. The Mayoral Cup is used as a selection forum for the ZDM team to represent the municipality at the annual SALGA Games. A minimum of 450 youth participate in the SALGA games in 15 sport codes every year. Zululand District Mayoral Netball and Soccer Tournament The tournament was initiated as means to encourage young people play throughout year and not wait for mayoral cup and SALGA Games. South African Football Association’s rules apply and technical guidance is rendered by SAFA. Netball and football clubs play at various levels, namely, Ward Level, Local Municipal level, Round Robin, Semi-final and Final. Zululand 56 km Ultra Marathon The marathon is instrumental in the social and economical development of the community of this district because people win money prizes which they use to improve their lives and it boosts local business and provides local vendors with the opportunity to sell their goods and services. The Zululand District started this race in 2005 for the communities of district to be exposed to professional running so that they could also run in big international races. The Marathon is organized in conjunction with KwaZulu-Natal athletics and runs between the towns of Nongoma and Ulundi.

58
Surprisingly, the ZDM marathon grew and developed into international race. It presently attracts runners from outside the borders of South Africa. This motivates local runners to form clubs and register them to run professional races. Also short distance walks are held to also encourage even senior citizens to also participate to enhance a healthy lifestyle. Relationships with professional soccer teams AmaZulu FC supported by the Zululand Region SAFA adopted soccer teams in primary schools in the Zululand District. Schools soccer coaches were trained over a weekend and all training materials were provided for training. After six months of training a tournament among the schools under the programme was held. Learners who display good talent would be offered bursaries in the next year and be placed in schools near AmaZulu FC headquarter so that they would continue with soccer whilst at school. MUNICIPAL HEALTH SERVICES On the current year training of food handlers took place, and a massive food and water sampling was conducted. Sampling of food was done on formal food premises as well as caterers and street vendors. 42 Food samples were taken and 11 were not satisfactory. Health education was conducted on those premises. 50 Water samples were taken on water used for drinking, watering plants and recreational purposes. Out of 50, 15 were found to be faecal contaminated. Health education was conducted on the construction of toilets and the treatment of the contaminated water by either boiling or using disinfectants. Other services performed by Municipal Health Services during the financial year are as follows: KEY PERFORMANCE AREA NUMBER OF INSPECTION Disposal of the Dead Mortuary Inspection 110 Exhumation 6 Pauper Burial 2 Cemetery Inspection 5 Issued COC 6 Food Control Food Premises Inspection Deli 497 Street Vendors Education 126 COA issued 90 Food Sampling 58 Water Quality Monitoring Water Sampling 68 Chlorine Testing 26 Health Surveillance of Premises Crèche’s/place of safety Inspection 206 School Inspection 189 Clinic/Hospitals Inspection 110 Accommodation Establishment 63 Surgeries 3 Prison and Holding Cells 10 Other Functions Building Plan Scrutinized 37

59
Complaint Attended 20 Health and Hygiene Education 45 Licensing Inspection 7 Students Practical Training 4 7.7. DEMOCRACY AND GOVERNANCE PERFORMANCE Compliance, Clean and Sound Administration (See guiding policies). Integrated Development Planning The Integrated Development Plan (IDP) Review Process is a vehicle through which Municipalities prepare strategic development plans called Integrated Development Plans for a five-year period. Because service delivery is progressive in nature, the IDP must be reviewed annually to keep up with the evolving nature of communities. The IDP is a legislative requirement, has a legal status and therefore supersedes all other plans that guide development at local government level. The timeframes below were followed in preparing the 2018/19 IDP. Phase/Activity Proposed Completion Timeframe Situational Analysis 30 Sept 2017 Development Strategies 30 Nov 2017 Projects 15 Dec 2017 Integration 15 Dec 2017 Draft Approval 28 Feb 2018 Final Approval 30 May 2018 Consultation with the Local Municipalities and stakeholders took place 5 times during the course of the financial year to establish alignment. The final IDP was adopted by Council as targeted. Consultation with the community took place. (See Public Accountability and Participation). 7.8. INSTITUTIONAL TRANSFORMATION PERFORMANCE (See Employment Equity and Skills Development) 7.9. SPATIAL AND ENVIRONMENTAL MANAGEMENT PERFORMANCE Development Planning Shared Services The principle of the Development Planning Shared Services is to render statutory and strategic town and regional planning support to local municipalities in the Zululand District Municipal area. The unit provides

60
strategic, development administration, information management, building control and performance management support to local municipalities. The contracts of all the DPSS employees expired 30 June 2018. The services of certain critical employees were extended on a month to month basis. A review will be conducted to prepare a business plan that will inform the direction of DPSS moving forward particularly in providing capacity support in relation to the Joint Municipal Planning Tribunal. Joint Municipal Planning Tribunal Four municipalities in Zululand elected to form a joint municipal planning tribunal. These include Ulundi, Nongoma, oPhongolo, eDumbe. An agreement was signed by all participating municipalities and gazetted. A business plan will now be prepared and submitted to the MEC. A panel of professionals to serve on the joint tribunal according to SPLUMA will also be co-ordinated by the District. 7.10. PERFORMANCE AGAINST GOVERNMENT LED PROGRAMMES FREE BASIC SERVICES AND INDIGENT SUPPORT The definition of a poor household relates to income poverty, or the lack of sufficient income to satisfy basic and essential needs such as food, clothing, energy and shelter. The ZDM Indigent Policy is in line with this definition which also takes into consideration the total monthly household income. Like many other Districts, the majority of the population in the Zululand District Municipality is indigent (approximately 65%) and that means a small revenue base. Therefore a significant portion of the budget goes towards infrastructure development with very little to no revenue generated. This cannot be sustained if the municipality is to ensure a consistent high quality basic level of service. The municipality must seek ways of improving increasing revenue as well as enhancement. National Government Policy derives its standard for free basic water supply from that of the World Health Organisation (25l/p/p/day) which is regarded as sufficient to promote healthy living. The ZDM has an average household rate of 8 persons, meaning that the standard is equal to 6 kilolitres per household per month. All households in ZDM receive the 6 kilolitres free water. EXPANDED PUBLIC WORKS PROGRAMME (EPWP) The EPWP incentive grant is a Conditional Grant Programme that is intended to increase job creation in municipalities by providing a financial performance reward. It is intended to create job opportunities and alleviate poverty in the poor communities. It is considered a conditional grant in the sense that it can only be used for the intended and approval projects only, within approved time frame, specific reporting requirements etc. The EPWP grant allocation in the 2016/2017 financial year was R3 624 000.00 and 2017/2018 ZDM has been allocated R 5 760 000. The municipality understands that the EPWP Integrated Grant is a NDPW fund intended to assist Municipalities in creating Job opportunities that is targets poor communities, through maximizing the labour component during construction of services delivery infrastructure The District targets for 2017/18 financial year are as per table below.

61
In terms of the MOU signed between the ZDM and the Department of Public Works the following projects/programmes were implemented during the financial year: SECTOR PROJECTS & SYSTEM PROFILE ID NUMBER WORK OPPORTUNITIES FTE Infrastructure sector IG/ZDM Operations & Maintenance 6442 492 123 Social sector IG/Provision of Protection Services 21245 172 52 Zululand DM Council has approved and adopted the EWP Phase 3 Policy which includes the establishment of EPWP institution organogram detailing roles and responsibilities and the management of EPWP programme. In terms of challenges the following should be noted: • Understanding of the EPWP programme for projects stakeholders. ZDM feels that there is still a need to train service providers who are directly working on the projects these includes Project steering committees, Contractors, Engineering Consultants and ISD Consultants. The initiative will ensure compliance in terms of documentation, proper use of EPWP templates, understanding of Ministerial Determination, appropriate system for recruitment of participants, timely communication and reporting, paper trail and the full understating of EPWP programme. • Delays in the implementation of infrastructure projects. In these projects, a large number of participants are recruited and their details captured on the EPWP system, however during the commencements of site works only few participants are allowed to start work and thus dropping the number of employment opportunities to be reported for current financial ending in March. • The sanitation projects, which are labour intensive, there was a delay in implementation due to a dispute regarding the award for the supplier. • Alignment of tender documents in terms of more labour intensity in all project to ensure that more participants are recruited to provide maximum work opportunities from projects. BACK TO BASICS Government has come up with multi-pronged strategies to strengthen the capacity of municipalities to improve service delivery, reduce red tape and fast track development to communities. Focus areas of the reports include Public Participation:Putting people first; Basic Services: Conditions for decent living; Good governance; Sound Financial Management; Building Capable Institutions and Administrations. Based on reports submitted municipalities are ranked in either of 3 categories: functional, challenged and requiring intervention.
DESCRIPTION ACHIEVED WORK OPPORTUNITIES TARGETED 2889 WORK OPPORTUNITIES ACHIEVED 2393 FTE TARGET 948 FTE ACHIEVED 954

62
District 2015/2016 2016/2017 uMzinyathi 76 68 Amajuba 47 56 Zululand 75 73 uMkhanyakude 35 42 King Cetshwayo 78 83 At the time of preparation of the Annual Report, the 2017/18 COGTA Back to Basics Summative Report had not been available. Zululand District Municipality was categorised as functional for both the 2015/2016 and 2016/2017 financial year. It is anticipated that the same categorisation will apply in the 2017/2018 assessment as well. According to the table above, compared to its neighbouring districts, the ZDM performed well pipped only by King Cetshwayo in the 2016/2017 financial year.
When comparing the performance of the ZDM during 2015/2016 and 2016/2017 financial years there were significant improvements under Pillar 2 (Basic Services) due to improved water and sanitation projects after the drought in 2015. Under Pillar 3 the municipality regressed due to the period of time it took for sufficient stability for EXCO and Council to sit after elections. Pillar 5 (Building capable institutions and administrations) was affected by the length of time it took to fill vacancies of Senior Managers. Pillar deals predominantly with ward committees and does not apply to the ZDM as a district. The score for 2015/2016 was due to some KPIs applicable to the district at the time but have since been relocated to other pillars. These elements that contributed to regress should not be a factor in the 2017/2018 financial year.
59 69 10053 90 75
0100 93 53 69 73
Pillar 1 Pillar 2 Pillar 3 Pillar 4 Pillar 5 Overall
Achievements per B2B Pillar2015/2016 2016/2017

63
8. CHAPTER 5 – OVERVIEW OF FINANCIAL PERFORMANCE 8.1. STATEMENT OF FINANCIAL PERFORMANCE INCOME Zululand District Municipality’s (ZDM) operating revenues grew-up by 1.18% from R890 million in 2017 to R901 million in 2018. The increase was mainly resulting from increase in our revenue from exchange transaction (service charges). Revenue from service charges (water and sewer services) has increased by 33.50% from R20 million in 2017 to R27 million in 2018 whereas revenue from investments has increased by 55.41% from R6 million in 2017 to R9 million in 2018. Own revenue remains as 4.22% of the total operating revenue. This indicates that Council is more dependent on grant funding from National and Provincial Government. The table below illustrates operating revenue over a period of three (3) years; Financial Year 2017-18 2016-17 2015-16 Amount R 901 291 074 R 890 766 173 R 896 439 449 SCHEDULE OF CONDITIONAL GRANTS RECEIVED Description Name of organ of state Total Financial Management Grant National Treasury R 1 250 000 Expanded Public Works Programme Department of Public Works R 5 760 000 Indonsa Grant Department of Arts & Culture R 1 911 000 Regional Bulk Infrastructure Grant (Schedule 5B Department of Water and Sanitation R 130 000 000 Water Services Infrastructure Grant (Schedule 5B) Department of Water and Sanitation R 107 746 000 Rural Road Assets Management Systems Grant Department of Co-operative Governance and Traditional Affairs R 2 359 000 Growth Development Summit Department of Co-operative Governance and Traditional Affairs R 300 000 Total R 249 326 000 CASH BALANCE The cash and cash equivalents of the municipality as at 30 June 2018 amounts to R13 201 448 and unspent conditional grants amounts to R552 951. This represents an increase of 77.53% as compared to the previous year’s (30 June 2017) cash and cash equivalent balance of R7 436 356. CASH COVERAGE The municipality does not have long term borrowings/loan as a results the Council is not expected to service any interest costs in the future. Cash and cash equivalent amount as at the year-end represents cash available i.e. petty cash and cash at the bank.

64
EXPENDITURE Overall increase in total expenditure of 20.25% was realised in 2018 as compared to a decrease of 1.25% in 2017. The table below illustrates operating expenditure over a period of three (3) years; Financial Year 2017-18 2016-17 2015-16 Amount R 650 793 855 R 541 213 742 R 548 077 765 • Employees and councillors related costs. This is attributable to a combination of the salary increases year on year and the filling of vacancies during the financial year. This type of expenditure contributes 28.42% to the current total expenditure. Employees and councillors remuneration costs has increased by 4.74% during the current financial year whilst the increase was 9.99% in 2017. • Contracted services costs. Included in contracted services costs are repairs and maintenance of property, plant and equipment items. This expenditure costs contribute 26.78% to the current total expenditure. The expenditure costs attributed to repairs and maintenance was R63 million (2018) and R21 million (2017-restated) respectively. An increase of 22.87% was realised during the current financial year whilst a decrease of 14.06% was realised in 2017. • Bulk purchases costs. The purchase of bulk electricity and water contributes 20.19% to the current total expenditure. An increase of 53.71% was realised during the current financial year whilst an increase of 9.16% was realised in 2017. Spending of operational grants Council had an operational budget of R573 million in 2018 and R480 million in 2017 respectively. The total grant spending for the year amounted to R537 million (99.90%) in 2018 and R478 million (99.69%) in 2017 respectively. Spending of capital grants The capital budget is committed largely on new infrastructure projects and the renewal of existing capital assets. The Council had an approved capital budget of R465 million in 2018 and R473 million in 2017. The municipality had spent all capital grant funding (100% spent) in both 2018 and 2017 financial years. Fruitless and wasteful expenditure The municipality had incurred fruitless and wasteful expenditure over the years. This type of expenditure is resultant from penalties and interest charged accounts due to late payment of a particular invoice or statements. Major portion of this expenditure if from interest charged by Eskom on accounts that were paid after due dates as per their statements. This table illustrates fruitless and wasteful expenditure incurred over the period of three years: Financial Year 2017-18 2016-17 2015-16 Amount R 420 411 R 381 729 R 90 017

65
LIQUIDITY MANAGEMENT The municipality has made self-assessment on liquidity management. The municipality uses current ratio and cash/cost coverage ratio to assess its ability to settle current obligations and meet its monthly fixed operating commitments. CURRENT RATIO The municipality used current ratio to assess its ability to pay its short term liabilities within its short-term assets. The determination of this ratio takes into account the possibility that the council can cede its receivables and inventories to settle its short-term liabilities. The norm of this ratio ranges from 1.5 to 2: 1. The table below depicts current ratios over the period of three years (restated): Financial Year 2017-18 2016-17 2015-16 Current ratio 0.33:1 1.37:1 0.43:1 The above assessment indicates current ratios below the norm for the period over three years. Our current liabilities exceed current assets. Furthermore, the trend is depleting over the period as from 2016 to 2018. This suggest that the municipality would be unable to pay current and short-term obligations should they become due. The municipality is facing a serious financial challenge of liquidity problem. CASH/COST COVERAGE RATIO The municipality had a cost coverage ratio of 0.33 in 2018 and 0.37 in 2017. This assessment results to ratios that are below the norm range of 1 month to 2 months and this impose a high risk of financial and its ability to meet obligations should they become due as any specific point in time. CURRENT DEBTORS COLLECTION RATE The municipality had a debt collection period of 160 days in 2018 as compared to 44 days in 2017. The result of this assessment is concerning. This is an indication that revenue collection requires urgent attention. ASSET MANAGEMENT The assets management system was effectively implemented during the year. Council had approved Asset Management Policy for implementation. The Fixed Assets Register is in place and is balanced on a monthly basis. Despite the inadequate funding to maintain assets, the assets are in a functional condition. CASHFLOW MANAGEMENT AND INVESTMENTS The cash flow position has improved as compared to the previous year. The municipality had a positive cash flow balances for both 2018 and 2017 financial years. Cash flow is being monitored on a regular basis to ensure budget savings. Budget and Finance Committee comprising all HODs is in place to meet every week to monitor the projected cash-flow against actual cash flows. MSCOA The Municipality adopted mSCOA in 2016/2017 financial year using Venus system. The budget was submitted successfully. On a monthly basis the submission is successful. The integration with other subsystems was done for most of the required business processes. We still have to ensure integration with

66
the asset register and GIS. We are upgrading the Venus system to Solar that will cater for all fifteen standard business processes. ASSESSMENT BY THE ACCOUNTING OFFICER ON AREARS ON MUNICIPAL TAXES AND SERVICE CHARGES Total debtors balance as at 30 June 2018 are made up as follows: Description Gross debtors Provision for impairment Net debtors Current receivables from exchange transactions. R94 716 238 R80 891 523 R13 824 715 Current receivables from non-exchange transactions. R8 055 298 - R8 055 298 Current receivables from exchange transactions. R1 595 713 R1 595 713 Non-current receivables from exchange transactions. R 12 438 779 R12 438 779 Current receivables from exchange transactions - VAT Receivables. R 20 029 280 R20 029 280 Total R136 835 308 R80 891 523 R55 943 785 The total net debtors amount to R55 943 785 as at 30 June 2018 representing a 15% increase as compared to net debtors amount of R48 515 523 as at 30 June 2017. The increase in net debtors balance of approximately R7.43 million over the reporting period is attributable to the following factors: • Eskom increased deposit paid on all active accounts over the reporting period based on their assessment of risk relating to having an account. This results to an increase in deposit paid to Eskom. • Change in consumers’ behaviour towards payment of water services. The negative behaviour was caused by draught experience by the municipality over the period of time. • The current economic recession climate. The increase in the level of debt did not negatively impact upon service delivery. However, the Council is concerned about sufficient cash reserves in order to meet financial obligations as this was highlighted during assessment of cost coverage ratio. Council will maintain efficient debtors collection and credit control systems and procedures to improve current revenue collection rate that is concerning as well. LONG TERM CONTRACTS AND PUBLIC PRIVATE PARTNERSHIPS There we no public private partnerships during 2017-18 financial year. The municipality has signed multi-year contracts with various service providers for construction of infrastructure works including other related management services. The Schedule of Long Term Contracts is attached as an Annexure.

67
REVENUE COLLECTION PERFORMANCE BY VOTE AND BY SOURCE Chapter 2 section 4C(ii) of the Municipal Systems Act allows a municipality to impose surcharges on fees, rates on property and, to the extent authorised by national legislation, other taxes, levies and duties. As a result the municipality collects revenue for provision of water and sanitation services to its consumers Revenue performance is as follows: Vote Description Revenue Collection Performance by Vote R'000 2016-2017 Current year:2017-2018 Year variance: 2017-2018 Actual OriginalBudget Adjusted Budget Actual Original Budget Adjustments Budget Vote 1 - COUNCIL - - - - - - Vote 2 - CORPORATE SERVICES - - - - - - Vote 3 - FINANCE R6 095.00 R6 848 R6 848 R9 472 R28 R28 Vote 4 - COMMUNITY DEVELOPMENT - - - - - - Vote 5 - PLANNING & WSA - - - - - - Vote 6 - TECHNICAL SERVICES R505 927.00 R449 830 R469 830 R470 130 R4 R0 Vote 7 - WATER PURIFICATION - - - - - - Vote 8 - WATER DISTRIBUTION R7 731.00 R15 683 R20 683 R9761 R61 R112 Vote 9 - WASTE WATER R3 561.00 R8 208 R8 208 R4674 R76 R76 Total Revenue by Vote R523 314.00 R480 569 R505 569 R494 037.00 R168 R215 Variances are calculated by dividing the difference between actual and original/adjustments budget by the actual. REVENUE COLLECTION PERFORMANCE BY SOURCE Description Year -1 Year 0 Variance R'000 Actual Original Budget Adjustments Budget Actual Original Budget Adjustments Budget Property rates - - - - - - Property rates - penalties & collection charges - - - - - - Service Charges - electricity revenue - - - - - - Service Charges - water revenue R 7 731.00 R15 683.00 R20 683.00 R9761 R60.67 R111.89 Service Charges - sanitation revenue R3 561.00 R8 208.00 R 8 208.00 R4674 R75.61 R75.61 Service Charges - refuse revenue - - - - - - Service Charges - other - - - - - - Rentals of facilities and equipment R135.00 R113.00 R113.00 R145 R22.07 R22.07 Interest earned - external investments R6 095.00 R 6 650.00 R6 650.00 R9 345 R28.84 R28.84 Interest earned - outstanding debtors - R85.00 R85.00 R127 R33.07 R33.07 Dividends received - - - - - - Fines - - - - - - Licences and permits - - - - - - Agency services - - - - - - Transfers recognised - operational R 356 848.00 R 391 492.00 R 391 492.00 R392 439 R0.24 R0.24

68
Other revenue R 1 335.00 - R 1 300.00 R1 853 R100.00 R29.84 Gains on disposal of PPE - - - - - - Enviromental Proctection - - - - - - Total Revenue (excluding capital transfersand contributions) R375 705.00 R 422 231.00 R 428 531.00 R418 344.00 R320.50 R301.57

9. CHAPTER 6 – APPENDICES

A
A. APPROVED ANNUAL FINANCIAL STATEMENTS The attached audited annual financial statements will be as per the Departmental Financial Reporting Framework as issued by National Treasury.

Zululand District MunicipalityAnnual Financial Statementsfor the year ended 30 June 2018

Zululand District MunicipalityAnnual Financial Statements for the year ended 30 June 2018General InformationNature of business and principal activities Water provision as per Water services Act and Schedule B ofMunicipal Structures ActMayoral committeeMayor Cllr Inkosi Buthelezi EM (Replaced by Cllr Buthelezi TD: 01.11.2017)Speaker Cllr Nkwanyana SEDeputy Mayor Cllr Kunene MMMember of the Executive Committee Cllr Dlamini SP ( Replaced by Cllr Mncwango BJ: 26 June 2018)Member of the Executive Committee Cllr Nkosi ISMember of the Executive Committee Cllr Nkosi RSMember of the Executive Committee Cllr Qwabe SEOther CouncillorsMember Cllr BJ Mncwango ( Replaced by Cllr Prince M Zulu : 26 June 2018)Member Cllr Buthelezi SNMember Cllr Buthelezi ZMember Cllr Khumalo MEMember Cllr Mashabane SPMember Cllr Mavuso NPMember Cllr Mazibuko MAMember Cllr Mbatha SMMember Cllr Mhlungu MMMember Cllr Mkhize TKMember Cllr Mkhwanazi SBMember Cllr Mncwango SAMember Cllr Mthethwa JBMember Cllr Ndlela NPMember Cllr Ndlovu TDMember Cllr Nsele TJMember Cllr Nxumalo NEMember Cllr Shabalala BMember Cllr Sibiya HZMember Cllr Sikhakhane MZMember Cllr Sithole ZNMember Cllr Siyaya SSMember Cllr Siyaya ZMember Cllr Tembe NHMember Cllr Victor MMember Cllr Ximba SPMember Cllr Zulu RMMember Cllr Zulu MMMMember Cllr Zungu JZGrading of local authority Grade 4, category 3 in terms of Upper limit of office bearersJurisdiction DC 26 as per the Demarcation BoardSenior Management Chief Financial Officer - Mr RN HlongwaHOD: Corporate Services - Mr P M ManqeleHOD: Community Services - Mr S MosiaHOD: Planning - Mr B MnguniHOD: Technical Services - Mr S Ngcobo1

Zululand District MunicipalityAnnual Financial Statements for the year ended 30 June 2018General InformationAccounting Officer MR S.B. NKOSIRegistered office B-400 GAGANE STREETULUNDI3838Business address B-400 GAGANE STREETULUNDISOUTH AFRICA3838Postal address PRIVATE BAG X76ULUNDI3838Bankers ABSA Bank LimitedAuditors Auditor-General South AfricaTelephone number: 035 874 5500Fax number: 035 874 5589/91E-mail address: [email protected]
2

Zululand District MunicipalityAnnual Financial Statements for the year ended 30 June 2018IndexIndex PageAccounting Officer's Responsibilities and Approval 5Statement of Financial Position 6Statement of Financial Performance 7Statement of Changes in Net Assets 8Cash Flow Statement 9Statement of Comparison of Budget and Actual Amounts 10 - 13Accounting Policies 14 - 26Notes to the Annual Financial Statements 27 - 69Appendixes:Appendix B: Analysis of Property, Plant and Equipment 70Appendix C: Segmental analysis of Property, Plant and Equipment 76Appendix D: Segmental Statement of Financial Performance 78Appendix F: Disclosure of Grants and Subsidies in terms of the Municipal FinanceManagement Act 79
3
Zululand District MunicipalityAnnual Financial Statements for the year ended 30 June 2018IndexAbbreviationsCOID Compensation for Occupational Injuries and DiseasesCRR Capital Replacement ReserveDBSA Development Bank of South AfricaSA GAAP South African Statements of Generally Accepted Accounting PracticeGRAP Generally Recognised Accounting PracticeGAMAP Generally Accepted Municipal Accounting PracticeHDF Housing Development FundIAS International Accounting StandardsIMFO Institute of Municipal Finance OfficersIPSAS International Public Sector Accounting StandardsME's Municipal EntitiesMEC Member of the Executive CouncilMFMA Municipal Finance Management ActMIG Municipal Infrastructure Grant (Previously CMIP)
4

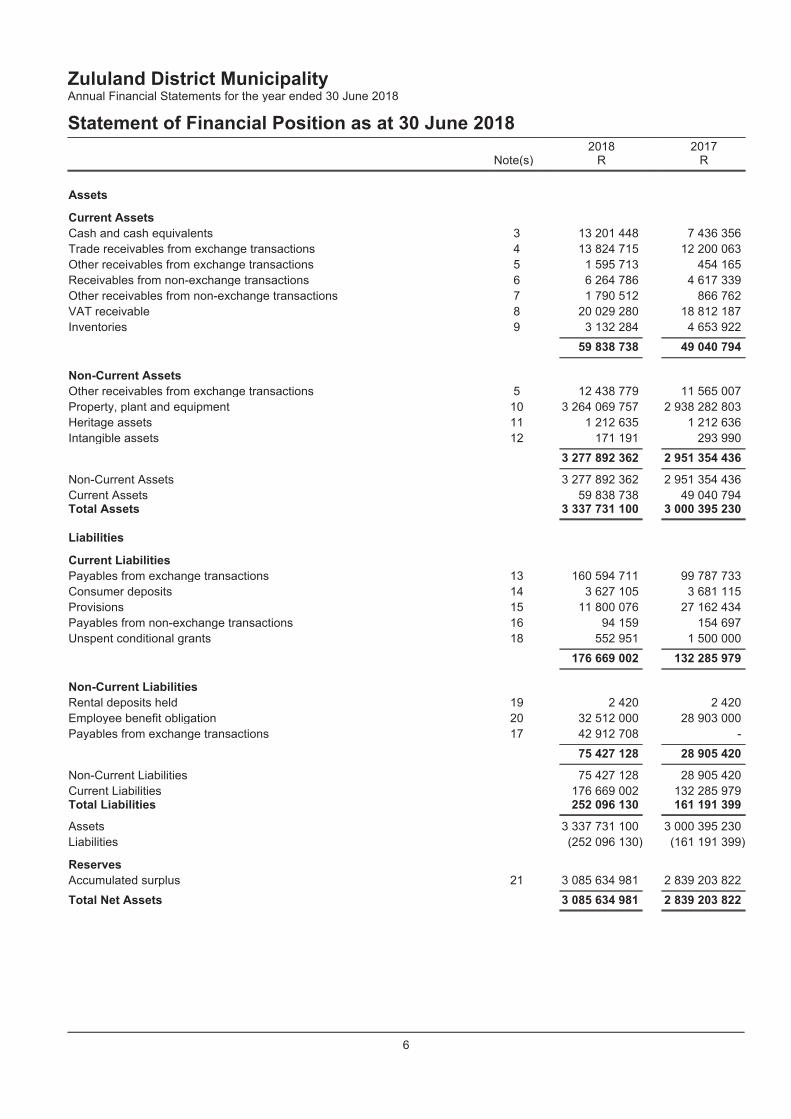
Zululand District MunicipalityAnnual Financial Statements for the year ended 30 June 2018Statement of Financial Position as at 30 June 2018 2018 2017Note(s) R RAssetsCurrent AssetsCash and cash equivalents 3 13 201 448 7 436 356Trade receivables from exchange transactions 4 13 824 715 12 200 063Other receivables from exchange transactions 5 1 595 713 454 165Receivables from non-exchange transactions 6 6 264 786 4 617 339Other receivables from non-exchange transactions 7 1 790 512 866 762VAT receivable 8 20 029 280 18 812 187Inventories 9 3 132 284 4 653 92259 838 738 49 040 794Non-Current AssetsOther receivables from exchange transactions 5 12 438 779 11 565 007Property, plant and equipment 10 3 264 069 757 2 938 282 803Heritage assets 11 1 212 635 1 212 636Intangible assets 12 171 191 293 9903 277 892 362 2 951 354 436Non-Current Assets 3 277 892 362 2 951 354 436Current Assets 59 838 738 49 040 794Total Assets 3 337 731 100 3 000 395 230LiabilitiesCurrent LiabilitiesPayables from exchange transactions 13 160 594 711 99 787 733Consumer deposits 14 3 627 105 3 681 115Provisions 15 11 800 076 27 162 434Payables from non-exchange transactions 16 94 159 154 697Unspent conditional grants 18 552 951 1 500 000176 669 002 132 285 979Non-Current LiabilitiesRental deposits held 19 2 420 2 420Employee benefit obligation 20 32 512 000 28 903 000Payables from exchange transactions 17 42 912 708 -75 427 128 28 905 420Non-Current Liabilities 75 427 128 28 905 420Current Liabilities 176 669 002 132 285 979Total Liabilities 252 096 130 161 191 399Assets 3 337 731 100 3 000 395 230Liabilities (252 096 130) (161 191 399)ReservesAccumulated surplus 21 3 085 634 981 2 839 203 822Total Net Assets 3 085 634 981 2 839 203 822
6

Zululand District MunicipalityAnnual Financial Statements for the year ended 30 June 2018Statement of Financial Performance 2018 2017Note(s) R RRevenueRevenue from exchange transactionsService charges 22 27 148 111 20 335 362Rental of facilities and equipment 23 144 952 134 862Other income 24 1 853 344 1 335 147Interest received - investment 25 9 472 244 6 095 079Total revenue from exchange transactions 38 618 651 27 900 450Revenue from non-exchange transactionsInterest, dividends and Rent on Land 26 94 501 -Government grants & subsidies 27 862 569 049 862 775 391Fines and penalties 28 8 873 81 683Other revenue from non-exchange 29 - 8 649Total revenue from non-exchange transactions 862 672 423 862 865 72338 618 651 27 900 450862 672 423 862 865 723Total revenue 901 291 074 890 766 173ExpenditureEmployee related costs 30 (177 209 749) (169 724 213)Remuneration of councillors 31 (7 715 207) (6 824 698)Employee benefit 20 (3 609 000) (219 000)Depreciation and amortisation 32 (57 372 054) (57 672 248)Lease rentals on operating lease 33 (1 329 064) (2 130 004)Debt Impairment 34 (12 185 740) (9 080 827)Collection costs 35 (858 484) (1 402 719)Bulk purchases 36 (131 389 903) (85 481 258)Contracted services 37 (174 308 153) (141 865 216)Transfers and subsidies Paid 38 (2 938 588) (1 347 448)Inventory consumed 39 (29 846 994) (18 321 956)General Expenses 40 (52 030 919) (47 143 952)Total expenditure (650 793 855) (541 213 539)- -Total revenue 901 291 074 890 766 173Total expenditure (650 793 855) (541 213 539)Operating surplus 250 497 219 349 552 634Gain on sales of assets 41 - 211 332Loss on donated assets 42 (3 996 288) (712 284)Proceeds from Insurance claims 43 753 278 1 542 899Inventories losses/write-downs 44 (1 353 515) -(4 596 525) 1 041 947Operating surplus/deficit (4 596 525) 1 041 947Surplus before taxation 245 900 694 350 594 581Taxation - -Surplus for the year 245 900 694 350 594 581
7

Zululand District MunicipalityAnnual Financial Statements for the year ended 30 June 2018Statement of Changes in Net Assets Accumulatedsurplus Total netassetsR RBalance at 01 July 2016 2 488 609 241 2 488 609 241Changes in net assetsSurplus for the year 350 594 581 350 594 581Total changes 350 594 581 350 594 581Opening balance as previously reported 2 839 924 749 2 839 924 749AdjustmentsPrior year adjustments (190 462) (190 462)Balance at 01 July 2017 as restated* 2 839 734 287 2 839 734 287Changes in net assetsSurplus for the year 245 900 694 245 900 694Total changes 245 900 694 245 900 694Balance at 30 June 2018 3 085 634 981 3 085 634 981
8

Zululand District MunicipalityAnnual Financial Statements for the year ended 30 June 2018Cash Flow Statement 2018 2017Note(s) R RCash flows from operating activitiesReceiptsSale of goods and services 27 148 111 27 633 940Grants 862 569 049 862 775 391Rental facilities and equipment 144 952 -Other income 1 853 344 -Interest, dividends and rent on land 94 501 -Interest income 9 472 244 6 095 079Fines and penalties 8 873 -901 291 074 896 504 410PaymentsEmployee costs (184 924 956) (169 724 213)Suppliers (325 202 722) (269 249 761)(510 127 678) (438 973 974)Total receipts 901 291 074 896 504 410Total payments (510 127 678) (438 973 974)Net cash flows from operating activities 46 391 163 396 457 530 436Cash flows from investing activitiesPurchase of property, plant and equipment 10 (386 507 450) (416 095 452)Proceeds from sale of property, plant and equipment 10 4 001 700 (1 990 275)Purchase of other intangible assets 12 - (58 200)Purchases of heritage assets 11 - (61 184)Proceeds from sale of biological assets that form part of an agricultural activity 753 278 1 542 899Net cash flows from investing activities (381 752 472) (416 662 212)Net increase/(decrease) in cash and cash equivalents 9 410 924 40 868 224Cash and cash equivalents at the beginning of the year 7 436 356 (33 431 872)Cash and cash equivalents at the end of the year 3 16 847 280 7 436 352
9

Zululand District MunicipalityAnnual Financial Statements for the year ended 30 June 2018Statement of Comparison of Budget and Actual AmountsOriginalbudget Budgetadjustments(i.t.o. s28 ands31 of theMFMA)Finaladjustmentsbudget Shifting offunds (i.t.o.s31 of theMFMA) Virement(i.t.o. councilapprovedpolicy) Final budget Actualoutcome Unauthorisedexpenditure Variance Actualoutcomeas % offinalbudget
Actualoutcomeas % oforiginalbudgetR R R R R R R R R R R2018Financial PerformanceService charges 23 540 763 5 000 000 28 540 763 - 28 540 763 27 148 111 (1 392 652) %95 %115Investment revenue 6 650 000 - 6 650 000 - 6 650 000 9 472 244 2 822 244 %142 %142Transfersrecognised -operational 391 492 000 - 391 492 000 - 391 492 000 392 439 049 947 049 %100 %100Other own revenue 132 244 000 (130 746 000) 1 498 000 - 1 498 000 2 854 948 1 356 948 %191 %2Total revenue(excluding capitaltransfers andcontributions) 553 926 763 (125 746 000) 428 180 763 - 428 180 763 431 914 352 3 733 589 %101 %78Employee costs (171 637 648) - (171 637 648) - - (171 637 648) (177 209 749) - (5 572 101) %103 %103Remuneration ofcouncillors (7 416 052) (1 000 000) (8 416 052) - - (8 416 052) (7 715 207) - 700 845 %92 %104Debt impairment (3 637 349) - (3 637 349) (3 637 349) (12 185 740) - (8 548 391) %335 %335Depreciation andasset impairment (75 444 626) - (75 444 626) (75 444 626) (57 372 054) - 18 072 572 %76 %76Materials and bulkpurchases (118 648 000) (44 484 000) (163 132 000) - - (163 132 000) (131 389 903) - 31 742 097 %81 %111Transfers andgrants (1 953 700) - (1 953 700) - - (1 953 700) (2 938 588) - (984 888) %150 %150Other expenditure (162 805 000) (16 571 000) (179 376 000) - - (179 376 000) (267 332 417) - (87 956 417) %149 %164Total expenditure (541 542 375) (62 055 000) (603 597 375) - - (603 597 375) (656 143 658) - (52 546 283) %109 %121
10

Zululand District MunicipalityAnnual Financial Statements for the year ended 30 June 2018Statement of Comparison of Budget and Actual AmountsOriginalbudget Budgetadjustments(i.t.o. s28 ands31 of theMFMA)Finaladjustmentsbudget Shifting offunds (i.t.o.s31 of theMFMA) Virement(i.t.o. councilapprovedpolicy) Final budget Actualoutcome Unauthorisedexpenditure Variance Actualoutcomeas % offinalbudget
Actualoutcomeas % oforiginalbudgetR R R R R R R R R R RTotal revenue(excluding capitaltransfers andcontributions) 553 926 763 (125 746 000) 428 180 763 - - 428 180 763 431 914 352 - 3 733 589 %101 %78Total expenditure (541 542 375) (62 055 000) (603 597 375) - - (603 597 375) (656 143 658) - (52 546 283) %109 %121Surplus/(Deficit) 12 384 388 (187 801 000) (175 416 612) - (175 416 612) (224 229 306) (48 812 694) %128 %(1 811)Transfersrecognised - capital 449 830 000 20 000 000 469 830 000 - 469 830 000 470 130 000 300 000 %100 %105Surplus/(Deficit) 12 384 388 (187 801 000) (175 416 612) - - (175 416 612) (224 229 306) - (48 812 694) %128 %(1 811)Capital transfersand contributions 449 830 000 20 000 000 469 830 000 - - 469 830 000 470 130 000 - 300 000 %100 %105Surplus (Deficit)after capitaltransfers andcontributions 462 214 388 (167 801 000) 294 413 388 - 294 413 388 245 900 694 (48 512 694) %84 %53Surplus (Deficit)after capitaltransfers andcontributions 462 214 388 (167 801 000) 294 413 388 - - 294 413 388 245 900 694 - (48 512 694) %84 %53Surplus/(Deficit)for the year 462 214 388 (167 801 000) 294 413 388 - 294 413 388 245 900 694 (48 512 694) %84 %53
11

Zululand District MunicipalityAnnual Financial Statements for the year ended 30 June 2018Statement of Comparison of Budget and Actual AmountsOriginalbudget Budgetadjustments(i.t.o. s28 ands31 of theMFMA)Finaladjustmentsbudget Shifting offunds (i.t.o.s31 of theMFMA) Virement(i.t.o. councilapprovedpolicy) Final budget Actualoutcome Unauthorisedexpenditure Variance Actualoutcomeas % offinalbudget
Actualoutcomeas % oforiginalbudgetR R R R R R R R R R RCapital expenditure and funds sourcesTotal capitalexpenditure 465 851 737 20 000 000 485 851 737 - 485 851 737 388 976 867 (96 874 870) %80 %83Sources of capitalfundsTransfersrecognised - capital 449 830 000 20 000 000 469 830 000 - 469 830 000 - (469 830 000) %- %-Internally generatedfunds 16 021 737 - 16 021 737 - 16 021 737 - (16 021 737) %- %-Total sources ofcapital funds 465 851 737 20 000 000 485 851 737 - 485 851 737 - (485 851 737) %- %-
12

Zululand District MunicipalityAnnual Financial Statements for the year ended 30 June 2018Statement of Comparison of Budget and Actual AmountsOriginalbudget Budgetadjustments(i.t.o. s28 ands31 of theMFMA)Finaladjustmentsbudget Shifting offunds (i.t.o.s31 of theMFMA) Virement(i.t.o. councilapprovedpolicy) Final budget Actualoutcome Unauthorisedexpenditure Variance Actualoutcomeas % offinalbudget
Actualoutcomeas % oforiginalbudgetR R R R R R R R R R RCash flowsNet cash from(used) operating - - - - - 391 163 396 391 163 396 %DIV/0 %DIV/0Net cash from(used) investing - - - - - (381 752 472) (381 752 472) %DIV/0 %DIV/0Netincrease/(decrease) in cash and cashequivalents - - - - - 9 410 924 9 410 924 %DIV/0 %DIV/0Cash and cashequivalents at thebeginning of theyear 7 436 356 (7 436 356) - - - 7 436 356 7 436 356 %DIV/0 %100Net increase /(decrease) in cashand cashequivalents - - - - - - 9 410 924 - (9 410 924) %DIV/0 %DIV/0Cash and cashequivalents at thebeginning of theyear 7 436 356 (7 436 356) - - - - 7 436 356 - (7 436 356) %DIV/0 %100Cash and cashequivalents at yearend 7 436 356 (7 436 356) - - - 16 847 280 (16 847 280) %DIV/0 %227
13

Zululand District MunicipalityAnnual Financial Statements for the year ended 30 June 2018Accounting Policies1. Presentation of Annual Financial StatementsThe annual financial statements have been prepared in accordance with the Standards of Generally RecognisedAccounting Practice (GRAP), issued by the Accounting Standards Board in accordance with Section 122(3) of theMunicipal Finance Management Act (Act 56 of 2003).These annual financial statements have been prepared on an accrual basis of accounting and are in accordance withhistorical cost convention as the basis of measurement, unless specified otherwise. They are presented in South AfricanRand.In the absence of an issued and effective Standard of GRAP, accounting policies for material transactions, events orconditions were developed in accordance with paragraphs 8, 10 and 11 of GRAP 3 as read with Directive 5.Assets, liabilities, revenues and expenses were not offset, except where offsetting is either required or permitted by aStandard of GRAP. A summary of the significant accounting policies, which have been consistently applied in the preparation of these annualfinancial statements, are disclosed below.1.1 Presentation currencyThese annual financial statements are presented in South African Rand, which is the functional currency of themunicipality. All figures are rounded to the nearest Rand.1.2 Significant judgements and sources of estimation uncertaintyIn preparing the annual financial statements, management is required to make estimates and assumptions that affect theamounts represented in the annual financial statements and related disclosures. Use of available information and theapplication of judgement is inherent in the formation of estimates. Actual results in the future could differ from theseestimates which may be material to the annual financial statements. Significant judgements include:Fair value estimationThe fair value of financial instruments that are not traded in an active market (for example, over-the counter derivatives) isdetermined by using valuation techniques. The municipality uses a variety of methods and makes assumptions that arebased on market conditions existing at the end of each reporting period. Quoted market prices or dealer quotes for similarinstruments are used for long-term debt. Other techniques, such as estimated discounted cash flows, are used todetermine fair value for the remaining financial instruments. The fair value of interest rate swaps is calculated as thepresent value of the estimated future cash flows. The fair value of forward foreign exchange contracts is determined usingquoted forward exchange rates at the end of the reporting period.The carrying value less impairment provision of trade receivables and payables are assumed to approximate their fairvalues. The fair value of financial liabilities for disclosure purposes is estimated by discounting the future contractual cashflows at the current market interest rate that is available to the municipality for similar financial instruments.Impairment testingThe recoverable amounts of cash-generating units and individual assets have been determined based on the higher ofvalue-in-use calculations and fair values less costs to sell. These calculations require the use of estimates andassumptions. It is reasonably possible that the [name a key assumption] assumption may change which may then impactour estimations and may then require a material adjustment to the carrying value of tangible assets.The municipality reviews and tests the carrying value of assets when events or changes in circumstances suggest that thecarrying amount may not be recoverable. Assets are grouped at the lowest level for which identifiable cash flows arelargely independent of cash flows of other assets and liabilities. If there are indications that impairment may haveoccurred, estimates are prepared of expected future cash flows for each group of assets. Expected future cash flows usedto determine the value in use of tangible assets are inherently uncertain and could materially change over time. They aresignificantly affected by a number of factors including [list entity specific variables, i.e. production estimates, supplydemand], together with economic factors such as [list economic factors such as exchange rates inflation interest].14

Zululand District MunicipalityAnnual Financial Statements for the year ended 30 June 2018Accounting Policies1.2 Significant judgements and sources of estimation uncertainty (continued)ProvisionsProvisions were raised and management determined an estimate based on the information available. Additionaldisclosure of these estimates of provisions are included in note 15 - Provisions.Contingent provisions on entity combinationsContingencies recognised in the current year required estimates and judgments, refer to note on entity combinations.Expected manner of realisation for deferred taxDeferred tax is provided for on the fair value adjustments of investment properties based on the expected manner ofrecovery, i.e. sale or use. This manner of recovery affects the rate used to determine the deferred tax liability. Refer note – Deferred tax.TaxationJudgement is required in determining the provision for income taxes due to the complexity of legislation. There are manytransactions and calculations for which the ultimate tax determination is uncertain during the ordinary course of business.The municipality recognises liabilities for anticipated tax audit issues based on estimates of whether additional taxes willbe due. Where the final tax outcome of these matters is different from the amounts that were initially recorded, suchdifferences will impact the income tax and deferred tax provisions in the period in which such determination is made.The municipality recognises the net future tax benefit related to deferred income tax assets to the extent that it is probablethat the deductible temporary differences will reverse in the foreseeable future. Assessing the recoverability of deferredincome tax assets requires the municipality to make significant estimates related to expectations of future taxable income.Estimates of future taxable income are based on forecast cash flows from operations and the application of existing taxlaws in each jurisdiction. To the extent that future cash flows and taxable income differ significantly from estimates, theability of the municipality to realise the net deferred tax assets recorded at the end of the reporting period could beimpacted.Useful lives of waste and water network and other assetsThe municipality's management determines the estimated useful lives and related depreciation charges for the wastewater and water networks. This estimate is based on industry norm. Management will increase the depreciation chargewhere useful lives are less than previously estimated useful lives.Post retirement benefitsThe present value of the post retirement obligation depends on a number of factors that are determined on an actuarialbasis using a number of assumptions. The assumptions used in determining the net cost (income) include the discountrate. Any changes in these assumptions will impact on the carrying amount of post retirement obligations.The municipality determines the appropriate discount rate at the end of each year. This is the interest rate that should beused to determine the present value of estimated future cash outflows expected to be required to settle the pensionobligations. In determining the appropriate discount rate, the municipality considers the interest rates of high-qualitycorporate bonds that are denominated in the currency in which the benefits will be paid, and that have terms to maturityapproximating the terms of the related pension liability.Other key assumptions for pension obligations are based on current market conditions. Additional information is disclosedin Note 20.Effective interest rateThe municipality used the prime interest rate to discount future cash flows.Allowance for doubtful debtsOn debtors an impairment loss is recognised in surplus and deficit when there is objective evidence that it is impaired.The impairment is measured as the difference between the debtors carrying amount and the present value of estimatedfuture cash flows discounted at the effective interest rate, computed at initial recognition.15

Zululand District MunicipalityAnnual Financial Statements for the year ended 30 June 2018Accounting Policies1.3 Going concern assumptionThese annual financial statements have been prepared based on the expectation that the municipality will continue tooperate as a going concern for at least the next 12 months. The assessment is done as per note 49.1.4 Comparative figuresWhen the presentation or classification of items in the annual financial statements is amended, prior period comparativeamounts are restated. The nature and reason for the reclassification is disclosed. Where accounting errors have beenidentified in the current year, the correction is made retrospectively as far as is practicable, and the prior yearcomparatives are restated accordingly. Where there has been a change in accounting policy in the current year, theadjustment is made retrospectively as far as is practicable, and the prior year comparatives are restated accordingly.The following standards, amendments to standards and interpretations have been issued but are not yet effective andhave not been early adopted by the municipality:The presentation and classification of items in the current year is consistent with prior periods.1.5 Property, plant and equipmentInitial RecognitionProperty, plant and equipment are tangible non-current assets (including infrastructure assets) that are held for use in theproduction or supply of goods or services, rental to others, or for administrative purposes, and are expected to be usedduring more than one period.When significant components of an item of property, plant and equipment have different useful lives, they are accountedfor as separate items (major components) of property, plant and equipment. The major components are depreciatedseparately over their useful lives.Where an asset is acquired by the municipality for no consideration (i.e. a non-exchange transaction), the cost is deemedto be equal to the fair value of that asset on the date acquired. Where an item of property, plant and equipment is acquired in exchange for a non-monetary asset or monetary assets, ora combination of monetary and non-monetary assets, the asset acquired is initially measured at fair value (the cost). If theacquired item's fair value was not determinable, it's deemed cost is the carrying amount of the asset(s) given up.Major spare parts and servicing equipment qualify as property, plant and equipment when the municipality expects to usethem during more than one period. Similarly, if the major spare parts and servicing equipment can be used only inconnection with an item of property, plant and equipment, they are accounted for as property, plant and equipment.Subsequent measurement - cost modelSubsequent to initial recognition, items of property, plant and equipment are measured at cost less accumulateddepreciation and impairment losses. Land is not depreciated as it is deemed to have indefinite useful life.Where the municipality replaces parts of an asset, it derecognises the part of the asset being replaced and capitalises thenew component. Subsequent expenditure incurred on an asset is capitalised when it increases the capacity or futureeconomic benefits associated with the asset.Depreciation and impairmentDepreciation is calculated on the depreciable amount, using the straight-line method over the estimated useful lives of theassets. Components of assets that are significant in relation to the whole asset and that have different useful lives aredepreciated separately. Depreciation on new acquisitions is charged to the statement of financial performance in thefinancial year in which the asset is available for use after taking into account the an assets' residual value whereapplicable.The useful lives of items of property, plant and equipment have been assessed as follows:Item Depreciation method Average useful life16

Zululand District MunicipalityAnnual Financial Statements for the year ended 30 June 2018Accounting Policies1.5 Property, plant and equipment (continued)Infrastructure Straight line� Water 7-70 years� Sewerage 7-70 yearsCommunity Straight line� Buildings 15-70 years� Recreational Facilities 15-70 yearsOther property, plant and equipment Straight line� Buildings 10-50 years� Specialist vehicles 4-15 years� Other vehicles 4-15 years� Office equipment 3-25 years� Furniture and fittings 3-5 years� Emergency equipment 10-30 years� Computer equipment 3-11 yearsFinance leased assets Straight line� Office equipment 5 yearsThe municipality separately discloses expenditure to repair and maintain property, plant and equipment in the notes to thefinancial statements (see note ).The municipality discloses relevant information relating to assets under construction or development, in the notes to thefinancial statements (see note ).The residual value, the useful life of an asset and the depreciation method is reviewed annually and adjusted wherenecessary. Any changes are recognised as a change in accounting estimate in the Statement of Financial Performance.The municipality tests for impairment where there is an indication that an asset may be impaired. An assessment ofwhether there is an indication of possible impairment is done at each reporting date. Where the carrying amount of anitem of property, plant and equipment is greater than the estimated recoverable amount (or recoverable service amount),it is written down immediately to its recoverable amount (or recoverable service amount) and an impairment loss ischarged to the Statement of Financial Performance. An impairment is reversed only to the extent that the asset’s carrying amount does not exceed the carrying amount thatwould have been determined had no impairment been recognised. A reversal of the impairment is recognised in theStatement of Financial Performance.Land is not depreciated as it is deemed to have an indefinite life.DerecognitionItems of Property, plant and equipment are derecognised when the asset is disposed of or when there are no furthereconomic benefits or service potential expected from the use of the asset. The gain or loss arising on the disposal orretirement of an item of property, plant and equipment is determined as the difference between the sales proceeds andthe carrying value and is recognised in the Statement of Financial Performance. Where the carrying amount of an item of property, plant and equipment is greater than the estimated recoverable amount,it is written down immediately to its recoverable amount and an impairment loss is charged to the Statement of FinancialPerformance.1.6 Heritage assetsInitial recognitionA heritage asset is defined as an asset that has a cultural, environmental, historical, natural, scientific, technological orartistic significance and are held and preserved indefinitely for the benefit of present and future generations. A heritageasset is recognised as an asset if, and only if it is probable that future economic benefits or service potential associatedwith the asset will flow to the entity, and the cost or fair value of the asset can be measured reliably.
17

Zululand District MunicipalityAnnual Financial Statements for the year ended 30 June 2018Accounting Policies1.6 Heritage assets (continued)Measurement at regocgnitionHeritage asset is initially measured at cost at the date of acquisition or in the case where a heritage asset is acquiredthrough a non-exchange transaction (i.e. donation or grant) at deemed cost, being the fair value of the asset at acquisitiondate. The cost of a heritage asset is a purchase price and other costs directly attributable to bring the heritage asset to thelocation and condition necessary for it to be capable of operating in the manner intended by management of themunicipality. Trade discounts and rebates are deducted in arriving at the cost. The cost also includes attributable costs ofdismantling and removing the asset and restoring the site on which the asset is located. Where there is no evidence to determine the market value of an item of heritage asset in an active market, a valuationtechnique is used to determine the fair value.Subsequent measurementThe municipality uses either cost model or revaluation model to value each class of heritage asset. Subsequentexpenditure relating to heritage assets is capitalised if that expenditure meets all the requirement of heritage asset andcan be measured reliable. Subsequent expenditure is only capitalised when that expenditure increases the level of benefitfrom present and future generation.If the municipality re-values heritage asset, the entire class of heritage assets to which that asset belongs is re-valued.The surplus or deficit realised during revaluation is either credited or debited against the revaluation surplus account.Heritage assets are not depreciated; however the municipality assesses impairment to all heritage assets at eachreporting date.DerecognitionThe carrying amount of an item of heritage asset is de-recognised on disposal or when no future economic benefit orservice potential or for the benefit of present and future generations. The gains or losses derived from de-recognition is recognised in the surplus or deficit when the heritage asset is de-recognised.Gains and losses are determined as the difference between the carrying amount (cost less accumulated impairmentlosses) and the disposal proceeds and included in the Statement of Financial Performance.1.7 Intangible assetsInitial recognitionAn intangible asset is an identifiable non-monetary asset without physical substance. Examples include computersoftware, licenses, and development costs. The municipality recognises an intangible asset in its Statement of FinancialPosition only when it is probable that the expected future economic benefits or service potential that are attributable to theasset will flow to the municipality and the cost or fair value of the asset can be measured reliably. Internally generated intangible assets are subject to strict recognition criteria before they are capitalised. Researchexpenditure is never capitalised, while development expenditure is only capitalised to the extent that:� the municipality intends to complete the intangible asset for use;� it is technically feasible to complete the intangible asset;� the municipality has the resources to complete the project; and� it is probable that the municipality will receive future economic benefits or service potential.After initial recognition, intangible assets are carried at revalued amount, being fair value at the date of revaluationless any subsequent accumulated amortisation and any subsequent accumulated impairment losses. Revaluationsare made with sufficient regularity such that at the reporting date the carrying amount of the asset does not differmaterially from its fair value.
18
Zululand District MunicipalityAnnual Financial Statements for the year ended 30 June 2018Accounting Policies1.7 Intangible assets (continued)Any increase in the carrying amount of an intangible asset, as a result of a revaluation, is credited directly to arevaluation surplus. The increase is recognised in surplus or deficit to the extent that it reverses a revaluationdecrease of the same asset previously recognised in surplus or deficit.Any decrease in the carrying amount of an intangible asset, as a result of a revaluation, is recognised in surplus ordeficit in the current period. The decrease is debited to a revaluation surplus to the extent of any credit balanceexisting in the revaluation surplus in respect of that asset.The amortisation period and the amortisation method for intangible assets are reviewed at each reporting date.Intangible assets are initially recognised at cost.Where an intangible asset is acquired by the municipality for no or nominal consideration (i.e. a non-exchangetransaction), the cost is deemed to be equal to the fair value of that asset on the date acquired. Where an intangible asset is acquired in exchange for a non-monetary asset or monetary assets, or a combination ofmonetary and non-monetary assets, the asset acquired is initially measured at fair value (the cost). If the acquired item'sfair value was not determinable, it's deemed cost is the carrying amount of the asset(s) given up.Subsequent measurement - Cost modelIntangible assets are subsequently carried at cost less accumulated amortisation and impairments. The cost of anintangible asset is amortised over the useful life where that useful life is finite. Where the useful life is indefinite, the assetis not amortised but is subject to an annual impairment test.Amoetisation and impairmentAmortisation is charged so as to write off the cost or valuation of intangible assets over their estimated useful lives usingthe straight line method. Amortisation is provided to write down the intangible assets, on a straight line basis, to their residual values as follows:Item Depreciation method Average useful lifeComputer software Straight line 5-7 yearsDerecognitionIntangible assets are derecognised when the asset is disposed of or when there are no further economic benefits orservice potential expected from the use of the asset. The gain or loss arising on the disposal or retirement of an intangibleasset is determined as the difference between the sales proceeds and the carrying value and is recognised in theStatement of Financial Performance.1.8 InventoriesInitial recognitionInventories are initially measured at cost except where inventories are acquired through a non-exchange transaction, thentheir costs are their fair value as at the date of acquisition.Subsequently inventories are measured at the lower of cost and net realisable value.Inventories are measured at the lower of cost and current replacement cost where they are held for;� distribution at no charge or for a nominal charge; or� consumption in the production process of goods to be distributed at no charge or for a nominal charge.Net realisable value is the estimated selling price in the ordinary course of operations less the estimated costs ofcompletion and the estimated costs necessary to make the sale, exchange or distribution.Current replacement cost is the cost the municipality incurs to acquire the asset on the reporting date.19

Zululand District MunicipalityAnnual Financial Statements for the year ended 30 June 2018Accounting Policies1.8 Inventories (continued)The cost of inventories comprises of all costs of purchase, costs of conversion and other costs incurred in bringing theinventories to their present location and condition.The cost of inventories of items that are not ordinarily interchangeable and goods or services produced and segregatedfor specific projects is assigned using specific identification of the individual costs.The cost of inventories is assigned using the weighted average cost formula. The same cost formula is used for allinventories having a similar nature and use to the municipality.When inventories are sold, the carrying amounts of those inventories are recognised as an expense in the period in whichthe related revenue is recognised. If there is no related revenue, the expenses are recognised when the goods aredistributed, or related services are rendered. The amount of any write-down of inventories to net realisable value orcurrent replacement cost and all losses of inventories are recognised as an expense in the period the write-down or lossoccurs. The amount of any reversal of any write-down of inventories, arising from an increase in net realisable value orcurrent replacement cost, are recognised as a reduction in the amount of inventories recognised as an expense in theperiod in which the reversal occurs.Subsequent measurementInventories, consisting of consumable stores and materials, are valued at the lower of cost and net realisable value unlessthey are to be distributed at no or nominal charge, in which case they are measured at the lower of cost and currentreplacement cost. Redundant and slow-moving inventories are identified and written down in this way. Differences arisingon the valuation of inventory are recognised in the Statement of Financial Performance in the year in which they arose.The amount of any reversal of any write-down of inventories arising from an increase in net realisable value or currentreplacement cost is recognised as a reduction in the amount of inventories recognised as an expense in the period inwhich the reversal occurs. The carrying amount of inventories is recognised as an expense in the period that the inventory was sold, distributed,written off or consumed, unless that cost qualifies for capitalisation to the cost of another asset. 1.9 Financial instrumentsInitial recognitionThe municipality has various types of financial instruments and these can be broadly categorised as either financialassets, financial liabilities or residual interests in accordance with the substance of the contractual agreement . Themunicipality only recognises a financial instrument when it becomes a party to the contractual provisions of theinstrument. Financial instruments are initially recognised at fair value.The Entity does not offset a financial asset and a financial liability unless a legally enforceable right to set off therecognised amounts currently exist; and the entity intends either to settle on a net basis, or to realise the asset and settlethe liability simultaneously.Financial instruments are evaluated, based on their terms, to determine if those instruments contain both liability andresidual interest components (i.e. to assess if the instruments are compound financial instruments). To the extent that aninstrument is in fact a compound instrument, the components are classified separately as financial liabilities and residualinterests as the case may be.ClassificationThe municipality has the following types of financial assets as reflected on the face of the Statement of Financial Positionor in the notes thereto:`Class CategoryOther receivables1 Financial asset measured at amortised costOther receivables2 Financial asset measured at amortised cost
20
Zululand District MunicipalityAnnual Financial Statements for the year ended 30 June 2018Accounting Policies1.9 Financial instruments (continued)Subsequent measurement of financial assets and financial liabilitiesThe municipality measures all financial assets and financial liabilities after initial recognition using the followingcategories:� Financial instruments at fair value.� Financial instruments at amortised cost.� Financial instruments at cost.All financial assets measured at amortised cost, or cost, are subject to an impairment review.Financial Assets are categorised according to their nature as either financial assets at fair value through profit or loss,held-to maturity, loans and receivables, or available for sale. Financial liabilities are categorised as either at fair valuethrough profit or loss or financial liabilities carried at amortised cost ("other"). The subsequent measurement of financialassets and liabilities depends on this categorisation and, in the absence of an approved GRAP 104 Standard on FinancialInstruments, is in accordance with IAS 39. Subsequent to initial recognition, financial assets and financial liabilities are measured at fair value, amortised cost orcost.Impairment and uncollectibility of financial assetsAll financial assets measured at amortised cost, or cost, are subject to an impairment review. The entity assesses at theend of each reporting period whether there is any objective evidence that a financial asset or group of financial assets isimpaired.A gain or loss arising from a change in the fair value of a financial asset or financial liability measured at fair value isrecognised in surplus or deficit.The entity does not offset financial assets and financial liabilities in the Statement of Financial Position unless a legal rightof set-off exists and the parties intend to settle on a net basis.DerecognitionFinancial assetsThe entity derecognises financial assets using trade date accounting.The entity derecognises a financial asset only when:� the contractual rights to the cash flows from the financial asset expire, are settled or waived;� the entity transfers to another party substantially all of the risks and rewards of ownership of the financial asset; orA financial liability is derecognised when the obligation is extinguished. Exchanges of debt instruments between aborrower and a lender are treated as the extinguishment of an existing liability and the recognition of a new financialliability. Where the terms of an existing financial liability are modified, it is also treated as the extinguishment of an existingliability and the recognition of a new liability.1.10 Trade and other receivablesTrade and other receivables are categorised as financial assets: loans and receivables and are initially recognised at fairvalue and subsequently carried at amortised cost. Amortised cost refers to the initial carrying amount, plus interest, lessrepayments and impairments. An estimate is made for doubtful receivables based on a review of all outstanding amountsat year-end. Significant financial difficulties of the debtor, probability that the debtor will enter bankruptcy or financialreorganisation, and default or delinquency in payments (more than 180 days overdue) are considered indicators that thetrade receivable is impaired. Impairments are determined by discounting expected future cash flows to their presentvalue. Amounts that are receivable within 12 months from the reporting date are classified as current.An impairment of trade receivables is accounted for by reducing the carrying amount of trade receivables through the useof an allowance account, and the amount of the loss is recognised in the Statement of Financial Performance withinoperating expenses. When a trade receivable is uncollectible, it is written off. Subsequent recoveries of amountspreviously written off are credited against operating expenses in the Statement of Financial Performance.21
Zululand District MunicipalityAnnual Financial Statements for the year ended 30 June 2018Accounting Policies1.11 Trade payables and borrowingsFinancial liabilities consist of trade payables and borrowings. They are categorised as financial liabilities held at amortisedcost, are initially recognised at fair value and subsequently measured at amortised cost which is the initial carryingamount, less repayments, plus interest. 1.12 Cash and cash equivalentsCash includes cash on hand (including petty cash) and cash with banks (including call deposits). Cash equivalents areshort-term highly liquid investments, readily convertible into known amounts of cash, that are held with registered bankinginstitutions with maturities of three months or less and are subject to an insignificant risk of change in value. For thepurposes of the cash flow statement, cash and cash equivalents comprise cash on hand, deposits held on call with banks,net of bank overdrafts. The municipality categorises cash and cash equivalents as financial assets: loans and receivables.Bank overdrafts are recorded based on the facility utilised. Finance charges on bank overdraft are expensed as incurred.Amounts owing in respect of bank overdrafts are categorised as financial liabilities: other financial liabilities carried atamortised cost.1.13 Unauthorised expenditureUnauthorised expenditure is expenditure that has not been budgeted, expenditure that is not in terms of the conditions ofan allocation received from another sphere of government, municipality or organ of state and expenditure in the form of agrant that is not permitted in terms of the Municipal Finance Management Act (Act No.56 of 2003). Unauthorisedexpenditure is accounted for as an expense in the Statement of Financial Performance and where recovered, it issubsequently accounted for as revenue in the Statement of Financial Performance.1.14 Irregular expenditureIrregular expenditure is expenditure that is contrary to the Municipal Finance Management Act (Act No.56 of 2003), theMunicipal Systems Act (Act No.32 of 2000), the Public Office Bearers Act (Act No. 20 of 1998) or is in contravention of theMunicipality’s supply chain management policy. Irregular expenditure excludes unauthorised expenditure. Irregularexpenditure is accounted for as expenditure in the Statement of Financial Performance and where recovered, it issubsequently accounted for as revenue in the Statement of Financial Performance.1.15 Fruitless and wasteful expenditureFruitless and wasteful expenditure is expenditure that was made in vain and would have been avoided had reasonablecare been exercised. Fruitless and wasteful expenditure is accounted for as expenditure in the Statement of FinancialPerformance and where recovered, it is subsequently accounted for as revenue in the Statement of FinancialPerformance.1.16 LeasesOperating leases - lessorRental income from operating leases is recognised on a straight-line basis over the term of the relevant lease.1.17 Provisions and contingenciesProvisions are recognised when the municipality has a present or constructive obligation as a result of past events, it isprobable that an outflow of resources embodying economic benefits will be required to settle the obligation and a reliableestimate of the provision can be made. Provisions are reviewed at reporting date and adjusted to reflect the current bestestimate. Where the effect is material, non-current provisions are discounted to their present value using a pre-taxdiscount rate that reflects the market's current assessment of the time value of money, adjusted for risks specific to theliability (for example in the case of obligations for the rehabilitation of land). The municipality does not recognise a contingent liability or contingent asset. A contingent liability is disclosed unless thepossibility of an outflow of resources embodying economic benefits is remote. A contingent asset is disclosed where aninflow of economic benefits is probable.22

Zululand District MunicipalityAnnual Financial Statements for the year ended 30 June 2018Accounting Policies1.17 Provisions and contingencies (continued)Future events that may affect the amount required to settle an obligation are reflected in the amount of a provision wherethere is sufficient objective evidence that they will occur. Gains from the expected disposal of assets are not taken intoaccount in measuring a provision. Provisions are not recognised for future operating losses. The present obligation underan onerous contract is recognised and measured as a provision.1.18 Revenue from exchange transactionsRevenue from exchange transactions refers to revenue that accrued to the municipality directly in return for servicesrendered / goods sold, the value of which approximates the consideration received or receivable. Service charges relating to sewerage and sanitation are based on the number of sewerage connections on eachdeveloped property using the tariffs approved by the council and are levied monthly.Service charges relating to water are based on consumption. Meters are read on a monthly basis and are recognised asrevenue when invoiced. Provisional estimates of consumption are made monthly by the system if the reading was notobtained. The provisional estimates of consumption are recognised as revenue when invoiced. The system automaticallyreverse the provisional readings, when the reading has been captured on the system.Interest revenue is recognised on a time proportion basis.Revenue from the rental of facilities and equipment is recognised on a straight-line basis over the term of the leaseagreement.Revenue arising from the application of the approved tariff of charges is recognised when the relevant service is renderedby applying the relevant tariff. Revenue from the sale of goods is recognised when substantially all the risks and rewards in those goods is passed tothe consumer.Revenue for agency services is recognised on a monthly basis once the revenue collected on behalf of agents has beenquantified and once the terms of the agency agreement have been complied with.1.19 Revenue from non-exchange transactionsRevenue from non-exchange transactions refers to transactions where the municipality received revenue from anotherentity without directly giving approximately equal value in exchange. Revenue from non-exchange transactions isgenerally recognised to the extent that the related receipt or receivable qualifies for recognition as an asset and there isno liability to repay the amount. Fines constitute both spot fines in the form of meter tampering fines. Fines are recognised when payment is received.Revenue from public contributions and donations is recognised when all conditions associated with the contribution havebeen met or where the contribution is to finance property, plant and equipment, when such items of property, plant andequipment qualifies for recognition and first becomes available for use by the municipality. Where public contributionshave been received but the municipality has not met the related conditions, a deferred income (liability) is recognised.Contributed property, plant and equipment is recognised when such items of property, plant and equipment qualifies forrecognition and become available for use by the municipality.Revenue from the recovery of unauthorised, irregular, fruitless and wasteful expenditure is based on legislatedprocedures, including those set out in the Municipal Finance Management Act (Act No.56 of 2003) and is recognisedwhen the recovery thereof from the responsible councillors or officials is virtually certain.1.20 Grants, transfer and donationsGrants, transfers and donations received or receivable are recognised when the resources that have been transferredmeet the criteria for recognition as an asset. A corresponding liability is raised to the extent that the grant, transfer ordonation is conditional. The liability is transferred to revenue as and when the conditions attached to the grant are met.Grants without any conditions attached are recognised as revenue when the asset or expense is recognised.23

Zululand District MunicipalityAnnual Financial Statements for the year ended 30 June 2018Accounting Policies1.21 Borrowing costsBorrowing cost are recognised as an expense in Statement of Financial Performance in the period they become due andpayable.1.22 Employee benefitsShort-term employee benefitsRemuneration to employees is recognised in the Statement of Financial Performance as the services are rendered,except for non-accumulating benefits, which are only recognised when the specific event occurs.The costs of all short-term employee benefits such as leave pay, are recognised during the period in which the employeerenders the related service. The liability for leave pay is based on the total accrued leave days at year end and is shownas a provision in the Statement of Financial Position. The municipality recognises the expected cost of performancebonuses only when the municipality has a present legal or constructive obligation to make such payment and a reliableestimate can be made.Post-employment benefits: Defined benefit plansDefined benefit plans are post-employment benefit plans other than defined contribution plans.Defined Contribution PlansA defined contribution plan is a plan under which the municipality pays fixed contributions into a separate entity. Themunicipality has no legal or constructive obligation to pay further contributions if the fund does not hold sufficient assets topay all employees the benefits relating to service in the current or prior periods.The municipality’s contributions to the defined contribution funds are established in terms of the rules governing thoseplans. Contributions are recognised in the Statement of Financial Performance in the period in which the service isrendered by the relevant employees. The municipality has no further payment obligations once the contributions havebeen paid.Pension obligationsThe Municipality’s personnel are members of either the Government Employees Pension Fund (GEPF) or one of the NatalJoint Municipal Pension (NJMPF) retirement funds, namely the Superannuation, Retirement and Provident Funds. Exceptfor the NJMPF Provident fund, the aforementioned funds are defined benefit funds. As these defined benefit funds aremulti-employer funds, the allocation of any surplus/deficit to individual municipalities cannot be determined. Furthermoredisclosure of further details such as actuarial assumptions, cannot be attributed to any specific employer and is of norelevance to users of the municipality’s financial statements. As the required disclosure information cannot be obtainedthe funds are all treated as defined contribution funds.Municipal CouncillorsCouncillors belong to the Councillors Pension Fund which is a defined contribution fund and employers have no legal orconstructive obligation for any shortfalls in valuation of the fund.Post-retirement Health Care BenefitsThe municipality has an obligation to provide Post-retirement Health Care Benefits for current employees of themunicipality. According to the municipality , a member (who is on the current Conditions of Service), on retirement, isentitled to remain a continued member of the Medical Aid Fund, in which case the municipality is liable for a certainportion of the medical aid membership fee. The defined benefit liability is the aggregate of the present value of the defined benefit obligation and unrecognisedactuarial gains and losses, reduced by unrecognised past service costs. The plan is unfunded. The present value of thedefined benefit obligation is calculated using the Projected Unit Credit Method, incorporating actuarial assumptions and adiscount rate based on the government bond rate. Valuations of these obligations are carried out annually byindependent qualified actuaries.Actuarial gains or losses are recognised immediately in the Statement of Financial Performance.24
Zululand District MunicipalityAnnual Financial Statements for the year ended 30 June 2018Accounting Policies1.22 Employee benefits (continued)Past-service costs are recognised immediately in the Statement of Financial Performance.1.23 VatVAT is accounted for on the payment basis i.e. VAT is paid over to SARS only once payment is received from debtorsand/ or when actual payment is made to creditors.1.24 Budget informationThe approved budget covers the fiscal period from 01 Jul 2017 to 30 Jun 2018.The annual budget figures have been prepared in accordance with the GRAP 24. The amounts are scheduled as aseparate additional financial statement, called the Statement of Comparison of Budget and Actual amounts.Explanatory comments on material differences are provided in a separate budget statement in the annual financialstatements giving firstly reasons for overall growth or decline in the budget and secondly motivations for over- orunderspending on line items. The changes between the approved and final budget are a consequence of reallocationswithin the approved budget by the Council at the beginning and during the year following a period of consultation with thepublic as part of the Integrated Development Plan. 1.25 CommitmentsMost of infrastructure projects are multi-year projects that requires budget funding over certain period of years. At year-end reporting date some funds are committed and contract signed with various contractors to carry out construction ofinfrastructure projects. Some funds are committed but not yet contracted for. Commitments are disclosed inclusive ofVAT.1.26 Non-cash-generating assetsThe municipality holds Non-Cash-Generating Assets that are used for service delivery purposes. All assets that are usedfor service delivery purposes are categorised as Non-cash-generating assets. GRAP 21 is used to determine impairmentof Non-Cash-Generating assets. Impairment loss is the amount the carrying value exceeds recoverable service amount ofan asset. Impairment is assessed annually during year-end reporting. Impairment loss is recognised to the Statement ofFinancial Performance. Reversal of the impairment loss affects surplus or deficit for that reporting period.1.27 Impairment of cash-generating assetsCash-generating assets are assets used with the objective of generating a commercial return. Commercial return meansthat positive cash flows are expected to be significantly higher than the cost of the asset.Impairment is a loss in the future economic benefits or service potential of an asset, over and above the systematicrecognition of the loss of the asset’s future economic benefits or service potential through depreciation (amortisation).Carrying amount is the amount at which an asset is recognised in the statement of financial position after deducting anyaccumulated depreciation and accumulated impairment losses thereon.A cash-generating unit is the smallest identifiable group of assets used with the objective of generating a commercialreturn that generates cash inflows from continuing use that are largely independent of the cash inflows from other assetsor groups of assets.Costs of disposal are incremental costs directly attributable to the disposal of an asset, excluding finance costs andincome tax expense.Depreciation (Amortisation) is the systematic allocation of the depreciable amount of an asset over its useful life.Fair value less costs to sell is the amount obtainable from the sale of an asset in an arm’s length transaction betweenknowledgeable, willing parties, less the costs of disposal.Recoverable amount of an asset or a cash-generating unit is the higher its fair value less costs to sell and its value in use.Useful life is either: 25

Zululand District MunicipalityAnnual Financial Statements for the year ended 30 June 2018Accounting Policies1.27 Impairment of cash-generating assets (continued)� the period of time over which an asset is expected to be used by the municipality; or� the number of production or similar units expected to be obtained from the asset by the municipality.DesignationAt initial recognition, the municipality designates an asset as non-cash-generating, or an asset or cash-generating unit ascash-generating. The designation is made on the basis of a municipality's objective of using the asset.The municipality designates an asset or a cash-generating unit as cash-generating when:� its objective is to use the asset or a cash-generating unit in a manner that generates a commercial return; such that� the asset or cash-generating unit will generate positive cash flows, from continuing use and its ultimate disposal, thatare expected to be significantly higher than the cost of the asset.
26

Zululand District MunicipalityAnnual Financial Statements for the year ended 30 June 2018Notes to the Annual Financial Statements 2018 2017R R2. New standards and interpretations2.1 Standards and interpretations issued, but not yet effectiveThe municipality has not applied the following standards and interpretations, which have been published and aremandatory for the municipality’s accounting periods beginning on or after 01 July 2018 or later periods:GRAP 34: Separate Financial StatementsThe objective of this Standard is to prescribe the accounting and disclosure requirements for investments in controlledentities, joint ventures and associates when an entity prepares separate financial statements.It furthermore covers Definitions, Preparation of separate financial statements, Disclosure, Transitional provisions andEffective date.The effective date of the standard is not yet set by the Minister of Finance.The municipality expects to adopt the standard for the first time when the Minister sets the effective date for thestandard.It is unlikely that the standard will have a material impact on the municipality's annual financial statements.GRAP 35: Consolidated Financial StatementsThe objective of this Standard is to establish principles for the presentation and preparation of consolidated financialstatements when an entity controls one or more other entities.To meet this objective, the Standard:� requires an entity (the controlling entity) that controls one or more other entities (controlled entities) to presentconsolidated financial statements;� defines the principle of control, and establishes control as the basis for consolidation;� sets out how to apply the principle of control to identify whether an entity controls another entity and thereforemust consolidate that entity;� sets out the accounting requirements for the preparation of consolidated financial statements; and� defines an investment entity and sets out an exception to consolidating particular controlled entities of aninvestment entity.It furthermore covers Definitions, Control, Accounting requirements, Investment entities: Fair value requirement,Transitional provisions and Effective date.The effective date of the standard is not yet set by the Minister of Finance.The municipality expects to adopt the standard for the first time when the Minister sets the effective date for thestandard.It is unlikely that the standard will have a material impact on the municipality's annual financial statements.GRAP 36: Investments in Associates and Joint VenturesThe objective of this Standard is to prescribe the accounting for investments in associates and joint ventures and toset out the requirements for the application of the equity method when accounting for investments in associates andjoint ventures.It furthermore covers Definitions, Significant influence, Equity method, Application of the equity method, Separatefinancial statements, Transitional provisions and Effective date.The effective date of the standard is not yet set by the Minister of Finance.The municipality expects to adopt the standard for the first time when the Minister sets the effective date for thestandard. 27

Zululand District MunicipalityAnnual Financial Statements for the year ended 30 June 2018Notes to the Annual Financial Statements2. New standards and interpretations (continued)It is unlikely that the standard will have a material impact on the municipality's annual financial statements.GRAP 37: Joint ArrangementsThe objective of this Standard is to establish principles for financial reporting by entities that have an interest inarrangements that are controlled jointly (i.e. joint arrangements).To meet this objective, the Standard defines joint control and requires an entity that is a party to a joint arrangement todetermine the type of joint arrangement in which it is involved by assessing its rights and obligations and to accountfor those rights and obligations in accordance with that type of joint arrangement.It furthermore covers Definitions, Joint arrangements, Financial statements and parties to a joint arrangement,Separate financial statements, Transitional provisions and Effective date.The effective date of the standard is not yet set by the Minister of Finance.The municipality expects to adopt the standard for the first time when the Minister sets the effective date for thestandard.It is unlikely that the standard will have a material impact on the municipality's annual financial statements.GRAP 38: Disclosure of Interests in Other EntitiesThe objective of this Standard is to require an entity to disclose information that enables users of its financialstatements to evaluate:� the nature of, and risks associated with, its interests in controlled entities, unconsolidated controlled entities, jointarrangements and associates, and structured entities that are not consolidated; and� the effects of those interests on its financial position, financial performance and cash flows.It furthermore covers Definitions, Disclosing information about interests in other entities, Significant judgements andassumptions, Investment entity status, Interests in controlled entities, Interests in joint arrangements and associates,Interests in structured entities that are not consolidated, Non-qualitative ownership interests, Controlling interestsacquired with the intention of disposal, Transitional provisions and Effective date.The effective date of the standard is not yet set by the Minister of Finance.The municipality expects to adopt the standard for the first time when the Minister sets the effective date for thestandard.It is unlikely that the standard will have a material impact on the municipality's annual financial statements.Guideline: Accounting for Arrangements Undertaken i.t.o the National Housing ProgrammeThe objective of this guideline: Entities in the public sector are frequently involved in the construction of houses as partof government’s housing policy, implemented through the national housing programme, which is aimed at developingsustainable human settlements. The Housing Act, Act No. 107 of 1997 provides information about the housingprogrammes that fall within the scope of the national housing programme. Concerns were raised by preparers aboutthe inconsistent accounting applied to housing arrangements undertaken by entities under the national housingprogramme. Different accounting may be appropriate where there are differences between the terms and conditions ofarrangements concluded by entities. However, under housing arrangements that are undertaken in terms of thenational housing programme, there are common features and issues that need to be considered. As a result, theBoard agreed to develop high-level guidance for arrangements undertaken in terms of the national housingprogramme.It covers: Background to arrangements undertaken in terms of the national housing programme, Transactions thataffect the accounting of housing arrangements, Consider whether the municipality undertakes transactions with thirdparties on behalf of another party, Accounting by municipalities appointed as project manager, Disclosurerequirements, Accounting by municipalities appointed as project developer, Accounting for the accreditation fee,commission, administration or transaction fee received, Land and infrastructure, Conclusion and Application of thisGuideline to existing arrangements. 28

Zululand District MunicipalityAnnual Financial Statements for the year ended 30 June 2018Notes to the Annual Financial Statements2. New standards and interpretations (continued)The effective date of the guideline is not yet set by the Minister of Finance.The municipality expects to adopt the guideline for the first time when the Minister sets the effective date for theguideline.It is unlikely that the guideline will have a material impact on the municipality's annual financial statements.GRAP 110: Living and Non-living ResourcesThe objective of this Standard is to prescribe the:� recognition, measurement, presentation and disclosure requirements for living resources; and� disclosure requirements for non-living resourcesIt furthermore covers Definitions, Recognition, Measurement, Depreciation, Impairment, Compensation for impairment,Transfers, Derecognition, Disclosure, Transitional provisions and Effective date.The effective date of the standard is not yet set by the Minister of Finance.The municipality expects to adopt the standard for the first time when the Minister sets the effective date for thestandard.It is unlikely that the standard will have a material impact on the municipality's annual financial statements.GRAP 110 (as amended 2016): Living and Non-living ResourcesAmendments to the Standard of GRAP on Living and Non-living Resources resulted from editorial changes to theoriginal text and inconsistencies in measurement requirements in GRAP 23 and other asset-related Standards ofGRAP in relation to the treatment of transaction costs. Other changes resulted from changes made to IPSAS 17 onProperty, Plant and Equipment (IPSAS 17) as a result of the IPSASB’s Improvements to IPSASs 2014 issued inJanuary 2015 and Improvements to IPSASs 2015 issued in March 2016.The most significant changes to the Standard are:� General improvements: To clarify the treatment of transaction costs and other costs incurred on assets acquiredin non-exchange transactions to be in line with the principle in GRAP 23; and To clarify the measurementprinciple when assets may be acquired in exchange for a non-monetary asset or assets, or a combination ofmonetary and non-monetary assets� IPSASB amendments: To clarify the revaluation methodology of the carrying amount and accumulateddepreciation when a living resource is revalued; To clarify acceptable methods of depreciating assets; and Todefine a bearer plant and include bearer plants within the scope of GRAP 17 or GRAP 110, while the producegrowing on bearer plants will remain within the scope of GRAP 27The effective date of the amendment is for years beginning on or after 01 April 2020.The municipality expects to adopt the amendment for the first time in the 2020 annual financial statements.It is unlikely that the amendment will have a material impact on the municipality's annual financial statements.GRAP 18 (as amended 2016): Segment ReportingAmendments to the Standard of GRAP on Segment Reporting resulted from editorial and other changes to the originaltext have been made to ensure consistency with other Standards of GRAP.The most significant changes to the Standard are:� General improvements: An appendix with illustrative segment disclosures has been deleted from the Standard asthe National Treasury has issued complete examples as part of its implementation guidance.The effective date of the amendment is for years beginning on or after 01 April 2019The municipality expects to adopt the amendment for the first time when the Minister sets the effective date for theamendment. 29

Zululand District MunicipalityAnnual Financial Statements for the year ended 30 June 2018Notes to the Annual Financial Statements2. New standards and interpretations (continued)It is unlikely that the amendment will have a material impact on the municipality's annual financial statements.GRAP 20: Related partiesThe objective of this standard is to ensure that a reporting entity’s annual financial statements contain the disclosuresnecessary to draw attention to the possibility that its financial position and surplus or deficit may have been affected bythe existence of related parties and by transactions and outstanding balances with such parties.An entity that prepares and presents financial statements under the accrual basis of accounting (in this standardreferred to as the reporting entity) shall apply this standard in:� identifying related party relationships and transactions;� identifying outstanding balances, including commitments, between an entity and its related parties;� identifying the circumstances in which disclosure of the items in (a) and (b) is required; and� determining the disclosures to be made about those items.This standard requires disclosure of related party relationships, transactions and outstanding balances, includingcommitments, in the consolidated and separate financial statements of the reporting entity in accordance with theStandard of GRAP on Consolidated and Separate Financial Statements. This standard also applies to individualannual financial statements.Disclosure of related party transactions, outstanding balances, including commitments, and relationships with relatedparties may affect users’ assessments of the financial position and performance of the reporting entity and its ability todeliver agreed services, including assessments of the risks and opportunities facing the entity. This disclosure alsoensures that the reporting entity is transparent about its dealings with related parties.The standard states that a related party is a person or an entity with the ability to control or jointly control the otherparty, or exercise significant influence over the other party, or vice versa, or an entity that is subject to commoncontrol, or joint control. As a minimum, the following are regarded as related parties of the reporting entity:� A person or a close member of that person’s family is related to the reporting entity if that person:- has control or joint control over the reporting entity;- has significant influence over the reporting entity;- is a member of the management of the entity or its controlling entity.� An entity is related to the reporting entity if any of the following conditions apply:- the entity is a member of the same economic entity (which means that each controlling entity, controlledentity and fellow controlled entity is related to the others);- one entity is an associate or joint venture of the other entity (or an associate or joint venture of a member ofan economic entity of which the other entity is a member);- both entities are joint ventures of the same third party;- one entity is a joint venture of a third entity and the other entity is an associate of the third entity;- the entity is a post-employment benefit plan for the benefit of employees of either the entity or an entityrelated to the entity. If the reporting entity is itself such a plan, the sponsoring employers are related to the entity;- the entity is controlled or jointly controlled by a person identified in (a); and- a person identified in (a)(i) has significant influence over that entity or is a member of the management ofthat entity (or its controlling entity).The standard furthermore states that related party transaction is a transfer of resources, services or obligationsbetween the reporting entity and a related party, regardless of whether a price is charged.The standard elaborates on the definitions and identification of:� Close member of the family of a person;� Management;� Related parties;� Remuneration; and� Significant influenceThe standard sets out the requirements, inter alia, for the disclosure of:� Control;� Related party transactions; and� Remuneration of management 30

Zululand District MunicipalityAnnual Financial Statements for the year ended 30 June 2018Notes to the Annual Financial Statements2. New standards and interpretations (continued)The effective date of the standard is not yet set by the Minister of Finance.The municipality expects to adopt the standard for the first time when the Minister sets the effective date for thestandard.It is unlikely that the standard will have a material impact on the municipality's annual financial statements.GRAP 32: Service Concession Arrangements: GrantorThe objective of this Standard is: to prescribe the accounting for service concession arrangements by the grantor, apublic sector entity.It furthermore covers: Definitions, recognition and measurement of a service concession asset, recognition andmeasurement of liabilities, other liabilities, contingent liabilities, and contingent assets, other revenues, presentationand disclosure, transitional provisions, as well as the effective date.The effective date of the standard is not yet set by the Minister of Finance.The municipality expects to adopt the standard for the first time when the Minister sets the effective date for thestandard.It is unlikely that the standard will have a material impact on the municipality's annual financial statements.GRAP 108: Statutory ReceivablesThe objective of this Standard is: to prescribe accounting requirements for the recognition, measurement, presentationand disclosure of statutory receivables.It furthermore covers: Definitions, recognition, derecognition, measurement, presentation and disclosure, transitionalprovisions, as well as the effective date.The effective date of the standard is not yet set by the Minister of Finance.The municipality expects to adopt the standard for the first time when the Minister sets the effective date for thestandard.It is unlikely that the standard will have a material impact on the municipality's annual financial statements.GRAP 109: Accounting by Principals and AgentsThe objective of this Standard is to outline principles to be used by an entity to assess whether it is party to a principal-agent arrangement, and whether it is a principal or an agent in undertaking transactions in terms of such anarrangement. The Standard does not introduce new recognition or measurement requirements for revenue, expenses,assets and/or liabilities that result from principal-agent arrangements. The Standard does however provide guidanceon whether revenue, expenses, assets and/or liabilities should be recognised by an agent or a principal, as well asprescribe what information should be disclosed when an entity is a principal or an agent.It furthermore covers Definitions, Identifying whether an entity is a principal or agent, Accounting by a principal oragent, Presentation, Disclosure, Transitional provisions and Effective date.The effective date of the standard is not yet set by the Minister of Finance.The municipality expects to adopt the standard for the first time when the Minister sets the effective date for thestandard.It is unlikely that the standard will have a material impact on the municipality's annual financial statements.IGRAP 17: Service Concession Arrangements where a Grantor Controls a Significant Residual Interest in anAsset 31

Zululand District MunicipalityAnnual Financial Statements for the year ended 30 June 2018Notes to the Annual Financial Statements2. New standards and interpretations (continued)This Interpretation of the Standards of GRAP provides guidance to the grantor where it has entered into a serviceconcession arrangement, but only controls, through ownership, beneficial entitlement or otherwise, a significantresidual interest in a service concession asset at the end of the arrangement, where the arrangement does notconstitute a lease. This Interpretation of the Standards of GRAP shall not be applied by analogy to other types oftransactions or arrangements.A service concession arrangement is a contractual arrangement between a grantor and an operator in which theoperator uses the service concession asset to provide a mandated function on behalf of the grantor for a specifiedperiod of time. The operator is compensated for its services over the period of the service concession arrangement,either through payments, or through receiving a right to earn revenue from third party users of the service concessionasset, or the operator is given access to another revenue-generating asset of the grantor for its use.Before the grantor can recognise a service concession asset in accordance with the Standard of GRAP on ServiceConcession Arrangements: Grantor, both the criteria as noted in paragraph .01 of this Interpretation of the Standardsof GRAP need to be met. In some service concession arrangements, the grantor only controls the residual interest inthe service concession asset at the end of the arrangement, and can therefore not recognise the service concessionasset in terms of the Standard of GRAP on Service Concession Arrangements: Grantor.A consensus is reached, in this Interpretation of the Standards of GRAP, on the recognition of the performanceobligation and the right to receive a significant interest in a service concession asset.The effective date of the interpretation is not yet set by the Minister of Finance.The municipality expects to adopt the interpretation for the first time when the Minister sets the effective date for theinterpretation.It is unlikely that the interpretation will have a material impact on the municipality's annual financial statements.IGRAP 18: Interpretation of the Standard of GRAP on Recognition and Derecognition of LandThis Interpretation of the Standards of GRAP applies to the initial recognition and derecognition of land in an entity’sfinancial statements. It also considers joint control of land by more than one entity.When an entity concludes that it controls the land after applying the principles in this Interpretation of the Standards ofGRAP, it applies the applicable Standard of GRAP, i.e. the Standard of GRAP on Inventories, Investment Property(GRAP 16), Property, Plant and Equipment (GRAP 17) or Heritage Assets. As this Interpretation of the Standards ofGRAP does not apply to the classification, initial and subsequent measurement, presentation and disclosurerequirements of land, the entity applies the applicable Standard of GRAP to account for the land once control of theland has been determined. An entity also applies the applicable Standards of GRAP to the derecognition of land whenit concludes that it does not control the land after applying the principles in this Interpretation of the Standards ofGRAP.In accordance with the principles in the Standards of GRAP, buildings and other structures on the land are accountedfor separately. These assets are accounted for separately as the future economic benefits or service potentialembodied in the land differs from those included in buildings and other structures. The recognition and derecognitionof buildings and other structures are not addressed in this Interpretation of the Standards of GRAP.The effective date of the interpretation is for years beginning on or after 01 April 2019.The municipality expects to adopt the interpretation for the first time in the 2019 annual financial statements.It is unlikely that the interpretation will have a material impact on the municipality's annual financial statements.IGRAP 19: Liabilities to Pay LeviesThis Interpretation of the Standards of GRAP provides guidance on the accounting for levies in the financialstatements of the entity that is paying the levy. It clarifies when entities need to recognise a liability to pay a levy that isaccounted for in accordance with GRAP 19.32

Zululand District MunicipalityAnnual Financial Statements for the year ended 30 June 2018Notes to the Annual Financial Statements2. New standards and interpretations (continued)To clarify the accounting for a liability to pay a levy, this Interpretation of the Standards of GRAP addresses thefollowing issues:� What is the obligating event that gives rise to the recognition of a liability to pay a levy?� Does economic compulsion to continue to operate in a future period create a constructive obligation to pay a levythat will be triggered by operating in that future period?� Does the going concern assumption imply that an entity has a present obligation to pay a levy that will betriggered by operating in a future period?� Does the recognition of a liability to pay a levy arise at a point in time or does it, in some circumstances, ariseprogressively over time?� What is the obligating event that gives rise to the recognition of a liability to pay a levy that is triggered if aminimum threshold is reached?Consensus reached in this interpretation:� The obligating event that gives rise to a liability to pay a levy is the activity that triggers the payment of the levy,as identified by the legislation;� An entity does not have a constructive obligation to pay a levy that will be triggered by operating in a futureperiod as a result of the entity being economically compelled to continue to operate in that future period;� The preparation of financial statements under the going concern assumption does not imply that an entity has apresent obligation to pay a levy that will be triggered by operating in a future period;� The liability to pay a levy is recognised progressively if the obligating event occurs over a period of time;� If an obligation to pay a levy is triggered when a minimum threshold is reached, the accounting for the liabilitythat arises from that obligation shall be consistent with the principles established in this Interpretation of theStandards of GRAP; and� An entity shall recognise an asset, in accordance with the relevant Standard of GRAP, if it has prepaid a levy butdoes not yet have a present obligation to pay that levy.The effective date of the interpretation is not yet set by the Minister of Finance.The municipality expects to adopt the interpretation for the first time when the Minister sets the effective date for theinterpretation.It is unlikely that the interpretation will have a material impact on the municipality's annual financial statements.GRAP 12 (as amended 2016): InventoriesAmendments to the Standard of GRAP on Inventories resulted from inconsistencies in measurement requirements inGRAP 23 and other asset-related Standards of GRAP in relation to the treatment of transaction costs. Other changesresulted from changes made to IPSAS 12 on Inventories (IPSAS 12) as a result of the IPSASB’s Improvements toIPSASs 2015 issued in March 2016.The most significant changes to the Standard are:� General improvements: To clarify the treatment of transaction costs and other costs incurred on assets acquiredin non-exchange transactions to be in line with the principle in GRAP 23 (paragraph .12)� IPSASB amendments: To align terminology in GRAP 12 with that in IPSAS 12. The term “ammunition” in IPSAS12 was replaced with the term “military inventories” and provides a description of what it comprises inaccordance with Government Finance Statistics terminologyThe effective date of the amendment is for years beginning on or after 01 April 2018.The municipality expects to adopt the amendment for the first time in the 2018 annual financial statements.It is unlikely that the amendment will have a material impact on the municipality's annual financial statements.GRAP 16 (as amended 2016): Investment PropertyAmendments to the Standard of GRAP on Investment Property resulted from editorial changes to the original text andinconsistencies in measurement requirements in GRAP 23 and other asset-related Standards of GRAP in relation tothe treatment of transaction costs. Other changes resulted from changes made to IAS 40 on Investment Property (IAS40) as a result of the IASB’s amendments on Annual Improvements to IFRSs 2011 – 2013 Cycle issued in December2013. 33

Zululand District MunicipalityAnnual Financial Statements for the year ended 30 June 2018Notes to the Annual Financial Statements2. New standards and interpretations (continued)The most significant changes to the Standard are:� General improvements: To clarify the treatment of transaction costs and other costs incurred on assets acquiredin non-exchange transactions to be in line with the principle in GRAP 23 (paragraph .12); and To clarify themeasurement principle when assets may be acquired in exchange for a non-monetary asset or assets, or acombination of monetary and non-monetary assets.� IASB amendments: To clarify the interrelationship between the Standards of GRAP on Transfer of FunctionsBetween Entities Not Under Common Control and Investment Property when classifying investment property orowner-occupied property.The effective date of the amendment is for years beginning on or after 01 April 2018.The municipality expects to adopt the amendment for the first time in the 2018 annual financial statements.It is unlikely that the amendment will have a material impact on the municipality's annual financial statements.GRAP 17 (as amended 2016): Property, Plant and EquipmentAmendments to the Standard of GRAP on Property, Plant and Equipment resulted from editorial changes to theoriginal text and inconsistencies in measurement requirements in GRAP 23 and other asset-related Standards ofGRAP in relation to the treatment of transaction costs. Other changes resulted from changes made to IPSAS 17 onProperty, Plant and Equipment (IPSAS 17) as a result of the IPSASB’s Improvements to IPSASs 2014 issued inJanuary 2015 and Improvements to IPSASs 2015 issued in March 2016.The most significant changes to the Standard are:� General improvements: To clarify the treatment of transaction costs and other costs incurred on assets acquiredin non-exchange transactions to be in line with the principle in GRAP 23 (paragraph .12); and To clarify themeasurement principle when assets may be acquired in exchange for a non-monetary asset or assets, or acombination of monetary and non-monetary assets.� IPSASB amendments: To clarify the revaluation methodology of the carrying amount and accumulateddepreciation when an item of property, plant, and equipment is revalued; To clarify acceptable methods ofdepreciating assets; To align terminology in GRAP 17 with that in IPSAS 17. The term “specialist militaryequipment” in IPSAS 17 was replaced with the term “weapon systems” and provides a description of what itcomprises in accordance with Government Finance Statistics terminology; and To define a bearer plant andinclude bearer plants within the scope of GRAP 17, while the produce growing on bearer plants will remain withinthe scope of GRAP 27.The effective date of the amendment is for years beginning on or after 01 April 2018.The municipality expects to adopt the amendment for the first time in the 2018 annual financial statements.It is unlikely that the amendment will have a material impact on the municipality's annual financial statements.GRAP 21 (as amended 2016): Impairment of non-cash-generating assetsAmendments to the Standard of GRAP on Impairment of Non-cash Generating Assets resulted from changes made toIPSAS 21 on Impairment of Non-Cash-Generating Assets (IPSAS 21) as a result of the IPSASB’s Impairment ofRevalued Assets issued in March 2016.The most significant changes to the Standard are:� IPSASB amendments: To update the Basis of conclusions and Comparison with IPSASs to reflect the IPSASB’srecent decision on the impairment of revalued assets.The effective date of the amendment is for years beginning on or after 01 April 2018.The municipality expects to adopt the amendment for the first time in the 2018 annual financial statements.It is unlikely that the amendment will have a material impact on the municipality's annual financial statements.GRAP 26 (as amended 2016): Impairment of cash-generating assets34

Zululand District MunicipalityAnnual Financial Statements for the year ended 30 June 2018Notes to the Annual Financial Statements2. New standards and interpretations (continued)Amendments Changes to the Standard of GRAP on Impairment of Cash Generating Assets resulted from changesmade to IPSAS 26 on Impairment of Cash-Generating Assets (IPSAS 26) as a result of the IPSASB’s Impairment ofRevalued Assets issued in March 2016.The most significant changes to the Standard are:� IPSASB amendments: To update the Basis of conclusions and Comparison with IPSASs to reflect the IPSASB’srecent decision on the impairment of revalued assets.The effective date of the amendment is for years beginning on or after 01 April 2018.The municipality expects to adopt the amendment for the first time in the 2018 annual financial statements.It is unlikely that the amendment will have a material impact on the municipality's annual financial statements.GRAP 27 (as amended 2016): AgricultureAmendments to the Standard of GRAP on Agriculture resulted from changes made to IPSAS 27 on Agriculture (IPSAS27) as a result of the IPSASB’s Improvements to IPSASs 2015 issued in March 2016.The most significant changes to the Standard are:� IPSASB amendments: To define a bearer plant and include bearer plants within the scope of GRAP 17, while theproduce growing on bearer plants will remain within the scope of GRAP 27. In addition to the changes made bythe IPSASB, a consequential amendment has been made to GRAP 103 on Heritage Assets. The IPSASBcurrently does not have a pronouncement on this topic.The effective date of the amendment is for years beginning on or after 01 April 2018.The municipality expects to adopt the amendment for the first time in the 2018 annual financial statements.It is unlikely that the amendment will have a material impact on the municipality's annual financial statements.GRAP 31 (as amended 2016): Intangible AssetsAmendments to the Standard of GRAP on Intangible Assets resulted from inconsistencies in measurementrequirements in GRAP 23 and other asset-related Standards of GRAP in relation to the treatment of transaction costs.Other changes resulted from changes made to IPSAS 31 on Intangible Assets (IPSAS 31) as a result of the IPSASB’sImprovements to IPSASs 2014 issued in January 2015.The most significant changes to the Standard are:� General improvements: To add the treatment of transaction costs and other costs incurred on assets acquired innon-exchange transactions to be in line with the principle in GRAP 23 (paragraph .12); and To clarify themeasurement principle when assets may be acquired in exchange for a non-monetary asset or assets, or acombination of monetary and non-monetary assets� IPSASB amendments: To clarify the revaluation methodology of the carrying amount and accumulateddepreciation when an item of intangible assets is revalued; and To clarify acceptable methods of depreciatingassetsThe effective date of the amendment is for years beginning on or after 01 April 2018.The municipality expects to adopt the amendment for the first time in the 2018 annual financial statements.It is unlikely that the amendment will have a material impact on the municipality's annual financial statements.GRAP 103 (as amended 2016): Heritage AssetsAmendments to the Standard of GRAP on Heritage Assets resulted from inconsistencies in measurementrequirements in GRAP 23 and other asset-related Standards of GRAP in relation to the treatment of transaction costs.Other changes resulted from editorial changes to the original text.The most significant changes to the Standard are: 35

Zululand District MunicipalityAnnual Financial Statements for the year ended 30 June 2018Notes to the Annual Financial Statements2. New standards and interpretations (continued)� General improvements: To clarify the treatment of transaction costs and other costs incurred on assets acquiredin non-exchange transactions to be in line with the principle in GRAP 23 (paragraph .12); and To clarify themeasurement principle when assets may be acquired in exchange for a non-monetary asset or assets, or acombination of monetary and non-monetary assetsThe effective date of the amendment is for years beginning on or after 01 April 2018.The municipality expects to adopt the amendment for the first time in the 2018 annual financial statements.It is unlikely that the amendment will have a material impact on the municipality's annual financial statements.
36

Zululand District MunicipalityAnnual Financial Statements for the year ended 30 June 2018Notes to the Annual Financial Statements 2018 2017R R3. Cash and cash equivalentsCash and cash equivalents consist of:Cash on hand 6 000 6 000Cash at bank 13 195 448 7 430 35613 201 448 7 436 356The municipality had the following bank accounts`Account number /description Bank statement balances Cash book balances30 June 2018 30 June 2017 30 June 2016 30 June 2018 30 June 2017 30 June 2016ABSA BANK - Primarybank account -4047162045 15 248 171 7 430 356 - 13 195 448 7 430 356 (33 437 872)
4. Trade receivable from exchange transactionGross balancesWater 69 986 812 62 421 420Waste water 24 646 579 18 311 204Other 112 089 173 22294 745 480 80 905 846Less: Allowance for impairmentWater (59 508 508) (50 842 279)Waste water (21 383 014) (17 863 504)(80 891 522) (68 705 783)Net balanceWater 12 725 695 11 579 141Waste water 986 931 447 700Other 112 089 173 22213 824 715 12 200 063WaterCurrent (0 -30 days) 13 901 293 2 829 17931 - 60 days 1 277 748 946 46861 - 90 days 1 063 191 822 85091 - 120 days 1 224 413 843 447121 - 365 days 7 493 256 6 542 062> 365 days 47 274 302 50 437 415Less: Impairment (59 508 508) (50 842 280)12 725 695 11 579 141
37
Zululand District MunicipalityAnnual Financial Statements for the year ended 30 June 2018Notes to the Annual Financial Statements 2018 2017R R4. Trade receivable from exchange transaction (continued)Waste waterCurrent (0 -30 days) 1 844 806 971 94031 - 60 days 143 802 308 91861 - 90 days 440 183 291 50591 - 120 days 1 486 769 314 301121 - 365 days 2 644 420 2 203 842> 365 days 15 809 965 14 220 698Less: Impairment (21 383 014) (17 863 504)986 931 447 700Other (specify)Current (0 -30 days) 16 862 13 55431 - 60 days 8 770 6 65961 - 90 days 8 079 6 63791 - 120 days 7 913 6 530121 - 365 days 82 513 45 965> 365 days 151 517 93 877Less: Impairment (163 565) -112 089 173 222Summary of debtors by customer classificationConsumersCurrent (0 -30 days) 2 970 056 2 864 17231 - 60 days 842 060 812 04061 - 90 days 1 089 417 1 050 57991 - 120 days 1 144 243 1 103 451121 - 365 days 8 471 568 8 169 553> 365 days 56 758 699 54 735 23171 276 043 68 735 026Less: Allowance for impairment (80 891 522) (59 988 020)(9 615 479) 8 747 006Industrial/ commercialCurrent (0 -30 days) 528 443 148 24531 - 60 days 149 633 41 97761 - 90 days 86 617 24 29991 - 120 days 64 382 18 061121 - 365 days 404 934 113 597> 365 days 1 095 893 307 4332 329 902 653 612National and provincial governmentCurrent (0 -30 days) 264 110 407 76931 - 60 days 438 627 78 98561 - 90 days 335 419 60 40091 - 120 days 427 340 76 953121 - 365 days 1 343 687 241 962> 365 days 1 000 176 1 933 3763 809 359 2 799 44538

Zululand District MunicipalityAnnual Financial Statements for the year ended 30 June 2018Notes to the Annual Financial Statements 2018 2017R R4. Trade receivable from exchange transaction (continued)TotalCurrent (0 -30 days) 5 762 961 3 420 18731 - 60 days 1 430 320 933 00261 - 90 days 1 511 452 1 135 27791 - 120 days 1 635 965 1 198 464121 - 365 days 10 220 189 8 525 112> 365 days 74 155 351 65 693 80494 716 238 80 905 846Less: Allowance for impairment (80 891 523) (68 705 783)13 824 715 12 200 063Less: Allowance for impairmentCurrent (0 -30 days) (2 970 056) (2 864 172)31 - 60 days (864 060) (812 040)61 - 90 days (1 067 417) (1 050 579)91 - 120 days (1 144 243) (1 103 451)121 - 365 days (8 471 568) (8 169 553)> 365 days (66 403 421) (54 705 988)(80 891 522) (68 705 783)Reconciliation of allowance for impairmentBalance at beginning of the year (68 705 783) (60 000 370)Contributions to allowance (12 185 740) (8 705 413)(80 891 522) (68 705 783)Debt imparment is only calculated on service debtors for exchange transactionsConsumer debtors pledged as securityConsumer deposits as reflected under note 14 are held as security for consumer debtors.5. Other receivables from exchange transactionsTrade debtors 12 438 779 11 565 007Debtor: D Khali - 89 500Debtor: Clyde - 15 000Debtor: Booysen & Co Inc - 475Debtors: Aqua Transport and Plants 1 161 352 -Debtor: B Sangweni - 12 500Debtor: N Moodley - 40 000Debtor: Tracker 134 248 134 248Debtor: KZN Aviation 1 950 1 950Debtor: P Biyela - 73 000Debtor: World Focus 284 241 12 500Debtors interest on investments - 34 348Debtor: Avis 3 487 3 487Debtor: Waphatha Group Pty Ltd - 37 157Other debtors 10 435 -14 034 492 12 019 172Non-current assets 12 438 779 11 565 007Current assets 1 595 713 454 16514 034 492 12 019 17239

Zululand District MunicipalityAnnual Financial Statements for the year ended 30 June 2018Notes to the Annual Financial Statements 2018 2017R R5. Other receivables from exchange transactions (continued)No security is held against any financial assets under the receivables from other exchange transactions.6. Receivables from non-exchange transactionsDebtor: JB Dlamini 18 440 18 440Debtor: DGM Event Management - 13 300Debtor: Insurance Claim 80 488 80 488Debtor: Ulundi Municipality - 503 854Debtor: Dumbe Municipality 369 621 369 621Debtor: Abaqulusi Municipality - 519 266Debtor: Nongoma Municipality 304 255 304 255Debtor: Water Affairs 2 717 840 2 717 840Other 560 584 90 275Debtor: Enduneni contractors 855 190 -Debtor: Amanzi ichweba 1 358 368 -6 264 786 4 617 339There are no receivables from non exchange transactions that are subject to restrictions.No security is held against any financial assets under the receivables from non exchange transactions.7. Other receivables from non-exchange transactionsPrepayments 1 790 512 866 762Overpayments on Eskom Accounts as at 30 June 20188. VAT receivableVAT 20 029 280 18 812 187The amount represent the invoices paid towards year end creditors The minicipality is on the payment basis
40
Zululand District MunicipalityAnnual Financial Statements for the year ended 30 June 2018Notes to the Annual Financial Statements 2018 2017R R9. InventoriesConsumable stores 3 063 892 4 585 530Fuel (Diesel, Petrol) 68 392 68 3923 132 284 4 653 922Consumable storesAt cost 317 867 465 071Additions 4 099 540 620 975Issued/(expensed) (1 353 515) (768 179)3 063 892 317 867FuelAt cost 104 097 173 019Additions - 48 378Issued/(expensed) (35 705) (117 300)68 392 104 097Inventory pledged as securityThere was no inventory pledged for as security for any ovedraft facility.
41
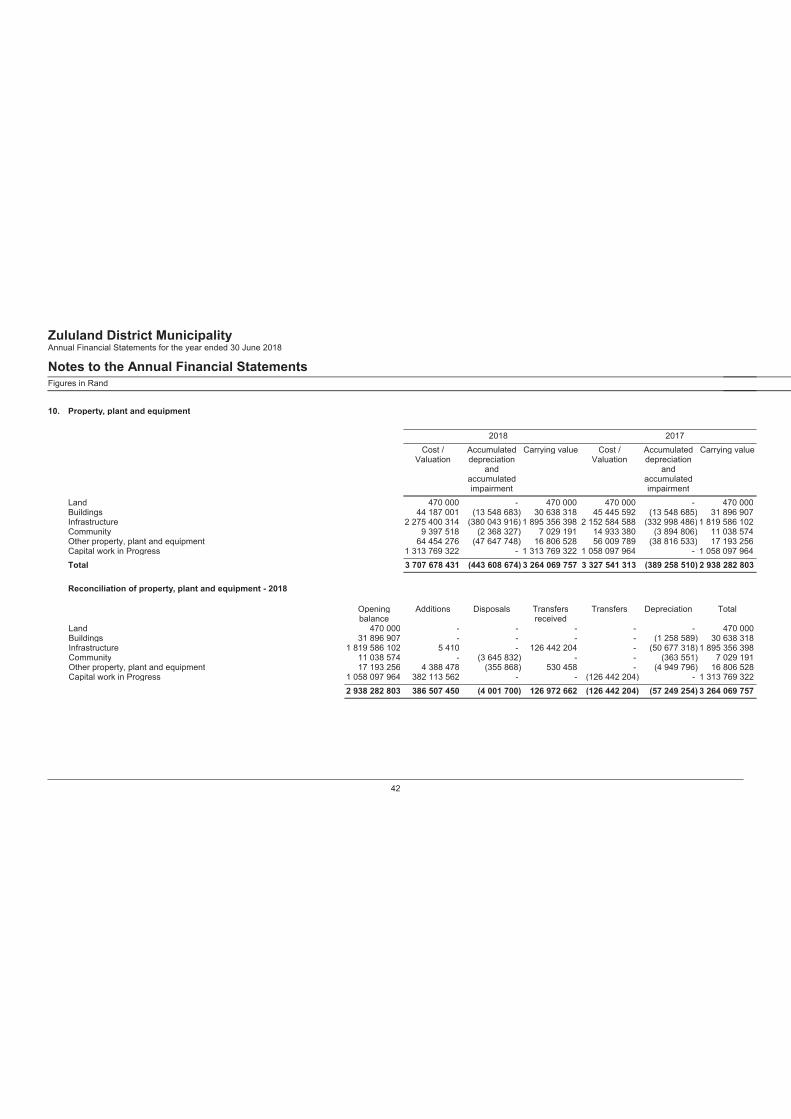
Zululand District MunicipalityAnnual Financial Statements for the year ended 30 June 2018Notes to the Annual Financial StatementsFigures in Rand10. Property, plant and equipment 2018 2017Cost /Valuation AccumulateddepreciationandaccumulatedimpairmentCarrying value Cost /Valuation Accumulateddepreciationandaccumulatedimpairment
Carrying valueLand 470 000 - 470 000 470 000 - 470 000Buildings 44 187 001 (13 548 683) 30 638 318 45 445 592 (13 548 685) 31 896 907Infrastructure 2 275 400 314 (380 043 916) 1 895 356 398 2 152 584 588 (332 998 486) 1 819 586 102Community 9 397 518 (2 368 327) 7 029 191 14 933 380 (3 894 806) 11 038 574Other property, plant and equipment 64 454 276 (47 647 748) 16 806 528 56 009 789 (38 816 533) 17 193 256Capital work in Progress 1 313 769 322 - 1 313 769 322 1 058 097 964 - 1 058 097 964Total 3 707 678 431 (443 608 674) 3 264 069 757 3 327 541 313 (389 258 510) 2 938 282 803Reconciliation of property, plant and equipment - 2018 Openingbalance Additions Disposals Transfersreceived Transfers Depreciation TotalLand 470 000 - - - - - 470 000Buildings 31 896 907 - - - - (1 258 589) 30 638 318Infrastructure 1 819 586 102 5 410 - 126 442 204 - (50 677 318) 1 895 356 398Community 11 038 574 - (3 645 832) - - (363 551) 7 029 191Other property, plant and equipment 17 193 256 4 388 478 (355 868) 530 458 - (4 949 796) 16 806 528Capital work in Progress 1 058 097 964 382 113 562 - - (126 442 204) - 1 313 769 3222 938 282 803 386 507 450 (4 001 700) 126 972 662 (126 442 204) (57 249 254) 3 264 069 757
42

Zululand District MunicipalityAnnual Financial Statements for the year ended 30 June 2018Notes to the Annual Financial StatementsFigures in Rand10. Property, plant and equipment (continued)Reconciliation of property, plant and equipment - 2017 Openingbalance Additions Disposals Transfers Depreciation TotalLand 470 000 - - - - 470 000Buildings 33 170 894 - - - (1 273 987) 31 896 907Infrastructure 1 611 857 122 - 2 920 764 253 191 802 (48 383 586) 1 819 586 102Community 12 009 600 - - - (971 026) 11 038 574Other property, plant and equipment 21 438 388 3 349 241 (719 157) - (6 875 216) 17 193 256Capital work in Progress 898 543 555 412 746 211 - (253 191 802) - 1 058 097 9642 577 489 559 416 095 452 2 201 607 - (57 503 815) 2 938 282 803Pledged as securityCarrying value of assets pledged as security:No security is held against any financial assets under the property, plant and equipment.Reconciliation of Work-in-Progress 2018 Included withinInfrastructure TotalOpening balance 1 058 097 964 1 058 097 964Additions/capital expenditure 382 113 562 382 113 562Transferred to completed items (126 442 204) (126 442 204)1 313 769 322 1 313 769 322
43

Zululand District MunicipalityAnnual Financial Statements for the year ended 30 June 2018Notes to the Annual Financial Statements 2018 2017R R10. Property, plant and equipment (continued)Reconciliation of Work-in-Progress 2017 Included withinInfrastructure TotalOpening balance 898 543 555 898 543 555Additions/capital expenditure 412 746 211 412 746 211Transferred to completed items (253 191 802) (253 191 802)1 058 097 964 1 058 097 964A register containing the information required by section 63 of the Municipal Finance Management Act is available forinspection at the registered office of the municipality.11. Heritage assets 2018 2017Cost /Valuation Accumulatedimpairmentlosses Carrying value Cost /Valuation Accumulatedimpairmentlosses Carrying valueWork in Progress 1 212 635 - 1 212 635 1 212 636 - 1 212 636Reconciliation of heritage assets 2018 Openingbalance TotalWork in Progress 1 212 635 1 212 635Reconciliation of heritage assets 2017 Openingbalance Additions TotalWork in Progress 1 151 452 61 184 1 212 636Heritage assets which fair values cannot be reliably measuredThe Heritage Asset represents the Zulu King's Stature. The heritage asset is not yet erected subject to confirmation of thelocation site. The heritage asset is measured at cost.Heritage assets used for more than one purposeThe following heritage assets are used by the entity for more than one purpose: Heritage assets in the process of being constructed or developedCarrying value of Heritage assets where construction or developmenthas been halted either during the current or previous reportingperiod(s)Project 1 or Class 1 or Asset 1 1 212 635 1 212 635The delay to finish this construction is the identification of the site to erectthe statueNo impairement is recognised. 1 212 635 1 212 63544
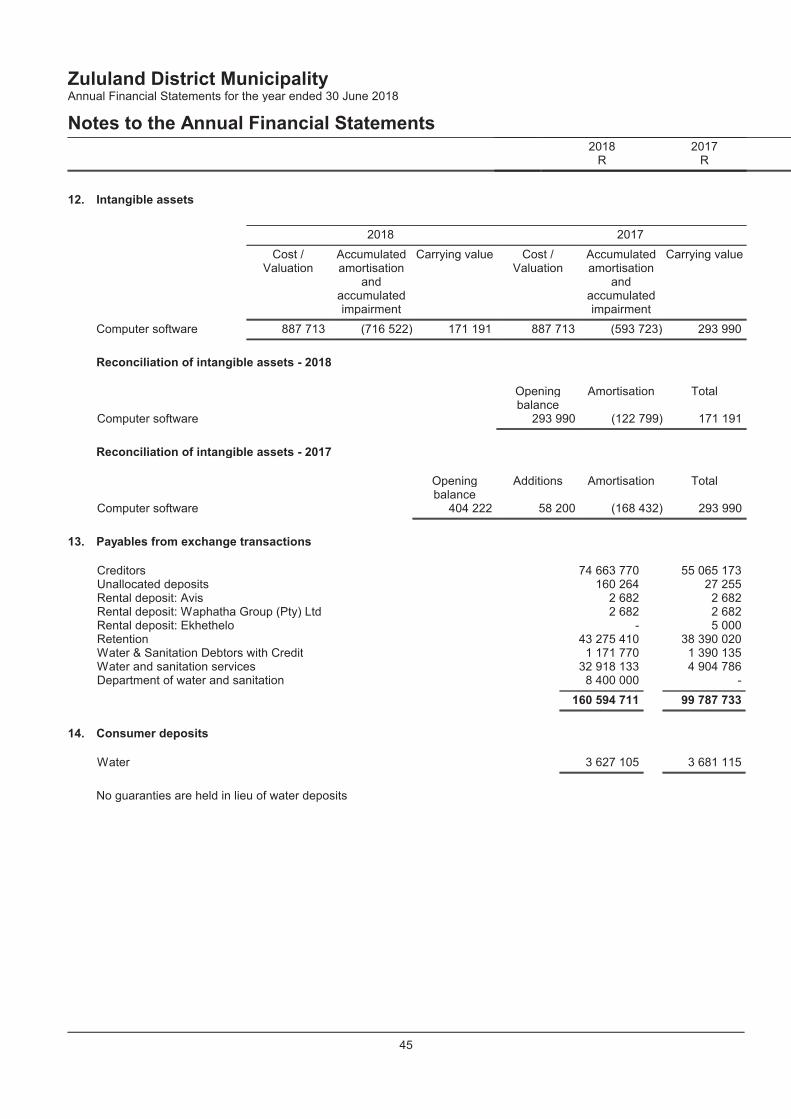
Zululand District MunicipalityAnnual Financial Statements for the year ended 30 June 2018Notes to the Annual Financial Statements 2018 2017R R12. Intangible assets 2018 2017Cost /Valuation AccumulatedamortisationandaccumulatedimpairmentCarrying value Cost /Valuation Accumulatedamortisationandaccumulatedimpairment
Carrying valueComputer software 887 713 (716 522) 171 191 887 713 (593 723) 293 990Reconciliation of intangible assets - 2018 Openingbalance Amortisation TotalComputer software 293 990 (122 799) 171 191Reconciliation of intangible assets - 2017 Openingbalance Additions Amortisation TotalComputer software 404 222 58 200 (168 432) 293 99013. Payables from exchange transactionsCreditors 74 663 770 55 065 173Unallocated deposits 160 264 27 255Rental deposit: Avis 2 682 2 682Rental deposit: Waphatha Group (Pty) Ltd 2 682 2 682Rental deposit: Ekhethelo - 5 000Retention 43 275 410 38 390 020Water & Sanitation Debtors with Credit 1 171 770 1 390 135Water and sanitation services 32 918 133 4 904 786Department of water and sanitation 8 400 000 -160 594 711 99 787 73314. Consumer depositsWater 3 627 105 3 681 115No guaranties are held in lieu of water deposits
45

Zululand District MunicipalityAnnual Financial Statements for the year ended 30 June 2018Notes to the Annual Financial Statements 2018 2017R R15. ProvisionsReconciliation of provisions - 2018 OpeningBalance Additions Utilised duringthe year Reversedduring the year TotalProvision for Leave Payout 7 603 898 4 276 470 (3 619 939) - 8 260 429Bonus 6 604 246 - - (3 064 599) 3 539 647Provision for Raw Water 12 954 290 - - (12 954 290) -27 162 434 4 276 470 (3 619 939) (16 018 889) 11 800 076Reconciliation of provisions - 2017 OpeningBalance TotalProvision for Leave Payout 7 603 898 7 603 898Bonus 6 604 246 6 604 246Provision for Raw Water 12 954 290 12 954 29027 162 434 27 162 434It is uncertain that the timing of the outflow will happen during the next 12 months period. The major assumption wasmade that all employees would have been used all their leave days within the next 12 months period and their bonusesbe paid within the period as well.16. Payable from - non-exchangeCreditors Deceased Staff (EP Zulu) 13 671 735Creditors (LB Shange) 80 488 80 488Standby allowance - 73 47494 159 154 69717. Payables from exchange transactionsDepartment of water and sanitation 42 912 708 -18. Unspent conditional grantsUnspent conditional grants and receipts comprises of:KZN Environmental grant 552 951 1 500 000The nature and extent of government grants recognised in the annual financial statements is an indication of other formsof government assistance from which the municipality has directly benefited.These amounts are invested in a ring-fenced investment until utilised.19. Rental deposits heldRental deposits held 2 420 2 420Rental for office space, refundable upon termination of contract20. Employee benefit obligations20.1 Post retirement medical benefit plan 46

Zululand District MunicipalityAnnual Financial Statements for the year ended 30 June 2018Notes to the Annual Financial Statements 2018 2017R R20. Employee benefit obligations (continued)The municipality provides certain post-retirement health care benefits by funding the medical aid contributions ofqualifying retired members of the municipality. According to the rules of the Medical Aid Funds, with which themunicipality is associated, a member (who is on the current Conditions of Service) is entitled to remain a continuedmember of such medical aid fund on retirement, in which case the municipality is liable for a certain portion of the medicalaid membership fee. The municipality operates an unfunded defined benefit plan for these qualifying employees. Noother post-retirement benefits are provided to these employees.The municipality operated on five accredited medical aid schemes, namely Keyhealth, LA Health, SAMWU, Bonitas andHosmed.The most recent actuarial valuations of plan assets and the present value of the defined benefit obligation were carriedout at 30 June 2018 by Independent Actuaries & Consultants. The present value of the defined benefit obligation, andthe related current service cost and past service cost were measured using the Projected Unit Credit Method.20.2 Multi-employer pension fundsThe municipality makes provision for post-retirement benefits to eligible councillors and employees, who belong todifferent pension schemes.All councillors belong to the pension fund for municipal councilors.Employees belong to a variety of approved pension and provident funds.These funds are governed by the Pension Funds Act and include both defined benefit and defined contribution schemes.All of these funds are multi-employer plans and are subject to either a tri-annual, bi-annual or annual actuarial valuation.Sufficient information is not available to use defined benefit accounting for the pension and retirement funds, due to thefollowing reasons:(i) The assets of each fund are held in one portfolio and are not notionally allocated to each of the participating employers.(ii) One set of financial statements are compiled for each fund and financial statements are not drafted for eachparticipating employer.(iii) The same rate of contribution applies to all participating employers and no regard is paid to differences in themembership distribution of the participating employers.It is therefore seen that each fund operates as asingle entity and is not divided in sub-funds for each participatingemployer.The only obligation of the municipality with respect to the retirement benefit plans is to make the specified contributions.Where councilors / employees leave the plans prior to full vesting of the contributions, the contributions payable by themunicipality are reduced by the amount of forfeited contributions.The total expense recognised in the Statement of Financial Performance represents contributions payable to these plansby the municipality at rates specified in the rules of the plans. These contributions have been exxpensed.The amounts recognised in the statement of financial position are as follows:Carrying valuePresent value of the defined benefit obligation-partly or wholly funded (32 512 000) (28 903 000)Changes in the present value of the defined benefit obligation are as follows:Opening balance 19 779 000 19 560 000Net expense recognised in the statement of financial performance 3 249 000 219 00023 028 000 19 779 00047

Zululand District MunicipalityAnnual Financial Statements for the year ended 30 June 2018Notes to the Annual Financial Statements 2018 2017R R20. Employee benefit obligations (continued)Net expense recognised in the statement of financial performanceCurrent service cost 2 088 000 1 994 000Interest cost 2 115 000 2 361 000Actuarial (gains) losses (899 000) (4 085 680)Benefits payment (55 000) (50 320)3 249 000 219 000Key assumptions usedFinancial variables: Two most important variables used in our valuation are discount rate and medical aid inflation rate.Nominal and real zero curve as at 29 June 2018 that was supplied by JSE to determine discount rate and CPIassumptions at each relevant time period. The average retirement age for all employees was assumed to be 63 yearshence this assumption allows for ill-health and early retirements. Normal retirement age for all active employees wasassumed to be 65 years. Mortality rate before retirement was based on SA 85-90 mortality tables whilst mortality post-employment (for pensioners) was based on PA (90) ultimate mortality tables. The assumption was made that the marritalstatus for married members will remain the same until retirement and 90% of all single employees will be married atretirement with no dependent children. The female spouses were assumed to be five (5) years younger than their malespouses.Average retirement age 63 63Discount rates used %9.74 %9.74Medical cost trend rates %8.76 %8.76%7.26 %7.26%0.90 %0.90Mortality tables SA 85-90 SA 85-90Ultimate mortality table PA 90-1 PA 90-1Percentage of in-service members withdrawing before retirementAge 20 %16.0 %16.0Age 30 %10.0 %10.0Age 40 %6.0 %6.0Age 50 %2.0 %2.0Age 55+ %- %-It is difficult to predict future investment returns and health care cost inflation rates. The relationship between them ismore stable and therefore easier to predict. GRAP 25 requires that financial assumptions be based on marketexpectations at the Valuation Date for the period over which the liability obligations are to be settled.Discount Rate: GRAP 25 stipulates that the choice of this rate should be derived from government bond yields. However,where the market in these bonds is not significant, the market yields on government bonds consistent with the estimatedterm of the post-employment liabilities should be used. The discount rate at 30 June 2018 is 8.76% which represents theaverage yield from zero coupon government bond curve overa 15 to 20 year termSalary Inflation Rate: This assumption is required to reflect the estimated growth in salaries of the eligible employeesuntil retirement.General Salary Inflation: This assumption is more stable relative to the growth in consumer Price Index (CPI) than in theabsolute terms. In most industries, experience has shown, that over the long-term, salary inflation is between 1.0% and1.5% above CPI inflation.The implied inflation assumption is 7.26% per annum which represents the market's pricing of inflation by comparing theyields on index linked government bonds and long term government bonds with a duration of 15 to 20 years, adjusting foran inflation risk premium of 0.5% per annum.It has been assumed that the next salary increase will take place on 1 July 201848
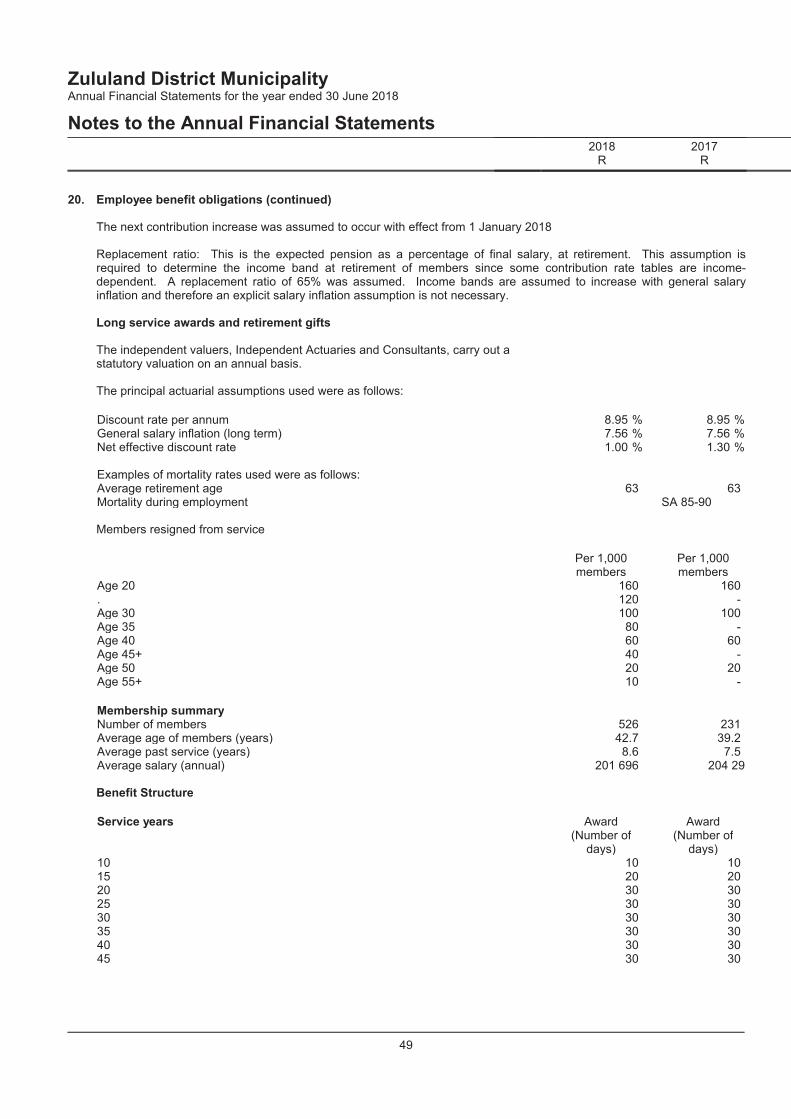
Zululand District MunicipalityAnnual Financial Statements for the year ended 30 June 2018Notes to the Annual Financial Statements 2018 2017R R20. Employee benefit obligations (continued)The next contribution increase was assumed to occur with effect from 1 January 2018Replacement ratio: This is the expected pension as a percentage of final salary, at retirement. This assumption isrequired to determine the income band at retirement of members since some contribution rate tables are income-dependent. A replacement ratio of 65% was assumed. Income bands are assumed to increase with general salaryinflation and therefore an explicit salary inflation assumption is not necessary.Long service awards and retirement giftsThe independent valuers, Independent Actuaries and Consultants, carry out astatutory valuation on an annual basis.The principal actuarial assumptions used were as follows:Discount rate per annum %8.95 %8.95General salary inflation (long term) %7.56 %7.56Net effective discount rate %1.00 %1.30Examples of mortality rates used were as follows:Average retirement age 63 63Mortality during employment SA 85-90Members resigned from service Per 1,000members Per 1,000membersAge 20 160 160. 120 -Age 30 100 100Age 35 80 -Age 40 60 60Age 45+ 40 -Age 50 20 20Age 55+ 10 -Membership summaryNumber of members 526 231Average age of members (years) 42.7 39.2Average past service (years) 8.6 7.5Average salary (annual) 201 696 204 290Benefit StructureService years Award(Number ofdays) Award(Number ofdays)10 10 1015 20 2020 30 3025 30 3030 30 3035 30 3040 30 3045 30 3049
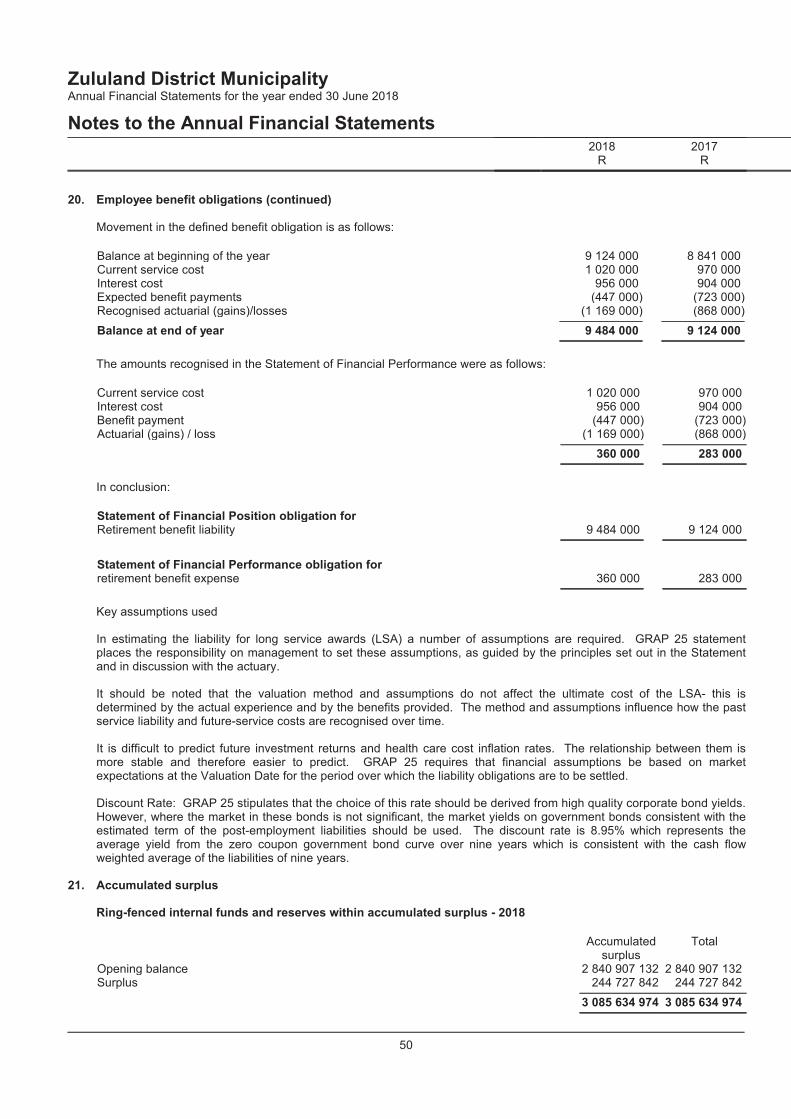
Zululand District MunicipalityAnnual Financial Statements for the year ended 30 June 2018Notes to the Annual Financial Statements 2018 2017R R20. Employee benefit obligations (continued)Movement in the defined benefit obligation is as follows:Balance at beginning of the year 9 124 000 8 841 000Current service cost 1 020 000 970 000Interest cost 956 000 904 000Expected benefit payments (447 000) (723 000)Recognised actuarial (gains)/losses (1 169 000) (868 000)Balance at end of year 9 484 000 9 124 000The amounts recognised in the Statement of Financial Performance were as follows: Current service cost 1 020 000 970 000Interest cost 956 000 904 000Benefit payment (447 000) (723 000)Actuarial (gains) / loss (1 169 000) (868 000)360 000 283 000In conclusion:Statement of Financial Position obligation forRetirement benefit liability 9 484 000 9 124 000Statement of Financial Performance obligation forretirement benefit expense 360 000 283 000Key assumptions usedIn estimating the liability for long service awards (LSA) a number of assumptions are required. GRAP 25 statementplaces the responsibility on management to set these assumptions, as guided by the principles set out in the Statementand in discussion with the actuary.It should be noted that the valuation method and assumptions do not affect the ultimate cost of the LSA- this isdetermined by the actual experience and by the benefits provided. The method and assumptions influence how the pastservice liability and future-service costs are recognised over time.It is difficult to predict future investment returns and health care cost inflation rates. The relationship between them ismore stable and therefore easier to predict. GRAP 25 requires that financial assumptions be based on marketexpectations at the Valuation Date for the period over which the liability obligations are to be settled.Discount Rate: GRAP 25 stipulates that the choice of this rate should be derived from high quality corporate bond yields.However, where the market in these bonds is not significant, the market yields on government bonds consistent with theestimated term of the post-employment liabilities should be used. The discount rate is 8.95% which represents theaverage yield from the zero coupon government bond curve over nine years which is consistent with the cash flowweighted average of the liabilities of nine years.21. Accumulated surplusRing-fenced internal funds and reserves within accumulated surplus - 2018 Accumulatedsurplus TotalOpening balance 2 840 907 132 2 840 907 132Surplus 244 727 842 244 727 8423 085 634 974 3 085 634 97450

Zululand District MunicipalityAnnual Financial Statements for the year ended 30 June 2018Notes to the Annual Financial Statements 2018 2017R R22. Service chargesSale of water 18 558 001 13 281 786Sewerage and sanitation charges 8 590 110 7 053 57627 148 111 20 335 36223. Rental of facilities and equipmentFacilities and equipmentRental of facilities 144 952 134 862Premises - -Garages and parking - -Facilities and equipment 144 952 134 862Included in the above rentals are operating lease rental of equipment at a straight line.24. Other incomeMarathon entry fee 86 476 76 744Connections fee - Water 67 012 112 526Connections fee - Sewerage 10 132 8 894Sundry income - 9 867Sale of Aviation fuel - 48 438Night Shift Allowance - 34 348Skills Levy Refunds 311 287 289 849Non-refundable tender deposit 1 331 176 303 069Revenue from flight tickets - 426 588Discount received - 24 610Clearance certification 2 478 -Handling fees 21 542 -Deposit 23 241 -Bad debt recovered - 2141 853 344 1 335 14725. Investment revenueInterest revenueBank 9 472 244 6 095 079- -9 472 244 6 095 079The amount included in Investment revenue arising from non-exchange transactions amounted to R 8 991 110.26. Interest, dividends and Rent on LandInterest - Receivables 94 501 -
51

Zululand District MunicipalityAnnual Financial Statements for the year ended 30 June 2018Notes to the Annual Financial Statements 2018 2017R R27. Government grants and subsidiesOperating grantsEquitable share 382 571 000 347 834 000Expanded Public Works Program 5 760 000 3 624 000INDONSA 1 911 000 1 911 000Financial Management Grant 1 250 000 1 250 000Roads Assets Management System - 2 229 000Government grant (operating) 5 947 049 -392 439 049 356 848 000Capital grantsRural Bulk Infrastructure Grant 130 000 000 168 542 391Municipal Infrastructure Grant 229 725 000 228 314 000Water Infrastructure Grant 107 746 000 109 071 000Road Asset Management Grant 2 659 000 -470 130 000 505 927 391392 439 049 356 848 000470 130 000 505 927 391862 569 049 862 775 391Equitable ShareBalance unspent at the beginningCurrent year receipts 382 571 000 347 834 000Conditions met - transferred to revenue (382 571 000) (347 834 000)- -In terms of the Constitution, this grant is used to subsidise the provision of basic services to indigent communitymembers.KZN Environmental grantBalance unspent at beginning of year 1 500 000 1 500 000Conditions met - transferred to revenue (947 049) -552 951 1 500 000INDONSACurrent-year receipts 1 911 000 1 911 000Conditions met - transferred to revenue (1 911 000) (1 911 000)- -Expanded Public Works ProgramCurrent-year receipts 5 760 000 3 624 000Conditions met - transferred to revenue (5 760 000) (3 624 000)- -52
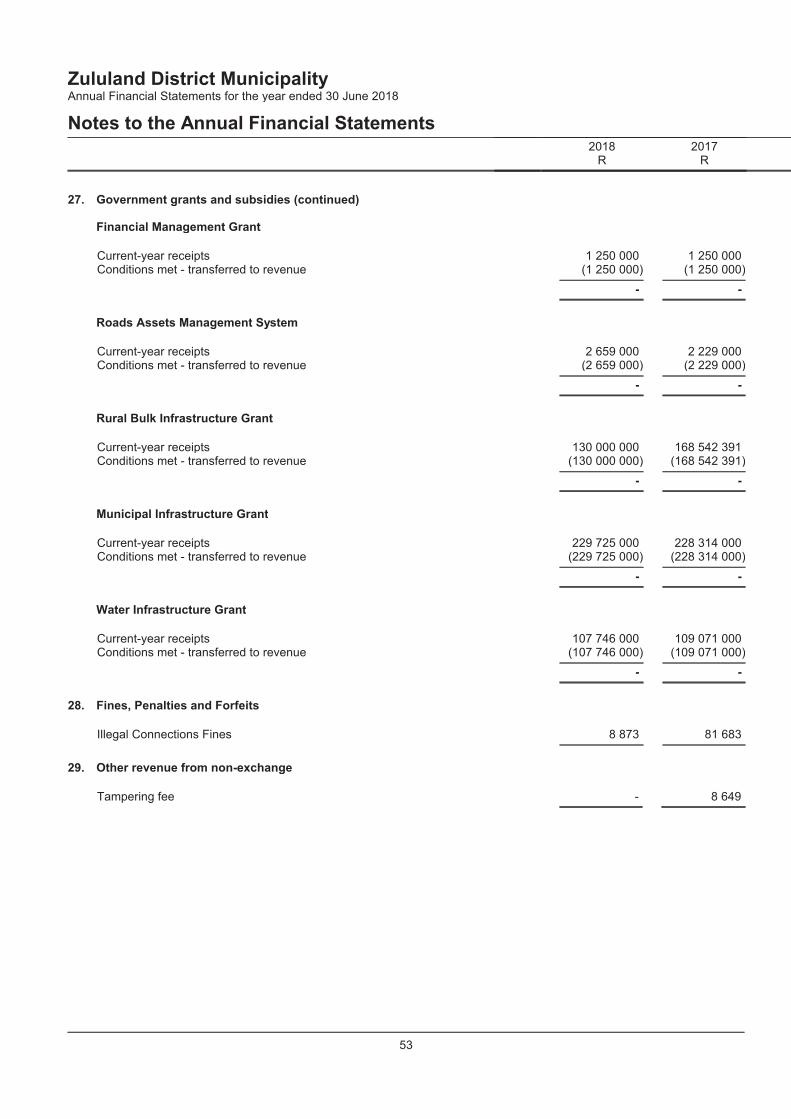
Zululand District MunicipalityAnnual Financial Statements for the year ended 30 June 2018Notes to the Annual Financial Statements 2018 2017R R27. Government grants and subsidies (continued)Financial Management GrantCurrent-year receipts 1 250 000 1 250 000Conditions met - transferred to revenue (1 250 000) (1 250 000)- -Roads Assets Management SystemCurrent-year receipts 2 659 000 2 229 000Conditions met - transferred to revenue (2 659 000) (2 229 000)- -Rural Bulk Infrastructure GrantCurrent-year receipts 130 000 000 168 542 391Conditions met - transferred to revenue (130 000 000) (168 542 391)- -Municipal Infrastructure GrantCurrent-year receipts 229 725 000 228 314 000Conditions met - transferred to revenue (229 725 000) (228 314 000)- -Water Infrastructure GrantCurrent-year receipts 107 746 000 109 071 000Conditions met - transferred to revenue (107 746 000) (109 071 000)- -28. Fines, Penalties and ForfeitsIllegal Connections Fines 8 873 81 68329. Other revenue from non-exchangeTampering fee - 8 649
53

Zululand District MunicipalityAnnual Financial Statements for the year ended 30 June 2018Notes to the Annual Financial Statements 2018 2017R R30. Employee related costsBasic 113 622 971 100 585 477Bonus 4 776 808 11 844 787Medical aid - company contributions 10 014 776 9 417 308UIF 1 016 399 955 946Stand by allowance 1 573 293 1 323 918Leave pay provision charge 4 276 470 4 436 655Industrial bargaining council levy 88 557 73 766Defined contribution plans 14 756 224 13 655 129Travel, motor car, accommodation, subsistence and other allowances 6 795 990 7 261 249Overtime payments 9 924 415 9 215 952Long-service awards 1 499 096 -Acting allowances 888 951 -Housing benefits and allowances 1 053 780 1 035 068Telephone allowance 462 400 519 073Non-pensionable allowance - 1 011 613170 750 130 161 335 941Remuneration of municipal managerAnnual Remuneration 1 089 368 894 020Car Allowance 333 735 573 011Performance Bonuses - 171 060Contributions to UIF, Medical and Pension Funds 37 317 47 4071 460 420 1 685 498Remuneration of chief finance officerAnnual Remuneration 618 657 573 212Car Allowance 187 383 380 127Performance Bonuses - 120 006Contributions to UIF, Medical and Pension Funds 1 189 45 118807 229 1 118 463Employee costs - Director of PlanningAnnual Remuneration 819 749 779 945Car Allowance 250 419 457 528Performance Bonuses - 120 006Contributions to UIF, Medical and Pension Funds 20 094 92 0101 090 262 1 449 489Employee costs - Director of Technical ServiceAnnual Remuneration 696 146 579 245Car Allowance 209 545 301 230Performance Bonuses - 120 006Contributions to UIF, Medical and Pension Funds 1 337 39 125907 028 1 039 606Employee costs - Director of Corporate servicesAnnual Remuneration 847 696 779 945Car Allowance 213 310 579 06254

Zululand District MunicipalityAnnual Financial Statements for the year ended 30 June 2018Notes to the Annual Financial Statements 2018 2017R R30. Employee related costs (continued)Performance Bonuses - 120 006Contributions to UIF, Medical and Pension Funds 34 157 108 3821 095 163 1 587 395Employee costs - Director of Community servicesAnnual Remuneration 801 001 330 000Car Allowance 250 861 1 005 868Performance Bonuses - 120 006Contributions to UIF, Medical and Pension Funds 47 655 51 9471 099 517 1 507 821The reasons for the major decrease on expenditure as compared to prior year is based on fact that the positions fordictors were vacant for the big part of the financial year. Total employee related costs 177 209 749 169 724 21331. Remuneration of councillorsMayor 850 098 787 061Deputy Mayor 443 051 392 411Executive Committee Members 2 561 296 2 361 184Speaker 725 919 629 647Councillors 3 039 972 2 390 073Councilors’ pension contribution 94 871 264 3227 715 207 6 824 698In-kind benefitsThe Speaker, the Mayor, the Deputy Mayor the and Executive Committee Members are full-time.The Speaker, Mayor and the Deputy Mayor each have the use of separate Council owned vehicles for official duties.The Speaker, Mayor and Deputy Mayor are provided with bodyguards. The Councillors are provided with body guards where request has been approvedl.32. Depreciation and amortisationProperty, plant and equipment 57 218 153 57 503 816Intangible assets 153 901 168 43257 372 054 57 672 24833. Lease rentals on operating leasePremisesContractual amounts 130 987 223 686Motor vehiclesContractual amounts 217 497 1 006 146EquipmentContractual amounts 980 580 900 1721 329 064 2 130 00455
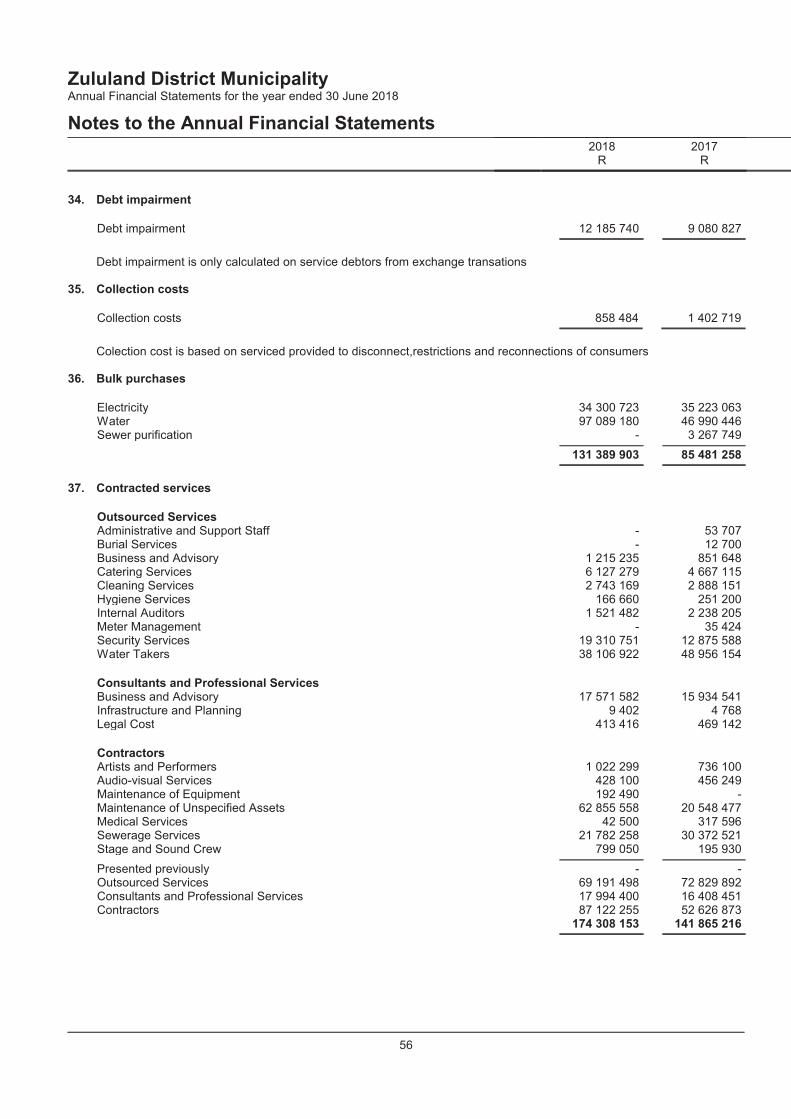
Zululand District MunicipalityAnnual Financial Statements for the year ended 30 June 2018Notes to the Annual Financial Statements 2018 2017R R34. Debt impairmentDebt impairment 12 185 740 9 080 827Debt impairment is only calculated on service debtors from exchange transations35. Collection costsCollection costs 858 484 1 402 719Colection cost is based on serviced provided to disconnect,restrictions and reconnections of consumers36. Bulk purchasesElectricity 34 300 723 35 223 063Water 97 089 180 46 990 446Sewer purification - 3 267 749131 389 903 85 481 25837. Contracted servicesOutsourced ServicesAdministrative and Support Staff - 53 707Burial Services - 12 700Business and Advisory 1 215 235 851 648Catering Services 6 127 279 4 667 115Cleaning Services 2 743 169 2 888 151Hygiene Services 166 660 251 200Internal Auditors 1 521 482 2 238 205Meter Management - 35 424Security Services 19 310 751 12 875 588Water Takers 38 106 922 48 956 154Consultants and Professional ServicesBusiness and Advisory 17 571 582 15 934 541Infrastructure and Planning 9 402 4 768Legal Cost 413 416 469 142ContractorsArtists and Performers 1 022 299 736 100Audio-visual Services 428 100 456 249Maintenance of Equipment 192 490 -Maintenance of Unspecified Assets 62 855 558 20 548 477Medical Services 42 500 317 596Sewerage Services 21 782 258 30 372 521Stage and Sound Crew 799 050 195 930Presented previously - -Outsourced Services 69 191 498 72 829 892Consultants and Professional Services 17 994 400 16 408 451Contractors 87 122 255 52 626 873174 308 153 141 865 21656

Zululand District MunicipalityAnnual Financial Statements for the year ended 30 June 2018Notes to the Annual Financial Statements 2018 2017R R38. Grants and subsidies paidOther subsidiesPoverty alleviation 1 973 539 1 346 999Tourism contribution 18 000 449Group co ID 11 947 049 -2 938 588 1 347 448Grants paid to ME's - -Other subsidies 2 938 588 1 347 448This amount is expended towards the poverty alliviation programes where destitude families and disaster affectecommunities are assisted with.39. Inventory consumedSale of goods 29 846 994 18 321 95640. General expensesAchievements and awards 192 500 580 809Advertising 3 365 024 1 165 851Assets expensed - 75 547Audit fees 3 059 212 2 180 872Bank charges 304 729 284 128Entertainment 358 860 293 282Workmen's compensation 887 900 927 531Honoraria 119 000 157 972Vehicle tracking 204 692 1 022 970Staff Bursary 5 135 11 130Fuel and oil 5 051 016 5 563 845Hire 2 370 784 3 392 522External Computer Service 181 018 152 524Insurance 521 130 438 856Skills development levies 1 708 753 1 559 199Driver's licenses and permits 510 929 503 949Communication 5 586 17 062Printing and Publication 807 477 611 341Registration 51 037 104 167Subscriptions and membership fees 1 730 033 1 716 898Telephone and fax 2 904 310 2 579 780Transport and freight 3 678 262 2 780 644Travel - local 11 746 713 13 035 592Uniforms 1 806 694 26 166Utilities - Other 5 179 900 -Management fees 5 280 225 7 961 31552 030 919 47 143 95241. Gain on sales of assetsGain on sales of assets - 211 33242. Loss on donated assetsLoss on donated assets (3 996 288) (712 284)Sports field and other computer items were donated as per the approved Council resolutions.57

Zululand District MunicipalityAnnual Financial Statements for the year ended 30 June 2018Notes to the Annual Financial Statements 2018 2017R R43. Proceeds from Insurance claimsProceeds from Insurance claims 753 278 1 542 89944. Inventories losses/write-downsInventories losses/write-downs (1 353 515) -45. Auditors' remunerationFees 3 059 212 2 180 87246. Cash generated from operationsSurplus 245 900 694 350 594 581Adjustments for:Depreciation and amortisation 57 372 054 57 672 248Loss on sale of assets and liabilities (753 278) (1 754 231)Loss on donated assets 3 996 288 -Inventories losses/write-downs 1 353 515 -Interest income - -Debt impairment 12 185 740 9 080 827Movements in retirement benefit assets and liabilities 3 609 000 219 000Movements in provisions - 7 252 418Movement in tax receivable and payable - (10 635 912)Changes other receivables from exchange (1 145 548) -Changes in working capital:Inventories 1 521 638 (777 534)Other receivables from exchange transactions (1 624 652) (415 475)Trade receivable from exchange transaction 12 790 860 (1 074)Receivables from non-exchange transactions (1 647 447) 920 693Other receivables from non-exchange transactions (923 750) (634 018)Payables from exchange transactions 60 806 978 50 173 922VAT (1 217 099) 8 912 808Payables from non - exchange transactions (60 538) (14 924 826)Unspent conditional grants (947 049) 1 500 000Consumer deposits (54 010) 347 009391 163 396 457 530 436
58
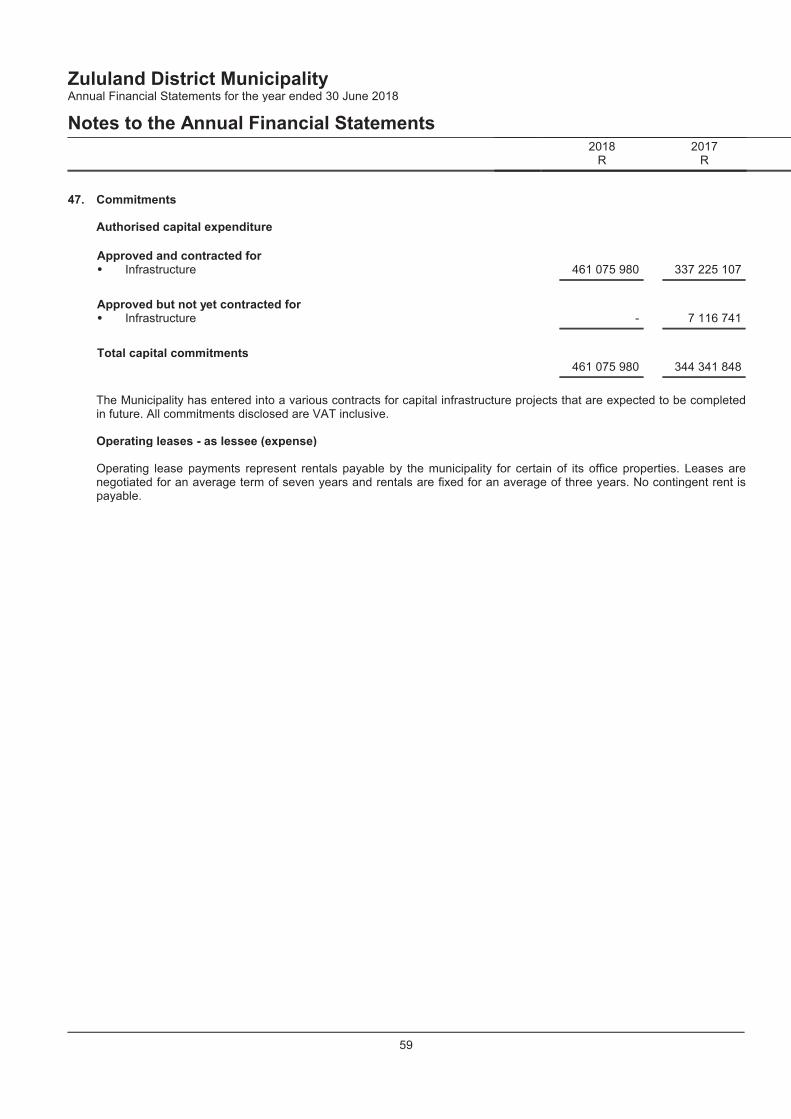
Zululand District MunicipalityAnnual Financial Statements for the year ended 30 June 2018Notes to the Annual Financial Statements 2018 2017R R47. CommitmentsAuthorised capital expenditureApproved and contracted for� Infrastructure 461 075 980 337 225 107Approved but not yet contracted for� Infrastructure - 7 116 741Total capital commitments 461 075 980 344 341 848The Municipality has entered into a various contracts for capital infrastructure projects that are expected to be completedin future. All commitments disclosed are VAT inclusive.Operating leases - as lessee (expense)Operating lease payments represent rentals payable by the municipality for certain of its office properties. Leases arenegotiated for an average term of seven years and rentals are fixed for an average of three years. No contingent rent ispayable.
59

Zululand District MunicipalityAnnual Financial Statements for the year ended 30 June 2018Notes to the Annual Financial Statements 2018 2017R R48. ContingenciesYear - 2018The Plaintiff is suing the Municipality out of the High Court for a certain amount.The Municipality is defending the matter awaiting for the trial date. 1 012 069The Municipality is being sued by a plaintiff in respect of a balance due for servicerendered by the plaintiff for a water supply scheme and tourism hub programme.The municipality is defending the matter and has filed a plea and claimreconvention 1 666 848The Plaintiff is suing the Municipality out of the Magistrate Court for allegedservices rendered. The Municipality is defending the matter and has filed a Notice ofIntention to defend and plea in order to dispute thi 147 808An Applicant is reviewing an award of a tender in the High Court. 120 000Claim for damagesClaim for damages 2 946 725Year - 2017Claim for damagesThe Plaintiff is suing the Municipality out of the High Court for a certain amount. TheMunicipality is defending the matter awaiting for the trial date. 1 012 069Claim for damagesThe Municipality is being sued by a plaintiff in respect of a balance due for servicerendered by the plaintiff for a water supply scheme and tourism hub programme. Themunicipality is defending the matter and has filed a plea and claim reconvention. 1 666 848Claim for damagesThe Plaintiff is suing the Municipality out of the Magistrate Court for alleged servicesrendered. The Municipality is defending the matter and has filed a Notice of Intention todefend and plea in order to dispute this matter. 147 808Final demand for payment of outstanding water use chargesThe Department of Water and Sanitation has issued statements to the Zululand DistrictMunicipality in terms of National Water Act (NWA) No. 36 of 1998 for raw waterabstraction and other related charges. The Municipality has disputed this amount with theDepartment. As at 30 June 2017 the outstanding amount was R 49 768 689 and R 12 954290 has been raised as provision against the total disputed amount. Thus the balance ofcontingent liability is disclosed. 36 814 399
Claim for damagesAn Applicant is reviewing an award of a tender in the High Court. 450 00040 091 12449. Risk managementFinancial risk managementThe Department Financial Services monitors and manafges the finacial risk relating to the operations through internalpolicies and procedures. These risk include interest rate and liquidity risk. Compliance with policy and procedures isreviewed by internal auditors on a continous basis an annual by external auditor. the municipality does not enter into ortrade financial imnstruments for speculative purposes. 60

Zululand District MunicipalityAnnual Financial Statements for the year ended 30 June 2018Notes to the Annual Financial Statements 2018 2017R R49. Risk management (continued)Liquidity riskLiquidity risk is the risk that the municipality will encounter difficulty in meeting the obligations associated with its FinancialLiabilities that are settled by delivering cash. The municipality's approach to managing liquidity is to ensure, as far aspossible, that it will always have sufficient liquidity to meet its liabilities when due, under both normal and stressedconditions, without incurring unacceptable losses or risking damage to the municiplitys reputations.Liquidity risk is managed by ensuring that all assets are reinvested at maturity at competitive interest rates in relation tocash flow requirements. Liabilities are managed by ensuring that all contractual payments are met on a timeous basisand, if required, additional new arrangement are establised at competitive rates to ensure that cash flow requirements aremet. The municipality has agreed to a payment plan with the respective creditor to settle its non-current liabilities.Capital risk managementThe capital structure of the municipality consist of accumulated surplus as disclosed in the statement of changes in netassets. Gearing ratioThe gearing ration is nil since the municipality does not have long term liabilities.50. Going concernWe draw attention to the fact that at 30 June 2018, the municipality had an accumulated surplus (deficit) of R3 085 634 981 and that the municipality's total assets exceed its liabilities by R 3 085 634 981.The annual financial statements have been prepared on the basis of accounting policies applicable to a going concern.This basis presumes that funds will be available to finance future operations and that the realisation of assets andsettlement of liabilities, contingent obligations and commitments will occur in the ordinary course of business.The ability of the municipality to continue as a going concern is dependent on a number of factors. The most significant ofthese is that the accounting officer continue to procure funding for the ongoing operations for the municipality. � The municipality is operating at a net asset position.� There are no fixed term borrowings.� There is no indication of withdrawals of support from creditors.� The Municipality is not operating at an overdrafyt facility.� The current ratio (CA/CL) is 0.34:1. However included in this calculation is retention of R 43 275 410 which isdependent on the future grant receipts and R 74 663 770 creditors at year-end. This retention does not have to becash backed. Norm ratio is 2:1.� The municipality has resulted to surplus for the current financial year and there is no significant deterioration in thevalue of assets used to generate cash flows.� The municipality is still able to pays its creditors as they become due.� National Sphere of Government will continue to allocate equitable share of national revenue and other Division ofRevenue Act grants to municipalities.� There is no loss of key Management without replacement.� There is no labour difficulties that will render the Municipality dysfunctional.� All conditional grants requirements are met.� There are no material pending legal claims that may render municipality dysfunctional.� There are no legal changes in law or regulation or government policy that may result in the liquidation of themunicipality.51. Additional disclosure in terms of Municipal Finance Management ActContributions to organised local governmentCurrent year subscription / fee 1 693 865 1 716 898Amount paid - current year (1 693 865) (1 716 898)- -61

Zululand District MunicipalityAnnual Financial Statements for the year ended 30 June 2018Notes to the Annual Financial Statements 2018 2017R R51. Additional disclosure in terms of Municipal Finance Management Act (continued)Audit feesCurrent year subscription / fee 3 059 212 2 180 872Amount paid - current year (3 059 212) (2 180 872)- -PAYE and UIFCurrent year subscription / fee 27 166 923 22 610 481Amount paid - current year (27 166 923) (22 610 481)- -Pension and Medical Aid DeductionsCurrent year subscription / fee 37 965 506 35 759 220Amount paid - current year (37 965 506) (35 759 220)- -Councillors' arrear consumer accountsThe following Councillors had arrear accounts outstanding for more than 90 days at 30 June 2018:30 June 2018 Outstandingless than 90daysR Outstandingmore than 90daysR TotalRTK Mkhize 276 - 27630 June 2017 Outstandingless than 90daysR Outstandingmore than 90daysR TotalRCllr B J Mncwango 714 - 714During the year the following Councillors’ had arrear accounts outstanding for more than 90 days.52. Budget differencesMaterial differences between budget and actual amountsThe material difference between approved budget and actual result are the consequence of activities during the financialperiod. For details on the comparatives please refer to the annual report.Differences between budget and actual amounts are basis of preparation and presentationThe budget and the accounting bases differ. The annual financial statements for the whole-of-government are preparedon the accrual basis using a classification based on the nature of expenses in the statement of financial performance.The annual financial statements differ from the budget, which is approved on the cash basis and which deals only with thegeneral government sector that excludes government business enterprises and certain other non-market governmententities and activities. 62
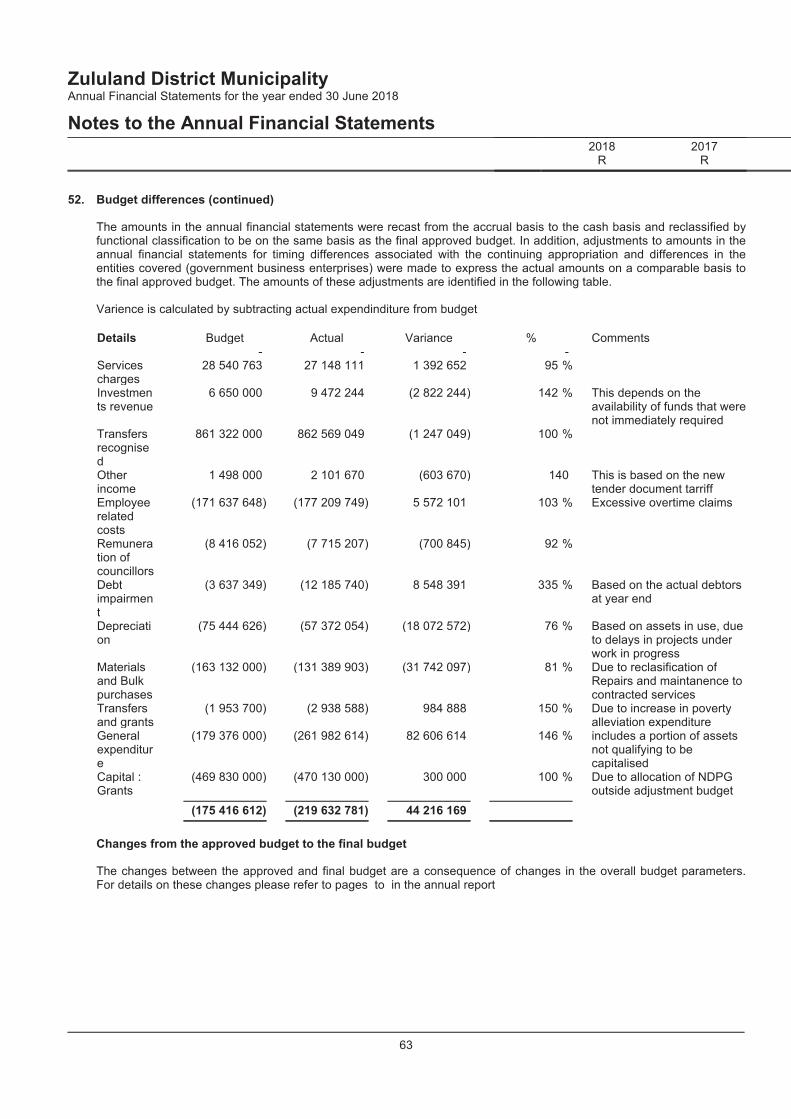
Zululand District MunicipalityAnnual Financial Statements for the year ended 30 June 2018Notes to the Annual Financial Statements 2018 2017R R52. Budget differences (continued)The amounts in the annual financial statements were recast from the accrual basis to the cash basis and reclassified byfunctional classification to be on the same basis as the final approved budget. In addition, adjustments to amounts in theannual financial statements for timing differences associated with the continuing appropriation and differences in theentities covered (government business enterprises) were made to express the actual amounts on a comparable basis tothe final approved budget. The amounts of these adjustments are identified in the following table. Varience is calculated by subtracting actual expendinditure from budgetDetails Budget Actual Variance % Comments- - - -Servicescharges 28 540 763 27 148 111 1 392 652 %95Investments revenue 6 650 000 9 472 244 (2 822 244) %142 This depends on theavailability of funds that werenot immediately requiredTransfersrecognised 861 322 000 862 569 049 (1 247 049) %100Otherincome 1 498 000 2 101 670 (603 670) 140 This is based on the newtender document tarriff Employeerelatedcosts (171 637 648) (177 209 749) 5 572 101 %103 Excessive overtime claimsRemuneration ofcouncillors (8 416 052) (7 715 207) (700 845) %92Debtimpairment (3 637 349) (12 185 740) 8 548 391 %335 Based on the actual debtorsat year endDepreciation (75 444 626) (57 372 054) (18 072 572) %76 Based on assets in use, dueto delays in projects underwork in progressMaterialsand Bulkpurchases (163 132 000) (131 389 903) (31 742 097) %81 Due to reclasification ofRepairs and maintanence tocontracted servicesTransfersand grants (1 953 700) (2 938 588) 984 888 %150 Due to increase in povertyalleviation expenditureGeneralexpenditure (179 376 000) (261 982 614) 82 606 614 %146 includes a portion of assetsnot qualifying to becapitalisedCapital :Grants (469 830 000) (470 130 000) 300 000 %100 Due to allocation of NDPGoutside adjustment budget(175 416 612) (219 632 781) 44 216 169Changes from the approved budget to the final budgetThe changes between the approved and final budget are a consequence of changes in the overall budget parameters.For details on these changes please refer to pages to in the annual report
63

Zululand District MunicipalityAnnual Financial Statements for the year ended 30 June 2018Notes to the Annual Financial Statements53. Prior period errorsStatement of Financial Position Audited Prior yearadjustments Reclassifyingadjustments RestatedNote(s) R R R RAssetsCurrent AssetsCash and cash equivalents 7 436 356 - - 7 436 356Receivables from exchange transactions 12 200 063 - - 12 200 063Other receivables from exchange transactions 454 165 - - 454 165Receivables from non-exchange transactions 4 617 339 - - 4 617 339Inventories 4 844 384 (190 462) - 4 653 922VAT receivable 18 812 186 - - 18 812 187Other receivables from non-exchange transactions 866 762 - - 866 76249 231 255 (190 462) - 49 040 794Non-Current AssetsProperty, plant and equipment 2 938 282 803 - - 2 938 282 803Intangible assets 293 990 - - 293 990Heritage assets 1 212 636 - - 1 212 636Other receivables from exchange transactions 11 565 007 - - 11 565 0072 951 354 436 - - 2 951 354 436Non-Current Assets 2 951 354 436 - - 2 951 354 436Current Assets 49 231 255 (190 462) - 49 040 794Non-current assets held for sale (and)(assets of disposal groups) - - - -Total Assets 3 000 585 691 (190 462) - 3 000 395 230LiabilitiesCurrent LiabilitiesPayables from exchange transactions 94 882 947 4 904 786 - 99 787 733Unspent conditional grants - - 1 500 000 1 500 000Consumer deposits 3 681 115 - - 3 681 115Provisions 27 162 434 - - 27 162 434Payables from exchange transactions (non-exchange) 1 654 697 - (1 500 000) 154 697127 381 193 4 904 786 - 132 285 979Non-Current LiabilitiesEmployee benefit obligation 19 779 000 9 124 000 - 28 903 000Rental deposits held 2 420 - - 2 42019 781 420 9 124 000 - 28 905 420Non-Current Liabilities 19 781 420 9 124 000 - 28 905 420Current Liabilities 127 381 193 4 904 786 - 132 285 979Liabilities of disposal groups - - - -Total Liabilities 147 162 613 14 028 786 - 161 191 399Assets 3 000 585 691 (190 462) - 3 000 395 230Liabilities (147 162 613) (14 028 786) - (161 191 399)Net Assets 2 853 423 078 (14 219 248) - 2 839 203 83164
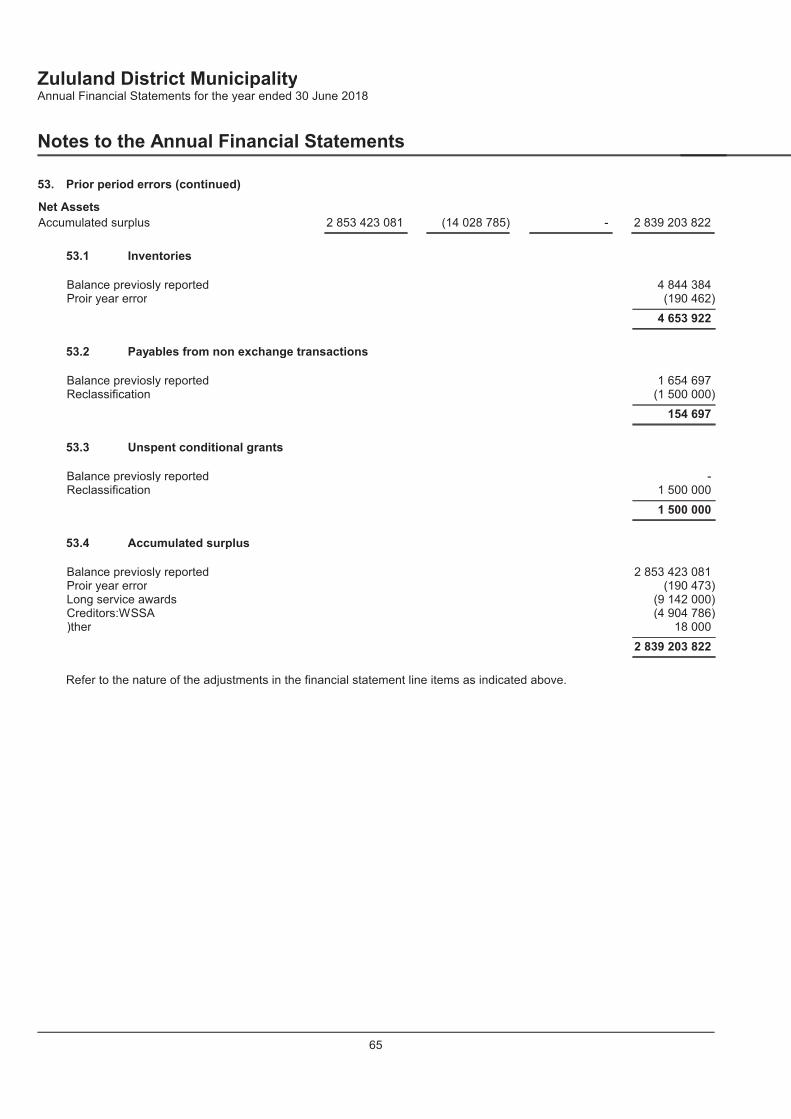
Zululand District MunicipalityAnnual Financial Statements for the year ended 30 June 2018Notes to the Annual Financial Statements53. Prior period errors (continued)Net AssetsAccumulated surplus 2 853 423 081 (14 028 785) - 2 839 203 82253.1 InventoriesBalance previosly reported 4 844 384Proir year error (190 462)4 653 92253.2 Payables from non exchange transactionsBalance previosly reported 1 654 697Reclassification (1 500 000)154 69753.3 Unspent conditional grantsBalance previosly reported -Reclassification 1 500 0001 500 00053.4 Accumulated surplusBalance previosly reported 2 853 423 081Proir year error (190 473)Long service awards (9 142 000)Creditors:WSSA (4 904 786))ther 18 0002 839 203 822Refer to the nature of the adjustments in the financial statement line items as indicated above.
65

Zululand District MunicipalityAnnual Financial Statements for the year ended 30 June 2018Notes to the Annual Financial Statements53. Prior period errors (continued)Statement of Financial PerformanceAudited Prior yearadjustments Reclassifyingadjustments RestatedNote(s) R R R RRevenueRevenue from exchange transactionsService charges 20 335 362 - - 20 335 362Rental of facilities and equipment 134 862 - - 134 862Other income 1 416 830 - (81 683) 1 335 147Investment revenue 6 095 079 - - 6 095 079Total revenue from exchange transactions 27 982 133 - (81 683) 27 900 450Revenue from non-exchange transactionsTransfer revenueGovernment grants & subsidies 862 775 391 - - 862 775 391Fines, Penalties and Forfeits - - 81 683 81 683Other revenue from non-exchange 8 649 - - 8 649Total revenue from non-exchange transactions 862 784 040 - 81 683 862 865 72327 982 133 - (81 683) 27 900 450862 784 040 - 81 683 862 865 723Total revenue 890 766 173 - - 890 766 173ExpenditureEmployee related costs (169 724 213) - - (169 724 213)Remuneration of councillors (6 824 698) - - (6 824 698)Employee benefits (219 000) - - (219 000)Lease rentals on operating lease - - (2 130 004) (2 130 004)Depreciation and amortisation (57 672 248) - - (57 672 248)Debt impairment (9 080 827) - - (9 080 827)Bad debts written off (214) (214) - -Collection costs - - 1 402 719 (1 402 719)Sale of goods/Inventory - - (18 321 956) (18 321 956)Bulk purchases (85 481 258) - - (85 481 258)Contracted services (17 812 748) - (124 052 468) (141 865 216)Transfers and subsidies - - (1 347 448) (1 347 448)Repairs and maintenance (19 017 684) - 19 017 684 -General Expenses (175 380 850) - 128 236 911 (47 143 952)Total expenditure (541 213 740) (214) - (541 213 539)- - - -Total revenue 890 766 173 - 890 766 173Total expenditure (541 213 740) (214) - (541 213 539)Operating surplus 349 552 433 (214) - 349 552 634Gain on disposal of assets and liabilities 211 332 - - 211 332Loss on donated assets (712 284) - - (712 284)Proceeds from Insurance claims 1 542 899 - - 1 542 8991 041 947 - - 1 041 947Surplus before taxation 350 594 380 (214) - 350 594 581Taxation - - - -Surplus for the year 350 594 380 (214) - 350 594 58166

Zululand District MunicipalityAnnual Financial Statements for the year ended 30 June 2018Notes to the Annual Financial Statements53. Prior period errors (continued)53.5 Other IncomeBalance previosly reported 1 416 830Reclassified (81 683)1 335 14753.6 Fine, Penalties and ForfeitsBalance previosly reported -Reclassification 81 68381 68353.7 Collection costsReclassification 1 402 71953.8 Repairs and maintenanceBalance previosly reported 19 017 684Reclassification (19 017 684)-53.9 Contracted servicesBalance previosly reported 17 812 748Reclassification 124 052 468141 865 216A data cleansing excercise was done for the clearing of all suspence accounts due to the mSCOA implementation.This group of accounts distinguish between "Outsourced Services, Contractors and Professional and Special Services". 53.10 'Grants and subsidies paidReclassification 1 347 44853.11 General ExpensesBalance previosly reported 175 380 850Reclassification (128 236 898)47 143 952A data cleansing excercise was done for the clearing of all suspence accounts due to the mSCOA implementation.53.12 Sale of goods/InventoryReclassification 18 321 95667

Zululand District MunicipalityAnnual Financial Statements for the year ended 30 June 2018Notes to the Annual Financial Statements53. Prior period errors (continued)53.13 Bad debts written offBalance previosly reported (214)Proir year error 214-54. Unauthorised expenditureUnauthorised incurred during the year - 2 733 609Unauthorised written-off by council - (2 733 609)- -55. Fruitless and wasteful expenditureOpening balance 381 729 90 017Fruitless and wasteful incurred during the year 38 682 483 047Prior year fruitless and wasteful expenditure incurred in the current year - 54 000Fruitless and wasteful written-off by council - (245 335)420 411 381 72956. Irregular expenditureOpening balance 185 026 191 11 252 819Add: Irregular Expenditure - current year 122 883 183 190 836 232Irregular expenditure written-off by council - (17 062 860)307 909 374 185 026 191Analysis of expenditure awaiting condonation per age classificationInvestigation to the root causes for irregular expenditure is still in process and no steps have been taken yet.57. Awards to close family members of person in the service of the stateEmployee Number 371 26 625 3 206 724Employee Number 524 - 136 271Emploee Number 499 - 55 000Employee Number 358 254 453 -281 078 3 397 99558. Water losses Water losses average 9% during the year 10 450 228 5 828 67359. Paragraph 17.c appointmentsReported to council - 3 936 779Awards awaiting to be reported to council - (3 936 779)- -68

Zululand District MunicipalityAnnual Financial Statements for the year ended 30 June 2018Notes to the Annual Financial Statements60. Report on approved deviationOpening balance 5 156 335 -Deviation incurred during the year 11 317 155 3 469 163Deviation reported to council - 10 384 869Deviation awaiting reporting to council - (8 697 697)16 473 490 5 156 33561. Related parties`RelationshipsAccounting Officer Salaries, allowances and other benefits are paid toCouncillors in terms of Remuneration of Public OfficeBearers Act.Shareholder with significant influence No shareholder with significant influence.Shareholder with joint control No shareholding with joint control.Close family member of key management No close family member for key managementidentified.Joint venture of key management No Joint ventures of Key ManagementAssociate of close family member of key management No associate of close family member of keymanagement62. Events after the reporting dateNo material adjusting or non-adjusting events have been identified after reporting date.
.
69

Zululand District MunicipalityZululand District MunicipalityAppendix BJune 2018 Analysis of property, plant and equipment as at 30 June 2018Cost/Revaluation Accumulated depreciationOpeningBalance Additions Disposals Transfers Revaluations Other changes,movements ClosingBalance OpeningBalance Disposals Transfers Depreciation Impairment loss ClosingBalance CarryingvalueRand Rand Rand Rand Rand Rand Rand Rand Rand Rand Rand Rand Rand RandLand and buildingsLand (Separate for AFS purposes) 470 000 - - - - - 470 000 - - - - - - 470 000Landfill Sites (Separate for AFSpursoses) - - - - - - - - - - - - - -Quarries (Separate for AFS purposes) - - - - - - - - - - - - - -Buildings (Separate for AFS purposes) 45 445 591 - - - - - 45 445 591 (13 548 683) - - (1 258 705) - (14 807 388) 30 638 20345 915 591 - - - - - 45 915 591 (13 548 683) - - (1 258 705) - (14 807 388) 31 108 203InfrastructureRoads, Pavements & Bridges - - - - - - - - - - - - - -Storm water - - - - - - - - - - - - - -Generation - - - - - - - - - - - - - -Transmission & Reticulation - - - - - - - - - - - - - -Street lighting - - - - - - - - - - - - - -Dams & Reservoirs 215 221 810 - - - - - 215 221 810 (30 926 001) - - (3 436 316) - (34 362 317) 180 859 493Water purification 278 930 699 - - - - - 278 930 699 (36 125 540) - - (5 670 598) - (41 796 138) 237 134 561Reticulation 1 339 235 027 - - - - - 1 339 235 027 (198 311 450) - - (31 944 792) - (230 256 242) 1 108 978 785Reticulation - - - - - - - - - - - - - -Sewerage purification 55 391 761 - - - - - 55 391 761 (18 310 142) - - (1 694 148) - (20 004 290) 35 387 471Transportation (Airports, Car Parks,Bus Terminals and Taxi Ranks) 24 312 868 - - - - - 24 312 868 (3 640 343) - - (1 219 496) - (4 859 839) 19 453 029Housing 95 159 301 - - - - - 95 159 301 (11 192 932) - - (1 728 141) - (12 921 073) 82 238 228Waste Management - - - - - - - - - - - - - -WIP - - - - - - - - - - - - - -Other (fibre optic, WIFI infrastructur) - - - - - - - - - - - - - -Other 1 144 333 122 5 410 - - - - 144 338 532 (34 492 078) - - (3 545 147) - (38 037 225) 106 301 3072 152 584 588 5 410 - - - - 2 152 589 998 (332 998 486) - - (49 238 638) - (382 237 124) 1 770 352 874Community AssetsParks & gardens - - - - - - - - - - - - - -Sportsfields and stadium 14 933 380 - - (4 965 844) - - 9 967 536 (3 894 807) 1 320 009 - (363 551) - (2 938 349) 7 029 187Swimming pools - - - - - - - - - - - - - -Community halls - - - - - - - - - - - - - -Libraries - - - - - - - - - - - - - -Recreational facilities - - - - - - - - - - - - - -Clinics - - - - - - - - - - - - - -Museums & art galleries - - - - - - - - - - - - - -Other - - - - - - - - - - - - - -Social rental housing - - - - - - - - - - - - - -Cemeteries - - - - - - - - - - - - - -Fire, safety & emergency - - - - - - - - - - - - - -Security and policing - - - - - - - - - - - - - -Buses - - - - - - - - - - - - - -14 933 380 - - (4 965 844) - - 9 967 536 (3 894 807) 1 320 009 - (363 551) - (2 938 349) 7 029 187
Page 70

Zululand District MunicipalityZululand District MunicipalityAppendix BJune 2018 Analysis of property, plant and equipment as at 30 June 2018Cost/Revaluation Accumulated depreciationOpeningBalance Additions Disposals Transfers Revaluations Other changes,movements ClosingBalance OpeningBalance Disposals Transfers Depreciation Impairment loss ClosingBalance CarryingvalueRand Rand Rand Rand Rand Rand Rand Rand Rand Rand Rand Rand Rand RandHeritage assetsBuildings - - - - - - - - - - - - - -Other - - - - - - - - - - - - - -- - - - - - - - - - - - - -Specialised vehiclesRefuse - - - - - - - - - - - - - -Fire - - - - - - - - - - - - - -Conservancy - - - - - - - - - - - - - -Ambulances - - - - - - - - - - - - - -Buses - - - - - - - - - - - - - -- - - - - - - - - - - - - -Other assetsGeneral vehicles 41 292 214 - - - - - 41 292 214 (29 164 101) - - (3 702 296) - (32 866 397) 8 425 817Plant & equipment 5 226 228 - - - - - 5 226 228 (2 769 517) - - (408 359) - (3 177 876) 2 048 352Computer Equipment 4 590 253 504 552 - - - - 5 094 805 (3 443 760) - - (573 946) - (4 017 706) 1 077 099Computer Software (part of computerequipment) - - - - - - - - - - - - - -Furniture & Fittings 1 955 826 29 143 - - - - 1 984 969 (1 032 114) - - (257 329) - (1 289 443) 695 526Office Equipment 2 466 184 - - - - - 2 466 184 (2 126 038) - - (144 815) - (2 270 853) 195 331Office Equipment - Leased - - - - - - - - - - - - - -Abattoirs - - - - - - - - - - - - - -Other equipment 256 419 72 000 - - - - 328 419 (110 568) - - (65 284) - (175 852) 152 567Airports - - - - - - - - - - - - - -Security measures 139 475 - - - - - 139 475 (138 332) - - (1 143) - (139 475) -Civic land and buildings - - - - - - - - - - - - - -Other buildings - - - - - - - - - - - - - -Other land - - - - - - - - - - - - - -Bins and Containers - - - - - - - - - - - - - -Work in progress - - - - - - - - - - - - - -Other 30 245 - - - - - 30 245 (4 654) - - (2 523) - (7 177) 23 068Other Assets - Leased - - - - - - - - - - - - - -Surplus Assets - (Investment orInventory) - - - - - - - - - - - - - -Housing development - - - - - - - - - - - - - -Other 52 945 - - - - - 52 945 (27 449) - - (2 608) - (30 057) 22 88856 009 789 605 695 - - - - 56 615 484 (38 816 533) - - (5 158 303) - (43 974 836) 12 640 648
Page 71

Zululand District MunicipalityZululand District MunicipalityAppendix BJune 2018 Analysis of property, plant and equipment as at 30 June 2018Cost/Revaluation Accumulated depreciationOpeningBalance Additions Disposals Transfers Revaluations Other changes,movements ClosingBalance OpeningBalance Disposals Transfers Depreciation Impairment loss ClosingBalance CarryingvalueRand Rand Rand Rand Rand Rand Rand Rand Rand Rand Rand Rand Rand RandTotal property plant and equipmentLand and buildings 45 915 591 - - - - - 45 915 591 (13 548 683) - - (1 258 705) - (14 807 388) 31 108 203Infrastructure 2 152 584 588 5 410 - - - - 2 152 589 998 (332 998 486) - - (49 238 638) - (382 237 124) 1 770 352 874Community Assets 14 933 380 - - (4 965 844) - - 9 967 536 (3 894 807) 1 320 009 - (363 551) - (2 938 349) 7 029 187Heritage assets - - - - - - - - - - - - - -Specialised vehicles - - - - - - - - - - - - - -Other assets 56 009 789 605 695 - - - - 56 615 484 (38 816 533) - - (5 158 303) - (43 974 836) 12 640 6482 269 443 348 611 105 - (4 965 844) - - 2 265 088 609 (389 258 509) 1 320 009 - (56 019 197) - (443 957 697) 1 821 130 912Agricultural/Biological assetsAgricultural - - - - - - - - - - - - - -Biological assets - - - - - - - - - - - - - -- - - - - - - - - - - - - -Intangible assetsComputers - software & programming 887 713 - - - - - 887 713 (593 723) - - (146 169) - (739 892) 147 821Other - - - - - - - - - - - - - -887 713 - - - - - 887 713 (593 723) - - (146 169) - (739 892) 147 821Investment propertiesInvestment property - - - - - - - - - - - - - -- - - - - - - - - - - - - -TotalLand and buildings 45 915 591 - - - - - 45 915 591 (13 548 683) - - (1 258 705) - (14 807 388) 31 108 203Infrastructure 2 152 584 588 5 410 - - - - 2 152 589 998 (332 998 486) - - (49 238 638) - (382 237 124) 1 770 352 874Community Assets 14 933 380 - - (4 965 844) - - 9 967 536 (3 894 807) 1 320 009 - (363 551) - (2 938 349) 7 029 187Heritage assets - - - - - - - - - - - - - -Specialised vehicles - - - - - - - - - - - - - -Other assets 56 009 789 605 695 - - - - 56 615 484 (38 816 533) - - (5 158 303) - (43 974 836) 12 640 648Agricultural/Biological assets - - - - - - - - - - - - - -Intangible assets 887 713 - - - - - 887 713 (593 723) - - (146 169) - (739 892) 147 821Investment properties - - - - - - - - - - - - - -2 270 331 061 611 105 - (4 965 844) - - 2 265 976 322 (389 852 232) 1 320 009 - (56 165 366) - (444 697 589) 1 821 278 733
Page 72

Zululand District MunicipalityZululand District MunicipalityAppendix B Analysis of property, plant and equipment as at 30 June 2011Cost/Revaluation Accumulated depreciationOpeningBalance Additions Disposals Transfers Revaluations Other changes,movements ClosingBalance OpeningBalance Disposals Transfers Depreciation Impairment loss ClosingBalance CarryingvalueRand Rand Rand Rand Rand Rand Rand Rand Rand Rand Rand Rand Rand RandLand and buildingsLand (Separate for AFS purposes) - - - - - - - - - - - - - -Landfill Sites (Separate for AFSpursoses) - - - - - - - - - - - - - -Quarries (Separate for AFS purposes) - - - - - - - - - - - - - -Buildings (Separate for AFS purposes) - - - - - - - - - - - - - -- - - - - - - - - - - - - -InfrastructureRoads, Pavements & Bridges - - - - - - - - - - - - - -Storm water - - - - - - - - - - - - - -Generation - - - - - - - - - - - - - -Transmission & Reticulation - - - - - - - - - - - - - -Street lighting - - - - - - - - - - - - - -Dams & Reservoirs - - - - - - - - - - - - - -Water purification - - - - - - - - - - - - - -Reticulation - - - - - - - - - - - - - -Reticulation - - - - - - - - - - - - - -Sewerage purification - - - - - - - - - - - - - -Transportation (Airports, Car Parks,Bus Terminals and Taxi Ranks) - - - - - - - - - - - - - -Housing - - - - - - - - - - - - - -Waste Management - - - - - - - - - - - - - -Gas - - - - - - - - - - - - - -Other (fibre optic, WIFI infrastructur) - - - - - - - - - - - - - -Other 1 - - - - - - - - - - - - - -- - - - - - - - - - - - - -Community AssetsParks & gardens - - - - - - - - - - - - - -Sportsfields and stadium - - - - - - - - - - - - - -Swimming pools - - - - - - - - - - - - - -Community halls - - - - - - - - - - - - - -Libraries - - - - - - - - - - - - - -Recreational facilities - - - - - - - - - - - - - -Clinics - - - - - - - - - - - - - -Museums & art galleries - - - - - - - - - - - - - -Other - - - - - - - - - - - - - -Social rental housing - - - - - - - - - - - - - -Cemeteries - - - - - - - - - - - - - -Fire, safety & emergency - - - - - - - - - - - - - -Security and policing - - - - - - - - - - - - - -Buses - - - - - - - - - - - - - -- - - - - - - - - - - - - -
Page 73

Zululand District MunicipalityZululand District MunicipalityAppendix BJune 2018 Analysis of property, plant and equipment as at 30 June 2011Cost/Revaluation Accumulated depreciationOpeningBalance Additions Disposals Transfers Revaluations Other changes,movements ClosingBalance OpeningBalance Disposals Transfers Depreciation Impairment loss ClosingBalance CarryingvalueRand Rand Rand Rand Rand Rand Rand Rand Rand Rand Rand Rand Rand RandHeritage assetsBuildings - - - - - - - - - - - - - -Other - - - - - - - - - - - - - -- - - - - - - - - - - - - -Specialised vehiclesRefuse - - - - - - - - - - - - - -Fire - - - - - - - - - - - - - -Conservancy - - - - - - - - - - - - - -Ambulances - - - - - - - - - - - - - -Buses - - - - - - - - - - - - - -- - - - - - - - - - - - - -Other assetsGeneral vehicles - - - - - - - - - - - - - -Plant & equipment - - - - - - - - - - - - - -Computer Equipment - - - - - - - - - - - - - -Computer Software (part of computerequipment) - - - - - - - - - - - - - -Furniture & Fittings - - - - - - - - - - - - - -Office Equipment - - - - - - - - - - - - - -Office Equipment - Leased - - - - - - - - - - - - - -Abattoirs - - - - - - - - - - - - - -Markets - - - - - - - - - - - - - -Airports - - - - - - - - - - - - - -Security measures - - - - - - - - - - - - - -Civic land and buildings - - - - - - - - - - - - - -Other buildings - - - - - - - - - - - - - -Other land - - - - - - - - - - - - - -Bins and Containers - - - - - - - - - - - - - -Work in progress - - - - - - - - - - - - - -Other - - - - - - - - - - - - - -Other Assets - Leased - - - - - - - - - - - - - -Surplus Assets - (Investment orInventory) - - - - - - - - - - - - - -Housing development - - - - - - - - - - - - - -Other - - - - - - - - - - - - - -- - - - - - - - - - - - - -
Page 74

Zululand District MunicipalityZululand District MunicipalityAppendix BJune 2018 Analysis of property, plant and equipment as at 30 June 2011Cost/Revaluation Accumulated depreciationOpeningBalance Additions Disposals Transfers Revaluations Other changes,movements ClosingBalance OpeningBalance Disposals Transfers Depreciation Impairment loss ClosingBalance CarryingvalueRand Rand Rand Rand Rand Rand Rand Rand Rand Rand Rand Rand Rand RandTotal property plant and equipmentLand and buildings - - - - - - - - - - - - - -Infrastructure - - - - - - - - - - - - - -Community Assets - - - - - - - - - - - - - -Heritage assets - - - - - - - - - - - - - -Specialised vehicles - - - - - - - - - - - - - -Other assets - - - - - - - - - - - - - -- - - - - - - - - - - - - -Agricultural/Biological assetsAgricultural - - - - - - - - - - - - - -Biological assets - - - - - - - - - - - - - -- - - - - - - - - - - - - -Intangible assetsComputers - software & programming - - - - - - - - - - - - - -Other - - - - - - - - - - - - - -- - - - - - - - - - - - - -Investment propertiesInvestment property - - - - - - - - - - - - - -- - - - - - - - - - - - - -TotalLand and buildings - - - - - - - - - - - - - -Infrastructure - - - - - - - - - - - - - -Community Assets - - - - - - - - - - - - - -Heritage assets - - - - - - - - - - - - - -Specialised vehicles - - - - - - - - - - - - - -Other assets - - - - - - - - - - - - - -Agricultural/Biological assets - - - - - - - - - - - - - -Intangible assets - - - - - - - - - - - - - -Investment properties - - - - - - - - - - - - - -- - - - - - - - - - - - - -
Page 75

Zululand District MunicipalityAppendix CJune 2018 Segmental analysis of property, plant and equipment as at 30 June 2018Cost/Revaluation Accumulated DepreciationOpeningBalance Additions Disposals Transfers Revaluations Other changes,movements ClosingBalance OpeningBalance Disposals Transfers Depreciation Impairment deficit ClosingBalance CarryingvalueRand Rand Rand Rand Rand Rand Rand Rand Rand Rand Rand Rand Rand RandMunicipalityExecutive & Council/Mayor andCouncil - - - - - - - - - - - - - -Finance & Admin/Finance - - - - - - - - - - - - - -Planning and Development/EconomicDevelopment/Plan - - - - - - - - - - - - - -Health/Clinics - - - - - - - - - - - - - -Comm. & Social/Libraries and archives - - - - - - - - - - - - - -Housing - - - - - - - - - - - - - -Public Safety/Police - - - - - - - - - - - - - -Sport and Recreation - - - - - - - - - - - - - -Environmental Protection/PollutionControl - - - - - - - - - - - - - -Waste Water Management/Sewerage - - - - - - - - - - - - - -Road Transport/Roads - - - - - - - - - - - - - -Water/Water Distribution - - - (1 875) - - (1 875) - - - - - - (1 875)Electricity /Electricity Distribution - - - - - - - - - - - - - -Other/Air Transport - - - - - - - - - - - - - -- - - (1 875) - - (1 875) - - - - - - (1 875)Municipal Owned Entities - - - - - - - - - - - - - -- - - - - - - - - - - - - -- - - - - - - - - - - - - -- - - - - - - - - - - - - -- - - - - - - - - - - - - -- - - - - - - - - - - - - -- - - - - - - - - - - - - -- - - - - - - - - - - - - -- - - - - - - - - - - - - -- - - - - - - - - - - - - -- - - - - - - - - - - - - -- - - - - - - - - - - - - -- - - - - - - - - - - - - -- - - - - - - - - - - - - -- - - - - - - - - - - - - -- - - - - - - - - - - - - -- - - - - - - - - - - - - -TotalMunicipality - - - (1 875) - - (1 875) - - - - - - (1 875)Municipal Owned Entities - - - - - - - - - - - - - -- - - - - - - - - - - - - -- - - - - - - - - - - - - -- - - - - - - - - - - - - -- - - - - - - - - - - - - -- - - - - - - - - - - - - -- - - - - - - - - - - - - -- - - - - - - - - - - - - -- - - - - - - - - - - - - -- - - - - - - - - - - - - -Page 76
Zululand District MunicipalityAppendix CJune 2018 Segmental analysis of property, plant and equipment as at 30 June 2018Cost/Revaluation Accumulated DepreciationOpeningBalance Additions Disposals Transfers Revaluations Other changes,movements ClosingBalance OpeningBalance Disposals Transfers Depreciation Impairment deficit ClosingBalance CarryingvalueRand Rand Rand Rand Rand Rand Rand Rand Rand Rand Rand Rand Rand Rand- - - - - - - - - - - - - -- - - - - - - - - - - - - -- - - (1 875) - - (1 875) - - - - - - (1 875)
Page 77

Zululand District Municipality0Appendix DJune 2018 Segmental Statement of Financial Performance for the year endedPrior Year Current YearActualIncome ActualExpenditure Surplus/(Deficit) ActualIncome ActualExpenditure Surplus/(Deficit)Rand Rand Rand Rand Rand RandMunicipality(712 284) 33 594 527 (34 306 811) Executive & Council/Mayor and Council - 49 879 228 (49 879 228)357 888 557 109 198 898 248 689 659 Finance & Admin/Finance 394 740 565 102 722 070 292 018 4952 229 000 21 020 340 (18 791 340) Planning and Development/EconomicDevelopment/Plan 2 659 000 22 864 019 (20 205 019)- 2 000 304 (2 000 304) Health/Clinics - 9 639 445 (9 639 445)1 911 000 33 251 806 (31 340 806) Comm. & Social/Libraries and archives 1 040 190 24 753 580 (23 713 390)- - - Housing - - -- - - Public Safety/Police - - -- - - Sport and Recreation - - -- - - Environmental Protection/PollutionControl - - -7 071 119 6 340 327 730 792 Waste Water Management/Sewerage 8 600 242 8 710 524 (110 282)- - - Road Transport/Roads - - -522 945 704 324 298 412 198 647 292 Water/Water Distribution 488 304 679 414 272 230 74 032 449- - - Electricity /Electricity Distribution - - -475 026 11 508 916 (11 033 890) Other/Air Transport - 11 719 160 (11 719 160)- - - - - -- - - - - -- - - - - -- - - - - -- - - - - -- - - - - -- - - - - -- - - - - -- - - - - -- - - - - -- - - - - -- - - - - -- - - - - -- - - - - -- - - - - -- - - - - -- - - - - -891 808 122 541 213 530 350 594 592 895 344 676 644 560 256 250 784 420
Page 78

Zululand District MunicipalityAppendix FDisclosures of Grants and Subsidies in terms of Section 123 MFMA, 56 of 2003June 2018Name ofGrants Name oforgan ofstate ormunicipalentityQuarterly Receipts Quarterly Expenditure Grants and Subsidies delayed /withheld Reason fordelay/withholding of funds Did yourmunicipality comply withthe grantconditions interms ofgrantframework in thelatestDivisionofRevenueAct
Reason fornoncompliance
Jun Sep Dec Mar Jun Jun Sep Dec Mar Jun Jun Sep Dec Mar Jun Yes/ NoEquitableShare NationalTreasury -59 406 00027 523 00093 642 000 - -95 642 75095 642 75095 642 75095 642 750 - - - - - YesFinancialManagement NationalTreasury -1 250 000 - - - - 67 760119 644543 523519 072 - - - - - YesExpandedPublic WorksProgramme Dept of PublicWorks -1 440 0002 592 0001 728 000 - -1 200 4661 658 5742 387 945513 015 - - - - - YesIndonsa Grant Art & Culture - 955 500 - 955 500 - -1 170 794740 206 - - - - - - - YesMunicipalInfrastructureGrant COGTA -85 000 00095 000 000 49 725 - -26 103 84154 660 00264 774 92884 186 229 - - - - - YesRegional BulkInfrastructureGrant(Schedule 5B DWS -40 000 00035 000 00055 000 000 - -34 498 80120 912 04219 150 62055 438 537 - - - - - YesWater ServicesInfrastructureGrant(Schedule 5B) DWS -53 873 00032 324 00021 549 000 - -25 548 78834 750 14114 684 76932 762 304 - - - - - YesRural RoadAssetsManagementSystems Grant COGTA -1 651 000 - 708 000 - - 447 640450 172685 207775 924 - - - - - YesEnvironmentalManagementFramework &StrategicEnvironmentalAssessment
EnvironmentalDevelopment1 500 000 - - - - - - - - 947 049 - - - - - Yes1 500 00043 575 50092 439 00073 632 225 - -84 680 84008 933 53197 869 74270 784 880 - - - - -Note: A municipality should provide additional information on how a grant was spent per Vote. This excludes allocations from the Equitable Share.Section 5 - Page 79 - 23 January 2019 - 10:29

B
B. REPORT AND OPINION OF THE AUDITOR GENERAL This is the auditor’s report as issued by AGSA.

Auditor-General of South Africa
Zululand District Municipality Audit report 2017-18

1
Report of the auditor-general to the KwaZulu-Natal Provincial Legislature and the council on Zululand District Municipality
Report on the audit of the financial statements
Qualified opinion
1. I have audited the financial statements of the Zululand District Municipality set out on pages … to …, which comprise the statement of financial position as at 30 June 2018, the statement of financial performance, statement of changes in net assets, cash flow statement and statement of comparison of budget and actual amounts for the year then ended, as well as the notes to the financial statements, including a summary of significant accounting policies.
2. In my opinion, except for the possible effects of the matters described in the basis for qualified opinion section of this auditor’s report, the financial statements present fairly, in all material respects, the financial position of the Zululand District Municipality as at 30 June 2018, and its financial performance and cash flows for the year then ended in accordance with South African Standards of Generally Recognised Accounting Practice (SA Standards of GRAP) and the requirements of the Municipal Finance Management Act of South Africa, 2003 (Act No. 56 of 2003) (MFMA) and the Division of Revenue Act of South Africa, 2017 (Act No. 3 of 2017) (Dora).
Basis for qualified opinion
Revenue from exchange transactions
3. I was unable to obtain sufficient appropriate audit evidence that management had properly accounted for all revenue from service charges, receivables and related impairments due to inadequate internal control in the billing process. I could not confirm revenue from service charges by alternative means. Consequently, I was unable to determine whether any adjustment was necessary to revenue from service charges stated at R27,15 million in note 22 to the financial statements.
Water losses
4. I was unable to obtain sufficient appropriate audit evidence for the disclosed water losses stated at R7,21 million in the note 59 to the financial statements. This was due to inadequate systems and processes for the monitoring and recording of these losses. I could not confirm the disclosed losses through alternative means. Consequently, I was unable to determine whether any adjustments were necessary relating to the water losses disclosed in note 59 to the financial statements.
Context for the opinion
5. I conducted my audit in accordance with the International Standards on Auditing (ISAs). My responsibilities under those standards are further described in the auditor-general’s responsibilities for the audit of the financial statements section of this auditor’s report.

2
6. I am independent of the municipality in accordance with the International Ethics Standards Board for Accountants’ Code of ethics for professional accountants (IESBA code) and the ethical requirements that are relevant to my audit in South Africa. I have fulfilled my other ethical responsibilities in accordance with these requirements and the IESBA code.
7. I believe that the audit evidence I have obtained is sufficient and appropriate to provide a basis for my qualified opinion.
Emphasis of matter
8. I draw attention to the matter below. My opinion is not modified in respect of this matter.
Restatement of corresponding figures
9. As disclosed in note 53 to the financial statements, the corresponding figures for 30 June 2017 were restated as a result of an error in the financial statements of the municipality at, and for the year ended, 30 June 2018.
Other matter
10. I draw attention to the matter below. My opinion is not modified in respect of this matter.
Unaudited disclosure notes
11. In terms of section 125(2)(e) of the MFMA, the municipality is required to disclose particulars of non-compliance with the MFMA in the financial statements. This disclosure requirement did not form part of the audit of the financial statements and, accordingly, I do not express an opinion on it.
Unaudited supplementary schedules
12. The supplementary information set out on pages XX to XX does not form part of the financial statements and is presented as additional information. I have not audited these schedules and, accordingly, I do not express an opinion on them.
Responsibilities of the accounting officer for the financial statements
13. The accounting officer is responsible for the preparation and fair presentation of the financial statements in accordance with the SA Standards of GRAP and the requirements of the MFMA and Dora, and for such internal control as the accounting officer determines is necessary to enable the preparation of financial statements that are free from material misstatement, whether due to fraud or error.
14. In preparing the financial statements, the accounting officer is responsible for assessing the Zululand District Municipality’s ability to continue as a going concern, disclosing, as applicable, matters relating to going concern and using the going concern basis of accounting unless the appropriate governance structure either intends to liquidate the municipality or to cease operations, or has no realistic alternative but to do so.

3
Auditor-general’s responsibilities for the audit of the financial statements
15. My objectives are to obtain reasonable assurance about whether the financial statements as a whole are free from material misstatement, whether due to fraud or error, and to issue an auditor’s report that includes my opinion. Reasonable assurance is a high level of assurance, but is not a guarantee that an audit conducted in accordance with the ISAs will always detect a material misstatement when it exists. Misstatements can arise from fraud or error and are considered material if, individually or in aggregate, they could reasonably be expected to influence the economic decisions of users taken on the basis of these financial statements.
16. A further description of my responsibilities for the audit of the financial statements is included in the annexure to this auditor’s report.
Report on the audit of the annual performance report
Introduction and scope
17. In accordance with the Public Audit Act of South Africa, 2004 (Act No. 25 of 2004) (PAA) and the general notice issued in terms thereof I have a responsibility to report material findings on the reported performance information against predetermined objectives for the selected development priority presented in the annual performance report. I was engaged to perform procedures to raise findings but not to gather evidence to express assurance.
18. I was engaged to evaluate the usefulness and reliability of the reported performance information in accordance with the criteria developed from the performance management and reporting framework, as defined in the general notice, for the infrastructure and services development priority presented on pages xx to xx of the annual performance report of the municipality for the year ended 30 June 2018.
19. The material findings in respect of the usefulness and reliability of the selected development priority are as follows:
KPA 1: Infrastructure and services
20. I was unable to obtain sufficient appropriate audit evidence to support the reported achievement of various targets. This was due to a lack of proper performance management systems and processes that predetermined how the achievement would be measured, monitored and reported. I was unable to confirm the reported achievement of the indicator by alternative means. Consequently, I was unable to determine whether any adjustments were required to the reported achievements in the annual performance report for the following indicators:
Indicator no. Indicator description Reported
achievement
2 Percentage of households with access to basic level of water (Reticulation-new household connections) 1 317
3 Percentage of households earning less than R1 600 pm with access to free water (Note: Rudimentary) 1 579
4 % of households with access to basic level of sanitation as per WSDP 3 132

4
Indicator no. Indicator description Reported
achievement
5 % of households earning less than R1 600 pm with access to free basic sanitation 3 132
Other matter
21. I draw attention to the matter below.
Achievement of planned targets
22. The annual performance report on pages xx to xx includes information on the achievement of planned targets for the year. This information should be considered in the context of the material findings on the usefulness and reliability of reported performance information in paragraph 18 of this report.
Report on the audit of compliance with legislation
Introduction and scope
23. In accordance with the PAA and the general notice issued in terms thereof, I have a responsibility to report material findings on the compliance of the municipality with specific matters in key legislation. I performed procedures to identify findings but not to gather evidence to express assurance.
24. The material findings on compliance with specific matters in key legislation are as follows:
Annual financial statements
25. The financial statements submitted for auditing were not prepared in all material respects in accordance with the requirements of section 122(1) of the MFMA. Material misstatements of disclosures, current and non-current liabilities, current assets, and non-current assets identified by the auditors in the submitted financial statements were subsequently corrected and/or the supporting records were provided subsequently but the uncorrected material misstatements and supporting records that could not be provided resulted in the financial statements receiving a qualified audit opinion.
Revenue management
26. Revenue due to the municipality was not calculated on a monthly basis, as required by section 64(2)(b) of the MFMA.
27. Accounts for municipal charges for municipal services were not prepared on a monthly basis, as required by section 64(2)(c) of the MFMA.
Procurement and contract management
28. Some of the bid documentation for procurement of commodities designated for local content and production, did not stipulated the minimum threshold for local production and content as required by the 2017 preferential procurement regulation 8(2).

5
29. Some of the commodities designated for local content and production, were procured from suppliers who did not submit a declaration on local production and content as required by the 2017 preferential procurement regulations.
30. Some of the commodities designated for local content and production, were procured from suppliers who did not meet the prescribed minimum threshold for local production and content, as required by the 2017 preferential procurement regulation 8(5).
31. Some of the goods and services with a transaction value below R200 000 were procured without obtaining the required price quotations, in contravention of by SCM regulation 17(a) and (c). Similar non-compliance was also reported in the prior year.
32. The preference point system was not applied for some of the procurement of goods and services above R30 000 as required by section 2(a) of the Preferential Procurement Policy Framework Act, 2000 (Act No. 5 of 2000). Similar non-compliance was also reported in the prior year.
Expenditure management
33. Reasonable steps were not taken to prevent irregular expenditure amounting to R107,39 million as disclosed in note 57 to the annual financial statements, as required by section 62(1)(d) of the MFMA. The majority of the irregular expenditure was caused by non-compliance relating to the application of the preference points system and obtaining of quotations.
Human resource management
34. Appropriate systems and procedures to monitor, measure and evaluate performance of staff, were not developed and adopted, as required by section 67(1)(d) of the Local Government: Municipal Systems Act, 2000 (Act No.32 of 2000).
Consequence management
35. Irregular expenditure incurred by the municipality was not investigated to determine if any person is liable for the expenditure, as required by section 32(2)(b) of the MFMA.
36. Fruitless and wasteful expenditure incurred by the municipality was not investigated to determine if any person is liable for the expenditure, as required by section 32(2)(b) of the MFMA.
Strategic planning and performance management
37. The performance management system and related controls were inadequate as it did not specifically describe how the performance measurement processes should be conducted, as required by municipal planning and performance management regulation 7(1).
Other information
38. The accounting officer is responsible for the other information. The other information comprises the information included in the annual report. The other information does not include the financial statements, the auditor’s report and the selected development priority presented in the annual performance report that have been specifically reported in this auditor’s report.

6
39. My opinion on the financial statements and findings on the reported performance information and compliance with legislation do not cover the other information and I do not express an audit opinion or any form of assurance conclusion thereon.
40. In connection with my audit, my responsibility is to read the other information and, in doing so, consider whether the other information is materially inconsistent with the financial statements and the selected development priority presented in the annual performance report, or my knowledge obtained in the audit, or otherwise appears to be materially misstated.
41. I did not receive the other information prior to the date of this auditor’s report. When I do receive and read this information, if I conclude that there is a material misstatement therein, I am required to communicate the matter to those charged with governance and request that the other information be corrected. If the other information is not corrected, I may have to retract this auditor’s report and re-issue an amended report as appropriate. However, if it is corrected this will not be necessary.
Internal control deficiencies
42. I considered internal control relevant to my audit of the financial statements, reported performance information and compliance with applicable legislation; however, my objective was not to express any form of assurance on it.
43. The matters reported below are limited to the significant internal control deficiencies that resulted in the basis for the qualified opinion, the findings on the performance report and the findings on compliance with legislation included in this report.
44. Leadership did not exercise adequate oversight responsibility regarding financial and performance reporting and compliance with legislation. In this regard, the accounting officer did not design appropriate policies and procedures to support the achievement of credible reporting and compliance with legislative requirements.
45. Management did not diligently undertake routine monthly reconciliations and reviews, to support amounts reported in the financial statements and the annual performance report. This was due to management not fully understanding the requirements of the financial and performance reporting frameworks as well as poor records management.

7
Annexure – Auditor-general’s responsibility for the audit
1. As part of an audit in accordance with the ISAs, I exercise professional judgement and maintain professional scepticism throughout my audit of the financial statements, and the procedures performed on reported performance information for selected development priority and on the municipality’s compliance with respect to the selected subject matters.
Financial statements 2. In addition to my responsibility for the audit of the financial statements as described in this
auditor’s report, I also:
identify and assess the risks of material misstatement of the financial statements whether due to fraud or error, design and perform audit procedures responsive to those risks, and obtain audit evidence that is sufficient and appropriate to provide a basis for my opinion. The risk of not detecting a material misstatement resulting from fraud is higher than for one resulting from error, as fraud may involve collusion, forgery, intentional omissions, misrepresentations, or the override of internal control
obtain an understanding of internal control relevant to the audit in order to design audit procedures that are appropriate in the circumstances, but not for the purpose of expressing an opinion on the effectiveness of the municipality’s internal control
evaluate the appropriateness of accounting policies used and the reasonableness of accounting estimates and related disclosures made by the accounting officer
conclude on the appropriateness of the accounting officer’s use of the going concern basis of accounting in the preparation of the financial statements. I also conclude, based on the audit evidence obtained, whether a material uncertainty exists related to events or conditions that may cast significant doubt on the Zululand District Municipality’s ability to continue as a going concern. If I conclude that a material uncertainty exists, I am required to draw attention in my auditor’s report to the related disclosures in the financial statements about the material uncertainty or, if such disclosures are inadequate, to modify the opinion on the financial statements. My conclusions are based on the information available to me at the date of this auditor’s report. However, future events or conditions may cause a municipality to cease continuing as a going concern
evaluate the overall presentation, structure and content of the financial statements, including the disclosures, and whether the financial statements represent the underlying transactions and events in a manner that achieves fair presentation
Communication with those charged with governance 3. I communicate with the accounting officer regarding, among other matters, the planned scope
and timing of the audit and significant audit findings, including any significant deficiencies in internal control that I identify during my audit.
4. I also confirm to the accounting officer that I have complied with relevant ethical requirements regarding independence, and communicate all relationships and other matters that may reasonably be thought to have a bearing on my independence and, where applicable, related safeguards.

C
C. AUDIT ACTION PLAN

No Nature of Finding Audit Finding Action to address audit finding Responsible Official Due Date1 Revenue from exchange transactions Consumers active on Venus system but not billedOn a monthly basis a report will be generated from the financial system to identify all active consumers that are not billed then the system will be updated with estimates. A project to implement new water meters has been awarded. Installation will depend on availability of funding.Chief Financial Officer Ongoing
2 Water losses Limitations in calculation of water losses disclosed in note 59 Water Conservation and Demand ManagementBusiness Plans are in place to address issues ofwater losses. A projects to collect database and toinstall water meters is bieng finalised. The Tender hasbeen awarded. Budget is being sourced to attend toinstallation.Director: Planning and Development Ongoing
3 Annual financial statement - Material misstatements. Material misstatements in the annual financial statements submitted for audit All the identified misstatement will be corrected and amount be adjusted on the amended set of AFS. Chief Financial Officer 12/11/20184 Expenditure management. Irregular and fruitless and wasteful expenditure not prevented Management will review the current existing controls in procurement and implement additional stringent controls over procurement and expenditure management. Investigations will be conducted and the condonment sourced from National treasuryChief Financial Officer Ongoing
5 Human resource management. Performance management not implemented for employees other than senior managers (Repeat) Performance management systems for all staff below level of S57 Managers will be implemented during 2018/19 financial year. HOD Corporate services Ongoing6 Consequence management. Irregular, fruitless and wasteful expenditure not investigated Management will institute Section 32 investigations on any UIFW expenditure identified in future. Chief Financial Officer Ongoing7 Procurement and contract management - commodities did not meet minimum threshold for local production and content.Winning service providers did not meet the minimum threshold for local production and content Tender Document compliance checklist will be implemented. Management will institute Section 32 investigations on any UIFW expenditure identified in future. Chief Financial Officer Ongoing
8 Procurement and contract management - minimum threshold for local production and content was not stipulated.Minimum threshold for local production and content not specified CFO will ensure that minimum threshold for local production and content is specified in all formal quotation invitations. Chief Financial Officer 12/11/2018
9 Procurement and contract management - Preferential Points System. Preference points system not applied for award of security services Stringent controls will be implemented to ensure compliance with all applicable legislation regarding procurement of goods and services. Chief Financial Officer Ongoing10 Procurement and contract management - evaluation of tenders not fair, equitable and transparent. Evaluation of tenders not fair, equitable andtransparent Irregular Expenditure note 56 of the AFS was amended to include the identified irregular expenditure.CFO will perform detailed review of all evaluation reports to ensure all evaluations are fair. Any UIFW will be investigated and reported accordingly for consequence management.Chief Financial Officer Ongoing
11 Non-compliance with legislation. Suppliers in which spouses of employees or councilors have an interest. Necessary disclosure of Awards made to close family members of person in the service of the state was provided in AFS Note 57. Chief Financial Officer 10/11/201812 Procurement and contract management - contravention of SCM Regulations for transactions below R200 000. Limitation and irregular expenditure in the awarding of ZDMQ-0165-05-2018. CFO will review the records of all awards before Annual Financial Statements are submitted for audit purposes to ensure that all irregular awards are disclosed as Irregular Expenditure. Chief Financial Officer 12/11/201813 Strategic planning and performance management. Completed projects as per the completed projects in the asset register not included in the annual performance report. The annual performance was revised to consider the items that were omitted by mistake. Director: Technical Services 07/11/201814 Infrastructure and services. Limitation of scope on Audit of Pre-determined Objectives (AOPO). The database for all communities that received waterwill be populated using ISD officers to reconcile thetotal number of beneficiaries as per project scope andthe beneficiaries that are receiving water andsanitation.
Director: Technical Services &Director: Planning and Development Ongoing
MANAGEMENT ACTION PLAN TO ADDRESS AUDIT REPORT FINDINGS.

D
D. ANNUAL PERFORMANCE REPORT
0 | P a g e
ZULULAND DISTRICT MUNICIPALITY ANNUAL PERFORMANCE REPORT 2017/2018 August 30 8
This report is prepared according to section 46 of the Municipal Systems Act. The report forms part of the annual report of the Zululand District Municipality

ZULULAND DISTRICT MUNICIPALITY ANNUAL PERFORMANCE REPORT 2017/2018 8
1 | P a g e
TABLE OF CONTENTS LEGISLATIVE BACKGROUND ................................................................................................................ 2 PERFORMANCE MANAGEMENT FRAMEWORK .................................................................................. 5 PERFORMANCE ANALYSIS ................................................................................................................. 12 CONCLUSION ..................................................................................................................................... 13 ANNEXURES ...................................................................................................................................... 14
ZULULAND DISTRICT MUNICIPALITY ANNUAL PERFORMANCE REPORT 2017/2018 8
2 | P a g e
LEGISLATIVE BACKGROUND The Constitution of the Republic of South Africa, Act 108 of 1996: Section 152(1) of the Constitution prescribes that the objects of local government are: (a) To provide democratic and accountable government for local communities; (b) To ensure the provision of services to communities in a sustainable manner; (c) To promote social and economic development; (d) To promote a safe and healthy environment; and (e) To encourage the involvement of communities and community organizations in the matters of local government. Section (152) (2) further states that: A u i ipality ust strive, within its financial and administrative capacity, to achieve the objects set
out i su se tio 1 . Municipal Systems Act (Act No 32 of 2000) Chapter 6 of the Municipal Systems Act, and specifically Sections 38 to 49, deal with organisational performance management. These legislative mandates require of all municipalities to: Development of a performance management system; Monitoring and review of performance management system; Setting of key performance indicators and performance targets, Publish an annual report on performance for the benefit of the communities served by the Municipality; Incorporate and report on a set of general key performance indicators prescribed nationally by the Minister responsible for local government; Auditing of performance measurement both internally and externally; Annual reporting on performance.

ZULULAND DISTRICT MUNICIPALITY ANNUAL PERFORMANCE REPORT 2017/2018 8
3 | P a g e
Chapter 7 of the Municipal Systems Act deals with local public administration and human resources. In particular, section 57 of this Chapter requires that the Municipal Manager and those officials reporting directly to the Municipal Manager (i.e Section 57 employees) sign annual performance agreements. An individual performance plan must be attached to the performance agreement and it must include a set of performance measures that will enable actual performance of individuals to be assessed against planned performance. Local Government: Municipal Planning and Performance Management Regulations, 2001 These Regulations were passed by the Minister responsible for local government in terms of Section 49 of the Municipal Systems Act. These Regulations spell out the performance management responsibilities of municipalities in more detail. They deal with: The nature of the PMS; The adoption of the PMS; The setting of key performance indicators; The general key performance indicators published by the Minister, which reflect the object of developmental local government; The review of key performance indicators; Setting of performance targets; Monitoring, measurement and review of performance; Internal auditing of performance measurements; and Community participation. The regulations further instruct a municipality to ensure that its performance management system: Complies with the requirements of the Act; Demonstrates how the system will operate and be managed from the planning stage up to the stages of performance and reporting; Clarifies the roles and responsibilities of each role player, including the local community, in the functioning of the system; Determines the frequency of reporting and the lines of accountability for performance; Relates to the u i ipalit ’s e plo ee pe fo a e a age e t p o esses;

ZULULAND DISTRICT MUNICIPALITY ANNUAL PERFORMANCE REPORT 2017/2018 8
4 | P a g e
P o ides fo the p o edu e hi h the s ste is li ked to the u i ipalit ’s I teg ated Development Planning processes; A performance management system must be adopted before or at the same time as the commencement by the municipality of the process of setting key performance indicators and targets in accordance with its integrated development plan. The implementation of the performance management framework should allow the municipality to collect, process, organize, analyse, audit, reflect and report on performance information. It should also allow the municipality to take practical steps to improve its performance. Local Government: Municipal Performance Regulations for Municipal Managers and Managers Directly Accountable to Municipal Managers, 2006:
These egulatio s p es i e ho the pe fo a e of u i ipal a age s a d a age s’ di e tl accountable to municipal managers must be directed, monitored and improved. The regulations include the following: (i) Chapter 2: requirements and provisions of employment contracts; (ii) Chapter 3: performance agreements, including prescribed key performance a eas KPA’s a d o e o pete e ui e e ts CCR’s ; (iii) Chapter 4: the content of a job description for municipal managers. The Municipal Finance Management Act 56 of 2003 The following provisions from the Municipal Finance Management Act (MFMA) relate largely to the PMS of the municipality: (i) Se tio 3 ii of the A t e ui es that the u i ipalit ’s Se i e Delivery and Budget Implementation Plan (SDBIP) is approved by the Mayor within 28 days after the approval of the budget; (ii) Section 53(1)(c)(iii) requires the Mayor to ensure that the performance agreements of Section 57 employees comply with the requirements of the MSA in that they promote sound financial management and that they are linked to measurable performance objectives approved with the budget and included in the SDBIP; (iii) Section 72 of the Act requires the accounting officer of the municipality to submit a mid-year budget and performance assessment by the 25 January each year. The assessment must include:

ZULULAND DISTRICT MUNICIPALITY ANNUAL PERFORMANCE REPORT 2017/2018 8
5 | P a g e
(a) The monthly budget statements, of the first 6 months of the financial year, as required in terms of Section 71 of the MFMA. o The u i ipalit ’s se i e deli e pe fo a e, fo the fi st o ths of the financial year, against targets and indicators as set out in the
u i ipalit ’s app o ed SDBIP. o Progress on resolving problems ide tified i the past ea ’s a ual report; o An assessment of the performance of every municipal entity taking into account reports in terms of Section 88 of the Act. (iv) Section 127(2) of the Act requires the Mayor to, within seven months after the end of the financial year, table in the municipal Council the annual report of the municipality and of any municipal entity under the
u i ipalit ’s sole o sha ed o t ol; (v) Section 129 (1) requires the Council of a municipality to consider the annual report of the municipality and of any municipal entity under the u i ipalit ’s sole o sha ed o t ol, a d o late tha t o o ths f o the date on which the annual report was tabled in the Council in terms of section 127, adopt an oversight report containing the ou il’s o e ts on the annual report, which must include a statement whether the Council-
Has approved the annual report with or without reservations; Has rejected the annual report; or Has referred the annual report back for revision of those components that can be revised. THE PERFORMANCE MANAGEMENT FRAMEWORK OVERVIEW In terms of the Municipal Systems Act No 32 of 2000, a municipality must document and approve internal policies and procedures to address planning, monitoring and reporting processes, events

ZULULAND DISTRICT MUNICIPALITY ANNUAL PERFORMANCE REPORT 2017/2018 8
6 | P a g e
pertaining to performance information and steps to improve performance information and steps to improve performance. The PMS Framework 2017/2022 was tabled and adopted by Council end of March 2017. The Framework captures the current state of performance management in the municipality, sets out the planning, monitoring and reporting process as well as defining roles and responsibilities that must be adhered to by Heads of Department, Section Heads and other staff. ZDM’s PMS s ste fo uses o sele ted KPI’s ke pe fo a e i di ato s . The KPI’s fa ilitate measurement and monitoring of progress that is made by implementing specific projects/initiatives, i p io itized st ategi a eas illust ated i Figu e . Si e the e a e u e ous KPI’s, KPI’s a e selected and finalized using the Balanced Score Card technique so that all of the four perspectives are represented. The four perspectives are: 1. Financial perspective which addresses budget, spending and Return on investment: E.g. operating margins, Budget Spent on capital expenditure and infrastructure 2. Customer perspective, which addresses customer satisfaction, relationships and customer demand: E.g. Customer satisfaction, Customer response time to queries, 3. Business process perspective, which addresses quality, timeliness and cost: E.g. Plant down times, processing cost, water quality level 4. Learning & Growth/Innovation Perspective, which addresses technologies, training, competencies, culture :E.g. Investments in people, information technology and organizational procedures to prepare the organization for success in the future ACCOUNTABILITY STRUCTURES The diagram below demonstrates the structures involved in the process management system.

7 | P a g e
Council
EXCO
Municipal Manager
Manco
Performance Audit
Committee
Internal Audit
ZDM Rep Forum
CFO
Accountability Framework for Performance Implementation, Monitoring and Review
IDP Manager
Project Task Teams Reporting to each HOD
ZDM (IDP) Planners
Forum
Finance
Corporate
Services
Planning
Technical Services
Community and
Social Services
Mayor
External Audit
Auditor General
Zululand District Municipality
Local Municipalities
(, Abaqulusi, eDumbe, umPhongola,
Nongoma, Ulundi
Private Sector /Chamber Of
Commerce
(ZAC Mine)
Financial/Banking Sector
Provincial and Local Government
Sectors (Education, Land Affairs,
Water and Forestry, Housing, Social
Welfare, Transport, Environmental
Affairs and Tourism, DPLGTA)
NGO’s, Community workers
(Aids Foundation of SA)
Various Significant Stakeholders
(Amafa KZN, Ezemvelo, Ophathe-
eMakhosini
External Stakeholders
Oversight Role
Portfolio Committee
Disaster
Management,
Health and safety
Finance and
Budget Portfolio
LED and Tourism
Portfolio
Community and
Social
Development
Capex and Water
Provision
Planning and GIS
Local Labour
Forum

8 | P a g e
PERFORMANCE MANAGEMENT PROCESS Performance planning commences with the development or review of the Integrated Development Plan, at the beginning of the term of council or as part of the annual review of the IDP. The IDP in fact constitutes an important part of the PMS and it is important to integrate the work done during the review of the IDP into the PMS and to ensure that the PMS is an extension of the IDP – it is the tool that is used for monitoring the implementation of the IDP. The municipal council will, as prescribed in its IDP process plan, adopt: The PMS framework; The municipal strategic balanced scorecard which outlines IDP priorities and objectives; Service Delivery and Budget Implementation Plans (SDBIPs) which outlines municipal initiatives, programmes, projects, services, key performance indicators, performance targets and budget summaries. The municipality must involve the community in the development of the performance management system, setting of KPIs and performance targets in accordance with section 9 and 15 of the Local Government: Municipal Planning and Performance Management Regulations, 2001. The procedures and dates listed in the table below indicate thestandard implementation procedures of the IDP and Performance Management in each financial year.

9 | P a g e
Accountability Action Deadline CFO Ensure vote structure supports reporting and t a ea ilit to KPI’s Allocate approved budget to vote numbers 30 Jul
CFO (delegated by MM) Set up internal audit and performance audit committees schedule Ensure that TOR is reviewed and is relevant for internal audit and Performance Audit Committee 01 August
HOD’s Capture project information in IMPI i.e. project description, vote number, KPI Number, planned quarterly milestones, estimated budget expenditure per quarter 01st of July, ongoing HOD’s Implement strategies, projects or initiatives for KPI 01 July to 30 June CFO Provide Monthly report to MM 7 days from month end MM Provide Monthly report to mayor and provincial treasury Statement in prescribed format on state of budget reflecting details for the month and year-to-date, including projections for rest of year as required by section 87, MFMA
10 working days from month end Mayor review monthly reports and only report to council if there are material deviations from the budget and SDBIP 10 working days from month end HOD Review and assess quarterly KPI performance. Identifying and implementing process improvement initiatives. 10 working days from month end for the quarter HOD Ensuring that portfolio of evidence is routinely collected. Make evidence available to internal audit.
10 working days from month end for the quarter CFO Produce and submit quarterly reports on performance to MM 7 days from month end for the quarter
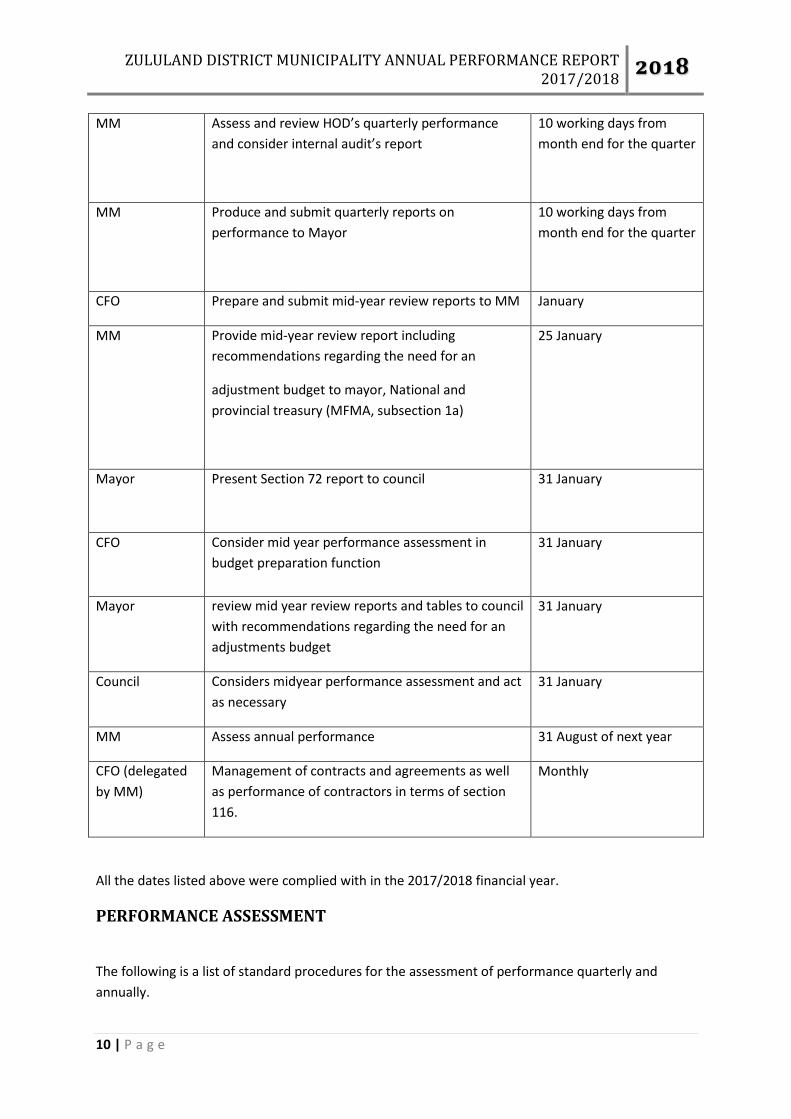
ZULULAND DISTRICT MUNICIPALITY ANNUAL PERFORMANCE REPORT 2017/2018 8
10 | P a g e
MM Assess a d e ie HOD’s ua te ly performance a d o side i te al audit’s epo t 10 working days from month end for the quarter MM Produce and submit quarterly reports on performance to Mayor 10 working days from month end for the quarter CFO Prepare and submit mid-year review reports to MM January MM Provide mid-year review report including recommendations regarding the need for an adjustment budget to mayor, National and provincial treasury (MFMA, subsection 1a)
25 January Mayor Present Section 72 report to council 31 January CFO Consider mid year performance assessment in budget preparation function 31 January Mayor review mid year review reports and tables to council with recommendations regarding the need for an adjustments budget 31 January Council Considers midyear performance assessment and act as necessary 31 January MM Assess annual performance 31 August of next year CFO (delegated by MM) Management of contracts and agreements as well as performance of contractors in terms of section 116. Monthly All the dates listed above were complied with in the 2017/2018 financial year. PERFORMANCE ASSESSMENT The following is a list of standard procedures for the assessment of performance quarterly and annually.

ZULULAND DISTRICT MUNICIPALITY ANNUAL PERFORMANCE REPORT 2017/2018 8
11 | P a g e
1. Performance will be measured and evaluated annually. 2. The performance assessment consists of two components, both of which must be contained in the performance agreement. The employee is assessed against both components, with a weighting of 80: 20 allocated to the Key Performance Areas (KPAs) and the Critical Leading Competencies (CLCs), respectively. 3. The e plo ee's assess e t ill e ased o his o he pe fo a e of the KPI’s that a e associated to a KPA. 4. In the case of managers directly accountable to the municipal manager, key performance areas related to the functional area of the relevant manager, must be subject to negotiation between the municipal manager and the relevant manager. 5. The CLCs will make up the other 20% of the employee's assessment score. 6. The performance of the employee in relation to his or her performance agreement is reviewed quarterly, with the understanding that reviews in the first and third quarter may be verbal if performance is satisfactory. 7. ZDM does a written assessment of the mid-year review and annual assessment meetings. 8. Performance feedback is based on the employer's assessment of the employee's performance. 9. The employer will be entitled to review and make reasonable changes to the provisions of the performance plan from time to time for operational reasons on agreement between both parties. 10. Calculation of scorecards: 11. KPI’s a e s o ed pe KPA, he e ea h KPA is eighted a d the total of the KPA weightings =1 KPA Score = KPA weighting * % KPI for associated KPA, where % KPI = Total of the KPI ati gs fo the easu ed KPI’s where rating ranges from of 1 to
/ u e of KPI’s fo the KPA *3 , si e 3 ep ese ts %. CLC Score = Sum of (CLC weighting *%CLC), where % CLC = CLC rating (1-5) /3 Performance Assessment Calculation = 0.8 * KPA score + 0.2 Competency Requirement Score Each KPI is evaluated according the following criteria: S = Specific Is the measure clear and focused to avoid misinterpretation? It should include measurement assumptions and definitions, and should be easily interpreted.
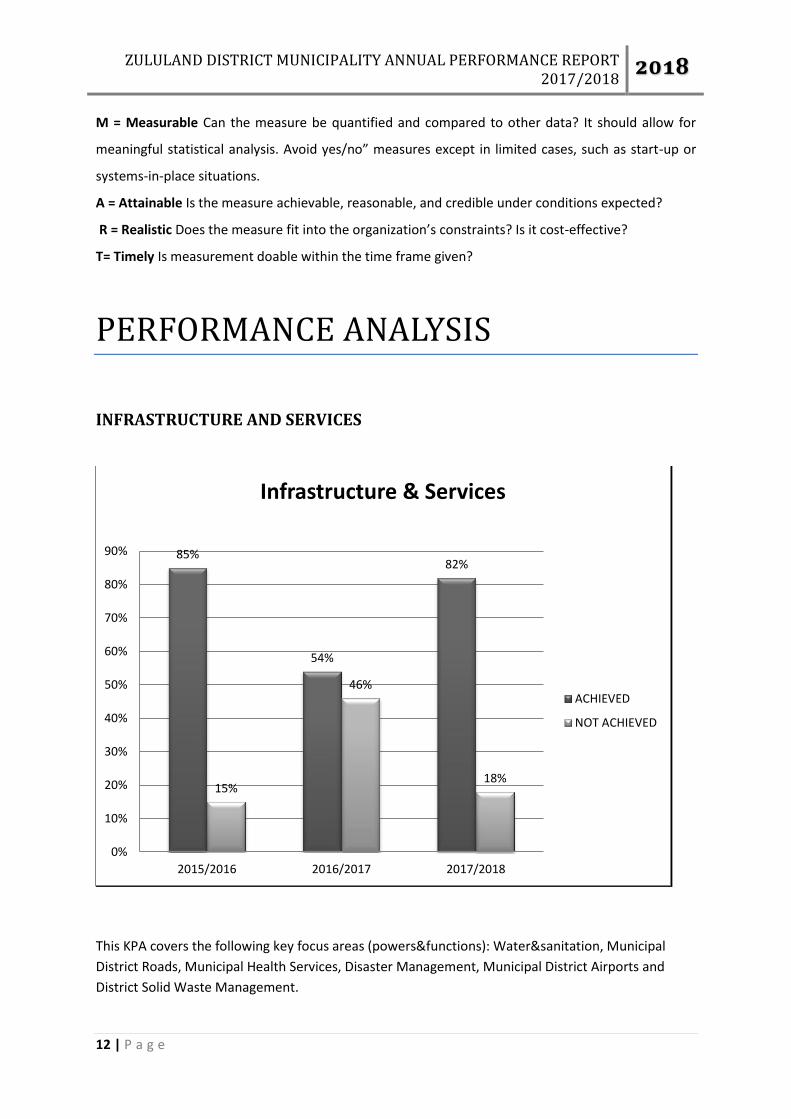
ZULULAND DISTRICT MUNICIPALITY ANNUAL PERFORMANCE REPORT 2017/2018 8
12 | P a g e
M = Measurable Can the measure be quantified and compared to other data? It should allow for ea i gful statisti al a al sis. A oid es/ o” easu es e ept i li ited ases, su h as sta t-up or systems-in-place situations. A = Attainable Is the measure achievable, reasonable, and credible under conditions expected? R = Realistic Does the easu e fit i to the o ga izatio ’s o st ai ts? Is it ost-effective? T= Timely Is measurement doable within the time frame given? PERFORMANCE ANALYSIS INFRASTRUCTURE AND SERVICES
This KPA covers the following key focus areas (powers&functions): Water&sanitation, Municipal District Roads, Municipal Health Services, Disaster Management, Municipal District Airports and District Solid Waste Management.
85% 54%
82%
15% 46%
18% 0%10%20%30%40%50%60%70%80%90%
2015/2016 2016/2017 2017/2018
Infrastructure & Services ACHIEVEDNOT ACHIEVED

ZULULAND DISTRICT MUNICIPALITY ANNUAL PERFORMANCE REPORT 2017/2018 8
13 | P a g e
In 2015/16 the Zululand District Municipality achieved 85% for Infrastructure, 54% in 2016/17 and 82% in 2017/18. One of the core functions of the municipality is to provide bulk water and sanitation. The significant decline in 2016/17 came as a result of the protracted drought experienced due to climate change across the country. It can be observed from the graph above that the common service delivery trend however returned to normal in the 2017/2018 financial year. Despite the massive funding shortfall in relation to the capital investment framework for water&sanitation infrastructure, service delivery continued at a reasonably high rate to communities around Zululand. All targets were met in respect of disaster management. With regards to municipal district roads, the allocation and gazetting of roads belonging to the district is still in process and cannot therefore perform this function. There are no regional solid waste sites. There is one municipal district airport based in Ulundi operated and maintained by the municipality. There are no significant issues impacting on performance during this period. SOCIAL DEVELOPMENT& LOCAL ECONOMIC DEVELOPMENT This KPA contains the following focus areas: social development and LED.
100% 100% 100%
0%20%40%60%80%100%120%
2015/2016 2016/2017 2017/2018
Local Economic Development & Social Development ACHIEVEDNOT ACHIEVED

ZULULAND DISTRICT MUNICIPALITY ANNUAL PERFORMANCE REPORT 2017/2018 8
14 | P a g e
All targets were achieved in this KPA which includes indicators the measure policy development, job creation, creating community awareness, quality of life and inspections. No challenges are recorded. MUNICIPAL FINANCIAL VIABILITY AND MANAGEMENT
Performance in term of this KPA has been consistent over the past 3 financial years. Key challenges include clearing of audit queries, debtor management and supply chain procurement appeals. In order to rectify the latter, the municipality has made provision for senior Procurement Personnel to beef up the SCM unit in the 2018 financial year. Debt recovery services have been procured to assist the municipality to recover debt from the community and stakeholders. Controls have been strengthened to limit the number of recurrent issues in audit assessments. A legal person has also been appointed by the municipality in the current financial year to assist with legal advice. DEMOCRACY & GOOD GOVERNANCE
87% 87% 85%
13% 13% 15% 0%10%20%30%40%50%60%70%80%90%100%
2015/2016 2016/2017 2017/2018
Municipal Financial Viability & Management ACHIEVEDNOT ACHIEVED

ZULULAND DISTRICT MUNICIPALITY ANNUAL PERFORMANCE REPORT 2017/2018 8
15 | P a g e
The slump in performance registered in the 2016/17 financial year was as a result of the vacancies experienced after the third quarter when senior manager contracts were not renewed. The risk management plan was also not submitted to the Municipal Manager as per target. In the 2017/18 financial year second quarter, all senior manager posts were filled. MUNICIPAL TRANSFORMATION AND INSTITUTIONAL DEVELOPMENT In 2015/16 and 2016/17, the municipality did not perform well in terms of utilising the budget allocated for skills development due to oversight. In 2017/18 the target was achieved.
100% 80% 100%
0% 20% 0% 0%20%40%60%80%100%120%
2015/2016 2016/2017 2017/2018
Democracy & Governance ACHIEVEDNOT ACHIEVED

ZULULAND DISTRICT MUNICIPALITY ANNUAL PERFORMANCE REPORT 2017/2018 8
16 | P a g e
PERFORMANCE OF SERVICE PROVIDERS The performance of service provider performance is monitored via Service Level Agreements signed between the municipality and service providers. The end user department in the municipality providesmonthly reports to the SCM unit. Service providers who fail to perform are reported to SCM and the necessary action is taken including the termination of the contract or cancellation of an order when all remedial measures fail. Performance in the 2015/16 financial year was mostly satisfactory and good. Performance of service p o ide s di e tl affe ts the u i ipalit ’s pe fo a e the efo e here remedial measures failed, the service provider services were terminated. In 2016/17 controls were applied more effectively and service provider performance improved. There were lesser satisfactory performances although terminations increased. In the year under review, service providers performed better followed by satisfactory performance and closed by poor performance. Controls will continue to be applied and monitoring closely to ensure that service delivery to communities is not disadvantaged.
88% 88% 100%
12% 12% 0% 0%20%40%60%80%100%120%
2015/2016 2016/2017 2017/2018
Municipal Transformation & Institutional Development ACHIEVEDNOT ACHIEVED

ZULULAND DISTRICT MUNICIPALITY ANNUAL PERFORMANCE REPORT 2017/2018 8
17 | P a g e
CONCLUSION Overall the performance of the Zululand District Municipality improved from 83% to 88% between the 2016/17 and 2017/18 financial year.
The performance was audited by PricewaterHouse Coopers in July and August 2018. The Annual Performance Report was tabled to the Audit Committee on the 24th August 2018. The performance of the 2017/18 will be used to adapt the strategic plan and monitoring and evaluation framework of the Zululand District Municipality for the 2018/2019 financial year as well as the strategic direction for the 2019/2020 financial year.
Zululand District Municipality Annual Performance Targets 2016/2017 Achieved 83%Not achieved 17%Zululand District Municipality Annual Performance Targets 2017/2018
Achieved 88%Not Achieved12%

ZULULAND DISTRICT MUNICIPALITY ANNUAL PERFORMANCE REPORT 2017/2018 8
18 | P a g e
ANNEXURES

ZULULAND DISTRICT MUNICIPALITY ANNUAL PERFORMANCE REPORT 2017/2018 8
19 | P a g e
ZULULAND ANNUAL PERFORMANCE REPORT 2017/2018
1 - National KPA: Infrastructure and Services
Focus Area:Infrastructure and Services
KPI No
Baseline (2016/2017)
Quarter 1 Quarter 2 Quarter 3 Quarter 4 2017/2018
2017/2018 Comment/ Reason
for variance/ Measures
to Improve
Program Driver
Objective Indicator Tagert Actual Target Actual Target Actual Target Actual Target Actual Annual Target
Annual Actual
Status
HOD (P) Review and facilitate the District WSDP
Final 2018/2019 WSDP submitted to Council for approval by specified date
1 30/06/2017
30/05/2017
Not measured this quarter
Not measured this quarter
30/03/2018
26/03/2018
30/06/2018
30/05/2018
30/06/2018
30/05/2018
Achieved
HOD (TS)
Ensuring universal access to water & sanitation
Percentage of households with access to basic level of water (Reticulation-new household connections)
2 0.76 0.74 0.17 0.16 0.16 0.32 0.24 0.09 0.17 0.15 0.76 0.72 Not Achieved
Note that % is
calculated based on 183 177 as the
Number of household
s within the
District. Achieved for the 4th Q is 268

ZULULAND DISTRICT MUNICIPALITY ANNUAL PERFORMANCE REPORT 2017/2018 8
20 | P a g e
HOD (TS)
Ensuring universal access to water & sanitation
Percentage of households earning less than R1600 pm with access to free water (Note: Rudimentary)
3 0.31 0.29 0.06 0.00 0.06 0.00 0.08 0.00 0.09 1.90 0.29 1.90 Achieved
HOD (TS)
Ensuring universal access to water & sanitation
Percentage of households with access to basic level of sanitation as per WSDP
4 2.47 0.95 0.31 0.00 0.44 0.34 0.76 1.01 0.95 0.35 2.47 1.70 Not Achieved
Note that % is
calculated based on 183 177 as the
Number of household
s within the
District. Achieved for the 4th Q is 647 and the
target was not
achieved because
implementation
commenced at the beginning of the 2nd
Q

ZULULAND DISTRICT MUNICIPALITY ANNUAL PERFORMANCE REPORT 2017/2018 8
21 | P a g e
HOD (TS)
Ensuring universal access to water & sanitation
Percentage of households earning less than R1600 pm with access to free basic sanitation
5 2.47 0.95 0.31 0.00 0.44 0.34 0.76 1.01 0.95 0.35 2.47 1.70 Not Achieved
Note that % is
calculated based on 183 177 as the
Number of household
s within the
District. Achievedfor the 4th Q is 647 and the
target was not
because implement
ation commenced at the beginning of the 2nd
Q
HOD (TS)
Improve water quality
Number of water quality tests conducted as per the approved strategy
6 1836.00
1773 459.00 502.00 459.00 566.00 459.00 480.00 459.00 495.00 1836.00
2043 Achieved
HOD (Co)
To develop business plans to secure capital to implement refurbishment and rehabilitation of airport infrastruct
Business plan to secure capital to implement refurbishment and rehabilitation of airport infrastructure submitted to MM by
7 N/A N/A 30/09/2017
30/12/2017
30/03/2018
29/03/2018
30/06/2018
28/05/2018
30/06/2018
28/05/2018
Achieved

ZULULAND DISTRICT MUNICIPALITY ANNUAL PERFORMANCE REPORT 2017/2018 8
22 | P a g e
ure 30 Jun 2018
HOD (Co)
To make the airport functional and viable
Advertise for expression of interest towards making the airport functional by 30/03/2018
8 N/A N/A 30/09/2017
13/09/2017
30/11/2017
13/12/2017
30/03/2018
30/03/2018
18/01/2018
Achieved
HOD (Co)
Review Disaster Management Plan
Final 2018/2019 Disaster Management Plan submitted to Council for approval by 30 Jun 2018
9 30/06/2017
15/06/2017
30/09/2017
30/12/2017
21/02/2018
30/03/2018
26/03/2018
30/06/2018
30/05/2018
30/06/2018
30/05/2018
Achieved
HOD (Co)
To ensure effective maintenance of Fleet
09 vehicles purchased by 30 March 2018
10 N/A N/A 30/09/2017
14/09/2017
20/12/2017
23/11/2017
30/03/2018
23/11/2017
30/06/2018
26/06/2018
30/06/2018
26/06/2018
Achieved
HOD (Co)
To ensure education, training & public awareness of Disaster
20 Disaster Management Awareness campaign
11 10.00 63.00 5.00 9.00 5.00 7.00 5.00 12.00 5.00 5.00 20.00 33 Achieved

ZULULAND DISTRICT MUNICIPALITY ANNUAL PERFORMANCE REPORT 2017/2018 8
23 | P a g e
Management
s held by 30 Jun 2018
HOD (Co)
To ensure education, training & public awareness of Disaster Management
1 Disaster Management Workshop held by 31 December 2017
12 N/A N/A Not measured this quarter
31/12/2017
07/11/2017
Not measured this quarter
Not measured this quarter
31/12/2017
07/11/2017
Achieved
HOD (Co)
To ensure education, training & public awareness of Disaster Management
4 Disaster Management Forums held by 30/06/2018
13 4 4 1.00 1.00 1.00 2.00 1.00 1.00 1.00 1.00 4.00 4.00 Achieved
HOD (P); HOD (CS); HOD (CO); CFO
To maximise the implementation of IDP identified projects
Percentage of a municipality's budget actually spent on identified projects for a particular financial year in terms of the municipality's IDP
14 100.00 %
100.00 %
20.00 19.00 30.00 38.00 70.00 67.11 100.00 100.00 100.00 98.33 Achieved

ZULULAND DISTRICT MUNICIPALITY ANNUAL PERFORMANCE REPORT 2017/2018 8
24 | P a g e
HOD (CS)
To develop a Municipal Environmental Health Strategy
Develop Municipal Health Strategy by 30 June 2018
15 N/A N/A Not measured this quarter
Not measured this quarter
30/03/2018
01/01/2018
30/06/2018
29/06/2018
30/06/2018
30/05/2018
Achieved
HOD (CS)
Implement food production compliance
Number of food production site inspection reports produced per quarter
16 48.00 122.00 25.00 39.00 25.00 26.00 25.00 82.00 20.00 30.00 95.00 158.00 Achieved
HOD (CS)
Enhance mortuary compliance
Number of mortuary inspection reports produced per quarter
17 48.00 51.00 12.00 12.00 12.00 14.00 12.00 20.00 12.00 26.00 44.00 72.00 Achieved
2 - National KPA : Economic, Agriculture & Tourism
Focus Area: Economic, Agriculture & Tourism
Baseline (2016/2017)
Quarter 1 Quarter 2 Quarter 3 Quarter 4 2017/2018
2017/2018
Program Driver
Objective Indicator KPI No
Tagert Actual Target Actual Target Actual Target Actual Target Actual Annual Target
Annual Actual
Status
Comment/ Reason
for variance/ Measures
to Improve
HOD (CS)
Co-Ordinated and Integrated Regional Economic
Final 2018/2019 LED Strategy submitted to Council
18 30/06/2017
30/05/2017
Not measured this quarter
Not measured this quarter
30/03/2018
30/03/2018
30/06/2018
29/06/2018
30/06/2018
30/05/2018
Achieved

ZULULAND DISTRICT MUNICIPALITY ANNUAL PERFORMANCE REPORT 2017/2018 8
25 | P a g e
Development
by specified date
HOD (CS)
Co-Ordinated and Integrated Regional Economic Development
Number of tourism awareness and training workshops held per year
19 8.00 7.00 2.00 3.00 2.00 3.00 2.00 3.00 2.00 3.00 8.00 12.00 Achieved
HOD (CS)
Co-Ordinated and Integrated Regional Economic Development
Number of Tourism forums held per quarter
20 N/A N/A 1.00 1.00 1.00 1.00 1.00 1.00 1.00 1.00 4.00 4.00 Achieved
HOD (CS)
Effectively co-ordinate LED in the District
Number of LED ward projects implemented
21 200.00 200.00 Not measured this quarter
Not measured this quarter
Not measured this quarter
200.00 200.00 200.00 200.00 Achieved
HOD (TS)
Effectively co-ordinate LED in the District
Number of jobs created through LED initiatives and capital projects
22 200.00 1523.00
50.00 268.00 50.00 79.00 50.00 871.00 50.00 2027.00
200.00 3245 Achieved
3 - National KPA: Social Development
Focus Area: Social Development
Baseline (2016/2017)
Quarter 1 Quarter 2 Quarter 3 Quarter 4 2017/2018
2017/2018

ZULULAND DISTRICT MUNICIPALITY ANNUAL PERFORMANCE REPORT 2017/2018 8
26 | P a g e
Program Driver
Objective Indicator KPI No
Tagert Actual Target Actual Target Actual Target Actual Target Actual Annual Target
Annual Actual
Status
Comment/ Reason
for variance/ Measures
to Improve
HOD (CS)
Plan and implement institutional measures that would reduce the impact of HIV/AIDs
HIV/ADS Strategy 2018/2019 submitted to Council by 30 June 2018
23 30/06/2017
30/05/2017
Not measured this quarter
Not measured this quarter
30/03/2018
23/03/2018
30/06/2018
29/06/2018
30/06/2018
30/05/2018
Achieved
HOD (CS)
Enhance Schools and Creches compliance
Number of Schools/Early Childhood development centres(ECDs) inspected per quarter
24 60.00 120.00 25.00 8.00 25.00 28.00 25.00 74.00 25.00 30.00 100.00 140.00 Achieved
HOD (CS)
Build the Capacity of the people
Number of District Youth Council Meetings held per quarter
25 4.00 5.00 1.00 2.00 1.00 2.00 1.00 3.00 1.00 1.00 4.00 8.00 Achieved
HOD (CS)
Enable participation and create awareness of Councils Youth and Gender Program
Number of quality of life Council Meetings held per quarter
26 4.00 4.00 1.00 2.00 1.00 2.00 1.00 4.00 1.00 2.00 4.00 10.00 Achieved

ZULULAND DISTRICT MUNICIPALITY ANNUAL PERFORMANCE REPORT 2017/2018 8
27 | P a g e
mes
HOD (CS)
Create HIV/AIDS awareness and education
Number of HIV/AIDS awareness campaigns held per quarter
27 16.00 16.00 2.00 4.00 2.00 2.00 2.00 4.00 2.00 4.00 8.00 14.00 Achieved
HOD (CS)
Strategically plan development and empowerment initiatives for youth and gender
Reviewed Social development strategy submitted to MM by 30 June 2018
28 30/06/2017
30/05/2017
Not measured this quarter
Not measured this quarter
30/03/2018
30/03/2018
30/06/2018
29/06/2018
30/06/2018
30/05/2018
Achieved
HOD (CS)
Reduce poverty by implementing Community Development Projects
Number of people participating in ZDM Community Capacity Building Programmes by 30 Jun
29 240.00 942.00 35.00 52.00 Not measured this quarter
30.00 40.00 Not measured this quarter
65.00 92.00
4 - National KPA: Institutional Development & Transformation
Focus Area: Institutional Development & Transformation
Baseline (2016/2017)
Quarter 1 Quarter 2 Quarter 3 Quarter 4 2017/2018
2017/2018

ZULULAND DISTRICT MUNICIPALITY ANNUAL PERFORMANCE REPORT 2017/2018 8
28 | P a g e
Program Driver
Objective Indicator KPI No
Tagert Actual Target Actual Target Actual Target Actual Target Actual Annual Target
Annual Actual
Status
Comment/ Reason
for variance/ Measures
to Improve
HOD (Co)
To ensure recruitment of skilled personell
8 vacant posts filled by 30 June
30 N/A N/A Not measured this quarter
Not measured this quarter
Not measured this quarter
8.00 8.00 8.00 8.00 Achieved
HOD (Co)
To train & build capacity of employees
Number of Municipal Employees trained as per Workplace Skills Plan by 30 Jun
31 N/A N/A Not measured this quarter
Not measured this quarter
Not measured this quarter
120.00 299.00 120.00 299.00 Achieved
HOD (Co)
Maintain an updated employment equity plan
Employment Equity Report submitted to MM for approval by 30 Jun 2018
32 N/A N/A Not measured this quarter
Not measured this quarter
30/03/2018
15/03/2018
Not measured this quarter
30/03/2018
15/12/2017
Achieved
HOD (Co)
Implement and Manage Employee Equity
Number of people from employment equity target groups employed in three highest levels of Management in complaince with a municipality's
33 13.00 15.00 3.00 18.00 3.00 18.00 3.00 18 3.00 18.00 3.00 18.00 Achieved

ZULULAND DISTRICT MUNICIPALITY ANNUAL PERFORMANCE REPORT 2017/2018 8
29 | P a g e
employment equity plan
HOD (P) Encourage participation in IDP process, ensure alignment with Local Municipalities
Number of stakeholder alignment meetings held by end of the financial year
34 8.00 16.00 2.00 2.00 2.00 2.00 2.00 2.00 2.00 7.00 8.00 13.00 Achieved
HOD (P) Encourage participation in IDP process, ensure alignment with Local Municipalities
Date of submission of 2018/2019 IDP Framework Plan to Council for adoption
35 30/09/2016
28/09/2016
30/09/2017
03/10/2017
Not measured this quarter
Not measured this quarter
Not measured this quarter
30/09/2017
03/10/2017
Not Achieved
HOD (P) Encourage participation in IDP process, ensure alignment with Local Municipalities
Integrated Development plan 2018/2019 submitted to Council for adoption by specified date
36 30/06/2017
30/05/2017
Not measured this quarter
Not measured this quarter
30/03/2018
26/03/2018
30/06/2018
30/05/2018
30/06/2018
30/05/2018
Achieved

ZULULAND DISTRICT MUNICIPALITY ANNUAL PERFORMANCE REPORT 2017/2018 8
30 | P a g e
HOD (Co)
Constantly monitor& introduce methods to increase productivity of employees
8 Staff Induction Workshops held by 30 Jun
37 N/A N/A 4.00 8 2.00 0.00 2.00 0.00 8.00 8.00 Achieved
HOD (Co)
Consistent analysis and review of the organogram against the service delivery model
Municipal Organogram submitted to Council for approval by 30 Jun 2018
38 N/A N/A 30/09/2017
26/09/2017
15/12/2017
30/03/2018
30/01/2018
30/06/2018
30/05/2018
30/06/2018
30/05/2018
Achieved
HOD (Co)
Maintain Institutional capacity to render municipal services
Percentage of municipality's skills budget allocated actually spent on implementing its workplace skills plan
39 100.00 %
95.10 %
20.00 14.70 40.00 59.00 70.00 70.55 100.00 97.20 100.00 97.20 Not Achieved
5 - National KPA: Financial Viability
Focus Area: Financial Viability
Baseline (2016/2017)
Quarter 1
Quarter 2
Quarter 3
Quarter 4
2017/2018
2017/2018

ZULULAND DISTRICT MUNICIPALITY ANNUAL PERFORMANCE REPORT 2017/2018 8
31 | P a g e
Program Driver
Objective Indicator KPI No
Targert
Actual Target Actual Target Actual Target Actual Target Actual Annual Target
Annual Actual
Status
Comment/ Reason
for variance/ Measures
to Improve
HOD (F) Improve revenue collection
Outstanding service debtors recovery rate to revenue per quarter
40 0.25 0.68 0.25 1.25 0.25 0.41 0.25 0.41 0.25 0.70 0.25 0.70 Not Achieved
HOD (F) Improve supply chain application
Number of successfull appeals per quarter
41 0.00 0.00 0.00 0.00 0.00 0.00 0.00 0.00 0.00 0.00 0.00 0.00 Achieved
HOD (F) Process payments in time
Processing time of invoices per quarter
42 30.00 day(s)
30.00 day(s)
100.00 100.00 100.00 100.00 100.00 100.00 100.00 100.00 100.00 100.00 Achieved
HOD (F) Complete and submit accurate annual financial statements
Reviewed Financial Statements submitted by 31 Aug 17
43 31/08/2016
31/08/2016
31/08/2017
31/08/2017
Not measured this quarter
Not measured this quarter
Not measured this quarter
31/08/2017
31/08/2017
Achieved
HOD (F) To consistently achieve a clean audit outcome
Maintain unqualified audit opinion from the Auditor General
44 Unqualified
Unqualified
Not measured this quarter
unqualified
unqualified
Not measured this quarter
Not measured this quarter
unqualified
unqualified
Achieved

ZULULAND DISTRICT MUNICIPALITY ANNUAL PERFORMANCE REPORT 2017/2018 8
32 | P a g e
HOD (F) To plan for and implement budget process
Final 2018/19 budget submitted to Council for approval by 30 Jun 2018
45 30/06/2017
30/05/2017
Not measured this quarter
Not measured this quarter
30/03/2018
26/03/2018
30/06/2018
30/05/2018
30/06/2018
30/05/2018
Achieved
HOD (F) Maintain a functional Auditing Structure
Number of Audit committee meetings held per quarter
46 4.00 4.00 1.00 2.00 1.00 0.00 1.00 1.00 1.00 2.00 4.00 5.00 Achieved
19.04.2018
&31.05.2018
HOD (F) Report timely and accurately
Quarterly SDBIP reports for 2017/2018 submitted to Mayor by the end of each quarter
47 30/07/2017
14/07/2017
19/10/2017
16/10/2017
19/01/2018
25/01/2018
19/04/2018
13/04/2018
19/07/2018
13/04/2018
30/07/2018
06/06/2018
Achieved
HOD (F) To maintain an effective Auditing Function
Percentage of audit queries addressed from the AG report by end of the financial year
48 90.00 70.00 Not measured this quarter
5.00 57.00 45.00 57.00 100.00 57.00 100.00 57.00 Not Achieved
(MFMA Section 32
(UIFW Expenditur
e) investigati
on is underway. Investigation is done by Internal Auditors. The said
investigation will be reported
to Council for
condonment.

ZULULAND DISTRICT MUNICIPALITY ANNUAL PERFORMANCE REPORT 2017/2018 8
33 | P a g e
HOD (F) Maintain positive cost coverage ratio
Cost Coverage ratio achieved per quarter
49 3.00 1.25 3.00 0.00 3.00 2.00 3.00 6.00 3.00 0.18 3.00 3.00 Achieved
(During Q4
management has
decided to increase security
measures.
HOD (F) Maintain positive debt coverage ratio
Debt Coverage Ratio achieved per quarter
50 3.00 0.00 3.00 N/A 3.00 N/A 3.00 N/A 3.00 N/A 3.00 N/A Achieved
N/A. The municipality does not have long term debt.
HOD (F) Report timely and accurately
Annual report 2016/2017 submitted to Council by 30 Jan 2018
51 30/01/2017
27/01/2017
Not measured this quarter
Not measured this quarter
30/01/2018
30/01/2018
Not measured this quarter
30/01/2018
30/01/2018
Achieved
HOD (F) Maintain consistency in producing accurate statements
Percentage of accounts adjustments effected per quarter
52 3.00 0.27 3.00 3.00 3.00 3.00 3.00 32.00 3.00 53.00 3.00 39.00 Achieved
6 - National KPA:Democracy & Governance
Focus Area: Democracy & Governance
Baseline (2016/2017)
Quarter 1 Quarter 2 Quarter 3 Quarter 4 2017/2018
2017/2018
Program Driver
Objective Indicator KPI No
Target Actual Target Actual Target Actual Target Actual Target Actual Annual Target
Annual Actual
Status
Comment/ Reason
for variance/ Measures
to Improve

ZULULAND DISTRICT MUNICIPALITY ANNUAL PERFORMANCE REPORT 2017/2018 8
34 | P a g e
HOD (Co), HOD (F), HOD (CS), Municipal ManagerHOD (TS),HOD (P),
Manage performance effectively
Budget inputs for adjustment budget submitted to CFO
53 Not measured this quarter
Not measured this quarter
31/12/2017
Not measured this quarter
Not measured this quarter
Not measured this quarter
Not measured this quarter
31/12/2017
14/12/2017
Achieved
HOD (Co)
To review and improve public participation mechanisms
Public Participation Strategy submitted to Council by 30 Jun 2018
54 N/A N/A 30/09/2017
31/12/2017
30/03/2018
30/06/2018
15/12/2017
30/06/2018
15/12/2017
Achieved
HOD (Co)
To ensure continuous feedback to communities on development programmes
10 annual events held by 30 Jun 2018
55 N/A N/A Not measured this quarter
5.00 Not measured this quarter
5.00 10.00 10.00 23.00 Achieved
HOD (Co)
Development and maintenance of an updated communication strategy
Communication Strategy tabled to Council for approval by 30 Jun 2018
56 N/A N/A 30/09/2017
31/12/2017
30/03/2018
30/05/2018
15/12/2017
30/06/2018
15/12/2017
Achieved
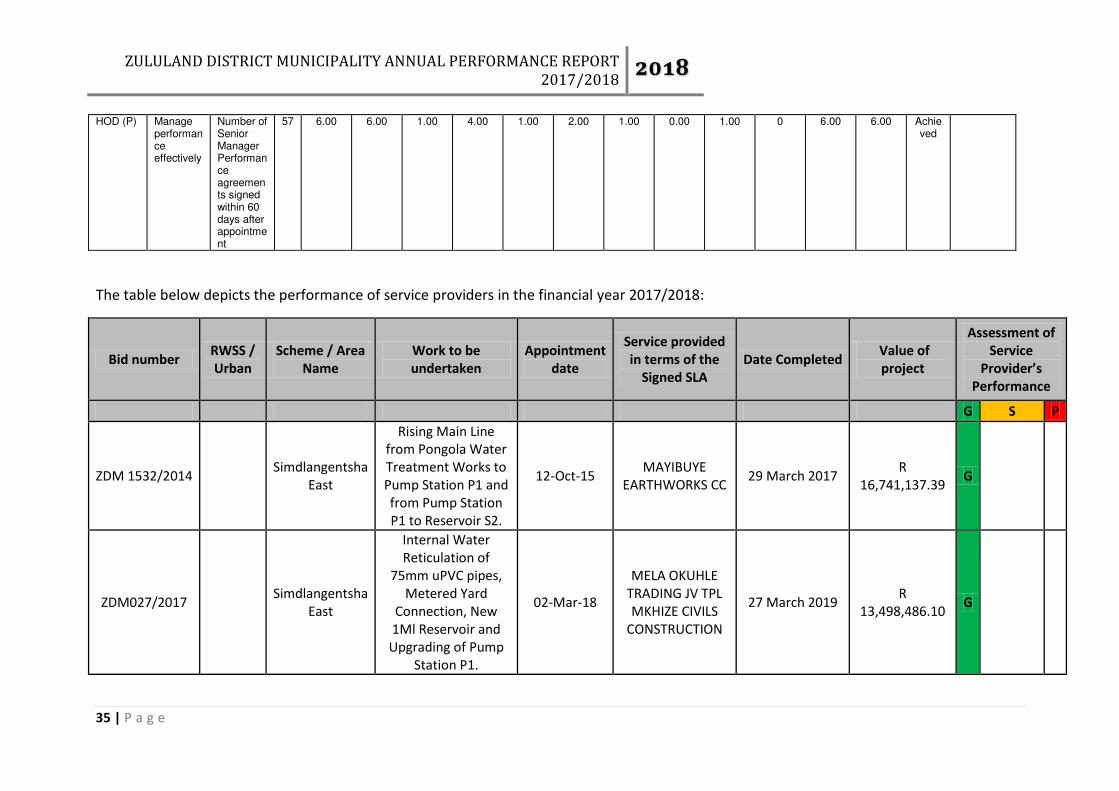
ZULULAND DISTRICT MUNICIPALITY ANNUAL PERFORMANCE REPORT 2017/2018 8
35 | P a g e
HOD (P) Manage performance effectively
Number of Senior Manager Performance agreements signed within 60 days after appointment
57 6.00 6.00 1.00 4.00 1.00 2.00 1.00 0.00 1.00 0 6.00 6.00 Achieved
The table below depicts the performance of service providers in the financial year 2017/2018: Bid number RWSS / Urban Scheme / Area Name Work to be undertaken Appointment date Service provided in terms of the Signed SLA Date Completed Value of project Assessment of Service
Provider’s Performance G S P ZDM 1532/2014 Simdlangentsha East Rising Main Line from Pongola Water Treatment Works to Pump Station P1 and from Pump Station P1 to Reservoir S2. 12-Oct-15 MAYIBUYE EARTHWORKS CC 29 March 2017 R 16,741,137.39 G ZDM027/2017 Simdlangentsha East
Internal Water Reticulation of 75mm uPVC pipes, Metered Yard Connection, New 1Ml Reservoir and Upgrading of Pump Station P1. 02-Mar-18 MELA OKUHLE TRADING JV TPL MKHIZE CIVILS CONSTRUCTION 27 March 2019 R 13,498,486.10 G
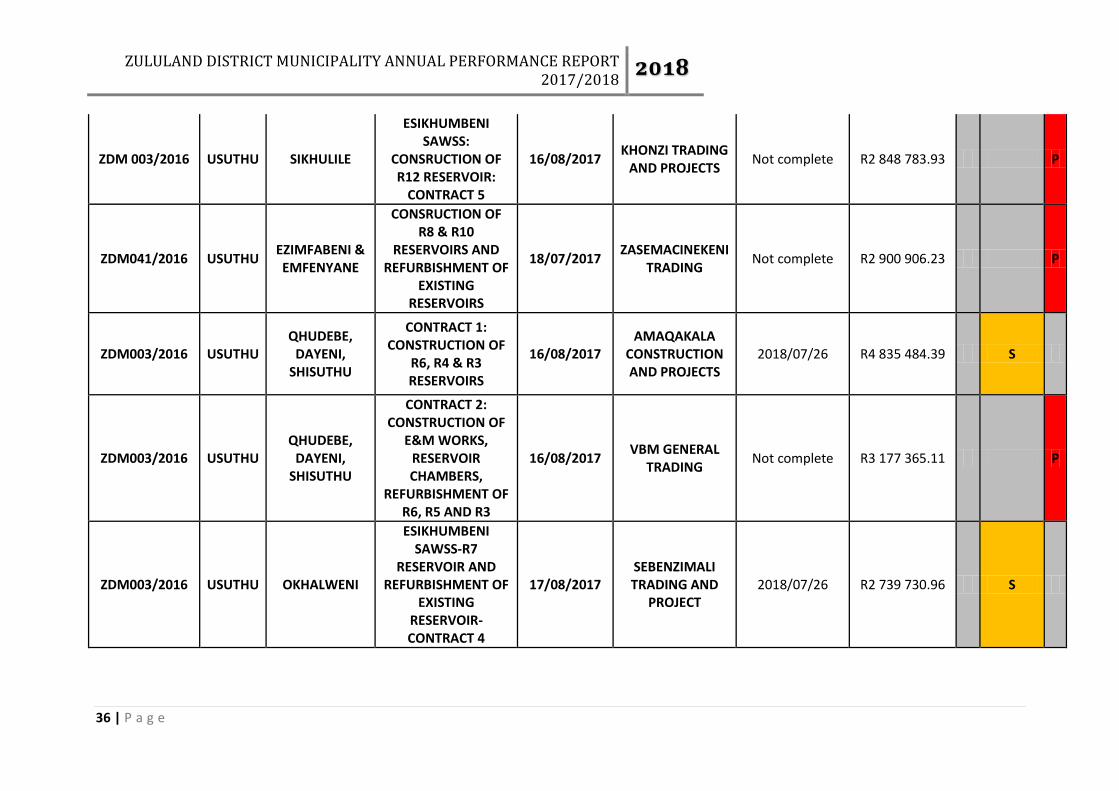
ZULULAND DISTRICT MUNICIPALITY ANNUAL PERFORMANCE REPORT 2017/2018 8
36 | P a g e
ZDM 003/2016 USUTHU SIKHULILE ESIKHUMBENI SAWSS: CONSRUCTION OF R12 RESERVOIR: CONTRACT 5 16/08/2017 KHONZI TRADING AND PROJECTS Not complete R2 848 783.93 P ZDM041/2016 USUTHU EZIMFABENI & EMFENYANE CONSRUCTION OF R8 & R10 RESERVOIRS AND REFURBISHMENT OF EXISTING RESERVOIRS 18/07/2017 ZASEMACINEKENI TRADING Not complete R2 900 906.23 P ZDM003/2016 USUTHU QHUDEBE, DAYENI, SHISUTHU CONTRACT 1: CONSTRUCTION OF R6, R4 & R3 RESERVOIRS 16/08/2017 AMAQAKALA CONSTRUCTION AND PROJECTS 2018/07/26 R4 835 484.39 S ZDM003/2016 USUTHU QHUDEBE, DAYENI, SHISUTHU
CONTRACT 2: CONSTRUCTION OF E&M WORKS, RESERVOIR CHAMBERS, REFURBISHMENT OF R6, R5 AND R3 16/08/2017 VBM GENERAL TRADING Not complete R3 177 365.11 P ZDM003/2016 USUTHU OKHALWENI ESIKHUMBENI SAWSS-R7 RESERVOIR AND REFURBISHMENT OF EXISTING RESERVOIR-CONTRACT 4 17/08/2017 SEBENZIMALI TRADING AND PROJECT 2018/07/26 R2 739 730.96 S
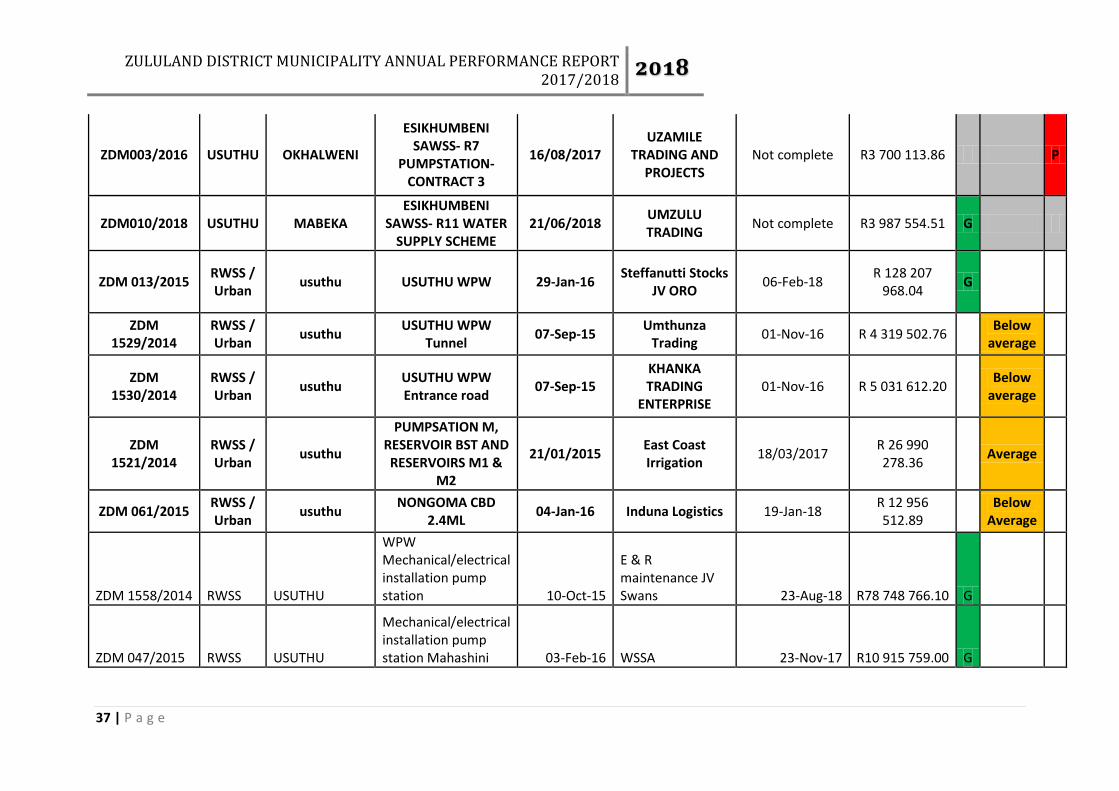
ZULULAND DISTRICT MUNICIPALITY ANNUAL PERFORMANCE REPORT 2017/2018 8
37 | P a g e
ZDM003/2016 USUTHU OKHALWENI ESIKHUMBENI SAWSS- R7 PUMPSTATION-CONTRACT 3 16/08/2017 UZAMILE TRADING AND PROJECTS Not complete R3 700 113.86 P ZDM010/2018 USUTHU MABEKA ESIKHUMBENI SAWSS- R11 WATER SUPPLY SCHEME 21/06/2018 UMZULU TRADING Not complete R3 987 554.51 G ZDM 013/2015 RWSS / Urban usuthu USUTHU WPW 29-Jan-16 Steffanutti Stocks JV ORO 06-Feb-18 R 128 207 968.04 G ZDM 1529/2014 RWSS / Urban usuthu USUTHU WPW Tunnel 07-Sep-15 Umthunza Trading 01-Nov-16 R 4 319 502.76 Below average ZDM 1530/2014 RWSS / Urban usuthu USUTHU WPW Entrance road 07-Sep-15 KHANKA TRADING ENTERPRISE 01-Nov-16 R 5 031 612.20 Below average ZDM 1521/2014 RWSS / Urban usuthu PUMPSATION M, RESERVOIR BST AND RESERVOIRS M1 & M2 21/01/2015 East Coast Irrigation 18/03/2017 R 26 990 278.36 Average ZDM 061/2015 RWSS / Urban usuthu NONGOMA CBD 2.4ML 04-Jan-16 Induna Logistics 19-Jan-18 R 12 956 512.89 Below Average
ZDM 1558/2014 RWSS USUTHU WPW Mechanical/electrical installation pump station 10-Oct-15 E & R maintenance JV Swans 23-Aug-18 R78 748 766.10 G ZDM 047/2015 RWSS USUTHU Mechanical/electrical installation pump station Mahashini 03-Feb-16 WSSA 23-Nov-17 R10 915 759.00 G

ZULULAND DISTRICT MUNICIPALITY ANNUAL PERFORMANCE REPORT 2017/2018 8
38 | P a g e
ZDM 031/2015 RWSS USUTHU Bulk main towards White city 27-Nov-15 Thuthuka Civils In progress R5 900 127.00 P ZDM 032/2015 RWSS USUTHU Gravity main towards Shosamase 27-Nov-15 Kulu Civils Terminated R5 148 395.00 P ZDM 003/2015 RWSS USUTHU Gravity main towards Shosamase + reticulation 16-Aug-17 Liwa Construction In progress R4 046 056.00 S ZDM 037/2015 RWSS USUTHU Reticulation to Shosamase ph 1 23-Oct-17 Maswidi Construction In progress R5 873 555.00 S ZDM 003/2016 RWSS USUTHU Reticulation Nongoma South ph 6 29-Sep-17 Miyelani trading In progress R2 420 853.00 G ZDM 003/2016 RWSS USUTHU Reticulation Nongoma South ph 5 29-Sep-17 Shalom a Trading In progress R3 623 542.00 G ZDM 050/2015 RWSS USUTHU Reticulation KwaMinya ph 2 10-Apr-16 Siyaya Construction Aug-17 R6 714 612.00 S ZDM 051/2015 RWSS USUTHU Reticulation Nongoma South ph 1 29-Jan-18 Khalipha Projects In progress R2 937 431.00 G ZDM 052/2015 RWSS USUTHU Reticulation Nongoma South ph 2 07-Apr-16 Ingwemabala Construction 03-May-17 R2 602 126.00 G ZDM 068/2015 RWSS USUTHU Reticulation Nongoma South ph 3 30-Oct-17 Sisonke Phambili In progress R5 006 518.17 S ZDM 069/2015 RWSS USUTHU Reticulation Nongoma South ph 4 10-May-18 Ulundi Landscape In progress R3 338 643.00 G ZDM 003/2016 RWSS USUTHU Ophalule Phase 1 29-Sep-17 Magaba Capital In progress R7 268 481.00 S ZDM 003/2016 RWSS USUTHU Bulk gravity line from PS 3 to res A3 16-Aug-17 Mpunga Construction May-18 R1 701 358.00 G

ZULULAND DISTRICT MUNICIPALITY ANNUAL PERFORMANCE REPORT 2017/2018 8
39 | P a g e
ZDM025/2016 RWSS Ceza Ceza WTW 29-Mar-17 Yes 14-Feb-18 R32 013 030.50 G ZDM042/2016 RWSS Ceza Reservoirs and Weir 29-Mar-17 Yes 15-Feb-18 R9 907 127.79 G ZDM003/2016 RWSS Ceza Bulk Pipeline 01 29-Mar-17 Yes 29-Sep-17 R2 201 192.82 S ZDM003/2016 RWSS Ceza Bulk Pipeline 02 29-Mar-17 Yes 29-Sep-17 R2 634 108.72 G ZDM003/2016 RWSS Ceza Bulk Pipeline 03 29-Mar-17 Yes 29-Sep-17 R2 093 702.95 G ZDM003/2016 RWSS Ceza Bulk Pipeline 04 29-Mar-17 Yes 29-Sep-17 R1 828 665.54 G ZDM003/2016 RWSS Ceza Bulk Pipeline 05 29-Mar-17 Yes 29-Sep-17 R1 949 585.58 S ZDM003/2016 RWSS Ceza Bulk Pipeline 06 29-Mar-17 Yes 29-Sep-17 R2 424 805.07 S ZDM003/2016 RWSS Ceza Bulk Pipeline 07 29-Mar-17 Yes 29-Sep-17 R1 547 752.64 G ZDM003/2016 RWSS Ceza Reticulation 01 29-Mar-17 Yes 29-Sep-17 R2 981 577.50 G ZDM003/2016 RWSS Ceza Reticulation 02 29-Mar-17 Yes 29-Sep-17 R3 273 290.76 G ZDM003/2016 RWSS Ceza Reticulation 03 29-Mar-17 Yes 29-Sep-17 R3 591 095.78 G ZDM003/2016 RWSS Rudimentary Drilling and Testing North 21-Sep-17 Yes 21-Jun-18 R4 132 762.02 G
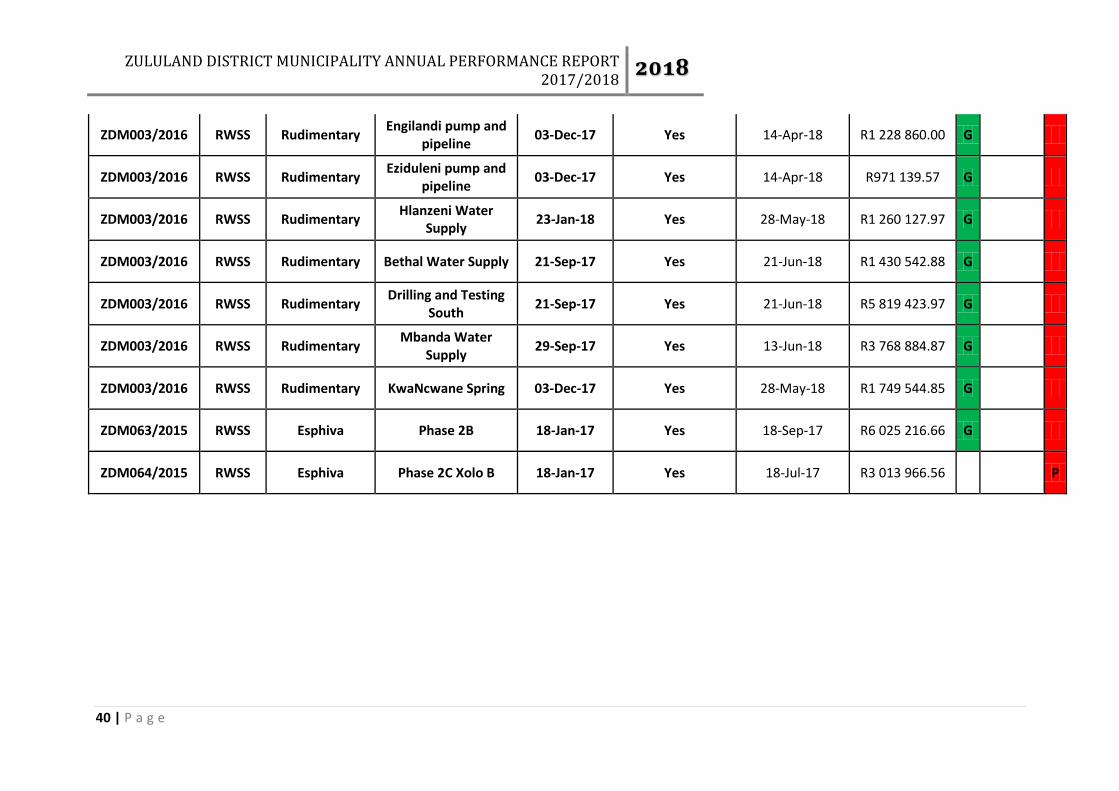
ZULULAND DISTRICT MUNICIPALITY ANNUAL PERFORMANCE REPORT 2017/2018 8
40 | P a g e
ZDM003/2016 RWSS Rudimentary Engilandi pump and pipeline 03-Dec-17 Yes 14-Apr-18 R1 228 860.00 G ZDM003/2016 RWSS Rudimentary Eziduleni pump and pipeline 03-Dec-17 Yes 14-Apr-18 R971 139.57 G ZDM003/2016 RWSS Rudimentary Hlanzeni Water Supply 23-Jan-18 Yes 28-May-18 R1 260 127.97 G ZDM003/2016 RWSS Rudimentary Bethal Water Supply 21-Sep-17 Yes 21-Jun-18 R1 430 542.88 G ZDM003/2016 RWSS Rudimentary Drilling and Testing South 21-Sep-17 Yes 21-Jun-18 R5 819 423.97 G ZDM003/2016 RWSS Rudimentary Mbanda Water Supply 29-Sep-17 Yes 13-Jun-18 R3 768 884.87 G ZDM003/2016 RWSS Rudimentary KwaNcwane Spring 03-Dec-17 Yes 28-May-18 R1 749 544.85 G ZDM063/2015 RWSS Esphiva Phase 2B 18-Jan-17 Yes 18-Sep-17 R6 025 216.66 G ZDM064/2015 RWSS Esphiva Phase 2C Xolo B 18-Jan-17 Yes 18-Jul-17 R3 013 966.56 P


D
F. REPORT OF THE AUDIT COMMITTEE Background We are pleased to present our report for the financial year ended 30 June 2018. The Audit Committee reports that it has complied with its responsibilities arising from Section 38 (1) (a) (ii) of the Public Finance Management Act and Treasury Regulation 3.1.13. The Audit Committee also reports that it has adopted appropriate formal terms of reference as its Audit Committee Charter, has regulated its affairs in compliance with this charter and has discharged all its responsibilities as contained therein, except that we have not reviewed changes in accounting policies and practices. Audit Committee mandate The Zululand District Municipality has established an Audit and Audit Performance Management Committee in accordance with section 166 of the Municipal Finance Management Act, Act no 56 of 2003 (MFMA) and section 14(2)(c) of the Local Government Municipal Planning and Performance Regulations, 2001 (Regulations). Consideration has also been given to section 14(2)(c) of the Regulations and MFMA Circular No. 65 issued by the National Treasury in November 2012 as well as the recommendations contained in the King Report on Governance for South Africa 2016 (King IV). Role of the Audit Committee The role of the Audit Committee is to assist the Zululand District Municipality in achieving its strategic goals and objectives, by helping to maintain effective internal controls, risk management, accurate financial reporting and corporate governance principles, and other such duties as may be directed by the Council and Accounting Officer. The Audit Committee must review and assess the qualitative aspects of financial reporting, the municipality’s processes to manage business and financial risk, governance processes and compliance with applicable legal, ethical and regulatory requirements. Audit Committee members The Audit and Performance Management Committee, consisting of independent, external members listed below, is required to meet at least 4 times per annum as per the Audit Committee Charter, although additional meetings may be called as the need arises. The Audit Committee has met more than 4 times for the financial year 2017-18. The Council of the Zululand District Municipality has appointed its Audit Committee to assist the municipality in advising the Council, the political office-bearers, the accounting officers and the management staff of the municipality, accounting officer and the management staff of the municipal entity, on matters relating to: 1. Internal financial control and internal audits; 2. Risk management

3. Accounting Policies 4. The adequacy , reliability and accuracy of financial reporting and information 5. Performance management 6. Effective governance 7. Compliance with this Act, DORA and any other applicable legislation (MFMA 56 of 2005, Section 166(2)(a)(i-ix). In order for the audit committee to be effective and able to advise according we rely on the reports prepared by internal audit, information obtained from the management and accounting officers. The following matter has been brought to the attention of the council of Zululand District Municipality: Internal financial control and internal audits There were no noted changes in the financial control during 2017/18 and per the work performed by internal audit unit there was no material changes reported. Internal Audit Unit The Internal audit is outsourced from PWC a firm of independent accountants and registered auditors. They have presented their audit plan which is risk based in August 2017. All assignments per the audit plan were performed and reported to the audit committee in our quarterly meeting. Recommendations The municipality to ensure that all recommendations for the Internal Audit and Audit Committee implemented. Risk management Risk management becomes an important part in any business because of an increase in probability of occurring of events that could have positive or negative impact in the business. The municipality has risk management committee in place and effective. However, there was no formal reports received from risk management committee. Audit Committee recommendation(s) The chairperson of risk committee to report to the chairperson of the audit committee of the risk assessment conducted. Accounting Policies A mid-year and final year annual financial statements and accompying policies and notes were reviewed. There were no changes in the accounting policy and were constantly apply in relation to prior year. The adequacy, reliability and accuracy of financial reporting and information

The financial statements are prepared internally by the Finance department. It is further reviewed by internal audit and audit committee. The audit committee further call another meeting to review and ensure all changes recommended are enacted in the annual financial statements. Therefore, the committee was satisfied with the adequacy, reliability and accuracy of financial reporting information. The audit committee wish to commend the finance department for exceptional work in preparation of credible and reliable AFS and were submitted on time to AG 31 August 2017. Performance management The performance management is also done internally through the department of Planning. The report then sent to Internal Audit for audit and to ensure its compliance with Act. The portfolio of evidence submitted for audit purposes had discrepancies. The external service providers were also not monitored on quarterly basis resulting in other contract exceeded contract period. Recommendations 1. The external service providers to be monitored on a quarterly basis. 2. Ensure credible evidence is submitted to auditors (Internal and External) Effective governance In ensuring good practice of governance the audit committee has managed to meet its target to at least meet four times per annum, in the committee has met more than 4 times and in our meetings the MPAC chair was always invited and MPAC always invite audit committee chair. Recommendations 1. The MPAC to ensure that council recommendations and audit committee recommendations be implemented on time. 2. To strengthen the MPAC and Audit committee relationship in ensuring good governance training. Compliance with this Act, DORA and any other applicable legislation In terms of the Internal Audit reported tabled to the audit committee the municipality had some challenges with compliance. Debtor Collection/Own Revenue Management Cash management is part of the strategy of revenue enhancement for the municipality. The municipality to improve the collection on long outstanding debts. The debts collection will improve the service delivery of the municipality. Service Delivery The main service delivery by the municipality is to supply water and sanitation through the whole district of Zululand. There is still a challenge to supply water in Zululand, one of the contributing factor is the water scheme which were not completed on time and incompetent service providers being awarded contract.

Recommendations: As a critical responsibility of the municipality it must ensure that all service provider are monitored and evaluated and ensure the service delivery does not interrupted. AG Queries The prior queries for 2016/17 were not resolved by the municipality regardless of the assistance by internal audit, the critical areas raised by AG has never adequately addressed. Cash Flow management/ Going Concern The audit committee has noted that the current liabilities exceed current assets and there is possibility of a going concern. Recommendations The management must investigate the causes of cash flow challenges and then implement strategies to overcome challenges. Supply Chain Management Unit The audit committee has noted weaknesses in SCM unit most of the quotations and tenders did not follow the normal process when procuring goods and services of the municipality. Most of the goods and services were purchased via deviations and without normal process. The irregular expenditure of the municipality has increased to more than R300million. Recommendations The Council must appoint an independent forensic investigation to probe some contracts awarded by the Municipality. Conclusion The audit committee wish commends a working relationship with the administration in discharging its responsibility. The Audit Committee concurs and accepts the conclusions of the Auditor-General on the annual financial statements and is of the opinion that the audited annual financial statements be accepted and read together with the report of the Auditor-General. Yours faithfully ___________________ Chairperson of the Audit Committee Name: Date:

D
F. REPORT OF THE AUDIT COMMITTEE
ZULULAND DISTRICT MUNICIPALITY Audit Committee Report
ABSTRACT Audit Committee Report to the Council of Zululand District Municipality

2 | P a g e
Audit Committee Report to the Council of Zululand District Municipality
Background
Audit Committee mandate
The Zululand District Municipality has established an Audit and Audit Performance Management
Committee in accordance with section 166 of the Municipal Finance Management Act, Act no 56 of
2003 (MFMA) and section 14(2)(c) of the Local Government Municipal Planning and Performance
Regulations, 2001 (Regulations). Consideration has also been given to section 14(2)(c) of the
Regulations and MFMA Circular No. 65 issued by the National Treasury in November 2012 as well as
the recommendations contained in the King Report on Governance for South Africa 2016 (King IV).
Role of the Audit Committee
The role of the Audit Committee is to assist the Zululand District Municipality in achieving its
strategic goals and objectives, by helping to maintain effective internal controls, risk management,
accurate financial reporting and corporate governance principles, and other such duties as may be
directed by the Council and Accounting Officer.
The Audit Committee must review and assess the qualitative aspects of financial reporting, the
municipality’s processes to manage business and financial risk, governance processes and compliance with applicable legal, ethical and regulatory requirements.
Audit Committee members
The Audit and Performance Management Committee, consisting of independent, external members
listed below, is required to meet at least 4 times per annum as per the Audit Committee Charter,
although additional meetings may be called as the need arises. The Audit Committee has met more
than 4 times for the financial year 2017-18.
We present our report for the year-end 30 June 2018
Audit Committee Members and Attendance
Details Qualifications Meetings Status
Mr. P. Mntambo(AC Chair) Bcompt, Project
Management, Forensic
Investigation & MBA
6/6 Active
Mr. M.C. Ndwandwe Bcom 6/6 Active
Mr. M. Ngcobo NDIP Town & Regional
Planning
6/6 Active

3 | P a g e
The Council of Zululand District Municipality has appointed its Audit Committee to assist the
municipality in advising:
Municipal Council, the political office-bearers, the accounting officers and the management
staff of the municipality, accounting officer and the management staff of the municipal entity,
on matters relating to:
1. Internal financial control and internal audits;
2. Risk management
3. Accounting Policies
4. The adequacy , reliability and accuracy of financial reporting and information
5. Performance management
6. Effective governance
7. Compliance with this Act, DORA and any other applicable legislation (MFMA 56 of
2005, Section 166(2)(a)(i-ix)
In order for the audit committee to be effective and able to advise according we rely on the reports
prepared by internal audit, information obtained from the management and accounting officers.
The following matter has been brought to the attention of the council of Zululand District
Municipality:
Internal financial control and internal audits
There were no noted changes in the financial control during 2017/18 and per the work performed by
internal audit unit there was no material changes reported.
Internal Audit Unit
The Internal audit is outsourced from PWC a firm of independent accountants and registered auditors.
They have presented their audit plan which is risk based in August 2017. All assignments per the audit
plan were performed and reported to the audit committee in our quarterly meeting.
Recommendations
The municipality to ensure that all recommendations for the Internal Audit and Audit
Committee implemented.
Risk management
Risk management becomes an important part in any business because of an increase in probability of
occurring of events that could have positive or negative impact in the business. The municipality has
risk management committee in place and effective. However, there was no formal reports received
from risk management committee.

4 | P a g e
Audit Committee recommendation(s)
The chairperson of risk committee to report to the chairperson of the audit committee of the
risk assessment conducted.
Accounting Policies
A mid-year and final year annual financial statements and accompying policies and notes were
reviewed. There were no changes in the accounting policy and were constantly apply in relation to
prior year.
The adequacy, reliability and accuracy of financial reporting and information
The financial statements are prepared internally by the Finance department. It is further reviewed by
internal audit and audit committee. The audit committee further call another meeting to review and
ensure all changes recommended are enacted in the annual financial statements. Therefore, the
committee was satisfied with the adequacy, reliability and accuracy of financial reporting information.
The audit committee wish to commend the finance department for exceptional work in preparation of
credible and reliable AFS and were submitted on time to AG 31 August 2017.
Performance management
The performance management is also done internally through the department of Planning. The report
then sent to Internal Audit for audit and to ensure its compliance with Act. The portfolio of evidence
submitted for audit purposes had discrepancies. The external service providers were also not monitored
on quarterly basis resulting in other contract exceeded contract period.
Recommendations
The external service provider to be monitored on a quarterly basis.
Ensure credible evidence is submitted to auditors (Internal and External)
Effective governance
In ensuring good practice of governance the audit committee has managed to meet its target to at least
meet four times per annum, in the committee has met more than 4 times and in our meetings the
MPAC chair was always invited and MPAC always invite audit committee chair.
Recommendations
The MPAC to ensure that council recommendations and audit committee recommendations be
implemented on time.
To strengthen the MPAC and Audit committee relationship in ensuring good governance
training.
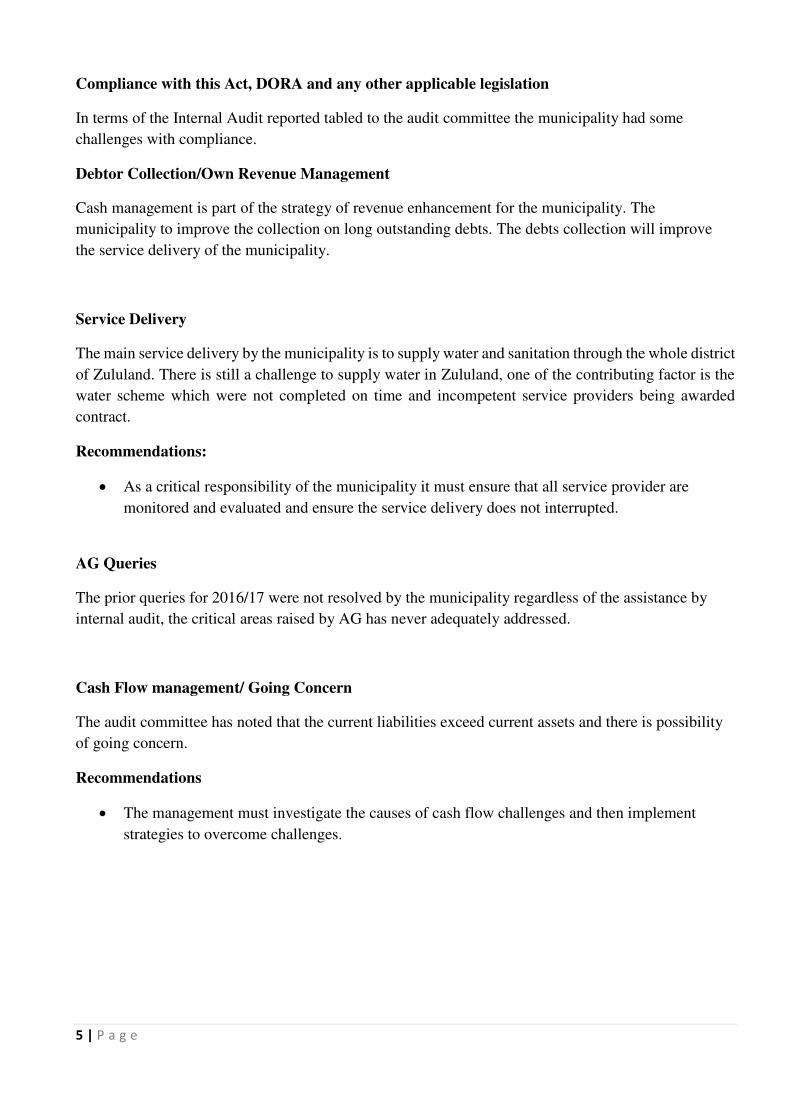
5 | P a g e
Compliance with this Act, DORA and any other applicable legislation
In terms of the Internal Audit reported tabled to the audit committee the municipality had some
challenges with compliance.
Debtor Collection/Own Revenue Management
Cash management is part of the strategy of revenue enhancement for the municipality. The
municipality to improve the collection on long outstanding debts. The debts collection will improve
the service delivery of the municipality.
Service Delivery
The main service delivery by the municipality is to supply water and sanitation through the whole district
of Zululand. There is still a challenge to supply water in Zululand, one of the contributing factor is the
water scheme which were not completed on time and incompetent service providers being awarded
contract.
Recommendations:
As a critical responsibility of the municipality it must ensure that all service provider are
monitored and evaluated and ensure the service delivery does not interrupted.
AG Queries
The prior queries for 2016/17 were not resolved by the municipality regardless of the assistance by
internal audit, the critical areas raised by AG has never adequately addressed.
Cash Flow management/ Going Concern
The audit committee has noted that the current liabilities exceed current assets and there is possibility
of going concern.
Recommendations
The management must investigate the causes of cash flow challenges and then implement
strategies to overcome challenges.

6 | P a g e
Supply Chain Management Unit
The audit committee has noted weaknesses in SCM unit most of the quotations and tenders did not
follow the normal process when procuring goods and services of the municipality. Most of the goods
and services were purchased via deviations and without normal process. The irregular expenditure of
the municipality has increased to more than R300million.
Recommendations
The Council must appoint an independent forensic investigation to probe some contracts
awarded by the Municipality.
Conclusion
The audit committee wish commends a working relationship with the administration in discharging its
responsibility.
Chairperson of the Audit Committee
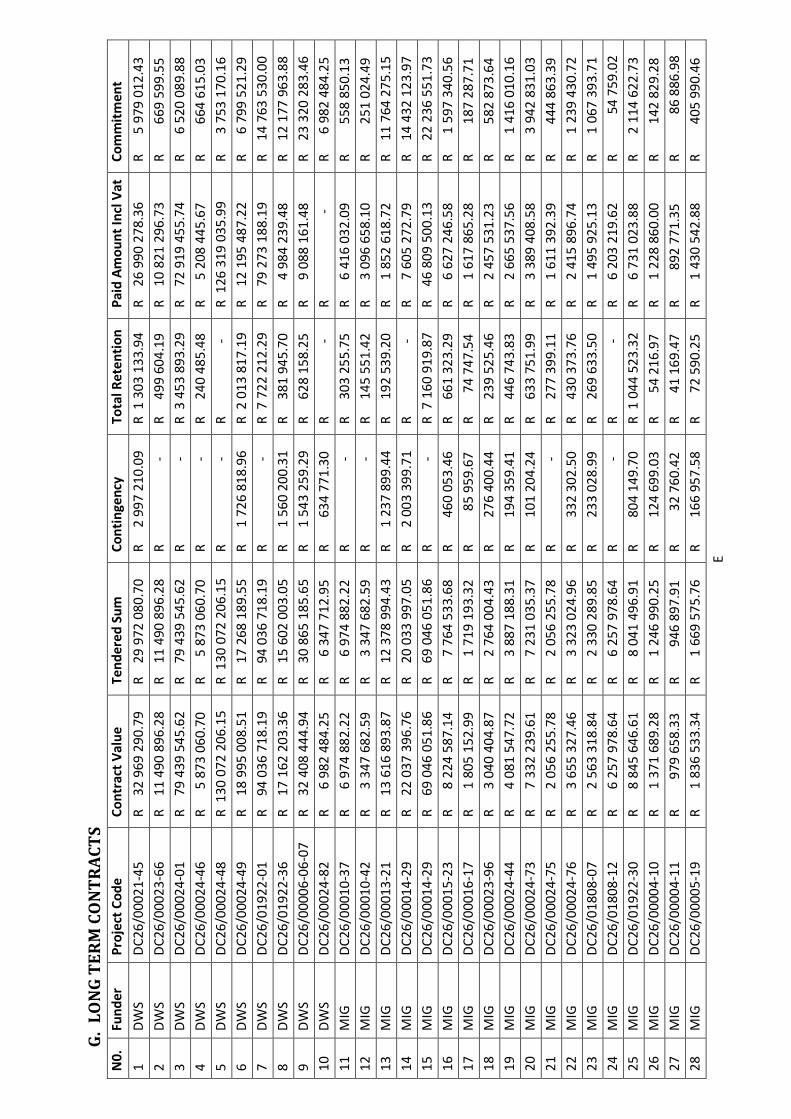
E G. LONG T
ERM CONTRACTS
N0. Funder Pro
ject Code Contract V
alue Tendered
Sum Contingen
cy Total Reten
tion Paid Amount
Incl Vat Commitme
nt 1 DWS
DC26/00021-4
5 R 32 969 29
0.79 R 29 972 08
0.70 R 2 997 21
0.09 R 1 303 133.
94 R 26 990 278.3
6 R 5 979 012
.43 2 DWS
DC26/00023-6
6 R 11 490 89
6.28 R 11 490 89
6.28 R
- R 499 604.1
9 R 10 821 296.73
R 669 599.
55 3 DWS
DC26/00024-0
1 R 79 439 54
5.62 R 79 439 54
5.62 R
- R 3 453 893.2
9 R 72 919 455.74
R 6 520 089.
88 4 DWS
DC26/00024-4
6 R 5 873 06
0.70 R 5 873 06
0.70 R
- R 240 485.4
8 R 5 208 445.67
R 664 615.
03 5 DWS
DC26/00024-4
8 R 130 072 20
6.15 R 130 072 20
6.15 R
- R
- R 126 319 035.9
9 R 3 753 170
.16 6 DWS
DC26/00024-4
9 R 18 995 00
8.51 R 17 268 18
9.55 R 1 726 81
8.96 R 2 013 817.
19 R 12 195 487.2
2 R 6 799 521
.29 7 DWS
DC26/01922-0
1 R 94 036 71
8.19 R 94 036 71
8.19 R
- R 7 722 212.2
9 R 79 273 188.19
R 14 763 530.0
0 8 DWS
DC26/01922-3
6 R 17 162 20
3.36 R 15 602 00
3.05 R 1 560 20
0.31 R 381 945.
70 R 4 984 239.
48 R 12 177 9
63.88 9 DWS
DC26/00006-0
6-07 R 32 408 44
4.94 R 30 865 18
5.65 R 1 543 25
9.29 R 628 158.
25 R 9 088 161.
48 R 23 320 2
83.46 10 DWS
DC26/00024-8
2 R 6 982 48
4.25 R 6 347 71
2.95 R 634 77
1.30 R
- R
- R 6 982 4
84.25 11 MIG
DC26/00010-3
7 R 6 974 88
2.22 R 6 974 88
2.22 R
- R 303 255.7
5 R 6 416 032.09
R 558 850.
13 12 MIG
DC26/00010-4
2 R 3 347 68
2.59 R 3 347 68
2.59 R
- R 145 551.4
2 R 3 096 658.10
R 251 024.
49 13 MIG
DC26/00013-2
1 R 13 616 89
3.87 R 12 378 99
4.43 R 1 237 89
9.44 R 192 539.
20 R 1 852 618.
72 R 11 764 2
75.15 14 MIG
DC26/00014-2
9 R 22 037 39
6.76 R 20 033 99
7.05 R 2 003 39
9.71 R
- R 7 605 272.
79 R 14 432 1
23.97 15 MIG
DC26/00014-2
9 R 69 046 05
1.86 R 69 046 05
1.86 R
- R 7 160 919.8
7 R 46 809 500.13
R 22 236 551.7
3 16 MIG
DC26/00015-2
3 R 8 224 58
7.14 R 7 764 53
3.68 R 460 05
3.46 R 661 323.
29 R 6 627 246.
58 R 1 597 3
40.56 17 MIG
DC26/00016-1
7 R 1 805 15
2.99 R 1 719 19
3.32 R 85 959
.67 R 74 747.5
4 R 1 617 865.28
R 187 287.
71 18 MIG
DC26/00023-9
6 R 3 040 40
4.87 R 2 764 00
4.43 R 276 40
0.44 R 239 525.
46 R 2 457 531.
23 R 582 87
3.64 19 MIG
DC26/00024-4
4 R 4 081 54
7.72 R 3 887 18
8.31 R 194 35
9.41 R 446 743.
83 R 2 665 537.
56 R 1 416 0
10.16 20 MIG
DC26/00024-7
3 R 7 332 23
9.61 R 7 231 03
5.37 R 101 20
4.24 R 633 751.
99 R 3 389 408.
58 R 3 942 8
31.03 21 MIG
DC26/00024-7
5 R 2 056 25
5.78 R 2 056 25
5.78 R
- R 277 399.1
1 R 1 611 392.39
R 444 863.
39 22 MIG
DC26/00024-7
6 R 3 655 32
7.46 R 3 323 02
4.96 R 332 30
2.50 R 430 373.
76 R 2 415 896.
74 R 1 239 4
30.72 23 MIG
DC26/01808-0
7 R 2 563 31
8.84 R 2 330 28
9.85 R 233 02
8.99 R 269 633.
50 R 1 495 925.
13 R 1 067 3
93.71 24 MIG
DC26/01808-1
2 R 6 257 97
8.64 R 6 257 97
8.64 R
- R
- R 6 203 219.6
2 R 54 759
.02 25 MIG
DC26/01922-3
0 R 8 845 64
6.61 R 8 041 49
6.91 R 804 14
9.70 R 1 044 523.
32 R 6 731 023.
88 R 2 114 6
22.73 26 MIG
DC26/00004-1
0 R 1 371 68
9.28 R 1 246 99
0.25 R 124 69
9.03 R 54 216.
97 R 1 228 860.
00 R 142 82
9.28 27 MIG
DC26/00004-1
1 R 979 65
8.33 R 946 89
7.91 R 32 760
.42 R 41 169.4
7 R 892 771.3
5 R 86 88
6.98 28 MIG
DC26/00005-1
9 R 1 836 53
3.34 R 1 669 57
5.76 R 166 95
7.58 R 72 590.
25 R 1 430 542.
88 R 405 99
0.46

29 MIG DC
26/00011-44 R
3 801 945.26 R
3 456 313.87 R
345 631.39 R
150 274.52 R
3 029 356.90 R
772 588.36
30 MIG DC
26/00011-46 R
1 764 891.73 R
1 604 447.03 R
160 444.70 R
69 758.57 R
1 232 194.29 R
532 697.44
31 MIG DC
26/00024-74 R
5 925 078.41 R
5 386 434.91 R
538 643.50 R
363 179.46 R
1 717 633.55 R
4 207 444.86
32 MIG DC
26/00015-24 R
12 831 549.29 R
11 665 044.81 R
1 166 504.48 R
120 620.00 R
554 852.00 R
12 276 697.29
33 MIG DC
26/00024-77 R
5 050 435.00 R
4 591 304.54 R
459 130.46 R
300 247.78 R
1 375 983.86 R
3 674 451.14
34 MIG DC
26/00024-83 R
2 963 197.99 R
2 693 816.35 R
269 381.64 R
113 150.60 R
1 494 023.39 R
1 469 174.60
35 MIG DC
26/00024-87 R
3 367 929.68 R
3 061 754.25 R
306 175.43 R
- R
- R
3 367 929.68
36 MIG DC
26/00024-88 R
3 205 669.11 R
2 914 244.65 R
291 424.46 R
- R
- R
3 205 669.11
37 MIG DC
26/01808-14 R
5 711 797.57 R
5 192 543.25 R
519 254.32 R
- R
- R
5 711 797.57
38 MIG DC
26/00005-20 R
1 472 220.43 R
1 338 382.21 R
133 838.22 R
- R
- R
1 472 220.43
39 MIG DC
26/00024-89 R
4 021 456.59 R
3 655 869.63 R
365 586.96 R
- R
- R
4 021 456.59
40 MIG DC
26/00023-95 R
6 078 069.42 R
5 525 517.65 R
552 551.77 R
240 239.90 R
5 178 039.74 R
900 029.68
41 RBIG DC
26/00021-46 R
39 308 733.46 R
35 735 212.24 R
3 573 521.22 R
119 000.00 R
1 231 650.00 R
38 077 083.46
42 RBIG DC
26/00021-47 R
17 498 618.50 R
15 907 835.00 R
1 590 783.50 R
143 716.10 R
1 487 461.64 R
16 011 156.86
43 RBIG DC
26/00021-48 R
18 813 746.78 R
17 103 406.16 R
1 710 340.62 R
138 090.86 R
1 429 240.40 R
17 384 506.38
44 WSIG DC
26/00020-21 R
10 050 015.13 R
10 046 581.05 R
3 434.08 R
436 957.18 R 9
461 088.27 R
588 926.86
45 WSIG DC
26/00023-44 R
4 133 514.00 R
4 133 514.00 R
- R
179 718.00 R 3
648 702.39 R
484 811.61
46 WSIG DC
26/00023-48 R
4 259 697.42 R
3 949 312.35 R
310 385.07 R
168 367.49 R
3 723 815.72 R
535 881.70
47 WSIG DC
26/00023-58 R
9 241 205.76 R
9 096 796.29 R
144 409.47 R
381 075.54 R
7 809 745.05 R
1 431 460.71
48 WSIG DC
26/00023-63 R
10 857 300.18 R
10 811 298.53 R
46 001.65 R
472 056.53 R 10
179 142.78 R
678 157.40
49 WSIG DC
26/00023-99 R
32 293 846.56 R
31 852 556.07 R
441 290.49 R
1 384 893.74 R 3
0 038 507.97 R
2 255 338.59
50 WSIG DC
26/00024-55 R
2 094 214.22 R
1 903 831.10 R
190 383.12 R
91 052.79 R
1 844 874.87 R
249 339.35
51 WSIG DC
26/00024-67 R
2 926 352.77 R
2 660 320.70 R
266 032.07 R
346 982.22 R
2 249 809.30 R
676 543.47
52 WSIG DC
26/00024-68 R
4 877 900.92 R
4 877 653.01 R
247.91 R
212 071.87 R
4 589 444.81 R
288 456.11
53 WSIG DC
26/00024-69 R
3 205 236.73 R
3 052 606.41 R
152 630.32 R
362 575.44 R
2 210 900.21 R
994 336.52
54 WSIG DC
26/00024-70 R
3 732 571.00 R
3 732 128.83 R
442.17 R
162 266.47 R
3 512 688.84 R
219 882.16
55 WSIG DC
26/00024-71 R
2 763 763.69 R
2 632 155.89 R
131 607.80 R
343 118.72 R
2 219 935.44 R
543 828.25
56 WSIG DC
26/00024-72 R
2 873 773.26 R
2 872 824.18 R
949.08 R
337 934.90 R
2 111 826.47 R
761 946.79
57 WSIG DC
26/00024-86 R
3 987 554.51 R
3 625 049.55 R
362 504.96 R
- R
- R
3 987 554.51
58 DWS DC
26/00016-11 R 1
210 526.32 R 1
210 526.32 R
- R
- R
721 231.83 R
489 294.49
59 DWS DC
26/00016-11 R 4
278 508.77 R 4
278 508.77 R
- R
- R 3
245 690.80 R
1 032 817.97
60 DWS DC
26/00016-11 R 6
910 087.72 R 6
910 087.72 R
- R
- R 5
930 564.84 R
979 522.88
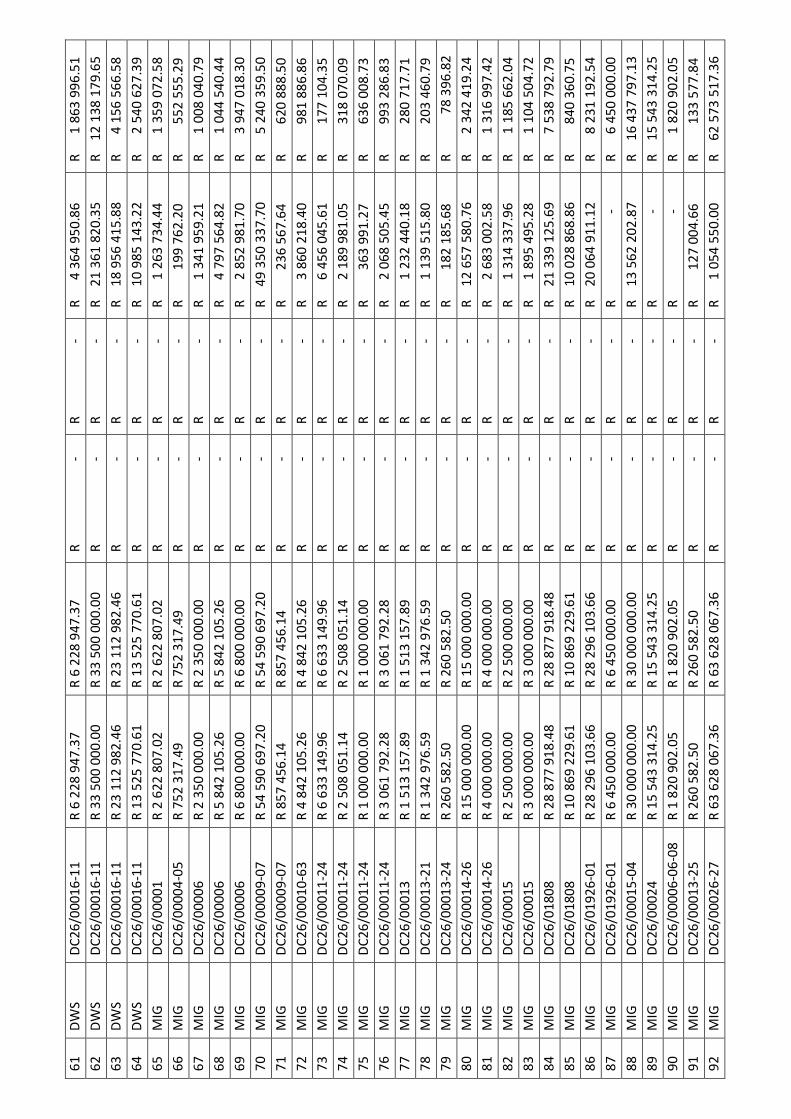
61 DWS DC
26/00016-11 R 6
228 947.37 R 6
228 947.37 R
- R
- R 4
364 950.86 R
1 863 996.51
62 DWS DC
26/00016-11 R 3
3 500 000.00 R 33
500 000.00 R
- R
- R 21
361 820.35 R 1
2 138 179.65
63 DWS DC
26/00016-11 R 2
3 112 982.46 R 23
112 982.46 R
- R
- R 18
956 415.88 R
4 156 566.58
64 DWS DC
26/00016-11 R 1
3 525 770.61 R 13
525 770.61 R
- R
- R 10
985 143.22 R
2 540 627.39
65 MIG DC
26/00001 R 2 622 807
.02 R 2 622 807.
02 R
- R
- R 1 263 734.
44 R 1 359 0
72.58 66 MIG
DC26/00004-0
5 R 752 317.49
R 752 317.49
R -
R - R
199 762.20
R 552 555.29
67 MIG DC
26/00006 R 2 350 000
.00 R 2 350 000.
00 R
- R
- R 1 341 959.
21 R 1 008 0
40.79 68 MIG
DC26/00006
R 5 842 105.26 R
5 842 105.26 R
- R
- R
4 797 564.82 R
1 044 540.44
69 MIG DC
26/00006 R 6 800 000
.00 R 6 800 000.
00 R
- R
- R 2 852 981.
70 R 3 947 0
18.30 70 MIG
DC26/00009-0
7 R 54 590 697.2
0 R 54 590 697.20
R
- R -
R 49 350 337.70
R 5 240 359.
50 71 MIG
DC26/00009-0
7 R 857 456.14
R 857 456.14
R -
R - R
236 567.64
R 620 888.50
72 MIG DC
26/00010-63 R 4
842 105.26 R 4
842 105.26 R
- R
- R 3
860 218.40 R
981 886.86
73 MIG DC
26/00011-24 R 6
633 149.96 R 6
633 149.96 R
- R
- R 6
456 045.61 R
177 104.35
74 MIG DC
26/00011-24 R 2
508 051.14 R 2
508 051.14 R
- R
- R 2
189 981.05 R
318 070.09
75 MIG DC
26/00011-24 R 1
000 000.00 R 1
000 000.00 R
- R
- R
363 991.27 R
636 008.73
76 MIG DC
26/00011-24 R 3
061 792.28 R 3
061 792.28 R
- R
- R 2
068 505.45 R
993 286.83
77 MIG DC
26/00013 R 1 513 157
.89 R 1 513 157.
89 R
- R
- R 1 232 440.
18 R 280 71
7.71 78 MIG
DC26/00013-2
1 R 1 342 976.59
R 1 342 976.59
R
- R -
R 1 139 515.80
R 203 460.
79 79 MIG
DC26/00013-2
4 R 260 582.50
R 260 582.50
R -
R - R
182 185.68
R 78 396.82
80 MIG DC
26/00014-26 R 1
5 000 000.00 R 15
000 000.00 R
- R
- R 12
657 580.76 R
2 342 419.24
81 MIG DC
26/00014-26 R 4
000 000.00 R 4
000 000.00 R
- R
- R 2
683 002.58 R
1 316 997.42
82 MIG DC
26/00015 R 2 500 000
.00 R 2 500 000.
00 R
- R
- R 1 314 337.
96 R 1 185 6
62.04 83 MIG
DC26/00015
R 3 000 000.00 R
3 000 000.00 R
- R
- R
1 895 495.28 R
1 104 504.72
84 MIG DC
26/01808 R 28 877 91
8.48 R 28 877 918
.48 R
- R
- R 21 339 125.6
9 R 7 538 792
.79 85 MIG
DC26/01808
R 10 869 229.61 R
10 869 229.61 R
- R
- R 1
0 028 868.86 R
840 360.75
86 MIG DC
26/01926-01 R 2
8 296 103.66 R 28
296 103.66 R
- R
- R 20
064 911.12 R
8 231 192.54
87 MIG DC
26/01926-01 R 6
450 000.00 R 6
450 000.00 R
- R
- R
- R
6 450 000.00
88 MIG DC
26/00015-04 R 3
0 000 000.00 R 30
000 000.00 R
- R
- R 13
562 202.87 R 1
6 437 797.13
89 MIG DC
26/00024 R 15 543 31
4.25 R 15 543 314
.25 R
- R
- R
- R 15 543 3
14.25 90 MIG
DC26/00006-0
6-08 R 1 820 902.05
R 1 820 902.05
R
- R -
R -
R 1 820 902
.05 91 MIG
DC26/00013-2
5 R 260 582.50
R 260 582.50
R -
R - R
127 004.66
R 133 577.84
92 MIG DC
26/00026-27 R 6
3 628 067.36 R 63
628 067.36 R
- R
- R 1 0
54 550.00 R 62 573
517.36

93 NTP DC
26/01851 R 4 450 289
.16 R 4 450 289.
16 R
- R
- R 3 940 928.
15 R 509 36
1.01 94 RBIG
DC26/00006-0
3 R 1 850 000.00
R 1 850 000.00
R
- R -
R 1 161 919.18
R 688 080.
82 95 RBIG
DC26/00006-0
3 R 39 254 385.9
6 R 39 254 385.96
R
- R -
R 38 474 178.90
R 780 207.
06 96 RBIG
DC26/00006-0
3 R 5 348 245.61
R 5 348 245.61
R
- R -
R 3 247 840.91
R 2 100 404.
70 97 WSI
G DC26/00023-2
4 R 5 996 275.34
R 5 996 275.34
R
- R -
R 5 894 927.53
R 101 347.
81 98 WSI
G DC26/00023-2
5 R 24 868 162.3
5 R 24 868 162.35
R
- R -
R 21 977 338.58
R 2 890 823.
77 99 WSI
G DC26/00023-2
5 R 625 438.60
R 625 438.60
R -
R - R
77 081.20
R 548 357.40
100 WSIG DC
26/00023-26 R 3
022 646.64 R 3
022 646.64 R
- R
- R 2
811 938.36 R
210 708.28
101 WSIG DC
26/00023-27 R 4
170 914.36 R 4
170 914.36 R
- R
- R 3
694 844.65 R
476 069.71
102 WSIG DC
26/00023-93 R 2
5 925 946.64 R 25
925 946.64 R
- R
- R 17
606 879.46 R
8 319 067.18
103 WSIG DC
26/00010-64 R 3
352 518.73 R 3
352 518.73 R
- R
- R
- R
3 352 518.73
104 WSIG DC
26/00004 R 4 000 000
.00 R 4 000 000.
00 R
- R
- R
- R 4 000 0
00.00 Total R
461 075 979.92

F H. Capital
Expenditure Projec
t Report at 30 June 2
018 USUTHU R
WSS PHASE 5 (MIG) -
2006MIGFDC265328
ITEM CONTRACT NO.
PROJECT NAME
SCOPE OF WORK
Ward Number & Villa
ge Name
APPROVED
PROJECT COSTS PROGRESS
(%)
COMMENTS
1 ZDM 003/201
6 Usuthu RWSS
Gravity main to sosha
mase and reticul
ation at Delini
and soshamase
Soshomase and Delen
i Ward 9 &1
6 R 4 04
6 056 95%
The contractor is busy
with pressu
re testing. 2 ZD
M 003/2016 Usuthu
RWSS Constructio
n of reticulation
line, bulk line standta
ps and chambers O
phalule village Opalule, W
ard 16 R 7 26
8 481 60%
The Contractor is busy
with 3 cham
bers and has
increased the team fo
r to start const
ructing other
chambers 3 ZD
M 003/2016 Usuthu
RWSS Constructio
n of reticulation
line at Esikhaleni villa
ge Lindizwe, Ward 9
R 2 420 853 98
% Project is c
omplete practical ce
rtificate to be
issued. 4 ZD
M 051/2015 Usuthu
RWSS Constructio
n of reticulation
line at Nongoma south
phase 1
Lindizwe, Ward 9
R 2 937 431 68
% The contra
ctor is busy
excavations and laying
of the pipelin
e. 5 ZD
M 068/2015 Usuthu
RWSS Constructio
n of reticulation
line at Nongoma south
phase 3
Lindizwe, Ndikandika,
Ward 9
R 5 006 518 37
% Almost com
pleted the pipelaying.
Will start with
construction of valves.
Material is
on site 6 ZD
M 037/2015 Usuthu
RWSS Constructio
n of reticulation
line at KwaMinya and
Soshamase
KwaZiphethe and
KwaMinya Ward 16
R 5 873 556 56
% The Contra
ctor is busy
with excavations and
laying of the pipeline,
installations valve
chambers and stand
pipes.
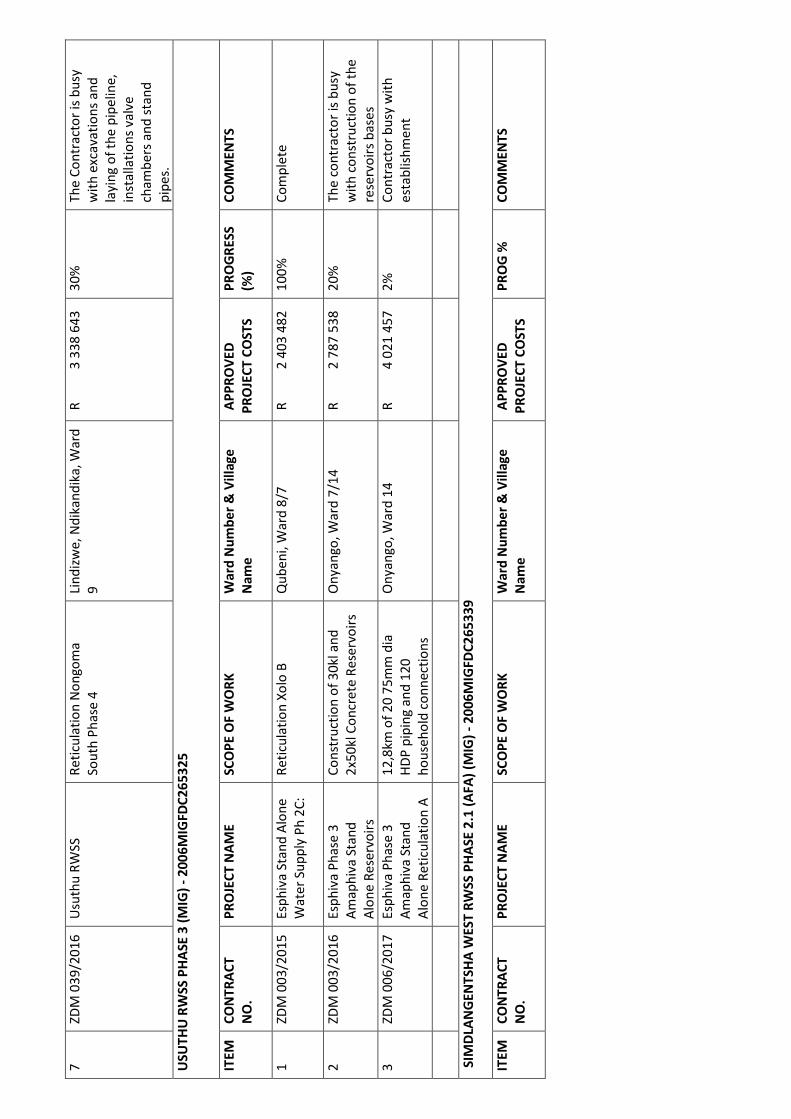
7 ZDM 039/201
6 Usuthu RWSS
Reticulation Nongoma
South Phas
e 4 Lindizwe, N
dikandika, Ward
9 R 3 33
8 643 30%
The Contractor is busy
with excav
ations and laying of th
e pipeline, installation
s valve chambers a
nd stand pipes.
USUTHU RWSS PHAS
E 3 (MIG) - 2006MIGF
DC265325 ITEM CO
NTRACT NO. PROJECT N
AME SCOPE OF W
ORK Ward Num
ber & Village
Name APPROVED
PROJECT C
OSTS PROGRESS
(%) COMMENT
S 1 ZD
M 003/2015 Esphiva
Stand Alone
Water Supply Ph 2C:
Reticulation Xolo B
Qubeni, Ward 8/7
R 2 403 482 10
0% Complete
2 ZDM 003/201
6 Esphiva Phase 3 Amaphiva S
tand Alone Rese
rvoirs Constructio
n of 30kl and
2x50kl Concrete Reser
voirs Onyango, Ward 7/14
R 2 787 538 20
% The contra
ctor is busy
with construction of th
e reservoirs b
ases 3 ZD
M 006/2017 Esphiva
Phase 3 Amaphiva Stand
Alone Reticulation A
12,8km of 20 75mm di
a HDP piping
and 120 household
connections Onyango, W
ard 14 R 4 02
1 457 2%
Contractor busy with
establishment
SIMDLANG
ENTSHA WEST RWSS
PHASE 2.1 (AFA) (MIG
) - 2006MIGFDC265339
ITEM CO
NTRACT NO. PROJECT N
AME SCOPE OF W
ORK Ward Num
ber & Village
Name APPROVED
PROJECT C
OSTS PROG % COMMENT
S

1 ZDM 053/201
5 Simdlangentsha W
est Regional W
ater Supply Sch
eme Frischgewa
ard WTW-constructio
n of a water
treatment works - civi
ls works
Bilanyoni, Ward 4
R 64 503 171 7
6% The contra
ctor has brought in
a subcontrac
tor to complete t
he works. Subcontrac
tor has commence
d on site and
progressing well.
Subcontractor current
ly busy with s
huttering for
the 2nd Clarifloculator
s, access road
, control building an
d site work
earthworks.
2 ZDM 054/201
5 Simdlangentsha W
est Regional W
ater Supply Sch
eme Frischgewa
ard WTW-Installation
of Mechanical
and Electrical equipm
ent Bilanyoni, Ward 4
R 21 845 676 1
5% The contra
ctor is busy
with pipework installa
tion SIMDLANG
ETSHA CENTRAL (MIG
) - 2013MIGFDC262135
08 ITEM CO
NTRACT NO. PROJECT N
AME SCOPE OF W
ORK Ward Num
ber & Village
Name APPROVED
PROJECT C
OSTS PROGRESS
(%) COMMENT
S 1 ZD
M031/2017 The con
struction of
bulk pipeline from
Mozane Weir to
Ombimini Reservoir –
Phase 2 The constru
ction of bulk
pipeline from Mozane
Weir to Ombimi
ni Reservoir Khiphunyaw
o,Mdiyane,Sgq
umeni Ward 3, Orange
dal Ward 3 and
Kwamasha
ya,Kipval &
Nkundla Ward 6
R 12 719 970 2
9% The contra
ctor is busy
with trench excavation
and pipelay
ing
SIMDLANGETSHA EAS
T (MIG) -2012MIGFDC
26207602 ITEM CO
NTRACT NO. PROJECT N
AME SCOPE OF W
ORK Ward Num
ber & Village
Name APPROVED
PROJECT C
OSTS PROGRESS
(%) COMMENT
S
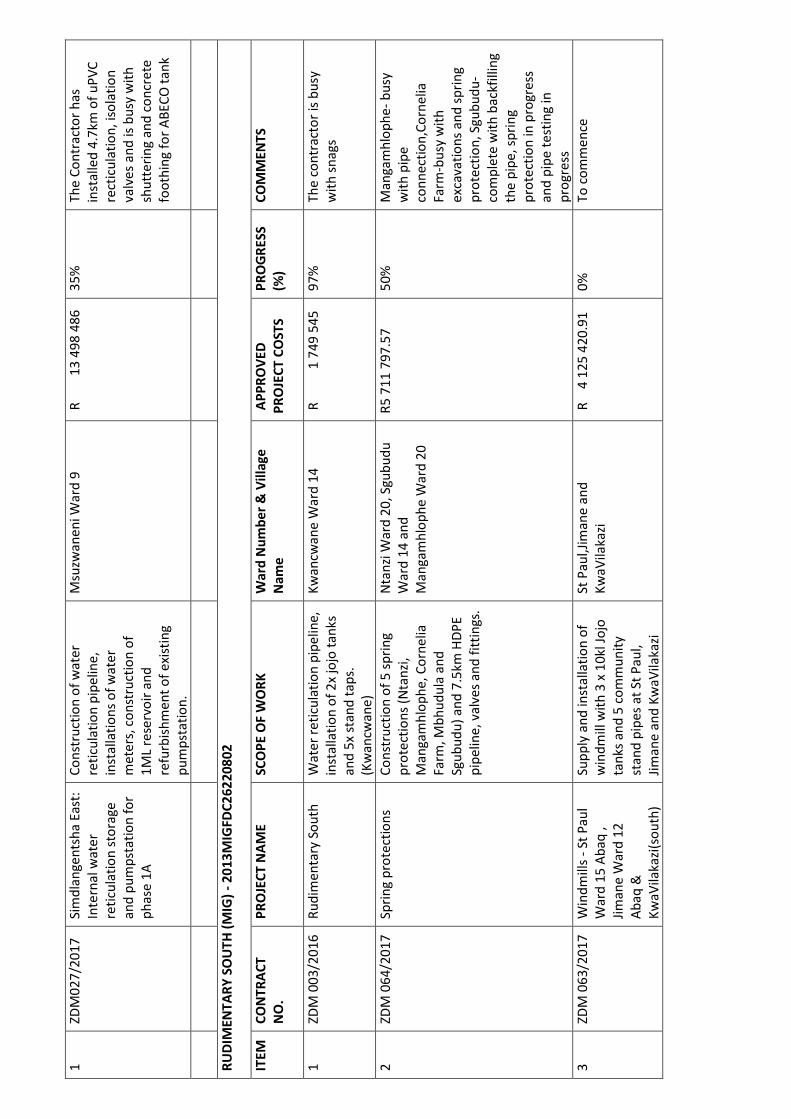
1 ZDM027/2017
Simdlangentsha Ea
st: Internal wa
ter reticulation
storage and pumps
tation for phase 1A
Construction of water
reticulation pipeline,
installations of water
meters, construction o
f 1ML reserv
oir and refurbishm
ent of existing
pumpstation.
Msuzwaneni Ward 9
R 13 498 486 3
5% The Contra
ctor has installed 4.
7km of uPVC
recticulation, isolation
valves and
is busy with
shuttering and concre
te foothing fo
r ABECO tank
RUDIMENT
ARY SOUTH (MIG) - 20
13MIGFDC26220802
ITEM CONTRACT NO.
PROJECT NAME
SCOPE OF WORK
Ward Number & Villa
ge Name
APPROVED
PROJECT COSTS PROGRESS
(%)
COMMENTS
1 ZDM 003/201
6 Rudimentary South
Water reticulatio
n pipeline, installation
of 2x jojo tanks
and 5x stand taps.
(Kwancwane)
Kwancwane Ward 14
R 1 749 545 97
% The contra
ctor is busy
with snags 2 ZD
M 064/2017 Spring
protections Cons
truction of 5 spring
protections (Ntanzi,
Mangamhlophe, Corn
elia Farm, Mbh
udula and Sgubudu) a
nd 7.5km HDPE
pipeline, valves and fit
tings. Ntanzi Ward 20, Sgubu
du Ward 14 an
d Mangamhl
ophe Ward 20 R5 711 797
.57 50%
Mangamhlophe- busy
with pipe connection
,Cornelia Farm-busy
with excavation
s and spring
protection, Sgubudu-
complete with backfilli
ng the pipe, sp
ring protection
in progress
and pipe testing in
progress 3 ZD
M 063/2017 Windm
ills - St Paul
Ward 15 Abaq ,
Jimane Ward 12
Abaq & KwaVilakazi(south)
Supply and installation
of windmill w
ith 3 x 10kl Jojo
tanks and 5 communit
y stand pipes
at St Paul, Jimane and
KwaVilakazi St Paul,Jim
ane and KwaVilakaz
i R 4 125 4
20.91 0%
To commence
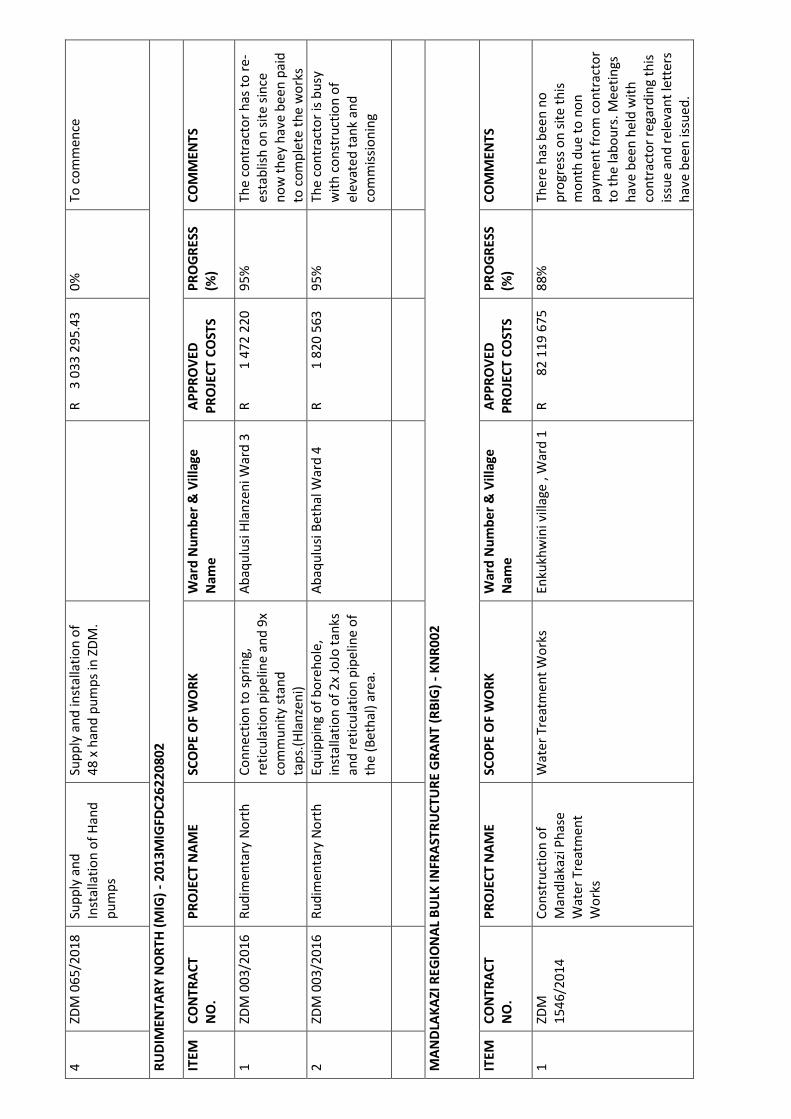
4 ZDM 065/201
8 Supply and Installation
of Hand pumps
Supply and installation
of 48 x hand p
umps in ZDM.
R 3 033 295.43 0%
To commen
ce RUDIMENT
ARY NORTH (MIG) - 20
13MIGFDC26220802
ITEM CONTRACT NO.
PROJECT NAME
SCOPE OF WORK
Ward Number & Villa
ge Name
APPROVED
PROJECT COSTS PROGRESS
(%)
COMMENTS
1 ZDM 003/201
6 Rudimentary North
Connection to spr
ing, reticulation
pipeline and 9x
community stand
taps.(Hlanzeni)
Abaqulusi Hlanzeni Wa
rd 3 R 1 472 2
20 95% The contra
ctor has to re-
establish on site since
now they h
ave been paid
to complete the work
s 2 ZD
M 003/2016 Rudime
ntary North Equipp
ing of borehole,
installation of 2x JoJo
tanks and reticul
ation pipeline of
the (Bethal) area.
Abaqulusi Bethal Ward
4 R 1 820 5
63 95% The contra
ctor is busy
with construction of
elevated tank and
commissioning
MANDLAK
AZI REGIONAL BULK IN
FRASTRUCTURE GRAN
T (RBIG) - KNR002
ITEM CONTRACT NO.
PROJECT NAME
SCOPE OF WORK
Ward Number & Villa
ge Name
APPROVED
PROJECT COSTS PROGRESS
(%)
COMMENTS
1 ZDM 1546/2014
Construction of
Mandlakazi Phase
Water Treatment
Works Water Trea
tment Works En
kukhwini village , War
d 1 R 82 119 67
5 88% There has b
een no progress on
site this month due
to non payment fr
om contractor
to the labours. Meetin
gs have been
held with contractor
regarding this
issue and relevant lett
ers have been
issued.

2 ZDM 035/201
5 Construction of Intermedia
te Pumpstatio
n (WTW to Comman
d Reservoir U
pgrade to 10Ml/day)
Contruction of new
pumpstation, including
new 10Ml suppl
y pump set,
construction of new 50
0Kl bulk reserv
oir, paved brick
paved roadworks, park
ing area, retain
ing wall, storm-
water drainage and tie
-in to existing ris
ing main and old
reservoir.
Enkukhwini village , W
ard 1 R 17 012
967 20%
The contractor has fo
und a massive r
ock on site ,
which has delayed the
construction of the
reservoir , as the rock
shelf exten
ds from the
proposed new reserv
oir location/po
sition through
to the existing reservo
ir base.
The contractor is
currently busy with
brickwork on the pump
station.
3 ZDM 065/201
5 Mandlakazi RWSS:
Bulk Gavity
lines Constructio
n of (350,250
and 100)DN ductile iro
n gravity mai
n, constructioon
of 150 Kl reservoir C1,
500Kl reservoir D
1 and access
roads. Kwamngwa
munde, Ward 1 R
32 126 632 18%
The contractor is busy
with excav
ations, clearing
and grubbing of the si
te in preparat
ion for constructio
n of reservoirs
and rehabilitation of t
he 350DN pipe
line.
USUTHU REGIONAL B
ULK INFRASTRUCTUR
E GRANT (RBIG) - KNR0
01 ITEM CO
NTRACT NO. PROJECT N
AME SCOPE OF W
ORK Ward Num
ber & Village
Name APPROVED
PROJECT C
OSTS PROGRESS
(%) COMMENT
S 1 ZD
M 1521/2014 Usuthu Pum
p Station M and Rese
rvoir BST 0.6ml and R
eservoir M1 and M2
(3ML Each)
Usuthu Pump Station M
and Reserv
oir BST 0.6ml)
and Reservoir M1 and
M2 (3ML Each)
Nongoma,
Ward 16 R 32 6
82 599 98%
The contractor is busy
with the re
-sealing of reservoir.

2 ZDM 1558/2014
Usuthu WPW Pump
Station Mech & Ele
c Installation Mje
ni/Mahlombe, Ward 9
& 15
R 74 211 587 9
8% The contra
ctor is busy
with testing and also
fixing the leaks from th
e previous co
ntractor. 3 ZD
M 031/2015 Gravity
main from
Res G towards White
City Bulk gravity
main White City,
Ward 20 R 5 13
6 325 90%
They are currently bu
sy with install
ation of chambers.
4 ZDM 028/201
7 Completion of Holinyoka a
nd Lindizwe Pumpstatio
n InletWork:
Civil work, Pumpstatio
n, substation
and balancing tank
Lindzwe Ward 4 &
Holinyoka Ward 9
R 18 650 149 3
0% The contra
ctor is busy
with construction of th
e new Roof t
russes started.
Office tiling & repairin
g of doors at th
e Main Pump
station and the retaini
ng wall started
at Mahlombe
Pump station.
5 ZDM 029/201
7 Completion of Concrete R
eservoir 7ML with A
ccess roads and U
suthu Reservoir B
Constuctio
n of a 7ML reservoir a
nd 3 ML reservoir
Okwaleni Ward 5
R 38 966 918 2
5% The contra
ctor is busy
with Insitu Layer
compaction, Septic Tan
k at Guardho
use 7ML reservoir a
nd Concrete
pillars built to support
existing wa
ter pipeline. A
letter of slow progress
has been is
sued. 6 ZD
M 057/2017 Nyoken
i Self Build Constructio
n of eletrical
poles for Pumpstation
Nzambakuluma &
Emfenyane Ward 5
R 3 127 007 59
% The contra
ctor is busy
with installation of po
les 7 ZD
M 061/2015 Concre
te reservoir
Nongoma CBD 1X
2,4ML Concrete re
servoir Nongoma C
BD 1X 2,4ML nongoma t
own R 18 8
29 835 90%
The contractor is busy
with backfi
lling on the
reservoir and new acc
ess roads, prog
ress has been
slow, letter of slow
progress has been issu
ed. Contractor
to be terminated
.
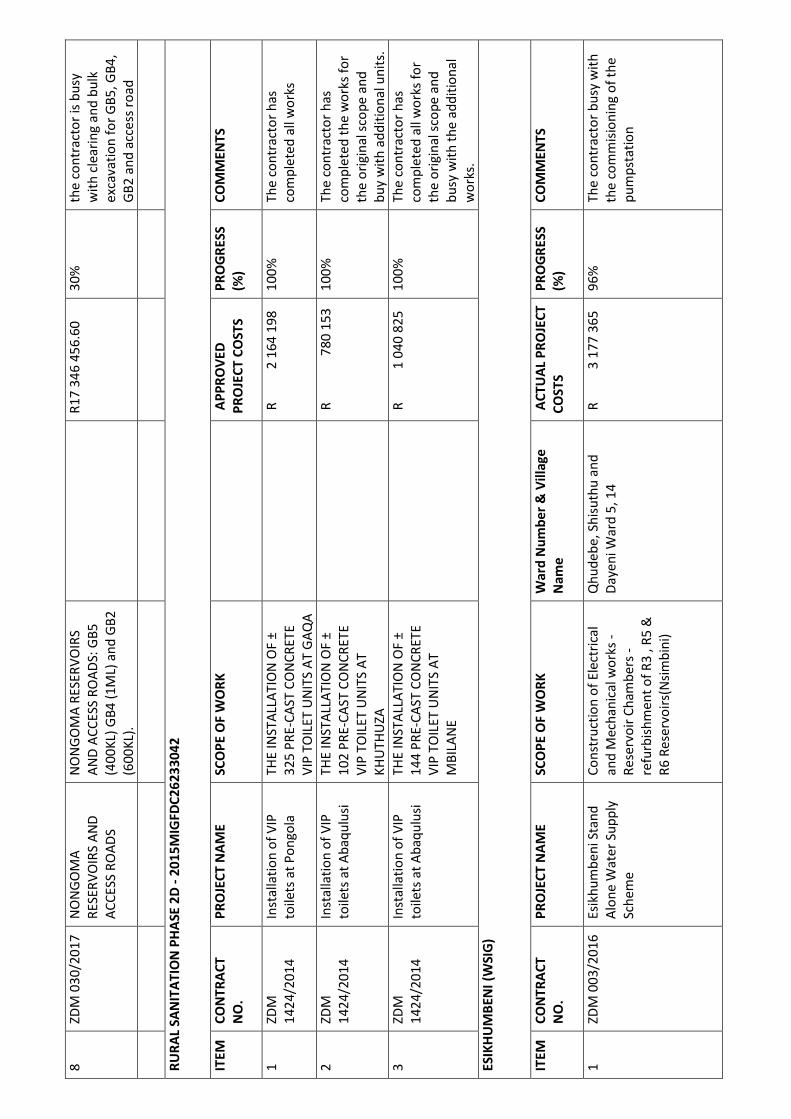
8 ZDM 030/201
7 NONGOMA RESERVOIR
S AND ACCESS RO
ADS NONGOMA
RESERVOIRS
AND ACCESS ROADS: G
B5 (400KL) GB
4 (1ML) and GB2
(600KL).
R17 346 456.60 3
0% the contrac
tor is busy with clearin
g and bulk excavation
for GB5, GB4,
GB2 and access road
RURAL SAN
ITATION PHASE 2D - 20
15MIGFDC26233042
ITEM CONTRACT NO.
PROJECT NAME
SCOPE OF WORK
APPROVED
PROJECT C
OSTS PROGRESS
(%) COMMENT
S 1 ZD
M 1424/2014 Installation
of VIP toilets at P
ongola THE INSTAL
LATION OF ±
325 PRE-CAST CONCRE
TE VIP TOILET
UNITS AT GAQA
R 2 164 198 10
0% The contra
ctor has completed
all works 2 ZD
M 1424/2014 Installation
of VIP toilets at A
baqulusi THE INSTAL
LATION OF ±
102 PRE-CAST CONCRE
TE VIP TOILET
UNITS AT KHUTHUZA
R 780 153 1
00% The contra
ctor has completed
the works for
the original scope and
buy with ad
ditional units.
3 ZDM 1424/2014
Installation of VIP
toilets at Abaqulusi
THE INSTALLATION OF
± 144 PRE-CA
ST CONCRETE
VIP TOILET UNITS AT
MBILANE
R 1 040 825 10
0% The contra
ctor has completed
all works for
the original scope and
busy with t
he additional
works. ESIKHUMB
ENI (WSIG)
ITEM CONTRACT NO.
PROJECT NAME
SCOPE OF WORK
Ward Number & Villa
ge Name
ACTUAL PROJECT
COSTS PROGRESS
(%)
COMMENTS
1 ZDM 003/201
6 Esikhumbeni Stand
Alone Wate
r Supply Scheme
Construction of Electri
cal and Mecha
nical works -
Reservoir Chambers -
refurbishment of R3 ,
R5 & R6 Reservo
irs(Nsimbini) Qhudebe, S
hisuthu and
Dayeni Ward 5, 14
R 3 177 365 96
% The contra
ctor busy with
the commisioning of t
he pumpstatio
n

2 ZDM 003/201
6 Esikhumbeni Stand
Alone Wate
r Supply Scheme
Construction of R7
pumpstation(okhalwen
i) Okwaleni Ward 5
R 3 700 114 90
% The contra
ctor was busy
with the installation o
f control pan
nel but work
has stoped due to cas
flow problems le
tter of slow
progress has been sent
. 3 ZD
M 041/2016 Esikhum
beni Stand
Alone Water Supply
Scheme Constructio
n of 2 reservoirs
and refurshment of 4
reservoirs(ezimfabeni
-250kl & 100kl)
Nzambakuluma &
Emfenyane Ward 5
R 2 900 906 97
% The contra
ctor was busy
with the finishes on th
e reservoir, p
rogress has
stop due to cashflow
problems but contract
or has left site
with out notice and
letter of terminatio
n has been
sent to the client.
4 ZDM 010/201
8 Esikhumbeni Stand
Alone Wate
r Supply Scheme
Installation of a water
network co
mprising approxima
tely 10.3 km of
25, and 50mm diamete
r HDPE Class
10 pipe. In
addition all associated
fittings, iso
lating valves, air
valves, scour valves, b
reak pressure ta
nks. Nzambakul
uma & Emfenyane
Ward 5 R 3 98
7 555 20%
The contractor was bu
sy with the ex
cavations and
laying of the pipeline,
but progress ha
s been slow
due to the delay in
procuring of materials
and letter of slow
progress has been sent
. ITEM CO
NTRACT NO.
START DATE PRO
JECT NAME DESC
RIPTION APPROVED
PROJECT COSTS
REVISED PROJECT COSTS ACTUAL PROJECT COSTS
PROG % Planned Completion
Date
Actual completion
date COMMENT
S 1 ZD
M 1414/2013
28/03/2014 Kw
aNkulu SAWSS Cons
truction of
Reservoirs R 4 898 34
0 R 4 898 340
R 4 497 401 100%
20-Nov-14 30-Jul-15
The project has
been completed
2 ZDM 1515/20
14 28/03/201
4 Ulundi WTW: Emergency
Water Interventio
n installation
of 2x1700 kVA
diesel generators
, fuel tank, switc
hgear, in sync pan
el and concrete sl
ab. R 9 417 77
8 R 9 056 931
R 6 894 563 100%
05-May-15 30-
Jul-15 Completed

3 ZDM 023/201
5 28/03/201
4 Esikhumbeni Stand Alon
e Water Supp
ly Scheme
Bulk Rising Main
from R1 to R6
R10 762 889 R10
762 889 R10 179 143
98% 04-Apr-17
04-Apr-17 The contra
ctor is busy with t
esting of the last s
ection. There is a challenge o
f getting wat
er to the testing
point and curren
tly it is awaiting pu
mp installation
by VBM Gene
ral Trading
4 ZDM 024/201
5 28/03/201
4 Esikhumbeni Stand Alon
e Water Supp
ly Scheme
Project R6 water
reticulation R 6 987 69
2 R 6 195 020
R 4 616 989 100%
10-Jan-17 10-Jan-17
Completed
5 ZDM 019/201
5 28/03/201
4 Dindi Water Reticulatio
n Scheme
Water reticulation
R 3 232 833 R 2
715 461 R 1 697 815
100% 13-Sep-16
Complete
6 ZDM 020/201
5 28/03/201
4 Dindi Bulk Sup
ply System
Reservoirs and
Bulk Pipelines R 3 413 09
4 R 2 923 735
R 2 192 085 100%
29-Sep-16
Complete 7 ZD
M 021/2015
28/03/2014 God
lankomo Water Reticulation
Water reticulation
R10 677 097 R 9
160 847 R 4 426 244
100% 21-Jan-17
30-Nov-16 Project Com
plete 8 ZD
M 022/2015
28/03/2014 God
lamkomo Bulk
Supply System Reservoirs
,Bulk Pipelines a
nd equipping o
f borehole
R 3 708 991 R 3
370 679 R 1 369 901
100% 20-Sep-16
15-Nov-16 Complete
9 ZDM 025/201
5 28/03/201
4 Esikhumbeni Stand Alon
e Water Supp
ly Scheme
Project R3 Water
Reticulation
R 3 632 342 R 3
247 050 R 2 019 822
100% 21-Sep-16
30-Jul-16 Complete.
10 ZDM 026/201
5 28/03/201
4 Esikhumbeni Stand Alon
e Water Supp
ly Scheme
Gravity Main from
Project R6 to R3
R 4 376 310 R 3
412 197 R 2 121 423
100% 07-Feb-17
30-Jul-16 Complete
11 ZDM 027/201
5 28/03/201
4 Esikhumbeni Stand Alon
e Water Supp
ly Scheme
Gravity Main from
Project R3 to R4
and R5 R 3 312 45
7 R 3 136 013
R 1 852 049 100%
07-Feb-17 07-Feb-17
Complete

12 ZDM 003/201
6 10/01/201
7 Esikhumbeni Stand Alon
e Water Supp
ly Scheme
Rising Main from
R7 to R12- Contract 1 R 3 354 35
4 R 2 627 531
R 2 025 450 100%
28-Apr-17 30-Nov-17
Project has been
completed
13 ZDM 003/201
8 06/10/201
6 Esikhumbeni Stand Alon
e Water Supp
ly Scheme
Rising Main from
R7 to R12- Contract 2 R 2 971 15
5 R 2 300 431
R 1 427 006 100%
28-Apr-17
Project has been
completed
14 ZDM 003/201
9 06/10/201
6 Esikhumbeni Stand Alon
e Water Supp
ly Scheme
Rising Main from
R7 to R12- Contract 3 R 3 019 92
7 R 3 142 766
R 2 120 687 100%
28-Apr-17
Project has been
completed
15 ZDM 003/201
6 6/10/2016
Esikhumbeni Stand Alon
e Water Supp
ly Scheme
R8 Water Reticulation
Contract 4 R 1 626 13
5 R 2 197 783
R 894 993 100%
28-Apr-17
Project has been
completed
16 ZDM 003/201
6 6/10/2016
Esikhumbeni Stand Alon
e Water Supp
ly Scheme
R8 Water Reticulation
Contract 5 R 3 066 83
0 R 3 619 699
R 1 544 083 100%
28-Apr-17
Project has been
completed
17 ZDM 003/201
6 6/10/2016
Esikhumbeni Stand Alon
e Water Supp
ly Scheme
R8 Water Reticulation
Contract 6 R 3 501 24
0 R 3 796 157
R 1 924 438 100%
28-Apr-17
Project has been
completed
18 ZDM 003/201
6 6/10/2016
Esikhumbeni Stand Alon
e Water Supp
ly Scheme
R8 Water Reticulation
Contract 7 R 3 887 26
0 R 4 284 100
R 2 241 169 100%
28-Apr-17
Project has been
completed
19 ZDM 003/201
6 6/10/2016
Esikhumbeni Stand Alon
e Water Supp
ly Scheme
R8 Water Reticulation
Contract 8 R 4 009 51
5 R 4 511 531
R 2 449 780 100%
28-Apr-17
Project has been
completed
20 ZDM 003/201
6 6/10/2016
Esikhumbeni Stand Alon
e Water Supp
ly Scheme
R7 Water Reticulation
Contract 9 R 2 609 55
4 R 2 755 880
R 1 500 162 100%
28-Apr-17
Project has been
completed
21 ZDM 003/201
6 6/10/2016
Esikhumbeni Stand Alon
e Water Supp
ly Scheme
R7 Water Reticulation
Contract 10 R 3 152 60
1 R 3 418 954
R 1 807 890 100%
28-Apr-17
Project has been
completed
22 ZDM 003/201
6 6/10/2016
Esikhumbeni Stand Alon
e Water Supp
ly Scheme
R10 Water
Reticulation
Contract 11 R 3 228 29
3 R 3 483 486
R 2 177 251 100%
Project has been
completed

23 ZDM 003/201
6 6/10/2016
Esikhumbeni Stand Alon
e Water Supp
ly Scheme
R10 Water
Reticulation
Contract 12 R 3 548 51
3 R 3 931 806
R 1 922 743 100%
28-Apr-17
Project has been
completed
24 ZDM 003/201
6 6/10/2016
Esikhumbeni Stand Alon
e Water Supp
ly Scheme
R10 Water
Reticulation
Contract 13 R 2 589 36
9 R 2 750 278
R 1 197 616 100%
28-Apr-17
Project has been
completed
25 ZDM 003/201
6 03/04/201
7 Esikhumbeni Stand Alon
e Water Supp
ly Scheme
R12 Water
Reticulation-
Contract 15 R 3 221 37
7 R 3 067 980
R 2 713 762 100%
25-Sep-17 30-Nov-17
Project has been
completed
26 ZDM 003/201
6 03/04/201
7 Esikhumbeni Stand Alon
e Water Supp
ly Scheme
Gravity Main from
Reservoir R8 to
R9- Contract 16
R 3 506 419 R 3
339 447 R 3 149 769
100% 25-Sep-17
30-Nov-17 Project has
been completed
27 ZD
M 003/2016
03/04/2017 Esik
humbeni Stand Alone
Water Supply
Scheme Gravity Ma
in from Reservoir R
8 to R9- Contra
ct 17 R 2 406 28
7 R 2 291 702
R 1 686 725 100%
25-Sep-17 30-Nov-17
Project has been
completed
28 ZDM 003/201
6 03/04/201
7 Esikhumbeni Stand Alon
e Water Supp
ly Scheme
R9 Water Reticulation-
Contract 18 R 4 215 83
5 R 4 015 081
R 3 299 057 100%
25-Sep-17 30-Nov-17
Project has been
completed
29 ZDM 003/201
6 28/03/201
4 Esikhumbeni Stand Alon
e Water Supp
ly Scheme
Project R1 Water
Reticulation
Completion R 3 732 35
9 R 3 732 359
R 1 887 374 100%
25-Sep-17 30-Nov-17
Project has been
completed
30 ZDM 003/201
5 6/10/2016
Esikhumbeni Stand Alon
e Water Supp
ly Scheme
Gravity Main from
reservoir R12 to
R10-R8 Contract
14 R 1 985 13
0 R 2 078 708
R 1 210 373 100%
26-Sep-17
Complete 31 ZD
M 022/2015
17/09/2017 Esik
humbeni Stand Alone
Water Supply
Scheme Reservoirs
R7 and R12 and Pumpstatio
n at R7 R 8 057 980 R 8
057 980 R -
2% 27-Sep-17
Contractor
s have been appo
inted 32 ZD
M 022/2015
15/09/2017 Esik
humbeni Stand Alone
Water Supply
Scheme Reservoirs
R8 and R10
R 2 652 595 R 2
900 906 R -
0% 28-Sep-17
Contractor
s have been appo
inted and busy w
ith establishm
ent.

33 ZDM 1309/20
12 14/04/201
6 Henenende
Vilane Reticulation
R 1 576 195 R 1
576 195 R 1 576 195
100% 29-Sep-17
Constructio
n complete. Awaiting si
te handover d
ate from ZDM.
34 ZD
M 1534/2014
28/11/2014 Hen
enende Vilane Risin
g Main and 100kl reservoir
R 5 900 170 R 5
900 170 R 5 900 170
100% 30-Sep-17
01-Dec-15 Constructio
n complete. Awaiting si
te handover d
ate from ZDM.
35 ZD
M 1535/2014
28/11/2014 Hen
enende Vilane and Ebukhalini Reticulatio
n R 3 996 59
2 R 3 996 592
R 3 996 592 100%
01-Oct-17 01-Dec-15
Construction
complete. Awaiting site
handover date
from ZDM.
36 ZDM 1309/20
12 01/02/201
5 Lomo
Water Bulk Pipe
Line and Reticulation
R 4 222 657 R 3
838 779 R 3 633 636
100% 02-Oct-17
15-Jan-16 Completed
37 ZD
M 1309/2012
01/02/2015 Lom
o Water Bulk
Pipe Line and Bo
rehole 1A_a
R 5 607 427 R 5
604 506 R 5 464 393
100% 03-Oct-17
29-Jan-16 Completed
38 ZD
M 1309/2012
01/02/2015 Lom
o Water Bulk
Pipe Line and Bo
rehole 1A_b
R 7 238 754 R 6
894 051 R 6 857 671
100% 04-Oct-17
Completed
39 ZD
M 1309/2012
01/02/2015 Lom
o Water Reti
culation 01
R 5 393 106 R 5
393 106 R 4 995 495
100% 05-Oct-17
29-Jan-16 Completed
40 ZD
M 1309/2012
01/02/2015 Lom
o Water Reti
culation 02
R 4 600 495 R 4
567 370 R 4 339 001
100% 06-Oct-17
Completed
41 ZD
M 1470/2013
26/02/2015 Lom
o Secondary reservoirs 2
X 80Kl Reservoir a
nd 60Kl Reservoir
R 2 222 580 R 2
222 580 R 2 222 580
85% 07-Oct-17
29-Jan-16 Contractor
terminated
. Works to be comp
leted by Fakude.
42 ZD
M 1309/2012
26/02/216 Lom
o Water Supp
ly Phase 01: Reservoirs
200KL R 5 155 49
6 R 4 698 682
R 4 601 819 100%
08-Oct-17
Complete 43 ZD
M 003/2016
5/9/2017 Esikhumbe
ni Stand Alon
e Water Supp
ly Scheme
Construction of
reservoir R12
(sikhulile) R 2 848 78
4 R 2 848 784
R 1 610 589 96%
24-Mar-18
The contractor is
busy with the
finishes on the
reservoir

44 ZDM 003/201
6 5/9/2017
Esikhumbeni
Stand Alone
Water Supply
Scheme Constructio
n of Electrical a
nd Mechanica
l works - Reservoir
Chambers
- refurbishm
ent of R3 , R5 & R
6 Reservoirs (Nsimbini)
R 3 177 365 R 3
177 365 R 1 098 796
90% 24-Mar-18
The contra
ctor is busy with installation
fittings in the cham
bers and chamb
ers ladders. Th
e contractor
is awaiting th
e delivery of
Control Panels befo
re M&E work
s can commence
45 ZD
M 003/2016
5/9/2017 Esikhumbe
ni Stand Alon
e Water Supp
ly Scheme
Construction of R3
, R4 & R6 Reservoirs (Dayeni, Sisuthu,
Qhudebe) R 4 835 48
4 R 4 835 484
R 441 470 97%
24-Mar-18
Busy with the
pressure testing.
46 ZDM 003/201
6 5/9/2017
Esikhumbeni
Stand Alone
Water Supply
Scheme Constructio
n of Reservoirs
7 Refurbishm
ent of R7 Reservo
irs (Odizima, kwasaku, Kwadayeni
, okhalweni)
R 2 739 73
1 R 2 739 731
R 254 263 48%
24-Mar-18
Contractor has not
done any works
due to cash flow
problems, cession
has been signed to
complete works,
awaiting the
subcontractor to
complete works,
consultant to
provide way
forward to the
client by the 12th
of June 2018.

47 ZDM 003/201
6 5/9/2017
Esikhumbeni
Stand Alone
Water Supply
Scheme Constructio
n of R7 pumpstatio
n (okhalweni
) R 3 700 11
4 R 3 700 114
R 332 527 82%
24-Mar-18
The contractor is
busy with installation of
Mechanical and
Electrical equipment, but is
still slow due to
cash flow problems 48 ZD
M 041/2016
2/8/2017 Esikhumbe
ni Stand Alon
e Water Supp
ly Scheme
Construction of 2
reservoirs and
refurshment of 4
reservoirs (ezimfabeni-250kl
& 100kl) R 2 900 90
6 R 2 900 906
R 392 573 70%
24-Mar-18
The contractor is
busy with concrete pouring
on R8 Reservoir
roof, and anticipate to
complete the
project by the
15th of July 2018
49 ZDM 1526/20
14 26/02/201
5 Lomo
Completion of
Esphiva and Lomo
R 3 449 233 R 3
449 233 R 2 262 590
95% 25-Jul-17
The contra
ctor has completed
the project.
50 ZDM 025/201
6 19-Apr-17
Ceza water
treatment works
Construction of
water treatment
works R32 013 03
1 R32 013 031
R18 910 257 100%
12-Dec-17
The project is
complete 51 ZD
M 042/2016
19-Apr-17 Ceza reserv
oirs and weir
Construction of
Weir B and
Reservoirs Phase 1
R 9 944 140 R 9
944 140 R 4 778 688
100% 04-Dec-17
The project
is complete
52 ZDM 003/201
6 19-Apr-17
Ceza bulk supply
lines Constructio
n of pipeline 01
- Weir to WTW
R 2 218 105 R 2
218 105 R 2 089 315
100% 29-Sep-17
31-Oct-17 The contra
ctor has completed
the project
53 ZDM 003/201
6 19-Apr-17
Ceza bulk supply
lines Constructio
n of pipeline 02
- Reservoir A
a to Ac R 2 663 305 R 2
663 305 R 2 075 765
100% 29-Sep-17
30-Nov-17 Project has
been completed
54 ZD
M 003/2016
19-Apr-17 Ceza bulk s
upply lines
Construction of
pipeline 03-
Reservoir Ac to Da R 2 102 25
7 R 2 102 257
R 1 392 155 100%
29-Sep-17
The contractor is
busy with snags.
55 ZDM 003/201
6 19-Apr-17
Ceza bulk supply
lines Constructio
n of pipeline 04
- Reservoir D
a to De R 1 830 307 R 1
830 307 R 1 635 995
100% 29-Sep-17
The contra
ctor is busy with s
nags.

56 ZDM 003/201
6 19-Apr-17
Ceza bulk supply
lines Constructio
n of pipeline 05
- Reservoir D
e to Dg R 2 076 004 R 2
076 004 R 1 727 202
100% 29-Sep-17
30-Nov-17 Project has
been completed
57 ZD
M 003/2016
19-Apr-17 Ceza bulk s
upply lines
Construction of
pipeline 06-
Reservoir Dg to Ea R 2 302 35
2 R 2 302 352
R 2 183 430 98%
29-Sep-17 30-Nov-17
Contractor is busy
with snags.
58 ZDM 003/201
6 19-Apr-17
Ceza bulk supply
lines Constructio
n of pipeline 07
- Reservoir E
a to Ec R 1 547 75
5 R 1 547 755
R 1 458 574 100%
29-Sep-17 31-Oct-17
The contractor has
completed the
project 59 ZD
M 003/2016
19-Apr-17 CEZA RETICULAT
ION SUPPLY LIN
ES Construction of
Reticulation 01
R 3 496 516 R 3
496 516 R 1 262 712
100% 29-Sep-17
Contractor
is busy with snags.
60 ZD
M 003/2016
19-Apr-17 Ceza reticu
lation supply line
s Constructio
n of Reticulatio
n 02 R 3 131 30
9 R 3 190 772
R 3 190 772 100%
29-Sep-17 31-Oct-17
The contractor has
completed the
project 61 ZD
M 003/2016
19-Apr-17 Ceza reticu
lation supply line
s Constructio
n of Reticulatio
n 03 R 3 590 12
1 R 3 590 121
R 3 320 820 100%
29-Sep-17 31-Oct-17
The contractor has
completed the
project
Related Documents