Dr. Yiyun Chen [email protected] School of Resource and Environmental Science Wuhan University 3 December, 2014

Welcome message from author
This document is posted to help you gain knowledge. Please leave a comment to let me know what you think about it! Share it to your friends and learn new things together.
Transcript
Dr. Yiyun Chen [email protected]
School of Resource and Environmental Science Wuhan University 3 December, 2014

Outline
• Case study 1 (Geographical space)
– Mapping of Cu and Pb Contaminations in Soil Using Combined Geochemistry, Topography, and Remote Sensing: A Case Study in the Le’an River Floodplain, China
• Case study 2 (Geographical and spectral spaces)
– Explore the spatial dependence of soil properties in both geographical space and spectral space

1 Background
Objectives
Materials and Methods
Results
Conclusion Mapping of Cu and Pb Contaminations in Soil Using Combined Geochemistry, Topography, and Remote Sensing: A Case Study in the Le’an River Floodplain, China

Background
Farmland Wetland
Mines
Largest fresh water lake in China
Case study 1
Le’an River Floodplain
Annual rainfall 1900 mm
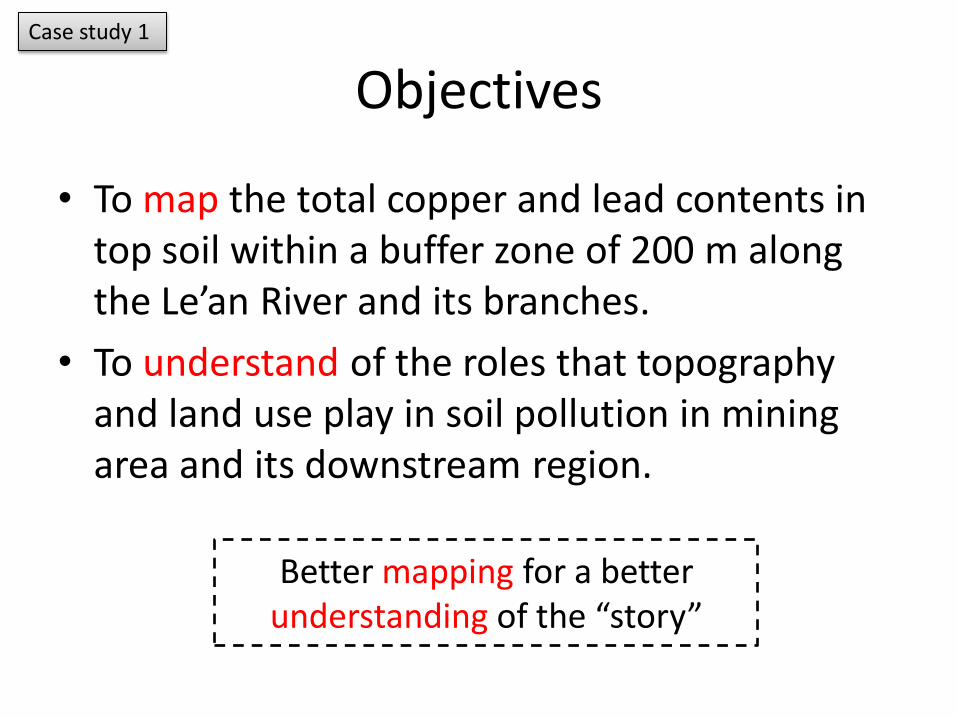
Objectives
• To map the total copper and lead contents in top soil within a buffer zone of 200 m along the Le’an River and its branches.
• To understand of the roles that topography and land use play in soil pollution in mining area and its downstream region.
Case study 1
Better mapping for a better understanding of the “story”
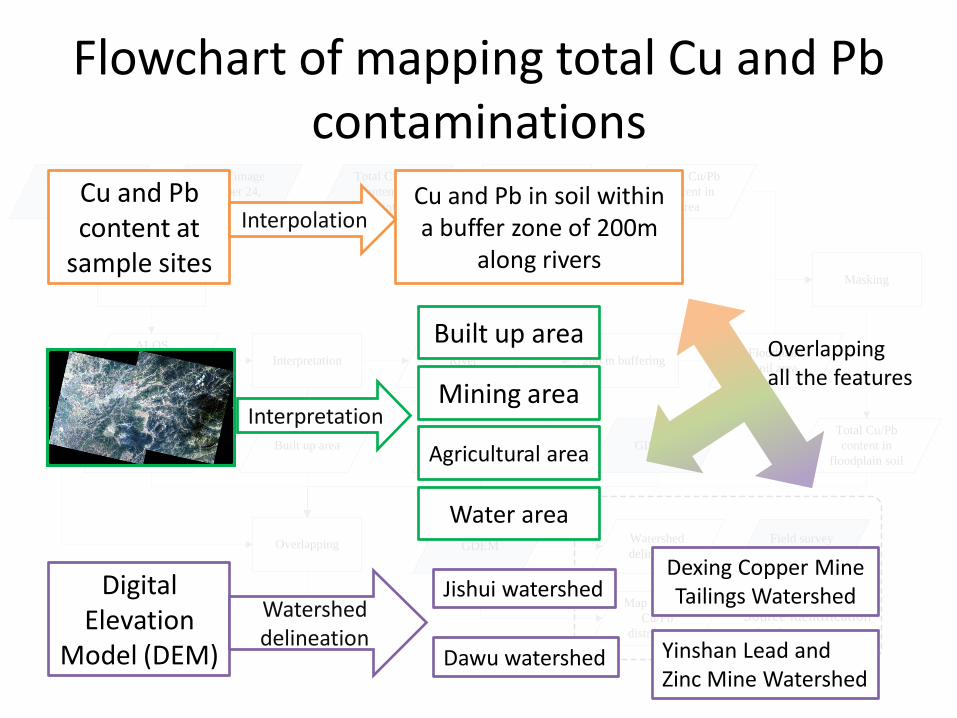
Flowchart of mapping total Cu and Pb contaminations
ALOS image
October 24,
2009
Total Cu/Pb
content at
points
GDEM
ALOS image
May 10,
2009
ALOS
image of
study area
Mosaic
Interpretation
Built up areaAgricultural
areaMining area
River 200 m bufferingFloodplain
soil area
Interpolation (IDW)
Total Cu/Pb
content in
area
Masking
Total Cu/Pb
content in
floodplain soil
Overlapping
GIS data
Watershed
delineation
Field survey
records
Source identification
and risk assessment
Map for total
Cu/Pb
distribution
Cu and Pb content at
sample sites
Digital Elevation
Model (DEM)
Built up area
Mining area
Agricultural area
Water area
Cu and Pb in soil within a buffer zone of 200m
along rivers
Interpolation
Interpretation
Watershed delineation
Jishui watershed
Dawu watershed
Dexing Copper Mine Tailings Watershed
Yinshan Lead and Zinc Mine Watershed
Overlapping all the features

Field sampling and chemical analysis
• A total of 71 top layer (0–15 cm) soil samples were collected along the Le’an River and its branches.
• About 75% of the samples (53 samples) were collected in the middle and upper reaches of the Le’an River where the Dexing copper mine and Yinshan lead-zinc extraction facility are located

Spatial distribution of Cu

Spatial distribution of Pb

Spatial distribution of Cu and Pb
• With 3D maps generated from multi-source data, the potential sources and transportation routes of Cu and Pb pollutants were inferred through visual inspections and field survey records.
• The inference was thereafter confirmed by mapping together the watersheds of the Dawu River, Jishui River and the mining area, the Cu/Pb content in soil, and sample sites.
Conclusion
• Bearing the idea “better mapping means better and easier understanding”, this study demonstrated the arts of utilizing multi-source data in the mapping of environmental pollution as well as in the understanding of the role that topography plays in the transportation of pollutants.
Case study 1
2 Background Background
Explore the spatial dependence of soil properties in both geographical space and spectral space
Remarks
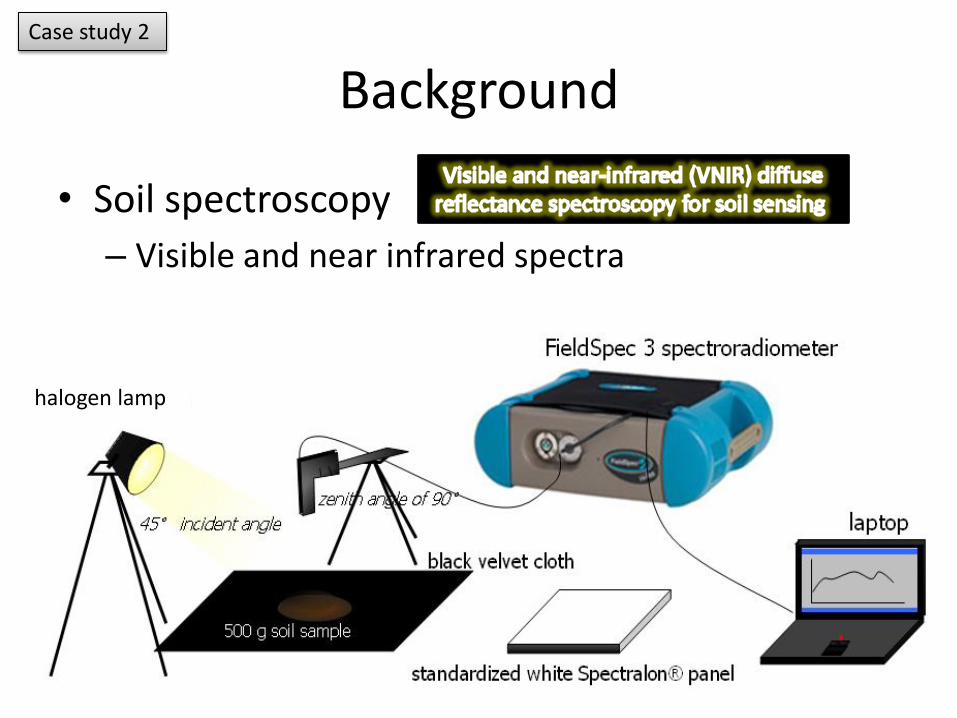
Background
• Soil spectroscopy
– Visible and near infrared spectra
350 nm 760 nm 2500 nm
Soil
Incident sunlight reflected (reflectance spectra) by soil contains information of soil components (e.g. minerals, organics, moisture and particle size)
halogen lamp
Case study 2
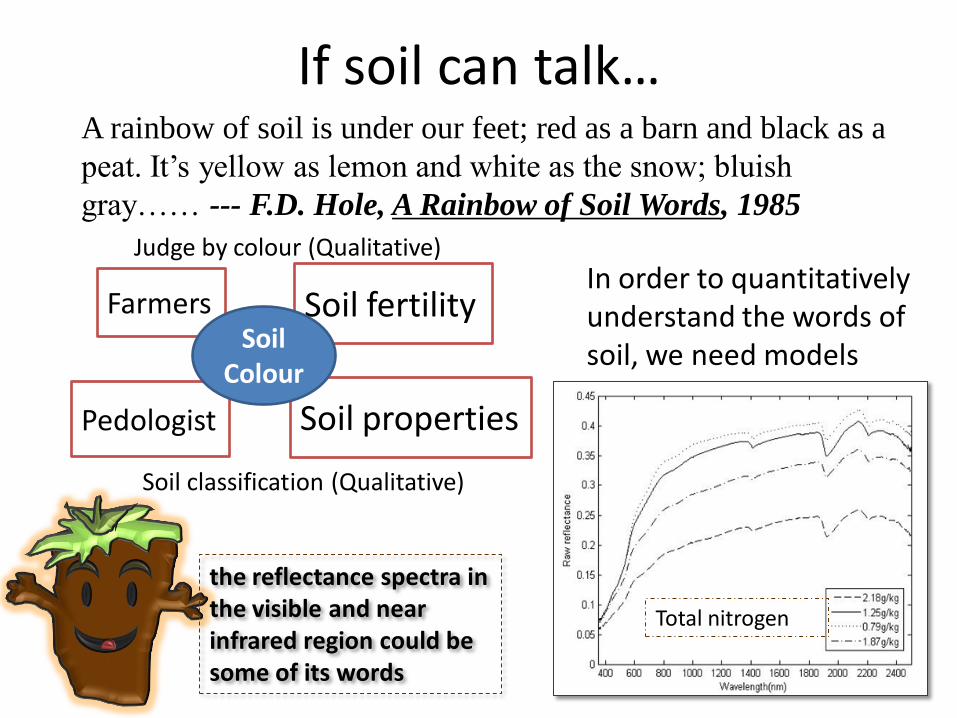
Total nitrogen
If soil can talk…
Farmers Soil fertility
Pedologist Soil properties
Judge by colour (Qualitative) In order to quantitatively understand the words of soil, we need models
Soil classification (Qualitative)
the reflectance spectra in the visible and near infrared region could be some of its words
A rainbow of soil is under our feet; red as a barn and black as a
peat. It’s yellow as lemon and white as the snow; bluish
gray…… --- F.D. Hole, A Rainbow of Soil Words, 1985
Soil Colour
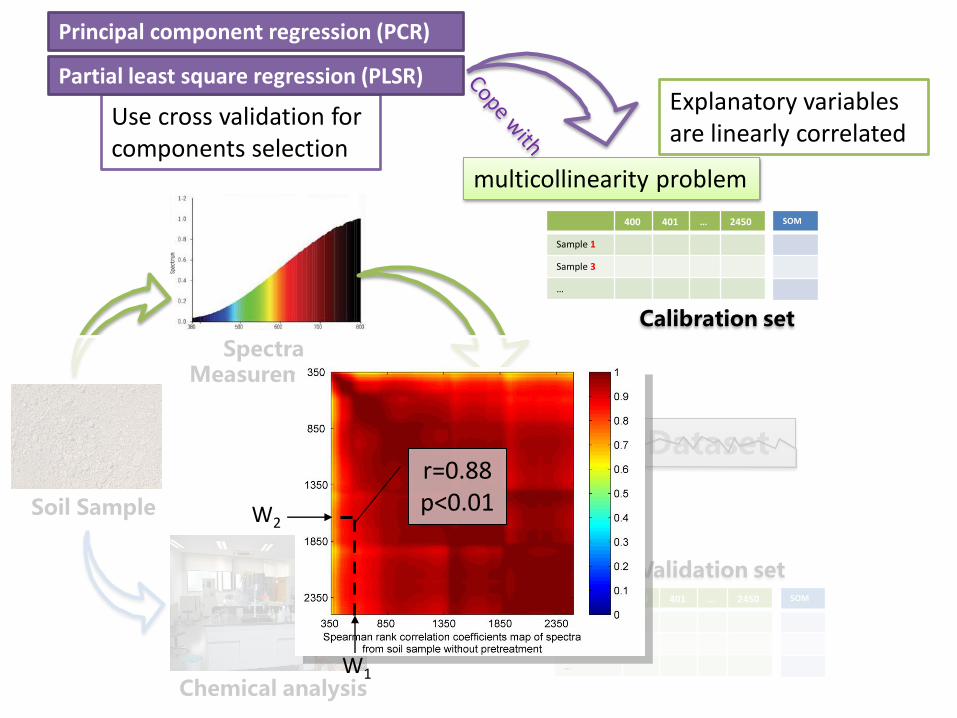
Use cross validation for components selection
Dataset
Soil Sample
Spectra Measurement
Chemical analysis
400 401 … 2450
Sample 1
Sample 2
…
Sample m
SOM
X Y
400 401 … 2450
Sample 1
Sample 3
…
SOM
400 401 … 2450
Sample 2
Sample 4
…
SOM
Calibration set
Validation set
multicollinearity problem
W2
r=0.88 p<0.01
W1
Principal component regression (PCR)
Partial least square regression (PLSR) Explanatory variables are linearly correlated
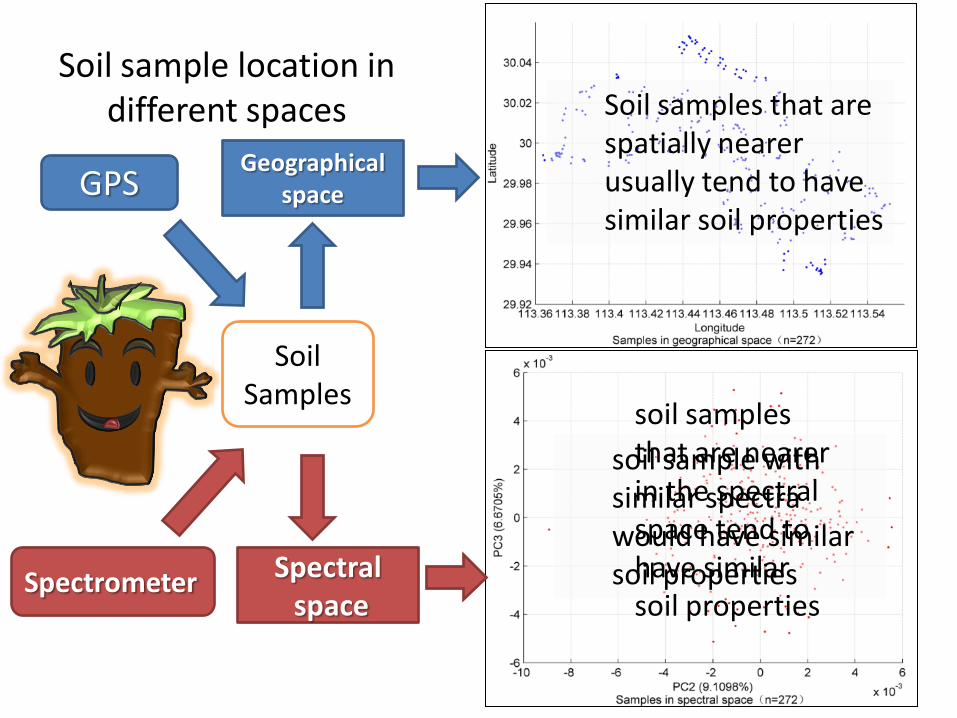
Geographical space
Spectral space
GPS
Spectrometer
Soil Samples
Soil sample location in different spaces
soil sample with similar spectra would have similar soil properties
Soil samples that are spatially nearer usually tend to have similar soil properties
soil samples that are nearer in the spectral space tend to have similar soil properties

Case study 2
• Objective
–To explore the spatial dependence of soil properties in both geographical space and spectral space

Paddy field Irrigated land
• Land use types could have spatial randomness. • For different land use types, soil properties (e.g. soil
organic content) could be from different populations . • Those soil properties potentially influenced by land use
types could also have randomness in geographical space .
Dataset

Spatial dependence in different spaces
SOM N Fe P
Permutations: 999
Ge
ogr
aph
ical
sp
ace
Sp
ect
ral
sp
ace
p<0.01 p<0.01
p<0.01 p<0.01 p<0.01 NO
NO NO
Usually, observation dependence is spatial dependence in geographical space; but sometimes, it could be dependence in spectral space

Spatial dependence in different spaces
Permutations: 999
Ge
ogr
aph
ical
sp
ace
Sp
ect
ral
spac
e X, p<0.01 Y, p<0.01
PC5 p<0.01
PC4 p<0.01
PC3 p<0.01
PC2 p<0.01
PC1 p<0.01

Further comparisons
SOM N Fe P PC1 PC2 PC3 PC4 PC5
Moran’ I 0.026 0.105 0.157 0.141 0.184 0.321 0.240 0.617 0.258

SOM
SOM
N
N Fe
Fe
P
P PC1
PC1
PC2
PC3
PC4
PC5
PC2 PC3 PC4 PC5
SOM
N
Fe
P
PC1
PC2
PC3
PC4
PC5
SOM N Fe P PC1 PC2 PC3 PC4 PC5
Pearson’s r p value
Why the PCs of spectra have spatial dependence in geographical space?
Their correlations with soil components (SOM, mineral content) might be an explanation, but…

• The original idea was to explore the independence of observation, and examine the autocorrelation of model residuals.
• There is no spatial autocorrelation in the dataset presented, when the soil chemical properties were estimated using OLS with PCs of soil spectra.
• BUT for the China Soil Spectra Library dataset…
Why introduce spectral space?

China Soil Spectra Library
• 1581 soil samples from 16 soil types
• Spectra recorded in the range 400-2450 nm
• Soil organic matter content for all the samples
Reference:

China Soil Spectra Library

OLS
R-squared : 0.172
Weights were created using PC1 and PC2
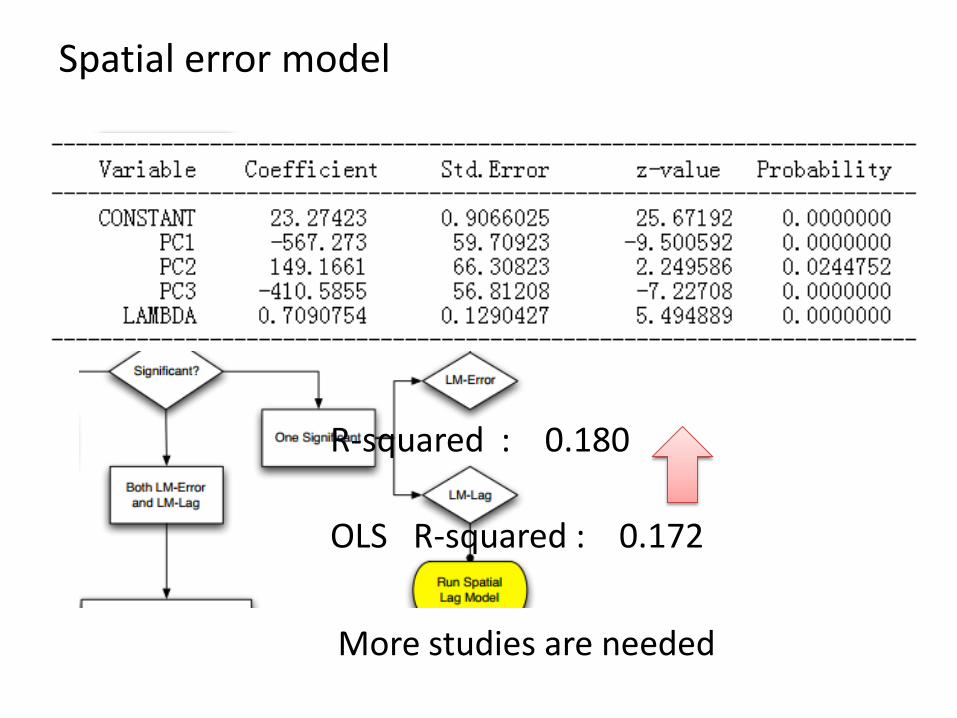
Spatial error model
R-squared : 0.180
OLS R-squared : 0.172
More studies are needed
• Y. Liu, Q. Jiang, T. Fei, J. Wang, T. Shi, K. Guo, X. Li, Y. Chen*, 2014. Transferability of a Visible and Near-Infrared Model for Soil Organic Matter Estimation in Riparian Landscapes. Remote Sensing. 6(5), 4305-4322.
• Y. Liu, Q. Jiang, T. Shi, T. Fei, J. Wang, G. Liu, Y. Chen*, 2014. Prediction of total nitrogen in cropland soil at different levels of soil moisture with Vis/NIR spectroscopy. Acta Agriculturae Scandinavica, Section B–Soil & Plant Science 64(3), 267-281.
• T. Shi, Y. Chen, H. Liu, J. Wang, G. Wu, 2014. Soil Organic Carbon Content Estimation with Laboratory-Based Visible-Near-Infrared Reflectance Spectroscopy: Feature Selection. Applied Spectroscopy. 68(8), 831-837.
• T. Shi, Y. Chen, Y. Liu, G. Wu, 2014. Visible and near-infrared reflectance spectroscopy—An alternative for monitoring soil contamination by heavy metals. Journal of Hazardous Materials. 265(0), 166-176.
• J. Wang, L. Cui, W. Gao, T. Shi, Y. Chen, Y. Gao, 2014. Prediction of low heavy metal concentrations in agricultural soils using visible and near-infrared reflectance spectroscopy. Geoderma. 216(0), 1-9.
• X. Peng, T. Shi, A. Song, Y. Chen, W. Gao, 2014. Estimating Soil Organic Carbon Using VIS/NIR Spectroscopy with SVMR and SPA Methods. Remote Sensing. 6(4), 2699-2717.
• T. Shi, H. Liu, J. Wang, Y. Chen, T. Fei, G. Wu, 2014. Monitoring Arsenic Contamination in Agricultural Soils with Reflectance Spectroscopy of Rice Plants. Environmental Science & Technology. 48(11), 6264-6272.
Some publications
• K. Guo, Y. Liu, C. Zeng, Y. Chen, X. Wei, 2014. Global research on soil contamination from 1999 to 2012: A bibliometric analysis. Acta Agriculturae Scandinavica, Section B–Soil & Plant Science. 64(5), 377-391.
• T. Shi, L. Cui, J. Wang, T. Fei, Y. Chen, G. Wu, 2013. Comparison of multivariate methods for estimating soil total nitrogen with visible/near-infrared spectroscopy. Plant and soil. 366(1-2), 363-375.
• Y. Chen, Y. Liu, Y. Liu, A. Lin, X. Kong, D. Liu, X. Li, Y. Zhang, Y. Gao, D. Wang, 2012. Mapping of Cu and Pb Contaminations in Soil Using Combined Geochemistry, Topography, and Remote Sensing: A Case Study in the Le’an River Floodplain, China. International Journal of Environmental Research and Public Health. 9(5), 1874-1886.
• Y. Liu, Y. Chen, 2012. Estimation of total iron content in floodplain soils using VNIR spectroscopy – a case study in the Le'an River floodplain, China. International Journal of Remote Sensing. 33(18), 5954-5972.
• Y. Liu, Y. Chen, 2012. Feasibility of Estimating Cu Contamination in Floodplain Soils using VNIR Spectroscopy—A Case Study in the Le’an River Floodplain, China. Soil and Sediment Contamination: An International Journal. 21(8), 951-969.
• Y. Liu, D. Liu, Y. Liu, J. He, L. Jiao, Y. Chen, X. Hong, 2012. Rural land use spatial allocation in the semiarid loess hilly area in China: Using a Particle Swarm Optimization model equipped with multi-objective optimization techniques. Science China Earth Sciences. 55(7), 1166-1177.
Some publications

Thank you for your attention
Related Documents