Dr L James Valverde, Jr Vice President, Economics and Risk Management Insurance Information Institute 110 William Street New York, NY 10038 Tel: (212) 346-5522 Fax: (212) 732-1916 [email protected] www.iii.org o Views of Risk in the Post-9/11 Era 26 September 2006 Casualty Actuaries of New England

Dr L James Valverde, Jr Vice President, Economics and Risk Management Insurance Information Institute 110 William Street New York, NY 10038 Tel: (212)
Dec 27, 2015
Welcome message from author
This document is posted to help you gain knowledge. Please leave a comment to let me know what you think about it! Share it to your friends and learn new things together.
Transcript

Dr L James Valverde, Jr
Vice President, Economics and Risk Management
Insurance Information Institute
110 William Street
New York, NY 10038
Tel: (212) 346-5522
Fax: (212) 732-1916
[email protected] www.iii.org
Two Views of Risk in the Post-9/11 Era
26 September 2006
Casualty Actuaries of New England

Broad Outline
Two Views of Risk:
1. Managing Natural Catastrophes in a Post-9/11 World
2. Government as Ultimate Risk Manager — What Role Should the Federal Government Play in Managing Extreme Events?

First View:
Managing Natural Catastrophes in a
Post-9/11 World

Components of the First View
• Catastrophe Loss Management: The Hurricane Seasons of 2005 and 2006
• Managing Natural Catastrophes – The Larger Context
• Emergency preparedness and response in the wake of 9/11
• Questions and emerging lessons from Hurricane Katrina
• The U.S. Department of Homeland Security
• Historic moment for America or bureaucracy writ large?
• Emergency Preparedness and Response
• All-hazards vs. terrorist myopia?
• FEMA – Challenges in the years ahead
• Implications for P/C Insurers and Reinsurers
• Transitioning Remarks Second View

Catastrophe Loss Management:
The Hurricane Seasons of 2005 and 2006

Most of U.S. Population and Property has Major CAT Exposure
Is Anyplace Safe?

2005 Was a Busy, Destructive, Deadly, and Expensive Hurricane Season
Source: WeatherUnderground.com, January 18, 2006.
All 21 names were used for the first time ever, so
Greek letters were used for the
final storms
2005 set a new record for the number of hurricanes &
tropical storms at 28, breaking the old record set in 1933

2006 Hurricane Season: Much Less Active Than Expected
Source: WeatherUnderground.com, September 17, 2006.
What a difference a year makes! Just 8
named storms through 18 Sept 2006 vs. 17 as of
same date in 2005!

2006 Hurricane Season: Forecasts Repeatedly Scaled Back
1310
1517
26100%
275%
140%
195%
90%
0
5
10
15
20
25
30
50-YearAverage*
2005 Actual May 31Forecast
August 3Forecast
September 1Forecast
Nam
ed S
torm
s
0%
50%
100%
150%
200%
250%
300%
Net
Tro
pic
al C
yclo
ne
Act
ivity
Named Storms Net Tropical Cyclone Activity
2006 hurricane seasons has turned out to be far less severe than anticipated
*Average over the period 1950-2000.Source: Insurance Information Institute compilation of forecasts by Dr. William Gray, Colorado State University.

U.S. Insured Catastrophe Losses ($ Billions)*
$7.5
$2.7
$4.7
$22.
9
$5.5 $1
6.9
$8.3
$7.4
$2.6 $1
0.1
$8.3
$4.6
$26.
5
$5.9 $1
2.9 $2
7.5
$100
.0
$61.
2
$5.2
$0
$20
$40
$60
$80
$100
$120
89 90 91 92 93 94 95 96 97 98 99 00 01 02 03 04 05
06**
20??
*Excludes $4B-$6b offshore energy losses from Hurricanes Katrina & Rita. ** As of June 30, 2006.Note: 2001 figure includes $20.3B for 9/11 losses reported through 12/31/01. Includes only business and personal property claims, business interruption and auto claims. Non-prop/BI losses = $12.2B.Source: Property Claims Service/ISO; Insurance Information Institute
$ Billions
2005 was by far the worst year ever for insured
catastrophe losses in the US, but the worst has yet to come
$100B CAT year looms
on the horizon

Number of Major (Category 3, 4, 5) Hurricanes Striking the U.S. by Decade
4
6
65
4
6
88
5
8
6
9
1900s 1910s 1920s 1930s 1940s 1950s 1960s 1970s 1980s 1990s 2000s
*Figure for 2000s is extrapolated based on data for 2000-2005 (6 major storms: Charley, Ivan, Jeanne (2004) & Katrina, Rita, Wilma (2005)).Source: Tillinghast from National Hurricane Center: http://www.nhc.noaa.gov/pastint.shtm.
10
1930s – mid-1960s:
Period of Intense Tropical Cyclone Activity
Mid-1990s – 2030s?
New Period of Intense Tropical Cyclone Activity
Tropical cyclone activity in the mid-1990s entered the active
phase of the “multi-decadal signal” that could last into the 2030s
Already as many major storms in
2000-2005 as in all of the 1990s

Top 10 Most Costly Hurricanes in US History, (Insured Losses, $2005)
$3.5 $3.8 $4.8 $5.0$6.6 $7.4 $7.7
$10.3
$21.6
$40.6
$0
$5
$10
$15
$20
$25
$30
$35
$40
$45
Georges(1998)
Jeanne(2004)
Frances(2004)
Rita (2005)
Hugo(1989)
Ivan (2004)
Charley(2004)
Wilma(2005)
Andrew(1992)
Katrina(2005)
$ B
illi
ons
Sources: ISO/PCS; Insurance Information Institute.
Seven of the 10 most expensive hurricanes in US history
occurred in the 14 months from Aug. 2004 – Oct. 2005:
Katrina, Rita, Wilma, Charley, Ivan, Frances & Jeanne

Insured Loss & Claim Count for Major Storms of 2005*
$1.1
$40.6
$10.3$5.0
104
383
1,047
1,744
$0$5
$10$15$20
$25$30$35
$40$45
Dennis Rita Wilma Katrina
Size of Industry Loss ($ Billions)
Ins
ure
d L
os
s (
$ B
illio
ns
)
02004006008001,0001,2001,4001,6001,8002,000
Cla
ims
(th
ou
sa
nd
s)
Insured Loss Claims
*Property and business interruption losses only. Excludes offshore energy & marine losses.
Source: ISO/PCS as of June 8, 2006; Insurance Information Institute.
Hurricanes Katrina, Rita, Wilma & Dennis produced a record 3.3
million claims

Hurricane Katrina Insured Loss Distribution by State ($ Millions)*
Mississippi, $13,605 , 33.5%
Louisiana, $25,275 , 62.3%
Tennessee, $59.0 , 0.1%Florida, $572.0 , 1.4%
Georgia, $36.0 , 0.1%Alabama, $1,032 ,
2.5%
*As of June 8, 2006Source: PCS division of ISO.
Louisiana accounted for
62% of the insured losses
paid and 56% of the claims filed
Total Insured Losses =
$40.579 Billion

Hurricane Katrina Loss Distribution by Line ($ Billions)*
Homeowners, $17,564.0 , 43%
Commercial Property & BI, $20,847.0 , 52%
Vehicle, $2,168.0 , 5%
Total insured losses are
estimated at $40.579 billion
from 1.7438 million claims.
Excludes $2-$3B in offshore energy losses
*As of June 8, 2006Source: PCS division of ISO.

Hurricane Rita Claim Count Distribution by State*
Texas, 171,000 , 44.6%
Tennessee, 3,500 , 0.9%
Louisiana, 185,000 , 48.3%
Arkansas, 5,500 , 1.4%Florida, 6,000 , 1.6%
Alabama, 5,000 , 1.3%
Mississippi, 7,000 , 1.8%
*As of June 8, 2006Source: PCS division of ISO.
Louisiana accounted for 48.3% of the
insured losses, Texas 44.6%.
Excludes offshore energy losses of $2-3BTotal # Claims
= 383,000

Hurricane Rita Loss Distribution, by Line ($ Millions)*
Homeowners, $2,974.2 , 59%
Commercial Property & BI, $1,861.2 , 37%
Vehicles, $211.0 , 4%Total insured
losses are estimated at $5.0
billion (excl. offshore energy of $2-$3B) from 383,000 claims.
*As of June 8, 2006Source: PCS division of ISO.

Hurricane Wilma Loss Distribution by Line ($ Millions)*
Homeowners, $7,350 , 72%
Commercial Property & BI, $2,200 , 21%
Vehicle, $750 , 7%Total insured
losses are estimated at $10.3 billion from 1.047
million claims
*As of June 8, 2006. All losses are in FL.Source: PCS division of ISO.

Inflation-Adjusted U.S. Insured Catastrophe Losses By Cause of Loss, 1986-2005¹
Utility Disruption0.1%
Terrorism7.7%
All Tropical
Cyclones3
47.5%
Tornadoes2
24.5%
Water Damage0.1%
Civil Disorders0.4%
Fire6
2.3%
Wind/Hail/Flood5
2.8%
Earthquakes4
6.7%
Winter Storms7.8%
Source: Insurance Services Office (ISO)..
1 Catastrophes are all events causing direct insured losses to property of $25 million or more in 2005 dollars. Catastrophe threshold changed from $5 million to $25 million beginning in 1997. Adjusted for inflation by the III.2 Excludes snow. 3 Includes hurricanes and tropical storms. 4 Includes other geologic events such as volcanic eruptions and other earth movement. 5 Does not include flood damage covered by the federally administered National Flood Insurance Program. 6 Includes wildland fires.
Insured disaster losses totaled $289.1 billion from
1984-2005 (in 2005 dollars). Tropical systems accounted for nearly half of all CAT losses from 1986-2005, up
from 27.1% from 1984-2003.

Total Value of Insured Coastal Exposure (2004, $ Billions)
$1,901.6$740.0
$662.4$505.8
$404.9$209.3
$148.8$129.7$117.2$105.3
$75.9$73.0
$46.4$45.6$44.7$43.8
$12.1
$1,937.3
$0 $500 $1,000 $1,500 $2,000 $2,500
FloridaNew York
TexasMassachusetts
New JerseyConnecticut
LouisianaS. Carolina
VirginiaMaine
North CarolinaAlabamaGeorgia
DelawareNew Hampshire
MississippiRhode Island
Maryland
Source: AIR Worldwide
Florida & New York lead the way for insured coastal property at more
than $1.9 trillion each

Insured Coastal Exposure as a % of Statewide Insured Exposure (2004, $ Billions)
63.1%60.9%
57.9%54.2%
37.9%33.6%33.2%
28.0%25.6%25.6%
23.3%13.5%
12.0%11.4%
8.9%5.9%
1.4%
79.3%
0% 10% 20% 30% 40% 50% 60% 70% 80% 90%
FloridaConnecticut
New YorkMaine
MassachusettsLouisiana
New JerseyDelaware
Rhode IslandS. Carolina
TexasNH
MississippiAlabamaVirginia
NCGeorgia
Maryland
Source: AIR Worldwide
After FL, many Northeast states have
among the highest coastal exposure as a share of all insured
exposure in the state

Value of Insured Commercial Coastal Exposure (2004, $ Billions)
$994.8$437.8
$355.8$258.4
$199.4$121.3
$83.7$69.7
$52.6$45.3$43.3$39.4
$23.8$20.9$19.9$17.9$6.7
$1,389.6
$0 $200 $400 $600 $800 $1,000 $1,200 $1,400 $1,600
New YorkFlorida
TexasMassachusetts
New JerseyConnecticut
LouisianaS. Carolina
VirginiaMaine
North CarolinaGeorgia
AlabamaMississippi
New HampshireDelaware
Rhode IslandMaryland
Source: AIR
Commercial property exposure also implies significant business interruption losses

The 2006 Hurricane Season:
Lowering Expectations

Outlook for 2006 Hurricane Season
Average* 2005 2006F
Named Storms 9.6 28 13
Named Storm Days 49.1 115.5 50
Hurricanes 5.9 14 5
Hurricane Days 24.5 47.5 13
Intense Hurricanes 2.3 7 2
Intense Hurricane Days 13 7 4
Net Tropical Cyclone Activity 100% 275% 90%
*Average over the period 1950-2000.Source: Dr. William Gray, Colorado State University, September 1, 2006.
Probability of Major Hurricane Landfall (CAT 3,4,5) in Sept/Oct 2006
9/06F Avg.* 10/06F Avg.*
Named Storms 74% 67% 22% 29%
Hurricanes 59% 48% 14% 15%
Intense Hurricanes 35% 27% 4% 6%
*Average over past 52 years.Source: Dr. William Gray, Colorado State University, September 1, 2006.

Managing Natural Catastrophes in a Post-9/11 World

The Broader Context:
Homeland Security

The Genesis of DHS
• In the wake of 9/11, President Bush issued the National Strategy for Homeland Security in July 2002.
• Legislation creating the U.S. Department of Homeland Security (DHS) was signed in November 2002.
• The creation of DHS represents a fusion of numerous federal agencies, with the objective of coordinating and centralizing the leadership of the nation’s homeland security activities under a single, cabinet-level department.
• Began operations in March 2003
• 22 separate agencies
• Approximately 180,000 employees
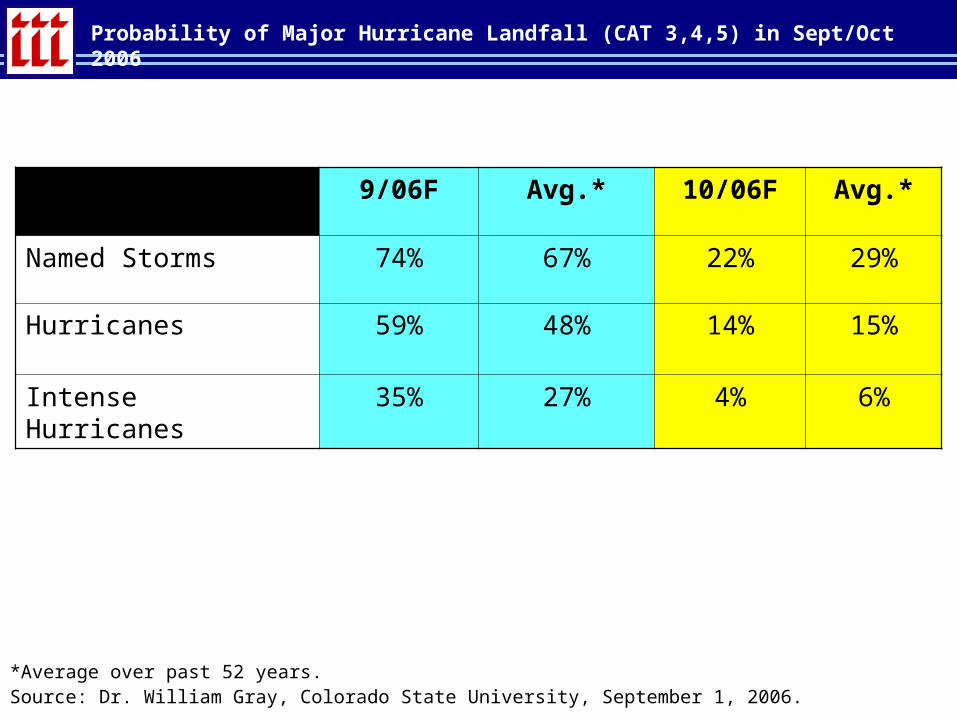
DHS: Historic Moment for the United States or Bureaucracy Writ Large?
• The creation of DHS represents a historic moment of almost unprecedented action by the federal government to transform how the nation protects itself from acts of terrorism.
• Rarely in the nation’s history has such a large and complex reorganization of government been attempted, with such a singular and urgent purpose.
• DHS represents a unique opportunity to transform a disparate group of agencies with multiple missions, values and cultures into an effective cabinet-level department.
• A central aspect of DHS’s mission involves coordinating efforts to protect critical infrastructure, prepare for possible attacks and other emergencies, and respond to catastrophic incidents and events.
• Accountability and performance thus far?• Hurricane Katrina as a specific case in point – first real test of
the system• DHS Inspector General• U.S. GAO• Academics and Think Tanks

Homeland Security: The Essential Tension
• Any coordinated and sustained effort to effectively manage homeland security must contend with two competing objectives/tasks:
• The prevention of terrorist acts
• Mitigation of consequences arising from acts of terrorism and other extreme events
• In a difficult decision context like this, the allocation of resources under what is, in reality, deep and pervasive uncertainty is one of the central challenges the federal government faces in its efforts to manage homeland security

The National Strategy for Homeland Security
• The National Strategy for Homeland Security describes six critical missions areas:
• Intelligence and Warning
• Border and Transportation Security
• Domestic Counterterrorism
• Protecting Critical Infrastructure and Key Assets
• Defending Against Catastrophic Threats
• Emergency Preparedness and Response
• The President has also issued several additional documents – called Homeland Security Presidential Directives (HSPDs) – that provide more detailed guidance on various homeland-security-related mission areas and initiatives.

Emergency Preparedness and Response: Key Elements of the National Strategy
Within the Emergency Preparedness and Response mission area, the National Strategy identifies 12 separate initiatives:
1. Integrate separate federal response plans into a single all-discipline incident management plan
2. Create a national incident management system
3. Improve tactical counter terrorist capabilities
4. Enable seamless communication among all responders
5. Prepare health care providers for catastrophic terrorism
6. Augment America’s pharmaceutical and vaccine stockpiles

Emergency Preparedness and Response: Key Elements of the National Strategy (cont.)
7. Prepare for chemical, biological, radiological and nuclear decontamination
8. Plan for military support to civil authorities
9. Build the Citizen Corps
10. Implement the First Responder initiative of the FY03 budget
11. Build a national training and evaluation system
12. Enhance the victim support system

FEMA
Past, Present, and Future

DHS Organizational Structure: FEMA’s Place in the Larger Context of Homeland Security

FEMA: Informed Opinion Prior to this Year’s Devastating Hurricane Season
“…consolidate DHS response missions into FEMA and strengthen that agency. FEMA should be engaged squarely in its traditional role of planning for national (not just federal) response to emergencies….” [emphasis added]
DHS 2.0
Heritage Foundation
December 2004

FEMA in the Wake of Hurricane Katrina
• FEMA has, of course, become synonymous with the government’s bungled response to the hurricane.
• To what extent is this a fair characterization of this agency and the difficult situation it now finds itself in?
• Skepticism going forward…

FEMA: What Went Wrong and Why?
• Many theories and explanations have been forthcoming
• Much of what is currently being said contains the following core elements:
• The agency is no longer cabinet-level, but rather a small cog within the organizational and bureaucratic behemoth that is DHS
• FEMA’s mission to help states prepare for “all hazards” – from terrorism to natural disasters – has become lost within DHS’s myopic focus on terrorism.
• FEMA should perhaps revert to being an independent, cabinet-level agency

The Centrality of the All-Hazards Context

HSPD 8 – National Preparedness: The National Planning Scenarios
• Developed under the leadership of the Homeland Security Council
• Overarching goals are to
• Create the agility and flexibility to meet a wide range of threats and hazards
• Provide a structure for the development of national preparedness standards
• 15 planning scenarios provide parameters regarding the nature, scale, and complexity of incidents of national significance, which include both terrorism and natural disasters.
• Each scenario provides a basis for defining prevention, protection, response, and recovery tasks that need to be performed, as well as required capabilities.

The National Planning Scenarios
The Homeland Security Council has developed 15 all-hazard planning scenarios for use in national, federal, state and local homeland security preparedness activities:
1. Nuclear Detonation – 10-Kiloton Improvised Nuclear Device
2. Biological Attack – Aerosol Attack
3. Biological Disease Outbreak – Pandemic Influenza
4. Biological Attack – Plague
5. Chemical Attack – Blister Agent
6. Chemical Attack – Toxic Industrial Chemicals
7. Chemical Attack – Nerve Agent

The National Planning Scenarios (cont.)
8. Chemical Attack – Chlorine Tank Explosion
9. Natural Disaster – Major Earthquake
10. Natural Disaster – Major Hurricane
11. Radiological Attack – Radiological Dispersal Devices
12. Explosives Attack – Bombing Using Improvised Explosive Device
13. Biological Attack – Food Contamination
14. Biological Attack – Foreign Animal Disease (Foot and Mouth Disease)
15. Cyber Attack

Scenario 10: Natural Disaster – A Major Hurricane
• In this scenario, a Category 5 hurricane hits a major metropolitan area
• Sustained winds are at 160 mph, with a storm surge greater than 20 feet above normal
• As the storm moves closer to land, massive evacuations are required
• Some low-lying escape routes are inundated by water anywhere from 5 hours before the eye of the hurricane reaches land
•Consequences associated with Scenario 10:
Casualties 1,000 fatalities; 5,000 hospitalizations
Infrastructure Damage Buildings destroyed; large debris
Evacuations/Displaced Persons
1 million evacuated; 100,000 homes seriously damaged
Contamination From hazardous materials, in some areas
Economic Impact Billions of dollars
Recovery Timeline Months

Looking Towards the Future:
Where Do We Go from Here?

Challenges in Emergency Preparedness
Adopting an All-Hazards Approach
• The National Strategy calls for the creation of
“a fully integrated national emergency response system that is adaptable enough to deal with any terrorist attach, no matter how unlikely or catastrophic, as well as all manner of natural disasters” [emphasis added]
• Challenges:
• Identifying the types of emergencies for which they should be prepared and the requirements for responding effectively
• Assessing current capabilities against those requirements
• Developing and implementing effective, coordinated plans among multiple first responder disciplines and jurisdictions
• Defining the roles and responsibilities of federal, state, and local governments and private entities

Challenges in Emergency Preparedness
Improving Intergovernmental Planning and Coordination
• The National Strategy emphasizes a shared national responsibility – involving all levels of government – in responding to a serious emergency.
• In May 2004, GAO reported that a major challenge involves what they saw as lack of coordination within DHS in terms of the agency’s ability to prepare for, respond to, and recover from terrorist and other emergency incidents:
“…there has been a lack of regional planning and coordination for developing first responder preparedness, defining preparedness goals, identifying spending priorities, and expending funds” (GAO-04-433)

Challenges in Emergency Preparedness
Establishing Emergency Preparedness Standards
• The National Strategy makes mention of benchmarks, standards and other performance measures for emergency preparedness.
• However, in January 2005, GAO found that
“…there is not yet a complete set of preparedness standards for assessing first responder capacities, identifying gaps in those capacities, and measuring progress in achieving performance
goals.” (GAO-05-33)

FEMA: The Story Thus Far
• Many are calling for Congress to restore FEMA to a separate, independent agency.
• In Congressional testimony some months ago, DHS Secretary Michael Chertoff acknowledged that Hurricane Katrina “challenged the disaster relief system in a way that has not ever happened.”
• He singled out planning as an area in need of improvement, saying it was responsible for 80% of the failures.
• Secretary Chertoff pledged to retool FEMA:• Improved aid delivery system• Qualified senior leaders• Modernizing business practices and communication systems
• However, Chertoff rejected the idea that FEMA should be removed from under the DHS umbrella.
• Partisan politics reigns supreme?
“Why shouldn’t you be arrested for negligent homicide?” Rep. Cynthia A. McKinney, D-GA
Source: Congressional Quarterly
Implications and Challenges for
P/C Insurers and Reinsurers

Mismanagement of Emergency Preparedness and Response Can Impact the Economic Losses Associated with Natural Disasters
• Clearly, there is a relationship between “recovery time” and the economic losses associated with a natural catastrophe such as Hurricane Katrina• Business interruption losses increase exponentially with
response lag• Fires burn uncontrolled• Failed law enforcement, rioting and looting• Delayed flood drainage• Untimely mitigation of environmental
release/contamination• etc.
• While precise estimates of this relationship will require future empirical study, a couple of points are worth considering in light of Katrina:• A key responsibility for P/C insurers is to play their
important and substantial role in the risk mitigation process.
• It is important for federal, state and local officials to understand and appreciate the role that insurance can play in both minimizing loss and expediting recovery.
• Both P/C insurers and property owners, alike, have a vested interested in seeing that the overall system works as well as possible.

Challenges for P/C Insurers: Uncertainty of Losses
• Natural disasters pose vexing challenges for insurers because they involve potentially high losses that are characterized by large degrees of uncertainty.
• Moreover, natural disasters involve spatially correlated losses or the simultaneous occurrence of many losses from a single event.
• Hurricane Katrina suggests a new “externality” for P/C insurers to consider:
Mismanagement of the government’s response and recovery efforts in the
affected region(s)

Rethinking Traditional Approaches to CAT Modeling and Risk Management in Light of Katrina
• Traditional approaches to risk assessment and CAT Modeling need to be revised to explicitly consider some of these new “externalities” (e.g., political uncertainty, etc.) into their overall analytical frameworks.
• A clear need for increased geo-spatial sophistication and detail within CAT models, combined with the ability to perform “cascaded inference” (broken levee ּ ּ ּ evacuation of affected area).
• Seriously rethink the implications of changes in risk appetite/tolerance and ambiguity aversion for risk management strategies and corporate decision-making.
• Decision-Makers must become critical consumers of this technology – not just passive receptors.

Summary Remarks
• The All-Hazards paradigm will become central to the policy dialogue in the years to come
• Policies and institutional regimes must be flexible and responsive to the evolving threat environment – both man-made and natural
• TRIEA 05’ is an important component in the country’s ability to confront and manage extreme events
• Public/Private partnerships are essential

Second View:
Government as Ultimate Risk Manager
What Role Should the Federal Government Play in Managing Extreme Events?

Components of the Second View
• Motivation
• The need for a public dialogue about natural disaster risk
• The Protection of People and Property as a Paramount Responsibility
• What Role Should the Federal Government Play?
• Potential Policy Responses: What Works and What Doesn’t
• Concluding Remarks

The Need for a Public Dialogue About Natural Disaster Risk
• The hurricane season of 2005 will surely be remembered for decades to come — not just for the human and economic toll that it extracted on those living in the Gulf Coast and Florida, but also for the profound influence it will have in shaping the public dialogue in the U.S. about how large-scale natural catastrophes should be managed in the post-9/11 era
• This dialogue holds the promise of engendering substantive changes in the interconnected web of social, political and economic systems that —through a variety of formal and informal mechanisms — shift, spread, or reduce the myriad risks that pervade life in the 21st century
• This year’s hurricane season brought with it a degree of destruction and devastation not seen in this country since the late 1920s
• Moving forward:
• How should we, from a societal perspective, shape our collective destiny in light of what has tragically come to pass?
• How might we do things better the next time around, taking into consideration all of the attendant risks and complexities?
• What role should the federal government play in managing natural disaster risk?

Fundamental Goal:
The Protection of People and Property

Top 10 Deadliest Hurricanes to Strike the US: 1851-2005
372 390 400 408 7001,250 1,323 1,500
2,500
8,000
01,0002,0003,0004,0005,0006,0007,0008,0009,000
LA-Gra
nde Isle
(190
9)
Audre
y-SW
LA,T
X (195
7)
LA-Las
t Isla
nd (185
6)
FL Key
s (19
35)
GA/SC (1
881)
LA-Chen
iere (
1893
)***
**
Katrin
a (SE
LA, M
S)***
*
SC/GA S
ea Is
lands (
1893
)***
SE FL/L
. Oke
chob
ee (1
928)
**
Galva
ston (1
900)
*
*Could be as high as 12,000 **Could be as high as 3,000 ***Midpoint of 1,000 – 2,000 range****Associated Press total as of Dec 11, 2005 *****Midpoint of 1,100-1,400 range.Sources: NOAA; Insurance Information Institute.
Hurricane Katrina was the deadliest hurricane to strike the
US since 1928

Global Number of Catastrophic Events, 1970–2005
0
50
100
150
200
250
19
70
19
72
19
74
19
76
19
78
19
80
19
82
19
84
19
86
19
88
19
90
19
92
19
94
19
96
19
98
20
00
20
02
20
04
Natural catastrophes Man-made disasters
Man-made disasters: without road disasters. Source: Swiss Re, sigma No. 1/2005 and 2/2006.
The number of natural and man-made
catastrophes has been increasing on a global
scale for 20 years
Record 248 man-made CATs &
record 149 natural CATs in 2005

Insured Property Catastrophe Losses as % Net Premiums Earned, 1983–2005E
0%
2%
4%
6%
8%
10%
12%
14%
16%
84
85
86
87
88
89
90
91
92
93
94
95
96
97
98
99
00
01
02
03
04
05
E
USWorldwideUS average: 1984-2004
*Insurance Information Institute figure of 13.8% for 2005 based estimated 2005 DPE of $417.7B and insured CAT losses of $57.7B.
Sources: ISO, A.M. Best, Swiss Re Economic Research & Consulting; Insurance Information Institute.
US CAT losses were a record 13.8% of
net premiums earned in 2005 and were 4.2 times the 1984-2004 average
of 3.3%

What Role Should the Federal Government Play?

Two Countervailing Viewpoints
• In the vigorous public dialogue that has ensued in the wake of Hurricane Katrina, two countervailing viewpoints have emerged concerning how society should pay for mega-catastrophes
• Each of these viewpoints proceeds from a particular vantage point and set of beliefs about the role of government in managing and financing natural catastrophe risk
• On the one hand, there are those who believe that natural catastrophes are fundamentally uninsurable and that the federal government should serve as the ultimate risk manager in these instances
• Key assumption: the federal government is in the best position to mitigate large losses (economic and otherwise), in economically efficient ways
• On the other hand, there are stakeholders in the debate that believe that the private sector and the free-markets are in the best position to adjudicate and manage these risks for those who choose to insure privately
• According to this view, the solution to the insurance dimension of this problem is not more government involvement and regulation, but rather, less
• Relaxing regulatory constraints and stringent tax policies will, they argue, stimulate markets to craft creative solutions to the problem of “who pays?” for mega-catastrophes.

Identifying Appropriate Federal Policy Responses
• In the coming years, these two opposing viewpoints will take center stage in numerous public policy debates seeking workable solutions to how we, as a country, move forward in light of the difficult lessons of Hurricane Katrina
• For its part, the U.S. Congress is likely to consider a broad range of proposals. For example:
• Look for ways in which specific federal insurance programs like the National Flood Insurance Program can be improved
• Potentially sweeping changes in how the nation deals (both ex ante and ex post) with mega-catastrophes, both natural and man-made
• While it is early to speculate as to what this process will yield by way of specific mandates, statutes and potential reorganizations of government, it is clear that change will be an inevitable feature of the institutional arrangements, mechanisms and conceptual schemes that have traditionally governed our thinking about how disaster policy should be formulated and implemented in this country

The Case For a Federal Natural Catastrophe Program
• Arguments in favor of a substantive federal role in the financing of natural disaster risk almost invariably proceed from a rather basic premise:
some risks are simply too large or unpredictable to be insurable within the current institutional, financial and regulatory frameworks that govern private insurance
markets in this country
• At the heart of these debates is the view that mega-catastrophes may soon exceed the ability and capacity of private insurance markets to deal effectively with incidents of this magnitude
• In the wake of Hurricane Katrina, some insurers and other relevant stakeholders are openly questioning whether natural catastrophes of this magnitude are insurable via the private markets

Policy Proposals: Towards a Comprehensive NAT CAT Plan
• Most of the proposals envisage a three-layer plan:
1. Policies sold by individual insurance companies
2. State or regional catastrophe pools that provide reinsurance
3. A national mega-catastrophe fund that provides a federal backstop for large-scale insured losses
• For its part, the U.S. House of Representatives has introduced two bills, the Homeowners Insurance Availability Act of 2005 (H.R.846) and the Homeowners Insurance Protection Act of 2005 (H.R. 4366), both of which would create federal catastrophe reinsurance programs
• Under H.R. 846, the Treasury would auction so-called excess-of-loss reinsurance contracts—a type of reinsurance that provides coverage above specified levels of loss
• Under H.R. 4366 the Treasury would be authorized to sell reinsurance contracts directly to eligible state catastrophe funds

NAIC’s Comprehensive National Catastrophe Plan
• Proposes Layered Approach to Risk
• Layer 1: Maximize resources of private insurance & reinsurance industry
• Includes “All Perils” Policy
• Encourage Mitigation
• Create Meaningful, Forward-Looking Reserves
• Layer 2: Establishes system of state catastrophe funds (like the Florida Hurricane CAT Fund)
• Layer 3: Federal Catastrophe Reinsurance Mechanism
Source: Insurance Information Institute

Objectives of NAIC’s Comprehensive National Catastrophe Plan
• Should Promote Personal Responsibility Among Policyholders
• Supports Reasonable Building Codes, Development Plans, and Other Mitigation Tools
• Maximize the Risk Bearing Capacity of the Private Markets
• Should Provide Quantifiable Risk Management to the Federal Government
Source: NAIC, Natural Catastrophe Risk: Creating a Comprehensive National Plan, Dec. 1, 2005; Insurance Information. Inst.

Existing Federal Insurance Programs
• Another reason that is often cited for expanding and enhancing the role of the federal government in financing natural catastrophe risk is that the federal government is, of course, already involved in numerous federal insurance programs, two of which deal specifically with natural disasters:
• The Federal Crop Insurance Program
• The National Flood Insurance Program
• These two programs are subsidized by the terms stipulated in their authorizing statutes and, at present, participation in the programs is voluntary
• Programs such as these are often criticized for the inherent difficulties in assessing the government’s true risk exposure and in setting premiums commensurate with that exposure
• Moreover, organizations such as the National Association of Insurance Commissioners have argued that requiring homeowners to purchase multiple insurance contracts to protect their property is both cumbersome and inefficient

Complicating Factors Going Forward
• Going forward, regulatory constraints may not allow insurers to charge actuarially sound rates that reflect the increased levels of risk
• Moreover, the price and availability of private reinsurance is volatile
• For these and a host of other reasons, the 2005 hurricane season has given risk managers within the property/casualty insurance and reinsurance industries much to consider
• For example, with many of the exposure predictions and projected loss estimates made prior to this year’s hurricane season proving, in hindsight, to be grossly in error, catastrophe models have come under considerable criticism and scrutiny
• Many insurers and reinsurers are openly questioning their confidence in these models. As one exasperated insurance CEO recently exclaimed, “They just don’t know what they’re talking about; they say these events are 1-in-100, 1-in-250, 1-in-1000, or maybe it’s 1-in-1,000,000, but they have no idea”
• Many within the industry fear that the risk assessment component of the insurance underwriting process may grow increasingly complex and unmanageable, as the coming decades may be marked by hurricane activity levels that well exceed recent historical baselines
• Difficult questions and complex scientific debates concerning the manner and degree to which global climate change is responsible for these emerging weather patterns will surely complicate matters even further

The Case Against a Federal Natural Catastrophe Program
• Most of the reticence on the part of insurers to back the idea of a federal backstop for large natural catastrophes stems, at a basic level, from a firmly-rooted laissez-faire mindset as to how insurance markets should operate in the global economy
• They believe that increased federal involvement and regulatory authority in these markets is something to be avoided, because such actions hold the potential to, in effect, crowd out private insurance and reinsurance markets, and to stifle innovation within these markets
• In this context, it is often argued that the relationship between price and risk assumed is diminished, as federal insurance programs are rarely actuarially sound
• With regard, then, to natural catastrophe risk, the fundamental belief is that this class of risk is, indeed, insurable in the free markets

Does the Evidence Support the Free Market View?
• Perhaps the truest measure of the veracity of this claim is that the free markets have, thus far, performed well under especially trying conditions
• The global insurance industry has experienced unprecedented disasters over the past four years:
• The tragedy of September 11th, at that time the most significant insurance catastrophe in history
• Record tornadoes and wildfires in 2003
• Four major hurricanes in Florida in 2004
• Hurricane Katrina will cost the insurance industry in excess of $40 billion, according to estimates by ISO’s Property Claims Services, but more of the cost will be borne by reinsurers than in previous years

Insurance Industry Resilience
• Wall Street analysts expect the insurance industry to be able to pay Katrina claims without any significant weakening of its overall financial strength
• Standard & Poor’s has stated that, for most of the companies that the ratings agency follows, Katrina will depress earnings for several years
• Catastrophe reinsurers will be the most severely impacted segment of the industry, and prices for property catastrophe reinsurance will likely increase significantly due to heightened expectations concerning the frequency and severity of natural disasters worldwide
• Clearly, the industry has responded well during this unprecedented period, demonstrating both its financial resilience and its commitment to individual and corporate customers
Potential Policy Responses:
What Works and What Doesn’t

Successful Tools for Controlling Hurricane Risk Exposure
• Strengthened building codes
• Stringent enforcement of building codes
• Fortified home programs
• Insurance rates based on sound actuarial principles (rates that are not government controlled); Works for commercial insurers
• Limits on underwriting
• Removing impediments to capital flows
• Incentives to adopt mitigation
• Forcing communities to consider their own catastrophe exposure
Source: Insurance Information Institute

Unsuccessful Tools for Controlling Hurricane Exposure
• Insurance rates that aren’t actuarially sound
• Political interference in rate process
• Inadequate underwriting controls
• Subsidies
• Intra-state (policyholders/taxpayers)
• US Taxpayer
• Litigation
• Retroactive rewriting of insurance contracts
• Low flood insurance penetration rates
Source: Insurance Information Institute

Problematic Issues
• Local control of land use and permitting creates significant incentive problems
• Benefits accrue locally while many costs can be redistributed to others via taxes, insurance, insurance assessments and aid
• Prospect of government aid reinforces unsound building and location decisions
• States don’t want to raise taxes to pay for mitigation/prevention even if state is sole beneficiary
• E.g., NO levees; Beach replenishment
Source: Insurance Information Institute

Recommendations for Controlling Hurricane Exposure
• Raise public awareness of risk
• Mandatory risk disclosure in all residential real estate transactions
• Require signed waivers if decline flood coverage that also waive rights to any and all disaster aid
• Continue to strengthen and enforce of building codes
• Allow markets to determine all property insurance rates
• Increase incentives to mitigate
• Require state-run insurer and reinsurer to charge actuarially sound rates
• Limit state-run insurer exposure to high-value properties
• Require communities/counties to a financial stake in their catastrophe exposure
• Reimburse disaster aid to state/federal government

Concluding Remarks: Moving Beyond the Potential Impasse
• Regardless of where specific industry stakeholders stand on the continuum of viewpoints outlined above, there are areas where they may find some basis for agreement and common ground
• Most stakeholders will agree, for example, that a key responsibility for P/C insurers is to play their important and substantial role in the overall risk mitigation process
• In the case of large-scale natural disasters, it is important for federal, state and local officials to understand and appreciate the role that insurance plays in both minimizing loss and expediting recovery
• In order to move beyond the potential impasse in which the industry could find itself with regard to these issues, what is needed is an earnest attempt on the part of the public and private spheres to look for areas where government can facilitate market-enhancing opportunities and more efficient private-sector coordination
• Practical proposals to this end will include such activities as the encouragement of various loss mitigation strategies, including strong building codes and improved land-use planning
• Going forward, the challenge remains one of finding workable means and mechanisms by which to align incentives in ways that jointly enhance social welfare and the market
The two activities do not necessarily need to be viewed as being mutually exclusive

www.iii.orgIf you would like a copy of this presentation, please give me your business card with e-mail address
Dr L James Valverde, JrVice President Economics and Risk ManagementInsurance Information Institute110 William StreetNew York, NY 10038Tel: (212) 346-5522Fax: (212) [email protected] www.iii.org
INSURANCE INFORMATION INSTITUTE ON-LINE
Related Documents