dr>? 7/ f " The Atmospheric Impact of the 1991 Mount Pinatub Stephen Self, l Jing-Xia Zhao, 2 Rick E. Holasek, I 3 Ronnie C. Torres, I 4 and Alan J. King I ABSTRACT The 1991 eruption of Pinatubo produced about 5 cubic kilometers of dacitic magma and may be the second largest volcanic eruption of the century. Eruption columns reached 40 kilometers in altitude and emplaced a giant umbrella cloud in the middle to lower stratosphere that injected about 17 megatons of SO2, slightly more than twice the amount yielded by the 1982 eruption of El Chich6n, Mexico. The SO2 formed sulfate aerosols that produced the largest per- turbation to the stratospheric aerosol layer since the erup- tion of Krakatau in 1883. The aerosol cloud spread rapidly around the Earth in about 3 weeks and attained global cov- erage by about l year after the eruption. Peak local midvisi- ble optical depths of up to 0.4 were measured in late 1992, and globally averaged values were about 0.1 to 0.15 for 2 years. The large aerosol cloud caused dramatic decreases in the amount of net radiation reaching the Earth's surface, producing a climate forcing that was two times stronger than the aerosols of El Chich6n. Effects on climate were an observed surface cooling in the Northern Hemisphere of up to 0.5 to 0.6°C, equivalent to a hemispheric-wide reduction in net radiation of 4 watts per square meter and a cooling of perhaps as large as -0.4°C over large parts of the Earth in 1992-93. Climate models appear to have predicted the cool- ing with a reasonable degree of accuracy. The Pinatubo cli- mate forcing was stronger than the opposite, warming effects of either the El Nifio event or anthropogenic green- house gases in the period 1991-93. As a result of the presence of the aerosol particles, midlatitude ozone concen- trations reached their lowest levels on record during 1992- 93, the Southern Hemisphere "ozone hole" increased in 1992 to an unprecedented size, and ozone depletion rates were observed to be faster than ever before recorded. The atmospheric impact of the Pinatubo eruption has been pro- I Hawaii Center for Volcanology and Department of Geology and Geophysics, University of Hawaii at Manoa, Honolulu, HI 96822, USA. 2Department of Meteorology, School of Ocean and Earth Science and Technology, University of Hawaii at Manoa, Honolulu, HI 96822, USA. 3Now at SETS Technology, Inc.. 30 Kalehu Ave. #10, Miliani, HI 96789. 4Also at Philippine Institute of Volcanology and Seismology, Quezon City, Philippines. found, and it has sparked a lively interest in the role that volcanic aerosols play in climate change. This event has shown that a powerful eruption providing a 15 to 20 mega- ton release of SO2 into the stratosphere can produce suffi- cient aerosols to offset the present global warming trends and severely impact the ozone budget. INTRODUCTION After 10 weeks of precursory activity, Mount Pinatubo (15008 ' N. lat, 120021 ' E. long) erupted on June 12-16, 1991, producing one of this century's greatest volcanic eruptions, the largest stratospheric SO2 cloud ever observed by modern instruments, and the major stratospheric aerosol event since Krakatau exploded in 1883. By far the largest volume of ejecta (perhaps >90% of the total), the highest eruption columns, and the longest duration of stratospheric injection occurred during the 9 h of more-or-less continuous high-output activity from about 1340 to about 2230 on June 15 (Hoblitt, Wolfe, and others, this volume). (All times are local time unless otherwise stated.) Stratospheric sulfate aerosols generated by the Pinatubo eruption cloud have had a far-reaching impact on the radiation budget, atmospheric and surface temperatures, regional weather patterns, global climatic changes, and atmospheric chemistry, including environmentally impor- tant atmospheric effects such as global ozone depletion. In this paper we review the widespread atmospheric impact of the Pinatubo eruption by considering the stratospheric injec- tion and mass of the aerosol-generating sulfur gases (prima- rily SO2), the transport of the eruption cloud and conversion of SO2 to stratospheric sulfate aerosols, and the effects of this aerosol layer on radiation, weather, and climate. Local weather phenomena caused by the eruption are discussed elsewhere (Oswalt and others, this volume). We close with a short retrospective comparing the atmospheric effects of Pinatubo with those of other eruptions of the past century. For the past 4 years, the Pinatubo stratospheric aerosol cloud has provided an exceptional natural laboratory for atmospheric scientists. The presence of the volcanic aerosol veil with a peak global midvisible optical depth ('t:) of at least 0.1 (Sato and others, 1993), initial radiation losses of up to 5% for the first 10 months (Dutton and Christy, 1992), 1089 https://ntrs.nasa.gov/search.jsp?R=19990021520 2018-09-21T04:34:34+00:00Z

Welcome message from author
This document is posted to help you gain knowledge. Please leave a comment to let me know what you think about it! Share it to your friends and learn new things together.
Transcript

dr>? 7/ f "
The Atmospheric Impact of the 1991 Mount Pinatub
Stephen Self, l Jing-Xia Zhao, 2 Rick E. Holasek, I 3 Ronnie C. Torres, I 4 and Alan J. King I
ABSTRACT
The 1991 eruption of Pinatubo produced about 5 cubic
kilometers of dacitic magma and may be the second largest
volcanic eruption of the century. Eruption columns reached
40 kilometers in altitude and emplaced a giant umbrella
cloud in the middle to lower stratosphere that injected about
17 megatons of SO2, slightly more than twice the amount
yielded by the 1982 eruption of El Chich6n, Mexico. The
SO2 formed sulfate aerosols that produced the largest per-
turbation to the stratospheric aerosol layer since the erup-
tion of Krakatau in 1883. The aerosol cloud spread rapidly
around the Earth in about 3 weeks and attained global cov-
erage by about l year after the eruption. Peak local midvisi-
ble optical depths of up to 0.4 were measured in late 1992,
and globally averaged values were about 0.1 to 0.15 for 2
years. The large aerosol cloud caused dramatic decreases in
the amount of net radiation reaching the Earth's surface,
producing a climate forcing that was two times strongerthan the aerosols of El Chich6n. Effects on climate were an
observed surface cooling in the Northern Hemisphere of up
to 0.5 to 0.6°C, equivalent to a hemispheric-wide reductionin net radiation of 4 watts per square meter and a cooling of
perhaps as large as -0.4°C over large parts of the Earth in1992-93. Climate models appear to have predicted the cool-
ing with a reasonable degree of accuracy. The Pinatubo cli-
mate forcing was stronger than the opposite, warming
effects of either the El Nifio event or anthropogenic green-
house gases in the period 1991-93. As a result of the
presence of the aerosol particles, midlatitude ozone concen-trations reached their lowest levels on record during 1992-
93, the Southern Hemisphere "ozone hole" increased in
1992 to an unprecedented size, and ozone depletion rateswere observed to be faster than ever before recorded. The
atmospheric impact of the Pinatubo eruption has been pro-
IHawaii Center for Volcanology and Department of Geology and
Geophysics, University of Hawaii at Manoa, Honolulu, HI 96822, USA.
2Department of Meteorology, School of Ocean and Earth Science and
Technology, University of Hawaii at Manoa, Honolulu, HI 96822, USA.
3Now at SETS Technology, Inc.. 30 Kalehu Ave. #10, Miliani,
HI 96789.
4Also at Philippine Institute of Volcanology and Seismology, Quezon
City, Philippines.
found, and it has sparked a lively interest in the role that
volcanic aerosols play in climate change. This event has
shown that a powerful eruption providing a 15 to 20 mega-
ton release of SO2 into the stratosphere can produce suffi-
cient aerosols to offset the present global warming trends
and severely impact the ozone budget.
INTRODUCTION
After 10 weeks of precursory activity, Mount Pinatubo
(15008 ' N. lat, 120021 ' E. long) erupted on June 12-16,
1991, producing one of this century's greatest volcanic
eruptions, the largest stratospheric SO2 cloud ever observed
by modern instruments, and the major stratospheric aerosol
event since Krakatau exploded in 1883. By far the largest
volume of ejecta (perhaps >90% of the total), the highest
eruption columns, and the longest duration of stratospheric
injection occurred during the 9 h of more-or-less continuous
high-output activity from about 1340 to about 2230 on June15 (Hoblitt, Wolfe, and others, this volume). (All times are
local time unless otherwise stated.)
Stratospheric sulfate aerosols generated by the
Pinatubo eruption cloud have had a far-reaching impact on
the radiation budget, atmospheric and surface temperatures,
regional weather patterns, global climatic changes, and
atmospheric chemistry, including environmentally impor-
tant atmospheric effects such as global ozone depletion. In
this paper we review the widespread atmospheric impact of
the Pinatubo eruption by considering the stratospheric injec-
tion and mass of the aerosol-generating sulfur gases (prima-
rily SO2), the transport of the eruption cloud and conversion
of SO2 to stratospheric sulfate aerosols, and the effects of
this aerosol layer on radiation, weather, and climate. Local
weather phenomena caused by the eruption are discussedelsewhere (Oswalt and others, this volume). We close with a
short retrospective comparing the atmospheric effects of
Pinatubo with those of other eruptions of the past century.
For the past 4 years, the Pinatubo stratospheric aerosolcloud has provided an exceptional natural laboratory for
atmospheric scientists. The presence of the volcanic aerosol
veil with a peak global midvisible optical depth ('t:) of atleast 0.1 (Sato and others, 1993), initial radiation losses of
up to 5% for the first 10 months (Dutton and Christy, 1992),
1089
https://ntrs.nasa.gov/search.jsp?R=19990021520 2018-09-21T04:34:34+00:00Z

1090 SELECTED IMPACTS
and the concomitant, measurable climate anomalies such as
global surface cooling of perhaps in excess of 0.5°C in 1992
(Dutton and Christy, 1992; Hansen and others, 1993) have
produced tremendous excitement in the atmospheric sci-
ence community. Measurements of Pinatubo aerosols and
their effects on the Earth's climate system will enable vali-
dation of the new generation of global circulation models,
improve our understanding of global aerosol dispersal and
decay (and thus stratospheric circulation), and permit test-
ing of models of aerosol formation. They will also provide
better knowledge of controls on the global ozone budget,
and will throw light on problems such as why surface cool-
ing is clearly documented after some eruptions (for exam-
ple, Gunung Agung, Bali, in 1963; Hansen and others,1978) but not others--for example, El Chich6n, Mexico, in
1982 (Angell, 1988; Ramanathan, 1988). Intense interest in
the atmospheric aftermath of Pinatubo has been expressed
by the tremendous proliferation of papers published since1991 on the aerosol cloud and its effects. A representative
portion of this considerable body of information has been
canvassed for this study, but the authors are aware that
many studies, especially some of those published after Fall
1993, when this paper was written, are not quoted herein; to
the authors of those works we extend our apologies. Obvi-
ously, the optimum time for complete evaluation of the
atmospheric effects of this exceptional eruption will be in a
few years, when the results of many studies in progress are
available.
ERUPTION CHARACTERISTICS AND
VOLATILE RELEASE
It is important both to overall considerations of the size
of the Pinatubo eruption and to the volume of magma that
accompanied the atmospheric injection of the SO2 cloud
that we briefly consider the magma volume and how the
material was ejected into the atmosphere. Moreover, some
studies published in the nonvolcanological literature have
made various erroneous claims regarding the size of the
Pinatubo eruption, suggesting, for instance, that it was the
century's largest eruption. We show here that the volume of
erupted magma is not necessarily related to the size of the
aerosol cloud generated, particularly in the case of Pinatubo
(see also Gerlach and others, this volume), and we put the
size of the Pinatubo eruption in perspective. As in most
great eruptions (Rampino and Self, 1982), plinian eruption
columns from a "point source" vent and co-ignimbrite erup-
tion clouds (Woods and Wohletz, 1991; Koyaguchi and
Tokuno, 1993; Koyaguchi, this volume) derived from the
pyroclastic flows at Pinatubo contributed to the eruptioncolumn and cloud, and thus to the mass of SO2 injected into
the atmosphere.
VOLUME OF EJECTA
The present best estimate of 8.4 to 10.4 km 3 total bulkvolume for Pinatubo 1991 ejecta is the sum of the -5-6 km 3
of bulk volume of ignimbrite (W.E. Scott and others, thisvolume) and the 3.4 to 4.4 km 3 bulk volume of fallout
deposits (Paladio-Melosantos and others, this volume). Adense rock equivalent (DRE) maximum of 3.7 to 5.3 km -_
(W.E. Scott and others, this volume) is probably as good a
figure as will be obtained. This value is in reasonable agree-ment with an independent volume estimate of -5.5 km 3
based on eruption column heights and durations obtained
from satellite images of the eruptive system and models of
eruption column dynamics (Holasek, 1995). Somewhatlarger values (18 km 3 bulk volume, which converts to <9
km 3 DRE) are supported by modeling of the giant Pinatubo
eruption cloud (Koyaguchi and Tokuno, 1993; Koyaguchi,this volume).
STRATOSPHERIC INJECTION
BY THE ERUPTION COLUMN
The maximum and average heights reached by the
eruption columns on June 12-15, 1991, are important in
assessing the original altitude of injection of the ash and gas
cloud. Table 1 shows all times during which emissions
reached stratospheric elevations (see also Hoblitt, Wolfe,
and others, this volume). The tropopause was at about
17 km over the Philippines during the eruption.
Of most importance to the generation of the aerosol
cloud is the period of 21 h from about 0555 on June 15 to
0300 on 16 June that had the highest eruption columns.
During this period, a series of explosions beginning at 1027
on June 15 produced a fluctuating eruption column andumbrella clouds above the volcano (see Tokuno, 1991a) and
gradually escalated into a 9-h-long climactic phase begin-
ning before 1340. Examination of images from the Japanese
Geostationary Meteorological Satellite (GMS-4) byTokuno (1991A,B), Tanaka and others (1991), Koyaguchi
and Tokuno (1993), and this study (fig. 1), provides some
details of this part of the eruption, which was ill observed
from the ground. It is noted elsewhere (Oswalt and others,
this volume) that the closest pass of tropical typhoon Yunya
to Pinatubo occurred just before the start of the climactic
phase.
The first GMS image of the climactic phase collected
at about 1340 (figs. IA,E) shows the center of the eruption
column located nearly over Pinatubo's vent, but it is diffi-
cult to pinpoint exactly where the center of the rising col-
umn is relative to the volcano in subsequent images as the
column rises and grows. This is due to an offset introduced
by the geometry of the spacecraft's look angle and position
with respect to any non-nadir point on the Earth's surface;
the offset increases with altitude of imaged objects above

THE ATMOSPHERIC IMPACT OF THE 1991 MOUNT PINATUBO ERUPTION 1091
Table 1. Chronology of ash columns with significant stratospheric injection of ash and volatiles during the June
1991 eruptions of Mount Pinatubo, Philippines.
[Local time = Gmt + 8 Dispersal of ash column is west-southwest in all cases. After Hoblitt, Wolfe, and others, this volume;
Pinatubo Volcano Qbservatory Team, 1991; and Smithsonian Institution. 1991]
Seismic Column Dispersal andDate, Time
duration height plume size, × Description of eventsJune 1991 Oocal time)
(minJ (kin) hours after
12 0852 42 >19 5.5xl04kin 2
in8h
12 2251 14 24--25 I.lxl05km 2
in8h
13 0841 5 24 lxl05 km 2
in6h
14 1307 2 21 5x10⁴ km 2
in4h
14 1410 '_ 15-20 6x10⁴ km 2
in 5h
14 1853 5 >24 7.5x10⁴km 2
in6h
14 2330 3 >21 5×10⁴ km 2in3h
15 0114 3-23 23-25 1.5x10⁵km 2
in4h
15 0555 3 12-20 l.lx105 km 2
in3h
15 0810 ? 12-20
15 1027 4---14 >20
15 1342 -9 h 235
15 2231 -4 h 26--28
16 0331 -4 h 23-25
Eruption with subsequent pyroclastic flows reaching
4-5 km along the NW. flank. Pyroclastic-flow depositsenriched with dense andesitic dome fragments; fallout
intense southwestward.
Fallout dispersed W., NW., and SW. with pumice lapilli and
coarse ash falling 15-20 km away from the vent;
pyroclastic flows on the N., NW., and W. flanks.
Formation of 200- to 300-m-diameter crater; partial
destruction of andesitic dome; pyroclastic flow traveled
4-5 km NW.
Eruption column reached the height of 21 km in about
15 min after onset of explosion; fallout toward SW.
Eruption appeared to issue from multiple vents; pyroclasticflows in the NW. flank reached 15 km downvalley.
Eruption with subsequent pyroclastic flows on the NW.flank.
Fallout at 25-30 km SW. to WSW. from the vent; pyroclas-
tic flow was detected on the upper E. flank.
Eruption with pyroclastic flows on the SW. and upper E.flanks.
Generation of outwardly moving pyroclastic flows initiallyreferred to as blast; ash column was momentarilyvisible, immediately obscured by elutriating ash.
1. lxl05 km 2 Gap in the seismic record; pyroclastic flows were observedin 3 h on N. and NW. flanks.
1.1xl06 km 2 Eruption followed by successive explosions, ash cloud
in 12 h buildup, and dispersal.
9 Beginning of paroxysmal eruption, consisting of several
indistinguishable column formations and accompanied
by massive deposition of pyroclastic flows all around
the vent, pumice lapilli fallout, and large earthquakes.,, Formation of the summit caldera.
'_ Ball-shaped column emanating from the newly formedcaldera.
9 Wedge-shaped plume; last observed eruption-related ash
column with height above 17 km
the surface (Holasek and Self, 1995). Tokuno (199 l b) notes
that in some of the satellite images presented in his work,
the locus of the growing volcanic umbrella cloud moves off
to 10 to 20 km west of Pinatubo, but the significance of this
observation is difficult to evaluate without knowing details
of the positioning (mapping) system used in creating these
images. In our images of the same data produced using the
MCIDAS software package (figs. 1B-D and F-H), the ris-
ing center of the cloud varies slightly in position relative to
Pinatubo's vent, suggesting that the vent-derived plinian
eruption column and giant umbrella cloud were augmented
later in the event by co-ignimbrite ash columns lifting off
the pyroclastic flows to the west and south of the volcano.
In fact, plinian and pyroclastic flow activity were probably
concomitant during much of the climactic phase (W.E. Scott
and others, this volume). Model calculations show that the
width of point-source plinian eruption columns near the top
is about twice the height for columns >30 km high (Wilson
and Walker, 1987), so that a mean column height of 35 km
would be predicted to have an umbrella region about 70 km
wide. Because the Pinatubo umbrella cloud reached >5thq
km in diameter by 1640, a larger surface area for the plume

1092 SELECTEDIMPACTS
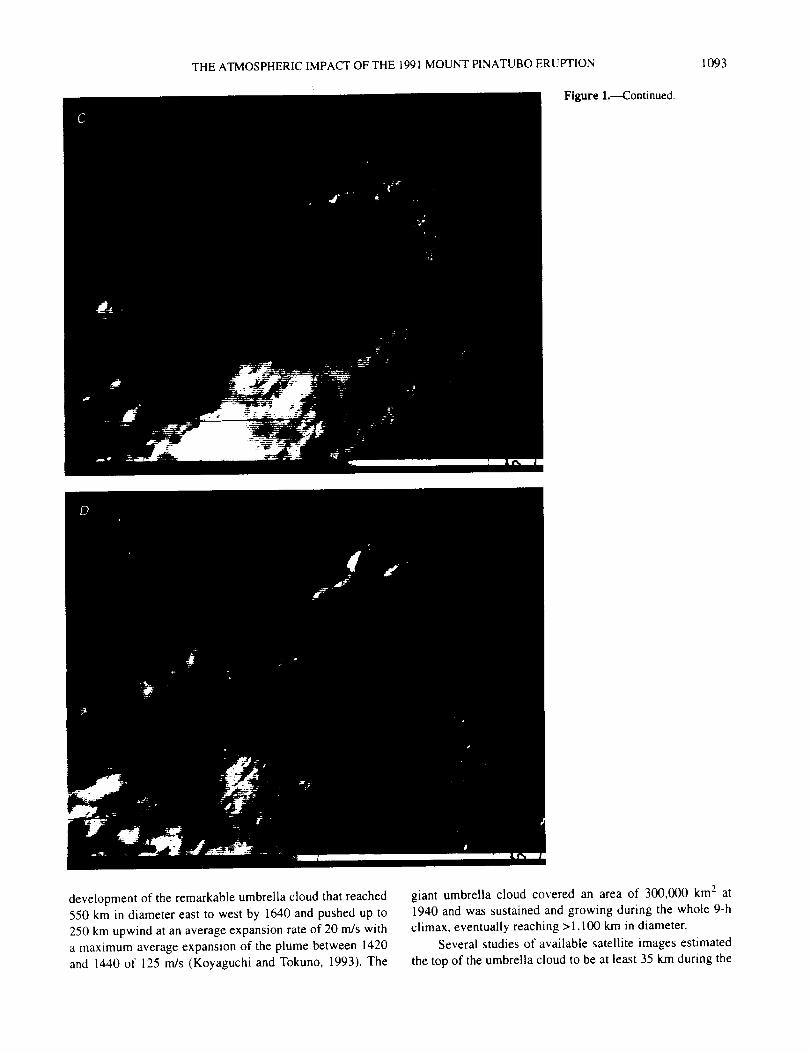
Figure 1. Japanese GMS vis-ible- and thermal-lR wave-
length satellite images of top of
giant umbrella cloud develop-
ing above eruption column of
Mount Pinatubo on June 15,
1991. A-D, Visible wave-
length images spanning 3 hfrom 1340 to 1640 local time;
E-H. Thermal-IR images atsame times. Scale bar shows
size of developing umbrella
cloud; x in visible wavelength
images marks center of Mount
Pinatubo volcano. Color bar in
bottom right of thermal-IR
images gives instrument-
perceived temperatures in
degrees Celsius.
source is indicated such as would be provided by the central
vent and surrounding pyroclastic flows (Woods and
Wohletz, 1991).
Although it is recognized that perhaps 90% of the
erupted volume was produced in the 9-h climax, infrasonic
records from Japan (fig. 6 in Tahira and others, this volume)
and barometric records collected near Pinatubo identify a
3-h period from about 1340 to 1640 during which the output
and, by inference, the mass eruption rate were the highest.
This period is covered by figure 1 and shows the
THE ATMOSPHERIC IMPACT OF THE 1991 MOUNT PINATUBO ERUPTION
Figure 1.---Continued
1093
development of the remarkable umbrella cloud that reached
550 km in diameter east to west by 1640 and pushed up to
250 km upwind at an average expansion rate of 20 m/s with
a maximum average expansion of the plume between 1420
and 1440 of 125 m/s (Koyaguchi and Tokuno, 1993). The
giant umbrella cloud covered an area of 300,1300 km 2 at
1940 and was sustained and growing during the whole 9-hclimax, eventually reaching > 1,100 km in diameter.
Several studies of available satellite images estimated
the top of the umbrella cloud to be at least 35 km during the

1094 SELECTEDIMPACTS
Figurel.---Continued.
climax (Koyaguchi and Tokuno, 1993; Lynch and Stephens,
this volume). This value is corroborated here by measure-
ment of cloud-top temperature on both NOAA Advanced
Very High Resolution Radiometer (AVHRR) and GMS
thermal infrared (IR) images, taking into account that the
central area of the umbrella cloud around the rising column
can potentially suffer brief but dramatic undercooling
(Woods and Self, 1992). That area had wildly varying tem-
peratures (fig. IE-H), and, therefore, temperatures were
determined on a high-level portion of the umbrella cloud

THEATMOSPHERICIMPACTOFTHE1991MOUNTPINATUBO ERUPTION
Figure l.--Continued.
1095
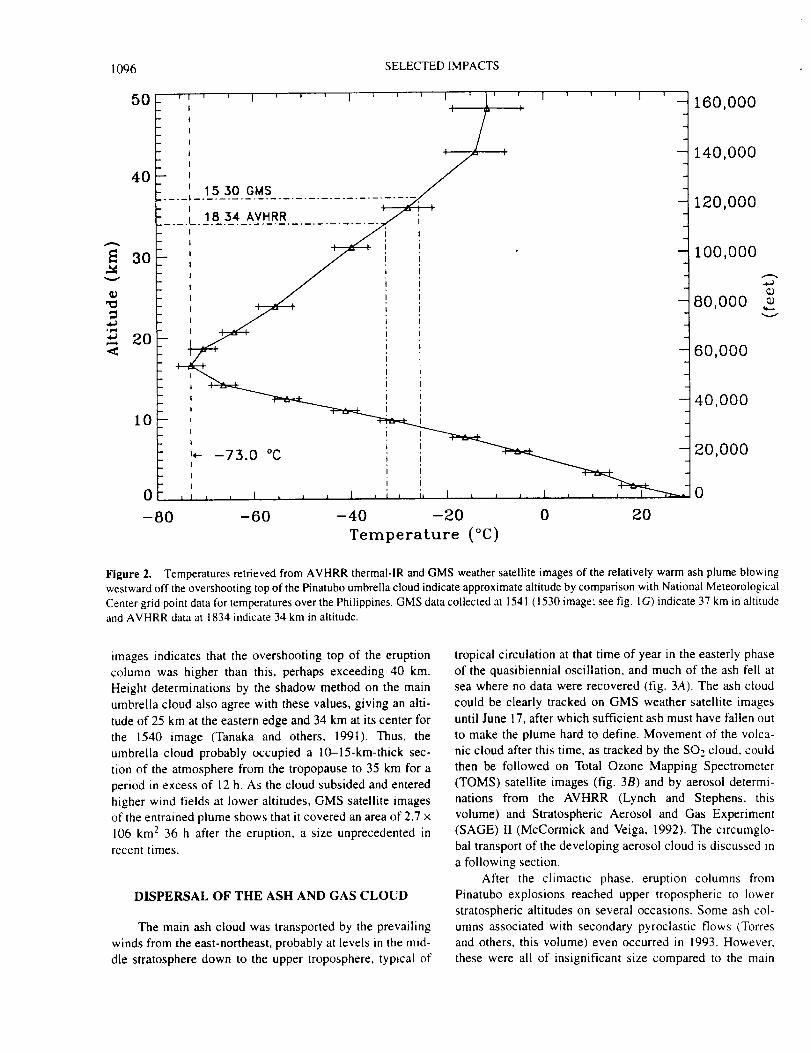
away from this central zone. The instrument-perceived
plume-top temperatures were compared with an
atmospheric temperature profile for the same period (fig. 2).Values indicate a middle-stratospheric height for the aver-
age cloud top (34-37 kin), if it is assumed that the cloud is
in the stratosphere. The assumption is based on the fact that
the umbrella region casts shadows in the visible images on
the tropospheric clouds associated with Typhoon Yunya.
Holasek (1995) compared several thermal-IR image alti-
tudes with shadow-determined plume heights in visible-IR
1096 SELECTEDIMPACTS
50
40
10
0
-80
1,5 30 GMS
18 34 AVHRR
160,000
140,000
120,000
I00,000
80,000
60,000
40,000
20,000
0
Figure 2. Temperatures retrieved from AVHRR thermal-lR and GMS weather satellite images of the relatively warm ash plume blowingwestward off the overshooting top of the Pinatubo umbrella cloud indicate approximate altitude by comparison with National MeteorologicalCenter grid point data for temperatures over the Philippines. GMS data collected at 1541 ( 1530 image; see fig. IG) indicate 37 km in altitudeand AVHRR data at 1834 indicate 34 km in altitude.
images indicates that the overshooting top of the eruption
column was higher than this, perhaps exceeding 40 km.
Height determinations by the shadow method on the main
umbrella cloud also agree with these values, giving an alti-
tude of 25 km at the eastern edge and 34 km at its center for
the 1540 image (Tanaka and others, 1991). Thus, the
umbrella cloud probably occupied a lO--15-km-thick sec-
tion of the atmosphere from the tropopause to 35 km for a
period in excess of 12 h. As the cloud subsided and entered
higher wind fields at lower altitudes, GMS satellite images
of the entrained plume shows that it covered an area of 2.7 x
106 km 2 36 h after the eruption, a size unprecedented in
recent times.
DISPERSAL OF THE ASH AND GAS CLOUD
The main ash cloud was transported by the prevailing
winds from the east-northeast, probably at levels in the mid-
dle stratosphere down to the upper troposphere, typical of
tropical circulation at that time of year in the easterly phase
of the quasibiennial oscillation, and much of the ash fell at
sea where no data were recovered (fig. 3A). The ash cloud
could be clearly tracked on GMS weather satellite imagesuntil June 17, after which sufficient ash must have fallen out
to make the plume hard to define. Movement of the volca-
nic cloud after this time, as tracked by the SO2 cloud, could
then be followed on Total Ozone Mapping Spectrometer
(TOMS) satellite images (fig. 3B) and by aerosol determi-
nations from the AVHRR (Lynch and Stephens, this
volume) and Stratospheric Aerosol and Gas Experiment
(SAGE) II (McCormick and Veiga, 1992). The circumglo-
bai transport of the developing aerosol cloud is discussed in
a following section.
After the climactic phase, eruption columns from
Pinatubo explosions reached upper tropospheric to lower
stratospheric altitudes on several occasions. Some ash col-
umns associated with secondary pyroclastic flows (Torres
and others, this volume) even occurred in 1993. However,
these were all of insignificant size compared to the main

THEATMOSPHERICIMPACT OF THE 1991 MOUNT PINATUBO ERUPTION 1097
A90* 105° 120 ° 135 ° 150 °
15"
Figure 3. A. The spreading ofPinatubo eruption cloud as derivedtTom Japanese GMS satelliteimages at the given times iPhilip-pine local time). B, The transitionfrom ash-laden eruption cloud toSO2-dominated stratosphericcloud mapped by TOMS satellite.(Data courtesy of Gregg Blurb andArlin Krueger. NASA GoddardSpace Flight Center
B120° 60° 0° 60* 120°
45°
0 o
45°
eruption and did not approach the atmospheric impact of the
main eruption, except, perhaps, to pose a threat to aircraft.
VOLATILE EMISSIONS
During the climactic phase of the Pinatubo eruption on
June 15, large amounts of volcanic S02 and other gases that
were released into the atmosphere rapidly produced a large
increase in the sulfate aerosol loading of the stratosphere.
The TOMS satellite measured the largest SO2 cloud ever
detected during the instrument's 13 years of operation, 20
(+61 megatons (1 Mt = 109 kg) of SO2, almost all from the
9-h climax (Bluth and others, 1992). The estimate is basedon a TOMS measurement of 18.5 Mt about 36 h after the
eruption ended, combined with an observed average
decrease in SO2 in the cloud of 1 to 1.5 Mt per day. We note
that TOMS measurements may be subject to errors of about
30% (A. Krueger, personal commun., 1993). The strato-
spheric cloud was observed by TOMS to encircle the Earth
in about 22 days (fig. 3B).Other estimates of the amount of SO-, released from
remote sensing data were made from the Microwave Limb
Sounder (MLS) on the Upper Atmosphere Research Satel-
lite (UARS), which made its first measurements on Septem-
ber 12, 1991 (Read and others, 1993), and from the spectral

1098 SELECTED IMPACTS
100.000_ _ _ _ _ I ' _ _ ' I ' ' ' ' I ....
F EXPLANATIONE ._ MLS columnabove21 kilometers
EL 4" MLS layer at 21 kilometers
A MLS layer at26 kilometers10.00_- _ X MLS layerat 31 kilometers
• - _ • TOMS column[] _ _ Aircraft column(Mankin and others,1992)
_ [] SBUVcolumn (McPeters, t993)1.00 .
_ + zx
x x x x /k
Xxx+ Ax ÷ x x
x
0.01 I t I I I I I I I I I t L i J = i J L50 1O0 150 200
TIME AFTER ERUPTION, IN 0AYS
Figure 4. Measurements of
the SO-, produced by the June
15, 1991, Pinatubo eruptionfrom MLS, TOMS, and
SBUV determination between
June 1991 and March 1993.
Upper and lower dotted lines
are uncertainty limits of MLS
measurements at 21 and 26.
and 31 km, respectively.(After Read and others, 1993.
See text for discussion.)
scan data of the SBUV-2 instrument on the NOAA-! 1 sat-
ellite (McPeters, 1993) (fig. 4). The initial masses indicated
are 17 and 13.5 +1.5 Mt, respectively, giving an average
when combined with the TOMS figure of 17 _+-2 Mt (see
also Gerlach and others, this volume). The initial mass of
the injection may have been greater than the estimates
obtained by extrapolation of the remotely sensed data,
because some unknown amount of sulfur was probably
scrubbed out of the atmosphere by the falling silicate ash
particles. However, the lower estimates of SO2 above are in
better agreement with the measured maximum aerosol
masses, as will be shown subsequently in the text.
The origin of this large amount of SO2 was probably
from a water-rich, sulfur-bearing fluid phase coexisting
with the dacitic Pinatubo magma (Gerlach and others, this
volume; see also several other papers in this volume for dis-
cussion of the origin of the erupted sulfur). The Gerlach
study shows convincingly that the dissolved sulfur con-
tained in the >5-kin 3 magma body before eruption, as esti-
mated by the petrologic method (Devine and others, 1984),
was insufficient to account for the SO2 cloud. Thus, in the
Pinatubo case (Hattori, 1993; this volume), and in other
eruptions of evolved magmas developed under highly
oxidizing conditions, such as with E1 Chich6n, Mexico, in
1982 (Luhr and others, 1984), the erupted magma volume
bears little, if any, relation to the size of the volatile release,
as discussed in more detail by Gerlach and others (this
volume).
As well as sulfur, CO2, H20, and a small amount of
chlorine were released to the stratosphere (Gerlach and oth-
ers, this volume), and some of the water may have been
important in early formation of aerosols. Electron micro-
probe analyses of glass inclusions and matrix glass in
Pinatubo dacitic pumice suggests that up to 4.4 wt% H20
was exsolved from the magma to a gas phase, implying the
release of about 250 to 500 Mt of H20 during the June 15
eruption (Westrich and Gerlach, 1992; Gerlach and others,
this volume). Although 3 Mt of chlorine was erupted
(Gerlach and others, this volume) and was potentially avail-
able for subsequent participation in ozone-destroying reac-
tions (Turco, 1991), observations by airborne infrared
Fourier transform spectrometry of the stratospheric cloud 3
weeks after the June 15 eruption showed little increase in
HCI above stratospheric background levels (Mankin and
others, 1992; Wallace and Livingston, 1992). Erupted chlo-
rine, as HCI, is highly soluble in water and is very effi-
ciently scavenged by water droplets in the eruption column
and rapidly returned to the surface of the Earth as precipita-
tion (Tabazadeh and Turco, 1993). Much of the chlorine
may have thus been remoyed from the atmosphere during or
shortly after eruption.
STRATOSPHERIC AEROSOLS
AND THEIR EFFECTS
GAS-TO-PARTICLE CONVERSION
The large Pinatubo stratospheric SO2 cloud began to
spread rapidly and oxidize to form stratospheric sulfuric
acid aerosols. Approximately half of the SO2 had been con-
verted to sulfuric acid aerosols by 21 to 28 days after the
eruption (Winker and Osborn, 1992a). The MLS on the
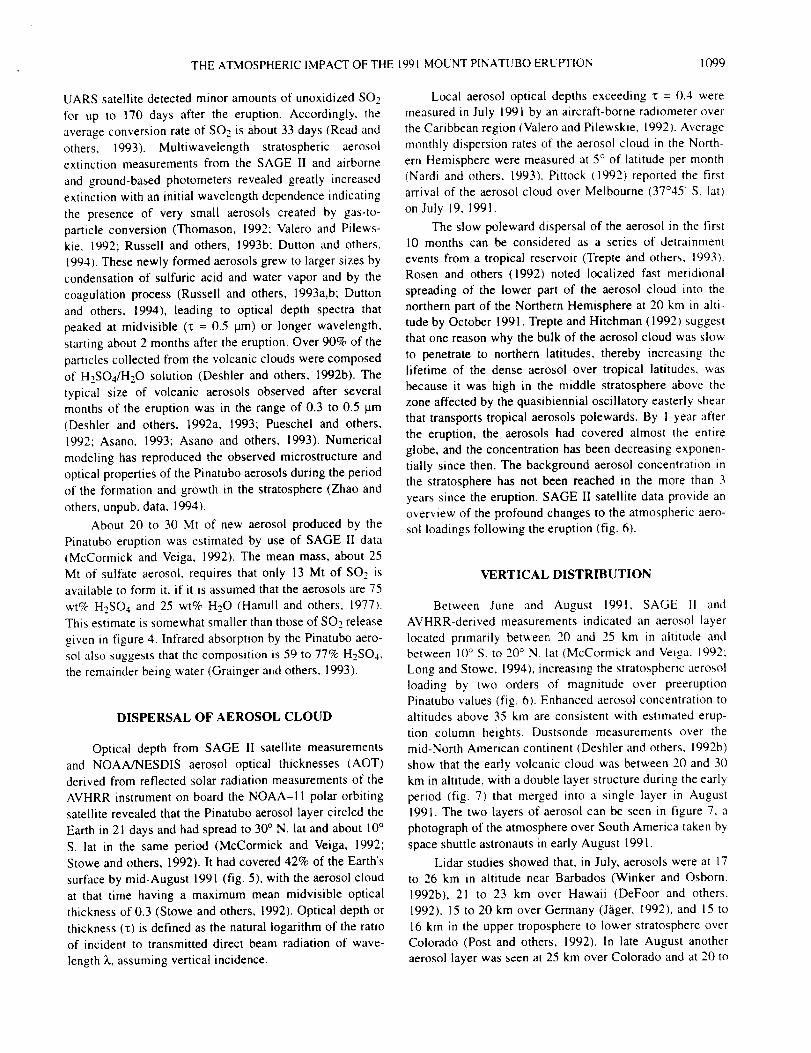
THE ATMOSPHERIC IMPACT OF THE 1991 MOUNT PINATUBO ERUPTION 1099
UARS satellite detected minor amounts of unoxidized SO2
for up to 170 days after the eruption. Accordingly, the
average conversion rate of SO2 is about 33 days (Read and
others, 1993). Multiwavelength stratospheric aerosol
extinction measurements from the SAGE II and airborne
and ground-based photometers revealed greatly increased
extinction with an initial wavelength dependence indicating
the presence of very small aerosols created by gas-to-
particle conversion (Thomason, 1992; Valero and Pilews-
kie, 1992; Russell and others, 1993b; Dutton and others,
1994). These newly formed aerosols grew to larger sizes by
condensation of sulfuric acid and water vapor and by the
coagulation process (Russell and others, 1993a, b; Dutton
and others, 1994), leading to optical depth spectra that
peaked at midvisible (_ = 0.5 lam) or longer wavelength,
starting about 2 months after the eruption. Over 90% of the
particles collected from the volcanic clouds were composed
of H2SOa/H20 solution (Deshler and others, 1992b). The
typical size of volcanic aerosols observed after severalmonths of the eruption was in the range of 0.3 to 0.5 lam
(Deshler and others, 1992a, 1993; Pueschel and others,1992: Asano, 1993; Asano and others, 1993). Numerical
modeling has reproduced the observed microstructure and
optical properties of the Pinatubo aerosols during the period
of the formation and growth in the stratosphere (Zhao and
others, unpub, data, 1994).
About 20 to 30 Mt of new aerosol produced by the
Pinatubo eruption was estimated by use of SAGE II data
(McCormick and Veiga, 1992). The mean mass, about 25
Mt of sulfate aerosol, requires that only 13 Mt of SO2 isavailable to form it, if it is assumed that the aerosols are 75
wt% H2SO 4 and 25 wt% H20 (Hamill and others, 1977).This estimate is somewhat smaller than those of SO2 release
given in figure 4. Infrared absorption by the Pinatubo aero-
sol also suggests that the composition is 59 to 77% H2SO4,
the remainder being water (Grainger ahd others, 1993).
DISPERSAL OF AEROSOL CLOUD
Optical depth from SAGE II satellite measurementsand NOAA/NESDIS aerosol optical thicknesses (AOT)
derived from reflected solar radiation measurements of the
AVHRR instrument on board the NOAA-I I polar orbiting
satellite revealed that the Pinatubo aerosol layer circled the
Earth in 21 days and had spread to 30° N. lat and about 10 °
S. lat in the same period (McCormick and Veiga, 1992;Stowe and others, 1992). It had covered 42% of the Earth's
surface by mid-August 1991 (fig. 5), with the aerosol cloud
at that time having a maximum mean midvisible optical
thickness of 0.3 (Stowe and others, 1992). Optical depth or
thickness (x) is defined as the natural logarithm of the ratioof incident to transmitted direct beam radiation of wave-
length 3,, assuming vertical incidence.
Local aerosol optical depths exceeding "t = 0.4 were
measured in July 1991 by an aircraft-borne radiometer over
the Caribbean region (Valero and Pilewskie, 1992). Average
monthly dispersion rates of the aerosol cloud in the North-
ern Hemisphere were measured at 5 ° of latitude per month(Nardi and others, 1993). Pittock (1992) reported the first
arrival of the aerosol cloud over Melbourne (37045 ' S. lat)
on July 19, 1991.
The slow poleward dispersal of the aerosol in the first10 months can be considered as a series of detrainment
events from a tropical reservoir (Trepte and others, 1993).Rosen and others (1992) noted localized fast meridional
spreading of the lower part of the aerosol cloud into the
northern part of the Northern Hemisphere at 20 km in alti-
tude by October 1991. Trepte and Hitchman (1992) suggest
that one reason why the bulk of the aerosol cloud was slow
to penetrate to northern latitudes, thereby increasing the
lifetime of the dense aerosol over tropical latitudes, was
because it was high in the middle stratosphere above the
zone affected by the quasibiennial oscillatory easterly shear
that transports tropical aerosols polewards. By I year after
the eruption, the aerosols had covered almost the entire
globe, and the concentration has been decreasing exponen-
tially since then. The background aerosol concentration inthe stratosphere has not been reached in the more than 3
years since the eruption. SAGE II satellite data provide anoverview of the profound changes to the atmospheric aero-
sol Ioadings following the eruption (fig. 6).
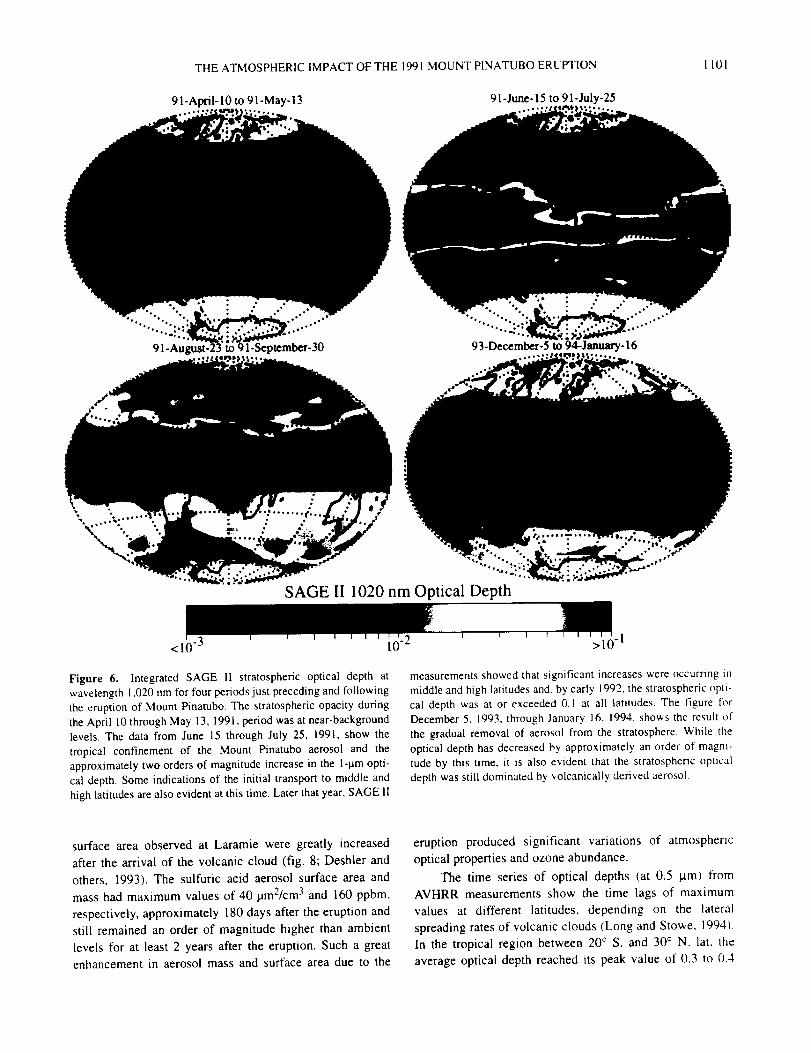
VERTICAL DISTRIBUTION
Between June and August 1991, SAGE II andAVHRR-derived measurements indicated an aerosol layer
located primarily between 20 and 25 km in altitude andbetween 10° S. to 20 ° N. lat (McCormick and Veiga. 1992:
Long and Stowe, 1994), increasing the stratospheric aerosol
loading by two orders of magnitude over preeruptionPinatubo values (fig. 6). Enhanced aerosol concentration to
altitudes above 35 km are consistent with estimated erup-
tion column heights. Dustsonde measurements over themid-North American continent (Deshler and others, 1992b)
show that the early volcanic cloud was between 20 and 30
km in altitude, with a double layer structure during the early
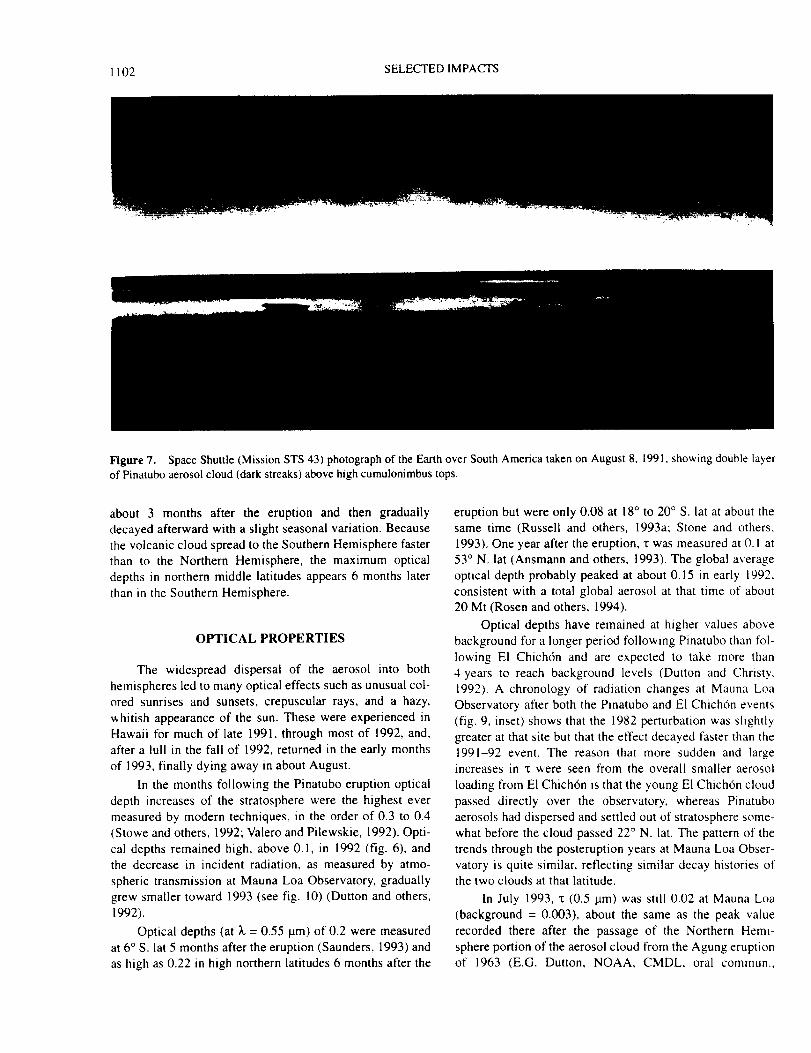
period (fig. 7) that merged into a single layer in August1991. The two layers of aerosol can be seen in figure 7. a
photograph of the atmosphere over South America taken by
space shuttle astronauts in early August 1991.
Lidar studies showed that, in July, aerosols were at 17to 26 km in altitude near Barbados (Winker and Osborn,
1992b), 21 to 23 km over Hawaii (DeFoor and others.
1992), 15 to 20 km over Germany (J_iger, 1992), and 15 to
16 km in the upper troposphere to lower stratosphere overColorado (Post and others, 1992). In late August another
aerosol layer was seen at 25 km over Colorado and at 20 to

r
l 100 SELECTED IMPACTS
NOAA/AVH R AEROSOLD IFFERENCE FROM
4'--- JULY -1991 TO
OPT I CAL TH I CKNESS2 YEAR AVERAGE
30-DEC-1993
6O
4O
2O
4O
6O
27 33 39 45 51 5 -II 17 23 29 35 41 47 i 7 13 19 25 31 37 43 49
WEEK OF YEAR
• 05 .I0 .15 .20 .25 .30 .35 .40 .45 .50
Figure 5. Dispersal of Pinatubo aerosols between July 4, 1991.
and December 30, 1993, shown by time series of one degree zonally
averaged optical thickness (depth) departures following the Mount
Pinatubo eruption. The departures are computed from the 2-year
weekly mean values observed before the eruption. Derived from
AVHRR NOAA-II satellite data, after Long and Stowe (1994).
The plot is made from intensity measurements of reflected solar
radiation by the AVHRR. Note Mount Hudson (Chile) aerosol
cloud from 40" S. to 60 ° S. lat beginning week 39.
25 km over Germany. This two-tiered aerosol layer has
been monitored after other tropical eruptions (Trepte and
others, 1993) and corresponds to typical transport patterns
at mid-latitudes in summer, with westerlies below 20 km
and easterlies above.
TEMPORAL VARIATION
The Pinatubo aerosol cloud persisted for 3 years at
concentration levels well above the preemption background
in the Northern Hemisphere (Dutton and others, 1992) as a
result of its original high density. The increase in decay
rates of the aerosol cloud depends strongly on location. An
e-folding time (time to decay to l/e of the original optical
depth) of over 13 months was estimated near the Arctic
(Stone and others, 1993), which is slightly longer than for
most volcanic aerosol events. SAGE II measurements and
analysis (McCormick and others, in press) yield peak sur-
face areas of >50 pm2/cm 3 and peak mass mixing ratios of
300 ppbm (parts per billion by mass). The aerosol mass and
THEATMOSPHERICIMPACTOFTHE 1991 MOUNT PINATUBO ERUPTION
9 I-April- 10 to 9 l-May- 13 91-June, 15 to 9 l-July-25
I101
,°,°'
t1-September-30 93-December-5 to
SAGE II 1020 nm Optical Depth
<10 -3 10-2 >10-1
Figure 6. Integrated SAGE II stratospheric optical depth at
wavelength 1,020 nm for four periods just preceding and following
the eruption of Mount Pinatubo. The stratospheric opacity during
the April 10 through May 13, 1991, period was at near-background
levels. The data from June 15 through July 25, 1991, show the
tropical confinement of the Mount Pinatubo aerosol and the
approximately two orders of magnitude increase in the l-lam opti-
cal depth. Some indications of the initial transport to middle and
high latitudes are also evident at this time. Later that year, SAGE II
measurements showed that significant increases were occurring in
middle and high latitudes and, by early 1992, the stratospheric opti-
cal depth was at or exceeded 0.1 at all latitudes. The figure ¢t_r
December 5, 1993, through January 16, 1994, shows the result of
the gradual removal of aerosol from the stratosphere. While the
optical depth has decreased by approximately an order of magni-
tude by this time, it is also evident that the stratospheric optical
depth was still dominated by volcanically derived aerosol.
surface area observed at Laramie were greatly increased
after the arrival of the volcanic cloud (fig. 8; Deshler and
others, 1993). The sulfuric acid aerosol surface area and
mass had maximum values of 40 lam2/cm 3 and 160 ppbm,
respectively, approximately 180 days after the eruption and
still remained an order of magnitude higher than ambient
levels for at least 2 years after the eruption. Such a great
enhancement in aerosol mass and surface area due to the
eruption produced significant variations of atmospheric
optical properties and ozone abundance.
The time series of optical depths (at 0.5 p.m) from
AVHRR measurements show the time lags of maximum
values at different latitudes, depending on the lateral
spreading rates of volcanic clouds (Long and Stowe, 1994).
In the tropical region between 20 ° S. and 30 ° N. lat, the
average optical depth reached its peak value of 0.3 to 0.4
1102 SELECTED IMPACTS
Figure 7. Space Shuttle (Mission STS 43) photograph of the Earth over South America taken on August 8, 1991, showing double layerof Pinatubo aerosol cloud (dark streaks) above high cumulonimbus tops.
about 3 months after the eruption and then gradually
decayed afterward with a slight seasonal variation. Because
the volcanic cloud spread to the Southern Hemisphere faster
than to the Northern Hemisphere, the maximum optical
depths in northern middle latitudes appears 6 months laterthan in the Southern Hemisphere.
OPTICAL PROPERTIES
The widespread dispersal of the aerosol into both
hemispheres led to many optical effects such as unusual col-
ored sunrises and sunsets, crepuscular rays, and a hazy,
_hitish appearance of the sun. These were experienced inHawaii for much of late 1991, through most of 1992, and,
after a lull in the fall of 1992, returned in the early months
of 1993, finally dying away in about August.
In the months following the Pinatubo eruption optical
depth increases of the stratosphere were the highest ever
measured by modern techniques, in the order of 0.3 to 0.4(Stowe and others, 1992; Valero and Pilewskie, 1992). Opti-
cal depths remained high, above 0.1, in 1992 (fig. 6), and
the decrease in incident radiation, as measured by atmo-
spheric transmission at Mauna Loa Observatory, gradually
grew smaller toward 1993 (see fig. 10) (Dutton and others,
1992).
Optical depths (at L = 0.55 !am) of 0.2 were measured
at 6 ° S. lat 5 months after the eruption (Saunders, 1993) and
as high as 0.22 in high northern latitudes 6 months after the
eruption but were only 0.08 at 18° to 20 ° S. lat at about thesame time (Russell and others, 1993a; Stone and others,
1993). One year after the eruption, z was measured at 0.1 at53 ° N. lat (Ansmann and others, 1993). The global average
optical depth probably peaked at about 0.15 in early 1992,consistent with a total global aerosol at that time of about
20 Mt (Rosen and others, 1994).
Optical depths have remained at higher values above
background for a longer period following Pinatubo than fol-
lowing El Chich6n and are expected to take more than
4 years to reach background levels (Dutton and Christy,
1992). A chronology of radiation changes at Mauna Loa
Observatory after both the Pinatubo and El Chich6n events
(fig. 9, inset) shows that the 1982 perturbation was slightly
greater at that site but that the effect decayed faster than the
1991-92 event. The reason that more sudden and largeincreases in z were seen from the overall smaller aerosol
loading from E1 Chich6n is that the young E1 Chich6n cloud
passed directly over the observatory, whereas Pinatubo
aerosols had dispersed and settled out of stratosphere some-
what before the cloud passed 22 ° N. lat. The pattern of the
trends through the posteruption years at Mauna Loa Obser-
vatory is quite similar, reflecting similar decay histories ofthe two clouds at that latitude.
In July 1993, x (0.5 lam) was still 0.02 at Mauna Loa
(background = 0.003), about the same as the peak value
recorded there after the passage of the Northern Hemi-
sphere portion of the aerosol cloud from the Agung eruptionof 1963 (E.G. Dutton, NOAA, CMDL, oral commun.,

THE ATMOSPHERIC IMPACT OF THE 1991 MOUNT PINATUBO ERUPTION 1103
-- E
_= &Z
n
_u × 10
1
- 60 0 60 120 180 240 300 360 420 480 540 600
70 3I I t I t I I I I I t I t t t I t I I I I I I I t I t I I I I I I t I ] I I t I III I I I I ] t + I I 11 I t I i t I _ I I Ttl July 199t 7 January 1992 STRATOSPHERIC_July 1992 MAXIMUM
10 2
_ karamle _I°N_
• Lauder (45:'S)Kiruna {68°N)
30 I I I I I I I 11 I ]111111111111 Ifllllllllll IIIIIIIIIII] I I I I I ] I I I I I I I I I I I
Mass Laramie (41_N)
Surface area Stratospheric maximum
25
o,_c
z 20
._ 15
lo-B0
II I I I II II III Ill Ill II]l II I I v
0 60 120 180 240 300 360 420 480 540 600
DAYS SINCE ERUPTION
Figure 8. History and altitudeof the maximum surface area and
mass of sulfuric acid of aerosol
from Pinatubo as based on
soundings made at Laramie
(Wyoming). Kiruna (Sweden),and Lauder (New Zealand).
(After Deshler and others, 1993. )
Z0i
O}
m
Z<
F-
0.95
0.9
0.8.5
0.8
0.75
MAUNA LOA BROADBAND SOLAR TRANSMISSION RATIO' 1 ' J ' i ' i ' I ' 1 ' I ' I ' t ' I ' i ' I ' i ' i ' I ' I '
0.95 .Jlllllllll I111111111111 II I I I I I I I I I I I -
0.9
0.85 _
0.8 _ __ O-ELCHICHON
z]3ee
0.75 l,,,,,t,,,,,l,,,,,,,,,,,l,,,,,,,,,,,,
0 1 2 3
YEARS AFTER ERUPTION
' I ' I ' I ' I ' I ' 1 ' I ' I ' I ' I ' I ' 1 ' I ' I ' I ' I ' I ' I
58 60 02 64 66 68 70 72 74 70 78 80 82 84 86 88 90 92 94
YEAR cu..E_ THRU 211 FEB 1894
96
0.95
0.9
0.85
0.8
0.75
Figure 9. Atmospheric transmission of direct solar radiation at Mauna Loa Observatory, Hawaii. Plotted values are monthly averages:
inset shows detail of the post-El Chich6n and post-Pinatubo years at an expanded time scale. (Diagram and data courtesy of E. Dutton.
NOAA-CMDL.)
1993). At most locations, maximum local values of t after
Pinatubo equaled or exceeded those after El Chich6n. The
much bigger aerosol mass loading from Pinatubo caused a
radiative perturbation to the whole climate system about
1.7 times larger than that of El Chich6n (Dutton and
Christy, 1992).
It is worth noting that up to the time of writing no stud-
ies had been published of radiative properties of the fine

1104 SELECTED IMPACTS
1.5
1.0-
0.5-
0.0
-0.5
-1.0-
-1.5 I I I I i I I i I I I I I I
1979 1980 1981 1982 1983 1984 1985 1986 1987 1988 1989 1990 1991 1992 1993 1994
silicate dust in the atmosphere due to this eruption or of its
role in aerosol-forming processes. Even though it had ashorter residence time than the sulfate aerosols, it may have
had a significant effect. Depolarization of airborne lidar
data shows that uneven-shaped particles, perhaps ash, were
present in the lower part of the aerosol cloud up to 7 to 9
months after the eruption (L.R. Poole, NASA, LARC, oralcommun., 1993). Aircraft impactor data also show the
coated silicate particles just above the tropopause throughMarch 1992 (Pueschel and others, 1992).
TEMPERATURE, WEATHER, AND
CLIMATIC EFFECTS
Radiative forcing of the climate system by strato-
spheric aerosols depends on the geographic distribution,altitude, size distribution, and optical depth of the aerosols,
but tropospheric temperatures are most strongly dependenton the total optical depth (Lacis and others, 1992). The opti-
cally dense Pinatubo aerosol cloud caused marked changes
in the amount of radiation reaching the Earth's surface: in
turn, these changes affected weather and climate over the
past 3 years following the eruption.
OBSERVATIONAL DATA
As observed after several eruptions, including Agung
in 1963 and El Chich6n in 1982, stratospheric warming and
lower tropospheric and surface cooling have been docu-mented after the Pinatubo eruption. Labitzke and
McCormick (1992) show that warming in the lower strato-
sphere (16 to 24 km or 30 to 100 mbar) of up to 2 to 3°Coccurred within 4 to 5 months of the eruption between the
equator and 20 ° N. [at., and it was also later noticed in mid-
dle northern latitudes (Angeil, 1993). The warming distri-
bution closely mirrored the dispersal pattern of the aerosolcloud; this mirroring strongly suggests that the warming
was due to absorption of radiation by the aerosols. The
warming was more intense in southern temperate-polar
Figure 10. Lower stratospherictemperature anomalies from themicrowave sounding unit (MSU)channel 4 for the globe 85° S. latto 85+ N lat. Anomalies are com-
puted from the 1982 to 1991 baseperiod. (After Christy and Drouil-bet, 19941.
latitudes, perhaps due to the presence of aerosols from the
Mount Hudson eruption. Such temperature changes can
influence stratospheric dynamics (Pitari, 1992). Since the
peak of stratospheric warming in late 1991, temperatures in
the 18- to 24-kin region have cooled considerably, passing
the average in early 1993 (fig. 10); temperatures in 1993
were the coldest ever recorded (Christ',' and Drouilhet+
1994; Monastersky, 1994) and may be related to ozone
destruction in the lower stratosphere. Stratospheric temper-
atures also plummeted and stayed cooler than average for
7 years after the El Chich6n eruption.
Several experiments have measured the radiative cli-
mate forcing of the Pinatubo aerosols. The NASA Earth
Radiation Budget Experiment (ERBE) recently provided
the first unambiguous direct measurement of the climate
forcing on a large scale in both hemispheres tMinnis andothers, 1993), an average radiative cooling of 2.7 W/m 2 by
August of 1991. Direct solar beam reductions of 25 to 30%
were measured at widely distributed stations by Dutton and
Christy (1992), while Stowe and others 11992) showed from
AVHRR-derived optical depth measurements that the glo-
bally averaged net radiation at the top of the atmosphere
may have decreased by about 2.5 W/m: in late 1991. These
values translate mto a global cooling of at least {).5 to 0.7°C.
as seen in the global and Northern Hemisphere temperature
records by September 1992 fDutton and Christy. 1992). A
net cooling effect of approximately I).3:C _as estimated as
a result of the El Chichdn aerosol I Angell and Korshover.
1983; Handler. 1989), but the o_erall potenttal cooling
caused by the El Chichdn cloud _'as moderated by warming
associated with El Nifio-Southern Oscillation (Angell.
1988, 1990). Pinatubo had a much larger radiative influence
than El Chich6n in the Southern Hemisphere (Dutton and
Christy, 1992). Pinatubo's cloud caused about 1.7 times the
global radiative forcing of El Chichdn, making the esti-
mated cooling of 0.5_C a more robust figure.
One posstble opposite effect, leading to surface warm-
ing, may have been caused by stratospheric to tropospheric
transport of aerosols, due to aerosol-induced changes m
atmospheric dynamtcs, and in a theoretical study Jensen and

THEATMOSPHERIC IMPACT OFTHE 1991 MOUNT PINATLBO ERUPTION 1105
Toon (1992) suggest that this process may cause higher than
usual amounts of cirrus clouds in the upper troposphere.Warmer than average winters and cooler than average sum-
mers over continental Northern Hemisphere areas havebeen documented and modeled after several eruptions,
including Pinatubo (fig. I l; Robock and Mao, 1992: Graf
and others, 1993), and this appears to be part of the normal
Northern Hemisphere response after volcanic aerosolevents (Groisman, 1992; Robock and Liu, 1994).
MODELING
Analysis of surface temperatures or weather patterns
postdating Pinatubo's eruption are still underway because
of the short time elapsed since the presence of the Pinatubo
aerosol, but a great deal of attention has been focused on
modeling of the potential climatic impact of the eruption.
The interest is in Pinatubo as a natural experiment and cli-
matic perturbation--what changes in surface temperature
and circulation a large volcanic aerosol event can bringabout--and also as a validation for climate models. Can the
models predict realistic climate changes, and could erup-
tion-induced cooling offset greenhouse-induced global
warming? With a three-dimensional global circulationmodel, Hansen and others (1992) were able to predict the
global cooling in 1991-1993 (fig. 12A) and then check their
results against real surface-temperature trends. Using a
forcing in the model equivalent to a global mean z of about0.15 based on conditions appropriate for the Pinatubo aero-
sol cloud yielded a model radiative forcing at the tropo-
pause of-4 W/m 2. Hansen and others (1993) show
observed maximum average coolings of up to 0.6°C by late
1992 over high-latitude land masses, and less elsewhere
(fig. 12B), in agreement with the modeled coolings. It
should be noted that temperature data plotted in figure 12
are dominantly from stations on land.
Other attempts to evaluate the climatic response to the
Pinatubo aerosol ihclude comparison with the global tem-
perature record of the University of East Anglia, which
includes surface air temperature over land and sea (Robock
and Mao, 1994), and on Southern Hemisphere sea surface
temperatures (Walsh and Pittock, 1992). These studies
shows that the temperature anomaly after Pinatubo is about
0.4 to 0.6 K cooler than average over a large part of the
Earth (fig. 13).
The superimposition of Pinatubo's aerosol-induced cli-
matic effects on long- and short-term variable trends, such
as El Nifio-Southern Oscillation and "greenhouse" warm-
ing, has led to much discussion as to the cooling effects on
the current warming trend. Global temperature trends show
a gradual, unsteady rise from the mid-1970's to the mid-
1980's (Hansen and Lebedeff, 1987), perhaps due to forcing
by greenhouse gases, and continuation of/his rise had led to
claims of record high temperatures in the early 1990's (see
Bassett and Lin, 1993: Hansen and Wilson. 1993). How-
ever, the cooling since Pinatubo's eruption has offset the
warming trend considerably, such that cooler than normal
conditions dominate the Northern Hemisphere IMo and
Wang, 1994).
The Pinatubo aerosol cloud was, like with El Chich6n.
coincident with sudden warming due to an El Nifio event.
but this warming event was not nearly as strong as in the El
Chich6n case. El Nifio may have provided a warming ofabout 0.2°C, partially offsetting the Pinatubo-induced coo]-
ing in the tropics, but modeling suggests a coincidence
rather than a cause and effect relation between erupti_nsand El Nifio (Robock and Liu, 1994). The Pinatubo climate
forcing is stronger than the opposite, warming effect of the
El Nifio event or anthropogenic greenhouse gases.
The predicted and observed Pinatubo climatic cooling
resulted in noticeable changes in the local climate and
weather. For example, in 1992, the United States had its
third coldest and third wettest summer in 77 years. Floods
along the Mississippi River in the summer of 1993 and
drought in the Sahel area of Africa may be attributable to
climatic shifts caused by the Pinatubo aerosols and aerosol-
induced temperature changes _Mo and Wang, 1994: Robock
and Liu, 1994). Moreover. the cooling is not spatially uni-
form, as underlined by the several recent models mentioned
above, and many areas have suffered above-average warmconditions such as the 1991 and 1992 _vinters in Eurasia.
Model results (Hansen and others, 19931 _how that global
circulation model runs do, for various plausible scenarios.predict actual temperature changes to date Ifig. 12A).
Exactly for how long the Pinatubo-induced cooling will
manifest itself as changing surface or regional climate and
weather patterns remains to be seen and v¢ill be documentedin future years.
IMPACT ON STRATOSPHERIC
CHEMISTRY AND OZONE
Sulfate aerosols in the _tratosphcre can catalsze heter-
ogeneous reactions that affect global ozone abundance (Far-man and others, 1985: Hofmann and Solomon. 1989: Wolff
and Mulvaney, 1991: Prather. 1992). These heterogeneous
processes occurring on the surface of _ulfate particles canconvert stable chlorine reser',oirs /_uch as HCI and
CIONO2) into photochemicall', active chlorine species ICI_.
C1NO 2, HOCII that are active in ozone destruction fHof-mann and Solomon, 1989: Solomon and others, 1993).Increase in aerosol surface area due to the Pinatubo volca-
nic eruption has had a considerable effect on global ozone(Bhartia and others, 1993: Deshler and others, 1902b: Glea-
son and others, 1993: Grant and others. 1992: Hofmann and
Oltmans, 1993: Hofmann and others, 1994a,b: Schoeberl
and others, 1993: Weaver and others, 1993_. For example,
reduced ozone concentrations with peak decreases as large
1106
A
Average90N'
Lower
SELECTED IMPACTS
Winter (DJF) 1991-92Troposphere Temperature Anoma I i es
6ON'
3ON'
30S'
60S'
90S180 12'0W 60W 6 60E 12'0E 180
< -3 -3 -2 -1 0 +1 +2!
Figure 11. Winter (December, January, February) 1991-92 (A)and summer (June, July. August) 1992 (B) temperature anomalies(departures from long-term means) in degrees Celsius, demonstrat-ing the Pinatubo-induced winter warming and summer coolingover Northern Hemisphere continental areas. Data are a combina-
+3 > +3
tion of satellite atmospheric temperature determinations by J.Christy, University of Alabama, Huntsville. and surface tempera-ture data from P.R. Jones, University of East Anglia, UK. Plots
courtesy of A. Robock, University of Maryland.
as 20% at 16 to 25 km in altitude were found in the tropical
stratosphere 3 to 6 months after the Pinatubo eruption
(Grant and others, 1992). Up to 6% reduction of equatorial
total ozone was observed by TOMS measurements follow-
ing the eruption of Pinatubo (Schoeberl and others, 1993).
At the time of maximum aerosol development, up to 20%
depletion in ozone was measured over Colorado and Hawaii
(Hofmann and others, 1993; 1994a), and mid-latitude ozone
abundance reached its lowest level on record during 1992-
93. The total ozone amount was 2 to 3% lower than in any
earlier year, with the largest decreases in the regions from
10° S. to 20 ° S. lat and 10° N. to 60 ° N. lat (Gleason and
others, 1993).
Startling decreases in ozone abundance and in rates ofozone destruction were also observed over Antarctica in
1991 and 1992. This ozone decrease may be due in part to
the presence of Pinatubo aerosols but also to the extra
aerosol injection from the Mount Hudson eruption in Chile
during August 1991 (Doiron and others, 1991: Barton and
others, 1992). A sharp decrease in ozone at 9 to 11 km in
altitude (approximately at the tropopause) in the austral
spring of 1991 was noted at the time of arrival of thePinatubo and Mount Hudson aerosols (Deshler and others.
1992a). The Southern Hemisphere "ozone hole" increased
in 1992 to an unprecedented 27 x 106 km 2 in size, and
depletion rates were observed to be faster than ever beforerecorded (Brasseur, 1992; Hofmann and others, 1992;
1994b). In late 1992, weather patterns caused a shift in the
polar vortex, and warm ozone-rich tropical air entered the
Antarctic atmosphere to partially halt the ozone depletion.
Ozone depletion causes an enhancement in the amount
of biologically destructive ultraviolet radiation that reaches
the Earth's surface (Smith and others, 1992; Vogelmann and
others, 1992). Although the Pinatubo eruption was probably
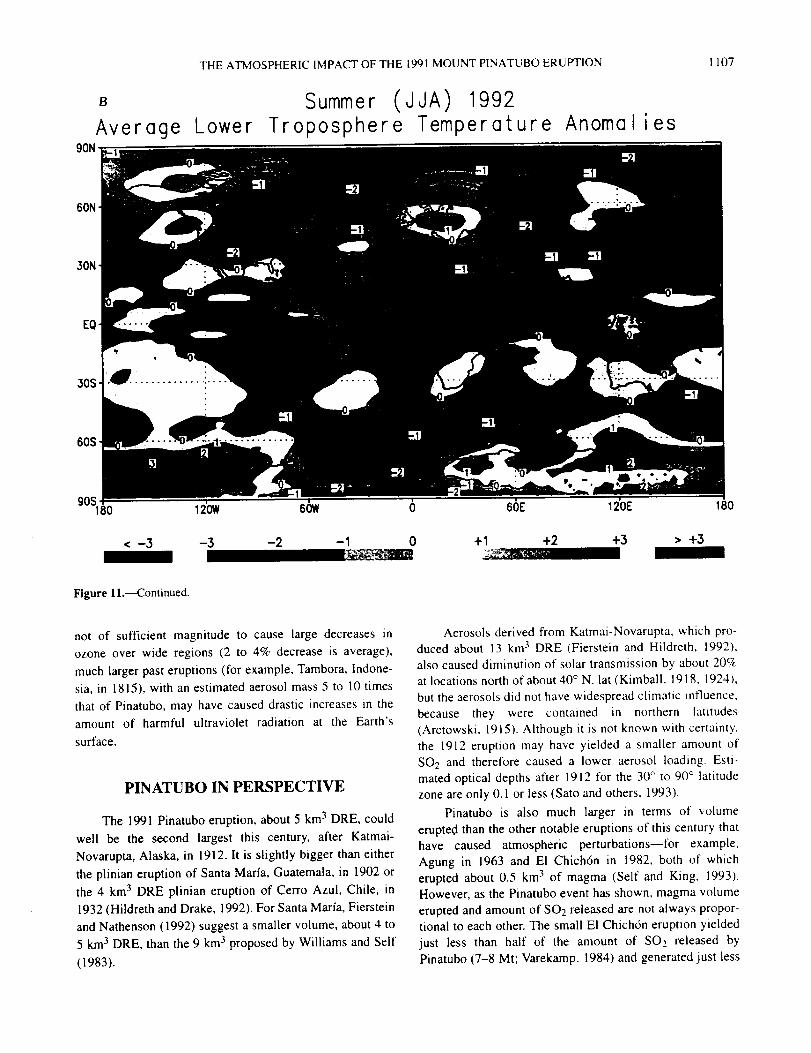
B
Average90N
THE ATMOSPHERIC IMPACT OF THE 1991 MOUNT PINATUBO ERUPTION
Summer (JJA) 1992Lower Troposphere Temperature Anomal ies
1107
60N
30N
EO
60S.
12'0W 6_w 6 66E 12bE 180
< -3 -3 -2 - 1 0 + 1 +2 +3 > +3
Figure 11.--47ontinued.
not of sufficient magnitude to cause large decreases in
ozone over wide regions (2 to 4% decrease is average),
much larger past eruptions (for example, Tambora, Indone-
sia, in 1815), with an estimated aerosol mass 5 to 10 times
that of Pinatubo, may have caused drastic increases in the
amount of harmful ultraviolet radiation at the Earth's
surface.
PINATUBO IN PERSPECTIVE
The 1991 Pinatubo eruption, about 5 km 3 DRE, could
well be the second largest this century, after Katmai-
Novarupta, Alaska, in 1912. It is slightly bigger than either
the plinian eruption of Santa Maria, Guatemala, in I902 or
the 4 km 3 DRE plinian eruption of Cerro Azui, Chile, in
1932 (Hildreth and Drake, 1992). For Santa Marfa, Fierstein
and Nathenson (1992) suggest a smaller volume, about 4 to
5 km 3 DRE, than the 9 km 3 proposed by Williams and Self
(1983).
Aerosols derived from Katmai-Novarupta, which pro-duced about 13 km 3 DRE (Fierstein and Hildreth, 1992),
also caused diminution of solar transmission by about 20%at locations north of about 40 ° N. lat (Kimball, 1918, 1924),
but the aerosols did not have widespread climatic influence,
because they were contained in northern latitudes
(Arctowski, 1915). Although it is not known with certainty,
the 1912 eruption may have yielded a smaller amount ofSO2 and therefore caused a lower aerosol loading. Esti-
mated optical depths after 1912 for the 30° to 90 ° latitude
zone are only 0.1 or less (Sato and others, 1993).
Pinatubo is also much larger in terms of volume
erupted than the other notable eruptions of this century that
have caused atmospheric perturbations--for example.
Agung in 1963 and El Chich6n in 1982, both of whicherupted about 0.5 km 3 of magma (Self and King, 1993).
However, as the Pinatubo event has shown, magma volume
erupted and amount of SO2 released are not always propor-
tional to each other. The small El Chich6n eruption yielded
just less than half of the amount of SO,_ released by
Pinatubo (7-8 Mt; Varekamp, 1984) and generated just less

1108 SELECTEDIMPACTS
thanhalftheamountofaerosol(McCormickandothers,inpress),butthemagmavolumeeruptedwasanorderofmag-nitudesmallerthanPinatubo's.Therelativesizeanddura-tionofthePinatuboaerosolperturbationcomparedto thatalterElChich6ncanbeseenontheintegratedaerosolback-scatterrecordfromLangley,ResearchCenter,Hampton,Va.,USA(37.1° N.)(fig. 14);thesetwoeventsdominatestratosphericloadingandchemistryoverthe pasttwodecades.ThepeakvaluesafterPinatuboarelessthanexpectedbecauseof thedelayedspreadof theaerosoltotheselatitudes,whiletheElChich6ncloudwasstillnearitspeakdensitywhenit passedoverthisarea.
Certainly,in termsof widespreadimpact,dueto itsequatoriallocation,theearlysummerdateoferuption,andthe resultingglobalspreadof the aerosolcloud,thePinatuboaerosolcloudthatenvelopedtheEarthfromtheendofJune1991tolate1993isthelargestsincethatcausedbytheapproximately10-kin3 DREKrakataueruptioninlateAugust1883,whichalsoproducedanaerosolveilofglobalextent.In fact,themaximum20-to30-MtPinatubostratosphericaerosolloadingmaynotbethatmuchsmallerthanKrakatau's,variouslyestimatedat between30and50Mt (RampinoandSelf,1982,1984).Thisconclusionisconsistentwithestimatedglobalaerosolmidvisibleopticaldepthsfor Krakatau,whichwere0.14in late1884toearly1885(Satoandothers,1993;fig. 15).Thisvalueis fortheKrakatauaerosollayeraftermorethan1year'sdispersal,and,presumably,muchsedimentationofparticles,andpeakopticaldepthsmayhavebeenconsiderablylarger.Theglo-balopticaldepthisequivalenttoaglobalaerosolloadingofabout25Mt,on thebasisof therelationshipof Stothers(1984a),similartothatofthePinatubopeakloading.BothPinatuboandKrakatau,however,aredwarfedbytheerup-tionofTamborain 1815,bothinvolumeerupted(50km3)andthepeakopticaldepthattainedbythewidespreadaero-sol cloud,estimatedto be>1.0in northernlatitudes6monthsaftertheeruption(Stothers,1984b).
CONCLUSIONS
The 1991 eruption of Pinatubo, culminating in a 9-h
climactic plinian and pyroclastic-flow-producing phase on
June 15, produced about 5 km 3 of dacitic magma and is the
second largest volcanic eruption of the century in terms of
magnitude (volume of magma produced). Eruption columns
rising above the vent and off the pyroclastic flows reached
in excess of 35 km in altitude and emplaced a giant
umbrella cloud in the middle to lower stratosphere thatattained a maximum dimension of over 1,100 km in diame-
ter. This cloud injected about 17 Mt of SO2 into the strato-
sphere (twice the amount produced by the 1982 El Chich6n
eruption), and this SO2 immediately began to convert into
H2SO 4 aerosols, forming the largest perturbation to the
A
Stratosphere2 : _ ....... Model
'. [_ r_ _ Observations
-al° ,-3 I
o_v_ 02 ! ',Troposphere
I JV ".\ /;?_
_l'l A , l It I _ • I _j[l-_l
' I;l /_'I {°gXoo ! VkV,-v_ , - - \.- - " ,._.;
, _ ¥I-- -0.8 I . I I I
0.2
0
-0.2
-0.4
-0.6
Surface
i -J
: I IA.,.\.VvIV""Vj
. :}IjI l I I I
1991 1992 1993 1994
Figure 12..4. Observed and modeled monthly temperaturechange of stratosphere, troposphere, and surface after the MountPinatubo eruption. Stratospheric observations are 30-mbar zonalmean temperature at 10° S. lat; model results are 10- to 70-mbarlayer at 8 ° to 16° S. lat. Other results are essentially global, withobserved surface temperature derived from a network of meteoro-
logical stations. Base period for tropospheric temperatures is1978-92. while troposphere and surface are referenced to the 12months preceding the Pinatubo eruption, the latter marked by avertical dashed line.

THE ATMOSPHERIC IMPACT OF THE 1991 MOUNT PINATUBO ERUPTION [ !09
B OBSERVED
1991
Jun-Jul, 1992
TEMPERATURE CHANGES
Global AveffiO.53 ° C
Global AveffiO.O1 *C
Figure 12B. Model cooling
predicted for 1991-92 (Hansen
and others. 1993) shown by
observed model air temperature
anomalies relative to the 1951-
80 mean for Northern Hemi-
sphere summers of 1991 and
1992. Figures courtesy of James
Hansen and Helene Wilson.
NASA Goddard Institute for
Space Studies. after Hansen and
others (1993).
-3
° C
ZERO is 1951-1980 Average Temperature NASA/GISS
stratospheric aerosol layer since the aerosol cloud of Kraka-
tau in 1883.
The aerosol cloud spread rapidly around the globe in
about 3 weeks and attained global coverage 1 year after the
eruption. The SO2 release was sufficient to generate over
25 Mt of sulfate aerosol, and peak local and regional mid-
visible optical depths of up to 0.4 were recorded. Global
values after widespread dispersal and sedimentation of
aerosol were about 0. I to 0.15, with a residence time of over
2 years. This large aerosol cloud caused dramatic decreases
in the amount of net radiation reaching the Earth's surface.
This was certainly the largest atmospheric perturbation by
an aerosol cloud in this century, producing a climate forcing
two times stronger than the aerosols of El Chich6n. The
lower stratosphere also warmed immediately after the erup-
tion and has cooled to the lowest temperatures recorded
since then, causing changes in atmospheric circulation.
Effects on climate were an observed surface cooling in
the Northern Hemisphere of up to 0.5 to 0.6°C, equivalent
to a hemispheric reduction in net radiation of 4 W/m 2, and
an overall cooling of perhaps as large as -0.4°C over large
parts of the Earth in 1992-93. Climate models appear to
have predicted the cooling currently occurring with a
reasonable degree of accuracy. The Pinatubo climate forc-
ing was stronger than the opposite, warming effects of
either the El Nifio event or anthropogenic greenhouse gases
in the period 1991-93.
Atmospheric composition also underwent some
remarkable changes that were due to the Pinatubo aerosols,
most notably that mid-latitude ozone abundance reached its
lowest level on record during 1992-93. The total ozone
amount was 2 to 3% lower than in any earlier year. with the
largest decreases in the regions from 10 ° to 20°S. lat and
10 ° to 60 ° N. lat. The Southern Hemisphere "'ozone hole'"
increased in 1992 to an unprecedented 27 × 106 km 2 in size,
and depletion rates were faster than ever before recorded.
The atmospheric impact of the Pinatubo eruption has
been profound, and it has sparked a lively interest in the role
that volcanic aerosols have played in climate change. It has
been an extremely important and timely event to the
atmospheric sciences, permitting climate models to be
tested and tuned, and showing that a powerful eruption

I 110 SELECTEDIMPACTS
2_Z
<
PINATUBO (0-30S)
04
021 " IIo, *5 4 3 2 1 0 I 2
'1'i'3 4 5
PINATUBO q0-3ON)
o!02
0
5 -4 3 -2 -1 0 1 2 3 4 5
PINATUSO (30-90N)
0
-0 4
o,l' ."i I _ ' i I ' J ' 'I
5 4 3 -2 -1 0 ] 2 3 4 5
LAG(YEARS)
providing a 15 to 20 Mt S02 release into the stratosphere
can produce sufficient aerosols to offset global warming
trends and severely impact the ozone budget.
ACKNOWLEDGMENTS
We thank E.G. Dutton (NOAA Climate Monitoring
and Diagnostic Laboratory (CMDL)), J.E. Hansen and
H. Wilson (NASA Goddard Institute for Space Studies
(GISS)), A. Robock (University of Maryland), and
G. Stephens (NOAA-NESDIS) for generously providing
data, and M.P. McCormick (NASA Langley Research
Center), E.A. Dutton, P.B. Russell (NASA Ames Research
Center), C.G. Newhall (USGS), A. Robock, L.S. Walter
(NASA Goddard Space Flight Center), and A. Tabazadeh
(University of California, Los Angeles) for reviews of ear-
lier versions of the manuscript. This work was supported by
NASA grants NAG 5-1839 and NAG W-3721. This is
SOEST contribution No. 3563.
Figure 13. Latitude band anomalies in temperature (Kelvin)
plotted with respect to the 5-year mean before the Pinatubo erup-
tion. Data are surface temperature for land-based stations com-
bined with sea surface temperatures, from P.R. Jones (University
of East Anglia, U.K.). Year 0 is the eruption year; precise time of
eruption indicated at bottom of each graph. Data and diagram
courtesy of A. Robock, University of Maryland, from Robock and
Mao (1995).

THEATMOSPHERICIMPACTOFTHE1991MOUNTPINATUBOERUPTION 1111
10-2=
10-5= ,= _,_aa c m o
- z_= _,=o ==
La-
1974 1976 1978 1980 1982 1984 1986
2
1988 1990 1992 t994
Figure 14. Integrated aero-
sol backscatter measurements
from the tropopause to 30 km
obtained by lidar at Hampton,
Va. (37 ° N. lat, 76 ° W. long).
at a wavelength of 694 nm
since 1974. The major volcanic
eruptions that increased North-
ern Hemispheric mid-latitude
aerosol loading are noted byarrows on the time axis. Data
courtesy of M. Osborn and M
P. McCormick. NASA Langley
Research Center.
0185o
I I I I I [ _ _ i I J i t i I i i I i I i t i i i i i t i
1900. I 1925
1950
?
I\-
i°i i
Figure 15. Estimated global
stratospheric optical depth at _, =
0.55 pm for the period 1850 to1993. after Sato and others ( 1993L
Most peaks are the result of instan-
taneous volcanic injections of SO,,
into the stratosphere and subse-
quent rapid formation and mono-
tonic decline of sulfate aerosols.
REFERENCES CITED
Angell, J.K., 1988, Impact of El Nifio on the delineation of tropo-
spheric cooling due to volcanic eruptions: Journal of Geo-
physical Research. v. 93, p. 3697-3704.
--1990, Variation in global tropospheric temperature after
adjustment for the El Nifio influences, 1958-1989: Geophys-
ical Research Letters, v. 17, p. 1093-1096.
--1993, Comparison of stratospheric warming following
Agung, El Chich6n and Pinatubo volcanic eruptions: Geo-
physical Research Letters, v. 20, p. 715-718.
Angell, J.K., and Korshover. J., 1983, Comparison of stratospheric
warming following Agung and El Chich6n: Monthly Weather
Review, v. 111, p. 2129-2135.
Ansmann. A., Wandinger, U., and Weitkamp, C., 1993. One-year
observations of Mount-Pinatubo aerosol with an advanced
raman lidar over Germany at 53.5°N: Geophysical Research
Letters, v. 20, p. 711-714.
Arctowski, H., 1915, Volcanic dust veils and climatic variations:
Annals of the New York Academy of Sciences, v. 26, p. 149-
174.
1112 SELECTEDIMPACTS
Asano.S..1993.EstimationofthesizedistributionofPinatubovolcanicdustfromBishop'sringsimulations:GeophysicalResearchLetters,v.20,p.447--450.
Asano.S..Uchiyama.A..andShiobara,M.,1993.SpectralopticalthicknessandsizedistributionofthePinatubovolcanicaero-solsasestimatedbyground-basedsunphotometry:Meteoro-logicalSocietyofJapanBulletin,v.71,p.165-173.
Barton,l.J,Prata.A.J..Watterson,I.G..andYoung,S.A..1992,IdentificationoftheMountHudsonvolcaniccloudoverSEAustralia;GeophysicalResearchLetters,v.19,p 121I-1214.
Bassett.GW.,andLin.Z., 1993,BreakingglobaltemperaturerecordsafterMr.Pinatubo:ClimaticChange,v.25,p 179-184.
Bhartia.PK,HermanJ..andMcPeters,R.D..1993.EffectofMountPinatuboaerosolsontotalozonemeasurementsfrombackscatterultraviolet(BUV)experiments:JournalofGeo-physicalResearchv.98,p.18547-18554.
Bluth,GJ.S.,Doiron.SD.,Schnetzler.C.C.,Krueger.A.J.,andWalter,L.S.,1992,Globaltrackingof theSO2cloudsfromtheJune1991MountPinatuboeruptions:GeophysicalResearchLetters, v. 19. p. 151-154.
Brasseur, G., 1992. Ozone depletion: Volcanic aerosols implicated:
Nature. v. 359, p. 275-276.
Christy, J.R., and Drouilhet, S.J., 1994. Variability in daily, zonal-
mean lower-stratospheric temperatures: Journal of Climate, v.
7, p.106-120.
Defoor. T.E., Robinson, E.. and Ryan, S., 1992, Early LIDAR
observations of the June 1991 Pinatubo eruption plume at
Mauna Loa Observatory, Hawaii: Geophysical Research Let-
ters, v. 19, p. 187-190.
Deshler. T., Adriani, A., Gobbi, G.P., Hofmann, D.J., DiDon-
francesco. G., and Johnson, B.J, 1992a, Volcanic aerosol and
ozone depletion within the Antarctic polar vortex during the
austral spring of 1991: Geophysical Research Letters, v. 19,
p. 1819-1822.
Deshler, T., Hofmann, D.J., Johnson. B.J., and Rozier, WR.,
1992b, Balloonborne measurements of Mt. Pinatubo aerosol
size distribution and volatility at Laramie, Wyoming, during
the summer of 1991: Geophysical Research Letters, v. 19,
p. 199-202.
Deshler, T., Johnson, B.J., and Rozier, WR., 1993, Balloonborne
measurements of Pinatubo aerosol during 1991 and 1992 at
41°N: Vertical profiles, size distribution and volatility: Geo-
physical Research Letters, v. 20, p. 1435-1438.
Devine, J.D.. Sigurdsson. H., Davis, A.N., and Self, S., 1984, Esti-
mates of sulfur and chlorine yield to the atmosphere from
volcanic eruptions and potential climatic effects: Journal of
Geophysical Research, v. 89. p. 6309-6325.
Doiron, S.D., Bluth, G.J.S.. Schnetzler, C.C., Krueger, A.J., and
Walter, LS., 1991, Transport of Cerro Hudson SO2 clouds:
Eos, Transactions, American Geophysical Union, v. 72,
no, 45, p. 489,498.
Dutton. E.G., and Christy, J.R., 1992, Solar radiative forcing at
selected locations and evidence for global lower tropospheric
cooling following the eruptions of El Chich6n and Pinatubo:
Geophysical Research Letters, v. 19, p. 2313-2316.
Dutton, E.G., Reddy, R., Ryan. S., and DeLuisi, J.. 1994, Features
and effects of aerosol optical depth observed at Mauna Loa,
Hawaii, 1982-1992: Journal of Geophysical Research. v. 99,
p.8295-8306.
Farman. J,C. Gardiner, B.G.. and Shanklin, J.D.. 1985, Large
losses of total O_ in atmosphere reveal seasonal CIO_YNO_
interaction: Science, v, 211, p. 832-834.
Fierstein, J,, and Hildreth. W. 1992. The plinian eruptions of 1912
at Novarupta, Katmai National Park. Alaska: Bulletin of Vol-
canology, v. 54. p. 646-684.
Gerlach, T.M.. Westrich. H.R, and Symonds. R.B.. this volume.
Preeruption vapor in magma of the climactic Mount Pinatubo
eruption: Source of the giant stratospheric sulfur dioxide
cloud.
Gleason, J.E, Bhartia, PK, Herman. J.R. and others. 1993, Record
low global ozone in 1992: Science. v, 260. p. 523-526.
Graf. H-F.. Kirchner. [.. Robock, A.. and Schult. I,, 1993, Pinatubo
eruption winter climate effects: Model versus observations:
Climate Dynamics, v. 9, p. 81-93.
Grainger, R.G., Lambert. A.. Taylor, EW.. Remedios, J,J., Rodg-
ers, CD.. and Corney. M.. 1993. Infrared absorption by vol-
canic stratospheric aerosols observed by [SAMS:
Geophysical Research Letters. v. 20. p. 1293-1286.
Grant. J.. Fishman. J.. Browell. EV.. and others, 1992, Observa-
tions of reduced ozone concentrations in the tropical strato-
sphere after the eruption of Mr. Pinatubo: Geophysical
Research Letters, v. 19, p. 1109-1112.
Groisman. P.Ya.. 1992. Possible regional climate consequences of
the Pinatubo eruption; An empirical approach: Geophysical
Research Letters, v. 19. p. 1603-1606.
Hamill, E, Kiang, CS.. and Cadle. RD.. 1977. The nucleation of
H2SO4-H20 solution aerosol particles in the stratosphere:
Journal of the Atmospheric Sciences, v. 34. p. 150-162.
Handler, P., 1989. The effect of volcanic aerosols on global cli-
mate: Journal of Volcanology and Geothermal Research.
v. 37, p. 233-249.
Hansen, J.. Lacis, A.. Ruedy, R. and Sato. M., 1992, Potential cli-
mate impact of the Mount Pinatubo eruption: Geophysical
Research Letters, v. 19. p. 215-218.
Hansen, J., Lacis, A.. Ruedy. R.. Sato, M, and Wilson. H_ 1993.
How sensitive is the world's climate'?: National Geographic
Research and Exploration. v. 9, p. 143-158.
Hansen. J,, and Lebedeff, S., 1987, Global trends of measured sur-
face air temperature: Journal of Geophysical Research. v. 92,
p. 13345-13372.
Hansen. JE., Wang, W.-C., and Lacis. A.. 1978. Mount Agung
eruption provides test of a global climatic perturbation: Sci-
ence. v. 199, p. 1065-1068.
Hansen, J., and Wilson, H.. 1993. Commentary on the significance
of global temperature records: Climate Change. v. 25. p. 185-191.
Hattori, K.. 1993. High-sulfur magma, a product of fluid discharge
from underlying marie magma: Evidence from Mount
Pinatubo. Philippines: Geology, v. 21, p. 1083-1086.
Hildreth, W.. and Drake, RE.. 1992. Volcan Quizapu, Chilean
Andes: Bulletin of Volcanology. v. 54, p. 93-125.
Hoblitt, RP, Wolfe, EW.. Scott. W.E.. Couchman, MR. Pallister,
J.S., and Javier, D., this volume. The preclimactic eruptions
of Mount Pinatubo, June 1991.
Hofmann. D.J., and Oltmans, S.J, 1993, Anomalous Antarctic
ozone during 1992: Evidence for Pinatubo volcanic aerosol
effects. Journal of Geophysical Research, v. 98, p 18555-18561.
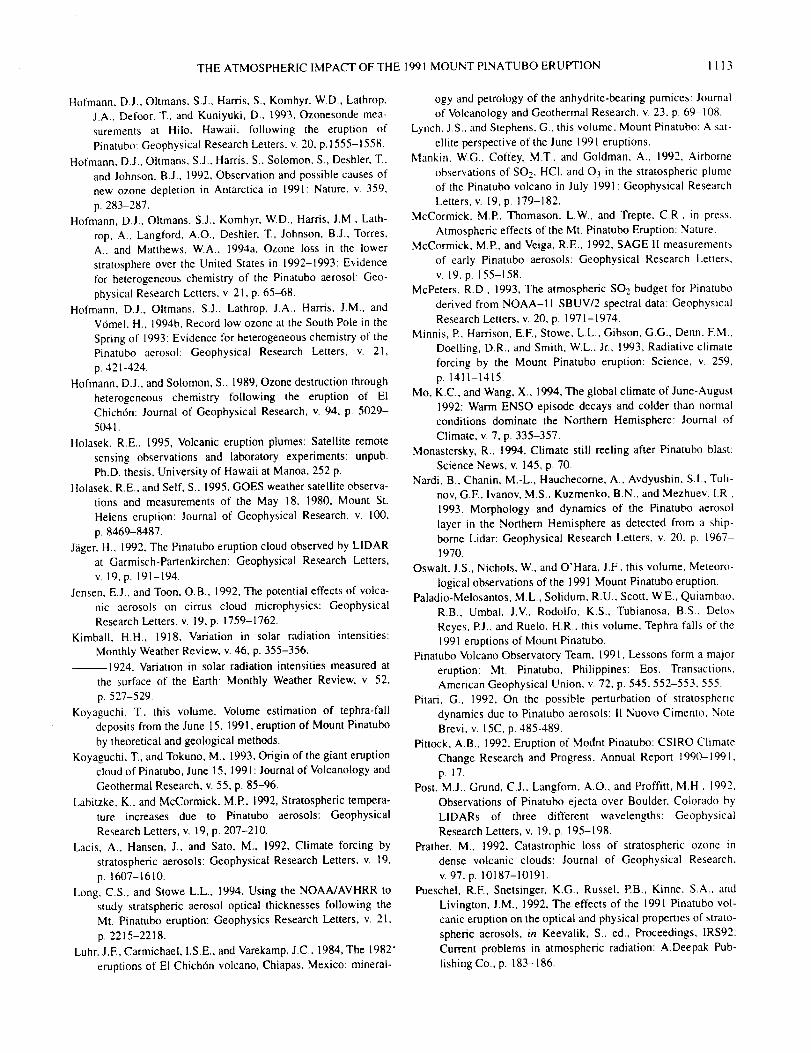
THEATMOSPHERICIMPACTOFTHE1991MOUNTPINATUBOERUPTION I I13
Hofmann,D.J.,Oltmans,S.J.,Harris,S.,Komhyr,W.D.,Lathrop,J.A.,Defoor,T.,andKuniyuki,D.,1993,Ozonesondemea-surementsat Hilo.Hawaii,followingtheeruptionofPinatubo:GeophysicalResearchLetters,v.20,p.1555-1558.
Hofmann.D.J..Oltmans,S.J.,Harris.S.,Solomon,S.,Deshler,T.andJohnson,B.J.,1992,ObservationandpossiblecausesofnewozonedepletioninAntarcticain1991:Nature,w359,p.283-287.
Hofmann,D.J.,Oltmans.S.J.,Komhyr,W.D.,Harris,J.M.,Lath-rop,A.,Langford,A.O.,Deshler,T. Johnson, B.J., Torres,
A., and Matthews, W.A., 1994a, Ozone loss in the lower
stratosphere over the United States in 1992-1993: Evidence
for heterogeneous chemistry of the Pinatubo aerosol: Geo-
physical Research Letters, v. 21, p. 65-68.
Hofmann, D.J., Oltmans, S.J., Lathrop, J.A., Harris. J.M., and
VOmel, H, 1994b, Record low ozone at the South Pole in the
Spring of 1993: Evidence for heterogeneous chemistry of the
Pinatubo aerosol: Geophysical Research Letters, v. 21,
p. 421-424.
Hofmann, D.J., and Solomon, S., 1989, Ozone destruction through
heterogeneous chemistry following the eruption of El
Chich6n: Journal of Geophysical Research, v. 94, p. 5029-
5041.
Holasek, RE., 1995, Volcanic eruption plumes: Satellite remote
sensing observations and laboratory experiments: unpub.
Ph.D. thesis, University of Hawaii at Manoa, 252 p.
Holasek, R.E., and Self, S., 1995, GOES weather satellite observa-
tions and measurements of the May 18, 1980, Mount St.
Helens eruption: Journal of Geophysical Research, v. 100,
p. 8469-8487.
Jfiger, H., 1992, The Pinatubo eruption cloud observed by LIDAR
at Garmisch-Partenkirchen: Geophysical Research Letters,
v. 19, p. 191-194.
Jensen, E.J., and Toon, O.B., 1992, The potential effects of volca-
nic aerosols on cirrus cloud microphysics: Geophysical
Research Letters, v. 19, p. 1759-1762.
Kimball, H.H., 1918, Variation in solar radiation intensities:
Monthly Weather Review, v. 46, p. 355-356.
--1924, Variation in solar radiation intensities measured at
the surface of the Earth: Monthly Weather Review, v. 52,
p. 527-529.
Koyaguchi, T., this volume, Volume estimation of tephra-fall
deposits from the June 15, 1991, eruption of Mount Pinatubo
by theoretical and geological methods.
Koyaguchi, T., and Tokuno, M., 1993, Origin of the giant eruption
cloud of Pinatubo, June 15, 1991: Journal of Volcanology and
Geothermal Research, v. 55, p. 85-96.
Labitzke, K., and McCormick, M.P., 1992, Stratospheric tempera-
ture increases due to Pinatubo aerosols: Geophysical
Research Letters, v. 19, p. 207-210.
Lacis, A., Hansen, J., and Sato, M, 1992, Climate forcing by
stratospheric aerosols: Geophysical Research Letters, v. 19,
p. 1607-1610.
Long, C.S., and Stowe L.L., 1994, Using the NOAA/AVHRR to
study stratspheric aerosol optical thicknesses following the
Mt. Pinatubo eruption: Geophysics Research Letters, v. 21,
p. 2215-2218.
Luhr, J.E, Carmichael, I.S.E., and Varekamp, J.C., 1984, The 1982"
eruptions of E1 Chich6n volcano, Chiapas, Mexico: mineral-
ogy and petrology of the anhydrite-bearing pumices: Journal
of Volcanology and Geothermal Research, v. 23, p. 69-108.
Lynch, JS., and Stephens, G., this volume, Mount Pinatubo: A sat-
ellite perspective of the June 1991 eruptions.
Mankin, W.G. Coffey. MT., and Goldman, A., 1992, Airborne
observations of SO2, HCI, and O 3 in the stratospheric plume
of the Pinatubo volcano in July 1991: Geophysical Research
Letters, v. 19, p. 179-182.
McCormick, M.P., Thomason, L.W., and Trepte, C.R., in press.
Atmospheric effects of the Mt. Pinatubo Eruption: Nature.
McCormick, MP, and Veiga, R.E, 1992, SAGE II measurements
of early Pinatubo aerosols: Geophysical Research Letters,
v. 19, p. 155-158.
McPeters, RD., 1993, The atmospheric SO2 budget for Pinatubo
derived from NOAA-II SBUV/2 spectral data: Geophysical
Research Letters, v. 20, p. 1971-1974.
Minnis, P., Harrison, E.E, Stowe, LL., Gibson, G.G., Denn, EM.,
Doelling, DR., and Smith, W.L., Jr., 1993, Radiative climate
forcing by the Mount Pinatubo eruption: Science, v. 259,
p. 1411-1415.
Mo, KC., and Wang, X., 1994, The global climate of June-August
1992: Warm ENSO episode decays and colder than normal
conditions dominate the Northern Hemisphere: Journal of
Climate, v. 7, p. 335-357.
Monastersky, R., 1994, Climate still reeling after Pinatubo blast:
Science News, v. 145, p. 70.
Nardi, B., Chanin, M.-L., Hauchecorne, A., Avdyushin, S.I., Tuli-
nov, G.E, lvanov, M.S., Kuzmenko, B.N, and Mezhuev, I.R.,
1993, Morphology and dynamics of the Pinatubo aerosol
layer in the Northern Hemisphere as detected from a ship-
borne Lidar: Geophysical Research Letters, v. 20, p. 1967-
1970.
Oswalt, J.S., Nichols, W., and O'Hara, J.F., this volume, Meteoro-
logical observations of the 1991 Mount Pinatubo eruption.Paladio-Melosantos, M.L., Solidum, R.U., Scott, WE., Quiambao.
R.B., Umbal, J.V., Rodolfo, KS., Tubianosa, B.S.. Delos
Reyes, P.J., and Ruelo, H.R., this volume, Tephra falls of the
1991 eruptions of Mount Pinatubo.
Pinatubo Volcano Observatory Team, 1991, Lessons form a major
eruption: Mt. Pinatubo. Philippines: Eos. Transactions.
American Geophysical Union, v. 72, p. 545,552-553,555.
Pitari, G., 1992, On the possible perturbation of stratospheric
dynamics due to Pinatubo aerosols: il Nuovo Cimento: Note
Brevi, v. 15C, p. 485-489.
Pittock, A.B., 1992, Eruption of Modnt Pinatubo: CSIRO Climate
Change Research and Progress, Annual Report 1990-1991.
p. 17.
Post, M.J., Grund, C.J., Langforn. A.O., and Proffitt, M.H., 1992,
Observations of Pinatubo ejecta over Boulder, Colorado by
LIDARs of three different wavelengths: Geophysical
Research Letters, v. 19, p. 195-198.
Prather, M., 1992, Catastrophic loss of stratospheric ozone in
dense volcanic clouds: Journal of Geophysical Research,
v. 97, p. 10187-10191.
Pueschel, R.F., Snetsinger, K.G., Russel, P.B., Kinne. S.A.. and
Livington, J.M., 1992, The effects of the 1991 Pinatubo vol-
canic eruption on the optical and physical properties of strato-
spheric aerosols, in Keevalik, S., ed., Proceedings, IRS92:
Current problems in atmospheric radiation: A.Deepak Pub-
lishing Co., p. 183-186.
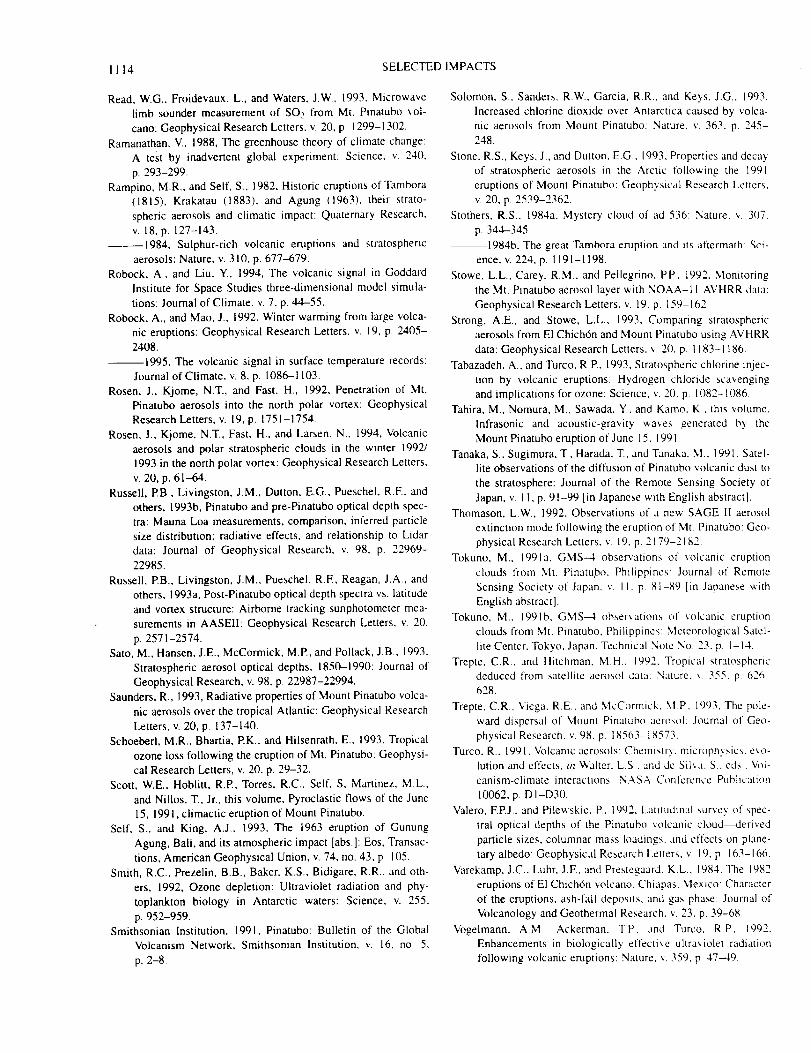
1114 SELECTED IMPACTS
Read, W.G., Froidevaux, L., and Waters, J.W., 1993, Microwave
limb sounder measurement of SO2 from Mr. Pinatubo rob
cano: Geophysical Research Letters, v. 20, p. 1299-1302.
Ramanathan, V., 1988, The greenhouse theory of climate change:
A test by inadvertent global experiment: Science, v. 240,
p. 293-299.
Rampino, M.R., and Self, S., 1982, Historic eruptions of Tambora
(1815), Krakatau (1883), and Agung (1963), their strato-
spheric aerosols and climatic impact: Quaternary Research,
v. 18, p. 127-143.
--1984, Sulphur-rich volcanic eruptions and stratospheric
aerosols: Nature, v. 310, p. 677-679.
Robock, A., and Liu, Y., 1994, The volcanic signal in Goddard
Institute for Space Studies three-dimensional model simula-
tions: Journal of Climate, v. 7, p. 44-55.
Robock, A., and Mao, J., 1992, Winter warming from large volca-
nic eruptions: Geophysical Research Letters, v. 19, p. 2405-
2408.
--1995, The volcanic signal in surface temperature records:
Journal of Climate, v. 8, p. 1086-1103.
Rosen, J., Kjome, N.T., and Fast, H., 1992, Penetration of Mt.
Pinatubo aerosols into the north polar vortex: Geophysical
Research Letters, v. 19, p. 1751-1754.
Rosen, J., Kjome, N.T., Fast, H.. and Larsen, N., 1994. Volcanic
aerosols and polar stratospheric clouds in the winter 1992/
1993 in the north polar vortex: Geophysical Research Letters,
v. 20, p. 61-64.
Russell, P.B., Livingston, J.M., Dutton, E.G., PuescheI, R.F., and
others, 1993b, Pinatubo and pre-Pinatubo optical depth spec-
tra: Mauna Loa measurements, comparison, inferred particle
size distribution; radiative effects, and relationship to Lidar
data: Journal of Geophysical Research, v. 98, p. 22969-
22985.
Russell, PB., Livingston, J.M., Pueschel, R.F., Reagan, J.A., and
others, 1993a, Post-Pinatubo optical depth spectra vs. latitude
and vortex structure: Airborne tracking sunphotometer mea-
surements in AASEII: Geophysical Research Letters, v. 20,
p. 2571-2574.
Sato, M., Hansen, JE., McCormick, M.P., and Pollack, J.B., 1993,
Stratospheric aerosol optical depths, 1850-1990: Journal of
Geophysical Research, v. 98, p. 22987-22994.
Saunders, R., 1993, Radiative properties of Mount Pinatubo volca-
nic aerosols over the tropical Atlantic: Geophysical Research
Letters, v. 20, p. 137-140.
Schoeberl, M.R., Bhartia, EK., and Hilsenrath, E., 1993, Tropical
ozone loss following the eruption of Mt. Pinatubo: Geophysi-
cal Research Letters, v. 20, p. 29-32.
Scott, W.E., Hoblitt, R.P., Torres, RC., Self, S, Martinez, M.L.,
and Nillos, T., Jr., this volume, Pyroclastic flows of the June
15, 1991, climactic eruption of Mount Pinatubo.
Self, S., and King, A.J., 1993, The 1963 eruption of Gunung
Agung, Bali, and its atmospheric impact labs.]: Eos, Transac-
tions, American Geophysical Union, v. 74, no. 43, p. 105.
Smith, R.C., Prezelin, B.B., Baker, K.S., Bidigare, R.R., and oth-
ers, 1992, Ozone depletion: Ultraviolet radiation and phy-
toplankton biology in Antarctic waters: Science, v. 255,
p. 952-959.Smithsonian Institution, 1991, Pinatubo: Bulletin of the Global
Volcanism Network, Smithsonian Institution, v. 16, no. 5,
p. 2-8.
Solomon, S., Sanders, R.W., Garcia. RR, and Keys, J.G., 1993,
Increased chlorine dioxide over Antarctica caused by volca-
nic aerosols from Mount Pinatubo: Nature. v. 363, p. 245-
248.
Stone, R.S., Keys, J., and Dutton. EG, 1993, Properties and decay
of stratospheric aerosols in the Arctic following the 1991
eruptions of Mount Pinatubo: Geophysical Research Letters.
v. 20, p. 2539-2362.
Stothers, R.S., 1984a. Mystery cloud of ad 536: Nature, _. 3()7.
p. 344-345.
--1984b. The great Tambora eruption and its aftermath: Sci-
ence, v. 224, p. 1191-1198.
Stowe, L.L., Carey, R.M., and Pellegrino. EE, 1992, Monitoring
the Mt. Pinatubo aerosol layer with NOAA-II AVHRR data:
Geophysical Research Letters. v. 19, p. 159-162.
Strong, A.E, and Stowe, L.L., 1993. Comparing stratospheric
aerosols from El Chich6n and Mount Pinatubo using AVHRR
data: Geophysical Research Letters, ,,. 20. p. 1183-1186.
Tabazadeh. A., and Turco, R.P., 1993, Stratospheric chlorine injec-
tion by volcanic eruptions: Hydrogen chloride scavenging
and implications for ozone: Science, v. 20. p. 1082-1086.
Tahira. M., Nomura, M., Sawada, Y., and Kamn, K. this volume,
Infrasonic and acoustic-gravity wa,,es generated by the
Mount Pinatubo eruption of June 15, 1991
Tanaka, S., Sugimura, T.. Harada. T., and Tanaka, M., 199l. Satel-lite observations of the diffusion of Pinatubo volcanic dust to
the stratosphere: Journal of the Remote Sensing Society of
Japan, v. I 1, p. 91-99 [in Japanese with English abstractl,
Thomason, L.W., 1992, Observations of a new SAGE II aerosol
extinction mode following the eruption of Mt. Pinatubo: Geo-
physical Research Letters, v. 19. p. 2179-2182.
Tokuno, M.. 1991a, GMS-4 observations of volcanic eruption
clouds from Mr. Pinatu.bo, Philippines: Journal of Remote
Sensing Society of Japan. v. I1. p. 81-89 [in Japanese with
English abstract].
Tokuno, M., 1991b, GMS-4 obser,,ations of _olcanic eruption
clouds from Mr. Pinatubo, Philippines: Meteorological Satel-
lite Center. Tokyo. Japan, Technical Note No. 23, p. 1-14.
Trepte. CR.. and Hitchman, M.H. 1992, Tropical stratospheric
deduced from satellite aerosol data: Nature. ", 355, p 626-
628.
Trepte, C.R., Viega, R.E., and McCormick, M.P. 1993. The pole-
ward dispersal of Mount Pinatubo aerosol: Journal of Geo-
physical Research, v. 98. p. 18563-18573.
Turco, R.. 1991. Volcanic aerosols: Chemistr,,. microph,,sics, e_ o-
lution and effects. W Walter, LS. and de Silva. S., eds.. M)t-
canism-climate interactions: NASA C_mlerence Publication
10062, p. DI-D30.
Valero, EEL and Pilewskie, P. 1992, Latitudinal surve', of spec-
tral optical depths of the Pinatubo volcanic cloud-_erived
particle sizes, columnar mass loadings, and effects on plane-
tary albedo: Geophysical Research Letters, v. 19. p. 163-166.
Varekamp. J.C., Luhr. J.F.. and Prestegaard, KL., 1984, The 1982
eruptions of El Chichon volcano. Chiapas. Mexico: Character
of the eruptions, ash-fall deposits, and gas phase: Journal of
Volcanology and Geothermal Research. v. 23, p. 39-68.
Vogelmann, A.M,, Ackerman. T.P, and Turco. R.P. I992.
Enhancements in biologically effectixe ultra'.iolet radiation
following volcanic eruptions: Nature. v. 359. p 47-49.

THEATMOSPHERICIMPACTOFTHE1991MOUNTPINATUBOERUPTION 1115
Wallace,L.,andLivingston,W.,1992,TheeffectofthePinatubocloudonhydrogenchlorideandhydrogenfluoride:Geophys-icalResearchLetters,v.19,p.1209-1211.
Walsh,K..andPittock,A.B.,1992,ModelingtheeffectsoftheMr.Pinatuboeruptiononseasurfacetemperaturesinthesouthernhemisphere:AustralianMeteorologicalandOceanographicSocietyBulletin.v,5,p.31-35.
Weaver,A.,Loewenstein,M.,Podolske,JR., and others, 1993,
Effects of Pinatubo aerosol on stratospheric ozone at mid-
latitudes: Geophysical Research Letters, v, 20, p. 2515-2518.
Westrich, H.R., and Gerlach, TM., 1992, Magmatic gas source for
the stratospheric SO2 cloud from the June 15, 199I, eruption
of Mount Pinatubo: Geology, v. 20, p. 867-870.
Williams, S.N., and Self, S.. 1983, The October 1902 plinian erup-
tion of Santa Maria volcano, Guatemala: Journal of Volcanol-
ogy and Geothermal Research, v, 16, p. 33-56.
Wilson, L., and Walker, GPL.. 1987, Explosive volcanic
eruptions--Vl, Ejecta dispersal in Plinian eruptions: The con-
trol of eruption conditions and atmospheric properties:
Geophysical Journal of the Royal Astronomical Society. v
89. p. 657-679.
Winker, DM.. and Oshorn. M.T., 1992a. Preliminary analysis of
observations of the Pinatubo volcanic plume with a polariza-
tion-sensiti',e LIDAR: Geophysical Research Letters, ,,. 19,
p. 155-158,
--t992b, Airborne LIDAR obser,,ations of the Pinatubo vol-
canic plume: Geophysical Research Letters. ,,. 19, p, 167-
170,
Wolff. E.W,. and Mulvaney. R., 1991. Reactions on sulphuric acid
aerosols and on polar stratospheric clouds in the Antarctic
stratosphere: Geophysical Research Letters, v 18, p l()(JT-
1010.
Woods, A.W., and Self, S.. 1992. Thermal disequilibrium at the top
of volcanic clouds and its effect on estimates of the column
heights: Nature, v. 355, p. 628-630.
Woods, A.W., and Wohletz, K, 1991. Dimensions and dynamics
of co-ignimbrite eruption columns: Nature, v. 350. p. 225-
227,


Reference:
Self, S, Zhao, J-X, Holasck, R.E.. Torres. RC., and King. A.J., 1096. The atmospheric impact of the 1991
Mount Pinatubo eruption, m I,)rc and ]tf_td. tirlqmom" and Lohar._ O//tfomTl ]'iJToliiho. l'l_ili/_pmc._', C.G.
Newhall and R. S. Punongbavan. cds.. Philil_l_me Institute of Volcanolog._ and Scisrnologx. Queen Citv,
and University of Washington Press, Seattle. 13. 11)89-1115
Please note: l) This paper was written in IL_,_3 and revised in carl,,' 1994. and is thcrcf'orc onh' current to
that time. A great deal of new material has been published on tills topic during the 3+ \ cars that the book
spent 'm press". The book was distributed in the US m May 1997.
2) The missing part of the title is due to an ill-placed Post-it that survived to the printers. Editor
Chris Nexvhall takes full responsibility for this unfortunate oversight. The running head shows the full title
Related Documents