Downtown Retail and Entertainment Strategy 2016-2025 In partnership with

Welcome message from author
This document is posted to help you gain knowledge. Please leave a comment to let me know what you think about it! Share it to your friends and learn new things together.
Transcript
Downtown Retail and Entertainment Strategy 2016-2025
In partnership with

i
Executive Summary The goal with any city’s downtown and its retail, service and entertainment offering - regardless of size or geographic market area - is to not only meet the needs and wants of residents, workers, and visitors, but serve as the social and civic heart of the community. A city’s downtown is in effect its calling card, communicating its uniqueness, personality, and appeal as a place to live, work, and invest. The pending update of the 2006 Downtown Plan by the City of Whitehorse initiated a corresponding update to the Retail Strategy that accompanied it a decade ago. Nurturing a healthy downtown core is an ongoing priority of the City of Whitehorse and has been a component of various City plans and strategies of recent years. The 2016 update to the Retail Strategy provides an opportunity to assess the current status of the retail-commercial elements of Downtown Whitehorse, note changes from 2006, and identify the issues and trends that merit action and/or follow-up investigation in the upcoming 2016 Downtown Plan. The City also chose to incorporate the added element of entertainment in the 2016 strategy in recognition of the vital role it plays creating a vibrant Downtown and quality of life for Whitehorse residents. The strategy aimed to achieve the following:
• Assess, on a quantitative and qualitative basis, the existing retail-commercial infrastructure and arts and entertainment offer Downtown;
• Assess Downtown Whitehorse retail and service provision strengths, weaknesses, opportunities and threats from the perspectives of the business community and local residents;
• Analyze changes in Downtown Whitehorse retail-commercial uses since 2006;
• Assess and identify the level of entertainment market support, absorption and general content for entertainment type uses;
• Review the local and regional entertainment market, its competitive influences, and relevant trends;
• Analyze the market opportunity for entertainment in Downtown Whitehorse;
• Identify merchandising gaps in Downtown Whitehorse;
• Forecast market demand for key retail categories in Whitehorse in terms of sales volume and warranted building floor area, based on population and expenditure data; and,
• Develop strategies to strengthen the Downtown core for retail-commercial and entertainment uses.
The strategy was undertaken over a three-month period from December 2015 to March 2016 and included a business survey, retail-commercial inventory of the Downtown, interviews with 16 stakeholders and leaders in the business and arts/cultural community, a retail market analysis, secondary research, and discussions with City representatives. The 2016 update to the retail-commercial inventory found that the commercial floor area of Downtown Whitehorse increased by 32% during the past decade with the addition of almost 500,000 ft2 of space. The proportion of retail, service, and office uses has stayed relatively similar. Factoring in new categories developed for this update (and recommended for inclusion in the future), service-oriented uses comprise about 39% of commercial floor area Downtown (with 8% being entertainment-specific), retail uses 35%, public/non-profit sector offices 14%, and private sector offices 7%. Vacant space accounts for about 5% of commercial floor area. The numbers speak to a relatively balanced retail-service mix with a vacancy rate
ii
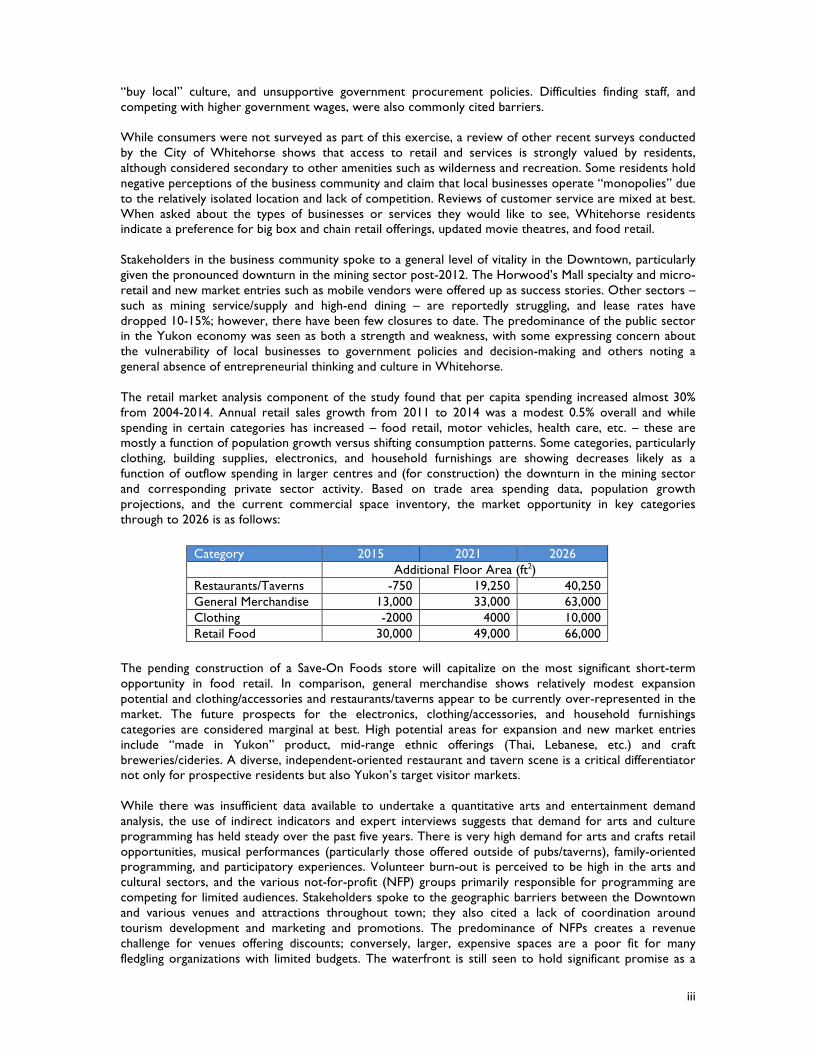
that falls within the 5-7% range generally considered conducive to business growth and development in a downtown.
The consultant team observed a number of significant changes from 2006, most notably the significant increase in both residential and commercial density via new development throughout the Downtown and the revitalization of the Whitehorse waterfront via the development of new attractions, venues, commercial spaces, parks, and attractions. Comparing the six Downtown sub-areas, the following trends were noted:
• Old Town has undergone the least amount of change, adding little in terms of retail-commercial space but considerable new residential, including multi-unit, construction;
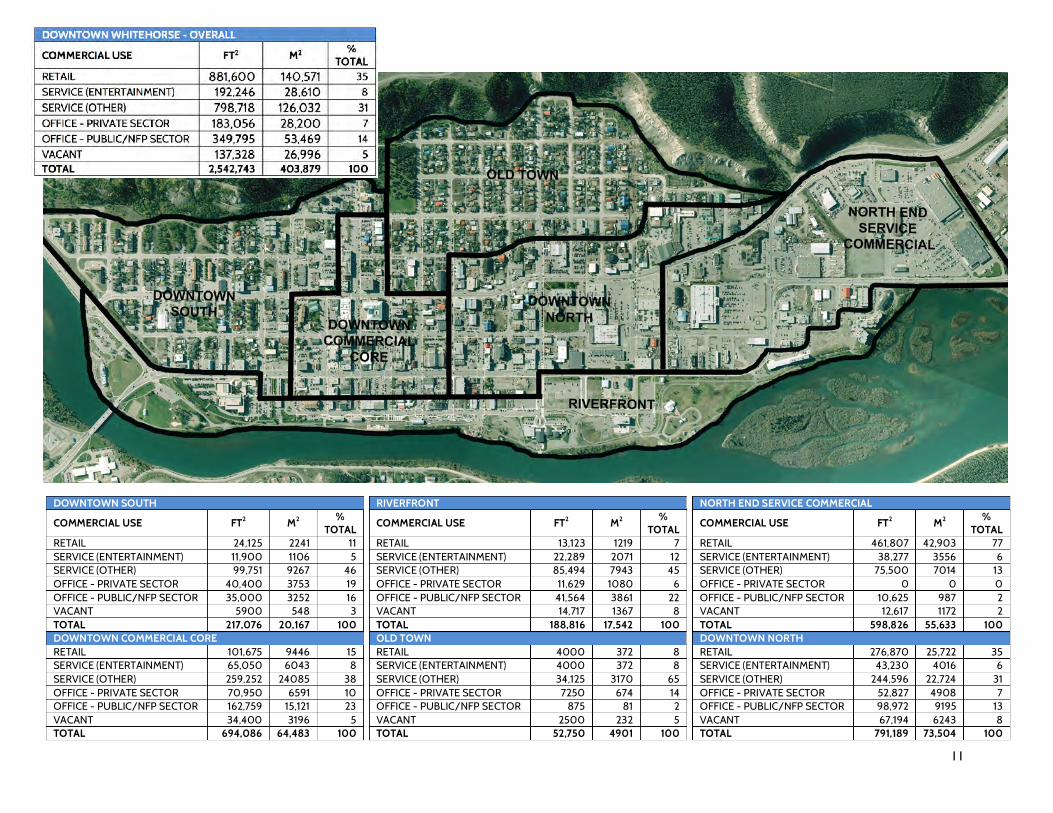
• Downtown North has now surpassed the North End Commercial Service area in terms of commercial floor area with 791,189 ft2 versus 598,826 ft2;
• The highest percentage of live-work units can be found in Downtown South (13% of units) and Downtown North (9%); live-work units represent only 2-4% of units in other sub-areas; and,
• There are relatively high levels of new construction or redevelopment in all sub-areas, with the Riverfront area the highest at 51% of units, followed by North End Service Commercial and Old Town (30%) and Downtown South (26%).
The Whitehorse arts, culture and entertainment scene is thriving, with a large number of active non-profit societies and the Yukon Arts Centre providing a diversity of programming and performances throughout the year at various government and privately run venues and facilities throughout the city. The Yukon is home to the highest percentage of people working in cultural occupations in the country and boasts the highest per capita artist funding: this strong foundation of public sector support leaves arts and entertainment consumers “spoiled for choice”. Along with arts and entertainment venues, Whitehorse boasts a number of cultural and heritage attractions such as the waterfront trolley, Macbride Museum, Old Log Church, Beringia Centre, and Yukon Transportation Museum. Festivals and events comprise another key facet of the local arts and entertainment scene, and the Whitehorse event calendar is full with a range of music, film, First Nation culture, and seasonally themed offerings, some of them attracting audiences outside of the territory. Downtown businesses surveyed as part of the strategy comprised a small sample of largely independent businesses who had been in operation between 3-10 years and were located throughout the Downtown area. The majority noted that revenues were up as compared to last year and 5 years ago. Businesses spoke to access, visibility, and location near offices and other businesses as key strengths. Parking was almost universally cited as a weakness. When asked what improvements could help their businesses succeed, survey respondents prioritized improved marketing, maintenance and cleanliness, and festivals and events. Entertainment, specialty food retail, restaurants and cafes, and art galleries and gift shops were seen as the establishment types most conducive to a vibrant downtown. Market/competitive constraints were considered the most significant barriers to business growth, most notably online shopping, lack of a
COMMERCIAL USE 2016 FLOOR AREA 2006 FLOOR AREA % CHANGE
FLOOR AREA FT2 M2
% TOTAL
% TOTAL
FT2 %
TOTAL RETAIL 881,600 140,571 43 35 632,000 41 +39 SERVICE (ENTERTAINMENT) 192,246 28,610
48 8 792,000
51 +25 SERVICE (OTHER) 798,718 126,032 31 N/A OFFICE - PRIVATE SECTOR 183,056 28,200 9 7 134,000 8 +37 OFFICE - PUBLIC/NFP SECTOR
349,795 53,469 N/A
14 N/A N/A N/A
VACANT 137,328 26,996 N/A 5 N/A N/A N/A TOTAL – 2006 CATEGORIES 2,055,620 323,414 100 N/A 1,558,000 100 +32 TOTAL 2,542,743 403,879 N/A 100
iii
“buy local” culture, and unsupportive government procurement policies. Difficulties finding staff, and competing with higher government wages, were also commonly cited barriers. While consumers were not surveyed as part of this exercise, a review of other recent surveys conducted by the City of Whitehorse shows that access to retail and services is strongly valued by residents, although considered secondary to other amenities such as wilderness and recreation. Some residents hold negative perceptions of the business community and claim that local businesses operate “monopolies” due to the relatively isolated location and lack of competition. Reviews of customer service are mixed at best. When asked about the types of businesses or services they would like to see, Whitehorse residents indicate a preference for big box and chain retail offerings, updated movie theatres, and food retail. Stakeholders in the business community spoke to a general level of vitality in the Downtown, particularly given the pronounced downturn in the mining sector post-2012. The Horwood’s Mall specialty and micro-retail and new market entries such as mobile vendors were offered up as success stories. Other sectors – such as mining service/supply and high-end dining – are reportedly struggling, and lease rates have dropped 10-15%; however, there have been few closures to date. The predominance of the public sector in the Yukon economy was seen as both a strength and weakness, with some expressing concern about the vulnerability of local businesses to government policies and decision-making and others noting a general absence of entrepreneurial thinking and culture in Whitehorse. The retail market analysis component of the study found that per capita spending increased almost 30% from 2004-2014. Annual retail sales growth from 2011 to 2014 was a modest 0.5% overall and while spending in certain categories has increased – food retail, motor vehicles, health care, etc. – these are mostly a function of population growth versus shifting consumption patterns. Some categories, particularly clothing, building supplies, electronics, and household furnishings are showing decreases likely as a function of outflow spending in larger centres and (for construction) the downturn in the mining sector and corresponding private sector activity. Based on trade area spending data, population growth projections, and the current commercial space inventory, the market opportunity in key categories through to 2026 is as follows:
Category 2015 2021 2026 Additional Floor Area (ft2) Restaurants/Taverns -750 19,250 40,250 General Merchandise 13,000 33,000 63,000 Clothing -2000 4000 10,000 Retail Food 30,000 49,000 66,000
The pending construction of a Save-On Foods store will capitalize on the most significant short-term opportunity in food retail. In comparison, general merchandise shows relatively modest expansion potential and clothing/accessories and restaurants/taverns appear to be currently over-represented in the market. The future prospects for the electronics, clothing/accessories, and household furnishings categories are considered marginal at best. High potential areas for expansion and new market entries include “made in Yukon” product, mid-range ethnic offerings (Thai, Lebanese, etc.) and craft breweries/cideries. A diverse, independent-oriented restaurant and tavern scene is a critical differentiator not only for prospective residents but also Yukon’s target visitor markets. While there was insufficient data available to undertake a quantitative arts and entertainment demand analysis, the use of indirect indicators and expert interviews suggests that demand for arts and culture programming has held steady over the past five years. There is very high demand for arts and crafts retail opportunities, musical performances (particularly those offered outside of pubs/taverns), family-oriented programming, and participatory experiences. Volunteer burn-out is perceived to be high in the arts and cultural sectors, and the various not-for-profit (NFP) groups primarily responsible for programming are competing for limited audiences. Stakeholders spoke to the geographic barriers between the Downtown and various venues and attractions throughout town; they also cited a lack of coordination around tourism development and marketing and promotions. The predominance of NFPs creates a revenue challenge for venues offering discounts; conversely, larger, expensive spaces are a poor fit for many fledgling organizations with limited budgets. The waterfront is still seen to hold significant promise as a
iv
focal point for arts, culture and entertainment in the Downtown, although parking is cited as a barrier to growth.
The consultant team concludes that Downtown Whitehorse is showing healthy levels of vitality overall. The increasing residential density of the Downtown, coupled with waterfront revitalization, preservation of Main Street character, and location of big box retailers in close proximity (versus the highway) are key strengths. The emergence of micro-retail units, increased presence of mobile vendors, and a growing complement of “made in Yukon” product are all highly encouraging signs. The waterfront and its cultural and recreational attractions serve as a perfect complement to the growing presence of specialty retail and restaurants and cafes in the area. The Horwoods Mall redevelopment is seen as an ideal springboard for the development of a Railspur Alley-type area showcasing locally-made product in a diversity of business types and formats ranging from established storefronts to small-scale, mobile vendors. There are, however, a number of weaknesses in the Downtown that merit monitoring and/or attention by the City and business community. While there have been significant commercial redevelopments since 2006, they have achieved varying levels of success, partly due to attention (or lack thereof) to basic retail-commercial design best practices. Parking is perceived to be a major challenge by the business community, and the City is seen to be an impediment as much as ally in addressing it. Aesthetic values require more protection in priority areas and the principle of highest and best use could be better applied to highly strategic built heritage assets located on the waterfront, as well as land-intensive uses located throughout the Downtown. Connectivity and walkability in the north end of Downtown are also problematic. The waterfront and other local heritage assets are underleveraged for their storytelling and place-making value to the city, and the lack of a central point-of-sale for visitors represents a missed opportunity to increase visitor spending and exposure to local arts and entertainment. Housing affordability is a critical barrier to private sector growth and success, and its indirect effects - homelessness, poor social cohesion, increased crime, and low levels of participation in both economic and social spheres of the community – impact local businesses in a myriad of ways. The private sector and arts and cultural communities have the primary role to play in creating Downtown retail-commercial and entertainment vibrancy, but the City of Whitehorse can exercise leadership within its sphere of policy and funding influence and provide support on a range of business-led initiatives. The City’s commitments to Downtown beautification, public art, trails, active transportation, and festivals and events facilitate the success of the Downtown; furthermore, the City interacts with the local business community as a major procurer and purchaser of goods and services. The City business licensing process provides an ideal starting point for improved communications with the business community and ongoing tracking of private sector performance and trends. Recommendations arising from the 2016 Retail and Entertainment Strategy include the following:
General
1. Maintain (or increase) funding for City key quality of life amenities in the Downtown that current (and prospective) residents and businesses value: parks, trails, street and sidewalk maintenance, beautification, public art, etc.
2. Continue to facilitate downtown densification via zoning and incentives for multi-unit residential development.
3. Continue to actively partner on and promote affordable housing and homelessness initiatives.
4. Champion continued place-making efforts along the waterfront, including wayfinding signage and enhanced interpretation of the cultural and historic aspects of the Yukon River.
5. Develop design guidelines for Main Street and consider the application of streetscape improvements from 3rd Avenue and Jarvis north to Black Street in the upcoming Downtown Plan.
6. Focus on strategies to improve walkability, active transportation and connectivity in the Downtown North and North End areas during the upcoming Downtown Plan.
v
7. Link to YG and other recruitment/retention initiatives and champion development of a Whitehorse-specific investment/resident attraction campaign and website.
8. Provide support for “buy local” campaigns.
9. Maximize opportunities for local business in City procurement policy and practice.
10. Pursue low-cost measures to improve Main Street area parking in conjunction with the 2011 plan, including:
• On-line payment and meter “top up” options; and, • A joint effort with the Government of Yukon to encourage employees to use other modes
of transport.
11. Improve communications with local businesses, particularly post-planning.
12. Champion entrepreneurial culture and innovation.
13. Improve/expand City business-related data gathering and analysis, including the adoption of North American Industry Classification System codes and use of the business licensing process to track trends and issues.
Arts, Culture and Entertainment
14. Facilitate coordinated planning efforts and communication among the multiple players involved with tourism, arts, and entertainment in the Main Street and waterfront areas.
15. Identify and implement opportunities to provide more City of Whitehorse family-oriented recreational and event-oriented programming in the Downtown.
16. Facilitate the increased use of Front Street for smaller public events and festivals via the City special events approval process.
17. Implement a paid parking “amnesty” from 5:30 pm on Fridays to 10:00 am on Saturdays1.
18. Partner on a pilot project with the Yukon Arts Centre to encourage residents to dine Downtown and use transit for major programming events.
1 Administering the Saturday morning amnesty could involve submission of proof of purchase at a Downtown entertainment venue, restaurant, or pub/tavern to City of Hall in the following business week for parking ticket amnesty.

vi
vii
Table of Contents
1.0 INTRODUCTION 1
1.1 PURPOSE AND SCOPE 1 1.2 HOW THE STRATEGY WAS DEVELOPED 1
2.0 RETAIL INVENTORY 2
2.1 METHODOLOGY 2 2.2 SUB-AREA INVENTORY ASSESSMENTS 3 2.2.1 Riverfront 3 2.2.2 Downtown South 4 2.1.3 Downtown Commercial Core 5 2.1.4 Old Town 6 2.1.5 Downtown North 7 2.1.6 North End Service Commercial 8 2.2 DOWNTOWN COMMERCIAL FLOOR AREA AND POST-2006 CHANGES 9
3.0 ARTS & ENTERTAINMENT INVENTORY 12
3.1 ARTS & ENTERTAINMENT SECTOR STRUCTURE 12 3.1.1 Artists and Performers 12 3.1.2 Government Organizations 13 3.1.3 Not-for-Profit Organizations 13 3.1.4 Private Sector 14 3.2 VENUES AND ATTRACTIONS 14 3.3 ARTS AND ENTERTAINMENT OPTIONS 15 3.3.1 Regular Programming and Events 15 3.3.2 Festivals 16
4.0 BUSINESS COMMUNITY PERSPECTIVES 17
4.1 DOWNTOWN RETAILER AND SERVICE PROVIDER SURVEY 17 4.1.1 Strengths and Weaknesses 17 4.1.2 Opportunities and Threats 18 4.2 STAKEHOLDER INTERVIEWS 20 4.2.1 Strengths and Weaknesses 20 4.2.2 Opportunities and Threats 21 5.0 RESIDENT/CONSUMER PERSPECTIVES 23 5.1 GENERAL ATTITUDES AND PERCEPTIONS 23 5.2 CUSTOMER SERVICE 24 5.3 AREAS OF RESIDENT/CONSUMER DEMAND 24 6.0 RETAIL MARKET ANALYSIS 26 6.1 DOWNTOWN WHITEHORSE RETAIL TRADE AREA 26 6.2 TRADE AREA POPULATION GROWTH 27 6.3 YUKON TOURISM ACTIVITY 27 6.3.1 Visitor Volumes 28 6.3.2 Visitor Spending 29
viii
6.4 HISTORICAL ANNUAL YUKON RETAIL SALES 30 6.5 CURRENT ANNUAL YUKON RETAIL SALES 31 6.6 WHITEHORSE RETAIL DEMAND ANALYSIS BY CATEGORY 33 6.6.1 Supermarkets and Grocery Stores 33 6.6.2 General Merchandise Stores 33 6.6.3 Clothing and Accessories 34 6.6.4 Restaurants and Taverns 34 6.7 CONCLUSIONS 36 7.0 ARTS & ENTERTAINMENT MARKET ANALYSIS 37 7.1 RESIDENT DEMAND 37 7.2 VISITOR DEMAND 39 7.3 ARTS AND ENTERTAINMENT COMMUNITY PERSPECTIVES 41 7.3.1 Strengths and Weaknesses 41 7.3.2 Opportunities and Threats 41
8.0 KEY ISSUES & OPPORTUNITIES 43
8.1 RESIDENTIAL DENSITY 43 8.2 WATERFRONT AS ARTS/ENTERTAINMENT HUB 43 8.3 INTEGRATION OF DOWNTOWN WITH ARTS/ENTERTAINMENT 44 8.4 PARKING AND PARKING MANAGEMENT 44 8.5 HOUSING AFFORDABILITY 45 8.6 ECONOMIC LEAKAGE 45 8.7 ENTREPENEURIAL CULTURE AND LEADERSHIP 46 8.8 HIGHEST AND BEST USES 46 8.9 AESTHETIC VALUES AND PLACE-MAKING 47 8.10 COMMUNICATIONS, DATA GATHERING, AND COORDINATION 47
9.0 BEST PRACTICES 48
10.0 CONCLUSIONS AND RECOMMENDATIONS 50
REFERENCES 53
KEY CONTACTS 55
APPENDIX A. DOWNTOWN BUSINESS OWNER SURVEY
APPENDIX B. DOWNTOWN BUSINESS OWNER SURVEY RESULTS
APPENDIX C. RETAIL MARKET ANALYSIS DETAILED CALCULATIONS
Photo Credits: Cover photo upper right, pp. 22, 36, 43, 45, 47 – Derek Crowe Photo Page 48 – Outland Design.ca All other images are courtesy Government of Yukon
1
1.0 INTRODUCTION
1.1 Purpose and Scope A healthy Downtown Whitehorse retail, services and entertainment sector is a priority of the City of Whitehorse and has been supported in numerous City documents including the 2010 Official Community Plan (OCP), 2006 Downtown Plan, and 2015 Community Economic Development Strategy. In 2006, a Downtown Whitehorse Retail Strategy was undertaken in conjunction with the 2006 Downtown Plan in order to achieve a broad view of both community and commercial interests. In preparing for the 10-year update of the Plan, the City again wished to examine the status of retail-commercial and entertainment uses in Downtown Whitehorse. The 2016 Downtown Whitehorse Retail Strategy aimed to:
• Assess, on a quantitative and qualitative basis, the existing retail-commercial infrastructure and arts and entertainment offer Downtown;
• Assess Downtown Whitehorse retail and service provision strengths, weaknesses, opportunities and threats from the perspectives of the business community and local residents;
• Analyze changes in Downtown Whitehorse retail-commercial uses since 2006;
• Assess and identify the level of entertainment market support, absorption and general content for entertainment type uses;
• Review the local and regional entertainment market, its competitive influences, and relevant trends;
• Analyze the market opportunity for entertainment in Downtown Whitehorse;
• Identify merchandising gaps in Downtown Whitehorse;
• Forecast market demand for key retail categories in Whitehorse in terms of sales volume and warranted building floor area, based on population and expenditure data; and,
• Develop strategies to strengthen the Downtown core for retail-commercial and entertainment uses.
. 1.2 How the Strategy was Developed The subject study was undertaken over a three month period from December 2015 to March 2016 and included the following tasks:
• An inventory of Downtown privately owned, non-residential spaces;
• Stakeholder and “expert” informant interviews with 16 individuals and organizations in the retail-commercial and arts/entertainment sectors;
• Primary and secondary research;
• An updated retail demand analysis and discussion of implications for key categories; and,
• Analysis, discussion and strategy formulation in consultation with City representatives.
2
2.0 RETAIL INVENTORY
Understanding the current extent and composition of retail-commercial uses in the Downtown is a pre-requisite to identifying merchandising gaps and forecasting incremental need for future retail-commercial facilities. The following section provides an overview of the methodology and results of the 2016 Downtown retail inventory. 2.1 Methodology An inventory of commercial retail, service and office floor area was conducted for Downtown Whitehorse in January and February of 2016. As in 2006, the inventory was conducted via a field survey and supported off-site with Google Earth and information provided by business owners and/or building managers. The consultant team refined the 2006 methodology in an effort to better examine interrelationships between the public and private sectors, pinpoint entertainment-related uses, and track the frequency and distribution of mixed residential-commercial uses in the Downtown. As in 2006, commercial units were categorized according to the nature of their use, with the key focus being privately owned, non-residential buildings. Accordingly, government, heritage, non-profit (community), and institutional uses occurring in privately owned buildings were included in calculations of Commercial Retail Unit Representation. The Professional/Business office category was focused on private sector uses such as doctors, dentists, architects, engineers, consultants, etc. Health care services such as physiotherapy and massage were included in the Services category, as were hotels (excluding any co-located Restaurants/Taverns). Vacancies were noted onsite and cross-referenced with commercial real estate listings. Floor area estimates for the various commercial retail units were converted into Commercial Floor Area totals as follows:
Commercial Floor Area Uses
Commercial Unit Representation Categories
Retail Clothing and Accessories, Household Furniture/Furnishings, Food Retail, Specialty Retail
Service (Entertainment) Restaurants/Taverns (and movie theatres) Service (Other) Services Office – Private Sector Professional/Business Office Office – Public/Not for Profit Sector
Government/Heritage/Institutional/Community
Vacant Vacant The Downtown sub-areas utilized in the 2006 study were carried over into the 2016 exercise for tracking purposes. (It should be noted that a minor discrepancy in the delineation of Old Town and Downtown North in the 2006 study may render comparisons for these sub-areas slightly inaccurate). Lastly, large public sector buildings and venues/attractions were noted separately for each sub-area but excluded from Commercial Retail Unit Representation calculations. While these uses may not qualify as commercial units per se, they do have an indirect impact on commercial uses by virtue of providing a nearby employment node and thus customer base. Noting these inter-relationships facilitates a broader understanding of Downtown vibrancy.
3
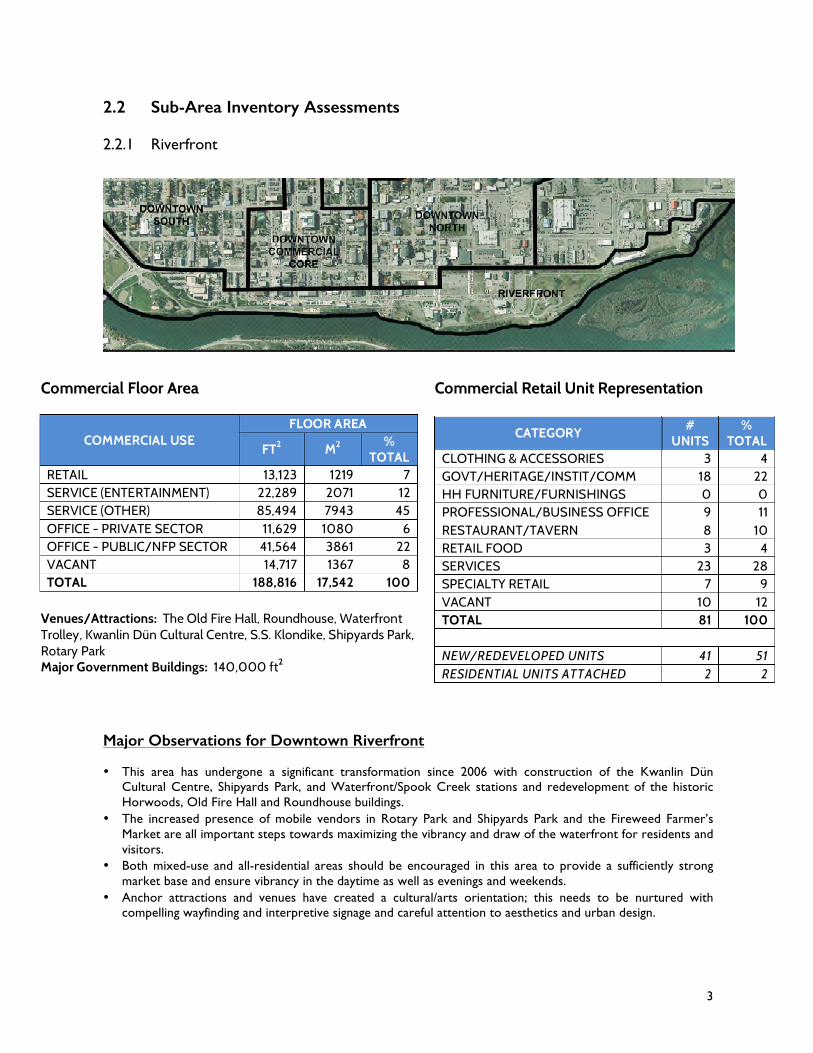
2.2 Sub-Area Inventory Assessments 2.2.1 Riverfront
Major Observations for Downtown Riverfront
• This area has undergone a significant transformation since 2006 with construction of the Kwanlin Dün Cultural Centre, Shipyards Park, and Waterfront/Spook Creek stations and redevelopment of the historic Horwoods, Old Fire Hall and Roundhouse buildings.
• The increased presence of mobile vendors in Rotary Park and Shipyards Park and the Fireweed Farmer’s Market are all important steps towards maximizing the vibrancy and draw of the waterfront for residents and visitors.
• Both mixed-use and all-residential areas should be encouraged in this area to provide a sufficiently strong market base and ensure vibrancy in the daytime as well as evenings and weekends.
• Anchor attractions and venues have created a cultural/arts orientation; this needs to be nurtured with compelling wayfinding and interpretive signage and careful attention to aesthetics and urban design.
CATEGORY #
UNITS %
TOTAL CLOTHING & ACCESSORIES 3 4 GOVT/HERITAGE/INSTIT/COMM 18 22 HH FURNITURE/FURNISHINGS 0 0 PROFESSIONAL/BUSINESS OFFICE 9 11 RESTAURANT/TAVERN 8 10 RETAIL FOOD 3 4 SERVICES 23 28 SPECIALTY RETAIL 7 9 VACANT 10 12 TOTAL 81 100
NEW/REDEVELOPED UNITS 41 51 RESIDENTIAL UNITS ATTACHED 2 2
COMMERCIAL USE FLOOR AREA
FT2 M2 %
TOTAL RETAIL 13,123 1219 7 SERVICE (ENTERTAINMENT) 22,289 2071 12 SERVICE (OTHER) 85,494 7943 45 OFFICE - PRIVATE SECTOR 11,629 1080 6 OFFICE - PUBLIC/NFP SECTOR 41,564 3861 22 VACANT 14,717 1367 8 TOTAL 188,816 17,542 100
Venues/Attractions: The Old Fire Hall, Roundhouse, Waterfront Trolley, Kwanlin Dün Cultural Centre, S.S. Klondike, Shipyards Park, Rotary Park Major Government Buildings: 140,000 ft2
Commercial Floor Area Commercial Retail Unit Representation
4
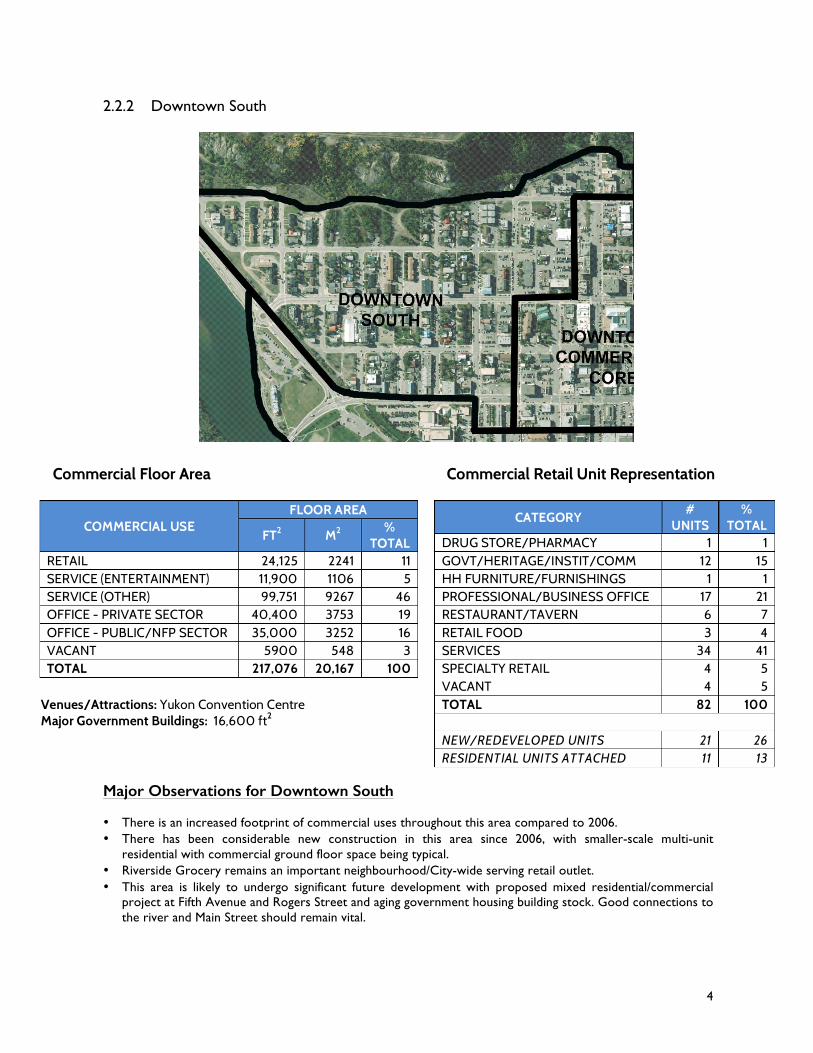
2.2.2 Downtown South
Major Observations for Downtown South
• There is an increased footprint of commercial uses throughout this area compared to 2006. • There has been considerable new construction in this area since 2006, with smaller-scale multi-unit
residential with commercial ground floor space being typical. • Riverside Grocery remains an important neighbourhood/City-wide serving retail outlet. • This area is likely to undergo significant future development with proposed mixed residential/commercial
project at Fifth Avenue and Rogers Street and aging government housing building stock. Good connections to the river and Main Street should remain vital.
COMMERCIAL USE FLOOR AREA
FT2 M2 %
TOTAL RETAIL 24,125 2241 11 SERVICE (ENTERTAINMENT) 11,900 1106 5 SERVICE (OTHER) 99,751 9267 46 OFFICE - PRIVATE SECTOR 40,400 3753 19 OFFICE - PUBLIC/NFP SECTOR 35,000 3252 16 VACANT 5900 548 3 TOTAL 217,076 20,167 100
Venues/Attractions: Yukon Convention Centre Major Government Buildings: 16,600 ft2
CATEGORY #
UNITS %
TOTAL DRUG STORE/PHARMACY 1 1 GOVT/HERITAGE/INSTIT/COMM 12 15 HH FURNITURE/FURNISHINGS 1 1 PROFESSIONAL/BUSINESS OFFICE 17 21 RESTAURANT/TAVERN 6 7 RETAIL FOOD 3 4 SERVICES 34 41 SPECIALTY RETAIL 4 5 VACANT 4 5 TOTAL 82 100
NEW/REDEVELOPED UNITS 21 26 RESIDENTIAL UNITS ATTACHED 11 13
Commercial Floor Area Commercial Retail Unit Representation
5
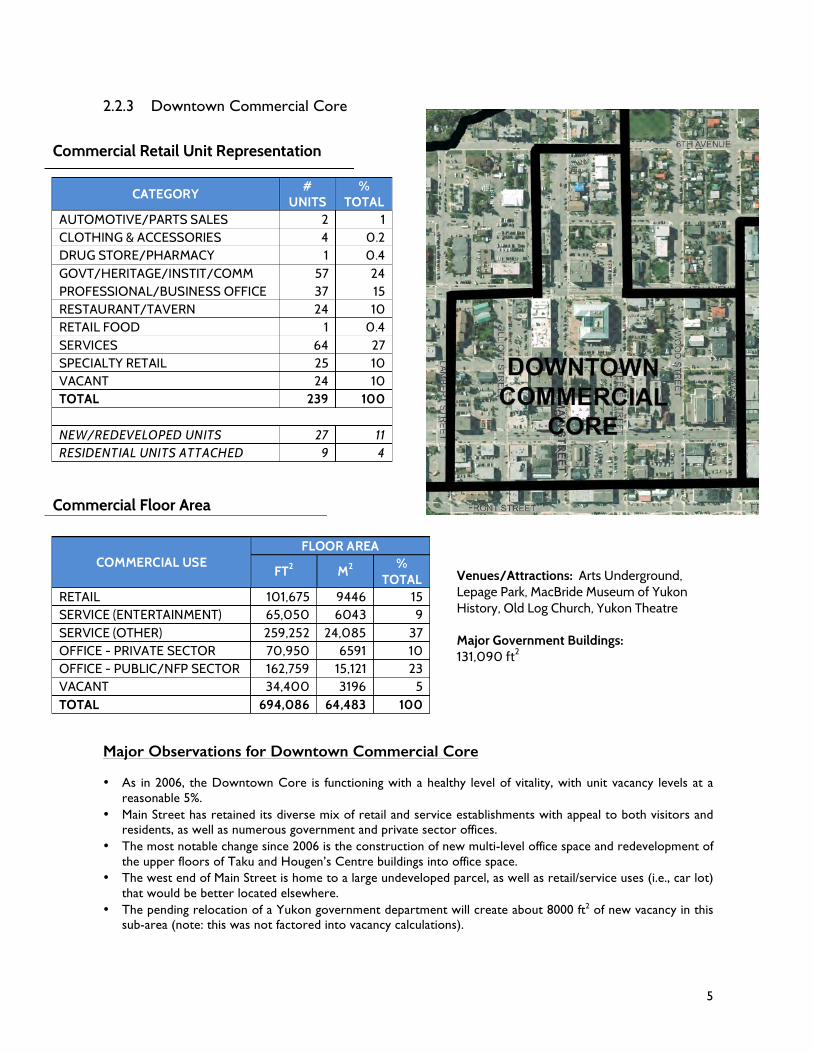
2.2.3 Downtown Commercial Core
Venues/Attractions: Arts Underground, Lepage Park, MacBride Museum of Yukon History, Old Log Church, Yukon Theatre Major Government Buildings: 131,090 ft2
Major Observations for Downtown Commercial Core • As in 2006, the Downtown Core is functioning with a healthy level of vitality, with unit vacancy levels at a
reasonable 5%. • Main Street has retained its diverse mix of retail and service establishments with appeal to both visitors and
residents, as well as numerous government and private sector offices. • The most notable change since 2006 is the construction of new multi-level office space and redevelopment of
the upper floors of Taku and Hougen’s Centre buildings into office space. • The west end of Main Street is home to a large undeveloped parcel, as well as retail/service uses (i.e., car lot)
that would be better located elsewhere. • The pending relocation of a Yukon government department will create about 8000 ft2 of new vacancy in this
sub-area (note: this was not factored into vacancy calculations).
COMMERCIAL USE FLOOR AREA
FT2 M2 %
TOTAL RETAIL 101,675 9446 15 SERVICE (ENTERTAINMENT) 65,050 6043 9 SERVICE (OTHER) 259,252 24,085 37 OFFICE - PRIVATE SECTOR 70,950 6591 10 OFFICE - PUBLIC/NFP SECTOR 162,759 15,121 23 VACANT 34,400 3196 5 TOTAL 694,086 64,483 100
CATEGORY #
UNITS %
TOTAL AUTOMOTIVE/PARTS SALES 2 1 CLOTHING & ACCESSORIES 4 0.2 DRUG STORE/PHARMACY 1 0.4 GOVT/HERITAGE/INSTIT/COMM 57 24 PROFESSIONAL/BUSINESS OFFICE 37 15 RESTAURANT/TAVERN 24 10 RETAIL FOOD 1 0.4 SERVICES 64 27 SPECIALTY RETAIL 25 10 VACANT 24 10 TOTAL 239 100
NEW/REDEVELOPED UNITS 27 11 RESIDENTIAL UNITS ATTACHED 9 4
Commercial Floor Area
Commercial Retail Unit Representation
6
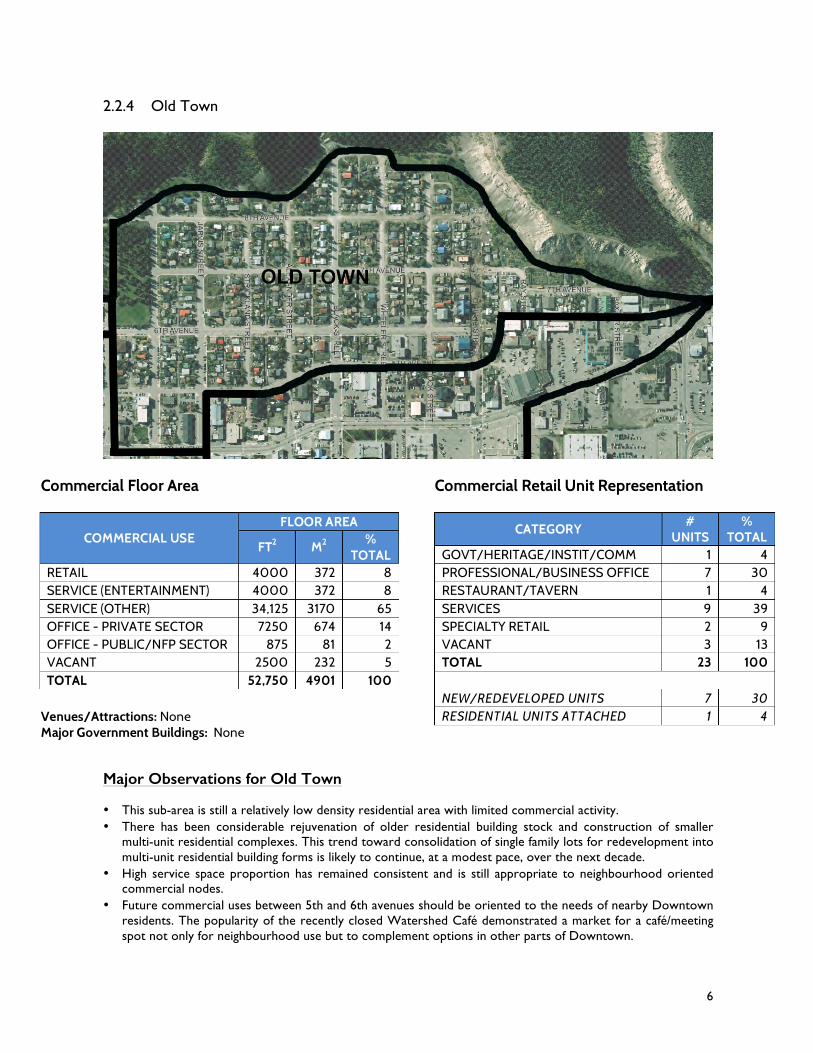
2.2.4 Old Town
Major Observations for Old Town • This sub-area is still a relatively low density residential area with limited commercial activity. • There has been considerable rejuvenation of older residential building stock and construction of smaller
multi-unit residential complexes. This trend toward consolidation of single family lots for redevelopment into multi-unit residential building forms is likely to continue, at a modest pace, over the next decade.
• High service space proportion has remained consistent and is still appropriate to neighbourhood oriented commercial nodes.
• Future commercial uses between 5th and 6th avenues should be oriented to the needs of nearby Downtown residents. The popularity of the recently closed Watershed Café demonstrated a market for a café/meeting spot not only for neighbourhood use but to complement options in other parts of Downtown.
COMMERCIAL USE FLOOR AREA
FT2 M2 %
TOTAL RETAIL 4000 372 8 SERVICE (ENTERTAINMENT) 4000 372 8 SERVICE (OTHER) 34,125 3170 65 OFFICE - PRIVATE SECTOR 7250 674 14 OFFICE - PUBLIC/NFP SECTOR 875 81 2 VACANT 2500 232 5 TOTAL 52,750 4901 100 Venues/Attractions: None Major Government Buildings: None
CATEGORY #
UNITS %
TOTAL GOVT/HERITAGE/INSTIT/COMM 1 4 PROFESSIONAL/BUSINESS OFFICE 7 30 RESTAURANT/TAVERN 1 4 SERVICES 9 39 SPECIALTY RETAIL 2 9 VACANT 3 13 TOTAL 23 100
NEW/REDEVELOPED UNITS 7 30 RESIDENTIAL UNITS ATTACHED 1 4
Commercial Floor Area Commercial Retail Unit Representation
7
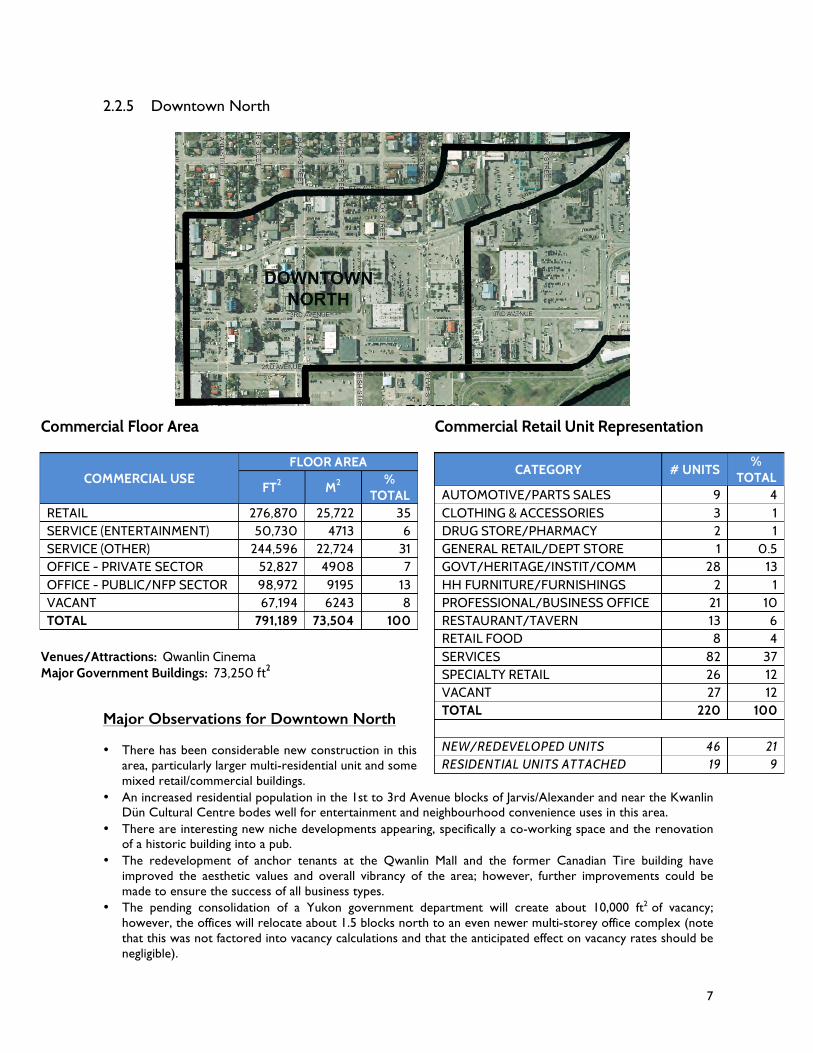
2.2.5 Downtown North
Major Observations for Downtown North • There has been considerable new construction in this
area, particularly larger multi-residential unit and some mixed retail/commercial buildings.
• An increased residential population in the 1st to 3rd Avenue blocks of Jarvis/Alexander and near the Kwanlin Dün Cultural Centre bodes well for entertainment and neighbourhood convenience uses in this area.
• There are interesting new niche developments appearing, specifically a co-working space and the renovation of a historic building into a pub.
• The redevelopment of anchor tenants at the Qwanlin Mall and the former Canadian Tire building have improved the aesthetic values and overall vibrancy of the area; however, further improvements could be made to ensure the success of all business types.
• The pending consolidation of a Yukon government department will create about 10,000 ft2 of vacancy; however, the offices will relocate about 1.5 blocks north to an even newer multi-storey office complex (note that this was not factored into vacancy calculations and that the anticipated effect on vacancy rates should be negligible).
COMMERCIAL USE FLOOR AREA
FT2 M2 %
TOTAL RETAIL 276,870 25,722 35 SERVICE (ENTERTAINMENT) 50,730 4713 6 SERVICE (OTHER) 244,596 22,724 31 OFFICE - PRIVATE SECTOR 52,827 4908 7 OFFICE - PUBLIC/NFP SECTOR 98,972 9195 13 VACANT 67,194 6243 8 TOTAL 791,189 73,504 100
Venues/Attractions: Qwanlin Cinema Major Government Buildings: 73,250 ft2
CATEGORY # UNITS %
TOTAL AUTOMOTIVE/PARTS SALES 9 4 CLOTHING & ACCESSORIES 3 1 DRUG STORE/PHARMACY 2 1 GENERAL RETAIL/DEPT STORE 1 0.5 GOVT/HERITAGE/INSTIT/COMM 28 13 HH FURNITURE/FURNISHINGS 2 1 PROFESSIONAL/BUSINESS OFFICE 21 10 RESTAURANT/TAVERN 13 6 RETAIL FOOD 8 4 SERVICES 82 37 SPECIALTY RETAIL 26 12 VACANT 27 12 TOTAL 220 100
NEW/REDEVELOPED UNITS 46 21 RESIDENTIAL UNITS ATTACHED 19 9
Commercial Floor Area Commercial Retail Unit Representation
8
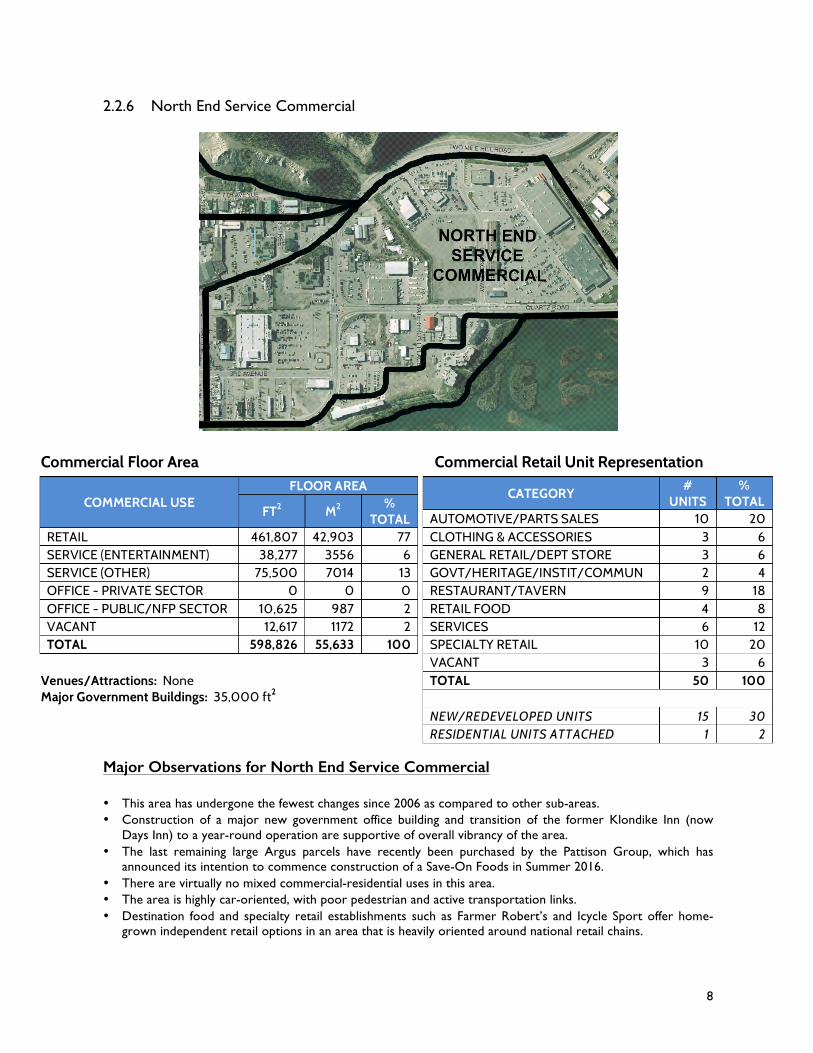
2.2.6 North End Service Commercial
Major Observations for North End Service Commercial • This area has undergone the fewest changes since 2006 as compared to other sub-areas. • Construction of a major new government office building and transition of the former Klondike Inn (now
Days Inn) to a year-round operation are supportive of overall vibrancy of the area. • The last remaining large Argus parcels have recently been purchased by the Pattison Group, which has
announced its intention to commence construction of a Save-On Foods in Summer 2016. • There are virtually no mixed commercial-residential uses in this area. • The area is highly car-oriented, with poor pedestrian and active transportation links. • Destination food and specialty retail establishments such as Farmer Robert’s and Icycle Sport offer home-
grown independent retail options in an area that is heavily oriented around national retail chains.
COMMERCIAL USE FLOOR AREA
FT2 M2 %
TOTAL RETAIL 461,807 42,903 77 SERVICE (ENTERTAINMENT) 38,277 3556 6 SERVICE (OTHER) 75,500 7014 13 OFFICE - PRIVATE SECTOR 0 0 0 OFFICE - PUBLIC/NFP SECTOR 10,625 987 2 VACANT 12,617 1172 2 TOTAL 598,826 55,633 100
Venues/Attractions: None Major Government Buildings: 35,000 ft2
CATEGORY #
UNITS %
TOTAL AUTOMOTIVE/PARTS SALES 10 20 CLOTHING & ACCESSORIES 3 6 GENERAL RETAIL/DEPT STORE 3 6 GOVT/HERITAGE/INSTIT/COMMUN 2 4 RESTAURANT/TAVERN 9 18 RETAIL FOOD 4 8 SERVICES 6 12 SPECIALTY RETAIL 10 20 VACANT 3 6 TOTAL 50 100
NEW/REDEVELOPED UNITS 15 30 RESIDENTIAL UNITS ATTACHED 1 2
Commercial Floor Area Commercial Retail Unit Representation
9
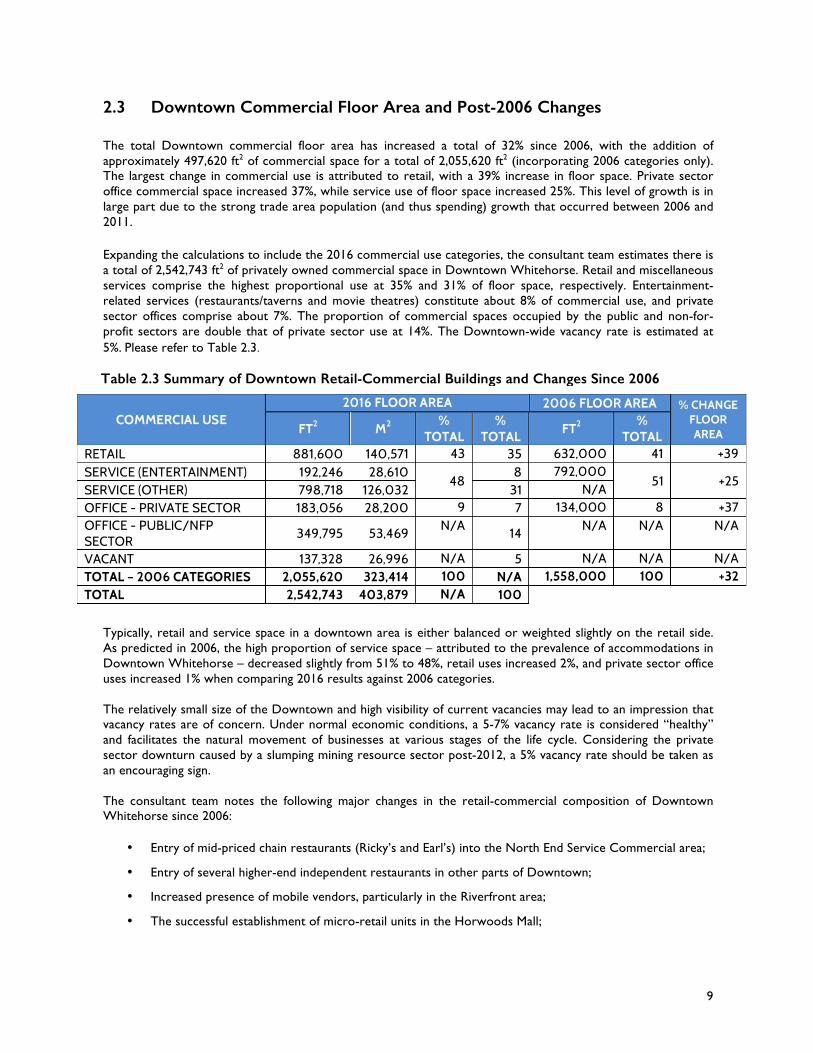
2.3 Downtown Commercial Floor Area and Post-2006 Changes The total Downtown commercial floor area has increased a total of 32% since 2006, with the addition of approximately 497,620 ft2 of commercial space for a total of 2,055,620 ft2 (incorporating 2006 categories only). The largest change in commercial use is attributed to retail, with a 39% increase in floor space. Private sector office commercial space increased 37%, while service use of floor space increased 25%. This level of growth is in large part due to the strong trade area population (and thus spending) growth that occurred between 2006 and 2011. Expanding the calculations to include the 2016 commercial use categories, the consultant team estimates there is a total of 2,542,743 ft2 of privately owned commercial space in Downtown Whitehorse. Retail and miscellaneous services comprise the highest proportional use at 35% and 31% of floor space, respectively. Entertainment-related services (restaurants/taverns and movie theatres) constitute about 8% of commercial use, and private sector offices comprise about 7%. The proportion of commercial spaces occupied by the public and non-for-profit sectors are double that of private sector use at 14%. The Downtown-wide vacancy rate is estimated at 5%. Please refer to Table 2.3.
Typically, retail and service space in a downtown area is either balanced or weighted slightly on the retail side. As predicted in 2006, the high proportion of service space – attributed to the prevalence of accommodations in Downtown Whitehorse – decreased slightly from 51% to 48%, retail uses increased 2%, and private sector office uses increased 1% when comparing 2016 results against 2006 categories. The relatively small size of the Downtown and high visibility of current vacancies may lead to an impression that vacancy rates are of concern. Under normal economic conditions, a 5-7% vacancy rate is considered “healthy” and facilitates the natural movement of businesses at various stages of the life cycle. Considering the private sector downturn caused by a slumping mining resource sector post-2012, a 5% vacancy rate should be taken as an encouraging sign. The consultant team notes the following major changes in the retail-commercial composition of Downtown Whitehorse since 2006:
• Entry of mid-priced chain restaurants (Ricky’s and Earl’s) into the North End Service Commercial area;
• Entry of several higher-end independent restaurants in other parts of Downtown;
• Increased presence of mobile vendors, particularly in the Riverfront area;
• The successful establishment of micro-retail units in the Horwoods Mall;
COMMERCIAL USE 2016 FLOOR AREA 2006 FLOOR AREA % CHANGE
FLOOR AREA FT2 M2
% TOTAL
% TOTAL
FT2 %
TOTAL RETAIL 881,600 140,571 43 35 632,000 41 +39 SERVICE (ENTERTAINMENT) 192,246 28,610
48 8 792,000
51 +25 SERVICE (OTHER) 798,718 126,032 31 N/A OFFICE - PRIVATE SECTOR 183,056 28,200 9 7 134,000 8 +37 OFFICE - PUBLIC/NFP SECTOR
349,795 53,469 N/A
14 N/A N/A N/A
VACANT 137,328 26,996 N/A 5 N/A N/A N/A TOTAL – 2006 CATEGORIES 2,055,620 323,414 100 N/A 1,558,000 100 +32 TOTAL 2,542,743 403,879 N/A 100
Table 2.3 Summary of Downtown Retail-Commercial Buildings and Changes Since 2006
10
• Increased presence of independent specialty retail stores, particularly in the Riverfront and Downtown Commercial Core sub-areas;
• Increased representation of independent food retail outlets, including bulk/health food stores, delicatessans, etc.;
• Redevelopment of the anchor tenants of the Qwanlin Mall and the former Canadian Tire building (now NVD Place), a key redevelopment opportunity noted in the 2006 study;
• Increased presence of ethnic restaurants since 2006, particularly in the Downtown Commercial Core;
• A geographic redistribution of commercial floor space in the Downtown, with the Downtown North sub-area space now exceeding that of the North End Service Commercial by about 200,000 ft2) and Downtown Riverfront business uses almost doubling;
• The emergence of alternatives to traditional office rental arrangements with (co)space, a non-profit co-working space targeted at local professionals and entrepreneurs; and,
• The establishment of “boutique” pubs/taverns separate from hotels, such as the Dirty Northern Public House and Woodcutter’s Blanket pursuant to the Liquor Act amendments (also a recommendation of the 2006 strategy).
The consultant team also notes that several major redevelopment opportunities identified in 2006 remain “in play”, including the following:
• Yukon Centre Mall (2nd Avenue and Cook Street)
• Jamieson Block
It is important to recognize that while redevelopment in and of itself is a highly positive trend, it is by no means a guarantee for success for landlords and/or tenants. Whether a space is newly built, redeveloped or other, attention must be paid to basic principles of retail planning. A mixed-use development should not treat retail and office spaces equally; retail uses have unique needs (please refer to Part 9.0 for best practices). Redeveloped properties in Whitehorse have met these principles to varying degrees. Speaking to broader changes in downtown Whitehorse, all of which directly or indirectly impact the retail and service sectors, the consultant team offers the following observations:
• A number of large government buildings have been constructed throughout the Downtown area since 2006, including the Health and Social Services/Community Services block in the Downtown North sub-area and Highways and Public Works/Health and Social Services building on Quartz Road in the North End Commercial Service sub-area. The result is a more even geographic distribution of professional/office uses throughout the Downtown and accompanying opportunity for nearby retail/service clusters, particularly restaurants/cafes.
• A significant building boom has occurred Downtown, particularly higher density mixed residential-
commercial spaces and “high-rise” multi-unit residential buildings (some of which have ground floor commercial space) in the Downtown North and Riverfront areas. Old Town has undergone a noticeable revitalization as well. The increased residential density of Downtown and revitalization of older single family dwellings signals confidence in Whitehorse’s centre as an attractive place to both live and work. These trends also optimize opportunities for expanding the retail-commercial sectors and the evening and weekend economies in particular.
• The increased desirability of Downtown as a walkable, compact residential area is likely to render some
commercial uses – particularly those with large space requirements - generally unsuitable for the area. Two prime examples are the remaining car lots located at the end of Main Street and on 4th Avenue; these may be better located in closer proximity to other lots in the North End Service area and/or on Range Road, a short drive from Downtown.
11
NORTH END SERVICE COMMERCIAL
COMMERCIAL USE FT2 M2 % TOTAL
RETAIL 461,807 42,903 77 SERVICE (ENTERTAINMENT) 38,277 3556 6 SERVICE (OTHER) 75,500 7014 13 OFFICE - PRIVATE SECTOR 0 0 0 OFFICE - PUBLIC/NFP SECTOR 10,625 987 2 VACANT 12,617 1172 2 TOTAL 598,826 55,633 100 DOWNTOWN NORTH RETAIL 276,870 25,722 35 SERVICE (ENTERTAINMENT) 43,230 4016 6 SERVICE (OTHER) 244,596 22,724 31 OFFICE - PRIVATE SECTOR 52,827 4908 7 OFFICE - PUBLIC/NFP SECTOR 98,972 9195 13 VACANT 67,194 6243 8 TOTAL 791,189 73,504 100
RIVERFRONT
COMMERCIAL USE FT2 M2 % TOTAL
RETAIL 13,123 1219 7 SERVICE (ENTERTAINMENT) 22,289 2071 12 SERVICE (OTHER) 85,494 7943 45 OFFICE - PRIVATE SECTOR 11,629 1080 6 OFFICE - PUBLIC/NFP SECTOR 41,564 3861 22 VACANT 14,717 1367 8 TOTAL 188,816 17,542 100 OLD TOWN RETAIL 4000 372 8 SERVICE (ENTERTAINMENT) 4000 372 8 SERVICE (OTHER) 34,125 3170 65 OFFICE - PRIVATE SECTOR 7250 674 14 OFFICE - PUBLIC/NFP SECTOR 875 81 2 VACANT 2500 232 5 TOTAL 52,750 4901 100
DOWNTOWN SOUTH
COMMERCIAL USE FT2 M2 % TOTAL
RETAIL 24,125 2241 11 SERVICE (ENTERTAINMENT) 11,900 1106 5 SERVICE (OTHER) 99,751 9267 46 OFFICE - PRIVATE SECTOR 40,400 3753 19 OFFICE - PUBLIC/NFP SECTOR 35,000 3252 16 VACANT 5900 548 3 TOTAL 217,076 20,167 100 DOWNTOWN COMMERCIAL CORE RETAIL 101,675 9446 15 SERVICE (ENTERTAINMENT) 65,050 6043 8 SERVICE (OTHER) 259,252 24085 38 OFFICE - PRIVATE SECTOR 70,950 6591 10 OFFICE - PUBLIC/NFP SECTOR 162,759 15,121 23 VACANT 34,400 3196 5 TOTAL 694,086 64,483 100
12
3.0 ARTS & ENTERTAINMENT INVENTORY
Arts, culture and entertainment play a prominent role in quality of life for Whitehorse residents and contribute to the economic and social resilience of the community. The growing recognition of the social and economic contributions of arts and entertainment is reflected in numerous City plans, policies and strategies in recent years, including the Community Economic Development Strategy and Strategic Sustainability Plan. The following sections explore the current status of the arts and entertainment sector and its relationship to Downtown Whitehorse. 3.1 Arts and Entertainment Sector
Structure
The Yukon – and by extension, Whitehorse – is a uniquely artistic place. A 2014 study by Hill Strategies found that the Yukon had the highest percentage of its labour force employed in cultural occupations as compared to other provinces and territories (4.62% versus the national average of 3.82%). A 2004 study1 of the cultural sector for the Government of Yukon had pegged labour force participation in the cultural industries at 4.2%; it further noted 10-year growth over 1994 of 33%. The provision of arts and entertainment in Whitehorse is the domain of a diverse mix of private, public and non-for-profit organizations, individual artists and performers, and venues and attractions. The following sections provide a brief overview of the key players. 3.1.1 Artists and Performers According to Statistics Canada, “artist occupations” include the following: • Actors and comedians • Musicians and singers • Artists and craftspersons • Authors and writers
• Other performers (including circus performers, magicians, models, puppeteers, etc.)
• Conductors, composers and arrangers • Dancers
• Producers, directors, choreographers, and related occupations • Visual artists
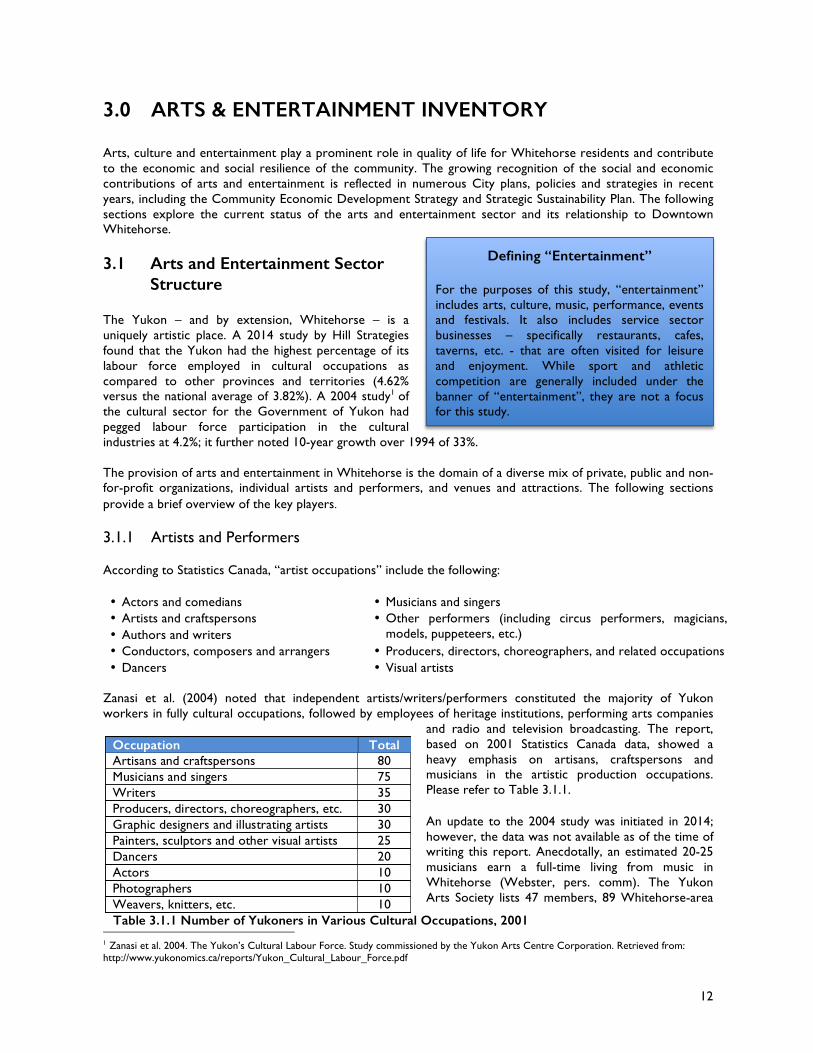
Zanasi et al. (2004) noted that independent artists/writers/performers constituted the majority of Yukon workers in fully cultural occupations, followed by employees of heritage institutions, performing arts companies
and radio and television broadcasting. The report, based on 2001 Statistics Canada data, showed a heavy emphasis on artisans, craftspersons and musicians in the artistic production occupations. Please refer to Table 3.1.1. An update to the 2004 study was initiated in 2014; however, the data was not available as of the time of writing this report. Anecdotally, an estimated 20-25 musicians earn a full-time living from music in Whitehorse (Webster, pers. comm). The Yukon Arts Society lists 47 members, 89 Whitehorse-area
1 Zanasi et al. 2004. The Yukon’s Cultural Labour Force. Study commissioned by the Yukon Arts Centre Corporation. Retrieved from: http://www.yukonomics.ca/reports/Yukon_Cultural_Labour_Force.pdf
Defining “Entertainment”
For the purposes of this study, “entertainment” includes arts, culture, music, performance, events and festivals. It also includes service sector businesses – specifically restaurants, cafes, taverns, etc. - that are often visited for leisure and enjoyment. While sport and athletic competition are generally included under the banner of “entertainment”, they are not a focus for this study.
Occupation Total Artisans and craftspersons 80 Musicians and singers 75 Writers 35 Producers, directors, choreographers, etc. 30 Graphic designers and illustrating artists 30 Painters, sculptors and other visual artists 25 Dancers 20 Actors 10 Photographers 10 Weavers, knitters, etc. 10
Table 3.1.1 Number of Yukoners in Various Cultural Occupations, 2001
13
artists are promoted on the Yukon Department of Tourism and Culture’s Yukon Artist Guide, and 26 artists are featured on the Yukon Artists at Work website.
3.1.2 Government Organizations Public governments play a significant role in facilitating arts and entertainment in Whitehorse. Yukon artists enjoy the highest level of per capita government funding in Canada (Burnet, pers. comm). The Government of Yukon is the primary funder of arts in the Yukon, and by extension, Whitehorse. The Arts Section of the Yukon Department of Tourism and Culture administers about $3.84 million in funding annually via the application-driven Arts Fund, Yukon Cultural Industries Training Fund, Advanced Artist Award, Culture Quest, and Touring Artist Fund and core funding for the Yukon Arts Centre and The Old Fire Hall via the Yukon Arts Centre Corporation. The territorial government is a direct buyer of Yukon art via its Yukon Permanent Art Collection. The government also provides funding support to the territory’s film and sound recording artists via the Yukon Film and Sound Commission and to the heritage sector via the Museums Unit. The Arts Act provides broad legislative support for the arts and public appreciation of them. The City of Whitehorse has an Arts Policy that mandates that 1% of the capital costs of municipal buildings must be allocated towards the development of public art. The City administers the Recreation and Festivals/Special Events grants, the Recreation stream including artistic and cultural endeavours. Funding amounts vary from year-to-year: the Recreation Grant awarded $100,587 and $213,739 in 2012 and 2014, respectively, and the Festivals/Special Events Grant awarded $108,325 and $20,100 in the same years. The Parks and Trails Branch lends significant in-kind support to various community events such as the Yukon Sourdough Rendezvous Festival. The City also owns and maintains Lepage Park, the premier outdoor music venue in Downtown Whitehorse. Kwanlin Dün First Nation has assumed a leadership role in the arts and culture sector of Whitehorse as the owner and manager of the Kwanlin Dün Cultural Centre, a waterfront tourism attraction and state-of-the-art multi-room venue located on the waterfront. 3.1.3 Not-for-Profit Organizations The Whitehorse arts and entertainment calendar is primarily driven by the activities of a wide range of not-for-profit (NFP) organizations. A brief overview of key NFP players in Whitehorse is provided in Table 3.1.3. Table 3.1.3 Key Not-for-Profit Organizations Active in Whitehorse Arts and Entertainment
Category Not-for-Profit Organizations Visual Arts and Crafts Northern Fibres Guild, Yukon Artists at Work, Yukon Arts Society, Yukon Crafts
Society Theatre Gwaandak Theatre, Guild Society, Nakai Theatre, Yukon Educational Theatre
First Nation Culture Northern Expressions Cultural Society, Yukon First Nation Cultural and Tourism Association
Music Frostbite Music Society, Jazz Yukon, Music Yukon, Whitehorse Pop Choir, Whitehorse Community Choir, Yukon Folk Society, Yukon Women in Music
Dance Breakdancing Yukon Society, Extremely Moving Youth Society, Northern Lights School of Dance
Film Screen Producers Yukon Association, Yukon Film Society
Heritage/Attractions MacBride Museum, Miles Canyon Historical Railway Society, Old Log Church, Yukon Historical and Museums Association, Yukon Transportation Museum
NFPs perform a wide range of functions, including developing local artists, staging performances and events, providing education and training, managing venues and attractions, and creating opportunities for Whitehorse residents and visitors to view and purchase local arts and crafts. In this latter function, NFPs overlap - and even compete - with private sector retailers.
14
3.1.4 Private Sector The private sector tends to operate in the background of the Whitehorse arts and entertainment scene, but its role is a critical one nonetheless. The following is a brief overview of the various roles the private sector plays: Sponsorship – Sponsorship of arts and cultural performances, events, and festivals is one of the most vital roles that the private sector plays. Most event posters feature numerous sponsors ranging from larger companies to small consultancies. Food and beverage – Restaurants and taverns provide the food and beverage portion of the entertainment spectrum in Whitehorse. They also provide an important venue for local musical performers, with some taverns featuring musical acts on a frequent basis and restaurants creating weekly musical theme nights. Retailing - A wide range of “made in Yukon” arts and cultural products – including CDs, books, fine art, and crafts – are retailed throughout Downtown Whitehorse. The Downtown Commercial Core is the premiere destination for “made in Yukon” arts and culture-related product; however, there are a few other nodes such as the Northern Expressions Cultural Society and Fireweed Market retail outlets located in the Downtown North and North End Service Commercial areas, respectively. Venues – The Yukon Convention Centre is a privately owned and operated venue that is used for various entertainment-related events. Arts Underground is a privately owned space that has been donated by the Hougen family for use by the Yukon Arts Society as a community arts workshop space and gallery. 3.2 Venues and Attractions Venues and attractions are in many respects the “backbone” of Whitehorse arts and entertainment, typically providing the space and opportunity through which both Yukoners and visitors interact with local artists and performers. Please refer to Table 3.2.1 for an overview of Downtown Whitehorse venues and attractions. Table 3.2.1 Downtown Venues and Attractions Arts Underground Studio and gallery space on Main Street; home to the Yukon Arts Society and donated
by the Hougen family Kwanlin Dun Cultural Centre
Multi-room venue with a range of spaces that can accommodate up to 450 people. Features displays of First Nation arts and crafts.
Lepage Park Outdoor performance venue, completed with tiered seating and stage; home to Arts in the Park in summer
MacBride Museum Located on Front Street, the only heritage attraction in Whitehorse open year-round
Old Log Church Historic church open for visitors in summer and by appointment in winter
Roundhouse & Waterfront Trolley
The waterfront trolley operates between Rotary Park and Spook Creek station from mid-May to mid-September. The Roundhouse is a historic building on Front Street that serves as the base of trolley operations but is being increasingly used as a venue.
S.S. Klondike Historic sternwheeler managed by Parks Canada via concession each summer
Shipyards Park City of Whitehorse operated park where virtually all major festivals, and the weekly (in summer) Fireweed Market are staged
The Old Fire Hall Community venue on Front Street managed by the Yukon Arts Centre Corporation; can accommodate 80-120
Yukon Convention Centre
Large venue managed by Coast Hotels/Northern Vision Development
Yukon Visitor Information Centre
Located on the waterfront, the VIC features a range of interpretive displays and is a key destination for visitors seeking out advice and information.
Other venues and attractions are located outside the Downtown area are shown in Table 3.2.2 as follows:
15
Table 3.2.2 Venues and Attractions in Other Parts of Whitehorse Beringia Centre A Yukon government operated attraction focusing on Ice Age-era Beringia. Open
Sunday and Monday during winter, it includes a theatre that is frequently booked for community events.
Copperbelt Railway and Mining Museum
An attraction focusing on Whitehorse/Yukon mining and rail history. Open from mid-May to mid-September.
Guild Hall Community theatre space with attached dance school in Porter Creek
Yukon Arts Centre Yukon’s premier arts and cultural facility; includes the mainstage theatre with 428 seats, gallery, and studio space
Yukon Transportation Museum
Focusing on the Yukon’s transportation heritage, the museum also functions as a venue for various community events. Open Sunday and Monday during winter.
It is important to note that both the Kwanlin Dün Cultural Centre and Yukon Convention Centre are typically busiest during the daytime with government-related conferences, workshops and meetings. A very small percentage of Yukon Convention Centre bookings are entertainment-related, whereas about 70% of Cultural Centre bookings are (Robinson, pers. comm). Both reported having considerable evening capacity available.
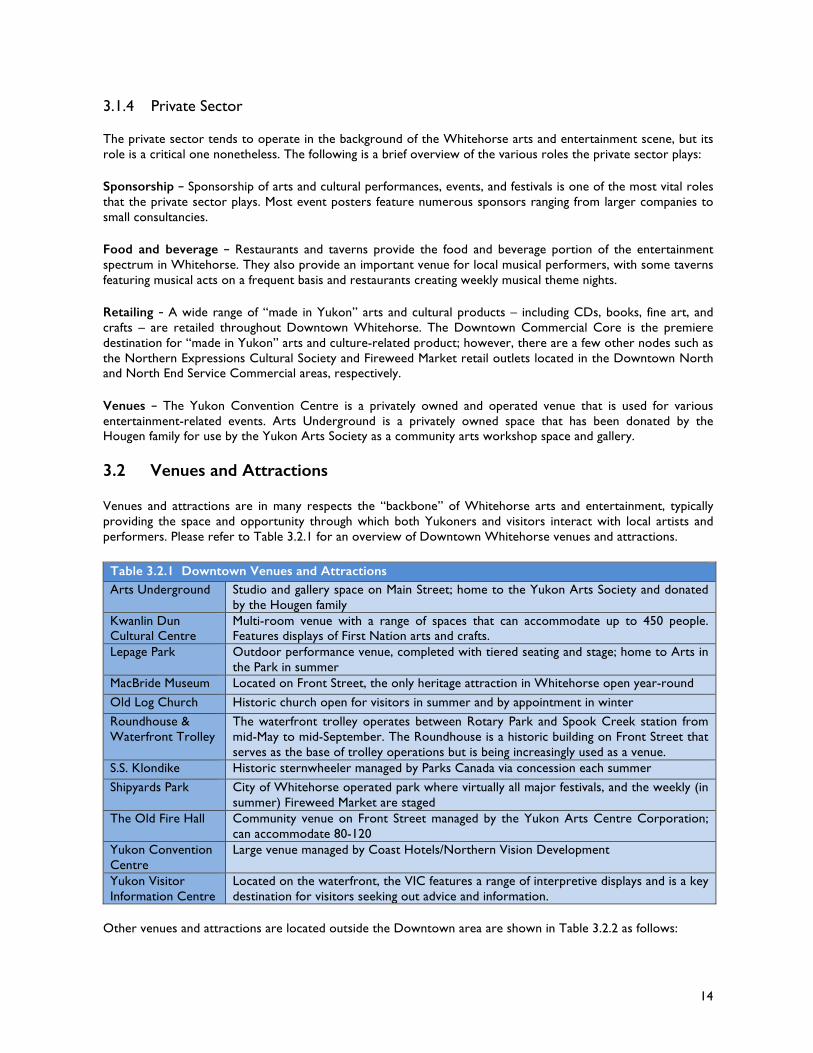
3.3 Arts and Entertainment Options 3.3.1 Regular Programming and
Events A look at the various Whitehorse arts and entertainment calendars in any given week in will typically yield a broad selection of options. Stakeholders in the arts and entertainment community spoke to a shift in recent years: whereas entertainment used to be focused around the weekends, it is now typical to have multiple options on any day of the week. The following provides a “snapshot” of regular programming at a few key arts and cultural venues in Whitehorse:
Yukon Arts Centre – In 2014/15, the Yukon Arts Centre mainstage and studio were in use a total of 259 and 176 days, respectively. The mainstage was utilized for 43 ticketed YAC events, 75 ticketed events hosted by others, 51 non-ticketed events and 90 rehearsals and technical sessions. The studio was rented for 145 days; only 31 days were dedicated to YAC use. The Old Fire Hall – In 2014/15, The Old Fire Hall hosted 179 rental dates during the year, including 33 musical events, 30 theatre show dates, 14 retail arts and crafts dates, 13 film screenings, 13 community events, 9 talks, and several book launches. Wharf – 2014/15 activity included 26 presentations by individual groups, works by 3 visual artists, and 64 performances, workshop and festival events. Lepage Park – Via the Arts in the Park program, 66 performances and 11 visual artist displays took place from May to August in 2015.
Photo credit: Derek Crowe
16
3.3.2 Festivals Festivals have long been a mainstay of the Whitehorse arts and entertainment scene. Some have come and gone, most notably the International Storytelling Festival that rose to prominence before folding in the mid-2000s. Others continue to adapt and evolve to accommodate the changing tastes of Yukon audiences. The following list includes a few of the more prominent festivals held throughout the year: Adäka Festival – Adäka started in 2011 and has since grown to a week-long festival held in late June and featuring over 150 First Nation artists and performers. The festival touches upon many disciplines, including music, dance, storytelling, traditional arts and crafts and offers both performances and hands-on learning opportunities. Available Light Film Festival - The Available Light Film Festival started in 2004 with 17 events and an admission of 1000 and has since grown to 40 events and 6500 admissions in 2016. The week-long festival, held in the middle of February each year, still appeals to locals primarily, but is attracting increasing national interest and attendance.
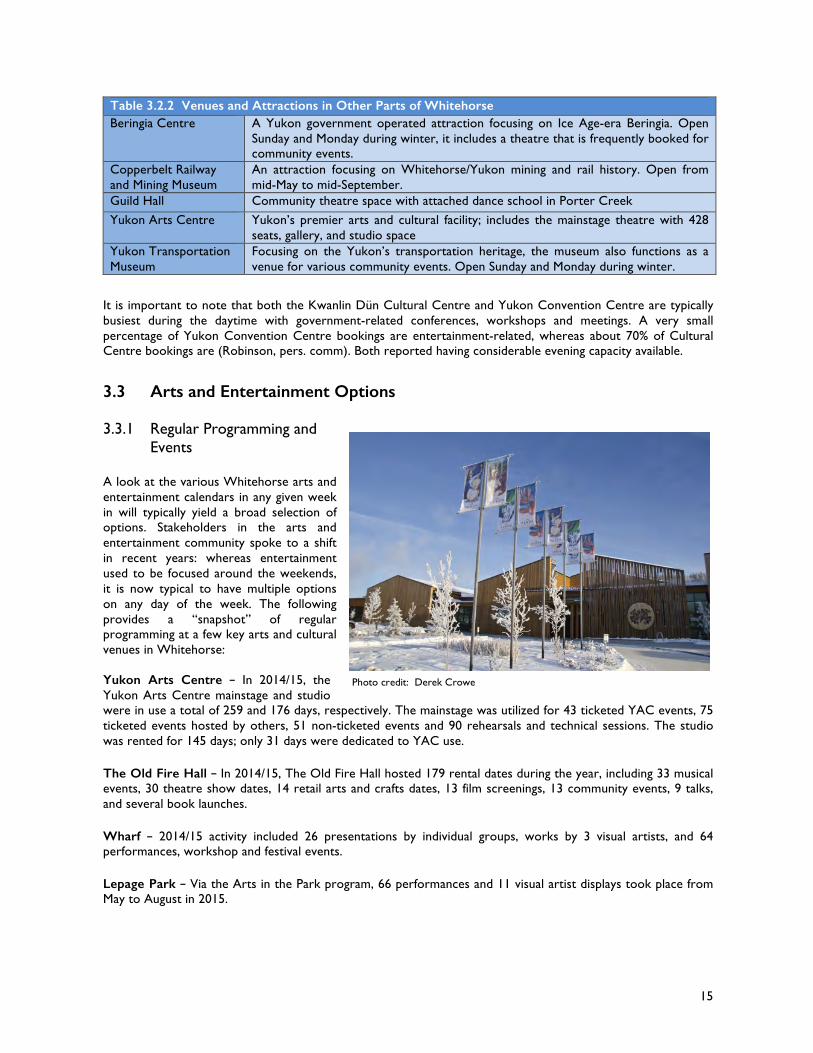
Culture Days – This newer 3-day celebration in late September is part of a national initiative aimed at “creating, participating, and sharing” culture. 35 events were hosted at various Whitehorse heritage attractions, artist studios, retailers, parks, and public sector spaces in 2015. Nuit Blanche – Whitehorse’s contribution to the international Nuit Blanche movement was a 12-hour overnight festival featuring over a dozen artist installations, performances and screenings, located at various indoor and outdoor venues throughout the Downtown.
Yukon Sourdough Rendezvous – The origins of Rendezvous date back to the 1940s-era Whitehorse Winter Carnival, but it officially marked its 50th anniversary in 2014. The 10-day festival, held in late February, includes many Gold Rush themed events, talent shows, musical performances, parade, contests, and an air show. Frostbite Music Festival – Frostbite was a veritable community institution for many years, offering a weekend of musical performers, including some bigger names from Canada and United States. Frostbite took a two-year hiatus in 2014 and 2015 and returned for its 36th edition in 2016, with a new focus on showcasing local artists. Sunstroke Music Festival – This weekend long music festival, featuring mostly local acts in conjunction with a few imports, hosted its 10th (and reportedly final) edition in in mid-June 2015. There are smaller-scale festivals and celebrations throughout the year, including the Blue Feather Music Festival, Yukon Quest International Sled Dog Race’s “QuestFest”, the Yukon Beer Festival, Culture Days, National Aboriginal Day, Canada Day, and annual events such as the “Burning Away the Winter Blues” parade, Santa Claus parade, etc.
Photo credit: Government of Yukon
17
4.0 BUSINESS COMMUNITY PERSPECTIVES
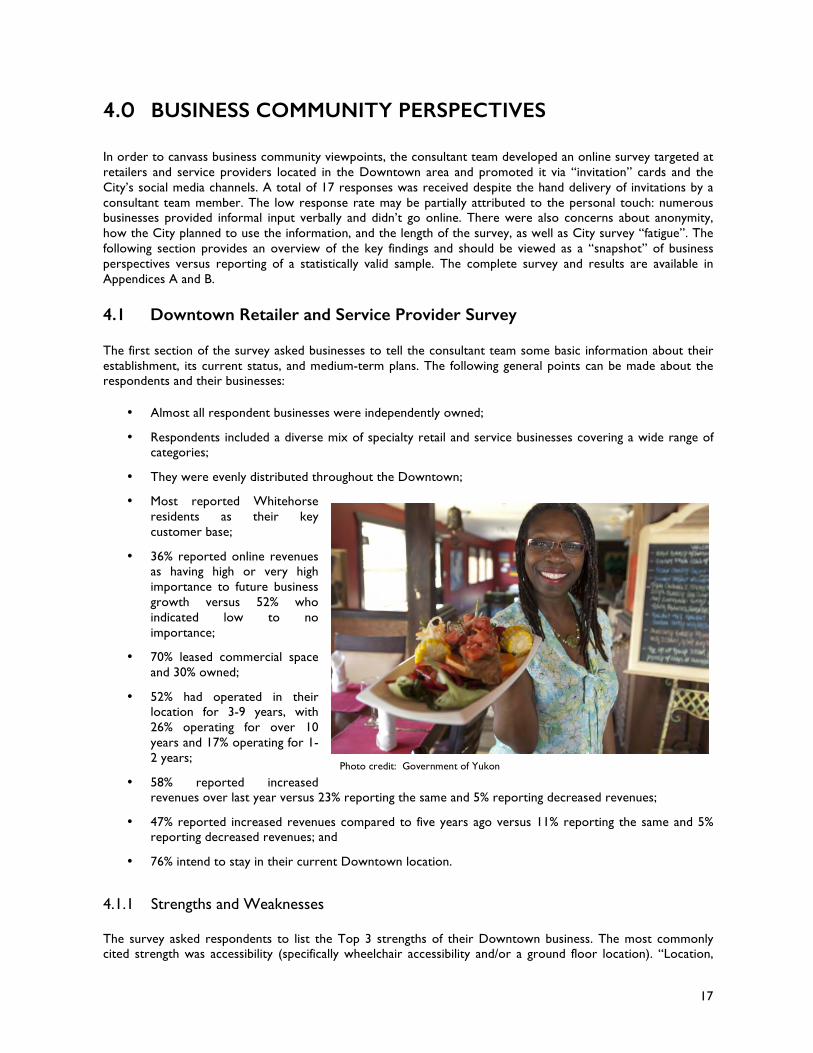
In order to canvass business community viewpoints, the consultant team developed an online survey targeted at retailers and service providers located in the Downtown area and promoted it via “invitation” cards and the City’s social media channels. A total of 17 responses was received despite the hand delivery of invitations by a consultant team member. The low response rate may be partially attributed to the personal touch: numerous businesses provided informal input verbally and didn’t go online. There were also concerns about anonymity, how the City planned to use the information, and the length of the survey, as well as City survey “fatigue”. The following section provides an overview of the key findings and should be viewed as a “snapshot” of business perspectives versus reporting of a statistically valid sample. The complete survey and results are available in Appendices A and B. 4.1 Downtown Retailer and Service Provider Survey The first section of the survey asked businesses to tell the consultant team some basic information about their establishment, its current status, and medium-term plans. The following general points can be made about the respondents and their businesses:
• Almost all respondent businesses were independently owned;
• Respondents included a diverse mix of specialty retail and service businesses covering a wide range of categories;
• They were evenly distributed throughout the Downtown;
• Most reported Whitehorse residents as their key customer base;
• 36% reported online revenues as having high or very high importance to future business growth versus 52% who indicated low to no importance;
• 70% leased commercial space and 30% owned;
• 52% had operated in their location for 3-9 years, with 26% operating for over 10 years and 17% operating for 1-2 years;
• 58% reported increased revenues over last year versus 23% reporting the same and 5% reporting decreased revenues;
• 47% reported increased revenues compared to five years ago versus 11% reporting the same and 5% reporting decreased revenues; and
• 76% intend to stay in their current Downtown location.
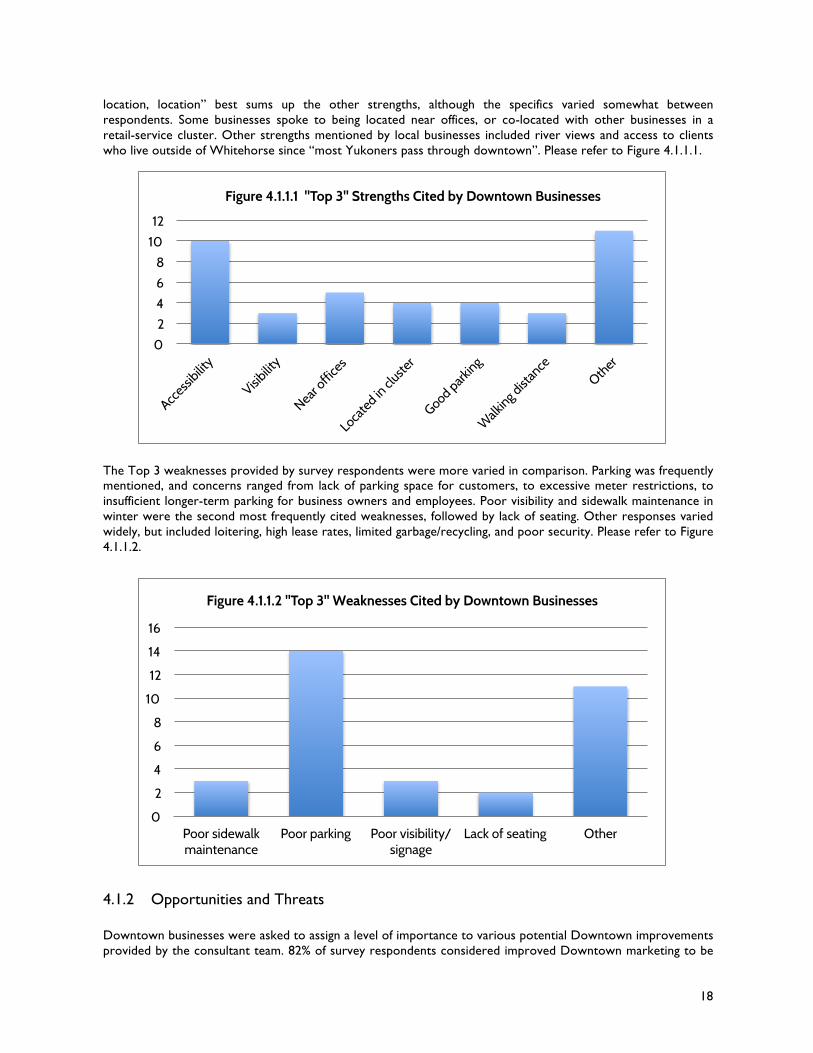
4.1.1 Strengths and Weaknesses The survey asked respondents to list the Top 3 strengths of their Downtown business. The most commonly cited strength was accessibility (specifically wheelchair accessibility and/or a ground floor location). “Location,
Photo credit: Government of Yukon
18
location, location” best sums up the other strengths, although the specifics varied somewhat between respondents. Some businesses spoke to being located near offices, or co-located with other businesses in a retail-service cluster. Other strengths mentioned by local businesses included river views and access to clients who live outside of Whitehorse since “most Yukoners pass through downtown”. Please refer to Figure 4.1.1.1.
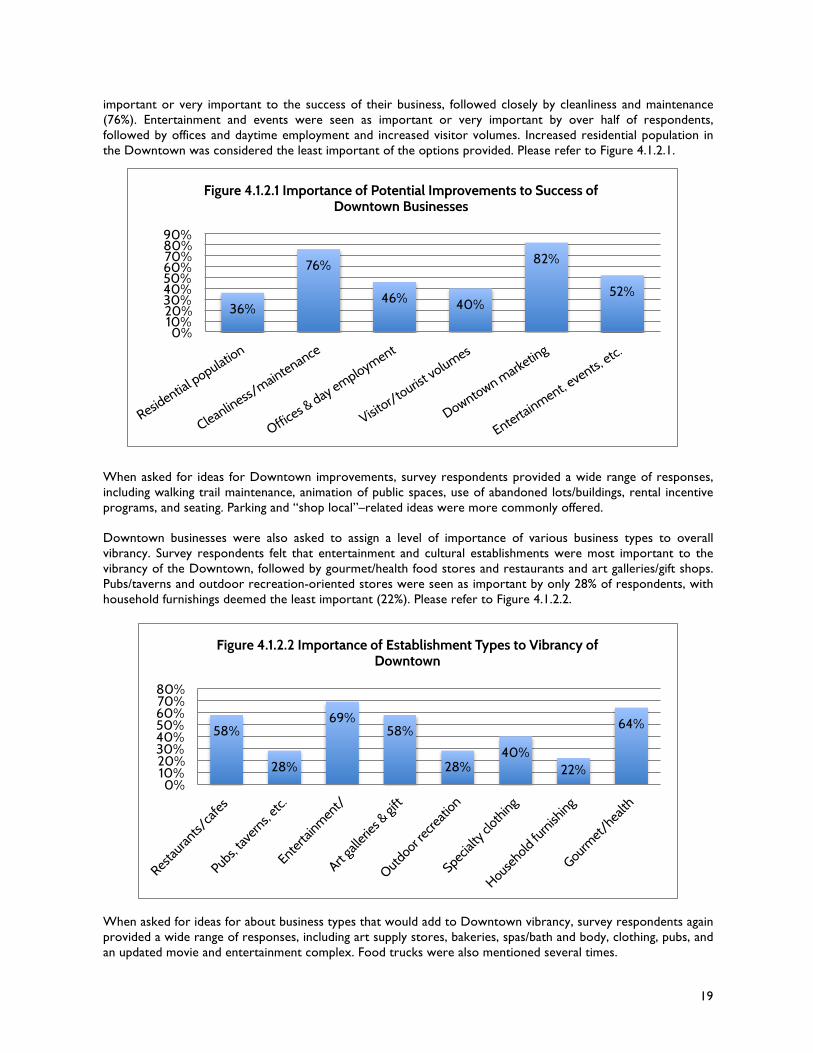
The Top 3 weaknesses provided by survey respondents were more varied in comparison. Parking was frequently mentioned, and concerns ranged from lack of parking space for customers, to excessive meter restrictions, to insufficient longer-term parking for business owners and employees. Poor visibility and sidewalk maintenance in winter were the second most frequently cited weaknesses, followed by lack of seating. Other responses varied widely, but included loitering, high lease rates, limited garbage/recycling, and poor security. Please refer to Figure 4.1.1.2. 4.1.2 Opportunities and Threats Downtown businesses were asked to assign a level of importance to various potential Downtown improvements provided by the consultant team. 82% of survey respondents considered improved Downtown marketing to be
0
2
4
6
8
10
12
14
16
Poor sidewalk maintenance
Poor parking Poor visibility/signage
Lack of seating Other
Figure 4.1.1.2 "Top 3" Weaknesses Cited by Downtown Businesses
0
2
4
6
8
10
12
Figure 4.1.1.1 "Top 3" Strengths Cited by Downtown Businesses
19
important or very important to the success of their business, followed closely by cleanliness and maintenance (76%). Entertainment and events were seen as important or very important by over half of respondents, followed by offices and daytime employment and increased visitor volumes. Increased residential population in the Downtown was considered the least important of the options provided. Please refer to Figure 4.1.2.1.
When asked for ideas for Downtown improvements, survey respondents provided a wide range of responses, including walking trail maintenance, animation of public spaces, use of abandoned lots/buildings, rental incentive programs, and seating. Parking and “shop local”–related ideas were more commonly offered. Downtown businesses were also asked to assign a level of importance of various business types to overall vibrancy. Survey respondents felt that entertainment and cultural establishments were most important to the vibrancy of the Downtown, followed by gourmet/health food stores and restaurants and art galleries/gift shops. Pubs/taverns and outdoor recreation-oriented stores were seen as important by only 28% of respondents, with household furnishings deemed the least important (22%). Please refer to Figure 4.1.2.2. When asked for ideas for about business types that would add to Downtown vibrancy, survey respondents again provided a wide range of responses, including art supply stores, bakeries, spas/bath and body, clothing, pubs, and an updated movie and entertainment complex. Food trucks were also mentioned several times.
58%
28%
69% 58%
28% 40%
22%
64%
0% 10% 20% 30% 40% 50% 60% 70% 80%
Figure 4.1.2.2 Importance of Establishment Types to Vibrancy of Downtown
36%
76%
46% 40%
82%
52%
0% 10% 20% 30% 40% 50% 60% 70% 80% 90%
Figure 4.1.2.1 Importance of Potential Improvements to Success of Downtown Businesses
20
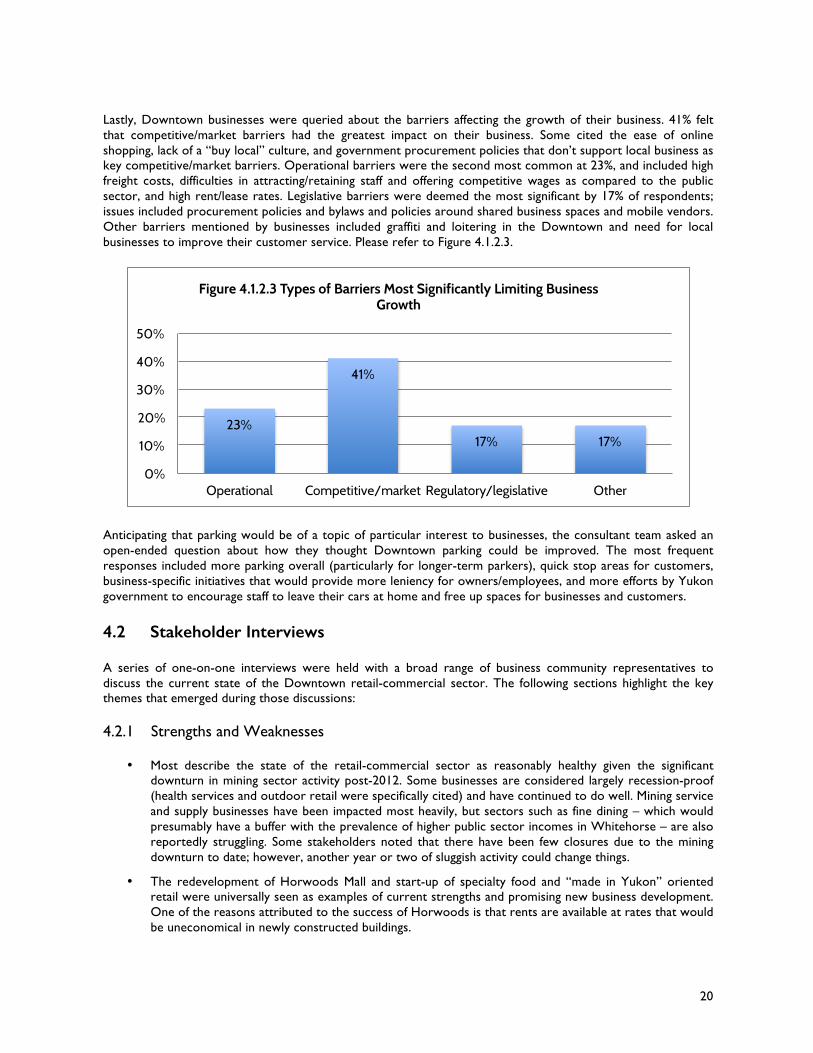
Lastly, Downtown businesses were queried about the barriers affecting the growth of their business. 41% felt that competitive/market barriers had the greatest impact on their business. Some cited the ease of online shopping, lack of a “buy local” culture, and government procurement policies that don’t support local business as key competitive/market barriers. Operational barriers were the second most common at 23%, and included high freight costs, difficulties in attracting/retaining staff and offering competitive wages as compared to the public sector, and high rent/lease rates. Legislative barriers were deemed the most significant by 17% of respondents; issues included procurement policies and bylaws and policies around shared business spaces and mobile vendors. Other barriers mentioned by businesses included graffiti and loitering in the Downtown and need for local businesses to improve their customer service. Please refer to Figure 4.1.2.3.
Anticipating that parking would be of a topic of particular interest to businesses, the consultant team asked an open-ended question about how they thought Downtown parking could be improved. The most frequent responses included more parking overall (particularly for longer-term parkers), quick stop areas for customers, business-specific initiatives that would provide more leniency for owners/employees, and more efforts by Yukon government to encourage staff to leave their cars at home and free up spaces for businesses and customers. 4.2 Stakeholder Interviews A series of one-on-one interviews were held with a broad range of business community representatives to discuss the current state of the Downtown retail-commercial sector. The following sections highlight the key themes that emerged during those discussions: 4.2.1 Strengths and Weaknesses
• Most describe the state of the retail-commercial sector as reasonably healthy given the significant downturn in mining sector activity post-2012. Some businesses are considered largely recession-proof (health services and outdoor retail were specifically cited) and have continued to do well. Mining service and supply businesses have been impacted most heavily, but sectors such as fine dining – which would presumably have a buffer with the prevalence of higher public sector incomes in Whitehorse – are also reportedly struggling. Some stakeholders noted that there have been few closures due to the mining downturn to date; however, another year or two of sluggish activity could change things.
• The redevelopment of Horwoods Mall and start-up of specialty food and “made in Yukon” oriented retail were universally seen as examples of current strengths and promising new business development. One of the reasons attributed to the success of Horwoods is that rents are available at rates that would be uneconomical in newly constructed buildings.
23%
41%
17% 17%
0%
10%
20%
30%
40%
50%
Operational Competitive/market Regulatory/legislative Other
Figure 4.1.2.3 Types of Barriers Most Significantly Limiting Business Growth
21
• Some redevelopments were originally intended for the retail-service sectors, but the current economic climate and high lease rates narrowed the field of eventual tenants largely to the public sector. Lease rates are generally down 10-15% over the past few years.
• Whitehorse’s quality of life was seen by many as a competitive advantage in attracting new entrepreneurs and businesses to the community.
• Yukon’s large public sector is seen as a simultaneous strength and weakness to the local economy. The government has a major influence on the private sector through its procurement policies. It was also noted that government also has significant influence as the primary tenant for commercial units in Whitehorse. Pending vacancies resulting from a Yukon government department consolidation will be quite visible in the Downtown Commercial Core.
• While Main Street may appear to be vibrant, some stressed the risk of complacency. Main Street was referred to as the “heart of the city”, and some stakeholders felt that proactive measures must be taken to preserve and protect it. The lack of parking was seen as a primary threat to the viability of Main Street businesses, particularly service-oriented ones that require longer parking times. It was also noted that Main Street has an abundance of office space where retail and service businesses would presumably be located if the economy were not so heavily weighted towards the public sector.
• Increased residential density in the Downtown was universally regarded as a strength by stakeholders. Some spoke to the importance of the City expanding on this trend and Whitehorse developing a stock of smaller alternative dwelling units that provide affordable options for employees of the private sector and aspiring entrepreneurs attracted to Whitehorse for its quality of life amenities. Some also felt that issues such as graffiti, vandalism and break-ins could only benefit from an increased number of “eyes” on the Downtown, as would a night-time and weekend economy based around arts and entertainment. The City’s leadership in improving active transportation and Downtown trails was also lauded; however, some cautioned that such future-focused measures shouldn’t be pursued in the absence of accompanying measures to assist businesses with the parking pressures they face in the present.
4.2.2 Opportunities and Threats
• Virtually all interviewees spoke to an overarching Whitehorse culture that is seen as somewhat unsupportive of private sector success and entrepreneurialism. They spoke to complacency and risk aversion on the part of governments, a disconnect for government employees who oppose resource development and criticize local businesses, and a growing reputation of the Yukon as being a business “unfriendly” jurisdiction.
• New commercial developments pose a “Catch 22”: very high construction costs require accompanying high lease rates and pose a barrier to small businesses.
• Parking was considered a challenge by most interviewees, and some even delved into the recent and not-so-recent past to substantiate their claims that the City has mishandled the issue. There were references to past City promises for parkades at 2nd and Steele and 3rd and Steele, and the reported promise made by the City when metering was first introduced to utilize the proceeds for a larger, cost-intensive parking “solution” such as a parkade.
• Several interviewees spoke to economic leakage from both Whitehorse and the Yukon. Increased communications and messaging about buying local was seen as a potential remedy. When asked about a website promoting the downtown, reaction was mixed: some questioned the capacity to keep such a site current, and others questioned the need when Downtown is effectively the only place to shop! There was some interest expressed in a broader resident attraction/investment website that would market Whitehorse more broadly.
• Perceptions of the City and its leadership vis-à-vis the private sector were mixed. Some commented that the City seemed to be perpetually planning and was bogged down with large processes where smaller, more incremental actions would be more impactful. Some felt the City should tackle more pilot projects, testing and refining based on results, The City’s recent decision to pursue curbside recycling
22
was cited on several occasions as being symbolic of an attitude that is unfriendly towards local business (even though the City intends to deliver the service via a private sector contract). Even seemingly benign actions such as moving festivals to Shipyards Park were perceived by some to be driven by City administrators hoping to reduce their workload versus an organization attuned to the interests of the business community.
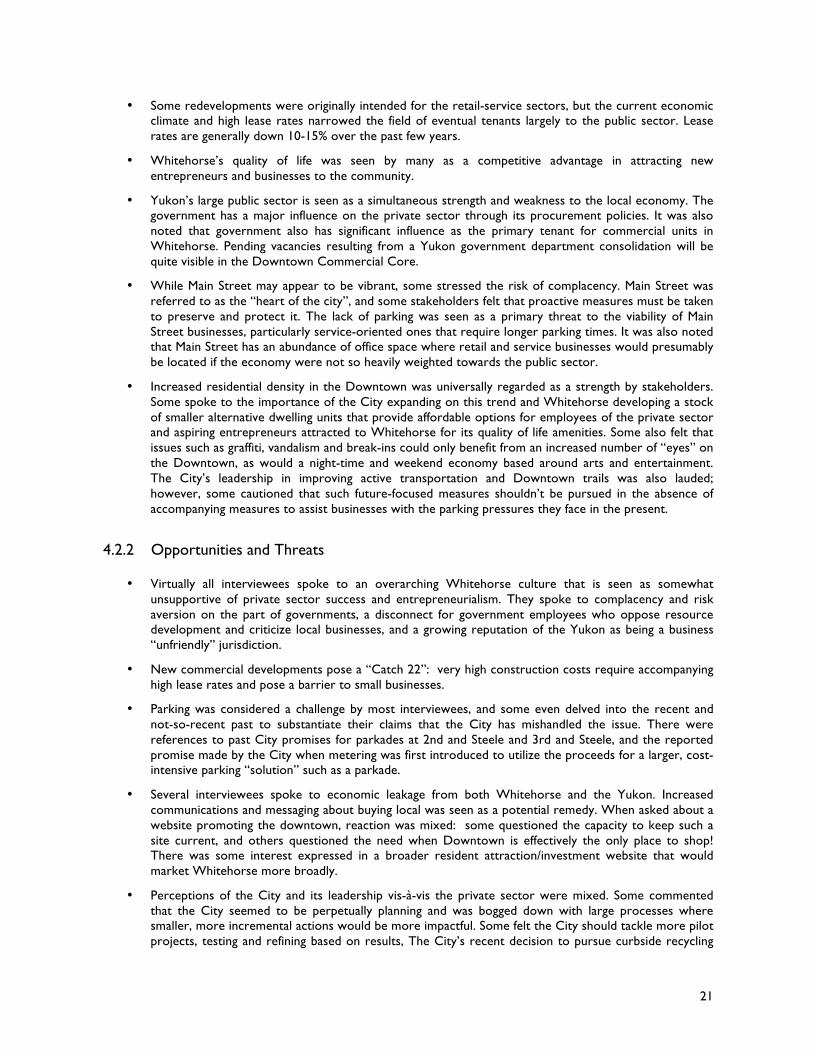
• The aesthetics of the Downtown urban environment were cited by several stakeholders as a cause for concern. Some felt strongly that the City needs to protect aesthetic values in the Main Street and waterfront areas in particular. While other areas are of concern, there was a reluctance for the City to over-regulate in this arena.
Photo credit: Derek Crowe
23
5.0 RESIDENT/CONSUMER PERSPECTIVES
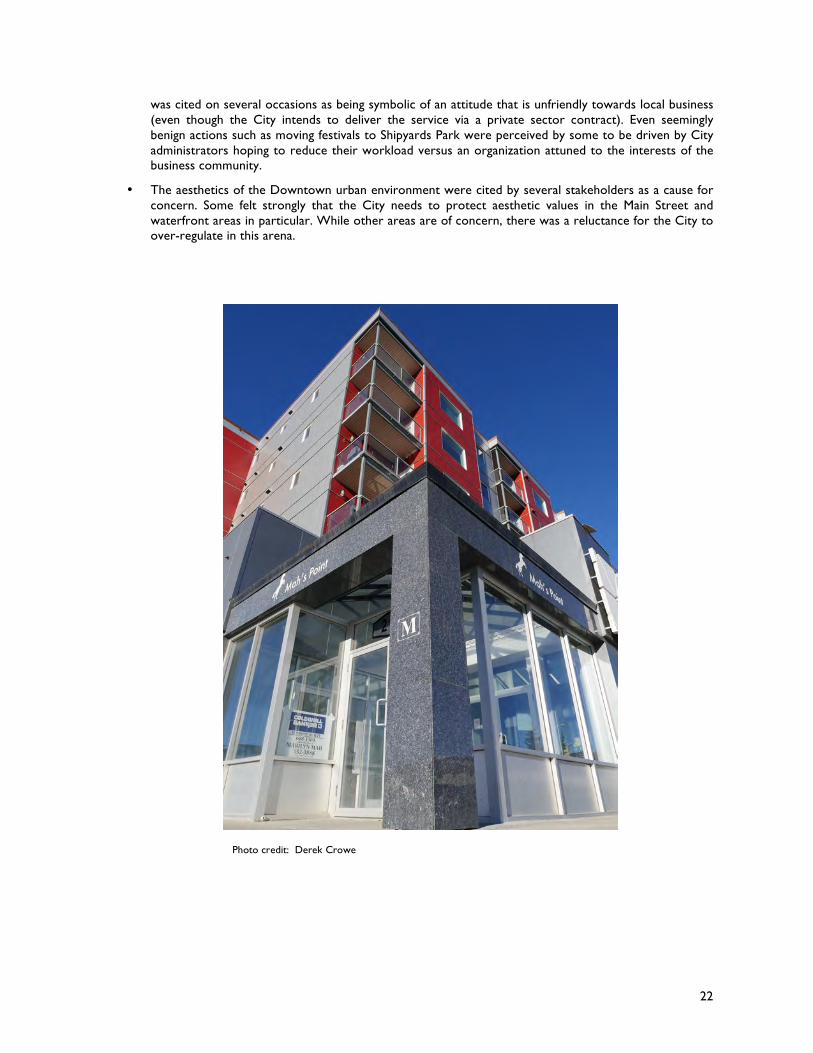
With limited resources available for this update, the consultant team chose to forego primary research into resident and consumer needs and issues and instead draw from the extensive data gathered during the 2015 City of Whitehorse Community Economic Development Strategy (CEDS). The CEDS public survey, held in the fall of 2014, generated a total of 816 responses. The survey ranged from multiple-choice questions about length of residency and levels of satisfaction with life in Whitehorse to open-ended questions about economic development. The following sections highlight particular areas from the resulting CEDS survey analysis that the consultant team deem to be of highest relevance to the subject study. 5.1 General Attitudes and Perceptions The CEDS survey asked respondents to describe businesses in Whitehorse with an open-ended question. While the most common type of response was positive in nature (176 out of 584), there was a significant number of negative responses (100 out of 584). Some qualified their response by saying that not all businesses are bad, but that the good ones are an exception rather than the norm. Higher prices, limited selection, and customer service were frequently cited issues. Others characterized local businesses as “monopolies” because they are the only one offering certain products/services. Generally speaking, it would appear there is room for improvement both on the part of local business performance and levels of awareness among Whitehorse residents about the reality and challenges of operating a business here. The CEDS survey also asked respondents to rank the importance of various amenities or aspects of community life to their choice to live in Whitehorse. Retail and services was rated “very important” by the smallest proportion of respondents as compared to the other 10 parameters. However, retail and services received the highest proportion of “somewhat important” ratings, and the “very important” ratings outnumbered the “not important” ratings. As such, Whitehorse residents would appear to place a relatively high value on a healthy retail and services sector. Please refer to Figure 5.1.
Figure 5.1 Response to Whitehorse CEDS Survey Question #7
24
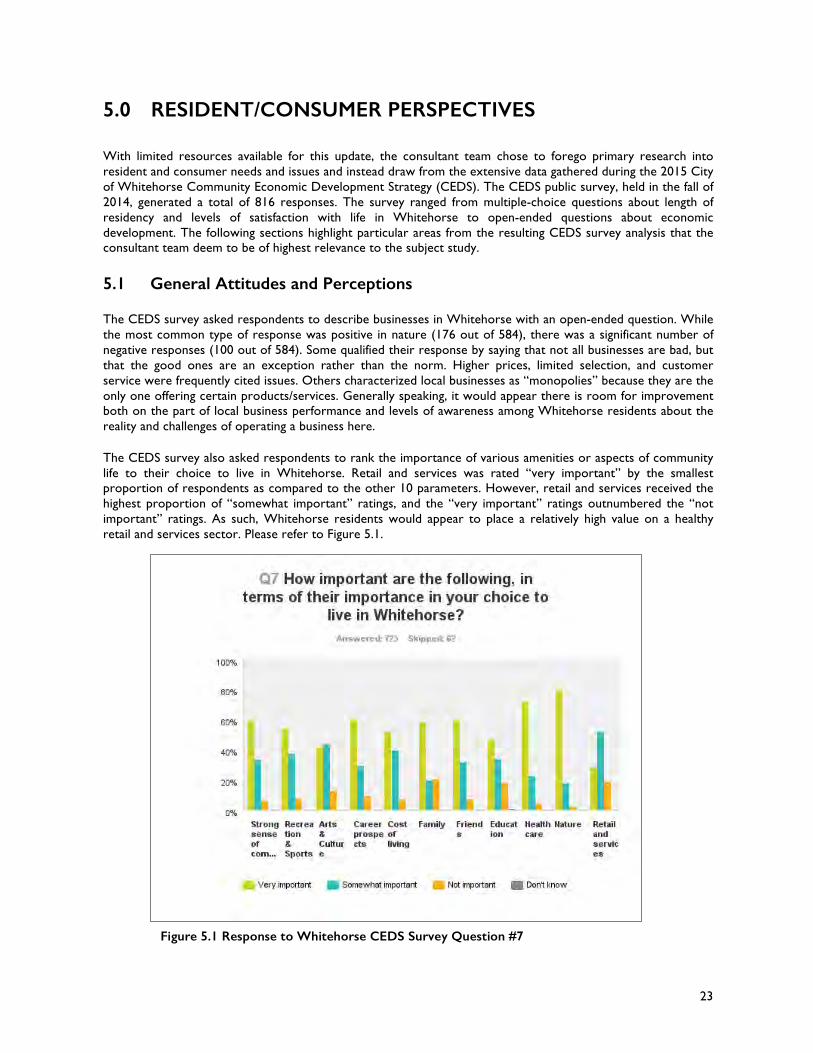
5.2 Customer Service The CEDS survey asked respondents to rate aspects of customer service they receive in Whitehorse, and in all aspects the responses were only slightly towards the positive end of the scale. The aspect of “friendly” received the most positive ratings, whereas “knowledgeable” received the most negative ratings. Please refer to Figure 5.2. 5.3 Areas of Resident/Consumer Demand
The CEDS survey asked respondents what business products or services they would like to see in Whitehorse. The most frequent answers pinpointed franchise or ‘big box’ retail, with Costco being the most cited (69 responses) and various clothing and home renovation brands also being common. The next most frequent response was related to arts/entertainment, in particular an updated movie theatre (61 responses). There were numerous suggestions for more grocery options; however, the CEDS survey summary notes that this may have been linked to the fact that Extra Foods was closed at the time of the survey, leaving only one major grocery option in town. Respondents also wanted to see more choice in telecommunications, restaurants, and independent & specialty retail options. Please refer to Figure 5.3.
Figure 5.2 Response to Whitehorse CEDS Survey Question #27
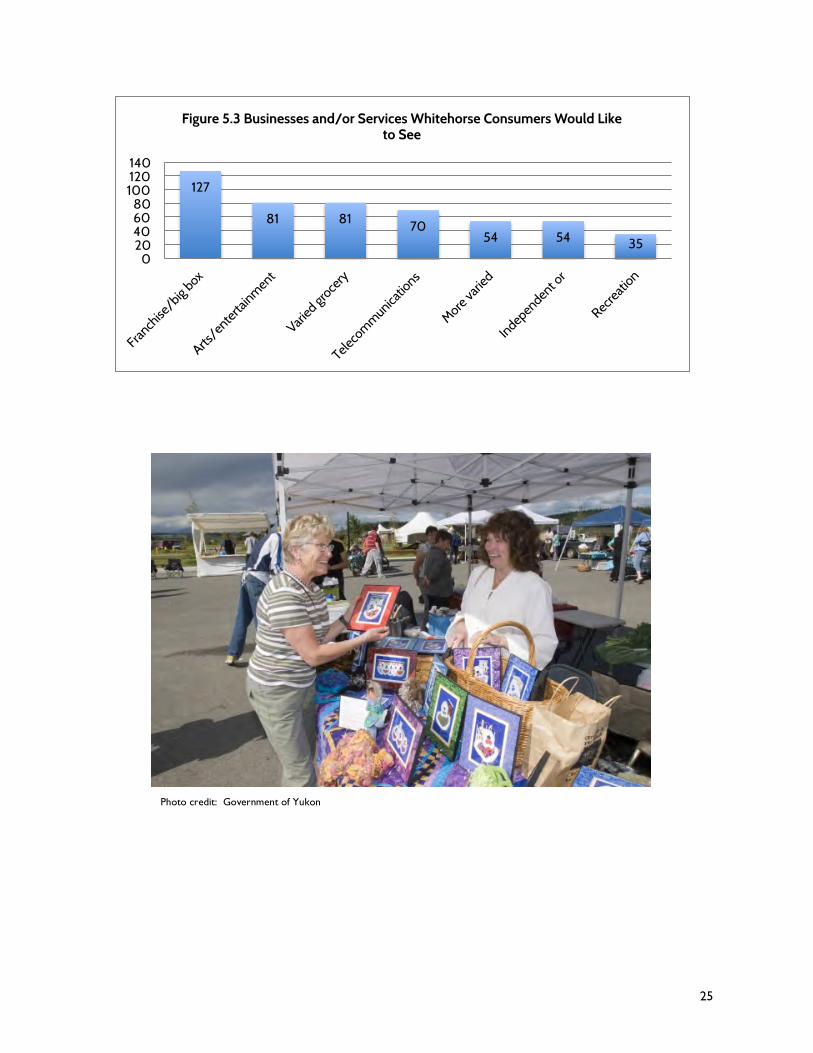
25
127
81 81 70 54 54 35
0 20 40 60 80
100 120 140
Figure 5.3 Businesses and/or Services Whitehorse Consumers Would Like to See
Photo credit: Government of Yukon
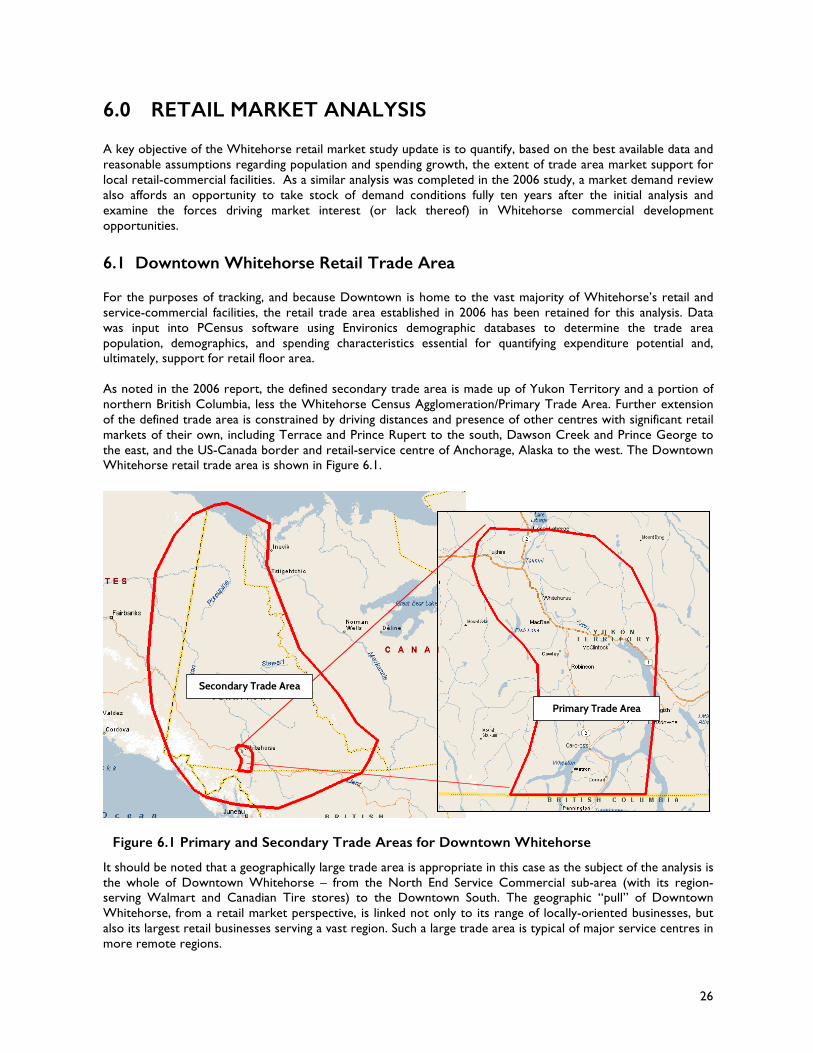
26
6.0 RETAIL MARKET ANALYSIS A key objective of the Whitehorse retail market study update is to quantify, based on the best available data and reasonable assumptions regarding population and spending growth, the extent of trade area market support for local retail-commercial facilities. As a similar analysis was completed in the 2006 study, a market demand review also affords an opportunity to take stock of demand conditions fully ten years after the initial analysis and examine the forces driving market interest (or lack thereof) in Whitehorse commercial development opportunities. 6.1 Downtown Whitehorse Retail Trade Area For the purposes of tracking, and because Downtown is home to the vast majority of Whitehorse’s retail and service-commercial facilities, the retail trade area established in 2006 has been retained for this analysis. Data was input into PCensus software using Environics demographic databases to determine the trade area population, demographics, and spending characteristics essential for quantifying expenditure potential and, ultimately, support for retail floor area. As noted in the 2006 report, the defined secondary trade area is made up of Yukon Territory and a portion of northern British Columbia, less the Whitehorse Census Agglomeration/Primary Trade Area. Further extension of the defined trade area is constrained by driving distances and presence of other centres with significant retail markets of their own, including Terrace and Prince Rupert to the south, Dawson Creek and Prince George to the east, and the US-Canada border and retail-service centre of Anchorage, Alaska to the west. The Downtown Whitehorse retail trade area is shown in Figure 6.1.
It should be noted that a geographically large trade area is appropriate in this case as the subject of the analysis is the whole of Downtown Whitehorse – from the North End Service Commercial sub-area (with its region-serving Walmart and Canadian Tire stores) to the Downtown South. The geographic “pull” of Downtown Whitehorse, from a retail market perspective, is linked not only to its range of locally-oriented businesses, but also its largest retail businesses serving a vast region. Such a large trade area is typical of major service centres in more remote regions.
Secondary Trade Area
Figure 6.1 Primary and Secondary Trade Areas for Downtown Whitehorse
Primary TradeArea
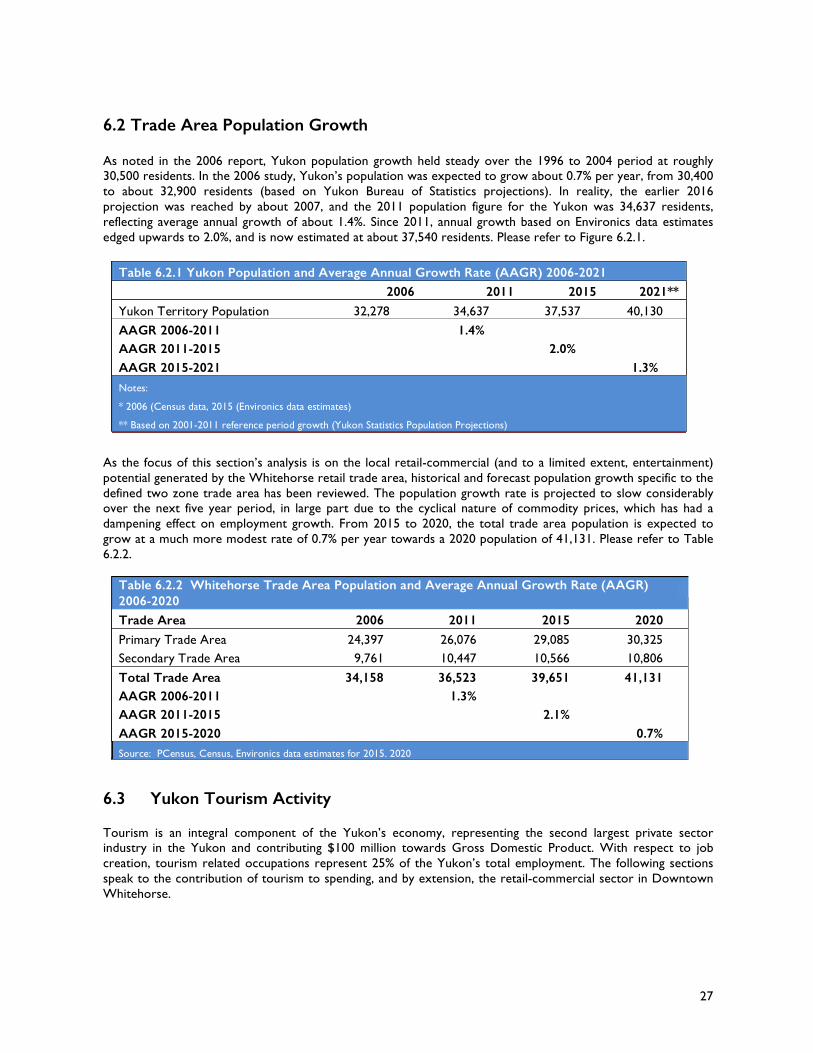
27
6.2 Trade Area Population Growth As noted in the 2006 report, Yukon population growth held steady over the 1996 to 2004 period at roughly 30,500 residents. In the 2006 study, Yukon’s population was expected to grow about 0.7% per year, from 30,400 to about 32,900 residents (based on Yukon Bureau of Statistics projections). In reality, the earlier 2016 projection was reached by about 2007, and the 2011 population figure for the Yukon was 34,637 residents, reflecting average annual growth of about 1.4%. Since 2011, annual growth based on Environics data estimates edged upwards to 2.0%, and is now estimated at about 37,540 residents. Please refer to Figure 6.2.1.
As the focus of this section’s analysis is on the local retail-commercial (and to a limited extent, entertainment) potential generated by the Whitehorse retail trade area, historical and forecast population growth specific to the defined two zone trade area has been reviewed. The population growth rate is projected to slow considerably over the next five year period, in large part due to the cyclical nature of commodity prices, which has had a dampening effect on employment growth. From 2015 to 2020, the total trade area population is expected to grow at a much more modest rate of 0.7% per year towards a 2020 population of 41,131. Please refer to Table 6.2.2.
6.3 Yukon Tourism Activity Tourism is an integral component of the Yukon’s economy, representing the second largest private sector industry in the Yukon and contributing $100 million towards Gross Domestic Product. With respect to job creation, tourism related occupations represent 25% of the Yukon’s total employment. The following sections speak to the contribution of tourism to spending, and by extension, the retail-commercial sector in Downtown Whitehorse.
Table 6.2.2 Whitehorse Trade Area Population and Average Annual Growth Rate (AAGR) 2006-2020 Trade Area 2006 2011 2015 2020 Primary Trade Area 24,397 26,076 29,085 30,325
Secondary Trade Area 9,761 10,447 10,566 10,806 Total Trade Area 34,158 36,523 39,651 41,131
AAGR 2006-2011
1.3% AAGR 2011-2015
2.1%
AAGR 2015-2020
0.7% Source: PCensus, Census, Environics data estimates for 2015. 2020
Table 6.2.1 Yukon Population and Average Annual Growth Rate (AAGR) 2006-2021 2006 2011 2015 2021** Yukon Territory Population 32,278 34,637 37,537 40,130
AAGR 2006-2011
1.4% AAGR 2011-2015
2.0%
AAGR 2015-2021
1.3% Notes: * 2006 (Census data, 2015 (Environics data estimates) ** Based on 2001-2011 reference period growth (Yukon Statistics Population Projections) AAGR: Average Annual Growth Rate
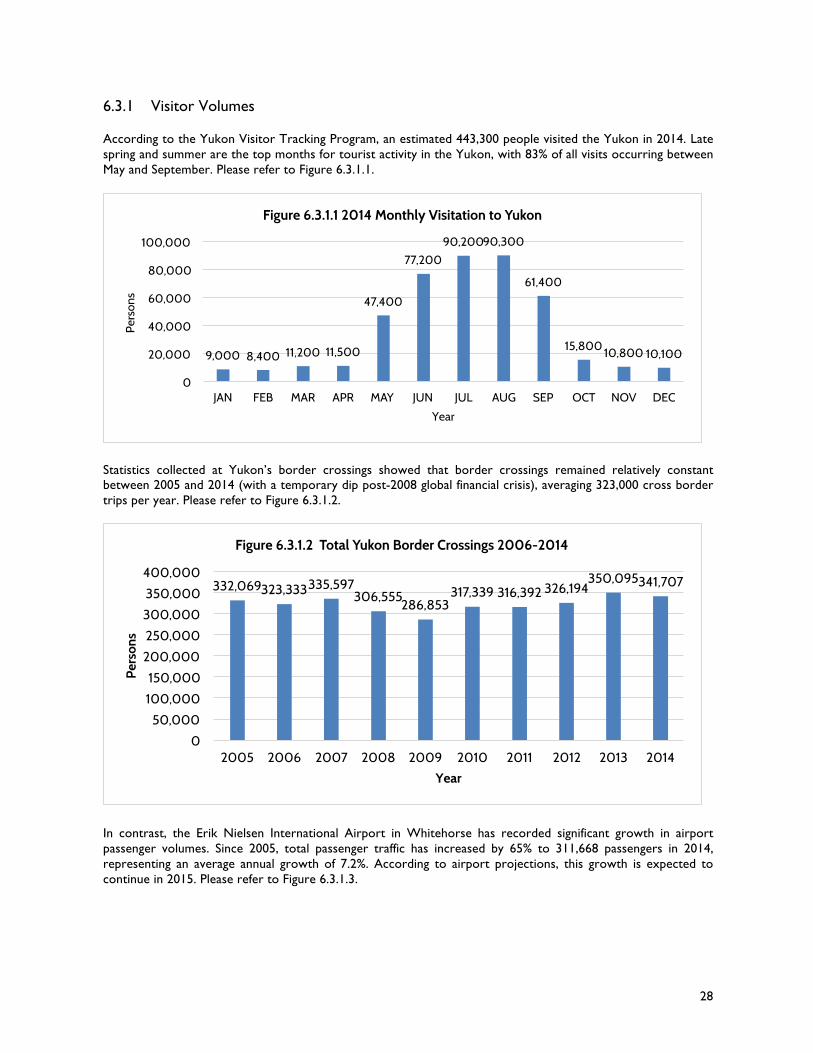
28
6.3.1 Visitor Volumes According to the Yukon Visitor Tracking Program, an estimated 443,300 people visited the Yukon in 2014. Late spring and summer are the top months for tourist activity in the Yukon, with 83% of all visits occurring between May and September. Please refer to Figure 6.3.1.1.
Statistics collected at Yukon’s border crossings showed that border crossings remained relatively constant between 2005 and 2014 (with a temporary dip post-2008 global financial crisis), averaging 323,000 cross border trips per year. Please refer to Figure 6.3.1.2.
In contrast, the Erik Nielsen International Airport in Whitehorse has recorded significant growth in airport passenger volumes. Since 2005, total passenger traffic has increased by 65% to 311,668 passengers in 2014, representing an average annual growth of 7.2%. According to airport projections, this growth is expected to continue in 2015. Please refer to Figure 6.3.1.3.
9,000 8,400 11,200 11,500
47,400
77,200
90,200 90,300
61,400
15,800 10,800 10,100
0
20,000
40,000
60,000
80,000
100,000
JAN FEB MAR APR MAY JUN JUL AUG SEP OCT NOV DEC
Pers
ons
Year
Figure 6.3.1.1 2014 Monthly Visitation to Yukon
332,069 323,333 335,597 306,555
286,853 317,339 316,392 326,194
350,095 341,707
0
50,000
100,000
150,000
200,000
250,000
300,000
350,000
400,000
2005 2006 2007 2008 2009 2010 2011 2012 2013 2014
Pers
ons
Year
Figure 6.3.1.2 Total Yukon Border Crossings 2006-2014
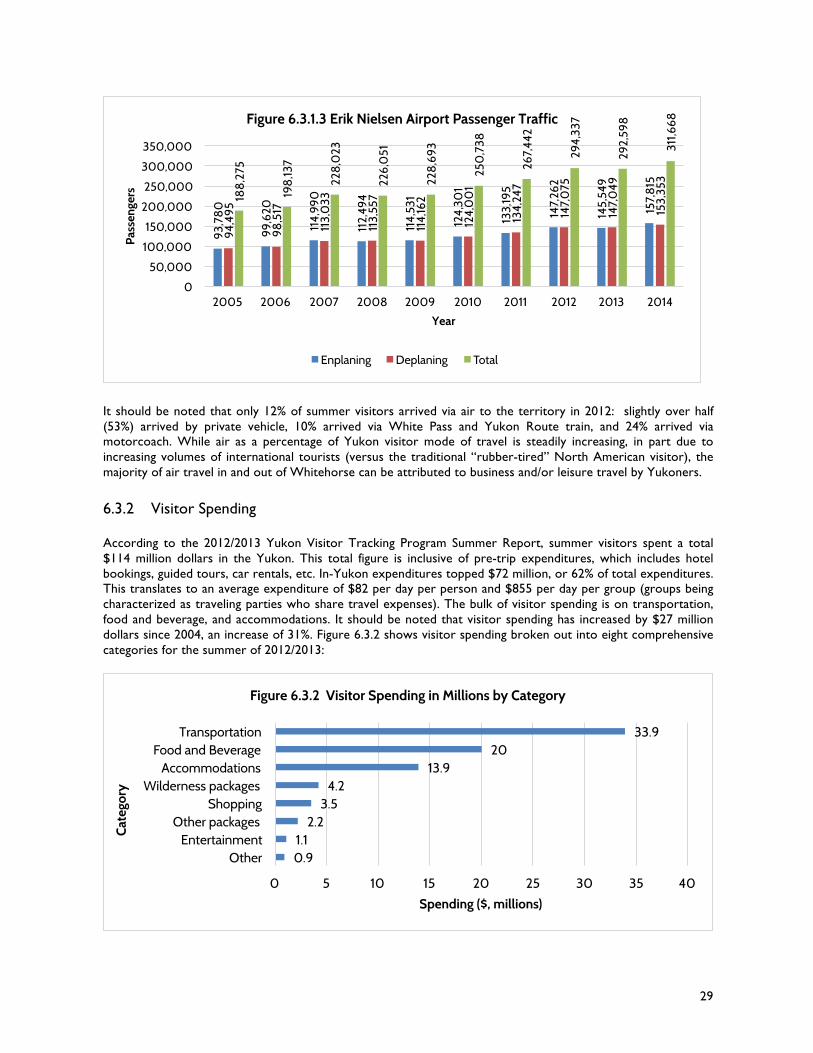
29
It should be noted that only 12% of summer visitors arrived via air to the territory in 2012: slightly over half (53%) arrived by private vehicle, 10% arrived via White Pass and Yukon Route train, and 24% arrived via motorcoach. While air as a percentage of Yukon visitor mode of travel is steadily increasing, in part due to increasing volumes of international tourists (versus the traditional “rubber-tired” North American visitor), the majority of air travel in and out of Whitehorse can be attributed to business and/or leisure travel by Yukoners. 6.3.2 Visitor Spending According to the 2012/2013 Yukon Visitor Tracking Program Summer Report, summer visitors spent a total $114 million dollars in the Yukon. This total figure is inclusive of pre-trip expenditures, which includes hotel bookings, guided tours, car rentals, etc. In-Yukon expenditures topped $72 million, or 62% of total expenditures. This translates to an average expenditure of $82 per day per person and $855 per day per group (groups being characterized as traveling parties who share travel expenses). The bulk of visitor spending is on transportation, food and beverage, and accommodations. It should be noted that visitor spending has increased by $27 million dollars since 2004, an increase of 31%. Figure 6.3.2 shows visitor spending broken out into eight comprehensive categories for the summer of 2012/2013:
93,7
80
99,6
20
114,
990
112,
494
114,
531
124,
301
133,
195
147,
262
145,
549
157,
815
94,4
95
98,5
17
113,
033
113,
557
114,
162
124,
00
1
134,
247
147,
075
147,
049
153,
353
188
,275
198
,137
228
,023
226,
051
228
,693
250
,738
267,
442
294,
337
292,
598
311,6
68
0
50,000
100,000
150,000
200,000
250,000
300,000
350,000
2005 2006 2007 2008 2009 2010 2011 2012 2013 2014
Pass
enge
rs
Year
Figure 6.3.1.3 Erik Nielsen Airport Passenger Traffic
Enplaning Deplaning Total
0.9 1.1
2.2 3.5
4.2 13.9
20 33.9
0 5 10 15 20 25 30 35 40
Other Entertainment
Other packages Shopping
Wilderness packages Accommodations
Food and Beverage Transportation
Spending ($, millions)
Cat
egor
y
Figure 6.3.2 Visitor Spending in Millions by Category
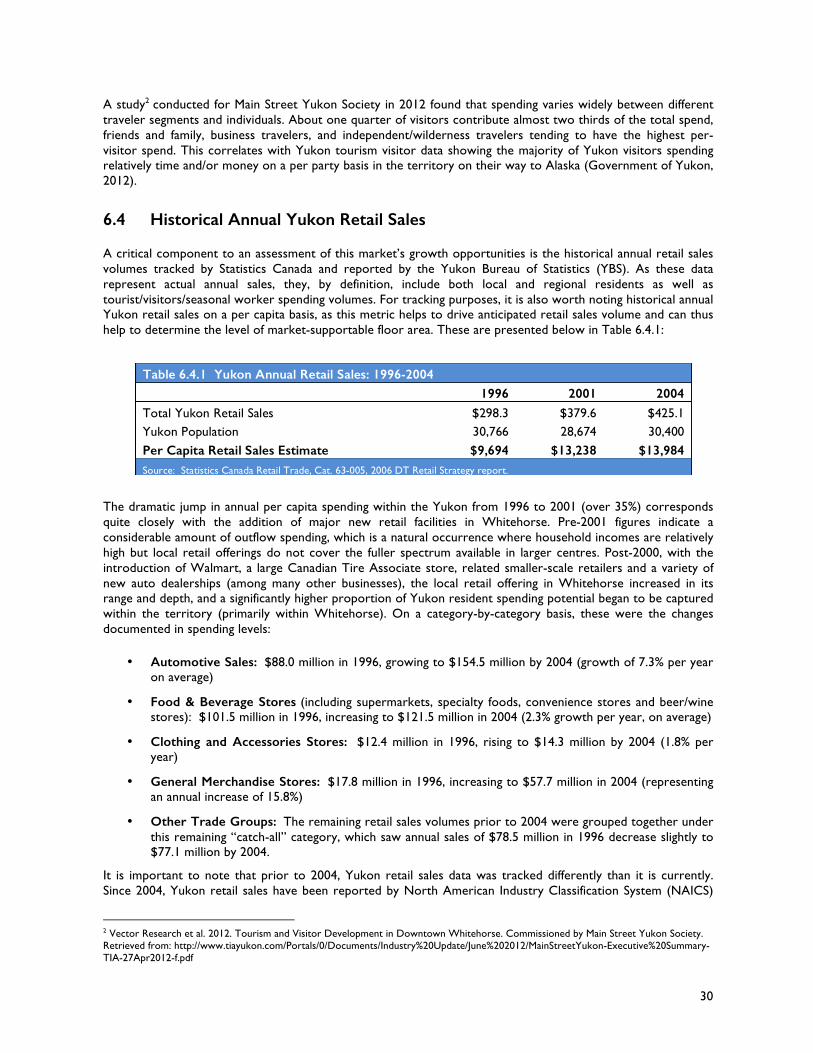
30
A study2 conducted for Main Street Yukon Society in 2012 found that spending varies widely between different traveler segments and individuals. About one quarter of visitors contribute almost two thirds of the total spend, friends and family, business travelers, and independent/wilderness travelers tending to have the highest per-visitor spend. This correlates with Yukon tourism visitor data showing the majority of Yukon visitors spending relatively time and/or money on a per party basis in the territory on their way to Alaska (Government of Yukon, 2012).
6.4 Historical Annual Yukon Retail Sales A critical component to an assessment of this market’s growth opportunities is the historical annual retail sales volumes tracked by Statistics Canada and reported by the Yukon Bureau of Statistics (YBS). As these data represent actual annual sales, they, by definition, include both local and regional residents as well as tourist/visitors/seasonal worker spending volumes. For tracking purposes, it is also worth noting historical annual Yukon retail sales on a per capita basis, as this metric helps to drive anticipated retail sales volume and can thus help to determine the level of market-supportable floor area. These are presented below in Table 6.4.1: The dramatic jump in annual per capita spending within the Yukon from 1996 to 2001 (over 35%) corresponds quite closely with the addition of major new retail facilities in Whitehorse. Pre-2001 figures indicate a considerable amount of outflow spending, which is a natural occurrence where household incomes are relatively high but local retail offerings do not cover the fuller spectrum available in larger centres. Post-2000, with the introduction of Walmart, a large Canadian Tire Associate store, related smaller-scale retailers and a variety of new auto dealerships (among many other businesses), the local retail offering in Whitehorse increased in its range and depth, and a significantly higher proportion of Yukon resident spending potential began to be captured within the territory (primarily within Whitehorse). On a category-by-category basis, these were the changes documented in spending levels:
• Automotive Sales: $88.0 million in 1996, growing to $154.5 million by 2004 (growth of 7.3% per year on average)
• Food & Beverage Stores (including supermarkets, specialty foods, convenience stores and beer/wine stores): $101.5 million in 1996, increasing to $121.5 million in 2004 (2.3% growth per year, on average)
• Clothing and Accessories Stores: $12.4 million in 1996, rising to $14.3 million by 2004 (1.8% per year)
• General Merchandise Stores: $17.8 million in 1996, increasing to $57.7 million in 2004 (representing an annual increase of 15.8%)
• Other Trade Groups: The remaining retail sales volumes prior to 2004 were grouped together under this remaining “catch-all” category, which saw annual sales of $78.5 million in 1996 decrease slightly to $77.1 million by 2004.
It is important to note that prior to 2004, Yukon retail sales data was tracked differently than it is currently. Since 2004, Yukon retail sales have been reported by North American Industry Classification System (NAICS)
2 Vector Research et al. 2012. Tourism and Visitor Development in Downtown Whitehorse. Commissioned by Main Street Yukon Society. Retrieved from: http://www.tiayukon.com/Portals/0/Documents/Industry%20Update/June%202012/MainStreetYukon-Executive%20Summary-TIA-27Apr2012-f.pdf
Table 6.4.1 Yukon Annual Retail Sales: 1996-2004 1996 2001 2004
Total Yukon Retail Sales $298.3 $379.6 $425.1 Yukon Population 30,766 28,674 30,400 Per Capita Retail Sales Estimate $9,694 $13,238 $13,984 Source: Statistics Canada Retail Trade, Cat. 63-005, 2006 DT Retail Strategy report.
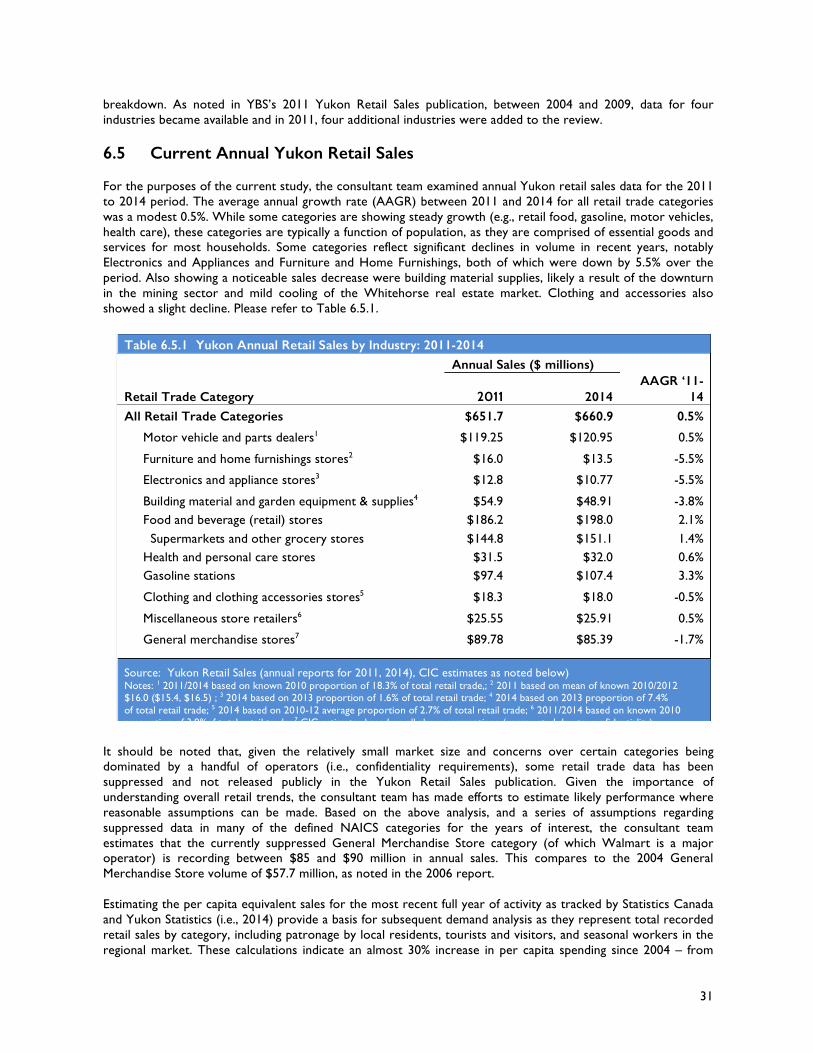
31
breakdown. As noted in YBS’s 2011 Yukon Retail Sales publication, between 2004 and 2009, data for four industries became available and in 2011, four additional industries were added to the review.
6.5 Current Annual Yukon Retail Sales For the purposes of the current study, the consultant team examined annual Yukon retail sales data for the 2011 to 2014 period. The average annual growth rate (AAGR) between 2011 and 2014 for all retail trade categories was a modest 0.5%. While some categories are showing steady growth (e.g., retail food, gasoline, motor vehicles, health care), these categories are typically a function of population, as they are comprised of essential goods and services for most households. Some categories reflect significant declines in volume in recent years, notably Electronics and Appliances and Furniture and Home Furnishings, both of which were down by 5.5% over the period. Also showing a noticeable sales decrease were building material supplies, likely a result of the downturn in the mining sector and mild cooling of the Whitehorse real estate market. Clothing and accessories also showed a slight decline. Please refer to Table 6.5.1.
It should be noted that, given the relatively small market size and concerns over certain categories being dominated by a handful of operators (i.e., confidentiality requirements), some retail trade data has been suppressed and not released publicly in the Yukon Retail Sales publication. Given the importance of understanding overall retail trends, the consultant team has made efforts to estimate likely performance where reasonable assumptions can be made. Based on the above analysis, and a series of assumptions regarding suppressed data in many of the defined NAICS categories for the years of interest, the consultant team estimates that the currently suppressed General Merchandise Store category (of which Walmart is a major operator) is recording between $85 and $90 million in annual sales. This compares to the 2004 General Merchandise Store volume of $57.7 million, as noted in the 2006 report. Estimating the per capita equivalent sales for the most recent full year of activity as tracked by Statistics Canada and Yukon Statistics (i.e., 2014) provide a basis for subsequent demand analysis as they represent total recorded retail sales by category, including patronage by local residents, tourists and visitors, and seasonal workers in the regional market. These calculations indicate an almost 30% increase in per capita spending since 2004 – from
Table 6.5.1 Yukon Annual Retail Sales by Industry: 2011-2014
Annual Sales ($ millions)
Retail Trade Category 2011 2014
AAGR ‘11-14
All Retail Trade Categories $651.7 $660.9 0.5%
Motor vehicle and parts dealers1 $119.25 $120.95 0.5%
Furniture and home furnishings stores2 $16.0 $13.5 -5.5%
Electronics and appliance stores3 $12.8 $10.77 -5.5%
Building material and garden equipment & supplies4 $54.9 $48.91 -3.8%
Food and beverage (retail) stores $186.2 $198.0 2.1%
Supermarkets and other grocery stores $144.8 $151.1 1.4%
Health and personal care stores $31.5 $32.0 0.6%
Gasoline stations $97.4 $107.4 3.3%
Clothing and clothing accessories stores5 $18.3 $18.0 -0.5%
Miscellaneous store retailers6 $25.55 $25.91 0.5%
General merchandise stores7 $89.78 $85.39 -1.7%
Source: Yukon Retail Sales (annual reports for 2011, 2014), CIC estimates as noted below) Notes: 1 2011/2014 based on known 2010 proportion of 18.3% of total retail trade,; 2 2011 based on mean of known 2010/2012 $16.0 ($15.4, $16.5) ; 3 2014 based on 2013 proportion of 1.6% of total retail trade; 4 2014 based on 2013 proportion of 7.4% of total retail trade; 5 2014 based on 2010-12 average proportion of 2.7% of total retail trade; 6 2011/2014 based on known 2010 proportion of 3.9%of total retail trade; 7 CIC estimates based on all above assumptions (unreported due to confidentiality)
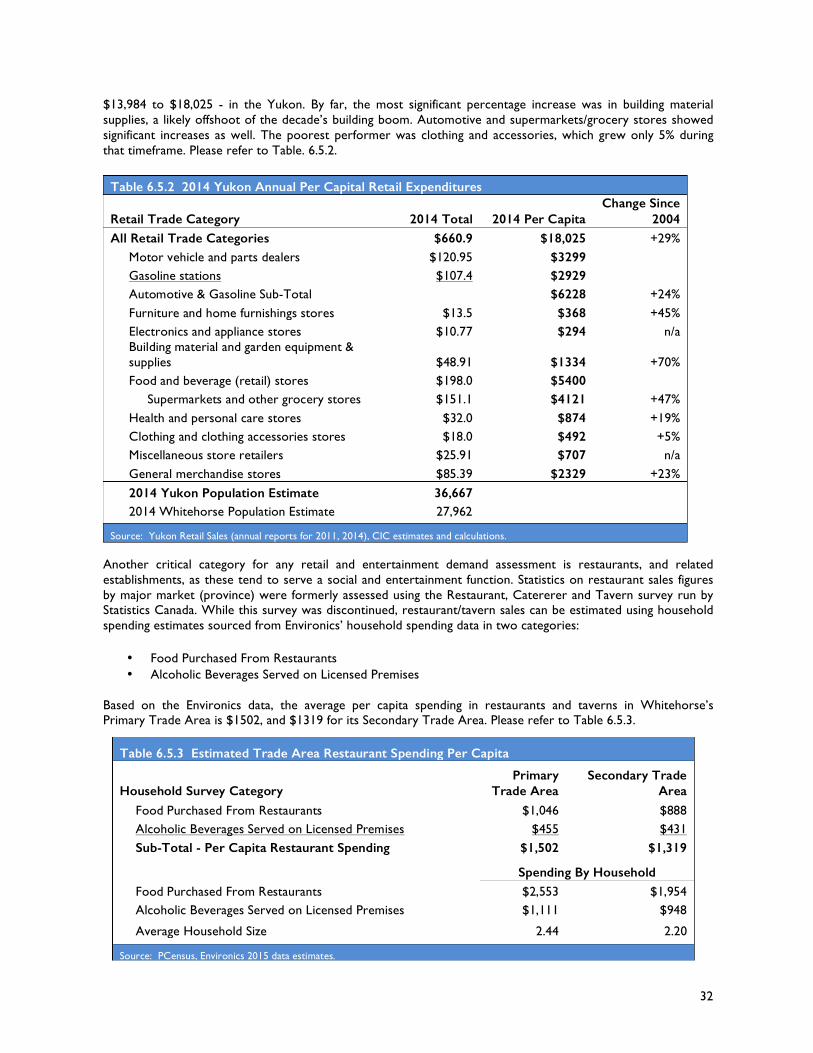
32
$13,984 to $18,025 - in the Yukon. By far, the most significant percentage increase was in building material supplies, a likely offshoot of the decade’s building boom. Automotive and supermarkets/grocery stores showed significant increases as well. The poorest performer was clothing and accessories, which grew only 5% during that timeframe. Please refer to Table. 6.5.2.
Another critical category for any retail and entertainment demand assessment is restaurants, and related establishments, as these tend to serve a social and entertainment function. Statistics on restaurant sales figures by major market (province) were formerly assessed using the Restaurant, Catererer and Tavern survey run by Statistics Canada. While this survey was discontinued, restaurant/tavern sales can be estimated using household spending estimates sourced from Environics’ household spending data in two categories:
• Food Purchased From Restaurants • Alcoholic Beverages Served on Licensed Premises
Based on the Environics data, the average per capita spending in restaurants and taverns in Whitehorse’s Primary Trade Area is $1502, and $1319 for its Secondary Trade Area. Please refer to Table 6.5.3.
Table 6.5.2 2014 Yukon Annual Per Capital Retail Expenditures
Retail Trade Category 2014 Total 2014 Per Capita Change Since
2004 All Retail Trade Categories $660.9 $18,025 +29%
Motor vehicle and parts dealers $120.95 $3299
Gasoline stations $107.4 $2929
Automotive & Gasoline Sub-Total
$6228 +24%
Furniture and home furnishings stores $13.5 $368 +45%
Electronics and appliance stores $10.77 $294 n/a
Building material and garden equipment & supplies $48.91 $1334 +70%
Food and beverage (retail) stores $198.0 $5400
Supermarkets and other grocery stores $151.1 $4121 +47%
Health and personal care stores $32.0 $874 +19%
Clothing and clothing accessories stores $18.0 $492 +5%
Miscellaneous store retailers $25.91 $707 n/a
General merchandise stores $85.39 $2329 +23%
2014 Yukon Population Estimate 36,667
2014 Whitehorse Population Estimate 27,962 Source: Yukon Retail Sales (annual reports for 2011, 2014), CIC estimates and calculations.
Table 6.5.3 Estimated Trade Area Restaurant Spending Per Capita
Household Survey Category Primary
Trade Area Secondary Trade
Area
Food Purchased From Restaurants $1,046 $888
Alcoholic Beverages Served on Licensed Premises $455 $431
Sub-Total - Per Capita Restaurant Spending $1,502 $1,319
Spending By Household
Food Purchased From Restaurants $2,553 $1,954
Alcoholic Beverages Served on Licensed Premises $1,111 $948
Average Household Size 2.44 2.20
Source: PCensus, Environics 2015 data estimates.
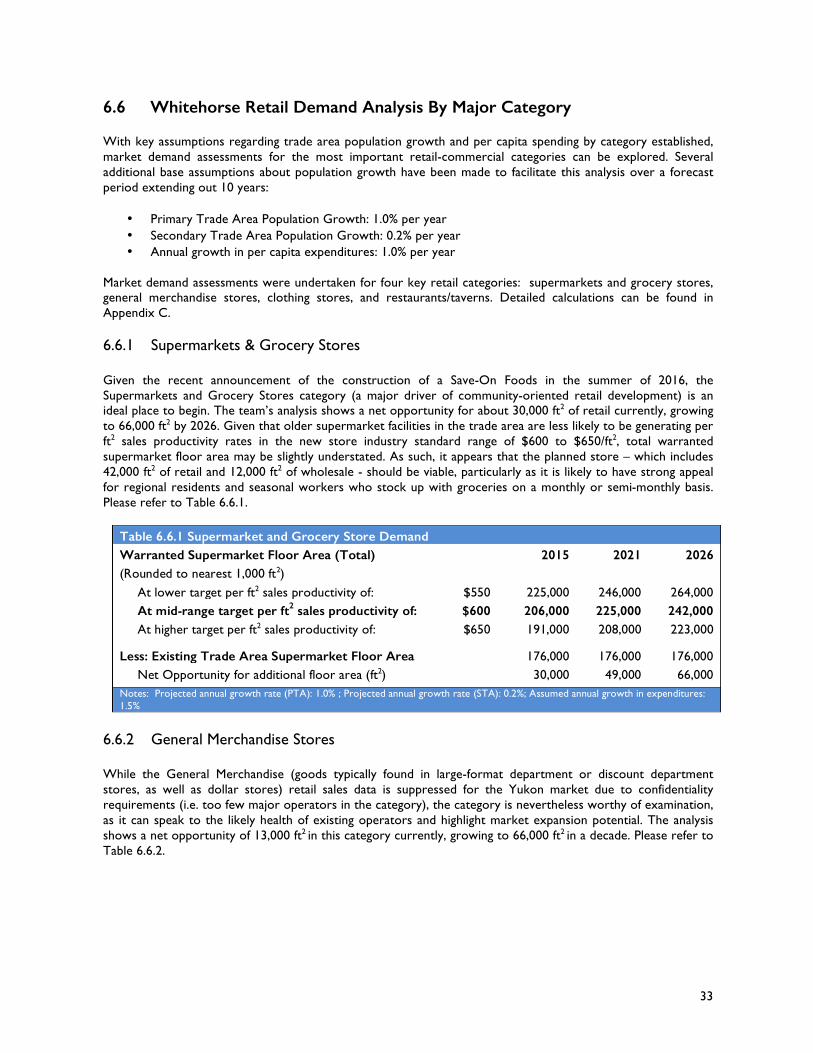
33
6.6 Whitehorse Retail Demand Analysis By Major Category With key assumptions regarding trade area population growth and per capita spending by category established, market demand assessments for the most important retail-commercial categories can be explored. Several additional base assumptions about population growth have been made to facilitate this analysis over a forecast period extending out 10 years:
• Primary Trade Area Population Growth: 1.0% per year • Secondary Trade Area Population Growth: 0.2% per year • Annual growth in per capita expenditures: 1.0% per year
Market demand assessments were undertaken for four key retail categories: supermarkets and grocery stores, general merchandise stores, clothing stores, and restaurants/taverns. Detailed calculations can be found in Appendix C. 6.6.1 Supermarkets & Grocery Stores Given the recent announcement of the construction of a Save-On Foods in the summer of 2016, the Supermarkets and Grocery Stores category (a major driver of community-oriented retail development) is an ideal place to begin. The team’s analysis shows a net opportunity for about 30,000 ft2 of retail currently, growing to 66,000 ft2 by 2026. Given that older supermarket facilities in the trade area are less likely to be generating per ft2 sales productivity rates in the new store industry standard range of $600 to $650/ft2, total warranted supermarket floor area may be slightly understated. As such, it appears that the planned store – which includes 42,000 ft2 of retail and 12,000 ft2 of wholesale - should be viable, particularly as it is likely to have strong appeal for regional residents and seasonal workers who stock up with groceries on a monthly or semi-monthly basis. Please refer to Table 6.6.1.
6.6.2 General Merchandise Stores While the General Merchandise (goods typically found in large-format department or discount department stores, as well as dollar stores) retail sales data is suppressed for the Yukon market due to confidentiality requirements (i.e. too few major operators in the category), the category is nevertheless worthy of examination, as it can speak to the likely health of existing operators and highlight market expansion potential. The analysis shows a net opportunity of 13,000 ft2 in this category currently, growing to 66,000 ft2 in a decade. Please refer to Table 6.6.2.
Table 6.6.1 Supermarket and Grocery Store Demand Warranted Supermarket Floor Area (Total) 2015 2021 2026 (Rounded to nearest 1,000 ft2)
At lower target per ft2 sales productivity of: $550 225,000 246,000 264,000
At mid-range target per ft2 sales productivity of: $600 206,000 225,000 242,000
At higher target per ft2 sales productivity of: $650 191,000 208,000 223,000
Less: Existing Trade Area Supermarket Floor Area
176,000 176,000 176,000
Net Opportunity for additional floor area (ft2)
30,000 49,000 66,000
Notes: Projected annual growth rate (PTA): 1.0% ; Projected annual growth rate (STA): 0.2%; Assumed annual growth in expenditures: 1.5%
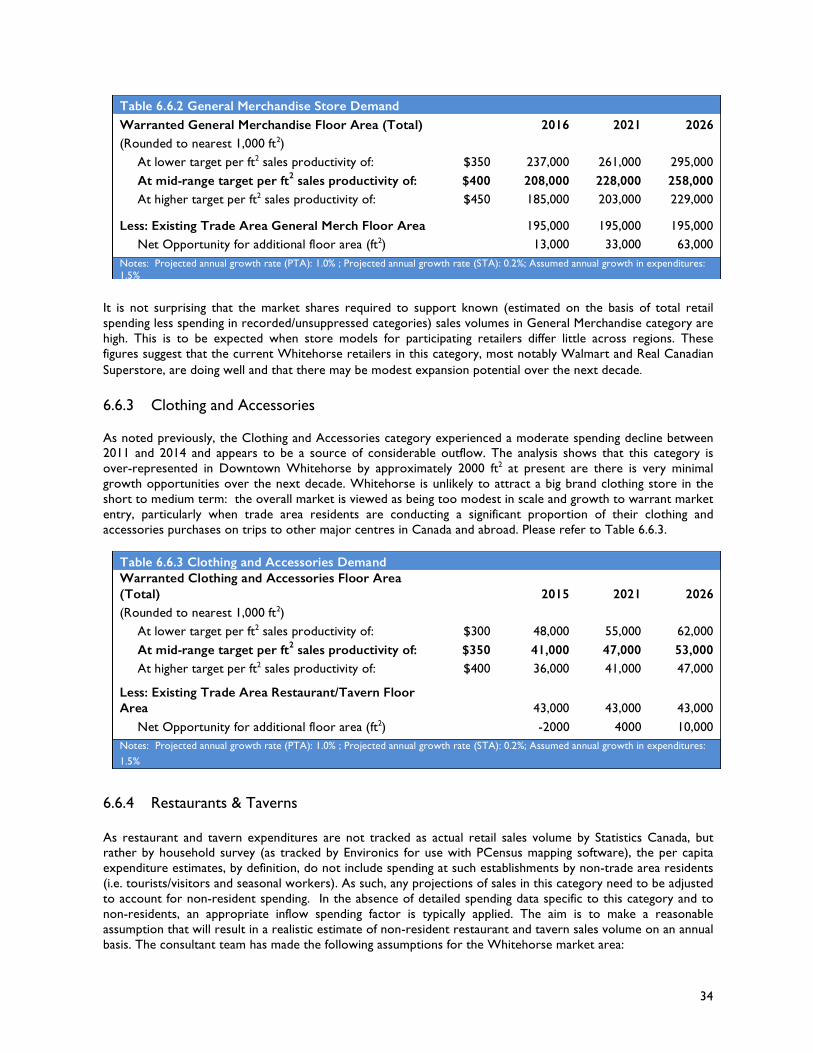
34
It is not surprising that the market shares required to support known (estimated on the basis of total retail spending less spending in recorded/unsuppressed categories) sales volumes in General Merchandise category are high. This is to be expected when store models for participating retailers differ little across regions. These figures suggest that the current Whitehorse retailers in this category, most notably Walmart and Real Canadian Superstore, are doing well and that there may be modest expansion potential over the next decade. 6.6.3 Clothing and Accessories As noted previously, the Clothing and Accessories category experienced a moderate spending decline between 2011 and 2014 and appears to be a source of considerable outflow. The analysis shows that this category is over-represented in Downtown Whitehorse by approximately 2000 ft2 at present are there is very minimal growth opportunities over the next decade. Whitehorse is unlikely to attract a big brand clothing store in the short to medium term: the overall market is viewed as being too modest in scale and growth to warrant market entry, particularly when trade area residents are conducting a significant proportion of their clothing and accessories purchases on trips to other major centres in Canada and abroad. Please refer to Table 6.6.3.
6.6.4 Restaurants & Taverns As restaurant and tavern expenditures are not tracked as actual retail sales volume by Statistics Canada, but rather by household survey (as tracked by Environics for use with PCensus mapping software), the per capita expenditure estimates, by definition, do not include spending at such establishments by non-trade area residents (i.e. tourists/visitors and seasonal workers). As such, any projections of sales in this category need to be adjusted to account for non-resident spending. In the absence of detailed spending data specific to this category and to non-residents, an appropriate inflow spending factor is typically applied. The aim is to make a reasonable assumption that will result in a realistic estimate of non-resident restaurant and tavern sales volume on an annual basis. The consultant team has made the following assumptions for the Whitehorse market area:
Table 6.6.2 General Merchandise Store Demand Warranted General Merchandise Floor Area (Total)
2016 2021 2026
(Rounded to nearest 1,000 ft2)
At lower target per ft2 sales productivity of: $350 237,000 261,000 295,000
At mid-range target per ft2 sales productivity of: $400 208,000 228,000 258,000
At higher target per ft2 sales productivity of: $450 185,000 203,000 229,000
Less: Existing Trade Area General Merch Floor Area
195,000 195,000 195,000
Net Opportunity for additional floor area (ft2)
13,000 33,000 63,000
Notes: Projected annual growth rate (PTA): 1.0% ; Projected annual growth rate (STA): 0.2%; Assumed annual growth in expenditures: 1.5%
Table 6.6.3 Clothing and Accessories Demand Warranted Clothing and Accessories Floor Area (Total)
2015 2021 2026
(Rounded to nearest 1,000 ft2)
At lower target per ft2 sales productivity of: $300 48,000 55,000 62,000
At mid-range target per ft2 sales productivity of: $350 41,000 47,000 53,000
At higher target per ft2 sales productivity of: $400 36,000 41,000 47,000
Less: Existing Trade Area Restaurant/Tavern Floor Area
43,000 43,000 43,000
Net Opportunity for additional floor area (ft2)
-2000 4000 10,000
Notes: Projected annual growth rate (PTA): 1.0% ; Projected annual growth rate (STA): 0.2%; Assumed annual growth in expenditures:
1.5%
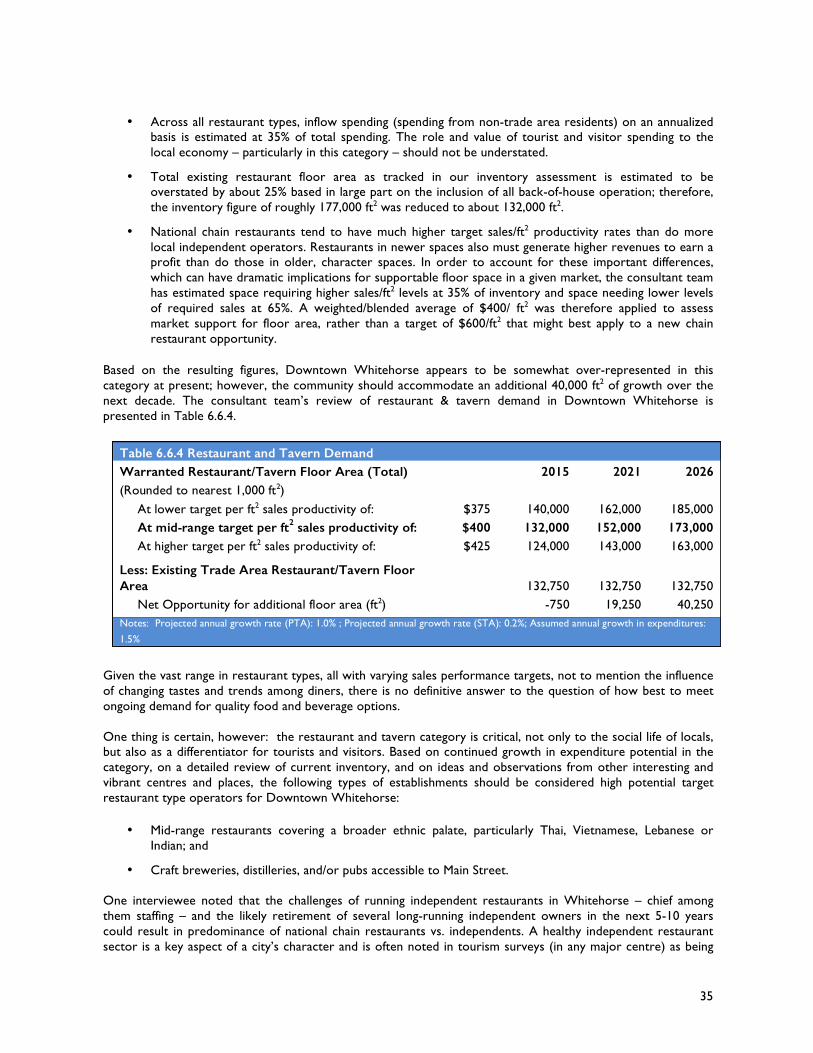
35
• Across all restaurant types, inflow spending (spending from non-trade area residents) on an annualized
basis is estimated at 35% of total spending. The role and value of tourist and visitor spending to the local economy – particularly in this category – should not be understated.
• Total existing restaurant floor area as tracked in our inventory assessment is estimated to be overstated by about 25% based in large part on the inclusion of all back-of-house operation; therefore, the inventory figure of roughly 177,000 ft2 was reduced to about 132,000 ft2.
• National chain restaurants tend to have much higher target sales/ft2 productivity rates than do more local independent operators. Restaurants in newer spaces also must generate higher revenues to earn a profit than do those in older, character spaces. In order to account for these important differences, which can have dramatic implications for supportable floor space in a given market, the consultant team has estimated space requiring higher sales/ft2 levels at 35% of inventory and space needing lower levels of required sales at 65%. A weighted/blended average of $400/ ft2 was therefore applied to assess market support for floor area, rather than a target of $600/ft2 that might best apply to a new chain restaurant opportunity.
Based on the resulting figures, Downtown Whitehorse appears to be somewhat over-represented in this category at present; however, the community should accommodate an additional 40,000 ft2 of growth over the next decade. The consultant team’s review of restaurant & tavern demand in Downtown Whitehorse is presented in Table 6.6.4.
Given the vast range in restaurant types, all with varying sales performance targets, not to mention the influence of changing tastes and trends among diners, there is no definitive answer to the question of how best to meet ongoing demand for quality food and beverage options. One thing is certain, however: the restaurant and tavern category is critical, not only to the social life of locals, but also as a differentiator for tourists and visitors. Based on continued growth in expenditure potential in the category, on a detailed review of current inventory, and on ideas and observations from other interesting and vibrant centres and places, the following types of establishments should be considered high potential target restaurant type operators for Downtown Whitehorse:
• Mid-range restaurants covering a broader ethnic palate, particularly Thai, Vietnamese, Lebanese or Indian; and
• Craft breweries, distilleries, and/or pubs accessible to Main Street.
One interviewee noted that the challenges of running independent restaurants in Whitehorse – chief among them staffing – and the likely retirement of several long-running independent owners in the next 5-10 years could result in predominance of national chain restaurants vs. independents. A healthy independent restaurant sector is a key aspect of a city’s character and is often noted in tourism surveys (in any major centre) as being
Table 6.6.4 Restaurant and Tavern Demand Warranted Restaurant/Tavern Floor Area (Total)
2015 2021 2026
(Rounded to nearest 1,000 ft2)
At lower target per ft2 sales productivity of: $375 140,000 162,000 185,000
At mid-range target per ft2 sales productivity of: $400 132,000 152,000 173,000
At higher target per ft2 sales productivity of: $425 124,000 143,000 163,000
Less: Existing Trade Area Restaurant/Tavern Floor Area
132,750 132,750 132,750
Net Opportunity for additional floor area (ft2)
-750 19,250 40,250
Notes: Projected annual growth rate (PTA): 1.0% ; Projected annual growth rate (STA): 0.2%; Assumed annual growth in expenditures:
1.5%
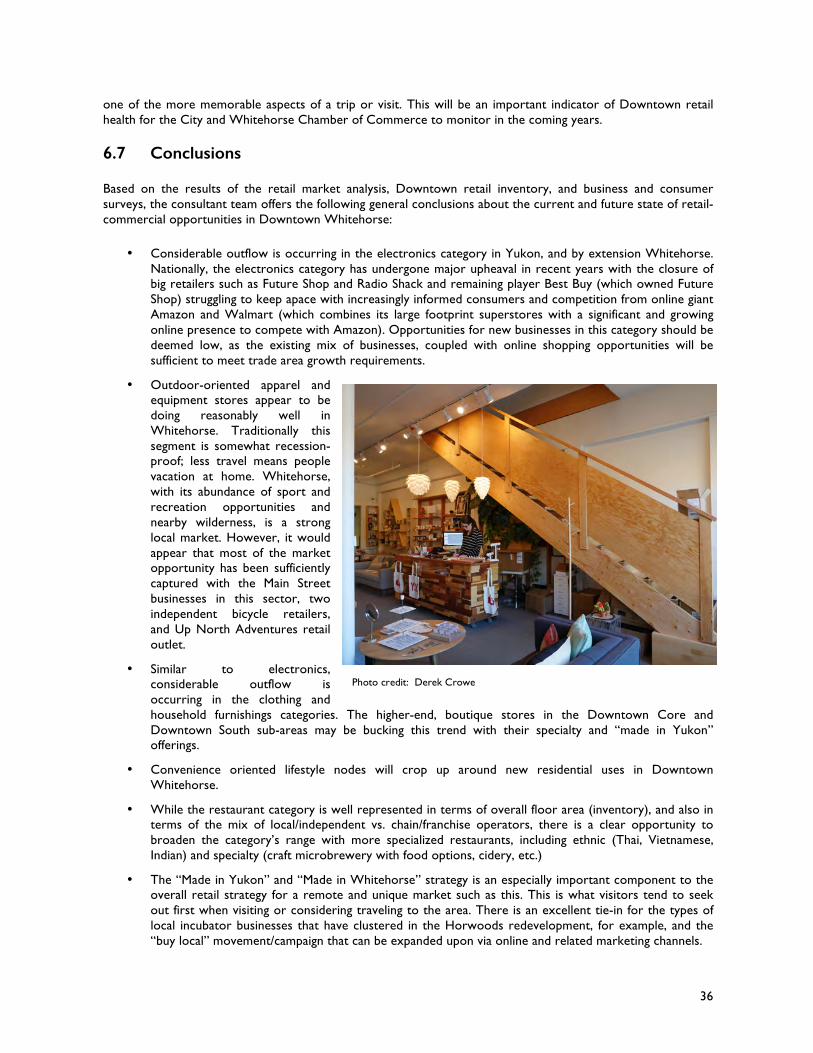
36
one of the more memorable aspects of a trip or visit. This will be an important indicator of Downtown retail health for the City and Whitehorse Chamber of Commerce to monitor in the coming years.
6.7 Conclusions Based on the results of the retail market analysis, Downtown retail inventory, and business and consumer surveys, the consultant team offers the following general conclusions about the current and future state of retail-commercial opportunities in Downtown Whitehorse:
• Considerable outflow is occurring in the electronics category in Yukon, and by extension Whitehorse. Nationally, the electronics category has undergone major upheaval in recent years with the closure of big retailers such as Future Shop and Radio Shack and remaining player Best Buy (which owned Future Shop) struggling to keep apace with increasingly informed consumers and competition from online giant Amazon and Walmart (which combines its large footprint superstores with a significant and growing online presence to compete with Amazon). Opportunities for new businesses in this category should be deemed low, as the existing mix of businesses, coupled with online shopping opportunities will be sufficient to meet trade area growth requirements.
• Outdoor-oriented apparel and equipment stores appear to be doing reasonably well in Whitehorse. Traditionally this segment is somewhat recession-proof; less travel means people vacation at home. Whitehorse, with its abundance of sport and recreation opportunities and nearby wilderness, is a strong local market. However, it would appear that most of the market opportunity has been sufficiently captured with the Main Street businesses in this sector, two independent bicycle retailers, and Up North Adventures retail outlet.
• Similar to electronics, considerable outflow is occurring in the clothing and household furnishings categories. The higher-end, boutique stores in the Downtown Core and Downtown South sub-areas may be bucking this trend with their specialty and “made in Yukon” offerings.
• Convenience oriented lifestyle nodes will crop up around new residential uses in Downtown Whitehorse.
• While the restaurant category is well represented in terms of overall floor area (inventory), and also in terms of the mix of local/independent vs. chain/franchise operators, there is a clear opportunity to broaden the category’s range with more specialized restaurants, including ethnic (Thai, Vietnamese, Indian) and specialty (craft microbrewery with food options, cidery, etc.)
• The “Made in Yukon” and “Made in Whitehorse” strategy is an especially important component to the overall retail strategy for a remote and unique market such as this. This is what visitors tend to seek out first when visiting or considering traveling to the area. There is an excellent tie-in for the types of local incubator businesses that have clustered in the Horwoods redevelopment, for example, and the “buy local” movement/campaign that can be expanded upon via online and related marketing channels.
Photo credit: Derek Crowe
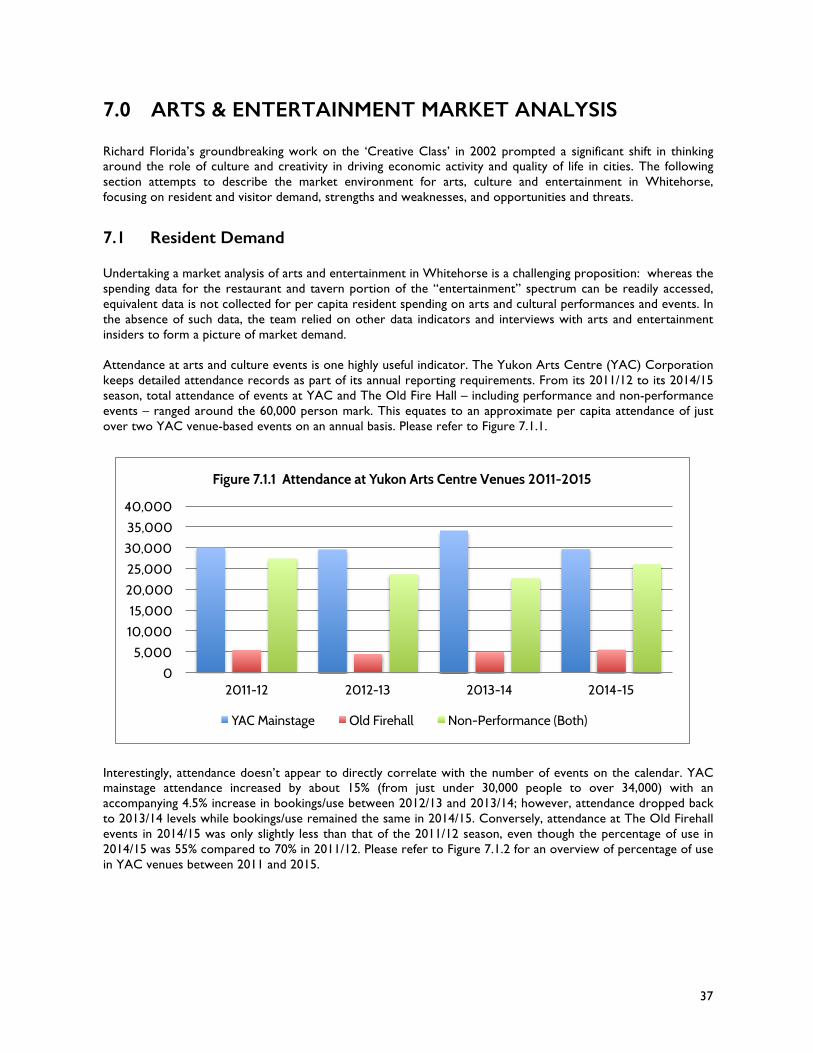
37
7.0 ARTS & ENTERTAINMENT MARKET ANALYSIS
Richard Florida’s groundbreaking work on the ‘Creative Class’ in 2002 prompted a significant shift in thinking around the role of culture and creativity in driving economic activity and quality of life in cities. The following section attempts to describe the market environment for arts, culture and entertainment in Whitehorse, focusing on resident and visitor demand, strengths and weaknesses, and opportunities and threats.
7.1 Resident Demand Undertaking a market analysis of arts and entertainment in Whitehorse is a challenging proposition: whereas the spending data for the restaurant and tavern portion of the “entertainment” spectrum can be readily accessed, equivalent data is not collected for per capita resident spending on arts and cultural performances and events. In the absence of such data, the team relied on other data indicators and interviews with arts and entertainment insiders to form a picture of market demand. Attendance at arts and culture events is one highly useful indicator. The Yukon Arts Centre (YAC) Corporation keeps detailed attendance records as part of its annual reporting requirements. From its 2011/12 to its 2014/15 season, total attendance of events at YAC and The Old Fire Hall – including performance and non-performance events – ranged around the 60,000 person mark. This equates to an approximate per capita attendance of just over two YAC venue-based events on an annual basis. Please refer to Figure 7.1.1.
Interestingly, attendance doesn’t appear to directly correlate with the number of events on the calendar. YAC mainstage attendance increased by about 15% (from just under 30,000 people to over 34,000) with an accompanying 4.5% increase in bookings/use between 2012/13 and 2013/14; however, attendance dropped back to 2013/14 levels while bookings/use remained the same in 2014/15. Conversely, attendance at The Old Firehall events in 2014/15 was only slightly less than that of the 2011/12 season, even though the percentage of use in 2014/15 was 55% compared to 70% in 2011/12. Please refer to Figure 7.1.2 for an overview of percentage of use in YAC venues between 2011 and 2015.
0
5,000
10,000
15,000
20,000
25,000
30,000
35,000
40,000
2011-12 2012-13 2013-14 2014-15
Figure 7.1.1 Attendance at Yukon Arts Centre Venues 2011-2015
YAC Mainstage Old Firehall Non-Performance (Both)
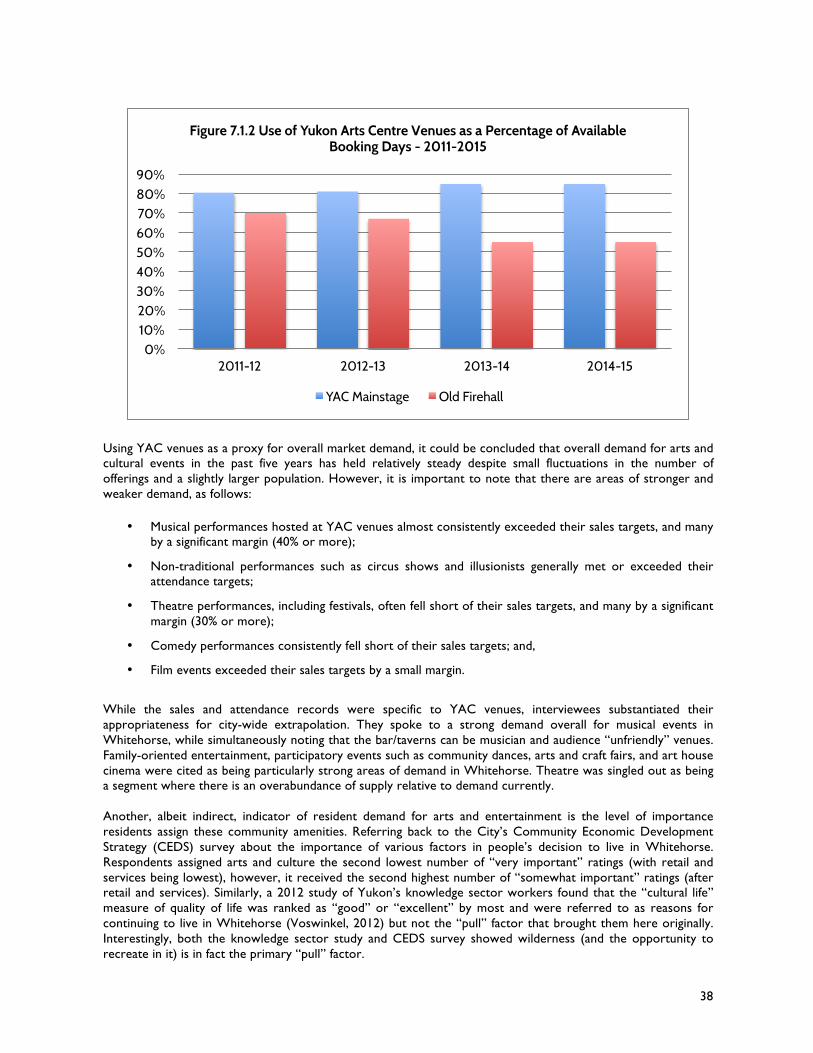
38
Using YAC venues as a proxy for overall market demand, it could be concluded that overall demand for arts and cultural events in the past five years has held relatively steady despite small fluctuations in the number of offerings and a slightly larger population. However, it is important to note that there are areas of stronger and weaker demand, as follows:
• Musical performances hosted at YAC venues almost consistently exceeded their sales targets, and many by a significant margin (40% or more);
• Non-traditional performances such as circus shows and illusionists generally met or exceeded their attendance targets;
• Theatre performances, including festivals, often fell short of their sales targets, and many by a significant margin (30% or more);
• Comedy performances consistently fell short of their sales targets; and,
• Film events exceeded their sales targets by a small margin.
While the sales and attendance records were specific to YAC venues, interviewees substantiated their appropriateness for city-wide extrapolation. They spoke to a strong demand overall for musical events in Whitehorse, while simultaneously noting that the bar/taverns can be musician and audience “unfriendly” venues. Family-oriented entertainment, participatory events such as community dances, arts and craft fairs, and art house cinema were cited as being particularly strong areas of demand in Whitehorse. Theatre was singled out as being a segment where there is an overabundance of supply relative to demand currently. Another, albeit indirect, indicator of resident demand for arts and entertainment is the level of importance residents assign these community amenities. Referring back to the City’s Community Economic Development Strategy (CEDS) survey about the importance of various factors in people’s decision to live in Whitehorse. Respondents assigned arts and culture the second lowest number of “very important” ratings (with retail and services being lowest), however, it received the second highest number of “somewhat important” ratings (after retail and services). Similarly, a 2012 study of Yukon’s knowledge sector workers found that the “cultural life” measure of quality of life was ranked as “good” or “excellent” by most and were referred to as reasons for continuing to live in Whitehorse (Voswinkel, 2012) but not the “pull” factor that brought them here originally. Interestingly, both the knowledge sector study and CEDS survey showed wilderness (and the opportunity to recreate in it) is in fact the primary “pull” factor.
0% 10% 20% 30% 40% 50% 60% 70% 80% 90%
2011-12 2012-13 2013-14 2014-15
Figure 7.1.2 Use of Yukon Arts Centre Venues as a Percentage of Available Booking Days - 2011-2015
YAC Mainstage Old Firehall
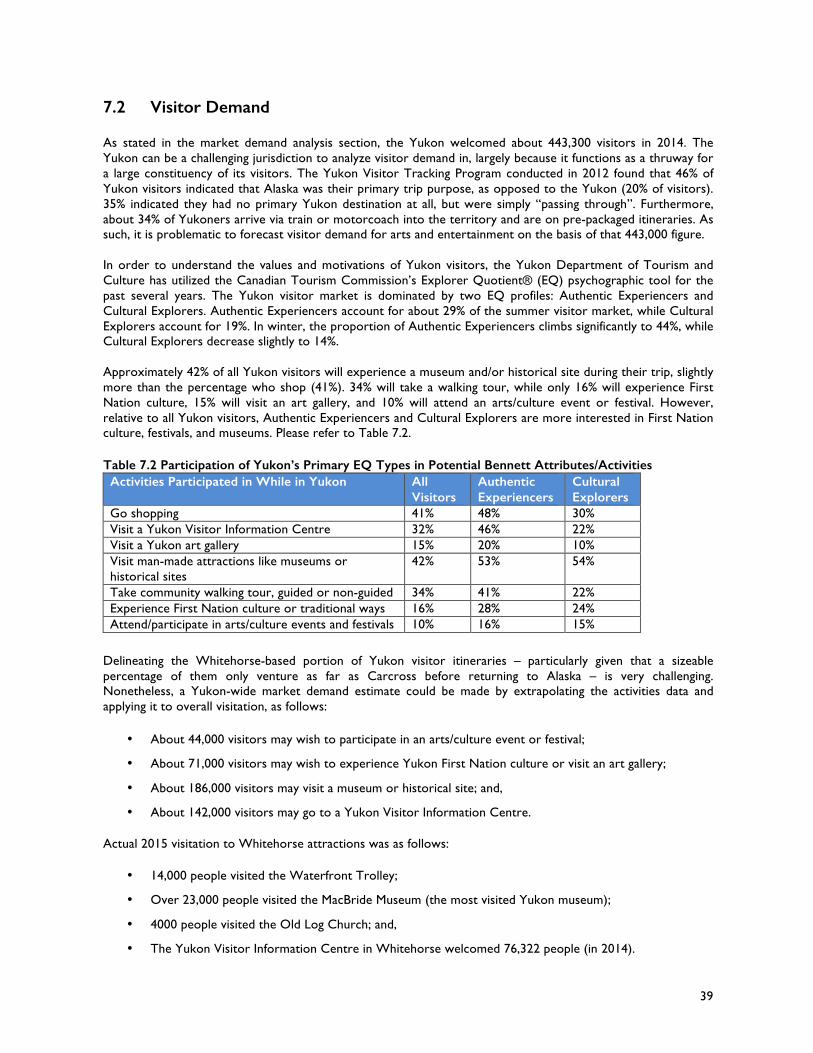
39
7.2 Visitor Demand As stated in the market demand analysis section, the Yukon welcomed about 443,300 visitors in 2014. The Yukon can be a challenging jurisdiction to analyze visitor demand in, largely because it functions as a thruway for a large constituency of its visitors. The Yukon Visitor Tracking Program conducted in 2012 found that 46% of Yukon visitors indicated that Alaska was their primary trip purpose, as opposed to the Yukon (20% of visitors). 35% indicated they had no primary Yukon destination at all, but were simply “passing through”. Furthermore, about 34% of Yukoners arrive via train or motorcoach into the territory and are on pre-packaged itineraries. As such, it is problematic to forecast visitor demand for arts and entertainment on the basis of that 443,000 figure. In order to understand the values and motivations of Yukon visitors, the Yukon Department of Tourism and Culture has utilized the Canadian Tourism Commission’s Explorer Quotient® (EQ) psychographic tool for the past several years. The Yukon visitor market is dominated by two EQ profiles: Authentic Experiencers and Cultural Explorers. Authentic Experiencers account for about 29% of the summer visitor market, while Cultural Explorers account for 19%. In winter, the proportion of Authentic Experiencers climbs significantly to 44%, while Cultural Explorers decrease slightly to 14%. Approximately 42% of all Yukon visitors will experience a museum and/or historical site during their trip, slightly more than the percentage who shop (41%). 34% will take a walking tour, while only 16% will experience First Nation culture, 15% will visit an art gallery, and 10% will attend an arts/culture event or festival. However, relative to all Yukon visitors, Authentic Experiencers and Cultural Explorers are more interested in First Nation culture, festivals, and museums. Please refer to Table 7.2. Table 7.2 Participation of Yukon’s Primary EQ Types in Potential Bennett Attributes/Activities Activities Participated in While in Yukon All
Visitors Authentic Experiencers
Cultural Explorers
Go shopping 41% 48% 30% Visit a Yukon Visitor Information Centre 32% 46% 22% Visit a Yukon art gallery 15% 20% 10% Visit man-made attractions like museums or historical sites
42% 53% 54%
Take community walking tour, guided or non-guided 34% 41% 22% Experience First Nation culture or traditional ways 16% 28% 24% Attend/participate in arts/culture events and festivals 10% 16% 15%
Delineating the Whitehorse-based portion of Yukon visitor itineraries – particularly given that a sizeable percentage of them only venture as far as Carcross before returning to Alaska – is very challenging. Nonetheless, a Yukon-wide market demand estimate could be made by extrapolating the activities data and applying it to overall visitation, as follows:
• About 44,000 visitors may wish to participate in an arts/culture event or festival;
• About 71,000 visitors may wish to experience Yukon First Nation culture or visit an art gallery;
• About 186,000 visitors may visit a museum or historical site; and,
• About 142,000 visitors may go to a Yukon Visitor Information Centre.
Actual 2015 visitation to Whitehorse attractions was as follows:
• 14,000 people visited the Waterfront Trolley;
• Over 23,000 people visited the MacBride Museum (the most visited Yukon museum);
• 4000 people visited the Old Log Church; and,
• The Yukon Visitor Information Centre in Whitehorse welcomed 76,322 people (in 2014).
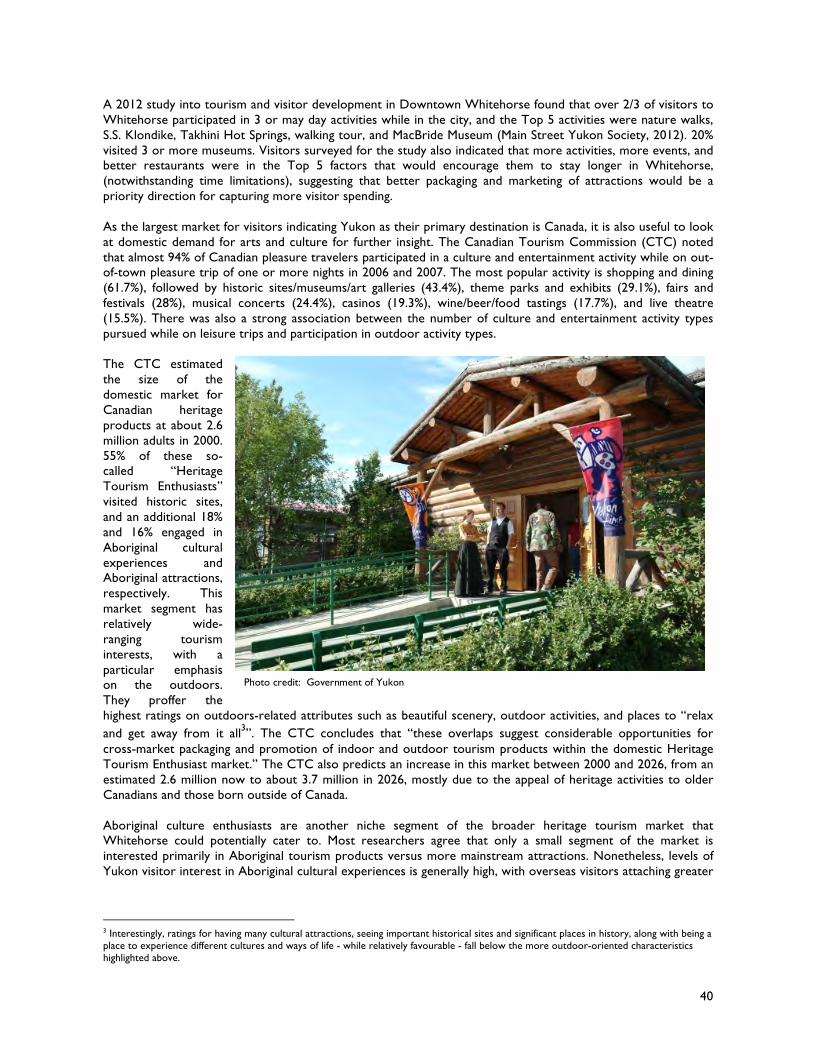
40
A 2012 study into tourism and visitor development in Downtown Whitehorse found that over 2/3 of visitors to Whitehorse participated in 3 or may day activities while in the city, and the Top 5 activities were nature walks, S.S. Klondike, Takhini Hot Springs, walking tour, and MacBride Museum (Main Street Yukon Society, 2012). 20% visited 3 or more museums. Visitors surveyed for the study also indicated that more activities, more events, and better restaurants were in the Top 5 factors that would encourage them to stay longer in Whitehorse, (notwithstanding time limitations), suggesting that better packaging and marketing of attractions would be a priority direction for capturing more visitor spending. As the largest market for visitors indicating Yukon as their primary destination is Canada, it is also useful to look at domestic demand for arts and culture for further insight. The Canadian Tourism Commission (CTC) noted that almost 94% of Canadian pleasure travelers participated in a culture and entertainment activity while on out-of-town pleasure trip of one or more nights in 2006 and 2007. The most popular activity is shopping and dining (61.7%), followed by historic sites/museums/art galleries (43.4%), theme parks and exhibits (29.1%), fairs and festivals (28%), musical concerts (24.4%), casinos (19.3%), wine/beer/food tastings (17.7%), and live theatre (15.5%). There was also a strong association between the number of culture and entertainment activity types pursued while on leisure trips and participation in outdoor activity types. The CTC estimated the size of the domestic market for Canadian heritage products at about 2.6 million adults in 2000. 55% of these so-called “Heritage Tourism Enthusiasts” visited historic sites, and an additional 18% and 16% engaged in Aboriginal cultural experiences and Aboriginal attractions, respectively. This market segment has relatively wide-ranging tourism interests, with a particular emphasis on the outdoors. They proffer the highest ratings on outdoors-related attributes such as beautiful scenery, outdoor activities, and places to “relax and get away from it all3”. The CTC concludes that “these overlaps suggest considerable opportunities for cross-market packaging and promotion of indoor and outdoor tourism products within the domestic Heritage Tourism Enthusiast market.” The CTC also predicts an increase in this market between 2000 and 2026, from an estimated 2.6 million now to about 3.7 million in 2026, mostly due to the appeal of heritage activities to older Canadians and those born outside of Canada. Aboriginal culture enthusiasts are another niche segment of the broader heritage tourism market that Whitehorse could potentially cater to. Most researchers agree that only a small segment of the market is interested primarily in Aboriginal tourism products versus more mainstream attractions. Nonetheless, levels of Yukon visitor interest in Aboriginal cultural experiences is generally high, with overseas visitors attaching greater
3 Interestingly, ratings for having many cultural attractions, seeing important historical sites and significant places in history, along with being a place to experience different cultures and ways of life - while relatively favourable - fall below the more outdoor-oriented characteristics highlighted above.
Photo credit: Government of Yukon
41
importance to them than North Americans4. Aboriginal culture is not the primary draw for most Yukon tourists, but may factor into trip decision-making. Most travelers interested in Aboriginal culture are primarily looking for a learning-centred experience, with older travelers more interested in passive learning and younger ones seeking out more active adventures (Taiga Research and Consulting, 2009). Pre-trip information seeking is minimal and participants in Aboriginal cultural products rely heavily on local knowledge and word-of-mouth.
7.3 Arts and Entertainment Community Perspectives A series of one-on-one interviews were held with a broad range of arts and entertainment community representatives to discuss the current state of the sector. The following are key themes that emerged during those discussions: 7.3.1 Strengths and Weaknesses
• Stakeholders spoke to an incredible diversity of arts and entertainment offerings in Whitehorse for a city its size. The level of support for artists in the community is perceived to be high, from the Yukon government to local retailers who showcase Yukon-made product to local radio stations who promote local artists.
• There are many promotional and marketing channels for various arts and entertainment offerings in Whitehorse, including ArtsNet, the Yukon Arts Centre calendar, What’s Up Yukon event listings, and Music Yukon’s weekly calendar. However, no one online calendar seems to meet the broader needs of the entire arts and culture community and simultaneously market the sector.
• The waterfront is viewed as a key Whitehorse arts and cultural strength by stakeholders. The redevelopment of The Old Fire Hall and Roundhouse, as well as Kwanlin Dün Cultural Centre, have made this area a key focal point for locals and visitors. While the area has transformed considerably, many saw it as a continuing work-in-progress.
• Levels of volunteerism in Whitehorse arts and culture are seen to be high. Conversely, the bulk of volunteer responsibilities were felt to be assumed by a relatively small group volunteers, and “burnout” was viewed as a persistent weakness.
• Stakeholders spoke to the wealth of stories and heritage that Whitehorse has to offer and some stressed the need to better animate and interpret the city’s special spaces. It was noted that a number of heritage assets are currently sitting empty, such as the train houses on the waterfront. Other heritage assets – such as the White Pass railway station – are felt to be poorly utilized as offices.
• The Yukon Arts Centre is widely seen as the focal point of Yukon arts and culture; however, its location out of the Downtown core was viewed almost unanimously as a major weakness.
7.3.2 Opportunities and Threats
• Some stakeholders articulated the need to educate the City about the economic value of arts, culture, and heritage. One commented that the use of the term “grant” for funding is indicative of a perceived disconnect; it was suggested that these should be termed “investments”.
• Venue managers spoke to the challenge of generating sufficient revenues when such a large percentage of arts and entertainment-related bookings are made by NFPs that receive a discount. Several mentioned that their pricing models were currently or would soon be under review.
• Several stakeholders spoke to a disconnect between many Whitehorse residents and “going out on the town”. One commented that Yukoners will splurge on a fancy dinner and show when in Vancouver, Calgary, etc. but that same spending behaviour is rarely replicated at home. Another noted that
4 Taiga Research and Consulting. 2009. Demand for Aboriginal Cultural Tourism in Yukon. Retrieved from: http://www.tc.gov.yk.ca/publications/Demand_for_Aboriginal_Cultural_Tourism_2009.pdf
42
Yukoners are highly generous and spend much of their disposable income supporting various community organizations instead of entertainment.
• Numerous interviewees spoke to general oversaturation in the Whitehorse arts and entertainment market, noting that even those “in the know” are challenged to keep apace with an events calendar that full with events and activities, all of them competing for a relatively small audience. One venue manager commented that the arts and entertainment market is “deep” rather than “broad” in Whitehorse, saying that much of the attendance can be attributed to a relatively small population of enthusiasts, many of whom work in the arts and culture sector. Several interviewees noted that mainstream audiences are more typically seen at community-oriented events, particularly those involving youth.
• Some stakeholders spoke to the challenge of finding a suitable venue for certain types of performances and events. The Arts Centre was said to be too expensive for many groups to book, and has more capacity than is typically needed. The Old Fire Hall is well regarded but considered an unsuitable venue for most theatre and film offerings. There was considerable interest expressed in a smaller, “black box” style theatre - ideally on the waterfront - to bridge the gap.
• Discussion around an arts and entertainment district on Front Street triggered the revisiting of past decisions for some interviewees. A majority expressed that the Arts Centre’s community building benefits would have been more fully realized on the waterfront or elsewhere Downtown. Some expressed hope for a smaller facility (“black box” theatre was referred to) on the waterfront, but also noted that parking is already a major constraint for the Kwanlin Dün Cultural Centre.
• The animation of the waterfront is a shared objective: however, several interviewees noted that the location of both the wharf and Shipyards Park expose these areas to high winds and make performances, artistic installations, and festivals challenging. One even suggested the construction of a functional windbreak on the wharf that could serve as a dual purpose as a visitor kiosk.
• Several NFP interviewees spoke to a lack of clarity around the City’s role in regards to arts, culture, and most particularly tourism. The former Tourism and Economic Development Coordinator role at the City had been well regarded and useful; several interviewees referred to it as a quasi “welcome wagon” for various delegations and interests visiting Whitehorse. Moreover, its (former) highly visible presence in the Downtown Commercial Core put the City front and centre.
• The City’s Recreation Grant program was mentioned by some NFPs as being a poor fit with arts and cultural organizations and a stand-alone heritage fund was suggested.
• There are very low levels of integration between the Downtown and Yukon Arts Centre and other venues. The idea of a summer shuttle between Downtown and other arts and cultural attractions was raised by several stakeholders. Improved transit connections between the Arts Centre and Downtown would also help, allowing more people to dine (and drink) before a show without worrying about driving.
• Stakeholders noted that visitors lack a “one-stop” shop for arts and culture related information in Whitehorse. The Yukon Visitor Information Centre staff is more focused on Yukon-wide attractions. The Kwanlin Dün Cultural Centre reports many visitors entering their facility looking for information about events and performances during the summer months. The Miles Canyon Historical Railway Society has recognized this gap and is launching a “cultural concierge” service in the summer of 2016.
• Several stakeholders noted that the Downtown business community, while a strong sponsor of local arts, is not maximizing potential connections to arts and culture. Co-promotion initiatives such as that of Toronto’s theatre district – where venues are paired with restaurants – should be explored here to reinforce the idea of dinner/drinks and a show, versus one or the other.
• The influence of NFPs and their access to government funding was viewed as an impediment in specific circumstances. One example cited was the government support for artist collectives, which coincided (or not) with the closure of a long-running private sector art gallery.
• Some stakeholders noted the lack of a local tourism promotion or coordination entity analogous to the Klondike Visitors Association as a problematic gap, even though the Department of Tourism and Culture and Yukon’s various tourism-oriented not-for-profit organizations are located in the capital.
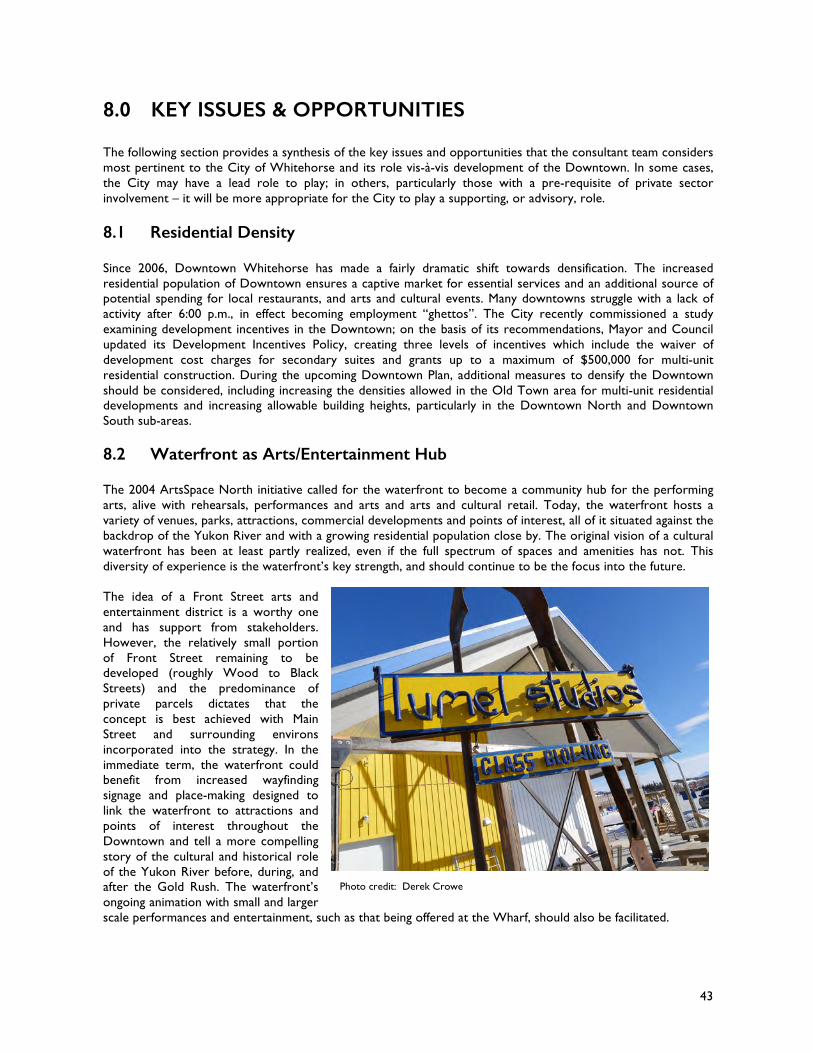
43
8.0 KEY ISSUES & OPPORTUNITIES
The following section provides a synthesis of the key issues and opportunities that the consultant team considers most pertinent to the City of Whitehorse and its role vis-à-vis development of the Downtown. In some cases, the City may have a lead role to play; in others, particularly those with a pre-requisite of private sector involvement – it will be more appropriate for the City to play a supporting, or advisory, role. 8.1 Residential Density Since 2006, Downtown Whitehorse has made a fairly dramatic shift towards densification. The increased residential population of Downtown ensures a captive market for essential services and an additional source of potential spending for local restaurants, and arts and cultural events. Many downtowns struggle with a lack of activity after 6:00 p.m., in effect becoming employment “ghettos”. The City recently commissioned a study examining development incentives in the Downtown; on the basis of its recommendations, Mayor and Council updated its Development Incentives Policy, creating three levels of incentives which include the waiver of development cost charges for secondary suites and grants up to a maximum of $500,000 for multi-unit residential construction. During the upcoming Downtown Plan, additional measures to densify the Downtown should be considered, including increasing the densities allowed in the Old Town area for multi-unit residential developments and increasing allowable building heights, particularly in the Downtown North and Downtown South sub-areas.
8.2 Waterfront as Arts/Entertainment Hub
The 2004 ArtsSpace North initiative called for the waterfront to become a community hub for the performing arts, alive with rehearsals, performances and arts and arts and cultural retail. Today, the waterfront hosts a variety of venues, parks, attractions, commercial developments and points of interest, all of it situated against the backdrop of the Yukon River and with a growing residential population close by. The original vision of a cultural waterfront has been at least partly realized, even if the full spectrum of spaces and amenities has not. This diversity of experience is the waterfront’s key strength, and should continue to be the focus into the future. The idea of a Front Street arts and entertainment district is a worthy one and has support from stakeholders. However, the relatively small portion of Front Street remaining to be developed (roughly Wood to Black Streets) and the predominance of private parcels dictates that the concept is best achieved with Main Street and surrounding environs incorporated into the strategy. In the immediate term, the waterfront could benefit from increased wayfinding signage and place-making designed to link the waterfront to attractions and points of interest throughout the Downtown and tell a more compelling story of the cultural and historical role of the Yukon River before, during, and after the Gold Rush. The waterfront’s ongoing animation with small and larger scale performances and entertainment, such as that being offered at the Wharf, should also be facilitated.
Photo credit: Derek Crowe
44
The current zoning for the waterfront is Mixed Use Waterfront (CMW). The consultant team supports these zoning regulations, including such details as ground storey glazing, awnings, encouragement of patio and pedestrian-friendly orientations, and design guidelines. The current zoning calls for a maximum 50% of office space on the ground floor and encourages the development of street animating uses such as patios; there may be merit to creating additional financial incentives to encourage these types of development. The City will want to give very careful thought to the future of its parcel located on the corner of Black and Front streets, currently occupied by a garage, as it could be utilized to highly strategic effect in shaping the area. The team notes Granville Island’s Railspur Alley as a concept for the waterfront area to emulate: the emphasis being on small-scale, artisan, “made in Yukon” product and experiences. The concept that has successfully taken root at Horwoods and should be recreated in a diversity of forms along the waterfront. The prospective micro-retail development being put forward by the Kwanlin Dün Cultural Centre would be an excellent step in this direction. As well, both the consultant team and various stakeholders see significant future potential in the White Pass and Yukon Route railway station to house a mix of visitor and local-oriented services, retail, and arts/culture. The lack of a central point of sale for attractions and experiences in the Downtown has been repeatedly identified as a significant gap in recent years (Amuse, 2009; Main Street Yukon Society, 2012). The intended 2016 start up of a “cultural concierge” service for visitors at the Roundhouse is an important step towards bridging the gap and should be supported. The consultant team also noted an overarching lack of coordination and communication around some arts/entertainment topics, understandable given the large number of active not-for-profit organizations with supportive (and slightly overlapping, in some cases) mandates. The City has made an organizational decision to divest of its former role in tourism; however, it should consider adopting a coordinating role around short-term, narrowly defined initiatives that have a high degree of overlap with the urban setting. The Whitehorse waterfront is a logical candidate.
8.3 Integration of Downtown with Arts and Entertainment While Whitehorse is home to a number of high-quality arts and cultural venues and attractions and a reasonable diversity of restaurants and taverns, there has been relatively little coordinated effort to integrate these elements to best effect. Improved co-marketing and promotion between Downtown businesses and various venues throughout Whitehorse would be an excellent starting point. A shuttle connecting experiences and attractions to the Downtown has been previously recommended to optimize visitor stays and spending (Main Street Yukon Society, 2012) and was reiterated during this exercise. While such initiatives are best left to the business, heritage and arts community itself, the City does potentially have a role to play in improving the physical integration of Whitehorse’s key arts and entertainment venue - the Yukon Arts Centre – with the Downtown. This could be as simple as scheduling (and promoting) a “theatre bus” to coincide with major programmed events, all of which are scheduled well in advance. The team notes that the final weekday bus departs Yukon College at 10:00 p.m., just shy of the typical end time for most shows5. Fares could even be heavily discounted (or complimentary) with proof of minimum purchase at a Downtown establishment.
8.4 Parking and Parking Management If there was one takeaway from the consultant team’s interactions with Downtown businesses, it would be this: parking is perceived to be a major issue, and the City is perceived to be doing little to resolve it. It is outside the consultant team’s scope to make any detailed conclusions in this regard; however, the team generally concurs with the findings of the 2011 City of Whitehorse Parking Management Plan that parking management – particularly for longer-term parkers - appears to be the central problem versus an outright lack of parking space. That said, the input of stakeholders serves as a reminder that the City’s Parking Development Reserve ($2,088,495 in 2014) is theoretically in place to fund capital or other improvements to alleviate parking pressure. It also points to the need for City leadership in working with other levels of government to manage the parking implications of the significant public sector employee presence Downtown and improve the convenience of payment to the extent possible. Low-cost but highly symbolic gestures – such as Friday night/Saturday morning
5 Cushing, personal communication.
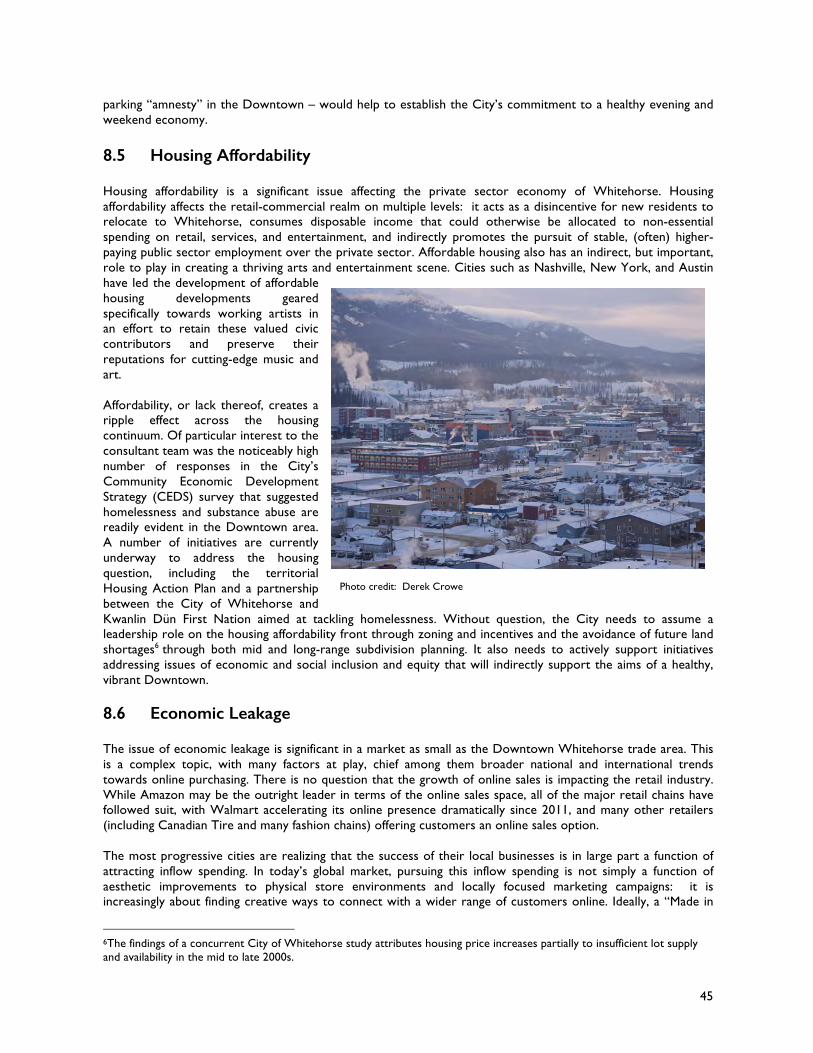
45
parking “amnesty” in the Downtown – would help to establish the City’s commitment to a healthy evening and weekend economy. 8.5 Housing Affordability Housing affordability is a significant issue affecting the private sector economy of Whitehorse. Housing affordability affects the retail-commercial realm on multiple levels: it acts as a disincentive for new residents to relocate to Whitehorse, consumes disposable income that could otherwise be allocated to non-essential spending on retail, services, and entertainment, and indirectly promotes the pursuit of stable, (often) higher-paying public sector employment over the private sector. Affordable housing also has an indirect, but important, role to play in creating a thriving arts and entertainment scene. Cities such as Nashville, New York, and Austin have led the development of affordable housing developments geared specifically towards working artists in an effort to retain these valued civic contributors and preserve their reputations for cutting-edge music and art. Affordability, or lack thereof, creates a ripple effect across the housing continuum. Of particular interest to the consultant team was the noticeably high number of responses in the City’s Community Economic Development Strategy (CEDS) survey that suggested homelessness and substance abuse are readily evident in the Downtown area. A number of initiatives are currently underway to address the housing question, including the territorial Housing Action Plan and a partnership between the City of Whitehorse and Kwanlin Dün First Nation aimed at tackling homelessness. Without question, the City needs to assume a leadership role on the housing affordability front through zoning and incentives and the avoidance of future land shortages6 through both mid and long-range subdivision planning. It also needs to actively support initiatives addressing issues of economic and social inclusion and equity that will indirectly support the aims of a healthy, vibrant Downtown.
8.6 Economic Leakage The issue of economic leakage is significant in a market as small as the Downtown Whitehorse trade area. This is a complex topic, with many factors at play, chief among them broader national and international trends towards online purchasing. There is no question that the growth of online sales is impacting the retail industry. While Amazon may be the outright leader in terms of the online sales space, all of the major retail chains have followed suit, with Walmart accelerating its online presence dramatically since 2011, and many other retailers (including Canadian Tire and many fashion chains) offering customers an online sales option. The most progressive cities are realizing that the success of their local businesses is in large part a function of attracting inflow spending. In today’s global market, pursuing this inflow spending is not simply a function of aesthetic improvements to physical store environments and locally focused marketing campaigns: it is increasingly about finding creative ways to connect with a wider range of customers online. Ideally, a “Made in
6The findings of a concurrent City of Whitehorse study attributes housing price increases partially to insufficient lot supply and availability in the mid to late 2000s.
Photo credit: Derek Crowe
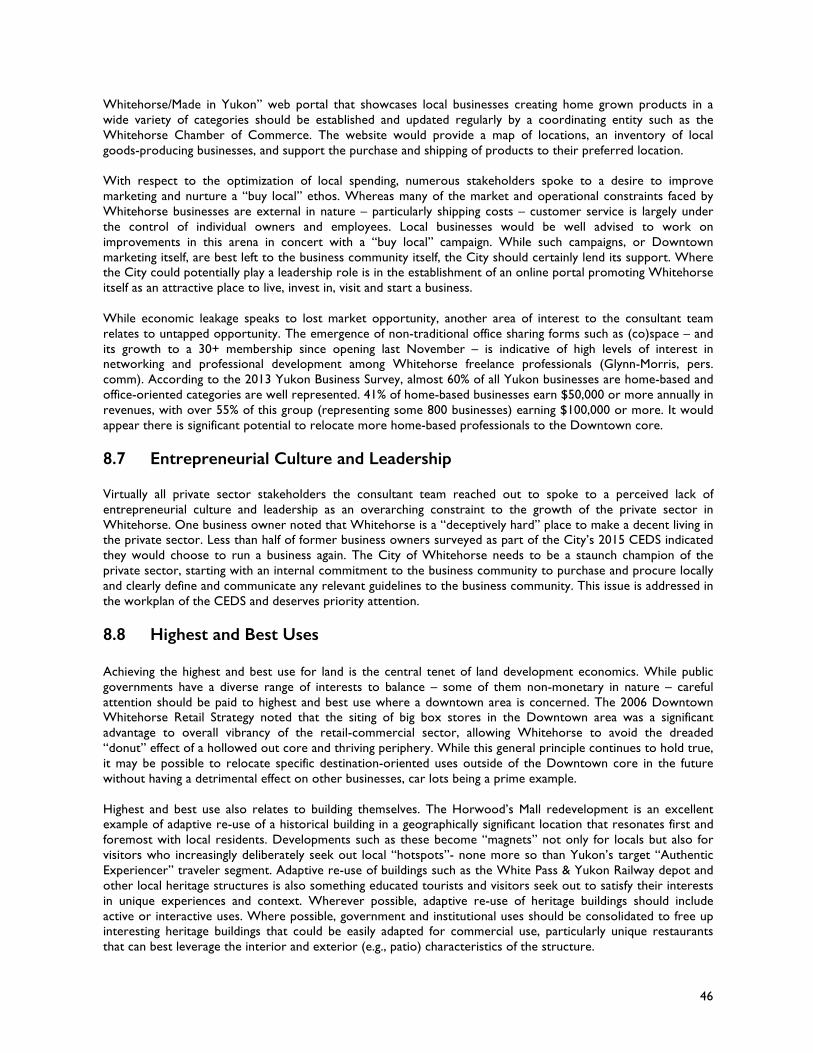
46
Whitehorse/Made in Yukon” web portal that showcases local businesses creating home grown products in a wide variety of categories should be established and updated regularly by a coordinating entity such as the Whitehorse Chamber of Commerce. The website would provide a map of locations, an inventory of local goods-producing businesses, and support the purchase and shipping of products to their preferred location. With respect to the optimization of local spending, numerous stakeholders spoke to a desire to improve marketing and nurture a “buy local” ethos. Whereas many of the market and operational constraints faced by Whitehorse businesses are external in nature – particularly shipping costs – customer service is largely under the control of individual owners and employees. Local businesses would be well advised to work on improvements in this arena in concert with a “buy local” campaign. While such campaigns, or Downtown marketing itself, are best left to the business community itself, the City should certainly lend its support. Where the City could potentially play a leadership role is in the establishment of an online portal promoting Whitehorse itself as an attractive place to live, invest in, visit and start a business. While economic leakage speaks to lost market opportunity, another area of interest to the consultant team relates to untapped opportunity. The emergence of non-traditional office sharing forms such as (co)space – and its growth to a 30+ membership since opening last November – is indicative of high levels of interest in networking and professional development among Whitehorse freelance professionals (Glynn-Morris, pers. comm). According to the 2013 Yukon Business Survey, almost 60% of all Yukon businesses are home-based and office-oriented categories are well represented. 41% of home-based businesses earn $50,000 or more annually in revenues, with over 55% of this group (representing some 800 businesses) earning $100,000 or more. It would appear there is significant potential to relocate more home-based professionals to the Downtown core.
8.7 Entrepreneurial Culture and Leadership Virtually all private sector stakeholders the consultant team reached out to spoke to a perceived lack of entrepreneurial culture and leadership as an overarching constraint to the growth of the private sector in Whitehorse. One business owner noted that Whitehorse is a “deceptively hard” place to make a decent living in the private sector. Less than half of former business owners surveyed as part of the City’s 2015 CEDS indicated they would choose to run a business again. The City of Whitehorse needs to be a staunch champion of the private sector, starting with an internal commitment to the business community to purchase and procure locally and clearly define and communicate any relevant guidelines to the business community. This issue is addressed in the workplan of the CEDS and deserves priority attention.
8.8 Highest and Best Uses
Achieving the highest and best use for land is the central tenet of land development economics. While public governments have a diverse range of interests to balance – some of them non-monetary in nature – careful attention should be paid to highest and best use where a downtown area is concerned. The 2006 Downtown Whitehorse Retail Strategy noted that the siting of big box stores in the Downtown area was a significant advantage to overall vibrancy of the retail-commercial sector, allowing Whitehorse to avoid the dreaded “donut” effect of a hollowed out core and thriving periphery. While this general principle continues to hold true, it may be possible to relocate specific destination-oriented uses outside of the Downtown core in the future without having a detrimental effect on other businesses, car lots being a prime example. Highest and best use also relates to building themselves. The Horwood’s Mall redevelopment is an excellent example of adaptive re-use of a historical building in a geographically significant location that resonates first and foremost with local residents. Developments such as these become “magnets” not only for locals but also for visitors who increasingly deliberately seek out local “hotspots”- none more so than Yukon’s target “Authentic Experiencer” traveler segment. Adaptive re-use of buildings such as the White Pass & Yukon Railway depot and other local heritage structures is also something educated tourists and visitors seek out to satisfy their interests in unique experiences and context. Wherever possible, adaptive re-use of heritage buildings should include active or interactive uses. Where possible, government and institutional uses should be consolidated to free up interesting heritage buildings that could be easily adapted for commercial use, particularly unique restaurants that can best leverage the interior and exterior (e.g., patio) characteristics of the structure.
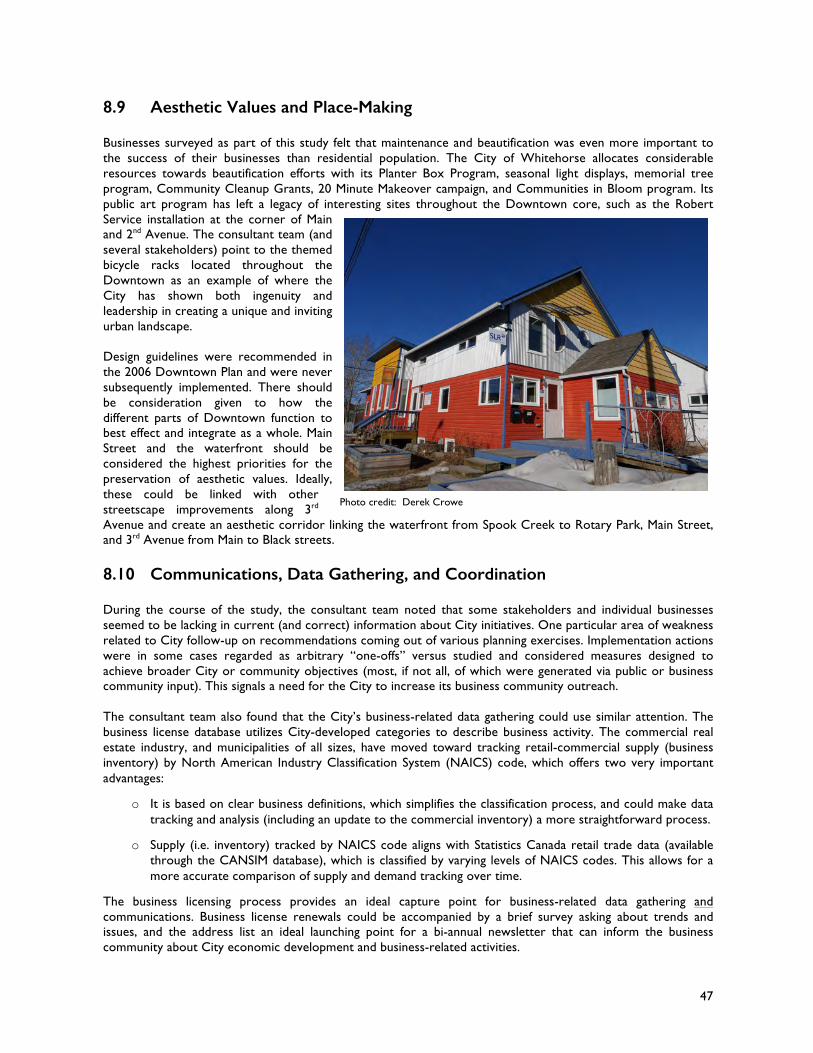
47
8.9 Aesthetic Values and Place-Making Businesses surveyed as part of this study felt that maintenance and beautification was even more important to the success of their businesses than residential population. The City of Whitehorse allocates considerable resources towards beautification efforts with its Planter Box Program, seasonal light displays, memorial tree program, Community Cleanup Grants, 20 Minute Makeover campaign, and Communities in Bloom program. Its public art program has left a legacy of interesting sites throughout the Downtown core, such as the Robert Service installation at the corner of Main and 2nd Avenue. The consultant team (and several stakeholders) point to the themed bicycle racks located throughout the Downtown as an example of where the City has shown both ingenuity and leadership in creating a unique and inviting urban landscape. Design guidelines were recommended in the 2006 Downtown Plan and were never subsequently implemented. There should be consideration given to how the different parts of Downtown function to best effect and integrate as a whole. Main Street and the waterfront should be considered the highest priorities for the preservation of aesthetic values. Ideally, these could be linked with other streetscape improvements along 3rd Avenue and create an aesthetic corridor linking the waterfront from Spook Creek to Rotary Park, Main Street, and 3rd Avenue from Main to Black streets. 8.10 Communications, Data Gathering, and Coordination
During the course of the study, the consultant team noted that some stakeholders and individual businesses seemed to be lacking in current (and correct) information about City initiatives. One particular area of weakness related to City follow-up on recommendations coming out of various planning exercises. Implementation actions were in some cases regarded as arbitrary “one-offs” versus studied and considered measures designed to achieve broader City or community objectives (most, if not all, of which were generated via public or business community input). This signals a need for the City to increase its business community outreach. The consultant team also found that the City’s business-related data gathering could use similar attention. The business license database utilizes City-developed categories to describe business activity. The commercial real estate industry, and municipalities of all sizes, have moved toward tracking retail-commercial supply (business inventory) by North American Industry Classification System (NAICS) code, which offers two very important advantages:
o It is based on clear business definitions, which simplifies the classification process, and could make data tracking and analysis (including an update to the commercial inventory) a more straightforward process.
o Supply (i.e. inventory) tracked by NAICS code aligns with Statistics Canada retail trade data (available through the CANSIM database), which is classified by varying levels of NAICS codes. This allows for a more accurate comparison of supply and demand tracking over time.
The business licensing process provides an ideal capture point for business-related data gathering and communications. Business license renewals could be accompanied by a brief survey asking about trends and issues, and the address list an ideal launching point for a bi-annual newsletter that can inform the business community about City economic development and business-related activities.
Photo credit: Derek Crowe
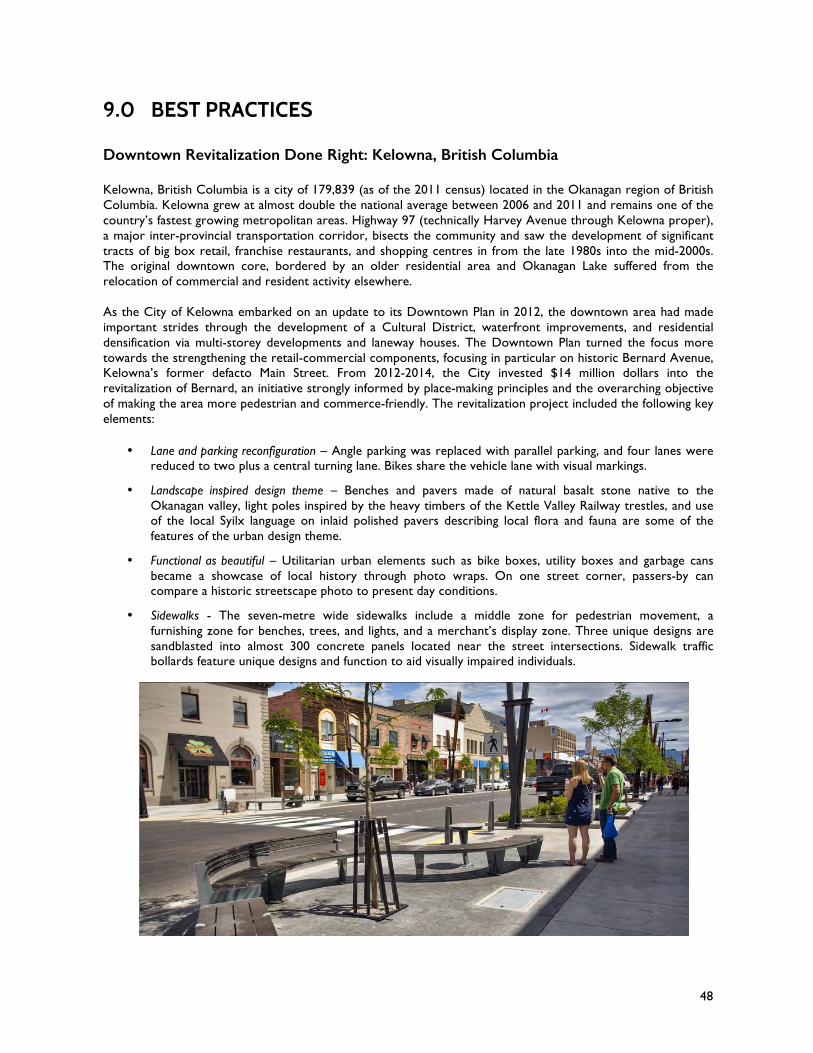
48
9.0 BEST PRACTICES
Downtown Revitalization Done Right: Kelowna, British Columbia
Kelowna, British Columbia is a city of 179,839 (as of the 2011 census) located in the Okanagan region of British Columbia. Kelowna grew at almost double the national average between 2006 and 2011 and remains one of the country’s fastest growing metropolitan areas. Highway 97 (technically Harvey Avenue through Kelowna proper), a major inter-provincial transportation corridor, bisects the community and saw the development of significant tracts of big box retail, franchise restaurants, and shopping centres in from the late 1980s into the mid-2000s. The original downtown core, bordered by an older residential area and Okanagan Lake suffered from the relocation of commercial and resident activity elsewhere. As the City of Kelowna embarked on an update to its Downtown Plan in 2012, the downtown area had made important strides through the development of a Cultural District, waterfront improvements, and residential densification via multi-storey developments and laneway houses. The Downtown Plan turned the focus more towards the strengthening the retail-commercial components, focusing in particular on historic Bernard Avenue, Kelowna’s former defacto Main Street. From 2012-2014, the City invested $14 million dollars into the revitalization of Bernard, an initiative strongly informed by place-making principles and the overarching objective of making the area more pedestrian and commerce-friendly. The revitalization project included the following key elements:
• Lane and parking reconfiguration – Angle parking was replaced with parallel parking, and four lanes were reduced to two plus a central turning lane. Bikes share the vehicle lane with visual markings.
• Landscape inspired design theme – Benches and pavers made of natural basalt stone native to the Okanagan valley, light poles inspired by the heavy timbers of the Kettle Valley Railway trestles, and use of the local Syilx language on inlaid polished pavers describing local flora and fauna are some of the features of the urban design theme.
• Functional as beautiful – Utilitarian urban elements such as bike boxes, utility boxes and garbage cans became a showcase of local history through photo wraps. On one street corner, passers-by can compare a historic streetscape photo to present day conditions.
• Sidewalks - The seven-metre wide sidewalks include a middle zone for pedestrian movement, a furnishing zone for benches, trees, and lights, and a merchant’s display zone. Three unique designs are sandblasted into almost 300 concrete panels located near the street intersections. Sidewalk traffic bollards feature unique designs and function to aid visually impaired individuals.
49
• Day-long animation – Back-lit art banners and six “Gobo” projectors – patterned templates placed in front of a lens to control the shape of the light – project the image of pinecones onto the sidewalk at night and create a unique night-time streetscape experience. Sidewalk patios were also highly encouraged.
• Gateway - A gateway treatment welcomes visitors and marks the transition from residential to commercial with eight unique light poles, double-sided artistic banners and metal plates with “Welcome” written in English and Syilx languages.
The project has been highly successful and the revitalization area currently boasts about 140 businesses and stores and over 20 sidewalk patios (City of Kelowna, 2014). The Bernard Avenue improvements now dovetail retail and commercial uses with the cultural, entertainment, and parks attractions in the adjacent Cultural District and lakefront areas. The Bernard Street revitalization is only one particularly visible element of the 2012 Downtown Plan. Supporting these urban design improvements are tax incentives to stimulate downtown development, lowering of development cost charges, rental housing grants, budget increases to downtown maintenance and beautification, pedestrian and transit improvements, building height increases, and many other commitments.
Retail-Commercial and Restaurant Design Best Practices
Retention of existing businesses and attraction of new businesses is key to a city’s commercial health; however, businesses of various types need very different physical design characteristics in order to thrive. For most retail and service businesses, these key characteristics include visibility, parking accessibility, walking/biking access and ease of access to back-of-house operations.
In the case of restaurants, which are essential to the lifeblood of a city’s downtown, and in particular to supporting tourist and visitor patronage, key elements of success which should be considered in the design review process include:
o Easy access to parking – More than any other commercial use, restaurants require the most parking in order to thrive. This is not to say that multi-modal access options (walking, biking, car share, etc.) will not temper this need for dedicated parking stalls; however, restaurants generally need access to a minimum of 5 to 6 stalls per 1,000 ft2 of gross leasable area (GLA).
o Visibility/Exposure – Restaurants, and in particular destination or specialty restaurants, need a high degree of visibility and exposure to a wide range of traffic (pedestrian, cyclist,auto). Within the context of a main street district where spaces have external street access, this is generally not an issue. Where internalized shopping environments are involved, best practice cues can be drawn from the shopping centre industry, which has seen the introduction of a much higher proportion of destination, full-service, sit-down restaurants over the last decade. These include:§ External exposure and access – Being visible to shopping centre or mixed-commercial shoppers and
visitors is helpful, but a restaurant tenant requires exposure on the street and external (as well as internal) entrances in order toreach the full range of its potential target markets.
§ Indoor/outdoor patio space – Regardless of climate, savvy shopping centre owners and restaurateurs have come to realize that patrons – especially visitors - prefer to feel connected to the locale. One of the most effective ways to provide this in a challenging winter climate is to incorporate indoor space that can adapt during the warmer weather, such as patio areas that can be easily converted to open air spaces, often with heaters.
50
10.0 CONCLUSIONS AND RECOMMENDATIONS
There are many success factors for a healthy and vibrant downtown and Whitehorse is succeeding on numerous key fronts. Main Street is healthy, showing a reasonable level of vacancy (particularly given the downturn in mining activity that has occurred since 2012) and offering a strong mix of specialty retail, restaurant, recreation, arts/cultural and service uses. Whitehorse’s primary cluster of big box retail uses provides a healthy counterpoint to the Main Street area experience and its location at the north end of the Downtown, versus the Alaska Highway, continues to be a significant contributing factor to the Downtown’s vitality.
Commercial units in Downtown Whitehorse account for almost 2.5 million square feet of space, and there has been an increase of 32% from 2006 in a direct comparison across categories. Retail uses account for about 35% of the commercial floor area, while entertainment-related services (restaurants, taverns, theatres, etc.) and other services comprise about 8% and 31% respectively. Private sector and public/non-profit sector offices account for 7% and 14%, respectively, of commercial floor space area in Whitehorse.
An active and vibrant downtown, both year-round and from day to night, is at least partially a function of the presence of a local residential population. In this regard, Downtown Whitehorse is doing very well. Not only has it retained a large proportion of its stock of older heritage homes in Old Town, a significant number of multi-unit residential buildings have been developed over the last decade, including condominiums and live-work units. This ensures a captive market for essential services and an additional source of potential spending for local restaurants, arts and cultural events.
Another significant and positive change since 2006 is the redevelopment of the Whitehorse waterfront to include a diversity of parks and green spaces, businesses, heritage buildings, commercial complexes, attractions and venues such as The Old Fire Hall and Kwanlin Dün Cultural Centre. These improvements combine to serve as a focal point for both visitors and locals, and work in tandem with Main Street to create a pedestrian-oriented experience conducive to passive recreation, shopping and entertainment.
Whitehorse residents enjoy and value an impressive diversity of arts, culture and entertainment offerings for a small city. Everything from musical and theatre performances to visual arts exhibitions, craft fairs, film screenings, and workshops/talks is offered throughout a variety of large state-of-the-art, outdoor, and smaller indoor venues, many of which are located Downtown. Whitehorse is home to the highest rates of cultural sector funding and employment participation in Canada. The city is perceived to offer a very high quality of life for a community of its size. While wilderness continues to be the primary draw for both visitors and new residents, Whitehorse’s cultural and entertainment offerings do influence resident retention, positive word-of-mouth, and destination reputation.
As with any city, there is room for improvement where retail-commercial uses and arts/entertainment are concerned in Whitehorse. Despite the City’s development of a Parking Management Plan in 2011 and subsequent implementation, parking is a major issue not only for business owners in the Main Street area, but increasingly throughout the Downtown. High freight costs, online shopping, and difficulties in retaining staff are ongoing challenges. Some Whitehorse residents hold negative perceptions of the business community and customer service is considered to be inconsistent, if not mediocre. The role of government as an employer, purchaser, and commercial tenant has significant influence over the private sector, and there is a prevailing belief that Whitehorse lacks an innovative, entrepreneurial culture. Principles of highest and best use, as well as best practices in retail-commercial design, are exercised to varying degrees and, where ignored, result in underperforming spaces. Housing affordability is a significant impediment to private sector growth and viability in the city.
While Whitehorse’s abundance of arts and entertainment is universally appreciated, key players in the sector cite an “oversaturation” of options and high rates of volunteer burn-out. Family-friendly entertainment is seen as a key gap, as are musical performances in non-tavern settings. The wide geographic distribution of venues and attractions makes physical integration with the Downtown challenging, and coordination between the Downtown business and arts communities is relatively non-existent. The waterfront area has made impressive strides over the past decade, but it falls somewhat short of telling a compelling story and linking effectively to other points of interest Downtown. The lack of a central point-of-sale for visitor attractions and services in the
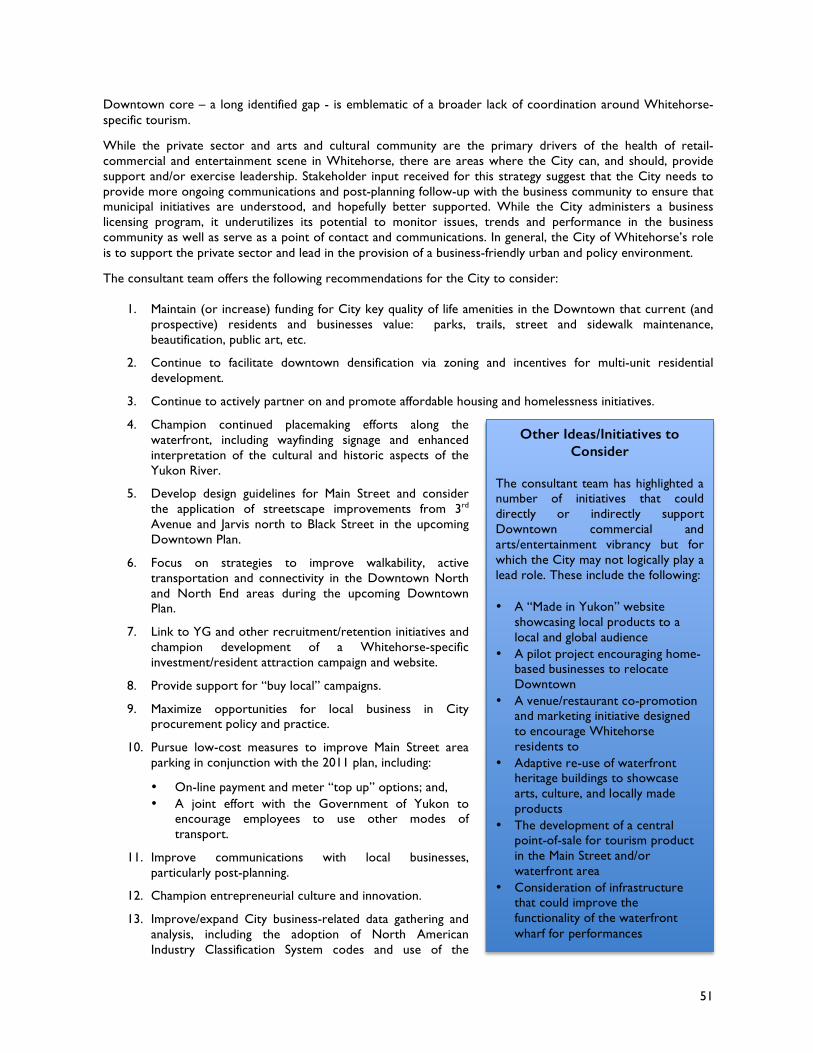
51
Downtown core – a long identified gap - is emblematic of a broader lack of coordination around Whitehorse-specific tourism.
While the private sector and arts and cultural community are the primary drivers of the health of retail-commercial and entertainment scene in Whitehorse, there are areas where the City can, and should, provide support and/or exercise leadership. Stakeholder input received for this strategy suggest that the City needs to provide more ongoing communications and post-planning follow-up with the business community to ensure that municipal initiatives are understood, and hopefully better supported. While the City administers a business licensing program, it underutilizes its potential to monitor issues, trends and performance in the business community as well as serve as a point of contact and communications. In general, the City of Whitehorse’s role is to support the private sector and lead in the provision of a business-friendly urban and policy environment.
The consultant team offers the following recommendations for the City to consider:
1. Maintain (or increase) funding for City key quality of life amenities in the Downtown that current (and prospective) residents and businesses value: parks, trails, street and sidewalk maintenance, beautification, public art, etc.
2. Continue to facilitate downtown densification via zoning and incentives for multi-unit residential development.
3. Continue to actively partner on and promote affordable housing and homelessness initiatives.
4. Champion continued placemaking efforts along the waterfront, including wayfinding signage and enhanced interpretation of the cultural and historic aspects of the Yukon River.
5. Develop design guidelines for Main Street and consider the application of streetscape improvements from 3rd Avenue and Jarvis north to Black Street in the upcoming Downtown Plan.
6. Focus on strategies to improve walkability, active transportation and connectivity in the Downtown North and North End areas during the upcoming Downtown Plan.
7. Link to YG and other recruitment/retention initiatives and champion development of a Whitehorse-specific investment/resident attraction campaign and website.
8. Provide support for “buy local” campaigns.
9. Maximize opportunities for local business in City procurement policy and practice.
10. Pursue low-cost measures to improve Main Street area parking in conjunction with the 2011 plan, including:
• On-line payment and meter “top up” options; and, • A joint effort with the Government of Yukon to
encourage employees to use other modes of transport.
11. Improve communications with local businesses, particularly post-planning.
12. Champion entrepreneurial culture and innovation.
13. Improve/expand City business-related data gathering and analysis, including the adoption of North American Industry Classification System codes and use of the
Other Ideas/Initiatives to Consider
The consultant team has highlighted a number of initiatives that could directly or indirectly support Downtown commercial and arts/entertainment vibrancy but for which the City may not logically play a lead role. These include the following: • A “Made in Yukon” website
showcasing local products to a local and global audience
• A pilot project encouraging home-based businesses to relocate Downtown
• A venue/restaurant co-promotion and marketing initiative designed to encourage Whitehorse residents to
• Adaptive re-use of waterfront heritage buildings to showcase arts, culture, and locally made products
• The development of a central point-of-sale for tourism product in the Main Street and/or waterfront area
• Consideration of infrastructure that could improve the functionality of the waterfront wharf for performances
52
business licensing process to track trends and issues.
Arts, Culture and Entertainment
14. Facilitate coordinated planning efforts and communication among the multiple players involved with tourism, arts, and entertainment in the Main Street and waterfront areas.
15. Identify and implement opportunities to provide more City of Whitehorse family-oriented recreational and event-oriented programming in the Downtown.
16. Facilitate the increased use of Front Street for smaller public events and festivals via the City special events approval process.
17. Implement a paid parking “amnesty” from 5:30 pm on Fridays to 10:00 am on Saturdays7.
18. Partner on a pilot project with the Yukon Arts Centre to encourage residents to dine Downtown and use transit for major programming events.
7 Administering the Saturday morning amnesty could involve submission of proof of purchase at a Downtown entertainment venue, restaurant, or pub/tavern to City of Hall in the following business week for parking ticket amnesty.
53
REFERENCES
Amuse. 2009. TIA Yukon Action Team Nodal Framework Assessment: Presentation. Retrieved from: http://www.tiayukon.com/Portals/0/Documents/Membership/Membership%20Resources/NodalDevelopment%202.pdf
Canadian Tourism Commission. (N.D.) EQ Profiles. Retrieved from: http://en-
corporate.canada.travel/sites/default/files/pdf/Resources/ctc_eq_profiles_2012-eng-lowres.pdf City of Kelowna. 2012. My Downtown! Retrieved from:
http://apps.kelowna.ca/CityPage/Docs/PDFs/Strategic%20Planning/Downtown_Plan/2012-02-28_Downtown_Plan_Report_FINAL.pdf
City of Kelowna. “Bernard Avenue Revitalization”. Retrieved from:
http://apps.kelowna.ca/CityPage/Docs/PDFs/Bernard%20Ave%20Revite/Bernard%20Avenue%20Details%20Brochure.pdf
City of Whitehorse. 2015. Community Economic Development Strategy. Retrieved from: http://www.whitehorse.ca/home/showdocument?id=5198 Government of Yukon Department of Tourism and Culture. (N.D.) 2012/2013 Yukon Visitor Tracking
Program: Summer Report. Pathways Report. http://www.tc.gov.yk.ca/publications/2012-2013-YVTP_Pathways_Report.pdf
Government of Yukon Department of Tourism and Culture. (N.D.) 2012/2013 Yukon Visitor Tracking
Program: Summer Report. Visitor Segmentation Report. http://www.tc.gov.yk.ca/publications/2012-2013-YVTP_Summer_Report.pdf
Government of Yukon Department of Tourism and Culture. (N.D.) 2012/2013 Yukon Visitor Tracking
Program: Visitor Segmentation Report. Retrieved from: http://www.tc.gov.yk.ca/publications/2012-2013_YVTP-Visitor_Segmentation_Report.pdf
Lang Research Inc. 2006. TAMS 2006: Canadian Activity Profile – Hiking, Climbing and Paddling While on
Trips. Prepared for the Canadian Tourism Commission. Retrieved from: https://en-corporate.canada.travel/sites/default/files/pdf/Research/Product-knowledge/TAMS/Canadian%20Travellers%20Outdoor%20Activity/CDN_Hiking_Climbing_Paddling_en.pdf
Lang Research Inc. 2008. Canadian Travel Market: Culture and Entertainment Activities While on Trips of
One or More Nights: Overview Report. Retrieved from: http://www.mtc.gov.on.ca/en/research/travel_activities/CDN_TAMS_2006_Culture_and_Entertainment_Activities_Overview_.pdf
Main Street Yukon Society. 2012. Tourism and Visitor Development in Downtown Whitehorse: Executive
Summary. Presentation. Retrieved from: http://www.tiayukon.com/Portals/0/Documents/Industry%20Update/June%202012/MainStreetYukon-Executive%20Summary-TIA-27Apr2012-f.pdf
Research Resolutions and Consulting Ltd. (N.D.) Canada’s Heritage Tourism Enthusiasts: A Special Analysis of
the Travel Activities and Motivation Survey (TAMS). Prepared for the Canadian Tourism Commission. Retrieved from: https://en-corporate.canada.travel/sites/default/files/pdf/Research/Product-knowledge/TAMS/Canadian%20Travellers%20Culture%20and%20Entertainment/tams_report_Canadas_heritage.pdf
54
Taiga Research and Consulting. 2009. Demand for Aboriginal Cultural Tourism in Yukon. Retrieved from: http://www.tc.gov.yk.ca/publications/Demand_for_Aboriginal_Cultural_Tourism_2009.pdf
Vector Research et al. 2012. Tourism and Visitor Development in Downtown Whitehorse. Commissioned by
Main Street Yukon Society. Retrieved from: http://www.tiayukon.com/Portals/0/Documents/Industry%20Update/June%202012/MainStreetYukon-Executive%20Summary-TIA-27Apr2012-f.pdf
Voswinkel, S. 2012. Survey of Yukon’s Knowledge Sector: Results and Recommendations. Yukon Research
Centre. Retrieved from: https://www.yukoncollege.yk.ca/downloads/Final_Report_Yukon_Knowledge_Sector_Survey_August_2012.pdf
Zanasi et al. 2004. The Yukon’s Cultural Labour Force. Study commissioned by the Yukon Arts Centre
Corporation. Retrieved from: http://www.yukonomics.ca/reports/Yukon_Cultural_Labour_Force.pdf
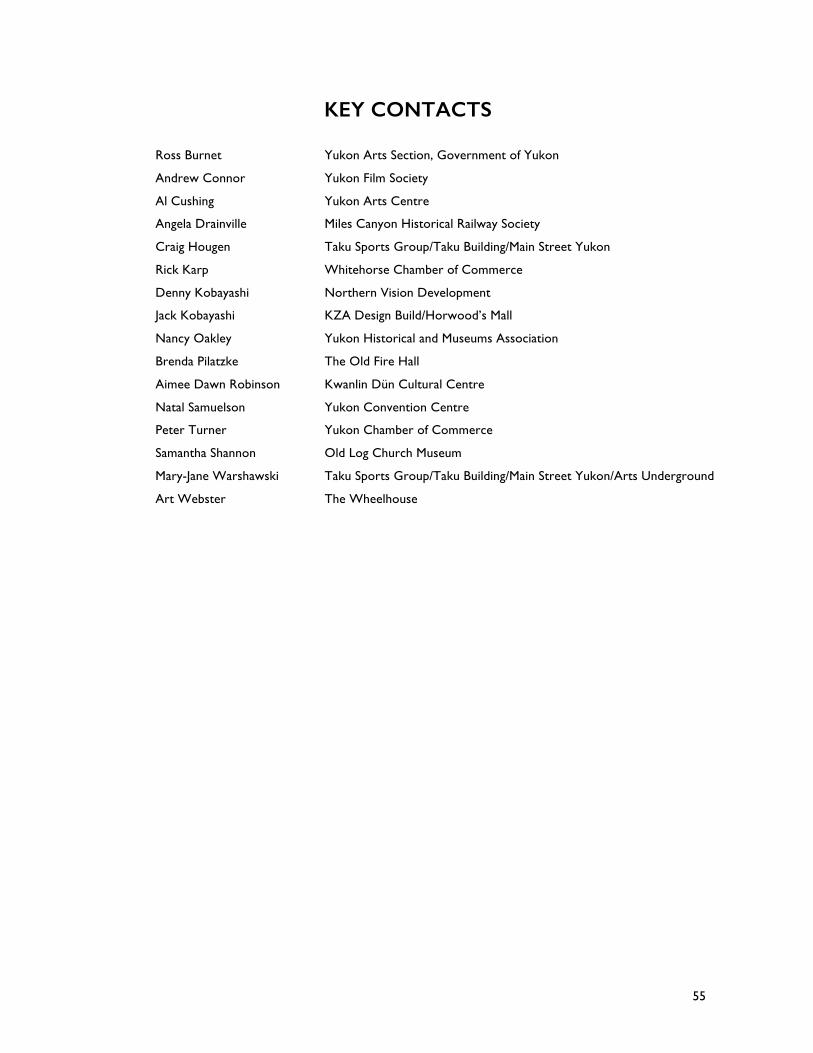
55
KEY CONTACTS
Ross Burnet Yukon Arts Section, Government of Yukon
Andrew Connor Yukon Film Society
Al Cushing Yukon Arts Centre
Angela Drainville Miles Canyon Historical Railway Society
Craig Hougen Taku Sports Group/Taku Building/Main Street Yukon
Rick Karp Whitehorse Chamber of Commerce
Denny Kobayashi Northern Vision Development
Jack Kobayashi KZA Design Build/Horwood’s Mall
Nancy Oakley Yukon Historical and Museums Association
Brenda Pilatzke The Old Fire Hall
Aimee Dawn Robinson Kwanlin Dün Cultural Centre
Natal Samuelson Yukon Convention Centre
Peter Turner Yukon Chamber of Commerce
Samantha Shannon Old Log Church Museum
Mary-Jane Warshawski Taku Sports Group/Taku Building/Main Street Yukon/Arts Underground
Art Webster The Wheelhouse

56

APPENDIX A. Downtown Business Owner Survey
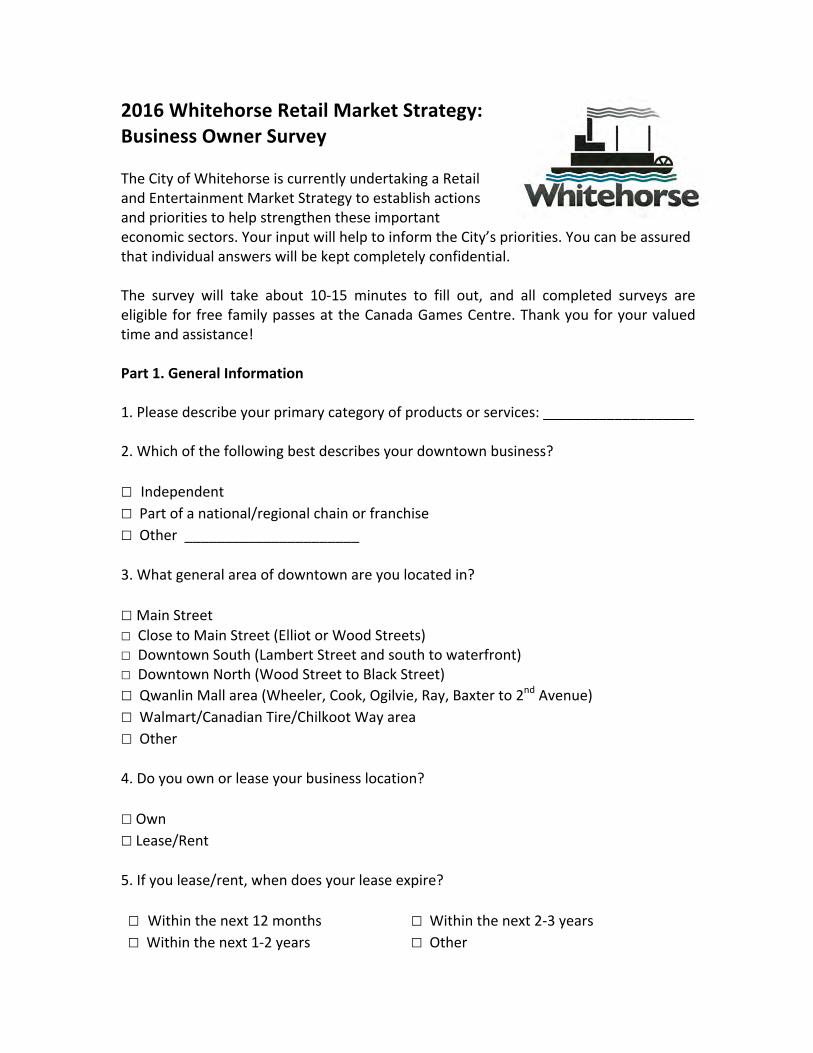
2016WhitehorseRetailMarketStrategy:BusinessOwnerSurvey The City of Whitehorse is currently undertaking a Retail and Entertainment Market Strategy to establish actions and priorities to help strengthen these important economic sectors. Your input will help to inform the City’s priorities. You can be assured that individual answers will be kept completely confidential. The survey will take about 10-15 minutes to fill out, and all completed surveys are eligible for free family passes at the Canada Games Centre. Thank you for your valued time and assistance! Part1.GeneralInformation 1. Please describe your primary category of products or services: ___________________ 2. Which of the following best describes your downtown business? ☐ Independent ☐ Part of a national/regional chain or franchise ☐ Other ______________________
3. What general area of downtown are you located in? ☐ Main Street ☐ Close to Main Street (Elliot or Wood Streets) ☐ Downtown South (Lambert Street and south to waterfront) ☐ Downtown North (Wood Street to Black Street) ☐ Qwanlin Mall area (Wheeler, Cook, Ogilvie, Ray, Baxter to 2nd Avenue) ☐ Walmart/Canadian Tire/Chilkoot Way area ☐ Other 4. Do you own or lease your business location? ☐ Own ☐ Lease/Rent 5. If you lease/rent, when does your lease expire? ☐ Within the next 12 months ☐ Within the next 1-2 years
☐ Within the next 2-3 years ☐ Other
6. What is the current floor area of your business establishment/unit in downtown Whitehorse?
______ square feet
7. How many people does your business employ on:
_____ a) Full-Time basis (35-40 hours/week) _____ b) Part-Time basis (less than 35 hours/week)
8. What are your business opening and closing times for each of the following? (If closed, please enter “N/A”) Open
(e.g., 9AM) Close (e.g., 5PM)
Monday to Friday _____ _____ Saturday _____ _____ Sunday _____ _____ Holidays _____ _____ 9. How long have you been operating in your current downtown location? ☐ Less than 1 year ☐ 1 to 2 years ☐ 2 to 5 years ☐ 5 to 10 years ☐ 10 to 20 years ☐ More than 20 years Part2.BusinessRevenuesandPerformance10. Which of the following best describes your primary customer base?
☐ Mainly downtown residents ☐ All Whitehorse residents ☐ Mainly tourists and visitors ☐ Other
11a) What is your business’ proportion of in-store vs. online (i.e. Internet-based) revenue?
In-store revenues as % of total revenues: _________%
On-line revenues as % of total revenues: _________%
11b) Please rate the importance of online revenues to your future business growth:
Notatallimportant Somewhatimportant Veryimportanto o o o o
12a) If your business has been open lessthanoneyear, how has your actual monthly revenue compared to your expectations? (If your business has been open for at least a year, please move on to Question 15b)
☐ More than expected ☐ About the same as expected ☐ Less than expected 12b) If your business has been open foratleastoneyear, how is your business’s current monthly revenue (monthly revenue) compared to:
1 year ago: ☐ More ☐ About the same ☐ Less 5 years ago: ☐ More ☐ About the same ☐ Less
13a) Which of the following best describes your plans over the next five years?
☐ Remain in present location, with only minor renovations planned ☐ Relocate but remain downtown ☐ Remain in present location, major renovations planned ☐ Relocate outside of downtown ☐ Other ____________________________ 13b) If you plan to relocate, what is the reason? ________________________________ 14. What are the top three strengths of your downtown location?
1) ______________________
2) ______________________ 3) ______________________
15. What are the top three weaknesses of your downtown location?
1) ______________________ 2) ______________________ 3) ______________________
Part3.PotentialDowntownImprovements 16a) How important do you think the following downtown improvements could be to the success of your business? Notatall
important Somewhat
important Very
importantIncreased downtown residential population o o o o oBetter downtown cleanliness and maintenance
o o o o o
More offices and daytime employment o o o o oHigher tourist/visitor volumes o o o o oSuperior downtown marketing efforts o o o o oMore entertainment, events, programming o o o o o 16b) What other downtown improvements (not already listed in #19a) do you feel could have the most significant positive impact on your business? ______________________ 17. Please rate the importance of adding the following types of establishments to downtown Whitehorse to improve overall vibrancy and customer interest: Notatall
important Somewhat
important Very
importantRestaurants and cafes o o o o oPubs, taverns, cabarets, etc. o o o o oLive entertainment/cultural venues o o o o oArt galleries and gift shops o o o o oOutdoor recreation/specialty stores o o o o oSpecialty clothing stores o o o o oHousehold furnishing stores o o o o oFresh/gourmet/health food stores o o o o o
18. Name the Top 3 business types (not listed in 20) that you think would make the downtown more vibrant:
1) ______________________ 2) ______________________ 3) ______________________
19. Which of the following best describes how your employees get to work? ☐ All drive ☐ Most drive but some take transit, cycle/walk (or other) ☐ Roughly split between driving and taking transit, cycling/walking (or other) ☐ Some drive but most take transit, cycle/walk (or other) ☐ All take transit, cycle/walk (or other) 20. Where do your employees tend to park if they drive to work? ☐ Free parking lot directly associated with the business ☐ Paid/metered parking nearby ☐ Free parking that is not directly associated with the business ☐ Other ____________________________ 21. On the basis of feedback from your customer and employee needs, please tell us how you think downtown parking could best be improved: ______________________________________________________________ Part4.BarrierstoBusinessGrowthThis section is intended to record issues and challenges that you feel may be limiting the growth of your business in downtown Whitehorse. 22. Please describe any operational barriers to the growth of your business (e.g.
attracting or retaining staff, cost of wages/salaries, cost and/or availability of space, access to online sales, etc.): _____________________________________________
23. Please describe any competitive/market-driven barriers to the growth of your business (e.g., competition within and outside of Whitehorse, size or nature of market, etc.): _________________________________________________________
24. Please describe any regulatory/legislative barriers to the growth of your business (e.g., City of Whitehorse/Yukon policies/legislation/processes): ____________________________________________________________________
25. Other (please explain): _______________________________________________ 26. Which type of barrier do you feel is most significantly limiting the growth of your business? ☐ Operational ☐ Competitive/market-driven ☐ Regulatory/legislative ☐ Other

APPENDIX B. Downtown Business Owner
Survey Results
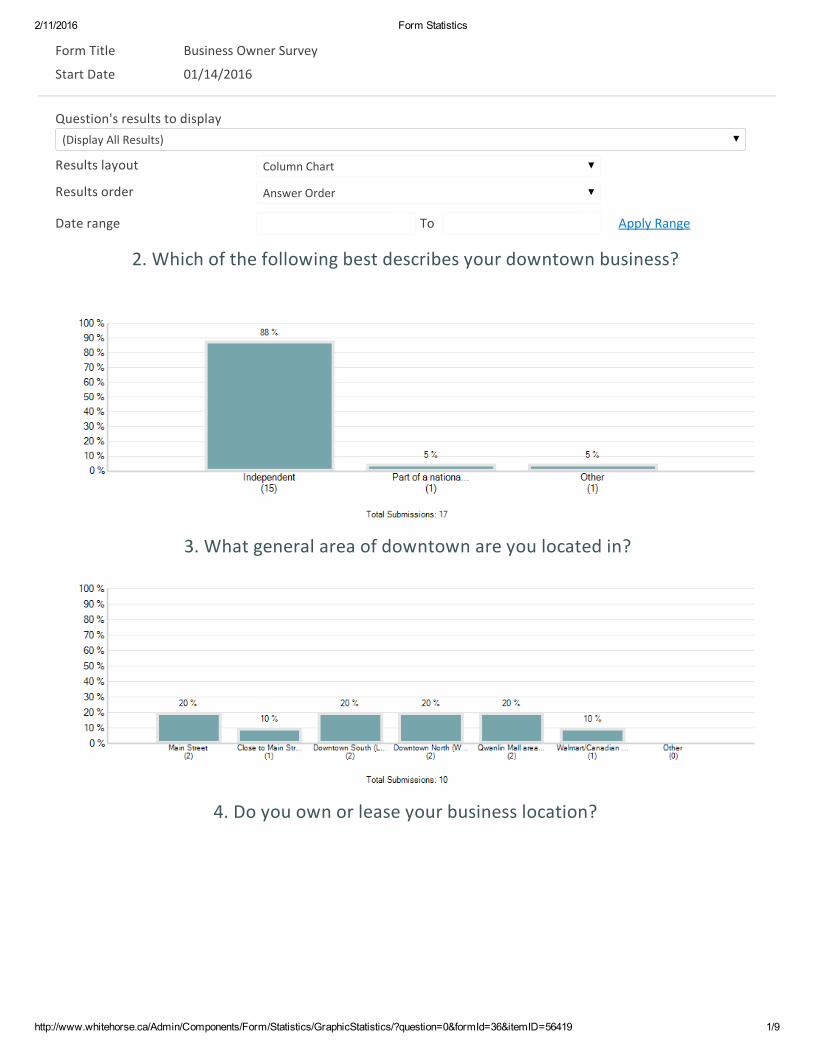
2/11/2016 Form Statistics
http://www.whitehorse.ca/Admin/Components/Form/Statistics/GraphicStatistics/?question=0&formId=36&itemID=56419 1/9
Form Title Business Owner Survey
Start Date 01/14/2016
Question's results to display(Display All Results)
Results layout Column Chart
Results order Answer Order
Date range To Apply Range
2. Which of the following best describes your downtown business?
3. What general area of downtown are you located in?
4. Do you own or lease your business location?
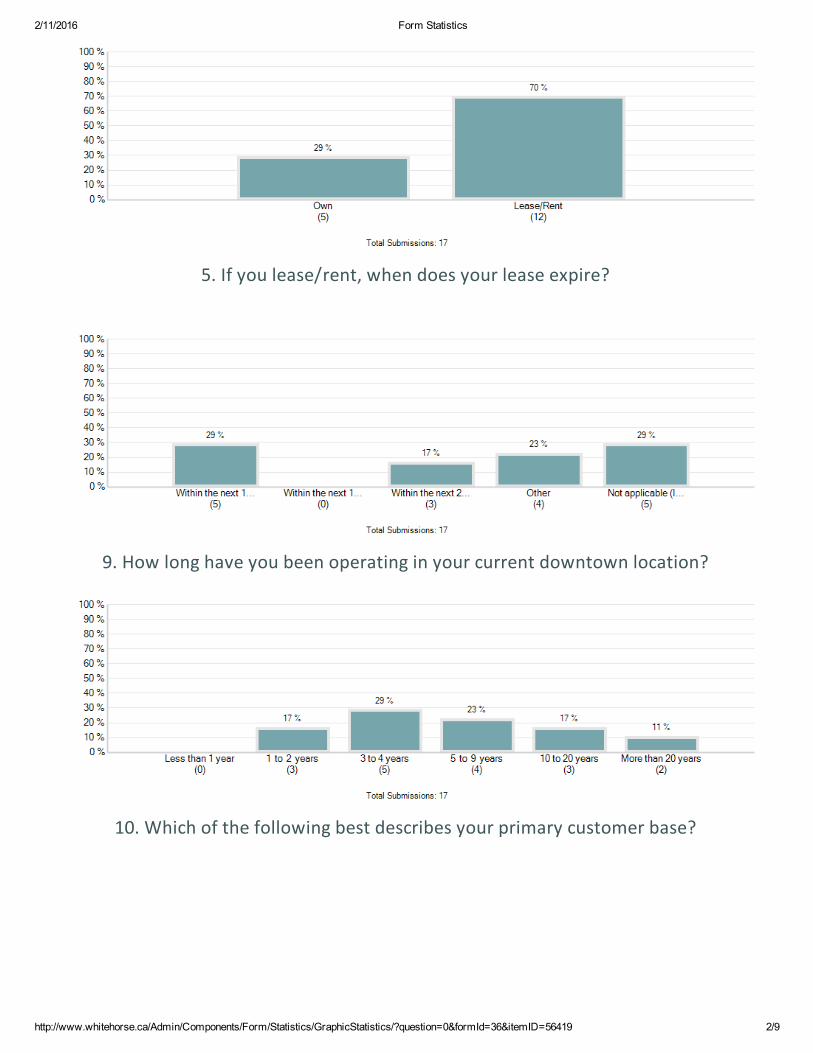
2/11/2016 Form Statistics
http://www.whitehorse.ca/Admin/Components/Form/Statistics/GraphicStatistics/?question=0&formId=36&itemID=56419 2/9
5. If you lease/rent, when does your lease expire?
9. How long have you been operating in your current downtown location?
10. Which of the following best describes your primary customer base?
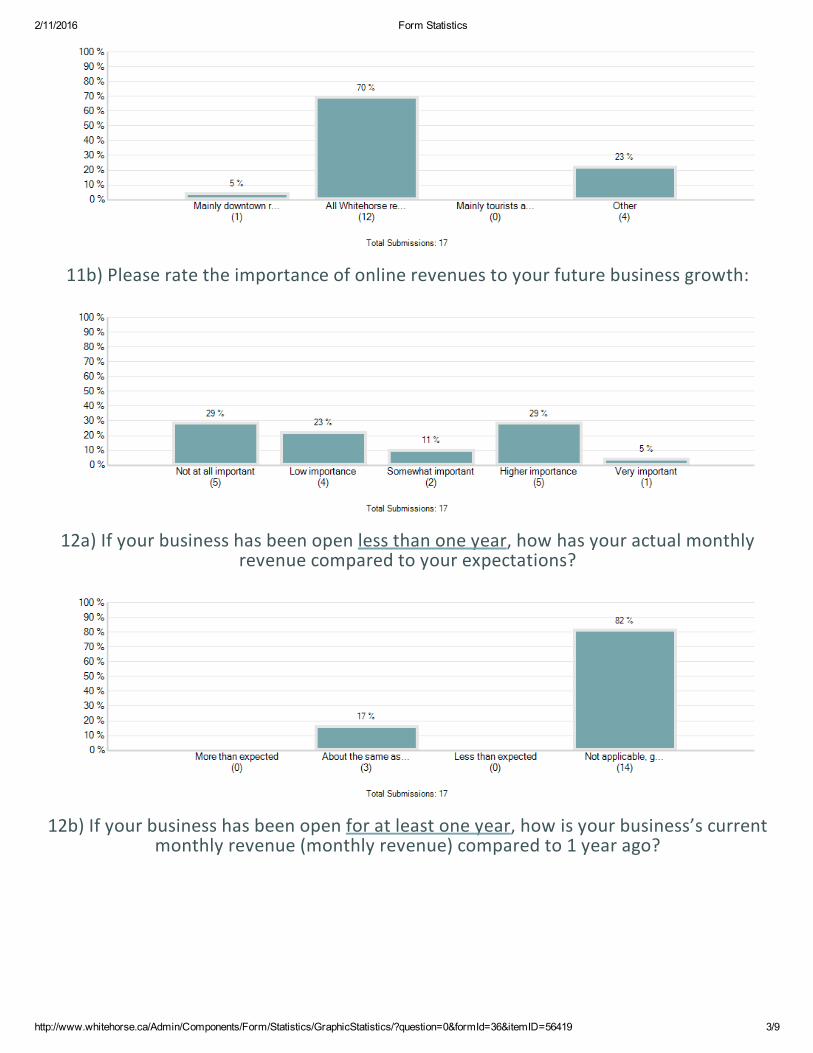
2/11/2016 Form Statistics
http://www.whitehorse.ca/Admin/Components/Form/Statistics/GraphicStatistics/?question=0&formId=36&itemID=56419 3/9
11b) Please rate the importance of online revenues to your future business growth:
12a) If your business has been open less than one year, how has your actual monthlyrevenue compared to your expectations?
12b) If your business has been open for at least one year, how is your business’s currentmonthly revenue (monthly revenue) compared to 1 year ago?
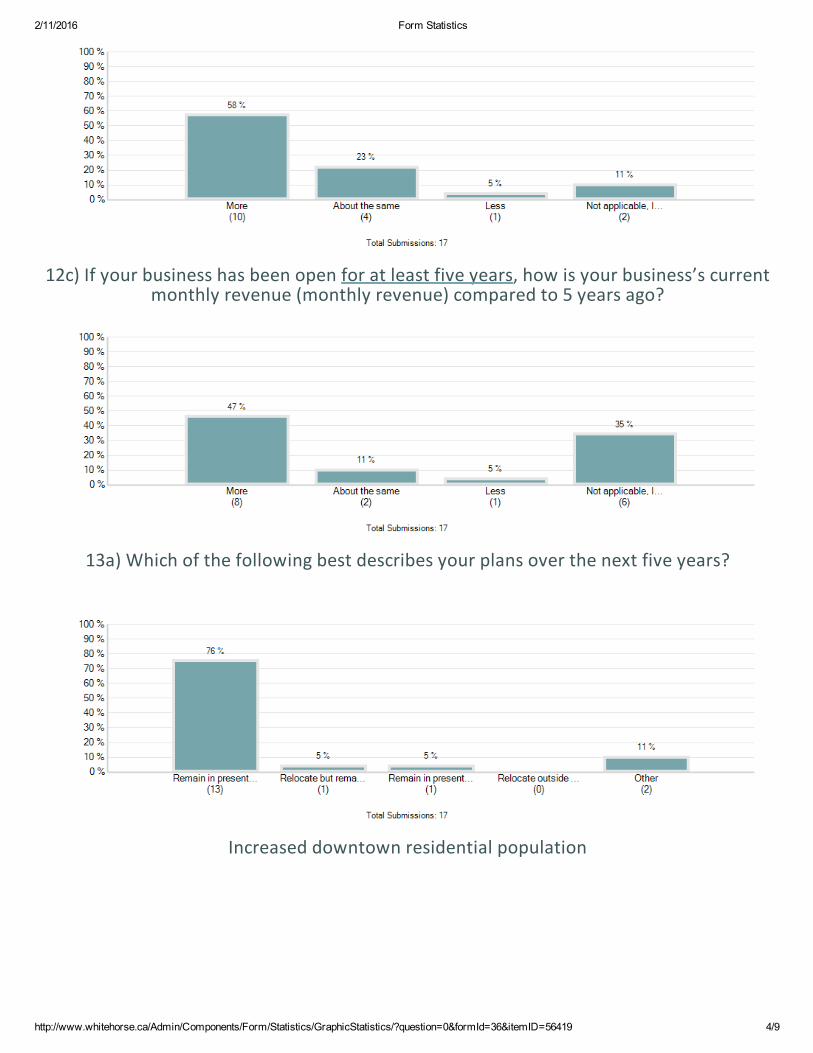
2/11/2016 Form Statistics
http://www.whitehorse.ca/Admin/Components/Form/Statistics/GraphicStatistics/?question=0&formId=36&itemID=56419 4/9
12c) If your business has been open for at least five years, how is your business’s currentmonthly revenue (monthly revenue) compared to 5 years ago?
13a) Which of the following best describes your plans over the next five years?
Increased downtown residential population
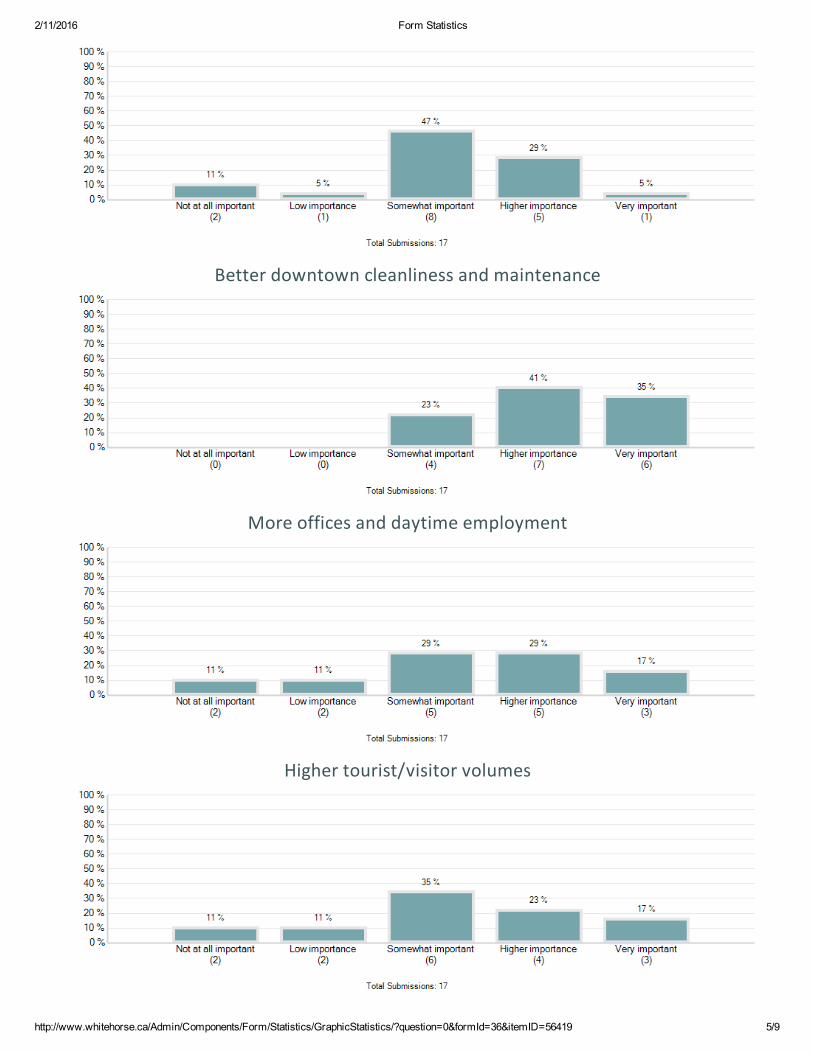
2/11/2016 Form Statistics
http://www.whitehorse.ca/Admin/Components/Form/Statistics/GraphicStatistics/?question=0&formId=36&itemID=56419 5/9
Better downtown cleanliness and maintenance
More offices and daytime employment
Higher tourist/visitor volumes
Superior downtown marketing efforts
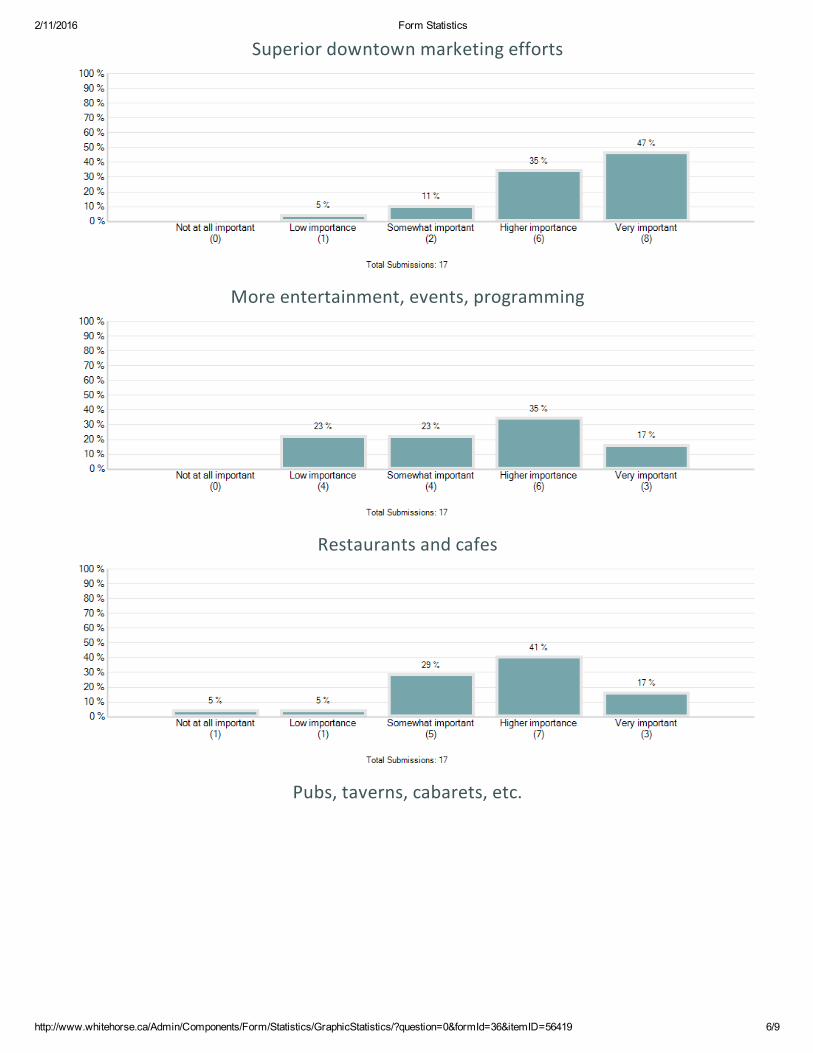
2/11/2016 Form Statistics
http://www.whitehorse.ca/Admin/Components/Form/Statistics/GraphicStatistics/?question=0&formId=36&itemID=56419 6/9
Superior downtown marketing efforts
More entertainment, events, programming
Restaurants and cafes
Pubs, taverns, cabarets, etc.
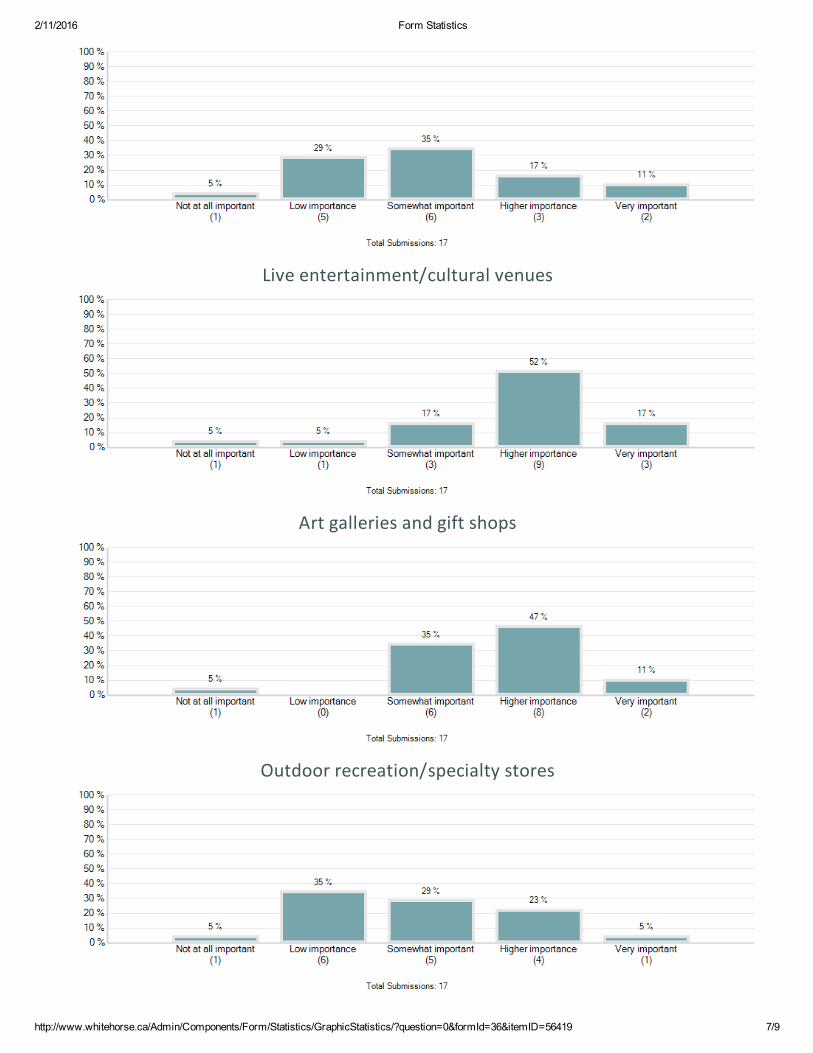
2/11/2016 Form Statistics
http://www.whitehorse.ca/Admin/Components/Form/Statistics/GraphicStatistics/?question=0&formId=36&itemID=56419 7/9
Live entertainment/cultural venues
Art galleries and gift shops
Outdoor recreation/specialty stores
Specialty clothing stores
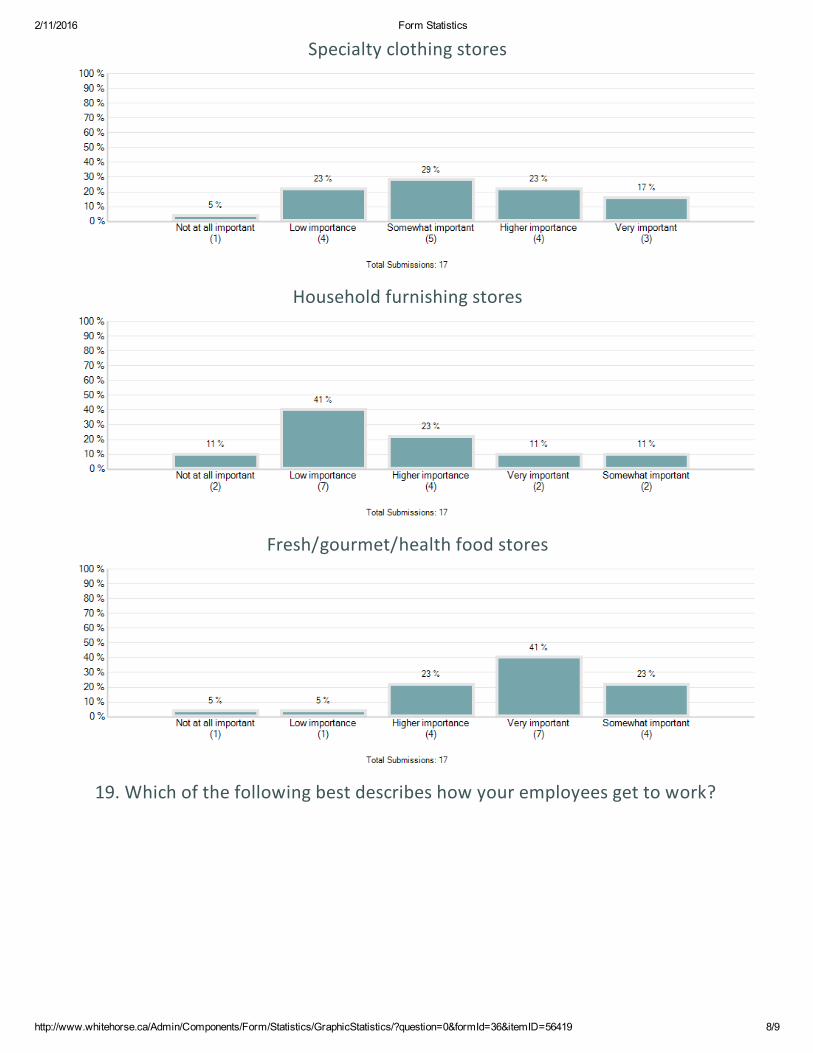
2/11/2016 Form Statistics
http://www.whitehorse.ca/Admin/Components/Form/Statistics/GraphicStatistics/?question=0&formId=36&itemID=56419 8/9
Specialty clothing stores
Household furnishing stores
Fresh/gourmet/health food stores
19. Which of the following best describes how your employees get to work?
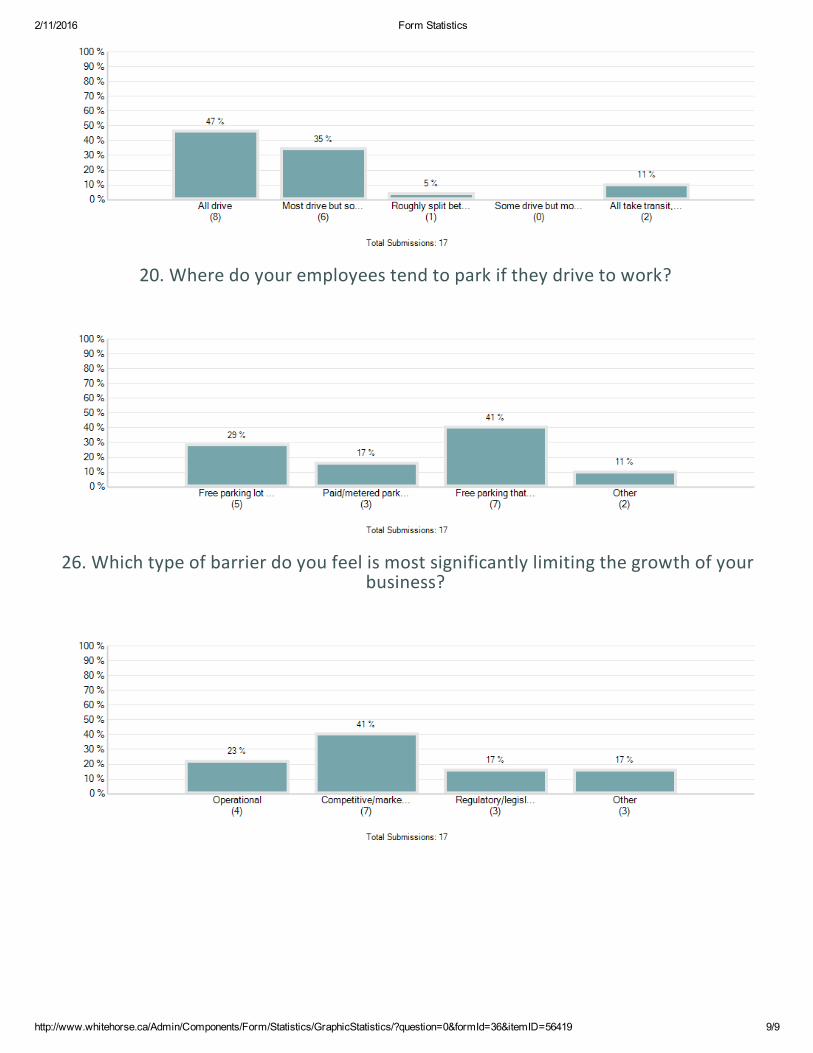
2/11/2016 Form Statistics
http://www.whitehorse.ca/Admin/Components/Form/Statistics/GraphicStatistics/?question=0&formId=36&itemID=56419 9/9
20. Where do your employees tend to park if they drive to work?
26. Which type of barrier do you feel is most significantly limiting the growth of yourbusiness?
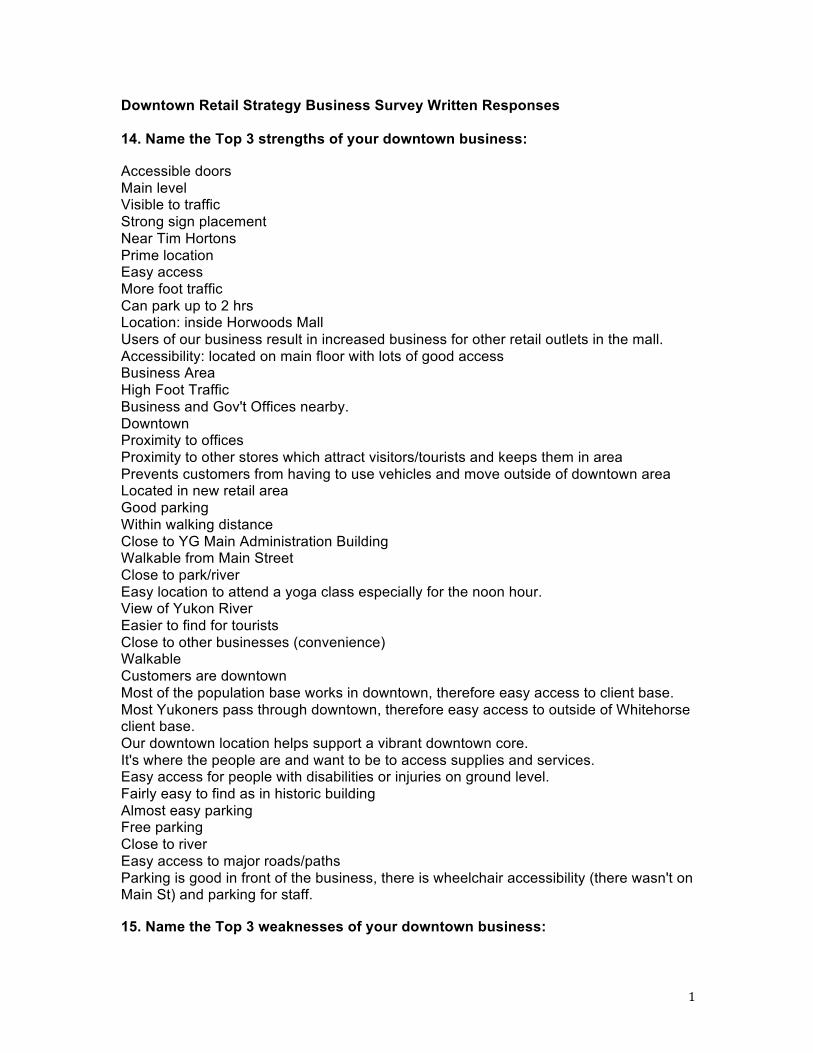
1
Downtown Retail Strategy Business Survey Written Responses 14. Name the Top 3 strengths of your downtown business: Accessible doors Main level Visible to traffic Strong sign placement Near Tim Hortons Prime location Easy access More foot traffic Can park up to 2 hrs Location: inside Horwoods Mall Users of our business result in increased business for other retail outlets in the mall. Accessibility: located on main floor with lots of good access Business Area High Foot Traffic Business and Gov't Offices nearby. Downtown Proximity to offices Proximity to other stores which attract visitors/tourists and keeps them in area Prevents customers from having to use vehicles and move outside of downtown area Located in new retail area Good parking Within walking distance Close to YG Main Administration Building Walkable from Main Street Close to park/river Easy location to attend a yoga class especially for the noon hour. View of Yukon River Easier to find for tourists Close to other businesses (convenience) Walkable Customers are downtown Most of the population base works in downtown, therefore easy access to client base. Most Yukoners pass through downtown, therefore easy access to outside of Whitehorse client base. Our downtown location helps support a vibrant downtown core. It's where the people are and want to be to access supplies and services. Easy access for people with disabilities or injuries on ground level. Fairly easy to find as in historic building Almost easy parking Free parking Close to river Easy access to major roads/paths Parking is good in front of the business, there is wheelchair accessibility (there wasn't on Main St) and parking for staff. 15. Name the Top 3 weaknesses of your downtown business:
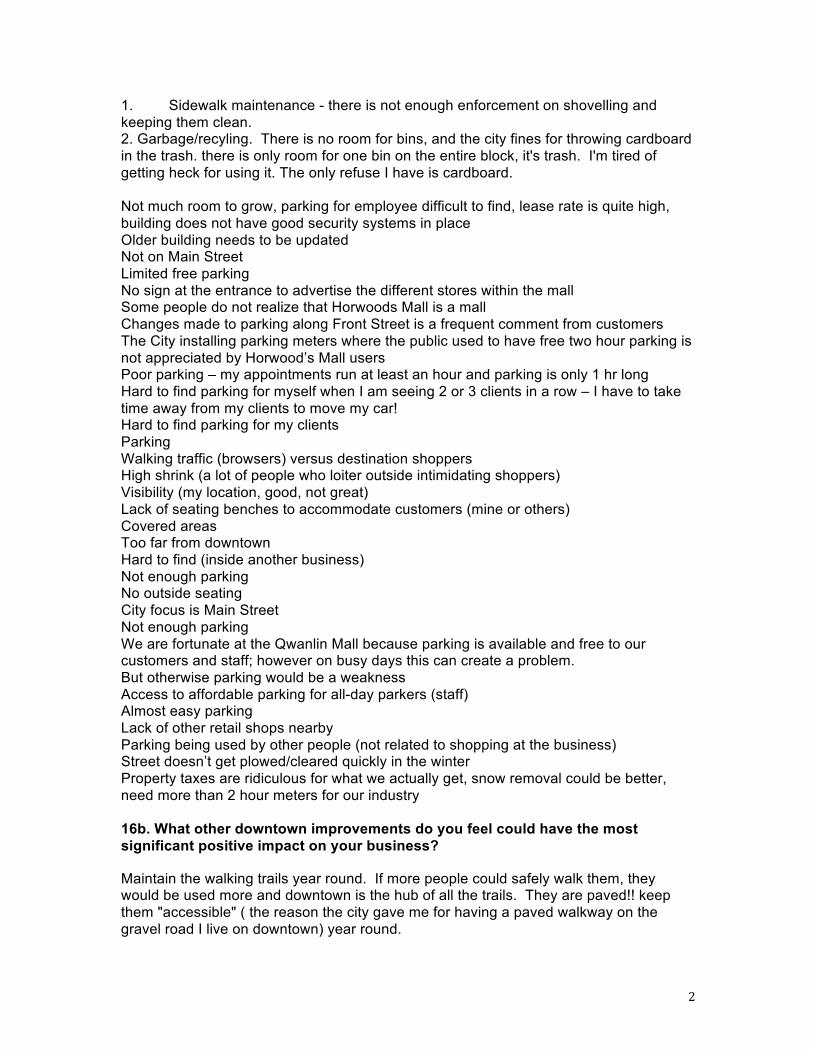
2
1. Sidewalk maintenance - there is not enough enforcement on shovelling and keeping them clean. 2. Garbage/recyling. There is no room for bins, and the city fines for throwing cardboard in the trash. there is only room for one bin on the entire block, it's trash. I'm tired of getting heck for using it. The only refuse I have is cardboard. Not much room to grow, parking for employee difficult to find, lease rate is quite high, building does not have good security systems in place Older building needs to be updated Not on Main Street Limited free parking No sign at the entrance to advertise the different stores within the mall Some people do not realize that Horwoods Mall is a mall Changes made to parking along Front Street is a frequent comment from customers The City installing parking meters where the public used to have free two hour parking is not appreciated by Horwood’s Mall users Poor parking – my appointments run at least an hour and parking is only 1 hr long Hard to find parking for myself when I am seeing 2 or 3 clients in a row – I have to take time away from my clients to move my car! Hard to find parking for my clients Parking Walking traffic (browsers) versus destination shoppers High shrink (a lot of people who loiter outside intimidating shoppers) Visibility (my location, good, not great) Lack of seating benches to accommodate customers (mine or others) Covered areas Too far from downtown Hard to find (inside another business) Not enough parking No outside seating City focus is Main Street Not enough parking We are fortunate at the Qwanlin Mall because parking is available and free to our customers and staff; however on busy days this can create a problem. But otherwise parking would be a weakness Access to affordable parking for all-day parkers (staff) Almost easy parking Lack of other retail shops nearby Parking being used by other people (not related to shopping at the business) Street doesn’t get plowed/cleared quickly in the winter Property taxes are ridiculous for what we actually get, snow removal could be better, need more than 2 hour meters for our industry 16b. What other downtown improvements do you feel could have the most significant positive impact on your business?
Maintain the walking trails year round. If more people could safely walk them, they would be used more and downtown is the hub of all the trails. They are paved!! keep them "accessible" ( the reason the city gave me for having a paved walkway on the gravel road I live on downtown) year round.
3
Yearly parking passes so customers don't have to worry about filling the meter, Greater police presence during the evening and weekends, Make it attractive to walk off Main ie. trees, flowers Easier to pay for parking or customer parking Parking meters need pay by phone app Main entrance signs Better parking for employees within the mall or other businesses in this location Offer a reasonable parking pass per month Market downtown and especially Main Street, similar to projects done for Yonge Street and major streets in vancouver. Seating Covered areas The area by the Miner in from of the ES Building is a wasteland. Cold and uninviting. I would like to see the abandoned buildings in the downtown area fixed up and used either for affordable housing or for new businesses. The Supervalu building is great example of ghettoizing your downtown, when there are restrictions on rentals of large buildings, left empty. It creates the doughnut effect, all box stores on the outside and a neglected downtown. By not allowing other businesses from renting these buildings, we are forced to find available space elsewhere. Many cities have bylaws to stop this from happening. It’s sad to see the core of a city become abandoned, especially when there are many retail businesses that could rent them. Also the rental prices for downtown are so expensive that many new businesses are forced to find out of the way locations. If the rent was a bit cheaper, it would be incentive for businesses to rent with in the city core. The city needs to work with the landlords, to find a way to make it feasible. Unless you only want box stores, which is what happens to cities when it becomes more affordable to rent out of town. Shopping locally can be made easier with the help of the city and local business owners working together. I would move my location, if there was any rentals the right size closer to Main Street, and perhaps look at businesses such as mine where buildings are shared by more than one business. Help business owners " be funky" by removing the bylaws that only allow one business in each building without a fire wall. There are great examples of shared businesses in bigger cities, we should advocate for shared space, especially in this day! It shouldn't be hindrance, but a model for a new way of doing business! More use of Rotary Park. The City should be working better with the Whitehorse Chamber. This study should be completed with the Chamber. The mayor more open to new ideas. Support a 'shop local' campaign, because the greatest threat to our business is Yukoners choosing to buy and support outside businesses - both internet and otherwise. Perhaps a 'downtown improvement' can be a high profile banner program saying something like: "Thank you for shopping local: your support supports our community". This will hopefully get people thinking that every dollar that leaves the community, hurts! Access to more available, affordable parking. Free parking Signage Keeping traffic flowing through downtown core/Main Street More "Shop Local" events Customer Service training resources for business owners I think it's imperative that the City really has a good look at the infrastructure in the downtown core and make an actual plan to deal with it. That also relates to NWTel and
4
Yukon Energy. There is nothing more frustrating than having work interrupted by emergencies that could have been dealt with before it became an emergency! 18. Name the Top 3 business types that you think would make the downtown more vibrant: Arts supply store Parent and tot classes Food trucks Bakeries Spas Bath and Body I believe the Food Vendors should all be relocated 3rd Ave, Main and Steele and establish a food court/Fair Market Area/Urban Mall during the summer months to create an attraction and keep People shopping/living downtown. Clothing Pubs Grocery Let the market decide - not City Hall An upgraded movie and entertainment complex. A 'youth oriented' activity centre Upscale bar/restaurant. Less vacant spaces (resulted by YG relocating to new office spaces, and in some cases, out of the core). Seniors assisted living complex. Upgraded movie/entertainment complex Sports and wellness complex. Men's clothing Kids clothing store I think we need to consider letting major retailers into the downtown core if they're interested. If major retailers keep moving away from the downtown core I think we're going to end up with a problem! Keep retail and service together whether it's big or small. 21. On the basis of feedback from your customers and employee needs, please tell us how you think downtown parking could best be improved: SIDEWALK CLEARING Less meters (quite disappointed with the new meters on wood by the 98') or better transit. I can not wait 1 hour to get to my kids Customer 20 minute parking Ticket people are there the minute it runs out! More free parking for owners and employees Right now we can park down by the Best Western-Riverview Hotel if there is a stop available otherwise we have to park at a parking meter which cause us to run out to puck the meter when needed. I believe there is enough meter parking for customers Customers have stated many times that they are receiving parking tickets mere minutes after their paid time has expired. They feel that the parking meter staff are "stalking" main street users in an effort to maximize their ticket quota in a day.
5
Owners/employees of businesses could have stickers so that they can park for more than 1 or 2 hours. Another dedicated weekly or monthly parking lot for business owners/employees Have more downtown parking available. A lot of empty spaces that we don't seem to leverage. Also tie this back to shopping. Those who are shopping and parking in the area shouldn't be penalized. If they are they should get a discount on the fine. Also make paying parking tickets easier. Absolutely silly that we don't have an online payment system and actually have to go to municipal building to pay the fines. Customers want more quick stop areas Employees want longer parking times There should be more lots, and more meters. It’s crazy that there is very little parking. But everyone knows this. It’s been like this for as long as i have lived here. I know Govt. employees and workers in the private sector who spend tons of dough on parking fines, as having to feed a meter every two hours, Doesn't really work for people who are actually working. Having to leave your job every two hours to feed a meter is insane. Better signage and more available free parking Parking is fine. Spaces/parkades should be made available at a very modest cost, in strategic locations, for all-day parkers (staff). This would free-up spaces for transient (customer) parking. When parking meters were first installed in the downtown core the intent was to have the funds go into a specific fund for future parking needs (parkades). Somewhere along the way, a 'cap' of ~$1M was put in place. Had this never been done, today we would likely have a completely funded downtown core parkade. It is folly to think people will park in the outskirts of town and 'shuttle' into work. Affordable and available all day parking for staff resulting in adequate parking for transient users. We need a parkade. I can't have staff dropping clients to go move their cars every two hours. Customers fumble for coins in a cashless society Build a parkade for all the employees who park in front of retail and service areas that make it hard for consumers to actually get to. I think it also falls onto YG to provide enough parking for their staff not just a municipal issue for the City to figure out! YG staff takes up most of the free parking past 4th Avenue, which is crazy when you think of all the businesses that could potentially open up in that area. 22. Please describe any operational barriers to the growth of your business: Shipping costs to the Yukon. We are on a main highway and shouldn't be more just because we are slightly above the 60th parallel Paying staff, no room to expand in current location, very high lease rates. Difficulties in attracting and retaining staff due to lack of competition and want for customer service and retail jobs is number one! Customer service course requirement could help as lots of applicants don't have the service levels or experience in retail. Attracting and retaining staff Access to online sales My barrier is growing my business is that our government and city in most case prefer to support corp or big box company. Even Need help in changing this behaviour and keeping money local. City Hall bureaucratic red tape and inside box thinking.
6
The lack of will to try new things without having to plan/study/consult with outside interests. Trust your citizens and their ideas, in fact some of very much willing to help Available space. City bylaws for shared space (not malls, shared space) I would grow my business, but am not allowed in my current location, seems idiotic. The price of commercial space in the city is definitely high as well as extra charges for businesses on utilities. One of the biggest challenges of operating a retail store in the Yukon is access to quality staff at an affordable rate. Retail is typically a 'stepping stone' to staff moving to the HIGH wages of the various levels of government. Freight costs of moving our retail goods to the Yukon is another challenge as it is very expensive to remain competitive. None. Attracting and retaining staff #1 Governments supporting local first #2 Attracting staff isn't too much of an issue, but competing with four different Gov'ts is tricky when it comes to wages! It's hard to retain key employees when they can earn almost double at the City! Eg: retail staff earning $14/hr vs CGC staff making $19 to $24/hr (or more) I sure don't hear any champions for small businesses making any sense! Property taxes keep going up, which then leads us to higher prices for our consumers and I realize that the economy is not amazing right now but the fallback can't keep falling to those of us in private industry. 23. Please describe any competitive/market-driven barriers to the growth of your business: Because of shipping rates, it is impossible to compete with/in online markets Lack of awareness about benefits of shopping local, Lack of environmental and social concern related to product purchases Lack of consistency in laws governing made in Canada vs. imported products Competition etiquettes of larger towns do not exist in Whitehorse. i.e., carrying the same brand of stores close in proximity. Buildings need to be renovated as they don't draw people in. Ways to reach and advertise to communities. Online shopping Marketing is expensive yet it is highly important Parking is hard to find and not easy accessible to everyone Marketing barriers - I do all my own marketing as I am a sole proprietor with no employees; There is nothing that is cost effective for me for marketing. The size of the market will definitely restrict growth. We have multiple businesses in whitehorse. However our technology business i don't see having enough space to ever justify two separate locations. The lease deals signed with City owned land that prevents me from operating during events or at peak demands. It is interference in business and competition. CGC/Takini Arena/Baseball Diamonds etc... None There should be a preference for local
7
Online sales sites are so easy for people to use - and the moment they press the 'purchase' button, money leaves the Yukon. All most retailers ask is for the 'opportunity' to sell to Yukoners. Retailers know they must be competitive and they wouldn't expect Yukoners to spend excessively to support local...but retailers would at least like the chance to earn Yukoners business! With more and more new office space being built for YG, there is an abundance of office space available. This results in visitors and locals perceiving the City in decline. Outside competition is growing. Ease of government online shopping. We definitely suffer from a small population base - and when that population base chooses to shop outside of the Yukon, it makes it even harder for a business to be profitable! Not suggesting that local businesses "deserve" a customer's money - just suggesting that if we could encourage people to "think local" first, that could go a long way to helping. Handling shipping to Yukon is a full time job to keep costs as low as possible to compete with outside buying power. Equally important - local businesses need to be ready and up to the task! Good customer service skills, knowledge, experience and training with the products, friendly helpful attitudes, "pride of place"...that can also lend itself to people choosing to support local businesses! 24. Please describe any legislative barriers to the growth of your business: There is no commercial tenancy act! Yukon employee remittance rate is higher than BC Tendering should be kept local. I firmly believe that if a local company can offer the same product but even at a slightly higher price why are we not supporting them. My argument is that do you want to save $1000, or you want all of what you spend to stay local. Policies in regard to the Motor Vehicle Act and how it applies to the City and to Food Vendors. When the YTG couldn't care less. Bylaws for shared space. Its short sighted, and archaic. its time to view shared business spaces as the way of the future, not a niche market. There are many great examples of shared space. in larger cities, one it creates a new and funky atmosphere, two it allows new business owners a bit of a safety net. It helps build community mindedness, it creates space for many people to meet and enjoy more than one business at the same time. Tourists LOVE IT!!!!!!!!!! as do the locals Poor buy local policies. Poor decision making practices (changing name of 1st Ave) that waste time and money Can't think of any at the moment. Where do I start? Government in general makes it difficult on a good day! Not a good question for me to answer! Other comments: A lot of people don't frequent new businesses. It’s surprising to find out how many people have not been in to see what my business is about for such a small town. People shop mostly during the week and go out of town on summer weekends. Most stores are not open Sundays. People get frustrated with the slow flow of traffic and parking in peak hours. We've got to find a solution to loiterers, panhandlers and the like for the betterment of tourists and locals. Tourism is very important to this City...when they choose Whitehorse,
8
we must always present our best face forward. Some locals avoid downtown because of real or perceived 'harassment'. Graffiti is a problem. There has to be a consequence for those that destroy property. It looks awful for locals and tells tourists that 'we don't care' about our City. Yukoners are generally known as friendly, however at our 'retail and service' establishments, we should promote and train for upgraded service levels for an exceptional experience not only for our tourists, but for our locals as well. Building GRAFFITI is an issue that should be addressed with the RCMP/CITY/STAKEHOLDERS/YG. Swift cleanup has been proven to be the best deterrent. Thanks for taking this on, City of Whitehorse! Everyone wins if we have a healthy, vibrant downtown core!

APPENDIX C. Retail Market Analysis Detailed
Calculations
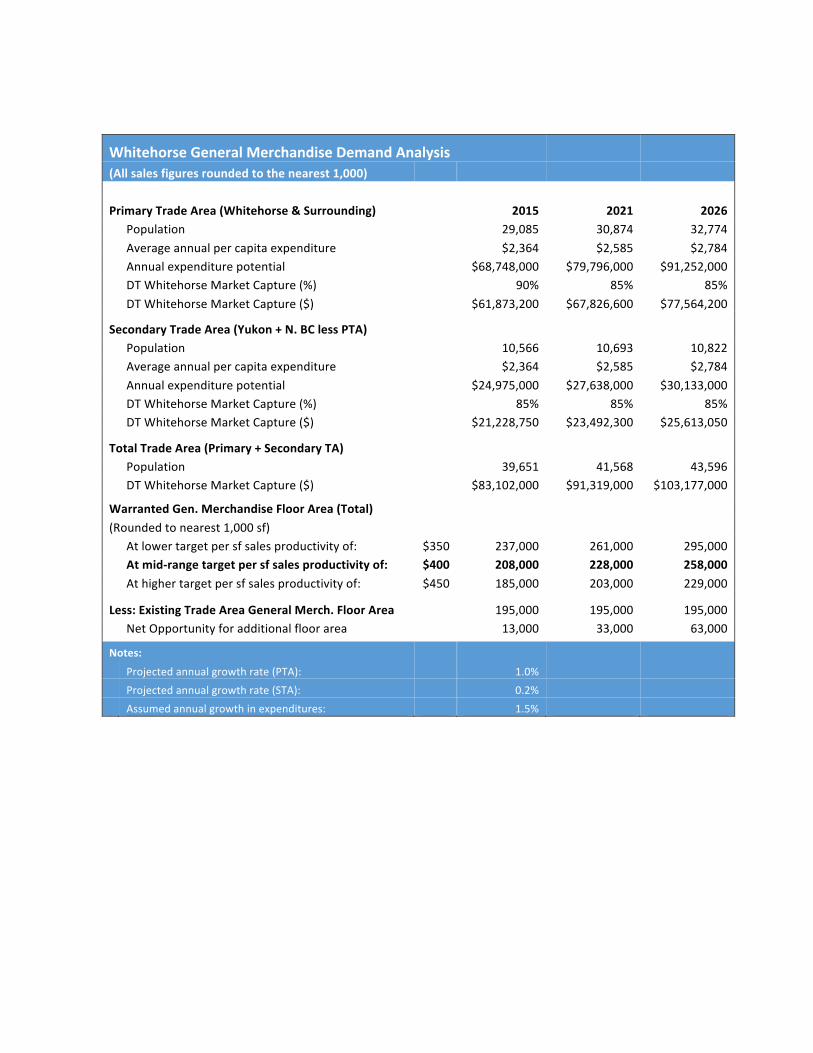
WhitehorseGeneralMerchandiseDemandAnalysis (Allsalesfiguresroundedtothenearest1,000)
PrimaryTradeArea(Whitehorse&Surrounding)
2015 2021 2026
Population
29,085 30,874 32,774
Average annual per capita expenditure
$2,364 $2,585 $2,784
Annual expenditure potential
$68,748,000 $79,796,000 $91,252,000
DT Whitehorse Market Capture (%)
90% 85% 85%
DT Whitehorse Market Capture ($)
$61,873,200 $67,826,600 $77,564,200
SecondaryTradeArea(Yukon+N.BClessPTA)
Population
10,566 10,693 10,822
Average annual per capita expenditure
$2,364 $2,585 $2,784
Annual expenditure potential
$24,975,000 $27,638,000 $30,133,000
DT Whitehorse Market Capture (%)
85% 85% 85%
DT Whitehorse Market Capture ($)
$21,228,750 $23,492,300 $25,613,050
TotalTradeArea(Primary+SecondaryTA)
Population
39,651 41,568 43,596
DT Whitehorse Market Capture ($)
$83,102,000 $91,319,000 $103,177,000
WarrantedGen.MerchandiseFloorArea(Total) (Rounded to nearest 1,000 sf)
At lower target per sf sales productivity of: $350 237,000 261,000 295,000
Atmid-rangetargetpersfsalesproductivityof: $400 208,000 228,000 258,000
At higher target per sf sales productivity of: $450 185,000 203,000 229,000
Less:ExistingTradeAreaGeneralMerch.FloorArea
195,000 195,000 195,000
Net Opportunity for additional floor area
13,000 33,000 63,000
Notes:
Projected annual growth rate (PTA): 1.0% Projected annual growth rate (STA): 0.2% Assumed annual growth in expenditures: 1.5%
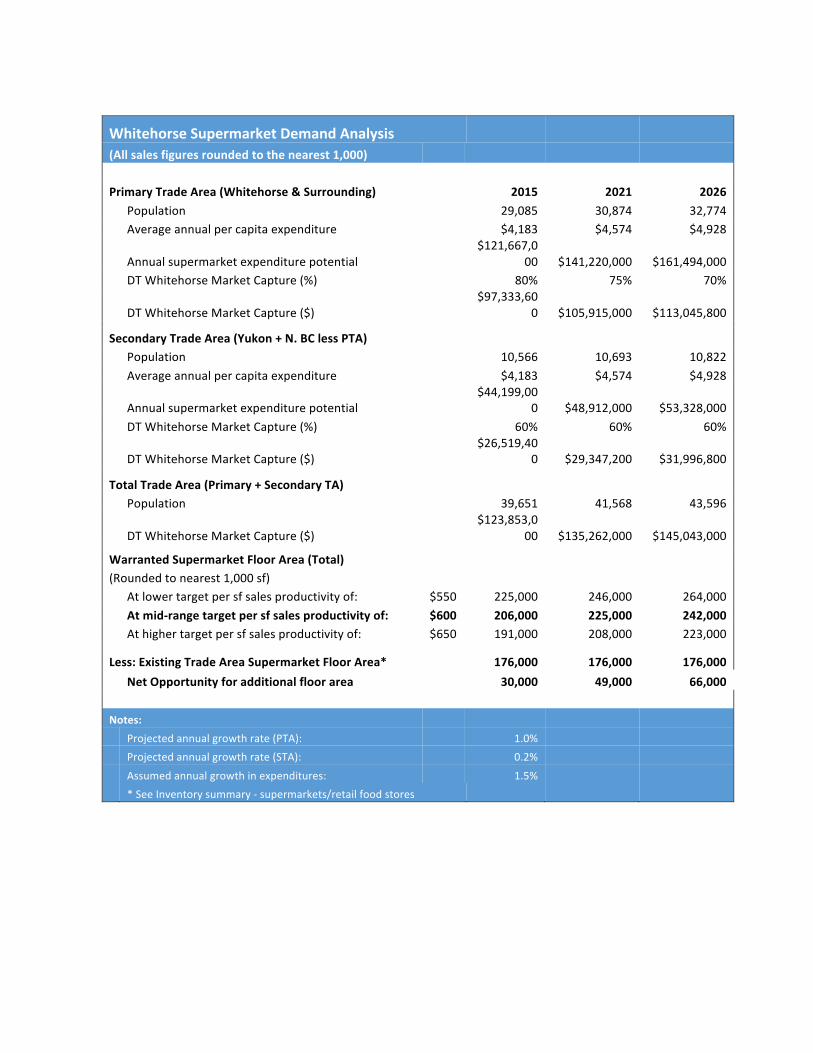
WhitehorseSupermarketDemandAnalysis (Allsalesfiguresroundedtothenearest1,000)
PrimaryTradeArea(Whitehorse&Surrounding)
2015 2021 2026
Population
29,085 30,874 32,774
Average annual per capita expenditure
$4,183 $4,574 $4,928
Annual supermarket expenditure potential
$121,667,000 $141,220,000 $161,494,000
DT Whitehorse Market Capture (%)
80% 75% 70%
DT Whitehorse Market Capture ($)
$97,333,600 $105,915,000 $113,045,800
SecondaryTradeArea(Yukon+N.BClessPTA)
Population
10,566 10,693 10,822
Average annual per capita expenditure
$4,183 $4,574 $4,928
Annual supermarket expenditure potential
$44,199,000 $48,912,000 $53,328,000
DT Whitehorse Market Capture (%)
60% 60% 60%
DT Whitehorse Market Capture ($)
$26,519,400 $29,347,200 $31,996,800
TotalTradeArea(Primary+SecondaryTA)
Population
39,651 41,568 43,596
DT Whitehorse Market Capture ($)
$123,853,000 $135,262,000 $145,043,000
WarrantedSupermarketFloorArea(Total) (Rounded to nearest 1,000 sf)
At lower target per sf sales productivity of: $550 225,000 246,000 264,000
Atmid-rangetargetpersfsalesproductivityof: $600 206,000 225,000 242,000
At higher target per sf sales productivity of: $650 191,000 208,000 223,000
Less:ExistingTradeAreaSupermarketFloorArea*
176,000 176,000 176,000
NetOpportunityforadditionalfloorarea 30,000 49,000 66,000
Notes: Projected annual growth rate (PTA): 1.0% Projected annual growth rate (STA): 0.2% Assumed annual growth in expenditures: 1.5% * See Inventory summary - supermarkets/retail food stores
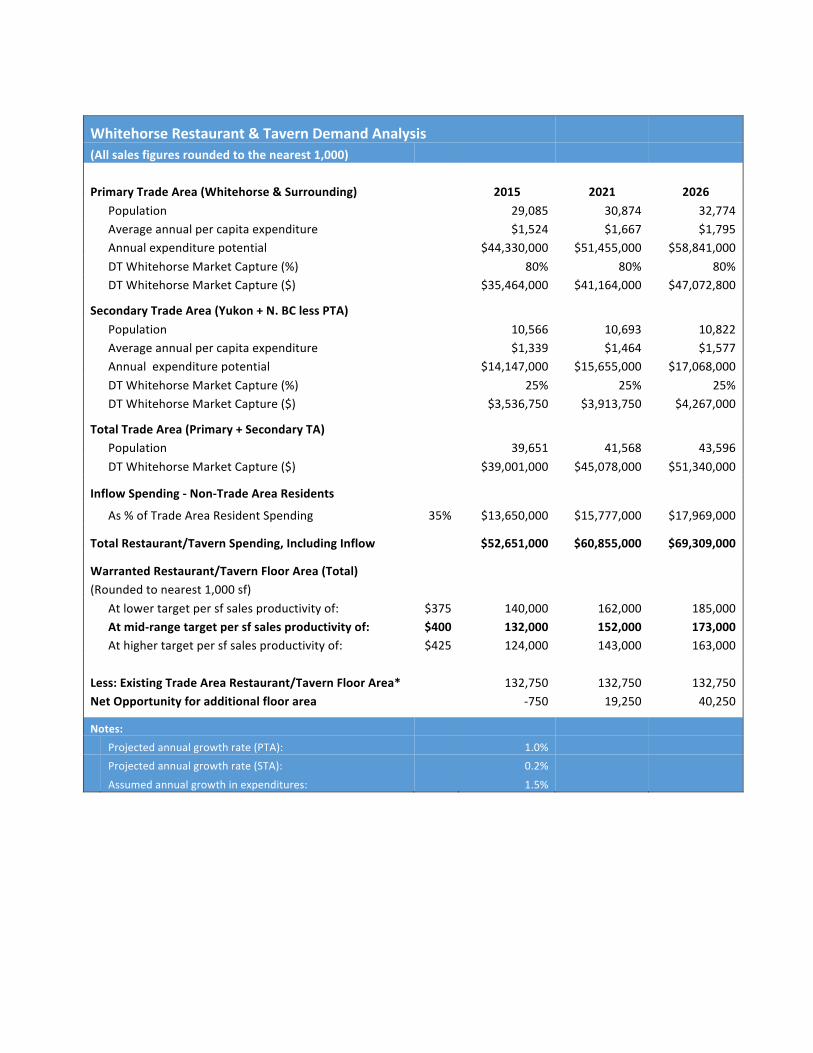
WhitehorseRestaurant&TavernDemandAnalysis (Allsalesfiguresroundedtothenearest1,000)
PrimaryTradeArea(Whitehorse&Surrounding)
2015 2021 2026
Population
29,085 30,874 32,774
Average annual per capita expenditure
$1,524 $1,667 $1,795
Annual expenditure potential
$44,330,000 $51,455,000 $58,841,000
DT Whitehorse Market Capture (%)
80% 80% 80%
DT Whitehorse Market Capture ($)
$35,464,000 $41,164,000 $47,072,800
SecondaryTradeArea(Yukon+N.BClessPTA)
Population
10,566 10,693 10,822
Average annual per capita expenditure
$1,339 $1,464 $1,577
Annual expenditure potential
$14,147,000 $15,655,000 $17,068,000
DT Whitehorse Market Capture (%)
25% 25% 25%
DT Whitehorse Market Capture ($)
$3,536,750 $3,913,750 $4,267,000
TotalTradeArea(Primary+SecondaryTA)
Population
39,651 41,568 43,596
DT Whitehorse Market Capture ($)
$39,001,000 $45,078,000 $51,340,000
InflowSpending-Non-TradeAreaResidents
As % of Trade Area Resident Spending 35% $13,650,000 $15,777,000 $17,969,000
TotalRestaurant/TavernSpending,IncludingInflow
$52,651,000 $60,855,000 $69,309,000
WarrantedRestaurant/TavernFloorArea(Total) (Rounded to nearest 1,000 sf)
At lower target per sf sales productivity of: $375 140,000 162,000 185,000
Atmid-rangetargetpersfsalesproductivityof: $400 132,000 152,000 173,000
At higher target per sf sales productivity of: $425 124,000 143,000 163,000
Less:ExistingTradeAreaRestaurant/TavernFloorArea* 132,750 132,750 132,750 NetOpportunityforadditionalfloorarea -750 19,250 40,250
Notes: Projected annual growth rate (PTA): 1.0% Projected annual growth rate (STA): 0.2% Assumed annual growth in expenditures: 1.5%
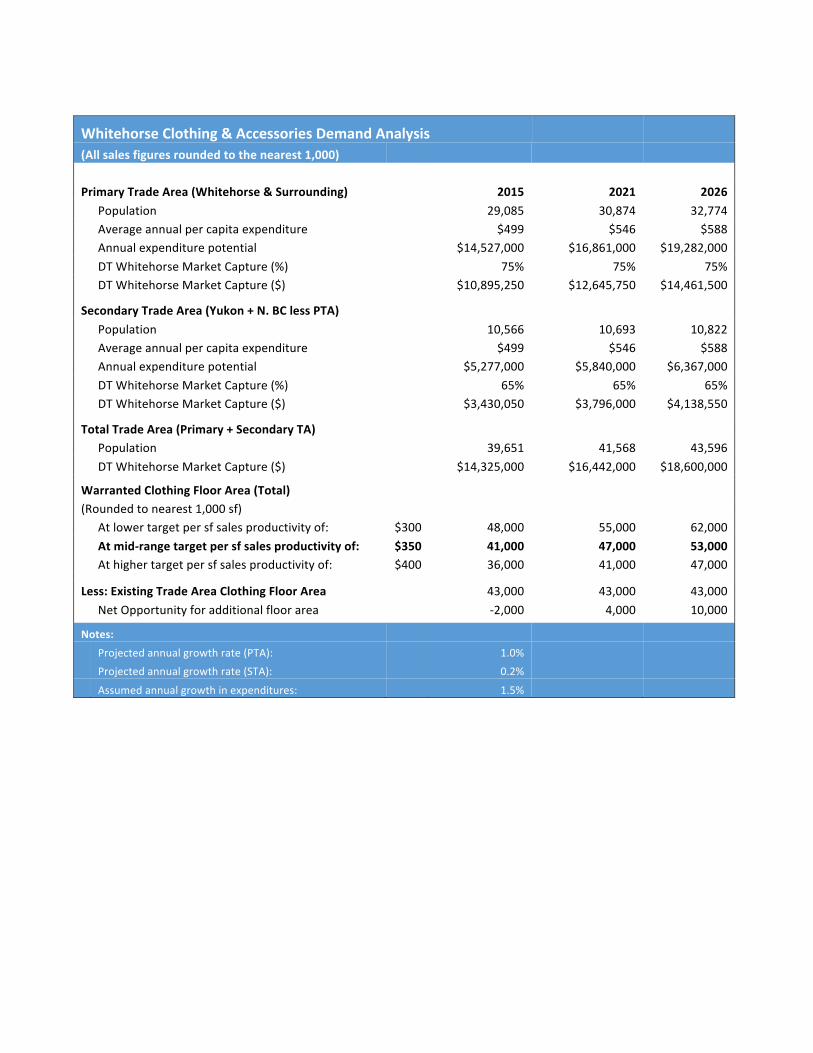
WhitehorseClothing&AccessoriesDemandAnalysis (Allsalesfiguresroundedtothenearest1,000)
PrimaryTradeArea(Whitehorse&Surrounding)
2015 2021 2026
Population
29,085 30,874 32,774
Average annual per capita expenditure
$499 $546 $588
Annual expenditure potential
$14,527,000 $16,861,000 $19,282,000
DT Whitehorse Market Capture (%)
75% 75% 75%
DT Whitehorse Market Capture ($)
$10,895,250 $12,645,750 $14,461,500
SecondaryTradeArea(Yukon+N.BClessPTA)
Population
10,566 10,693 10,822
Average annual per capita expenditure
$499 $546 $588
Annual expenditure potential
$5,277,000 $5,840,000 $6,367,000
DT Whitehorse Market Capture (%)
65% 65% 65%
DT Whitehorse Market Capture ($)
$3,430,050 $3,796,000 $4,138,550
TotalTradeArea(Primary+SecondaryTA)
Population
39,651 41,568 43,596
DT Whitehorse Market Capture ($)
$14,325,000 $16,442,000 $18,600,000
WarrantedClothingFloorArea(Total) (Rounded to nearest 1,000 sf)
At lower target per sf sales productivity of: $300 48,000 55,000 62,000
Atmid-rangetargetpersfsalesproductivityof: $350 41,000 47,000 53,000
At higher target per sf sales productivity of: $400 36,000 41,000 47,000
Less:ExistingTradeAreaClothingFloorArea
43,000 43,000 43,000
Net Opportunity for additional floor area
-2,000 4,000 10,000
Notes: Projected annual growth rate (PTA): 1.0% Projected annual growth rate (STA): 0.2%
Assumed annual growth in expenditures: 1.5%
Related Documents