DOWNTOWN PLAN AUGUST 2018 ANNUAL MONITORING REPORT

Welcome message from author
This document is posted to help you gain knowledge. Please leave a comment to let me know what you think about it! Share it to your friends and learn new things together.
Transcript

DOWNTOWN PLAN
AU
GU
ST
201
8
ANNUAL MONITORING REPORT
Cover photo by: Paolo Ikezoe | San Francisco Planning Department

2017 SUMMARY & INFOGRAPHIC ii
INTRODUCTION 01
The Downtown Plan 01
Report Structure 01
Data Sources 02
PART 1: COMMERCIAL SPACE, EMPLOYMENT, AND REVENUE TRENDS 03
Commercial Space 03
Employment 06
Revenue 07
PART 2: DOWNTOWN SUPPORT INFRASTRUCTURE 09
Housing 09
Transportation 11
Privately-Owned Public Open Space (POPOS) & Public Art 14
TABLES
Table 1: Commercial Project Pipeline 03
Table 2: Existing Office Space 04
Table 3: Office Vacancy 05
Table 4: Retail Vacancy 05
Table 5: Hotel Occupancy and Rate 05
Table 6: Employment -- Citywide 06
Table 7: Employment -- Downtown C-3 Zone 06
Table 8: Business Taxes 08
Table 9: Property Taxes 08
Table 10: Sales and Use Taxes 08
Table 11: Hotel Room Tax 08
Table 12: Net Housing Change: Citywide 09
Table 13: Net Housing Change: Downtown 09
Table 14: Residential Project Pipeline 10
Table 15: Jobs-Housing Linkage Fees Collected 10
Table 16: Net Parking Change -- Downtown C-3 Zone 11
Table 17: Local and Regional Transit Ridership 11
Table 18: Average Vehicle Occupancy 13
Table 19: Transit Impact Development Fee (TIDF) Collections 13
Table 20: Privately-Owned Public Open Space (POPOS) & Public Art 14
MAPS
Map 1. Downtown C-3 Zone and Greater Downtown area 02
Map 2. C-3 Zone and corresponding Census Tracts 13Tabl
e of
Con
tent
s
2017 Summary & Infographic
Downtown San Francisco continues to be a resil-ient district for San Francisco and the region in 2017, largely because of Downtown Plan polices. Adopted in 1985, these policies guide land use decisions to create the physical form and pattern of a vibrant, compact, pedestrian-oriented, livable, and vital downtown.
The Downtown Plan directed dense employment growth to the C-3 district, generally along both sides of Market Street from the Embarcadero to Van Ness Avenue. In order to accommodate this growth, the Plan contains a series of goals, policies and targets designed to ensure that new development is supported with the infrastructure and services required of great places, pays its way, and generates a net benefit for the city.
The city’s economy continued to grow in 2017, albeit at a slightly slower pace than in 2016. Office rents, employment, and tax revenue continued to grow, though transit ridership, after record numbers in 2016, fell slightly. Downtown continues to have the majority of San Francisco’s office and hotel jobs, and overall employment in the Downtown area grew by 3% in 2017, a slight decrease from the 5% growth seen in 2016.
The housing and transportation goals are among the most important in the Downtown Plan. The Plan states that without sufficient and appropriate housing to serve new commercial development, local housing costs would increase, thereby compromising the vitality of downtown. The Plan also states that if employment growth increases the number of cars downtown, thereby signifi-cantly increasing traffic, the area’s attractiveness and livability could be affected adversely. As a result, the Plan contains various targets relating to these policy issues.
After a significant downturn due to the global financial crisis, housing production in the city has rebounded from less than 270 net new units in 2011 to just over 5,000 in 2016, though it fell somewhat to 4,440 net new units in 2017. Over a fifth of these new housing units in 2016 were located in the Downtown C-3 and DTR districts. Significant recent housing production downtown, along with the potential addition of thousands of new units (about 10,150 units in the current pipeline are planned for Downtown), will continue to increase the Downtown residential population and vitality of the district.
Available transportation data suggests that transit use for commuting grows along with jobs in the Downtown, and that transit continues to serve a high proportion of trips for downtown workers and residents. The data also indicates that carpooling has declined, but this could be due to a larger nationwide trend, an increase in the use of other forms of transportation, or an increase in the number of individuals working from home.
By most measures, the San Francisco Downtown Plan has been a success. It guided the creation of one of the most successful core areas of any American city. The vitality, job and housing density, retail activity and overall character of the downtown have improved dramatically. The Plan-ning Department will continue to monitor these trends so that land use policy adjustments can be made as required to maintain and enhance a successful Downtown and Plan and avoid unin-tended consequences.
The annual changes in Downtown land use, employment, and transportation trends are summarized on the following pages (downtown’s share of citywide total is listed in red when appli-
ii
24%1%
DOWNTOWNC3 ZONE
179,700
35,200
9,800
O�ce Jobs
Retail Jobs
Hotel Jobs
Part 1. Commercial Space, Employment, and Revenue Trends
EXISTING COMMERCIAL SPACE
2017 DOWNTOWN PLANANNUAL MONITORING REPORT
SUMMARY
72,400,000
8,800,000
20,000
O�ce Square feet
Square feet
Net Square feet
Net Square feet
Net Square feet
Retail
RoomsHotel
VACANCY
$245AVERAGE RATE / ROOMOCCUPANCY
/ SQUARE FOOT
83%
61%
28%
61%24%
11%
17%
60%
16%
64%
O�ce Vacancy
Retail Vacancy
Downtown O�ce Rent
Hotel
25,140,0005,910,000
COMMERCIAL DEVELOPMENT PIPELINEDowntown share of CitywideDowntown share of Citywide
Downtown
2,910,000
430,000
O�ce
Retail
Downtown share of Citywide
4%
9%
6%
0 20 40 60 80 100
9.7%8.6%9.8%
0 20 40 60 80 100
4.0%3.2%
EMPLOYMENT (JOBS)
CHART COLOR KEY:
SAN FRANCISCO
1%3%
40% 710,600288,000
TOTAL JOBS
TOTAL
Citywide Bay Area
295,800112,500,000 16,880,000 1%
125,60056,100,000 3,970,000 --
16,20033,600 2%
SEE TABLE 2
SEE TABLE 3 (P. 5)SEE TABLE 4 (P. 5)
SEE TABLE 5 (P. 5)
1%$71.02
CITYWIDE
BAY AREA
DOWNTOWN
CITYWIDE
DOWNTOWN
SEE TABLE 1 (P. 3)
29,800
32,500
1,000
CIE Jobs
Other Jobs
18%
33%
14%
72%
24%
168,800
97,400 4%
6,800 --
SEE TABLES 6 & 7 (P. 6)
PDR Jobs
PART 1: Commercial
24%1%
DOWNTOWNC3 ZONE
179,700
35,200
9,800
O�ce Jobs
Retail Jobs
Hotel Jobs
Part 1. Commercial Space, Employment, and Revenue Trends
EXISTING COMMERCIAL SPACE
2017 DOWNTOWN PLANANNUAL MONITORING REPORT
SUMMARY
72,400,000
8,800,000
20,000
O�ce Square feet
Square feet
Net Square feet
Net Square feet
Net Square feet
Retail
RoomsHotel
VACANCY
$245AVERAGE RATE / ROOMOCCUPANCY
/ SQUARE FOOT
83%
61%
28%
61%24%
11%
17%
60%
16%
64%
O�ce Vacancy
Retail Vacancy
Downtown O�ce Rent
Hotel
25,140,0005,910,000
COMMERCIAL DEVELOPMENT PIPELINEDowntown share of CitywideDowntown share of Citywide
Downtown
2,910,000
430,000
O�ce
Retail
Downtown share of Citywide
4%
9%
6%
0 20 40 60 80 100
9.7%8.6%9.8%
0 20 40 60 80 100
4.0%3.2%
EMPLOYMENT (JOBS)
CHART COLOR KEY:
SAN FRANCISCO
1%3%
40% 710,600288,000
TOTAL JOBS
TOTAL
Citywide Bay Area
295,800112,500,000 16,880,000 1%
125,60056,100,000 3,970,000 --
16,20033,600 2%
SEE TABLE 2
SEE TABLE 3 (P. 5)SEE TABLE 4 (P. 5)
SEE TABLE 5 (P. 5)
1%$71.02
CITYWIDE
BAY AREA
DOWNTOWN
CITYWIDE
DOWNTOWN
SEE TABLE 1 (P. 3)
29,800
32,500
1,000
CIE Jobs
Other Jobs
18%
33%
14%
72%
24%
168,800
97,400 4%
6,800 --
SEE TABLES 6 & 7 (P. 6)
PDR Jobs
iiiDOWNTOWN PLAN: ANNUAL MONITORING REPORT 2017
PART 1: Commercial (cont’d)
$810.4 million
$191.7 million $372.3 million
Business Taxes
Sales & Use Taxes Hotel Room Tax
REVENUE
15%
1%1%
SEE TABLE 8SEE TABLE 10
SEE TABLE 11
$1.9 billionProperty Taxes
12%
SEE TABLE 9
24%1%
DOWNTOWNC3 ZONE
179,700
35,200
9,800
O�ce Jobs
Retail Jobs
Hotel Jobs
Part 1. Commercial Space, Employment, and Revenue Trends
EXISTING COMMERCIAL SPACE
2017 DOWNTOWN PLANANNUAL MONITORING REPORT
SUMMARY
72,400,000
8,800,000
20,000
O�ce Square feet
Square feet
Net Square feet
Net Square feet
Net Square feet
Retail
RoomsHotel
VACANCY
$245AVERAGE RATE / ROOMOCCUPANCY
/ SQUARE FOOT
83%
61%
28%
61%24%
11%
17%
60%
16%
64%
O�ce Vacancy
Retail Vacancy
Downtown O�ce Rent
Hotel
25,140,0005,910,000
COMMERCIAL DEVELOPMENT PIPELINEDowntown share of CitywideDowntown share of Citywide
Downtown
2,910,000
430,000
O�ce
Retail
Downtown share of Citywide
4%
9%
6%
0 20 40 60 80 100
9.7%8.6%9.8%
0 20 40 60 80 100
4.0%3.2%
EMPLOYMENT (JOBS)
CHART COLOR KEY:
SAN FRANCISCO
1%3%
40% 710,600288,000
TOTAL JOBS
TOTAL
Citywide Bay Area
295,800112,500,000 16,880,000 1%
125,60056,100,000 3,970,000 --
16,20033,600 2%
SEE TABLE 2
SEE TABLE 3 (P. 5)SEE TABLE 4 (P. 5)
SEE TABLE 5 (P. 5)
1%$71.02
CITYWIDE
BAY AREA
DOWNTOWN
CITYWIDE
DOWNTOWN
SEE TABLE 1 (P. 3)
29,800
32,500
1,000
CIE Jobs
Other Jobs
18%
33%
14%
72%
24%
168,800
97,400 4%
6,800 --
SEE TABLES 6 & 7 (P. 6)
PDR Jobs
iv

4,270
RESIDENTIAL UNITS
Units constructed
13%915 6%
714,900
TRANSIT RIDERSHIPDowntown Transit Boardings(Average Weekday) Citywide
18% 65,20010,200
RESIDENTIAL PIPELINEPROJECTS
UnitsDowntown % of Citywide
$48.1 million
TRANSIT IMPACT DEVELOPMENT FEE(FY 2016-17)Total
na PEAK-PERIOD TO/FROM DOWNTOWN SYSTEMWIDE
Part 2. Downtown Support Infrastructure
2017 DOWNTOWN PLANANNUAL MONITORING REPORTSUMMARY
SEE TABLES 12 & 13 (P. 9)SEE TABLE 14 (P. 10)
SEE TABLE 17 (P. 11)
SEE TABLE 19 ( P. 13)
POPOS Public Art
PRIVATELY-OWNED PUBLIC OPEN SPACE (POPOS) & ART
SEE TABLE 20 (P. 14)
2624
9187 DOWNTOWN
CITYWIDE
MODE SPLITC-3 RESIDENTS C-3 WORKERS
1% 423,400 147,300 AT DOWNTOWN BART STATIONS
3% 62,200 14,800 AT 4TH & KING STATION
178,900 13,500 TRANSBAY LINES*
2016 2010
TRANSIT
CAR
BIKE
Mode
34% 51%20% 37%3% 2%
WALK
WORK AT HOME
35% 7%5% 1%
OTHER3% 3%
2016 2010
2%
$66.9 million
JOBS-HOUSING LINKAGE FEES(FY 2016-17)Total
SEE TABLE 15
*Data from 2016
2%
SYSTEMWIDE
SYSTEMWIDE
SYSTEMWIDE
1%
PART 2: Infrastructure
24%1%
DOWNTOWNC3 ZONE
179,700
35,200
9,800
O�ce Jobs
Retail Jobs
Hotel Jobs
Part 1. Commercial Space, Employment, and Revenue Trends
EXISTING COMMERCIAL SPACE
2017 DOWNTOWN PLANANNUAL MONITORING REPORT
SUMMARY
72,400,000
8,800,000
20,000
O�ce Square feet
Square feet
Net Square feet
Net Square feet
Net Square feet
Retail
RoomsHotel
VACANCY
$245AVERAGE RATE / ROOMOCCUPANCY
/ SQUARE FOOT
83%
61%
28%
61%24%
11%
17%
60%
16%
64%
O�ce Vacancy
Retail Vacancy
Downtown O�ce Rent
Hotel
25,140,0005,910,000
COMMERCIAL DEVELOPMENT PIPELINEDowntown share of CitywideDowntown share of Citywide
Downtown
2,910,000
430,000
O�ce
Retail
Downtown share of Citywide
4%
9%
6%
0 20 40 60 80 100
9.7%8.6%9.8%
0 20 40 60 80 100
4.0%3.2%
EMPLOYMENT (JOBS)
CHART COLOR KEY:
SAN FRANCISCO
1%3%
40% 710,600288,000
TOTAL JOBS
TOTAL
Citywide Bay Area
295,800112,500,000 16,880,000 1%
125,60056,100,000 3,970,000 --
16,20033,600 2%
SEE TABLE 2
SEE TABLE 3 (P. 5)SEE TABLE 4 (P. 5)
SEE TABLE 5 (P. 5)
1%$71.02
CITYWIDE
BAY AREA
DOWNTOWN
CITYWIDE
DOWNTOWN
SEE TABLE 1 (P. 3)
29,800
32,500
1,000
CIE Jobs
Other Jobs
18%
33%
14%
72%
24%
168,800
97,400 4%
6,800 --
SEE TABLES 6 & 7 (P. 6)
PDR Jobs
4,270
RESIDENTIAL UNITS
Units constructed
13%915 6%
714,900
TRANSIT RIDERSHIPDowntown Transit Boardings(Average Weekday) Citywide
18% 65,20010,200
RESIDENTIAL PIPELINEPROJECTS
UnitsDowntown % of Citywide
$48.1 million
TRANSIT IMPACT DEVELOPMENT FEE(FY 2016-17)Total
na PEAK-PERIOD TO/FROM DOWNTOWN SYSTEMWIDE
Part 2. Downtown Support Infrastructure
2017 DOWNTOWN PLANANNUAL MONITORING REPORTSUMMARY
SEE TABLES 12 & 13 (P. 9)SEE TABLE 14 (P. 10)
SEE TABLE 17 (P. 11)
SEE TABLE 19 ( P. 13)
POPOS Public Art
PRIVATELY-OWNED PUBLIC OPEN SPACE (POPOS) & ART
SEE TABLE 20 (P. 14)
2624
9187 DOWNTOWN
CITYWIDE
MODE SPLITC-3 RESIDENTS C-3 WORKERS
1% 423,400 147,300 AT DOWNTOWN BART STATIONS
3% 62,200 14,800 AT 4TH & KING STATION
178,900 13,500 TRANSBAY LINES*
2016 2010
TRANSIT
CAR
BIKE
Mode
34% 51%20% 37%3% 2%
WALK
WORK AT HOME
35% 7%5% 1%
OTHER3% 3%
2016 2010
2%
$66.9 million
JOBS-HOUSING LINKAGE FEES(FY 2016-17)Total
SEE TABLE 15
*Data from 2016
2%
SYSTEMWIDE
SYSTEMWIDE
SYSTEMWIDE
1%
vDOWNTOWN PLAN: ANNUAL MONITORING REPORT 2017
4,270
RESIDENTIAL UNITS
Units constructed
13%915 6%
714,900
TRANSIT RIDERSHIPDowntown Transit Boardings(Average Weekday) Citywide
18% 65,20010,200
RESIDENTIAL PIPELINEPROJECTS
UnitsDowntown % of Citywide
$48.1 million
TRANSIT IMPACT DEVELOPMENT FEE(FY 2016-17)Total
na PEAK-PERIOD TO/FROM DOWNTOWN SYSTEMWIDE
Part 2. Downtown Support Infrastructure
2017 DOWNTOWN PLANANNUAL MONITORING REPORTSUMMARY
SEE TABLES 12 & 13 (P. 9)SEE TABLE 14 (P. 10)
SEE TABLE 17 (P. 11)
SEE TABLE 19 ( P. 13)
POPOS Public Art
PRIVATELY-OWNED PUBLIC OPEN SPACE (POPOS) & ART
SEE TABLE 20 (P. 14)
2624
9187 DOWNTOWN
CITYWIDE
MODE SPLITC-3 RESIDENTS C-3 WORKERS
1% 423,400 147,300 AT DOWNTOWN BART STATIONS
3% 62,200 14,800 AT 4TH & KING STATION
178,900 13,500 TRANSBAY LINES*
2016 2010
TRANSIT
CAR
BIKE
Mode
34% 51%20% 37%3% 2%
WALK
WORK AT HOME
35% 7%5% 1%
OTHER3% 3%
2016 2010
2%
$66.9 million
JOBS-HOUSING LINKAGE FEES(FY 2016-17)Total
SEE TABLE 15
*Data from 2016
2%
SYSTEMWIDE
SYSTEMWIDE
SYSTEMWIDE
1%
PART 2: Infrastructure (cont’d)
vi

The Downtown Plan
The Downtown Plan’s central premise is that a compact, walkable, and transit oriented downtown will create a lively and attractive center for the city and the region. The Plan also capitalizes on the city’s core assets, including its transit infrastructure, visitor economy, and vibrant diversity.
The Plan’s vision is to create a vibrant district known the world over as a center of ideas, services, and trade, and as a place rich in human experience - characteris-tics that are true of all great cities. The essential com-ponents of such places are a compact mix of activities, historical values, distinctive architecture, and urban form that engenders the special excitement of a world city. To achieve this vision, the Plan’s objectives and policies guide land use decisions to create the physical form and pattern of a livable, compact, and pedestrian-oriented downtown.
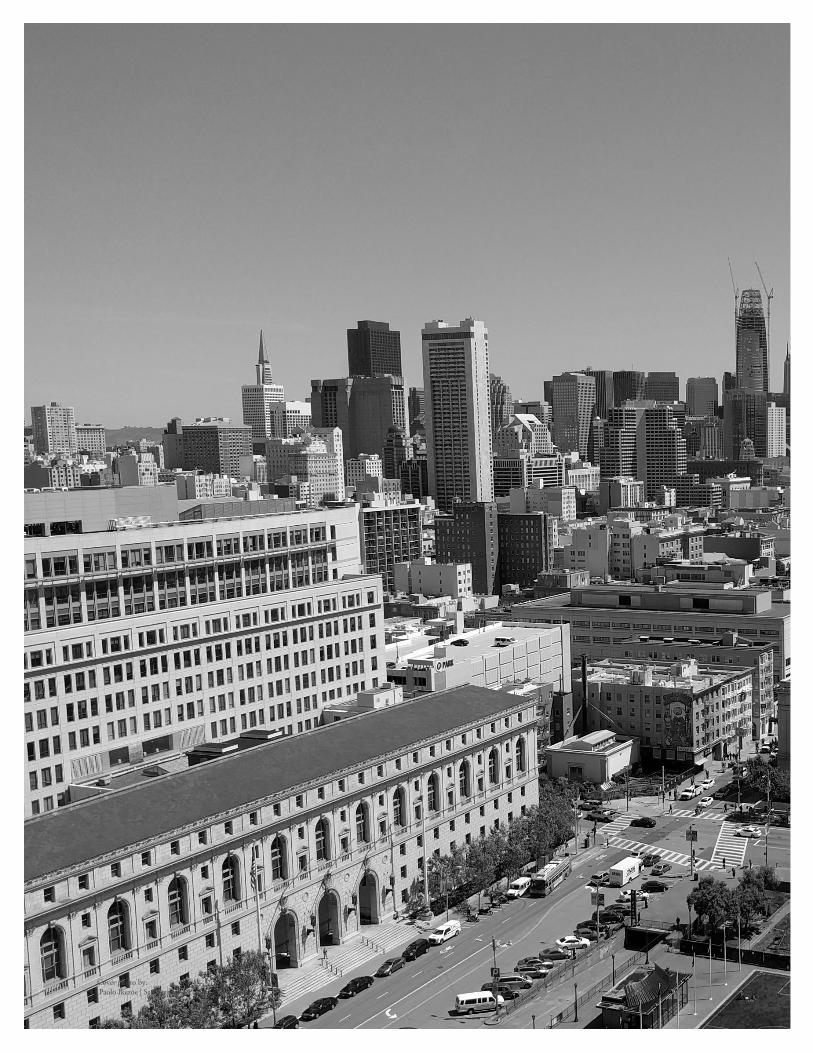
The Downtown Plan is one Area Plan of the General Plan. The Downtown area is traditionally defined as the C-3-zoned district (see Map 1). Some of the Plan’s policies refer to a less precisely defined area germane to housing and transportation policies that have wider effects geographically. Some policies, such as those involving net new housing units, are citywide goals.
The Downtown Plan guides development decisions and public policy actions; it creates programs designed to improve services and infrastructure. When the Board of Supervisors approved the Downtown Plan in 1985, the Board also required that the Planning Department prepare monitoring reports periodically to track performance and make adjustments if required. This document is one such report as described below.
Introduction
Report Structure
This Downtown Plan Annual Monitoring Report 2017 summarizes business and development trends affecting downtown San Francisco as required by SF Admin-istrative Code, Chapter 10E. The report covers the 2017 calendar year or fiscal years 2016-17 or 2017-18 depending on data available. This annual report notes changes in the amount of commercial space, employ-ment, housing production, parking supply, collection and use of fees and other revenues that occurred over the year related to the objectives of the Downtown Plan and statutory monitoring requirements.
Part 1 of this report, “Commercial Space, Employment and Revenue Trends,” highlights the growth that the Downtown Plan enabled, and discusses the produc-tion of new commercial space, employment activity, and recent sales tax revenues on both a citywide and Downtown basis. Part 2, “Downtown Support Infra-structure,” reviews housing, transportation, Privately Owned Public Open Spaces (POPOS) and Public Art – key elements supporting the functioning of the Downtown core.
The most recent 5-year report, 2014 Downtown Plan 5 Year Monitoring Report, contains more detailed information and assessment. Previous annual and five-year reports are available on the Department’s web site: http://sf-planning.org/citywide-policy-reports-and-publications#dag
1DOWNTOWN PLAN: ANNUAL MONITORING REPORT 2017
DTR Districts
28028
80
0800
China Basin
CentralBasin
S A N
F R A N C I S C O
B A Y
FOLSOM S
T
BRYANT ST
BRANNAN ST
HARRISON S
T
07TH ST
10TH ST
12TH ST
HOWARD S
T
04TH ST
05TH ST
06TH ST
03RD ST
TS
D
R3
0
02ND ST
TOWNSEND S
T
WASHINGTON ST
CALIFORNIA ST
BROADWAY ST
LOMBARD ST
CHESTNUT ST
BUSH ST
GEARY BLVD
GROVE ST
OAK ST
FELL ST
EMBAR
CAD
ERO
VA
N N
ES
S A
VE
GO
UG
H S
T
LAG
UN
A S
T
DIV
ISA
DE
RO
ST
ST
OC
KT
ON
ST
MO
NT
GO
ME
RY
ST
TA
YLO
R S
T
LEA
VE
NW
OT
H S
T
LAR
KIN
ST
COLUMBUS AVE
AT&T Park
Ferry BuildingPlaza
AlamoSquare
Alta PlazaPark
Buena VistaPark
Fort Mason
Rincon Park
MosconeCenter
Yerba BuenaGardens
UnionSquare
SouthPark
CityHall
MARKET S
T
MARKET S
T
17TH ST
16TH ST
GU
ER
RE
RO
ST
SA
NS
OM
E S
T
MIS
SION S
T
BAY B
RI D
GE
C-3 Zoning District
eliM 5.00
BEALE ST
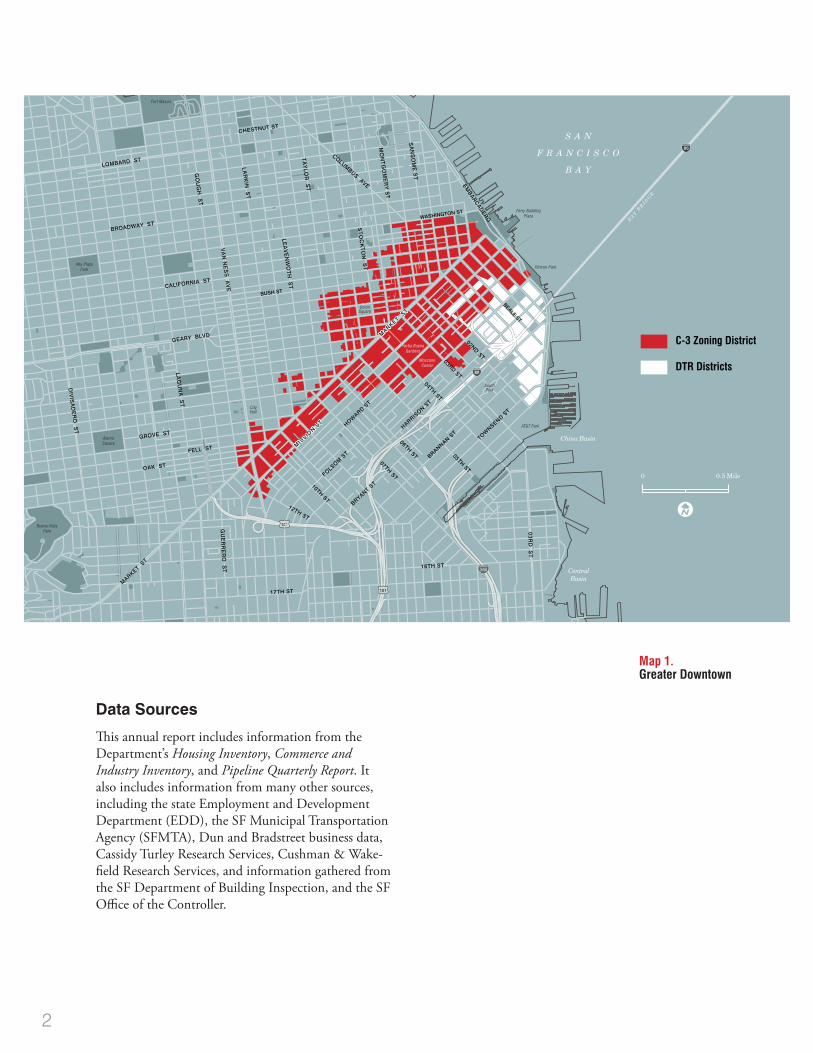
Map 1. Greater Downtown
Data Sources
This annual report includes information from the Department’s Housing Inventory, Commerce and Industry Inventory, and Pipeline Quarterly Report. It also includes information from many other sources, including the state Employment and Development Department (EDD), the SF Municipal Transportation Agency (SFMTA), Dun and Bradstreet business data, Cassidy Turley Research Services, Cushman & Wake-field Research Services, and information gathered from the SF Department of Building Inspection, and the SF Office of the Controller.
2
the Eastern Neighborhoods Area Plans will establish new mixed-use residential neighborhoods encompass-ing light industrial and production-distribution-repair, retail, smaller offices, and institutional uses. The Eastern Neighborhoods will not be locations for dense, high-rise office developments. As a result, future high-rise office development will remain concentrated in and around the Downtown Plan Area.
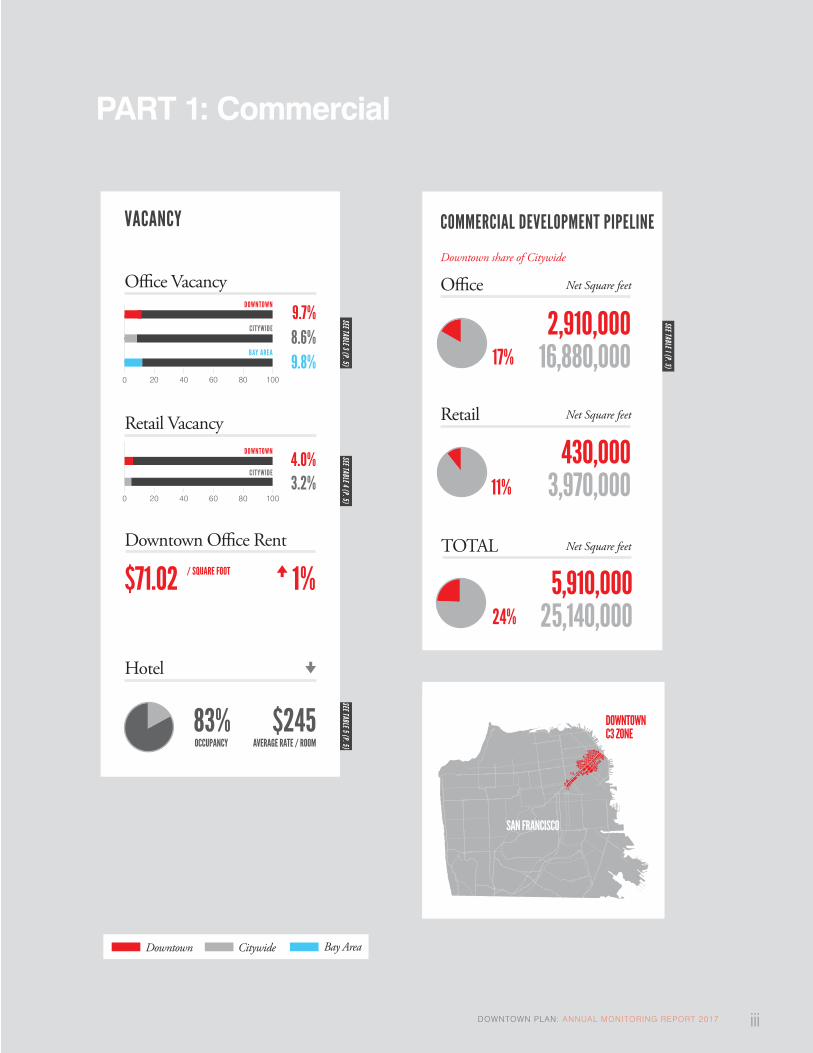
Commercial Space
Pipeline Development Projects
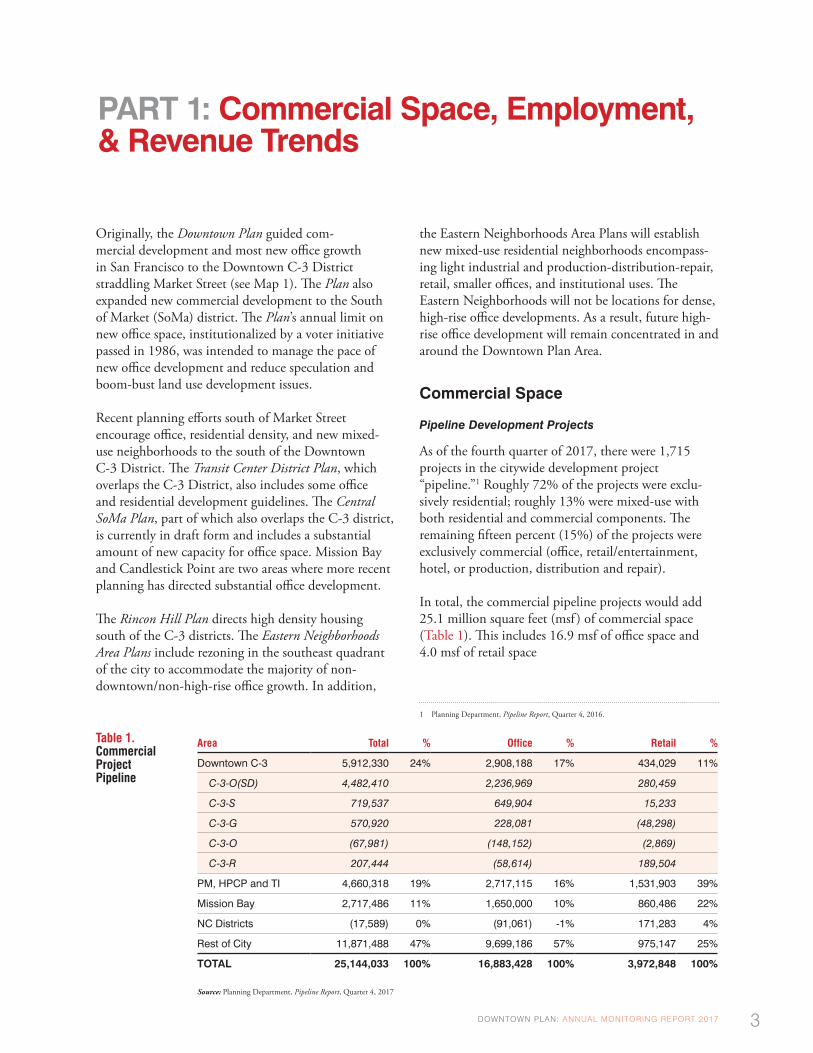
As of the fourth quarter of 2017, there were 1,715 projects in the citywide development project “pipeline.”1 Roughly 72% of the projects were exclu-sively residential; roughly 13% were mixed-use with both residential and commercial components. The remaining fifteen percent (15%) of the projects were exclusively commercial (office, retail/entertainment, hotel, or production, distribution and repair).
In total, the commercial pipeline projects would add 25.1 million square feet (msf ) of commercial space (Table 1). This includes 16.9 msf of office space and 4.0 msf of retail space
1 Planning Department, Pipeline Report, Quarter 4, 2016.
Originally, the Downtown Plan guided com-mercial development and most new office growth in San Francisco to the Downtown C-3 District straddling Market Street (see Map 1). The Plan also expanded new commercial development to the South of Market (SoMa) district. The Plan’s annual limit on new office space, institutionalized by a voter initiative passed in 1986, was intended to manage the pace of new office development and reduce speculation and boom-bust land use development issues.
Recent planning efforts south of Market Street encourage office, residential density, and new mixed-use neighborhoods to the south of the Downtown C-3 District. The Transit Center District Plan, which overlaps the C-3 District, also includes some office and residential development guidelines. The Central SoMa Plan, part of which also overlaps the C-3 district, is currently in draft form and includes a substantial amount of new capacity for office space. Mission Bay and Candlestick Point are two areas where more recent planning has directed substantial office development.
The Rincon Hill Plan directs high density housing south of the C-3 districts. The Eastern Neighborhoods Area Plans include rezoning in the southeast quadrant of the city to accommodate the majority of non-downtown/non-high-rise office growth. In addition,
Area Total % Office % Retail %
Downtown C-3 5,912,330 24% 2,908,188 17% 434,029 11%
C-3-O(SD) 4,482,410 2,236,969 280,459
C-3-S 719,537 649,904 15,233
C-3-G 570,920 228,081 (48,298)
C-3-O (67,981) (148,152) (2,869)
C-3-R 207,444 (58,614) 189,504
PM, HPCP and TI 4,660,318 19% 2,717,115 16% 1,531,903 39%
Mission Bay 2,717,486 11% 1,650,000 10% 860,486 22%
NC Districts (17,589) 0% (91,061) -1% 171,283 4%
Rest of City 11,871,488 47% 9,699,186 57% 975,147 25%
TOTAL 25,144,033 100% 16,883,428 100% 3,972,848 100%
Source: Planning Department, Pipeline Report, Quarter 4, 2017
Table 1. Commercial Project Pipeline
PART 1: Commercial Space, Employment, & Revenue Trends
3DOWNTOWN PLAN: ANNUAL MONITORING REPORT 2017
The Downtown C-3 districts account for about 5.9 million sf, or 24% of proposed commercial space in the pipeline. Large master planned developments in Candlestick Point, Treasure Island and Parkmerced would add about 4.6 msf (19%) of new commercial space, and Mission Bay would add 2.7 msf (11%). The rest of the city will receive about 11.9 msf of commercial development, or 47% of the pipeline project total. The vast majority of this development is slated for neighborhoods adjacent to downtown (other parts of SoMa and Showplace Square/Potrero Hill). The non-residential commercial projects include office, retail, visitor (hotel and entertainment), production-distribution-repair (PDR), and cultural-institutional-educational (CIE) land uses.
Of the total 5.9 msf of commercial space in the pipe-line for downtown, 49% are office land uses. About 1.2 msf (21%) of downtown’s pipeline development is currently under construction. Another 3.3 msf worth of pipeline projects have received building permit approval or have been issued a permit, and should begin construction soon. The remaining 1.4 msf of the pipeline projects are still in the early stages of approval, with Planning applications filed or approved, and building permits filed but not yet approved with the Department of Building Inspection.
Projects under construction are typically ready for occupancy within two years. Projects not yet under construction but approved by the Planning Depart-ment are usually available for occupancy within two to four years. Projects filed for planning approval take two to four or more years to complete, depending on complexity.
Office Space
Close to two-thirds of the city’s office space is located in the Downtown C-3 District (Table 2). At 343 acres (or slightly more than half a square mile), the district represents one of the densest concentrations of office space in the country.
Table 2. Existing Office Space
Area Square Feet
San Francisco 116,100,000
C-3 District 74,800,000
% office in C-3 District 64%
Source: Costar Group, SF Planning.
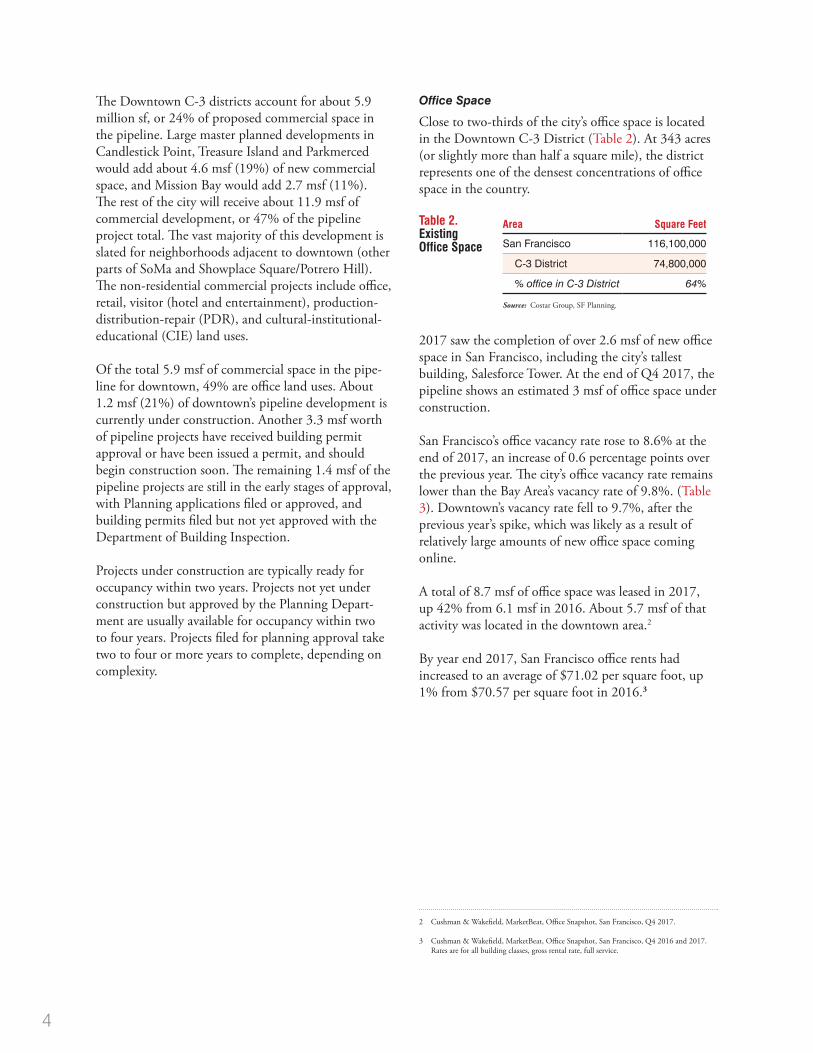
2017 saw the completion of over 2.6 msf of new office space in San Francisco, including the city’s tallest building, Salesforce Tower. At the end of Q4 2017, the pipeline shows an estimated 3 msf of office space under construction. San Francisco’s office vacancy rate rose to 8.6% at the end of 2017, an increase of 0.6 percentage points over the previous year. The city’s office vacancy rate remains lower than the Bay Area’s vacancy rate of 9.8%. (Table 3). Downtown’s vacancy rate fell to 9.7%, after the previous year’s spike, which was likely as a result of relatively large amounts of new office space coming online.
A total of 8.7 msf of office space was leased in 2017, up 42% from 6.1 msf in 2016. About 5.7 msf of that activity was located in the downtown area.2
By year end 2017, San Francisco office rents had increased to an average of $71.02 per square foot, up 1% from $70.57 per square foot in 2016.3
2 Cushman & Wakefield, MarketBeat, Office Snapshot, San Francisco, Q4 2017.
3 Cushman & Wakefield, MarketBeat, Office Snapshot, San Francisco, Q4 2016 and 2017. Rates are for all building classes, gross rental rate, full service.
4
Retail Space
San Francisco’s downtown is the Bay Area’s preeminent retail hub, with the Union Square area serving local, regional, and visitor shopping needs. However, the majority of retail space in San Francisco is outside the downtown area, mostly along the city’s many neighbor-hood commercial streets and shopping areas.
At the end of 2017, San Francisco’s retail vacancy rate was 3.2%, up from 1.9% the previous year (Table 4). The retail vacancy rate for the Union Square area was 4%. Retail rents in Union Square now average $700 psf/year, roughly the same as last year.4
There is approximately 434,030 net square feet of retail space in the development pipeline for the Downtown C-3 area, with another 3.5m net square feet anticipated for the rest of the city. Major downtown retail projects in the pipeline include the soon to open Transbay Tran-sit Center (43,000 sf ) and retail spaces in the ground floors of various residential mixed-use projects.
4 Cushman & Wakefield, San Francisco Retail Snapshot Q4 2017.
Hotel Space
San Francisco has 220 hotels with a total of over 34,000 hotel rooms.5 Several large hotel projects in the Downtown C-3 area have entered the pipeline since 2015: 526 Mission Street (Oceanwide Project), 555 Howard Street, 950 Market Street and 447 Battery Street. Both hotel occupancy and average daily rates decreased in 2017 (Table 5). Average hotel occupancy decreased to 83.3% from 87.6% in 2016. Average daily room rates increased to $249 per room, compared to $276 in 2016.
5 San Francisco Travel Association, March, 2018.
Table 3. Office Vacancy
Area 2015 2016 2017 % Change 2016-17
San Francisco 5.9% 8.0% 8.6% 0.6 pts
Downtown Financial District 6.8% 12.2% 9.7% -2.5 pts
Other Downtown* 5.0% 6.4% 5.5% -0.8 pts
Bay Area 8.1% 9.6% 9.8% 0.2 pts
* Includes Jackson Square, South of Market, Union Square, Mid Market and Van Ness.Sources: Cushman & Wakefield San Francisco Market Beat Office Report, Q4 2017, Cushman & Wakefield US Office Marketbeat, Q4 2016.
Table 4. Retail Vacancy
Area 2015 2016 2017 % Change 2016-17
San Francisco 1.9% 1.9% 3.2% 1.3 pts
Downtown* 3.6% 3.5% 4.0% 0.5 pts
* Defined as Union Square and Post Street, the retail core of the C-3 zone.Source: Cushman & Wakefield, San Francisco Retail Snapshot, Q4 2017.
Table 5. Hotel Occupancy and Rate
2015 2016 2017
Average Occupancy 86.6% 87.6% 83.3%
Average Daily Room Rate $268.17 $276.43 $249.49
Source: San Francisco Center for Economic Development.
5DOWNTOWN PLAN: ANNUAL MONITORING REPORT 2017
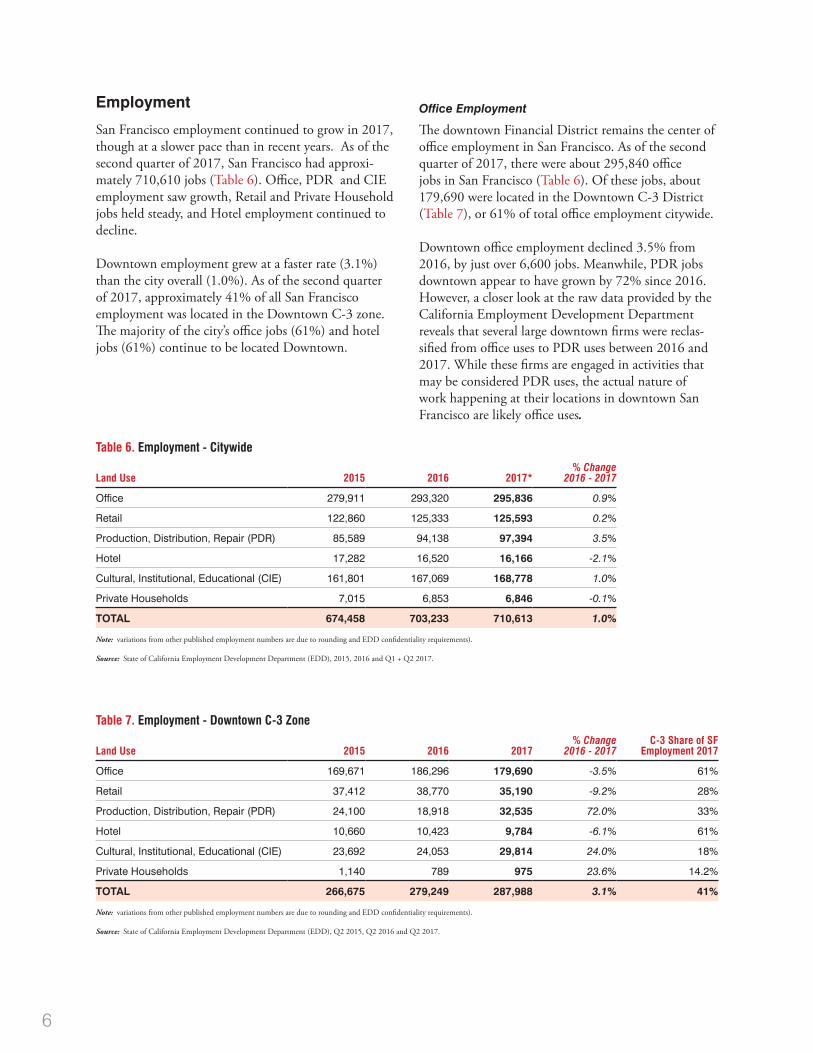
Table 6. Employment - Citywide
Land Use 2015 2016 2017*% Change
2016 - 2017
Office 279,911 293,320 295,836 0.9%
Retail 122,860 125,333 125,593 0.2%
Production, Distribution, Repair (PDR) 85,589 94,138 97,394 3.5%
Hotel 17,282 16,520 16,166 -2.1%
Cultural, Institutional, Educational (CIE) 161,801 167,069 168,778 1.0%
Private Households 7,015 6,853 6,846 -0.1%
TOTAL 674,458 703,233 710,613 1.0%
Note: variations from other published employment numbers are due to rounding and EDD confidentiality requirements).
Source: State of California Employment Development Department (EDD), 2015, 2016 and Q1 + Q2 2017.
Table 7. Employment - Downtown C-3 Zone
Land Use 2015 2016 2017% Change
2016 - 2017C-3 Share of SF
Employment 2017
Office 169,671 186,296 179,690 -3.5% 61%
Retail 37,412 38,770 35,190 -9.2% 28%
Production, Distribution, Repair (PDR) 24,100 18,918 32,535 72.0% 33%
Hotel 10,660 10,423 9,784 -6.1% 61%
Cultural, Institutional, Educational (CIE) 23,692 24,053 29,814 24.0% 18%
Private Households 1,140 789 975 23.6% 14.2%
TOTAL 266,675 279,249 287,988 3.1% 41%
Note: variations from other published employment numbers are due to rounding and EDD confidentiality requirements).
Source: State of California Employment Development Department (EDD), Q2 2015, Q2 2016 and Q2 2017.
Employment
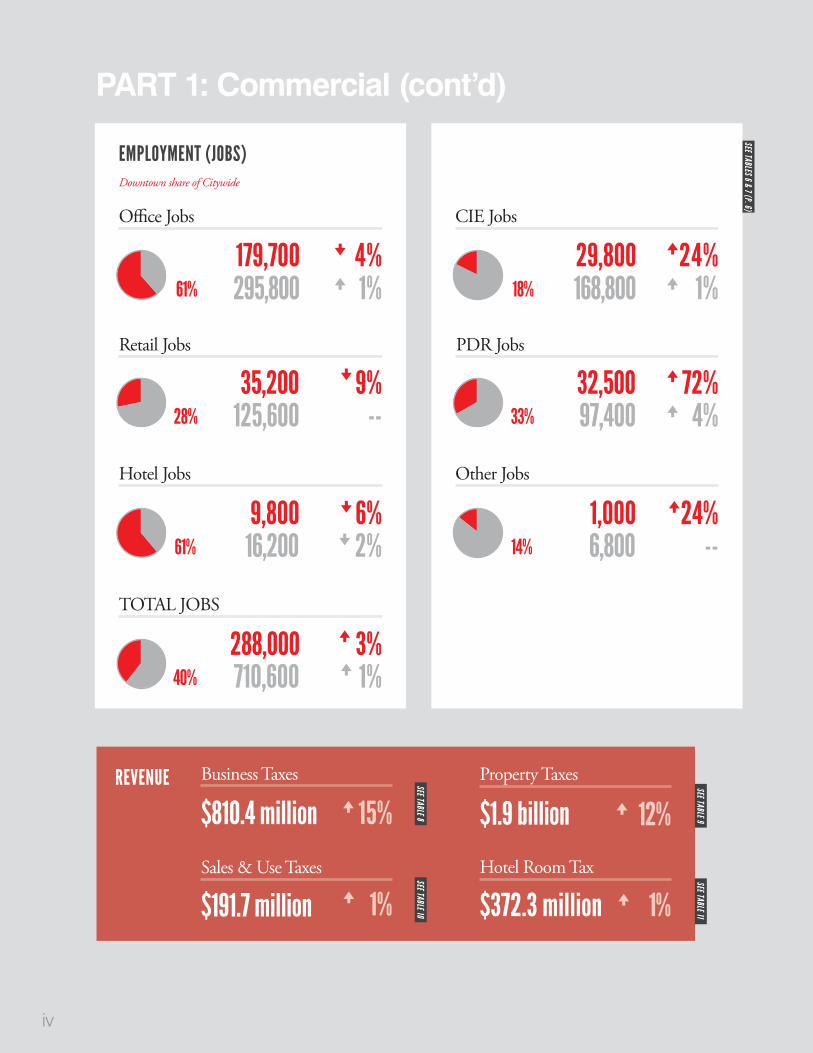
San Francisco employment continued to grow in 2017, though at a slower pace than in recent years. As of the second quarter of 2017, San Francisco had approxi-mately 710,610 jobs (Table 6). Office, PDR and CIE employment saw growth, Retail and Private Household jobs held steady, and Hotel employment continued to decline.
Downtown employment grew at a faster rate (3.1%) than the city overall (1.0%). As of the second quarter of 2017, approximately 41% of all San Francisco employment was located in the Downtown C-3 zone. The majority of the city’s office jobs (61%) and hotel jobs (61%) continue to be located Downtown.
Office Employment
The downtown Financial District remains the center of office employment in San Francisco. As of the second quarter of 2017, there were about 295,840 office jobs in San Francisco (Table 6). Of these jobs, about 179,690 were located in the Downtown C-3 District (Table 7), or 61% of total office employment citywide.
Downtown office employment declined 3.5% from 2016, by just over 6,600 jobs. Meanwhile, PDR jobs downtown appear to have grown by 72% since 2016. However, a closer look at the raw data provided by the California Employment Development Department reveals that several large downtown firms were reclas-sified from office uses to PDR uses between 2016 and 2017. While these firms are engaged in activities that may be considered PDR uses, the actual nature of work happening at their locations in downtown San Francisco are likely office uses.
6
Retail EmploymentAs of the second quarter of 2017, there were 125,590 retail jobs in San Francisco (Table 6). About 35,190 (28%) of these jobs are found in the C-3 District (Table 7).
Hotel Employment
San Francisco’s hotel jobs are heavily concentrated downtown. As of the second quarter of 2017, there were approximately 16,170 hotel jobs in the city. About 9,780 (61%) of these jobs were in the C-3 District.
Revenue
This section reports tax revenues from business taxes (including registration and payroll), property taxes (including transfer tax and annual tax), sales and use taxes, and the hotel tax for the 2017-2018 fiscal year (FY).6 The information reported for FY17-18 are revenue projections for the full fiscal year, and are based on the amount collected as of March 31, 2017. In general, the FY 2017-18 budget assumed increases in tax revenue thanks to continued economic growth.7
Business Taxes
Business tax revenue (Table 8) in FY 2017-18 is estimated at $810.4 million, up 15.1% from $703.8 million collected in FY 2017-18. In November 2012, San Francisco voters approved the Gross Receipts Tax and Business Registration Fees Ordinance (Proposition E), which introduced major changes to the way busi-nesses are taxed in the city. On January 1, 2014, the City started collecting a Gross Receipts tax, and phas-ing out the existing Payroll tax. In this fiscal year, total business tax revenue is comprised of business payroll tax, registration tax, gross receipts tax, and administra-tive office tax.
Business payroll taxes assess the payroll expense of persons and associations engaging in business in San Francisco and continue to represent the vast majority of business taxes collected. This tax imposes a fee on all businesses that employ or contract with one or more employees to perform work or render services
6 Fiscal Year 2017 begins on July 1, 2017 and ends on June 30, 2018.
7 City and County of San Francisco, Controller’s Office, FY 2017-18 Nine-Month Budget Status Report, May 11, 2018.
within the city. In FY 2017-18, the Controller’s Office estimated that it will collect $340.5 million in payroll taxes, down 2.7% from $349.8 million in FY 2017-18. Payroll tax collections should continue to fall as this tax continues to be phased out in coming years.
Business registration tax is an annual fee assessed for general revenue purposes on all business in the city. The formula for calculating this fee was amended as part of Prop E, resulting in significantly higher col-lections starting in FY 13-14. The Controller’s Office estimates that approximately $44.5 million in business registration fees will be collected in FY 2017-18, up 1.6% from $43.8 million in FY 2016-17.
Gross receipts and Administrative office taxes are based on a business’s gross receipts from business done in San Francisco, rather than on a business’s payroll expense. As the Gross Receipts Tax is phased in to replace the Payroll Tax, collections have grown significantly, to an estimated $398 million in FY 2017-18, a 40.2% increase over FY 16-17. The Controller’s Office estimates that approximately $27.4m in administrative office taxes will be collected in FY 2017-18.
Property Taxes
Real property taxes (Table 9) are the largest single source of tax revenue for the City. The Controller’s Office expects property taxes to increase in fiscal year 2017-18.8 Together, an estimated $1.9 billion in property related taxes will be collected in FY 2017-18, up 0.9% from $1.89 billion last year.
Real property taxes allocated to the general fund in FY 2017-18 are estimated at $1.65 billion, up 11.5% from $1.48 billion in FY 2016-17 (Table 9).
Property transfer taxes are estimated to drop by 37.4% during the reporting period. Projected collections for FY 2017-18 are estimated to be about $257 million, down from $410.6 million in FY 2016-17. (Table 9). Unlike real property taxes, which are collected annually and based on property valuation assessments, property transfer tax is highly volatile because it is collected only at the time of sale and is based on sales price.
8 Ibid.
7DOWNTOWN PLAN: ANNUAL MONITORING REPORT 2017

Table 8. Business Taxes
Revenue Source ($ Millions) FY 2015-16 FY 2016-17 *FY 2017-18 % Change 2016-17
Payroll $492.9 $349.8 $340.5 -2.7%
Registration $37.7 $43.8 $44.5 1.6%
Gross Receipts $139.4 $283.8 $398.0 40.2%
Administrative Office $15.0 $26.4 $27.4 3.8%
Total $685.0 $703.8 $810.4 15.1%
* Estimates from Office of the Controller, FY 2017-18 Nine-Month Budget Status Report, May 11, 2018.
Table 9. Property Taxes
Revenue Source ($ Millions) FY 2015-16 FY 2016-17 *FY 2017-18 % Change 2016-17
Property Tax $1,392.3 $1,481.1 $1,651.0 11.5%
Property Transfer Tax $269.1 $410.6 $257.0 -37.4%
TOTAL $1,661.4 $1,891.7 $1,908.0 0.9%
* Estimates from Office of the Controller, FY 2017-18 Nine-Month Budget Status Report, May 11, 2018.
Table 10. Sales and Use Taxes
Revenue Source ($ Millions) FY 2015-16 FY 2016-17 *FY 2017-18 % Change 2016-17
Sales and Use Tax $167.9 $189.5 $191.7 1.2%
* Estimates from Office of the Controller, FY 2017-18 Nine-Month Budget Status Report, May 11, 2018.
Table 11. Hotel Room Tax
Revenue Source ($ Millions) FY 2015-16 FY 2016-17 *FY 2017-18 % Change 2016-17
Hotel Room Tax $387.7 $370.3 $372.3 0.5%
* Estimates from Office of the Controller, FY 2017-18 Nine-Month Budget Status Report, May 11, 2018.
Sales TaxSales tax revenues (Table 10) fluctuate with economic conditions and reflect consumer confidence and spending. Of the 8.75% sales tax rate, San Francisco receives 1%, with the rest going to the State and other districts. A portion of this revenue is deposited in the City’s general fund with the balance allocated by law for specific programs and services.
As shown in Table 10, FY 2017-18 sales tax collections are expected to increase 1.2% to $191.7 million from $178.5 million in FY 2016-17.
Hotel TaxThe hotel tax rate (Table 11) remained at 14% for the 2015-16 fiscal year reporting period. A substantial portion of this revenue is dedicated to the Moscone Convention Center, grants for the arts, museums, and other visitor amenities with the balance deposited into the City’s general fund.
As shown in Table 11, $372.3 million in hotel taxes are expected to be collected and deposited into the general fund in fiscal year 2017-18. This represents a 0.5% increase from FY 2016-17, when $370.3 million was deposited into the general fund.
8
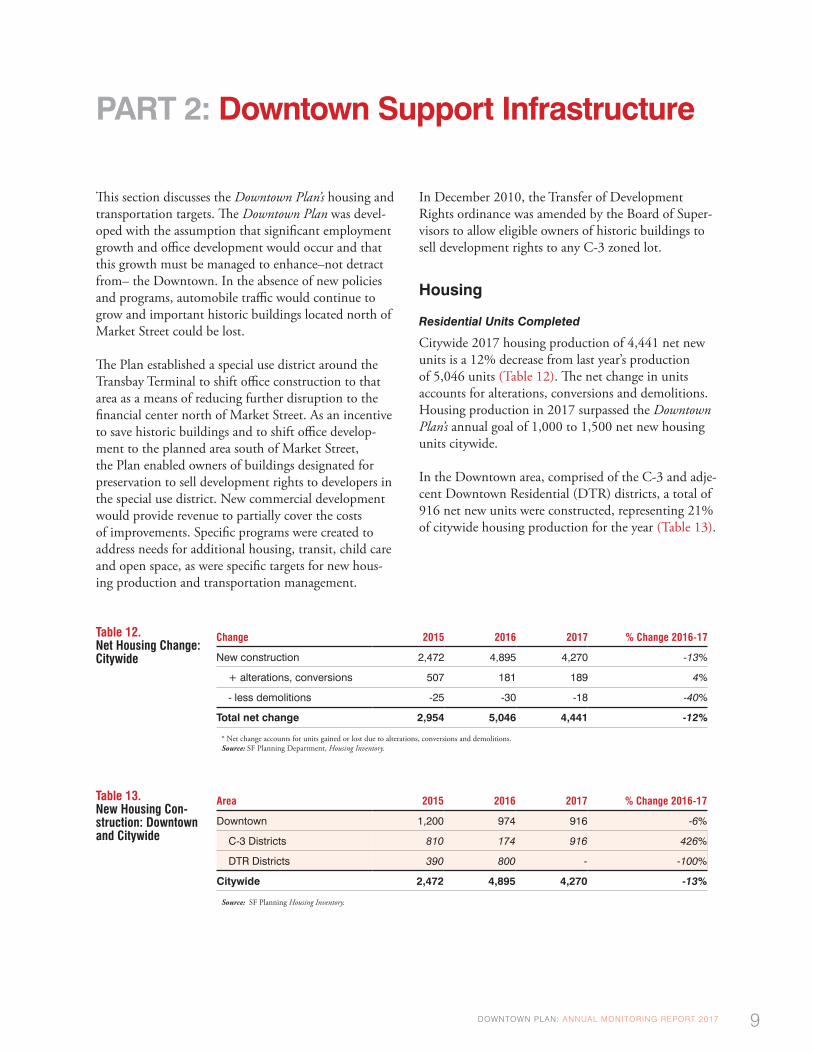
Table 12. Net Housing Change: Citywide
Change 2015 2016 2017 % Change 2016-17
New construction 2,472 4,895 4,270 -13%
+ alterations, conversions 507 181 189 4%
- less demolitions -25 -30 -18 -40%
Total net change 2,954 5,046 4,441 -12%
* Net change accounts for units gained or lost due to alterations, conversions and demolitions. Source: SF Planning Department, Housing Inventory.
Table 13. New Housing Con-struction: Downtown and Citywide
Area 2015 2016 2017 % Change 2016-17
Downtown 1,200 974 916 -6%
C-3 Districts 810 174 916 426%
DTR Districts 390 800 - -100%
Citywide 2,472 4,895 4,270 -13%
Source: SF Planning Housing Inventory.
In December 2010, the Transfer of Development Rights ordinance was amended by the Board of Super-visors to allow eligible owners of historic buildings to sell development rights to any C-3 zoned lot.
Housing
Residential Units Completed
Citywide 2017 housing production of 4,441 net new units is a 12% decrease from last year’s production of 5,046 units (Table 12). The net change in units accounts for alterations, conversions and demolitions. Housing production in 2017 surpassed the Downtown Plan’s annual goal of 1,000 to 1,500 net new housing units citywide.
In the Downtown area, comprised of the C-3 and adje-cent Downtown Residential (DTR) districts, a total of 916 net new units were constructed, representing 21% of citywide housing production for the year (Table 13).
This section discusses the Downtown Plan’s housing and transportation targets. The Downtown Plan was devel-oped with the assumption that significant employment growth and office development would occur and that this growth must be managed to enhance–not detract from– the Downtown. In the absence of new policies and programs, automobile traffic would continue to grow and important historic buildings located north of Market Street could be lost.
The Plan established a special use district around the Transbay Terminal to shift office construction to that area as a means of reducing further disruption to the financial center north of Market Street. As an incentive to save historic buildings and to shift office develop-ment to the planned area south of Market Street, the Plan enabled owners of buildings designated for preservation to sell development rights to developers in the special use district. New commercial development would provide revenue to partially cover the costs of improvements. Specific programs were created to address needs for additional housing, transit, child care and open space, as were specific targets for new hous-ing production and transportation management.
PART 2: Downtown Support Infrastructure
9DOWNTOWN PLAN: ANNUAL MONITORING REPORT 2017

Residential Pipeline Projects
As of the fourth quarter 2017, the citywide pipeline of projects under construction or seeking planning approval and building permits contained a total of about 65,250 residential units, up 2.6% from 63,600 units in 2016. The area with the largest number of pipeline units is in the master-planned Candlestick-Hunters Point development (11,100 units). The Downtown C-3 and DTR zoning districts, taken together, contain the second largest number of housing units in the pipeline: 10,150 units, or 16% of the city’s total pipeline. The remainder of units in the pipeline are located in large master-planned developments such as Treasure Island (7,800 units) and Parkmerced (5,680 units), or scattered throughout the rest of the city (30,520 units) (see Table 14).
Table 14. Residential Project Pipeline (net units)
Rank Area Units % Share
1 Candlestick-HP 11,096 17%
2 Greater Downtown* 10,152 16%
3 Treasure Island 7,800 12%
4 Parkmerced 5,679 9%
Rest of city 30,522 47%
TOTAL 65,249 100.0%
*Includes Downtown C-3 and DTR zoning districts. Source: Planning Department, Pipeline Report, Quarter 4, 2017.
The permit status of the proposed units is as follows: 10% are under construction (6,270 units); 10% hold a building permit that has been approved, reinstated, or issued, 13% have filed for a building permit, 45% have planning approval and need to seek a building permit, and 21% have filed for planning approval.
Approximately 24,580 units (just under 38%) are associated with the three large projects that will be built out over a longer period (Candlestick, Treasure Island and Parkmerced). These units have all received planning approval.
The remaining approximately 41,250 units would be expected to be built out under the more typical time frames: two years from beginning construction and two to four years from planning approval. If production were to follow the pace of the city’s average annual pro-duction, roughly 2,600 units per year over the past ten years, the 41,250 units associated with smaller projects would be expected to be built out over 15-16 years.
Jobs Housing Linkage Program (JHLP)
Prompted by the Downtown Plan, the City determined that employment growth associated with large office development projects would attract new residents and therefore increase demand for housing. In response, the Office Affordable Housing Production Program (OAHPP) was established in 1985 to require large office developments to contribute to a fund to increase the amount of affordable housing. In 2001, the OAHPP was re-named the Jobs-Housing Linkage Program (JHLP) and revised to require all commercial projects with a net addition of 25,000 gross square feet or more to contribute to the fund.
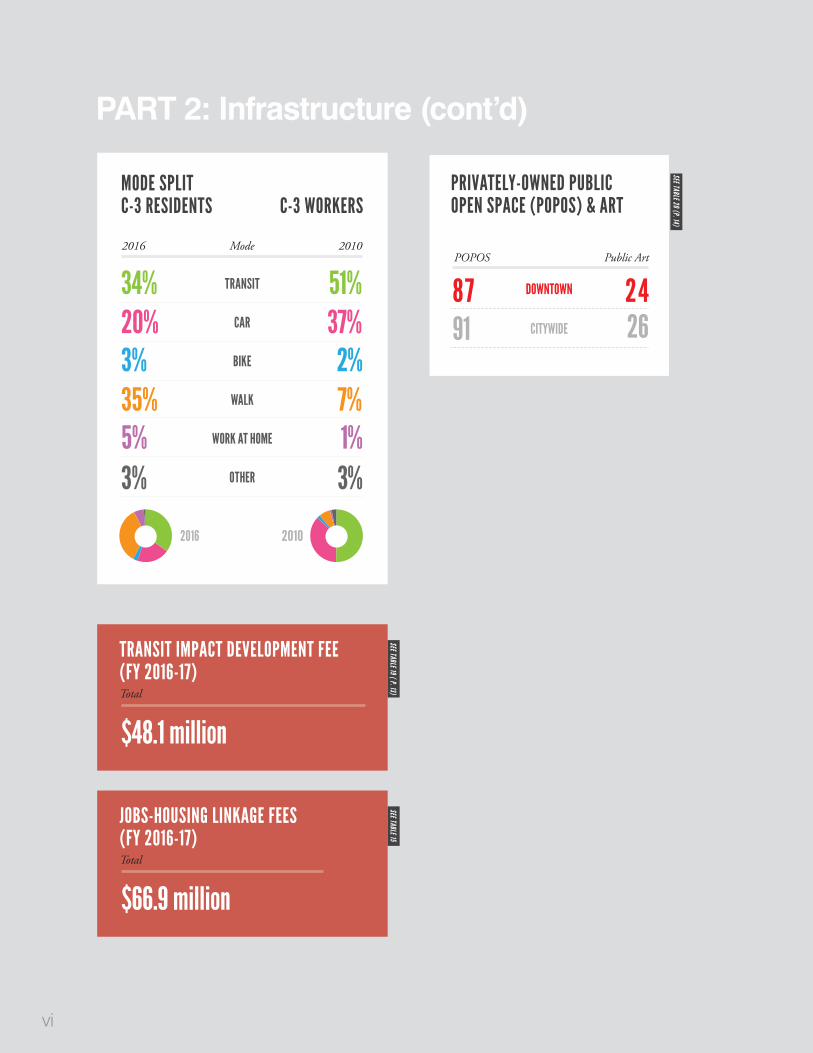
In fiscal year 2016-2017, $66.9 million was collected in Jobs-Housing Linkage fees (Table 15).
Table 15. Jobs-Housing Linkage Fees Collected
Fiscal Year Revenue
2014-2015 $8,918,731
2015-2016 $30,198,421
2016-2017 $66,930,604
Source: San Francisco Controller’s Office.
10
Transportation
This section reports on Downtown Plan transportation targets including an inventory of parking spaces, vehicle occupancy rates, peak period transit ridership, commute mode split, and fees collected by the Transit Impact Development Fee (TIDF) as required by the Downtown Plan monitoring ordinance.
Parking Inventory
Downtown Plan policies discourage new long-term commuter parking facilities (surface lots and garages) in and around the periphery of downtown. No new long-term parking facilities have been built Downtown since Plan adoption, although the supply of off-street parking in new buildings continues to grow with new development, as allowed under the Planning Code.
Table 16. Net Parking Change - Downtown C-3 Zone** Parking data will be updated once the full
roll-out of PPTS is completed
Year Net Parking
2015 n/a
2016 n/a
2017 n/a
As the department’s Permit and Project Tracking System (PPTS) continues to roll out, more accurate accounting of parking spaces included in new down-town development should be possible in the coming years.
There are over 25,640 off-street parking spaces in the Downtown C-3 district, about 15% of the 166,520 off-street parking spaces citywide.1 The SFMTA on-street parking census counts roughly 5,300 on-street parking spaces in the C-3 district.2
1 SFMTA, Off-Street Parking Census 2011
2 SFMTA, On-Street Parking Census April 2014
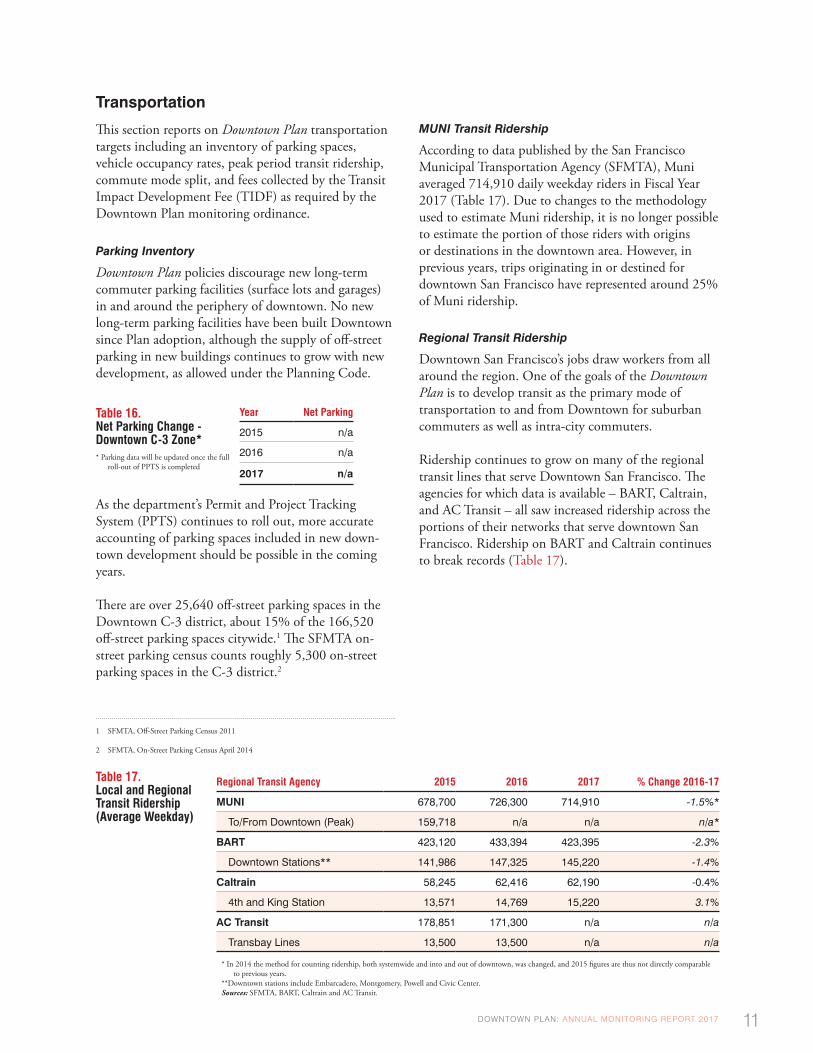
MUNI Transit Ridership
According to data published by the San Francisco Municipal Transportation Agency (SFMTA), Muni averaged 714,910 daily weekday riders in Fiscal Year 2017 (Table 17). Due to changes to the methodology used to estimate Muni ridership, it is no longer possible to estimate the portion of those riders with origins or destinations in the downtown area. However, in previous years, trips originating in or destined for downtown San Francisco have represented around 25% of Muni ridership.
Regional Transit Ridership
Downtown San Francisco’s jobs draw workers from all around the region. One of the goals of the Downtown Plan is to develop transit as the primary mode of transportation to and from Downtown for suburban commuters as well as intra-city commuters.
Ridership continues to grow on many of the regional transit lines that serve Downtown San Francisco. The agencies for which data is available – BART, Caltrain, and AC Transit – all saw increased ridership across the portions of their networks that serve downtown San Francisco. Ridership on BART and Caltrain continues to break records (Table 17).
Table 17. Local and Regional Transit Ridership (Average Weekday)
Regional Transit Agency 2015 2016 2017 % Change 2016-17
MUNI 678,700 726,300 714,910 -1.5%*
To/From Downtown (Peak) 159,718 n/a n/a n/a*
BART 423,120 433,394 423,395 -2.3%
Downtown Stations** 141,986 147,325 145,220 -1.4%
Caltrain 58,245 62,416 62,190 -0.4%
4th and King Station 13,571 14,769 15,220 3.1%
AC Transit 178,851 171,300 n/a n/a
Transbay Lines 13,500 13,500 n/a n/a
* In 2014 the method for counting ridership, both systemwide and into and out of downtown, was changed, and 2015 figures are thus not directly comparable to previous years.
**Downtown stations include Embarcadero, Montgomery, Powell and Civic Center. Sources: SFMTA, BART, Caltrain and AC Transit.
11DOWNTOWN PLAN: ANNUAL MONITORING REPORT 2017
Downtown Commute Mode Split
Another goal of the Downtown Plan is that transit’s share would increase from 64% when the Plan was adopted in 1984 to 70% by 2000 for all peak period commute trips to and from the Downtown C-3 District. While 70% transit mode-split has never been achieved, the share of downtown workers commuting by means other than single-occupancy vehicle now appears to surpass 70%.
The most recent commute mode information for work-ers with jobs located in the Downtown C-3 District is available at the census tract level, through the 2006-2010 ACS Census Transportation Planning Package (see Map 2). According to these figures, just over half (51.4%) of downtown workers commute via public transportation. This compares to 32.4% of all San Francisco residents, and 36.9% of individuals working in San Francisco. 27.4% of downtown workers drove alone to their jobs, 9.5% carpooled, and 6.6% walked. In general, individuals who work in Downtown San Francisco are far more likely to take transit, and less likely to drive alone, to their jobs than their counter-parts city, region, and nation-wide.
Vehicle Occupancy Rate
The Downtown Plan sought to increase ridesharing into downtown with a goal of increasing vehicle occupancy from 1.48 persons per vehicle in 1985, when the Plan was adopted, to 1.66 persons per vehicle by the year 2000. Indicative information is available for the census tracts that generally correspond to the zone (Map 2).
The average vehicle occupancy for downtown workers has been declining steadily, mirroring nationwide trends. In 1980, five years before the Downtown Plan’s adoption, vehicle occupancy was 1.28 passengers per car. In 1990 it dropped to 1.22, and by the 2000 Census, vehicle occupancy had dropped to 1.21 for workers. The latest available data at this scale for downtown workers comes from the 2006-2010 ACS Census Transportation Planning Package, which showed vehicle occupancy falling even further, to 1.17 for downtown workers.3 4
3 The vehicle occupancy rate is the average number of individuals riding in a vehicle. The lowest possible rate is 1, where all vehicles are single occupant.
4 These rates are for commute trips to work and do not necessarily reflect peak period patterns.
Vehicle occupancy rates for workers and residents are available from the American Community Survey (ACS) for the City of San Francisco and the Bay Area. For smaller areas, such as the Downtown C-3 census tracts, information is only available for residents. ACS data shows vehicle occupancy rates are far below the 1.66 persons per vehicle goal, and are essentially unchanged from 2011 to 2016. San Francisco workers and residents do appear to commute in carpools at a higher rate than the region as a whole (Table 18).
However, the decline in vehicle occupancy does not necessarily mean that more vehicles are entering downtown during peak hours. Census data shows the number of solo car commuters holding relatively steady since 2000, while the number of 2 and 3+ carpools declined. However, that decline is more than made up for by increases in transit use, biking, and working from home, suggesting that downtown workers who previously carpooled, may be switching to those modes. Transit Impact Development Fee (TIDF)
In 1981, as a precursor to the Downtown Plan and responding to a substantial increase in downtown office development, San Francisco enacted a fee to recover a portion of additional transit operating and capital costs incurred by this growth. Initially, all new office developments were required to pay $5 per square foot of office space to cover the added transit service to downtown office buildings. In 2004, the Municipal Transportation Agency (MTA) modified this fee to include all proposed non-residential developments in San Francisco.
San Francisco collected about $48.1 million in TIDF revenues in fiscal year 2016-17 (Table 19). This is almost triple the amount collected in the previous fiscal year.
12
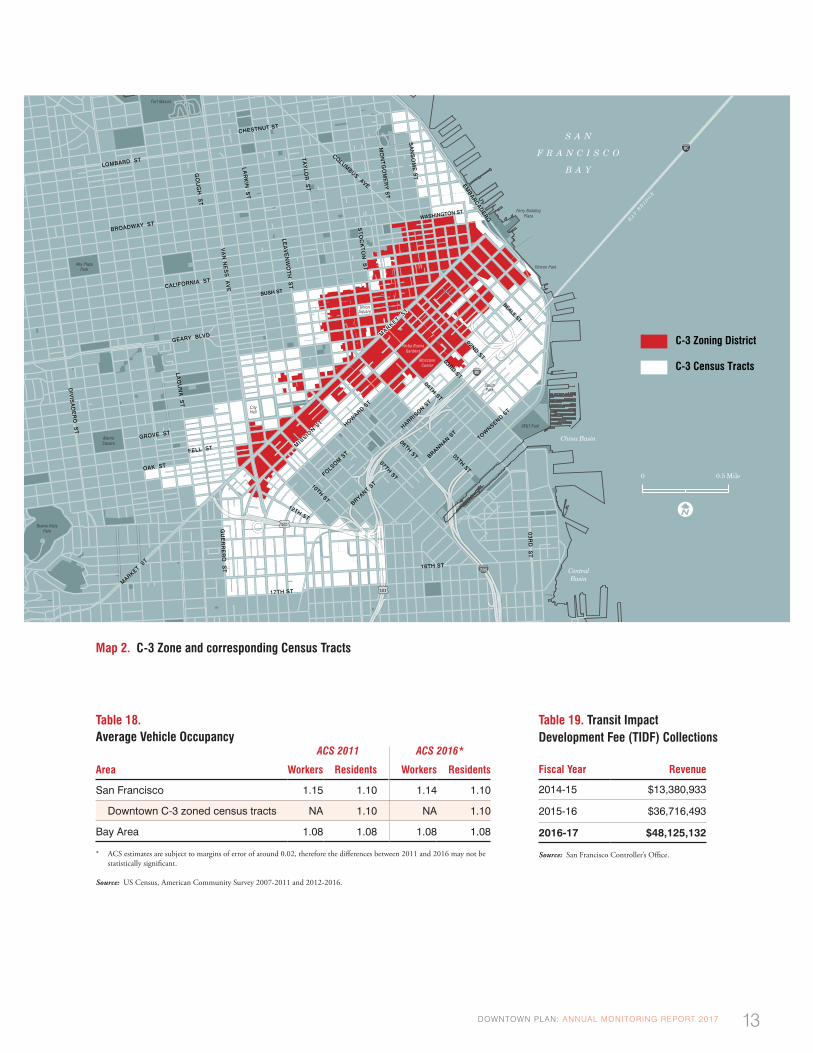
Table 18. Average Vehicle Occupancy
ACS 2011 ACS 2016*
Area Workers Residents Workers Residents
San Francisco 1.15 1.10 1.14 1.10
Downtown C-3 zoned census tracts NA 1.10 NA 1.10
Bay Area 1.08 1.08 1.08 1.08
* ACS estimates are subject to margins of error of around 0.02, therefore the differences between 2011 and 2016 may not be statistically significant.
Source: US Census, American Community Survey 2007-2011 and 2012-2016.
Map 2. C-3 Zone and corresponding Census Tracts
Table 19. Transit Impact Development Fee (TIDF) Collections
Fiscal Year Revenue
2014-15 $13,380,933
2015-16 $36,716,493
2016-17 $48,125,132
Source: San Francisco Controller’s Office.
C-3 Census Tracts
101
1101010110011001
28028
80
0800
China Basin
CentralBasin
S A N
F R A N C I S C O
B A Y
FOLSOM S
T
BRYANT ST
BRANNAN ST
HARRISON S
T
07TH ST
10TH ST
12TH ST
HOWARD S
T
04TH ST
05TH ST
06TH ST
03RD ST
03
RD
ST
02ND ST
TOWNSEND S
T
BEALE ST
WASHINGTON ST
CALIFORNIA ST
BROADWAY ST
LOMBARD ST
CHESTNUT ST
BUSH ST
GEARY BLVD
GROVE ST
OAK ST
FELL ST
EMBAR
CAD
ERO
VA
N N
ES
S A
VE
GO
UG
H S
T
LAG
UN
A S
T
DIV
ISA
DE
RO
ST
ST
OC
KT
ON
ST
MO
NT
GO
ME
RY
ST
TA
YLO
R S
T
LEA
VE
NW
OT
H S
T
LAR
KIN
ST
COLUMBUS AVE
AT&T Park
Ferry BuildingPlaza
AlamoSquare
Alta PlazaPark
Buena VistaPark
Fort Mason
Rincon Park
MosconeCenter
Yerba BuenaGardens
UnionSquare
SouthPark
CityHall
MARKET S
T
MARKET S
T
17TH ST
16TH ST
GU
ER
RE
RO
ST
SA
NS
OM
E S
T
MIS
SION S
T
BAY B
RI D
GE
C-3 Zoning District
0 0.5 Mile
13DOWNTOWN PLAN: ANNUAL MONITORING REPORT 2017
Privately-Owned Public Open Space (POPOS) and Public Art
Presuming that significant employment and office development growth would occur, the Downtown Plan requires new commercial development to support asso-ciated urban service improvements, including specific programs for open space and art.
POPOS
Privately-owned public open spaces (POPOS) are publicly accessible spaces in forms of plazas, terraces, atriums, and small parks that are provided and main-tained by private developers. In San Francisco, POPOS are mostly in the Downtown office district. Prior to 1985, developers provided POPOS under three general circumstances: voluntarily, in exchange for a density bonus, or as a condition of approval. The Downtown Plan created the first requirements for developers to provide publicly accessible open space as a part of projects in C-3 Districts. The goal was to provide qual-ity open space in sufficient quantity and variety to meet the needs of downtown workers, residents and visitors. Since then, project sponsors may provide POPOS instead of their required open spaces, and locate them in other districts such as Eastern Neighborhoods (Sec-tion 135 of the Planning Code).
Public Art
The public art requirement created by the Downtown Plan is commonly known as the “1% for Art” program. Its purpose is to ensure that the public has access to a variety of high-quality art. This requirement, governed by Section 429 of the Planning Code, provides that construction of a new building or addition of 25,000 square feet or more within the downtown C-3 district triggers a requirement to provide public art that equals at least 1% of the total construction cost. After more than 25 years since the adoption of the Downtown Plan, development has created an extensive outdoor gallery that enriches the Downtown environment for workers and tourists alike.
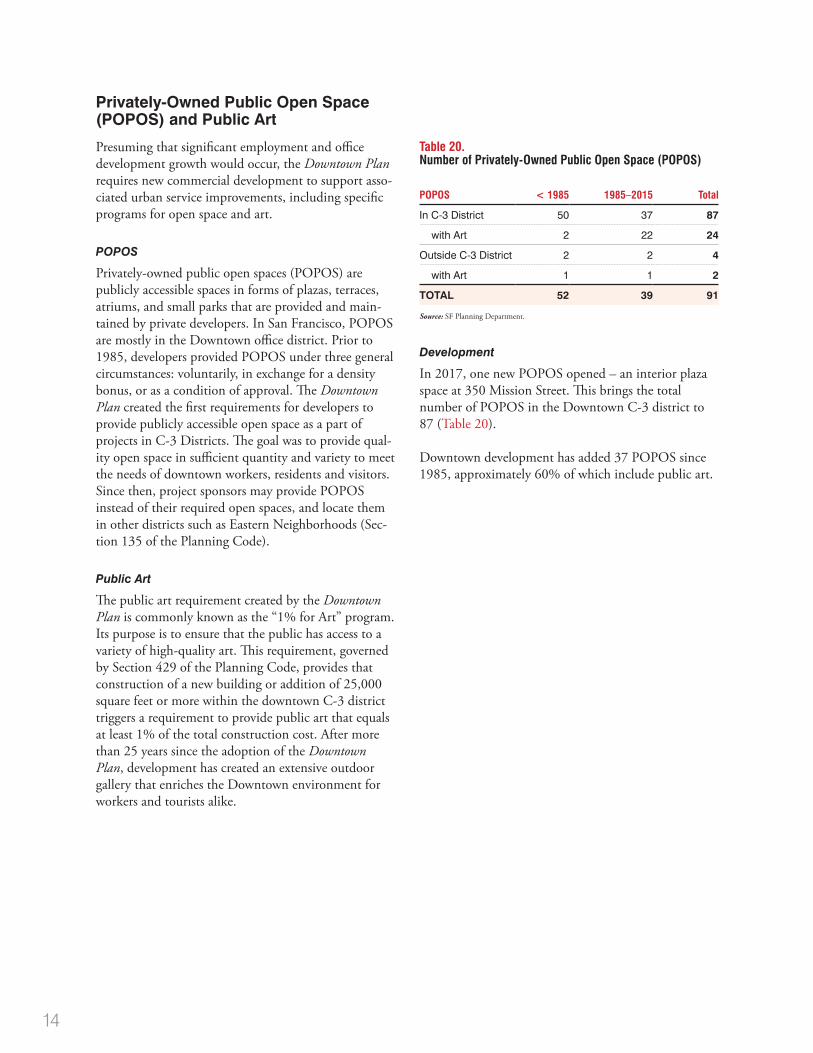
Table 20. Number of Privately-Owned Public Open Space (POPOS)
POPOS < 1985 1985–2015 Total
In C-3 District 50 37 87
with Art 2 22 24
Outside C-3 District 2 2 4
with Art 1 1 2
TOTAL 52 39 91
Source: SF Planning Department.
Development
In 2017, one new POPOS opened – an interior plaza space at 350 Mission Street. This brings the total number of POPOS in the Downtown C-3 district to 87 (Table 20).
Downtown development has added 37 POPOS since 1985, approximately 60% of which include public art.
14
Acknowledgments
Mayor
London Breed
Board of Supervisors
Malia Cohen, PresidentVallie BrownSandra Lee FewerJane KimRafael MandelmanAaron PeskinHillary RonenAhsha SafaiCatherine StefaniKaty TangNorman Yee
Planning Department
John Rahaim, Planning Director Teresa Ojeda, Manager, Information & Analysis GroupPaolo Ikezoe, Senior Planner Adrienne Hyder, Graphics
Data Sources:
AC TransitAssociation of Bay Area Governments (ABAG)Bay Area Rapid TransitCalifornia Department of FinanceCalifornia Employment Development DepartmentCaltrainCassidy TurleyCostar GroupCushman & WakefieldDun & BradstreetSan Francisco Controller’s OfficeSan Francisco Department of Building InspectionSan Francisco Planning DepartmentSan Francisco Municipal Transportation AgencyU.S. Bureau of Labor StatisticsU.S. Census Bureau
Planning Commission
Rich Hillis, PresidentMyrna Melgar, Vice-PresidentRodney Fong Milicent A. JohnsonJoel KoppelKathrin MooreDennis Richards

FOR MORE INFORMATION ABOUT THIS REPORT, CONTACT:
Paolo IkezoeSan Francisco Planning Department1650 Mission Street, Suite 400San Francisco CA 94103-2479
E: [email protected]: 415.575.9137F: 415.558.6409W: http://www.sfplanning.org
NOTE: For additional information that is available on the Planning Department web site under the heading “Data and Analysis Reports,” please see previous reports (annual, five-year, and 25-year) at: http://www.sf-planning.org/index.aspx?page=1663
Related Documents