Downsizing Multigenic Predictors of the Response to Preoperative Chemotherapy in Breast Cancer René Natowicz 1 , Roberto Incitti 2 , Roman Rouzier 3 , Arben Çela 1 , Antõnio Braga 4 , Euler Horta 4 , Thiago Rodrigues 5 , Marcelo Costa 4 , and Carmen D. M. Pataro 4 1 Université Paris-Est, ESIEE-Paris, France, {r.natowicz, a.cela}@esiee.fr 2 Institut Mondor de Médecine Moléculaire, Créteil, France, [email protected] 3 Hôpital Tenon, department of Gynecology, Paris, France, [email protected] 4 Universidade Federal de Minas Gerais, Depto. Engenharia Eletrônica, Brazil, {apbraga, eulerhorta, carmen}@cpdee.ufmg.br, [email protected] 5 Universidade Federal de Lavras, Depto. Ciência da Computação, Brazil, [email protected] Abstract. We present a method for designing efficient multigenic predictors with few probes and its application to the prediction of the response to preoperative chemotherapy in breast cancer. In this study, each DNA probe was regarded as an elementary predictor of the response to the chemotherapy and the probes which were selected performed a faithful sampling of the training dataset. In a first stage of the study, the prediction delivered by a multigenic predictor was that of the ma- jority of the elementary predictions of its probes. For the data set at hand, the best majority decision predictor (MD predictor) had 30 probes. It significantly outper- formed the best predictor previously published, which was designed on probes that had been selected by p-value of a t-test. In a second stage, the majority de- cision was replaced by a support vector machine (SVM) with linear kernel. With the same set of probes, the performances of the SVM predictor were slightly bet- ter for both training and testing sets of data. The main improvement was that the performances of the best MD predictor were achieved by the SVM predictors with only 17 probes. This more than 40% downsizing of the predictors is an in- teresting property for the potential use of the predictors in clinical routine, and for the task of modeling the biological mechanisms underlying the patient’s response to the chemotherapy. 1 Introduction Nowadays, adjuvant and neoadjuvant (preoperative) administration of chemotherapy is based on prognostic factors, not on predictive ones. It is well known that the prognostic factors do not provide enough information for tailoring the treatment to the individual patients. Hence, nearly all breast cancer patients are given a standard chemotherapy treatment, despite their potentially poor response to the therapy, adverse side effects, and healthcare costs. The ability to predict the patients’ response to the chemotherapy would be of high interest in the treatment of breast cancer for avoiding useless chemotherapy treatments

Welcome message from author
This document is posted to help you gain knowledge. Please leave a comment to let me know what you think about it! Share it to your friends and learn new things together.
Transcript
Downsizing Multigenic Predictors of the Response toPreoperative Chemotherapy in Breast Cancer
René Natowicz1, Roberto Incitti2, Roman Rouzier3, Arben Çela1, Antõnio Braga4,Euler Horta4, Thiago Rodrigues5, Marcelo Costa4, and Carmen D. M. Pataro4
1 Université Paris-Est, ESIEE-Paris, France, {r.natowicz, a.cela}@esiee.fr2 Institut Mondor de Médecine Moléculaire, Créteil, France,
[email protected] Hôpital Tenon, department of Gynecology, Paris, France,
[email protected] Universidade Federal de Minas Gerais, Depto. Engenharia Eletrônica, Brazil, {apbraga,
eulerhorta, carmen}@cpdee.ufmg.br, [email protected] Universidade Federal de Lavras, Depto. Ciência da Computação, Brazil,
Abstract. We present a method for designing efficient multigenic predictors withfew probes and its application to the prediction of the response to preoperativechemotherapy in breast cancer. In this study, each DNA probe was regarded as anelementary predictor of the response to the chemotherapy and the probes whichwere selected performed a faithful sampling of the training dataset. In a first stageof the study, the prediction delivered by a multigenic predictor was that of the ma-jority of the elementary predictions of its probes. For the data set at hand, the bestmajority decision predictor (MD predictor) had 30 probes. It significantly outper-formed the best predictor previously published, which was designed on probesthat had been selected by p-value of a t-test. In a second stage, the majority de-cision was replaced by a support vector machine (SVM) with linear kernel. Withthe same set of probes, the performances of the SVM predictor were slightly bet-ter for both training and testing sets of data. The main improvement was that theperformances of the best MD predictor were achieved by the SVM predictorswith only 17 probes. This more than 40% downsizing of the predictors is an in-teresting property for the potential use of the predictors in clinical routine, and forthe task of modeling the biological mechanisms underlying the patient’s responseto the chemotherapy.
1 Introduction
Nowadays, adjuvant and neoadjuvant (preoperative) administration of chemotherapy isbased on prognostic factors, not on predictive ones. It is well known that the prognosticfactors do not provide enough information for tailoring the treatment to the individualpatients. Hence, nearly all breast cancer patients are given a standard chemotherapytreatment, despite their potentially poor response to the therapy, adverse side effects,and healthcare costs.
The ability to predict the patients’ response to the chemotherapy would be of highinterest in the treatment of breast cancer for avoiding useless chemotherapy treatments
and for selecting the most effective regimen for every patient. To this end, no singlefactor or biomarker ever has been in position to discriminate the patients who wouldrespond to the treatment from those who would not. It appears that primary chemother-apy provides an ideal opportunity to correlate the gene expressions with the responseto the treatment. Although gene expression microarrays provide novel tools and holdgreat promise in cancer research, the achievements in terms of improved predictionof drug sensitivity have been thus far rather moderate [1]. A strategy for translatingmicroarray profiles into efficient clinical tests could consist in identifying small diag-nostic gene-expression profiles with the help of microarrays then, in a second step, tovalidate the clinical usefulness of these genes, either retrospectively or prospectively, bymaking use of a simple and robust conventional assay, such as the quantitative reverse-transcriptase polymerase chain reaction (RT-PCR). Such a strategy requires microarraysanalysis methods able to provide oncogenic signatures made out of few probe sets.
In the present study, every selected probe delivered an elementary prediction of theresponse to the treatment: pathologic complete response (pcr), residual disease (nopcr),or unspecified. In a first stage, we have defined very simple predictors whose predic-tions of the patient’s response were those of the majority of their probes’ elementarypredictions: PCR if the majority of the probes predicted the response to be pcr; NoPCRif the majority was nopcr; and UNSPECIFIED in case of tie. In the second part ofthe study, the classification criterion of majority decision (MD) was replaced by sup-port vector machines (SVM) with linear kernel. The resulting classifiers had slightlybetter training and testing performances with the same numbers of probes. Moreover,the performances of the best MD predictor were achieved by a SVM predictor withsignificantly less probes, 17 probes instead of 30, i.e. were more than 40% downsized.
In this paper, we will present the low level treatment through which a probe deliv-ered an elementary prediction of the patient’s response; the valuation function by whichthe probes were ranked then selected in this ranking; and we will give the performancesof the MD predictors then those of the SMV predictors for the same dataset.
2 Patients and Data
This work was conducted based on data from Hess et al. The clinical trial was con-ducted at the Nellie B. Connally Breast Center of The University of Texas M.D. Ander-son Cancer Center [2]. One hundred thirty-three patients with stage I-III breast cancerwere included. All patients underwent a single-pass, pretreatment fine-needle aspirationof the primary breast tumor before starting chemotherapy. Pretreatment gene expressionprofiling was performed with oligonucleotide microarrays (Affymetrix U133A) on fine-needle aspiration specimens. Patient cases were separated into patient training cases(82 cases) and patient testing cases (51 patient cases). At the completion of neoadju-vant chemotherapy, all patients had surgical resection of the tumor bed, with negativemargins. Pathologic complete response (PCR) was defined as no histopathologic evi-dence of any residual invasive cancer cells in the breast, whereas residual disease wasdefined as any residual cancer cells after histopathologic study. The low level treatmentof the microarray data was performed by software dCHIP V1.3 to generate probe levelintensities. This program normalizes all arrays to one standard array that represents a
chip with median overall intensity. Finally, normalized gene expression values weretransformed to the log10 scale for analysis because in microarrays, the log-values of theexpression levels are closer to normal distributions than the non-transformed ones.
The set of training cases was composed of 82 patient data, each of which being theresponse to the treatment and the expression levels of the 22283 DNA probes. Amongthe training set, the response to the treatment was PCR for 21 patient cases and NoPCRfor 61 cases. The testing set was composed of 51 patient data among which the responseto the treatment was PCR for 13 patient cases and NoPCR for 38 patients. Hence, theratios of PCR to NoPCR patient cases were the same for both the training and testingdatasets.
3 Probes Valuation
A first research on these data is reported In [2]. In this study, the authors the probes wereselected in the ranking of the p-value of a t-test, and the study was more focused on thequestion of choosing the best decision model for the prediction. To this end, the authorschecked several models of classification: k-nearest neighbors, support vector machine,diagonal linear discriminant analysis, with various parameters for each of them. A totalof 780 different classifiers have been evaluated and statistically assessed, all of themtaking as input the expression levels of the probes selected by the p-values of a t-test.This study has shown that, for this criterion of probes selection, the best predictor was aone taking as input the expression levels of the 30 probes of least p-values, these expres-sion levels being weighted thanks to a diagonal linear discriminant analysis (predictorDLDA-30). For the set of validation cases, the performances of the DLDA-30 predictorwere1: accuracy=0.76, sensitivity=0.92, specificity=0.71, PPV=0.52, NPV=0.96.
Hence, the predictor DLDA-30 had very high sensitivity and negative predictivevalues. Taking the results of this study as a starting point, we wanted to design pre-dictors with higher specificity values, while preserving the very high sensitivity valueof the DLDA-30 predictor. Furthermore, because the study reported in [2] had put theemphasis on the classification models and was very complete in this regard, we havedecided to investigate the process of probes selection, with the wish of improving theperformances with models of classification as simple as possible.
For the dataset at hand, it has appeared to us that the probes selection criterion ofp-value to a t-test favored probes that mainly gave some information on the membershipof the patients to the NoPCR class. For instance, the probe of smallest p-value was theprobe 203929_s_at, of the gene MAPT. The box-plot of its expression levels (fig. 1)
1 Definitions: let TP and TN be the numbers of true positives and negatives returned by a givenpredictor, and let FP and FN be the numbers of false positives and negatives. The accuracyof the predictor is the proportion of correctly predicted cases, the sensitivity that of correctlypredicted PCR cases, the specificity is the proportion of correctly predicted NoPCR cases,the positive predictive value (PPV) is the probability of a case predicted as PCR to be a PCRcase, and the negative predictive value (NPV) is the probability of a case predicted NoPCRto be a NoPCR case. Therefore, these criteria are: accuracy=(TP+TN)/(TP+FN+TN+FP),sensitivity=(TP)/(TP+FN), specificity=(TN)/(TN+FP), the positive predictive value PPV is(TP)/(TP+FP) and the negative predictive value is (TN)/(TN+FN).
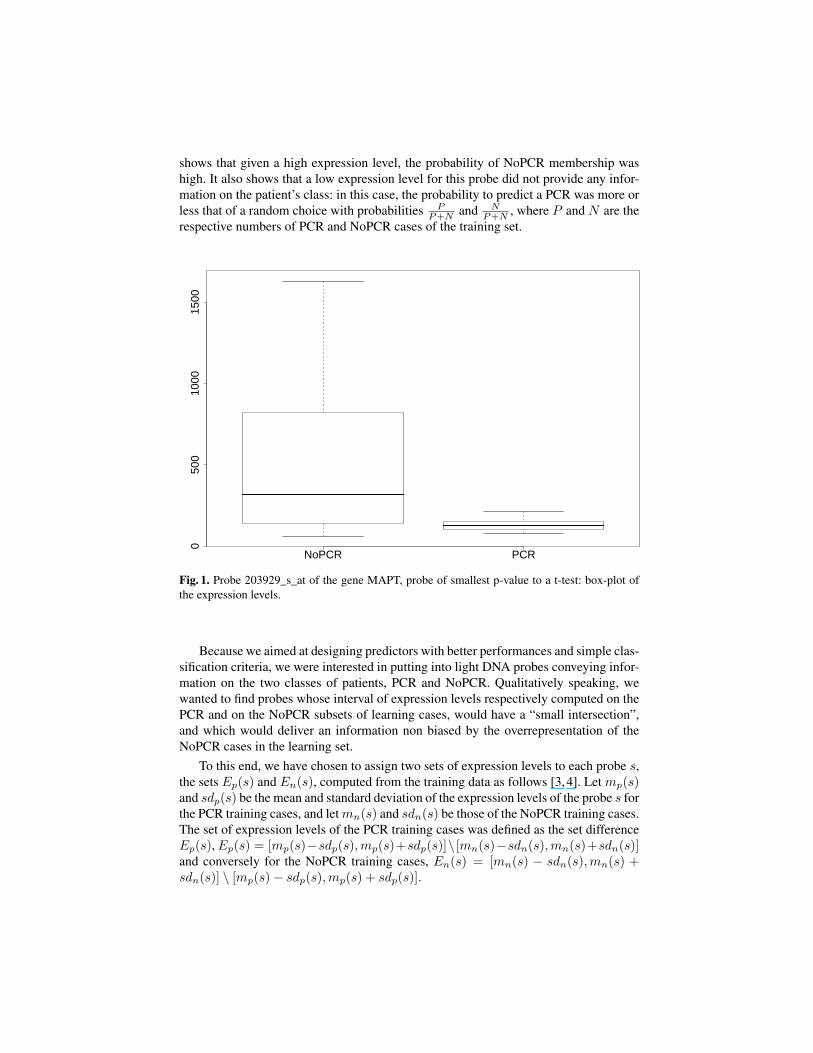
shows that given a high expression level, the probability of NoPCR membership washigh. It also shows that a low expression level for this probe did not provide any infor-mation on the patient’s class: in this case, the probability to predict a PCR was more orless that of a random choice with probabilities P
P+N and NP+N , where P and N are the
respective numbers of PCR and NoPCR cases of the training set.
NoPCR PCR
050
010
0015
00
Fig. 1. Probe 203929_s_at of the gene MAPT, probe of smallest p-value to a t-test: box-plot ofthe expression levels.
Because we aimed at designing predictors with better performances and simple clas-sification criteria, we were interested in putting into light DNA probes conveying infor-mation on the two classes of patients, PCR and NoPCR. Qualitatively speaking, wewanted to find probes whose interval of expression levels respectively computed on thePCR and on the NoPCR subsets of learning cases, would have a “small intersection”,and which would deliver an information non biased by the overrepresentation of theNoPCR cases in the learning set.
To this end, we have chosen to assign two sets of expression levels to each probe s,the sets Ep(s) and En(s), computed from the training data as follows [3,4]. Let mp(s)and sdp(s) be the mean and standard deviation of the expression levels of the probe s forthe PCR training cases, and let mn(s) and sdn(s) be those of the NoPCR training cases.The set of expression levels of the PCR training cases was defined as the set differenceEp(s), Ep(s) = [mp(s)−sdp(s),mp(s)+sdp(s)]\ [mn(s)−sdn(s),mn(s)+sdn(s)]and conversely for the NoPCR training cases, En(s) = [mn(s) − sdn(s),mn(s) +sdn(s)] \ [mp(s)− sdp(s),mp(s) + sdp(s)].
Discrete probes’ predictions. For any patient case, the individual prediction of aprobe was a discrete value in the set {pcr , nopcr , unspecified} : pcr if the expressionlevel of patient p was in the interval Ep(s) and nopcr if it was in En(s). Otherwise, theindividual prediction value was unspecified.
Probes’ valuation function. Let p(s) be the number of PCR training cases correctlypredicted pcr by the probe s, and let n(s) be the number of NoPCR training casescorrectly predicted nopcr by the probe. The valuation function of the probes was de-fined so as to favor probes which correctly predicted high numbers of training cases andwhose sets of correctly predicted training cases were ‘good’ samplings of the trainingset. To this end, we have considered the sensitivity and specificity values of the probe s,i.e. the ratios p(s)/P and n(s)/N of correctly predicted training cases. The valuationfunction v(s), v(s) ∈ [0, 1], was defined as the sum of its sensitivity and specificity,v(s) = 0.5 ×
(p(s)P + n(s)
N
)(the coefficient ensures that the valuation is in the unit
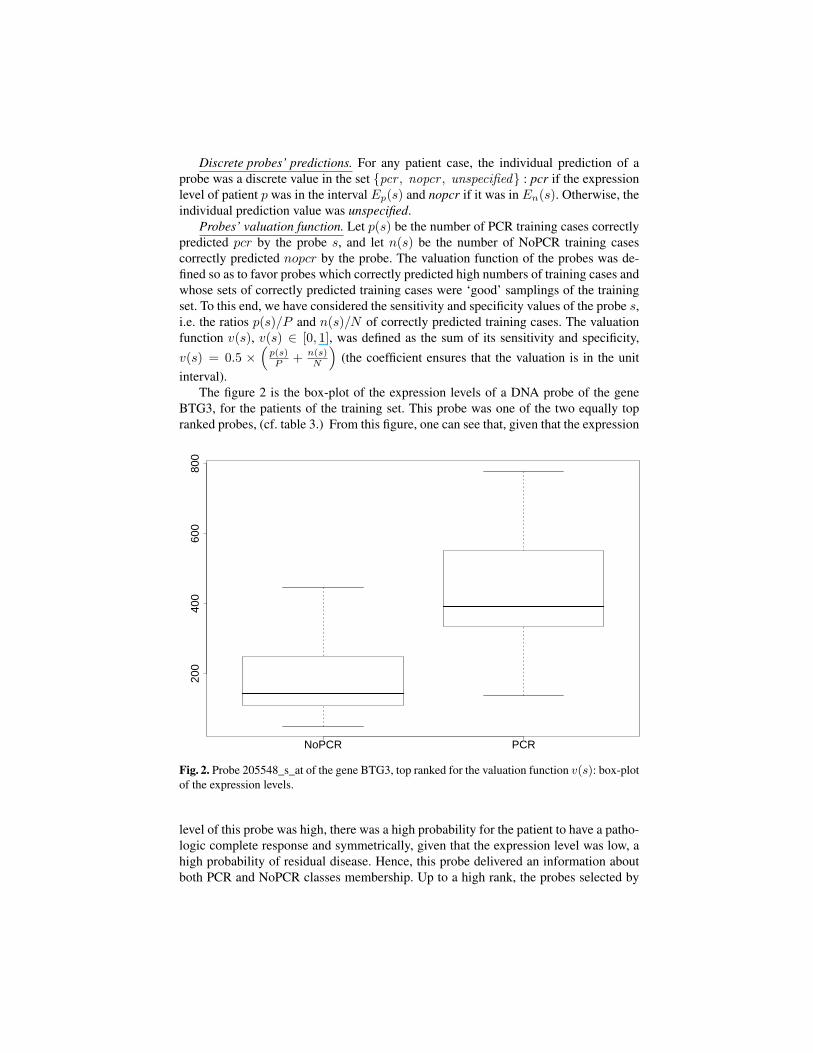
interval).The figure 2 is the box-plot of the expression levels of a DNA probe of the gene
BTG3, for the patients of the training set. This probe was one of the two equally topranked probes, (cf. table 3.) From this figure, one can see that, given that the expression
NoPCR PCR
200
400
600
800
Fig. 2. Probe 205548_s_at of the gene BTG3, top ranked for the valuation function v(s): box-plotof the expression levels.
level of this probe was high, there was a high probability for the patient to have a patho-logic complete response and symmetrically, given that the expression level was low, ahigh probability of residual disease. Hence, this probe delivered an information aboutboth PCR and NoPCR classes membership. Up to a high rank, the probes selected by
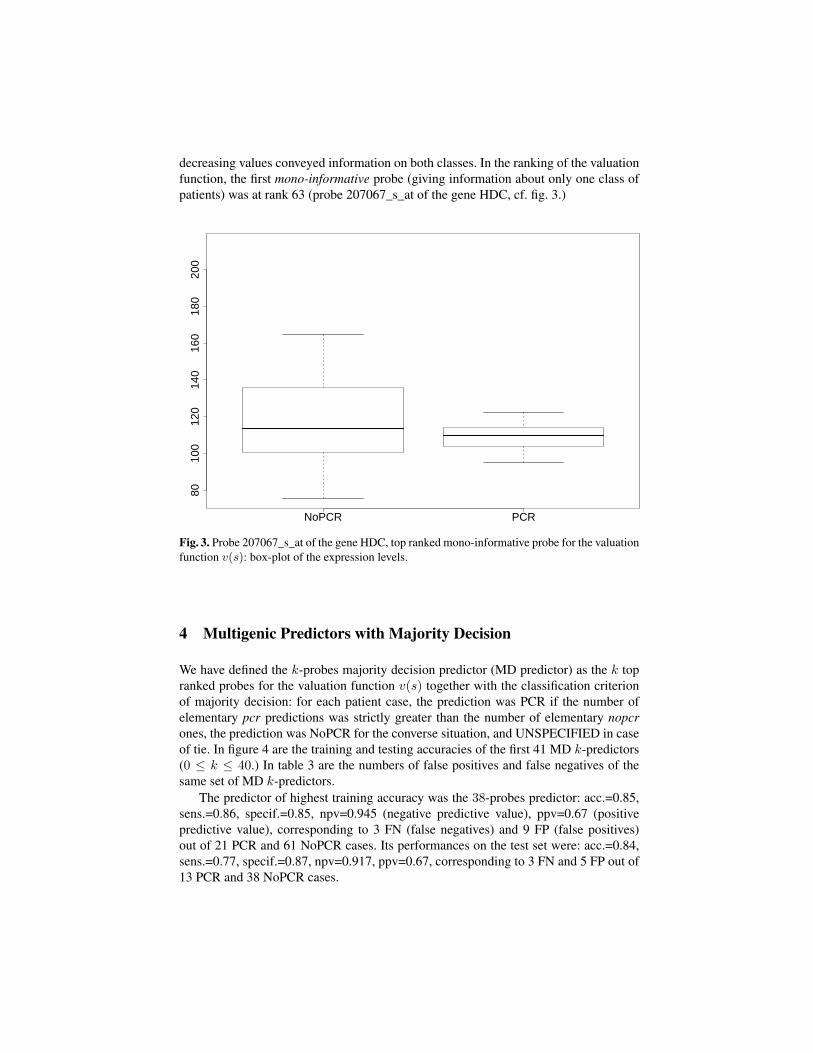
decreasing values conveyed information on both classes. In the ranking of the valuationfunction, the first mono-informative probe (giving information about only one class ofpatients) was at rank 63 (probe 207067_s_at of the gene HDC, cf. fig. 3.)
NoPCR PCR
8010
012
014
016
018
020
0
Fig. 3. Probe 207067_s_at of the gene HDC, top ranked mono-informative probe for the valuationfunction v(s): box-plot of the expression levels.
4 Multigenic Predictors with Majority Decision
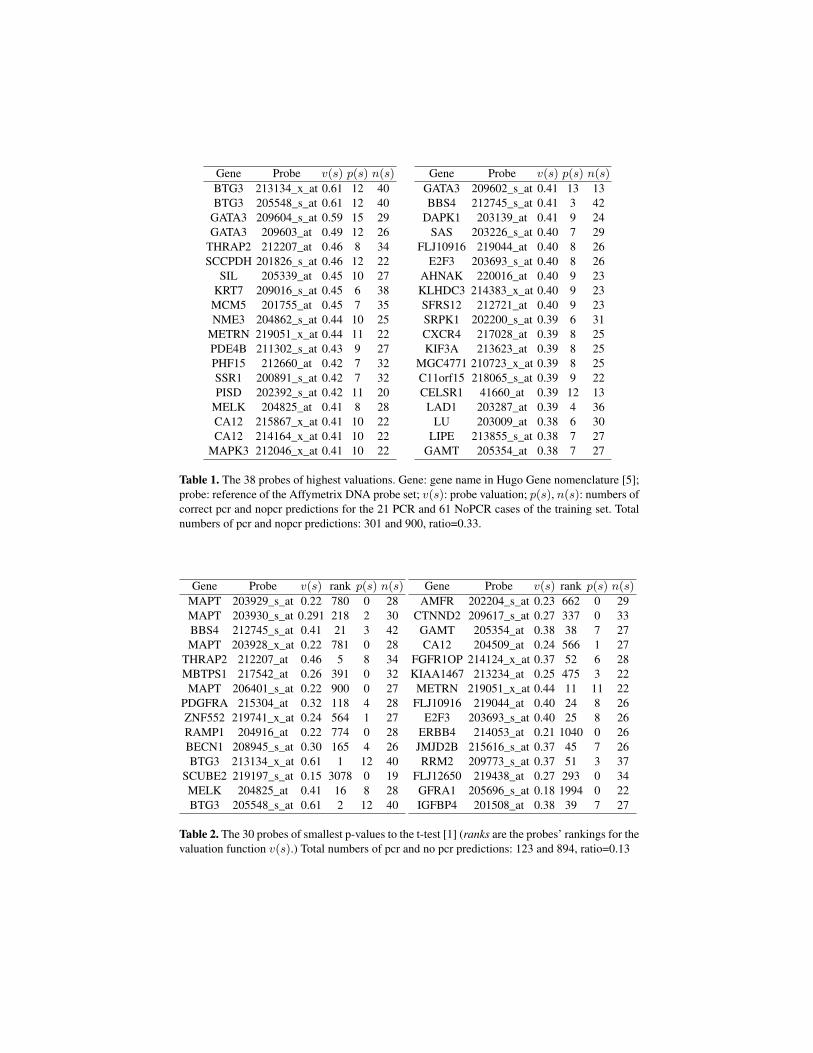
We have defined the k-probes majority decision predictor (MD predictor) as the k topranked probes for the valuation function v(s) together with the classification criterionof majority decision: for each patient case, the prediction was PCR if the number ofelementary pcr predictions was strictly greater than the number of elementary nopcrones, the prediction was NoPCR for the converse situation, and UNSPECIFIED in caseof tie. In figure 4 are the training and testing accuracies of the first 41 MD k-predictors(0 ≤ k ≤ 40.) In table 3 are the numbers of false positives and false negatives of thesame set of MD k-predictors.
The predictor of highest training accuracy was the 38-probes predictor: acc.=0.85,sens.=0.86, specif.=0.85, npv=0.945 (negative predictive value), ppv=0.67 (positivepredictive value), corresponding to 3 FN (false negatives) and 9 FP (false positives)out of 21 PCR and 61 NoPCR cases. Its performances on the test set were: acc.=0.84,sens.=0.77, specif.=0.87, npv=0.917, ppv=0.67, corresponding to 3 FN and 5 FP out of13 PCR and 38 NoPCR cases.
Gene Probe v(s) p(s) n(s)
BTG3 213134_x_at 0.61 12 40BTG3 205548_s_at 0.61 12 40
GATA3 209604_s_at 0.59 15 29GATA3 209603_at 0.49 12 26
THRAP2 212207_at 0.46 8 34SCCPDH 201826_s_at 0.46 12 22
SIL 205339_at 0.45 10 27KRT7 209016_s_at 0.45 6 38
MCM5 201755_at 0.45 7 35NME3 204862_s_at 0.44 10 25
METRN 219051_x_at 0.44 11 22PDE4B 211302_s_at 0.43 9 27PHF15 212660_at 0.42 7 32SSR1 200891_s_at 0.42 7 32PISD 202392_s_at 0.42 11 20
MELK 204825_at 0.41 8 28CA12 215867_x_at 0.41 10 22CA12 214164_x_at 0.41 10 22
MAPK3 212046_x_at 0.41 10 22
Gene Probe v(s) p(s) n(s)
GATA3 209602_s_at 0.41 13 13BBS4 212745_s_at 0.41 3 42
DAPK1 203139_at 0.41 9 24SAS 203226_s_at 0.40 7 29
FLJ10916 219044_at 0.40 8 26E2F3 203693_s_at 0.40 8 26
AHNAK 220016_at 0.40 9 23KLHDC3 214383_x_at 0.40 9 23SFRS12 212721_at 0.40 9 23SRPK1 202200_s_at 0.39 6 31CXCR4 217028_at 0.39 8 25KIF3A 213623_at 0.39 8 25
MGC4771 210723_x_at 0.39 8 25C11orf15 218065_s_at 0.39 9 22CELSR1 41660_at 0.39 12 13
LAD1 203287_at 0.39 4 36LU 203009_at 0.38 6 30
LIPE 213855_s_at 0.38 7 27GAMT 205354_at 0.38 7 27
Table 1. The 38 probes of highest valuations. Gene: gene name in Hugo Gene nomenclature [5];probe: reference of the Affymetrix DNA probe set; v(s): probe valuation; p(s), n(s): numbers ofcorrect pcr and nopcr predictions for the 21 PCR and 61 NoPCR cases of the training set. Totalnumbers of pcr and nopcr predictions: 301 and 900, ratio=0.33.
Gene Probe v(s) rank p(s) n(s)
MAPT 203929_s_at 0.22 780 0 28MAPT 203930_s_at 0.291 218 2 30BBS4 212745_s_at 0.41 21 3 42MAPT 203928_x_at 0.22 781 0 28
THRAP2 212207_at 0.46 5 8 34MBTPS1 217542_at 0.26 391 0 32
MAPT 206401_s_at 0.22 900 0 27PDGFRA 215304_at 0.32 118 4 28ZNF552 219741_x_at 0.24 564 1 27RAMP1 204916_at 0.22 774 0 28BECN1 208945_s_at 0.30 165 4 26BTG3 213134_x_at 0.61 1 12 40
SCUBE2 219197_s_at 0.15 3078 0 19MELK 204825_at 0.41 16 8 28BTG3 205548_s_at 0.61 2 12 40
Gene Probe v(s) rank p(s) n(s)
AMFR 202204_s_at 0.23 662 0 29CTNND2 209617_s_at 0.27 337 0 33
GAMT 205354_at 0.38 38 7 27CA12 204509_at 0.24 566 1 27
FGFR1OP 214124_x_at 0.37 52 6 28KIAA1467 213234_at 0.25 475 3 22METRN 219051_x_at 0.44 11 11 22
FLJ10916 219044_at 0.40 24 8 26E2F3 203693_s_at 0.40 25 8 26
ERBB4 214053_at 0.21 1040 0 26JMJD2B 215616_s_at 0.37 45 7 26RRM2 209773_s_at 0.37 51 3 37
FLJ12650 219438_at 0.27 293 0 34GFRA1 205696_s_at 0.18 1994 0 22IGFBP4 201508_at 0.38 39 7 27
Table 2. The 30 probes of smallest p-values to the t-test [1] (ranks are the probes’ rankings for thevaluation function v(s).) Total numbers of pcr and no pcr predictions: 123 and 894, ratio=0.13
The MD predictors of second highest training accuracy had k = 30, k = 33 andk = 34 probes: acc.=0.84, sens.=0.81, specif.=0.85, npv=0.929, ppv=0.65 (4 FN and9 FP). On the set of testing cases the performances of the 30-probes predictor were:acc.=086, sens.=0.92, specif.=0.84, npv=0.970, ppv=0.67, corresponding to 1 FN and6 FP. The performances of the 33 and 34-probes predictors were approximatively thesame on the set of testing cases (cf. table 3.)
Training Testk FP FN FP FN1 21 9 18 72 21 9 18 53 19 6 16 44 22 7 15 45 22 7 15 46 21 6 15 37 18 6 13 38 17 6 12 49 15 6 9 410 16 6 7 4
Training Testk FP FN FP FN11 15 6 7 312 14 6 7 313 15 5 7 314 11 4 8 315 12 3 7 316 12 3 8 317 12 3 8 318 12 3 8 319 11 3 9 220 12 3 8 2
Training Testk FP FN FP FN21 11 3 8 222 11 3 6 223 11 4 7 224 10 4 7 325 10 4 7 226 10 4 6 227 10 4 6 128 10 4 5 329 10 4 6 130 9 4 6 1
Training Testk FP FN FP FN31 10 4 5 232 10 4 5 233 9 4 4 234 9 4 5 235 10 4 5 236 10 4 5 237 10 4 5 238 9 3 5 339 10 4 5 240 10 4 5 2
Table 3. Confusion table for majority decision predictors. FP, FN: number of false positives andfalse negatives for training and testing cases. In bold: 1st and 2nd maximum training accuracies.
0 10 20 30 40
0.0
0.2
0.4
0.6
0.8
Fig. 4. Training and testing accuracies of the majority decision predictors. Solid line: testingaccuracy, dashed line: training accuracy, horizontal line: maximum testing accuracy (0.88) fork = 33 probes. X axis: number of probes.
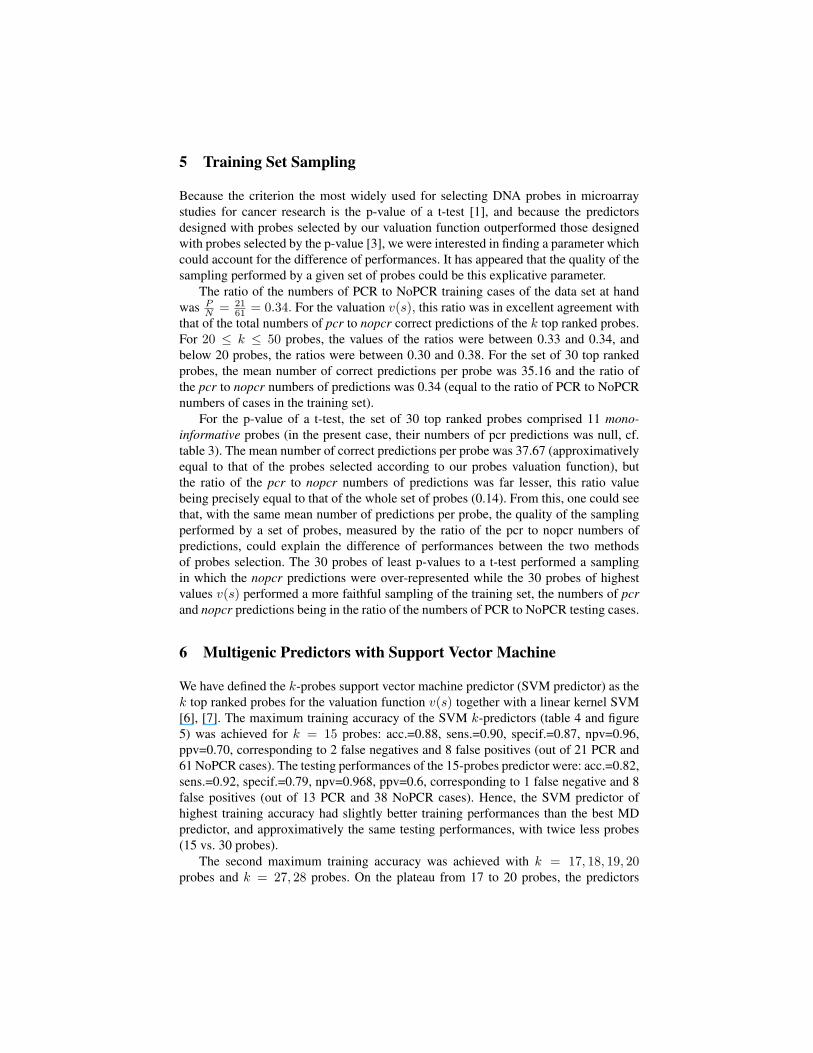
5 Training Set Sampling
Because the criterion the most widely used for selecting DNA probes in microarraystudies for cancer research is the p-value of a t-test [1], and because the predictorsdesigned with probes selected by our valuation function outperformed those designedwith probes selected by the p-value [3], we were interested in finding a parameter whichcould account for the difference of performances. It has appeared that the quality of thesampling performed by a given set of probes could be this explicative parameter.
The ratio of the numbers of PCR to NoPCR training cases of the data set at handwas P
N = 2161 = 0.34. For the valuation v(s), this ratio was in excellent agreement with
that of the total numbers of pcr to nopcr correct predictions of the k top ranked probes.For 20 ≤ k ≤ 50 probes, the values of the ratios were between 0.33 and 0.34, andbelow 20 probes, the ratios were between 0.30 and 0.38. For the set of 30 top rankedprobes, the mean number of correct predictions per probe was 35.16 and the ratio ofthe pcr to nopcr numbers of predictions was 0.34 (equal to the ratio of PCR to NoPCRnumbers of cases in the training set).
For the p-value of a t-test, the set of 30 top ranked probes comprised 11 mono-informative probes (in the present case, their numbers of pcr predictions was null, cf.table 3). The mean number of correct predictions per probe was 37.67 (approximativelyequal to that of the probes selected according to our probes valuation function), butthe ratio of the pcr to nopcr numbers of predictions was far lesser, this ratio valuebeing precisely equal to that of the whole set of probes (0.14). From this, one could seethat, with the same mean number of predictions per probe, the quality of the samplingperformed by a set of probes, measured by the ratio of the pcr to nopcr numbers ofpredictions, could explain the difference of performances between the two methodsof probes selection. The 30 probes of least p-values to a t-test performed a samplingin which the nopcr predictions were over-represented while the 30 probes of highestvalues v(s) performed a more faithful sampling of the training set, the numbers of pcrand nopcr predictions being in the ratio of the numbers of PCR to NoPCR testing cases.
6 Multigenic Predictors with Support Vector Machine
We have defined the k-probes support vector machine predictor (SVM predictor) as thek top ranked probes for the valuation function v(s) together with a linear kernel SVM[6], [7]. The maximum training accuracy of the SVM k-predictors (table 4 and figure5) was achieved for k = 15 probes: acc.=0.88, sens.=0.90, specif.=0.87, npv=0.96,ppv=0.70, corresponding to 2 false negatives and 8 false positives (out of 21 PCR and61 NoPCR cases). The testing performances of the 15-probes predictor were: acc.=0.82,sens.=0.92, specif.=0.79, npv=0.968, ppv=0.6, corresponding to 1 false negative and 8false positives (out of 13 PCR and 38 NoPCR cases). Hence, the SVM predictor ofhighest training accuracy had slightly better training performances than the best MDpredictor, and approximatively the same testing performances, with twice less probes(15 vs. 30 probes).
The second maximum training accuracy was achieved with k = 17, 18, 19, 20probes and k = 27, 28 probes. On the plateau from 17 to 20 probes, the predictors
had approximatively the performances of the k = 15 probes predictor for both trainingand testing accuracies. Because of this plateau, and because the 15-probes predictorappeared isolated, we have considered that 17-probes was a safer lower limit for down-sizing the best MD predictor. On the small plateau of two predictors showing the secondmaximum training accuracy, k = 27, 28 probes, the testing performances were betterthan those of the best MD predictor but, obviously, without significant downsizing. Thetesting performances were: acc.=0.88, sens.=0.92, spec.=0.87, npv=0.971, ppv=0.71,corresponding to 1 false negative and 5 false positives. One noticed that this plateauof two predictors was the beginning of a longer plateau of predictors, from k = 27 tok = 32 probes, showing approximatively the same training performances and the same,or even better, testing performances.
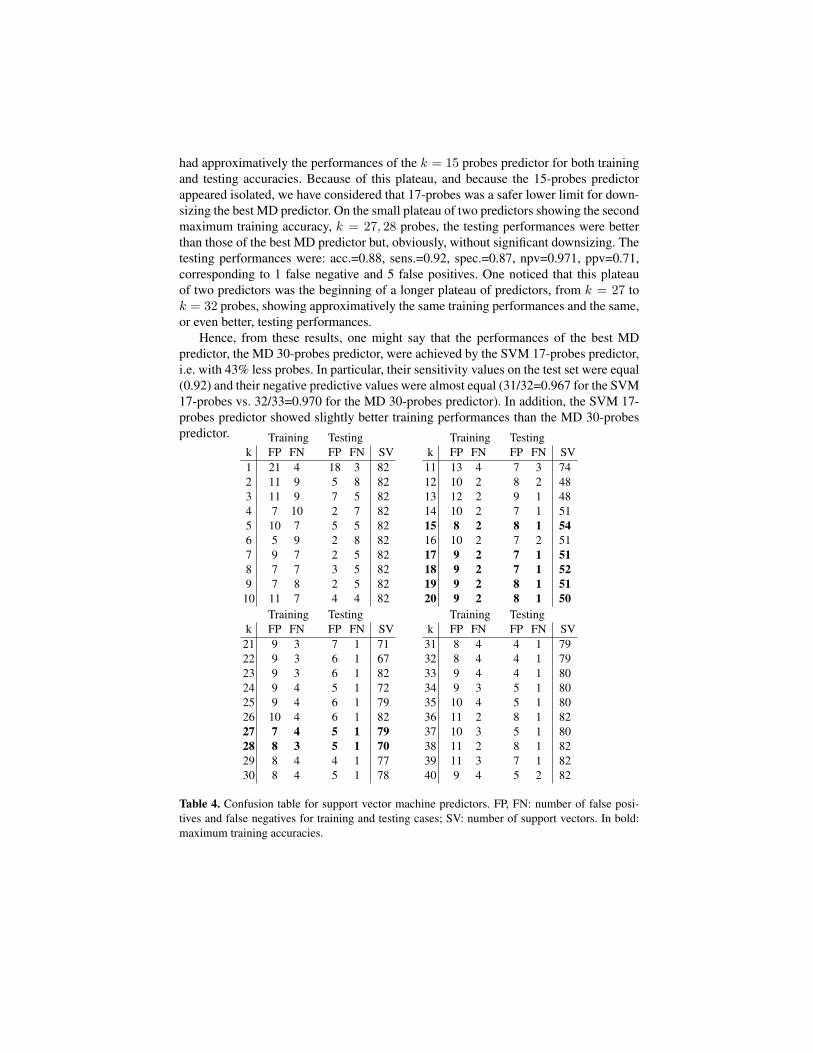
Hence, from these results, one might say that the performances of the best MDpredictor, the MD 30-probes predictor, were achieved by the SVM 17-probes predictor,i.e. with 43% less probes. In particular, their sensitivity values on the test set were equal(0.92) and their negative predictive values were almost equal (31/32=0.967 for the SVM17-probes vs. 32/33=0.970 for the MD 30-probes predictor). In addition, the SVM 17-probes predictor showed slightly better training performances than the MD 30-probespredictor. Training Testing
k FP FN FP FN SV1 21 4 18 3 822 11 9 5 8 823 11 9 7 5 824 7 10 2 7 825 10 7 5 5 826 5 9 2 8 827 9 7 2 5 828 7 7 3 5 829 7 8 2 5 8210 11 7 4 4 82
Training Testingk FP FN FP FN SV
11 13 4 7 3 7412 10 2 8 2 4813 12 2 9 1 4814 10 2 7 1 5115 8 2 8 1 5416 10 2 7 2 5117 9 2 7 1 5118 9 2 7 1 5219 9 2 8 1 5120 9 2 8 1 50
Training Testingk FP FN FP FN SV
21 9 3 7 1 7122 9 3 6 1 6723 9 3 6 1 8224 9 4 5 1 7225 9 4 6 1 7926 10 4 6 1 8227 7 4 5 1 7928 8 3 5 1 7029 8 4 4 1 7730 8 4 5 1 78
Training Testingk FP FN FP FN SV
31 8 4 4 1 7932 8 4 4 1 7933 9 4 4 1 8034 9 3 5 1 8035 10 4 5 1 8036 11 2 8 1 8237 10 3 5 1 8038 11 2 8 1 8239 11 3 7 1 8240 9 4 5 2 82
Table 4. Confusion table for support vector machine predictors. FP, FN: number of false posi-tives and false negatives for training and testing cases; SV: number of support vectors. In bold:maximum training accuracies.
0 10 20 30 40
0.0
0.2
0.4
0.6
0.8
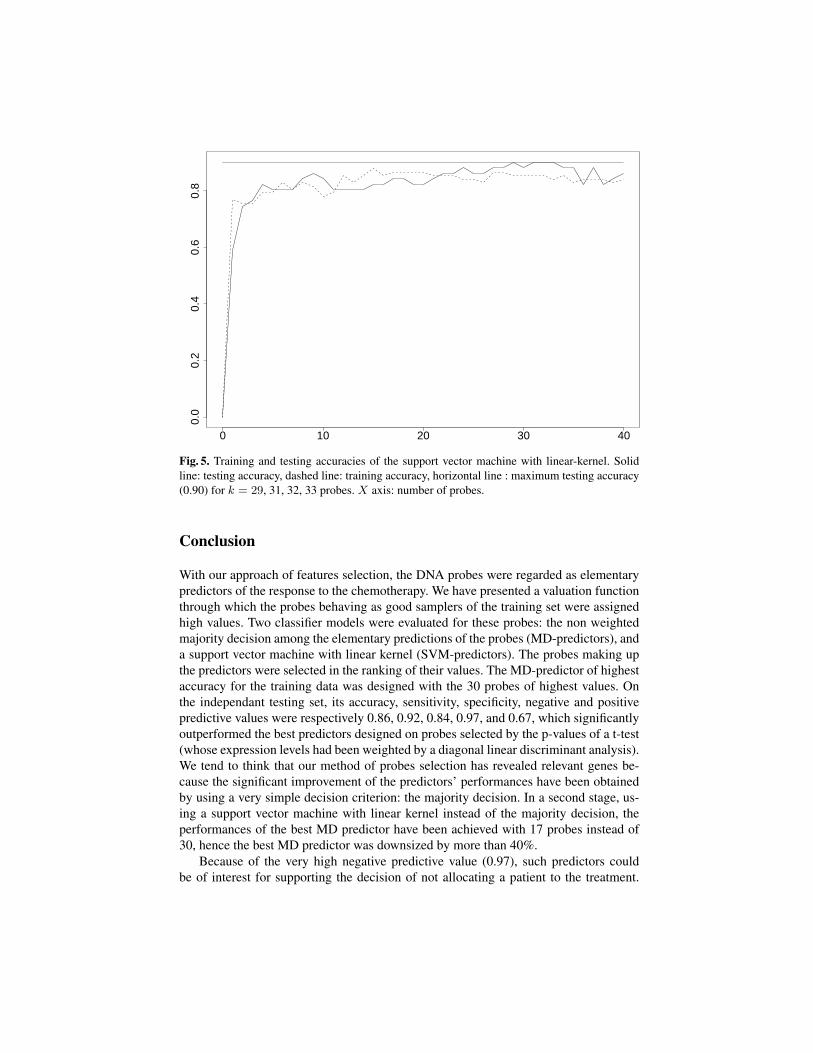
Fig. 5. Training and testing accuracies of the support vector machine with linear-kernel. Solidline: testing accuracy, dashed line: training accuracy, horizontal line : maximum testing accuracy(0.90) for k = 29, 31, 32, 33 probes. X axis: number of probes.
Conclusion
With our approach of features selection, the DNA probes were regarded as elementarypredictors of the response to the chemotherapy. We have presented a valuation functionthrough which the probes behaving as good samplers of the training set were assignedhigh values. Two classifier models were evaluated for these probes: the non weightedmajority decision among the elementary predictions of the probes (MD-predictors), anda support vector machine with linear kernel (SVM-predictors). The probes making upthe predictors were selected in the ranking of their values. The MD-predictor of highestaccuracy for the training data was designed with the 30 probes of highest values. Onthe independant testing set, its accuracy, sensitivity, specificity, negative and positivepredictive values were respectively 0.86, 0.92, 0.84, 0.97, and 0.67, which significantlyoutperformed the best predictors designed on probes selected by the p-values of a t-test(whose expression levels had been weighted by a diagonal linear discriminant analysis).We tend to think that our method of probes selection has revealed relevant genes be-cause the significant improvement of the predictors’ performances have been obtainedby using a very simple decision criterion: the majority decision. In a second stage, us-ing a support vector machine with linear kernel instead of the majority decision, theperformances of the best MD predictor have been achieved with 17 probes instead of30, hence the best MD predictor was downsized by more than 40%.
Because of the very high negative predictive value (0.97), such predictors couldbe of interest for supporting the decision of not allocating a patient to the treatment.
Beside, the predictor would unadvisedly allocate 16% of the non-responder patients tothe treatment (specificity=0.84). This result has to be compared to the nowadays almostsystematic allocation to the treatment.
The small number of probes involved in the SVM predictor (17 probes) could allowthe design of predictors at very low cost, which is an important issue for their potentialuse in clinical routine. Furthermore, because of the focusing on a small number ofpotentially relevant genes, this downsizing could also be an interesting property formodeling the biological mechanisms underlying the response to the chemotherapy.
Acknowledgments. The authors would like to thank the CAPES-COFECUB french-brazilian cooperation program and the CNPq for their support.
References
1. Knudsen, S.: Cancer Diagnostics with DNA Microarrays. John Wiley & Sons, Inc. (2006)2. Hess, K.R., Anderson, K., Symmans, W.F., Valero, V., Ibrahim N., Mejia, J.A., Booser, D.,
Theriault, R.L., Buzdar, A.U., Dempsey, P.J., Rouzier, R., Sneige, N., Ross, J.S., Vidaurre,T., Gómez, H.L., Hortobagyi, G.N., Pusztai, L.: Pharmacogenomic Predictor of Sensitivity toPreoperative Chemotherapy with Paclitaxel and Fluorouracil, Doxorubicin, and Cyclophos-phamide in Breast Cancer. J. Clin. Onc. 24, pp. 4236-4244 (2006)
3. Natowicz, R., Incitti, R., Horta E.G., Charles, B., Guinot, P., Yan, K., Coutant, C., Andre,F., Pusztai, L., Rouzier, R.: Prediction of the Outcome of Preoperative Chemotherapy inBreast Cancer by DNA Probes that Convey Information on Both Complete and Non CompleteResponses. BMC Bioinformatics 9, 149 (2008)
4. Natowicz, R., Braga, A.P., Incitti, R., Horta, E.G., Rouzier, R., Rodrigues, T.S, Costa, M.A.:A New Method of DNA Probes Selection and its Use with Multi-Objective Neural Networksfor Predicting the Outcome of Breast Cancer Preoperative Chemotherapy. In: 16th EuropeanSymposium on Artificial Neural Networks, pp. 71-76. d-side ed., Evere, Belgium (2008)
5. Wain, M.H., Bruford, E.A., Lovering, R.C., Lush, M.J., Wright, M.W., Povey S.: Guidelinesfor Human Gene Nomenclature. Genomics, 79, pp. 464-470 (2002)
6. Cortes, C., Vapnik, V.: Support-vector networks. Machine Leaming, 20, 273–297 (1995)7. Burges, C.J.C.: A Tutorial on Support Vector Machines for Pattern Recognition. Data Mining
and Knowledge Discovery, 2, pp. 121-167 (1998)
Related Documents