What role could downscaled climate change impact models have on people’s perceptions towards action on climate change? Submitted by Andrew Merton Bell to the University of Exeter as a dissertation towards the degree of Master of Science by advanced study in Sustainable Development, September 2009 I certify that all material in this dissertation which is not my own work has been identified with appropriate acknowledgement and referencing and I also certify that no material is included for which a degree has previously been conferred upon me..............................

Welcome message from author
This document is posted to help you gain knowledge. Please leave a comment to let me know what you think about it! Share it to your friends and learn new things together.
Transcript
What role could downscaled climate change impact models have on people’s perceptions towards action
on climate change? Submitted by Andrew Merton Bell to the University of Exeter as a dissertation towards the degree of Master
of Science by advanced study in Sustainable Development, September 2009
I certify that all material in this dissertation which is not my own work has been identified with appropriate acknowledgement and referencing and I also certify that no material is included for which a degree has previously been conferred upon me�������������������..............................
Abstract
Climate change is a global issue but requires action at all levels from the individual to
intergovernmental conventions. The actions required at a national and international
level often require a personal response from the community. Although reported
emissions have dropped by 16.4% since 1990 Domestic energy consumption has
increased by 8% since 1990 (Committee on Climate Change, 2009) and there has
been an increase from 79MtCO2eq by 4Mt CO2eq by the residential sector between
1990 and 2005 (Lorenzoni et al 2007). Therefore, one might suggest that the
community at large is not behaving in a way that is conscious about its carbon
footprint. A combination of a downscaled climate model and a lumped catchment
model has been developed for the Taw Torridge catchments in North Devon that
combines 1 m resolution grid data of soil properties and land-use. The data are
presented as an interim model to stakeholders from the general public who advice on
scenarios for the future. The research explores the communication issues associated
with the uncertainty of combined climate and hydrological models and whether the
presentation of impacts that are closer in geography to the participants changes their
behaviour. Qualitative results suggest that the models provide a focus for the people
who become animated about the choices they can make for the future. The model
provides a decision support tool for the possible land-use changes associated with the
different choices the participants make.
ii
Table of Contents
Abstract .............................................................................................................................................. i
List of Tables ................................................................................................................................. iv
List of Figures ............................................................................................................................... iv
Chapter 1 Introduction .................................................................................................................... 1
Section 1.1 Aims and Objectives .......................................................................................... 3
Chapter 2 Literature Review ........................................................................................................ 4
Section 2.1 Communication of climate change ............................................................. 4
Section 2.2 Combined climate and hydrological models. ......................................... 6
2.2.1 A review of methods for downscaling Regional Climate Models (RCM) ........................................................................................................................................... 6
2.2.2 A review of methods for modelling catchment-wide hydrological behaviour (including soil erosion) .................................................................................... 8
2.2.3 A review of methods of combining RCMs and Hydrological catchment models ................................................................................................................... 9
2.2.4 Incorporating the social dimension into scenario modelling ................ 11
Chapter 3 Methodology .............................................................................................................. 13
3.1 Outline Approach; ............................................................................................................. 13
3.2 Detailed Methodology ..................................................................................................... 13
Area of study .......................................................................................................................... 13
3.2.1 Sampling from the general public ..................................................................... 14
3.2.2 Design of Public Questionnaire ......................................................................... 14
3.2.3 Sampling from the Landowning community ................................................ 15
3.2.4 Analysis of Questionnaires .................................................................................. 16
3.2.5 Focus Groups ............................................................................................................. 16
3.3 Development of the Impacts model. ........................................................................ 17
3.3.1 River catchment behaviour .................................................................................. 17
Chapter 4 RESULTS AND ANALYSIS ................................................................................ 23
4.1 The Description of the population: ............................................................................ 23
4.2 The Environmental attitudes of the North Devon survey ............................... 25
4.3 Reported Behaviours ...................................................................................................... 29
4.4 Communication issues: .................................................................................................. 31
4.4.1 Supporting information from the Public Focus Group analysis and open questions responses. ............................................................................................. 34
4.5 Farmers Questionnaire and Focus Group ............................................................ 37
Focus group description: .................................................................................................. 38
Section 4.6 Model ..................................................................................................................... 40
iii
4.6.1 Development of the hydrological model: ....................................................... 40
4.6.2 Results of Climate Model Downscaling ......................................................... 42
4.6.3 Focus group results for scenarios ........................................................................ 46
4.6.4 Secondary Modelling results .................................................................................. 48
4.6.5 Focus Group responses to the process ............................................................... 50
Chapter 5 Discussion ................................................................................................................... 52
Limitations .................................................................................................................................... 52
Summary of main findings ...................................................................................................... 52
The focus group and the model ............................................................................................ 55
The communication issues ..................................................................................................... 56
Chapter 6 CONCLUSIONS ....................................................................................................... 58
Acknowledgements ....................................................................................................................... 60
Bibliography ...................................................................................................................................... 61
Appendices ....................................................................................................................................... 64
Appendix 1 Public Questionnaire. ..................................................................................... 64
Appendix 2 Land owner Questionnaire (map images reduced to save space) ........................................................................................................................................................... 76
Appendix 3 Localised Climate change model presentation .................................. 84
Appendix 4 Daily Rainfall distribution for 20 worst floods (source MIDAS and interpolated using inverse distance weighting) ........................................................... 90
iv
List of Tables Table 3-1 Summary of data and what we expect to learn from it ............................... 17 Table 3-2 Catchments used in the analysis of hydrographs for rainfall responses. First order rivers are the larger main rivers, 2nd and 3rd order are the tributaries branching from the main rivers. (the terms “greater” and “upper” have been inserted to assist definition in the analysis) ........................................................................................... 20 Table 3-3 Data used in developing the catchment response model defining the source data and transformations of the data. ........................................................................ 22 Table 4-1 Mann-Whitney test results for comparison of Gender, age group, urban rural classification of dwelling and social grade. ........................................................ 23 Table 4-2 Mann Whitney statistic test results for the questions relating to reported climate change knowledge between the survey samples in the DEFRA 2007 Survey of Public Attitudes and Behaviours toward the environment and the North Devon Survey....................................................................................................................... 24 Table 4-3Distribution of scores for accuracy of explanation of “40% chance of rain” . 31 Table 4-4 Accuracy score for the response to interpretation of 1 in 10 year flood protection .................................................................................................................. 32 Table 4-5 Advice move from Place “X” v Advise move from Place “A” Cross-tabulation ................................................................................................................................. 33 Table 4-6 Responses and terminology used to identify risk to health, economy and environment of the area 25 years from now. ............................................................. 35 Table 4-7 Size distribution of farms responding to questionnaire............................... 37 4-8 Catchments and their distribution in the sample after filtering extreme values for the Flood curve ......................................................................................................... 40 Table 4-9 Catchments and associated percentage of land-use derived from 1 km grid ITE land cover data. .................................................................................................. 42 Table 4-10 Table of land-use scenario changes ........................................................ 48 Table 5-1 Suggested terminology to define bands of probability when communicating with the public. .......................................................................................................... 56
List of Figures Figure 3-1 The study area, showing the extent of the UNESCO Biosphere Reserve. 14 Figure 3-2 Location of gauging stations and catchment boundaries used in the model. ................................................................................................................................. 21 Figure 4-1 Comparative graphs of the distribution of percentage of the samples from the 2007 Survey of Public Attitudes and Behaviours toward the environment and the North Devon survey .................................................................................................. 24 Figure 4-2 Relative priorities of respondents to the North Devon survey. This is a cumulative score of those issues in the top 3 of people’s concerns. .......................... 25 Figure 4-3 Aggregated NEP score derived from summing re-coded NEP questions. 26 Figure 4-4 Histogram of Response of question “Climate change is more important than a dip in the economy” (1=strongly agree, 5 strongly disagree) (n=64) ............... 27 Figure 4-5 Histogram of degree of agreement about personal behaviour and climate change ...................................................................................................................... 28 Figure 4-6 Histogram of degree of agreement about government total responsibility and climate change. .................................................................................................. 28 Figure 4-7 Proportion of respondents and their reported behaviour for climate change mitigation. ................................................................................................................. 29 Figure 4-8 Qualitative representation of potential carbon saving based on proportion of people reporting a certain behaviour multiplied by an index of carbon saving potential for that behaviour. ....................................................................................... 30 Figure 4-9 Frequency of terms used to describe 40% chance of rain ........................ 32
v
Figure 4-10 Histogram of terms used in describing a 1 in 100 year flood protection. . 33 Figure 4-11 Personal priority for concerns about climate impacts .............................. 36 Figure 4-12 Comparison of mean measured response time and modelled response time for time from base to peak flow in a rainfall event. ............................................. 41 Figure 4-13 Current expected monthly winter (DJF) Rainfall based on 61-90 LTA .... 43 Figure 4-14 Expected monthly winter (DJF) rainfall 2040-2059 ................................. 43 Figure 4-15 Figure 4 15 Current expected rainfall summer (JJA) 61-90 LTA (mm/month) .............................................................................................................. 44 Figure 4-16 Expected rainfall summer 2040-2059 (mm/month) ................................. 44 Figure 4-17 Expected mean temp of warmest July day current 61-90 LTA ................ 45 Figure 4-18 Expected mean temp of warmest July day 2040-2059 ........................... 45 Figure 4-19 Change in flood response time of rivers under new land-use scenarios . 49 Figure 4-20 Soil sensitivity in 2050. The most vulnerable 20% of grids are in yellow . 50
What role could downscaled climate change impact models have on people’s perceptions towards action on climate change?
Chapter 1 Introduction
Climate change is a global issue but requires action at all levels from the individual to
intergovernmental conventions. The actions required at a national and international
level often require a personal response from the community, such as the choice to
change behaviour in the selection of travel, energy providers, food choice and
responses to various new developments and not forgetting the expression of their
concerns within a democratic system. Although reported emissions have dropped by
16.4% since 1990 (Jackson et al 2008, DEFRA 2008), much of this has been gained
through rapid industrial measures on potent greenhouse gasses (such as methane
and hydrofluorocarbons) and latterly through emissions trading in the EU emission
trading scheme. Domestic energy consumption has increased by 8% since 1990
(Committee on Climate Change, 2009) and there has been an increase from
79MtCO2eq by 4Mt CO2eq by the residential sector between 1990 and 2005
(Lorenzoni et al 2007). Therefore, one might suggest that the community at large is
not behaving in a way that is conscious about its carbon footprint.
What are the reasons for this? Some authors believe that the human cognitive
response to threats is based on the perception of risk severity and probability
(Grothmann and Patt; 2005). Some businesses and people will not contemplate
threats beyond a 5 year time frame (Stoll and Kleemann, 2001).Unless there are
imminent extreme events, those perceptions of risk will not be high, there is little too
offer any stimulus for adaptive behaviour.
The evidence and the communication of climate science has been very prolific but
expressed mainly in very large scales of time and geography terms. These scenarios
may be on too great a scale to illicit a response from the community. If this is true,
then possibly a series of credible information presented to the community which make
the expected impacts more “real and relevant” to them yet still presenting a scenario
that is below the threshold of panic or fear, lead to a more constructive debate and
action for climate change adaptation and mitigation. Therefore, if we wish to illicit a
positive cognitive response and change in behaviour on climate change we need to
2
identify ways to express the science and the risk increasing the relevance to the
audience. This will help us to understand what motivates people to make these
changes. Justus et al (2007) advocate useful and relevant scientific data as a key
component to stakeholder engagement in developing a climate change policy.
A key question is how to communicate these scientific data. Dessai et al, have sought
to indentify how “deep uncertainty” can be expressed consistently. To date this has
been focussed on the scientific community and policy makers but not to the public at
large or even key stakeholders. Therefore modes of communication and engagement
need to be developed and tested that impart the climate change information that is
still credible and understandable.
This dissertation seeks to develop a communication or decision support tool for
climate impacts at a local scale and test its use as an engagement and planning tool
with a range of people from the general public and from the farming sector in a
UNESCO designated area in North Devon, UK.
In this document I will refine the aims and objectives of the study, present a review of
the literature relating to communication of climate change issues to the public and the
development of local scale climate impacts models. The report then details the
methodology of the data collection and its subsequent analysis. The results are then
presented, followed by a discussion and conclusion.
3
Section 1.1 Aims and Objectives
This dissertation combines social and natural science approaches to understanding
the potential of downscaled climate impact modelling as an interactive mechanism to
engage and encourage a positive behaviour change in the community. The model
developed can be a platform for further work on the development of local ecosystem
service modelling and to put in place scientifically sound planning policies. (Jonsson,
2005). The developed model will be a decision support tool to stimulate a deeper
consideration by the stakeholders.
The aim of the dissertation is to ascertain whether the regionalised model information
will stimulate a deeper concern over climate change within a selected group and
increase the likelihood of positive behaviour change towards mitigation and
adaptation.
The objectives for this dissertation are:
1. Identify the current attitudes and behaviours of the community in the study
area towards climate change.
2. Explore the range of terminology and presentation methods that will assist the
public to engage them is discussions about climate change and their
behaviour using the model as a stimulus for that discussion.
3. Develop a representation of the climate change predictions translated to a
local scale.
4. Develop a model of the response of the river systems to climate change and
changes in land-use through societal decisions.
The structure of the dissertation is as follows:
• a literature review of the subject areas that guides the work that will ultimately
be undertaken,
• a detailed account of the methods used in gathering and handling the data for
the research question
• an analysis of the results from the exercises followed by
• a discussion of the results
• conclusions for wider consideration
4
Chapter 2 Literature Review
This proposal relates to modelling the impacts on a local scale and communicating
about climate change, including those impact models. This literature review will
address firstly the communication issues and the modelling aspects secondly.
Section 2.1 Communication of climate change
The communication of climate change, its impacts, how to mitigate and how to adapt
are critical to the success of any policy measures that might be put in place to counter
the damage that might happen to people and ecosystems that might arise. Many of
these policies and programmes require that the public understand the consequences
of climate change either as a result of their own actions or of the authorities they elect
and appoint in democratic systems.
The issues of communication centre on 3 areas;
• Psychology of communicating climate change and motivation of the audience
towards positive action
• Understanding of the science of climate change and global warming
• Communication of “deep uncertainty” about the models and the science of
climate change
When communicating climate issues to stakeholders and the public, a key objective is
to motivate towards pro-environmental or pro-climate behaviours and towards
adaptation. Kollmuss and Agyeman (2002) identify the mechanisms for behavioural
change and the barriers to those changes. The paper is a good review of the various
mechanisms and culminates in complex sociological models. They identify key
barriers to true environmental behaviour. These included lack of environmental
awareness due to complexity of environmental issues, time lag between behaviour
and impact and remoteness from the impact. Another key factor cited is lack of
emotional investment with the issue; this can be because the issue does not coincide
with the audience’s values and beliefs and the issue does not directly impact on their
personal well-being. A key motivational factor is whether the individual can do
anything about the problem; will their actions count? This is seems to be as true for
adaptation as it is about mitigation. (Grothmann and Patt, 2005).
5
Moving from awareness to action involves several stages according to various
authors reviewed in Kollmuss and Angyeman (2002). Crucially for this project
proposal, they acknowledge the work of various authors (Riordan & Burrgess, Owens
and Bloomfield) that “deliberative and inclusionary procedures (aka DIPS) are an
essential ingredient in the development of more responsive decision making and for
transformative potential for wider governance.
The emotional factor has an optimum level to which it can be taken. Pure
informational campaigns are limited in their impact and in particular the tactic of shock
has its constraints. O’Neill and Nicholson-Cole (2008) reviewed whether fear was a
good approach as motivating emotion. Whilst fear can be a method of getting the
attention of the audience, it proves not to be a persistent way of sustaining
environmental behaviour. As is the nature of the climate change, the changes can
take too long or happen too far away to sustain the positive behaviour, unless there
have been some meteorological events re-enforce the belief. Furthermore, the fear
can have a tendency to paralyse people into sensation of futility or apathy. It is
suggested that a little bit of fear helps, particularly where solutions are also presented.
The “bottleneck” that stifles adaptive behaviour can also be caused by agents’ and
stakeholders’ under-estimation of their capacity to adapt. (Grothmann and Patt, 2005).
Lorenzoni et al (2007) in their extensive survey and subsequent focus groups
identified a similar range of issues for UK laypeople. Featuring in the list was
information presented in formats that were too difficult for the general public. They
comment that the uncertainty surrounding climate change science is compounded by
the individual’s uncertainty or lack of knowledge about the science. This suggests that
education about climate science in its own right would assist a more rational response
to climate change issues.
A major body of work on communicating climate change models and scenarios has
been done by Dessai, Hulme and various co-authors since 2005. In their 2008 paper,
they propose that downscaled models and scenarios such as UKCIP02 are the
product of a negotiation between policy makers, communicators, stakeholders and
(restricted part of) the science community. The scenarios presented are not
necessarily a scientific produce but a social construct. Such a product can only
contribute to the uncertainty and the public doubt over such models.
“Deep Uncertainty” is a strong characteristic of climate models due to the chaotic
nature of the earth’s atmospheric/ocean/earth interactions. Kandlikar et al (2004)
6
proposed a schema for communicating the deep uncertainty for outputs that can be
supported by a full probability density function that quantifies the certainty of any
statement being made and another approach for which a probability density function
(PDF) cannot be provided. This particular review of communicating uncertainty was
targeted towards the scientific community and not towards the general public, where
terms such as “orders of magnitude” are unlikely to be used correctly if at all. The next
step should be to define a methodology for communicating the uncertainty to the
public.
To summarise the communication and risk perception issues from the literature; the
overall problem for motivating people to behavioural change and communicating
climate change centres on the technical nature of the subject bewildering the
community. There are key issues associated with the deep uncertainty and the scale
(time and space) of the impacts and changes. The audience needs a consistent and
comprehendible framework for communicating the levels of uncertainty. There is a
need to engage people in understanding the issues, understand the possible impacts
(including their likelihoods) and present them with achievable actions to provide a
sense of control and empowerment. A strategy for increasing the understanding and
deepening the engagement is through a participatory planning process whereby the
science can be explained, the consequences of decisions can be reviewed and
optimal solutions identified that are ultimately enacted.
Section 2.2 Combined climate and hydrological models.
In this section I will review the literature of combining climate change and hydrological
models. From the outset it must be understood that the time and resource constraints
on this project will not permit the development of a brand new methodology. The
objective of this review is to identify the optimum methodology to develop a model that
will reflect the climate change on the currently observed hydrology and how that might
be used as an interactive decision support tool as part of the communication exercise.
Consideration will be given towards a methodology that might be transferable to other
areas.
2.2.1 A review of methods for downscaling Regional Climate Models (RCM)
The development of impact models has been very prolific over the last 10 years. The
range of models, from the large scale circulation models developed by CSIRO in
Australia, Hadley Centre in the UK amongst others, have dominated the scientific
7
press and have been the basis for much of the published information from the
Intergovernmental Panel on Climate Change (IPCC).
The ability to refine the models to a higher resolution has been achieved through
methods of downscaling based on methodologies such as dynamic, statistical
downscaling and change factor. Much of the published work on the methodology has
been done by Wilby. Guidelines for downscaling techniques have been produced for
the IPCC by (Wilby et al 2004).
Essentially the statistical downscaling will produce climate change parameters based
on the statistical point data provided from individual meteorological stations that
reflect the variations caused by local factors (such as topography, land-use and sea
proximity) and linked to a single General Circulation Model (GCM). Change factor is
done by applying the coarse output of a GCM to finer resolution historical
meteorological data. Again this is based on a single GCM but can be repeated for the
various possible outcomes and probabilities for a given GCM or indeed repeated with
other GCMs.
Referring to the application of modelling methodologies, Diaz-Nieto and Wilby (2005)
suggest the complementary application of change factor and statistical downscale
modelling techniques. These papers suggest methods to produce finer scale
resolutions whilst retaining scientific validity by defining probabilities and ranges of
potential outcomes.
Regional climate models are treated with great caution, in that they are derived from
the larger scale models that are known to have wide error margins associated with
them (Lahsen, 2005). The resulting model might appear to be regarded by the non-
specialist to have a degree of accuracy that cannot stand to scientific rigour.
However, the models have been generally performing within parameters over the last
decade, with the exception of precipitation on downscaled models (Dessai and Hulme
2008). Bell et al (2007) suggest that the models are capable of predicting extreme
rainfall events and their return periods. (Fowler et al 2005).The value of the model is
determined by its utility; if temperature is the main factor of interest, then the models
have proven to very worthwhile. Conversely, if one was mainly interested in
precipitation, the models will attract a degree of public criticism.
The explanation of this variation and the public interpretation of these outputs is
advocated by Dessai and Hulme (2008). For example the weakness of UKCIP02 data
8
is that it is based on the one large scale model output, and from one emission
scenario, that has then been interpolated for different emission scenarios. Therefore
what might be taken as a credible model, does not use the full range of data and other
outputs to support its validity. However, it moves towards a presentation of
information at geographical and temporal scales that stakeholders and policy makers
are seeking. UKCIP09 addresses this particular issue by offering a range of 3
emission scenarios (A1F1, A1, B1). Furthermore, the range of outcomes are
supported by a stated probability. These are generated by a system that has been
called “Perturbed Physics Ensemble” (PPE). In this methodology, the important (but
small scale parameters but whose scale of impact is not known precisely that can
determine the outcome of a model run), are altered to produce a range of possible
outcomes that build up a probability distribution of a certain climate variable.
(UKCIP09, August 09) The net result is a large matrix of possible outcomes based on
possible emission scenarios and each output grid having a range of probabilities for
each parameter. The result, although much more technically correct, is bewildering for
a general member of the public.
Further to the climate predictions, the UKCIP09 models include a weather generator,
which can produce up to 1000 (minimum 100) weather outputs for a given future year
for a particular 5 km grid square. These outputs include derived variables such as
Potential evapo-transpiration (PET) and are varied by the PPE set of variables as
described above. It is possible to state which of these variables can be altered. I
suggest that such a generation of weather possibilities will help to explain to the public
how a climate model incorporates variability and uncertainty.
2.2.2 A review of methods for modelling catchment-wide hydrological behaviour (including soil erosion)
Olsson and Pilesjo (2002) define methodologies to produce hydrological models
based on catchments categorised as stochastic and deterministic. The former will
produce, eventually, a probability distribution function for the behaviour of the
catchment given the statistical factors put into the model. The deterministic model
must be consistent in its results and can be classified as empirical models based on
statistical analysis of the phenomena and identifying correlations. This “black box
approach” does not require a full understanding of the physical processes. This
approach can be applied at the individual cell level or it can be done at an aggregated
level by looking at catchment behaviour as a whole. Spatially distributed data to
create a catchment model will include; climate parameters (such as precipitation,
9
cloud cover, daytime temperature, wind-speed, precipitation intensity & relative
humidity), soil properties (texture, permeability, hydraulic conductivity, infiltration
capacity and velocity), vegetation cover, land-use and topography. From these
parameters it is possible to identify the hydrologically effective rainfall (HER), overland
flows, sub-surface flow, groundwater flow and channel flow in the rivers. With a lack of
data and the time to gather what there is, the development of a model starting form
basic processes is not going to be achieved in the time permitted for this study. Later
in this document it will be shown that this has been done for the UK though various
projects.
Olsson and Pilesjo (2002) define a difference between distributed hydrological models
and those that aggregate the data for each catchment known as lumped models. The
former are used to identify changes within any particular catchment in particular land-
use, the latter tend to be used for rainfall and run-off models.
TOPMODEL is one of many models that have been produced but has been
successful because of its relative simplicity using a slope index based on the tangent
of the gradient Beven (1997). Mendoza et al (2002) classify spatial hydrology models
into 4 categories; these are: 1. Integrate hydrology and GIS, 2. Integrate hydrology
and remote sensing, 3. Integrate hydrology, remote sensing and GIS, and 4
Integration of geomorphological knowledge with remote sensing and GIS. This
demonstrates a number of routes to providing an hydrological prediction depending
on the data available. The benefit of these varied approaches is that it can help to
support management decision for catchments where there may be a lack of direct
data to guide decision makers. Brazier (2004) points out that modelling should be no
substitute for real data and, indeed, Mendoza suggests that each model developed
requires calibration sites and therefore transferral of model to an unknown catchment
must be treated with caution.
2.2.3 A review of methods of combining RCMs and Hydrological catchment models
Various authors have now begun to incorporate climate models into river basin
hydrological models.Yu-Pin(2007), Bronstert et al, 2002, Bell et al 2007 offer some
good examples. A degree of the focus of this work has been targeted towards water
resource management and disaster prediction, such as floods and how to handle
droughts. Dessai and Hulme, 2008, suggest that only very recently has the
anthropogenic signal been detected in rainfall at a global level, the remaining rainfall
10
patterns are attributed to normal variation, or possibly through other climate
interactions not yet included in the models. Bell et al (2007) suggest that the
precipitation predictions fromUKCIP02 data provides reasonable accuracy for return
periods between 2 and 20 years, and reports accuracy of up to 50 years.
Furthermore the literature suggests that the development of a pareto distribution of
return periods for floods can only provide reasonable information for return periods up
to 15 years when incorporating the RCM model outputs. (Kay et al, 2006)
To date there has not been a local impacts model for the catchment of the Taw
Torridge catchment basin. Bell et al (2007) incorporated the Taw as a suite of
catchments to assess the increase in flood risk arising from increased precipitation
identified in UKCIP02. In this circumstance long-term average data was used to
compile the catchment response to rainfall events without consideration to the large
variation of rainfall across the catchment.
The model development that most closely parallels the proposed project is that
devised by Bell at al (2007). This is known as the grid to grid (G2G) model which
incorporates downscaled region climate model data for rainfall, potential evapo-
transpiration (calculated from MORECS but closely matching the Penman-Monteith
equation), topographic digital terrain model to provide average slope and maximum
slop within the 1 Km grids.
The G2G model is relatively simple with only a few parameters that need to be
included in the input stage. The variation within each 1km grid is accommodated by a
variation factor determined by a weighting of mean gradient and maximum gradient
within each of the grid squares.
Fortunately there has been a body of work on modelling and to account for land-use
and rainfall for UK and their catchments to consider not only the hydrology but also
the associated processes, such as soil erosion. Two particular approaches are
MAGPIE and NEAP. Within MAGPIE (Lord & Anthony, 2000) the inputs ot the model
on a 1km grid distribution include data from the agricultural census; (crops, livestock
numbers) land-use types from Institute of Terrestrial Ecology, climate data from the
UK Met Office and soil physical properties. The MAGPIE framework is a GIS model
that was developed through the incorporation of lessons from field scale models
developed between 1971 and 1999. NEAP-N incorporates rainfall, hydrologically
effective rainfall (HER), soil properties as well as the land-use, stocking and
11
application of nitrates. This grid still provides a useful database for the application of
grid based GIS modelling. However the variation of soil properties across a 1Km grid
can be quite significant and will not be shown at this level.
Closely aligned to modelling hydrology and a climate impact is nitrogen leaching and
soil erosion potential of the water movement over land. The weakness of the NEAP-N
model is that it caters for current land management and farming practices. Fawcett,
Anthony and Silgram (2004) comment that as management practices change, the
model will need to be re-calibrated. Given that much of the nitrogen leaching is
coming from application of artificial fertilisers based on oil products, the practices will
and indeed already are changing significantly due to the price and ultimately the
availability of chemical fertilisers.
There have been reports produced for the Taw Torridge estuary on the impacts of
sea-level rise on the geomorphology of the estuary and including a simple change
factor (100% increase of maximum flow) for the fluvial component for the shape of the
residual channels (Pethick 2006). This has been used to inform the current production
of Shoreline Management Plans, as a tool for engagement with stakeholders and
planners.
2.2.4 Incorporating the social dimension into scenario modelling
Scenario development is not just a physical climate science discipline but also social
process that is influenced by the adaptive behaviour of society (Hulme & Dessai
2008). Therefore scenario planning is an iterative and feedback process that requires
clear communication with the audience, about probabilities, ranges and uncertainty
that is confounded by shifting goal posts as models improve and as society reacts
(positively and negatively) with policy and action.
The recommendation for engaging people about the impacts demands better
modelling of low probability, high impact events, such as floods, storm surges and
heat waves (Goodess et al 2003). These have the effect of presenting the risks that
have a scale large enough to warrant a response from the audience. However, this
can build in the fear factor to too high a degree as highlighted already in preceding
text. (Lorenzoni et al, 2007).
Models have a strong potential for stakeholder dialogue. Once developed, they are
useful tools in their own right but have a stronger role in developing participatory
12
planning scenarios and exploring integrated assessments (Tansey et al 2002, Olssen
et al 2005, Jonsson 2005). This has also been referred to earlier in this text with
regard to interactive models being part of a DIPS. However, implicit in this is the
development of models on a temporal and geographic scale that meet the needs of
the stakeholder, and include variables within the model that the stakeholders will have
some control over. These might include land-use, derived through a societal choice of
policies such as local purchasing, food security policies, development and land-use
policies, mitigation options for flood attenuation.
To summarise, I have reviewed an evolution of modelling in the recent years of the
very recent downscaled climate models and how all but the very recent UKCIP09 has
been incorporated into hydrological and catchment scale modelling. Each of these
models has been devised for specific technical purposes to assist management or
assessment of specific issues rather than a tool for public engagement. The literature
provides us with insights into the variables and how they are treated in such modelling
within a range of types of modelling suited for this exercise.
The development of the climate change impact model will focus on the response of
the catchment and its associated hydrographs and what this might mean for flooding
within the catchment area. This project will assist our understanding of communicating
climate change with a group of people who might not regard themselves as obvious
decision makers. The resulting work and methodology might be applicable to any area
in Europe or the developing world as a participatory planning tool and a method of
implementing the Ecosystem Approach as defined in the Convention on Biological
Diversity. (CBD,2009)
13
Chapter 3 Methodology The dissertation works in both social and natural science sectors, through quantitative
analysis response of climate data and physical data of a region, quantitative analysis
of questionnaires. Because the research will also investigate language, terminology
and a deeper understanding of values, the work will also involve a qualitative analysis
of transcripts from focus groups and sections from the questionnaire interviews.
3.1 Outline Approach;
The model of climate change impacts was developed that interpolates the recent
UKCIP09 predictions and will attempt to incorporate these factors under the range of
land-use scenarios developed.
The approach to the human sciences part of this project will involve recruiting 2
samples of population of the Taw Torridge basin. One cohort represents the wider
public and the second represents the landowning public along a transect descending
the River Taw from the upper catchment to the estuary. A focus group from each of
these samples was created. Each group was;
• Analysed further for their attitudes to risk and uncertainty
• Asked for a collective view on future scenarios supported by interim outputs of
the climate change impacts model.
3.2 Detailed Methodology
Area of study
The area for this study is the catchments of the rivers Taw and Torridge in northern
Devon, which forms a substantial part of the UNESCO Biosphere Reserve (see figure
3.1). This area has not benefited from such a study in the past, but the presence of
such as designation lends itself to providing a framework for such a programme and
any follow on work that might ensue. The total population in the Biosphere Reserve
area is around 160,000 people.
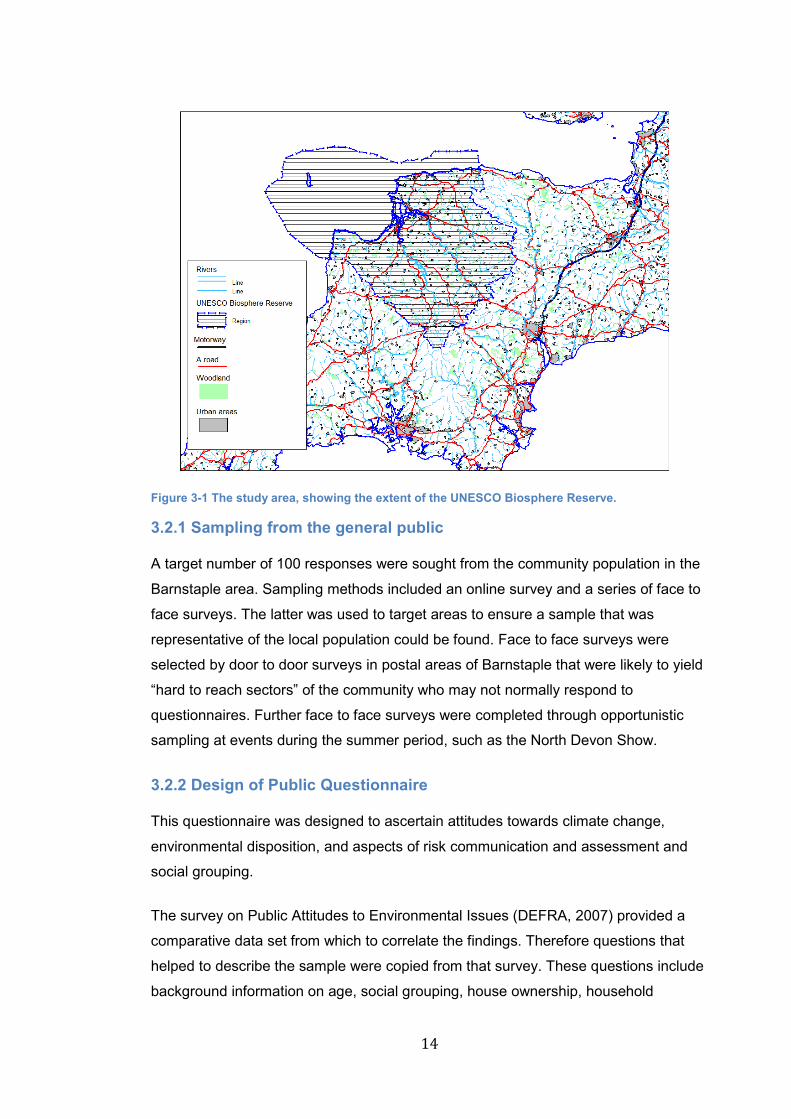
14
Figure 3-1 The study area, showing the extent of the UNESCO Biosphere Reserve.
3.2.1 Sampling from the general public
A target number of 100 responses were sought from the community population in the
Barnstaple area. Sampling methods included an online survey and a series of face to
face surveys. The latter was used to target areas to ensure a sample that was
representative of the local population could be found. Face to face surveys were
selected by door to door surveys in postal areas of Barnstaple that were likely to yield
“hard to reach sectors” of the community who may not normally respond to
questionnaires. Further face to face surveys were completed through opportunistic
sampling at events during the summer period, such as the North Devon Show.
3.2.2 Design of Public Questionnaire
This questionnaire was designed to ascertain attitudes towards climate change,
environmental disposition, and aspects of risk communication and assessment and
social grouping.
The survey on Public Attitudes to Environmental Issues (DEFRA, 2007) provided a
comparative data set from which to correlate the findings. Therefore questions that
helped to describe the sample were copied from that survey. These questions include
background information on age, social grouping, house ownership, household
15
income, and climate change behaviour in the household with regard to energy
conservation, water conservation and waste. These responses were recorded as tick
boxes or through Likert scale responses.
A section of the questionnaire was dedicated to gaining a level of comprehension
about climate change terminology, also replicated from the DEFRA 2007
Questionnaire. A standard set of questions was included to measure environmental
attitudes using the New Environmental Paradigm (NEP) standard questions and other
possible priority areas of concern to the individual.
The communication of risk questions included open ended questions that required
people to define the level of risk in their own words the impacts that climate change
might have on the region’s and their own financial/economic, health and
environmental well-being. This question was intended to draw out the terminology that
people use and give an indication of the comparative levels of importance between
these three factors to the respondent.
On understanding geographic representation of risk, the face to face respondents
were asked to advise the questioner whether he or she should move from a house
identified on 2 maps that showed flood risk represented in two ways. One map
showed the probability of flooding on a continuous spectrum of colour shading, the
second showed the probability divided by contour and contrasting shading. The
locations of the fictitious house on both maps were placed at exactly the same level of
probability of flooding.
The questionnaire concluded with further questions on respondent’s background and
willingness to participate in a focus group.
The public questionnaire can be found in Appendix 1.
3.2.3 Sampling from the Landowning community
Landowners were contacted within the catchment with a different self-completion
postal questionnaire. 250 self completion questionnaires were sent to farmers in three
areas of the Taw catchment. The database used was a register of livestock holders,
which was 5 years old. As a database of this type, the term “stock holders” also
includes households that had pet sheep or goats for example. Addresses that
appeared to be of this type were filtered out of the data base, prior to selection.
16
Questions similar to those used in the public questionnaire were used to gauge the
farming community’s disposition towards climate change and their behaviour either
primarily as a business and their communication and understanding of risk. It also
asked what changes the landowners had seen that had arisen from what they felt was
climate change.
Their perceptions on climate change and current and future land-use were sought
through a set of questions that were scored through a Likert scale of level of
agreement with certain statements. Individuals from this sample were asked to join a
second focus group to consider specifically the landownership and practical land-use
issues.
The landowners’ questionnaire and geographic sampling area can be found in
Appendix 2
3.2.4 Analysis of Questionnaires
The questionnaire results were compiled in an SPSS database and tested against the
national survey for a comparison of the populations using Student’s test.
Quantitative data unique to the survey was tested with appropriate tests for
nonparametric data (Mann Whitney, Chi-Squared) and correlation of parametric data
to establish trends within the community and their attitudes and actions towards
climate change. (Wheeler et al, 2004). Of particular interest are the comparisons
between reported behaviour and environmental attitudes set against the social and
economic background of the respondents and the identification of the potential for
more carbon reduction behaviours within the sample.
The qualitative responses within the questionnaire are given a score for the accuracy
of the response but also examined for frequency of certain terms and for any
particular underlying themes of the response. These were considered thematically
and for some consideration of the scale of impacts that people thought would be
apparent.
3.2.5 Focus Groups
Participants in the group were offered a minor payment as compensation. The group
size should be in the order of 10 individuals as recommended in the published works
(Goss 1996, Zeigler, 1996 and Burgess 1996). Each focus group was held in 2 parts;
17
the first part to deepen the questioning about the understanding of risk and
uncertainty and how they are communicated. The second to consider the downscaled
model of the UKCIP09 outputs to a local catchment scale, climate change and to
explore a number of scenarios of the type of community they think might happen in
the epochs of the 2020s, the 2050s and the 2080s years. The groups were asked to
give some opinion on the future land-uses they thought would be needed for their low
carbon future, in terms of food production and food security as well as energy
production.
Each focus group meeting was digitally recorded with the consent of participants and
the transcripts were analysed thematically according to the questions. Each group
meeting was approximately one and a half hours long. Data and its uses are
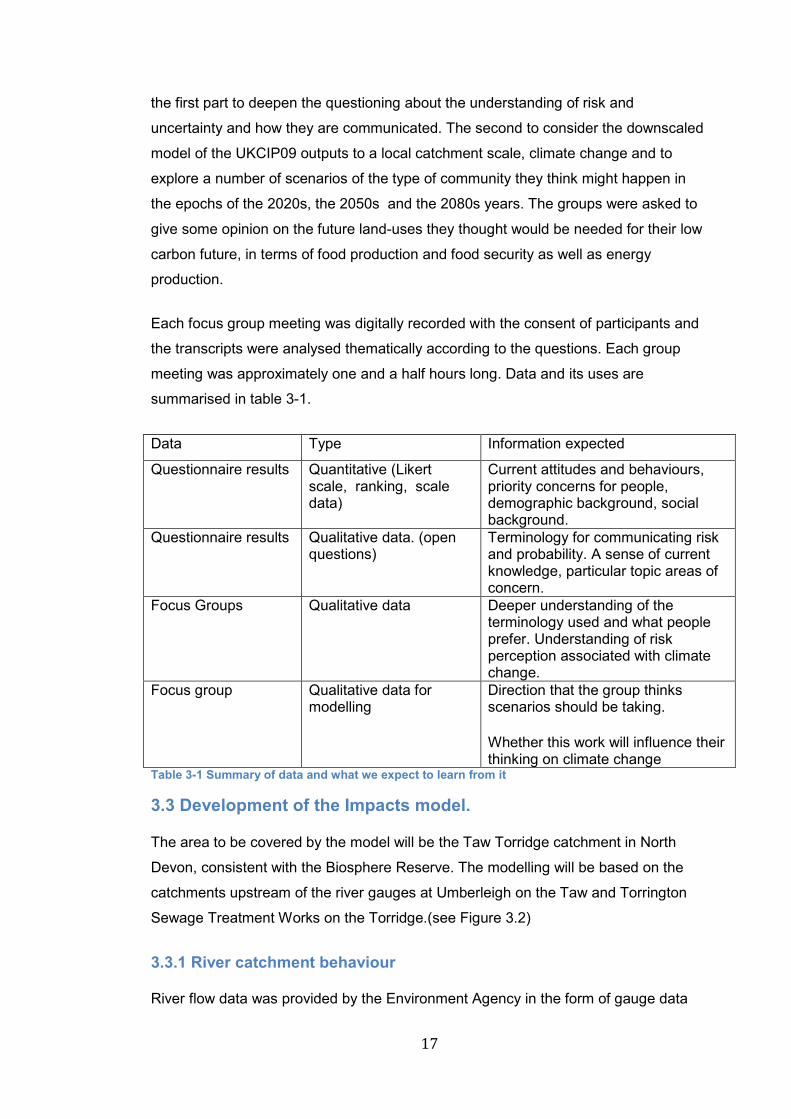
summarised in table 3-1.
Data Type Information expected
Questionnaire results Quantitative (Likert scale, ranking, scale data)
Current attitudes and behaviours, priority concerns for people, demographic background, social background.
Questionnaire results Qualitative data. (open questions)
Terminology for communicating risk and probability. A sense of current knowledge, particular topic areas of concern.
Focus Groups Qualitative data Deeper understanding of the terminology used and what people prefer. Understanding of risk perception associated with climate change.
Focus group Qualitative data for modelling
Direction that the group thinks scenarios should be taking.
Whether this work will influence their thinking on climate change
Table 3-1 Summary of data and what we expect to learn from it
3.3 Development of the Impacts model.
The area to be covered by the model will be the Taw Torridge catchment in North
Devon, consistent with the Biosphere Reserve. The modelling will be based on the
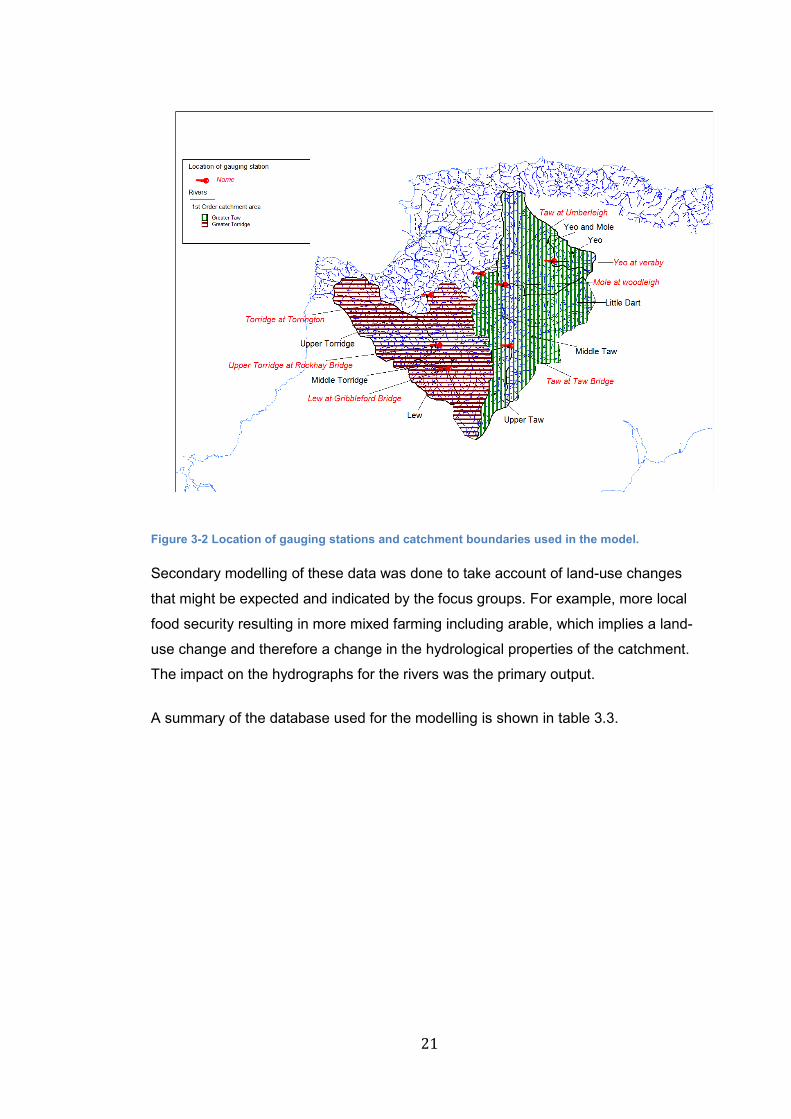
catchments upstream of the river gauges at Umberleigh on the Taw and Torrington
Sewage Treatment Works on the Torridge.(see Figure 3.2)
3.3.1 River catchment behaviour
River flow data was provided by the Environment Agency in the form of gauge data
18
from 7 gauging stations. Data for the 20 worst flood events was provided for flow rate
against time recorded at hourly intervals in the early data sets and at 15 minute
intervals for the more recent years.
Hydrographs were isolated for the 2 main rivers and the 5 sub-catchments using the
straight line method (Blume et al, 2007). This hydrograph was defined by the flood
response time, the recession time, baseline flow and peak flow for each of the flood
events.
The rainfall events causing these flood events were retrieved from the MIDAS
database, accessed through the British Atmospheric Data Centre
(http://badc.nerc.ac.uk/home/). Over 8000 daily rainfall records from this network of
rain gauge stations for the day and the day before each event were compiled and
interpolated across the catchments. Inverse distance weighting model was used so
that total rainfall was not overestimated for any event.
UK Climate Impacts Partnership (UKCIP) has produced smaller scale model outputs
based on the HADCM3 (300Km2) called UKCIP02 that is presented in a series of
smaller scale outputs at the 50 x 50 km grid scale. Very recently a series of climate
parameters have been published as UKCIP09 which down-scales the large-scale
model to 25 x25 km. These recent UKCIP09 outputs are incorporated into the model.
UKCIP09 presents the scenarios with a probability distribution function. The scenario
adopted for the model is the 50% range which depicts the most common result of the
downscaled model and used the high emissions scenario (SRES A1FI, based on 810
ppm CO2). Other scenarios were not likely to yield a greater change in the factors
being modelled and the target audience is one whose behaviour indicates a high
emissions future.
The UKCIP09 25km grid outputs for the SW river basin region were interpolated using
a Kriging method. It is acknowledged that this takes the UKCIP model beyond its
intended level of geographic accuracy; the justification was to develop a model as a
communication tool that had a reasonable degree of credibility. The UKCIP09 data is
presented on a grid that has a “rotated pole” projection. The majority of the other data
is presented as either a grid format or point data format with an OSGB projection. To
enable cross-interrogation and combination of the grids requires all data is presented
in the same orientation (at least for MapInfo ® and Vertical Mapper ®). Therefore the
grids are re-projected to a common format.
19
For change factor modelling, the known climatic parameter is increased (or
decreased) by the factor of change from the UKCIP09 data for each part of the grid.
E.g. If the model suggests a rainfall increase by 30% in winter months, the entire
rainfall winter grid of the long-term average data of 1961 to 1990 ( the baseline for the
climate models) is multiplied by 1.3 to give absolute numbers. For interval data, such
as temperature in degrees centigrade, the change was added to the whole grid. The
same change factor approach was done for relative humidity.
Each of these change factors vary across the grid according to the gridded
interpolation and therefore any transformations are executed as “grid to grid”.
It was intended to incorporate a flood risk map based on known historical food events
and their extent. However, the data is not available from the usual sources (South
West Water, EA or the local authorities) The development of flood risk assessment
currently being undertaken by the Environment Agency is not yet available. Level1 of
the flood risk study (North Devon Council and Torridge District Council, 2009
(prepared by the Environment Agency)) highlights the same lack of data.
The data provided for land use, aggregated farm census data, soil texture, nitrogen
leaching and erosion potential information was provided in 1 Km grid format.
Topographical data was provided by the Ordnance Survey though EDINA to give a
100m grid. Coefficients for the overland flows were adopted from Engel (2004).
A GIS layer of unknown origin was provided by the University of Exeter which, after
investigation and consideration was taken to be a cumulative flow path of the
catchments i.e. any point on the map indicated the sum of all lengths of travel for
water in the catchment to reach that point.
The gridded data was imported into “MapInfo ®” geographical information system
(GIS) software which included “Vertical Mapper ®” add-in to provide interpolation and
grid software.
The gridded outputs and feature outputs such as river flows, land-use were analysed
individually using SPSS for correlations and multivariate regression equations to build
the model equations. The 7 gauging station data sets allowed the analysis of 7
catchments as though they were separate because the sub-catchments were small in
comparison to the main.
20
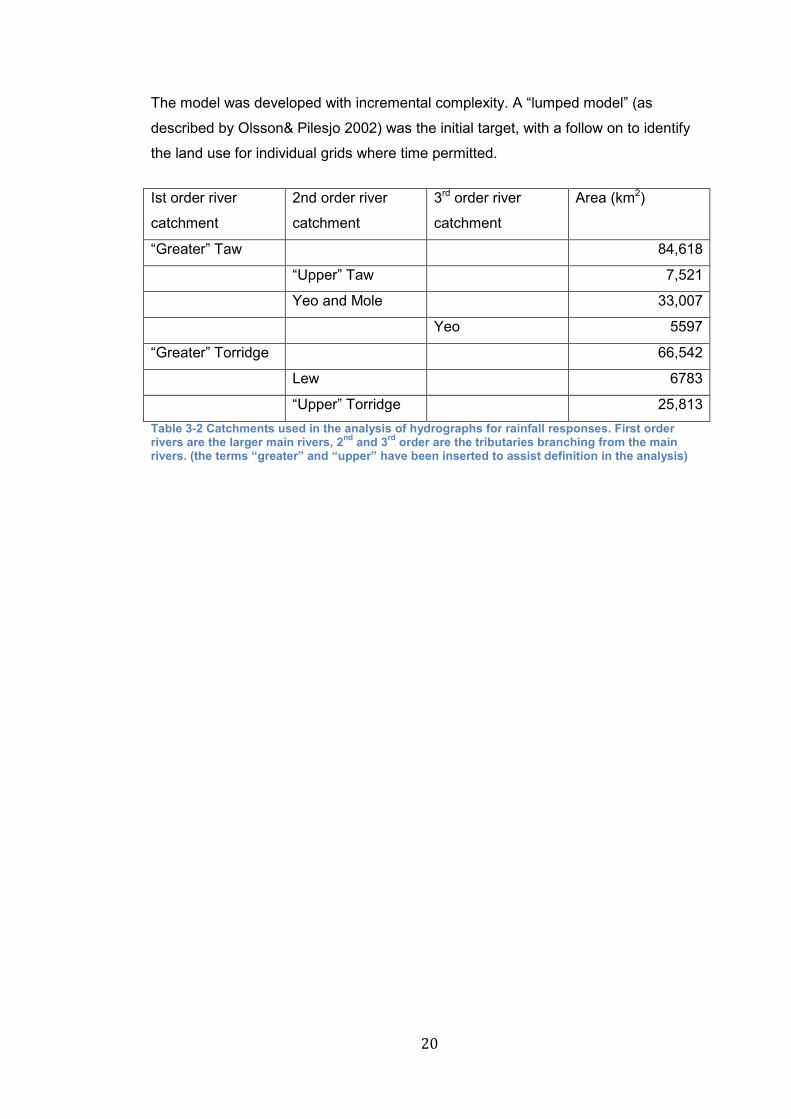
The model was developed with incremental complexity. A “lumped model” (as
described by Olsson& Pilesjo 2002) was the initial target, with a follow on to identify
the land use for individual grids where time permitted.
Ist order river
catchment
2nd order river
catchment
3rd order river
catchment
Area (km2)
“Greater” Taw 84,618
“Upper” Taw 7,521
Yeo and Mole 33,007
Yeo 5597
“Greater” Torridge 66,542
Lew 6783
“Upper” Torridge 25,813
Table 3-2 Catchments used in the analysis of hydrographs for rainfall responses. First order rivers are the larger main rivers, 2
nd and 3
rd order are the tributaries branching from the main
rivers. (the terms “greater” and “upper” have been inserted to assist definition in the analysis)
21
Figure 3-2 Location of gauging stations and catchment boundaries used in the model.
Secondary modelling of these data was done to take account of land-use changes
that might be expected and indicated by the focus groups. For example, more local
food security resulting in more mixed farming including arable, which implies a land-
use change and therefore a change in the hydrological properties of the catchment.
The impact on the hydrographs for the rivers was the primary output.
A summary of the database used for the modelling is shown in table 3.3.
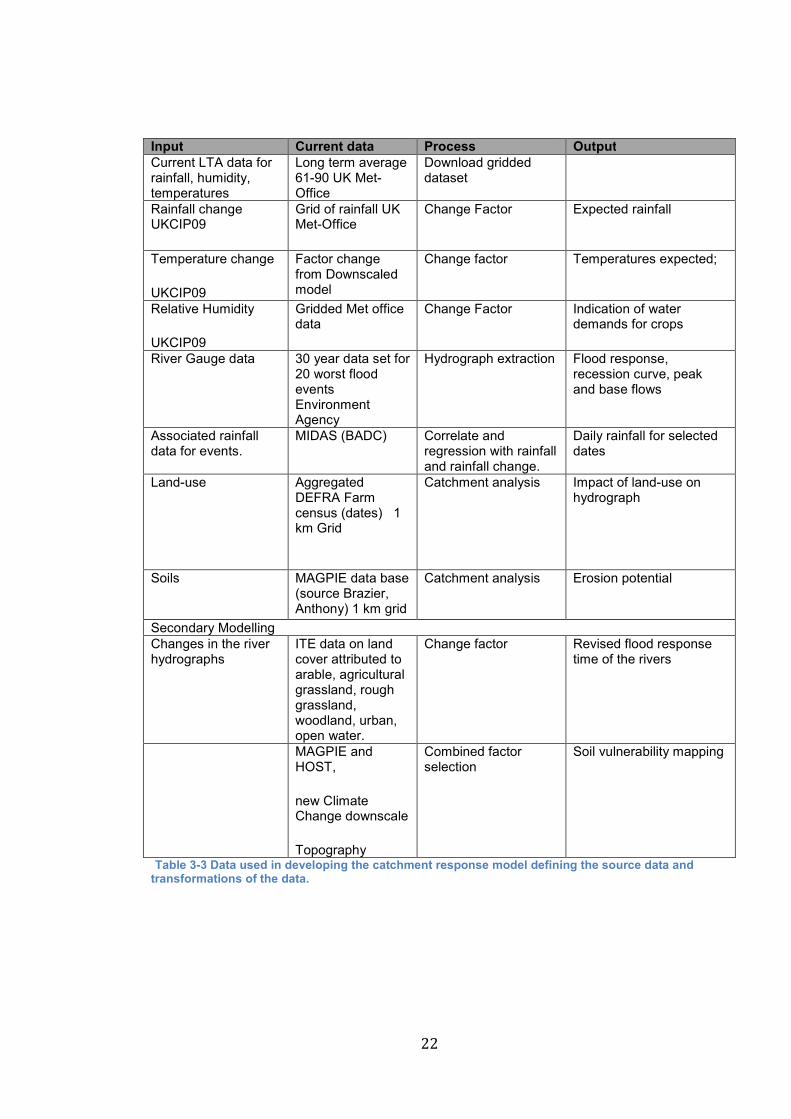
22
Input Current data Process Output
Current LTA data for rainfall, humidity, temperatures
Long term average 61-90 UK Met-Office
Download gridded dataset
Rainfall change UKCIP09
Grid of rainfall UK Met-Office
Change Factor Expected rainfall
Temperature change
UKCIP09
Factor change from Downscaled model
Change factor
Temperatures expected;
Relative Humidity
UKCIP09
Gridded Met office data
Change Factor Indication of water demands for crops
River Gauge data
30 year data set for 20 worst flood events Environment Agency
Hydrograph extraction Flood response, recession curve, peak and base flows
Associated rainfall data for events.
MIDAS (BADC) Correlate and regression with rainfall and rainfall change.
Daily rainfall for selected dates
Land-use
Aggregated DEFRA Farm census (dates) 1 km Grid
Catchment analysis Impact of land-use on hydrograph
Soils MAGPIE data base (source Brazier, Anthony) 1 km grid
Catchment analysis Erosion potential
Secondary Modelling Changes in the river hydrographs
ITE data on land cover attributed to arable, agricultural grassland, rough grassland, woodland, urban, open water.
Change factor Revised flood response time of the rivers
MAGPIE and HOST,
new Climate Change downscale
Topography
Combined factor selection
Soil vulnerability mapping
Table 3-3 Data used in developing the catchment response model defining the source data and transformations of the data.
23
Chapter 4 RESULTS AND ANALYSIS
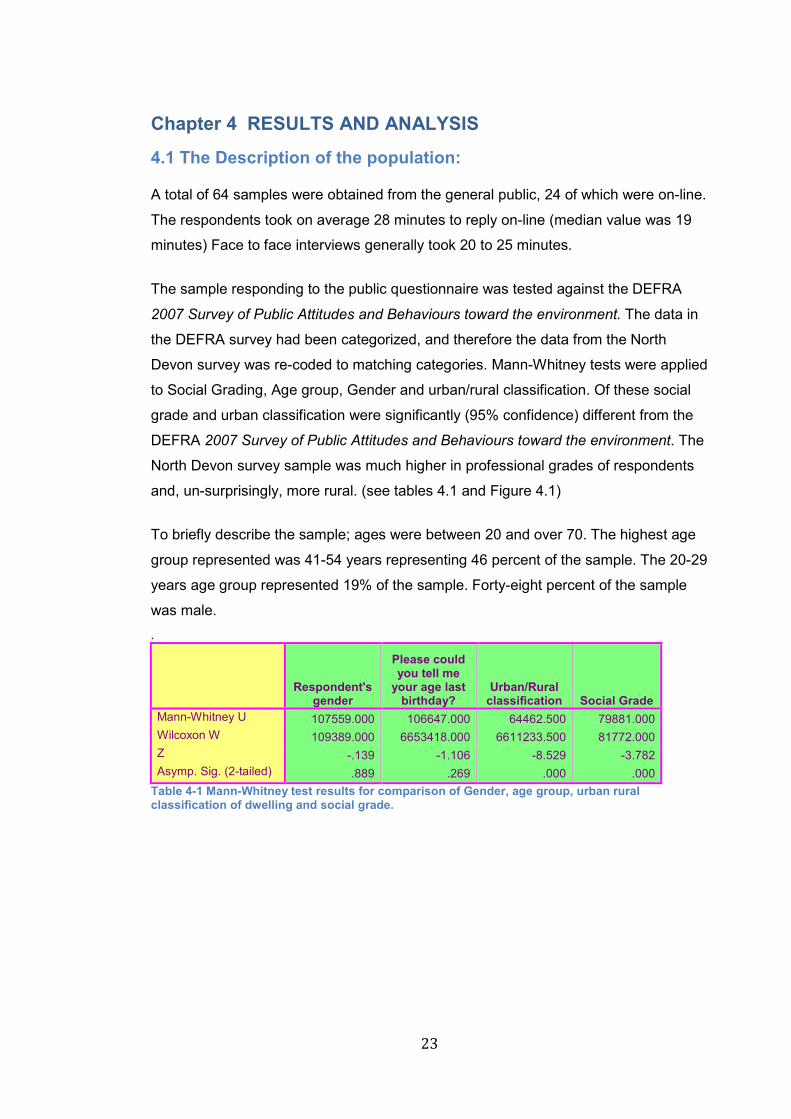
4.1 The Description of the population:
A total of 64 samples were obtained from the general public, 24 of which were on-line.
The respondents took on average 28 minutes to reply on-line (median value was 19
minutes) Face to face interviews generally took 20 to 25 minutes.
The sample responding to the public questionnaire was tested against the DEFRA
2007 Survey of Public Attitudes and Behaviours toward the environment. The data in
the DEFRA survey had been categorized, and therefore the data from the North
Devon survey was re-coded to matching categories. Mann-Whitney tests were applied
to Social Grading, Age group, Gender and urban/rural classification. Of these social
grade and urban classification were significantly (95% confidence) different from the
DEFRA 2007 Survey of Public Attitudes and Behaviours toward the environment. The
North Devon survey sample was much higher in professional grades of respondents
and, un-surprisingly, more rural. (see tables 4.1 and Figure 4.1)
To briefly describe the sample; ages were between 20 and over 70. The highest age
group represented was 41-54 years representing 46 percent of the sample. The 20-29
years age group represented 19% of the sample. Forty-eight percent of the sample
was male.
.
Respondent's
gender
Please could you tell me your age last birthday?
Urban/Rural classification Social Grade
Mann-Whitney U 107559.000 106647.000 64462.500 79881.000 Wilcoxon W 109389.000 6653418.000 6611233.500 81772.000 Z -.139 -1.106 -8.529 -3.782 Asymp. Sig. (2-tailed) .889 .269 .000 .000
Table 4-1 Mann-Whitney test results for comparison of Gender, age group, urban rural classification of dwelling and social grade.
24
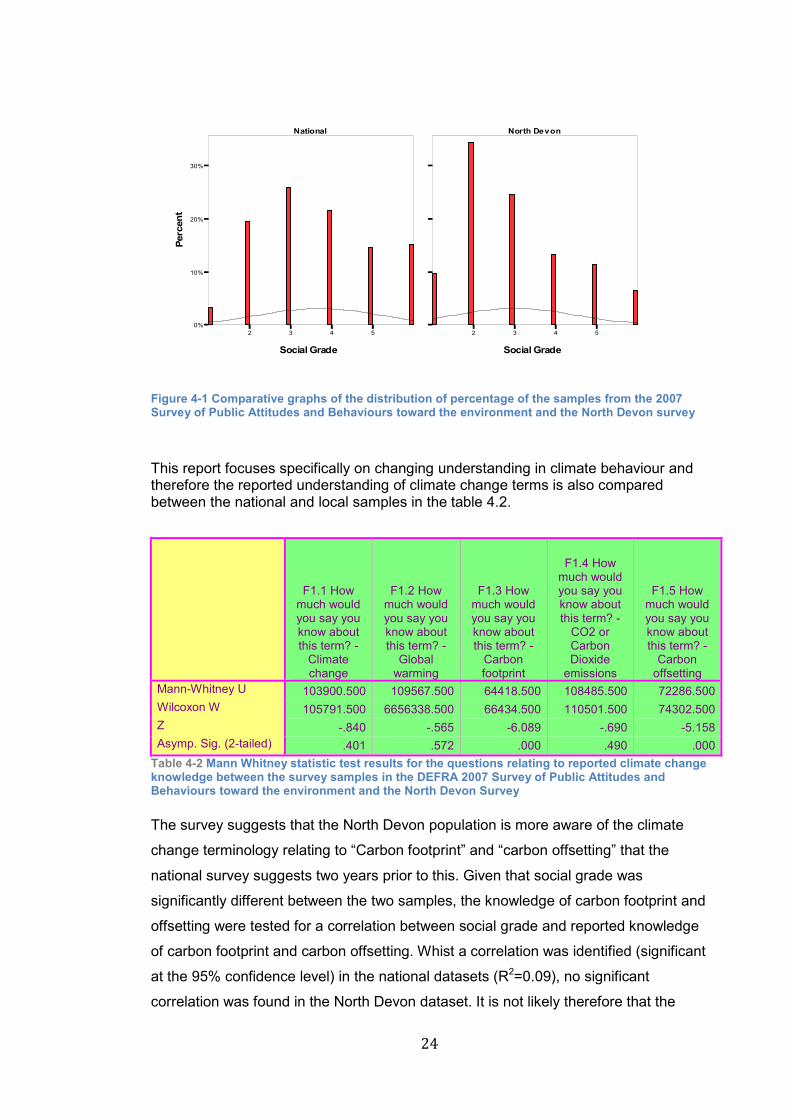
Figure 4-1 Comparative graphs of the distribution of percentage of the samples from the 2007 Survey of Public Attitudes and Behaviours toward the environment and the North Devon survey
This report focuses specifically on changing understanding in climate behaviour and therefore the reported understanding of climate change terms is also compared between the national and local samples in the table 4.2.
F1.1 How much would you say you know about this term? -
Climate change
F1.2 How much would you say you know about this term? -
Global warming
F1.3 How much would you say you know about this term? -
Carbon footprint
F1.4 How much would you say you know about this term? -
CO2 or Carbon Dioxide
emissions
F1.5 How much would you say you know about this term? -
Carbon offsetting
Mann-Whitney U 103900.500 109567.500 64418.500 108485.500 72286.500 Wilcoxon W 105791.500 6656338.500 66434.500 110501.500 74302.500 Z -.840 -.565 -6.089 -.690 -5.158 Asymp. Sig. (2-tailed) .401 .572 .000 .490 .000
Table 4-2 Mann Whitney statistic test results for the questions relating to reported climate change knowledge between the survey samples in the DEFRA 2007 Survey of Public Attitudes and Behaviours toward the environment and the North Devon Survey
The survey suggests that the North Devon population is more aware of the climate
change terminology relating to “Carbon footprint” and “carbon offsetting” that the
national survey suggests two years prior to this. Given that social grade was
significantly different between the two samples, the knowledge of carbon footprint and
offsetting were tested for a correlation between social grade and reported knowledge
of carbon footprint and carbon offsetting. Whist a correlation was identified (significant
at the 95% confidence level) in the national datasets (R2=0.09), no significant
correlation was found in the North Devon dataset. It is not likely therefore that the
2 3 4 5
Social Grade
0%
10%
20%
30%
Percent
National North Devon
2 3 4 5
Social Grade
25
difference in understanding of these terms is related to social grading. We therefore
conclude that the North Devon sample of people reports to be more climate
terminology aware than the national dataset taken in 2007. The reasons for this might
be related to publicity, information campaigns or policy activity in the intervening two
years. These may include the development of the Climate Change Act 2008, local
planning applications and decisions relating to energy installations as well as national
media and local campaigns.
4.2 The Environmental attitudes of the North Devon survey
From this point forward the analysis of the questionnaire will relate to the North Devon
survey only. The North Devon sample was tested for differences in the gender, age
and social grading between those who completed the survey online form those who
completed face to face, through a “t” test. No significant difference in the means was
highlighted at the 95% confidence limit. We can therefore regard the 2 samples as
representative of the same population.
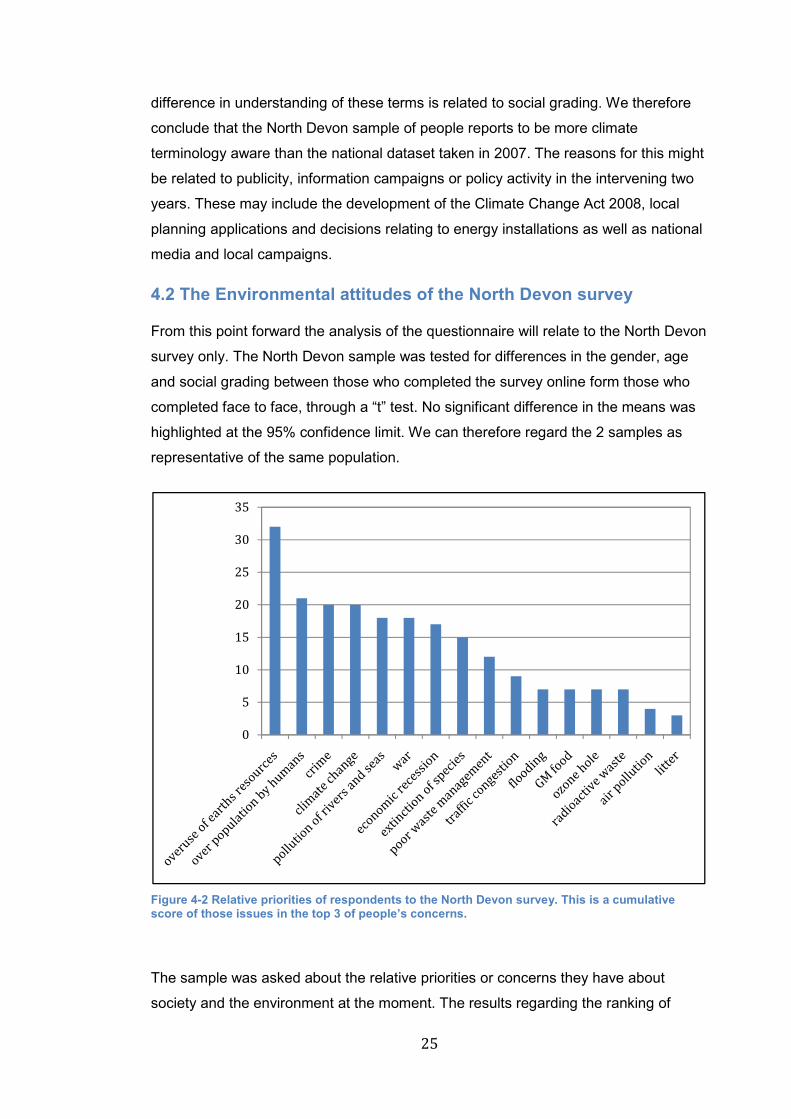
Figure 4-2 Relative priorities of respondents to the North Devon survey. This is a cumulative score of those issues in the top 3 of people’s concerns.
The sample was asked about the relative priorities or concerns they have about
society and the environment at the moment. The results regarding the ranking of
0
5
10
15
20
25
30
35
26
concerns can be seen in figure 4.2. Climate change appears as ranked jointly 3rd in
the set of concerns.
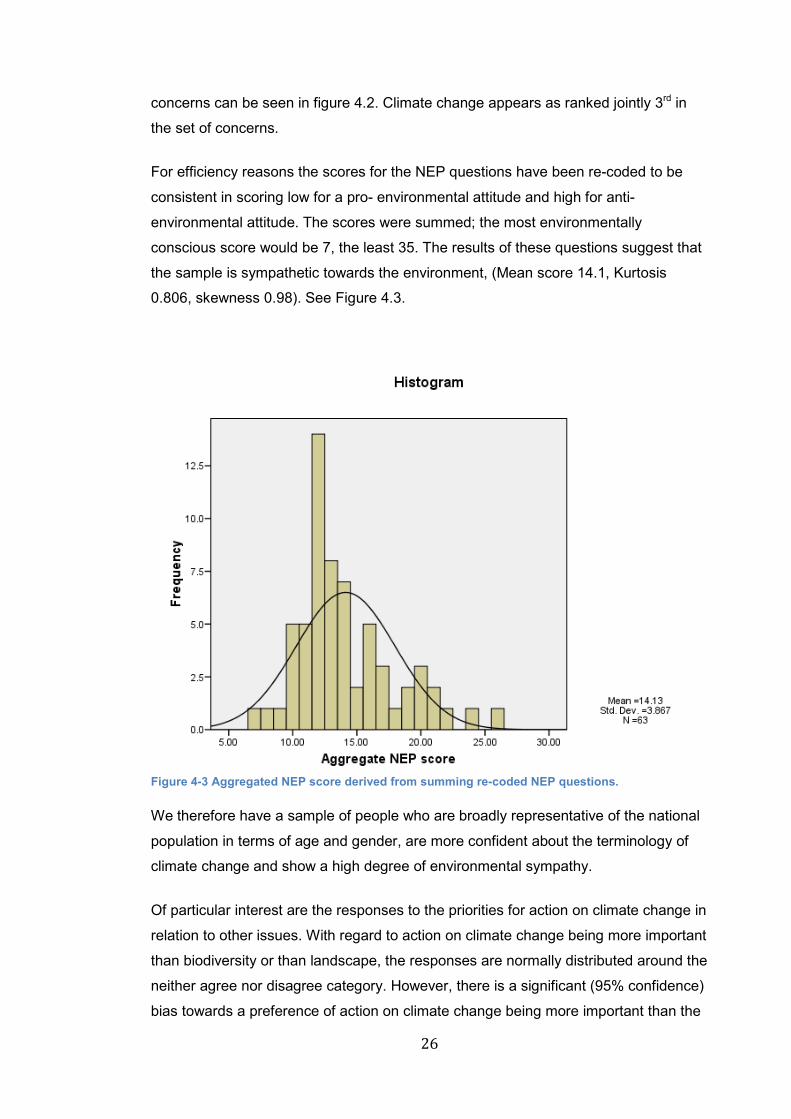
For efficiency reasons the scores for the NEP questions have been re-coded to be
consistent in scoring low for a pro- environmental attitude and high for anti-
environmental attitude. The scores were summed; the most environmentally
conscious score would be 7, the least 35. The results of these questions suggest that
the sample is sympathetic towards the environment, (Mean score 14.1, Kurtosis
0.806, skewness 0.98). See Figure 4.3.
Figure 4-3 Aggregated NEP score derived from summing re-coded NEP questions.
We therefore have a sample of people who are broadly representative of the national
population in terms of age and gender, are more confident about the terminology of
climate change and show a high degree of environmental sympathy.
Of particular interest are the responses to the priorities for action on climate change in
relation to other issues. With regard to action on climate change being more important
than biodiversity or than landscape, the responses are normally distributed around the
neither agree nor disagree category. However, there is a significant (95% confidence)
bias towards a preference of action on climate change being more important than the
27
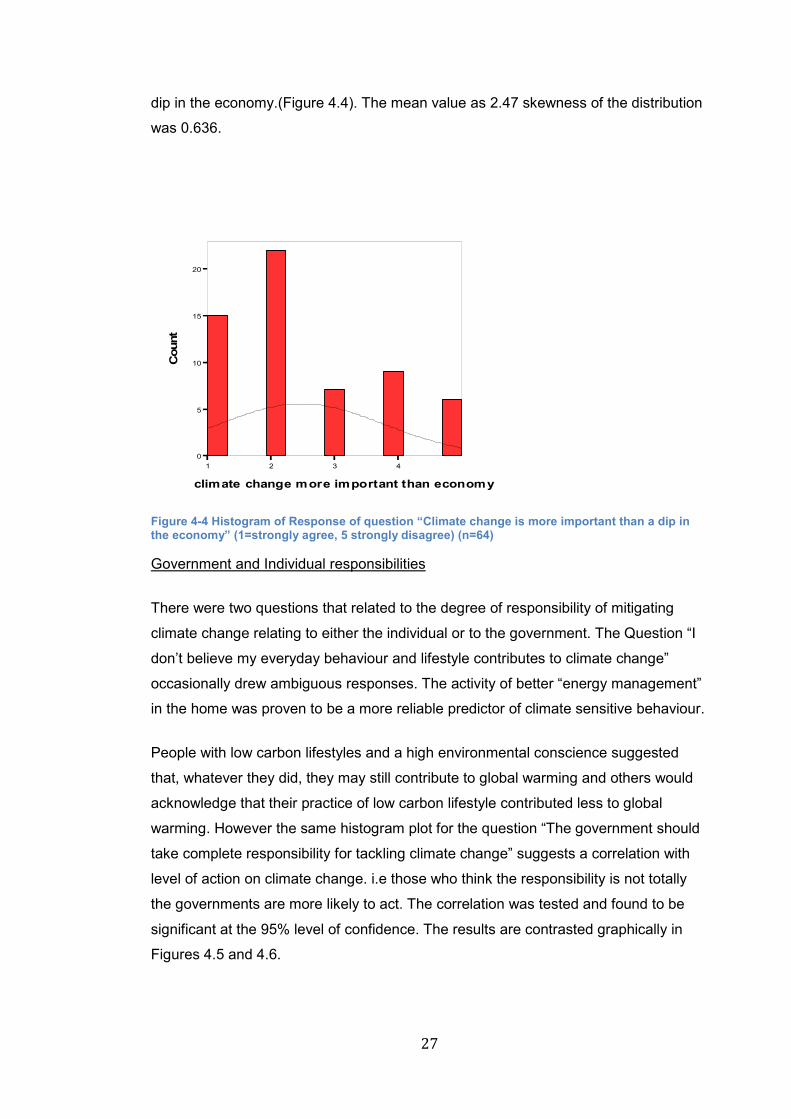
dip in the economy.(Figure 4.4). The mean value as 2.47 skewness of the distribution
was 0.636.
Figure 4-4 Histogram of Response of question “Climate change is more important than a dip in the economy” (1=strongly agree, 5 strongly disagree) (n=64)
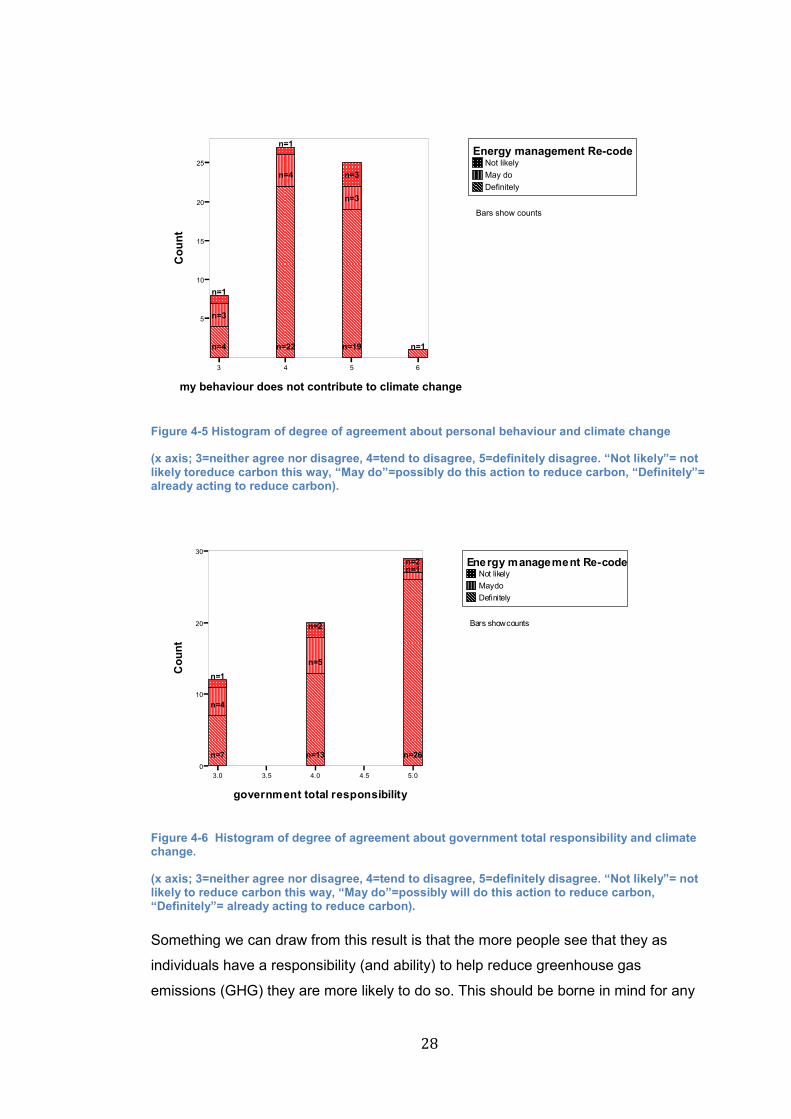
Government and Individual responsibilities
There were two questions that related to the degree of responsibility of mitigating
climate change relating to either the individual or to the government. The Question “I
don’t believe my everyday behaviour and lifestyle contributes to climate change”
occasionally drew ambiguous responses. The activity of better “energy management”
in the home was proven to be a more reliable predictor of climate sensitive behaviour.
People with low carbon lifestyles and a high environmental conscience suggested
that, whatever they did, they may still contribute to global warming and others would
acknowledge that their practice of low carbon lifestyle contributed less to global
warming. However the same histogram plot for the question “The government should
take complete responsibility for tackling climate change” suggests a correlation with
level of action on climate change. i.e those who think the responsibility is not totally
the governments are more likely to act. The correlation was tested and found to be
significant at the 95% level of confidence. The results are contrasted graphically in
Figures 4.5 and 4.6.
1 2 3 4
climate change more important than economy
0
5
10
15
20
Count
28
Figure 4-5 Histogram of degree of agreement about personal behaviour and climate change
(x axis; 3=neither agree nor disagree, 4=tend to disagree, 5=definitely disagree. “Not likely”= not likely toreduce carbon this way, “May do”=possibly do this action to reduce carbon, “Definitely”= already acting to reduce carbon).
Figure 4-6 Histogram of degree of agreement about government total responsibility and climate change.
(x axis; 3=neither agree nor disagree, 4=tend to disagree, 5=definitely disagree. “Not likely”= not likely to reduce carbon this way, “May do”=possibly will do this action to reduce carbon, “Definitely”= already acting to reduce carbon).
Something we can draw from this result is that the more people see that they as
individuals have a responsibility (and ability) to help reduce greenhouse gas
emissions (GHG) they are more likely to do so. This should be borne in mind for any
Not likely
May do
Definitely
Energy management Re-code
Bars show counts
3 4 5 6
my behaviour does not contribute to climate change
5
10
15
20
25
Count
n=4
n=3
n=1
n=22
n=4
n=1
n=19
n=3
n=3
n=1
Not likely
May do
Definitely
Energy management Re-code
Bars show counts
3.0 3.5 4.0 4.5 5.0
government total responsibility
0
10
20
30
Count
n=7
n=4
n=1
n=13
n=5
n=2
n=26
n=1n=2
29
information and campaigns on climate change behaviour.
The survey was designed to test for a relationship between a sense of futility and
reported actions. However, none of the respondents strongly agree or tend to agree
that the “climate is beyond control”. The same response applies to the question
whether the “effects of climate change are too far in the future to affect them”. This
can be a reflection of the fact that this is a coastal community, where the impacts of
sea-level rise are already evident.
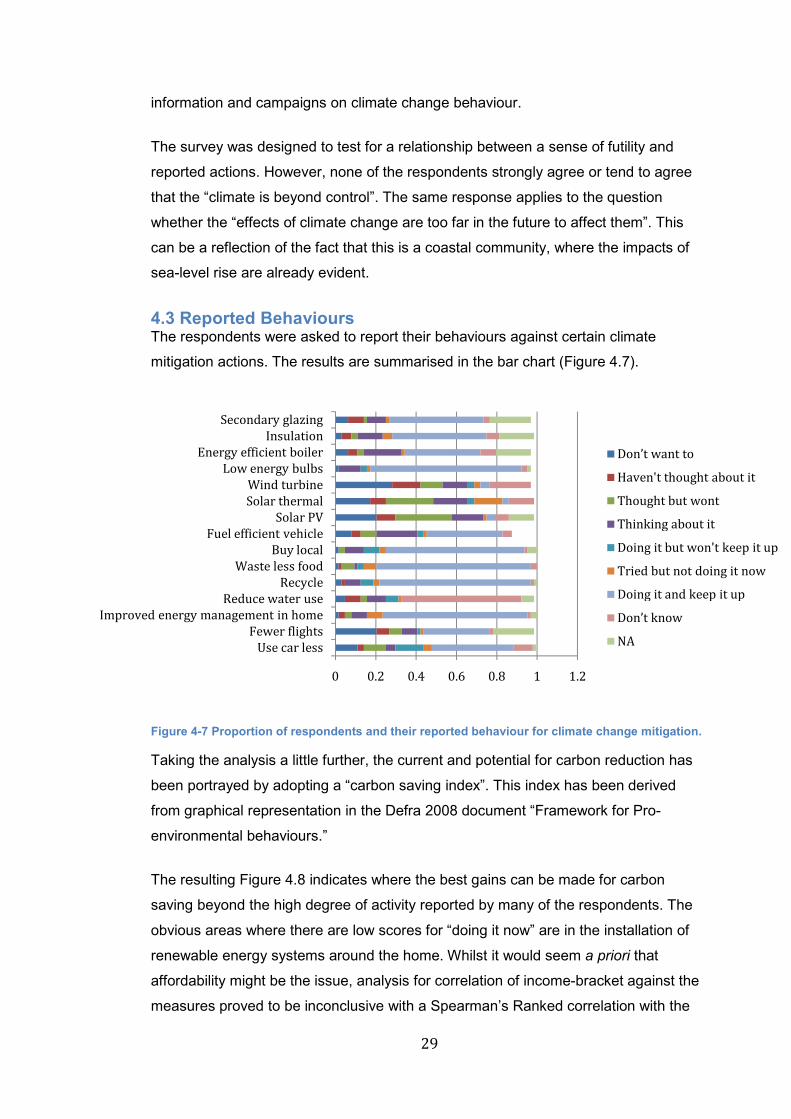
4.3 Reported Behaviours The respondents were asked to report their behaviours against certain climate
mitigation actions. The results are summarised in the bar chart (Figure 4.7).
Figure 4-7 Proportion of respondents and their reported behaviour for climate change mitigation.
Taking the analysis a little further, the current and potential for carbon reduction has
been portrayed by adopting a “carbon saving index”. This index has been derived
from graphical representation in the Defra 2008 document “Framework for Pro-
environmental behaviours.”
The resulting Figure 4.8 indicates where the best gains can be made for carbon
saving beyond the high degree of activity reported by many of the respondents. The
obvious areas where there are low scores for “doing it now” are in the installation of
renewable energy systems around the home. Whilst it would seem a priori that
affordability might be the issue, analysis for correlation of income-bracket against the
measures proved to be inconclusive with a Spearman’s Ranked correlation with the
0 0.2 0.4 0.6 0.8 1 1.2
Use car less
Fewer flights
Improved energy management in home
Reduce water use
Recycle
Waste less food
Buy local
Fuel efficient vehicle
Solar PV
Solar thermal
Wind turbine
Low energy bulbs
Energy efficient boiler
Insulation
Secondary glazing
Don’t want to
Haven't thought about it
Thought but wont
Thinking about it
Doing it but won't keep it up
Tried but not doing it now
Doing it and keep it up
Don’t know
NA
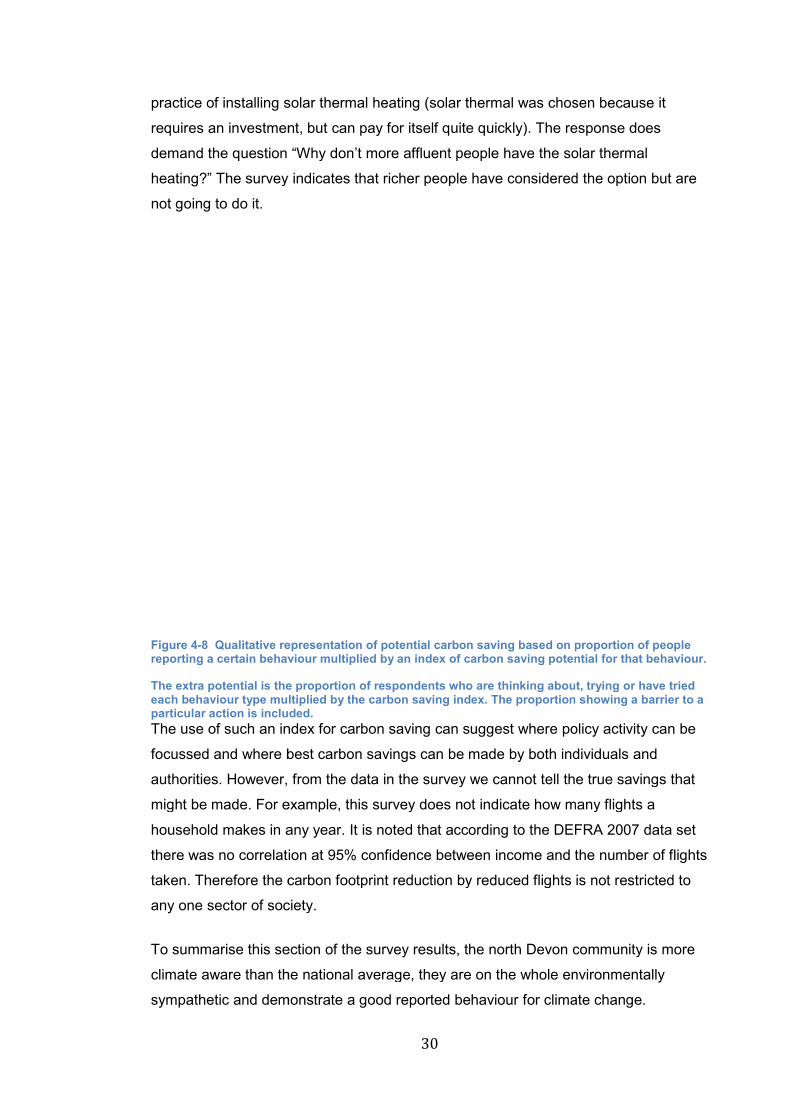
practice of installing solar thermal heating (solar thermal was chos
requires an investment, but can pay for itself quite quickly).
demand the question
heating?” The survey indicates that richer people h
not going to do it.
Figure 4-8 Qualitative representation of potential carbon saving based on proportion of people reporting a certain behaviour multiplied by an index of c
The extra potential is the proportion of respondents who are thinking about, trying or have tried each behaviour type multiplied by the carbon saving index. The proportion showing a barrier to a particular action is included.
The use of such an index for carbon saving can suggest where policy activity can be
focussed and where best carbon savings can be made by both individuals and
authorities. However,
might be made. For example
household makes in any year.
there was no correlation at 95% confidence between income
taken. Therefore the carbon footprint reduction by reduced flights
any one sector of society.
To summarise this section
climate aware than the national average, they are on the whole envi
sympathetic and demonstrate a good reported behaviour for climate change.
30
practice of installing solar thermal heating (solar thermal was chos
requires an investment, but can pay for itself quite quickly). The response does
demand the question “Why don’t more affluent people have the solar thermal
The survey indicates that richer people have considered the option but are
Qualitative representation of potential carbon saving based on proportion of people reporting a certain behaviour multiplied by an index of carbon saving potential for that behaviour.
The extra potential is the proportion of respondents who are thinking about, trying or have tried each behaviour type multiplied by the carbon saving index. The proportion showing a barrier to a
is included.
The use of such an index for carbon saving can suggest where policy activity can be
focussed and where best carbon savings can be made by both individuals and
, from the data in the survey we cannot tell the true savings th
might be made. For example, this survey does not indicate how many flights a
household makes in any year. It is noted that according to the DEFRA 2007
there was no correlation at 95% confidence between income and the number of flights
erefore the carbon footprint reduction by reduced flights
sector of society.
section of the survey results, the north Devon community is more
climate aware than the national average, they are on the whole envi
sympathetic and demonstrate a good reported behaviour for climate change.
practice of installing solar thermal heating (solar thermal was chosen because it
The response does
Why don’t more affluent people have the solar thermal
ave considered the option but are
Qualitative representation of potential carbon saving based on proportion of people arbon saving potential for that behaviour.
The extra potential is the proportion of respondents who are thinking about, trying or have tried each behaviour type multiplied by the carbon saving index. The proportion showing a barrier to a
The use of such an index for carbon saving can suggest where policy activity can be
focussed and where best carbon savings can be made by both individuals and
from the data in the survey we cannot tell the true savings that
this survey does not indicate how many flights a
DEFRA 2007 data set
and the number of flights
erefore the carbon footprint reduction by reduced flights is not restricted to
community is more
climate aware than the national average, they are on the whole environmentally
sympathetic and demonstrate a good reported behaviour for climate change.
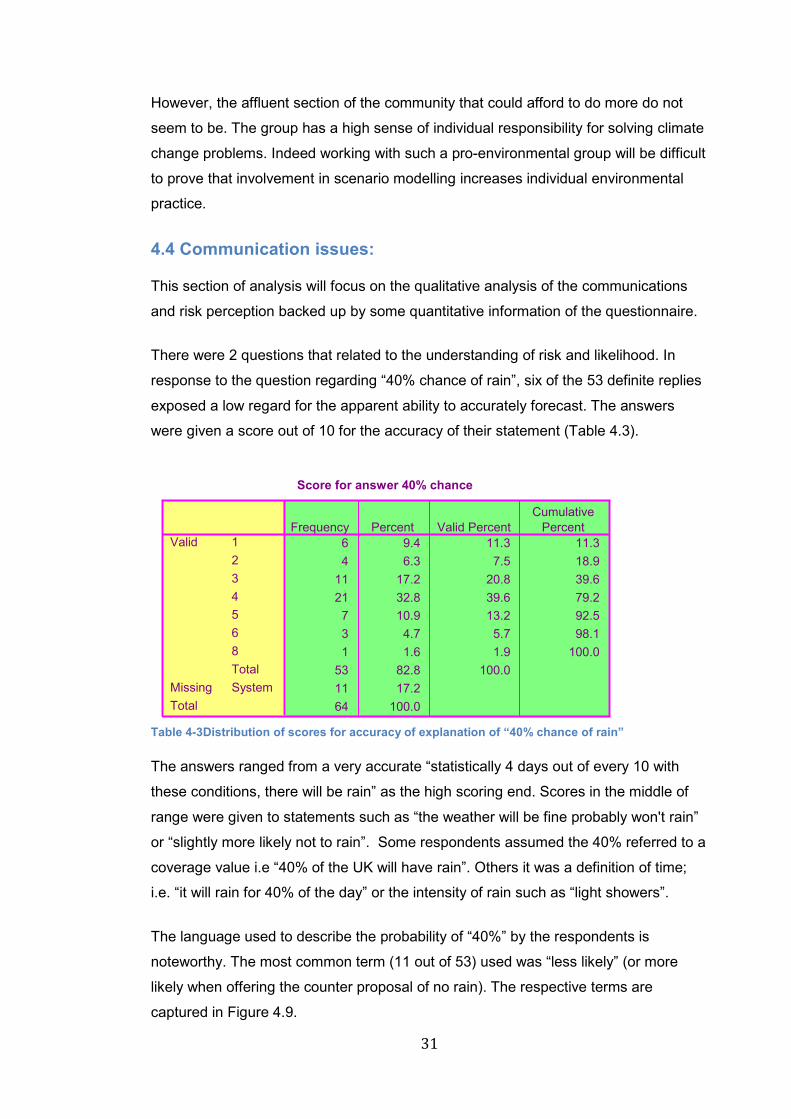
31
However, the affluent section of the community that could afford to do more do not
seem to be. The group has a high sense of individual responsibility for solving climate
change problems. Indeed working with such a pro-environmental group will be difficult
to prove that involvement in scenario modelling increases individual environmental
practice.
4.4 Communication issues:
This section of analysis will focus on the qualitative analysis of the communications
and risk perception backed up by some quantitative information of the questionnaire.
There were 2 questions that related to the understanding of risk and likelihood. In
response to the question regarding “40% chance of rain”, six of the 53 definite replies
exposed a low regard for the apparent ability to accurately forecast. The answers
were given a score out of 10 for the accuracy of their statement (Table 4.3).
Table 4-3Distribution of scores for accuracy of explanation of “40% chance of rain”
The answers ranged from a very accurate “statistically 4 days out of every 10 with
these conditions, there will be rain” as the high scoring end. Scores in the middle of
range were given to statements such as “the weather will be fine probably won't rain”
or “slightly more likely not to rain”. Some respondents assumed the 40% referred to a
coverage value i.e “40% of the UK will have rain”. Others it was a definition of time;
i.e. “it will rain for 40% of the day” or the intensity of rain such as “light showers”.
The language used to describe the probability of “40%” by the respondents is
noteworthy. The most common term (11 out of 53) used was “less likely” (or more
likely when offering the counter proposal of no rain). The respective terms are
captured in Figure 4.9.
Score for answer 40% chance
6 9.4 11.3 11.3
4 6.3 7.5 18.9
11 17.2 20.8 39.6
21 32.8 39.6 79.2
7 10.9 13.2 92.5
3 4.7 5.7 98.1
1 1.6 1.9 100.0
53 82.8 100.0
11 17.2
64 100.0
1
2
3
4
5
6
8
Total
Valid
SystemMissing
Total
Frequency Percent Valid PercentCumulative
Percent
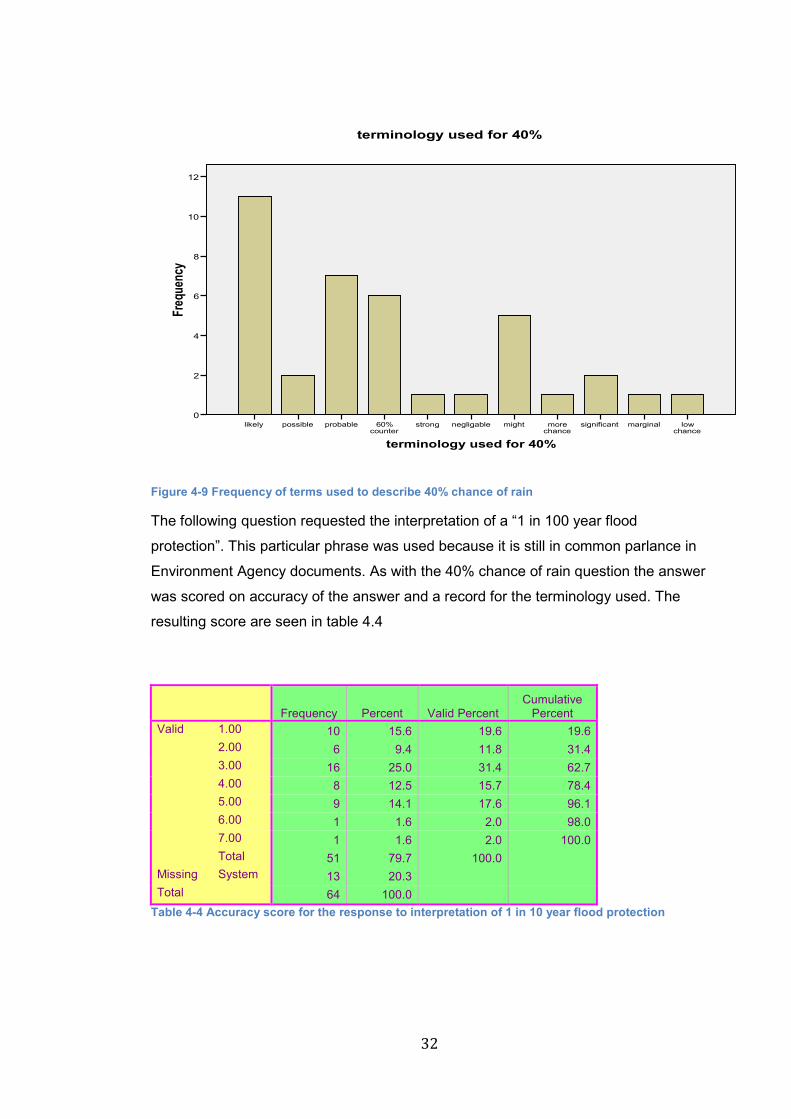
32
Figure 4-9 Frequency of terms used to describe 40% chance of rain
The following question requested the interpretation of a “1 in 100 year flood
protection”. This particular phrase was used because it is still in common parlance in
Environment Agency documents. As with the 40% chance of rain question the answer
was scored on accuracy of the answer and a record for the terminology used. The
resulting score are seen in table 4.4
Frequency Percent Valid Percent Cumulative
Percent Valid 1.00 10 15.6 19.6 19.6
2.00 6 9.4 11.8 31.4 3.00 16 25.0 31.4 62.7 4.00 8 12.5 15.7 78.4 5.00 9 14.1 17.6 96.1 6.00 1 1.6 2.0 98.0 7.00 1 1.6 2.0 100.0 Total 51 79.7 100.0
Missing System 13 20.3 Total 64 100.0
Table 4-4 Accuracy score for the response to interpretation of 1 in 10 year flood protection
terminology used for 40%
low chance
marginalsignificantmore chance
mightnegligablestrong60% counter
probablepossiblelikely
Frequ
ency
12
10
8
6
4
2
0
terminology used for 40%
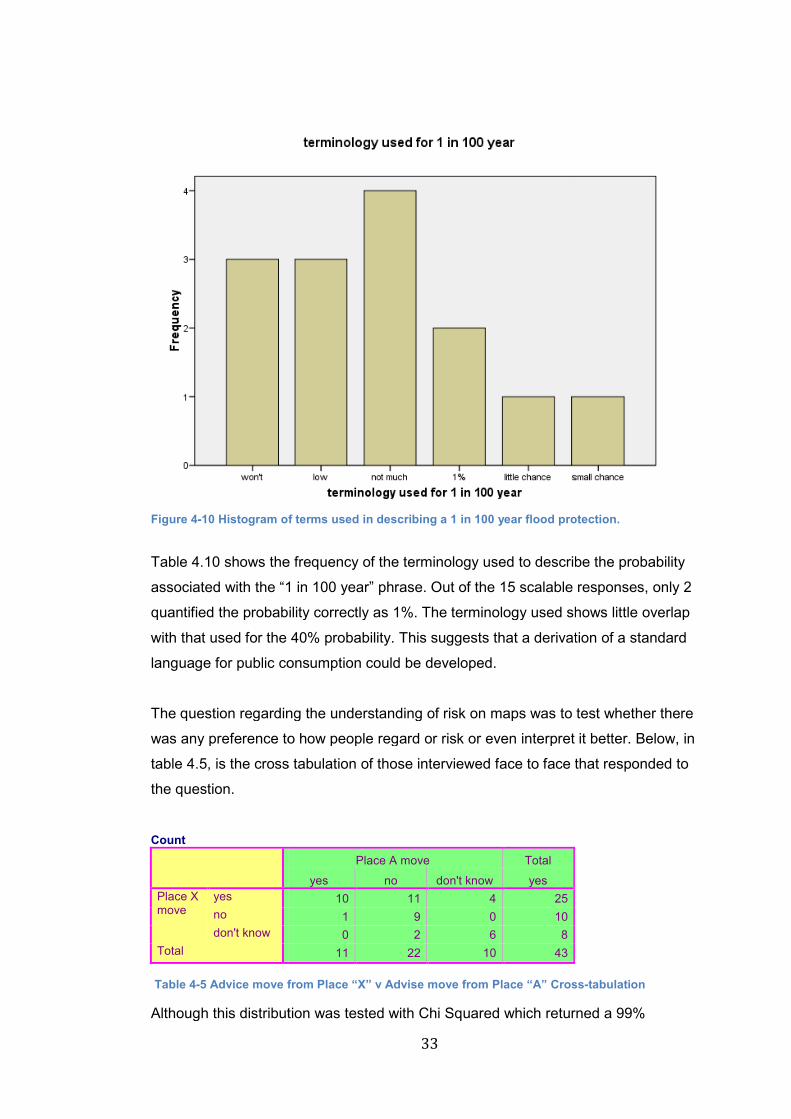
Figure 4-10 Histogram of terms used in describing a 1 in 100 year flood protection.
Table 4.10 shows the frequency of the terminology used to describe the probability
associated with the “1 in 1
quantified the probability correctly as 1%. The terminology used shows little overlap
with that used for the 40% probability. This suggests that a derivation of a standard
language for public consum
The question regarding the
was any preference to how people regard or risk or even interpret it better. Below
table 4.5, is the cross tabulation of those interviewed f
the question.
Count
Place X move
yes
no
don't know
Total
Table 4-5 Advice move from Place “X” v Advise move from Place “A” Cross
Although this distribution was tested with Chi Squared which returned a 99%
33
Histogram of terms used in describing a 1 in 100 year flood protection.
shows the frequency of the terminology used to describe the probability
associated with the “1 in 100 year” phrase. Out of the 15 scalable responses, only 2
quantified the probability correctly as 1%. The terminology used shows little overlap
with that used for the 40% probability. This suggests that a derivation of a standard
consumption could be developed.
question regarding the understanding of risk on maps was to test
was any preference to how people regard or risk or even interpret it better. Below
is the cross tabulation of those interviewed face to face that responded to
Place A move Total
yes no don't know yes
10 11 4 25
1 9 0 10
0 2 6 8
11 22 10 43
from Place “X” v Advise move from Place “A” Cross
Although this distribution was tested with Chi Squared which returned a 99%
Histogram of terms used in describing a 1 in 100 year flood protection.
shows the frequency of the terminology used to describe the probability
00 year” phrase. Out of the 15 scalable responses, only 2
quantified the probability correctly as 1%. The terminology used shows little overlap
with that used for the 40% probability. This suggests that a derivation of a standard
understanding of risk on maps was to test whether there
was any preference to how people regard or risk or even interpret it better. Below, in
ace to face that responded to
from Place “X” v Advise move from Place “A” Cross-tabulation
Although this distribution was tested with Chi Squared which returned a 99%
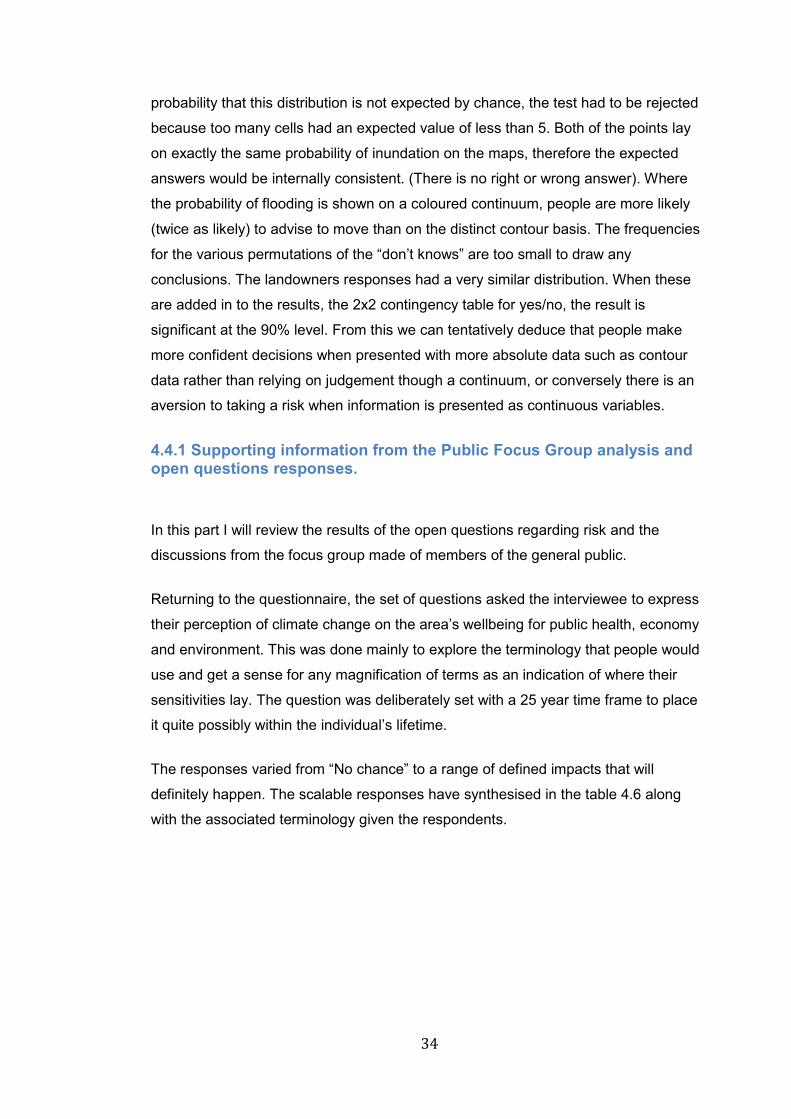
34
probability that this distribution is not expected by chance, the test had to be rejected
because too many cells had an expected value of less than 5. Both of the points lay
on exactly the same probability of inundation on the maps, therefore the expected
answers would be internally consistent. (There is no right or wrong answer). Where
the probability of flooding is shown on a coloured continuum, people are more likely
(twice as likely) to advise to move than on the distinct contour basis. The frequencies
for the various permutations of the “don’t knows” are too small to draw any
conclusions. The landowners responses had a very similar distribution. When these
are added in to the results, the 2x2 contingency table for yes/no, the result is
significant at the 90% level. From this we can tentatively deduce that people make
more confident decisions when presented with more absolute data such as contour
data rather than relying on judgement though a continuum, or conversely there is an
aversion to taking a risk when information is presented as continuous variables.
4.4.1 Supporting information from the Public Focus Group analysis and open questions responses.
In this part I will review the results of the open questions regarding risk and the
discussions from the focus group made of members of the general public.
Returning to the questionnaire, the set of questions asked the interviewee to express
their perception of climate change on the area’s wellbeing for public health, economy
and environment. This was done mainly to explore the terminology that people would
use and get a sense for any magnification of terms as an indication of where their
sensitivities lay. The question was deliberately set with a 25 year time frame to place
it quite possibly within the individual’s lifetime.
The responses varied from “No chance” to a range of defined impacts that will
definitely happen. The scalable responses have synthesised in the table 4.6 along
with the associated terminology given the respondents.
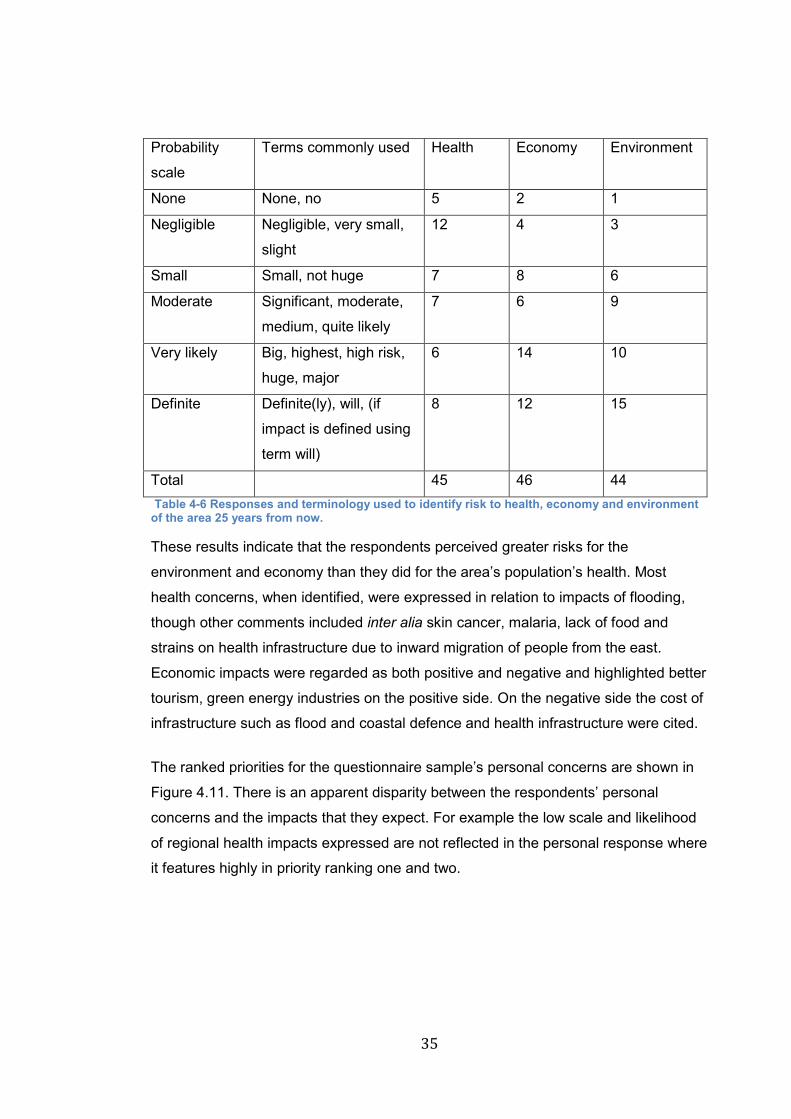
35
Probability
scale
Terms commonly used Health Economy Environment
None None, no 5 2 1
Negligible Negligible, very small,
slight
12 4 3
Small Small, not huge 7 8 6
Moderate Significant, moderate,
medium, quite likely
7 6 9
Very likely Big, highest, high risk,
huge, major
6 14 10
Definite Definite(ly), will, (if
impact is defined using
term will)
8 12 15
Total 45 46 44
Table 4-6 Responses and terminology used to identify risk to health, economy and environment of the area 25 years from now.
These results indicate that the respondents perceived greater risks for the
environment and economy than they did for the area’s population’s health. Most
health concerns, when identified, were expressed in relation to impacts of flooding,
though other comments included inter alia skin cancer, malaria, lack of food and
strains on health infrastructure due to inward migration of people from the east.
Economic impacts were regarded as both positive and negative and highlighted better
tourism, green energy industries on the positive side. On the negative side the cost of
infrastructure such as flood and coastal defence and health infrastructure were cited.
The ranked priorities for the questionnaire sample’s personal concerns are shown in
Figure 4.11. There is an apparent disparity between the respondents’ personal
concerns and the impacts that they expect. For example the low scale and likelihood
of regional health impacts expressed are not reflected in the personal response where
it features highly in priority ranking one and two.
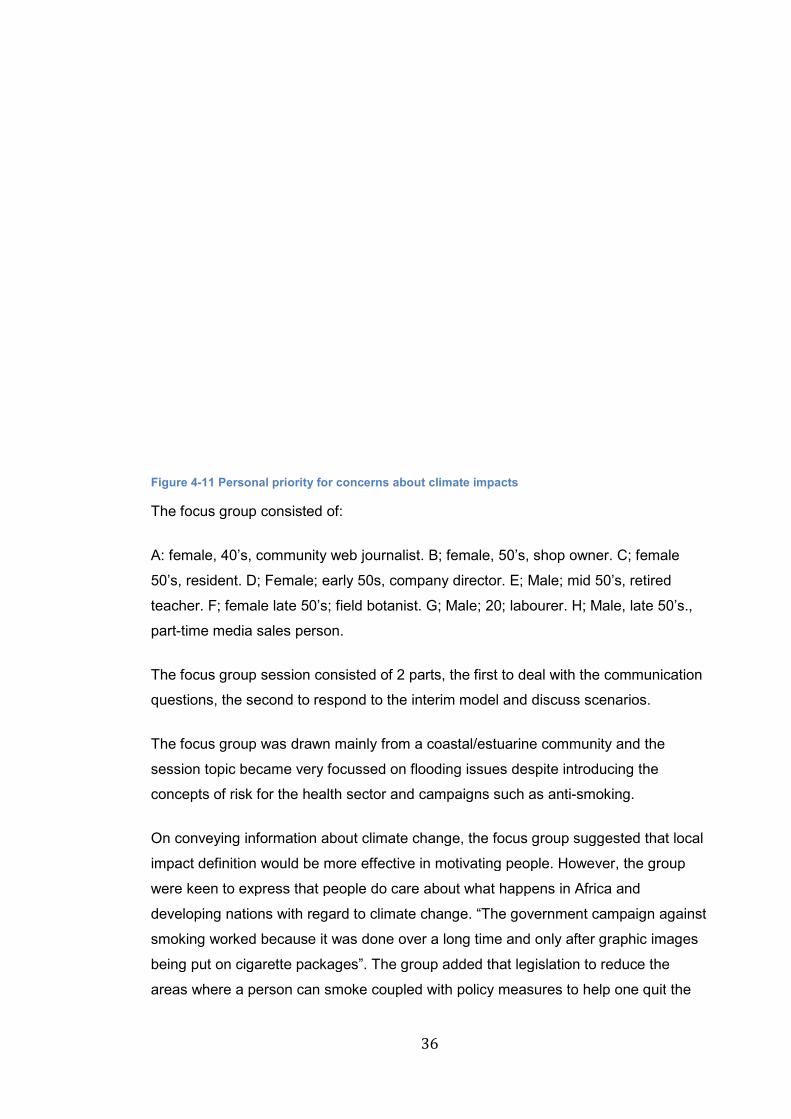
Figure 4-11 Personal priority for concerns about climate impacts
The focus group consisted of
A: female, 40’s, community
50’s, resident. D; Female; early 50s, company director. E; Male; mid 50’s, retired
teacher. F; female late 50’s;
part-time media sales person.
The focus group session consisted of 2 parts, the first to deal with the communication
questions, the second to respond to the interim model and discuss scenarios.
The focus group was drawn mainly from a coastal/estuarine community and the
session topic became very focussed on flooding issues despite introducing the
concepts of risk for the health sector and campaigns such as
On conveying information about climate change, the
impact definition would
were keen to express that people do care about what happens in Africa and
developing nations with regard to climate change. “The government campaign against
smoking worked because it was done over a long time and only after gr
being put on cigarette packages
areas where a person can smoke coupled with p
36
Personal priority for concerns about climate impacts
focus group consisted of:
A: female, 40’s, community web journalist. B; female, 50’s, shop owner. C; female
50’s, resident. D; Female; early 50s, company director. E; Male; mid 50’s, retired
teacher. F; female late 50’s; field botanist. G; Male; 20; labourer. H; Male, late 50’s.,
media sales person.
The focus group session consisted of 2 parts, the first to deal with the communication
questions, the second to respond to the interim model and discuss scenarios.
The focus group was drawn mainly from a coastal/estuarine community and the
session topic became very focussed on flooding issues despite introducing the
concepts of risk for the health sector and campaigns such as anti-
On conveying information about climate change, the focus group suggested that local
impact definition would be more effective in motivating people. However, the group
were keen to express that people do care about what happens in Africa and
developing nations with regard to climate change. “The government campaign against
smoking worked because it was done over a long time and only after gr
being put on cigarette packages”. The group added that legislation to reduce the
areas where a person can smoke coupled with policy measures to help one quit
. B; female, 50’s, shop owner. C; female
50’s, resident. D; Female; early 50s, company director. E; Male; mid 50’s, retired
rer. H; Male, late 50’s.,
The focus group session consisted of 2 parts, the first to deal with the communication
questions, the second to respond to the interim model and discuss scenarios.
The focus group was drawn mainly from a coastal/estuarine community and the
session topic became very focussed on flooding issues despite introducing the
-smoking.
group suggested that local
ng people. However, the group
were keen to express that people do care about what happens in Africa and
developing nations with regard to climate change. “The government campaign against
smoking worked because it was done over a long time and only after graphic images
The group added that legislation to reduce the
olicy measures to help one quit the
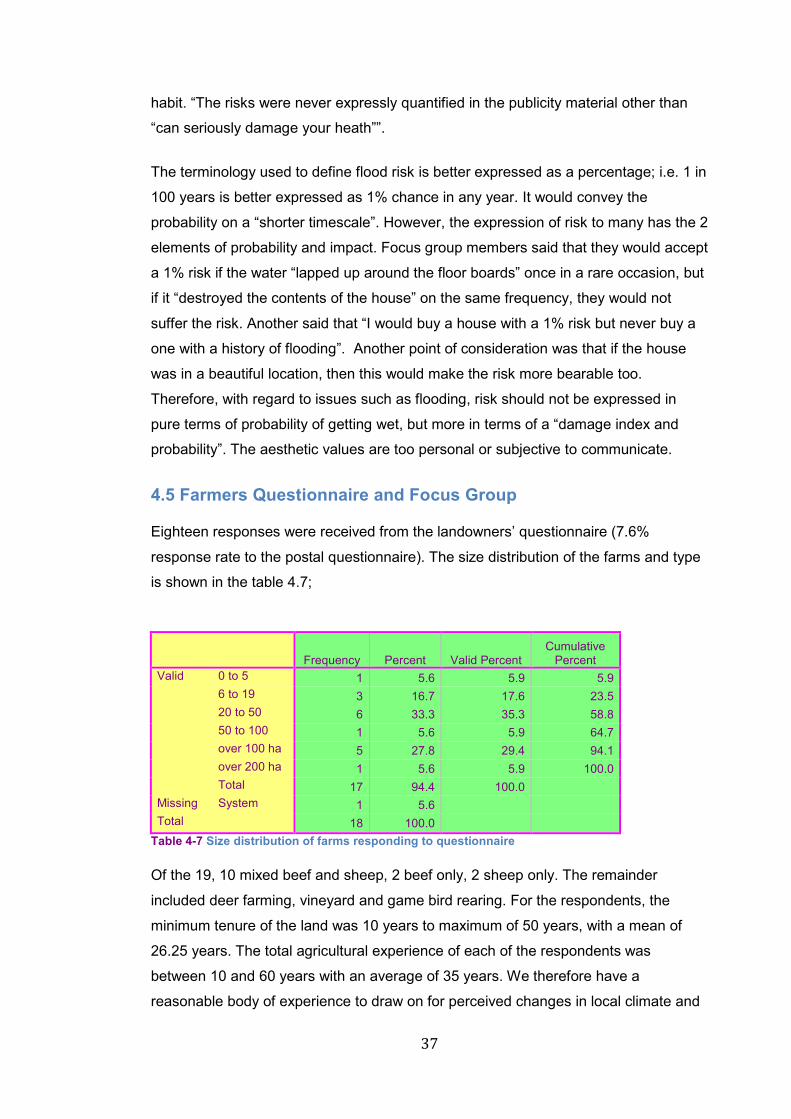
37
habit. “The risks were never expressly quantified in the publicity material other than
“can seriously damage your heath””.
The terminology used to define flood risk is better expressed as a percentage; i.e. 1 in
100 years is better expressed as 1% chance in any year. It would convey the
probability on a “shorter timescale”. However, the expression of risk to many has the 2
elements of probability and impact. Focus group members said that they would accept
a 1% risk if the water “lapped up around the floor boards” once in a rare occasion, but
if it “destroyed the contents of the house” on the same frequency, they would not
suffer the risk. Another said that “I would buy a house with a 1% risk but never buy a
one with a history of flooding”. Another point of consideration was that if the house
was in a beautiful location, then this would make the risk more bearable too.
Therefore, with regard to issues such as flooding, risk should not be expressed in
pure terms of probability of getting wet, but more in terms of a “damage index and
probability”. The aesthetic values are too personal or subjective to communicate.
4.5 Farmers Questionnaire and Focus Group
Eighteen responses were received from the landowners’ questionnaire (7.6%
response rate to the postal questionnaire). The size distribution of the farms and type
is shown in the table 4.7;
Frequency Percent Valid Percent Cumulative
Percent Valid 0 to 5 1 5.6 5.9 5.9
6 to 19 3 16.7 17.6 23.5 20 to 50 6 33.3 35.3 58.8 50 to 100 1 5.6 5.9 64.7 over 100 ha 5 27.8 29.4 94.1 over 200 ha 1 5.6 5.9 100.0 Total 17 94.4 100.0
Missing System 1 5.6 Total 18 100.0
Table 4-7 Size distribution of farms responding to questionnaire
Of the 19, 10 mixed beef and sheep, 2 beef only, 2 sheep only. The remainder
included deer farming, vineyard and game bird rearing. For the respondents, the
minimum tenure of the land was 10 years to maximum of 50 years, with a mean of
26.25 years. The total agricultural experience of each of the respondents was
between 10 and 60 years with an average of 35 years. We therefore have a
reasonable body of experience to draw on for perceived changes in local climate and
38
adaptations made over a time-span of 25 years.
Focus group description:
Five people from this pool joined the landowner focus group from the nine that offered
to join from the questionnaire responses. The five comprised:
A: Male, Mid forties, organic farmer, B: Female, Mid Forties, Organic farmer and
retailer, C: Male, Mid fifties, beef and sheep farmer high in the Culm grassland area,
D: Male; 60’s small holder with cattle. E: Male late 60’s part time farmer assisting
son/daughter, mixed farm.
A further 3 people were expected to attend. However, unfortunately the meeting was
scheduled for a time that coincided with a rare weather opportunity to harvest.
The main function of this focus group was to serve as a panel of community experts
on what land-uses would be realistic for the area in future years with expected
impacts. It was also an opportunity for them to see the interim model and comment on
its findings and its application. The opportunity was also taken to explore their
attitudes to risk and climate change.
The changes that the farmers mainly reported were the milder winters. The main
concern for them was the persistence of pests and diseases over the winter months
that would not die out. There was a strong interest in “Blue Tongue” which is a
disease that is thought to have gradually moved north through warming temperatures
and mainly transmitted by flies. Therefore the year-round existence of flies was a
concern.
The group were asked to consider what adaptations they had made over recent years
to climate change. Examples included drainage enhancements and also technology.
The advent of silage meant that the opportunity to harvest a winter feed with smaller
weather windows, another adaptation was wrapping bales in plastic. The other
adaptation mentioned was the growing of crimped corn as a way of gathering grain
based crops when not fully dry and treating the same way as silage. On dealing with
risk and adaptation, the farming life is seldom planned very far into the future
therefore the farms have to be very adaptive. A crop plan may be made 1 year in
advance, but the day to day activity and the harvest is determined by the weather of
the day. Naturally, a longer term approach to a type of farming determines the
investment in machinery and buildings etc which does carry a risk. One of the

39
participants said “It’s difficult to know which way to go sometimes; hanging on in hope
for another year.” Another quote “Farmers constantly have to adapt”.
From the questionnaire to the farmers most adaptation actions that can be attributed
to climate change were driven primarily by cost as opposed to directly for climate
change.
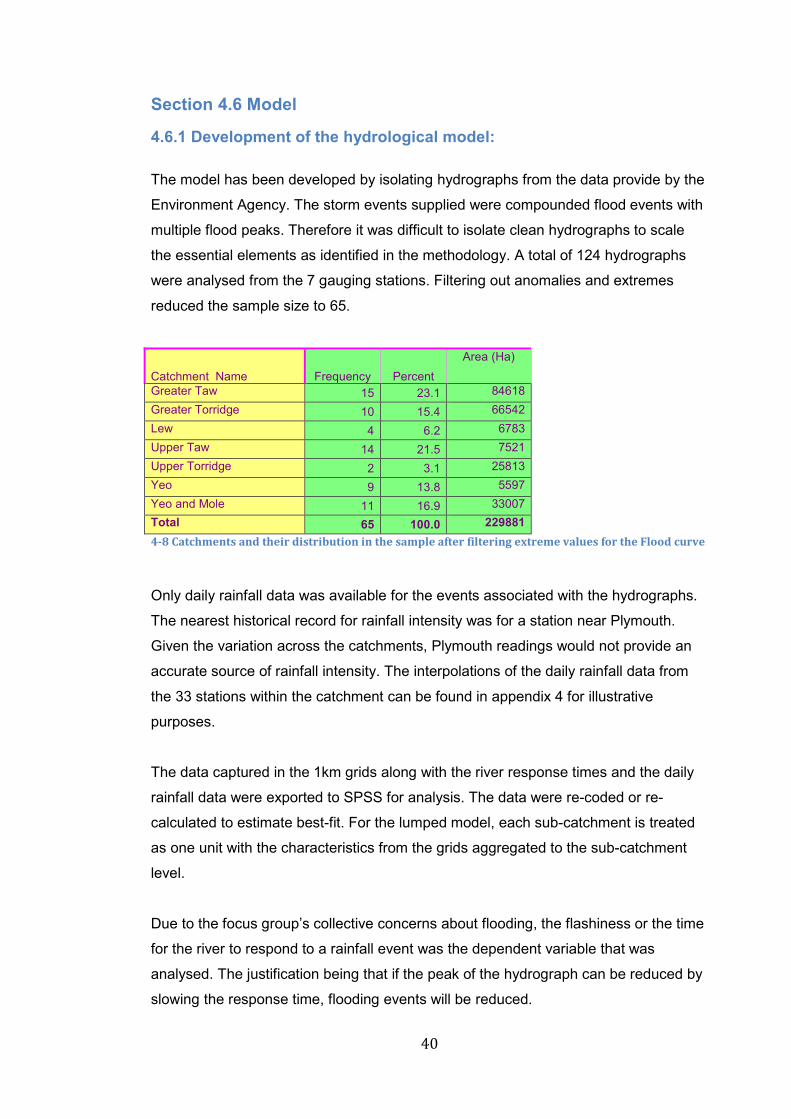
40
Section 4.6 Model
4.6.1 Development of the hydrological model:
The model has been developed by isolating hydrographs from the data provide by the
Environment Agency. The storm events supplied were compounded flood events with
multiple flood peaks. Therefore it was difficult to isolate clean hydrographs to scale
the essential elements as identified in the methodology. A total of 124 hydrographs
were analysed from the 7 gauging stations. Filtering out anomalies and extremes
reduced the sample size to 65.
Catchment Name Frequency Percent
Area (Ha)
Greater Taw 15 23.1 84618
Greater Torridge 10 15.4 66542
Lew 4 6.2 6783
Upper Taw 14 21.5 7521
Upper Torridge 2 3.1 25813
Yeo 9 13.8 5597
Yeo and Mole 11 16.9 33007
Total 65 100.0 229881
4-8 Catchments and their distribution in the sample after filtering extreme values for the Flood curve
Only daily rainfall data was available for the events associated with the hydrographs.
The nearest historical record for rainfall intensity was for a station near Plymouth.
Given the variation across the catchments, Plymouth readings would not provide an
accurate source of rainfall intensity. The interpolations of the daily rainfall data from
the 33 stations within the catchment can be found in appendix 4 for illustrative
purposes.
The data captured in the 1km grids along with the river response times and the daily
rainfall data were exported to SPSS for analysis. The data were re-coded or re-
calculated to estimate best-fit. For the lumped model, each sub-catchment is treated
as one unit with the characteristics from the grids aggregated to the sub-catchment
level.
Due to the focus group’s collective concerns about flooding, the flashiness or the time
for the river to respond to a rainfall event was the dependent variable that was
analysed. The justification being that if the peak of the hydrograph can be reduced by
slowing the response time, flooding events will be reduced.
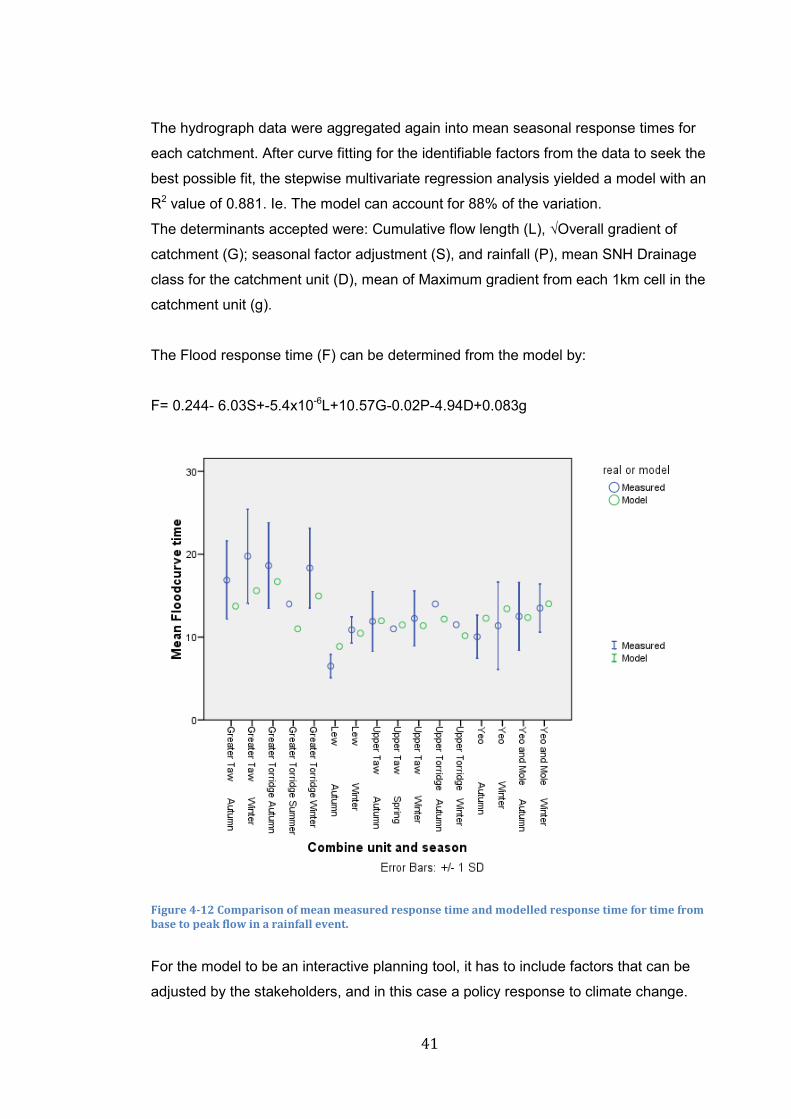
The hydrograph data were aggregated again into mean seasonal response times for
each catchment. After
best possible fit, the st
R2 value of 0.881. Ie. The model can account for
The determinants accepted were: Cumulative flow length (
catchment (G); seasonal factor a
class for the catchment unit
catchment unit (g).
The Flood response time (F) can be determined from the model by:
F= 0.244- 6.03S+-5.4
Figure 4-12 Comparison of mean measured response time and modelled response time for time from
base to peak flow in a rainfall event.
For the model to be an interactive planning tool, it has t
adjusted by the stakeholders, and in this case a policy response to climate change.
41
The hydrograph data were aggregated again into mean seasonal response times for
After curve fitting for the identifiable factors from the data
best possible fit, the stepwise multivariate regression analysis yielded a model with an
. Ie. The model can account for 88% of the variation.
The determinants accepted were: Cumulative flow length (L), √Ov
; seasonal factor adjustment (S), and rainfall (P), mean SNH Drainage
class for the catchment unit (D), mean of Maximum gradient from each 1km cell in the
The Flood response time (F) can be determined from the model by:
5.4x10⁻⁶L+10.57G-0.02P-4.94D+0.083g
Comparison of mean measured response time and modelled response time for time from
base to peak flow in a rainfall event.
For the model to be an interactive planning tool, it has to include factors that can
adjusted by the stakeholders, and in this case a policy response to climate change.
The hydrograph data were aggregated again into mean seasonal response times for
for the identifiable factors from the data to seek the
epwise multivariate regression analysis yielded a model with an
% of the variation.
√Overall gradient of
t (S), and rainfall (P), mean SNH Drainage
gradient from each 1km cell in the
The Flood response time (F) can be determined from the model by:
Comparison of mean measured response time and modelled response time for time from
o include factors that can be
adjusted by the stakeholders, and in this case a policy response to climate change.
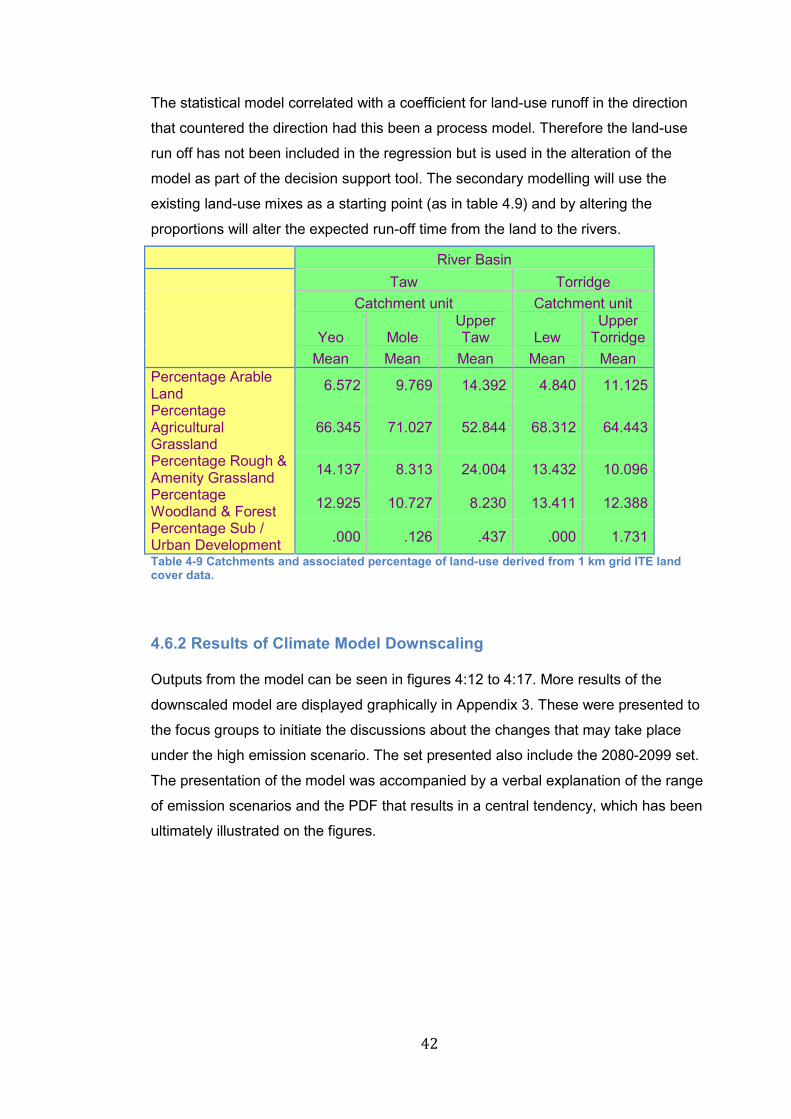
42
The statistical model correlated with a coefficient for land-use runoff in the direction
that countered the direction had this been a process model. Therefore the land-use
run off has not been included in the regression but is used in the alteration of the
model as part of the decision support tool. The secondary modelling will use the
existing land-use mixes as a starting point (as in table 4.9) and by altering the
proportions will alter the expected run-off time from the land to the rivers.
River Basin
Taw Torridge
Catchment unit Catchment unit
Yeo Mole Upper Taw Lew
Upper Torridge
Mean Mean Mean Mean Mean Percentage Arable Land
6.572 9.769 14.392 4.840 11.125
Percentage Agricultural Grassland
66.345 71.027 52.844 68.312 64.443
Percentage Rough & Amenity Grassland
14.137 8.313 24.004 13.432 10.096
Percentage Woodland & Forest
12.925 10.727 8.230 13.411 12.388
Percentage Sub / Urban Development
.000 .126 .437 .000 1.731
Table 4-9 Catchments and associated percentage of land-use derived from 1 km grid ITE land cover data.
4.6.2 Results of Climate Model Downscaling
Outputs from the model can be seen in figures 4:12 to 4:17. More results of the
downscaled model are displayed graphically in Appendix 3. These were presented to
the focus groups to initiate the discussions about the changes that may take place
under the high emission scenario. The set presented also include the 2080-2099 set.
The presentation of the model was accompanied by a verbal explanation of the range
of emission scenarios and the PDF that results in a central tendency, which has been
ultimately illustrated on the figures.
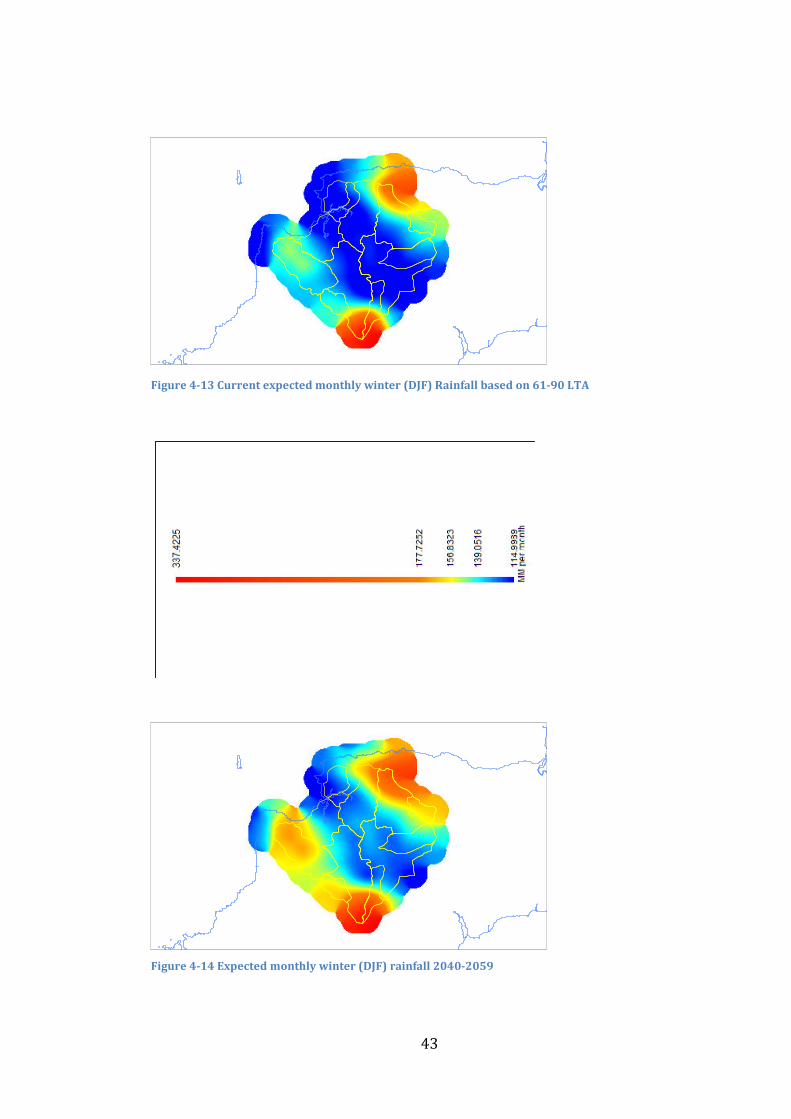
43
Figure 4-13 Current expected monthly winter (DJF) Rainfall based on 61-90 LTA
Figure 4-14 Expected monthly winter (DJF) rainfall 2040-2059
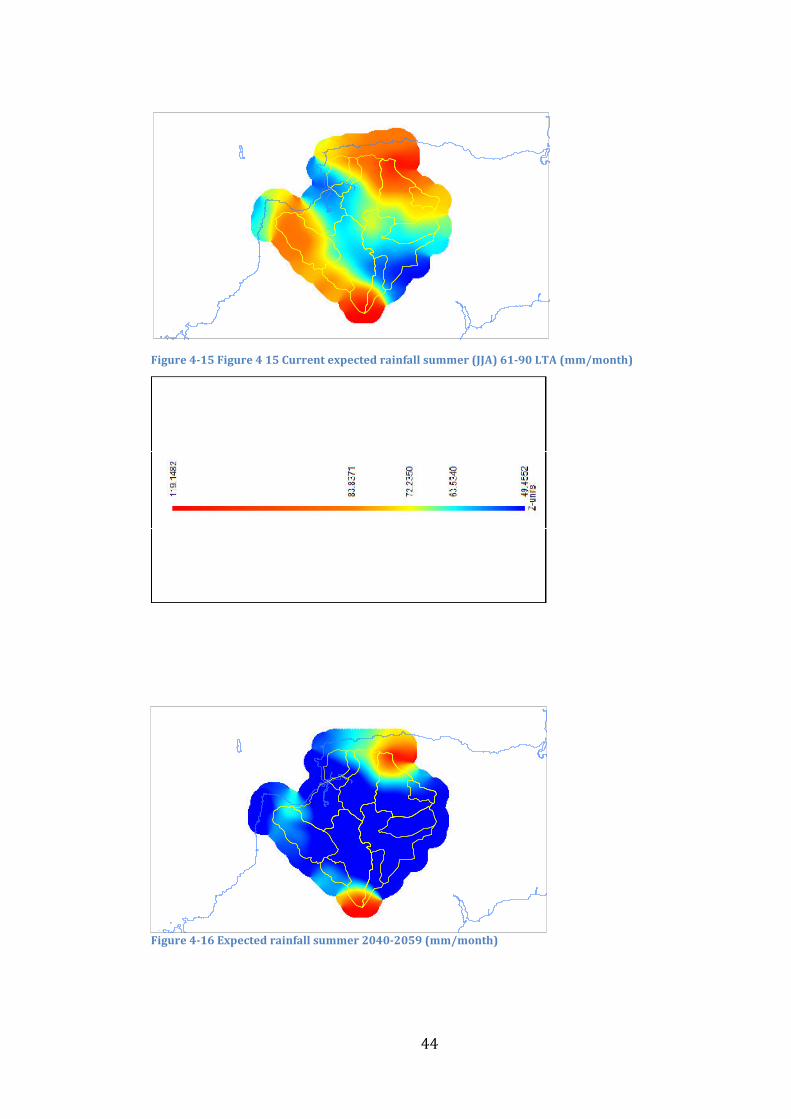
44
Figure 4-15 Figure 4 15 Current expected rainfall summer (JJA) 61-90 LTA (mm/month)
Figure 4-16 Expected rainfall summer 2040-2059 (mm/month)
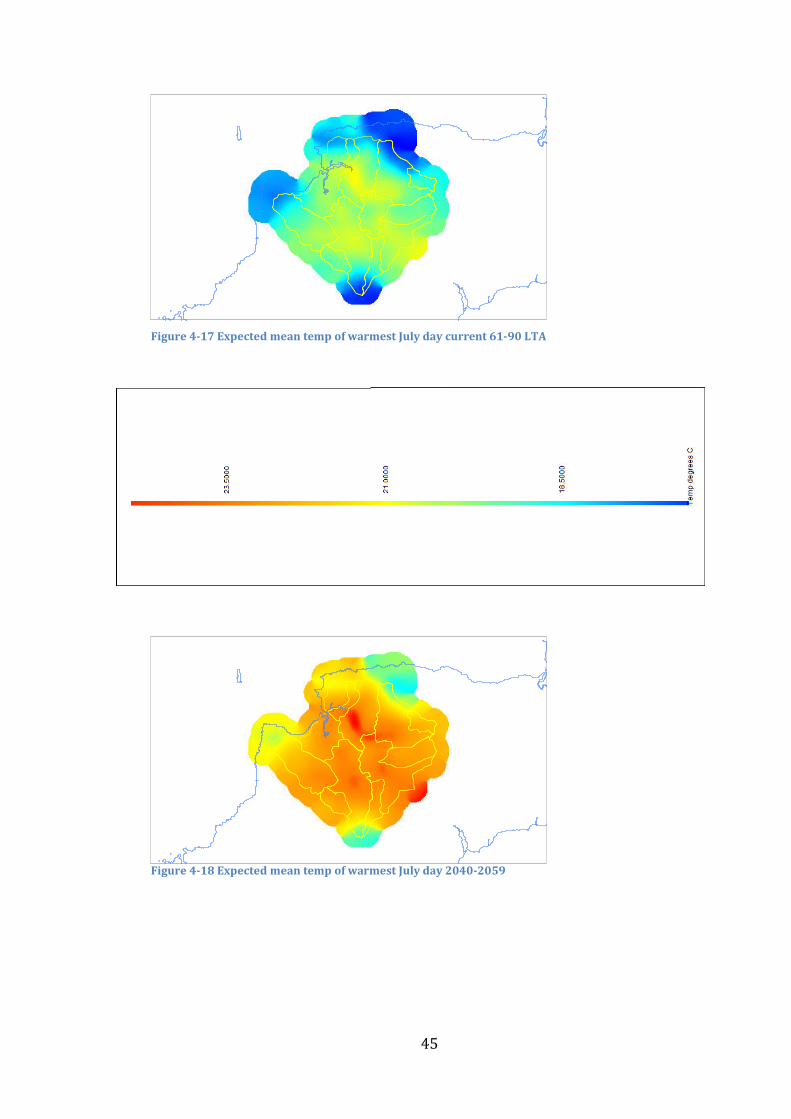
45
Figure 4-17 Expected mean temp of warmest July day current 61-90 LTA
Figure 4-18 Expected mean temp of warmest July day 2040-2059
46
4.6.3 Focus group results for scenarios
The groups were encouraged to explore a range of policy areas for scenarios. They
included food supply policy, rural/urban population balance, energy policy and
resources such as availability of fertilisers.
Both groups anticipated an increase in local food being more important. Implicit in this
is a land-use change to include more arable. The farmers commented that the area
could never be totally self-reliant for all types of food.
The challenges were the physical property of the ground:
• “Soils and topography work against you. We have either clays, steep or thin stony
soils.”
The crop husbandry required to produce food in a “post peak-oil” world:
• “long fallow periods or plenty of organic manure; otherwise only one third of
potential arable land could be in production at any one time.”
• “Would like to see more variation in agriculture and produce more fruit plums,
cherries etc, but also root crops in the right areas.”
• “This emphasises a regional approach for more localised production, but some
trans-national ideas. Such as grow more vegetables in the east and meat in the
west.”
• “Organic farming is often said that it won’t feed the world. However an allotment
the size of the [meeting] room will produce a huge amount; multi-cropping. People
grow food, not the machines!”
• “Mixing Barley Oats and peas seems to work well in Brittany. Oats and peas and
barley and peas mix has been really good.”
• “Farm size will reach a maximum; there are no more efficiency gains to be had.
Zero grazing is a time bomb waiting to go off; big welfare problems and pollution.”
On the societal aspects of the future rural economy
• “Food may not be as cheap. Need to be more efficient with the way we use food.
Subtle and sub-conscious education.”
• “Co-ordination and co-operative between farmers mean that production and
variety is shared, people will need to lower their standards of expectation about
standard sizes.”
Both groups were attracted to the multiple farm use for production of energy, food,
fibre, supported safeguarded biodiversity and water management.
47
• “Are there the skills to manage all of these “ecosystem services”, how do we get
the skills back into the rural areas. Such a diversity of skills is not found in the one
place. The way the UK has gone does not help. There is a step back needed.”
Energy production for the areas was “eagerly” discussed in the public group, mainly
around the issues of wind energy. The group conceded that some wind was inevitable
in the mix of energy in the future along with solar in towns, biomass and tidal energy.
The groups individually highlighted a rural re-population in order to produce the food.
• “Removal of workforce has reduced the productivity of farmland. Developing
nations have lessons to teach the west.”
• “Local community farming and community farm shares might be a growing idea.”
The focus groups were very energetic when it came to exploring the future, based on
the climate scenarios. There was a degree of disbelief about the summer rain
predictions, coloured by the recent 3 years of wet summers. Set in the context of long-
term changes the downscaled climate models were accepted as credible.
Based on the discussion with both groups, the scenario put into the secondary
modelling:
• An increase in the proportion of arable land in areas where the topography
and soils are suited to it.
• Maintenance of grazing land. With some extensification and allowing year
round grazing.
• Biomass production on areas of land that may flood or even help to attenuate
floods.
• Increase in woodland cover (for multi-use) on steeper slopes
• Food production systems that support biodiversity
• No target to be totally self-reliant
• An increase in developed land to accommodate the increased food producing/
land management sector and in line with population growth as presented.
These scenarios do not conflict with the attitudes reported in the landowner
questionnaire.
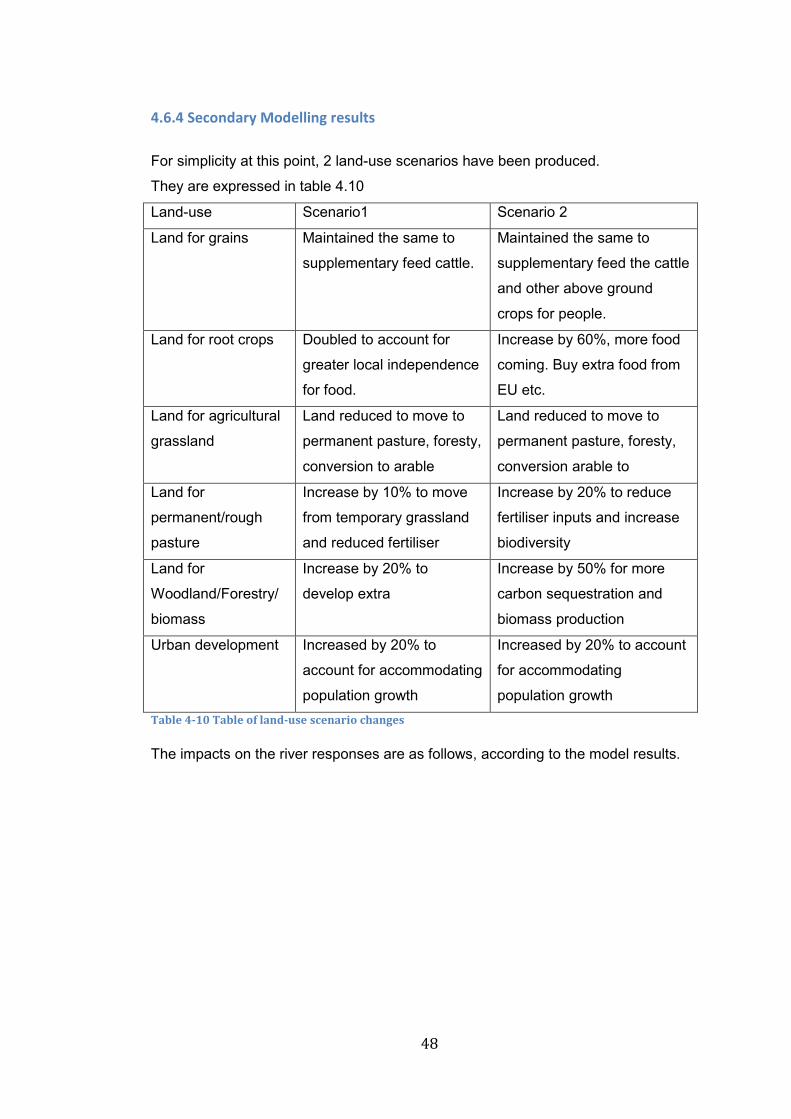
48
4.6.4 Secondary Modelling results
For simplicity at this point, 2 land-use scenarios have been produced.
They are expressed in table 4.10
Land-use Scenario1 Scenario 2
Land for grains Maintained the same to
supplementary feed cattle.
Maintained the same to
supplementary feed the cattle
and other above ground
crops for people.
Land for root crops Doubled to account for
greater local independence
for food.
Increase by 60%, more food
coming. Buy extra food from
EU etc.
Land for agricultural
grassland
Land reduced to move to
permanent pasture, foresty,
conversion to arable
Land reduced to move to
permanent pasture, foresty,
conversion arable to
Land for
permanent/rough
pasture
Increase by 10% to move
from temporary grassland
and reduced fertiliser
Increase by 20% to reduce
fertiliser inputs and increase
biodiversity
Land for
Woodland/Forestry/
biomass
Increase by 20% to
develop extra
Increase by 50% for more
carbon sequestration and
biomass production
Urban development Increased by 20% to
account for accommodating
population growth
Increased by 20% to account
for accommodating
population growth
Table 4-10 Table of land-use scenario changes
The impacts on the river responses are as follows, according to the model results.
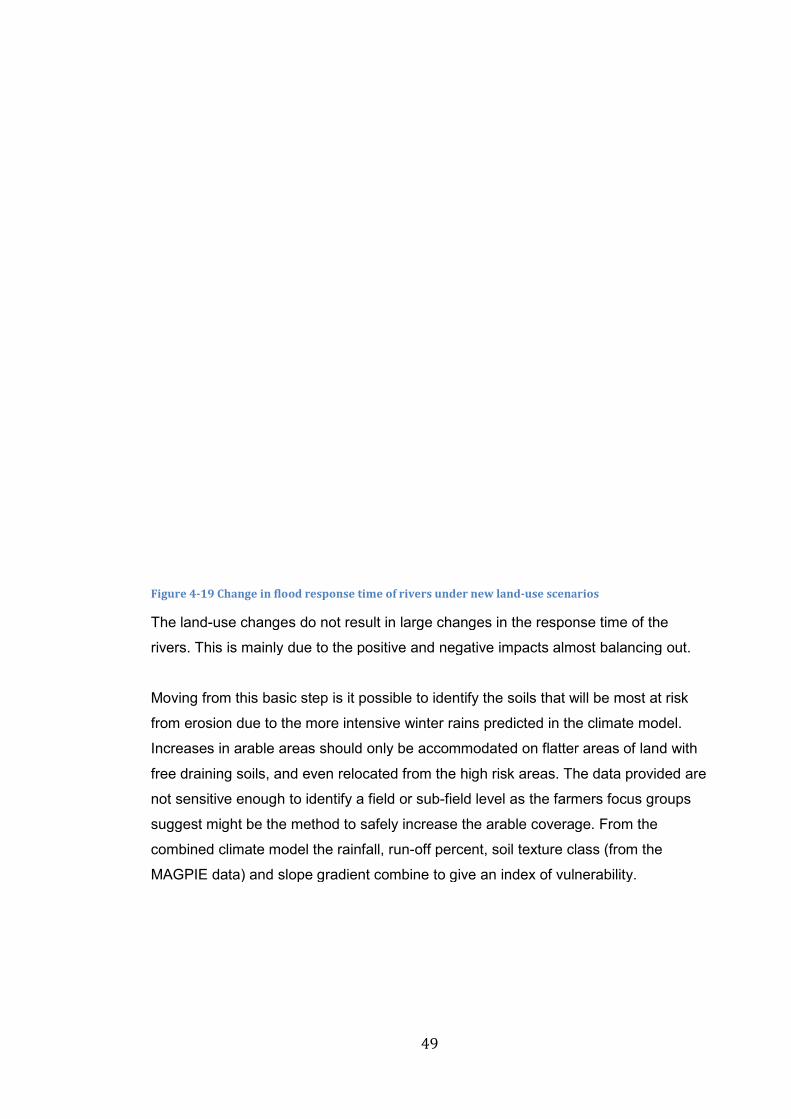
Figure 4-19 Change in flood response
The land-use changes do not result in large c
rivers. This is mainly due to the positive and negative impacts almost balancing out.
Moving from this basic step is it possible to identify the soils that will be most at risk
from erosion due to the more intensive winter rains predicted in the climate model.
Increases in arable areas should only be accommodated on flatter areas of lan
free draining soils, and even relocated from the high risk
not sensitive enough to
suggest might be the method to safely increase the arable coverage.
combined climate model the rainfall, run
MAGPIE data) and slope gradient combine to give an index of vulnerability.
49
flood response time of rivers under new land-use scenarios
use changes do not result in large changes in the response time of the
rivers. This is mainly due to the positive and negative impacts almost balancing out.
Moving from this basic step is it possible to identify the soils that will be most at risk
from erosion due to the more intensive winter rains predicted in the climate model.
Increases in arable areas should only be accommodated on flatter areas of lan
free draining soils, and even relocated from the high risk areas. The data provided are
sensitive enough to identify a field or sub-field level as the farmers focus groups
suggest might be the method to safely increase the arable coverage.
combined climate model the rainfall, run-off percent, soil texture class (from the
MAGPIE data) and slope gradient combine to give an index of vulnerability.
use scenarios
hanges in the response time of the
rivers. This is mainly due to the positive and negative impacts almost balancing out.
Moving from this basic step is it possible to identify the soils that will be most at risk
from erosion due to the more intensive winter rains predicted in the climate model.
Increases in arable areas should only be accommodated on flatter areas of land with
areas. The data provided are
field level as the farmers focus groups
suggest might be the method to safely increase the arable coverage. From the
off percent, soil texture class (from the
MAGPIE data) and slope gradient combine to give an index of vulnerability.
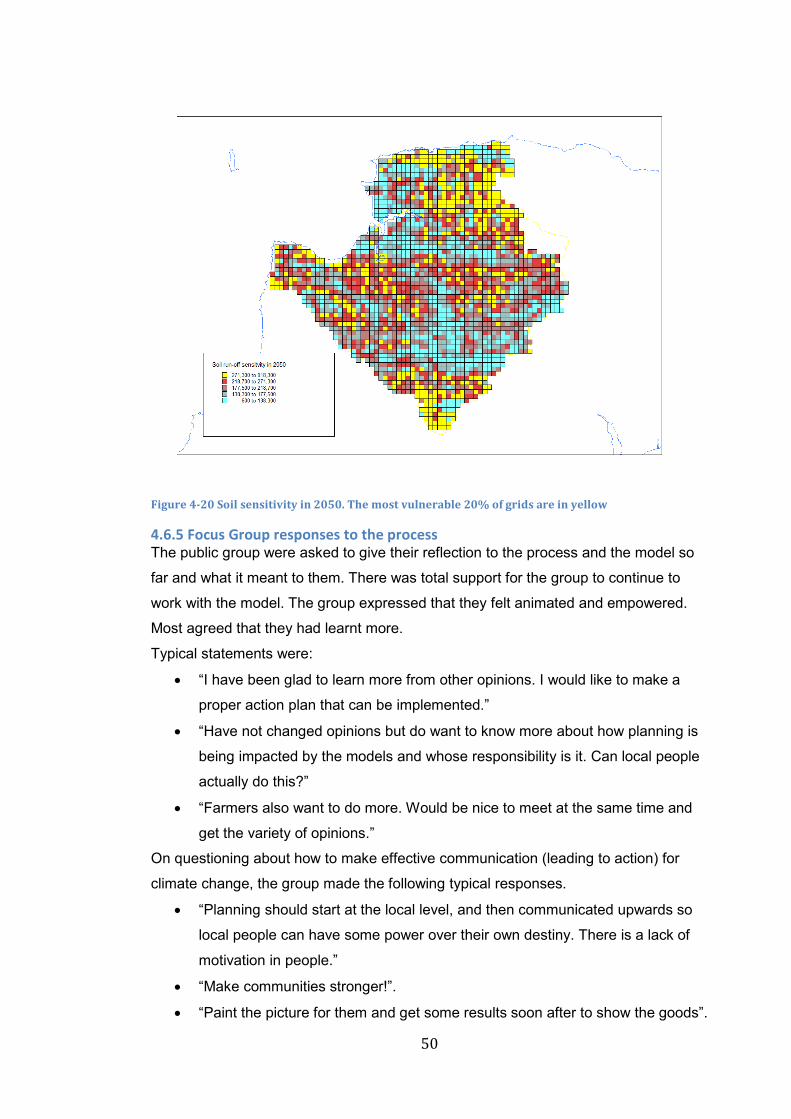
50
Figure 4-20 Soil sensitivity in 2050. The most vulnerable 20% of grids are in yellow
4.6.5 Focus Group responses to the process
The public group were asked to give their reflection to the process and the model so
far and what it meant to them. There was total support for the group to continue to
work with the model. The group expressed that they felt animated and empowered.
Most agreed that they had learnt more.
Typical statements were:
• “I have been glad to learn more from other opinions. I would like to make a
proper action plan that can be implemented.”
• “Have not changed opinions but do want to know more about how planning is
being impacted by the models and whose responsibility is it. Can local people
actually do this?”
• “Farmers also want to do more. Would be nice to meet at the same time and
get the variety of opinions.”
On questioning about how to make effective communication (leading to action) for
climate change, the group made the following typical responses.
• “Planning should start at the local level, and then communicated upwards so
local people can have some power over their own destiny. There is a lack of
motivation in people.”
• “Make communities stronger!”.
• “Paint the picture for them and get some results soon after to show the goods”.

51
Although the farmers were not part of the test group, they also stated that they would
like the work to continue and for them to be part of the programme to move the local
climate response plan further as a community initiative.
These qualitative results do not offer any definitive proof of full engagement as
defined by Lorenonzi (2007). Time constraints did not allow a follow up study to see if
the enthusiasm expressed at the focus group meetings is sustained and translated
into continued action.
The following discussion section will explore the meaning of these results with regard
to the aims of the dissertation.
52
Chapter 5 Discussion
Limitations The limitations to the work have been on time and availability of the data. This work
has been fitted around a busy full-time career and within 3 months.
The resolution of the land-use and soil data along with the lack of hourly rainfall data
precluded the development of a more sensitive hydrological model. The model is still
in a relatively unrefined form and is based on one set of scenarios from one climate
model. Prudhomme et al (2009) advocate the use of not just a range of scenarios but
also a suite of different models for any climate change impact on river flows.
However, the information provided and the model developed functions as a decision
support tool and a communication tool about the impacts of climate change and
meets the requirements, if not the author’s aspirations, for the project.
The survey of the public was intended to achieve 100 responses; in effect only 65
were produced. Although short of the target, the length of the interview and the
numbers achieved provided a great deal of quantitative and qualitative data. A
longitudinal study of the behaviour of the focus groups at least 1 month after the
working with the model would provide more conclusive evidence of change in
awareness, individual actions and ultimately advocacy for policy implementation.
Summary of main findings The thrust of the work looked into the communication issues around public
understanding climate change and how the derivation of a localised model animates
discussion about the climate issues. I will start with a discussion about the model, its
derivation, results it indicates and its use as a communication or decision support tool.
The discussion will then link that model to the work with the community responses
and the focus group.
The catchment model has provided us with an understanding of the factors that
impact on the hydrographs of the main rivers. The model internalises the catchment
characteristics in a “black box” method, where the processes are assumed to
demonstrate the cause and effect through the multivariate analysis. This is not always
the case, and therefore the land-use run off coefficient had to be externalised from the
equation. It is suggested that the negative correlation between the land-use and the
response time of the river in the catchment is because there is less arable and less
53
urban areas in the faster catchments, so the relationship is not causal in terms of
hydrological processes but purely of land-use and settlement. The scaling effect of the
rainfall is very minor; this is generally expected. The classic hydrograph described by
time to peak (or response curve) and regression or decay curve is broadly
independent of the intensity of the rainfall event but more on the duration of the event.
The size of the peak is rainfall dependant.
Examining the land-use data in the 1km grid against the vulnerability of soils suggests
that the choice of arable fields is not ideally suited to the conditions of the soil and
topography. The distribution of land-use throughout the area has been the result of
overlays of government agricultural policy over the years, coupled with economic
drivers to the extent that the initial concept of land-use matching land capability has
been somewhat blurred. These distortions have resulted in fields losing soil and
nutrients to the extent that the Taw catchment is a Nitrate Vulnerable Zone as a
requirement under the EC Nitrates Directive (91/676/EEC). It will be possible through
the analysis to theoretically re-locate arable areas to soils that have good drainage
capacity, on lower gradients and lower run-off coefficients, so that the increase in
demand for locally grown vegetables does not exacerbate the risk of flooding.
The conservation of mass leads us to assume an inverse relationship between the
value of peak flow in the river and the response time of the flood curve for any given
rainfall event. Therefore, even if the extension of the flood response curve is small,
due to the asymptotic nature of the return periods and flood peaks, the extension in
return periods can be high. Analysis of return curves (Figure 5.1) for the Taw at
Umberleigh from CEH data suggests that a 7% extension in response time will alter a
flooding probability of 0.025 to 0.0111. However, these will be countered by the
increases in rainfall intensity that are anticipated during the winter months in the area.
The application of the climate model data incorporated to date does not permit a
credible calculation of the expected change in rainfall intensity. We can qualitatively
assume that the intensity of winter rains will increase and therefore the return periods
for any given rainfall event will decrease. This will counter any gains from the changes
in land-use that have been modelled.
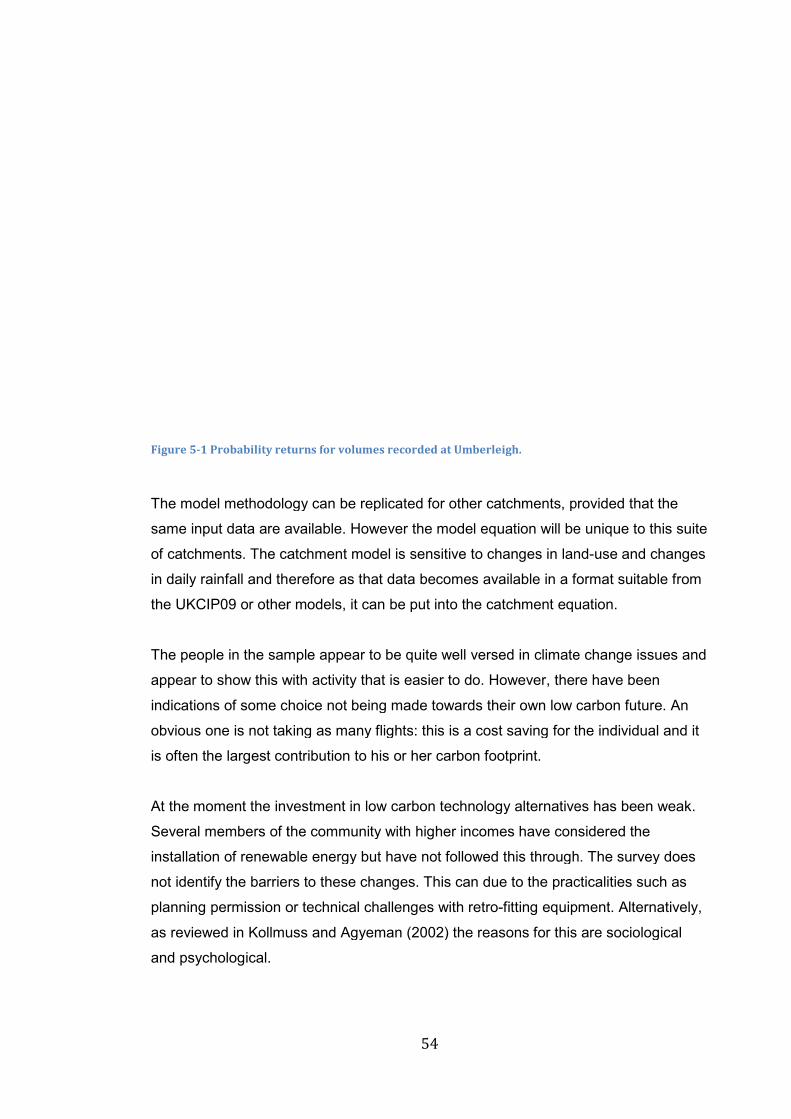
Figure 5-1 Probability returns for volumes recorded at Umberleigh.
The model methodology can be replicated for other catchments, provided that the
same input data are available. However the model equation will b
of catchments. The catchment model is sensitive to changes in land
in daily rainfall and therefore as that data becomes available in a format suitable from
the UKCIP09 or other models, it can be p
The people in the sample
appear to show this with
indications of some choice not being
obvious one is not taking as many flights
is often the largest contribution to his or her carbon footprint.
At the moment the investment in low carbon technology alternatives has been weak.
Several members of the community with
installation of renewable energy but have not followed this through. The survey does
not identify the barriers to these changes
planning permission or technical
as reviewed in Kollmuss and Agyeman (2002)
and psychological.
54
Probability returns for volumes recorded at Umberleigh.
The model methodology can be replicated for other catchments, provided that the
same input data are available. However the model equation will be unique to this suite
of catchments. The catchment model is sensitive to changes in land
in daily rainfall and therefore as that data becomes available in a format suitable from
or other models, it can be put into the catchment equation.
in the sample appear to be quite well versed in climate change issues and
appear to show this with activity that is easier to do. However, there have been
indications of some choice not being made towards their own low
taking as many flights: this is a cost saving for the individual and it
is often the largest contribution to his or her carbon footprint.
At the moment the investment in low carbon technology alternatives has been weak.
eral members of the community with higher incomes have considered the
installation of renewable energy but have not followed this through. The survey does
not identify the barriers to these changes. This can due to the practicalities
ssion or technical challenges with retro-fitting equipment
Kollmuss and Agyeman (2002) the reasons for this are sociological
The model methodology can be replicated for other catchments, provided that the
e unique to this suite
of catchments. The catchment model is sensitive to changes in land-use and changes
in daily rainfall and therefore as that data becomes available in a format suitable from
equation.
to be quite well versed in climate change issues and
there have been
towards their own low carbon future. An
cost saving for the individual and it
At the moment the investment in low carbon technology alternatives has been weak.
incomes have considered the
installation of renewable energy but have not followed this through. The survey does
. This can due to the practicalities such as
fitting equipment. Alternatively,
the reasons for this are sociological
55
As Dessai et al (2008) have already pointed out that decisions made within the
current levels of uncertainty, fortunately have for the greater part been correct. The
predictive skill of this model is dependent on the climate models used as its basis. As
a consequence, it would not yet be wise to use this as a planning and adaptation tool.
Counter to this, the over-riding concern of the coastal communities is flooding from
the both the rivers and the seas. Therefore as a model it has two functions; first to
provide planners with the possible impacts of land-use decisions on the trends of
catchment responses and secondly as a communication tool to engage the local
community.
The focus group and the model
The evidence of what climatic changes have already been happening along with the
localised predictions of what might happen in the future has provided a good stimulus
for debate with the groups. The climate model is not the be-all and end-all for the
community focus group. It has offered a sense of direction and established a
framework for adaptive management and the stimulus for discussions about the
stakeholder’s future. There is still a sense within the community members of the focus
group to treat the models as absolute truth, despite the warnings that accompanied
the presentation.
The model’s apparent function with the focus group has been to establish a visual tool
for them to understand the impacts and how their decisions can impact on the future.
This is a form of empowerment has given them a status of “agency” (or the start of it).
Agency gives them the greater freedom to act differently, enabled by the knowledge
they have gained, not only from the model and their interactions with it but from the
dynamics of the group itself and the fact that they had something to say and that they
were being listened to.
Could this have happened without the catchment and climate model? As already
stated it was the focus of the second half of the focus group meetings and akin to the
processes of “backcasting” (Tansey et al, 2002) or scenario planning to incorporate
social and moral judgements rather than purely physical or natural science
phenomena.
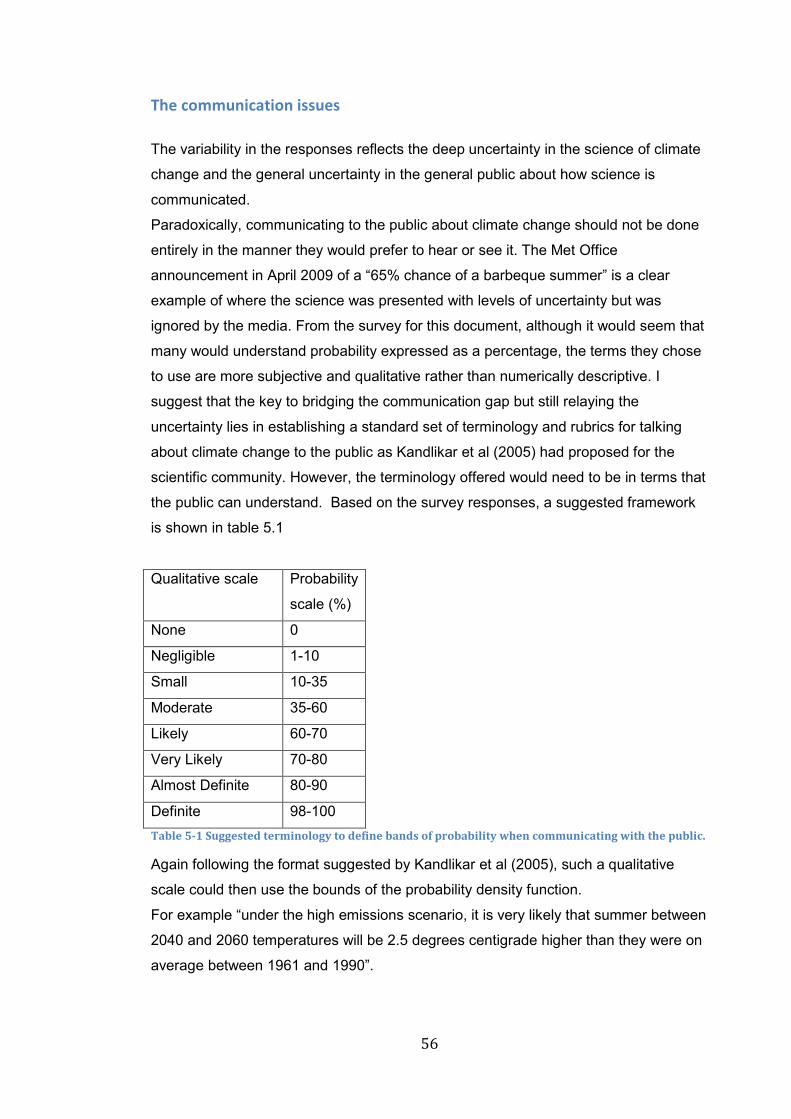
56
The communication issues
The variability in the responses reflects the deep uncertainty in the science of climate
change and the general uncertainty in the general public about how science is
communicated.
Paradoxically, communicating to the public about climate change should not be done
entirely in the manner they would prefer to hear or see it. The Met Office
announcement in April 2009 of a “65% chance of a barbeque summer” is a clear
example of where the science was presented with levels of uncertainty but was
ignored by the media. From the survey for this document, although it would seem that
many would understand probability expressed as a percentage, the terms they chose
to use are more subjective and qualitative rather than numerically descriptive. I
suggest that the key to bridging the communication gap but still relaying the
uncertainty lies in establishing a standard set of terminology and rubrics for talking
about climate change to the public as Kandlikar et al (2005) had proposed for the
scientific community. However, the terminology offered would need to be in terms that
the public can understand. Based on the survey responses, a suggested framework
is shown in table 5.1
Qualitative scale Probability
scale (%)
None 0
Negligible 1-10
Small 10-35
Moderate 35-60
Likely 60-70
Very Likely 70-80
Almost Definite 80-90
Definite 98-100
Table 5-1 Suggested terminology to define bands of probability when communicating with the public.
Again following the format suggested by Kandlikar et al (2005), such a qualitative
scale could then use the bounds of the probability density function.
For example “under the high emissions scenario, it is very likely that summer between
2040 and 2060 temperatures will be 2.5 degrees centigrade higher than they were on
average between 1961 and 1990”.
57
The focus group confirmed the statement made by Grothmann and Patt (2005) about
risk being a combination of probability of an event and the damage that might occur.
For anyone in the public to make a valued judgement on any risk, the probability
should be accompanied by some scale of damage that may be associated.
A degree of scaling damage has already been done by Association of British Insurers.
The insurance industry has an accurate figure for this scale, but expresses the
combined risk and hazard in financial terms (McCarthy, 2007) and only to its
customers in the form of an insurance premium. According to McCarthy (2007), the
data is commercially sensitive and only used in aggregate form within the industry and
ultimately used to lobby for policy support or change. Whilst this data might not cover
all of the aspects of an integrated assessment on climate change, the data will refer to
events and losses that are very pertinent to the local community and individuals.
Using this following example; a house in a 1 in 100 year flood plain that when floods
will ruin everything on the ground-floor might be expressed (using the terms of
probability mentioned in table 5.1.)
“There is a negligible (but real) risk that in any year this house might suffer
50% contents damage”.
Although the focus group suggested that 1% was negligible, the problem might arise
that “negligible” is interpreted as “no chance”. In which case, a resident might place
themselves at risk (however small) without knowing; hence the addition of “but real” in
parenthesis.
The results of the advice choice on the map question in the survey suggested that
public have a tendency for risk aversion when faced with a continuum on which to
make a decision. This has an impact on how we might consider communicating
climate change related information. Whilst there is uncertainty in the underpinning
information, it would be irresponsible in terms of adaptation planning for the
uncertainly to be ignored. Referring back to Dessai et al (2008) the reminder of the
uncertainty to the end-user is essential. The presentation of geographic data on
climate change in clearly defined contours conveys an apparent precision that does
not exist. Therefore, based on the outcomes of this work, geographic, or even
graphic information should be presented as part of a continuum.
58
Chapter 6 CONCLUSIONS
In this project I have identified the attitudes and awareness of and action for climate
change within the northern Devon population. The research has identified some the
problems and some solutions related the communication of climate change and its
associated uncertainty with the public. The key challenges are to communicate
climate change science in a way that describes the projections and the uncertainty
associated with them in terms that are easily digestible.
The research suggests that effective communication of the issues with the uncertainty
embedded in could be achieved through acceptable framework of terminology and
through the graphic portrayal of the range of possible outcomes through a continuum.
Further research on communication should centre on the derivation of a suitable
framework for describing uncertainty to the lay community with graphics as well as
language and how this ultimately sways their decisions for adaptation.
Through the derivation of a downscaled climate impact model, the inputs and the
outputs have been a focal point for debate with focus groups for them to suggest
scenarios for the future based on societal as well as physical parameters. These
scenarios have been incorporated into a lumped catchment model to explore the
impacts on the flood response curve of the river hydrographs as recorded at the
gauging stations. The inclusion of the model in the focus groups was a clear stimulus
to exploring possible scenarios for the future.
Outputs from the model suggest that in order to slow down run-off after a rain event to
reduce the risk of flooding, acute and chronic soil erosion, increases in arable and
urban land-cover must be countered by increased woodland and permanent or rough
grassland. Such measures applied to the current land cover regime may reduce the
return periods of flooding considerably between the 2% and 1% (1 in 50 and 1 in 100
return periods).
The key conclusions are that although the methodology can be applied in any
catchment with the same limited data, the catchment model should be refined further
towards a more transferable process based model that can accept the data from a
range of outcomes from a single climate model, or other models. The variation in the
outcomes should be relayed as suggested in the communication recommendations.
59
To assist the development of the process model, monitoring stations giving hourly
rainfall records and up to date field level data of land-use will be an added advantage.
Exploring these topics with the two focus groups suggests that the area has features
that warrant special study. For example the predominance of grazing land and the
challenges of producing arable goods, puts the area quite distinct from the typical
mixed farm approach where land capability might offer more choice than here.
Coupling the evidence of a very high environmental quality of the catchment
recognised as UNESCO Biosphere Reserve with the expectation that environmental
regulation will increase for the protection of water courses through the Water
Framework Directive and the protection of soils, constraints will be placed on the land-
use choices of the future. The further development of this model can assist in
considering the alternatives for reduced emissions from farming and food production,
strengthened local economies and sustained ecosystem services. Such a model must
be backed up by appropriate field measurements and monitoring.
60
Acknowledgements Data sources:
UKCIP; For outputs from the UKCIP09 (c) Crown Copyright 2009.
The UK Climate Projections data have been made available by the
Department for Environment, Food and Rural Affairs (Defra) and
Department for Energy and Climate Change (DECC) under licence
from the Met Office, Newcastle University, University of East
Anglia and Proudman Oceanographic Laboratory. These organisations
accept no responsibility for any inaccuracies or omissions in
the data, nor for any loss or damage directly or indirectly
caused to any person or body by reason of, or arising out of,
any use of this data.
MIDAS (BADC): For rain gauge data and Long-term Average climate data for the
climate model.
EDINA Ordnance Survey for Digital Elevation Model
===========================================================
© Crown Copyright/database right 2009. An Ordnance Survey/EDINA supplied
service.
===========================================================
My thanks go to Dr R E Brazier University of Exeter and Dr. Suraje Dessai for their
support and advice for this dissertation and the provision of data and extra reading
material associated with this project.
My deepest thanks go to Sarah Felgate who helped to gather the face to face
interviews with the questionnaires. I would also like to express gratitude to my house-
mate, Peter Yeo, who provided logistic support of nourishment and refreshments.
Finally, I am extremely grateful to the focus group members from both of the groups
contributed willingly and freely with their time and opinions. Long may it continue!
61
Bibliography
Bathurst et al. Validation of catchment models for predicting land-use and climate change. Journal of Hydrology (2004) vol. 287 pp. 74-94
Bell, V A, Kay, A L, Jones, R G, Moore, R J(2007) Development of a high resolution grid-based river flow model for use with regional climate model �. Hydrology and Earth System Sciences (2007)
Blume T, Zehe E, Bronstert A; 2007 Rainfall–runoff response, event-based runoff coefficients and hydrograph separation. Hydrological Sciences–Journal–des Sciences Hydrologique, 52,5 843-862
Bronstert et al. Effects of climate and land-use change on storm runoff generation: present knowledge and modelling capabilities. Hydrol. Process. (2002) vol. 16 (2) pp. 509-529
Burgess. Focusing on Fear: The Use of Focus Groups in a Project for the Community Forest Unit, Countryside Commission. (1996) Area vol. 28 (2) pp. 130-135
Committee on Climate Change, 2009, http://www.theccc.org.uk/sectors/residential-property/emissions; Sourced 02/05/09
Convention on Biological Diversity, Ecosystem Approach, sourced 2009 http://www.cbd.int/ecosystem/
DEFRA, 2008, http://www.defra.gov.uk/news/2008/080131a.htm sourced 02/05/09
DEFRA, 2008, A framework for Pro-environmental behaviours http://www.defra.gov.uk/evidence/social/behaviour/pdf/behaviours-jan08-report.pdf
Defra, (2007) Survey of Public Attitudes and Behaviours toward the Environment, 2007 http://www.defra.gov.uk/environment/statistics/pubatt/download/pubattsum2007.pdf
Dessai and Hulme. (2008) How do UK climate scenarios compare with recent observations? Atmos. Sci. Lett. vol. 9 (4) pp. 189-195
Diaz-Nieto and Wilby. (2005) Statistical downscaling and climate change factor methods: impacts on low flows in the River Thames �. Climatic Change
Engel, B. 2004 SEDSPEC, Purdue Research Foundation http://cobweb.ecn.purdue.edu/~engelb/abe526/Runoff/C_table.html. Accessed August 09 Fawcett L, Anthony S, Silgram M, 2004 Application of the EveNFlow model to the Vansjø-Hobøl Catchment, Norway, EUROHARP WP3-2004 (http://www.euroharp.org/toolbox/catchment%20reports/EveNflow/ADAS_CatchmentResportNorwayV2.doc.)
62
Fowler et al. New estimates of future changes in extreme rainfall across the UK using regional climate model integrations. 1 Assessment of control climate. Journal of Hydrology 300 (2005) 212–233 (2005) pp. 1-22
Goodess, C, Osborn, T, Hulme, M, 2003, The identification and evaluation of suitable scenario development methods for the estimation of future probabilities of extreme weather events. . Tyndall Centre for Climate Change Research, Technical Report 4. (2003) pp. 1-69
Goss. J. (1996) Introduction to Focus groups. Area vol. 28 (2) pp. 113-114
Grothmann T, and Patt A; 2005; Adaptive capacity and human cognition: The process of individual adaptation to climate change; Global Environmental Change Part A Volume 15, Issue 3, October 2005, Pages 199-213
Hulme M and Dessai S (2008) Predicting, deciding, learning: can one evaluate the 'success' of national climate scenarios? . Environmental Research Letters (2008) pp. 1-14
Jackson J, Li Y, Passant N, Thomas J, Thistlethwaite G, Thomson A and Cardenas L; 2008, Greenhouse Gas Inventories for England, Scotland, Wales and Northern Ireland: 1990 - 2006 (http://www.airquality.co.uk/reports/cat07/0809291432_DA_GHGI_report_2006_main_text_Issue_1r.pdf ; Sourced 02/05/09)
Jonsson and Alkan-Olsson. (2005) Participatory Modelling–(how) can computer generated information affect the” room of action” of local stakeholders ACSIS nationella forskarkonferens för kulturstudier
Jonsson A. 2005 Public Participation in Water Resources Management: Stakeholder Voices on Degree, Scale, Potential, and Methods in Future Water Management. AMBIO: A Journal of the Human Environment (2005) vol. 34 (7) pp. 1-6
Justus, M., P. Kinrade and B.L. Preston; 2007; Translating Scientific Understanding of Climate Change Impacts into Effective Policy Response – The Critical Role of Stakeholder Engagement
Kandlikar M, Risbey J, Dessai S, (2005) Representing and communicating deep uncertainty in climate change assessments. C R Geoscience 337, 443,455 Kollmuss and Agyeman (2002). Mind the gap: why do people act environmentally and what are the barriers to pro-environmental �. Environmental Education Research
Lahsen. M (2005) Seductive Simulations? Uncertainty Distribution Around Climate Models. Social Studies of Science vol. 35 (6) pp. 895-922
Lorenzoni I, Nicholson-Cole S & Whitmarsh L, (2007). Barriers perceived to engaging with climate change among the public and their policy implications. UK Global Environmental Change 17, 445–459 (2007) pp. 1-15 McCarthy S (2007) Contextual influences on national level flood risk communication. Environmental Hazards, 7,2,128-140
63
Nicholson-Cole and ONeill. Promoting Positive Engagement With Climate Change Through Visual and Iconic Representations. Science Communication In print (2008) pp. 1-25
Olsson AJ and Karin Berg K 2005 Local Stakeholders' Acceptance of Model-generated Data Used as a Communication Tool in Water Management: The Rönneå Study; AMBIO: A Journal of the Human Environment 34(7):507-512.
Olsson L & Pilesjo P; Approaches to spatially distributed hydrological modelling in a GIS environment; Environmental Modelling with GIS and remote sensing, Edited Andrew Skidmore 2002 isbn 0415241707
Pethick, J. (2006) Taw Torridge Final Report final version. pp. 1-87
Pidgeon, N.F. et al. , 2006, Public Risk Perceptions, Climate Change and the Reframing of UK Energy Policy in Britain, 2005 Colchester, Essex: UK Data Archive May 2006. SN: 5357.
Prudhomme and Davies. (2009) Assessing uncertainties in climate change impact analyses on the river flow regimes in the UK. Part 2: future climate. Climatic Change vol. 93 (1-2) pp. 197-222
Tansey, James, Carmichael, Jeff, VanWynsberghe, Rob, Robinson, John. (2002) The future is not what it used to be-participatory integrated assessment in the Georgia Basin. Global Environmental Change (2002) vol. 12 pp. 1-8
Stoll-Kleemann et al. The psychology of denial concerning climate mitigation measures: evidence from Swiss focus groups. Global Environmental Change (2001)
Wheeler, D., Shaw, G. and Barr, S. (2004) Statistical Techniques in Geographical Analysis. (Fulton, London).
Wilby et al. (2004) Guidelines Use of Climate Scenarios from statistical downscaling methods. IPCC pp. 1-27
Yu-Pin Lin a, Nien-Ming Hong , Pei-Jung Wu , Chen-Fa Wu , Peter H. Verburg; Impacts of land use change scenarios on hydrology and land use patterns in the Wu-Tu watershed in Northern Taiwan. Landscape and Urban Planning 80 (2007) 111–126 (2007) pp. 1-16
Zeigler et al. (1996) Focusing on Hurricane Andrew through the Eyes of the Victims . Area vol. 28 (2) pp. 124-129
64
Appendices
Appendix 1 Public Questionnaire. (face to face interviews were supported by answer cards to give options to the
respondent. Page breaks have been removed)
NDCCS
Bideford Station East the Water
Bideford Devon
EX39 4BB Dear Sir or madam, I am carrying out research in the North Devon’s UNESCO Biosphere Reserve and part of a Master in Science (sustainable development) research at University of Exeter on people’s perceptions about climate change. I expect the Biosphere Reserve use the data to help to develop suitable action and how to present our information on climate change. After helping us with this questionnaire, we are seeking a small group of people (around 8 to 10) to help us to describe a range of possible outcomes of the future for this area such as landscape, types of food production. To do this the group will need to meet all together twice for just about an hour each time. Participants will be paid a small fee for their participation. If you wish to participate we will ask for your details at the end of this questionnaire. We hope the meetings will be fun as well as interesting for the participants. The meeting is likely to be in Barnstaple Library early in the evening. The following questions will help us to understand the general feeling by people in the area from a range of backgrounds about climate change and their actions and attitudes. I guarantee that any personal data is solely for the purpose of this research and will not be passed on to any other organisation in any form that individuals will be identifiable, nor will any individual be identifiable within work. Thank you in advance for participating. If you wish to follow up the progress of this study or more information on the UNESCO Biosphere Reserve in North Devon, please refer to the website: www.northdevonbiosphere.org.uk

65
A About the respondent HOUSEHOLD AND RESPONDENT CHARACTERISTICS, WELLBEING Household and respondent characteristics First of all, I’d just like to ask some questions about you and your household. ASK ALL SHOW CARD A1 A1 Which of the statements on this card applies to you?
1. Working full time 2. Working part time 3. On a local or government training scheme (GTS) 4. On an Apprenticeship 5. Registered unemployed/signing on for jobseekers allowance 6. Not registered unemployed but seeking work 7. At home/not seeking work 8. Long-term sick or disabled 9. Retired 10. In full-time education 11. Other (specify) 12. Don’t know 13. Refused
A2 Including yourself, how many people usually live in your home? Please include all adults and children. ENTER NUMBER SHOW CARD A2 A4 First of all, which of these best describes your home?
1. Detached house 2. Semi-detached house 3. Terraced house 4. Bungalow 5. Flat (in a block of flats) 6. Flat (in a house) 7. Maisonette 8. Other (specify) 9. Don’t know
Refused SHOW CARD A3 A5 In which of these ways do you occupy this accommodation?
1. Own it outright 2. Buying it with the help of a mortgage or loan 3. Pay part rent and part mortgage (shared ownership) 4. Rent it 5. Live here rent free (inc. rent free in relative/friend's property, 6. excluding squatting) 7. Squatting 8. Don’t know
A7 And how long have you lived in your current home?
1. Up to 1 year 2. More than 1 year, up to 2 years 3. More than 2 years, up to 5 years 4. More than 5 years, up to 10 years 5. More than 10 years, up to 20 years

66
6. More than 20 years 7. Don’t know 8. Refused
SHOW CARD A4 A8 Which phrase on this card best describes the area where you live?
1. A big city 2. The suburbs or outskirts of a big city 3. A town or a small city 4. A country village 5. A farm or home in the countryside 6. Other (specify) 7. Don’t know
Wellbeing SHOW CARD A5 A9 The next few questions ask about some different aspects of your life. First, all things considered, how satisfied are you with your life as a whole nowadays? Please answer using this card, where 0 means extremely dissatisfied and 10 means extremely satisfied. 0 (Extremely dissatisfied) - 10 (Extremely satisfied) Don’t know Refused Wellbeing Value statements A10 Card A6 ASK RESPONDENT TO READ BACK NUMBERS IN EACH ANSWER CATEGORY, STARTING WITH ‘DEFINITELY AGREE’
1. In general I feel very positive about myself 2. I spend a lot of time worrying about things
A6 Value responses
1. Definitely agree 2. Tend to agree 3. Neither agree nor disagree 4. Tend to disagree 5. Definitely disagree 6. Not applicable 7. Don’t know
A11 Priorities Card A7 Which 3 of the following issues concern you the most?
1. Air pollution 2. Pollution of rivers and seas 3. Flooding 4. Crime 5. Litter 6. Poor waste management (e.g. overuse of landfills) 7. Traffic/ congestion 8. War in the Middle East and Afghanistan 9. GM food
67
10. Climate change 11. Economic recession 12. The hole in the ozone layer 13. Using up the earth's resources 14. Extinction of species 15. Radioactive waste 16. Overpopulation (of the earth by humans
B About climate change awareness
ATTITUDES AND KNOWLEDGE IN RELATION TO THE ENVIRONMENT/CLIMATE CHANGE Next some more general questions to do with the environment SHOW CARD B1 B1 How much, if anything, would you say you know about the following terms? READ OUT � (RANDOMISE ORDER OF STATEMENTS) 1. Climate Change (TO ALWAYS APPEAR FIRST IN LIST) 2. Global Warming 3. Carbon footprint 4. C02 or Carbon dioxide emissions 5. Carbon offsetting Responses
1. A lot 2. A fair amount 3. Just a little 4. Nothing – have only heard of the name 5. Nothing – have never heard of it 6. Don’t know
ASK ALL SHOW CARD B2 B2 I am going to read out some changes that people might make to their lifestyles/homes. For each one, please tell me which answer on the card applies to you personally at the moment. There are no right or wrong answers – we’re just interested in what you do at the moment, not what you think you should or shouldn’t be doing.

68
1 I don't re
ally want to do th
is
2 I haven't re
ally thought ab
out doing this
3 I've thoug
ht abou
t doin
g this, but pro
bably w
on't do
it
4 I'm thinking
about doing this
5 I'm a
lready do
ing th
is, but I prob
ably won't m
anag
e to
keep it up
6 I've tried doing this, b
ut I've given up
7 I'm
already do
ing th
is and in
tend to ke
ep it up
8 Don
’t know
9 Not app
licable
1. Use a car less
2. Take fewer flights
3. Reduce the use of gas/oil/electricity
4. Cut down on water usage
5. Recycle more waste 6. Waste less food
7. Buy food produced locally rather than food produced abroad
8. Use a more fuel-efficient vehicle
9. Install Solar panels for electricity
10. Install Solar panels for heating
11. Install Wind turbine
12. Install Low energy bulbs
13. Install Energy efficient boiler
14. Install Increased insulation
15. Install Secondary Glazing
69
Show card B3 B3 Which of these best describes how you feel about your current lifestyle and the environment?
1. I’m happy with what I do at the moment 2. I’d like to do a bit more to help the environment 3. I’d like to do a lot more to help to environment 4. Don’t know
B4 And which of these would you say best describes your current lifestyle? (tick one)
1. I don’t really do anything that is environmentally-friendly 2. I do one or two things that are environmentally-friendly 3. I do quite a few things that are environmentally-friendly 4. I’m environmentally-friendly in most things I do 5. I’m environmentally-friendly in everything I do 6. Don’t know
Show Card B5 B5
How much do you agree or disagree with the following statements? 1. Strongly agree 2. Tend to agree 3. Neither agree nor disagree 4. Tend to disagree 5. Strongly disagree 6. Don't Know
1. We are close to the limit of the number of people the earth can support 2. Humans are severely abusing the environment 3. The Earth has very limited room and resources 4. The so-called ‘environmental crisis’ facing humanity has been greatly exaggerated 5. Reducing carbon footprint is more important than saving biodiversity 6. Scientists will find a solution to global warming without people having to make big
changes to their lifestyles 7. Reducing carbon footprint is more important than preserving landscape 8. Humans were meant to rule over the rest of nature 9. Dealing with climate change is more important than a dip in the economy 10. The government should defend houses and property from erosion and flooding
regardless of their value and cost of the defences. 11. The environment is a low priority for me compared with a lot of other things in my life 12. Climate Change is beyond control – it’s too late to do anything about it 13. So many people are environmentally-friendly these days, it does make a difference 14. The effects of climate change are too far in the future to really worry me 15. I do worry about the changes to the countryside in the UK and the loss of native
animals and plants 16. I don’t believe my behaviour and everyday lifestyle contribute to climate change 17. The government should take complete responsibility for tackling climate change
B6 Where do you mainly get your information on environmental issues? Tick no more than 3.
1. News Paper 2. Radio 3. TV

70
4. Internet 5. Friends/family 6. Local authority leaflet/government leaflet 7. Environmental group publications
C1 About understanding uncertainty and understanding the areas of
perceived risk.
Show card C1
1. What does is mean when weather forecast says “40% chance of rain?”
2. What does a “1 in 100 year flood protection” area mean to you?
Show card Map Card
1. If I live in the yellow box next to X on this map, would you advise me to move?
2. If I live in the If I live in the black box next to A on this map, would you advise me to move?
C2 Show card C2 (In this question I wish to find out how people express risk and what risk is perceived to be the most significant to the respondent.) Using your own words, give a value to the following;
1. Describe the risk of global warming and climate change forcing a significant impact on public health in Devon in 25 years from now.
2. Describe the risk of global warming and climate change forcing a significant impact on economic development in Devon in 25 years from now?
3. Describe the risk of global warming and climate change forcing a significant impact on the environment in Devon in 25 years from now?
C3 In terms of being impacted by climate change which subject area concerns you most? Place them in order (1 being first)
a. Your health
b. Your environment
c. Your financial circumstances
d. none

71
D About climate change behaviour ENERGY AND WATER EFFICIENCY IN THE HOME Energy efficiency Next some questions about your home D1 Do you have a room thermostat for your heating system?
1. Yes 2. No 3. Don’t know
D2 Do you know what temperature your thermostat is set at most of the time? IF YES: What temperature is it set at? Temperature in degrees C/F Varies too much to say Don’t know SHOW CARD D5 D6 Please could you tell me how often you personally do each of the following 1. Leave your TV on standby overnight 2. Leave the lights on in rooms that aren’t being used 3. Leave a mobile phone charger switched on at the socket when not in use 4. Fill the kettle with more water than you are going to use 5. Keep the tap running while you brush your teeth 6. Leave the heating on when you go out for a few hours 7. When there is a choice, have a bath rather than a shower 8. Put more clothes on when you feel cold, rather than putting the heating on or turning it up 9. Throw away food because it has gone off 10. Decide not to buy something because you feel it has too much packaging 11. Take your own shopping bag when shopping 12. Re-use things like empty bottles, tubs or jars, envelopes or paper
1. Always/Very often 2. Quite often 3. Sometimes 4. Rarely 5. Never 6. Not applicable/cannot do this 7. Don’t know
E. Final personal details Finally, I’d just like to ask you a few more questions about your circumstances E4
1. Have you ever heard of the Biosphere Reserve? i. Yes No
2. Do you know where it is? i. Yes No
E8 CODE RESPONDENT’S GENDER
1. Male 2. Female
E9 Please could you tell me your age last birthday?
1. Numeric range (16 – 99) or age group? 2. Refused
72
E10 To which of these groups do you consider you belong?
A. White - British B. White – Irish C. White – other white background D. Mixed – White and Black Caribbean E. Mixed – White and Black African F. Mixed – White and Asian G. Mixed – any other Mixed background H. Asian or Asian British – Indian I. Asian or Asian British – Pakistani J. Asian or Asian British – Bangladeshi K. Asian or Asian British – other Asian background L. Black or Black British – Caribbean M. Black or Black British – African N. Black or Black British – other Black background O. Chinese P. Other (specify) Don’t know Refused
SHOW CARD E2 E13 I am now going to ask you about your household income. I only need to know an approximate amount, to see if this influences people’s views and experiences. Please can you tell me your overall HOUSEHOLD income from all sources in the last year? This includes earnings from employment or self-employment, income from benefits and pensions, and income from other sources such as interest and savings. Please look at this card and tell me which letter represents your TOTAL HOUSEHOLD INCOME in the last year from all sources BEFORE tax and other deductions.
Annual Weekly Monthly 1 Under £10, 000 Under £200 Under £830 4 £10,000 - £14,999 £200 - £289 £830 - £1,249 5 £15,000 - £19,999 £290 - £389 £1,250 - £1,649 6 £20,000 - £24,999 £390 - £489 £1,650 - £2,099 7 £25,000 - £29,999 £490 - £579 £2,100 - £2,499 8 £30,000 - £40,000 £580 - £770 £2,500 - £3, 350 10 £40,000 - £50, 000 £770 - £969 £3,350 - £4149 12 £50,000 -£59,999 £970 - £1,149 £4,150 - £4,999 13 More than £60,000 More than £1149 More than £6250 E15 Do you have any qualifications...?
1. Yes 2. No 3. refuse
E16 What is the highest qualification you have? DO NOT READ OUT, BUT PROMPT AS NECESSARY. CODE THE ANSWER WHICH IS HIGHER UP THE LIST.
1. Degree level qualification including foundation degrees, graduate membership of a professional institute, PGCE or higher
2. Diploma in higher education 3. HNC/HND 4. ONC/OND 5. BTEC/BEC/TEC/EdExcel 6. Teaching qualifications (excluding PGCE) 7. Nursing or other medical qualification not covered above

73
8. Other higher education qualification below degree level 9. A-level/vocational A-level or equivalent 10. International Baccalaureate 11. NVQ/SVQ 12. GNVQ/GSVQ 13. AS-level/vocational AS-level or equivalent 14. Access to HE 15. O-level or equivalent 16. GCSE/vocational GCSE 17. CSE 18. RSA/OCR 19. City and Guilds 20. YT certificate 21. Key skills 22. Basic skills 23. Don't Know 24. Any other professional/vocational/foreign/other qualification (SPECIFY)
Could you tell me your current or most recent job��������.. E18 INTERVIEWER: CODE RESPONDENT’S SOCIAL GRADE.
• A • B • C1 • C2 and r • D • E
F Willingness to participate As part of this project we are asking a small group of people meeting on 2 occasions to discuss their thoughts on climate change and the future of this area. Participants will be paid small amount for their time. All data will be kept anonymous. Name ADDRESS POST CODE CONTACT NUMBER EMAIL ADDRESS
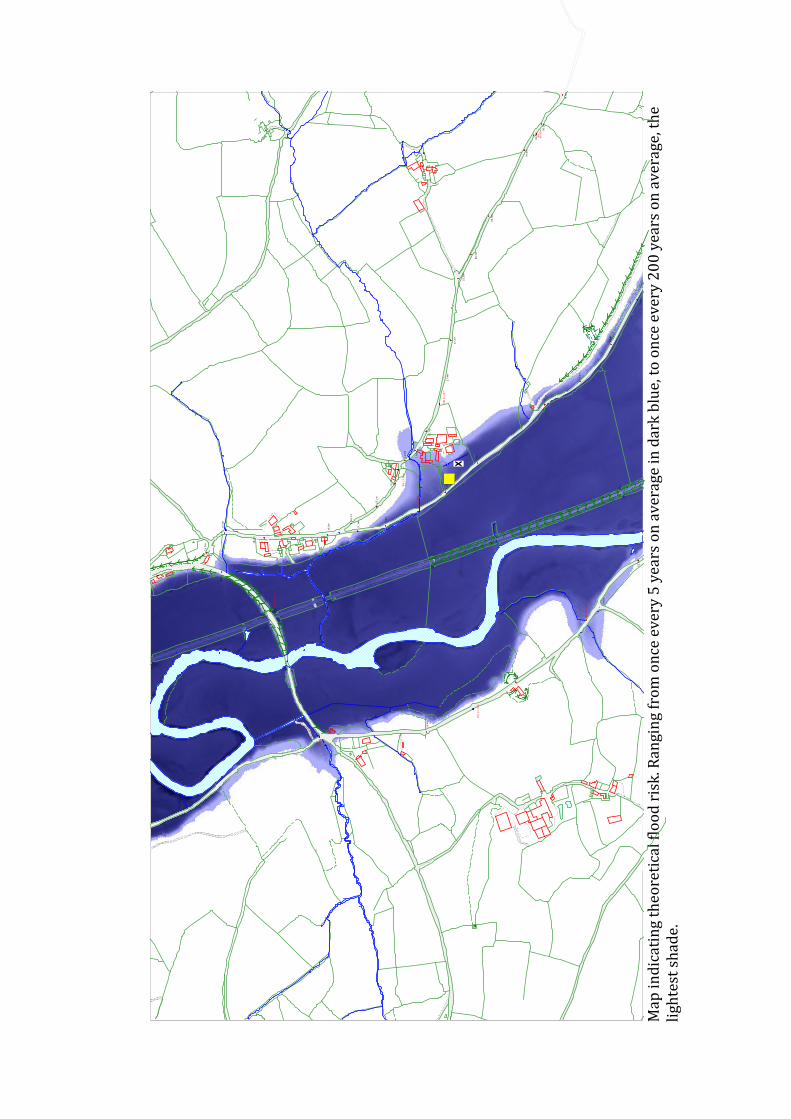
M
ap
in
dic
ati
ng
th
eo
reti
cal
flo
od
ris
k. R
an
gin
g f
rom
on
ce e
ve
ry 5
ye
ars
on
av
era
ge
in
da
rk b
lue
, to
on
ce e
ve
ry 2
00
ye
ars
on
av
era
ge
, th
e
lig
hte
st s
ha
de
.
79.0m
79.5m
80.1m
80.2m
BM
80.85m
65.9m
7.7m
7.6m
7.5m
7.8m
7.6m
15.7m
11.0m
19.9m
11.2m
10.9m
15.6m
BM 17.14m
9.23m
BM
52.2m
56.3m
BM 22.66m
37.2m
27.4m
BM 8.24m
7.5m
15.1m
13.7m
BM 13.30m
16.5m
11.3m
BM 13.69m
16.7m
7.6m
9.6m
BM 10.49m
12.0m
BM 13.19m
8.7m
18.2m
16.0m
15.3m
X
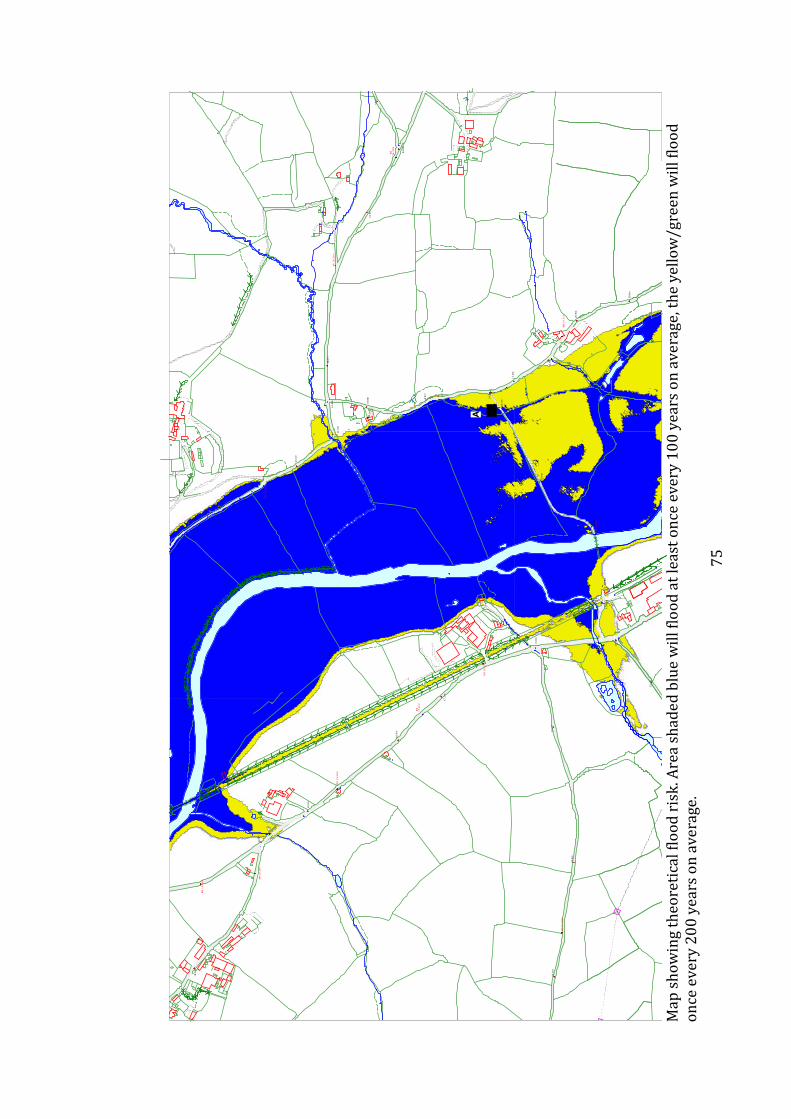
75
M
ap
sh
ow
ing
th
eo
reti
cal
flo
od
ris
k. A
rea
sh
ad
ed
blu
e w
ill
flo
od
at
lea
st o
nce
ev
ery
10
0 y
ea
rs o
n a
ve
rag
e, t
he
ye
llo
w/
gre
en
wil
l fl
oo
d
on
ce e
ve
ry 2
00
ye
ars
on
av
era
ge
.
9.3m
12.1m
45.2m
BM 54.1m
54.32m
41.6m
BM 28.21m
BM 16.71m
29.8m
20.9m
10.5m
11.3m
12.4m
9.9m
10.7m
BM
14.6m
14.8m
14.50m
18.1m
9.6m
BM 10.28m
13.5m
11.0m
11.8m
9.8m
10.4m
BM 11.87m
10.8m
11.3m
13.9m
17.1m
21.0m
BM 16.61m
11.5m
17.20m
BM
13.8m
BM 15.97m
16.9m
BM 16.14m
12.4m
BM 14.18m
18.9m
BM 51.50m
42.5m
54.5m
A
Appendix 2 Land owner Questionnaire (map images reduced to save space)
Bideford Station
East the Water
Bideford
Devon
EX39 4BB
Dear Sir or madam I am carrying out research in the North Devon’s UNESCO Biosphere Reserve on people’s perceptions about climate change as part of a Masters Research Project at University of Exeter. I expect that the Biosphere Reserve will use the data to help to develop suitable action for climate change and how to present that type of information. We are firstly asking a large group of landowners to complete this questionnaire to get a broad understanding of attitudes. After helping us with this questionnaire, we are seeking a small group of people (around 8 to 10) to help us to describe a range of possible outcomes of the future for this area. To do this, the group will need to meet all together once or possibly twice for just over an hour each time. Participants will be paid a small fee for their participation. The first meeting will be on 12 August in the late afternoon in the Eggesford/Umberleigh area. If you wish to participate we will ask for your details at the end of this questionnaire. I guarantee that this data is solely for the purpose of this research and will not be passed on to any other organisation, nor will any individual be identifiable within the report. When you have completed the questionnaire, please post it back as soon as possible using the pre-paid envelope provided. Thank you in advance for participating. If you wish to follow up the progress of this study or more information on the UNESCO Biosphere Reserve in North Devon, please refer to the website: www.northdevonbiosphere.org.uk Kind regards
Andrew Bell

77
Questionnaire: Section A
1. In order to consider issues of farming and climate change for a range of farms we need some basic details about the farm you have and the land-use on it.
i. Total Size (ha),
2. Type of topography; what are the main features of the farm? i. Gently sloping hillside, ii. steeply sloping, iii. large flood plain, iv. hill top plain, v. gentle rolling or undulation
3. Type of farm: please indicate the type(s) of farming you do. Tick as many as apply i. Dairy ii. Beef iii. Pigs iv. Sheep v. Poultry vi. Other
4. Landcover; What area (hectares please) of land comes under the following
categories? i. Set-aside ii. Arable iii. Permanent grassland iv. Temporary ley v. Spring Cereal (not including maize) vi. Winter cereal (not including maize) vii. Maize viii. Root crops ix. Woodland x. Orchard xi. other
5. We would like to identify river catchments where we will do some modelling of future scenarios. We will be able to locate the catchment from your post-code and you will still have reasonable anonymity. Please enter your post code������
6. Type of tenancy/occupancy on the majority of your holding. Please enter the number of hectares under each category
i. Freehold ii. Farm Business Tenancy iii. Full agricultural tenancy iv. Annual rent/grass keep
7. How long have you been farming on that holding? �����..Years
8. What is the total number of years farming experience you have?............years
9. Is your farm under any Agri-environment schemes? (Higher level Stewardship, Entry
level Stewardship, Countryside Stewardship, ESA, Organic Stewardship i. Current
1. Type 2. Date entered
ii. Applied for (type)
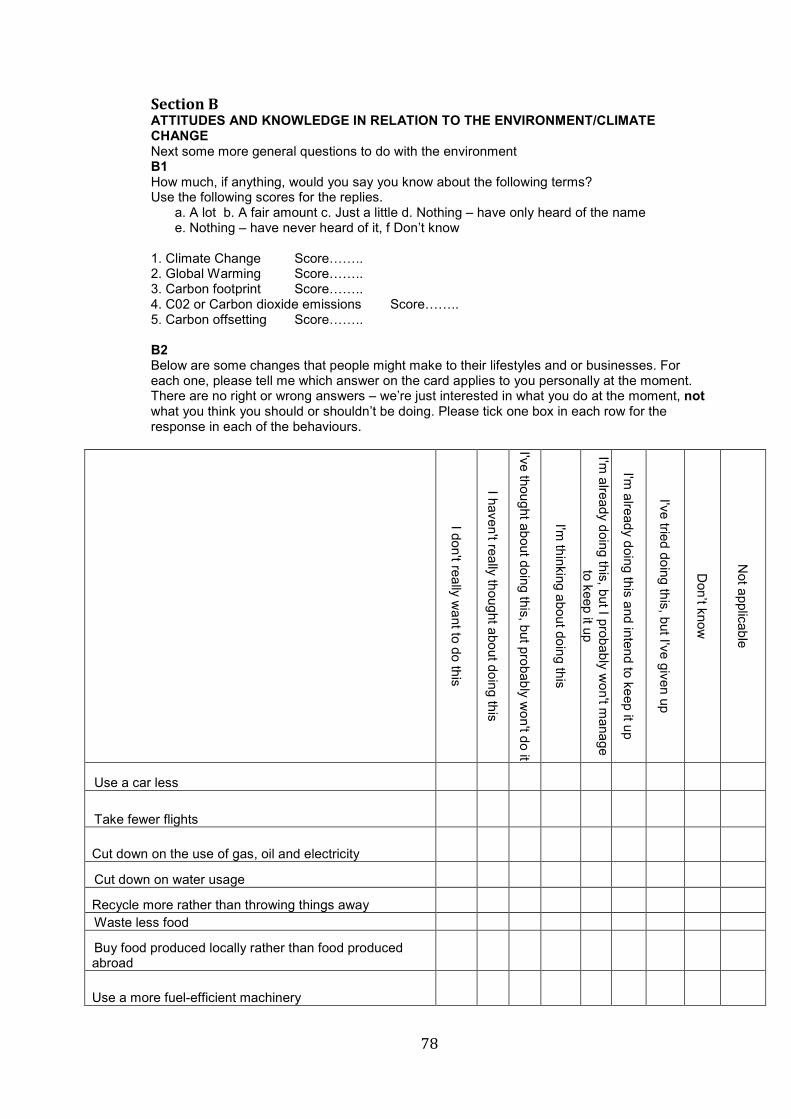
78
Section B ATTITUDES AND KNOWLEDGE IN RELATION TO THE ENVIRONMENT/CLIMATE CHANGE Next some more general questions to do with the environment B1 How much, if anything, would you say you know about the following terms? Use the following scores for the replies.
a. A lot b. A fair amount c. Just a little d. Nothing – have only heard of the name e. Nothing – have never heard of it, f Don’t know
1. Climate Change Score��.. 2. Global Warming Score��.. 3. Carbon footprint Score��.. 4. C02 or Carbon dioxide emissions Score��.. 5. Carbon offsetting Score��.. B2 Below are some changes that people might make to their lifestyles and or businesses. For each one, please tell me which answer on the card applies to you personally at the moment. There are no right or wrong answers – we’re just interested in what you do at the moment, not what you think you should or shouldn’t be doing. Please tick one box in each row for the response in each of the behaviours.
I don't really w
ant to do
this
I haven't really th
ought a
bout do
ing th
is
I've thought ab
out doing this, but probab
ly wo
n't do it
I'm th
inking abou
t doin
g this
I'm a
lready doing this, but I proba
bly wo
n't mana
ge to keep
it up
I'm a
lready doing this a
nd intend to ke
ep it up
I've tried do
ing th
is, but I've given
up
Don’t know
Not a
pplicable
Use a car less
Take fewer flights
Cut down on the use of gas, oil and electricity
Cut down on water usage
Recycle more rather than throwing things away Waste less food
Buy food produced locally rather than food produced abroad
Use a more fuel-efficient machinery
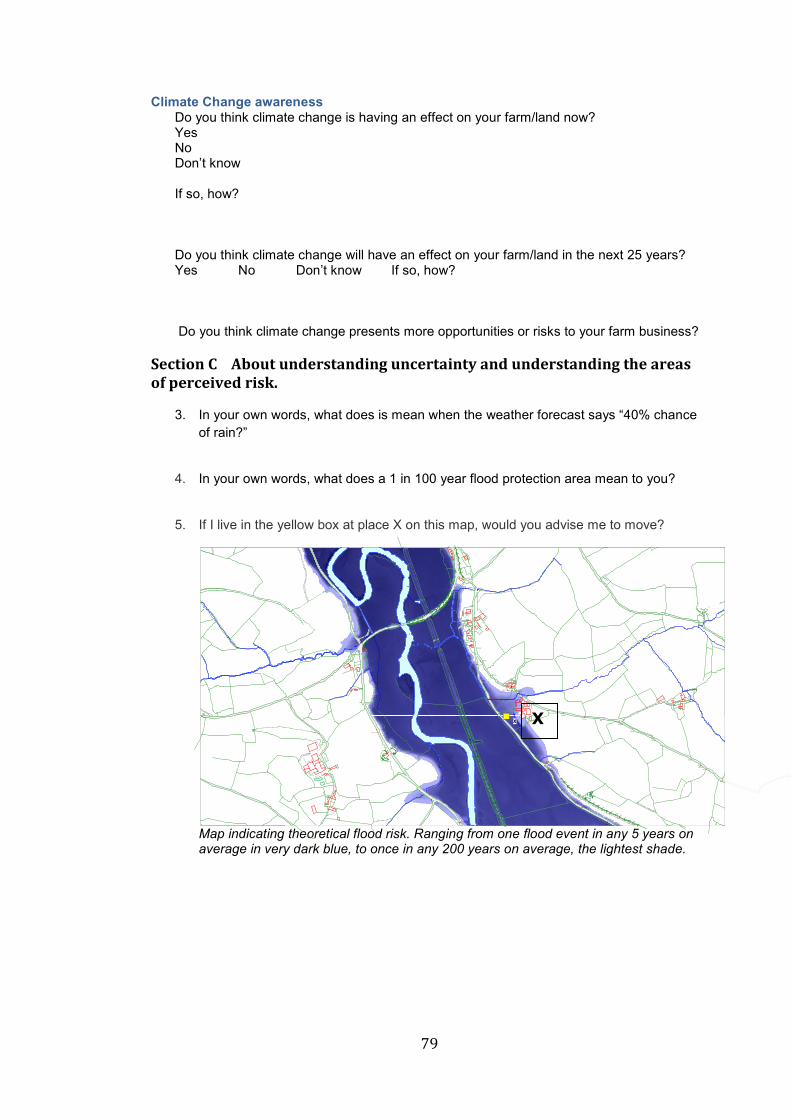
79
Climate Change awareness Do you think climate change is having an effect on your farm/land now? Yes No Don’t know If so, how? Do you think climate change will have an effect on your farm/land in the next 25 years? Yes No Don’t know If so, how? Do you think climate change presents more opportunities or risks to your farm business?
Section C About understanding uncertainty and understanding the areas
of perceived risk.
3. In your own words, what does is mean when the weather forecast says “40% chance of rain?”
4. In your own words, what does a 1 in 100 year flood protection area mean to you?
5. If I live in the yellow box at place X on this map, would you advise me to move?
Map indicating theoretical flood risk. Ranging from one flood event in any 5 years on average in very dark blue, to once in any 200 years on average, the lightest shade.
79.0m
79.5m
80.1m
80.2m
BM80.85m
65.9m
7.7m
7.6m
7.5m
7.8m
7.6m
15.7m
11.0m
19.9m
11.2m
10.9m
15.6m
BM 17.14m
9.23m
BM
52.2m
56.3m
BM 22.66m
37.2m
27.4m
BM 8.24m
7.5m
15.1m
13.7m
BM 13.30m
16.5m
11.3m
BM 13.69m
16.7m
7.6m
9.6m
BM 10.49m
12.0m
BM 13.19m
8.7m
18.2m
16.0m
15.3m
X X
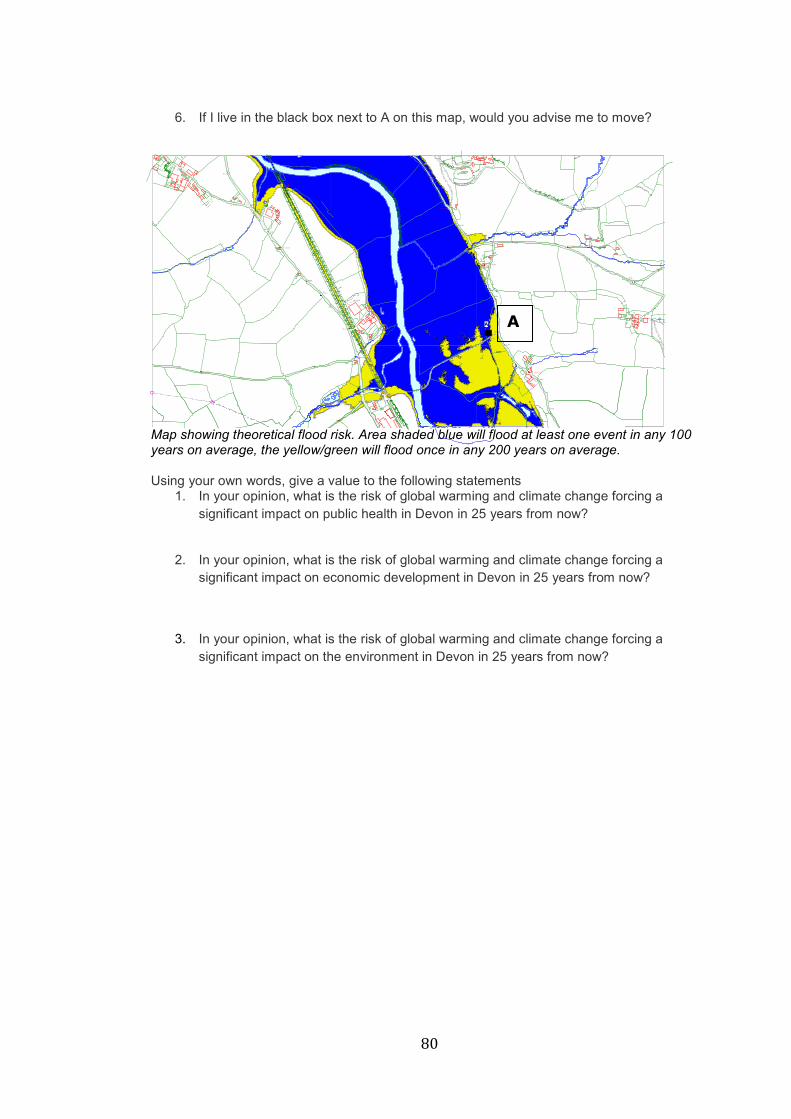
80
6. If I live in the black box next to A on this map, would you advise me to move?
Map showing theoretical flood risk. Area shaded blue will flood at least one event in any 100 years on average, the yellow/green will flood once in any 200 years on average. Using your own words, give a value to the following statements
1. In your opinion, what is the risk of global warming and climate change forcing a significant impact on public health in Devon in 25 years from now?
2. In your opinion, what is the risk of global warming and climate change forcing a
significant impact on economic development in Devon in 25 years from now?
3. In your opinion, what is the risk of global warming and climate change forcing a significant impact on the environment in Devon in 25 years from now?
9.3m
12.1m
45.2m
BM
54.1m
54.32m
41.6m
BM 28.21m
BM 16.71m
29.8m
20.9m
10.5m
11.3m
12.4m
9.9m
10.7m
BM
14.6m
14.8m
14.50m
18.1m
9.6m
BM 10.28m
13.5m
11.0m
11.8m9.8m
10.4m
BM 11.87m
10.8m11.3m
13.9m
17.1m
21.0m
BM 16.61m
11.5m
17.20m
BM
13.8m
BM 15.97m
16.9m
BM 16.14m 12.4m
BM 14.18m
18.9m
BM 51.50m
42.5m
54.5m
A A
81
State to what degree you agree or disagree with the following statements (1 is totally disagree, 5 is totally agree)
1. Global warming and climate change will have a noticeably negative impact on my health in the next 25 years.
Score ��. 2. Global warming and climate change will have a noticeably negative impact on my
economic and financial situation in the next 25 years.
Score��. 3. Global warming and climate change will have a noticeably negative impact on the
environment in which my family and I live.
Score���
Current Climate behaviour 1. Are you taking any action to adapt to the impacts (past or expected) of climate change
on your farm? (e.g. reduce water usage, different crops, different tillage mechanisms). If so, what are they?
2. Are you taking any action to reduce greenhouse gas emissions from your farm? (biogas digestion, energy efficiency, machinery efficiency, soil restoration, carbon fixing, solar heating). If so, what are they
3. Are these actions driven by cost saving or environmental factors?
a. Only environment b. Only cost saving c. Both
4. Do you or are you interested in measuring your on-farm carbon emissions? Yes b. No
82
General Questions about how think about the environment
1. Which of these best describes how you feel about your current lifestyle and farming ethic and the environment? a) I’m happy with what I do at the moment b) I’d like to do a bit more to help the environment c) I’d like to do a lot more to help to environment d) Don’t know
2. Which 3 of the following issues concern you the most? Please tick the three greatest
concerns. a. Air pollution b. Pollution of rivers and seas c. Flooding d. Crime e. Litter f. Poor waste management (e.g. overuse of landfills) g. Traffic/ congestion h. War in the Middle East and Afghanistan i. GM food j. Climate change k. Economic recession l. The hole in the ozone layer m. Using up the earth's resources n. Extinction of species o. Radioactive waste p. Overpopulation (of the earth by humans)
On a scale of 1 to 5 (1=totally disagree to 5=totally agree)
1. I feel optimistic about the future of farming in the UK for the next 25 years. ���.
2. Food production within the UK will become increasingly important. ����.
3. Environmental factors will become increasingly important over the next 25 years. �.
4. Food security and a wildlife rich environment are incompatible concepts. ��..
5. The UK will increasingly import its food from EU and beyond. ���
6. The way I manage my land has an impact on communities some distance away. ��..
7. Agricultural land provides more public benefits than food alone. ���..
83
1. Which, if any, of these statements would you say applies to you? You can choose as
many or as few as you like. Please tick against the numbers.
a) I know a lot about environmental issues, such as climate change b) I often talk to friends or family about things they can do to help the environment c) I try to persuade people I know in farming to become more environmentally-friendly d) I’ve suggested improvements at my farm to make it more environmentally-friendly e) I’ve told relatives or friends to avoid buying from a particular company because I feel
they are damaging the environment f) Don’t know g) None of these
1. Where do you normally go for your farm business/financial advice?
2. Where do you go for your land management advice?
3. Do you ever receive wildlife and environment advice?
a. If so from where/who?
4. What other sources of information do you use?
a. Trade publications (Farmers weekly etc)
b. Internet
c. Newspapers
Personal information To strengthen the findings of this questionnaire, we wish to hold 1 possibly 2 focus groups involving a selection of landowners. The purpose of these is to explore what perceptions of risk there are or lack of risk relating to climate change and land-use. We also need your experience to contribute to the model of a range of scenarios for land-use in the future given expected climate change impacts. We will pay a small fee for attending the groups, each will be about 1.5 hours long. Are you willing to help with these groups? Yes No If so, Please can I have a contact email address and phone number to confirm the venue and time? Name
Address Phone Number Email address Thank you again for your help.
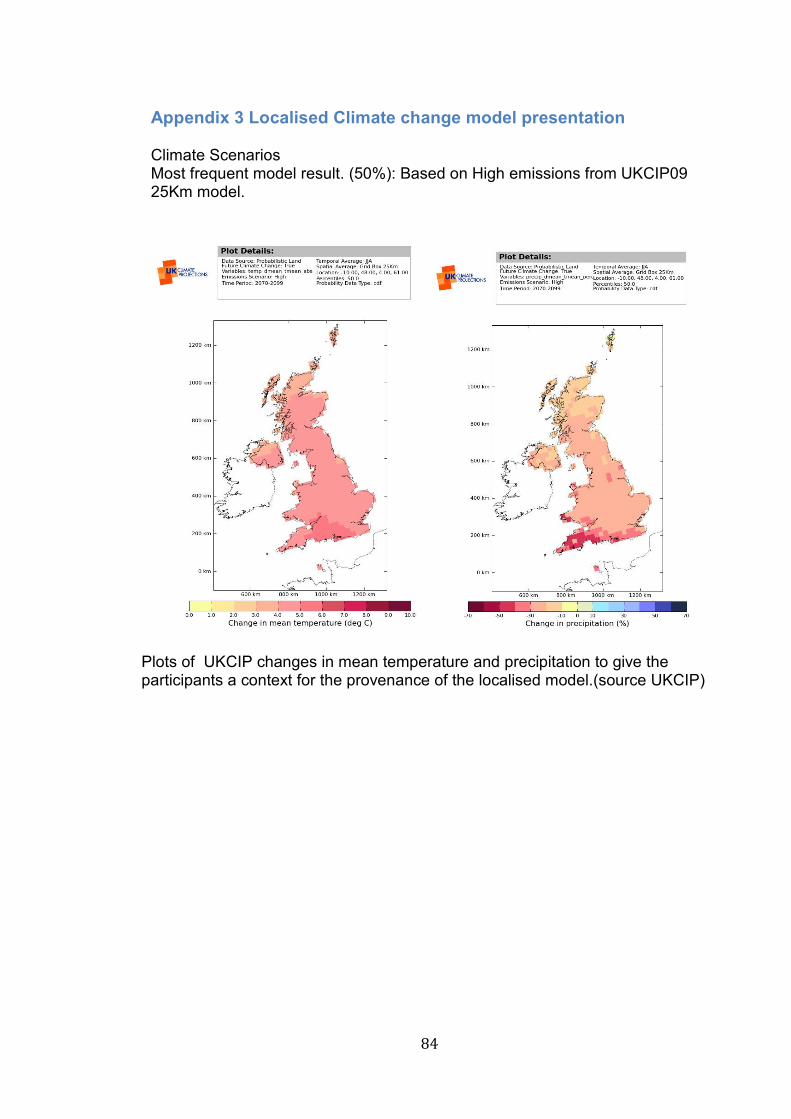
84
Appendix 3 Localised Climate change model presentation Climate Scenarios Most frequent model result. (50%): Based on High emissions from UKCIP09 25Km model.
Plots of UKCIP changes in mean temperature and precipitation to give the participants a context for the provenance of the localised model.(source UKCIP)
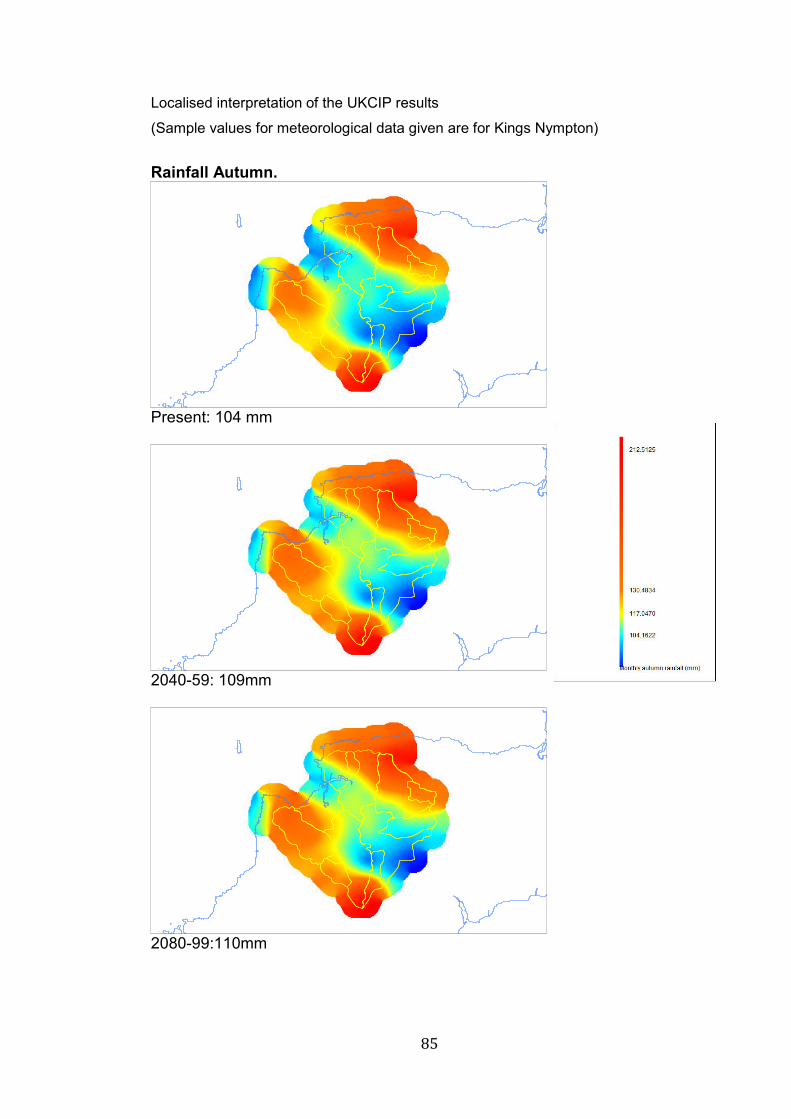
85
Localised interpretation of the UKCIP results
(Sample values for meteorological data given are for Kings Nympton)
Rainfall Autumn.
Present: 104 mm
2040-59: 109mm
2080-99:110mm
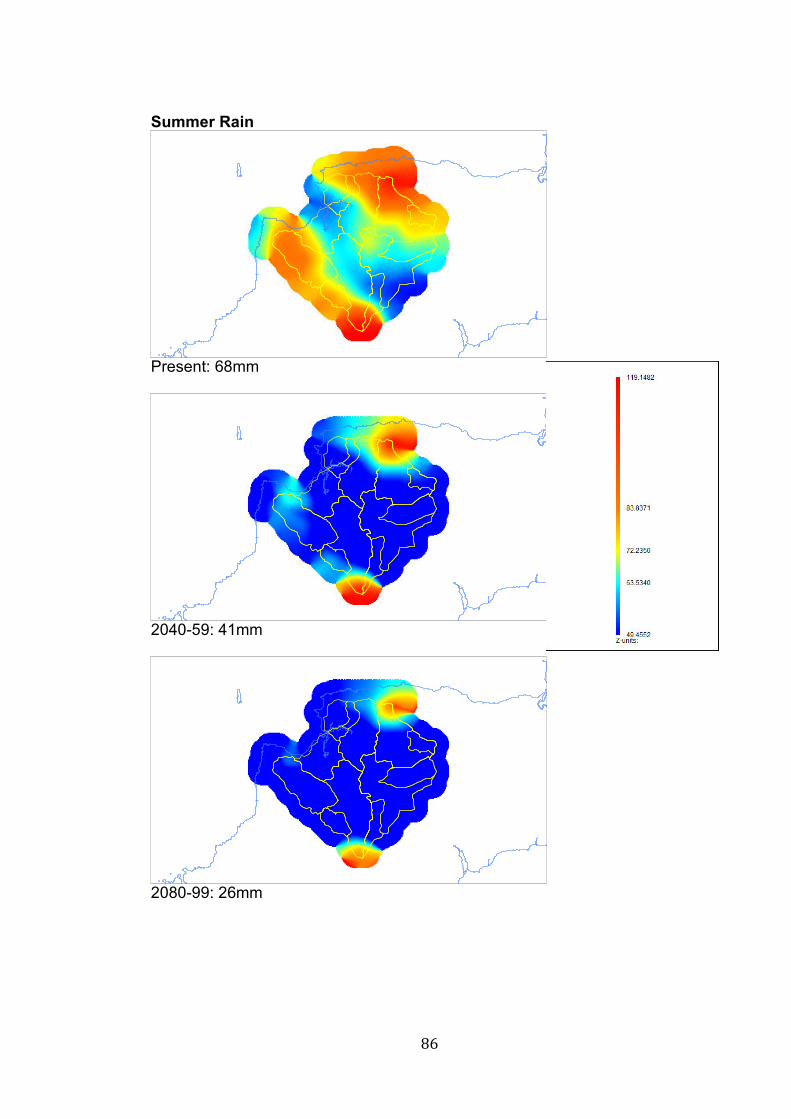
86
Summer Rain
Present: 68mm
2040-59: 41mm
2080-99: 26mm
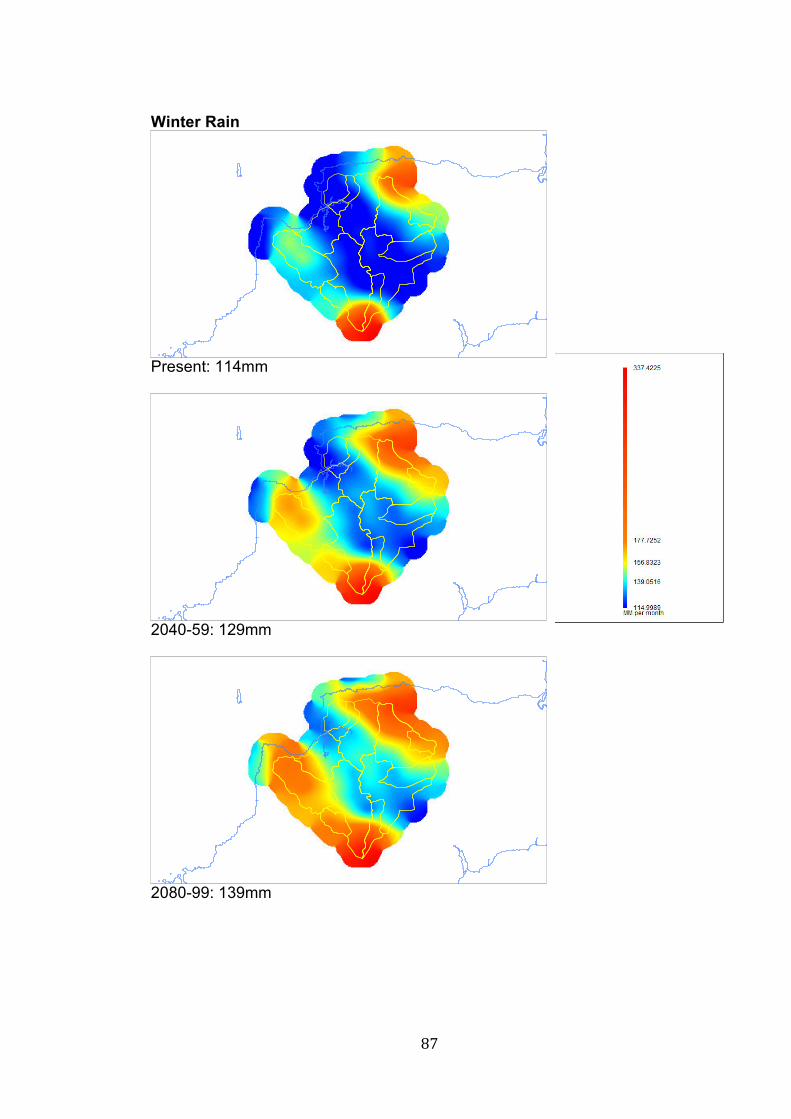
87
Winter Rain
Present: 114mm
2040-59: 129mm
2080-99: 139mm
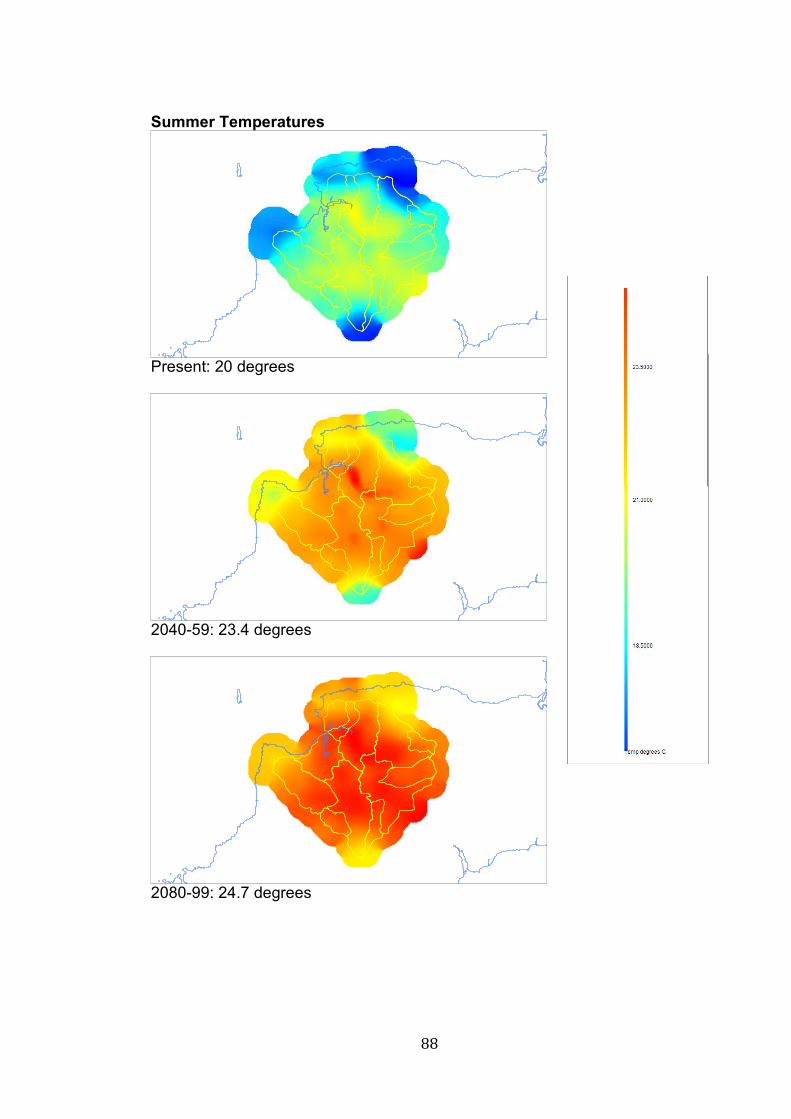
88
Summer Temperatures
Present: 20 degrees
2040-59: 23.4 degrees
2080-99: 24.7 degrees
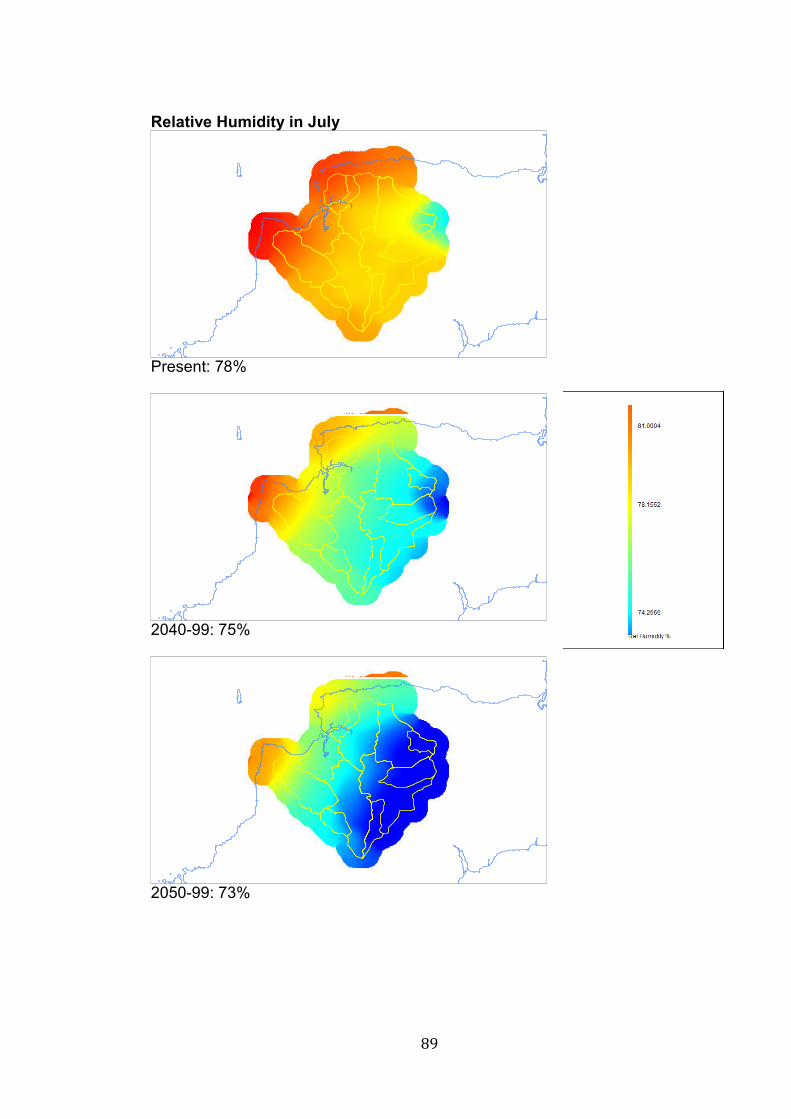
89
Relative Humidity in July
Present: 78%
2040-99: 75%
2050-99: 73%
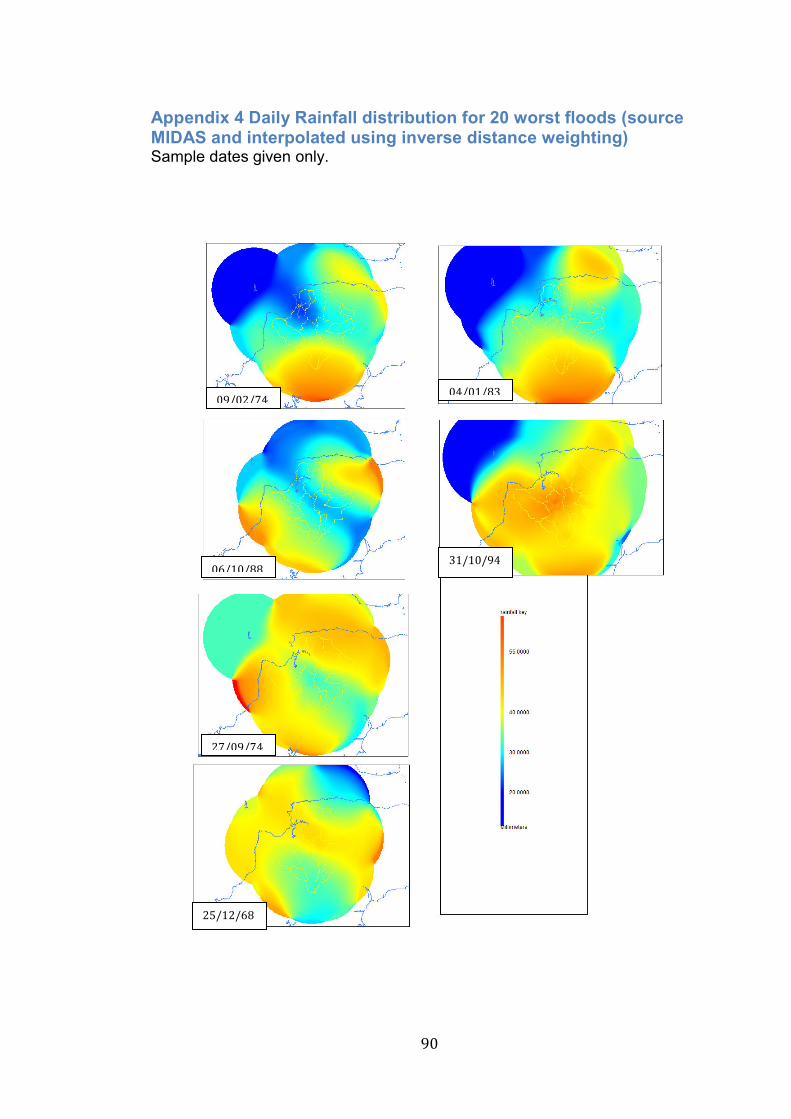
90
Appendix 4 Daily Rainfall distribution for 20 worst floods (source MIDAS and interpolated using inverse distance weighting) Sample dates given only.
04/01/83 09/02/74
06/10/88 31/10/94
27/09/74
25/12/68
Related Documents