Welcome message from author
This document is posted to help you gain knowledge. Please leave a comment to let me know what you think about it! Share it to your friends and learn new things together.
Transcript


The International Journal on Advances in Software is published by IARIA.
ISSN: 1942-2628
journals site: http://www.iariajournals.org
contact: [email protected]
Responsibility for the contents rests upon the authors and not upon IARIA, nor on IARIA volunteers,
staff, or contractors.
IARIA is the owner of the publication and of editorial aspects. IARIA reserves the right to update the
content for quality improvements.
Abstracting is permitted with credit to the source. Libraries are permitted to photocopy or print,
providing the reference is mentioned and that the resulting material is made available at no cost.
Reference should mention:
International Journal on Advances in Software, issn 1942-2628
vol. 6, no. 1 & 2, year 2013, http://www.iariajournals.org/software/
The copyright for each included paper belongs to the authors. Republishing of same material, by authors
or persons or organizations, is not allowed. Reprint rights can be granted by IARIA or by the authors, and
must include proper reference.
Reference to an article in the journal is as follows:
<Author list>, “<Article title>”
International Journal on Advances in Software, issn 1942-2628
vol. 6, no. 1 & 2, year 2013,<start page>:<end page> , http://www.iariajournals.org/software/
IARIA journals are made available for free, proving the appropriate references are made when their
content is used.
Sponsored by IARIA
www.iaria.org
Copyright © 2013 IARIA

International Journal on Advances in Software
Volume 6, Number 1 & 2, 2013
Editor-in-Chief
Luigi Lavazza, Università dell'Insubria - Varese, Italy
Editorial Advisory Board
Hermann Kaindl, TU-Wien, AustriaHerwig Mannaert, University of Antwerp, Belgium
Editorial Board
Witold Abramowicz, The Poznan University of Economics, Poland
Abdelkader Adla, University of Oran, Algeria
Syed Nadeem Ahsan, Technical University Graz, Austria / Iqra University, Pakistan
Marc Aiguier, École Centrale Paris, France
Rajendra Akerkar, Western Norway Research Institute, Norway
Zaher Al Aghbari, University of Sharjah, UAE
Riccardo Albertoni, Istituto per la Matematica Applicata e Tecnologie Informatiche “Enrico Magenes” Consiglio
Nazionale delle Ricerche, (IMATI-CNR), Italy / Universidad Politécnica de Madrid, Spain
Ahmed Al-Moayed, Hochschule Furtwangen University, Germany
Giner Alor Hernández, Instituto Tecnológico de Orizaba, México
Zakarya Alzamil, King Saud University, Saudi Arabia
Frederic Amblard, IRIT - Université Toulouse 1, France
Vincenzo Ambriola , Università di Pisa, Italy
Renato Amorim, University of London, UK
Andreas S. Andreou, Cyprus University of Technology - Limassol, Cyprus
Annalisa Appice, Università degli Studi di Bari Aldo Moro, Italy
Philip Azariadis, University of the Aegean, Greece
Thierry Badard, Université Laval, Canada
Muneera Bano, International Islamic University - Islamabad, Pakistan
Fabian Barbato, Technology University ORT, Montevideo, Uruguay
Barbara Rita Barricelli, Università degli Studi di Milano, Italy
Peter Baumann, Jacobs University Bremen / Rasdaman GmbH Bremen, Germany
Gabriele Bavota, University of Salerno, Italy
Grigorios N. Beligiannis, University of Western Greece, Greece
Noureddine Belkhatir, University of Grenoble, France
Imen Ben Lahmar, Institut Telecom SudParis, France
Jorge Bernardino, ISEC - Institute Polytechnic of Coimbra, Portugal
Rudolf Berrendorf, Bonn-Rhein-Sieg University of Applied Sciences - Sankt Augustin, Germany
Ateet Bhalla, Oriental Institute of Science & Technology, Bhopal, India
Ling Bian, University at Buffalo, USA
Kenneth Duncan Boness, University of Reading, England

Fernando Boronat Seguí, Universidad Politecnica de Valencia, Spain
Pierre Borne, Ecole Centrale de Lille, France
Farid Bourennani, University of Ontario Institute of Technology (UOIT), Canada
Narhimene Boustia, Saad Dahlab University - Blida, Algeria
Hongyu Pei Breivold, ABB Corporate Research, Sweden
Carsten Brockmann, Universität Potsdam, Germany
Mikey Browne, IBM, USA
Antonio Bucchiarone, Fondazione Bruno Kessler, Italy
Georg Buchgeher, Software Competence Center Hagenberg GmbH, Austria
Dumitru Burdescu, University of Craiova, Romania
Martine Cadot, University of Nancy / LORIA, France
Isabel Candal-Vicente, Universidad del Este, Puerto Rico
Juan-Vicente Capella-Hernández, Universitat Politècnica de València, Spain
Jose Carlos Metrolho, Polytechnic Institute of Castelo Branco, Portugal
Alain Casali, Aix-Marseille University, France
Alexandra Suzana Cernian, University POLITEHNICA of Bucharest, Romania
Yaser Chaaban, Leibniz University of Hanover, Germany
Savvas A. Chatzichristofis, Democritus University of Thrace, Greece
Antonin Chazalet, Orange, France
Jiann-Liang Chen, National Dong Hwa University, China
Shiping Chen, CSIRO ICT Centre, Australia
Wen-Shiung Chen, National Chi Nan University, Taiwan
Zhe Chen, College of Computer Science and Technology, Nanjing University of Aeronautics and Astronautics, China
PR
Po-Hsun Cheng, National Kaohsiung Normal University, Taiwan
Yoonsik Cheon, The University of Texas at El Paso, USA
Lau Cheuk Lung, INE/UFSC, Brazil
Robert Chew, Lien Centre for Social Innovation, Singapore
Andrew Connor, Auckland University of Technology, New Zealand
Rebeca Cortázar, University of Deusto, Spain
Noël Crespi, Institut Telecom, Telecom SudParis, France
Carlos E. Cuesta, Rey Juan Carlos University, Spain
Duilio Curcio, University of Calabria, Italy
Mirela Danubianu, "Stefan cel Mare" University of Suceava, Romania
Paulo Asterio de Castro Guerra, Tapijara Programação de Sistemas Ltda. - Lambari, Brazil
Cláudio de Souza Baptista, University of Campina Grande, Brazil
Maria del Pilar Angeles, Universidad Nacional Autonónoma de México, México
Rafael del Vado Vírseda, Universidad Complutense de Madrid, Spain
Giovanni Denaro, University of Milano-Bicocca, Italy
Hepu Deng, RMIT University, Australia
Nirmit Desai, IBM Research, India
Vincenzo Deufemia, Università di Salerno, Italy
Leandro Dias da Silva, Universidade Federal de Alagoas, Brazil
Javier Diaz, Rutgers University, USA
Nicholas John Dingle, University of Manchester, UK
Roland Dodd, CQUniversity, Australia

Aijuan Dong, Hood College, USA
Suzana Dragicevic, Simon Fraser University- Burnaby, Canada
Cédric du Mouza, CNAM, France
Ann Dunkin, Palo Alto Unified School District, USA
Jana Dvorakova, Comenius University, Slovakia
Lars Ebrecht, German Aerospace Center (DLR), Germany
Hans-Dieter Ehrich, Technische Universität Braunschweig, Germany
Jorge Ejarque, Barcelona Supercomputing Center, Spain
Atilla Elçi, Süleyman Demirel University, Turkey
Khaled El-Fakih, American University of Sharjah, UAE
Gledson Elias, Federal University of Paraíba, Brazil
Sameh Elnikety, Microsoft Research, USA
Fausto Fasano, University of Molise, Italy
Michael Felderer, University of Innsbruck, Austria
João M. Fernandes, Universidade de Minho, Portugal
Luis Fernandez-Sanz, University of de Alcala, Spain
Felipe Ferraz, C.E.S.A.R, Brazil
Adina Magda Florea, University "Politehnica" of Bucharest, Romania
Wolfgang Fohl, Hamburg Universiy, Germany
Simon Fong, University of Macau, Macau SAR
Gianluca Franchino, Scuola Superiore Sant'Anna, Pisa, Italy
Naoki Fukuta, Shizuoka University, Japan
Martin Gaedke, Chemnitz University of Technology, Germany
Félix J. García Clemente, University of Murcia, Spain
José García-Fanjul, University of Oviedo, Spain
Felipe Garcia-Sanchez, Universidad Politecnica de Cartagena (UPCT), Spain
Michael Gebhart, Gebhart Quality Analysis (QA) 82, Germany
Tejas R. Gandhi, Virtua Health-Marlton, USA
Andrea Giachetti, Università degli Studi di Verona, Italy
Robert L. Glass, Griffith University, Australia
Afzal Godil, National Institute of Standards and Technology, USA
Luis Gomes, Universidade Nova Lisboa, Portugal
Diego Gonzalez Aguilera, University of Salamanca - Avila, Spain
Pascual Gonzalez, University of Castilla-La Mancha, Spain
Björn Gottfried, University of Bremen, Germany
Victor Govindaswamy, Texas A&M University, USA
Gregor Grambow, University of Ulm, Germany
Carlos Granell, European Commission / Joint Research Centre, Italy
Daniela Grigori, Université de Versailles, France
Christoph Grimm. TU Wien, Austria
Michael Grottke, University of Erlangen-Nuernberg, Germany
Vic Grout, Glyndwr University, UK
Ensar Gul, Marmara University, Turkey
Richard Gunstone, Bournemouth University, UK
Zhensheng Guo, Siemens AG, Germany
Phuong H. Ha, University of Tromso, Norway

Ismail Hababeh, German Jordanian University, Jordan
Shahliza Abd Halim, Lecturer in Universiti Teknologi Malaysia, Malaysia
Herman Hartmann, University of Groningen, The Netherlands
Jameleddine Hassine, King Fahd University of Petroleum & Mineral (KFUPM), Saudi Arabia
Tzung-Pei Hong, National University of Kaohsiung, Taiwan
Peizhao Hu, NICTA, Australia
Chih-Cheng Hung, Southern Polytechnic State University, USA
Edward Hung, Hong Kong Polytechnic University, Hong Kong
Noraini Ibrahim, Universiti Teknologi Malaysia, Malaysia
Anca Daniela Ionita, University "POLITEHNICA" of Bucharest, Romania
Chris Ireland, Open University, UK
Kyoko Iwasawa, Takushoku University - Tokyo, Japan
Mehrshid Javanbakht, Azad University - Tehran, Iran
Wassim Jaziri, ISIM Sfax, Tunisia
Dayang Norhayati Abang Jawawi, Universiti Teknologi Malaysia (UTM), Malaysia
Jinyuan Jia, Tongji University. Shanghai, China
Maria Joao Ferreira, Universidade Portucalense, Portugal
Ahmed Kamel, Concordia College, Moorhead, Minnesota, USA
Teemu Kanstrén, VTT Technical Research Centre of Finland, Finland
Nittaya Kerdprasop, Suranaree University of Technology, Thailand
Ayad ali Keshlaf, Newcastle University, UK
Nhien An Le Khac, University College Dublin, Ireland
Sadegh Kharazmi, RMIT University - Melbourne, Australia
Kyoung-Sook Kim, National Institute of Information and Communications Technology, Japan
Youngjae Kim, Oak Ridge National Laboratory, USA
Roger "Buzz" King, University of Colorado at Boulder, USA
Cornel Klein, Siemens AG, Germany
Alexander Knapp, University of Augsburg, Germany
Radek Koci, Brno University of Technology, Czech Republic
Christian Kop, University of Klagenfurt, Austria
Michal Krátký, VŠB - Technical University of Ostrava, Czech Republic
Narayanan Kulathuramaiyer, Universiti Malaysia Sarawak, Malaysia
Satoshi Kurihara, Osaka University, Japan
Eugenijus Kurilovas, Vilnius University, Lithuania
Philippe Lahire, Université de Nice Sophia-Antipolis, France
Alla Lake, Linfo Systems, LLC, USA
Fritz Laux, Reutlingen University, Germany
Luigi Lavazza, Università dell'Insubria, Italy
Fábio Luiz Leite Júnior, Universidade Estadual da Paraiba,Brazil
Alain Lelu, University of Franche-Comté / LORIA, France
Cynthia Y. Lester, Georgia Perimeter College, USA
Clement Leung, Hong Kong Baptist University, Hong Kong
Weidong Li, University of Connecticut, USA
Corrado Loglisci, University of Bari, Italy
Francesco Longo, University of Calabria, Italy
Sérgio F. Lopes, University of Minho, Portugal

Pericles Loucopoulos, Loughborough University, UK
Alen Lovrencic, University of Zagreb, Croatia
Qifeng Lu, MacroSys, LLC, USA
Xun Luo, Qualcomm Inc., USA
Shuai Ma, Beihang University, China
Stephane Maag, Telecom SudParis, France
Ricardo J. Machado, University of Minho, Portugal
Maryam Tayefeh Mahmoudi, Research Institute for ICT, Iran
Nicos Malevris, Athens University of Economics and Business, Greece
Herwig Mannaert, University of Antwerp, Belgium
José Manuel Molina López, Universidad Carlos III de Madrid, Spain
Francesco Marcelloni, University of Pisa, Italy
Eda Marchetti, Consiglio Nazionale delle Ricerche (CNR), Italy
Leonardo Mariani, University of Milano Bicocca, Italy
Gerasimos Marketos, University of Piraeus, Greece
Abel Marrero, Bombardier Transportation, Germany
Adriana Martin, Universidad Nacional de la Patagonia Austral / Universidad Nacional del Comahue, Argentina
Goran Martinovic, J.J. Strossmayer University of Osijek, Croatia
Paulo Martins, University of Trás-os-Montes e Alto Douro (UTAD), Portugal
Stephan Mäs, Technical University of Dresden, Germany
Constandinos Mavromoustakis, University of Nicosia, Cyprus
Jose Merseguer, Universidad de Zaragoza, Spain
Seyedeh Leili Mirtaheri, Iran University of Science & Technology, Iran
Lars Moench, University of Hagen, Germany
Yasuhiko Morimoto, Hiroshima University, Japan
Muhanna A Muhanna, University of Nevada - Reno, USA
Antonio Navarro Martín, Universidad Complutense de Madrid, Spain
Filippo Neri, University of Naples, Italy
Toàn Nguyên, INRIA Grenobel Rhone-Alpes/ Montbonnot, France
Muaz A. Niazi, Bahria University, Islamabad, Pakistan
Natalja Nikitina, KTH Royal Institute of Technology, Sweden
Marcellin Julius Nkenlifack, Université de Dschang, Cameroun
Michael North, Argonne National Laboratory, USA
Roy Oberhauser, Aalen University, Germany
Pablo Oliveira Antonino, Fraunhofer IESE, Germany
Rocco Oliveto, University of Molise, Italy
Sascha Opletal, Universität Stuttgart, Germany
Flavio Oquendo, European University of Brittany/IRISA-UBS, France
Claus Pahl, Dublin City University, Ireland
Marcos Palacios, University of Oviedo, Spain
Constantin Paleologu, University Politehnica of Bucharest, Romania
Kai Pan, UNC Charlotte, USA
Yiannis Papadopoulos, University of Hull, UK
Andreas Papasalouros, University of the Aegean, Greece
Rodrigo Paredes, Universidad de Talca, Chile
Päivi Parviainen, VTT Technical Research Centre, Finland

João Pascoal Faria, Faculty of Engineering of University of Porto / INESC TEC, Portugal
Fabrizio Pastore, University of Milano - Bicocca, Italy
Kunal Patel, Ingenuity Systems, USA
Óscar Pereira, Instituto de Telecomunicacoes - University of Aveiro, Portugal
Willy Picard, Poznań University of Economics, Poland
Jose R. Pires Manso, University of Beira Interior, Portugal
Sören Pirk, Universität Konstanz, Germany
Meikel Poess, Oracle Corporation, USA
Thomas E. Potok, Oak Ridge National Laboratory, USA
Dilip K. Prasad, Nanyang Technological University, Singapore
Christian Prehofer, Fraunhofer-Einrichtung für Systeme der Kommunikationstechnik ESK, Germany
Ela Pustułka-Hunt, Bundesamt für Statistik, Neuchâtel, Switzerland
Mengyu Qiao, South Dakota School of Mines and Technology, USA
Kornelije Rabuzin, University of Zagreb, Croatia
J. Javier Rainer Granados, Universidad Politécnica de Madrid, Spain
Muthu Ramachandran, Leeds Metropolitan University, UK
Thurasamy Ramayah, Universiti Sains Malaysia, Malaysia
Prakash Ranganathan, University of North Dakota, USA
José Raúl Romero, University of Córdoba, Spain
Henrique Rebêlo, Federal University of Pernambuco, Brazil
Bernd Resch, Massachusetts Institute of Technology, USA
Hassan Reza, UND Aerospace, USA
Elvinia Riccobene, Università degli Studi di Milano, Italy
Daniel Riesco, Universidad Nacional de San Luis, Argentina
Mathieu Roche, LIRMM / CNRS / Univ. Montpellier 2, France
Aitor Rodríguez-Alsina, University Autonoma of Barcelona, Spain
José Rouillard, University of Lille, France
Siegfried Rouvrais, TELECOM Bretagne, France
Claus-Peter Rückemann, Leibniz Universität Hannover / Westfälische Wilhelms-Universität Münster / North-
German Supercomputing Alliance, Germany
Djamel Sadok, Universidade Federal de Pernambuco, Brazil
Arun Saha, Fujitsu, USA
Ismael Sanz, Universitat Jaume I, Spain
M. Saravanan, Ericsson India Pvt. Ltd -Tamil Nadu, India
Idrissa Sarr, University of Cheikh Anta Diop, Dakar, Senegal / University of Quebec, Canada
Patrizia Scandurra, University of Bergamo, Italy
Giuseppe Scanniello, Università degli Studi della Basilicata, Italy
Daniel Schall, Vienna University of Technology, Austria
Rainer Schmidt, Austrian Institute of Technology, Austria
Cristina Seceleanu, Mälardalen University, Sweden
Sebastian Senge, TU Dortmund, Germany
Isabel Seruca, Universidade Portucalense - Porto, Portugal
Kewei Sha, Oklahoma City University, USA
Simeon Simoff, University of Western Sydney, Australia
Jacques Simonin, Institut Telecom / Telecom Bretagne, France
Cosmin Stoica Spahiu, University of Craiova, Romania

George Spanoudakis, City University London, UK
Alin Stefanescu, University of Pitesti, Romania
Lena Strömbäck, SMHI, Sweden
Kenji Suzuki, The University of Chicago, USA
Osamu Takaki, Japan Advanced Institute of Science and Technology, Japan
Antonio J. Tallón-Ballesteros, University of Seville, Spain
Wasif Tanveer, University of Engineering & Technology - Lahore, Pakistan
Ergin Tari, Istanbul Technical University, Turkey
Steffen Thiel, Furtwangen University of Applied Sciences, Germany
Jean-Claude Thill, Univ. of North Carolina at Charlotte, USA
Pierre Tiako, Langston University, USA
Ioan Toma, STI, Austria
Božo Tomas, HT Mostar, Bosnia and Herzegovina
Davide Tosi, Università degli Studi dell'Insubria, Italy
Peter Trapp, Ingolstadt, Germany
Guglielmo Trentin, National Research Council, Italy
Dragos Truscan, Åbo Akademi University, Finland
Chrisa Tsinaraki, Technical University of Crete, Greece
Roland Ukor, FirstLinq Limited, UK
Torsten Ullrich, Fraunhofer Austria Research GmbH, Austria
José Valente de Oliveira, Universidade do Algarve, Portugal
Dieter Van Nuffel, University of Antwerp, Belgium
Shirshu Varma, Indian Institute of Information Technology, Allahabad, India
Konstantina Vassilopoulou, Harokopio University of Athens, Greece
Miroslav Velev, Aries Design Automation, USA
Tanja E. J. Vos, Universidad Politécnica de Valencia, Spain
Krzysztof Walczak, Poznan University of Economics, Poland
Jianwu Wang, San Diego Supercomputer Center / University of California, San Diego, USA
Yandong Wang, Wuhan University, China
Rainer Weinreich, Johannes Kepler University Linz, Austria
Stefan Wesarg, Fraunhofer IGD, Germany
Sebastian Wieczorek, SAP Research Center Darmstadt, Germany
Wojciech Wiza, Poznan University of Economics, Poland
Martin Wojtczyk, Technische Universität München, Germany
Hao Wu, School of Information Science and Engineering, Yunnan University, China
Mudasser F. Wyne, National University, USA
Zhengchuan Xu, Fudan University, P.R.China
Yiping Yao, National University of Defense Technology, Changsha, Hunan, China
Stoyan Yordanov Garbatov, Instituto de Engenharia de Sistemas e Computadores - Investigação e
Desenvolvimento, INESC-ID, Portugal
Weihai Yu, University of Tromsø, Norway
Wenbing Zhao, Cleveland State University, USA
Hong Zhu, Oxford Brookes University, UK
Qiang Zhu, The University of Michigan - Dearborn, USA

International Journal on Advances in Software
Volume 6, Numbers 1 & 2, 2013
CONTENTS
pages: 1 - 13An Empirical Evaluation of Simplified Function Point Measurement ProcessesLuigi Lavazza, Università degli Studi dell’Insubria, ItalyGeng Liu, Università degli Studi dell’Insubria, Italy
pages: 14 - 24Basic Building Blocks for Column-StoresAndreas Schmidt, Karlsruhe Institut of Technology/Karlsruhe University of Applied Sciences, GermanyDaniel Kimmig, Karlsruhe Institut of Technology, GermanyReimar Hofmann, Karlsruhe University of Applied Sciences, Germany
pages: 25 - 44Theoretical and Practical Implications of User Interface Patterns Applied for the Development ofGraphical User InterfacesStefan Wendler, Ilmenau University of Technology, GermanyDanny Ammon, Ilmenau University of Technology, GermanyTeodora Kikova, Ilmenau University of Technology, GermanyIlka Philippow, Ilmenau University of Technology, GermanyDetlef Streitferdt, Ilmenau University of Technology, Germany
pages: 45 - 55Message-Passing Interface for Java Applications: Practical Aspects of Leveraging High PerformanceComputing to Speed and Scale Up the Semantic WebAlexey Cheptsov, High Performance Computing Center Stuttgart, GermanyBastian Koller, High Performance Computing Center Stuttgart, Germany
pages: 56 - 68A QoS-Aware BPEL Framework for Service Selection and Composition Using QoS PropertiesChiaen Lin, University of North Texas, USAKrishna Kavi, University of North Texas, USA
pages: 69 - 79Supporting Test Code Generation with an Easy to Understand Business Rule LanguageChristian Bacherler, Software Technology Research Lab, DeMontfort University, Leicester, UKBen Moszkowski, Software Technology Research Lab, DeMontfort University, Leicester, UKChristian Facchi, Institute of Applied Research, Ingolstadt University of Applied Sciences, Ingolstadt, Germany
pages: 80 - 91Design and Classification of Mutation Operators for Abstract State MachinesJameleddine Hassine, KFUPM, KSA
pages: 92 - 103Transformational Implementation of Business Processes in SOA

Krzysztof Sacha, Warsaw University of Technology, PolandAndrzej Ratkowski, Warsaw University of Technology, Poland
pages: 104 - 118Automated Tailoring of Application Lifecycle Management Systems to Existing Development ProcessesMatthias Biehl, Royal Institute of Technology, SwedenJad El-khoury, Royal Institute of Technology, SwedenMartin Törngren, Royal Institute of Technology, Sweden
pages: 119 - 130Towards an Approach for Analysing the Strategic Alignment of Software Requirements usingQuantified Goal GraphsRichard Ellis-Braithwaite, Loughborough University, United KingdomRussell Lock, Loughborough University, United KingdomRay Dawson, Loughborough University, United KingdomBadr Haque, Rolls-Royce Plc., United Kingdom
pages: 131 - 141Towards the Standardization of Industrial Scientific and Engineering Workflows with QVTTransformationsCorina Abdelahad, Universidad Nacional de San Luis, ArgentinaDaniel Riesco, Universidad Nacional de San Luis, ArgentinaAlessandro Carrara, ESTECO SPA, ItalyCarlo Comin, ESTECO SPA, ItalyCarlos Kavka, ESTECO SPA, Italy
pages: 142 - 154GUI Failures of In-Vehicle Infotainment: Analysis, Classification, Challenges, and CapabilitiesDaniel Mauser, Daimler AG, GermanyAlexander Klaus, Fraunhofer IESE, GermanyKonstantin Holl, Fraunhofer IESE, GermanyRan Zhang, Robert Bosch GmbH, Germany
pages: 155 - 169Linear Constraints and Guarded Predicates as a Modeling Language for Discrete Time Hybrid SystemsFederico Mari, Sapienza University of Rome, ItalyIgor Melatti, Sapienza University of Rome, ItalyIvano Salvo, Sapienza University of Rome, ItalyEnrico Tronci, Sapienza University of Rome, Italy
pages: 170 - 180Derivation of Web Service Implementation Artifacts from Service Designs Based on SoaMLMichael Gebhart, Gebhart Quality Analysis (QA) 82, GermanyJaouad Bouras, ISB AG, Germany
pages: 181 - 195Incorporating Design Knowledge into the Software Development Process using Normalized SystemsTheoryPeter De Bruyn, University of Antwerp, BelgiumPhilip Huysmans, University of Antwerp, Belgium

Gilles Oorts, University of Antwerp, BelgiumDieter Van Nuffel, University of Antwerp, BelgiumHerwig Mannaert, University of Antwerp, BelgiumJan Verelst, University of Antwerp, BelgiumArco Oost, Normalized Systems eXpanders factory, Belgium
pages: 196 - 212Enhancing the Performance of J2EE Applications through Entity Consolidation Design PatternsReinhard Klemm, Avaya Labs Research, USA
pages: 213 - 224Automated Software Engineering Process Assessment: Supporting Diverse Models using an OntologyGregor Grambow, Computer Science Dept., Aalen University, GermanyRoy Oberhauser, Computer Science Dept., Aalen University, GermanyManfred Reichert, Institute for Databases and Information Systems, Ulm University, Germany
1
International Journal on Advances in Software, vol 6 no 1 & 2, year 2013, http://www.iariajournals.org/software/
2013, © Copyright by authors, Published under agreement with IARIA - www.iaria.org
An Empirical Evaluation of Simplified Function Point
Measurement Processes
Luigi Lavazza Geng Liu
Dipartimento di Scienze Teoriche e Applicate
Università degli Studi dell’Insubria
Varese, Italy
[email protected], [email protected]
Abstract— Function Point Analysis is widely used, especially to
quantify the size of applications in the early stages of
development, when effort estimates are needed. However, the
measurement process is often too long or too expensive, or it
requires more knowledge than available when development effort
estimates are due. To overcome these problems, simplified
methods have been proposed to measure Function Points. We
used simplified methods for sizing both “traditional” and Real-
Time applications, with the aim of evaluating the accuracy of the
sizing with respect to full-fledged Function Point Analysis. To
this end, a set of projects, which had already been measured by
means of Function Point Analysis, have been measured using a
few simplified processes, including those proposed by NESMA,
the Early&Quick Function Points, the ISBSG average weights,
and others; the resulting size measures were then compared. We
also derived simplified size models by analyzing the dataset used
for experimentations. In general, all the methods that provide
predefined weights for all the transaction and data types
identified in Function Point Analysis provided similar results,
characterized by acceptable accuracy. On the contrary, methods
that rely on just one of the elements that contribute to size tend to
be quite inaccurate. In general, different methods show different
accuracy for Real-Time and non Real-Time applications. The
results of the analysis reported here show that in general it is
possible to size software via simplified measurement processes
with an acceptable accuracy. In particular, the simplification of
the measurement process allows the measurer to skip the
function weighting phases, which are usually expensive, since
they require a thorough analysis of the details of both data and
operations. Deriving our own models from the project datasets
proved possible, and yielded results that are similar to those
obtained via the methods proposed in the literature.
Keywords-Functional Size Measures; Function Points;
Simplified measurement processes; Early&Quick Function Points
(EQFP); NESMA estimated; NESMA indicative.
I. INTRODUCTION
The empirical evaluation of simplified Function Points processes [1] is motivated by the popularity of Function Points. In fact, Function Point Analysis (FPA) [2][3][4][5] is widely used. Among the reasons for the success of FPA is that it can provide measures of size in the early stages of software development, when they are most needed for cost estimation.
However, FPA performed by a certified function point consultant proceeds at a relatively slow pace: between 400 and
600 function points (FP) per day, according to Capers Jones [6], between 200 and 300 function points per day according to experts from Total Metrics [7]. Consequently, measuring the size of a moderately large application can take too long, if cost estimation is needed urgently. Also the cost of measurement can be often considered excessive by software developers. In addition, cost estimates may be needed when requirements have not yet been specified in detail and completely.
To overcome the aforementioned problems, simplified FP measurement processes have been proposed. A quite comprehensive list of such methods is given in [8]. Among these are the NESMA (NEtherland Software Metrics Association) indicative and estimated methods, and the Early & Quick Function Points method. Other methods were also proposed, including the Tichenor ILF Model [9] and models featuring fixed weights for the computation of size measures. These models are briefly described in Section II. The proposers of these methods claim that they allow measurers to compute good approximations of functional size measures with little effort and in a fairly short time.
The goal of the work reported here is to test the application of several simplified functional size measurement processes to real projects in both the “traditional” and Real-Time domains. Function Points are often reported as not suited for measuring the functional size of embedded applications, since FP –conceived by Albrecht when the programs to be sized were mostly Electronic Data Processing applications– capture well the functional size of data storage and movement operations, but are ill-suited for representing the complexity of control and elaboration that are typical of embedded and Real-Time software. However, it has been shown that a careful interpretation of FP counting rules makes it possible to apply FPA to embedded software as well [10].
In this paper, we apply the International Function Points User Group (IFPUG) measurement rules [4] to size a set of non Real-Time programs, and we apply the guidelines given in [11] (which are as IFPUG-compliant as possible) to measure a set of embedded Real-Time avionic applications. All these measures are used to test the accuracy of simplified functional size measurement processes. In fact, there is little doubt that the simplified Functional Size Measurement (FSM) methods actually allow for early and quick sizing; the real point is to evaluate to what extent the savings in time and costs are paid in terms of inaccurate size estimates. So, we concentrate on the assessment of the accuracy of size estimates, for both Real-
2
International Journal on Advances in Software, vol 6 no 1 & 2, year 2013, http://www.iariajournals.org/software/
2013, © Copyright by authors, Published under agreement with IARIA - www.iaria.org
Time and embedded applications, as well as “traditional” business applications. Throughout the paper, by “accuracy” we mean the closeness of a size estimate to the real size measure, i.e., the size measured according to IFPUG rules by an experienced measurer.
In this paper, we enhance the work reported in [1] by using an extended dataset, and by testing the usage of additional simplified FSM techniques, not used in [1]. However, in the paper we do not just evaluate existing proposals for simplifying the functional size measurement process; instead, we produce our own simplified models for estimating the functional size of software applications. This is done using the same approaches already used to produce the existing simplified methods: in fact, we obtained models that are structurally similar to the existing ones, but featuring different parameters (e.g., weights for basic functional components).
All the methods –i.e., both those proposed in the literature and ours– are tested on a set of projects and the results are compared.
We also analyze the differences between Real-Time and non Real-Time applications, and derive a few considerations on what models are best suited to estimate the size of each class of applications.
The results of the measurements and analyses reported in the paper are expected to provide two types of benefits: on the one hand, they contribute to enhancing our understanding of functional size measurement processes and their suitability; on the other hand, we provide useful information and suggestions to the practitioners that have to decide whether to use simplified FSM methods, and which one to choose.
The paper is organized as follows: Section II briefly introduces the simplified FSM processes used in the paper. Section III describes the projects being measured and gives their sizes measured according to the full-fledged, canonical FPA process. Section IV illustrates the sizes obtained via simplified functional size measurement processes. Section V discusses the accuracy of the measures obtained via the simplified methods used and outlines the lessons that can be learned from the reported experiment. In Section VI, the dataset described in Section III is analyzed, in order to get simplified FSM models that are similar to those presented in Section II, but which rely on the measures of the considered projects. Section VII accounts for related work. Section VIII discusses the threats to the validity of the study. Finally, Section IX draws some conclusions and outlines future work.
Throughout the paper, we assume that the reader is familiar with the concepts of FPA and the IFPUG rules. Readers that need explanations and details about FP counting can refer to official documentation and manuals [4][5].
Throughout the paper, we refer exclusively to unadjusted function points (UFP), even when we talk generically of “Function Points” or “FP”.
II. A BRIEF INTRODUCTION TO SIMPLIFIED SIZE
MEASUREMENT PROCESSES
The FP measurement process involves (among others) the following activities:
− Identifying logic data;
− Identifying elementary processes;
− Classifying logic data as internal logic files (ILF) or external interface files (EIF);
− Classifying elementary processes as external inputs (EI), outputs (EO), or queries (EQ);
− Weighting data functions;
− Weighting transaction functions. Simplified measurement processes allow measurers to skip
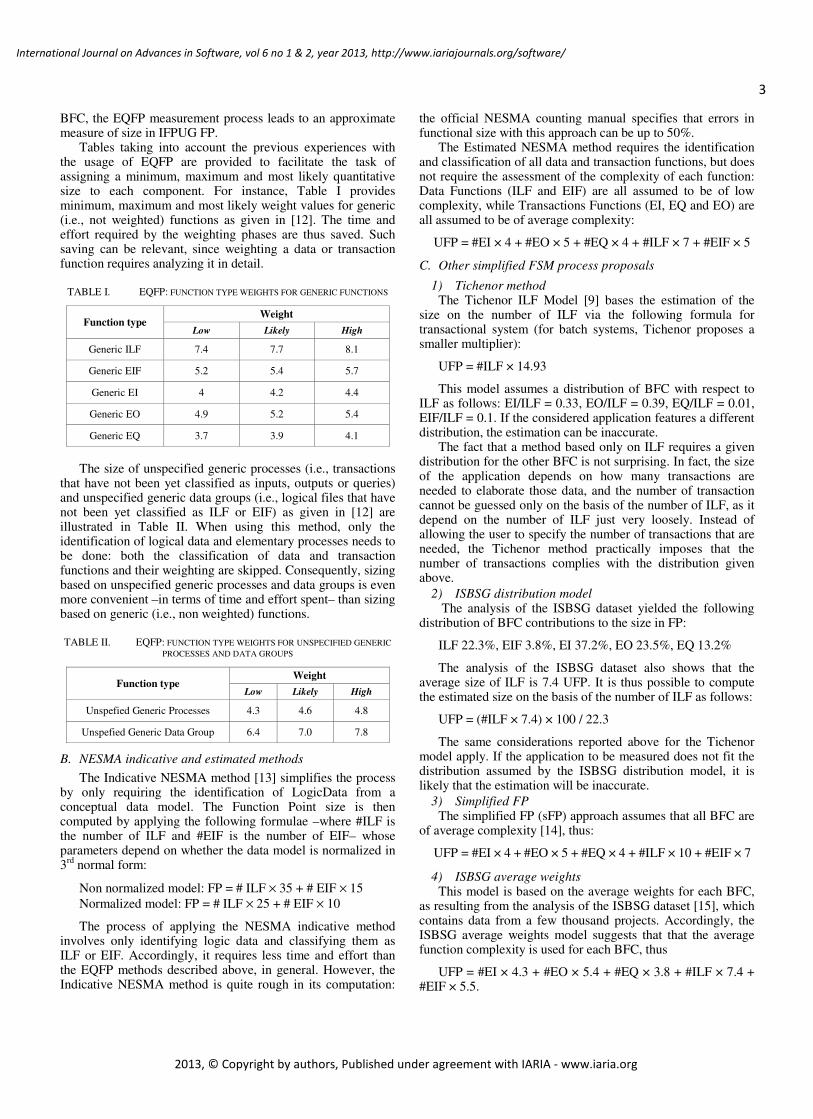
–possibly in part– one or more of the aforementioned activities, thus making the measurement process faster and cheaper. Table III provides a quick overview of the activities required by FP measurement and estimation methods. Of course, the IFPUG method requires all the activities listed in Table III, while simplified methods require a subset of such activities.
A. Early & Quick Function Points
The most well-known approach for simplifying the process of FP counting is probably the Early & Quick Function Points (EQFP) method [12]. EQFP descends from the consideration that estimates are sometimes needed before requirements analysis is completed, when the information on the software to be measured is incomplete or not sufficiently detailed.
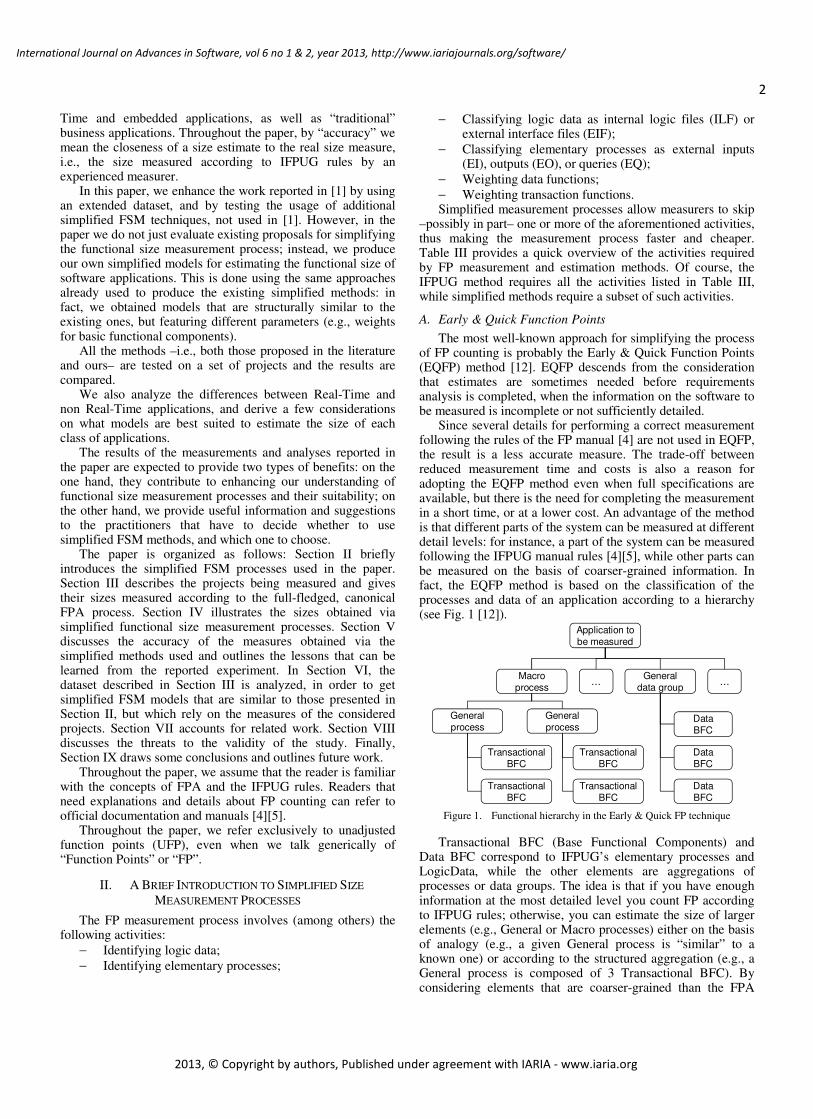
Since several details for performing a correct measurement following the rules of the FP manual [4] are not used in EQFP, the result is a less accurate measure. The trade-off between reduced measurement time and costs is also a reason for adopting the EQFP method even when full specifications are available, but there is the need for completing the measurement in a short time, or at a lower cost. An advantage of the method is that different parts of the system can be measured at different detail levels: for instance, a part of the system can be measured following the IFPUG manual rules [4][5], while other parts can be measured on the basis of coarser-grained information. In fact, the EQFP method is based on the classification of the processes and data of an application according to a hierarchy (see Fig. 1 [12]).
Application to
be measured
Macro
process
General
data group
General
process
General
process
Transactional
BFC
Transactional
BFC
Transactional
BFC
Transactional
BFC
Data
BFC
Data
BFC
Data
BFC
……
Figure 1. Functional hierarchy in the Early & Quick FP technique
Transactional BFC (Base Functional Components) and Data BFC correspond to IFPUG’s elementary processes and LogicData, while the other elements are aggregations of processes or data groups. The idea is that if you have enough information at the most detailed level you count FP according to IFPUG rules; otherwise, you can estimate the size of larger elements (e.g., General or Macro processes) either on the basis of analogy (e.g., a given General process is “similar” to a known one) or according to the structured aggregation (e.g., a General process is composed of 3 Transactional BFC). By considering elements that are coarser-grained than the FPA
3
International Journal on Advances in Software, vol 6 no 1 & 2, year 2013, http://www.iariajournals.org/software/
2013, © Copyright by authors, Published under agreement with IARIA - www.iaria.org
BFC, the EQFP measurement process leads to an approximate measure of size in IFPUG FP.
Tables taking into account the previous experiences with the usage of EQFP are provided to facilitate the task of assigning a minimum, maximum and most likely quantitative size to each component. For instance, Table I provides minimum, maximum and most likely weight values for generic (i.e., not weighted) functions as given in [12]. The time and effort required by the weighting phases are thus saved. Such saving can be relevant, since weighting a data or transaction function requires analyzing it in detail.
TABLE I. EQFP: FUNCTION TYPE WEIGHTS FOR GENERIC FUNCTIONS
Function type Weight
Low Likely High
Generic ILF 7.4 7.7 8.1
Generic EIF 5.2 5.4 5.7
Generic EI 4 4.2 4.4
Generic EO 4.9 5.2 5.4
Generic EQ 3.7 3.9 4.1
The size of unspecified generic processes (i.e., transactions
that have not been yet classified as inputs, outputs or queries) and unspecified generic data groups (i.e., logical files that have not been yet classified as ILF or EIF) as given in [12] are illustrated in Table II. When using this method, only the identification of logical data and elementary processes needs to be done: both the classification of data and transaction functions and their weighting are skipped. Consequently, sizing based on unspecified generic processes and data groups is even more convenient –in terms of time and effort spent– than sizing based on generic (i.e., non weighted) functions.
TABLE II. EQFP: FUNCTION TYPE WEIGHTS FOR UNSPECIFIED GENERIC
PROCESSES AND DATA GROUPS
Function type Weight
Low Likely High
Unspefied Generic Processes 4.3 4.6 4.8
Unspefied Generic Data Group 6.4 7.0 7.8
B. NESMA indicative and estimated methods
The Indicative NESMA method [13] simplifies the process by only requiring the identification of LogicData from a conceptual data model. The Function Point size is then computed by applying the following formulae –where #ILF is the number of ILF and #EIF is the number of EIF– whose parameters depend on whether the data model is normalized in 3
rd normal form:
Non normalized model: FP = # ILF × 35 + # EIF × 15
Normalized model: FP = # ILF × 25 + # EIF × 10
The process of applying the NESMA indicative method involves only identifying logic data and classifying them as ILF or EIF. Accordingly, it requires less time and effort than the EQFP methods described above, in general. However, the Indicative NESMA method is quite rough in its computation:
the official NESMA counting manual specifies that errors in functional size with this approach can be up to 50%.
The Estimated NESMA method requires the identification and classification of all data and transaction functions, but does not require the assessment of the complexity of each function: Data Functions (ILF and EIF) are all assumed to be of low complexity, while Transactions Functions (EI, EQ and EO) are all assumed to be of average complexity:
UFP = #EI × 4 + #EO × 5 + #EQ × 4 + #ILF × 7 + #EIF × 5
C. Other simplified FSM process proposals
1) Tichenor method The Tichenor ILF Model [9] bases the estimation of the
size on the number of ILF via the following formula for transactional system (for batch systems, Tichenor proposes a smaller multiplier):
UFP = #ILF × 14.93
This model assumes a distribution of BFC with respect to ILF as follows: EI/ILF = 0.33, EO/ILF = 0.39, EQ/ILF = 0.01, EIF/ILF = 0.1. If the considered application features a different distribution, the estimation can be inaccurate.
The fact that a method based only on ILF requires a given distribution for the other BFC is not surprising. In fact, the size of the application depends on how many transactions are needed to elaborate those data, and the number of transaction cannot be guessed only on the basis of the number of ILF, as it depend on the number of ILF just very loosely. Instead of allowing the user to specify the number of transactions that are needed, the Tichenor method practically imposes that the number of transactions complies with the distribution given above.
2) ISBSG distribution model The analysis of the ISBSG dataset yielded the following
distribution of BFC contributions to the size in FP:
ILF 22.3%, EIF 3.8%, EI 37.2%, EO 23.5%, EQ 13.2%
The analysis of the ISBSG dataset also shows that the average size of ILF is 7.4 UFP. It is thus possible to compute the estimated size on the basis of the number of ILF as follows:
UFP = (#ILF × 7.4) × 100 / 22.3
The same considerations reported above for the Tichenor model apply. If the application to be measured does not fit the distribution assumed by the ISBSG distribution model, it is likely that the estimation will be inaccurate.
3) Simplified FP The simplified FP (sFP) approach assumes that all BFC are
of average complexity [14], thus:
UFP = #EI × 4 + #EO × 5 + #EQ × 4 + #ILF × 10 + #EIF × 7
4) ISBSG average weights This model is based on the average weights for each BFC,
as resulting from the analysis of the ISBSG dataset [15], which contains data from a few thousand projects. Accordingly, the ISBSG average weights model suggests that that the average function complexity is used for each BFC, thus
UFP = #EI × 4.3 + #EO × 5.4 + #EQ × 3.8 + #ILF × 7.4 + #EIF × 5.5.
4
International Journal on Advances in Software, vol 6 no 1 & 2, year 2013, http://www.iariajournals.org/software/
2013, © Copyright by authors, Published under agreement with IARIA - www.iaria.org
TABLE III. ACTIVITIES REQUIRED BY DIFFERENT SIMPLIFIED MEASUREMENT PROCESSES
Measurement activities IFPUG NESMA
indic. NESMA
estim.
EQFP Generic
func.
EQFP Unspec.
generic func.
Tichenor ILF Model
ISBSG distribution
sFP ISBSG average weights
Identifying logic data
Identifying elementary processes
Classifying logic data as ILF or EIF
Classifying elementary processes as EI, EO, or EQ
Weighting data functions
Weighting transaction functions
III. THE CASE STUDY
A. Real-Time projects
Most of the Real-Time projects measured are from a European organization that develops avionic applications, and other types of embedded and Real-Time applications. All the measured projects concerned typical Real-Time applications for avionics or electro-optical projects, and involved algorithms, interface management, process control and graphical visualization.
The projects’ FUR were modeled using UML as described in [11], and then were measured according to IFPUG measurement rules [4]. When the Real-Time nature of the software made IFPUG guidelines inapplicable, we adopted ad-hoc counting criteria, using common sense and striving to preserve the principles of FPA, as described in [10]. The same projects were then sized using the simplified functional size measurement processes mentioned in Section II, using the data that were already available as a result of the IFPUG measurement.
Table IV reports the size in UFP of the measured projects, together with the BFC and –in parentheses– the number of unweighted BFC. For instance, project 1 involved 18 Internal Logic Files, having a size of 164 FP.
B. Non Real-Time projects
The considered non Real-Time projects are mostly programs that allow users to play board or card games vs. remote players via the internet; a few ones are typical business information systems.
The projects were measured –as the Real-Time ones– in two steps: the UML model of each product was built along the guidelines described in [16]; then, the function points were counted, on the basis of the model, according to IFPUG rules.
Table V reports the size in UFP of the measured projects, together with the BFC and –in parentheses– the number of unweighted BFC.
TABLE IV. REAL-TIME PROJECTS’ SIZES (IFPUG METHOD)
Project
ID. ILF EIF EI EO EQ UFP
1 164
(18)
5
(1)
90
(21)
8
(2)
22
(5) 289
2 56
(8)
0
(0)
21
(6)
18
(3)
6
(1) 101
3 73
(7)
0
(0)
12
(2)
47
(8)
4
(1) 136
4 130
(15)
15
(3)
44
(11)
0
(0)
6
(1) 195
5 39
(4)
0
(0)
28
(8)
39
(8)
0
(0) 106
6 71
(9)
5
(1)
8
(2)
139
(28)
0
(0) 223
7 7
(1)
0
(0)
3
(1)
5
(1)
0
(0) 15
8 21
(3)
0
(0)
4
(1)
8
(2)
0
(0) 33
9 21
(3)
0
(0)
7
(2)
16
(4)
0
(0) 44
TABLE V. NON REAL-TIME PROJECTS’ SIZES (IFPUG METHOD)
Project
ID. ILF EIF EI EO EQ UFP
1 45
(6)
7
(1)
34
(10)
6
(1)
0
(0) 92
2 28
(4)
20
(4)
37
(9)
5
(1)
4
(1) 94
3 21
(3)
5
(1)
27
(7)
8
(2)
18
(6) 79
4 31
(4)
0
(0)
49
(16)
13
(3)
3
(1) 96
5 24
(3)
0
(0)
45
(14)
21
(5)
0
(0) 90
6 49
(7)
0
(0)
36
(9)
0
(0)
6
(2) 91
7 21
(3)
0
(0)
31
(9)
14
(3)
14
(4) 80
8 42
(6)
5
(1)
35
(9)
17
(3)
10
(2) 109
9 21
(3)
0
(0)
38
(11)
15
(5)
8
(2) 82

5
International Journal on Advances in Software, vol 6 no 1 & 2, year 2013, http://www.iariajournals.org/software/
2013, © Copyright by authors, Published under agreement with IARIA - www.iaria.org
IV. RESULTS OF SIMPLIFIED MEASUREMENT
Simplified measurement processes were applied following their definitions, which require data that can be easily derived from the tables above. So, for instance, the data required for Real-Time project 1 are the following:
− The NESMA indicative method requires the numbers of ILF and EIF. Table I shows that the number of ILF is 18, and the number of EIF is 1.
− Similarly, the Tichenor ILF model and the ISBSG distribution models just require the ILF number.
− The NESMA estimated method, the EQFP generic functions method, the sFP method and the ISBSG average weights method require the numbers of ILF, EIF, EI, EO, and EQ. Table I shows that the numbers of ILF, EIF, EI, EO, and EQ are, respectively, 18, 1, 21, 2, and 5.
− The EQFP unspecified generic functions method requires the numbers of data groups (that is, the number of ILF plus the number of EIF) and the number of transactions (that is, the sum of the numbers of EI, EO, and EQ). Table I shows that the number of data groups is 18+1 = 19, and the number of transactions is 21+2+5 = 28.
TABLE VI. SIZES OF REAL-TIME PROJECTS OBTAINED VIA THE NESMA
METHODS
Project
ID IFPUG
NESMA
indicative
non
normalized
NESMA
indicative
normalized
NESMA
estimated
1 289 645 460 245
2 101 280 200 99
3 136 245 175 101
4 195 570 405 168
5 106 140 100 100
6 223 330 235 216
7 15 35 25 16
8 33 105 75 35
9 44 105 75 49
A. Applying NESMA indicative
The applications to be measured were modeled according to the guidelines described in [16]. The logic data files –modeled as UML classes– provide a data model that cannot be easily recognized as normalized or not normalized. Therefore, we applied both the formulae for the normalized and not normalized models.
The formulae of the NESMA indicative method were applied to the number of ILF and EIF that had been identified during the IFPUG function point counting process. The results are given in Table VI for Real-Time projects and in Table VII for non Real-Time projects.
B. Applying NESMA estimated
The formulae of the NESMA indicative method were
applied to the number of ILF, EIF, EI, EO, and EQ that had been identified during the IFPUG function point counting process. The results are given in Table VI for Real-Time projects and in Table VII for non Real-Time projects.
TABLE VII. SIZES OF NON REAL-TIME PROJECTS OBTAINED VIA THE
NESMA METHODS
Project
ID IFPUG
NESMA
indicative
non normalized
NESMA
indicative
normalized
NESMA
estimated
1 92 225 160 92
2 94 200 140 93
3 79 120 85 88
4 96 140 100 111
5 90 105 75 102
6 91 245 175 93
7 80 105 75 88
8 109 225 160 106
9 82 105 75 98
C. Applying EQFP
As described in Figure 1. , the EQFP method can be applied at different levels. Since we had the necessary data, we adopted the BFC aggregation level. At this level it is possible to use the data functions and transaction functions without weighting them or even without classifying transactions into EI, EO, and EQ and logic data into ILF and EIF. In the former case (generic functions) the weights given in Table I are used, while in the latter case (unspecified generic functions) the weights given in Table II are used.
The results of the application of EQFP are given in Table VIII for Real-Time projects, and in Table IX for non Real-Time projects.
TABLE VIII. MEASURES OF REAL-TIME PROJECTS OBTAINED VIA THE
EQFP METHOD
Project ID IFPUG
EQFP – unspecified
generic processes and
data groups
EQFP –generic
transactions and
data files
1 289 262 262
2 101 102 106
3 136 100 108
4 195 181 182
5 106 102 106
6 223 208 229
7 15 16 17
8 33 35 38
9 44 49 52

6
International Journal on Advances in Software, vol 6 no 1 & 2, year 2013, http://www.iariajournals.org/software/
2013, © Copyright by authors, Published under agreement with IARIA - www.iaria.org
TABLE IX. MEASURES OF NON REAL-TIME PROJECTS OBTAINED VIA THE
EQFP METHOD
Project ID IFPUG
EQFP – unspecified
generic processes and
data groups
EQFP –generic
transactions and
data files
1 92 100 99
2 94 107 99
3 79 97 92
4 96 120 118
5 90 108 108
6 91 100 100
7 80 95 92
8 109 113 113
9 82 104 103
TABLE X. MEASURES OF NON REAL-TIME PROJECTS OBTAINED VIA THE
TICHENOR ILF MODEL, ISBSG DEISTRIBUTION, SFP AND ISBSG AVERAGE
WEIGHTS METHODS.
Project ID IFPUG Tichenor
ILF model ISBSG distrib.
sFP ISBSG average weights
1 92 90 199 112 98
2 94 60 133 113 100
3 79 45 100 99 91
4 96 60 133 123 118
5 90 45 100 111 109
6 91 105 232 114 98
7 80 45 100 97 92
8 109 90 199 126 112
9 82 45 100 107 104
TABLE XI. MEASURES OF REAL-TIME PROJECTS OBTAINED VIA THE
TICHENOR ILF MODEL, ISBSG DEISTRIBUTION, SFP AND ISBSG AVERAGE
WEIGHTS METHODS.
Project ID IFPUG Tichenor
ILF model ISBSG distrib.
sFP ISBSG average weights
1 289 269 597 301 259
2 101 119 265 123 105
3 136 105 232 122 107
4 195 224 498 219 179
5 106 60 133 112 107
6 223 134 299 245 232
7 15 15 33 19 17
8 33 45 100 44 37
9 44 45 100 58 52
D. Applying Tichenor ILF Model
In order to apply the model we just had to multiply the number of ILF of each of our projects for the constant 14.93 suggested by Tichenor. The obtained results are illustrated in Table X and Table XI for non Real-Time and Real-Time projects, respectively.
When applying this method, it should be remembered that the results are likely to be incorrect if the distribution of BFC in the estimated application does not match the distribution observed by Tichenor. Accordingly, when applying the method, one should also check the distribution of BFC. Unfortunately, this implies making more work, namely, one should count the number of EIF, EI, EO, and EQ in addition to ILF. Even worse, one could discover that the distribution of his/her application is different from the distribution assumed by Tichenor, so that the estimated size is not reliable.
In our case, the projects do not appear to fit well in the distribution assumed by Tichenor: the differences between the measured ratios and the ratios expected by Tichenor are the following:
− For Real-Time projects: 14.3% for EI/ILF, 43.7% for EO/ILF, 3.9% for EQ/ILF, 7.9% for EIF/ILF.
− For non Real-Time projects: 96.7% for EI/ILF, 22.2% for EO/ILF, 27.3% for EQ/ILF, 14.7% for EIF/ILF.
In practice, our projects have a very different distribution of BFC sizes with respect to Tichenor expectations (for instance, in non Real-Time projects EI had often a larger size than ILF, while it is expected that the size of EI is about one third of the size of ILF). So, we must expect a quite poor accuracy from Tichenor estimates. This is actually confirmed by the data in Table XIV, Table XV and Table XVI.
E. Applying the ISBSG distribution model
We applied the formula UFP = (#ILF × 7.4) × 100 / 22.3 prescribed by the method. Then, we evaluated the differences between the measured percentage contribution of BFC and the ISBSG averages. The differences we found were relatively small:
− For Real-Time projects: 28.7% for ILF, 3.4% for EIF, 19.3% for EI, 21.3% for EO, 13.2% for EQ.
− For non Real-Time projects: 12% for ILF, 4.8% for EIF, 5.6% for EI, 15.4% for EO, 13.2% for EQ.
Accordingly, we expect that the ISBSG distribution model applies reasonably well to our dataset, especially as non Real-Time projects are involved.
The obtained size estimates are illustrated in Table X and Table XI for non Real-Time and Real-Time projects, respectively.
F. Applying the sFP and ISBSG average weights
The application of the sFP and ISBSG average weights methods was extremely similar to the application of the NESMA estimated and EQFP generic methods, only the values of weights being different.
The obtained results are illustrated in Table X and Table XI for non Real-Time and Real-Time projects, respectively.
7
International Journal on Advances in Software, vol 6 no 1 & 2, year 2013, http://www.iariajournals.org/software/
2013, © Copyright by authors, Published under agreement with IARIA - www.iaria.org
V. SUMMARY AND LESSONS LEARNED
In this section, the results of our empirical analysis are reports. First we discuss the quantitative results, then we analyze the results from a more theoretical point of view.
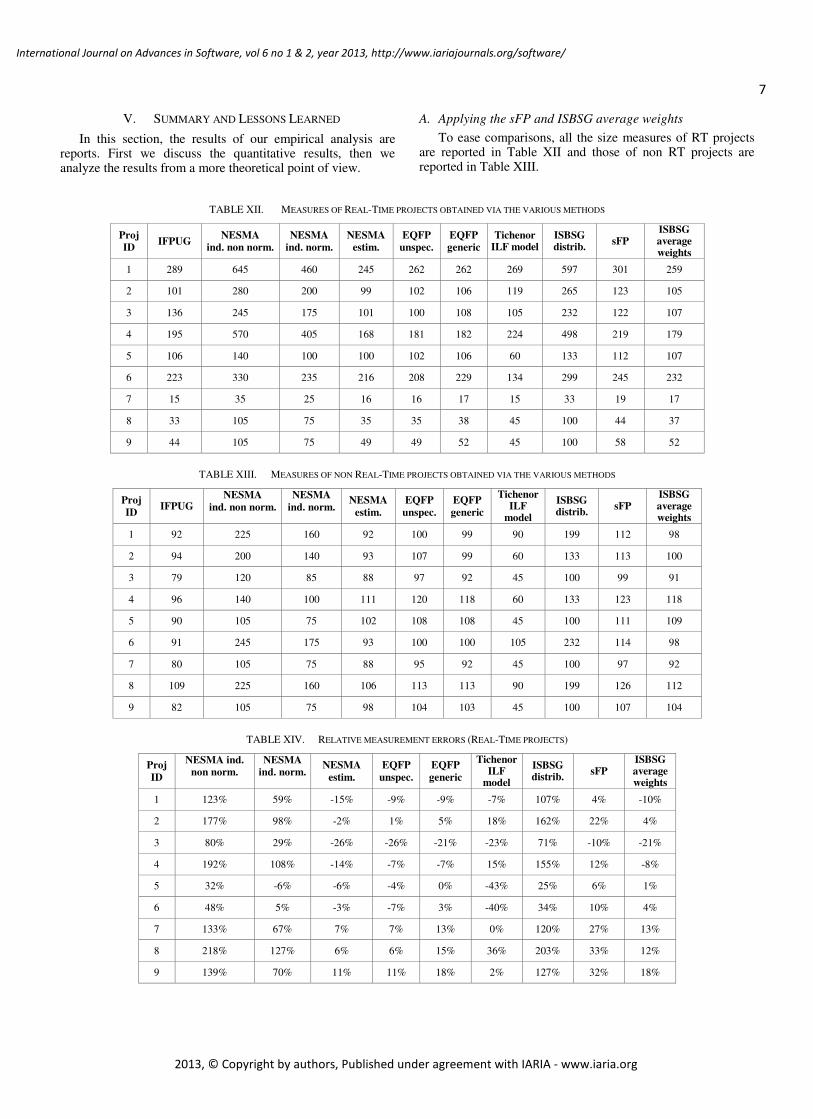
A. Applying the sFP and ISBSG average weights
To ease comparisons, all the size measures of RT projects are reported in Table XII and those of non RT projects are reported in Table XIII.
TABLE XII. MEASURES OF REAL-TIME PROJECTS OBTAINED VIA THE VARIOUS METHODS
Proj
ID IFPUG
NESMA
ind. non norm.
NESMA
ind. norm.
NESMA
estim.
EQFP
unspec.
EQFP
generic
Tichenor ILF model
ISBSG distrib.
sFP ISBSG average weights
1 289 645 460 245 262 262 269 597 301 259
2 101 280 200 99 102 106 119 265 123 105
3 136 245 175 101 100 108 105 232 122 107
4 195 570 405 168 181 182 224 498 219 179
5 106 140 100 100 102 106 60 133 112 107
6 223 330 235 216 208 229 134 299 245 232
7 15 35 25 16 16 17 15 33 19 17
8 33 105 75 35 35 38 45 100 44 37
9 44 105 75 49 49 52 45 100 58 52
TABLE XIII. MEASURES OF NON REAL-TIME PROJECTS OBTAINED VIA THE VARIOUS METHODS
Proj
ID IFPUG
NESMA
ind. non norm.
NESMA
ind. norm. NESMA
estim.
EQFP
unspec.
EQFP
generic
Tichenor ILF
model
ISBSG distrib.
sFP ISBSG average weights
1 92 225 160 92 100 99 90 199 112 98
2 94 200 140 93 107 99 60 133 113 100
3 79 120 85 88 97 92 45 100 99 91
4 96 140 100 111 120 118 60 133 123 118
5 90 105 75 102 108 108 45 100 111 109
6 91 245 175 93 100 100 105 232 114 98
7 80 105 75 88 95 92 45 100 97 92
8 109 225 160 106 113 113 90 199 126 112
9 82 105 75 98 104 103 45 100 107 104
TABLE XIV. RELATIVE MEASUREMENT ERRORS (REAL-TIME PROJECTS)
Proj
ID
NESMA ind.
non norm.
NESMA
ind. norm. NESMA
estim.
EQFP
unspec.
EQFP
generic
Tichenor ILF
model
ISBSG distrib.
sFP ISBSG average weights
1 123% 59% -15% -9% -9% -7% 107% 4% -10%
2 177% 98% -2% 1% 5% 18% 162% 22% 4%
3 80% 29% -26% -26% -21% -23% 71% -10% -21%
4 192% 108% -14% -7% -7% 15% 155% 12% -8%
5 32% -6% -6% -4% 0% -43% 25% 6% 1%
6 48% 5% -3% -7% 3% -40% 34% 10% 4%
7 133% 67% 7% 7% 13% 0% 120% 27% 13%
8 218% 127% 6% 6% 15% 36% 203% 33% 12%
9 139% 70% 11% 11% 18% 2% 127% 32% 18%
8
International Journal on Advances in Software, vol 6 no 1 & 2, year 2013, http://www.iariajournals.org/software/
2013, © Copyright by authors, Published under agreement with IARIA - www.iaria.org
TABLE XV. RELATIVE MEASUREMENT ERRORS (NON REAL-TIME PROJECTS)
Proj
ID
NESMA ind.
non norm.
NESMA
ind. norm. NESMA
estim.
EQFP
unspec.
EQFP
generic
Tichenor ILF
model
ISBSG distrib.
sFP ISBSG average weights
1 145% 74% 0% 9% 8% -2% 116% 22% 7%
2 113% 49% -1% 14% 5% -36% 41% 20% 6%
3 52% 8% 11% 23% 16% -43% 27% 25% 15%
4 46% 4% 16% 25% 23% -38% 39% 28% 23%
5 17% -17% 13% 20% 20% -50% 11% 23% 21%
6 169% 92% 2% 10% 10% 15% 155% 25% 8%
7 31% -6% 10% 19% 15% -44% 25% 21% 15%
8 106% 47% -3% 4% 4% -17% 83% 16% 3%
9 28% -9% 20% 27% 26% -45% 22% 30% 27%
TABLE XVI. MEAN AND STDEV OF ABSOLUTE RELATIVE ERRORS
NESMA
ind.
non norm.
NESMA
ind. norm. NESMA
estim.
EQFP
unspec.
EQFP
generic Tichenor
ILF model ISBSG distrib.
sFP ISBSG average weights
Mean
(RT only) 127% 63% 10% 9% 10% 20% 112% 17% 10%
Stdev
(RT only) 64% 44% 7% 7% 7% 16% 59% 11% 7%
Mean
(non RT) 79% 34% 8% 17% 14% 32% 58% 23% 14%
Stdev
(non RT) 56% 33% 7% 8% 8% 17% 50% 4% 8%
Mean
(all) 103% 49% 9% 13% 12% 26% 85% 20% 12%
Stdev
(all) 63% 40% 7% 8% 8% 17% 60% 9% 8%
The relative measurement errors are given in Table XIV and Table XV.
The obtained results show that we can divide the simplified FSM methods in two classes: those which base the size estimation exclusively on some measure of the data (like the NESMA indicative, the Tichenor and ISBSG distribution methods) and those which propose fixed weights for all the BFC of FPA.
The former methods yield the largest errors. Although it was expected that estimates based on less information are generally less accurate than estimates based on more information, the really important finding of our experimental evaluation is that the size estimates based on data measures feature quite often intolerably large errors, i.e., errors that are likely to cause troubles, if development plans were based on such estimates. For instance, let us consider the Tichenor method (which appears the best of those based on data measures) and assume that only size estimation errors not larger than 20% are acceptable: 10 estimates out of 18 would be unacceptable.
On the contrary, the methods that take into consideration all BFC and provide fixed weights for them yield size estimates that are close to the actual size. Among these methods sFP is an exception, since it regularly overestimates the size of projects, often by over 20%. This seems to indicate that
“average” projects are characterized by data and/or transactions whose actual complexity is smaller than the complexity expected by the sFP method.
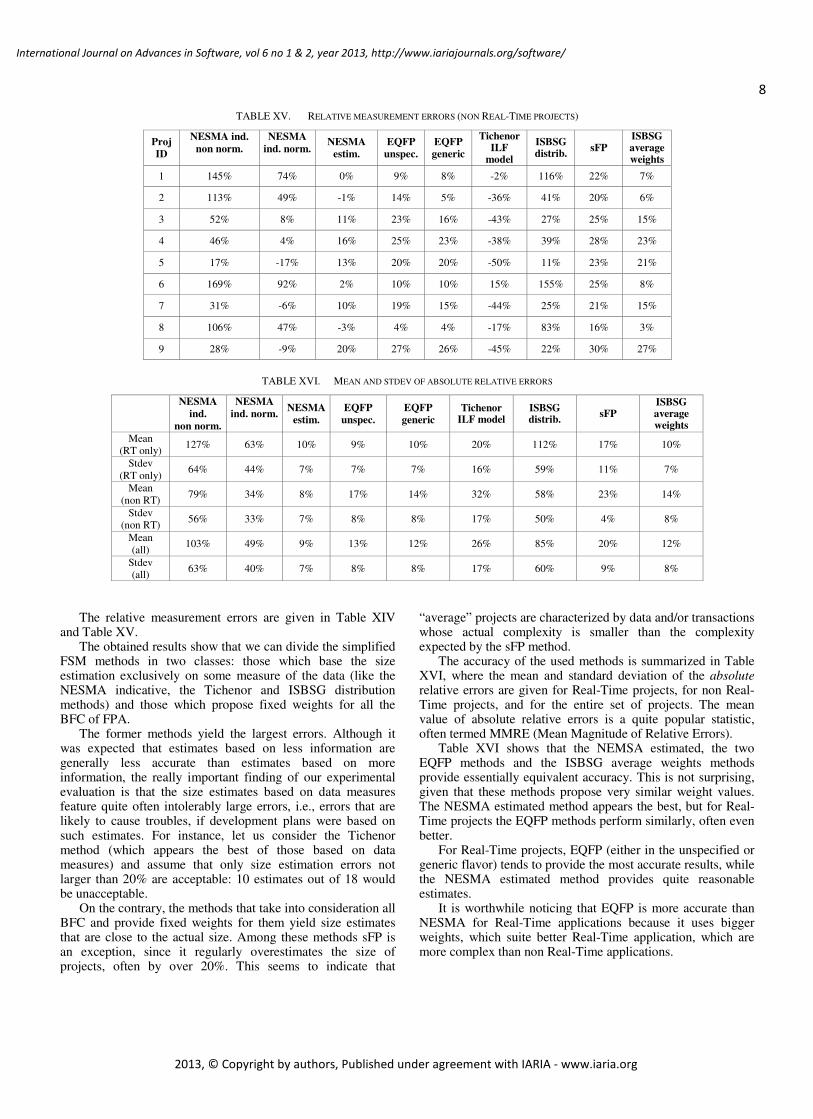
The accuracy of the used methods is summarized in Table XVI, where the mean and standard deviation of the absolute relative errors are given for Real-Time projects, for non Real-Time projects, and for the entire set of projects. The mean value of absolute relative errors is a quite popular statistic, often termed MMRE (Mean Magnitude of Relative Errors).
Table XVI shows that the NEMSA estimated, the two EQFP methods and the ISBSG average weights methods provide essentially equivalent accuracy. This is not surprising, given that these methods propose very similar weight values. The NESMA estimated method appears the best, but for Real-Time projects the EQFP methods perform similarly, often even better.
For Real-Time projects, EQFP (either in the unspecified or generic flavor) tends to provide the most accurate results, while the NESMA estimated method provides quite reasonable estimates.
It is worthwhile noticing that EQFP is more accurate than NESMA for Real-Time applications because it uses bigger weights, which suite better Real-Time application, which are more complex than non Real-Time applications.
9
International Journal on Advances in Software, vol 6 no 1 & 2, year 2013, http://www.iariajournals.org/software/
2013, © Copyright by authors, Published under agreement with IARIA - www.iaria.org
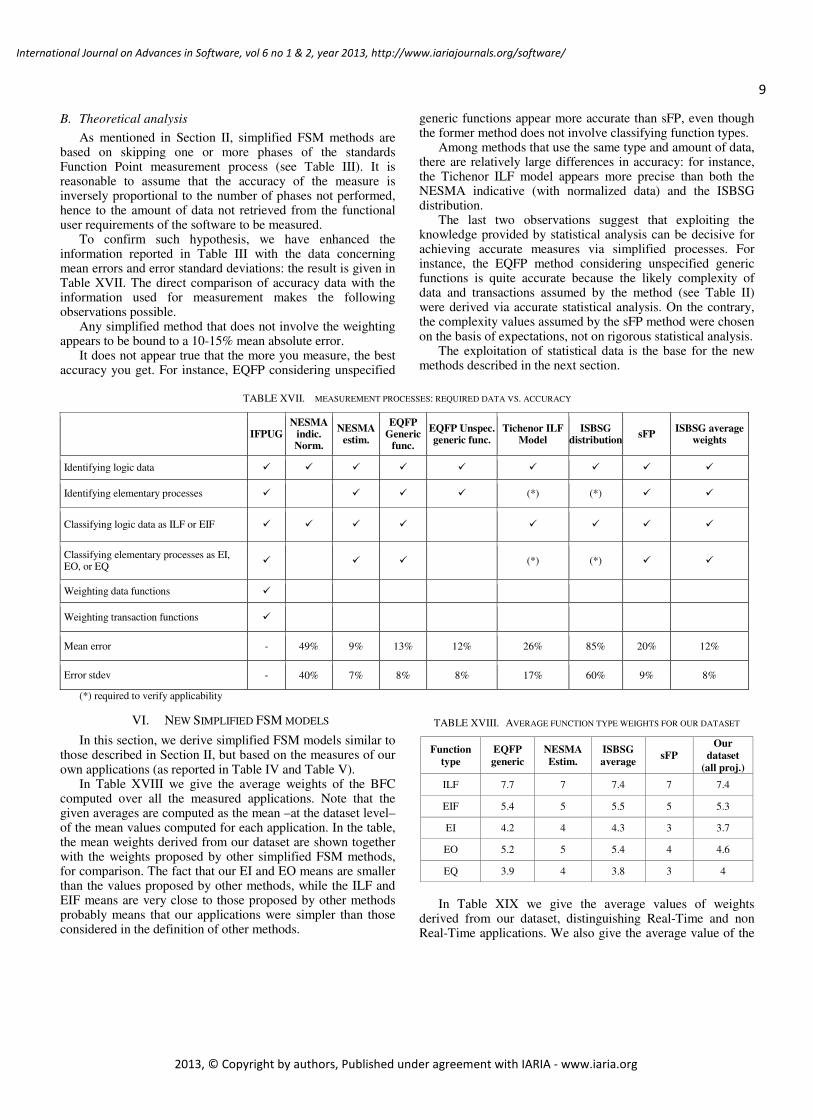
B. Theoretical analysis
As mentioned in Section II, simplified FSM methods are based on skipping one or more phases of the standards Function Point measurement process (see Table III). It is reasonable to assume that the accuracy of the measure is inversely proportional to the number of phases not performed, hence to the amount of data not retrieved from the functional user requirements of the software to be measured.
To confirm such hypothesis, we have enhanced the information reported in Table III with the data concerning mean errors and error standard deviations: the result is given in Table XVII. The direct comparison of accuracy data with the information used for measurement makes the following observations possible.
Any simplified method that does not involve the weighting appears to be bound to a 10-15% mean absolute error.
It does not appear true that the more you measure, the best accuracy you get. For instance, EQFP considering unspecified
generic functions appear more accurate than sFP, even though the former method does not involve classifying function types.
Among methods that use the same type and amount of data, there are relatively large differences in accuracy: for instance, the Tichenor ILF model appears more precise than both the NESMA indicative (with normalized data) and the ISBSG distribution.
The last two observations suggest that exploiting the knowledge provided by statistical analysis can be decisive for achieving accurate measures via simplified processes. For instance, the EQFP method considering unspecified generic functions is quite accurate because the likely complexity of data and transactions assumed by the method (see Table II) were derived via accurate statistical analysis. On the contrary, the complexity values assumed by the sFP method were chosen on the basis of expectations, not on rigorous statistical analysis.
The exploitation of statistical data is the base for the new methods described in the next section.
TABLE XVII. MEASUREMENT PROCESSES: REQUIRED DATA VS. ACCURACY
IFPUG
NESMA indic. Norm.
NESMA estim.
EQFP Generic
func.
EQFP Unspec. generic func.
Tichenor ILF Model
ISBSG distribution
sFP ISBSG average
weights
Identifying logic data
Identifying elementary processes
(*) (*)
Classifying logic data as ILF or EIF
Classifying elementary processes as EI, EO, or EQ
(*) (*)
Weighting data functions
Weighting transaction functions
Mean error - 49% 9% 13% 12% 26% 85% 20% 12%
Error stdev - 40% 7% 8% 8% 17% 60% 9% 8%
(*) required to verify applicability
VI. NEW SIMPLIFIED FSM MODELS
In this section, we derive simplified FSM models similar to those described in Section II, but based on the measures of our own applications (as reported in Table IV and Table V).
In Table XVIII we give the average weights of the BFC computed over all the measured applications. Note that the given averages are computed as the mean –at the dataset level– of the mean values computed for each application. In the table, the mean weights derived from our dataset are shown together with the weights proposed by other simplified FSM methods, for comparison. The fact that our EI and EO means are smaller than the values proposed by other methods, while the ILF and EIF means are very close to those proposed by other methods probably means that our applications were simpler than those considered in the definition of other methods.
TABLE XVIII. AVERAGE FUNCTION TYPE WEIGHTS FOR OUR DATASET
Function
type
EQFP
generic
NESMA
Estim.
ISBSG
average sFP
Our
dataset
(all proj.)
ILF 7.7 7 7.4 7 7.4
EIF 5.4 5 5.5 5 5.3
EI 4.2 4 4.3 3 3.7
EO 5.2 5 5.4 4 4.6
EQ 3.9 4 3.8 3 4
In Table XIX we give the average values of weights
derived from our dataset, distinguishing Real-Time and non Real-Time applications. We also give the average value of the

10
International Journal on Advances in Software, vol 6 no 1 & 2, year 2013, http://www.iariajournals.org/software/
2013, © Copyright by authors, Published under agreement with IARIA - www.iaria.org
ratio between the number of ILF and the size in UFP. It is possible to note that the average number of UFP per ILF we found is quite larger than that found by Tichenor. This suggests that models based just on ILF can be hardly generalized.
Note that we computed also the weights for transaction functions (TF) and data functions (DF). These weights can be used in simplified measurement processes like the EQFP unspecified generic method.
TABLE XIX. MEAN AND MDEIAN WEIGHTS FOR THE PROJECTS IN OUR
DATASET
Mean (median) weight
Dataset ILF EIF EI EO EQ TF DF UFP/ #ILF
All non RT proj
6.6 5.5 3.5 4.4 3.4 7.0 3.7 22.7
All RT proj
8.2 5.0 4.0 4.8 5.1 8.1 4.4 17.0
All proj 7.4 5.3 3.7 4.6 4.0 7.6 4.1 19.9
The values in Table XIX suggest that transactions were
generally more complex in Real-Time applications than in non Real-Time applications. The latter are probably responsible for relatively smaller weights of transaction (EI, EO, and EQ) in Table XVIII.
Using the values in Table XIX it was possible to derive models that are similar to those described in Section II: they are described in Table XX and Table XXI.
TABLE XX. MODELS FOR NON RT PROJECTS.
Average weights
(all BFC)
UFP = 6.6 #ILF+ 5.5 #EIF + 3.5 #EI + 4.4 #EO + 3.4
#EQ
Average weights
(DF and TF) UFP = 7.0 #TF + 3.7 #DF
ILF based model UFP = 22.7 #ILF
TABLE XXI. MODELS FOR RT PROJECTS.
Average weights
(all BFC) UFP = 8.2 #ILF+ 5 #EIF + 4 #EI + 4.8 #EO + 5.1 #EQ
Average weights
(DF and TF) UFP = 8.1 #TF + 4.4 #DF
ILF based model UFP = 17 #ILF
We used such models to estimate the size of the projects in
our dataset. The results of the estimations are reported in Table XXII and Table XXIII for Real-Time and non Real-Time projects, respectively.
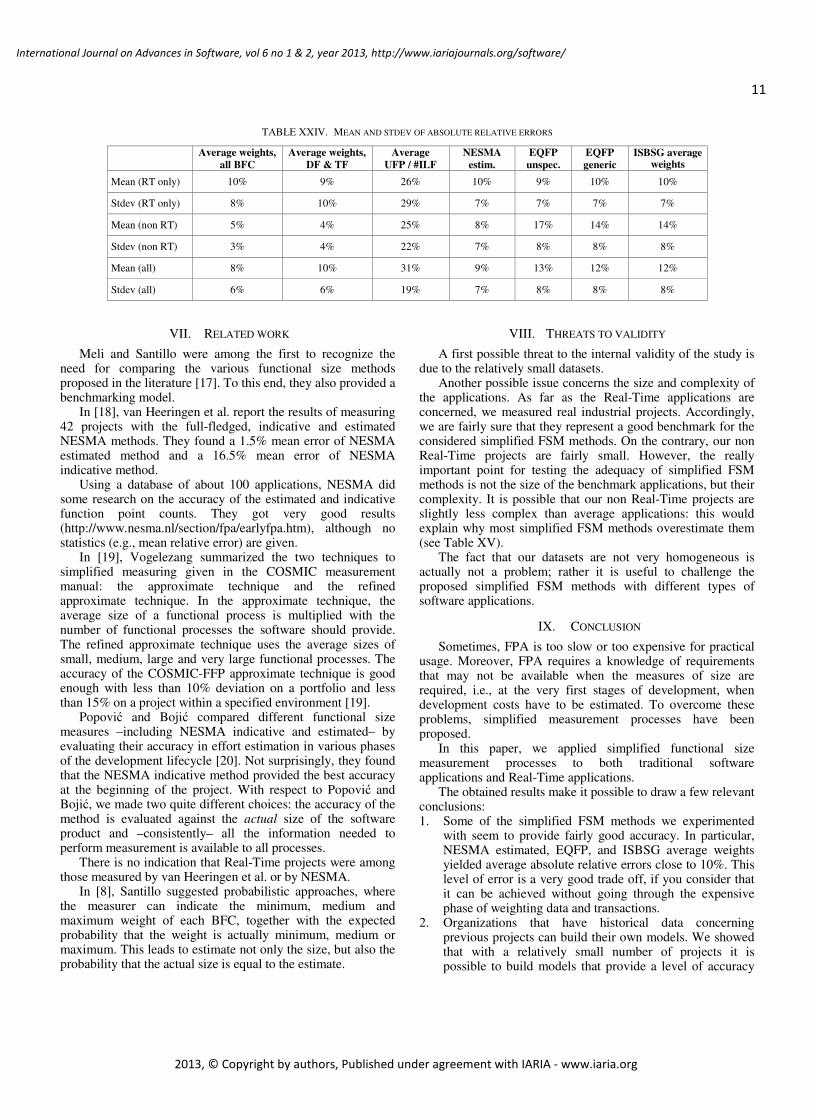
Table XXII and Table XXIII show a rather poor accuracy of the estimation based on ILF, with error greater than 20% for several projects.
On the contrary, the estimations based on average weights are reasonably accurate; the obtained results are particularly good for non Real-Time projects, with all the estimates featuring errors not greater than 10%.
The average values of the absolute relative errors are reported in Table XXIV together with the average values of the absolute relative errors obtained with the best among the other methods, for comparison.
It is easy to see that the estimates obtained using the average weights of the projects being estimated feature practically the same accuracy as the other methods.
TABLE XXII. ESTIMATES OF RT PROJECTS BASED ON MODELS USING THE
PARAMETERS GIVEN IN TABLE XIX.
Proj.
ID
Average
weights
(all BFC)
Average
weights
(DF and TF)
ILF based
model
Actual
size
Est.
size % err
Est.
size % err
Est.
size % err
1 289 273 -6% 277 -4% 306 6%
2 101 110 9% 109 8% 136 35%
3 136 109 -20% 105 -23% 119 -13%
4 195 187 -4% 198 2% 255 31%
5 106 104 -2% 103 -3% 68 -36%
6 223 223 0% 213 -4% 153 -31%
7 15 17 13% 17 13% 17 13%
8 33 39 18% 37 12% 51 55%
9 44 52 18% 51 16% 51 16%
TABLE XXIII. ESTIMATES OF NON RT PROJECTS BASED ON MODELS USING
THE PARAMETERS GIVEN IN TABLE XIX.
Proj.
ID
Average
weights (all
BFC)
Average
weights (DF
and TF)
ILF based
model
Actual
size
Est.
size % err
Est.
size % err
Est.
size % err
1 92 85 -8% 90 -2% 136 48%
2 94 87 -7% 97 3% 91 -3%
3 79 81 3% 84 6% 68 -14%
4 96 98 2% 102 6% 91 -5%
5 90 91 1% 92 2% 68 -24%
6 91 85 -7% 90 -1% 159 75%
7 80 79 -1% 79 -1% 68 -15%
8 109 98 -10% 101 -7% 136 25%
9 82 88 7% 88 7% 68 -17%
It is a bit surprising that in the literature a few models of
type UFP = k × #ILF were proposed, while model of type UFP = k × #EP (where #EP is the number of elementary processes, i.e., #EI + #EO + #EQ) received hardly any attention. We computed the ratio UFP/#EP for each application, and used the average value k in models UFP = k × #EP, to estimate the size of the applications in our dataset. The obtained estimates were characterized by errors quite similar to those of ILF-based models (the average absolute error was 25% for Real-Time projects and 27% for non Real-Time projects). Accordingly, it seems that models of type UFP = k × #EP are not likely to provide good estimates.
11
International Journal on Advances in Software, vol 6 no 1 & 2, year 2013, http://www.iariajournals.org/software/
2013, © Copyright by authors, Published under agreement with IARIA - www.iaria.org
TABLE XXIV. MEAN AND STDEV OF ABSOLUTE RELATIVE ERRORS
Average weights,
all BFC
Average weights,
DF & TF
Average
UFP / #ILF
NESMA
estim.
EQFP
unspec.
EQFP
generic
ISBSG average weights
Mean (RT only) 10% 9% 26% 10% 9% 10% 10%
Stdev (RT only) 8% 10% 29% 7% 7% 7% 7%
Mean (non RT) 5% 4% 25% 8% 17% 14% 14%
Stdev (non RT) 3% 4% 22% 7% 8% 8% 8%
Mean (all) 8% 10% 31% 9% 13% 12% 12%
Stdev (all) 6% 6% 19% 7% 8% 8% 8%
VII. RELATED WORK
Meli and Santillo were among the first to recognize the need for comparing the various functional size methods proposed in the literature [17]. To this end, they also provided a benchmarking model.
In [18], van Heeringen et al. report the results of measuring 42 projects with the full-fledged, indicative and estimated NESMA methods. They found a 1.5% mean error of NESMA estimated method and a 16.5% mean error of NESMA indicative method.
Using a database of about 100 applications, NESMA did some research on the accuracy of the estimated and indicative function point counts. They got very good results (http://www.nesma.nl/section/fpa/earlyfpa.htm), although no statistics (e.g., mean relative error) are given.
In [19], Vogelezang summarized the two techniques to simplified measuring given in the COSMIC measurement manual: the approximate technique and the refined approximate technique. In the approximate technique, the average size of a functional process is multiplied with the number of functional processes the software should provide. The refined approximate technique uses the average sizes of small, medium, large and very large functional processes. The accuracy of the COSMIC-FFP approximate technique is good enough with less than 10% deviation on a portfolio and less than 15% on a project within a specified environment [19].
Popović and Bojić compared different functional size measures –including NESMA indicative and estimated– by evaluating their accuracy in effort estimation in various phases of the development lifecycle [20]. Not surprisingly, they found that the NESMA indicative method provided the best accuracy at the beginning of the project. With respect to Popović and Bojić, we made two quite different choices: the accuracy of the method is evaluated against the actual size of the software product and –consistently– all the information needed to perform measurement is available to all processes.
There is no indication that Real-Time projects were among those measured by van Heeringen et al. or by NESMA.
In [8], Santillo suggested probabilistic approaches, where the measurer can indicate the minimum, medium and maximum weight of each BFC, together with the expected probability that the weight is actually minimum, medium or maximum. This leads to estimate not only the size, but also the probability that the actual size is equal to the estimate.
VIII. THREATS TO VALIDITY
A first possible threat to the internal validity of the study is due to the relatively small datasets.
Another possible issue concerns the size and complexity of the applications. As far as the Real-Time applications are concerned, we measured real industrial projects. Accordingly, we are fairly sure that they represent a good benchmark for the considered simplified FSM methods. On the contrary, our non Real-Time projects are fairly small. However, the really important point for testing the adequacy of simplified FSM methods is not the size of the benchmark applications, but their complexity. It is possible that our non Real-Time projects are slightly less complex than average applications: this would explain why most simplified FSM methods overestimate them (see Table XV).
The fact that our datasets are not very homogeneous is actually not a problem; rather it is useful to challenge the proposed simplified FSM methods with different types of software applications.
IX. CONCLUSION
Sometimes, FPA is too slow or too expensive for practical usage. Moreover, FPA requires a knowledge of requirements that may not be available when the measures of size are required, i.e., at the very first stages of development, when development costs have to be estimated. To overcome these problems, simplified measurement processes have been proposed.
In this paper, we applied simplified functional size measurement processes to both traditional software applications and Real-Time applications.
The obtained results make it possible to draw a few relevant conclusions: 1. Some of the simplified FSM methods we experimented
with seem to provide fairly good accuracy. In particular, NESMA estimated, EQFP, and ISBSG average weights yielded average absolute relative errors close to 10%. This level of error is a very good trade off, if you consider that it can be achieved without going through the expensive phase of weighting data and transactions.
2. Organizations that have historical data concerning previous projects can build their own models. We showed that with a relatively small number of projects it is possible to build models that provide a level of accuracy

12
International Journal on Advances in Software, vol 6 no 1 & 2, year 2013, http://www.iariajournals.org/software/
2013, © Copyright by authors, Published under agreement with IARIA - www.iaria.org
very close to that of methods like NESMA estimated and EQFP.
3. The simplified FSM methods are generally based on average values of ratios among the elements of FP measurement. Accordingly, projects that have unusual characteristics tend to be ill suited for simplified size estimation. For instance, project 3 in our set of Real-Time projects is more complex than the other projects in the set, having most EI and EO characterized by high complexity. This causes most method to underestimate the size of the project by over 20%. Therefore, before applying a simplified FSM method to a given application, it is a good idea to verify that this application is not too much (or too less) complex with respect to “average” applications. Our Real-Time project 3 was characterized by the need to store or communicate many data at a time: this situation could have suggested that using average values for an early measurement leads to a rather large underestimation.
EQFP methods proved more accurate in estimating the size of Real-Time applications, while the NESMA estimated method proved fairly good in estimating both Real-Time and non Real-Time applications. However, the relatively small number of projects involved in the analysis does not allow generalizing these results.
Even considering the relatively small dataset, it is however probably not casual that the NESMA estimated method happened to underestimate all projects. Probably NESMA should consider reviewing the weights used in the estimated method, in the sense of increasing them.
When considering the results of our analysis from a practical viewpoint, a very interesting question is “what simplified method is the best one for my application(s)?”. Table XIV and Table XV show that the methods that are better on average are not necessarily the best ones for a given project. To answer the question above it would be useful to characterize the projects according to properties not considered in FSM, and look for correlations with the measures provided by different simplified methods. This would allow selecting the simplified measurement method that provided the best accuracy for applications of the same type as the one to be sized. Unfortunately, it was not possible to analyze the possibly relevant features of the dataset described in Section III (we had no access to the code of Real-Time projects), thus this analysis is among future activities.
As already mentioned, the results presented here are based on datasets in which the largest project has size of 289 FP: further work for verifying the accuracy of simplified measurement methods when dealing with larger project is needed.
Among the future work is also the experimentation of simplified measurement processes in conjunction with measurement-oriented UML modeling [16], as described in [21].
The models described in Section II are generally derived in a rather naive way, i.e., simply computing averages of some elements that are involved in the measurement: e.g., the average ration between the measure of BFC and their number. Simplified measurement models should be better derived via regression analysis. Unfortunately, the relatively little number of applications in our datasets does not support this type of
analysis, especially if multiple independent variables are involved, as in models of type UFP = f(EI, EO, EQ, ILF, EIF) or UFP = f(TF, DF). Performing this type of analysis is among our goal for future activities, provided that we can get enough data points.
ACKNOWLEDGMENT
The research presented in this paper has been partially supported by the project “Metodi, tecniche e strumenti per l’analisi, l’implementazione e la valutazione di sistemi software” funded by the Università degli Studi dell’Insubria.
REFERENCES
[1] L. Lavazza and G. Liu, “A Report on Using Simplified Function Point Measurement Processes”, Int. Conf. on Software Engineering Advances, (ICSEA 2012), Nov. 2012, pp. 18-25.
[2] A.J. Albrecht, “Measuring Application Development Productivity”, Joint SHARE/ GUIDE/IBM Application Development Symposium, 1979.
[3] A.J. Albrecht and J.E. Gaffney, “Software function, lines of code and development effort prediction: a software science validation”, IEEE Transactions on Software Engineering, vol. 9, 1983.
[4] International Function Point Users Group, “Function Point Counting Practices Manual - Release 4.3.1”, 2010.
[5] ISO/IEC 20926: 2003, “Software engineering – IFPUG 4.1 Unadjusted functional size measurement method – Counting Practices Manual”, ISO, Geneva, 2003.
[6] C. Jones, “A new business model for function point metrics”, http://www.itmpi.org/assets/base/images/itmpi/privaterooms/capersjones/FunctPtBusModel2008.pdf, 2008
[7] “Methods for Software Sizing – How to Decide which Method to Use”, Total Metrics, www.totalmetrics.com/function-point-resources/downloads/R185_Why-use-Function-Points.pdf, August 2007.
[8] L. Santillo, “Easy Function Points – ‘Smart’ Approximation Technique for the IFPUG and COSMIC Methods”, Joint Conf. of the 22nd Int. Workshop on Software Measurement and the 7th Int. Conf. on Software Process and Product Measurement, Oct. 2012.
[9] C. Tichenor, “The IRS Development and Application of the Internal Logical File Model to Estimate Function Point Counts”, IFPUG Fall Conference of Use (ESCOM-ENCRESS 1998), May 1998.
[10] L. Lavazza and C. Garavaglia, “Using Function Points to Measure and Estimate Real-Time and Embedded Software: Experiences and Guidelines”, 3rd Int. Symp. on Empirical SW Engineering and Measurement (ESEM 2009), Oct. 2009.
[11] L. Lavazza and C. Garavaglia, “Using Function Point in the Estimation of Real-Time Software: an Experience”, Software Measurement European Forum (SMEF 2008), May 2008.
[12] “Early & Quick Function Points for IFPUG methods v. 3.1 Reference Manual 1.1”, April 2012.
[13] ISO, Iec 24570: 2004, “Software Engineering-NESMA Functional Size Measurement Method version 2.1 - Definitions and Counting Guidelines for the Application of Function Point Analysis. International Organization for Standardization”, Geneva, 2004.
[14] L. Bernstein and C. M. Yuhas, “Trustworthy Systems Through Quantitative Software Engineering”, John Wiley & Sons, 2005.
[15] International Software Benchmarking Standards Group, “Worldwide Software Development: The Benchmark, release 11”, 2009.
[16] L. Lavazza, V. del Bianco, C. Garavaglia, “Model-based Functional Size Measurement”, 2nd International Symposium on Empirical Software Engineering and Measurement (ESEM 2008), Oct. 2008.
[17] R. Meli and L. Santillo, “Function point estimation methods: a comparative overview”, Software Measurement European Forum (FESMA 1999), Oct. 1999.
[18] H. van Heeringen, E. van Gorp, and T. Prins, “Functional size measurement - Accuracy versus costs - Is it really worth it?”, Software Measurement European Forum (SMEF 2009), May 2009.

13
International Journal on Advances in Software, vol 6 no 1 & 2, year 2013, http://www.iariajournals.org/software/
2013, © Copyright by authors, Published under agreement with IARIA - www.iaria.org
[19] F.W. Vogelezang, “COSMIC Full Function Points, the Next Generation”, in Measure! Knowledge! Action! – The NESMA anniversary book, NESMA, 2004.
[20] J. Popović and D. Bojić, “A Comparative Evaluation of Effort Estimation Methods in the Software Life Cycle”, Computer Science and Information Systems, vol. 9, Jan. 2012.
[21] V. del Bianco, L. Lavazza, and S. Morasca, “A Proposal for Simplified Model-Based Cost Estimation Models”, 13th Int. Conf. on Product-Focused Software Development and Process Improvement (PROFES 2012), June 2012.
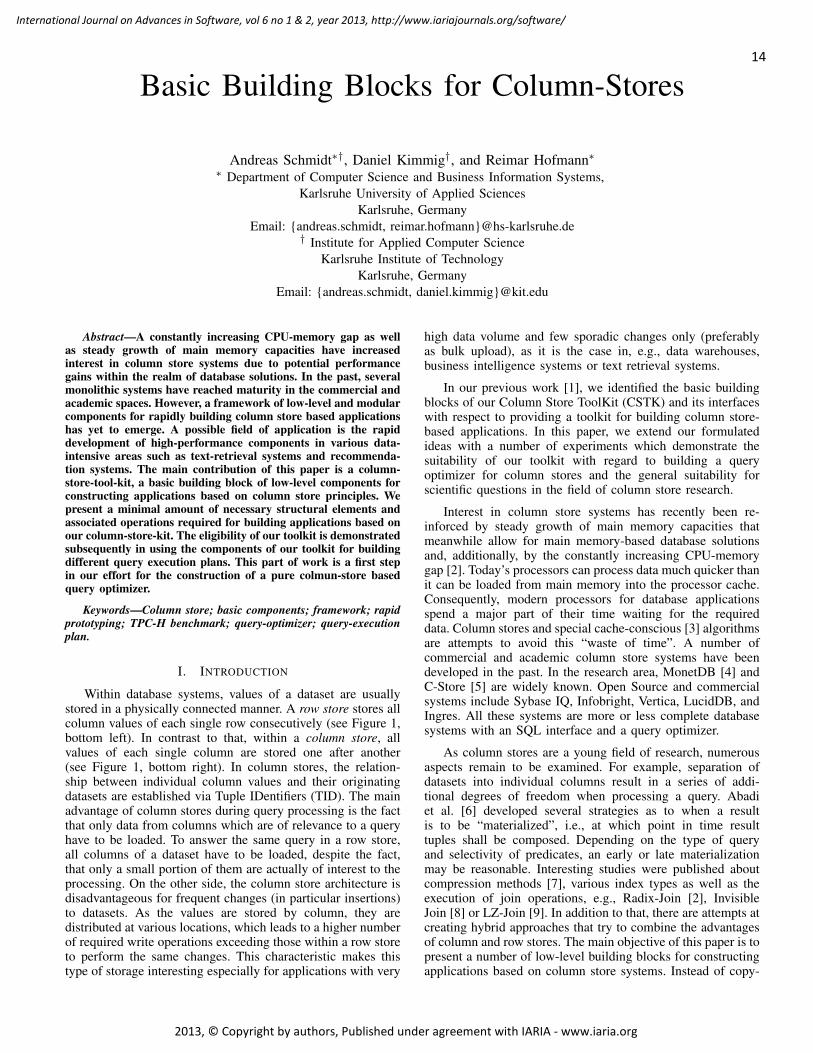
14
International Journal on Advances in Software, vol 6 no 1 & 2, year 2013, http://www.iariajournals.org/software/
2013, © Copyright by authors, Published under agreement with IARIA - www.iaria.org
Basic Building Blocks for Column-Stores
Andreas Schmidt∗†, Daniel Kimmig†, and Reimar Hofmann∗∗ Department of Computer Science and Business Information Systems,
Karlsruhe University of Applied SciencesKarlsruhe, Germany
Email: andreas.schmidt, [email protected]† Institute for Applied Computer Science
Karlsruhe Institute of TechnologyKarlsruhe, Germany
Email: andreas.schmidt, [email protected]
Abstract—A constantly increasing CPU-memory gap as wellas steady growth of main memory capacities have increasedinterest in column store systems due to potential performancegains within the realm of database solutions. In the past, severalmonolithic systems have reached maturity in the commercial andacademic spaces. However, a framework of low-level and modularcomponents for rapidly building column store based applicationshas yet to emerge. A possible field of application is the rapiddevelopment of high-performance components in various data-intensive areas such as text-retrieval systems and recommenda-tion systems. The main contribution of this paper is a column-store-tool-kit, a basic building block of low-level components forconstructing applications based on column store principles. Wepresent a minimal amount of necessary structural elements andassociated operations required for building applications based onour column-store-kit. The eligibility of our toolkit is demonstratedsubsequently in using the components of our toolkit for buildingdifferent query execution plans. This part of work is a first stepin our effort for the construction of a pure colmun-store basedquery optimizer.
Keywords—Column store; basic components; framework; rapidprototyping; TPC-H benchmark; query-optimizer; query-executionplan.
I. INTRODUCTION
Within database systems, values of a dataset are usuallystored in a physically connected manner. A row store stores allcolumn values of each single row consecutively (see Figure 1,bottom left). In contrast to that, within a column store, allvalues of each single column are stored one after another(see Figure 1, bottom right). In column stores, the relation-ship between individual column values and their originatingdatasets are established via Tuple IDentifiers (TID). The mainadvantage of column stores during query processing is the factthat only data from columns which are of relevance to a queryhave to be loaded. To answer the same query in a row store,all columns of a dataset have to be loaded, despite the fact,that only a small portion of them are actually of interest to theprocessing. On the other side, the column store architecture isdisadvantageous for frequent changes (in particular insertions)to datasets. As the values are stored by column, they aredistributed at various locations, which leads to a higher numberof required write operations exceeding those within a row storeto perform the same changes. This characteristic makes thistype of storage interesting especially for applications with very
high data volume and few sporadic changes only (preferablyas bulk upload), as it is the case in, e.g., data warehouses,business intelligence systems or text retrieval systems.
In our previous work [1], we identified the basic buildingblocks of our Column Store ToolKit (CSTK) and its interfaceswith respect to providing a toolkit for building column store-based applications. In this paper, we extend our formulatedideas with a number of experiments which demonstrate thesuitability of our toolkit with regard to building a queryoptimizer for column stores and the general suitability forscientific questions in the field of column store research.
Interest in column store systems has recently been re-inforced by steady growth of main memory capacities thatmeanwhile allow for main memory-based database solutionsand, additionally, by the constantly increasing CPU-memorygap [2]. Today’s processors can process data much quicker thanit can be loaded from main memory into the processor cache.Consequently, modern processors for database applicationsspend a major part of their time waiting for the requireddata. Column stores and special cache-conscious [3] algorithmsare attempts to avoid this “waste of time”. A number ofcommercial and academic column store systems have beendeveloped in the past. In the research area, MonetDB [4] andC-Store [5] are widely known. Open Source and commercialsystems include Sybase IQ, Infobright, Vertica, LucidDB, andIngres. All these systems are more or less complete databasesystems with an SQL interface and a query optimizer.
As column stores are a young field of research, numerousaspects remain to be examined. For example, separation ofdatasets into individual columns result in a series of addi-tional degrees of freedom when processing a query. Abadiet al. [6] developed several strategies as to when a resultis to be “materialized”, i.e., at which point in time resulttuples shall be composed. Depending on the type of queryand selectivity of predicates, an early or late materializationmay be reasonable. Interesting studies were published aboutcompression methods [7], various index types as well as theexecution of join operations, e.g., Radix-Join [2], InvisibleJoin [8] or LZ-Join [9]. In addition to that, there are attempts atcreating hybrid approaches that try to combine the advantagesof column and row stores. The main objective of this paper is topresent a number of low-level building blocks for constructingapplications based on column store systems. Instead of copy-
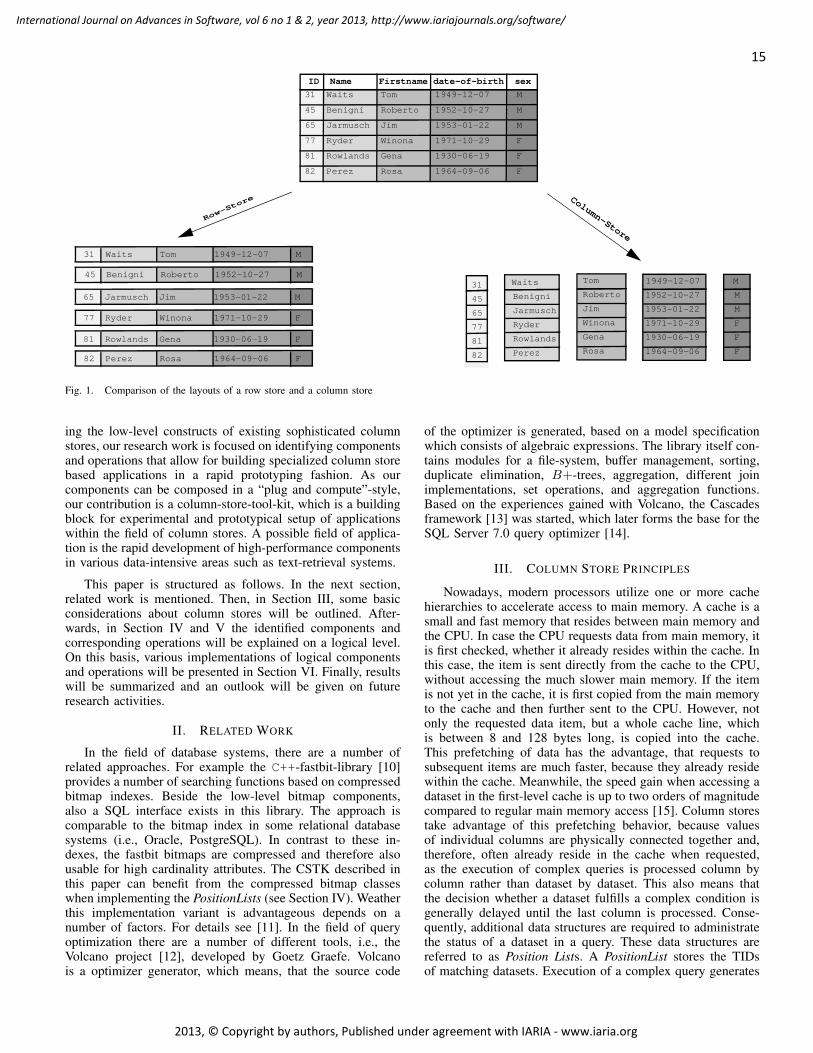
15
International Journal on Advances in Software, vol 6 no 1 & 2, year 2013, http://www.iariajournals.org/software/
2013, © Copyright by authors, Published under agreement with IARIA - www.iaria.org
ID Name Firstname date-of-birth sex
31 Waits Tom 1949-12-07 M
45 Benigni Roberto 1952-10-27 M
65 Jarmusch Jim 1953-01-22 M
77 Ryder Winona 1971-10-29 F
81 Rowlands Gena 1930-06-19 F
82 Perez Rosa 1964-09-06 F
Row-Store Column-Store
31 Waits Tom 1949-12-07 M
3145 Benigni Roberto 1952-10-27 M
65 Jarmusch Jim 1953-01-22 M
77 Ryder Winona 1971-10-29 F
81 Rowlands Gena 1930-06-19 F
82 Perez Rosa 1964-09-06 F
45
65
77
81
82
Benigni
Jarmusch
Ryder
Rowlands
Perez
1952-10-27
1953-01-22
1971-10-29
1930-06-19
1964-09-06
M
M
F
F
F
Waits Tom 1949-12-07 M
Roberto
Jim
Winona
Gena
Rosa
Fig. 1. Comparison of the layouts of a row store and a column store
ing the low-level constructs of existing sophisticated columnstores, our research work is focused on identifying componentsand operations that allow for building specialized column storebased applications in a rapid prototyping fashion. As ourcomponents can be composed in a “plug and compute”-style,our contribution is a column-store-tool-kit, which is a buildingblock for experimental and prototypical setup of applicationswithin the field of column stores. A possible field of applica-tion is the rapid development of high-performance componentsin various data-intensive areas such as text-retrieval systems.
This paper is structured as follows. In the next section,related work is mentioned. Then, in Section III, some basicconsiderations about column stores will be outlined. After-wards, in Section IV and V the identified components andcorresponding operations will be explained on a logical level.On this basis, various implementations of logical componentsand operations will be presented in Section VI. Finally, resultswill be summarized and an outlook will be given on futureresearch activities.
II. RELATED WORK
In the field of database systems, there are a number ofrelated approaches. For example the C++-fastbit-library [10]provides a number of searching functions based on compressedbitmap indexes. Beside the low-level bitmap components,also a SQL interface exists in this library. The approach iscomparable to the bitmap index in some relational databasesystems (i.e., Oracle, PostgreSQL). In contrast to these in-dexes, the fastbit bitmaps are compressed and therefore alsousable for high cardinality attributes. The CSTK described inthis paper can benefit from the compressed bitmap classeswhen implementing the PositionLists (see Section IV). Weatherthis implementation variant is advantageous depends on anumber of factors. For details see [11]. In the field of queryoptimization there are a number of different tools, i.e., theVolcano project [12], developed by Goetz Graefe. Volcanois a optimizer generator, which means, that the source code
of the optimizer is generated, based on a model specificationwhich consists of algebraic expressions. The library itself con-tains modules for a file-system, buffer management, sorting,duplicate elimination, B+-trees, aggregation, different joinimplementations, set operations, and aggregation functions.Based on the experiences gained with Volcano, the Cascadesframework [13] was started, which later forms the base for theSQL Server 7.0 query optimizer [14].
III. COLUMN STORE PRINCIPLES
Nowadays, modern processors utilize one or more cachehierarchies to accelerate access to main memory. A cache is asmall and fast memory that resides between main memory andthe CPU. In case the CPU requests data from main memory, itis first checked, whether it already resides within the cache. Inthis case, the item is sent directly from the cache to the CPU,without accessing the much slower main memory. If the itemis not yet in the cache, it is first copied from the main memoryto the cache and then further sent to the CPU. However, notonly the requested data item, but a whole cache line, whichis between 8 and 128 bytes long, is copied into the cache.This prefetching of data has the advantage, that requests tosubsequent items are much faster, because they already residewithin the cache. Meanwhile, the speed gain when accessing adataset in the first-level cache is up to two orders of magnitudecompared to regular main memory access [15]. Column storestake advantage of this prefetching behavior, because valuesof individual columns are physically connected together and,therefore, often already reside in the cache when requested,as the execution of complex queries is processed column bycolumn rather than dataset by dataset. This also means thatthe decision whether a dataset fulfills a complex condition isgenerally delayed until the last column is processed. Conse-quently, additional data structures are required to administratethe status of a dataset in a query. These data structures arereferred to as Position Lists. A PositionList stores the TIDsof matching datasets. Execution of a complex query generates
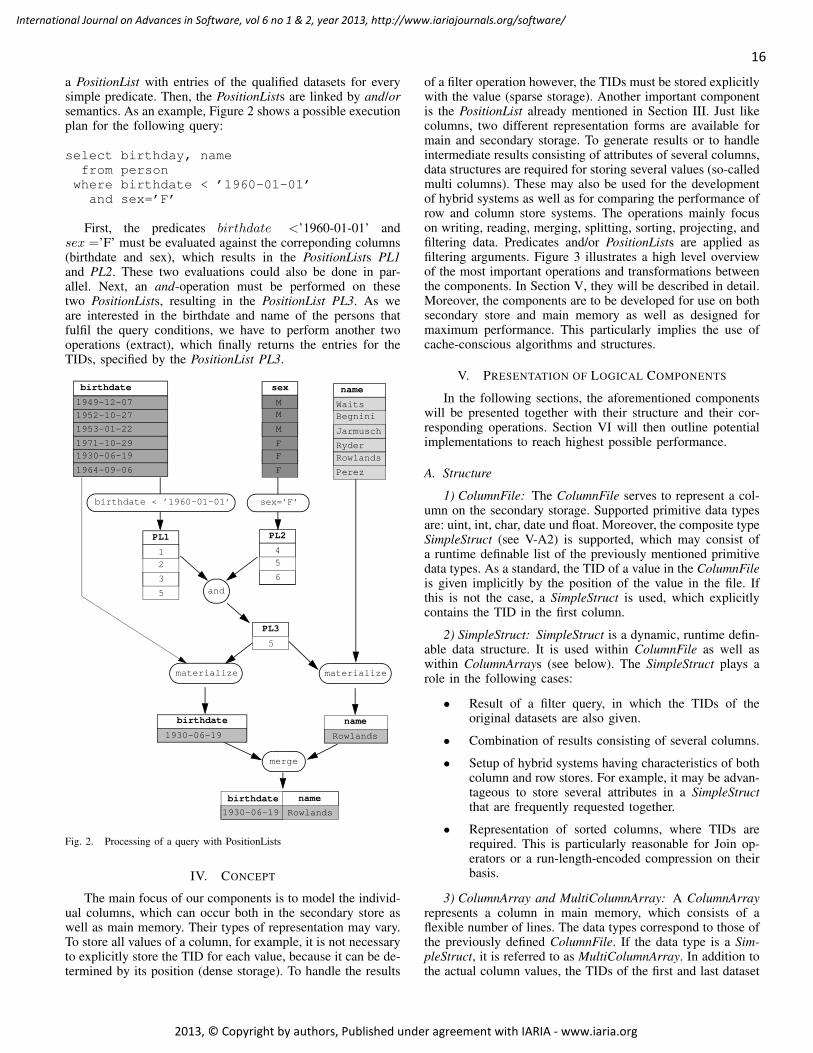
16
International Journal on Advances in Software, vol 6 no 1 & 2, year 2013, http://www.iariajournals.org/software/
2013, © Copyright by authors, Published under agreement with IARIA - www.iaria.org
a PositionList with entries of the qualified datasets for everysimple predicate. Then, the PositionLists are linked by and/orsemantics. As an example, Figure 2 shows a possible executionplan for the following query:
select birthday, namefrom personwhere birthdate < ’1960-01-01’and sex=’F’
First, the predicates birthdate <’1960-01-01’ andsex =’F’ must be evaluated against the correponding columns(birthdate and sex), which results in the PositionLists PL1and PL2. These two evaluations could also be done in par-allel. Next, an and-operation must be performed on thesetwo PositionLists, resulting in the PositionList PL3. As weare interested in the birthdate and name of the persons thatfulfil the query conditions, we have to perform another twooperations (extract), which finally returns the entries for theTIDs, specified by the PositionList PL3.
name
Waits Begnini
Jarmusch
Ryder
Rowlands
Perez
birthdate
1949-12-07
1952-10-27
1953-01-22
1971-10-29
1930-06-19
1964-09-06
sex
M M
M
F
F
F
PL2
4
6
5
PL1
1
3
5
2
sex=’F’birthdate < ’1960-01-01’
PL3
5
and
name
Rowlands
materializematerialize
birthdate
1930-06-19
merge
birthdate
1930-06-19
name
Rowlands
Fig. 2. Processing of a query with PositionLists
IV. CONCEPT
The main focus of our components is to model the individ-ual columns, which can occur both in the secondary store aswell as main memory. Their types of representation may vary.To store all values of a column, for example, it is not necessaryto explicitly store the TID for each value, because it can be de-termined by its position (dense storage). To handle the results
of a filter operation however, the TIDs must be stored explicitlywith the value (sparse storage). Another important componentis the PositionList already mentioned in Section III. Just likecolumns, two different representation forms are available formain and secondary storage. To generate results or to handleintermediate results consisting of attributes of several columns,data structures are required for storing several values (so-calledmulti columns). These may also be used for the developmentof hybrid systems as well as for comparing the performance ofrow and column store systems. The operations mainly focuson writing, reading, merging, splitting, sorting, projecting, andfiltering data. Predicates and/or PositionLists are applied asfiltering arguments. Figure 3 illustrates a high level overviewof the most important operations and transformations betweenthe components. In Section V, they will be described in detail.Moreover, the components are to be developed for use on bothsecondary store and main memory as well as designed formaximum performance. This particularly implies the use ofcache-conscious algorithms and structures.
V. PRESENTATION OF LOGICAL COMPONENTS
In the following sections, the aforementioned componentswill be presented together with their structure and their cor-responding operations. Section VI will then outline potentialimplementations to reach highest possible performance.
A. Structure
1) ColumnFile: The ColumnFile serves to represent a col-umn on the secondary storage. Supported primitive data typesare: uint, int, char, date und float. Moreover, the composite typeSimpleStruct (see V-A2) is supported, which may consist ofa runtime definable list of the previously mentioned primitivedata types. As a standard, the TID of a value in the ColumnFileis given implicitly by the position of the value in the file. Ifthis is not the case, a SimpleStruct is used, which explicitlycontains the TID in the first column.
2) SimpleStruct: SimpleStruct is a dynamic, runtime defin-able data structure. It is used within ColumnFile as well aswithin ColumnArrays (see below). The SimpleStruct plays arole in the following cases:
• Result of a filter query, in which the TIDs of theoriginal datasets are also given.
• Combination of results consisting of several columns.
• Setup of hybrid systems having characteristics of bothcolumn and row stores. For example, it may be advan-tageous to store several attributes in a SimpleStructthat are frequently requested together.
• Representation of sorted columns, where TIDs arerequired. This is particularly reasonable for Join op-erators or a run-length-encoded compression on theirbasis.
3) ColumnArray and MultiColumnArray: A ColumnArrayrepresents a column in main memory, which consists of aflexible number of lines. The data types correspond to those ofthe previously defined ColumnFile. If the data type is a Sim-pleStruct, it is referred to as MultiColumnArray. In addition tothe actual column values, the TIDs of the first and last dataset
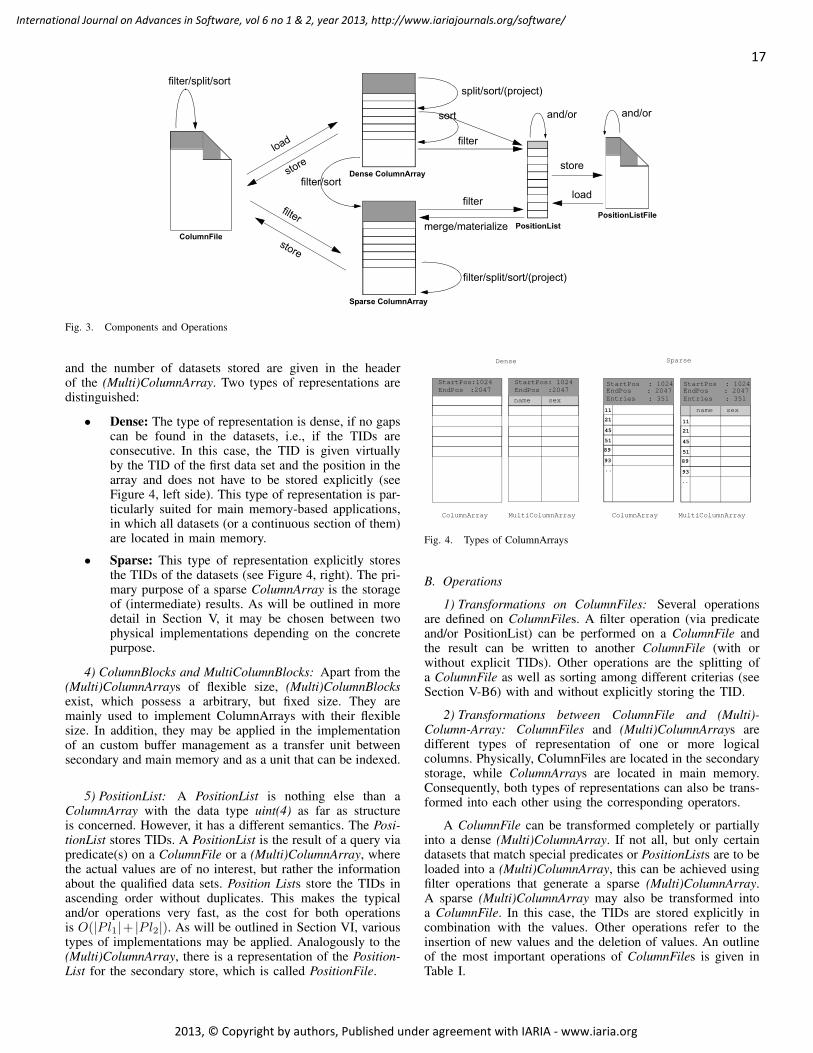
17
International Journal on Advances in Software, vol 6 no 1 & 2, year 2013, http://www.iariajournals.org/software/
2013, © Copyright by authors, Published under agreement with IARIA - www.iaria.org
and/or
Dense ColumnArray
ColumnFile
PositionList
PositionListFile
Sparse ColumnArray
load
filter
filter/split/sort/(project)
filter
load
store
split/sort/(project)filter/split/sort
store
store
filter/sort
filter
merge/materialize
sort and/or
Fig. 3. Components and Operations
and the number of datasets stored are given in the headerof the (Multi)ColumnArray. Two types of representations aredistinguished:
• Dense: The type of representation is dense, if no gapscan be found in the datasets, i.e., if the TIDs areconsecutive. In this case, the TID is given virtuallyby the TID of the first data set and the position in thearray and does not have to be stored explicitly (seeFigure 4, left side). This type of representation is par-ticularly suited for main memory-based applications,in which all datasets (or a continuous section of them)are located in main memory.
• Sparse: This type of representation explicitly storesthe TIDs of the datasets (see Figure 4, right). The pri-mary purpose of a sparse ColumnArray is the storageof (intermediate) results. As will be outlined in moredetail in Section V, it may be chosen between twophysical implementations depending on the concretepurpose.
4) ColumnBlocks and MultiColumnBlocks: Apart from the(Multi)ColumnArrays of flexible size, (Multi)ColumnBlocksexist, which possess a arbitrary, but fixed size. They aremainly used to implement ColumnArrays with their flexiblesize. In addition, they may be applied in the implementationof an custom buffer management as a transfer unit betweensecondary and main memory and as a unit that can be indexed.
5) PositionList: A PositionList is nothing else than aColumnArray with the data type uint(4) as far as structureis concerned. However, it has a different semantics. The Posi-tionList stores TIDs. A PositionList is the result of a query viapredicate(s) on a ColumnFile or a (Multi)ColumnArray, wherethe actual values are of no interest, but rather the informationabout the qualified data sets. Position Lists store the TIDs inascending order without duplicates. This makes the typicaland/or operations very fast, as the cost for both operationsis O(|Pl1|+ |Pl2|). As will be outlined in Section VI, varioustypes of implementations may be applied. Analogously to the(Multi)ColumnArray, there is a representation of the Position-List for the secondary store, which is called PositionFile.
StartPos:1024EndPos :2047
11
21
45
51
89
93
..
StartPos: 1024EndPos :2047
11
21
45
51
89
93
name sex
name sex
..
StartPos : 1024EndPos : 2047Entries : 351
StartPos : 1024EndPos : 2047Entries : 351
ColumnArray MultiColumnArray ColumnArray MultiColumnArray
Dense Sparse
Fig. 4. Types of ColumnArrays
B. Operations
1) Transformations on ColumnFiles: Several operationsare defined on ColumnFiles. A filter operation (via predicateand/or PositionList) can be performed on a ColumnFile andthe result can be written to another ColumnFile (with orwithout explicit TIDs). Other operations are the splitting ofa ColumnFile as well as sorting among different criterias (seeSection V-B6) with and without explicitly storing the TID.
2) Transformations between ColumnFile and (Multi)-Column-Array: ColumnFiles and (Multi)ColumnArrays aredifferent types of representation of one or more logicalcolumns. Physically, ColumnFiles are located in the secondarystorage, while ColumnArrays are located in main memory.Consequently, both types of representations can also be trans-formed into each other using the corresponding operators.
A ColumnFile can be transformed completely or partiallyinto a dense (Multi)ColumnArray. If not all, but only certaindatasets that match special predicates or PositionLists are to beloaded into a (Multi)ColumnArray, this can be achieved usingfilter operations that generate a sparse (Multi)ColumnArray.A sparse (Multi)ColumnArray may also be transformed intoa ColumnFile. In this case, the TIDs are stored explicitly incombination with the values. Other operations refer to theinsertion of new values and the deletion of values. An outlineof the most important operations of ColumnFiles is given inTable I.
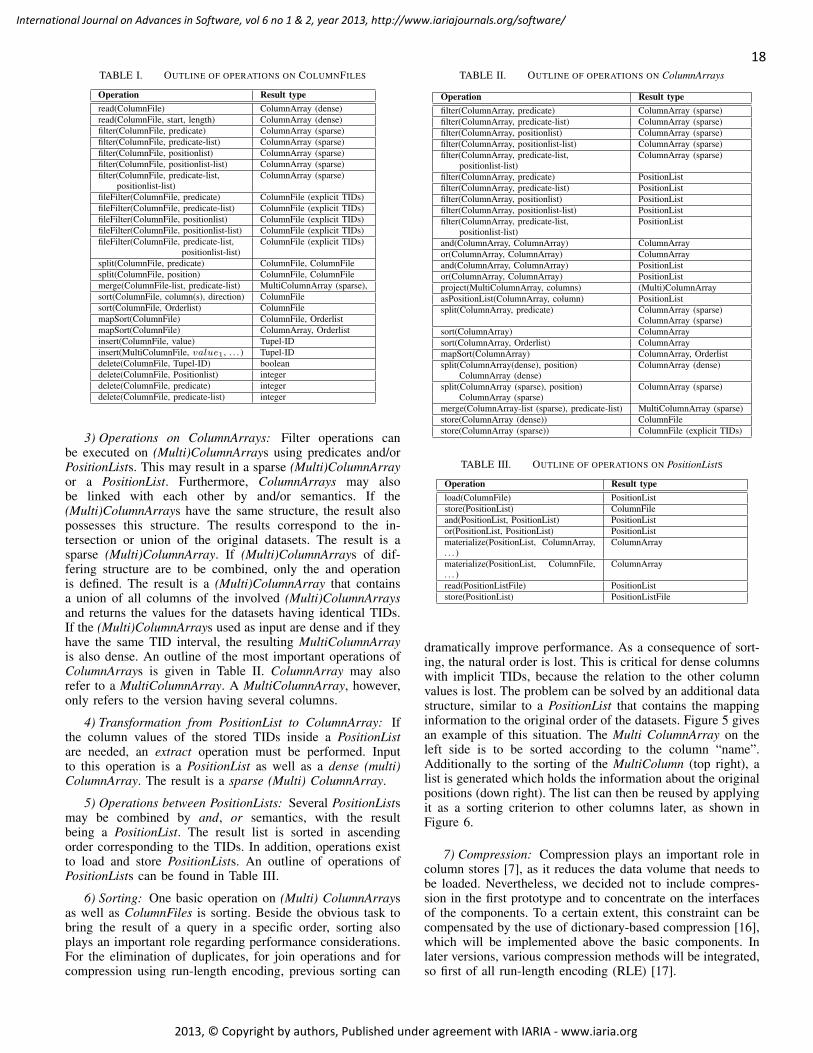
18
International Journal on Advances in Software, vol 6 no 1 & 2, year 2013, http://www.iariajournals.org/software/
2013, © Copyright by authors, Published under agreement with IARIA - www.iaria.org
TABLE I. OUTLINE OF OPERATIONS ON COLUMNFILES
Operation Result typeread(ColumnFile) ColumnArray (dense)read(ColumnFile, start, length) ColumnArray (dense)filter(ColumnFile, predicate) ColumnArray (sparse)filter(ColumnFile, predicate-list) ColumnArray (sparse)filter(ColumnFile, positionlist) ColumnArray (sparse)filter(ColumnFile, positionlist-list) ColumnArray (sparse)filter(ColumnFile, predicate-list, ColumnArray (sparse)
positionlist-list)fileFilter(ColumnFile, predicate) ColumnFile (explicit TIDs)fileFilter(ColumnFile, predicate-list) ColumnFile (explicit TIDs)fileFilter(ColumnFile, positionlist) ColumnFile (explicit TIDs)fileFilter(ColumnFile, positionlist-list) ColumnFile (explicit TIDs)fileFilter(ColumnFile, predicate-list, ColumnFile (explicit TIDs)
positionlist-list)split(ColumnFile, predicate) ColumnFile, ColumnFilesplit(ColumnFile, position) ColumnFile, ColumnFilemerge(ColumnFile-list, predicate-list) MultiColumnArray (sparse),sort(ColumnFile, column(s), direction) ColumnFilesort(ColumnFile, Orderlist) ColumnFilemapSort(ColumnFile) ColumnFile, OrderlistmapSort(ColumnFile) ColumnArray, Orderlistinsert(ColumnFile, value) Tupel-IDinsert(MultiColumnFile, value1, . . . ) Tupel-IDdelete(ColumnFile, Tupel-ID) booleandelete(ColumnFile, Positionlist) integerdelete(ColumnFile, predicate) integerdelete(ColumnFile, predicate-list) integer
3) Operations on ColumnArrays: Filter operations canbe executed on (Multi)ColumnArrays using predicates and/orPositionLists. This may result in a sparse (Multi)ColumnArrayor a PositionList. Furthermore, ColumnArrays may alsobe linked with each other by and/or semantics. If the(Multi)ColumnArrays have the same structure, the result alsopossesses this structure. The results correspond to the in-tersection or union of the original datasets. The result is asparse (Multi)ColumnArray. If (Multi)ColumnArrays of dif-fering structure are to be combined, only the and operationis defined. The result is a (Multi)ColumnArray that containsa union of all columns of the involved (Multi)ColumnArraysand returns the values for the datasets having identical TIDs.If the (Multi)ColumnArrays used as input are dense and if theyhave the same TID interval, the resulting MultiColumnArrayis also dense. An outline of the most important operations ofColumnArrays is given in Table II. ColumnArray may alsorefer to a MultiColumnArray. A MultiColumnArray, however,only refers to the version having several columns.
4) Transformation from PositionList to ColumnArray: Ifthe column values of the stored TIDs inside a PositionListare needed, an extract operation must be performed. Inputto this operation is a PositionList as well as a dense (multi)ColumnArray. The result is a sparse (Multi) ColumnArray.
5) Operations between PositionLists: Several PositionListsmay be combined by and, or semantics, with the resultbeing a PositionList. The result list is sorted in ascendingorder corresponding to the TIDs. In addition, operations existto load and store PositionLists. An outline of operations ofPositionLists can be found in Table III.
6) Sorting: One basic operation on (Multi) ColumnArraysas well as ColumnFiles is sorting. Beside the obvious task tobring the result of a query in a specific order, sorting alsoplays an important role regarding performance considerations.For the elimination of duplicates, for join operations and forcompression using run-length encoding, previous sorting can
TABLE II. OUTLINE OF OPERATIONS ON ColumnArrays
Operation Result typefilter(ColumnArray, predicate) ColumnArray (sparse)filter(ColumnArray, predicate-list) ColumnArray (sparse)filter(ColumnArray, positionlist) ColumnArray (sparse)filter(ColumnArray, positionlist-list) ColumnArray (sparse)filter(ColumnArray, predicate-list, ColumnArray (sparse)
positionlist-list)filter(ColumnArray, predicate) PositionListfilter(ColumnArray, predicate-list) PositionListfilter(ColumnArray, positionlist) PositionListfilter(ColumnArray, positionlist-list) PositionListfilter(ColumnArray, predicate-list, PositionList
positionlist-list)and(ColumnArray, ColumnArray) ColumnArrayor(ColumnArray, ColumnArray) ColumnArrayand(ColumnArray, ColumnArray) PositionListor(ColumnArray, ColumnArray) PositionListproject(MultiColumnArray, columns) (Multi)ColumnArrayasPositionList(ColumnArray, column) PositionListsplit(ColumnArray, predicate) ColumnArray (sparse)
ColumnArray (sparse)sort(ColumnArray) ColumnArraysort(ColumnArray, Orderlist) ColumnArraymapSort(ColumnArray) ColumnArray, Orderlistsplit(ColumnArray(dense), position) ColumnArray (dense)
ColumnArray (dense)split(ColumnArray (sparse), position) ColumnArray (sparse)
ColumnArray (sparse)merge(ColumnArray-list (sparse), predicate-list) MultiColumnArray (sparse)store(ColumnArray (dense)) ColumnFilestore(ColumnArray (sparse)) ColumnFile (explicit TIDs)
TABLE III. OUTLINE OF OPERATIONS ON PositionListS
Operation Result typeload(ColumnFile) PositionListstore(PositionList) ColumnFileand(PositionList, PositionList) PositionListor(PositionList, PositionList) PositionListmaterialize(PositionList, ColumnArray,. . . )
ColumnArray
materialize(PositionList, ColumnFile,. . . )
ColumnArray
read(PositionListFile) PositionListstore(PositionList) PositionListFile
dramatically improve performance. As a consequence of sort-ing, the natural order is lost. This is critical for dense columnswith implicit TIDs, because the relation to the other columnvalues is lost. The problem can be solved by an additional datastructure, similar to a PositionList that contains the mappinginformation to the original order of the datasets. Figure 5 givesan example of this situation. The Multi ColumnArray on theleft side is to be sorted according to the column “name”.Additionally to the sorting of the MultiColumn (top right), alist is generated which holds the information about the originalpositions (down right). The list can then be reused by applyingit as a sorting criterion to other columns later, as shown inFigure 6.
7) Compression: Compression plays an important role incolumn stores [7], as it reduces the data volume that needs tobe loaded. Nevertheless, we decided not to include compres-sion in the first prototype and to concentrate on the interfacesof the components. To a certain extent, this constraint can becompensated by the use of dictionary-based compression [16],which will be implemented above the basic components. Inlater versions, various compression methods will be integrated,so first of all run-length encoding (RLE) [17].
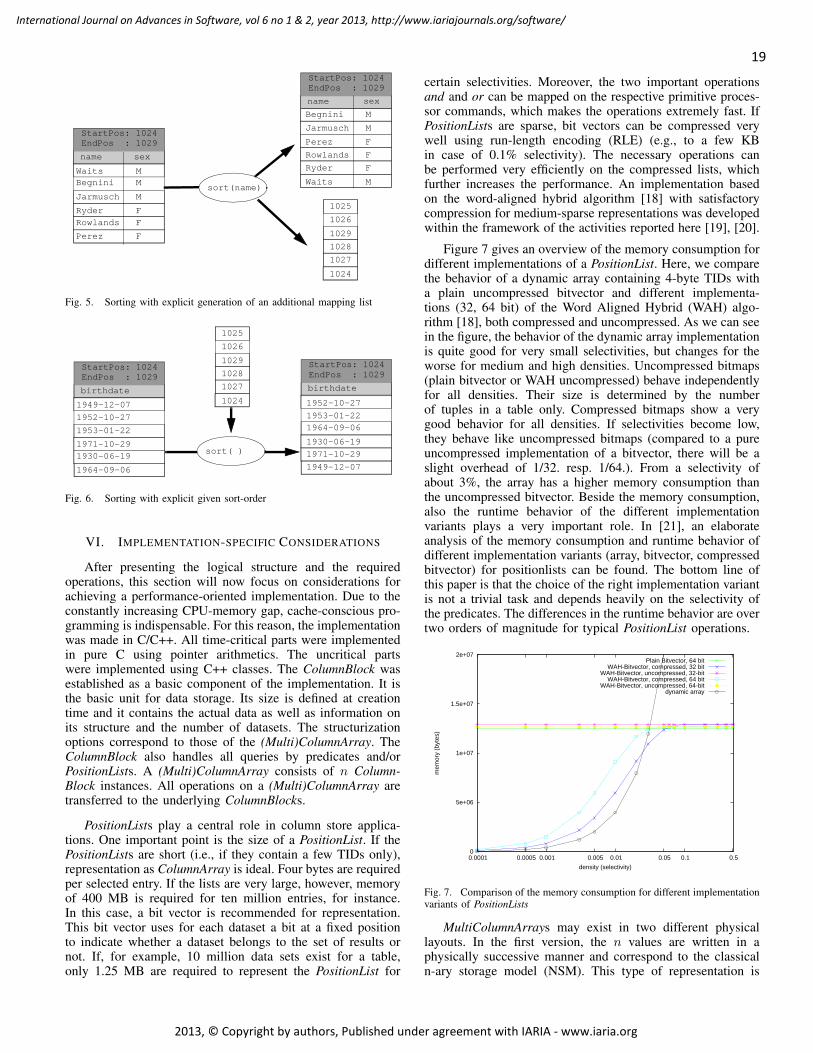
19
International Journal on Advances in Software, vol 6 no 1 & 2, year 2013, http://www.iariajournals.org/software/
2013, © Copyright by authors, Published under agreement with IARIA - www.iaria.org
StartPos: 1024EndPos : 1029
name sex
Waits M
Begnini M
Jarmusch M
Ryder F
Rowlands F
Perez F
1024
1025
1026
1027
1028
1029
sort(name)
StartPos: 1024EndPos : 1029
name sex
Waits MBegnini M
Jarmusch M
Ryder F
Rowlands F
Perez F
Fig. 5. Sorting with explicit generation of an additional mapping list
StartPos: 1024EndPos : 1029
birthdate
1949-12-07
1952-10-27
1953-01-22
1971-10-29
1930-06-19
1964-09-06
1024
1025
1026
1027
1028
1029
sort( )
StartPos: 1024EndPos : 1029
birthdate
1949-12-07
1952-10-27
1953-01-22
1971-10-29
1930-06-19
1964-09-06
Fig. 6. Sorting with explicit given sort-order
VI. IMPLEMENTATION-SPECIFIC CONSIDERATIONS
After presenting the logical structure and the requiredoperations, this section will now focus on considerations forachieving a performance-oriented implementation. Due to theconstantly increasing CPU-memory gap, cache-conscious pro-gramming is indispensable. For this reason, the implementationwas made in C/C++. All time-critical parts were implementedin pure C using pointer arithmetics. The uncritical partswere implemented using C++ classes. The ColumnBlock wasestablished as a basic component of the implementation. It isthe basic unit for data storage. Its size is defined at creationtime and it contains the actual data as well as information onits structure and the number of datasets. The structurizationoptions correspond to those of the (Multi)ColumnArray. TheColumnBlock also handles all queries by predicates and/orPositionLists. A (Multi)ColumnArray consists of n Column-Block instances. All operations on a (Multi)ColumnArray aretransferred to the underlying ColumnBlocks.
PositionLists play a central role in column store applica-tions. One important point is the size of a PositionList. If thePositionLists are short (i.e., if they contain a few TIDs only),representation as ColumnArray is ideal. Four bytes are requiredper selected entry. If the lists are very large, however, memoryof 400 MB is required for ten million entries, for instance.In this case, a bit vector is recommended for representation.This bit vector uses for each dataset a bit at a fixed positionto indicate whether a dataset belongs to the set of results ornot. If, for example, 10 million data sets exist for a table,only 1.25 MB are required to represent the PositionList for
certain selectivities. Moreover, the two important operationsand and or can be mapped on the respective primitive proces-sor commands, which makes the operations extremely fast. IfPositionLists are sparse, bit vectors can be compressed verywell using run-length encoding (RLE) (e.g., to a few KBin case of 0.1% selectivity). The necessary operations canbe performed very efficiently on the compressed lists, whichfurther increases the performance. An implementation basedon the word-aligned hybrid algorithm [18] with satisfactorycompression for medium-sparse representations was developedwithin the framework of the activities reported here [19], [20].
Figure 7 gives an overview of the memory consumption fordifferent implementations of a PositionList. Here, we comparethe behavior of a dynamic array containing 4-byte TIDs witha plain uncompressed bitvector and different implementa-tions (32, 64 bit) of the Word Aligned Hybrid (WAH) algo-rithm [18], both compressed and uncompressed. As we can seein the figure, the behavior of the dynamic array implementationis quite good for very small selectivities, but changes for theworse for medium and high densities. Uncompressed bitmaps(plain bitvector or WAH uncompressed) behave independentlyfor all densities. Their size is determined by the numberof tuples in a table only. Compressed bitmaps show a verygood behavior for all densities. If selectivities become low,they behave like uncompressed bitmaps (compared to a pureuncompressed implementation of a bitvector, there will be aslight overhead of 1/32. resp. 1/64.). From a selectivity ofabout 3%, the array has a higher memory consumption thanthe uncompressed bitvector. Beside the memory consumption,also the runtime behavior of the different implementationvariants plays a very important role. In [21], an elaborateanalysis of the memory consumption and runtime behavior ofdifferent implementation variants (array, bitvector, compressedbitvector) for positionlists can be found. The bottom line ofthis paper is that the choice of the right implementation variantis not a trivial task and depends heavily on the selectivity ofthe predicates. The differences in the runtime behavior are overtwo orders of magnitude for typical PositionList operations.
0
5e+06
1e+07
1.5e+07
2e+07
0.0001 0.0005 0.001 0.005 0.01 0.05 0.1 0.5
mem
ory
(byt
es)
density (selectivity)
Plain Bitvector, 64 bitWAH-Bitvector, compressed, 32 bit
WAH-Bitvector, uncompressed, 32-bitWAH-Bitvector, compressed, 64 bit
WAH-Bitvector, uncompressed, 64-bitdynamic array
Fig. 7. Comparison of the memory consumption for different implementationvariants of PositionLists
MultiColumnArrays may exist in two different physicallayouts. In the first version, the n values are written in aphysically successive manner and correspond to the classicaln-ary storage model (NSM). This type of representation is
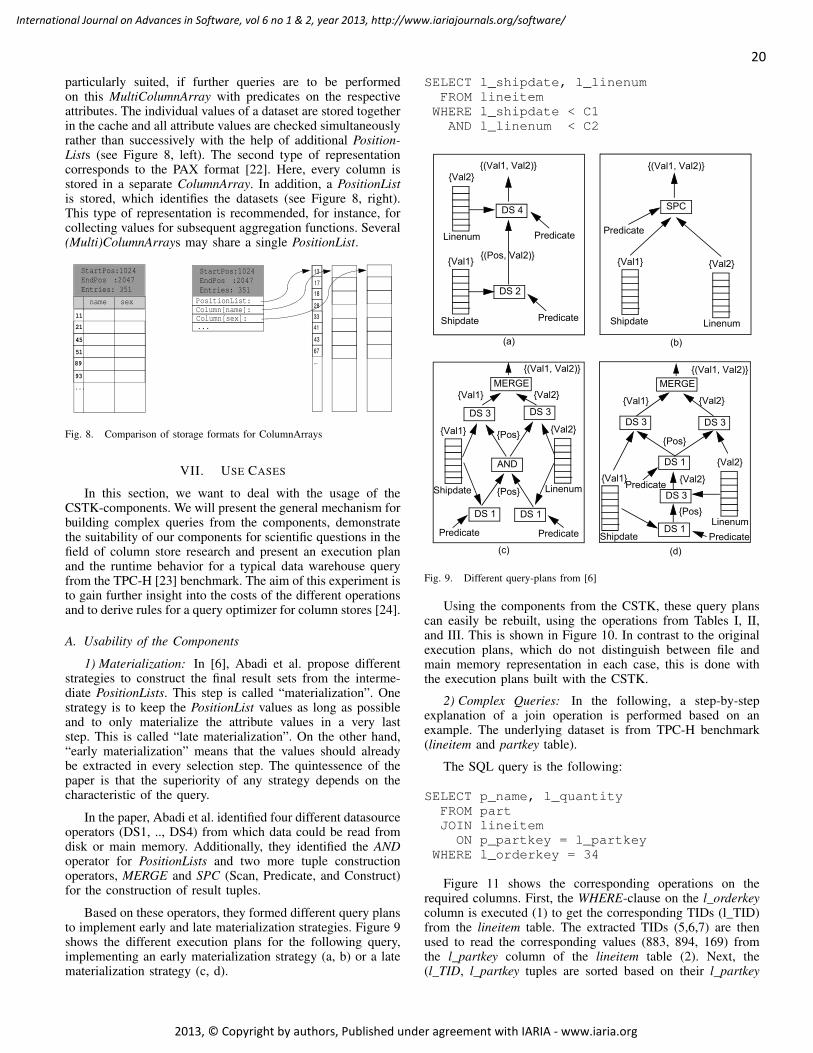
20
International Journal on Advances in Software, vol 6 no 1 & 2, year 2013, http://www.iariajournals.org/software/
2013, © Copyright by authors, Published under agreement with IARIA - www.iaria.org
particularly suited, if further queries are to be performedon this MultiColumnArray with predicates on the respectiveattributes. The individual values of a dataset are stored togetherin the cache and all attribute values are checked simultaneouslyrather than successively with the help of additional Position-Lists (see Figure 8, left). The second type of representationcorresponds to the PAX format [22]. Here, every column isstored in a separate ColumnArray. In addition, a PositionListis stored, which identifies the datasets (see Figure 8, right).This type of representation is recommended, for instance, forcollecting values for subsequent aggregation functions. Several(Multi)ColumnArrays may share a single PositionList.
11
21
45
51
89
93
name sex
...
StartPos:1024EndPos :2047Entries: 351
StartPos:1024EndPos :2047
13
17
18
28
33
41
...
67
43
Entries: 351PositionList:Column[name]:Column[sex]:...
Fig. 8. Comparison of storage formats for ColumnArrays
VII. USE CASES
In this section, we want to deal with the usage of theCSTK-components. We will present the general mechanism forbuilding complex queries from the components, demonstratethe suitability of our components for scientific questions in thefield of column store research and present an execution planand the runtime behavior for a typical data warehouse queryfrom the TPC-H [23] benchmark. The aim of this experiment isto gain further insight into the costs of the different operationsand to derive rules for a query optimizer for column stores [24].
A. Usability of the Components
1) Materialization: In [6], Abadi et al. propose differentstrategies to construct the final result sets from the interme-diate PositionLists. This step is called “materialization”. Onestrategy is to keep the PositionList values as long as possibleand to only materialize the attribute values in a very laststep. This is called “late materialization”. On the other hand,“early materialization” means that the values should alreadybe extracted in every selection step. The quintessence of thepaper is that the superiority of any strategy depends on thecharacteristic of the query.
In the paper, Abadi et al. identified four different datasourceoperators (DS1, .., DS4) from which data could be read fromdisk or main memory. Additionally, they identified the ANDoperator for PositionLists and two more tuple constructionoperators, MERGE and SPC (Scan, Predicate, and Construct)for the construction of result tuples.
Based on these operators, they formed different query plansto implement early and late materialization strategies. Figure 9shows the different execution plans for the following query,implementing an early materialization strategy (a, b) or a latematerialization strategy (c, d).
SELECT l_shipdate, l_linenumFROM lineitem
WHERE l_shipdate < C1AND l_linenum < C2
DS 2
DS 4
Shipdate
Linenum
Predicate
Predicate
(Val1, Val2)
(Pos, Val2)
Val2
Val1
Shipdate Linenum
Val2Val1
SPC
Predicate
(Val1, Val2)
DS 1 DS 1
PredicatePredicate
Shipdate
Val1
Linenum
Val2
AND
Pos
DS 3 DS 3
MERGE
(Val1, Val2)
Shipdate
Val1
Linenum
Val2
DS 1
DS 3
DS 1
DS 3 DS 3
MERGE
(Val1, Val2)
Pos
Val1 Val2
Pos
Val2
Pos
Val1 Val2
(a) (b)
(c) (d)
Predicate
Predicate
Fig. 9. Different query-plans from [6]
Using the components from the CSTK, these query planscan easily be rebuilt, using the operations from Tables I, II,and III. This is shown in Figure 10. In contrast to the originalexecution plans, which do not distinguish between file andmain memory representation in each case, this is done withthe execution plans built with the CSTK.
2) Complex Queries: In the following, a step-by-stepexplanation of a join operation is performed based on anexample. The underlying dataset is from TPC-H benchmark(lineitem and partkey table).
The SQL query is the following:
SELECT p_name, l_quantityFROM partJOIN lineitem
ON p_partkey = l_partkeyWHERE l_orderkey = 34
Figure 11 shows the corresponding operations on therequired columns. First, the WHERE-clause on the l_orderkeycolumn is executed (1) to get the corresponding TIDs (l_TID)from the lineitem table. The extracted TIDs (5,6,7) are thenused to read the corresponding values (883, 894, 169) fromthe l_partkey column of the lineitem table (2). Next, the(l_TID, l_partkey tuples are sorted based on their l_partkey
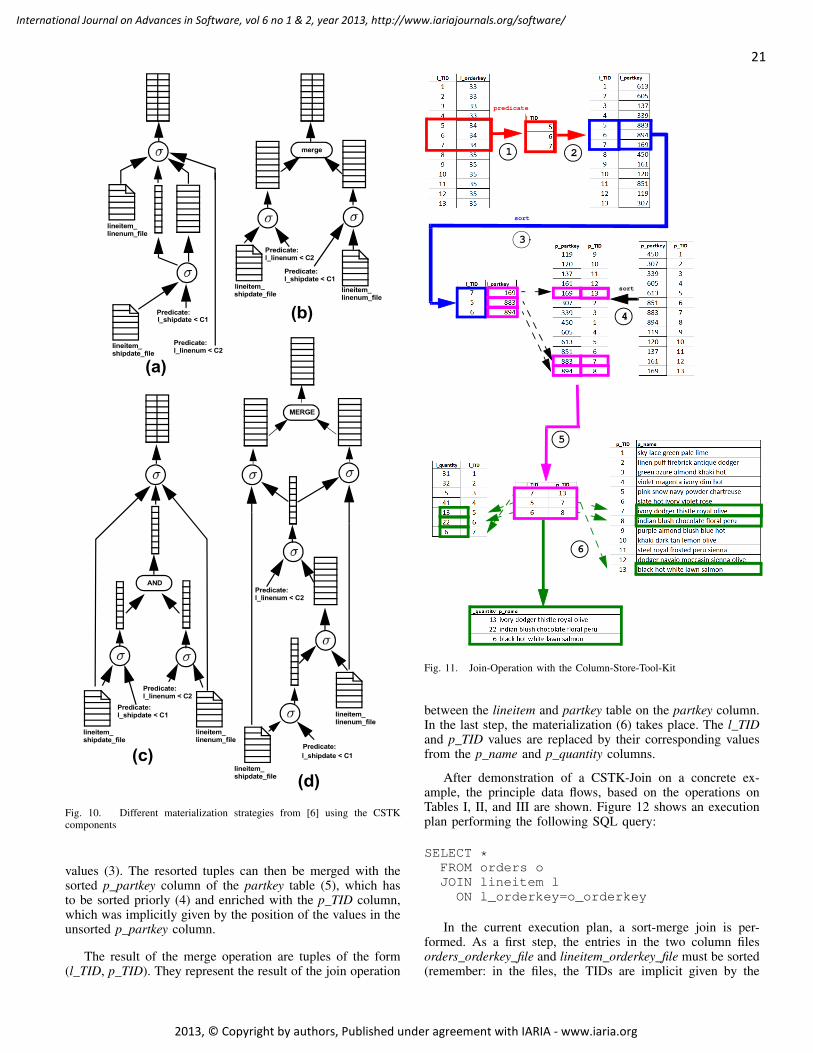
21
International Journal on Advances in Software, vol 6 no 1 & 2, year 2013, http://www.iariajournals.org/software/
2013, © Copyright by authors, Published under agreement with IARIA - www.iaria.org
lineitem_
lineitem_
Predicate:
Predicate:
lineitem_lineitem_
Predicate:
Predicate:
merge
lineitem_ lineitem_
Predicate:
Predicate:
AND
lineitem_
lineitem_
Predicate:
Predicate:
MERGE
(a)
(b)
(c)
(d)
l_linenum < C2
l_shipdate < C1
l_linenum < C2
l_shipdate < C1
l_linenum < C2
l_shipdate < C1
l_linenum < C2
l_shipdate < C1
linenum_file
shipdate_file
shipdate_filelinenum_file
shipdate_file linenum_file
shipdate_file
linenum_file
Fig. 10. Different materialization strategies from [6] using the CSTKcomponents
values (3). The resorted tuples can then be merged with thesorted p_partkey column of the partkey table (5), which hasto be sorted priorly (4) and enriched with the p_TID column,which was implicitly given by the position of the values in theunsorted p_partkey column.
The result of the merge operation are tuples of the form(l_TID, p_TID). They represent the result of the join operation
predicate
sort
sort
1 2
4
6
5
3
Fig. 11. Join-Operation with the Column-Store-Tool-Kit
between the lineitem and partkey table on the partkey column.In the last step, the materialization (6) takes place. The l_TIDand p_TID values are replaced by their corresponding valuesfrom the p_name and p_quantity columns.
After demonstration of a CSTK-Join on a concrete ex-ample, the principle data flows, based on the operations onTables I, II, and III are shown. Figure 12 shows an executionplan performing the following SQL query:
SELECT *FROM orders oJOIN lineitem l
ON l_orderkey=o_orderkey
In the current execution plan, a sort-merge join is per-formed. As a first step, the entries in the two column filesorders_orderkey_file and lineitem_orderkey_file must be sorted(remember: in the files, the TIDs are implicit given by the
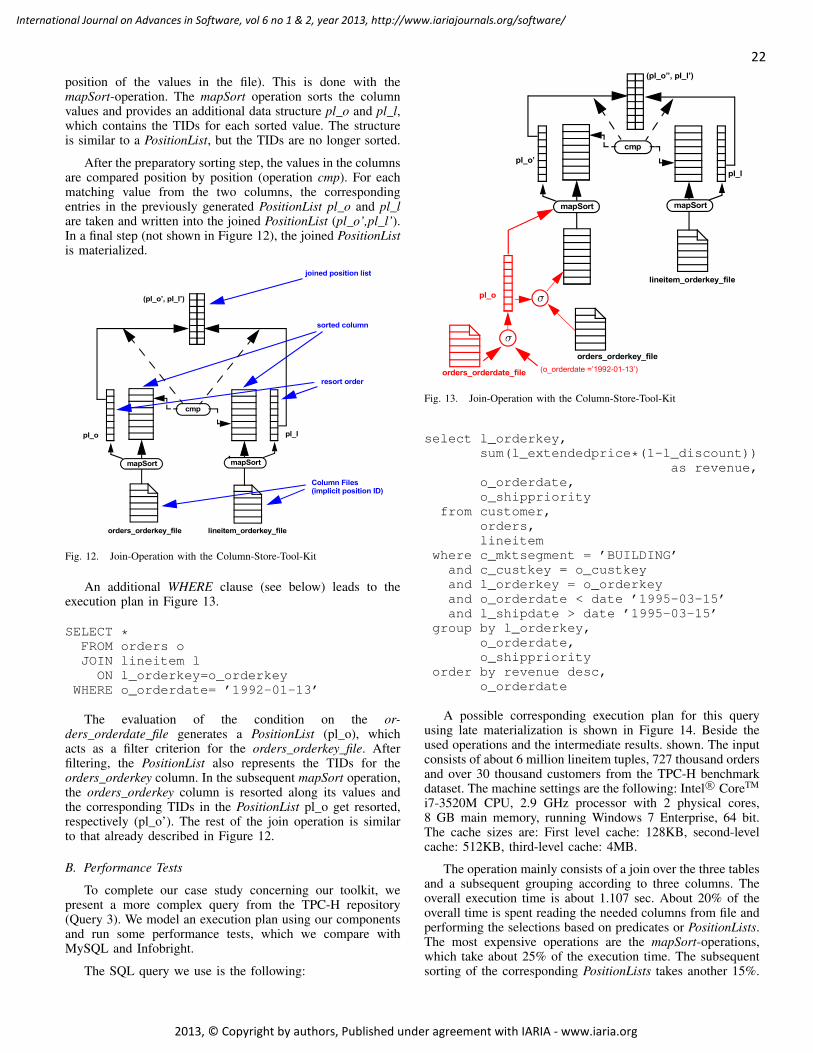
22
International Journal on Advances in Software, vol 6 no 1 & 2, year 2013, http://www.iariajournals.org/software/
2013, © Copyright by authors, Published under agreement with IARIA - www.iaria.org
position of the values in the file). This is done with themapSort-operation. The mapSort operation sorts the columnvalues and provides an additional data structure pl_o and pl_l,which contains the TIDs for each sorted value. The structureis similar to a PositionList, but the TIDs are no longer sorted.
After the preparatory sorting step, the values in the columnsare compared position by position (operation cmp). For eachmatching value from the two columns, the correspondingentries in the previously generated PositionList pl_o and pl_lare taken and written into the joined PositionList (pl_o’,pl_l’).In a final step (not shown in Figure 12), the joined PositionListis materialized.
orders_orderkey_file
mapSort
lineitem_orderkey_file
mapSort
cmp
Column Files (implicit position ID)
resort order
sorted column
joined position list
pl_o pl_l
(pl_o’, pl_l’)
Fig. 12. Join-Operation with the Column-Store-Tool-Kit
An additional WHERE clause (see below) leads to theexecution plan in Figure 13.
SELECT *FROM orders oJOIN lineitem l
ON l_orderkey=o_orderkeyWHERE o_orderdate= ’1992-01-13’
The evaluation of the condition on the or-ders_orderdate_file generates a PositionList (pl_o), whichacts as a filter criterion for the orders_orderkey_file. Afterfiltering, the PositionList also represents the TIDs for theorders_orderkey column. In the subsequent mapSort operation,the orders_orderkey column is resorted along its values andthe corresponding TIDs in the PositionList pl_o get resorted,respectively (pl_o’). The rest of the join operation is similarto that already described in Figure 12.
B. Performance Tests
To complete our case study concerning our toolkit, wepresent a more complex query from the TPC-H repository(Query 3). We model an execution plan using our componentsand run some performance tests, which we compare withMySQL and Infobright.
The SQL query we use is the following:
orders_orderdate_file
mapSort
lineitem_orderkey_file
mapSort
cmp
(o_orderdate =’1992-01-13’)
(pl_o’’, pl_l’)
pl_l
pl_o
pl_o’
orders_orderkey_file
Fig. 13. Join-Operation with the Column-Store-Tool-Kit
select l_orderkey,sum(l_extendedprice*(1-l_discount))
as revenue,o_orderdate,o_shippriority
from customer,orders,lineitem
where c_mktsegment = ’BUILDING’and c_custkey = o_custkeyand l_orderkey = o_orderkeyand o_orderdate < date ’1995-03-15’and l_shipdate > date ’1995-03-15’
group by l_orderkey,o_orderdate,o_shippriority
order by revenue desc,o_orderdate
A possible corresponding execution plan for this queryusing late materialization is shown in Figure 14. Beside theused operations and the intermediate results. shown. The inputconsists of about 6 million lineitem tuples, 727 thousand ordersand over 30 thousand customers from the TPC-H benchmarkdataset. The machine settings are the following: Intel R⃝ CoreTM
i7-3520M CPU, 2.9 GHz processor with 2 physical cores,8 GB main memory, running Windows 7 Enterprise, 64 bit.The cache sizes are: First level cache: 128KB, second-levelcache: 512KB, third-level cache: 4MB.
The operation mainly consists of a join over the three tablesand a subsequent grouping according to three columns. Theoverall execution time is about 1.107 sec. About 20% of theoverall time is spent reading the needed columns from file andperforming the selections based on predicates or PositionLists.The most expensive operations are the mapSort-operations,which take about 25% of the execution time. The subsequentsorting of the corresponding PositionLists takes another 15%.
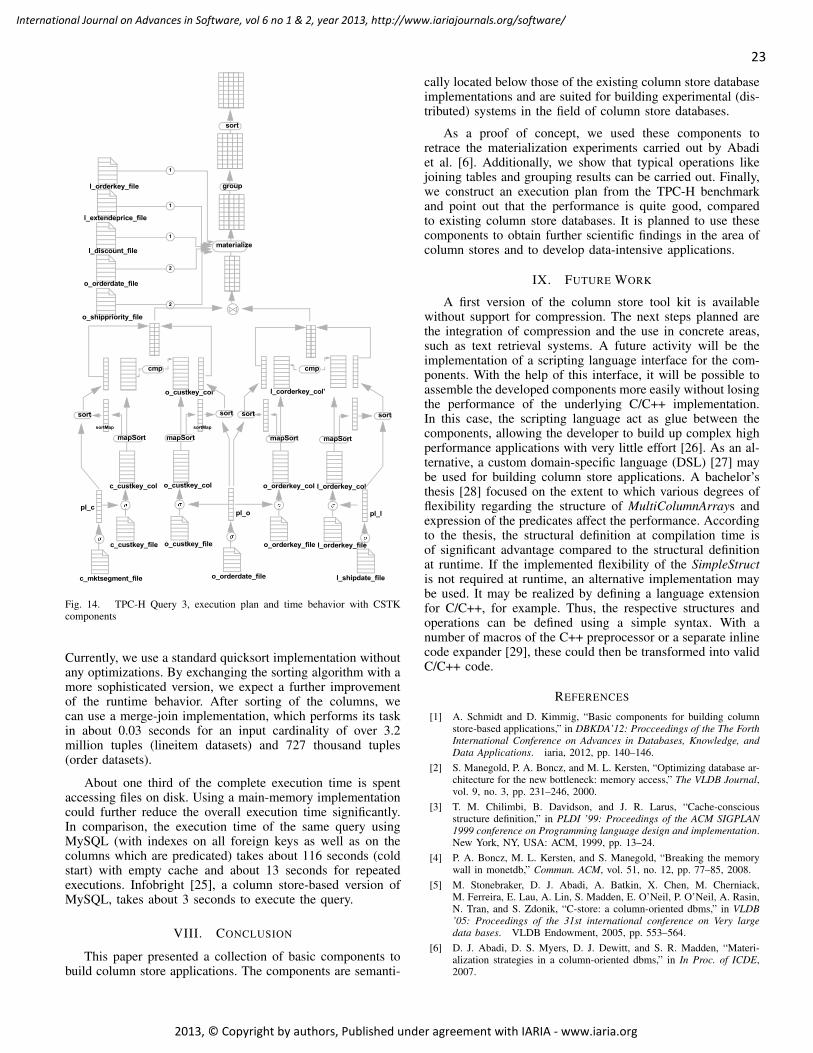
23
International Journal on Advances in Software, vol 6 no 1 & 2, year 2013, http://www.iariajournals.org/software/
2013, © Copyright by authors, Published under agreement with IARIA - www.iaria.org
materialize
o_shippriority_file
l_extendeprice_file
o_orderdate_file
l_discount_file
l_orderkey_file
1
1
1
2
2
group
o_orderdate_file
o_custkey_file
o_custkey_col
o_custkey_col’
mapSort
pl_o
sortMap
cmp
sort
o_orderkey_file
o_orderkey_col
mapSort
sort
l_shipdate_file
l_orderkey_file
l_orderkey_col
pl_l
l_corderkey_col’
mapSort
sort
cmp
c_mktsegment_file
c_custkey_file
c_custkey_col
mapSort
pl_c
sort
sortMap
sort
Fig. 14. TPC-H Query 3, execution plan and time behavior with CSTKcomponents
Currently, we use a standard quicksort implementation withoutany optimizations. By exchanging the sorting algorithm with amore sophisticated version, we expect a further improvementof the runtime behavior. After sorting of the columns, wecan use a merge-join implementation, which performs its taskin about 0.03 seconds for an input cardinality of over 3.2million tuples (lineitem datasets) and 727 thousand tuples(order datasets).
About one third of the complete execution time is spentaccessing files on disk. Using a main-memory implementationcould further reduce the overall execution time significantly.In comparison, the execution time of the same query usingMySQL (with indexes on all foreign keys as well as on thecolumns which are predicated) takes about 116 seconds (coldstart) with empty cache and about 13 seconds for repeatedexecutions. Infobright [25], a column store-based version ofMySQL, takes about 3 seconds to execute the query.
VIII. CONCLUSION
This paper presented a collection of basic components tobuild column store applications. The components are semanti-
cally located below those of the existing column store databaseimplementations and are suited for building experimental (dis-tributed) systems in the field of column store databases.
As a proof of concept, we used these components toretrace the materialization experiments carried out by Abadiet al. [6]. Additionally, we show that typical operations likejoining tables and grouping results can be carried out. Finally,we construct an execution plan from the TPC-H benchmarkand point out that the performance is quite good, comparedto existing column store databases. It is planned to use thesecomponents to obtain further scientific findings in the area ofcolumn stores and to develop data-intensive applications.
IX. FUTURE WORK
A first version of the column store tool kit is availablewithout support for compression. The next steps planned arethe integration of compression and the use in concrete areas,such as text retrieval systems. A future activity will be theimplementation of a scripting language interface for the com-ponents. With the help of this interface, it will be possible toassemble the developed components more easily without losingthe performance of the underlying C/C++ implementation.In this case, the scripting language act as glue between thecomponents, allowing the developer to build up complex highperformance applications with very little effort [26]. As an al-ternative, a custom domain-specific language (DSL) [27] maybe used for building column store applications. A bachelor’sthesis [28] focused on the extent to which various degrees offlexibility regarding the structure of MultiColumnArrays andexpression of the predicates affect the performance. Accordingto the thesis, the structural definition at compilation time isof significant advantage compared to the structural definitionat runtime. If the implemented flexibility of the SimpleStructis not required at runtime, an alternative implementation maybe used. It may be realized by defining a language extensionfor C/C++, for example. Thus, the respective structures andoperations can be defined using a simple syntax. With anumber of macros of the C++ preprocessor or a separate inlinecode expander [29], these could then be transformed into validC/C++ code.
REFERENCES
[1] A. Schmidt and D. Kimmig, “Basic components for building columnstore-based applications,” in DBKDA’12: Procceedings of the The ForthInternational Conference on Advances in Databases, Knowledge, andData Applications. iaria, 2012, pp. 140–146.
[2] S. Manegold, P. A. Boncz, and M. L. Kersten, “Optimizing database ar-chitecture for the new bottleneck: memory access,” The VLDB Journal,vol. 9, no. 3, pp. 231–246, 2000.
[3] T. M. Chilimbi, B. Davidson, and J. R. Larus, “Cache-consciousstructure definition,” in PLDI ’99: Proceedings of the ACM SIGPLAN1999 conference on Programming language design and implementation.New York, NY, USA: ACM, 1999, pp. 13–24.
[4] P. A. Boncz, M. L. Kersten, and S. Manegold, “Breaking the memorywall in monetdb,” Commun. ACM, vol. 51, no. 12, pp. 77–85, 2008.
[5] M. Stonebraker, D. J. Abadi, A. Batkin, X. Chen, M. Cherniack,M. Ferreira, E. Lau, A. Lin, S. Madden, E. O’Neil, P. O’Neil, A. Rasin,N. Tran, and S. Zdonik, “C-store: a column-oriented dbms,” in VLDB’05: Proceedings of the 31st international conference on Very largedata bases. VLDB Endowment, 2005, pp. 553–564.
[6] D. J. Abadi, D. S. Myers, D. J. Dewitt, and S. R. Madden, “Materi-alization strategies in a column-oriented dbms,” in In Proc. of ICDE,2007.
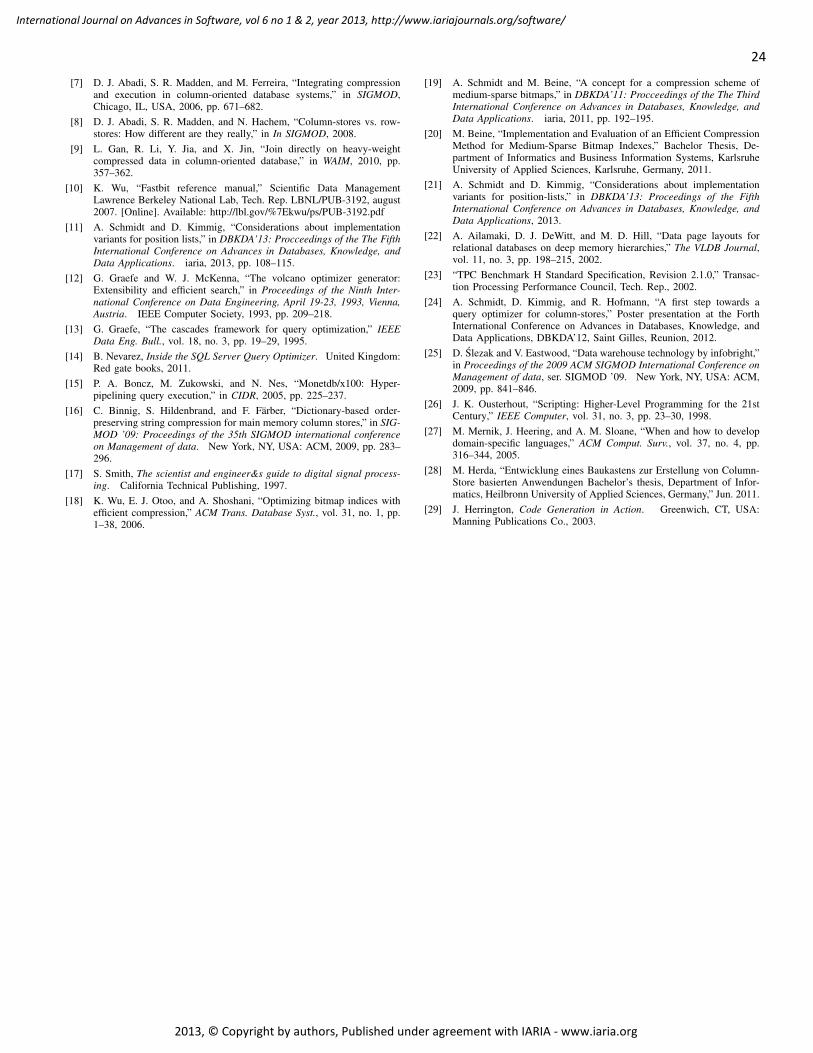
24
International Journal on Advances in Software, vol 6 no 1 & 2, year 2013, http://www.iariajournals.org/software/
2013, © Copyright by authors, Published under agreement with IARIA - www.iaria.org
[7] D. J. Abadi, S. R. Madden, and M. Ferreira, “Integrating compressionand execution in column-oriented database systems,” in SIGMOD,Chicago, IL, USA, 2006, pp. 671–682.
[8] D. J. Abadi, S. R. Madden, and N. Hachem, “Column-stores vs. row-stores: How different are they really,” in In SIGMOD, 2008.
[9] L. Gan, R. Li, Y. Jia, and X. Jin, “Join directly on heavy-weightcompressed data in column-oriented database,” in WAIM, 2010, pp.357–362.
[10] K. Wu, “Fastbit reference manual,” Scientific Data ManagementLawrence Berkeley National Lab, Tech. Rep. LBNL/PUB-3192, august2007. [Online]. Available: http://lbl.gov/%7Ekwu/ps/PUB-3192.pdf
[11] A. Schmidt and D. Kimmig, “Considerations about implementationvariants for position lists,” in DBKDA’13: Procceedings of the The FifthInternational Conference on Advances in Databases, Knowledge, andData Applications. iaria, 2013, pp. 108–115.
[12] G. Graefe and W. J. McKenna, “The volcano optimizer generator:Extensibility and efficient search,” in Proceedings of the Ninth Inter-national Conference on Data Engineering, April 19-23, 1993, Vienna,Austria. IEEE Computer Society, 1993, pp. 209–218.
[13] G. Graefe, “The cascades framework for query optimization,” IEEEData Eng. Bull., vol. 18, no. 3, pp. 19–29, 1995.
[14] B. Nevarez, Inside the SQL Server Query Optimizer. United Kingdom:Red gate books, 2011.
[15] P. A. Boncz, M. Zukowski, and N. Nes, “Monetdb/x100: Hyper-pipelining query execution,” in CIDR, 2005, pp. 225–237.
[16] C. Binnig, S. Hildenbrand, and F. Färber, “Dictionary-based order-preserving string compression for main memory column stores,” in SIG-MOD ’09: Proceedings of the 35th SIGMOD international conferenceon Management of data. New York, NY, USA: ACM, 2009, pp. 283–296.
[17] S. Smith, The scientist and engineer&s guide to digital signal process-ing. California Technical Publishing, 1997.
[18] K. Wu, E. J. Otoo, and A. Shoshani, “Optimizing bitmap indices withefficient compression,” ACM Trans. Database Syst., vol. 31, no. 1, pp.1–38, 2006.
[19] A. Schmidt and M. Beine, “A concept for a compression scheme ofmedium-sparse bitmaps,” in DBKDA’11: Procceedings of the The ThirdInternational Conference on Advances in Databases, Knowledge, andData Applications. iaria, 2011, pp. 192–195.
[20] M. Beine, “Implementation and Evaluation of an Efficient CompressionMethod for Medium-Sparse Bitmap Indexes,” Bachelor Thesis, De-partment of Informatics and Business Information Systems, KarlsruheUniversity of Applied Sciences, Karlsruhe, Germany, 2011.
[21] A. Schmidt and D. Kimmig, “Considerations about implementationvariants for position-lists,” in DBKDA’13: Proceedings of the FifthInternational Conference on Advances in Databases, Knowledge, andData Applications, 2013.
[22] A. Ailamaki, D. J. DeWitt, and M. D. Hill, “Data page layouts forrelational databases on deep memory hierarchies,” The VLDB Journal,vol. 11, no. 3, pp. 198–215, 2002.
[23] “TPC Benchmark H Standard Specification, Revision 2.1.0,” Transac-tion Processing Performance Council, Tech. Rep., 2002.
[24] A. Schmidt, D. Kimmig, and R. Hofmann, “A first step towards aquery optimizer for column-stores,” Poster presentation at the ForthInternational Conference on Advances in Databases, Knowledge, andData Applications, DBKDA’12, Saint Gilles, Reunion, 2012.
[25] D. Slezak and V. Eastwood, “Data warehouse technology by infobright,”in Proceedings of the 2009 ACM SIGMOD International Conference onManagement of data, ser. SIGMOD ’09. New York, NY, USA: ACM,2009, pp. 841–846.
[26] J. K. Ousterhout, “Scripting: Higher-Level Programming for the 21stCentury,” IEEE Computer, vol. 31, no. 3, pp. 23–30, 1998.
[27] M. Mernik, J. Heering, and A. M. Sloane, “When and how to developdomain-specific languages,” ACM Comput. Surv., vol. 37, no. 4, pp.316–344, 2005.
[28] M. Herda, “Entwicklung eines Baukastens zur Erstellung von Column-Store basierten Anwendungen Bachelor’s thesis, Department of Infor-matics, Heilbronn University of Applied Sciences, Germany,” Jun. 2011.
[29] J. Herrington, Code Generation in Action. Greenwich, CT, USA:Manning Publications Co., 2003.
25
International Journal on Advances in Software, vol 6 no 1 & 2, year 2013, http://www.iariajournals.org/software/
2013, © Copyright by authors, Published under agreement with IARIA - www.iaria.org
Theoretical and Practical Implications of User Interface Patterns Applied for the
Development of Graphical User Interfaces
Stefan Wendler, Danny Ammon, Teodora Kikova, Ilka Philippow, and Detlef StreitferdtSoftware Systems / Process Informatics Department
Ilmenau University of Technology Ilmenau, Germany
stefan.wendler, danny.ammon, teodora.kikova, ilka.philippow, [email protected]
Abstract — We address current research concerning patterns
dedicated to enable higher reusability during the automated
development of GUI systems. User interface patterns are
promising artifacts for improvements in this regard. Both
general models for abstractions of graphical user interfaces
and user interface pattern based concepts such as potential
notations and model-based processes are considered. On that
basis, the present limitations and potentials surrounding user
interface patterns are to be investigated. We elaborate what
theoretical implications emerge from user interface patterns
applied for reuse and automation within user interface
transformation steps. For this purpose, formal descriptions of
user interface patterns are necessary. We analyze the
capabilities of the mature XML-based user interface
description languages UIML and UsiXML to express user
interface patterns. Additionally, we experimentally investigate
and analyze strengths and weaknesses of two general
transformation approaches to derive practical implications of
user interface patterns. As a result, we develop suggestions on
how to apply positive effects of user interface patterns for the
development of pattern-based graphical user interfaces.
Keywords — graphical user interface development; model-
based software development; HCI patterns; user interface
patterns; UIML; UsiXML
I. INTRODUCTION
Interactive systems. Interactive systems demand for a fast and efficient development of their graphical user interface (GUI), as well as its adaptation to changing requirements throughout the software life cycle. In this paper, E-Commerce software serves as a representative of these interactive systems. Currently, these are a fundamental asset of modern business models providing B2C interaction via online-shops. In many cases, such systems are offered as standard software, which allows several customization options after installation. In this context, they are differentiated into the application kernel and a GUI system.
The application kernel software architecture relies on well-proven and, partially, self-developed software patterns. Thus, it offers a consistent structure with defined and differentiated types of system elements. So, the design has a
positive influence on the understanding of the modular functional structures as well as their modification options.
Limited customizability of GUIs. Contrary to the application kernel, the customization of the GUI is possible only with rather high efforts. An important reason is that software patterns do not cover all aspects needed for GUIs. These patterns have been commonly applied for GUIs [2][3], but in most cases they are limited to functional and control related aspects [4]. The visual and interactive components of the GUI are not supported by software patterns yet. Furthermore, the reuse of GUI components, e.g., layout, navigation structures, choice of user interface controls (UI-Controls) and type of interaction, is only sparsely supported by current methods and tools. For each project with its varying context, those potentially reusable entities have to be implemented and customized anew, leading to high efforts.
Moreover, the functional range of standard software does not allow a comprehensive customization of its GUI system. The GUI requirements are very customer-specific. In this regard, the customers want to apply the functionality of the standard software in their individual work processes along with customized dialogs. However, due to the characteristics of standard software, only basic variants or standard GUIs can be offered. So far, combinations of components of the application architecture with a GUI are too versatile for a customizable standard product.
User interface patterns. Along with other researchers [5] [6] [7] [8] [9], we propose an approach to this problem through the deployment of User Interface Patterns (UIPs). These patterns offer well-proven solutions for GUI designs [10], which embody a high quality of usability [11]. So far, UIPs usually have not been considered as source code artifacts, in contrast to software patterns. Current UIPs and their compilations mostly reside on an informal level of description [5]. The research towards formal pattern representations is still in progress.
A. Objectives
In this paper, we elaborate that formal UIPs can assist in raising effectiveness and efficiency of the development process of a GUI system. For a start, we present and analyze conceptual models for the GUI development to valuate and position UIPs as unique artifacts. In this regard, we describe, from a theoretical point of view, how reuse and automation within GUI transformation steps can be established by the deployment of UIPs.
This is a revisited and substantially augmented version of “Development of Graphical User Interfaces based on User Interface Patterns”, which appeared in the in Proceedings of The Fourth International Conferences on Pervasive Patterns and Applications (PATTERNS 2012) [1].
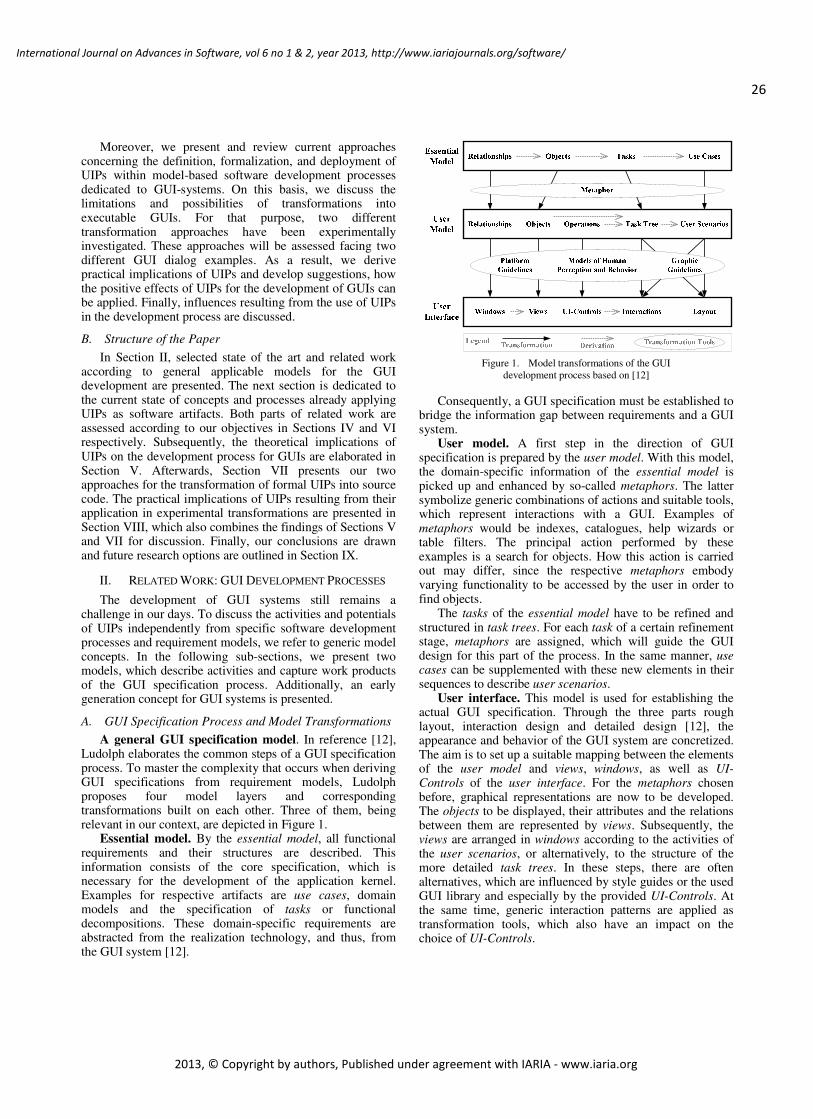
26
International Journal on Advances in Software, vol 6 no 1 & 2, year 2013, http://www.iariajournals.org/software/
2013, © Copyright by authors, Published under agreement with IARIA - www.iaria.org
Moreover, we present and review current approaches concerning the definition, formalization, and deployment of UIPs within model-based software development processes dedicated to GUI-systems. On this basis, we discuss the limitations and possibilities of transformations into executable GUIs. For that purpose, two different transformation approaches have been experimentally investigated. These approaches will be assessed facing two different GUI dialog examples. As a result, we derive practical implications of UIPs and develop suggestions, how the positive effects of UIPs for the development of GUIs can be applied. Finally, influences resulting from the use of UIPs in the development process are discussed.
B. Structure of the Paper
In Section II, selected state of the art and related work according to general applicable models for the GUI development are presented. The next section is dedicated to the current state of concepts and processes already applying UIPs as software artifacts. Both parts of related work are assessed according to our objectives in Sections IV and VI respectively. Subsequently, the theoretical implications of UIPs on the development process for GUIs are elaborated in Section V. Afterwards, Section VII presents our two approaches for the transformation of formal UIPs into source code. The practical implications of UIPs resulting from their application in experimental transformations are presented in Section VIII, which also combines the findings of Sections V and VII for discussion. Finally, our conclusions are drawn and future research options are outlined in Section IX.
II. RELATED WORK: GUI DEVELOPMENT PROCESSES
The development of GUI systems still remains a challenge in our days. To discuss the activities and potentials of UIPs independently from specific software development processes and requirement models, we refer to generic model concepts. In the following sub-sections, we present two models, which describe activities and capture work products of the GUI specification process. Additionally, an early generation concept for GUI systems is presented.
A. GUI Specification Process and Model Transformations
A general GUI specification model. In reference [12], Ludolph elaborates the common steps of a GUI specification process. To master the complexity that occurs when deriving GUI specifications from requirement models, Ludolph proposes four model layers and corresponding transformations built on each other. Three of them, being relevant in our context, are depicted in Figure 1.
Essential model. By the essential model, all functional requirements and their structures are described. This information consists of the core specification, which is necessary for the development of the application kernel. Examples for respective artifacts are use cases, domain models and the specification of tasks or functional decompositions. These domain-specific requirements are abstracted from the realization technology, and thus, from the GUI system [12].
Figure 1. Model transformations of the GUI
development process based on [12]
Consequently, a GUI specification must be established to bridge the information gap between requirements and a GUI system.
User model. A first step in the direction of GUI specification is prepared by the user model. With this model, the domain-specific information of the essential model is picked up and enhanced by so-called metaphors. The latter symbolize generic combinations of actions and suitable tools, which represent interactions with a GUI. Examples of metaphors would be indexes, catalogues, help wizards or table filters. The principal action performed by these examples is a search for objects. How this action is carried out may differ, since the respective metaphors embody varying functionality to be accessed by the user in order to find objects.
The tasks of the essential model have to be refined and structured in task trees. For each task of a certain refinement stage, metaphors are assigned, which will guide the GUI design for this part of the process. In the same manner, use cases can be supplemented with these new elements in their sequences to describe user scenarios.
User interface. This model is used for establishing the actual GUI specification. Through the three parts rough layout, interaction design and detailed design [12], the appearance and behavior of the GUI system are concretized. The aim is to set up a suitable mapping between the elements of the user model and views, windows, as well as UI-Controls of the user interface. For the metaphors chosen before, graphical representations are now to be developed. The objects to be displayed, their attributes and the relations between them are represented by views. Subsequently, the views are arranged in windows according to the activities of the user scenarios, or alternatively, to the structure of the more detailed task trees. In these steps, there are often alternatives, which are influenced by style guides or the used GUI library and especially by the provided UI-Controls. At the same time, generic interaction patterns are applied as transformation tools, which also have an impact on the choice of UI-Controls.
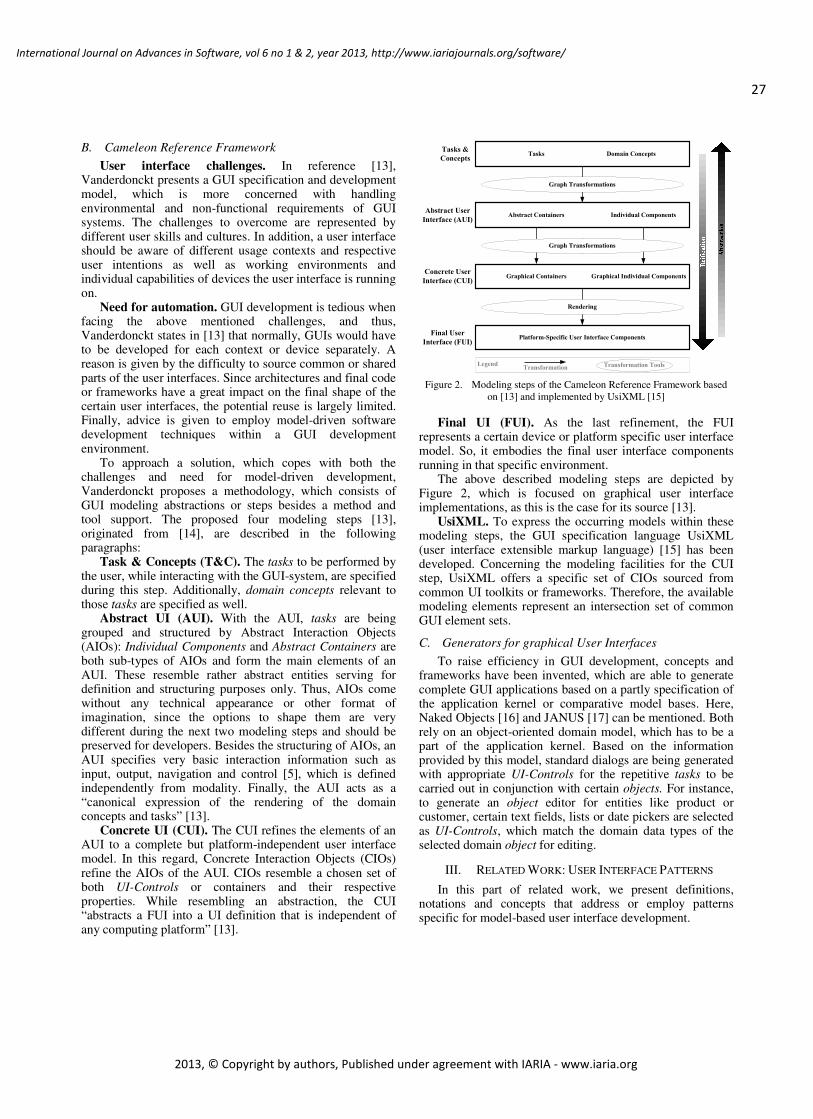
27
International Journal on Advances in Software, vol 6 no 1 & 2, year 2013, http://www.iariajournals.org/software/
2013, © Copyright by authors, Published under agreement with IARIA - www.iaria.org
B. Cameleon Reference Framework
User interface challenges. In reference [13], Vanderdonckt presents a GUI specification and development model, which is more concerned with handling environmental and non-functional requirements of GUI systems. The challenges to overcome are represented by different user skills and cultures. In addition, a user interface should be aware of different usage contexts and respective user intentions as well as working environments and individual capabilities of devices the user interface is running on.
Need for automation. GUI development is tedious when facing the above mentioned challenges, and thus, Vanderdonckt states in [13] that normally, GUIs would have to be developed for each context or device separately. A reason is given by the difficulty to source common or shared parts of the user interfaces. Since architectures and final code or frameworks have a great impact on the final shape of the certain user interfaces, the potential reuse is largely limited. Finally, advice is given to employ model-driven software development techniques within a GUI development environment.
To approach a solution, which copes with both the challenges and need for model-driven development, Vanderdonckt proposes a methodology, which consists of GUI modeling abstractions or steps besides a method and tool support. The proposed four modeling steps [13], originated from [14], are described in the following paragraphs:
Task & Concepts (T&C). The tasks to be performed by the user, while interacting with the GUI-system, are specified during this step. Additionally, domain concepts relevant to those tasks are specified as well.
Abstract UI (AUI). With the AUI, tasks are being grouped and structured by Abstract Interaction Objects (AIOs): Individual Components and Abstract Containers are both sub-types of AIOs and form the main elements of an AUI. These resemble rather abstract entities serving for definition and structuring purposes only. Thus, AIOs come without any technical appearance or other format of imagination, since the options to shape them are very different during the next two modeling steps and should be preserved for developers. Besides the structuring of AIOs, an AUI specifies very basic interaction information such as input, output, navigation and control [5], which is defined independently from modality. Finally, the AUI acts as a “canonical expression of the rendering of the domain concepts and tasks” [13].
Concrete UI (CUI). The CUI refines the elements of an AUI to a complete but platform-independent user interface model. In this regard, Concrete Interaction Objects (CIOs) refine the AIOs of the AUI. CIOs resemble a chosen set of both UI-Controls or containers and their respective properties. While resembling an abstraction, the CUI “abstracts a FUI into a UI definition that is independent of any computing platform” [13].
Tasks &
ConceptsTasks Domain Concepts
Abstract User
Interface (AUI)
Concrete User
Interface (CUI)
Final User
Interface (FUI)
Abstract Containers Individual Components
Graphical Containers Graphical Individual Components
Graph Transformations
Graph Transformations
Rendering
Platform-Specific User Interface Components
LegendTransformation Transformation Tools
Figure 2. Modeling steps of the Cameleon Reference Framework based on [13] and implemented by UsiXML [15]
Final UI (FUI). As the last refinement, the FUI represents a certain device or platform specific user interface model. So, it embodies the final user interface components running in that specific environment.
The above described modeling steps are depicted by Figure 2, which is focused on graphical user interface implementations, as this is the case for its source [13].
UsiXML. To express the occurring models within these modeling steps, the GUI specification language UsiXML (user interface extensible markup language) [15] has been developed. Concerning the modeling facilities for the CUI step, UsiXML offers a specific set of CIOs sourced from common UI toolkits or frameworks. Therefore, the available modeling elements represent an intersection set of common GUI element sets.
C. Generators for graphical User Interfaces
To raise efficiency in GUI development, concepts and frameworks have been invented, which are able to generate complete GUI applications based on a partly specification of the application kernel or comparative model bases. Here, Naked Objects [16] and JANUS [17] can be mentioned. Both rely on an object-oriented domain model, which has to be a part of the application kernel. Based on the information provided by this model, standard dialogs are being generated with appropriate UI-Controls for the repetitive tasks to be carried out in conjunction with certain objects. For instance, to generate an object editor for entities like product or customer, certain text fields, lists or date pickers are selected as UI-Controls, which match the domain data types of the selected domain object for editing.
III. RELATED WORK: USER INTERFACE PATTERNS
In this part of related work, we present definitions, notations and concepts that address or employ patterns specific for model-based user interface development.
28
International Journal on Advances in Software, vol 6 no 1 & 2, year 2013, http://www.iariajournals.org/software/
2013, © Copyright by authors, Published under agreement with IARIA - www.iaria.org
A. User Interface Pattern Definition and Types
Current research has been discussing Human-Computer-Interaction (HCI) patterns [18] and especially User Interface Patterns (UIPs) for a longer period [19] [5] now. A UIP can be defined as a universal and reusable solution for common interaction and visual structures of GUIs. UIPs are distinguished by two types according to Vanderdonckt and Simarro [5]:
Descriptive UIPs. Primarily, UIPs are provided by means of verbal and graphical descriptions. In this context, UIPs are commonly specified following a scheme similar to the one used for design patterns [20]. By reference [21], a specialized language for patterns was proposed, which is named PLML (pattern language markup language). Details about the language structure can be found in [22] as well as its XML DTD in [5]. A practical application of its descriptive capabilities for several types of patterns, which may occur in conjunction with the Cameleon Reference Framework, is also outlined in [5].
UIP-Libraries. UIP libraries such as [23], [24], and [25] provide numerous examples for descriptive UIPs. Based on the presented categories, concepts about possible UIP hierarchies and their collaborations can be imagined.
Formal UIPs. Generative UIPs [5] are presented rarely. In contrast to descriptive UIPs, they feature a machine-readable form and are regarded as formal UIPs accordingly. The format for storing such UIPs may constitute of a graphic, e.g., UML [19] or XML based notation [26] [8] [9]. The formal UIPs are of great importance, since they can be used within development environments, especially for automated transformations to certain GUI-implementations.
B. Formalization of User Interface Patterns
In order to permit the processing of descriptive UIPs, they have to be converted to formal UIPs. Possible means for this step can be provided by formal languages applied for specifying GUIs. These languages, however, have been designed for the specification of certain GUIs and were not intended for a pattern-based approach in the first place. Until now, there is no specialized language available for formalizing UIPs.
UsiXML and UIML. In our preparation, we conducted an extensive investigation on formal GUI specification languages and their applicability for UIPs. As result, two languages with an outstanding maturity have been identified.
Intentionally, the XML-based languages UsiXML [15] and UIML [27] were developed for specifying a GUI independently from technology and platform specifics. However, such languages may be applicable for UIPs. One the one hand, UIML offers templates and associated parameters for reusing pre-defined structures and behavior of GUI components. On the other hand, UsiXML is designed to implement the Cameleon Reference Framework, which already propagated higher reuse by its abstractions of GUI modeling steps as well as automated processing by model-driven software development techniques. Moreover, both indeed have been applied in model-based processes or have been extended for that context. More information on that is provided in Section III.C.
IDEALXML. To raise the efficiency of GUI development environments, tools are necessary that facilitate formal specifications of UIPs with regard to language definitions and rules. A widespread tool concept for UsiXML is presented with IDEALXML [13] [5]. By using the various models defined by UsiXML as an information basis, many aspects of a GUI and additionally the applied domain model of the application kernel are included in the GUI specification. As a result, a detailed and comprehensive XML specification for the GUI can be created. Many aspects of the user model from [12] are already included.
C. Model-based Processes with User Interface Pattern
Integration
The pattern conception emerged from the HCI research has already been taken into consideration for model-based software development of GUI-systems. Researchers have introduced several model frameworks and notations to express generative UIPs, and thus, enable formalization facilities for descriptive UIPs. A common basis assumed for all different processes is a task based user model that is exploited to derive dialog and navigation structures of the user interface. Yet, all approaches have not reached a sufficient maturity level according to the available publications. They still were drafting or enhancing their processes, tools or notations as they had been by challenged relevant issues surrounding generative pattern definition and application.
Queen’s University Kingston. Zhao et al. [6] proposed the detailed modeling of tasks in order to be able to group them into segments, which are being transformed to dialogs displaying the associated data or contained sub-tasks.
As challenges for future work, two main aspects remained: the evaluation of achieved usability by the pattern application and the extension of customization abilities of the underlying framework to allow the definition of specific UI-Controls and even patterns to be integrated into the established process were suggested in [28]. In addition, the integration of more user interface patterns along with guidelines for final UI design as well as an enhancement of the task analysis to exploit more information relevant for UI generation were outlined in [6] as future work.
University of Rostock. Radeke et al. [29] presented a modeling framework that would be capable of employing patterns for all involved models (task, dialog, presentation and layout). Since the approach was focused on task modeling and respective patterns, the derivation of dialog structures was a main outcome. In order to enhance their capabilities towards pattern application for CUI models, UsiPXML (user interface modeling pattern language) was introduced in [26] as a notation to express all kinds of involved patterns. Being based on UsiXML as well as PLML, the new notation incorporated enhancements like structure attributes and variables to allow for a context-specific instantiation of a defined pattern.
However, future challenges were stated as follows. The need for enhanced tool support and the definition of more complex patterns was raised in [30]. Moreover, the pattern representation on the CUI level with UsiXML should be
29
International Journal on Advances in Software, vol 6 no 1 & 2, year 2013, http://www.iariajournals.org/software/
2013, © Copyright by authors, Published under agreement with IARIA - www.iaria.org
revised as well according to [31]. Lastly, the expansion of the set of available patterns and the concept of pattern inter-relationships were relevant considerations in [26]. For the latter, the research question about how task and dialog patterns would influence other patterns situated on lower levels is left open.
University of Augsburg. An alternative modeling framework integrating patterns on selected model stages was suggested by Engel and Märtin in [8]. Rooted in principles on the structuring of pattern languages [32], the main emphasis was laid on the hierarchy of patterns and their notation [33], which was based on a custom XML DTD for the generative part.
For the encountered challenges, future activities were considered, which would enrich the implementation aspects of pattern descriptions [34] and deliver concepts of pattern relationships. In the focus of transformations, future work was seen for the derivation of concrete UI models from abstract ones [35].
University of Kaiserslautern. Starting with criticism of recent approaches of other researchers, Seissler et al. [9] proposed a third modeling framework with comparative models and patterns, but they employed different notations and introduced a suggestion for a classification of pattern relationships. Additionally, the need for runtime adaptation of user interfaces was considered [36] as well as the concept of encapsulation of UIML fragments [9] within their notation to express user interface patterns.
They emphasized on tool support for pattern instantiation or the adaptation of patterns to different contexts of use that may even change at runtime [36]. Moreover, a proper tool for pattern selection and integration as well as the refinement of inter-model pattern relationships were stated as future challenges in [9]. The latter was considered to reflect the relations between pattern of different abstractions in order to offer better modularization and provide options for patterns that may be better suited for a specific context. Finally, Seissler et al. recognized in [9] that their future work should extend the pattern language for further testing of their notation approach.
IV. MODEL CONSIDERATIONS FOR DEPLOYING USER
INTERFACE PATTERNS
This section is intended to discuss the first part of related work presented in Section II. Before the more advanced concepts of Section III are addressed, the transition of traditional GUI specification and development towards a pattern-based solution shall be attended to. In this context, we outline the possible deployment of UIPs in development processes referring to both conceptual models elaborated by Ludolph and Vanderdonckt.
A. Review of the GUI Specification Model by Ludolph
Model transformations as described by Ludolph [12] illustrate a detailed account of relevant model elements for the GUI specification of the covered domain. However, any transformations are carried out manually. Besides that, no automation and only few options for reuse are mentioned.
However, artifact dependencies are detailed and the transformation of essential model requirement elements to certain user interface model elements is outlined. For the final transformation, Ludolph suggests manual and cognitive means of transformation, which lead to clearly defined dependencies between user model and user interface entities. These prerequisites are ideal to be considered in the discussion on how UIPs influence artifacts. Particularly, it is of interest, how a GUI specification can be developed starting from a basis of functional requirement artifacts and using UIPs as bridging elements for transformations.
B. Review of the Cameleon Reference Framework
Relevance. From our point of view, the Cameleon Reference Framework as presented in [13] resembles a valuable model foundation or mental concept for UIPs, since it addresses the following two aspects. Firstly, GUI development activities and related tool support to decide on automation steps are covered. Secondly, pattern deployment possibilities and related abstractions may be derived. In this regard, a developer can decide on the granularity, reach and modularization of potential patterns while having the four segregated modeling steps on his mind. However, the latter aspect was not met by the original source and is only inspired.
GUI development aspect. As far as the first aspect is addressed, the proposed model abstractions or steps resemble UI concerns applicable to a wide range of different domains. The model abstractions make sense as they address the elaborated challenges in [13] by a separation of concerns. The four steps have been introduced to handle the various challenges or requirements by sharing or distributing them across the abstractions. Consequently, the separation of models enables different grades of reuse and an isolation of particular challenges, as they are no longer bound to single GUI models but to a set of models as proposed.
To approach the modeling steps, a strict top-down decomposition procedure is not required. In contrast, the entry point is variable so that one can start with an AUI or CUI without tasks modeling at all. A user interface may be subsequently abstracted or refined across the proposed reification model stages.
Moreover, the steps aid both in forward and reverse engineering, since they demand for explicitly capturing implicit knowledge applied in both model transformation paths: the refinement towards a FUI can be approached by subsequent increase in detail, which is stored in segregated models and their elemental notations. As the reification of an AUI towards CUI is progressing, the elementary concepts embodied by AIOs of different dialogs can be lined up to identify reoccurring structures. In this respect, AIOs are an abstraction and so they do share the commonalities of certain GUI structures. Consequently, identified AIO structures offer potentials to discover UIPs for the particular domain during the transition to the CUI.
Concerning reverse engineering, the abstraction of a given FUI or CUI model to abstract grouped tasks embodied by AIOs is also supported. The derived AUI may be reified to another platforms’ CUI. If an AUI was already created by
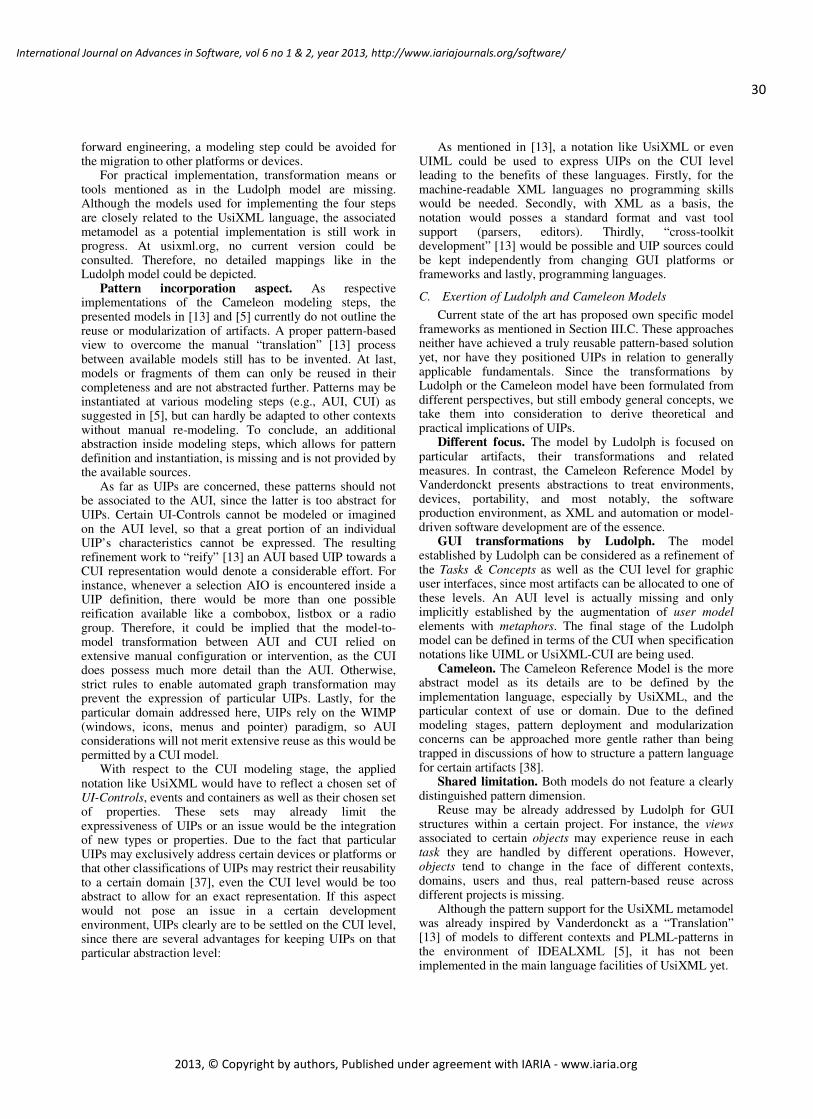
30
International Journal on Advances in Software, vol 6 no 1 & 2, year 2013, http://www.iariajournals.org/software/
2013, © Copyright by authors, Published under agreement with IARIA - www.iaria.org
forward engineering, a modeling step could be avoided for the migration to other platforms or devices.
For practical implementation, transformation means or tools mentioned as in the Ludolph model are missing. Although the models used for implementing the four steps are closely related to the UsiXML language, the associated metamodel as a potential implementation is still work in progress. At usixml.org, no current version could be consulted. Therefore, no detailed mappings like in the Ludolph model could be depicted.
Pattern incorporation aspect. As respective implementations of the Cameleon modeling steps, the presented models in [13] and [5] currently do not outline the reuse or modularization of artifacts. A proper pattern-based view to overcome the manual “translation” [13] process between available models still has to be invented. At last, models or fragments of them can only be reused in their completeness and are not abstracted further. Patterns may be instantiated at various modeling steps (e.g., AUI, CUI) as suggested in [5], but can hardly be adapted to other contexts without manual re-modeling. To conclude, an additional abstraction inside modeling steps, which allows for pattern definition and instantiation, is missing and is not provided by the available sources.
As far as UIPs are concerned, these patterns should not be associated to the AUI, since the latter is too abstract for UIPs. Certain UI-Controls cannot be modeled or imagined on the AUI level, so that a great portion of an individual UIP’s characteristics cannot be expressed. The resulting refinement work to “reify” [13] an AUI based UIP towards a CUI representation would denote a considerable effort. For instance, whenever a selection AIO is encountered inside a UIP definition, there would be more than one possible reification available like a combobox, listbox or a radio group. Therefore, it could be implied that the model-to-model transformation between AUI and CUI relied on extensive manual configuration or intervention, as the CUI does possess much more detail than the AUI. Otherwise, strict rules to enable automated graph transformation may prevent the expression of particular UIPs. Lastly, for the particular domain addressed here, UIPs rely on the WIMP (windows, icons, menus and pointer) paradigm, so AUI considerations will not merit extensive reuse as this would be permitted by a CUI model.
With respect to the CUI modeling stage, the applied notation like UsiXML would have to reflect a chosen set of UI-Controls, events and containers as well as their chosen set of properties. These sets may already limit the expressiveness of UIPs or an issue would be the integration of new types or properties. Due to the fact that particular UIPs may exclusively address certain devices or platforms or that other classifications of UIPs may restrict their reusability to a certain domain [37], even the CUI level would be too abstract to allow for an exact representation. If this aspect would not pose an issue in a certain development environment, UIPs clearly are to be settled on the CUI level, since there are several advantages for keeping UIPs on that particular abstraction level:
As mentioned in [13], a notation like UsiXML or even UIML could be used to express UIPs on the CUI level leading to the benefits of these languages. Firstly, for the machine-readable XML languages no programming skills would be needed. Secondly, with XML as a basis, the notation would posses a standard format and vast tool support (parsers, editors). Thirdly, “cross-toolkit development” [13] would be possible and UIP sources could be kept independently from changing GUI platforms or frameworks and lastly, programming languages.
C. Exertion of Ludolph and Cameleon Models
Current state of the art has proposed own specific model frameworks as mentioned in Section III.C. These approaches neither have achieved a truly reusable pattern-based solution yet, nor have they positioned UIPs in relation to generally applicable fundamentals. Since the transformations by Ludolph or the Cameleon model have been formulated from different perspectives, but still embody general concepts, we take them into consideration to derive theoretical and practical implications of UIPs.
Different focus. The model by Ludolph is focused on particular artifacts, their transformations and related measures. In contrast, the Cameleon Reference Model by Vanderdonckt presents abstractions to treat environments, devices, portability, and most notably, the software production environment, as XML and automation or model-driven software development are of the essence.
GUI transformations by Ludolph. The model established by Ludolph can be considered as a refinement of the Tasks & Concepts as well as the CUI level for graphic user interfaces, since most artifacts can be allocated to one of these levels. An AUI level is actually missing and only implicitly established by the augmentation of user model elements with metaphors. The final stage of the Ludolph model can be defined in terms of the CUI when specification notations like UIML or UsiXML-CUI are being used.
Cameleon. The Cameleon Reference Model is the more abstract model as its details are to be defined by the implementation language, especially by UsiXML, and the particular context of use or domain. Due to the defined modeling stages, pattern deployment and modularization concerns can be approached more gentle rather than being trapped in discussions of how to structure a pattern language for certain artifacts [38].
Shared limitation. Both models do not feature a clearly distinguished pattern dimension.
Reuse may be already addressed by Ludolph for GUI structures within a certain project. For instance, the views associated to certain objects may experience reuse in each task they are handled by different operations. However, objects tend to change in the face of different contexts, domains, users and thus, real pattern-based reuse across different projects is missing.
Although the pattern support for the UsiXML metamodel was already inspired by Vanderdonckt as a “Translation” [13] of models to different contexts and PLML-patterns in the environment of IDEALXML [5], it has not been implemented in the main language facilities of UsiXML yet.
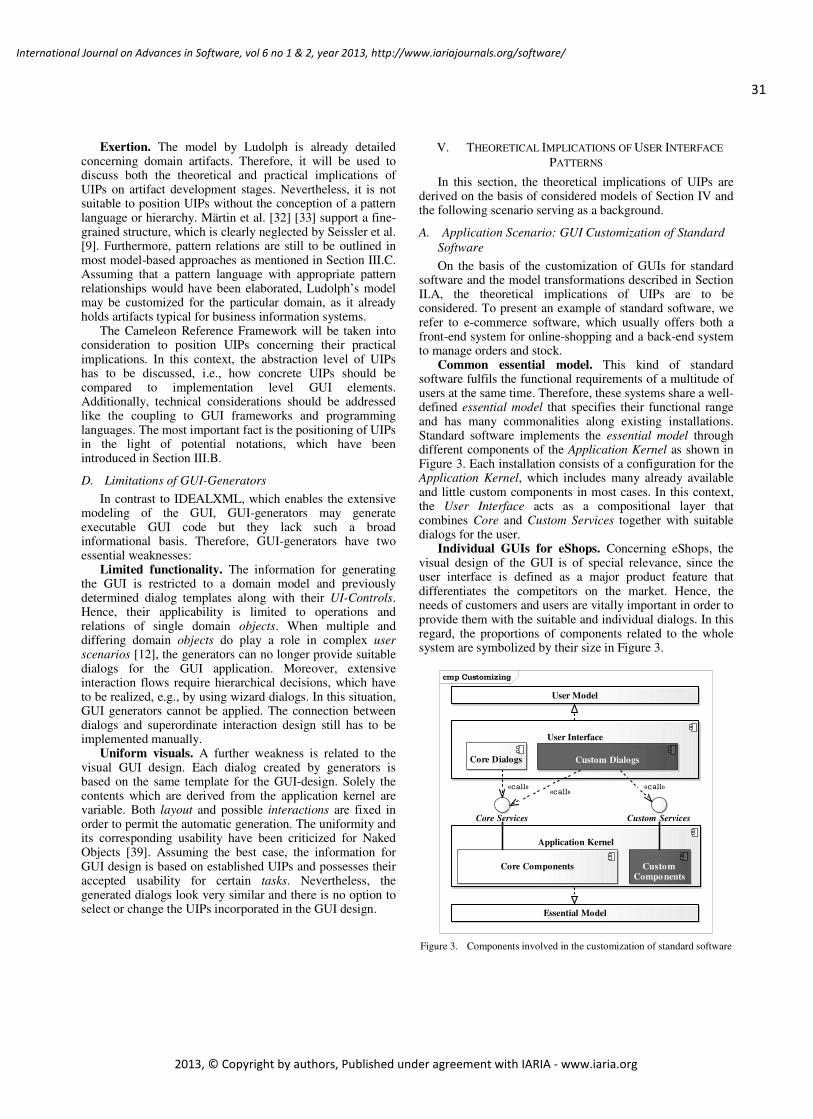
31
International Journal on Advances in Software, vol 6 no 1 & 2, year 2013, http://www.iariajournals.org/software/
2013, © Copyright by authors, Published under agreement with IARIA - www.iaria.org
Exertion. The model by Ludolph is already detailed concerning domain artifacts. Therefore, it will be used to discuss both the theoretical and practical implications of UIPs on artifact development stages. Nevertheless, it is not suitable to position UIPs without the conception of a pattern language or hierarchy. Märtin et al. [32] [33] support a fine-grained structure, which is clearly neglected by Seissler et al. [9]. Furthermore, pattern relations are still to be outlined in most model-based approaches as mentioned in Section III.C. Assuming that a pattern language with appropriate pattern relationships would have been elaborated, Ludolph’s model may be customized for the particular domain, as it already holds artifacts typical for business information systems.
The Cameleon Reference Framework will be taken into consideration to position UIPs concerning their practical implications. In this context, the abstraction level of UIPs has to be discussed, i.e., how concrete UIPs should be compared to implementation level GUI elements. Additionally, technical considerations should be addressed like the coupling to GUI frameworks and programming languages. The most important fact is the positioning of UIPs in the light of potential notations, which have been introduced in Section III.B.
D. Limitations of GUI-Generators
In contrast to IDEALXML, which enables the extensive modeling of the GUI, GUI-generators may generate executable GUI code but they lack such a broad informational basis. Therefore, GUI-generators have two essential weaknesses:
Limited functionality. The information for generating the GUI is restricted to a domain model and previously determined dialog templates along with their UI-Controls. Hence, their applicability is limited to operations and relations of single domain objects. When multiple and differing domain objects do play a role in complex user scenarios [12], the generators can no longer provide suitable dialogs for the GUI application. Moreover, extensive interaction flows require hierarchical decisions, which have to be realized, e.g., by using wizard dialogs. In this situation, GUI generators cannot be applied. The connection between dialogs and superordinate interaction design still has to be implemented manually.
Uniform visuals. A further weakness is related to the visual GUI design. Each dialog created by generators is based on the same template for the GUI-design. Solely the contents which are derived from the application kernel are variable. Both layout and possible interactions are fixed in order to permit the automatic generation. The uniformity and its corresponding usability have been criticized for Naked Objects [39]. Assuming the best case, the information for GUI design is based on established UIPs and possesses their accepted usability for certain tasks. Nevertheless, the generated dialogs look very similar and there is no option to select or change the UIPs incorporated in the GUI design.
V. THEORETICAL IMPLICATIONS OF USER INTERFACE
PATTERNS
In this section, the theoretical implications of UIPs are derived on the basis of considered models of Section IV and the following scenario serving as a background.
A. Application Scenario: GUI Customization of Standard
Software
On the basis of the customization of GUIs for standard software and the model transformations described in Section II.A, the theoretical implications of UIPs are to be considered. To present an example of standard software, we refer to e-commerce software, which usually offers both a front-end system for online-shopping and a back-end system to manage orders and stock.
Common essential model. This kind of standard software fulfils the functional requirements of a multitude of users at the same time. Therefore, these systems share a well-defined essential model that specifies their functional range and has many commonalities along existing installations. Standard software implements the essential model through different components of the Application Kernel as shown in Figure 3. Each installation consists of a configuration for the Application Kernel, which includes many already available and little custom components in most cases. In this context, the User Interface acts as a compositional layer that combines Core and Custom Services together with suitable dialogs for the user.
Individual GUIs for eShops. Concerning eShops, the visual design of the GUI is of special relevance, since the user interface is defined as a major product feature that differentiates the competitors on the market. Hence, the needs of customers and users are vitally important in order to provide them with the suitable and individual dialogs. In this regard, the proportions of components related to the whole system are symbolized by their size in Figure 3.
cmp Customizing
Application Kernel
Core Components Custom Components
User Interface
Core Dialogs Custom Dialogs
Core Services Custom Services
Essential Model
User Model
«call»«call»
«call»
Figure 3. Components involved in the customization of standard software
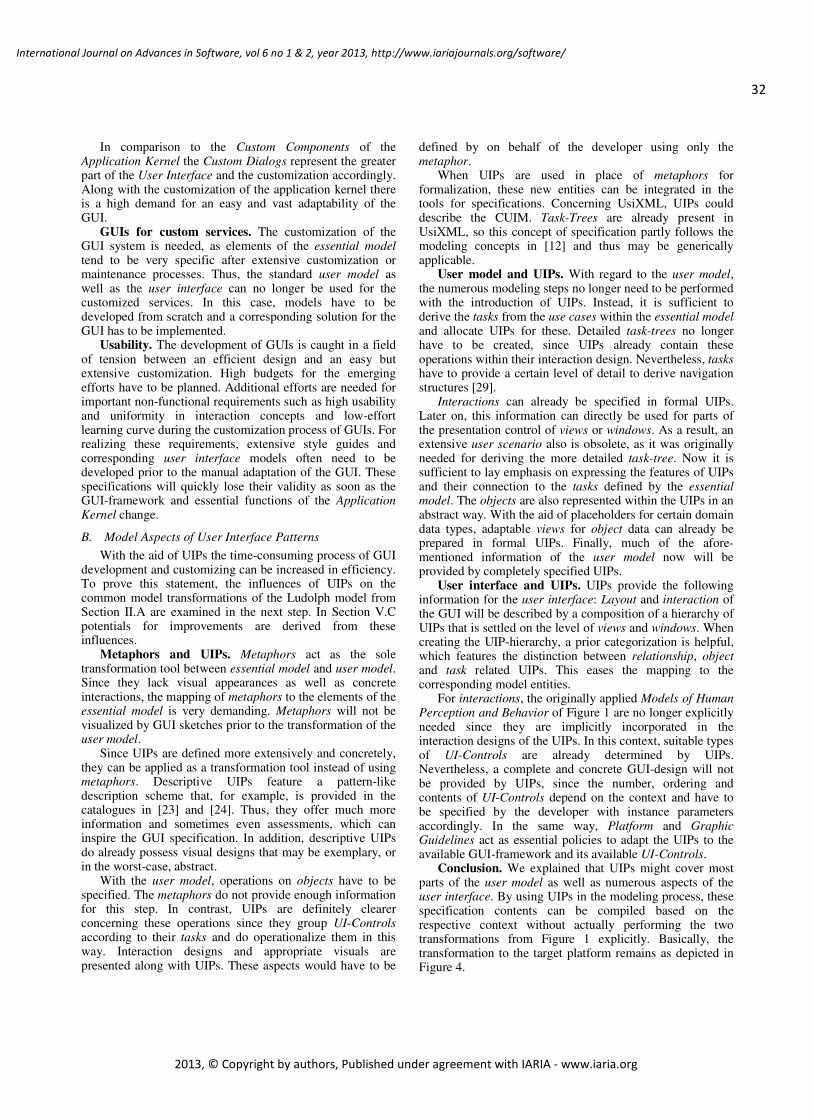
32
International Journal on Advances in Software, vol 6 no 1 & 2, year 2013, http://www.iariajournals.org/software/
2013, © Copyright by authors, Published under agreement with IARIA - www.iaria.org
In comparison to the Custom Components of the Application Kernel the Custom Dialogs represent the greater part of the User Interface and the customization accordingly. Along with the customization of the application kernel there is a high demand for an easy and vast adaptability of the GUI.
GUIs for custom services. The customization of the GUI system is needed, as elements of the essential model tend to be very specific after extensive customization or maintenance processes. Thus, the standard user model as well as the user interface can no longer be used for the customized services. In this case, models have to be developed from scratch and a corresponding solution for the GUI has to be implemented.
Usability. The development of GUIs is caught in a field of tension between an efficient design and an easy but extensive customization. High budgets for the emerging efforts have to be planned. Additional efforts are needed for important non-functional requirements such as high usability and uniformity in interaction concepts and low-effort learning curve during the customization process of GUIs. For realizing these requirements, extensive style guides and corresponding user interface models often need to be developed prior to the manual adaptation of the GUI. These specifications will quickly lose their validity as soon as the GUI-framework and essential functions of the Application Kernel change.
B. Model Aspects of User Interface Patterns
With the aid of UIPs the time-consuming process of GUI development and customizing can be increased in efficiency. To prove this statement, the influences of UIPs on the common model transformations of the Ludolph model from Section II.A are examined in the next step. In Section V.C potentials for improvements are derived from these influences.
Metaphors and UIPs. Metaphors act as the sole transformation tool between essential model and user model. Since they lack visual appearances as well as concrete interactions, the mapping of metaphors to the elements of the essential model is very demanding. Metaphors will not be visualized by GUI sketches prior to the transformation of the user model.
Since UIPs are defined more extensively and concretely, they can be applied as a transformation tool instead of using metaphors. Descriptive UIPs feature a pattern-like description scheme that, for example, is provided in the catalogues in [23] and [24]. Thus, they offer much more information and sometimes even assessments, which can inspire the GUI specification. In addition, descriptive UIPs do already possess visual designs that may be exemplary, or in the worst-case, abstract.
With the user model, operations on objects have to be specified. The metaphors do not provide enough information for this step. In contrast, UIPs are definitely clearer concerning these operations since they group UI-Controls according to their tasks and do operationalize them in this way. Interaction designs and appropriate visuals are presented along with UIPs. These aspects would have to be
defined by on behalf of the developer using only the metaphor.
When UIPs are used in place of metaphors for formalization, these new entities can be integrated in the tools for specifications. Concerning UsiXML, UIPs could describe the CUIM. Task-Trees are already present in UsiXML, so this concept of specification partly follows the modeling concepts in [12] and thus may be generically applicable.
User model and UIPs. With regard to the user model, the numerous modeling steps no longer need to be performed with the introduction of UIPs. Instead, it is sufficient to derive the tasks from the use cases within the essential model and allocate UIPs for these. Detailed task-trees no longer have to be created, since UIPs already contain these operations within their interaction design. Nevertheless, tasks have to provide a certain level of detail to derive navigation structures [29].
Interactions can already be specified in formal UIPs. Later on, this information can directly be used for parts of the presentation control of views or windows. As a result, an extensive user scenario also is obsolete, as it was originally needed for deriving the more detailed task-tree. Now it is sufficient to lay emphasis on expressing the features of UIPs and their connection to the tasks defined by the essential model. The objects are also represented within the UIPs in an abstract way. With the aid of placeholders for certain domain data types, adaptable views for object data can already be prepared in formal UIPs. Finally, much of the afore-mentioned information of the user model now will be provided by completely specified UIPs.
User interface and UIPs. UIPs provide the following information for the user interface: Layout and interaction of the GUI will be described by a composition of a hierarchy of UIPs that is settled on the level of views and windows. When creating the UIP-hierarchy, a prior categorization is helpful, which features the distinction between relationship, object and task related UIPs. This eases the mapping to the corresponding model entities.
For interactions, the originally applied Models of Human Perception and Behavior of Figure 1 are no longer explicitly needed since they are implicitly incorporated in the interaction designs of the UIPs. In this context, suitable types of UI-Controls are already determined by UIPs. Nevertheless, a complete and concrete GUI-design will not be provided by UIPs, since the number, ordering and contents of UI-Controls depend on the context and have to be specified by the developer with instance parameters accordingly. In the same way, Platform and Graphic Guidelines act as essential policies to adapt the UIPs to the available GUI-framework and its available UI-Controls.
Conclusion. We explained that UIPs might cover most parts of the user model as well as numerous aspects of the user interface. By using UIPs in the modeling process, these specification contents can be compiled based on the respective context without actually performing the two transformations from Figure 1 explicitly. Basically, the transformation to the target platform remains as depicted in Figure 4.
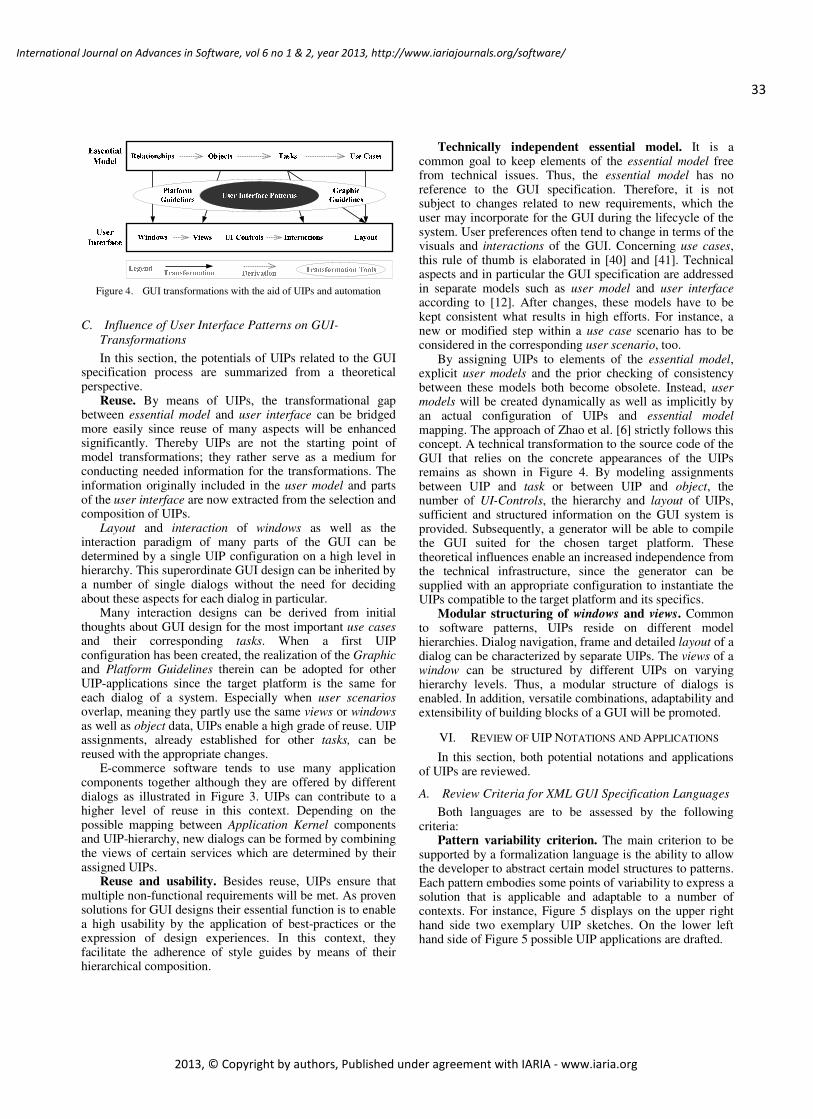
33
International Journal on Advances in Software, vol 6 no 1 & 2, year 2013, http://www.iariajournals.org/software/
2013, © Copyright by authors, Published under agreement with IARIA - www.iaria.org
Figure 4. GUI transformations with the aid of UIPs and automation
C. Influence of User Interface Patterns on GUI-
Transformations
In this section, the potentials of UIPs related to the GUI specification process are summarized from a theoretical perspective.
Reuse. By means of UIPs, the transformational gap between essential model and user interface can be bridged more easily since reuse of many aspects will be enhanced significantly. Thereby UIPs are not the starting point of model transformations; they rather serve as a medium for conducting needed information for the transformations. The information originally included in the user model and parts of the user interface are now extracted from the selection and composition of UIPs.
Layout and interaction of windows as well as the interaction paradigm of many parts of the GUI can be determined by a single UIP configuration on a high level in hierarchy. This superordinate GUI design can be inherited by a number of single dialogs without the need for deciding about these aspects for each dialog in particular.
Many interaction designs can be derived from initial thoughts about GUI design for the most important use cases and their corresponding tasks. When a first UIP configuration has been created, the realization of the Graphic and Platform Guidelines therein can be adopted for other UIP-applications since the target platform is the same for each dialog of a system. Especially when user scenarios overlap, meaning they partly use the same views or windows as well as object data, UIPs enable a high grade of reuse. UIP assignments, already established for other tasks, can be reused with the appropriate changes.
E-commerce software tends to use many application components together although they are offered by different dialogs as illustrated in Figure 3. UIPs can contribute to a higher level of reuse in this context. Depending on the possible mapping between Application Kernel components and UIP-hierarchy, new dialogs can be formed by combining the views of certain services which are determined by their assigned UIPs.
Reuse and usability. Besides reuse, UIPs ensure that multiple non-functional requirements will be met. As proven solutions for GUI designs their essential function is to enable a high usability by the application of best-practices or the expression of design experiences. In this context, they facilitate the adherence of style guides by means of their hierarchical composition.
Technically independent essential model. It is a common goal to keep elements of the essential model free from technical issues. Thus, the essential model has no reference to the GUI specification. Therefore, it is not subject to changes related to new requirements, which the user may incorporate for the GUI during the lifecycle of the system. User preferences often tend to change in terms of the visuals and interactions of the GUI. Concerning use cases, this rule of thumb is elaborated in [40] and [41]. Technical aspects and in particular the GUI specification are addressed in separate models such as user model and user interface according to [12]. After changes, these models have to be kept consistent what results in high efforts. For instance, a new or modified step within a use case scenario has to be considered in the corresponding user scenario, too.
By assigning UIPs to elements of the essential model, explicit user models and the prior checking of consistency between these models both become obsolete. Instead, user models will be created dynamically as well as implicitly by an actual configuration of UIPs and essential model mapping. The approach of Zhao et al. [6] strictly follows this concept. A technical transformation to the source code of the GUI that relies on the concrete appearances of the UIPs remains as shown in Figure 4. By modeling assignments between UIP and task or between UIP and object, the number of UI-Controls, the hierarchy and layout of UIPs, sufficient and structured information on the GUI system is provided. Subsequently, a generator will be able to compile the GUI suited for the chosen target platform. These theoretical influences enable an increased independence from the technical infrastructure, since the generator can be supplied with an appropriate configuration to instantiate the UIPs compatible to the target platform and its specifics.
Modular structuring of windows and views. Common to software patterns, UIPs reside on different model hierarchies. Dialog navigation, frame and detailed layout of a dialog can be characterized by separate UIPs. The views of a window can be structured by different UIPs on varying hierarchy levels. Thus, a modular structure of dialogs is enabled. In addition, versatile combinations, adaptability and extensibility of building blocks of a GUI will be promoted.
VI. REVIEW OF UIP NOTATIONS AND APPLICATIONS
In this section, both potential notations and applications of UIPs are reviewed.
A. Review Criteria for XML GUI Specification Languages
Both languages are to be assessed by the following criteria:
Pattern variability criterion. The main criterion to be supported by a formalization language is the ability to allow the developer to abstract certain model structures to patterns. Each pattern embodies some points of variability to express a solution that is applicable and adaptable to a number of contexts. For instance, Figure 5 displays on the upper right hand side two exemplary UIP sketches. On the lower left hand side of Figure 5 possible UIP applications are drafted.
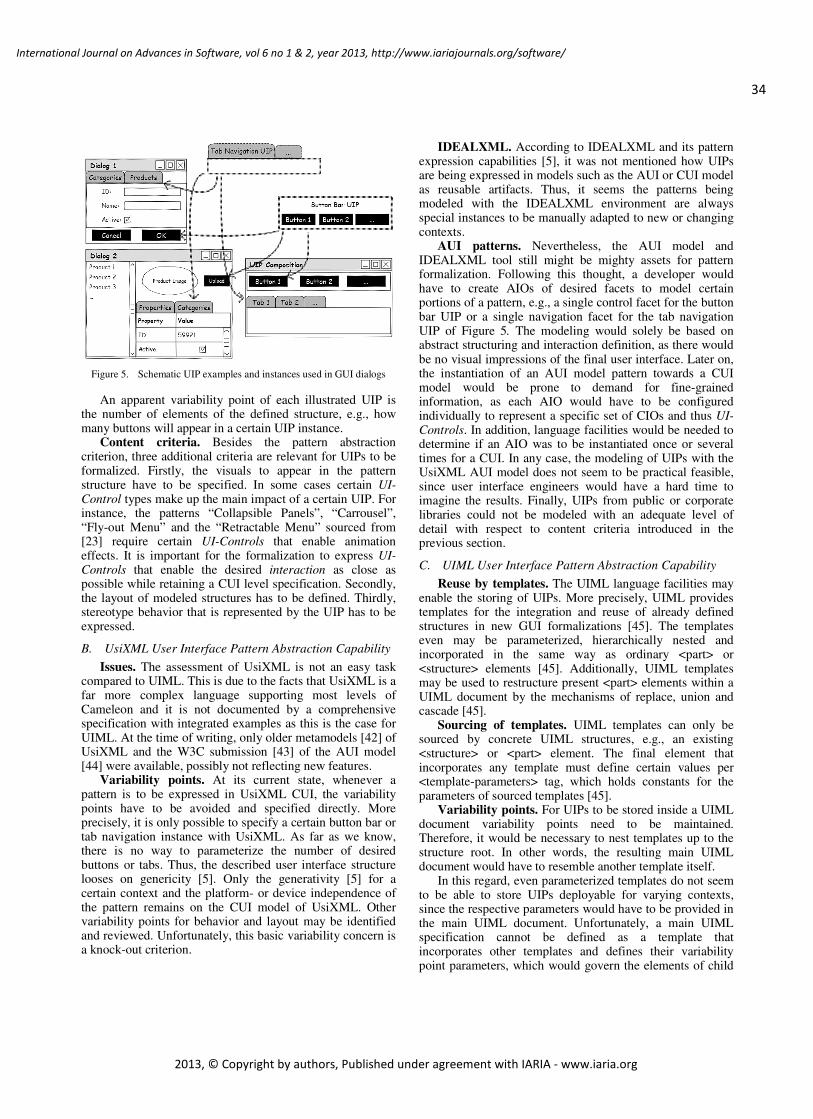
34
International Journal on Advances in Software, vol 6 no 1 & 2, year 2013, http://www.iariajournals.org/software/
2013, © Copyright by authors, Published under agreement with IARIA - www.iaria.org
Figure 5. Schematic UIP examples and instances used in GUI dialogs
An apparent variability point of each illustrated UIP is the number of elements of the defined structure, e.g., how many buttons will appear in a certain UIP instance.
Content criteria. Besides the pattern abstraction criterion, three additional criteria are relevant for UIPs to be formalized. Firstly, the visuals to appear in the pattern structure have to be specified. In some cases certain UI-Control types make up the main impact of a certain UIP. For instance, the patterns “Collapsible Panels”, “Carrousel”, “Fly-out Menu” and the “Retractable Menu” sourced from [23] require certain UI-Controls that enable animation effects. It is important for the formalization to express UI-Controls that enable the desired interaction as close as possible while retaining a CUI level specification. Secondly, the layout of modeled structures has to be defined. Thirdly, stereotype behavior that is represented by the UIP has to be expressed.
B. UsiXML User Interface Pattern Abstraction Capability
Issues. The assessment of UsiXML is not an easy task compared to UIML. This is due to the facts that UsiXML is a far more complex language supporting most levels of Cameleon and it is not documented by a comprehensive specification with integrated examples as this is the case for UIML. At the time of writing, only older metamodels [42] of UsiXML and the W3C submission [43] of the AUI model [44] were available, possibly not reflecting new features.
Variability points. At its current state, whenever a pattern is to be expressed in UsiXML CUI, the variability points have to be avoided and specified directly. More precisely, it is only possible to specify a certain button bar or tab navigation instance with UsiXML. As far as we know, there is no way to parameterize the number of desired buttons or tabs. Thus, the described user interface structure looses on genericity [5]. Only the generativity [5] for a certain context and the platform- or device independence of the pattern remains on the CUI model of UsiXML. Other variability points for behavior and layout may be identified and reviewed. Unfortunately, this basic variability concern is a knock-out criterion.
IDEALXML. According to IDEALXML and its pattern expression capabilities [5], it was not mentioned how UIPs are being expressed in models such as the AUI or CUI model as reusable artifacts. Thus, it seems the patterns being modeled with the IDEALXML environment are always special instances to be manually adapted to new or changing contexts.
AUI patterns. Nevertheless, the AUI model and IDEALXML tool still might be mighty assets for pattern formalization. Following this thought, a developer would have to create AIOs of desired facets to model certain portions of a pattern, e.g., a single control facet for the button bar UIP or a single navigation facet for the tab navigation UIP of Figure 5. The modeling would solely be based on abstract structuring and interaction definition, as there would be no visual impressions of the final user interface. Later on, the instantiation of an AUI model pattern towards a CUI model would be prone to demand for fine-grained information, as each AIO would have to be configured individually to represent a specific set of CIOs and thus UI-Controls. In addition, language facilities would be needed to determine if an AIO was to be instantiated once or several times for a CUI. In any case, the modeling of UIPs with the UsiXML AUI model does not seem to be practical feasible, since user interface engineers would have a hard time to imagine the results. Finally, UIPs from public or corporate libraries could not be modeled with an adequate level of detail with respect to content criteria introduced in the previous section.
C. UIML User Interface Pattern Abstraction Capability
Reuse by templates. The UIML language facilities may enable the storing of UIPs. More precisely, UIML provides templates for the integration and reuse of already defined structures in new GUI formalizations [45]. The templates even may be parameterized, hierarchically nested and incorporated in the same way as ordinary <part> or <structure> elements [45]. Additionally, UIML templates may be used to restructure present <part> elements within a UIML document by the mechanisms of replace, union and cascade [45].
Sourcing of templates. UIML templates can only be sourced by concrete UIML structures, e.g., an existing <structure> or <part> element. The final element that incorporates any template must define certain values per <template-parameters> tag, which holds constants for the parameters of sourced templates [45].
Variability points. For UIPs to be stored inside a UIML document variability points need to be maintained. Therefore, it would be necessary to nest templates up to the structure root. In other words, the resulting main UIML document would have to resemble another template itself.
In this regard, even parameterized templates do not seem to be able to store UIPs deployable for varying contexts, since the respective parameters would have to be provided in the main UIML document. Unfortunately, a main UIML specification cannot be defined as a template that incorporates other templates and defines their variability point parameters, which would govern the elements of child
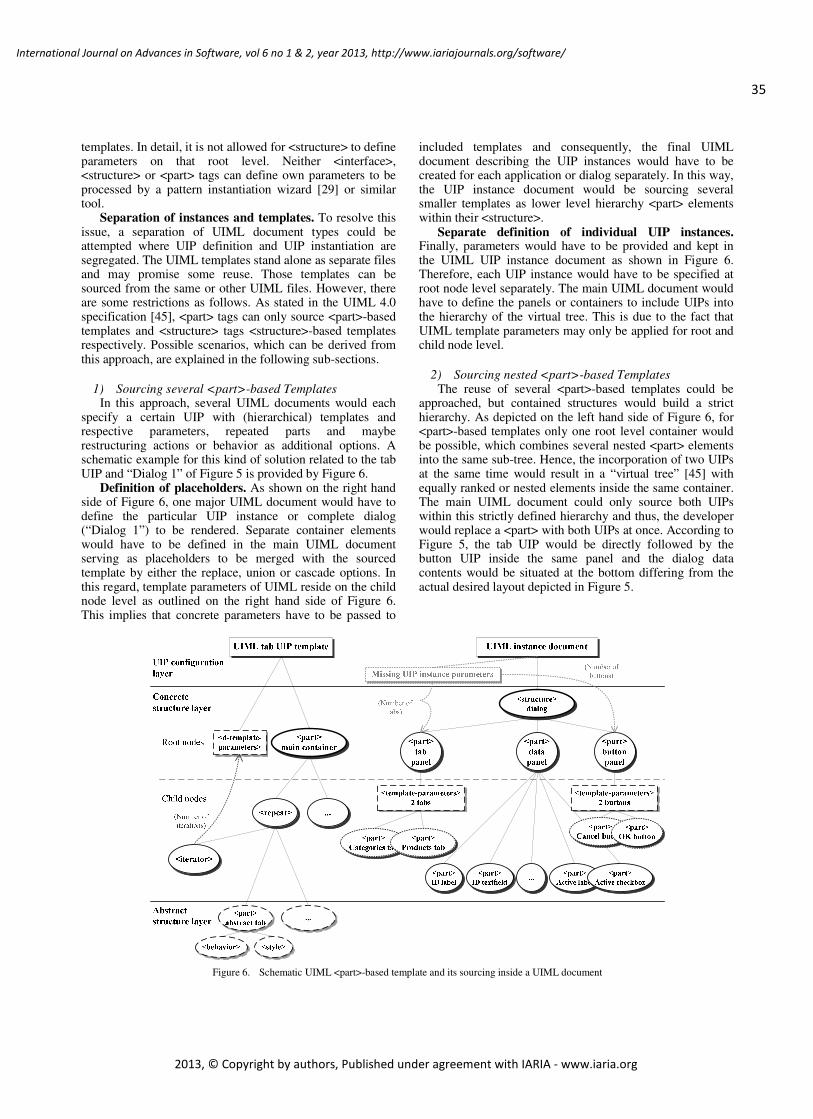
35
International Journal on Advances in Software, vol 6 no 1 & 2, year 2013, http://www.iariajournals.org/software/
2013, © Copyright by authors, Published under agreement with IARIA - www.iaria.org
templates. In detail, it is not allowed for <structure> to define parameters on that root level. Neither <interface>, <structure> or <part> tags can define own parameters to be processed by a pattern instantiation wizard [29] or similar tool.
Separation of instances and templates. To resolve this issue, a separation of UIML document types could be attempted where UIP definition and UIP instantiation are segregated. The UIML templates stand alone as separate files and may promise some reuse. Those templates can be sourced from the same or other UIML files. However, there are some restrictions as follows. As stated in the UIML 4.0 specification [45], <part> tags can only source <part>-based templates and <structure> tags <structure>-based templates respectively. Possible scenarios, which can be derived from this approach, are explained in the following sub-sections.
1) Sourcing several <part>-based Templates
In this approach, several UIML documents would each specify a certain UIP with (hierarchical) templates and respective parameters, repeated parts and maybe restructuring actions or behavior as additional options. A schematic example for this kind of solution related to the tab UIP and “Dialog 1” of Figure 5 is provided by Figure 6.
Definition of placeholders. As shown on the right hand side of Figure 6, one major UIML document would have to define the particular UIP instance or complete dialog (“Dialog 1”) to be rendered. Separate container elements would have to be defined in the main UIML document serving as placeholders to be merged with the sourced template by either the replace, union or cascade options. In this regard, template parameters of UIML reside on the child node level as outlined on the right hand side of Figure 6. This implies that concrete parameters have to be passed to
included templates and consequently, the final UIML document describing the UIP instances would have to be created for each application or dialog separately. In this way, the UIP instance document would be sourcing several smaller templates as lower level hierarchy <part> elements within their <structure>.
Separate definition of individual UIP instances. Finally, parameters would have to be provided and kept in the UIML UIP instance document as shown in Figure 6. Therefore, each UIP instance would have to be specified at root node level separately. The main UIML document would have to define the panels or containers to include UIPs into the hierarchy of the virtual tree. This is due to the fact that UIML template parameters may only be applied for root and child node level.
2) Sourcing nested <part>-based Templates
The reuse of several <part>-based templates could be approached, but contained structures would build a strict hierarchy. As depicted on the left hand side of Figure 6, for <part>-based templates only one root level container would be possible, which combines several nested <part> elements into the same sub-tree. Hence, the incorporation of two UIPs at the same time would result in a “virtual tree” [45] with equally ranked or nested elements inside the same container. The main UIML document could only source both UIPs within this strictly defined hierarchy and thus, the developer would replace a <part> with both UIPs at once. According to Figure 5, the tab UIP would be directly followed by the button UIP inside the same panel and the dialog data contents would be situated at the bottom differing from the actual desired layout depicted in Figure 5.
Figure 6. Schematic UIML <part>-based template and its sourcing inside a UIML document
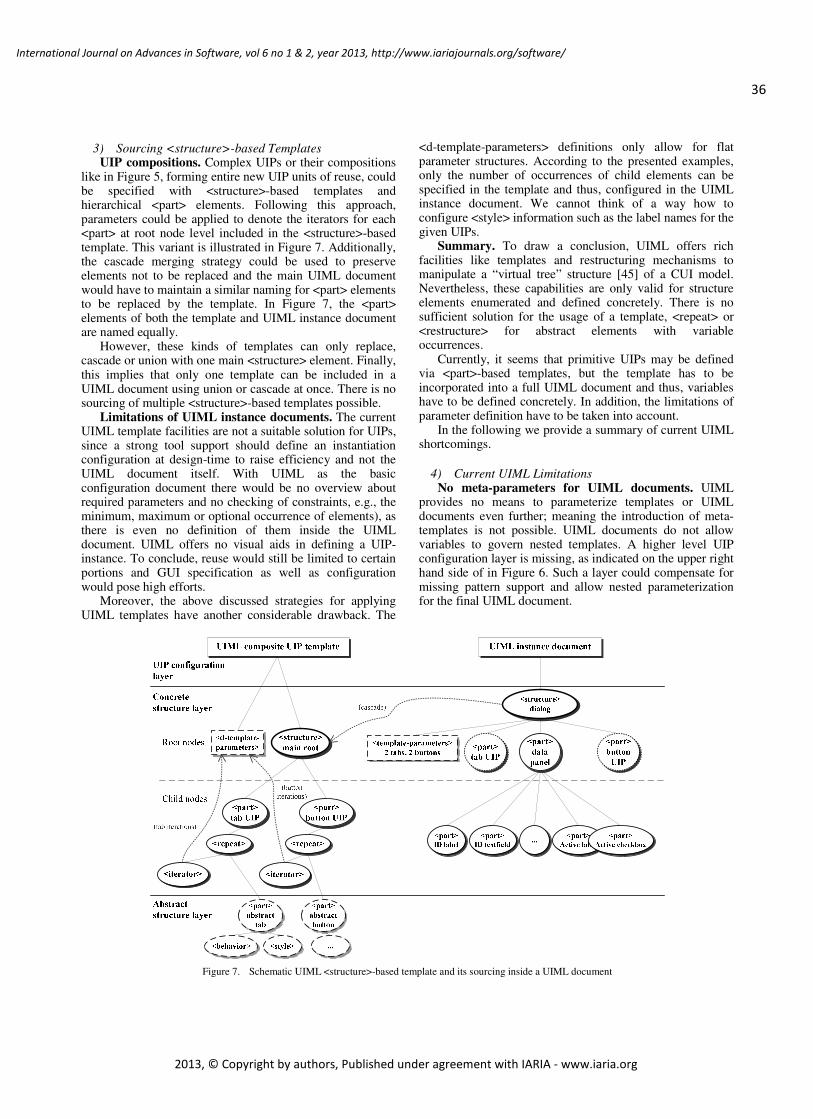
36
International Journal on Advances in Software, vol 6 no 1 & 2, year 2013, http://www.iariajournals.org/software/
2013, © Copyright by authors, Published under agreement with IARIA - www.iaria.org
3) Sourcing <structure>-based Templates UIP compositions. Complex UIPs or their compositions
like in Figure 5, forming entire new UIP units of reuse, could be specified with <structure>-based templates and hierarchical <part> elements. Following this approach, parameters could be applied to denote the iterators for each <part> at root node level included in the <structure>-based template. This variant is illustrated in Figure 7. Additionally, the cascade merging strategy could be used to preserve elements not to be replaced and the main UIML document would have to maintain a similar naming for <part> elements to be replaced by the template. In Figure 7, the <part> elements of both the template and UIML instance document are named equally.
However, these kinds of templates can only replace, cascade or union with one main <structure> element. Finally, this implies that only one template can be included in a UIML document using union or cascade at once. There is no sourcing of multiple <structure>-based templates possible.
Limitations of UIML instance documents. The current UIML template facilities are not a suitable solution for UIPs, since a strong tool support should define an instantiation configuration at design-time to raise efficiency and not the UIML document itself. With UIML as the basic configuration document there would be no overview about required parameters and no checking of constraints, e.g., the minimum, maximum or optional occurrence of elements), as there is even no definition of them inside the UIML document. UIML offers no visual aids in defining a UIP-instance. To conclude, reuse would still be limited to certain portions and GUI specification as well as configuration would pose high efforts.
Moreover, the above discussed strategies for applying UIML templates have another considerable drawback. The
<d-template-parameters> definitions only allow for flat parameter structures. According to the presented examples, only the number of occurrences of child elements can be specified in the template and thus, configured in the UIML instance document. We cannot think of a way how to configure <style> information such as the label names for the given UIPs.
Summary. To draw a conclusion, UIML offers rich facilities like templates and restructuring mechanisms to manipulate a “virtual tree” structure [45] of a CUI model. Nevertheless, these capabilities are only valid for structure elements enumerated and defined concretely. There is no sufficient solution for the usage of a template, <repeat> or <restructure> for abstract elements with variable occurrences.
Currently, it seems that primitive UIPs may be defined via <part>-based templates, but the template has to be incorporated into a full UIML document and thus, variables have to be defined concretely. In addition, the limitations of parameter definition have to be taken into account.
In the following we provide a summary of current UIML shortcomings.
4) Current UIML Limitations
No meta-parameters for UIML documents. UIML provides no means to parameterize templates or UIML documents even further; meaning the introduction of meta-templates is not possible. UIML documents do not allow variables to govern nested templates. A higher level UIP configuration layer is missing, as indicated on the upper right hand side of in Figure 6. Such a layer could compensate for missing pattern support and allow nested parameterization for the final UIML document.
Figure 7. Schematic UIML <structure>-based template and its sourcing inside a UIML document
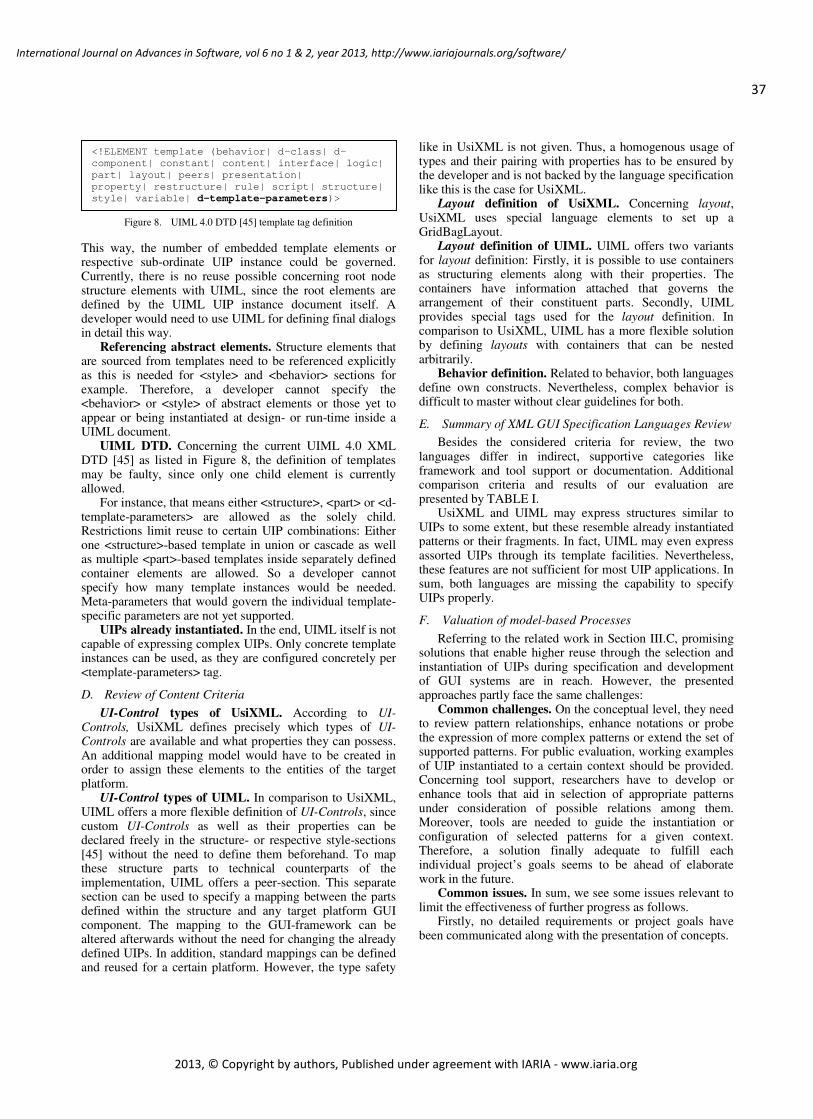
37
International Journal on Advances in Software, vol 6 no 1 & 2, year 2013, http://www.iariajournals.org/software/
2013, © Copyright by authors, Published under agreement with IARIA - www.iaria.org
Figure 8. UIML 4.0 DTD [45] template tag definition
This way, the number of embedded template elements or respective sub-ordinate UIP instance could be governed. Currently, there is no reuse possible concerning root node structure elements with UIML, since the root elements are defined by the UIML UIP instance document itself. A developer would need to use UIML for defining final dialogs in detail this way.
Referencing abstract elements. Structure elements that are sourced from templates need to be referenced explicitly as this is needed for <style> and <behavior> sections for example. Therefore, a developer cannot specify the <behavior> or <style> of abstract elements or those yet to appear or being instantiated at design- or run-time inside a UIML document.
UIML DTD. Concerning the current UIML 4.0 XML DTD [45] as listed in Figure 8, the definition of templates may be faulty, since only one child element is currently allowed.
For instance, that means either <structure>, <part> or <d-template-parameters> are allowed as the solely child. Restrictions limit reuse to certain UIP combinations: Either one <structure>-based template in union or cascade as well as multiple <part>-based templates inside separately defined container elements are allowed. So a developer cannot specify how many template instances would be needed. Meta-parameters that would govern the individual template-specific parameters are not yet supported.
UIPs already instantiated. In the end, UIML itself is not capable of expressing complex UIPs. Only concrete template instances can be used, as they are configured concretely per <template-parameters> tag.
D. Review of Content Criteria
UI-Control types of UsiXML. According to UI-Controls, UsiXML defines precisely which types of UI-Controls are available and what properties they can possess. An additional mapping model would have to be created in order to assign these elements to the entities of the target platform.
UI-Control types of UIML. In comparison to UsiXML, UIML offers a more flexible definition of UI-Controls, since custom UI-Controls as well as their properties can be declared freely in the structure- or respective style-sections [45] without the need to define them beforehand. To map these structure parts to technical counterparts of the implementation, UIML offers a peer-section. This separate section can be used to specify a mapping between the parts defined within the structure and any target platform GUI component. The mapping to the GUI-framework can be altered afterwards without the need for changing the already defined UIPs. In addition, standard mappings can be defined and reused for a certain platform. However, the type safety
like in UsiXML is not given. Thus, a homogenous usage of types and their pairing with properties has to be ensured by the developer and is not backed by the language specification like this is the case for UsiXML.
Layout definition of UsiXML. Concerning layout, UsiXML uses special language elements to set up a GridBagLayout.
Layout definition of UIML. UIML offers two variants for layout definition: Firstly, it is possible to use containers as structuring elements along with their properties. The containers have information attached that governs the arrangement of their constituent parts. Secondly, UIML provides special tags used for the layout definition. In comparison to UsiXML, UIML has a more flexible solution by defining layouts with containers that can be nested arbitrarily.
Behavior definition. Related to behavior, both languages define own constructs. Nevertheless, complex behavior is difficult to master without clear guidelines for both.
E. Summary of XML GUI Specification Languages Review
Besides the considered criteria for review, the two languages differ in indirect, supportive categories like framework and tool support or documentation. Additional comparison criteria and results of our evaluation are presented by TABLE I.
UsiXML and UIML may express structures similar to UIPs to some extent, but these resemble already instantiated patterns or their fragments. In fact, UIML may even express assorted UIPs through its template facilities. Nevertheless, these features are not sufficient for most UIP applications. In sum, both languages are missing the capability to specify UIPs properly.
F. Valuation of model-based Processes
Referring to the related work in Section III.C, promising solutions that enable higher reuse through the selection and instantiation of UIPs during specification and development of GUI systems are in reach. However, the presented approaches partly face the same challenges:
Common challenges. On the conceptual level, they need to review pattern relationships, enhance notations or probe the expression of more complex patterns or extend the set of supported patterns. For public evaluation, working examples of UIP instantiated to a certain context should be provided. Concerning tool support, researchers have to develop or enhance tools that aid in selection of appropriate patterns under consideration of possible relations among them. Moreover, tools are needed to guide the instantiation or configuration of selected patterns for a given context. Therefore, a solution finally adequate to fulfill each individual project’s goals seems to be ahead of elaborate work in the future.
Common issues. In sum, we see some issues relevant to limit the effectiveness of further progress as follows.
Firstly, no detailed requirements or project goals have been communicated along with the presentation of concepts.
<!ELEMENT template (behavior| d-class| d-
component| constant| content| interface| logic|
part| layout| peers| presentation|
property| restructure| rule| script| structure|
style| variable| d-template-parameters)>
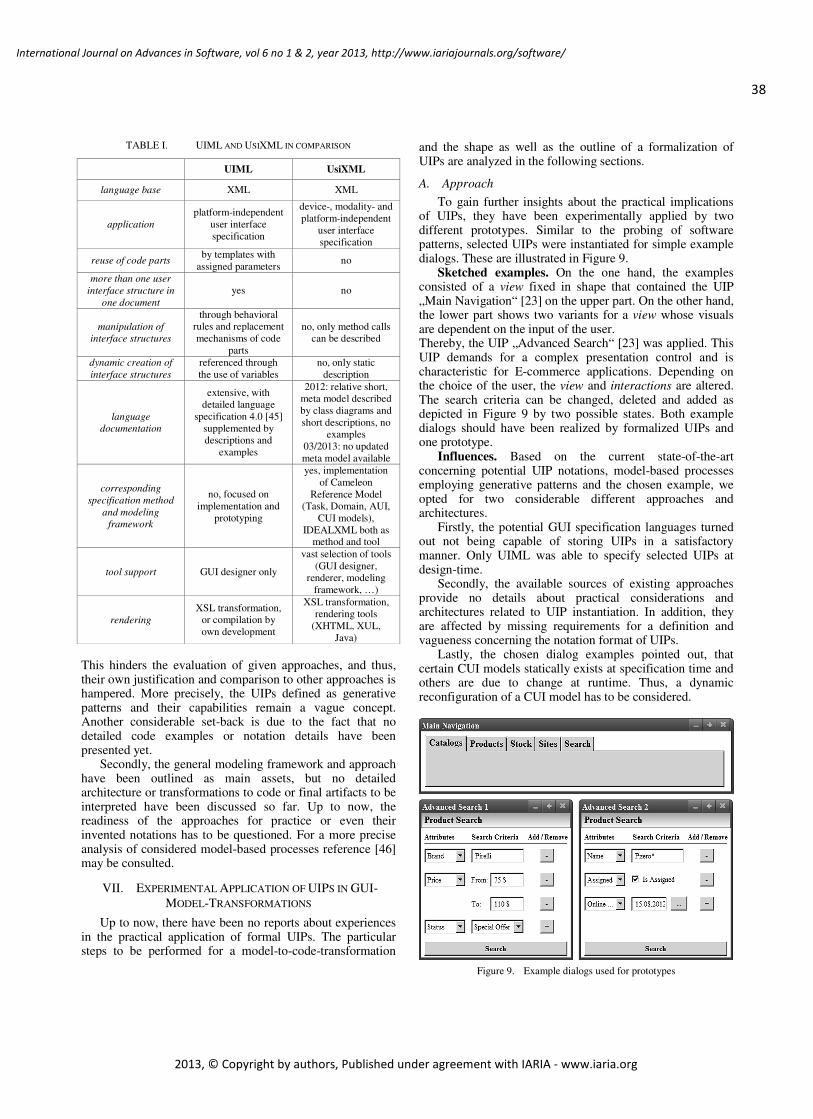
38
International Journal on Advances in Software, vol 6 no 1 & 2, year 2013, http://www.iariajournals.org/software/
2013, © Copyright by authors, Published under agreement with IARIA - www.iaria.org
TABLE I. UIML AND USIXML IN COMPARISON
UIML UsiXML
language base XML XML
application
platform-independent user interface specification
device-, modality- and platform-independent
user interface specification
reuse of code parts by templates with
assigned parameters no
more than one user
interface structure in
one document
yes no
manipulation of
interface structures
through behavioral rules and replacement mechanisms of code
parts
no, only method calls can be described
dynamic creation of
interface structures
referenced through the use of variables
no, only static description
language
documentation
extensive, with detailed language
specification 4.0 [45] supplemented by descriptions and
examples
2012: relative short, meta model described by class diagrams and short descriptions, no
examples 03/2013: no updated meta model available
corresponding
specification method
and modeling
framework
no, focused on implementation and
prototyping
yes, implementation of Cameleon
Reference Model (Task, Domain, AUI,
CUI models), IDEALXML both as
method and tool
tool support GUI designer only
vast selection of tools (GUI designer,
renderer, modeling framework, …)
rendering
XSL transformation, or compilation by own development
XSL transformation, rendering tools
(XHTML, XUL, Java)
This hinders the evaluation of given approaches, and thus, their own justification and comparison to other approaches is hampered. More precisely, the UIPs defined as generative patterns and their capabilities remain a vague concept. Another considerable set-back is due to the fact that no detailed code examples or notation details have been presented yet.
Secondly, the general modeling framework and approach have been outlined as main assets, but no detailed architecture or transformations to code or final artifacts to be interpreted have been discussed so far. Up to now, the readiness of the approaches for practice or even their invented notations has to be questioned. For a more precise analysis of considered model-based processes reference [46] may be consulted.
VII. EXPERIMENTAL APPLICATION OF UIPS IN GUI-MODEL-TRANSFORMATIONS
Up to now, there have been no reports about experiences in the practical application of formal UIPs. The particular steps to be performed for a model-to-code-transformation
and the shape as well as the outline of a formalization of UIPs are analyzed in the following sections.
A. Approach
To gain further insights about the practical implications of UIPs, they have been experimentally applied by two different prototypes. Similar to the probing of software patterns, selected UIPs were instantiated for simple example dialogs. These are illustrated in Figure 9.
Sketched examples. On the one hand, the examples consisted of a view fixed in shape that contained the UIP „Main Navigation“ [23] on the upper part. On the other hand, the lower part shows two variants for a view whose visuals are dependent on the input of the user. Thereby, the UIP „Advanced Search“ [23] was applied. This UIP demands for a complex presentation control and is characteristic for E-commerce applications. Depending on the choice of the user, the view and interactions are altered. The search criteria can be changed, deleted and added as depicted in Figure 9 by two possible states. Both example dialogs should have been realized by formalized UIPs and one prototype.
Influences. Based on the current state-of-the-art concerning potential UIP notations, model-based processes employing generative patterns and the chosen example, we opted for two considerable different approaches and architectures.
Firstly, the potential GUI specification languages turned out not being capable of storing UIPs in a satisfactory manner. Only UIML was able to specify selected UIPs at design-time.
Secondly, the available sources of existing approaches provide no details about practical considerations and architectures related to UIP instantiation. In addition, they are affected by missing requirements for a definition and vagueness concerning the notation format of UIPs.
Lastly, the chosen dialog examples pointed out, that certain CUI models statically exists at specification time and others are due to change at runtime. Thus, a dynamic reconfiguration of a CUI model has to be considered.
Figure 9. Example dialogs used for prototypes
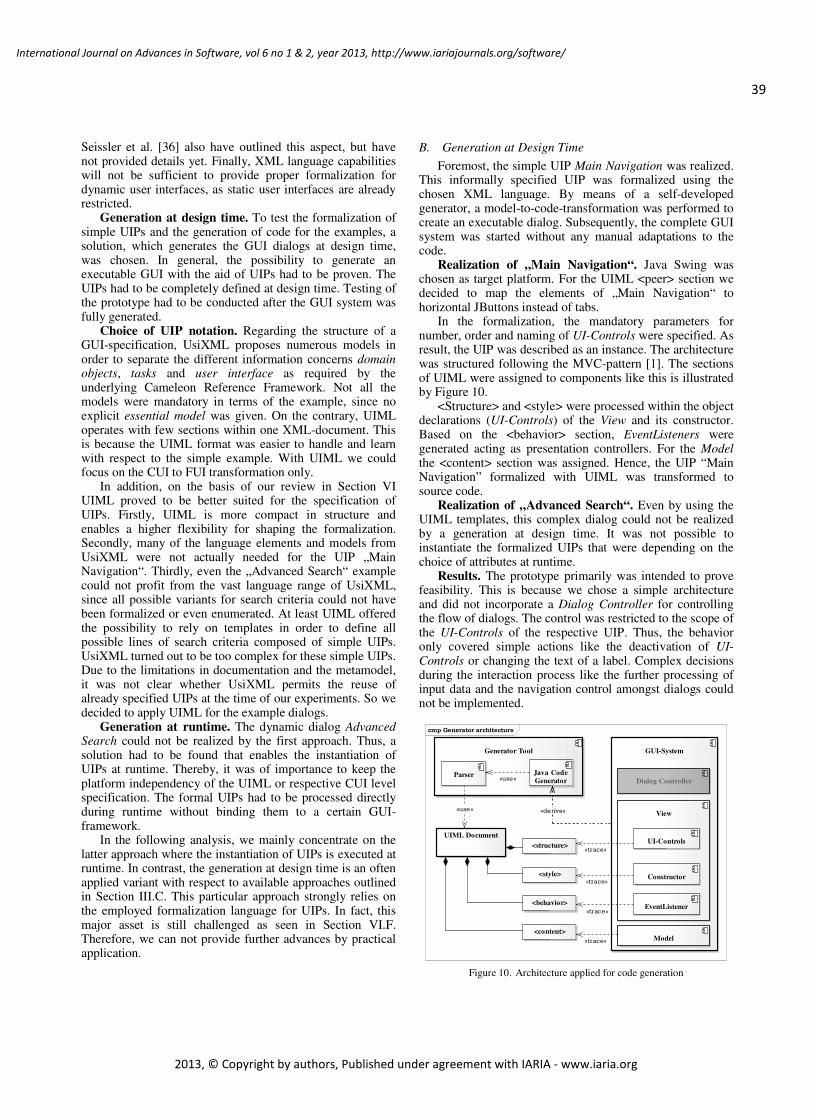
39
International Journal on Advances in Software, vol 6 no 1 & 2, year 2013, http://www.iariajournals.org/software/
2013, © Copyright by authors, Published under agreement with IARIA - www.iaria.org
Seissler et al. [36] also have outlined this aspect, but have not provided details yet. Finally, XML language capabilities will not be sufficient to provide proper formalization for dynamic user interfaces, as static user interfaces are already restricted.
Generation at design time. To test the formalization of simple UIPs and the generation of code for the examples, a solution, which generates the GUI dialogs at design time, was chosen. In general, the possibility to generate an executable GUI with the aid of UIPs had to be proven. The UIPs had to be completely defined at design time. Testing of the prototype had to be conducted after the GUI system was fully generated.
Choice of UIP notation. Regarding the structure of a GUI-specification, UsiXML proposes numerous models in order to separate the different information concerns domain objects, tasks and user interface as required by the underlying Cameleon Reference Framework. Not all the models were mandatory in terms of the example, since no explicit essential model was given. On the contrary, UIML operates with few sections within one XML-document. This is because the UIML format was easier to handle and learn with respect to the simple example. With UIML we could focus on the CUI to FUI transformation only.
In addition, on the basis of our review in Section VI UIML proved to be better suited for the specification of UIPs. Firstly, UIML is more compact in structure and enables a higher flexibility for shaping the formalization. Secondly, many of the language elements and models from UsiXML were not actually needed for the UIP „Main Navigation“. Thirdly, even the „Advanced Search“ example could not profit from the vast language range of UsiXML, since all possible variants for search criteria could not have been formalized or even enumerated. At least UIML offered the possibility to rely on templates in order to define all possible lines of search criteria composed of simple UIPs. UsiXML turned out to be too complex for these simple UIPs. Due to the limitations in documentation and the metamodel, it was not clear whether UsiXML permits the reuse of already specified UIPs at the time of our experiments. So we decided to apply UIML for the example dialogs.
Generation at runtime. The dynamic dialog Advanced Search could not be realized by the first approach. Thus, a solution had to be found that enables the instantiation of UIPs at runtime. Thereby, it was of importance to keep the platform independency of the UIML or respective CUI level specification. The formal UIPs had to be processed directly during runtime without binding them to a certain GUI-framework.
In the following analysis, we mainly concentrate on the latter approach where the instantiation of UIPs is executed at runtime. In contrast, the generation at design time is an often applied variant with respect to available approaches outlined in Section III.C. This particular approach strongly relies on the employed formalization language for UIPs. In fact, this major asset is still challenged as seen in Section VI.F. Therefore, we can not provide further advances by practical application.
B. Generation at Design Time
Foremost, the simple UIP Main Navigation was realized. This informally specified UIP was formalized using the chosen XML language. By means of a self-developed generator, a model-to-code-transformation was performed to create an executable dialog. Subsequently, the complete GUI system was started without any manual adaptations to the code.
Realization of „Main Navigation“. Java Swing was chosen as target platform. For the UIML <peer> section we decided to map the elements of „Main Navigation“ to horizontal JButtons instead of tabs.
In the formalization, the mandatory parameters for number, order and naming of UI-Controls were specified. As result, the UIP was described as an instance. The architecture was structured following the MVC-pattern [1]. The sections of UIML were assigned to components like this is illustrated by Figure 10.
<Structure> and <style> were processed within the object declarations (UI-Controls) of the View and its constructor. Based on the <behavior> section, EventListeners were generated acting as presentation controllers. For the Model the <content> section was assigned. Hence, the UIP “Main Navigation” formalized with UIML was transformed to source code.
Realization of „Advanced Search“. Even by using the UIML templates, this complex dialog could not be realized by a generation at design time. It was not possible to instantiate the formalized UIPs that were depending on the choice of attributes at runtime.
Results. The prototype primarily was intended to prove feasibility. This is because we chose a simple architecture and did not incorporate a Dialog Controller for controlling the flow of dialogs. The control was restricted to the scope of the UI-Controls of the respective UIP. Thus, the behavior only covered simple actions like the deactivation of UI-Controls or changing the text of a label. Complex decisions during the interaction process like the further processing of input data and the navigation control amongst dialogs could not be implemented.
cmp Generator architecture
UIML Document
<structure>
<style>
<behavior>
<content>
Generator Tool
Parser Java Code Generator
GUI-System
Model
View
Dialog Controller
UI-Controls
EventListener
Constructor«trace»
«trace»
«trace»
«trace»
«derive»
«use»
«use»
Figure 10. Architecture applied for code generation
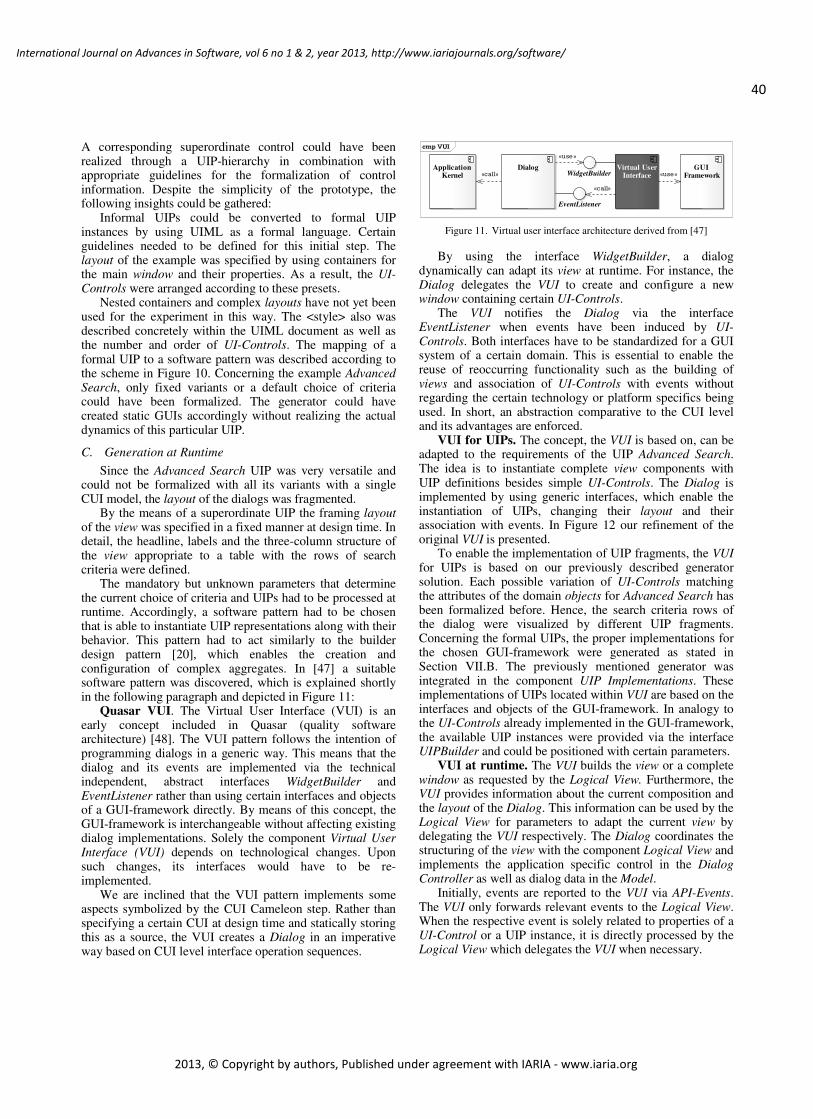
40
International Journal on Advances in Software, vol 6 no 1 & 2, year 2013, http://www.iariajournals.org/software/
2013, © Copyright by authors, Published under agreement with IARIA - www.iaria.org
A corresponding superordinate control could have been realized through a UIP-hierarchy in combination with appropriate guidelines for the formalization of control information. Despite the simplicity of the prototype, the following insights could be gathered:
Informal UIPs could be converted to formal UIP instances by using UIML as a formal language. Certain guidelines needed to be defined for this initial step. The layout of the example was specified by using containers for the main window and their properties. As a result, the UI-Controls were arranged according to these presets.
Nested containers and complex layouts have not yet been used for the experiment in this way. The <style> also was described concretely within the UIML document as well as the number and order of UI-Controls. The mapping of a formal UIP to a software pattern was described according to the scheme in Figure 10. Concerning the example Advanced Search, only fixed variants or a default choice of criteria could have been formalized. The generator could have created static GUIs accordingly without realizing the actual dynamics of this particular UIP.
C. Generation at Runtime
Since the Advanced Search UIP was very versatile and could not be formalized with all its variants with a single CUI model, the layout of the dialogs was fragmented.
By the means of a superordinate UIP the framing layout of the view was specified in a fixed manner at design time. In detail, the headline, labels and the three-column structure of the view appropriate to a table with the rows of search criteria were defined.
The mandatory but unknown parameters that determine the current choice of criteria and UIPs had to be processed at runtime. Accordingly, a software pattern had to be chosen that is able to instantiate UIP representations along with their behavior. This pattern had to act similarly to the builder design pattern [20], which enables the creation and configuration of complex aggregates. In [47] a suitable software pattern was discovered, which is explained shortly in the following paragraph and depicted in Figure 11:
Quasar VUI. The Virtual User Interface (VUI) is an early concept included in Quasar (quality software architecture) [48]. The VUI pattern follows the intention of programming dialogs in a generic way. This means that the dialog and its events are implemented via the technical independent, abstract interfaces WidgetBuilder and EventListener rather than using certain interfaces and objects of a GUI-framework directly. By means of this concept, the GUI-framework is interchangeable without affecting existing dialog implementations. Solely the component Virtual User Interface (VUI) depends on technological changes. Upon such changes, its interfaces would have to be re-implemented.
We are inclined that the VUI pattern implements some aspects symbolized by the CUI Cameleon step. Rather than specifying a certain CUI at design time and statically storing this as a source, the VUI creates a Dialog in an imperative way based on CUI level interface operation sequences.
cmp VUI
GUI Framework
Virtual User Interface
DialogApplication Kernel
EventListener
WidgetBuilder
«call»
«use»
«use»«call»
Figure 11. Virtual user interface architecture derived from [47]
By using the interface WidgetBuilder, a dialog dynamically can adapt its view at runtime. For instance, the Dialog delegates the VUI to create and configure a new window containing certain UI-Controls.
The VUI notifies the Dialog via the interface EventListener when events have been induced by UI-Controls. Both interfaces have to be standardized for a GUI system of a certain domain. This is essential to enable the reuse of reoccurring functionality such as the building of views and association of UI-Controls with events without regarding the certain technology or platform specifics being used. In short, an abstraction comparative to the CUI level and its advantages are enforced.
VUI for UIPs. The concept, the VUI is based on, can be adapted to the requirements of the UIP Advanced Search. The idea is to instantiate complete view components with UIP definitions besides simple UI-Controls. The Dialog is implemented by using generic interfaces, which enable the instantiation of UIPs, changing their layout and their association with events. In Figure 12 our refinement of the original VUI is presented.
To enable the implementation of UIP fragments, the VUI for UIPs is based on our previously described generator solution. Each possible variation of UI-Controls matching the attributes of the domain objects for Advanced Search has been formalized before. Hence, the search criteria rows of the dialog were visualized by different UIP fragments. Concerning the formal UIPs, the proper implementations for the chosen GUI-framework were generated as stated in Section VII.B. The previously mentioned generator was integrated in the component UIP Implementations. These implementations of UIPs located within VUI are based on the interfaces and objects of the GUI-framework. In analogy to the UI-Controls already implemented in the GUI-framework, the available UIP instances were provided via the interface UIPBuilder and could be positioned with certain parameters.
VUI at runtime. The VUI builds the view or a complete window as requested by the Logical View. Furthermore, the VUI provides information about the current composition and the layout of the Dialog. This information can be used by the Logical View for parameters to adapt the current view by delegating the VUI respectively. The Dialog coordinates the structuring of the view with the component Logical View and implements the application specific control in the Dialog Controller as well as dialog data in the Model.
Initially, events are reported to the VUI via API-Events. The VUI only forwards relevant events to the Logical View. When the respective event is solely related to properties of a UI-Control or a UIP instance, it is directly processed by the Logical View which delegates the VUI when necessary.
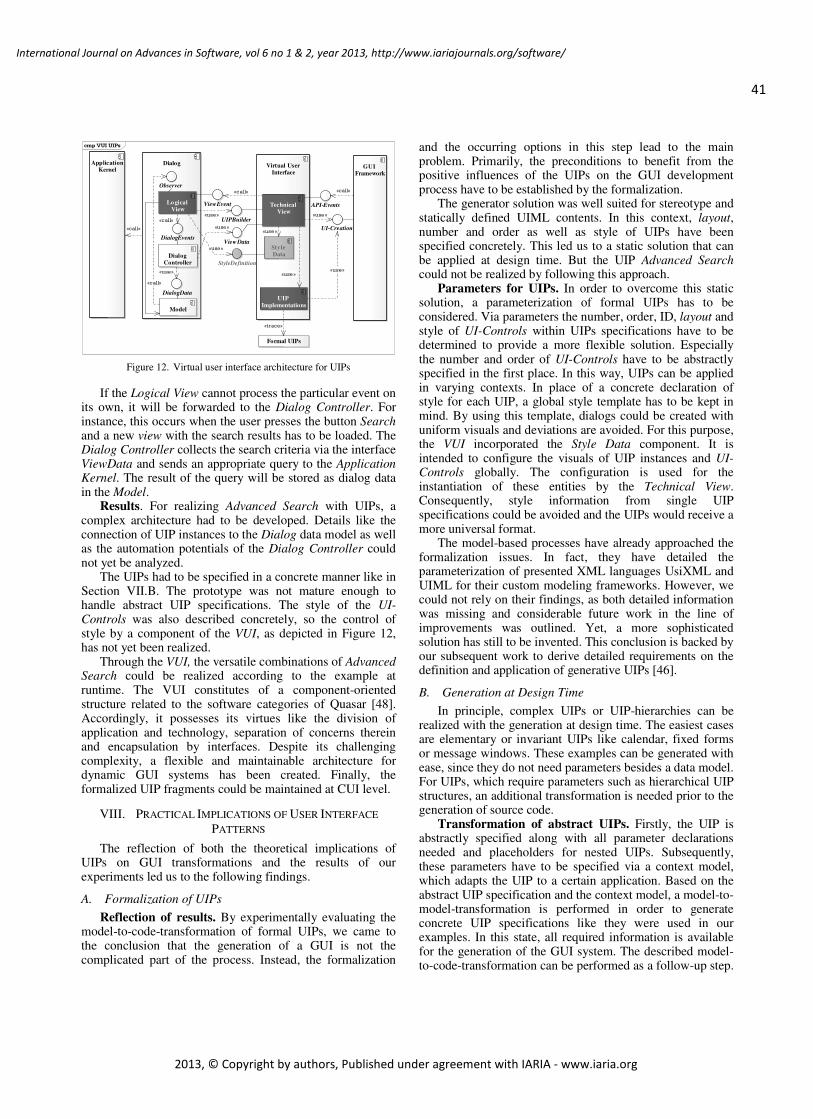
41
International Journal on Advances in Software, vol 6 no 1 & 2, year 2013, http://www.iariajournals.org/software/
2013, © Copyright by authors, Published under agreement with IARIA - www.iaria.org
cmp VUI UIPs
GUI Framework
UI-Creation
API-Events
Virtual User Interface
Dialog
Formal UIPs
UIPBuilder
ViewEvent
Application Kernel
ViewDataStyle Data
Logical View
Dialog Controller
DialogEvents
Model
DialogData
StyleDefinition
Technical View
UIP Implementations
Observer
«use»
«call»
«call»
«use»«call»
«use»
«use»
«call»
«use»
«call»
«use»
«use»
«trace»
«use»
Figure 12. Virtual user interface architecture for UIPs
If the Logical View cannot process the particular event on its own, it will be forwarded to the Dialog Controller. For instance, this occurs when the user presses the button Search and a new view with the search results has to be loaded. The Dialog Controller collects the search criteria via the interface ViewData and sends an appropriate query to the Application Kernel. The result of the query will be stored as dialog data in the Model.
Results. For realizing Advanced Search with UIPs, a complex architecture had to be developed. Details like the connection of UIP instances to the Dialog data model as well as the automation potentials of the Dialog Controller could not yet be analyzed.
The UIPs had to be specified in a concrete manner like in Section VII.B. The prototype was not mature enough to handle abstract UIP specifications. The style of the UI-Controls was also described concretely, so the control of style by a component of the VUI, as depicted in Figure 12, has not yet been realized.
Through the VUI, the versatile combinations of Advanced Search could be realized according to the example at runtime. The VUI constitutes of a component-oriented structure related to the software categories of Quasar [48]. Accordingly, it possesses its virtues like the division of application and technology, separation of concerns therein and encapsulation by interfaces. Despite its challenging complexity, a flexible and maintainable architecture for dynamic GUI systems has been created. Finally, the formalized UIP fragments could be maintained at CUI level.
VIII. PRACTICAL IMPLICATIONS OF USER INTERFACE
PATTERNS
The reflection of both the theoretical implications of UIPs on GUI transformations and the results of our experiments led us to the following findings.
A. Formalization of UIPs
Reflection of results. By experimentally evaluating the model-to-code-transformation of formal UIPs, we came to the conclusion that the generation of a GUI is not the complicated part of the process. Instead, the formalization
and the occurring options in this step lead to the main problem. Primarily, the preconditions to benefit from the positive influences of the UIPs on the GUI development process have to be established by the formalization.
The generator solution was well suited for stereotype and statically defined UIML contents. In this context, layout, number and order as well as style of UIPs have been specified concretely. This led us to a static solution that can be applied at design time. But the UIP Advanced Search could not be realized by following this approach.
Parameters for UIPs. In order to overcome this static solution, a parameterization of formal UIPs has to be considered. Via parameters the number, order, ID, layout and style of UI-Controls within UIPs specifications have to be determined to provide a more flexible solution. Especially the number and order of UI-Controls have to be abstractly specified in the first place. In this way, UIPs can be applied in varying contexts. In place of a concrete declaration of style for each UIP, a global style template has to be kept in mind. By using this template, dialogs could be created with uniform visuals and deviations are avoided. For this purpose, the VUI incorporated the Style Data component. It is intended to configure the visuals of UIP instances and UI-Controls globally. The configuration is used for the instantiation of these entities by the Technical View. Consequently, style information from single UIP specifications could be avoided and the UIPs would receive a more universal format.
The model-based processes have already approached the formalization issues. In fact, they have detailed the parameterization of presented XML languages UsiXML and UIML for their custom modeling frameworks. However, we could not rely on their findings, as both detailed information was missing and considerable future work in the line of improvements was outlined. Yet, a more sophisticated solution has still to be invented. This conclusion is backed by our subsequent work to derive detailed requirements on the definition and application of generative UIPs [46].
B. Generation at Design Time
In principle, complex UIPs or UIP-hierarchies can be realized with the generation at design time. The easiest cases are elementary or invariant UIPs like calendar, fixed forms or message windows. These examples can be generated with ease, since they do not need parameters besides a data model. For UIPs, which require parameters such as hierarchical UIP structures, an additional transformation is needed prior to the generation of source code.
Transformation of abstract UIPs. Firstly, the UIP is abstractly specified along with all parameter declarations needed and placeholders for nested UIPs. Subsequently, these parameters have to be specified via a context model, which adapts the UIP to a certain application. Based on the abstract UIP specification and the context model, a model-to-model-transformation is performed in order to generate concrete UIP specifications like they were used in our examples. In this state, all required information is available for the generation of the GUI system. The described model-to-code-transformation can be performed as a follow-up step.

42
International Journal on Advances in Software, vol 6 no 1 & 2, year 2013, http://www.iariajournals.org/software/
2013, © Copyright by authors, Published under agreement with IARIA - www.iaria.org
It has to be analyzed whether a suitable format is available to realize this approach, by means of UsiXML or IDEALXML and the respective AUI and CUI models.
C. Generation at Runtime
Regarding the UIP Advanced Search, it is clear that a large gap has to be bridged between the essential model and the user interface. A use case, which demands for such dynamic UIPs, hides a whole variety of different GUI-designs and thus CUI level models. Consequently, one static user interface cannot always be established for the elements of the essential model. However, even for these dynamic GUIs UIPs can serve as media to enable reuse of numerous aspects directly by generation along with a composition at runtime. The combined application of both our approaches can provide a feasible solution. Concerning the example from Figure 9, the previously generated layouts actually were reused for the Advanced Search window and the views of search criteria. By instantiation of matching UIPs, even the interactions respectively the presentation control was reused.
Generation of dialogs. As shown with our example, the current VUI is capable of the instantiation and composition of single parts of a certain Logical View. The generation of complete Logical Views on the basis of formal UIPs and their hierarchy could possibly be realized with the VUI architecture. The model describing the Logical View has to refer to the standardized interfaces of the VUI and a common UIP catalog.
To formally specify the UIPs to be used in this environment, only UIML currently seems to be suitable. Firstly, an analysis of the required and reused elementary UIPs as well as the relevant UI-Controls has to be conducted in order to populate the basic level in the hierarchy of UIPs. Next, these UIPs have to be formalized with UIML along with their required data types and invariant behavior that acts as a basis for presentation control within the VUI. Furthermore, the interaction and layout within the Logical View have to be specified using UIML as well. This is because UIML already offers templates that can be parameterized and thus used for the composition of several UIP-documents into one master document establishing a UIP of higher level. Concerning UsiXML, one dialog can only be specified by a single AUI or respective CUI model.
To complete the Dialog, meaning Dialog Controller and Model, relevant information on tasks and data objects has to be included into a formal model. The research on the collaboration between adaptable UIPs and these logical aspects already has advanced [6] [26] [29] [31].
D. Limitations through the Application of UIPs
Individualization. Using UIPs instead of time-consuming manual transformations, a compromise is being contracted: A full individualization of the GUI is not possible with UIPs, since the customization is conducted within the limits of available and formalized UIPs reside on a CUI level of abstraction. Nevertheless, UIPs can embody a further building block of standard software. Customization will be facilitated by defined parameters and automation.
Metamodels. The application of UIPs demands for clear guidelines for modeling of the essential model, which result in a second limitation. The rules for this model need to define stereotype element types and their delimitations. The definition of the essential model should be governed by a metamodel to ensure the uniformity of defined model instance elements. In this respect, it will be defined what types and refinements of tasks, domain objects and domain data types do exist in order to assign them homogenously to certain UIP categories. This concept is essential for the proposal of suitable UIPs for the automated development of GUI systems.
The proposing system needs to work in two ways: On the one hand, the GUI developer asks for a suitable selection of UIPs for a certain part of the essential model at design time. On the other hand, users need to be provided with suitable UIPs in dynamic dialogs at runtime based on their current inputs. The mechanisms can only work if a uniform essential model with clearly defined abstractions derived from fixed guidelines is available as fundamental information.
IX. CONCLUSION AND FUTURE WORK
A. Conclusion
We theoretically and experimentally elaborated that UIPs do have numerous positive influences on the GUI development process. UIPs integrate well in the common GUI transformations and respective models. Therefore, our findings are not restricted to the domain of E-commerce software, but rather can be adapted to other standard software such as enterprise resource planning systems. Even for individual software systems, UIPs can be of interest in case that numerous GUI aspects are similar and their reuse appears reasonable.
Currently, adaptability and reuse of UIPs are limited due to inadequate formalization options. Mostly invariant UIP and simple flat structures can be described by available template facilities of UIML. UIP compositions could only be created by manual implementation. We pointed to the limitations of current UIP specification format options and presented architectural solutions for their practical application. Above all, the upstream transformation of the abstract UIP description into UsiXML or UIML is worth to be considered, since one could use their strength in concretely specifying user interfaces. As an alternative to attempt to fully define UIPs in a single model, the approach to generate complete CUI level models on the basis of either UsiXML or UIML should be considered. Afterwards, the generation of GUIs based on this information would pose a minor issue.
B. Future Work
Formalization. For future work, we primarily see the research in formalizing UIPs. An important goal is to enable UIPs to act as real patterns that are adaptable to various contexts. The synthesis of a UIP-description model is the next step to determine properties and parameters of UIPs exactly and independently from GUI specification languages. Consequently, it can be more accurately assessed whether
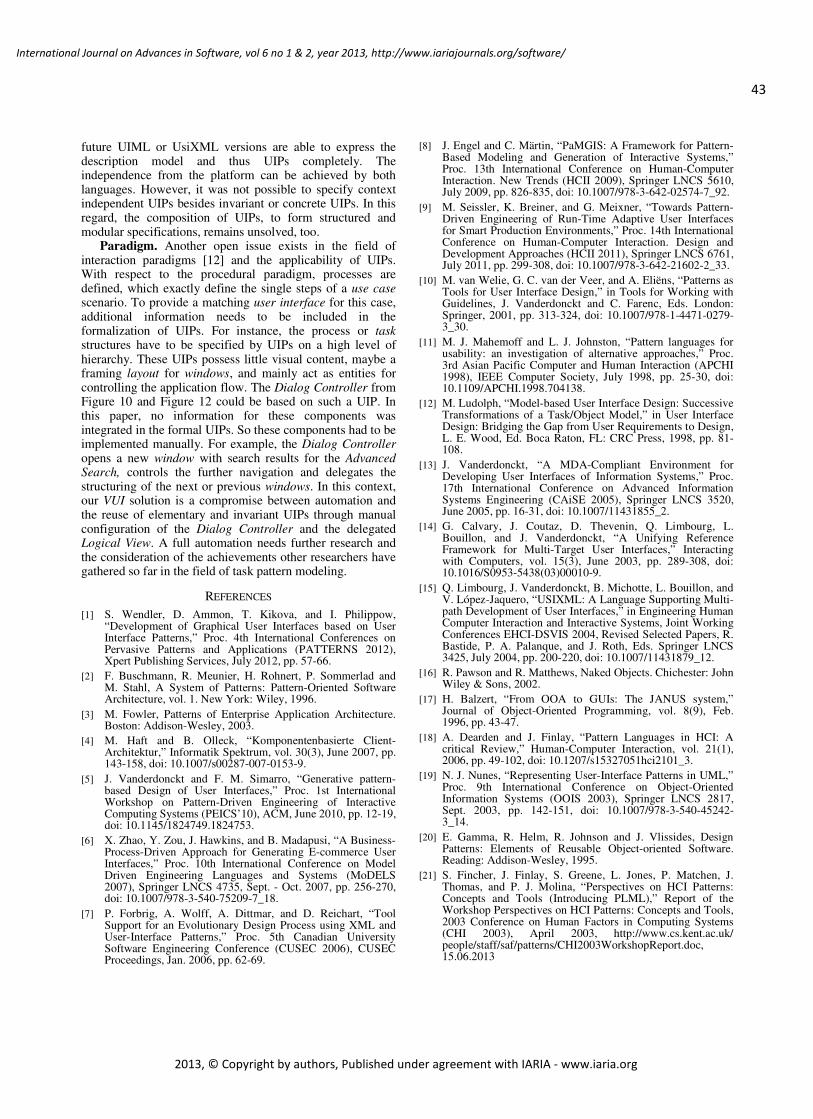
43
International Journal on Advances in Software, vol 6 no 1 & 2, year 2013, http://www.iariajournals.org/software/
2013, © Copyright by authors, Published under agreement with IARIA - www.iaria.org
future UIML or UsiXML versions are able to express the description model and thus UIPs completely. The independence from the platform can be achieved by both languages. However, it was not possible to specify context independent UIPs besides invariant or concrete UIPs. In this regard, the composition of UIPs, to form structured and modular specifications, remains unsolved, too.
Paradigm. Another open issue exists in the field of interaction paradigms [12] and the applicability of UIPs. With respect to the procedural paradigm, processes are defined, which exactly define the single steps of a use case scenario. To provide a matching user interface for this case, additional information needs to be included in the formalization of UIPs. For instance, the process or task structures have to be specified by UIPs on a high level of hierarchy. These UIPs possess little visual content, maybe a framing layout for windows, and mainly act as entities for controlling the application flow. The Dialog Controller from Figure 10 and Figure 12 could be based on such a UIP. In this paper, no information for these components was integrated in the formal UIPs. So these components had to be implemented manually. For example, the Dialog Controller opens a new window with search results for the Advanced Search, controls the further navigation and delegates the structuring of the next or previous windows. In this context, our VUI solution is a compromise between automation and the reuse of elementary and invariant UIPs through manual configuration of the Dialog Controller and the delegated Logical View. A full automation needs further research and the consideration of the achievements other researchers have gathered so far in the field of task pattern modeling.
REFERENCES
[1] S. Wendler, D. Ammon, T. Kikova, and I. Philippow, “Development of Graphical User Interfaces based on User Interface Patterns,” Proc. 4th International Conferences on Pervasive Patterns and Applications (PATTERNS 2012), Xpert Publishing Services, July 2012, pp. 57-66.
[2] F. Buschmann, R. Meunier, H. Rohnert, P. Sommerlad and M. Stahl, A System of Patterns: Pattern-Oriented Software Architecture, vol. 1. New York: Wiley, 1996.
[3] M. Fowler, Patterns of Enterprise Application Architecture. Boston: Addison-Wesley, 2003.
[4] M. Haft and B. Olleck, “Komponentenbasierte Client-Architektur,” Informatik Spektrum, vol. 30(3), June 2007, pp. 143-158, doi: 10.1007/s00287-007-0153-9.
[5] J. Vanderdonckt and F. M. Simarro, “Generative pattern-based Design of User Interfaces,” Proc. 1st International Workshop on Pattern-Driven Engineering of Interactive Computing Systems (PEICS’10), ACM, June 2010, pp. 12-19, doi: 10.1145/1824749.1824753.
[6] X. Zhao, Y. Zou, J. Hawkins, and B. Madapusi, “A Business-Process-Driven Approach for Generating E-commerce User Interfaces,” Proc. 10th International Conference on Model Driven Engineering Languages and Systems (MoDELS 2007), Springer LNCS 4735, Sept. - Oct. 2007, pp. 256-270, doi: 10.1007/978-3-540-75209-7_18.
[7] P. Forbrig, A. Wolff, A. Dittmar, and D. Reichart, “Tool Support for an Evolutionary Design Process using XML and User-Interface Patterns,” Proc. 5th Canadian University Software Engineering Conference (CUSEC 2006), CUSEC Proceedings, Jan. 2006, pp. 62-69.
[8] J. Engel and C. Märtin, “PaMGIS: A Framework for Pattern-Based Modeling and Generation of Interactive Systems,” Proc. 13th International Conference on Human-Computer Interaction. New Trends (HCII 2009), Springer LNCS 5610, July 2009, pp. 826-835, doi: 10.1007/978-3-642-02574-7_92.
[9] M. Seissler, K. Breiner, and G. Meixner, “Towards Pattern-Driven Engineering of Run-Time Adaptive User Interfaces for Smart Production Environments,” Proc. 14th International Conference on Human-Computer Interaction. Design and Development Approaches (HCII 2011), Springer LNCS 6761, July 2011, pp. 299-308, doi: 10.1007/978-3-642-21602-2_33.
[10] M. van Welie, G. C. van der Veer, and A. Eliëns, “Patterns as Tools for User Interface Design,” in Tools for Working with Guidelines, J. Vanderdonckt and C. Farenc, Eds. London: Springer, 2001, pp. 313-324, doi: 10.1007/978-1-4471-0279-3_30.
[11] M. J. Mahemoff and L. J. Johnston, “Pattern languages for usability: an investigation of alternative approaches,” Proc. 3rd Asian Pacific Computer and Human Interaction (APCHI 1998), IEEE Computer Society, July 1998, pp. 25-30, doi: 10.1109/APCHI.1998.704138.
[12] M. Ludolph, “Model-based User Interface Design: Successive Transformations of a Task/Object Model,” in User Interface Design: Bridging the Gap from User Requirements to Design, L. E. Wood, Ed. Boca Raton, FL: CRC Press, 1998, pp. 81-108.
[13] J. Vanderdonckt, “A MDA-Compliant Environment for Developing User Interfaces of Information Systems,” Proc. 17th International Conference on Advanced Information Systems Engineering (CAiSE 2005), Springer LNCS 3520, June 2005, pp. 16-31, doi: 10.1007/11431855_2.
[14] G. Calvary, J. Coutaz, D. Thevenin, Q. Limbourg, L. Bouillon, and J. Vanderdonckt, “A Unifying Reference Framework for Multi-Target User Interfaces,” Interacting with Computers, vol. 15(3), June 2003, pp. 289-308, doi: 10.1016/S0953-5438(03)00010-9.
[15] Q. Limbourg, J. Vanderdonckt, B. Michotte, L. Bouillon, and V. López-Jaquero, “USIXML: A Language Supporting Multi-path Development of User Interfaces,” in Engineering Human Computer Interaction and Interactive Systems, Joint Working Conferences EHCI-DSVIS 2004, Revised Selected Papers, R. Bastide, P. A. Palanque, and J. Roth, Eds. Springer LNCS 3425, July 2004, pp. 200-220, doi: 10.1007/11431879_12.
[16] R. Pawson and R. Matthews, Naked Objects. Chichester: John Wiley & Sons, 2002.
[17] H. Balzert, “From OOA to GUIs: The JANUS system,” Journal of Object-Oriented Programming, vol. 8(9), Feb. 1996, pp. 43-47.
[18] A. Dearden and J. Finlay, “Pattern Languages in HCI: A critical Review,” Human-Computer Interaction, vol. 21(1), 2006, pp. 49-102, doi: 10.1207/s15327051hci2101_3.
[19] N. J. Nunes, “Representing User-Interface Patterns in UML,” Proc. 9th International Conference on Object-Oriented Information Systems (OOIS 2003), Springer LNCS 2817, Sept. 2003, pp. 142-151, doi: 10.1007/978-3-540-45242-3_14.
[20] E. Gamma, R. Helm, R. Johnson and J. Vlissides, Design Patterns: Elements of Reusable Object-oriented Software. Reading: Addison-Wesley, 1995.
[21] S. Fincher, J. Finlay, S. Greene, L. Jones, P. Matchen, J. Thomas, and P. J. Molina, “Perspectives on HCI Patterns: Concepts and Tools (Introducing PLML),” Report of the Workshop Perspectives on HCI Patterns: Concepts and Tools, 2003 Conference on Human Factors in Computing Systems (CHI 2003), April 2003, http://www.cs.kent.ac.uk/ people/staff/saf/patterns/CHI2003WorkshopReport.doc, 15.06.2013
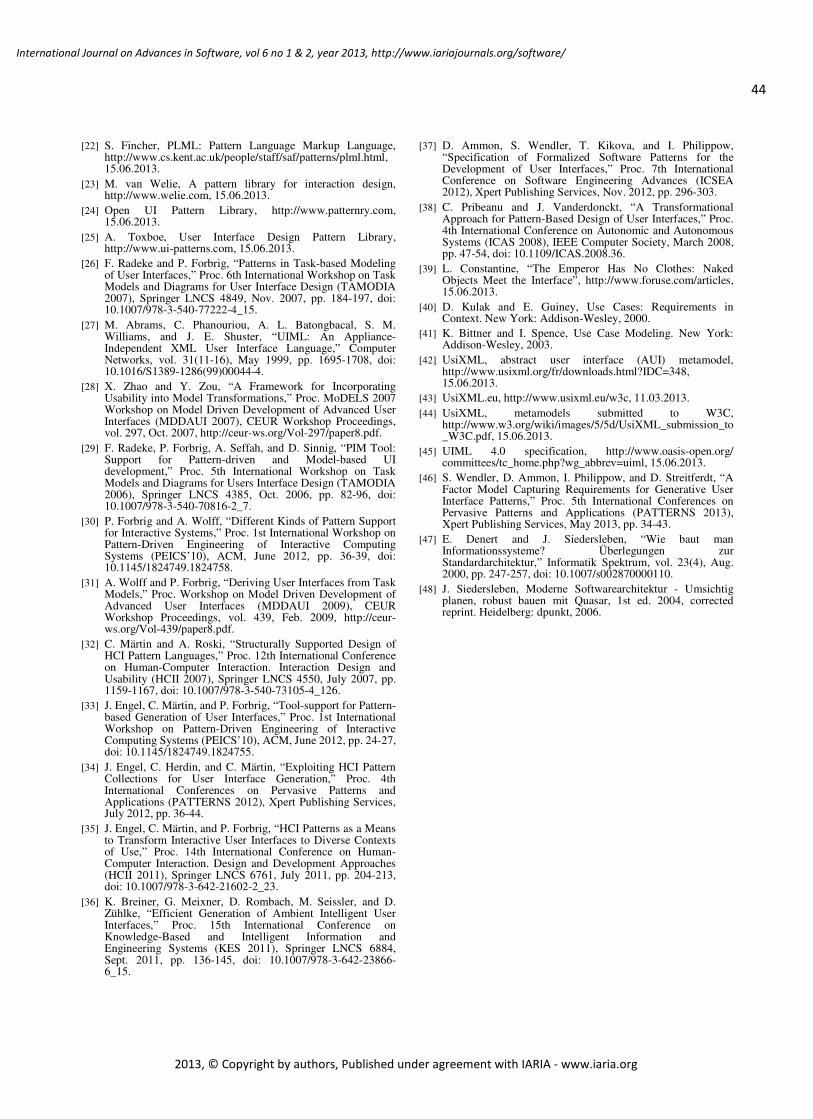
44
International Journal on Advances in Software, vol 6 no 1 & 2, year 2013, http://www.iariajournals.org/software/
2013, © Copyright by authors, Published under agreement with IARIA - www.iaria.org
[22] S. Fincher, PLML: Pattern Language Markup Language, http://www.cs.kent.ac.uk/people/staff/saf/patterns/plml.html, 15.06.2013.
[23] M. van Welie, A pattern library for interaction design, http://www.welie.com, 15.06.2013.
[24] Open UI Pattern Library, http://www.patternry.com, 15.06.2013.
[25] A. Toxboe, User Interface Design Pattern Library, http://www.ui-patterns.com, 15.06.2013.
[26] F. Radeke and P. Forbrig, “Patterns in Task-based Modeling of User Interfaces,” Proc. 6th International Workshop on Task Models and Diagrams for User Interface Design (TAMODIA 2007), Springer LNCS 4849, Nov. 2007, pp. 184-197, doi: 10.1007/978-3-540-77222-4_15.
[27] M. Abrams, C. Phanouriou, A. L. Batongbacal, S. M. Williams, and J. E. Shuster, “UIML: An Appliance-Independent XML User Interface Language,” Computer Networks, vol. 31(11-16), May 1999, pp. 1695-1708, doi: 10.1016/S1389-1286(99)00044-4.
[28] X. Zhao and Y. Zou, “A Framework for Incorporating Usability into Model Transformations,” Proc. MoDELS 2007 Workshop on Model Driven Development of Advanced User Interfaces (MDDAUI 2007), CEUR Workshop Proceedings, vol. 297, Oct. 2007, http://ceur-ws.org/Vol-297/paper8.pdf.
[29] F. Radeke, P. Forbrig, A. Seffah, and D. Sinnig, “PIM Tool: Support for Pattern-driven and Model-based UI development,” Proc. 5th International Workshop on Task Models and Diagrams for Users Interface Design (TAMODIA 2006), Springer LNCS 4385, Oct. 2006, pp. 82-96, doi: 10.1007/978-3-540-70816-2_7.
[30] P. Forbrig and A. Wolff, “Different Kinds of Pattern Support for Interactive Systems,” Proc. 1st International Workshop on Pattern-Driven Engineering of Interactive Computing Systems (PEICS’10), ACM, June 2012, pp. 36-39, doi: 10.1145/1824749.1824758.
[31] A. Wolff and P. Forbrig, “Deriving User Interfaces from Task Models,” Proc. Workshop on Model Driven Development of Advanced User Interfaces (MDDAUI 2009), CEUR Workshop Proceedings, vol. 439, Feb. 2009, http://ceur-ws.org/Vol-439/paper8.pdf.
[32] C. Märtin and A. Roski, “Structurally Supported Design of HCI Pattern Languages,” Proc. 12th International Conference on Human-Computer Interaction. Interaction Design and Usability (HCII 2007), Springer LNCS 4550, July 2007, pp. 1159-1167, doi: 10.1007/978-3-540-73105-4_126.
[33] J. Engel, C. Märtin, and P. Forbrig, “Tool-support for Pattern-based Generation of User Interfaces,” Proc. 1st International Workshop on Pattern-Driven Engineering of Interactive Computing Systems (PEICS’10), ACM, June 2012, pp. 24-27, doi: 10.1145/1824749.1824755.
[34] J. Engel, C. Herdin, and C. Märtin, “Exploiting HCI Pattern Collections for User Interface Generation,” Proc. 4th International Conferences on Pervasive Patterns and Applications (PATTERNS 2012), Xpert Publishing Services, July 2012, pp. 36-44.
[35] J. Engel, C. Märtin, and P. Forbrig, “HCI Patterns as a Means to Transform Interactive User Interfaces to Diverse Contexts of Use,” Proc. 14th International Conference on Human-Computer Interaction. Design and Development Approaches (HCII 2011), Springer LNCS 6761, July 2011, pp. 204-213, doi: 10.1007/978-3-642-21602-2_23.
[36] K. Breiner, G. Meixner, D. Rombach, M. Seissler, and D. Zühlke, “Efficient Generation of Ambient Intelligent User Interfaces,” Proc. 15th International Conference on Knowledge-Based and Intelligent Information and Engineering Systems (KES 2011), Springer LNCS 6884, Sept. 2011, pp. 136-145, doi: 10.1007/978-3-642-23866-6_15.
[37] D. Ammon, S. Wendler, T. Kikova, and I. Philippow, “Specification of Formalized Software Patterns for the Development of User Interfaces,” Proc. 7th International Conference on Software Engineering Advances (ICSEA 2012), Xpert Publishing Services, Nov. 2012, pp. 296-303.
[38] C. Pribeanu and J. Vanderdonckt, “A Transformational Approach for Pattern-Based Design of User Interfaces,” Proc. 4th International Conference on Autonomic and Autonomous Systems (ICAS 2008), IEEE Computer Society, March 2008, pp. 47-54, doi: 10.1109/ICAS.2008.36.
[39] L. Constantine, “The Emperor Has No Clothes: Naked Objects Meet the Interface”, http://www.foruse.com/articles, 15.06.2013.
[40] D. Kulak and E. Guiney, Use Cases: Requirements in Context. New York: Addison-Wesley, 2000.
[41] K. Bittner and I. Spence, Use Case Modeling. New York: Addison-Wesley, 2003.
[42] UsiXML, abstract user interface (AUI) metamodel, http://www.usixml.org/fr/downloads.html?IDC=348, 15.06.2013.
[43] UsiXML.eu, http://www.usixml.eu/w3c, 11.03.2013. [44] UsiXML, metamodels submitted to W3C,
http://www.w3.org/wiki/images/5/5d/UsiXML_submission_to_W3C.pdf, 15.06.2013.
[45] UIML 4.0 specification, http://www.oasis-open.org/ committees/tc_home.php?wg_abbrev=uiml, 15.06.2013.
[46] S. Wendler, D. Ammon, I. Philippow, and D. Streitferdt, “A Factor Model Capturing Requirements for Generative User Interface Patterns,” Proc. 5th International Conferences on Pervasive Patterns and Applications (PATTERNS 2013), Xpert Publishing Services, May 2013, pp. 34-43.
[47] E. Denert and J. Siedersleben, “Wie baut man Informationssysteme? Überlegungen zur Standardarchitektur,” Informatik Spektrum, vol. 23(4), Aug. 2000, pp. 247-257, doi: 10.1007/s002870000110.
[48] J. Siedersleben, Moderne Softwarearchitektur - Umsichtig planen, robust bauen mit Quasar, 1st ed. 2004, corrected reprint. Heidelberg: dpunkt, 2006.
45
International Journal on Advances in Software, vol 6 no 1 & 2, year 2013, http://www.iariajournals.org/software/
2013, © Copyright by authors, Published under agreement with IARIA - www.iaria.org
Message-Passing Interface for Java Applications: Practical Aspects of LeveragingHigh Performance Computing to Speed and Scale Up the Semantic Web
Alexey Cheptsov and Bastian KollerHigh Performance Computing Center Stuttgart (HLRS)
University of Stuttgart70550 Stuttgart, Germany
Email: cheptsov,[email protected]
Abstract—The age of Big Data introduces a variety ofchallenges in how to store, access, process, and stream mas-sive amounts of structured and unstructured data effectively.Among those domains that are impacted by the Big Dataproblem at most, the Semantic Web holds a leading position.By current estimates, the volume of Semantic Web data is ex-ceeding the order of magnitude of billions of triples. Using HighPerformance Computing infrastructures is essential in dealingwith these massive data volumes. Unfortunately, the mostSemantic Web applications are developed in Java language,which makes them incompatible with the traditional highperformance computing software solutions, which are tailoredfor compiled codes developed in C and Fortran languages. Theknown attempts to port existing parallelization frameworks,such as the Message-Passing Interface, to the Java platformhave proved either a poor efficiency in terms of performanceand scalability, or a limited usability due to a considerableconfiguration and installation overhead. We present an efficientporting of Java bindings based on Open MPI - one of the mostpopular Message-Passing Interface implementations for thetraditional (C, C++, and Fortran) supercomputing applications.
Keywords-High Performance Computing, Big Data, SemanticWeb, Performance, Scalability, Message-Passing Interface, OpenMPI.
I. INTRODUCTION
The data volumes collected by the Semantic Web havealready reached the order of magnitude of billions of triplesand is expected to further grow in the future, which positionsthis Web extension to dominate the data-centric computingin the oncoming decade. Processing (e.g., inferring) suchvolume of data, such as generated in the social networkslike Facebook or Twitter, or collected in domain-orientedknowledge bases like pharmacological data integration plat-form OpenPHACTS, poses a lot of challenges in terms ofreaching the high performance and scalability by the soft-ware applications. As discussed in our previous publication[1], while there is a number of existing highly-scalablesoftware solutions for storing data, such as Jena [2], thescalable data processing constitutes the major challenge fordata-centric applications. This work is discussing applicationof the techniques elaborated in the previous paper to theBig Data application domain. In the literature, it is oftenreferred as “Big Data” a set of issues related to scaling
Figure 1. Parallelization patterns in a Reasoning application’s workflow.
existing processing techniques to large amounts of data, forwhich standard computing platforms have proved inefficient[3]. Among those data-centric communities that address theBig Data, the Semantic Web enjoys a prominent position.Semantic Data are massively produced and published at thespeed that makes traditional processing techniques (suchas reasoning) inefficient when applied to the real-scaledata. It is worth mentioning that the typical Semantic Webapplication workflows are highly parallel in their nature (seeFigure 1) and are well-suited to run in high performancecomputing environments.
The data scaling problem in the Semantic Web is con-sidered in two its main aspects - horizontal and verticalscale. Horizontal scaling means dealing with heterogeneous,and often unstructured data acquired from heterogeneoussources. The famous Linked Open Data cloud diagram [4]consists of hundreds of diverse data sources, ranging fromgeo-spatial cartographic sources like Open Street Map, togovernmental data, opened to the publicity, like data.gov.Vertical scaling implies scaling up the size of similarlystructured data. Along the open government data spawnsover 851,000 data sets across 153 catalogues from more than30 countries, as estimated in [5] at the beginning of 2012.Processing data in such an amount is not straightforward andchallenging for any of the currently existing frameworks andinfrastructures. Whereas there are some known algorithmsdealing with the horizontal scaling complexity, such as
46
International Journal on Advances in Software, vol 6 no 1 & 2, year 2013, http://www.iariajournals.org/software/
2013, © Copyright by authors, Published under agreement with IARIA - www.iaria.org
Figure 2. Execution of a reasoning application’s workflow on a highperformance computing system.
identification of the information subsets related to a specificproblem, i.e., subsetting, the vertical scaling remains themajor challenge for all existing algorithms.
Another essential property of the Big Data is complexity.Semantic applications must deal with rich ontological mod-els describing complex domain knowledge, and at the sametime highly dynamic data representing recent or relevant in-formation, as produced by streaming or search-enabled datasources. A considerable part of the web data is produced asa result of automatic reasoning over streaming informationfrom sensors, social networks, and other sources, which arehighly unstructured, inconsistent, noisy and incomplete.
The availability of such an amount of complex data makesit attractive for Semantic Web applications to exploit HighPerformance Computing (HPC) infrastructures to effectivelyprocess the Big Data. There have been several pilot researchprojects aiming to enable the potential of supercomputinginfrastructures to the Semantic Web application develop-ment. One of the prominent examples of such projects isthe Large Knowledge Collider (LarKC), which is a softwareplatform for large-scale incomplete reasoning. In particular,LarKC provides interfaces for loading off the computation-intensive part of a reasoning application’s workflow to asupercomputing infrastructure (see Figure 2).
Both commodity and more dedicated HPC architectures,such as the Cray XMT [6], have been held in focus ofthe data-intensive Web applications. The XMT dedicatedsystem, however, has proved successful only for a limitednumber of tasks so far, which is mainly due to the complex-ity of exploiting the offered software frameworks (mainlynon-standard pragma-based C extensions).
Unfortunately, most Semantic Web applications are writ-ten in the Java programming language, whereas currentframeworks that make the most out of HPC infrastructures,such as the Message Passing Interface (MPI), only target Cor Fortran applications. MPI is a process-based paralleliza-tion strategy, which is a de-facto standard in the area ofparallel computing for C, C++, and Fortran applications.Known alternative parallelization frameworks to MPI that
conform with Java, such as Hadoop[7] or Ibis [8], prove tobe scalable though but are not even nearly as efficient orwell-developed as numerous open-source implementationsof MPI, such as MPICH or Open MPI[9].
The implementation in Java has prevented MPI to beadopted by Semantic Web applications. However, given thevast data size addressed by the modern Web applications,and given the emergence of the new communities interestedin adopting MPI, it seems natural to explore the benefits ofMPI for Java applications on the HPC platforms as well.Introducing MPI to Java poses several challenges. First,the API set should be compliant with the MPI standard[9], but not downgrade the flexibility of the native Javalanguage constructions. Second, the hardware support shouldbe offered in a way that overcomes the limitation of the Javarun-time environment, but meet such important requirementsas thread-safety. Third, MPI support should be seamlesslyintegrated in the parallel application’s execution environ-ment. All of these three issues of functionality, adaptivity,and usability must complexly be addressed to make the useof MPI in Java applications practical and useful.
We look how to resolve the above-mentioned issues ina way that leverages the advances of the existing MPIframeworks. We present and evaluate our solution for intro-ducing Java support in Open MPI [10], which is one of themost popular open source MPI-2 standard’s implementationsnowadays. Our approach is based on the integration of JavaMPI bindings developed for mpiJava [11] directly in thenative C realization of Open MPI, thus minimizing thebindings overhead and leveraging the Open MPI’s run-timeand development environment to ensure the high scalabilityof the Java parallel application. We also give examples ofsuccessful pilot scenarios implemented with our solution anddiscuss future work in terms of the development, implemen-tation, and standardization activities.
II. RELATED WORK
There are only a few alternatives to MPI in introducingthe large-scale parallelism to Java applications. The mostpromising among those alternatives in terms of the perfor-mance and usability are solutions offered by IBIS/JavaGATand MapReduce/Hadoop.
IBIS [12] is a middleware stack used for running Javaapplications in distributed and heterogeneous computing en-vironments. IBIS leverages the peer-to-peer communicationtechnology by means of the proprietary Java RMI (Re-mote Memory Invocation) implementation, based on GAT(Grid Application Toolkit) [13]. The Java realization ofGAT (JavaGAT) is a middleware stack that allows the Javaapplication to instatiate its classes remotely on the network-connected resource, i.e., a remote Java Virtual Machine.Along with the traditional access protocols. e.g., telnet orssh, the advanced access protocols, such as ssh-pbs forclusters with PBS(cluster Portable Batch System)-like job
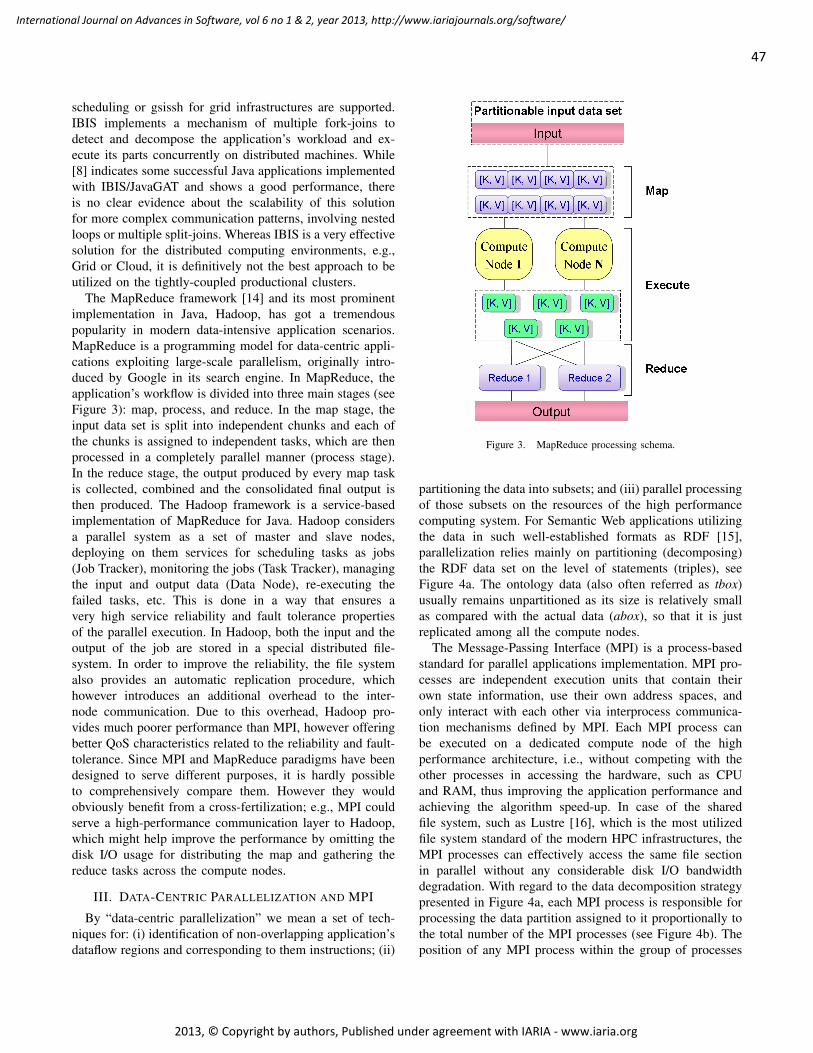
47
International Journal on Advances in Software, vol 6 no 1 & 2, year 2013, http://www.iariajournals.org/software/
2013, © Copyright by authors, Published under agreement with IARIA - www.iaria.org
scheduling or gsissh for grid infrastructures are supported.IBIS implements a mechanism of multiple fork-joins todetect and decompose the application’s workload and ex-ecute its parts concurrently on distributed machines. While[8] indicates some successful Java applications implementedwith IBIS/JavaGAT and shows a good performance, thereis no clear evidence about the scalability of this solutionfor more complex communication patterns, involving nestedloops or multiple split-joins. Whereas IBIS is a very effectivesolution for the distributed computing environments, e.g.,Grid or Cloud, it is definitively not the best approach to beutilized on the tightly-coupled productional clusters.
The MapReduce framework [14] and its most prominentimplementation in Java, Hadoop, has got a tremendouspopularity in modern data-intensive application scenarios.MapReduce is a programming model for data-centric appli-cations exploiting large-scale parallelism, originally intro-duced by Google in its search engine. In MapReduce, theapplication’s workflow is divided into three main stages (seeFigure 3): map, process, and reduce. In the map stage, theinput data set is split into independent chunks and each ofthe chunks is assigned to independent tasks, which are thenprocessed in a completely parallel manner (process stage).In the reduce stage, the output produced by every map taskis collected, combined and the consolidated final output isthen produced. The Hadoop framework is a service-basedimplementation of MapReduce for Java. Hadoop considersa parallel system as a set of master and slave nodes,deploying on them services for scheduling tasks as jobs(Job Tracker), monitoring the jobs (Task Tracker), managingthe input and output data (Data Node), re-executing thefailed tasks, etc. This is done in a way that ensures avery high service reliability and fault tolerance propertiesof the parallel execution. In Hadoop, both the input and theoutput of the job are stored in a special distributed file-system. In order to improve the reliability, the file systemalso provides an automatic replication procedure, whichhowever introduces an additional overhead to the inter-node communication. Due to this overhead, Hadoop pro-vides much poorer performance than MPI, however offeringbetter QoS characteristics related to the reliability and fault-tolerance. Since MPI and MapReduce paradigms have beendesigned to serve different purposes, it is hardly possibleto comprehensively compare them. However they wouldobviously benefit from a cross-fertilization; e.g., MPI couldserve a high-performance communication layer to Hadoop,which might help improve the performance by omitting thedisk I/O usage for distributing the map and gathering thereduce tasks across the compute nodes.
III. DATA-CENTRIC PARALLELIZATION AND MPI
By “data-centric parallelization” we mean a set of tech-niques for: (i) identification of non-overlapping application’sdataflow regions and corresponding to them instructions; (ii)
Figure 3. MapReduce processing schema.
partitioning the data into subsets; and (iii) parallel processingof those subsets on the resources of the high performancecomputing system. For Semantic Web applications utilizingthe data in such well-established formats as RDF [15],parallelization relies mainly on partitioning (decomposing)the RDF data set on the level of statements (triples), seeFigure 4a. The ontology data (also often referred as tbox)usually remains unpartitioned as its size is relatively smallas compared with the actual data (abox), so that it is justreplicated among all the compute nodes.
The Message-Passing Interface (MPI) is a process-basedstandard for parallel applications implementation. MPI pro-cesses are independent execution units that contain theirown state information, use their own address spaces, andonly interact with each other via interprocess communica-tion mechanisms defined by MPI. Each MPI process canbe executed on a dedicated compute node of the highperformance architecture, i.e., without competing with theother processes in accessing the hardware, such as CPUand RAM, thus improving the application performance andachieving the algorithm speed-up. In case of the sharedfile system, such as Lustre [16], which is the most utilizedfile system standard of the modern HPC infrastructures, theMPI processes can effectively access the same file sectionin parallel without any considerable disk I/O bandwidthdegradation. With regard to the data decomposition strategypresented in Figure 4a, each MPI process is responsible forprocessing the data partition assigned to it proportionally tothe total number of the MPI processes (see Figure 4b). Theposition of any MPI process within the group of processes
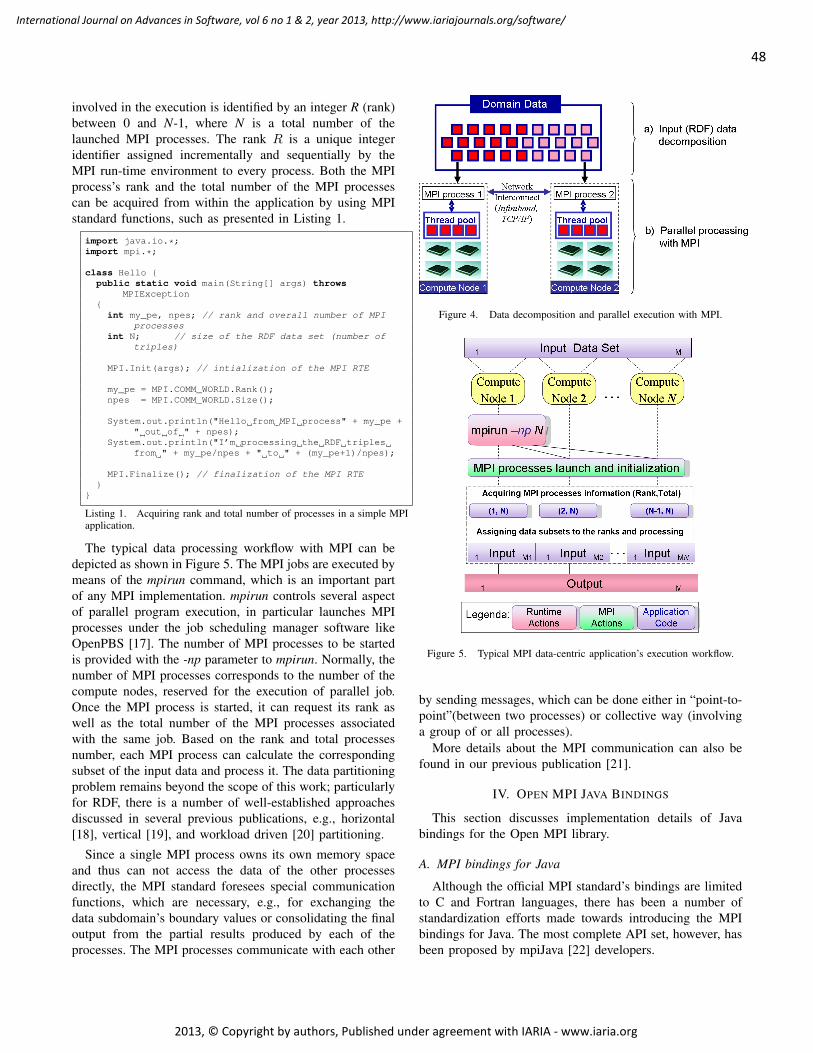
48
International Journal on Advances in Software, vol 6 no 1 & 2, year 2013, http://www.iariajournals.org/software/
2013, © Copyright by authors, Published under agreement with IARIA - www.iaria.org
involved in the execution is identified by an integer R (rank)between 0 and N-1, where N is a total number of thelaunched MPI processes. The rank R is a unique integeridentifier assigned incrementally and sequentially by theMPI run-time environment to every process. Both the MPIprocess’s rank and the total number of the MPI processescan be acquired from within the application by using MPIstandard functions, such as presented in Listing 1.
import java.io.*;import mpi.*;
class Hello public static void main(String[] args) throws
MPIExceptionint my_pe, npes; // rank and overall number of MPI
processesint N; // size of the RDF data set (number of
triples)
MPI.Init(args); // intialization of the MPI RTE
my_pe = MPI.COMM_WORLD.Rank();npes = MPI.COMM_WORLD.Size();
System.out.println("Hello from MPI process" + my_pe +" out of " + npes);
System.out.println("I’m processing the RDF triplesfrom " + my_pe/npes + " to " + (my_pe+1)/npes);
MPI.Finalize(); // finalization of the MPI RTE
Listing 1. Acquiring rank and total number of processes in a simple MPIapplication.
The typical data processing workflow with MPI can bedepicted as shown in Figure 5. The MPI jobs are executed bymeans of the mpirun command, which is an important partof any MPI implementation. mpirun controls several aspectof parallel program execution, in particular launches MPIprocesses under the job scheduling manager software likeOpenPBS [17]. The number of MPI processes to be startedis provided with the -np parameter to mpirun. Normally, thenumber of MPI processes corresponds to the number of thecompute nodes, reserved for the execution of parallel job.Once the MPI process is started, it can request its rank aswell as the total number of the MPI processes associatedwith the same job. Based on the rank and total processesnumber, each MPI process can calculate the correspondingsubset of the input data and process it. The data partitioningproblem remains beyond the scope of this work; particularlyfor RDF, there is a number of well-established approachesdiscussed in several previous publications, e.g., horizontal[18], vertical [19], and workload driven [20] partitioning.
Since a single MPI process owns its own memory spaceand thus can not access the data of the other processesdirectly, the MPI standard foresees special communicationfunctions, which are necessary, e.g., for exchanging thedata subdomain’s boundary values or consolidating the finaloutput from the partial results produced by each of theprocesses. The MPI processes communicate with each other
Figure 4. Data decomposition and parallel execution with MPI.
Figure 5. Typical MPI data-centric application’s execution workflow.
by sending messages, which can be done either in “point-to-point”(between two processes) or collective way (involvinga group of or all processes).
More details about the MPI communication can also befound in our previous publication [21].
IV. OPEN MPI JAVA BINDINGS
This section discusses implementation details of Javabindings for the Open MPI library.
A. MPI bindings for Java
Although the official MPI standard’s bindings are limitedto C and Fortran languages, there has been a number ofstandardization efforts made towards introducing the MPIbindings for Java. The most complete API set, however, hasbeen proposed by mpiJava [22] developers.
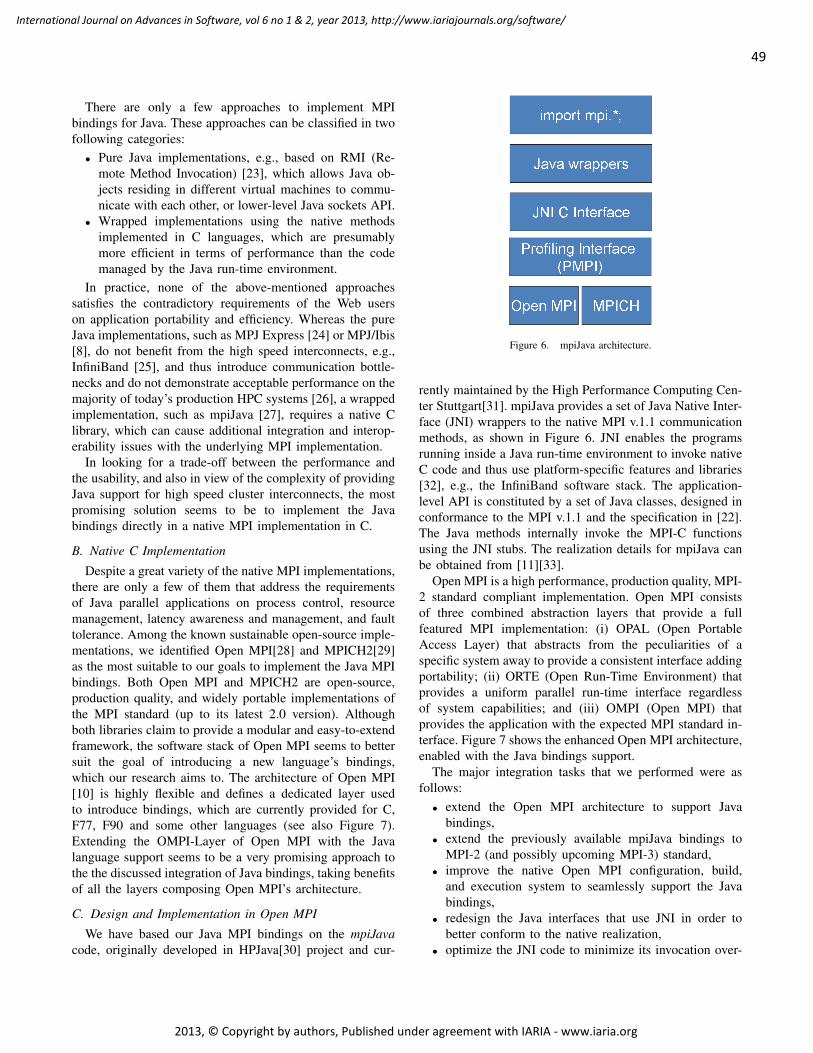
49
International Journal on Advances in Software, vol 6 no 1 & 2, year 2013, http://www.iariajournals.org/software/
2013, © Copyright by authors, Published under agreement with IARIA - www.iaria.org
There are only a few approaches to implement MPIbindings for Java. These approaches can be classified in twofollowing categories:
• Pure Java implementations, e.g., based on RMI (Re-mote Method Invocation) [23], which allows Java ob-jects residing in different virtual machines to commu-nicate with each other, or lower-level Java sockets API.
• Wrapped implementations using the native methodsimplemented in C languages, which are presumablymore efficient in terms of performance than the codemanaged by the Java run-time environment.
In practice, none of the above-mentioned approachessatisfies the contradictory requirements of the Web userson application portability and efficiency. Whereas the pureJava implementations, such as MPJ Express [24] or MPJ/Ibis[8], do not benefit from the high speed interconnects, e.g.,InfiniBand [25], and thus introduce communication bottle-necks and do not demonstrate acceptable performance on themajority of today’s production HPC systems [26], a wrappedimplementation, such as mpiJava [27], requires a native Clibrary, which can cause additional integration and interop-erability issues with the underlying MPI implementation.
In looking for a trade-off between the performance andthe usability, and also in view of the complexity of providingJava support for high speed cluster interconnects, the mostpromising solution seems to be to implement the Javabindings directly in a native MPI implementation in C.
B. Native C Implementation
Despite a great variety of the native MPI implementations,there are only a few of them that address the requirementsof Java parallel applications on process control, resourcemanagement, latency awareness and management, and faulttolerance. Among the known sustainable open-source imple-mentations, we identified Open MPI[28] and MPICH2[29]as the most suitable to our goals to implement the Java MPIbindings. Both Open MPI and MPICH2 are open-source,production quality, and widely portable implementations ofthe MPI standard (up to its latest 2.0 version). Althoughboth libraries claim to provide a modular and easy-to-extendframework, the software stack of Open MPI seems to bettersuit the goal of introducing a new language’s bindings,which our research aims to. The architecture of Open MPI[10] is highly flexible and defines a dedicated layer usedto introduce bindings, which are currently provided for C,F77, F90 and some other languages (see also Figure 7).Extending the OMPI-Layer of Open MPI with the Javalanguage support seems to be a very promising approach tothe the discussed integration of Java bindings, taking benefitsof all the layers composing Open MPI’s architecture.
C. Design and Implementation in Open MPI
We have based our Java MPI bindings on the mpiJavacode, originally developed in HPJava[30] project and cur-
Figure 6. mpiJava architecture.
rently maintained by the High Performance Computing Cen-ter Stuttgart[31]. mpiJava provides a set of Java Native Inter-face (JNI) wrappers to the native MPI v.1.1 communicationmethods, as shown in Figure 6. JNI enables the programsrunning inside a Java run-time environment to invoke nativeC code and thus use platform-specific features and libraries[32], e.g., the InfiniBand software stack. The application-level API is constituted by a set of Java classes, designed inconformance to the MPI v.1.1 and the specification in [22].The Java methods internally invoke the MPI-C functionsusing the JNI stubs. The realization details for mpiJava canbe obtained from [11][33].
Open MPI is a high performance, production quality, MPI-2 standard compliant implementation. Open MPI consistsof three combined abstraction layers that provide a fullfeatured MPI implementation: (i) OPAL (Open PortableAccess Layer) that abstracts from the peculiarities of aspecific system away to provide a consistent interface addingportability; (ii) ORTE (Open Run-Time Environment) thatprovides a uniform parallel run-time interface regardlessof system capabilities; and (iii) OMPI (Open MPI) thatprovides the application with the expected MPI standard in-terface. Figure 7 shows the enhanced Open MPI architecture,enabled with the Java bindings support.
The major integration tasks that we performed were asfollows:
• extend the Open MPI architecture to support Javabindings,
• extend the previously available mpiJava bindings toMPI-2 (and possibly upcoming MPI-3) standard,
• improve the native Open MPI configuration, build,and execution system to seamlessly support the Javabindings,
• redesign the Java interfaces that use JNI in order tobetter conform to the native realization,
• optimize the JNI code to minimize its invocation over-
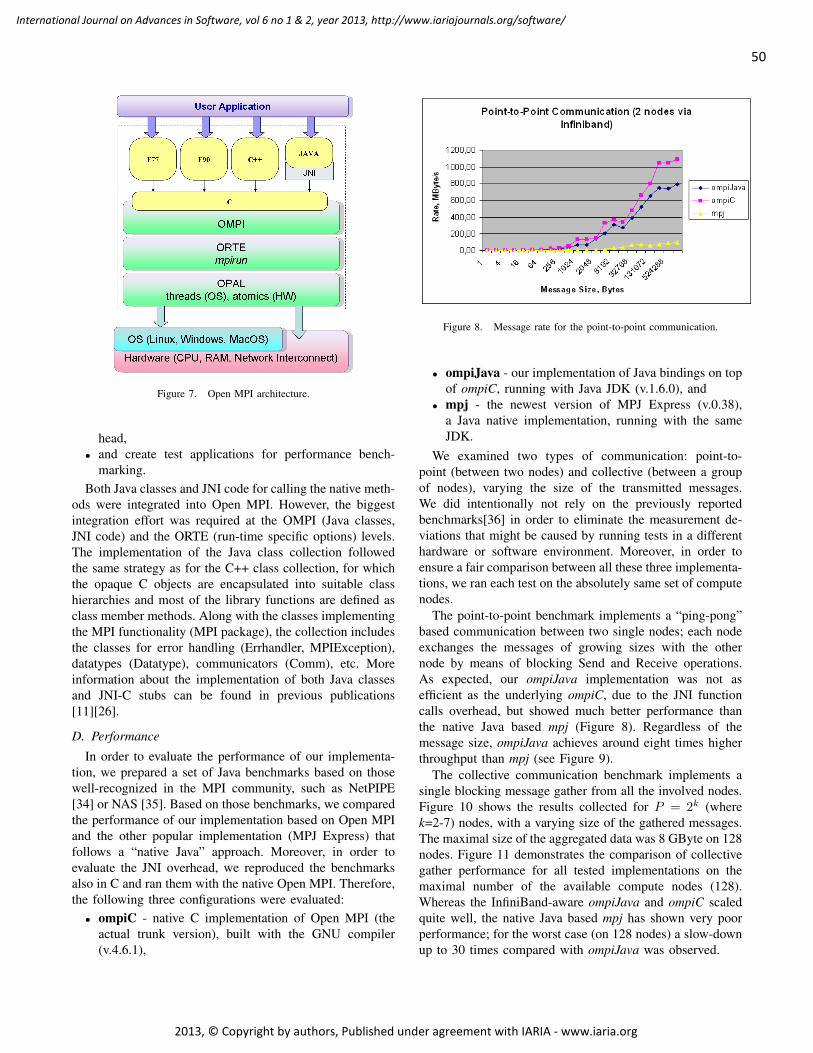
50
International Journal on Advances in Software, vol 6 no 1 & 2, year 2013, http://www.iariajournals.org/software/
2013, © Copyright by authors, Published under agreement with IARIA - www.iaria.org
Figure 7. Open MPI architecture.
head,• and create test applications for performance bench-
marking.Both Java classes and JNI code for calling the native meth-
ods were integrated into Open MPI. However, the biggestintegration effort was required at the OMPI (Java classes,JNI code) and the ORTE (run-time specific options) levels.The implementation of the Java class collection followedthe same strategy as for the C++ class collection, for whichthe opaque C objects are encapsulated into suitable classhierarchies and most of the library functions are defined asclass member methods. Along with the classes implementingthe MPI functionality (MPI package), the collection includesthe classes for error handling (Errhandler, MPIException),datatypes (Datatype), communicators (Comm), etc. Moreinformation about the implementation of both Java classesand JNI-C stubs can be found in previous publications[11][26].
D. Performance
In order to evaluate the performance of our implementa-tion, we prepared a set of Java benchmarks based on thosewell-recognized in the MPI community, such as NetPIPE[34] or NAS [35]. Based on those benchmarks, we comparedthe performance of our implementation based on Open MPIand the other popular implementation (MPJ Express) thatfollows a “native Java” approach. Moreover, in order toevaluate the JNI overhead, we reproduced the benchmarksalso in C and ran them with the native Open MPI. Therefore,the following three configurations were evaluated:
• ompiC - native C implementation of Open MPI (theactual trunk version), built with the GNU compiler(v.4.6.1),
Figure 8. Message rate for the point-to-point communication.
• ompiJava - our implementation of Java bindings on topof ompiC, running with Java JDK (v.1.6.0), and
• mpj - the newest version of MPJ Express (v.0.38),a Java native implementation, running with the sameJDK.
We examined two types of communication: point-to-point (between two nodes) and collective (between a groupof nodes), varying the size of the transmitted messages.We did intentionally not rely on the previously reportedbenchmarks[36] in order to eliminate the measurement de-viations that might be caused by running tests in a differenthardware or software environment. Moreover, in order toensure a fair comparison between all these three implementa-tions, we ran each test on the absolutely same set of computenodes.
The point-to-point benchmark implements a “ping-pong”based communication between two single nodes; each nodeexchanges the messages of growing sizes with the othernode by means of blocking Send and Receive operations.As expected, our ompiJava implementation was not asefficient as the underlying ompiC, due to the JNI functioncalls overhead, but showed much better performance thanthe native Java based mpj (Figure 8). Regardless of themessage size, ompiJava achieves around eight times higherthroughput than mpj (see Figure 9).
The collective communication benchmark implements asingle blocking message gather from all the involved nodes.Figure 10 shows the results collected for P = 2k (wherek=2-7) nodes, with a varying size of the gathered messages.The maximal size of the aggregated data was 8 GByte on 128nodes. Figure 11 demonstrates the comparison of collectivegather performance for all tested implementations on themaximal number of the available compute nodes (128).Whereas the InfiniBand-aware ompiJava and ompiC scaledquite well, the native Java based mpj has shown very poorperformance; for the worst case (on 128 nodes) a slow-downup to 30 times compared with ompiJava was observed.
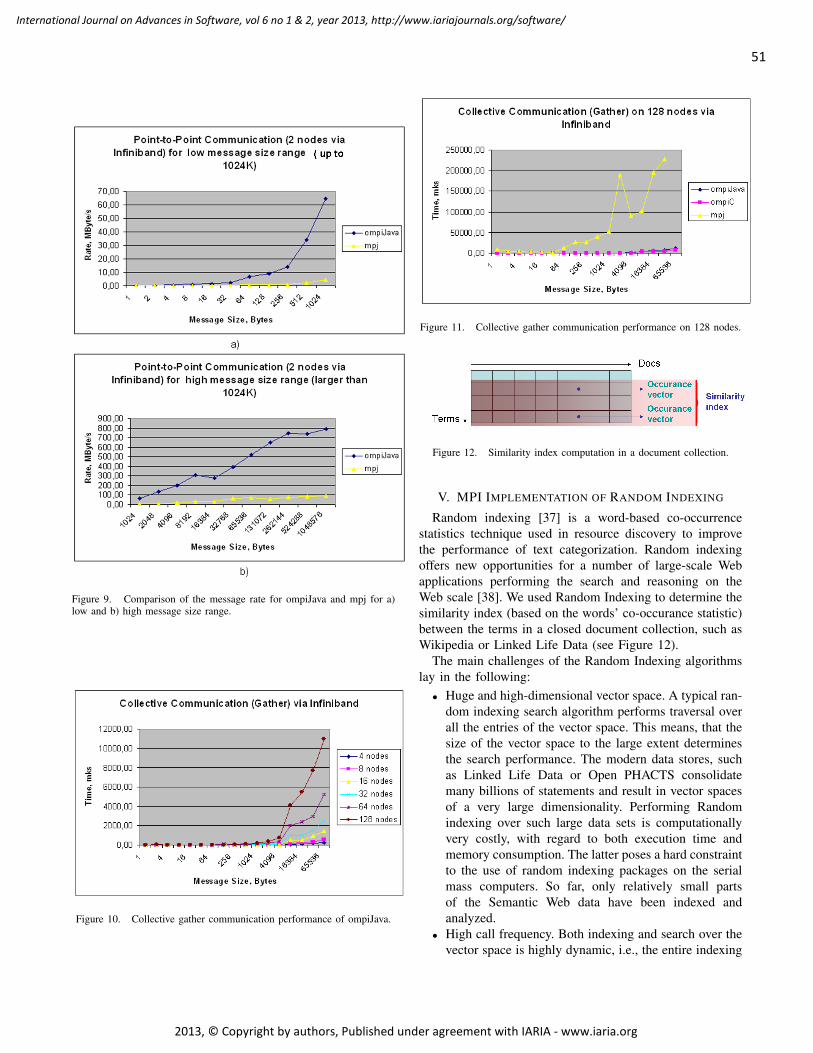
51
International Journal on Advances in Software, vol 6 no 1 & 2, year 2013, http://www.iariajournals.org/software/
2013, © Copyright by authors, Published under agreement with IARIA - www.iaria.org
Figure 9. Comparison of the message rate for ompiJava and mpj for a)low and b) high message size range.
Figure 10. Collective gather communication performance of ompiJava.
Figure 11. Collective gather communication performance on 128 nodes.
Figure 12. Similarity index computation in a document collection.
V. MPI IMPLEMENTATION OF RANDOM INDEXING
Random indexing [37] is a word-based co-occurrencestatistics technique used in resource discovery to improvethe performance of text categorization. Random indexingoffers new opportunities for a number of large-scale Webapplications performing the search and reasoning on theWeb scale [38]. We used Random Indexing to determine thesimilarity index (based on the words’ co-occurance statistic)between the terms in a closed document collection, such asWikipedia or Linked Life Data (see Figure 12).
The main challenges of the Random Indexing algorithmslay in the following:
• Huge and high-dimensional vector space. A typical ran-dom indexing search algorithm performs traversal overall the entries of the vector space. This means, that thesize of the vector space to the large extent determinesthe search performance. The modern data stores, suchas Linked Life Data or Open PHACTS consolidatemany billions of statements and result in vector spacesof a very large dimensionality. Performing Randomindexing over such large data sets is computationallyvery costly, with regard to both execution time andmemory consumption. The latter poses a hard constraintto the use of random indexing packages on the serialmass computers. So far, only relatively small partsof the Semantic Web data have been indexed andanalyzed.
• High call frequency. Both indexing and search over thevector space is highly dynamic, i.e., the entire indexing
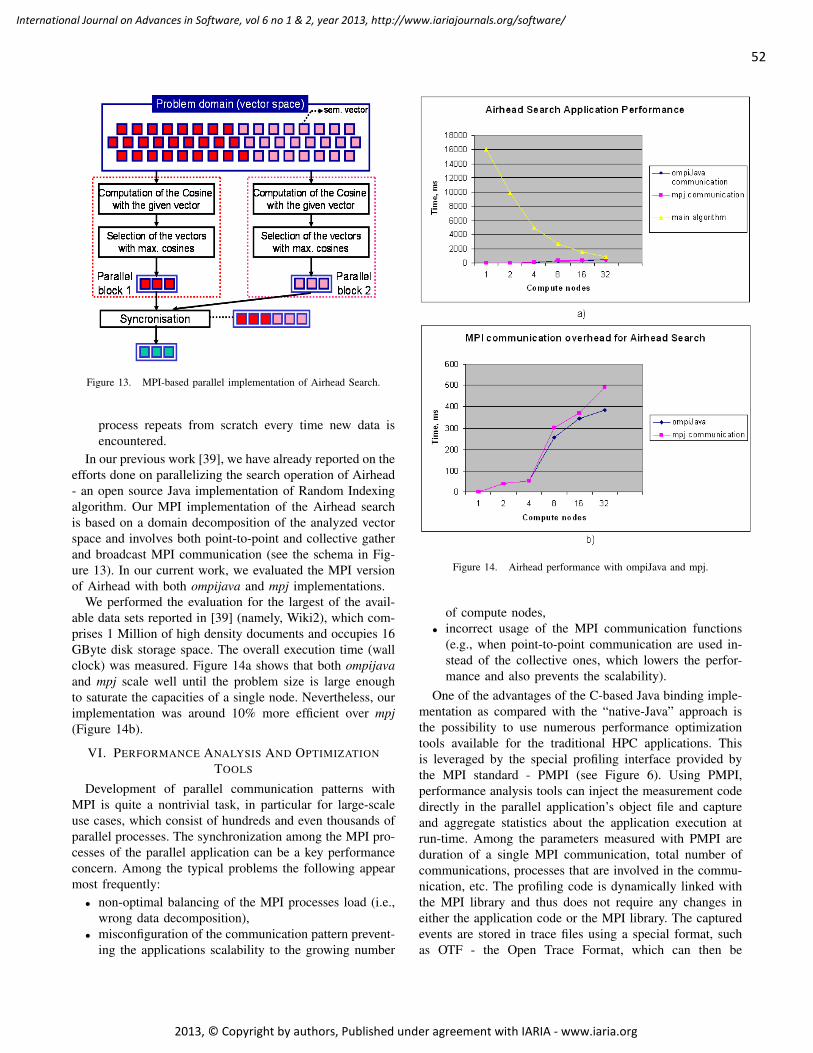
52
International Journal on Advances in Software, vol 6 no 1 & 2, year 2013, http://www.iariajournals.org/software/
2013, © Copyright by authors, Published under agreement with IARIA - www.iaria.org
Figure 13. MPI-based parallel implementation of Airhead Search.
process repeats from scratch every time new data isencountered.
In our previous work [39], we have already reported on theefforts done on parallelizing the search operation of Airhead- an open source Java implementation of Random Indexingalgorithm. Our MPI implementation of the Airhead searchis based on a domain decomposition of the analyzed vectorspace and involves both point-to-point and collective gatherand broadcast MPI communication (see the schema in Fig-ure 13). In our current work, we evaluated the MPI versionof Airhead with both ompijava and mpj implementations.
We performed the evaluation for the largest of the avail-able data sets reported in [39] (namely, Wiki2), which com-prises 1 Million of high density documents and occupies 16GByte disk storage space. The overall execution time (wallclock) was measured. Figure 14a shows that both ompijavaand mpj scale well until the problem size is large enoughto saturate the capacities of a single node. Nevertheless, ourimplementation was around 10% more efficient over mpj(Figure 14b).
VI. PERFORMANCE ANALYSIS AND OPTIMIZATIONTOOLS
Development of parallel communication patterns withMPI is quite a nontrivial task, in particular for large-scaleuse cases, which consist of hundreds and even thousands ofparallel processes. The synchronization among the MPI pro-cesses of the parallel application can be a key performanceconcern. Among the typical problems the following appearmost frequently:
• non-optimal balancing of the MPI processes load (i.e.,wrong data decomposition),
• misconfiguration of the communication pattern prevent-ing the applications scalability to the growing number
Figure 14. Airhead performance with ompiJava and mpj.
of compute nodes,• incorrect usage of the MPI communication functions
(e.g., when point-to-point communication are used in-stead of the collective ones, which lowers the perfor-mance and also prevents the scalability).
One of the advantages of the C-based Java binding imple-mentation as compared with the “native-Java” approach isthe possibility to use numerous performance optimizationtools available for the traditional HPC applications. Thisis leveraged by the special profiling interface provided bythe MPI standard - PMPI (see Figure 6). Using PMPI,performance analysis tools can inject the measurement codedirectly in the parallel application’s object file and captureand aggregate statistics about the application execution atrun-time. Among the parameters measured with PMPI areduration of a single MPI communication, total number ofcommunications, processes that are involved in the commu-nication, etc. The profiling code is dynamically linked withthe MPI library and thus does not require any changes ineither the application code or the MPI library. The capturedevents are stored in trace files using a special format, suchas OTF - the Open Trace Format, which can then be
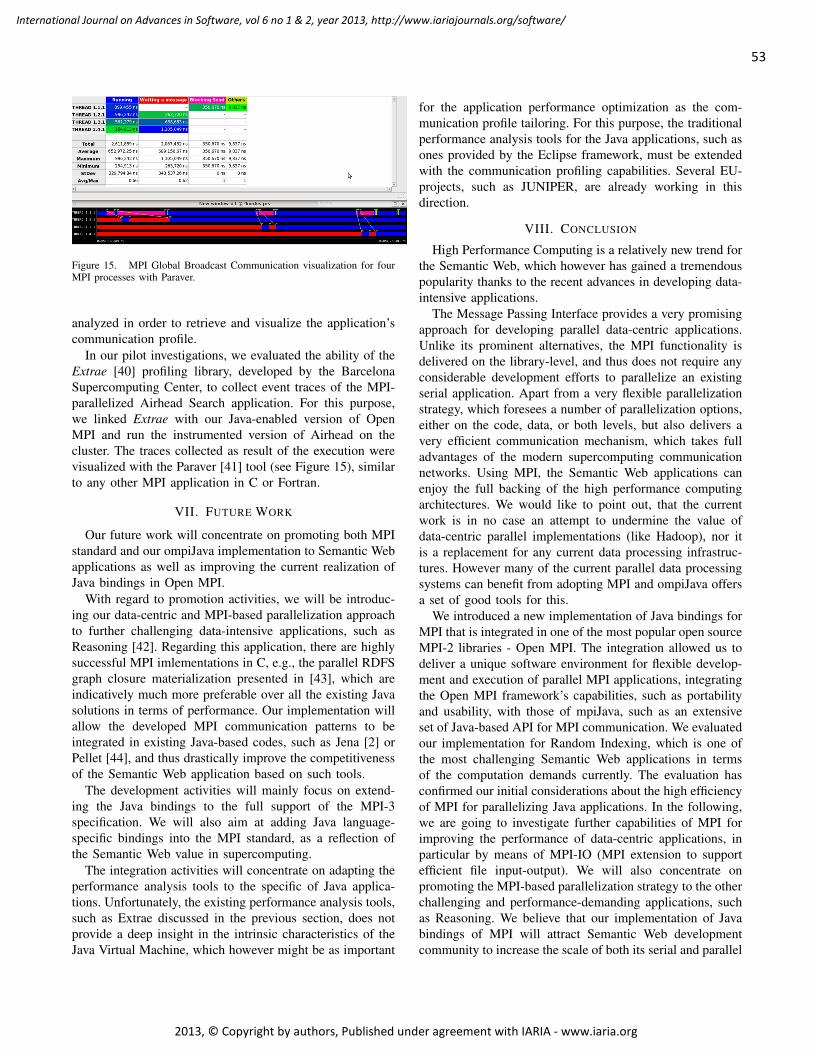
53
International Journal on Advances in Software, vol 6 no 1 & 2, year 2013, http://www.iariajournals.org/software/
2013, © Copyright by authors, Published under agreement with IARIA - www.iaria.org
Figure 15. MPI Global Broadcast Communication visualization for fourMPI processes with Paraver.
analyzed in order to retrieve and visualize the application’scommunication profile.
In our pilot investigations, we evaluated the ability of theExtrae [40] profiling library, developed by the BarcelonaSupercomputing Center, to collect event traces of the MPI-parallelized Airhead Search application. For this purpose,we linked Extrae with our Java-enabled version of OpenMPI and run the instrumented version of Airhead on thecluster. The traces collected as result of the execution werevisualized with the Paraver [41] tool (see Figure 15), similarto any other MPI application in C or Fortran.
VII. FUTURE WORK
Our future work will concentrate on promoting both MPIstandard and our ompiJava implementation to Semantic Webapplications as well as improving the current realization ofJava bindings in Open MPI.
With regard to promotion activities, we will be introduc-ing our data-centric and MPI-based parallelization approachto further challenging data-intensive applications, such asReasoning [42]. Regarding this application, there are highlysuccessful MPI imlementations in C, e.g., the parallel RDFSgraph closure materialization presented in [43], which areindicatively much more preferable over all the existing Javasolutions in terms of performance. Our implementation willallow the developed MPI communication patterns to beintegrated in existing Java-based codes, such as Jena [2] orPellet [44], and thus drastically improve the competitivenessof the Semantic Web application based on such tools.
The development activities will mainly focus on extend-ing the Java bindings to the full support of the MPI-3specification. We will also aim at adding Java language-specific bindings into the MPI standard, as a reflection ofthe Semantic Web value in supercomputing.
The integration activities will concentrate on adapting theperformance analysis tools to the specific of Java applica-tions. Unfortunately, the existing performance analysis tools,such as Extrae discussed in the previous section, does notprovide a deep insight in the intrinsic characteristics of theJava Virtual Machine, which however might be as important
for the application performance optimization as the com-munication profile tailoring. For this purpose, the traditionalperformance analysis tools for the Java applications, such asones provided by the Eclipse framework, must be extendedwith the communication profiling capabilities. Several EU-projects, such as JUNIPER, are already working in thisdirection.
VIII. CONCLUSION
High Performance Computing is a relatively new trend forthe Semantic Web, which however has gained a tremendouspopularity thanks to the recent advances in developing data-intensive applications.
The Message Passing Interface provides a very promisingapproach for developing parallel data-centric applications.Unlike its prominent alternatives, the MPI functionality isdelivered on the library-level, and thus does not require anyconsiderable development efforts to parallelize an existingserial application. Apart from a very flexible parallelizationstrategy, which foresees a number of parallelization options,either on the code, data, or both levels, but also delivers avery efficient communication mechanism, which takes fulladvantages of the modern supercomputing communicationnetworks. Using MPI, the Semantic Web applications canenjoy the full backing of the high performance computingarchitectures. We would like to point out, that the currentwork is in no case an attempt to undermine the value ofdata-centric parallel implementations (like Hadoop), nor itis a replacement for any current data processing infrastruc-tures. However many of the current parallel data processingsystems can benefit from adopting MPI and ompiJava offersa set of good tools for this.
We introduced a new implementation of Java bindings forMPI that is integrated in one of the most popular open sourceMPI-2 libraries - Open MPI. The integration allowed us todeliver a unique software environment for flexible develop-ment and execution of parallel MPI applications, integratingthe Open MPI framework’s capabilities, such as portabilityand usability, with those of mpiJava, such as an extensiveset of Java-based API for MPI communication. We evaluatedour implementation for Random Indexing, which is one ofthe most challenging Semantic Web applications in termsof the computation demands currently. The evaluation hasconfirmed our initial considerations about the high efficiencyof MPI for parallelizing Java applications. In the following,we are going to investigate further capabilities of MPI forimproving the performance of data-centric applications, inparticular by means of MPI-IO (MPI extension to supportefficient file input-output). We will also concentrate onpromoting the MPI-based parallelization strategy to the otherchallenging and performance-demanding applications, suchas Reasoning. We believe that our implementation of Javabindings of MPI will attract Semantic Web developmentcommunity to increase the scale of both its serial and parallel
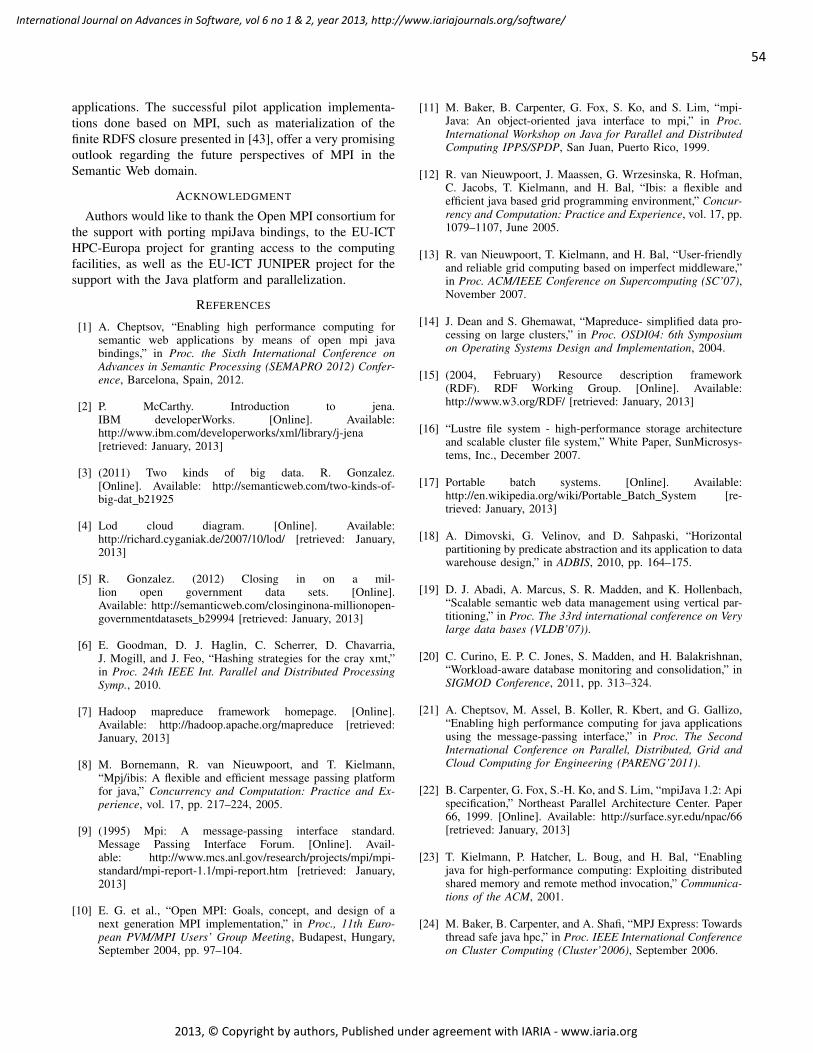
54
International Journal on Advances in Software, vol 6 no 1 & 2, year 2013, http://www.iariajournals.org/software/
2013, © Copyright by authors, Published under agreement with IARIA - www.iaria.org
applications. The successful pilot application implementa-tions done based on MPI, such as materialization of thefinite RDFS closure presented in [43], offer a very promisingoutlook regarding the future perspectives of MPI in theSemantic Web domain.
ACKNOWLEDGMENT
Authors would like to thank the Open MPI consortium forthe support with porting mpiJava bindings, to the EU-ICTHPC-Europa project for granting access to the computingfacilities, as well as the EU-ICT JUNIPER project for thesupport with the Java platform and parallelization.
REFERENCES
[1] A. Cheptsov, “Enabling high performance computing forsemantic web applications by means of open mpi javabindings,” in Proc. the Sixth International Conference onAdvances in Semantic Processing (SEMAPRO 2012) Confer-ence, Barcelona, Spain, 2012.
[2] P. McCarthy. Introduction to jena.IBM developerWorks. [Online]. Available:http://www.ibm.com/developerworks/xml/library/j-jena[retrieved: January, 2013]
[3] (2011) Two kinds of big data. R. Gonzalez.[Online]. Available: http://semanticweb.com/two-kinds-of-big-dat b21925
[4] Lod cloud diagram. [Online]. Available:http://richard.cyganiak.de/2007/10/lod/ [retrieved: January,2013]
[5] R. Gonzalez. (2012) Closing in on a mil-lion open government data sets. [Online].Available: http://semanticweb.com/closinginona-millionopen-governmentdatasets b29994 [retrieved: January, 2013]
[6] E. Goodman, D. J. Haglin, C. Scherrer, D. Chavarria,J. Mogill, and J. Feo, “Hashing strategies for the cray xmt,”in Proc. 24th IEEE Int. Parallel and Distributed ProcessingSymp., 2010.
[7] Hadoop mapreduce framework homepage. [Online].Available: http://hadoop.apache.org/mapreduce [retrieved:January, 2013]
[8] M. Bornemann, R. van Nieuwpoort, and T. Kielmann,“Mpj/ibis: A flexible and efficient message passing platformfor java,” Concurrency and Computation: Practice and Ex-perience, vol. 17, pp. 217–224, 2005.
[9] (1995) Mpi: A message-passing interface standard.Message Passing Interface Forum. [Online]. Avail-able: http://www.mcs.anl.gov/research/projects/mpi/mpi-standard/mpi-report-1.1/mpi-report.htm [retrieved: January,2013]
[10] E. G. et al., “Open MPI: Goals, concept, and design of anext generation MPI implementation,” in Proc., 11th Euro-pean PVM/MPI Users’ Group Meeting, Budapest, Hungary,September 2004, pp. 97–104.
[11] M. Baker, B. Carpenter, G. Fox, S. Ko, and S. Lim, “mpi-Java: An object-oriented java interface to mpi,” in Proc.International Workshop on Java for Parallel and DistributedComputing IPPS/SPDP, San Juan, Puerto Rico, 1999.
[12] R. van Nieuwpoort, J. Maassen, G. Wrzesinska, R. Hofman,C. Jacobs, T. Kielmann, and H. Bal, “Ibis: a flexible andefficient java based grid programming environment,” Concur-rency and Computation: Practice and Experience, vol. 17, pp.1079–1107, June 2005.
[13] R. van Nieuwpoort, T. Kielmann, and H. Bal, “User-friendlyand reliable grid computing based on imperfect middleware,”in Proc. ACM/IEEE Conference on Supercomputing (SC’07),November 2007.
[14] J. Dean and S. Ghemawat, “Mapreduce- simplified data pro-cessing on large clusters,” in Proc. OSDI04: 6th Symposiumon Operating Systems Design and Implementation, 2004.
[15] (2004, February) Resource description framework(RDF). RDF Working Group. [Online]. Available:http://www.w3.org/RDF/ [retrieved: January, 2013]
[16] “Lustre file system - high-performance storage architectureand scalable cluster file system,” White Paper, SunMicrosys-tems, Inc., December 2007.
[17] Portable batch systems. [Online]. Available:http://en.wikipedia.org/wiki/Portable Batch System [re-trieved: January, 2013]
[18] A. Dimovski, G. Velinov, and D. Sahpaski, “Horizontalpartitioning by predicate abstraction and its application to datawarehouse design,” in ADBIS, 2010, pp. 164–175.
[19] D. J. Abadi, A. Marcus, S. R. Madden, and K. Hollenbach,“Scalable semantic web data management using vertical par-titioning,” in Proc. The 33rd international conference on Verylarge data bases (VLDB’07)).
[20] C. Curino, E. P. C. Jones, S. Madden, and H. Balakrishnan,“Workload-aware database monitoring and consolidation,” inSIGMOD Conference, 2011, pp. 313–324.
[21] A. Cheptsov, M. Assel, B. Koller, R. Kbert, and G. Gallizo,“Enabling high performance computing for java applicationsusing the message-passing interface,” in Proc. The SecondInternational Conference on Parallel, Distributed, Grid andCloud Computing for Engineering (PARENG’2011).
[22] B. Carpenter, G. Fox, S.-H. Ko, and S. Lim, “mpiJava 1.2: Apispecification,” Northeast Parallel Architecture Center. Paper66, 1999. [Online]. Available: http://surface.syr.edu/npac/66[retrieved: January, 2013]
[23] T. Kielmann, P. Hatcher, L. Boug, and H. Bal, “Enablingjava for high-performance computing: Exploiting distributedshared memory and remote method invocation,” Communica-tions of the ACM, 2001.
[24] M. Baker, B. Carpenter, and A. Shafi, “MPJ Express: Towardsthread safe java hpc,” in Proc. IEEE International Conferenceon Cluster Computing (Cluster’2006), September 2006.
55
International Journal on Advances in Software, vol 6 no 1 & 2, year 2013, http://www.iariajournals.org/software/
2013, © Copyright by authors, Published under agreement with IARIA - www.iaria.org
[25] R. K. Gupta and S. D. Senturia, “Pull-in time dynamics asa measure of absolute pressure,” in Proc. IEEE InternationalWorkshop on Microelectromechanical Systems (MEMS’97),Nagoya, Japan, Jan. 1997, pp. 290–294.
[26] G. Judd, M. Clement, Q. Snell, and V. Getov, “Design issuesfor efficient implementation of mpi in java,” in Proc. the 1999ACM Java Grande Conference, 1999, pp. 58–65.
[27] B. Carpenter, V. Getov, G. Judd, A. Skjellum, and G. Fox,“MPJ: Mpi-like message passing for java,” Concurrency andComputation - Practice and Experience, vol. 12(11), pp.1019–1038, 2000.
[28] Open mpi homepaga. [Online]. Available: http://www.open-mpi.org [retrieved: January, 2013]
[29] Mpich2 project website. [Online]. Available:http://www.mcs.anl.gov/research/projects/mpich2/ [retrieved:January, 2013]
[30] Hpjava project website. [Online]. Available:http://www.hpjava.org [retrieved: January, 2013]
[31] mpijava website. [Online]. Available:http://sourceforge.net/projects/mpijava/ [retrieved: January,2013]
[32] S. Liang, Ed., Java Native Interface: Programmer’s Guideand Reference. Addison-Wesley, 1999.
[33] M. Vodel, M. Sauppe, and W. Hardt, “Parallel high-performance applications with mpi2java - a capable javainterface for mpi 2.0 libraries,” in Proc. The 16th Asia-Pacific Conference on Communications (APCC), Nagoya,Japan, 2010, pp. 509–513.
[34] Net pipe parallel benchmark website. [Online]. Available:http://www.scl.ameslab.gov/netpipe/ [retrieved: January,2013]
[35] Nas parallel benchmark website. [Online]. Available:http://sourceforge.net/projects/mpijava/ [retrieved: January,2013]
[36] Mpj express benchmarking results. [Online]. Available:http://mpj-express.org/performance.html [retrieved: January,2013]
[37] M. Sahlgren, “An introduction to random indexing,” in Proc.Methods and Applications of Semantic Indexing Workshopat the 7th International Conference on Terminology andKnowledge Engineering (TKE)’2005, 2005, pp. 1–9.
[38] D. Jurgens, “The S-Space package: An open source packagefor word space models,” in Proc. the ACL 2010 SystemDemonstrations, 2010, pp. 30–35.
[39] M. Assel, A. Cheptsov, B. Czink, D. Damljanovic, andJ. Quesada, “Mpi realization of high performance search forquerying large rdf graphs using statistical semantics,” in Proc.The 1st Workshop on High-Performance Computing for theSemantic Web, Heraklion, Greece, May 2011.
[40] Extrae performance trace generation library homepage. [On-line]. Available: http://www.bsc.es/computer-sciences/extrae[retrieved: January, 2013]
[41] Extrae performance trace generation library home-page. [Online]. Available: http://www.bsc.es/computer-sciences/performance-tools/paraver [retrieved: January, 2013]
[42] D. Fensel and F. van Harmelen, “Unifying reasoning andsearch to web scale,” IEEE Internet Computing, vol. 11(2),pp. 95–96, 2007.
[43] J. Weaver and J. A. Hendler, “Parallel materialization of thefinite rdfs closure for hundreds of millions of triples,” in Proc.International Semantic Web Conference (ISWC) 2009, A. B.et al., Ed., 2009.
[44] E. Sirin, B. Parsia, B. C. Grau, A. Kalyanpur,and Y. Katz. Pellet: a practical owl-dl reasoner.Journal of Web Semantics. [Online]. Available:http://www.mindswap.org/papers/PelletJWS.pdf [retrieved:January, 2013]
56
International Journal on Advances in Software, vol 6 no 1 & 2, year 2013, http://www.iariajournals.org/software/
2013, © Copyright by authors, Published under agreement with IARIA - www.iaria.org
A QoS-Aware BPEL Framework for ServiceSelection and Composition Using QoS Properties
Chiaen Lin and Krishna KaviDepartment of Computer Science and Engineering
Unitersity of North TexasDenton, TX 76203 USA
[email protected], [email protected]
Abstract—The promise of service oriented computing, andthe availability of web services in particular, promote deliveryof services and creation of new services composed of existingservices – service components are assembled to achieve integratedcomputational goals. Business organizations strive to utilize theservices and to provide new service solutions and they will needappropriate tools to achieve these goals. As web and internetbased services grow into clouds, inter-dependency of servicesand their complexity increases tremendously. The cloud ontologydepicts service layers from a high-level, such as Application andSoftware, to a low-level, such as Infrastructure and Platform.Each component resides at one layer can be useful to others as aservice. It hints the amount of complexity resulting from not onlyhorizontal but also vertical integrations in building and deployinga composite service. Our framework tackles the complexity ofthe selection and composition issues with additional qualitativeinformation to the service descriptions using Business ProcessExecution Language (BPEL). Engineers can use BPEL to exploredesign options, and have the QoS properties analyzed for thedesign. QoS properties of each service are annotated with ourextension to Web Service Description Language (WSDL). In thispaper, we describe our framework and illustrate its application toone QoS property, performance. We translate BPEL orchestrationand choreography into appropriate queuing networks, and ana-lyze the resulting model to obtain the performance properties ofthe composed service. Our framework is also designed to supportutilizations of other QoS extensions of WSDL, adaptable businesslogic languages, and composition models for other QoS properties.
Keywords—WSDL; WS-BPEL; Quality of Services; Non-functional Properties; Service Composition.
I. INTRODUCTION
Service oriented architecture (SOA) is a flexible and scalabledesign methodology to seamlessly integrate and cooperateservices in distributed software and systems. As more servicesare on the web and in the cloud, it becomes easier to createcustomized services dynamically by composing existing ser-vices and meet the service requirements. The framework weproposed serves the purposes [1]. Before invoking a service,a service requester has to query the functionality as wellas the interaction protocols defined to access the service.Web Service Description Language (WSDL) [2] is a widelyaccepted standard from World Wide Web Consortium (W3C)for describing functionality of web services. The UniversalDescription, Discovery and Integration (UDDI) registry serves
as a repository for the services with WSDL descriptions. Userscan query the UDDI and find services meeting their needssince the functionality of the services can be obtained fromtheir WSDL specifications [3].
Once the services are selected, interactions among the ser-vices are achieved using messaging protocol defined in WSDL.Even with ever increasing number of services, it may still notbe possible to find the ”right” service, and in such cases, onehas to either create a new service from scratch, or composethe service using existing services. Tools and frameworks arebecoming available to aid in the dynamic composition ofservices [4], [5], [6], [7], [8]. Another issue that needs tobe addressed is related to selecting the appropriate servicesthat takes part in a composition, particularly when multipleservices with the same functionality are available. In suchcases, non-functional or Quality of Service (QoS) properties,such as performance, security, reliability become the delimiters[9], [10], [11], [12].
While standard WSDL describes the functionality of aservice, it does not specify QoS or non-functional properties.In the previous work [1], we augmented the WSDL to permitspecification of non-functional properties of a service. Theadditional information can help distinguish between serviceswith the same functionality, and these properties can be usedwhile composing new services to ascertain the QoS propertiesof the composed service.
Enterprise software systems or cloud computing often usebusiness logic to refine their design and regulate the behaviorof services according to business processes [13]. BusinessProcess Execution Language (BPEL) has become the standardfor describing the architecture of a service process [14]. Itcontains control constructs for the orchestration of componentservices in a workflow style. While tools and frameworks areavailable to use BPEL orchestrations in composing services,they are not suitable to evaluate the QoS properties of spe-cific orchestrations [15], [16]. In this paper, we expand ourframework to adapt the notion of BPEL to describe QoS-aware services for their selection and composition. We arguethat based on our previous QoS-extension framework, BPELis compatible for use of QoS extensions. The expansion isalso backward compatible with the SOA in general and webservices in particular. It is suitable for the incorporation of anytools that facilitate QoS extensions and models for analyzingQoS properties. We illustrate how to create queuing models
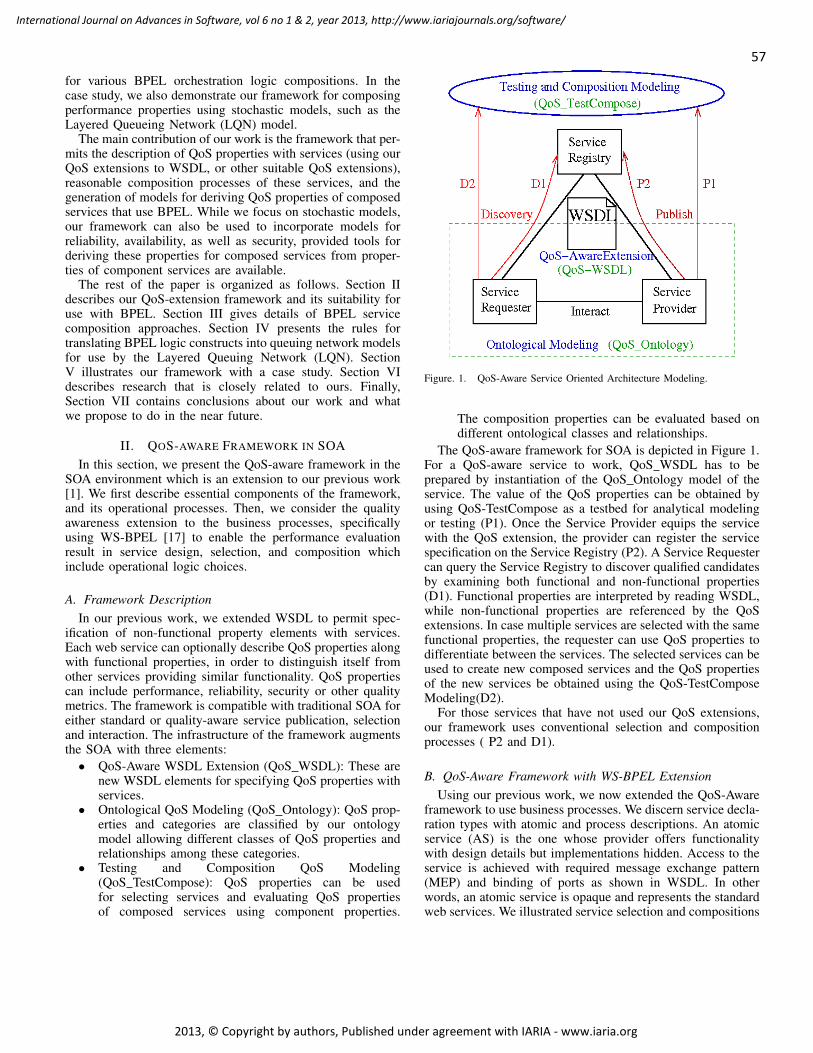
57
International Journal on Advances in Software, vol 6 no 1 & 2, year 2013, http://www.iariajournals.org/software/
2013, © Copyright by authors, Published under agreement with IARIA - www.iaria.org
for various BPEL orchestration logic compositions. In thecase study, we also demonstrate our framework for composingperformance properties using stochastic models, such as theLayered Queueing Network (LQN) model.
The main contribution of our work is the framework that per-mits the description of QoS properties with services (using ourQoS extensions to WSDL, or other suitable QoS extensions),reasonable composition processes of these services, and thegeneration of models for deriving QoS properties of composedservices that use BPEL. While we focus on stochastic models,our framework can also be used to incorporate models forreliability, availability, as well as security, provided tools forderiving these properties for composed services from proper-ties of component services are available.
The rest of the paper is organized as follows. Section IIdescribes our QoS-extension framework and its suitability foruse with BPEL. Section III gives details of BPEL servicecomposition approaches. Section IV presents the rules fortranslating BPEL logic constructs into queuing network modelsfor use by the Layered Queuing Network (LQN). SectionV illustrates our framework with a case study. Section VIdescribes research that is closely related to ours. Finally,Section VII contains conclusions about our work and whatwe propose to do in the near future.
II. QOS-AWARE FRAMEWORK IN SOAIn this section, we present the QoS-aware framework in the
SOA environment which is an extension to our previous work[1]. We first describe essential components of the framework,and its operational processes. Then, we consider the qualityawareness extension to the business processes, specificallyusing WS-BPEL [17] to enable the performance evaluationresult in service design, selection, and composition whichinclude operational logic choices.
A. Framework DescriptionIn our previous work, we extended WSDL to permit spec-
ification of non-functional property elements with services.Each web service can optionally describe QoS properties alongwith functional properties, in order to distinguish itself fromother services providing similar functionality. QoS propertiescan include performance, reliability, security or other qualitymetrics. The framework is compatible with traditional SOA foreither standard or quality-aware service publication, selectionand interaction. The infrastructure of the framework augmentsthe SOA with three elements:
• QoS-Aware WSDL Extension (QoS WSDL): These arenew WSDL elements for specifying QoS properties withservices.
• Ontological QoS Modeling (QoS Ontology): QoS prop-erties and categories are classified by our ontologymodel allowing different classes of QoS properties andrelationships among these categories.
• Testing and Composition QoS Modeling(QoS TestCompose): QoS properties can be usedfor selecting services and evaluating QoS propertiesof composed services using component properties.
Figure. 1. QoS-Aware Service Oriented Architecture Modeling.
The composition properties can be evaluated based ondifferent ontological classes and relationships.
The QoS-aware framework for SOA is depicted in Figure 1.For a QoS-aware service to work, QoS WSDL has to beprepared by instantiation of the QoS Ontology model of theservice. The value of the QoS properties can be obtained byusing QoS-TestCompose as a testbed for analytical modelingor testing (P1). Once the Service Provider equips the servicewith the QoS extension, the provider can register the servicespecification on the Service Registry (P2). A Service Requestercan query the Service Registry to discover qualified candidatesby examining both functional and non-functional properties(D1). Functional properties are interpreted by reading WSDL,while non-functional properties are referenced by the QoSextensions. In case multiple services are selected with the samefunctional properties, the requester can use QoS properties todifferentiate between the services. The selected services can beused to create new composed services and the QoS propertiesof the new services be obtained using the QoS-TestComposeModeling(D2).
For those services that have not used our QoS extensions,our framework uses conventional selection and compositionprocesses ( P2 and D1).
B. QoS-Aware Framework with WS-BPEL ExtensionUsing our previous work, we now extended the QoS-Aware
framework to use business processes. We discern service decla-ration types with atomic and process descriptions. An atomicservice (AS) is the one whose provider offers functionalitywith design details but implementations hidden. Access to theservice is achieved with required message exchange pattern(MEP) and binding of ports as shown in WSDL. In otherwords, an atomic service is opaque and represents the standardweb services. We illustrated service selection and compositions
58
International Journal on Advances in Software, vol 6 no 1 & 2, year 2013, http://www.iariajournals.org/software/
2013, © Copyright by authors, Published under agreement with IARIA - www.iaria.org
with respect to service performance in [1]. However, at thattime, we did not use any specific logic for the composition.
A process service (PS) is a service that facilitates collabora-tions between services controlled by business logic. A PS maybe composed by multiple AS and/or PS. PSes can be nested.At the lowest layer of the hierarchy, a PS should only consistof ASes. We will show that both AS and PS can be modeledand analyzed in our QoS-aware framework.
There are many well-known business process modeling lan-guages available to formally describe the interactions amongdifferent service components with business logic [18]. Theselanguages rely on well-defined workflow formats. In somecases they use meta-data that can be used for managementpurposes. In this paper, we use WS-BPEL or BPEL for short, todemonstrate the service selection and composition capabilitiesof our framework.
In the web service context, BPEL can be treated as alayer on top of WSDL [19]. BPEL provides the descriptionof behavior and interactions of a process instance with itspartners and resources through Web Service interfaces. Boththe process and its partners are exposed as WSDL services[17]. Furthermore, BPEL follows WSDL model of separationbetween abstract information, such as message and port type,and concrete information, such as binding and endpoint. Thetwo use cases for modeling BPEL processes are abstract andexecutable. Abstract processes describe the protocol that spec-ifies the message exchange between parties without revealingtheir underlining implementations. While abstract processesmay hide some of the required operational details, executableprocesses are fully specified and can be executed. Both abstractand executable processes share all the BPEL constructs, exceptthat the former has additional opaque mechanisms for hidingoperational details [17].
To include a PS in our framework, we assume that WSDLdescriptions for all services are available. WSDL files describehow to use services, while BPEL describe collaborationsamong the services or tasks. In accordance to our previousdesign of the framework, only concrete WSDL is relied upon inour QoS-aware framework. Quality of Services with concretebindings provides more specific range of values, derived fromactual tests or analyses. The service that is extended for usein our framework can be viewed as an AS with a concreteWSDL. Or an abstract AS can be included in our framework,provided the QoS properties are derived through a concretebinding (as shown by process P1 in Figure 1).
Now we consider if the assumptions can be applied to thecases of acquiring a PS in the framework. For an executablePS, it is natural to assume that the services involved in the PShave concrete WSDLs, since an executable process is assumedto be concrete. For an abstract PS to be included in theframework, it must first be transformed into an executable PS.The transformation is called Executable Completion [17] in theweb services context of WS-BPEL. The main algorithm of thetransformation and related issues concerning QoS propertieswill be addressed in later sections.
With the adaptation of PS into the framework, we nowconsider the process of publishing and discovery operationsfor processes. Once again, an executable PS can be observed
as services with concrete WSDL in the framework. To publisha PS service, it applies the same process P1 and P2, shown inFigure 1; for service registration of ASes, additional servicemeta data is added to the QoS Ontology compartment fordescribing management related information. Since the frame-work differentiates a PS from an AS, the ontology model notesthe service identification and service type classification whena service is instantiated. The additional information includesidentification of a PS, the business process structure, andits sub-components. Note that the additional information ofa PS is stored in the framework and is independent of thedata minted in a Service Register of the SOA triangle. Todiscover a PS service, it makes no difference as to discoveringany AS with QoS annotations in its registered WSDL (D1).Re-discovery of a PS service is required to first discoverits sub-services as ASes, and submit the business process toQoS TestCompose for updating QoS values (D2).
Although only concrete AS and executable PS are allowedin the framework, abstract processes can still be included. Anabstract process can be viewed as embedding multiple usecases. The use cases are differentiated by their usage profiles.From the abstract processes, one can analyze the profiles toobtain specific values for QoS properties of the processes.To this end, we suggest that records of abstract processes bekept so as to facilitate QoS-aware compositions using differentbusiness process operations. We will discuss how PSes can beused in our framework in Section III.
III. SERVICE COMPOSITIONS WITH WS-BPEL IN THEQOS-AWARE FRAMEWORK
SOA enables a flexible and adaptable web service discoveryand service composition. To allow for selection and compo-sition based on QoS properties within our framework, weneed to devise processes to guide QoS-aware business processselection and compositions. Since WS-BPEL is an establishedstandard to describe business processes in the web servicescontext, we will use BPEL to describe business processes inour framework.
Orchestration and choreography are two aspects of creatingbusinesses from composite web services [19]. Orchestrationrefers to an executable process that interacts with internaland external web services. Since the executable process mayinclude business logic and task execution order, it representsthe control flow among the participating services. On the otherhand, choreography refers to the interactions (or data flow)among participants who cooperate to achieve the objectivesof the composed services. Choreography coordinates messageexchanges occurring among services. For our purpose, weadapted BPEL4Chor [20], an extension of BPEL to addressservice composition, as the choreography framework. Engi-neers can use the language and available tools to readily modelservice interactions. We will show how this BPEL choreogra-phy can be used within our QoS-aware service compositionframework.
The following subsections include discussions of the ap-plicability of quality awareness to both orchestration andchoreography compositions, and their operational processes.
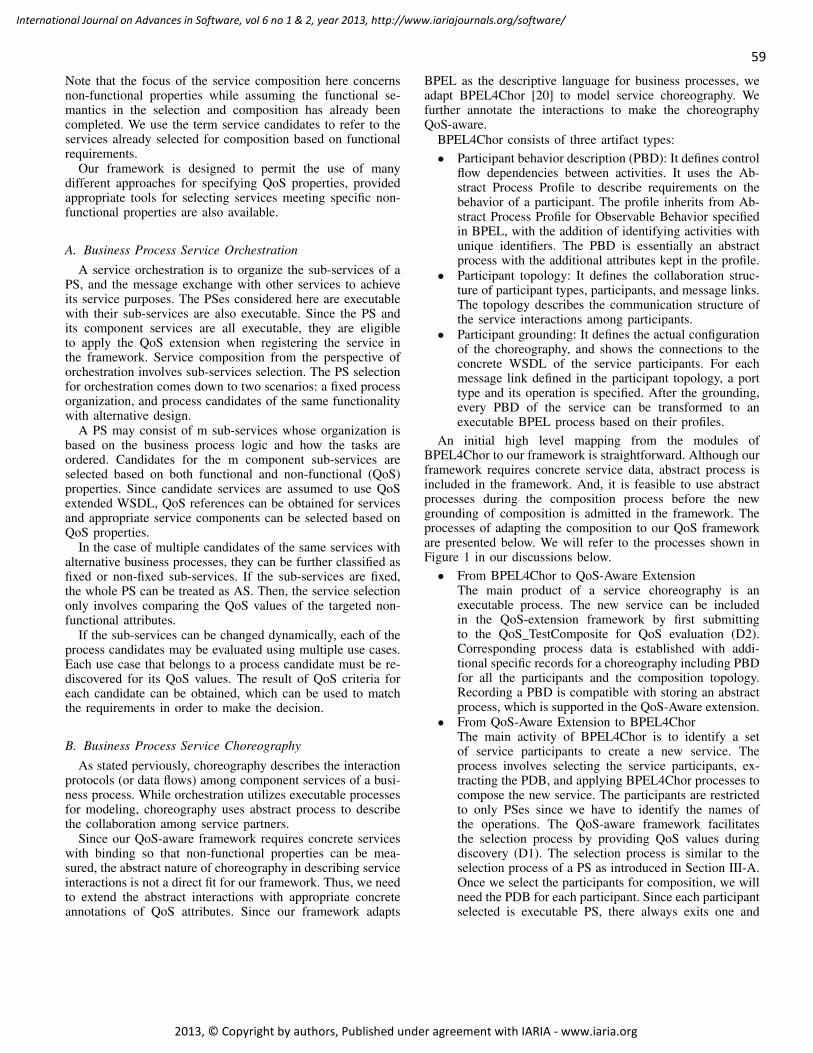
59
International Journal on Advances in Software, vol 6 no 1 & 2, year 2013, http://www.iariajournals.org/software/
2013, © Copyright by authors, Published under agreement with IARIA - www.iaria.org
Note that the focus of the service composition here concernsnon-functional properties while assuming the functional se-mantics in the selection and composition has already beencompleted. We use the term service candidates to refer to theservices already selected for composition based on functionalrequirements.
Our framework is designed to permit the use of manydifferent approaches for specifying QoS properties, providedappropriate tools for selecting services meeting specific non-functional properties are also available.
A. Business Process Service OrchestrationA service orchestration is to organize the sub-services of a
PS, and the message exchange with other services to achieveits service purposes. The PSes considered here are executablewith their sub-services are also executable. Since the PS andits component services are all executable, they are eligibleto apply the QoS extension when registering the service inthe framework. Service composition from the perspective oforchestration involves sub-services selection. The PS selectionfor orchestration comes down to two scenarios: a fixed processorganization, and process candidates of the same functionalitywith alternative design.
A PS may consist of m sub-services whose organization isbased on the business process logic and how the tasks areordered. Candidates for the m component sub-services areselected based on both functional and non-functional (QoS)properties. Since candidate services are assumed to use QoSextended WSDL, QoS references can be obtained for servicesand appropriate service components can be selected based onQoS properties.
In the case of multiple candidates of the same services withalternative business processes, they can be further classified asfixed or non-fixed sub-services. If the sub-services are fixed,the whole PS can be treated as AS. Then, the service selectiononly involves comparing the QoS values of the targeted non-functional attributes.
If the sub-services can be changed dynamically, each of theprocess candidates may be evaluated using multiple use cases.Each use case that belongs to a process candidate must be re-discovered for its QoS values. The result of QoS criteria foreach candidate can be obtained, which can be used to matchthe requirements in order to make the decision.
B. Business Process Service ChoreographyAs stated perviously, choreography describes the interaction
protocols (or data flows) among component services of a busi-ness process. While orchestration utilizes executable processesfor modeling, choreography uses abstract process to describethe collaboration among service partners.
Since our QoS-aware framework requires concrete serviceswith binding so that non-functional properties can be mea-sured, the abstract nature of choreography in describing serviceinteractions is not a direct fit for our framework. Thus, we needto extend the abstract interactions with appropriate concreteannotations of QoS attributes. Since our framework adapts
BPEL as the descriptive language for business processes, weadapt BPEL4Chor [20] to model service choreography. Wefurther annotate the interactions to make the choreographyQoS-aware.
BPEL4Chor consists of three artifact types:• Participant behavior description (PBD): It defines control
flow dependencies between activities. It uses the Ab-stract Process Profile to describe requirements on thebehavior of a participant. The profile inherits from Ab-stract Process Profile for Observable Behavior specifiedin BPEL, with the addition of identifying activities withunique identifiers. The PBD is essentially an abstractprocess with the additional attributes kept in the profile.
• Participant topology: It defines the collaboration struc-ture of participant types, participants, and message links.The topology describes the communication structure ofthe service interactions among participants.
• Participant grounding: It defines the actual configurationof the choreography, and shows the connections to theconcrete WSDL of the service participants. For eachmessage link defined in the participant topology, a porttype and its operation is specified. After the grounding,every PBD of the service can be transformed to anexecutable BPEL process based on their profiles.
An initial high level mapping from the modules ofBPEL4Chor to our framework is straightforward. Although ourframework requires concrete service data, abstract process isincluded in the framework. And, it is feasible to use abstractprocesses during the composition process before the newgrounding of composition is admitted in the framework. Theprocesses of adapting the composition to our QoS frameworkare presented below. We will refer to the processes shown inFigure 1 in our discussions below.• From BPEL4Chor to QoS-Aware Extension
The main product of a service choreography is anexecutable process. The new service can be includedin the QoS-extension framework by first submittingto the QoS TestComposite for QoS evaluation (D2).Corresponding process data is established with addi-tional specific records for a choreography including PBDfor all the participants and the composition topology.Recording a PBD is compatible with storing an abstractprocess, which is supported in the QoS-Aware extension.
• From QoS-Aware Extension to BPEL4ChorThe main activity of BPEL4Chor is to identify a setof service participants to create a new service. Theprocess involves selecting the service participants, ex-tracting the PDB, and applying BPEL4Chor processes tocompose the new service. The participants are restrictedto only PSes since we have to identify the names ofthe operations. The QoS-aware framework facilitatesthe selection process by providing QoS values duringdiscovery (D1). The selection process is similar to theselection process of a PS as introduced in Section III-A.Once we select the participants for composition, we willneed the PDB for each participant. Since each participantselected is executable PS, there always exits one and
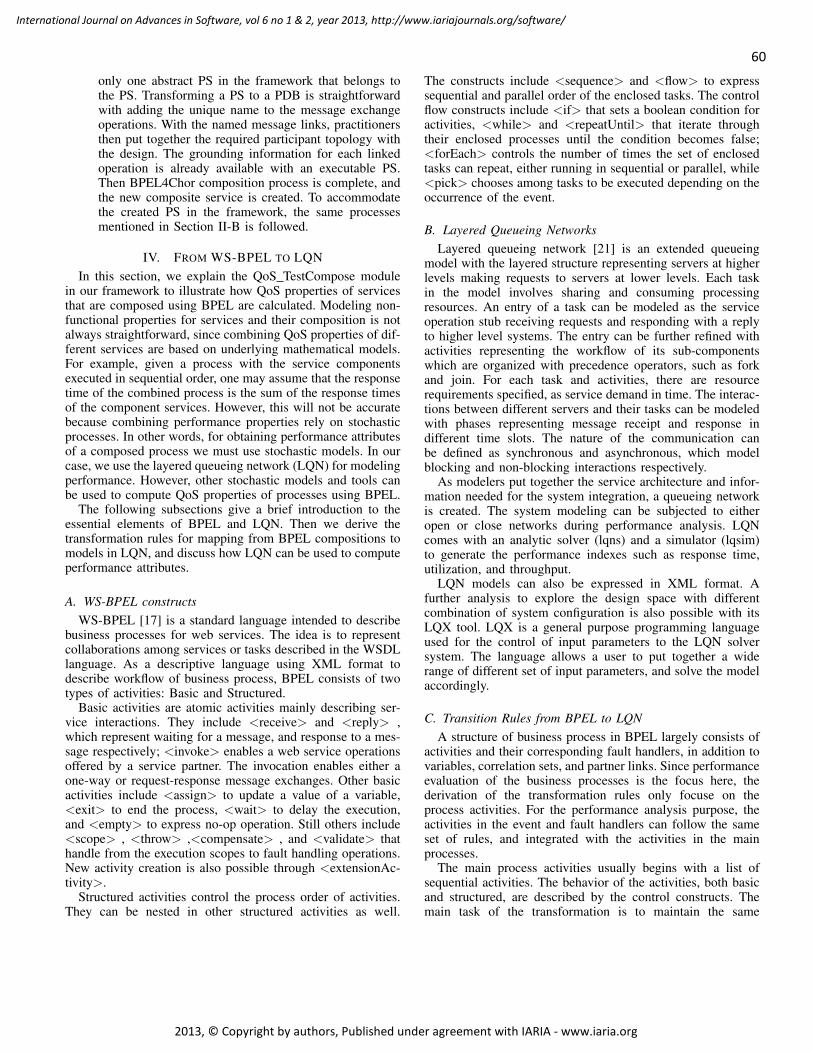
60
International Journal on Advances in Software, vol 6 no 1 & 2, year 2013, http://www.iariajournals.org/software/
2013, © Copyright by authors, Published under agreement with IARIA - www.iaria.org
only one abstract PS in the framework that belongs tothe PS. Transforming a PS to a PDB is straightforwardwith adding the unique name to the message exchangeoperations. With the named message links, practitionersthen put together the required participant topology withthe design. The grounding information for each linkedoperation is already available with an executable PS.Then BPEL4Chor composition process is complete, andthe new composite service is created. To accommodatethe created PS in the framework, the same processesmentioned in Section II-B is followed.
IV. FROM WS-BPEL TO LQNIn this section, we explain the QoS TestCompose module
in our framework to illustrate how QoS properties of servicesthat are composed using BPEL are calculated. Modeling non-functional properties for services and their composition is notalways straightforward, since combining QoS properties of dif-ferent services are based on underlying mathematical models.For example, given a process with the service componentsexecuted in sequential order, one may assume that the responsetime of the combined process is the sum of the response timesof the component services. However, this will not be accuratebecause combining performance properties rely on stochasticprocesses. In other words, for obtaining performance attributesof a composed process we must use stochastic models. In ourcase, we use the layered queueing network (LQN) for modelingperformance. However, other stochastic models and tools canbe used to compute QoS properties of processes using BPEL.
The following subsections give a brief introduction to theessential elements of BPEL and LQN. Then we derive thetransformation rules for mapping from BPEL compositions tomodels in LQN, and discuss how LQN can be used to computeperformance attributes.
A. WS-BPEL constructsWS-BPEL [17] is a standard language intended to describe
business processes for web services. The idea is to representcollaborations among services or tasks described in the WSDLlanguage. As a descriptive language using XML format todescribe workflow of business process, BPEL consists of twotypes of activities: Basic and Structured.
Basic activities are atomic activities mainly describing ser-vice interactions. They include <receive> and <reply> ,which represent waiting for a message, and response to a mes-sage respectively; <invoke> enables a web service operationsoffered by a service partner. The invocation enables either aone-way or request-response message exchanges. Other basicactivities include <assign> to update a value of a variable,<exit> to end the process, <wait> to delay the execution,and <empty> to express no-op operation. Still others include<scope> , <throw> ,<compensate> , and <validate> thathandle from the execution scopes to fault handling operations.New activity creation is also possible through <extensionAc-tivity>.
Structured activities control the process order of activities.They can be nested in other structured activities as well.
The constructs include <sequence> and <flow> to expresssequential and parallel order of the enclosed tasks. The controlflow constructs include <if> that sets a boolean condition foractivities, <while> and <repeatUntil> that iterate throughtheir enclosed processes until the condition becomes false;<forEach> controls the number of times the set of enclosedtasks can repeat, either running in sequential or parallel, while<pick> chooses among tasks to be executed depending on theoccurrence of the event.
B. Layered Queueing NetworksLayered queueing network [21] is an extended queueing
model with the layered structure representing servers at higherlevels making requests to servers at lower levels. Each taskin the model involves sharing and consuming processingresources. An entry of a task can be modeled as the serviceoperation stub receiving requests and responding with a replyto higher level systems. The entry can be further refined withactivities representing the workflow of its sub-componentswhich are organized with precedence operators, such as forkand join. For each task and activities, there are resourcerequirements specified, as service demand in time. The interac-tions between different servers and their tasks can be modeledwith phases representing message receipt and response indifferent time slots. The nature of the communication canbe defined as synchronous and asynchronous, which modelblocking and non-blocking interactions respectively.
As modelers put together the service architecture and infor-mation needed for the system integration, a queueing networkis created. The system modeling can be subjected to eitheropen or close networks during performance analysis. LQNcomes with an analytic solver (lqns) and a simulator (lqsim)to generate the performance indexes such as response time,utilization, and throughput.
LQN models can also be expressed in XML format. Afurther analysis to explore the design space with differentcombination of system configuration is also possible with itsLQX tool. LQX is a general purpose programming languageused for the control of input parameters to the LQN solversystem. The language allows a user to put together a widerange of different set of input parameters, and solve the modelaccordingly.
C. Transition Rules from BPEL to LQNA structure of business process in BPEL largely consists of
activities and their corresponding fault handlers, in addition tovariables, correlation sets, and partner links. Since performanceevaluation of the business processes is the focus here, thederivation of the transformation rules only focuse on theprocess activities. For the performance analysis purpose, theactivities in the event and fault handlers can follow the sameset of rules, and integrated with the activities in the mainprocesses.
The main process activities usually begins with a list ofsequential activities. The behavior of the activities, both basicand structured, are described by the control constructs. Themain task of the transformation is to maintain the same
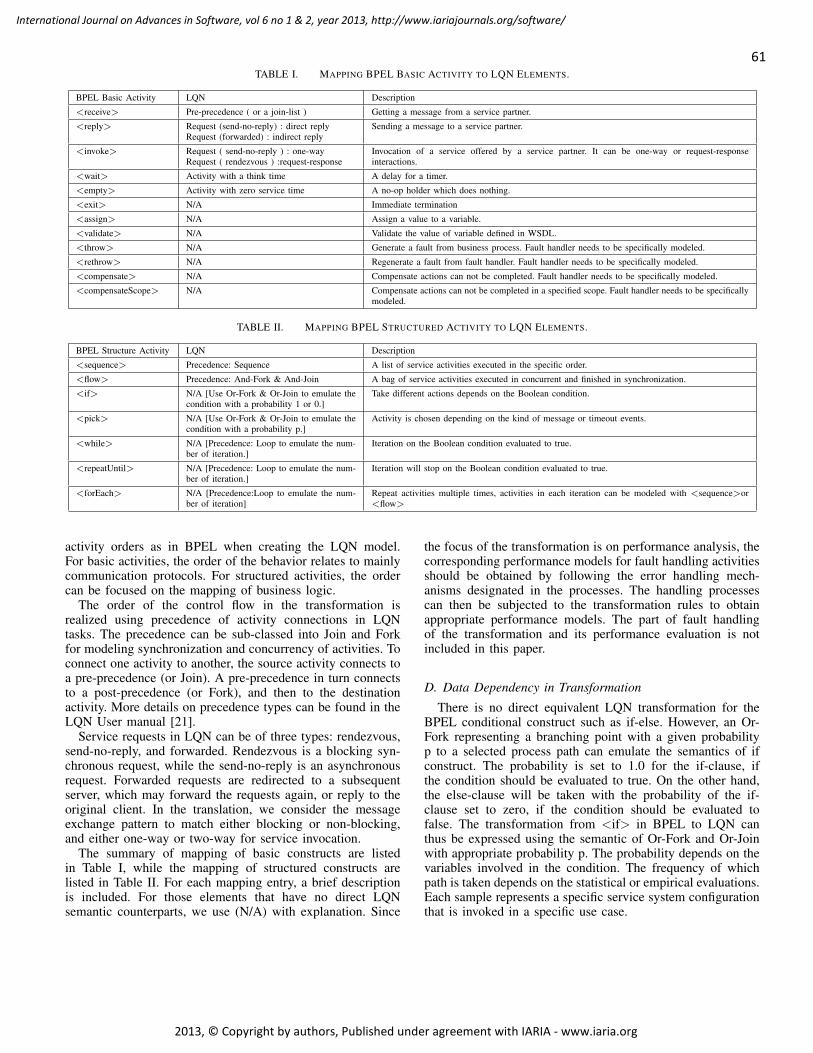
61
International Journal on Advances in Software, vol 6 no 1 & 2, year 2013, http://www.iariajournals.org/software/
2013, © Copyright by authors, Published under agreement with IARIA - www.iaria.org
TABLE I. MAPPING BPEL BASIC ACTIVITY TO LQN ELEMENTS.
BPEL Basic Activity LQN Description
<receive> Pre-precedence ( or a join-list ) Getting a message from a service partner.
<reply> Request (send-no-reply) : direct replyRequest (forwarded) : indirect reply
Sending a message to a service partner.
<invoke> Request ( send-no-reply ) : one-wayRequest ( rendezvous ) :request-response
Invocation of a service offered by a service partner. It can be one-way or request-responseinteractions.
<wait> Activity with a think time A delay for a timer.
<empty> Activity with zero service time A no-op holder which does nothing.
<exit> N/A Immediate termination
<assign> N/A Assign a value to a variable.
<validate> N/A Validate the value of variable defined in WSDL.
<throw> N/A Generate a fault from business process. Fault handler needs to be specifically modeled.
<rethrow> N/A Regenerate a fault from fault handler. Fault handler needs to be specifically modeled.
<compensate> N/A Compensate actions can not be completed. Fault handler needs to be specifically modeled.
<compensateScope> N/A Compensate actions can not be completed in a specified scope. Fault handler needs to be specificallymodeled.
TABLE II. MAPPING BPEL STRUCTURED ACTIVITY TO LQN ELEMENTS.
BPEL Structure Activity LQN Description
<sequence> Precedence: Sequence A list of service activities executed in the specific order.
<flow> Precedence: And-Fork & And-Join A bag of service activities executed in concurrent and finished in synchronization.
<if> N/A [Use Or-Fork & Or-Join to emulate thecondition with a probability 1 or 0.]
Take different actions depends on the Boolean condition.
<pick> N/A [Use Or-Fork & Or-Join to emulate thecondition with a probability p.]
Activity is chosen depending on the kind of message or timeout events.
<while> N/A [Precedence: Loop to emulate the num-ber of iteration.]
Iteration on the Boolean condition evaluated to true.
<repeatUntil> N/A [Precedence: Loop to emulate the num-ber of iteration.]
Iteration will stop on the Boolean condition evaluated to true.
<forEach> N/A [Precedence:Loop to emulate the num-ber of iteration]
Repeat activities multiple times, activities in each iteration can be modeled with <sequence>or<flow>
activity orders as in BPEL when creating the LQN model.For basic activities, the order of the behavior relates to mainlycommunication protocols. For structured activities, the ordercan be focused on the mapping of business logic.
The order of the control flow in the transformation isrealized using precedence of activity connections in LQNtasks. The precedence can be sub-classed into Join and Forkfor modeling synchronization and concurrency of activities. Toconnect one activity to another, the source activity connects toa pre-precedence (or Join). A pre-precedence in turn connectsto a post-precedence (or Fork), and then to the destinationactivity. More details on precedence types can be found in theLQN User manual [21].
Service requests in LQN can be of three types: rendezvous,send-no-reply, and forwarded. Rendezvous is a blocking syn-chronous request, while the send-no-reply is an asynchronousrequest. Forwarded requests are redirected to a subsequentserver, which may forward the requests again, or reply to theoriginal client. In the translation, we consider the messageexchange pattern to match either blocking or non-blocking,and either one-way or two-way for service invocation.
The summary of mapping of basic constructs are listedin Table I, while the mapping of structured constructs arelisted in Table II. For each mapping entry, a brief descriptionis included. For those elements that have no direct LQNsemantic counterparts, we use (N/A) with explanation. Since
the focus of the transformation is on performance analysis, thecorresponding performance models for fault handling activitiesshould be obtained by following the error handling mech-anisms designated in the processes. The handling processescan then be subjected to the transformation rules to obtainappropriate performance models. The part of fault handlingof the transformation and its performance evaluation is notincluded in this paper.
D. Data Dependency in Transformation
There is no direct equivalent LQN transformation for theBPEL conditional construct such as if-else. However, an Or-Fork representing a branching point with a given probabilityp to a selected process path can emulate the semantics of ifconstruct. The probability is set to 1.0 for the if-clause, ifthe condition should be evaluated to true. On the other hand,the else-clause will be taken with the probability of the if-clause set to zero, if the condition should be evaluated tofalse. The transformation from <if> in BPEL to LQN canthus be expressed using the semantic of Or-Fork and Or-Joinwith appropriate probability p. The probability depends on thevariables involved in the condition. The frequency of whichpath is taken depends on the statistical or empirical evaluations.Each sample represents a specific service system configurationthat is invoked in a specific use case.
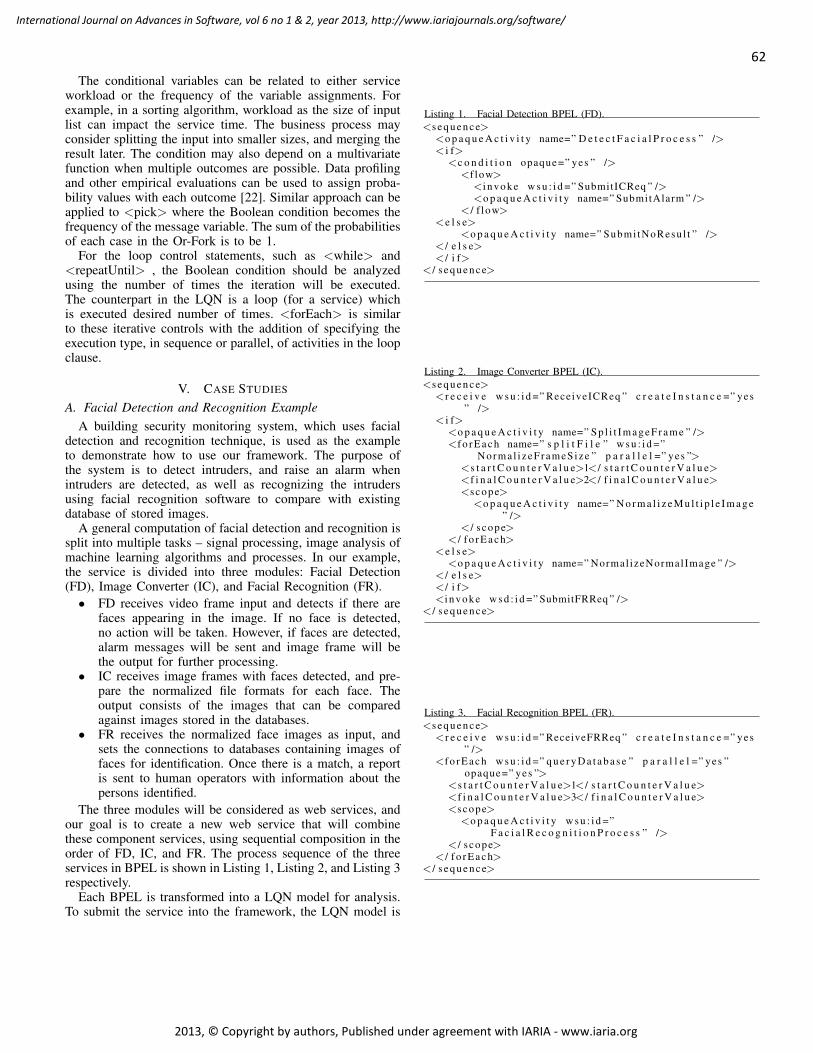
62
International Journal on Advances in Software, vol 6 no 1 & 2, year 2013, http://www.iariajournals.org/software/
2013, © Copyright by authors, Published under agreement with IARIA - www.iaria.org
The conditional variables can be related to either serviceworkload or the frequency of the variable assignments. Forexample, in a sorting algorithm, workload as the size of inputlist can impact the service time. The business process mayconsider splitting the input into smaller sizes, and merging theresult later. The condition may also depend on a multivariatefunction when multiple outcomes are possible. Data profilingand other empirical evaluations can be used to assign proba-bility values with each outcome [22]. Similar approach can beapplied to <pick> where the Boolean condition becomes thefrequency of the message variable. The sum of the probabilitiesof each case in the Or-Fork is to be 1.
For the loop control statements, such as <while> and<repeatUntil> , the Boolean condition should be analyzedusing the number of times the iteration will be executed.The counterpart in the LQN is a loop (for a service) whichis executed desired number of times. <forEach> is similarto these iterative controls with the addition of specifying theexecution type, in sequence or parallel, of activities in the loopclause.
V. CASE STUDIES
A. Facial Detection and Recognition ExampleA building security monitoring system, which uses facial
detection and recognition technique, is used as the exampleto demonstrate how to use our framework. The purpose ofthe system is to detect intruders, and raise an alarm whenintruders are detected, as well as recognizing the intrudersusing facial recognition software to compare with existingdatabase of stored images.
A general computation of facial detection and recognition issplit into multiple tasks – signal processing, image analysis ofmachine learning algorithms and processes. In our example,the service is divided into three modules: Facial Detection(FD), Image Converter (IC), and Facial Recognition (FR).
• FD receives video frame input and detects if there arefaces appearing in the image. If no face is detected,no action will be taken. However, if faces are detected,alarm messages will be sent and image frame will bethe output for further processing.
• IC receives image frames with faces detected, and pre-pare the normalized file formats for each face. Theoutput consists of the images that can be comparedagainst images stored in the databases.
• FR receives the normalized face images as input, andsets the connections to databases containing images offaces for identification. Once there is a match, a reportis sent to human operators with information about thepersons identified.
The three modules will be considered as web services, andour goal is to create a new web service that will combinethese component services, using sequential composition in theorder of FD, IC, and FR. The process sequence of the threeservices in BPEL is shown in Listing 1, Listing 2, and Listing 3respectively.
Each BPEL is transformed into a LQN model for analysis.To submit the service into the framework, the LQN model is
Listing 1. Facial Detection BPEL (FD).<s e q u e n c e>
<o p a q u e A c t i v i t y name=” D e t e c t F a c i a l P r o c e s s ” />< i f>
<c o n d i t i o n opaque=” yes ” /><f low>
<i n vo ke w s u : i d =” SubmitICReq ” /><o p a q u e A c t i v i t y name=” SubmitAlarm ” />
< / f low><e l s e>
<o p a q u e A c t i v i t y name=” Submi tNoResu l t ” />< / e l s e>< / i f>
< / s e q u e n c e>
Listing 2. Image Converter BPEL (IC).<s e q u e n c e>
<r e c e i v e w s u : i d =” ReceiveICReq ” c r e a t e I n s t a n c e =” yes” />
< i f><o p a q u e A c t i v i t y name=” S p l i t I m a g e F r a m e ” /><f o r E a c h name=” s p l i t F i l e ” w s u : i d =”
Norma l i zeFrameSize ” p a r a l l e l =” yes ”><s t a r t C o u n t e r V a l u e>1< / s t a r t C o u n t e r V a l u e><f i n a l C o u n t e r V a l u e>2< / f i n a l C o u n t e r V a l u e><scope>
<o p a q u e A c t i v i t y name=” N o r m a l i z e M u l t i p l e I m a g e” />
< / s cope>< / f o r E a c h>
<e l s e><o p a q u e A c t i v i t y name=” Normal izeNormalImage ” />
< / e l s e>< / i f><i n vo ke w s d : i d =” SubmitFRReq ” />
< / s e q u e n c e>
Listing 3. Facial Recognition BPEL (FR).<s e q u e n c e>
<r e c e i v e w s u : i d =” ReceiveFRReq ” c r e a t e I n s t a n c e =” yes” />
<f o r E a c h w s u : i d =” q u e r y D a t a b a s e ” p a r a l l e l =” yes ”opaque=” yes ”>
<s t a r t C o u n t e r V a l u e>1< / s t a r t C o u n t e r V a l u e><f i n a l C o u n t e r V a l u e>3< / f i n a l C o u n t e r V a l u e><scope>
<o p a q u e A c t i v i t y w s u : i d =”F a c i a l R e c o g n i t i o n P r o c e s s ” />
< / s cope>< / f o r E a c h>
< / s e q u e n c e>
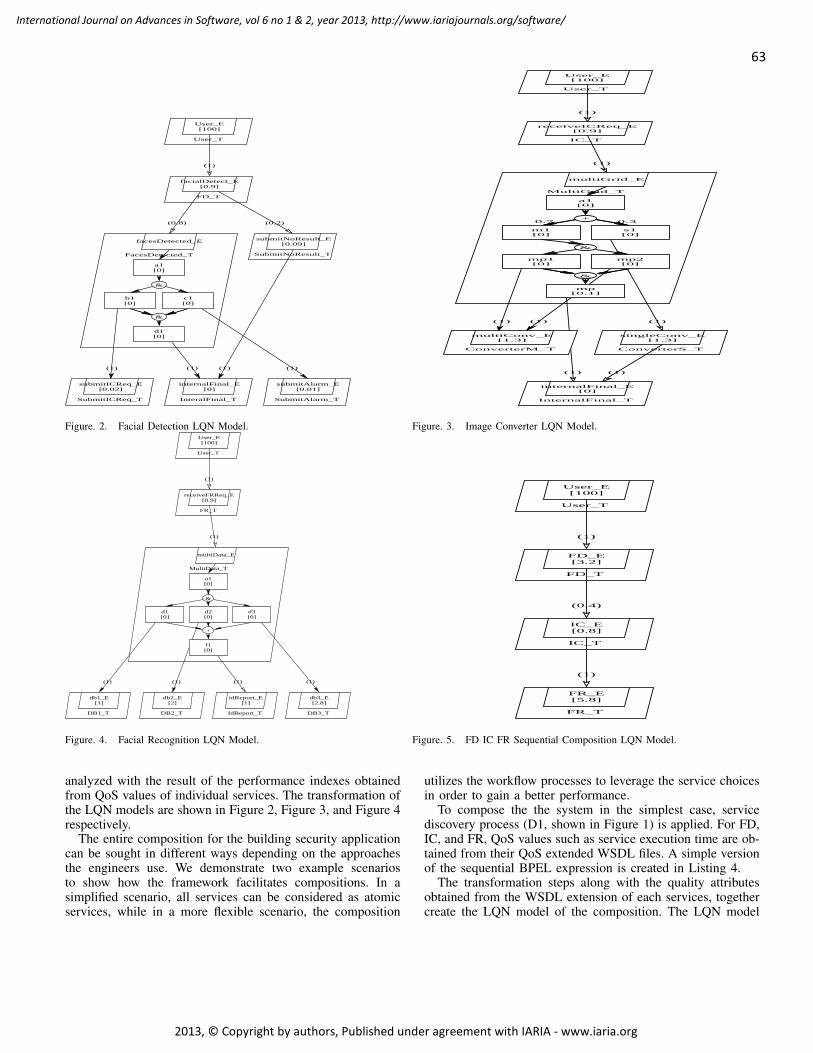
63
International Journal on Advances in Software, vol 6 no 1 & 2, year 2013, http://www.iariajournals.org/software/
2013, © Copyright by authors, Published under agreement with IARIA - www.iaria.org
User_T
User_E[100]
(1)
FD_T
facialDetect_E[0.9]
(0.8) (0.2)
FacesDetected_T
facesDetected_E
a1[0]
(1)
b1[0]
(1)
c1[0]
(1)
d1[0]
SubmitNoResult_T
submitNoResult_E[0.09]
(1)
SubmitICReq_T
submitICReq_E[0.02]
InteralFinal_T
internalFinal_E[0]
SubmitAlarm_T
submitAlarm_E[0.01]
&
&
Figure. 2. Facial Detection LQN Model.
User_T
User_E[100]
(1)
IC_T
receiveICReq_E[0.9]
(1)
MultiGrid_T
multiGrid_E
a1[0]
m1[0]
0.7 0.3
(1)
mp[0.1]
(1)
mp1[0]
(1)
mp2[0]
(1)
s1[0]
ConverterM_T
multiConv_E[1.3]
ConverterS_T
singleConv_E[1.3]
(1)
InternalFinal_T
internalFinal_E[0]
+
&
&
Figure. 3. Image Converter LQN Model.
User_T
User_E[100]
(1)
FR_T
receiveFRReq_E[0.9]
(1)
MultiData_T
multiData_E
a1[0]
(1)
d1[0]
(1)
d2[0]
(1)
d3[0]
(1)
f1[0]
DB1_T
db1_E[1]
DB2_T
db2_E[2]
IdReport_T
idReport_E[1]
DB3_T
db3_E[2.8]
+
&
Figure. 4. Facial Recognition LQN Model.
User_T
User_E[100]
(1)
FD_T
FD_E[3.2]
(0.4)
IC_T
IC_E[0.8]
(1)
FR_T
FR_E[5.8]
Figure. 5. FD IC FR Sequential Composition LQN Model.
analyzed with the result of the performance indexes obtainedfrom QoS values of individual services. The transformation ofthe LQN models are shown in Figure 2, Figure 3, and Figure 4respectively.
The entire composition for the building security applicationcan be sought in different ways depending on the approachesthe engineers use. We demonstrate two example scenariosto show how the framework facilitates compositions. In asimplified scenario, all services can be considered as atomicservices, while in a more flexible scenario, the composition
utilizes the workflow processes to leverage the service choicesin order to gain a better performance.
To compose the the system in the simplest case, servicediscovery process (D1, shown in Figure 1) is applied. For FD,IC, and FR, QoS values such as service execution time are ob-tained from their QoS extended WSDL files. A simple versionof the sequential BPEL expression is created in Listing 4.
The transformation steps along with the quality attributesobtained from the WSDL extension of each services, togethercreate the LQN model of the composition. The LQN model
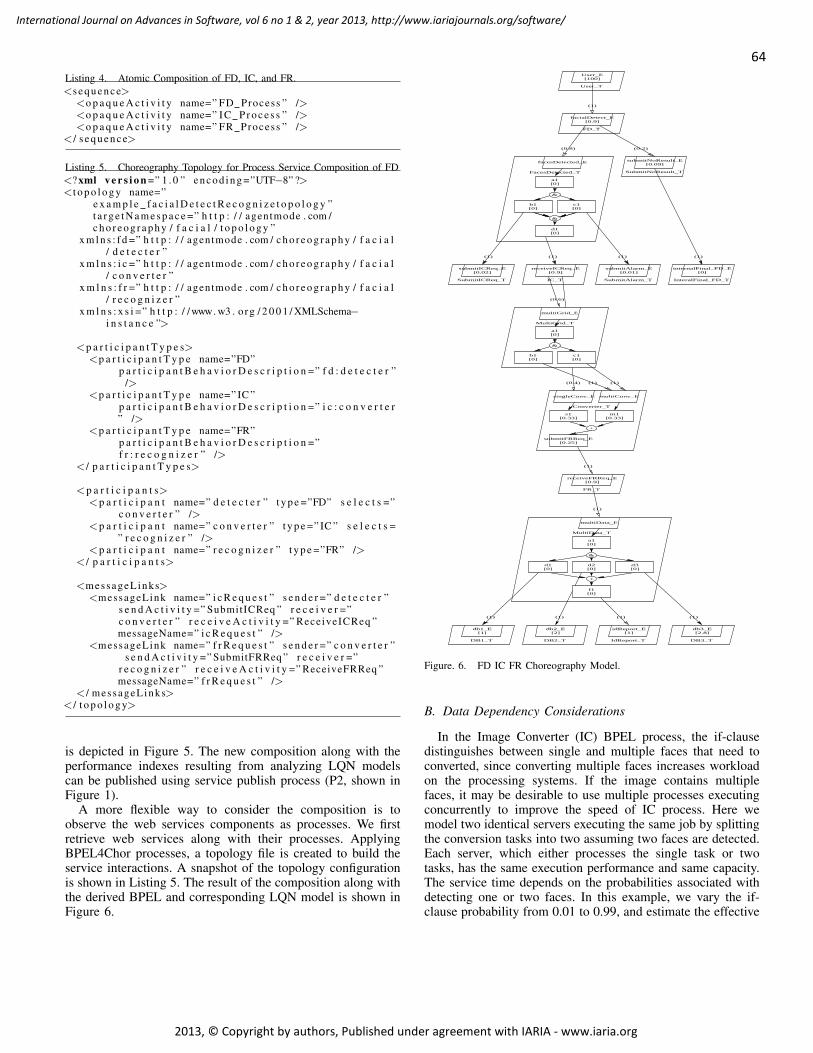
64
International Journal on Advances in Software, vol 6 no 1 & 2, year 2013, http://www.iariajournals.org/software/
2013, © Copyright by authors, Published under agreement with IARIA - www.iaria.org
Listing 4. Atomic Composition of FD, IC, and FR.<s e q u e n c e>
<o p a q u e A c t i v i t y name=” FD Process ” /><o p a q u e A c t i v i t y name=” I C P r o c e s s ” /><o p a q u e A c t i v i t y name=” FR Process ” />
< / s e q u e n c e>
Listing 5. Choreography Topology for Process Service Composition of FD<? xml v e r s i o n =” 1 . 0 ” e n c o d i n g =”UTF−8” ?><t o p o l o g y name=”
e x a m p l e f a c i a l D e t e c t R e c o g n i z e t o p o l o g y ”t a r g e t N a m e s p a c e =” h t t p : / / agentmode . com /c h o r e o g r a p h y / f a c i a l / t o p o l o g y ”
x m l n s : f d =” h t t p : / / agentmode . com / c h o r e o g r a p h y / f a c i a l/ d e t e c t e r ”
x m l n s : i c =” h t t p : / / agentmode . com / c h o r e o g r a p h y / f a c i a l/ c o n v e r t e r ”
x m l n s : f r =” h t t p : / / agentmode . com / c h o r e o g r a p h y / f a c i a l/ r e c o g n i z e r ”
x m l n s : x s i =” h t t p : / /www. w3 . org / 2 0 0 1 / XMLSchema−i n s t a n c e ”>
<p a r t i c i p a n t T y p e s><p a r t i c i p a n t T y p e name=”FD”
p a r t i c i p a n t B e h a v i o r D e s c r i p t i o n =” f d : d e t e c t e r ”/>
<p a r t i c i p a n t T y p e name=” IC ”p a r t i c i p a n t B e h a v i o r D e s c r i p t i o n =” i c : c o n v e r t e r” />
<p a r t i c i p a n t T y p e name=”FR”p a r t i c i p a n t B e h a v i o r D e s c r i p t i o n =”f r : r e c o g n i z e r ” />
< / p a r t i c i p a n t T y p e s>
<p a r t i c i p a n t s><p a r t i c i p a n t name=” d e t e c t e r ” t y p e =”FD” s e l e c t s =”
c o n v e r t e r ” /><p a r t i c i p a n t name=” c o n v e r t e r ” t y p e =” IC ” s e l e c t s =
” r e c o g n i z e r ” /><p a r t i c i p a n t name=” r e c o g n i z e r ” t y p e =”FR” />
< / p a r t i c i p a n t s>
<messageLinks><messageLink name=” i c R e q u e s t ” s e n d e r =” d e t e c t e r ”
s e n d A c t i v i t y =” SubmitICReq ” r e c e i v e r =”c o n v e r t e r ” r e c e i v e A c t i v i t y =” ReceiveICReq ”messageName=” i c R e q u e s t ” />
<messageLink name=” f r R e q u e s t ” s e n d e r =” c o n v e r t e r ”s e n d A c t i v i t y =” SubmitFRReq ” r e c e i v e r =”
r e c o g n i z e r ” r e c e i v e A c t i v i t y =” ReceiveFRReq ”messageName=” f r R e q u e s t ” />
< / messageLinks>< / t o p o l o g y>
is depicted in Figure 5. The new composition along with theperformance indexes resulting from analyzing LQN modelscan be published using service publish process (P2, shown inFigure 1).
A more flexible way to consider the composition is toobserve the web services components as processes. We firstretrieve web services along with their processes. ApplyingBPEL4Chor processes, a topology file is created to build theservice interactions. A snapshot of the topology configurationis shown in Listing 5. The result of the composition along withthe derived BPEL and corresponding LQN model is shown inFigure 6.
User_T
User_E[100]
(1)
FD_T
facialDetect_E[0.9]
(0.8) (0.2)
FacesDetected_T
facesDetected_E
a1[0]
(1)
b1[0]
(1)
c1[0]
(1)
d1[0]
SubmitNoResult_T
submitNoResult_E[0.09]
(1)
SubmitICReq_T
submitICReq_E[0.02]
IC_T
receiveICReq_E[0.9]
(0.6)
(0.4)
SubmitAlarm_T
submitAlarm_E[0.01]
InteralFinal_FD_T
internalFinal_FD_E[0]
MultiGrid_T
multiGrid_E
a1[0]
(1)
b1[0]
(1)
c1[0]
Converter_T
singleConv_E multiConv_E
m1[0.33]
s1[0.33]
(1)
submitFRReq_E[0.25]
FR_T
receiveFRReq_E[0.9]
(1)
MultiData_T
multiData_E
a1[0]
(1)
d1[0]
(1)
d2[0]
(1)
d3[0]
(1)
f1[0]
DB1_T
db1_E[1]
DB2_T
db2_E[2]
IdReport_T
idReport_E[1]
DB3_T
db3_E[2.8]
&
&
&
+
+
&
Figure. 6. FD IC FR Choreography Model.
B. Data Dependency Considerations
In the Image Converter (IC) BPEL process, the if-clausedistinguishes between single and multiple faces that need toconverted, since converting multiple faces increases workloadon the processing systems. If the image contains multiplefaces, it may be desirable to use multiple processes executingconcurrently to improve the speed of IC process. Here wemodel two identical servers executing the same job by splittingthe conversion tasks into two assuming two faces are detected.Each server, which either processes the single task or twotasks, has the same execution performance and same capacity.The service time depends on the probabilities associated withdetecting one or two faces. In this example, we vary the if-clause probability from 0.01 to 0.99, and estimate the effective
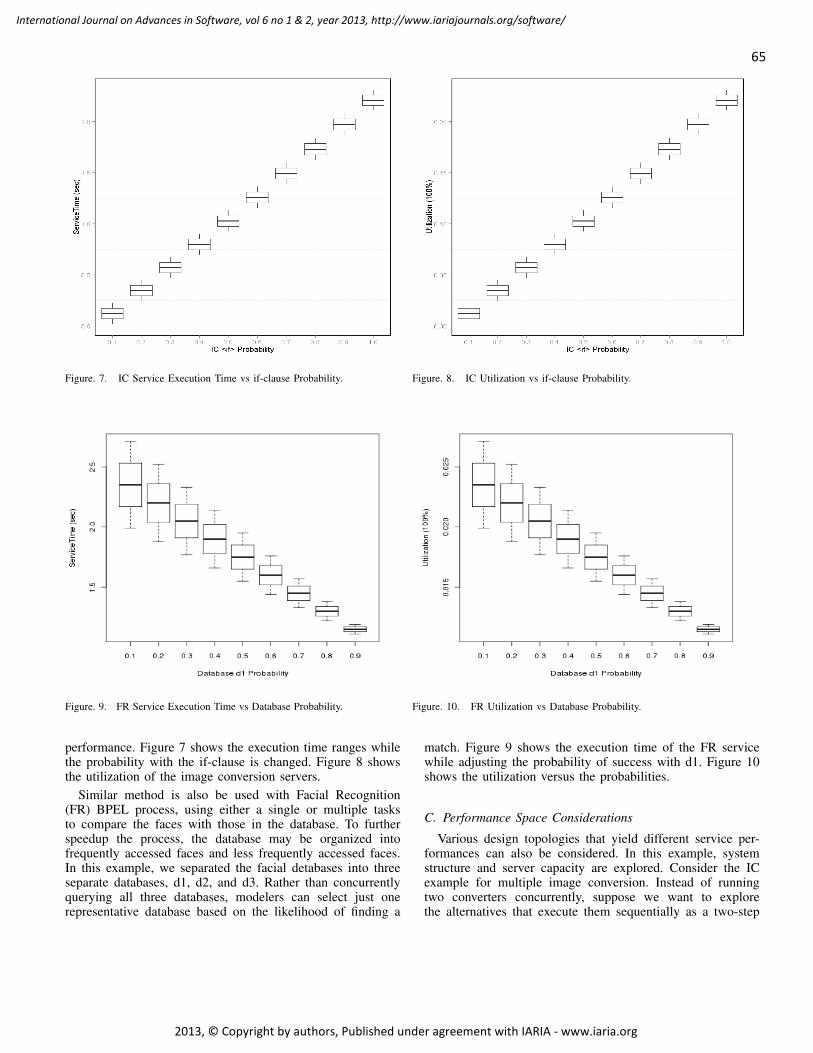
65
International Journal on Advances in Software, vol 6 no 1 & 2, year 2013, http://www.iariajournals.org/software/
2013, © Copyright by authors, Published under agreement with IARIA - www.iaria.org
Figure. 7. IC Service Execution Time vs if-clause Probability. Figure. 8. IC Utilization vs if-clause Probability.
Figure. 9. FR Service Execution Time vs Database Probability. Figure. 10. FR Utilization vs Database Probability.
performance. Figure 7 shows the execution time ranges whilethe probability with the if-clause is changed. Figure 8 showsthe utilization of the image conversion servers.
Similar method is also be used with Facial Recognition(FR) BPEL process, using either a single or multiple tasksto compare the faces with those in the database. To furtherspeedup the process, the database may be organized intofrequently accessed faces and less frequently accessed faces.In this example, we separated the facial detabases into threeseparate databases, d1, d2, and d3. Rather than concurrentlyquerying all three databases, modelers can select just onerepresentative database based on the likelihood of finding a
match. Figure 9 shows the execution time of the FR servicewhile adjusting the probability of success with d1. Figure 10shows the utilization versus the probabilities.
C. Performance Space Considerations
Various design topologies that yield different service per-formances can also be considered. In this example, systemstructure and server capacity are explored. Consider the ICexample for multiple image conversion. Instead of runningtwo converters concurrently, suppose we want to explorethe alternatives that execute them sequentially as a two-step
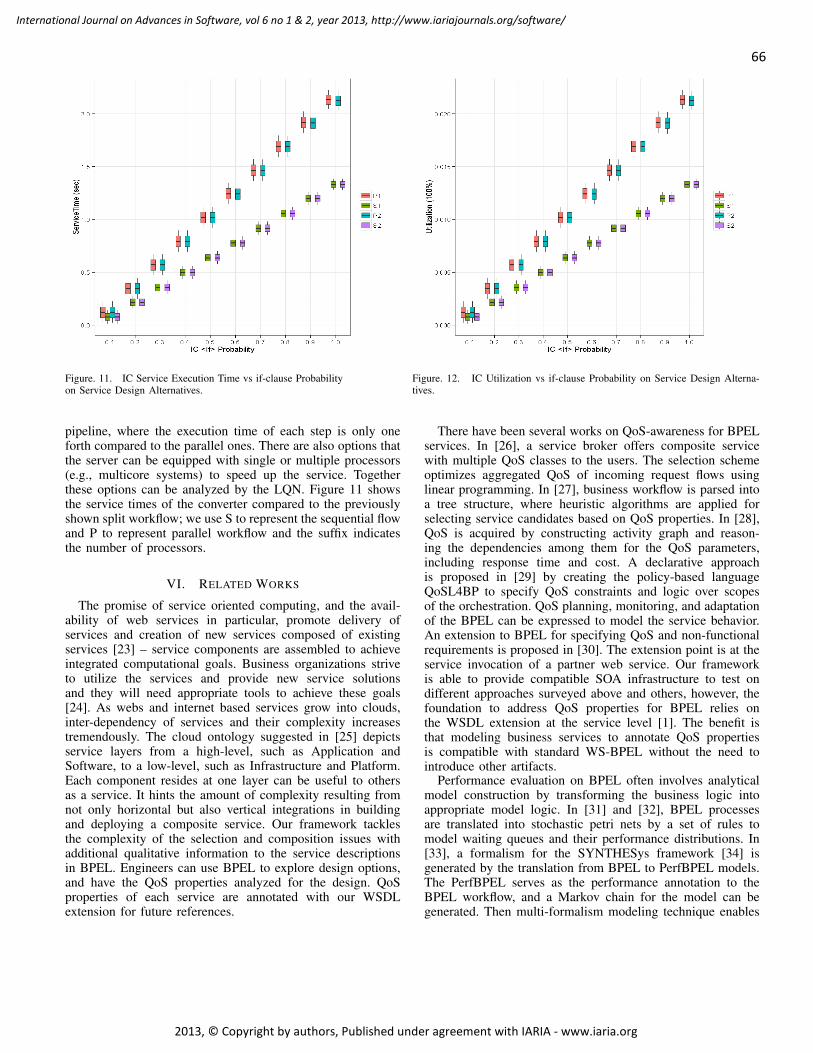
66
International Journal on Advances in Software, vol 6 no 1 & 2, year 2013, http://www.iariajournals.org/software/
2013, © Copyright by authors, Published under agreement with IARIA - www.iaria.org
Figure. 11. IC Service Execution Time vs if-clause Probabilityon Service Design Alternatives.
Figure. 12. IC Utilization vs if-clause Probability on Service Design Alterna-tives.
pipeline, where the execution time of each step is only oneforth compared to the parallel ones. There are also options thatthe server can be equipped with single or multiple processors(e.g., multicore systems) to speed up the service. Togetherthese options can be analyzed by the LQN. Figure 11 showsthe service times of the converter compared to the previouslyshown split workflow; we use S to represent the sequential flowand P to represent parallel workflow and the suffix indicatesthe number of processors.
VI. RELATED WORKS
The promise of service oriented computing, and the avail-ability of web services in particular, promote delivery ofservices and creation of new services composed of existingservices [23] – service components are assembled to achieveintegrated computational goals. Business organizations striveto utilize the services and provide new service solutionsand they will need appropriate tools to achieve these goals[24]. As webs and internet based services grow into clouds,inter-dependency of services and their complexity increasestremendously. The cloud ontology suggested in [25] depictsservice layers from a high-level, such as Application andSoftware, to a low-level, such as Infrastructure and Platform.Each component resides at one layer can be useful to othersas a service. It hints the amount of complexity resulting fromnot only horizontal but also vertical integrations in buildingand deploying a composite service. Our framework tacklesthe complexity of the selection and composition issues withadditional qualitative information to the service descriptionsin BPEL. Engineers can use BPEL to explore design options,and have the QoS properties analyzed for the design. QoSproperties of each service are annotated with our WSDLextension for future references.
There have been several works on QoS-awareness for BPELservices. In [26], a service broker offers composite servicewith multiple QoS classes to the users. The selection schemeoptimizes aggregated QoS of incoming request flows usinglinear programming. In [27], business workflow is parsed intoa tree structure, where heuristic algorithms are applied forselecting service candidates based on QoS properties. In [28],QoS is acquired by constructing activity graph and reason-ing the dependencies among them for the QoS parameters,including response time and cost. A declarative approachis proposed in [29] by creating the policy-based languageQoSL4BP to specify QoS constraints and logic over scopesof the orchestration. QoS planning, monitoring, and adaptationof the BPEL can be expressed to model the service behavior.An extension to BPEL for specifying QoS and non-functionalrequirements is proposed in [30]. The extension point is at theservice invocation of a partner web service. Our frameworkis able to provide compatible SOA infrastructure to test ondifferent approaches surveyed above and others, however, thefoundation to address QoS properties for BPEL relies onthe WSDL extension at the service level [1]. The benefit isthat modeling business services to annotate QoS propertiesis compatible with standard WS-BPEL without the need tointroduce other artifacts.
Performance evaluation on BPEL often involves analyticalmodel construction by transforming the business logic intoappropriate model logic. In [31] and [32], BPEL processesare translated into stochastic petri nets by a set of rules tomodel waiting queues and their performance distributions. In[33], a formalism for the SYNTHESys framework [34] isgenerated by the translation from BPEL to PerfBPEL models.The PerfBPEL serves as the performance annotation to theBPEL workflow, and a Markov chain for the model can begenerated. Then multi-formalism modeling technique enables
67
International Journal on Advances in Software, vol 6 no 1 & 2, year 2013, http://www.iariajournals.org/software/
2013, © Copyright by authors, Published under agreement with IARIA - www.iaria.org
the use of other tools for analysis. In [35], BPEL is annotatedwith a performance metadata for operations and resources. Aqueueing model can be derived from these annotations to gen-erate the bounds of throughput and response times. While thetranslation is similar to ours, our framework uses an ontologyfor QoS data management, and use LQN to keep the originalmapping of service architecture. In [36], support from abstractto executable processes for service orchestration is proposedaccording to three levels: needed functionality, expected QoS,and composition flow. Process realization, discovery, classifica-tion, and selection steps lead to the composition. The expectedQoS is reasoned by a classification method to select servicesfor composition. While our framework can also rank servicesusing ontology models and plug in different selection filters,the QoS prediction for service composition is based on theresult of modeling analysis.
A feature-completed Petri net semantic counterpart forBPEL has been established in [16]. As mapping from BPELis easily obtained, Petri net can be subjected to formal modelchecking [37] and workflow performance analysis [38].
VII. CONCLUSION
In this paper, we described our framework for web serviceQoS-aware selection and composition of web services usingBPEL. With the foundation of WSDL extension to annotatenon-functional properties, web services can be selected basedon both functional and non-functional (QoS) properties. Wedescribed the process for publishing and discovering serviceswhich meet requirements in the standard service orientedarchitecture. We show that services in BPEL description canbe seamlessly accommodated in the framework. By adaptingBPEL and BPEL4Chor for service composition, we reasonabout the feasibility of service orchestration and choreogra-phy in our framework. To illustrate the applicability of ourframework to derive QoS properties of composed services, weuse performance properties such as throughput, response timesand utilization. To this end, we described transformation rulesfor converting BPEL into appropriate queuing networks whichcan be used by the LQN (Layered Queuing Network) tool thatcan compute throughput, utilization, and response times. Weused a case study to demonstrate this process. Although wefocused on performance in the paper, our framework can alsobe used to compute other QoS properties such as reliability,security, availability, with appropriate rules for convertingBPEL logic into corresponding models and tools for obtainingQoS properties from these models.
VIII. ACKNOWLEDGEMENTS
This work is supported in part by the NSF Net-CentricIURCRC and a grant #1128344. The authors acknowledge helpgiven by Sagarika Adepu.
REFERENCES
[1] C. Lin, K. Kavi, and S. Adepu, “A description language for qos proper-ties and a framework for service composition using qos properties,”in ICSEA 2012, The Seventh International Conference on SoftwareEngineering Advances, 2012, pp. 90–97.
[2] R. Chinnici, J.-J. Moreau, A. Ryman, and S. Weerawarana, “Webservices description language (wsdl) version 2.0 part 1: Core language,”W3C Recommendation, vol. 26, 2007.
[3] F. Curbera, M. Duftler, R. Khalaf, W. Nagy, N. Mukhi, and S. Weer-awarana, “Unraveling the web services web: an introduction to soap,wsdl, and uddi,” Internet Computing, IEEE, vol. 6, no. 2, pp. 86–93,2002.
[4] L. Zeng, B. Benatallah, A. H. H. Ngu, M. Dumas, J. Kalagnanam,and H. Chang, “Qos-aware middleware for web services composition,”Software Engineering, IEEE Transactions on, vol. 30, no. 5, pp. 311–327, 2004.
[5] R. Mietzner, C. Fehling, D. Karastoyanova, and F. Leymann, “Combin-ing horizontal and vertical composition of services,” in Service-OrientedComputing and Applications (SOCA), 2010 IEEE International Confer-ence on. IEEE, 2010, pp. 1–8.
[6] A. Mukhija, A. Dingwall-Smith, and D. S. Rosenblum, “Qos-awareservice composition in dino,” in Web Services, 2007. ECOWS’07. FifthEuropean Conference on. IEEE, 2007, pp. 3–12.
[7] R. Hamadi and B. Benatallah, “A petri net-based model for webservice composition,” in Proceedings of the 14th Australasian databaseconference-Volume 17. Australian Computer Society, Inc., 2003, pp.191–200.
[8] D. Bonetta, A. Peternier, C. Pautasso, and W. Binder, “A multicore-aware runtime architecture for scalable service composition,” in ServicesComputing Conference (APSCC), 2010 IEEE Asia-Pacific. IEEE, 2010,pp. 83–90.
[9] Y. Liu, A. H. Ngu, and L. Z. Zeng, “Qos computation and policing indynamic web service selection,” in Proceedings of the 13th internationalWorld Wide Web conference on Alternate track papers & posters. ACM,2004, pp. 66–73.
[10] N. Limam and R. Boutaba, “Assessing software service quality andtrustworthiness at selection time,” Software Engineering, IEEE Trans-actions on, vol. 36, no. 4, pp. 559–574, 2010.
[11] S. Reiff-Marganiec, H. Q. Yu, and M. Tilly, “Service selection basedon non-functional properties,” in Service-Oriented Computing-ICSOC2007 Workshops. Springer, 2009, pp. 128–138.
[12] H.-C. Wang, C.-S. Lee, and T.-H. Ho, “Combining subjective andobjective qos factors for personalized web service selection,” ExpertSystems with Applications, vol. 32, no. 2, pp. 571–584, 2007.
[13] T. Anstett, F. Leymann, R. Mietzner, and S. Strauch, “Towards bpelin the cloud: Exploiting different delivery models for the execution ofbusiness processes,” in Services-I, 2009 World Conference on. IEEE,2009, pp. 670–677.
[14] F. Curbera, F. Leymann, T. Storey, D. Ferguson, and S. Weerawarana,Web services platform architecture: SOAP, WSDL, WS-policy, WS-addressing, WS-BPEL, WS-reliable messaging and more. Prentice HallPTR Englewood Cliffs, 2005.
[15] C. Ouyang, E. Verbeek, W. M. van der Aalst, S. Breutel, M. Dumas, andA. H. ter Hofstede, “Wofbpel: A tool for automated analysis of bpelprocesses,” in Service-Oriented Computing-ICSOC 2005. Springer,2005, pp. 484–489.
[16] N. Lohmann, “A feature-complete petri net semantics for ws-bpel 2.0and its compiler bpel2owfn,” Techn. report, vol. 212, 2007.
[17] D. Jordan, J. Evdemon, A. Alves, A. Arkin, S. Askary, C. Barreto,B. Bloch, F. Curbera, M. Ford, Y. Goland et al., “Web services businessprocess execution language version 2.0,” OASIS Standard, vol. 11, 2007.
[18] H. Mili, G. Tremblay, G. B. Jaoude, E. Lefebvre, L. Elabed, and G. E.Boussaidi, “Business process modeling languages: Sorting through thealphabet soup,” ACM Computing Surveys (CSUR), vol. 43, no. 1, p. 4,2010.
[19] C. Peltz, “Web services orchestration and choreography,” Computer,vol. 36, no. 10, pp. 46–52, 2003.
[20] G. Decker, O. Kopp, F. Leymann, and M. Weske, “Bpel4chor: Extend-ing bpel for modeling choreographies,” in Web Services, 2007. ICWS2007. IEEE International Conference on. IEEE, 2007, pp. 296–303.
68
International Journal on Advances in Software, vol 6 no 1 & 2, year 2013, http://www.iariajournals.org/software/
2013, © Copyright by authors, Published under agreement with IARIA - www.iaria.org
[21] G. Franks, P. Maly, M. Woodside, D. C. Petriu, and A. Hubbard,“Layered queueing network solver and simulator user manual,” Real-time and Distributed Systems Lab, Carleton University, Ottawa, 2005.
[22] D. Ivanovic, M. Carro, and M. Hermenegildo, “Towards data-aware qos-driven adaptation for service orchestrations,” in Web Services (ICWS),2010 IEEE International Conference on. IEEE, 2010, pp. 107–114.
[23] M. P. Papazoglou, P. Traverso, S. Dustdar, and F. Leymann, “Service-oriented computing: State of the art and research challenges,” Computer,vol. 40, no. 11, pp. 38–45, 2007.
[24] M. B. Blake, W. Tan, and F. Rosenberg, “Composition as a service[web-scale workflow],” Internet Computing, IEEE, vol. 14, no. 1, pp.78–82, 2010.
[25] L. Youseff, M. Butrico, and D. Da Silva, “Toward a unified ontology ofcloud computing,” in Grid Computing Environments Workshop, 2008.GCE’08. IEEE, 2008, pp. 1–10.
[26] V. Cardellini, E. Casalicchio, V. Grassi, and F. Lo Presti, “Flow-based service selection forweb service composition supporting multipleqos classes,” in Web Services, 2007. ICWS 2007. IEEE InternationalConference on. IEEE, 2007, pp. 743–750.
[27] D. Comes, H. Baraki, R. Reichle, M. Zapf, and K. Geihs, “Heuristic ap-proaches for qos-based service selection,” Service-Oriented Computing,pp. 441–455, 2010.
[28] D. Mukherjee, P. Jalote, and M. Gowri Nanda, “Determining qos ofws-bpel compositions,” Service-Oriented Computing–ICSOC 2008, pp.378–393, 2008.
[29] F. Baligand, N. Rivierre, and T. Ledoux, “A declarative approach forqos-aware web service compositions,” Service-Oriented Computing–ICSOC 2007, pp. 422–428, 2007.
[30] V. Agarwal and P. Jalote, “From specification to adaptation: an in-tegrated qos-driven approach for dynamic adaptation of web servicecompositions,” in Web Services (ICWS), 2010 IEEE International Con-ference on. IEEE, 2010, pp. 275–282.
[31] M. Teixeira, R. Lima, C. Oliveira, and P. Maciel, “Performance evalu-ation of service-oriented architecture through stochastic petri nets,” inSystems, Man and Cybernetics, 2009. SMC 2009. IEEE InternationalConference on. IEEE, 2009, pp. 2831–2836.
[32] D. Bruneo, S. Distefano, F. Longo, and M. Scarpa, “Qos assessmentof ws-bpel processes through non-markovian stochastic petri nets,” inParallel & Distributed Processing (IPDPS), 2010 IEEE InternationalSymposium on. IEEE, 2010, pp. 1–12.
[33] E. Barbierato, M. Iacono, and S. Marrone, “Perfbpel: A graph-basedapproach for the performance analysis of bpel soa applications,” inPerformance Evaluation Methodologies and Tools (VALUETOOLS),2012 6th International Conference on. IEEE, 2012, pp. 64–73.
[34] M. Iacono and M. Gribaudo, “Element based semantics in multiformalism performance models,” in Proceedings of the 2010 IEEEInternational Symposium on Modeling, Analysis and Simulation ofComputer and Telecommunication Systems. IEEE Computer Society,2010, pp. 413–416.
[35] M. Marzolla and R. Mirandola, “Performance prediction of web serviceworkflows,” Software Architectures, Components, and Applications, pp.127–144, 2007.
[36] Z. Azmeh, M. Huchard, F. Hamoui, and N. Moha, “From abstract toexecutable bpel processes with continuity support,” in Web Services(ICWS), 2012 IEEE 19th International Conference on. IEEE, 2012,pp. 368–375.
[37] F. Van Breugel and M. Koshkina, “Models and verification of bpel,”Unpublished Draft (January 1, 2006), 2006.
[38] W. M. van der Aalst, “The application of petri nets to workflowmanagement,” Journal of circuits, systems, and computers, vol. 8,no. 01, pp. 21–66, 1998.
69
International Journal on Advances in Software, vol 6 no 1 & 2, year 2013, http://www.iariajournals.org/software/
2013, © Copyright by authors, Published under agreement with IARIA - www.iaria.org
Supporting Test Code Generation with anEasy to Understand Business Rule Language
Christian Bacherler, Ben MoszkowskiSoftware Technology Research Lab
DeMontfort UniversityLeicester, UK
[email protected], [email protected]
Christian FacchiInstitute of Applied Research
Ingolstadt University of Applied SciencesIngolstadt, Germany
Abstract—The paper addresses two fundamental problems inrequirements engineering. First, the conflict between understand-ability for non-programmers and a semantically well-foundedrepresentation of business rules. Second, the verification of pro-ductive code against business rules in requirements documents.As a solution, a language to specify business rules that are closeto natural language and at the same time formal enough to beprocessed by computers is introduced. A case study with 30 testpersons indicates that the proposed language caters to a betterunderstandability for domain experts. For more domain specificexpressiveness, the language framework permits the definitionof basic language statements. The language also defines businessrules as atomic formulas, that are frequently used in practice.This kind of constraints is also called common constraints.Each atomic formula has a precise semantics by means ofpredicate or Interval Temporal Logic. The customization featureis demonstrated by an example from the logistics domain.Behavioral business rule statements are specified for this domainand automatically translated to an executable representationof Interval Temporal Logic. Subsequently, the verification ofrequirements by automated test generation is shown. Thus, ourframework contributes to an integrated software developmentprocess by providing the mechanisms for a human and machinereadable specification of business rules and for a direct reuse ofsuch formalized business rules for test cases.
Keywords—Requirements engineering; business rules; commonconstraints; natural language; testing; logic.
I. INTRODUCTION
In software development, different stakeholders with dif-ferent knowledge and intention cooperate, typically domainexperts and developers. Requirements engineers are acting asnegotiators between these two worlds and prepare requirementspecifications in a way that can be understood by both sides.Unstructured natural language in requirements documents doesnot ensure identical interpretations by different stakeholders,especially by domain experts and developers. In order toovercome the problem of divergence between specificationand implementation we proposed AtomsPro Rule IntegrationLanguage (APRIL) [1] [2], a business rule language that isboth, understandable enough to domain experts and translat-able to executable representations. To raise the expressivenessof APRIL we have also defined a framework to add newlanguage constructs.
By the introduction of APRIL, we propose a means todevelop a formalized version of business rules specifications
by precise semantics that support human- as well as machine-readability. The APRIL statements representing business rulesare easy to design and can be customized by the constructionof tailored statements, a feature, which we introduce via anovel combination of pattern building mechanisms. In thispaper, we show how to utilize the framework for extendingAPRIL’s expressiveness using atomic formulas that constitutethe link between statements that are like natural language andformal frameworks. Moreover, we also present some commonconstraints that are incorporated as atomic formulas.
Formal specifications enhance the established software de-velopment process. As a general advantage, such specificationsallow consistency checking of business rules, e.g., revealconflicts or proof properties. The aspect we want to focus onin this work is based on the fact that in the established soft-ware development process, code and corresponding tests aredeveloped based on the natural language specification. In orderto reduce complexity of the development process, we supportautomated creation of tests based on formal APRIL state-ments representing business rules. With our method, humanunderstandable formal specifications can be used to directlygenerate formal logical conditions and behavior specificationsfor testing. This approach shifts the creation of the test codefrom the developer to the requirements engineer, which helpsto improve test-driven development projects [3] [4].
The paper is structured as follows: Section II gives animpression of the context and the facets of the work presented.Section III presents the framework for our language to describebusiness rules close to natural language. After laying downthe fundamentals, we demonstrate in Section VII the transfor-mation of example statements in our language into computerprocessable test code. In Section IV, we present the utilizationof the extension mechanism to incorporate a set of frequentlyused constraints, known as common constraints, into APRIL.Section VII-B deals with usability aspect of APRIL, exploredin a case study. After the discussion of related work (SectionVIII), a conclusion will be drawn and future work will bepresented (Section IX).
II. OVERVIEW
The APRIL framework can be embedded into standardsoftware development processes. As an example, the seamlessintegration into the V-Model is shown in Figure 1. Aspectsthat will be detailed in this paper are highlighted in dark grey.
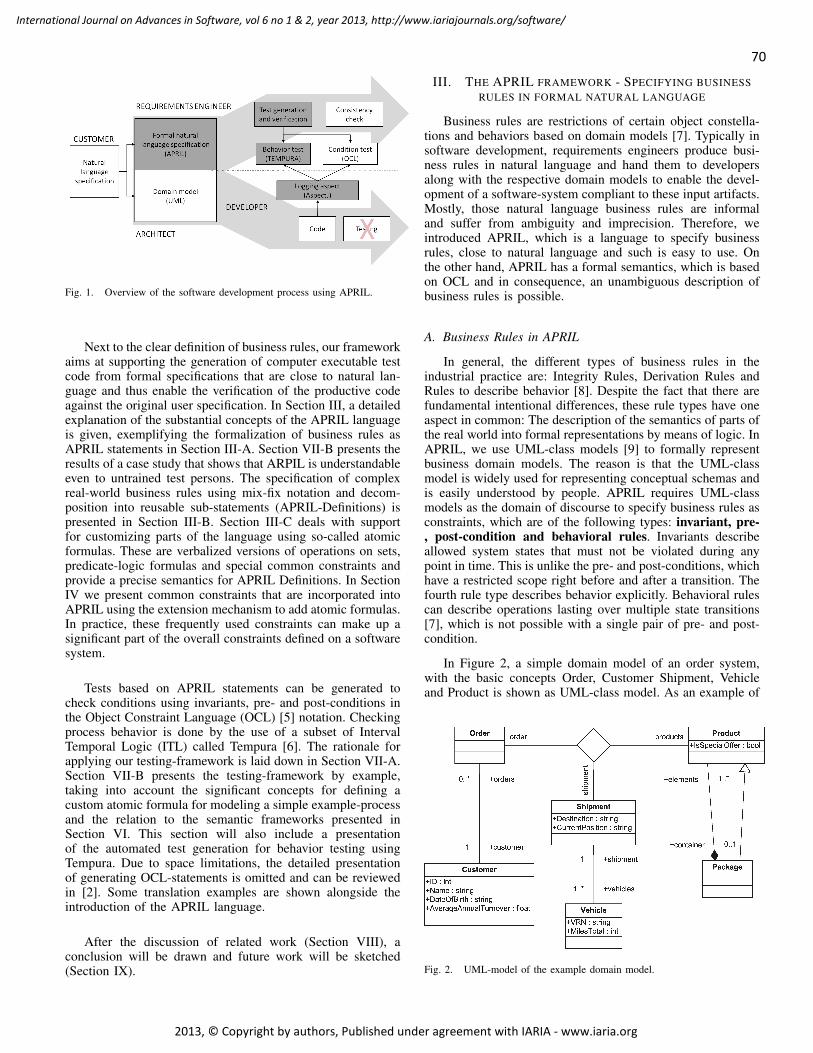
70
International Journal on Advances in Software, vol 6 no 1 & 2, year 2013, http://www.iariajournals.org/software/
2013, © Copyright by authors, Published under agreement with IARIA - www.iaria.org
Fig. 1. Overview of the software development process using APRIL.
Next to the clear definition of business rules, our frameworkaims at supporting the generation of computer executable testcode from formal specifications that are close to natural lan-guage and thus enable the verification of the productive codeagainst the original user specification. In Section III, a detailedexplanation of the substantial concepts of the APRIL languageis given, exemplifying the formalization of business rules asAPRIL statements in Section III-A. Section VII-B presents theresults of a case study that shows that ARPIL is understandableeven to untrained test persons. The specification of complexreal-world business rules using mix-fix notation and decom-position into reusable sub-statements (APRIL-Definitions) ispresented in Section III-B. Section III-C deals with supportfor customizing parts of the language using so-called atomicformulas. These are verbalized versions of operations on sets,predicate-logic formulas and special common constraints andprovide a precise semantics for APRIL Definitions. In SectionIV we present common constraints that are incorporated intoAPRIL using the extension mechanism to add atomic formulas.In practice, these frequently used constraints can make up asignificant part of the overall constraints defined on a softwaresystem.
Tests based on APRIL statements can be generated tocheck conditions using invariants, pre- and post-conditions inthe Object Constraint Language (OCL) [5] notation. Checkingprocess behavior is done by the use of a subset of IntervalTemporal Logic (ITL) called Tempura [6]. The rationale forapplying our testing-framework is laid down in Section VII-A.Section VII-B presents the testing-framework by example,taking into account the significant concepts for defining acustom atomic formula for modeling a simple example-processand the relation to the semantic frameworks presented inSection VI. This section will also include a presentationof the automated test generation for behavior testing usingTempura. Due to space limitations, the detailed presentationof generating OCL-statements is omitted and can be reviewedin [2]. Some translation examples are shown alongside theintroduction of the APRIL language.
After the discussion of related work (Section VIII), aconclusion will be drawn and future work will be sketched(Section IX).
III. THE APRIL FRAMEWORK - SPECIFYING BUSINESSRULES IN FORMAL NATURAL LANGUAGE
Business rules are restrictions of certain object constella-tions and behaviors based on domain models [7]. Typically insoftware development, requirements engineers produce busi-ness rules in natural language and hand them to developersalong with the respective domain models to enable the devel-opment of a software-system compliant to these input artifacts.Mostly, those natural language business rules are informaland suffer from ambiguity and imprecision. Therefore, weintroduced APRIL, which is a language to specify businessrules, close to natural language and such is easy to use. Onthe other hand, APRIL has a formal semantics, which is basedon OCL and in consequence, an unambiguous description ofbusiness rules is possible.
A. Business Rules in APRIL
In general, the different types of business rules in theindustrial practice are: Integrity Rules, Derivation Rules andRules to describe behavior [8]. Despite the fact that there arefundamental intentional differences, these rule types have oneaspect in common: The description of the semantics of parts ofthe real world into formal representations by means of logic. InAPRIL, we use UML-class models [9] to formally representbusiness domain models. The reason is that the UML-classmodel is widely used for representing conceptual schemas andis easily understood by people. APRIL requires UML-classmodels as the domain of discourse to specify business rules asconstraints, which are of the following types: invariant, pre-, post-condition and behavioral rules. Invariants describeallowed system states that must not be violated during anypoint in time. This is unlike the pre- and post-conditions, whichhave a restricted scope right before and after a transition. Thefourth rule type describes behavior explicitly. Behavioral rulescan describe operations lasting over multiple state transitions[7], which is not possible with a single pair of pre- and post-condition.
In Figure 2, a simple domain model of an order system,with the basic concepts Order, Customer Shipment, Vehicleand Product is shown as UML-class model. As an example of
Fig. 2. UML-model of the example domain model.
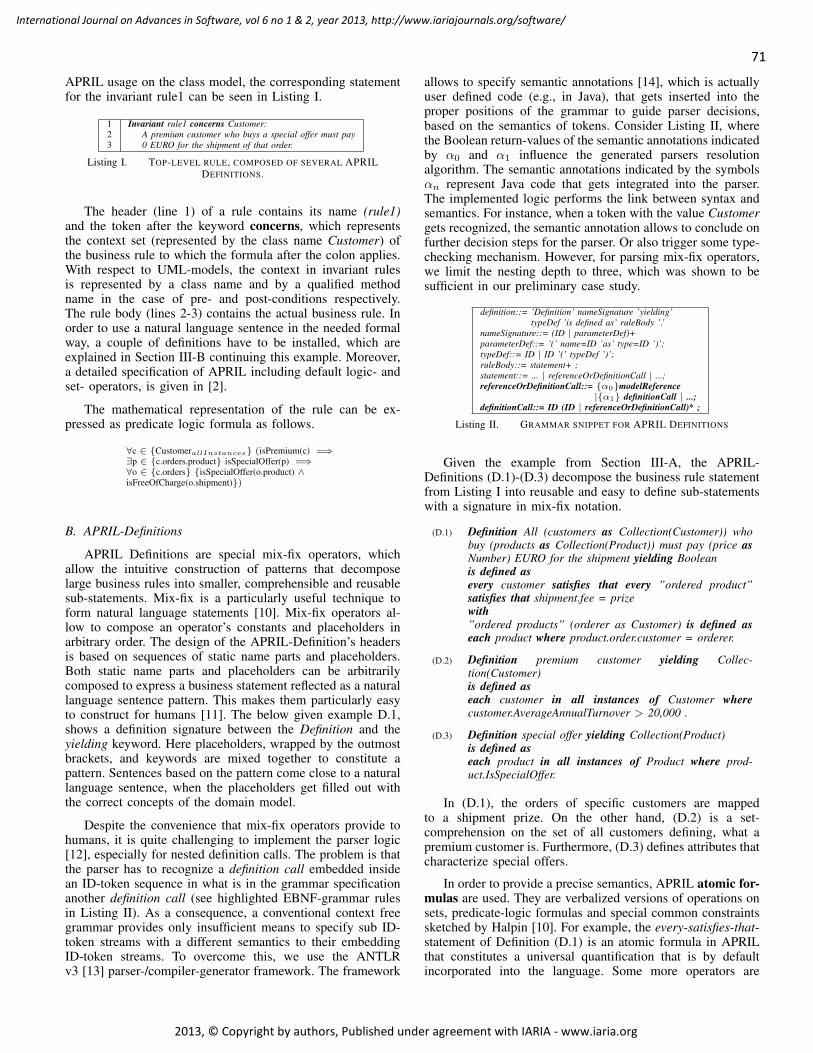
71
International Journal on Advances in Software, vol 6 no 1 & 2, year 2013, http://www.iariajournals.org/software/
2013, © Copyright by authors, Published under agreement with IARIA - www.iaria.org
APRIL usage on the class model, the corresponding statementfor the invariant rule1 can be seen in Listing I.
1 Invariant rule1 concerns Customer:2 aaaA premium customer who buys a special offer must pay3 aaa0 EURO for the shipment of that order.
Listing I. TOP-LEVEL RULE, COMPOSED OF SEVERAL APRILDEFINITIONS.
The header (line 1) of a rule contains its name (rule1)and the token after the keyword concerns, which representsthe context set (represented by the class name Customer) ofthe business rule to which the formula after the colon applies.With respect to UML-models, the context in invariant rulesis represented by a class name and by a qualified methodname in the case of pre- and post-conditions respectively.The rule body (lines 2-3) contains the actual business rule. Inorder to use a natural language sentence in the needed formalway, a couple of definitions have to be installed, which areexplained in Section III-B continuing this example. Moreover,a detailed specification of APRIL including default logic- andset- operators, is given in [2].
The mathematical representation of the rule can be ex-pressed as predicate logic formula as follows.
∀c ∈ CustomerallInstances (isPremium(c) =⇒∃p ∈ c.orders.product isSpecialOffer(p) =⇒∀o ∈ c.orders isSpecialOffer(o.product) ∧isFreeOfCharge(o.shipment))
B. APRIL-Definitions
APRIL Definitions are special mix-fix operators, whichallow the intuitive construction of patterns that decomposelarge business rules into smaller, comprehensible and reusablesub-statements. Mix-fix is a particularly useful technique toform natural language statements [10]. Mix-fix operators al-low to compose an operator’s constants and placeholders inarbitrary order. The design of the APRIL-Definition’s headersis based on sequences of static name parts and placeholders.Both static name parts and placeholders can be arbitrarilycomposed to express a business statement reflected as a naturallanguage sentence pattern. This makes them particularly easyto construct for humans [11]. The below given example D.1,shows a definition signature between the Definition and theyielding keyword. Here placeholders, wrapped by the outmostbrackets, and keywords are mixed together to constitute apattern. Sentences based on the pattern come close to a naturallanguage sentence, when the placeholders get filled out withthe correct concepts of the domain model.
Despite the convenience that mix-fix operators provide tohumans, it is quite challenging to implement the parser logic[12], especially for nested definition calls. The problem is thatthe parser has to recognize a definition call embedded insidean ID-token sequence in what is in the grammar specificationanother definition call (see highlighted EBNF-grammar rulesin Listing II). As a consequence, a conventional context freegrammar provides only insufficient means to specify sub ID-token streams with a different semantics to their embeddingID-token streams. To overcome this, we use the ANTLRv3 [13] parser-/compiler-generator framework. The framework
allows to specify semantic annotations [14], which is actuallyuser defined code (e.g., in Java), that gets inserted into theproper positions of the grammar to guide parser decisions,based on the semantics of tokens. Consider Listing II, wherethe Boolean return-values of the semantic annotations indicatedby α0 and α1 influence the generated parsers resolutionalgorithm. The semantic annotations indicated by the symbolsαn represent Java code that gets integrated into the parser.The implemented logic performs the link between syntax andsemantics. For instance, when a token with the value Customergets recognized, the semantic annotation allows to conclude onfurther decision steps for the parser. Or also trigger some type-checking mechanism. However, for parsing mix-fix operators,we limit the nesting depth to three, which was shown to besufficient in our preliminary case study.
definition::= ’Definition’ nameSignature ’yielding’definition::= typeDef ’is defined as’ ruleBody ’.’nameSignature::= (ID | parameterDef)+parameterDef::= ’(’ name=ID ’as’ type=ID ’)’;typeDef::= ID | ID ’(’ typeDef ’)’;ruleBody::= statement+ ;statement::= ... | referenceOrDefinitionCall | ...;referenceOrDefinitionCall::= α0modelReferencereferenceOrDefinitionCall:: |α1 definitionCall | ...;definitionCall::= ID (ID | referenceOrDefinitionCall)* ;
Listing II. GRAMMAR SNIPPET FOR APRIL DEFINITIONS
Given the example from Section III-A, the APRIL-Definitions (D.1)-(D.3) decompose the business rule statementfrom Listing I into reusable and easy to define sub-statementswith a signature in mix-fix notation.
(D.1) Definition All (customers as Collection(Customer)) whobuy (products as Collection(Product)) must pay (price asNumber) EURO for the shipment yielding Booleanis defined asevery customer satisfies that every ”ordered product”satisfies that shipment.fee = prizewith”ordered products” (orderer as Customer) is defined aseach product where product.order.customer = orderer.
(D.2) Definition premium customer yielding Collec-tion(Customer)is defined aseach customer in all instances of Customer wherecustomer.AverageAnnualTurnover > 20,000 .
(D.3) Definition special offer yielding Collection(Product)is defined aseach product in all instances of Product where prod-uct.IsSpecialOffer.
In (D.1), the orders of specific customers are mappedto a shipment prize. On the other hand, (D.2) is a set-comprehension on the set of all customers defining, what apremium customer is. Furthermore, (D.3) defines attributes thatcharacterize special offers.
In order to provide a precise semantics, APRIL atomic for-mulas are used. They are verbalized versions of operations onsets, predicate-logic formulas and special common constraintssketched by Halpin [10]. For example, the every-satisfies-that-statement of Definition (D.1) is an atomic formula in APRILthat constitutes a universal quantification that is by defaultincorporated into the language. Some more operators are
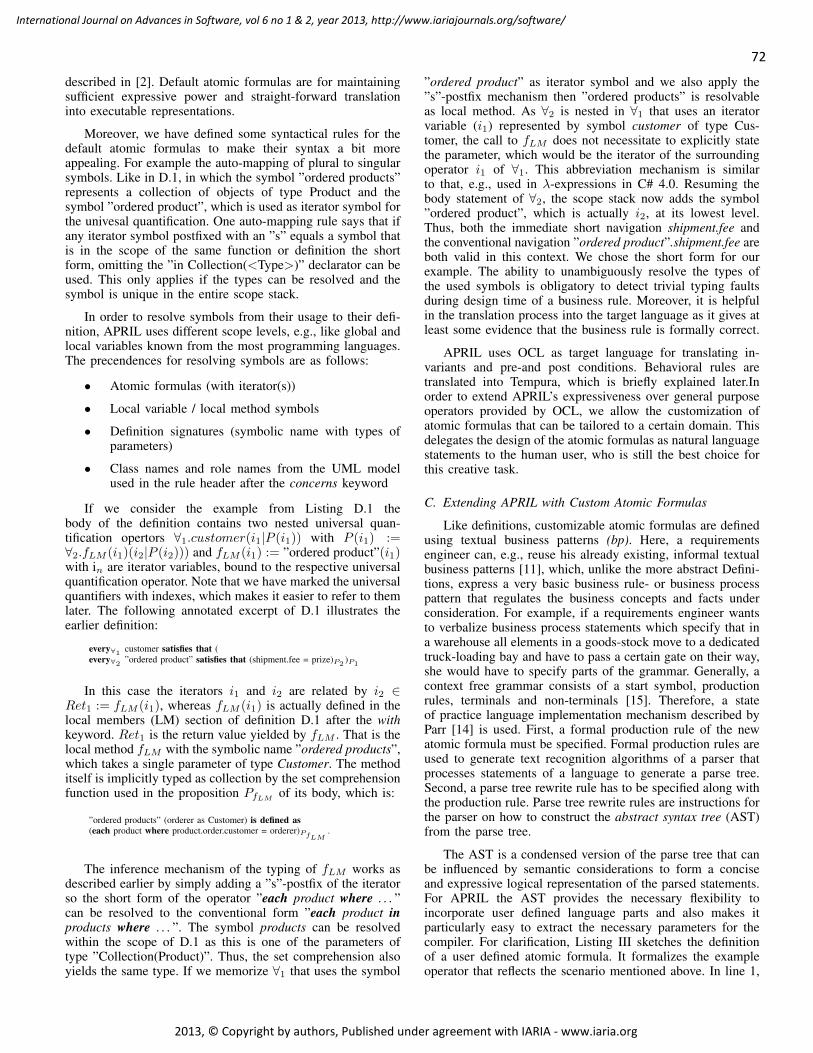
72
International Journal on Advances in Software, vol 6 no 1 & 2, year 2013, http://www.iariajournals.org/software/
2013, © Copyright by authors, Published under agreement with IARIA - www.iaria.org
described in [2]. Default atomic formulas are for maintainingsufficient expressive power and straight-forward translationinto executable representations.
Moreover, we have defined some syntactical rules for thedefault atomic formulas to make their syntax a bit moreappealing. For example the auto-mapping of plural to singularsymbols. Like in D.1, in which the symbol ”ordered products”represents a collection of objects of type Product and thesymbol ”ordered product”, which is used as iterator symbol forthe univesal quantification. One auto-mapping rule says that ifany iterator symbol postfixed with an ”s” equals a symbol thatis in the scope of the same function or definition the shortform, omitting the ”in Collection(<Type>)” declarator can beused. This only applies if the types can be resolved and thesymbol is unique in the entire scope stack.
In order to resolve symbols from their usage to their defi-nition, APRIL uses different scope levels, e.g., like global andlocal variables known from the most programming languages.The precendences for resolving symbols are as follows:
• Atomic formulas (with iterator(s))
• Local variable / local method symbols
• Definition signatures (symbolic name with types ofparameters)
• Class names and role names from the UML modelused in the rule header after the concerns keyword
If we consider the example from Listing D.1 thebody of the definition contains two nested universal quan-tification opertors ∀1.customer(i1|P (i1)) with P (i1) :=∀2.fLM (i1)(i2|P (i2))) and fLM (i1) := ”ordered product”(i1)with in are iterator variables, bound to the respective universalquantification operator. Note that we have marked the universalquantifiers with indexes, which makes it easier to refer to themlater. The following annotated excerpt of D.1 illustrates theearlier definition:
every∀1customer satisfies that (
every∀2”ordered product” satisfies that (shipment.fee = prize)P2
)P1
In this case the iterators i1 and i2 are related by i2 ∈Ret1 := fLM (i1), whereas fLM (i1) is actually defined in thelocal members (LM) section of definition D.1 after the withkeyword. Ret1 is the return value yielded by fLM . That is thelocal method fLM with the symbolic name ”ordered products”,which takes a single parameter of type Customer. The methoditself is implicitly typed as collection by the set comprehensionfunction used in the proposition PfLM of its body, which is:
”ordered products” (orderer as Customer) is defined as(each product where product.order.customer = orderer)PfLM
.
The inference mechanism of the typing of fLM works asdescribed earlier by simply adding a ”s”-postfix of the iteratorso the short form of the operator ”each product where . . . ”can be resolved to the conventional form ”each product inproducts where . . . ”. The symbol products can be resolvedwithin the scope of D.1 as this is one of the parameters oftype ”Collection(Product)”. Thus, the set comprehension alsoyields the same type. If we memorize ∀1 that uses the symbol
”ordered product” as iterator symbol and we also apply the”s”-postfix mechanism then ”ordered products” is resolvableas local method. As ∀2 is nested in ∀1 that uses an iteratorvariable (i1) represented by symbol customer of type Cus-tomer, the call to fLM does not necessitate to explicitly statethe parameter, which would be the iterator of the surroundingoperator i1 of ∀1. This abbreviation mechanism is similarto that, e.g., used in λ-expressions in C# 4.0. Resuming thebody statement of ∀2, the scope stack now adds the symbol”ordered product”, which is actually i2, at its lowest level.Thus, both the immediate short navigation shipment.fee andthe conventional navigation ”ordered product”.shipment.fee areboth valid in this context. We chose the short form for ourexample. The ability to unambiguously resolve the types ofthe used symbols is obligatory to detect trivial typing faultsduring design time of a business rule. Moreover, it is helpfulin the translation process into the target language as it gives atleast some evidence that the business rule is formally correct.
APRIL uses OCL as target language for translating in-variants and pre-and post conditions. Behavioral rules aretranslated into Tempura, which is briefly explained later.Inorder to extend APRIL’s expressiveness over general purposeoperators provided by OCL, we allow the customization ofatomic formulas that can be tailored to a certain domain. Thisdelegates the design of the atomic formulas as natural languagestatements to the human user, who is still the best choice forthis creative task.
C. Extending APRIL with Custom Atomic Formulas
Like definitions, customizable atomic formulas are definedusing textual business patterns (bp). Here, a requirementsengineer can, e.g., reuse his already existing, informal textualbusiness patterns [11], which, unlike the more abstract Defini-tions, express a very basic business rule- or business processpattern that regulates the business concepts and facts underconsideration. For example, if a requirements engineer wantsto verbalize business process statements which specify that ina warehouse all elements in a goods-stock move to a dedicatedtruck-loading bay and have to pass a certain gate on their way,she would have to specify parts of the grammar. Generally, acontext free grammar consists of a start symbol, productionrules, terminals and non-terminals [15]. Therefore, a stateof practice language implementation mechanism described byParr [14] is used. First, a formal production rule of the newatomic formula must be specified. Formal production rules areused to generate text recognition algorithms of a parser thatprocesses statements of a language to generate a parse tree.Second, a parse tree rewrite rule has to be specified along withthe production rule. Parse tree rewrite rules are instructions forthe parser on how to construct the abstract syntax tree (AST)from the parse tree.
The AST is a condensed version of the parse tree that canbe influenced by semantic considerations to form a conciseand expressive logical representation of the parsed statements.For APRIL the AST provides the necessary flexibility toincorporate user defined language parts and also makes itparticularly easy to extract the necessary parameters for thecompiler. For clarification, Listing III sketches the definitionof a user defined atomic formula. It formalizes the exampleoperator that reflects the scenario mentioned above. In line 1,
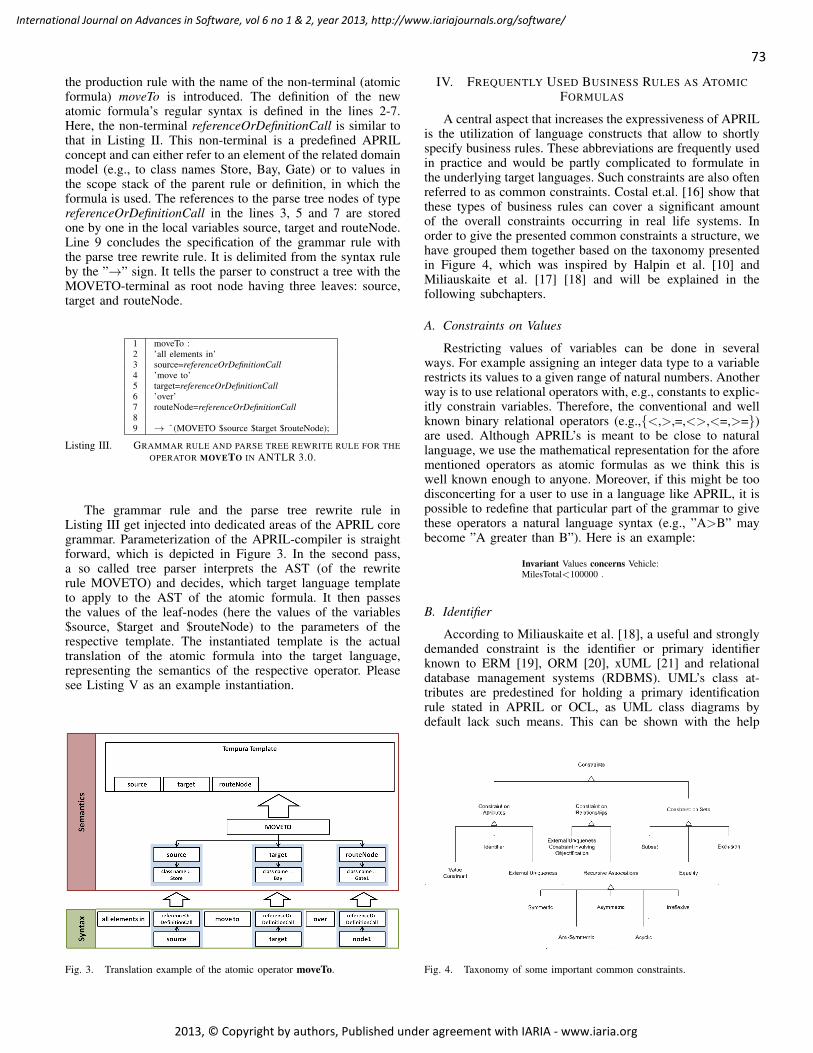
73
International Journal on Advances in Software, vol 6 no 1 & 2, year 2013, http://www.iariajournals.org/software/
2013, © Copyright by authors, Published under agreement with IARIA - www.iaria.org
the production rule with the name of the non-terminal (atomicformula) moveTo is introduced. The definition of the newatomic formula’s regular syntax is defined in the lines 2-7.Here, the non-terminal referenceOrDefinitionCall is similar tothat in Listing II. This non-terminal is a predefined APRILconcept and can either refer to an element of the related domainmodel (e.g., to class names Store, Bay, Gate) or to values inthe scope stack of the parent rule or definition, in which theformula is used. The references to the parse tree nodes of typereferenceOrDefinitionCall in the lines 3, 5 and 7 are storedone by one in the local variables source, target and routeNode.Line 9 concludes the specification of the grammar rule withthe parse tree rewrite rule. It is delimited from the syntax ruleby the ”→” sign. It tells the parser to construct a tree with theMOVETO-terminal as root node having three leaves: source,target and routeNode.
1 moveTo :2 ’all elements in’3 source=referenceOrDefinitionCall4 ’move to’5 target=referenceOrDefinitionCall6 ’over’7 routeNode=referenceOrDefinitionCall89 → a(MOVETO $source $target $routeNode);
Listing III. GRAMMAR RULE AND PARSE TREE REWRITE RULE FOR THEOPERATOR MOVETO IN ANTLR 3.0.
The grammar rule and the parse tree rewrite rule inListing III get injected into dedicated areas of the APRIL coregrammar. Parameterization of the APRIL-compiler is straightforward, which is depicted in Figure 3. In the second pass,a so called tree parser interprets the AST (of the rewriterule MOVETO) and decides, which target language templateto apply to the AST of the atomic formula. It then passesthe values of the leaf-nodes (here the values of the variables$source, $target and $routeNode) to the parameters of therespective template. The instantiated template is the actualtranslation of the atomic formula into the target language,representing the semantics of the respective operator. Pleasesee Listing V as an example instantiation.
Fig. 3. Translation example of the atomic operator moveTo.
IV. FREQUENTLY USED BUSINESS RULES AS ATOMICFORMULAS
A central aspect that increases the expressiveness of APRILis the utilization of language constructs that allow to shortlyspecify business rules. These abbreviations are frequently usedin practice and would be partly complicated to formulate inthe underlying target languages. Such constraints are also oftenreferred to as common constraints. Costal et.al. [16] show thatthese types of business rules can cover a significant amountof the overall constraints occurring in real life systems. Inorder to give the presented common constraints a structure, wehave grouped them together based on the taxonomy presentedin Figure 4, which was inspired by Halpin et al. [10] andMiliauskaite et al. [17] [18] and will be explained in thefollowing subchapters.
A. Constraints on Values
Restricting values of variables can be done in severalways. For example assigning an integer data type to a variablerestricts its values to a given range of natural numbers. Anotherway is to use relational operators with, e.g., constants to explic-itly constrain variables. Therefore, the conventional and wellknown binary relational operators (e.g.,<,>,=,<>,<=,>=)are used. Although APRIL’s is meant to be close to naturallanguage, we use the mathematical representation for the aforementioned operators as atomic formulas as we think this iswell known enough to anyone. Moreover, if this might be toodisconcerting for a user to use in a language like APRIL, it ispossible to redefine that particular part of the grammar to givethese operators a natural language syntax (e.g., ”A>B” maybecome ”A greater than B”). Here is an example:
Invariant Values concerns Vehicle:MilesTotal<100000 .
B. Identifier
According to Miliauskaite et al. [18], a useful and stronglydemanded constraint is the identifier or primary identifierknown to ERM [19], ORM [20], xUML [21] and relationaldatabase management systems (RDBMS). UML’s class at-tributes are predestined for holding a primary identificationrule stated in APRIL or OCL, as UML class diagrams bydefault lack such means. This can be shown with the help
Fig. 4. Taxonomy of some important common constraints.
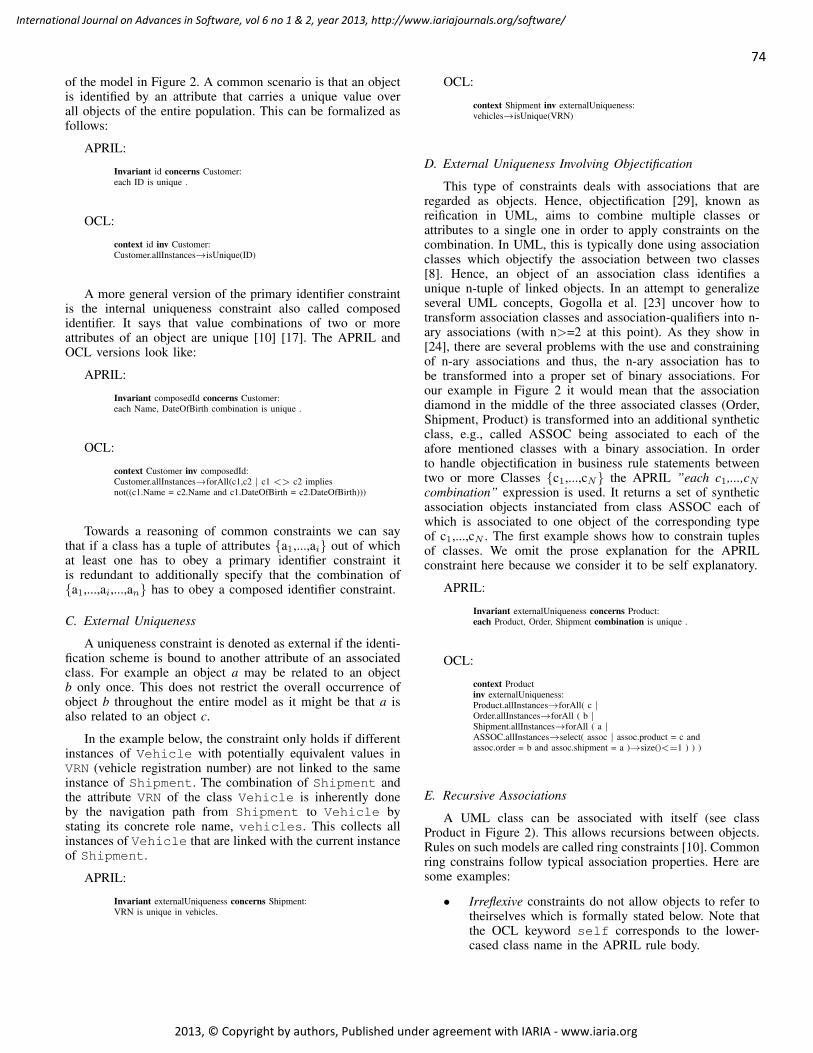
74
International Journal on Advances in Software, vol 6 no 1 & 2, year 2013, http://www.iariajournals.org/software/
2013, © Copyright by authors, Published under agreement with IARIA - www.iaria.org
of the model in Figure 2. A common scenario is that an objectis identified by an attribute that carries a unique value overall objects of the entire population. This can be formalized asfollows:
APRIL:
Invariant id concerns Customer:each ID is unique .
OCL:
context id inv Customer:Customer.allInstances→isUnique(ID)
A more general version of the primary identifier constraintis the internal uniqueness constraint also called composedidentifier. It says that value combinations of two or moreattributes of an object are unique [10] [17]. The APRIL andOCL versions look like:
APRIL:
Invariant composedId concerns Customer:each Name, DateOfBirth combination is unique .
OCL:
context Customer inv composedId:Customer.allInstances→forAll(c1,c2 | c1 <> c2 impliesnot((c1.Name = c2.Name and c1.DateOfBirth = c2.DateOfBirth)))
Towards a reasoning of common constraints we can saythat if a class has a tuple of attributes a1,...,ai out of whichat least one has to obey a primary identifier constraint itis redundant to additionally specify that the combination ofa1,...,ai,...,an has to obey a composed identifier constraint.
C. External Uniqueness
A uniqueness constraint is denoted as external if the identi-fication scheme is bound to another attribute of an associatedclass. For example an object a may be related to an objectb only once. This does not restrict the overall occurrence ofobject b throughout the entire model as it might be that a isalso related to an object c.
In the example below, the constraint only holds if differentinstances of Vehicle with potentially equivalent values inVRN (vehicle registration number) are not linked to the sameinstance of Shipment. The combination of Shipment andthe attribute VRN of the class Vehicle is inherently doneby the navigation path from Shipment to Vehicle bystating its concrete role name, vehicles. This collects allinstances of Vehicle that are linked with the current instanceof Shipment.
APRIL:
Invariant externalUniqueness concerns Shipment:VRN is unique in vehicles.
OCL:
context Shipment inv externalUniqueness:vehicles→isUnique(VRN)
D. External Uniqueness Involving Objectification
This type of constraints deals with associations that areregarded as objects. Hence, objectification [29], known asreification in UML, aims to combine multiple classes orattributes to a single one in order to apply constraints on thecombination. In UML, this is typically done using associationclasses which objectify the association between two classes[8]. Hence, an object of an association class identifies aunique n-tuple of linked objects. In an attempt to generalizeseveral UML concepts, Gogolla et al. [23] uncover how totransform association classes and association-qualifiers into n-ary associations (with n>=2 at this point). As they show in[24], there are several problems with the use and constrainingof n-ary associations and thus, the n-ary association has tobe transformed into a proper set of binary associations. Forour example in Figure 2 it would mean that the associationdiamond in the middle of the three associated classes (Order,Shipment, Product) is transformed into an additional syntheticclass, e.g., called ASSOC being associated to each of theafore mentioned classes with a binary association. In orderto handle objectification in business rule statements betweentwo or more Classes c1,...,cN the APRIL ”each c1,...,cNcombination” expression is used. It returns a set of syntheticassociation objects instanciated from class ASSOC each ofwhich is associated to one object of the corresponding typeof c1,...,cN . The first example shows how to constrain tuplesof classes. We omit the prose explanation for the APRILconstraint here because we consider it to be self explanatory.
APRIL:
Invariant externalUniqueness concerns Product:each Product, Order, Shipment combination is unique .
OCL:
context Productinv externalUniqueness:Product.allInstances→forAll( c |Order.allInstances→forAll ( b |Shipment.allInstances→forAll ( a |ASSOC.allInstances→select( assoc | assoc.product = c andassoc.order = b and assoc.shipment = a )→size()<=1 ) ) )
E. Recursive Associations
A UML class can be associated with itself (see classProduct in Figure 2). This allows recursions between objects.Rules on such models are called ring constraints [10]. Commonring constrains follow typical association properties. Here aresome examples:
• Irreflexive constraints do not allow objects to refer totheirselves which is formally stated below. Note thatthe OCL keyword self corresponds to the lower-cased class name in the APRIL rule body.
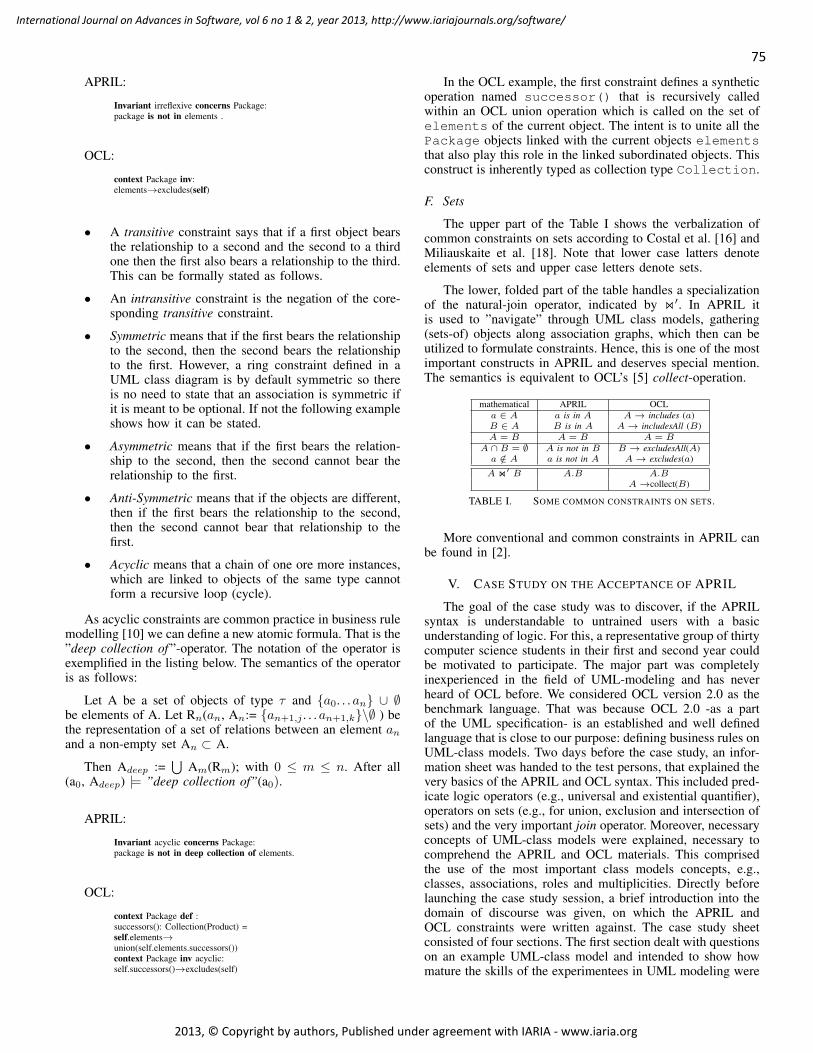
75
International Journal on Advances in Software, vol 6 no 1 & 2, year 2013, http://www.iariajournals.org/software/
2013, © Copyright by authors, Published under agreement with IARIA - www.iaria.org
APRIL:
Invariant irreflexive concerns Package:package is not in elements .
OCL:
context Package inv:elements→excludes(self)
• A transitive constraint says that if a first object bearsthe relationship to a second and the second to a thirdone then the first also bears a relationship to the third.This can be formally stated as follows.
• An intransitive constraint is the negation of the core-sponding transitive constraint.
• Symmetric means that if the first bears the relationshipto the second, then the second bears the relationshipto the first. However, a ring constraint defined in aUML class diagram is by default symmetric so thereis no need to state that an association is symmetric ifit is meant to be optional. If not the following exampleshows how it can be stated.
• Asymmetric means that if the first bears the relation-ship to the second, then the second cannot bear therelationship to the first.
• Anti-Symmetric means that if the objects are different,then if the first bears the relationship to the second,then the second cannot bear that relationship to thefirst.
• Acyclic means that a chain of one ore more instances,which are linked to objects of the same type cannotform a recursive loop (cycle).
As acyclic constraints are common practice in business rulemodelling [10] we can define a new atomic formula. That is the”deep collection of ”-operator. The notation of the operator isexemplified in the listing below. The semantics of the operatoris as follows:
Let A be a set of objects of type τ and a0. . .an ∪ ∅be elements of A. Let Rn(an, An:= an+1,j . . .an+1,k\∅ ) bethe representation of a set of relations between an element anand a non-empty set An ⊂ A.
Then Adeep :=⋃
Am(Rm); with 0 ≤ m ≤ n. After all(a0, Adeep) |= ”deep collection of”(a0).
APRIL:
Invariant acyclic concerns Package:package is not in deep collection of elements.
OCL:
context Package def :successors(): Collection(Product) =self.elements→union(self.elements.successors())context Package inv acyclic:self.successors()→excludes(self)
In the OCL example, the first constraint defines a syntheticoperation named successor() that is recursively calledwithin an OCL union operation which is called on the set ofelements of the current object. The intent is to unite all thePackage objects linked with the current objects elementsthat also play this role in the linked subordinated objects. Thisconstruct is inherently typed as collection type Collection.
F. Sets
The upper part of the Table I shows the verbalization ofcommon constraints on sets according to Costal et al. [16] andMiliauskaite et al. [18]. Note that lower case latters denoteelements of sets and upper case letters denote sets.
The lower, folded part of the table handles a specializationof the natural-join operator, indicated by on′. In APRIL itis used to ”navigate” through UML class models, gathering(sets-of) objects along association graphs, which then can beutilized to formulate constraints. Hence, this is one of the mostimportant constructs in APRIL and deserves special mention.The semantics is equivalent to OCL’s [5] collect-operation.
mathematical APRIL OCLa ∈ A a is in A A→ includes (a)B ∈ A B is in A A→ includesAll (B)A = B A = B A = B
A ∩ B = ∅ A is not in B B → excludesAll(A)a /∈ A a is not in A A→ excludes(a)
A on′ B A.B A.BA→collect(B)
TABLE I. SOME COMMON CONSTRAINTS ON SETS.
More conventional and common constraints in APRIL canbe found in [2].
V. CASE STUDY ON THE ACCEPTANCE OF APRIL
The goal of the case study was to discover, if the APRILsyntax is understandable to untrained users with a basicunderstanding of logic. For this, a representative group of thirtycomputer science students in their first and second year couldbe motivated to participate. The major part was completelyinexperienced in the field of UML-modeling and has neverheard of OCL before. We considered OCL version 2.0 as thebenchmark language. That was because OCL 2.0 -as a partof the UML specification- is an established and well definedlanguage that is close to our purpose: defining business rules onUML-class models. Two days before the case study, an infor-mation sheet was handed to the test persons, that explained thevery basics of the APRIL and OCL syntax. This included pred-icate logic operators (e.g., universal and existential quantifier),operators on sets (e.g., for union, exclusion and intersection ofsets) and the very important join operator. Moreover, necessaryconcepts of UML-class models were explained, necessary tocomprehend the APRIL and OCL materials. This comprisedthe use of the most important class models concepts, e.g.,classes, associations, roles and multiplicities. Directly beforelaunching the case study session, a brief introduction into thedomain of discourse was given, on which the APRIL andOCL constraints were written against. The case study sheetconsisted of four sections. The first section dealt with questionson an example UML-class model and intended to show howmature the skills of the experimentees in UML modeling were
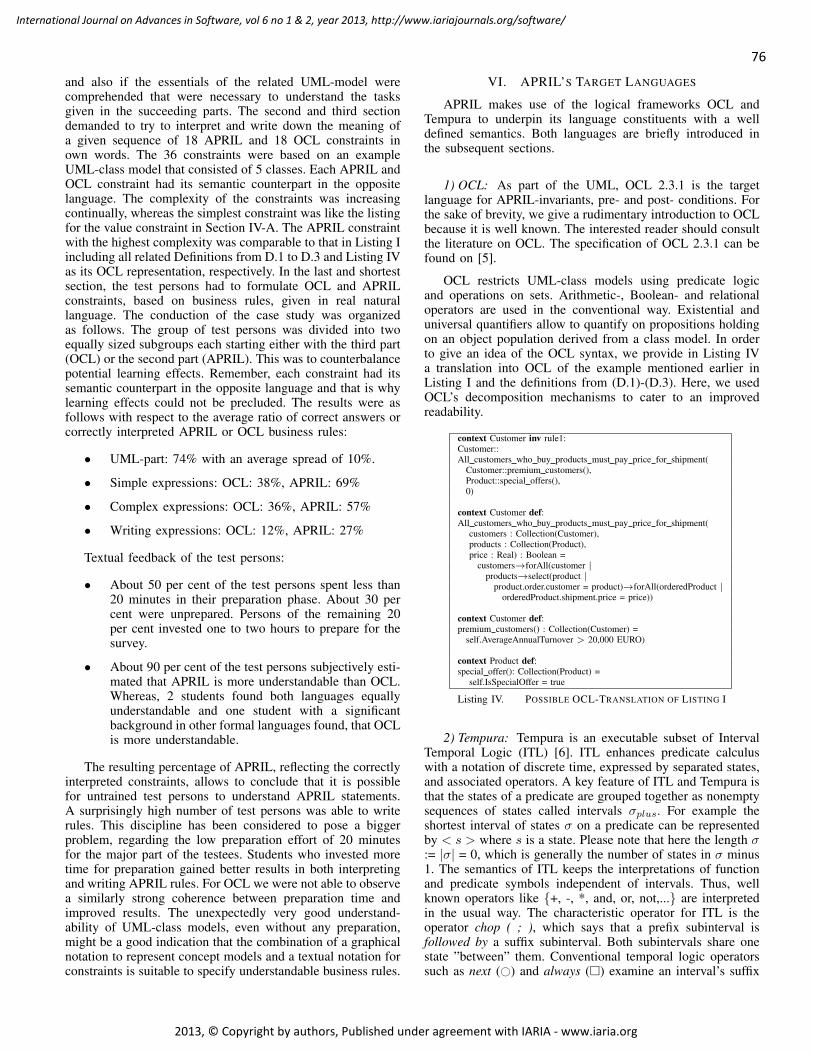
76
International Journal on Advances in Software, vol 6 no 1 & 2, year 2013, http://www.iariajournals.org/software/
2013, © Copyright by authors, Published under agreement with IARIA - www.iaria.org
and also if the essentials of the related UML-model werecomprehended that were necessary to understand the tasksgiven in the succeeding parts. The second and third sectiondemanded to try to interpret and write down the meaning ofa given sequence of 18 APRIL and 18 OCL constraints inown words. The 36 constraints were based on an exampleUML-class model that consisted of 5 classes. Each APRIL andOCL constraint had its semantic counterpart in the oppositelanguage. The complexity of the constraints was increasingcontinually, whereas the simplest constraint was like the listingfor the value constraint in Section IV-A. The APRIL constraintwith the highest complexity was comparable to that in Listing Iincluding all related Definitions from D.1 to D.3 and Listing IVas its OCL representation, respectively. In the last and shortestsection, the test persons had to formulate OCL and APRILconstraints, based on business rules, given in real naturallanguage. The conduction of the case study was organizedas follows. The group of test persons was divided into twoequally sized subgroups each starting either with the third part(OCL) or the second part (APRIL). This was to counterbalancepotential learning effects. Remember, each constraint had itssemantic counterpart in the opposite language and that is whylearning effects could not be precluded. The results were asfollows with respect to the average ratio of correct answers orcorrectly interpreted APRIL or OCL business rules:
• UML-part: 74% with an average spread of 10%.
• Simple expressions: OCL: 38%, APRIL: 69%
• Complex expressions: OCL: 36%, APRIL: 57%
• Writing expressions: OCL: 12%, APRIL: 27%
Textual feedback of the test persons:
• About 50 per cent of the test persons spent less than20 minutes in their preparation phase. About 30 percent were unprepared. Persons of the remaining 20per cent invested one to two hours to prepare for thesurvey.
• About 90 per cent of the test persons subjectively esti-mated that APRIL is more understandable than OCL.Whereas, 2 students found both languages equallyunderstandable and one student with a significantbackground in other formal languages found, that OCLis more understandable.
The resulting percentage of APRIL, reflecting the correctlyinterpreted constraints, allows to conclude that it is possiblefor untrained test persons to understand APRIL statements.A surprisingly high number of test persons was able to writerules. This discipline has been considered to pose a biggerproblem, regarding the low preparation effort of 20 minutesfor the major part of the testees. Students who invested moretime for preparation gained better results in both interpretingand writing APRIL rules. For OCL we were not able to observea similarly strong coherence between preparation time andimproved results. The unexpectedly very good understand-ability of UML-class models, even without any preparation,might be a good indication that the combination of a graphicalnotation to represent concept models and a textual notation forconstraints is suitable to specify understandable business rules.
VI. APRIL’S TARGET LANGUAGES
APRIL makes use of the logical frameworks OCL andTempura to underpin its language constituents with a welldefined semantics. Both languages are briefly introduced inthe subsequent sections.
1) OCL: As part of the UML, OCL 2.3.1 is the targetlanguage for APRIL-invariants, pre- and post- conditions. Forthe sake of brevity, we give a rudimentary introduction to OCLbecause it is well known. The interested reader should consultthe literature on OCL. The specification of OCL 2.3.1 can befound on [5].
OCL restricts UML-class models using predicate logicand operations on sets. Arithmetic-, Boolean- and relationaloperators are used in the conventional way. Existential anduniversal quantifiers allow to quantify on propositions holdingon an object population derived from a class model. In orderto give an idea of the OCL syntax, we provide in Listing IVa translation into OCL of the example mentioned earlier inListing I and the definitions from (D.1)-(D.3). Here, we usedOCL’s decomposition mechanisms to cater to an improvedreadability.
context Customer inv rule1:Customer::All customers who buy products must pay price for shipment(aaCustomer::premium customers(),aaProduct::special offers(),aa0)
context Customer def:All customers who buy products must pay price for shipment(aa customers : Collection(Customer),aa products : Collection(Product),aa price : Real) : Boolean =aaaa customers→forAll(customer |aaaaaa products→select(product |aaaaaaaa product.order.customer = product)→forAll(orderedProduct |aaaaaaaaaa orderedProduct.shipment.price = price))
context Customer def:premium customers() : Collection(Customer) =aaself.AverageAnnualTurnover > 20,000 EURO)
context Product def:special offer(): Collection(Product) =aa self.IsSpecialOffer = true
Listing IV. POSSIBLE OCL-TRANSLATION OF LISTING I
2) Tempura: Tempura is an executable subset of IntervalTemporal Logic (ITL) [6]. ITL enhances predicate calculuswith a notation of discrete time, expressed by separated states,and associated operators. A key feature of ITL and Tempura isthat the states of a predicate are grouped together as nonemptysequences of states called intervals σplus. For example theshortest interval of states σ on a predicate can be representedby < s > where s is a state. Please note that here the length σ:= |σ| = 0, which is generally the number of states in σ minus1. The semantics of ITL keeps the interpretations of functionand predicate symbols independent of intervals. Thus, wellknown operators like +, -, *, and, or, not,... are interpretedin the usual way. The characteristic operator for ITL is theoperator chop ( ; ), which says that a prefix subinterval isfollowed by a suffix subinterval. Both subintervals share onestate ”between” them. Conventional temporal logic operatorssuch as next (#) and always () examine an interval’s suffix

77
International Journal on Advances in Software, vol 6 no 1 & 2, year 2013, http://www.iariajournals.org/software/
2013, © Copyright by authors, Published under agreement with IARIA - www.iaria.org
subintervals whereas chop splits the interval into two parts andtests both. Furthermore, Moszkowski [6] shows how to deriveoperators such as always and sometimes from chop. In ITL, theformula w := w1;w2 is true if I〈σ0..σi〉 Jw1K and I〈σi..σ|σ|〉Jw2K are true in the respective sub-formulas. Note that w1 andw2 share the same subinterval σi. We adopt some examplesfrom [6], which are as follows:
σ P Rs 1 2t 2 1u 3 1
The lenght of interval σ is expressed by |σ| and is definedas the number of the states in σ minus one. Thus, in ourexample, |σ| = 2.
The following formulas on the predicates P and R are trueon the interval < stu >:
• P = 1. The initial value of P is 1.
• #(P ) = 2 and #(#(P )) = 3. The next value of P is2 and the next next value of P is 3.
• P = 1 and P gets P + 1. The initial value of P is 1and P gets increased by 1 in each subsequent state.
• R = 2 and #((R)) = 1 The initial value of R is 2and R is always 1 beginning from the next state.
• P ← 1 ; P ← P + 1 ; P ← P + 1. The formula e2← e1 is true on an interval if σ0(e1) equals σ|σ|(e2).Thus, ← is called temporal assignment.
We adopt Tempura because it is able to model operationslasting over multiple state transitions, which would not bepossible with a single pair of OCL pre- and post-conditions.Moreover, the reader will recognize similarities with the ratio-nale of the test-definitions given in Section VII-A.
VII. GENERATING TEST CODE FROM APRILSTATEMENTS
This section clarifies the connection between APRIL andits target languages utilizing the moveTo-operator exampleintroduced earlier. Section VII-A describes the basic rationalethat influence the test framework presented in Section VII-B.The test framework is applied to an application, which helps totrack movements of goods in a logistics centre. For testing thecorrect routing, we use the example operator moveTo describedin Section III-C.
A. Testing
For generating proper test-code based on APRIL state-ments, the classification of different test types into black- andwhite-box testing has to be clarified. Our definition of the testtypes is as follows: Each function fi in the set of functions F::= f0, . . . , fn of a component under test (CUT) triggers astate transition and obeys a predefined signature. This signaturerequires a tuple of input values (fIN ) and yields a tuple ofoutput values (fOUT ). A signature of a function is an interfacedescribing a contract [22] with IN- and OUT-data, which isspecified in UML-class models. We assume that a composite
function gik is a conglomerate of some functions fi to fk, forsome natural numbers 0 <= i < k <= n. Then, any OUT-signature of a proceeding function fj must correspond to theIN-signature of the succeeding function fj+1, for some naturalnumbers k < j <= i. This convention of the inner structurecan be formalized by OUT (fj) == IN(fj+1), which we wantto abbreviate with Dj . It represents an element of a functionsequence. Moreover, the following holds IN(gik) == IN(fi)and OUT (gik) == OUT (fk).
A white-box test necessitates the knowledge of the entiresequence of DD0,...,Dn as the internal structure of g (gik),which is normally the case as the user knows the source code.If D(g) is unknown, tests are limited to reason on the datagiven by IN(g) and OUT (g), they are called black-box tests.In APRIL, black-box tests are issued to the invariants, pre-and post-conditions.
For the specification of behavioral models, we extend ourrecent definition of white-box tests beyond reasoning on D. Weuse Interval Temporal Logic (ITL) [6] for modeling behavior inwhite-box-tests. Therefore, we introduce behavioral constraintsin APRIL, which we regard as orthogonal to the invariants aswell as pre- and post-conditions. Assume D represents a stateσ1 that maps a set of values to their corresponding variables atone certain point in time. Then let σ be an ordered set of statesσ0 to σn, each of which describes a different D at differentsubsequent, discrete points in time. In our understanding, theknowledge of σ is sufficient for applying white-box-tests,which we want to utilize in our framework.
B. Test Framework and Case Study
In this section, we build a representative example aroundthe behavioral all-elements-move-to-operator introduced inSection III-C. The definitions of the previous section are usedin our test framework, which deals with logistic processesto handle the material flow in a warehouse. It consists of asimple 3-tier architecture with RFID-readers and light sensorsat the field-level and an ERP-system at the top level. Betweenthese two levels, we use an RFID-middleware -Rifidi [23]- forinformation exchange and filtering.
The connection between a specification in Tempura anda function in the productive code is the test data. Therefore,the user has to provide initial test data IN(f0), constitutingan important part of a test-case. The productive code affectsthe data OUT (fi) in the memory for each invocation of fi,which marks a new interval at the same time. Thus, each time afunction under test fi gets invoked a snapshot of the input data(fIN ) prior to the invocation and output data (fOUT ) when fiis left gets generated. The test data for the Tempura-statementsis provided by recorded history-data that is stored in a properlyformatted log-file containing a condensed version of the data-snapshots. The retrieval of the test data from the runningsystem is achieved via AspectJ [24]. Therefore, AspectJ point-cut statements are generated based on the reference-nodes (seeListing III) to class-attributes found in the AST of an APRILstatement. The use of AspectJ permits us to leave the originalcode of the productive system untouched.
The use case for the earlier mentioned example with thebehavioral operator moveTo formalized in Listing III is asfollows: Imagine a warehouse that has a high-bay storage
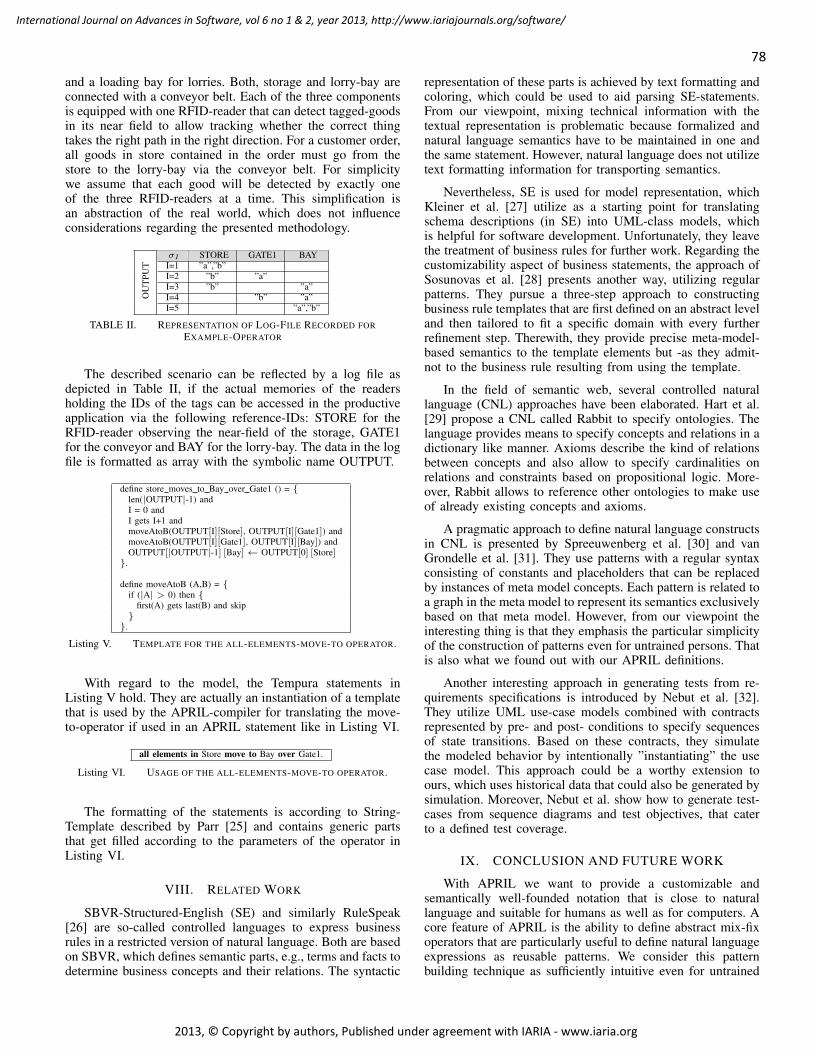
78
International Journal on Advances in Software, vol 6 no 1 & 2, year 2013, http://www.iariajournals.org/software/
2013, © Copyright by authors, Published under agreement with IARIA - www.iaria.org
and a loading bay for lorries. Both, storage and lorry-bay areconnected with a conveyor belt. Each of the three componentsis equipped with one RFID-reader that can detect tagged-goodsin its near field to allow tracking whether the correct thingtakes the right path in the right direction. For a customer order,all goods in store contained in the order must go from thestore to the lorry-bay via the conveyor belt. For simplicitywe assume that each good will be detected by exactly oneof the three RFID-readers at a time. This simplification isan abstraction of the real world, which does not influenceconsiderations regarding the presented methodology.
OU
TPU
T
σI STORE GATE1 BAYI=1 ”a”,”b”I=2 ”b” ”a”I=3 ”b” ”a”I=4 ”b” ”a”I=5 ”a”,”b”
TABLE II. REPRESENTATION OF LOG-FILE RECORDED FOREXAMPLE-OPERATOR
The described scenario can be reflected by a log file asdepicted in Table II, if the actual memories of the readersholding the IDs of the tags can be accessed in the productiveapplication via the following reference-IDs: STORE for theRFID-reader observing the near-field of the storage, GATE1for the conveyor and BAY for the lorry-bay. The data in the logfile is formatted as array with the symbolic name OUTPUT.
define store moves to Bay over Gate1 () = aalen(|OUTPUT|-1) andaaI = 0 andaaI gets I+1 andaamoveAtoB(OUTPUT[I][Store], OUTPUT[I][Gate1]) andaamoveAtoB(OUTPUT[I][Gate1], OUTPUT[I][Bay]) andaaOUTPUT[|OUTPUT|-1] [Bay] ← OUTPUT[0] [Store].
define moveAtoB (A,B) = aaif (|A| > 0) then aaaafirst(A) gets last(B) and skipaa.
Listing V. TEMPLATE FOR THE ALL-ELEMENTS-MOVE-TO OPERATOR.
With regard to the model, the Tempura statements inListing V hold. They are actually an instantiation of a templatethat is used by the APRIL-compiler for translating the move-to-operator if used in an APRIL statement like in Listing VI.
all elements in Store move to Bay over Gate1.
Listing VI. USAGE OF THE ALL-ELEMENTS-MOVE-TO OPERATOR.
The formatting of the statements is according to String-Template described by Parr [25] and contains generic partsthat get filled according to the parameters of the operator inListing VI.
VIII. RELATED WORK
SBVR-Structured-English (SE) and similarly RuleSpeak[26] are so-called controlled languages to express businessrules in a restricted version of natural language. Both are basedon SBVR, which defines semantic parts, e.g., terms and facts todetermine business concepts and their relations. The syntactic
representation of these parts is achieved by text formatting andcoloring, which could be used to aid parsing SE-statements.From our viewpoint, mixing technical information with thetextual representation is problematic because formalized andnatural language semantics have to be maintained in one andthe same statement. However, natural language does not utilizetext formatting information for transporting semantics.
Nevertheless, SE is used for model representation, whichKleiner et al. [27] utilize as a starting point for translatingschema descriptions (in SE) into UML-class models, whichis helpful for software development. Unfortunately, they leavethe treatment of business rules for further work. Regarding thecustomizability aspect of business statements, the approach ofSosunovas et al. [28] presents another way, utilizing regularpatterns. They pursue a three-step approach to constructingbusiness rule templates that are first defined on an abstract leveland then tailored to fit a specific domain with every furtherrefinement step. Therewith, they provide precise meta-model-based semantics to the template elements but -as they admit-not to the business rule resulting from using the template.
In the field of semantic web, several controlled naturallanguage (CNL) approaches have been elaborated. Hart et al.[29] propose a CNL called Rabbit to specify ontologies. Thelanguage provides means to specify concepts and relations in adictionary like manner. Axioms describe the kind of relationsbetween concepts and also allow to specify cardinalities onrelations and constraints based on propositional logic. More-over, Rabbit allows to reference other ontologies to make useof already existing concepts and axioms.
A pragmatic approach to define natural language constructsin CNL is presented by Spreeuwenberg et al. [30] and vanGrondelle et al. [31]. They use patterns with a regular syntaxconsisting of constants and placeholders that can be replacedby instances of meta model concepts. Each pattern is related toa graph in the meta model to represent its semantics exclusivelybased on that meta model. However, from our viewpoint theinteresting thing is that they emphasis the particular simplicityof the construction of patterns even for untrained persons. Thatis also what we found out with our APRIL definitions.
Another interesting approach in generating tests from re-quirements specifications is introduced by Nebut et al. [32].They utilize UML use-case models combined with contractsrepresented by pre- and post- conditions to specify sequencesof state transitions. Based on these contracts, they simulatethe modeled behavior by intentionally ”instantiating” the usecase model. This approach could be a worthy extension toours, which uses historical data that could also be generated bysimulation. Moreover, Nebut et al. show how to generate test-cases from sequence diagrams and test objectives, that caterto a defined test coverage.
IX. CONCLUSION AND FUTURE WORK
With APRIL we want to provide a customizable andsemantically well-founded notation that is close to naturallanguage and suitable for humans as well as for computers. Acore feature of APRIL is the ability to define abstract mix-fixoperators that are particularly useful to define natural languageexpressions as reusable patterns. We consider this patternbuilding technique as sufficiently intuitive even for untrained
79
International Journal on Advances in Software, vol 6 no 1 & 2, year 2013, http://www.iariajournals.org/software/
2013, © Copyright by authors, Published under agreement with IARIA - www.iaria.org
persons, which we could show in a case study with 30 testpersons. The semantic underpinning of the mix-fix operatorsis achieved by customizable atomic formulas. Te ease the useof APRIL, we have encorporated additional atomic formulasthat are based on frequently used constraints in practice, socalled common constraints. The syntax of atomic formulascan be tailor-made for any domain. This is exemplified bya new atomic formula taken from the logistics domain tomodel behavior. We extend APRIL’s grammar and presenta mapping to the interpretation function based on IntervalTemporal Logic. With the use of the new atomic formula andthe transformation into the instantiated Tempura statement, ex-ecutable test code can be generated. This way, our frameworkcontributes to an integrated software development process byproviding unambiguous and understandable business rules thatcan be used for specification purposes and for automaticallygenerating tests.
From the current viewpoint, some issues are still open. Fur-ther evaluation is needed to determine wether the specificationof the grammar rules and their corresponding rewrite rules aresuitable to a typical requirements engineer. The use of OCLand especially Tempura, for creating the templates requires aconsiderable amount of skills. Moreover, using APRIL require-ments requires a basic understanding of logic and set-theory.It has to be discovered if the aforementioned challenges aremanageable by the typical requirements engineer in reasonableamout of training-time. Hence, future work will target onrefining the presented approach with a focus on methodologiesto improve APRIL’s usability.
ACKNOWLEDGEMENTS
The authors are greatful for many hours of inspiring dis-cussion and feedback received from Hans-Michael Windisch.
REFERENCES
[1] Christian Bacherler, B. Moszkowski, C. Facchi, and A. Huebner, “Au-tomated Test Code Generation Based on Formalized Natural LanguageBusiness Rules,” in ICSEA 2012, The Seventh International Conferenceon Software Engineering Advances: IARIA Conference., 2012, pp. 165–171.
[2] C. Bacherler, C. Facchi, and H.-M. Windisch. (2010) EnhancingDomain Modeling with Easy to Understand Business Rules. HAW-Ingolstadt. [retrieved: 09,2012]. [Online]. Available: http://www.haw-ingolstadt.de/fileadmin/daten/allgemein/dokumente/WorkingPaper/ABWP 19.pdf
[3] K. Beck, Test-driven development: by example. Addison-WesleyProfessional, 2003.
[4] P. Liggesmeyer, Software-Qualitat. Spektrum, Akad. Verl, 2002.[5] Object Management Group. (2010) OCL Specification:
version 2.3.1. [retrieved: 09,2012]. [Online]. Available:http://www.omg.org/spec/OCL/2.3.1/PDF/
[6] B. Moszkowski, Executing Temporal Logic Programs. Cambridge,1986.
[7] A. van Lamsweerde, Requirements engineering: from system goals toUML models to software specifications. Chichester: Wiley, 2009.
[8] J. Cabot, R. Pau, and R. Raventos, “From UML/OCL to SBVR speci-fications: A challenging transformation,” Information Systems, vol. 35,no. 4, pp. 417–440, 2010.
[9] Object Management Group. (2010) UML Specification: version 2.2.[retrieved: 09,2012]. [Online]. Available: www.omg.com/uml
[10] T. A. Halpin, “Verbalizing Business Rules : Part 1-16,” Business RulesJournal, 2006.
[11] C. Rupp, Requirements-Engineering und -Management: Professionelle,iterative Anforderungsanalyse fur die Praxis, 5th ed. Munchen andWien: Hanser, 2009.
[12] N. Danielsson and U. Norell, “Parsing mixfix operators,” Proceedingsof the 20th International Symposium on the Implementation and Appli-cation of Functional Languages (IFL 2008), 2009.
[13] T. Parr. (2012) ANTLR v3. [retrieved: 09,2012]. [Online]. Available:http://www.antlr.org/
[14] ——, The Definitive ANTLR Reference. Pragmatic Bookshelf, 2007.[15] A. Aho, M. Lam, R. Sethi, and J. Ullman, Compilers: principles,
techniques, and tools. Pearson/Addison Wesley, 2007.[16] D. Costal, C. Gomez, A. Queralt, R. Raventos, and E. Teniente,
“Facilitating the Definition of General Constraints in UML,” in ModelDriven Engineering Languages and Systems, ser. Lecture Notes inComputer Science, O. Nierstrasz, J. Whittle, D. Harel, and G. Reggio,Eds. Springer Berlin / Heidelberg, 2006, vol. 4199, pp. 260–274.
[17] E. Miliauskait and L. Nemurait, “Representation of integrity constraintsin conceptual models,” Information technology and control, Kaunotechnologijos universitetas, ISSN, pp. 34–4, 2005.
[18] E. Miliauskaite and L. Nemuraite, “Taxonomy of integrity constraintsin conceptual models,” Proceedings of IADIS Database Systems, 2005.
[19] S. Navathe and e. Ramez, Fundamentals of Database Systems.Addison-Wesley, 2002.
[20] T. Halpin, A. Morgan, and T. Morgan, Information modeling andrelational databases. Morgan Kaufmann, 2008.
[21] S. Mellor and M. Balcer, Executable UML: A foundation for model-driven architectures. Addison-Wesley Longman Publishing Co., Inc,2002.
[22] B. Meyer, “Applying Design by Contract,” Computer, vol. 25, no. 10,pp. 40–51, 1992.
[23] Rifidi Community. (2012) Rifidi-Platform. [retrieved: 09,2012].[Online]. Available: http://www.transcends.co/community
[24] Eclipse Open Plattform Community. (2012) AspectJ: Version 1.7.0. [re-trieved: 09,2012]. [Online]. Available: http://www.eclipse.org/aspectj/
[25] T. Parr. (2012) String Template: Version 4.0. [retrieved: 09,2012].[Online]. Available: http://www.stringtemplate.org/
[26] Object Management Group. (2008) SBVR Specification:version 1.0. [retrieved: 09,2012]. [Online]. Available:http://www.omg.org/spec/SBVR/1.0/
[27] M. Kleiner, P. Albert, and J. Bezivin, “Parsing SBVR-Based ControlledLanguages,” in Model Driven Engineering Languages and Systems,ser. Lecture Notes in Computer Science, A. Schurr and B. Selic, Eds.Springer Berlin / Heidelberg, 2009, vol. 5795, pp. 122–136.
[28] S. Sosunovas and O. Vasilecas, “Precise notation for business rulestemplates,” Databases and Information Systems, 2006 7th InternationalBaltic Conference on, pp. 55–60, 2006.
[29] G. Hart, M. Johnson, and C. Dolbear, “Rabbit: Developing a ControlNatural Language for Authoring Ontologies,” in The Semantic Web:Research and Applications, ser. Lecture Notes in Computer Science,S. Bechhofer, M. Hauswirth, J. Hoffmann, and M. Koubarakis, Eds.Springer Berlin Heidelberg, 2008, vol. 5021, pp. 348–360.
[30] S. Spreeuwenberg, J. van Grondelle, R. Heller, and G. Grijzen, “UsingCNL techniques and pattern sentences to involve domain experts inmodeling,” Controlled Natural Language, pp. 175–193, 2012.
[31] J. van Grondelle, R. Heller, E. van Haandel, and T. Verburg, “Involvingbusiness users in formal modeling using natural language patternsentences,” Knowledge Engineering and Management by the Masses,pp. 31–43, 2010.
[32] C. Nebut, F. Fleurey, Y. Le Traon, and J. Jezequel, “Automatic testgeneration: A use case driven approach,” Software Engineering, IEEETransactions on, vol. 32, no. 3, pp. 140–155, 2006.
80
International Journal on Advances in Software, vol 6 no 1 & 2, year 2013, http://www.iariajournals.org/software/
2013, © Copyright by authors, Published under agreement with IARIA - www.iaria.org
Design and Classification of Mutation Operators forAbstract State Machines
Jameleddine HassineDepartment of Information and Computer Science
King Fahd University of Petroleum and Minerals, Dhahran, [email protected]
Abstract—Mutation testing is a well established fault-basedtechnique for assessing and improving the quality of test suites.Mutation testing can be applied at different levels of abstraction,e.g., the unit level, the integration level, and the specification level.Designing mutation operators is the most critical activity towardsconducting effective mutation testing and analysis. Mutationoperators are well defined for a number of programming (e.g., C,Java, etc.) and specification (e.g., FSM, Petri Nets, etc.) languages.In this paper, we design and classify mutation operators forthe Abstract State Machines (ASM) formalism. The designedoperators are defined based on the types of faults that mayoccur in ASM specifications and can be classified into threecategories: (1) Domain operators, (2) function update operators,and (3) transition rules operators. Furthermore, a prototypemutation tool for the CoreASM language, has been built toautomatically generate mutants and check their validity. Weillustrate our approach using a simple CoreASM implementationof the Fibonacci series. Finally, an empirical comparison of thedesigned operators is presented and discussed.
Keywords—Mutation testing; specification; mutation operator;Abstract State Machines (ASM); domain operators; function updateoperators; transition rules operators; CoreASM.
I. INTRODUCTION
In this article, we describe an extension of our work on de-signing Abstract State Machines mutation operators publishedin [1].
Fault based testing strategies aim at finding prescribed faultsin a program [2]. Mutation testing [3] is a well establishedfault-based testing technique for assessing and improving thequality of test suites. Mutation testing uses mutation opera-tors to introduce small modifications, or mutations, into thesoftware artifact (i.e., source code or specification) under test.Mutation operators are classified by the language constructsthey are created to alter. Given the fact that a program/spec-ification being mutated is syntactically correct, a mutationoperator must produce a mutant that is also syntacticallycorrect. The objective is then to select test cases that arecapable to distinguish the behavior of the mutants from thebehavior of the original artifact. Such test cases are said tokill the mutants. However, it may also be that the mutantkeeps the program’s semantics unchanged-and thus cannot bedetected by any test case. Such mutants are called equivalentmutants. The detection of equivalent mutants is, in general, oneof biggest obstacles for practical usage of mutation testing. The
effort needed to check if mutants are equivalent or not, can bevery high even for small programs [4].
Since the number of possible faults for a given program orspecification can be large, mutation-based testing strategies arebased on the following two principles: (1) the Competent Pro-grammer Hypothesis [3], which states that competent program-mers tend to write programs that are close to being correct. Inother words, a program written by a competent programmermay be incorrect but it is generally likely close to being correct(containing relatively simple faults) (2) the Coupling Effect [3],which states that a test data set that catches all simple faults ina program is so sensitive that it will also catch more complexfaults. Analogously to the Competent Programmer Hypothesis[3], Ammann and Black [5] have proposed the CompetentSpecifier Hypothesis stating that analysts write specificationswhich are likely to be close to what is desired.
In a recent survey on the development of mutation testing,Jia and Harman [4] have stated that more than 50% of themutation related publications have been applied to Java [6],[7], Fortran [8], [9] and C [10]. Although mutation testinghas mostly been applied at the source code level, it has alsobeen applied at the specification and design level [11], [4].Formal specification languages to which mutation testing hasbeen applied include Finite State Machines [12], [13], [14],Statecharts [15], Petri Nets [16], and Estelle [17].
Fabbri et al. [12] have applied specification mutation tovalidate specifications based on Finite State Machines (FSM).They have proposed 9 mutation operators, representing faultsrelated to the states (e.g., wrong-starting-state, state-extra,etc.), transitions (e.g., event-missing, event-exchanged, etc.)and outputs (e.g., output-missing, output-exchanged, etc.) ofan FSM. In a related work, Fabbri et al. [15] have definedmutation operators for Statecharts, an extension of FSM for-malism, while Batth et al. [18] have applied mutation testing toExtended Finite State Machines (EFSM) formalism. Hieronsand Merayo [14] have investigated the application of mutationtesting to Probabilistic (PFSMs) or stochastic time (PSFSMs)Finite State Machines. The authors have defined new mutationoperators representing FSM faults related to altering proba-bilities (PFSMs) or changing its associated random variables(PSFSMs) (i.e., the time consumed between the input beingapplied and the output being received).
The widespread interest in model-based testing techniquesprovides the major motivation of this research. We, in par-ticular, focus on investigating the applicability of fault-based

81
International Journal on Advances in Software, vol 6 no 1 & 2, year 2013, http://www.iariajournals.org/software/
2013, © Copyright by authors, Published under agreement with IARIA - www.iaria.org
testing (vs. scenario-based testing) to Abstract State Machines(ASM) [19] specifications. In this paper, we extend our pre-vious work [1] on designing ASM-based mutation operatorsby:• Extending the set of operators, introduced in [1], by
adding the Call Rule Operators, the Pick Rule Oper-ators, and the Extend Rule Operators.
• Refining the classification of the proposed ASM-basedmutation operators. The resulting ASM-based operatorscan be classified using three categories: (1) ASM domainoperators, (2) ASM function update operators, and (3)ASM transition rules operators.
• Presenting CoreASM [20], an ASM-based language,illustrative examples of the proposed mutation operators.
• Presenting an enhanced version of our CoreASM [20]mutation prototype tool, for automatic generation, vali-dation, and execution of CoreASM mutants.
• Analyzing the generated mutants using an illustrativeexample of a CoreASM specification of Fibonacci series.
• Presenting an empirical comparison of the pro-posed CoreASM mutation operators using three Core-ASM specifications: Dining Philosophers, Vending Ma-chine, and Rail Road Crossing.
The remainder of this paper is organized as follows. Thenext section provides an overview of the Abstract State Ma-chines (ASM) [19] formalism and the CoreASM language.In Section III, we define and classify a collection of mu-tation operators for CoreASM language. An analysis of thegenerated mutants is presented in Section IV. Section Vdescribes the CoreASM Mutation toolkit. To demonstrate theapplicability of the proposed approach, Section VI describesthe application of CoreASM mutation operators to Fibonaccispecification. An empirical comparison of CoreASM-basedmutation operators is presented in Section VII. Finally, con-clusions are drawn in Section VIII.
II. ABSTRACT STATE MACHINES
Abstract State Machines (ASMs), originally knownas Evolving Algebras, were first introduced by Yuri Gure-vich [21], [19] in an attempt to improve on Turing’s thesis [22]so that:
“Every algorithm is an ASM as far as the behav-ior is concerned. In particular the given algorithmcan be step-for-step simulated by an appropriateASM [23].” (The ASM Thesis)
This means that an activity that is conceptually done in onestep can be executed in the model in one step. This is incontrast to Turing machines, where simple operations mightneed any finite number of steps.
Abstract State Machines have been used to capture sequen-tial, parallel and distributed algorithms. ASMs combine twofundamental concepts of transition systems: (1) transitions tomodel the dynamic aspects of a system, and (2) abstract statesto model the static aspects at any desired level of abstraction.Borger and Stark [24] further developed ASMs into a systemengineering method that guides the development of softwarefrom requirements capture to implementation.
Widely recognized applications of ASMs include semanticfoundations of a wide variety of programming languageslike C++ [25], C# [26], and Java [27], logic programminglanguages such as Prolog [28] and its variants, hardwarelanguages such as VHDL [29], system design languages likethe ITU-T standard for SDL [30], [31], Web service descriptionlanguages [32], design of distributed systems [33], [34], etc.
A. ASM ProgramAbstract State Machines (ASM) [19] define a state-based
computational model, where computations (runs) are finite orinfinite sequences of states Si obtained from a given initialstate S0 by repeatedly executing transitions δi:
S0δ1 // S1
δ2 // S2. . . δn // Sn
An ASM A is defined over a fixed vocabulary V , a finitecollection of function names and relation names. Each functionname f has an arity (number of arguments that the functiontakes). Function names can be static (i.e., fixed interpretationin each computation state of A) or dynamic (i.e., can be alteredby transitions fired in a computation step). Dynamic functionscan be further classified into:• Input functions that A can only read, which means that
these functions are determined entirely by the environ-ment of A. They are also called monitored.
• Controlled functions of A are those which are updatedby some of the rules of A and are never changed by theenvironment.
• Output functions of A are functions which A can onlyupdate but not read, whereas the environment can readthem (without updating them).
• Shared functions are functions which can be read andupdated by both A and the environment.
Static nullary (i.e., 0-ary) function names are called constantswhile Dynamic nullary functions are called variables.
Given a vocabulary V , an ASM A is defined by its programP and a set of distinguished initial states S0. The programP consists of transition rules and specifies possible statetransitions of A in terms of finite sets of local function updateson a given global state. Such transitions are atomic actions. Atransition rule that describes the modification of the functionsfrom one state to the next has the following form:
if Condition then <Updates> endif
where Updates is a set of function updates (containing onlyvariable free terms) of the form:
f(t1,t2,. . .,tn) := t
where t1, t2, . . ., tn, and t are first order terms.The set of function updates are simultaneously executed
when Condition (called also guard) is true. In a given state,first all parameters ti, t are evaluated to their values, vi, v,then the value of f(v1,. . .,vn) is updated to v. Such pairs ofa function name f, which is fixed by the signature, and anoptional argument (v1,. . .,vn), which is formed by a list ofdynamic parameters value vi, are called locations.
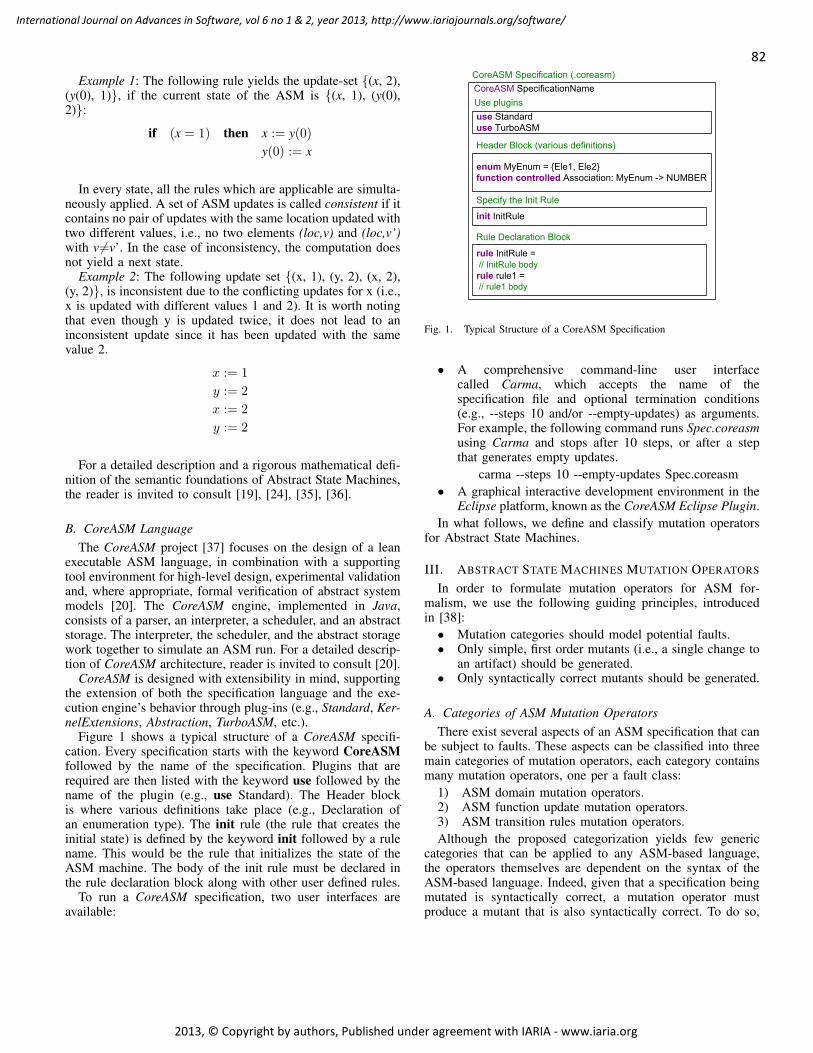
82
International Journal on Advances in Software, vol 6 no 1 & 2, year 2013, http://www.iariajournals.org/software/
2013, © Copyright by authors, Published under agreement with IARIA - www.iaria.org
Example 1: The following rule yields the update-set (x, 2),(y(0), 1), if the current state of the ASM is (x, 1), (y(0),2):
if (x = 1) then x := y(0)y(0) := x
In every state, all the rules which are applicable are simulta-neously applied. A set of ASM updates is called consistent if itcontains no pair of updates with the same location updated withtwo different values, i.e., no two elements (loc,v) and (loc,v’)with v =v’. In the case of inconsistency, the computation doesnot yield a next state.
Example 2: The following update set (x, 1), (y, 2), (x, 2),(y, 2), is inconsistent due to the conflicting updates for x (i.e.,x is updated with different values 1 and 2). It is worth notingthat even though y is updated twice, it does not lead to aninconsistent update since it has been updated with the samevalue 2.
x := 1
y := 2
x := 2
y := 2
For a detailed description and a rigorous mathematical defi-nition of the semantic foundations of Abstract State Machines,the reader is invited to consult [19], [24], [35], [36].
B. CoreASM LanguageThe CoreASM project [37] focuses on the design of a lean
executable ASM language, in combination with a supportingtool environment for high-level design, experimental validationand, where appropriate, formal verification of abstract systemmodels [20]. The CoreASM engine, implemented in Java,consists of a parser, an interpreter, a scheduler, and an abstractstorage. The interpreter, the scheduler, and the abstract storagework together to simulate an ASM run. For a detailed descrip-tion of CoreASM architecture, reader is invited to consult [20].
CoreASM is designed with extensibility in mind, supportingthe extension of both the specification language and the exe-cution engine’s behavior through plug-ins (e.g., Standard, Ker-nelExtensions, Abstraction, TurboASM, etc.).
Figure 1 shows a typical structure of a CoreASM specifi-cation. Every specification starts with the keyword CoreASMfollowed by the name of the specification. Plugins that arerequired are then listed with the keyword use followed by thename of the plugin (e.g., use Standard). The Header blockis where various definitions take place (e.g., Declaration ofan enumeration type). The init rule (the rule that creates theinitial state) is defined by the keyword init followed by a rulename. This would be the rule that initializes the state of theASM machine. The body of the init rule must be declared inthe rule declaration block along with other user defined rules.
To run a CoreASM specification, two user interfaces areavailable:
enum MyEnum = Ele1, Ele2
function controlled Association: MyEnum -> NUMBER
Specify the Init Rule
use Standard
use TurboASM
CoreASM SpecificationName
Use plugins
CoreASM Specification (.coreasm)
Header Block (various definitions)
init InitRule
rule InitRule =
// InitRule body
rule rule1 =// rule1 body
Rule Declaration Block
Fig. 1. Typical Structure of a CoreASM Specification
• A comprehensive command-line user interfacecalled Carma, which accepts the name of thespecification file and optional termination conditions(e.g., --steps 10 and/or --empty-updates) as arguments.For example, the following command runs Spec.coreasmusing Carma and stops after 10 steps, or after a stepthat generates empty updates.
carma --steps 10 --empty-updates Spec.coreasm• A graphical interactive development environment in the
Eclipse platform, known as the CoreASM Eclipse Plugin.In what follows, we define and classify mutation operators
for Abstract State Machines.
III. ABSTRACT STATE MACHINES MUTATION OPERATORS
In order to formulate mutation operators for ASM for-malism, we use the following guiding principles, introducedin [38]:• Mutation categories should model potential faults.• Only simple, first order mutants (i.e., a single change to
an artifact) should be generated.• Only syntactically correct mutants should be generated.
A. Categories of ASM Mutation OperatorsThere exist several aspects of an ASM specification that can
be subject to faults. These aspects can be classified into threemain categories of mutation operators, each category containsmany mutation operators, one per a fault class:
1) ASM domain mutation operators.2) ASM function update mutation operators.3) ASM transition rules mutation operators.Although the proposed categorization yields few generic
categories that can be applied to any ASM-based language,the operators themselves are dependent on the syntax of theASM-based language. Indeed, given that a specification beingmutated is syntactically correct, a mutation operator mustproduce a mutant that is also syntactically correct. To do so,
83
International Journal on Advances in Software, vol 6 no 1 & 2, year 2013, http://www.iariajournals.org/software/
2013, © Copyright by authors, Published under agreement with IARIA - www.iaria.org
it is required that a valid syntactic construct be mapped toanother syntactic construct in the same language. In addition,peculiarities of language syntax have an effect on the kindof mistakes that a modeler could make. For instance, aspectssuch as procedural (e.g., CoreASM [20] language) versusobject oriented (e.g., AsmL [39] language) are captured in thelanguage syntax. In this paper, we target the CoreASM [20]language.
B. ASM Domain Mutation OperatorsA domain (called also universe or background) consists
of a set of declarations that establish the ASM vocabulary.Each declaration establishes the meaning of an identifierwithin its scope. For example, the following CoreASM [20]code defines a new enumeration background PRODUCThaving three elements (Soda, Candy, and Chips) and threefunctions selectedProduct, price, and packaging:
enum PRODUCT = Soda, Candy, Chipsfunction selectedProduct: → PRODUCTfunction price: PRODUCT → NUMBERfunction packaging: PRODUCT*PRODUCT → NUMBER
ASM domains/universes can be mutated by adding or re-moving elements:• Extend Domain Operator (EDO): the domain is extended
with a new element.• Reduce Domain Operator (RDO): the domain is reduced
by removing one element.• Empty Domain Operator (EYDO): the domain is emp-
tied.These mutation operators can be applied to enumeration
(See Table I), universes, collections, the set background, thelist background, and the map background.
TABLE I. EXAMPLES OF ASM DOMAIN MUTATION OPERATORSFOR CoreASM
Domain Mutation Operator CoreASM Mutant S’
Extend Domain Operator(EDO)
enum PRODUCT = Soda, Candy,Chips, Sandwich
Reduce Domain Operator(RDO)
enum PRODUCT = Soda, Candy
Empty Domain Operator(EYDO)
enum PRODUCT =
C. ASM Function Update Mutation OperatorsA function update has the following form:
f(t1, t2, . . ., tn):= value
Depending on the type of operands, the traditional opera-tors [8], [40] such as Absolute Value Insertion (ABS), Arith-metic Operator Replacement (AOR), Logical Operator Re-placement (LOR), Statement Deletion (SDL), Scalar VariableReplacement (SVR), and Unary Operator Insertion (UOI) canbe applied. In addition to these traditional mutation operators,we define Function Parameter Replacement (FPR) operator,
where parameters of a function are replaced by other parame-ters of a compatible type. Two Types are compatible if valuesof one type can appear wherever values of the other type areexpected, and vice versa.• Function Parameter Replacement (FPR): parameters of
a function are replaced by other parameters of the sametype.
• Function Parameter Permutation (FPP): parameters ofa function of same type are permuted.
Table II illustrates some examples of the proposed functionupdate mutation operators.
TABLE II. EXAMPLES OF FUNCTION UPDATE MUTATION OPERATORSFOR CoreASM
MutationOperator
CoreASM Spec S CoreASM Mutant S’
ABS x := a + b x := a + abs(b)AOR x := a + b x := a - bLOR y := m and n y := m or nSDL x := a + b skipSVR x := a * b a := a * bUOI x := 3 * a x := 3 * -aFPR price(Soda):=70 price(Candy):=70FPP packaging(Soda, Candy):=1 packaging(Candy, Soda):=1
D. ASM Transition Rules Mutation OperatorsThe transition relation is specified by guarded function
updates, called rules, describing the modification of the func-tions from one state to the next. An ASM state transition isperformed by firing a set of rules in one step.
1) Conditional Rule Mutation Operators: The generalschema of an ASM transition system appears as a set ofguarded rules:
if Cond then Rulethen else Ruleelse endif
where Cond, the guard, is a term representing a booleancondition. Rulethen and Ruleelse are transition rules.
Many types of faults may occur on the guards of conditionalrules [41]. Some of these faults include Literal Negationfault (LNF), Expression Negation fault (ENF), Missing Literalfault (MLF), Associative Shift fault (ASF), Operator Refer-ence fault (ORF), Relational Operator fault (ROF), Stuck at0(true)/1(false) fault (STF). Table III illustrates the mutationoperators addressing the above fault classes. Furthermore, wedefine three additional conditional rule mutation operators:• Then Rule Replacement Operator (TRRO): replaces the
rule Rulethen by another existing rule.• Else Rule Replacement Operator (ERRO): replaces the
rule Ruleelse by another existing rule.• Then Else Rule Permutation Operator (TERPEO): per-
mutes the Rulethen and the Ruleelse rules. It is worthnoting that operators TERPEO and ENO would producesyntactically different but semantically equivalent mu-tants.
2) Sequence Rule Mutation Operators: The sequence ruleaims at executing rules/function updates in sequence. Tur-boASM plugin offers two forms of sequential rules:
seq Rule1 next Rule2 (1)
84
International Journal on Advances in Software, vol 6 no 1 & 2, year 2013, http://www.iariajournals.org/software/
2013, © Copyright by authors, Published under agreement with IARIA - www.iaria.org
TABLE III. EXAMPLES OF CONDITIONAL RULE MUTATION OPERATORS FOR CoreASM
Mutation Operator CoreASM Spec S CoreASM Mutant S’
LNO (Literal Negation) if (a and b) if (not a and b)ENO (Expression Negation) if (a and b) if not (a and b)MLO (Missing Literal) if (a and b) if (b)ASO (Associative Shift) if (a and (b or a)) if ((a and b) or a)ORO (Operator Reference) if (a and b) if (a or b)ROO (Relational Operator) if (x >= c) if (x <= c)STO (Stuck at 0/1) if (a and b) if (true)TRRO (Then Rule Replacement) if a then R1 else R2 if a then R3 else R2ERRO (Else Rule Replacement) if a then R1 else R2 if a then R1 else R3TERPEO (Then Else Rule Permutation) if a then R1 else R2 if a then R2 else R1
Evaluates Rule1, applies the generated updates in a virtualstate, and evaluates Rule2 in that state. The resulting updateset is a sequential composition of the updates generated byRule1 and Rule2.
seqblock Rule1 . . . Rulen endseqblock (2)
Similar to the seq rule (above), this rule form executes thelisted rules in sequence. The resulting update set is a sequentialcomposition of the updates generated by Rule1 . . . Rulen.
We define the following mutation operators for the sequencerule:• Add Rule Operator (ARO): adds a new rule to the
sequence of rules.• Delete Rule Operator (DRO): deletes a rule from the
sequence of rules.• Replace Rule Operator (RRO): replaces one of the rules
in the sequence by another rule.• Permute Rule Operator (PRO): changes the order of the
sequence rules by permuting two rules.Table IV illustrates examples of the sequence rule mutation
operators.
TABLE IV. EXAMPLES OF THE SEQUENCE RULE MUTATIONOPERATORS FOR CoreASM
MutationOperator
CoreASM Spec S CoreASM Mutant S’
ARO seqblock R1 R2 endseqblock seqblock R1 R2 R3 endseqblockDRO seqblock R1 R2 R3 endseqblock seqblock R1 R3 endseqblockRRO seqblock R1 R2 endseqblock seqblock R1 R3 endseqblockPRO seqblock R1 R2 endseqblock seqblock R2 R1 endseqblock
3) Block Rule Mutation Operators: If a set of ASM tran-sition rules have to be executed simultaneously, a block rule(included in the BlockRule plugin) is used:
par Rule1 . . . Rulen endpar
The update generated by this rule is the union of all the updatesgenerated by Rule1 . . .Rulen. The sequence rule operators(i.e., ARO, DRO, and RRO defined in Section III-D2) can beapplied to the block rule. Table V illustrates the sequence-blockexchange mutation operator.
Applying PRO to a block rule, will produce an equiv-alent specification (i.e., par R1 R2 endpar is equivalentto par R2 R1 endpar). Section IV-B discusses equivalentmutants.
TABLE V. EXAMPLES OF THE BLOCK RULE MUTATION OPERATORSFOR CoreASM
MutationOperator
CoreASM Spec S CoreASM Mutant S’
ARO par R1 R2 endpar par R1 R2 R3 endparDRO par R1 R2 R3 endpar par R1 R3 endparRRO par R1 R2 endpar par R1 R3 endpar
4) Sequence-Block Exchange Operator: In addition tothe sequence and block mutation operators, we definethe Sequence-Block Exchange Operator (SBEO) to exchangea sequence rule with a block rule and vice versa. Table VIillustrates the sequence-block exchange mutation operator.
TABLE VI. EXAMPLES OF THE SEQUENCE-BLOCK RULE MUTATIONOPERATOR
MutationOperator
CoreASM Spec S CoreASM Mutant S’
SBEO seqblock R1 R2 endseqblock par R1 R2 endparSBEO par R1 R2 endpar seqblock R1 R2 endseqblock
5) Choose Rule Mutation Operators: The choose rule con-sists on selecting elements (non deterministically) from spec-ified domains that satisfy guards φ, then evaluates Ruledo. Ifno such elements exist, then evaluates Ruleifnone.
choose x1 in D1, . . ., xn in Dn with φ (x1, . . ., xn) doRuledo ifnone Ruleifnone
The with and ifnone blocks are optional. The guard φ maybe a simple boolean expression of predicate logic expressions.
To cover the choose rule, we define the following mutationoperators:• Choose Domain Replacement Operator (CDRO): re-
places a variable domain with another compatible do-main.
• Choose Guard Modification Operator (CGMO): altersthe guard φ using the operators described in Table III.In this paper, we consider simple boolean expressionsas guards. Predicate logic expressions such as exists areleft for future work.
• Choose DoRule Replacement Operator (CDoRO): re-places the rule Ruledo by another rule.
• Choose IfNoneRule Replacement Operator (CIRO):replaces the rule Ruleifnone by another rule.
• Choose Rule Exchange Operator (CREO): replaces theRuledo rule by Ruleifnone rule.
Table VII illustrates the choose rule mutation operators.

85
International Journal on Advances in Software, vol 6 no 1 & 2, year 2013, http://www.iariajournals.org/software/
2013, © Copyright by authors, Published under agreement with IARIA - www.iaria.org
TABLE VII. EXAMPLE OF THE CHOOSE RULE MUTATION OPERATORSFOR CoreASM
MutationOperator
CoreASM Spec S CoreASM Mutant S’
CDRO choose x in Set1 with (x>= 0)
choose x in Set2 with (x>= 0)
CGMO choose x in Set1 with (x>= 0)
choose x in Set1 with (x<= 0)
CDoRO choose x in Set1 do R1 choose x in Set1 do R2CIRO choose x in Set1 do R1
ifnone R2choose x in Set1 do R1ifnone R3
CREO choose x in Set1 do R1ifnone R2
choose x in Set1 do R2ifnone R1
6) Forall Rule Mutation Operators: The synchronous par-allelism is expressed by a forall rule, which has the followingform:
forall x1 in D1, . . ., xn in Dn with φ do Ruledo
where x1, . . ., xn are variables, D1, . . ., Dn are the domainswhere xi take their value, φ is a boolean condition, Ruledois a transition rule containing occurences of the variables xi
bound by the quantifier.We define the following mutation operators for the forall
rule that are quite similar to the ones of the choose rule :• Forall Domain Replacement Operator (FDRO): replaces
a variable domain with another compatible domain.• Forall Guard Modification Operator (FGMO): alters the
guard φ using the set of operators introduced in TableIII.
• Forall DoRule Replacement Operator (FDoRO): re-places the rule Ruledo by any other rule.
TABLE VIII. EXAMPLES OF THE FORALL RULE MUTATIONOPERATORS FOR CoreASM
MutationOperator
CoreASM Spec S CoreASM Mutant S’
FDRO forall x in Set1 with (x = 0)do R1
forall x in Set2 with (x >=0) do R1
FGMO forall x in Set1 with (x = 0)do R1
forall x in Set1 with (x <=0) do R1
FDoRO forall x in Set1 do R1 forall x in Set1 do R2
7) Choose-Forall Exchange Operator: In addition to theproposed forall and choose rule mutation operators illustratedin Tables VIII and VII, we define the Choose-Forall ExchangeOperator (CFEO) to exchange a choose rule with a forall ruleand vice versa (See Table IX).
TABLE IX. EXAMPLES OF THE CHOOSE-FORALL EXCHANGEOPERATOR FOR CoreASM
MutationOperator
CoreASM Spec S CoreASM Mutant S’
CFEO forall x in Set1 do R1 choose x in Set1 do R1CFEO choose x in Set1 do R1 forall x in Set1 do R1
8) Let Rule Mutation Operators: The let rule, included inthe LetRule plugin, assigns a value of a term t to the variable xand then execute the rule Rule which contains occurrences ofthe variable x. The syntax of a Let rule is:
let (x = t) in Rule
We define the following Let rule mutation operators (seeTable X):• Let Variable Assignment Operator (LVAO): assigns a
different value to x, other than t, of a compatible type.• Let Rule Replacement Operator (LRRO): replaces the
rule Rule by another rule that has occurrences of x.• Let Rule Variable Replacement (LRVR): replaces the
variable x by another variable of same type.
TABLE X. EXAMPLES OF THE LET RULE OPERATORS FOR CoreASM
MutationOperator
CoreASM Spec S CoreASM Mutant S’
LVAO let x = 1 in R1 let x = 2 in R1LRRO let x = 1 in R1 let x = 1 in R2LRVR let x = 1 in R1 let y = 1 in R1
9) Call Rule Mutation Operators: The call rule executes thepreviously defined transition rule R with the given parameters.Parameters are passed in a call-by-name fashion; i.e., they arepassed unevaluated. The syntax of a Call rule is:
R(a1, . . . , an)
We define the following Call rule mutation operators (seeTable XI):• Call Rule Parameter Replacement (CRPR): replaces the
actual rule parameter by another parameter of the sametype.
• Call Rule Parameter Exchange (CRPE): permutes actualparameters if they are of the same type.
TABLE XI. EXAMPLE OF CALL RULE MUTATION OPERATOR
MutationOperator
CoreASM Spec S CoreASM Mutant S’
CRPR rule Add(a, b)= rule Add(a, b)=return a+b return a+b
rule Main = rule Main =addition := Add(x,y) addition := Add (x,z)
CRPE rule Add(a, b)= rule Add(a, b)=return a+b return a+b
rule Main = rule Main =addition := Add(x,y) addition := Add (y,x)
10)Pick Rule Mutation Operators: The pick rule, part ofthe ChooseRule plugin, provides another way of pick non-deterministically a value that satisfies a given condition froman enumerable. Its syntax is as follows:
pick x in D with guard
To cover the pick rule, we define the following mutationoperators:• Pick Domain Replacement Operator (PDRO): replaces
the domain D with another compatible domain.• Pick Guard Modification Operator (PGMO): alters the
guard φ using the operators described in Table III.Table XII illustrates the pick rule mutation operators.11)Extend Rule Mutation Operators: The extend rule, part
of ExtendRule plugin, is used to construct new elements andadd them to a specific domain. The resulting update set is theupdates generated by Rule.

86
International Journal on Advances in Software, vol 6 no 1 & 2, year 2013, http://www.iariajournals.org/software/
2013, © Copyright by authors, Published under agreement with IARIA - www.iaria.org
TABLE XII. EXAMPLE OF THE PICK RULE MUTATION OPERATORSFOR CoreASM
MutationOperator
CoreASM Spec S CoreASM Mutant S’
PDRO pick x in D1 with (x >=0)
pick x in D2 with (x >=0)
PGMO pick x in D1 with (x >=0)
pick x in D1 with (x <=0)
extend D with id do Rule
We define the following Extend rule mutation operators (seeTable XIII):• Extend Domain Replacement Operator (EDRO): re-
places the domain by another compatible domain.• Extend Rule Replacement Operator (ERRO): replaces
the rule Rule by another one.• Extend Id Replacement Operator (EIRO): extends the
domain with another element of a compatible type (e.g.,extend the domain D1 with id2 instead of id1). Alloccurrences of the id are replaced in Rule.
TABLE XIII. EXAMPLES OF THE EXTEND RULE OPERATORSFOR CoreASM
MutationOperator
CoreASM Spec S CoreASM Mutant S’
EDRO extend D1 with id1 do R1 extend D2 with id1 do R1ERRO extend D1 with id1 do R1 extend D1 with id1 do R2EIRO extend D1 with id1 do R1 extend D1 with id2 do R1
Other CoreASM-specific rules and constructs such as Caserule, add/remove List constructs, enqueue/dequeue Queue con-structs, etc. are not covered in this paper.
E. CoreASM: What is not MutatedSome mutation operators may have a possible infinite do-
main on which they operate. For instance, given the fact thatthe set of types might be infinite, it is difficult to determinehow the declaration of a variable of one specific type maybe mutated. This is applicable to libraries, functions names,etc. For the CoreASM language, the following entities are notmutated:• Variable declarations.• Format of strings in I/O functions.• The init rule declaration (i.e., init InitRule)• Plugin names introduced using the use keyword.• Rule declarations• Rule names indicating a call to a rule. Note that the
actual parameters in a Call rule are mutated (e.g., CRPRand CRPE operators) but the rule names are not.
IV. ANALYSIS OF THE GENERATED MUTANTS
A. Inconsistent UpdatesApplying SBEO operator may result into mutants that
are syntactically correct but containing inconsistent updates.Therefore, the computation does not yield a next state. Ta-ble XIV shows a simple CoreASM sequence rule and its
corresponding mutant after applying SBEO operator. The ex-ecution of the produced mutant may lead to an inconsistentupdate of variable a (i.e., in case variable a is updated twicesimultaneously with different values (a+1 = b)).
TABLE XIV. APPLYING SBEO OPERATOR THAT LEADS TO ANINCONSISTENT UPDATE
CoreASM Spec S CoreASM Mutant S’
rule Main = rule Main =seqblock par
a := a + 1 a := a + 1a := b a := b
endseqblock endpar
B. Equivalent MutantsIn many cases, applying CoreASM mutation operator pro-
duces a specification that is equivalent to the original specifica-tion. For instance, the application of the PRO (Permute RuleOperator) to a block rule (e.g., par R1 R2 endpar), wouldproduce a mutant (e.g., par R2 R1 endpar) that is equivalentto the original specification.
Similarly, applying SBEO operator may produce a mutantthat is equivalent to the original specification. This might bethe case when the rules enclosed within the parallel/sequenceblocks are independent (i.e., with different functions updates).Table XV shows a specifications S and its mutant S’. Rules “a:=a+1” and “b:=b+1” are independent (i.e., Variables a and bare updated independently). Hence, no test cases would killmutant S’. However, the original specification S produces 2states (i.e., one a:= a + 1 and one for b := b +1) whereas itsmutant S’ produces only one single state (i.e., a:= a +1 and b:= b + 1 are executed in one single step).
TABLE XV. APPLYING SBEO OPERATOR PRODUCES A MUTANTTHAT IS EQUIVALENT TO THE ORIGINAL SPEC
CoreASM Spec S CoreASM Mutant S’
rule Main = rule Main =seqblock par
a := a + 1 a := a + 1b := b + 1 b := b + 1
endseqblock endpar
In general, like traditional programming languages, detect-ing CoreASM equivalent mutants is an undecidable prob-lem [40].
V. COREASM MUTATION TOOLKIT
Figures 2, 3, and 4 illustrate the Microsoft .NET C#-based, CoreASM Mutation Toolkit GUI. The GUI is composedof four tab pages: (1) Mutants Generator tab (Figure 2), (2)Mutants Viewer tab (Figure 3), (3) Test Execution tab (Figure4), and (4) Help tab. The user starts with loading a CoreASMspecification, then he/she selects one or multiple operatorsfrom the three operator categories. The produced mutants arecreated and stored in separate files in a separate directory.
In Section III, we have stated that only syntactically correctmutants are generated, as a result of applying the mutation
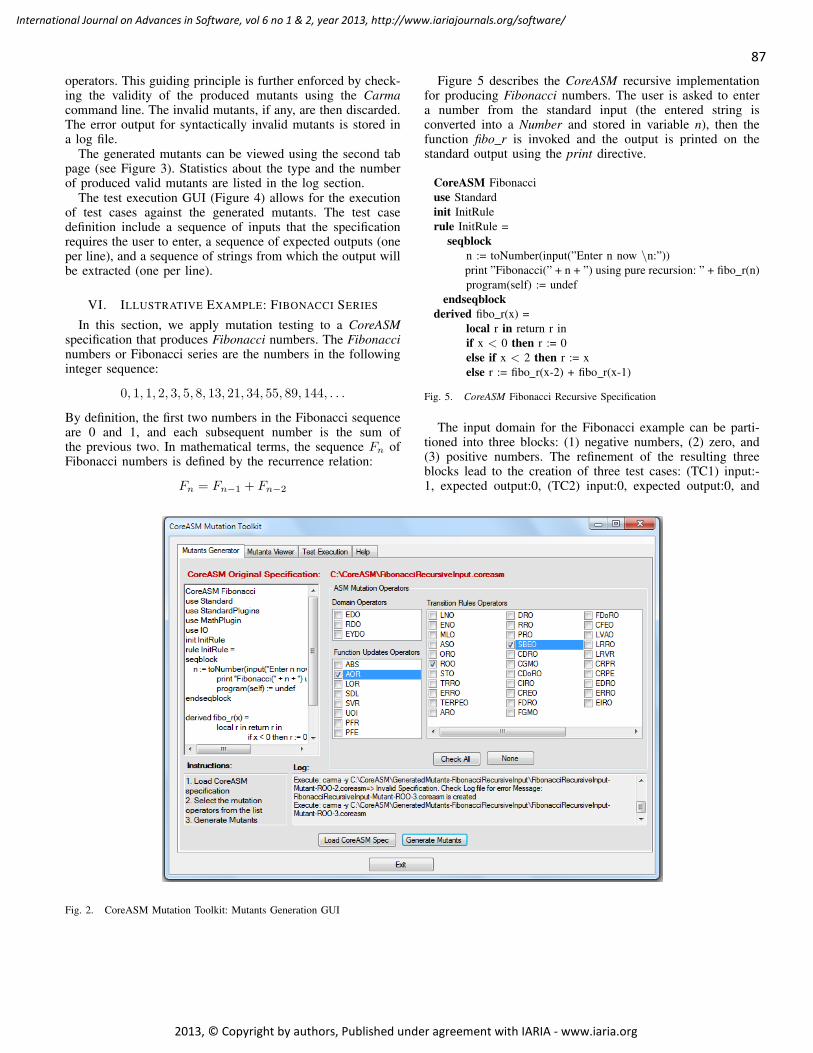
87
International Journal on Advances in Software, vol 6 no 1 & 2, year 2013, http://www.iariajournals.org/software/
2013, © Copyright by authors, Published under agreement with IARIA - www.iaria.org
operators. This guiding principle is further enforced by check-ing the validity of the produced mutants using the Carmacommand line. The invalid mutants, if any, are then discarded.The error output for syntactically invalid mutants is stored ina log file.
The generated mutants can be viewed using the second tabpage (see Figure 3). Statistics about the type and the numberof produced valid mutants are listed in the log section.
The test execution GUI (Figure 4) allows for the executionof test cases against the generated mutants. The test casedefinition include a sequence of inputs that the specificationrequires the user to enter, a sequence of expected outputs (oneper line), and a sequence of strings from which the output willbe extracted (one per line).
VI. ILLUSTRATIVE EXAMPLE: FIBONACCI SERIES
In this section, we apply mutation testing to a CoreASMspecification that produces Fibonacci numbers. The Fibonaccinumbers or Fibonacci series are the numbers in the followinginteger sequence:
0, 1, 1, 2, 3, 5, 8, 13, 21, 34, 55, 89, 144, . . .
By definition, the first two numbers in the Fibonacci sequenceare 0 and 1, and each subsequent number is the sum ofthe previous two. In mathematical terms, the sequence Fn ofFibonacci numbers is defined by the recurrence relation:
Fn = Fn−1 + Fn−2
Figure 5 describes the CoreASM recursive implementationfor producing Fibonacci numbers. The user is asked to entera number from the standard input (the entered string isconverted into a Number and stored in variable n), then thefunction fibo r is invoked and the output is printed on thestandard output using the print directive.
CoreASM Fibonacciuse Standardinit InitRulerule InitRule =
seqblockn := toNumber(input(”Enter n now \n:”))print ”Fibonacci(” + n + ”) using pure recursion: ” + fibo r(n)program(self) := undef
endseqblockderived fibo r(x) =
local r in return r inif x < 0 then r := 0else if x < 2 then r := xelse r := fibo r(x-2) + fibo r(x-1)
Fig. 5. CoreASM Fibonacci Recursive Specification
The input domain for the Fibonacci example can be parti-tioned into three blocks: (1) negative numbers, (2) zero, and(3) positive numbers. The refinement of the resulting threeblocks lead to the creation of three test cases: (TC1) input:-1, expected output:0, (TC2) input:0, expected output:0, and
Fig. 2. CoreASM Mutation Toolkit: Mutants Generation GUI
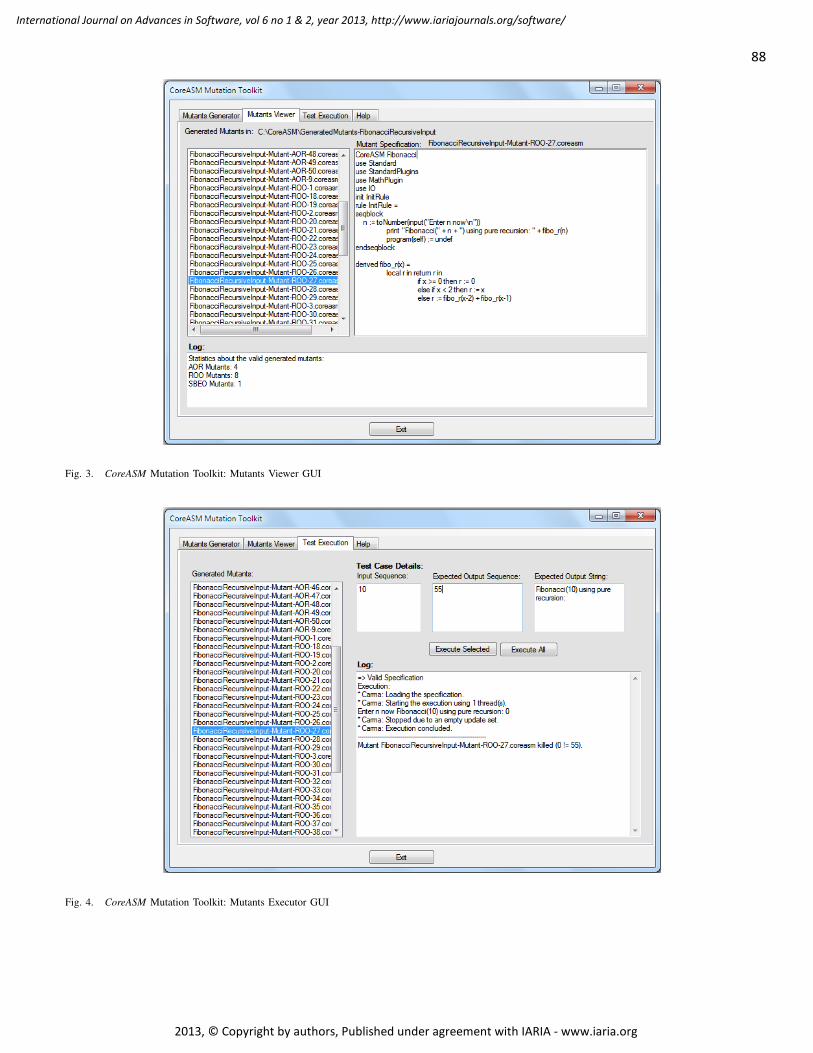
88
International Journal on Advances in Software, vol 6 no 1 & 2, year 2013, http://www.iariajournals.org/software/
2013, © Copyright by authors, Published under agreement with IARIA - www.iaria.org
Fig. 3. CoreASM Mutation Toolkit: Mutants Viewer GUI
Fig. 4. CoreASM Mutation Toolkit: Mutants Executor GUI
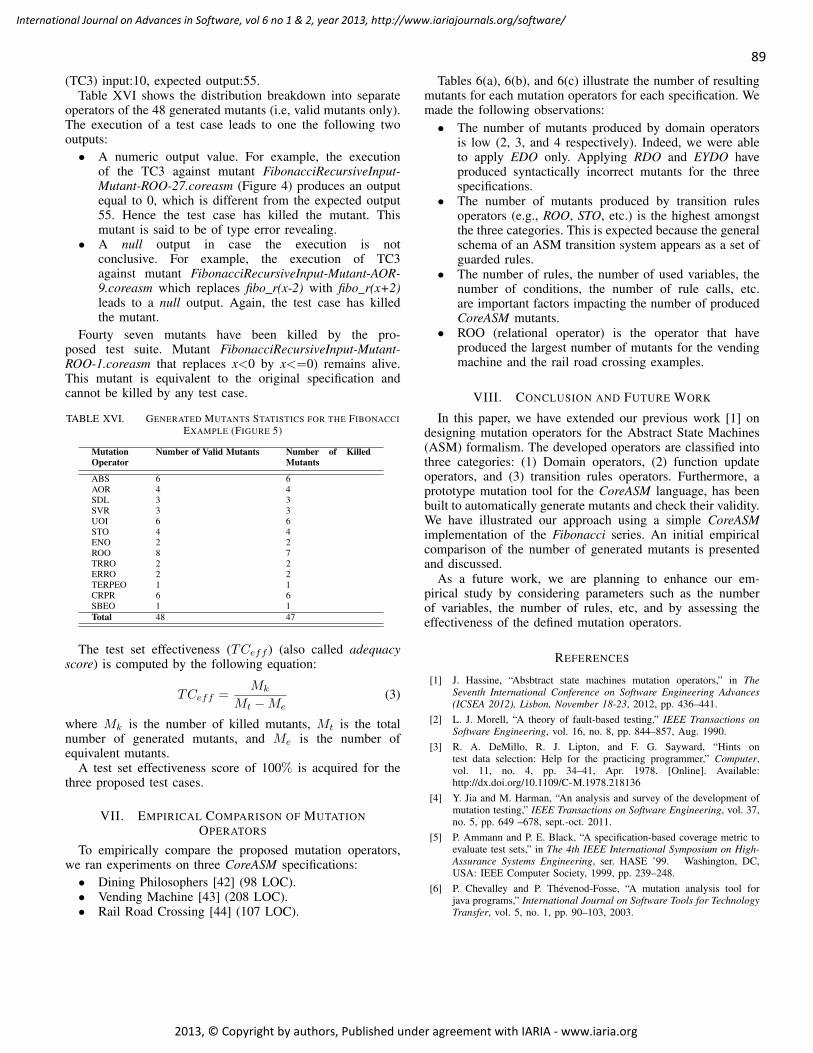
89
International Journal on Advances in Software, vol 6 no 1 & 2, year 2013, http://www.iariajournals.org/software/
2013, © Copyright by authors, Published under agreement with IARIA - www.iaria.org
(TC3) input:10, expected output:55.Table XVI shows the distribution breakdown into separate
operators of the 48 generated mutants (i.e, valid mutants only).The execution of a test case leads to one the following twooutputs:• A numeric output value. For example, the execution
of the TC3 against mutant FibonacciRecursiveInput-Mutant-ROO-27.coreasm (Figure 4) produces an outputequal to 0, which is different from the expected output55. Hence the test case has killed the mutant. Thismutant is said to be of type error revealing.
• A null output in case the execution is notconclusive. For example, the execution of TC3against mutant FibonacciRecursiveInput-Mutant-AOR-9.coreasm which replaces fibo r(x-2) with fibo r(x+2)leads to a null output. Again, the test case has killedthe mutant.
Fourty seven mutants have been killed by the pro-posed test suite. Mutant FibonacciRecursiveInput-Mutant-ROO-1.coreasm that replaces x<0 by x<=0) remains alive.This mutant is equivalent to the original specification andcannot be killed by any test case.
TABLE XVI. GENERATED MUTANTS STATISTICS FOR THE FIBONACCIEXAMPLE (FIGURE 5)
MutationOperator
Number of Valid Mutants Number of KilledMutants
ABS 6 6AOR 4 4SDL 3 3SVR 3 3UOI 6 6STO 4 4ENO 2 2ROO 8 7TRRO 2 2ERRO 2 2TERPEO 1 1CRPR 6 6SBEO 1 1Total 48 47
The test set effectiveness (TCeff ) (also called adequacyscore) is computed by the following equation:
TCeff =Mk
Mt −Me(3)
where Mk is the number of killed mutants, Mt is the totalnumber of generated mutants, and Me is the number ofequivalent mutants.
A test set effectiveness score of 100% is acquired for thethree proposed test cases.
VII. EMPIRICAL COMPARISON OF MUTATIONOPERATORS
To empirically compare the proposed mutation operators,we ran experiments on three CoreASM specifications:• Dining Philosophers [42] (98 LOC).• Vending Machine [43] (208 LOC).• Rail Road Crossing [44] (107 LOC).
Tables 6(a), 6(b), and 6(c) illustrate the number of resultingmutants for each mutation operators for each specification. Wemade the following observations:• The number of mutants produced by domain operators
is low (2, 3, and 4 respectively). Indeed, we were ableto apply EDO only. Applying RDO and EYDO haveproduced syntactically incorrect mutants for the threespecifications.
• The number of mutants produced by transition rulesoperators (e.g., ROO, STO, etc.) is the highest amongstthe three categories. This is expected because the generalschema of an ASM transition system appears as a set ofguarded rules.
• The number of rules, the number of used variables, thenumber of conditions, the number of rule calls, etc.are important factors impacting the number of producedCoreASM mutants.
• ROO (relational operator) is the operator that haveproduced the largest number of mutants for the vendingmachine and the rail road crossing examples.
VIII. CONCLUSION AND FUTURE WORK
In this paper, we have extended our previous work [1] ondesigning mutation operators for the Abstract State Machines(ASM) formalism. The developed operators are classified intothree categories: (1) Domain operators, (2) function updateoperators, and (3) transition rules operators. Furthermore, aprototype mutation tool for the CoreASM language, has beenbuilt to automatically generate mutants and check their validity.We have illustrated our approach using a simple CoreASMimplementation of the Fibonacci series. An initial empiricalcomparison of the number of generated mutants is presentedand discussed.
As a future work, we are planning to enhance our em-pirical study by considering parameters such as the numberof variables, the number of rules, etc, and by assessing theeffectiveness of the defined mutation operators.
REFERENCES
[1] J. Hassine, “Absbtract state machines mutation operators,” in TheSeventh International Conference on Software Engineering Advances(ICSEA 2012), Lisbon, November 18-23, 2012, pp. 436–441.
[2] L. J. Morell, “A theory of fault-based testing,” IEEE Transactions onSoftware Engineering, vol. 16, no. 8, pp. 844–857, Aug. 1990.
[3] R. A. DeMillo, R. J. Lipton, and F. G. Sayward, “Hints ontest data selection: Help for the practicing programmer,” Computer,vol. 11, no. 4, pp. 34–41, Apr. 1978. [Online]. Available:http://dx.doi.org/10.1109/C-M.1978.218136
[4] Y. Jia and M. Harman, “An analysis and survey of the development ofmutation testing,” IEEE Transactions on Software Engineering, vol. 37,no. 5, pp. 649 –678, sept.-oct. 2011.
[5] P. Ammann and P. E. Black, “A specification-based coverage metric toevaluate test sets,” in The 4th IEEE International Symposium on High-Assurance Systems Engineering, ser. HASE ’99. Washington, DC,USA: IEEE Computer Society, 1999, pp. 239–248.
[6] P. Chevalley and P. Thevenod-Fosse, “A mutation analysis tool forjava programs,” International Journal on Software Tools for TechnologyTransfer, vol. 5, no. 1, pp. 90–103, 2003.
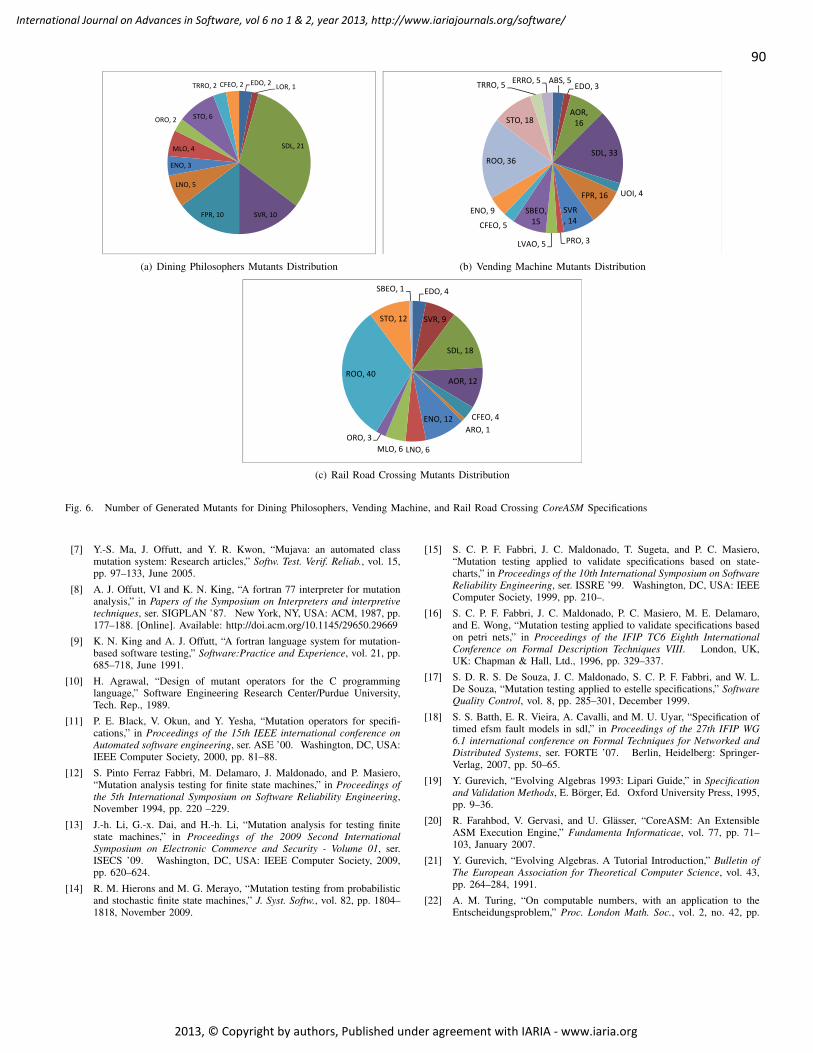
90
International Journal on Advances in Software, vol 6 no 1 & 2, year 2013, http://www.iariajournals.org/software/
2013, © Copyright by authors, Published under agreement with IARIA - www.iaria.org
EDO, 2LOR, 1
SDL, 21
SVR, 10FPR, 10
LNO, 5
ENO, 3
MLO, 4
ORO, 2STO, 6
TRRO, 2 CFEO, 2
(a) Dining Philosophers Mutants Distribution
ABS, 5EDO, 3
AOR,
16
SDL, 33
UOI, 4FPR, 16
SVR
, 14
PRO, 3LVAO, 5
SBEO,
15CFEO, 5
ENO, 9
ROO, 36
STO, 18
TRRO, 5ERRO, 5
(b) Vending Machine Mutants Distribution
EDO, 4
SVR, 9
SDL, 18
AOR, 12
CFEO, 4
ARO, 1
ENO, 12
LNO, 6MLO, 6
ORO, 3
ROO, 40
STO, 12
SBEO, 1
(c) Rail Road Crossing Mutants Distribution
Fig. 6. Number of Generated Mutants for Dining Philosophers, Vending Machine, and Rail Road Crossing CoreASM Specifications
[7] Y.-S. Ma, J. Offutt, and Y. R. Kwon, “Mujava: an automated classmutation system: Research articles,” Softw. Test. Verif. Reliab., vol. 15,pp. 97–133, June 2005.
[8] A. J. Offutt, VI and K. N. King, “A fortran 77 interpreter for mutationanalysis,” in Papers of the Symposium on Interpreters and interpretivetechniques, ser. SIGPLAN ’87. New York, NY, USA: ACM, 1987, pp.177–188. [Online]. Available: http://doi.acm.org/10.1145/29650.29669
[9] K. N. King and A. J. Offutt, “A fortran language system for mutation-based software testing,” Software:Practice and Experience, vol. 21, pp.685–718, June 1991.
[10] H. Agrawal, “Design of mutant operators for the C programminglanguage,” Software Engineering Research Center/Purdue University,Tech. Rep., 1989.
[11] P. E. Black, V. Okun, and Y. Yesha, “Mutation operators for specifi-cations,” in Proceedings of the 15th IEEE international conference onAutomated software engineering, ser. ASE ’00. Washington, DC, USA:IEEE Computer Society, 2000, pp. 81–88.
[12] S. Pinto Ferraz Fabbri, M. Delamaro, J. Maldonado, and P. Masiero,“Mutation analysis testing for finite state machines,” in Proceedings ofthe 5th International Symposium on Software Reliability Engineering,November 1994, pp. 220 –229.
[13] J.-h. Li, G.-x. Dai, and H.-h. Li, “Mutation analysis for testing finitestate machines,” in Proceedings of the 2009 Second InternationalSymposium on Electronic Commerce and Security - Volume 01, ser.ISECS ’09. Washington, DC, USA: IEEE Computer Society, 2009,pp. 620–624.
[14] R. M. Hierons and M. G. Merayo, “Mutation testing from probabilisticand stochastic finite state machines,” J. Syst. Softw., vol. 82, pp. 1804–1818, November 2009.
[15] S. C. P. F. Fabbri, J. C. Maldonado, T. Sugeta, and P. C. Masiero,“Mutation testing applied to validate specifications based on state-charts,” in Proceedings of the 10th International Symposium on SoftwareReliability Engineering, ser. ISSRE ’99. Washington, DC, USA: IEEEComputer Society, 1999, pp. 210–.
[16] S. C. P. F. Fabbri, J. C. Maldonado, P. C. Masiero, M. E. Delamaro,and E. Wong, “Mutation testing applied to validate specifications basedon petri nets,” in Proceedings of the IFIP TC6 Eighth InternationalConference on Formal Description Techniques VIII. London, UK,UK: Chapman & Hall, Ltd., 1996, pp. 329–337.
[17] S. D. R. S. De Souza, J. C. Maldonado, S. C. P. F. Fabbri, and W. L.De Souza, “Mutation testing applied to estelle specifications,” SoftwareQuality Control, vol. 8, pp. 285–301, December 1999.
[18] S. S. Batth, E. R. Vieira, A. Cavalli, and M. U. Uyar, “Specification oftimed efsm fault models in sdl,” in Proceedings of the 27th IFIP WG6.1 international conference on Formal Techniques for Networked andDistributed Systems, ser. FORTE ’07. Berlin, Heidelberg: Springer-Verlag, 2007, pp. 50–65.
[19] Y. Gurevich, “Evolving Algebras 1993: Lipari Guide,” in Specificationand Validation Methods, E. Borger, Ed. Oxford University Press, 1995,pp. 9–36.
[20] R. Farahbod, V. Gervasi, and U. Glasser, “CoreASM: An ExtensibleASM Execution Engine,” Fundamenta Informaticae, vol. 77, pp. 71–103, January 2007.
[21] Y. Gurevich, “Evolving Algebras. A Tutorial Introduction,” Bulletin ofThe European Association for Theoretical Computer Science, vol. 43,pp. 264–284, 1991.
[22] A. M. Turing, “On computable numbers, with an application to theEntscheidungsproblem,” Proc. London Math. Soc., vol. 2, no. 42, pp.
91
International Journal on Advances in Software, vol 6 no 1 & 2, year 2013, http://www.iariajournals.org/software/
2013, © Copyright by authors, Published under agreement with IARIA - www.iaria.org
230–265, 1936.[23] Y. Gurevich, “Abstract state machines: An overview of the project,” in
Foundations of Information and Knowledge Systems, ser. Lecture Notesin Computer Science, D. Seipel and J. Turull-Torres, Eds. SpringerBerlin Heidelberg, 2004, vol. 2942, pp. 6–13.
[24] E. Borger and R. F. Stark, Abstract State Machines: A Method forHigh-Level System Design and Analysis. Secaucus, NJ, USA: Springer-Verlag New York, Inc., 2003.
[25] C. Wallace, “The semantics of the C++ programming language,” inSpecification and validation methods. New York, NY, USA: OxfordUniversity Press, Inc., 1995, pp. 131–164.
[26] E. Borger, N. G. Fruja, V. Gervasi, and R. F. Stark, “A high-levelmodular definition of the semantics of c#,” Theor. Comput. Sci., vol.336, no. 2-3, pp. 235–284, May 2005.
[27] E. Borger and W. Schulte, “Defining the java virtual machine as plat-form for provably correct java compilation,” in MFCS ’98: Proceedingsof the 23rd International Symposium on Mathematical Foundations ofComputer Science. London, UK: Springer-Verlag, 1998, pp. 17–35.
[28] E. Borger and D. Rosenzweig, “A mathematical definition of fullprolog,” Sci. Comput. Program., vol. 24, no. 3, pp. 249–286, 1995.
[29] U. Glasser, E. Borger, and W. Muller, “Formal definition of an abstractvhdl’93 simulator by ea-machines,” in Formal Semantics for VHDL,C. Delgado Kloos and P. T. Breuer, Eds. Kluwer Academic Publishers,1995.
[30] U. Glasser and R. Karges, “Abstract state machine semantics of SDL,”Journal of Universal Computer Science, vol. 3, no. 12, pp. 1382–1414,1997.
[31] R. Eschbach, U. Glasser, R. Gotzhein, M. von Lowis, and A. Prinz,“Formal definition of SDL-2000: Compiling and running SDL spec-ifications as ASM models,” Journal of Universal Computer Science,Special Issue on Abstract State Machines - Theory and Applications,2001, springer-Verlag.
[32] R. Farahbod, U. Glsser, and M. Vajihollahi, “Specification and valida-tion of the business process execution language for web services,” inAbstract State Machines 2004. Advances in Theory and Practice, ser.Lecture Notes in Computer Science, W. Zimmermann and B. Thalheim,Eds. Springer Berlin / Heidelberg, 2004, vol. 3052, pp. 78–94.
[33] U. Glasser and Q.-P. Gu, “Formal description and analysis of a
distributed location service for mobile ad hoc networks,” Theor. Comput.Sci., vol. 336, no. 2-3, pp. 285–309, May 2005.
[34] U. Glasser, Y. Gurevich, and M. Veanes, “Abstract communicationmodel for distributed systems,” IEEE Transactions on Software Engi-neering, vol. 30, no. 7, pp. 458–472, Jul. 2004.
[35] Y. Gurevich, “Sequential abstract-state machines capture sequentialalgorithms,” ACM Trans. Comput. Logic, vol. 1, no. 1, pp. 77–111,Jul. 2000.
[36] A. Blass and Y. Gurevich, “Abstract state machines capture parallelalgorithms: Correction and extension,” ACM Trans. Comput. Logic,vol. 9, no. 3, pp. 19:1–19:32, Jun. 2008. [Online]. Available:http://doi.acm.org/10.1145/1352582.1352587
[37] CoreASM, “The CoreASM Project,” http://www.coreasm.org, 2012, lastaccessed, June 2013.
[38] M. Woodward, “Errors in algebraic specifications and an experimentalmutation testing tool,” Software Engineering Journal, vol. 8, no. 4, pp.211 –224, jul 1993.
[39] AsmL, “Microsoft Research: The Abstract State Machine Language,”http://research.microsoft.com/en-us/projects/asml/, 2006, last accessed,June 2013.
[40] P. Ammann and J. Offutt, Introduction to Software Testing, 1st ed. NewYork, NY, USA: Cambridge University Press, 2008.
[41] M. F. Lau and Y. T. Yu, “An extended fault class hierarchy forspecification-based testing,” ACM Trans. Softw. Eng. Methodol., vol. 14,pp. 247–276, July 2005.
[42] G. Ma and R. Farahbod, “Dining Philosphers: A SampleSpecification in CoreASM,” 2006, last accessed, June
2013. [Online]. Available: http://coreasm.svn.sourceforge.net/viewvc/coreasm/engine-carma/trunk/sampleSpecs/DiningPhilosophers.coreasm
[43] M. Vajihollahi and R. Farahbod, “Vending Machine CoreASMSpec,” 2006, last accessed, June 2013. [Online]. Avail-able: http://coreasm.svn.sourceforge.net/viewvc/coreasm/engine-carma/trunk/sampleSpecs/VendingMachine.coreasm
[44] R. Farahbod, “Rail Road Crossing CoreASM Spec,”2009, last accessed, June 2013. [Online]. Avail-able: http://coreasm.svn.sourceforge.net/viewvc/coreasm/engine-carma/trunk/sampleSpecs/RailroadCrossing.coreasm
92
International Journal on Advances in Software, vol 6 no 1 & 2, year 2013, http://www.iariajournals.org/software/
2013, © Copyright by authors, Published under agreement with IARIA - www.iaria.org
Transformational Implementation of Business Processes in SOA
Krzysztof Sacha and Andrzej Ratkowski Warsaw University of Technology
Warszawa, Poland k.sacha, [email protected]
Abstract—The paper develops a method for transformational implementation and optimization of business processes in a service oriented architecture. The method promotes separation of concerns and allows making business decisions by business people and technical decisions by technical people. To achieve this goal, a description of a business process designed by business people is automatically translated into a program in Business Process Execution Language, which is then subject to a series of transformations developed by technical people. Each transformation changes the process structure in order to improve the quality characteristics. Two approaches to the verification of the process correctness are discussed. The first one applies a correct-by-construction approach to transformations. The other one relies on automatic verification of the transformed process behavior against the behavior of the original reference process. The verification mechanism is based on a mapping from Business Process Execution Language to Language of Temporal Ordering Specification, followed by a comparison of the trace set that is generated using a program dependence graph of the reference process and the trace set of the transformed one. When the design goals have been reached, the transformed BPEL process can be executed on a target SOA environment using a BPEL engine.
Keywords-business process; service oriented architecture; BPEL; LOTOS; transformational implementation.
I. INTRODUCTION This paper is an extension of the ICSEA paper [1] on
transformational implementation of business processes in a service oriented architecture. A business process is a set of logically related activities performed to achieve a defined business outcome [2]. The structure of a business process and the ordering of activities reflect business decisions made by business people and, when defined, can be visualized using an appropriate notation, e.g., Business Process Model and Notation [3] or the notation of ARIS [4]. The implementation of a business process on a computer system is expected to exhibit the defined behavior at a satisfactory level of quality. Reaching the required level of quality may need decisions, made by technical people and aimed at restructuring of the initial process in order to benefit from the characteristics offered by an execution environment. The structure of the implementation can be described using another notation, e.g., Business Process Execution Language [5] or UML activity diagrams [6].
This paper describes a transformational method for the implementation and optimization of business processes in a
service oriented architecture (SOA). The method begins with an initial definition of a business process, written by business people using Business Process Modeling Notation (BPMN). The business process is automatically translated into a program in Business Process Executable Language (BPEL), called a reference process. The program is subject to a series of transformations, each of which preserves the behavior of the reference process, but changes the order of activities, as means to improve the quality of the process implementation, e.g., by benefiting from the parallel structure of services. Transformations applied to the reference process are selected manually by human designers (technical people) and performed automatically, by a software tool. When the design goals have been reached, the iteration stops and the result is a transformed BPEL process, which can be executed on a target SOA environment.
Such an approach promotes separation of concerns and allows making business decisions by business people and technical decisions by technical people.
A critical part of the method is providing assurance on the correctness of the transformational implementation of a business process. Two approaches to the verification of the process correctness are discussed in this paper. The first one applies a correct-by-construction approach that consists in defining a set of safe transformations, which do not change the process behavior. If all transformations are safe, then the transformed program will also be correct, i.e., semantically equivalent to the original reference process.
The other approach relies on automatic verification of the transformed process behavior against the behavior of the original reference process. The verification mechanism is based on a mapping from BPEL to Language of Temporal Ordering Specification (LOTOS), followed by a comparison of the trace set that is generated using a program dependence graph of the reference process and the trace set of the transformed one.
The rest of this paper is organized as follows. Related work is briefly surveyed in Section II. The semantics of a BPEL process and its behavior are defined in Section III. A set of safe transformations are introduced in Section IV. An illustrative case study is provided in Section V. A method for the verification of correctness, based on LOTOS language and a BPEL to LOTOS mapping is covered in Section VI. Quality metrics to assess transformation results are described in Section VII. Conclusions and plans for future research are given in Section VIII.
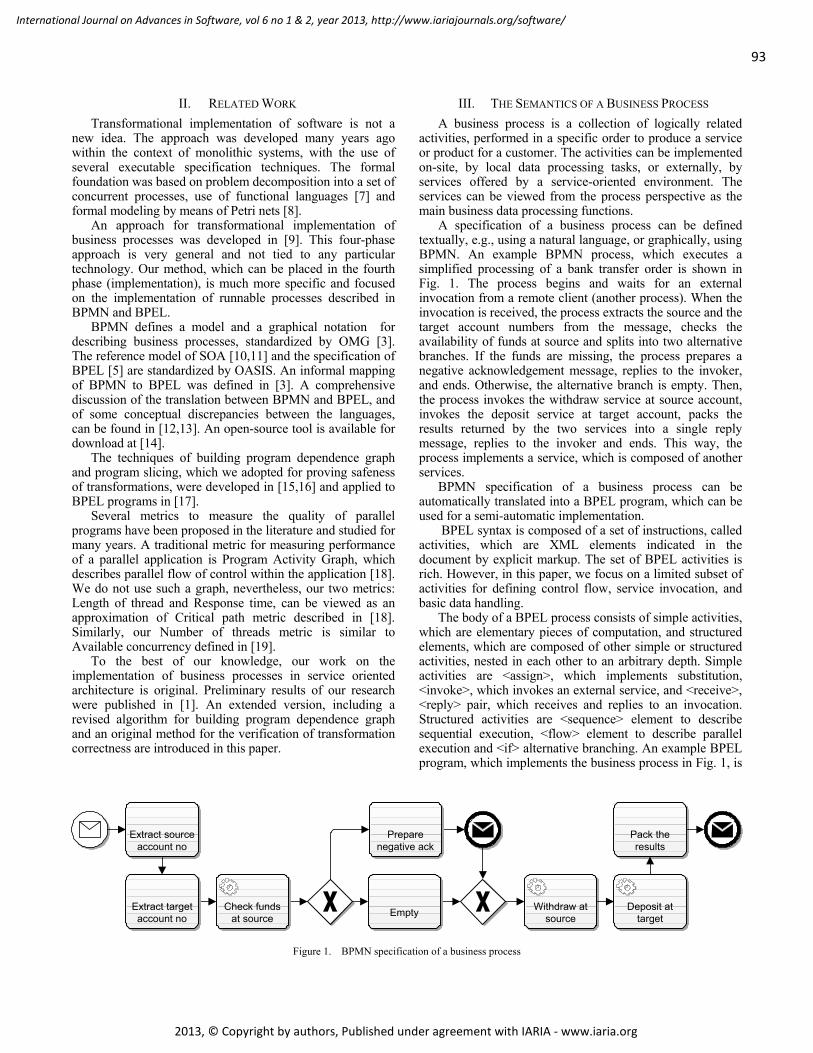
93
International Journal on Advances in Software, vol 6 no 1 & 2, year 2013, http://www.iariajournals.org/software/
2013, © Copyright by authors, Published under agreement with IARIA - www.iaria.org
II. RELATED WORK Transformational implementation of software is not a
new idea. The approach was developed many years ago within the context of monolithic systems, with the use of several executable specification techniques. The formal foundation was based on problem decomposition into a set of concurrent processes, use of functional languages [7] and formal modeling by means of Petri nets [8].
An approach for transformational implementation of business processes was developed in [9]. This four-phase approach is very general and not tied to any particular technology. Our method, which can be placed in the fourth phase (implementation), is much more specific and focused on the implementation of runnable processes described in BPMN and BPEL.
BPMN defines a model and a graphical notation for describing business processes, standardized by OMG [3]. The reference model of SOA [10,11] and the specification of BPEL [5] are standardized by OASIS. An informal mapping of BPMN to BPEL was defined in [3]. A comprehensive discussion of the translation between BPMN and BPEL, and of some conceptual discrepancies between the languages, can be found in [12,13]. An open-source tool is available for download at [14].
The techniques of building program dependence graph and program slicing, which we adopted for proving safeness of transformations, were developed in [15,16] and applied to BPEL programs in [17].
Several metrics to measure the quality of parallel programs have been proposed in the literature and studied for many years. A traditional metric for measuring performance of a parallel application is Program Activity Graph, which describes parallel flow of control within the application [18]. We do not use such a graph, nevertheless, our two metrics: Length of thread and Response time, can be viewed as an approximation of Critical path metric described in [18]. Similarly, our Number of threads metric is similar to Available concurrency defined in [19].
To the best of our knowledge, our work on the implementation of business processes in service oriented architecture is original. Preliminary results of our research were published in [1]. An extended version, including a revised algorithm for building program dependence graph and an original method for the verification of transformation correctness are introduced in this paper.
III. THE SEMANTICS OF A BUSINESS PROCESS A business process is a collection of logically related
activities, performed in a specific order to produce a service or product for a customer. The activities can be implemented on-site, by local data processing tasks, or externally, by services offered by a service-oriented environment. The services can be viewed from the process perspective as the main business data processing functions.
A specification of a business process can be defined textually, e.g., using a natural language, or graphically, using BPMN. An example BPMN process, which executes a simplified processing of a bank transfer order is shown in Fig. 1. The process begins and waits for an external invocation from a remote client (another process). When the invocation is received, the process extracts the source and the target account numbers from the message, checks the availability of funds at source and splits into two alternative branches. If the funds are missing, the process prepares a negative acknowledgement message, replies to the invoker, and ends. Otherwise, the alternative branch is empty. Then, the process invokes the withdraw service at source account, invokes the deposit service at target account, packs the results returned by the two services into a single reply message, replies to the invoker and ends. This way, the process implements a service, which is composed of another services.
BPMN specification of a business process can be automatically translated into a BPEL program, which can be used for a semi-automatic implementation.
BPEL syntax is composed of a set of instructions, called activities, which are XML elements indicated in the document by explicit markup. The set of BPEL activities is rich. However, in this paper, we focus on a limited subset of activities for defining control flow, service invocation, and basic data handling.
The body of a BPEL process consists of simple activities, which are elementary pieces of computation, and structured elements, which are composed of other simple or structured activities, nested in each other to an arbitrary depth. Simple activities are <assign>, which implements substitution, <invoke>, which invokes an external service, and <receive>, <reply> pair, which receives and replies to an invocation. Structured activities are <sequence> element to describe sequential execution, <flow> element to describe parallel execution and <if> alternative branching. An example BPEL program, which implements the business process in Fig. 1, is
Extract source account no
Extract target account no
Check funds at source
Prepare negative ack
Empty
Pack the results
Withdraw at source
Deposit at target
Figure 1. BPMN specification of a business process
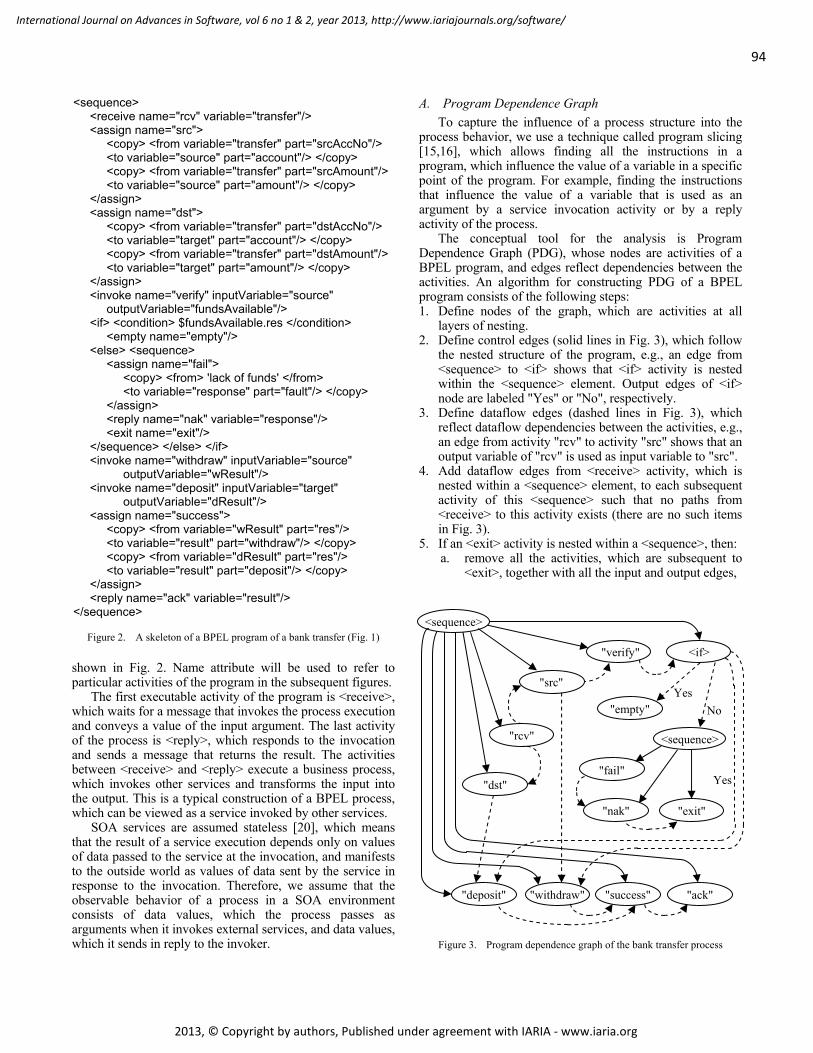
94
International Journal on Advances in Software, vol 6 no 1 & 2, year 2013, http://www.iariajournals.org/software/
2013, © Copyright by authors, Published under agreement with IARIA - www.iaria.org
shown in Fig. 2. Name attribute will be used to refer to particular activities of the program in the subsequent figures.
The first executable activity of the program is <receive>, which waits for a message that invokes the process execution and conveys a value of the input argument. The last activity of the process is <reply>, which responds to the invocation and sends a message that returns the result. The activities between <receive> and <reply> execute a business process, which invokes other services and transforms the input into the output. This is a typical construction of a BPEL process, which can be viewed as a service invoked by other services.
SOA services are assumed stateless [20], which means that the result of a service execution depends only on values of data passed to the service at the invocation, and manifests to the outside world as values of data sent by the service in response to the invocation. Therefore, we assume that the observable behavior of a process in a SOA environment consists of data values, which the process passes as arguments when it invokes external services, and data values, which it sends in reply to the invoker.
A. Program Dependence Graph To capture the influence of a process structure into the
process behavior, we use a technique called program slicing [15,16], which allows finding all the instructions in a program, which influence the value of a variable in a specific point of the program. For example, finding the instructions that influence the value of a variable that is used as an argument by a service invocation activity or by a reply activity of the process.
The conceptual tool for the analysis is Program Dependence Graph (PDG), whose nodes are activities of a BPEL program, and edges reflect dependencies between the activities. An algorithm for constructing PDG of a BPEL program consists of the following steps:
<sequence> <receive name="rcv" variable="transfer"/> <assign name="src"> <copy> <from variable="transfer" part="srcAccNo"/> <to variable="source" part="account"/> </copy> <copy> <from variable="transfer" part="srcAmount"/> <to variable="source" part="amount"/> </copy> </assign> <assign name="dst"> <copy> <from variable="transfer" part="dstAccNo"/> <to variable="target" part="account"/> </copy> <copy> <from variable="transfer" part="dstAmount"/> <to variable="target" part="amount"/> </copy> </assign> <invoke name="verify" inputVariable="source" outputVariable="fundsAvailable"/> <if> <condition> $fundsAvailable.res </condition> <empty name="empty"/> <else> <sequence> <assign name="fail"> <copy> <from> 'lack of funds' </from> <to variable="response" part="fault"/> </copy> </assign> <reply name="nak" variable="response"/> <exit name="exit"/> </sequence> </else> </if> <invoke name="withdraw" inputVariable="source" outputVariable="wResult"/> <invoke name="deposit" inputVariable="target" outputVariable="dResult"/> <assign name="success"> <copy> <from variable="wResult" part="res"/> <to variable="result" part="withdraw"/> </copy> <copy> <from variable="dResult" part="res"/> <to variable="result" part="deposit"/> </copy> </assign> <reply name="ack" variable="result"/> </sequence>
Figure 2. A skeleton of a BPEL program of a bank transfer (Fig. 1)
1. Define nodes of the graph, which are activities at all layers of nesting.
2. Define control edges (solid lines in Fig. 3), which follow the nested structure of the program, e.g., an edge from <sequence> to <if> shows that <if> activity is nested within the <sequence> element. Output edges of <if> node are labeled "Yes" or "No", respectively.
3. Define dataflow edges (dashed lines in Fig. 3), which reflect dataflow dependencies between the activities, e.g., an edge from activity "rcv" to activity "src" shows that an output variable of "rcv" is used as input variable to "src".
4. Add dataflow edges from <receive> activity, which is nested within a <sequence> element, to each subsequent activity of this <sequence> such that no paths from <receive> to this activity exists (there are no such items in Fig. 3).
5. If an <exit> activity is nested within a <sequence>, then: a. remove all the activities, which are subsequent to
<exit>, together with all the input and output edges,
<sequence>
Figure 3. Program dependence graph of the bank transfer process
"dst"
"withdraw" "ack" "deposit" "success"
"empty"
<sequence>
"nak" "exit"
"fail"
"verify"
"src"
<if>
Yes No
"rcv"
Yes
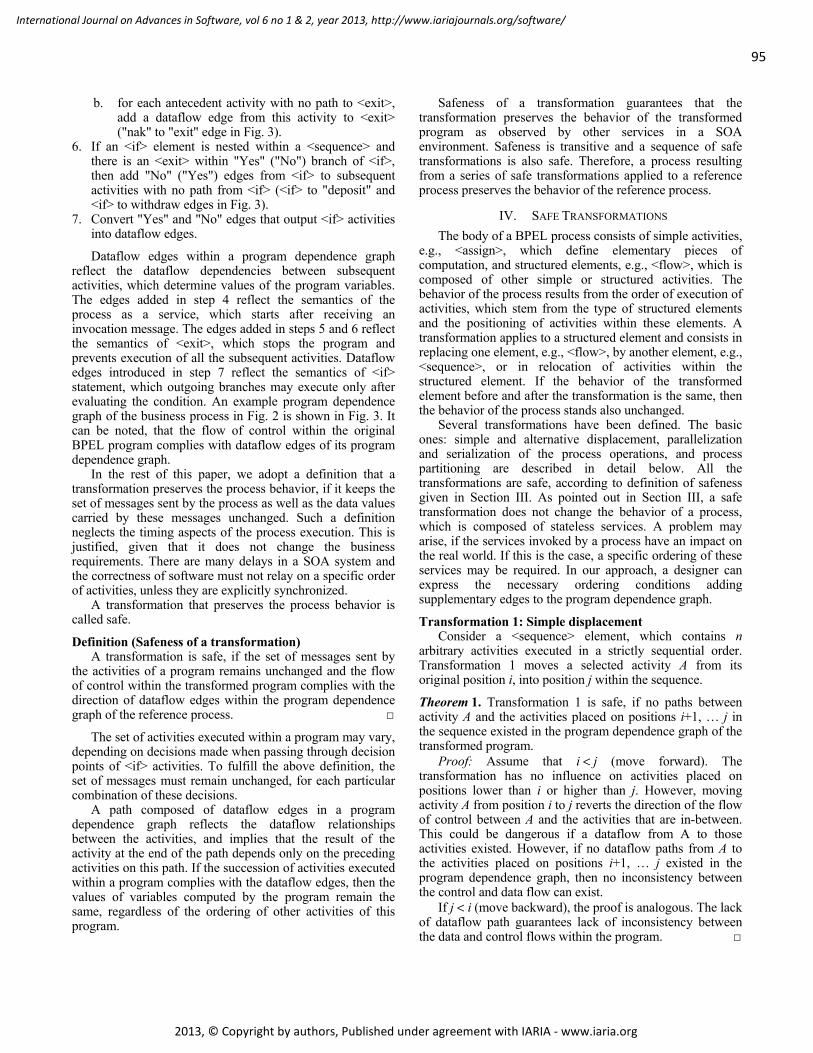
95
International Journal on Advances in Software, vol 6 no 1 & 2, year 2013, http://www.iariajournals.org/software/
2013, © Copyright by authors, Published under agreement with IARIA - www.iaria.org
b. for each antecedent activity with no path to <exit>, add a dataflow edge from this activity to <exit> ("nak" to "exit" edge in Fig. 3).
6. If an <if> element is nested within a <sequence> and there is an <exit> within "Yes" ("No") branch of <if>, then add "No" ("Yes") edges from <if> to subsequent activities with no path from <if> (<if> to "deposit" and <if> to withdraw edges in Fig. 3).
7. Convert "Yes" and "No" edges that output <if> activities into dataflow edges.
Dataflow edges within a program dependence graph reflect the dataflow dependencies between subsequent activities, which determine values of the program variables. The edges added in step 4 reflect the semantics of the process as a service, which starts after receiving an invocation message. The edges added in steps 5 and 6 reflect the semantics of <exit>, which stops the program and prevents execution of all the subsequent activities. Dataflow edges introduced in step 7 reflect the semantics of <if> statement, which outgoing branches may execute only after evaluating the condition. An example program dependence graph of the business process in Fig. 2 is shown in Fig. 3. It can be noted, that the flow of control within the original BPEL program complies with dataflow edges of its program dependence graph.
In the rest of this paper, we adopt a definition that a transformation preserves the process behavior, if it keeps the set of messages sent by the process as well as the data values carried by these messages unchanged. Such a definition neglects the timing aspects of the process execution. This is justified, given that it does not change the business requirements. There are many delays in a SOA system and the correctness of software must not relay on a specific order of activities, unless they are explicitly synchronized.
A transformation that preserves the process behavior is called safe.
Definition (Safeness of a transformation) A transformation is safe, if the set of messages sent by
the activities of a program remains unchanged and the flow of control within the transformed program complies with the direction of dataflow edges within the program dependence graph of the reference process.
The set of activities executed within a program may vary, depending on decisions made when passing through decision points of <if> activities. To fulfill the above definition, the set of messages must remain unchanged, for each particular combination of these decisions.
A path composed of dataflow edges in a program dependence graph reflects the dataflow relationships between the activities, and implies that the result of the activity at the end of the path depends only on the preceding activities on this path. If the succession of activities executed within a program complies with the dataflow edges, then the values of variables computed by the program remain the same, regardless of the ordering of other activities of this program.
Safeness of a transformation guarantees that the transformation preserves the behavior of the transformed program as observed by other services in a SOA environment. Safeness is transitive and a sequence of safe transformations is also safe. Therefore, a process resulting from a series of safe transformations applied to a reference process preserves the behavior of the reference process.
IV. SAFE TRANSFORMATIONS The body of a BPEL process consists of simple activities,
e.g., <assign>, which define elementary pieces of computation, and structured elements, e.g., <flow>, which is composed of other simple or structured activities. The behavior of the process results from the order of execution of activities, which stem from the type of structured elements and the positioning of activities within these elements. A transformation applies to a structured element and consists in replacing one element, e.g., <flow>, by another element, e.g., <sequence>, or in relocation of activities within the structured element. If the behavior of the transformed element before and after the transformation is the same, then the behavior of the process stands also unchanged.
Several transformations have been defined. The basic ones: simple and alternative displacement, parallelization and serialization of the process operations, and process partitioning are described in detail below. All the transformations are safe, according to definition of safeness given in Section III. As pointed out in Section III, a safe transformation does not change the behavior of a process, which is composed of stateless services. A problem may arise, if the services invoked by a process have an impact on the real world. If this is the case, a specific ordering of these services may be required. In our approach, a designer can express the necessary ordering conditions adding supplementary edges to the program dependence graph.
Transformation 1: Simple displacement Consider a <sequence> element, which contains n
arbitrary activities executed in a strictly sequential order. Transformation 1 moves a selected activity A from its original position i, into position j within the sequence.
Theorem 1. Transformation 1 is safe, if no paths between activity A and the activities placed on positions i+1, … j in the sequence existed in the program dependence graph of the transformed program.
Proof: Assume that i < j (move forward). The transformation has no influence on activities placed on positions lower than i or higher than j. However, moving activity A from position i to j reverts the direction of the flow of control between A and the activities that are in-between. This could be dangerous if a dataflow from A to those activities existed. However, if no dataflow paths from A to the activities placed on positions i+1, … j existed in the program dependence graph, then no inconsistency between the control and data flow can exist.
If j < i (move backward), the proof is analogous. The lack of dataflow path guarantees lack of inconsistency between the data and control flows within the program.
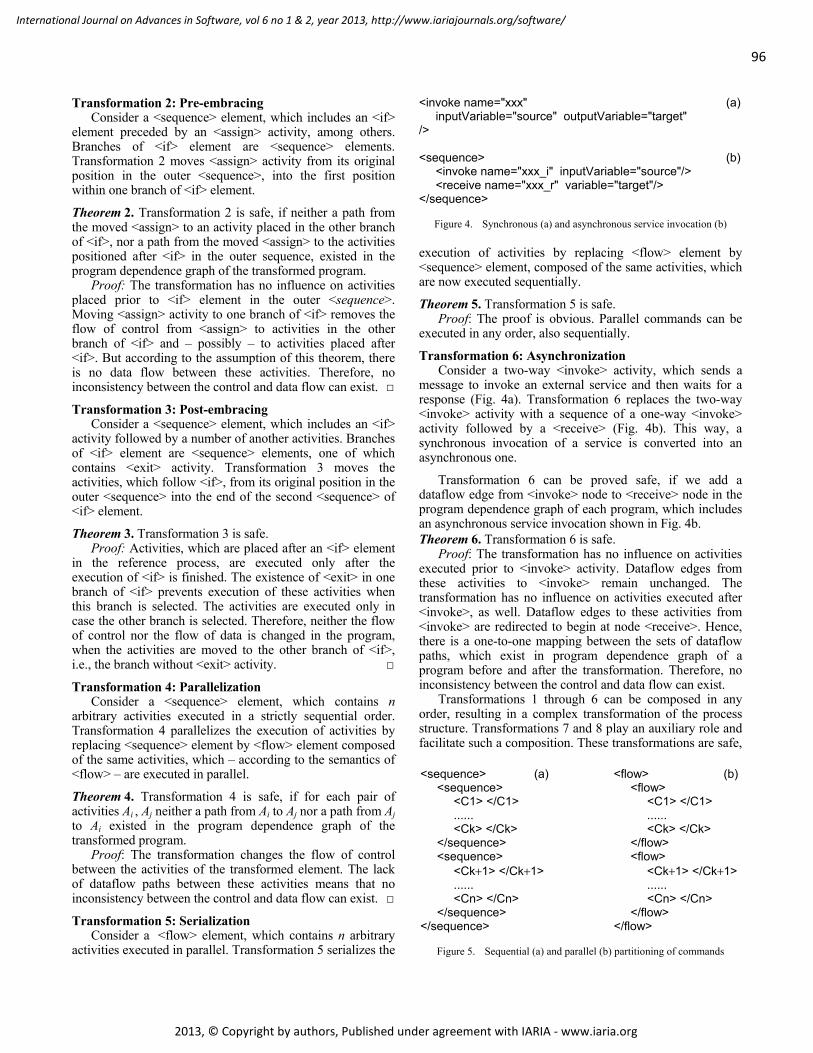
96
International Journal on Advances in Software, vol 6 no 1 & 2, year 2013, http://www.iariajournals.org/software/
2013, © Copyright by authors, Published under agreement with IARIA - www.iaria.org
Transformation 2: Pre-embracing <invoke name="xxx" (a) inputVariable="source" outputVariable="target" /> <sequence> (b) <invoke name="xxx_i" inputVariable="source"/> <receive name="xxx_r" variable="target"/> </sequence>
Figure 4. Synchronous (a) and asynchronous service invocation (b)
Consider a <sequence> element, which includes an <if> element preceded by an <assign> activity, among others. Branches of <if> element are <sequence> elements. Transformation 2 moves <assign> activity from its original position in the outer <sequence>, into the first position within one branch of <if> element.
Theorem 2. Transformation 2 is safe, if neither a path from the moved <assign> to an activity placed in the other branch of <if>, nor a path from the moved <assign> to the activities positioned after <if> in the outer sequence, existed in the program dependence graph of the transformed program.
Proof: The transformation has no influence on activities placed prior to <if> element in the outer <sequence>. Moving <assign> activity to one branch of <if> removes the flow of control from <assign> to activities in the other branch of <if> and – possibly – to activities placed after <if>. But according to the assumption of this theorem, there is no data flow between these activities. Therefore, no inconsistency between the control and data flow can exist.
Transformation 3: Post-embracing Consider a <sequence> element, which includes an <if>
activity followed by a number of another activities. Branches of <if> element are <sequence> elements, one of which contains <exit> activity. Transformation 3 moves the activities, which follow <if>, from its original position in the outer <sequence> into the end of the second <sequence> of <if> element.
Theorem 3. Transformation 3 is safe. Proof: Activities, which are placed after an <if> element
in the reference process, are executed only after the execution of <if> is finished. The existence of <exit> in one branch of <if> prevents execution of these activities when this branch is selected. The activities are executed only in case the other branch is selected. Therefore, neither the flow of control nor the flow of data is changed in the program, when the activities are moved to the other branch of <if>, i.e., the branch without <exit> activity.
Transformation 4: Parallelization Consider a <sequence> element, which contains n
arbitrary activities executed in a strictly sequential order. Transformation 4 parallelizes the execution of activities by replacing <sequence> element by <flow> element composed of the same activities, which – according to the semantics of <flow> – are executed in parallel.
Theorem 4. Transformation 4 is safe, if for each pair of activities Ai , Aj neither a path from Ai to Aj nor a path from Aj to Ai existed in the program dependence graph of the transformed program.
Proof: The transformation changes the flow of control between the activities of the transformed element. The lack of dataflow paths between these activities means that no inconsistency between the control and data flow can exist.
Transformation 5: Serialization Consider a <flow> element, which contains n arbitrary
activities executed in parallel. Transformation 5 serializes the
execution of activities by replacing <flow> element by <sequence> element, composed of the same activities, which are now executed sequentially.
Theorem 5. Transformation 5 is safe. Proof: The proof is obvious. Parallel commands can be
executed in any order, also sequentially.
Transformation 6: Asynchronization Consider a two-way <invoke> activity, which sends a
message to invoke an external service and then waits for a response (Fig. 4a). Transformation 6 replaces the two-way <invoke> activity with a sequence of a one-way <invoke> activity followed by a <receive> (Fig. 4b). This way, a synchronous invocation of a service is converted into an asynchronous one.
Transformation 6 can be proved safe, if we add a dataflow edge from <invoke> node to <receive> node in the program dependence graph of each program, which includes an asynchronous service invocation shown in Fig. 4b. Theorem 6. Transformation 6 is safe.
Proof: The transformation has no influence on activities executed prior to <invoke> activity. Dataflow edges from these activities to <invoke> remain unchanged. The transformation has no influence on activities executed after <invoke>, as well. Dataflow edges to these activities from <invoke> are redirected to begin at node <receive>. Hence, there is a one-to-one mapping between the sets of dataflow paths, which exist in program dependence graph of a program before and after the transformation. Therefore, no inconsistency between the control and data flow can exist.
Transformations 1 through 6 can be composed in any order, resulting in a complex transformation of the process structure. Transformations 7 and 8 play an auxiliary role and facilitate such a composition. These transformations are safe,
<sequence> (a) <flow> (b) <sequence> <flow> <C1> </C1> <C1> </C1> ...... ...... <Ck> </Ck> <Ck> </Ck> </sequence> </flow> <sequence> <flow> <Ck+1> </Ck+1> <Ck+1> </Ck+1> ...... ...... <Cn> </Cn> <Cn> </Cn> </sequence> </flow> </sequence> </flow>
Figure 5. Sequential (a) and parallel (b) partitioning of commands
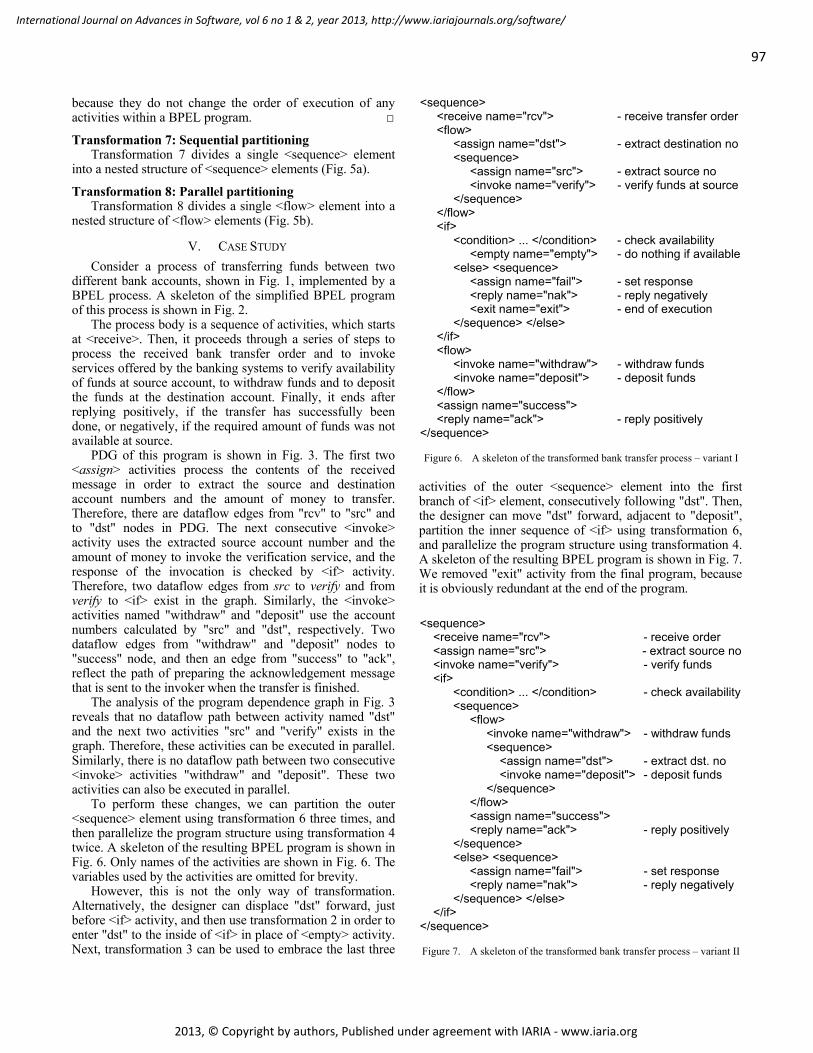
97
International Journal on Advances in Software, vol 6 no 1 & 2, year 2013, http://www.iariajournals.org/software/
2013, © Copyright by authors, Published under agreement with IARIA - www.iaria.org
because they do not change the order of execution of any activities within a BPEL program.
Transformation 7: Sequential partitioning Transformation 7 divides a single <sequence> element
into a nested structure of <sequence> elements (Fig. 5a).
Transformation 8: Parallel partitioning Transformation 8 divides a single <flow> element into a
nested structure of <flow> elements (Fig. 5b).
V. CASE STUDY Consider a process of transferring funds between two
different bank accounts, shown in Fig. 1, implemented by a BPEL process. A skeleton of the simplified BPEL program of this process is shown in Fig. 2.
The process body is a sequence of activities, which starts at <receive>. Then, it proceeds through a series of steps to process the received bank transfer order and to invoke services offered by the banking systems to verify availability of funds at source account, to withdraw funds and to deposit the funds at the destination account. Finally, it ends after replying positively, if the transfer has successfully been done, or negatively, if the required amount of funds was not available at source.
PDG of this program is shown in Fig. 3. The first two <assign> activities process the contents of the received message in order to extract the source and destination account numbers and the amount of money to transfer. Therefore, there are dataflow edges from "rcv" to "src" and to "dst" nodes in PDG. The next consecutive <invoke> activity uses the extracted source account number and the amount of money to invoke the verification service, and the response of the invocation is checked by <if> activity. Therefore, two dataflow edges from src to verify and from verify to <if> exist in the graph. Similarly, the <invoke> activities named "withdraw" and "deposit" use the account numbers calculated by "src" and "dst", respectively. Two dataflow edges from "withdraw" and "deposit" nodes to "success" node, and then an edge from "success" to "ack", reflect the path of preparing the acknowledgement message that is sent to the invoker when the transfer is finished.
The analysis of the program dependence graph in Fig. 3 reveals that no dataflow path between activity named "dst" and the next two activities "src" and "verify" exists in the graph. Therefore, these activities can be executed in parallel. Similarly, there is no dataflow path between two consecutive <invoke> activities "withdraw" and "deposit". These two activities can also be executed in parallel.
To perform these changes, we can partition the outer <sequence> element using transformation 6 three times, and then parallelize the program structure using transformation 4 twice. A skeleton of the resulting BPEL program is shown in Fig. 6. Only names of the activities are shown in Fig. 6. The variables used by the activities are omitted for brevity.
However, this is not the only way of transformation. Alternatively, the designer can displace "dst" forward, just before <if> activity, and then use transformation 2 in order to enter "dst" to the inside of <if> in place of <empty> activity. Next, transformation 3 can be used to embrace the last three
activities of the outer <sequence> element into the first branch of <if> element, consecutively following "dst". Then, the designer can move "dst" forward, adjacent to "deposit", partition the inner sequence of <if> using transformation 6, and parallelize the program structure using transformation 4. A skeleton of the resulting BPEL program is shown in Fig. 7. We removed "exit" activity from the final program, because it is obviously redundant at the end of the program.
<sequence> <receive name="rcv"> - receive transfer order <flow> <assign name="dst"> - extract destination no <sequence> <assign name="src"> - extract source no <invoke name="verify"> - verify funds at source </sequence> </flow> <if> <condition> ... </condition> - check availability <empty name="empty"> - do nothing if available <else> <sequence> <assign name="fail"> - set response <reply name="nak"> - reply negatively <exit name="exit"> - end of execution </sequence> </else> </if> <flow> <invoke name="withdraw"> - withdraw funds <invoke name="deposit"> - deposit funds </flow> <assign name="success"> <reply name="ack"> - reply positively </sequence> Figure 6. A skeleton of the transformed bank transfer process – variant I
<sequence> <receive name="rcv"> - receive order <assign name="src"> - extract source no <invoke name="verify"> - verify funds <if> <condition> ... </condition> - check availability <sequence> <flow> <invoke name="withdraw"> - withdraw funds <sequence> <assign name="dst"> - extract dst. no <invoke name="deposit"> - deposit funds </sequence> </flow> <assign name="success"> <reply name="ack"> - reply positively </sequence> <else> <sequence> <assign name="fail"> - set response <reply name="nak"> - reply negatively </sequence> </else> </if> </sequence>
Figure 7. A skeleton of the transformed bank transfer process – variant II
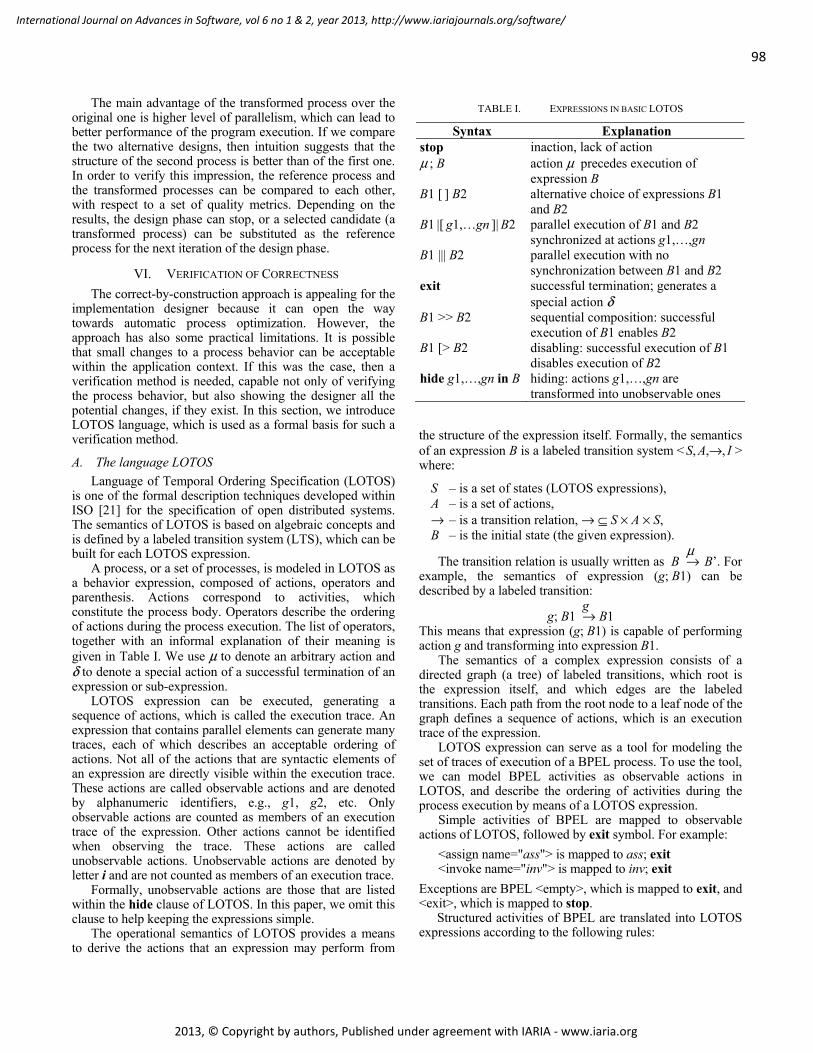
98
International Journal on Advances in Software, vol 6 no 1 & 2, year 2013, http://www.iariajournals.org/software/
2013, © Copyright by authors, Published under agreement with IARIA - www.iaria.org
The main advantage of the transformed process over the original one is higher level of parallelism, which can lead to better performance of the program execution. If we compare the two alternative designs, then intuition suggests that the structure of the second process is better than of the first one. In order to verify this impression, the reference process and the transformed processes can be compared to each other, with respect to a set of quality metrics. Depending on the results, the design phase can stop, or a selected candidate (a transformed process) can be substituted as the reference process for the next iteration of the design phase.
TABLE I. EXPRESSIONS IN BASIC LOTOS
Syntax Explanation stop inaction, lack of action µ ; B action µ precedes execution of
expression B B1 [ ] B2 alternative choice of expressions B1
and B2 B1 |[ g1,…gn ]| B2 parallel execution of B1 and B2
synchronized at actions g1,…,gn B1 ||| B2 parallel execution with no
synchronization between B1 and B2 exit successful termination; generates a
special action δ B1 >> B2 sequential composition: successful
execution of B1 enables B2 B1 [> B2 disabling: successful execution of B1
disables execution of B2 hide g1,…,gn in B hiding: actions g1,…,gn are
transformed into unobservable ones
VI. VERIFICATION OF CORRECTNESS The correct-by-construction approach is appealing for the
implementation designer because it can open the way towards automatic process optimization. However, the approach has also some practical limitations. It is possible that small changes to a process behavior can be acceptable within the application context. If this was the case, then a verification method is needed, capable not only of verifying the process behavior, but also showing the designer all the potential changes, if they exist. In this section, we introduce LOTOS language, which is used as a formal basis for such a verification method.
A. The language LOTOS Language of Temporal Ordering Specification (LOTOS)
is one of the formal description techniques developed within ISO [21] for the specification of open distributed systems. The semantics of LOTOS is based on algebraic concepts and is defined by a labeled transition system (LTS), which can be built for each LOTOS expression.
A process, or a set of processes, is modeled in LOTOS as a behavior expression, composed of actions, operators and parenthesis. Actions correspond to activities, which constitute the process body. Operators describe the ordering of actions during the process execution. The list of operators, together with an informal explanation of their meaning is given in Table I. We use µ to denote an arbitrary action and δ to denote a special action of a successful termination of an expression or sub-expression.
LOTOS expression can be executed, generating a sequence of actions, which is called the execution trace. An expression that contains parallel elements can generate many traces, each of which describes an acceptable ordering of actions. Not all of the actions that are syntactic elements of an expression are directly visible within the execution trace. These actions are called observable actions and are denoted by alphanumeric identifiers, e.g., g1, g2, etc. Only observable actions are counted as members of an execution trace of the expression. Other actions cannot be identified when observing the trace. These actions are called unobservable actions. Unobservable actions are denoted by letter i and are not counted as members of an execution trace.
Formally, unobservable actions are those that are listed within the hide clause of LOTOS. In this paper, we omit this clause to help keeping the expressions simple.
The operational semantics of LOTOS provides a means to derive the actions that an expression may perform from
the structure of the expression itself. Formally, the semantics of an expression B is a labeled transition system < S, A,→, I > where:
S – is a set of states (LOTOS expressions), A – is a set of actions, → – is a transition relation, → ⊆ S × A × S, B – is the initial state (the given expression).
The transition relation is usually written as B →µ
B’. For example, the semantics of expression (g; B1) can be described by a labeled transition:
g; B1 →g
B1 This means that expression (g; B1) is capable of performing action g and transforming into expression B1.
The semantics of a complex expression consists of a directed graph (a tree) of labeled transitions, which root is the expression itself, and which edges are the labeled transitions. Each path from the root node to a leaf node of the graph defines a sequence of actions, which is an execution trace of the expression.
LOTOS expression can serve as a tool for modeling the set of traces of execution of a BPEL process. To use the tool, we can model BPEL activities as observable actions in LOTOS, and describe the ordering of activities during the process execution by means of a LOTOS expression.
Simple activities of BPEL are mapped to observable actions of LOTOS, followed by exit symbol. For example:
<assign name="ass"> is mapped to ass; exit <invoke name="inv"> is mapped to inv; exit
Exceptions are BPEL <empty>, which is mapped to exit, and <exit>, which is mapped to stop.
Structured activities of BPEL are translated into LOTOS expressions according to the following rules:
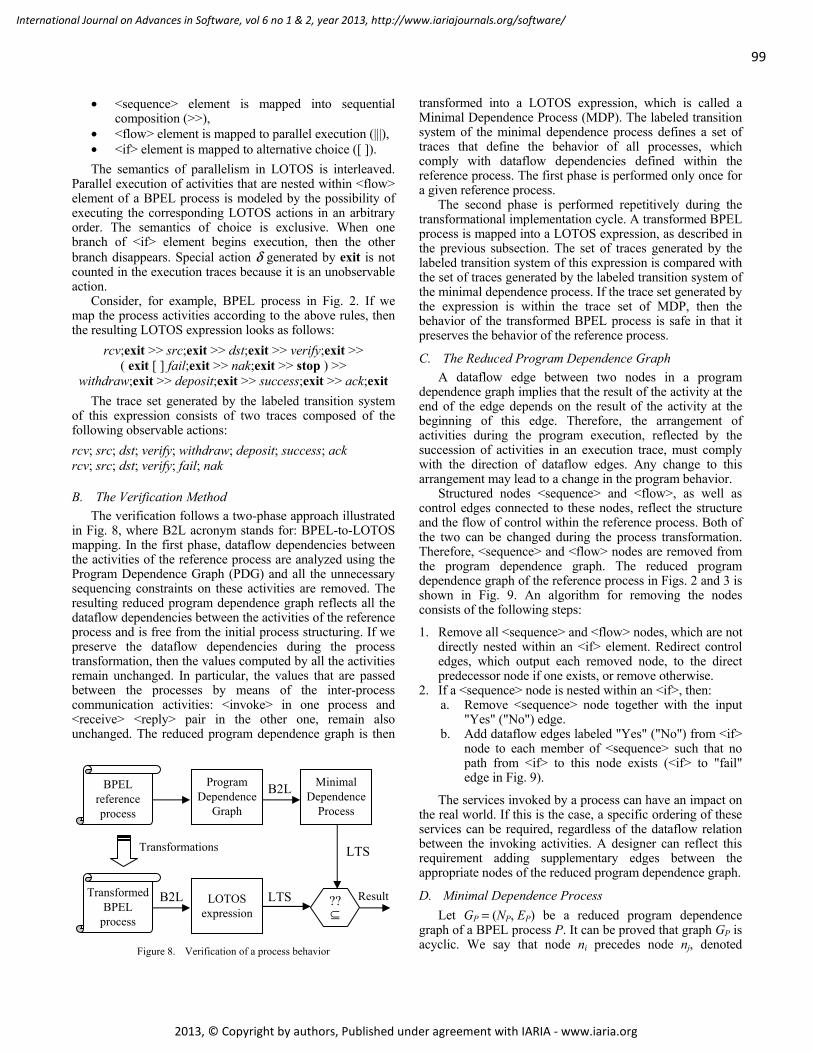
99
International Journal on Advances in Software, vol 6 no 1 & 2, year 2013, http://www.iariajournals.org/software/
2013, © Copyright by authors, Published under agreement with IARIA - www.iaria.org
• <sequence> element is mapped into sequential composition (>>),
• <flow> element is mapped to parallel execution (|||), • <if> element is mapped to alternative choice ([ ]). The semantics of parallelism in LOTOS is interleaved.
Parallel execution of activities that are nested within <flow> element of a BPEL process is modeled by the possibility of executing the corresponding LOTOS actions in an arbitrary order. The semantics of choice is exclusive. When one branch of <if> element begins execution, then the other branch disappears. Special action δ generated by exit is not counted in the execution traces because it is an unobservable action.
Consider, for example, BPEL process in Fig. 2. If we map the process activities according to the above rules, then the resulting LOTOS expression looks as follows:
rcv;exit >> src;exit >> dst;exit >> verify;exit >> ( exit [ ] fail;exit >> nak;exit >> stop ) >>
withdraw;exit >> deposit;exit >> success;exit >> ack;exit The trace set generated by the labeled transition system
of this expression consists of two traces composed of the following observable actions: rcv; src; dst; verify; withdraw; deposit; success; ack rcv; src; dst; verify; fail; nak
B. The Verification Method The verification follows a two-phase approach illustrated
in Fig. 8, where B2L acronym stands for: BPEL-to-LOTOS mapping. In the first phase, dataflow dependencies between the activities of the reference process are analyzed using the Program Dependence Graph (PDG) and all the unnecessary sequencing constraints on these activities are removed. The resulting reduced program dependence graph reflects all the dataflow dependencies between the activities of the reference process and is free from the initial process structuring. If we preserve the dataflow dependencies during the process transformation, then the values computed by all the activities remain unchanged. In particular, the values that are passed between the processes by means of the inter-process communication activities: <invoke> in one process and <receive> <reply> pair in the other one, remain also unchanged. The reduced program dependence graph is then
transformed into a LOTOS expression, which is called a Minimal Dependence Process (MDP). The labeled transition system of the minimal dependence process defines a set of traces that define the behavior of all processes, which comply with dataflow dependencies defined within the reference process. The first phase is performed only once for a given reference process.
The second phase is performed repetitively during the transformational implementation cycle. A transformed BPEL process is mapped into a LOTOS expression, as described in the previous subsection. The set of traces generated by the labeled transition system of this expression is compared with the set of traces generated by the labeled transition system of the minimal dependence process. If the trace set generated by the expression is within the trace set of MDP, then the behavior of the transformed BPEL process is safe in that it preserves the behavior of the reference process.
C. The Reduced Program Dependence Graph A dataflow edge between two nodes in a program
dependence graph implies that the result of the activity at the end of the edge depends on the result of the activity at the beginning of this edge. Therefore, the arrangement of activities during the program execution, reflected by the succession of activities in an execution trace, must comply with the direction of dataflow edges. Any change to this arrangement may lead to a change in the program behavior.
Structured nodes <sequence> and <flow>, as well as control edges connected to these nodes, reflect the structure and the flow of control within the reference process. Both of the two can be changed during the process transformation. Therefore, <sequence> and <flow> nodes are removed from the program dependence graph. The reduced program dependence graph of the reference process in Figs. 2 and 3 is shown in Fig. 9. An algorithm for removing the nodes consists of the following steps:
1. Remove all <sequence> and <flow> nodes, which are not directly nested within an <if> element. Redirect control edges, which output each removed node, to the direct predecessor node if one exists, or remove otherwise.
2. If a <sequence> node is nested within an <if>, then: a. Remove <sequence> node together with the input
"Yes" ("No") edge. b. Add dataflow edges labeled "Yes" ("No") from <if>
node to each member of <sequence> such that no path from <if> to this node exists (<if> to "fail" edge in Fig. 9). Program
Dependence Graph
Minimal Dependence
Process
BPEL reference process
B2L The services invoked by a process can have an impact on
the real world. If this is the case, a specific ordering of these services can be required, regardless of the dataflow relation between the invoking activities. A designer can reflect this requirement adding supplementary edges between the appropriate nodes of the reduced program dependence graph.
D. Minimal Dependence Process Let GP = (NP, EP) be a reduced program dependence
graph of a BPEL process P. It can be proved that graph GP is acyclic. We say that node ni precedes node nj, denoted
Transformations
Transformed BPEL
process
B2L LTS
LTS
ResultLTS LOTOS expression ⊆
??
Figure 8. Verification of a process behavior
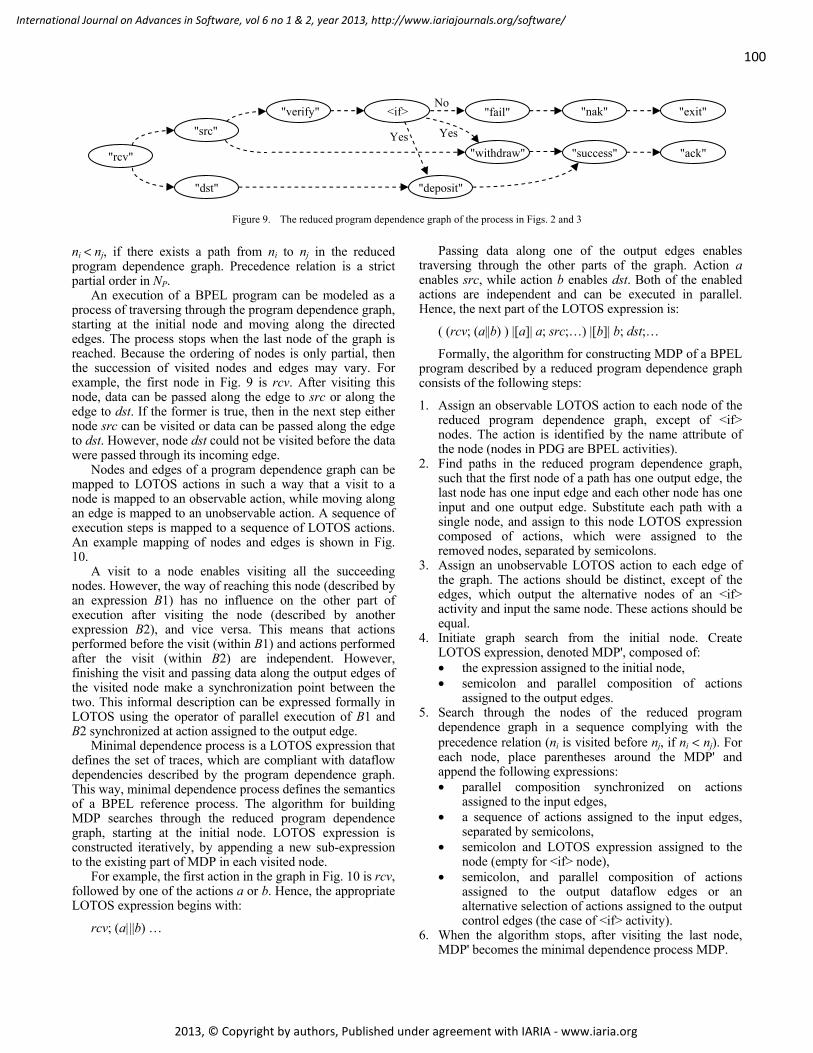
100
International Journal on Advances in Software, vol 6 no 1 & 2, year 2013, http://www.iariajournals.org/software/
2013, © Copyright by authors, Published under agreement with IARIA - www.iaria.org
ni < nj, if there exists a path from ni to nj in the reduced program dependence graph. Precedence relation is a strict partial order in NP.
An execution of a BPEL program can be modeled as a process of traversing through the program dependence graph, starting at the initial node and moving along the directed edges. The process stops when the last node of the graph is reached. Because the ordering of nodes is only partial, then the succession of visited nodes and edges may vary. For example, the first node in Fig. 9 is rcv. After visiting this node, data can be passed along the edge to src or along the edge to dst. If the former is true, then in the next step either node src can be visited or data can be passed along the edge to dst. However, node dst could not be visited before the data were passed through its incoming edge.
Nodes and edges of a program dependence graph can be mapped to LOTOS actions in such a way that a visit to a node is mapped to an observable action, while moving along an edge is mapped to an unobservable action. A sequence of execution steps is mapped to a sequence of LOTOS actions. An example mapping of nodes and edges is shown in Fig. 10.
A visit to a node enables visiting all the succeeding nodes. However, the way of reaching this node (described by an expression B1) has no influence on the other part of execution after visiting the node (described by another expression B2), and vice versa. This means that actions performed before the visit (within B1) and actions performed after the visit (within B2) are independent. However, finishing the visit and passing data along the output edges of the visited node make a synchronization point between the two. This informal description can be expressed formally in LOTOS using the operator of parallel execution of B1 and B2 synchronized at action assigned to the output edge.
Minimal dependence process is a LOTOS expression that defines the set of traces, which are compliant with dataflow dependencies described by the program dependence graph. This way, minimal dependence process defines the semantics of a BPEL reference process. The algorithm for building MDP searches through the reduced program dependence graph, starting at the initial node. LOTOS expression is constructed iteratively, by appending a new sub-expression to the existing part of MDP in each visited node.
For example, the first action in the graph in Fig. 10 is rcv, followed by one of the actions a or b. Hence, the appropriate LOTOS expression begins with:
rcv; (a|||b) …
Passing data along one of the output edges enables traversing through the other parts of the graph. Action a enables src, while action b enables dst. Both of the enabled actions are independent and can be executed in parallel. Hence, the next part of the LOTOS expression is:
( (rcv; (a||b) ) |[a]| a; src;…) |[b]| b; dst;…
Formally, the algorithm for constructing MDP of a BPEL program described by a reduced program dependence graph consists of the following steps:
1. Assign an observable LOTOS action to each node of the reduced program dependence graph, except of <if> nodes. The action is identified by the name attribute of the node (nodes in PDG are BPEL activities).
2. Find paths in the reduced program dependence graph, such that the first node of a path has one output edge, the last node has one input edge and each other node has one input and one output edge. Substitute each path with a single node, and assign to this node LOTOS expression composed of actions, which were assigned to the removed nodes, separated by semicolons.
3. Assign an unobservable LOTOS action to each edge of the graph. The actions should be distinct, except of the edges, which output the alternative nodes of an <if> activity and input the same node. These actions should be equal.
4. Initiate graph search from the initial node. Create LOTOS expression, denoted MDP', composed of: • the expression assigned to the initial node, • semicolon and parallel composition of actions
assigned to the output edges. 5. Search through the nodes of the reduced program
dependence graph in a sequence complying with the precedence relation (ni is visited before nj, if ni < nj). For each node, place parentheses around the MDP' and append the following expressions: • parallel composition synchronized on actions
assigned to the input edges, • a sequence of actions assigned to the input edges,
separated by semicolons, • semicolon and LOTOS expression assigned to the
node (empty for <if> node), • semicolon, and parallel composition of actions
assigned to the output dataflow edges or an alternative selection of actions assigned to the output control edges (the case of <if> activity).
6. When the algorithm stops, after visiting the last node, MDP' becomes the minimal dependence process MDP.
Figure 9. The reduced program dependence graph of the process in Figs. 2 and 3
Yes
"rcv"
"src"
"dst"
"verify" <if> "fail" "nak" "exit"
"deposit"
"success" "ack"
No
"withdraw"Yes
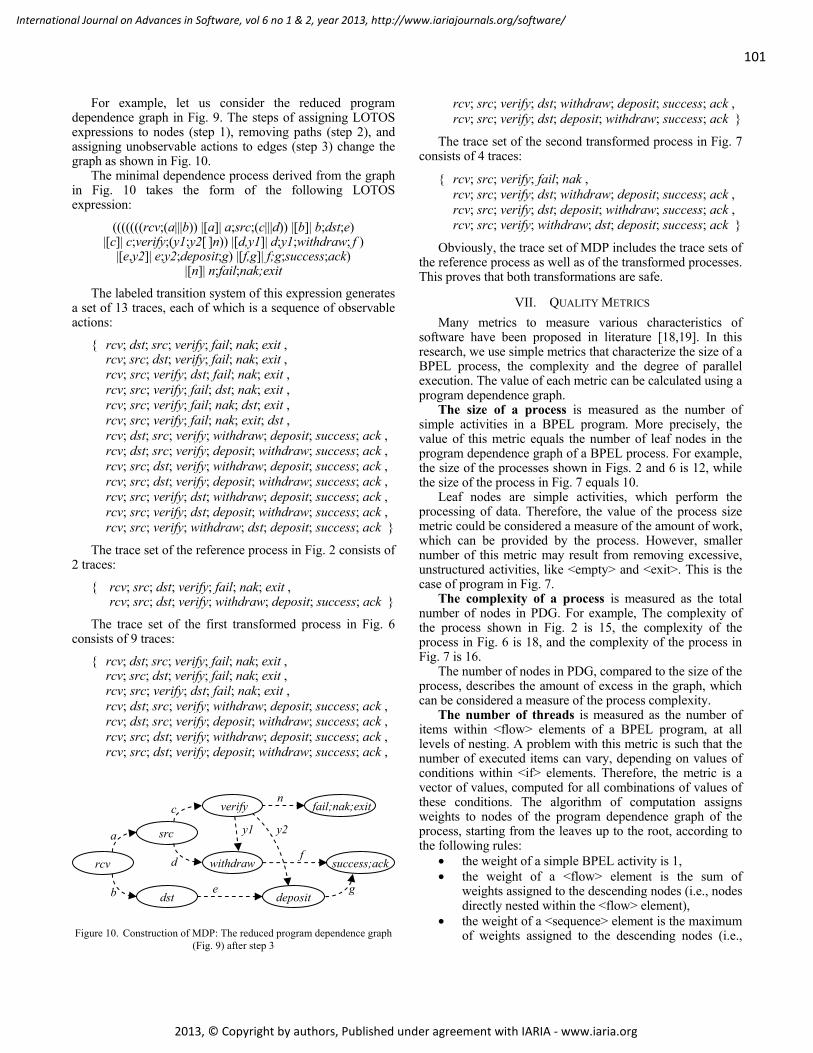
101
International Journal on Advances in Software, vol 6 no 1 & 2, year 2013, http://www.iariajournals.org/software/
2013, © Copyright by authors, Published under agreement with IARIA - www.iaria.org
For example, let us consider the reduced program endence graph in Fig. 9. The steps of assigning LOTOdep S
exp
ify;(y1;y2[ ]n)) |[d,y1]| d;y1;withdraw; f )
The erates a set of 13 traces, each of which is a sequence of observable act
; src; dst; verify; fail; nak; exit ,
sit; success; ack , ; success; ack ,
The trace set of the reference process in Fig. 2 consists of
; src; dst; verify; withdraw; deposit; success; ack
process in Fig. 6 con ist
erify; fail; nak; exit ,
sit; success; ack , ; success; ack ,
Th
; dst; withdraw; deposit; success; ack , t; withdraw; success; ack ,
Ob
Thi
Many metrics re v s characteristics of software have be [18,19]. In this res
program. More precisely, the val
f the process size me
For example, The complexity of the
ribes the amount of excess in the graph, which can
all lev
of a <flow> element is the sum of i.e., nodes
• es (i.e.,
ressions to nodes (step 1), removing paths (step 2), and assigning unobservable actions to edges (step 3) change the graph as shown in Fig. 10.
The minimal dependence process derived from the graph in Fig. 10 takes the form of the following LOTOS expression:
(((((((rcv;(a|||b)) |[a]| a;src;(c|||d)) |[b]| b;dst;e) |[c]| c;ver
|[e,y2]| e;y2;deposit;g) |[f,g]| f;g;success;ack) |[n]| n;fail;nak;exit
labeled transition system of this expression gen
ions:
rcv; dst; src; verify; fail; nak; exit , rcv
rcv; src; verify; dst; fail; nak; exit , rcv; src; verify; fail; dst; nak; exit , rcv; src; verify; fail; nak; dst; exit , rcv; src; verify; fail; nak; exit; dst , rcv; dst; src; verify; withdraw; depo rcv; dst; src; verify; deposit; withdraw rcv; src; dst; verify; withdraw; deposit; success; ack , rcv; src; dst; verify; deposit; withdraw; success; ack , rcv; src; verify; dst; withdraw; deposit; success; ack , rcv; src; verify; dst; deposit; withdraw; success; ack , rcv; src; verify; withdraw; dst; deposit; success; ack
2 traces:
rcv; src; dst; verify; fail; nak; exit , rcv
The trace set of the first transformed s s of 9 traces:
rcv; dst; src; verify; fail; nak; exit , rcv; src; dst; v
rcv; src; verify; dst; fail; nak; exit , rcv; dst; src; verify; withdraw; depo rcv; dst; src; verify; deposit; withdraw rcv; src; dst; verify; withdraw; deposit; success; ack , rcv; src; dst; verify; deposit; withdraw; success; ack ,
rcv; src; verify; dst; withdraw; deposit; success; ack , rcv; src; verify; dst; deposit; withdraw; success; ack
e trace set of the second transformed process in Fig. 7 consists of 4 traces:
rcv; src; verify; fail; nak , rcv; src; verify
rcv; src; verify; dst; deposi rcv; src; verify; withdraw; dst; deposit; success; ack
viously, the trace set of MDP includes the trace sets of the reference process as well as of the transformed processes.
s proves that both transformations are safe.
VII. QUALITY METRICS to measu ariouen proposed in literature
earch, we use simple metrics that characterize the size of a BPEL process, the complexity and the degree of parallel execution. The value of each metric can be calculated using a program dependence graph.
The size of a process is measured as the number of simple activities in a BPEL
ue of this metric equals the number of leaf nodes in the program dependence graph of a BPEL process. For example, the size of the processes shown in Figs. 2 and 6 is 12, while the size of the process in Fig. 7 equals 10.
Leaf nodes are simple activities, which perform the processing of data. Therefore, the value o
tric could be considered a measure of the amount of work, which can be provided by the process. However, smaller number of this metric may result from removing excessive, unstructured activities, like <empty> and <exit>. This is the case of program in Fig. 7.
The complexity of a process is measured as the total number of nodes in PDG.
process shown in Fig. 2 is 15, the complexity of the process in Fig. 6 is 18, and the complexity of the process in Fig. 7 is 16.
The number of nodes in PDG, compared to the size of the process, desc
be considered a measure of the process complexity. The number of threads is measured as the number of
items within <flow> elements of a BPEL program, atels of nesting. A problem with this metric is such that the
number of executed items can vary, depending on values of conditions within <if> elements. Therefore, the metric is a vector of values, computed for all combinations of values of these conditions. The algorithm of computation assigns weights to nodes of the program dependence graph of the process, starting from the leaves up to the root, according to the following rules:
• the weight of a simple BPEL activity is 1, • the weight
weights assigned to the descending nodes (directly nested within the <flow> element), the weight of a <sequence> element is the maximum of weights assigned to the descending nodFigure 10. Construction of MDP: The reduced program dependence graph
(Fig. 9) after step 3
rcv
src
dst
withdraw
fail;nak;exit
deposit
success;ack
n
a
b
c
d
e
y2
f
g
verify
y1
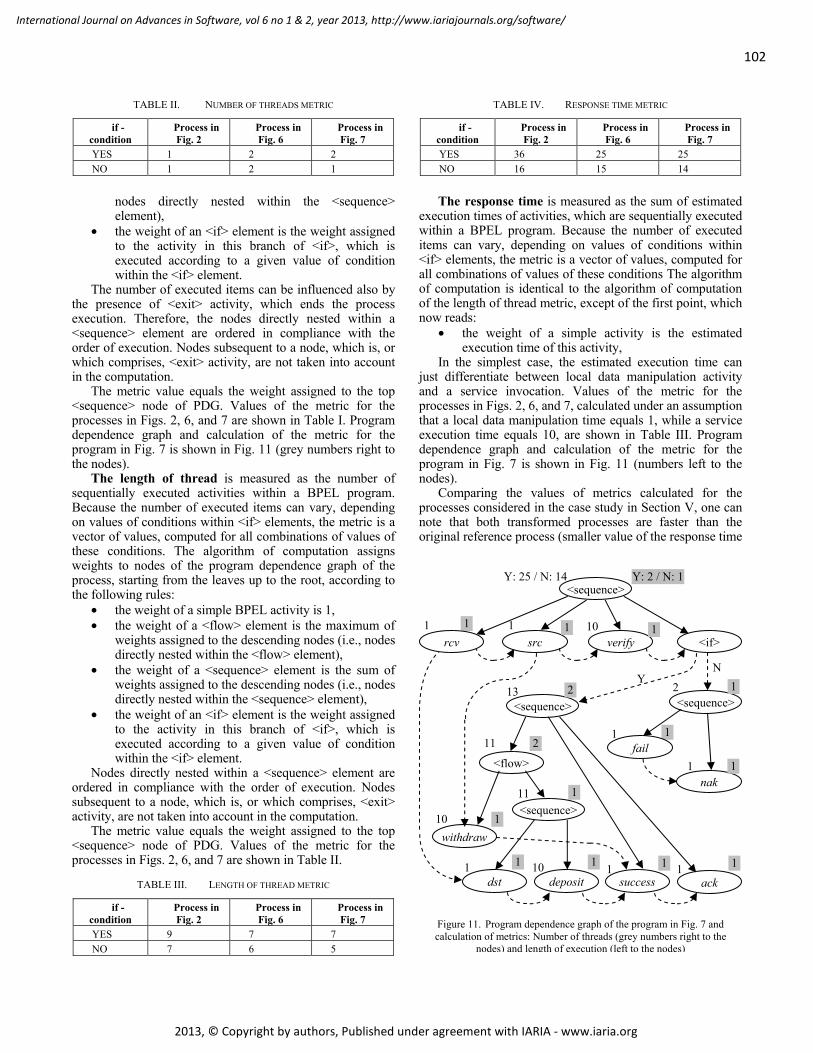
102
International Journal on Advances in Software, vol 6 no 1 & 2, year 2013, http://www.iariajournals.org/software/
2013, © Copyright by authors, Published under agreement with IARIA - www.iaria.org
TABLE II. NUMBER OF THREADS METRIC
if - condition
Process in Fig. 2
Process in Fig. 6
Process in Fig. 7
YES 1 2 2 NO 1 2 1
nodes directly nested within the <sequence> element), the weight of an <if> element is the weight assigned to the act
• ivity in this branch of <if>, which is
Thethe pre , which ends the process exe
f PDG. Values of the metric for the pro
executed activities within a BPEL program. Be
f a <flow> element is the maximum of i.e., nodes
• e., nodes
• is
Nodordered order of execution. Nodes sub
r the pro
xecuted wit
ution time of this activity,
just dif ipulation activity and
s considered in the case study in Section V, one can not
executed according to a given value of condition within the <if> element.
number of executed items can be influenced also by sence of <exit> activity
cution. Therefore, the nodes directly nested within a <sequence> element are ordered in compliance with the order of execution. Nodes subsequent to a node, which is, or which comprises, <exit> activity, are not taken into account in the computation.
The metric value equals the weight assigned to the top <sequence> node o
cesses in Figs. 2, 6, and 7 are shown in Table I. Program dependence graph and calculation of the metric for the program in Fig. 7 is shown in Fig. 11 (grey numbers right to the nodes).
The length of thread is measured as the number of sequentially
cause the number of executed items can vary, depending on values of conditions within <if> elements, the metric is a vector of values, computed for all combinations of values of these conditions. The algorithm of computation assigns weights to nodes of the program dependence graph of the process, starting from the leaves up to the root, according to the following rules:
• the weight of a simple BPEL activity is 1, • the weight o
weights assigned to the descending nodes (directly nested within the <flow> element), the weight of a <sequence> element is the sum of weights assigned to the descending nodes (i.directly nested within the <sequence> element), the weight of an <if> element is the weight assigned to the activity in this branch of <if>, whichexecuted according to a given value of condition within the <if> element. es directly nested within a <sequence> element are in compliance with the
sequent to a node, which is, or which comprises, <exit> activity, are not taken into account in the computation.
The metric value equals the weight assigned to the top <sequence> node of PDG. Values of the metric fo
cesses in Figs. 2, 6, and 7 are shown in Table II.
The response time is measured as the sum of estimated execution times of activities, which are sequentially e
hin a BPEL program. Because the number of executed items can vary, depending on values of conditions within <if> elements, the metric is a vector of values, computed for all combinations of values of these conditions The algorithm of computation is identical to the algorithm of computation of the length of thread metric, except of the first point, which now reads:
• the weight of a simple activity is the estimated exec
In the simplest case, the estimated execution time can ferentiate between local data man
a service invocation. Values of the metric for the processes in Figs. 2, 6, and 7, calculated under an assumption that a local data manipulation time equals 1, while a service execution time equals 10, are shown in Table III. Program dependence graph and calculation of the metric for the program in Fig. 7 is shown in Fig. 11 (numbers left to the nodes).
Comparing the values of metrics calculated for the processe
e that both transformed processes are faster than the original reference process (smaller value of the response time
TABLE III. LENGTH OF THREAD METRIC
if - condition
Process in Fig. 2
Process in Fig. 6
Process in Fig. 7
YES 9 7 7 NO 7 6 5
TABLE IV. RESPONSE TIME METRIC
if - condition
Process in Fig. 2
Process in Fig. 6
Process in Fig. 7
YES 36 25 25 NO 16 15 14
verify
dst
<if>
<sequence>
withdraw
deposit ack
nak
Y N
<sequence>
src
<sequence>
<flow>
1 10
11
10
11
1
13
1
1
2
1 1 10
Y: 25 / N: 14 Y: 2 / N: 1
1 1 1
1
1 1 1
1
2
2
1
1
1
success 1
rcv
fail
<sequence>
1
Figure 11. Program dependence graph of the program in Fig. 7 and calculation of metrics: Number of threads (grey numbers right to the
nodes) and length of execution (left to the nodes)
103
International Journal on Advances in Software, vol 6 no 1 & 2, year 2013, http://www.iariajournals.org/software/
2013, © Copyright by authors, Published under agreement with IARIA - www.iaria.org
metric). Speeding up the process execution is a benefit from parallel invocation of services in a SOA environment. Comparing the variants of the transformed bank transfer process (Fig. 6 and Fig. 7), one can note that the second variant is a bit faster and simpler (smaller values of the size metrics). This variant can be accepted by the customer or used as a new reference process in the next transformation cycle.
VIII. CONCLUSION AND FUTURE WORK Defi siness
decision rocess on
ot change the behavior of a tran
matic process optimization. However, the app
text. Th
[1] K. Sacha and A. Ratkowski, “Impleme ness Processes in Service Oriented A The Seventh International
[2] d Business Process Redesign,” Sloan
[3] N/2.0/PDF/,10.06.2013.
ge Version 2.0,” OASIS Standard, Apr. 2007,
[6]
[7]
ol. 6, 1994, pp. 153–172.
ystems,”
[10] tecture 1.0,” OASIS
ning the behavior of a business process is a bu. Defining the implementation of a business p
a computer system is a technical decision. The transformational method for implementing business processes in a service oriented architecture, described in this paper, promotes separation of concerns and allows making business decisions by business people and technical decisions by technical people.
The transformations described in this paper are correct by construction in that they do n
sformed process. However, the transformations change the process structure in order to improve efficiency and benefit from the parallel execution of services in a SOA environment. The quality characteristics of the process implementation are measured by means of quality metrics, which account for the process size, complexity and the response time of the process as a service. Other quality features, such as modifiability or reliability, are not covered in this paper.
The correct-by-construction approach opens the way towards auto
roach has also some practical limitations. If the external services invoked by a process have an impact on the real world, as is usually the case, a specific ordering of these services may be required, regardless of the dataflow dependencies between the service invocation activities within a program. In our approach, a designer can express the necessary ordering conditions adding supplementary edges to the program dependence graph. Therefore, the approach cannot be fully automated and a manual supervision over the transformation process is needed.
It is also possible that small changes to a process behavior can be acceptable within the application con
erefore, part of our research was aimed at finding a verification method capable not only of verifying the process behavior, but also of showing the designer all the potential changes, if they exist. A decision on whether to accept the changes or not is made by a human.
REFERENCES ntation of Busi
rchitecture,” Proc.Conference on Software Engineering Advances (ICSEA 2012), IARIA, 2012, pp. 129–136.
T. H. Davenport and J. E. Short, “The New Industrial Engineering: Information Technology anManagement Review, 1990, pp. 11–27. OMG, “Business Process Model and Notation (BPMN), Version 2.0,” Jan. 2011, http://www.omg.org/spec/BPM
[4] A. W. Scheer, ARIS – Business Process Modeling, Springer, Berlin Heidelberg, 2007.
[5] D. Jordan and J. Evdemon, “Web Services Business Process Execution Languahttp://docs.oasis-open.org/wsbpel/2.0/wsbpel-v2.0.html, 10.06.2013. OMG, “OMG Unified Modeling Language (OMG UML), Superstructure, V2.1.2,” Nov. 2007, http://www.omg.org/spec/UML/2.1.2/Superstructure/PDF, 10.06.2013. P. Zave, “An Insider's Evaluation of Paisley,” IEEE Trans. Software Eng., vol. 17, 1991, pp. 212–225.
[8] K. Sacha, “Real-Time Software Specification and Validation with Transnet,” Real-Time Systems J., v
[9] F. J. Duarte, R. J. Machado, and J. M. Fernandes, “BIM: A methodology to transform business processes into software sSWQD 2012, LNBIP vol. 94, 2012, pp. 39–58. C. M. MacKenzie, K. Laskey, F. McCabe, P. F. Brown, and R. Metz, “Reference Model for Service Oriented ArchiStandard, Oct. 2006, http://docs.oasis-open.org/soa-rm/v1.0/soa-rm.html, 10.06.2013. J. A. Estefan, K. Laskey, F. G. McCabe, and D. Thornton, “Reference Architecture for Servi
[11] ce Oriented Architecture Version 1.0,” OASIS
Public Review Draft 1, Apr. 2008, http://docs.oasis-open.org/soa-rm/soa-ra/v1.0/soa-ra-pr-01.pdf, 10.06.2013. S. A. White, “Using BPMN to Model a BPEL Process,” BPTrends 3, 2005, pp. 1–18.
[12]
al Mismatch between Process Modeling Languages,”
[14]
[13] J. Recker and J. Mendling, “On the Translation between BPMN and BPEL: ConceptuThe 18th International Conference on Advanced Information Systems Engineering (CAISE 2006), Proc. Workshops and Doctoral Consortium, Namur University Press, 2006, pp. 521–532. Bpmn2bpel, “A tool for translating BPMN models into BPEL processes,” http://code.google.com/p/bpmn2bpel/, 10.06.2013
, pp. 1–50.
Service-Oriented Computing and
[18] EEE Conference
[19]
[20] l, Englewood Cliffs, 2005.
Technique Based on
[15] M. Weiser, “Program slicing,” IEEE Trans. Software Eng., vol. 10, 1984, pp. 352–357.
[16] D. Binkley and K. B. Gallagher, “Program slicing,” Advances in Computers, 43, 1996
[17] C. Mao, “Slicing web service-based software,” Proc. IEEE International Conference on Applications (SOCA 2009), IEEE, 2009, pp. 1–8. J. K. Hollingsworth and B. P. Miller, “Parallel program performance metrics: A comparison and validation,” Proc. ACM/Ion Supercomputing (SC 92), IEEE Computer Society Press, pp. 4–13. A. S. Van Amesfoort, A. L. Varbanescu, and H. J. Sips, “Parallel Application Characterization with Quantitative Metrics,” Concurrency and Computation: Practice and Experience, vol. 24, 2012, pp. 445–462. T. Erl, Service-oriented Architecture: Concepts, Technology, and Design. Prentice Hal
[21] ISO 8807, “Information Processing Systems: Open Systems Interconnection: LOTOS: A Formal Descriptionthe Temporal Ordering of Observational Behaviour,” International Organization for Standards, 1989.
104
International Journal on Advances in Software, vol 6 no 1 & 2, year 2013, http://www.iariajournals.org/software/
2013, © Copyright by authors, Published under agreement with IARIA - www.iaria.org
Automated Tailoring of Application Lifecycle Management Systemsto Existing Development Processes
Matthias Biehl, Jad El-khoury, and Martin TorngrenEmbedded Control Systems
Royal Institute of TechnologyStockholm, Sweden
biehl, jad, [email protected]
Abstract—Application lifecycle management approaches areused to tame the increasing complexity, size and number ofdevelopment artifacts. Throughout the application lifecycle, anumber of tools are used to create a diversity of developmentartifacts. It is widely believed that the efficiency of developmentcan be improved by the integration of these tools. However,such integrated solutions are not accepted by practitioners ifthe solutions are not aligned with the established developmentculture, processes and standards. Thus, application lifecyclemanagement needs to be tailored to the specific corporateneeds. The tailoring, however, is typically performed manuallyand is thus resource intensive. We propose a cost efficienttailoring approach for application lifecycle management, whichis based on reuse and automation. We explore to what extentexisting process models can be reused for automatically con-figuring the application lifecycle management system, so it isaligned with the development process. We identify a numberof relationship patterns between the development process andits supporting tool chain and show how the patterns can beused for constructing a tool chain. In three case studies, weexamine the practical applicability of the approach.
Keywords-Application Lifecycle Management; Process Model-ing; Tool Integration; Tool Chain; Generative Approach; ModelDriven Development.
I. INTRODUCTION
The development of software-intensive products, such asembedded systems, produces a large number of diversedevelopment artifacts, such as documents, models and sourcecode. The artifacts are produced and used throughout theproduct lifecycle and are ideally managed systematically inan application lifecycle management (ALM) system [1]. Inthis article, we focus on one specific aspect of applicationlifecycle management systems – the aspect of tool integra-tion. Currently available commercial application lifecyclemanagement systems do not provide adequate tool integra-tion, as shown in a recent analysis [2]. Tool integration is anessential aspect of ALM, since the development artifacts inthe ALM system are typically developed with a number ofdifferent development tools. The development tools ideallyinteroperate seamlessly, however, the tools are often “islandsolutions” and a considerable engineering effort is necessaryto make a specific set of tools interoperate. Thus, toolintegration is realized externally to the development tools,
in the form of tool chains. A tool chain can be regardedas an integrated development environment consisting ofseveral development tools, which is intended to increase theefficiency of development by providing connections betweenthe tools used in a development process [3].
To be effectively used, tool chains need to be customizedto a specific selection of development tools and a specificdevelopment process. For example, a company might se-lect IBM DOORS for requirements management, EnterpriseArchitect for UML modeling and MATLAB/Simulink fordesigning and simulating control algorithms. The tool chainneeds to include these development tools. The way in whichthese tools are connected, is determined by the developmentprocess, which might prescribe that a connection betweenrequirements and UML models is needed, and a connectionbetween UML models and MATLAB/Simulink models.
Building automated tool chains that fit the individualneeds is an expensive and time-consuming task. In SectionII, we describe the challenges involved in building suchcustomized tool chains and study the perspective of involvedstakeholders. If a systematic and automated developmentapproach for tool chains was available, tool chains couldbe efficiently developed for each new development context.We introduce a domain-specific modeling language for toolchains in Section III. The language allows us to expressthe essential design decisions for creating a tool chain. InSection V, we propose a systematic development process forbuilding tool chains with this language, including the designphase, analysis phase, verification phase and implementationphase of tool chains. In Section IV, we focus in-depth on therelationship between process models and tool chain modelsand ways of leveraging this relationship in the conceptualdesign and verification phases of tool chain construction.We describe the relationship between process and toolchain in the form of patterns, implement them as modeltransformations and leverage these patterns for design andverification. We apply the approach in three case studies inSection VI. In the remaining Sections VII - IX, we relateour approach to other work in the field, sketch future workand consider the implications of this work.
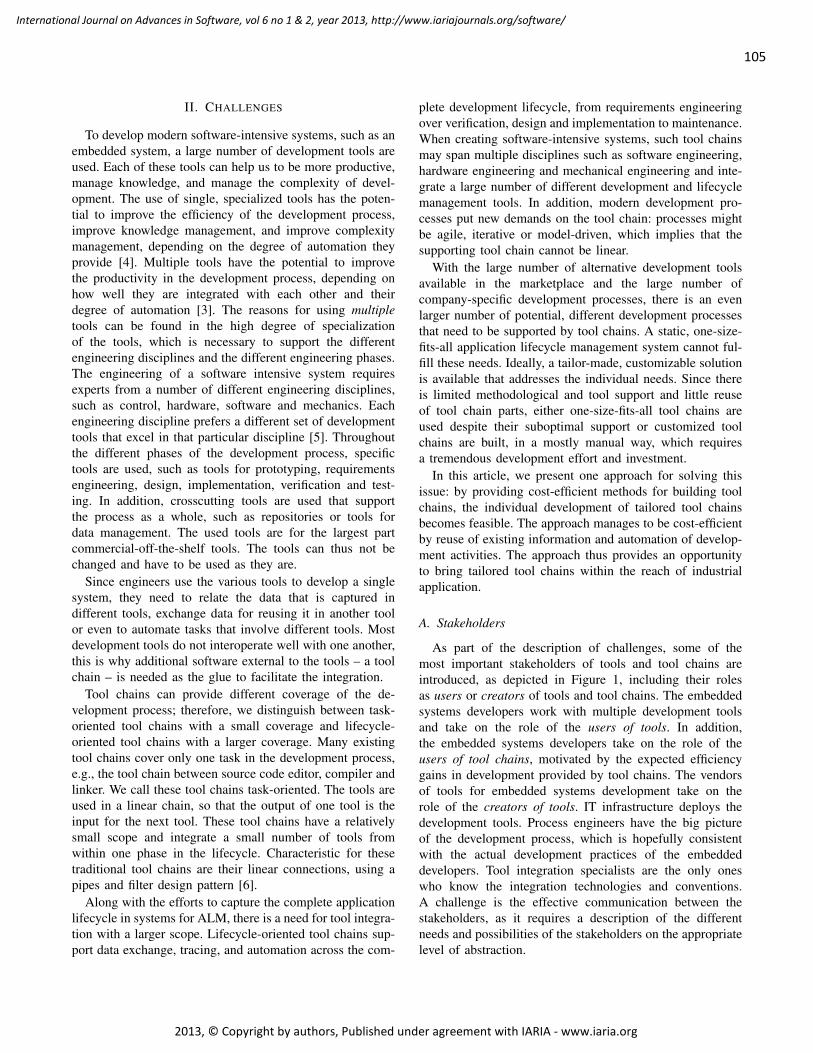
105
International Journal on Advances in Software, vol 6 no 1 & 2, year 2013, http://www.iariajournals.org/software/
2013, © Copyright by authors, Published under agreement with IARIA - www.iaria.org
II. CHALLENGES
To develop modern software-intensive systems, such as anembedded system, a large number of development tools areused. Each of these tools can help us to be more productive,manage knowledge, and manage the complexity of devel-opment. The use of single, specialized tools has the poten-tial to improve the efficiency of the development process,improve knowledge management, and improve complexitymanagement, depending on the degree of automation theyprovide [4]. Multiple tools have the potential to improvethe productivity in the development process, depending onhow well they are integrated with each other and theirdegree of automation [3]. The reasons for using multipletools can be found in the high degree of specializationof the tools, which is necessary to support the differentengineering disciplines and the different engineering phases.The engineering of a software intensive system requiresexperts from a number of different engineering disciplines,such as control, hardware, software and mechanics. Eachengineering discipline prefers a different set of developmenttools that excel in that particular discipline [5]. Throughoutthe different phases of the development process, specifictools are used, such as tools for prototyping, requirementsengineering, design, implementation, verification and test-ing. In addition, crosscutting tools are used that supportthe process as a whole, such as repositories or tools fordata management. The used tools are for the largest partcommercial-off-the-shelf tools. The tools can thus not bechanged and have to be used as they are.
Since engineers use the various tools to develop a singlesystem, they need to relate the data that is captured indifferent tools, exchange data for reusing it in another toolor even to automate tasks that involve different tools. Mostdevelopment tools do not interoperate well with one another,this is why additional software external to the tools – a toolchain – is needed as the glue to facilitate the integration.
Tool chains can provide different coverage of the de-velopment process; therefore, we distinguish between task-oriented tool chains with a small coverage and lifecycle-oriented tool chains with a larger coverage. Many existingtool chains cover only one task in the development process,e.g., the tool chain between source code editor, compiler andlinker. We call these tool chains task-oriented. The tools areused in a linear chain, so that the output of one tool is theinput for the next tool. These tool chains have a relativelysmall scope and integrate a small number of tools fromwithin one phase in the lifecycle. Characteristic for thesetraditional tool chains are their linear connections, using apipes and filter design pattern [6].
Along with the efforts to capture the complete applicationlifecycle in systems for ALM, there is a need for tool integra-tion with a larger scope. Lifecycle-oriented tool chains sup-port data exchange, tracing, and automation across the com-
plete development lifecycle, from requirements engineeringover verification, design and implementation to maintenance.When creating software-intensive systems, such tool chainsmay span multiple disciplines such as software engineering,hardware engineering and mechanical engineering and inte-grate a large number of different development and lifecyclemanagement tools. In addition, modern development pro-cesses put new demands on the tool chain: processes mightbe agile, iterative or model-driven, which implies that thesupporting tool chain cannot be linear.
With the large number of alternative development toolsavailable in the marketplace and the large number ofcompany-specific development processes, there is an evenlarger number of potential, different development processesthat need to be supported by tool chains. A static, one-size-fits-all application lifecycle management system cannot ful-fill these needs. Ideally, a tailor-made, customizable solutionis available that addresses the individual needs. Since thereis limited methodological and tool support and little reuseof tool chain parts, either one-size-fits-all tool chains areused despite their suboptimal support or customized toolchains are built, in a mostly manual way, which requiresa tremendous development effort and investment.
In this article, we present one approach for solving thisissue: by providing cost-efficient methods for building toolchains, the individual development of tailored tool chainsbecomes feasible. The approach manages to be cost-efficientby reuse of existing information and automation of develop-ment activities. The approach thus provides an opportunityto bring tailored tool chains within the reach of industrialapplication.
A. Stakeholders
As part of the description of challenges, some of themost important stakeholders of tools and tool chains areintroduced, as depicted in Figure 1, including their rolesas users or creators of tools and tool chains. The embeddedsystems developers work with multiple development toolsand take on the role of the users of tools. In addition,the embedded systems developers take on the role of theusers of tool chains, motivated by the expected efficiencygains in development provided by tool chains. The vendorsof tools for embedded systems development take on therole of the creators of tools. IT infrastructure deploys thedevelopment tools. Process engineers have the big pictureof the development process, which is hopefully consistentwith the actual development practices of the embeddeddevelopers. Tool integration specialists are the only oneswho know the integration technologies and conventions.A challenge is the effective communication between thestakeholders, as it requires a description of the differentneeds and possibilities of the stakeholders on the appropriatelevel of abstraction.
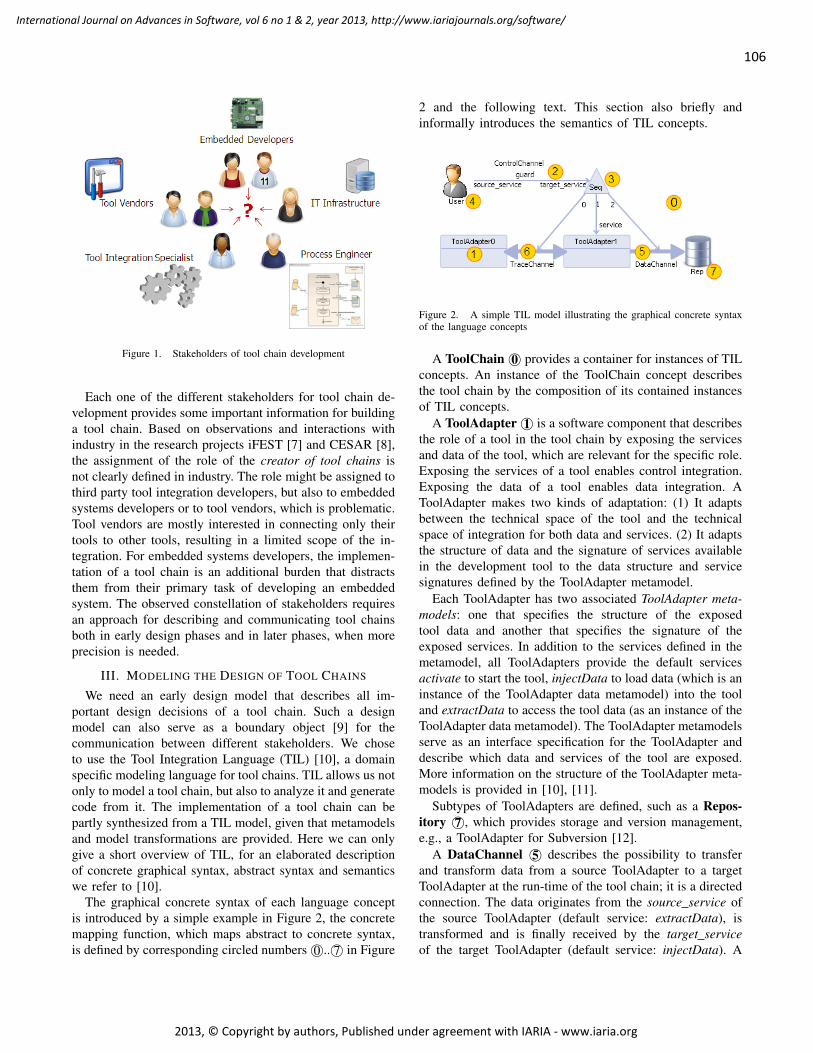
106
International Journal on Advances in Software, vol 6 no 1 & 2, year 2013, http://www.iariajournals.org/software/
2013, © Copyright by authors, Published under agreement with IARIA - www.iaria.org
Figure 1. Stakeholders of tool chain development
Each one of the different stakeholders for tool chain de-velopment provides some important information for buildinga tool chain. Based on observations and interactions withindustry in the research projects iFEST [7] and CESAR [8],the assignment of the role of the creator of tool chains isnot clearly defined in industry. The role might be assigned tothird party tool integration developers, but also to embeddedsystems developers or to tool vendors, which is problematic.Tool vendors are mostly interested in connecting only theirtools to other tools, resulting in a limited scope of the in-tegration. For embedded systems developers, the implemen-tation of a tool chain is an additional burden that distractsthem from their primary task of developing an embeddedsystem. The observed constellation of stakeholders requiresan approach for describing and communicating tool chainsboth in early design phases and in later phases, when moreprecision is needed.
III. MODELING THE DESIGN OF TOOL CHAINS
We need an early design model that describes all im-portant design decisions of a tool chain. Such a designmodel can also serve as a boundary object [9] for thecommunication between different stakeholders. We choseto use the Tool Integration Language (TIL) [10], a domainspecific modeling language for tool chains. TIL allows us notonly to model a tool chain, but also to analyze it and generatecode from it. The implementation of a tool chain can bepartly synthesized from a TIL model, given that metamodelsand model transformations are provided. Here we can onlygive a short overview of TIL, for an elaborated descriptionof concrete graphical syntax, abstract syntax and semanticswe refer to [10].
The graphical concrete syntax of each language conceptis introduced by a simple example in Figure 2, the concretemapping function, which maps abstract to concrete syntax,is defined by corresponding circled numbers 0©.. 7© in Figure
2 and the following text. This section also briefly andinformally introduces the semantics of TIL concepts.
Figure 2. A simple TIL model illustrating the graphical concrete syntaxof the language concepts
A ToolChain 0© provides a container for instances of TILconcepts. An instance of the ToolChain concept describesthe tool chain by the composition of its contained instancesof TIL concepts.
A ToolAdapter 1© is a software component that describesthe role of a tool in the tool chain by exposing the servicesand data of the tool, which are relevant for the specific role.Exposing the services of a tool enables control integration.Exposing the data of a tool enables data integration. AToolAdapter makes two kinds of adaptation: (1) It adaptsbetween the technical space of the tool and the technicalspace of integration for both data and services. (2) It adaptsthe structure of data and the signature of services availablein the development tool to the data structure and servicesignatures defined by the ToolAdapter metamodel.
Each ToolAdapter has two associated ToolAdapter meta-models: one that specifies the structure of the exposedtool data and another that specifies the signature of theexposed services. In addition to the services defined in themetamodel, all ToolAdapters provide the default servicesactivate to start the tool, injectData to load data (which is aninstance of the ToolAdapter data metamodel) into the tooland extractData to access the tool data (as an instance of theToolAdapter data metamodel). The ToolAdapter metamodelsserve as an interface specification for the ToolAdapter anddescribe which data and services of the tool are exposed.More information on the structure of the ToolAdapter meta-models is provided in [10], [11].
Subtypes of ToolAdapters are defined, such as a Repos-itory 7©, which provides storage and version management,e.g., a ToolAdapter for Subversion [12].
A DataChannel 5© describes the possibility to transferand transform data from a source ToolAdapter to a targetToolAdapter at the run-time of the tool chain; it is a directedconnection. The data originates from the source service ofthe source ToolAdapter (default service: extractData), istransformed and is finally received by the target serviceof the target ToolAdapter (default service: injectData). A
107
International Journal on Advances in Software, vol 6 no 1 & 2, year 2013, http://www.iariajournals.org/software/
2013, © Copyright by authors, Published under agreement with IARIA - www.iaria.org
model transformation is attached to the DataChannel; thesource and target metamodels of the transformation need tomatch the respective data metamodels of source and targetToolAdapters.
A TraceChannel 6© describes the possibility to establishtrace links between the data of two ToolAdapters at the run-time of the tool chain; it is an undirected connection. ATraceChannel is a design-time representative for a numberof trace links at run-time. At design-time one can specifythe type of data that can be linked by traces. The endpointsof the traces can be restricted to a subset of the tool databy specifying the source service and target service (defaultservice: extractData), which provide the data. At run-time,these services provide a list of all the source and targetelements that are offered as endpoints for specifying a trace.
A ControlChannel 2© describes an invocation or notifi-cation, it is a directed connection originating from a sourcecomponent and ending in a target component. If the targetof the ControlChannel is a ToolAdapter, the ControlChanneldenotes the invocation of a tool service; if the target is aDataChannel, the data-transfer is executed; if the target isa TraceChannel, a dialog for creating traces is presented.If the target is a User, it denotes notification of the User.A condition for the execution of the ControlChannel canbe specified by a guard expression. A service of the sourcecomponent, called source service (default value: activate),can be specified as the event that triggers the ControlChan-nel. The invoked service in the target component is spec-ified as the target service (default value: activate) of theControlChannel.
A Sequencer 3© describes a sequence of invocations ornotifications. When a Sequencer is activated by an incomingControlChannel, it activates the outgoing ControlChannelsin the specified order. The order is specified by the events(0..n), which are specified as the source service in theoutgoing ControlChannels from the Sequencer. Only afterthe service executed by the previous ControlChannel isfinished, will the next ControlChannel be activated.
A User 4© represents a real-world tool chain user. Theconcept is used to describe the possible interactions of thereal-world users with the tool chain. Outgoing ControlChan-nels from the User denote the invocation of tool chainservices by the real-world user. Incoming ControlChannelsto a User denote a notification sent to the real-world user,e.g., by e-mail.
By default, all TIL concepts describe parts of an auto-mated tool chain, however some parts of the tool chainmay not need to be automated and are manually integrated.TIL allows marking ControlChannels, DataChannels andTraceChannels as manually executed, in which case theyare depicted by dashed lines.
The semantics of TIL is defined in the text above, inaddition, compatible formal semantics of the behavior of TILcan be described by a mapping of TIL concepts to networks
of finite state machines (FSMs) [13].
IV. RELATIONSHIP BETWEEN PROCESS AND TOOLCHAIN
When building a tool chain, it is important to study whichdevelopment tools need to be connected. This informationabout the relationship between development tools is oftenalready available in a process model. Process models existfor a variety of reasons, i.e., for documenting, planning ortracking progress in a development project. The Software& Systems Process Engineering Metamodel (SPEM) [14] isthe standardized formalism by the OMG for this purpose.A SPEM model might already be available independentlyfrom a tool integration effort, e.g., as it is the case indevelopment with the Automotive Open Software Architec-ture (AUTOSAR) [15]. The information available in processmodels forms the skeleton of a tool chain, i.e., which toolsare involved and how they are connected in the process. Toconstruct an executable tool chain as a software solution,additional details are needed, e.g., information about thedata of tools, how to access it, how to convert it and howto describe the relation between data of different tools. Inthis Section we evaluate, to what extent information fromexisting SPEM models can be used for constructing a toolchain.
Ideally, connections for all tools used throughout thedevelopment process are provided; and in this case the toolchain supports the development process. The process pro-vides constraints and requirements for the construction of thetool chain. While generic process models are available, e.g.,the SPEM models for the Rational Unified Process (RUP)[16] or for AUTOSAR [15], companies also create individualprocess models for various purposes, e.g., to customizethese generic models to their individual environments, todocument the development process, to plan the developmentprocess, to track the progress in the development or todocument their selection of tools.
If both the process is described as a model and the toolchain is described as a model, information from the processmodel can be reused for constructing a tool chain model.This approach ensures that the tool chain and the process arealigned. Alignment decreases the friction experienced whenusing the development tools according to the process model.Process models only contain some, but not all informationnecessary for specifying tool chains. Especially the type ofthe connection between tools needs to be added later on.
1) Modeling the Product Development Process: In thissection, we introduce a modeling language that is usedfor describing the development process. There are bothformal and informal processes in companies, documented todifferent degrees and there is an increasing trend to modelprocesses. Several established languages exist for modelingprocesses or workflows. These languages have various pur-poses, for example BPMN [17] and BPEL [18] describe
108
International Journal on Advances in Software, vol 6 no 1 & 2, year 2013, http://www.iariajournals.org/software/
2013, © Copyright by authors, Published under agreement with IARIA - www.iaria.org
business processes and SPEM describes development pro-cesses. We apply SPEM, since it is a standardized andrelatively widespread language for modeling developmentprocesses with mature and diverse tool support. A SPEMmodel describes both the product development process andthe set of tools used and can thus be applied to describe theprocess requirements of a tool chain. An example model isprovided in Figure 5.
A number of concepts are defined in SPEM, we introducehere the core concepts that are relevant in the context oftool chains: a Process is composed of several Activities; anActivity is described by a set of linked Tasks, WorkProductsand Roles. A number of relationships, here represented by., are defined between the concepts of the metamodel:a Role, typically an engineer or software, can performa Task and a WorkProduct can be marked as the inputor output of a Task. A WorkProduct can be managedby a Tool and a Task can use a Tool.
A. Development Process Model as Requirements for ToolChains
In general, a requirement is a documented need of thenature or behavior of a particular product or service. Re-quirements can have different degrees of formalization andstructure. In the context of developing tool chains, the toolchain is the product. The nature or behavior of a particulartool chain is documented by process models, which thus canbe interpreted as the requirements. Process models containthe selection of tools and the description of the connectionsbetween the tools. Since process models describe the processin a structured and formalized form, the requirements ofa tool chain are formalized and structured, which we willuse for describing the relationship between process and toolchain and using this relationship for efficiently constructingand verifying tool chains.
B. Relationship Patterns between Process and Tool Chain
If both the process and tool chain are described as amodel, we can also model the relationship between them. Aprocess described in SPEM might provide several opportu-nities for tool integration. Such an opportunity involves twotools and a direct or indirect connection between them. Thetools and the connections found in SPEM are included intothe tool chain architecture as ToolAdapters and Channels.The direction of the DataChannel can be determined by theinvolved work products, which have either the role of inputor output of the task. Tasks connected to only one tool ortasks dealing with work products connected to the same tooldo not require support from a tool chain; in these tasksengineers work directly with this tool, e.g., by using theGUI of the tool.
The challenge is to identify those parts in a SPEMmodel that are relevant for tool integration. The relationshipcannot be described by mapping single metaclasses, as in
Table I, instead the relationship needs to be described bycombinations of several connected metaclasses, which wecall patterns. To describe this relationship in more detail,we list patterns of both SPEM and TIL models and theircorrespondences.
Table ICORRESPONDENCES BETWEEN SPEM AND TIL METACLASSES
SPEM Metaclass TIL MetaclassRole UserTool ToolAdapterTask Channel
The relationship patterns consist of a SPEM part, whichmatches a subgraph of a process model in SPEM, and aTIL part, which will become a new subgraph in the toolchain model in TIL. The mapping is established by pairsof model elements from both SPEM and TIL, whose nameattribute is equivalent and whose types are mapped accordingto the correspondences of metaclasses presented in Table I.In the following, we show four SPEM patterns that describetool integration related activities, they are illustrated in thetop part of Figure 3, and the corresponding TIL pattern isillustrated in the bottom.
1) Task-centered Integration Pattern: For each Task inSPEM that has associated WorkProducts as input andoutput, where the input WorkProduct has a differentassociated Tool than the output WorkProduct, thispattern produces ToolAdapters and a Channel betweenthem in the TIL model. The pattern is shown in (1)and can be observed in case study 1 in Figure 5 for theTask TraceReq2UML connecting the WorkProduct Re-quirementsDatabase and the WorkProduct UMLFile.
2) Multi-tool Task-centered Integration Pattern: For eachSPEM Task with two SPEM Tools associated with it,this pattern produces ToolAdapters and two Channelsbetween them in the TIL model, since no directionalityis modeled in SPEM. This pattern is theoretically pos-sible according to the SPEM metamodel, but we havenot observed it in practice. The pattern is illustratedin (2).
3) WorkProduct-centered Integration Pattern: For eachSPEM WorkProduct that is both input and outputof its associated Tasks, which have a different asso-ciated Tool, this pattern produces ToolAdapters anda Channel between them in the TIL model. Thepattern is illustrated in (3) and can be observed incase study 2 in Figure 7 for the WorkProduct ECU-ConfigurationDescription, which is output of the TaskGenerateBaseECUConfiguration and input to the TaskGenerateRTE.
4) Multi-tool WorkProduct-centered Integration Pattern:For each SPEM WorkProduct in that is associated totwo different Tools, this pattern produces ToolAdapters
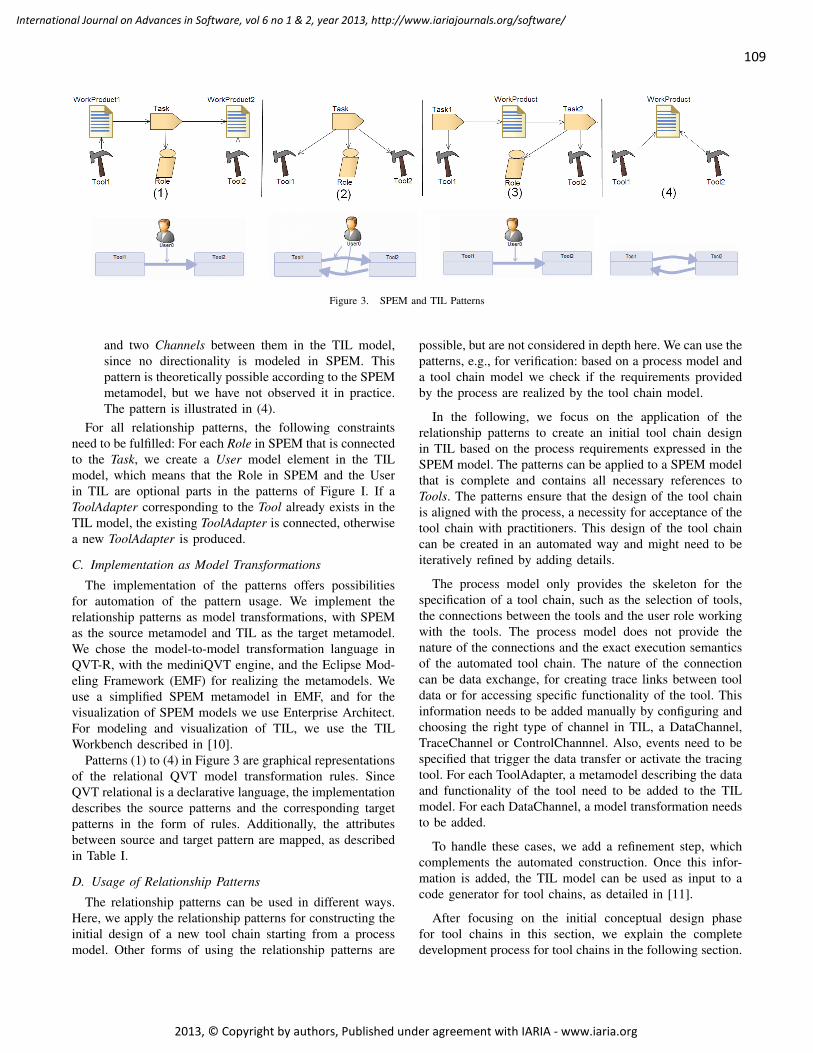
109
International Journal on Advances in Software, vol 6 no 1 & 2, year 2013, http://www.iariajournals.org/software/
2013, © Copyright by authors, Published under agreement with IARIA - www.iaria.org
Figure 3. SPEM and TIL Patterns
and two Channels between them in the TIL model,since no directionality is modeled in SPEM. Thispattern is theoretically possible according to the SPEMmetamodel, but we have not observed it in practice.The pattern is illustrated in (4).
For all relationship patterns, the following constraintsneed to be fulfilled: For each Role in SPEM that is connectedto the Task, we create a User model element in the TILmodel, which means that the Role in SPEM and the Userin TIL are optional parts in the patterns of Figure I. If aToolAdapter corresponding to the Tool already exists in theTIL model, the existing ToolAdapter is connected, otherwisea new ToolAdapter is produced.
C. Implementation as Model Transformations
The implementation of the patterns offers possibilitiesfor automation of the pattern usage. We implement therelationship patterns as model transformations, with SPEMas the source metamodel and TIL as the target metamodel.We chose the model-to-model transformation language inQVT-R, with the mediniQVT engine, and the Eclipse Mod-eling Framework (EMF) for realizing the metamodels. Weuse a simplified SPEM metamodel in EMF, and for thevisualization of SPEM models we use Enterprise Architect.For modeling and visualization of TIL, we use the TILWorkbench described in [10].
Patterns (1) to (4) in Figure 3 are graphical representationsof the relational QVT model transformation rules. SinceQVT relational is a declarative language, the implementationdescribes the source patterns and the corresponding targetpatterns in the form of rules. Additionally, the attributesbetween source and target pattern are mapped, as describedin Table I.
D. Usage of Relationship Patterns
The relationship patterns can be used in different ways.Here, we apply the relationship patterns for constructing theinitial design of a new tool chain starting from a processmodel. Other forms of using the relationship patterns are
possible, but are not considered in depth here. We can use thepatterns, e.g., for verification: based on a process model anda tool chain model we check if the requirements providedby the process are realized by the tool chain model.
In the following, we focus on the application of therelationship patterns to create an initial tool chain designin TIL based on the process requirements expressed in theSPEM model. The patterns can be applied to a SPEM modelthat is complete and contains all necessary references toTools. The patterns ensure that the design of the tool chainis aligned with the process, a necessity for acceptance of thetool chain with practitioners. This design of the tool chaincan be created in an automated way and might need to beiteratively refined by adding details.
The process model only provides the skeleton for thespecification of a tool chain, such as the selection of tools,the connections between the tools and the user role workingwith the tools. The process model does not provide thenature of the connections and the exact execution semanticsof the automated tool chain. The nature of the connectioncan be data exchange, for creating trace links between tooldata or for accessing specific functionality of the tool. Thisinformation needs to be added manually by configuring andchoosing the right type of channel in TIL, a DataChannel,TraceChannel or ControlChannnel. Also, events need to bespecified that trigger the data transfer or activate the tracingtool. For each ToolAdapter, a metamodel describing the dataand functionality of the tool need to be added to the TILmodel. For each DataChannel, a model transformation needsto be added.
To handle these cases, we add a refinement step, whichcomplements the automated construction. Once this infor-mation is added, the TIL model can be used as input to acode generator for tool chains, as detailed in [11].
After focusing on the initial conceptual design phasefor tool chains in this section, we explain the completedevelopment process for tool chains in the following section.
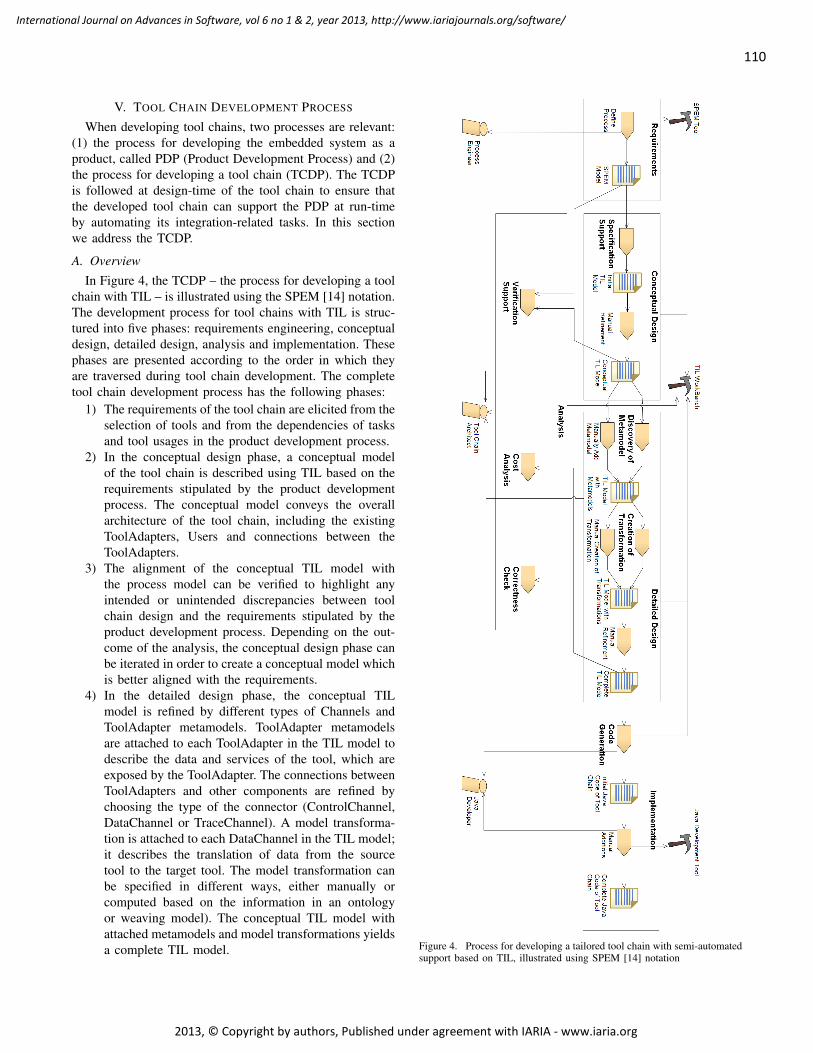
110
International Journal on Advances in Software, vol 6 no 1 & 2, year 2013, http://www.iariajournals.org/software/
2013, © Copyright by authors, Published under agreement with IARIA - www.iaria.org
V. TOOL CHAIN DEVELOPMENT PROCESS
When developing tool chains, two processes are relevant:(1) the process for developing the embedded system as aproduct, called PDP (Product Development Process) and (2)the process for developing a tool chain (TCDP). The TCDPis followed at design-time of the tool chain to ensure thatthe developed tool chain can support the PDP at run-timeby automating its integration-related tasks. In this sectionwe address the TCDP.
A. OverviewIn Figure 4, the TCDP – the process for developing a tool
chain with TIL – is illustrated using the SPEM [14] notation.The development process for tool chains with TIL is struc-tured into five phases: requirements engineering, conceptualdesign, detailed design, analysis and implementation. Thesephases are presented according to the order in which theyare traversed during tool chain development. The completetool chain development process has the following phases:
1) The requirements of the tool chain are elicited from theselection of tools and from the dependencies of tasksand tool usages in the product development process.
2) In the conceptual design phase, a conceptual modelof the tool chain is described using TIL based on therequirements stipulated by the product developmentprocess. The conceptual model conveys the overallarchitecture of the tool chain, including the existingToolAdapters, Users and connections between theToolAdapters.
3) The alignment of the conceptual TIL model withthe process model can be verified to highlight anyintended or unintended discrepancies between toolchain design and the requirements stipulated by theproduct development process. Depending on the out-come of the analysis, the conceptual design phase canbe iterated in order to create a conceptual model whichis better aligned with the requirements.
4) In the detailed design phase, the conceptual TILmodel is refined by different types of Channels andToolAdapter metamodels. ToolAdapter metamodelsare attached to each ToolAdapter in the TIL model todescribe the data and services of the tool, which areexposed by the ToolAdapter. The connections betweenToolAdapters and other components are refined bychoosing the type of the connector (ControlChannel,DataChannel or TraceChannel). A model transforma-tion is attached to each DataChannel in the TIL model;it describes the translation of data from the sourcetool to the target tool. The model transformation canbe specified in different ways, either manually orcomputed based on the information in an ontologyor weaving model). The conceptual TIL model withattached metamodels and model transformations yieldsa complete TIL model. Figure 4. Process for developing a tailored tool chain with semi-automated
support based on TIL, illustrated using SPEM [14] notation
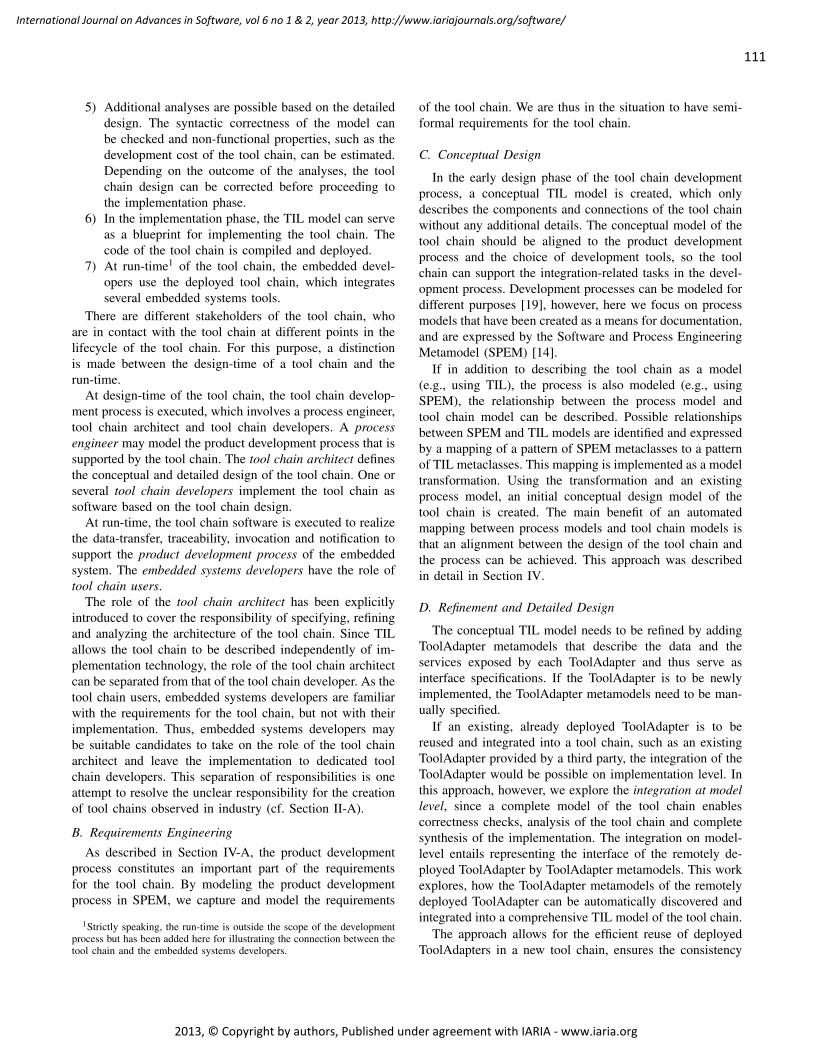
111
International Journal on Advances in Software, vol 6 no 1 & 2, year 2013, http://www.iariajournals.org/software/
2013, © Copyright by authors, Published under agreement with IARIA - www.iaria.org
5) Additional analyses are possible based on the detaileddesign. The syntactic correctness of the model canbe checked and non-functional properties, such as thedevelopment cost of the tool chain, can be estimated.Depending on the outcome of the analyses, the toolchain design can be corrected before proceeding tothe implementation phase.
6) In the implementation phase, the TIL model can serveas a blueprint for implementing the tool chain. Thecode of the tool chain is compiled and deployed.
7) At run-time1 of the tool chain, the embedded devel-opers use the deployed tool chain, which integratesseveral embedded systems tools.
There are different stakeholders of the tool chain, whoare in contact with the tool chain at different points in thelifecycle of the tool chain. For this purpose, a distinctionis made between the design-time of a tool chain and therun-time.
At design-time of the tool chain, the tool chain develop-ment process is executed, which involves a process engineer,tool chain architect and tool chain developers. A processengineer may model the product development process that issupported by the tool chain. The tool chain architect definesthe conceptual and detailed design of the tool chain. One orseveral tool chain developers implement the tool chain assoftware based on the tool chain design.
At run-time, the tool chain software is executed to realizethe data-transfer, traceability, invocation and notification tosupport the product development process of the embeddedsystem. The embedded systems developers have the role oftool chain users.
The role of the tool chain architect has been explicitlyintroduced to cover the responsibility of specifying, refiningand analyzing the architecture of the tool chain. Since TILallows the tool chain to be described independently of im-plementation technology, the role of the tool chain architectcan be separated from that of the tool chain developer. As thetool chain users, embedded systems developers are familiarwith the requirements for the tool chain, but not with theirimplementation. Thus, embedded systems developers maybe suitable candidates to take on the role of the tool chainarchitect and leave the implementation to dedicated toolchain developers. This separation of responsibilities is oneattempt to resolve the unclear responsibility for the creationof tool chains observed in industry (cf. Section II-A).
B. Requirements Engineering
As described in Section IV-A, the product developmentprocess constitutes an important part of the requirementsfor the tool chain. By modeling the product developmentprocess in SPEM, we capture and model the requirements
1Strictly speaking, the run-time is outside the scope of the developmentprocess but has been added here for illustrating the connection between thetool chain and the embedded systems developers.
of the tool chain. We are thus in the situation to have semi-formal requirements for the tool chain.
C. Conceptual Design
In the early design phase of the tool chain developmentprocess, a conceptual TIL model is created, which onlydescribes the components and connections of the tool chainwithout any additional details. The conceptual model of thetool chain should be aligned to the product developmentprocess and the choice of development tools, so the toolchain can support the integration-related tasks in the devel-opment process. Development processes can be modeled fordifferent purposes [19], however, here we focus on processmodels that have been created as a means for documentation,and are expressed by the Software and Process EngineeringMetamodel (SPEM) [14].
If in addition to describing the tool chain as a model(e.g., using TIL), the process is also modeled (e.g., usingSPEM), the relationship between the process model andtool chain model can be described. Possible relationshipsbetween SPEM and TIL models are identified and expressedby a mapping of a pattern of SPEM metaclasses to a patternof TIL metaclasses. This mapping is implemented as a modeltransformation. Using the transformation and an existingprocess model, an initial conceptual design model of thetool chain is created. The main benefit of an automatedmapping between process models and tool chain models isthat an alignment between the design of the tool chain andthe process can be achieved. This approach was describedin detail in Section IV.
D. Refinement and Detailed Design
The conceptual TIL model needs to be refined by addingToolAdapter metamodels that describe the data and theservices exposed by each ToolAdapter and thus serve asinterface specifications. If the ToolAdapter is to be newlyimplemented, the ToolAdapter metamodels need to be man-ually specified.
If an existing, already deployed ToolAdapter is to bereused and integrated into a tool chain, such as an existingToolAdapter provided by a third party, the integration of theToolAdapter would be possible on implementation level. Inthis approach, however, we explore the integration at modellevel, since a complete model of the tool chain enablescorrectness checks, analysis of the tool chain and completesynthesis of the implementation. The integration on model-level entails representing the interface of the remotely de-ployed ToolAdapter by ToolAdapter metamodels. This workexplores, how the ToolAdapter metamodels of the remotelydeployed ToolAdapter can be automatically discovered andintegrated into a comprehensive TIL model of the tool chain.
The approach allows for the efficient reuse of deployedToolAdapters in a new tool chain, ensures the consistency
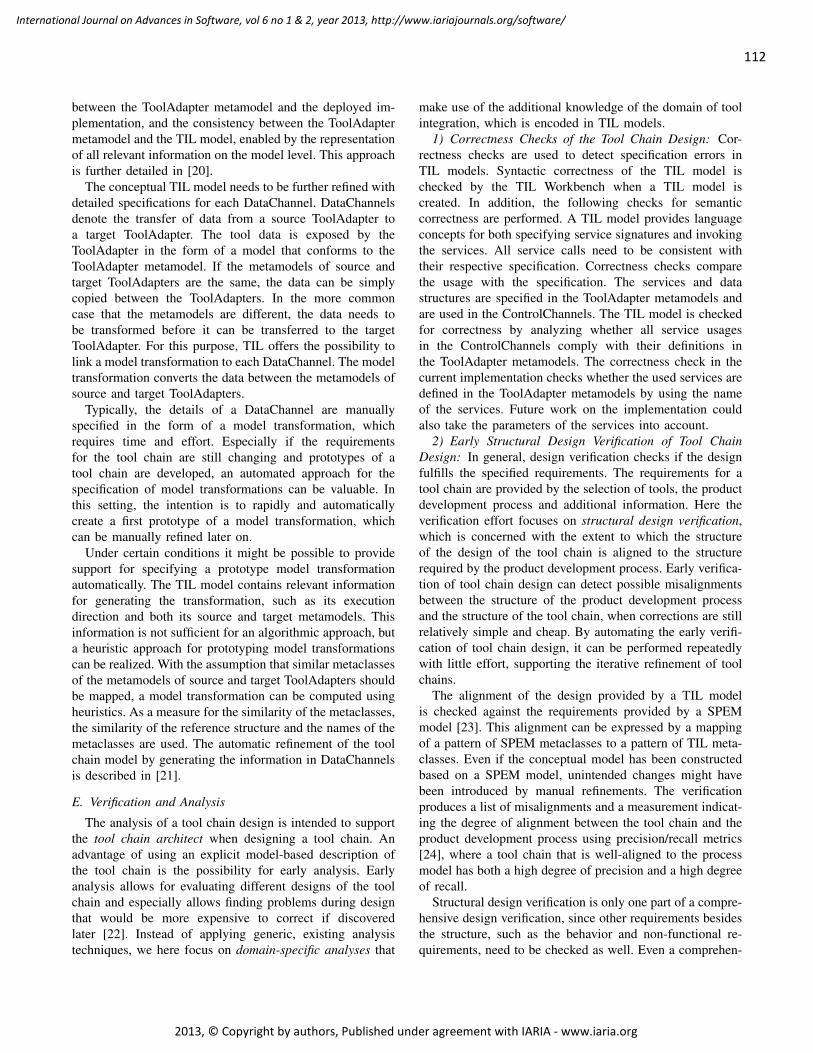
112
International Journal on Advances in Software, vol 6 no 1 & 2, year 2013, http://www.iariajournals.org/software/
2013, © Copyright by authors, Published under agreement with IARIA - www.iaria.org
between the ToolAdapter metamodel and the deployed im-plementation, and the consistency between the ToolAdaptermetamodel and the TIL model, enabled by the representationof all relevant information on the model level. This approachis further detailed in [20].
The conceptual TIL model needs to be further refined withdetailed specifications for each DataChannel. DataChannelsdenote the transfer of data from a source ToolAdapter toa target ToolAdapter. The tool data is exposed by theToolAdapter in the form of a model that conforms to theToolAdapter metamodel. If the metamodels of source andtarget ToolAdapters are the same, the data can be simplycopied between the ToolAdapters. In the more commoncase that the metamodels are different, the data needs tobe transformed before it can be transferred to the targetToolAdapter. For this purpose, TIL offers the possibility tolink a model transformation to each DataChannel. The modeltransformation converts the data between the metamodels ofsource and target ToolAdapters.
Typically, the details of a DataChannel are manuallyspecified in the form of a model transformation, whichrequires time and effort. Especially if the requirementsfor the tool chain are still changing and prototypes of atool chain are developed, an automated approach for thespecification of model transformations can be valuable. Inthis setting, the intention is to rapidly and automaticallycreate a first prototype of a model transformation, whichcan be manually refined later on.
Under certain conditions it might be possible to providesupport for specifying a prototype model transformationautomatically. The TIL model contains relevant informationfor generating the transformation, such as its executiondirection and both its source and target metamodels. Thisinformation is not sufficient for an algorithmic approach, buta heuristic approach for prototyping model transformationscan be realized. With the assumption that similar metaclassesof the metamodels of source and target ToolAdapters shouldbe mapped, a model transformation can be computed usingheuristics. As a measure for the similarity of the metaclasses,the similarity of the reference structure and the names of themetaclasses are used. The automatic refinement of the toolchain model by generating the information in DataChannelsis described in [21].
E. Verification and Analysis
The analysis of a tool chain design is intended to supportthe tool chain architect when designing a tool chain. Anadvantage of using an explicit model-based description ofthe tool chain is the possibility for early analysis. Earlyanalysis allows for evaluating different designs of the toolchain and especially allows finding problems during designthat would be more expensive to correct if discoveredlater [22]. Instead of applying generic, existing analysistechniques, we here focus on domain-specific analyses that
make use of the additional knowledge of the domain of toolintegration, which is encoded in TIL models.
1) Correctness Checks of the Tool Chain Design: Cor-rectness checks are used to detect specification errors inTIL models. Syntactic correctness of the TIL model ischecked by the TIL Workbench when a TIL model iscreated. In addition, the following checks for semanticcorrectness are performed. A TIL model provides languageconcepts for both specifying service signatures and invokingthe services. All service calls need to be consistent withtheir respective specification. Correctness checks comparethe usage with the specification. The services and datastructures are specified in the ToolAdapter metamodels andare used in the ControlChannels. The TIL model is checkedfor correctness by analyzing whether all service usagesin the ControlChannels comply with their definitions inthe ToolAdapter metamodels. The correctness check in thecurrent implementation checks whether the used services aredefined in the ToolAdapter metamodels by using the nameof the services. Future work on the implementation couldalso take the parameters of the services into account.
2) Early Structural Design Verification of Tool ChainDesign: In general, design verification checks if the designfulfills the specified requirements. The requirements for atool chain are provided by the selection of tools, the productdevelopment process and additional information. Here theverification effort focuses on structural design verification,which is concerned with the extent to which the structureof the design of the tool chain is aligned to the structurerequired by the product development process. Early verifica-tion of tool chain design can detect possible misalignmentsbetween the structure of the product development processand the structure of the tool chain, when corrections are stillrelatively simple and cheap. By automating the early verifi-cation of tool chain design, it can be performed repeatedlywith little effort, supporting the iterative refinement of toolchains.
The alignment of the design provided by a TIL modelis checked against the requirements provided by a SPEMmodel [23]. This alignment can be expressed by a mappingof a pattern of SPEM metaclasses to a pattern of TIL meta-classes. Even if the conceptual model has been constructedbased on a SPEM model, unintended changes might havebeen introduced by manual refinements. The verificationproduces a list of misalignments and a measurement indicat-ing the degree of alignment between the tool chain and theproduct development process using precision/recall metrics[24], where a tool chain that is well-aligned to the processmodel has both a high degree of precision and a high degreeof recall.
Structural design verification is only one part of a compre-hensive design verification, since other requirements besidesthe structure, such as the behavior and non-functional re-quirements, need to be checked as well. Even a comprehen-
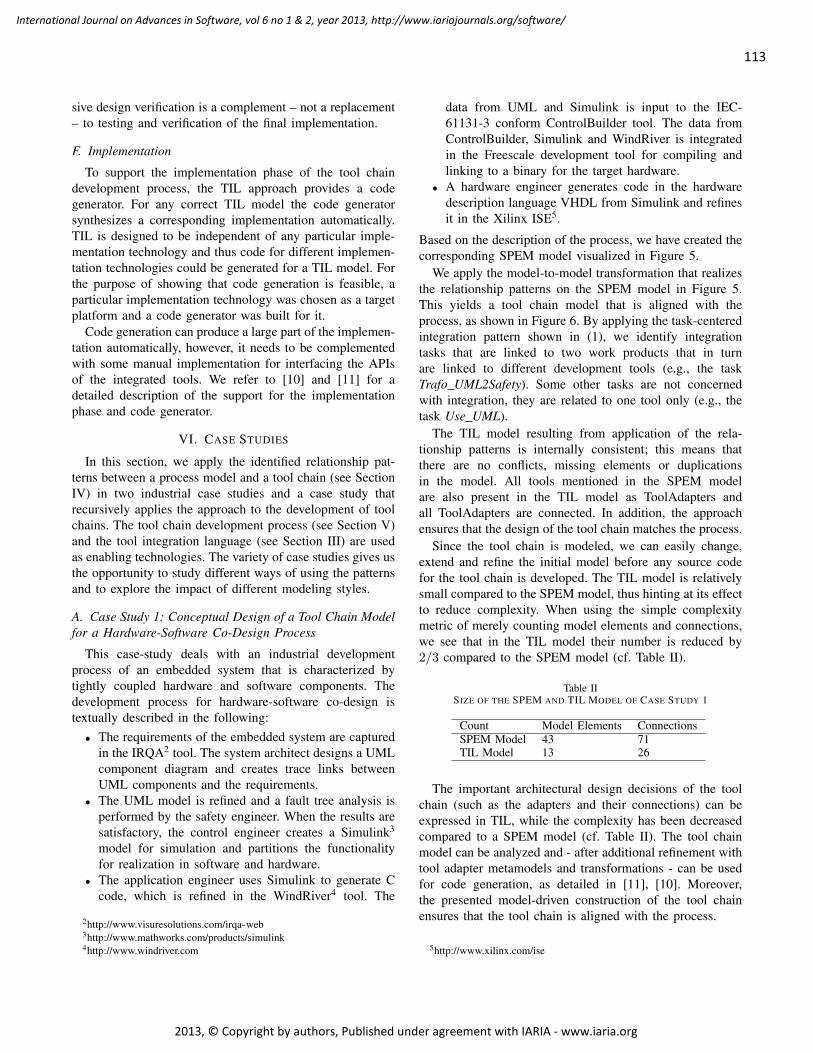
113
International Journal on Advances in Software, vol 6 no 1 & 2, year 2013, http://www.iariajournals.org/software/
2013, © Copyright by authors, Published under agreement with IARIA - www.iaria.org
sive design verification is a complement – not a replacement– to testing and verification of the final implementation.
F. Implementation
To support the implementation phase of the tool chaindevelopment process, the TIL approach provides a codegenerator. For any correct TIL model the code generatorsynthesizes a corresponding implementation automatically.TIL is designed to be independent of any particular imple-mentation technology and thus code for different implemen-tation technologies could be generated for a TIL model. Forthe purpose of showing that code generation is feasible, aparticular implementation technology was chosen as a targetplatform and a code generator was built for it.
Code generation can produce a large part of the implemen-tation automatically, however, it needs to be complementedwith some manual implementation for interfacing the APIsof the integrated tools. We refer to [10] and [11] for adetailed description of the support for the implementationphase and code generator.
VI. CASE STUDIES
In this section, we apply the identified relationship pat-terns between a process model and a tool chain (see SectionIV) in two industrial case studies and a case study thatrecursively applies the approach to the development of toolchains. The tool chain development process (see Section V)and the tool integration language (see Section III) are usedas enabling technologies. The variety of case studies gives usthe opportunity to study different ways of using the patternsand to explore the impact of different modeling styles.
A. Case Study 1: Conceptual Design of a Tool Chain Modelfor a Hardware-Software Co-Design Process
This case-study deals with an industrial developmentprocess of an embedded system that is characterized bytightly coupled hardware and software components. Thedevelopment process for hardware-software co-design istextually described in the following:
• The requirements of the embedded system are capturedin the IRQA2 tool. The system architect designs a UMLcomponent diagram and creates trace links betweenUML components and the requirements.
• The UML model is refined and a fault tree analysis isperformed by the safety engineer. When the results aresatisfactory, the control engineer creates a Simulink3
model for simulation and partitions the functionalityfor realization in software and hardware.
• The application engineer uses Simulink to generate Ccode, which is refined in the WindRiver4 tool. The
2http://www.visuresolutions.com/irqa-web3http://www.mathworks.com/products/simulink4http://www.windriver.com
data from UML and Simulink is input to the IEC-61131-3 conform ControlBuilder tool. The data fromControlBuilder, Simulink and WindRiver is integratedin the Freescale development tool for compiling andlinking to a binary for the target hardware.
• A hardware engineer generates code in the hardwaredescription language VHDL from Simulink and refinesit in the Xilinx ISE5.
Based on the description of the process, we have created thecorresponding SPEM model visualized in Figure 5.
We apply the model-to-model transformation that realizesthe relationship patterns on the SPEM model in Figure 5.This yields a tool chain model that is aligned with theprocess, as shown in Figure 6. By applying the task-centeredintegration pattern shown in (1), we identify integrationtasks that are linked to two work products that in turnare linked to different development tools (e.g., the taskTrafo UML2Safety). Some other tasks are not concernedwith integration, they are related to one tool only (e.g., thetask Use UML).
The TIL model resulting from application of the rela-tionship patterns is internally consistent; this means thatthere are no conflicts, missing elements or duplicationsin the model. All tools mentioned in the SPEM modelare also present in the TIL model as ToolAdapters andall ToolAdapters are connected. In addition, the approachensures that the design of the tool chain matches the process.
Since the tool chain is modeled, we can easily change,extend and refine the initial model before any source codefor the tool chain is developed. The TIL model is relativelysmall compared to the SPEM model, thus hinting at its effectto reduce complexity. When using the simple complexitymetric of merely counting model elements and connections,we see that in the TIL model their number is reduced by2/3 compared to the SPEM model (cf. Table II).
Table IISIZE OF THE SPEM AND TIL MODEL OF CASE STUDY 1
Count Model Elements ConnectionsSPEM Model 43 71TIL Model 13 26
The important architectural design decisions of the toolchain (such as the adapters and their connections) can beexpressed in TIL, while the complexity has been decreasedcompared to a SPEM model (cf. Table II). The tool chainmodel can be analyzed and - after additional refinement withtool adapter metamodels and transformations - can be usedfor code generation, as detailed in [11], [10]. Moreover,the presented model-driven construction of the tool chainensures that the tool chain is aligned with the process.
5http://www.xilinx.com/ise
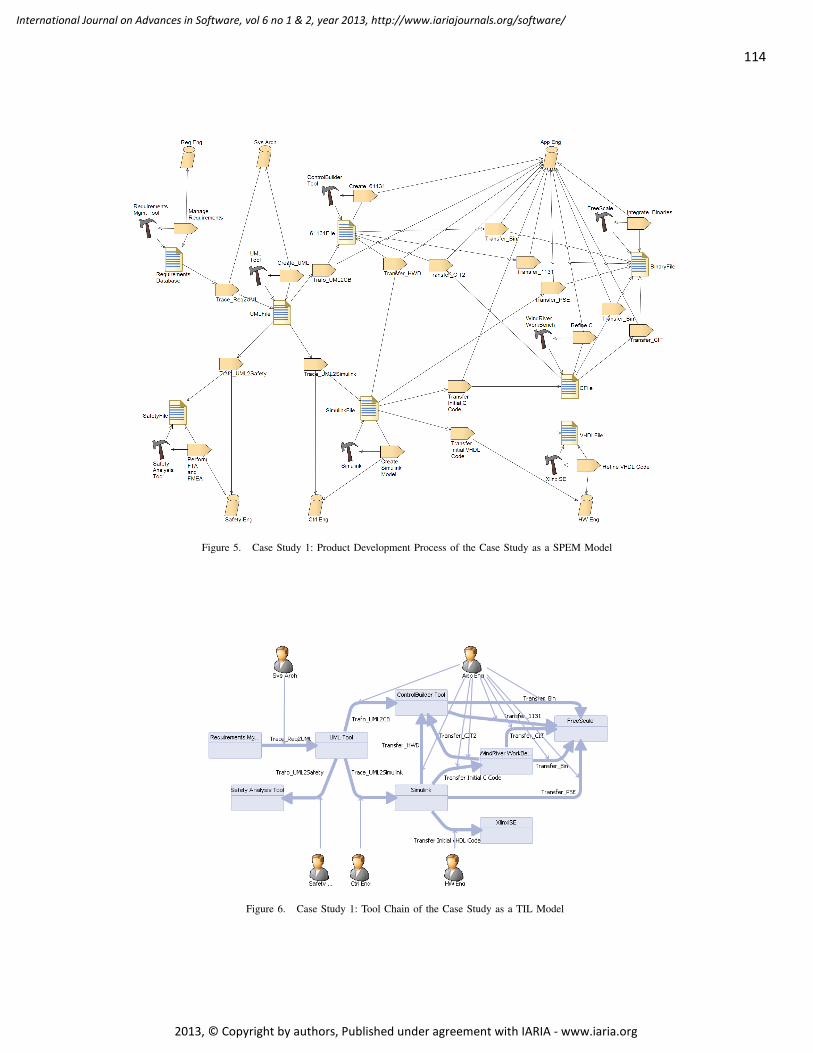
114
International Journal on Advances in Software, vol 6 no 1 & 2, year 2013, http://www.iariajournals.org/software/
2013, © Copyright by authors, Published under agreement with IARIA - www.iaria.org
Figure 5. Case Study 1: Product Development Process of the Case Study as a SPEM Model
Figure 6. Case Study 1: Tool Chain of the Case Study as a TIL Model
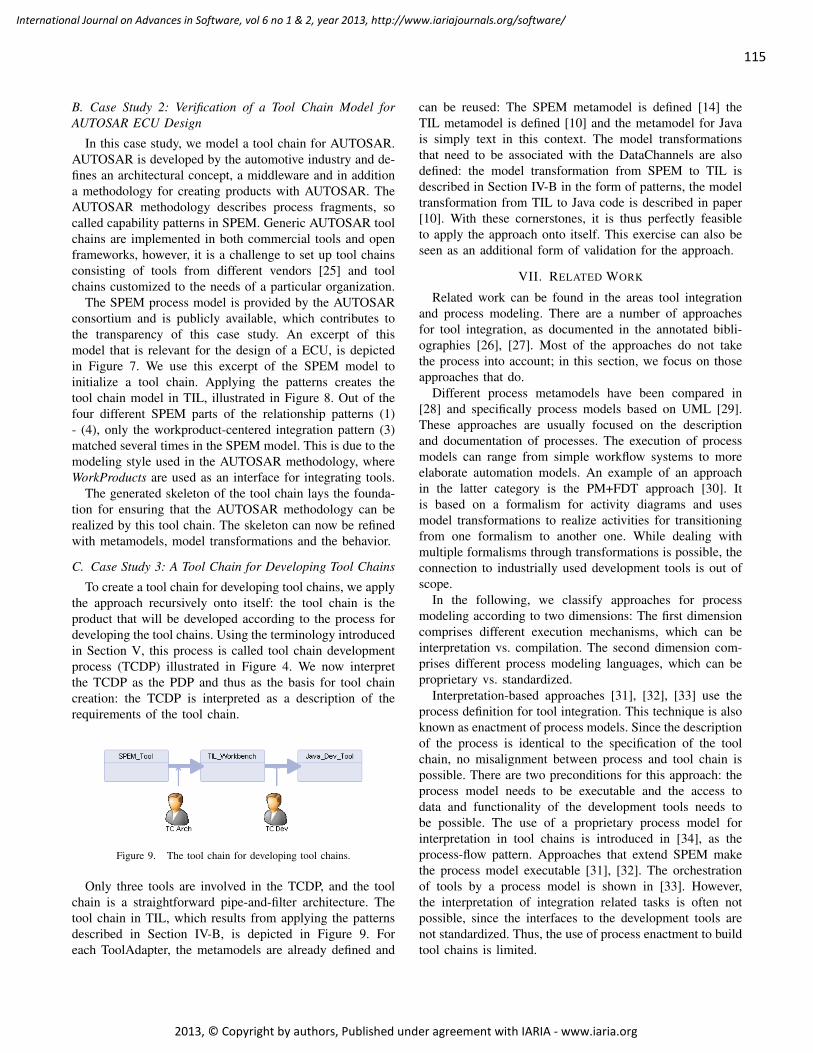
115
International Journal on Advances in Software, vol 6 no 1 & 2, year 2013, http://www.iariajournals.org/software/
2013, © Copyright by authors, Published under agreement with IARIA - www.iaria.org
B. Case Study 2: Verification of a Tool Chain Model forAUTOSAR ECU Design
In this case study, we model a tool chain for AUTOSAR.AUTOSAR is developed by the automotive industry and de-fines an architectural concept, a middleware and in additiona methodology for creating products with AUTOSAR. TheAUTOSAR methodology describes process fragments, socalled capability patterns in SPEM. Generic AUTOSAR toolchains are implemented in both commercial tools and openframeworks, however, it is a challenge to set up tool chainsconsisting of tools from different vendors [25] and toolchains customized to the needs of a particular organization.
The SPEM process model is provided by the AUTOSARconsortium and is publicly available, which contributes tothe transparency of this case study. An excerpt of thismodel that is relevant for the design of a ECU, is depictedin Figure 7. We use this excerpt of the SPEM model toinitialize a tool chain. Applying the patterns creates thetool chain model in TIL, illustrated in Figure 8. Out of thefour different SPEM parts of the relationship patterns (1)- (4), only the workproduct-centered integration pattern (3)matched several times in the SPEM model. This is due to themodeling style used in the AUTOSAR methodology, whereWorkProducts are used as an interface for integrating tools.
The generated skeleton of the tool chain lays the founda-tion for ensuring that the AUTOSAR methodology can berealized by this tool chain. The skeleton can now be refinedwith metamodels, model transformations and the behavior.
C. Case Study 3: A Tool Chain for Developing Tool Chains
To create a tool chain for developing tool chains, we applythe approach recursively onto itself: the tool chain is theproduct that will be developed according to the process fordeveloping the tool chains. Using the terminology introducedin Section V, this process is called tool chain developmentprocess (TCDP) illustrated in Figure 4. We now interpretthe TCDP as the PDP and thus as the basis for tool chaincreation: the TCDP is interpreted as a description of therequirements of the tool chain.
Figure 9. The tool chain for developing tool chains.
Only three tools are involved in the TCDP, and the toolchain is a straightforward pipe-and-filter architecture. Thetool chain in TIL, which results from applying the patternsdescribed in Section IV-B, is depicted in Figure 9. Foreach ToolAdapter, the metamodels are already defined and
can be reused: The SPEM metamodel is defined [14] theTIL metamodel is defined [10] and the metamodel for Javais simply text in this context. The model transformationsthat need to be associated with the DataChannels are alsodefined: the model transformation from SPEM to TIL isdescribed in Section IV-B in the form of patterns, the modeltransformation from TIL to Java code is described in paper[10]. With these cornerstones, it is thus perfectly feasibleto apply the approach onto itself. This exercise can also beseen as an additional form of validation for the approach.
VII. RELATED WORK
Related work can be found in the areas tool integrationand process modeling. There are a number of approachesfor tool integration, as documented in the annotated bibli-ographies [26], [27]. Most of the approaches do not takethe process into account; in this section, we focus on thoseapproaches that do.
Different process metamodels have been compared in[28] and specifically process models based on UML [29].These approaches are usually focused on the descriptionand documentation of processes. The execution of processmodels can range from simple workflow systems to moreelaborate automation models. An example of an approachin the latter category is the PM+FDT approach [30]. Itis based on a formalism for activity diagrams and usesmodel transformations to realize activities for transitioningfrom one formalism to another one. While dealing withmultiple formalisms through transformations is possible, theconnection to industrially used development tools is out ofscope.
In the following, we classify approaches for processmodeling according to two dimensions: The first dimensioncomprises different execution mechanisms, which can beinterpretation vs. compilation. The second dimension com-prises different process modeling languages, which can beproprietary vs. standardized.
Interpretation-based approaches [31], [32], [33] use theprocess definition for tool integration. This technique is alsoknown as enactment of process models. Since the descriptionof the process is identical to the specification of the toolchain, no misalignment between process and tool chain ispossible. There are two preconditions for this approach: theprocess model needs to be executable and the access todata and functionality of the development tools needs tobe possible. The use of a proprietary process model forinterpretation in tool chains is introduced in [34], as theprocess-flow pattern. Approaches that extend SPEM makethe process model executable [31], [32]. The orchestrationof tools by a process model is shown in [33]. However,the interpretation of integration related tasks is often notpossible, since the interfaces to the development tools arenot standardized. Thus, the use of process enactment to buildtool chains is limited.
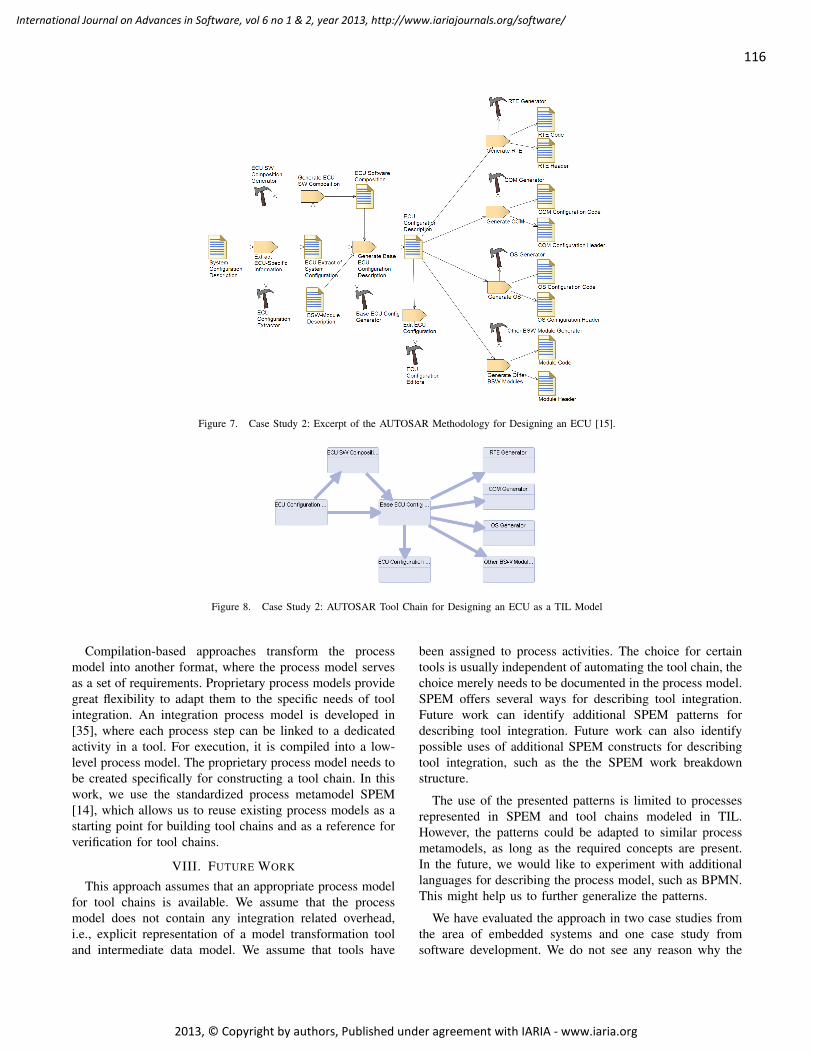
116
International Journal on Advances in Software, vol 6 no 1 & 2, year 2013, http://www.iariajournals.org/software/
2013, © Copyright by authors, Published under agreement with IARIA - www.iaria.org
Figure 7. Case Study 2: Excerpt of the AUTOSAR Methodology for Designing an ECU [15].
Figure 8. Case Study 2: AUTOSAR Tool Chain for Designing an ECU as a TIL Model
Compilation-based approaches transform the processmodel into another format, where the process model servesas a set of requirements. Proprietary process models providegreat flexibility to adapt them to the specific needs of toolintegration. An integration process model is developed in[35], where each process step can be linked to a dedicatedactivity in a tool. For execution, it is compiled into a low-level process model. The proprietary process model needs tobe created specifically for constructing a tool chain. In thiswork, we use the standardized process metamodel SPEM[14], which allows us to reuse existing process models as astarting point for building tool chains and as a reference forverification for tool chains.
VIII. FUTURE WORK
This approach assumes that an appropriate process modelfor tool chains is available. We assume that the processmodel does not contain any integration related overhead,i.e., explicit representation of a model transformation tooland intermediate data model. We assume that tools have
been assigned to process activities. The choice for certaintools is usually independent of automating the tool chain, thechoice merely needs to be documented in the process model.SPEM offers several ways for describing tool integration.Future work can identify additional SPEM patterns fordescribing tool integration. Future work can also identifypossible uses of additional SPEM constructs for describingtool integration, such as the the SPEM work breakdownstructure.
The use of the presented patterns is limited to processesrepresented in SPEM and tool chains modeled in TIL.However, the patterns could be adapted to similar processmetamodels, as long as the required concepts are present.In the future, we would like to experiment with additionallanguages for describing the process model, such as BPMN.This might help us to further generalize the patterns.
We have evaluated the approach in two case studies fromthe area of embedded systems and one case study fromsoftware development. We do not see any reason why the
117
International Journal on Advances in Software, vol 6 no 1 & 2, year 2013, http://www.iariajournals.org/software/
2013, © Copyright by authors, Published under agreement with IARIA - www.iaria.org
patterns could not be applied for creating tool chain fromprocess models in other application areas in the future andare thus generalizable. For further validation, we thus planto apply the presented techniques in another area of softwareand systems engineering.
IX. CONCLUSION
In modern development processes, tools are no longerused in a linear sequence, but as networks of interactingtools. The tool chain represents this network of interactingtools that needs to be tailored to the the developmentprocess. Processes are increasingly described as processmodels, which exist for a variety of reasons, i.e., for doc-umenting, planning or tracking progress in a developmentproject. SPEM is the standardized language by the OMG forthis purpose. In this article, we recognize the developmentprocess modeled in SPEM as a set of requirements for thearchitecture of tool chains. We devise a number of patternsfor creating the skeleton of a tool chain model in TIL, whichis aligned with the process. This allows us to automate thecreation of an initial tool chain design.
We have further shown how a tool chain model can besystematically developed into a tool chain implementationby following a structured tool chain development process.We have shown that many phases of this tool chain develop-ment process can be automated. If this process is followed,a semi-automated construction of tool chain software ispossible. The semi-automation makes the construction cost-efficient, which is one of the decisive factors for buildingand configuring tailored application lifecycle managementsystems.
The presented cost-efficient construction has the potentialto resolves the dilemma faced by industry today: Applica-tion lifecycle management can only deliver the promisedefficiency improvements and cost savings, if it is tailoredto the given set of tools and processes, but tailoring itselfis expensive, has a cost and thus reduces the net-valueof application lifecycle management. By automating thetailoring, as described in this article, the cost of tailoringis reduced and thus the net-value of application lifecyclemanagement is highly improved.
Acknowledgement
The authors acknowledge partial funding by theARTEMIS project iFEST.
REFERENCES
[1] M. Biehl and M. Torngren, “Constructing Tool Chains basedon SPEM Process Models,” in Seventh International Confer-ence on Software Engineering Advances (ICSEA2012), Nov.2012.
[2] C. Singh and M. Azoff, “Ovum Decision Matrix: Selectingan Application Lifecycle Management Solution, 2013-14,”Ovum, Tech. Rep., Jan. 2013.
[3] M. Wicks and R. Dewar, “A new research agenda for toolintegration,” Journal of Systems and Software, vol. 80, no. 9,pp. 1569–1585, Sep. 2007. [Online]. Last accessed June2013. Available: http://dx.doi.org/10.1016/j.jss.2007.03.089
[4] T. Bruckhaus, N. H. Madhavii, I. Janssen, and J. Henshaw,“The impact of tools on software productivity,” Software,IEEE, vol. 13, no. 5, pp. 29–38, Sep. 1996. [Online]. Lastaccessed June 2013. Available: http://dx.doi.org/10.1109/52.536456
[5] J. El-khoury, O. Redell, and M. Torngren, “A ToolIntegration Platform for Multi-Disciplinary Development,”in 31st EUROMICRO Conference on Software Engineeringand Advanced Applications. IEEE, 2005, pp. 442–450. [Online]. Last accessed June 2013. Available: http://dx.doi.org/10.1109/euromicro.2005.10
[6] M. Shaw and D. Garlan, Software architecture. PrenticeHall, 1996.
[7] iFEST Project: Industrial Framework for Embedded SystemsTools. [Online]. Last accessed June 2013. Available:http://www.artemis-ifest.eu
[8] CESAR Project: Cost-Efficient Methods and Processes forSafety Relevant Embedded Systems. [Online]. Last accessedJune 2013. Available: http://www.cesarproject.eu
[9] S. L. Star and J. R. Griesemer, “Institutional Ecology,’Translations’ and Boundary Objects: Amateurs andProfessionals in Berkeley’s Museum of Vertebrate Zoology,1907-39,” Social Studies of Science, vol. 19, no. 3, pp.387–420, 1989. [Online]. Last accessed June 2013. Available:http://dx.doi.org/10.2307/285080
[10] M. Biehl, J. El-Khoury, F. Loiret, and M. Torngren, “Onthe modeling and generation of service-oriented tool chains,”Journal of Software and Systems Modeling, vol. 0275,Sep. 2012. [Online]. Last accessed June 2013. Available:http://dx.doi.org/10.1007/s10270-012-0275-7
[11] M. Biehl, J. El-Khoury, and M. Torngren, “High-LevelSpecification and Code Generation for Service-Oriented ToolAdapters,” in Proceedings of the International Conference onComputational Science (ICCSA2012), Jun. 2012.
[12] C. M. Pilato, B. Collins-Sussman, and B. W. Fitzpatrick,Version Control with Subversion, 1st ed. O’Reilly Media,Jun. 2004. [Online]. Last accessed June 2013. Available:http://www.worldcat.org/isbn/0596004486
[13] M. Biehl, “Semantic Anchoring of TIL,” Royal Instituteof Technology, Tech. Rep. ISRN/KTH/MMK/R-12/19-SE,Oct. 2012. [Online]. Last accessed June 2013. Available:http://www1.md.kth.se/∼biehl/files/papers/semantics.pdf
[14] OMG, “Software & Systems Process Engineering MetamodelSpecification (SPEM),” ”OMG”, Tech. Rep., Apr. 2008.[Online]. Last accessed June 2013. Available: http://www.omg.org/spec/SPEM/2.0
[15] AUTOSAR Consortium. (2011, Apr.) Automotive opensoftware architecture (AUTOSAR) 3.2. [Online]. Lastaccessed June 2013. Available: http://autosar.org/
118
International Journal on Advances in Software, vol 6 no 1 & 2, year 2013, http://www.iariajournals.org/software/
2013, © Copyright by authors, Published under agreement with IARIA - www.iaria.org
[16] P. Kruchten and P. Kruchten, The Rational Unified Process.Addison-Wesley Pub (Sd), Dec. 1998. [Online]. Lastaccessed June 2013. Available: http://www.worldcat.org/isbn/0201604590
[17] OMG, “Business Process Model And Notation (BPMN),””OMG”, Tech. Rep., Jan. 2011. [Online]. Last accessed June2013. Available: http://www.omg.org/spec/BPMN/2.0/
[18] OASIS, “OASIS Web Services Business Process ExecutionLanguage (WSBPEL) TC,” ”OASIS”, Tech. Rep., Apr. 2007.
[19] B. Curtis, M. I. Kellner, and J. Over, “Process modeling,”Commun. ACM, vol. 35, no. 9, pp. 75–90, Sep. 1992.[Online]. Last accessed June 2013. Available: http://dx.doi.org/10.1145/130994.130998
[20] M. Biehl, W. Gu, and F. Loiret, “Model-based Service Discov-ery and Orchestration for OSLC Services in Tool Chains,” inInternational Conference on Web Engineering (ICWE2012),Jul. 2012.
[21] M. Biehl, J. Hong, and F. Loiret, “Automated Constructionof Data Integration Solutions for Tool Chains,” in SeventhInternational Conference on Software Engineering Advances(ICSEA2012), Nov. 2012.
[22] D. Jackson and M. Rinard, “Software analysis: a roadmap,”in Proceedings of the Conference on The Future of SoftwareEngineering, ser. ICSE ’00. New York, NY, USA: ACM,2000, pp. 133–145. [Online]. Last accessed June 2013.Available: http://dx.doi.org/10.1145/336512.336545
[23] OMG, “Software & Systems Process Engineering Metamodelspecification (SPEM) 2.0,” OMG, Tech. Rep., 2008. [Online].Last accessed June 2013. Available: http://www.omg.org/spec/SPEM/2.0/PDF
[24] C. J. Van Rijsbergen, Information Retrieval, 2nd ed.Butterworth-Heinemann. [Online]. Last accessed June 2013.Available: http://www.dcs.gla.ac.uk/Keith/Preface.html
[25] S. Voget, “AUTOSAR and the automotive tool chain,” inProceedings of the Conference on Design, Automation andTest in Europe, ser. DATE ’10. 3001 Leuven, Belgium,Belgium: European Design and Automation Association,2010, pp. 259–262. [Online]. Last accessed June 2013.Available: http://portal.acm.org/citation.cfm?id=1870988
[26] M. N. Wicks, “Tool Integration within Software EngineeringEnvironments: An Annotated Bibliography,” Heriot-WattUniversity, Tech. Rep., 2006. [Online]. Last accessed June2013. Available: http://www.macs.hw.ac.uk:8080/techreps/docs/files/HW-MACS-TR-0041.pdf
[27] A. W. Brown and M. H. Penedo, “An annotated bibliographyon integration in software engineering environments,”SIGSOFT Softw. Eng. Notes, vol. 17, no. 3, pp. 47–55, 1992. [Online]. Last accessed June 2013. Available:http://dx.doi.org/10.1145/140938.140944
[28] B. Henderson-Sellers and C. Gonzalez-Perez, “A comparisonof four process metamodels and the creation of a newgeneric standard,” Information and Software Technology,vol. 47, no. 1, pp. 49–65, Jan. 2005. [Online]. Last accessedJune 2013. Available: http://dx.doi.org/10.1016/j.infsof.2004.06.001
[29] R. Bendraou, J. M. Jezequel, M. P. Gervais, and X. Blanc,“A Comparison of Six UML-Based Languages for SoftwareProcess Modeling,” IEEE Trans. Softw. Eng., vol. 36, no. 5,pp. 662–675, Sep. 2010. [Online]. Last accessed June 2013.Available: http://dx.doi.org/10.1109/tse.2009.85
[30] L. Lucio, S. Mustafiz, J. Denil, B. Meyers, andH. Vangheluwe, “The Formalism Transformation Graph as aGuide to Model Driven Engineering,” School of ComputerScience, McGill University, Tech. Rep. SOCS-TR2012.1,Mar. 2012.
[31] A. Koudri and J. Champeau, “MODAL: A SPEM Extensionto Improve Co-design Process Models,” in ICSP’10Proceedings of the 2010 international conference onNew modeling concepts for today’s software processes, ser.Lecture Notes in Computer Science, J. Munch, Y. Yang,and W. Schafer, Eds., vol. 6195. Springer, 2010, pp.248–259. [Online]. Last accessed June 2013. Available:http://dx.doi.org/10.1007/978-3-642-14347-2 22
[32] R. Bendraou, B. Combemale, X. Cregut, and M. P. Gervais,“Definition of an Executable SPEM 2.0,” in SoftwareEngineering Conference, 2007. APSEC 2007. 14th Asia-Pacific. IEEE, Dec. 2007, pp. 390–397. [Online]. Lastaccessed June 2013. Available: http://dx.doi.org/10.1109/aspec.2007.60
[33] B. Polgar, I. Rath, Z. Szatmari, A. Horvath, and I. Majzik,“Model-based Integration, Execution and Certification of De-velopment Tool-chains,” in Workshop on model driven tooland process integration, Jun. 2009.
[34] G. Karsai, A. Lang, and S. Neema, “Design patterns foropen tool integration,” Software and Systems Modeling,vol. 4, no. 2, pp. 157–170, May 2005. [Online]. Lastaccessed June 2013. Available: http://dx.doi.org/10.1007/s10270-004-0073-y
[35] A. Balogh, G. Bergmann, G. Csertan, L. Gonczy, Horvath,I. Majzik, A. Pataricza, B. Polgar, I. Rath, D. Varro, andG. Varro, “Workflow-driven tool integration using modeltransformations,” in Graph transformations and model-drivenengineering, G. Engels, C. Lewerentz, W. Schafer, A. Schurr,and B. Westfechtel, Eds. Springer-Verlag, 2010, ch. 10,pp. 224–248. [Online]. Last accessed June 2013. Available:http://portal.acm.org/citation.cfm?id=1985534
119
International Journal on Advances in Software, vol 6 no 1 & 2, year 2013, http://www.iariajournals.org/software/
2013, © Copyright by authors, Published under agreement with IARIA - www.iaria.org
Towards an Approach for Analysing the Strategic Alignment
of Software Requirements using Quantified Goal Graphs
Richard Ellis-Braithwaite1
Russell Lock1
Ray Dawson1
Badr Haque2
1Computer Science, Loughborough University
2Rolls-Royce Plc.
Leicestershire, United Kingdom
Derby, United Kingdom
[email protected], [email protected], [email protected], [email protected]
Abstract—Analysing the strategic alignment of software re-
quirements primarily provides assurance to stakeholders that
the software-to-be will add value to the organization. Addi-
tionally, such analysis can improve a requirement by disam-
biguating its purpose and value, thereby supporting validation
and value-oriented decisions in requirements engineering pro-
cesses, such as prioritization, release planning, and tradeoff
analysis. We review current approaches that could enable such
an analysis. We focus on Goal Oriented Requirements Engineer-
ing methodologies, since goal graphs are well suited for relating
software goals to business goals. However, we argue that unless
the extent of goal-goal contribution is quantified with verifiable
metrics, goal graphs are not sufficient for demonstrating the
strategic alignment of software requirements. Since the con-
cept of goal contribution is predictive, what results is a forecast
of the benefits of implementing software requirements. Thus,
we explore how the description of the contribution relationship
can be enriched with concepts such as uncertainty and confi-
dence, non-linear causation, and utility. We introduce the ap-
proach using an example software project from Rolls-Royce.
Keywords—Requirements Engineering; Strategic Alignment;
Quantified Goal Graphs; Requirements Traceability
I. INTRODUCTION
This paper describes in more detail the concepts and the technique originally presented at the 7
th International Con-
ference on Software Engineering Advances [1]. It extends the work namely through a more comprehensive literature review, and the introduction of multi-point goal contribution.
The growth of the strategic importance of IT [2] necessi-tates the need to ensure that software to be developed or procured is aligned with the strategic business objectives of the organization it will support [3]. Attaining this alignment is a non-trivial problem; firstly, decisions in the Require-ments Engineering (RE) phase are some of the most complex in the software development or procurement lifecycle [4], and secondly, there is a gulf of understanding between busi-ness strategists and IS/IT engineers [5]. If alignment were trivial and easy, then it would not have been the “top ranking concern” of business executives for the last two decades [6], over 150 papers would not have been published on the topic [7], and perhaps there would be less software features im-plemented but never used (currently half of all features [8]).
Decisions made in the requirements phase greatly affect the value of the resulting software, e.g., in requirements pri-oritisation, the selection of the least important requirements
allows costs to be cut by trading off the development of those requirements. The correctness of any such decision depends entirely on the availability of information about the choices available to the decision maker [9]. In this context, infor-mation about the value of a requirement, in particular, the causes and dependencies of value creation, is highly useful. Goal graphs are of great interest because they are well suited for visualising cause-effect, dependency, and hierarchical relationships between requirements [10].
This paper explores the suitability of goal graphs for demonstrating a software requirement’s strategic alignment. Current Goal Oriented Requirements Engineering (GORE) approaches primarily take a qualitative or subjective approach to describing goal contribution, such as GRL’s --,-,+,++ or [-100,100] scores [11]. As a result, any strategic alignment proposed by the use of goal graphs is not specific, measura-ble or testable. Proposed extensions by Van Lamsweerde [12] do not consider that a chain of linked goals may contain a variety of metrics that need to be translated in order to demonstrate strategic alignment. Additionally, the certainty, confidence, and credibility of the predicted contribution is not explored. A probabilistic layer for goal graphs is pro-posed in [13], which recognises that goals are often only partially satisfied by software requirements. However, the (often non-linear [14]) effects of the incomplete goal satis-faction on an organisation’s various levels of business strate-gy are not explored. Furthermore, current methods do not consider how goal contribution scores are elicited [15], and how their calculation affects the credibility and accuracy of the claimed benefits. This paper attempts to demonstrate how the above problems can be addressed, thereby improving the applicability of goal graphs for the problem of analysing the strategic alignment of software requirements. By making assumptions about business value explicit, our approach com-plements Value-Based Software Engineering (VBSE) [16].
We have developed and implemented our approach in partnership with an industrial partner (Rolls-Royce) to en-sure its usability and utility in real world settings. We use examples in the context of a software project for a Business Unit (BU) responsible for part of a Gas Turbine (GT) engine, henceforth referred to as GT-BU. The software will automate geometry design and analysis for engine components, as well as for their manufacturing tools such as casting molds. Simp-ly put, engineers will input the desired design parameters and the software will output the component’s geometry. At the time of our involvement with the project, some high level
120
International Journal on Advances in Software, vol 6 no 1 & 2, year 2013, http://www.iariajournals.org/software/
2013, © Copyright by authors, Published under agreement with IARIA - www.iaria.org
software requirements had already been elicited and defined according to the Volere template [17].
In Section II, we describe the problem that this paper ad-dresses. Then, in Section III, we define and describe the essential terminology and concepts, while in Section IV, we present and evaluate the extent to which existing solutions address it. Section V presents our approach and tool in order to address the gaps outlined in Section IV. We conclude in Section VI with the paper’s contributions and future work.
II. THE PROBLEM
Stakeholders responsible for a software project’s funding need to be able to demonstrate that the software they want to develop or purchase will be beneficial. Decision makers require granularity at the requirement level, rather than the project level, since individual software functionalities or qualities may significantly affect the benefit or cost of the software’s development or procurement. Furthermore, stake-holders performing requirements engineering processes where the benefit of a requirement is questioned (e.g., in prioritisation, release planning, trade-off, etc.) need to know how benefit is defined by the stakeholders, and then how the requirements (and their alternatives) contribute to it.
As an example of the problem that this paper examines, we introduce the following high-level software requirement taken from our example project: “While operating in an analysis solution domain and when demanded, the system shall run analysis models”. The rationale attached to this requirement is “So that structural integrity analysis models can be solved as part of an automated process”. Although the rationale hints at automation, the requirement’s benefit to the business and the potential for alignment with business strate-gy are unclear. In order to understand the latter (i.e., the alignment with business strategy), the extent to which the organisation wants to reduce the problems related to manual structural integrity analysis needs to be understood (i.e., it’s business objectives). In order to understand the former (i.e., the business value), the extent of the requirement’s contribu-tion to the problem-to-be-solved needs to be made clear, e.g., the extent that automation is likely to solve the problems related to manual structural integrity analysis. For example, if the manual process costs the business in terms of employee time and computing time, how much time is consumed, and at what cost? Then finally, to what extent will the software requirement’s successful (or partially successful) implemen-tation reduce the time consumption and cost?
To paraphrase Jackson & Zave [18], for every stated ben-efit (or an answer to “why?”), there is always a discoverable super benefit (i.e., benefit that arises from that benefit). For example, the slow and human resource intensive process may constrain the designer’s ability to innovate (by not being able to analyse new design ideas), which may ultimately harm the organisation’s competitive advantage. Many levels of benefit follow a requirement’s implementation. Each level provides the possibility of contributing to a business objec-tive at a different level of the organisation. There are argua-bly more levels of benefit than it would be sensible to ex-press within a requirement, since several requirements may achieve the same benefit, but their contribution will vary.
III. BACKGROUND TERMINOLOGY
Software Requirements A.
In 1977, Ross and Schoman stated that software require-ments “must say why a system is needed, based on current or foreseen conditions” as well as “what system features will serve and satisfy this context” [19]. Robertson & Robertson later expanded the concept of a “feature” by defining a re-quirement as: “something that a product must do or a quality that the product must have” [17], otherwise known as func-tional and non-functional requirements, respectively. It is worth noting here that, according to the “what, not how” [20] paradigm, software requirements are often incorrectly speci-fied in practice (i.e., they often describe how features should work, rather than what features should be implemented). Consequently, implementation bias may occur, unnecessarily constraining the design space. Practitioners are not entirely to blame however, since the what and how separation is con-fusing. This is because a requirement describes both con-cepts at the same time, but at different levels of abstraction. For example, “print a report” is what the system should do, but also how the system should “make the report portable” – which again, is what the system should do, but also how the system should “make reports shareable”. The how and why aspects of a what statement are simply shifts in the level of the statement’s abstraction (down, and up, respectively).
Popular requirements engineering templates (e.g., Volere [17] and IEEE Std 830-1998 [21]) and meta models (e.g., SysML [22] and the Core Metamodel [23]) tend not to focus on the why aspect, typically addressing it by stipulating that rationale be attached to a requirement. However, rationale is not always an adequate description of why the requirement is valuable. If only one why question is asked about the re-quirement then the rationale can still be distant from the true problem to be solved (i.e., the essence of the requirement), and it may be defined without consideration of its wider implications. A stakeholder’s “line of sight” (i.e., the ability to relate low level requirements to high level business goals), and thus, the ability to determine the value of a requirement, depends on their ability to find answers to enough recursive why questions. Anecdotally, empirical studies at Toyota de-termined that the typical number of why questions required to reach the root cause of a problem is five (thus spawning the “five why’s” method popularised by Six Sigma) [24].
Strategic Alignment B.
Singh and Woo define business-IT strategic alignment as “the synergy between strategic business goals and IT goals” [7]. In the IT context, Van Lamsweerde defines the term “goal” as a prescriptive, optative statement (i.e., desired fu-ture state) about an objective that the system hopes to achieve [25]. In the business context, a goal is defined as an abstract indication of “what must be satisfied on a continuing basis to effectively attain the vision of the business” [26]. In order to relate the goals of the system to those of the busi-ness, an integrated definition of the terms used by business strategists and software developers is required. Furthermore, the first definition does not make “objective” distinct from “goal”. The Object Management Group (OMG) defines such
121
International Journal on Advances in Software, vol 6 no 1 & 2, year 2013, http://www.iariajournals.org/software/
2013, © Copyright by authors, Published under agreement with IARIA - www.iaria.org
terms in its Business Motivation Model (BMM) [26]. There, an objective is defined as a specific “statement of an attaina-ble, time-targeted, and measurable target that the enterprise seeks to meet in order to achieve its goals”. According to the definitions of goals and objectives provided by the BMM, the difference between a goal and an objective lies in the goal’s hardness (i.e., whether the goal’s satisfaction can be determined). Therefore, from now on, we use the terms “hard goal” and “objective” interchangeably.
Finally, the BMM defines that a collection of business objectives forms a business strategy [26], thus satisfaction of objectives leads to the satisfaction of the strategy. It logically follows that the extent to which a software requirement aligns to business strategy depends on the extent to which the requirement contributes to the satisfaction of the strategy’s objectives. Attempting to demonstrate a requirement’s strate-gic alignment to soft goals (e.g., “maximise profit”) would be inappropriate, since it would not be possible to describe the extent of the requirement’s contribution to the goal. Therefore, when demonstrating strategic alignment, require-ments should be related to objectives rather than goals.
IV. RELATED WORK
The following areas of research are related to analysing the strategic alignment of software requirements: (A) Value Based Software Engineering, (B) Goal Oriented Require-ments Engineering, (C) Strategic Alignment Approaches, (D) Quantitative Requirements and Metrics, and (E) Require-ments Traceability Approaches.
Value Based Software Engineering A.
The Value Based Software Engineering (VBSE) agenda is motivated by observations that most software projects fail because they don’t deliver stakeholder value, yet, much software engineering practice is done in a value-neutral set-ting (e.g., where project cost and schedule is tracked rather than value) [27]. Value Based Requirements Engineering (VBRE) takes the economic value of software systems into perspective through activities such as stakeholder identifica-tion, business case analysis, requirements prioritisation, and requirements negotiation [28]. The primary VBRE activities are Business Case Analysis (BCA) and Benefits Realization Analysis (BRA) [16]. Other VBRE activities such as prioriti-sation are considered secondary to these, since they depend on (and often start with) benefit estimation [29].
In its simplest form, BCA involves calculating a system’s Return on Investment (ROI) - which is the estimated finan-cial gain versus cost, defined in present value. While simple in definition, accurately calculating ROI is complex, since the validity of any concise financial figure depends on as-sumptions holding true, e.g., that independent variables re-main within expected intervals (e.g., time saved is between [x,y]). Estimating benefit involves further intricacies such as uncertainty and the translation of qualitative variables (e.g., the software user’s happiness) to quantitative benefits (e.g., sales revenue) - none of which are made explicit by BCA. An advancement from BCA in descriptiveness, e
3value mod-
elling seeks to understand the economic value of a system by mapping value exchanges between actors, ultimately leading
to financial analysis such as discounted cash flow [30]. However, it does not address how economic value creation is linked to requirements, nor are links between value creation and business strategy attempted.
BRA’s fundamental concept is the Results Chain [2], which visually demonstrates traceability between an initia-tive (i.e., a new software system) and its outcomes (i.e., ben-efits) using a directed graph, where nodes represent initia-tives, outcomes, and assumptions, while edges represent contribution links. BRA’s contribution links allow one initia-tive to spawn multiple outcomes, but the links are not quanti-tative, e.g., outcome: “reduced time to deliver product” can contribute to outcome: “increased sales” if assumption: “de-livery time is an important buying criterion” holds true – but the quantitative relationship between “delivery time” and “sales increase” is not explored. This is problematic when outcomes are business objectives, since their satisfaction depends on the extent that they are contributed to, e.g., in the case of a cost reduction objective, the primary concern is the amount of reduction that is contributed by the actions.
In summary, neither BCA nor BRA estimates the benefit of individual requirements, but rather for whole systems. A similar criticism also applies to the majority of requirements prioritisation methods, as a systematic literature review “found no methods which estimate benefit for [primary] individual requirements” [29], nor were any found which derive the benefits of secondary requirements from their contribution to primary requirements. In this context, prima-ry refers to stakeholder requirements or business objectives while secondary refers to those derived from the primary requirements (e.g., a refined functional requirement).
Goal Oriented Requirements Engineering (GORE) B.
GORE seeks to provide answers to “why?” software functionality should exist. The most well-known GORE methodologies include KAOS [31], i* [32] and GRL [33]. Such methodologies produce goal graphs whereby goals at a high level represent the end state that should be achieved and lower level goals represent possible means to that end. A goal graph is traversed upwards in order to understand why a goal should be satisfied and downwards to understand how that goal could be satisfied. In this context, a requirement is a low level goal, which is simply a means to achieving an end (a high level goal). Other related concepts such as resources, beliefs and obstacles are typically related to goals to describe what a goal’s satisfaction requires, while agents (or actors) indicate which stakeholders are responsible for (or depend on) a goal’s satisfaction. Relationships between goals are typically represented by means-end links, where optional AND/OR constraints represent alternative options for satis-ficing a goal. Contribution links are enhanced means-end links, in that they describe the extent to which a goal con-tributes to the achievement of another. However, “extent” is usually defined in terms of sufficiency and necessity (logic), not as in the quantitative extent of the contribution [34].
i. Goal-Goal Contribution Links
Contribution links are usually annotated with a score or a weight, to represent the degree of contribution made by the
122
International Journal on Advances in Software, vol 6 no 1 & 2, year 2013, http://www.iariajournals.org/software/
2013, © Copyright by authors, Published under agreement with IARIA - www.iaria.org
goal. Three approaches for applying scores to contribution links in goals graphs are described by Van Lamsweerde [12]:
1. Subjective qualitative scores e.g., --, -, +, ++. 2. Subjective quantified scores e.g., -100 to 100. 3. Objective gauge variable (i.e., a measured quantity
predicted to be increased, reduced, etc.). After evaluating the above approaches, Van Lamsweerde
concludes that the specification of contribution scores with objective gauge variables (the third option) is the most ap-propriate for deciding among alternatives, due to its verifia-bility and rooting in observable phenomena. Of course, the subjective approaches are no doubt quicker to use, but their sole use risks misunderstanding the actual contribution mechanism. A comprehensive comparison of the qualitative contribution reasoning techniques can be found in [35].
Just as objective contribution scoring adds rigour and testability to the task of deciding between alternatives, the same applies to the task of demonstrating alignment to busi-ness objectives. Thus, contribution scores should be quanti-fied in terms of the contribution likely to be made to the objective. Our rationale is that, by definition, objectives are quantitatively prescribed, and reasoning qualitatively about degrees of satisfaction of a quantitative target is highly am-biguous. Additionally, this will allow the contribution scores to be verifiable so that they (as predictions) may be later compared to actual results in the evaluation stage of the pro-ject. It must be noted here, however, that this option is not without its disadvantages - empirical studies in requirements prioritisation show that practitioners find providing subjec-tive data far easier than objective data [36]. A parallel can be drawn here to the decision analysis field, where inferior (i.e., qualitative) processes have found favour with decision mak-ers because “they do not force you to think very hard” [9].
Van Lamsweerde goes on to explain how alternative goal (i.e., requirement) options can be evaluated by predicting contributions made by goals to soft goals (which define the qualities to be used for comparison) [12]. However, in the prescribed approach, the relationship between the soft goals and the predicted benefit to be gained by their achievement is not made explicit. In other words, the contribution scores are not abstracted to different levels of benefit such that they may eventually relate to business objectives. Each of these potential benefit abstractions require that the metrics used to measure contribution (and satisfaction) are translated (e.g., from time saved to money saved). Furthermore, the expected values allocated to the objective gauge variables are single-point representations of inconstant and variable phenomena. For example, when estimating the number of interactions re-quired to “arrange a meeting via email” – an alternative re-quirement option taken from the paper’s meeting scheduling system example – a single number does not describe the possible variance, or how that variance can affect the desired end. This is important for predicting strategic alignment, since variance in a requirement’s satisfaction is likely [13], and it will affect the satisfaction of the related business objective(s).
GORE approaches typically describe a goal’s benefit rel-ative to other goals with an importance or weight attribute [12], where importance is a qualitative label (e.g., high, me-dium, low) and weight is a percentage (where the total of all
assigned weights is 100%). Both of these approaches are ambiguous and subjective, and are not traceable to observa-ble benefits, e.g., alignment with business objectives.
A probabilistic layer for quantified goal graphs is pro-posed in [13] to represent the variance of goal contributions in terms of probability density functions (pdf’s). However, effects of the variance on the satisfaction of high level goals, or business objectives, are not described. To use the example provided in the paper, the effects of an ambulance arriving at a scene within 8, 14, or 16 minutes (i.e., satisfaction of the target exceedingly, completely, or partially) are not described in the context of the benefits of doing so – i.e., to what extent will some problem(s) be affected given these possible goal satisfaction levels. If this is not explored, then it might be that there are no significant benefits to be gained at certain intervals of goal satisfaction levels (note that this point is more significant for non-life-threating systems). Thus, if a goal is defined with a specific target (e.g., target arrival time) in mind, without the rationale for doing so explored as fur-ther goal abstractions, then satisfying that goal may not be worthwhile - “wrong decisions may be taken if they are based on wrong objectives” [13]. Furthermore, probabilistic approaches have limited applications (pdf’s are not often available and are time consuming to construct), and do not capture stakeholder “attitude, preference and likings” [15].
ii. The Goal-oriented Requirements Language (GRL)
Given the choice of GORE methodologies, we chose to focus on and adopt GRL [33] for the following reasons:
1. GRL’s diagrammatic notation is well known within the RE community (since it originates from i*) [33].
2. i* (GRL’s primary component) has been shown to be the most suitable for modelling Information Sys-tem (IS) strategic alignment according to the strate-gy map concept (GRL not included in review) [37].
3. GRL has an ontology describing its modelling con-cepts (where others are described informally) [34].
4. GRL was recently made an international standard through ITU specification Z.151 [11].
GRL integrates the core concepts of i* and the NFR Framework [33] (where i* inherits the qualitative goal con-tribution mechanism from NFR [32]), but GRL adds to i* the capability to express contributions quantitatively. Thus, goal contributions in GRL can be specified with either subjective numeric scores (interval [-100,100]) or qualitative labels (one of --,-,+,++) [33], i.e., the first and second options outlined in Van Lamsweerde’s paper [12]. For example, a time reduction goal might contribute to an overall-cost sav-ing goal with a contribution weight of 67 out of 100 with positive polarity (+). Such a contribution score is untestable and not grounded by observable phenomena. Moreover it is not refutable, which, according to Jackson [38], means that the description is inadequate because no one can dispute it. The only way such scales could be testable is if the goals were specified with fit criterions (e.g., a cost to be saved), which mapped to the scale, e.g., that they implied percentage satisfaction (which they do not). In which case, a 50/100 contribution might imply that 50% of a £20,000 annual cost saving will be achieved. However, this is only applicable for
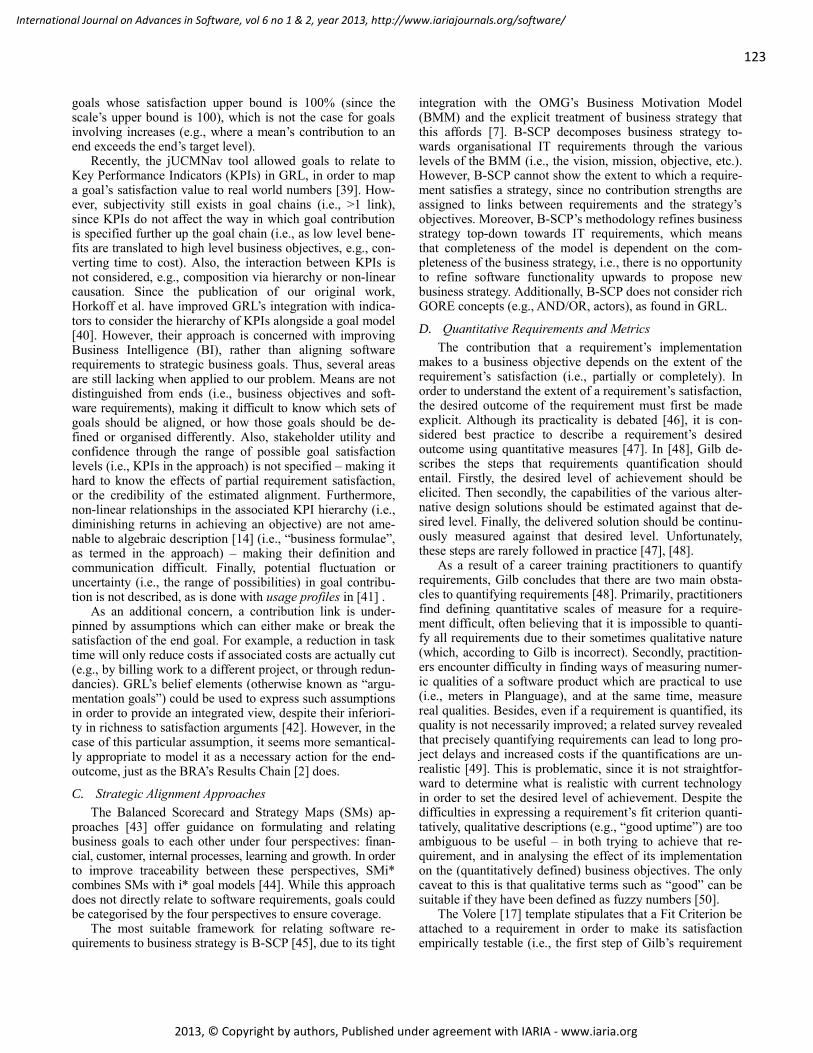
123
International Journal on Advances in Software, vol 6 no 1 & 2, year 2013, http://www.iariajournals.org/software/
2013, © Copyright by authors, Published under agreement with IARIA - www.iaria.org
goals whose satisfaction upper bound is 100% (since the scale’s upper bound is 100), which is not the case for goals involving increases (e.g., where a mean’s contribution to an end exceeds the end’s target level).
Recently, the jUCMNav tool allowed goals to relate to Key Performance Indicators (KPIs) in GRL, in order to map a goal’s satisfaction value to real world numbers [39]. How-ever, subjectivity still exists in goal chains (i.e., >1 link), since KPIs do not affect the way in which goal contribution is specified further up the goal chain (i.e., as low level bene-fits are translated to high level business objectives, e.g., con-verting time to cost). Also, the interaction between KPIs is not considered, e.g., composition via hierarchy or non-linear causation. Since the publication of our original work, Horkoff et al. have improved GRL’s integration with indica-tors to consider the hierarchy of KPIs alongside a goal model [40]. However, their approach is concerned with improving Business Intelligence (BI), rather than aligning software requirements to strategic business goals. Thus, several areas are still lacking when applied to our problem. Means are not distinguished from ends (i.e., business objectives and soft-ware requirements), making it difficult to know which sets of goals should be aligned, or how those goals should be de-fined or organised differently. Also, stakeholder utility and confidence through the range of possible goal satisfaction levels (i.e., KPIs in the approach) is not specified – making it hard to know the effects of partial requirement satisfaction, or the credibility of the estimated alignment. Furthermore, non-linear relationships in the associated KPI hierarchy (i.e., diminishing returns in achieving an objective) are not ame-nable to algebraic description [14] (i.e., “business formulae”, as termed in the approach) – making their definition and communication difficult. Finally, potential fluctuation or uncertainty (i.e., the range of possibilities) in goal contribu-tion is not described, as is done with usage profiles in [41] .
As an additional concern, a contribution link is under-pinned by assumptions which can either make or break the satisfaction of the end goal. For example, a reduction in task time will only reduce costs if associated costs are actually cut (e.g., by billing work to a different project, or through redun-dancies). GRL’s belief elements (otherwise known as “argu-mentation goals”) could be used to express such assumptions in order to provide an integrated view, despite their inferiori-ty in richness to satisfaction arguments [42]. However, in the case of this particular assumption, it seems more semantical-ly appropriate to model it as a necessary action for the end-outcome, just as the BRA’s Results Chain [2] does.
Strategic Alignment Approaches C.
The Balanced Scorecard and Strategy Maps (SMs) ap-proaches [43] offer guidance on formulating and relating business goals to each other under four perspectives: finan-cial, customer, internal processes, learning and growth. In order to improve traceability between these perspectives, SMi* combines SMs with i* goal models [44]. While this approach does not directly relate to software requirements, goals could be categorised by the four perspectives to ensure coverage.
The most suitable framework for relating software re-quirements to business strategy is B-SCP [45], due to its tight
integration with the OMG’s Business Motivation Model (BMM) and the explicit treatment of business strategy that this affords [7]. B-SCP decomposes business strategy to-wards organisational IT requirements through the various levels of the BMM (i.e., the vision, mission, objective, etc.). However, B-SCP cannot show the extent to which a require-ment satisfies a strategy, since no contribution strengths are assigned to links between requirements and the strategy’s objectives. Moreover, B-SCP’s methodology refines business strategy top-down towards IT requirements, which means that completeness of the model is dependent on the com-pleteness of the business strategy, i.e., there is no opportunity to refine software functionality upwards to propose new business strategy. Additionally, B-SCP does not consider rich GORE concepts (e.g., AND/OR, actors), as found in GRL.
Quantitative Requirements and Metrics D.
The contribution that a requirement’s implementation makes to a business objective depends on the extent of the requirement’s satisfaction (i.e., partially or completely). In order to understand the extent of a requirement’s satisfaction, the desired outcome of the requirement must first be made explicit. Although its practicality is debated [46], it is con-sidered best practice to describe a requirement’s desired outcome using quantitative measures [47]. In [48], Gilb de-scribes the steps that requirements quantification should entail. Firstly, the desired level of achievement should be elicited. Then secondly, the capabilities of the various alter-native design solutions should be estimated against that de-sired level. Finally, the delivered solution should be continu-ously measured against that desired level. Unfortunately, these steps are rarely followed in practice [47], [48].
As a result of a career training practitioners to quantify requirements, Gilb concludes that there are two main obsta-cles to quantifying requirements [48]. Primarily, practitioners find defining quantitative scales of measure for a require-ment difficult, often believing that it is impossible to quanti-fy all requirements due to their sometimes qualitative nature (which, according to Gilb is incorrect). Secondly, practition-ers encounter difficulty in finding ways of measuring numer-ic qualities of a software product which are practical to use (i.e., meters in Planguage), and at the same time, measure real qualities. Besides, even if a requirement is quantified, its quality is not necessarily improved; a related survey revealed that precisely quantifying requirements can lead to long pro-ject delays and increased costs if the quantifications are un-realistic [49]. This is problematic, since it is not straightfor-ward to determine what is realistic with current technology in order to set the desired level of achievement. Despite the difficulties in expressing a requirement’s fit criterion quanti-tatively, qualitative descriptions (e.g., “good uptime”) are too ambiguous to be useful – in both trying to achieve that re-quirement, and in analysing the effect of its implementation on the (quantitatively defined) business objectives. The only caveat to this is that qualitative terms such as “good” can be suitable if they have been defined as fuzzy numbers [50].
The Volere [17] template stipulates that a Fit Criterion be attached to a requirement in order to make its satisfaction empirically testable (i.e., the first step of Gilb’s requirement
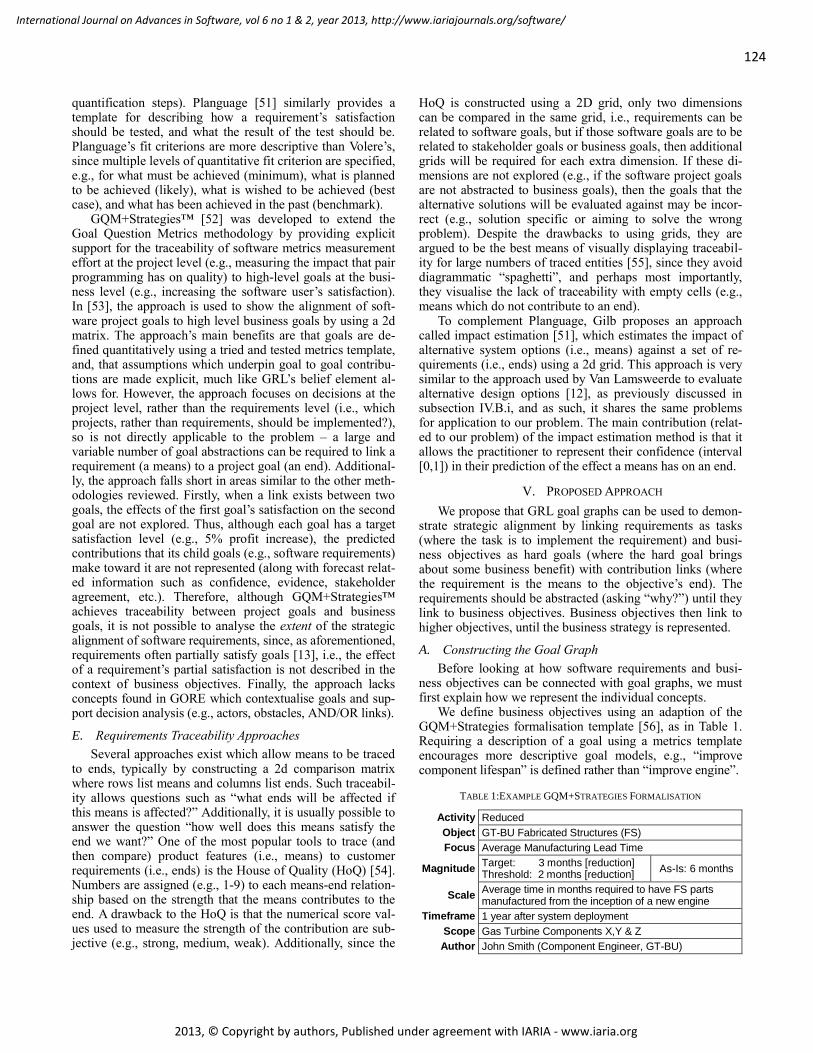
124
International Journal on Advances in Software, vol 6 no 1 & 2, year 2013, http://www.iariajournals.org/software/
2013, © Copyright by authors, Published under agreement with IARIA - www.iaria.org
quantification steps). Planguage [51] similarly provides a template for describing how a requirement’s satisfaction should be tested, and what the result of the test should be. Planguage’s fit criterions are more descriptive than Volere’s, since multiple levels of quantitative fit criterion are specified, e.g., for what must be achieved (minimum), what is planned to be achieved (likely), what is wished to be achieved (best case), and what has been achieved in the past (benchmark).
GQM+Strategies™ [52] was developed to extend the Goal Question Metrics methodology by providing explicit support for the traceability of software metrics measurement effort at the project level (e.g., measuring the impact that pair programming has on quality) to high-level goals at the busi-ness level (e.g., increasing the software user’s satisfaction). In [53], the approach is used to show the alignment of soft-ware project goals to high level business goals by using a 2d matrix. The approach’s main benefits are that goals are de-fined quantitatively using a tried and tested metrics template, and, that assumptions which underpin goal to goal contribu-tions are made explicit, much like GRL’s belief element al-lows for. However, the approach focuses on decisions at the project level, rather than the requirements level (i.e., which projects, rather than requirements, should be implemented?), so is not directly applicable to the problem – a large and variable number of goal abstractions can be required to link a requirement (a means) to a project goal (an end). Additional-ly, the approach falls short in areas similar to the other meth-odologies reviewed. Firstly, when a link exists between two goals, the effects of the first goal’s satisfaction on the second goal are not explored. Thus, although each goal has a target satisfaction level (e.g., 5% profit increase), the predicted contributions that its child goals (e.g., software requirements) make toward it are not represented (along with forecast relat-ed information such as confidence, evidence, stakeholder agreement, etc.). Therefore, although GQM+Strategies™ achieves traceability between project goals and business goals, it is not possible to analyse the extent of the strategic alignment of software requirements, since, as aforementioned, requirements often partially satisfy goals [13], i.e., the effect of a requirement’s partial satisfaction is not described in the context of business objectives. Finally, the approach lacks concepts found in GORE which contextualise goals and sup-port decision analysis (e.g., actors, obstacles, AND/OR links).
Requirements Traceability Approaches E.
Several approaches exist which allow means to be traced to ends, typically by constructing a 2d comparison matrix where rows list means and columns list ends. Such traceabil-ity allows questions such as “what ends will be affected if this means is affected?” Additionally, it is usually possible to answer the question “how well does this means satisfy the end we want?” One of the most popular tools to trace (and then compare) product features (i.e., means) to customer requirements (i.e., ends) is the House of Quality (HoQ) [54]. Numbers are assigned (e.g., 1-9) to each means-end relation-ship based on the strength that the means contributes to the end. A drawback to the HoQ is that the numerical score val-ues used to measure the strength of the contribution are sub-jective (e.g., strong, medium, weak). Additionally, since the
HoQ is constructed using a 2D grid, only two dimensions can be compared in the same grid, i.e., requirements can be related to software goals, but if those software goals are to be related to stakeholder goals or business goals, then additional grids will be required for each extra dimension. If these di-mensions are not explored (e.g., if the software project goals are not abstracted to business goals), then the goals that the alternative solutions will be evaluated against may be incor-rect (e.g., solution specific or aiming to solve the wrong problem). Despite the drawbacks to using grids, they are argued to be the best means of visually displaying traceabil-ity for large numbers of traced entities [55], since they avoid diagrammatic “spaghetti”, and perhaps most importantly, they visualise the lack of traceability with empty cells (e.g., means which do not contribute to an end).
To complement Planguage, Gilb proposes an approach called impact estimation [51], which estimates the impact of alternative system options (i.e., means) against a set of re-quirements (i.e., ends) using a 2d grid. This approach is very similar to the approach used by Van Lamsweerde to evaluate alternative design options [12], as previously discussed in subsection IV.B.i, and as such, it shares the same problems for application to our problem. The main contribution (relat-ed to our problem) of the impact estimation method is that it allows the practitioner to represent their confidence (interval [0,1]) in their prediction of the effect a means has on an end.
V. PROPOSED APPROACH
We propose that GRL goal graphs can be used to demon-strate strategic alignment by linking requirements as tasks (where the task is to implement the requirement) and busi-ness objectives as hard goals (where the hard goal brings about some business benefit) with contribution links (where the requirement is the means to the objective’s end). The requirements should be abstracted (asking “why?”) until they link to business objectives. Business objectives then link to higher objectives, until the business strategy is represented.
Constructing the Goal Graph A.
Before looking at how software requirements and busi-ness objectives can be connected with goal graphs, we must first explain how we represent the individual concepts.
We define business objectives using an adaption of the GQM+Strategies formalisation template [56], as in Table 1. Requiring a description of a goal using a metrics template encourages more descriptive goal models, e.g., “improve component lifespan” is defined rather than “improve engine”.
TABLE 1:EXAMPLE GQM+STRATEGIES FORMALISATION
Activity Reduced
Object GT-BU Fabricated Structures (FS)
Focus Average Manufacturing Lead Time
Magnitude Target: 3 months [reduction] Threshold: 2 months [reduction]
As-Is: 6 months
Scale Average time in months required to have FS parts manufactured from the inception of a new engine
Timeframe 1 year after system deployment
Scope Gas Turbine Components X,Y & Z
Author John Smith (Component Engineer, GT-BU)
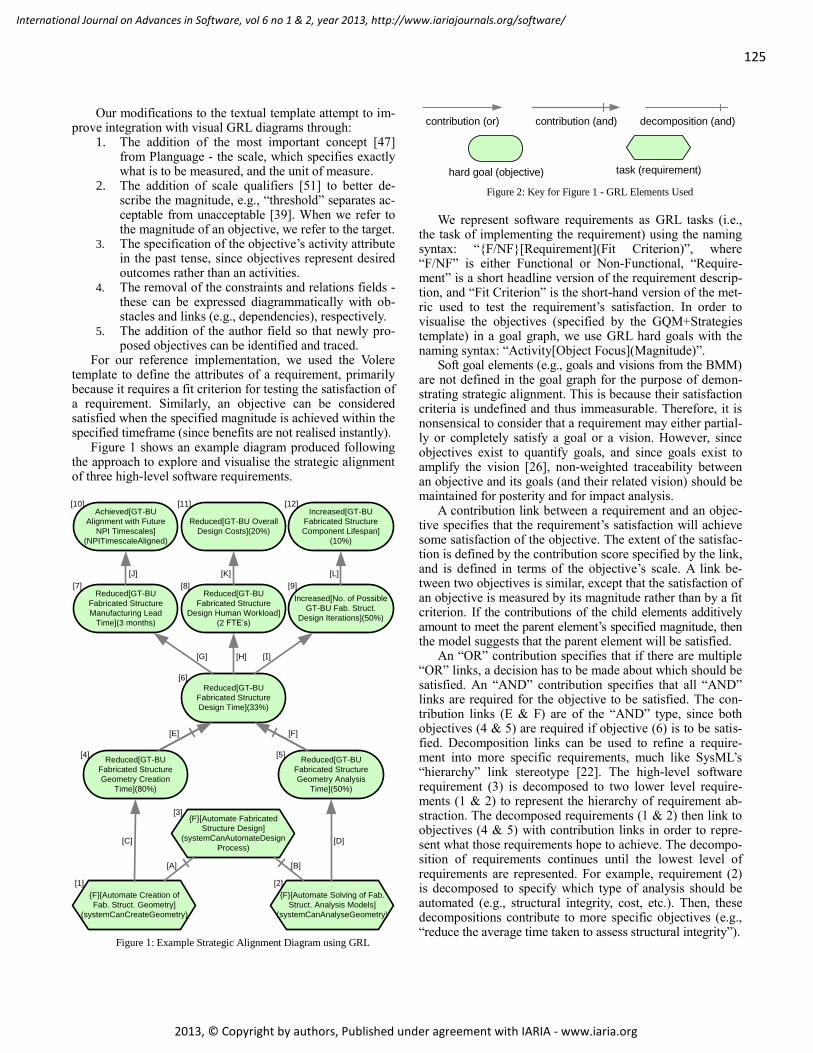
125
International Journal on Advances in Software, vol 6 no 1 & 2, year 2013, http://www.iariajournals.org/software/
2013, © Copyright by authors, Published under agreement with IARIA - www.iaria.org
Our modifications to the textual template attempt to im-prove integration with visual GRL diagrams through:
1. The addition of the most important concept [47] from Planguage - the scale, which specifies exactly what is to be measured, and the unit of measure.
2. The addition of scale qualifiers [51] to better de-scribe the magnitude, e.g., “threshold” separates ac-ceptable from unacceptable [39]. When we refer to the magnitude of an objective, we refer to the target.
3. The specification of the objective’s activity attribute in the past tense, since objectives represent desired outcomes rather than an activities.
4. The removal of the constraints and relations fields - these can be expressed diagrammatically with ob-stacles and links (e.g., dependencies), respectively.
5. The addition of the author field so that newly pro-posed objectives can be identified and traced.
For our reference implementation, we used the Volere template to define the attributes of a requirement, primarily because it requires a fit criterion for testing the satisfaction of a requirement. Similarly, an objective can be considered satisfied when the specified magnitude is achieved within the specified timeframe (since benefits are not realised instantly).
Figure 1 shows an example diagram produced following the approach to explore and visualise the strategic alignment of three high-level software requirements.
Achieved[GT-BU
Alignment with Future
NPI Timescales]
(NPITimescaleAligned)
Reduced[GT-BU Overall
Design Costs](20%)
Increased[GT-BU
Fabricated Structure
Component Lifespan]
(10%)
Reduced[GT-BU
Fabricated Structure
Manufacturing Lead
Time](3 months)
Reduced[GT-BU
Fabricated Structure
Design Human Workload]
(2 FTE’s)
Increased[No. of Possible
GT-BU Fab. Struct.
Design Iterations](50%)
Reduced[GT-BU
Fabricated Structure
Design Time](33%)
Reduced[GT-BU
Fabricated Structure
Geometry Analysis
Time](50%)
Reduced[GT-BU
Fabricated Structure
Geometry Creation
Time](80%)
F[Automate Creation of
Fab. Struct. Geometry]
(systemCanCreateGeometry)
F[Automate Fabricated
Structure Design]
(systemCanAutomateDesign
Process)
F[Automate Solving of Fab.
Struct. Analysis Models]
(systemCanAnalyseGeometry)
[C]
[A] [B]
[D]
[1] [2]
[4] [5]
[3]
[6]
[E] [F]
[G] [H] [I]
[J] [K] [L]
[12][11][10]
[9][8][7]
Figure 1: Example Strategic Alignment Diagram using GRL
Figure 2: Key for Figure 1 - GRL Elements Used
We represent software requirements as GRL tasks (i.e.,
the task of implementing the requirement) using the naming syntax: “F/NF[Requirement](Fit Criterion)”, where “F/NF” is either Functional or Non-Functional, “Require-ment” is a short headline version of the requirement descrip-tion, and “Fit Criterion” is the short-hand version of the met-ric used to test the requirement’s satisfaction. In order to visualise the objectives (specified by the GQM+Strategies template) in a goal graph, we use GRL hard goals with the naming syntax: “Activity[Object Focus](Magnitude)”.
Soft goal elements (e.g., goals and visions from the BMM) are not defined in the goal graph for the purpose of demon-strating strategic alignment. This is because their satisfaction criteria is undefined and thus immeasurable. Therefore, it is nonsensical to consider that a requirement may either partial-ly or completely satisfy a goal or a vision. However, since objectives exist to quantify goals, and since goals exist to amplify the vision [26], non-weighted traceability between an objective and its goals (and their related vision) should be maintained for posterity and for impact analysis.
A contribution link between a requirement and an objec-tive specifies that the requirement’s satisfaction will achieve some satisfaction of the objective. The extent of the satisfac-tion is defined by the contribution score specified by the link, and is defined in terms of the objective’s scale. A link be-tween two objectives is similar, except that the satisfaction of an objective is measured by its magnitude rather than by a fit criterion. If the contributions of the child elements additively amount to meet the parent element’s specified magnitude, then the model suggests that the parent element will be satisfied.
An “OR” contribution specifies that if there are multiple “OR” links, a decision has to be made about which should be satisfied. An “AND” contribution specifies that all “AND” links are required for the objective to be satisfied. The con-tribution links (E & F) are of the “AND” type, since both objectives (4 & 5) are required if objective (6) is to be satis-fied. Decomposition links can be used to refine a require-ment into more specific requirements, much like SysML’s “hierarchy” link stereotype [22]. The high-level software requirement (3) is decomposed to two lower level require-ments (1 & 2) to represent the hierarchy of requirement ab-straction. The decomposed requirements (1 & 2) then link to objectives (4 & 5) with contribution links in order to repre-sent what those requirements hope to achieve. The decompo-sition of requirements continues until the lowest level of requirements are represented. For example, requirement (2) is decomposed to specify which type of analysis should be automated (e.g., structural integrity, cost, etc.). Then, these decompositions contribute to more specific objectives (e.g., “reduce the average time taken to assess structural integrity”).
contribution (or)
contribution (and)
decomposition (and)
hard goal (objective)
task (requirement)
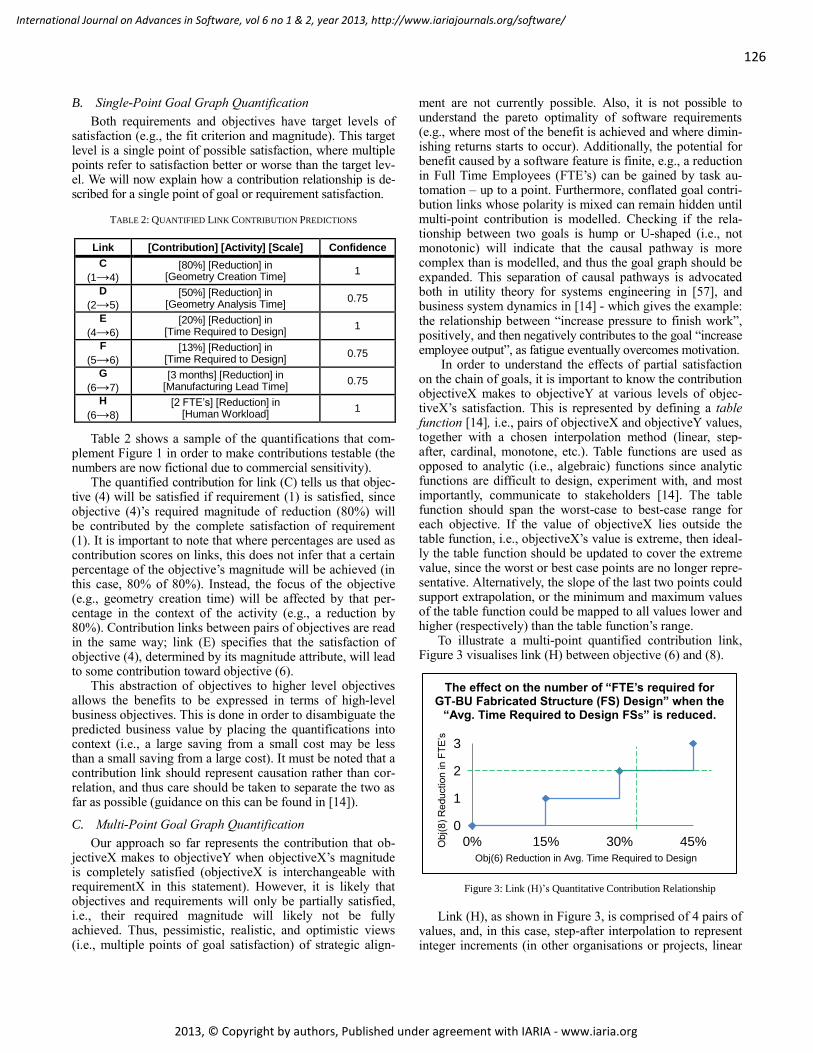
126
International Journal on Advances in Software, vol 6 no 1 & 2, year 2013, http://www.iariajournals.org/software/
2013, © Copyright by authors, Published under agreement with IARIA - www.iaria.org
Single-Point Goal Graph Quantification B.
Both requirements and objectives have target levels of satisfaction (e.g., the fit criterion and magnitude). This target level is a single point of possible satisfaction, where multiple points refer to satisfaction better or worse than the target lev-el. We will now explain how a contribution relationship is de-scribed for a single point of goal or requirement satisfaction.
TABLE 2: QUANTIFIED LINK CONTRIBUTION PREDICTIONS
Table 2 shows a sample of the quantifications that com-
plement Figure 1 in order to make contributions testable (the numbers are now fictional due to commercial sensitivity).
The quantified contribution for link (C) tells us that objec-tive (4) will be satisfied if requirement (1) is satisfied, since objective (4)’s required magnitude of reduction (80%) will be contributed by the complete satisfaction of requirement (1). It is important to note that where percentages are used as contribution scores on links, this does not infer that a certain percentage of the objective’s magnitude will be achieved (in this case, 80% of 80%). Instead, the focus of the objective (e.g., geometry creation time) will be affected by that per-centage in the context of the activity (e.g., a reduction by 80%). Contribution links between pairs of objectives are read in the same way; link (E) specifies that the satisfaction of objective (4), determined by its magnitude attribute, will lead to some contribution toward objective (6).
This abstraction of objectives to higher level objectives allows the benefits to be expressed in terms of high-level business objectives. This is done in order to disambiguate the predicted business value by placing the quantifications into context (i.e., a large saving from a small cost may be less than a small saving from a large cost). It must be noted that a contribution link should represent causation rather than cor-relation, and thus care should be taken to separate the two as far as possible (guidance on this can be found in [14]).
Multi-Point Goal Graph Quantification C.
Our approach so far represents the contribution that ob-jectiveX makes to objectiveY when objectiveX’s magnitude is completely satisfied (objectiveX is interchangeable with requirementX in this statement). However, it is likely that objectives and requirements will only be partially satisfied, i.e., their required magnitude will likely not be fully achieved. Thus, pessimistic, realistic, and optimistic views (i.e., multiple points of goal satisfaction) of strategic align-
ment are not currently possible. Also, it is not possible to understand the pareto optimality of software requirements (e.g., where most of the benefit is achieved and where dimin-ishing returns starts to occur). Additionally, the potential for benefit caused by a software feature is finite, e.g., a reduction in Full Time Employees (FTE’s) can be gained by task au-tomation – up to a point. Furthermore, conflated goal contri-bution links whose polarity is mixed can remain hidden until multi-point contribution is modelled. Checking if the rela-tionship between two goals is hump or U-shaped (i.e., not monotonic) will indicate that the causal pathway is more complex than is modelled, and thus the goal graph should be expanded. This separation of causal pathways is advocated both in utility theory for systems engineering in [57], and business system dynamics in [14] - which gives the example: the relationship between “increase pressure to finish work”, positively, and then negatively contributes to the goal “increase employee output”, as fatigue eventually overcomes motivation.
In order to understand the effects of partial satisfaction on the chain of goals, it is important to know the contribution objectiveX makes to objectiveY at various levels of objec-tiveX’s satisfaction. This is represented by defining a table function [14], i.e., pairs of objectiveX and objectiveY values, together with a chosen interpolation method (linear, step-after, cardinal, monotone, etc.). Table functions are used as opposed to analytic (i.e., algebraic) functions since analytic functions are difficult to design, experiment with, and most importantly, communicate to stakeholders [14]. The table function should span the worst-case to best-case range for each objective. If the value of objectiveX lies outside the table function, i.e., objectiveX’s value is extreme, then ideal-ly the table function should be updated to cover the extreme value, since the worst or best case points are no longer repre-sentative. Alternatively, the slope of the last two points could support extrapolation, or the minimum and maximum values of the table function could be mapped to all values lower and higher (respectively) than the table function’s range.
To illustrate a multi-point quantified contribution link, Figure 3 visualises link (H) between objective (6) and (8).
Figure 3: Link (H)’s Quantitative Contribution Relationship
Link (H), as shown in Figure 3, is comprised of 4 pairs of
values, and, in this case, step-after interpolation to represent integer increments (in other organisations or projects, linear
Link [Contribution] [Activity] [Scale] Confidence
C
(1→4) [80%] [Reduction] in
[Geometry Creation Time] 1
D
(2→5) [50%] [Reduction] in
[Geometry Analysis Time] 0.75
E
(4→6)
[20%] [Reduction] in [Time Required to Design]
1
F
(5→6)
[13%] [Reduction] in [Time Required to Design]
0.75
G
(6→7)
[3 months] [Reduction] in [Manufacturing Lead Time]
0.75
H
(6→8)
[2 FTE’s] [Reduction] in [Human Workload]
1
0
1
2
3
0% 15% 30% 45%Obj(
8)
Re
du
ction
in
FT
E’s
Obj(6) Reduction in Avg. Time Required to Design
The effect on the number of “FTE’s required for GT-BU Fabricated Structure (FS) Design” when the
“Avg. Time Required to Design FSs” is reduced.
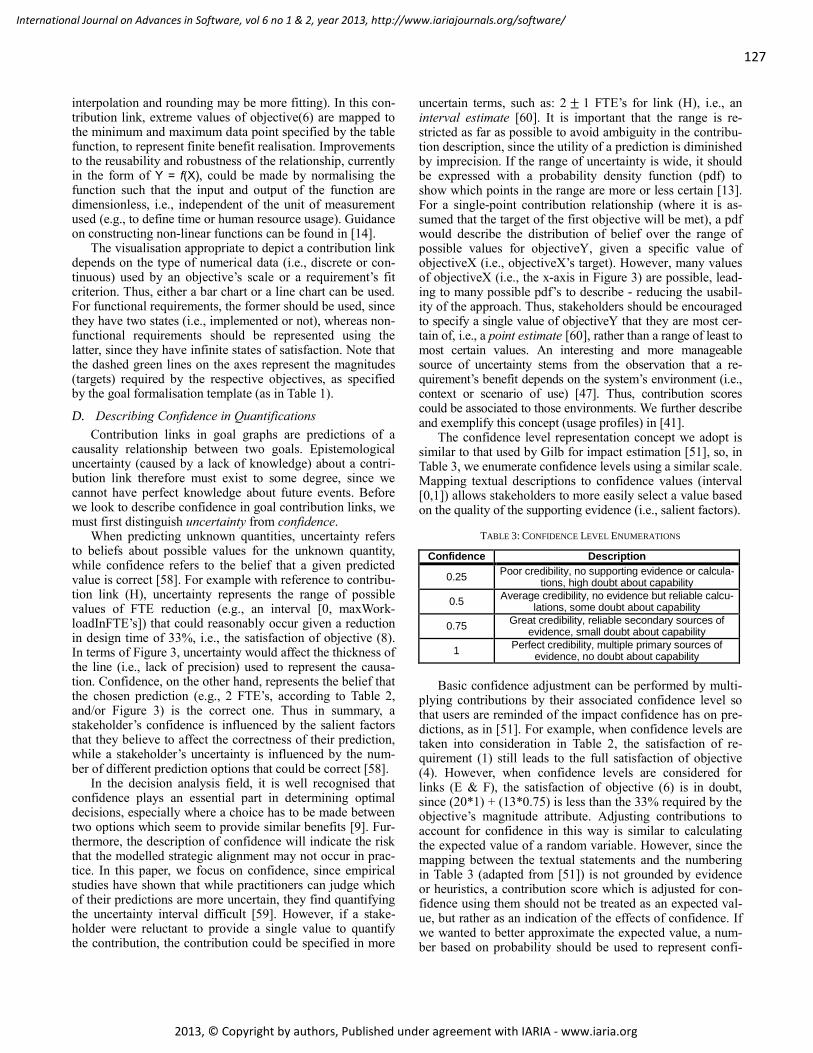
127
International Journal on Advances in Software, vol 6 no 1 & 2, year 2013, http://www.iariajournals.org/software/
2013, © Copyright by authors, Published under agreement with IARIA - www.iaria.org
interpolation and rounding may be more fitting). In this con-tribution link, extreme values of objective(6) are mapped to the minimum and maximum data point specified by the table function, to represent finite benefit realisation. Improvements to the reusability and robustness of the relationship, currently in the form of Y = f(X), could be made by normalising the function such that the input and output of the function are dimensionless, i.e., independent of the unit of measurement used (e.g., to define time or human resource usage). Guidance on constructing non-linear functions can be found in [14].
The visualisation appropriate to depict a contribution link depends on the type of numerical data (i.e., discrete or con-tinuous) used by an objective’s scale or a requirement’s fit criterion. Thus, either a bar chart or a line chart can be used. For functional requirements, the former should be used, since they have two states (i.e., implemented or not), whereas non-functional requirements should be represented using the latter, since they have infinite states of satisfaction. Note that the dashed green lines on the axes represent the magnitudes (targets) required by the respective objectives, as specified by the goal formalisation template (as in Table 1).
Describing Confidence in Quantifications D.
Contribution links in goal graphs are predictions of a causality relationship between two goals. Epistemological uncertainty (caused by a lack of knowledge) about a contri-bution link therefore must exist to some degree, since we cannot have perfect knowledge about future events. Before we look to describe confidence in goal contribution links, we must first distinguish uncertainty from confidence.
When predicting unknown quantities, uncertainty refers to beliefs about possible values for the unknown quantity, while confidence refers to the belief that a given predicted value is correct [58]. For example with reference to contribu-tion link (H), uncertainty represents the range of possible values of FTE reduction (e.g., an interval [0, maxWork-loadInFTE’s]) that could reasonably occur given a reduction in design time of 33%, i.e., the satisfaction of objective (8). In terms of Figure 3, uncertainty would affect the thickness of the line (i.e., lack of precision) used to represent the causa-tion. Confidence, on the other hand, represents the belief that the chosen prediction (e.g., 2 FTE’s, according to Table 2, and/or Figure 3) is the correct one. Thus in summary, a stakeholder’s confidence is influenced by the salient factors that they believe to affect the correctness of their prediction, while a stakeholder’s uncertainty is influenced by the num-ber of different prediction options that could be correct [58].
In the decision analysis field, it is well recognised that confidence plays an essential part in determining optimal decisions, especially where a choice has to be made between two options which seem to provide similar benefits [9]. Fur-thermore, the description of confidence will indicate the risk that the modelled strategic alignment may not occur in prac-tice. In this paper, we focus on confidence, since empirical studies have shown that while practitioners can judge which of their predictions are more uncertain, they find quantifying the uncertainty interval difficult [59]. However, if a stake-holder were reluctant to provide a single value to quantify the contribution, the contribution could be specified in more
uncertain terms, such as: 2 ± 1 FTE’s for link (H), i.e., an interval estimate [60]. It is important that the range is re-stricted as far as possible to avoid ambiguity in the contribu-tion description, since the utility of a prediction is diminished by imprecision. If the range of uncertainty is wide, it should be expressed with a probability density function (pdf) to show which points in the range are more or less certain [13]. For a single-point contribution relationship (where it is as-sumed that the target of the first objective will be met), a pdf would describe the distribution of belief over the range of possible values for objectiveY, given a specific value of objectiveX (i.e., objectiveX’s target). However, many values of objectiveX (i.e., the x-axis in Figure 3) are possible, lead-ing to many possible pdf’s to describe - reducing the usabil-ity of the approach. Thus, stakeholders should be encouraged to specify a single value of objectiveY that they are most cer-tain of, i.e., a point estimate [60], rather than a range of least to most certain values. An interesting and more manageable source of uncertainty stems from the observation that a re-quirement’s benefit depends on the system’s environment (i.e., context or scenario of use) [47]. Thus, contribution scores could be associated to those environments. We further describe and exemplify this concept (usage profiles) in [41].
The confidence level representation concept we adopt is similar to that used by Gilb for impact estimation [51], so, in Table 3, we enumerate confidence levels using a similar scale. Mapping textual descriptions to confidence values (interval [0,1]) allows stakeholders to more easily select a value based on the quality of the supporting evidence (i.e., salient factors).
TABLE 3: CONFIDENCE LEVEL ENUMERATIONS
Confidence Description
0.25 Poor credibility, no supporting evidence or calcula-
tions, high doubt about capability
0.5 Average credibility, no evidence but reliable calcu-
lations, some doubt about capability
0.75 Great credibility, reliable secondary sources of
evidence, small doubt about capability
1 Perfect credibility, multiple primary sources of
evidence, no doubt about capability
Basic confidence adjustment can be performed by multi-
plying contributions by their associated confidence level so that users are reminded of the impact confidence has on pre-dictions, as in [51]. For example, when confidence levels are taken into consideration in Table 2, the satisfaction of re-quirement (1) still leads to the full satisfaction of objective (4). However, when confidence levels are considered for links (E & F), the satisfaction of objective (6) is in doubt, since (20*1) + (13*0.75) is less than the 33% required by the objective’s magnitude attribute. Adjusting contributions to account for confidence in this way is similar to calculating the expected value of a random variable. However, since the mapping between the textual statements and the numbering in Table 3 (adapted from [51]) is not grounded by evidence or heuristics, a contribution score which is adjusted for con-fidence using them should not be treated as an expected val-ue, but rather as an indication of the effects of confidence. If we wanted to better approximate the expected value, a num-ber based on probability should be used to represent confi-
128
International Journal on Advances in Software, vol 6 no 1 & 2, year 2013, http://www.iariajournals.org/software/
2013, © Copyright by authors, Published under agreement with IARIA - www.iaria.org
dence [58], i.e., the answer to such a question: if the re-quirement were implemented a large number of times, what percentage of those times would the stated contribution be contributed? Formulating an answer to such a question de-pends on the experiences of the stakeholders in implement-ing similar requirements in similar projects in a similar envi-ronment. Similarity in this sense is difficult to achieve, since there are many socio-technical variables that can affect the benefits realised by a software project or a particular feature.
Additional confidence levels could be associated to the user’s predictions to represent how qualified that user is at predicting contribution scores. For example, someone who has implemented similar systems should be able to provide more accurate predictions than someone who has not. The accuracy of a person’s previous predictions (i.e., their credi-bility) could also be considered in order to improve the relia-bility of the predictions (i.e., calibrated confidence levels).
Describing the Utility of a Goal’s Satisfaction E.
One important value consideration is so far, untreated: “what is the benefit in achieving a root goal to various de-grees of satisfaction?” i.e., business objectives that do not contribute to other business objectives, such as objective (12). Root objectives exist when the business has not defined any objectives higher than the objective, and where it would not make sense for them to have done so. To address this, we map various levels of a root goal’s satisfaction to degrees of utility [9], whereby various levels of “goodness” can be achieved. For example, referring to objective (12), various levels of component lifespan improvement map to utility values (interval [0,1]). This allows the representation of non-linear relationships between component lifespan improve-ment and the associated benefit; perhaps after a 60% im-provement on the average component’s lifespan, there is no more benefit to be gained since the engine would be retired before the component would fail. Thus, the utility of a 60% improvement would peak at 1. The concept of utility is both subjective and specific to the stakeholder who assigned it. However, capturing it will explain the criticality of a root goal’s satisfaction criteria, and differences in utility assign-ment between stakeholders will be made apparent for con-flict resolution before the requirement is implemented.
Note that the maximum utility of some goal satisfaction is defined in isolation from other goals. That is to say that the maximum utility value (i.e., 1) should be defined for each root goal, and then weights can be assigned to those root goals to determine the relative utility of some goal satisfac-tion, in the context of the system-to-be as a whole. This is done in order to decide on the relative importance of root goals, as in [61]. Pairwise comparison or balance beam dia-grams can be used to decide on, and refine the weights [57].
Describing & Monitoring As-Is Values for Goals F.
Wherever the magnitude attribute of an objective (and re-lated contribution scores) is/are specified a percentage, it is especially important that the objective’s as-is value is de-scribed. Otherwise, it is not possible to later verify that the magnitude (i.e., change) has happened. These values can then be recorded over time in order to evaluate the system (valida-
tion) and provide a benchmark for future improvement. Fur-thermore, prescribed goal satisfaction levels and predicted goal contribution levels, in current and future projects, can then be made more realistic through a feedback mechanism.
Describing Assumptions or Necessary Goals G.
When a contribution link is made between two goals, there may be an implicit assumption behind it, e.g., that some other phenomenon will occur which will enable the contribu-tion. Without this assumption holding true, the contribution made by the contributing goal would be inhibited. For exam-ple, Figure 1’s contribution link (K) is underpinned by the assumption that, given a reduction in human workload, some design costs can be reduced. While this may seem trivial to highlight, the actual cost reducing mechanism (perhaps re-dundancy) is often a thorny issue, and it should be communi-cated as early as possible for conflict resolution. To describe this assumption, either a GRL belief node can be used, or a new task can be added as a decomposition of objective (11); in GRL, decomposition links represent necessity, while con-tribution links represent sufficiency and polarity (+ive or -ive).
Intended Context of Use H.
We suggest that this approach should be performed after the high-level requirements have been elicited, so that re-sources are not wasted eliciting lower level requirements that do not align well to business strategy. It is especially im-portant that the strategic alignment of solution oriented re-quirements (i.e., specified for the machine [38]) is explored, since they do not explain the problem to be solved.
It is important to note that software engineers and busi-ness analysts may not know the objectives (or the goals and visions, for that matter) at different levels of the business (i.e., the project, the business unit, the department, the over-all business, etc.). Therefore, managers should work with stakeholders to define the business objectives before the requirements can be abstracted toward them. Indeed, it is likely that some software requirements will be abstracted toward business objectives that were not previously elicited.
Users may resist quantifying benefits of requirements, especially for non-functional requirements where the subject may be intangible, however, Gilb has found that it has al-ways been possible to do so in his experience (e.g., by poll-ing customers to quantify customer satisfaction) and has provided guidance on doing so in [51]. Even if the quantifica-tions cannot be elicited at first, providing a scale by which the objective’s success will be measured improves the definition of the objective by reducing ambiguity, as aforementioned. Where stakeholders are unable to explain the causal relation-ship between a requirement and higher goals, the risk that the contribution may not occur as expected will have been indicated.
While we have focused on the benefits of software re-quirements, both sides of the value equation need to be consid-ered (i.e., costs). Effort estimation models such as COCOMO [62] would be useful in predicting the cost of a requirement.
Tool Support I.
Tool support (GoalViz) has been developed (free to download at [63]) to support the approach through:
129
International Journal on Advances in Software, vol 6 no 1 & 2, year 2013, http://www.iariajournals.org/software/
2013, © Copyright by authors, Published under agreement with IARIA - www.iaria.org
Input support for requirements, objectives, and con-tribution data (with graphical function input).
Automatic diagram drawing to focus the user on the approach and data rather than the graph layout.
Project libraries to facilitate learning about the con-tributions predicted in previous projects to improve future quantification of confidence assignment.
Automatic evaluation and summarisation of chains of links to enable efficient understanding.
What-if analysis allowing comparison of outcomes for different inputs where there is some uncertainty.
VI. CONCLUSION AND FUTURE WORK
The presented approach facilitates the disambiguation of a requirement’s business value through the enrichment of contribution links in a goal graph. The approach is descrip-tive (a goal is abstracted to describe the underlying problem), prescriptive (a certain amount of goal satisfaction is re-quired), and predictive (a quantitative goal contribution score predicts how much of the prescription will be achieved by the means). This paper’s unique contribution includes:
1. We have argued that the strategic alignment of software requirements depends on the contribution they make to business objectives, and since they are quantitative in nature, reasoning about the contribu-tion made toward them should also be quantitative.
2. We have argued that since strategic alignment is based on predictions of benefit, confidence (and sometimes uncertainty) should be made explicit.
3. We have shown that the non-linear dynamics of contribution links can be explored as quantitative causation relationships (defined with table func-tions) through more than one level of goal abstrac-tion, in order to understand the effects of partial re-quirement satisfaction on high level goals.
Future work will evaluate this approach (and those relat-ed to it) against required capabilities elicited from our indus-trial partners. We have outlined two case studies within dif-ferent industrial settings, such that the benefits and challeng-es can be evaluated in the context of a range of domains. Feedback resulting from the evaluations in industry will be used to improve the approach and the tool. Planned investi-gations into optimising the utility and the usability of the approach include empirically evaluating the:
1. extent to which stakeholder utility functions for a goal’s satisfaction can be aggregated to represent the preferences and uncertainty of a collective;
2. optimal representation of uncertainty, confidence, and credibility in the causal relationships;
3. optimal way (especially with regards to reusability) to specify the causal relationship between two vari-ables (i.e., gauge variables, KPIs, or goal satisfac-tion levels), e.g., with causal loop diagrams and di-mensionless table functions using Vensim® [14], or specifying “business formulae” as in [40];
4. optimal way to maintain traceability between re-quirements and design artefacts, perhaps through SysML Requirements [22] and a GRL UML profile.
ACKNOWLEDGEMENTS
The authors wish to thank Ralph Boyce from Rolls-Royce for his valued participation and feedback in this pro-ject, and also Rolls-Royce for granting permission to publish.
REFERENCES
[1] R. Ellis-Braithwaite, R. Lock, R. Dawson, and B. Haque,
“Modelling the Strategic Alignment of Software Require-
ments using Goal Graphs,” in 7th International Conference
on Software Engineering Advances, 2012, pp. 524–529.
[2] J. Thorp, The Information Paradox: Realizing the Business
Benefits of Information Technology. McGraw-Hill, 1999.
[3] A. Aurum and C. Wohlin, “Aligning requirements with busi-
ness objectives: A framework for requirements engineering
decisions,” in Requirements Engineering Decision Support
Workshop, 2005.
[4] Frederick P. Brooks, The Mythical Man Month and Other
Essays on Software Engineering, 2nd ed. Addison Wesley, 1995.
[5] J Luftman, “Assessing business-IT alignment maturity,”
Commun Assoc Inf Syst 4, Article 4, 2000.
[6] J. Luftman and T. Ben-Zvi, “Key Issues for IT Executives
2011: Cautious Optimism in Uncertain Economic Times,”
MIS Quarterly Executive, vol. 10, no. 4, 2011.
[7] S. Singh and C. Woo, “Investigating business-IT alignment
through multi-disciplinary goal concepts,” Requirements En-
gineering, vol. 14, no. 3, pp. 177–207, 2009.
[8] The Standish Group, “CHAOS Summary for 2010,” 2010.
[9] R. A. Howard, “The foundations of decision analysis revisit-
ed,” Advances in decision analysis: From foundations to ap-
plications, pp. 32–56, 2007.
[10] A. van Lamsweerde, “Requirements engineering: from craft
to discipline,” in 16th ACM SIGSOFT FSE, 2008, pp. 238–249.
[11] International Telecommunication Union, “Z.151 : User re-
quirements notation (URN) - Language definition.” [Online].
Available: http://www.itu.int/rec/T-REC-Z.151/en. [Ac-
cessed: 02-Jul-2012].
[12] A. Van Lamsweerde, “Reasoning about alternative require-
ments options,” Conceptual Modeling: Foundations and Ap-
plications, pp. 380–397, 2009.
[13] E. Letier and A. Van Lamsweerde, “Reasoning about partial
goal satisfaction for requirements and design engineering,”
in ACM SIGSOFT SEN, 2004, vol. 29, pp. 53–62.
[14] J. Sterman, Business Dynamics: Systems Thinking and Mod-
eling for a Complex World. McGraw-Hill/Irwin, 2000.
[15] S. Liaskos, R. Jalman, and J. Aranda, “On eliciting contribu-
tion measures in goal models,” in 20th IEEE RE, 2012, pp.
221 –230.
[16] B. Boehm, “Value-based software engineering: Seven key
elements and ethical considerations,” Value-Based Software
Engineering, pp. 109–132, 2006.
[17] S. Roberson and J. Robertson, “Volere: Requirements
Specifcation Template.” The Atlantic Systems Guild, 2012.
[18] M. Jackson and P. Zave, “Four Dark Corners of Require-
ments Engineering,” ACM TOSEM, vol. 6, no. 1, 1997.
[19] D. T. Ross and K. E. Schoman Jr, “Structured analysis for
requirements definition,” IEEE TSE, no. 1, pp. 6–15, 1977.
[20] R. Stevens, Systems Engineering: Coping With Complexity.
Pearson Education, 1998.
[21] The Institute of Electrical and Electronics Engineers, IEEE
Std 830-1998: IEEE Recommended Practice for Software
Requirements Specifications. IEEE-SA Standards Board, 1998.
130
International Journal on Advances in Software, vol 6 no 1 & 2, year 2013, http://www.iariajournals.org/software/
2013, © Copyright by authors, Published under agreement with IARIA - www.iaria.org
[22] M. S. Soares and J. Vrancken, “Model-driven user require-
ments specification using SysML,” Journal of Software, vol.
3, no. 6, pp. 57–68, 2008.
[23] A. Goknil, I. Kurtev, and K. van den Berg, “A metamodeling
approach for reasoning about requirements,” in Model Driven
Architecture–Foundations and Applications, 2008, pp. 310–325.
[24] T. Ōno, Toyota Production System: Beyond Large-Scale
Production. Productivity Press, 1988.
[25] A. Van Lamsweerde, “Goal-oriented requirements engineer-
ing: A guided tour,” 5th IEEE RE, pp. 249–262, 2001.
[26] Object Management Group, “BMM 1.1.” [Online]. Availa-
ble: http://www.omg.org/spec/BMM/1.1/. [Accessed: 16-
Mar-2012].
[27] B. Boehm, “Value-Based Software Engineering: Overview
and Agenda,” USC-CSE-2005-504, Feb. 2005.
[28] J. M. Akkermans and J. Gordijn, “Value-based requirements
engineering: exploring innovative e-commerce ideas,” Re-
quirements Engineering, vol. 8, no. 2, pp. 114–134, Jul. 2003.
[29] A. Herrmann and M. Daneva, “Requirements Prioritization
Based on Benefit and Cost Prediction: An Agenda for Future
Research,” in 16th IEEE RE, 2008, pp. 125 –134.
[30] J. Gordijn, E. Yu, and B. van der Raadt, “E-service design
using i* and e3value modeling,” IEEE Software, vol. 23, no.
3, pp. 26–33, 2006.
[31] A. Dardenne, A. Van Lamsweerde, and S. Fickas, “Goal-
directed requirements acquisition,” Science of Computer
Programming, vol. 20, no. 1–2, pp. 3–50, Apr. 1993.
[32] E. Yu, “Modelling Strategic Relationships for Process Ren-
gineering,” University of Toronto, 1995.
[33] D. Amyot, S. Ghanavati, J. Horkoff, G. Mussbacher, L.
Peyton, and E. Yu, “Evaluating goal models within the goal-
oriented requirement language,” International Journal of In-
telligent Systems, vol. 25, no. 8, pp. 841–877, 2010.
[34] L. Liu, “GRL Ontology,” University of Toronto Computer
Science. [Online]. Available:
http://www.cs.toronto.edu/km/GRL/grl_syntax.html. [Ac-
cessed: 14-Aug-2012].
[35] J. Horkoff and E. Yu, “Comparison and evaluation of goal-
oriented satisfaction analysis techniques,” Requirements
Eng, pp. 1–24, 2012.
[36] J. Karlsson, “Software requirements prioritizing,” in 2nd
IEEE RE, 1996, pp. 110 –116.
[37] A. Babar, B. Wong, and A. Q. Gill, “An evaluation of the
goal-oriented approaches for modelling strategic alignment
concept,” in 5th IEEE RCIS, 2011, pp. 1 –8.
[38] M. Jackson, Software requirements & specifications: a lexi-
con of practice, principles, and prejudices. ACM Press, 1995.
[39] A. Pourshahid, D. Amyot, L. Peyton, S. Ghanavati, P. Chen,
M. Weiss, and A. J. Forster, “Business process management
with the user requirements notation,” Electronic Commerce
Research, vol. 9, no. 4, pp. 269–316, Aug. 2009.
[40] J. Horkoff, D. Barone, L. Jiang, E. Yu, D. Amyot, A. Bor-
gida, and J. Mylopoulos, “Strategic business modeling: repre-
sentation and reasoning,” Softw Syst Model, pp. 1–27, 2012.
[41] R. Ellis-Braithwaite, “Analysing the Assumed Benefits of
Software Requirements,” in 19th REFSQ, Proceedings of the
Workshops and the Doctoral Symposium, 2013.
[42] N. Maiden, J. Lockerbie, D. Randall, S. Jones, and D. Bush,
“Using Satisfaction Arguments to Enhance i* Modelling of an Air
Traffic Management System,” in 15th IEEE RE, 2007, pp. 49 –52.
[43] R. S. Kaplan and D. P. Norton, “Linking the balanced scorecard
to strategy,” California Management Review, vol. 39, no. 1, 1996.
[44] A. Babar, D. Zowghi, and E. Chew, “Using Goals to Model
Strategy Map for Business IT Alignment,” in 5th BUSITAL, 2010.
[45] S. J. Bleistein, K. Cox, J. Verner, and K. T. Phalp, “B-SCP: A
requirements analysis framework for validating strategic
alignment of organizational IT based on strategy, context,
and process,” Information and Software Technology, vol. 48,
no. 9, pp. 846–868, Sep. 2006.
[46] T. Gilb and A. Cockburn, “Point/Counterpoint,” IEEE Soft-
ware, vol. 25, no. 2, pp. 64 –67, Apr. 2008.
[47] N. Maiden, “Improve Your Requirements: Quantify Them,”
Software, IEEE, vol. 23, no. 6, pp. 68 –69, Dec. 2006.
[48] T. Gilb, “What’s Wrong With Agile Methods? Some Princi-
ples and Values to Encourage Quantification,” in Agile Soft-
ware Development Quality Assurance, Information Science
Reference, 2007.
[49] N. Juristo, A. M. Moreno, and A. Silva, “Is the European
industry moving toward solving requirements engineering
problems?,” IEEE Software, vol. 19, no. 6, pp. 70 – 77, 2002.
[50] J. Yen and W. A. Tiao, “A systematic tradeoff analysis for
conflicting imprecise requirements,” in 3rd IEEE RE, 1997,
pp. 87 –96.
[51] T. Gilb, Competitive Engineering: A Handbook For Systems
Engineering, Requirements Engineering, and Software Engi-
neering Using Planguage. Butterworth-Heinemann Ltd, 2005.
[52] V. Basili, J. Heidrich, M. Lindvall, J. Münch, M. Regardie,
D. Rombach, C. Seaman, and A. Trendowicz, “Bridging the
gap between business strategy and software development,”
in 28th ICIS, 2007, pp. 1–16.
[53] A. Trendowicz, J. Heidrich, and K. Shintani, “Aligning
Software Projects with Business Objectives,” in 21st IWSM-
MENSURA, 2011, pp. 142 –150.
[54] J. R. Hauser and D. Clausing, “The house of quality,” Har-
vard Business Review, pp. 63–73, 1988.
[55] D. L. Moody, P. Heymans, and R. Matulevičius, “Visual
syntax does matter: improving the cognitive effectiveness of
the i* visual notation,” Requirements Engineering, vol. 15,
no. 2, pp. 141–175, Jun. 2010.
[56] V. Mandić, V. Basili, L. Harjumaa, M. Oivo, and J. Markku-
la, “Utilizing GQM+Strategies for business value analysis:
an approach for evaluating business goals,” in ACM-IEEE
ESEM, New York, NY, USA, 2010, pp. 20:1–20:10.
[57] D. M. Buede, The Engineering Design of Systems: Models
and Methods. John Wiley & Sons, 2011.
[58] D. K. Peterson and G. F. Pitz, “Confidence, uncertainty, and the
use of information,” Journal of Experimental Psychology: Learn-
ing, Memory, and Cognition, vol. 14, no. 1, pp. 85–92, 1988.
[59] A. Herrmann, “REFSQ 2011 Live Experiment about Risk-
Based Requirements Prioritization: The Influence of Word-
ing and Metrics,” in 17th REFSQ, Proceedings of the Empir-
ical Track, 2011.
[60] R A. Kent, “Estimation,” in Data Construction and Data
Analysis for Survey Research, 2001.
[61] W. Heaven, D. Sykes, J. Magee, and J. Kramer, “A case
study in goal-driven architectural adaptation,” Software En-
gineering for Self-Adaptive Systems, pp. 109–127, 2009.
[62] B. Boehm, B. Clark, E. Horowitz, C. Westland, R. Madachy,
and R. Selby, “Cost models for future software life cycle
processes: COCOMO 2.0,” Annals of Software Engineering,
vol. 1, no. 1, pp. 57–94, 1995.
[63] R. Ellis-Braithwaite, “GoalViz Tool.” [Online]. Available:
http://www.goalviz.info/IJAS/index.html. [Accessed: 10-
Jan-2013].
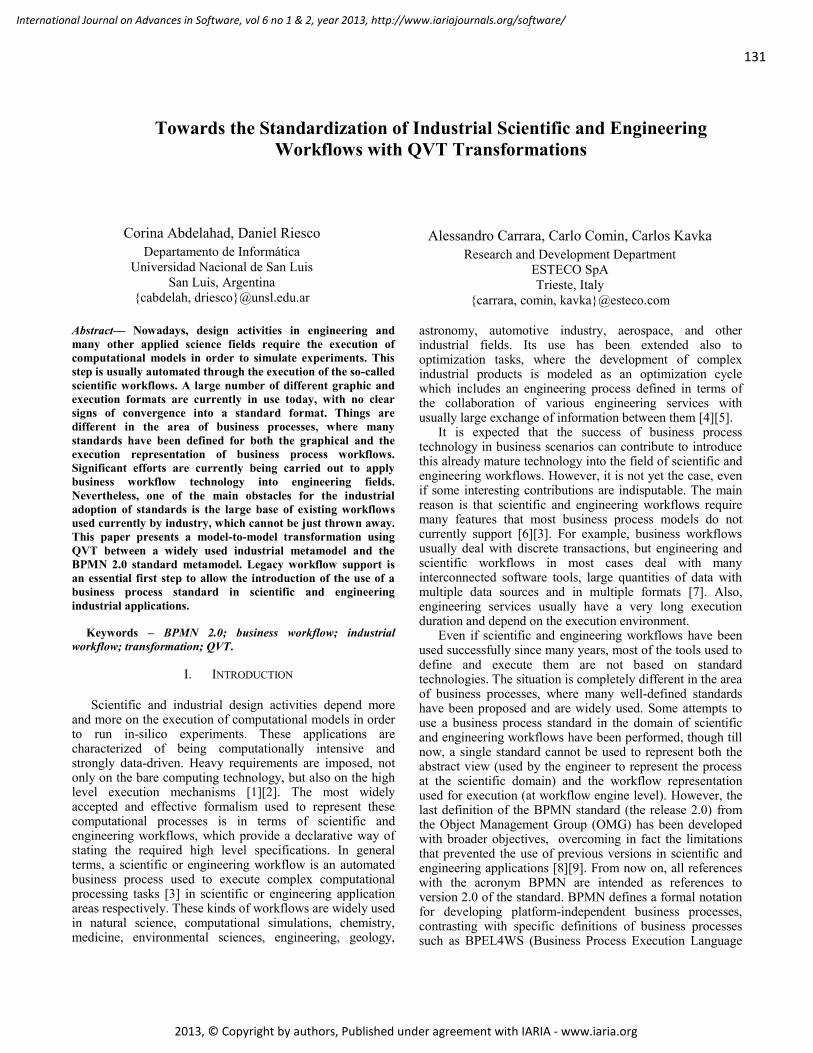
131
International Journal on Advances in Software, vol 6 no 1 & 2, year 2013, http://www.iariajournals.org/software/
2013, © Copyright by authors, Published under agreement with IARIA - www.iaria.org
Towards the Standardization of Industrial Scientific and Engineering
Workflows with QVT Transformations
Corina Abdelahad, Daniel Riesco
Departamento de Informática
Universidad Nacional de San Luis
San Luis, Argentina
cabdelah, [email protected]
Alessandro Carrara, Carlo Comin, Carlos Kavka
Research and Development Department
ESTECO SpA
Trieste, Italy
carrara, comin, [email protected]
Abstract— Nowadays, design activities in engineering and
many other applied science fields require the execution of
computational models in order to simulate experiments. This
step is usually automated through the execution of the so-called
scientific workflows. A large number of different graphic and
execution formats are currently in use today, with no clear
signs of convergence into a standard format. Things are
different in the area of business processes, where many
standards have been defined for both the graphical and the
execution representation of business process workflows.
Significant efforts are currently being carried out to apply
business workflow technology into engineering fields.
Nevertheless, one of the main obstacles for the industrial
adoption of standards is the large base of existing workflows
used currently by industry, which cannot be just thrown away.
This paper presents a model-to-model transformation using
QVT between a widely used industrial metamodel and the
BPMN 2.0 standard metamodel. Legacy workflow support is
an essential first step to allow the introduction of the use of a
business process standard in scientific and engineering
industrial applications.
Keywords – BPMN 2.0; business workflow; industrial
workflow; transformation; QVT.
I. INTRODUCTION
Scientific and industrial design activities depend more and more on the execution of computational models in order to run in-silico experiments. These applications are characterized of being computationally intensive and strongly data-driven. Heavy requirements are imposed, not only on the bare computing technology, but also on the high level execution mechanisms [1][2]. The most widely accepted and effective formalism used to represent these computational processes is in terms of scientific and engineering workflows, which provide a declarative way of stating the required high level specifications. In general terms, a scientific or engineering workflow is an automated business process used to execute complex computational processing tasks [3] in scientific or engineering application areas respectively. These kinds of workflows are widely used in natural science, computational simulations, chemistry, medicine, environmental sciences, engineering, geology,
astronomy, automotive industry, aerospace, and other industrial fields. Its use has been extended also to optimization tasks, where the development of complex industrial products is modeled as an optimization cycle which includes an engineering process defined in terms of the collaboration of various engineering services with usually large exchange of information between them [4][5].
It is expected that the success of business process technology in business scenarios can contribute to introduce this already mature technology into the field of scientific and engineering workflows. However, it is not yet the case, even if some interesting contributions are indisputable. The main reason is that scientific and engineering workflows require many features that most business process models do not currently support [6][3]. For example, business workflows usually deal with discrete transactions, but engineering and scientific workflows in most cases deal with many interconnected software tools, large quantities of data with multiple data sources and in multiple formats [7]. Also, engineering services usually have a very long execution duration and depend on the execution environment.
Even if scientific and engineering workflows have been used successfully since many years, most of the tools used to define and execute them are not based on standard technologies. The situation is completely different in the area of business processes, where many well-defined standards have been proposed and are widely used. Some attempts to use a business process standard in the domain of scientific and engineering workflows have been performed, though till now, a single standard cannot be used to represent both the abstract view (used by the engineer to represent the process at the scientific domain) and the workflow representation used for execution (at workflow engine level). However, the last definition of the BPMN standard (the release 2.0) from the Object Management Group (OMG) has been developed with broader objectives, overcoming in fact the limitations that prevented the use of previous versions in scientific and engineering applications [8][9]. From now on, all references with the acronym BPMN are intended as references to version 2.0 of the standard. BPMN defines a formal notation for developing platform-independent business processes, contrasting with specific definitions of business processes such as BPEL4WS (Business Process Execution Language
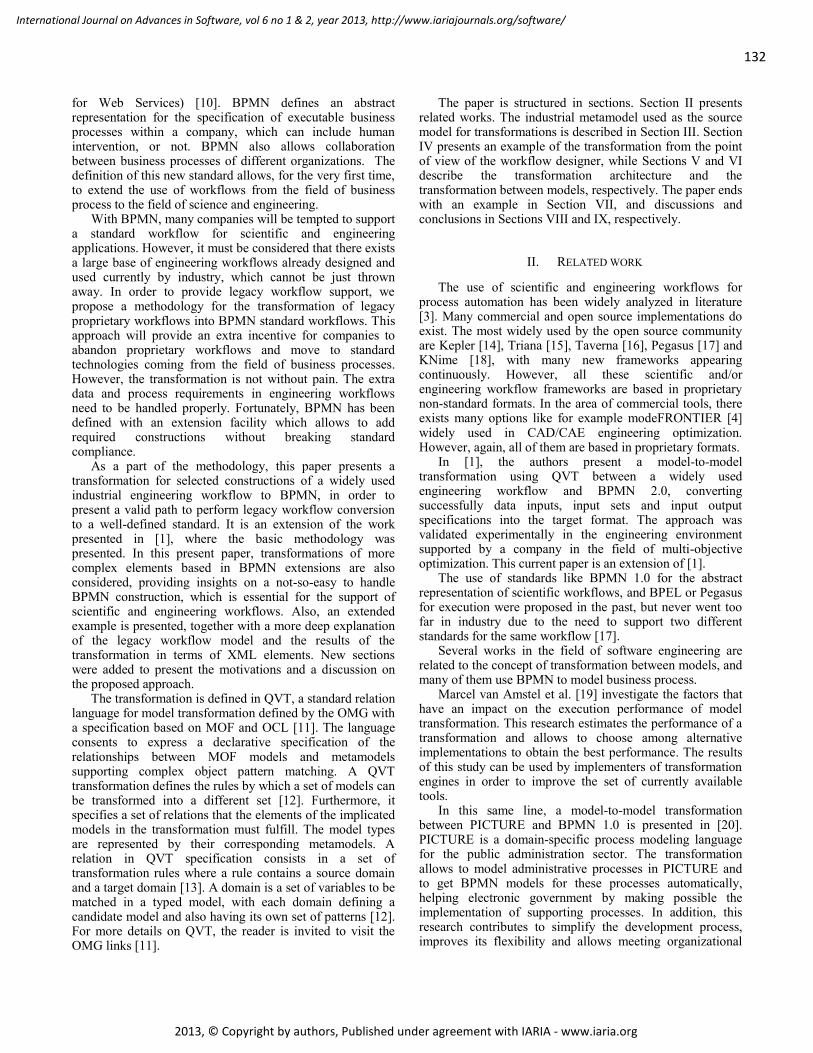
132
International Journal on Advances in Software, vol 6 no 1 & 2, year 2013, http://www.iariajournals.org/software/
2013, © Copyright by authors, Published under agreement with IARIA - www.iaria.org
for Web Services) [10]. BPMN defines an abstract representation for the specification of executable business processes within a company, which can include human intervention, or not. BPMN also allows collaboration between business processes of different organizations. The definition of this new standard allows, for the very first time, to extend the use of workflows from the field of business process to the field of science and engineering.
With BPMN, many companies will be tempted to support a standard workflow for scientific and engineering applications. However, it must be considered that there exists a large base of engineering workflows already designed and used currently by industry, which cannot be just thrown away. In order to provide legacy workflow support, we propose a methodology for the transformation of legacy proprietary workflows into BPMN standard workflows. This approach will provide an extra incentive for companies to abandon proprietary workflows and move to standard technologies coming from the field of business processes. However, the transformation is not without pain. The extra data and process requirements in engineering workflows need to be handled properly. Fortunately, BPMN has been defined with an extension facility which allows to add required constructions without breaking standard compliance.
As a part of the methodology, this paper presents a transformation for selected constructions of a widely used industrial engineering workflow to BPMN, in order to present a valid path to perform legacy workflow conversion to a well-defined standard. It is an extension of the work presented in [1], where the basic methodology was presented. In this present paper, transformations of more complex elements based in BPMN extensions are also considered, providing insights on a not-so-easy to handle BPMN construction, which is essential for the support of scientific and engineering workflows. Also, an extended example is presented, together with a more deep explanation of the legacy workflow model and the results of the transformation in terms of XML elements. New sections were added to present the motivations and a discussion on the proposed approach.
The transformation is defined in QVT, a standard relation language for model transformation defined by the OMG with a specification based on MOF and OCL [11]. The language consents to express a declarative specification of the relationships between MOF models and metamodels supporting complex object pattern matching. A QVT transformation defines the rules by which a set of models can be transformed into a different set [12]. Furthermore, it specifies a set of relations that the elements of the implicated models in the transformation must fulfill. The model types are represented by their corresponding metamodels. A relation in QVT specification consists in a set of transformation rules where a rule contains a source domain and a target domain [13]. A domain is a set of variables to be matched in a typed model, with each domain defining a candidate model and also having its own set of patterns [12]. For more details on QVT, the reader is invited to visit the OMG links [11].
The paper is structured in sections. Section II presents related works. The industrial metamodel used as the source model for transformations is described in Section III. Section IV presents an example of the transformation from the point of view of the workflow designer, while Sections V and VI describe the transformation architecture and the transformation between models, respectively. The paper ends with an example in Section VII, and discussions and conclusions in Sections VIII and IX, respectively.
II. RELATED WORK
The use of scientific and engineering workflows for process automation has been widely analyzed in literature [3]. Many commercial and open source implementations do exist. The most widely used by the open source community are Kepler [14], Triana [15], Taverna [16], Pegasus [17] and KNime [18], with many new frameworks appearing continuously. However, all these scientific and/or engineering workflow frameworks are based in proprietary non-standard formats. In the area of commercial tools, there exists many options like for example modeFRONTIER [4] widely used in CAD/CAE engineering optimization. However, again, all of them are based in proprietary formats.
In [1], the authors present a model-to-model transformation using QVT between a widely used engineering workflow and BPMN 2.0, converting successfully data inputs, input sets and input output specifications into the target format. The approach was validated experimentally in the engineering environment supported by a company in the field of multi-objective optimization. This current paper is an extension of [1].
The use of standards like BPMN 1.0 for the abstract representation of scientific workflows, and BPEL or Pegasus for execution were proposed in the past, but never went too far in industry due to the need to support two different standards for the same workflow [17].
Several works in the field of software engineering are related to the concept of transformation between models, and many of them use BPMN to model business process.
Marcel van Amstel et al. [19] investigate the factors that have an impact on the execution performance of model transformation. This research estimates the performance of a transformation and allows to choose among alternative implementations to obtain the best performance. The results of this study can be used by implementers of transformation engines in order to improve the set of currently available tools.
In this same line, a model-to-model transformation between PICTURE and BPMN 1.0 is presented in [20]. PICTURE is a domain-specific process modeling language for the public administration sector. The transformation allows to model administrative processes in PICTURE and to get BPMN models for these processes automatically, helping electronic government by making possible the implementation of supporting processes. In addition, this research contributes to simplify the development process, improves its flexibility and allows meeting organizational
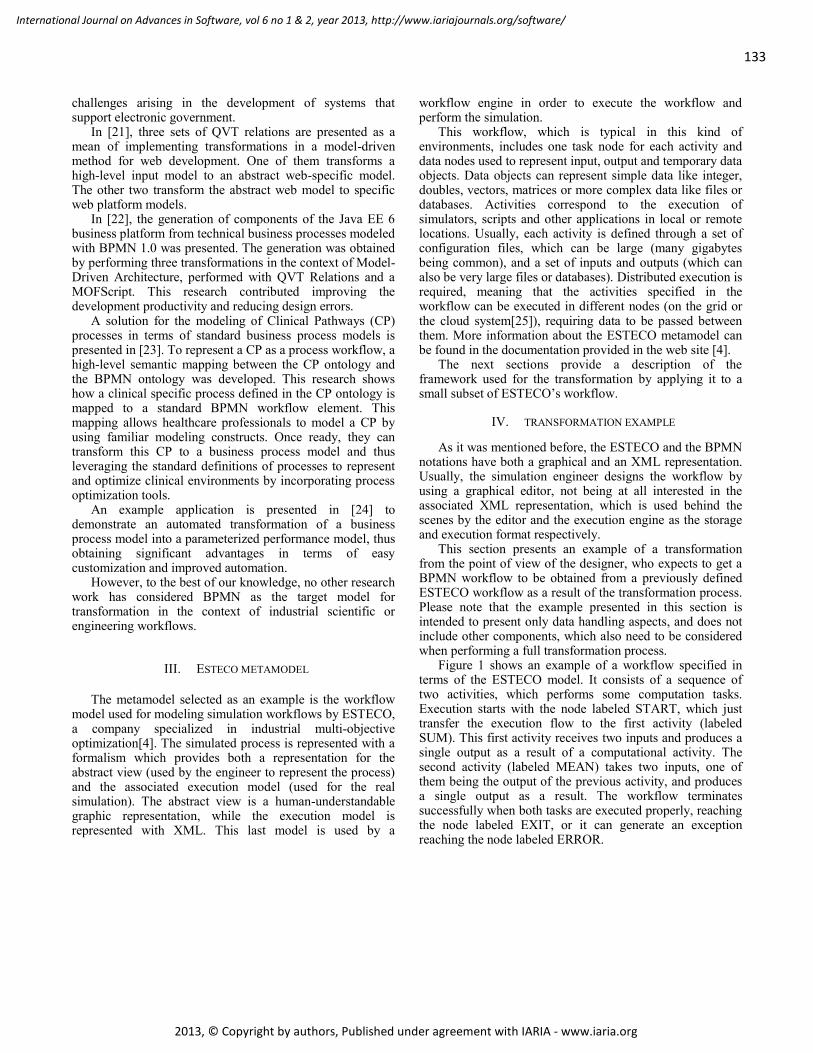
133
International Journal on Advances in Software, vol 6 no 1 & 2, year 2013, http://www.iariajournals.org/software/
2013, © Copyright by authors, Published under agreement with IARIA - www.iaria.org
challenges arising in the development of systems that support electronic government.
In [21], three sets of QVT relations are presented as a mean of implementing transformations in a model-driven method for web development. One of them transforms a high-level input model to an abstract web-specific model. The other two transform the abstract web model to specific web platform models.
In [22], the generation of components of the Java EE 6 business platform from technical business processes modeled with BPMN 1.0 was presented. The generation was obtained by performing three transformations in the context of Model-Driven Architecture, performed with QVT Relations and a MOFScript. This research contributed improving the development productivity and reducing design errors.
A solution for the modeling of Clinical Pathways (CP) processes in terms of standard business process models is presented in [23]. To represent a CP as a process workflow, a high-level semantic mapping between the CP ontology and the BPMN ontology was developed. This research shows how a clinical specific process defined in the CP ontology is mapped to a standard BPMN workflow element. This mapping allows healthcare professionals to model a CP by using familiar modeling constructs. Once ready, they can transform this CP to a business process model and thus leveraging the standard definitions of processes to represent and optimize clinical environments by incorporating process optimization tools.
An example application is presented in [24] to demonstrate an automated transformation of a business process model into a parameterized performance model, thus obtaining significant advantages in terms of easy customization and improved automation.
However, to the best of our knowledge, no other research work has considered BPMN as the target model for transformation in the context of industrial scientific or engineering workflows.
III. ESTECO METAMODEL
The metamodel selected as an example is the workflow model used for modeling simulation workflows by ESTECO, a company specialized in industrial multi-objective optimization[4]. The simulated process is represented with a formalism which provides both a representation for the abstract view (used by the engineer to represent the process) and the associated execution model (used for the real simulation). The abstract view is a human-understandable graphic representation, while the execution model is represented with XML. This last model is used by a
workflow engine in order to execute the workflow and perform the simulation.
This workflow, which is typical in this kind of environments, includes one task node for each activity and data nodes used to represent input, output and temporary data objects. Data objects can represent simple data like integer, doubles, vectors, matrices or more complex data like files or databases. Activities correspond to the execution of simulators, scripts and other applications in local or remote locations. Usually, each activity is defined through a set of configuration files, which can be large (many gigabytes being common), and a set of inputs and outputs (which can also be very large files or databases). Distributed execution is required, meaning that the activities specified in the workflow can be executed in different nodes (on the grid or the cloud system[25]), requiring data to be passed between them. More information about the ESTECO metamodel can be found in the documentation provided in the web site [4].
The next sections provide a description of the framework used for the transformation by applying it to a small subset of ESTECO’s workflow.
IV. TRANSFORMATION EXAMPLE
As it was mentioned before, the ESTECO and the BPMN notations have both a graphical and an XML representation. Usually, the simulation engineer designs the workflow by using a graphical editor, not being at all interested in the associated XML representation, which is used behind the scenes by the editor and the execution engine as the storage and execution format respectively.
This section presents an example of a transformation from the point of view of the designer, who expects to get a BPMN workflow to be obtained from a previously defined ESTECO workflow as a result of the transformation process. Please note that the example presented in this section is intended to present only data handling aspects, and does not include other components, which also need to be considered when performing a full transformation process.
Figure 1 shows an example of a workflow specified in terms of the ESTECO model. It consists of a sequence of two activities, which performs some computation tasks. Execution starts with the node labeled START, which just transfer the execution flow to the first activity (labeled SUM). This first activity receives two inputs and produces a single output as a result of a computational activity. The second activity (labeled MEAN) takes two inputs, one of them being the output of the previous activity, and produces a single output as a result. The workflow terminates successfully when both tasks are executed properly, reaching the node labeled EXIT, or it can generate an exception reaching the node labeled ERROR.
134
International Journal on Advances in Software, vol 6 no 1 & 2, year 2013, http://www.iariajournals.org/software/
2013, © Copyright by authors, Published under agreement with IARIA - www.iaria.org
Figure 2 shows the equivalent BPMN process. Note that the overall graphical structure is not too different between the two workflows. In both of them there is a start node, an end node and an exception event node. There is, however, one extra data object used to transfer intermediate data between the two activities, something that is not required by the ESTECO workflow presented before, which allows direct communication between activities. Note that different kind of arrows and lines are required to indicate the data flow and process flow in BPMN, something that is not so nicely differentiated in the original ESTECO workflow.
An important point to note is that, even if the overall graphical structure is very similar in both workflows, the XML representation is definitely very different. And of course, the transformation process does not take place at the graphical level, but at the XML representation level. This transformation is made possible since both workflow models are defined formally with an XML schema, which provides the basis for a formal transformation process. This transformation process, including selected transformation code in QVT and some examples, is presented in next sections.
V. TRANSFORMATION ARCHITECTURE
Our proposal aims to apply the most recent concepts of business processes to the field of engineering workflows in industrial fields. The use of standards in industry is important since it guarantees portability between tools that support BPMN.
The industrial legacy workflow selected has an XML representation, allowing the use of tools like Medini QVT for transformation [26]. There is no one-to-one correspondence between the different components of ESTECO’s workflow and BPMN constructions, since control nodes and data nodes are very differently handled in both models. Also, files and database handling put extra requirements which can only be handled properly with BPMN extensions.
The QVT transformations describe relations between the source metamodel and the target metamodel, both specified in MOF. The transformation defined is then applied to a source model, which is an instance of the ESTECO source metamodel, to obtain a target model, which is an instance of the BPMN target metamodel, as can be seen in Figure 3. The metamodels used in the definition of the transformation are shown at the top level. The specific models to which the transformation defined in the metamodel level is applied in order to obtain BPMN models is shown at the middle level. The lower level represents the instances of the models which can be executed in the corresponding workflow engines.
As mentioned before, activities and processes need data in order to be executed, and in addition, they can produce data during or as a result of their execution. In BPMN, data requirements are captured as DataInputs and InputSets. The produced data is captured using DataOutputs and OutputSets. These elements are aggregated in an InputOutputSpecification class [2], as can be seen from the UML class diagram presented in Figure 4. The DataInputs and DataOutputs are additional attributes of the InputOutputSpecification element; these elements are optional references to the DataInputs and DataOutputs respectively. A DataInput is a declaration that a particular
Figure 1. Example of an ESTECO workflow.
Figure 2. Example of the equivalent BPMN 2.0 workflow.
Figure 3. Transformation architecture.
ESTECOmeta-model
ESTECOmodel
ESTECOinstance
BPMN2meta-model
BPMN2model
BPMN2instance
Definition of transformationusing QVT
Application of thetransformation
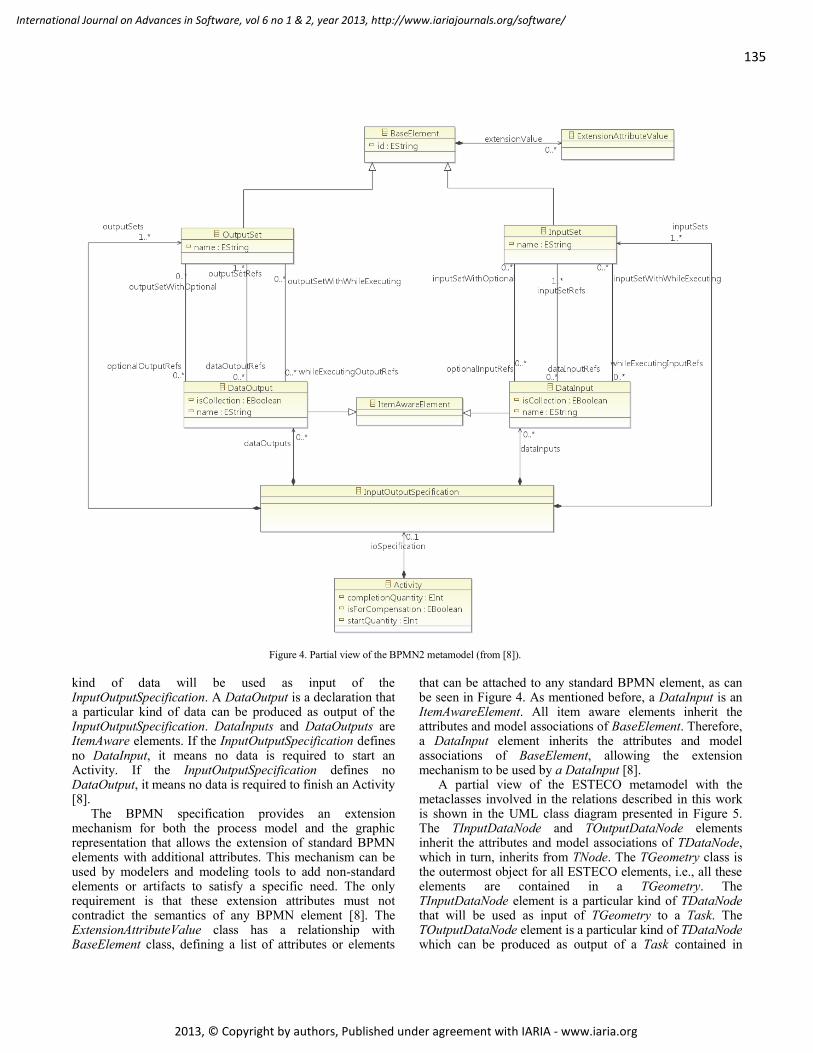
135
International Journal on Advances in Software, vol 6 no 1 & 2, year 2013, http://www.iariajournals.org/software/
2013, © Copyright by authors, Published under agreement with IARIA - www.iaria.org
kind of data will be used as input of the InputOutputSpecification. A DataOutput is a declaration that a particular kind of data can be produced as output of the InputOutputSpecification. DataInputs and DataOutputs are ItemAware elements. If the InputOutputSpecification defines no DataInput, it means no data is required to start an Activity. If the InputOutputSpecification defines no DataOutput, it means no data is required to finish an Activity [8].
The BPMN specification provides an extension mechanism for both the process model and the graphic representation that allows the extension of standard BPMN elements with additional attributes. This mechanism can be used by modelers and modeling tools to add non-standard elements or artifacts to satisfy a specific need. The only requirement is that these extension attributes must not contradict the semantics of any BPMN element [8]. The ExtensionAttributeValue class has a relationship with BaseElement class, defining a list of attributes or elements
that can be attached to any standard BPMN element, as can be seen in Figure 4. As mentioned before, a DataInput is an ItemAwareElement. All item aware elements inherit the attributes and model associations of BaseElement. Therefore, a DataInput element inherits the attributes and model associations of BaseElement, allowing the extension mechanism to be used by a DataInput [8].
A partial view of the ESTECO metamodel with the metaclasses involved in the relations described in this work is shown in the UML class diagram presented in Figure 5. The TInputDataNode and TOutputDataNode elements inherit the attributes and model associations of TDataNode, which in turn, inherits from TNode. The TGeometry class is the outermost object for all ESTECO elements, i.e., all these elements are contained in a TGeometry. The TInputDataNode element is a particular kind of TDataNode that will be used as input of TGeometry to a Task. The TOutputDataNode element is a particular kind of TDataNode which can be produced as output of a Task contained in
Figure 4. Partial view of the BPMN2 metamodel (from [8]).

136
International Journal on Advances in Software, vol 6 no 1 & 2, year 2013, http://www.iariajournals.org/software/
2013, © Copyright by authors, Published under agreement with IARIA - www.iaria.org
TGeometry. A TTaskNode class represents the task that is performed within an industrial workflow.
VI. TRANSFORMATION BETWEEN MODELS
A transformation specifies a group of relations that the elements of the involved models must fulfill. A transformation may have any number of input or output parameters known as domains. For each output parameter, a new model instance is created according to the metamodel of the output metamodel (in this case, the metamodel BPMN).
Each domain identifies a corresponding set of elements
defined by means of patterns. A domain pattern can be
considered an object template. A relation in QVT defines
the transformation rules. A relation implies the existence of
classes for each one of its domains. In a relation, a domain
is a type that may be the root of a template pattern. A
domain implies the existence of a property of the same type
in a class. A pattern can be viewed as a set of variables and
a set of constraints that model elements must satisfy. A
template pattern is a combination of a literal that can match
against instances of a class and values for its properties. A
domain can be marked as checkonly or enforced. A
checkonly domain simply verifies if the model contains a
valid correspondence that satisfies the relation. When a
domain is enforced, if checking fails, the elements of target
model can be created, deleted or modified so as to satisfy
the relationship. A relation can contain two sets of predicates identified by
a when or a where clause. The when clause specifies the condition that must be satisfied to execute the transformation. The where clause specifies the condition that must be satisfied by all model elements involved in the relation, and it may contain any variable involved in the relation and its domains [5]. In the context of transformation, a model type represents the type of the model. A model type is defined by a metamodel and an optional set of constraint expressions. Please note that the definition of these terms can be found in the QVT specification, where the interested reader is referred to [5].
The transformation between ESTECO metamodel and BPMN metamodel is defined as follows:
transformation ESTECOToBPMN2(source : esteco_m, target : bpmn2)
Figure 5. Partial view of ESTECO metamodel (from [4]).
137
International Journal on Advances in Software, vol 6 no 1 & 2, year 2013, http://www.iariajournals.org/software/
2013, © Copyright by authors, Published under agreement with IARIA - www.iaria.org
Note that this transformation takes as input an ESTECO
model, which is an instance of the ESTECO metamodel, and produces a BPMN model, that will be an instance of the BPMN metamodel.
Below, the relations which define the mapping between ESTECO metamodel classes and BPMN metamodel classes are presented. This correspondence is not straightforward. As we mentioned in the previous section, the DataInputs are captured in InputSets and both are added into an InputOutputSpecification. The same happens with the DataOutputs. So, in the transformation it is necessary to generate an IoSpecification object to aggregate DataInputs, DataOutputs, InputSets and OutputSets.
The relation used to create an IoSpecification object is shown below:
The relations that are referenced in the previous code,
which are used to create InputSets and OutputSets, are the following:
Note that an InputSet is a collection of DataInput
elements that together define a valid set of data inputs associated to an InputOutputSpecification. An InputOutputSpecification must define at least one InputSet element. An OutputSet is a collection of DataOutputs elements that together can be produced as output from an Activity. An InputOutputSpecification element must have at least OutputSet element [3].
The relation used to obtain the DataInputs of the ESTECO model and the generation of DataInputs in BPMN is the following:
relation createIOSpecificationTask checkonly domain source g:esteco_m::TGeometry ; enforce domain target t:bpmn2::Task ioSpecification= ioSpecif : bpmn2::InputOutputSpecification ; primitive domain id_task:String; where getDataInputTask(g,ioSpecif, id_task); createInputSetsTask(ioSpecif,ioSpecif); getDataOutputTask(g, ioSpecif, id_task); createOutputSetsTask(ioSpecif, ioSpecif);
relation createInputSetsTask checkonly domain target ioSpecif: bpmn2::InputOutputSpecification ; enforce domain target ioSpecif : bpmn2::InputOutputSpecification inputSets = input_set :bpmn2::InputSet dataInputRefs= ioSpecif.dataInputs ;
...
... relation createOutputSetsTask checkonly domain target ioSpecif: bpmn2::InputOutputSpecification ; enforce domain target ioSpecif : bpmn2::InputOutputSpecification outputSets = output_set :bpmn2::OutputSet dataOutputRefs= ioSpecif.dataOutputs ;
relation getDataInputTask id_input, name_input : String; value_input : Real; checkonly domain source g:esteco_m::TGeometry taskNode = t:esteco_m::TTaskNode bufferInputDataConnector = buffer_input : esteco_m::TBufferInputDataConnector , inputDataNode = input : esteco_m::TInputDataNode id = id_input, name = name_input, value = value_input, outputDataConnector = output_data : esteco_m::TOutputDataConnector , dataEdge = data_edge : esteco_m::TDataEdge ;
...
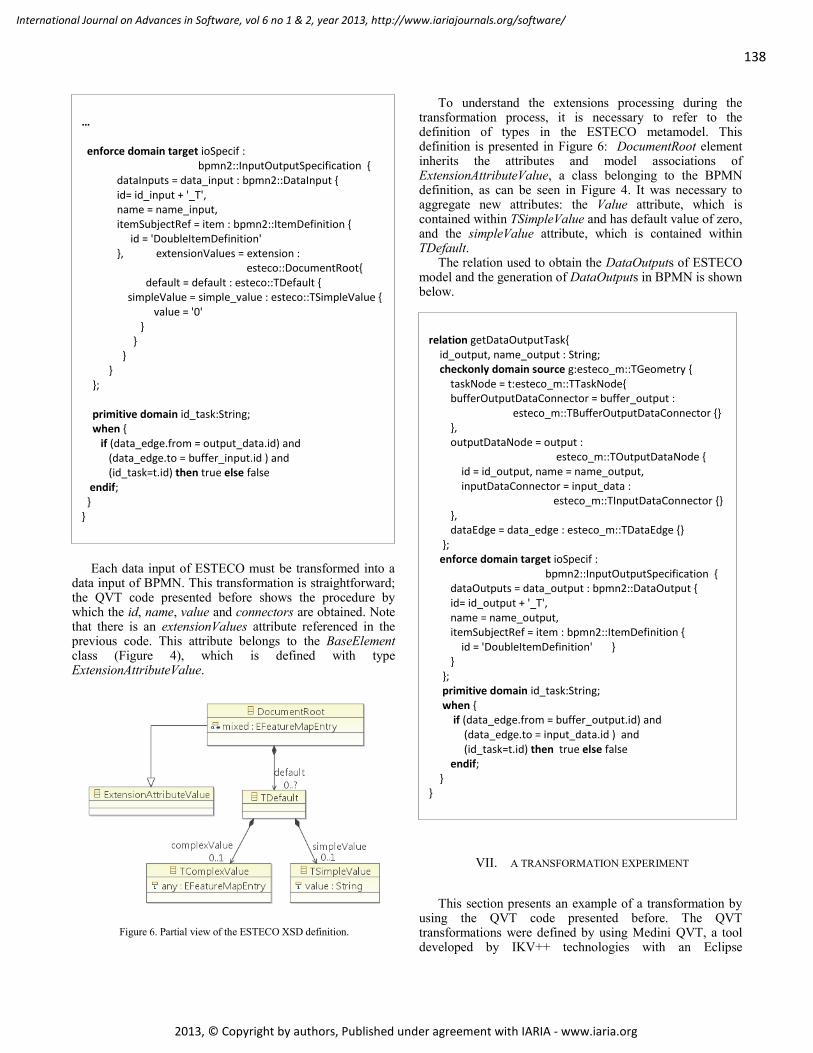
138
International Journal on Advances in Software, vol 6 no 1 & 2, year 2013, http://www.iariajournals.org/software/
2013, © Copyright by authors, Published under agreement with IARIA - www.iaria.org
Each data input of ESTECO must be transformed into a
data input of BPMN. This transformation is straightforward; the QVT code presented before shows the procedure by which the id, name, value and connectors are obtained. Note that there is an extensionValues attribute referenced in the previous code. This attribute belongs to the BaseElement class (Figure 4), which is defined with type ExtensionAttributeValue.
To understand the extensions processing during the transformation process, it is necessary to refer to the definition of types in the ESTECO metamodel. This definition is presented in Figure 6: DocumentRoot element inherits the attributes and model associations of ExtensionAttributeValue, a class belonging to the BPMN definition, as can be seen in Figure 4. It was necessary to aggregate new attributes: the Value attribute, which is contained within TSimpleValue and has default value of zero, and the simpleValue attribute, which is contained within TDefault.
The relation used to obtain the DataOutputs of ESTECO model and the generation of DataOutputs in BPMN is shown below.
VII. A TRANSFORMATION EXPERIMENT
This section presents an example of a transformation by
using the QVT code presented before. The QVT transformations were defined by using Medini QVT, a tool developed by IKV++ technologies with an Eclipse
… enforce domain target ioSpecif : bpmn2::InputOutputSpecification dataInputs = data_input : bpmn2::DataInput id= id_input + '_T', name = name_input, itemSubjectRef = item : bpmn2::ItemDefinition id = 'DoubleItemDefinition' , extensionValues = extension : esteco::DocumentRoot default = default : esteco::TDefault simpleValue = simple_value : esteco::TSimpleValue value = '0' ; primitive domain id_task:String; when if (data_edge.from = output_data.id) and (data_edge.to = buffer_input.id ) and (id_task=t.id) then true else false endif;
relation getDataOutputTask id_output, name_output : String; checkonly domain source g:esteco_m::TGeometry taskNode = t:esteco_m::TTaskNode bufferOutputDataConnector = buffer_output : esteco_m::TBufferOutputDataConnector , outputDataNode = output : esteco_m::TOutputDataNode id = id_output, name = name_output, inputDataConnector = input_data : esteco_m::TInputDataConnector , dataEdge = data_edge : esteco_m::TDataEdge ; enforce domain target ioSpecif : bpmn2::InputOutputSpecification dataOutputs = data_output : bpmn2::DataOutput id= id_output + '_T', name = name_output, itemSubjectRef = item : bpmn2::ItemDefinition id = 'DoubleItemDefinition' ; primitive domain id_task:String; when if (data_edge.from = buffer_output.id) and (data_edge.to = input_data.id ) and (id_task=t.id) then true else false endif;
Figure 6. Partial view of the ESTECO XSD definition.
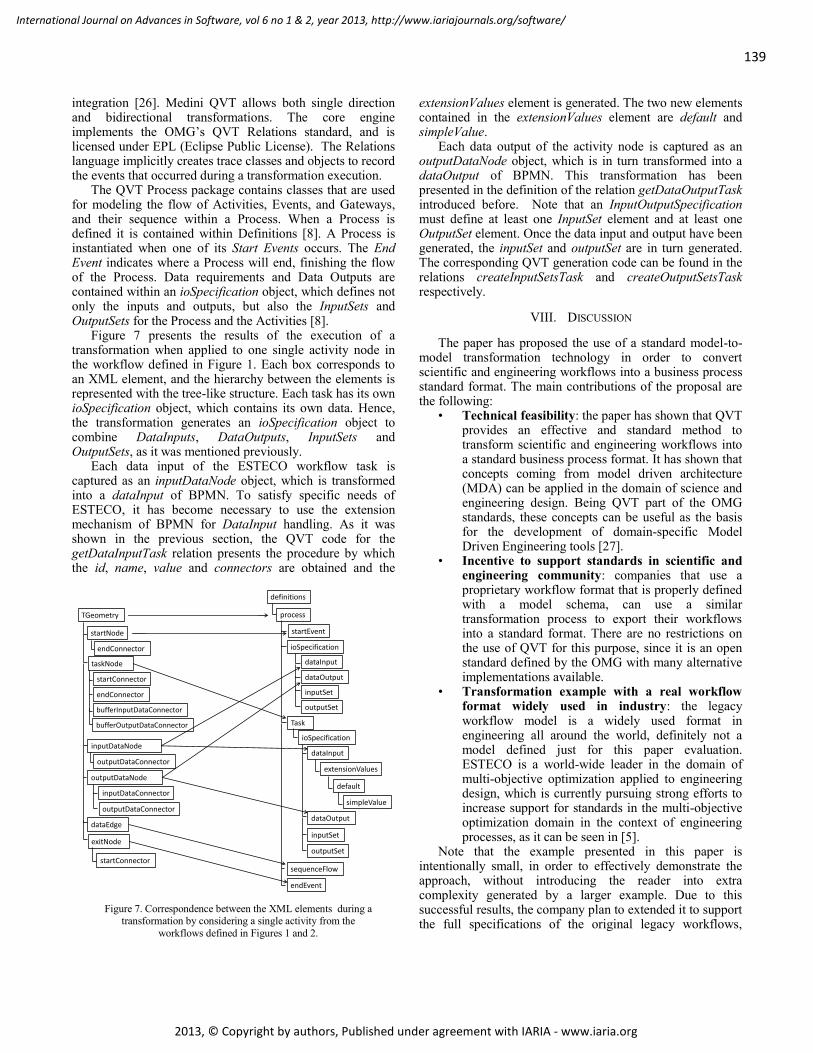
139
International Journal on Advances in Software, vol 6 no 1 & 2, year 2013, http://www.iariajournals.org/software/
2013, © Copyright by authors, Published under agreement with IARIA - www.iaria.org
integration [26]. Medini QVT allows both single direction and bidirectional transformations. The core engine implements the OMG’s QVT Relations standard, and is licensed under EPL (Eclipse Public License). The Relations language implicitly creates trace classes and objects to record the events that occurred during a transformation execution.
The QVT Process package contains classes that are used for modeling the flow of Activities, Events, and Gateways, and their sequence within a Process. When a Process is defined it is contained within Definitions [8]. A Process is instantiated when one of its Start Events occurs. The End Event indicates where a Process will end, finishing the flow of the Process. Data requirements and Data Outputs are contained within an ioSpecification object, which defines not only the inputs and outputs, but also the InputSets and OutputSets for the Process and the Activities [8].
Figure 7 presents the results of the execution of a transformation when applied to one single activity node in the workflow defined in Figure 1. Each box corresponds to an XML element, and the hierarchy between the elements is represented with the tree-like structure. Each task has its own ioSpecification object, which contains its own data. Hence, the transformation generates an ioSpecification object to combine DataInputs, DataOutputs, InputSets and OutputSets, as it was mentioned previously.
Each data input of the ESTECO workflow task is captured as an inputDataNode object, which is transformed into a dataInput of BPMN. To satisfy specific needs of ESTECO, it has become necessary to use the extension mechanism of BPMN for DataInput handling. As it was shown in the previous section, the QVT code for the getDataInputTask relation presents the procedure by which the id, name, value and connectors are obtained and the
extensionValues element is generated. The two new elements contained in the extensionValues element are default and simpleValue.
Each data output of the activity node is captured as an outputDataNode object, which is in turn transformed into a dataOutput of BPMN. This transformation has been presented in the definition of the relation getDataOutputTask introduced before. Note that an InputOutputSpecification must define at least one InputSet element and at least one OutputSet element. Once the data input and output have been generated, the inputSet and outputSet are in turn generated. The corresponding QVT generation code can be found in the relations createInputSetsTask and createOutputSetsTask respectively.
VIII. DISCUSSION
The paper has proposed the use of a standard model-to-model transformation technology in order to convert scientific and engineering workflows into a business process standard format. The main contributions of the proposal are the following:
• Technical feasibility: the paper has shown that QVT provides an effective and standard method to transform scientific and engineering workflows into a standard business process format. It has shown that concepts coming from model driven architecture (MDA) can be applied in the domain of science and engineering design. Being QVT part of the OMG standards, these concepts can be useful as the basis for the development of domain-specific Model Driven Engineering tools [27].
• Incentive to support standards in scientific and engineering community: companies that use a proprietary workflow format that is properly defined with a model schema, can use a similar transformation process to export their workflows into a standard format. There are no restrictions on the use of QVT for this purpose, since it is an open standard defined by the OMG with many alternative implementations available.
• Transformation example with a real workflow format widely used in industry: the legacy workflow model is a widely used format in engineering all around the world, definitely not a model defined just for this paper evaluation. ESTECO is a world-wide leader in the domain of multi-objective optimization applied to engineering design, which is currently pursuing strong efforts to increase support for standards in the multi-objective optimization domain in the context of engineering processes, as it can be seen in [5].
Note that the example presented in this paper is intentionally small, in order to effectively demonstrate the approach, without introducing the reader into extra complexity generated by a larger example. Due to this successful results, the company plan to extended it to support the full specifications of the original legacy workflows,
process
ioSpecification
startEvent
Task
ioSpecification
dataInput
extensionValues
simpleValue
default
dataOutput
inputSet
outputSet
endEvent
sequenceFlow
TGeometry
startNode
endConnector
taskNode
startConnector
bufferInputDataConnector
inputDataNode
outputDataNode
outputDataConnector
inputDataConnector
outputDataConnector
dataEdge
endConnector
bufferOutputDataConnector
dataInput
dataOutput
inputSet
outputSet
exitNode
startConnector
definitions
Figure 7. Correspondence between the XML elements during a transformation by considering a single activity from the
workflows defined in Figures 1 and 2.
140
International Journal on Advances in Software, vol 6 no 1 & 2, year 2013, http://www.iariajournals.org/software/
2013, © Copyright by authors, Published under agreement with IARIA - www.iaria.org
becoming a part of the tool sets provided in a new BPMN compatible workflow environment.
IX. CONCLUSION
The paper has proposed the use of QVT-based
transformation technology in order to transform engineering workflows defined in a legacy proprietary format to a well-defined business process standard. An example involving only data related components has been presented. The approach has been validated experimentally in an engineering environment supported by a company specialized in multi-objective optimization. It is important to stress that this transformation allows the conversion of most ESTECO industrial workflows to BPMN, consenting their execution in BPMN workflow engines with adequate extensions support.
The objective of this work has been to apply important concepts of business processes to the industrial field. Furthermore, it intended to show the importance of the use of standards in industrial fields in order to guarantee portability between tools that support BPMN. As a more general objective, it is expected that the use of a standard for scientific and engineering workflows will facilitate the collaboration between scientists and industrial designers, enhance the interaction between different engineering and scientific fields, providing also a common vocabulary in scientific and engineering publications [5].
ACKNOWLEDGMENT
The authors thank the reviewers of the ICSEA’12
conference and the IARIA Journal for the very useful comments that have contributed to enhance both the original and the extended versions of the paper.
REFERENCES
[1] Corina Abdelahad, Daniel Riesco, Carlo Comin, Alessandro
Carrara, and Carlos Kavka, “Data Transformations using QVT between Industrial Workflows and Business Models in BPMN”, Proceedings of the Seventh International Conference on Software Engineering Advances ICSEA, 2012, IARIA.
[2] Yolanda Gil, Ewa Deelman, Mark Ellisman, Thomas Fahringer, Geoffrey Fox et al., “Examining the challenges of scientific workflows”, IEEE Computer vol. 40, no. 12, 2007, pp. 24-32.
[3] Cui Lin, Shiyong Lu, Xubo Fei, Artem Chebotko, Darshan Pai et al., “A reference architecture for scientific workflow management systems and the VIEW SOA solution”, IEEE Transactions on Service Computing, vol. 2, no. 1, 2009, pp. 79-92.
[4] ESTECO S.p.A., “modeFRONTIER applications across industrial sectors involving advanced CAD/CAE packages”, http://www.esteco.com/home/mode_frontier/by_industry, [re-trieved: March, 2013]
[5] Carlo Comin, Luka Onesti, and Carlos Kavka, “Towards a Standard Approach for Optimization in Science and
Engineering”, Proceedings of the 8th International Conference on Software Engineering and Applications ICSOFT-EA, 2013, SciTePress.
[6] Li Hongbiao, Li Feng, and Yu Wanjun, “The research of scientific workflow engine”, Proceedings of the IEEE International Conference on Software Engineering and Service Sciences (ICSESS), 2010, pp. 412-414.
[7] Shown Bowers. “Scientific Workflow, Provenance and Data Modeling Challenges and Approaches”, Journal on Data Semantics, vol. 1, pp. 19-30, 2012, Springer.
[8] Object Management Group (OMG), “Business process model and notation”, http://www.omg.org/spec/BPMN/2.0 [retrieved: March, 2013]
[9] The Business Process Management Initiative (BPMI.org), http://www.bpmi.org/ [retrieved: October, 2012]
[10] Oasis, “Web services business process execution language version 2.0”, http://docs.oasis-open.org/wsbpel/2.0/wsbpel-v2.0.html, [retrieved: March, 2013]
[11] Object Management Group (OMG), “Modeling and metadata specifications”, http://www.omg.org/spec, [retrieved: October 2012]
[12] Object Management Group (OMG), “Meta object facility (MOF) 2.0 query/view/transformation, V1.1”, http://www.omg.org/spec/QVT/1.1 [retrieved: October, 2012]
[13] Li Dan, “QVT based model transformation from sequence diagram to CSP”, Proceedings of the 15th IEEE International Conference on Engineering of Complex Computer Systems (ICECCS), 2010, pp. 349-354.
[14] Bertram Ludascher, Ilkay Altintas, Shawn Bowers, Julian Cummings, Terence Critchlow et al., “Scientific Process Automation and Workflow Management”, in “Scientific Data Management: Challenges, Technology, and Deployment”, edited by A. Shoshan and D. Rotem, 2009, Chapman and Hall/CDC.
[15] Ian Taylor, Matthew Shields, Ian Wang, and Andrew Harrison, “The Triana workflow environment: architecture and applications”, in “Workflows for e-Science: Scientific Workflows for Grids”, I. Taylor et al., 2007, Springer.
[16] Pablo Missier, Stian Soiland-Reyes, Stuart Owen, Wei Tan, Alexrandra Nenadic et al., “Taverna, Reloaded”, Lecture Notes in Computer Science, vol. 6187, pp. 471-481, 2010, Springer.
[17] Mirko Sonntag, Dimka Karastoyanova, and Ewa Deelman, “Bridging The Gap Between Business And Scientific Workflows”, Proceedings of the ESCIENCE 2010, 6th IEEE International Conference on e-Science, 2010, IEEE Computer Society.
[18] Michael Berthold, Nicolas Cebtron, Fabian Dill, Thomas R. Gabriel, Tobias Kotter et al., “KNIME: The Konstanz Information Miner”, in “Data Analysis, Machine Learning and Applications”, ed. H. Bock, W. Gaul, M. Vichi, pp. 319-326, 2008, Springer.
[19] Marcel van Amstel, Steven Bosems, Ivan Kurtev, and Luís Ferreira Pires, “Performance in model transformations: experiments with ATL and QVT”, Lecture Notes in Computer Science, Volume 6707, Theory and Practice of Model Transformations, Springer, 2011, pp. 198-212.
[20] Henning Heitkoetter, “Transforming PICTURE to BPMN 2.0 as part of the model-driven development of electronic government systems”, Proceedings of the 44th Hawaii International Conference on System Sciences (HICSS), 2011, pp. 1-10.
[21] Ali Fatolahi, Stéphane Somé, and TimothyLethbridge, “Automated generation of abstract web models using QVT relations”, Technical Report TR-2010-06, School of Information Technology and Engineering, University of Ottawa, September 2010.

141
International Journal on Advances in Software, vol 6 no 1 & 2, year 2013, http://www.iariajournals.org/software/
2013, © Copyright by authors, Published under agreement with IARIA - www.iaria.org
[22] Narayan Debnath, Carlos Alejandro Martinez, Fabio Zorzan, Daniel Riesco, and German Montejano, “Transformation of business process models BPMN 2.0 into components of the Java business platform”, Proceedings of the Industrial Informatics (INDIN), 10th IEEE International Conference on Digital Objects, 2012, pp. 1035-1040, IEEE
[23] Nima Hashemian and Samina Sibte Raza Abidi, “Modeling clinical workflows using business process modeling notation”, Computer-Based Medical Systems (CBMS), 25th International Symposium on Digital Object, 2012 , pp. 1-4, IEEE
[24] Paolo Bocciarelli and Andrea D'Ambrogio, “A BPMN extension for modeling non functional properties of business processes”, Proceedings of the 2011 Symposium on Theory of Modeling & Simulation: DEVS Integrative M&S Symposium, Springer-Verlag, 2011, pp. 160-168.
[25] Gideon Juve and Ewa Deelman, “Scientific workflows and clouds”, ACM Crossroads, vol. 16, no. 3, 2010, pp. 14-18.
[26] IKV, “The Medini QVT project”, http://projects.ikv.de/qvt, [retrieved: March, 2013]
[27] D. Schmidt, “Guest Editor's Introduction: Model-Driven Engineering”, Computer IEEE, vol. 39, pp. 25-31, 2006.
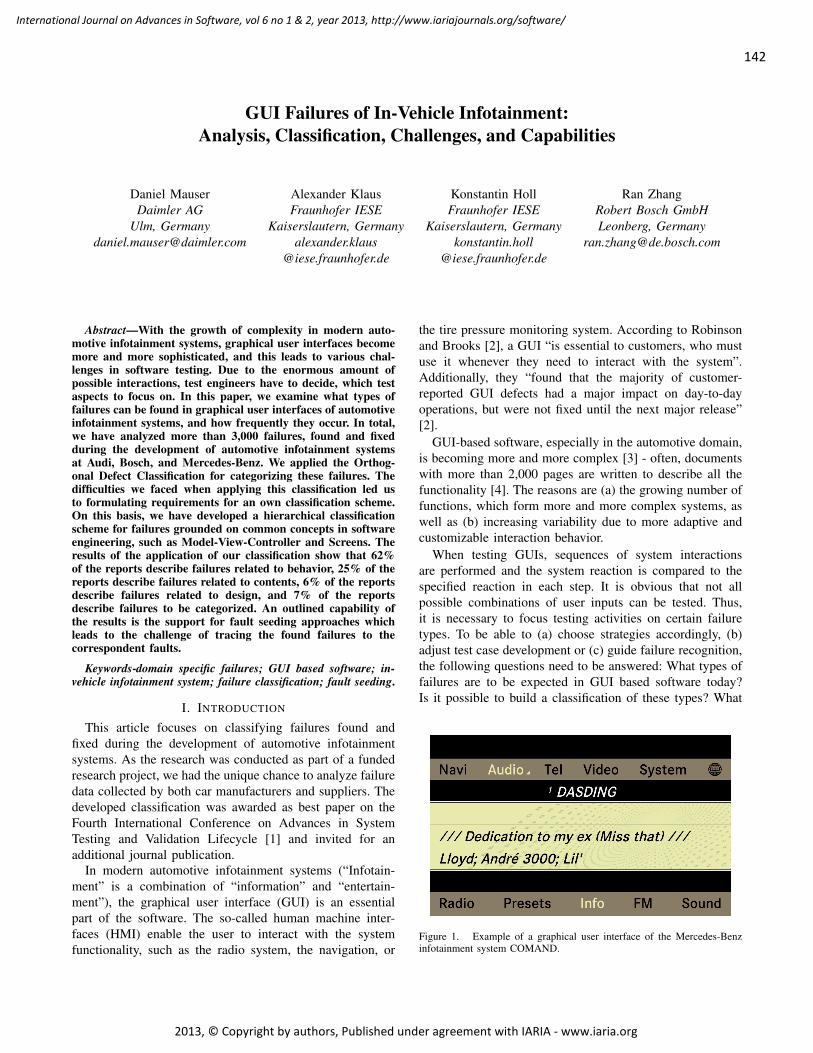
142
International Journal on Advances in Software, vol 6 no 1 & 2, year 2013, http://www.iariajournals.org/software/
2013, © Copyright by authors, Published under agreement with IARIA - www.iaria.org
GUI Failures of In-Vehicle Infotainment:Analysis, Classification, Challenges, and Capabilities
Daniel MauserDaimler AG
Ulm, [email protected]
Alexander KlausFraunhofer IESE
Kaiserslautern, Germanyalexander.klaus
@iese.fraunhofer.de
Konstantin HollFraunhofer IESE
Kaiserslautern, Germanykonstantin.holl
@iese.fraunhofer.de
Ran ZhangRobert Bosch GmbHLeonberg, Germany
Abstract—With the growth of complexity in modern auto-motive infotainment systems, graphical user interfaces becomemore and more sophisticated, and this leads to various chal-lenges in software testing. Due to the enormous amount ofpossible interactions, test engineers have to decide, which testaspects to focus on. In this paper, we examine what types offailures can be found in graphical user interfaces of automotiveinfotainment systems, and how frequently they occur. In total,we have analyzed more than 3,000 failures, found and fixedduring the development of automotive infotainment systemsat Audi, Bosch, and Mercedes-Benz. We applied the Orthog-onal Defect Classification for categorizing these failures. Thedifficulties we faced when applying this classification led usto formulating requirements for an own classification scheme.On this basis, we have developed a hierarchical classificationscheme for failures grounded on common concepts in softwareengineering, such as Model-View-Controller and Screens. Theresults of the application of our classification show that 62%of the reports describe failures related to behavior, 25% of thereports describe failures related to contents, 6% of the reportsdescribe failures related to design, and 7% of the reportsdescribe failures to be categorized. An outlined capability ofthe results is the support for fault seeding approaches whichleads to the challenge of tracing the found failures to thecorrespondent faults.
Keywords-domain specific failures; GUI based software; in-vehicle infotainment system; failure classification; fault seeding.
I. INTRODUCTION
This article focuses on classifying failures found andfixed during the development of automotive infotainmentsystems. As the research was conducted as part of a fundedresearch project, we had the unique chance to analyze failuredata collected by both car manufacturers and suppliers. Thedeveloped classification was awarded as best paper on theFourth International Conference on Advances in SystemTesting and Validation Lifecycle [1] and invited for anadditional journal publication.
In modern automotive infotainment systems (“Infotain-ment” is a combination of “information” and “entertain-ment”), the graphical user interface (GUI) is an essentialpart of the software. The so-called human machine inter-faces (HMI) enable the user to interact with the systemfunctionality, such as the radio system, the navigation, or
the tire pressure monitoring system. According to Robinsonand Brooks [2], a GUI “is essential to customers, who mustuse it whenever they need to interact with the system”.Additionally, they “found that the majority of customer-reported GUI defects had a major impact on day-to-dayoperations, but were not fixed until the next major release”[2].
GUI-based software, especially in the automotive domain,is becoming more and more complex [3] - often, documentswith more than 2,000 pages are written to describe all thefunctionality [4]. The reasons are (a) the growing number offunctions, which form more and more complex systems, aswell as (b) increasing variability due to more adaptive andcustomizable interaction behavior.
When testing GUIs, sequences of system interactionsare performed and the system reaction is compared to thespecified reaction in each step. It is obvious that not allpossible combinations of user inputs can be tested. Thus,it is necessary to focus testing activities on certain failuretypes. To be able to (a) choose strategies accordingly, (b)adjust test case development or (c) guide failure recognition,the following questions need to be answered: What types offailures are to be expected in GUI based software today?Is it possible to build a classification of these types? What
Figure 1. Example of a graphical user interface of the Mercedes-Benzinfotainment system COMAND.
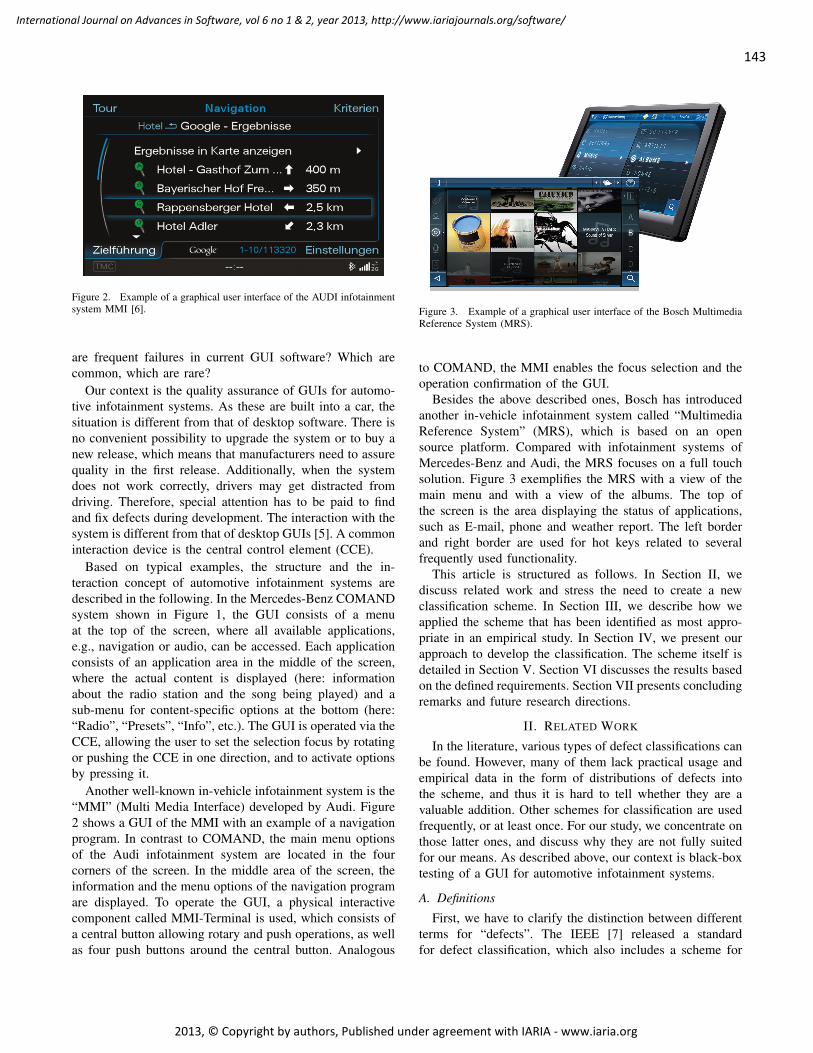
143
International Journal on Advances in Software, vol 6 no 1 & 2, year 2013, http://www.iariajournals.org/software/
2013, © Copyright by authors, Published under agreement with IARIA - www.iaria.org
Figure 2. Example of a graphical user interface of the AUDI infotainmentsystem MMI [6].
are frequent failures in current GUI software? Which arecommon, which are rare?
Our context is the quality assurance of GUIs for automo-tive infotainment systems. As these are built into a car, thesituation is different from that of desktop software. There isno convenient possibility to upgrade the system or to buy anew release, which means that manufacturers need to assurequality in the first release. Additionally, when the systemdoes not work correctly, drivers may get distracted fromdriving. Therefore, special attention has to be paid to findand fix defects during development. The interaction with thesystem is different from that of desktop GUIs [5]. A commoninteraction device is the central control element (CCE).
Based on typical examples, the structure and the in-teraction concept of automotive infotainment systems aredescribed in the following. In the Mercedes-Benz COMANDsystem shown in Figure 1, the GUI consists of a menuat the top of the screen, where all available applications,e.g., navigation or audio, can be accessed. Each applicationconsists of an application area in the middle of the screen,where the actual content is displayed (here: informationabout the radio station and the song being played) and asub-menu for content-specific options at the bottom (here:“Radio”, “Presets”, “Info”, etc.). The GUI is operated via theCCE, allowing the user to set the selection focus by rotatingor pushing the CCE in one direction, and to activate optionsby pressing it.
Another well-known in-vehicle infotainment system is the“MMI” (Multi Media Interface) developed by Audi. Figure2 shows a GUI of the MMI with an example of a navigationprogram. In contrast to COMAND, the main menu optionsof the Audi infotainment system are located in the fourcorners of the screen. In the middle area of the screen, theinformation and the menu options of the navigation programare displayed. To operate the GUI, a physical interactivecomponent called MMI-Terminal is used, which consists ofa central button allowing rotary and push operations, as wellas four push buttons around the central button. Analogous
Figure 3. Example of a graphical user interface of the Bosch MultimediaReference System (MRS).
to COMAND, the MMI enables the focus selection and theoperation confirmation of the GUI.
Besides the above described ones, Bosch has introducedanother in-vehicle infotainment system called “MultimediaReference System” (MRS), which is based on an opensource platform. Compared with infotainment systems ofMercedes-Benz and Audi, the MRS focuses on a full touchsolution. Figure 3 exemplifies the MRS with a view of themain menu and with a view of the albums. The top ofthe screen is the area displaying the status of applications,such as E-mail, phone and weather report. The left borderand right border are used for hot keys related to severalfrequently used functionality.
This article is structured as follows. In Section II, wediscuss related work and stress the need to create a newclassification scheme. In Section III, we describe how weapplied the scheme that has been identified as most appro-priate in an empirical study. In Section IV, we present ourapproach to develop the classification. The scheme itself isdetailed in Section V. Section VI discusses the results basedon the defined requirements. Section VII presents concludingremarks and future research directions.
II. RELATED WORK
In the literature, various types of defect classifications canbe found. However, many of them lack practical usage andempirical data in the form of distributions of defects intothe scheme, and thus it is hard to tell whether they are avaluable addition. Other schemes for classification are usedfrequently, or at least once. For our study, we concentrate onthose latter ones, and discuss why they are not fully suitedfor our means. As described above, our context is black-boxtesting of a GUI for automotive infotainment systems.
A. Definitions
First, we have to clarify the distinction between differentterms for “defects”. The IEEE [7] released a standardfor defect classification, which also includes a scheme for
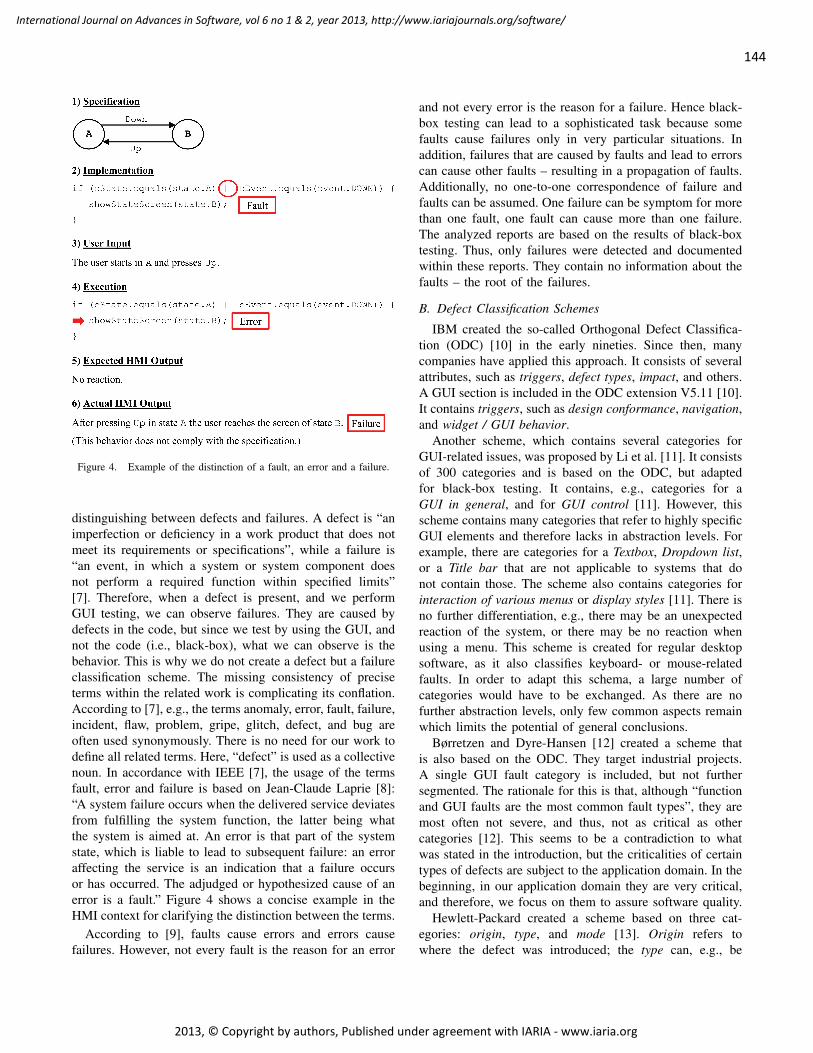
144
International Journal on Advances in Software, vol 6 no 1 & 2, year 2013, http://www.iariajournals.org/software/
2013, © Copyright by authors, Published under agreement with IARIA - www.iaria.org
Figure 4. Example of the distinction of a fault, an error and a failure.
distinguishing between defects and failures. A defect is “animperfection or deficiency in a work product that does notmeet its requirements or specifications”, while a failure is“an event, in which a system or system component doesnot perform a required function within specified limits”[7]. Therefore, when a defect is present, and we performGUI testing, we can observe failures. They are caused bydefects in the code, but since we test by using the GUI, andnot the code (i.e., black-box), what we can observe is thebehavior. This is why we do not create a defect but a failureclassification scheme. The missing consistency of preciseterms within the related work is complicating its conflation.According to [7], e.g., the terms anomaly, error, fault, failure,incident, flaw, problem, gripe, glitch, defect, and bug areoften used synonymously. There is no need for our work todefine all related terms. Here, “defect” is used as a collectivenoun. In accordance with IEEE [7], the usage of the termsfault, error and failure is based on Jean-Claude Laprie [8]:“A system failure occurs when the delivered service deviatesfrom fulfilling the system function, the latter being whatthe system is aimed at. An error is that part of the systemstate, which is liable to lead to subsequent failure: an erroraffecting the service is an indication that a failure occursor has occurred. The adjudged or hypothesized cause of anerror is a fault.” Figure 4 shows a concise example in theHMI context for clarifying the distinction between the terms.
According to [9], faults cause errors and errors causefailures. However, not every fault is the reason for an error
and not every error is the reason for a failure. Hence black-box testing can lead to a sophisticated task because somefaults cause failures only in very particular situations. Inaddition, failures that are caused by faults and lead to errorscan cause other faults – resulting in a propagation of faults.Additionally, no one-to-one correspondence of failure andfaults can be assumed. One failure can be symptom for morethan one fault, one fault can cause more than one failure.The analyzed reports are based on the results of black-boxtesting. Thus, only failures were detected and documentedwithin these reports. They contain no information about thefaults – the root of the failures.
B. Defect Classification Schemes
IBM created the so-called Orthogonal Defect Classifica-tion (ODC) [10] in the early nineties. Since then, manycompanies have applied this approach. It consists of severalattributes, such as triggers, defect types, impact, and others.A GUI section is included in the ODC extension V5.11 [10].It contains triggers, such as design conformance, navigation,and widget / GUI behavior.
Another scheme, which contains several categories forGUI-related issues, was proposed by Li et al. [11]. It consistsof 300 categories and is based on the ODC, but adaptedfor black-box testing. It contains, e.g., categories for aGUI in general, and for GUI control [11]. However, thisscheme contains many categories that refer to highly specificGUI elements and therefore lacks in abstraction levels. Forexample, there are categories for a Textbox, Dropdown list,or a Title bar that are not applicable to systems that donot contain those. The scheme also contains categories forinteraction of various menus or display styles [11]. There isno further differentiation, e.g., there may be an unexpectedreaction of the system, or there may be no reaction whenusing a menu. This scheme is created for regular desktopsoftware, as it also classifies keyboard- or mouse-relatedfaults. In order to adapt this schema, a large number ofcategories would have to be exchanged. As there are nofurther abstraction levels, only few common aspects remainwhich limits the potential of general conclusions.
Børretzen and Dyre-Hansen [12] created a scheme thatis also based on the ODC. They target industrial projects.A single GUI fault category is included, but not furthersegmented. The rationale for this is that, although “functionand GUI faults are the most common fault types”, they aremost often not severe, and thus, not as critical as othercategories [12]. This seems to be a contradiction to whatwas stated in the introduction, but the criticalities of certaintypes of defects are subject to the application domain. In thebeginning, in our application domain they are very critical,and therefore, we focus on them to assure software quality.
Hewlett-Packard created a scheme based on three cat-egories: origin, type, and mode [13]. Origin refers towhere the defect was introduced; the type can, e.g., be
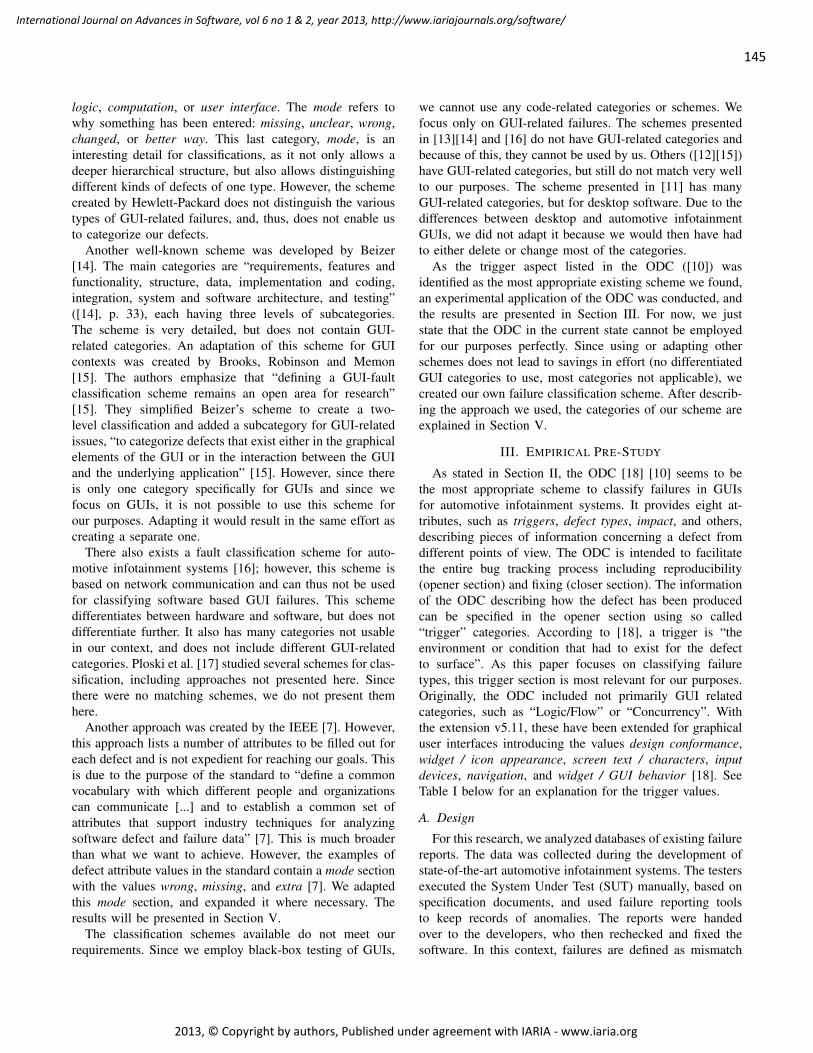
145
International Journal on Advances in Software, vol 6 no 1 & 2, year 2013, http://www.iariajournals.org/software/
2013, © Copyright by authors, Published under agreement with IARIA - www.iaria.org
logic, computation, or user interface. The mode refers towhy something has been entered: missing, unclear, wrong,changed, or better way. This last category, mode, is aninteresting detail for classifications, as it not only allows adeeper hierarchical structure, but also allows distinguishingdifferent kinds of defects of one type. However, the schemecreated by Hewlett-Packard does not distinguish the varioustypes of GUI-related failures, and, thus, does not enable usto categorize our defects.
Another well-known scheme was developed by Beizer[14]. The main categories are “requirements, features andfunctionality, structure, data, implementation and coding,integration, system and software architecture, and testing”([14], p. 33), each having three levels of subcategories.The scheme is very detailed, but does not contain GUI-related categories. An adaptation of this scheme for GUIcontexts was created by Brooks, Robinson and Memon[15]. The authors emphasize that “defining a GUI-faultclassification scheme remains an open area for research”[15]. They simplified Beizer’s scheme to create a two-level classification and added a subcategory for GUI-relatedissues, “to categorize defects that exist either in the graphicalelements of the GUI or in the interaction between the GUIand the underlying application” [15]. However, since thereis only one category specifically for GUIs and since wefocus on GUIs, it is not possible to use this scheme forour purposes. Adapting it would result in the same effort ascreating a separate one.
There also exists a fault classification scheme for auto-motive infotainment systems [16]; however, this scheme isbased on network communication and can thus not be usedfor classifying software based GUI failures. This schemedifferentiates between hardware and software, but does notdifferentiate further. It also has many categories not usablein our context, and does not include different GUI-relatedcategories. Ploski et al. [17] studied several schemes for clas-sification, including approaches not presented here. Sincethere were no matching schemes, we do not present themhere.
Another approach was created by the IEEE [7]. However,this approach lists a number of attributes to be filled out foreach defect and is not expedient for reaching our goals. Thisis due to the purpose of the standard to “define a commonvocabulary with which different people and organizationscan communicate [...] and to establish a common set ofattributes that support industry techniques for analyzingsoftware defect and failure data” [7]. This is much broaderthan what we want to achieve. However, the examples ofdefect attribute values in the standard contain a mode sectionwith the values wrong, missing, and extra [7]. We adaptedthis mode section, and expanded it where necessary. Theresults will be presented in Section V.
The classification schemes available do not meet ourrequirements. Since we employ black-box testing of GUIs,
we cannot use any code-related categories or schemes. Wefocus only on GUI-related failures. The schemes presentedin [13][14] and [16] do not have GUI-related categories andbecause of this, they cannot be used by us. Others ([12][15])have GUI-related categories, but still do not match very wellto our purposes. The scheme presented in [11] has manyGUI-related categories, but for desktop software. Due to thedifferences between desktop and automotive infotainmentGUIs, we did not adapt it because we would then have hadto either delete or change most of the categories.
As the trigger aspect listed in the ODC ([10]) wasidentified as the most appropriate existing scheme we found,an experimental application of the ODC was conducted, andthe results are presented in Section III. For now, we juststate that the ODC in the current state cannot be employedfor our purposes perfectly. Since using or adapting otherschemes does not lead to savings in effort (no differentiatedGUI categories to use, most categories not applicable), wecreated our own failure classification scheme. After describ-ing the approach we used, the categories of our scheme areexplained in Section V.
III. EMPIRICAL PRE-STUDY
As stated in Section II, the ODC [18] [10] seems to bethe most appropriate scheme to classify failures in GUIsfor automotive infotainment systems. It provides eight at-tributes, such as triggers, defect types, impact, and others,describing pieces of information concerning a defect fromdifferent points of view. The ODC is intended to facilitatethe entire bug tracking process including reproducibility(opener section) and fixing (closer section). The informationof the ODC describing how the defect has been producedcan be specified in the opener section using so called“trigger” categories. According to [18], a trigger is “theenvironment or condition that had to exist for the defectto surface”. As this paper focuses on classifying failuretypes, this trigger section is most relevant for our purposes.Originally, the ODC included not primarily GUI relatedcategories, such as “Logic/Flow” or “Concurrency”. Withthe extension v5.11, these have been extended for graphicaluser interfaces introducing the values design conformance,widget / icon appearance, screen text / characters, inputdevices, navigation, and widget / GUI behavior [18]. SeeTable I below for an explanation for the trigger values.
A. Design
For this research, we analyzed databases of existing failurereports. The data was collected during the development ofstate-of-the-art automotive infotainment systems. The testersexecuted the System Under Test (SUT) manually, based onspecification documents, and used failure reporting toolsto keep records of anomalies. The reports were handedover to the developers, who then rechecked and fixed thesoftware. In this context, failures are defined as mismatch
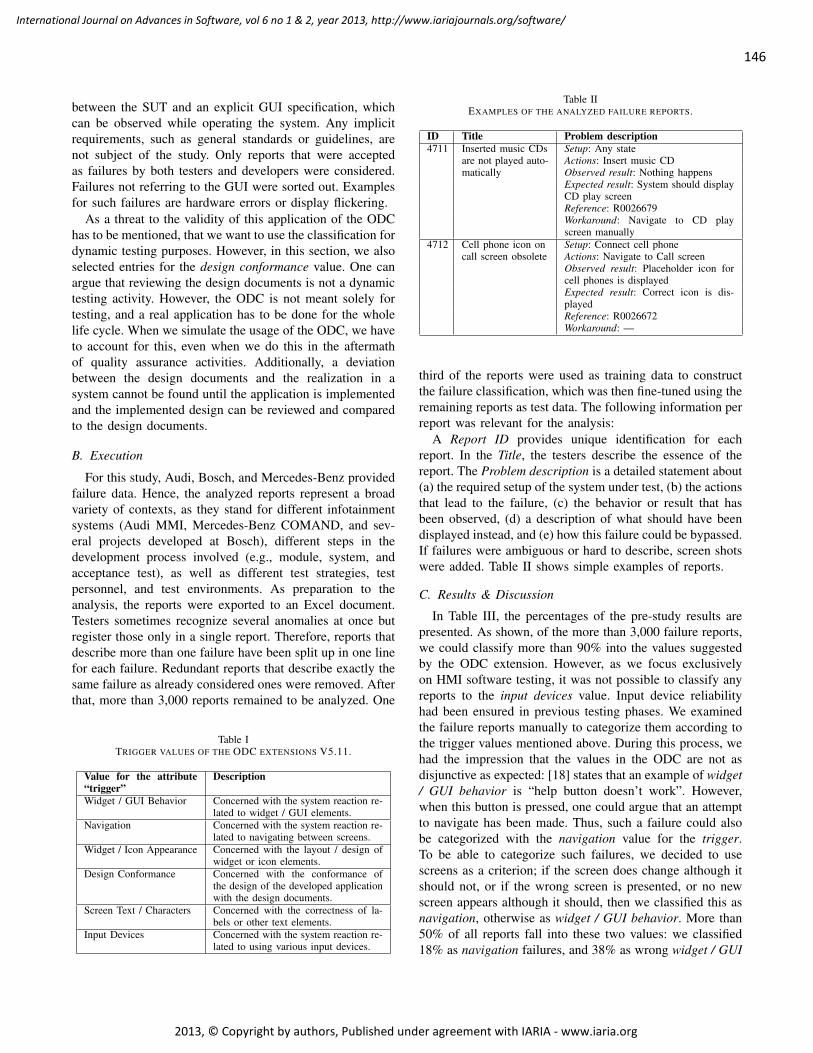
146
International Journal on Advances in Software, vol 6 no 1 & 2, year 2013, http://www.iariajournals.org/software/
2013, © Copyright by authors, Published under agreement with IARIA - www.iaria.org
between the SUT and an explicit GUI specification, whichcan be observed while operating the system. Any implicitrequirements, such as general standards or guidelines, arenot subject of the study. Only reports that were acceptedas failures by both testers and developers were considered.Failures not referring to the GUI were sorted out. Examplesfor such failures are hardware errors or display flickering.
As a threat to the validity of this application of the ODChas to be mentioned, that we want to use the classification fordynamic testing purposes. However, in this section, we alsoselected entries for the design conformance value. One canargue that reviewing the design documents is not a dynamictesting activity. However, the ODC is not meant solely fortesting, and a real application has to be done for the wholelife cycle. When we simulate the usage of the ODC, we haveto account for this, even when we do this in the aftermathof quality assurance activities. Additionally, a deviationbetween the design documents and the realization in asystem cannot be found until the application is implementedand the implemented design can be reviewed and comparedto the design documents.
B. Execution
For this study, Audi, Bosch, and Mercedes-Benz providedfailure data. Hence, the analyzed reports represent a broadvariety of contexts, as they stand for different infotainmentsystems (Audi MMI, Mercedes-Benz COMAND, and sev-eral projects developed at Bosch), different steps in thedevelopment process involved (e.g., module, system, andacceptance test), as well as different test strategies, testpersonnel, and test environments. As preparation to theanalysis, the reports were exported to an Excel document.Testers sometimes recognize several anomalies at once butregister those only in a single report. Therefore, reports thatdescribe more than one failure have been split up in one linefor each failure. Redundant reports that describe exactly thesame failure as already considered ones were removed. Afterthat, more than 3,000 reports remained to be analyzed. One
Table ITRIGGER VALUES OF THE ODC EXTENSIONS V5.11.
Value for the attribute“trigger”
Description
Widget / GUI Behavior Concerned with the system reaction re-lated to widget / GUI elements.
Navigation Concerned with the system reaction re-lated to navigating between screens.
Widget / Icon Appearance Concerned with the layout / design ofwidget or icon elements.
Design Conformance Concerned with the conformance ofthe design of the developed applicationwith the design documents.
Screen Text / Characters Concerned with the correctness of la-bels or other text elements.
Input Devices Concerned with the system reaction re-lated to using various input devices.
Table IIEXAMPLES OF THE ANALYZED FAILURE REPORTS.
ID Title Problem description4711 Inserted music CDs Setup: Any state
are not played auto- Actions: Insert music CDmatically Observed result: Nothing happens
Expected result: System should displayCD play screenReference: R0026679Workaround: Navigate to CD playscreen manually
4712 Cell phone icon on Setup: Connect cell phonecall screen obsolete Actions: Navigate to Call screen
Observed result: Placeholder icon forcell phones is displayedExpected result: Correct icon is dis-playedReference: R0026672Workaround: —
third of the reports were used as training data to constructthe failure classification, which was then fine-tuned using theremaining reports as test data. The following information perreport was relevant for the analysis:
A Report ID provides unique identification for eachreport. In the Title, the testers describe the essence of thereport. The Problem description is a detailed statement about(a) the required setup of the system under test, (b) the actionsthat lead to the failure, (c) the behavior or result that hasbeen observed, (d) a description of what should have beendisplayed instead, and (e) how this failure could be bypassed.If failures were ambiguous or hard to describe, screen shotswere added. Table II shows simple examples of reports.
C. Results & Discussion
In Table III, the percentages of the pre-study results arepresented. As shown, of the more than 3,000 failure reports,we could classify more than 90% into the values suggestedby the ODC extension. However, as we focus exclusivelyon HMI software testing, it was not possible to classify anyreports to the input devices value. Input device reliabilityhad been ensured in previous testing phases. We examinedthe failure reports manually to categorize them according tothe trigger values mentioned above. During this process, wehad the impression that the values in the ODC are not asdisjunctive as expected: [18] states that an example of widget/ GUI behavior is “help button doesn’t work”. However,when this button is pressed, one could argue that an attemptto navigate has been made. Thus, such a failure could alsobe categorized with the navigation value for the trigger.To be able to categorize such failures, we decided to usescreens as a criterion; if the screen does change although itshould not, or if the wrong screen is presented, or no newscreen appears although it should, then we classified this asnavigation, otherwise as widget / GUI behavior. More than50% of all reports fall into these two values: we classified18% as navigation failures, and 38% as wrong widget / GUI
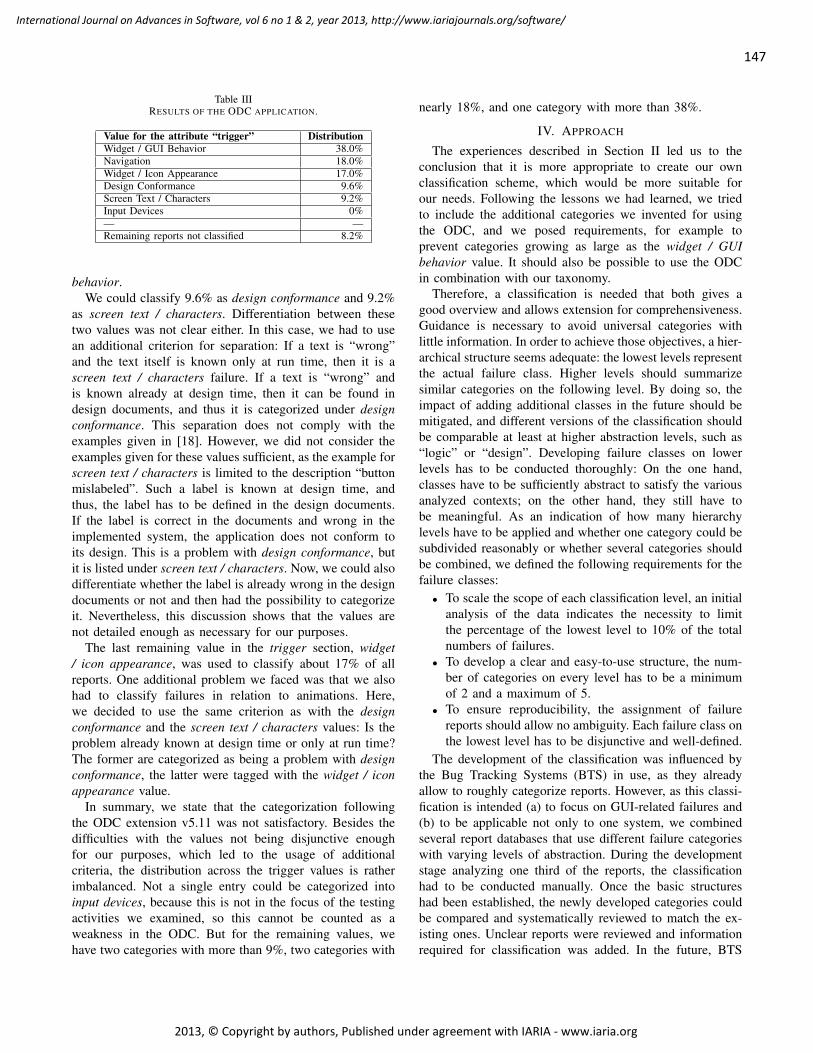
147
International Journal on Advances in Software, vol 6 no 1 & 2, year 2013, http://www.iariajournals.org/software/
2013, © Copyright by authors, Published under agreement with IARIA - www.iaria.org
Table IIIRESULTS OF THE ODC APPLICATION.
Value for the attribute “trigger” DistributionWidget / GUI Behavior 38.0%Navigation 18.0%Widget / Icon Appearance 17.0%Design Conformance 9.6%Screen Text / Characters 9.2%Input Devices 0%— —Remaining reports not classified 8.2%
behavior.We could classify 9.6% as design conformance and 9.2%
as screen text / characters. Differentiation between thesetwo values was not clear either. In this case, we had to usean additional criterion for separation: If a text is “wrong”and the text itself is known only at run time, then it is ascreen text / characters failure. If a text is “wrong” andis known already at design time, then it can be found indesign documents, and thus it is categorized under designconformance. This separation does not comply with theexamples given in [18]. However, we did not consider theexamples given for these values sufficient, as the example forscreen text / characters is limited to the description “buttonmislabeled”. Such a label is known at design time, andthus, the label has to be defined in the design documents.If the label is correct in the documents and wrong in theimplemented system, the application does not conform toits design. This is a problem with design conformance, butit is listed under screen text / characters. Now, we could alsodifferentiate whether the label is already wrong in the designdocuments or not and then had the possibility to categorizeit. Nevertheless, this discussion shows that the values arenot detailed enough as necessary for our purposes.
The last remaining value in the trigger section, widget/ icon appearance, was used to classify about 17% of allreports. One additional problem we faced was that we alsohad to classify failures in relation to animations. Here,we decided to use the same criterion as with the designconformance and the screen text / characters values: Is theproblem already known at design time or only at run time?The former are categorized as being a problem with designconformance, the latter were tagged with the widget / iconappearance value.
In summary, we state that the categorization followingthe ODC extension v5.11 was not satisfactory. Besides thedifficulties with the values not being disjunctive enoughfor our purposes, which led to the usage of additionalcriteria, the distribution across the trigger values is ratherimbalanced. Not a single entry could be categorized intoinput devices, because this is not in the focus of the testingactivities we examined, so this cannot be counted as aweakness in the ODC. But for the remaining values, wehave two categories with more than 9%, two categories with
nearly 18%, and one category with more than 38%.
IV. APPROACH
The experiences described in Section II led us to theconclusion that it is more appropriate to create our ownclassification scheme, which would be more suitable forour needs. Following the lessons we had learned, we triedto include the additional categories we invented for usingthe ODC, and we posed requirements, for example toprevent categories growing as large as the widget / GUIbehavior value. It should also be possible to use the ODCin combination with our taxonomy.
Therefore, a classification is needed that both gives agood overview and allows extension for comprehensiveness.Guidance is necessary to avoid universal categories withlittle information. In order to achieve those objectives, a hier-archical structure seems adequate: the lowest levels representthe actual failure class. Higher levels should summarizesimilar categories on the following level. By doing so, theimpact of adding additional classes in the future should bemitigated, and different versions of the classification shouldbe comparable at least at higher abstraction levels, such as“logic” or “design”. Developing failure classes on lowerlevels has to be conducted thoroughly: On the one hand,classes have to be sufficiently abstract to satisfy the variousanalyzed contexts; on the other hand, they still have tobe meaningful. As an indication of how many hierarchylevels have to be applied and whether one category could besubdivided reasonably or whether several categories shouldbe combined, we defined the following requirements for thefailure classes:
• To scale the scope of each classification level, an initialanalysis of the data indicates the necessity to limitthe percentage of the lowest level to 10% of the totalnumbers of failures.
• To develop a clear and easy-to-use structure, the num-ber of categories on every level has to be a minimumof 2 and a maximum of 5.
• To ensure reproducibility, the assignment of failurereports should allow no ambiguity. Each failure class onthe lowest level has to be disjunctive and well-defined.
The development of the classification was influenced bythe Bug Tracking Systems (BTS) in use, as they alreadyallow to roughly categorize reports. However, as this classi-fication is intended (a) to focus on GUI-related failures and(b) to be applicable not only to one system, we combinedseveral report databases that use different failure categorieswith varying levels of abstraction. During the developmentstage analyzing one third of the reports, the classificationhad to be conducted manually. Once the basic structureshad been established, the newly developed categories couldbe compared and systematically reviewed to match the ex-isting ones. Unclear reports were reviewed and informationrequired for classification was added. In the future, BTS
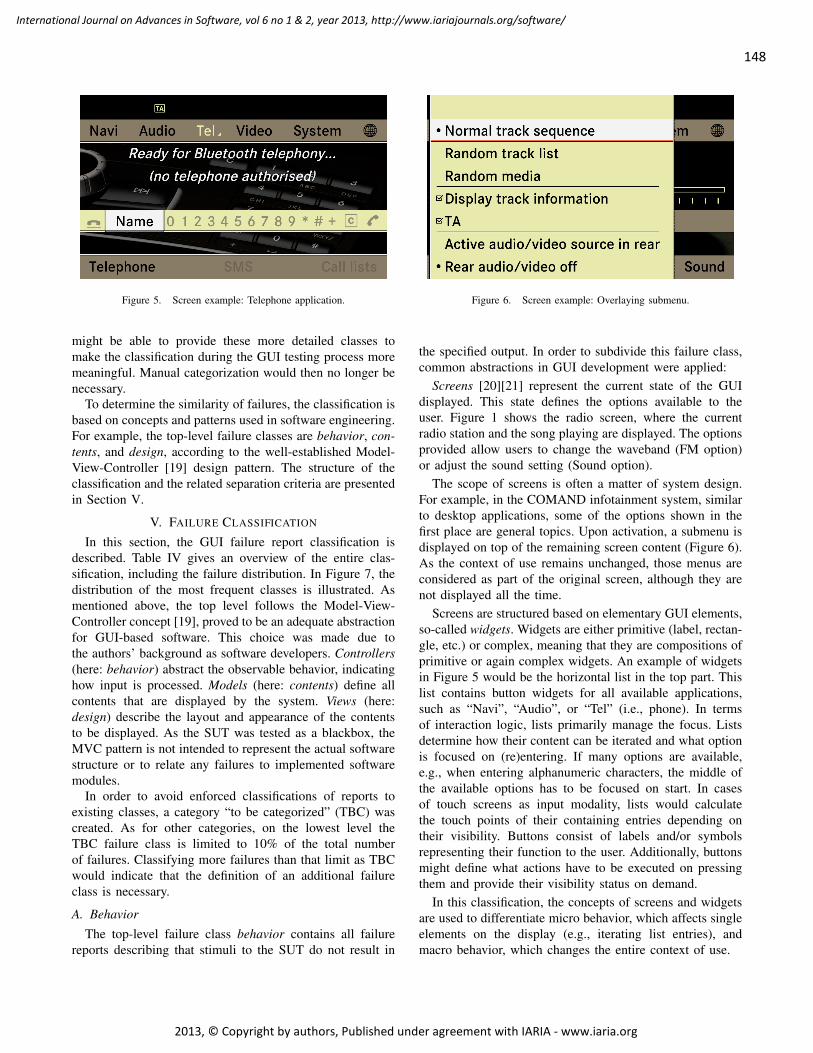
148
International Journal on Advances in Software, vol 6 no 1 & 2, year 2013, http://www.iariajournals.org/software/
2013, © Copyright by authors, Published under agreement with IARIA - www.iaria.org
Figure 5. Screen example: Telephone application.
might be able to provide these more detailed classes tomake the classification during the GUI testing process moremeaningful. Manual categorization would then no longer benecessary.
To determine the similarity of failures, the classification isbased on concepts and patterns used in software engineering.For example, the top-level failure classes are behavior, con-tents, and design, according to the well-established Model-View-Controller [19] design pattern. The structure of theclassification and the related separation criteria are presentedin Section V.
V. FAILURE CLASSIFICATION
In this section, the GUI failure report classification isdescribed. Table IV gives an overview of the entire clas-sification, including the failure distribution. In Figure 7, thedistribution of the most frequent classes is illustrated. Asmentioned above, the top level follows the Model-View-Controller concept [19], proved to be an adequate abstractionfor GUI-based software. This choice was made due tothe authors’ background as software developers. Controllers(here: behavior) abstract the observable behavior, indicatinghow input is processed. Models (here: contents) define allcontents that are displayed by the system. Views (here:design) describe the layout and appearance of the contentsto be displayed. As the SUT was tested as a blackbox, theMVC pattern is not intended to represent the actual softwarestructure or to relate any failures to implemented softwaremodules.
In order to avoid enforced classifications of reports toexisting classes, a category “to be categorized” (TBC) wascreated. As for other categories, on the lowest level theTBC failure class is limited to 10% of the total numberof failures. Classifying more failures than that limit as TBCwould indicate that the definition of an additional failureclass is necessary.
A. BehaviorThe top-level failure class behavior contains all failure
reports describing that stimuli to the SUT do not result in
Figure 6. Screen example: Overlaying submenu.
the specified output. In order to subdivide this failure class,common abstractions in GUI development were applied:
Screens [20][21] represent the current state of the GUIdisplayed. This state defines the options available to theuser. Figure 1 shows the radio screen, where the currentradio station and the song playing are displayed. The optionsprovided allow users to change the waveband (FM option)or adjust the sound setting (Sound option).
The scope of screens is often a matter of system design.For example, in the COMAND infotainment system, similarto desktop applications, some of the options shown in thefirst place are general topics. Upon activation, a submenu isdisplayed on top of the remaining screen content (Figure 6).As the context of use remains unchanged, those menus areconsidered as part of the original screen, although they arenot displayed all the time.
Screens are structured based on elementary GUI elements,so-called widgets. Widgets are either primitive (label, rectan-gle, etc.) or complex, meaning that they are compositions ofprimitive or again complex widgets. An example of widgetsin Figure 5 would be the horizontal list in the top part. Thislist contains button widgets for all available applications,such as “Navi”, “Audio”, or “Tel” (i.e., phone). In termsof interaction logic, lists primarily manage the focus. Listsdetermine how their content can be iterated and what optionis focused on (re)entering. If many options are available,e.g., when entering alphanumeric characters, the middle ofthe available options has to be focused on start. In casesof touch screens as input modality, lists would calculatethe touch points of their containing entries depending ontheir visibility. Buttons consist of labels and/or symbolsrepresenting their function to the user. Additionally, buttonsmight define what actions have to be executed on pressingthem and provide their visibility status on demand.
In this classification, the concepts of screens and widgetsare used to differentiate micro behavior, which affects singleelements on the display (e.g., iterating list entries), andmacro behavior, which changes the entire context of use.
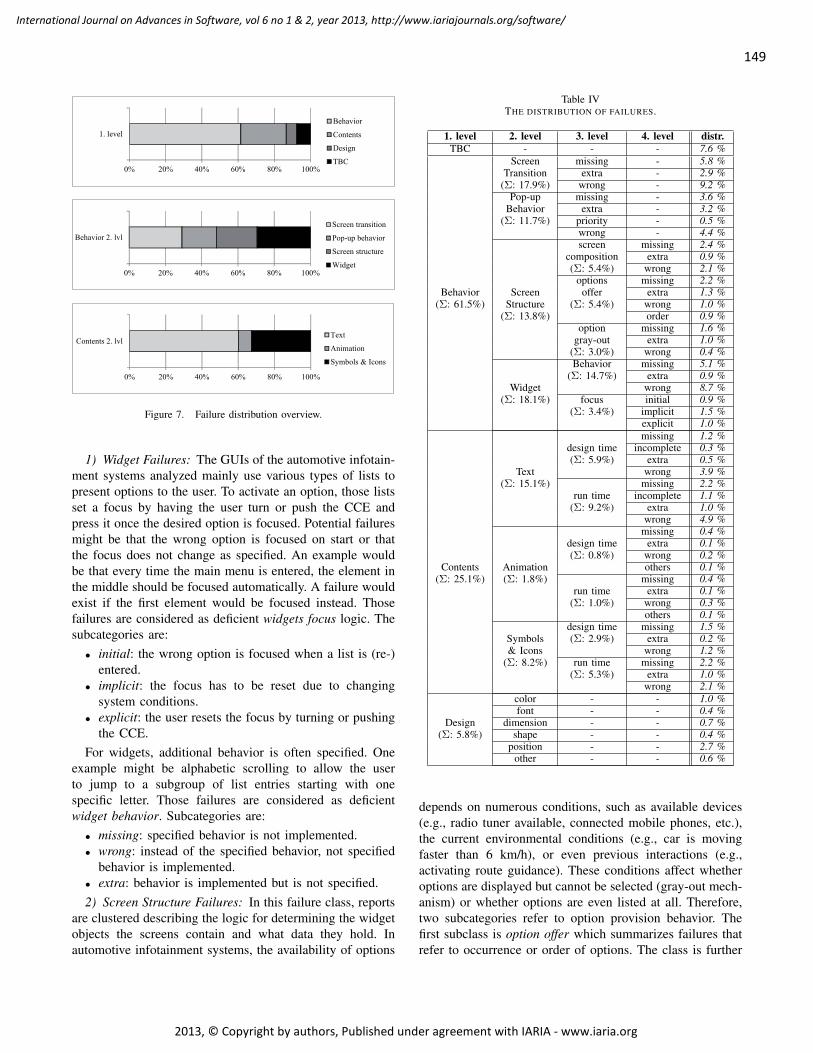
149
International Journal on Advances in Software, vol 6 no 1 & 2, year 2013, http://www.iariajournals.org/software/
2013, © Copyright by authors, Published under agreement with IARIA - www.iaria.org
0% 20% 40% 60% 80% 100%
Behavior 2. lvl
Screen transition
Pop-up behavior
Screen structure
Widget
0% 20% 40% 60% 80% 100%
Contents 2. lvlText
Animation
Symbols & Icons
0% 20% 40% 60% 80% 100%
1. level
Behavior
Contents
Design
TBC
Figure 7. Failure distribution overview.
1) Widget Failures: The GUIs of the automotive infotain-ment systems analyzed mainly use various types of lists topresent options to the user. To activate an option, those listsset a focus by having the user turn or push the CCE andpress it once the desired option is focused. Potential failuresmight be that the wrong option is focused on start or thatthe focus does not change as specified. An example wouldbe that every time the main menu is entered, the element inthe middle should be focused automatically. A failure wouldexist if the first element would be focused instead. Thosefailures are considered as deficient widgets focus logic. Thesubcategories are:
• initial: the wrong option is focused when a list is (re-)entered.
• implicit: the focus has to be reset due to changingsystem conditions.
• explicit: the user resets the focus by turning or pushingthe CCE.
For widgets, additional behavior is often specified. Oneexample might be alphabetic scrolling to allow the userto jump to a subgroup of list entries starting with onespecific letter. Those failures are considered as deficientwidget behavior. Subcategories are:
• missing: specified behavior is not implemented.• wrong: instead of the specified behavior, not specified
behavior is implemented.• extra: behavior is implemented but is not specified.2) Screen Structure Failures: In this failure class, reports
are clustered describing the logic for determining the widgetobjects the screens contain and what data they hold. Inautomotive infotainment systems, the availability of options
Table IVTHE DISTRIBUTION OF FAILURES.
1. level 2. level 3. level 4. level distr.TBC - - - 7.6 %
Behavior
Screen missing - 5.8 %Transition extra - 2.9 %
(Σ: 17.9%) wrong - 9.2 %Pop-up missing - 3.6 %
Behavior extra - 3.2 %(Σ: 11.7%) priority - 0.5 %
wrong - 4.4 %screen missing 2.4 %
composition extra 0.9 %(Σ: 5.4%) wrong 2.1 %
options missing 2.2 %Screen offer extra 1.3 %
(Σ: 61.5%) Structure (Σ: 5.4%) wrong 1.0 %(Σ: 13.8%) order 0.9 %
option missing 1.6 %gray-out extra 1.0 %
(Σ: 3.0%) wrong 0.4 %Behavior missing 5.1 %
(Σ: 14.7%) extra 0.9 %Widget wrong 8.7 %
(Σ: 18.1%) focus initial 0.9 %(Σ: 3.4%) implicit 1.5 %
explicit 1.0 %
Contents
missing 1.2 %design time incomplete 0.3 %(Σ: 5.9%) extra 0.5 %
Text wrong 3.9 %(Σ: 15.1%) missing 2.2 %
run time incomplete 1.1 %(Σ: 9.2%) extra 1.0 %
wrong 4.9 %missing 0.4 %
design time extra 0.1 %(Σ: 0.8%) wrong 0.2 %
Animation others 0.1 %(Σ: 25.1%) (Σ: 1.8%) missing 0.4 %
run time extra 0.1 %(Σ: 1.0%) wrong 0.3 %
others 0.1 %design time missing 1.5 %
Symbols (Σ: 2.9%) extra 0.2 %& Icons wrong 1.2 %
(Σ: 8.2%) run time missing 2.2 %(Σ: 5.3%) extra 1.0 %
wrong 2.1 %
Design
color - - 1.0 %font - - 0.4 %
dimension - - 0.7 %(Σ: 5.8%) shape - - 0.4 %
position - - 2.7 %other - - 0.6 %
depends on numerous conditions, such as available devices(e.g., radio tuner available, connected mobile phones, etc.),the current environmental conditions (e.g., car is movingfaster than 6 km/h), or even previous interactions (e.g.,activating route guidance). These conditions affect whetheroptions are displayed but cannot be selected (gray-out mech-anism) or whether options are even listed at all. Therefore,two subcategories refer to option provision behavior. Thefirst subclass is option offer which summarizes failures thatrefer to occurrence or order of options. The class is further
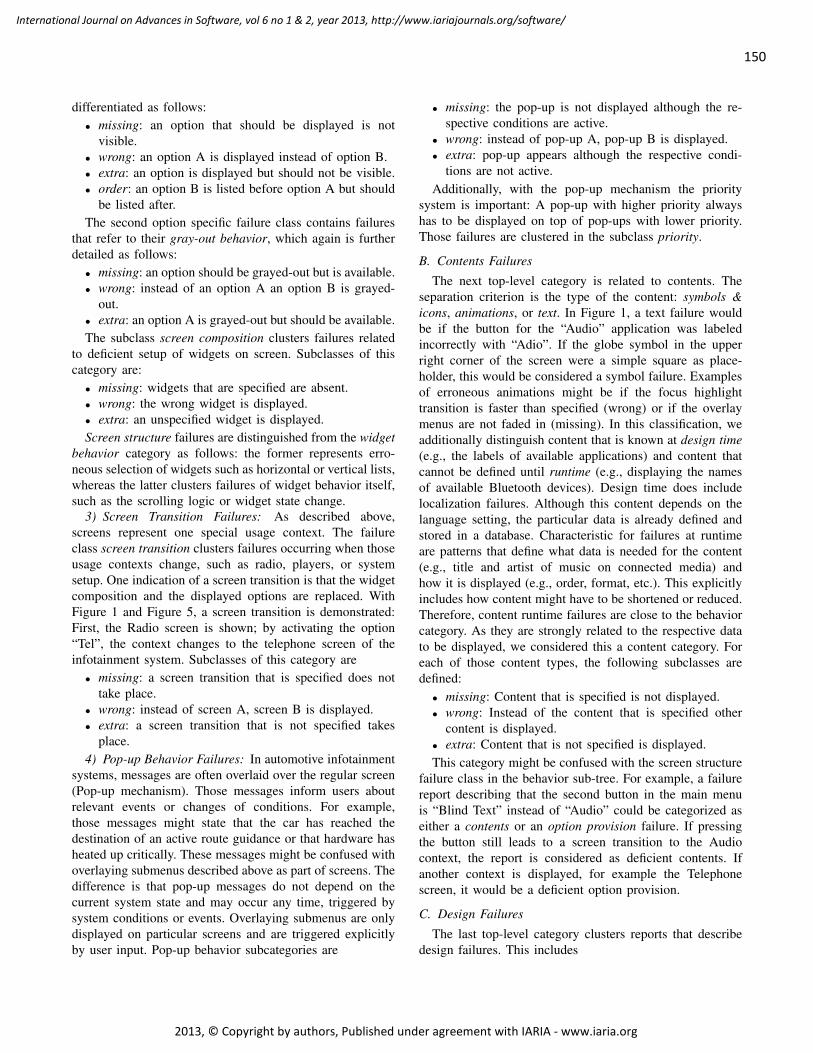
150
International Journal on Advances in Software, vol 6 no 1 & 2, year 2013, http://www.iariajournals.org/software/
2013, © Copyright by authors, Published under agreement with IARIA - www.iaria.org
differentiated as follows:• missing: an option that should be displayed is not
visible.• wrong: an option A is displayed instead of option B.• extra: an option is displayed but should not be visible.• order: an option B is listed before option A but should
be listed after.The second option specific failure class contains failures
that refer to their gray-out behavior, which again is furtherdetailed as follows:
• missing: an option should be grayed-out but is available.• wrong: instead of an option A an option B is grayed-
out.• extra: an option A is grayed-out but should be available.The subclass screen composition clusters failures related
to deficient setup of widgets on screen. Subclasses of thiscategory are:
• missing: widgets that are specified are absent.• wrong: the wrong widget is displayed.• extra: an unspecified widget is displayed.Screen structure failures are distinguished from the widget
behavior category as follows: the former represents erro-neous selection of widgets such as horizontal or vertical lists,whereas the latter clusters failures of widget behavior itself,such as the scrolling logic or widget state change.
3) Screen Transition Failures: As described above,screens represent one special usage context. The failureclass screen transition clusters failures occurring when thoseusage contexts change, such as radio, players, or systemsetup. One indication of a screen transition is that the widgetcomposition and the displayed options are replaced. WithFigure 1 and Figure 5, a screen transition is demonstrated:First, the Radio screen is shown; by activating the option“Tel”, the context changes to the telephone screen of theinfotainment system. Subclasses of this category are
• missing: a screen transition that is specified does nottake place.
• wrong: instead of screen A, screen B is displayed.• extra: a screen transition that is not specified takes
place.4) Pop-up Behavior Failures: In automotive infotainment
systems, messages are often overlaid over the regular screen(Pop-up mechanism). Those messages inform users aboutrelevant events or changes of conditions. For example,those messages might state that the car has reached thedestination of an active route guidance or that hardware hasheated up critically. These messages might be confused withoverlaying submenus described above as part of screens. Thedifference is that pop-up messages do not depend on thecurrent system state and may occur any time, triggered bysystem conditions or events. Overlaying submenus are onlydisplayed on particular screens and are triggered explicitlyby user input. Pop-up behavior subcategories are
• missing: the pop-up is not displayed although the re-spective conditions are active.
• wrong: instead of pop-up A, pop-up B is displayed.• extra: pop-up appears although the respective condi-
tions are not active.Additionally, with the pop-up mechanism the priority
system is important: A pop-up with higher priority alwayshas to be displayed on top of pop-ups with lower priority.Those failures are clustered in the subclass priority.
B. Contents Failures
The next top-level category is related to contents. Theseparation criterion is the type of the content: symbols &icons, animations, or text. In Figure 1, a text failure wouldbe if the button for the “Audio” application was labeledincorrectly with “Adio”. If the globe symbol in the upperright corner of the screen were a simple square as place-holder, this would be considered a symbol failure. Examplesof erroneous animations might be if the focus highlighttransition is faster than specified (wrong) or if the overlaymenus are not faded in (missing). In this classification, weadditionally distinguish content that is known at design time(e.g., the labels of available applications) and content thatcannot be defined until runtime (e.g., displaying the namesof available Bluetooth devices). Design time does includelocalization failures. Although this content depends on thelanguage setting, the particular data is already defined andstored in a database. Characteristic for failures at runtimeare patterns that define what data is needed for the content(e.g., title and artist of music on connected media) andhow it is displayed (e.g., order, format, etc.). This explicitlyincludes how content might have to be shortened or reduced.Therefore, content runtime failures are close to the behaviorcategory. As they are strongly related to the respective datato be displayed, we considered this a content category. Foreach of those content types, the following subclasses aredefined:
• missing: Content that is specified is not displayed.• wrong: Instead of the content that is specified other
content is displayed.• extra: Content that is not specified is displayed.This category might be confused with the screen structure
failure class in the behavior sub-tree. For example, a failurereport describing that the second button in the main menuis “Blind Text” instead of “Audio” could be categorized aseither a contents or an option provision failure. If pressingthe button still leads to a screen transition to the Audiocontext, the report is considered as deficient contents. Ifanother context is displayed, for example the Telephonescreen, it would be a deficient option provision.
C. Design Failures
The last top-level category clusters reports that describedesign failures. This includes
151
International Journal on Advances in Software, vol 6 no 1 & 2, year 2013, http://www.iariajournals.org/software/
2013, © Copyright by authors, Published under agreement with IARIA - www.iaria.org
• color: e.g., focus color is red instead of orange.• font: e.g., text font is Courier instead of Arial.• dimension: e.g., a button is higher or broader than
specified.• shape: e.g., a button should be displayed with rounded
instead of sharp edges.• position: e.g., a label of a button is centered instead of
left-aligned.
As design failures were often described vaguely, a subcat-egory for other design failures was defined. Ambiguousdescriptions were, for example, that wrong arrows, wrongCyrillic letters, or a wrong clock were observed. As itbecame obvious early that a low percentage of reports werecategorized as design failures, no additional work was doneto clarify this category.
VI. DISCUSSION
The requirements defined in Section IV were fulfilled formost failure classes. We intended to cover at least 90% of alldefect reports analyzed. Only 7.6% of the reported failureshad to be classified as “to be categorized”. Furthermore, weintended to limit the percentage of the classes on the lowestlevel of the hierarchy to 10%. This could be achieved aswell: with 9.2%, the largest category was behavior - screentransition - wrong. We intended to allow only 2-5 categorieson each hierarchy level. This could not be realized for thedesign category (6 sub classes). However, due to a very smallnumber of failures classified as design-related (5.8%), we didnot consider it necessary to restructure this category.
The requirements further stated that the failure classeshave to be disjunctive. Most of the distinction was clearduring the classification process. In the available reports,there was no interference between logic and design failures.However, failures regarding design, which is determined byalgorithms were not analyzed. For those cases, a new classwithin the logic sub-tree has to be defined. No ambiguitywas noticed in terms of differences between content anddesign failures.
Most challenges were experienced in differentiating con-tent and logic failures, especially in cases where severalfailures occurred at once. This was due to the fact thatthe systems had to be tested as a black-box and only theinformation displayed on the screen could be accessed. Thefollowing scenario exemplifies the key issues: let us assumeall 5 buttons in the main menu line illustrated in Figure1 are labeled as “Blind Text”. This is definitely a contenttext failure. However, it has to be checked whether there areadditional failure symptoms such as wrong, missing, or extraoptions provided, or a failure regarding the order of menuentries. Those additional failures have to be revealed byanalyzing other button properties. In this case, it would havebeen checked which screen transition they trigger. However,several alternatives have to be considered:
• If pressing the second button in the menu line – whichshould be the Audio button – triggers the transitionto the Audio context, no additional failure has to bereported.
• If pressing not the second but the third button triggersthe transition to the Audio screen, an additional optionprovision (order or extra) failure has been revealed.
• If pressing a button labeled Telephone triggers theAudio screen, this could be a screen transition failureor a content text failure.
In the analyzed reports, this distinction was possible dueto the given descriptions. However, problems might occurwhen applying the classification in the future. This is notonly an issue with failure classifications, but an issue withreporting failures in general. We recommend bearing theambiguity of symptoms in mind while testing and reporting.It is essential to provide the information that is neededto differentiate failure symptoms. A detailed classification,such as the one presented in this paper, might help to clarifythe exact circumstances even in early phases.
Further, we answered the question raised in this paperwhat types of failures are frequent in current informationsystems. The results show that the majority (61.5%) arefailures related to behavior. This demonstrates the complexmacro and micro behavior in modern infotainment systems.Most of the failure reports are related to missing or wrongindividual widget behavior (13.8%) as well as missing orwrong screen transitions (15.0%). The content categoryis the second largest top-level failure class (25.1%), witherroneous text being the biggest subcategory (15.1%). Themajority (9.2%) is not known until runtime. Explanationsare (a) that in most infotainment systems, information ismainly displayed textually and (b) that testing texts is easierfor human testers than comparing symbols or animationsin detail. Very few failures (5.8%) describe erroneous de-sign. One explanation might be that design is hard to testmanually. For example, it is a problem to differentiateshades of colors visually. In addition, most design errorsare less critical and even might not be recognized by users.Therefore, testing design might not be of high priority to testplanners. Hence, this data cannot be seen as definite evidenceshowing that design failures are indeed this rare. However,we addressed this limitation by analyzing failure reportsrepresenting a broad variety of contexts such as testing goals,test personnel, or test environments.
VII. CONCLUSION AND FUTURE WORK
In this paper, we answered the question of what types offailures can be found in GUI-based software in the auto-motive domain today. A failure classification was developedand applied to more than 3,000 failure reports. Ultimately,each related fault concerning the reported failures was fixedduring the development process. The reports were createdduring the development of modern automotive infotainment
152
International Journal on Advances in Software, vol 6 no 1 & 2, year 2013, http://www.iariajournals.org/software/
2013, © Copyright by authors, Published under agreement with IARIA - www.iaria.org
systems at AUDI, Bosch, and Mercedes-Benz. 61.5% ofthe reports describe failures related to high- and low-levelbehavior, 25.1% of the reports describe failures related tocontents, and 5.8% of the reports describe failures related todesign. We support not only the testers in creating detailedand clear reports, but also the entire GUI developmentprocess by pointing out pitfalls leading to gaps betweenthe specification and the implementation. The classificationindicates, which aspects need special attention in specifi-cation documents and might need to be described moreexplicitly than is common today. For roles responsible forthe implementation of GUI concepts, this work points outaspects that might be ambiguous and require clarification.
Requirements were defined in order to guide the classifi-cation process and to avoid categories that are too general ortoo specific. These requirements proved to be effective forguiding the classes development process. General sectionssuch as those suggested by the ODC extension v5.11 [18]could be avoided. However, as there are classes with lessthan 1%, the presented classification seems to be over de-tailed. In most cases, classes follow the missing/extra/wrongpattern suggested by the IEEE classification [7], which wasapplied with ease. In future applications, those minor classesmight be ignored.
In future research, the suggested classification might bescaled by reducing the maximum percentages of lowest-levelcategories. Thus, some categories have to be differentiatedfurther and additional failure classes have to be defined.Moreover, additional parameters such as “failure criticality”,“predicted number of affected users”, or “costs for testing”could be added to the classification. Those aspects arenot in focus at the current stage and might influence thechoice of test strategies significantly. Future failure reportsshould include information about those aspects. Extensionof the failure reports would require intensive collaborationbetween testers, programmers, requirement engineers, andother participants in the development process. Extendedreports together with the failure distribution might enablethe derivation of prioritization factors. The usage of ex-isting prioritization approaches, such as the techniques forselecting cost-effective test cases shown by Elbaum [22], isconceivable. One could then focus or prioritize testing onthose types of failures that are most critical based on theirfrequency and these additional parameters. For this purpose,coverage criteria and prioritization techniques are currentlybeing examined to check which of them, if any, can beused for our purposes. This classification could be applied tofuture automotive infotainment systems to analyze changesof the failure focus.
Another part of future work will be to analyze whether ourdefined classification scheme and the ascertained distributionof failures could be combined with fault seeding approaches,which are used to measure and predict reliability. One of themost popular fault seeding models is the hypergeometric
model by Harlan D. Mills [23]. According to [24] and[25], fault seeding is based on seeding a known number offaults in a software program whose total number of faultsis unknown. After testing the software, the comparison ofthe number of “found seeded faults” and “found indigenousfaults” allows estimating the number of remaining faults.In the case of [23], estimation is realized by using thehypergeometric distribution. Related work like [26], [27]and [28] focus on the described principle “with the purposeof simulating the occurrence of real software faults” [29].Andrews [30] shows that generated mutants are similar toreal faults and consequently claims that mutation operatorsyield trustworthy results. Based on Andrews, the work of[31] is about adding numerous faults for each module byselecting mutation operators simultaneously applied to thesource code. This results in a single high-order mutant thatrepresents the faulty version of the system. The approachperforms a “1/10 sampling” to limit the number of seededfaults. This means that 10% of the maximum number of thecalculated faults – e.g., faults regarding the logical operatorsor any constants – are seeded into the system.
The knowledge of the classified distribution of faultscould improve fault seeding approaches by considering theknown fault rates during the seeding process. However, theanalyzed reports in our work contain the description offailures and not faults. Due to the fact that the origin ofa failure is always a fault and that fault seeding is basedon faults and not failures, traceability between faults andfailures (through errors) is necessary to obtain the benefitsof a known classified distribution of failures. An enabler forthese benefits could be failure proximity approaches, whichidentify failing traces and group traces to the same faulttogether. [32] regards “two failing traces as similar if theysuggest roughly the same fault location” and assumes thatcollecting failing traces can support developers, respectivelytesters, in prioritizing and diagnosing faults. In conclusion,our classified distribution of failures could support theeffectiveness of fault seeding approaches. Applications willfollow.
ACKNOWLEDGMENT
The authors would like to thank Krishna Murthy Murlid-har, Sven Neuendorf, and Jasmin Zieger for their contribu-tions. The research described in this paper was conductedwithin the project automotiveHMI1. The project automo-tiveHMI is funded by the German Federal Ministry of Eco-nomics and Technology under grant number 01MS11007.
REFERENCES
[1] D. Mauser, A. Klaus, R. Zhang, and L. Duan, “GUI failureanalysis and classification for the development of in-vehicleinfotainment,” in Proceedings of the Fourth InternationalConference on Advances in System Testing and ValidationLifecycle, 2012, pp. 79–84.
1http://www.automotive-hmi.org/
153
International Journal on Advances in Software, vol 6 no 1 & 2, year 2013, http://www.iariajournals.org/software/
2013, © Copyright by authors, Published under agreement with IARIA - www.iaria.org
[2] B. Robinson and P. Brooks, “An initial study of customer-reported GUI defects,” in Proceedings of the IEEE Inter-national Conference on Software Testing, Verification, andValidation Workshops. IEEE Computer Society, 2009, pp.267–274.
[3] S. Gerlach, “Modellgetriebene entwicklung von automotive-hmi-produktlinien.” Ph.D. dissertation, AutoUni, LogosVerlag Berlin, 2012, pp. 2–6.
[4] C. Bock, “Model-driven hmi development: Can meta-casetools do the job?” in Proceedings of 40th Annual HawaiiInternational Conference on System Sciences (HICSS 2007).IEEE Computer Society, 2007, pp. 287b–287b.
[5] L. Duan, “Model-based testing of automotive hmis withconsideration for product variability.” Ph.D. dissertation,Ludwig-Maximilians-Universitat Munchen, 2012, pp. 18–22.
[6] “Audi infotainment system MMI.” [Online]. Avail-able: https://www.audi-mediaservices.com [last visited:25.02.2013]
[7] IEEE Standard Classification for Software Anomalies, IEEEStd., Rev. 1044-2009, 1994.
[8] J.-C. Laprie, “Dependability of computer systems: concepts,limits, improvements,” in Proceedings of Sixth InternationalSymposium on Software Reliability Engineering, Oct 1995,pp. 2–11.
[9] E. Dubrova, “Fault tolerant design: An introduction,” De-partment of Microelectronics and Information Technology,Royal Institute of Technology, Stockholm, Sweden, Tech.Rep., 2008.
[10] R. Chillarege, “Orthogonal defect classification,” Handbookof Software Reliability Engineering, pp. 359–399, 1996.
[11] N. Li, Z. Li, and X. Sun, “Classification of software defectdetected by black-box testing: An empirical study,” in Pro-ceedings of Second World Congress on Software Engineering(WCSE), vol. 2. IEEE, 2010, pp. 234–240.
[12] J. Børretzen and R. Conradi, “Results and experiences froman empirical study of fault reports in industrial projects,” inProceedings of the 7th international conference on Product-Focused Software Process Improvement. Springer-Verlag,2006, pp. 389–394.
[13] R. Grady, Practical software metrics for project managementand process improvement. Prentice-Hall, Inc., 1992.
[14] B. Beizer, Software testing techniques (2nd ed.). VanNostrand Reinhold Co., 1990.
[15] P. Brooks, B. Robinson, and A. Memon, “An initial charac-terization of industrial graphical user interface systems,” inProceedings of International Conference on Software TestingVerification and Validation, ser. ICST ’09. IEEE ComputerSociety, 2009, pp. 11–20.
[16] M. Kabir, “A fault classification model of modern automotiveinfotainment system,” in Proceedings of Applied Electronics,2009, pp. 145–148.
[17] J. Ploski, M. Rohr, P. Schwenkenberg, and W. Hasselbring,“Research issues in software fault categorization,” SIGSOFTSoftware Engineering Notes, vol. 32, no. 6, pp. 1–8, Novem-ber 2007.
[18] IBM Research Center for Software Engineering,Extensions to ODC, 2002. [Online]. Available:http://www.research.ibm.com/softeng/SDA/EXTODC.HTM[last visited: 19.02.2013]
[19] E. Gamma, R. Helm, R. Johnson, and J. Vlissides, De-sign Patterns: Elements of reusable object-oriented software.Reading, MA: Addison Wesley, 1995.
[20] S. Stoecklin and C. Allen, “Creating a reusable GUI compo-nent,” Software: Practice and Experience, vol. 32, no. 5, pp.403–416, Apr. 2002.
[21] J. Chen and S. Subramaniam, “Specification-based testing forGUI-based applications,” Software Quality Journal, vol. 10,pp. 205–224, 2002.
[22] S. Elbaum, G. Rothermel, S. K, and A. G. Malishevsky,“Selecting a cost-effective test case prioritization technique,”Software Quality Journal, vol. 12, no. 3, pp. 185–210,September 2004.
[23] H. Mills, “On the statistical validation of computer programs,”Federal Systems Division, IBM, Report FSC-72-6015, 1972.
[24] A. L. Goel, “Software reliability models: Assumptions, lim-itations, and applicability,” IEEE Transactions on SoftwareEngineering, vol. 11, no. 12, pp. 1411–1423, 1985.
[25] G. Schick and R. Wolverton, “An analysis of competingsoftware reliability models,” IEEE Transactions on SoftwareEngineering, vol. SE-4, no. 2, pp. 104–120, March 1978.
[26] M. J. Harrold, A. J. Offutt, and K. Tewary, “An approach tofault modeling and fault seeding using the program depen-dence graph,” The Journal of Systems and Software, vol. 36,no. 3, pp. 273–296, March 1997.
[27] C. Artho, A. Biere, and S. Honiden, “Enforcer - efficientfailure injection,” in Proceedings of the 14th internationalconference on Formal Methods. Springer-Verlag, 2006, pp.412–427.
[28] J. Voas, G. McGraw, L. Kassab, and L. Voas, “A crystal ballfor software liability,” Computer, vol. 30, pp. 29–36, June1997.
[29] A. Marchetto, F. Ricca, and P. Tonella, “Empirical validationof a web fault taxonomy and its usage for fault seeding,” inProceedings of 9th IEEE International Workshop on Web SiteEvolution (WSE 2007), Oct. 2007, pp. 31–38.
[30] J. Andrews, L. Briand, and Y. Labiche, “Is mutation anappropriate tool for testing experiments?” in Proceedings ofthe 27th International Conference on Software Engineering,2005, pp. 402–411.
[31] F. Belli, M. Beyazit, and N. Guler, “Event-oriented, model-based GUI testing and reliability assessment - approach andcase study,” Advances in Computers, vol. 85, pp. 277–326,2012.

154
International Journal on Advances in Software, vol 6 no 1 & 2, year 2013, http://www.iariajournals.org/software/
2013, © Copyright by authors, Published under agreement with IARIA - www.iaria.org
[32] C. Liu and J. Han, “Failure proximity: A fault localization-based approach,” in Proceedings of the 14th ACM SIGSOFTinternational symposium on Foundations of software engi-neering, 2006, pp. 46–56.
155
International Journal on Advances in Software, vol 6 no 1 & 2, year 2013, http://www.iariajournals.org/software/
2013, © Copyright by authors, Published under agreement with IARIA - www.iaria.org
Linear Constraints and Guarded Predicates as a Modeling Language for Discrete
Time Hybrid Systems
Federico Mari, Igor Melatti, Ivano Salvo, and Enrico Tronci
Department of Computer Science – Sapienza University of Rome
Via Salaria 113, 00198 Rome, Italy
Email: mari,melatti,salvo,[email protected]
Abstract—Model based design is particularly appealing insoftware based control systems (e.g., embedded software) design,since in such a case system level specifications are mucheasier to define than the control software behavior itself.In turn, model based design of embedded systems requiresmodeling both continuous subsystems (typically, the plant) aswell as discrete subsystems (the controller). This is typicallydone using hybrid systems. Mixed Integer Linear Programming(MILP) based abstraction techniques have been successfullyapplied to automatically synthesize correct-by-constructioncontrol software for discrete time linear hybrid systems, whereplant dynamics is modeled as a linear predicate over state,input, and next state variables. Unfortunately, MILP solversrequire such linear predicates to be conjunctions of linearconstraints, which is not a natural way of modeling hybridsystems. In this paper we show that, under the hypothesisthat each variable ranges over a bounded interval, any linearpredicate built upon conjunction and disjunction of linearconstraints can be automatically translated into an equivalentconjunctive predicate. Since variable bounds play a key rolein this translation, our algorithm includes a procedure tocompute all implicit variable bounds of the given linearpredicate. Furthermore, we show that a particular form oflinear predicates, namely guarded predicates, are a naturaland powerful language to succinctly model discrete time linearhybrid systems dynamics. Finally, we experimentally show thefeasibility of our approach on an important and challengingcase study taken from the literature, namely the multi-inputBuck DC-DC Converter. As an example, the guarded predicatethat models (with 57 constraints) a 6-inputs Buck DC-DCConverter is translated in a conjunctive predicate (with 102linear constraints) in about 40 minutes.
Keywords-Model-based software design; Linear predicates;Hybrid systems
I. INTRODUCTION
Many embedded systems are
Software Based Control Systems (SBCS). An SBCS
consists of two main subsystems: the controller and
the plant. Typically, the plant is a physical system
consisting, for example, of mechanical or electrical
devices, while the controller consists of control software
running on a microcontroller. In an endless loop, each
T seconds (sampling time), the controller, after an
Analog-to-Digital (AD) conversion (quantization), reads
sensor outputs from the plant and, possibly after a
Digital-to-Analog (DA) conversion, sends commands to
plant actuators. The controller selects commands in order
to guarantee that the closed loop system (that is, the system
consisting of both plant and controller) meets given safety
and liveness specifications (system level specifications).
This paper is an extension of the ICSEA 2012 pa-
per [1], and contributes to model based design of embed-
ded software [2]. Software generation from models and
formal specifications forms the core of model based de-
sign of embedded software. This approach is particularly
interesting for SBCSs, since in such a case system level
specifications are much easier to define than the con-
trol software behavior itself. In this setting, correct-by-
construction software generation from (as well as formal
verification of) system level specifications for SBCSs re-
quires modeling both the continuous subsystem (the plant)
and discrete systems (the controller). This is typically done
using hybrid systems (e.g., see [3][4]). Here we focus
on Discrete Time Linear Hybrid Systems (DTLHS) [5][6]
which provide an expressive model for closed loop systems.
A DTLHS is a discrete time hybrid system whose dynamics
is defined as a linear predicate (i.e., a boolean combination
of linear constraints) on its continuous as well as discrete
(modes) variables. A large class of hybrid systems, including
mixed-mode analog circuits, can be modeled using DTLHSs.
System level safety as well as liveness specifications are
modeled as set of states defined, in turn, as linear predicates.
Moreover, discrete time non-linear hybrid systems may be
properly overapproximated with DTLHSs [7] in such a
way that a controller for the overapproximated system is
guaranteed to work also for the original non-linear system.
In our previous work [8][9], stemming from a constructive
sufficient condition for the existence of a quantized sampling
controller for an SBCS modelled as a DTLHS (which is
an undecidable problem [10]), we presented an algorithm
that, given a DTLHS model H for the plant, a quantization
schema (i.e., how many bits we use for AD conversion)
and system level specifications, returns the C code [11] of a
correct-by-construction quantized feedback control software
(if any) meeting the given system level specifications. The
synthesis algorithm rests on the fact that, because of the
quantization process, the plant P is seen by the controller as
a Nondeterministic Finite State Automaton (NFSA) P , that
156
International Journal on Advances in Software, vol 6 no 1 & 2, year 2013, http://www.iariajournals.org/software/
2013, © Copyright by authors, Published under agreement with IARIA - www.iaria.org
is an abstraction of P . The NFSA P is computed by
solving Mixed Integer Linear Programming (MILP) prob-
lems which contains the definition of the DTLHS dynam-
ics as a sub-problem. Since available MILP solvers (e.g.,
GLPK [12] and CPLEX [13]) require conjunctive predicates
(i.e., a conjunction of linear constraints) as input, we have
that the DTLHS dynamics must be given as a conjunctive
predicate.
While this is not a limitation for DTLHSs with a not
too complex dynamics, this may turn in an obstruction
for more complex systems. As an example, the dynamics
of the 6-inputs Buck DC-DC Converter of Section VII-A
is described by the conjunction of 102 linear constraints.
However, by allowing disjunction, the same dynamics may
be written as a linear predicate consisting of 45 linear
constraints. Moreover, constants occurring in such a linear
constraint are directly linked to the system physical (known)
parameters, while the ones in the conjunctive predicate must
be suitably computed. This results in a practical limitation
for the effective application of the method in [8][9].
This paper is motivated by circumventing such a limita-
tion, by showing that, under the hypothesis that each variable
ranges over a bounded interval, any linear predicate can
be automatically translated into an equivalent conjunctive
predicate.
Note that it is a reasonable hypothesis to assume variables
describing a DTLHS behavior to be bounded. In fact, control
software drives the plant towards a goal, while keeping it
inside a given desired bounded admissible region. Namely,
bounds on present state variables essentially model the
sensing region, that is the range of values observable by
the sensors. Such a region is usually a bounded rectangular
region (i.e., the Cartesian product of bounded intervals).
Bounds on controllable input variables model the actuation
region, that is the range of values of commands that the
actuators may send to the plant and it is also typically a
bounded rectangular region. Other variables may model both
non-observable plant state variables and uncontrollable in-
puts (i.e., disturbances). Therefore, bounds on such variables
are usually derived from reasonable assumptions or DTLHS
knowledge. On the other hand, next state variable bounds are
typically not explicitly given. However, they may be derived
from all other above mentioned variable bounds (as it will
be shown in Example 4 of Section V).
Finally, note that the application of the methods outlined
here is not limited to the scenario shown above, but may be
applied to nearly all possible usages of MILP solvers in any
field.
A. Our Main Contributions
In this paper, we give an algorithm to translate any linear
predicate into an equivalent (as for solving MILP problems,
as it will be shown in Proposition 1 of Section II-B) con-
junctive predicate, i.e., a conjunction of linear constraints.
This allows us to circumvent the limitation mentioned above,
i.e., that conjunctive predicates must be used to describe
DTLHSs dynamics.
We consider predicates built upon conjunctions and dis-
junctions of linear constraints (i.e., inequalities of the shape∑n
i=1 aixi ≤ b, Section II). In order to translate them into
a conjunctive predicate, we employ a two-stage approach.
First, we show that, at the price of introducing fresh boolean
variables, a predicate can be translated into an equivalent
guarded predicate (Section IV-A), i.e., a conjunction of
guarded constraints of the shape y → (∑n
i=1 aixi ≤ b).Guarded predicates themselves are shown to be a power-
ful means of modeling DTLHSs dynamics in Section VI.
Second, once a guarded predicate has been obtained (or a
guarded predicate has been directly provided as the input
DTLHS model), we show that it can be in turn translated into
a conjunctive predicate (Section IV-B). This latter translation
needs, as a further input, the (finite) upper and lower bounds
for each variable in the predicate. To this end, in Section V
we give an algorithm that computes bounds for a variable xin a given guarded predicate G(X), i.e., either it returns
two values mx,Mx ∈ R such that if G(X) holds, then
mx ≤ x ≤ Mx, or it concludes that such values do not
exist.
An experimental evaluation of the translation algorithm
presented in this paper is in Section VII. As an example, we
show that the linear predicate that models a 4-inputs Buck
DC-DC Converter with 39 linear constraints is translated
into a conjunctive predicate of 82 linear constraints in
slightly more than 3 hours.
Note that there are two available inputs for our translation
algorithm: i) a linear predicate or ii) a guarded predicate.
Namely, if a guarded predicate is provided as input, only
the second stage mentioned above is performed. Our ex-
perimental evaluation also shows that it is more convenient
to use guarded predicates instead of linear predicates when
modeling DTLHSs dynamics. As an example, the guarded
predicate that models a 6-inputs Buck DC-DC Converter
with 57 constraints (including 12 different guards), is trans-
lated into a conjunctive predicate of 102 linear constraints
in about 40 minutes.
B. Paper Outline
The paper is organized as follows. Section II provides the
basic definitions to understand our approach. In Section III,
we formally define DTLHSs. In Section IV, our two-steps
approach (from linear predicates to guarded predicates and
then to conjunctive predicates) is outlined, assuming vari-
ables bounds to be known. In Section V, we show how we
automatically compute bounds for all variables in a guarded
predicate, thus completing the description of our approach.
Section VI shows that guarded predicates are a powerful
and natural modeling language for DTLHSs. Section VII
shows experimental results on a meaningful case study,
157
International Journal on Advances in Software, vol 6 no 1 & 2, year 2013, http://www.iariajournals.org/software/
2013, © Copyright by authors, Published under agreement with IARIA - www.iaria.org
namely the multi-input Buck DC-DC Converter. Finally,
Sections VIII and IX conclude the paper, by comparing
the approach presented here with previous work and by
providing concluding remarks and future work.
II. BASIC DEFINITIONS
An initial segment 1, . . . , n of N is denoted by [n]. We
denote with X = [x1, . . . , xn] a finite sequence of distinct
variables, that we may regard, when convenient, as a set.
Each variable x ranges on a known (bounded or unbounded)
interval Dx either of the reals (continuous variables) or of the
integers (discrete variables). The set∏
x∈X Dx is denoted
by DX . Boolean variables are discrete variables ranging on
the set B = 0, 1. If x is a boolean variable we write xfor (1− x). The sequence of continuous (discrete, boolean)
variables in X is denoted by Xr (Xd, Xb).
The set of sequences of n boolean values is denoted
by Bn. The set B
nk ⊆ B
n denotes sequences that contains
exactly k elements equal to 1. Given a, b ∈ Bn, we say that
a ≤ b if a is point-wise less or equal to b, i.e., if for all
i ∈ [n] we have that ai ≤ bi. Given a set B ⊆ Bn and
a ∈ Bn we write a ≤ B if there exists b ∈ B such that
a ≤ b and a ≥ B if there exists b ∈ B such that a ≥ b. We
denote with Ones(b) be the set of indexes such that bj = 1,
i.e., Ones(b) = j ∈ [n] | bj = 1.
A. Predicates
A linear expression L(X) =∑n
i=1 aixi is a linear
combination of variables in X with rational coefficients. A
constraint is an expression of the form L(X) ≤ b, where bis a rational constant. We write L(X) ≥ b for −L(X) ≤ −b,L(X) = b for (L(X) ≤ b) ∧ (−L(X) ≤ −b), and
a ≤ L(X) ≤ b for (L(X) ≤ b) ∧ (L(X) ≥ a).(Linear) predicates are inductively defined as follows. A
constraint C(X) is a predicate over X . If A(X) and B(X)are predicates, then (A(X)∧B(X)) and (A(X)∨B(X)) are
predicates over X . Parentheses may be omitted, assuming
usual associativity and precedence rules of logical operators.
A conjunctive predicate is a conjunction of constraints.
A valuation over X is a function v that maps each variable
x ∈ X to a value v(x) in Dx. We denote with X∗ ∈ DX
the sequence of values v(x1), . . . , v(xn). We call valuation
also the sequence of values X∗. Given a valuation X∗, the
value for variable x is X∗(x). Given a predicate P (Y,X),P (Y,X∗) denotes the predicate obtained by replacing each
occurrence of x with X∗(x). A satisfying assignment to a
predicate P (X) is a valuation X∗ such that P (X∗) holds.
A predicate is said to be satisfiable if there exists at least
one satisfying assignment. Abusing notation, we denote with
P also the set of satisfying assignments to the predicate
P . P (X) and Q(X) are equivalent, notation P ≡ Q, if
they have the same set of satisfying assignments. P (X) and
Q(Z) are equisatisfiable, notation P ≃ Q, if P is satisfiable
if and only if Q is satisfiable. Finally, two predicates P (X)
and Q(X,Z) are X-equivalent, notation P ≡X Q, if the
following holds for all valuations X∗, Z∗:
1) if P (X∗) holds, then Q(X∗, Z) is satisfiable;
2) if Q(X∗, Z∗) holds, then P (X∗) holds.
B. Mixed Integer Linear Programming
A Mixed Integer Linear Programming (MILP) problem
with decision variables X is a tuple (max, J(X), A(X))where X is a list of variables, J(X) (objective function)
is a linear expression over X , and A(X) (constraints) is a
predicate over X . A solution to (max, J(X), A(X)) is a
valuation X∗ such that A(X∗) and ∀Z (A(Z)→ (J(Z)≤J(X∗))). J(X∗) is the optimal value of the MILP problem.
A feasibility problem is a MILP problem of the form
(max, 0, A(X)). We write also A(X) for (max, 0, A(X)).In algorithm outlines, MILP solver invocations are denoted
by function feasible(A(X)) that returns 1 if A(X) is satis-
fiable and 0 otherwise, and by function optimalValue(max,
J(X), A(X)) that returns either the optimal value of the
MILP problem (max, J(X), A(X)) or ∞ if such MILP
problem is unbounded. We write (min, J(X), A(X)) for
(max,−J(X), A(X)).
Note that available MILP solvers (e.g., GLPK [12] or
CPLEX [13]) require A(X) to be a conjunctive predicate.
However, as explained in Section I, MILP problems arising
in methods like [8][9] are more easily represented as linear
predicates. Thus, we need a translation algorithm from a
linear predicate A to a conjunctive predicate A′ such that a
solution to (max, J, A′) (which may be computed by a MILP
solver) is also a solution to (max, J, A) (which may not be
computed by a MILP solver). To this end, Proposition 1
clarifies that X-equivalence between predicates must be
sought.
Proposition 1: Let (max, J(X), A(X)) be a MILP prob-
lem, let B(X,Z) be a conjunctive predicate which is X-
equivalent to A(X) and let J(X,Z) = J(X) +∑
z∈Z 0z.
Then for all solutions X∗, Z∗ of (max, J(X,Z), B(X,Z)),X∗ is a solution of (max, J(X), A(X)). Moreover, for
all solutions X∗ of (max, J(X), A(X)), there exists
Z∗ such that X∗, Z∗ is a solution of (max, J(X,Z),B(X,Z)). Finally, optimalValue(max, J(X), A(X)) = op-
timalValue(max, J(X,Z), B(X,Z)).
Proof: Let X∗, Z∗ be a solution of (max, J(X,Z),B(X,Z)). This entails that B(X∗, Z∗) holds, and that
∀X+, Z+ such that B(X+, Z+) holds, J(X∗, Z∗) ≥J(X+, Z+). Suppose by absurd that X∗ is not a solution for
(max, J(X), A(X)). Then, either i) A(X∗) does not hold or
ii) there exist X such that A(X) holds and J(X∗) < J(X).Case i) is not possible, since B(X∗, Z∗) holds and B(X,Z)is X-equivalent to A(X). Case ii) is not possible since, by
X-equivalence of B(X,Z) and A(X) and by definition of
J(X,Z), there would exist Z such that B(X, Z) holds and
J(X, Z) = J(X) > J(X∗) = J(X∗, Z∗).
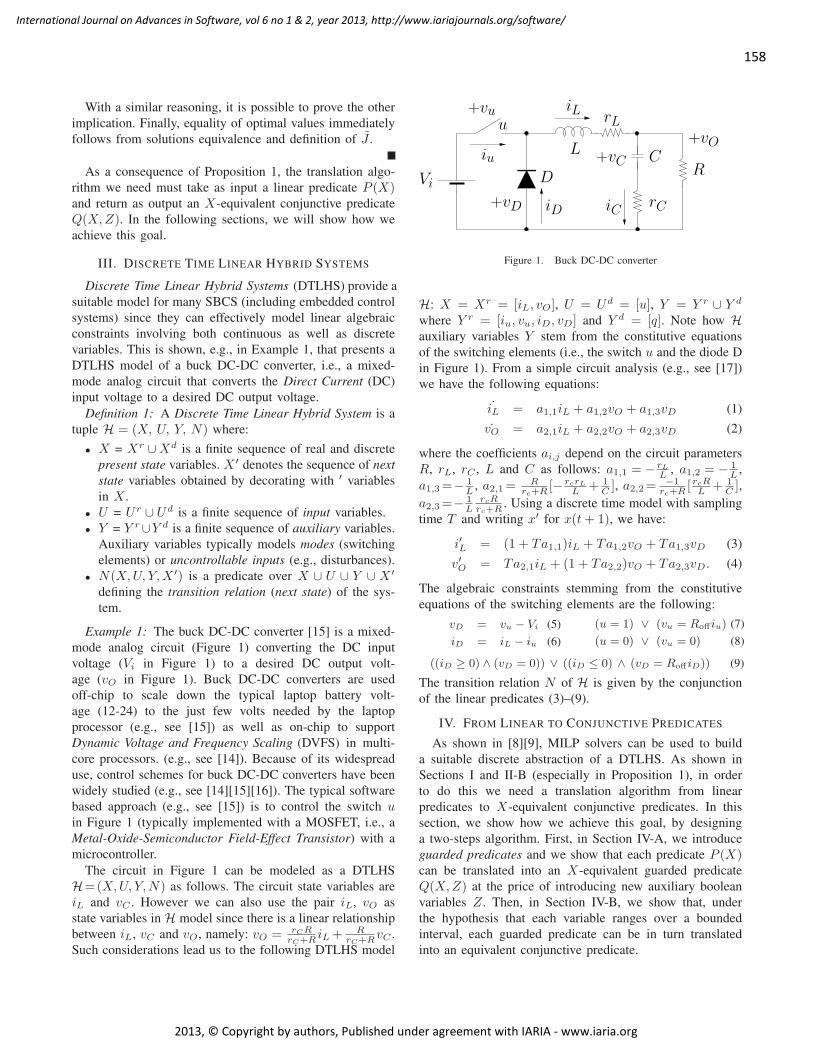
158
International Journal on Advances in Software, vol 6 no 1 & 2, year 2013, http://www.iariajournals.org/software/
2013, © Copyright by authors, Published under agreement with IARIA - www.iaria.org
With a similar reasoning, it is possible to prove the other
implication. Finally, equality of optimal values immediately
follows from solutions equivalence and definition of J .
As a consequence of Proposition 1, the translation algo-
rithm we need must take as input a linear predicate P (X)and return as output an X-equivalent conjunctive predicate
Q(X,Z). In the following sections, we will show how we
achieve this goal.
III. DISCRETE TIME LINEAR HYBRID SYSTEMS
Discrete Time Linear Hybrid Systems (DTLHS) provide a
suitable model for many SBCS (including embedded control
systems) since they can effectively model linear algebraic
constraints involving both continuous as well as discrete
variables. This is shown, e.g., in Example 1, that presents a
DTLHS model of a buck DC-DC converter, i.e., a mixed-
mode analog circuit that converts the Direct Current (DC)
input voltage to a desired DC output voltage.
Definition 1: A Discrete Time Linear Hybrid System is a
tuple H = (X, U, Y, N) where:
• X = Xr ∪Xd is a finite sequence of real and discrete
present state variables. X ′ denotes the sequence of next
state variables obtained by decorating with ′ variables
in X .
• U = Ur ∪ Ud is a finite sequence of input variables.
• Y = Y r∪Y d is a finite sequence of auxiliary variables.
Auxiliary variables typically models modes (switching
elements) or uncontrollable inputs (e.g., disturbances).
• N(X,U, Y,X ′) is a predicate over X ∪ U ∪ Y ∪ X ′
defining the transition relation (next state) of the sys-
tem.
Example 1: The buck DC-DC converter [15] is a mixed-
mode analog circuit (Figure 1) converting the DC input
voltage (Vi in Figure 1) to a desired DC output volt-
age (vO in Figure 1). Buck DC-DC converters are used
off-chip to scale down the typical laptop battery volt-
age (12-24) to the just few volts needed by the laptop
processor (e.g., see [15]) as well as on-chip to support
Dynamic Voltage and Frequency Scaling (DVFS) in multi-
core processors. (e.g., see [14]). Because of its widespread
use, control schemes for buck DC-DC converters have been
widely studied (e.g., see [14][15][16]). The typical software
based approach (e.g., see [15]) is to control the switch uin Figure 1 (typically implemented with a MOSFET, i.e., a
Metal-Oxide-Semiconductor Field-Effect Transistor) with a
microcontroller.
The circuit in Figure 1 can be modeled as a DTLHS
H=(X,U, Y,N) as follows. The circuit state variables are
iL and vC . However we can also use the pair iL, vO as
state variables in H model since there is a linear relationship
between iL, vC and vO, namely: vO = rCRrC+R
iL+ RrC+R
vC .
Such considerations lead us to the following DTLHS model
RC
rC
D
iD
L
u
+vu
+vD iC
+vO
Vi
iLrL
iu +vC
Figure 1. Buck DC-DC converter
H: X = Xr = [iL, vO], U = Ud = [u], Y = Y r ∪ Y d
where Y r = [iu, vu, iD, vD] and Y d = [q]. Note how Hauxiliary variables Y stem from the constitutive equations
of the switching elements (i.e., the switch u and the diode D
in Figure 1). From a simple circuit analysis (e.g., see [17])
we have the following equations:
˙iL = a1,1iL + a1,2vO + a1,3vD (1)
˙vO = a2,1iL + a2,2vO + a2,3vD (2)
where the coefficients ai,j depend on the circuit parameters
R, rL, rC , L and C as follows: a1,1 = −rLL
, a1,2 = −1L
,
a1,3=−1L
, a2,1=R
rc+R[− rcrL
L+ 1
C], a2,2=
−1rc+R
[ rcRL
+ 1C],
a2,3=−1L
rcRrc+R
. Using a discrete time model with sampling
time T and writing x′ for x(t+ 1), we have:
i′L = (1 + Ta1,1)iL + Ta1,2vO + Ta1,3vD (3)
v′O = Ta2,1iL + (1 + Ta2,2)vO + Ta2,3vD. (4)
The algebraic constraints stemming from the constitutive
equations of the switching elements are the following:
vD = vu − Vi (5)
iD = iL − iu (6)
(u = 1) ∨ (vu = Roff iu) (7)
(u = 0) ∨ (vu = 0) (8)
((iD ≥ 0) ∧ (vD = 0)) ∨ ((iD ≤ 0) ∧ (vD = Roff iD)) (9)
The transition relation N of H is given by the conjunction
of the linear predicates (3)–(9).
IV. FROM LINEAR TO CONJUNCTIVE PREDICATES
As shown in [8][9], MILP solvers can be used to build
a suitable discrete abstraction of a DTLHS. As shown in
Sections I and II-B (especially in Proposition 1), in order
to do this we need a translation algorithm from linear
predicates to X-equivalent conjunctive predicates. In this
section, we show how we achieve this goal, by designing
a two-steps algorithm. First, in Section IV-A, we introduce
guarded predicates and we show that each predicate P (X)can be translated into an X-equivalent guarded predicate
Q(X,Z) at the price of introducing new auxiliary boolean
variables Z. Then, in Section IV-B, we show that, under
the hypothesis that each variable ranges over a bounded
interval, each guarded predicate can be in turn translated
into an equivalent conjunctive predicate.
159
International Journal on Advances in Software, vol 6 no 1 & 2, year 2013, http://www.iariajournals.org/software/
2013, © Copyright by authors, Published under agreement with IARIA - www.iaria.org
A. Guarded Predicates
As formalized in Definition 2, a guarded predicate is
an implication between a boolean variable (guard) and a
predicate.
Definition 2: Given a predicate P (X) and a fresh boolean
variable z 6∈ X , the predicate z → P (X) (resp. z →P (X)) denotes the predicate (z = 0) ∨ P (X) (resp.
(z = 1) ∨ P (X)). We call z the guard variable and
both z and z guard literals. Let C(X) be a constraint. A
predicate of the form z → C(X) or z → C(X) is called
guarded constraint. A predicate of the form z → C(X) is
called positive guarded constraint, whilst a predicate of the
form z → C(X) is called negative guarded constraint. A
generalized guarded constraint is a predicate of the form
z1 → (z2 → . . . → (zn → C(X)) . . .) A guarded predi-
cate (resp. generalized guarded predicate, positive guarded
predicate) is a conjunction of either constraints or guarded
constraints (resp. generalized guarded constraints, positive
guarded constraints).
To simplify proofs and notations, without loss of gen-
erality, we always assume guard literals to be distinct: a
conjunction z → C1(X) ∧ z → C2(X) is X-equivalent to
the guarded predicate z1 → C1(X) ∧ z2 → C2(X) ∧ z1 =z ∧ z2 = z, being z1, z2 fresh boolean variables. Moreover,
in algorithm outlines, conjunctive (resp., guarded) predicates
will be sometimes regarded as sets of linear (resp., guarded)
constraints.
By applying standard propositional equivalences, we have
the following facts.
Fact 2: A predicate of the form z →∧
i∈[n] Pi(X) is
equivalent to the predicate∧
i∈[n](z → Pi(X)).
Fact 3: A generalized guarded constraint z1 → (z2 →. . . → (zn → C(X)) . . .) is X-equivalent to the positive
guarded predicate (z −∑
i∈[n] zi ≥ 1− n) ∧ (z → C(X)),where z is a fresh boolean variable.
Proof: Let z be a fresh boolean variable. We have:
z1 → (z2 → . . .→ (zn → C(X)) . . .)≡ z1 ∧ z2 ∧ . . . ∧ zn → C(X)≡X ((z1 ∧ z2 ∧ . . . ∧ zn)→ z) ∧ (z → C(X))≡ (z1 ∨ z2 ∨ . . . ∨ zn ∨ z) ∧ (z → C(X))≡ z +
∑
i∈[n](1− zi) ≥ 1 ∧ (z → C(X))
≡ (z −∑
i∈[n] zi ≥ 1− n) ∧ (z → C(X))
Lemma 4 and its constructive proof allow us to translate
any predicate P (X) to an X-equivalent generalized guarded
predicate Q(X,Z).Lemma 4: For all predicates P (X), there exists a predi-
cate Q(X,Z) = G(X,Z) ∧D(Z) such that:
1) P (X) is X-equivalent to Q(X,Z);2) G(X,Z) and D(Z) (and hence Q(X,Z)) are gener-
alized guarded predicates;
3) each generalized guarded constraint in G(X,Z) is of
the form z1 → z2 → . . .→ zm → C(X), with zi ∈ Zand zi /∈ X for all i ∈ [m].
Proof: The proof is by induction on the structure of the
predicate P (X).
• Case P (X) = C(X) for some linear constraint C(X)(base of the induction). Then the thesis holds with
G(X,Z) = P (X), D(Z) = 1 and Z = ∅.
• Case P (X) = P1(X) ∧ P2(X) for some predicates
P1(X), P2(X). By inductive hypothesis there exist
Z1, Z2, G1(X,Z1), D1(X,Z1), G2(X,Z2), D2(X,Z2)such that Pi is X-equivalent to Gi(X,Zi)∧Di(Zi) for
all i ∈ 1, 2. This entails that P (X) is X-equivalent to
G1(X,Z1)∧G2(X,Z1)∧D1(Z1)∧D2(Z1). By taking
Z = Z1∪Z2, G(X,Z) = G1(X,Z1)∧G2(X,Z2) and
D(X,Z) = D1(Z1) ∧ D2(Z2), and recalling that by
inductive hypothesis Gi, Di are generalized guarded
predicates and Zi is the set of boolean variables that
occur positively as guards in Gi (for all i ∈ 1, 2),the thesis follows.
• Case P (X) = P1(X) ∨ P2(X) for some predicates
P1(X), P2(X). By inductive hypothesis there exist
Z1, Z2, G1(X,Z1), D1(X,Z1), G2(X,Z2), D2(X,Z2)such that Pi is X-equivalent to Qi(X,Zi) =Gi(X,Zi) ∧Di(Zi) for all i ∈ 1, 2. We can always
choose auxiliary boolean variables in such a way that
Z1 ∩ Z2 = ∅.
Taken two fresh boolean variables y1, y2 /∈ Z1 ∪ Z2,
the predicate y1 → Q1(X,Z1) ∧ y2 → Q2(X,Z2) ∧y1 + y2 ≥ 1 is X-equivalent to P (X). For all
i ∈ 1, 2, the predicate Qi(X,Zi, yi) = yi →Qi(X,Zi) = yi → (Gi(X,Zi) ∧ Di(Zi)) is not
a generalized guarded predicate. Since Gi(X,Zi)and Di(Zi) are generalized guarded predicates by
inductive hypothesis, we have that Gi(X,Zi) =∧
j∈[n] Gi,j(X,Zi) and Di(Zi) =∧
j∈[p] Di,j(Zi),
being Gi,j(X,Zi), Di,j(Zi) generalized guarded con-
straints. This allows us to apply Fact 2 to Qi(X,Zi, yi),obtaining an equivalent predicate Ri(X,Zi, yi) =(∧
j∈[n] yi → Gi,j(X,Zi)) ∧ (∧
j∈[p] yi → Di,j(Zi)).The thesis follows by taking Z = Z1 ∪ Z2 ∪ y1, y2,G(X,Z) =
∧
i∈1,2(∧
j∈[n] yi → Gi,j(X,Zi)), and
D(Z) =∧
i∈1,2(∧
j∈[p] yi → Di,j(Zi))∧ (y1 + y2 ≥1). As for point 3, note that this is the only case in
which generalized guarded constraints in G(X,Z) are
generated, and that the generation takes place by adding
boolean fresh guards only. Being the starting predicate
only dependent on X , also point 3 is proved.
Lemma 4 and its constructive proof are exploited in
Algorithm 1, which takes as input a linear predicate P (X)and outputs the generalized guarded predicates G(X,Z) and
D(Z). The function fresh( ) returns at each invocation a
160
International Journal on Advances in Software, vol 6 no 1 & 2, year 2013, http://www.iariajournals.org/software/
2013, © Copyright by authors, Published under agreement with IARIA - www.iaria.org
(globally) fresh variable. Correctness of Algorithm 1 is given
as a corollary of Lemma 4.
Corollary 5: For all predicates P (X), Algorithm 1 re-
turns 〈G,D,Z〉 such that G(X,Z)∧D(Z) is X-equivalent
to P and fulfills all properties of Lemma 4.
Proposition 6 and its constructive proof allow us to
translate any predicate P (X) in an X-equivalent positive
guarded predicate Q(X,Z). Moreover, predicate Q(X,Z)has a special form, i.e., it is the conjunction of two positive
guarded predicates G(X, Z) and D(Z), with Z ⊆ Z. This is
accomplished by first translating P (X) in an X-equivalent
generalized guarded predicate Q(X, Z) by using Lemma 4.
Proposition 6: For all predicates P (X), there exists
an X-equivalent positive guarded predicate Q(X,Z) =G(X, Z) ∧ D(Z), where G and D are positive guarded
predicates and Z ⊆ Z.
Proof: Let Q(X,Z1) = G(X,Z1) ∧ D(Z1) be the
generalized guarded predicate obtained by applying the
proof of Lemma 4 (i.e., by applying Algorithm 1 to
P (X)). Let G(X,Z1) = G1(X,Z1) ∧∧
i∈[n](zi,1 →zi,2 → . . . zi,qi → Ci,1(X))), being G1 a positive
guarded predicate. By Fact 3, G(X,Z1) is (X ∪ Z1)-equivalent to the positive guarded predicate G1(X,Z1) ∧∧
i∈[n]
(
zi → Ci,1(X) ∧ zi −∑
j∈[qi]zi,j ≥ 1− qi
)
, where
zi /∈ Z1 for all i ∈ [n]. Analogously, by Fact 3 D(Z1) is
Z1-equivalent to the positive guarded predicate D1(Z1) ∧∧
i∈[p]
(
zi → Ci,2(Z1) ∧ zi −∑
j∈[ri]zi,j ≥ 1− ri
)
,
where zi /∈ Z1 ∪ zj | j ∈ [n] for all i ∈ [p]. Thus the
thesis follows by taking:
• Z = Z1 ∪ zj | j ∈ [n]• Z = Z ∪ zj | j ∈ [p]• G(X, Z) = G1(X,Z1) ∧
∧
i∈[n] zi → Ci,1(X)• D(Z) = D1(Z1) ∧
(
∧
i∈[n] zi −∑
j∈[qi]zi,j ≥ 1− qi
)
∧(
∧
i∈[p] zi → Ci,2(Z1) ∧ zi −∑
j∈[ri]zi,j ≥ 1− ri
)
Proposition 6 and its constructive proof are exploited in
Algorithm 2, which takes as input a linear predicate P (X)and outputs the positive guarded predicates G(X, Z) and
D(Z). To this aim, Algorithm 1 is used as an auxiliary
procedure. Correctness of Algorithm 2 is given as a corollary
of Proposition 6.
Corollary 7: For all predicates P (X), Algorithm 2 re-
turns 〈G,D, Z, Z〉 such that G(X, Z)∧D(Z) is X-equivalent
to P and Z ⊆ Z.
Example 2: Let H be DTLHS in Example 1. Given the
predicate N(X,U, Y,X ′) that defines the transition rela-
tion of H, function PtoG computes the guarded predicate
Ngp(X,U, Y,X ′) which is (X ∪U ∪Y ∪X ′)-equivalent to
N as follows.
Constraints (3)–(6) remain unchanged, as they are linear
constraints in a top-level conjunction. The disjunction (9) is
Algorithm 1 From predicates to generalized guarded pred-
icates (auxiliary for Algorithm 5)
Input: P predicate over XOutput: 〈G,D,Z〉 where G(X,Z)∧D(Z) is a generalized
guarded predicate X-equivalent to P (X) (see Lemma 4)
function PtoGG(P,X)1. if P is a constraint C(X) then return 〈C(X),∅,∅〉2. let P = P1 ⋄ P2 (⋄ ∈ ∧,∨)3. 〈G1, D1, Z1〉 ←PtoGG (P1)
4. 〈G2, D2, Z2〉 ←PtoGG (P2)
5. if P = P1∧P2 then return 〈G1∪G2, D1∪D2, Z1∪Z2〉
6. if P = P1 ∨ P2 then
7. y1← fresh( ), y2← fresh( ), Z←Z1 ∪ Z2 ∪ y1, y28. D=y1→γ|γ∈D1∪y2→γ|γ∈D2∪y1+y2≥1
9. G = y1 → γ | γ ∈ G1 ∪ y2 → γ | γ ∈ G210. return 〈G, D, Z〉
first replaced by the conjunction of linear predicates (10)–
(12) as follows.
z1→(iD≥0 ∧ vD=0) (10) z2→(iD≤0 ∧ vD=Roff iD) (11)
z1 + z2 ≥ 1 (12)
Then, predicates (10)–(11) are replaced by guarded con-
straints (17)–(20) below, obtained by moving arrows in-
side the conjunctions, as shown by Fact 2. Similarly,
disjunctions (7) and (8) are replaced by guarded lin-
ear constraints (21)–(24) and (26)–(27). Summing up,
Ngp(X,U, Y,X ′) is given by the conjunction of the fol-
lowing (guarded) constraints:
i′
L = (1 + Ta1,1)iL + Ta1,2vO + Ta1,3vD (13)
v′
O = Ta2,1iL + (1 + Ta2,2)vO + Ta2,3vD. (14)
vD = vu − Vi (15) iD = iL − iu (16)
z1→(iD≥0) (17)
z1→(vD=0) (18)
z2→(iD≤0) (19)
z2→(vD=Roff iD) (20)
z3→(u=1) (21)
z4→(vu=Roff iu) (22)
z5→(u=0) (23)
z6→(vu=0) (24)
z1+z2≥1 (25) z3+z4≥1 (26) z5+z6≥1 (27)
With respect to the statement of Proposition 6, we have
that Z = Z = z1, z2, z3, z4, z5, z6, G(X,Z ′) is the
conjunction of guarded constraints (13)–(24) and D(Z) is
the conjunction of constraints (25)–(27).
B. From Guarded Predicates to Conjunctive Predicates
Guarded predicates may be translated into equivalent con-
junctive predicates (our final target for Proposition 1) once
bounds for all variables occurring in them are known. In
this section, we will show how this translation is performed,
assuming bounds to be known. In Section V, we will show
161
International Journal on Advances in Software, vol 6 no 1 & 2, year 2013, http://www.iariajournals.org/software/
2013, © Copyright by authors, Published under agreement with IARIA - www.iaria.org
Algorithm 2 From predicates to positive guarded predicates
(auxiliary for Algorithm 5)
Input: P predicate over XOutput: 〈G,D,Z, Z〉 where G(X, Z)∧D(Z) is a positive
guarded predicate X-equivalent to P (X) (see Proposi-
tion 6)
function PtoG(P,X)1. 〈G,D,Z〉 ←PtoGG (P , X)
2. G← ∅, D ← ∅, Z = Z3. for all γ ∈ G ∪D do
4. if γ ≡ z1 → (. . .→ (zn → C(W )) . . .) then
5. w ←fresh( ), Z ← Z ∪ w6. if W ⊆ X then
7. G← G ∪ w → C(W ), Z ← Z ∪ w8. else
9. D ← D ∪ w → C(W )10. D ← D ∪ w −
∑
i∈[n] zi ≥ 1− n11. else if vars(γ)⊆ X then
12. G← G ∪ γ13. else
14. D ← D ∪ γ15. return 〈G, D, Z, Z〉
how bounds for variables may be computed if some bounds
are already known.
Definition 3: Let P (X) be a predicate. A variable x ∈ Xis said to be bounded in P if there exist a, b ∈ Dx such that
P (X) implies a ≤ x ≤ b. A predicate P is bounded if all its
variables are bounded. We write sup(P, x) and inf(P, x) for
the minimum and maximum value that the variable x may
assume in a satisfying assignment for P . When P is clear
from the context, we will write simply sup(x) and inf(x).
Given a real number a and a variable x ∈ X over a
bounded interval, we write sup(ax) for a sup(x) if a ≥ 0and for a inf(x) if a < 0. We write inf(ax) for a inf(x) if
a ≥ 0 and for a sup(x) if a < 0. Given a linear expression
L(X) =∑n
i=1 aixi over a set of bounded variables, we
write sup(L(X)) for∑n
i=1 sup(aixi) and inf(L(X)) for∑n
i=1 inf(aixi).
Proposition 8: For each bounded guarded predicate P (X)there exists an equivalent conjunctive predicate Q(X).
Proof: The conjunctive predicate Q(X) is obtained from
the guarded predicate P (X) by replacing each guarded con-
straint C(X) of the shape z → (L(X) ≤ b) in P (X)with the constraint C(X) = (sup(L(X)) − b)z + L(X) ≤sup(L(X)). If z = 0 we have C(X) ≡ C(X) since C(X)holds trivially and C(X) reduces to L(X) ≤ sup(L(X))that holds by construction. If z = 1 both C(X) and C(X)reduce to L(X) ≤ b. Along the same line of reasoning,
if C(X) has the form z → (L(X) ≤ b) we set C(X) to
(b− sup(L(X)))z + L(X) ≤ b.
Together with Proposition 6, Proposition 8 implies that
any bounded predicate P (X) can be translated into an X-
equivalent conjunctive predicate, at the cost of adding new
auxiliary boolean variables, as stated in the following propo-
sition.
Proposition 9: For each bounded predicate P (X), there
exists an X-equivalent conjunctive predicate Q(X,Z).
Example 3: Let H be the DTLHS in Example 2. We setthe parameters of H as follows:
rL=0.1Ω R=5Ω Vi=15V L=2 · 10−4H
rC =0.1Ω Roff =104 T =10−6secs C=5 · 10−5F
and we assume variables bounds as follows:
−2·104≤vu≤15 −4≤ iL≤4 −1≤vO≤7 −4≤ i′L≤96−2·104≤vD≤0 −1.1≤v′O≤17 −4≤ iu≤4 −2≤ iD≤4
By first decomposing equations of the shape L(X) = bin the conjunctive predicate L(X)≤ b ∧ −L(X)≤−b and
then by applying the transformation given in the proof of
Proposition 8, guarded constraints (17)–(24) are replaced by
the following linear constraints:
2z1 − iD ≤ 2 (28)
4 · 104z4 + vu − 104iu ≤ 4 · 104 (29)
6 · 104z4 − vu + 104iu ≤ 6 · 104 (30)
−2.104z1 − vD ≤ 2 · 104 (31)
2.104z2 + vD − 104iD ≤ 2.104 (32)
6.104z2 − vD + 104iD ≤ 6.104 (33)
2 · 104z6 + vu ≤ 15 (34)
2 · 104z4 − vu ≤ 2 · 104 (35)
vD ≤ 0 (36)
4z2 + iD ≤ 4 (37)
z5 + u ≤ 1 (38)
−u ≤ 0 (39)
15z6 + vu ≤ 15 (40)
z3 − u ≤ 1 (41)
u ≤ 1 (42)
V. COMPUTING VARIABLE BOUNDS
In this section, we present two algorithms that check if
a variable x is bounded in a guarded predicate G(X,Z),where Z is the set of guard variables. If this is the case, both
algorithms return BND (for bounded) and compute a, b ∈DX such that G(X,Z) implies a ≤ x ≤ b. If this is not the
case, then INFEAS (for infeasible) is returned if G(X,Z) is
unfeasible, and UNB (for unbounded) is returned otherwise.
The first algorithm, described in function exhCompute-
Bounds of Algorithm 3, works for all guarded predicates
G(X,Z), where Z is the set of (boolean) variables occurring
as guards in G(X,Z). Namely, it is the naïve algorithm
which, for all valuations Z∗ of B|Z| (line 5), builds the
conjunctive predicate Q(X) = G(X,Z∗). This implies that,
for all guarded constraints G(X,Z) = z → C(X,Z) inside
G, if Z∗(z) is false then Q will not contain G, and will con-
tain only C(X,Z∗) otherwise (line 6). Then, if G(X,Z∗) is
feasible, the upper and lower bounds for x under G(X,Z∗)are computed (lines 9 and 10). The overall maximum upper
bound and minimum lower bound are finally returned in
line 15. Unfortunately, this exhaustive procedure requires to
solve 2|Z| MILP problems.
The second algorithm, described in function compute-
Bounds of Algorithm 4, refines Algorithm 3 in order to
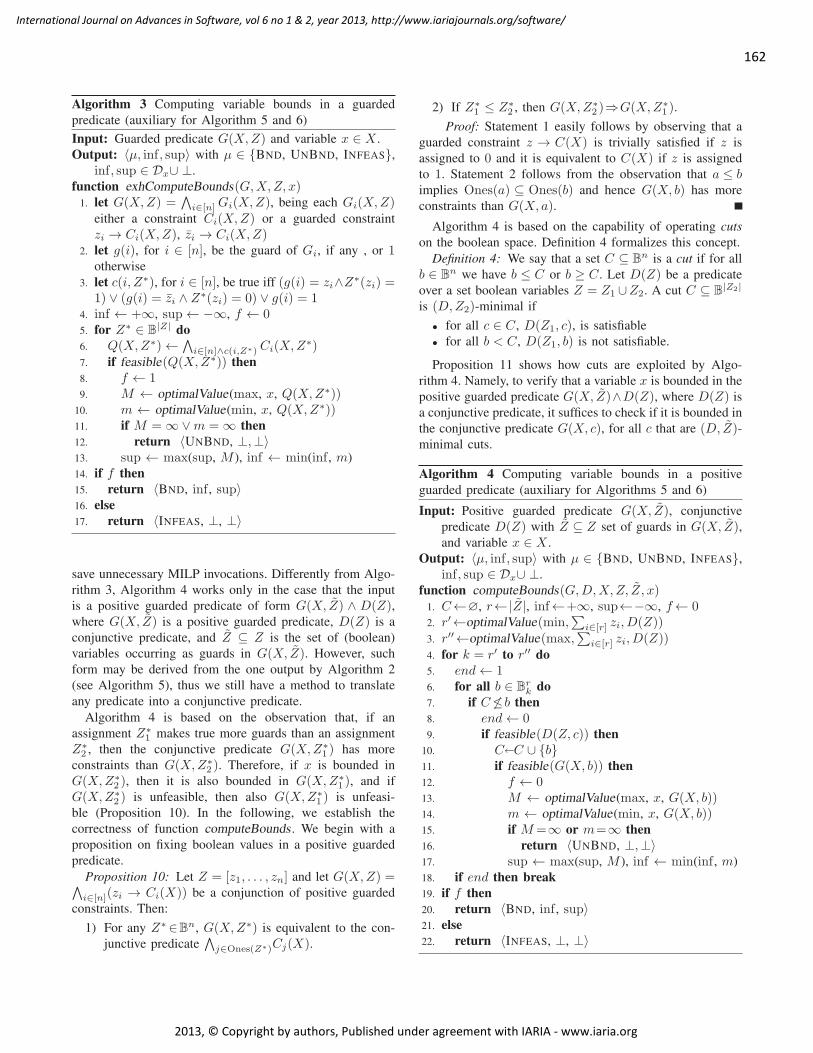
162
International Journal on Advances in Software, vol 6 no 1 & 2, year 2013, http://www.iariajournals.org/software/
2013, © Copyright by authors, Published under agreement with IARIA - www.iaria.org
Algorithm 3 Computing variable bounds in a guarded
predicate (auxiliary for Algorithm 5 and 6)
Input: Guarded predicate G(X,Z) and variable x ∈ X .
Output: 〈µ, inf, sup〉 with µ ∈ BND, UNBND, INFEAS,inf, sup ∈ Dx∪ ⊥.
function exhComputeBounds(G,X,Z, x)1. let G(X,Z) =
∧
i∈[n] Gi(X,Z), being each Gi(X,Z)either a constraint Ci(X,Z) or a guarded constraint
zi → Ci(X,Z), zi → Ci(X,Z)2. let g(i), for i ∈ [n], be the guard of Gi, if any , or 1
otherwise
3. let c(i, Z∗), for i ∈ [n], be true iff (g(i) = zi∧Z∗(zi) =
1) ∨ (g(i) = zi ∧ Z∗(zi) = 0) ∨ g(i) = 14. inf ← +∞, sup← −∞, f ← 05. for Z∗ ∈ B
|Z| do
6. Q(X,Z∗)←∧
i∈[n]∧c(i,Z∗) Ci(X,Z∗)7. if feasible(Q(X,Z∗)) then
8. f ← 19. M ← optimalValue(max, x, Q(X,Z∗))
10. m ← optimalValue(min, x, Q(X,Z∗))11. if M =∞∨m =∞ then
12. return 〈UNBND, ⊥,⊥〉13. sup ← max(sup, M ), inf ← min(inf , m)
14. if f then
15. return 〈BND, inf , sup〉16. else
17. return 〈INFEAS, ⊥, ⊥〉
save unnecessary MILP invocations. Differently from Algo-
rithm 3, Algorithm 4 works only in the case that the input
is a positive guarded predicate of form G(X, Z) ∧ D(Z),where G(X, Z) is a positive guarded predicate, D(Z) is a
conjunctive predicate, and Z ⊆ Z is the set of (boolean)
variables occurring as guards in G(X, Z). However, such
form may be derived from the one output by Algorithm 2
(see Algorithm 5), thus we still have a method to translate
any predicate into a conjunctive predicate.
Algorithm 4 is based on the observation that, if an
assignment Z∗1 makes true more guards than an assignment
Z∗2 , then the conjunctive predicate G(X,Z∗
1 ) has more
constraints than G(X,Z∗2 ). Therefore, if x is bounded in
G(X,Z∗2 ), then it is also bounded in G(X,Z∗
1 ), and if
G(X,Z∗2 ) is unfeasible, then also G(X,Z∗
1 ) is unfeasi-
ble (Proposition 10). In the following, we establish the
correctness of function computeBounds . We begin with a
proposition on fixing boolean values in a positive guarded
predicate.
Proposition 10: Let Z = [z1, . . . , zn] and let G(X,Z) =∧
i∈[n](zi → Ci(X)) be a conjunction of positive guarded
constraints. Then:
1) For any Z∗∈Bn, G(X,Z∗) is equivalent to the con-
junctive predicate∧
j∈Ones(Z∗)Cj(X).
2) If Z∗1 ≤ Z∗
2 , then G(X,Z∗2 )⇒G(X,Z∗
1 ).
Proof: Statement 1 easily follows by observing that a
guarded constraint z → C(X) is trivially satisfied if z is
assigned to 0 and it is equivalent to C(X) if z is assigned
to 1. Statement 2 follows from the observation that a ≤ bimplies Ones(a) ⊆ Ones(b) and hence G(X, b) has more
constraints than G(X, a).
Algorithm 4 is based on the capability of operating cuts
on the boolean space. Definition 4 formalizes this concept.
Definition 4: We say that a set C ⊆ Bn is a cut if for all
b ∈ Bn we have b ≤ C or b ≥ C. Let D(Z) be a predicate
over a set boolean variables Z = Z1 ∪Z2. A cut C ⊆ B|Z2|
is (D,Z2)-minimal if
• for all c ∈ C, D(Z1, c), is satisfiable
• for all b < C, D(Z1, b) is not satisfiable.
Proposition 11 shows how cuts are exploited by Algo-
rithm 4. Namely, to verify that a variable x is bounded in the
positive guarded predicate G(X, Z)∧D(Z), where D(Z) is
a conjunctive predicate, it suffices to check if it is bounded in
the conjunctive predicate G(X, c), for all c that are (D, Z)-minimal cuts.
Algorithm 4 Computing variable bounds in a positive
guarded predicate (auxiliary for Algorithms 5 and 6)
Input: Positive guarded predicate G(X, Z), conjunctive
predicate D(Z) with Z ⊆ Z set of guards in G(X, Z),and variable x ∈ X .
Output: 〈µ, inf, sup〉 with µ ∈ BND, UNBND, INFEAS,inf, sup ∈ Dx∪ ⊥.
function computeBounds(G,D,X,Z, Z, x)1. C←∅, r←|Z|, inf←+∞, sup←−∞, f← 02. r′←optimalValue(min,
∑
i∈[r] zi, D(Z))3. r′′←optimalValue(max,
∑
i∈[r] zi, D(Z))4. for k = r′ to r′′ do
5. end← 16. for all b ∈ B
rk do
7. if C 6≤b then
8. end← 09. if feasible(D(Z, c)) then
10. CC ∪ b11. if feasible(G(X, b)) then
12. f ← 013. M ← optimalValue(max, x, G(X, b))14. m ← optimalValue(min, x, G(X, b))15. if M=∞ or m=∞ then
16. return 〈UNBND, ⊥,⊥〉17. sup ← max(sup, M ), inf ← min(inf , m)
18. if end then break
19. if f then
20. return 〈BND, inf , sup〉21. else
22. return 〈INFEAS, ⊥, ⊥〉
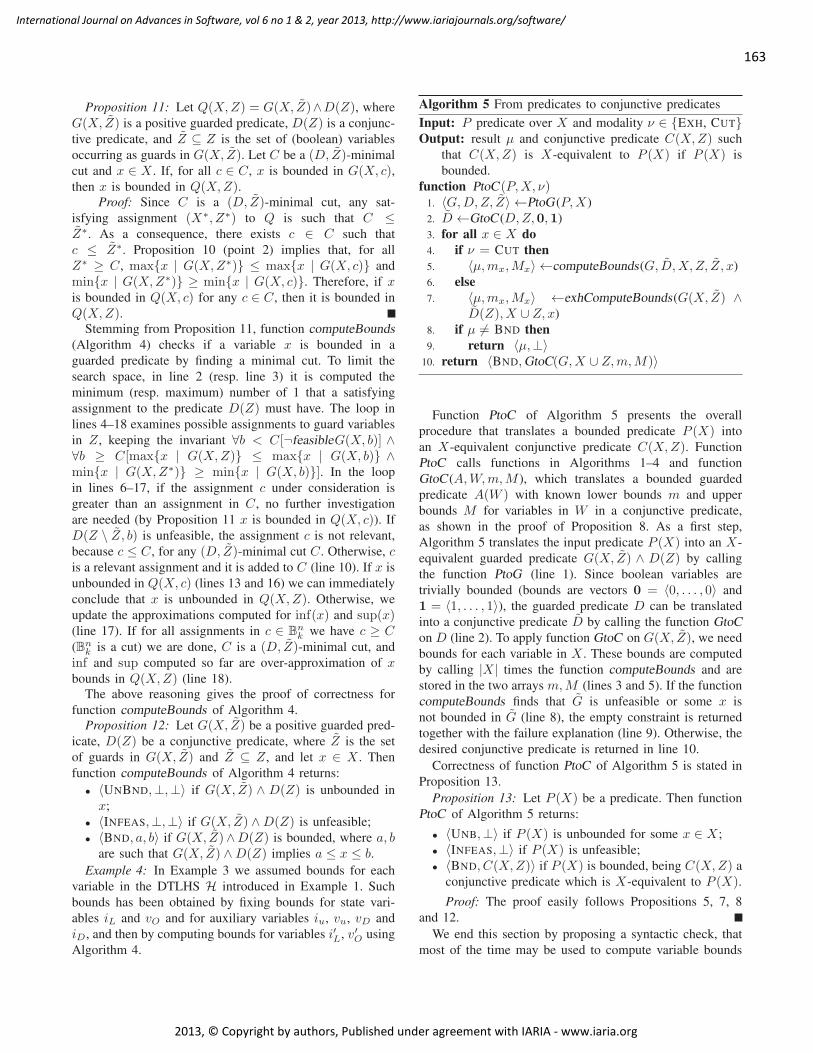
163
International Journal on Advances in Software, vol 6 no 1 & 2, year 2013, http://www.iariajournals.org/software/
2013, © Copyright by authors, Published under agreement with IARIA - www.iaria.org
Proposition 11: Let Q(X,Z) = G(X, Z)∧D(Z), where
G(X, Z) is a positive guarded predicate, D(Z) is a conjunc-
tive predicate, and Z ⊆ Z is the set of (boolean) variables
occurring as guards in G(X, Z). Let C be a (D, Z)-minimal
cut and x ∈ X . If, for all c ∈ C, x is bounded in G(X, c),then x is bounded in Q(X,Z).
Proof: Since C is a (D, Z)-minimal cut, any sat-
isfying assignment (X∗, Z∗) to Q is such that C ≤Z∗. As a consequence, there exists c ∈ C such that
c ≤ Z∗. Proposition 10 (point 2) implies that, for all
Z∗ ≥ C, maxx | G(X,Z∗) ≤ maxx | G(X, c) and
minx | G(X,Z∗) ≥ minx | G(X, c). Therefore, if xis bounded in Q(X, c) for any c ∈ C, then it is bounded in
Q(X,Z).Stemming from Proposition 11, function computeBounds
(Algorithm 4) checks if a variable x is bounded in a
guarded predicate by finding a minimal cut. To limit the
search space, in line 2 (resp. line 3) it is computed the
minimum (resp. maximum) number of 1 that a satisfying
assignment to the predicate D(Z) must have. The loop in
lines 4–18 examines possible assignments to guard variables
in Z, keeping the invariant ∀b < C[¬feasibleG(X, b)] ∧∀b ≥ C[maxx | G(X,Z) ≤ maxx | G(X, b) ∧minx | G(X,Z∗) ≥ minx | G(X, b)]. In the loop
in lines 6–17, if the assignment c under consideration is
greater than an assignment in C, no further investigation
are needed (by Proposition 11 x is bounded in Q(X, c)). If
D(Z \ Z, b) is unfeasible, the assignment c is not relevant,
because c ≤ C, for any (D, Z)-minimal cut C. Otherwise, cis a relevant assignment and it is added to C (line 10). If x is
unbounded in Q(X, c) (lines 13 and 16) we can immediately
conclude that x is unbounded in Q(X,Z). Otherwise, we
update the approximations computed for inf(x) and sup(x)(line 17). If for all assignments in c ∈ B
nk we have c ≥ C
(Bnk is a cut) we are done, C is a (D, Z)-minimal cut, and
inf and sup computed so far are over-approximation of xbounds in Q(X,Z) (line 18).
The above reasoning gives the proof of correctness for
function computeBounds of Algorithm 4.
Proposition 12: Let G(X, Z) be a positive guarded pred-
icate, D(Z) be a conjunctive predicate, where Z is the set
of guards in G(X, Z) and Z ⊆ Z, and let x ∈ X . Then
function computeBounds of Algorithm 4 returns:
• 〈UNBND,⊥,⊥〉 if G(X, Z) ∧ D(Z) is unbounded in
x;
• 〈INFEAS,⊥,⊥〉 if G(X, Z) ∧D(Z) is unfeasible;
• 〈BND, a, b〉 if G(X, Z)∧D(Z) is bounded, where a, bare such that G(X, Z) ∧D(Z) implies a ≤ x ≤ b.
Example 4: In Example 3 we assumed bounds for each
variable in the DTLHS H introduced in Example 1. Such
bounds has been obtained by fixing bounds for state vari-
ables iL and vO and for auxiliary variables iu, vu, vD and
iD, and then by computing bounds for variables i′L, v′O using
Algorithm 4.
Algorithm 5 From predicates to conjunctive predicates
Input: P predicate over X and modality ν ∈ EXH, CUTOutput: result µ and conjunctive predicate C(X,Z) such
that C(X,Z) is X-equivalent to P (X) if P (X) is
bounded.
function PtoC(P,X, ν)1. 〈G,D,Z, Z〉 ←PtoG (P,X)
2. D ←GtoC (D,Z,0,1)
3. for all x ∈ X do
4. if ν = CUT then
5. 〈µ,mx,Mx〉 ←computeBounds(G, D,X,Z, Z, x)
6. else
7. 〈µ,mx,Mx〉 ←exhComputeBounds(G(X, Z) ∧D(Z), X ∪ Z, x)
8. if µ 6= BND then
9. return 〈µ,⊥〉10. return 〈BND,GtoC(G,X ∪ Z,m,M)〉
Function PtoC of Algorithm 5 presents the overall
procedure that translates a bounded predicate P (X) into
an X-equivalent conjunctive predicate C(X,Z). Function
PtoC calls functions in Algorithms 1–4 and function
GtoC (A,W,m,M ), which translates a bounded guarded
predicate A(W ) with known lower bounds m and upper
bounds M for variables in W in a conjunctive predicate,
as shown in the proof of Proposition 8. As a first step,
Algorithm 5 translates the input predicate P (X) into an X-
equivalent guarded predicate G(X, Z) ∧ D(Z) by calling
the function PtoG (line 1). Since boolean variables are
trivially bounded (bounds are vectors 0 = 〈0, . . . , 0〉 and
1 = 〈1, . . . , 1〉), the guarded predicate D can be translated
into a conjunctive predicate D by calling the function GtoC
on D (line 2). To apply function GtoC on G(X, Z), we need
bounds for each variable in X . These bounds are computed
by calling |X| times the function computeBounds and are
stored in the two arrays m,M (lines 3 and 5). If the function
computeBounds finds that G is unfeasible or some x is
not bounded in G (line 8), the empty constraint is returned
together with the failure explanation (line 9). Otherwise, the
desired conjunctive predicate is returned in line 10.
Correctness of function PtoC of Algorithm 5 is stated in
Proposition 13.
Proposition 13: Let P (X) be a predicate. Then function
PtoC of Algorithm 5 returns:
• 〈UNB,⊥〉 if P (X) is unbounded for some x ∈ X;
• 〈INFEAS,⊥〉 if P (X) is unfeasible;
• 〈BND, C(X,Z)〉 if P (X) is bounded, being C(X,Z) a
conjunctive predicate which is X-equivalent to P (X).
Proof: The proof easily follows Propositions 5, 7, 8
and 12.
We end this section by proposing a syntactic check, that
most of the time may be used to compute variable bounds
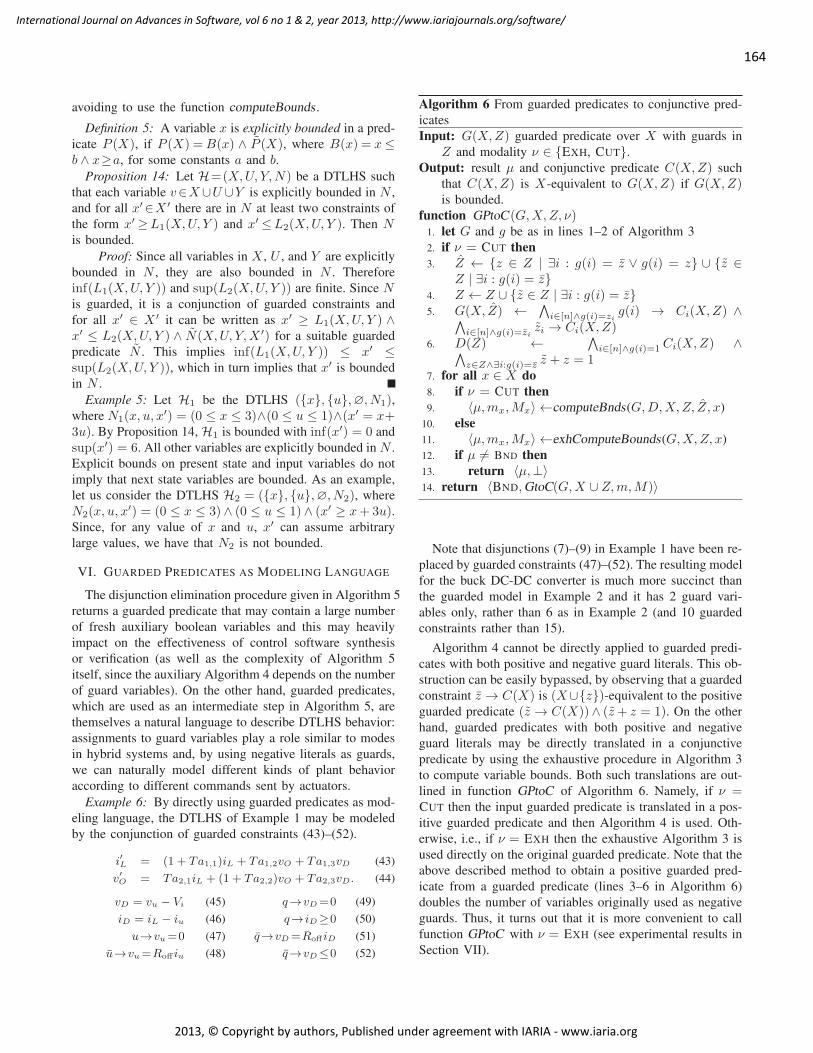
164
International Journal on Advances in Software, vol 6 no 1 & 2, year 2013, http://www.iariajournals.org/software/
2013, © Copyright by authors, Published under agreement with IARIA - www.iaria.org
avoiding to use the function computeBounds .
Definition 5: A variable x is explicitly bounded in a pred-
icate P (X), if P (X) =B(x) ∧ P (X), where B(x) = x≤b ∧ x≥a, for some constants a and b.
Proposition 14: Let H=(X,U, Y,N) be a DTLHS such
that each variable v∈X∪U ∪Y is explicitly bounded in N ,
and for all x′∈X ′ there are in N at least two constraints of
the form x′≥L1(X,U, Y ) and x′≤L2(X,U, Y ). Then Nis bounded.
Proof: Since all variables in X , U , and Y are explicitly
bounded in N , they are also bounded in N . Therefore
inf(L1(X,U, Y )) and sup(L2(X,U, Y )) are finite. Since Nis guarded, it is a conjunction of guarded constraints and
for all x′ ∈ X ′ it can be written as x′ ≥ L1(X,U, Y ) ∧x′ ≤ L2(X,U, Y ) ∧ N(X,U, Y,X ′) for a suitable guarded
predicate N . This implies inf(L1(X,U, Y )) ≤ x′ ≤sup(L2(X,U, Y )), which in turn implies that x′ is bounded
in N .
Example 5: Let H1 be the DTLHS (x, u,∅, N1),where N1(x, u, x
′) = (0 ≤ x ≤ 3)∧(0 ≤ u ≤ 1)∧(x′ = x+3u). By Proposition 14, H1 is bounded with inf(x′) = 0 and
sup(x′) = 6. All other variables are explicitly bounded in N .
Explicit bounds on present state and input variables do not
imply that next state variables are bounded. As an example,
let us consider the DTLHS H2 = (x, u,∅, N2), where
N2(x, u, x′) = (0 ≤ x ≤ 3)∧ (0 ≤ u ≤ 1)∧ (x′ ≥ x+3u).
Since, for any value of x and u, x′ can assume arbitrary
large values, we have that N2 is not bounded.
VI. GUARDED PREDICATES AS MODELING LANGUAGE
The disjunction elimination procedure given in Algorithm 5
returns a guarded predicate that may contain a large number
of fresh auxiliary boolean variables and this may heavily
impact on the effectiveness of control software synthesis
or verification (as well as the complexity of Algorithm 5
itself, since the auxiliary Algorithm 4 depends on the number
of guard variables). On the other hand, guarded predicates,
which are used as an intermediate step in Algorithm 5, are
themselves a natural language to describe DTLHS behavior:
assignments to guard variables play a role similar to modes
in hybrid systems and, by using negative literals as guards,
we can naturally model different kinds of plant behavior
according to different commands sent by actuators.
Example 6: By directly using guarded predicates as mod-
eling language, the DTLHS of Example 1 may be modeled
by the conjunction of guarded constraints (43)–(52).
i′
L = (1 + Ta1,1)iL + Ta1,2vO + Ta1,3vD (43)
v′
O = Ta2,1iL + (1 + Ta2,2)vO + Ta2,3vD. (44)
vD = vu − Vi (45)
iD = iL − iu (46)
u→vu=0 (47)
u→vu=Roff iu (48)
q→vD=0 (49)
q→ iD≥0 (50)
q→vD=Roff iD (51)
q→vD≤0 (52)
Algorithm 6 From guarded predicates to conjunctive pred-
icates
Input: G(X,Z) guarded predicate over X with guards in
Z and modality ν ∈ EXH, CUT.Output: result µ and conjunctive predicate C(X,Z) such
that C(X,Z) is X-equivalent to G(X,Z) if G(X,Z)is bounded.
function GPtoC(G,X,Z, ν)1. let G and g be as in lines 1–2 of Algorithm 3
2. if ν = CUT then
3. Z ← z ∈ Z | ∃i : g(i) = z ∨ g(i) = z ∪ z ∈Z | ∃i : g(i) = z
4. Z ← Z ∪ z ∈ Z | ∃i : g(i) = z5. G(X, Z) ←
∧
i∈[n]∧g(i)=zig(i) → Ci(X,Z) ∧
∧
i∈[n]∧g(i)=zizi → Ci(X,Z)
6. D(Z) ←∧
i∈[n]∧g(i)=1 Ci(X,Z) ∧∧
z∈Z∧∃i:g(i)=z z + z = 17. for all x ∈ X do
8. if ν = CUT then
9. 〈µ,mx,Mx〉 ←computeBnds(G,D,X,Z, Z, x)
10. else
11. 〈µ,mx,Mx〉 ←exhComputeBounds(G,X,Z, x)
12. if µ 6= BND then
13. return 〈µ,⊥〉14. return 〈BND,GtoC(G,X ∪ Z,m,M)〉
Note that disjunctions (7)–(9) in Example 1 have been re-
placed by guarded constraints (47)–(52). The resulting model
for the buck DC-DC converter is much more succinct than
the guarded model in Example 2 and it has 2 guard vari-
ables only, rather than 6 as in Example 2 (and 10 guarded
constraints rather than 15).
Algorithm 4 cannot be directly applied to guarded predi-
cates with both positive and negative guard literals. This ob-
struction can be easily bypassed, by observing that a guarded
constraint z → C(X) is (X∪z)-equivalent to the positive
guarded predicate (z → C(X))∧ (z+ z = 1). On the other
hand, guarded predicates with both positive and negative
guard literals may be directly translated in a conjunctive
predicate by using the exhaustive procedure in Algorithm 3
to compute variable bounds. Both such translations are out-
lined in function GPtoC of Algorithm 6. Namely, if ν =CUT then the input guarded predicate is translated in a pos-
itive guarded predicate and then Algorithm 4 is used. Oth-
erwise, i.e., if ν = EXH then the exhaustive Algorithm 3 is
used directly on the original guarded predicate. Note that the
above described method to obtain a positive guarded pred-
icate from a guarded predicate (lines 3–6 in Algorithm 6)
doubles the number of variables originally used as negative
guards. Thus, it turns out that it is more convenient to call
function GPtoC with ν = EXH (see experimental results in
Section VII).
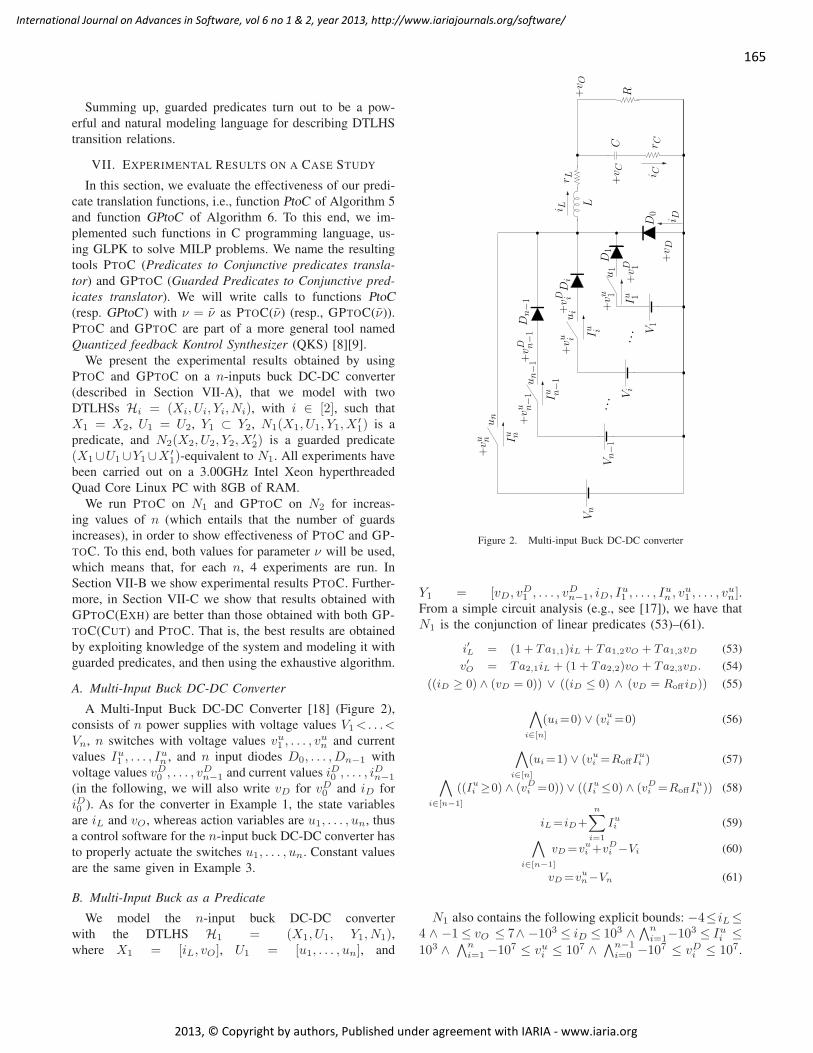
165
International Journal on Advances in Software, vol 6 no 1 & 2, year 2013, http://www.iariajournals.org/software/
2013, © Copyright by authors, Published under agreement with IARIA - www.iaria.org
Summing up, guarded predicates turn out to be a pow-
erful and natural modeling language for describing DTLHS
transition relations.
VII. EXPERIMENTAL RESULTS ON A CASE STUDY
In this section, we evaluate the effectiveness of our predi-
cate translation functions, i.e., function PtoC of Algorithm 5
and function GPtoC of Algorithm 6. To this end, we im-
plemented such functions in C programming language, us-
ing GLPK to solve MILP problems. We name the resulting
tools PTOC (Predicates to Conjunctive predicates transla-
tor) and GPTOC (Guarded Predicates to Conjunctive pred-
icates translator). We will write calls to functions PtoC
(resp. GPtoC ) with ν = ν as PTOC(ν) (resp., GPTOC(ν)).
PTOC and GPTOC are part of a more general tool named
Quantized feedback Kontrol Synthesizer (QKS) [8][9].
We present the experimental results obtained by using
PTOC and GPTOC on a n-inputs buck DC-DC converter
(described in Section VII-A), that we model with two
DTLHSs Hi = (Xi, Ui, Yi, Ni), with i ∈ [2], such that
X1 = X2, U1 = U2, Y1 ⊂ Y2, N1(X1, U1, Y1, X′1) is a
predicate, and N2(X2, U2, Y2, X′2) is a guarded predicate
(X1∪U1∪Y1∪X′1)-equivalent to N1. All experiments have
been carried out on a 3.00GHz Intel Xeon hyperthreaded
Quad Core Linux PC with 8GB of RAM.
We run PTOC on N1 and GPTOC on N2 for increas-
ing values of n (which entails that the number of guards
increases), in order to show effectiveness of PTOC and GP-
TOC. To this end, both values for parameter ν will be used,
which means that, for each n, 4 experiments are run. In
Section VII-B we show experimental results PTOC. Further-
more, in Section VII-C we show that results obtained with
GPTOC(EXH) are better than those obtained with both GP-
TOC(CUT) and PTOC. That is, the best results are obtained
by exploiting knowledge of the system and modeling it with
guarded predicates, and then using the exhaustive algorithm.
A. Multi-Input Buck DC-DC Converter
A Multi-Input Buck DC-DC Converter [18] (Figure 2),
consists of n power supplies with voltage values V1<. . .<Vn, n switches with voltage values vu1 , . . . , v
un and current
values Iu1 , . . . , Iun , and n input diodes D0, . . . , Dn−1 with
voltage values vD0 , . . . , vDn−1 and current values iD0 , . . . , iDn−1
(in the following, we will also write vD for vD0 and iD for
iD0 ). As for the converter in Example 1, the state variables
are iL and vO, whereas action variables are u1, . . . , un, thus
a control software for the n-input buck DC-DC converter has
to properly actuate the switches u1, . . . , un. Constant values
are the same given in Example 3.
B. Multi-Input Buck as a Predicate
We model the n-input buck DC-DC converter
with the DTLHS H1 = (X1, U1, Y1, N1),where X1 = [iL, vO], U1 = [u1, . . . , un], and
R+vO
L
i D
Vn
Vn−1
Vi
V1
Iu n
Iu n−1
Iu i
+vu n
un
D0
D1
Di
Dn−1
i LrL
+vC
C rC
i C
+vu i
un−1
ui
+vD
. ..
. ..
Iu 1
+vD 1
+vD i
+vu n−1
+vD n−1
+vu 1
u1
Figure 2. Multi-input Buck DC-DC converter
Y1 = [vD, vD1 , . . . , vDn−1, iD, Iu1 , . . . , Iun , v
u1 , . . . , v
un].
From a simple circuit analysis (e.g., see [17]), we have that
N1 is the conjunction of linear predicates (53)–(61).
i′
L = (1 + Ta1,1)iL + Ta1,2vO + Ta1,3vD (53)
v′
O = Ta2,1iL + (1 + Ta2,2)vO + Ta2,3vD. (54)
((iD ≥ 0) ∧ (vD = 0)) ∨ ((iD ≤ 0) ∧ (vD = Roff iD)) (55)
∧
i∈[n]
(ui=0) ∨ (vui =0) (56)
∧
i∈[n]
(ui=1) ∨ (vui =RoffIui ) (57)
∧
i∈[n−1]
((Iui ≥0) ∧ (vDi =0)) ∨ ((Iui ≤0) ∧ (vDi =RoffIui )) (58)
iL= iD+
n∑
i=1
Iui (59)
∧
i∈[n−1]
vD=vui +v
Di −Vi (60)
vD=vun−Vn (61)
N1 also contains the following explicit bounds: −4≤ iL≤4 ∧ −1≤ vO ≤ 7∧ −103 ≤ iD ≤ 103 ∧
∧n
i=1−103 ≤ Iui ≤
103 ∧∧n
i=1−107 ≤ vui ≤ 107 ∧
∧n−1i=0 −10
7 ≤ vDi ≤ 107.
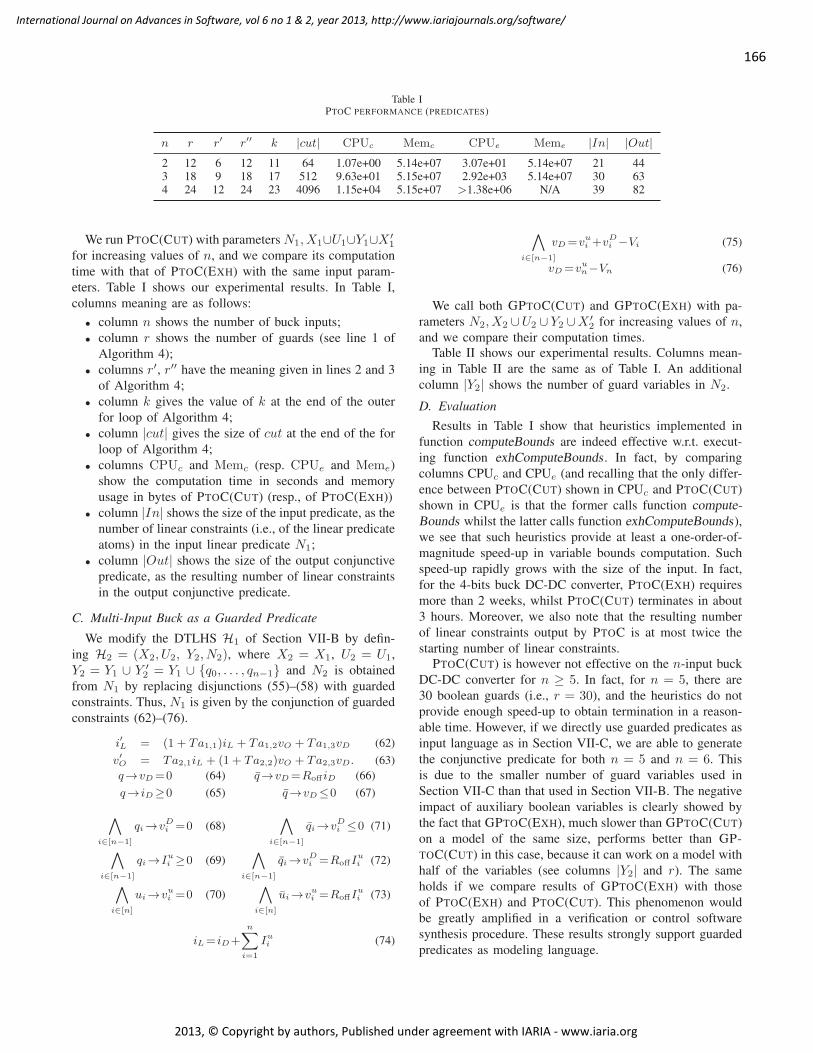
166
International Journal on Advances in Software, vol 6 no 1 & 2, year 2013, http://www.iariajournals.org/software/
2013, © Copyright by authors, Published under agreement with IARIA - www.iaria.org
Table IPTOC PERFORMANCE (PREDICATES)
n r r′ r′′ k |cut| CPUc Memc CPUe Meme |In| |Out|
2 12 6 12 11 64 1.07e+00 5.14e+07 3.07e+01 5.14e+07 21 443 18 9 18 17 512 9.63e+01 5.15e+07 2.92e+03 5.14e+07 30 634 24 12 24 23 4096 1.15e+04 5.15e+07 >1.38e+06 N/A 39 82
We run PTOC(CUT) with parameters N1, X1∪U1∪Y1∪X′1
for increasing values of n, and we compare its computation
time with that of PTOC(EXH) with the same input param-
eters. Table I shows our experimental results. In Table I,
columns meaning are as follows:
• column n shows the number of buck inputs;
• column r shows the number of guards (see line 1 of
Algorithm 4);
• columns r′, r′′ have the meaning given in lines 2 and 3
of Algorithm 4;
• column k gives the value of k at the end of the outer
for loop of Algorithm 4;
• column |cut| gives the size of cut at the end of the for
loop of Algorithm 4;
• columns CPUc and Memc (resp. CPUe and Meme)
show the computation time in seconds and memory
usage in bytes of PTOC(CUT) (resp., of PTOC(EXH))
• column |In| shows the size of the input predicate, as the
number of linear constraints (i.e., of the linear predicate
atoms) in the input linear predicate N1;
• column |Out| shows the size of the output conjunctive
predicate, as the resulting number of linear constraints
in the output conjunctive predicate.
C. Multi-Input Buck as a Guarded Predicate
We modify the DTLHS H1 of Section VII-B by defin-
ing H2 = (X2, U2, Y2, N2), where X2 = X1, U2 = U1,
Y2 = Y1 ∪ Y ′2 = Y1 ∪ q0, . . . , qn−1 and N2 is obtained
from N1 by replacing disjunctions (55)–(58) with guarded
constraints. Thus, N1 is given by the conjunction of guarded
constraints (62)–(76).
i′
L = (1 + Ta1,1)iL + Ta1,2vO + Ta1,3vD (62)
v′
O = Ta2,1iL + (1 + Ta2,2)vO + Ta2,3vD. (63)
q→vD=0 (64)
q→ iD≥0 (65)
q→vD=Roff iD (66)
q→vD≤0 (67)
∧
i∈[n−1]
qi→vDi =0 (68)
∧
i∈[n−1]
qi→Iui ≥0 (69)
∧
i∈[n]
ui→vui =0 (70)
∧
i∈[n−1]
qi→vDi ≤0 (71)
∧
i∈[n−1]
qi→vDi =RoffI
ui (72)
∧
i∈[n]
ui→vui =RoffI
ui (73)
iL= iD+
n∑
i=1
Iui (74)
∧
i∈[n−1]
vD=vui +v
Di −Vi (75)
vD=vun−Vn (76)
We call both GPTOC(CUT) and GPTOC(EXH) with pa-
rameters N2, X2 ∪U2 ∪ Y2 ∪X′2 for increasing values of n,
and we compare their computation times.
Table II shows our experimental results. Columns mean-
ing in Table II are the same as of Table I. An additional
column |Y2| shows the number of guard variables in N2.
D. Evaluation
Results in Table I show that heuristics implemented in
function computeBounds are indeed effective w.r.t. execut-
ing function exhComputeBounds . In fact, by comparing
columns CPUc and CPUe (and recalling that the only differ-
ence between PTOC(CUT) shown in CPUc and PTOC(CUT)
shown in CPUe is that the former calls function compute-
Bounds whilst the latter calls function exhComputeBounds),
we see that such heuristics provide at least a one-order-of-
magnitude speed-up in variable bounds computation. Such
speed-up rapidly grows with the size of the input. In fact,
for the 4-bits buck DC-DC converter, PTOC(EXH) requires
more than 2 weeks, whilst PTOC(CUT) terminates in about
3 hours. Moreover, we also note that the resulting number
of linear constraints output by PTOC is at most twice the
starting number of linear constraints.
PTOC(CUT) is however not effective on the n-input buck
DC-DC converter for n ≥ 5. In fact, for n = 5, there are
30 boolean guards (i.e., r = 30), and the heuristics do not
provide enough speed-up to obtain termination in a reason-
able time. However, if we directly use guarded predicates as
input language as in Section VII-C, we are able to generate
the conjunctive predicate for both n = 5 and n = 6. This
is due to the smaller number of guard variables used in
Section VII-C than that used in Section VII-B. The negative
impact of auxiliary boolean variables is clearly showed by
the fact that GPTOC(EXH), much slower than GPTOC(CUT)
on a model of the same size, performs better than GP-
TOC(CUT) in this case, because it can work on a model with
half of the variables (see columns |Y2| and r). The same
holds if we compare results of GPTOC(EXH) with those
of PTOC(EXH) and PTOC(CUT). This phenomenon would
be greatly amplified in a verification or control software
synthesis procedure. These results strongly support guarded
predicates as modeling language.
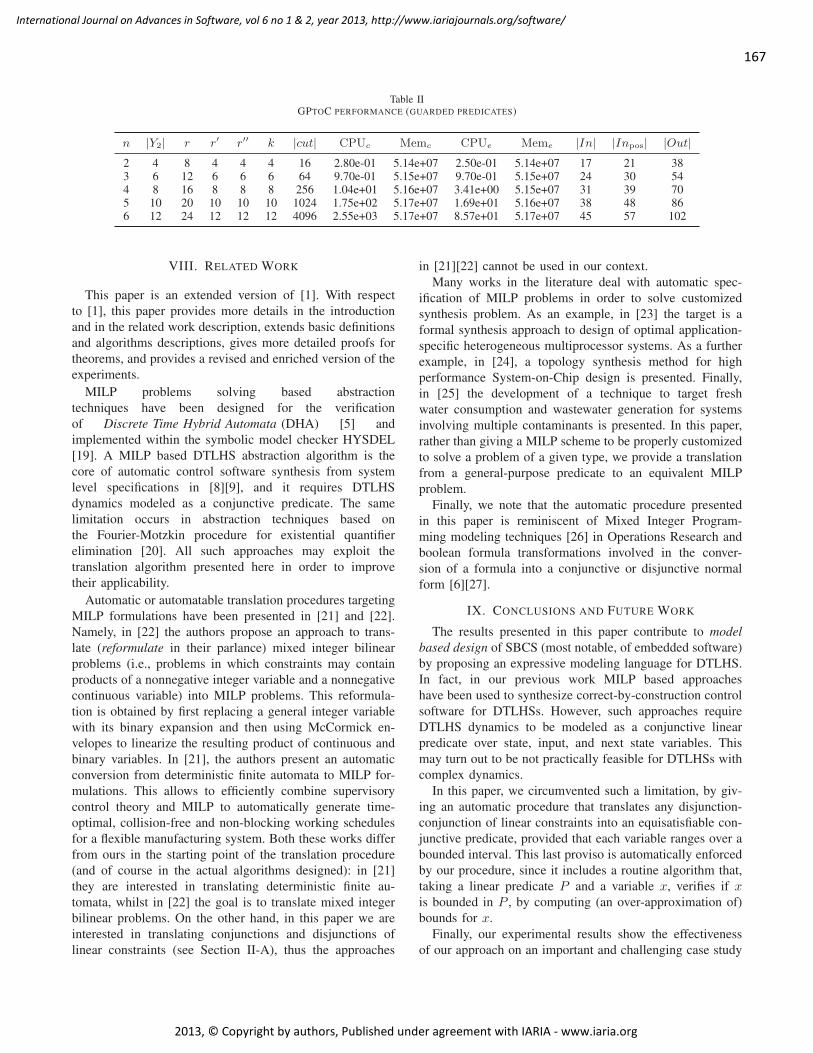
167
International Journal on Advances in Software, vol 6 no 1 & 2, year 2013, http://www.iariajournals.org/software/
2013, © Copyright by authors, Published under agreement with IARIA - www.iaria.org
Table IIGPTOC PERFORMANCE (GUARDED PREDICATES)
n |Y2| r r′ r′′ k |cut| CPUc Memc CPUe Meme |In| |Inpos| |Out|
2 4 8 4 4 4 16 2.80e-01 5.14e+07 2.50e-01 5.14e+07 17 21 383 6 12 6 6 6 64 9.70e-01 5.15e+07 9.70e-01 5.15e+07 24 30 544 8 16 8 8 8 256 1.04e+01 5.16e+07 3.41e+00 5.15e+07 31 39 705 10 20 10 10 10 1024 1.75e+02 5.17e+07 1.69e+01 5.16e+07 38 48 866 12 24 12 12 12 4096 2.55e+03 5.17e+07 8.57e+01 5.17e+07 45 57 102
VIII. RELATED WORK
This paper is an extended version of [1]. With respect
to [1], this paper provides more details in the introduction
and in the related work description, extends basic definitions
and algorithms descriptions, gives more detailed proofs for
theorems, and provides a revised and enriched version of the
experiments.
MILP problems solving based abstraction
techniques have been designed for the verification
of Discrete Time Hybrid Automata (DHA) [5] and
implemented within the symbolic model checker HYSDEL
[19]. A MILP based DTLHS abstraction algorithm is the
core of automatic control software synthesis from system
level specifications in [8][9], and it requires DTLHS
dynamics modeled as a conjunctive predicate. The same
limitation occurs in abstraction techniques based on
the Fourier-Motzkin procedure for existential quantifier
elimination [20]. All such approaches may exploit the
translation algorithm presented here in order to improve
their applicability.
Automatic or automatable translation procedures targeting
MILP formulations have been presented in [21] and [22].
Namely, in [22] the authors propose an approach to trans-
late (reformulate in their parlance) mixed integer bilinear
problems (i.e., problems in which constraints may contain
products of a nonnegative integer variable and a nonnegative
continuous variable) into MILP problems. This reformula-
tion is obtained by first replacing a general integer variable
with its binary expansion and then using McCormick en-
velopes to linearize the resulting product of continuous and
binary variables. In [21], the authors present an automatic
conversion from deterministic finite automata to MILP for-
mulations. This allows to efficiently combine supervisory
control theory and MILP to automatically generate time-
optimal, collision-free and non-blocking working schedules
for a flexible manufacturing system. Both these works differ
from ours in the starting point of the translation procedure
(and of course in the actual algorithms designed): in [21]
they are interested in translating deterministic finite au-
tomata, whilst in [22] the goal is to translate mixed integer
bilinear problems. On the other hand, in this paper we are
interested in translating conjunctions and disjunctions of
linear constraints (see Section II-A), thus the approaches
in [21][22] cannot be used in our context.
Many works in the literature deal with automatic spec-
ification of MILP problems in order to solve customized
synthesis problem. As an example, in [23] the target is a
formal synthesis approach to design of optimal application-
specific heterogeneous multiprocessor systems. As a further
example, in [24], a topology synthesis method for high
performance System-on-Chip design is presented. Finally,
in [25] the development of a technique to target fresh
water consumption and wastewater generation for systems
involving multiple contaminants is presented. In this paper,
rather than giving a MILP scheme to be properly customized
to solve a problem of a given type, we provide a translation
from a general-purpose predicate to an equivalent MILP
problem.
Finally, we note that the automatic procedure presented
in this paper is reminiscent of Mixed Integer Program-
ming modeling techniques [26] in Operations Research and
boolean formula transformations involved in the conver-
sion of a formula into a conjunctive or disjunctive normal
form [6][27].
IX. CONCLUSIONS AND FUTURE WORK
The results presented in this paper contribute to model
based design of SBCS (most notable, of embedded software)
by proposing an expressive modeling language for DTLHS.
In fact, in our previous work MILP based approaches
have been used to synthesize correct-by-construction control
software for DTLHSs. However, such approaches require
DTLHS dynamics to be modeled as a conjunctive linear
predicate over state, input, and next state variables. This
may turn out to be not practically feasible for DTLHSs with
complex dynamics.
In this paper, we circumvented such a limitation, by giv-
ing an automatic procedure that translates any disjunction-
conjunction of linear constraints into an equisatisfiable con-
junctive predicate, provided that each variable ranges over a
bounded interval. This last proviso is automatically enforced
by our procedure, since it includes a routine algorithm that,
taking a linear predicate P and a variable x, verifies if xis bounded in P , by computing (an over-approximation of)
bounds for x.
Finally, our experimental results show the effectiveness
of our approach on an important and challenging case study
168
International Journal on Advances in Software, vol 6 no 1 & 2, year 2013, http://www.iariajournals.org/software/
2013, © Copyright by authors, Published under agreement with IARIA - www.iaria.org
taken from the literature, namely the multi-input Buck DC-
DC Converter. As an example, the linear predicate that
models a 4-inputs buck DC-DC converter with 39 linear con-
straints is translated into a conjunctive predicate of 82 linear
constraints in slightly more than 3 hours. Most notably, our
experimental results show that guarded predicates, which
are used by our translation procedure as an intermediate
language, turn out to be a natural language to succinctly
describe DTLHS dynamics. In fact, the guarded predicate
that models a 6-inputs Buck DC-DC Converter with 57
constraints (including 12 different guards), is translated into
a conjunctive predicate of 102 linear constraints in about 40
minutes.
The presented approach has the main drawback to be
exponential on the number of boolean guards used in the
(initial or intermediate) guarded predicate. As a future work,
we aim to counteract such a limitation by recognizing if the
input predicate is of some known structure. As an example,
if the guarded predicate is composed by k blocks of the same
structure, we may translate just one of such blocks and then
suitably copy the resulting conjunctive predicate k times.
ACKNOWLEDGMENTS
Our work has been partially supported by: MIUR project
DM24283 (TRAMP) and by the EC FP7 projects GA600773
(PAEON) and GA317761 (SmartHG).
ACRONYMS
AD Analog-to-Digital. 1
DA Digital-to-Analog. 1
DC Direct Current. 4
DHA Discrete Time Hybrid Automata. 12
DTLHS Discrete Time Linear Hybrid System. 1, 2, 4, 6,
7, 9–13
DVFS Dynamic Voltage and Frequency Scaling. 4
MILP Mixed Integer Linear Programming. 1–4, 7, 10, 12,
13
NFSA Nondeterministic Finite State Automaton. 1
QKS Quantized feedback Kontrol Synthesizer. 10
SBCS Software Based Control System. 1
REFERENCES
[1] F. Mari, I. Melatti, I. Salvo, and E. Tronci, “Linear constraintsas a modeling language for discrete time hybrid systems,” inICSEA, 2012, pp. 664–671.
[2] T. A. Henzinger and J. Sifakis, “The embedded systemsdesign challenge,” in FM, ser. LNCS 4085, 2006, pp. 1–15.
[3] R. Alur, C. Courcoubetis, N. Halbwachs, T. A. Henzinger,P. H. Ho, X. Nicollin, A. Olivero, J. Sifakis, and S. Yovine,“The algorithmic analysis of hybrid systems,” TheoreticalComputer Science, vol. 138, no. 1, pp. 3 – 34, 1995.
[4] R. Alur, T. A. Henzinger, and P.-H. Ho, “Automatic symbolicverification of embedded systems,” IEEE Trans. Softw. Eng.,vol. 22, no. 3, pp. 181–201, 1996.
[5] A. Bemporad and M. Morari, “Verification of hybrid systemsvia mathematical programming,” in HSCC, ser. LNCS 1569,1999, pp. 31–45.
[6] F. Mari and E. Tronci, “CEGAR based bounded modelchecking of discrete time hybrid systems,” in HSCC, ser.LNCS 4416, 2007, pp. 399–412.
[7] V. Alimguzhin, F. Mari, I. Melatti, I. Salvo, and E. Tronci,“Automatic control software synthesis for quantized discretetime hybrid systems,” in CDC. IEEE, 2012, pp. 6120–6125.
[8] F. Mari, I. Melatti, I. Salvo, and E. Tronci, “Synthesis ofquantized feedback control software for discrete time linearhybrid systems,” in CAV, ser. LNCS 6174, 2010, pp. 180–195.
[9] ——, “Model based synthesis of control software fromsystem level formal specifications,” ACM Trans. on Soft.Eng. and Meth., vol. To appear. [Online]. Available:http://mclab.di.uniroma1.it/publications/papers/federicomari/2013/110_FedericoMari2013.pdf
[10] ——, “Undecidability of quantized state feedback control fordiscrete time linear hybrid systems,” in Proceedings of theInternational Colloquium on Theoretical Aspects of Comput-ing, ICTAC, ser. LNCS, A. Roychoudhury and M. D’Souza,Eds., vol. 7521. Springer-Verlag Berlin Heidelberg, 2012,pp. 243–258.
[11] ——, “Synthesizing control software from boolean relations,”Int. J. on Advances in SW, vol. 5, no. 3&4, pp. 212–223, 2012.
[12] “Gnu GLPK Web Page: http://www.gnu.org/software/glpk/,”last accessed 6 mar 2013.
[13] “CPLEX Web Page: http://www-01.ibm.com/software/integration/optimization/cplex-optimization-studio/,” last accessed 6 mar 2013.
[14] W. Kim, M. S. Gupta, G.-Y. Wei, and D. M. Brooks, “En-abling on-chip switching regulators for multi-core processorsusing current staggering,” in ASGI, 2007.
[15] W.-C. So, C. Tse, and Y.-S. Lee, “Development of a fuzzylogic controller for dc/dc converters: design, computer simu-lation, and experimental evaluation,” IEEE Trans. on PowerElectronics, vol. 11, no. 1, pp. 24–32, 1996.
[16] V. Yousefzadeh, A. Babazadeh, B. Ramachandran, E. Alar-con, L. Pao, and D. Maksimovic, “Proximate time-optimaldigital control for synchronous buck dc–dc converters,” IEEETrans. on Power Electronics, vol. 23, no. 4, pp. 2018–2026,2008.
[17] P.-Z. Lin, C.-F. Hsu, and T.-T. Lee, “Type-2 fuzzy logiccontroller design for buck dc-dc converters,” in FUZZ, 2005,pp. 365–370.
[18] M. Rodriguez, P. Fernandez-Miaja, A. Rodriguez, and J. Se-bastian, “A multiple-input digitally controlled buck converterfor envelope tracking applications in radiofrequency poweramplifiers,” IEEE Trans. on Power Electronics, vol. 25, no. 2,pp. 369–381, 2010.
169
International Journal on Advances in Software, vol 6 no 1 & 2, year 2013, http://www.iariajournals.org/software/
2013, © Copyright by authors, Published under agreement with IARIA - www.iaria.org
[19] F. Torrisi and A. Bemporad, “HYSDEL — A tool for gener-ating computational hybrid models for analysis and synthesisproblems,” IEEE Transactions on Control System Technology,vol. 12, no. 2, pp. 235–249, 2004.
[20] S. K. Jha, B. H. Krogh, J. E. Weimer, and E. M. Clarke,“Reachability for linear hybrid automata using iterative re-laxation abstraction,” in HSCC, ser. LNCS 4416, 2007, pp.287–300.
[21] A. Kobetski and M. Fabian, “Scheduling of discrete eventsystems using mixed integer linear programming,” in DiscreteEvent Systems, 2006 8th International Workshop on, july2006, pp. 76 –81.
[22] A. Gupte, S. Ahmed, M. S. Cheon, and S. S.Dey, “Solving mixed integer bilinear problems usingmilp formulations,” SIAM J. on Optimization, vol.To appear. [Online]. Available: http://www.optimization-online.org/DB_FILE/2011/07/3087.pdf
[23] S. Prakash and A. C. Parker, “Readings in hardware/softwareco-design,” G. De Micheli, R. Ernst, and W. Wolf, Eds.Norwell, MA, USA: Kluwer Academic Publishers, 2002,ch. SOS: synthesis of application-specific heterogeneous
multiprocessor systems, pp. 324–337. [Online]. Available:http://dl.acm.org/citation.cfm?id=567003.567031
[24] M. Jun, S. Yoo, and E.-Y. Chung, “Mixed integer linearprogramming-based optimal topology synthesis of cascadedcrossbar switches,” in Proceedings of the 2008 Asia andSouth Pacific Design Automation Conference, ser. ASP-DAC ’08. Los Alamitos, CA, USA: IEEE ComputerSociety Press, 2008, pp. 583–588. [Online]. Available:http://dl.acm.org/citation.cfm?id=1356802.1356945
[25] Z. Handani, H. Hashim, S. Alwi, and Z. Manan, “A mixedinteger linear programming (milp) model for optimal designof water network,” in Modeling, Simulation and AppliedOptimization (ICMSAO), 2011 4th International Conferenceon, april 2011, pp. 1 –6.
[26] F. S. Hillier and G. J. Lieberman, Introduction to operationsresearch. McGraw-Hill Inc., 2001.
[27] D. Sheridan, “The optimality of a fast cnf conversion and itsuse with sat,” in SAT, 2004.
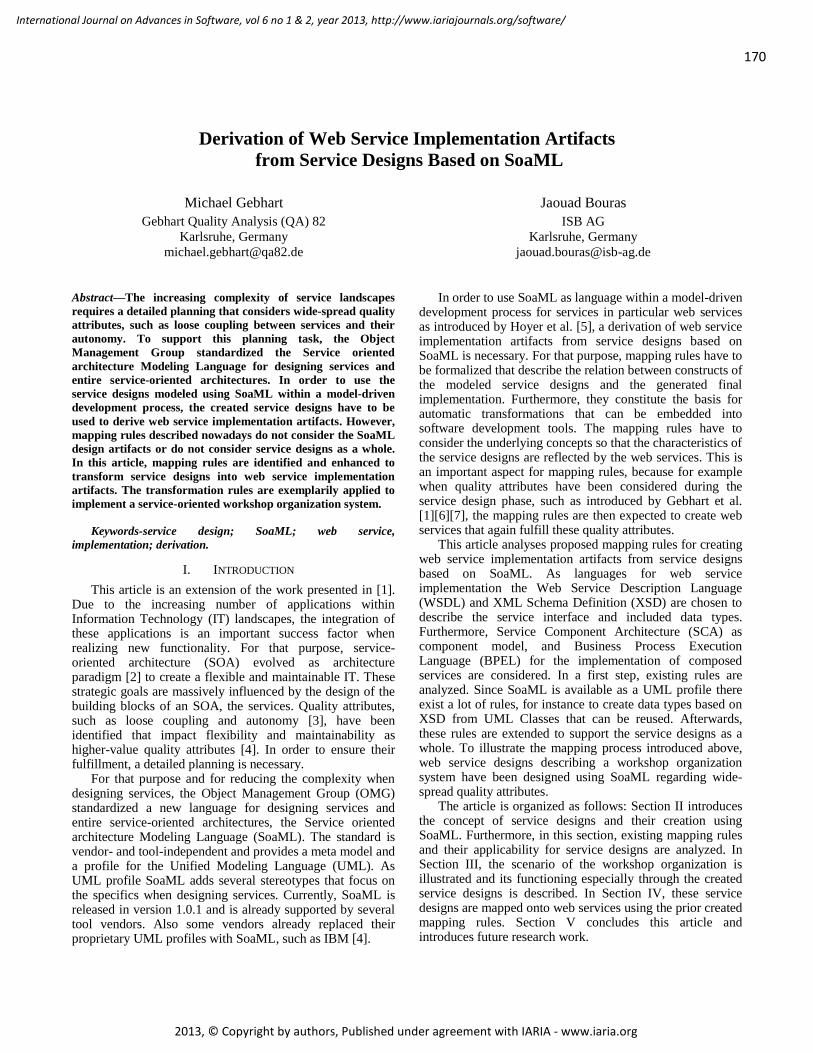
170
International Journal on Advances in Software, vol 6 no 1 & 2, year 2013, http://www.iariajournals.org/software/
2013, © Copyright by authors, Published under agreement with IARIA - www.iaria.org
Derivation of Web Service Implementation Artifacts
from Service Designs Based on SoaML
Michael Gebhart
Gebhart Quality Analysis (QA) 82
Karlsruhe, Germany
Jaouad Bouras
ISB AG
Karlsruhe, Germany
Abstract—The increasing complexity of service landscapes
requires a detailed planning that considers wide-spread quality
attributes, such as loose coupling between services and their
autonomy. To support this planning task, the Object
Management Group standardized the Service oriented
architecture Modeling Language for designing services and
entire service-oriented architectures. In order to use the
service designs modeled using SoaML within a model-driven
development process, the created service designs have to be
used to derive web service implementation artifacts. However,
mapping rules described nowadays do not consider the SoaML
design artifacts or do not consider service designs as a whole.
In this article, mapping rules are identified and enhanced to
transform service designs into web service implementation
artifacts. The transformation rules are exemplarily applied to
implement a service-oriented workshop organization system.
Keywords-service design; SoaML; web service,
implementation; derivation.
I. INTRODUCTION
This article is an extension of the work presented in [1]. Due to the increasing number of applications within Information Technology (IT) landscapes, the integration of these applications is an important success factor when realizing new functionality. For that purpose, service-oriented architecture (SOA) evolved as architecture paradigm [2] to create a flexible and maintainable IT. These strategic goals are massively influenced by the design of the building blocks of an SOA, the services. Quality attributes, such as loose coupling and autonomy [3], have been identified that impact flexibility and maintainability as higher-value quality attributes [4]. In order to ensure their fulfillment, a detailed planning is necessary.
For that purpose and for reducing the complexity when designing services, the Object Management Group (OMG) standardized a new language for designing services and entire service-oriented architectures, the Service oriented architecture Modeling Language (SoaML). The standard is vendor- and tool-independent and provides a meta model and a profile for the Unified Modeling Language (UML). As UML profile SoaML adds several stereotypes that focus on the specifics when designing services. Currently, SoaML is released in version 1.0.1 and is already supported by several tool vendors. Also some vendors already replaced their proprietary UML profiles with SoaML, such as IBM [4].
In order to use SoaML as language within a model-driven development process for services in particular web services as introduced by Hoyer et al. [5], a derivation of web service implementation artifacts from service designs based on SoaML is necessary. For that purpose, mapping rules have to be formalized that describe the relation between constructs of the modeled service designs and the generated final implementation. Furthermore, they constitute the basis for automatic transformations that can be embedded into software development tools. The mapping rules have to consider the underlying concepts so that the characteristics of the service designs are reflected by the web services. This is an important aspect for mapping rules, because for example when quality attributes have been considered during the service design phase, such as introduced by Gebhart et al. [1][6][7], the mapping rules are then expected to create web services that again fulfill these quality attributes.
This article analyses proposed mapping rules for creating web service implementation artifacts from service designs based on SoaML. As languages for web service implementation the Web Service Description Language (WSDL) and XML Schema Definition (XSD) are chosen to describe the service interface and included data types. Furthermore, Service Component Architecture (SCA) as component model, and Business Process Execution Language (BPEL) for the implementation of composed services are considered. In a first step, existing rules are analyzed. Since SoaML is available as a UML profile there exist a lot of rules, for instance to create data types based on XSD from UML Classes that can be reused. Afterwards, these rules are extended to support the service designs as a whole. To illustrate the mapping process introduced above, web service designs describing a workshop organization system have been designed using SoaML regarding wide-spread quality attributes.
The article is organized as follows: Section II introduces the concept of service designs and their creation using SoaML. Furthermore, in this section, existing mapping rules and their applicability for service designs are analyzed. In Section III, the scenario of the workshop organization is illustrated and its functioning especially through the created service designs is described. In Section IV, these service designs are mapped onto web services using the prior created mapping rules. Section V concludes this article and introduces future research work.
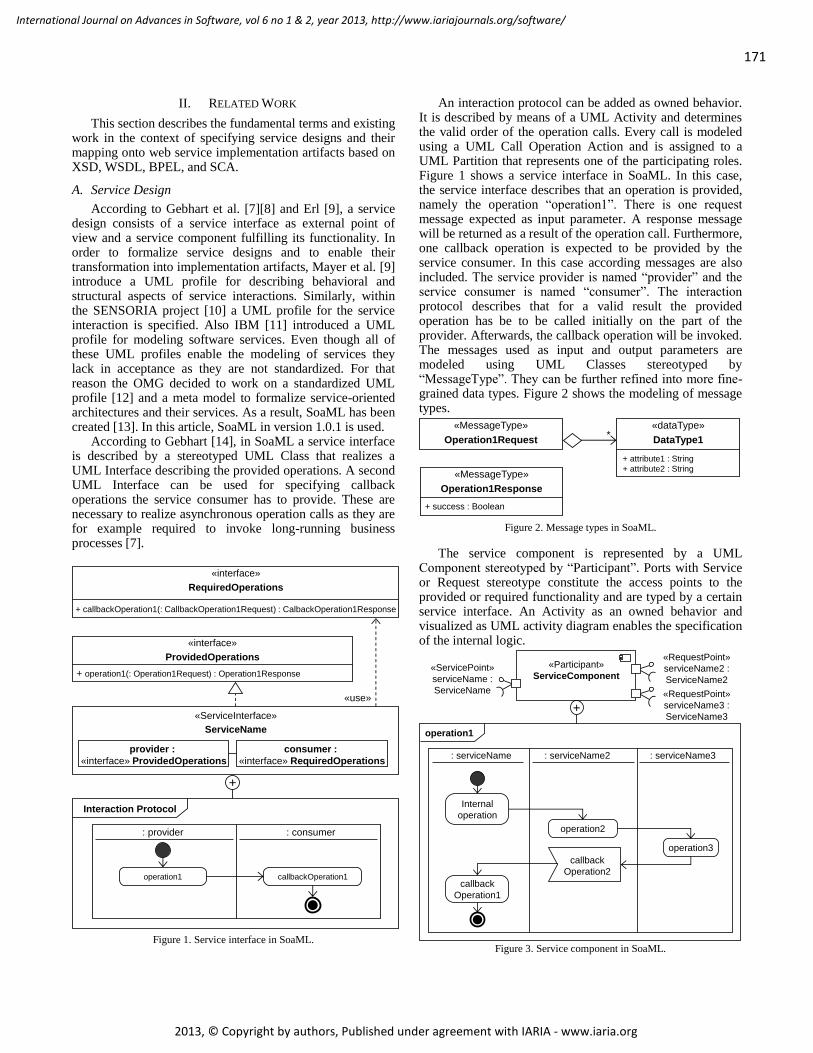
171
International Journal on Advances in Software, vol 6 no 1 & 2, year 2013, http://www.iariajournals.org/software/
2013, © Copyright by authors, Published under agreement with IARIA - www.iaria.org
II. RELATED WORK
This section describes the fundamental terms and existing work in the context of specifying service designs and their mapping onto web service implementation artifacts based on XSD, WSDL, BPEL, and SCA.
A. Service Design
According to Gebhart et al. [7][8] and Erl [9], a service design consists of a service interface as external point of view and a service component fulfilling its functionality. In order to formalize service designs and to enable their transformation into implementation artifacts, Mayer et al. [9] introduce a UML profile for describing behavioral and structural aspects of service interactions. Similarly, within the SENSORIA project [10] a UML profile for the service interaction is specified. Also IBM [11] introduced a UML profile for modeling software services. Even though all of these UML profiles enable the modeling of services they lack in acceptance as they are not standardized. For that reason the OMG decided to work on a standardized UML profile [12] and a meta model to formalize service-oriented architectures and their services. As a result, SoaML has been created [13]. In this article, SoaML in version 1.0.1 is used.
According to Gebhart [14], in SoaML a service interface is described by a stereotyped UML Class that realizes a UML Interface describing the provided operations. A second UML Interface can be used for specifying callback operations the service consumer has to provide. These are necessary to realize asynchronous operation calls as they are for example required to invoke long-running business processes [7].
Figure 1. Service interface in SoaML.
An interaction protocol can be added as owned behavior. It is described by means of a UML Activity and determines the valid order of the operation calls. Every call is modeled using a UML Call Operation Action and is assigned to a UML Partition that represents one of the participating roles. Figure 1 shows a service interface in SoaML. In this case, the service interface describes that an operation is provided, namely the operation “operation1”. There is one request message expected as input parameter. A response message will be returned as a result of the operation call. Furthermore, one callback operation is expected to be provided by the service consumer. In this case according messages are also included. The service provider is named “provider” and the service consumer is named “consumer”. The interaction protocol describes that for a valid result the provided operation has be to be called initially on the part of the provider. Afterwards, the callback operation will be invoked. The messages used as input and output parameters are modeled using UML Classes stereotyped by “MessageType”. They can be further refined into more fine-grained data types. Figure 2 shows the modeling of message types.
Figure 2. Message types in SoaML.
The service component is represented by a UML Component stereotyped by “Participant”. Ports with Service or Request stereotype constitute the access points to the provided or required functionality and are typed by a certain service interface. An Activity as an owned behavior and visualized as UML activity diagram enables the specification of the internal logic.
Figure 3. Service component in SoaML.
«ServiceInterface»
ServiceName
«interface»
ProvidedOperations
+ operation1(: Operation1Request) : Operation1Response
consumer :
«interface» RequiredOperations
provider :
«interface» ProvidedOperations
+
Interaction Protocol
: provider : consumer
operation1
«use»
«interface»
RequiredOperations
+ callbackOperation1(: CallbackOperation1Request) : CalbackOperation1Response
callbackOperation1
«MessageType»
Operation1Request
«dataType»
DataType1
+ attribute1 : String
+ attribute2 : String«MessageType»
Operation1Response
+ success : Boolean
*
«Participant»
ServiceComponent«ServicePoint»
serviceName :
ServiceName
«RequestPoint»
serviceName2 :
ServiceName2
«RequestPoint»
serviceName3 :
ServiceName3+
operation1
: serviceName : serviceName2 : serviceName3
Internal
operation
operation2
operation3
callback
Operation1
callback
Operation2
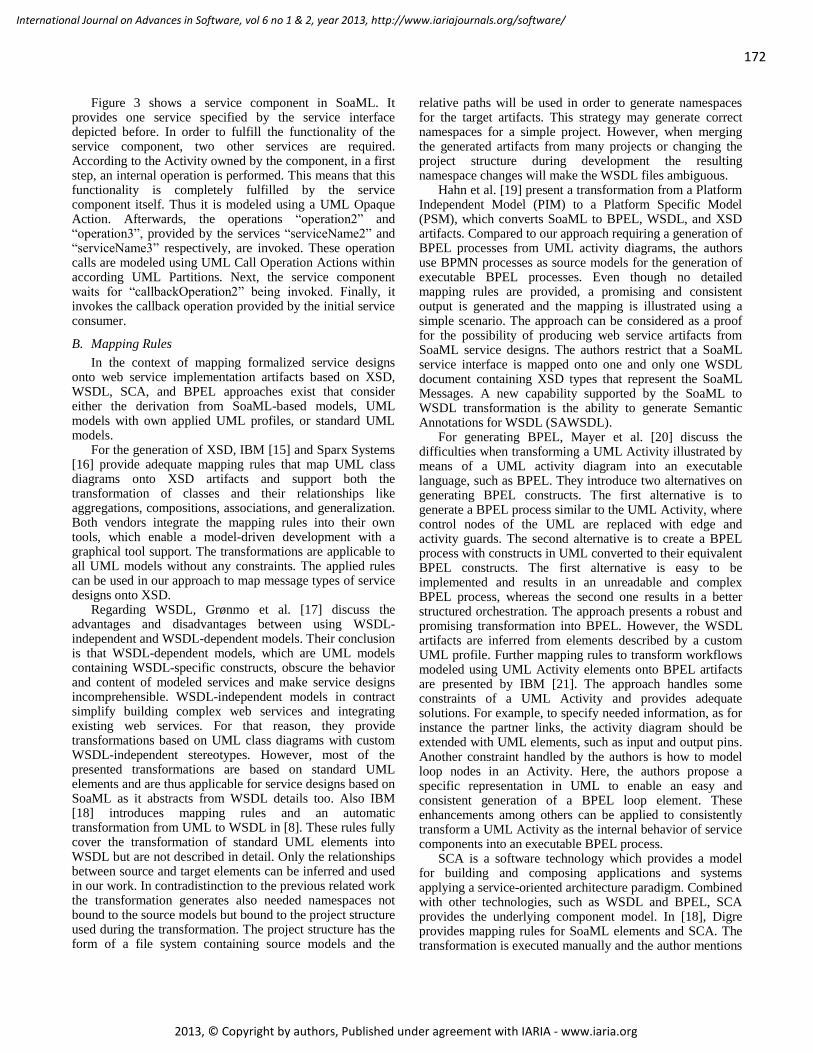
172
International Journal on Advances in Software, vol 6 no 1 & 2, year 2013, http://www.iariajournals.org/software/
2013, © Copyright by authors, Published under agreement with IARIA - www.iaria.org
Figure 3 shows a service component in SoaML. It provides one service specified by the service interface depicted before. In order to fulfill the functionality of the service component, two other services are required. According to the Activity owned by the component, in a first step, an internal operation is performed. This means that this functionality is completely fulfilled by the service component itself. Thus it is modeled using a UML Opaque Action. Afterwards, the operations “operation2” and “operation3”, provided by the services “serviceName2” and “serviceName3” respectively, are invoked. These operation calls are modeled using UML Call Operation Actions within according UML Partitions. Next, the service component waits for “callbackOperation2” being invoked. Finally, it invokes the callback operation provided by the initial service consumer.
B. Mapping Rules
In the context of mapping formalized service designs onto web service implementation artifacts based on XSD, WSDL, SCA, and BPEL approaches exist that consider either the derivation from SoaML-based models, UML models with own applied UML profiles, or standard UML models.
For the generation of XSD, IBM [15] and Sparx Systems [16] provide adequate mapping rules that map UML class diagrams onto XSD artifacts and support both the transformation of classes and their relationships like aggregations, compositions, associations, and generalization. Both vendors integrate the mapping rules into their own tools, which enable a model-driven development with a graphical tool support. The transformations are applicable to all UML models without any constraints. The applied rules can be used in our approach to map message types of service designs onto XSD.
Regarding WSDL, Grønmo et al. [17] discuss the advantages and disadvantages between using WSDL-independent and WSDL-dependent models. Their conclusion is that WSDL-dependent models, which are UML models containing WSDL-specific constructs, obscure the behavior and content of modeled services and make service designs incomprehensible. WSDL-independent models in contract simplify building complex web services and integrating existing web services. For that reason, they provide transformations based on UML class diagrams with custom WSDL-independent stereotypes. However, most of the presented transformations are based on standard UML elements and are thus applicable for service designs based on SoaML as it abstracts from WSDL details too. Also IBM [18] introduces mapping rules and an automatic transformation from UML to WSDL in [8]. These rules fully cover the transformation of standard UML elements into WSDL but are not described in detail. Only the relationships between source and target elements can be inferred and used in our work. In contradistinction to the previous related work the transformation generates also needed namespaces not bound to the source models but bound to the project structure used during the transformation. The project structure has the form of a file system containing source models and the
relative paths will be used in order to generate namespaces for the target artifacts. This strategy may generate correct namespaces for a simple project. However, when merging the generated artifacts from many projects or changing the project structure during development the resulting namespace changes will make the WSDL files ambiguous.
Hahn et al. [19] present a transformation from a Platform Independent Model (PIM) to a Platform Specific Model (PSM), which converts SoaML to BPEL, WSDL, and XSD artifacts. Compared to our approach requiring a generation of BPEL processes from UML activity diagrams, the authors use BPMN processes as source models for the generation of executable BPEL processes. Even though no detailed mapping rules are provided, a promising and consistent output is generated and the mapping is illustrated using a simple scenario. The approach can be considered as a proof for the possibility of producing web service artifacts from SoaML service designs. The authors restrict that a SoaML service interface is mapped onto one and only one WSDL document containing XSD types that represent the SoaML Messages. A new capability supported by the SoaML to WSDL transformation is the ability to generate Semantic Annotations for WSDL (SAWSDL).
For generating BPEL, Mayer et al. [20] discuss the difficulties when transforming a UML Activity illustrated by means of a UML activity diagram into an executable language, such as BPEL. They introduce two alternatives on generating BPEL constructs. The first alternative is to generate a BPEL process similar to the UML Activity, where control nodes of the UML are replaced with edge and activity guards. The second alternative is to create a BPEL process with constructs in UML converted to their equivalent BPEL constructs. The first alternative is easy to be implemented and results in an unreadable and complex BPEL process, whereas the second one results in a better structured orchestration. The approach presents a robust and promising transformation into BPEL. However, the WSDL artifacts are inferred from elements described by a custom UML profile. Further mapping rules to transform workflows modeled using UML Activity elements onto BPEL artifacts are presented by IBM [21]. The approach handles some constraints of a UML Activity and provides adequate solutions. For example, to specify needed information, as for instance the partner links, the activity diagram should be extended with UML elements, such as input and output pins. Another constraint handled by the authors is how to model loop nodes in an Activity. Here, the authors propose a specific representation in UML to enable an easy and consistent generation of a BPEL loop element. These enhancements among others can be applied to consistently transform a UML Activity as the internal behavior of service components into an executable BPEL process.
SCA is a software technology which provides a model for building and composing applications and systems applying a service-oriented architecture paradigm. Combined with other technologies, such as WSDL and BPEL, SCA provides the underlying component model. In [18], Digre provides mapping rules for SoaML elements and SCA. The transformation is executed manually and the author mentions
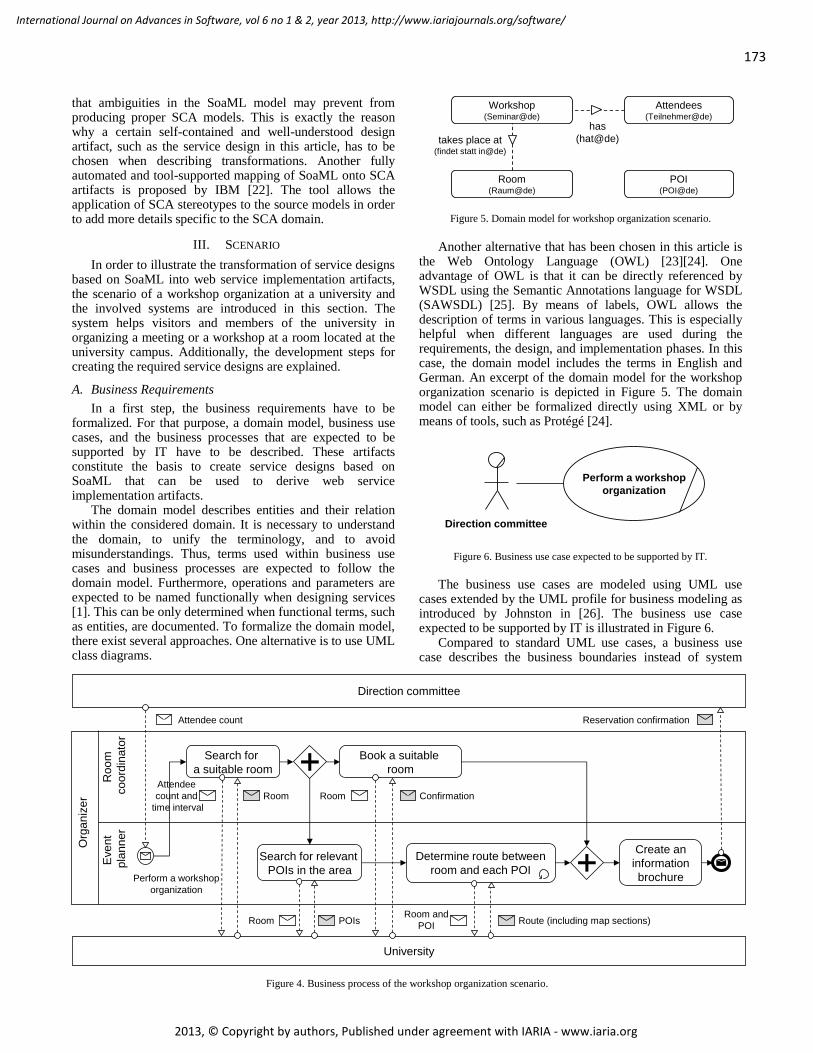
173
International Journal on Advances in Software, vol 6 no 1 & 2, year 2013, http://www.iariajournals.org/software/
2013, © Copyright by authors, Published under agreement with IARIA - www.iaria.org
that ambiguities in the SoaML model may prevent from producing proper SCA models. This is exactly the reason why a certain self-contained and well-understood design artifact, such as the service design in this article, has to be chosen when describing transformations. Another fully automated and tool-supported mapping of SoaML onto SCA artifacts is proposed by IBM [22]. The tool allows the application of SCA stereotypes to the source models in order to add more details specific to the SCA domain.
III. SCENARIO
In order to illustrate the transformation of service designs based on SoaML into web service implementation artifacts, the scenario of a workshop organization at a university and the involved systems are introduced in this section. The system helps visitors and members of the university in organizing a meeting or a workshop at a room located at the university campus. Additionally, the development steps for creating the required service designs are explained.
A. Business Requirements
In a first step, the business requirements have to be formalized. For that purpose, a domain model, business use cases, and the business processes that are expected to be supported by IT have to be described. These artifacts constitute the basis to create service designs based on SoaML that can be used to derive web service implementation artifacts.
The domain model describes entities and their relation within the considered domain. It is necessary to understand the domain, to unify the terminology, and to avoid misunderstandings. Thus, terms used within business use cases and business processes are expected to follow the domain model. Furthermore, operations and parameters are expected to be named functionally when designing services [1]. This can be only determined when functional terms, such as entities, are documented. To formalize the domain model, there exist several approaches. One alternative is to use UML class diagrams.
Figure 5. Domain model for workshop organization scenario.
Another alternative that has been chosen in this article is the Web Ontology Language (OWL) [23][24]. One advantage of OWL is that it can be directly referenced by WSDL using the Semantic Annotations language for WSDL (SAWSDL) [25]. By means of labels, OWL allows the description of terms in various languages. This is especially helpful when different languages are used during the requirements, the design, and implementation phases. In this case, the domain model includes the terms in English and German. An excerpt of the domain model for the workshop organization scenario is depicted in Figure 5. The domain model can either be formalized directly using XML or by means of tools, such as Protégé [24].
Figure 6. Business use case expected to be supported by IT.
The business use cases are modeled using UML use
cases extended by the UML profile for business modeling as introduced by Johnston in [26]. The business use case expected to be supported by IT is illustrated in Figure 6.
Compared to standard UML use cases, a business use case describes the business boundaries instead of system
Workshop(Seminar@de)
Room(Raum@de)
POI(POI@de)
Attendees(Teilnehmer@de)
takes place at(findet statt in@de)
has
(hat@de)
Perform a workshop
organization
Direction committee
Figure 4. Business process of the workshop organization scenario.
University
Search for
a suitable room
Book a suitable
room
Search for relevant
POIs in the area
Create an
information
brochure
Determine route between
room and each POI
Direction committee
Eve
nt
pla
nn
er
Ro
om
co
ord
inato
r
Org
an
ize
r
Perform a workshop
organization
Reservation confirmationAttendee count
Attendee
count and
time interval
Room Room Confirmation
Room POIsRoom and
POIRoute (including map sections)
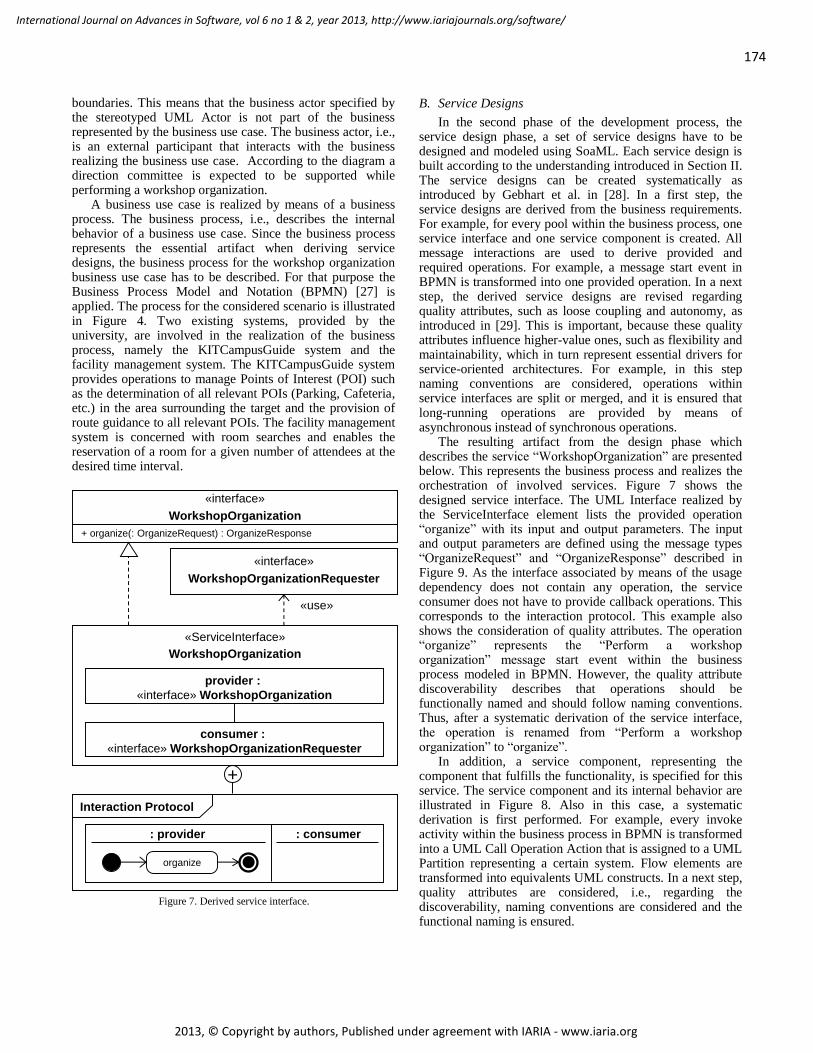
174
International Journal on Advances in Software, vol 6 no 1 & 2, year 2013, http://www.iariajournals.org/software/
2013, © Copyright by authors, Published under agreement with IARIA - www.iaria.org
boundaries. This means that the business actor specified by the stereotyped UML Actor is not part of the business represented by the business use case. The business actor, i.e., is an external participant that interacts with the business realizing the business use case. According to the diagram a direction committee is expected to be supported while performing a workshop organization.
A business use case is realized by means of a business process. The business process, i.e., describes the internal behavior of a business use case. Since the business process represents the essential artifact when deriving service designs, the business process for the workshop organization business use case has to be described. For that purpose the Business Process Model and Notation (BPMN) [27] is applied. The process for the considered scenario is illustrated in Figure 4. Two existing systems, provided by the university, are involved in the realization of the business process, namely the KITCampusGuide system and the facility management system. The KITCampusGuide system provides operations to manage Points of Interest (POI) such as the determination of all relevant POIs (Parking, Cafeteria, etc.) in the area surrounding the target and the provision of route guidance to all relevant POIs. The facility management system is concerned with room searches and enables the reservation of a room for a given number of attendees at the desired time interval.
B. Service Designs
In the second phase of the development process, the service design phase, a set of service designs have to be designed and modeled using SoaML. Each service design is built according to the understanding introduced in Section II. The service designs can be created systematically as introduced by Gebhart et al. in [28]. In a first step, the service designs are derived from the business requirements. For example, for every pool within the business process, one service interface and one service component is created. All message interactions are used to derive provided and required operations. For example, a message start event in BPMN is transformed into one provided operation. In a next step, the derived service designs are revised regarding quality attributes, such as loose coupling and autonomy, as introduced in [29]. This is important, because these quality attributes influence higher-value ones, such as flexibility and maintainability, which in turn represent essential drivers for service-oriented architectures. For example, in this step naming conventions are considered, operations within service interfaces are split or merged, and it is ensured that long-running operations are provided by means of asynchronous instead of synchronous operations.
The resulting artifact from the design phase which describes the service “WorkshopOrganization” are presented below. This represents the business process and realizes the orchestration of involved services. Figure 7 shows the designed service interface. The UML Interface realized by the ServiceInterface element lists the provided operation “organize” with its input and output parameters. The input and output parameters are defined using the message types “OrganizeRequest” and “OrganizeResponse” described in Figure 9. As the interface associated by means of the usage dependency does not contain any operation, the service consumer does not have to provide callback operations. This corresponds to the interaction protocol. This example also shows the consideration of quality attributes. The operation “organize” represents the “Perform a workshop organization” message start event within the business process modeled in BPMN. However, the quality attribute discoverability describes that operations should be functionally named and should follow naming conventions. Thus, after a systematic derivation of the service interface, the operation is renamed from “Perform a workshop organization” to “organize”.
In addition, a service component, representing the component that fulfills the functionality, is specified for this service. The service component and its internal behavior are illustrated in Figure 8. Also in this case, a systematic derivation is first performed. For example, every invoke activity within the business process in BPMN is transformed into a UML Call Operation Action that is assigned to a UML Partition representing a certain system. Flow elements are transformed into equivalents UML constructs. In a next step, quality attributes are considered, i.e., regarding the discoverability, naming conventions are considered and the functional naming is ensured.
«ServiceInterface»
WorkshopOrganization
«interface»
WorkshopOrganization
consumer :
«interface» WorkshopOrganizationRequester
provider :
«interface» WorkshopOrganization
Interaction Protocol
: provider : consumer
organize
«interface»
WorkshopOrganizationRequester
«use»
+ organize(: OrganizeRequest) : OrganizeResponse
+
Figure 7. Derived service interface.
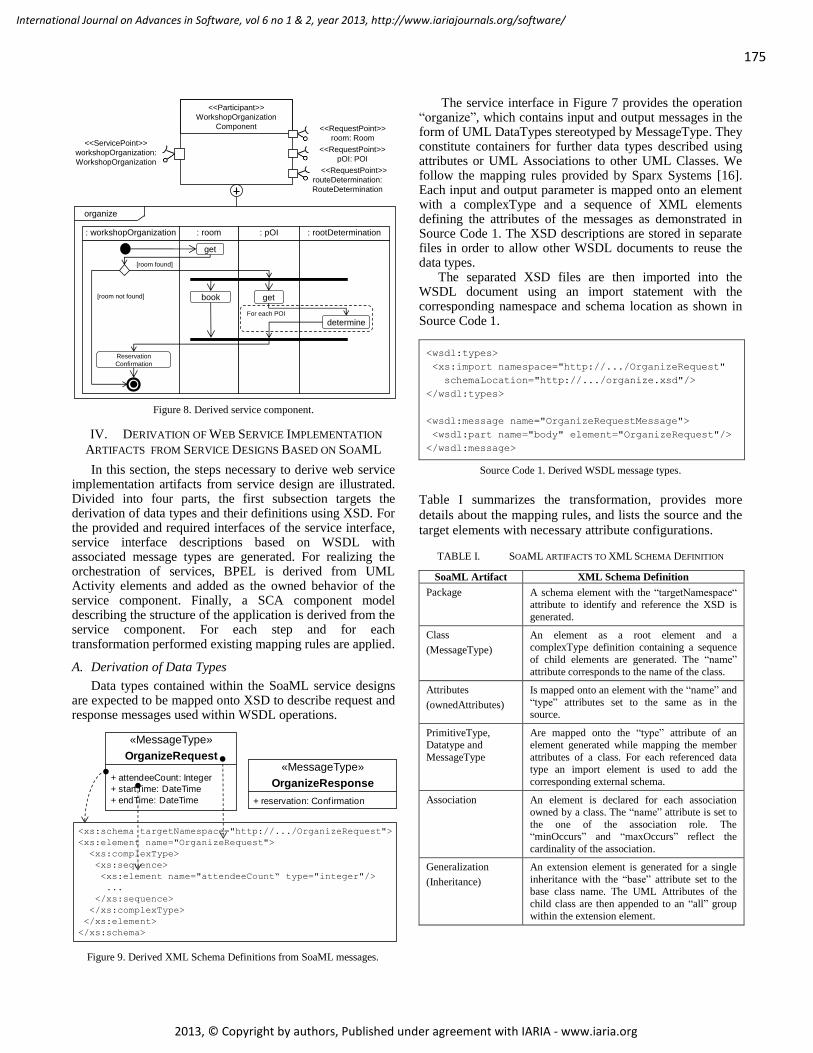
175
International Journal on Advances in Software, vol 6 no 1 & 2, year 2013, http://www.iariajournals.org/software/
2013, © Copyright by authors, Published under agreement with IARIA - www.iaria.org
Figure 8. Derived service component.
IV. DERIVATION OF WEB SERVICE IMPLEMENTATION
ARTIFACTS FROM SERVICE DESIGNS BASED ON SOAML
In this section, the steps necessary to derive web service implementation artifacts from service design are illustrated. Divided into four parts, the first subsection targets the derivation of data types and their definitions using XSD. For the provided and required interfaces of the service interface, service interface descriptions based on WSDL with associated message types are generated. For realizing the orchestration of services, BPEL is derived from UML Activity elements and added as the owned behavior of the service component. Finally, a SCA component model describing the structure of the application is derived from the service component. For each step and for each transformation performed existing mapping rules are applied.
A. Derivation of Data Types
Data types contained within the SoaML service designs are expected to be mapped onto XSD to describe request and response messages used within WSDL operations.
The service interface in Figure 7 provides the operation “organize”, which contains input and output messages in the form of UML DataTypes stereotyped by MessageType. They constitute containers for further data types described using attributes or UML Associations to other UML Classes. We follow the mapping rules provided by Sparx Systems [16]. Each input and output parameter is mapped onto an element with a complexType and a sequence of XML elements defining the attributes of the messages as demonstrated in Source Code 1. The XSD descriptions are stored in separate files in order to allow other WSDL documents to reuse the data types.
The separated XSD files are then imported into the WSDL document using an import statement with the corresponding namespace and schema location as shown in Source Code 1.
<wsdl:types>
<xs:import namespace="http://.../OrganizeRequest"
schemaLocation="http://.../organize.xsd"/>
</wsdl:types>
<wsdl:message name="OrganizeRequestMessage">
<wsdl:part name="body" element="OrganizeRequest"/>
</wsdl:message>
Source Code 1. Derived WSDL message types.
Table I summarizes the transformation, provides more
details about the mapping rules, and lists the source and the
target elements with necessary attribute configurations.
TABLE I. SOAML ARTIFACTS TO XML SCHEMA DEFINITION
SoaML Artifact XML Schema Definition
Package A schema element with the “targetNamespace“ attribute to identify and reference the XSD is
generated.
Class
(MessageType)
An element as a root element and a complexType definition containing a sequence
of child elements are generated. The “name”
attribute corresponds to the name of the class.
Attributes
(ownedAttributes)
Is mapped onto an element with the “name” and
“type” attributes set to the same as in the source.
PrimitiveType, Datatype and
MessageType
Are mapped onto the “type” attribute of an element generated while mapping the member
attributes of a class. For each referenced data type an import element is used to add the
corresponding external schema.
Association An element is declared for each association owned by a class. The “name” attribute is set to
the one of the association role. The “minOccurs” and “maxOccurs” reflect the
cardinality of the association.
Generalization
(Inheritance)
An extension element is generated for a single
inheritance with the “base” attribute set to the
base class name. The UML Attributes of the
child class are then appended to an “all” group
within the extension element.
<<Participant>>
WorkshopOrganization
Component
<<ServicePoint>>
workshopOrganization:
WorkshopOrganization
<<RequestPoint>>
room: Room
<<RequestPoint>>
pOI: POI
: workshopOrganization
organize
Reservation
Confirmation
: room
get
: pOI : rootDetermination
book get
determineFor each POI
[room found]
[room not found]
<<RequestPoint>>
routeDetermination:
RouteDetermination
«MessageType»
OrganizeResponse
+ reservation: Conf irmation
«MessageType»
OrganizeRequest
+ attendeeCount: Integer
+ startTime: DateTime
+ endTime: DateTime
<xs:schema targetNamespace="http://.../OrganizeRequest">
<xs:element name="OrganizeRequest">
<xs:complexType>
<xs:sequence>
<xs:element name="attendeeCount“ type="integer"/>
...
</xs:sequence>
</xs:complexType>
</xs:element>
</xs:schema>
Figure 9. Derived XML Schema Definitions from SoaML messages.
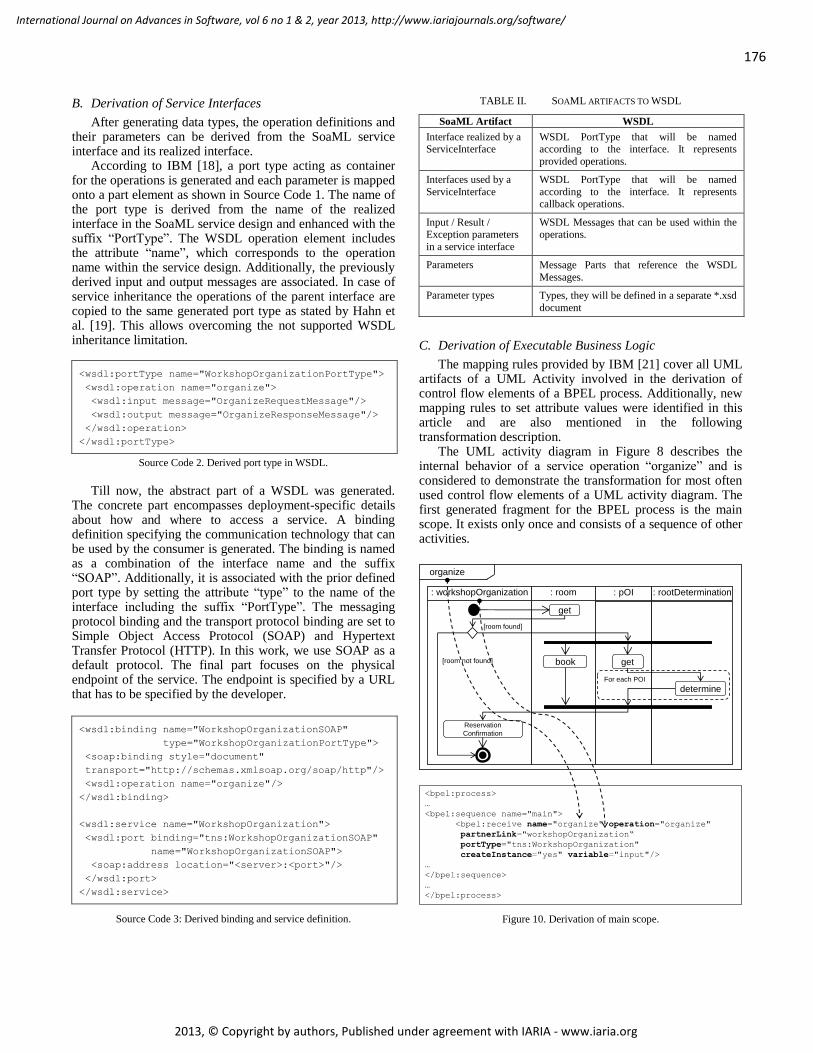
176
International Journal on Advances in Software, vol 6 no 1 & 2, year 2013, http://www.iariajournals.org/software/
2013, © Copyright by authors, Published under agreement with IARIA - www.iaria.org
B. Derivation of Service Interfaces
After generating data types, the operation definitions and their parameters can be derived from the SoaML service interface and its realized interface.
According to IBM [18], a port type acting as container for the operations is generated and each parameter is mapped onto a part element as shown in Source Code 1. The name of the port type is derived from the name of the realized interface in the SoaML service design and enhanced with the suffix “PortType”. The WSDL operation element includes the attribute “name”, which corresponds to the operation name within the service design. Additionally, the previously derived input and output messages are associated. In case of service inheritance the operations of the parent interface are copied to the same generated port type as stated by Hahn et al. [19]. This allows overcoming the not supported WSDL inheritance limitation.
<wsdl:portType name="WorkshopOrganizationPortType">
<wsdl:operation name="organize">
<wsdl:input message="OrganizeRequestMessage"/>
<wsdl:output message="OrganizeResponseMessage"/>
</wsdl:operation>
</wsdl:portType>
Source Code 2. Derived port type in WSDL.
Till now, the abstract part of a WSDL was generated.
The concrete part encompasses deployment-specific details about how and where to access a service. A binding definition specifying the communication technology that can be used by the consumer is generated. The binding is named as a combination of the interface name and the suffix “SOAP”. Additionally, it is associated with the prior defined port type by setting the attribute “type” to the name of the interface including the suffix “PortType”. The messaging protocol binding and the transport protocol binding are set to Simple Object Access Protocol (SOAP) and Hypertext Transfer Protocol (HTTP). In this work, we use SOAP as a default protocol. The final part focuses on the physical endpoint of the service. The endpoint is specified by a URL that has to be specified by the developer.
<wsdl:binding name="WorkshopOrganizationSOAP"
type="WorkshopOrganizationPortType">
<soap:binding style="document"
transport="http://schemas.xmlsoap.org/soap/http"/>
<wsdl:operation name="organize"/>
</wsdl:binding>
<wsdl:service name="WorkshopOrganization">
<wsdl:port binding="tns:WorkshopOrganizationSOAP"
name="WorkshopOrganizationSOAP">
<soap:address location="<server>:<port>"/>
</wsdl:port>
</wsdl:service>
Source Code 3: Derived binding and service definition.
TABLE II. SOAML ARTIFACTS TO WSDL
SoaML Artifact WSDL
Interface realized by a ServiceInterface
WSDL PortType that will be named according to the interface. It represents
provided operations.
Interfaces used by a
ServiceInterface
WSDL PortType that will be named
according to the interface. It represents callback operations.
Input / Result / Exception parameters
in a service interface
WSDL Messages that can be used within the operations.
Parameters Message Parts that reference the WSDL
Messages.
Parameter types Types, they will be defined in a separate *.xsd
document
C. Derivation of Executable Business Logic
The mapping rules provided by IBM [21] cover all UML artifacts of a UML Activity involved in the derivation of control flow elements of a BPEL process. Additionally, new mapping rules to set attribute values were identified in this article and are also mentioned in the following transformation description.
The UML activity diagram in Figure 8 describes the internal behavior of a service operation “organize” and is considered to demonstrate the transformation for most often used control flow elements of a UML activity diagram. The first generated fragment for the BPEL process is the main scope. It exists only once and consists of a sequence of other activities.
Figure 10. Derivation of main scope.
: workshopOrganization
organize
Reservation
Confirmation
: room
get
: pOI : rootDetermination
book get
determineFor each POI
[room found]
[room not found]
<bpel:process>
…
<bpel:sequence name="main">
<bpel:receive name="organize" operation="organize"
partnerLink="workshopOrganization“
portType="tns:WorkshopOrganization"
createInstance="yes" variable="input"/>
…
</bpel:sequence>
…
</bpel:process>
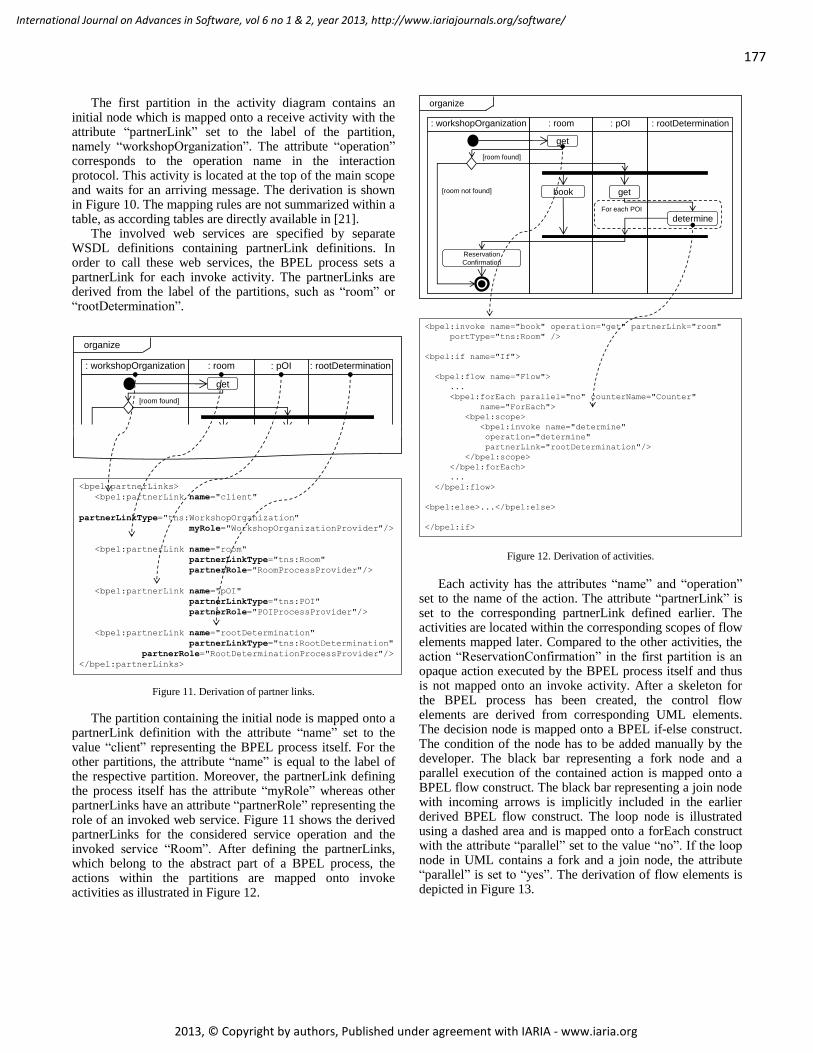
177
International Journal on Advances in Software, vol 6 no 1 & 2, year 2013, http://www.iariajournals.org/software/
2013, © Copyright by authors, Published under agreement with IARIA - www.iaria.org
The first partition in the activity diagram contains an initial node which is mapped onto a receive activity with the attribute “partnerLink” set to the label of the partition, namely “workshopOrganization”. The attribute “operation” corresponds to the operation name in the interaction protocol. This activity is located at the top of the main scope and waits for an arriving message. The derivation is shown in Figure 10. The mapping rules are not summarized within a table, as according tables are directly available in [21].
The involved web services are specified by separate WSDL definitions containing partnerLink definitions. In order to call these web services, the BPEL process sets a partnerLink for each invoke activity. The partnerLinks are derived from the label of the partitions, such as “room” or “rootDetermination”.
Figure 11. Derivation of partner links.
The partition containing the initial node is mapped onto a partnerLink definition with the attribute “name” set to the value “client” representing the BPEL process itself. For the other partitions, the attribute “name” is equal to the label of the respective partition. Moreover, the partnerLink defining the process itself has the attribute “myRole” whereas other partnerLinks have an attribute “partnerRole” representing the role of an invoked web service. Figure 11 shows the derived partnerLinks for the considered service operation and the invoked service “Room”. After defining the partnerLinks, which belong to the abstract part of a BPEL process, the actions within the partitions are mapped onto invoke activities as illustrated in Figure 12.
Figure 12. Derivation of activities.
Each activity has the attributes “name” and “operation”
set to the name of the action. The attribute “partnerLink” is set to the corresponding partnerLink defined earlier. The activities are located within the corresponding scopes of flow elements mapped later. Compared to the other activities, the action “ReservationConfirmation” in the first partition is an opaque action executed by the BPEL process itself and thus is not mapped onto an invoke activity. After a skeleton for the BPEL process has been created, the control flow elements are derived from corresponding UML elements. The decision node is mapped onto a BPEL if-else construct. The condition of the node has to be added manually by the developer. The black bar representing a fork node and a parallel execution of the contained action is mapped onto a BPEL flow construct. The black bar representing a join node with incoming arrows is implicitly included in the earlier derived BPEL flow construct. The loop node is illustrated using a dashed area and is mapped onto a forEach construct with the attribute “parallel” set to the value “no”. If the loop node in UML contains a fork and a join node, the attribute “parallel” is set to “yes”. The derivation of flow elements is depicted in Figure 13.
: workshopOrganization
organize
Reservation
Confirmation
: room
get
: pOI : rootDetermination
book get
determineFor each POI
[room found]
[room not found]
<bpel:partnerLinks>
<bpel:partnerLink name="client"
partnerLinkType="tns:WorkshopOrganization"
myRole="WorkshopOrganizationProvider"/>
<bpel:partnerLink name="room"
partnerLinkType="tns:Room"
partnerRole="RoomProcessProvider"/>
<bpel:partnerLink name="pOI"
partnerLinkType="tns:POI"
partnerRole="POIProcessProvider"/>
<bpel:partnerLink name="rootDetermination"
partnerLinkType="tns:RootDetermination"
partnerRole="RootDeterminationProcessProvider"/>
</bpel:partnerLinks>
: workshopOrganization
organize
Reservation
Confirmation
: room
get
: pOI : rootDetermination
book get
determineFor each POI
[room found]
[room not found]
<bpel:invoke name="book" operation="get" partnerLink="room"
portType="tns:Room" />
<bpel:if name="If">
<bpel:flow name="Flow">
...
<bpel:forEach parallel="no" counterName="Counter"
name="ForEach">
<bpel:scope>
<bpel:invoke name="determine"
operation="determine"
partnerLink="rootDetermination"/>
</bpel:scope>
</bpel:forEach>
...
</bpel:flow>
<bpel:else>...</bpel:else>
</bpel:if>
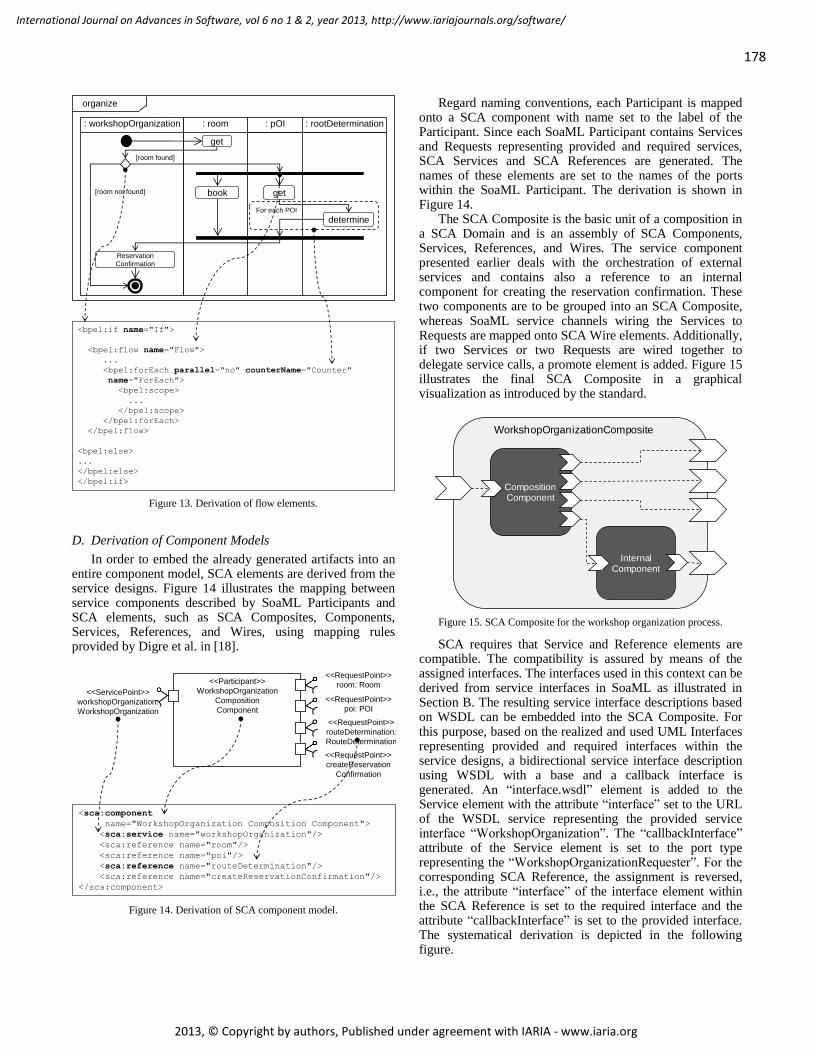
178
International Journal on Advances in Software, vol 6 no 1 & 2, year 2013, http://www.iariajournals.org/software/
2013, © Copyright by authors, Published under agreement with IARIA - www.iaria.org
Figure 13. Derivation of flow elements.
D. Derivation of Component Models
In order to embed the already generated artifacts into an entire component model, SCA elements are derived from the service designs. Figure 14 illustrates the mapping between service components described by SoaML Participants and SCA elements, such as SCA Composites, Components, Services, References, and Wires, using mapping rules provided by Digre et al. in [18].
Figure 14. Derivation of SCA component model.
Regard naming conventions, each Participant is mapped onto a SCA component with name set to the label of the Participant. Since each SoaML Participant contains Services and Requests representing provided and required services, SCA Services and SCA References are generated. The names of these elements are set to the names of the ports within the SoaML Participant. The derivation is shown in Figure 14.
The SCA Composite is the basic unit of a composition in a SCA Domain and is an assembly of SCA Components, Services, References, and Wires. The service component presented earlier deals with the orchestration of external services and contains also a reference to an internal component for creating the reservation confirmation. These two components are to be grouped into an SCA Composite, whereas SoaML service channels wiring the Services to Requests are mapped onto SCA Wire elements. Additionally, if two Services or two Requests are wired together to delegate service calls, a promote element is added. Figure 15 illustrates the final SCA Composite in a graphical visualization as introduced by the standard.
Figure 15. SCA Composite for the workshop organization process.
SCA requires that Service and Reference elements are compatible. The compatibility is assured by means of the assigned interfaces. The interfaces used in this context can be derived from service interfaces in SoaML as illustrated in Section B. The resulting service interface descriptions based on WSDL can be embedded into the SCA Composite. For this purpose, based on the realized and used UML Interfaces representing provided and required interfaces within the service designs, a bidirectional service interface description using WSDL with a base and a callback interface is generated. An “interface.wsdl” element is added to the Service element with the attribute “interface” set to the URL of the WSDL service representing the provided service interface “WorkshopOrganization”. The “callbackInterface” attribute of the Service element is set to the port type representing the “WorkshopOrganizationRequester”. For the corresponding SCA Reference, the assignment is reversed, i.e., the attribute “interface” of the interface element within the SCA Reference is set to the required interface and the attribute “callbackInterface” is set to the provided interface. The systematical derivation is depicted in the following figure.
: workshopOrganization
organize
Reservation
Confirmation
: room
get
: pOI : rootDetermination
book get
determineFor each POI
[room found]
[room not found]
<bpel:if name="If">
<bpel:flow name="Flow">
...
<bpel:forEach parallel="no" counterName="Counter"
name="ForEach">
<bpel:scope>
...
</bpel:scope>
</bpel:forEach>
</bpel:flow>
<bpel:else>
...
</bpel:else>
</bpel:if>
<sca:component
name="WorkshopOrganization Composition Component">
<sca:service name="workshopOrganization"/>
<sca:reference name="room"/>
<sca:reference name="poi"/>
<sca:reference name="routeDetermination"/>
<sca:reference name="createReservationConfirmation"/>
</sca:component>
<<Participant>>
WorkshopOrganization
Composition
Component
<<ServicePoint>>
workshopOrganization:
WorkshopOrganization
<<RequestPoint>>
room: Room
<<RequestPoint>>
poi: POI
<<RequestPoint>>
routeDetermination:
RouteDetermination
<<RequestPoint>>
createReservation
Confirmation
InternalComponent
CompositionComponent
WorkshopOrganizationComposite
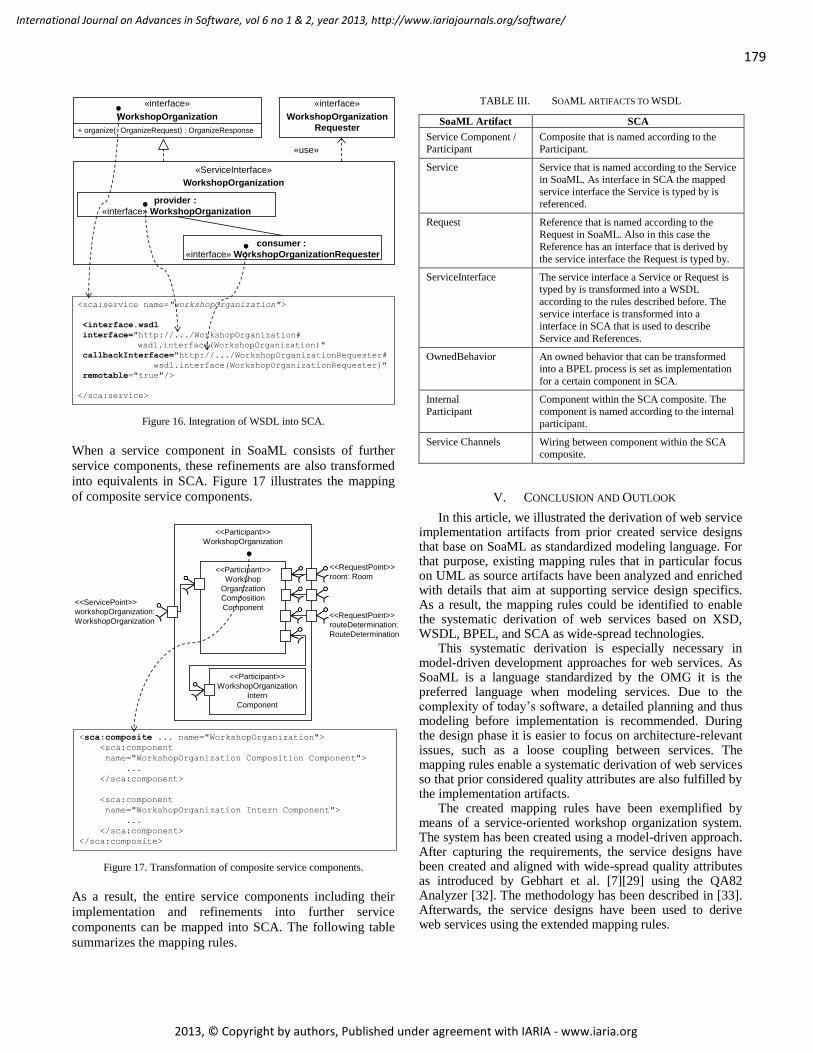
179
International Journal on Advances in Software, vol 6 no 1 & 2, year 2013, http://www.iariajournals.org/software/
2013, © Copyright by authors, Published under agreement with IARIA - www.iaria.org
Figure 16. Integration of WSDL into SCA.
When a service component in SoaML consists of further
service components, these refinements are also transformed
into equivalents in SCA. Figure 17 illustrates the mapping
of composite service components.
Figure 17. Transformation of composite service components.
As a result, the entire service components including their
implementation and refinements into further service
components can be mapped into SCA. The following table
summarizes the mapping rules.
TABLE III. SOAML ARTIFACTS TO WSDL
SoaML Artifact SCA
Service Component / Participant
Composite that is named according to the Participant.
Service Service that is named according to the Service in SoaML. As interface in SCA the mapped
service interface the Service is typed by is referenced.
Request Reference that is named according to the Request in SoaML. Also in this case the
Reference has an interface that is derived by
the service interface the Request is typed by.
ServiceInterface The service interface a Service or Request is typed by is transformed into a WSDL
according to the rules described before. The
service interface is transformed into a interface in SCA that is used to describe
Service and References.
OwnedBehavior An owned behavior that can be transformed into a BPEL process is set as implementation
for a certain component in SCA.
Internal Participant
Component within the SCA composite. The component is named according to the internal
participant.
Service Channels Wiring between component within the SCA composite.
V. CONCLUSION AND OUTLOOK
In this article, we illustrated the derivation of web service implementation artifacts from prior created service designs that base on SoaML as standardized modeling language. For that purpose, existing mapping rules that in particular focus on UML as source artifacts have been analyzed and enriched with details that aim at supporting service design specifics. As a result, the mapping rules could be identified to enable the systematic derivation of web services based on XSD, WSDL, BPEL, and SCA as wide-spread technologies.
This systematic derivation is especially necessary in model-driven development approaches for web services. As SoaML is a language standardized by the OMG it is the preferred language when modeling services. Due to the complexity of today’s software, a detailed planning and thus modeling before implementation is recommended. During the design phase it is easier to focus on architecture-relevant issues, such as a loose coupling between services. The mapping rules enable a systematic derivation of web services so that prior considered quality attributes are also fulfilled by the implementation artifacts.
The created mapping rules have been exemplified by means of a service-oriented workshop organization system. The system has been created using a model-driven approach. After capturing the requirements, the service designs have been created and aligned with wide-spread quality attributes as introduced by Gebhart et al. [7][29] using the QA82 Analyzer [32]. The methodology has been described in [33]. Afterwards, the service designs have been used to derive web services using the extended mapping rules.
«ServiceInterface»
WorkshopOrganization
consumer :
«interface» WorkshopOrganizationRequester
provider :
«interface» WorkshopOrganization
«interface»
WorkshopOrganization
+ organize(: OrganizeRequest) : OrganizeResponse
<sca:service name="workshopOrganization">
<interface.wsdl
interface="http://.../WorkshopOrganization#
wsdl.interface(WorkshopOrganization)"
callbackInterface="http://.../WorkshopOrganizationRequester#
wsdl.interface(WorkshopOrganizationRequester)"
remotable="true"/>
</sca:service>
«interface»
WorkshopOrganization
Requester
«use»
<<Participant>>
WorkshopOrganization
<<Participant>>
Workshop
Organization
Composition
Component
<<Participant>>
WorkshopOrganization
Intern
Component
<<RequestPoint>>
room: Room
<<RequestPoint>>
routeDetermination:
RouteDetermination
<<ServicePoint>>
workshopOrganization:
WorkshopOrganization
<sca:composite ... name="WorkshopOrganization">
<sca:component
name="WorkshopOrganization Composition Component">
...
</sca:component>
<sca:component
name="WorkshopOrganization Intern Component">
...
</sca:component>
</sca:composite>
180
International Journal on Advances in Software, vol 6 no 1 & 2, year 2013, http://www.iariajournals.org/software/
2013, © Copyright by authors, Published under agreement with IARIA - www.iaria.org
The rules on the one hand help IT architects to understand the relation between service designs, the language SoaML, and web services as implementation, which allows IT architects to reduce the impact of service design changes on the final implementation. On the other hand, the mapping rules constitute the conceptual basis for automatic transformation as they can be realized using languages, such as Query Views Transformation (QVT) [34]. This will increase the significance of SoaML in model-driven development processes as it represents a full-fledged development artifact.
In the past, we especially focused on the creation of quality attributes and metrics for service designs based on SoaML. Also our tool, the QA82 Analyzer that enables automatic quality analyses aimed at the analyses of SoaML models. The conceptual understanding about how characteristics of service designs are reflected within web service implementations enables us to transform our existing SoaML metrics into metrics for web services. Thus, in the future our QA82 Analyzer will also be able to analyze web services regarding wide-spread quality attributes, such as loose coupling and autonomy.
REFERENCES
[1] M. Gebhart and J. Bouras, “Mapping between service designs based on soaml and web service implementation artifacts”, Seventh International Conference on Software Engineering Advances (ICSEA 2012), Lisbon, Portugal, November 2012, pp. 260-266.
[2] D. Krafzig, K. Banke, and D. Slama, Enterprise SOA – Service-Oriented Architecture Best Practices, 2005. ISBN 0-13-146575-9.
[3] T. Erl, SOA – Principles of Service Design, Prentice Hall, 2008. ISBN 978-0-13-234482-1.
[4] L. Bass, P. Clements, and R. Kazman, Software Architecture in Practice, Addison-Wesley, 2003. ISBN 978-0321154958.
[5] P. Hoyer, M. Gebhart, I. Pansa, S. Link, A. Dikanski, and S. Abeck, “A model-driven development approach for service-oriented integration scenarios”, 2009.
[6] M. Gebhart and S. Abeck, “Quality-oriented design of services”, International Journal on Advances in Software, 4(1&2), 2011, pp. 144-157.
[7] M. Gebhart, M. Baumgartner, S. Oehlert, M. Blersch, and S. Abeck, “Evaluation of service designs based on soaml”, Fifth International Conference on Software Engineering Advances (ICSEA 2010), Nice, France, August 2010, pp. 7-13.
[8] M. Gebhart, M. Baumgartner, and S. Abeck, “Supporting service design decisions”, Fifth International Conference on Software Engineering Advances (ICSEA 2010), Nice, France, August 2010, pp. 76-81.
[9] T. Erl, Service-Oriented Architecture – Concepts, Technology, and Design, Pearson Education, 2006. ISBN 0-13-185858-0.
[10] SENSORIA, “D1.4a: UML for Service-Oriented Systems”, http://www.sensoria-ist.eu/, 2006. [accessed: July 11, 2012]
[11] S. Johnston, “UML 2.0 profile for software services”, IBM Developer Works, http://www.ibm.com/developerworks/rational/library/05/ 419_soa/, 2005. [accessed: July 11, 2012]
[12] OMG, “Unified modeling language (UML), superstructure”, Version 2.2, 2009.
[13] OMG, “Service oriented architecture modeling language (SoaML) – specification for the uml profile and metamodel for services (UPMS)”, Version 1.0, 2012.
[14] M. Gebhart, “Service Identification and Specification with SoaML”, in Migrating Legacy Applications: Challenges in Service Oriented Architecture and Cloud Computing Environments, Vol. I, A. D.
Ionita, M. Litoiu, and G. Lewis, Eds. 2012. IGI Global. ISBN 978-1-46662488-7.
[15] IBM, Generating XSD Schemas from UML Models, Rational Systems Developer Information Center. http://publib.boulder.ibm.com/infocenter/rsdvhelp/v6r0m1/index.jsp. [accessed: July 11, 2012]
[16] Sparx Systems, XML Schema Generation, http://www.sparxsystems.com.au/resources/xml_schema_generation.html, 2011. [accessed: July 11, 2012]
[17] Roy Grønmo, David Skogan, Ida Solheim and Jon Oldevik, Model-driven Web Services Development, SINTEF Telecom and Informatics, 2004.
[18] IBM, Transforming UML models into WSDL documents, Rational Software Architect. http://publib.boulder.ibm.com/infocenter/ rsahelp/v7r0m0/index.jsp. [accessed: July 11, 2012]
[19] Christian Hahn, David Cerri, Dima Panfilenko, Gorka Benguria, Andrey Sadovykh and Cyril Carrez, Model transformations and deployment, SHAPE 2010.
[20] Philip Mayer, Andreas Schroeder and Nora Koch, MDD4SOA Model-Driven Service Orchestration, 2008.
[21] IBM: Transforming UML models to BPEL artifacts, Rational Software Architect. http://publib.boulder.ibm.com/infocenter/rsahelp/ v7r0m0/index.jsp, 2010. [accessed: July 11, 2012]
[22] IBM, Transforming UML models to Service Component Architecture artifacts, Rational Software Architect. http://publib.boulder.ibm.com/ infocenter/rsahelp/v7r0m0/index.jsp. [accessed: July 11, 2012]
[23] W3C, “OWL 2 web ontology language (OWL)”, W3C Recommendation, 2009.
[24] M. Horridge, “A practical guide to building owl ontologies using protégé 4 and co-ode tools”, http://owl.cs.manchester.ac.uk/tutorials/ protegeowltutorial/, Version 1.2, 2009. [accessed: January 04, 2011]
[25] W3C, “Semantic Annotations for WSDL and XML Schema (SAWSDL)”, W3C Recommendation, 2007.
[26] S. Johnston, “Rational uml profile for business modeling”, IBM Developer Works, http://www.ibm.com/developerworks/rational/ library/5167.html, 2004. [accessed: March 04, 2013]
[27] OMG, “Business process model and notation (BPMN)”, Version 2.0 Beta 1, 2009.
[28] M. Gebhart, S. Sejdovic, and S. Abeck, “Case study for a quality-oriented service design process”, Sixth International Conference on Software Engineering Advances (ICSEA 2011), Barcelona, Spain, October 2011, pp. 92-97.
[29] M. Gebhart and S. Abeck, “Metrics for evaluating service designs based on soaml”, International Journal on Advances in Software, 4(1&2), 2011, pp. 61-75.
[30] Tom Digre, ModelDriven.org, http://lib.modeldriven.org/MDLibrary/ trunk/Applications/ModelPro/docs/SoaML/SCA/SoaML to SCA.docx, May 2009. [accessed: July 11, 2012]
[31] J. Amsden, “Modeling with soaml, the service-oriented architecture modeling language – part 1 – service identification”, IBM Developer Works, http://www.ibm.com/developerworks/rational/library/09/ modelingwithsoaml-1/index.html, 2010. [accessed: July 11, 2012]
[32] Gebhart Quality Analysis (QA) 82, QA82 Analyzer, http://www.qa82.de. [accessed: July 11, 2012]
[33] M. Gebhart and S. Sejdovic, “Quality-oriented design of software services in geographical information systems”, International Journal on Advances in Software, 5(3&4), 2012, pp. 293-307.
[34] OMG, “Meta Object Facility (MOF) 2.0 Query/View/Transformation Specification”, Version 1.1, 2011. [accessed: July 11, 2012]
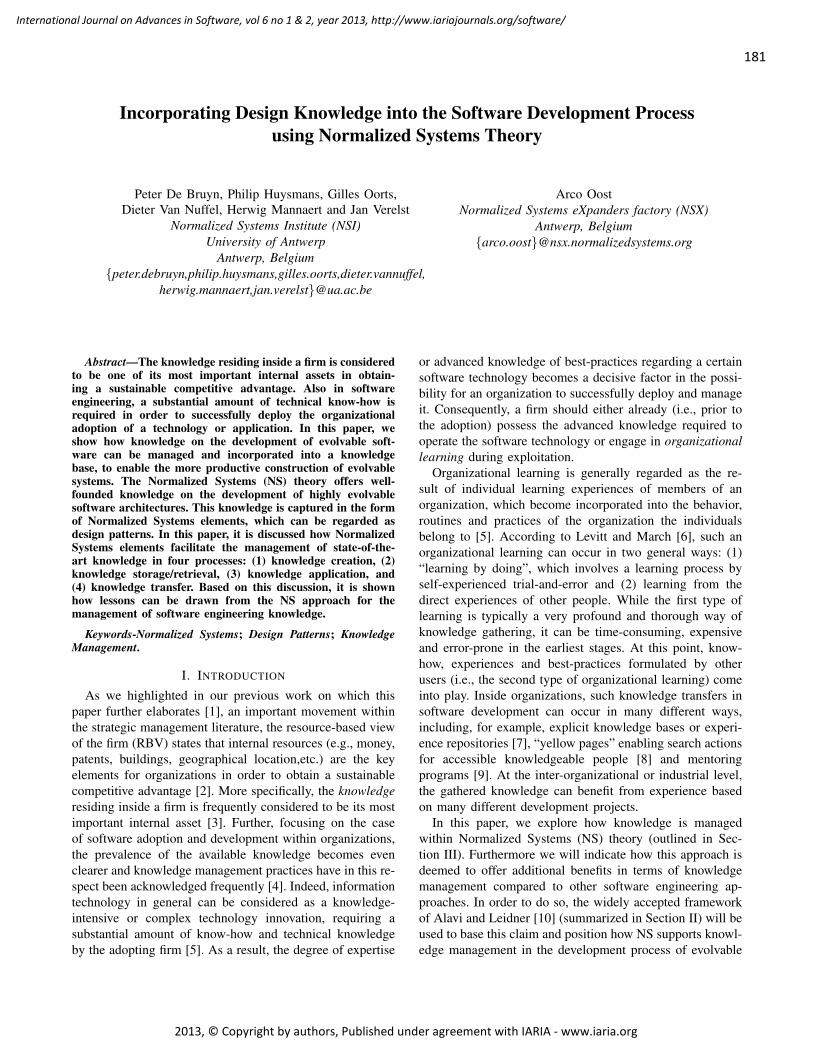
181
International Journal on Advances in Software, vol 6 no 1 & 2, year 2013, http://www.iariajournals.org/software/
2013, © Copyright by authors, Published under agreement with IARIA - www.iaria.org
Incorporating Design Knowledge into the Software Development Processusing Normalized Systems Theory
Peter De Bruyn, Philip Huysmans, Gilles Oorts,Dieter Van Nuffel, Herwig Mannaert and Jan Verelst
Normalized Systems Institute (NSI)University of Antwerp
Antwerp, Belgiumpeter.debruyn,philip.huysmans,gilles.oorts,dieter.vannuffel,
herwig.mannaert,[email protected]
Arco OostNormalized Systems eXpanders factory (NSX)
Antwerp, [email protected]
Abstract—The knowledge residing inside a firm is consideredto be one of its most important internal assets in obtain-ing a sustainable competitive advantage. Also in softwareengineering, a substantial amount of technical know-how isrequired in order to successfully deploy the organizationaladoption of a technology or application. In this paper, weshow how knowledge on the development of evolvable soft-ware can be managed and incorporated into a knowledgebase, to enable the more productive construction of evolvablesystems. The Normalized Systems (NS) theory offers well-founded knowledge on the development of highly evolvablesoftware architectures. This knowledge is captured in the formof Normalized Systems elements, which can be regarded asdesign patterns. In this paper, it is discussed how NormalizedSystems elements facilitate the management of state-of-the-art knowledge in four processes: (1) knowledge creation, (2)knowledge storage/retrieval, (3) knowledge application, and(4) knowledge transfer. Based on this discussion, it is shownhow lessons can be drawn from the NS approach for themanagement of software engineering knowledge.
Keywords-Normalized Systems; Design Patterns; KnowledgeManagement.
I. INTRODUCTION
As we highlighted in our previous work on which thispaper further elaborates [1], an important movement withinthe strategic management literature, the resource-based viewof the firm (RBV) states that internal resources (e.g., money,patents, buildings, geographical location,etc.) are the keyelements for organizations in order to obtain a sustainablecompetitive advantage [2]. More specifically, the knowledgeresiding inside a firm is frequently considered to be its mostimportant internal asset [3]. Further, focusing on the caseof software adoption and development within organizations,the prevalence of the available knowledge becomes evenclearer and knowledge management practices have in this re-spect been acknowledged frequently [4]. Indeed, informationtechnology in general can be considered as a knowledge-intensive or complex technology innovation, requiring asubstantial amount of know-how and technical knowledgeby the adopting firm [5]. As a result, the degree of expertise
or advanced knowledge of best-practices regarding a certainsoftware technology becomes a decisive factor in the possi-bility for an organization to successfully deploy and manageit. Consequently, a firm should either already (i.e., prior tothe adoption) possess the advanced knowledge required tooperate the software technology or engage in organizationallearning during exploitation.
Organizational learning is generally regarded as the re-sult of individual learning experiences of members of anorganization, which become incorporated into the behavior,routines and practices of the organization the individualsbelong to [5]. According to Levitt and March [6], such anorganizational learning can occur in two general ways: (1)“learning by doing”, which involves a learning process byself-experienced trial-and-error and (2) learning from thedirect experiences of other people. While the first type oflearning is typically a very profound and thorough way ofknowledge gathering, it can be time-consuming, expensiveand error-prone in the earliest stages. At this point, know-how, experiences and best-practices formulated by otherusers (i.e., the second type of organizational learning) comeinto play. Inside organizations, such knowledge transfers insoftware development can occur in many different ways,including, for example, explicit knowledge bases or experi-ence repositories [7], “yellow pages” enabling search actionsfor accessible knowledgeable people [8] and mentoringprograms [9]. At the inter-organizational or industrial level,the gathered knowledge can benefit from experience basedon many different development projects.
In this paper, we explore how knowledge is managedwithin Normalized Systems (NS) theory (outlined in Sec-tion III). Furthermore we will indicate how this approach isdeemed to offer additional benefits in terms of knowledgemanagement compared to other software engineering ap-proaches. In order to do so, the widely accepted frameworkof Alavi and Leidner [10] (summarized in Section II) will beused to base this claim and position how NS supports knowl-edge management in the development process of evolvable
182
International Journal on Advances in Software, vol 6 no 1 & 2, year 2013, http://www.iariajournals.org/software/
2013, © Copyright by authors, Published under agreement with IARIA - www.iaria.org
software. Specifically, the role of knowledge in NS will bedemonstrated according to four knowledge processes [10]:
• Knowledge Creation• Knowledge Storage/Retrieval• Knowledge Application• and Knowledge Transfer.
This analysis will be presented in Section IV, after whichan overview and a discussion regarding some significantdifferences between NS patterns and more commonly knowndesign patterns, will be offered in Section V. Finally, weconclude the the paper in Section VI.
This paper is an extension of our previous work [1], as itoffers a more in-depth analysis of knowledge managementpractices regarding NS and includes additional illustratingexamples, guided by the widely accepted work of Alavi andLeidner [10].
II. KNOWLEDGE MANAGEMENT AND INFORMATIONTECHNOLOGY
Over the last decades, knowledge and knowledge manage-ment (KM) have been the subject of research within severaldisciplines, such as knowledge engineering, artificial intel-ligence, social science, management science, informationscience, etc. [11]. Due to this multidisciplinary character ofthe research topic, knowledge and knowledge managementhave been defined in numerous ways. In spite of this varietyof definitions, the goal of knowledge management can mostordinarily be defined as to facilitate the flow of knowledge.To define what knowledge management covers, Tuzhilinidentified some common aspects among the variety of KMdefinitions [12]. In its essence, the management of knowl-edge should include the acquisition, conversion, structuringand organizing and sharing of knowledge. These essentialand agreed upon components of knowledge managementare very similar to the framework formulated by Alavi andLeidner [10], of which the core aspects will be summarizedbelow. Given the fact that Alavi and Leidner [10] have per-formed an in-depth, overarching and widely cited overviewand analysis of knowledge management aspects present dur-ing the use of information systems, we choose to discuss andemploy this framework in the current paper. Hence, in thissection, we highlight this particular framework to analyzeand discuss how information technology and IT artifactsin general can be used to engage in knowledge manage-ment. Alavi and Leidner distinguish four main processes ofknowledge management facilitated by information systems:(1) knowledge creation, (2) knowledge storage/retrieval, (3)knowledge application and (4) knowledge transfer. We willhighlight each of these processes briefly in the followingsub-sections. The concepts of this framework are representedin Figure 1. During our discussion, we will systematicallyrelate each of the processes to the this figure. Also, we willillustrate the application of this framework in previous workby showing how other authors have used this framework to
analyze their knowledge management efforts by using infor-mation systems [13]. Later on, we will use this frameworkas our starting point for analyzing how NS theory enablesan efficient way of knowledge management.
A. Knowledge Creation
Before one can only begin to point out the importanceof knowledge management, knowledge needs to be created.Such knowledge creation can both entail the developmentof new content or the replacement or improvement of al-ready existing knowledge within the organization. Althoughthis creation process always fundamentally starts from anindividual, interactions between individuals are an equallyimportant factor in the knowledge creation process [14].These interactions are represented by the conversion typesof knowledge presented by Nonaka, which are based on thedifferentiation of explicit and tacit knowledge [14]. Basedon the conversion of knowledge between these two types,he distinguishes four possible modes of knowledge creation(although they are mentioned to be often interdependent andintertwined in reality) [10]: (1) socialization (the transfer ofone’s personal tacit knowledge to new tacit knowledge ofanother person), (2) externalization (the conversion of tacitknowledge to new explicit knowledge, such as formulatedin best practices), (3) internalization (the conversion ofexplicit knowledge to one’s tactic knowledge, such as trulyunderstanding some read findings) and (4) combination(“the creation of new explicit knowledge by merging, cat-egorizing, reclassifying, and synthesizing existing explicitknowledge”).
Each of these knowledge creation modes are also visu-ally represented in Figure 1. More specifically, arrow Erepresents socialization, arrows C represent externalization,arrows D represent internalization and arrow F representscombination. For each of the discussed knowledge cre-ation modes, facilitating conditions or environments canbe considered. Also, for these processes, the interactionwith information systems and technology is twofold. Onthe one hand, the knowledge creation modes facilitate theamassment of knowledge on technologies and informationsystems used within an organization. On the other hand,information systems can be used to facilitate each of theseknowledge creation modes in several ways (e.g., by the useof information systems for collaboration support).
As an example of academic efforts to identify knowl-edge creation, one can cite the work Lee et al. [13], whostudied the knowledge management of a Korean automobilecompany. More specifically, they reviewed the process ofmaking engineering changes to the finished design of auto-mobiles from a knowledge-management perspective. Theyhowever found that little attention is payed to the knowledgecreation within the knowledge-intensive process of makingengineering changes. The knowledge that is amassed from adesign change is documented in separate documents, without
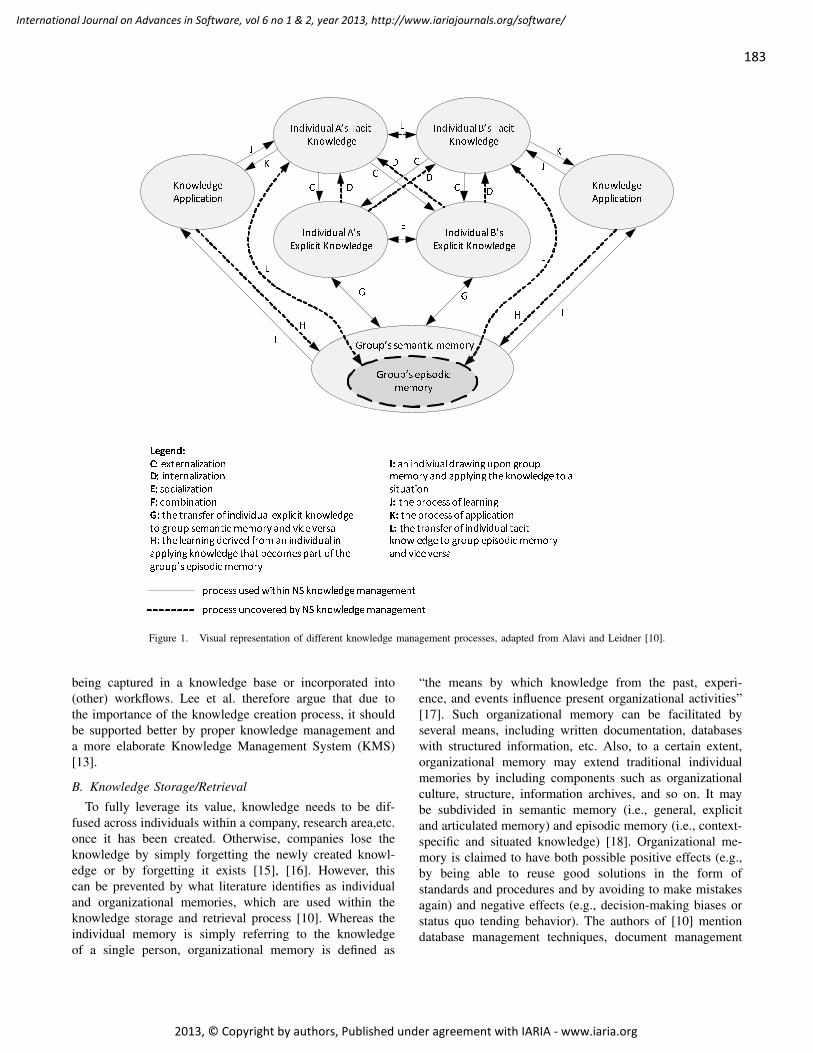
183
International Journal on Advances in Software, vol 6 no 1 & 2, year 2013, http://www.iariajournals.org/software/
2013, © Copyright by authors, Published under agreement with IARIA - www.iaria.org
!!! " !! "
# # # !$ % & &' !!! " % & !"'%$! &% !! " !! ""%' % & % & % & &' !! " %()'!! $"()'!!
Figure 1. Visual representation of different knowledge management processes, adapted from Alavi and Leidner [10].
being captured in a knowledge base or incorporated into(other) workflows. Lee et al. therefore argue that due tothe importance of the knowledge creation process, it shouldbe supported better by proper knowledge management anda more elaborate Knowledge Management System (KMS)[13].
B. Knowledge Storage/Retrieval
To fully leverage its value, knowledge needs to be dif-fused across individuals within a company, research area,etc.once it has been created. Otherwise, companies lose theknowledge by simply forgetting the newly created knowl-edge or by forgetting it exists [15], [16]. However, thiscan be prevented by what literature identifies as individualand organizational memories, which are used within theknowledge storage and retrieval process [10]. Whereas theindividual memory is simply referring to the knowledgeof a single person, organizational memory is defined as
“the means by which knowledge from the past, experi-ence, and events influence present organizational activities”[17]. Such organizational memory can be facilitated byseveral means, including written documentation, databaseswith structured information, etc. Also, to a certain extent,organizational memory may extend traditional individualmemories by including components such as organizationalculture, structure, information archives, and so on. It maybe subdivided in semantic memory (i.e., general, explicitand articulated memory) and episodic memory (i.e., context-specific and situated knowledge) [18]. Organizational me-mory is claimed to have both possible positive effects (e.g.,by being able to reuse good solutions in the form ofstandards and procedures and by avoiding to make mistakesagain) and negative effects (e.g., decision-making biases orstatus quo tending behavior). The authors of [10] mentiondatabase management techniques, document management
184
International Journal on Advances in Software, vol 6 no 1 & 2, year 2013, http://www.iariajournals.org/software/
2013, © Copyright by authors, Published under agreement with IARIA - www.iaria.org
and groupware applications as typical IT means to developand maintain (i.e., store) the “memory” of an organization.Additionally, IT artifacts in terms of design patterns havebeen claimed to provide useful means to store and retrieveorganizational knowledge and best-practices. This is obviouswithin the domain of software engineering, as for instanceinitiated by the work of Gamma et al. [19]. The useof design patterns facilitates the translation of individualknowledge to organizational knowledge and the oppositetranslation (see the bidirectional arrow G in Figure 1) byoffering a central organizational knowledge base (i.e., thedesign patterns). The design patterns within this knowledgerepository can be accessed by all programmers for bothstorage and retrieval of the latest iteration of the designpatterns. In this way, the central knowledge base acts as theorganizational memory and thereby “helps in storing andreapplying workable solutions in the form of standards andprocedures, which in turn avoid the waste of organizationalresources in replicating previous work” [10]. In Section V,we will further elaborate on this specific way of enablingknowledge storage and retrieval by means of design patternsand how these more traditional design pattern approachesdiffer from the Normalized Systems theory patterns onwhich we focus in the remainder of the paper.
In Figure 1, the various kinds of knowledge reposito-ries are represented by the ovals, as they represent bothknowledge repositories or memories at the organizationaland individual level. Obviously, as the aim in organiza-tional knowledge management is to leverage the storageand retrieval of the organizational memory, the main focusshould be placed on the ovals labeled as containing groupmemory. The processes of knowledge storage and retrieval,are represented by the bidirectional arrow G.
In the previously discussed research of Lee et al. [13],knowledge is stored in an intranet system. All engineeringchange requests (ECRs) and engineering change orders(ECOs) are automatically stored in a repository. The problemwith this repository is however that it does not provide thefunctionality to navigate for relevant knowledge. Anotherimportant aspect that the repository lacks is the possibility oflinking specific engineering changes with related problems,solutions,etc. These shortcomings clearly show the differentlevels and possible implementations of knowledge storagemanagement [13].
C. Knowledge Application
The only way an organization can valorize the knowl-edge stored in its organizational memory, is by eventuallyapplying the knowledge. Such applications might be realizedby practices ranging between a continuum from directives(i.e., a set of specific rules, standard and procedures to makethe tacit knowledge of specialists explicit for efficient com-munication, including non-specialists) to self-contained taskmechanisms (i.e., a group of individuals with prerequisite
knowledge in several domains which becomes combined inthe considered team without explicitly formulated routinesor procedures).
As typical examples of the usage of IT systems, corporateintranets are mentioned as useful means to access andmaintain directives. Similarly, workflow automation systemsand rule-based expert systems are suggested as interestingIT artifacts to enable the efficient automation of capturedorganizational knowledge and procedures.
Also, a large amount of codified best-practice mightgenerate a new problem as the organizational members needto become competent in choosing the adequate best-practicesto be employed.
The extent to which practitioners depend on the ap-plication of centrally available knowledge is demonstratedby Lee et al. [13]. When valuable knowledge about theincorporation of design changes is not readily available,engineers have to solely rely on their own tacit knowl-edge and off-line communication with colleagues to dealwith challenging engineering changes. This shows that theapplication of knowledge highly depends on the availableknowledge stored in a repository or transferred betweenagents.
D. Knowledge Transfer
The fourth knowledge management process discussedby Alavi and Leidner is the transfer of knowledge [10].This process is considered to be an important process inknowledge management, as it provides the transfer of knowl-edge between individuals, groups, organizations and othersources. In spite of the acknowledgment of its importance,the dissociation of knowledge transfer from knowledgesharing is still unclear and both terms are often used inter-changeably in academic literature [20]. Transfer and sharingcan however be differentiated based on some parameters.While knowledge transfer is considered to be focused anddirect communication to a receiver, sharing is far more away of diffusing knowledge widespread (i.e., to multiplepeople via for example a repository). These two definitionsare however just two extremes of an hypothetical continuumin which characteristics of both terms can be combined [21].Others authors also point out that knowledge sharing is aboutexchanging tacit knowledge [22], while knowledge transferexchanges more explicit knowledge [23], [24].
Within the case study of Lee et al. [13], one out of threeproblems related to a change in the final design of a carwhere not new. Because of significant differences betweencar models, knowledge on a specific problem (requiring adesign change) on one component or car model cannot beeasily transferred to another component or car model. Theknowledge in this case can therefore be classified as verycontext-specific, consistent with the definition of episodicknowledge by El Sawy et al. [13], [18]. This example
185
International Journal on Advances in Software, vol 6 no 1 & 2, year 2013, http://www.iariajournals.org/software/
2013, © Copyright by authors, Published under agreement with IARIA - www.iaria.org
therefore shows how the type of knowledge also impactsthe transfer of knowledge.
III. NORMALIZED SYSTEMS
The Normalized Systems (NS) theory starts from thepostulate that software architectures should exhibit evolv-ability due to ever changing business requirements, whilemany indications are present that most current softwareimplementations do not conform with this evolvability req-uisite. Evolvability in this theory is operationalized as beingthe absence of so-called combinatorial effects: changes tothe system of which the impact is related to the size ofthe system, not only to the kind of the change which isperformed. As the assumption is made that software systemsare subject to unlimited evolution (i.e., both additionaland changing requirements), such combinatorial effects areobviously highly undesirable. In the event that changes aredependent on the size of the system and the system itselfkeeps on growing, changes proportional to the systems sizebecome ever more difficult to cope with (i.e., requiringmore efforts) and hence hampering evolvability. NormalizedSystems theory further captures its software engineeringknowledge by offering a set of four theorems and fiveelements, and enables the application of this knowledgethrough pattern expansion of the elements. The theoremsconsist of a set of formally proven principles which offer aset of necessary conditions which should be strictly adheredto, in order to obtain an evolvable software architecture(i.e., in absence of combinatorial effects). The elementsoffer a set of predefined higher-level structures, primitivesor “building blocks” offering an unambiguous blueprint forthe implementation of the core functionalities of realisticinformation systems, adhering to the four stated principles[25].
A. Theorems
Normalized Systems theory proposes four theorems,which have been proven to be necessary conditions to obtainsoftware architectures in absence of combinatorial effects[26] :
• Separation of Concerns, requiring that every changedriver (concern) is separated from other concerns byseparating it in its own construct;
• Data Version Transparency, requiring that data entitiescan be updated without impacting the entities using itas an input or producing it as an output;
• Action Version Transparency, requiring that an actionentity can be upgraded without impacting its callingcomponents;
• Separation of States, requiring that each step in a work-flow is separated from the others in time by keepingstate after every step.
In terms of knowledge management, as mentioned ex-plicitly in [27], it must clearly be noted that the design
theorems proposed are not new themselves; in fact, theyrelate to well-known (but often tacit or implicit) heuristicdesign knowledge of experienced software developers. Forinstance, well-known concepts such as an integration bus, aseparated external workflow or the use of multiple tiers canall be seen as manifestations of the Separation of Concernstheorem [27]. Consequently, the added value of the theoremsshould then rather be situated in the fact that they (1)make certain aspects of that heuristic design knowledgeexplicit, (2) offer this knowledge in an unambiguous way(i.e., violations against the theorems can be proven), (3)are unified based on one single postulate (i.e., the needfor evolvable software architectures having no combinatorialeffects) and (4) have all been proven in a formal way in [26].
B. Normalized Systems Elements as Patterns
The theorems stated above illustrate that traditional soft-ware primitives do not offer explicit mechanisms to incorpo-rate the principles. As (1) each violation of the NS theoremsduring any stage of the development process results ina combinatorial effect, and (2) the systematic applicationof these theorems results in very fine-grained structures,it becomes extremely challenging for a human developerto consistently obtain such modular structures. Indeed, thefine-grained modular structure might become a complexity-issue on its own when performed “from scratch”. Therefore,NS theory proposes a set of five elements as encapsulatedhigher-level patterns complying with the four theorems:
• data elements, being the structured encapsulation of adata construct into a data element (having get- and set-methods, exhibiting version transparency,etc.);
• action elements, being the structured encapsulation ofan action construct into an action element;
• workflow elements, being the structured encapsulationof software constructs into a workflow element describ-ing the sequence in which a set of action elementsshould be performed in order to fulfill a flow;
• connector elements, being the structured encapsulationof software constructs into a connector element allow-ing external systems to interact with the NS systemwithout calling components in a stateless way;
• trigger elements, being the structured encapsulation ofsoftware constructs into a trigger element controllingthe states of the system and checking whether anyaction element should be triggered accordingly.
More extensive descriptions of these elements have beenincluded in other papers (e.g., [25]–[27]). As these elab-orated descriptions would offer little to no value to thispaper, they were not included here. Each of the elementsis a pattern as it represents a recurring set of constructs:besides the intended, encapsulated core construct, also a setof relevant cross-cutting concerns (such as remote access,logging, access control, etc.) is incorporated in each of theseelements. For each of the patterns, it is further described
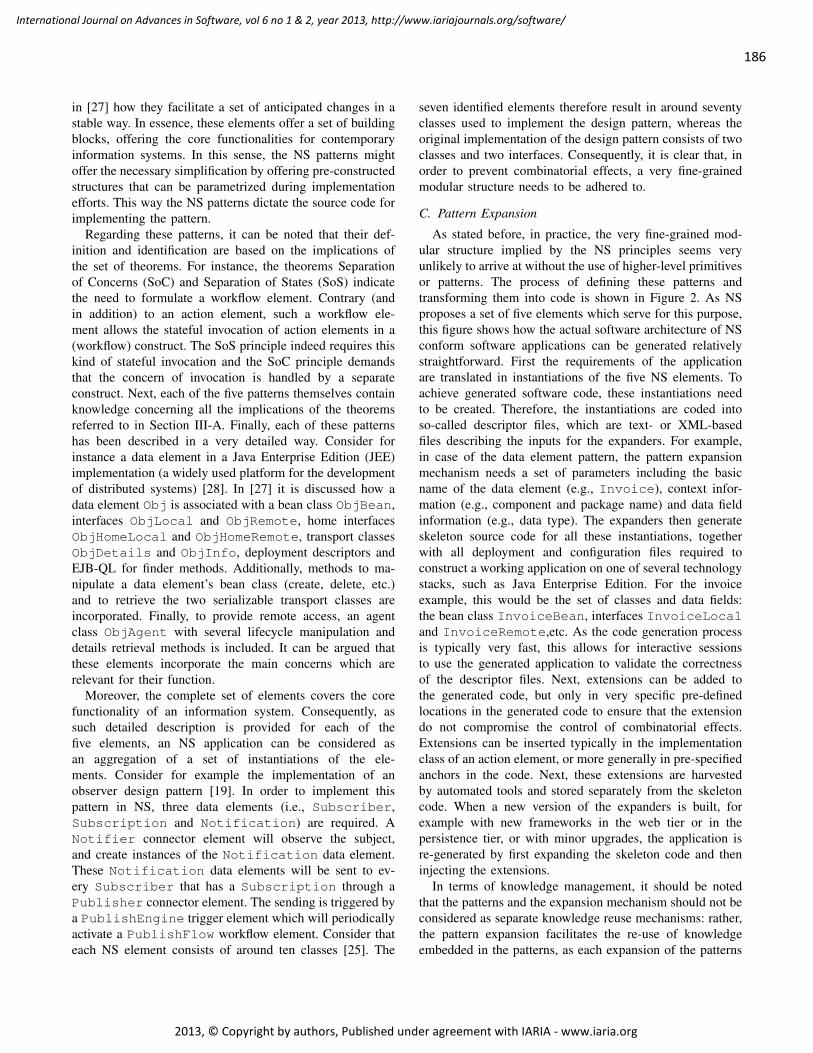
186
International Journal on Advances in Software, vol 6 no 1 & 2, year 2013, http://www.iariajournals.org/software/
2013, © Copyright by authors, Published under agreement with IARIA - www.iaria.org
in [27] how they facilitate a set of anticipated changes in astable way. In essence, these elements offer a set of buildingblocks, offering the core functionalities for contemporaryinformation systems. In this sense, the NS patterns mightoffer the necessary simplification by offering pre-constructedstructures that can be parametrized during implementationefforts. This way the NS patterns dictate the source code forimplementing the pattern.
Regarding these patterns, it can be noted that their def-inition and identification are based on the implications ofthe set of theorems. For instance, the theorems Separationof Concerns (SoC) and Separation of States (SoS) indicatethe need to formulate a workflow element. Contrary (andin addition) to an action element, such a workflow ele-ment allows the stateful invocation of action elements in a(workflow) construct. The SoS principle indeed requires thiskind of stateful invocation and the SoC principle demandsthat the concern of invocation is handled by a separateconstruct. Next, each of the five patterns themselves containknowledge concerning all the implications of the theoremsreferred to in Section III-A. Finally, each of these patternshas been described in a very detailed way. Consider forinstance a data element in a Java Enterprise Edition (JEE)implementation (a widely used platform for the developmentof distributed systems) [28]. In [27] it is discussed how adata element Obj is associated with a bean class ObjBean,interfaces ObjLocal and ObjRemote, home interfacesObjHomeLocal and ObjHomeRemote, transport classesObjDetails and ObjInfo, deployment descriptors andEJB-QL for finder methods. Additionally, methods to ma-nipulate a data element’s bean class (create, delete, etc.)and to retrieve the two serializable transport classes areincorporated. Finally, to provide remote access, an agentclass ObjAgent with several lifecycle manipulation anddetails retrieval methods is included. It can be argued thatthese elements incorporate the main concerns which arerelevant for their function.
Moreover, the complete set of elements covers the corefunctionality of an information system. Consequently, assuch detailed description is provided for each of thefive elements, an NS application can be considered asan aggregation of a set of instantiations of the ele-ments. Consider for example the implementation of anobserver design pattern [19]. In order to implement thispattern in NS, three data elements (i.e., Subscriber,Subscription and Notification) are required. ANotifier connector element will observe the subject,and create instances of the Notification data element.These Notification data elements will be sent to ev-ery Subscriber that has a Subscription through aPublisher connector element. The sending is triggered bya PublishEngine trigger element which will periodicallyactivate a PublishFlow workflow element. Consider thateach NS element consists of around ten classes [25]. The
seven identified elements therefore result in around seventyclasses used to implement the design pattern, whereas theoriginal implementation of the design pattern consists of twoclasses and two interfaces. Consequently, it is clear that, inorder to prevent combinatorial effects, a very fine-grainedmodular structure needs to be adhered to.
C. Pattern Expansion
As stated before, in practice, the very fine-grained mod-ular structure implied by the NS principles seems veryunlikely to arrive at without the use of higher-level primitivesor patterns. The process of defining these patterns andtransforming them into code is shown in Figure 2. As NSproposes a set of five elements which serve for this purpose,this figure shows how the actual software architecture of NSconform software applications can be generated relativelystraightforward. First the requirements of the applicationare translated in instantiations of the five NS elements. Toachieve generated software code, these instantiations needto be created. Therefore, the instantiations are coded intoso-called descriptor files, which are text- or XML-basedfiles describing the inputs for the expanders. For example,in case of the data element pattern, the pattern expansionmechanism needs a set of parameters including the basicname of the data element (e.g., Invoice), context infor-mation (e.g., component and package name) and data fieldinformation (e.g., data type). The expanders then generateskeleton source code for all these instantiations, togetherwith all deployment and configuration files required toconstruct a working application on one of several technologystacks, such as Java Enterprise Edition. For the invoiceexample, this would be the set of classes and data fields:the bean class InvoiceBean, interfaces InvoiceLocaland InvoiceRemote,etc. As the code generation processis typically very fast, this allows for interactive sessionsto use the generated application to validate the correctnessof the descriptor files. Next, extensions can be added tothe generated code, but only in very specific pre-definedlocations in the generated code to ensure that the extensiondo not compromise the control of combinatorial effects.Extensions can be inserted typically in the implementationclass of an action element, or more generally in pre-specifiedanchors in the code. Next, these extensions are harvestedby automated tools and stored separately from the skeletoncode. When a new version of the expanders is built, forexample with new frameworks in the web tier or in thepersistence tier, or with minor upgrades, the application isre-generated by first expanding the skeleton code and theninjecting the extensions.
In terms of knowledge management, it should be notedthat the patterns and the expansion mechanism should not beconsidered as separate knowledge reuse mechanisms: rather,the pattern expansion facilitates the re-use of knowledgeembedded in the patterns, as each expansion of the patterns
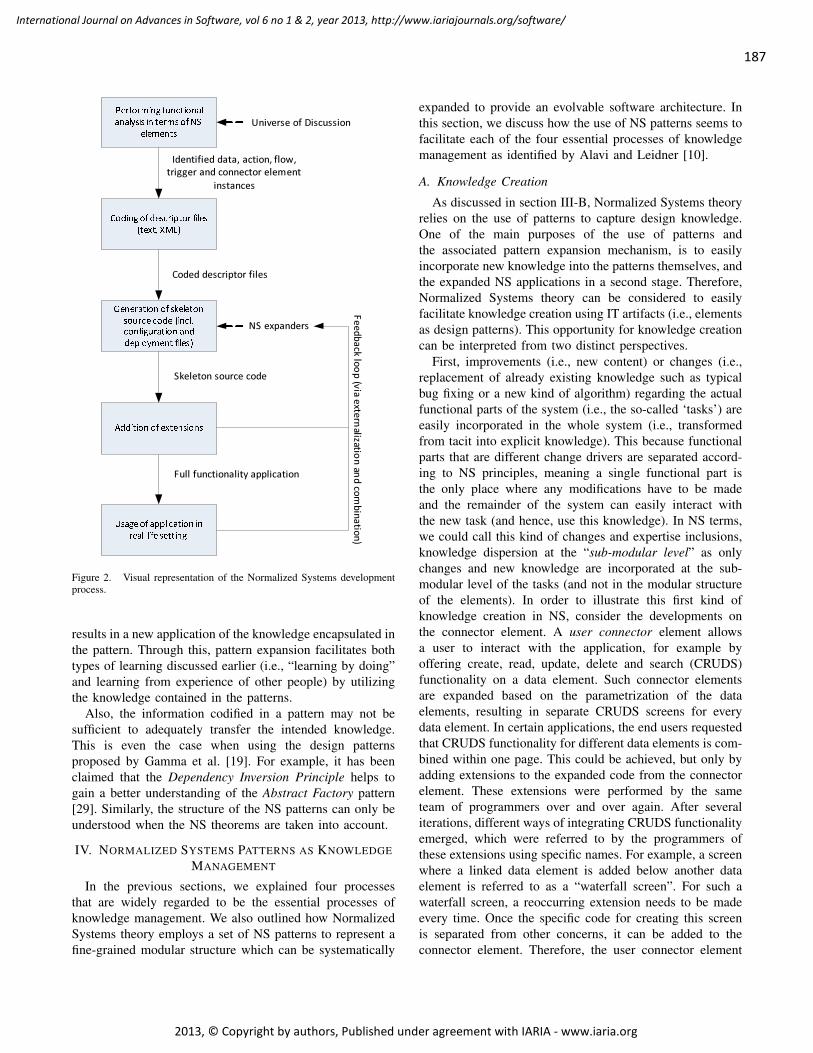
187
International Journal on Advances in Software, vol 6 no 1 & 2, year 2013, http://www.iariajournals.org/software/
2013, © Copyright by authors, Published under agreement with IARIA - www.iaria.org
!
" #
Figure 2. Visual representation of the Normalized Systems developmentprocess.
results in a new application of the knowledge encapsulated inthe pattern. Through this, pattern expansion facilitates bothtypes of learning discussed earlier (i.e., “learning by doing”and learning from experience of other people) by utilizingthe knowledge contained in the patterns.
Also, the information codified in a pattern may not besufficient to adequately transfer the intended knowledge.This is even the case when using the design patternsproposed by Gamma et al. [19]. For example, it has beenclaimed that the Dependency Inversion Principle helps togain a better understanding of the Abstract Factory pattern[29]. Similarly, the structure of the NS patterns can only beunderstood when the NS theorems are taken into account.
IV. NORMALIZED SYSTEMS PATTERNS AS KNOWLEDGEMANAGEMENT
In the previous sections, we explained four processesthat are widely regarded to be the essential processes ofknowledge management. We also outlined how NormalizedSystems theory employs a set of NS patterns to represent afine-grained modular structure which can be systematically
expanded to provide an evolvable software architecture. Inthis section, we discuss how the use of NS patterns seems tofacilitate each of the four essential processes of knowledgemanagement as identified by Alavi and Leidner [10].
A. Knowledge Creation
As discussed in section III-B, Normalized Systems theoryrelies on the use of patterns to capture design knowledge.One of the main purposes of the use of patterns andthe associated pattern expansion mechanism, is to easilyincorporate new knowledge into the patterns themselves, andthe expanded NS applications in a second stage. Therefore,Normalized Systems theory can be considered to easilyfacilitate knowledge creation using IT artifacts (i.e., elementsas design patterns). This opportunity for knowledge creationcan be interpreted from two distinct perspectives.
First, improvements (i.e., new content) or changes (i.e.,replacement of already existing knowledge such as typicalbug fixing or a new kind of algorithm) regarding the actualfunctional parts of the system (i.e., the so-called ‘tasks’) areeasily incorporated in the whole system (i.e., transformedfrom tacit into explicit knowledge). This because functionalparts that are different change drivers are separated accord-ing to NS principles, meaning a single functional part isthe only place where any modifications have to be madeand the remainder of the system can easily interact withthe new task (and hence, use this knowledge). In NS terms,we could call this kind of changes and expertise inclusions,knowledge dispersion at the “sub-modular level” as onlychanges and new knowledge are incorporated at the sub-modular level of the tasks (and not in the modular structureof the elements). In order to illustrate this first kind ofknowledge creation in NS, consider the developments onthe connector element. A user connector element allowsa user to interact with the application, for example byoffering create, read, update, delete and search (CRUDS)functionality on a data element. Such connector elementsare expanded based on the parametrization of the dataelements, resulting in separate CRUDS screens for everydata element. In certain applications, the end users requestedthat CRUDS functionality for different data elements is com-bined within one page. This could be achieved, but only byadding extensions to the expanded code from the connectorelement. These extensions were performed by the sameteam of programmers over and over again. After severaliterations, different ways of integrating CRUDS functionalityemerged, which were referred to by the programmers ofthese extensions using specific names. For example, a screenwhere a linked data element is added below another dataelement is referred to as a “waterfall screen”. For such awaterfall screen, a reoccurring extension needs to be madeevery time. Once the specific code for creating this screenis separated from other concerns, it can be added to theconnector element. Therefore, the user connector element
188
International Journal on Advances in Software, vol 6 no 1 & 2, year 2013, http://www.iariajournals.org/software/
2013, © Copyright by authors, Published under agreement with IARIA - www.iaria.org
will be updated to provide the expansion such waterfallscreen without needing any extension. According to theprogrammers, this can only be achieved because all otherconcerns are removed from within the functional class ofthe connector element, allowing them to focus solely on theorganization of the user interface components.
Second, knowledge can be incorporated at the “modularlevel” as well. This kind of knowledge inclusion wouldinclude change (e.g., an extra separated class in the pattern)and modifications (e.g., improved persistence mechanism)regarding the internal structure of an element (the pattern).Indeed, once the basic structure or cross-cutting concern im-plementation of an element is changed due to a certain iden-tified need or improvement, the new best-practice knowledgecan be expanded throughout the whole (existing) modularstructure and used for new (i.e., additional) instantiationsof the elements. In order to further illustrate this secondkind of knowledge creation based on NS patterns, considerthe following example, based on real-life experience fromdevelopers using NS.
For instance, one way to adopt a model-view-controller(MVC) architecture in a JEE distributed programming envi-ronment is by adopting (amongst others) the Struts frame-work. In such MVC architecture, a separate controller isresponsible for handling an incoming request from theclient (e.g., a user via a web interface) and will invoke(based on this request) the appropriate model (i.e., businesslogic) and view (i.e., presentation format), after which theresult will eventually be returned to the client. Struts isa framework providing the controller (ActionServlet) andenabling the creation of templates for the presentation layer.Obviously, security issues need to be handled properly insuch architecture as well. Applied to our example, thesesecurity issues in Struts were handled in the implementationof the Struts Action itself in a previous implementationof our elements. In other words, the implementation classitself was responsible for determining whether or not aparticular operation was allowed to be executed (based oninformation such as the user’s access rights, the screenin which the action was called, etc.). As a result, this“security function” became present in all instantiations ofan action element type (i.e., each session). Moreover, thisresulted in a combinatorial effect as the impact of a changesuch as switching towards an equivalent framework (i.e.,handling similar functions as Struts), would entail a setof changes dependent on the number of instantiated actionelements (and hence, on the size of the system). In orderto solve the identified combinatorial effect, the Separationof Concern theorem has to be applied: separating the partof the implementation class responsible for the discussedsecurity issues (i.e., a separate change driver) in its ownmodule within the action element. In our example, a separateinterceptor module was implemented, next to the alreadyexisting implementation class. This way, not only the com-
binatorial effect was excluded, but the new knowledge interms of a separate interceptor class was applied to all actionelements after isolating the relevant implementation classparts and executing the pattern expansion. Additionally, allnew applications will use the new action element.
Considering the underlying idea of design patterns andthe NS element, namely to transform tacit knowledge intoexplicit knowledge, one can readily understand why theoriesusing design patterns (such as NS) mostly rely on “exter-nalization” and “combination” regarding the relevant knowl-edge management aspects. Thereby, both these knowledgecreation processes refer to the definition of new explicitknowledge, be it from existing tacit knowledge (i.e. exter-nalization) or existing explicit knowledge (i.e. combination).First, the use of externalization is demonstrated by the facta lot of good programming practices (i.e., best-practices)are incorporated in the structure of the elements themselves.Indeed, while the NS theorems prescribe a set of necessaryconditions in order to attain evolvable and easily adaptablesoftware architectures, the elements provide a constructiveproof and explicit way of working regarding how to achievethis in reality, which is generally conceived to be onlyattainable by very highly experienced and skilled program-mers. For instance, designing software architectures in sucha way that the cross-cutting concerns are integrated in a fine-grained modular way is considered to be rather challenging.The formulation of the elements in combination with theexpansion mechanism allow a way to externalize this ex-perience and apply it at large scale. Second, one exampleof the use of combination to formulate new explicit designknowledge within NS, is the elimination of combinatorialeffects within a software application. Whenever violations ofthe four NS principles are discovered within new software,programmers report the violations and their effects to theircolleagues and supervisors. This way, a solution can befound for eliminating the violations (using both tacit andexplicit knowledge).
B. Knowledge Storage/retrieval
Knowledge storage and retrieval should ensure that a cer-tain expertise within companies is retained and placed easilyat the disposal of the relevant people within the organization,in order to be applied at a later stage. In the NormalizedSystems approach, a major part of the knowledge is storedwithin the NS elements. These elements offer a standard-ized way to create (i.e., generate) software applications byprescribing a set of predefined and systematically re-usedmodules. Consequently, the use of design patterns (i.e.,the NS elements) facilitates the translation of individualknowledge to organizational knowledge by offering a centralorganizational knowledge base (i.e., the design patterns).The design patterns within this knowledge repository can beaccessed by all programmers for both storage and retrievalof the latest iteration of the design pattern, and can hence
189
International Journal on Advances in Software, vol 6 no 1 & 2, year 2013, http://www.iariajournals.org/software/
2013, © Copyright by authors, Published under agreement with IARIA - www.iaria.org
be considered to be a part of the organizational memory.With Normalized Systems, this advantage of re-using the“standard” design patterns is in fact exceeded by the benefitof using a solution that —from an evolvability viewpoint—is proven to be optimal.
To further position knowledge used within NormalizedSystems, we can refer once more to the classification ofEl Sawy et al. [18], which breaks down organizationalmemory into semantic memory and episodic memory. Asthe design patterns formulate a sound software structure thatis generally applicable to every software application, thisknowledge should be classified as semantic knowledge. Theopposite of this general and explicit semantic knowledgeis the so-called episodic knowledge, which is defined ascontext-specific knowledge. As Normalized Systems formu-lates general software architecture principles for software,this type of organizational knowledge is not part of thegeneral Normalized Systems patterns. This context-specificknowledge in incorporated in so-called extensions that areadded to the software after the expansion based on the fiverecurrent elementary structures. Because the patterns aredetailed enough to be instantiated, no manual implemen-tation of the patterns (as is the case with the design patternsproposed by Gamma et al. [19]) is required. Consequently,an identical code structure reoccurs in every applicationwhich is created using the expansion of NS elements. Thecommonality of the structure of the patterns makes thatonce one understands the patterns, one understands all itsinstantiations as well. In this way, it could be argued that—at least partially— the pattern structure becomes the docu-mentation. Therefore, no source code level documentation isrequired and all knowledge is stored in the NS patterns. Suchadvantages can only be achieved for semantic knowledge,since episodic knowledge is different is various contexts.
C. Knowledge Application
In the Normalized Systems theory rationale, the knowl-edge present in the NS elements is applied by employingthe elements as a design template for evolvable software.Each NS compliant software application is an aggregationof a set of instantiation of one of the five NS elements.Therefore, the knowledge of NS contained in the NS el-ements and their accompanying expansion mechanism canbe considered to be prescriptions or directives as definedby Grant [3] (i.e., a set of rather unambiguous and specificstandards or rules used to guide the actions of persons).When writing a software application, a programmer retrievesthe latest version of the software design patterns from theknowledge repository. Afterwards, the element instancesare parametrized and configured in descriptors files (e.g.,the relevant fields, relationships,etc. for a data element arespecified). Hence, by combining their tacit knowledge withthe described structure of the NS elements, the programmersbuild evolvable software.
The use of the NS elements and theorems indeed resultsin evolvable and easily adaptable software architectures. Forinstance, an important characteristic of these structures isthat they separate technology-dependent aspects from theactual implementation, resulting in the fact that one caneasily switch the underlying technology stack of the soft-ware. One transition that has been performed, is changing theunderlying implementation architecture from Enterprise JavaBeans (EJB) version 2 to EJB version 3. Because these stan-dards encapsulate the business logic of an application, theyuse a different way of communicating between agents andbeans. Therefore, this transition normally is a labor-intensiveand difficult task. Using the architecture described in thispaper, this transition can however be achieved rather easilyby using the pattern expansion mechanism. This is becausethe expanders that perform the expansion are very similarfor different technologies. This is done by clearly separatingfunctional requirements of the system (i.e., input variables,transfer functions and output variables) from constructionalaspects of the system (i.e., composition of the system).Whereas all constructional aspects are described in patterns,functional aspects are separately included in descriptor files(such as data elements, action elements,etc.). As each patterncan be conceived a recurring structure of programmingconstructs in a particular programming environment (e.g.,classes), one can conclude that the functional/constructionaltransformation then becomes located at one abstraction levelhigher than before.
An important result from the application of knowledgeis that it is often combined with a learning process. Bybuilding software using the expansion of NS elements, theprogrammers improve both their tacit knowledge on building(evolvable) software and explicit knowledge that will beincorporated in the design pattern (i.e., NS elements). Thisincreased tacit knowledge (“experience”) will over time alsocontribute to the definition of changes to the design patterns.The inherent way of working implied by the NS expansionmechanism (i.e., expanding software architectures by sys-tematically instantiating the NS elements, and incorporatingnew bits knowledge again into this core of patterns) alsoefficiently copes with the issue articulated in Section II-C,namely that the automated ways of working should becontinually kept up-to-date.
D. Knowledge Transfer
Within a knowledge system, knowledge is transferredfrom where it is available (i.e., a repository) to where it isneeded. For Normalized Systems, the knowledge repositoryof the NS design patterns (NS elements) needs consistentupdating to reflect the most recent software architecturefor evolvable software. This is done by transferring thenew explicit design knowledge created by individuals to thegroup semantic knowledge repository of NS elements. Theuse of this repository can be characterized as impersonal
190
International Journal on Advances in Software, vol 6 no 1 & 2, year 2013, http://www.iariajournals.org/software/
2013, © Copyright by authors, Published under agreement with IARIA - www.iaria.org
and formal, which promotes a faster and further distributionand is a good way to transfer knowledge that can bereadily generalized to other contexts (which is the case forNS) [10]. Analogously to the discussion in Section II, theexchange of explicit knowledge (i.e., NS elements) in NStheory can be classified most appropriately as knowledgetransfer. The use of a NS repository however bears closerresemblance to knowledge sharing process. This shows thatthe exchange of NS knowledge should be placed on thepreviously discussed continuum between knowledge transferand knowledge sharing.
V. DISCUSSION
In this section, in order to provide a summarizingoverview of our analysis presented above, we will first dis-cuss to which extent the knowledge management practiceswithin Normalized Systems cover all aspects as identifiedby Alavi and Leidner [10], based on Figure 1. Next, wewill present some reflections with respect to design patternsin general and how the use of elements within NormalizedSystems seems to enhance the existing practices of designpatterns regarding knowledge management on several do-mains.
A. Overview of knowledge management aspects of Normal-ized Systems
To recapitulate the NS knowledge management processes,we will discuss these processes according to the represen-tation introduced by Alavi and Leidner [10], as shown inFigure 1. This figure has been adapted to represent whetheror not the defined knowledge processes are used withinNormalized Systems theory. This is done by indicating thoseprocesses which are not covered by the Normalized Systemstheory by dotted lines. Consequently, full lines indicate theknowledge processes that are used within NS knowledgemanagement.
Regarding the knowledge management creation processes(i.e., arrows C, D, E, and F), we can notice that the Nor-malized Systems theory primarily enables the externalizationand combination processes (i.e., the processes indicated bythe arrows C and F respectively). These processes aim tomake implicit knowledge and best practices explicit (as isdone by the formulation of the NS theorems and elements)and to combine already existing explicit knowledge amongseveral members of the group (e.g., discussing additionalconcerns which need to be separated or improvements ofthe current elements). While the processes of socialization(i.e., arrow E) and internalization (i.e., arrow D) might oc-casionally occur in the NS community, those aspects are notexplicitly managed within the Normalized Systems rationale.Indeed, the aim of the Normalized Systems approach is todesign evolvable software architectures based on formallyproven and tested (and hence, explicit) principles and theirimplications.
The bidirectional interaction between an individual’s ex-plicit knowledge repository and the group’s memory is visu-alized trough arrow G. In NS reasoning, such explicit knowl-edge (e.g., the formally known need to separate a certainexternal technology in a distinct module) becomes embeddedin the group’s memory by incorporating it in the generalstructure of the NS elements and might subsequently offernew insights regarding the explicit knowledge of anotherperson as well. Also arrows K and J are relevant in a NScontext. The first represents the application of a developer’snew tacit insights (i.e., new possible improvements of theelements) into a trial-version of the elements, while the lattermay occur in the situation where the real-life implementationof software in an organizational setting may point out thata certain part of of a ‘task’ implemented in an actionelement evolves independently in a realistic setting, thusconstitutes a separate change driver and should consequentlybe separated.
The transfer of individual tacit knowledge to group’sepisodic memory (i.e., arrows L), is a type of knowledgetransfer that is not used in NS knowledge management.This simply because the knowledge repository does notinclude any type of episodic memory, rendering the transferof knowledge non-existent. Arguably the most importanttransfer of knowledge within NS theory is the expansionof NS elements into evolvable software. This transfer isshown by arrows I, which represent the repeated use ofdesign patterns (i.e., the NS elements) for building agilesoftware. In the opposite direction, directly learning fromthe application of the NS elements is not supported in theknowledge management for NS theory (i.e., arrows H). Asthe Normalized Systems rationale stipulates a deterministicand proven way of constructing evolvable software basedon the NS design theory, it does not allow new knowledgeto be formulated directly from the application of the NSelements. Instead, new knowledge should always be rigor-ously verified by traditional knowledge creation processes ofexternalization and combination before being added to theexisting knowledge base of NS elements.
Finally, the extension of the NS knowledge managementto multiple groups will add an extra layer of complexityto the management of knowledge. However, the centralityof the current knowledge base and the limited size ofdevelopers working on the development of the NS elementsare the reasons these challenges are not the main point ofinterest at this moment.
B. Knowledge Management using Design Patterns
As discussed in the introduction, knowledge managementalso plays an important parts in software engineering. Thespecific use of design patterns in object-orientation duringthe 90’s, exemplified by the seminal work of Gamma et al.[19], was incited by the fact that modern computer literatureregularly failed to make tacit (success determining) knowl-
191
International Journal on Advances in Software, vol 6 no 1 & 2, year 2013, http://www.iariajournals.org/software/
2013, © Copyright by authors, Published under agreement with IARIA - www.iaria.org
edge regarding low-level principles of good software designexplicit [30]. Patterns provide high-level solution templatesfor often-occurring problems. The patterns proposed byGamma et al. [19] were conceived as the bundling of a set ofgenerally accepted high-quality and best-practice solutionsto frequently occurring problems in object-orientation pro-gramming environments. For instance, in order to create anone-to-many dependency between objects so that when thestate of one object changes, all its dependents are notifiedand automatically updated, the observer pattern (i.e., an over-all structure of classes giving a description or template ofhow to solve the concerned problem) was proposed [19]. Asa consequence, the use of these patterns can be consideredas specifically aimed at facilitating (inter-)organizationallearning by learning from direct experiences of other people— in this case experienced software engineers —, and beingone specific way of knowledge transfer.
According to Schmidt [31], design patterns have been sosuccessful because they explicitly capture knowledge thatexperienced developers already understand implicitly. Thecaptured knowledge is called implicit because it is oftennot captured adequately with design methods and notations.Instead, it has been accumulated through timely processes oftrial and error. Capturing this expertise allows other devel-opers to avoid spending time rediscovering these solutions.Moreover, the captured knowledge has been claimed toprovide benefits in several areas [32]. Such benefits include(a) documentation of software code, (b) knowledge reusewhen building new applications, and (c) incorporation ofnew knowledge in existing software applications. In thissection, we focus on these benefits, and discuss how NSelements can be considered to be an improvement on thisway of working.
1) Documentation: Patterns provide developers with avocabulary which can be used to document a design in amore concise way [19], [32], [33]. For example, pattern-based communication can be used to preserve design de-cisions without elaborate descriptions. By delineating andnaming groups of classes which belong to the same pattern,the descriptive complexity of the design documentation (e.g.,a UML class diagram) can be reduced [33]. Consequently,the vocabulary offered by patterns allows a shift in theabstraction level of the discussions. This usage of designpatterns is mostly applied at the conceptual level, and ne-glects the source code documentation. However, the abstractnature of patterns, i.e., as a solution template, means thatit is possible to implement a certain design pattern usingdifferent alternatives. Therefore, it has been argued that theaddition of source-code level documentation of the patternusage is required to perform coding and maintenance tasksfaster and with fewer errors [34].
In NS, the structure of the five software patterns couldbe described in a similar way. The focus would then be onthe different concerns which need to be separated in each
element. As discussed in Section III, each concern needsto be encapsulated in a separate module (e.g., a class inthe object-oriented paradigm). Consequently, the differentconcerns dictate the modular structure of the element. Asa result, this documentation could provide similar insightsas obtained by traditional design patterns. However, theNS elements are described in such detail that they can beexpanded, resulting in working code. In Section IV-B, wediscussed how the reoccurring code structure in itself be-comes the documentation for expanded software: because acertain piece of code is identical in every expanded instance,a programmer only needs to inspect this piece of code oncein order to understand how that particular piece works. Thiseliminates the need for including documentation in everyinstance of source code. In conclusion, the pattern expansionallows documentation at the pattern level to be sufficient,eliminating the need for code-level documentation.
2) Using knowledge to build new applications: Severalauthors propose the usage of design patterns to create newsoftware applications (e.g., [35]). Earlier we discussed howpatterns provide high-level solution templates, and conse-quently, do not dictate the actual source code. As a result,knowledge concerning the implementation platform remainsimportant. A correct and efficient implementation of a designpattern requires a careful selection of language features [31].Clearly, design patterns alone are not sufficient to buildsoftware. As a result, the implementation of a design patternduring a software development process remains essentiallya complex activity [31]. Developing software for a con-crete application then requires the concrete experience ofa domain and the specifics of the programming language,as well as the ability to abstract away from details andadhere to the structure prescribed by the design pattern.Nevertheless, certain companies and researchers attempt tointegrate the knowledge available in design patterns in otherapproaches, in order to create automated code generation.For example, so-called software factories attempt to createsoftware similar to automated manufacturing plants [36].This should drastically improve software development pro-ductivity. However, such approaches have not yet reachedwidespread adoption.
The code expansion which occurs when using NS ele-ments needs to be distinguished from this approach. Con-sider for example the action element. The functional classof such an element still needs to be programmed manually.However, the code for reoccurring concerns, such as remoteaccess, can be expanded since this code is identical fordifferent action element instantiations. Similarly, an instan-tiation of a data element needs to be functionally defined(i.e., through descriptor files which contain data field defi-nitions). However, the concerns which reoccur in every dataelement instantiation are expanded. In Section IV-C, theseare referred to as constructional elements. Consequently,the building of new applications applies code reuse to an
192
International Journal on Advances in Software, vol 6 no 1 & 2, year 2013, http://www.iariajournals.org/software/
2013, © Copyright by authors, Published under agreement with IARIA - www.iaria.org
extent as large as possible: the common source code, whichis similar for all element instantiations, is expanded, whilefunctional requirements need to be provided by the program-mer. As a result, an optimal way of using knowledge to buildapplications is applied, without restricting the programmerin addressing functional requirements.
3) Incorporating new knowledge in existing applications:Because of the increasing change in the organizational envi-ronment in which software applications are used, adaptabil-ity is considered to be an important characteristic. However,adapting software remains a complex task. Various studieshave shown that the main part of the software developmentcost is spent after the initial deployment [37], [38]. Severaldesign patterns focus on incorporating adaptability into theirsolution template. Empirical observations have been reportedwhich confirm the increased adaptability when using de-sign patterns [39]. Adaptations could be made easier incomparison with an alternative that was programmed usingno design patterns, and achieved adaptability was retainedmore successfully because of the prescribed structure. Nev-ertheless, some researchers also report negative effects onadaptability, caused by the added complexity of the designpatterns. By prescribing additional classes in comparison tosimpler solutions, more errors have been introduced in somecases [39].
Both observations are consistent with the experiences ob-tained by developing NS. By separating all concerns withinthe elements, combinatorial effects are prevented, whichallows improved adaptability. Since this is similar to howdesign patterns work, it shows how NS incorporates existingdesign knowledge. However, NS prescribes to separate moreconcerns than traditional patterns or methods. This leads toa very fine-grained, but complex structure. As described byPrechelt et al., such complexity reduces adaptability [39].Therefore, the pattern expansion mechanism is a crucialcomponent of NS, as discussed in Section III-C. We dis-cussed how code expansion seems to be indispensable forknowledge reuse to separate concerns and prevent combina-torial effects. Moreover, the expansion mechanism also al-lows to make adaptations in a structured way. When changesor updates are applied to the elements, the expanded codecan be updated by either re-expanding, or by using marginalexpansion. Marginal expansion updates only parts of alreadyexpanded code, without replacing the expanded element as awhole. Consequently, newly generated knowledge (such as,e.g., a newly identified combinatorial effect) can be appliedin existing applications as well.
C. Positioning NS as knowledge management
The approach of capturing knowledge using NS as de-scribed in this paper clearly deviates from the body ofthought of other knowledge management approaches. Forexample, in the article by Tuzilin [12], the evolution ofknowledge management systems from content management
systems is discussed, and it is highlighted how the processof making tacit knowledge explicit was initially regardedto be optimal for capturing knowledge. However, as thisproved to be an insurmountable challenge, future devel-opments of knowledge management are expected to focuson the indexation of tacit knowledge. Consequently, whenknowledge is needed, the responsible knowledge source canbe identified, and can be shared without needing to makeall tacit knowledge explicit. NS theory opposes this idea.The rate of reuse of the evolvable modular structure ofsoftware elements is too high to be supported by suchcommunication-based approaches. Therefore, the knowledgecaptured in NS (i.e., being the modular structure of evolvablesoftware patterns) is made explicit. Consider for examplethe implications of the Separation of Concerns theorem, asdiscussed in Section III-A. It implies that each concern needsto be separated in a separate module. Compare this to a non-normalized system, where multiple concerns are mixed in amodule. These concerns are on a sub-modular level, and arenot explicitly identified as different concerns. Nevertheless,knowledge of these concerns is vital, since they introducecombinatorial effects, and hence limit evolvability. Theknowledge related to which concerns need to be separatedis made explicit in NS through the modular structure, asavailable in the expanders.
Our discussed way of knowledge capture in NS is feasiblesince a specific kind of knowledge is focused on: the modu-lar structure of software. For organizational knowledge, sucha modular structure may not be well-suited, and differentsystems may be needed here (cf. infra). Nevertheless, manyorganizational issues are being studied as being modularstructures. For example, coordination issues in supply chainshave been claimed to be modularity issues [40]–[42]. Conse-quently, making knowledge concerning such issues explicitin a modular structure could be explored as well.
D. Contributions and Future Work
This paper could be claimed to have several contri-butions, while indicating several opportunities of futurework. Regarding contributions, first, this paper might helpin clarifying the particular way of how software applica-tions are built according to the Normalized Systems wayof thinking and —more specifically— how this enablesthe creation, storage/retrieval, application and transfer ofknowledge. Our aim was to provide a practical overview,including examples, of how NS might enhance knowledgemanagement in practice, based on a theoretically foundedframework and its concepts. Second, this paper illustratesthe possibility of readily applying the published frame-work of Alavi and Leidner [10] to analyze the knowledgemanagement processes regarding a software developmentapproach. To the authors’ knowledge, no other researchershave described their software development approach basedon this framework in such an extensive way. Therefore, this
193
International Journal on Advances in Software, vol 6 no 1 & 2, year 2013, http://www.iariajournals.org/software/
2013, © Copyright by authors, Published under agreement with IARIA - www.iaria.org
paper illustrates the benefits researchers might realize bypresenting their software development approach accordingto this framework for clarifying any related knowledgemanagement benefits or issues, as well as the relevanceof the considered framework for this purpose. Third, ouranalysis clearly highlighted how NS differentiates from thedirection which is taken in other knowledge managementapproaches. In NS, knowledge is made explicit by capturingit into modular structures of evolvable software patterns,instead of pure textual descriptions. While we are notthe first to argue that more efficient ways of knowledgemanagement can be attained by the use of design patterns,we argued that the NS patterns could be hypothesized to be asort of “enhanced design patterns” regarding documentation(i.e., only requiring documentation at the pattern level),knowledge usage (i.e., maximal code expansion) and newknowledge incorporation (i.e., including new knowledge bysimple re-expansion or marginal expansions).
Regarding future work, we could first notice that, althoughthe discussion in this paper is limited to Normalized Systemstheory for software, the theory has recently been appliedto both Business Process Management [43] and EnterpriseArchitecture [44] domains. As part of future research, thepossible formulation and investigation of patterns on thelevel of business processes and enterprise architecture (andtheir knowledge management implications) can be studied.However, we already mentioned in Section V-C that theconcerns (and hence modular structures) identified at theselevels are of a different kind. Therefore, the knowledgemanagement issues regarding the identification, storage and“deployment” of such modular structures at the organiza-tional level should be investigated in the future as well.
Another area of future research concerns a more elab-orated and detailed way of describing how the discussedknowledge management processes in NS relate to similarsoftware development approaches. The Normalized Systemsapproach was shown to include and support the four widelyadopted types of knowledge management processes. Thequestion however remains how the support of these knowl-edge management processes by NS precisely relates to othersoftware development paradigms and approaches. Such acomparison calls for rather extensive research efforts andis therefore suggested as part of future research.
VI. CONCLUSION
Creating, managing and applying knowledge is a crucialcompetence for organizations today. Therefore, knowledgemanagement is a widely investigated and popular researchtopic. In this paper, we explored how Normalized Sys-tems theory, and its use of elements and their expansionmechanisms in particular, support knowledge managementin the development process of evolvable software. For thispurpose, we employed the framework of Alavi and Leidner[10] to analyze how the four essential processes within
knowledge management are facilitated in the NormalizedSystems reasoning: (1) knowledge creation, (2) knowledgestorage/retrieval, (3) knowledge application and (4) knowl-edge transfer. Our analysis shows that design patterns asa central knowledge repository facilitate the transfer ofknowledge from an individual to others in an explicit andefficient way. All processes of Alavi and Leidner [10] seemto be supported by Normalized Systems reasoning. Sometransformations are considered to be essential (e.g., newknowledge can be absorbed by arrow J in Figure 1 goingfrom “knowledge application” to an individual tacit knowl-edge), while others are not directly (but rather indirectly)included in the NS rationale (e.g., not directly incorporatingknowledge from applications into the group’s memory, butthrough the knowledge creation processes of externalizationand combination).
Further, we showed in this paper that the NS elementscan be considered to be enhanced patterns for software de-velopment with benefits on three dimensions (i.e., less needfor explicit documentation, more deterministic developmentof new applications and more convenient incorporation ofnew knowledge into existing applications). From interviewswith developers, these benefits have shown to enhance thetransfer of knowledge, success rate and the overall qualityof NS developments.
ACKNOWLEDGMENT
P.D.B. is supported by a Research Grant of the Agency forInnovation by Science and Technology in Flanders (IWT).
REFERENCES
[1] P. De Bruyn, P. Huysmans, G. Oorts, D. Van Nuffel, H. Man-naert, J. Verelst, and A. Oorst, “Using normalized systemspatterns as knowledge management,” in Proceedings of theSeventh International Conference of Software EngineeringAdvances (ICSEA), Lisbon, Portugal, 2012, pp. 28–33.
[2] B. Wernerfelt, “A resource-based view of the firm,” StrategicManagement Journal, vol. 5, no. 2, pp. 171–180, 1984.
[3] R. M. Grant, “Toward a knowledge-based theory of the firm,”Strategic Management Journal, vol. 17, pp. 109–122, 1996.
[4] F. Bjrnson and T. Dingsyr, “Knowledge management insoftware engineering: A systematic review of studied con-cepts, findings and research methods used,” Information andSoftware Technology, vol. 50, no. 11, pp. 1055–1068, 2008.
[5] P. Attewell, “Technology diffusion and organizational learn-ing: The case of business computing,” Organization Science,vol. 3, no. 1, pp. 1–19, 1992.
[6] B. Levitt and J. G. March, “Organizational learning,” AnnualReview of Sociology, vol. 14, pp. 319–340, 1988.
[7] C. Chewar and D. McCrickaerd, “Links for a human-centeredscience of design: integrated design knowledge environmentsfor a software development process,” in Proceedings of theHawaii International Conference on System Sciences, 2005,p. 256.3.
194
International Journal on Advances in Software, vol 6 no 1 & 2, year 2013, http://www.iariajournals.org/software/
2013, © Copyright by authors, Published under agreement with IARIA - www.iaria.org
[8] T. Dings yr, H. K. Djarraya, and E. Røyrvik, “Practicalknowledge management tool use in a software consultingcompany,” Communications of the ACM, vol. 48, no. 12, pp.96–100, 2005.
[9] F. Bjrnson and T. Dingsyr, “A study of a mentoring programfor knowledge transfer in a small software consultancy com-pany,” in Product Focused Software Process Improvement,ser. Lecture Notes in Computer Science. Springer Berlin/ Heidelberg, 2005, vol. 3547, pp. 245–256.
[10] M. Alavi and D. E. Leidner, “Review: Knowledge man-agement and knowledge management systems: Conceptualfoundations and research issues,” MIS Quarterly, vol. 25,no. 1, pp. 107–136, 2001.
[11] N. K. Kakabadse, A. Kakabadse, and A. Kouzmin, “Re-viewing the knowledge management literature: towards ataxonomy,” Journal of Knowledge Management, vol. 7, no. 4,pp. 75–91, 2003.
[12] A. Tuzhilin, “Knowledge management revisited: Old dogs,new tricks,” ACM Trans. Manage. Inf. Syst., vol. 2, no. 3, pp.13:1–13:11, 2011.
[13] H. Lee, H. Ahn, J. Kim, and S. Park, “Capturing and reusingknowledge in engineering change management: A case of au-tomobile development,” Information Systems Frontiers, vol. 8,pp. 375–394, 2006.
[14] I. Nonaka, “A dynamic theory of organizational knowledgecreation.” Organization Science, vol. 5, no. 1, pp. 14–37,1994.
[15] L. Argote, S. L. Beckman, and D. Epple, “The persistenceand transfer of learning in industrial settings,” Manage. Sci.,vol. 36, no. 2, pp. 140–154, 1990.
[16] E. D. Darr, L. Argote, and D. Epple, “The acquisition, trans-fer, and depreciation of knowledge in service organizations:productivity in franchises,” Manage. Sci., vol. 41, no. 11, pp.1750–1762, 1995.
[17] E. W. Stein and V. Zwass, “Actualizing organizational me-mory with information systems,” Information Systems Re-search, vol. 6, no. 2, pp. 85–117, 1995.
[18] O. A. El Sawy, G. M. Gomes, and M. V. Gonzalez, “Pre-serving institutional memory: The management of history asan organizational resource.” Academy of Management BestPapers Proceedings, vol. 1, pp. 118–122, 1986.
[19] E. Gamma, R. Helm, R. Johnson, and J. Vlissides, DesignPatterns: Elements of Reusable Object-Oriented Software.Addison Wesley Professional, 1994.
[20] J. A. Kumar and L. Ganesh, “Research on knowledge trans-fer in organizations: a morphology,” Journal of KnowledgeManagement, vol. 13, pp. 161–174, 2009.
[21] W. R. King, T. R. Chung, and M. H. Haney, “Knowledgemanagement and organizational learning,” Omega, vol. 36,no. 2, pp. 167–172, 2008.
[22] M. Polanyi, The Tacit Dimension. Routledge, London, 1967.
[23] M. Hansen, N. Nohria, and T. Tierney, “Whats your strategyfor managing knowledge?” Harvard Business Review, vol. 77,no. 2, pp. 106–116, 1999.
[24] I. Pinho, A. Rego, and M. Pina e Cunha, “Improving knowl-edge management processes: a hybrid positive approach,”Journal of Knowledge Management, vol. 16, no. 2, pp. 215–242, 2012.
[25] H. Mannaert and J. Verelst, Normalized systems: re-creatinginformation technology based on laws for software evolvabil-ity. Koppa, 2009.
[26] H. Mannaert, J. Verelst, and K. Ven, “The transformation ofrequirements into software primitives: Studying evolvabilitybased on systems theoretic stability,” Science of ComputerProgramming, vol. 76, no. 12, pp. 1210–1222, 2011.
[27] ——, “Towards evolvable software architectures based onsystems theoretic stability,” Software: Practice and Experi-ence, vol. 42, pp. 89–116, 2012.
[28] Oracle. Java platform, enterprise edition. Last accessdate: 04.01.2013. [Online]. Available: http://www.oracle.com/technetwork/java/javaee/overview/index.html
[29] L. Welicki, J. Manuel, C. Lovelle, and L. J. Aguilar, “Patternsmeta-specification and cataloging: towards knowledge man-agement in software engineering,” in Companion to the 21stACM SIGPLAN symposium on Object-oriented programmingsystems, languages, and applications, 2006, pp. 679–680.
[30] J. Coplien, “The culture of patterns,” Computer Science andInformation Systems, vol. 1, no. 2, pp. 1–26, 2004.
[31] D. C. Schmidt, “Using design patterns to develop reusableobject-oriented communication software,” Commun. ACM,vol. 38, no. 10, pp. 65–74, 1995.
[32] D. Riehle, “Lessons learned from using design patterns inindustry projects,” in Transactions on pattern languages ofprogramming II, J. Noble and R. Johnson, Eds. Berlin,Heidelberg: Springer-Verlag, 2011, ch. Lessons learned fromusing design patterns in industry projects, pp. 1–15.
[33] G. Odenthal and K. Quibeldey-Cirkel, “Using patterns fordesign and documentation,” in ECOOP, 1997, pp. 511–529.
[34] L. Prechelt, B. Unger-Lamprecht, M. Philippsen, and W. F.Tichy, “Two controlled experiments assessing the usefulnessof design pattern documentation in program maintenance,”IEEE Trans. Softw. Eng., vol. 28, no. 6, pp. 595–606, 2002.
[35] C. Larman, Applying UML and Patterns. Prentice Hall, 1997.
[36] J. Greenfield and K. Short, “Software factories: assemblingapplications with patterns, models, frameworks and tools,” inCompanion of the 18th annual ACM SIGPLAN conferenceon Object-oriented programming, systems, languages, andapplications, 2003, pp. 16–27.
[37] D. Coleman, D. Ash, B. Lowther, and P. Oman, “Using met-rics to evaluate software system maintainability,” Computer,vol. 27, no. 8, pp. 44–49, 1994.
195
International Journal on Advances in Software, vol 6 no 1 & 2, year 2013, http://www.iariajournals.org/software/
2013, © Copyright by authors, Published under agreement with IARIA - www.iaria.org
[38] R. L. Glass, “Maintenance: Less is not more,” IEEE Software,vol. 15, no. 4, pp. 67–68, 1998.
[39] L. Prechelt, B. Unger, W. Tichy, P. Brossler, and L. Votta,“A controlled experiment in maintenance: comparing designpatterns to simpler solutions,” Software Engineering, IEEETransactions on, vol. 27, no. 12, pp. 1134–1144, 2001.
[40] S. K. Ethiraj and D. Levinthal, “Bounded rationality and thesearch for organizational architecture: An evolutionary per-spective on the design of organizations and their evolvability.”Administrative Science Quarterly, vol. 49, no. 3, pp. 404–437,2004.
[41] C. Y. Baldwin and K. B. Clark, Design Rules, Volume 1: ThePower of Modularity, ser. MIT Press Books. The MIT Press,January 2000.
[42] Y. K. Ro, J. K. Liker, and S. K. Fixson, “Modularity as astrategy for supply chain coordination: The case of u.s. auto,”Engineering Management, IEEE Transactions on, vol. 54,no. 1, pp. 172 –189, feb. 2007.
[43] D. Van Nuffel, “Towards designing modular and evolv-able business processes,” Ph.D. dissertation, University ofAntwerp, 2011.
[44] P. Huysmans, “On the feasibility of normalized enterprises:Applying normalized systems theory to the high-level designof enterprises,” Ph.D. dissertation, University of Antwerp,2011.
196
International Journal on Advances in Software, vol 6 no 1 & 2, year 2013, http://www.iariajournals.org/software/
2013, © Copyright by authors, Published under agreement with IARIA - www.iaria.org
Enhancing the Performance of J2EE Applications through Entity Consolidation
Design Patterns
Reinhard Klemm
Collaborative Applications Research Department
Avaya Labs Research
Basking Ridge, New Jersey, U.S.A.
Abstract— J2EE is a specification of services and interfaces
that support the design and implementation of Java server
applications. Persistent and transacted entity Enterprise
JavaBean objects are important components in J2EE
applications. The persistence and transaction semantics of
entity Enterprise JavaBeans, however, lead to a sometimes
significantly decreased performance relative to traditional
Java objects. From an application performance point of view, a
J2EE-compliant object persistence and transaction mechanism
with a lower performance penalty would be highly desirable.
In this article, we present and evaluate two J2EE software
design patterns aimed at enhancing the performance of entity
Enterprise JavaBeans in J2EE applications with large
numbers of JavaBean instances. Both design patterns
consolidate multiple real-world entities of the same type, such
as users and communication sessions, into a single consolidated
entity Enterprise JavaBean. The entity consolidation results in
a smaller number of entity JavaBean instances in a given J2EE
application, thereby increasing JavaBean cache hit rates and
database search performance. We present detailed
experimental assessments of performance gains due to entity
consolidation and show that consolidated Enterprise
JavaBeans can accelerate common JavaBean operations in
large-data J2EE applications by factors of more than 2.
Keywords-Enterprise Java Beans; object caching; object
consolidation; software design patterns; software performance
I. INTRODUCTION
In this article, we extend our earlier work on performance-enhancing J2EE software design patterns published in [1]. To make the article self-contained and thus easier to read, we include a comprehensive description of the research presented in [1]. The focus of our work is entity Enterprise JavaBeans (EJBs) [2]. Entity EJB objects take advantage of a plethora of platform services from EJB containers in J2EE application servers [3]. Examples of platform services are data persistence, object caching and pooling, object lifecycle management, database connection pooling, transaction semantics and concurrency control, entity relationship management, security, and clustering. EJB containers obviate the need for redeveloping such generic functionality for each application and thus allow developers to more quickly build complex and robust server-side applications.
A common and important component in J2EE application servers is an in-memory EJB cache that speeds up access to entity EJBs in an application’s working set [4]. Yet, common entity EJB operations such as creating, accessing, modifying,
and removing entity EJBs tend to execute much more slowly than analogous operations for traditional Java objects (J2SE objects, also often referred to as Plain Old Java Objects or simply POJOs) that do not implement the functional equivalent of the J2EE platform services. The performance of data-intensive J2EE applications, i. e., those with large numbers of entity EJBs, can therefore be much slower than desired.
Although not mandated by the EJB specification, entity EJBs are typically stored as rows in relational database tables and we will assume this type of storage in the remainder of this article. Furthermore, we will concentrate on entity EJBs with container-managed persistence (CMP) rather than bean-managed persistence (BMP). CMP entity EJBs have the advantage of receiving more platform assistance than BMP entity EJBs and are thus usually preferable from a software engineering point of view. They also tend to perform better than BMP entity EJBs because of extensive application-independent performance optimizations that EJB containers incorporate for CMP EJBs [5]. For the sake of simplicity, we will refer to CMP entity EJBs simply as “EJBs”.
Note that the mapping from EJBs to database tables and the data transfer between cached EJBs and the database is the responsibility of the proprietary J2EE platform and can therefore be only minimally influenced by the EJB developer. Hence, we cannot discuss the direct impact of the design patterns presented in this article on structural or operational details of the data persistence layer of the J2EE platform. Instead, we will discuss how our technique changes the characteristics of the EJB layer that is under the control of the EJB developer and show how these changes affect the overall performance of EJB operations.
In the past, much research into improving J2EE application performance has focused on tuning the configuration of EJBs and of the EJB operating environment consisting of J2EE application servers, databases, Web servers, and hardware. In addition, some software engineering methods such as software design patterns and coding guidelines have been developed to address performance issues with J2EE applications. This article presents two J2EE software design patterns for accelerating J2EE applications. Both patterns result in specialized EJBs that we call consolidated EJBs (CEJBs). By applying the first pattern, we obtain fixed-size consolidated EJBs (fCEJBs). Fixed-size CEJBs are the topic of our earlier work published in [1]. The second, new pattern generates variable-size consolidated EJBs (vCEJBs). Both CEJB patterns attempt to optimize the caching and database storage of EJBs
197
International Journal on Advances in Software, vol 6 no 1 & 2, year 2013, http://www.iariajournals.org/software/
2013, © Copyright by authors, Published under agreement with IARIA - www.iaria.org
for enhanced execution speed of common EJB operations (creating, accessing, modifying, and removing entities).
We devised these two software design patterns during a multiyear research project at Avaya Labs Research where we developed a J2EE-based context aware communications middleware called Mercury. Mercury operates on a large number of EJB instances that represent enterprise users and communication sessions (hence our User and Session EJB examples later in this article). Due to the large frequency of retrieval, query, and update operations on these EJBs, Mercury suffered from slow performance even after tuning J2EE application server and database settings. Thus, we felt compelled to investigate structural changes to Mercury’s J2EE implementation as a remedy for the performance problems and arrived at the CEJB design patterns. The technical discussion in this article will show that our design patterns are more generally applicable in a wide range of J2EE applications.
The J2EE and entity Enterprise JavaBeans specifications that we refer to in this article have meanwhile been supplanted by updated standards and with a new terminology: The J2EE 1.4 specification has been replaced with Java EE 6 [6], and the entity EJBs in the Enterprise JavaBeans specification 2.1 have been replaced with entities according to the Java Persistence API 2.0 [7]. The software design patterns in this article remain equally relevant in the context of the new specifications and require mostly syntactic changes.
The remainder of this article is organized as follows. In Section II, we describe some of the related work. Section III contains an overview of the key idea behind both CEJB software design patterns. Section IV presents the fCEJB pattern and its use in J2EE applications. We describe the details of fCEJB allocation, the mapping of entities to fCEJBs, the storage of entities within fCEJBs, and retrieval of entities from fCEJBs. Similarly, Section V contains a detailed explanation of the vCEJB pattern. We compare the performance of fCEJBs, vCEJBs, and traditional EJBs in Section VI. A summary and an outline of future work conclude the article in Section VII.
II. RELATED WORK
The performance penalty of using EJBs in J2EE applications has been well documented in the relevant literature, some of which we review in this section. A substantial number of articles present various remedies for this performance penalty, ranging from performance-tuning of application servers to alternative object persistence mechanisms to performance-enhancing EJB software design patterns. However, to our knowledge, our CEJBs are the first application-level approach that yields verified, substantial performance improvements in a wide range of J2EE applications where alternatives to EJBs are not acceptable, practical, or desirable. In our earlier research presented in [1] we introduced fCEJBs as a performance-enhancing J2EE software design pattern. However, in the presence of entities that do not have the cluster property that we describe in Section IV, fCEJBs perform no better than traditional EJBs.
Our new vCEJB design pattern aims at addressing this shortcoming of fCEJBs.
Much research has been devoted to speeding up J2EE applications by tuning EJBs and J2EE application server parameters. Pugh and Spacco [8] and Raghavachari et al. [9] discuss the potentially large performance impact and difficulties of tuning J2EE application servers, connected software systems such as databases, and the underlying hardware. In contrast, CEJBs constitute an application-level technique to attain additional J2EE application speed-ups.
The MTE project [10][11] offers more insight into the relationship between J2EE application server parameters, application structure, and application deployment parameters on the one hand and performance on the other hand. The MTE project underscores the sensitivity of J2EE application performance to application server parameters as well as to the application structure and deployment parameters.
Another large body of research into J2EE application performance has investigated the relationship between J2EE software design patterns and performance. Cecchet et al. [12] study the impact of the internal structure of a J2EE application on its performance. Many examples of J2EE design patterns such as the session façade EJB pattern can be found in [13] and [14], while Cecchet et al. [15] and Rudzki [16] discuss performance implications of selected J2EE design patterns. The CEJB design patterns improve specifically the performance of EJB caches and database searches for EJBs. The Aggregate Entity Bean Pattern [17] consolidates logically dependent entities of different types into the same EJB while CEJBs consolidate entities of the same type into an EJB. Converting EJBs into CEJBs can therefore be automated by a tool whereas the aggregation pattern requires knowledge of the specific application and the logical dependencies of its entities. Aggregation and CEJBs can be synergistically used in the same application to increase overall execution speed. No performance measurements are reported in [17].
Leff and Rayfield [4] show the importance of an EJB cache in a J2EE application server for improving application performance. We can find an in-depth study of performance issues with entity EJBs in [5]. The authors point out that caching is one of the greatest benefits of using entity EJBs provided that the EJB cache is properly configured and entity EJB transaction settings are optimized.
Our CEJB design patterns comply with the EJB specification and therefore can be applied to any J2EE application on any J2EE application server. Several J2SE-based technologies, from Java Data Objects (JDO) to Java Object Serialization (JOS), sacrifice the benefit of J2EE platform services in return for much higher performance than would be possible on a J2EE platform. Jordan [18] provides an extensive comparison of EJB data persistence and several J2SE-based data persistence mechanisms and their relative performance. The comparison includes EJB, JDO, Java Database Connectivity (JDBC), Orthogonal Persistence (OPJ), JavaBeans Persistence (JBP), and Java Object Serialization (JOS). Interestingly, the comparison revealed that EJBs had the worst performance among the compared persistence mechanisms, while JDOs had the best
198
International Journal on Advances in Software, vol 6 no 1 & 2, year 2013, http://www.iariajournals.org/software/
2013, © Copyright by authors, Published under agreement with IARIA - www.iaria.org
performance. The author states that “acceptable EJB performance seems unattainable at present unless dramatic changes are made to the application object model to avoid fine-grain objects when mapped to EJB”. The fCEJB and vCEJB design patterns are an application-level approach to avoiding the mapping of fine-grained objects to EJBs and thus the performance penalty associated with using EJB-based persistence in J2EE applications. Not included in the study in [18] is another popular J2SE persistence mechanism, Hibernate. The performance of Hibernate – in comparison to the object database db4o, but not in comparison to EJBs – is discussed in [19].
Trofin and Murphy [20] present the idea of collecting runtime information in J2EE application servers and to modify EJB containers accordingly to improve performance. CEJBs, on the other hand, execute in unmodified EJB containers and improve performance by multiplexing multiple logical entities into one entity as seen by the EJB container.
III. CEJB GOALS AND CONCEPT
The intention of both of our CEJB software design patterns is to narrow the performance gap between EJBs and POJOs in J2EE applications with large numbers of EJBs. A look at common operations during the life span of an EJB explains some of the performance differences between EJBs and POJOs:
Creating EJBs entails the addition of rows in a table in the underlying relational database at transaction commit time, whereas POJOs exist only in memory.
Accessing EJBs requires the execution of finder methods to locate the EJBs in the EJB cache of the J2EE application server or in the database, whereas access to POJOs is accomplished by simply following object references.
Depending on the selected transaction commit options (pessimistic or optimistic), the execution of business methods on EJBs is either serialized or requires synchronization with the underlying database. Calling POJO methods, on the other hand, simply means accessing objects in the Java heap in memory, possibly with application-specific concurrency control in place.
Deleting EJBs implies the removal of the EJB objects from the EJB cache, if they are stored there, and the deletion of the corresponding database table rows at commit time. Deleting POJOs affects only the Java heap in memory.
The preceding list identifies the interaction between EJBs and the persistence mechanism (EJB cache plus database) as a performance bottleneck for EJBs that POJOs do not suffer from. One way of decreasing the performance gap between EJBs and POJOs, therefore, is to increase the EJB cache hit rate, thereby reducing the database access frequency. In case of EJB cache misses and when synchronizing the state of EJBs with the database, we would like to speed up the search for the database table rows that represent EJBs. CEJBs are intended to significantly decrease the number of EJBs in a
J2EE application. A smaller number of EJBs translates into higher EJB cache hit rates and faster EJB access in the database due to a smaller search space in database tables for EJB finder operations. In other words, CEJBs reduce the number and execution times of database accesses by increasing the rate of in-memory search operations.
CEJBs are based on a simple idea. Traditionally, when developing EJBs we map each real-world entity in the application domain to a separate EJB. Examples of such entities are users and communication sessions, to stay with the example of the Mercury system in Section I. This approach can result in a large number of EJB instances in the application. With CEJBs, on the other hand, we consolidate multiple entities of the same type into a single “special” EJB. The difference between fCEJBs and vCEJBs is in the way the entities are organized within each CEJB and the resulting impact on the overall pool of CEJBs. In the remainder of this article, when we speak of “entities”, we implicitly assume “entities of the same type” unless otherwise noted.
IV. FIXED-SIZE CONSOLIDATED EJBS
In this section, we present the key idea, design methodology, and some practical aspects of developing fCEJBs.
A. Concept of the fCEJB Pattern
In the case of fCEJBs, we store up to N POJO entities in the same EJB (the fCEJB), where N is a constant that is determined at application design time. We store the entities in arrays of size N inside the fCEJB. Hence, locating an entity within an fCEJB can be accomplished through simple array indexing operations requiring only constant time. The challenge for developing fCEJBs is devising an appropriate mapping function
,
where KE is the primary key space of the real-world entities and KC is the primary key space of the fCEJBs. Function m maps a given entity primary key k, for example a communication session ID, to a tuple (k1, k2) where
k1 is an artificial primary key for an fCEJB that will store the entity,
k2 is the index of the array elements inside the fCEJB that store the POJO with primary key k.
The mapping function m has to ensure that no more than N entities are mapped to the same fCEJB. On the other hand, m also has to attempt to map as many entities to the same fCEJB as possible. Otherwise, fCEJBs would perform little or no better than EJBs. Moreover, the computation of m for a given entity primary key has to be fast.
B. Developing an fCEJB
Consider a simple communication session entity represented as an EJB Session with the J2EE-mandated local interface, local home interface, and bean implementation:
The local home interface is responsible for creating
new Sessions through a method create(String
sessionID, long startTime) and finding existing ones
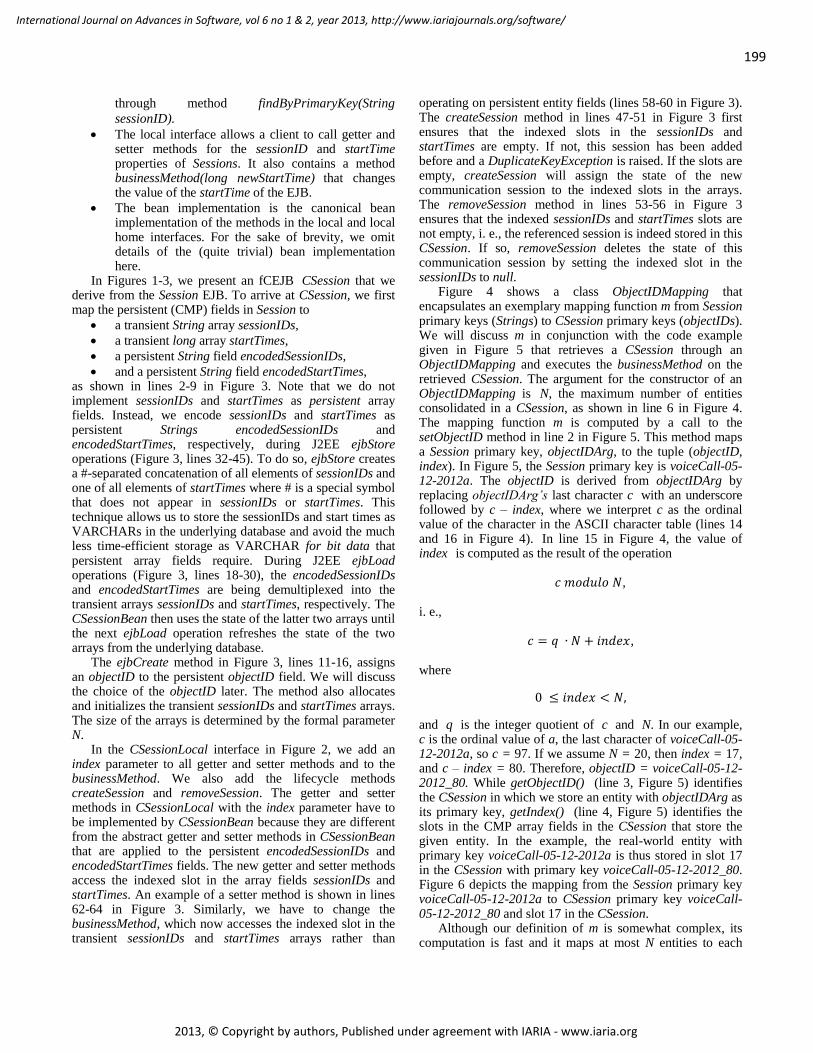
199
International Journal on Advances in Software, vol 6 no 1 & 2, year 2013, http://www.iariajournals.org/software/
2013, © Copyright by authors, Published under agreement with IARIA - www.iaria.org
through method findByPrimaryKey(String
sessionID).
The local interface allows a client to call getter and setter methods for the sessionID and startTime properties of Sessions. It also contains a method businessMethod(long newStartTime) that changes the value of the startTime of the EJB.
The bean implementation is the canonical bean implementation of the methods in the local and local home interfaces. For the sake of brevity, we omit details of the (quite trivial) bean implementation here.
In Figures 1-3, we present an fCEJB CSession that we derive from the Session EJB. To arrive at CSession, we first map the persistent (CMP) fields in Session to
a transient String array sessionIDs,
a transient long array startTimes,
a persistent String field encodedSessionIDs,
and a persistent String field encodedStartTimes, as shown in lines 2-9 in Figure 3. Note that we do not implement sessionIDs and startTimes as persistent array fields. Instead, we encode sessionIDs and startTimes as persistent Strings encodedSessionIDs and encodedStartTimes, respectively, during J2EE ejbStore operations (Figure 3, lines 32-45). To do so, ejbStore creates a #-separated concatenation of all elements of sessionIDs and one of all elements of startTimes where # is a special symbol that does not appear in sessionIDs or startTimes. This technique allows us to store the sessionIDs and start times as VARCHARs in the underlying database and avoid the much less time-efficient storage as VARCHAR for bit data that persistent array fields require. During J2EE ejbLoad operations (Figure 3, lines 18-30), the encodedSessionIDs and encodedStartTimes are being demultiplexed into the transient arrays sessionIDs and startTimes, respectively. The CSessionBean then uses the state of the latter two arrays until the next ejbLoad operation refreshes the state of the two arrays from the underlying database.
The ejbCreate method in Figure 3, lines 11-16, assigns an objectID to the persistent objectID field. We will discuss the choice of the objectID later. The method also allocates and initializes the transient sessionIDs and startTimes arrays. The size of the arrays is determined by the formal parameter N.
In the CSessionLocal interface in Figure 2, we add an index parameter to all getter and setter methods and to the businessMethod. We also add the lifecycle methods createSession and removeSession. The getter and setter methods in CSessionLocal with the index parameter have to be implemented by CSessionBean because they are different from the abstract getter and setter methods in CSessionBean that are applied to the persistent encodedSessionIDs and encodedStartTimes fields. The new getter and setter methods access the indexed slot in the array fields sessionIDs and startTimes. An example of a setter method is shown in lines 62-64 in Figure 3. Similarly, we have to change the businessMethod, which now accesses the indexed slot in the transient sessionIDs and startTimes arrays rather than
operating on persistent entity fields (lines 58-60 in Figure 3). The createSession method in lines 47-51 in Figure 3 first ensures that the indexed slots in the sessionIDs and startTimes are empty. If not, this session has been added before and a DuplicateKeyException is raised. If the slots are empty, createSession will assign the state of the new communication session to the indexed slots in the arrays. The removeSession method in lines 53-56 in Figure 3 ensures that the indexed sessionIDs and startTimes slots are not empty, i. e., the referenced session is indeed stored in this CSession. If so, removeSession deletes the state of this communication session by setting the indexed slot in the sessionIDs to null.
Figure 4 shows a class ObjectIDMapping that encapsulates an exemplary mapping function m from Session primary keys (Strings) to CSession primary keys (objectIDs). We will discuss m in conjunction with the code example given in Figure 5 that retrieves a CSession through an ObjectIDMapping and executes the businessMethod on the retrieved CSession. The argument for the constructor of an ObjectIDMapping is N, the maximum number of entities consolidated in a CSession, as shown in line 6 in Figure 4. The mapping function m is computed by a call to the setObjectID method in line 2 in Figure 5. This method maps a Session primary key, objectIDArg, to the tuple (objectID, index). In Figure 5, the Session primary key is voiceCall-05-12-2012a. The objectID is derived from objectIDArg by replacing objectIDArg’s last character c with an underscore followed by c – index, where we interpret c as the ordinal value of the character in the ASCII character table (lines 14 and 16 in Figure 4). In line 15 in Figure 4, the value of index is computed as the result of the operation
,
i. e.,
,
where
and q is the integer quotient of c and N. In our example, c is the ordinal value of a, the last character of voiceCall-05-12-2012a, so c = 97. If we assume N = 20, then index = 17, and c – index = 80. Therefore, objectID = voiceCall-05-12-2012_80. While getObjectID() (line 3, Figure 5) identifies the CSession in which we store an entity with objectIDArg as its primary key, getIndex() (line 4, Figure 5) identifies the slots in the CMP array fields in the CSession that store the given entity. In the example, the real-world entity with primary key voiceCall-05-12-2012a is thus stored in slot 17 in the CSession with primary key voiceCall-05-12-2012_80. Figure 6 depicts the mapping from the Session primary key voiceCall-05-12-2012a to CSession primary key voiceCall-05-12-2012_80 and slot 17 in the CSession.
Although our definition of m is somewhat complex, its computation is fast and it maps at most N entities to each
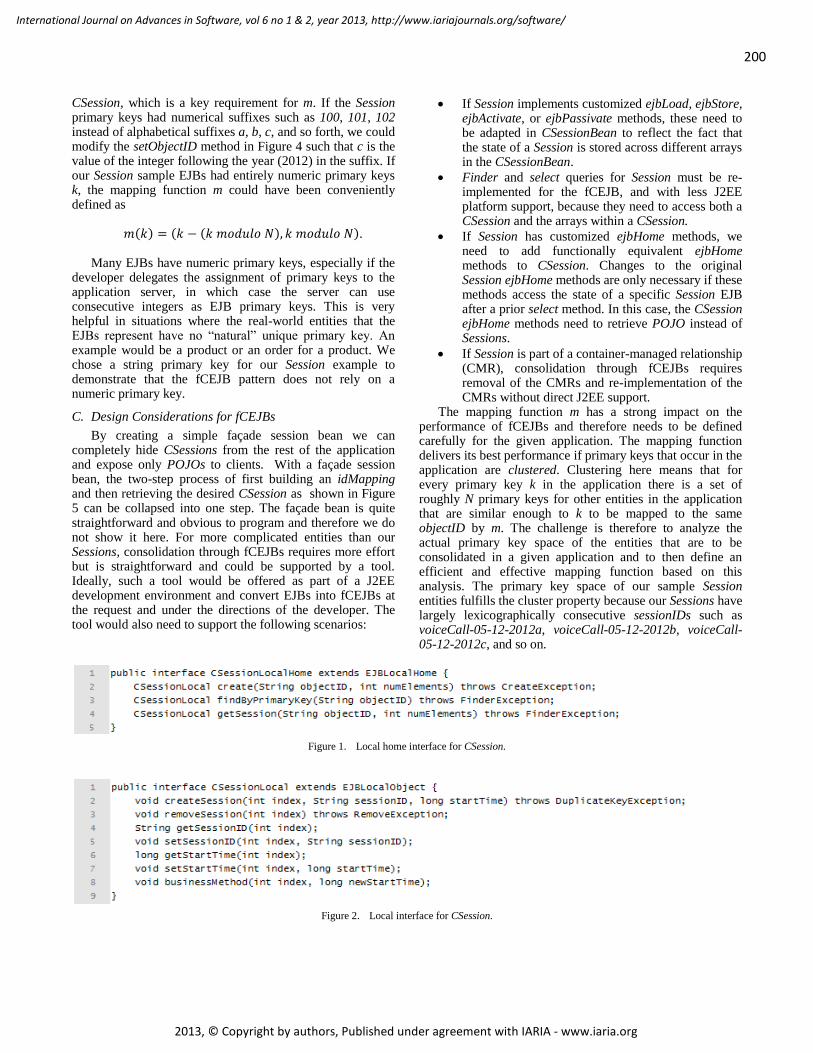
200
International Journal on Advances in Software, vol 6 no 1 & 2, year 2013, http://www.iariajournals.org/software/
2013, © Copyright by authors, Published under agreement with IARIA - www.iaria.org
CSession, which is a key requirement for m. If the Session primary keys had numerical suffixes such as 100, 101, 102 instead of alphabetical suffixes a, b, c, and so forth, we could modify the setObjectID method in Figure 4 such that c is the value of the integer following the year (2012) in the suffix. If our Session sample EJBs had entirely numeric primary keys k, the mapping function m could have been conveniently defined as
.
Many EJBs have numeric primary keys, especially if the
developer delegates the assignment of primary keys to the application server, in which case the server can use consecutive integers as EJB primary keys. This is very helpful in situations where the real-world entities that the EJBs represent have no “natural” unique primary key. An example would be a product or an order for a product. We chose a string primary key for our Session example to demonstrate that the fCEJB pattern does not rely on a numeric primary key.
C. Design Considerations for fCEJBs
By creating a simple façade session bean we can completely hide CSessions from the rest of the application and expose only POJOs to clients. With a façade session bean, the two-step process of first building an idMapping and then retrieving the desired CSession as shown in Figure 5 can be collapsed into one step. The façade bean is quite straightforward and obvious to program and therefore we do not show it here. For more complicated entities than our Sessions, consolidation through fCEJBs requires more effort but is straightforward and could be supported by a tool. Ideally, such a tool would be offered as part of a J2EE development environment and convert EJBs into fCEJBs at the request and under the directions of the developer. The tool would also need to support the following scenarios:
If Session implements customized ejbLoad, ejbStore, ejbActivate, or ejbPassivate methods, these need to be adapted in CSessionBean to reflect the fact that the state of a Session is stored across different arrays in the CSessionBean.
Finder and select queries for Session must be re-implemented for the fCEJB, and with less J2EE platform support, because they need to access both a CSession and the arrays within a CSession.
If Session has customized ejbHome methods, we need to add functionally equivalent ejbHome methods to CSession. Changes to the original Session ejbHome methods are only necessary if these methods access the state of a specific Session EJB after a prior select method. In this case, the CSession ejbHome methods need to retrieve POJO instead of Sessions.
If Session is part of a container-managed relationship (CMR), consolidation through fCEJBs requires removal of the CMRs and re-implementation of the CMRs without direct J2EE support.
The mapping function m has a strong impact on the performance of fCEJBs and therefore needs to be defined carefully for the given application. The mapping function delivers its best performance if primary keys that occur in the application are clustered. Clustering here means that for every primary key k in the application there is a set of roughly N primary keys for other entities in the application that are similar enough to k to be mapped to the same objectID by m. The challenge is therefore to analyze the actual primary key space of the entities that are to be consolidated in a given application and to then define an efficient and effective mapping function based on this analysis. The primary key space of our sample Session entities fulfills the cluster property because our Sessions have largely lexicographically consecutive sessionIDs such as voiceCall-05-12-2012a, voiceCall-05-12-2012b, voiceCall-05-12-2012c, and so on.
Figure 1. Local home interface for CSession.
Figure 2. Local interface for CSession.
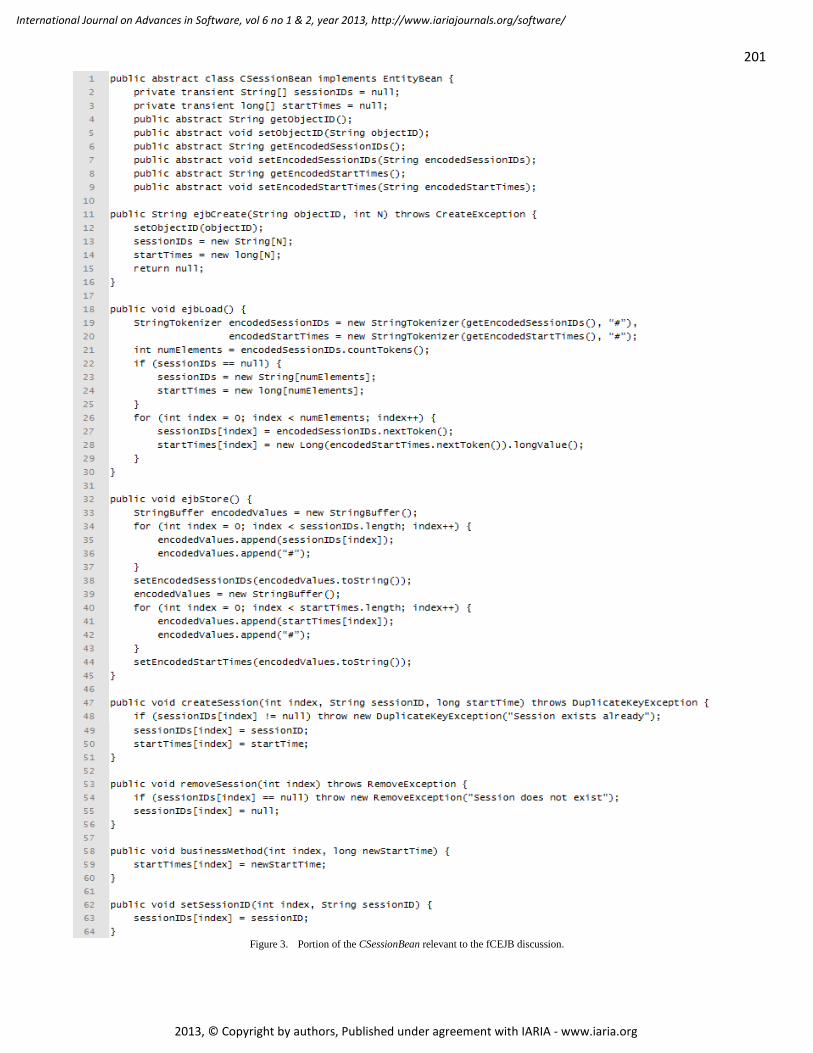
201
International Journal on Advances in Software, vol 6 no 1 & 2, year 2013, http://www.iariajournals.org/software/
2013, © Copyright by authors, Published under agreement with IARIA - www.iaria.org
Figure 3. Portion of the CSessionBean relevant to the fCEJB discussion.
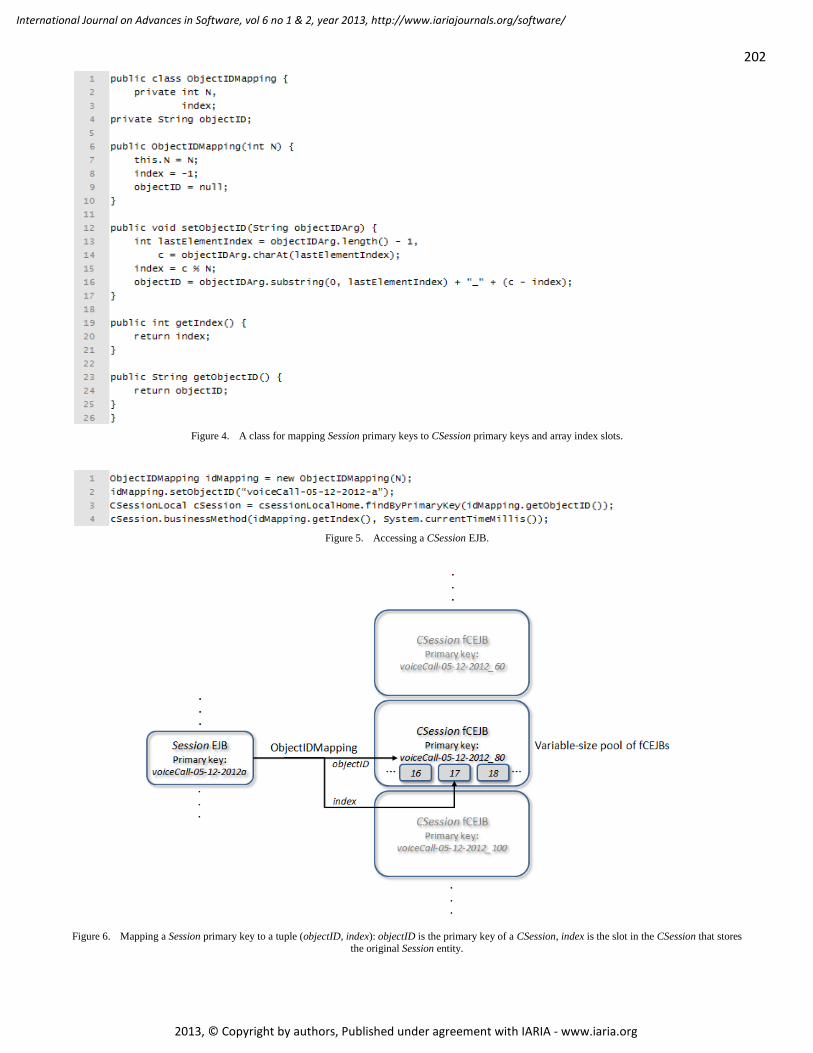
202
International Journal on Advances in Software, vol 6 no 1 & 2, year 2013, http://www.iariajournals.org/software/
2013, © Copyright by authors, Published under agreement with IARIA - www.iaria.org
Figure 4. A class for mapping Session primary keys to CSession primary keys and array index slots.
Figure 5. Accessing a CSession EJB.
Figure 6. Mapping a Session primary key to a tuple (objectID, index): objectID is the primary key of a CSession, index is the slot in the CSession that stores the original Session entity.
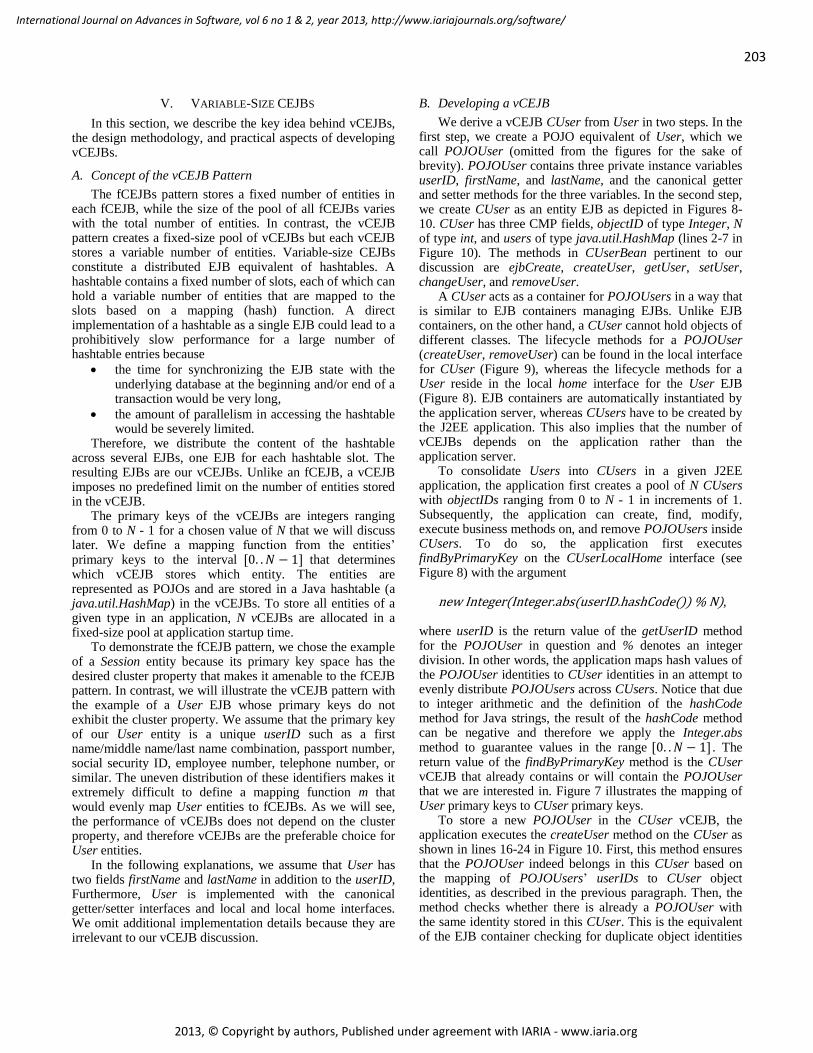
203
International Journal on Advances in Software, vol 6 no 1 & 2, year 2013, http://www.iariajournals.org/software/
2013, © Copyright by authors, Published under agreement with IARIA - www.iaria.org
V. VARIABLE-SIZE CEJBS
In this section, we describe the key idea behind vCEJBs, the design methodology, and practical aspects of developing vCEJBs.
A. Concept of the vCEJB Pattern
The fCEJBs pattern stores a fixed number of entities in each fCEJB, while the size of the pool of all fCEJBs varies with the total number of entities. In contrast, the vCEJB pattern creates a fixed-size pool of vCEJBs but each vCEJB stores a variable number of entities. Variable-size CEJBs constitute a distributed EJB equivalent of hashtables. A hashtable contains a fixed number of slots, each of which can hold a variable number of entities that are mapped to the slots based on a mapping (hash) function. A direct implementation of a hashtable as a single EJB could lead to a prohibitively slow performance for a large number of hashtable entries because
the time for synchronizing the EJB state with the underlying database at the beginning and/or end of a transaction would be very long,
the amount of parallelism in accessing the hashtable would be severely limited.
Therefore, we distribute the content of the hashtable across several EJBs, one EJB for each hashtable slot. The resulting EJBs are our vCEJBs. Unlike an fCEJB, a vCEJB imposes no predefined limit on the number of entities stored in the vCEJB.
The primary keys of the vCEJBs are integers ranging from 0 to N - 1 for a chosen value of N that we will discuss later. We define a mapping function from the entities’ primary keys to the interval that determines which vCEJB stores which entity. The entities are represented as POJOs and are stored in a Java hashtable (a java.util.HashMap) in the vCEJBs. To store all entities of a given type in an application, N vCEJBs are allocated in a fixed-size pool at application startup time.
To demonstrate the fCEJB pattern, we chose the example of a Session entity because its primary key space has the desired cluster property that makes it amenable to the fCEJB pattern. In contrast, we will illustrate the vCEJB pattern with the example of a User EJB whose primary keys do not exhibit the cluster property. We assume that the primary key of our User entity is a unique userID such as a first name/middle name/last name combination, passport number, social security ID, employee number, telephone number, or similar. The uneven distribution of these identifiers makes it extremely difficult to define a mapping function m that would evenly map User entities to fCEJBs. As we will see, the performance of vCEJBs does not depend on the cluster property, and therefore vCEJBs are the preferable choice for User entities.
In the following explanations, we assume that User has two fields firstName and lastName in addition to the userID, Furthermore, User is implemented with the canonical getter/setter interfaces and local and local home interfaces. We omit additional implementation details because they are irrelevant to our vCEJB discussion.
B. Developing a vCEJB
We derive a vCEJB CUser from User in two steps. In the first step, we create a POJO equivalent of User, which we call POJOUser (omitted from the figures for the sake of brevity). POJOUser contains three private instance variables userID, firstName, and lastName, and the canonical getter and setter methods for the three variables. In the second step, we create CUser as an entity EJB as depicted in Figures 8-10. CUser has three CMP fields, objectID of type Integer, N of type int, and users of type java.util.HashMap (lines 2-7 in Figure 10). The methods in CUserBean pertinent to our discussion are ejbCreate, createUser, getUser, setUser, changeUser, and removeUser.
A CUser acts as a container for POJOUsers in a way that is similar to EJB containers managing EJBs. Unlike EJB containers, on the other hand, a CUser cannot hold objects of different classes. The lifecycle methods for a POJOUser (createUser, removeUser) can be found in the local interface for CUser (Figure 9), whereas the lifecycle methods for a User reside in the local home interface for the User EJB (Figure 8). EJB containers are automatically instantiated by the application server, whereas CUsers have to be created by the J2EE application. This also implies that the number of vCEJBs depends on the application rather than the application server.
To consolidate Users into CUsers in a given J2EE application, the application first creates a pool of N CUsers with objectIDs ranging from 0 to N - 1 in increments of 1. Subsequently, the application can create, find, modify, execute business methods on, and remove POJOUsers inside CUsers. To do so, the application first executes findByPrimaryKey on the CUserLocalHome interface (see Figure 8) with the argument
new Integer(Integer.abs(userID.hashCode()) % N),
where userID is the return value of the getUserID method for the POJOUser in question and % denotes an integer division. In other words, the application maps hash values of the POJOUser identities to CUser identities in an attempt to evenly distribute POJOUsers across CUsers. Notice that due to integer arithmetic and the definition of the hashCode method for Java strings, the result of the hashCode method can be negative and therefore we apply the Integer.abs method to guarantee values in the range . The return value of the findByPrimaryKey method is the CUser vCEJB that already contains or will contain the POJOUser that we are interested in. Figure 7 illustrates the mapping of User primary keys to CUser primary keys.
To store a new POJOUser in the CUser vCEJB, the application executes the createUser method on the CUser as shown in lines 16-24 in Figure 10. First, this method ensures that the POJOUser indeed belongs in this CUser based on the mapping of POJOUsers’ userIDs to CUser object identities, as described in the previous paragraph. Then, the method checks whether there is already a POJOUser with the same identity stored in this CUser. This is the equivalent of the EJB container checking for duplicate object identities

204
International Journal on Advances in Software, vol 6 no 1 & 2, year 2013, http://www.iariajournals.org/software/
2013, © Copyright by authors, Published under agreement with IARIA - www.iaria.org
when creating an entity EJB. Finally, the method stores the mapping from the userID to the POJOUser in the vCEJB’s internal HashMap.
The equivalent of an EJB finder method for POJOUsers is the getUser method in the CUserLocal interface (Figure 9, line 3). After a prior call to the findByPrimaryKey method on the CUserLocalHome interface to obtain the appropriate CUser, the application calls the getUser method on the local interface of that CUser to obtain the desired POJOUser. The application can now execute business methods on the returned POJOUser. The users field (a HashMap) in CUser is a so-called dependent value object in the J2EE world. By extension, the same applies to POJOUsers inside the users HashMap. Hence, the EJB container returns a copy of a POJOUser whenever the getUser method is invoked, as prescribed by the Enterprise JavaBeans specification. To reflect changes to the state of a POJOUser due to business method calls, the application has to store the POJOUser back to users. The setUser and changeUser methods in Figure 10 in lines 33-38 and 40-49, respectively, serve this purpose. The changeUser method is useful in situations where we want to change the state of a POJOUser without a need to know the previous state of this POJOUser. Rather than calling getUser followed by setUser, one call to changeUser will suffice in that situation, hence reducing the number of accesses to the users HashMap and consequently the number of HashMap copy operations from two to one.
To delete a POJOUser, the application calls the removeUser method on the CUser (lines 51-56 in Figure 10). Like the setUser, getUser, and changeUser methods, removeUser first checks that the referenced POJOUser indeed exists in this CUser vCEJB. Then, removeUser deletes the POJOUser from the users HashMap.
C. Design Considerations for vCEJBs
By creating a simple façade session bean we can completely hide CUsers from the rest of the application and expose only POJOUsers to clients. With a façade session bean, the two-step process of first retrieving a CUser and subsequently accessing a POJOUser turns into one step for clients. The façade bean is straightforward and we will therefore not show it here.
Our sample User EJB is very simple. For more complicated entities, consolidation through vCEJBs requires more effort but, as with fCEJBs, is straightforward and could be automated by a tool as part of a J2EE development environment. The following is a list of considerations during vCEJB creation in the context of the User EJB that Section V.B did not address.
1. If the original User EJB implements the ejbLoad, ejbStore, ejbActivate, or ejbPassivate methods, the CUser methods getUser, setUser, and changeUser need to be modified. For example, the content of a User ejbLoad method needs to be moved into the getUser and changeUser methods after some modifications. The modifications reflect the fact that the state of a User is stored in a POJOUser and needs to be retrieved from a HashMap rather than from the CMP fields of a User.
2. Finder and select queries for User must be re-implemented for the vCEJB because they need to access the users HashMap. Notice that the getUser method in our example is derived from the findByPrimaryKey method for the User EJB. More complicated finder methods in User would require more complicated getUser methods in CUser.
3. If User has ejbHome methods, we need to add functionally equivalent ejbHome methods to CUser. Changes to the original User ejbHome methods will only be necessary if these methods access the state of a specific User EJB after a prior select method. In this case, the CUser ejbHome methods need to retrieve POJOUsers instead of Users.
4. If User is part of a container-managed relationship (CMR), consolidation through vCEJBs requires removal of the CMRs and re-implementation of the CMRs without direct J2EE support.
5. Variable-size CEJBs aggravate the existing problem of variable-size data structures in EJBs. EJBs with variable-size data structures as CMP fields and databases as persistent storage require a design-time decision for the maximum length of each database column that stores a variable-size CMP field. If such a maximum size is exceeded a runtime error will occur during EJB storage in the database. CUser contains a variable-size CMP field (users) even though User does not. To safely use vCEJBs, we require knowledge of the maximum number of EJBs that are stored in each CEJB and have to appropriately size the database column that stores the users HashMap.
D. Configuring the vCEJB Pool Size N
By consolidating a large number of EJBs into a small number of vCEJBs, the number of rows in a relational database required to store entity EJB state can be substantially reduced. At the same time, the degree of locality in EJB operations increases, which has a positive effect on the efficacy of the EJB cache in a J2EE application server. In our example, we can reduce the number of database rows and EJB cache entries for storing n user entities from n to N.
With CUsers, the time for retrieving a user entity is divided into time for searching cached or uncached CUsers and time for an in-memory search within a HashMap. In the extreme case of N = 1, there is only one CUser and it is likely to be present in the EJB cache of the application server. In this case, the vCEJB is essentially a persistent and transacted HashMap. Even if the CUser is not cached, it can be located very quickly in the database. Most of the search time is spent in memory within the HashMap of the CUser. However, this HashMap grows potentially very large (to n entries) and can itself turn into a performance bottleneck. Moreover, the time for synchronizing the in-memory representation of CUser with the database at transaction commit time could be very long. The same applies to loading the CUser from the database at the beginning of a transaction with J2EE commit options B and C [2]. Note that for a
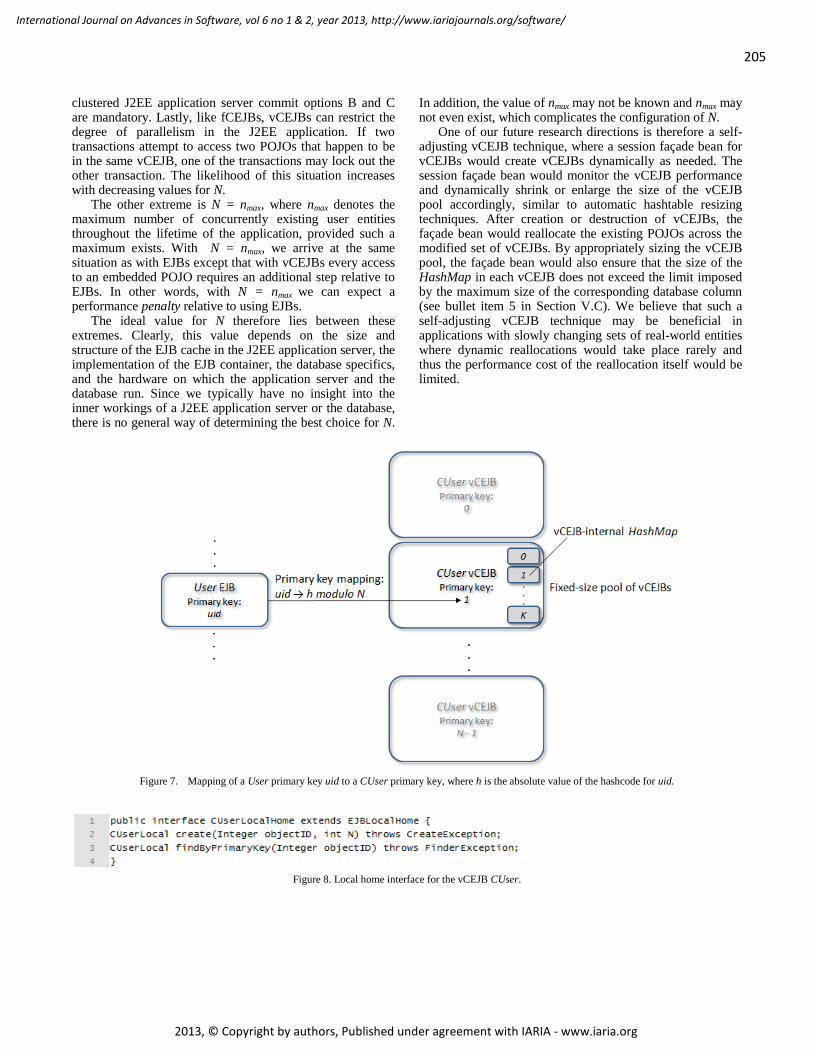
205
International Journal on Advances in Software, vol 6 no 1 & 2, year 2013, http://www.iariajournals.org/software/
2013, © Copyright by authors, Published under agreement with IARIA - www.iaria.org
clustered J2EE application server commit options B and C are mandatory. Lastly, like fCEJBs, vCEJBs can restrict the degree of parallelism in the J2EE application. If two transactions attempt to access two POJOs that happen to be in the same vCEJB, one of the transactions may lock out the other transaction. The likelihood of this situation increases with decreasing values for N.
The other extreme is N = nmax, where nmax denotes the maximum number of concurrently existing user entities throughout the lifetime of the application, provided such a maximum exists. With N = nmax, we arrive at the same situation as with EJBs except that with vCEJBs every access to an embedded POJO requires an additional step relative to EJBs. In other words, with N = nmax we can expect a performance penalty relative to using EJBs.
The ideal value for N therefore lies between these extremes. Clearly, this value depends on the size and structure of the EJB cache in the J2EE application server, the implementation of the EJB container, the database specifics, and the hardware on which the application server and the database run. Since we typically have no insight into the inner workings of a J2EE application server or the database, there is no general way of determining the best choice for N.
In addition, the value of nmax may not be known and nmax may not even exist, which complicates the configuration of N.
One of our future research directions is therefore a self-adjusting vCEJB technique, where a session façade bean for vCEJBs would create vCEJBs dynamically as needed. The session façade bean would monitor the vCEJB performance and dynamically shrink or enlarge the size of the vCEJB pool accordingly, similar to automatic hashtable resizing techniques. After creation or destruction of vCEJBs, the façade bean would reallocate the existing POJOs across the modified set of vCEJBs. By appropriately sizing the vCEJB pool, the façade bean would also ensure that the size of the HashMap in each vCEJB does not exceed the limit imposed by the maximum size of the corresponding database column (see bullet item 5 in Section V.C). We believe that such a self-adjusting vCEJB technique may be beneficial in applications with slowly changing sets of real-world entities where dynamic reallocations would take place rarely and thus the performance cost of the reallocation itself would be limited.
Figure 7. Mapping of a User primary key uid to a CUser primary key, where h is the absolute value of the hashcode for uid.
Figure 8. Local home interface for the vCEJB CUser.
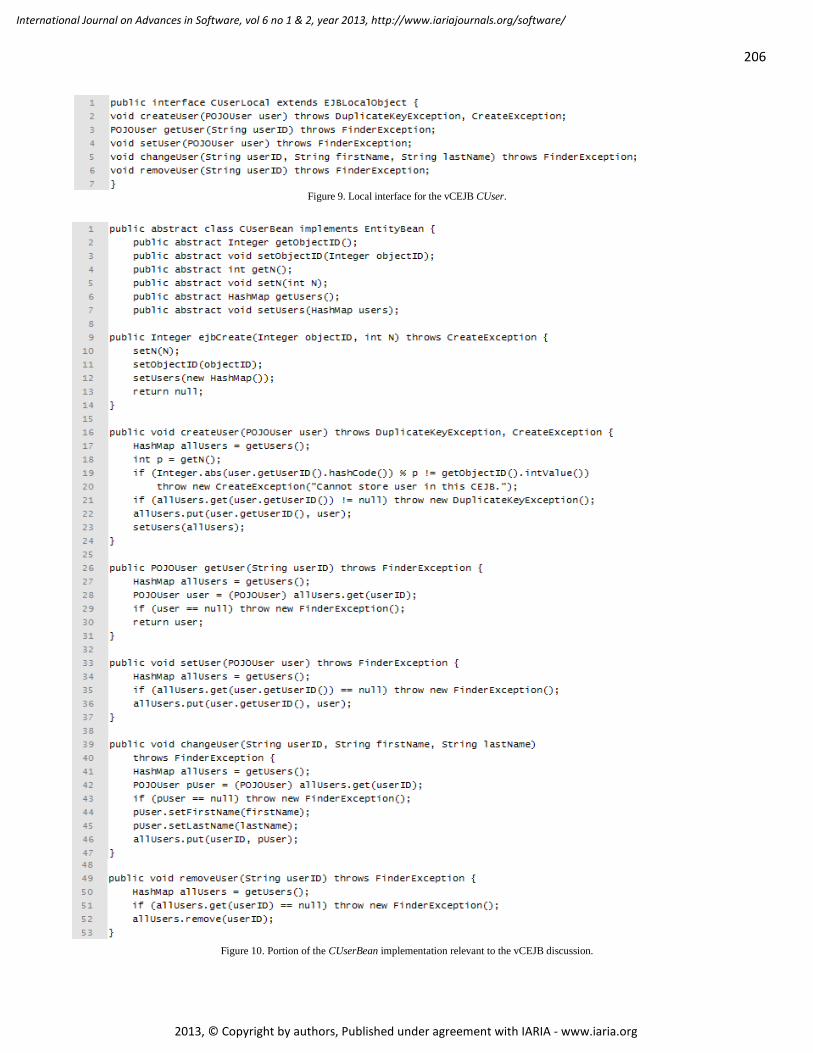
206
International Journal on Advances in Software, vol 6 no 1 & 2, year 2013, http://www.iariajournals.org/software/
2013, © Copyright by authors, Published under agreement with IARIA - www.iaria.org
Figure 9. Local interface for the vCEJB CUser.
Figure 10. Portion of the CUserBean implementation relevant to the vCEJB discussion.
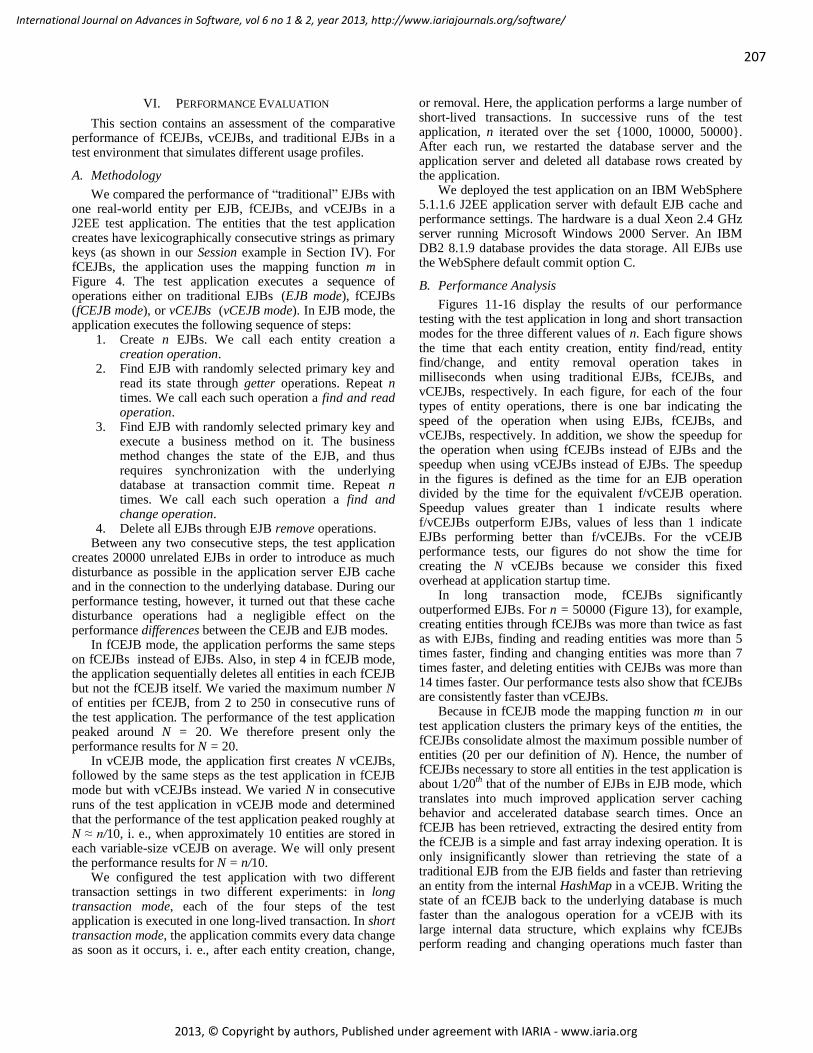
207
International Journal on Advances in Software, vol 6 no 1 & 2, year 2013, http://www.iariajournals.org/software/
2013, © Copyright by authors, Published under agreement with IARIA - www.iaria.org
VI. PERFORMANCE EVALUATION
This section contains an assessment of the comparative performance of fCEJBs, vCEJBs, and traditional EJBs in a test environment that simulates different usage profiles.
A. Methodology
We compared the performance of “traditional” EJBs with one real-world entity per EJB, fCEJBs, and vCEJBs in a J2EE test application. The entities that the test application creates have lexicographically consecutive strings as primary keys (as shown in our Session example in Section IV). For fCEJBs, the application uses the mapping function m in Figure 4. The test application executes a sequence of operations either on traditional EJBs (EJB mode), fCEJBs (fCEJB mode), or vCEJBs (vCEJB mode). In EJB mode, the application executes the following sequence of steps:
1. Create n EJBs. We call each entity creation a creation operation.
2. Find EJB with randomly selected primary key and read its state through getter operations. Repeat n times. We call each such operation a find and read operation.
3. Find EJB with randomly selected primary key and execute a business method on it. The business method changes the state of the EJB, and thus requires synchronization with the underlying database at transaction commit time. Repeat n times. We call each such operation a find and change operation.
4. Delete all EJBs through EJB remove operations. Between any two consecutive steps, the test application
creates 20000 unrelated EJBs in order to introduce as much disturbance as possible in the application server EJB cache and in the connection to the underlying database. During our performance testing, however, it turned out that these cache disturbance operations had a negligible effect on the performance differences between the CEJB and EJB modes.
In fCEJB mode, the application performs the same steps on fCEJBs instead of EJBs. Also, in step 4 in fCEJB mode, the application sequentially deletes all entities in each fCEJB but not the fCEJB itself. We varied the maximum number N of entities per fCEJB, from 2 to 250 in consecutive runs of the test application. The performance of the test application peaked around N = 20. We therefore present only the performance results for N = 20.
In vCEJB mode, the application first creates N vCEJBs, followed by the same steps as the test application in fCEJB mode but with vCEJBs instead. We varied N in consecutive runs of the test application in vCEJB mode and determined that the performance of the test application peaked roughly at N ≈ n/10, i. e., when approximately 10 entities are stored in each variable-size vCEJB on average. We will only present the performance results for N = n/10.
We configured the test application with two different transaction settings in two different experiments: in long transaction mode, each of the four steps of the test application is executed in one long-lived transaction. In short transaction mode, the application commits every data change as soon as it occurs, i. e., after each entity creation, change,
or removal. Here, the application performs a large number of short-lived transactions. In successive runs of the test application, n iterated over the set 1000, 10000, 50000. After each run, we restarted the database server and the application server and deleted all database rows created by the application.
We deployed the test application on an IBM WebSphere 5.1.1.6 J2EE application server with default EJB cache and performance settings. The hardware is a dual Xeon 2.4 GHz server running Microsoft Windows 2000 Server. An IBM DB2 8.1.9 database provides the data storage. All EJBs use the WebSphere default commit option C.
B. Performance Analysis
Figures 11-16 display the results of our performance testing with the test application in long and short transaction modes for the three different values of n. Each figure shows the time that each entity creation, entity find/read, entity find/change, and entity removal operation takes in milliseconds when using traditional EJBs, fCEJBs, and vCEJBs, respectively. In each figure, for each of the four types of entity operations, there is one bar indicating the speed of the operation when using EJBs, fCEJBs, and vCEJBs, respectively. In addition, we show the speedup for the operation when using fCEJBs instead of EJBs and the speedup when using vCEJBs instead of EJBs. The speedup in the figures is defined as the time for an EJB operation divided by the time for the equivalent f/vCEJB operation. Speedup values greater than 1 indicate results where f/vCEJBs outperform EJBs, values of less than 1 indicate EJBs performing better than f/vCEJBs. For the vCEJB performance tests, our figures do not show the time for creating the N vCEJBs because we consider this fixed overhead at application startup time.
In long transaction mode, fCEJBs significantly outperformed EJBs. For n = 50000 (Figure 13), for example, creating entities through fCEJBs was more than twice as fast as with EJBs, finding and reading entities was more than 5 times faster, finding and changing entities was more than 7 times faster, and deleting entities with CEJBs was more than 14 times faster. Our performance tests also show that fCEJBs are consistently faster than vCEJBs.
Because in fCEJB mode the mapping function m in our test application clusters the primary keys of the entities, the fCEJBs consolidate almost the maximum possible number of entities (20 per our definition of N). Hence, the number of fCEJBs necessary to store all entities in the test application is about 1/20
th that of the number of EJBs in EJB mode, which
translates into much improved application server caching behavior and accelerated database search times. Once an fCEJB has been retrieved, extracting the desired entity from the fCEJB is a simple and fast array indexing operation. It is only insignificantly slower than retrieving the state of a traditional EJB from the EJB fields and faster than retrieving an entity from the internal HashMap in a vCEJB. Writing the state of an fCEJB back to the underlying database is much faster than the analogous operation for a vCEJB with its large internal data structure, which explains why fCEJBs perform reading and changing operations much faster than
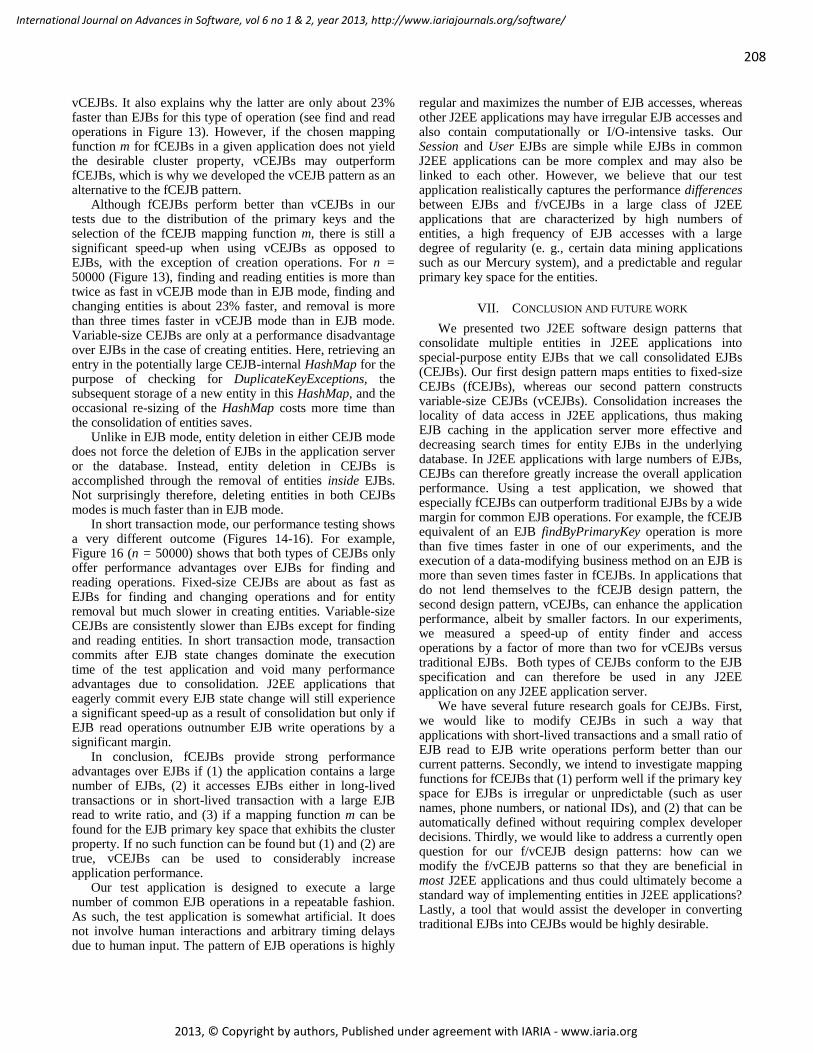
208
International Journal on Advances in Software, vol 6 no 1 & 2, year 2013, http://www.iariajournals.org/software/
2013, © Copyright by authors, Published under agreement with IARIA - www.iaria.org
vCEJBs. It also explains why the latter are only about 23% faster than EJBs for this type of operation (see find and read operations in Figure 13). However, if the chosen mapping function m for fCEJBs in a given application does not yield the desirable cluster property, vCEJBs may outperform fCEJBs, which is why we developed the vCEJB pattern as an alternative to the fCEJB pattern.
Although fCEJBs perform better than vCEJBs in our tests due to the distribution of the primary keys and the selection of the fCEJB mapping function m, there is still a significant speed-up when using vCEJBs as opposed to EJBs, with the exception of creation operations. For n = 50000 (Figure 13), finding and reading entities is more than twice as fast in vCEJB mode than in EJB mode, finding and changing entities is about 23% faster, and removal is more than three times faster in vCEJB mode than in EJB mode. Variable-size CEJBs are only at a performance disadvantage over EJBs in the case of creating entities. Here, retrieving an entry in the potentially large CEJB-internal HashMap for the purpose of checking for DuplicateKeyExceptions, the subsequent storage of a new entity in this HashMap, and the occasional re-sizing of the HashMap costs more time than the consolidation of entities saves.
Unlike in EJB mode, entity deletion in either CEJB mode does not force the deletion of EJBs in the application server or the database. Instead, entity deletion in CEJBs is accomplished through the removal of entities inside EJBs. Not surprisingly therefore, deleting entities in both CEJBs modes is much faster than in EJB mode.
In short transaction mode, our performance testing shows a very different outcome (Figures 14-16). For example, Figure 16 (n = 50000) shows that both types of CEJBs only offer performance advantages over EJBs for finding and reading operations. Fixed-size CEJBs are about as fast as EJBs for finding and changing operations and for entity removal but much slower in creating entities. Variable-size CEJBs are consistently slower than EJBs except for finding and reading entities. In short transaction mode, transaction commits after EJB state changes dominate the execution time of the test application and void many performance advantages due to consolidation. J2EE applications that eagerly commit every EJB state change will still experience a significant speed-up as a result of consolidation but only if EJB read operations outnumber EJB write operations by a significant margin.
In conclusion, fCEJBs provide strong performance advantages over EJBs if (1) the application contains a large number of EJBs, (2) it accesses EJBs either in long-lived transactions or in short-lived transaction with a large EJB read to write ratio, and (3) if a mapping function m can be found for the EJB primary key space that exhibits the cluster property. If no such function can be found but (1) and (2) are true, vCEJBs can be used to considerably increase application performance.
Our test application is designed to execute a large number of common EJB operations in a repeatable fashion. As such, the test application is somewhat artificial. It does not involve human interactions and arbitrary timing delays due to human input. The pattern of EJB operations is highly
regular and maximizes the number of EJB accesses, whereas other J2EE applications may have irregular EJB accesses and also contain computationally or I/O-intensive tasks. Our Session and User EJBs are simple while EJBs in common J2EE applications can be more complex and may also be linked to each other. However, we believe that our test application realistically captures the performance differences between EJBs and f/vCEJBs in a large class of J2EE applications that are characterized by high numbers of entities, a high frequency of EJB accesses with a large degree of regularity (e. g., certain data mining applications such as our Mercury system), and a predictable and regular primary key space for the entities.
VII. CONCLUSION AND FUTURE WORK
We presented two J2EE software design patterns that consolidate multiple entities in J2EE applications into special-purpose entity EJBs that we call consolidated EJBs (CEJBs). Our first design pattern maps entities to fixed-size CEJBs (fCEJBs), whereas our second pattern constructs variable-size CEJBs (vCEJBs). Consolidation increases the locality of data access in J2EE applications, thus making EJB caching in the application server more effective and decreasing search times for entity EJBs in the underlying database. In J2EE applications with large numbers of EJBs, CEJBs can therefore greatly increase the overall application performance. Using a test application, we showed that especially fCEJBs can outperform traditional EJBs by a wide margin for common EJB operations. For example, the fCEJB equivalent of an EJB findByPrimaryKey operation is more than five times faster in one of our experiments, and the execution of a data-modifying business method on an EJB is more than seven times faster in fCEJBs. In applications that do not lend themselves to the fCEJB design pattern, the second design pattern, vCEJBs, can enhance the application performance, albeit by smaller factors. In our experiments, we measured a speed-up of entity finder and access operations by a factor of more than two for vCEJBs versus traditional EJBs. Both types of CEJBs conform to the EJB specification and can therefore be used in any J2EE application on any J2EE application server.
We have several future research goals for CEJBs. First, we would like to modify CEJBs in such a way that applications with short-lived transactions and a small ratio of EJB read to EJB write operations perform better than our current patterns. Secondly, we intend to investigate mapping functions for fCEJBs that (1) perform well if the primary key space for EJBs is irregular or unpredictable (such as user names, phone numbers, or national IDs), and (2) that can be automatically defined without requiring complex developer decisions. Thirdly, we would like to address a currently open question for our f/vCEJB design patterns: how can we modify the f/vCEJB patterns so that they are beneficial in most J2EE applications and thus could ultimately become a standard way of implementing entities in J2EE applications? Lastly, a tool that would assist the developer in converting traditional EJBs into CEJBs would be highly desirable.
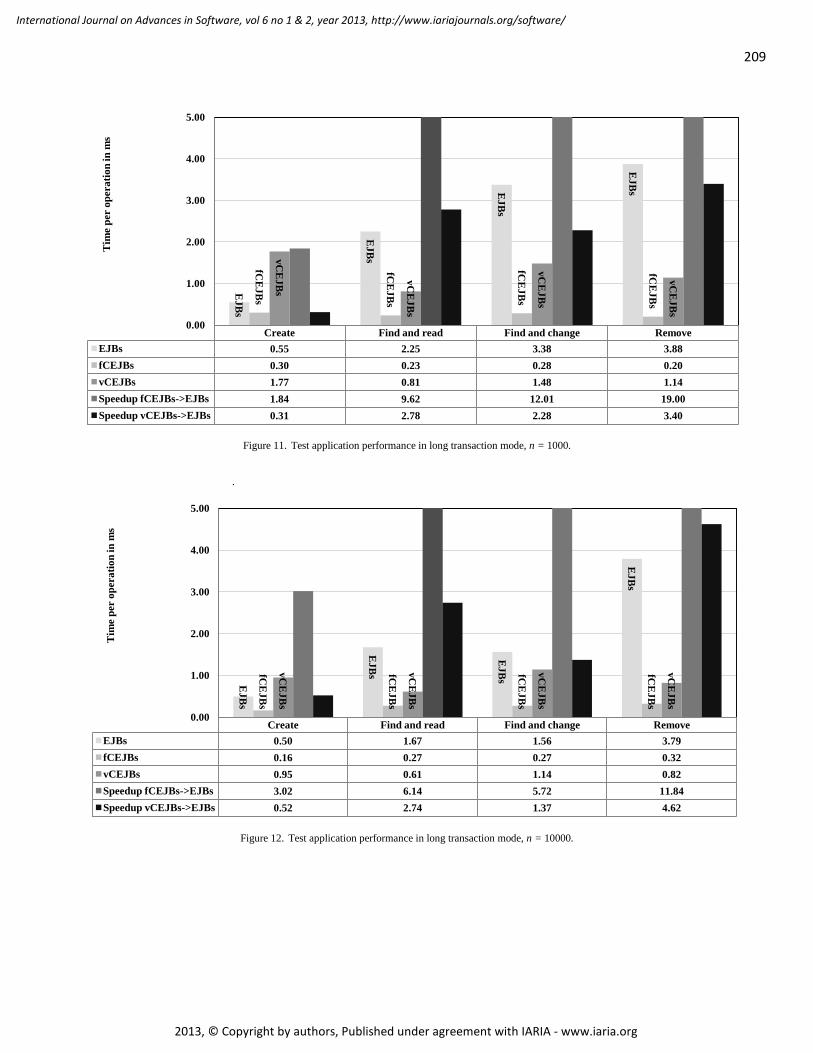
209
International Journal on Advances in Software, vol 6 no 1 & 2, year 2013, http://www.iariajournals.org/software/
2013, © Copyright by authors, Published under agreement with IARIA - www.iaria.org
Figure 11. Test application performance in long transaction mode, n = 1000.
.
Figure 12. Test application performance in long transaction mode, n = 10000.
Create Find and read Find and change Remove
EJBs 0.55 2.25 3.38 3.88
fCEJBs 0.30 0.23 0.28 0.20
vCEJBs 1.77 0.81 1.48 1.14
Speedup fCEJBs->EJBs 1.84 9.62 12.01 19.00
Speedup vCEJBs->EJBs 0.31 2.78 2.28 3.40
EJ
Bs
EJ
Bs
EJ
Bs
EJ
Bs
fCE
JB
s
fCE
JB
s
fCE
JB
s
fCE
JB
s
vC
EJ
Bs
vC
EJ
Bs
vC
EJ
Bs
vC
EJ
Bs
0.00
1.00
2.00
3.00
4.00
5.00 T
ime p
er o
pera
tio
n in
ms
Create Find and read Find and change Remove
EJBs 0.50 1.67 1.56 3.79
fCEJBs 0.16 0.27 0.27 0.32
vCEJBs 0.95 0.61 1.14 0.82
Speedup fCEJBs->EJBs 3.02 6.14 5.72 11.84
Speedup vCEJBs->EJBs 0.52 2.74 1.37 4.62
EJ
Bs
EJ
Bs
EJ
Bs
EJ
Bs
fCE
JB
s
fCE
JB
s
fCE
JB
s
fCE
JB
s
vC
EJ
Bs
vC
EJ
Bs
vC
EJ
Bs
vC
EJ
Bs
0.00
1.00
2.00
3.00
4.00
5.00
Tim
e p
er o
pera
tio
n in
ms
210
International Journal on Advances in Software, vol 6 no 1 & 2, year 2013, http://www.iariajournals.org/software/
2013, © Copyright by authors, Published under agreement with IARIA - www.iaria.org
Figure 13. Test application performance in long transaction mode, n = 50000.
Figure 14. Test application performance in short transaction mode, n = 1000.
Create Find and read Find and change Remove
EJBs 0.39 1.38 1.48 3.21
fCEJBs 0.17 0.24 0.20 0.23
vCEJBs 0.93 0.58 1.20 0.87
Speedup fCEJBs->EJBs 2.24 5.75 7.58 14.28
Speedup vCEJBs->EJBs 0.42 2.37 1.23 3.69
EJ
Bs
EJ
Bs
EJ
Bs
EJ
Bs
fCE
JB
s
fCE
JB
s
fCE
JB
s
fCE
JB
s
vC
EJ
Bs
vC
EJ
Bs
vC
EJ
Bs
vC
EJ
Bs
0.00
1.00
2.00
3.00
4.00
5.00 T
ime p
er o
pera
tio
n in
ms
Create Find and read Find and change Remove
EJBs 7.41 2.31 12.05 5.81
fCEJBs 10.34 0.36 12.41 5.08
vCEJBs 11.47 0.83 14.42 6.98
Speedup fCEJBs->EJBs 0.72 6.44 0.97 1.14
Speedup vCEJBs->EJBs 0.65 2.79 0.84 0.83
EJ
Bs
EJ
Bs
EJ
Bs
EJ
Bs
fCE
JB
s
fCE
JB
s
fCE
JB
s
fCE
JB
s
vC
EJ
Bs
vC
EJ
Bs
vC
EJ
Bs
vC
EJ
Bs
0.00
1.00
2.00
3.00
4.00
5.00
6.00
7.00
8.00
9.00
10.00
11.00
12.00
13.00
14.00
15.00
Tim
e p
er o
pera
tio
n in
ms
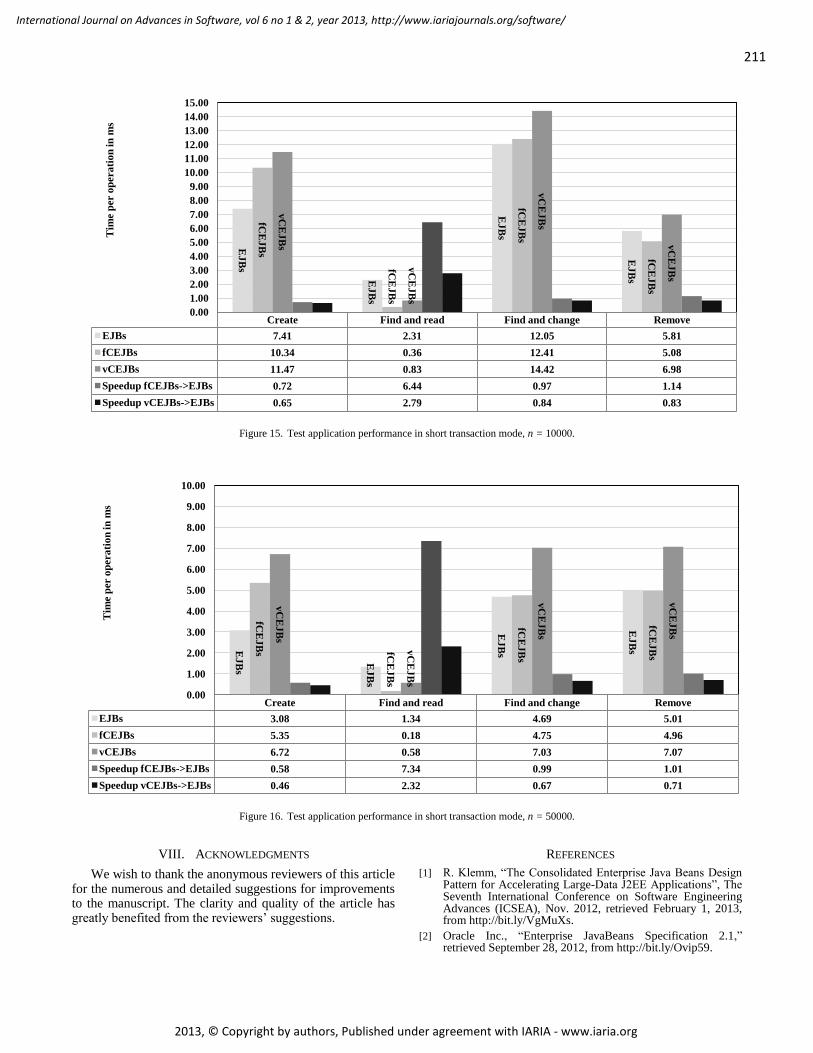
211
International Journal on Advances in Software, vol 6 no 1 & 2, year 2013, http://www.iariajournals.org/software/
2013, © Copyright by authors, Published under agreement with IARIA - www.iaria.org
Figure 15. Test application performance in short transaction mode, n = 10000.
Figure 16. Test application performance in short transaction mode, n = 50000.
VIII. ACKNOWLEDGMENTS
We wish to thank the anonymous reviewers of this article for the numerous and detailed suggestions for improvements to the manuscript. The clarity and quality of the article has greatly benefited from the reviewers’ suggestions.
REFERENCES
[1] R. Klemm, “The Consolidated Enterprise Java Beans Design Pattern for Accelerating Large-Data J2EE Applications”, The Seventh International Conference on Software Engineering Advances (ICSEA), Nov. 2012, retrieved February 1, 2013, from http://bit.ly/VgMuXs.
[2] Oracle Inc., “Enterprise JavaBeans Specification 2.1,” retrieved September 28, 2012, from http://bit.ly/Ovip59.
Create Find and read Find and change Remove
EJBs 7.41 2.31 12.05 5.81
fCEJBs 10.34 0.36 12.41 5.08
vCEJBs 11.47 0.83 14.42 6.98
Speedup fCEJBs->EJBs 0.72 6.44 0.97 1.14
Speedup vCEJBs->EJBs 0.65 2.79 0.84 0.83
EJ
Bs
EJ
Bs
EJ
Bs
EJ
Bs
fCE
JB
s
fCE
JB
s
fCE
JB
s
fCE
JB
s
vC
EJ
Bs
vC
EJ
Bs
vC
EJ
Bs
vC
EJ
Bs
0.00
1.00
2.00
3.00
4.00
5.00
6.00
7.00
8.00
9.00
10.00
11.00
12.00
13.00
14.00
15.00 T
ime p
er o
pera
tio
n in
ms
Create Find and read Find and change Remove
EJBs 3.08 1.34 4.69 5.01
fCEJBs 5.35 0.18 4.75 4.96
vCEJBs 6.72 0.58 7.03 7.07
Speedup fCEJBs->EJBs 0.58 7.34 0.99 1.01
Speedup vCEJBs->EJBs 0.46 2.32 0.67 0.71
EJ
Bs
EJ
Bs
EJ
Bs
EJ
Bs
fCE
JB
s fCE
JB
s
fCE
JB
s
fCE
JB
s
vC
EJ
Bs
vC
EJ
Bs
vC
EJ
Bs
vC
EJ
Bs
0.00
1.00
2.00
3.00
4.00
5.00
6.00
7.00
8.00
9.00
10.00
Tim
e p
er o
pera
tio
n in
ms
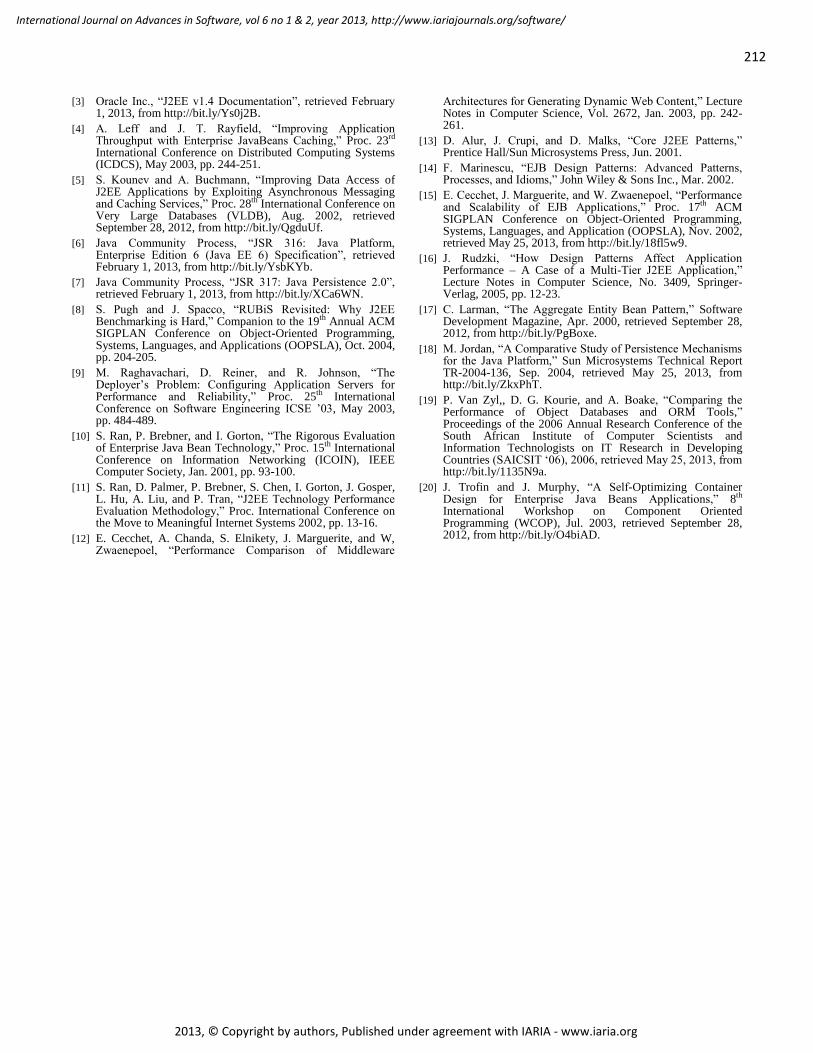
212
International Journal on Advances in Software, vol 6 no 1 & 2, year 2013, http://www.iariajournals.org/software/
2013, © Copyright by authors, Published under agreement with IARIA - www.iaria.org
[3] Oracle Inc., “J2EE v1.4 Documentation”, retrieved February 1, 2013, from http://bit.ly/Ys0j2B.
[4] A. Leff and J. T. Rayfield, “Improving Application Throughput with Enterprise JavaBeans Caching,” Proc. 23rd International Conference on Distributed Computing Systems (ICDCS), May 2003, pp. 244-251.
[5] S. Kounev and A. Buchmann, “Improving Data Access of J2EE Applications by Exploiting Asynchronous Messaging and Caching Services,” Proc. 28th International Conference on Very Large Databases (VLDB), Aug. 2002, retrieved September 28, 2012, from http://bit.ly/QgduUf.
[6] Java Community Process, “JSR 316: Java Platform, Enterprise Edition 6 (Java EE 6) Specification”, retrieved February 1, 2013, from http://bit.ly/YsbKYb.
[7] Java Community Process, “JSR 317: Java Persistence 2.0”, retrieved February 1, 2013, from http://bit.ly/XCa6WN.
[8] S. Pugh and J. Spacco, “RUBiS Revisited: Why J2EE Benchmarking is Hard,” Companion to the 19th Annual ACM SIGPLAN Conference on Object-Oriented Programming, Systems, Languages, and Applications (OOPSLA), Oct. 2004, pp. 204-205.
[9] M. Raghavachari, D. Reiner, and R. Johnson, “The Deployer’s Problem: Configuring Application Servers for Performance and Reliability,” Proc. 25th International Conference on Software Engineering ICSE ’03, May 2003, pp. 484-489.
[10] S. Ran, P. Brebner, and I. Gorton, “The Rigorous Evaluation of Enterprise Java Bean Technology,” Proc. 15th International Conference on Information Networking (ICOIN), IEEE Computer Society, Jan. 2001, pp. 93-100.
[11] S. Ran, D. Palmer, P. Brebner, S. Chen, I. Gorton, J. Gosper, L. Hu, A. Liu, and P. Tran, “J2EE Technology Performance Evaluation Methodology,” Proc. International Conference on the Move to Meaningful Internet Systems 2002, pp. 13-16.
[12] E. Cecchet, A. Chanda, S. Elnikety, J. Marguerite, and W, Zwaenepoel, “Performance Comparison of Middleware
Architectures for Generating Dynamic Web Content,” Lecture Notes in Computer Science, Vol. 2672, Jan. 2003, pp. 242-261.
[13] D. Alur, J. Crupi, and D. Malks, “Core J2EE Patterns,” Prentice Hall/Sun Microsystems Press, Jun. 2001.
[14] F. Marinescu, “EJB Design Patterns: Advanced Patterns, Processes, and Idioms,” John Wiley & Sons Inc., Mar. 2002.
[15] E. Cecchet, J. Marguerite, and W. Zwaenepoel, “Performance and Scalability of EJB Applications,” Proc. 17th ACM SIGPLAN Conference on Object-Oriented Programming, Systems, Languages, and Application (OOPSLA), Nov. 2002, retrieved May 25, 2013, from http://bit.ly/18fl5w9.
[16] J. Rudzki, “How Design Patterns Affect Application Performance – A Case of a Multi-Tier J2EE Application,” Lecture Notes in Computer Science, No. 3409, Springer-Verlag, 2005, pp. 12-23.
[17] C. Larman, “The Aggregate Entity Bean Pattern,” Software Development Magazine, Apr. 2000, retrieved September 28, 2012, from http://bit.ly/PgBoxe.
[18] M. Jordan, “A Comparative Study of Persistence Mechanisms for the Java Platform,” Sun Microsystems Technical Report TR-2004-136, Sep. 2004, retrieved May 25, 2013, from http://bit.ly/ZkxPhT.
[19] P. Van Zyl,, D. G. Kourie, and A. Boake, “Comparing the Performance of Object Databases and ORM Tools,” Proceedings of the 2006 Annual Research Conference of the South African Institute of Computer Scientists and Information Technologists on IT Research in Developing Countries (SAICSIT ‘06), 2006, retrieved May 25, 2013, from http://bit.ly/1135N9a.
[20] J. Trofin and J. Murphy, “A Self-Optimizing Container Design for Enterprise Java Beans Applications,” 8th International Workshop on Component Oriented Programming (WCOP), Jul. 2003, retrieved September 28, 2012, from http://bit.ly/O4biAD.
213
International Journal on Advances in Software, vol 6 no 1 & 2, year 2013, http://www.iariajournals.org/software/
2013, © Copyright by authors, Published under agreement with IARIA - www.iaria.org
Automated Software Engineering Process Assessment: Supporting Diverse Models using an Ontology
Gregor Grambow and Roy Oberhauser Computer Science Dept.
Aalen University Aalen, Germany
gregor.grambow, [email protected]
Manfred Reichert Institute for Databases and Information Systems
Ulm University Ulm, Germany
Abstract—Current software engineering process assessment reference models rely primarily on manual acquisition of evidence of practices. This manually collected data is then correlated with expected model attributes to assess compliance. Such manual data acquisition is inefficient and error-prone, and any assessment feedback is temporally detached from the original context by months or years. Yet in order to automate the process data acquisition and assessment, one is confronted with various challenges that such diverse project-specific software engineering environments involve. This paper presents an ontology-based approach for enhancing the degree of automation in current process assessment while simultaneously supporting diverse process assessment reference models (CMMI, ISO/IEC 15504, ISO 9001). It also provides an in-the-loop automated process assessment capability that can help software engineers receive immediate feedback on process issues. The evaluation showed the approach’s technical feasibility, model diversifiability across various process assessment models (CMMI, ISO/IEC 15504, ISO 9001), and suitable performance and scalability. The approach can reduce the effort required to determine process compliance, maturity, or improvement, and can provide more timely and precise feedback compared to current manual process assessment methods and tools.
Keywords-software engineering process assessment tooling; semantic technology; Capability Maturity Model Integration; ISO/IEC 15504; ISO 9000
I. INTRODUCTION This article extends our previous work in [1]. Processes -
be they technical, managerial, or quality processes, are an inherent part of software engineering (SE), and subsequently so is process assessment and process improvement [2]. Software process improvement typically involves some assessment, and common reference model assessment standards utilize external audits (CMMI [3], ISO 15504 [4], and ISO 9001 [5]) that are performed manually to gather compliance evidence. Often the maturity of software organizations is assessed based primarily on their process-orientation and correlation of processes to a reference model.
If SE processes were supported or enacted by process-aware information systems (PAIS), then the efficiency of data acquisition and analysis for process assessment could also be improved. One prerequisite - the adoption and use of
automated process enactment support is relatively rare in SE projects. This can be attributed to a number of factors: (1) software development projects face a high degree of new and changing technological dependencies (typically impacting project tool environments, knowledge management, process integration, and process data acquisition); (2) significant process modeling effort is necessary and PAIS usage has been somewhat restrictive [6]; (3) SE processes are knowledge processes [7], so that the exact operational determination and sequencing of tasks and activities is not readily foreknown; and (4) most current process models are too inflexible to mirror such detailed operational dynamics.
We developed the Context-aware Software Engineering Environment Event-driven frameworK (CoSEEEK) [8] to improve SE process support and guidance in an automated fashion. That way, enhanced support features are possible, such as automatically gathering information from the environment and users, uniting it with information from a knowledge base, and utilizing this information for on-the-fly process optimization (Section IIIC provides more information on CoSEEEK). Given such a context-aware event-driven automated process guidance system, we investigated the feasibility of enabling in-the-loop automated process assessment support. Our ontology-based approach semantically enhances a PAIS for SE operational process enactment and assessment support.
The paper is organized as follows: Section II describes the attributes of three common SE process reference models used in later sections. Section III describes general requirements and the solution approach for automated process assessment. An evaluation of this approach is described in Section IV. Section V positions related work relative to the solution approach. Section VII concludes the paper.
II. PROCESS ASSESSMENT MODELS Three of the most mature and prevalent process
assessment approaches used in software projects (CMMI, ISO/IEC 15504 / SPICE, and ISO 9001) are described in order to later show how automation was achieved. Despite the differences, with ISO 9000 being more of a requirement model and CMMI and SPICE meta-process models, they are similarly used for assessing process compliance or maturity. All three models have several basic concepts in common:

214
International Journal on Advances in Software, vol 6 no 1 & 2, year 2013, http://www.iariajournals.org/software/
2013, © Copyright by authors, Published under agreement with IARIA - www.iaria.org
They define basic activities to be executed in a project such as ‘Identify Configuration Items’ for configuration management. (These will be mapped by a concept called base practice in our approach.) These activities are grouped together (e.g., ‘Establish Baselines’ in the configuration management example, with these groupings being mapped by a concept called process in our approach.) In turn, the latter are further grouped (e.g., ‘Configuration Management’) to allow further structuring. (This will be mapped by a concept called process category in our approach.) To be able to rate these practices and processes, the assessment models feature a performance scale to quantify the assessment. Finally, most models use the quantified assessments to assign capability levels to processes.
A. CMMI CMMI (Capability Maturity Model Integration) [3] is one
of the most widely used assessment models. It exists in different constellations, from which CMMI-DEV (CMMI for Development) is utilized in our context. The CMMI staged representation model comprises five maturity levels (1-‘Initial’, 2-‘Managed’, 3-‘Defined’, 4-‘Quantitatively Managed’, 5-‘Optimizing’). The levels indicate ‘Degree of process improvement across a predefined set of process areas, in which all goals within the set are attained’ (cf. [3]). To implement this, each of the levels has subordinate activities that are organized as follows: A maturity level (e.g., ‘2’) has process categories (e.g., ‘Support’) that have process areas (e.g., ‘Configuration Management’) that have specific goals (e.g., ‘Establish Baselines’) that finally have specific practices (e.g., ‘Identify Configuration Items’). To illustrate the CMMI, the maturity levels, categories, and areas are shown in the following table:
To quantify the assessment, CMMI has a performance scale (1-‘unrated’, 2-‘not applicable’, 3-‘unsatisfied’, 4-‘satisfied’). Using these concepts, process assessment is applied as follows:
• Rate each generic and specific goal of a process area using the introduced performance scale.
• A maturity level is achieved if all process areas within the level and within each lower level are either 2 or 4 (cf. the performance scale introduced).
In addition to these concrete activities and maturity levels, CMMI features generic goals (e.g., ‘Institutionalize a Managed Process’) with generic practices (e.g., ‘Control Work Products’). These are subordinate to capability levels (0-‘Incomplete’, 1-‘Performed’, 2-‘Managed’, 3-‘Defined’, 4-‘Quantitatively Managed’, 5-‘Optimizing’). The latter indicate ‘Achievement of process improvement within an individual process area’ (cf. [3]). SCAMPI (Standard CMMI Appraisal Method for Process Improvement) [9] is the official CMMI appraisal method. It collects and characterizes findings in a Practice Implementation Indicator Database. According to SCAMPI, there is a direct relationship between specific and generic goals (SG and GG), which are required model components, and the specific and generic practices (SP and GP), which are expected model components. Satisfaction of the goals is determined by a detailed
investigation, and alternative practices could be implemented that are equally effective in achieving the intent of the goals.
TABLE I. CMMI
Mat. Level Category Process Area
2 Support Configuration Management (CM/SCM) 2 Support Measurement and Analysis (MA) 2 Project Man. Project Monitoring and Control (PMC) 2 Project Man. Project Planning (PP)
2 Support Process and Product Quality Assurance (PPQA)
2 Project Man. Requirements Management (REQM) 2 Project Man. Supplier Agreement Management (SAM) 3 Support Decision Analysis and Resolution (DAR) 3 Project Man. Integrated Project Management (IPM)
3 Process Man. Organizational Process Definition (OPD)
3 Process Man. Organizational Process Focus (OPF)
3 Process Man. Organizational Training (OT)
3 Engineering Product Integration (PI) 3 Engineering Requirements Development (RD) 3 Project Man. Risk Management (RSKM) 3 Engineering Technical Solution (TS) 3 Engineering Validation (VAL) 3 Engineering Verification (VER)
4 Process Man. Organizational Process Performance (OPP)
4 Project Man. Quantitative Project Management (QPM) 5 Support Causal Analysis and Resolution (CAR)
5 Process Man.
Organizational Performance Management (OPM)
B. ISO/IEC 15504 (SPICE) The SPICE (Software Process Improvement and
Capability Determination) [4][10] model is an international standard for measuring process performance. It originated from the process lifecycle standard ISO/IEC 12207 [11] and maturity models such as CMM (the predecessor of CMMI). SPICE comprises six capability levels (0-‘Incomplete process’, 1-‘Performed process’, 2-‘Managed process’, 3-‘Established process’, 4-‘Predictable process’, 5-‘Optimizing process’). Each of the latter has one or multiple process attributes (e.g., ‘2.1 Performance Management’). In the following table, the capability levels and process attributes are shown:
A process reference model was included in the initial version of the standard. This was later removed to support different process models (or the ISO/IEC 12207). Thus, mappings to various process models are possible. In this paper, the examples use the initial process model specifications for illustration. These comprised process categories (e.g., ‘Organization’) with processes (e.g., ‘Improve the process’) that contained base practices (e.g., ‘Identify reusable components’). SPICEs measurement model applies the following performance scale for

215
International Journal on Advances in Software, vol 6 no 1 & 2, year 2013, http://www.iariajournals.org/software/
2013, © Copyright by authors, Published under agreement with IARIA - www.iaria.org
assessment: 1-‘not achieved’ (0-15%), 2-‘partially achieved’ (16% - 50%), 3-‘largely achieved’ (51% - 85%), and 4-‘fully achieved’ (86% - 100%).
TABLE II. SPICE
Cap. Level Name Process Attribute
0 Incomplete process - 1 Performed process Process Performance 2 Managed process Performance Management Work Product Management 3 Established process Process Definition Process Deployment 4 Predictable process Process Measurement Process Control 5 Optimizing process Process Innovation Process Optimization. SPICE does not use assessments of practices to directly
determine whether an overall capability level is achieved, but uses them to assign to each process one or more capability levels and to use them to recursively calculate assessments for projects and organizations. The assessment comprises the following steps:
• Assess every base practice with respect to each of the process attributes.
• Determine the percentage of base practices of one process that have the same performance scale with respect to one process attribute.
• Assessment of the processes: Assign the capability level for process attributes where all base practices of the process have performance scale 3 or 4 and for all lower capability levels, the same applies with performance scale 4.
• Assessment of a project is done by using the mathematical mean of the ratings of all of its processes.
• Assessment of an organization is done by using the mathematical mean of the ratings of all of its projects.
C. ISO 9001 ISO 9000 comprises a family of standards relating to
quality management systems. ISO 9001 [5] deals with the requirements organizations must fulfill to meet the standard. Formal ISO 9001 certifications have gained great importance for organizations worldwide. The ISO 9001 assessment model uses no capability scale; it only determines whether a certain practice is in place. Therefore, a simple performance scale suffices: 0-‘not satisfied’, 1-‘satisfied'. The assessed practices are structured by process sub-systems (e.g., ‘Organization Management’) that contain main topic areas (e.g., ‘Management responsibility’). In turn, the latter contain management issues (e.g., ‘Define organization structure’). Based on these concepts, a recursive assessment can be applied rating an organization by its process sub-systems and the contained management issues with a pass threshold of 100%. Our approach is targeted at creating more quality
awareness in companies, not at replacing or conducting formal reviews. Therefore, the standard ISO 19001:2011 (Guidelines for auditing management systems) [12] is not taken into account here.
D. Summary As shown by these three assessment models, the
approaches to process assessment differ significantly. This applies for the concepts utilized as well as for the applied procedures: For example, CMMI knows two different types of levels that have subordinate activities. For ISO/IEC 15504, the levels have certain attributes that serve to assess all existing practices. As opposed to the two other models, ISO 9001 does not apply levels or different performance scales. These differences hamper convergence to a unified model or approach and present the primary technical challenge.
III. AUTOMATED PROCESS ASSESSMENT This section describes the approach taken to provide
automated process assessment including the requirements elicited for such an approach, application concept, conceptual framework, and procedure applied. The approach extends and annotates process management concepts, enhancing them with additional information required for assessment. The aim of our approach is not to replace manual ratings of processes conducted by humans or to be used in formal process audits. It shall rather contribute to the quality awareness of a company and provide information on the current state of the process as it is executed. Therefore, our approach, despite adding automated rating facilities, still integrates and relies on manual ratings or confirmations for ratings.
A. Requirements This sub-section briefly elicits basic requirements for
providing automated integration of process assessment and process execution facilities into SE project environments. These requirements are: - R:Proc: If a system aims at automatically integrating
assessments with the executed process, the first basic requirements is that the system must be aware of the process and be able to govern the latter.
- R:Cntx: To be able to not only be aware of the planned process, but also integrate with the real operational process as it is enacted by SE project members, facilities must be in place the provide usable context information to the system.
- R:MultModel: To be able to provide flexible support for diverse projects and organizations, the assessment approach should not be tied to a single assessment model. It should support implementation and customization of various models.
- R:Integrate: An automated assessment approach should not produce much additional effort or disturb users in their normal work. Therefore, the assessment facilities should integrate seamlessly with normal process execution.
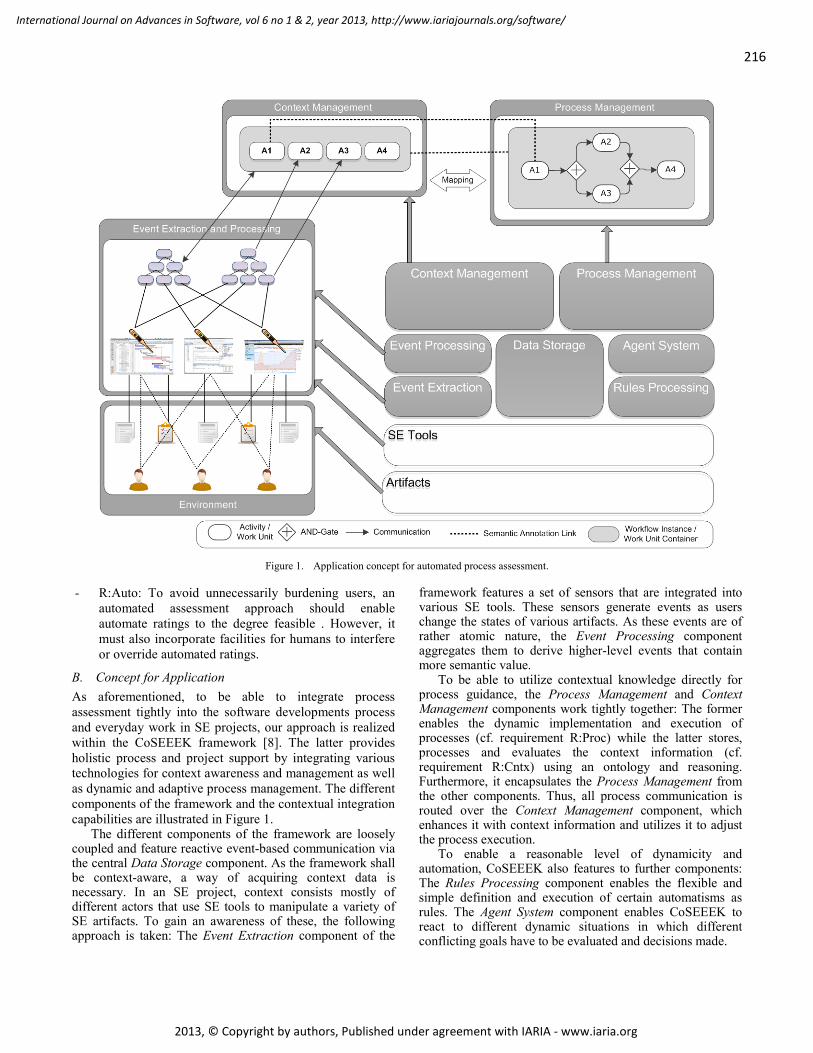
216
International Journal on Advances in Software, vol 6 no 1 & 2, year 2013, http://www.iariajournals.org/software/
2013, © Copyright by authors, Published under agreement with IARIA - www.iaria.org
Figure 1. Application concept for automated process assessment.
- R:Auto: To avoid unnecessarily burdening users, an automated assessment approach should enable automate ratings to the degree feasible . However, it must also incorporate facilities for humans to interfere or override automated ratings.
B. Concept for Application As aforementioned, to be able to integrate process assessment tightly into the software developments process and everyday work in SE projects, our approach is realized within the CoSEEEK framework [8]. The latter provides holistic process and project support by integrating various technologies for context awareness and management as well as dynamic and adaptive process management. The different components of the framework and the contextual integration capabilities are illustrated in Figure 1.
The different components of the framework are loosely coupled and feature reactive event-based communication via the central Data Storage component. As the framework shall be context-aware, a way of acquiring context data is necessary. In an SE project, context consists mostly of different actors that use SE tools to manipulate a variety of SE artifacts. To gain an awareness of these, the following approach is taken: The Event Extraction component of the
framework features a set of sensors that are integrated into various SE tools. These sensors generate events as users change the states of various artifacts. As these events are of rather atomic nature, the Event Processing component aggregates them to derive higher-level events that contain more semantic value.
To be able to utilize contextual knowledge directly for process guidance, the Process Management and Context Management components work tightly together: The former enables the dynamic implementation and execution of processes (cf. requirement R:Proc) while the latter stores, processes and evaluates the context information (cf. requirement R:Cntx) using an ontology and reasoning. Furthermore, it encapsulates the Process Management from the other components. Thus, all process communication is routed over the Context Management component, which enhances it with context information and utilizes it to adjust the process execution.
To enable a reasonable level of dynamicity and automation, CoSEEEK also features to further components: The Rules Processing component enables the flexible and simple definition and execution of certain automatisms as rules. The Agent System component enables CoSEEEK to react to different dynamic situations in which different conflicting goals have to be evaluated and decisions made.
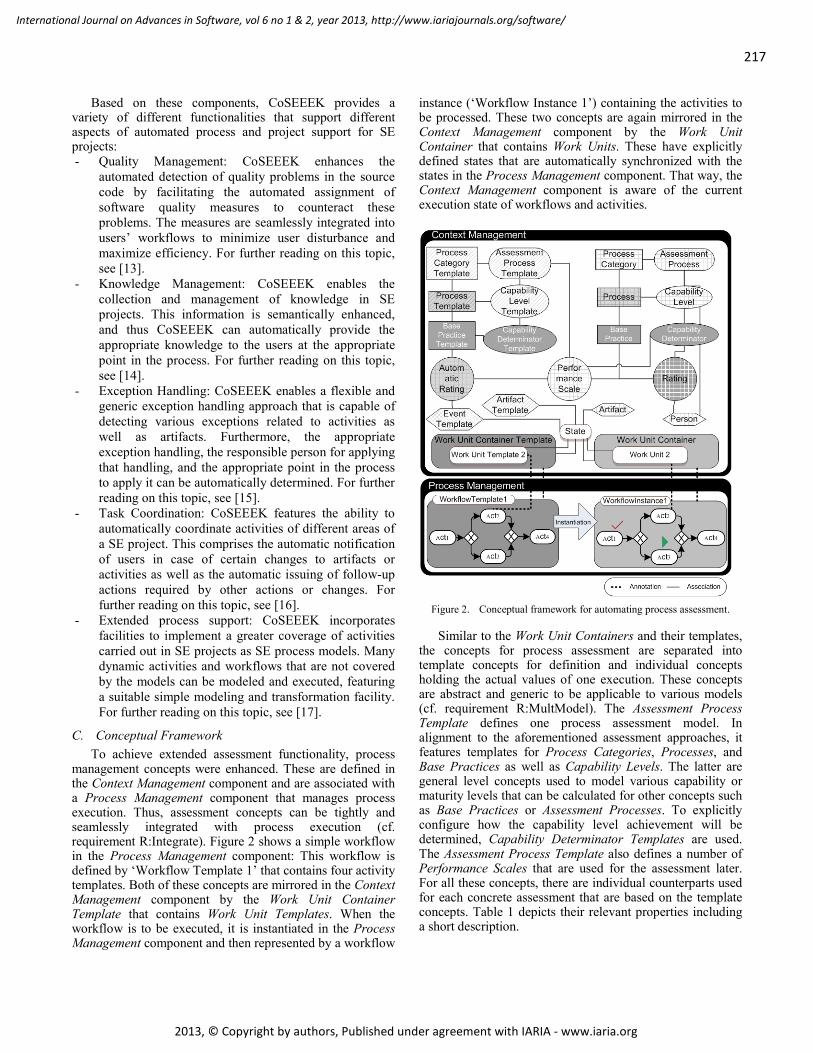
217
International Journal on Advances in Software, vol 6 no 1 & 2, year 2013, http://www.iariajournals.org/software/
2013, © Copyright by authors, Published under agreement with IARIA - www.iaria.org
Based on these components, CoSEEEK provides a variety of different functionalities that support different aspects of automated process and project support for SE projects: - Quality Management: CoSEEEK enhances the
automated detection of quality problems in the source code by facilitating the automated assignment of software quality measures to counteract these problems. The measures are seamlessly integrated into users’ workflows to minimize user disturbance and maximize efficiency. For further reading on this topic, see [13].
- Knowledge Management: CoSEEEK enables the collection and management of knowledge in SE projects. This information is semantically enhanced, and thus CoSEEEK can automatically provide the appropriate knowledge to the users at the appropriate point in the process. For further reading on this topic, see [14].
- Exception Handling: CoSEEEK enables a flexible and generic exception handling approach that is capable of detecting various exceptions related to activities as well as artifacts. Furthermore, the appropriate exception handling, the responsible person for applying that handling, and the appropriate point in the process to apply it can be automatically determined. For further reading on this topic, see [15].
- Task Coordination: CoSEEEK features the ability to automatically coordinate activities of different areas of a SE project. This comprises the automatic notification of users in case of certain changes to artifacts or activities as well as the automatic issuing of follow-up actions required by other actions or changes. For further reading on this topic, see [16].
- Extended process support: CoSEEEK incorporates facilities to implement a greater coverage of activities carried out in SE projects as SE process models. Many dynamic activities and workflows that are not covered by the models can be modeled and executed, featuring a suitable simple modeling and transformation facility. For further reading on this topic, see [17].
C. Conceptual Framework To achieve extended assessment functionality, process
management concepts were enhanced. These are defined in the Context Management component and are associated with a Process Management component that manages process execution. Thus, assessment concepts can be tightly and seamlessly integrated with process execution (cf. requirement R:Integrate). Figure 2 shows a simple workflow in the Process Management component: This workflow is defined by ‘Workflow Template 1’ that contains four activity templates. Both of these concepts are mirrored in the Context Management component by the Work Unit Container Template that contains Work Unit Templates. When the workflow is to be executed, it is instantiated in the Process Management component and then represented by a workflow
instance (‘Workflow Instance 1’) containing the activities to be processed. These two concepts are again mirrored in the Context Management component by the Work Unit Container that contains Work Units. These have explicitly defined states that are automatically synchronized with the states in the Process Management component. That way, the Context Management component is aware of the current execution state of workflows and activities.
Figure 2. Conceptual framework for automating process assessment.
Similar to the Work Unit Containers and their templates, the concepts for process assessment are separated into template concepts for definition and individual concepts holding the actual values of one execution. These concepts are abstract and generic to be applicable to various models (cf. requirement R:MultModel). The Assessment Process Template defines one process assessment model. In alignment to the aforementioned assessment approaches, it features templates for Process Categories, Processes, and Base Practices as well as Capability Levels. The latter are general level concepts used to model various capability or maturity levels that can be calculated for other concepts such as Base Practices or Assessment Processes. To explicitly configure how the capability level achievement will be determined, Capability Determinator Templates are used. The Assessment Process Template also defines a number of Performance Scales that are used for the assessment later. For all these concepts, there are individual counterparts used for each concrete assessment that are based on the template concepts. Table 1 depicts their relevant properties including a short description.
218
International Journal on Advances in Software, vol 6 no 1 & 2, year 2013, http://www.iariajournals.org/software/
2013, © Copyright by authors, Published under agreement with IARIA - www.iaria.org
TABLE III. CONCEPTS PROPERTIES
Property Description Assessment Process Template capabilityLevels all defined capability levels templates procCatTempls all defined process category templates Capability Level Template calcFor concept, for which the level is calculated capDet attached capability determinator templates perfScale required performance scale for achievement
scaleRatio ratio of capability determinators that must meet required performance scale
subCL subordinate capability level template subCLPerfScale required performance scale of subordinate level Level number indicating the level Capability Determinator Template Source base practice to be assessed Target capability level, for which this determinator is used
For flexibility in the assessment calculation, the
Capability Level Templates have a property ‘calcFor’ that is used to attach them to the target concept to be calculated (e.g., the whole assessment process when calculated for a project of a single process). As proposed by the three introduced models, level achievement calculation can rely on the assessment of the designated practices (be they required or expected) or subordinate levels. Therefore, the achievement of a capability level is determined by the following properties: ‘perfScale’ defines which Performance Scale the attached Capability Determinators has, and via ‘scaleRatio’ a ratio of Capability Determinators can be defined as required for the Performance Scale. Additionally, as the Capability Levels are connected to other subordinate levels, the Performance Scale of their determinators can also be used (cf. SPICE, required by the ‘subCLPerfScale’ property).
The assessment of the concrete individual concepts is then applied via the explicit Rating concept, which connects a Performance Scale with a Base Practice and a Capability Determinator. It can also be connected to a concrete Person who will then be asked to do the assessment. To support automation in the assessment procedure and unburden the users, it is also possible to automate ratings with Automated Rating. It can be connected to an Event Template concept that, in turn, is connected to the States of Artifacts or Work Unit Containers. That way, it can be configured so that when the Concept Management component receives certain status change events, a certain Performance Scale is assigned to a certain rating. Examples of such a definition include: ‘Assign Performance Scale 1 if workflow x is present (created)’ or ‘Assign Performance Scale 2 if workflow x is completed’ or ‘Assign Performance Scale 3 if Artifact y is in state z’.
D. Assessment Procedure The concrete assessment procedure applied to rate
process performance is shown in Listing 1. The following algorithm describes how a concrete Assessment Process is created from its template, how the ratings are applied to the
different Base Practices contained in the process, and how achievement of maturity/capability levels is determined.
Listing 1. The Rate Process Performance algorithm in pseudocode.
Require: Project P, AssessmentProcessTemplate APT, Person Pers 01: AssessmentProcess AP ← createConcept(APT) 02: linkConcepts(P, AP) 03: for all APT.processCategoryTemplates PCT do 04: ProcessCategory PC ← createConcept(PCT) 05: linkConcepts(AP, PC) 06: for all PCT.processTemplates PT do 07: Process PR ← createConcept(PRT) 08: linkConcepts(PC, PR) 09: for all PRT.basePracticesTemplates BPT do 10: BasePractice BP ← createConcept(BPT) 11: linkConcepts(PR, BP) 12: end for 13: end for 14: end for 15: for all APT.capabilityLevelTemplates CLT do 16: CapabilityLevel CL ← createConcept(CLT) 17: linkConcepts(AP, CL) 18: linkConcepts(CL, CLT.calculatedFor) 19: for all CLT.capabilityDeterminatorTemplates CDT do 20: CapabilityDeterminator CD ← createConcept(CDT) 21: linkConcepts(CL, CD) 22: List relatedBPs ← getRelatedBasePracts(CD, AP) 23: for all relatedBPs BP do 24: new rating(CD, BP, AP.getStandardPerformanceScale,Pers) 25: end for 26: end for 27: end for 28: automatedRating(AP) 29: manualRating(AP) 30: for all AP.capabilityLevels CL do 31: checkAchievement(CL) 32: end for
The algorithm requires a concrete project and an Assessment Process Template to be used for that project. The first part of the algorithm (lines 01-14) then creates a structure comprising Process Categories, Processes, and Base Practices for the new Assessment Process. For this paper, the following two functions are used: ‘createConcept’ creates an individual concept from a given template and ‘linkConcepts’ links two individual concepts together.
The second part of the algorithm (line 15-27) creates the Capability Level structure. Therefore, the Capability Levels and their attached Determinators are created first. Thereafter the Determinators are linked to the Base Practices they use for determining capability. This is done using the function ‘getRelatedBasePractices’ that gets all Base Practices in the current Assessment Process that are configured to be connected to a certain Capability Determinator via their templates. For each of these Base Practices, a new Rating is created linking them to the Capability Determinator. To this Rating, a standard Performance Scale (usually the one equal to ‘not achieved’) and a responsible person are attached.
The third part of the algorithm (lines 28-32) deals with the concrete assessment. During the whole project, an
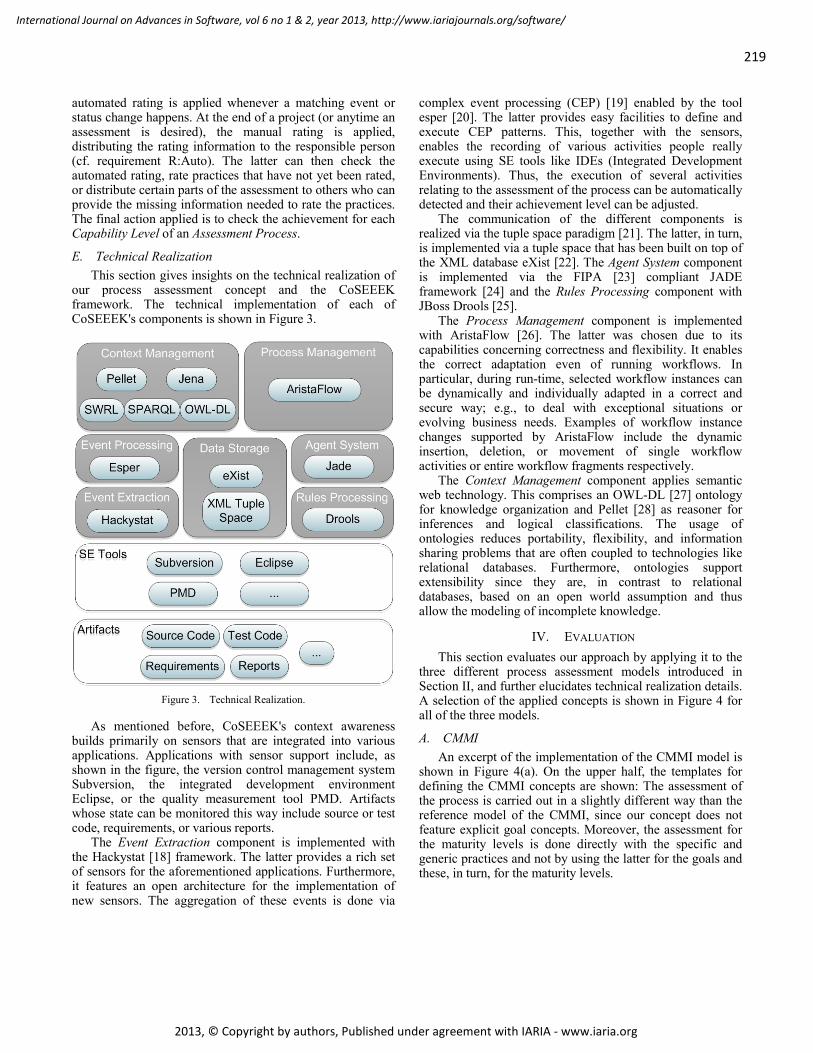
219
International Journal on Advances in Software, vol 6 no 1 & 2, year 2013, http://www.iariajournals.org/software/
2013, © Copyright by authors, Published under agreement with IARIA - www.iaria.org
automated rating is applied whenever a matching event or status change happens. At the end of a project (or anytime an assessment is desired), the manual rating is applied, distributing the rating information to the responsible person (cf. requirement R:Auto). The latter can then check the automated rating, rate practices that have not yet been rated, or distribute certain parts of the assessment to others who can provide the missing information needed to rate the practices. The final action applied is to check the achievement for each Capability Level of an Assessment Process.
E. Technical Realization This section gives insights on the technical realization of
our process assessment concept and the CoSEEEK framework. The technical implementation of each of CoSEEEK's components is shown in Figure 3.
Figure 3. Technical Realization.
As mentioned before, CoSEEEK's context awareness builds primarily on sensors that are integrated into various applications. Applications with sensor support include, as shown in the figure, the version control management system Subversion, the integrated development environment Eclipse, or the quality measurement tool PMD. Artifacts whose state can be monitored this way include source or test code, requirements, or various reports.
The Event Extraction component is implemented with the Hackystat [18] framework. The latter provides a rich set of sensors for the aforementioned applications. Furthermore, it features an open architecture for the implementation of new sensors. The aggregation of these events is done via
complex event processing (CEP) [19] enabled by the tool esper [20]. The latter provides easy facilities to define and execute CEP patterns. This, together with the sensors, enables the recording of various activities people really execute using SE tools like IDEs (Integrated Development Environments). Thus, the execution of several activities relating to the assessment of the process can be automatically detected and their achievement level can be adjusted.
The communication of the different components is realized via the tuple space paradigm [21]. The latter, in turn, is implemented via a tuple space that has been built on top of the XML database eXist [22]. The Agent System component is implemented via the FIPA [23] compliant JADE framework [24] and the Rules Processing component with JBoss Drools [25].
The Process Management component is implemented with AristaFlow [26]. The latter was chosen due to its capabilities concerning correctness and flexibility. It enables the correct adaptation even of running workflows. In particular, during run-time, selected workflow instances can be dynamically and individually adapted in a correct and secure way; e.g., to deal with exceptional situations or evolving business needs. Examples of workflow instance changes supported by AristaFlow include the dynamic insertion, deletion, or movement of single workflow activities or entire workflow fragments respectively.
The Context Management component applies semantic web technology. This comprises an OWL-DL [27] ontology for knowledge organization and Pellet [28] as reasoner for inferences and logical classifications. The usage of ontologies reduces portability, flexibility, and information sharing problems that are often coupled to technologies like relational databases. Furthermore, ontologies support extensibility since they are, in contrast to relational databases, based on an open world assumption and thus allow the modeling of incomplete knowledge.
IV. EVALUATION This section evaluates our approach by applying it to the
three different process assessment models introduced in Section II, and further elucidates technical realization details. A selection of the applied concepts is shown in Figure 4 for all of the three models.
A. CMMI An excerpt of the implementation of the CMMI model is
shown in Figure 4(a). On the upper half, the templates for defining the CMMI concepts are shown: The assessment of the process is carried out in a slightly different way than the reference model of the CMMI, since our concept does not feature explicit goal concepts. Moreover, the assessment for the maturity levels is done directly with the specific and generic practices and not by using the latter for the goals and these, in turn, for the maturity levels.
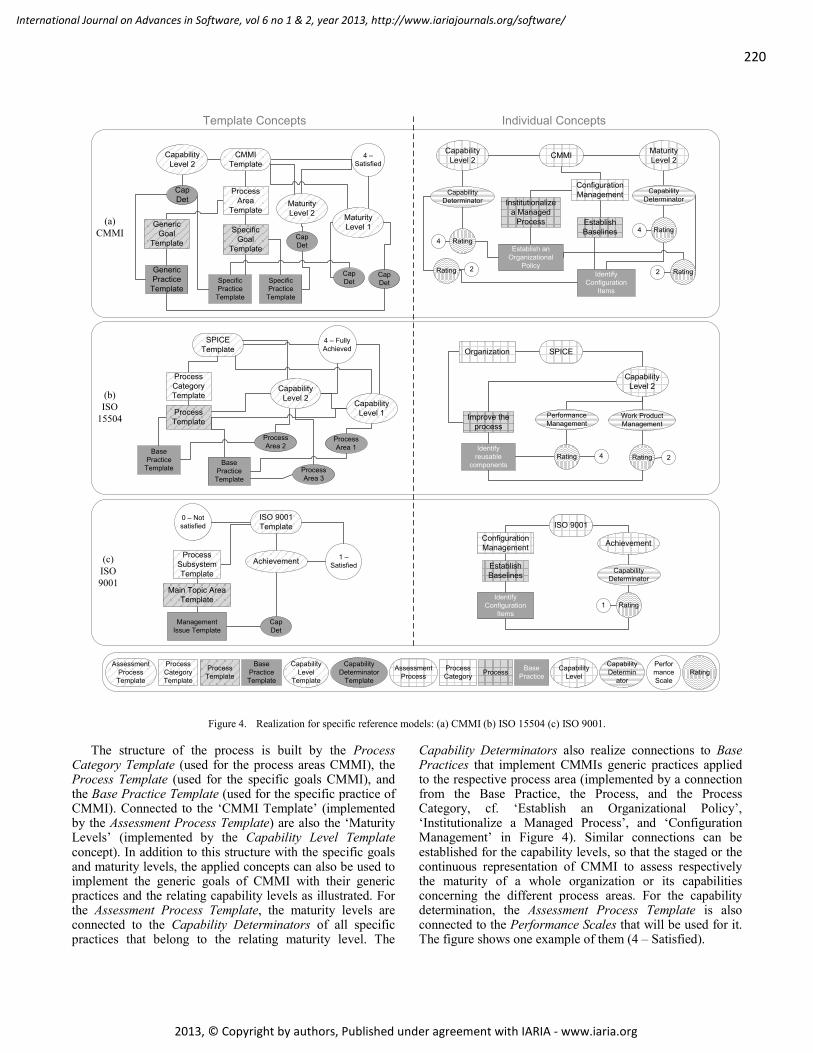
220
International Journal on Advances in Software, vol 6 no 1 & 2, year 2013, http://www.iariajournals.org/software/
2013, © Copyright by authors, Published under agreement with IARIA - www.iaria.org
Process Category Template
Capability Level
Template
ProcessTemplate
BasePractice Template
Process Category Process
Performance Scale
Base Practice
Assessment Process
Assessment Process Template
Capability Determinator
Template
Capability Level
Capability Determin
atorRating
CMMI Template
SPICE Template
ISO 9001 Template
CMMI
ISO 9001
SPICE
Process Category Template
Process Area
Template
Process Subsystem Template
Generic Goal
Template
Specific Goal
Template
ProcessTemplate
Main Topic AreaTemplate
Generic Practice Template
BasePractice Template
Specific Practice Template
Specific Practice Template
BasePractice Template
Management Issue Template
Capability Level 2
Maturity Level 2 Maturity
Level 1
Capability Level 2
Capability Level 1
Achievement
Cap Det
Cap Det
Cap Det
Cap Det
Process Area 1
Process Area 2
Process Area 3
4 – Fully Achieved
0 – Not satisfied
1 – Satisfied
Configuration Management
Organization
Configuration Management
Establish Baselines
Institutionalize a Managed
Process
Improve the process
Establish Baselines
Establish an Organizational
PolicyIdentify
Configuration Items
Identify reusable
components
Identify Configuration
Items
Capability Level 2
Maturity Level 2
Capability Level 2
Achievement
Capability Determinator
Capability Determinator
Performance Management
Work Product Management
Capability Determinator
Rating
Rating
Rating
Rating
RatingRating
Rating
2
1
4
2
44
2
(a) CMMI
(b) ISO
15504
(c) ISO 9001
Individual ConceptsTemplate Concepts
4 – Satisfied
Cap Det
Figure 4. Realization for specific reference models: (a) CMMI (b) ISO 15504 (c) ISO 9001.
The structure of the process is built by the Process Category Template (used for the process areas CMMI), the Process Template (used for the specific goals CMMI), and the Base Practice Template (used for the specific practice of CMMI). Connected to the ‘CMMI Template’ (implemented by the Assessment Process Template) are also the ‘Maturity Levels’ (implemented by the Capability Level Template concept). In addition to this structure with the specific goals and maturity levels, the applied concepts can also be used to implement the generic goals of CMMI with their generic practices and the relating capability levels as illustrated. For the Assessment Process Template, the maturity levels are connected to the Capability Determinators of all specific practices that belong to the relating maturity level. The
Capability Determinators also realize connections to Base Practices that implement CMMIs generic practices applied to the respective process area (implemented by a connection from the Base Practice, the Process, and the Process Category, cf. ‘Establish an Organizational Policy’, ‘Institutionalize a Managed Process’, and ‘Configuration Management’ in Figure 4). Similar connections can be established for the capability levels, so that the staged or the continuous representation of CMMI to assess respectively the maturity of a whole organization or its capabilities concerning the different process areas. For the capability determination, the Assessment Process Template is also connected to the Performance Scales that will be used for it. The figure shows one example of them (4 – Satisfied).
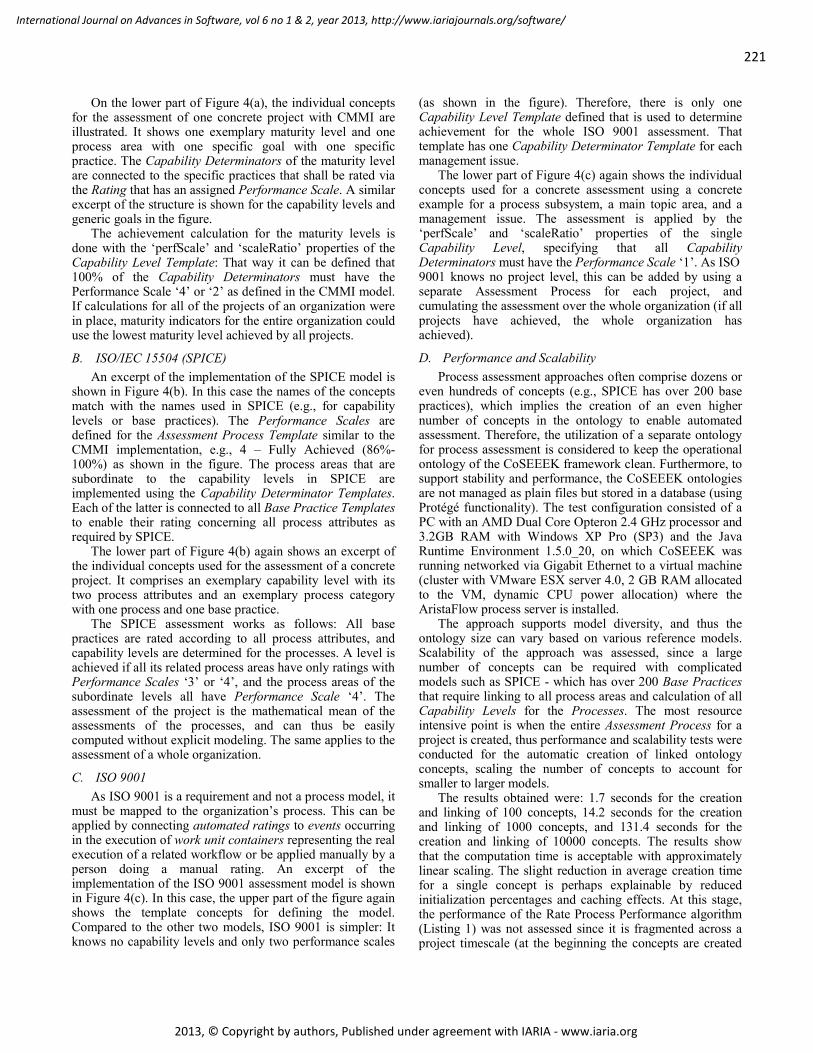
221
International Journal on Advances in Software, vol 6 no 1 & 2, year 2013, http://www.iariajournals.org/software/
2013, © Copyright by authors, Published under agreement with IARIA - www.iaria.org
On the lower part of Figure 4(a), the individual concepts for the assessment of one concrete project with CMMI are illustrated. It shows one exemplary maturity level and one process area with one specific goal with one specific practice. The Capability Determinators of the maturity level are connected to the specific practices that shall be rated via the Rating that has an assigned Performance Scale. A similar excerpt of the structure is shown for the capability levels and generic goals in the figure.
The achievement calculation for the maturity levels is done with the ‘perfScale’ and ‘scaleRatio’ properties of the Capability Level Template: That way it can be defined that 100% of the Capability Determinators must have the Performance Scale ‘4’ or ‘2’ as defined in the CMMI model. If calculations for all of the projects of an organization were in place, maturity indicators for the entire organization could use the lowest maturity level achieved by all projects.
B. ISO/IEC 15504 (SPICE) An excerpt of the implementation of the SPICE model is
shown in Figure 4(b). In this case the names of the concepts match with the names used in SPICE (e.g., for capability levels or base practices). The Performance Scales are defined for the Assessment Process Template similar to the CMMI implementation, e.g., 4 – Fully Achieved (86%-100%) as shown in the figure. The process areas that are subordinate to the capability levels in SPICE are implemented using the Capability Determinator Templates. Each of the latter is connected to all Base Practice Templates to enable their rating concerning all process attributes as required by SPICE.
The lower part of Figure 4(b) again shows an excerpt of the individual concepts used for the assessment of a concrete project. It comprises an exemplary capability level with its two process attributes and an exemplary process category with one process and one base practice.
The SPICE assessment works as follows: All base practices are rated according to all process attributes, and capability levels are determined for the processes. A level is achieved if all its related process areas have only ratings with Performance Scales ‘3’ or ‘4’, and the process areas of the subordinate levels all have Performance Scale ‘4’. The assessment of the project is the mathematical mean of the assessments of the processes, and can thus be easily computed without explicit modeling. The same applies to the assessment of a whole organization.
C. ISO 9001 As ISO 9001 is a requirement and not a process model, it
must be mapped to the organization’s process. This can be applied by connecting automated ratings to events occurring in the execution of work unit containers representing the real execution of a related workflow or be applied manually by a person doing a manual rating. An excerpt of the implementation of the ISO 9001 assessment model is shown in Figure 4(c). In this case, the upper part of the figure again shows the template concepts for defining the model. Compared to the other two models, ISO 9001 is simpler: It knows no capability levels and only two performance scales
(as shown in the figure). Therefore, there is only one Capability Level Template defined that is used to determine achievement for the whole ISO 9001 assessment. That template has one Capability Determinator Template for each management issue.
The lower part of Figure 4(c) again shows the individual concepts used for a concrete assessment using a concrete example for a process subsystem, a main topic area, and a management issue. The assessment is applied by the ‘perfScale’ and ‘scaleRatio’ properties of the single Capability Level, specifying that all Capability Determinators must have the Performance Scale ‘1’. As ISO 9001 knows no project level, this can be added by using a separate Assessment Process for each project, and cumulating the assessment over the whole organization (if all projects have achieved, the whole organization has achieved).
D. Performance and Scalability Process assessment approaches often comprise dozens or
even hundreds of concepts (e.g., SPICE has over 200 base practices), which implies the creation of an even higher number of concepts in the ontology to enable automated assessment. Therefore, the utilization of a separate ontology for process assessment is considered to keep the operational ontology of the CoSEEEK framework clean. Furthermore, to support stability and performance, the CoSEEEK ontologies are not managed as plain files but stored in a database (using Protégé functionality). The test configuration consisted of a PC with an AMD Dual Core Opteron 2.4 GHz processor and 3.2GB RAM with Windows XP Pro (SP3) and the Java Runtime Environment 1.5.0_20, on which CoSEEEK was running networked via Gigabit Ethernet to a virtual machine (cluster with VMware ESX server 4.0, 2 GB RAM allocated to the VM, dynamic CPU power allocation) where the AristaFlow process server is installed.
The approach supports model diversity, and thus the ontology size can vary based on various reference models. Scalability of the approach was assessed, since a large number of concepts can be required with complicated models such as SPICE - which has over 200 Base Practices that require linking to all process areas and calculation of all Capability Levels for the Processes. The most resource intensive point is when the entire Assessment Process for a project is created, thus performance and scalability tests were conducted for the automatic creation of linked ontology concepts, scaling the number of concepts to account for smaller to larger models.
The results obtained were: 1.7 seconds for the creation and linking of 100 concepts, 14.2 seconds for the creation and linking of 1000 concepts, and 131.4 seconds for the creation and linking of 10000 concepts. The results show that the computation time is acceptable with approximately linear scaling. The slight reduction in average creation time for a single concept is perhaps explainable by reduced initialization percentages and caching effects. At this stage, the performance of the Rate Process Performance algorithm (Listing 1) was not assessed since it is fragmented across a project timescale (at the beginning the concepts are created
222
International Journal on Advances in Software, vol 6 no 1 & 2, year 2013, http://www.iariajournals.org/software/
2013, © Copyright by authors, Published under agreement with IARIA - www.iaria.org
and later the ratings are applied), it is dependent on human responses (manual ratings), and live project data has not as yet been collected.
V. RELATED WORK This section reviews different areas of related work: At
first, approaches covering the basic requirements for implementing automated process assessment support are reviewed. This includes automated process and project support as well as the contextual integration of process management. After that, approaches enabling semantic extensions to process management concepts are examined. Finally, approaches aiming at directly supporting automated assessments are discussed.
A. Automated Process Support To integrate automated assessments with operational
process execution, holistic process support should be enabled by that system. In related work, many approaches target that topic. However, many of them focus strongly on governing activities and their dependencies. One of them is the framework CASDE [29]. It utilizes activity theory to provide a role-based awareness module managing mutual awareness of different roles in the project. The collaborative SE framework CAISE [30] enables the integration of SE tools and the development of new SE tools based on collaboration patterns. Caramba [31] provides coordination capabilities for virtual teams. It features support for ad-hoc workflows utilizing connections between different artifacts, resources, and processes. For pre-modeled workflows, UML activity diagram notation is used. For ad-hoc workflows not matching a template, an empty process is instantiated. In that case, work between different project members is coordinated via so-called Organizational Objects. The process-centered SE environment EPOS [32] applies planning techniques to automatically adapt a process instance if certain goals are violated. All of these approaches have capabilities for supporting and automating process execution in SE projects, yet none enacted an entire SE process model and thus failed to provide holistic project support.
B. Contextual Process Integration As discussed in the requirements section, to be integrated
with the real operational process of SE projects, a system providing process support must also take into account contextual data. In related work, numerous approaches for context modeling exist, including frameworks like Context Management [33], CASS [34], SOCAM [35], and CORTEX [36]. These provide support for gathering, storing, and processing context data, but leave the reaction to context changes to the application, or use rule-based approaches that are hard to maintain. There are only few approaches combining context-awareness with workflows. One of these is inContext [37] that makes heavy use of context knowledge for supporting teamwork. However, inContext does not offer the necessary capabilities to implement whole SE process models.
C. Semantic Process Extensions As aforementioned, the assessment concepts elaborated
in this work are implemented as semantic extensions of process management concepts. This enables tight integration with process execution. In related work, there are various approaches implementing such extensions to process management for different purposes: COBRA [38] focuses business process analysis and, for that purpose, presents a core ontology. With the latter, it supports better and easier analysis of processes to comply with standards or laws like the Sarbanes-Oxley act. [39] presents a semantic business process repository that fosters automation of the business process lifecycle and offers capabilities for checking in and out, as well as locking and options for simple querying and complex reasoning. The approach presented in [40] features multiple levels of semantic annotations: a meta-model annotation, a model content annotation, and a model profile annotation as well as a process template modeling language. With these annotations, it aims at facilitating process models across various model representations and languages. A concept for machine-readable process models is presented by [41]. It targets achieving better integration and automation and utilizes a combination of Petri Nets and an ontology, whereby direct mappings of Petri Net concepts in the ontology are established. [42] describes an approach that proposes an effective method for managing and evaluating business processes via the combination of semantic and agent technology to monitor business processes. None of these approaches provides a general semantic extension that allows direct interaction with and management of process execution as well as extensibility to achieve an integration between the latter and process assessment approaches.
D. Automated Process Assessment Support The core area of related work for this paper is automated
process assessment. In this area, a number of approaches exist. One of these constitutes a multi-agent system approach that is presented in [43], to enable automatic measurements for the SW-CMM (Software Capability Maturity Model). The latter is combined with the GQM (Goal-Question-Metric) [44] method, where Goals of the SW-CMM are used as a first step for GQM.
An OWL ontology and reasoner approach for CMMI-SW (CMMI for Software) is presented in [45]. In contrast to our approach, the size of the ontology caused issues for the reasoner. A software process ontology in [46] enables the capturing of software processes on a conceptual level. An extension includes specific models such as SPICE or CMMI. Ontological modeling of both CMMI and ISO 9001 as well as certain process interoperability features is shown in [47]. The authors identify issues in consistently implementing both models simultaneously. This problem was addressed in our approach by including concepts abstracted from a single model. In [48], a Process-Centered Software Engineering Environment supports process implementation focused on CMMI and a Brazilian process improvement model. For CMMI-specific appraisals, multiple supportive tools are available such as the Appraisal Assistant [49]. However, these focus only on CMMI / SCAMPI support.
223
International Journal on Advances in Software, vol 6 no 1 & 2, year 2013, http://www.iariajournals.org/software/
2013, © Copyright by authors, Published under agreement with IARIA - www.iaria.org
We provide a more general and flexible approach, since the applied concepts are abstracted from a single model. In contrast to above related work that focused on one or two specific models, ours is capable of assessment model diversity as shown in Section IV. Furthermore, it integrates automated SE process enactment support and supports a combination of automated and manual ratings. That way, the assessment is tightly and automatically integrated with SE process execution support, providing the option of automatic on-the-fly assessments while preserving the ability for humans to manually rate practices and processes. This can support quality awareness.
VI. CONCLUSION AND FUTURE WORK This paper has described an ontology-based multi-model
holistic approach for automating the assessment of software engineering processes. Extending our prior work in [1], richer technical details were presented and related work was expanded. Also general requirements for such an approach were described, those being R:Proc, R:Cntx, R:MultModel, R:Integrate, and R:Auto. Then the differences between three common SE process reference models were elucidated. Thereafter, our conceptual framework with semantic extensions to a process-aware information system was presented. It was shown how process reference models such as CMMI, ISO 15504, and ISO 9001 were unified in the ontology and the algorithm that performs the assessment was described. The evaluation demonstrated the technical feasibility, model diversity, and that performance with current technology for expected application scenarios is sufficient.
Our approach is not meant to replace manual ratings or formal appraisals. In our opinion, this is not possible in an automated fashion due to the many factors influencing such ratings in real world process execution. However, our approach can support automatic data collection, supplement manual ratings of practices or processes, contribute to the quality awareness of an organization, and (automatically) highlight areas for process optimization. Furthermore, it can help prepare an organization for a formal appraisal.
Future work involves empirical studies to evaluate the effectiveness of the approach in industrial settings with a variety of software organizations, with various SE process lifecycle models in various projects, at various process capability levels and utilizing different process assessment standards simultaneously.
ACKNOWLEDGMENT This work was sponsored by the BMBF (Federal
Ministry of Education and Research) of the Federal Republic of Germany under Contract No. 17N4809.
REFERENCES [1] G. Grambow, R. Oberhauser, and M. Reichert, “Towards Automated
Process Assessment in Software Engineering,” 7th Int’l Conf. on Software Engineering Advances, 2012, pp. 289-295.
[2] P. Bourque and R. Dupuis, (ed.), “Guide to the Software Engineering Body of Knowledge”, IEEE Computer Society, 2004.
[3] CMMI Product Team, “CMMI for Development, Version 1.3,” Software Engineering Institute, Carnegie Mellon University, 2010.
[4] ISO, “ISO/IEC 15504-2 -- Part 2: Performing an assessment,” 2003. [5] R. Bamford, and W. J. Deibler, “ISO 9001: 2000 for software and
systems providers: an engineering approach,” CRC-Press, 2004. [6] M. Reichert and B. Weber, “Enabling Flexibility in Process-aware
Information Systems – Challenges, Methods, Technologies,” Springer, 2012.
[7] G. Grambow, R. Oberhauser, and M. Reichert, “Towards Dynamic Knowledge Support in Software Engineering Processes,” 6th Int’l Workshop Applications of Semantic Technologies, 2011, pp. 149.
[8] R. Oberhauser and R. Schmidt, “Towards a Holistic Integration of Software Lifecycle Processes using the Semantic Web,” Proc. 2nd Int. Conf. on Software and Data Technologies, 3, 2007, pp. 137-144.
[9] SCAMPI Upgrade Team, "Standard CMMI Appraisal Method for Process Improvement (SCAMPI) A, v. 1.3," Software Engineering Institute, 2011.
[10] ISO, “ISO/IEC 15504-5:2012 -- Part 5: An exemplar software life cycle process assessment model,” 2012.
[11] ISO, “ISO/IEC 12207:2008 -- Software life cycle processes,” 2008. [12] ISO, “ISO 19011 - Guidelines for auditing management systems,”
2011. [13] G. Grambow, R. Oberhauser, and M. Reichert, “Contextual Injection
of Quality Measures into Software Engineering Processes,” Int'l Journal on Advances in Software, 4(1 & 2), 2011, pp. 76-99.
[14] G. Grambow, R. Oberhauser, and M. Reichert, “Knowledge Provisioning: A Context-Sensitive Process-Oriented Approach Applied to Software Engineering Environments,” Proc. 7th Int’l Conf. on Software and Data Technologies, 2012.
[15] G. Grambow, R. Oberhauser, and M. Reichert, “Event-driven Exception Handling for Software Engineering Processes,” 5th Int’l Workshop on event-driven Business Process Management, LNBIP 99, 2011, pp. 414-426.
[16] G. Grambow, R. Oberhauser, and M. Reichert, “Enabling Automatic Process-aware Collaboration Support in Software Engineering Projects,” Selected Papers of the ICSOFT'11 Conference. Communications in Computer and Information Science (CCIS) 303, pp. 73-89, 2012.
[17] G. Grambow, R. Oberhauser, and M. Reichert, “Contextual Generation of Declarative Workflows and their Application to Software Engineering Processes,” Int'l Journal On Advances in Intelligent Systems, vol. 4, no. 3 & 4, pp. 158-179, 2012.
[18] P.M. Johnson, “Requirement and design trade-offs in Hackystat: An in-process software engineering measurement and analysis system,” Proc. 1st Int. Symp. on Empirical Software Engineering and Measurement, 2007, pp. 81-90.
[19] D.C. Luckham, “The power of events: an introduction to complex event processing in distributed enterprise systems,” Addison-Wesley Longman Publishing Co., Inc. Boston, MA, USA, 2001
[20] Esper: http://esper.codehaus.org/ [January 2013] [21] D. Gelernter, “Generative communication in Linda,” ACM
Transactions on Programming Languages and Systems (TOPLAS), 7(1), 1985, pp. 80-112
[22] W. Meier, “eXist: An open source native XML database,” Web, Web-Services, and Database Systems, LNCS, 2593, 2009, pp. 169-183
[23] P.D. O'Brien and R.C. Nicol, “FIPA — Towards a Standard for Software Agents,” BT Technology Journal, 16 (3):51-59, 1998.
[24] F. Bellifemine, A. Poggi, and G. Rimassa, “JADE - A FIPA-compliant Agent Framework,” Proc. 4th Int’l Conf. and Exhibition on the Practical Application of Intelligent Agents and Multi-Agents. London, 1999.
[25] P. Browne, “JBoss Drools Business Rules,” Packt Publishing, 2009. [26] P. Dadam and M. Reichert, “The ADEPT project: a decade of
research and development for robust and flexible process support,” Computer Science-Research & Development, 23(2), 2009, pp. 81-97.
224
International Journal on Advances in Software, vol 6 no 1 & 2, year 2013, http://www.iariajournals.org/software/
2013, © Copyright by authors, Published under agreement with IARIA - www.iaria.org
[27] World Wide Web Consortium, “OWL Web Ontology Language Semantics and Abstract Syntax,” 2004.
[28] E. Sirin, , B. Parsia, B. C. Grau, A. Kalyanpur, and Y. Katz, “Pellet: A practical owl-dl reasoner,” Web Semantics: Science, Services and Agents on the World Wide Web, 5(2), 2007, pp. 51-53.
[29] T. Jiang, J. Ying, and M, Wu, “CASDE: An Environment for Collaborative Software Development,” Computer Supported Cooperative Work in Design III, LNCS, 4402, 2007, pp. 367-376
[30] C. Cook, N. Churcher, and W. Irwin, “Towards synchronous collaborative software engineering,” Proc. 11th Asia-Pacific Software Engineering Conference, 2004, pp. 230-239
[31] S. Dustdar, “Caramba—a process-aware collaboration system supporting ad hoc and collaborative processes in virtual teams,” Distributed and parallel databases, 15(1), 2004, pp. 45-66
[32] R. Conradi, C. Liu, and M. Hagaseth, “Planning support for cooperating transactions in EPOS,” Information Systems, 20(4), 1995, pp. 317-336
[33] P. Korpipipää, J. Mantyjarvi, J. Kela, H. Keranen, and E.J. Malm, “Managing context information in mobile devices,” IEEE Pervasive Computing 2(3), pp.42-51, 2003
[34] P. Fahy and S. Clarke, “CASS – a middleware for mobile context-aware applications,” Proc. Workshop on Context-awareness (held in connection with MobiSys’04), 2004.
[35] T. Gu., H.K. Pung, and D.Q. Zhang, “A middleware for building context-aware mobile services,” Proc. IEEE Vehicular Technology Conference (VTC), Milan, Italy, pp. 2656 – 2660, 2004.
[36] G. Biegel. and V. Cahill, “A framework for developing mobile, context-aware applications,” Proc. 2nd IEEE Conference on Pervasive Computing and Communication, pp. 361 - 365 , 2004
[37] C. Dorn, S. Dustdar, “Sharing Hierarchical Context for Mobile Web services,” Distributed and Parallel Databases 21(1), pp. 85-111, 2007.
[38] C. Pedrinaci, J. Domingue, and A. Alves de Medeiros, “A Core Ontology for Business Process Analysis,” LNCS 5021, pp. 49-64, 2008.
[39] Z. Ma, B. Wetzstein, D. Anicic, S. Heymans, and F. Leymann, “Semantic Business Process Repository,” Proc. Workshop on Semantic Business Process and Product Lifecycle Management, pp. 92–100, 2007
[40] Y. Lin and D. Strasunskas, “Ontology-based Semantic Annotation of Process Templates for Reuse,” Proc.10th Int’l Workshop on Exploring Modeling Methods for Systems Analysis and Design (EMMSAD'05), 2005.
[41] A. Koschmider and A. Oberweis, “Ontology based Business Process Description,” Proc. CAiSE´05 Workshops, pp. 321-333, 2005.
[42] M. Thomas, R. Redmond, V. Yoon, and R. Singh, “A Semantic Approach to Monitor Business Process Performance,” Communications of the ACM 48(12), pp. 55-59, 2005
[43] M.A. Seyyedi, M. Teshnehlab, and F. Shams, “Measuring software processes performance based on the fuzzy multi agent measurements,” Proc. Intl Conf. on Information Technology: Coding and Computing (ITCC'05) – Vol. II, IEEE CS, 2005, pp. 410-415.
[44] V.R. Basili, V.R.B.G. Caldiera, and H.D. Rombach, “The goal question metric approach,” Encycl. of SW Eng., 2, 1994, pp. 528-532.
[45] G.H. Soydan and M. Kokar, “An OWL ontology for representing the CMMI-SW model,” Proc. 2nd Int'l Workshop on Semantic Web Enabled Software Engineering, 2006, pp. 1-14.
[46] L. Liao, Y. Qu, and H. Leung, “A software process ontology and its application,” Proc. ISWC2005 Workshop on Semantic Web Enabled Software Engineering, 2005, pp. 6–10.
[47] A. Ferchichi, M. Bigand, and H. Lefebvre, “An ontology for quality standards integration in software collaborative projects,” Proc. 1st Int'l Workshop on Model Driven Interoperability for Sustainable Information Systems, 2008, pp. 17-30.
[48] M. Montoni et al., “Taba workstation: Supporting software process deployment based on CMMI and MR-MPS,” Proc. 7th Int’l Conf. on Product-Focused Software Process Improvement, 2006, pp. 249-262.
[49] Appraisal Assistant, http://www.sqi.gu.edu.au/AppraisalAssistant/about.html [June 2013]

www.iariajournals.org
International Journal On Advances in Intelligent Systems
ICAS, ACHI, ICCGI, UBICOMM, ADVCOMP, CENTRIC, GEOProcessing, SEMAPRO, BIOSYSCOM,BIOINFO, BIOTECHNO, FUTURE COMPUTING, SERVICE COMPUTATION, COGNITIVE, ADAPTIVE,CONTENT, PATTERNS, CLOUD COMPUTING, COMPUTATION TOOLS, ENERGY, COLLA, IMMM, INTELLI,SMART, DATA ANALYTICS
issn: 1942-2679
International Journal On Advances in Internet Technology
ICDS, ICIW, CTRQ, UBICOMM, ICSNC, AFIN, INTERNET, AP2PS, EMERGING, MOBILITY, WEB
issn: 1942-2652
International Journal On Advances in Life Sciences
eTELEMED, eKNOW, eL&mL, BIODIV, BIOENVIRONMENT, BIOGREEN, BIOSYSCOM, BIOINFO,BIOTECHNO, SOTICS, GLOBAL HEALTH
issn: 1942-2660
International Journal On Advances in Networks and Services
ICN, ICNS, ICIW, ICWMC, SENSORCOMM, MESH, CENTRIC, MMEDIA, SERVICE COMPUTATION,VEHICULAR, INNOV
issn: 1942-2644
International Journal On Advances in Security
ICQNM, SECURWARE, MESH, DEPEND, INTERNET, CYBERLAWS
issn: 1942-2636
International Journal On Advances in Software
ICSEA, ICCGI, ADVCOMP, GEOProcessing, DBKDA, INTENSIVE, VALID, SIMUL, FUTURECOMPUTING, SERVICE COMPUTATION, COGNITIVE, ADAPTIVE, CONTENT, PATTERNS, CLOUDCOMPUTING, COMPUTATION TOOLS, IMMM, MOBILITY, VEHICULAR, DATA ANALYTICS
issn: 1942-2628
International Journal On Advances in Systems and Measurements
ICQNM, ICONS, ICIMP, SENSORCOMM, CENICS, VALID, SIMUL, INFOCOMP
issn: 1942-261x
International Journal On Advances in Telecommunications
AICT, ICDT, ICWMC, ICSNC, CTRQ, SPACOMM, MMEDIA, COCORA, PESARO, INNOV
issn: 1942-2601
Related Documents