Journal of Earth Energy Science, Engineering, and Technology, Vol. 3, No. 2, 2020 URL: https://trijurnal.lemlit.trisakti.ac.id/jeeset eISSN: 2614-0268 40 pISSN: 2615-3653 Pipe Network Evaluation for "X" Field Production Optimization (Evaluasi Jaringan Pipa Untuk Optimasi Produksi Lapangan “X”) Slamet Widodo Kurniansyah 1* , Esaim Mustafa Abrahim Omar 2 , Dwi Atty Mardiana 3 1 CNOOC SES Ltd., Indonesia 2 Al Safwa Group, Libya 3 Petroleum Engineering Department, Universitas Trisakti, Jakarta, Indonesia Abstract Fields "X" is an old field in the South East Sumatra Block. The area was developed using ten platforms. One main problems on this field is the disruption of some wells productivity due to flow constraints in the piping network. The objective of this paper is to evaluate the pipeline network for area "X1" using simulation model. The simulation results show that there are bottlenecking and backpressure problems in the network. By fixing the problems, total oil production in this area can be increased up to 19 percent or 1,006.2 BOPD higer than initial condition. Keywords: Pipeline Network, Bottlenecking, Back Pressure, Production Optimization Sari Lapangan “X” merupakan lapangan tua yang termasuk ke dalam Blok South East Sumatra. Lapangan tersebut telah dikembangkan dengan menggunakan sepuluh anjungan. Masalah utama yang dihadapi lapangan ini adalah gangguan terhadap produktifitas beberapa sumuryang diakibatkan oleh hambatan pada jaringan pipa. Tujuan dilakukannya penelitian ini adalah untuk mengevaluasi jaringan pemipaan Area “X1” dengan model simulasi. Hasil simulasi memperlihatkan adanya bottlenecking dan back pressure pada jaringan pipa tersebut. Dengan mengatasi permasalahan tersebut total laju produksi minyak dapat ditingkatkan sampai dengan 19 persen atau 1.006,2 BOPD lebih tinggi dari laju produksi awal. Kata-kata kunci: Jaringan Pemipaan, Peleheran Botol, Tekanan Balik, Optimisasi Produksi *Corresponding author E-mail: [email protected] Tel: +(62) 8176586120 I. INTRODUCTION Field "X" is a mature field that is included in the South East Sumatra Block. The pipeline network in the "X1" area has been developed since the field was produced in 1974. The area was developed using ten platforms, namely Sundari-A, Sundari-B, Yvone-A, Yvone-B, Krisna-A, Krisna-B, Krisna-C, Krisna-D, Krisna-E and Krisna-P. Until now there have been 90 producing wells through these 10 platforms. Oil production is mostly derived from the carbonate reservoir of the Baturaja Formation which is divided into two units, namely the Upper Baturaja Unit (Krisna D and E) and the Lower Baturaja Unit (Krisna A, B, C, and E), and only a small portion comes from sandstones Talang Akar Formation. Currently, the inspection of production fluid flow is done manually, by analyzing wellhead pressure change to the increase or decrease of production flow rate at separator and storage station. All platforms are in the offshore area with a considerable distance between platforms in average of 25,365 ft. The limitation of sea transportation as a link between platforms becomes an obstacle to the inspection of production fluid flow. This process takes one to two days considering the distance between well head and production facility platform (separator) and storage station. The farthest distance of well head to the production facility platform is 87,300 ft. One main problem on this field is the disruption of some wells productivity due to flow constraints in the pipeline network or better known as bottlenecking. Bottlenecking results in a high pressure drop in the pipe segment that connects two or more pipes behind it so as if the flow is narrowed which will then provide high back pressure to the wellhead. It may lead to some problems such pipe abrasion, corrosion, and rupture. To overcome this, a model that resembles field conditions needs to be made so it can be simulated. There are two common ways of repairs the bottlenecking, by replacing the bottled-affected pipe with a new pipe that has an optimum inner diameter, or adding a parallel pipe next to the pipe affected by the bottlenecking. A result comparison of the two methods is made to determine the best solution [1-5]. A network modeling can simulate various production optimization scenarios to reduce the

Welcome message from author
This document is posted to help you gain knowledge. Please leave a comment to let me know what you think about it! Share it to your friends and learn new things together.
Transcript
Journal of Earth Energy Science, Engineering, and Technology, Vol. 3, No. 2, 2020 URL: https://trijurnal.lemlit.trisakti.ac.id/jeeset
eISSN: 2614-0268 40 pISSN: 2615-3653
Pipe Network Evaluation for "X" Field Production Optimization
(Evaluasi Jaringan Pipa Untuk Optimasi Produksi Lapangan “X”)
Slamet Widodo Kurniansyah1*
, Esaim Mustafa Abrahim Omar2, Dwi Atty Mardiana
3
1CNOOC SES Ltd., Indonesia
2Al Safwa Group, Libya
3Petroleum Engineering Department, Universitas Trisakti, Jakarta, Indonesia
Abstract
Fields "X" is an old field in the South East Sumatra Block. The area was developed using ten platforms. One main problems
on this field is the disruption of some wells productivity due to flow constraints in the piping network. The objective of this
paper is to evaluate the pipeline network for area "X1" using simulation model. The simulation results show that there are
bottlenecking and backpressure problems in the network. By fixing the problems, total oil production in this area can be
increased up to 19 percent or 1,006.2 BOPD higer than initial condition.
Keywords: Pipeline Network, Bottlenecking, Back Pressure, Production Optimization
Sari
Lapangan “X” merupakan lapangan tua yang termasuk ke dalam Blok South East Sumatra. Lapangan tersebut telah
dikembangkan dengan menggunakan sepuluh anjungan. Masalah utama yang dihadapi lapangan ini adalah gangguan
terhadap produktifitas beberapa sumuryang diakibatkan oleh hambatan pada jaringan pipa. Tujuan dilakukannya penelitian
ini adalah untuk mengevaluasi jaringan pemipaan Area “X1” dengan model simulasi. Hasil simulasi memperlihatkan
adanya bottlenecking dan back pressure pada jaringan pipa tersebut. Dengan mengatasi permasalahan tersebut total laju
produksi minyak dapat ditingkatkan sampai dengan 19 persen atau 1.006,2 BOPD lebih tinggi dari laju produksi awal.
Kata-kata kunci: Jaringan Pemipaan, Peleheran Botol, Tekanan Balik, Optimisasi Produksi
*Corresponding author
E-mail: [email protected]
Tel: +(62) 8176586120
I. INTRODUCTION
Field "X" is a mature field that is included in
the South East Sumatra Block. The pipeline
network in the "X1" area has been developed since
the field was produced in 1974. The area was
developed using ten platforms, namely Sundari-A,
Sundari-B, Yvone-A, Yvone-B, Krisna-A,
Krisna-B, Krisna-C, Krisna-D, Krisna-E and
Krisna-P. Until now there have been 90 producing
wells through these 10 platforms. Oil production is
mostly derived from the carbonate reservoir of the
Baturaja Formation which is divided into two units,
namely the Upper Baturaja Unit (Krisna D and E)
and the Lower Baturaja Unit (Krisna A, B, C, and
E), and only a small portion comes from sandstones
Talang Akar Formation.
Currently, the inspection of production fluid
flow is done manually, by analyzing wellhead
pressure change to the increase or decrease of
production flow rate at separator and storage
station. All platforms are in the offshore area with a
considerable distance between platforms in average
of 25,365 ft. The limitation of sea transportation as
a link between platforms becomes an obstacle to
the inspection of production fluid flow. This
process takes one to two days considering the
distance between well head and production facility
platform (separator) and storage station. The
farthest distance of well head to the production
facility platform is 87,300 ft.
One main problem on this field is the disruption
of some wells productivity due to flow constraints
in the pipeline network or better known as
bottlenecking. Bottlenecking results in a high
pressure drop in the pipe segment that connects two
or more pipes behind it so as if the flow is
narrowed which will then provide high back
pressure to the wellhead. It may lead to some
problems such pipe abrasion, corrosion, and
rupture. To overcome this, a model that resembles
field conditions needs to be made so it can be
simulated. There are two common ways of repairs
the bottlenecking, by replacing the bottled-affected
pipe with a new pipe that has an optimum inner
diameter, or adding a parallel pipe next to the pipe
affected by the bottlenecking. A result comparison
of the two methods is made to determine the best
solution [1-5].
A network modeling can simulate various
production optimization scenarios to reduce the
Journal of Earth Energy Science, Engineering, and Technology, Vol. 3, No. 2, 2020 URL: https://trijurnal.lemlit.trisakti.ac.id/jeeset
eISSN: 2614-0268 41 pISSN: 2615-3653
risk of trial and error compared to directly carried
out in the pipeline network, as well as simulations
of the current pipeline network readiness in case
there is an increase or decrease in production rate
[6].
Pipeline network modeling has been applied to
other areas in the south of the "X1" Area "X" Field,
and no significant back pressure problems were
found. However, the model is useful in making
simulations of production rate optimization
scenarios and looking at the ability of the network
when there is an increase or decrease in production.
Accurate pipeline modeling is required because
small amounts of fluid flow can significantly
impact pressures in a large gathering system [7-8].
In this paper the "X1" Area pipeline network
model was evaluated to identify whether
bottlenecking and back pressure problems occur in
the pipeline network and to determine the optimal
condition.
II. METHOD
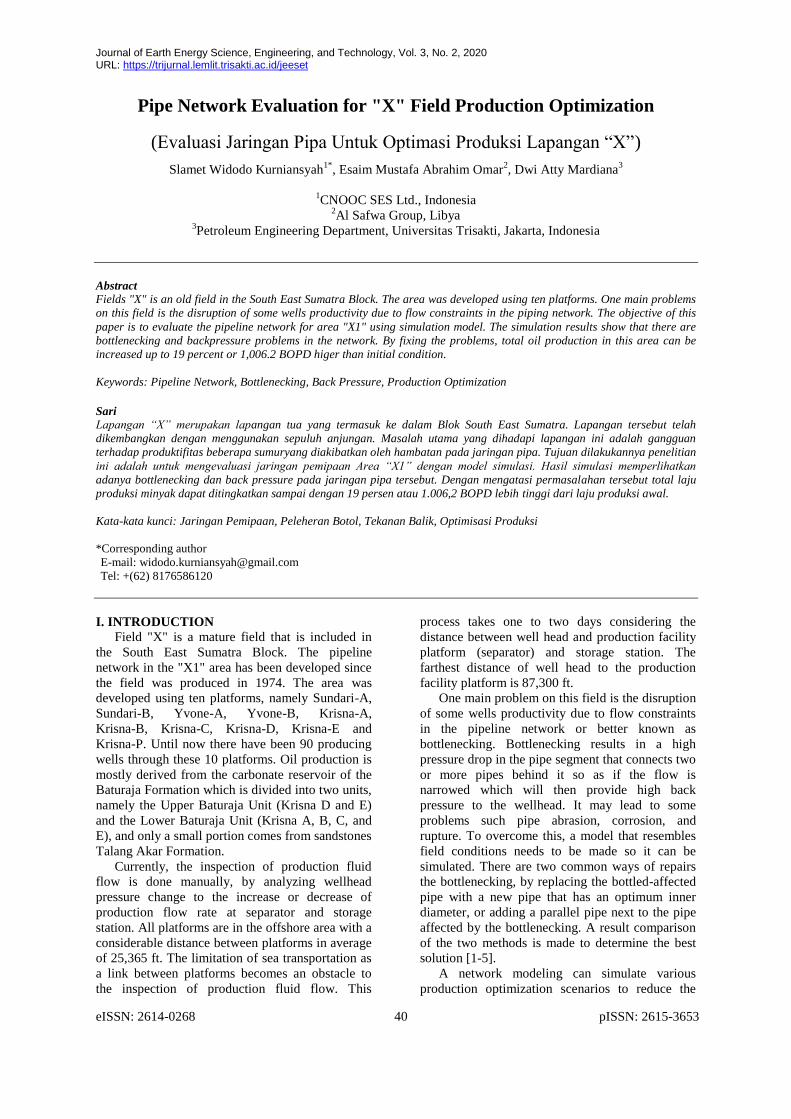
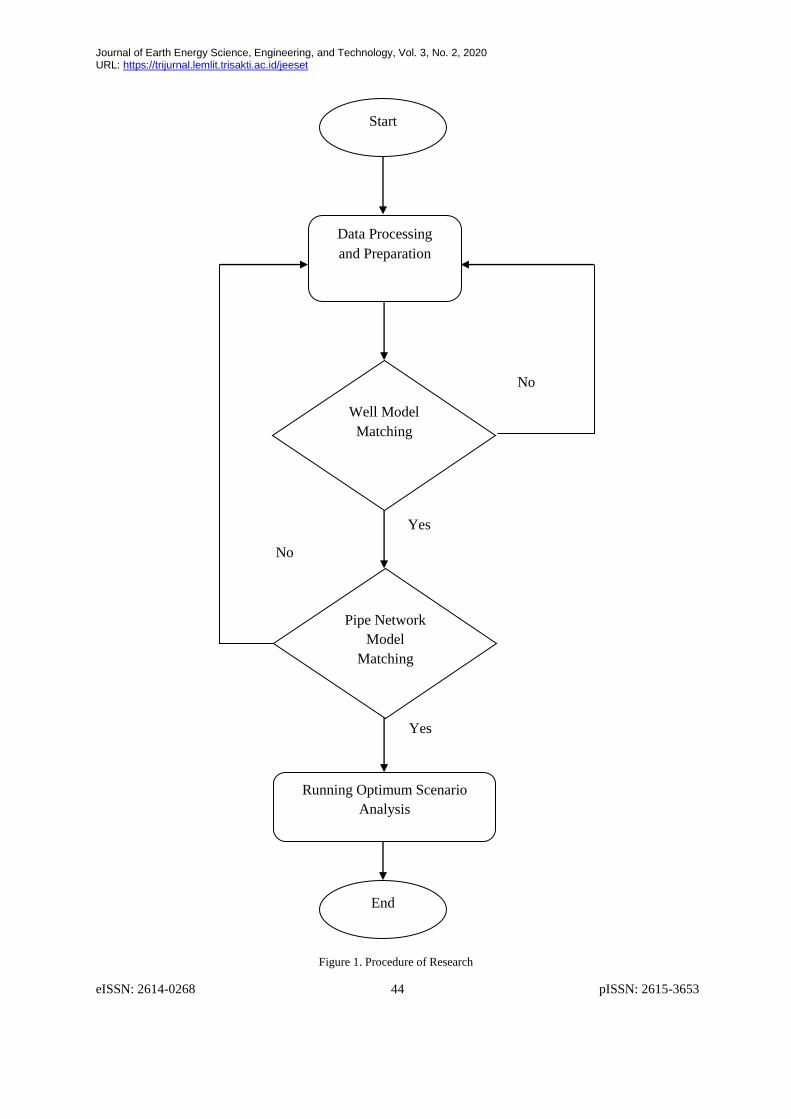
The work flow research is shown in Figure 1.
The work procedures performed to evaluate the
production network optimization in this study are
as follows:
1. Collecting field data such as well test
production data, reservoir data, fluid data, and
pressure data on risers at each platform.
2. Collecting technical design data and technical
specifications from wells and pipeline
networks, namely data wellbore diagrams,
pipeline network layout diagrams, technical
specification data from pipelines and fluid flow
diagrams on each related platform.
3. Modeling and simulation of each production
well and pipeline in Area "X1" using the
WellFlo and ReO applications.
4. Performing production rate matching and
network matching against pressures between
field data and data from the WellFlo and ReO
2014 pipeline network simulation results.
5. Conducting analysis on pipelines such as nodal
analysis, well performance analysis, pressure
drop analysis per foot and production
optimization analysis.
6. Conducting pipeline network optimization
scenarios by increasing or decreasing fluid
pressure through choke control of the wellhead
and riser pipes in the pipeline network to
increase the optimal production rate.
Data required in the production and pipeline
network model are:
1. Trajectory data as true vertical depth (TVD),
measure depth (MD), and slope angles of wells.
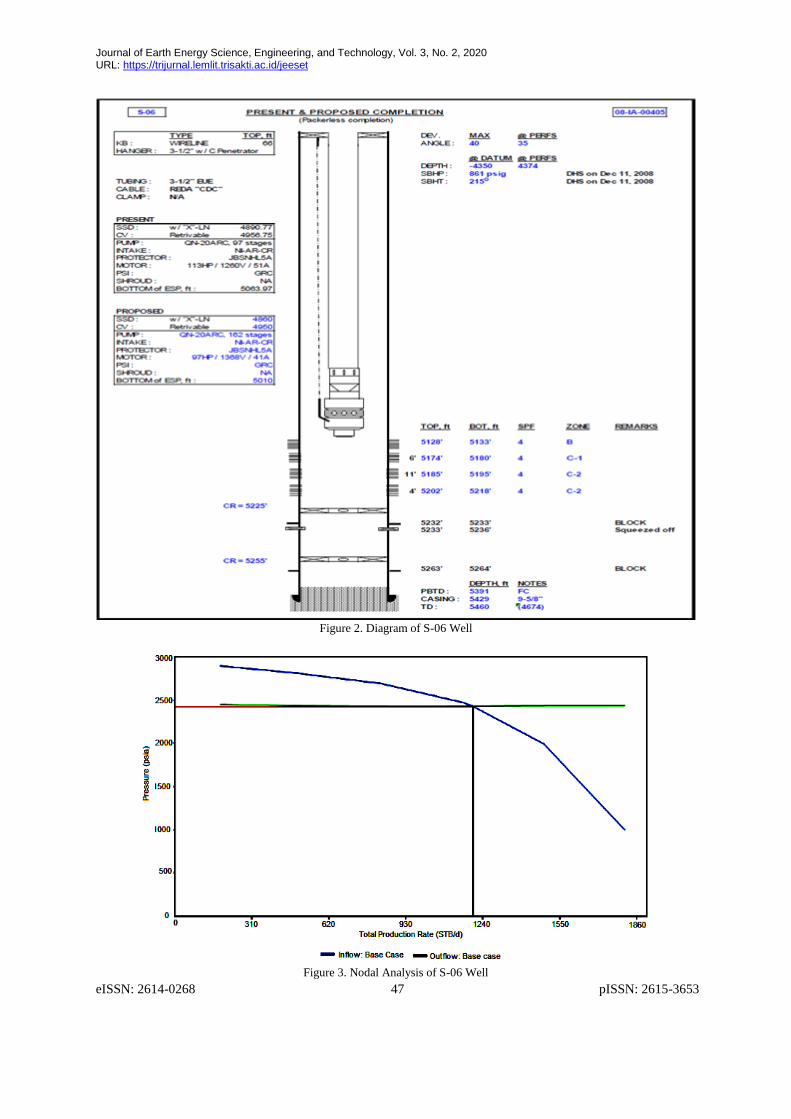
2. Completion diagram that is the data of layers of
rock that are skipped, perforation, production
casing, screen, blank pipe, packer, tubing, ESP
pump.
3. Reservoir data, namely fluid properties data in
the form of reservoir pressure, volume and
temperature, and rock formation (PVT).
4. Production data from the well test conducted on
the separator. Production data that is used as a
reference is production data dated January 27,
2016, considering to the active production wells
during that period was above the average of 41
active wells.
5. Well performance data that is obtained from
simulation results on the production well
model.
6. Pipeline data consist of pipeline material
specification, length, diameter, thickness, water
depth, and coating material.
7. Fluid data as fluid flowing in the pipeline
obtained from the simulation results of the
production well model.
8. Pressure riser data is the pressure of the riser
out and into the platform.
9. Subsea pipeline layout data.
The equipment used in evaluating this area
pipeline network is the WellFlo 2011 and ReO
2014 software.
III. RESULTS AND DISCUSSION
The stages of modeling and simulation begin
with making simulation models, matching, and
analysis. Modeling for production well simulation
in Area "X1" using the WellFlo application.
Modeling and matching of production wells begins
with the preparation of data, modeling, and
validation or matching the results of simulations
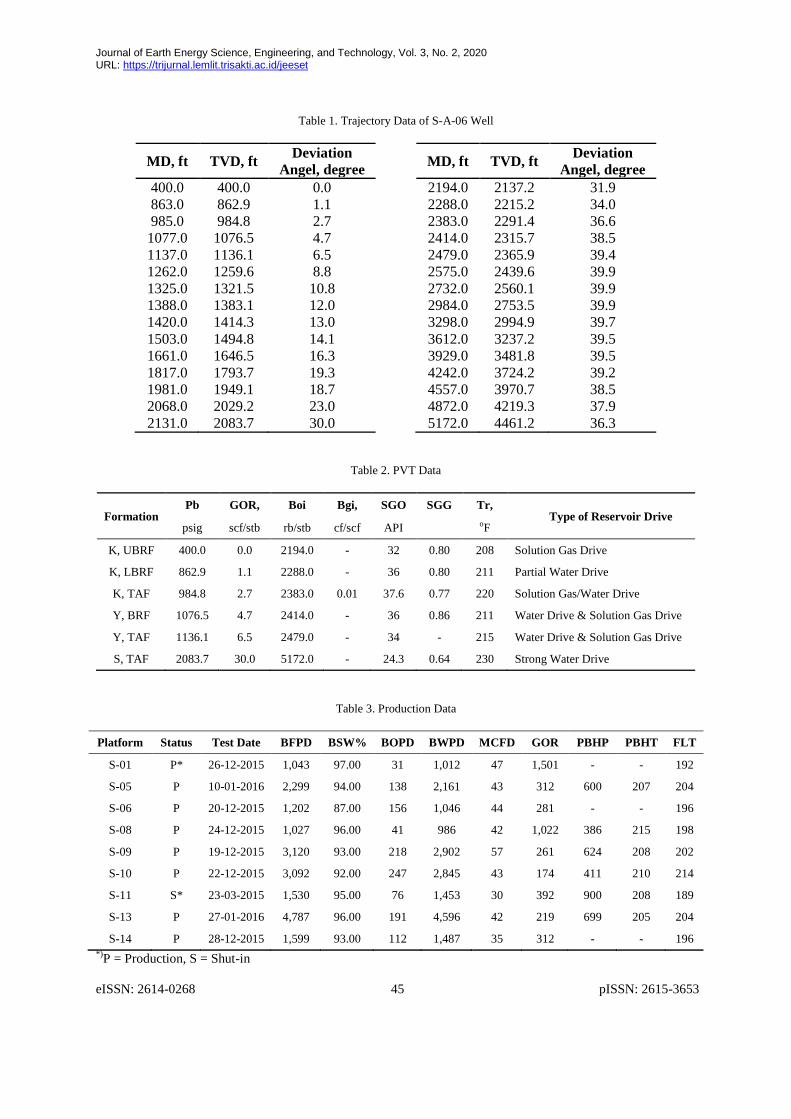
against field data. The data needed is trajectory
data (Table 1), PVT data (Table 2), reservoir and
production data (Table 3), and completion data
(Figure 2).
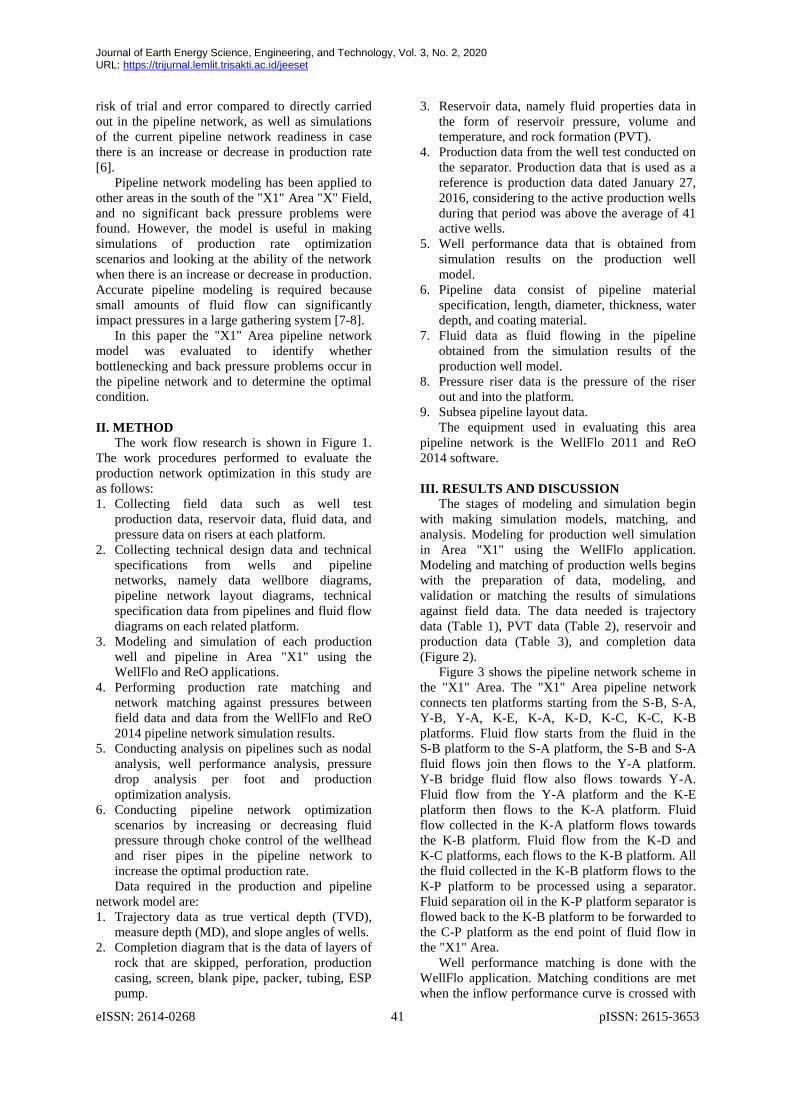
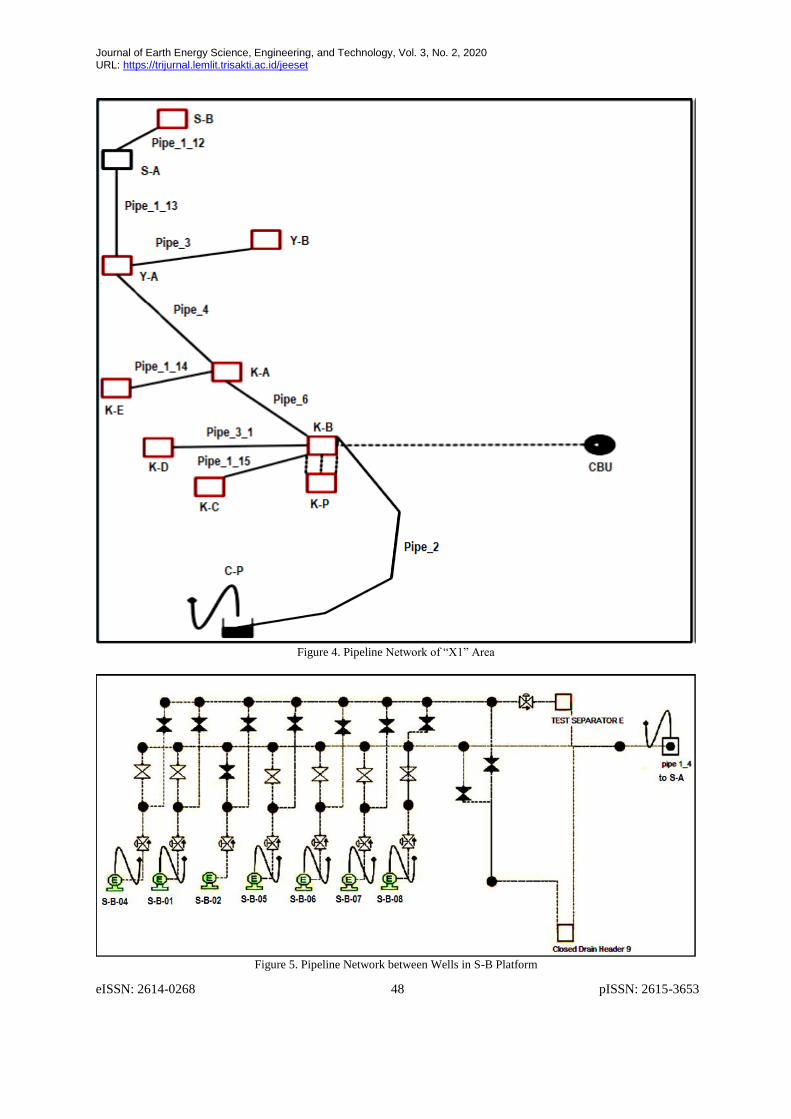
Figure 3 shows the pipeline network scheme in
the "X1" Area. The "X1" Area pipeline network
connects ten platforms starting from the S-B, S-A,
Y-B, Y-A, K-E, K-A, K-D, K-C, K-C, K-B
platforms. Fluid flow starts from the fluid in the
S-B platform to the S-A platform, the S-B and S-A
fluid flows join then flows to the Y-A platform.
Y-B bridge fluid flow also flows towards Y-A.
Fluid flow from the Y-A platform and the K-E
platform then flows to the K-A platform. Fluid
flow collected in the K-A platform flows towards
the K-B platform. Fluid flow from the K-D and
K-C platforms, each flows to the K-B platform. All
the fluid collected in the K-B platform flows to the
K-P platform to be processed using a separator.
Fluid separation oil in the K-P platform separator is
flowed back to the K-B platform to be forwarded to
the C-P platform as the end point of fluid flow in
the "X1" Area.
Well performance matching is done with the
WellFlo application. Matching conditions are met
when the inflow performance curve is crossed with
Journal of Earth Energy Science, Engineering, and Technology, Vol. 3, No. 2, 2020 URL: https://trijurnal.lemlit.trisakti.ac.id/jeeset
eISSN: 2614-0268 42 pISSN: 2615-3653
the outflow performance curve at a flow rate that is
consistent with production data. In Figure 3, the
intersection point between the inflow and outflow
curves occurs at an operating pressure of 2,433.46
psia and a liquid flow rate of 1,201.9 BFPD.
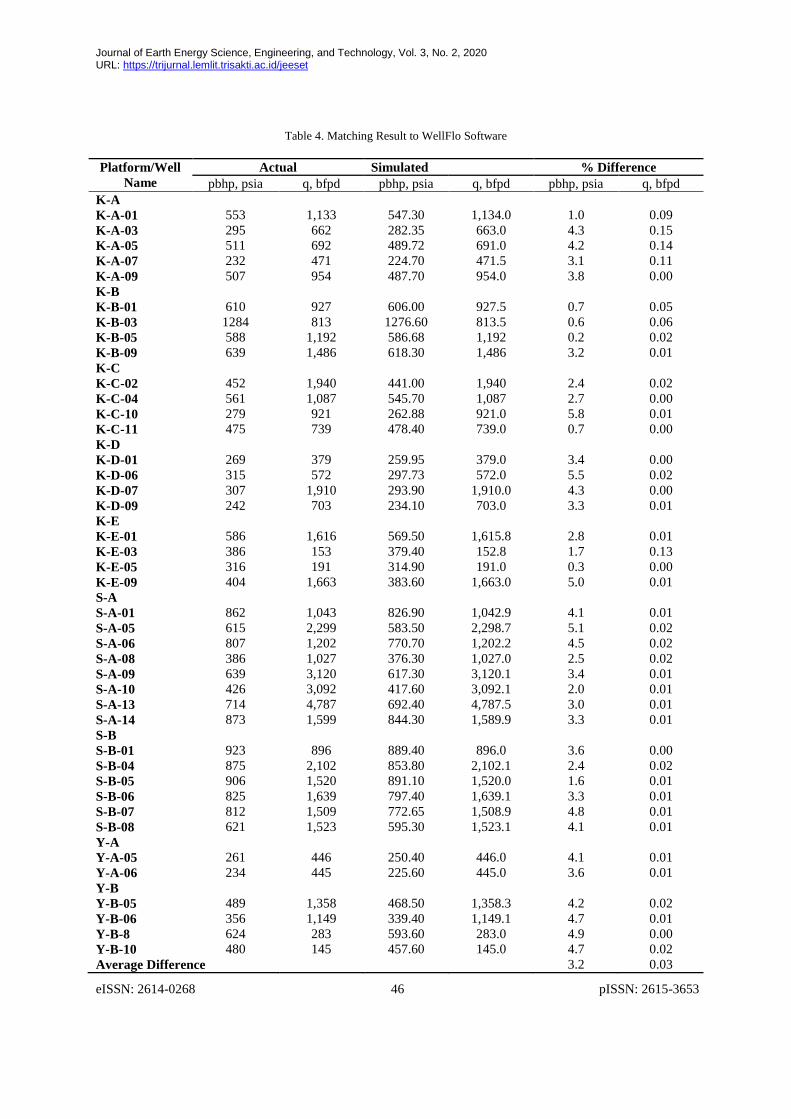
Similar method was applied for other 41 wells,
resulted on matching between actual and
simulation data for the production flow and
pressure as shown in Table 4. The table shows that
the average of percentage difference liquid flow
rate was 0.03% with a maximum difference of
0.15% in KA-03: BR wells, and average of
bottomhole pressure is 3.2% with a maximum
difference of 5.8% in KC-10: BR wells.
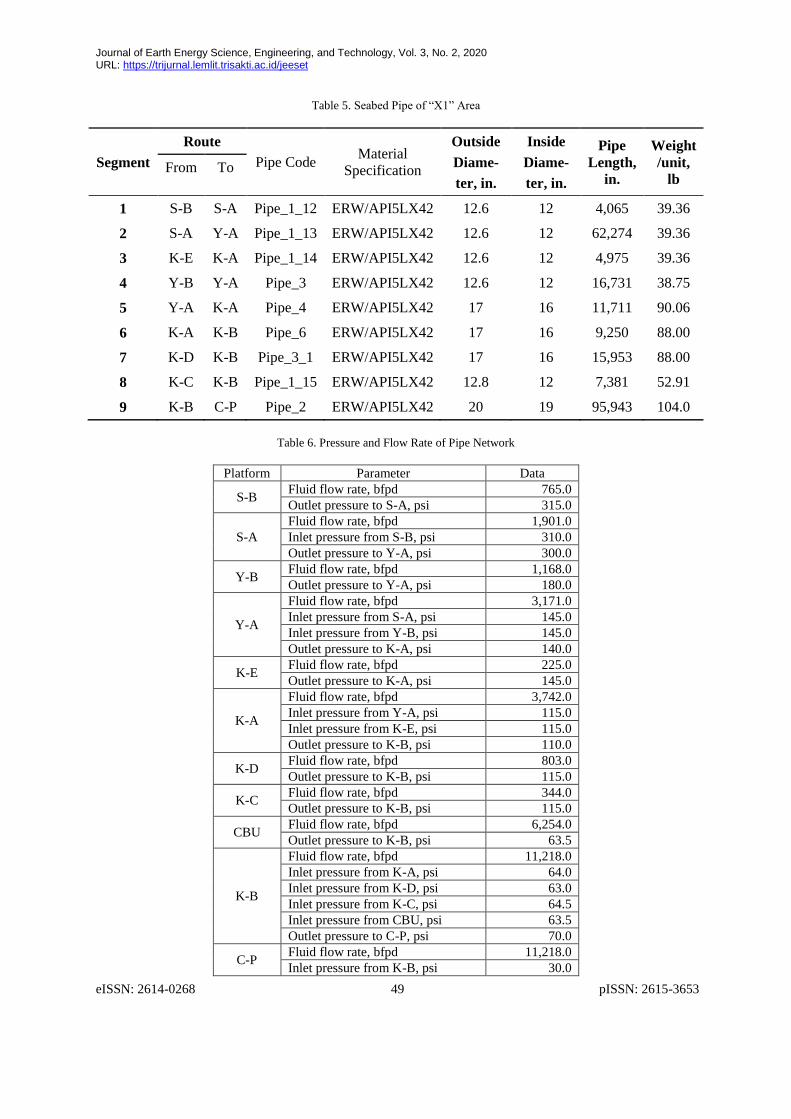
Pipeline modeling for network simulations in
the "X1" Area using the ReO application. Figure 4
is a complete picture of the pipeline network model
in the "X1" Area. The pipeline connects ten
platforms starting from the S-B, S-A, Y-B, Y-A,
K-E, K-A, K-D, K-C, K-B, K-P platforms. The
final point of liquid production is processed at the
K-B process platform, while the end point of this
area is the C-P platform. Table 5 and Table 6 show
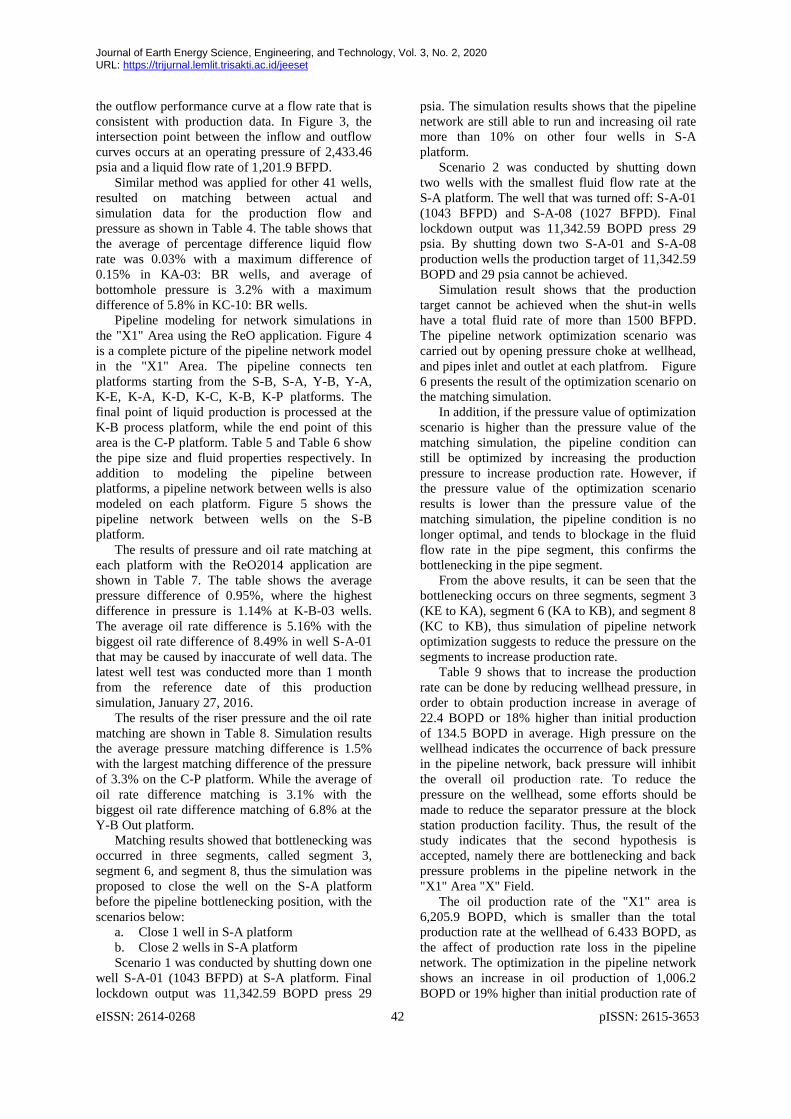
the pipe size and fluid properties respectively. In
addition to modeling the pipeline between
platforms, a pipeline network between wells is also
modeled on each platform. Figure 5 shows the
pipeline network between wells on the S-B
platform.
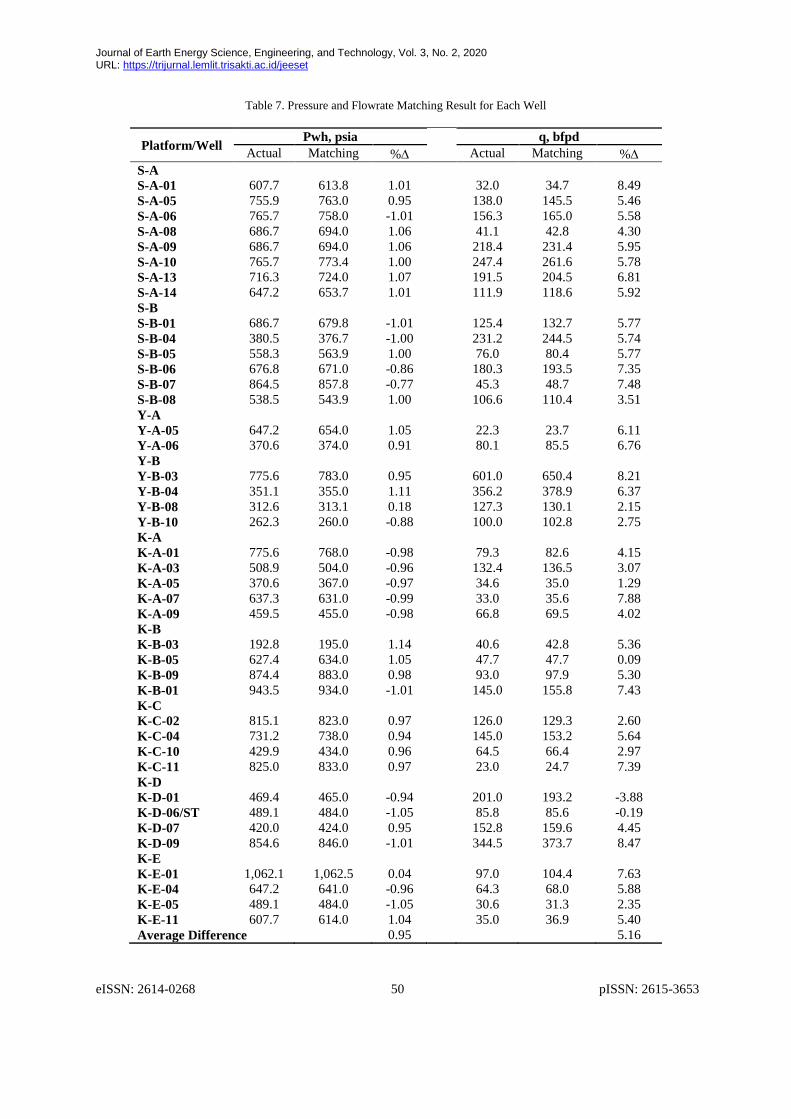
The results of pressure and oil rate matching at
each platform with the ReO2014 application are
shown in Table 7. The table shows the average
pressure difference of 0.95%, where the highest
difference in pressure is 1.14% at K-B-03 wells.
The average oil rate difference is 5.16% with the
biggest oil rate difference of 8.49% in well S-A-01
that may be caused by inaccurate of well data. The
latest well test was conducted more than 1 month
from the reference date of this production
simulation, January 27, 2016.
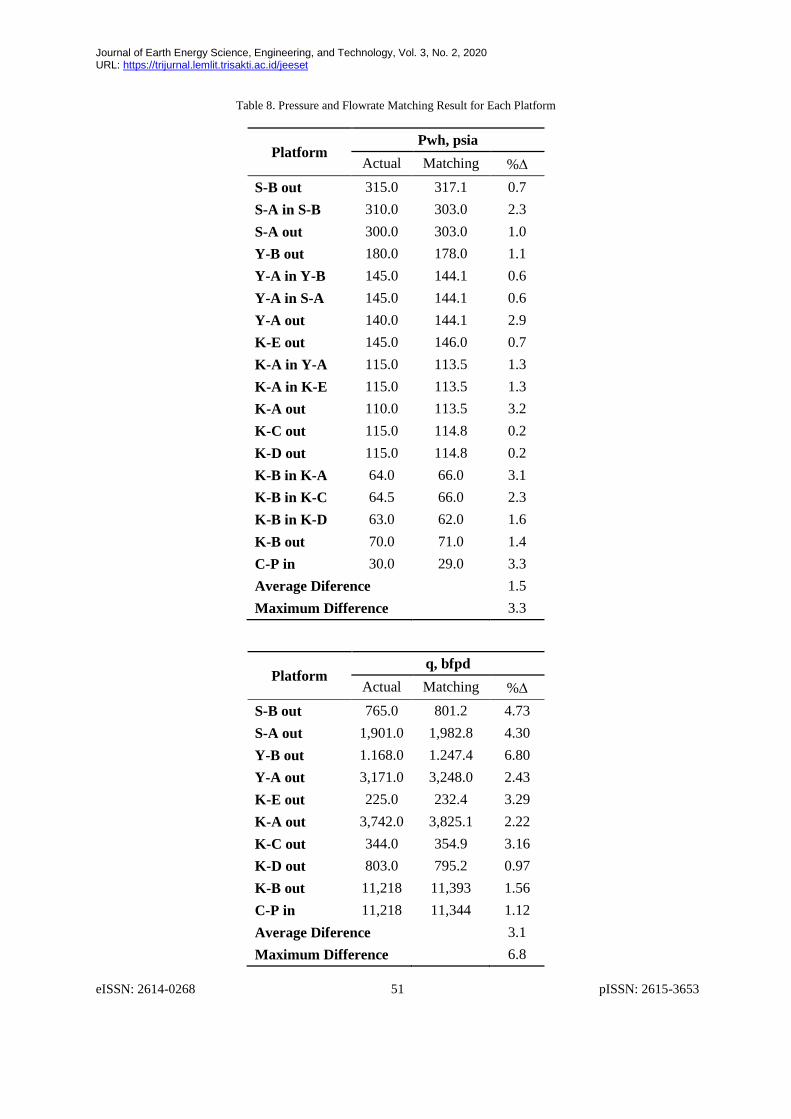
The results of the riser pressure and the oil rate
matching are shown in Table 8. Simulation results
the average pressure matching difference is 1.5%
with the largest matching difference of the pressure
of 3.3% on the C-P platform. While the average of
oil rate difference matching is 3.1% with the
biggest oil rate difference matching of 6.8% at the
Y-B Out platform.
Matching results showed that bottlenecking was
occurred in three segments, called segment 3,
segment 6, and segment 8, thus the simulation was
proposed to close the well on the S-A platform
before the pipeline bottlenecking position, with the
scenarios below:
a. Close 1 well in S-A platform
b. Close 2 wells in S-A platform
Scenario 1 was conducted by shutting down one
well S-A-01 (1043 BFPD) at S-A platform. Final
lockdown output was 11,342.59 BOPD press 29
psia. The simulation results shows that the pipeline
network are still able to run and increasing oil rate
more than 10% on other four wells in S-A
platform.
Scenario 2 was conducted by shutting down
two wells with the smallest fluid flow rate at the
S-A platform. The well that was turned off: S-A-01
(1043 BFPD) and S-A-08 (1027 BFPD). Final
lockdown output was 11,342.59 BOPD press 29
psia. By shutting down two S-A-01 and S-A-08
production wells the production target of 11,342.59
BOPD and 29 psia cannot be achieved.
Simulation result shows that the production
target cannot be achieved when the shut-in wells
have a total fluid rate of more than 1500 BFPD.
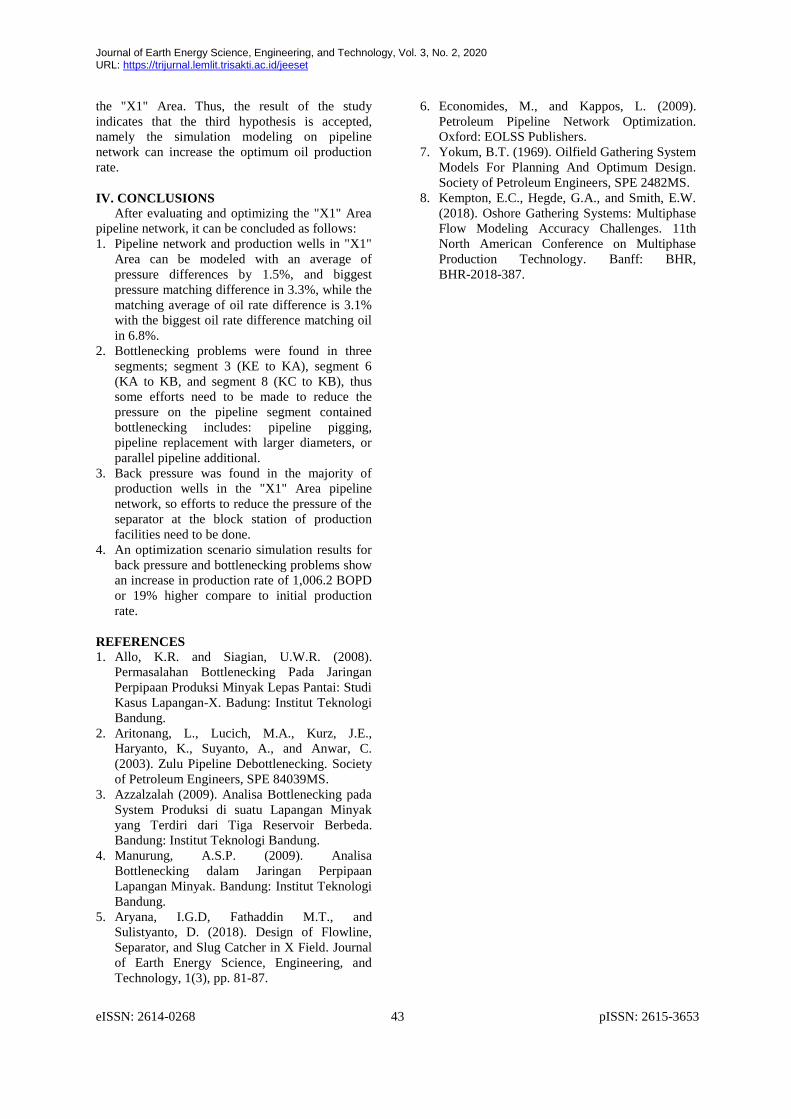
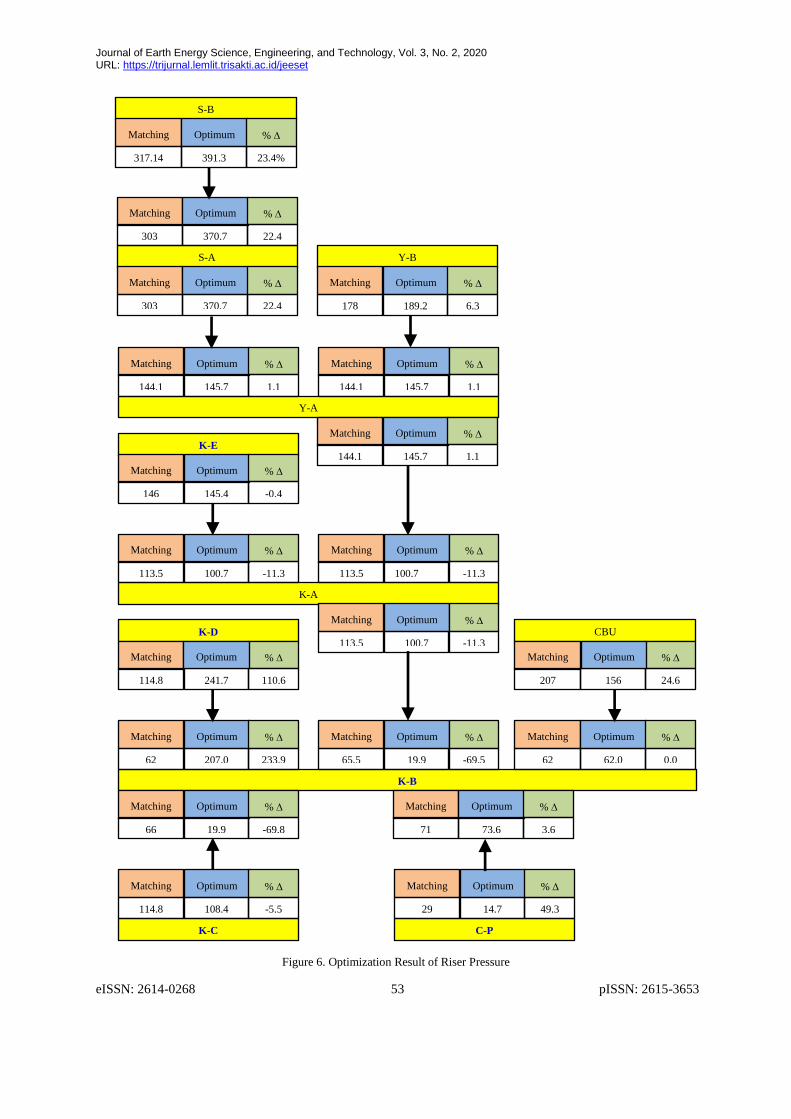
The pipeline network optimization scenario was
carried out by opening pressure choke at wellhead,
and pipes inlet and outlet at each platfrom. Figure
6 presents the result of the optimization scenario on
the matching simulation.
In addition, if the pressure value of optimization
scenario is higher than the pressure value of the
matching simulation, the pipeline condition can
still be optimized by increasing the production
pressure to increase production rate. However, if
the pressure value of the optimization scenario
results is lower than the pressure value of the
matching simulation, the pipeline condition is no
longer optimal, and tends to blockage in the fluid
flow rate in the pipe segment, this confirms the
bottlenecking in the pipe segment.
From the above results, it can be seen that the
bottlenecking occurs on three segments, segment 3
(KE to KA), segment 6 (KA to KB), and segment 8
(KC to KB), thus simulation of pipeline network
optimization suggests to reduce the pressure on the
segments to increase production rate.
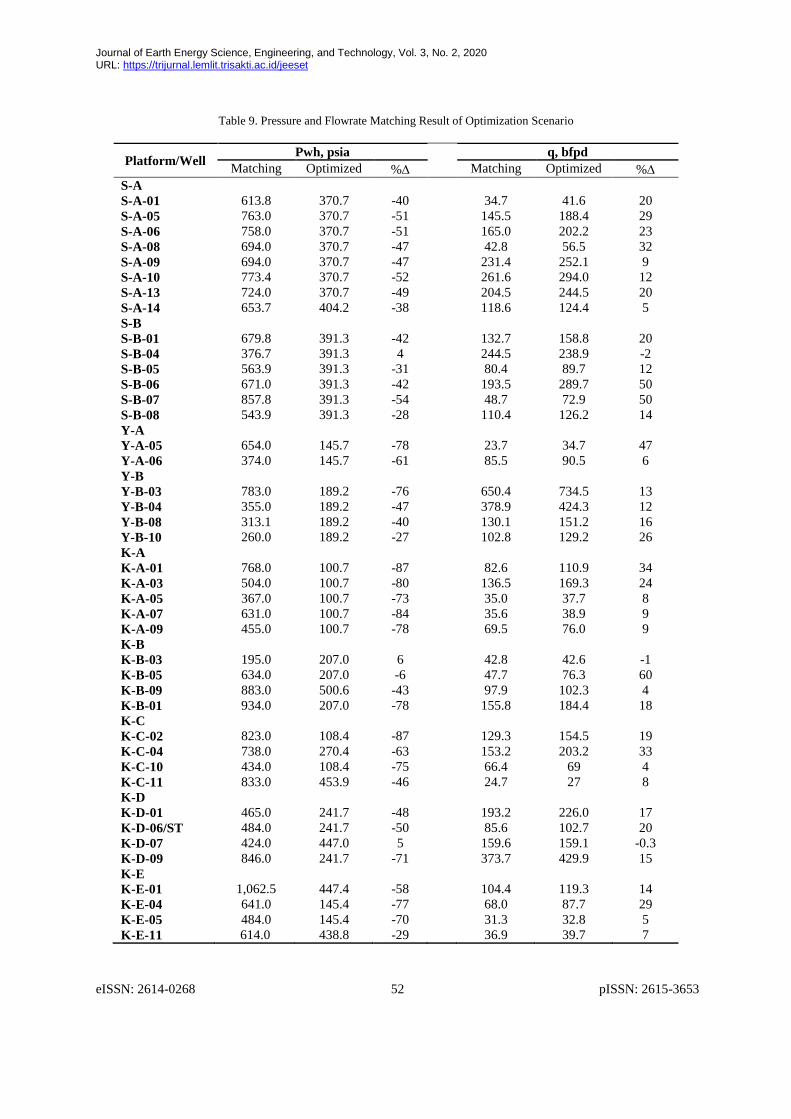
Table 9 shows that to increase the production
rate can be done by reducing wellhead pressure, in
order to obtain production increase in average of
22.4 BOPD or 18% higher than initial production
of 134.5 BOPD in average. High pressure on the
wellhead indicates the occurrence of back pressure
in the pipeline network, back pressure will inhibit
the overall oil production rate. To reduce the
pressure on the wellhead, some efforts should be
made to reduce the separator pressure at the block
station production facility. Thus, the result of the
study indicates that the second hypothesis is
accepted, namely there are bottlenecking and back
pressure problems in the pipeline network in the
"X1" Area "X" Field.
The oil production rate of the "X1" area is
6,205.9 BOPD, which is smaller than the total
production rate at the wellhead of 6.433 BOPD, as
the affect of production rate loss in the pipeline
network. The optimization in the pipeline network
shows an increase in oil production of 1,006.2
BOPD or 19% higher than initial production rate of
Journal of Earth Energy Science, Engineering, and Technology, Vol. 3, No. 2, 2020 URL: https://trijurnal.lemlit.trisakti.ac.id/jeeset
eISSN: 2614-0268 43 pISSN: 2615-3653
the "X1" Area. Thus, the result of the study
indicates that the third hypothesis is accepted,
namely the simulation modeling on pipeline
network can increase the optimum oil production
rate.
IV. CONCLUSIONS
After evaluating and optimizing the "X1" Area
pipeline network, it can be concluded as follows:
1. Pipeline network and production wells in "X1"
Area can be modeled with an average of
pressure differences by 1.5%, and biggest
pressure matching difference in 3.3%, while the
matching average of oil rate difference is 3.1%
with the biggest oil rate difference matching oil
in 6.8%.
2. Bottlenecking problems were found in three
segments; segment 3 (KE to KA), segment 6
(KA to KB, and segment 8 (KC to KB), thus
some efforts need to be made to reduce the
pressure on the pipeline segment contained
bottlenecking includes: pipeline pigging,
pipeline replacement with larger diameters, or
parallel pipeline additional.
3. Back pressure was found in the majority of
production wells in the "X1" Area pipeline
network, so efforts to reduce the pressure of the
separator at the block station of production
facilities need to be done.
4. An optimization scenario simulation results for
back pressure and bottlenecking problems show
an increase in production rate of 1,006.2 BOPD
or 19% higher compare to initial production
rate.
REFERENCES
1. Allo, K.R. and Siagian, U.W.R. (2008).
Permasalahan Bottlenecking Pada Jaringan
Perpipaan Produksi Minyak Lepas Pantai: Studi
Kasus Lapangan-X. Badung: Institut Teknologi
Bandung.
2. Aritonang, L., Lucich, M.A., Kurz, J.E.,
Haryanto, K., Suyanto, A., and Anwar, C.
(2003). Zulu Pipeline Debottlenecking. Society
of Petroleum Engineers, SPE 84039MS.
3. Azzalzalah (2009). Analisa Bottlenecking pada
System Produksi di suatu Lapangan Minyak
yang Terdiri dari Tiga Reservoir Berbeda.
Bandung: Institut Teknologi Bandung.
4. Manurung, A.S.P. (2009). Analisa
Bottlenecking dalam Jaringan Perpipaan
Lapangan Minyak. Bandung: Institut Teknologi
Bandung.
5. Aryana, I.G.D, Fathaddin M.T., and
Sulistyanto, D. (2018). Design of Flowline,
Separator, and Slug Catcher in X Field. Journal
of Earth Energy Science, Engineering, and
Technology, 1(3), pp. 81-87.
6. Economides, M., and Kappos, L. (2009).
Petroleum Pipeline Network Optimization.
Oxford: EOLSS Publishers.
7. Yokum, B.T. (1969). Oilfield Gathering System
Models For Planning And Optimum Design.
Society of Petroleum Engineers, SPE 2482MS.
8. Kempton, E.C., Hegde, G.A., and Smith, E.W.
(2018). Oshore Gathering Systems: Multiphase
Flow Modeling Accuracy Challenges. 11th
North American Conference on Multiphase
Production Technology. Banff: BHR,
BHR-2018-387.
Journal of Earth Energy Science, Engineering, and Technology, Vol. 3, No. 2, 2020 URL: https://trijurnal.lemlit.trisakti.ac.id/jeeset
eISSN: 2614-0268 44 pISSN: 2615-3653
Figure 1. Procedure of Research
Yes
No
Start
Data Processing
and Preparation
Well Model
Matching
End
Running Optimum Scenario
Analysis
Pipe Network
Model
Matching
Yes
No
Journal of Earth Energy Science, Engineering, and Technology, Vol. 3, No. 2, 2020 URL: https://trijurnal.lemlit.trisakti.ac.id/jeeset
eISSN: 2614-0268 45 pISSN: 2615-3653
Table 1. Trajectory Data of S-A-06 Well
MD, ft TVD, ft Deviation
Angel, degree
MD, ft TVD, ft
Deviation
Angel, degree
400.0 400.0 0.0 2194.0 2137.2 31.9
863.0 862.9 1.1 2288.0 2215.2 34.0
985.0 984.8 2.7 2383.0 2291.4 36.6
1077.0 1076.5 4.7 2414.0 2315.7 38.5
1137.0 1136.1 6.5 2479.0 2365.9 39.4
1262.0 1259.6 8.8 2575.0 2439.6 39.9
1325.0 1321.5 10.8 2732.0 2560.1 39.9
1388.0 1383.1 12.0 2984.0 2753.5 39.9
1420.0 1414.3 13.0 3298.0 2994.9 39.7
1503.0 1494.8 14.1 3612.0 3237.2 39.5
1661.0 1646.5 16.3 3929.0 3481.8 39.5
1817.0 1793.7 19.3 4242.0 3724.2 39.2
1981.0 1949.1 18.7 4557.0 3970.7 38.5
2068.0 2029.2 23.0 4872.0 4219.3 37.9
2131.0 2083.7 30.0 5172.0 4461.2 36.3
Table 2. PVT Data
Formation Pb GOR, Boi Bgi, SGO SGG Tr,
Type of Reservoir Drive psig scf/stb rb/stb cf/scf API oF
K, UBRF 400.0 0.0 2194.0 - 32 0.80 208 Solution Gas Drive
K, LBRF 862.9 1.1 2288.0 - 36 0.80 211 Partial Water Drive
K, TAF 984.8 2.7 2383.0 0.01 37.6 0.77 220 Solution Gas/Water Drive
Y, BRF 1076.5 4.7 2414.0 - 36 0.86 211 Water Drive & Solution Gas Drive
Y, TAF 1136.1 6.5 2479.0 - 34 - 215 Water Drive & Solution Gas Drive
S, TAF 2083.7 30.0 5172.0 - 24.3 0.64 230 Strong Water Drive
Table 3. Production Data
Platform Status Test Date BFPD BSW% BOPD BWPD MCFD GOR PBHP PBHT FLT
S-01 P* 26-12-2015 1,043 97.00 31 1,012 47 1,501 - - 192
S-05 P 10-01-2016 2,299 94.00 138 2,161 43 312 600 207 204
S-06 P 20-12-2015 1,202 87.00 156 1,046 44 281 - - 196
S-08 P 24-12-2015 1,027 96.00 41 986 42 1,022 386 215 198
S-09 P 19-12-2015 3,120 93.00 218 2,902 57 261 624 208 202
S-10 P 22-12-2015 3,092 92.00 247 2,845 43 174 411 210 214
S-11 S* 23-03-2015 1,530 95.00 76 1,453 30 392 900 208 189
S-13 P 27-01-2016 4,787 96.00 191 4,596 42 219 699 205 204
S-14 P 28-12-2015 1,599 93.00 112 1,487 35 312 - - 196
*)P = Production, S = Shut-in
Journal of Earth Energy Science, Engineering, and Technology, Vol. 3, No. 2, 2020 URL: https://trijurnal.lemlit.trisakti.ac.id/jeeset
eISSN: 2614-0268 46 pISSN: 2615-3653
Table 4. Matching Result to WellFlo Software
Platform/Well
Name
Actual Simulated % Difference
pbhp, psia q, bfpd pbhp, psia q, bfpd pbhp, psia q, bfpd
K-A
K-A-01 553 1,133 547.30 1,134.0 1.0 0.09
K-A-03 295 662 282.35 663.0 4.3 0.15
K-A-05 511 692 489.72 691.0 4.2 0.14
K-A-07 232 471 224.70 471.5 3.1 0.11
K-A-09 507 954 487.70 954.0 3.8 0.00
K-B
K-B-01 610 927 606.00 927.5 0.7 0.05
K-B-03 1284 813 1276.60 813.5 0.6 0.06
K-B-05 588 1,192 586.68 1,192 0.2 0.02
K-B-09 639 1,486 618.30 1,486 3.2 0.01
K-C
K-C-02 452 1,940 441.00 1,940 2.4 0.02
K-C-04 561 1,087 545.70 1,087 2.7 0.00
K-C-10 279 921 262.88 921.0 5.8 0.01
K-C-11 475 739 478.40 739.0 0.7 0.00
K-D
K-D-01 269 379 259.95 379.0 3.4 0.00
K-D-06 315 572 297.73 572.0 5.5 0.02
K-D-07 307 1,910 293.90 1,910.0 4.3 0.00
K-D-09 242 703 234.10 703.0 3.3 0.01
K-E
K-E-01 586 1,616 569.50 1,615.8 2.8 0.01
K-E-03 386 153 379.40 152.8 1.7 0.13
K-E-05 316 191 314.90 191.0 0.3 0.00
K-E-09 404 1,663 383.60 1,663.0 5.0 0.01
S-A
S-A-01 862 1,043 826.90 1,042.9 4.1 0.01
S-A-05 615 2,299 583.50 2,298.7 5.1 0.02
S-A-06 807 1,202 770.70 1,202.2 4.5 0.02
S-A-08 386 1,027 376.30 1,027.0 2.5 0.02
S-A-09 639 3,120 617.30 3,120.1 3.4 0.01
S-A-10 426 3,092 417.60 3,092.1 2.0 0.01
S-A-13 714 4,787 692.40 4,787.5 3.0 0.01
S-A-14 873 1,599 844.30 1,589.9 3.3 0.01
S-B
S-B-01 923 896 889.40 896.0 3.6 0.00
S-B-04 875 2,102 853.80 2,102.1 2.4 0.02
S-B-05 906 1,520 891.10 1,520.0 1.6 0.01
S-B-06 825 1,639 797.40 1,639.1 3.3 0.01
S-B-07 812 1,509 772.65 1,508.9 4.8 0.01
S-B-08 621 1,523 595.30 1,523.1 4.1 0.01
Y-A
Y-A-05 261 446 250.40 446.0 4.1 0.01
Y-A-06 234 445 225.60 445.0 3.6 0.01
Y-B
Y-B-05 489 1,358 468.50 1,358.3 4.2 0.02
Y-B-06 356 1,149 339.40 1,149.1 4.7 0.01
Y-B-8 624 283 593.60 283.0 4.9 0.00
Y-B-10 480 145 457.60 145.0 4.7 0.02
Average Difference 3.2 0.03
Journal of Earth Energy Science, Engineering, and Technology, Vol. 3, No. 2, 2020 URL: https://trijurnal.lemlit.trisakti.ac.id/jeeset
eISSN: 2614-0268 47 pISSN: 2615-3653
Figure 2. Diagram of S-06 Well
Figure 3. Nodal Analysis of S-06 Well
Journal of Earth Energy Science, Engineering, and Technology, Vol. 3, No. 2, 2020 URL: https://trijurnal.lemlit.trisakti.ac.id/jeeset
eISSN: 2614-0268 48 pISSN: 2615-3653
Figure 4. Pipeline Network of “X1” Area
Figure 5. Pipeline Network between Wells in S-B Platform
Journal of Earth Energy Science, Engineering, and Technology, Vol. 3, No. 2, 2020 URL: https://trijurnal.lemlit.trisakti.ac.id/jeeset
eISSN: 2614-0268 49 pISSN: 2615-3653
Table 5. Seabed Pipe of “X1” Area
Segment
Route
Pipe Code Material
Specification
Outside
Diame-
ter, in.
Inside
Diame-
ter, in.
Pipe
Length,
in.
Weight
/unit,
lb From To
1 S-B S-A Pipe_1_12 ERW/API5LX42 12.6 12 4,065 39.36
2 S-A Y-A Pipe_1_13 ERW/API5LX42 12.6 12 62,274 39.36
3 K-E K-A Pipe_1_14 ERW/API5LX42 12.6 12 4,975 39.36
4 Y-B Y-A Pipe_3 ERW/API5LX42 12.6 12 16,731 38.75
5 Y-A K-A Pipe_4 ERW/API5LX42 17 16 11,711 90.06
6 K-A K-B Pipe_6 ERW/API5LX42 17 16 9,250 88.00
7 K-D K-B Pipe_3_1 ERW/API5LX42 17 16 15,953 88.00
8 K-C K-B Pipe_1_15 ERW/API5LX42 12.8 12 7,381 52.91
9 K-B C-P Pipe_2 ERW/API5LX42 20 19 95,943 104.0
Table 6. Pressure and Flow Rate of Pipe Network
Platform Parameter Data
S-B Fluid flow rate, bfpd 765.0
Outlet pressure to S-A, psi 315.0
S-A
Fluid flow rate, bfpd 1,901.0
Inlet pressure from S-B, psi 310.0
Outlet pressure to Y-A, psi 300.0
Y-B Fluid flow rate, bfpd 1,168.0
Outlet pressure to Y-A, psi 180.0
Y-A
Fluid flow rate, bfpd 3,171.0
Inlet pressure from S-A, psi 145.0
Inlet pressure from Y-B, psi 145.0
Outlet pressure to K-A, psi 140.0
K-E Fluid flow rate, bfpd 225.0
Outlet pressure to K-A, psi 145.0
K-A
Fluid flow rate, bfpd 3,742.0
Inlet pressure from Y-A, psi 115.0
Inlet pressure from K-E, psi 115.0
Outlet pressure to K-B, psi 110.0
K-D Fluid flow rate, bfpd 803.0
Outlet pressure to K-B, psi 115.0
K-C Fluid flow rate, bfpd 344.0
Outlet pressure to K-B, psi 115.0
CBU Fluid flow rate, bfpd 6,254.0
Outlet pressure to K-B, psi 63.5
K-B
Fluid flow rate, bfpd 11,218.0
Inlet pressure from K-A, psi 64.0
Inlet pressure from K-D, psi 63.0
Inlet pressure from K-C, psi 64.5
Inlet pressure from CBU, psi 63.5
Outlet pressure to C-P, psi 70.0
C-P Fluid flow rate, bfpd 11,218.0
Inlet pressure from K-B, psi 30.0
Journal of Earth Energy Science, Engineering, and Technology, Vol. 3, No. 2, 2020 URL: https://trijurnal.lemlit.trisakti.ac.id/jeeset
eISSN: 2614-0268 50 pISSN: 2615-3653
Table 7. Pressure and Flowrate Matching Result for Each Well
Platform/Well Pwh, psia q, bfpd
Actual Matching % Actual Matching %
S-A
S-A-01 607.7 613.8 1.01 32.0 34.7 8.49
S-A-05 755.9 763.0 0.95 138.0 145.5 5.46
S-A-06 765.7 758.0 -1.01 156.3 165.0 5.58
S-A-08 686.7 694.0 1.06 41.1 42.8 4.30
S-A-09 686.7 694.0 1.06 218.4 231.4 5.95
S-A-10 765.7 773.4 1.00 247.4 261.6 5.78
S-A-13 716.3 724.0 1.07 191.5 204.5 6.81
S-A-14 647.2 653.7 1.01 111.9 118.6 5.92
S-B
S-B-01 686.7 679.8 -1.01 125.4 132.7 5.77
S-B-04 380.5 376.7 -1.00 231.2 244.5 5.74
S-B-05 558.3 563.9 1.00 76.0 80.4 5.77
S-B-06 676.8 671.0 -0.86 180.3 193.5 7.35
S-B-07 864.5 857.8 -0.77 45.3 48.7 7.48
S-B-08 538.5 543.9 1.00 106.6 110.4 3.51
Y-A
Y-A-05 647.2 654.0 1.05 22.3 23.7 6.11
Y-A-06 370.6 374.0 0.91 80.1 85.5 6.76
Y-B
Y-B-03 775.6 783.0 0.95 601.0 650.4 8.21
Y-B-04 351.1 355.0 1.11 356.2 378.9 6.37
Y-B-08 312.6 313.1 0.18 127.3 130.1 2.15
Y-B-10 262.3 260.0 -0.88 100.0 102.8 2.75
K-A
K-A-01 775.6 768.0 -0.98 79.3 82.6 4.15
K-A-03 508.9 504.0 -0.96 132.4 136.5 3.07
K-A-05 370.6 367.0 -0.97 34.6 35.0 1.29
K-A-07 637.3 631.0 -0.99 33.0 35.6 7.88
K-A-09 459.5 455.0 -0.98 66.8 69.5 4.02
K-B
K-B-03 192.8 195.0 1.14 40.6 42.8 5.36
K-B-05 627.4 634.0 1.05 47.7 47.7 0.09
K-B-09 874.4 883.0 0.98 93.0 97.9 5.30
K-B-01 943.5 934.0 -1.01 145.0 155.8 7.43
K-C
K-C-02 815.1 823.0 0.97 126.0 129.3 2.60
K-C-04 731.2 738.0 0.94 145.0 153.2 5.64
K-C-10 429.9 434.0 0.96 64.5 66.4 2.97
K-C-11 825.0 833.0 0.97 23.0 24.7 7.39
K-D
K-D-01 469.4 465.0 -0.94 201.0 193.2 -3.88
K-D-06/ST 489.1 484.0 -1.05 85.8 85.6 -0.19
K-D-07 420.0 424.0 0.95 152.8 159.6 4.45
K-D-09 854.6 846.0 -1.01 344.5 373.7 8.47
K-E
K-E-01 1,062.1 1,062.5 0.04 97.0 104.4 7.63
K-E-04 647.2 641.0 -0.96 64.3 68.0 5.88
K-E-05 489.1 484.0 -1.05 30.6 31.3 2.35
K-E-11 607.7 614.0 1.04 35.0 36.9 5.40
Average Difference 0.95 5.16
Journal of Earth Energy Science, Engineering, and Technology, Vol. 3, No. 2, 2020 URL: https://trijurnal.lemlit.trisakti.ac.id/jeeset
eISSN: 2614-0268 51 pISSN: 2615-3653
Table 8. Pressure and Flowrate Matching Result for Each Platform
Platform Pwh, psia
Actual Matching %
S-B out 315.0 317.1 0.7
S-A in S-B 310.0 303.0 2.3
S-A out 300.0 303.0 1.0
Y-B out 180.0 178.0 1.1
Y-A in Y-B 145.0 144.1 0.6
Y-A in S-A 145.0 144.1 0.6
Y-A out 140.0 144.1 2.9
K-E out 145.0 146.0 0.7
K-A in Y-A 115.0 113.5 1.3
K-A in K-E 115.0 113.5 1.3
K-A out 110.0 113.5 3.2
K-C out 115.0 114.8 0.2
K-D out 115.0 114.8 0.2
K-B in K-A 64.0 66.0 3.1
K-B in K-C 64.5 66.0 2.3
K-B in K-D 63.0 62.0 1.6
K-B out 70.0 71.0 1.4
C-P in 30.0 29.0 3.3
Average Diference 1.5
Maximum Difference 3.3
Platform q, bfpd
Actual Matching %
S-B out 765.0 801.2 4.73
S-A out 1,901.0 1,982.8 4.30
Y-B out 1.168.0 1.247.4 6.80
Y-A out 3,171.0 3,248.0 2.43
K-E out 225.0 232.4 3.29
K-A out 3,742.0 3,825.1 2.22
K-C out 344.0 354.9 3.16
K-D out 803.0 795.2 0.97
K-B out 11,218 11,393 1.56
C-P in 11,218 11,344 1.12
Average Diference 3.1
Maximum Difference 6.8
Journal of Earth Energy Science, Engineering, and Technology, Vol. 3, No. 2, 2020 URL: https://trijurnal.lemlit.trisakti.ac.id/jeeset
eISSN: 2614-0268 52 pISSN: 2615-3653
Table 9. Pressure and Flowrate Matching Result of Optimization Scenario
Platform/Well Pwh, psia q, bfpd
Matching Optimized % Matching Optimized %
S-A
S-A-01 613.8 370.7 -40 34.7 41.6 20
S-A-05 763.0 370.7 -51 145.5 188.4 29
S-A-06 758.0 370.7 -51 165.0 202.2 23
S-A-08 694.0 370.7 -47 42.8 56.5 32
S-A-09 694.0 370.7 -47 231.4 252.1 9
S-A-10 773.4 370.7 -52 261.6 294.0 12
S-A-13 724.0 370.7 -49 204.5 244.5 20
S-A-14 653.7 404.2 -38 118.6 124.4 5
S-B
S-B-01 679.8 391.3 -42 132.7 158.8 20
S-B-04 376.7 391.3 4 244.5 238.9 -2
S-B-05 563.9 391.3 -31 80.4 89.7 12
S-B-06 671.0 391.3 -42 193.5 289.7 50
S-B-07 857.8 391.3 -54 48.7 72.9 50
S-B-08 543.9 391.3 -28 110.4 126.2 14
Y-A
Y-A-05 654.0 145.7 -78 23.7 34.7 47
Y-A-06 374.0 145.7 -61 85.5 90.5 6
Y-B
Y-B-03 783.0 189.2 -76 650.4 734.5 13
Y-B-04 355.0 189.2 -47 378.9 424.3 12
Y-B-08 313.1 189.2 -40 130.1 151.2 16
Y-B-10 260.0 189.2 -27 102.8 129.2 26
K-A
K-A-01 768.0 100.7 -87 82.6 110.9 34
K-A-03 504.0 100.7 -80 136.5 169.3 24
K-A-05 367.0 100.7 -73 35.0 37.7 8
K-A-07 631.0 100.7 -84 35.6 38.9 9
K-A-09 455.0 100.7 -78 69.5 76.0 9
K-B
K-B-03 195.0 207.0 6 42.8 42.6 -1
K-B-05 634.0 207.0 -6 47.7 76.3 60
K-B-09 883.0 500.6 -43 97.9 102.3 4
K-B-01 934.0 207.0 -78 155.8 184.4 18
K-C
K-C-02 823.0 108.4 -87 129.3 154.5 19
K-C-04 738.0 270.4 -63 153.2 203.2 33
K-C-10 434.0 108.4 -75 66.4 69 4
K-C-11 833.0 453.9 -46 24.7 27 8
K-D
K-D-01 465.0 241.7 -48 193.2 226.0 17
K-D-06/ST 484.0 241.7 -50 85.6 102.7 20
K-D-07 424.0 447.0 5 159.6 159.1 -0.3
K-D-09 846.0 241.7 -71 373.7 429.9 15
K-E
K-E-01 1,062.5 447.4 -58 104.4 119.3 14
K-E-04 641.0 145.4 -77 68.0 87.7 29
K-E-05 484.0 145.4 -70 31.3 32.8 5
K-E-11 614.0 438.8 -29 36.9 39.7 7
Journal of Earth Energy Science, Engineering, and Technology, Vol. 3, No. 2, 2020 URL: https://trijurnal.lemlit.trisakti.ac.id/jeeset
eISSN: 2614-0268 53 pISSN: 2615-3653
Figure 6. Optimization Result of Riser Pressure
S-B
Matching Optimum %
317.14 391.3 23.4%
S-A
Matching Optimum %
303 370.7 22.4
Matching Optimum %
303 370.7 22.4
Y-A
Matching Optimum %
144.1 145.7 1.1
Matching Optimum %
144.1 145.7 1.1
Y-B
Matching Optimum %
178 189.2 6.3
Matching Optimum %
144.1 145.7 1.1
CBU
Matching %
207 24.6 156
K-A
Matching Optimum %
113.5 100.7 -11.3
Matching Optimum %
113.5 100.7 -11.3
Matching Optimum %
113.5 100.7 -11.3
K-E
Matching Optimum %
146 145.4 -0.4
K-D
Matching %
114.8 241.7 110.6
K-B
Matching Optimum %
62 207.0 233.9
Matching Optimum %
65.5 19.9 -69.5
Matching Optimum %
71 73.6 3.6
Matching Optimum %
62 62.0 0.0
Matching Optimum %
66 19.9 -69.8
K-C
Matching Optimum %
114.8 108.4 -5.5
C-P
Matching Optimum %
29 14.7 49.3
Optimum Optimum
Related Documents