Are Refiners Entering a Are Refiners Entering a Golden Age or a Short Golden Age or a Short Cycle? Cycle? Global Refining Strategies 2007 Barcelona, Spain April 2007 Joanne Shore John Hackworth Energy Information Administration www.eia.doe.gov

Download presentation source
Nov 01, 2014
Welcome message from author
This document is posted to help you gain knowledge. Please leave a comment to let me know what you think about it! Share it to your friends and learn new things together.
Transcript

Are Refiners Entering a Are Refiners Entering a Golden Age or a Short Cycle?Golden Age or a Short Cycle?
Global Refining Strategies 2007Barcelona, SpainApril 2007
Joanne ShoreJohn HackworthEnergy Information Administration
www.eia.doe.gov

Short-Term Cycle or Golden Age? Short-Term Cycle or Golden Age?
• What has driven prices, margins, and light heavy price differentials to current high levels?– How are these three variables
related?
– What are the main drivers?
• How long might prices, margins, & differentials stay elevated? 0
10
20
30
40
50
60
70
80
90
100
Jan-95 Jan-00 Jan-05
$/B
arre
l
No. 2 Heating Oil Gulf Coast
WTI Crude Price
Crude Oil & Distillate Fuel Prices
Source: Bloomberg spot prices

OutlineOutline
• High Prices: Crude Oil
• Drivers and Uncertainties Behind Margins and Differentials
• Other Supply/Demand Factors Affecting Future Petroleum Markets– Energy Efficiency– Biofuels– Surge in Capacity
Expansion Plans

The Main Factor Behind High Product The Main Factor Behind High Product Prices: Crude Oil PricesPrices: Crude Oil Prices
• Strong Demand Growth
• Less Supply Growth
• Different Prospects for Future than seen in 1980

0
1
2
3
4
5
6
1991-1997
Average
1998 1999 2000 2001 2002 2003 2004 2005 2006 2007 2008
Mil
lio
n B
arr
els
Pe
r D
ay
World Surplus Crude Oil Production Capacity Forecast
Today: Little World Crude Oil Surplus Today: Little World Crude Oil Surplus Production CapacityProduction Capacity
Source: EIA Short Term Energy Outlook March 2007

0
10
20
30
40
50
60
70
80
0 1 2 3 4 5 6 7 8
Surplus OPEC Capacity MMB/D
WT
I P
rice
- 2
005
$/B
arre
l
WTI Crude Price vs. OPEC Surplus Crude Production Capacity (Apr 1999 - Sept 2006)
Source: Bloomberg WTI; EIA Calculations
Today: See Typical Economic Relationship Today: See Typical Economic Relationship Between Little Surplus Capacity and PriceBetween Little Surplus Capacity and Price

Prospects for Demand Correction Different Prospects for Demand Correction Different than Early 1980’s Correctionthan Early 1980’s Correction
World Demand (MMB/D)
0102030405060708090
1965 1974 1983 1992 2001
Gasoline & Naphtha
Middle Distillates
Fuel Oil
Other
• Fuel oil decline will not ease market pressure today as in early 1980s
• Easy fuel efficiency gains made in early 1980s
• Large Asian economies account for more growth today
Notes: World Excluding FSU, Gasoline includes aviation gasoline & light distillate feedstocks
Source: BP World Statistical Review 2006

Today’s OPEC & Non-OPEC Production Today’s OPEC & Non-OPEC Production Requirements Different Than 1979-80Requirements Different Than 1979-80
0
5
10
15
20
25
30
35
40
4519
65
1969
1973
1977
1981
1985
1989
1993
1997
2001
2005
Mil
lio
n B
arre
sl P
er D
ay
OPEC
Non-OPEC
OPEC & Non-OPEC Crude Oil Production
Source: EIA Annual & Monthly Energy Reviews.

Limited Prospects for Non-OPEC Crude Limited Prospects for Non-OPEC Crude Supply Increases in Short RunSupply Increases in Short Run
• Fewer non-OPEC exploration prospects, field size declining
• Most efficient companies have limited access to known reserves
• Tar sands growth costly and slow
1%14%
85%
FullInternationalCompanyAccess
LimitedInternationalAccess
SovietReserves
National OilCompanyReserves
Source: Data from Business Week Online Slide Show: Why the Oil Giants Look Weaker http://www.businessweek.com/magazine/content/06_20/b3984001.htm May 15, 2006
16%
19%
65%
2004
1960s Known Reserve Access

Prices Expected to Remain Relatively High Prices Expected to Remain Relatively High in Short Termin Short Term
• Future uncertain but could stay relatively high
• OPEC position has strengthened
• Demand growth has moderated only slightly
• No large surge in non-OPEC crude or other supply -- and costly
• Only OPEC can build excess capacity
$0
$10
$20
$30
$40
$50
$60
$70
$80
Jan
-98
Jan
-99
Jan
-00
Jan
-01
Jan
-02
Jan
-03
Jan
-04
Jan
-05
Jan
-06
Jan
-07
Jan
-08
WTI Crude Oil Price $/Barrel
Source: EIA Short Term Energy Outlook March 2007

Drivers & Uncertainties Behind Refinery Drivers & Uncertainties Behind Refinery Margins and DifferentialsMargins and Differentials
• Margins– Growing, but volatile
– Shift in gasoline and distillate contributions
– Refining utilization – over-emphasized factor?
• Light-Heavy Differentials and the Importance of Crude oil Price
• Future Considerations

3-2-1 Spread (Margin Indicator) Grew with 3-2-1 Spread (Margin Indicator) Grew with Crude Price – But Not SmoothlyCrude Price – But Not Smoothly
$0
$5
$10
$15
$20
$25
$30
$35
$40Ja
n-9
0
Jan
-92
Jan
-94
Jan
-96
Jan
-98
Jan
-00
Jan
-02
Jan
-04
Jan
-06
Sp
read
--
$/B
arre
l
$0
$10
$20
$30
$40
$50
$60
$70
$80
Cru
de
Pri
ce -
- $/
Bar
rel
Crude Price and Spread ($/Barrel)
WTI Spot
3-2-1 Spread
Source: Bloomberg Spot Data: Gulf Coast Gasoline, No. 2 and WTI.

Distillate Cracks Increased More than Distillate Cracks Increased More than GasolineGasoline
$0
$2
$4
$6
$8
$10
$12
$141
99
0
19
92
19
94
19
96
19
98
20
00
20
02
20
04
20
06
$/B
arre
l
GC Conv - WTI GC No2 - WTI
Annual Average Gulf Coast Spot Cracks
Source: Bloomberg spot prices – Gulf Coast Conventional & No. 2 minus WTI

World Utilization Up, But Atlantic Basin World Utilization Up, But Atlantic Basin Utilization Not Changed Much RecentlyUtilization Not Changed Much Recently
50%55%60%65%70%75%80%85%90%95%
100%
1980 1985 1990 1995 2000 2005
World
U.S.
EU-25
U.S & European Refinery Utilizations
Source: BP World Statistics 2006 (crude runs/capacity) and EIA Annual Energy Review (gross inputs/capacity).

Light-Heavy Differentials Rose Since 2000, Light-Heavy Differentials Rose Since 2000, But Will They Remain High?But Will They Remain High?
38%
35%
24%
3%
60%
25%
14%1% LPG & Gases
Gasoline
Distillate
Heavy Gas Oil &Bottoms
Light Crude
Heavy Crude
Crude Oil Fractions
• Product markets drive light-heavy product prices
• Impact of total product barrel value on crude value
• Differential: Incentives for heavy-crude high-conversion refining

Light-Heavy Product Price Difference Light-Heavy Product Price Difference Increases with Crude Oil PriceIncreases with Crude Oil Price
0102030405060708090
100J
an
-95
Ja
n-9
6
Ja
n-9
7
Ja
n-9
8
Ja
n-9
9
Ja
n-0
0
Ja
n-0
1
Ja
n-0
2
Ja
n-0
3
Ja
n-0
4
Ja
n-0
5
Ja
n-0
6
Ja
n-0
7
$/B
arr
el
No. 2 Heating Oil Gulf Coast
WTI Crude Price
3% Resid Gulf Coast
Crude Oil, Distillate, Residual Fuel Prices
Source: Bloomberg spot price

Light-Heavy Crude Price Differential Light-Heavy Crude Price Differential & Crude Oil Price Move Together& Crude Oil Price Move Together
$0
$4
$8
$12
$16
$20Ja
n-9
5
Jan
-96
Jan
-97
Jan
-98
Jan
-99
Jan
-00
Jan
-01
Jan
-02
Jan
-03
Jan
-04
Jan
-05
Jan
-06
Jan
-07
Lig
ht-
Hea
vy D
iffe
ren
tial
$0
$16
$32
$48
$64
$80
Cru
de
Pri
ce
WTI-Maya
WTI Crude Price
Crude Price & Price Differential ($/Barrel)
Source: Bloomberg spot prices

If WTI Drops from $70 to $40, Will Differential Drop If WTI Drops from $70 to $40, Will Differential Drop by 40% ($17-$10)?by 40% ($17-$10)?
R2 = 0.807
$0
$5
$10
$15
$20
$25
$0 $20 $40 $60 $80
WTI
WT
I-M
aya
Sp
read
WTI Price Versus WTI-Maya Spread 1/91-3/07
Source Bloomberg WTI Cushing and Maya.

If WTI Drops from $70 to $40, Margin Relationship If WTI Drops from $70 to $40, Margin Relationship Less CertainLess Certain
R2 = 0.467
$0
$5
$10
$15
$20
$25
$0 $20 $40 $60 $80
WTI
3-2
-1 P
ric
e S
pre
ad
WTI Price Versus 3-2-1 Spread (1/91-3/07*)
Note: Three hurricane months excluded (Aug-Oct 2006) Source Bloomberg Gulf Coast product spot prices and WTI Cushing.

Bottom Line: Crude Price Important Bottom Line: Crude Price Important Indicator of Future ReturnsIndicator of Future Returns
• Rising price: Increasing margins, increasing differentials
• Declining price: Decreasing margins, decreasing differentials
• Price settles within a high price band– Margins lose their boost from rising market dynamics,
but may stay higher than seen in the 1990’s– Differentials remain high -- even with more conversion
capacity

Other Supply/Demand Factors Affecting Other Supply/Demand Factors Affecting Future Petroleum MarketsFuture Petroleum Markets
Demand • Distillate/Gasoline Shift • Energy Efficiency
Supply• Biofuels Reducing Need for
Some Capacity• Capacity Expansions –
Oversupply?40%
45%
50%
55%
60%
65%
70%
1985
1988
1991
1994
1997
2000
2003
Middle Distillates Share of Gasoline and Middle Distillates Consumption
EU-25
World Excl FSU and EU-25
Source: BP World Statistics 2006.

Demand Factors Impacting Future Atlantic Demand Factors Impacting Future Atlantic Basin NeedsBasin Needs
• Europe’s growing imbalance between distillate & gasoline
• U.S. continued growth in gasoline & distillate – with distillate growing more strongly
• Potential increase in efficiency requirements (greenhouse gas, energy security, etc.)
– Europe’s potential mandates– U.S potential policy change– Slow impacts 0
200
400
600
800
1,000
1,200
19
95
19
97
19
99
20
01
20
03
20
05
Th
ou
sa
nd
Ba
rre
ls P
er
Da
y
Europe's Gasoline Exports & U.S. Net Imports
OECD Europe Exports
U.S. Imports
Note: U.S. imports includes blending components. 2006 is based on January-October data. Source: IEA, EIA Petroleum Supply Monthly & Annual

Biofuels Changing Capacity NeedsBiofuels Changing Capacity Needs
• Europe’s biofuel interest increasing– Biodiesel compatible with diesel
capacity shortfall– Ethanol in gasoline exacerbates
over-supply situation
• U.S. seeing diminishing need for new gasoline capacity– Increase in ethanol– Increase in import availability
from Europe
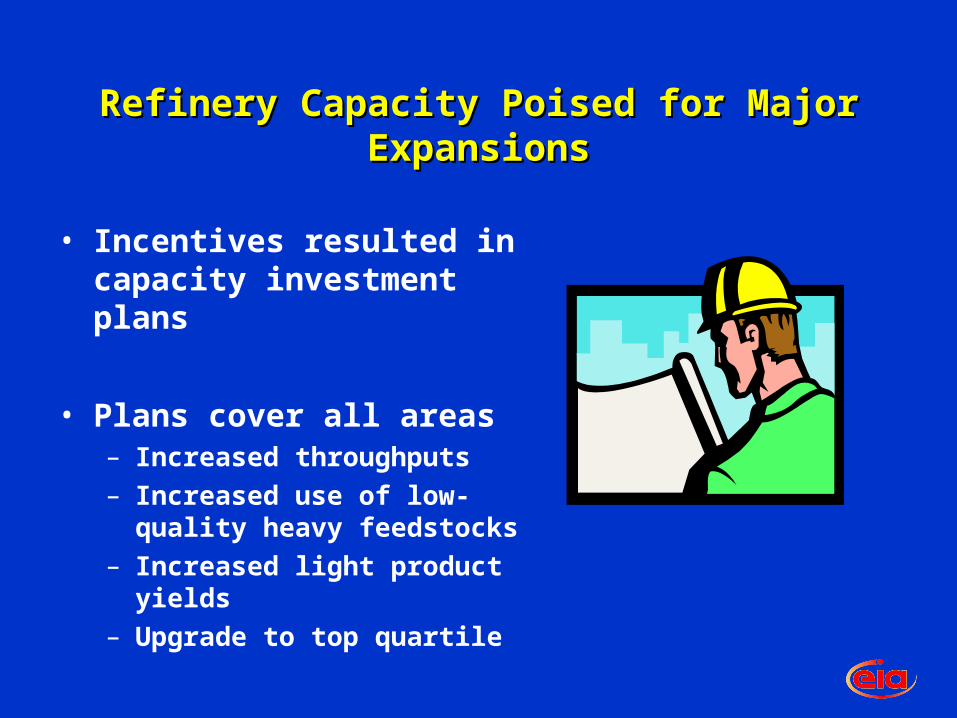
Refinery Capacity Poised for Major Refinery Capacity Poised for Major ExpansionsExpansions
• Incentives resulted in capacity investment plans
• Plans cover all areas– Increased throughputs– Increased use of low-quality
heavy feedstocks– Increased light product yields– Upgrade to top quartile

U.S. Capacity Expansions 2007 through 2011 (KB/D)U.S. Capacity Expansions 2007 through 2011 (KB/D)
5-Year Expansions
Dist. FCC HC Coking
Conoco Phillips 120 0 20 90
Flint Hills 50 0 0 0
Marathon 180 0 70 44
Motiva 325 0 75 80
Total 0 0 0 50
Sinclair 0 0 0 30
Valero 75 0 0 0
Other 57 33 30 4
Creep-Closings 250 158 0 0
TOTAL 1057 191 195 298
Note: Dist: Crude distillation unit; FCC: Fluid catalytic cracking; HC: Hydrocracking. Sources: Oil & Gas Journal, company presentations, Hydrocarbon Processing Boxscore

Capacity and Complexity Increases Through Capacity and Complexity Increases Through Next 5 YearsNext 5 Years
0
500
1000
1500
2000
2500
3000
3500
4000
Asia-Pacific Middle East Europe U.S.
Th
ou
sa
nd
Ba
rre
ls P
er
Da
y
Dist FCC HC Coker
Refinery Capacity Expansions 2007 through 2011
Note: Dist: Crude distillation; FCC: Fluid catalytic cracking; HC: Hydrocracking. Source: EIA, FACTS, company presentations, Oil and Gas Journal, Hydrocarbon Processing Boxscore.

Complexity is IncreasingComplexity is Increasing
0%
7%
14%
21%
28%
35%
FCC HC Coking
Jan '07Jan '12
Asia Pacific
0%
7%
14%
21%
28%
35%
FCC HC Coking
Jan '07Jan '12
Middle East
0%
7%
14%
21%
28%
35%
FCC HC Coking
Jan '07
Jan '12
Europe
0%
7%
14%
21%
28%
35%
FCC HC Coking
Jan '07
Jan '12
U.S.
Down-Stream Capacity as Percent of Distillation Capacity Jan 1, 2007 and Jan 1, 2012
Note: FCC: Fluid catalytic cracking; HC: Hydrocracking.

Capacity and Consumption 5-Year ChangesCapacity and Consumption 5-Year Changes2007 through 20112007 through 2011
0
500
1000
1500
2000
2500
3000
3500
4000
U.S. Europe Middle East Asia Pacific
Distillation Capacity Demand
Th
ou
san
d B
arre
ls P
er D
ay
Sources: Capacity see previous slides; Demand: EIA, BP World Statistical World Review 2006, FACTS, IEA

Not Surprising that Outlooks/Plans VaryNot Surprising that Outlooks/Plans Vary
Group RegionsFuture Market Expectations
Refinery Investment Strategy
Super Majors AllMargins revert to
historic
Maintain top-quartile
performance , little expansion need
Majors with Large Downstream
U.S. & EuropeImproved margins
with cycles
Heavy crude projects & cautious
expansion
Independent Refiners
U.S."Golden Age of Refining“ but…
Expand or upgrade operations
Export Refiners
Middle East Tight capacity & high light-heavy
Expand for export, add bottoms upgrading
State & Private
India & ChinaHigh demand growth, better
margins
Rapid expansion existing & grassroots
Sources: Trade press articles, company presentations and press releases.

Potential for Over or Under Expansion – And Potential for Over or Under Expansion – And Does it Matter?Does it Matter?
• Barring calamities: – In the next 2-3 years, capacity will likely remain tight – In next 5-10 years, not likely to see utilizations drop to levels
seen in early 1980’s from expansion
• Expansion that reduces utilization several percentage points not likely to have much impact on margins
• Regionally, the highest risk for oversupply that might impact Atlantic Basin margins is in Middle East; Atlantic Basin is not likely to over-expand
• Decrease in residual fuel supply from bottoms upgrading not likely to be enough to push residual fuel prices much closer to crude oil price and significantly reduce differentials. (Demand for residual fuel is declining.)
• Rising facility construction costs and biofuels use may reduce rate of facility expansion

Looking Ahead: Crude Price FactorLooking Ahead: Crude Price Factor
• Forecast: Fluctuate in band much higher than during the 1990’s (perhaps in the $60-$70 range?)
• Margin impact:– Lose the boost from being in a “rising” market– But still may support higher margins than in the 1990’s
• Light-Heavy differential impact:– Remain elevated– Demand for residual fuel is shrinking (e.g., bunker fuel
market)– Even with more conversion capacity destroying residual
fuel supply, residual price not likely to rise more towards crude oil
• Uncertainty: If crude oil prices fall, margins and differentials fall

Looking Ahead: Other Supply/Demand Looking Ahead: Other Supply/Demand FactorsFactors
• Policies affecting biofuels and energy efficiency– Biofuels impact supply mix and volume
– Ethanol use in U.S. reducing need for increased gasoline capacity, but U.S. still needs distillate capacity
– Biodiesel in Europe may help slow growing diesel supply gap, but ethanol in Europe adds to already excess gasoline supply
– Ultimate margin impact may be small – affecting gasoline cracks more than distillate
– Energy efficiency improvements have slow impacts – can adjust
• Will refinery expansion plans result in capacity oversupply?– Seeing U.S. capacity plans shrink
– Largest potential for oversupply margin impact is in the Middle East, where could dampen European margins and thus Atlantic Basin margins some

Short Cycle or Golden Age?Short Cycle or Golden Age?
Related Documents