Welcome message from author
This document is posted to help you gain knowledge. Please leave a comment to let me know what you think about it! Share it to your friends and learn new things together.
Transcript


TABLE OF CONTENTS
FEDERATION OF EURO-ASIAN STOCK EXCHANGES ANNUAL REPORT JUNE 2010
PAGE 1
Federation of Euro-Asian Stock Exchanges 4NASDAQ OMX 28Bloomberg 30IS Investment 32Central Registry Agency Inc. 34Finans Asset Management 35Tayburn Kurumsal 37Garanti Asset Management 38
Stock Exchange ProfilesAbu Dhabi Securities Exchange 42Amman Stock Exchange 46Bahrain Stock Exchange 50Baku Interbank Currency Exchange 54Baku Stock Exchange 56Banja Luka Stock Exchange 60Belarusian Currency and Stock Exchange 64Belgrade Stock Exchange 68Bucharest Stock Exchange 72Bulgarian Stock Exchange 76Egyptian Exchange 80Georgian Stock Exchange 84Iraq Stock Exchange 88Istanbul Gold Exchange 92Istanbul Stock Exchange 94Karachi Stock Exchange 98Kazakhstan Stock Exchange 102Kyrgyz Stock Exchange 106Lahore Stock Exchange 110Macedonian Stock Exchange 112Moldova Stock Exchange 116Mongolian Stock Exchange 120Montenegro Stock Exchange 124Muscat Securities Market 128NASDAQ OMX Armenia 132Palestine Securities Exchange 136Sarajevo Stock Exchange 140State Commodity & Raw Materials Exchange of Turkmenistan 142Tehran Stock Exchange 146Tirana Stock Exchange 150“Toshkent” Republican Stock Exchange 154Ukrainian Stock Exchange 158Zagreb Stock Exchange 162
Affiliate Member ProfilesCentral Registry Agency Inc. 167Central Securities Depository of Iran 168Macedonian Central Securities Depository 169National Depository Center of Azerbaijan 170Misr for Clearing, Settlement & Central Depository 171Securities and Exchange Brokers Association of Iran (SEBA) 172Securities Depository Center (SDC) of Jordan 173Takasbank - ISE Settlement and Custody Bank, Inc. 174Tehran Securities Exchange Technology Management Company (TSETMC) 175The Association of Capital Market Intermediary Institutions of Turkey (TSPAKB) 176
Member List 177
FEDERATION OF EURO-ASIAN STOCK EXCHANGES (FEAS)
I.M.K.B Building, Emirgan 34467 Istanbul, TurkeyTel: (90 212) 298 2160Fax: (90 212) 298 2209E-mail: [email protected] address: www.feas.orgContacts: Mr. Aril Seren, Secretary GeneralMs. Ege Adalioglu, Assistant Secretary GeneralMrs. Susan Gogus, Assistant Secretary General
The Federation of Euro-Asian Stock Exchanges Annual Report June 2010 is published by the Federation of Euro-Asian StockExchanges.
All editorial material was collated and edited by the Federation of Euro-Asian Stock Exchanges. The design, production and distributionwas coordinated by the Federation of Euro-Asian Stock Exchanges.
Designed by: Tayburn Kurumsal
Although every care has been taken to ensure the accuracy of theinformation contained within the publication, the Secretariat cannot beheld liable for any inaccuracies, errors or omissions, nor held liable forany actions taken on the basis of the information provided herein.
© The Federation of Euro-Asian Stock Exchanges

MEMBERS
Abu Dhabi Securities Exchange Amman Stock ExchangeBahrain Stock Exchange Baku Interbank Currency Exchange Baku Stock Exchange Banja Luka Stock Exchange Belarusian Currency and Stock Exchange Belgrade Stock Exchange Bucharest Stock Exchange Bulgarian Stock Exchange Egyptian Exchange Georgian Stock Exchange Iraq Stock Exchange Istanbul Gold Exchange Istanbul Stock Exchange Karachi Stock ExchangeKazakhstan Stock Exchange Kyrgyz Stock Exchange Lahore Stock Exchange Macedonian Stock Exchange Moldova Stock Exchange Mongolian Stock Exchange Montenegro Stock Exchange Muscat Securities Market NASDAQ OMX ArmeniaPalestine Securities ExchangeSarajevo Stock ExchangeState Commodity & Raw Materials Exchange of TurkmenistanTehran Stock Exchange Tirana Stock Exchange “Toshkent” Republican Stock Exchange Ukrainian Stock Exchange Zagreb Stock Exchange
AFFILIATE MEMBERS
Association of Certified Capital Market Professionals (ACCMP), Jordan Central Registry Agency Inc. Central Securities Depository of Iran Macedonian Central Securities Depository Misr for Clearing, Settlement & Central Depository MSM Brokers Association, Oman National Depository Center of Azerbaijan Securities and Exchange Brokers Association of Iran (SEBA) Securities Depository Center (SDC) of Jordan Takasbank - ISE Settlement and Custody Bank, Inc. Tehran Securities Exchange Technology Management Company (TSETMC) The Association of Capital Market Intermediary Institutions of Turkey (TSPAKB)
Established on 16 May 1995, the Federation of Euro-Asian StockExchanges (FEAS) today has 33 members and 12 affiliatemembers in 29 countries.
FEDERATION OF EURO-ASIAN STOCK EXCHANGES ANNUAL REPORT JUNE 2010
PAGE 2

FEDERATION OF EURO-ASIAN STOCK EXCHANGES
The future outlook for our markets seems todepict that our member markets continue toprovide competitive and viable financingoptions to both public and private sectors.
After the most severe global recession fordecades, most of the economists now expecta sustained recovery in the global economy. Infact, some major economies have exited fromrecession in the second and third quarter of2009 by burst of global monetary and fiscalstimuli. After contracting by 2.1% in 2009,global real GDP is forecasted to expand by3.2% in 2010. Within this context, anothersignificant expectation is the differential ineconomic growth between developed (2.1%)and emerging economies (5.7%). Yet,conservative recovery forecasts still reflectconcerns about credit availability and themedium-term fiscal outlook in the developedcountries. As regards to the average GDP-weighted public-debt-to- GDP ratio indeveloped markets and emerging markets, itis obvious that many developed countrieshave moved into unchartered territory over thepast couple of years. While the emergingcountries’ public debt stock climbed to around44% of GDP in 2009 from just 35% in 2006,the developed countries debt ratioskyrocketed from less than 80% to around95% of GDP .
Even though developed countries felt theburden of the crisis most heavily in 2008, thedomino effect of the crisis on the developingmarkets of FEAS were felt in 2009. During2009, the FEAS region’s financial marketshave performed in excess of world marketswhen you compare the performance of theFEAS Index to that of the Dow Jones WorldIndex (i.e. 52% vs. 30% increase respectively).While the market capitalization of the FEASregion has increased by 35% in 2009, theaverage daily trading volume is down by15.3%. (We have included a special sectionafter the FEAS pages that review the growth ofour markets over the past 15th years.)
On the verge of completing the fifteenth yearof its operations, the FEAS accomplishedsome noteworthy achievements such asimplementation of the Dow Jones FEASIndexes and production of the FEAS movie.The FEAS Index is the first benchmark tomeasure the performance of companiesacross the Euro-Asian region. It covers 95% ofthe free-float market capitalization of eachcountry in the respective index. Actually, threeindexes were launched on June 2009, onecomposite, and two regional sub-indices. TheIndices are designed to underlie index-linked
investment products such as funds andstructured products. The FEAS CompositeIndex currently includes 375 stocks from 12 ofthe 33 member exchanges, including AbuDhabi, Amman, Bahrain, Belgrade, Bulgaria,Istanbul, Karachi, Macedonia, Muscat,Sarajevo and Zagreb. Our aim is to launch aninvestable blue chip index in the forthcomingyears.
During 2009, the FEAS jointly hosted with itsmembers three meetings and conferences.These were the Executive Committee Meetingand Working Committee Meeting held inMinsk, Belarus in June; the 15th FEAS GeneralAssembly Meeting and Executive CommitteeMeeting held in Budva, Montenegro, togetherwith the Exchange Traded ProductsConference hosted by STOXX in September;furthermore in October a meeting of the PostTrade Affiliate Members of FEAS was held inAntalya, Turkey. Besides these meetings, theFEAS Secretariat continues to pursue activitiesthat will promote the growth of member stockexchanges operations such as bilateral visits,workshops and seminars held by the FEASTraining Center, and the joint ISE/FEASprojects with international associations andorganizations such as the UNPRI, WorldFederation of Exchanges (WFE) and otherInternational Organizations.
Our renewed commitment to the revised FEAS5-year strategic plan is also designed toachieve the objectives as specified in themission statement of the Federation and to geta more vital role in the global marketenvironment. During the next five years, ourfocus will be more on promoting “corporategovernance”, facilitating timely disclosure,encouraging convergence among FEASMembers, promoting mechanisms for reliable,transparent and uninterrupted securitiestrading and settlement, creating greaterrecognition and visibility for the region’ssecurities and investment opportunities,encouraging the listing of “investment grade”securities in the respective home markets ofthe Region, encouraging foreign investorparticipation in Member Markets, promotinglinkages among the Region’s intermediaries,data vendors, settlement and custodyinstitutions, exchanges; and also encouragingcooperation among Region’s Regulators,promoting and encouraging research activitiesand training for FEAS Members and their
personnel and assisting FEAS Members toincrease financial literacy through publicawareness.
I would like to take this opportunity to extend my heartfelt thanks for their contributions toBloomberg, Central Registry Agency, FinansAsset Management, Garanti Asset Management,IS Investment, Muscat Securities Market,NASDAQ OMX, Takasbank, Tayburn Kurumsaland The Association of Capital MarketIntermediary Institutions of Turkey for makingthis publication possible. We hope that you willtake a moment to visit our contributor sectionin the FEAS website at www.feas.org and readtheir articles in the following pages.
The future outlook for our markets seems todepict that our member markets continue toprovide competitive and viable financingoptions to both government and privatesectors, while enhancing operations throughtechnology and expanding the services offeredto market participants. We surely continue tofocus on the areas of increased transparencythrough investing in infrastructure anddeveloping regulations to promote strongerenvironmental social governance. The effortsof all our Task Force Members will surely playa vital role in achieving our objectives throughtheir commitment and hard work and theSecretariat for maintaining our cohesiveorganization. As we close our 15th year, welook to the future with a renewed sense ofpurpose and a detailed strategy for achievingour goals.
Huseyin ErkanPresident of FEAS & Chairman andCEO of the Istanbul Stock Exchange
FEDERATION OF EURO-ASIAN STOCK EXCHANGES ANNUAL REPORT JUNE 2010
PAGE 3
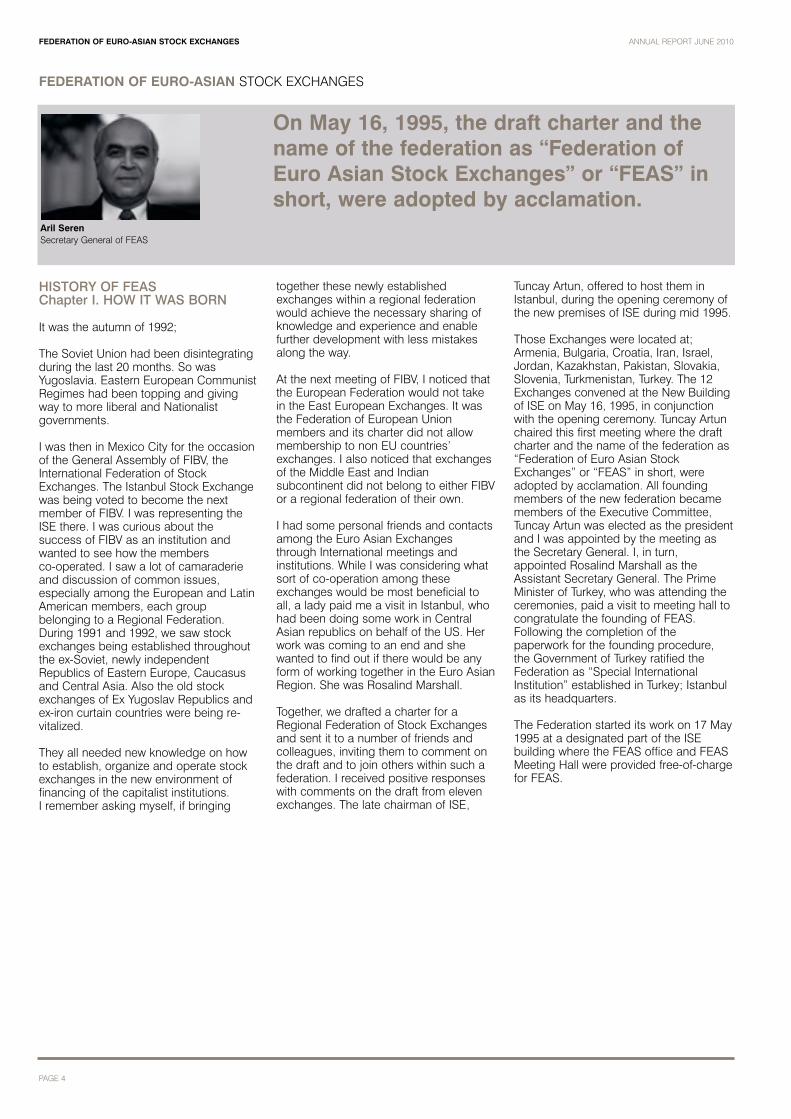
HISTORY OF FEAS Chapter I. HOW IT WAS BORN
It was the autumn of 1992;
The Soviet Union had been disintegratingduring the last 20 months. So wasYugoslavia. Eastern European CommunistRegimes had been topping and givingway to more liberal and Nationalistgovernments.
I was then in Mexico City for the occasionof the General Assembly of FIBV, theInternational Federation of StockExchanges. The Istanbul Stock Exchangewas being voted to become the nextmember of FIBV. I was representing theISE there. I was curious about thesuccess of FIBV as an institution andwanted to see how the members co-operated. I saw a lot of camaraderieand discussion of common issues,especially among the European and LatinAmerican members, each groupbelonging to a Regional Federation.During 1991 and 1992, we saw stockexchanges being established throughoutthe ex-Soviet, newly independentRepublics of Eastern Europe, Caucasusand Central Asia. Also the old stockexchanges of Ex Yugoslav Republics andex-iron curtain countries were being re-vitalized.
They all needed new knowledge on howto establish, organize and operate stockexchanges in the new environment offinancing of the capitalist institutions. I remember asking myself, if bringing
together these newly establishedexchanges within a regional federationwould achieve the necessary sharing ofknowledge and experience and enablefurther development with less mistakesalong the way.
At the next meeting of FIBV, I noticed thatthe European Federation would not takein the East European Exchanges. It wasthe Federation of European Unionmembers and its charter did not allowmembership to non EU countries’exchanges. I also noticed that exchangesof the Middle East and Indiansubcontinent did not belong to either FIBVor a regional federation of their own.
I had some personal friends and contactsamong the Euro Asian Exchangesthrough International meetings andinstitutions. While I was considering whatsort of co-operation among theseexchanges would be most beneficial toall, a lady paid me a visit in Istanbul, whohad been doing some work in CentralAsian republics on behalf of the US. Herwork was coming to an end and shewanted to find out if there would be anyform of working together in the Euro AsianRegion. She was Rosalind Marshall.
Together, we drafted a charter for aRegional Federation of Stock Exchangesand sent it to a number of friends andcolleagues, inviting them to comment onthe draft and to join others within such afederation. I received positive responseswith comments on the draft from elevenexchanges. The late chairman of ISE,
Tuncay Artun, offered to host them inIstanbul, during the opening ceremony ofthe new premises of ISE during mid 1995.
Those Exchanges were located at;Armenia, Bulgaria, Croatia, Iran, Israel,Jordan, Kazakhstan, Pakistan, Slovakia,Slovenia, Turkmenistan, Turkey. The 12Exchanges convened at the New Buildingof ISE on May 16, 1995, in conjunctionwith the opening ceremony. Tuncay Artunchaired this first meeting where the draftcharter and the name of the federation as“Federation of Euro Asian StockExchanges” or “FEAS” in short, wereadopted by acclamation. All foundingmembers of the new federation becamemembers of the Executive Committee,Tuncay Artun was elected as the presidentand I was appointed by the meeting asthe Secretary General. I, in turn,appointed Rosalind Marshall as theAssistant Secretary General. The PrimeMinister of Turkey, who was attending theceremonies, paid a visit to meeting hall tocongratulate the founding of FEAS.Following the completion of thepaperwork for the founding procedure,the Government of Turkey ratified theFederation as “Special InternationalInstitution” established in Turkey; Istanbulas its headquarters.
The Federation started its work on 17 May1995 at a designated part of the ISEbuilding where the FEAS office and FEASMeeting Hall were provided free-of-chargefor FEAS.
FEDERATION OF EURO-ASIAN STOCK EXCHANGES ANNUAL REPORT JUNE 2010
PAGE 4
FEDERATION OF EURO-ASIAN STOCK EXCHANGES
On May 16, 1995, the draft charter and thename of the federation as “Federation ofEuro Asian Stock Exchanges” or “FEAS” inshort, were adopted by acclamation.
Aril SerenSecretary General of FEAS

FEDERATION OF EURO-ASIAN STOCK EXCHANGES
FEDERATION OF EURO-ASIAN STOCK EXCHANGES ANNUAL REPORT JUNE 2010
PAGE 5
THE FEAS ALBUM OF THE PAST 15 YEARS
Founding Meeting May 1995 Istanbul,Turkey. Sitting in the middle Ms. TansuCiller, Prime Minister of Turkey
Founding Meeting May 1995 Istanbul,Turkey. Front row on the 15th left Mr. Tuncay Artun, President & CEO,Istanbul Stock Exchange
1st General Assembly, October 1995,Istanbul, Turkey. 6th left on the front rowMr. Tuncay Artun, President & CEO,Istanbul Stock Exchange

FEDERATION OF EURO-ASIAN STOCK EXCHANGES ANNUAL REPORT JUNE 2010
PAGE 6
FEDERATION OF EURO-ASIAN STOCK EXCHANGES
2nd General Assembly, October 1996Isfahan, Iran. 4th left on the front row Mr. Asadollah Amiraslani, Chairman,Tehran Stock Exchange
3rd General Assembly, October 1997Karachi, Pakistan. 2nd left on the top rowMr. Khawaya Hamad Saeed, President,Lahore Stock Exchange
4th General Assembly, October 1998,Istanbul, Turkey. On the left front Mr. ArilSeren, Secretary General, FEAS

FEDERATION OF EURO-ASIAN STOCK EXCHANGES ANNUAL REPORT JUNE 2010
PAGE 7
FEDERATION OF EURO-ASIAN STOCK EXCHANGES
5th General Assembly, October 1999,Amman, Jordan. First left Mr. Jalil Tarif,CEO, Amman Stock Exchange
6th General Assembly, September 2000Ohrid, Macedonia. 2nd left on the top Mr. Nikola Gruevski, Chairman, SecuritiesExchange Commission
7th General Assembly, Istanbul, Turkey.Sitting in the middle Mr. Osman Birsen,President & CEO, Istanbul StockExchange

FEDERATION OF EURO-ASIAN STOCK EXCHANGES ANNUAL REPORT JUNE 2010
PAGE 8
FEDERATION OF EURO-ASIAN STOCK EXCHANGES
8th General Assembly, September 2002Kiev, Ukraine. 1st on the left front Mr. Valentin Oskolsky, Chairman, Ukrainian Stock Exchange
9th General Assembly, September 2003,Sofia, Bulgaria. 3rd from the front left Ms. Bistra Ilkova, CEO, Bulgarian StockExchange
10th General Assembly, September 2004,Novigrad, Croatia. First eight on the toprow Mr. Marinko Papuga, CEO, ZagrebStock Exchange

FEDERATION OF EURO-ASIAN STOCK EXCHANGES ANNUAL REPORT JUNE 2010
PAGE 9
FEDERATION OF EURO-ASIAN STOCK EXCHANGES
11th General Assembly, September 2005Shiraz, Iran
12th General Assembly, November 2006,Sharm El Sheikh, Egypt. 6th on the frontright, Mr. Maged Shawky, Chairman,Egyptian Exchange
13th General Assembly, September 2007,Belgrade, Serbia. 2nd on the left front Ms. Gordana Dostanic, Managing Director,Belgrade Stock Exchange

FEDERATION OF EURO-ASIAN STOCK EXCHANGES ANNUAL REPORT JUNE 2010
PAGE 10
FEDERATION OF EURO-ASIAN STOCK EXCHANGES
14th General Assembly, November 2008Abu Dhabi, UAE. 4th from the left on thefront row, Mr. Nadee Azar, WorkingCommittee Chair FEAS, Amman StockExchange. 5th Mr. Huseyin ErkanPresident & CEO, Istanbul StockExchange. 7th Mr. Ahmed Salih Al-Marhoan, Director General MuscatSecurities Market
15th General Assembly, September 2009,Budva, Montenegro. 5th from the left Mrs. Dejena Suskavcevic M.A, CEO,Montenegro Stock Exchange
2010, the FEAS Team
from left to right:Ege Adalioglu, Assistant Secretary GeneralAril Seren, Secretary General Susan Gogus, Assistant Secretary General Aydan Bal, Coordinator

FEDERATION OF EURO-ASIAN STOCK EXCHANGES ANNUAL REPORT JUNE 2010
PAGE 11
FEDERATION OF EURO-ASIAN STOCK EXCHANGES
Jalil TarifCEO, Amman Stock Exchange
In 1995 the idea was born, few exchangesmet together with ambitious and incisivevision to create a regional club. At thatmoment we have had faith that thisFederation will grow up. We wereconfident that this would represent thefirst step and many steps will follow. Now,as were hoping, the Federation becameone of the most active gatherings in theworld and its members became 45representing major exchanges in theregion. We will continue expanding thisFederation with the same momentum thatwe had.
Bakhtiyar AzizovCEO NDC Azerbaijan
Dear friends!
We sincerely congratulate you on thesignificant event - the 15th anniversary ofthe foundation of your organization!Owing to purposefulness and highprofessionalism FEAS invariably achievessuccesses. It’s been 15 years that yourorganization has been creating fair,effective and transparent marketconditions for the trading between itsmembers. We wish you successes,prosperity, fruitful work and look forwardto our continuous cooperation!
Armen MelikyanCEO, NASDAQ OMX Armenia
I would like to send my warmest and mostaffectionate wishes to the Federation, itsgreat management and staff on theoccasion of the FEAS 15th anniversary.
Being a member since 2002, we havealways felt strongly about the unifying roleof the Federation and its mission tosupport the creation of fair, efficient, andtransparent marketplaces in FEASmember countries. At all times, wewitnessed the Federation’s untiring effortsto bring the region’s capital marketinstitutions together, providing a forum forsharing challenges faced, exchangingsolutions and experiences, and identifyingand exploring new areas of partnership. Ina global world, where international and,specifically, regional cooperation makesincreasing sense pushing past obstaclesfor opportunities, I see a growing role forthe Federation and – on behalf ofNASDAQ OMX Armenia – pledge our fullsupport to FEAS’ future initiatives andundertakings. I am also more thanconfident that under the current dynamicmanagement and with the excellent teamthat FEAS has built over these years,there is no goal that is impossible toreach.
I wish FEAS many more happyanniversaries in the future and manyexisting and new members to share thecelebrations!
Osman Sarac CEO & President – Istanbul GoldExchange
As it is 15-year celebration of FEAS, ismuch more than an anniversary - it is acelebration of a time-honoredcommitment for cooperation andconvergence of the Exchanges andOrganizations as a globally recognizedregional institution. FEAS is growing withits member Exchanges which are servingto millions of investors in the region. AsIstanbul Gold Exchange we are honoredto be a member of this large family andwe will be contributing to achieve theobjectives of the Federation and will becreating linkage among differentinvestment opportunities in thecompetitive global market environment.FEAS will reach larger influence on marketenvironment with the achievement of theobjectives and convergence amongmembers with long term plans.
Ahmad Aweidah CEO, Palestine Securities Exchange
Ever since being members at the FEAS,we witnessed active interaction,coordination, communication, andexchange of experiences and expertiseamong Euro-Asian Stock Exchangemembers; this could have never beenachieved without the FEAS commitmentand high dedication to serve its members.We believe the year 2010 will witnessmore and more successes andaccomplishments for the FEAS in manyperspectives.
Thank you FEAS for your continuousdedication.
15TH ANNIVERSARY CONGRATULATIONS MESSAGES

FEDERATION OF EURO-ASIAN STOCK EXCHANGES
Samir JaradatCEO, Securities Depository Center(SDC) of Jordan
Since the Securities Depository Center ofJordan became a member in the FEAS,we perceived the tremendous effortspresented for the benefit of its members;through creating transparent marketenvironment, establishing an appropriatetechnical infrastructure for enhancinglinkages among members for cross-border trading. In addition to its major role in the investor education andensuring a solid legal framework. Wehope that FEAS continue makingcontributions to furthering enhancementsfor the above fields.
Dr. Corneliu DoduPresident, Moldova Stock Exchange
In connection with the celebration of FEAS 15th year anniversary wecongratulate all the members and wish them success and prosperity. Taking into account the past stages and accumulated experience during theexistence of FEAS, we hope that thefuture opens new opportunities, allowingto set new goals for further developmentof the FEAS.
Ahmed Saleh Al-MarhoonDirector General, Muscat SecuritiesMarket
We at Muscat Securities Marketcongratulate FEAS members on theoccasion of the 15th Anniversary.
During the past 15 years, the FEASwitnessed significant progress in alldimensions. Today the number of FEASmembers reached 43 representingexchanges from various continents withexchanges having vast experience andable to pass the same to othermembers.
As matter of fact, the diversity of FEASgroup made the organization remarkablyunique in addressing issues that benefitless experienced exchanges throughdifferent learning programs which theFederation offers to its members.
I would like to thank the President ofFEAS, Mr. Huseyin ERKAN, for hisexcellent leadership, commitment andservice to the Federation.
We also extend our gratitude to FEASsecretariat for their continual assistanceand efforts towards strengthening therelations between FEAS members.
Gordana Dostanic, CEOBelgrade Stock Exchange
Though Belgrade SE was not a memberof the FEAS right from the very beginningin 1995, we have been an active memberof the association for the last 6 years.Since its creation the FEAS has growninto a professionally and globallyrecognized organization which stretchesfrom Adriatic Sea to China.
Past 6 years would have been much moredemanding and time consuming withoutthe constant support we receive from theFederation. The core principles in theheart of the FEAS focused on discoveringand applying best practices have easedour journey down the road of the stockmarket development. During this time wehave had an opportunity to meet andwork with some incredible people, shareexperiences and problems with our peers,and of course visit some beautiful newplaces.
Perseverance, efforts and dedication topromoting the Euro-Asian region andspecially to maintaining close ties with itsmembers makes us proud to be amember of the FEAS.
We wish to congratulate the FEAS on its15th anniversary. At the same time, wewould like to take this opportunity toexpress our thanks for the many years ofclose cooperation we all have enjoyed.
FEDERATION OF EURO-ASIAN STOCK EXCHANGES ANNUAL REPORT JUNE 2010
PAGE 12
Kadyrzhan DamitovPresident, Kazakhstan Stock Exchange
Federation of Euro-Asian StockExchanges (FEAS) is a legitimate andimportant mechanism for exchange ofideas, experience and information amongthe members that represent the marketsof Eurasia. FEAS created an environmentof trust and impartiality among themember exchanges and encouragedcloser collaboration.
Since inception, the organizationremained true to its mission of developingfair, efficient and transparent marketenvironments among FEAS members.Being a part of FEAS is extremelyimportant to Kazakhstan Stock Exchangeas it opens up the door to manyinteresting international initiatives andallows to exchange ideas with othermembers.
FEAS provides a forum for discussion ofvitally important issues and helps to voicethe concerns of the Euro-Asianexchanges internationally. Thanks to thehard work of this organization, themember exchanges were able to promotethemselves among internationalinvestment community and continuouslydisclose information about theirdevelopments.
FEAS is located in Istanbul - the meetingpoint of Europe and Asia and the home ofTurkey's capital market and Istanbul StockExchange. Thus, referring to FEAS, it isimportant to note the enormouscontribution of Istanbul Stock Exchangeinto the creation and development of thisorganization. It takes tremendous effortsto support the work of the association ofsuch large and diverse region.
On behalf of Kazakhstan Stock ExchangeI would like to congratulate FEAS on theoccasion of its 15th Anniversary and wishfurther success in all its endeavors!
Dr. Yakup ErgincanCEO, Central Registry Agency Inc.
As a platform that initiates long-termcooperation and promotes a continuingrelationship between stock exchanges,market infrastructures and intermediaryinstitutions FEAS played a significant rolein supporting the development of theregional capital markets in the last 15years.
CRA is an affiliate member of theassociation since 2006 and in such ashort time we benefited greatly from ourcollaborations with other members.Establishing bilateral links betweeninstitutions will help all parties indeveloping efficient post-tradeinfrastructures that serve settlementparticipants and investors alike.
As a member of the FEAS Affiliate TaskForce we are determined to contribute tojoint efforts by bringing our expertise andtechnological know-how in post-tradeindustry and improve the level of post-trade services at both national andinternational level.
In addition to working groups, FEASorganizations such as the bilateralexchange program, joint seminars andtraining programs are not only useful butnecessary for the member institutions tokeep up pace with the rapidly changingglobal financial environment. We wouldlike to thank the management and staff ofthe general secretariat, and all memberorganizations for their hard work andcooperation in helping us reach that goal.
Hassan Ghalibaf AslCEO & President, Tehran StockExchange
FEAS Secretariat,
I am specially pleased to have the honorof sending my greetings to all those whohave contributed during the past years forestablishing and developing FEAS.
For Tehran Stock Exchange, as a co-founder of the federation, it is particularlygratifying to observe FEAS as anincreasingly more significant entity in theinternational capital market.
We should all feel happy to be a memberof Exchanges, whose stabilizing roleduring the recent financial crisis wasappreciated; however, as more effortswere asked to increase transparency andto diminish needless complexities, theessential contribution of all members willhelp us conduct the region’s capital flowinto valuable investments opportunitiesglobally.
On behalf of all TSE’s staff, I congratulateFEAS 15th year anniversary.
Best regards,
FEDERATION OF EURO-ASIAN STOCK EXCHANGES ANNUAL REPORT JUNE 2010
PAGE 13
FEDERATION OF EURO-ASIAN STOCK EXCHANGES

FEDERATION OF EURO-ASIAN STOCK EXCHANGES
Thomas KrantzWFE Secretary General
In 2010, two exchange federations will becelebrating important anniversaries, apoint well worth noting. The WorldFederation of Exchanges (WFE) willcelebrate its 50th anniversary, while theFederation of Euro Asian StockExchanges (FEAS) will celebrate its 15thanniversary.
The two sister exchange federations havea great deal in common, as well as theirseparate, distinct missions.
The World Federation of Exchangesmission is categorized under 4 headings:
• Quality: promote market standards andreliable statistics
• Advocacy: working with policy-makers,regulators and government organizationsfor fair, transparent and efficient markets
• Networking: bringing together exchangeexperts to improve markets
• Development: helping newer, smallerexchanges to meet WFE standards.
In achieving the objectives of its mission,WFE collaborates with seven regionalfederations. These regional federationshave similar objectives, but given thenature of economics and geography,much of their work remains specific andlocal. That is the great advantage of thesystem.
FEAS is the Federation for Euro AsianExchanges. WFE has maintained closecollaboration with FEAS since itsfounding. The FEAS Secretariat has madeextensive use of WFE materials, adjustingand reapplying them in very appropriateways for the region in which it operates,and so continuously working with WFE toachieve its objectives. Special emphasishas been put on the development of themember exchanges to meet the WFEstandards. Frequent training opportunitiesfacilitated by FEAS through the meetings,publications, bilateral visits financed byFEAS, and collaboration on task forces,have enabled the member exchanges toachieve high standards in the operation ofregulated, public markets.
WFE workshops, committee meetings,and the annual meeting, geared towardsnetworking among exchanges and capitalmarkets experts, have been open tomembers of regional federations, and allprofessional documentation outside thegovernance of WFE has been sent fordissemination by the FEAS secretariat.
In support of good corporate governanceand responsible investment, WFE hasparticipated in the working of regionalfederations, among which FEAS had aprominent role. The alignment of work isprobably clearest in the standardization ofmarket statistics, which could not havebeen achieved without the collaborationbetween WFE and the regionalfederations.
In summary, if WFE is the central core ofindustry information for exchanges, thecommon base to all, the regionalfederations extend the reach of thisinformation base far beyond what theWFE could do on its own. Together, thegroupings of exchange federations createa broad and deep interaction that is sovital for a healthy and prosperousexchange industry across the world.
Today I congratulate the WFE’s sisterfederation, FEAS, on the occasion of thisanniversary. The work it hasaccomplished has enabled exchangemanagers to work far better across theregion on behalf of developing savings fornational investment, and FEAS itself hasalso created solid personal ties amongthese persons. That, too, advances thespread of knowledge quite efficiently.These are real achievements to note. I have every reason to expect that theseachievements will continue to be moreprofound going forward.
To all FEAS exchanges, the WFESecretariat extends its cordial regards.
FEDERATION OF EURO-ASIAN STOCK EXCHANGES ANNUAL REPORT JUNE 2010
PAGE 14
Aftab Ahmad ChaudhrySecretary General South Asian Federation of Exchanges
It is heartening to note that the Federationof Euro-Asian Stock Exchanges (FEAS) iscelebrating 15th anniversary of itsfoundation. The journey of 15 years hasbeen quite remarkable for the Federationand it has grown from strength to strengthduring all these years. It is quite good toknow that FEAS has now beentransformed into a vibrant organizationproviding a platform for enhanced co-operation, mutual consultations andsharing of experiences amongst a largenumber of its member stock exchanges.
The regional bodies of the exchangesenable their members to build networkeffect with the other exchanges andenable them to leverage their potential,domain knowledge and experience tohelp attract foreign investments andunlock the potential of their individual andcombined markets. After the recent spellof global recession and economicmeltdown, greater cooperation amongstthe markets is now, more than ever, theneed of the hour and it has becomeimperative to draw from the strengths ofthe diversified and efficient markets so asto achieve the common goal of theintegration of the markets and a unifiedsystem of market regulation. As thechallenge before all nations is torestructure and reshape their markets tobe more competitive, broad-based, andrelevant to their domestic economies,therefore the bodies like FEAS can play avery active role in connecting thesedisparate markets and help achieve thesort of harmonization which results in thebroadening of the investment options forthe investors.
Financial markets in FEAS region areexperiencing intense growth and diversity.Some of the fast growing emerging andfrontier markets are located in this regionbesides having one of the most dynamicand enterprising professional communitywell conversant with the nuances oftrading, technology and operations. FEASexchanges, besides having led in thecreation of new markets and financialproducts, have also introduced severalrounds of reforms in the recent period,which have given a big boost to thegrowth of the financial services industry.There is a major spurt in the region interms of institutions, intermediaries andinvestors each reinforcing with oneanother-making FEAS region as one ofthe most vibrant regions that is furtherpoised for attracting huge interest fromthe international investors.
Whereas over the years, the FEAS hasbecome an important institution for thepromotion of cross border cooperation inthe exchange industry, and for developinga strategy for mutual cooperationamongst its constituent exchanges,however for the next phase of growth, it iscritical that FEAS reaches out to othersister organizations of exchanges such asthe South Asian Federation of Exchanges(SAFE) so as to discuss the ways ofpromoting inter regional cooperation. Asthe wave of consolidation has alreadymade many major exchanges to tie upwith some prominent regional exchangesof the World, so the mutual cooperationbetween FEAS and SAFE may also leadto some further inter regional linking up ofthe businesses of some of our memberexchanges. While it may take some timeto happen, but at the least the spirit ofcooperation can certainly lead us toimprove and standardize the operations
of our respective exchange industries. Thecloser interaction may also enable us tolearn from the experiences of each otherand implement the best practices for theindustry practitioners such as theintermediaries, the broker dealers, and thesecurity analysts etc. Furthermore, boththe sister organizations can also worktowards the development of the exchangeindustry specific human resource byinstituting programs for bilateral training &study visits to each other’s memberexchanges. SAFE is very keen to boostsuch a cooperation to ensure that bothFEAS and SAFE are positioned to reapthe benefits of our combined synergies.Towards this end, SAFE has alreadyproposed the signing of a MoU betweenour Federations so as to kick start theprocess of cooperation between us.Furthermore, SAFE is also willing toextend an “Affiliate Body” status to FEASso that FEAS members can participate inthe events and programs organized bySAFE, which are the best vehicles topromote cooperation and goodwillbetween our Federations and ourrespective Members. SAFE would keenlylook forward to further development in thisregard.
At the end, I once again congratulateFEAS for completing 15 years of itspurposeful existence and wish it the bestduring the times ahead.
FEDERATION OF EURO-ASIAN STOCK EXCHANGES ANNUAL REPORT JUNE 2010
PAGE 15
FEDERATION OF EURO-ASIAN STOCK EXCHANGES
FEDERATION OF EURO-ASIAN STOCK EXCHANGES
Elvira Maria SchamannSecretary General FIAB
The Ibero-American Federation ofExchanges- FIAB joins with joy the 15°Anniversary of FEAS, and congratulatesall FEAS directors, management and stafffor the success they reached in such ashort time.
We have seen FEAS’ constant growthsince its first years, in order to becometoday a regional organization that clearlyfulfils its objectives, reaching 29 countries,and which represents, in the internationalarena, exchanges and securitiesinstitutions from such an importantgeographic, economic and cultural area.
The mission that regional Federationshave within their own geographic zonestowards their members, extendsinternationally in many diverse fields–standardization of statisticsmethodology, standardization of marketbest practices, corporate governance,etc- and the cooperation among them, aswell as with the World Federation ofExchanges, has become extremelyrelevant.
In this sense, FIAB and FEAS have set atradition of cooperation since long timeago. Not only the exchange of information–statistics and news- has been regularthrough the internet, but also theSecretaries General of both organizationshave had the opportunity to attendseveral meetings organized by theirFederations, as well as by the WFE, andupdate personally their Federation’s workin progress.
Worth mentioning this last year was theparticipation of FEAS Secretary General,Mr. Aril Seren, in the FIAB Annual Meetingheld in Lima, jointly with the WFEEmerging Markets Conference. Mr Serenjoined as panelist for the session“Developing markets experience in thecrisis environment; a focus on post-crisisprojects and markets growth” andpresented a very comprehensive andinteresting report on FEAS membersreaction to the crisis and their prospects.
With special emphasis, post crisisopportunities and challenges foremerging securities markets will certainlybe reflected in the Federations agendasand strategic priorities. That is why wehope that the cooperation among FIABand FEAS will go on, even with moreweight, in the future.
Finally, we wish FEAS success continuing,both regionally and internationally, in theyears to come and, once more, weextend to the sister Federation ourcongratulations for the excellent workdone all along this first 15th FEASAnniversary.
FEDERATION OF EURO-ASIAN STOCK EXCHANGES ANNUAL REPORT JUNE 2010
PAGE 16
FEDERATION OF EURO-ASIAN STOCK EXCHANGES
Emin S. Catana, Ph.D.ChairmanFEAS Affiliate Members Task Force
President and CEOTakasbank
It is my pleasure to congratulate the 15thanniversary of the foundation ofFederation of Euro-Asian StockExchanges (FEAS). After 15 years ofremarkable success, FEAS wastransformed from a stock exchangesfederation into a mutual cooperationplatform embracing all capital marketinstitutions operating in the FEAS region.The success of FEAS in years is theevidence of the good timing for theestablishment of FEAS. Today, FEASbecame a momentous regionalassociation by increasing the number ofits members as well as by enlarging itsarea.
In the course of time, through itsactivities, FEAS links with the industryfrom around the region and works closelywith the post-trade institutions which arethe integral parts of the securities marketsas much as stock exchanges. Then, theFEAS membership included the posttrade institutions as its affiliate members.
The crucial element for providing a safeand efficient clearing and settlementsystem is to create an environment whereregulatory and technical infra-structure ismostly consistent for the market playersat international level. As a result, all localcapital markets have to re-structure andre-shape their infra-structure in order toachieve harmonization among marketsand hence, increase cross-border tradingvolume. Organizations like FEAS play avery crucial role in helping to achieve the level of harmonization needed forlocal capital markets. This level ofharmonization is tried to be achievedthrough the studies made in meetings.The inclusion of post trade institutions toFEAS family should be expected to
complement all the hard work that theStock Exchanges have endeavored toaccomplish, since the inception of thisorganization, for the sake of FEASmarkets. This initiative brought enrichedexpertise and knowledge into FEAS, inthe areas of clearing, settlement andcustody, which are key components of organized securities markets. Asproviding an efficient and productiveworking platform and betterunderstanding the needs and goals ofaffiliate members, a task force wasformed. Consequently, Takasbankassumed the convenorship of AffiliateMembers Task Force (TF) which startedstudying issues that will create addedvalue to FEAS markets.
Contribution of FEAS to the securitiesindustry in the region and to its membersconsists of the harmonization of rules andregulations among the members’ marketsas well as the exchange of know-how andinformation relating to the securitiesorganizations. I am pleased to say that,affiliate members, as active andrespected participants of the InternationalSecurities Industry, are always excitedand ready to exchange views and ideason securities services with their peers atFEAS and to share the experience andknowledge that have been accumulatedin their markets and in the internationalmarkets.
With the cooperation of the Affiliate TaskForce Members and the FEAS Secretariatprepared three leaflets named “GlobalRecommendations and Standards onClearing and Settlement Issues”,“International Corporate GovernancePrincipals for Clearing and SettlementInstitutions & CSDs Recommendationsand Best Practices” and “ BusinessContinuity and Disaster RecoveryStandards and Best Practices for post-trade institutions” and distributed them toall TF members in the TF meetings.
Looking at the history of FEAS, it is clear that FEAS and its membership have made a significant contribution tothe efforts of harmonization of thesecurities transactions in the FEAS region. Implementation of theinternationally accepted standards andrecommendations in order to reduce thecauses of fragmentation and inefficienciesbased in market practice/regulatoryrequirements, tax procedures and issuesof legal certainty as well as centralcounter party practice and evaluation ofthe principles of “European Code ofConduct” were some of the topics thatwere studied in TF meetings. Within thecontext of studying on the adoption ofinternational standards already used inthe securities markets worldwide to theFEAS region and developing compliancewith European markets, FEAS AffiliateTask Force maintains its studies on thelatest developments in the post-tradeservice industry.
As per date, the Affiliate Members TaskForce realized remarkable contributionsfor improving the post trade services inFEAS region, but in a world getting closerto global integration in financial areas,industry’s needs are both increasing andalso changing day by day. So, continuousefforts and contributions should be moreactively maintained in order to assist inthe mission of the FEAS for futuredevelopment and promotion of theindividual securities markets.
Having enjoyed the honor of being amember of the FEAS family, we shallendeavor to take this excellentrelationship further ahead. Takasbanksincerely wishes to continue the good and fruitful relationship it has enjoyed withFEAS in the future.
I reiterate my sincere greetings to FEASfor completion of 15 years of operationand wish every success for the comingyears.
FEDERATION OF EURO-ASIAN STOCK EXCHANGES ANNUAL REPORT JUNE 2010
PAGE 17

FEDERATION OF EURO-ASIAN STOCK EXCHANGES
E. Nevzat Oztangut Chairman, The Association of CapitalMarket Intermediary Institutions ofTurkey
I would like to extend my sincerecongratulations for the 15th anniversary of FEAS, for successfully bringingtogether exchanges, post tradeinstitutions and brokers’ associations of the Euro-Asian region.
Since its inception in 1995, the Federationof Euro-Asian Stock Exchanges hasplayed a key role in the development ofthe region’s capital markets through itsvarious training programs, which we areproud to have supported. These trainingprograms provided us with a deepunderstanding of each other's marketsand further strengthened the partnershipbetween neighbouring markets.
I am confident that FEAS will continue toprovide the high level of commitment ithas already demonstrated to develop thecapital markets of its members.
Panteley Karassimeonov,Director “InternationalAffairs&Communications” Bulgarian Stock Exchange
“I had my first contacts with FEAS in1997, when I took up the job ofInternational Affairs Director at theBulgarian Stock Exchange. This was the beginning of a long and lastingrelationship between me and a whole lotof people from the Secretariat and themember exchanges. Looking back now Imust say that our exchange gained a lotfrom its membership in FEAS, especiallyat a time when our capital market waspretty young and inexperienced.
But apart from the serious work that we accomplished in the organization,there were always very pleasant andmemorable moments at our gatherings.Every year a different exchange washosting the FEAS annual assemblymeetings and that gave us theopportunity not only to get to know eachother better, but to also get acquaintedwith new countries and their traditions. I will always remember the wonderfulmoments I experienced in Turkey,Macedonia, Jordan, Ukraine, Croatia,Romania, Georgia, Serbia, Egypt… I amtruly sorry that I missed for one reason oranother some of the meetings held indistant capitals in Asia and the MiddleEast.
What is very valuable to me is thatthroughout all these past years I made somany friends from different countries,whom I am sure I can always rely on forsome good advice or information. This iswhat makes FEAS such a unique, cross-cultural organization. I use the opportunityto thank all the staff at the Secretariat fortheir efforts to coordinate the interests ofso many member exchanges and toassist us on many different occasions.”
Osman BirsenThe President of the Federation ofEuro-Asian Stock Exchanges (1997-2007)
Since the beginning of the 1980’s,liberalization, globalization and thewidespread use of advancedtelecommunication technology haveallowed the world to change at muchfaster pace as compared to the previouscentury. The increased access to facilitiescreated by the internet has in effectcaused the world to shrink; this as aresult has brought about a broaderplaying field and tougher competition inall areas. Inevitably through thesechanges stock exchanges have had totransform and grow their business modelsand operating practices. In order to copewith this new environment, someexchanges have chosen to merge andsome others have looked forgeographical integration and cooperationas a means for survival. The IstanbulStock Exchange has carried out itsinternational relations in line with the world trends and worked to enhancecooperation among the emergingexchanges in the Euro-Asian area as afounder and strong supporter of theFederation of Euro-Asian StockExchanges.
During my chairmanship in both theIstanbul Stock Exchange and theFederation of Euro-Asian StockExchanges I have placed the upmostimportance on international cooperation.During my 10 year tenure we have tried todevelop the Federation by increasing thenumber of its members and moreimportantly, by fostering relations amongthe member exchanges and theirmanagers to create a real familyatmosphere which in turn, encouragescollaboration amongst the Federation’smembers. I am very proud to see that themembers of FEAS still share the sameviews and the excitement to bear theresponsibility in improving the Federationalong the same principles today.
FEDERATION OF EURO-ASIAN STOCK EXCHANGES ANNUAL REPORT JUNE 2010
PAGE 18

FEDERATION OF EURO-ASIAN STOCK EXCHANGES ANNUAL REPORT JUNE 2010
PAGE 20
FEDERATION OF EURO-ASIAN STOCK EXCHANGES
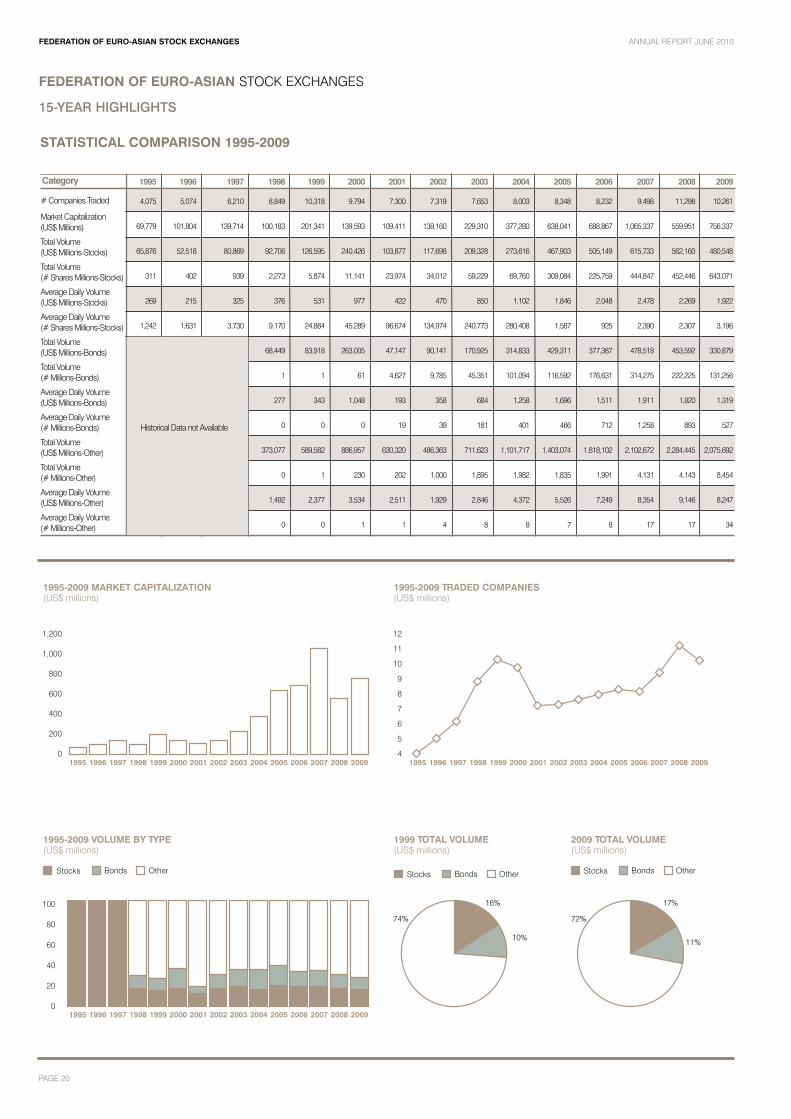
15-YEAR HIGHLIGHTS
STATISTICAL COMPARISON 1995-2009
Category
# Companies Traded
Market Capitalization(US$ Millions)
Total Volume(US$ Millions-Stocks)
Total Volume(# Shares Millions-Stocks)
Average Daily Volume(US$ Millions-Stocks)
Average Daily Volume(# Shares Millions-Stocks)
Total Volume(US$ Millions-Bonds)
Total Volume(# Millions-Bonds)
Average Daily Volume(US$ Millions-Bonds)
Average Daily Volume(# Millions-Bonds)
Total Volume(US$ Millions-Other)
Total Volume(# Millions-Other)
Average Daily Volume(US$ Millions-Other)
Average Daily Volume(# Millions-Other)
1995 1996 1997 1998 1999 2000 2001 2002 2003 2004 2005 2006 2007 2008 2009
4,075 5,074 6,210 8,849 10,318 9,794 7,300 7,319 7,653 8,003 8,348 8,232 9,498 11,298 10,261
69,779 101,804 139,714 100,183 201,341 139,593 109,411 138,160 229,310 377,280 638,041 688,867 1,065,337 559,951 756,337
65,876 52,518 80,869 92,706 126,595 240,426 103,877 117,698 209,328 273,616 467,903 505,149 615,733 562,160 480,548
311 402 939 2,273 5,874 11,141 23,974 34,012 59,229 69,760 309,084 225,759 444,847 452,446 643,071
269 215 325 376 531 977 422 470 850 1,102 1,846 2,048 2,478 2,269 1,922
1,242 1,631 3,730 9,170 24,884 45,289 96,674 134,974 240,773 280,408 1,587 925 2,390 2,307 3,196
68,449 83,918 263,005 47,147 90,141 170,925 314,833 429,311 377,387 478,518 453,592 330,879
1 1 61 4,627 9,785 45,351 101,094 116,592 176,631 314,275 222,225 131,256
277 343 1,048 193 358 684 1,258 1,696 1,511 1,911 1,820 1,319
0 0 0 19 39 181 401 466 712 1,258 893 527
373,077 589,582 886,957 630,320 486,363 711,623 1,101,717 1,403,074 1,818,102 2,102,672 2,284,445 2,075,692
0 1 230 202 1,000 1,895 1,982 1,835 1,991 4,131 4,143 8,454
1,492 2,377 3,534 2,511 1,929 2,846 4,372 5,526 7,249 8,354 9,146 8,247
0 0 1 1 4 8 8 7 8 17 17 34
Stocks Bonds Other
1999 TOTAL VOLUME(US$ millions)
17%
72%
Stocks Bonds Other
74%
Stocks Bonds Other
11%
2009 TOTAL VOLUME(US$ millions)
16%
10%
1995-2009 MARKET CAPITALIZATION(US$ millions)
19950
200
400
600
800
1,000
1,200
1996 1997 1998 1999 2000 2001 2002 2003 2004 2005 2006 2007 2008 2009
1995-2009 TRADED COMPANIES(US$ millions)
19954
5
6
7
8
9
10
11
12
1996 1997 1998 1999 2000 2001 2002 2003 2004 2005 2006 2007 2008 2009
1995-2009 VOLUME BY TYPE(US$ millions)
1995 1996 1997 1998 1999 2000 2001 2002 2003 2004 2005 2006 2007 2008 20090
20
40
60
80
100
Historical Data not Available
FEDERATION OF EURO-ASIAN STOCK EXCHANGES
FEDERATION OF EURO-ASIAN STOCK EXCHANGES ANNUAL REPORT JUNE 2010
PAGE 21
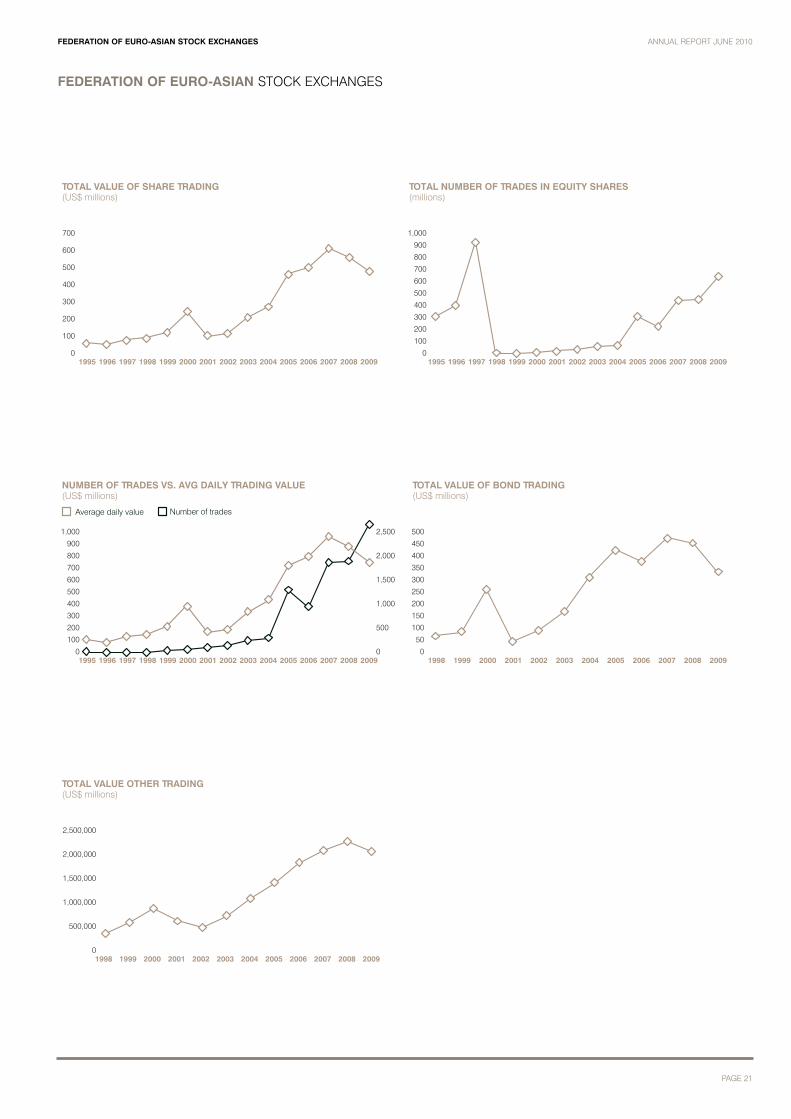
TOTAL VALUE OF SHARE TRADING(US$ millions)
TOTAL NUMBER OF TRADES IN EQUITY SHARES (millions)
19950
100
200
300
400
500
600
700
800
900
1,000
1996 1997 1998 1999 2000 2001 2002 2003 2004 2005 2006 2007 2008 200919950
100
200
300
400
500
600
700
1996 1997 1998 1999 2000 2001 2002 2003 2004 2005 2006 2007 2008 2009
NUMBER OF TRADES VS. AVG DAILY TRADING VALUE(US$ millions)
TOTAL VALUE OF BOND TRADING(US$ millions)
19980
50
100
150
200
250
300
350
400
450
500
1999 2000 2001 2002 2003 2004 2005 2006 2007 2008 200919950
100
200
300
400
500
600
700
800
900
1,000
1996 1997 1998 1999 2000 2001 2002 2003 2004 2005 2006 2007 2008 2009
TOTAL VALUE OTHER TRADING(US$ millions)
0
500,000
1,000,000
1,500,000
2,000,000
2,500,000
1998 1999 2000 2001 2002 2003 2004 2005 2006 2007 2008 2009
0
500
1,000
1,500
2,000
2,500
Average daily value Number of trades
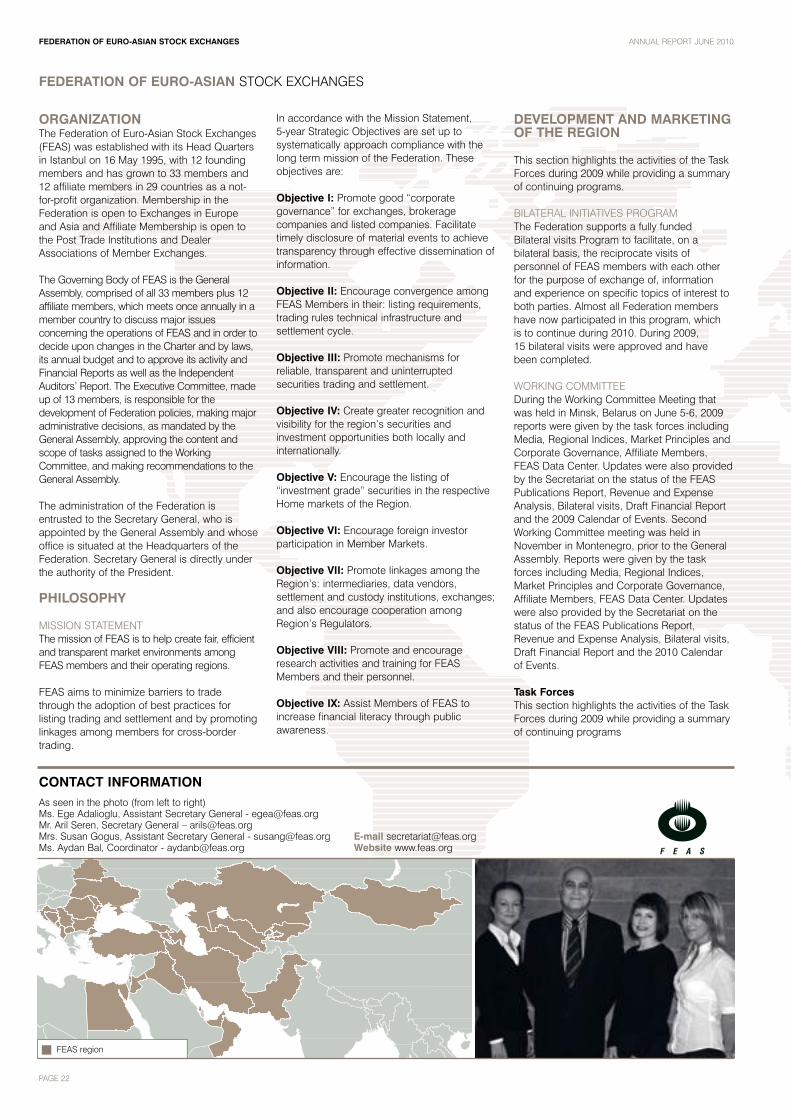
ORGANIZATION The Federation of Euro-Asian Stock Exchanges(FEAS) was established with its Head Quartersin Istanbul on 16 May 1995, with 12 foundingmembers and has grown to 33 members and12 affiliate members in 29 countries as a not-for-profit organization. Membership in theFederation is open to Exchanges in Europeand Asia and Affiliate Membership is open tothe Post Trade Institutions and DealerAssociations of Member Exchanges.
The Governing Body of FEAS is the GeneralAssembly, comprised of all 33 members plus 12affiliate members, which meets once annually in amember country to discuss major issuesconcerning the operations of FEAS and in order todecide upon changes in the Charter and by laws,its annual budget and to approve its activity andFinancial Reports as well as the IndependentAuditors’ Report. The Executive Committee, madeup of 13 members, is responsible for thedevelopment of Federation policies, making majoradministrative decisions, as mandated by theGeneral Assembly, approving the content andscope of tasks assigned to the WorkingCommittee, and making recommendations to theGeneral Assembly.
The administration of the Federation isentrusted to the Secretary General, who isappointed by the General Assembly and whoseoffice is situated at the Headquarters of theFederation. Secretary General is directly underthe authority of the President.
PHILOSOPHY
MISSION STATEMENTThe mission of FEAS is to help create fair, efficientand transparent market environments amongFEAS members and their operating regions.
FEAS aims to minimize barriers to tradethrough the adoption of best practices forlisting trading and settlement and by promotinglinkages among members for cross-bordertrading.
In accordance with the Mission Statement, 5-year Strategic Objectives are set up tosystematically approach compliance with thelong term mission of the Federation. Theseobjectives are:
Objective I: Promote good “corporategovernance” for exchanges, brokeragecompanies and listed companies. Facilitatetimely disclosure of material events to achievetransparency through effective dissemination ofinformation.
Objective II: Encourage convergence amongFEAS Members in their: listing requirements,trading rules technical infrastructure andsettlement cycle.
Objective III: Promote mechanisms forreliable, transparent and uninterruptedsecurities trading and settlement.
Objective IV: Create greater recognition andvisibility for the region’s securities andinvestment opportunities both locally andinternationally.
Objective V: Encourage the listing of“investment grade” securities in the respectiveHome markets of the Region.
Objective VI: Encourage foreign investorparticipation in Member Markets.
Objective VII: Promote linkages among theRegion’s: intermediaries, data vendors,settlement and custody institutions, exchanges;and also encourage cooperation amongRegion’s Regulators.
Objective VIII: Promote and encourageresearch activities and training for FEASMembers and their personnel.
Objective IX: Assist Members of FEAS toincrease financial literacy through publicawareness.
DEVELOPMENT AND MARKETINGOF THE REGION
This section highlights the activities of the TaskForces during 2009 while providing a summaryof continuing programs.
BILATERAL INITIATIVES PROGRAMThe Federation supports a fully funded Bilateral visits Program to facilitate, on abilateral basis, the reciprocate visits ofpersonnel of FEAS members with each otherfor the purpose of exchange of, informationand experience on specific topics of interest toboth parties. Almost all Federation membershave now participated in this program, which is to continue during 2010. During 2009, 15 bilateral visits were approved and havebeen completed.
WORKING COMMITTEEDuring the Working Committee Meeting thatwas held in Minsk, Belarus on June 5-6, 2009reports were given by the task forces includingMedia, Regional Indices, Market Principles andCorporate Governance, Affiliate Members,FEAS Data Center. Updates were also providedby the Secretariat on the status of the FEASPublications Report, Revenue and ExpenseAnalysis, Bilateral visits, Draft Financial Reportand the 2009 Calendar of Events. SecondWorking Committee meeting was held inNovember in Montenegro, prior to the GeneralAssembly. Reports were given by the taskforces including Media, Regional Indices,Market Principles and Corporate Governance,Affiliate Members, FEAS Data Center. Updateswere also provided by the Secretariat on thestatus of the FEAS Publications Report,Revenue and Expense Analysis, Bilateral visits,Draft Financial Report and the 2010 Calendarof Events.
Task ForcesThis section highlights the activities of the TaskForces during 2009 while providing a summaryof continuing programs
FEDERATION OF EURO-ASIAN STOCK EXCHANGES ANNUAL REPORT JUNE 2010
PAGE 22
FEDERATION OF EURO-ASIAN STOCK EXCHANGES
CONTACT INFORMATIONAs seen in the photo (from left to right)Ms. Ege Adalioglu, Assistant Secretary General - [email protected]. Aril Seren, Secretary General – [email protected]. Susan Gogus, Assistant Secretary General - [email protected]. Aydan Bal, Coordinator - [email protected]
E-mail [email protected] www.feas.org
FEAS region

FEDERATION OF EURO-ASIAN STOCK EXCHANGES
In 2005, decision was taken to combine the twoworking committees into one and to form, 8 TaskForces to carry out the mandates given by theExecutive Committee. Since then, some TaskForces have completed the tasks assigned tothem and some new task forces were formed, theexisting Task Forces are listed below:
Task Force 0404 – Media (Led by MuscatSecurities Market)Following the Media Relations Task Force meetingheld on prior to the General Assembly in Budva,Montenegro on September 24, the TF participantsagreed on the following issues;
1. Journalists from the member countries will beinvited to be present at the FEAS meetings tocover the events in local media. The aim is toincrease awareness for the Federation and thehosting exchange. In line with that, a MarketingExhibition will be organized, with a co-host duringthe General Assembly Meetings in Istanbul for the15th Year Anniversary of FEAS.2. A workshop for Media Relations took place inJanuary 2010, in Istanbul. 3. Muscat Securities Market Forum was held inMuscat in November 20094. A FEAS movie was produced by the FEASSecretariat based on the EC decision for theproduction company.5. The Task Force will continue with its work inaccordance with the 2010 Activity Plan asapproved at the General Assembly Meeting inMontenegro.6. Muscat Securities Market Projects onencouraging the more advanced members ofFEAS to partner with less developed exchangeswithin FEAS to help foster their growth through theexperience and resources of the more advancedexchanges.
Task Force 0406 – Regional Indices (Ledby Tehran Stock Exchange)As part of the Marketing plan for the FEASRegion, and following approval by GeneralAssembly, The FEAS Dow Jones IndexAgreement was signed in October, 2007.Three indexes were launched in June of 2009;a composite, and two regional sub-indexes.The Dow Jones FEAS Indexes are designed tounderlie index-linked investment products suchas funds and structured products. Dow JonesFEAS Composite Index currently includes anumber of component stocks of 11 of the 33member exchanges of the Federation of Euro-Asian Stock Exchanges.
Task Force 0412 – Environmental andSocial Corporate Governance (Led byBucharest Stock Exchange)All members of FEAS, place a strong emphasison good Corporate Governance. A task forcewas created to provide a vehicle for membersto update the information contained in theCorporate Governance section of the RuleBook and to inform all member stockexchanges of international regulations andpractices regarding corporate governancewhich are gaining importance for a bettervaluation of stocks. At the same time, the issueof good Corporate Governance for StockExchanges has become important as Stock
Exchanges are changing from Mutual Entitiesinto For-profit Companies. The Bucharest StockExchange hosted a conference on CorporateGovernance in June of 2005 and FEAS jointlyhosted roundtable meetings with the OECD onFebruary 15-16, 2006.
The Belgrade Stock Exchange, in partnershipwith the IFC, published a CorporateGovernance Manual in 2007.
FEAS Secretariat has conducted a survey anda glossary and the draft was discussed duringthe Working Committee in Baku. Half of themembers have filled out the survey and thereport was discussed General Assembly.
Bucharest Stock Exchange has beenappointed as the new leader of the CorporateGovernance Task Force at the GeneralAssembly in Abu Dhabi.
FEAS Secretariat held a workshop onEnvironmental and Corporate Governance onJanuary 2010 for the members where membersdiscussed ideas on CG processes withexperts.
Also FEAS Secretariat co-organized a seminarwith UNPRI in January 2010, where the host ofthe seminar Istanbul Stock Exchange becameone of the signatories of UNPRI.
Task Force 0501 – Affiliate Members (Led by ISE Settlement and Custody Bank,Takasbank)The fourth meeting of the Affiliate Task Forcewas held on October 21, 22, 2009 in Antalya,Turkey. Task Force 0502 – Technology (Led by Istanbul Stock Exchange)The database has been upgraded to allowmore space to add additional FEAS membersin addition to the capability to upload corporateactions of the participating exchanges. TheFDC will be instrumental in the development ofthe FEAS Index and promotion of members’daily trading data. This year additional memberexchanges will be implementing a feed into theFEAS Data Center from their respectiveexchanges.
Task Force 0504 – Research andDevelopment (Led by the Istanbul StockExchange)This task force brings members together towork on joint research projects of generalinterest for FEAS members that will consolidatetheir experiences and knowledge. This TaskForce has recently conducted a study and apresentation on a model of Linkages betweenFEAS Member Exchanges, at FEAS WorkingCommittee prior to the General Assembly inMontenegro.
Training Center ProjectIn accordance with the decision taken at theFEAS General Assembly, FEAS established aFEAS Training Center in Istanbul at the IstanbulStock Exchange FEAS Headquarters facilities.It is designed to provide members with
educational opportunities and trainingprograms for their personnel. The primary goalof the FEAS Training Center, with the FEASTraining Program, is to provide FEAS Memberswith a wide range of educational and trainingoptions with emphasis on Exchangemanagement whereby the Exchange Personnelwill have the opportunity to receive training inline with their interests and motives. Othertarget groups for training are Companies andMedia and the Personnel of listed. In line withthe Media Task force goal, the Media membersand the personnel of the stock exchanges willbenefit from Media Trainings in Muscat and inIstanbul.
In November 2007, MSM Stock Exchange helda gathering in Muscat where all topics onMedia have been discussed and exhibited.In July 7-8, 2008 the FEAS Media RelationsWorkshop for FEAS members was held inIstanbul where they have discussed ‘’How tointeract with Media during times of crises’’.Several members and speakers from Turkishand Egyptian Media talked about the currentglobal crisis and its effects. Also, a trainingprogram will be designed in 2009 where thefirst topic will be based on private equity andinvestment of venture capital.
On January 19-21, 2010, FEAS MediaRelations Workshop and GEAS Environmentaland Corporate Governance Workshop wereheld in Istanbul for FEAS members. Severalmembers and experts discussed the differentMedia Tools and the new era of theEnvironmental Corporate Governance.
2009 Mandates:a. Continuation of Task Force Activities
i. Media Task Force1. Training2. Exhibition
ii. FEAS Index1. Investable Index
iii. Environmental Social and Corporate Governance1. Training
iv. Affiliate Members1. Conference2. Business Continuity Study for CSD Affiliate Members
v. FDC Implementation (Technology)1. Further implementation of FDC2. Development of Corporate Actions website
vi. Research and Development1. Closer coordination with members on regional approach
vii. Rules and Regulation1. Revision of FEAS Rulebook2. Conference for CEOs of Exchanges and Regulators
viii. Blue Chip Listing1. Survey and Report2. Training on Listing of Blue Chips
b. GEMS Trainingc. FEAS Publicationsd. Bilateral Programe. FEAS Movie f. New Products/Marketing Conferenceg. Sponsor’s Conference
FEDERATION OF EURO-ASIAN STOCK EXCHANGES ANNUAL REPORT JUNE 2010
PAGE 23

FEAS MEETINGS DURING 2009
WORKING COMMITTEE MEETING 5-6 MAY2009 – MINSK, BELARUSThe first working committee meeting of 2009was held in Minsk, Belarus on the 5-6th May,2009 at the invitation of the Belarus Currencyand Stock Exchange. The Working Committeefocused on issues mandated by the GeneralAssembly in 2008 and The Secretariat prepareda report for participants to discuss.
15TH GENERAL ASSEMBLY MEETING –SEPTEMBER 29, 2009 – BUDVA,MONTENEGROThe 15th Annual General Assembly of FEASwas held in Budva, Montenegro on September29, hosted by the Montenegro Stock Exchange.The Media Task Force Meeting and theResearch Task Force Meetings were held priorto the 19th Executive Committee meeting and aWorking Committee meeting were also heldprior to the General Assembly.
Main topics that were discussed and decidedupon at the 15th GA are;1. The 2008 Audited Financial Statementsapproved2. Auditors for 2009 Appointed and Auditor’sFee Approved3. The 2010 Dues Schedule approved4. The 2010 Budget approved5. Charter Amendments approved6. 2008 Activity Report approved7. 2010 Activity Plan approved 8. Membership Applications approveda. Association of Certified Capital MarketProfessionals (ACCMP) Jordan (Affiliate) b. Muscat Securities Market BrokersAssociation Oman (Affiliate) c. The Association of Capital Market Institutionsof Turkey (TSPAKB) – Turkey (Affiliate) d. Securities and Exchange Brokers Association(SEBA) – Iran (Affiliate) 9. 5 Year Strategic Plan approved10. Revised Mission Statement approved11. 2010 Calendar approved12. Working Committee Mandates approved(see above)
PUBLICATIONS & INFORMATION
FEAS Library: The Library can be accessed through thePublications drop down menu on the mainpage at www.feas.org or through this linkhttp://www.feas.org/Library.cfm. The FEASLibrary is open to experts and organizationswith financial market related material. If youwould like to make a submission to the FEASLibrary, please send your electronic files andlinks to the FEAS secretariat [email protected].
FEAS Year Book (FEAS BOOK) & QuarterlyMagazines (INTERFEAS):This publication of annual activities of theFederation and information on its members,began in 1997 and is available electronically onthe website:http://www.feas.org/Publications.cfm?Get=Yearbook&Top=Pubs.
FEAS Website: The FEAS website was re-launched in March2010 and can be found at www.feas.org. Thenew site contains a new home page with theFEAS movie, dedicated pages to the FEASIndexes a more concentrated emphasis onFEAS member data with profile pages(including statistics, holidays, market policiesand practices and direct links to their sites),Excel downloads for all statistical data andcross member comparisons on policies,practices and statistical data, and a NewsCenter with headlines from member markets.
Newsletter: A monthly publication which includes generalsecretariat news, statistical stock, bond andother volume comparisons on monthly, year-to-date and prior period bases, in addition tomarket cap, currency, number of companiestraded and index statistics. Quarterlysupplemental publications include quarterlystatistical analysis, press releases of FEASmembers and headlines of FEAS activities.Archived copies of the newsletter can be foundon our website
http://www.feas.org/Publications.cfm?Get=Newsletter&Top=Pubs.
SUBSCRIBETo subscribe for the electronic version of FEASpublications, please go to www.feas.org andclick on subscribe. Subscriptions includemonthly notifications of statistics and newsletterupdates, as well as advance notice of FEASevents and activities.
CONTRIBUTORSPlease visit our Contributor sites. They can beseen on the FEAS website at:http://www.feas.org/Contributors.cfm
Bloombergwww.bloomberg.net
Central Registry Agencywww.mkk.com.tr
Emirateswww.emirates.com
Finans Asset Managementwww.finansportfoy.com
Garanti Asset Managementwww.gpy.com.tr
IS Investmentwww.isinvestment.com
Muscat Securities Marketwww.msm.gov.om
NASDAQ OMX Groupwww.nasdaqomx.com
Takasbankwww.takasbank.com.tr
Tayburn Kurumsalwww.tayburnkurumsal.com
The Association of Capital MarketIntermediary Institutions of Turkey(TSPAKB)www.tspakb.org.tr
FEDERATION OF EURO-ASIAN STOCK EXCHANGES ANNUAL REPORT JUNE 2010
PAGE 24
FEDERATION OF EURO-ASIAN STOCK EXCHANGES
FEDERATION OF EURO-ASIAN STOCK EXCHANGES
FEDERATION OF EURO-ASIAN STOCK EXCHANGES ANNUAL REPORT JUNE 2010
PAGE 25
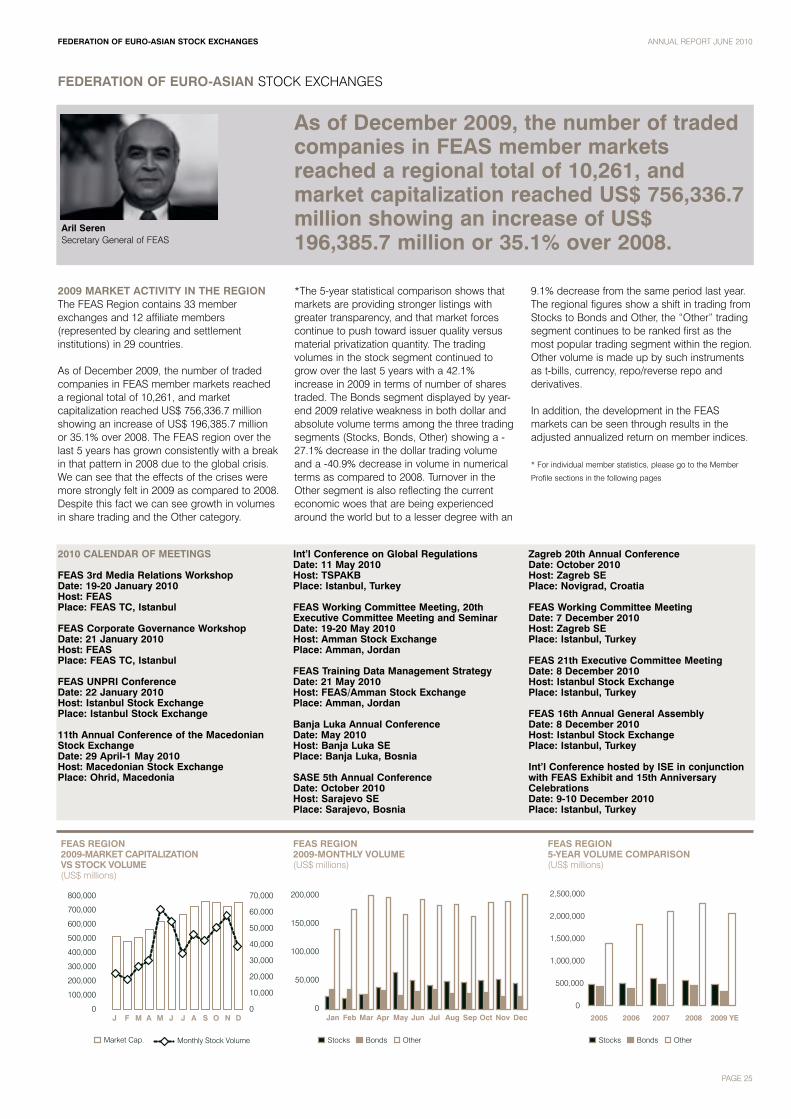
As of December 2009, the number of tradedcompanies in FEAS member marketsreached a regional total of 10,261, andmarket capitalization reached US$ 756,336.7million showing an increase of US$196,385.7 million or 35.1% over 2008.
FEAS REGION2009-MARKET CAPITALIZATIONVS STOCK VOLUME(US$ millions)
FEAS REGION2009-MONTHLY VOLUME(US$ millions)
BondsStocks Other
FEAS REGION5-YEAR VOLUME COMPARISON(US$ millions)
2005 2006 2007 2008
BondsStocks Other
0
50,000
100,000
150,000
200,000
2009 YE
Monthly Stock VolumeMarket Cap.
0
100,000
200,000
300,000
400,000
500,000
600,000
700,000
800,000
J F M A M J J A S O N D Jul Aug Sep Oct Nov DecJan Feb Mar JunApr May0
10,000
20,000
30,000
40,000
50,000
60,000
70,000
0
500,000
1,000,000
1,500,000
2,000,000
2,500,000
2009 MARKET ACTIVITY IN THE REGIONThe FEAS Region contains 33 memberexchanges and 12 affiliate members(represented by clearing and settlementinstitutions) in 29 countries.
As of December 2009, the number of tradedcompanies in FEAS member markets reacheda regional total of 10,261, and marketcapitalization reached US$ 756,336.7 millionshowing an increase of US$ 196,385.7 millionor 35.1% over 2008. The FEAS region over thelast 5 years has grown consistently with a breakin that pattern in 2008 due to the global crisis.We can see that the effects of the crises weremore strongly felt in 2009 as compared to 2008.Despite this fact we can see growth in volumesin share trading and the Other category.
*The 5-year statistical comparison shows thatmarkets are providing stronger listings withgreater transparency, and that market forcescontinue to push toward issuer quality versusmaterial privatization quantity. The tradingvolumes in the stock segment continued togrow over the last 5 years with a 42.1%increase in 2009 in terms of number of sharestraded. The Bonds segment displayed by year-end 2009 relative weakness in both dollar andabsolute volume terms among the three tradingsegments (Stocks, Bonds, Other) showing a -27.1% decrease in the dollar trading volumeand a -40.9% decrease in volume in numericalterms as compared to 2008. Turnover in theOther segment is also reflecting the currenteconomic woes that are being experiencedaround the world but to a lesser degree with an
9.1% decrease from the same period last year.The regional figures show a shift in trading fromStocks to Bonds and Other, the “Other” tradingsegment continues to be ranked first as themost popular trading segment within the region.Other volume is made up by such instrumentsas t-bills, currency, repo/reverse repo andderivatives.
In addition, the development in the FEASmarkets can be seen through results in theadjusted annualized return on member indices.
* For individual member statistics, please go to the Member
Profile sections in the following pages
2010 CALENDAR OF MEETINGS
FEAS 3rd Media Relations WorkshopDate: 19-20 January 2010Host: FEASPlace: FEAS TC, Istanbul
FEAS Corporate Governance WorkshopDate: 21 January 2010Host: FEASPlace: FEAS TC, Istanbul
FEAS UNPRI ConferenceDate: 22 January 2010Host: Istanbul Stock ExchangePlace: Istanbul Stock Exchange
11th Annual Conference of the MacedonianStock Exchange Date: 29 April-1 May 2010Host: Macedonian Stock ExchangePlace: Ohrid, Macedonia
Int’l Conference on Global RegulationsDate: 11 May 2010Host: TSPAKBPlace: Istanbul, Turkey
FEAS Working Committee Meeting, 20thExecutive Committee Meeting and SeminarDate: 19-20 May 2010Host: Amman Stock ExchangePlace: Amman, Jordan
FEAS Training Data Management StrategyDate: 21 May 2010Host: FEAS/Amman Stock ExchangePlace: Amman, Jordan
Banja Luka Annual ConferenceDate: May 2010Host: Banja Luka SEPlace: Banja Luka, Bosnia
SASE 5th Annual Conference Date: October 2010Host: Sarajevo SEPlace: Sarajevo, Bosnia
Zagreb 20th Annual Conference Date: October 2010Host: Zagreb SEPlace: Novigrad, Croatia
FEAS Working Committee Meeting Date: 7 December 2010Host: Zagreb SEPlace: Istanbul, Turkey
FEAS 21th Executive Committee MeetingDate: 8 December 2010Host: Istanbul Stock ExchangePlace: Istanbul, Turkey
FEAS 16th Annual General AssemblyDate: 8 December 2010Host: Istanbul Stock ExchangePlace: Istanbul, Turkey
Int’l Conference hosted by ISE in conjunctionwith FEAS Exhibit and 15th AnniversaryCelebrations Date: 9-10 December 2010Place: Istanbul, Turkey
Aril SerenSecretary General of FEAS

2005 2006 2007 2008 2009 YE 2008 2007 2006 2005# Companies Traded 8,348 9,057 9,498 11,298 10,261 -9.2% 8.0% 13.3% 22.9%Market Capitalization (US$ Millions) 638,040.9 690,454.7 1,065,337.3 559,951.0 756,336.7 35.1% -29.0% 9.5% 18.5%Total Volume (US$ Millions-Stocks) 467,902.8 505,163.7 615,732.9 562,159.6 480,548.1 -14.5% -22.0% -4.9% 2.7%Total Volume (# Shares Millions-Stocks) 309,083.6 225,759.2 444,847.4 452,445.8 643,070.6 42.1% 44.6% 184.8% 108.1%Average Daily Volume (US$ Millions-Stocks) 1,846.2 2,047.4 2,478.0 2,269.1 1,921.8 -15.3% -22.4% -6.1% 4.1%Average Daily Volume (# Shares Millions-Stocks) 1,586.8 915.7 2,389.5 2,306.7 3,196.3 38.6% 33.8% 249.0% 101.4%Total Volume (US$ Millions-Bonds) 429,310.8 380,662.4 478,517.5 453,592.0 330,879.4 -27.1% -30.9% -13.1% -22.9%Total Volume (# Shares Millions-Bonds) 116,592.2 176,705.0 314,274.6 222,225.0 131,256.0 -40.9% -58.2% -25.7% 12.6%Average Daily Volume (US$ Millions-Bonds) 1,695.8 1,523.5 1,911.5 1,819.7 1,319.1 -27.5% -31.0% -13.4% -22.2%Average Daily Volume (# Millions-Bonds) 466.2 711.9 1,257.7 892.6 527.3 -40.9% -58.1% -25.9% 13.1%Total Volume (US$ Millions-Other) 1,403,074.3 1,825,351.1 2,102,671.9 2,284,445.1 2,075,692.5 -9.1% -1.3% 13.7% 47.9%Total Volume (# Millions-Other) 1,835.0 1,919.9 4,131.1 4,142.5 8,454.4 104.1% 104.6% 340.3% 360.7%Average Daily Volume (US$ Millions-Other) 5,525.9 7,277.6 8,354.1 9,146.2 8,247.4 -9.8% -1.3% 13.3% 49.2%Average Daily Volume (# Millions-Other) 7.44 8.12 17.04 17.23 34.09 97.9% 100.1% 319.8% 358.5%
PAGE 26
FEDERATION OF EURO-ASIAN STOCK EXCHANGES
Jan-09 21,248.62 1,037.80 33,280.94 2,088.20 33,190.45 1,636.27 12,343.95 649.68 134,222.04 6,449.01 475.79 25.03 519,742.26Feb-09 18,659.72 21,624.41 43,681.54 3,139.85 32,550.46 1,627.75 13,702.21 685.14 167,009.76 8,350.49 597.00 29.85 479,844.36Mar-09 24,004.94 1,104.30 50,048.56 2,923.78 25,113.92 1,236.69 8,888.10 442.68 190,809.47 8,747.20 703.14 32.00 508,279.35Apr-09 36,058.80 1,720.50 74,359.20 5,272.82 30,815.37 1,483.88 8,104.17 368.62 186,805.60 8,879.06 911.29 45.59 567,605.88
May-09 62,219.83 3,128.77 50,295.22 2,892.28 22,935.53 1,207.69 1,277.12 67.07 158,172.75 8,321.75 1,104.26 52.87 621,982.46Jun-09 47,733.10 2,181.04 44,547.23 2,200.57 30,097.64 1,368.95 26,140.99 1,189.98 184,099.73 8,369.36 850.93 38.68 628,819.36Jul-09 40,050.37 7,594.53 70,903.46 4,282.27 32,493.85 1,425.07 15,622.67 710.05 174,346.39 7,607.57 554.61 27.49 670,289.58
Aug-09 46,327.48 2,192.52 47,657.92 2,543.83 26,285.44 1,406.74 6,437.02 321.72 174,684.31 8,345.74 450.27 20.49 730,302.47Sep-09 44,024.18 2,246.59 51,654.22 3,283.84 26,259.99 1,303.64 7,406.97 336.76 154,613.69 7,686.26 449.75 23.66 762,308.75Oct-09 47,464.75 2,266.39 52,535.96 2,970.38 28,355.21 1,380.64 12,978.93 591.37 178,333.45 8,474.14 471.05 23.55 756,063.07Nov-09 49,831.49 2,553.85 80,773.61 4,031.85 21,265.36 1,112.28 7,103.11 354.33 180,300.27 9,421.92 1,090.82 54.40 725,837.93Dec-09 42,924.80 3,355.79 43,332.74 2,408.41 21,516.17 948.52 11,250.79 535.27 192,295.00 8,411.63 795.43 34.74 756,336.65
Total 480,548.07 4,250.54 643,070.60 3,169.84 330,879.40 1,344.84 131,256.03 521.06 2,075,692.47 8,255.34 8,454.36 34.03
Total Volume
(US$ millions)
Total Volume
(# millions)
Average Daily
Volume(US$ millions)
Average Daily
Volume(# millions)
CONSOLIDATED FEAS MEMBERS 2009 STATISTICS
STOCKSTotal
Volume(US$
millions)
Total Volume
(# millions)
Average Daily
Volume(US$ millions)
Average Daily
Volume(# millions)
BONDS
Total Volume
(US$ millions)
Total Volume
(# millions)
Average Daily
Volume(US$ millions)
Average Daily
Volume(# millions)
MarketCapitalization
(US$ millions)
OTHER
STATISTICAL COMPARISON 2004 THRU YE 2009 / FEAS REGION
STATISTICS 2009 YE % CHANGE OVER
2008-FEAS REGION VOLUME BY TYPE 2009-FEAS REGION VOLUME BY TYPE
Stocks Bonds Other
NUMBER OF COMPANIES TRADED VSMARKET CAPITALIZATION(US$ millions)
Market Cap Companies Traded
Stocks Bonds
17%
72% 11%
Other
0
100,000
200,000
300,000
400,000
500,000
600,000
700,000
17%
69%14%
20062005 2007 20080
200,000
400,000
600,000
800,000
1,000,000
1,200,000
2009-ANNUALIZED RETURN ON INDEX
Indices are adjusted for currency fluctuations.(Formula: 1+(return)=((1+%chg. index)/(1+%chg. currency))
ISE 100/IstanbulIraq/Iraq
LSE 25/LahoreBET/Romania
KSE 100/KarachiEgyptian SE Egypt
B.I./MacedoniaTehran SE Iran
KazakhstanBSE/Bulgaria
Muscat SM OmanCROBEX/Zagreb
ADX/Abu DhabiMOSTE/Montenegro
Al Quds/PalestineBIRS/Banja Luka
Belex15/SerbiaTop-20/Mongolia
Amman SE JordanBIFX/Sarajevo
KSE Index/KyrgyzBelarusian C&SE Belarus
BahrainTASIX/Uzbekistan
45.739.4
33.428.4
26.325.7
23.521.2
18.0316.115.5
12.912.2
10.4
8.3-8.8-8.9
-13.8-15.8
-21.9-23.7
-34.6
51.9
2009
9.3
FEDERATION OF EURO-ASIAN STOCK EXCHANGES ANNUAL REPORT JUNE 2010


NASDAQ OMX
In the future, the need for transparency,liquidity and efficiency in the world’s powermarkets can be met by open, electronicmarketplaces for trading and clearing.
In the future, the need for transparency,liquidity and efficiency in the world’s powermarkets can be met by open, electronicmarketplaces for trading and clearing.
There are many benefits to establishing anopen power market. The main ones includeincreasing overall market efficiency bycreating clear price signals, and promotinginvestment in additional production capacityby creating a market to attract domestic andinternational capital.
Open power markets already exist in somegeographies, most notably in the Nordiccountries of Finland, Sweden, Denmark andNorway where Nord Pool ASA, recentlyacquired by NASDAQ OMX, has beenoperating since the early 1990s.
The Nordic financial power exchange is now apart of NASDAQ OMX Commodities, whichoffers global commodities trading andclearing services. The NASDAQ OMX Nordicpower market now counts more than 385members in 22 countries, and its operationsserve a wide range of energy producers,consumers and financial institutions.NASDAQ OMX Commodities also offerstrading in Dutch and German powerderivatives and has been part of starting anew physical power market, N2EX, in theUnited Kingdom.
The Nordic experience
The underlying Nordic physical market,operated by Nord Pool Spot, accounts forover 60 percent of the total value of theNordic region’s power consumption. A keybenefit of the Nordic power market is that itenables each country to assist each otherwhen additional electricity supplies arerequired. If one country is unable to satisfydemand from its own output, it can import thenecessary power from a neighbor.
The common Nordic market primarily involveselectricity generation from such resources aswater, nuclear energy and coal. Since thegenerating modes differ and are distributeddifferently in the various countries, the needfor additional power will vary from country tocountry and at different times.
Well functioning power markets, such as theNordic, generally tend to ensure thatelectricity gets generated wherever the cost ofgeneration is lowest at any time of the day.Increases in demand are balanced againstmore expensive modes of generation. Insocio-economic terms, this provides a clearindication of the cost society would have tobear to incorporate new output in the system.Where commercial considerations areconcerned, generators will receive a goodindication of where the break-even point lies
for developing new generating capacity. TheNordic’s physical market also helps to ensurethat power supply and demand are balancedright up to one hour before the time ofconsumption.
Risks associated with changes in physicalmarket prices can normally be managedthrough a financial market for energy relatedderivatives products. A buyer or seller ofpower may be able to reduce the risk offuture price changes by selling or buying thecost of future electricity to or from otherplayers with the ability and willingness toaccept these price risks. Players may therebyhave the opportunity to change their riskexposure and to hedge the price of futureoutput or consumption.
With the acquisition of Nord Pool ASA,NASDAQ OMX Commodities is now thelargest and most liquid energy exchange inEurope. NASDAQ OMX Commodities alsoincludes a clearing house for all productstraded at the energy exchange, making it theworld leader in cleared power volumes.
Stellan RåbergHead of Advisory Services, NASDAQ OMX
FEDERATION OF EURO-ASIAN STOCK EXCHANGES ANNUAL REPORT JUNE 2010
PAGE 28

The U.K. experience
The U.K. power market is almost as large asthe Nordic countries combined, yet hassuffered from a lack of transparency andliquidity. Volumes have failed to increase inspite of the general surge in othercommodities trading, and new entrants havetended to avoid the market.
Britain’s Futures and Options Association(FOA) chose the combination of Nord PoolSpot and NASDAQ OMX Commodities toestablish the new U.K. power market, N2EX,based on the companies’ vast experiencefrom Nordic physical and financial electricitytrading and the proven systems expertise ofNASDAQ OMX in international powerderivatives and clearing services.
FEAS region
Other markets are learning from the Nordicexperience. NASDAQ OMX Advisory Serviceshas incorporated the former Nord PoolConsulting group, which provides strategicand management consulting services withinthe power business worldwide. The group hasbeen involved in projects in more than 65countries and has conducted more than 20major studies since 2002 including projects inFEAS member nations Albania, Bosnia andHerzegovina, Bulgaria, Croatia, India,Kazakhstan, Romania, Serbia, Turkey and theFormer Yugoslavian Republic of Macedoniaand Montenegro.
NASDAQ OMX also offers a wide range ofsystem solutions for global energy markets.The core commodities market system,CONDICO, combines full functionality with alow total cost of ownership and is the perfectsolution for marketplaces that want to keeptechnology investments in line with growth.There are also other system solutionsavailable to handle more high intensitymarkets with special needs. Besides theNordic and U.K. energy markets, NASDAQOMX technology today powers energymarkets in India, Poland, Romania andSouthern Africa.
Building on the success in the Nordic region,NASDAQ OMX Advisory Services offers awide range of services to the power industry.As an example, we recently completedstudies on developing regional wholesaleelectricity markets in both South East (SEE)and Central East (CEE) Europe. We recentlyparticipated in a stakeholder workshop in theCEE region to provide high level design andbusiness recommendations, and we will workwith several of the countries as they take theinitiatives to the next level.
In the SEE study, the proposed first step is forBulgaria, Romania and Serbia to establishnational power exchanges and a regional day-ahead auction market linking the countries’electricity prices with implicit auctions. OtherSEE countries will join as they are ready.
While each region is unique, there aresimilarities. Member countries within eachregion want to meet European Unionrequirements to maintain a market-basedmethod for buying and selling electricity.Each needs price transparency in order toattract investors. And, while the individualcountries want to maintain a national powerinfrastructure, their markets are generally notlarge enough to generate neededcompetition.
In addition to creating competition, regionalcooperation reduces the risk of fragmentation,creates diversity of power supply, potentiallylowers costs, increases security of supply,and promotes more efficient utilization ofgeneration capacity. By interconnecting alarger system, pricing stabilizes, reducing therisks for investors. So, in the long run, regionalcooperation should also attract new investorsto the region.
All Advisory Services power industry clientsare directly or indirectly involved inrestructuring power markets and may includeauthorities, system operators, marketplaceoperators, marketplace participants, R&Dinstitutes, banks, investors and systemvendors. All recognize the need fortransparency, liquidity and efficiency in theworld’s power markets and the need for open,electronic marketplaces for trading andclearing.
FEDERATION OF EURO-ASIAN STOCK EXCHANGES ANNUAL REPORT JUNE 2010
PAGE 29
CONTACT INFORMATION
Contact Name Mr. Henri Bergström E-mail [email protected] Website www.nasdaqomx.com
Advisory Services for thepower industry
NASDAQ OMX Advisory Services providesstrategic and operational guidance toexchange industry clients around the globe.
NASDAQ OMX Advisory Services partnerswith its clients and often gets involved in thevery early stages of market development.Core offerings to the power industry include:
• Feasibility studies: Experts assess criticalissues prior to development of a competitivepower market or within an already existingmarket.
• Infrastructure and market design: Helpdesign and develop an entire power marketincluding roles, responsibilities and interfaces,ending with a complete framework for themarket including regulations.
• IT implementation: Ensure the successfulspecification, selection and implementation ofrequired IT software and systems.
• Training: Update and advance clients’ in-house competence in power market conceptsand improve market participants’ skills viainteractive training.
• Market simulation: Computer-based priceformation analysis and evaluations of pricelevel and power flow in a competitive physicaldelivery market using the SAPRI market simulator.
For additional information, please go tonasdaqomx.com/commodities.


IS INVESTMENT
IS Investment provides a wide array offinancial services to local and foreigninvestors.
With a distinctive role in the development of thecapital markets, IS Investment was establishedin 1996 as the investment banking arm ofIsbank Group. IS Investment provides a widearray of financial services to local and foreigninvestors, including Corporate Finance,Investment Advisory, Asset Management,Brokerage and Research.
IS Investment has equity stakes in CamisInvestment, IS Asset Management, IS PrivateEquity, IS Investment Trust, Turkish DerivativesExchange and Maxis Securities Ltd, a fullsubsidiary of IS Investment in London.
With its largest individual and institutionalcustomer base, IS Investment has eightbranches in Ankara, Izmir, Istanbul (Akaretler,Kalamis, Levent, Maslak, Yenikoy, Yesilkoy) and two representative offices in Almaty-Kazakhstan and Istanbul-Suadiye. IS Investment announced its investors thedecision to open a new branch in Bursa.
IS Investment has a strong and widespreaddistribution network through the agency ofmore than 1,000 Isbank branches.
IS Investment, representing approximately 40%of the sector with its US$ 1.6 billion asset size,has reached US$ 45.8 consolidated netincome by the end of 2009. As the only publicinvestment house (listed on the Istanbul StockExchange, ISE), IS Investment (ISMEN) is alsothe only investment house rated and wasgranted with a credit rating of 'AAA(tur)' withStable Outlook by Fitch Ratings in December2009.
IS Investment represents a large andcommanding presence in the Turkishinvestment market, reflected in its transactionvolumes, ranking first not only in the ISE StockMarket since 2003, but also in the TurkishDerivatives Exchange (TurkDEX), since thefoundation of the market in 2005. IS Investmentalso leads the Securities L/B Market.
IS Investment also provides a wide range ofcorporate finance services including PublicOfferings, Mergers & Acquisitions, PrivateSector Advisory, Project Finance Advisory andPrivate Equity Advisory. The Company, whichacted as the lead manager in 63 PublicOfferings between 1988 and 2010, is the leaderin the public offerings market in Turkey in termsof both deal size and number of transactions.Since 2000, IS Investment has completed 71M&A transactions – a number rendering theCompany as the leading investment bank asper the M&A league rankings.
Also known with its pioneer role and innovativereputation in the sector with new products andmarket tools; IS Investment has established thefirst hedge fund in Turkey, in November 2008.Besides, IS Investment is the first financialinstitution in Turkey applied for theestablishment of warrants in September 2009.
Ilhami KocGeneral Manager
FEDERATION OF EURO-ASIAN STOCK EXCHANGES ANNUAL REPORT JUNE 2010
PAGE 32
Full Range of Investment Banking ServicesBrokerageInvestment AdvisoryAsset ManagementCorporate Finance: IPOs, M&As, Strategic PlanningResearch
Widest Client BaseLargest domestic network – more than1000 Isbank branches areour agent4,300 high-net-worth individuals560 corporate clients420 foreign institutional clients
Largest assets under managementTRY 6.7 bn mainly through subsidiary Is Asset Management
Volume Leader #1 in Stock Market#2 in Bonds Market*#1 in Derivatives – TurkDEX#1 in Eurobond Transactions**among brokerage houses
Shareholders EquityTL 223.6 million
Only Listed Investment House in ISEWent public in May 2007 with Mcap US$ 250 million
Only Brokerage House with Credit RatingNational Long-Term AAA (Tur) / Stable Outlook by Fitch Ratings
FACTS AND FIGURES
Date of Establishment December 18th,1996Registered Capital TL 300 Million / US$ 201 millionIssued Capital TL 119.4 Million / US$ 80 millionShareholders’ Equity TL 334 Million / US$ 224 millionAssets (as of end of 2009) TL 2.5 Billion / US$ 1.6 billionFree-Float 27.87% Branches Akaretler, Ankara, Izmir, Kalamis, Maslak,
Yenikoy, Yesilkoy
Representative Office Levent, Suadiye (Istanbul), Almaty (Kazakhstan)
Agents More than 1,000 Isbank branches
Ownership StructureIsbank 65.65%Is Factoring 2.43%Is Leasing 2.43%Sisecam 1.45%Camis Investment Holding 0.17%Free Float 27.87%
Subsidiaries* IS Investment's Share Maxis Securities Limited 100.00%Camis Investment 99.79%IS Asset Management 70.00%IS Investment Trust 29.12%IS Private Equity 29.00%TurkDEX 6.00%
* Subsidiaries in which IS Investment has more than 5% shares. IS Investment has alsoshares in Growing Enterprise Market Automatic Quotation, Is REIT, ISE Settlement andCustody Bank Inc. and Yatirim Finansman Securities.

CONTACT INFORMATION
IS INVESTMENTIs Kuleleri, Kule-2 Kat: 12 4. Levent 34330 Istanbul-TurkeyTel: +90 212 350 20 00 Fax: +90 212 350 20 01 isyatirim.com.tr / isinvestment.com
For International Capital Markets Contact Name Mr. Ilkay Dalkilic Tel. +90 212 350 2314 E-mail [email protected] For Turkish Capital Markets Contact Name Ms. Ozlem Tumer Tel. +90 212 350 2320 E-mail [email protected] For Almaty/Kazakhstan Rep. Office Contact Name Mr. Samad Azimov Tel. +7 7273 340508 E-mail [email protected]
ANNUAL REPORT JUNE 2010
PAGE 33
Since its establishment, IS Investment’sinternational capital markets division continuesto provide direct access to financial marketsaround the globe and professional assistancethrough which our clients have a better scopeof investment products for achieving adiversified portfolio.
The latest liquidity crisis that crippled theeconomies around the World, once againhighlighted the importance of diversification.While the World's biggest economies havebeen pushed deep into the arms of recession,the biggest and most prominent financial firmshad disclosed holdings in problematicmortgage backed securities, which stunnedthe World markets as there is no safe groundamong the companies that are a vital part ofthe economic system. However, the ongoingexcessive measures that the major CentralBanks took in order to lessen the severity ofthis worldwide crisis, created anunprecedented rally in the financial marketsduring 2009. With the help of its extensiveglobal markets coverage by a team ofprofessionals, IS Investment’s client werefortunate enough to be positioned in the rightplace and the right time.
IS Investment has been investing heavily onimproving our product mix in order to satisfythe needs and spread out the single country
risks of our customers. As the latest liquiditycrisis put the international capital markets tothe foreground of investor's attentions, ISInvestment has already had an ever increasingactivity in these markets. IS Investment hasdirect market access capabilities through themajor equity exchanges around the world andalso has execution facilities to emergingmarkets like in Middle East and CIS region. Inequity markets, our activities are not onlylimited to secondary market trading as we alsoprovide means for our customers toparticipate in primary issues all around theworld and chance to invest in equity optionsrather than directly in cash markets. In fixedincome markets, with a volume reachingalmost US$ 3 billion in 2009, IS Investmentwas rated as the top financial firm among theother Turkish financial institutions based ontransactions booked outside the exchange.Not only, as IS Investment, we concentratepurely on Turkish Eurobonds, but also focusheavily on high grade credits as well as creditsfrom emerging market economies likeKazakhstan, Brazil, Russia and interact withmore than hundred counterparties around theWorld. Latest being the Bank Pozitif’s 2014maturity Eurobond issue, the syndication partsthat we have taken on the Eurobond issueslisted below demonstrate our commitment andwillingness to be a more active player in thesemarkets as a Turkish institution.
As the financial crisis have created roller-coaster rides in the World markets, adding tothe ways of diversification, the opportunitiesthat keep on knocking increased the needs for exchange-listed derivative instruments. In order to facilitate our clients' needs for theseleveraged instruments, IS Investment launchedTrade Master International in the beginning of2008, which is giving execution capabilities toour investors for investing on their own inmajor equity markets and more importantly infutures markets like CBOT and CME.
Rating ourselves by far as the top Turkishinstitution in international capital markets, not only IS Investment will work on improvingits abilities in organized exchanges around the World, but also will pursue to provideaccess to opportunities in emergingeconomies to its clients whom IS Investmentmade believe the importance of diversificationwith a little kick in it.
In 2009
• ISE Stock Market leader, with US$ 49.3billion trading volume and 7.9% marketshare.
• TurkDEX Market leader with US$ 56.9billion trading volume and 13.2% marketshare.
• ISE Securities L/B Market Leader withUS$ 1.1 billion trading volume and 37.8%market share.
• #2 in ISE Bonds&Bills Market amongbrokerage houses with US$ 11.1 billiontransaction volume and 12.9 % marketshare.
• ISE Turkish Eurobonds Market leaderamong brokerage houses, with US$ 0.5billion trading volume and 0.9% marketshare.
FEDERATION OF EURO-ASIAN STOCK EXCHANGES

CENTRAL REGISTRY AGENCY INC.
CRA is the Central Securities Depository ofTurkey for dematerialised capital marketinstruments that are traded in Turkishcapital markets.
Central Registry Agency Inc. (CRA) is theCentral Securities Depository of Turkey fordematerialised capital market instruments -equities, mutual funds, exchange traded funds,corporate bonds, commercial papers and bankbonds- that are traded in Turkish capitalmarkets.
CRA was established in accordance with theTurkish Capital Markets Law in 2001, and itbecame fully operational on November 28,2005 -the date when all equity certificatestraded at the Istanbul Stock Exchange becamedematerialised. Between April 2005 and March2006, all mutual fund certificates weredematerialised at the CRA platform. In August2006, after approximately 5 years, firstcorporate bond in Turkish Capital Markets wasissued through CRA.
All transactions regarding dematerialisedcapital market instruments, such as opening ofinvestor accounts, transfer of securities forsettlements, transfer of securities as collaterals,corporate actions, legal operations andreporting, are conducted by CRA participantsvia the central registry software, CDS, aproprietary software developed in-house.
CRA also acts as the securities agent for on-exchange settlements of equities traded at theISE and real time settlements of equities forSecurities Lending and Borrowing facility ofTakasbank.
Issuers as participants of CRA, can benefitfrom all custody services for non-floatingshares. CRA also offers a full range ofcorporate action facilities including rightsissues, interest and dividend distributions,stock splits, conversions and mergers enablingissuers to deliver new securities and cash toinvestors.
Investor services are a key element of ourbusiness. As such, we provide accountinformation and market statistics to investorsvia our WebInvestors portal, e-CAS, SMS, IVRand call center. We also provide shareholderservices for general meetings.
CRA manages and represents the InvestorProtection Fund, a crucial tool in constitutinginvestor confidence in Turkey. Our tasksinvolve, conducting all the formalities on behalfof the Fund according to the applicableregulatory provisions and implementingliquidation formalities of intermediaryinstitutions, which are subject to administrativeliquidation per the Capital Markets Board ofTurkey (CMB) resolution.
CRA continues to increase the variety of itsproducts and services. Since the end of thedematerialisation process for physical equitiesand mutual funds CRA has been working toextend the range of assets held in its electronicbook-keeping system. We are also working onjoint projects with our partners which will bringabout necessary improvements to the Turkishcapital market infrastructure in order toconform to international sector standards intechnology and custody services.
As a member institution, CRA has been activelyparticipating in various working projects andinformation sharing networks withininternational industry associations such as theAssociation of European Central SecuritiesDepositories (ECSDA) and the InternationalSecurities Services Association (ISSA). Ourexperts closely monitor the harmonisationefforts in the European post-trade sector andthe ongoing post-crisis standard setting atglobal level.
Furthermore, as an affiliate member of theFederation of Euro-Asian Stock Exchanges(FEAS) our depository contributes to thedevelopment of capital markets in the regionby bringing our expertise and technologicalknow-how into various collaborations withregard to the regional post-trade industry.
Dr. Yakup ErgincanCEO
FEDERATION OF EURO-ASIAN STOCK EXCHANGES ANNUAL REPORT JUNE 2010
PAGE 34
CONTACT INFORMATION
Address Askerocagi Cad. Suzer Plaza No: 15 Kat: 3 34367 Elmadag/IstanbulTel +90 (212) 334 57 00 Fax +90 (212) 334 57 57Contact Name Mr. Ozgur Uysal E-mail [email protected] Website www.mkk.com.tr
CONTACT INFORMATION
Contact Name Mr. C. Ozgur Guneri E-mail [email protected] Website www.finansportfoy.com
FINANS ASSET MANAGEMENT
Turkish economy has proved to be one of thefastest recovering economies following a sharpdeterioration in major economic indicators in2009 driven by the worst global turmoil sincethe World War II. Solid financial institutions,economic and social reforms which took effectsince the beginning of the decade, significantexperience of the Turkish business communityin crises management, relatively strongerpublic balance sheet have all played role tosome extent in the economic upturn.
Turkish banking sector has remained profitablethroughout the crisis. With its strong capitalbase, the banking industry in Turkey continuedto provide jobs, support the vital functions ofthe economy and facilitate financial markets tocontinue to remain healthy. Turkey is expectedto benefit more from healthy financial sectorthrough a rapid recovery and create theinfrastructure towards long-term sustainablegrowth of the economy.
Turkey is believed to be one of the key growthdrivers of economy not only in its region butglobally as well. Turkey’s encouragingdemographics, rapid urbanization, unsaturatedconsumer markets, favourable socio andeconomic indicators and increasing impact onregional politics well position Turkey to make aleap forward in terms of secular development.For this reason, local and foreign investors areincreasingly trying to develop strategies tobenefit from excellent prospects of Turkey
through direct and portfolio investments. Alongwith changes of expectations on a globalscale, investors investing in Turkey look forwardto new products that will enable them to benefitfrom bright prospects of the country.
Finans Asset Management continues to focuson offering the widest range of financialproducts and plans to offer new products forlocal and foreign investors. Exchange tradedfunds have been a major tool for investors toinvest directly to the performance of Turkishequities or fixed income assets. Finans AssetManagement currently offers six exchangetraded funds which track the performance ofTurkish equities and fixed income with differentstrategies.
Investors’ needs and expectations have beenchanging rapidly following the unpleasantmemories of the recent global crises. Investorsnow seek for financial products which offerflexibility, transparency, ease of transaction.Changing investor needs have already startedshaping the future of financial products.Finans Asset Management, the issuer of manyinnovative financial products in Turkey andEmerging Europe for the first time, will continueto play a significant role to shape the future offinancial products in Turkey.
Award winning exchange Traded Funds offeredby Finans Asset Management continues toattract high foreign investor interest with many
advantages such as diversification, coreholding, flexibility, continuous pricing,transparency, ease of transaction and ease ofoperations.
As a part of its strategy, Finans AssetManagement issued the first exchange tradedfund (ETF) based on Istanbul Stock Exchange(ISE) Index. Based on ISE National 30 Index,IST30 ETF has been listed on the IstanbulStock Exchange since April 2009. IST30 is thefirst ETF in Turkey that offers cash market andfutures market simultaneously. Finans AssetManagement is currently working on the firstmulti market ETF in Turkey. The first joint indexdeveloped by the Istanbul Stock Exchange,Greece-Turkey 30 Index will be used as thebasis for GT 30 Greece-Turkey ETF. Diversesector breakdown of GT30 will offer investorsto invest in a basket of stocks and gainexposure to various sectors such as telecoms,shipping, retail, and refinery.
In addition to Exchange Traded Funds, FinansAsset Management also offers capitalprotected funds, actively managed funds withvarious strategies and the first fund of funds inTurkish market.
Finans Asset Management believes in creatingvalue for investors through transparent andefficient products which enables investorscapturing the performance of rapidly growingTurkish market in the most efficient way.
Finans Asset Management offers investorsto get exposure to Turkey through a widevariety of innovative products.
C. Ozgur GuneriExecutive President
FEDERATION OF EURO-ASIAN STOCK EXCHANGES ANNUAL REPORT JUNE 2010
PAGE 35


FEDERATION OF EURO-ASIAN STOCK EXCHANGES ANNUAL REPORT JUNE 2010
PAGE 37
TAYBURN KURUMSAL
The privilege of serving our clients is whatshapes our mission…
Tayburn Kurumsal provides a complete line ofcreative, integrated corporate communicationproducts and services tailored according to itsclients’ needs.
Tayburn GroupWith 31 years of experience in international aswell as European markets, Tayburn is thebiggest corporate communication company inScotland and one of the top-10 in the UnitedKingdom. It has been 16 years since we beganblending Tayburn's know-how with our ownknowledge of the local market and putting themto work in the service of clients. For more than adecade we have developed and offeredproductive, high-quality, and creative solutionsfor some of Turkey's leading companies in theareas of annual reports, branding, design, newmedia, advertising, and marketing.
Thanks to our expert team, to the knowledgeand experience acquired on our own andthrough Tayburn, to our customer focus, and toour innovative and creative approach to service,we are today Turkey's most sought-after serviceprovider in the corporate communicationsegment. Our service area as Tayburn Kurumsalis not limited to Turkey. Because of our world-class know-how and quality of service, we are also called upon by clients operating inEurope and in neighboring countries. Our owntechnological infrastructure makes it easy for usto provide such clients with fast, comprehensiveservice too.
Professional approach to businessOne notion defines the reason for our existenceand our mission: Enable our clients to establishand maintain accurate, sustainable, and high-yield communication with their target audiencesby means of our high added value products andservices.
With our professional approach to business, our national and international marketknowledge, and our global experience incorporate communication we transform thismission into reality for our clients.
Since the day we commenced operations, wehave been doing business and taking pride inthe knowledge that we have been consistentlysuccessful in the face of Turkey’s rapidlychanging and developing market conditionsand, what’s even more important, that we havebeen providing solutions that precisely serve ourclients’ needs.
Reporting and investor relations: Printed and online corporate reporting andcommunicating with investors…Our activities in the area of reporting and investorrelations consist of the turnkey design anddelivery of:• Annual reports• Sustainability reports• COP reports • Investor relations products• Road show presentationsas well as similar products and services thatenable our clients to establish and maintaintimely, precise, uninterrupted, and transparentcommunication with investors, shareholders,creditors, business partners, customers,employees, and the society at large.
High added value services in investorrelationsUnderlying all investor relations is the need tocommunicate corporate information accuratelyand clearly to investors, shareholders, creditors,employees, business partners, and society atlarge. Speed and transparency are of theutmost importance in investor relations today. It is vitally important for publicly-held companiesto keep abreast and quickly comply with therequirements of national and internationalregulations (Capital Markets Board, SarbanesOxley, NYSE, LSE, etc). Providing truthfulinformation at the right time and in a format thatis easy to understand and to access heads thelist of the objectives of everyone involved ininvestor relations in today’s world. TayburnKurumsal offers clients in Turkey all the productsand services that they need in the area ofinvestor relations.
Copywriting and editing services: Conveying your message clearly to the right audience…Tayburn prepares and edits text in Turkish and other languages to ensure that its clients’messages are conveyed to their target audiencesclearly and effectively. We provide high addedvalue corporate communication services in thefollowing languages: Turkish, English, French,German, Italian, Spanish, Russian, Chinese, andArabic . Other languages are also available onrequest.
Branding: High-profile corporate and consumerbrands…In the areas of creating, developing, defining andmaintaining standards for our clients’ corporateand consumer brands, our brand-relatedactivities consist of:• Designing logos and emblems• Developing corporate identities from A to Z• Launching and relaunching brands• Consultancy services
Marketing: Satisfying marketing needs in theproduct/service-consumer cycle…Our activities under the heading of marketingconsist of a providing all the advertising,promotional, and corporate communicationproducts and services that our clients may need such as:• Advertising campaigns• Corporate information films• Web-based solutions• Brochures• Information kits• Electronic presentations
Web and electronic products: Realistic expectations, feasible goalsTayburn Kurumsal is dedicated to the creation ofweb-based communication solutions that arehighly functional, robust, and audience-specific.
The knowledge and experience that TayburnKurumsal has built up over the years is put towork to develop whatever web-based productsand services its clients might need. Regardingthe ability to combine creativity with workablesolutions as the bedrock of all web-basedservices, Tayburn Kurumsal comes up withsolutions ranging from corporate portals toinvestor relations websites and from e-commerceapplications to web-based annual reports andadvertising / publicity campaigns.
Well aware that internet design demands athoroughly specialized understanding andapproach, Tayburn Kurumsal makes sure that it is equipped with all of the resources andcompetencies that may be required to satisfy a client’s every need.
Ediz UsmanPartner & Client Relations Director
CONTACT INFORMATION
Contact Name Mr. Ediz Usman E-mail [email protected] Website www.tayburnkurumsal.com

GARANTI ASSET MANAGEMENT
Providing a unique service with high addedvalue to investors, Garanti AssetManagement has won acclaim at nationaland international platforms.
Garanti Portfoy (Garanti Asset Management) asubsidiary (100%) of Turkiye Garanti BankasiA.S. (Garanti Bank); was founded as the firstasset management company of Turkey in 1997.The Company holds asset management andinvestment consultancy authorizationcertificates and serves domestic and foreigncorporate and individual investors as its targetgroup. Garanti Asset Management serves inthe following business lines: Mutual FundsManagement, Pension Funds Management,Discretionary Portfolio Management andAlternative Investments.
Garanti Asset Management built its investmentphilosophy on the following grounds: tomanage customer assets in the most effectivemanner possible; to ensure sustainable assetgrowth; to reflect investor demands to portfoliostructures in the swiftest and most appropriatemanner and to keep continuous control overrisk levels. The success of Garanti AssetManagement’s investment policy lies insystematically researching various investmentinstruments, effective decision-makingprocesses, and subjecting all investmentdecisions to disciplined and persistent riskmanagement.
Providing a unique service with high addedvalue to investors with 61 professional staff,Garanti Asset Management has won acclaim atnational and international platforms, thanks toits effective business approach and robustbrand image.
Garanti Asset Management’s decision-makingprocess is composed of two basic steps:determination of asset allocation and selectionof assets.
The determination of asset allocation is the firststep in the decision-making process at GarantiAsset Management. The General Manager andDeputy General Managers are briefed ontargets and expectations during the weeklymeetings of the Strategy Committee. Scenariosare analyzed by the committee to determinethe returns expected for each investmentinstrument; alternative scenarios areconsidered and debated in detail to decide onthe best relative weights for investmentvehicles. The results of the strategies arefollowed and their impacts on performance arereviewed during a daily morning meeting.Garanti Asset Management also obtainsconsultancy support from third parties beforethe Strategy Committee within the framework ofthe circumstances of the day.
Selection Process is the second step of thedecision-making procedure at Garanti AssetManagement. In the selection of fixed incomeinstruments, decisions taken at the StrategyCommittee, which take account ofmacroeconomic data and expectations areapplied to the portfolios by the initiatives ofrelated coordinators and fund managers.
The selection of equities is coordinated by theEquity Selection Committee. This committee,comprised of investment analysts and equityfund/portfolio managers, evaluates relatedresearch reports in a comprehensive mannerand initiates the equity selection process withcorrect market timing. At the end of thecommittee meeting, model portfolios aredesigned and asset allocations are determinedby evaluating return potentials of equities.
In addition to ordinary committee meetings,Garanti Asset Management closely monitorsimmediate developments on economic andpolitical platforms. Within this framework, theCompany may make immediate adjustments ininvestment decisions, which it swiftly applies tothe portfolios.
Garanti Asset Management employs effectiveand active risk management mechanismswhich encompass all investment processes. Aspart of its pre-defined risk control mechanisms,the Company continuously monitors theexpected returns and maximum sustainablelosses for all investment instruments. In otherwords, at Garanti Asset Management, the yieldand loss potential of each investment is knownin advance.
Garanti Asset Management employs twodifferent resources in its market riskmanagement activities,:
• The Management Information System (MIS)reporting is one of the techniques utilized byGaranti Asset Management in the field of riskmanagement. MIS reporting, which is highlyprecious in terms of summarizing all of thecorporation’s risks, is simple, brief andexclusive. Data fed into the system designedby Rasyonet is submitted over infrastructuresupplied by Garanti Technology.
• The risk management product developedwith Rasyonet allows assessment of marketrisks, as well as the liquidity risk.
Garanti Asset Management boasts its perfectdistribution channel. We are effectively usingthe distribution channel which we developedwith our main shareholder, Garanti Bank. Weare highly ambitious in this segment. We boastthe best practice in Turkey while proactivelyand continuously taking part and working in thefield in collaboration with Garanti Bank.
Garanti Asset Management continues to pressahead with its assertion of being the best andthe most effective provider of services in theTurkish asset management industry and movedahead with its partnership, and also as the firstcompany of the sector through realizing newprojects and products.
The Capital Guaranteed Fund, the PrincipalProtected Fund and Hedge Fund were all keysteps taken in 2009 within our synergiccooperation with Garanti Bank. Having offeredguaranteed and protecting funds to the marketjust at the right point in the conjuncture,Garanti Bank became one of the leadingissuers in this field through the robustcooperation developed with our company.
At a time when change has gained pace and iseffectively experience, we as a team areextremely proud to present Garanti AssetManagement as a shining example ofperformance and sustainability.
As our 13-year past offers an insight to thehistory of the collective investment instrumentsindustry in our country, growth andperformance that we have shown is in view asa real example of sustainability.
The “Istanbull Fund”, a hedge fund founded byGaranti Bank, which is managed by GarantiAsset Management, was registered to theCapital Markets Board in April 2009. ManagingTurkey’s largest hedge fund will present anexciting expansion for Garanti AssetManagement.
The fund addresses a segment of qualifiedinvestors seeking high returns by taking highrisks. These funds primarily aim at thoseinstitutions and individuals with large scaleportfolios in Turkey.
The Istanbull Fund, with its maximum leveragerate of 3, invests in various money and capitalmarket instruments including, but not limitedto, fixed income securities, government bonds,equities, private sector bonds, forwardexchange contracts and loan derivatives.
Gur CagdasGeneral Manager
FEDERATION OF EURO-ASIAN STOCK EXCHANGES ANNUAL REPORT JUNE 2010
PAGE 38

CONTACT INFORMATION
Contact Name Gur Cagdas Tel. +90 212 381 31 00 E-mail [email protected] Website www.garantiassetmanagement.com
ANNUAL REPORT JUNE 2010
PAGE 39
Turkish Asset Management market reached TL 40.1 billion, realizing 30.6% growth in 2009.Garanti Asset Management’s AUM size grewby 34.0% to TL 6.3 billion, increasing marketshare to 15.8% from 15.4% in the sameperiod.
While total size of mutual funds nominallyincreased by 27.0% and rise to TL 30.1 billion,Garanti reached TL 4.5 billion by 29.8%increase in 2009.
Individual pension funds have notched upstrong growth in 2009. Total volume of fundscollected in the Individual Pension System(IPS) increased by 42% year-on-year to TL 9.1 billion (from TRY 6.4 billion in 2008). In the same period, the number of IndividualPension System investors rose from 1,745,354to 1,991,000.
Garanti Asset Management maintained itsgrowth in pension funds and reached TL 1.30billion size with 14.3% market share in 2009.
As the new legislation concerning PensionSystem took effect, the expectation of atransfer of savings kept at foundations andfunds to the individual pension system andarrangements regarding vesting conditions will stimulate the corporate market, whilecontributing to the minimization of the crisis-related negative impacts. This is expected tostimulate the growth trend.
Garanti Asset Management’s business volumewas realized as TRY 456 million in 2009,commanding a market share of 14,2% inDiscretionary Asset Management.
The Company’s proactive marketing activitiesand consistently high levels of customersatisfaction kept Garanti Asset Managementeffective in the management of individual andcorporate private portfolios. By the end of2009, a total of 36 individual customers and18 corporate customers were using GarantiAsset Management’s private assetmanagement services.
We would define the forthcoming period, withthe economic recovery set to get underwayafter 2010, as a period of improvement. In thisperiod, investors swiftly heading to collectiveinvestment instruments along with the falls weexpect in interest rates in particular, in additionto the sector’s strengthening infrastructure, toset the stage for strong growth for our sectorand Garanti Asset Management.
In the upcoming period, Garanti AssetManagement will demonstrate maximum effortto take its pioneering and indispensableposition in the sector forward, thanks to itsperfect structuring, competent team andvision. We have full confidence that ourinvestors’ custom will continue to evolve intolong-term relationships.
Projections indicate that the assetmanagement industry will grow rapidly in theupcoming period. As the array of financialproducts on offer increases, short-terminstruments will no longer be attractive andsignificant changes will take place in investors’preferences and behavior as the Turkishcapital markets develop.
In line with its target of being among the first 3participants of the sector on the basis of • performance• volume• profitability
Garanti Asset Management is committed tobeing the service provider to benefit most fromthe prospective economic recovery and periodof growth from 2010, based on its corporatestructure which fully complies with modernasset management practices, as well as itssuperior abilities. Garanti Asset Management,which works to the competition benchmarkbuilt within capital markets in order to produceever growing value to all of its stakeholders,will continue to manage change and ensure asustainable performance.
Although the growth rate of Turkish investmentfunds market slowed down slightly by therecent financial crisis, it hasn’t been affectedas dramatically as developed countries. Owingto the relatively high yields in treasury bills andhigh interest rates in Turkish money market,Turkish investors preferred time deposits andfixed income products over more riskier assetclasses such as equities and structuredproducts. Alternative investment instrumentsshowed a slower progress due to thispersistent high interest rate environment.However, together with the real interest ratescoming down, crowding-out effect of theTurkish treasury has been diminishing over themarkets and investors’ risk perception hasbegun to change in favor of more riskier assetclasses. Investment fund industry and newinvestment instruments are expected to getmore attention in the forthcoming period.Moreover, with the growth in the market anddiversification in the investment instruments inTurkey, it’s also been expected that Turkishasset management companies will start toexpand abroad. The recent position of theEuropean fund market is considered as anopportunity for the Turkish companies.
FEDERATION OF EURO-ASIAN STOCK EXCHANGES
0
1,000
2,000
2,500
3,000
3,500
4,000
4,500
GARANTI ASSET MANAGEMENT TOTAL AUM(US$ millions)
2000 2003 2006 2007 2008 2009
1,500
500
FACTS AND FIGURES
Date of Establishment June 5th, 1997Ownership Structure Garanti Bank 100%Total Assets Under Management (AUM) US$4.2 billion #3Mutual Funds US$3.0 billion #3Pension Funds US$900 million #4Discretionary Asset Management US$304 million #4


STOCK EXCHANGE PROFILES
FEDERATION OF EURO-ASIAN STOCK EXCHANGES ANNUAL REPORT JUNE 2010
PAGE 41
Abu Dhabi Securities Exchange 42UAE Economy 44
Amman Stock Exchange 46Jordan Economy 48
Bahrain Stock Exchange 50Bahrain Economy 52
Baku Interbank Currency Exchange 54
Baku Stock Exchange 56Azerbaijan Economy 58
Banja Luka Stock Exchange 60Bosnia and Herzegovina Economy 62
Belarusian Currency and Stock Exchange 64Belarus Economy 66
Belgrade Stock Exchange 68Serbian Economy 70
Bucharest Stock Exchange 72Romanian Economy 74
Bulgarian Stock Exchange 76Bulgarian Economy 78
Egyptian Exchange 80Egyptian Economy 82
Georgian Stock Exchange 84Georgian Economy 86
Iraq Stock Exchange 88Iraq Economy 90
Istanbul Gold Exchange 92
Istanbul Stock Exchange 94Turkish Economy 96
Karachi Stock Exchange 98Pakistan Economy 100
Kazakhstan Stock Exchange 102Kazakhstan Economy 104
Kyrgyz Stock Exchange 106Kyrgyz Economy 108
Lahore Stock Exchange 110
Macedonian Stock Exchange 112Macedonian Economy 114
Moldova Stock Exchange 116Moldovan Economy 118
Mongolian Stock Exchange 120Mongolian Economy 122
Montenegro Stock Exchange 124Montenegro Economy 126
Muscat Securities Market 128Oman Economy 130
NASDAQ OMX Armenia 132Armenian Economy 134
Palestine Securities Exchange 136Palestine Economy 138
Sarajevo Stock Exchange 140
State Commodity & Raw Materials Exchange of Turkmenistan 142Turkmenistan Economy 143
Tehran Stock Exchange 146Iran Economy 148
Tirana Stock Exchange 150Albanian Economy 152
“Toshkent” Republican Stock Exchange 154Uzbekistan Economy 156
Ukrainian Stock Exchange 158Ukrainian Economy 160
Zagreb Stock Exchange 162Croatian Economy 164

ABU DHABI SECURITIES EXCHANGE
The market capitalization of companieslisted at the ADX at the end of 2009 wasUS$ 80.2 billion AED 295 billion with anincrease of 17%.
At the end of 2009 the Abu Dhabi SecuritiesExchange (ADX) had 67 companies listed,whereas, the number of listed companies atthe end of 2008 was 65. The indexincreased from 2390.01 in 2008 to2743.61in 2009.
The value of trading decreased from US$63.1 billion (AED 231.9 billion) in 2008compared to US$ 19 billion (AED 69.9billion) in 2009, an decrease of 70%.Moreover, the daily average value of tradingin 2009 decreased to US$ 76.2 million (AED
280 million) compared to US$ 256 million(AED 940 million) in 2008. In 2009 therewere 250 trading days compared to 247days in the previous year.
The number of shares traded in 2009decreased to 37.6 billion shares comparedto 49.9 billion shares traded over theprevious year 2008, a decrease of 25%.Moreover, the daily average of tradedshares also decreased to 150 million sharescompared with 202 million shares in 2008.
The number of executed trades declined to744,697 trades compared to 1,126,373trades in 2008, a decrease of -34%.
The market capitalization of companieslisted at the ADX at the end of 2009 wasUS$ 80.2 billion AED 295 billion with anincrease of 17%.
HISTORY AND DEVELOPMENT
ADX was established on November 15,2000, as the official stock exchange of AbuDhabi, and throughout this relatively briefhistory, the exchange was able to achieveremarkable growth in tandem with the robusteconomic performance of the emirate ofAbu Dhabi during the past decade.
ADX serves the domestic cash equitymarket with 67 listed companies and amarket capitalization of AED 294.57 billion(US$ 80.26 billion) as on December 31,2009.
On March 25, 2010, ADX launched the firstExchange Traded Funds (ETFs) tradingplatform in the GCC region. The exchangewas ranked as the second best governmententity in Abu Dhabi in terms of e-servicesand solutions.
ADX has custody agreements with majorinternational financial institutions includingHSBC, Standard Chartered Bank, DeutscheBank and Citi.
FUTURE OUTLOOK
In 2010 ADX will:• Increase institutional participation• Attract more foreign investors• Enhance the quality of marketintermediation• Strengthen the equity and debt markets• Develop some new indices includinginvestor confidence and satisfaction• Develop internal processes andtechnology• Invest in the social infrastructure• Develop human resourcesand;• Promote the implementation ofinternational best practices
Rashed AL BaloushiDeputy Chief Executive
FEDERATION OF EURO-ASIAN STOCK EXCHANGES ANNUAL REPORT JUNE 2010
PAGE 42
TRADING VOLUME(US$ millions)
0
10,000
20,000
30,000
40,000
50,000
60,000
70,000
02 03 04 05 06 0701 08
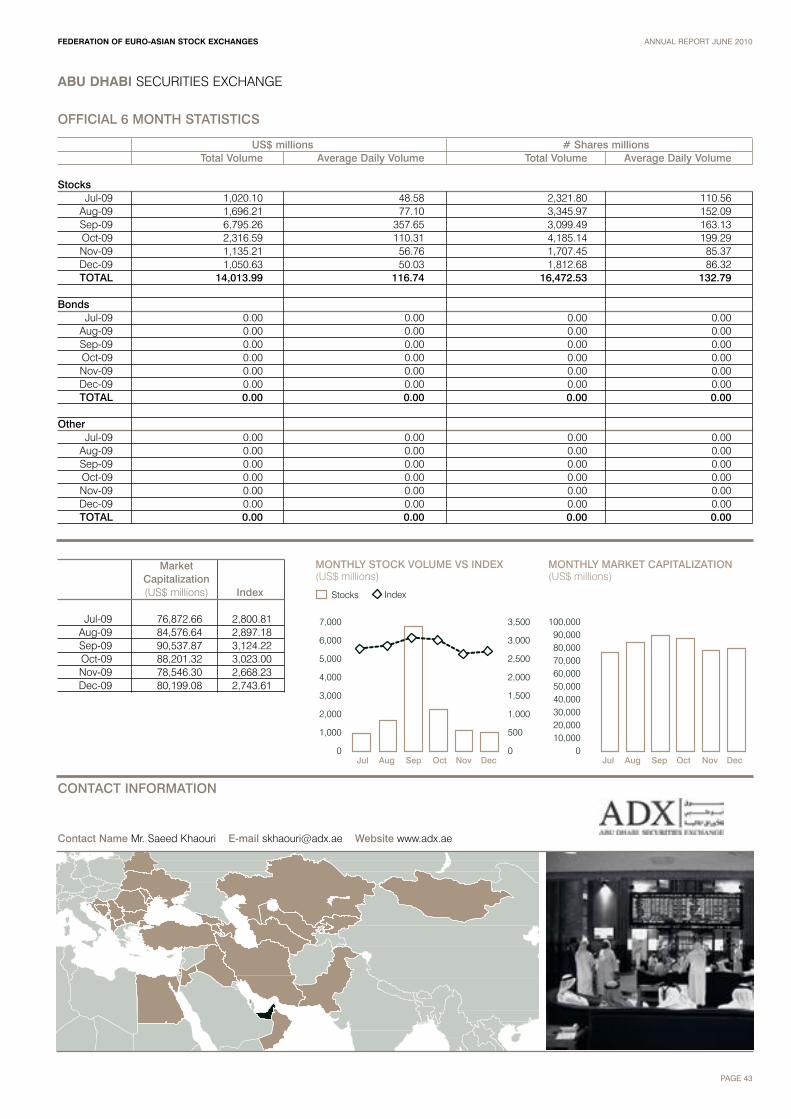
ABU DHABI SECURITIES EXCHANGE
FEDERATION OF EURO-ASIAN STOCK EXCHANGES ANNUAL REPORT JUNE 2010
PAGE 43
OFFICIAL 6 MONTH STATISTICS
US$ millions # Shares millionsTotal Volume Average Daily Volume Total Volume Average Daily Volume
StocksJul-09 1,020.10 48.58 2,321.80 110.56
Aug-09 1,696.21 77.10 3,345.97 152.09Sep-09 6,795.26 357.65 3,099.49 163.13Oct-09 2,316.59 110.31 4,185.14 199.29Nov-09 1,135.21 56.76 1,707.45 85.37Dec-09 1,050.63 50.03 1,812.68 86.32TOTAL 14,013.99 116.74 16,472.53 132.79
BondsJul-09 0.00 0.00 0.00 0.00
Aug-09 0.00 0.00 0.00 0.00Sep-09 0.00 0.00 0.00 0.00Oct-09 0.00 0.00 0.00 0.00Nov-09 0.00 0.00 0.00 0.00Dec-09 0.00 0.00 0.00 0.00TOTAL 0.00 0.00 0.00 0.00
OtherJul-09 0.00 0.00 0.00 0.00
Aug-09 0.00 0.00 0.00 0.00Sep-09 0.00 0.00 0.00 0.00Oct-09 0.00 0.00 0.00 0.00Nov-09 0.00 0.00 0.00 0.00Dec-09 0.00 0.00 0.00 0.00TOTAL 0.00 0.00 0.00 0.00
0
1,000
2,000
3,000
4,000
5,000
6,000
7,000
MONTHLY STOCK VOLUME VS INDEX(US$ millions)
MONTHLY MARKET CAPITALIZATION(US$ millions)
Stocks Index
Jul Aug Sep Oct Nov Dec Jul Aug Sep Oct Nov Dec0
10,00020,00030,00040,00050,00060,00070,00080,00090,000
100,000
0
500
1,000
1,500
2,000
2,500
3,000
3,500
Market Capitalization(US$ millions) Index
Jul-09 76,872.66 2,800.81Aug-09 84,576.64 2,897.18Sep-09 90,537.87 3,124.22Oct-09 88,201.32 3,023.00Nov-09 78,546.30 2,668.23Dec-09 80,199.08 2,743.61
CONTACT INFORMATION
Contact Name Mr. Saeed Khaouri E-mail [email protected] Website www.adx.ae
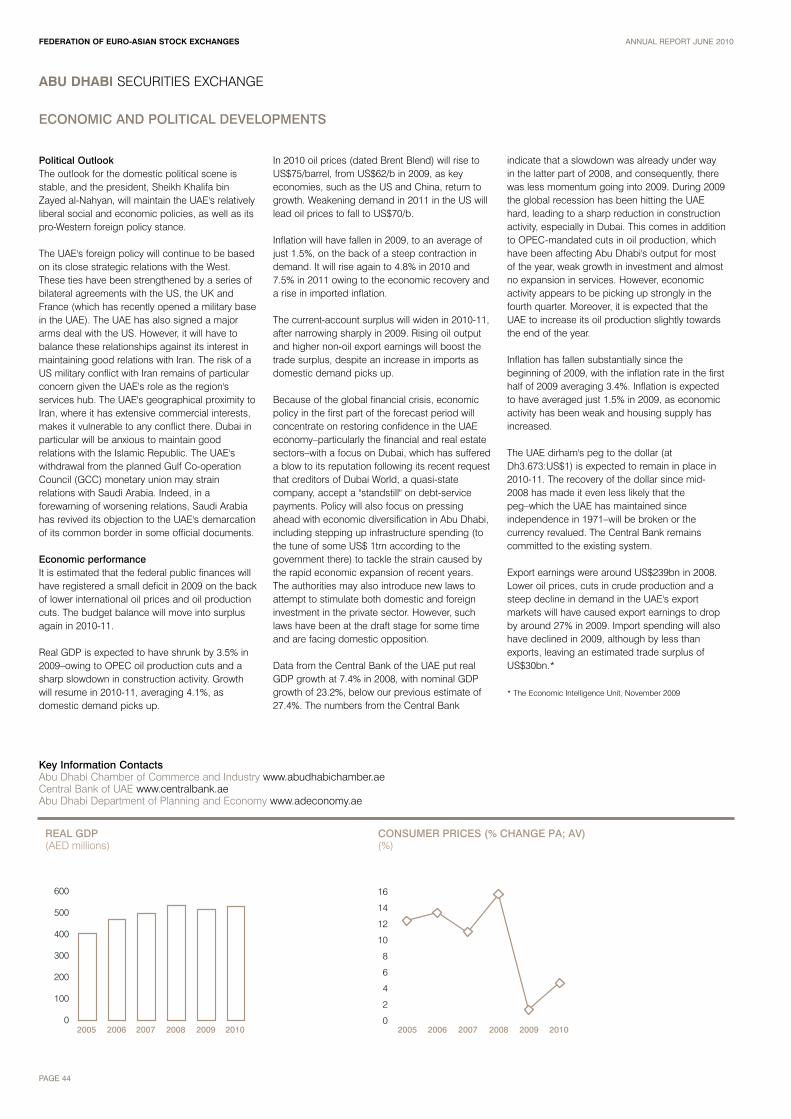
0
100
200
300
400
500
600
REAL GDP(AED millions)
CONSUMER PRICES (% CHANGE PA; AV)(%)
0
2
4
6
8
10
12
14
16
2005 2006 2007 2008 2009 2010 2005 2006 2007 2008 2009 2010
FEDERATION OF EURO-ASIAN STOCK EXCHANGES ANNUAL REPORT JUNE 2010
PAGE 44
ABU DHABI SECURITIES EXCHANGE
ECONOMIC AND POLITICAL DEVELOPMENTS
Political OutlookThe outlook for the domestic political scene isstable, and the president, Sheikh Khalifa binZayed al-Nahyan, will maintain the UAE's relativelyliberal social and economic policies, as well as itspro-Western foreign policy stance.
The UAE's foreign policy will continue to be basedon its close strategic relations with the West.These ties have been strengthened by a series ofbilateral agreements with the US, the UK andFrance (which has recently opened a military basein the UAE). The UAE has also signed a majorarms deal with the US. However, it will have tobalance these relationships against its interest inmaintaining good relations with Iran. The risk of aUS military conflict with Iran remains of particularconcern given the UAE's role as the region'sservices hub. The UAE's geographical proximity toIran, where it has extensive commercial interests,makes it vulnerable to any conflict there. Dubai inparticular will be anxious to maintain goodrelations with the Islamic Republic. The UAE'swithdrawal from the planned Gulf Co-operationCouncil (GCC) monetary union may strainrelations with Saudi Arabia. Indeed, in aforewarning of worsening relations, Saudi Arabiahas revived its objection to the UAE's demarcationof its common border in some official documents.
Economic performanceIt is estimated that the federal public finances willhave registered a small deficit in 2009 on the backof lower international oil prices and oil productioncuts. The budget balance will move into surplusagain in 2010-11.
Real GDP is expected to have shrunk by 3.5% in2009–owing to OPEC oil production cuts and asharp slowdown in construction activity. Growthwill resume in 2010-11, averaging 4.1%, asdomestic demand picks up.
In 2010 oil prices (dated Brent Blend) will rise toUS$75/barrel, from US$62/b in 2009, as keyeconomies, such as the US and China, return togrowth. Weakening demand in 2011 in the US will lead oil prices to fall to US$70/b.
Inflation will have fallen in 2009, to an average ofjust 1.5%, on the back of a steep contraction indemand. It will rise again to 4.8% in 2010 and7.5% in 2011 owing to the economic recovery anda rise in imported inflation.
The current-account surplus will widen in 2010-11,after narrowing sharply in 2009. Rising oil outputand higher non-oil export earnings will boost thetrade surplus, despite an increase in imports asdomestic demand picks up.
Because of the global financial crisis, economicpolicy in the first part of the forecast period willconcentrate on restoring confidence in the UAEeconomy–particularly the financial and real estatesectors–with a focus on Dubai, which has suffereda blow to its reputation following its recent requestthat creditors of Dubai World, a quasi-statecompany, accept a "standstill" on debt-servicepayments. Policy will also focus on pressingahead with economic diversification in Abu Dhabi,including stepping up infrastructure spending (tothe tune of some US$ 1trn according to thegovernment there) to tackle the strain caused bythe rapid economic expansion of recent years.The authorities may also introduce new laws toattempt to stimulate both domestic and foreigninvestment in the private sector. However, suchlaws have been at the draft stage for some timeand are facing domestic opposition.
Data from the Central Bank of the UAE put realGDP growth at 7.4% in 2008, with nominal GDPgrowth of 23.2%, below our previous estimate of27.4%. The numbers from the Central Bank
indicate that a slowdown was already under wayin the latter part of 2008, and consequently, therewas less momentum going into 2009. During 2009the global recession has been hitting the UAEhard, leading to a sharp reduction in constructionactivity, especially in Dubai. This comes in additionto OPEC-mandated cuts in oil production, whichhave been affecting Abu Dhabi's output for mostof the year, weak growth in investment and almostno expansion in services. However, economicactivity appears to be picking up strongly in thefourth quarter. Moreover, it is expected that theUAE to increase its oil production slightly towardsthe end of the year.
Inflation has fallen substantially since thebeginning of 2009, with the inflation rate in the firsthalf of 2009 averaging 3.4%. Inflation is expectedto have averaged just 1.5% in 2009, as economicactivity has been weak and housing supply hasincreased.
The UAE dirham's peg to the dollar (atDh3.673:US$1) is expected to remain in place in2010-11. The recovery of the dollar since mid-2008 has made it even less likely that thepeg–which the UAE has maintained sinceindependence in 1971–will be broken or thecurrency revalued. The Central Bank remainscommitted to the existing system.
Export earnings were around US$239bn in 2008.Lower oil prices, cuts in crude production and asteep decline in demand in the UAE's exportmarkets will have caused export earnings to dropby around 27% in 2009. Import spending will alsohave declined in 2009, although by less thanexports, leaving an estimated trade surplus ofUS$30bn.*
* The Economic Intelligence Unit, November 2009
Key Information ContactsAbu Dhabi Chamber of Commerce and Industry www.abudhabichamber.aeCentral Bank of UAE www.centralbank.aeAbu Dhabi Department of Planning and Economy www.adeconomy.ae

FEDERATION OF EURO-ASIAN STOCK EXCHANGES ANNUAL REPORT JUNE 2010
PAGE 45
ABU DHABI SECURITIES EXCHANGE
0
10
20
30
40
50
60
70
TRADE BALANCE(US$ billions)
2005 2006 2007 2008 2009 20100
10
20
30
40
50
60
70
80
INTERNATIONAL RESERVES(US$ millions)
2005 2006 2007 2008 2009 2010
UAE ECONOMIC CHARTS AND TABLES
2005 2006 2007 2008 2009 2010
Nominal GDP (US$ at PPP) bil US$ 134 (a) 160 (a) 174 (a) 191 (a) 187 (a) 196 (b)Real GDP mil AED 409,218 470,214 498,302 535,354 516,741 (a) 534,119 (b)Real private consumption mil AED n/a n/a n/a n/a n/a n/aReal government consumption mil AED n/a n/a n/a n/a n/a n/aReal gross fixed investment mil AED n/a n/a n/a n/a n/a n/aReal stockbuilding mil AED n/a n/a n/a n/a n/a n/aReal exports of G&S mil AED n/a n/a n/a n/a n/a n/aReal imports of G&S mil AED n/a n/a n/a n/a n/a n/aReal domestic demand mil AED n/a n/a n/a n/a n/a n/aReal GDP at factor cost mil AED 409,218 470,214 498,302 535,354 516,741 (a) 534,119 (b)Real agriculture mil AED 8,720 8,298 8,235 8,252 8,417 (a) 8,501 (b)Real industry mil AED 252,456 303,453 324,264 355,613 333,920 (a) 348,074 (b)Real manufacturing mil AED 57,263 61,926 63,718 66,582 69,911 (a) 71,379 (b)Real services mil AED 148,042 158,463 165,803 171,489 174,404 (a) 177,544 (b)Gross national savings rate (%) % 39.7 40.7 43.3 42.6 (a) 33.2 (a) 36.9 (b)Gross national savings/investment % 202.2 204.9 128.2 126.0 100.8 (a) 114.0 (b)Budget balance (% of GDP) % 7.8 11.3 (a) 10.3 (a) 13.6 (a) -0.4 (a) 3.0 (b)Consumer prices (% change pa; av) % 12.5 (a) 13.5 (a) 11.1 (a) 15.8 (a) 1.5 (a) 4.8 (b)Exchange rate LCU:US$ (av) AED/US$ 3.6725 3.6725 3.6725 3.6725 3.6730 (a) 3.6730 (b)Lending interest rate (%) % 7.2 7.9 8.0 7.8 (a) 5.9 (a) 5.6 (b)Stock of domestic credit mil AED 283,200 399,456 570,194 851,927 920,081 (a) 1,030,491 (b)Domestic credit growth (%) % 46.2 41.1 42.7 49.4 8.0 (a) 12.0 (b)Deposit interest rate (%) % 2.9 4.4 4.3 3.5 (a) 3.7 (a) 2.6 (b)Population million 4.6 (a) 4.9 (a) 5.3 (a) 5.6 5.5 5.6 (b)GDP per head ($ at PPP) US$ 29,170 (a) 32,410 (a) 32,990 (a) 33,890 (a) 34,200 (a) 35,160 (b)Current account balance/GDP % 20.1 20.8 9.5 8.8 0.3 (a) 4.5 (b)International reserves bil US$ 21 28 77 32 35 (a) 38 (b)Trade balance bil US$ 43 58 47 63 30 (a) 41 (b)Foreign-exchange reserves bil US$ 21 28 77 32 35 (a) 38 (b)Total foreign debt bil US$ 56 (a) 79 (a) 110 (a) 135 (a) 129 (a) 130 (b)Public medium & long-term bil US$ 33 (a) 53 (a) 75 (a) 90 (a) 100 (a) 100 (b)Private medium & long-term bil US$ 0 0 (a) 0 (a) 0 0 (a) 0 (b)IMF debt bil US$ 0 0 0 0 0 0 (b)Short term bil US$ 23 (a) 25 (a) 36 (a) 45 (a) 29 (a) 30 (b)Net debt bil US$ 35 (a) 51 (a) 33 (a) 103 (a) 94 (a) 92 (b)Export credits bil US$ 2 3 (a) 4 (a) 5 4 (a) 4 (b)
(a) Estimate (b) Forecast
The Economist Intelligence Unit Limited, December 2009

AMMAN STOCK EXCHANGE
The Amman Stock Exchange maintainedstable performance despite the effects ofthe global financial crisis.
The Amman Stock Exchange (ASE) hasmanaged to pass the year 2009 with a stableperformance despite the effects of the globalfinancial crisis. The crisis which continued toaffect many of the financial markets andeconomies worldwide affected mainly the tradingvalue in the ASE, however the foreign investors’ownership in the ASE market capitalization keptits high level which reflects the investors’confidence in the Jordanian capital market.
The Amman Stock Exchange, launched the newversion of the electronic trading system NSCV900 in March 2009, the new version entailedintroducing comprehensive changes to all thecomponents of the electronic infrastructure of theStock Exchange as well as the other capitalmarket institutions. Under the new version, newphases as well as new features were added tothe trading phases and features, which aremeant to increase the efficiency of the trading.This project is considered a major leap for theconcerned institutions and it crowns two-years ofpersistent efforts started by the Jordan SecuritiesCommission (JSC), the ASE and the SecuritiesDepository Center SDC.
The ASE has launched a new version of thewebsite. The new website is enhanced with afresh, new design, architecture, navigation andbranding. The new design is dynamic and willincrease interaction with the user, which will helpto create a smooth experience.
Within the framework of the ASE's objectives ofdeveloping trading techniques, Amman StockExchange has finished the preparationsnecessary to launch the Internet Trading service,which will give the opportunity for a largernumber of investors and interested people to beengaged in securities trading In this regard, theASE has entered into effect the Internet TradingDirectives which will regulate the securitiestrading on the Internet.
The ASE is working on with the new project tocomplete the Jordan National Financial Center ofwhich His Majesty King Abdullah II laid thefoundation stone. This center will contain theASE, the Securities Depository Center, brokers’offices, banks’ offices, Investor’s Gallery, inaddition to a specialized institute for teachinginvestment and finance related subjects.
On the level of regional and internationalcooperation, the ASE has signed MoUs with anumber of parties; mainly the Egyptian,Romanian and Greece stock exchanges, inaddition to the Financial Services VolunteersCorps (FSVC), which will present the capitalmarket institutions with services in fields ofinvestment and securities industry.
As for the performance, the ASE Free FloatWeighted Price Index at the end of the year 2009stood at 2534 points compared with 2758 at theend of 2008 with a decrease of 8%. The tradingvalue during 2009 reached US$ 13.6 billion witha decrease of 52% compared to the year 2008.The number of transactions decreased by 22%reaching 3.0 million, where the number of sharestraded increased by 11% compared with 2008reaching 6.0 billion shares. The ASE marketcapitalization reached US$31.8 billion by the endof 2009 with a decrease of 11% over the end of2008 representing 150% of the GDP.
HISTORY AND DEVELOPMENT
The Amman Stock Exchange (ASE) wasestablished in March 1999 as a non-profit,private institution with administrative andfinancial autonomy. It is authorized to functionas an exchange for the trading of securities. The Exchange is governed by a seven-memberboard of directors. A Chief Executive Officeroversees day-to-day responsibilities and reportsto the board. The ASE membership iscomprised of Jordan’s 70 brokerage firms.
The history of securities trading in Jordan tracesits origins back to the 1930s. In 1976, theAmman Financial Market was established tocreate a regulated trading market. Morerecently, as part of Jordan’s move to upgrade itscapital market, a Securities Law was enacted in1997 separating the supervisory and legislativeroles from those of exchange operations. As aresult, the Jordan Securities Commission (JSC)was created in the year 1997, the ASE and theSecurities Depository Center (SDC) wereestablished in 1999. The JSC supervises theissuance of and trading in securities andmonitors and regulates the market. The SDCoversees clearing and settlement and maintainsownership records.
To provide a transparent and efficient market,the ASE implemented internationally recognizeddirectives regarding market divisions and listing
criteria. It also adopted procedures forimproving regulatory effectiveness.
The ASE is charged with: • Providing companies with means of raisingcapital by listing on the ASE, • Encouraging an active market in listedsecurities based on the effective determinationof prices and fair and transparent trading, • Providing modern and effective facilities andequipment for trading, recording the trades anddissemination of prices, • Monitoring and regulating trading, incoordination with the JSC as necessary, toensure compliance with the law, a fair marketand investor protection, • Setting out and enforcing a professional codeof ethics among its member directors and staff, • Ensuring the provision of timely and accurateinformation of issuers to the market anddisseminating market information to the public.
On March 26th 2000, the ASE launched anautomated order-driven Electronic TradingSystem. The system is in compliance withinternational standards and takes into accountthe G-30 recommendations. This system alsooffers brokers immediate access to stock pricesand orders and enables members to traderemotely.
On May 2006, The ASE has activated a newversion of the electronic trading system (NSC
V2+), which comes as part of the efforts tomeet the increasing needs of the Jordaniancapital market and in order to raise the capacityof the current electronic trading system toaccommodate the increase in the daily tradingvolume.
On March 22th 2009, The ASE launched thenew version of the electronic trading systemNSC V900, this project is considered a quantumleap for the concerned institutions as theelectronic trading system have now becomelinked with the SDC systems and the JSC newmonitoring systems. The new version will helpdevelop the trading process at the ASE andenhance the capacity of the electronic tradingsystem.
FUTURE OUTLOOK
The Amman Stock Exchange will embark on anumber of key projects that will ensuremaintaining the lead that the ASE has amongstArab and regional stock exchanges. Theseprojects can be summarized as follows: • Continue the construction works of the JordanNational Financial Center. • Continue upgrading of the technicalinfrastructure.• Introduce Internet trading. • Launching new financial instruments.
Jalil TarifChief Executive Officer
FEDERATION OF EURO-ASIAN STOCK EXCHANGES ANNUAL REPORT JUNE 2010
PAGE 46

AMMAN STOCK EXCHANGE
FEDERATION OF EURO-ASIAN STOCK EXCHANGES ANNUAL REPORT JUNE 2010
PAGE 47
OFFICIAL 6 MONTH STATISTICS
US$ millions # Shares millionsTotal Volume Average Daily Volume Total Volume Average Daily Volume
StocksJul-09 776.30 35.29 367.82 16.72
Aug-09 680.42 30.93 373.87 16.99Sep-09 1,028.00 57.11 575.17 31.95Oct-09 1,054.92 50.23 485.24 23.11Nov-09 668.84 35.20 360.69 18.98Dec-09 923.91 42.00 530.42 24.11TOTAL 5,132.39 41.79 2,693.22 21.98
BondsJul-09 0.22 0.01 0.00 0.00
Aug-09 0.29 0.01 0.00 0.00Sep-09 0.00 0.00 0.00 0.00Oct-09 0.00 0.00 0.00 0.00Nov-09 0.00 0.00 0.00 0.00Dec-09 0.87 0.04 0.00 0.00TOTAL 1.37 0.02 0.00 0.00
OtherJul-09 0.00 0.00 0.00 0.00
Aug-09 0.00 0.00 0.00 0.00Sep-09 0.00 0.00 0.00 0.00Oct-09 0.00 0.00 0.00 0.00Nov-09 0.00 0.00 0.00 0.00Dec-09 0.00 0.00 0.00 0.00TOTAL 0.00 0.00 0.00 0.00
MONTHLY STOCK VOLUME VS INDEX(US$ millions)
MONTHLY MARKET CAPITALIZATION(US$ millions)
Stocks Index
0
5,000
10,000
15,000
20,000
25,000
30,000
35,000
Jul Aug Sep Oct Nov Dec Jul Aug Sep Oct Nov Dec0
200
400
600
800
1,000
1,200
0
500
1,000
1,500
2,000
2,500
3,000
Market Capitalization(US$ millions) Index
Jul-09 33,188.53 2,618.79Aug-09 33,485.83 2,564.50Sep-09 34,065.46 2,688.20Oct-09 32,825.43 2,615.89Nov-09 32,477.70 2,583.49Dec-09 31,835.10 2,533.50
CONTACT INFORMATION
Contact Name Mrs. Sundos Jamayed E-mail [email protected] Website www.exchange.jo

FEDERATION OF EURO-ASIAN STOCK EXCHANGES ANNUAL REPORT JUNE 2010
PAGE 48
AMMAN STOCK EXCHANGE
ECONOMIC AND POLITICAL DEVELOPMENTS
Outlook for 2010-11Power in Jordan will remain firmly in the hands of theking, Abdullah II, who is expected to retain the loyalsupport of the army and the security services.
The cabinet will prioritise economic reform andstability over political liberalisation. An election isscheduled for late 2011, but parliament shouldremain conservative and tribally dominated, and thusgenerally pliant.
The government is set to keep a tight rein onspending in 2010-11, in an effort to bring the fiscaldeficit down to a more manageable level. However,with revenue growth sluggish, the deficit will remainlarge.
Although it will recover over the forecast period, realGDP growth is likely to remain below the highs of2004-08, as the economy struggles because of weakpublic spending growth and the end of theconstruction boom.
Headline average inflation will rise sharply in 2010,but, once the declines in commodity prices of early2009 fall out of the year-on-year comparison, weexpect price growth to fall, to an average of 2.5% in2011.
DOMESTIC POLITICS: King Abdullah is expected toremain in power throughout the forecast period andbeyond, supported by his loyal, well-trained andeffective armed forces. In July the king appointed hiseldest son, Prince Hussein, as crown prince,banishing any residual doubts there may have beenabout the succession. (The position had been vacantsince 2004, when King Abdullah removed the titlefrom his half-brother, Hamzah.) Nevertheless, threatsto stability will persist, with periodic outbursts ofIslamist violence possible, although these are mostlikely to be the result of actions of aggrievedindividuals (rather than organised groups), and thegeneral threat to security is relatively low. An electionis due in late 2011, but the EIU expects parliament toremain conservative and tribally dominated, and thusgenerally pliant (albeit resistant to economic reform).The only coherent parliamentary opposition, theIslamic Action Front, will remain beset by factional in-fighting, which, should it participate in the election,will undermine its chances of a strong showing. Onthe whole, however, domestic political machinationswill remain subordinate to the more immediateproblems associated with Israeli-Palestinian violenceand the fallout from the global economic recession.
INTERNATIONAL RELATIONS: Jordan's pro-Westernorientation will remain the cornerstone of the king'sforeign policy, complemented by a policy ofmaintaining good relations with all Middle Easternstates in order to prevent regional tensions fromhaving a negative effect on the country. Jordan's tieswith the US have been buttressed by the increasedattention given to the Israeli-Palestinian conflict by theUS president, Barack Obama, but the failure of hisefforts to revive the peace process may lead Jordan
to increasingly criticise US tactics–in particularregarding the US's perceived bias in favour of Israel.Meanwhile, ties with Iraq will continue to improve, ascommercial links between the two countries deepen,although Jordan will be wary of any resurgence inviolence in Iraq as the US troop drawdownprogresses. However, in reality, although the kingmay have a sympathetic ear in the White House,Jordan's direct influence on the myriad conflicts andrivalries that afflict the region will be limited, given theleadership's unwillingness to jeopardise its peacetreaty with Israel and its reliance on the US (andSaudi Arabia) for financial aid.
POLICY TRENDS: Government policy will continue tofocus on shielding the population from the impact ofthe economic downturn, forcing the government todelay the introduction of a host of economic reforms.(For example, the National Investment Strategyappears to have been postponed.) The governmentis planning to overhaul the tax system, including byintroducing a 12% flat tax for nearly all corporationsand a simpler, two-tier income tax for individuals,although gaining parliamentary approval will bechallenging (and the fiscal cost of these measuresraises questions about affordability). Nevertheless, ifpassed, such changes, together with a scheme tostreamline the tariff system, could boost Jordan'sattractiveness to foreign investors. Because of itsheavy reliance on tourism and financial services, andbecause of the recent property boom, Jordan isespecially vulnerable to the global economicslowdown. Mindful of this, the government front-loaded capital spending in the first half of 2009,although, given the fragile state of the publicfinances, it will be forced to rein in spending growthconsiderably from 2010.
INTERNATIONAL ASSUMPTIONS: We estimate thatworld GDP (at purchasing power parity rates) willhave contracted by an estimated 1.3% in 2009, asthe deep recession in the EU and the US hasdragged down global growth, and expect it toexpand only weakly over the forecast period, by 3.2%in 2010 and 3.4% in 2011, led by non-OECD states.We forecast that the average price of dated BrentBlend will decline in 2011, as a number of OECDeconomies, including the US, experience a slowdownthat year, from US$74/barrel in 2010 to US$70/b.
ECONOMIC GROWTH: Although it will recover overthe forecast period, real GDP growth in Jordan islikely to remain far below the highs it reached in2004-08, as the economy struggles in the face ofweak government spending growth and the ending ofthe construction boom. Although a number of leadingindicators, including the industrial price index, havepicked up lately, the ongoing slowdown in thedomestic financial sector will gradually spread acrossthe broader economy. In addition, having surged inrecent years (as the Gulf Arab states have channelledsome of their oil wealth into the country), inwardforeign direct investment will almost certainly declineas many Arab investors scale back their investmentplans. The difficult global economic situation is also
likely to depress consumer confidence, although theeffect of this will dissipate in the latter stages of theforecast period. Exports will be restrained by sluggishgrowth in the US, but this should be partly offset byfast-rising demand for Jordanian goods fromneighbouring Iraq. Meanwhile, the gradual softeningof domestic demand will restrain import growth.Overall, we expect economic expansion to remain ataround 3% in 2010, before rising slightly in 2011, to3.7%, as a number of Jordan's export markets beginto strengthen and domestic construction activitypicks up again.
INFLATION: We expect the year-on-year inflation rateto be volatile over the forecast period, although thiswill largely reflect the sharp variations in theconsumer price index in 2008-09 (owing to swings incommodity prices), rather than any shifting pricefundamentals within Jordan. Consumer prices havefallen back since the start of 2009, reflecting lowerinternational oil and food prices, as well as thestrengthening US dollar. However, with thesecurrency and commodity trends likely to reverseduring 2010, we expect inflation to rise from anestimated average rate of just 0.1% in 2009 to 5.5%in 2010. However, by end-2010, as the decreases incommodity prices fall out of the year-on-yearcomparison, we forecast that year-on-year pricegrowth will be just 1.1%. In 2011 we expect averageinflation to remain low, at 2.5%, as oil prices fallslightly and interest rates begin to rise.
EXCHANGE RATES: The Central Bank of Jordan iscommitted to the maintenance of the Jordaniandinar's peg to the dollar, despite the associated lackof monetary flexibility and the recent weakening ofthe US currency. The peg has instilled monetaryconfidence and has not substantially harmedcompetitiveness (perhaps because the US isJordan's largest single export market). As a result, weexpect the CBJ to maintain the peg at JD0.709:US$1in 2010-11. We also believe that the stock ofinternational reserves (including gold), which hassurged in recent months, will be sufficient to offsetany pressure on the currency stemming from short-term liquidity problems or negative politicaldevelopments.
EXTERNAL SECTOR: We expect Jordan's current-account deficit to narrow slowly over the forecastperiod, as a widening of the non-merchandisesurplus offsets increases in the trade deficit. Havingdeclined by an estimated 19% in 2009, toUS$12.1bn, the import bill is set to grow by around7% a year in 2010-11, as global commodity pricesand domestic demand begin to recover. Exports,meanwhile, will grow by an annual average of over8%, reaching US$7.9bn in 2011, as recoveringdemand in Asia, and increased re-export trade withIraq, makes up for sluggish demand in the US.Nevertheless, the trade deficit is forecast to widenfrom an estimated US$5.5bn (26.6% of GDP) in 2009to US$5.8bn 2010-11.*
*Information provided by Amman Stock Exchange
Key Information ContactsJordan Securities Commission www.jsc.gov.joSecurities Depository Center www.sdc.com.joJordan Investment Board www.jordaninvestment.comArab Monetary Fund www.amf.org.ae
Ministry of Finance www.mof.gov.joCentral Bank of Jordan (CBJ) www.cbj.gov.joNational Information Center www.nic.gov.joDepartment of Statistics www.dos.gov.jo

FEDERATION OF EURO-ASIAN STOCK EXCHANGES ANNUAL REPORT JUNE 2010
PAGE 49
AMMAN STOCK EXCHANGE
JORDAN ECONOMIC CHARTS AND TABLES
2005 2006 2007 2008 2009 2010
Nominal GDP (US$ at PPP) bil US$ 24.25 26.9 30.8 33.8 32 (a) 33 (b)Real GDP mil JOD 6,403.9 6,923.9 7,468.4 8,047.6 9,246 (a) 9,524 (b)Real private consumption mil JOD 7,679 (a) 7,792 (a) 7,220 (a) 7,495 (a) 7,697 (a) 7,889 (b)Real government consumption mil JOD 1,170 (a) 1,234 (a) 1,317 (a) 1,395 (a) 1,430 (a) 1,458 (b)Real gross fixed investment mil JOD 1,830 (a) 2,031 (a) 2,214 (a) 2,383 (a) 2,371 (a) 2,394 (b)Real stockbuilding mil JOD 0 0 (a) 0 (a) 0 0 (a) 0 (b)Real exports of G&S mil JOD 2,995 (a) 3,411 (a) 3,586 (a) 4,363 (a) 5,022 (a) 5,077 (b)Real imports of G&S mil JOD 7,310 (a) 7,568 (a) 8,580 (a) 9,341 (a) 7,273 (a) 7,295 (b)Real domestic demand mil JOD 9,456 (a) 10,128 (a) 10,751 (a) 11,272 (a) 11,497 (a) 11,742 (b)Real GDP at factor cost mil JOD 6,392 6,920 7,349 7,743 (a) 7,962 (a) 8,200 (b)Real agriculture mil JOD 247 279 284 279 (a) 281 (a) 291 (b)Real industry mil JOD 1,932 2,104 2,208 2,314 (a) 2,383 (a) 2,446 (b)Real manufacturing mil JOD 1,272 1,399 1,459 1,532 (a) 1,578 (a) 1,625 (b)Real services mil JOD 4,213 4,538 4,858 5,149 (a) 5,299 (a) 5,463 (b)Gross national savings rate (%) % 16.6 (a) 21.6 (a) 19.5 (a) 25.9 (a) 29.9 (a) 30.1 (b)Gross national savings/investment % 48.8 67.0 (a) 52.5 (a) 68.9 (a) 82.9 (a) 85.1 (b)Budget balance (% of GDP) % -5.2 -4.1 -4.9 -2.2 (a) -11.4 (a) -10.3 (b)Consumer prices (% change pa; av) % 3.5 6.3 4.7 13.9 0.1 (a) 5.5 (b)Exchange rate LCU:US$ (av) JOD/US$ 0.7090 0.7090 0.7090 0.7090 0.7090 (a) 0.7090 (b)Lending interest rate (%) % 8.1 8.6 8.9 9.5 9.4 (a) 8.9 (b)Stock of domestic credit mil JOD 9,795 11,644 13,869 17,304 17,823 (a) 19,035 (b)Domestic credit growth (%) % 33.5 18.9 19.1 24.8 3.0 (a) 6.8 (b)Deposit interest rate (%) % 2.9 4.6 5.5 5.5 4.8 (a) 5.0 (b)Population million 5.6 5.8 5.9 6.1 6.3 (a) 6.4 (b)GDP per head ($ at PPP) US$ 4,431 4,805 (a) 5,382 (a) 5,783 (a) 5,110 (a) 5,170 (b)Current account balance/GDP % -16.9 -10.5 -16.5 -10.8 (a) -6.2 (a) -5.2 (b)International reserves bil US$ 5 6 7 8 11 (a) 12 (b)Trade balance bil US$ -5 -5 -6 -7 -6 (a) -6 (b)Foreign-exchange reserves bil US$ 5 7 8 9 11 (a) 11 (b)Total foreign debt bil US$ 7 7 7 5 7 (a) 7 (b)Public medium & long-term bil US$ 7 7 7 6 6 (a) 6 (b)Private medium & long-term bil US$ 0 0 0 0 0 (a) 0 (b)IMF debt bil US$ 0 0 0 0 0 (a) 0 (b)Short term bil US$ 1 1 1 1 1 (a) 1 (b)Net debt bil US$ 2 1 0 -2 (a) -5 (a) -5 (b)Export credits bil US$ 2 3 (a) 4 (a) 5 5 (a) 6 (b)
01,0002,0003,0004,0005,0006,0007,0008,0009,000
10,000
REAL GDP(JOD millions)
CONSUMER PRICES (% CHANGE PA; AV)(%)
2
4
6
8
10
12
14
16
2005 2006 2007 2008 2009 2010 2005 2006 2007 2008 2009 2010
(a) Estimate (b) Forecast
The Economist Intelligence Unit Limited, December 2009

BAHRAIN STOCK EXCHANGE
During 2008, BSE implemented its strategicplan in which it upgraded its technicalcapabilities, allowing the Exchange tolaunch its online trading service to brokers.
The global financial crisis that began with themortgage crisis in the U.S. has severelyaffected the performance of bourses andfinancial markets worldwide, triggering sharpdeclines in indices compared to the gainsrecorded in the previous years.
The indices of GCC and Arab financialmarkets along with Bahrain Stock Exchangewere apparently affected by the crisis toreflect the interrelation between financialmarkets worldwide.
The performance of Bahrain All Share Indexin 2008 was not any different than the otherindices of bourses, Arab and financialmarkets. The index posted negative growthof 34.52% during 2008 compared to 2007although the trading activity wasunprecedented in terms of the value andvolume of shares traded, and the number oftransactions executed throughout the year.
During 2008, BSE implemented its strategicplan that was approved in 2007 in which itupgraded its technical capabilities, allowingthe Exchange to launch its online tradingservice to brokers. Moreover, BSE developedthe Exchange’s Settlement and CentralDepositary services with the aim offacilitating investors’ transactions andallowing them to perform most of theirtransactions through the Exchange’swebsite. In implementing BSE’s strategy,
BSE in cooperation with the Central Bank ofBahrain listed several mutual funds on theExchange during the year.
Shaikh Salman bin Hamad Al Khalifa, DeputySupreme Commander and Chairman of theEconomic Board (EDB), honored the signingceremony held in Singapore by hispresence, where a consultancy agreementbetween BSE and Singapore Exchange(SGX) was signed. The MoU mainly aims tofoster a closer relationship and developchannels of information exchange in theareas of operations, regulatory framework,and the equities products traded on therespective markets.
In addition, BSE has taken a strategic movetowards developing the Exchange by signinga consultancy agreement with SingaporeExchange (SGX). According to thisconsultancy agreement, SGX will providedetailed recommendations to BSE for thepurpose of enhancing BSE’scompetitiveness both regionally andinternationally.
In regards to BSE’s relocation to BahrainFinancial Harbor, the project’s manager hasbeen appointed and BSE’s offices are nearcompletion. The Exchange is expected tofully commence its operations and provideits services from its new premises in thesecond half of 2009.
BSE’s financial results for the year 2008, asincluded in the budget of this report, showedthat the Exchange has reported positiveresults for its third consecutive year. Itrecorded a surplus of BD 1,284,338compared with BD 901,334 in 2007, postinga growth of 42.49%. The accumulatedsurplus also increased to reach BD3,950,112 compared to BD 2,665,774 in2007 recording a growth of 48.17%.
On behalf of the members of the Board ofDirectors of BSE and BSE’s staff, I would liketo express my thanks and gratitude to HisMajesty King Hamad bin Isa bin Salman AlKhalifa, King of the Kingdom of Bahrain andHis Highness Shaikh Khalifa bin Salman AlKhalifa, the Prime Minister, and His HighnessShaikh Salman bin Hamad Al Khalifa, theCrown Prince and Deputy SupremeCommander for their guidance andcontinuous support of BSE.
I would also like to extend my thanks to themembers of BSE's Board of Directors fortheir efforts in developing the BSE during theprevious years. I would also like to thankBSE’s management and staff for their hardwork during the year, hoping that such effortswill continue to further develop theExchange.
HISTORY AND DEVELOPMENT
It was back in 1920 that the first branch of acommercial bank, Standard Chartered Bank,formerly known as Eastern Bank, opened itsdoors in Bahrain, the first to do so in theregion in order to facilitate the businesscommunity at that time. By 1957, Bahrainhad its first public shareholding company–the National Bank of Bahrain. However, itwas not until the late 1970s and early 1980sthat Bahrain realized there was a growingneed for an organized stock market, due tothe growth provided by the oil price boom inthe region.
As a result, the Government, in cooperationwith the International Finance Corporation(IFC), prepared a feasibility studyhighlighting the importance of establishingan official stock market in Bahrain. In 1987,Bahrain Stock Exchange was establishedfollowing the issuance of Amiri Decree No.4, and officially commenced operations on17th June 1989.
FUTURE OUTLOOK
In the year 2009, the BSE will continue itsefforts to attract more local, regional, andinternational mutual funds despite the globalfinancial crisis. The BSE will also seek morecooperation with stock exchangesworldwide, with the aim of exchanginginformation and expertise. The BSE will alsocontinue to attract more listed companies,both local and international.
Rasheed Mohammed Al-MarajChairman
FEDERATION OF EURO-ASIAN STOCK EXCHANGES ANNUAL REPORT JUNE 2010
PAGE 50

BAHRAIN STOCK EXCHANGE
FEDERATION OF EURO-ASIAN STOCK EXCHANGES ANNUAL REPORT JUNE 2010
PAGE 51
OFFICIAL 6 MONTH STATISTICS
US$ millions # Shares millionsTotal Volume Average Daily Volume Total Volume Average Daily Volume
StocksJul-09 13.45 0.61 25.76 1.17
Aug-09 25.62 1.17 47.01 2.17Sep-09 60.81 3.20 108.48 5.71Oct-09 20.54 0.98 40.13 1.91Nov-09 60.35 3.02 72.56 3.63Dec-09 51.53 3.03 64.78 3.81TOTAL 232.29 2.00 358.72 3.06
BondsJul-09 0.00 0.00 0.00 0.00
Aug-09 0.00 0.00 0.00 0.00Sep-09 0.00 0.00 0.00 0.00Oct-09 0.00 0.00 0.00 0.00Nov-09 0.00 0.00 0.00 0.00Dec-09 0.00 0.00 0.00 0.00TOTAL 0.00 0.00 0.00 0.00
OtherJul-09 0.00 0.00 0.00 0.00
Aug-09 0.00 0.00 0.00 0.00Sep-09 0.00 0.00 0.00 0.00Oct-09 0.00 0.00 0.00 0.00Nov-09 0.00 0.00 0.00 0.00Dec-09 0.00 0.00 0.00 0.00TOTAL 0.00 0.00 0.00 0.00
0
10
20
30
40
50
60
70
MONTHLY STOCK VOLUME VS INDEX(US$ millions)
MONTHLY MARKET CAPITALIZATION(US$ millions)
0
2,000
4,000
6,000
8,000
10,000
12,000
14,000
16,000
18,000
Stocks Index
Jul Aug Sep Oct Nov Dec Jul Aug Sep Oct Nov Dec0
200
400
600
800
1,000
1,200
1,400
1,600
Market Capitalization(US$ millions) Index
Jul-09 16,444.52 1,502.23Aug-09 16,562.02 1,517.02Sep-09 16,977.93 1,554.51Oct-09 16,665.39 1,525.83Nov-09 15,717.52 1,438.32Dec-09 16,305.88 1,458.24
CONTACT INFORMATION
Contact Name Mr. Ali Mansoor E-mail [email protected] Website www.bahrainstock.com

FEDERATION OF EURO-ASIAN STOCK EXCHANGES ANNUAL REPORT JUNE 2010
PAGE 52
BAHRAIN STOCK EXCHANGE
ECONOMIC AND POLITICAL DEVELOPMENTS
Political OutlookIn 2010-11 the rule of the king, Hamad binIsa al-Khalifa, is expected to remain broadlysecure. The weakness of the legislaturesuggests that no major changes to policy willarise as a result of the 2010 parliamentaryelection.
There will be underlying tensions overeconomic inequalities, the halting pace ofpolitical liberalisation and perceptions ofsectarian discrimination.
The main foreign policy concern will be Iran's(officially civilian) nuclear programme,although Bahrain will seek to maintain cordialties with Iran.
The central government budget is forecast torecord deficits of less than 1% of GDP inboth years as spending continues to grow.The fiscal deficits will give more urgency toefforts to develop non-oil governmentrevenue, possibly including value-added tax.Bahrain will continue to take part in efforts tocreate a Gulf monetary union, despite theUAE's decision.
The US will remain one of Bahrain's keyinternational allies and is expanding theonshore facilities used by the US Navy's FifthFleet. The former colonial power, the UK, willalso remain an important political ally andbusiness partner, and France is seeking tostep up its political and trade relations withBahrain.
Economic performanceEconomic policy will remain focused onefforts to attract more foreign investment toBahrain and improve the local skills base.
These policies are driven by the need todiversify the economy away from oil (asoutput is declining), stimulate private-sectorgrowth and foreign investment, and addressunemployment among nationals.
"Bahrainisation" quotas for employingnationals have not solved the unemploymentproblem and so the government is pursuingother initiatives, including a 1% levy onsalaries to fund an unemployment insurancescheme and a levy on employers for eachexpatriate they employ, which financestraining for nationals. From August 2009,expatriate workers will have greater freedomto change jobs, which should slowlycontribute to narrowing the cost gapbetween them and nationals. The state'sability to upgrade its infrastructure and investin education will be constrained by thedependence of the public finances on oilrevenue.
The price of dated Brent Blend, a benchmarkcrude, is expected to rise to US$75/barrel in2010 but to fall back again to US$70/b in2011, with knock-on effects for Bahrain'sexport earnings and government revenue.
Lower regional growth and a slowdown inforeign investment and trade flows are likelyto have reduced economic growth sharply in2009, to 2.9%. Data for the first half of theyear show that total employment has beenrising, but unemployment, a laggingindicator, is likely to climb later in 2009 andpossibly into 2010. The impact on privateconsumption will be limited by the likelihoodthat low-paid expatriate workers, whotypically remit much of their earningsoverseas, will bear the brunt of job cuts,
however. Government spending is believedto have been a vital support to growth in2009, especially with consumer creditstagnating. The government is likely tomaintain an expansionary fiscal policy in2010 but to begin to rein in its spending–inreal terms–in 2011 as private investmentpicks up and as it seeks to avoid a persistentbudget deficit. Investment will beunderpinned by government spending in2010 but as the global economic recoverycontinues, foreign investment should rise in2011, particularly into services sectors thatcater to the regional market.. The officialconsumer price index is widely believed tounderstate price pressures. The main risksstem from the medium-term trajectory of theUS dollar (and thus the Bahraini dinar)against the euro and other world currencies.
Bahrain intends to enter into a currencyunion with Kuwait, Qatar and Saudi Arabiaand to set up a joint monetary council in2010 as a precursor to a single central bank,a plan ratified by the parliament inNovember. The introduction of a singlecurrency is likely to take until at least 2013,as the member states pursue convergenceon inflation and seek a consensus on thefunctions of the planned central bank.
The current-account surplus is projected tonarrow from 6.3% of GDP in 2010 to 4.2% in2011, based on our oil price forecasts. Oilprice trends will remain the main determinantof the trade balance, with oil accounting foraround 80% of export earnings and over halfof the import bill.*
* The Economist Intelligence Unit Limited, November 2009
Key Information ContactsCentral Bank of Bahrain http://www.cbb.gov.bh/cmsrule/bmaindex.jspMinistry of Finance http://www.mofne.gov.bh/English/eindex.aspBahrain Government http://www.bahrain.gov.bhEconomic Development Board http://www.bahrainedb.com
0
1
2
3
4
5
6
REAL GDP(BHD millions)
CONSUMER PRICES (% CHANGE PA; AV)(%)
2.02.53.03.54.04.55.05.56.06.57.0
2005 2006 2007 2008 2009 2010 2005 2006 2007 2008 2009 2010

FEDERATION OF EURO-ASIAN STOCK EXCHANGES ANNUAL REPORT JUNE 2010
PAGE 53
BAHRAIN STOCK EXCHANGE
BAHRAIN ECONOMIC CHARTS AND TABLES
2005 2006 2007 2008 2009 2010
Nominal GDP (US$ at PPP) bil US$ 20 (a) 22 (a) 25 (a) 27 (a) 28 (a) 30 (b)Real GDP mil BHD 3,853 4,109 4,454 4,734 4,869 (a) 5,050 (b)Real private consumption mil BHD 1,744 1,843 1,890 1,987 2,026 (a) 2,076 (b)Real government consumption mil BHD 701 720 738 788 883 (a) 913 (b)Real gross fixed investment mil BHD 919 1,205 1,387 1,482 1,497 (a) 1,572 (b)Real stockbuilding mil BHD 20 -43 29 29 9 8 (b)Real exports of G&S mil BHD 3,569 4,195 4,625 5,377 5,565 (a) 5,907 (b)Real imports of G&S mil BHD 3,099 3,811 4,215 4,928 5,110 (a) 5,427 (b)Real domestic demand mil BHD 3,383 3,725 4,044 4,285 4,414 (a) 4,570 (b)Real GDP at factor cost mil BHD 3,799 4,049 4,387 4,664 4,797 (a) 4,976 (b)Real agriculture mil BHD 13 12 15 15 15 (a) 16 (b)Real industry mil BHD 2,060 2,192 2,325 2,429 2,466 (a) 2,504 (b)Real manufacturing mil BHD 576 663 707 758 765 (a) 796 (b)Real services mil BHD 1,726 1,845 2,048 2,220 2,316 (a) 2,456 (b)Gross national savings rate (%) % 35.4 (a) 38.2 (a) 42.7 (a) 43.5 (a) 41.3 (a) 41.9 (b)Gross national savings/investment % 144.7 156.6 158.3 131.0 117.6 (a) 118.0 (b)Budget balance (% of GDP) % 7.5 4.3 3.1 7.5 -0.8 (a) -1.2 (b)Consumer prices (% change pa; av) % 2.6 2.0 3.3 7.0 (a) 3.0 (a) 3.5 (b)Exchange rate LCU:US$ (av) BHD/US$ 0.3760 0.3760 0.3760 0.3760 0.3760 (a) 0.3760 (b)Lending interest rate (%) % 7.9 8.1 8.4 7.9 (a) 8.4 (a) 9.0 (b)Stock of domestic credit mil BHD 2,512 2,804 3,922 5,540 5,534 (a) 6,364 (b)Domestic credit growth (%) % 24.4 11.6 39.9 41.3 -0.1 (a) 15.0 (b)Deposit interest rate (%) % 3.1 4.4 4.5 2.5 (a) 2.1 (a) 3.5 (b)Population million 0.9 1.0 1.0 1.1 (a) 1.1 (a) 1.2 (b)GDP per head ($ at PPP) US$ 22,905 23,344 24,051 24,060 (a) 25,100 (a) 25,390 (b)Current account balance/GDP % 11.0 13.8 15.7 10.3 6.2 (a) 6.4 (b)International reserves bil US$ 2 3 4 4 4 4 (b)Trade balance bil US$ 1 2 3 3 2 2 (b)Foreign-exchange reserves bil US$ 2 3 4 4 4 4 (b)Total foreign debt bil US$ 6 8 (a) 8 (a) 10 (a) 11 (a) 11 (b)Public medium & long-term bil US$ 5 6 (a) 6 (a) 7 7 (a) 8 (b)Private medium & long-term bil US$ 1 1 (a) 1 (a) 2 2 (a) 2 (b)IMF debt bil US$ 0 0 0 0 0 0 (b)Short term bil US$ 1 1 (a) 1 (a) 2 1 (a) 2 (b)Net debt bil US$ 5 5 (a) 4 (a) 7 7 (a) 7 (b)Export credits bil US$ 0 0 (a) 0 (a) 0 0 (a) 0 (b)
0.0
0.5
1.0
1.5
2.0
2.5
3.0
TRADE BALANCE(US$ billions)
2005 2006 2007 2008 2009 20100.0
0.2
0.4
0.6
0.8
1.0
1.2
1.4
1.6
REAL GROSS FIXED INVESTMENT(BHD millions)
2005 2006 2007 2008 2009 2010
(a) Estimate (b) Forecast
The Economist Intelligence Unit Limited, December 2009

BAKU INTERBANK CURRENCY EXCHANGE
I assure that dynamical growth of theAzerbaijan economy and development of anexchange infrastructure will promote thefurther growth of appeal of the financialmarket of the country.
The dynamic growth of the Azerbaijan economyincreases in the credit ratings and the subsequentarrival of large investors, promoting the furtherdevelopment of the financial infrastructure of thecountry. Today the BBVB takes a central role inthe infrastructure of the Azerbaijan capital market,integrating on a uniform technological platformtrading and settlement systems. I am sure thatthe dynamic growth of the Azerbaijan economyand development of the exchange infrastructurewill promote further growth and the appeal of thefinancial market of the country.
In the near future, BBVB plans to introduce newtechnological ideas, new financial tools andservices for clients. We will continue to work onperfection of a technological infrastructure for the
exchange and a risk control system. The maingoal for the exchange innovations is not only theservice of currency transactions of banks but alsowhich is very important for us, that the exchangemarket has begun to play more significant role inthe banking system. Therefore I especially wouldlike to allocate such projects, as a start of themarket for currency swaps. The main objective inthe development of the exchange currencymarket, consists in increasing its appeal for theexpansion of a number of the interconnectedtools. We make plans, proceeding from necessityto correspond with the world standards both ontechnologies and on a spectrum of offered toolsand services. For this purpose, all of ourperspective projects are subjected to these samestandards.
It is obvious that, creation of a uniform exchangecentre in the region will provide not only closeintegration of Azerbaijan into the world market,but also will give stability to the country’s financialsystem. And here, the importance of theexchange market as the infrastructural element ina financial system, consists in the performance ofa variety of unique functions, realized by otherinstitutes either impossible, or inconvenient. Isincerely hope that realization of these plans willallow us strengthen our positions, rendering bestpractices level service to our trade participants.This will lead the BBVB to be the base player increating a world class regional financial centre.
HISTORY AND DEVELOPMENT
Central Bank of Azerbaijan and the four biggeststate banks of Azerbaijan Republic founded theBaku Interbank Currency Exchange (BakiBanklarasi Valyuta Birjasi- BBVB) on 26 July 1993and this year it marks a decade from the momentof starting its activities in the financial market.Becoming one of the central financial institutions ofthe country since the beginning, BBVB is today anoriginal symbol for the economic reforms in publicbusiness of Azerbaijan. Using the advancedinformation technologies, based on successfulexperience in the creation of the universal tradingplatforms, BBVB became the largest exchangeinstitute in the Caucasian region, by volumes oftrades and number of financial tools.
The objectives of the BBVB are as follows:
• to set up regular exchange trading to carry outcurrency operations;• to determine the market exchange rate of theAzerbaijan currency (manat) to foreign currencies;• to create a mechanism for inter-statesettlements;• to maintain management and informationservices for currency operations;• to settle transactions made at the BBVB both innational and foreign currencies;• to organize and carry out exchange trading andauctions with interbank credits; • to conduct exchange trading with futures.
MAJOR HISTORICAL DATES
18 October 1991 Declaration of Independence ofthe Azerbaijan Republic
15 August 1992 Putting in circulation nationalcurrency–Manat
21 June 1993 Establishment of the BBVB
26 August 1994 Beginning of regular exchangetrading in the currency market
31 March 1995 First credit auction of the NationalBank at the BBVB
20 September 1996 First T-bill auction
22 January 1997 First exchange trading in theBBVB Stock Department
5 May 1997 The beginning of preparation of thefirst rating estimations of banks
1 July 1997 Creation of the first exchange site
30 August 1997 Beginning of trading in theOrganized Interbank Currency Market (OICM)
25 September 1997 First trading in the OICM bymeans of universal trading e-network of the BBVB
17 December 1997 Corresponding emergingmarket membership status in WFE
6 March 1998 Signing in Baku Protocol oncooperation of BBVB with Istanbul Stock Exchange
2 October 1998 Full member of FEAS (Istanbul)
24 February 1999 Membership in the AzerbaijanCommercial Chamber (Baku)
14 December 1999 Membership in the AzerbaijanCommercial Banks Association (Baku)
20 April 2000 Co-founder and membership in theInternational Association of CIS Exchanges(Moscow)
3 July 2001 Signing in Moscow Arrangement onstrategic cooperation of BBVB with MICEX(Moscow Interbank Currency Exchange)
27 March 2002 Start of e-system of trades onInterbank credits–the Organized Interbank CreditMarket
8 July 2002 Creation of the commission on tradinglimits
9 July 2002 Start of Bourse E-System of Trades(BEST)
24 November 2003 Signing in Almaty agreementon mutual cooperation of BBVB with KASE(Kazakhstan Stock Exchange)
16 June 2004 Signing in Baku agreement onmutual cooperation of BBVB with BSE (BulgarianStock Exchange)
31 August 2004 Registration of index AzeriREIdeveloped by experts BBVB
16 June 2005 Start of the tool-currency swap inBourse E-system of trade (BEST)
1 January 2006 Technical transition of BESTsystem for using denominated manat
14 August 2007 Signing in Baku agreement onmutual cooperation of BBVB with TICEX (TbilisiInterbank Currency Exchange)
28 February 2008 Signing in Moldova agreementon mutual cooperation of BBVB with MOLDSE(Moldova Stock Exchange)
FUTURE OUTLOOK
• Development of settlement and clearingservices, in particularly software for managementof banks trading limits on money and the currencymarkets;• Improvement of the risk management system inrealization of clearing operations;• Further increasing professional skills ofExchange’s personnel;• Development of modern corporate governanceprinciples;• Development of Internet–technologies ande–commerce;• Intensification of activity in organized interbankmoney market.
Farkhad Amirbekov General Manager
FEDERATION OF EURO-ASIAN STOCK EXCHANGES ANNUAL REPORT JUNE 2010
PAGE 54

BAKU INTERBANK CURRENCY EXCHANGE
FEDERATION OF EURO-ASIAN STOCK EXCHANGES ANNUAL REPORT JUNE 2010
PAGE 55
OFFICIAL 6 MONTH STATISTICS
US$ millions # Shares millionsTotal Volume Average Daily Volume Total Volume Average Daily Volume
StocksJul-09 0.00 0.00 0.00 0.00
Aug-09 0.00 0.00 0.00 0.00Sep-09 0.00 0.00 0.00 0.00Oct-09 0.00 0.00 0.00 0.00Nov-09 0.00 0.00 0.00 0.00Dec-09 0.00 0.00 0.00 0.00TOTAL 0.00 0.00 0.00 0.00
BondsJul-09 0.00 0.00 0.00 0.00
Aug-09 0.00 0.00 0.00 0.00Sep-09 0.00 0.00 0.00 0.00Oct-09 0.00 0.00 0.00 0.00Nov-09 0.00 0.00 0.00 0.00Dec-09 0.00 0.00 0.00 0.00TOTAL 0.00 0.00 0.00 0.00
OtherJul-09 69.02 3.00 0.07 0.00
Aug-09 57.33 2.73 0.06 0.00Sep-09 65.35 3.27 0.07 0.00Oct-09 68.64 3.12 0.07 0.00Nov-09 128.64 6.77 0.13 0.01Dec-09 211.70 10.08 0.21 0.01TOTAL 600.69 4.83 0.60 0.00
Market Capitalization(US$ millions) Index
Jul-09 n/a n/aAug-09 n/a n/aSep-09 n/a n/aOct-09 n/a n/aNov-09 n/a n/aDec-09 n/a n/a
CONTACT INFORMATION
Contact Name Ms. Aynur Bayramli E-mail [email protected] Website www.bbvb.org
MONTHLY OTHER VOLUME(US$ millions)
0
50
100
150
200
250
5-YEAR OTHER VOLUME(US$ millions)
0
500
1,000
1,500
2,000
2,500
3,000
0905 06 07Jul Aug Sep Oct Nov Dec 08
* Please refer to page 58 for the Azerbaijan country report.

BAKU STOCK EXCHANGE
The efforts described above all are beingdone with the belief into the recovery soonto come and positioning ourselves tobenefit from it.
Till the middle of 2008 the world economy wasin a growing mode the effects of which werealso felt at Baku Stock Exchange, by that timeour turnover grew multiple times. But startingwith 2009 we sharply felt the effects of theglobal financial crisis. If in the past the growthwas providing substantial quantity of supply,with the crisis both buy and sell sides loweredtheir appetites, and new risks becameapparent. Reaction of the exchange was toreconsider its strategy, and now we morefocus on the quality of the issuers andinvestors than quantity, and reevaluating therisks of the market.
The unveiling events around the world forcedus to review our strategy and risks. We startedby improving the listing rules; tightening on therequirements on corporate governance andproviding more safety mechanisms for minorityshareholders. Also in 2009 with the help ofmajor market participants we started theprocess of reshaping of the local capitalmarket architecture. We will continue this effortthis year and possible in 2011. As a part of thesame effort, the BSE will further strengthen itscorporate structure, continue to modernize IT,and of course will be developing newproducts. The globalization does not pass usby, and as a result, we are investigating theopportunities of cross and dual listing with theexchanges.
The efforts described above all are being donewith the belief into the recovery soon to comeand positioning ourselves to benefit from it.
Taking the opportunity, I would like to thank themanagement and members of FEAS for thecontinuous support to our exchange andbeing responsive to the various queriescoming from our side.
HISTORY AND DEVELOPMENT
The establishment of a stock exchange was anecessary step in the creation of a modernstock market in Azerbaijan. Due to itsgeopolitical location Azerbaijan is an importantregional center of business activity. In thisrespect the availability of a stable anddeveloped securities market plays a substantialrole in the raising of investors' confidence in theeconomy of Azerbaijan and the region.
The shareholders of the BSE are leading Azeriand foreign banks and investment companies.The supreme decision-making authority of theBaku Stock Exchange is the GeneralShareholders Meeting.
The trading floor of the BSE is equipped with30 computerized trading stations, 18 of whichbelong to the shareholders of the Exchange.The other 12 are available for new members.
Legal bodies (banks, investment funds, brokerfirms) involved in professional activities in thesecurities market with special license from theState Committee for Securities under theauspices of the President of the AzerbaijanRepublic can become members of the BSE.
FUTURE OUTLOOK
The BSE plans for 2010:
• to strengthen the internal corporate structure;• to modernize its IT sphere; • to improve internal risk managementmechanisms • to continue promotion of listing.
Khayal AbdinovChairman
FEDERATION OF EURO-ASIAN STOCK EXCHANGES ANNUAL REPORT JUNE 2010
PAGE 56
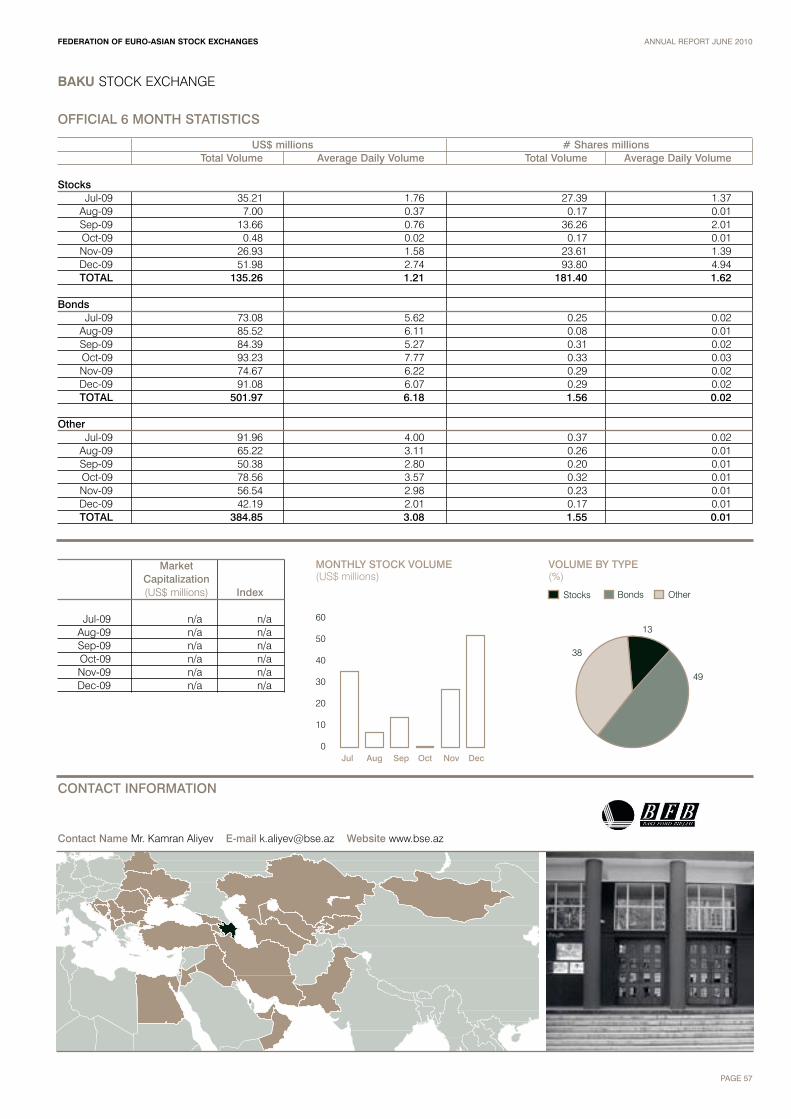
BAKU STOCK EXCHANGE
FEDERATION OF EURO-ASIAN STOCK EXCHANGES ANNUAL REPORT JUNE 2010
PAGE 57
OFFICIAL 6 MONTH STATISTICS
US$ millions # Shares millionsTotal Volume Average Daily Volume Total Volume Average Daily Volume
StocksJul-09 35.21 1.76 27.39 1.37
Aug-09 7.00 0.37 0.17 0.01Sep-09 13.66 0.76 36.26 2.01Oct-09 0.48 0.02 0.17 0.01Nov-09 26.93 1.58 23.61 1.39Dec-09 51.98 2.74 93.80 4.94TOTAL 135.26 1.21 181.40 1.62
BondsJul-09 73.08 5.62 0.25 0.02
Aug-09 85.52 6.11 0.08 0.01Sep-09 84.39 5.27 0.31 0.02Oct-09 93.23 7.77 0.33 0.03Nov-09 74.67 6.22 0.29 0.02Dec-09 91.08 6.07 0.29 0.02TOTAL 501.97 6.18 1.56 0.02
OtherJul-09 91.96 4.00 0.37 0.02
Aug-09 65.22 3.11 0.26 0.01Sep-09 50.38 2.80 0.20 0.01Oct-09 78.56 3.57 0.32 0.01Nov-09 56.54 2.98 0.23 0.01Dec-09 42.19 2.01 0.17 0.01TOTAL 384.85 3.08 1.55 0.01
VOLUME BY TYPE(%)
Stocks Bonds
38
13
49
Other
MONTHLY STOCK VOLUME(US$ millions)
0
10
20
30
40
50
60
Jul Aug Sep Oct Nov Dec
Market Capitalization(US$ millions) Index
Jul-09 n/a n/aAug-09 n/a n/aSep-09 n/a n/aOct-09 n/a n/aNov-09 n/a n/aDec-09 n/a n/a
CONTACT INFORMATION
Contact Name Mr. Kamran Aliyev E-mail [email protected] Website www.bse.az
FEDERATION OF EURO-ASIAN STOCK EXCHANGES ANNUAL REPORT JUNE 2010
PAGE 58
BAKU STOCK EXCHANGE
ECONOMIC AND POLITICAL DEVELOPMENTS
Economic PerformanceAzerbaijan has experienced the repercussionsof the global downturn through weaker oilprices and heightened risk aversion towardsemerging markets. In the initial part of ourforecast period, commercial banks willcontinue to face difficulties raising capitalabroad, and access to credit for domesticcompanies and households will be reduced.However, a return to global economic growthin 2010, along with higher oil prices comparedwith 2009, will increase budget revenue, andthe government will also be able to draw onthe State Oil Fund of the Republic ofAzerbaijan (SOFAZ) to help to fund socialspending and infrastructure projects.
Although Azerbaijan has felt the effects of theglobal economic downturn, with real GDPgrowth estimated to have slowed from 10.8%in 2008, the effects have been much lesssevere than in other countries in the eastEuropean region. Azerbaijan recorded realGDP growth of 8.3% year on year in January-October 2009, compared with expansion of12.7% in the year-earlier period, when theglobal economic downturn had already begun.Higher oil prices in 2010, compared with 2009,and higher external demand for oil will have apositive impact on the outlook for theeconomy, which is highly dependent on theenergy sector. Real GDP growth is forecast torise to 9.5% in 2010. Lower oil prices in 2011will weigh on the economic outlook, so thatreal GDP is forecast to slow moderately, to9.2%.
Average annual consumer price inflationreached 20.8% in 2008, the fastest rate ofgrowth in prices for more than a decade, but isestimated to have decelerated to around 1.7%in 2009. Weaker domestic demand growth andlower international oil prices have reducedexport revenue inflows, lowering inflationarypressures. These factors have been partlyoffset by increased social spending, as theauthorities have sought to alleviate the impactof rising unemployment. Higher fuel andcommodity prices–combined with thecontinuation of higher government spending,increased capital inflows and a rebound indomestic demand–will contribute to a pick-upin the pace of price rises in 2010, to a forecastaverage of 6.6%. Inflation will fall to 6.4% in2011 as global energy prices fall moderately.
The manat depreciated slightly against the USdollar in August-October 2008, owing todisruptions to oil exports. The authoritiesappear to have been supporting the currency,as in the first nine months of 2009 the manatwas stable against the US dollar, at aroundManat0.8:US$1, even though oil prices werelower than in 2008. In 2010-11 oil and gasexport volumes are expected to rise comparedwith 2009, but global energy prices will remainconsiderably lower than in 2008. Nonetheless,a modest increase in export revenue isexpected over the forecast period. Spendingon imports will pick up in 2010-11 as investorsincrease capital outlays, albeit at a slower ratethan in 2008. In addition, refurbishment ofinfrastructure will require imports of machineryand equipment, although expenditure on
imported consumer goods will be lower than inrecent years, owing to reduced access tocredit. Services debits for the hydrocarbonssector, on activities such as consultancy andgeological services, will moderate, as foreigninvestors seek to reduce costs in response tothe impact on firm's revenue of the globaleconomic recession in 2009. This will lead to anarrowing of the deficits on the services andincome accounts compared with 2008. Afterfalling to an estimated US$7.2bn in 2009(equal to 13.4% of GDP), the current-accountsurplus will rise to around US$12.3bn in 2010(19.3% of GDP). A moderate drop in globalenergy prices in 2011 will weigh on the tradesurplus, resulting in a drop of the current-account surplus to around 15.3% of GDP.*
* The Economist Intelligence Unit Limited, December 2009
Key Information ContactsNational Bank www.nba.azState Committee for Securities www.scs.gov.azMinistry of Finance www.maliyye.gov.azNational Depository Center www.mdm.azMinistry of Economic Development www.economy.gov.az

FEDERATION OF EURO-ASIAN STOCK EXCHANGES ANNUAL REPORT JUNE 2010
PAGE 59
BAKU STOCK EXCHANGE
Russia
10.9
8.2
7.2
Germany UKItaly
8.3
Russia
15.517.4
Italy TurkeyIran
7.2
2007-MAIN DESTINATIONS OF EXPORTS (%) 2007-MAIN ORIGINS OF IMPORTS (%)
8.7
Machinery & equipment
30.2
12.4
15.5
Food productsTransport equipment Metals
16.0
Petroleum products
81.4
3.0
Food products & animalsMetals Chemicals & petrochemicals
2007-PRINCIPAL EXPORTS (%) 2007-PRINCIPAL IMPORTS (%)
8.4
Georgia
45.5
Turkey
17.6
Other
1.5
5.9
OtherPlastics
1.2
20.0
Chemicals
5.7
Other Other
47.8
4.5
(a) Actual. (b) The Economist Intelligence Unit estimates.
AZERBAIJAN ECONOMIC CHARTS AND TABLES
Annual data 2007 (a) Historical averages (%) 2003-07
Population (m) 8.6 Population growth 1.0GDP (US$ m; market exchange rate) 29,399 Real GDP growth 21.1GDP (US$ m; purchasing power parity) 87,844 (b) Real domestic demand growth 17.2GDP per head (US$; market exchange rate) 3,407 Inflation 8.6GDP per head (US$; purchasing power parity) 10,179 (b) Current-account balance (% of GDP) -1.6Exchange rate (av) Manat:US$ 0.858 FDI inflows (% of GDP) 16.0
ECONOMIC FORECAST SUMMARY 2008 2009 2010 2011 2012 2013
Real GDP growth (%) 13.1 7.8 7.4 6.0 5.8 5.0Consumer price inflation (av; %) 21.6 16.5 10.2 8.6 7.7 7.5General government balance (% of GDP) -2.7 -3.6 -3.4 -2.2 -3.3 -3.9Current-account balance (% of GDP) 45.9 30.3 29.1 30.2 28.7 24.7Exchange rate Manat:US$ (av) 0.82 0.81 0.80 0.79 0.78 0.76Exchange rate Manat:[euro] (av) 1.23 1.14 1.10 1.06 1.03 1.00

BANJA LUKA STOCK EXCHANGE
We have understood the crisis as anopportunity to look at the real possibilitiesfor the development of the capital market inthe Republic of Srpska.
Introduction by DirectorDuring 2009, the trading on the Banja Luka StockExchange (BLSE) was conducted within thelimitations imposed by the global economic crisis.Low liquidity of the stock market is a result ofuncertainty regarding its long-term impact oncompanies’ business results. Therefore, theattention of investors has been largely focused onbonds. The total turnover of BAM 180 million waslower by 52% compared to the previous year. Thestock exchange index (BIRS) almost fullyrecovered at the end of the year after thesignificant decline in the first half of the year, thusending year with the 3.5% loss.
At the BLSE, we have understood the crisis as anopportunity to look at the real possibilities for thedevelopment of the capital market in the Republicof Srpska. Priority goals have been identified inthe newly adopted Stock Exchange developmentstrategy whose implementation should create anenvironment where the BLSE will become amodern service to investors and issuers which isintegrated into the regional capital market.
Primary Market At the beginning of the year, the stocks of privatecompany that successfully completed the firstIPO in Bosnia and Herzegovina were listed on theBLSE. The significance of this event for the futuredevelopment of the capital market is greater thanit illustrates the amount of issue (BAM 0.86million). In the six secondary public offerings ofshares on the stock exchange has been raisedBAM 7.3 million. BAM 17.7 million has beenborrowed through the three issues of municipalbonds and another BAM 2.1 million by bonds of amicro-credit institution. Six bonds issued by BrckoDistrict and two bonds issued by the Republic ofSrpska for the settlement of old foreign currencysavings and war damage in total value of BAM109 million were listed on the BLSE.
New Technologies The special attention has been given tostrengthen the technological basis of the BLSE,through the introduction of the FIX protocol in thestock exchange trading system and developmentof integrated trading systems for the brokerage
houses based on the FIX protocol. Thesesystems provide a completely new opportunity forinvestors in terms of ability to monitor in real-timetheir positions on the stock exchange and toexecute transactions. In future, new technologieswill be used to connect with other capital marketsin the region and for international datadistribution.
International cooperationThe joint road-shows organized by the stockexchanges from the former Yugoslavia have beenthe most important international projects in whichthe BLSE was participated in 2009. At road-shows in Belgrade and Vienna, Telekom Srpsketogether with 30 companies from six othercountries was presented to investors. Incooperation with the Vienna and Sarajevo SE thefirst investible index that includes shares ofcompanies from the Republic of Srpska andFederation of BiH was created. The index shouldserve as a basis for creating the first derivativeson the domestic securities by foreign investmentinstitutions. Together with other stock exchangesthe first steps were made towards linking marketsthrough brokerage house cooperation within theregion. This regional cooperation will be based onthe use of advanced technological solutions.
Data Distribution The availability of data on securities listed in theRepublic of Srpska has significantly increasedafter the final implementation of ISINs. Data fromthe BLSE is available in real-time through tenvendors such as; Thomson Reuters, Bloomberg,SIX Telekurs, TeleTrader Europoint, etc. Significantnews in the field of data distribution is related toan agreement with the Vienna SE. According toagreement the Vienna SE undertakes themarketing and distribution of BLSE data in thefuture as part of data-feed package in which areincluded data from the Vienna, Budapest,Ljubljana, Prague, Bucharest and Sarajevo SE.
Corporate governanceThe valuation of securities is in direct correlationwith the view that investors have about the qualityof corporate governance in the companies.Therefore, the development of corporate
governance will permanently remain one of themost important priorities of the BLSE. Therefore,the BLSE together with the International FinanceCorporation (IFC), has created a scorecard; a toolfor monitoring the implementation of standards ofcorporate governance in accordance with theOECD principles. In cooperation with the AthensSE seminars for companies dedicated to themost important aspects of corporate governancelisted the official market were organized. However,we believe that the greatest contribution to thedevelopment of corporate governance in theRepublic of Srpska is our ongoing commitment tothe transparency and disclosure of detailedinformation on companies and investment fundsat our web pages. With this approach wemanaged to position the BLSE in the region as astock exchange that pays the most attention inproviding the investors with sufficient information.
EducationUnderstanding trends in capital markets implies aseries of theoretical knowledge and practicaldisciplines. Therefore, we always point out thatthe formal education needs to pay greaterattention in educating young people in the area offinance. We have not stopped on that, but incooperation with the Republic of SrpskaPedagogical Institute we have begun a series ofeducational projects such as; organization ofseminars for teachers, publishing a manual forteachers in financial markets, organizingcompetitions for high school and universitystudents through a virtual stock exchange. TheBLSE its understanding of socially responsiblebehavior showed by creating a specific webapplication for the practical teaching ofaccounting that is available to all students of highschools of economics in the Republic of Srpska.At the same time, in cooperation with theChamber of Commerce we have designed basicand advanced seminars for investors which willbe periodically organized in the future.
Profit achieved in a complex businessenvironment is an indicator of stability ofoperations, is a clear sign that the BLSE cancontinue to pursue its strategic developmentobjectives.
HISTORY AND DEVELOPMENT
15.07.1998 The adoption of the Law onSecurities provided the necessary legalframework to establish the capital market of theRepublic of Srpska. 09.05.2001 Eight banks and one companytrading in securities signed the Contract thatestablished the Banja Luka Stock Exchange. 14.03.2002 The first trading session took place.20.08.2003 The first auction for state ownedcapital took a place on the BLSE. 03.05.2004 BIRS – The Stock Exchange Index ofRepublic of Srpska established. 01.08.2004 FIRS - The Investment Fund Index ofRepublic of Srpska established.
17.09.2004 Full membership to FEAS.01.01.2006 ERS10 - Index of ten companies fromElectric Power System of Republic of Srpska wasestablished. 20.03.2006 Introduction of continuous trading inshares from the Free Market which fulfill theliquidity criteria. 18-19.05.2006 First International Conference ofthe BLSE was held. 29.01.2007 Correspondent membership to WFE.22.11.2007 Correspondent membership to FESE. 24.06.2008 The BLSE real-time data started to bedistributed by the Bloomberg. 09.3.2009 New trading system (BST 2.4) thatsupports FIX protocol was implemented.04.08.2009 The BLSE real-time data available viaThomson Reuters.
FUTURE OUTLOOK
In 2010 the BLSE plans to:• Increase the market liquidity • Increase the quality and quantity of securitiesoffered to investors • Increase the efficiency of the stock exchangetrading system • Support the primary market development • International promotion of domestic capitalmarket to foreign investors • Implement systemic approach to education • Maintain partnership with capital marketinstitutions and listed companies
Milan BozicCEO
FEDERATION OF EURO-ASIAN STOCK EXCHANGES ANNUAL REPORT JUNE 2010
PAGE 60

BANJA LUKA STOCK EXCHANGE
FEDERATION OF EURO-ASIAN STOCK EXCHANGES ANNUAL REPORT JUNE 2010
PAGE 61
OFFICIAL 6 MONTH STATISTICS
US$ millions # Shares millionsTotal Volume Average Daily Volume Total Volume Average Daily Volume
StocksJul-09 1.70 0.07 5.88 0.26
Aug-09 2.13 0.10 5.42 0.26Sep-09 2.94 0.13 5.73 0.26Oct-09 3.06 0.14 3.52 0.16Nov-09 2.27 0.11 6.02 0.29Dec-09 5.19 0.23 17.21 0.75TOTAL 17.30 0.13 43.78 0.33
BondsJul-09 0.96 0.04 3.20 0.14
Aug-09 1.50 0.07 4.67 0.22Sep-09 2.49 0.11 6.24 0.28Oct-09 1.65 0.08 4.33 0.20Nov-09 3.19 0.15 10.00 0.48Dec-09 5.69 0.25 19.33 0.84TOTAL 15.49 0.12 47.77 0.36
OtherJul-09 0.00 0.00 0.00 0.00
Aug-09 0.00 0.00 0.00 0.00Sep-09 0.00 0.00 0.00 0.00Oct-09 0.00 0.00 0.00 0.00Nov-09 0.00 0.00 0.00 0.00Dec-09 0.00 0.00 0.00 0.00TOTAL 0.00 0.00 0.00 0.00
MONTHLY STOCK VOLUME VS INDEX(US$ millions)
MONTHLY MARKET CAPITALIZATION(US$ millions)
0
500
1,000
1,500
2,000
2,500
3,000
Stocks Index
0
1
2
3
4
5
6
Jul Aug Sep Oct Nov Dec Jul Aug Sep Oct Nov Dec0
100
200
300
400
500
600
700
800
Market Capitalization(US$ millions) Index
Jul-09 2,563.45 682.87Aug-09 2,746.69 744.15Sep-09 2,877.23 776.18Oct-09 2,909.85 776.50Nov-09 2,962.72 778.91Dec-09 2,820.76 728.68
CONTACT INFORMATION
Contact Name Mr. Nebojsa Vukovic E-mail [email protected] Website www.blberza.com

FEDERATION OF EURO-ASIAN STOCK EXCHANGES ANNUAL REPORT JUNE 2010
PAGE 62
BANJA LUKA STOCK EXCHANGE
ECONOMIC AND POLITICAL DEVELOPMENTS
Economic and Political EnvironmentThe rising political temperature in BiH makes ithighly unlikely that the main parties will reachagreement in the near future on the internationallybacked reform agenda. The most importantelement of this is the reform of BiH's constitutionalstructure, with Bosniak (Bosnian Muslim) leaderspushing for greater centralization, and BosnianSerbs and Bosnian Croats favoring decentralizedstructures.
BiH signed a stabilization and associationagreement (SAA) with the EU in June. Talks onvisa facilitation began recently, but there aredoubts as to whether BiH will be granted EUcandidate status during the forecast period. BiH'sprogress in EU integration will depend in part onthe pace of reforms and the EU's own appetite forfurther enlargement following the rejection of theLisbon treaty by Irish voters in June 2008.
The SAA will set the broad policy framework forthe forecast period. The immediate consequenceis the reduction or abolition of customs duties ona wide range of imports from the EU, which tookeffect on July 1st 2008 and will greatly increasecompetition for local producers in some sectors.The SAA will require the BiH authorities toimplement a wide range of reforms affectingbusiness, but there are likely to be further delaysduring 2009-10 in strengthening policy co-ordination between the entity governments andcreating a single economic space in BiH.Developing a single economic space entailsliberalizing labor markets and making pensionand health benefits transferable across thecountry.
Economic PerformanceEconomic growth in BiH in 2009-10 will beinfluenced by the demand from the country'smain trading partners in the EU and in south-eastern Europe. Growth forecast for the Eurozone in 2009 has gone down to 0.8% (from aprevious forecast of 0.9%) following weaker thanexpected second-quarter GDP data. Rapidexpansion elsewhere in south-eastern Europeshould boost import demand in several of BiH'smain regional export markets. However, overalldeceleration in growth of import demand in BiH'stop export markets in 2009 is expected. Theexternal picture should improve in 2010 as aconsequence of a modest recovery in the Eurozone.
Real GDP growth in 2008 is estimated at 5%. Thisprimarily reflects strong expansion of privateconsumption, driven by rapid growth in realwages and consumer borrowing. Large energyand road building projects will boost constructionin 2009-10, and industry should grow strongly asleading metals producers expand capacity.Private consumption is expected to continue togrow robustly, from a relatively low base,reflecting further growth in bank lending and realwages.
Inflation decelerated to 9.5% year on year inAugust after rising steadily for more than a year.There are signs that inflationary pressures mayhave peaked for now, because international oilprices have fallen and food prices are rising lesssharply. As expenditure on food, housing andheating accounts for 55% of average householdconsumption in BiH, prices of these goods andservices are the main determinants of inflation.Nonetheless, rapid growth of wages and bankcredit, as well as increases in administeredprices, will continue to feed inflationary pressures.
Price growth will be only partly held in check bythe continued stabilizing influence of the currencyboard arrangement, and it is estimated that theaverage inflation in 2008 of 8%. A deceleration ofprice growth over the forecast period is alsoexpected, reflecting base-period effects andsome policy tightening. The marka appears to beconsiderably overvalued, but the likelihood of achange in the exchange-rate regime over theforecast period is very low. The Central Bank ofBiH maintains sufficient reserves to cover thewhole of its monetary liabilities, although therecent surge in the current-account deficit hasforced the authorities to use some of these tofinance the deficit. Despite the large externaldeficit, a speculative attack on the marka is asunlikely. This is because of the continuing trust inthe currency board arrangement by investors, andBiH's low levels of integration with global financialmarkets.
The current-account deficit widened to anestimated 16.1% of GDP in 2008, from 13.5% ofGDP in 2007. Import costs will continue to riserapidly over the forecast period as a result of strong growth in private consumption,high food and oil prices, new investment inindustry and infrastructure, and the reduction orabolition of import tariffs on many goods fromJuly 1st under the SAA. Export expansion will besupported by productivity gains stemming fromrecent investment in heavy industry. However,BiH's export base will remain relatively narrow andvulnerable to swings in international commodityprices, and growth of import demand in BiH'sleading export markets is forecast to slow. Weforecast average annual current-account deficitsequivalent to more than 15% of GDP in 2009-10.*
* The Economic Intelligence Unit Ltd., October 2008.
Key Information ContactsMinisters Council of Bosnia and Herzegovina www.vijeceministara.gov.baMinistry of Foreign Affairs of Bosnia and Herzegovina www.mvp.gov.baRepublic of Srpska Government www.vladars.netCentral Bank of Bosnia and Herzegovina www.cbbh.baRepublic of Srpska Securities Commission www.sec.rs.baCentral Registry of Securities of Republic of Srpska www.crhovrs.org Foreign Investment Promotion Agency of Bosnia and Herzegovina www.fipa.gov.baDirectorate of European Integration www.dei.gov.ba
0
2
4
6
8
10
12
14
REAL GDP(BAM millions)
CONSUMER PRICES (% CHANGE PA; AV)(%)
0
1
2
3
4
5
6
7
8
2005 2006 2007 2008 2009 2010 2005 2006 2007 2008 2009 2010
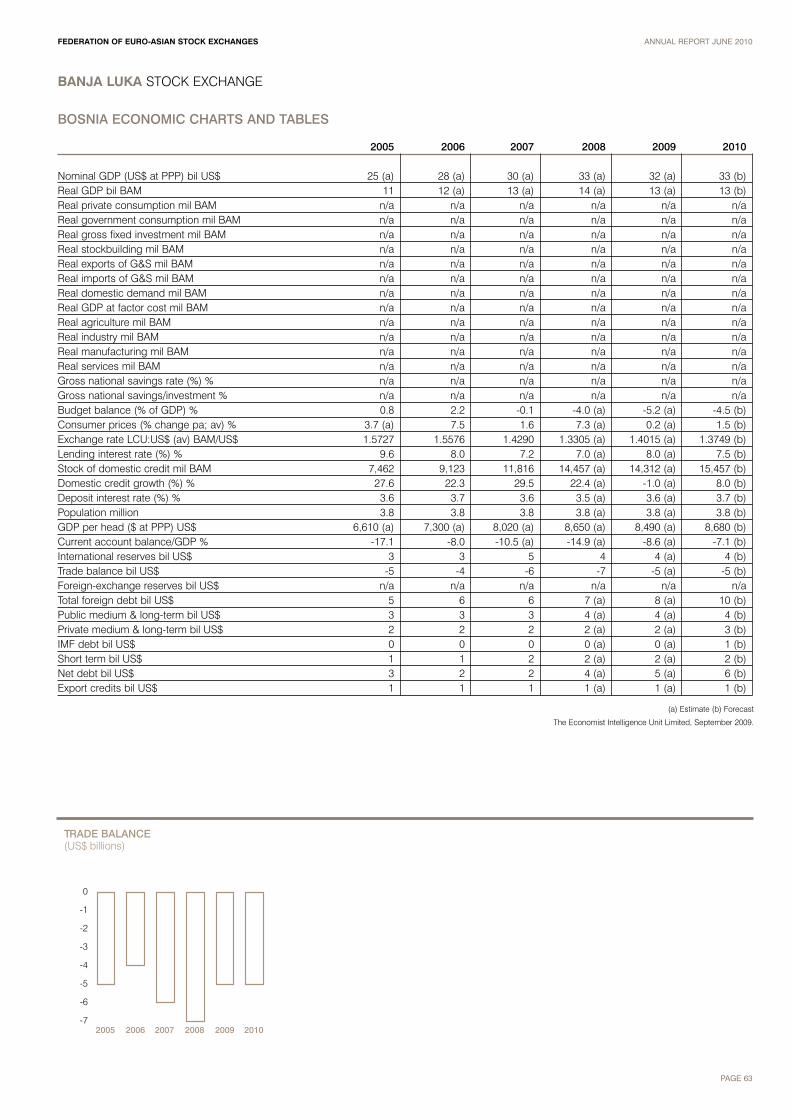
FEDERATION OF EURO-ASIAN STOCK EXCHANGES ANNUAL REPORT JUNE 2010
PAGE 63
BANJA LUKA STOCK EXCHANGE
BOSNIA ECONOMIC CHARTS AND TABLES
2005 2006 2007 2008 2009 2010
Nominal GDP (US$ at PPP) bil US$ 25 (a) 28 (a) 30 (a) 33 (a) 32 (a) 33 (b)Real GDP bil BAM 11 12 (a) 13 (a) 14 (a) 13 (a) 13 (b)Real private consumption mil BAM n/a n/a n/a n/a n/a n/aReal government consumption mil BAM n/a n/a n/a n/a n/a n/aReal gross fixed investment mil BAM n/a n/a n/a n/a n/a n/aReal stockbuilding mil BAM n/a n/a n/a n/a n/a n/aReal exports of G&S mil BAM n/a n/a n/a n/a n/a n/aReal imports of G&S mil BAM n/a n/a n/a n/a n/a n/aReal domestic demand mil BAM n/a n/a n/a n/a n/a n/aReal GDP at factor cost mil BAM n/a n/a n/a n/a n/a n/aReal agriculture mil BAM n/a n/a n/a n/a n/a n/aReal industry mil BAM n/a n/a n/a n/a n/a n/aReal manufacturing mil BAM n/a n/a n/a n/a n/a n/aReal services mil BAM n/a n/a n/a n/a n/a n/aGross national savings rate (%) % n/a n/a n/a n/a n/a n/aGross national savings/investment % n/a n/a n/a n/a n/a n/aBudget balance (% of GDP) % 0.8 2.2 -0.1 -4.0 (a) -5.2 (a) -4.5 (b)Consumer prices (% change pa; av) % 3.7 (a) 7.5 1.6 7.3 (a) 0.2 (a) 1.5 (b)Exchange rate LCU:US$ (av) BAM/US$ 1.5727 1.5576 1.4290 1.3305 (a) 1.4015 (a) 1.3749 (b)Lending interest rate (%) % 9.6 8.0 7.2 7.0 (a) 8.0 (a) 7.5 (b)Stock of domestic credit mil BAM 7,462 9,123 11,816 14,457 (a) 14,312 (a) 15,457 (b)Domestic credit growth (%) % 27.6 22.3 29.5 22.4 (a) -1.0 (a) 8.0 (b)Deposit interest rate (%) % 3.6 3.7 3.6 3.5 (a) 3.6 (a) 3.7 (b)Population million 3.8 3.8 3.8 3.8 (a) 3.8 (a) 3.8 (b)GDP per head ($ at PPP) US$ 6,610 (a) 7,300 (a) 8,020 (a) 8,650 (a) 8,490 (a) 8,680 (b)Current account balance/GDP % -17.1 -8.0 -10.5 (a) -14.9 (a) -8.6 (a) -7.1 (b)International reserves bil US$ 3 3 5 4 4 (a) 4 (b)Trade balance bil US$ -5 -4 -6 -7 -5 (a) -5 (b)Foreign-exchange reserves bil US$ n/a n/a n/a n/a n/a n/aTotal foreign debt bil US$ 5 6 6 7 (a) 8 (a) 10 (b)Public medium & long-term bil US$ 3 3 3 4 (a) 4 (a) 4 (b)Private medium & long-term bil US$ 2 2 2 2 (a) 2 (a) 3 (b)IMF debt bil US$ 0 0 0 0 (a) 0 (a) 1 (b)Short term bil US$ 1 1 2 2 (a) 2 (a) 2 (b)Net debt bil US$ 3 2 2 4 (a) 5 (a) 6 (b)Export credits bil US$ 1 1 1 1 (a) 1 (a) 1 (b)
(a) Estimate (b) Forecast
The Economist Intelligence Unit Limited, September 2009.
-7
-6
-5
-4
-3
-2
-1
0
TRADE BALANCE(US$ billions)
2005 2006 2007 2008 2009 20100
1
2
3
4
5
6
7
8
REAL GROSS FIXED INVESTMENT(BAM millions)
2005 2006 2007 2008 2009 2010

BELARUSIAN CURRENCY AND STOCK EXCHANGE
The mission of the BCSE is to become themain power on the way of reforming theBelarusian organized financial market andto make it the basic source of investmentsfor Belarusian enterprises.
Established in 1993, the Belarusian Currencyand Stock Exchange (BCSE) is a uniquetrading platform in the country that serves thefinancial market of Belarus. Today, the BCSE isa stable working organization with constantlygrowing trade turnovers.
The mission of the BCSE is to become themain power on the way of reforming theBelarusian organized financial market and tomake it the basic source of investments forBelarusian enterprises.
Functions of the BCSE• Organization of exchange trading in foreigncurrencies, futures and securities • Clearing Center in Belarusian settlementclearing system • Depository functions for corporate securities • Registration of OTC transactions withcorporate securities • Information Center functions
HISTORY AND DEVELOPMENT
The BCSE was established on the basis of thestate-run Interbank Currency Exchange inDecember 29, 1998 as a non-profit, publiccompany with administrative and financialautonomy. Having obtained the license topursue exchange activities and the depositorylicense, the exchange began to organize tradingin the main segments of the financial market ofBelarus (the currency market, the governmentsecurities market, the market of the NationalBank’s bonds, the corporate securities market,the market of bonds of local loans and themarket of bills of exchange).
In 1999, the BCSE developed the first listingcriteria to provide a transparent and efficientmarket. The Exchange is governed by a five-member board of directors. The highest body is the General Meeting of Stockholders, themanagerial body is the Supervisory Board (8 members).
The BCSE membership is comprised of 29banks, 64 brokerage and dealer firms and 5individuals.
The Interbank Currency Exchange wasestablished 4 March 1993 by 18 leadingbusiness banks as a closed-type joint-stockcompany. Its main task was organizing tradingin foreign currencies. On 24 March 1993, first
trades in the Russian ruble were held in theelectronic trading system. In 1995, the NationalBank of Belarus granted the Interbank CurrencyExchange the right to organize the purchaseand sale of futures on foreign currency andother financial assets.
On 24 September 1996 the Interbank CurrencyExchange was made a subdivision of theNational Bank, in which capacity it organizedtrading in foreign currencies for 2 years. In 1997,the Interbank Currency Exchange was grantedthe right to organize the secondary market ofgovernment securities (except for registeredprivatization vouchers) and the securities of theNational Bank.
First electronic government securities tradeswere carried out at the Interbank CurrencyExchange on 16 January 1998.
The BCSE aims to: • minimize risks and transaction charges fromcapital formation in the organized market;• provide transparency of transactions;• protect investors’ legal rights and theirinterests;• implement programs on financial resourcesformation necessary for their development;• develop state monetary and credit policymarket mechanisms;• create necessary conditions for effectivecontrolling functioning of the State
FUTURE OUTLOOK
• Expansion of technological capacity -upgrading the corporate network infrastructure • Expansion of SED functionality; • Works on information resources anddatabases integration based on OracleWebLogic software;• Development and upgrade of the Internet-based exchange systems; • Introduction of new sectors and instrumentsin different segments of the exchange market;
All the work performed by the BCSE and itsfuture plans are aimed at providing allnecessary conditions for civilized financialmarket functioning in the republic, which isable to protect the interests of all participantsand ensure a successful and sustainabledevelopment of their business.
Pavel TsekhanovichChairman of the Board
FEDERATION OF EURO-ASIAN STOCK EXCHANGES ANNUAL REPORT JUNE 2010
PAGE 64

BELARUSIAN CURRENCY AND STOCK EXCHANGE
FEDERATION OF EURO-ASIAN STOCK EXCHANGES ANNUAL REPORT JUNE 2010
PAGE 65
OFFICIAL 6 MONTH STATISTICS
US$ millions # Shares millionsTotal Volume Average Daily Volume Total Volume Average Daily Volume
StocksJul-09 4.17 0.19 0.41 0.02
Aug-09 5.02 0.24 1.04 0.05Sep-09 5.86 0.27 2.90 0.13Oct-09 3.80 0.17 8.72 0.40Nov-09 3.54 0.17 2.29 0.11Dec-09 2.10 0.10 1.35 0.06TOTAL 24.49 0.19 16.70 0.13
BondsJul-09 1,338.68 60.85 35.44 1.61
Aug-09 1,384.54 65.93 35.48 1.69Sep-09 1,556.04 70.73 39.52 1.80Oct-09 1,382.35 62.83 35.98 1.64Nov-09 981.24 46.73 21.72 1.03Dec-09 1,297.91 59.00 30.81 1.40TOTAL 7,940.76 61.01 198.95 1.53
OtherJul-09 0.00 0.00 0.00 0.00
Aug-09 0.00 0.00 0.00 0.00Sep-09 0.00 0.00 0.00 0.00Oct-09 0.00 0.00 0.00 0.00Nov-09 0.00 0.00 0.00 0.00Dec-09 0.00 0.00 0.00 0.00TOTAL 0.00 0.00 0.00 0.00
MONTHLY STOCK VOLUME(US$ millions)
MONTHLY BOND VOLUME(US$ millions)
0
200
400
600
800
1,000
1,200
1,400
1,600
0
1
2
3
4
5
6
Jul Aug Sep Oct Nov Dec Jul Aug Sep Oct Nov Dec
Stocks Index
0
20
40
60
80
100
120
140
Market Capitalization(US$ millions) Index
Jul-09 n/a 120.78Aug-09 n/a 120.45Sep-09 n/a 120.68Oct-09 n/a 120.81Nov-09 n/a 120.88Dec-09 n/a 121.04
CONTACT INFORMATION
Contact Name Ms. Olga Blusson E-mail [email protected] Website www.bcse.by

FEDERATION OF EURO-ASIAN STOCK EXCHANGES ANNUAL REPORT JUNE 2010
PAGE 66
BELARUSIAN CURRENCY AND STOCK EXCHANGE
ECONOMIC AND POLITICAL DEVELOPMENTS
Economic and Political EnvironmentThe president, Alyaksandar Lukashenka,retains tight control over the bureaucracy—including regional administrators, and military,security and law enforcement bodies—and will use this to prevent the emergence ofalternative centres of power, and to discouragepotential rivals from seriously considering anattempt to dislodge him. Opposition partieswill continue to co-ordinate their strategies tosome degree, but will still face limits onpolitical participation and expression, and willremain divided along ideological lines.Nevertheless, the economic recessionexpected in 2009, exacerbated by adeterioration of Belarus's energy terms oftrade, brings risks.
Engagement between the Lukashenka regimeand the EU and US is likely to continue toincrease, in a context of concerns about thethreat to Belarusian independence from aresurgent Russia and Mr Lukashenka's desireto attract more Western investment. However,Mr Lukashenka's reluctance to accept the bareminimum of political openness demanded bythe EU and the US will limit the improvement inties with the West, and the process could besubject to reversal if Mr Lukashenka feels thatit is not bringing the expected benefits.Belarus will remain closely tied to Russia.Russia's focus on its own commercial interestsin relation to Belarus—in particular, the long-standing goal of its oil and gas companies toobtain important distribution and processingassets in Belarus—will continue to strainrelations at times. However, the two countrieswill remain close partners, co-operating ininternational and military affairs in the comingyears.
Economic PerformanceThe government's statist economic model willcome under strain in 2009-10 as a result of theimpact of the global recession. Belarus agreeda US$2.5bn 15-month stand-by agreementwith the IMF in December 2008. However, theLukashenka administration derives much of itslegitimacy from tight state control over mostaspects of the economy and the prioritisationof social goals, such as full employment and equitable income distribution. A wholesaledeparture from these policies is thereforeunlikely, and the government will avoid far-ranging economic restructuring orderegulation, although limited improvements in business regulation are possible.
Russia, Ukraine and the EU, which areBelarus's leading export markets, willexperience recession in 2009. Real GDP grewby 10% in 2008. However, the global creditcrunch and the fall in export revenue willseriously constrain the authorities' ability tomaintain the loose fiscal and credit policiesthat have previously supported growth. Afurther rise, on average, in the price of Russiangas will place further strain on the economy.
Inflation decelerated in the final months of2008, and after a brief spike in the first twomonths of 2009, under the impact of currencydepreciation and gas price rises, has sinceresumed its downward trend.. Average annualinflation will therefore fall from 14.8% in 2008to 12.1% in 2009 and 10% in 2010.
The rubel was devalued by 20.5% against theUS dollar at the beginning of January and hassubsequently weakened further, despiteinterventions by the National Bank of theRepublic of Belarus (NBRB, the central bank)on foreign-exchange markets to support thecurrency.
The trade deficit widened in 2008 and in thefirst quarter of 2009. Although high exportprices supported a strong export performancefor much of 2008, imports also rose rapidly,partly because of high energy prices, but alsobecause of rising domestic demand, and havebeen slower to correct following the collapseof exports from the final quarter of 2008. Thecurrent-account deficit in 2008 was 9.4% ofGDP and is forecast to narrow to around 6.5%of GDP in 2009. On the one hand, exports willfall owing to recessions in important markets.On the other hand, limited access to externalfinancing will force a marked correction todomestic demand, and imports will thereforefall even more sharply. The deficit will contractin 2010, to 5.5% of GDP, as exports pick upmore quickly than imports.*
* The Economist Intelligence Unit Limited, May 2009
Key Information ContactsPresident of Belarus www.president.gov.by/en/ Council of Ministers www.government.by/en/eng_news.htmlMinistry of Foreign Affairs www.mfa.gov.by/eng/index.php?id=2&d=contacts/linksBelarusian Telegraph Agency (National Source of Information) www.belta.by/en/
0
2
4
6
8
10
12
14
16
18
REAL GDP(BYB millions)
CONSUMER PRICES (% CHANGE PA; AV)(%)
7
8
9
10
11
12
13
14
15
2005 2006 2007 2008 2009 2010 2005 2006 2007 2008 2009 2010
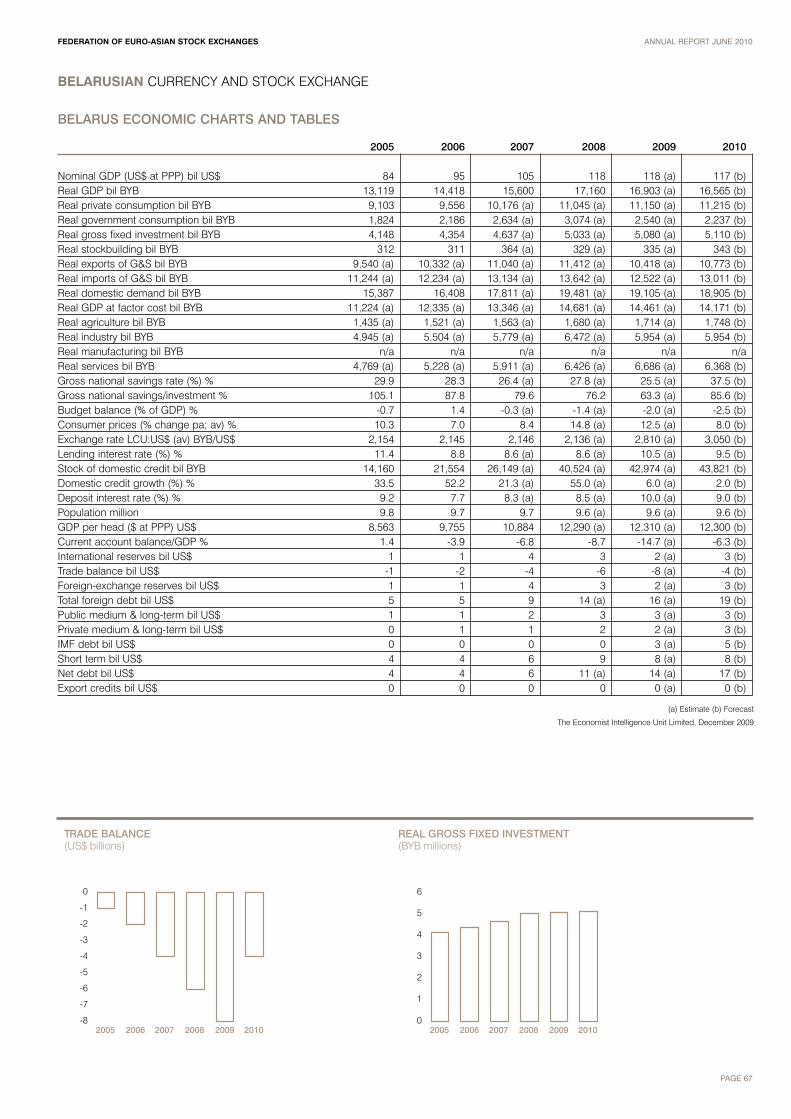
FEDERATION OF EURO-ASIAN STOCK EXCHANGES ANNUAL REPORT JUNE 2010
PAGE 67
BELARUSIAN CURRENCY AND STOCK EXCHANGE
BELARUS ECONOMIC CHARTS AND TABLES
2005 2006 2007 2008 2009 2010
Nominal GDP (US$ at PPP) bil US$ 84 95 105 118 118 (a) 117 (b)Real GDP bil BYB 13,119 14,418 15,600 17,160 16,903 (a) 16,565 (b)Real private consumption bil BYB 9,103 9,556 10,176 (a) 11,045 (a) 11,150 (a) 11,215 (b)Real government consumption bil BYB 1,824 2,186 2,634 (a) 3,074 (a) 2,540 (a) 2,237 (b)Real gross fixed investment bil BYB 4,148 4,354 4,637 (a) 5,033 (a) 5,080 (a) 5,110 (b)Real stockbuilding bil BYB 312 311 364 (a) 329 (a) 335 (a) 343 (b)Real exports of G&S bil BYB 9,540 (a) 10,332 (a) 11,040 (a) 11,412 (a) 10,418 (a) 10,773 (b)Real imports of G&S bil BYB 11,244 (a) 12,234 (a) 13,134 (a) 13,642 (a) 12,522 (a) 13,011 (b)Real domestic demand bil BYB 15,387 16,408 17,811 (a) 19,481 (a) 19,105 (a) 18,905 (b)Real GDP at factor cost bil BYB 11,224 (a) 12,335 (a) 13,346 (a) 14,681 (a) 14,461 (a) 14,171 (b)Real agriculture bil BYB 1,435 (a) 1,521 (a) 1,563 (a) 1,680 (a) 1,714 (a) 1,748 (b)Real industry bil BYB 4,945 (a) 5,504 (a) 5,779 (a) 6,472 (a) 5,954 (a) 5,954 (b)Real manufacturing bil BYB n/a n/a n/a n/a n/a n/aReal services bil BYB 4,769 (a) 5,228 (a) 5,911 (a) 6,426 (a) 6,686 (a) 6,368 (b)Gross national savings rate (%) % 29.9 28.3 26.4 (a) 27.8 (a) 25.5 (a) 37.5 (b)Gross national savings/investment % 105.1 87.8 79.6 76.2 63.3 (a) 85.6 (b)Budget balance (% of GDP) % -0.7 1.4 -0.3 (a) -1.4 (a) -2.0 (a) -2.5 (b)Consumer prices (% change pa; av) % 10.3 7.0 8.4 14.8 (a) 12.5 (a) 8.0 (b)Exchange rate LCU:US$ (av) BYB/US$ 2,154 2,145 2,146 2,136 (a) 2,810 (a) 3,050 (b)Lending interest rate (%) % 11.4 8.8 8.6 (a) 8.6 (a) 10.5 (a) 9.5 (b)Stock of domestic credit bil BYB 14,160 21,554 26,149 (a) 40,524 (a) 42,974 (a) 43,821 (b)Domestic credit growth (%) % 33.5 52.2 21.3 (a) 55.0 (a) 6.0 (a) 2.0 (b)Deposit interest rate (%) % 9.2 7.7 8.3 (a) 8.5 (a) 10.0 (a) 9.0 (b)Population million 9.8 9.7 9.7 9.6 (a) 9.6 (a) 9.6 (b)GDP per head ($ at PPP) US$ 8,563 9,755 10,884 12,290 (a) 12,310 (a) 12,300 (b)Current account balance/GDP % 1.4 -3.9 -6.8 -8.7 -14.7 (a) -6.3 (b)International reserves bil US$ 1 1 4 3 2 (a) 3 (b)Trade balance bil US$ -1 -2 -4 -6 -8 (a) -4 (b)Foreign-exchange reserves bil US$ 1 1 4 3 2 (a) 3 (b)Total foreign debt bil US$ 5 5 9 14 (a) 16 (a) 19 (b)Public medium & long-term bil US$ 1 1 2 3 3 (a) 3 (b)Private medium & long-term bil US$ 0 1 1 2 2 (a) 3 (b)IMF debt bil US$ 0 0 0 0 3 (a) 5 (b)Short term bil US$ 4 4 6 9 8 (a) 8 (b)Net debt bil US$ 4 4 6 11 (a) 14 (a) 17 (b)Export credits bil US$ 0 0 0 0 0 (a) 0 (b)
-8
-7
-6
-5
-4
-3
-2
-1
0
TRADE BALANCE(US$ billions)
2005 2006 2007 2008 2009 20100
1
2
3
4
5
6
REAL GROSS FIXED INVESTMENT(BYB millions)
2005 2006 2007 2008 2009 2010
(a) Estimate (b) Forecast
The Economist Intelligence Unit Limited, December 2009

BELGRADE STOCK EXCHANGE
During 2009, the BSE made intensiveefforts to motivate the Exchange membersto actively engage in the market-makingoperations.
The movements at the Belgrade Stock Exchangein 2009 were considerably affected by movementson the global financial market. During the year, theinvestment activities diminished in terms of theturnover value due to an increased risk aversion.The total turnover at BSE during 2009 amountedto US$ 636.8m, a fall of 52% compared to theprevious year. In the same period, the averagedaily turnover also recorded a fall of around 52%.
The effects of a significant decline in investmentactivities at BSE during the last year could not bealleviated due to the lack of a broader range offinancial instruments, above all debt instruments,(municipal and corporate bonds) which, as a rule,in the conditions of increased risks, enable anefficient restructuring of investment portfolios forthe purpose of minimizing the overall riskinvestment.
During the first quarter, when the turbulences inthe global economy reached a peak, the index
describing the movement of the most liquid BSEshares BELEX15 hit its historic low of 347.46index points. In the same period, the investorsstarted to relax with the first signals that themeasures taken by the governments of G20countries could lead the world economy out of thecrisis. The same relaxation, slightly delayed, wasalso felt at the BSE. Thus, during 2009, BELEX15recorded an annual rise of 17.44%. On the lastday in 2009, the value of this index amounted to663.77 index points, still far below its base valueof 1,000.00 index points.
During 2009, the BSE made intensive efforts tomotivate the Exchange members to activelyengage, in addition to their usual activities in thesecurities trading, in the market-makingoperations, for the purpose of enhancing marketliquidity, reducing the risk of an uncontrolled pricevolatility and successful establishment of pricesfor less liquid securities. The BSE entered 2009with only one market maker, but during the year,
recognizing the importance of these activities andseeing the first positive effects on the market,three more members started performing market-making operations.
In order to enable the electronic order routingfrom the “backoffice“ applications of theExchange members into the BSE trading system,a special module FIXAPI (FIX ApplicationProgramming Interface) was developed enablingthe automatic transfer of orders from an Exchangemember to the BSE trading system BELEXFIX.In the second half of the year, the BSE launchedinto production its new internet presentation,which has the following advantages over theprevious version: it provides easier access tomore information, use of new development toolsenabling a more efficient development,maintenance and control of performances,modern design, faster web site search, etc.
HISTORY AND DEVELOPMENT
The Belgrade SE was originally founded in 1894,on November 21, but the first transactions weremade in January 1895. The last trading sessionwas held on April 4, 1941. The Stock Exchangewas closed in 1953, and again refounded in 1989,as a “Yugoslav Capital Market”. In 1992, BelgradeSE officially got its name back. The key events inthe history are:
• In September 2002 Republic of Serbia Bondstrading began;• In March 2004, remote trading was launched;• In September 2004, Belgrade SE achieved fullmembership in FEAS;• In October 2004 continuous trading of stockshas begun;• In November 2004 the Third InternationalConference was held. The 110 anniversary ofBelgrade SE celebrated;• In December 2004, BELEXfm index has beenlunched; • In February 2005, Belgrade SE became anassociate member of FESE;• In March 2005, BELEX.info service was lunched;• In May 2005 the data distribution via Data Feedhas begun;• In October 2005 the BELEX15 index has beenintroduced;• In November 2005 the Fourth InternationalConference “Preserving Integrity and Efficiency ofthe Capital Market” was held;• In January 2006 new website was launched;• In April 2006 various training courses started;• In April 2006 MoU signed with the IFC;• In November 2006 the Fifth InternationalConference was held;• In March 2007, SRX index (Serbian TradedIndex) launched by the Vienna SE;
• In April 2007, the Belgrade SE launched its newgeneral equity index BELEXline, successor of theBELEXfm; • In April 2007, first company listed on thepremium Listing A – Tigar Corporation from Pirot;• In June 2007, BELEX 15 Open End - IndexCertificate issued and listed at the Frankfurt SEand Stuttgart SE;• In November 2007, Serbian stocks included infirst Balkan Blue-Chip index - DJ STOXX Balkan50;• In November 2007, VI International Conferencewas held;• In December 2007, ’Discobolos’ was rewardedto the Belgrade SE for applying new technologies;• In December 2007 the Memorandum ofPartnership was signed with exchanges from theregion;• In January 2008, ABN AMRO bought a licencefor BELEX15 • In April 2008, the new trading system BELEXFIXwas launched;• in September 2008, first closed-end fund sharesadmitted to trading;• In November 2008, VII Annual Conference washeld;• In December 2008, first market maker in TIGRshares;• In May 2009, Third International Roadshow washeld in Belgrade;• In June 2009, three new market makers wereintroduced to the market;• In August 2009, new website was launched;• In September 2009, Luxembourg ForeignMinister Jean Asselborn visited the Belgrade SE;• In November 2009, SEE Regional CapitalMarkets Conference was held in Vienna;• In November 2009, VIII Annual Conference washeld;
FUTURE OUTLOOK
In 2010 the BSE will work on the execution of thefollowing projects:
• Upgrading of all operations, rules andprocedures to provide state-of-art service;• Introduction of the electronic order routing in theBSE trading system, BELEXFIX;• Launching of modern BSE Disaster recovery site;• Organization of international roadshows;• Further development of the existing indexes andindicators;• Continuous motivation of the best Serbiancompanies to apply for Official Listing;• Further development of market segmentation bycreating new segments and improving the existingones;• Development of sector classification in line withthe leading global standards;• Market liquidity boosting through automation ofthe market-making function;• Exploring the possibilities of introducing newinstruments into the market;• Promotion of news on listed companies throughdirect cooperation with media and news agencies;• A reduction in the transaction costs and taxes incooperation with other capital market institutionsand state bodies;• Broadening the network of international datavendors;• Work on promotion of importance of corporategovernance among issuers;• Educational activities with the existing and newtraining programs;• Improvement of media coverage of stockexchange activities;• Editing and publishing of new editions andpublications;• Work on developing human resources;• Organization of the annual 9th InternationalConference in November.
Gordana DostanicManaging Director
FEDERATION OF EURO-ASIAN STOCK EXCHANGES ANNUAL REPORT JUNE 2010
PAGE 68

BELGRADE STOCK EXCHANGE
FEDERATION OF EURO-ASIAN STOCK EXCHANGES ANNUAL REPORT JUNE 2010
PAGE 69
OFFICIAL 6 MONTH STATISTICS
US$ millions # Shares millionsTotal Volume Average Daily Volume Total Volume Average Daily Volume
StocksJul-09 12.38 0.54 0.87 0.04
Aug-09 17.07 0.81 0.89 0.04Sep-09 34.42 1.56 1.25 0.06Oct-09 23.72 1.08 1.54 0.07Nov-09 51.96 2.47 1.77 0.08Dec-09 289.49 12.59 3.49 0.15TOTAL 429.03 3.18 9.83 0.07
BondsJul-09 5.28 0.23 4.88 0.21
Aug-09 6.62 0.32 5.49 0.26Sep-09 4.64 0.21 4.05 0.18Oct-09 4.68 0.21 3.81 0.17Nov-09 3.10 0.15 2.47 0.12Dec-09 5.56 0.24 4.51 0.20TOTAL 29.88 0.23 25.21 0.19
OtherJul-09 0.00 0.00 0.00 0.00
Aug-09 0.00 0.00 0.00 0.00Sep-09 0.00 0.00 0.00 0.00Oct-09 0.00 0.00 0.00 0.00Nov-09 0.00 0.00 0.00 0.00Dec-09 0.00 0.00 0.00 0.00TOTAL 0.00 0.00 0.00 0.00
0
50
100
150
200
250
300
MONTHLY STOCK VOLUME VS INDEX(US$ millions)
MONTHLY MARKET CAPITALIZATION(US$ millions)
Stocks Index
0
2,000
4,000
6,000
8,000
10,000
12,000
14,000
Jul Aug Sep Oct Nov Dec Jul Aug Sep Oct Nov Dec0
100
200
300
400
500
600
700
800
900
Market Capitalization(US$ millions) Index
Jul-09 11,400.99 570.25Aug-09 12,030.30 710.80Sep-09 12,779.54 825.97Oct-09 12,749.80 806.19Nov-09 12,206.77 681.24Dec-09 11,521.56 663.77
CONTACT INFORMATION
Contact Name Ms. Svetlana Cerovic E-mail [email protected] Website www.belex.co.yu

FEDERATION OF EURO-ASIAN STOCK EXCHANGES ANNUAL REPORT JUNE 2010
PAGE 70
BELGRADE STOCK EXCHANGE
ECONOMIC AND POLITICAL DEVELOPMENTS
Economic and Political EnvironmentThe government–led by For a EuropeanSerbia (ZES), an alliance dominated by thepro-EU DS of the president, Boris Tadic–isexpected to come under increasing strain asthe need for harsher austerity measures tomeet budget deficit targets in 2010-11generates internal dissension and publicprotest. Pressure on the coalition will alsoincrease as tensions over other issues–suchas the greatly modified version of theVojvodina Statute, giving a large degree ofautonomy to Vojvodina province–come to ahead. The government has the support of sixdeputies representing minorities, giving it aslim parliamentary majority, with 128 out of250 seats. Fear of an early election in whichthey could lose ground to the opposition willpush the government parties towardsagreement, however.
The government is committed to EUintegration, but progress has beendisappointing, prompting Serbia to pursue amultipolar foreign policy that focuses onRussia, China, the US, the Non-AlignedMovement (NAM) and neighbouring countries,as well as on the EU. There has been abreakthrough in one area, however, with theEuropean Commission recommending thelifting, by the end of 2009, of visa restrictionson Serbian citizens travelling in the Schengenarea.
Economic PerformanceThe main policy challenge facing thegovernment is how to handle theconsequences for Serbia of the globalfinancial and economic crisis. The crisis hashad a far-reaching impact on the country,putting the dinar under pressure, causingoutput to contract, and making access toexternal finance more difficult and expensive.The government negotiated a stand-byagreement with the IMF in March, securing aEUR3bn (US$4bn) loan to support thebalance of payments. The agreement alloweda larger than planned budget deficit, equal to3% of GDP, but committed the authorities tosignificant fiscal tightening, includingsubstantial cuts in public expenditure.Because of a substantial revenue shortfall andabove-target current spending, the budgetdeficit target set in March has becomeunattainable. The IMF agreed to increase the2009 deficit target to 4.5% of GDP and the2010 target to 3.5% in talks during a secondreview of the stand-by arrangement in lateAugust. The government has proposed thereform of the public administration, entailingjob losses and spending cuts, but themeasures may be insufficient. The IMF arguesthat the problem could be resolved throughan increase in the rate of value-added tax(VAT) from 18% to at least 19%. Resistancewithin the government to increasing taxes maybe wearing thin, given the lack of optionsavailable to it and continuing IMF pressure.
A weak recovery in growth is expected, of 1%,in 2010, following an estimated contraction inreal GDP of 4% in 2009. Real GDP declinedby 4.1% year on year in the first half of 2009and by an estimated 2.7% in the third quarter,
and assuming further improvement in the finalquarter, there is some upside risk attached toour estimate for 2009. After a feeble recoveryin 2010, growth is forecast to rebound to 4%in 2011. There is a considerable downside riskto our baseline forecast, given the danger offurther reversals once the upturn gets underway and the possibility that the recovery willnot be sustained.
Year-on-year retail price inflation remainedstuck at 9.5% year on year in September, butconsumer price inflation slowed to 7.3%. A good harvest, the decline in prices ofagricultural products and recession-inducedfalls in the prices of most commodities areexpected to bring about a series of positivesupply shocks. Additionally, the abrupteconomic slowdown and fiscal tightening willdepress real incomes, easing demandpressures.
The dinar has stabilised since the signing ofthe IMF agreement in March. Nevertheless,given the sharp decline in the value of thecurrency before this, and continuingdepreciation, a correction in the exchangerate occurred in 2009, with the dinardepreciating to an estimated RSD93.4:EUR1and to RSD63.1:US$1 at end-2009. Thisimplies an average real effective depreciationagainst a trade-weighted basket of currenciesof about 5.7% in 2009. A modest nominaldepreciation is expected against the euro in2010-11 and a fairly stable real effectiveexchange rate (REER).*
* The Economist Intelligence Unit Limited, November 2009
Key Information ContactsNational Bank of Serbia: www.nbs.rsSecurities and Exchange Commission: www.sec.gov.rsCentral Securities Depository and Clearing House: www.crhov.rsMinistry of Economy and Regional Development: www.merr.sr.gov.yu
0.0
0.2
0.4
0.6
0.8
1.0
1.2
1.4
REAL GDP(RSD millions)
CONSUMER PRICES (% CHANGE PA; AV)(%)
6
8
10
12
14
16
18
2005 2006 2007 2008 2009 2010 2005 2006 2007 2008 2009 2010

FEDERATION OF EURO-ASIAN STOCK EXCHANGES ANNUAL REPORT JUNE 2010
PAGE 71
BELGRADE STOCK EXCHANGE
ROMANIA ECONOMIC CHARTS AND TABLES
2005 2006 2007 2008 2009 2010
Nominal GDP (US$ at PPP) bil US$ 64 70 77 82 (a) 81 (a) 83 (b)Real GDP mil RSD 1,139,986 (a) 1,199,418 (a) 1,282,178 (a) 1,353,219 (a) 1,305,856 (a) 1,318,915 (b)Real private consumption mil RSD 949,622 (a) 1,016,095 (a) 1,092,302 (a) 1,157,840 (a) 1,123,105 (a) 1,145,567 (b)Real government consumption mil RSD 216,193 (a) 221,598 (a) 226,030 (a) 228,290 (a) 229,432 (a) 231,726 (b)Real gross fixed investment mil RSD 157,283 (a) 171,439 (a) 186,183 (a) 204,801 (a) 194,561 (a) 198,452 (b)Real stockbuilding mil RSD 80,056 (a) 82,846 (a) 100,446 (a) 114,587 (a) 62,397 (a) 55,917 (b)Real exports of G&S mil RSD 280,206 (a) 296,458 (a) 313,356 (a) 330,277 (a) 303,855 (a) 312,971 (b)Real imports of G&S mil RSD 543,374 (a) 589,017 (a) 636,139 (a) 682,577 (a) 607,494 (a) 625,718 (b)Real domestic demand mil RSD 1,403,154 (a) 1,491,978 (a) 1,604,961 (a) 1,705,519 (a) 1,609,495 (a) 1,631,662 (b)Real GDP at factor cost mil RSD 970,858 1,019,531 1,087,840 1,144,407 1,103,208 (a) 1,114,241 (b)Real agriculture mil RSD 136,500 136,205 125,577 136,316 139,043 (a) 141,823 (b)Real industry mil RSD 248,451 261,800 274,953 280,388 257,957 (a) 261,310 (b)Real manufacturing mil RSD 164,431 173,626 182,039 184,304 171,403 (a) 173,117 (b)Real services mil RSD 585,907 621,525 687,310 727,703 706,209 (a) 711,107 (b)Gross national savings rate (%) % n/a n/a n/a n/a n/a n/aGross national savings/investment % n/a n/a n/a n/a n/a n/aBudget balance (% of GDP) % 0.9 -1.5 -1.9 -2.2 -4.5 (a) -4.2 (b)Consumer prices (% change pa; av) % 17.3 12.7 6.5 10.9 9.8 (a) 6.5 (b)Exchange rate LCU:US$ (av) RSD/US$ 67.2059 66.8170 58.1513 55.8318 67.3287 (a) 66.3148Lending interest rate (%) % 15.4 18.3 12.6 16.1 14.5 (a) 13.0 (b)Stock of domestic credit mil RSD 490,465 504,960 722,018 1,073,070 1,169,646 (a) 1,380,183 (b)Domestic credit growth (%) % 40.7 3.0 43.0 48.6 9.0 (a) 18.0 (b)Deposit interest rate (%) % 3.5 5.1 4.4 6.0 5.8 (a) 5.4 (b)Population million 7.4 7.4 7.4 7.3 7.3 (a) 7.3 (b)GDP per head ($ at PPP) US$ 8,623 9,412 10,394 11,234 11,040 (a) 11,350 (b)Current account balance/GDP % -8.4 -9.4 -15.2 -17.2 -6.6 (a) -6.3 (b)International reserves bil US$ 6 12 14 11 13 (a) 14 (b)Trade balance bil US$ -5 -6 -9 -11 -7 (a) -6 (b)Foreign-exchange reserves bil US$ 6 12 14 11 13 (a) 14 (b)Total foreign debt bil US$ 16 20 26 30 (a) 29 (a) 31 (b)Public medium & long-term bil US$ 8 7 8 8 7 (a) 7 (b)Private medium & long-term bil US$ 5 10 15 19 18 (a) 18 (b)IMF debt bil US$ 1 0 0 0 2 (a) 3 (b)Short term bil US$ 2 2 3 3 2 (a) 3 (b)Net debt bil US$ 10 8 12 19 (a) 16 (a) 17 (b)Export credits bil US$ 0 0 (a) 0 (a) 0 0 (a) 0 (b)
-12
-10
-8
-6
-4
-2
0
TRADE BALANCE(US$ billions)
2005 2006 2007 2008 2009 20100
50
100
150
200
250
REAL GROSS FIXED INVESTMENT(RSD millions)
2005 2006 2007 2008 2009 2010
(a) Estimate (b) Forecast
The Economist Intelligence Unit Limited, December 2009
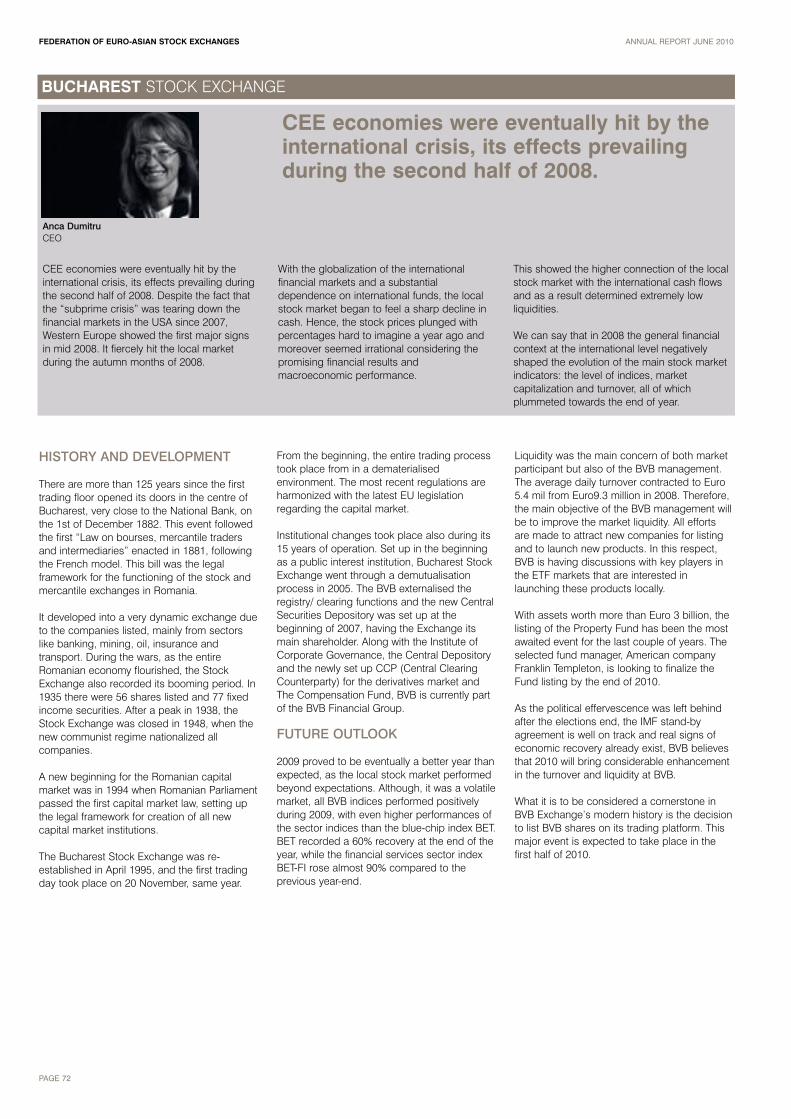
BUCHAREST STOCK EXCHANGE
CEE economies were eventually hit by theinternational crisis, its effects prevailingduring the second half of 2008.
CEE economies were eventually hit by theinternational crisis, its effects prevailing duringthe second half of 2008. Despite the fact thatthe “subprime crisis” was tearing down thefinancial markets in the USA since 2007,Western Europe showed the first major signsin mid 2008. It fiercely hit the local marketduring the autumn months of 2008.
With the globalization of the internationalfinancial markets and a substantialdependence on international funds, the localstock market began to feel a sharp decline incash. Hence, the stock prices plunged withpercentages hard to imagine a year ago andmoreover seemed irrational considering thepromising financial results andmacroeconomic performance.
This showed the higher connection of the localstock market with the international cash flowsand as a result determined extremely lowliquidities.
We can say that in 2008 the general financialcontext at the international level negativelyshaped the evolution of the main stock marketindicators: the level of indices, marketcapitalization and turnover, all of whichplummeted towards the end of year.
HISTORY AND DEVELOPMENT
There are more than 125 years since the firsttrading floor opened its doors in the centre ofBucharest, very close to the National Bank, onthe 1st of December 1882. This event followedthe first “Law on bourses, mercantile tradersand intermediaries” enacted in 1881, followingthe French model. This bill was the legalframework for the functioning of the stock andmercantile exchanges in Romania.
It developed into a very dynamic exchange dueto the companies listed, mainly from sectorslike banking, mining, oil, insurance andtransport. During the wars, as the entireRomanian economy flourished, the StockExchange also recorded its booming period. In1935 there were 56 shares listed and 77 fixedincome securities. After a peak in 1938, theStock Exchange was closed in 1948, when thenew communist regime nationalized allcompanies.
A new beginning for the Romanian capitalmarket was in 1994 when Romanian Parliamentpassed the first capital market law, setting upthe legal framework for creation of all newcapital market institutions.
The Bucharest Stock Exchange was re-established in April 1995, and the first tradingday took place on 20 November, same year.
From the beginning, the entire trading processtook place from in a dematerialisedenvironment. The most recent regulations areharmonized with the latest EU legislationregarding the capital market.
Institutional changes took place also during its15 years of operation. Set up in the beginningas a public interest institution, Bucharest StockExchange went through a demutualisationprocess in 2005. The BVB externalised theregistry/ clearing functions and the new CentralSecurities Depository was set up at thebeginning of 2007, having the Exchange itsmain shareholder. Along with the Institute ofCorporate Governance, the Central Depositoryand the newly set up CCP (Central ClearingCounterparty) for the derivatives market andThe Compensation Fund, BVB is currently partof the BVB Financial Group.
FUTURE OUTLOOK
2009 proved to be eventually a better year thanexpected, as the local stock market performedbeyond expectations. Although, it was a volatilemarket, all BVB indices performed positivelyduring 2009, with even higher performances ofthe sector indices than the blue-chip index BET.BET recorded a 60% recovery at the end of theyear, while the financial services sector indexBET-FI rose almost 90% compared to theprevious year-end.
Liquidity was the main concern of both marketparticipant but also of the BVB management.The average daily turnover contracted to Euro5.4 mil from Euro9.3 million in 2008. Therefore,the main objective of the BVB management willbe to improve the market liquidity. All effortsare made to attract new companies for listingand to launch new products. In this respect,BVB is having discussions with key players inthe ETF markets that are interested inlaunching these products locally.
With assets worth more than Euro 3 billion, thelisting of the Property Fund has been the mostawaited event for the last couple of years. Theselected fund manager, American companyFranklin Templeton, is looking to finalize theFund listing by the end of 2010.
As the political effervescence was left behindafter the elections end, the IMF stand-byagreement is well on track and real signs ofeconomic recovery already exist, BVB believesthat 2010 will bring considerable enhancementin the turnover and liquidity at BVB.
What it is to be considered a cornerstone inBVB Exchange’s modern history is the decisionto list BVB shares on its trading platform. Thismajor event is expected to take place in thefirst half of 2010.
Anca DumitruCEO
FEDERATION OF EURO-ASIAN STOCK EXCHANGES ANNUAL REPORT JUNE 2010
PAGE 72

BUCHAREST STOCK EXCHANGE
FEDERATION OF EURO-ASIAN STOCK EXCHANGES ANNUAL REPORT JUNE 2010
PAGE 73
OFFICIAL 6 MONTH STATISTICS
US$ millions # Shares millionsTotal Volume Average Daily Volume Total Volume Average Daily Volume
StocksJul-09 101.35 4.41 852.11 37.05
Aug-09 191.56 9.12 1,259.68 59.99Sep-09 223.34 10.15 1,980.05 90.00Oct-09 174.59 7.94 1,129.45 51.34Nov-09 147.48 7.02 734.64 34.98Dec-09 187.20 11.01 781.77 45.99TOTAL 1,025.50 8.28 6,737.71 53.22
BondsJul-09 43.53 2.56 0.31 0.02
Aug-09 27.26 1.70 0.45 0.03Sep-09 68.11 3.78 0.14 0.01Oct-09 125.07 6.58 0.38 0.02Nov-09 4.58 0.27 0.02 0.00Dec-09 82.30 5.49 0.37 0.02TOTAL 350.85 3.40 1.66 0.02
OtherJul-09 1.32 0.08 0.00 0.00
Aug-09 1.02 0.07 0.00 0.00Sep-09 6.86 0.40 0.00 0.00Oct-09 1.81 0.14 0.00 0.00Nov-09 0.00 0.00 2.34 0.17Dec-09 4.28 0.29 0.00 0.00TOTAL 15.29 0.16 2.35 0.03
0
50
100
150
200
250
MONTHLY STOCK VOLUME VS INDEX(US$ millions)
MONTHLY MARKET CAPITALIZATION(US$ millions)
0
5,000
10,000
15,000
20,000
25,000
30,000
Stocks Index
Jul Aug Sep Oct Nov DecJul Aug Sep Oct Nov Dec05001,0001,5002,0002,5003,0003,5004,0004,5005,000
Market Capitalization(US$ millions) Index
Jul-09 22,147.18 3,920.30Aug-09 25,850.78 4,249.22Sep-09 28,104.62 4,397.40Oct-09 26,539.88 4,469.06Nov-09 29,430.55 4,841.58Dec-09 27,455.68 4,690.57
CONTACT INFORMATION
Contact Name Ms. Daniela Dimcica E-mail [email protected] Website www.bvb.ro

FEDERATION OF EURO-ASIAN STOCK EXCHANGES ANNUAL REPORT JUNE 2010
PAGE 74
BUCHAREST STOCK EXCHANGE
ECONOMIC AND POLITICAL DEVELOPMENTS
Economic and Political EnvironmentRomania was plunged into a political crisis inOctober after the Social Democratic Party (SDP)withdrew from the government, leaving a minorityDemocratic Liberal Party (DLP) administration ledby the prime minister, Emil Boc, to face aparliamentary censure motion on October 13th.Mr Boc's government became the first post-communist government in Romania to fall as aresult of a successful no-confidence vote inparliament. A new government is unlikely to beformed until after the presidential election in earlyDecember.
Romania was a net recipient of EU funding ofEUR1.4bn (US$2.1bn) in 2008, and EUassistance to Romania will play a central role inpreventing a sharper economic collapse andstimulating economic recovery. The EuropeanCommission's full report on Romania's progressin implementing judicial reform and combatingcorruption, released on July 22nd, recommendedthat safeguard clauses, which could haveincluded financial sanctions, should not beimplemented, in view of the progress made sincethe publication of the previous full report in July2008. The EU is also likely to have been alarmedby the speed with which the current political crisisdeveloped, and by the apparent inability ofleading political figures to compromise in order tofind a solution.
Economic PerformanceIn 2007-08 the minority NLP governmentimplemented loose fiscal and wage policies at atime of excess aggregate demand, contributing toburgeoning current-account deficits, which werelargely financed by inflows of private capital.Consequently, Romania faced structuralmacroeconomic deficits that were aggravated by the international financial crisis of September2008. The crisis choked off external finance and hit investor confidence, resulting in anaccelerated depreciation of the leu and significantfalls on the Bucharest Stock Exchange (BSE).
In March 2009 the new government secured aprogramme of financial support worth EUR19.5bnfrom the IMF, the EU, the European InvestmentBank (EIB), and the European Bank forReconstruction and Development (EBRD), to bedisbursed over two or three years. It is intendedthat these credits will be repaid from 2011, largelythrough improved absorption of EU grant finance.
Only a modest recovery is expected in 2010, withgrowth forecast at 1%, following an estimatedcontraction of 7.6% in 2009. Real GDP fell by7.6% year on year in the first half of 2009. In thesecond quarter it fell by 8.7% year on year and by1.1% quarter on quarter–the fourth consecutivequarterly decline. We expect further quarter-on-quarter falls in the third and fourth quarters, asdomestic consumption remains depressed. Aftera slow recovery in 2010, growth is forecast torebound in 2011, to 4%. There is still a downsiderisk that the recession will be deeper and moreprotracted than in our baseline forecast,especially if additional austerity measures arerequired in 2010-11 to bring budget deficits intoline with EU targets.
After slowing to an estimated average of 5.4% in2009, average consumer price inflation is forecastto decelerate further, to 3.5% in 2010 and to 3.4%in 2011. The depreciation of the leu provided animpetus to inflation in early 2009, but low world oilprices (relative to 2007-08), as well as fallinginternational and domestic demand, exerteddownward pressure on prices as the yearprogressed. Consumer prices rose by 3.2% inJanuary-September 2009, taking the year-on-yearrate to 4.9% in September. We estimate that thecontraction in domestic demand, and the fall incost-push inflation from energy and food prices,will bring inflation below the top end of the NBR'starget range by the end of 2009. Provided thatfiscal and incomes policies are tightened, andthat wage growth is curtailed, inflation should fallto 3.8% by the end of 2010, and to around 3.3%by the end of 2011. The main risks to the inflation
forecast are tied to the exchange rate, which maycome under further downward pressure, and tothe possibility that the rate of value-added tax(VAT) may be raised in 2010.
The leu fell to a historic low of Lei3.4:US$1 and ofLei4.3:EUR1 in February 2009, despiteinterventions by the NBR, but rallied after theannouncement of multilateral assistance inMarch. The leu appreciated against both the USdollar and the euro before the political crisis inlate 2009, but fell back towards Lei4.3:EUR1thereafter. The NBR has announced that itsinterventions in the foreign-exchange market willbe "cautious", which could result in increasedvolatility. Its attempts to mitigate this will behelped by its strengthened foreign-exchangereserves, which reached EUR28.3bn at the end ofSeptember. A correction to the exchange rate ofthe long-overvalued leu was desirable, givenworries about declining competitiveness.However, based on estimates of equilibriumexchange rates, it is possible that the leu is stillsignificantly overvalued. The potential problemsfor Romania's competitiveness are compoundedby the fact that other currencies in the regiondepreciated substantially in 2009.
The current-account deficit shrank by 79% yearon year in January-August 2009, to EUR2.4bn,mainly because of a 69% contraction of the tradedeficit, to EUR3.9bn, and a 61% reduction in theincome deficit, as repatriated profits from directinvestment declined. However, the currenttransfers surplus declined by 31% and servicesrecorded a small deficit, compared with aEUR448m (US$630m) surplus in the year-earlierperiod. A sharp downward adjustment of thecurrent-account deficit, from 12.4% of GDP in2008 to around 5% of GDP, is estimated in 2009.Slower lending and wage growth will keep acheck on both imports and the trade deficit in2010-11.*
* The Economist Intelligence Unit Limited, November 2009
Key Information ContactsNational Securities Commission www.cnvmr.roMinistry of Public Finance www.mfinante.ro National Bank of Romania www.bnro.roUNOPC www.unopc.roNational Institute of Statistics www.insse.roRomanian capital market www.kmarket.ro
0
50
100
150
200
250
REAL GDP(ROL millions)
CONSUMER PRICES (% CHANGE PA; AV)(%)
4.04.55.05.56.06.57.07.58.08.59.0
2005 2006 2007 2008 2009 2010 2005 2006 2007 2008 2009 2010

FEDERATION OF EURO-ASIAN STOCK EXCHANGES ANNUAL REPORT JUNE 2010
PAGE 75
BUCHAREST STOCK EXCHANGE
ROMANIA ECONOMIC CHARTS AND TABLES
2005 2006 2007 2008 2009 2010
Nominal GDP (US$ at PPP) bil US$ 203 226 246 269 253 (a) 259 (b)Real GDP bil ROL 180 194 206 221 204 (a) 206 (b)Real private consumption bil ROL 150 167 184 199 174 (a) 175 (b)Real government consumption bil ROL 11 11 12 12 12 (a) 13 (b)Real gross fixed investment bil ROL 44 52 67 80 62 (a) 64 (b)Real stockbuilding bil ROL 3 3 1 3 -1 (a) 1 (b)Real exports of G&S bil ROL 74 81 88 106 95 (a) 100 (b)Real imports of G&S bil ROL 99 121 153 180 138 (a) 147 (b)Real domestic demand bil ROL 207 233 263 294 248 (a) 252 (b)Real GDP at factor cost bil ROL 44 47 50 54 50 (a) 50 (b)Real agriculture bil ROL 6 6 5 6 6 (a) 6 (b)Real industry bil ROL 16 18 20 21 19 (a) 19 (b)Real manufacturing bil ROL 14 14 15 15 14 (a) 14 (b)Real services bil ROL 22 23 26 27 25 (a) 25 (b)Gross national savings rate (%) % 14.6 16.0 17.5 19.0 19.2 (a) 18.9 (b)Gross national savings/investment % 62.7 60.6 143.9 60.5 81.3 (a) 80.6 (b)Budget balance (% of GDP) % -0.8 -1.5 -3.1 -4.8 -7.9 (a) -5.9 (b)Consumer prices (% change pa; av) % 9.0 6.6 4.8 7.8 5.5 (a) 4.2 (b)Exchange rate LCU:US$ (av) ROL/US$ 2.9137 2.8090 2.4383 2.5189 3.0500 (a) 2.9500 (b)Lending interest rate (%) % 19.6 14.0 13.3 15.1 17.0 (a) 14.0 (b)Stock of domestic credit bil ROL 60 83 145 206 243 (a) 288 (b)Domestic credit growth (%) % 43.7 38.5 74.5 42.6 17.8 (a) 18.5 (b)Deposit interest rate (%) % 6.4 4.8 6.7 9.6 12.0 (a) 10.0 (b)Population million 21.6 21.5 21.5 21.5 21.5 (a) 21.4 (b)GDP per head ($ at PPP) US$ 9,393 10,485 11,453 12,540 11,790 (a) 12,090 (b)Current account balance/GDP % -8.7 -10.4 -13.6 -12.4 -4.4 (a) -4.6 (b)International reserves bil US$ 22 30 40 39 45 (a) 49 (b)Trade balance bil US$ -10 -15 -24 -27 -10 (a) -11 (b)Foreign-exchange reserves bil US$ 20 28 37 37 42 (a) 45 (b)Total foreign debt bil US$ 39 54 85 98 (a) 114 (a) 121 (b)Public medium & long-term bil US$ 13 14 15 17 (a) 19 (a) 20 (b)Private medium & long-term bil US$ 18 23 40 50 (a) 63 (a) 64 (b)IMF debt bil US$ 0 0 0 0 9 14 (b)Short term bil US$ 7 17 31 31 (a) 23 (a) 24 (b)Net debt bil US$ 17 24 45 58 (a) 69 (a) 72 (b)Export credits bil US$ 0 0 0 0 0 (a) 0 (b)
(a) Estimate (b) Forecast
The Economist Intelligence Unit Limited, September 2009.
-30
-25
-20
-15
-10
-5
0
TRADE BALANCE(US$ billions)
2005 2006 2007 2008 2009 20100
10
20
30
40
50
60
70
80
REAL GROSS FIXED INVESTMENT(ROL millions)
2005 2006 2007 2008 2009 2010

BULGARIAN STOCK EXCHANGE
Our Exchange plans also to introduce someadditional technological innovations andimprovements to our trading system.
In terms of market performance 2009 wasprobably the worst year for the Bulgarian StockExchange in the last decade. The globalfinancial crisis had its hardest impact onBulgaria in 2008/2009 and as a result ourcapital market suffered significant losses. Hereare some figures illustrating the negative effectof the crisis on a year-to-year basis: thetrading turnover decreased by 46%, thetrading volume of shares went down by 17%and the number of transactions – by 49%.
Nevertheless, in 2009 we managed topreserve a significant interest among thepotential issuer companies and investors inthe stock market. We registered 51 new issuesfor trading on the BSE, 1 of which was an IPO,15 – secondary listings, 15 – bond issues, 14 -capital increases through rights issues, 4 –
mutual funds and 2 –REIT’s. The main indexSOFIX showed a more stable performanceand gained almost 20% in the same period.
We believe that in 2010 the country will beslowly getting out of the economic recession,which will also have a positive effect on thefinancial sector, incl. the capital market. Weexpect a gradual increase in public offeringsand new listings, as well as an ongoingprocess of regaining the investors’ trust in thestock market.
As of January 20th 2010 a new managementboard has been put in place by the generalshareholders assembly of the BSE. The newboard sees as its main mission for the coming period (1) to improve the trust andcommunication among the key players and
institutions on the Bulgarian capital market, (2)to help modernize the post-trading services inorder to enhance dual listings and launchderivatives trading in the near future and (3) tofurther improve the image of the BSE in thecountry and abroad by raising its operationalefficiency.
After having been successfully connected tothe Deutsche Boerse trading platform XETRAin June 2008, our Exchange plans also tointroduce some additional technologicalinnovations and improvements to our tradingsystem, which should make the Bulgarianmarket even more attractive to the foreigninvestors, as well as to the local ones.
HISTORY AND DEVELOPMENT
The first Stock Exchange Act was adopted in1907 and regulated the structure andoperations of stock and commoditiesexchanges. The Securities, Stock Exchanges &Investment Intermediaries Act was adopted inJuly 1995, which led to a process of stockexchange consolidation. In July 1997, thepresent Bulgarian Stock Exchange-Sofia wasestablished. In accordance with therequirements of the new law, a Securities &Stock Exchange Commission was set up.
On 9 October 1997 the Commission officiallylicensed the BSE-Sofia. The first tradingsession on the regulated market took place on21 October 1997. By the end of 1999 therewere 32 companies listed on the Official Marketand about 1,000 companies admitted fortrading on the Free (OTC) Market as a result ofthe mass privatization program. On 6December 2001 the Commission officiallylicensed the BSE-Sofia to organize anUnofficial Market, which replaced the FreeMarket and set clear rules for regulation of allcompanies traded on the Exchange.
In December 1999 a new Public Offering ofSecurities Act was adopted by the Parliament.The law is aimed at providing protection forinvestors and creating prerequisites for thedevelopment of a transparent capital market in
Bulgaria with criteria similar to those of theEuropean Union.
The Securities & Stock Exchange Commissionwas first renamed the National SecuritiesCommission, but in March 2003 it wasreplaced by a new supervisory body - theFinancial Supervision Commission (FSC). Morethan just a name change, the move pulledtogether the regulation of a number of financial(non-banking) sectors under one body. Theregulatory changes during the year directlyimproved conditions for investors and issuers,as well as underlined the government’scommitment to encourage wider overalldevelopment of the capital markets.
FUTURE OUTLOOK
Although 2009 was characterized by a certainstabilization of the Bulgarian capital market andthe stock prices even registered an increase ofaround 25%, the overall situation remainedextremely volatile. There are certain signs latelythat the crisis is slowly coming to an end,which gives many analysts the reason tobelieve that 2010 will be the year of therecovery.
Despite the difficulties on the market, causinglow trading volumes and turnover, lack of newlistings and investors’ interest, the BulgarianStock Exchange followed a pro-active strategy
with the aim of attracting new companies andregaining the investors’ trust. This will remainthe core policy of the BSE in 2010, while at thesame time efforts will also be pursued todevelop new services for the members andintroduce new instruments on the market. Theexchange plans to launch this year a newsegment for structured products, mainlywarrants and certificates.
The key players on the market welcomed thegovernment’s plans to privatize fully or partiallythrough the stock exchange some of the stateowned monopolies. Special attention is givento the idea to list stakes of energy producingand energy distributing companies. The overallperception is that such listings will not onlyboost the liquidity on the market, but attract asubstantial amount of foreign investment.
Among the BSE’s priorities in 2010 will be toimprove the post-trading procedures in closeco-operation with the Central Depository inorder to facilitate the clearing and settlement oftransactions executed by foreign dealers, as well as to promote dual listings.
Co-operation with partner exchanges fromFEAS, development of common strategies forattracting global investors will also remain animportant part of BSE’s activities in 2010.
Ivan Takev CEO
FEDERATION OF EURO-ASIAN STOCK EXCHANGES ANNUAL REPORT JUNE 2010
PAGE 76
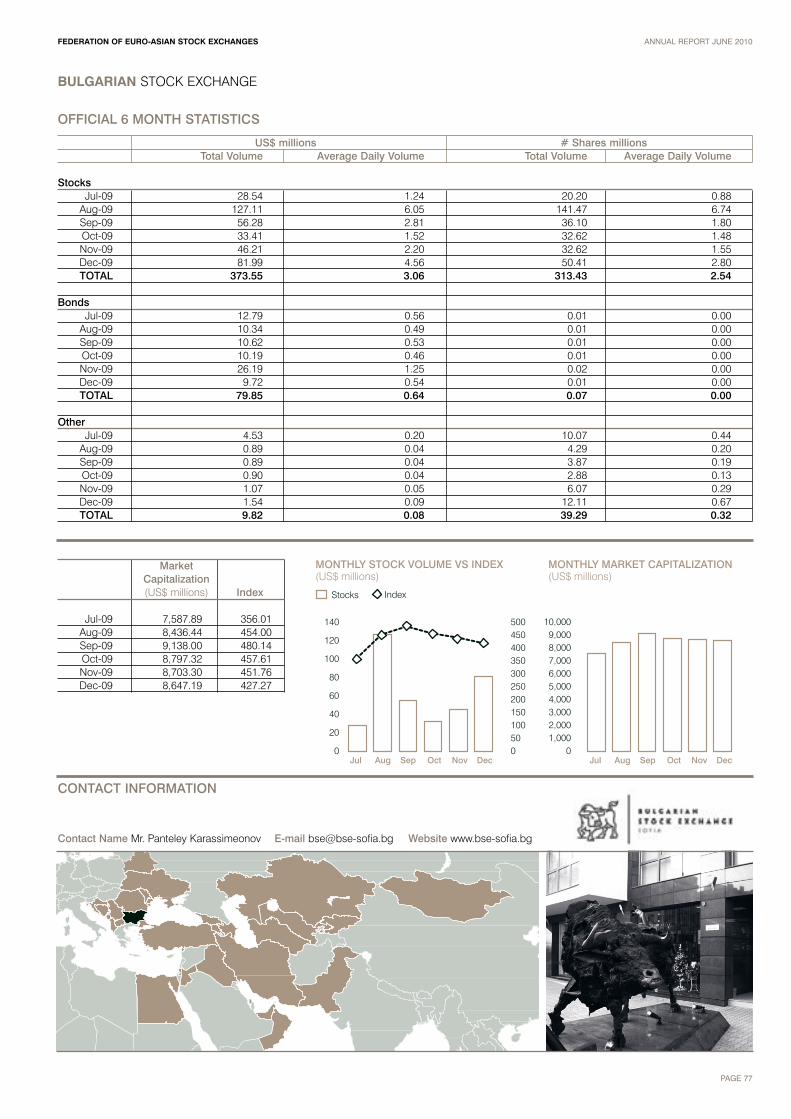
BULGARIAN STOCK EXCHANGE
FEDERATION OF EURO-ASIAN STOCK EXCHANGES ANNUAL REPORT JUNE 2010
PAGE 77
OFFICIAL 6 MONTH STATISTICS
US$ millions # Shares millionsTotal Volume Average Daily Volume Total Volume Average Daily Volume
StocksJul-09 28.54 1.24 20.20 0.88
Aug-09 127.11 6.05 141.47 6.74Sep-09 56.28 2.81 36.10 1.80Oct-09 33.41 1.52 32.62 1.48Nov-09 46.21 2.20 32.62 1.55Dec-09 81.99 4.56 50.41 2.80TOTAL 373.55 3.06 313.43 2.54
BondsJul-09 12.79 0.56 0.01 0.00
Aug-09 10.34 0.49 0.01 0.00Sep-09 10.62 0.53 0.01 0.00Oct-09 10.19 0.46 0.01 0.00Nov-09 26.19 1.25 0.02 0.00Dec-09 9.72 0.54 0.01 0.00TOTAL 79.85 0.64 0.07 0.00
OtherJul-09 4.53 0.20 10.07 0.44
Aug-09 0.89 0.04 4.29 0.20Sep-09 0.89 0.04 3.87 0.19Oct-09 0.90 0.04 2.88 0.13Nov-09 1.07 0.05 6.07 0.29Dec-09 1.54 0.09 12.11 0.67TOTAL 9.82 0.08 39.29 0.32
0
20
40
60
80
100
120
140
MONTHLY STOCK VOLUME VS INDEX(US$ millions)
MONTHLY MARKET CAPITALIZATION(US$ millions)
01,0002,0003,0004,0005,0006,0007,0008,0009,000
10,000
Stocks Index
Jul Aug Sep Oct Nov DecJul Aug Sep Oct Nov Dec050100150200250300350400450500
Market Capitalization(US$ millions) Index
Jul-09 7,587.89 356.01Aug-09 8,436.44 454.00Sep-09 9,138.00 480.14Oct-09 8,797.32 457.61Nov-09 8,703.30 451.76Dec-09 8,647.19 427.27
CONTACT INFORMATION
Contact Name Mr. Panteley Karassimeonov E-mail [email protected] Website www.bse-sofia.bg

FEDERATION OF EURO-ASIAN STOCK EXCHANGES ANNUAL REPORT JUNE 2010
PAGE 78
BULGARIAN STOCK EXCHANGE
ECONOMIC AND POLITICAL DEVELOPMENTS
Economic and Political EnvironmentIn the aftermath of a resounding victory in theparliamentary election in July 2009, the centre-right CEDB has set out to govern alone,despite lacking a majority in parliament (theCEDB won 116 out of 240 seats). Thispresents some risk to political stability,although the prime minister and CEDB leader,Boiko Borisov–who until the election victorywas the mayor of the capital, Sofia–feels thatthis is the most effective path and hopes thatthe other centre-right and right-wing parties inparliament.
In 2008 the European Commission took a hardline with Bulgaria regarding EU funds. Thesuspension and loss of some EU funds hasdelayed the implementation of severalimportant projects related to infrastructure,institution-building and agriculturaldevelopment. However, it is also galvanisingthe authorities to demonstrate greatercommitment to the kind of judicial andadministrative reforms demanded by theCommission. These reforms, if continued,should deliver more tangible results in the fightagainst corruption and organised crime.
Economic PerformanceThe recovery in 2010 is expected to bemodest, with world growth picking up to 3.2%at PPP exchange rates, and the euro zoneeconomy growing by just 0.8%. The weaknessof demand in the EU will continue to curtailBulgarian exports of goods and services. Theaverage price for dated Brent Blend crude oilto is estimated to have reached US$62/barrelin 2009, and expect it to rise to US$75/b in
2010, before slipping to US$70/b in 2011. Thedecline in real GDP worsened in the thirdquarter, to 5.8% year on year, compared with4.9% year on year in the second quarter and3.5% in the first quarter. Industrial output andretail trade remain subdued, the constructionsector is struggling, and the rise inunemployment has intensified. Real GDP iscontracting because of falling domesticdemand and the lack of external demand forBulgarian exports. Private consumption isdeclining significantly as a result of the pooroutlook for jobs and wages, limited availabilityof borrowing, the repayment of debt, and thenegative wealth effect from lower houseprices. The scarcity of external finance isleading to an abrupt scaling back ofinvestment activity. Bulgaria's foreign sales aresuffering a sharp decline in 2009, but weexpect the fall in imports to be greater, whichwill help the ongoing correction of the largecurrent-account deficit and is allowing trade tomake a positive contribution to growth in 2009.
Political commitment to the currency boardarrangement remains strong, and thearrangement is expected to stay in place untileuro adoption in 2013-14, with the lev fixed tothe euro at the rate of Lv1.95583:EUR1. Thegovernment will apply for entry into the EU'sexchange-rate mechanism (ERM2) in February2010. Despite a sharp drop in inflationcompared with 2008, the real effectiveexchange rate (REER) of the lev is continuingto appreciate in 2009, owing to the fall in thevalue of the currencies of many of Bulgaria'strade competitors. At this stage, concernsabout competitiveness are not likely to prompt
a move away from the currency board, butadditional pressure would arise if Latvia andthe other Baltic states were to give up theircurrency pegs.
The contraction of the merchandise tradedeficit has been the main factor behind thepartial correction of the current-account deficitin 2009. The current-account deficit to isexpected to turn 10.9% of GDP in 2009 andforecast that it will average 7.7% GDP in 2010-11, down from 25.2% of GDP in 2008. Thisforecast depends on a sharp contraction inimports–sharp enough to outweigh theestimated contraction in exports in 2009–asincomes fall, consumers become morecautious, and firms import fewer goods forfixed investment in response to the depressedeconomic outlook and a scarcity of externalfinance.*
* The Economist Intelligence Unit Limited, December 2009
Key Information ContactsFinancial Supervision Commission www.fsc.bgCentral Depository www.csd-bg.bgBulgarian National Bank www.bnb.bgInvest Bulgaria Agency www.investbg.government.bg National Statistical Institute www.nsi.bg
0
5
10
15
20
25
30
35
40
45
REAL GDP(BGL millions)
CONSUMER PRICES (% CHANGE PA; AV)(%)
2
4
6
8
10
12
14
2005 2006 2007 2008 2009 2010 2005 2006 2007 2008 2009 2010

FEDERATION OF EURO-ASIAN STOCK EXCHANGES ANNUAL REPORT JUNE 2010
PAGE 79
BULGARIAN STOCK EXCHANGE
BULGARIA ECONOMIC CHARTS AND TABLES
2005 2006 2007 2008 2009 2010
Nominal GDP (US$ at PPP) bil US$ 72 (a) 79 (a) 87 (a) 94 (a) 90 (a) 92 (b)Real GDP mil BGL 34,975 37,186 39,480 41,854 39,618 (a) 39,873 (b)Real private consumption mil BGL 24,721 27,074 28,509 29,887 27,596 (a) 27,596 (b)Real government consumption mil BGL 5,814 5,734 5,913 5,914 6,092 (a) 5,909 (b)Real gross fixed investment mil BGL 8,969 10,288 12,521 15,073 12,209 (a) 12,355 (b)Real stockbuilding mil BGL 1,718 2,533 3,051 2,589 -200 (a) -100 (b)Real exports of G&S mil BGL 23,373 25,415 26,748 27,524 23,279 (a) 23,635 (b)Real imports of G&S mil BGL 29,865 34,052 37,418 39,246 29,471 (a) 29,636 (b)Real domestic demand mil BGL 41,222 45,629 49,994 53,462 45,697 (a) 45,760 (b)Real GDP at factor cost mil BGL 29,809 (a) 31,748 (a) 33,748 (a) 35,807 (a) 33,894 (a) 34,112 (b)Real agriculture mil BGL 3,341 (a) 3,345 (a) 2,352 (a) 2,930 (a) 2,857 (a) 2,880 (b)Real industry mil BGL 8,021 (a) 8,308 (a) 9,471 (a) 9,755 (a) 8,390 (a) 8,423 (b)Real manufacturing mil BGL n/a n/a n/a n/a n/a n/aReal services mil BGL 18,551 (a) 19,585 (a) 21,054 (a) 22,296 (a) 21,839 (a) 21,995 (b)Gross national savings rate (%) % 15.7 13.8 14.8 (a) 13.1 (a) 17.6 (a) 20.0 (b)Gross national savings/investment % 56.1 43.6 40.1 34.2 (a) 61.8 (a) 70.3 (b)Budget balance (% of GDP) % 3.1 3.5 3.5 3.0 (a) -0.7 (a) 0.3 (b)Consumer prices (% change pa; av) % 5.0 7.3 8.4 12.3 2.7 (a) 2.0 (b)Exchange rate LCU:US$ (av) BGL/US$ 1.5700 1.5576 1.4290 1.3305 1.4015 (a) 1.3749 (b)Lending interest rate (%) % 8.7 8.9 10.0 10.9 11.1 (a) 10.9 (b)Stock of domestic credit mil BGL 18,300 21,090 33,485 44,531 (a) 46,924 (a) 48,908 (b)Domestic credit growth (%) % 33.0 15.2 58.8 33.0 (a) 5.4 (a) 4.2 (b)Deposit interest rate (%) % 3.1 3.2 3.7 4.4 6.2 (a) 5.4 (b)Population million 7.7 7.6 7.6 7.5 (a) 7.5 (a) 7.4 (b)GDP per head ($ at PPP) US$ 9,410 (a) 10,390 (a) 11,430 (a) 12,440 (a) 12,020 (a) 12,340 (b)Current account balance/GDP % -12.3 -17.9 -22.0 -25.2 (a) -10.9 (a) -8.4 (b)International reserves bil US$ 9 12 18 18 17 (a) 17 (b)Trade balance bil US$ -5 -7 -10 -13 -7 (a) -6 (b)Foreign-exchange reserves bil US$ 8 11 16 17 16 (a) 16 (b)Total foreign debt bil US$ 16 21 33 50 (a) 51 (a) 51 (b)Public medium & long-term bil US$ 5 5 5 5 7 (a) 9 (b)Private medium & long-term bil US$ 6 8 14 26 (a) 29 (a) 30 (b)IMF debt bil US$ 1 0 0 0 0 0 (b)Short term bil US$ 4 8 14 19 15 (a) 12 (b)Net debt bil US$ 7 9 15 32 (a) 33 (a) 34 (b)Export credits bil US$ 0 0 0 0 0 (a) 0 (b)
-14
-12
-10
-8
-6
-4
-2
0
TRADE BALANCE(US$ billions)
2005 2006 2007 2008 2009 20100
2
4
6
8
10
12
14
16
REAL GROSS FIXED INVESTMENT(BGL millions)
2005 2006 2007 2008 2009 2010
(a) Estimate (b) Forecast
The Economist Intelligence Unit Limited, December 2009

EGYPTIAN EXCHANGE
Despite the decrease in the number oflisted companies, the total marketcapitalization reached LE 500 billion thisyear, surging by 5%.
Despite the repercussions of the global financialcrisis, the Egyptian market has shown a goodperformance during 2009. The year has started,though, on a negative note till February, whereEGX 30 Index touched one of its lowest levels overthe past four years, however it bounced back by83% from its lowest point in year 2009 to concludethe year with an annual increase of 35%.
EGX has also been able to achieve good tradingrecords in 2009, with a total trading value of LE448 billion compared to LE 530 billion in theprevious year. Meanwhile, the volume tradedsoared to 37 billion securities in 2009 surging by43% compared to last year. Likewise, the numberof transactions recorded 15 million transactionsthis year versus 13.5 million in 2008.
The number of listed companies continued todecrease, reaching 306 companies at the end of2009, down from 373 at the end of 2008, owing toEGX effective policy in enforcing listing, disclosureand corporate governance rules on issuers. Thepercentage of the total number of tradedcompanies to listed companies reached 94% in2009, up from 86% in the previous year. Despitethe decrease in the number of listed companies,the total market capitalization reached LE 500
billion this year, surging by 5% compared to thelast year, representing 48% of GDP.
Moreover, EGX continued its efforts to increase thetransparency available in the market. In thatrespect, EGX launched 2 new price indices; EGX70 Price Index, that measures the performance ofthe 70 active companies, after excluding the 30most active constituent-companies of EGX 30Index, as well as EGX 100 Price Index, that tracksthe performance of the 100 active companies,including both the 30 constituent-companies ofEGX 30 Index and the 70 constituent-companiesof EGX 70 Index. Both indices, EGX 70 index andEGX 100, soared during 2009 to conclude theyear with an increase of 33% and 36%,respectively.
Additionally, EGX launched a new version of itswebsite; www.egx.com.eg, that includes a wealthof information about EGX indices, issuerinformation, market data, education corner,international relations and information services,with a better navigation, more user-friendlyinterface and easier access to information.
With regards to NILEX, the mid and small capmarket in the EGX, thirteen financial institutions
were granted the license to be nominated advisorsduring 2009, raising the number of nominatedadvisors in NILEX, to 23 financial institutions,which reflects the interest of many financialinstitutions in the small and medium enterprises.Four companies, operating in different sectors,have got listed on NILEX to conclude 2009 withseven listed companies.
On the international front, EGX is eager tostrengthen and maintain strong relations with theregional and international exchanges andassociations. During 2009, EGX signedmemoranda of Understanding with severalExchanges, namely; Casablanca SE, ShenzhenSE, Amman SE, Libyan Stock Market and the IraqiSE. The MoUs tackled the areas of mutualcooperation on capital markets' developmentsincluding exchange of information, experts, staffand experiences for the respective benefit of thesecurities markets.
With these developments in the market, I trust thatEGX is on the right path to achieve its vision ofbeing a World-Class Egypt-based Exchange: thePremier Capital Market in the Middle East & NorthAfrica Region.
HISTORY AND DEVELOPMENT
The Egyptian Exchange (EGX), formerly Cairo &Alexandria Stock Exchanges (CASE), dates back tomore than 125 years. Operating through twolocations, the Alexandria Stock Exchange wasofficially established in 1883, followed by CairoStock Exchange in 1903. In 1997, the PresidentialDecree No. 51/1997, re-defined the legal structureof the Exchanges and since then both Exchangeswere managed by one Chairman and the sameBoard of Directors. The two exchanges were veryactive in the 1940s to the extent that they rankedfifth among the world exchanges. The socialistregime and the nationalization policy in the early1960s have put both CASE on hold, then in 1991,Egypt’s new era of economic reform started. Thus,by 1992, the role of CASE was re-activated, having656 listed companies on the trading system.
Despite the repercussions of the global financialcrisis, the Egyptian market has shown a goodperformance during 2009 with its main index EGX30 concluding the year with an annual increase of35%. On the other hand, EGX has been able toachieve good trading records in 2009, with a totaltrading value of LE 448 billion compared to LE 530billion in the previous year. However, the volumetraded soared to 37 billion securities in 2009compared to 26 billion securities in 2008, surgingby 43% compared to last year. Likewise, thenumber of transactions recorded 15 milliontransactions this year versus 13.5 million in 2008.In its efforts to continue the enhancement of themarket activity and transparency, EGX launched 2
new price indices; EGX 70 Price Index, thatmeasures the performance of the 70 activecompanies, after excluding the 30 most activeconstituent-companies of EGX 30 Index, as well asEGX 100 Price Index, that tracks the performanceof the 100 active companies, including both the 30constituent-companies of EGX 30 Index and the 70constituent-companies of EGX 70 Index. Bothindices, EGX 70 index and EGX 100, soared during2009 to conclude the year with an increase of 33%and 36%, respectively.
From another perspective, the Listing and De-listing Rules were amended to ensure furtherenforcement of corporate governance and to retainand attract quality issuers as well as regulating thetrading of EDRs and ETFs.
In its endeavor to keep abreast with technologicaladvancements in order to be the Premier market inthe Middle East North African (MENA) Region thatbest serves its stakeholders, EGX signed anagreement with London SE to connect the 2markets via FIX connectivity system. This willfacilitate capital flow from London to Egypt andvice versa and set EGX as the hub in the MiddleEast and African region.
Additionally, EGX launched a new version of itswebsite; www.egx.com.eg, that includes a wealthof information about EGX indices, issuerinformation, market data, education corner,international relations and information services,with a better navigation, more user-friendlyinterface and easier access to information.
On the international front, EGX has signed during2009 memoranda of Understanding with severalExchanges, namely; Casablanca SE, ShenzhenSE, Amman SE, Libyan Stock Market and the IraqiSE. The MoUs tackled the areas of mutualcooperation on capital markets' developmentsincluding exchange of information, experts, staffand experiences for the respective benefit of thesecurities markets.
These developments are expected to promote theactivity of the Egyptian market, which has beenperceived as one of the most developed emergingmarkets during the past years.
FUTURE OUTLOOK
• Continuous development of the regulatoryinfrastructure to increase the quality of servicesand ensure investor protection.• Increasing the product mix available to investorsby listing and trading ETFs, Sukuks and laterderivatives, etc.• Encouraging dual listing of blue chip companiesand more investment flows to the market. EGXplans for three road shows covering the US, FarEast and the MENA regions.• Listing selected prominent and fast growing midand small cap companies on Nilex.• Continuous enhancement of EGX internationalrelations with stock exchanges around the globeas well as regional and international federationsand associations working in the exchange industry.
Maged Shawky SourialChairman
FEDERATION OF EURO-ASIAN STOCK EXCHANGES ANNUAL REPORT JUNE 2010
PAGE 80

EGYPTIAN EXCHANGE
FEDERATION OF EURO-ASIAN STOCK EXCHANGES ANNUAL REPORT JUNE 2010
PAGE 81
OFFICIAL 6 MONTH STATISTICS
US$ millions # Shares millionsTotal Volume Average Daily Volume Total Volume Average Daily Volume
StocksJul-09 3,378.94 168.95 2,133.15 106.66
Aug-09 4,786.46 217.57 2,573.42 116.97Sep-09 3,786.11 199.27 1,642.32 86.44Oct-09 4,280.73 214.04 1,873.98 93.70Nov-09 5,707.87 285.39 1,531.22 76.56Dec-09 4,613.86 200.60 1,676.25 72.88TOTAL 26,553.98 214.30 11,430.34 92.20
BondsJul-09 546.24 27.31 2.97 0.15
Aug-09 1,007.30 45.79 5.46 0.25Sep-09 455.22 23.96 2.56 0.13Oct-09 553.38 27.67 2.90 0.15Nov-09 446.67 22.33 2.45 0.12Dec-09 600.86 26.12 3.20 0.14TOTAL 3,609.67 28.86 19.54 0.16
OtherJul-09 389.22 19.46 516.30 25.82
Aug-09 350.84 15.95 444.65 20.21Sep-09 473.34 24.91 445.08 23.43Oct-09 480.24 24.01 467.68 23.38Nov-09 14,143.09 707.15 1,003.23 50.16Dec-09 1,001.61 43.55 632.42 27.50TOTAL 16,838.34 139.17 3,509.36 28.42
0
1,000
2,000
3,000
4,000
5,000
6,000
MONTHLY STOCK VOLUME VS INDEX(US$ millions)
MONTHLY MARKET CAPITALIZATION(US$ millions)
0
20,000
40,000
60,000
80,000
100,000
120,000
Stocks Index
Jul Aug Sep Oct Nov Dec Jul Aug Sep Oct Nov Dec0
1,000
2,000
3,000
4,000
5,000
6,000
7,000
Market Capitalization(US$ millions) Index
Jul-09 89,768.49 6,052.44Aug-09 96,632.85 6,596.61Sep-09 102,299.43 6,633.82Oct-09 100,200.80 6,838.33Nov-09 89,081.59 5,761.96Dec-09 91,004.33 6,092.17
CONTACT INFORMATION
Contact Name Ms. Heba Serafi E-mail [email protected] Website www.egx.com.eg

FEDERATION OF EURO-ASIAN STOCK EXCHANGES ANNUAL REPORT JUNE 2010
PAGE 82
EGYPTIAN EXCHANGE
ECONOMIC AND POLITICAL DEVELOPMENTS
Besides the minor political tension that hasbeen going on in the region, Egypt hasmaintained a stable political environmentduring 2009 that is considered investorfriendly.
On the economic front, the Egyptian economyhas outbalanced the impact of the globalfinancial crisis throughout year 2009 mainly onthe back of the measures undertaken by theEgyptian government, including the US$ 3billion subsidy to support the infrastructureprojects and to stimulate the economy as wellas rising the domestic demand by decliningcommodity prices. In addition, the country’ssound banking system, whereby high riskinvestments is rejected, have helped toalleviate the effect of the crisis.
Projections were limiting the economic growthrate between 3-4% but the Egyptian economyhas grew by 4.7% during fiscal year2008/2009, recording one of the best growthrates among emerging countries.
Moreover, the Central Bank has reduced theovernight deposit and lending rates sixconsecutive times during 2009 to reach 8.25%for deposits and 9.75% for lending, which inturn decreased the inflation rate to reach 10%during 2009 down from 18% the previous year.
The FDIs highly surpassed expectations by27% to record US$8.1 billion in fiscal year08/09 highlighting investors' confidence inEgypt's potential. Furthermore, Egypt's NetInternational Reserves reached US$ 34.2billion in December 2009, compared to US$ 34.1 billion last year.
However, like the rest of the world, Egyptfaced a fall in international trade and externaldemand which has negatively affected Egypt'sExport, Suez Canal and tourism proceeds,which have collectively materialized a negativeBalance of Payments in fiscal year 2008/2009.
Despite exposure to the consequences ofglobal imbalances in international prices andeffects of the global financial turmoil during2008/2009, the Egyptian governmentmanaged to remain the budget deficitstabilizing at 6.9%.*
* Information provided by EGX
Key Information ContactsMinistry of Finance www.mof.gov.egMinistry of Investment www.investment.gov.egCentral Bank of Egypt www.cbe.org.egEgyptian Financial Supervisory Authority www.efsa.gov.egMisr for Clearing, Depository and Central Registry www.mcsd.com.egSMEs Market (NILEX) www.nilex.egyptse.com
2008/09-COMPONENTS OF GROSS DOMESTIC PRODUCT (%)
0
10
20
30
40
50
60
70
80
2008/09-ORIGINS OF GROSS DOMESTIC PRODUCT (%)
Manufacturing
8.54
13.37
16.10
Mining (incl. oil & gas) AgricultureWholesale & Retail Trade General government
14.34
10.89
Private consumption Government consumption Gross fixed investmentExports of goods & services Imports of goods & services Changes in stocksTransportation
8.03
Other
28.73
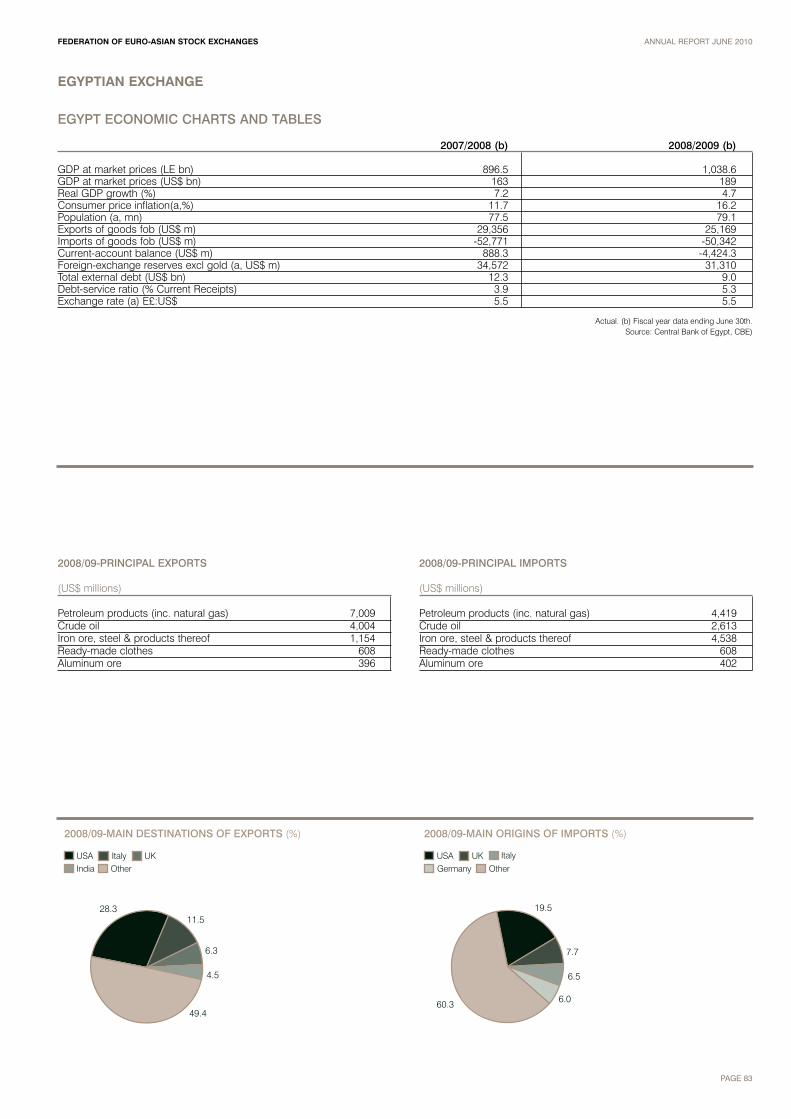
FEDERATION OF EURO-ASIAN STOCK EXCHANGES ANNUAL REPORT JUNE 2010
PAGE 83
EGYPTIAN EXCHANGE
USA
6.5
7.7
UK Italy
GermanyUSA
6.3
28.3
Italy UKIndia
49.4
2008/09-MAIN DESTINATIONS OF EXPORTS (%) 2008/09-MAIN ORIGINS OF IMPORTS (%)
4.5
Other
11.5
Other
19.5
6.060.3
Actual. (b) Fiscal year data ending June 30th. Source: Central Bank of Egypt, CBE)
EGYPT ECONOMIC CHARTS AND TABLES
2007/2008 (b) 2008/2009 (b)
GDP at market prices (LE bn) 896.5 1,038.6GDP at market prices (US$ bn) 163 189Real GDP growth (%) 7.2 4.7Consumer price inflation(a,%) 11.7 16.2Population (a, mn) 77.5 79.1Exports of goods fob (US$ m) 29,356 25,169Imports of goods fob (US$ m) -52,771 -50,342Current-account balance (US$ m) 888.3 -4,424.3Foreign-exchange reserves excl gold (a, US$ m) 34,572 31,310Total external debt (US$ bn) 12.3 9.0Debt-service ratio (% Current Receipts) 3.9 5.3Exchange rate (a) E£:US$ 5.5 5.5
2008/09-PRINCIPAL IMPORTS
(US$ millions)
Petroleum products (inc. natural gas) 4,419Crude oil 2,613Iron ore, steel & products thereof 4,538Ready-made clothes 608Aluminum ore 402
2008/09-PRINCIPAL EXPORTS
(US$ millions)
Petroleum products (inc. natural gas) 7,009Crude oil 4,004Iron ore, steel & products thereof 1,154Ready-made clothes 608Aluminum ore 396

GEORGIAN STOCK EXCHANGE
We look with hope on year 2010 andbelieve that it will become a turning point indevelopment of the Georgian securitiesmarket.
2009 was quite a busy year both with significantevents and problems. No surprise, the globalfinancial crises affected Georgian Stock Exchangeactivities as well. However, despite the sharpdecline in trading volumes, GSE stably playssignificant role of the only organized securitiesmarket in Georgia. Though, the legislativechanges of 2008, along with some positivefeatures, stimulated rising of “grey” securitiesmarket in Georgia, the large investors and issuersstill prefer to operate at the Georgian StockExchange.
As mentioned above, 2009 was remarkable bysignificant events for GSE. First of all, the decisionof GSE shareholders on considering strategicpartnership options with the world-leading stockexchanges shall be mentioned. This became notjust a general line of GSE development strategybut certain practical steps were taken in thedirection of NASDAQ-OMX.
Another important event of 2009 for the wholefinancial sector of Georgia was decision of theGeorgian Parliament to move regulation of all
financial services under auspices of the NationalBank of Georgia (NBG). We strongly believe thatin cooperation with NBG it will be possible toimplement significant reforms and innovations atthe Georgian capital market.
Based on all the aforementioned, we look withhope on year 2010 and believe that it will becomea turning point in development of the Georgiansecurities market.
HISTORY AND DEVELOPMENT
Equity securities first appeared in Georgia in 1991after the declaration of independence thatsignaled the beginning of market-oriented reforms.A vast majority of the newly established joint-stockcompanies were owned by a rather small numberof private shareholders and trading in theseshares was relatively inactive. With the launchingof the Mass Privatization Program in 1994,approximately 1,300 state-owned enterprises wereorganized as joint-stock companies, creatingabout half a million individual private shareholders.However, during a five-year period (1994-1999),the lack of an appropriate legal framework andorganized market infrastructure seriously impededthe secondary trading of these shares and anyover-the-counter market activity was nearlynonexistent.
The Georgian Stock Exchange (GSE) wasfounded in 1999 by a group of Georgian securitiesmarket professionals, leading banks, investmentand insurance companies. Today it is the onlyorganized securities market in Georgia. Designedand established with the assistance of the UnitedStates Agency for International Development(USAID) and operating within the legal frameworkof corporate and securities laws drafted with theassistance of American and German experts, theGSE can assert that it is designed and operatedto comply with “global best practices” and offersan attractive investment environment to foreigninvestors.
To promote the concept of self-regulation, the GSEmembership adopted new rules. After approval ofthese rules by the National Securities Commissionof Georgia, the GSE was officially recognized as aself-regulatory organization (SRO) and received astock exchange license in January 2000.
The GSE utilizes an automated trading facility.Thousands of securities can be traded by itsmembers from the workstations at the GSE flooror remotely from their offices. The GSE adoptedthe platform employed by the Russian tradingsystem (RTS) in Moscow. However, RTS - as anexcellent informational-communication system -was significantly modified to ensure those
requirements outlined under the GSE trading rulesreflected the peculiarities of Georgian securitiesmarket.
Official trading at the GSE began in March 2000.The number of companies admitted for trading atthe GSE trading system increased gradually andby the end of 2004 reached 277. Practically all ofthese companies are former state owned andoperated companies transformed into joint-stockcompanies and then privatized. The growing butstill low trade volumes reflect the nascent stage ofthe Georgian capital market and the level ofdevelopment of the Georgian economy.
In 2002, as a result of active cooperation with theNational Securities Commission and the Ministryof State Property Management, the SpecialPrivatization Auctions commenced at the GSE. In2003 the GSE started trading governmentsecurities.
2004, was a landmark year for the GSE, due tothe unprecedented increase in basic tradingfigures compared with previous years, reflectingthe overall revitalization of the economy in thewake of the “Rose Revolution” of 2003.
In the end of November, 2006 Bank of Georgia(GSE:BOG), the company listed at the GSE since2001, concluded successful IPO at the LondonStock Exchange Main Market and throughissuance of GDRs raised circa US$160 ml. Thebank is the first Georgian company ever and thesecond bank from the CIS since 1999 listed on theLondon Stock Exchange.
In 2007 the remote trading system was practicallyimplemented at the GSE and number ofbrokerage companies started remote tradingoperations from their offices via internet and VPNtechnology. Number of trading days increasedfrom two to three days a week.
In 2008 significant amendments were made inGeorgian legislation, GSE Charter and Rulesensuring GSE demutualization, stock-exchangemembership for various licensed financialinstitutions, including remote membership forrespective foreign entities.
In August 2009 the decision on GSE capitalincrease was taken by GSE General Meeting ofShareholders with purpose of attraction ofNASDAQ-OMX as a strategic partner.
FUTURE OUTLOOK
Based on the significant interest of a leadingEuropean stock exchange operator, as well as ofthe various financial investors, significant changesin GSE ownership structure is anticipated,entailing, among other, attraction of requiredinvestments for further development of the GSE.Also, in 2010 the GSE plans to:1. Make important changes in its trading systemand trading rules so as to increase the efficiencyof trading and increase the liquidity of the market: • Intensify the trading process. In particular, thetrading sessions will be conducted on daily basisand/or time period of the trading sessions will beextended;• Further improve remote trading system forbrokerage companies;• Establish electronic links between securitiesmarket participants (stock exchange, centraldepository, brokerage companies, banks,securities registrars)• Increase the efficiency of the governmentsecurities trading on the stock exchange;• Introduce partially guaranteed trading ofsecurities;• Introducing of price quotation both in local andforeign currencies.2. Launch a new web-site for the GSE, whichalong with traditional statistics will providecorporate reports database for the companieswho are admitted to the trading system. Inaddition, the creation and publication of acompany database will allow companies topublish their annual, semi-annual and currentreports which are required by law and thusimprove disclosure standards and corporatetransparency;3. Introduce the Georgian Stock Exchange Index.
George LoladzeChairman of the Supervisory Board
FEDERATION OF EURO-ASIAN STOCK EXCHANGES ANNUAL REPORT JUNE 2010
PAGE 84

GEORGIAN STOCK EXCHANGE
FEDERATION OF EURO-ASIAN STOCK EXCHANGES ANNUAL REPORT JUNE 2010
PAGE 85
OFFICIAL 6 MONTH STATISTICS
US$ millions # Shares millionsTotal Volume Average Daily Volume Total Volume Average Daily Volume
StocksJul-09 0.01 0.00 0.01 0.00
Aug-09 0.29 0.02 1.55 0.13Sep-09 0.23 0.02 3.09 0.22Oct-09 0.15 0.01 1.48 0.12Nov-09 0.18 0.02 2.77 0.23Dec-09 0.82 0.06 3.57 0.27TOTAL 1.68 0.02 12.47 0.16
BondsJul-09 0.00 0.00 0.00 0.00
Aug-09 0.00 0.00 0.00 0.00Sep-09 0.00 0.00 0.00 0.00Oct-09 0.00 0.00 0.00 0.00Nov-09 0.00 0.00 0.00 0.00Dec-09 0.00 0.00 0.00 0.00TOTAL 0.00 0.00 0.00 0.00
OtherJul-09 0.00 0.00 0.00 0.00
Aug-09 0.00 0.00 0.00 0.00Sep-09 0.00 0.00 0.00 0.00Oct-09 0.00 0.00 0.00 0.00Nov-09 0.00 0.00 0.00 0.00Dec-09 0.00 0.00 0.00 0.00TOTAL 0.00 0.00 0.00 0.00
0.0
0.1
0.2
0.3
0.4
0.5
0.6
0.7
0.8
0.9
MONTHLY STOCK VOLUME(US$ millions)
MONTHLY MARKET CAPITALIZATION(US$ millions)
0
100
200
300
400
500
600
700
800
Jul Aug Sep Oct Nov Dec Jul Aug Sep Oct Nov Dec
Market Capitalization(US$ millions) Index
Jul-09 512.79 n/aAug-09 640.63 n/aSep-09 724.07 n/aOct-09 721.72 n/aNov-09 738.82 n/aDec-09 733.32 n/a
CONTACT INFORMATION
Contact Name Mrs. Ekaterine Katamadze E-mail [email protected] Website www.gse.ge

FEDERATION OF EURO-ASIAN STOCK EXCHANGES ANNUAL REPORT JUNE 2010
PAGE 86
GEORGIAN STOCK EXCHANGE
ECONOMIC AND POLITICAL DEVELOPMENTS
Political OutlookDespite existing concerns that politicalprocess in Georgia may develop inunpredictable manner, fortunately, clear signsof increased stability and inevitability ofelections process are in place. Today,practically there is no doubt that for politicalparties the next three years will be period ofpreparation to elections (local government -2010, parliamentary - 2012 and presidential -2013), election campaigns and the relatedprocesses. Hopefully, the pending localgovernment elections in 2010 will take place innormal, constructive atmosphere and putgrounds for stable political and economicdevelopment of the country.
No doubt, there still remain many political andsocial problems, first of all related withoccupation of 20% of the country (Abkhaziaand Tskhinvali region) by Russian militaryforces and the heaviest burden of about halfmillion refugees from the mentioned regions.However, the likeliness of worsening of thesituation is very low, though chances forrestoring territorial integrity of the country in2010 are also very low.
As for the economic situation, according Mr.Edward Gardner, IMF Resident Representativein the country, Georgia’s economy is showingtentative signs of turning around, but a full-fledged recovery will depend on a moreupbeat global environment and the easing ofcredit conditions in the country.
Until mid-2008, the Georgian economy wasgrowing rapidly, fueled by high levels offoreign direct investment and strong creditgrowth. But in August of that year, the armedconflict with Russia over the disputedTskhinvali region proved a devastating setbackfor Georgia’s economy, prompting theauthorities to request a US$750 million Stand-By Arrangement (SBA) from the IMF and tosecure emergency financing from donorstotaling US$4.5 billion for next three years. Inthe months that followed, Georgia’s difficultieswere compounded by the impact of the globaleconomic crisis.
However, the country authorities’ economicprogram has been successful in putting a flooron the contraction of economic activity in 2009and in restoring confidence. On the back ofthese achievements, the economic recoverythat started in the second half of 2009 isexpected to continue in 2010, although at amoderate pace. The 2010 economic programis built on a 2 percent real GDP growthprojection, and CPI inflation of 5 percent. Thecontainment of public expenditures within thebudget envelope approved by parliamentshould lead to a reduction of the governmentdeficit to 7.4 percent of GDP, down from 9.2percent in 2009. By contrast, the externalcurrent account deficit is projected to widen to14 percent of GDP, largely on account of apick up of import growth. With private capitalinflows expected to lag behind, IMF financingwill help cover the resulting balance ofpayments gap.
As for the business climate in the country –according Mr. Gardner, it was hurt by thepolitical uncertainty that followed the conflictwith Russia and the domestic unrest thatfollowed. That unrest has now subsided, andthe fact that foreign direct investment hasbeen growing in the course of 2009 attests tothat improvement. When it comes to the legaland institutional business environment,Georgia is very well placed. The country hasmade remarkable strides over the last fewyears—the World Bank’s Doing BusinessIndex ranks Georgia first in Eastern Europeand Central Asia and first among lowermiddle-income countries. Georgia has alsomoved up quickly through the ranks ofTransparency International’s CorruptionPerception Index, and there’s a generalperception that interactions between the publicand the government are now free ofcorruption. The authorities’ structural reformprogram is now focusing on improvinggovernment efficiency and transparency, whilecontinuing the privatization of public sectorassets.*
* Information provided by GSE.
Key Information ContactsNational Bank of Georgia www.nbg.gov.geMinistry of Finance of Georgia www.mof.geFinancial Monitoring Service of Georgia www.fms.gov.geGeorgian Central Securities Depository www.gcsd.geGeorgian Securities Industry Association www.gsia.geGeorgian Corporate Directors Association www.gcda.ge
0.00.20.40.60.81.01.21.41.61.82.0
REAL GDP(GEL millions)
CONSUMER PRICES (% CHANGE PA; AV)(%)
1
2
3
4
5
6
7
8
9
10
2005 2006 2007 2008 2009 2010 2005 2006 2007 2008 2009 2010

FEDERATION OF EURO-ASIAN STOCK EXCHANGES ANNUAL REPORT JUNE 2010
PAGE 87
GEORGIAN STOCK EXCHANGE
GEORGIA ECONOMIC CHARTS AND TABLES
2005 2006 2007 2008 2009 2010
Nominal GDP (US$ at PPP) bil US$ 15 17 (a) 20 (a) 21 (a) 20 (a) 21 (b)Real GDP bil GEL 2 2 2 2 2 2 (b)Real private consumption bil GEL 2 2 (a) 3 (a) 3 3 (a) 3 (b)Real government consumption bil GEL 0 0 (a) 0 (a) 0 0 (a) 0 (b)Real gross fixed investment bil GEL 0 0 (a) 0 (a) 0 0 (a) 0 (b)Real stockbuilding bil GEL 0 0 (a) 0 (a) 0 0 (a) 0 (b)Real exports of G&S bil GEL 1 1 (a) 2 (a) 2 1 (a) 2 (b)Real imports of G&S bil GEL 2 2 (a) 3 (a) 3 3 (a) 3 (b)Real domestic demand bil GEL 2 3 (a) 3 (a) 3 3 (a) 3 (b)Real GDP at factor cost bil GEL 7 7 8 8 8 8 (b)Real agriculture bil GEL 1 1 1 1 1 1 (b)Real industry bil GEL 2 2 2 2 2 2 (b)Real manufacturing bil GEL n/a n/a n/a n/a n/a n/aReal services bil GEL 3 4 4 5 4 4 (b)Gross national savings rate (%) % 21.5 (a) 14.6 (a) 11.2 (a) 1.7 (a) 8.4 (a) 8.8 (b)Gross national savings/investment % 64.1 47.5 38.4 15.6 43.4 (a) 45.5 (b)Budget balance (% of GDP) % -1.1 -3.0 -4.7 -6.3 -8.9 (a) -6.3 (b)Consumer prices (% change pa; av) % 8.3 9.2 9.2 10.0 1.5 (a) 5.4 (b)Exchange rate LCU:US$ (av) GEL/US$ 1.8127 1.7804 1.6705 1.4908 1.6708 (a) 1.6575 (b)Lending interest rate (%) % 21.6 18.8 20.4 21.2 25.2 (a) 22.0 (b)Stock of domestic credit bil GEL 3 3 5 6 6 7 (b)Domestic credit growth (%) % 34.4 30.8 62.9 16.9 1.0 (a) 10.2 (b)Deposit interest rate (%) % 7.6 11.4 9.5 10.4 10.6 (a) 9.7 (b)Population million 4.3 4.4 4.4 4.4 4.4 (a) 4.4 (b)GDP per head ($ at PPP) US$ 3,540 3,930 (a) 4,540 (a) 4,750 (a) 4,540 (a) 4,690 (b)Current account balance/GDP % -12.0 -16.2 -19.8 -22.8 -15.3 (a) -15.1 (b)International reserves bil US$ 0 1 1 1 1 2 (b)Trade balance bil US$ -1 -2 -3 -4 -3 (a) -3 (b)Foreign-exchange reserves bil US$ 0 1 1 1 1 2 (b)Total foreign debt bil US$ n/a n/a n/a n/a n/a n/aPublic medium & long-term bil US$ n/a n/a n/a n/a n/a n/aPrivate medium & long-term bil US$ n/a n/a n/a n/a n/a n/aIMF debt bil US$ n/a n/a n/a n/a n/a n/aShort term bil US$ n/a n/a n/a n/a n/a n/aNet debt bil US$ n/a n/a n/a n/a n/a n/aExport credits bil US$ n/a n/a n/a n/a n/a n/a
(a) Estimate (b) Forecast
The Economist Intelligence Unit Limited, September 2009.
-4.0
-3.5
-3.0
-2.5
-2.0
-1.5
-1.0
-0.5
0.0
TRADE BALANCE(US$ billions)
2005 2006 2007 2008 2009 20100
20
40
60
80
100
120
140
160
180
REAL GROSS FIXED INVESTMENT(GEL millions)
2005 2006 2007 2008 2009 2010

IRAQ STOCK EXCHANGE
The total trading volume for the year of2009 reached US$ 368 million, a increase of36% when compared with the year 2008.
Iraq Stock Exchange (ISX) had established andstart operations in June 2004. The ISX operatesunder the oversight of the Iraq SecuritiesCommission (ISC).
The exchange is a self-regulated organization,owned by the members. The ISX is financially andadministratively independent from the Iraqigovernment including the Ministry of Finance. It isorganized as a non-profit entity that is owned byits members, namely licensed brokers. It isregulated by the Iraq Securities Commission andfollows the operational procedures outlined in itsBy-laws that are fully compliant with the IraqiSecurities Law.
Iraq Stock Exchange (ISX) introduced a specialindex in August 2009 after Automation go lifewhich closed in December 2009 at 100 points.
The ISX held approximately 152 sessions in 2009compared with 139 sessions in 2008. The totaltrading volume for the year of 2009 reached US$368 million, a increase of 36% when comparedwith the year 2008. The total traded shares in
2009 were 211 billion shares, a increase of 40%compared with the year 2008 The total numbersof transactions realized in 2009was 49 thousands.The number of shares traded for non Iraqis was15 billion shares and the trading volume was US$ 21.5 million.
The most important event in 2009 was lunch theAutomation in Iraq stock exchange for the firsttime in Iraq, in April 19th 2009, the second thingsincreasing the sessions to five in November 2009.
ISX has organized a number of training coursesfor brokers and training courses for the IT staffand other ISX employees. These training coursesinclude Automation Trading in ISX and run TWSfor the brokers, ELECTRONIC SYSTEMS (Equator& Horizon SYSTEMS).
The ISX publishes a monthly newsletter called theCapital Market. Published in Arabic, the CapitalMarket covers all financial events which happenwithin the ISX and the listed companies. The IraqStock Exchange publishes its information in thewebsite www.isx-iq.net.
The ISX has successfully joined FEAS (Federationof Euro-Asia Stock Exchanges), which held itsannual meeting in Shiraz on September 21st,2005. Also, ISX has successfully joined the Unionof Arab Stock Exchange in June 2006. and joinedthe Arab SE Federation in June 2006.
The ISX signed Data Feed Agreement withMUBASHER to distribute the ISX data andaccordingly enable its interested subscribersaccess to the delayed and real-time marketinformation via the Internet, satellites and othercommunication networks. Mubasher shalldisseminate the Data in Arabic and English inreal-time or delayed basis through its online andoffline network in 2010.
The world financial crises didn’t affect the ISX, Ibelieve that because Iraq Stock Exchange is stilla small market and we don’t work very closelywith banks and insurance companies we didn’thave credit problems. We at the ISX are doing ourbest to transform our exchange to meet orexceed the standards in the region.
HISTORY AND DEVELOPMENT
1. For the period of 1992-2003 the BaghdadStock Exchange was operating and was wellknown.
The previous Baghdad Stock Exchange wasestablished by the law No. 24 in 1991. Themarket was related to the government and itlisted (113) different companies, some privateand others from the mixed sector. During thatperiod, especially in 2003, the market hadgained an annual trading volume exceeding,US$17.5 million. However, this market wasclosed by a decision of its Governing Councilin March 19, 2003.
2. Establishment of Iraq Stock ExchangeOn 18 of April 2004, the temporary law No. 74was issued. It gave the authority to establishtwo important capital development bodiesconcerning financial sectors, they are:A. Iraq Stock Exchange (ISX).B. Iraq Security Commission (ISC).
3. Meaning of Iraq Stock ExchangeThe ISX is an entity capital market not relatedor powered by the government. It is directed bya Board of Governors (BOG) and consists ofnine members, representing different economicsectors of investment.
The market is where the investments,exchange stocks, purchasing and selling takesplace. It is considered one of the channels inwhich funds can flow between persons andcommissions through different sectors thatmay help to mobilize and develop financingand financial channels in order to givereadiness for different investments.
FUTURE OUTLOOK
Iraq Stock Exchange official financialinvestment and trading securities in Iraq, wecan identify the following goals for 2010:
1 - Work to Issue the New Securities Law, whoworked by the Commission from a number ofBoard of Commissioners of the SecuritiesCommission and a number of Board ofGovernors of the Iraqi market for securities andISX CEO during 2006 and 2007. And theissuance of regulatory instructions that wouldactively promote investment in the Iraqi StockExchange and the creation of mechanisms topatterns of new investment were not to exist inIraq before.
2 - complete electronic applications for e-trading system and the status of the filingthrough the application of trading via theInternet and agree on the organization of themechanisms of the guarantor banks CustodianBanks. And attract new investment patternsthat were not valid or allowed for investmentactivity in the private sector.
3 - on the status of the filing after thecompletion of the implementation of the plan toregister all companies to contribute and toallow circulation electronically. Follow-up ofjoint stock companies to implementmechanisms to increase capital andcapitalization of profits and the distribution ofprofits through the deposit center incooperation with the banks for their execution.
4 - broadening the base of the brokerage firmsthrough the implementation of the Help theadmission of five brokerage firms annually,beginning in 2010 and follow-up activity to themediation of the border met the requiredstandards of the Securities Commission.
5 - Encouraging the establishment of jointstock companies with a combined capital ofIraq and Iraqi non-Iraqi, and attract local and foreign investment through the liquid.
6 - Developing active interest in the media afterthe success of the organization of the Iraqimarket for securities, which is broadcast on thescreens of the Iraqi satellite channel everyFriday.
7- Issue new website for ISX
Taha Ahmed Abdul SalamCEO
FEDERATION OF EURO-ASIAN STOCK EXCHANGES ANNUAL REPORT JUNE 2010
PAGE 88

IRAQ STOCK EXCHANGE
FEDERATION OF EURO-ASIAN STOCK EXCHANGES ANNUAL REPORT JUNE 2010
PAGE 89
OFFICIAL 6 MONTH STATISTICS
US$ millions # Shares millionsTotal Volume Average Daily Volume Total Volume Average Daily Volume
StocksJul-09 284.37 25.85 20,824.39 1,893.13
Aug-09 19.13 1.47 9,657.83 742.91Sep-09 20.78 2.08 13,092.09 1,309.21Oct-09 24.64 2.46 15,949.43 1,594.94Nov-09 50.16 2.51 31,041.17 1,552.06Dec-09 19.99 1.54 14,074.44 1,082.65TOTAL 419.07 5.99 104,639.35 1,362.48
BondsJul-09 0.00 0.00 0.00 0.00
Aug-09 0.00 0.00 0.00 0.00 Sep-09 0.00 0.00 0.00 0.00 Oct-09 0.00 0.00 0.00 0.00 Nov-09 0.00 0.00 0.00 0.00 Dec-09 0.00 0.00 0.00 0.00 TOTAL 0.00 0.00 0.00 0.00
OtherJul-08 0.00 0.00 0.00 0.00
Aug-08 0.00 0.00 0.00 0.00 Sep-08 0.00 0.00 0.00 0.00 Oct-08 0.00 0.00 0.00 0.00 Nov-08 0.00 0.00 0.00 0.00 Dec-08 0.00 0.00 0.00 0.00 TOTAL 0.00 0.00 0.00 0.00
0
50
100
150
200
250
300
MONTHLY STOCK VOLUME VS INDEX(US$ millions)
MONTHLY MARKET CAPITALIZATION(US$ millions)
0
500
1,000
1,500
2,000
2,500
3,000
Stocks Index
Jul Aug Sep Oct Nov Dec Jul Aug Sep Oct Nov Dec0
20
40
60
80
100
120
Market Capitalization(US$ millions) Index
Jul-09 1,263.90 0Aug-09 1,552.90 0Sep-09 2,090.21 113.84Oct-09 2,591.57 109.08Nov-09 2,802.27 102.54Dec-09 2,637.91 110.86
CONTACT INFORMATION
Contact Name Mr. Jimmy Afham Toma E-mail [email protected] Website www.isx-iq.net

FEDERATION OF EURO-ASIAN STOCK EXCHANGES ANNUAL REPORT JUNE 2010
PAGE 90
IRAQ STOCK EXCHANGE
ECONOMIC AND POLITICAL DEVELOPMENTS
Outlook for 2010-11The drawdown of US forces, and the continuedweakness of central authority, may allow militia andinsurgent groups to re-establish themselves insome areas, although violence is unlikely to returnto 2006-07 levels.
There is a growing likelihood of a realignment ofIraqi politics, with the prime minister, Nouri al-Maliki,as head of the State of Law list, set to run againsthis former allies in the Iraqi National Alliance in theparliamentary election in January 2010.
The role of foreign oil companies will graduallyexpand, as they are drawn in by the uniqueopportunity presented by Iraq's massive oilreserves.
The Economist Intelligence Unit expects the fiscaldeficit to narrow markedly in 2010-11, to an annualaverage of US$4.4bn (equivalent to 4.6% of GDP),compared with an estimated US$9.5bn in 2009, asoil revenue recovers.
Economic growth is likely to strengthen in 2010-11,as foreign direct investment (FDI) in a range of oiland infrastructure projects picks up, and improvingsecurity boosts consumer demand and, in turn,wholesale and retail trade.
Iraq's current account will largely track movementsin oil export receipts. Having fallen sharply in 2009,export earnings are forecast to recover strongly in2010, although earnings growth will be held back in2011 as oil prices fall.
DOMESTIC POLITICS: We expect the politicalsituation in Iraq to remain unstable. Although thegradual drawdown of US forces, and theparliamentary election in January 2010, will beaccompanied by intermittent spikes in violence, wedo not expect a repeat of the sectarian conflict thatengulfed Iraq in 2006 and early 2007. However,much will depend on the future integration of theSunni-dominated Awakening Councils (many ofwhich include former insurgents) into the stateapparatus. The prime minister has been boosted byhis Daawa Party's impressive performance in theJanuary 2009 provincial elections, which owedmuch to his strategy of portraying himself as anationalist "strong man". However, this approachhas led to increased tensions between the centralgovernment and the Kurdish parties, which willcontinue to be aggravated by growing Kurdishimpatience at the failure to resolve the status of thenorthern province of Kirkuk and several other"disputed" areas. Mr Maliki's relations with otherShia leaders are also becoming increasingly tense.
INTERNATIONAL RELATIONS: Iraq's foreign policywill be dominated by its efforts to carve out a moreindependent role for itself, in the wake of thegradual US military withdrawal, while seeking tobalance its ties with Iran to the east and its Arabneighbours to the south and west. The US militarypresence will be reduced to 30,000-50,000 troopsby September 2010, as part of the wider drawdownenvisaged under the Status of Forces Agreement,which provides a legal framework for a full US
military pull-out by end-2011. In the meantime, Iraq will seek to strengthen ties with its Arabneighbours–a strategy that it hopes will eventuallylead to new debt write-offs. However, this processwill remain hostage to security developments andpolitical posturing, as demonstrated by Mr Maliki'scondemnation of Syria after the Iraqi authoritiespresented evidence purporting to show that thoseresponsible for a series of bomb attacks inBaghdad in August were based in Syria. Elsewhere,dealings with Iran will remain cautious, althougheconomic ties will continue to strengthen. Althoughmany of Iraq's political leaders maintain close ties tothe Islamic Republic, many Iraqis remain wary ofIran (in part because it is widely thought to bearming Iraqi Shia militias), which will dampenenthusiasm for a deeper alliance.
POLICY TRENDS: Economic policymaking will beconstrained by the weakness of central governmentcontrol. As a result, the government's primary aimwill be to improve project implementation, in part byencouraging greater local participation and cuttingbureaucratic constraints. Although progress willremain slow and piecemeal, hindered by vestedinterests, rampant corruption and the difficult fiscalposition, better security should at least allowprogress with upgrading basic services, such aselectricity and water.
INTERNATIONAL ASSUMPTIONS: We estimate thatworld GDP (at purchasing power parity rates) willhave contracted by 1.3% in 2009, as the deeprecession in the EU and the US has dragged downglobal growth, and expect it to expand only weakly,by an average of 3.3%, in 2010-11, led by non-OECD states. We forecast that the average price ofdated Brent Blend will decline in 2011, as a numberof OECD economies, including the US, experiencea slowdown that year, from US$74/barrel in 2010 toUS$70/b.
ECONOMIC GROWTH: Economic growth isforecast to strengthen in 2010-11, having weakenedin 2009 in the wake of lower oil prices. Theimproved security situation should permit arecovery in some of Iraq's more ethnically andreligiously homogenous southern and westernprovinces, leading to greater wholesale and retailtrade. In addition, FDI is also set to surge, as workon a number of large oilfield and infrastructureprojects gathers speed. The robust economicgrowth already witnessed in the more stableKurdistan Regional Government-administeredprovinces is likely to persist, although some mixedareas in central and eastern Iraq will continue toexperience economic stagnation. However,government spending growth is likely to remainrelatively slow, which will have a knock-on impacton private consumption (one-third of Iraqi workersare employed by the state). A key area ofuncertainty will remain the agricultural sector, whichhas suffered from two consecutive years of verypoor rainfall. Exports will largely track changes in oilproduction. Having stagnated in 2009, as Iraq'sdecrepit and deteriorating oil infrastructure heldback output growth, oil production will increase overthe forecast period. Exports from two fields in IraqiKurdistan will increase (assuming difficulties
regarding the participation of a Norwegian oilcompany, DNO, can be overcome), as will oilproduction from those fields included in the first oillicensing round. This will lift output to almost 2.8mbarrels/day (b/d) in 2011, from under 2.5m b/d in2009. (We do not, however, expect majorproduction increases from fields operated byinternational oil companies until 2012.) Importgrowth will rise markedly, as Iraq relies heavily onimports for both consumer goods and capitalinputs. Overall, we expect real GDP growth to risefrom an estimated 5.8% in 2009 to an annualaverage of 6.4% in 2010-11.
INFLATION: Consumer price growth has been lowsince early 2008, as the Central Bank of Iraq (CBI)-overseen appreciation of the dinar, an improvementin the supply of basic items and, more recently,falling global commodity prices have loweredimport costs and dampened inflationaryexpectations. Indeed, fast-falling fuel and transportcosts kept Iraq in deflation during most of the firstnine months of 2009. However, the government'srecent decision to assume control over vegetableimports, and the poor harvest, has recently led to asharp upturn in prices, and, with the dollarweakening, global commodity prices recoveringand, potentially, import tariffs being lifted, weforecast that inflation will average 5.3% in 2010-11,compared with an estimated average of just 1% thisyear.
EXCHANGE RATES: The CBI has overseen a steepappreciation of the dinar over the past two years, aspart of its anti-inflation strategy. However, withinflation low and the dollar strengthening, the CBIhas kept the dinar steady at ID1,170:US$1 sinceJanuary, and we now forecast that this unofficialpeg will remain in place over the forecast period.However, with lower oil prices and occasionalpolitical shocks likely to cause intermittentdownward pressure on the dinar, we expect that theCBI will occasionally have to dip into its substantialstock of foreign reserves to avoid bouts of volatility.
EXTERNAL SECTOR: Iraq's current account willlargely mirror movements in oil export receipts(which constitute some 98% of total exportearnings). Having fallen by an estimated 33% in2009, export revenue is forecast to recover stronglyin 2010, lifted by higher oil prices and production,although earnings growth will be held back in 2011as oil prices fall. The import bill, meanwhile, is likelyto grow robustly, led by rising demand for capitalinputs and consumer goods. Nevertheless, weexpect the trade surplus to widen markedly in 2010,from an estimated US$3.4bn (4.6% of GDP) in 2009to US$7.3bn, before narrowing to US$2.6bn in2011. The non-merchandise deficit will widensteadily over the forecast period, as services debitsincrease in line with import spending. Overall, thecurrent account, which we estimate will haverecorded a small deficit in 2009, is forecast torecord a surplus of US$3.5bn (3.8% of GDP) in2010, on the back of sharply higher oil earnings.The current account is expected to slip back intodeficit in 2011, however, as export growth slows.*
* The Economist Intelligence Unit Limited
Key Information ContactsIraq Association of Securities Dealers: www.iasd-iq.orgIraq Central Bank: www.cbiraq.org

FEDERATION OF EURO-ASIAN STOCK EXCHANGES ANNUAL REPORT JUNE 2010
PAGE 91
IRAQ STOCK EXCHANGE
IRAQ ECONOMIC CHARTS AND TABLES
2005 2006 2007 2008 2009 2010
Nominal GDP (US$ at PPP) bil US$ 90 (a) 98 (a) 103 (a) 113 (a) 120 (a) 129 (b)Real GDP mil IQD 34,268 (a) 36,393 (a) 36,939 (a) 39,820 (a) 41,811 (a) 44,382 (b)Real private consumption mil IQD n/a n/a n/a n/a n/a n/aReal government consumption mil IQD n/a n/a n/a n/a n/a n/aReal gross fixed investment mil IQD n/a n/a n/a n/a n/a n/aReal stockbuilding mil IQD n/a n/a n/a n/a n/a n/aReal exports of G&S mil IQD n/a n/a n/a n/a n/a n/aReal imports of G&S mil IQD n/a n/a n/a n/a n/a n/aReal domestic demand mil IQD n/a n/a n/a n/a n/a n/aReal GDP at factor cost mil IQD 34,268 36,393 (a) 36,939 (a) 39,820 (a) 41,811 (a) 44,382 (b)Real agriculture mil IQD 4,320 4,268 (a) 4,366 (a) 3,995 (a) 4,039 (a) 4,241 (b)Real industry mil IQD 19,605 20,847 (a) 22,254 (a) 24,597 (a) 25,431 (a) 26,664 (b)Real manufacturing mil IQD 956 937 (a) 939 (a) 948 (a) 1,024 (a) 1,092 (b)Real services mil IQD 9,387 10,340 (a) 9,380 (a) 10,279 (a) 11,317 (a) 12,385 (b)Gross national savings rate (%) % n/a n/a n/a n/a n/a n/aGross national savings/investment % n/a n/a n/a n/a n/a n/aBudget balance (% of GDP) % 10.0 (a) 14.1 (a) 11.7 (a) 13.3 (a) -12.8 (a) -4.1 (b)Consumer prices (% change pa; av) % 37.0 53.2 30.7 2.8 -2.3 (a) 6.1 (b)Exchange rate LCU:US$ (av) IQD/US$ 1,470 1,466 1,255 1,193 1,170 (a) 1,170 (b)Lending interest rate (%) % 7.0 16.0 20.0 15.0 7.0 (a) 8.5 (b)Stock of domestic credit mil IQD -688 -3,503 -12,345 -25,718 -15,482 (a) -12,618 (b)Domestic credit growth (%) % -118.2 409.3 252.4 108.3 -39.8 (a) -18.5 (b)Deposit interest rate (%) % n/a n/a n/a n/a n/a n/aPopulation million 28.2 28.9 29.5 30.1 30.7 (a) 31.3 (b)GDP per head ($ at PPP) US$ 3,170 (a) 3,400 (a) 3,480 (a) 3,750 (a) 3,910 (a) 4,130 (b)Current account balance/GDP % -22.1 (a) 3.0 (a) 22.5 (a) 16.1 (a) -0.2 (a) 4.5 (b)International reserves bil US$ 12 19 31 50 45 (a) 46 (b)Trade balance bil US$ 4 12 23 22 (a) 3 (a) 8 (b)Foreign-exchange reserves bil US$ 12 19 31 50 45 (a) 46 (b)Total foreign debt bil US$ 111 (a) 99 (a) 102 (a) 68 (a) 50 (a) 52 (b)Public medium & long-term bil US$ n/a n/a n/a n/a n/a n/aPrivate medium & long-term bil US$ n/a n/a n/a n/a n/a n/aIMF debt bil US$ 0 0 0 (a) 0 1 (a) 1 (b)Short term bil US$ n/a n/a n/a n/a n/a n/aNet debt bil US$ 99 (a) 80 (a) 71 (a) 18 (a) 6 (a) 6 (b)Export credits bil US$ n/a n/a n/a n/a n/a n/a
0
5
10
15
20
25
30
35
40
45
REAL GDP(IQD millions)
CONSUMER PRICES (% CHANGE PA; AV)(%)
-10
0
10
20
30
40
50
60
2005 2006 2007 2008 2009 2010 2005 2006 2007 2008 2009 2010
(a) Estimate (b) Forecast
The Economist Intelligence Unit Limited, December 2009

Istanbul Gold Exchange targets tostimulate local business and internationalattention with all other globally competitiveenterprises which will provide Turkey to bea central hub for the gold business.
Istanbul Gold Exchange targets to stimulate localbusiness and international attention with all otherglobally competitive enterprises which will provideTurkey to be a central hub for the gold business,due to its strategic position, as it lies in the heartof a major gold trade area, exposed to MiddleEast, Europe and Gulf States.
In 2009 we have managed technicalinfrastructural studies as well as market structuresand gold backed financial instruments studies.Since 2007 we have been making important stepsto integrate international communities.
For the integration of the Exchange to theinternational markets, there have been importantsteps since 2007. In March 2008 we have beenan associate member to London Bullion MarketAssociation, by May 2008 we have joined WorldFederation of Diamond Bourses, by February2010, we are honored to be part of a large familywith distinguished members, FEAS as an affiliatemember. The Exchange became a member of theKimberley Process Certification Scheme (KPCS),
in August 2007, which aims to curb the flow ofconflict diamonds, with 49 participants worldwide. By 2008 and 2009 IGE organized InternationalGold Summit in corporation with Active Academyto share the experiences of the Turkish andforeign participants in the Jewelry Sector whichhas been gaining important goals in the recentyears.
The Turkish gold Jewelry market has undergone amajor revival since the early 1990s with thetraditional and long-standing historical affinity forgold jewellery adjusted for modern tastes. Turkeyis now the world’s fourth largest market for goldjewellery, third largest manufacturing centre andsecond biggest exporter.
The annual export is estimated at US$ 2.5-3billion, part of which is from exports towholesalers and retailers abroad while the bulkcomes from sales to tourists sold in the localmarket. By 2009, due to the supply of scrap goldto the market, Turkey turned to be an exporter ofgold in the market.
As a first spot trading gold exchange in the world, IGE was founded with the principle semi-electronic system trading floor. By 2009, a newscreen-based fully electronic trading system hasbeen launched with remote access in order toprovide investors 24 hours trading.
Istanbul Gold Exchange is having a role ofsafeguard for gold funds and gold ETF which islisted in ISE. Over 6.000 kgs of Gold kept in theExchange on the name of the 21 funds.
For the upcoming years, our target is to establisha secure and organized market condition inTurkey for diamond and precious stones trading.Turkey is launching its first diamond market andaiming to become a regional trading hub for theprecious stones. Istanbul Gold Exchange is alsoworking on a project to launch a foreignexchange market, base metals market andCarbon Licenses Market. We aim to see tangibleprogress on these objectives in 2010.
Osman SARAC Chairman
FEDERATION OF EURO-ASIAN STOCK EXCHANGES ANNUAL REPORT JUNE 2010
ISTANBUL GOLD EXCHANGE
General InformationIstanbul Gold Exchange is a state institution whichhas an autonomous system, for precious metalstrading in organized market conditions with timeand price priority. Gold prices on the Istanbul GoldExchange are determined by the market, generallyreflecting trends in international prices. Members ofIstanbul Gold Exchange are authorized to importgold to Turkey.
Services Provided• Spot gold, silver and platinum trading, • Precious Metals Lending Market transactions, • Physical settlement of the transactions, • Depository for the precious metals belonging tomutual funds and gold ETF in Turkey. • Depository for individual investors. • Authority for Kimberley Process CertificationScheme for rough diamonds in Turkey. • Determination of local and international PreciousMetals Refineries, whose products can be importedto Turkey and be transacted in the Exchange,
Brief HistoryIstanbul Gold Exchange began its operations onJuly 26, 1995. The Exchange has two types ofmarkets: Precious Metals Market, Precious MetalLending Market. In markets, standard and non-standard gold, silver and platinum are traded. Spot gold trading started at the opening of theExchange. Silver and non standard precious metals
started to trade in 1999. Precious Metals LendingMarket started its operations in Istanbul GoldExchange on March 24, 2000 for the purpose ofbringing supply and demand into an organizedmarket, lowering the production costs of thejewellery sector and securitization of gold.
Domestic or foreign banks, precious metalscompanies, currency offices, precious metalsproducing and marketing companies and preciousmetals refineries that obtained the membershipcertificate from the Under-Secretariat of TurkishTreasury and complied with the requirements setforth by the IGE Board of Directors can trade on theexchange. There are 83 members consisting of 22banks, 32 Foreign Exchange Offices, 21 PreciousMetals Brokerage Houses and 21 Precious Metalsproducing and marketing companies.
Form of Settlement and TransfersThrough member accounts by Clearing Center andClearing Bank
Legal StatusState Institution
Settlement PeriodFrom T+0 up to T+9
Regulated byState Ministry Under –Secretariat of Treasury
Board of Directors: 5 MembersPresident of the Exchange Vakifbank T.A.O (bank)Atasay Kiymetli Madenler A.S. (Precious MetalsBrokerage House)Istanbul Altin Rafinerisi A.S. (Precious MetalsRefinery)Yildiz Doviz ve Kiymetli Maden Tic. A.S. (ForeignExchange Office)
Memberships to InternationalOrganizationsLondon Bullion Market Association (LBMA)World Federation of Diamond Bourses (WFDB) Federation of Euro-Asian Stock Exchanges (FEAS)
Future OutlookIn 2010, IGE intends to:
• To complete the new infrastructure for internetbased 24 hours trading, •Establish the customer based ordering, tradingsystem and mobile trading system• To open Diamond and Precious Stones Market, •Establishment and implementation of Base MetalsMarket in IGE, • Establishment and implementation of CurrencyMarket in the Exchange, • Establishment and implementation of Carbon,Rights and Licenses Market in the Exchange,
PAGE 92

CONTACT INFORMATION
Contact Name Y. Oguzhan Aloglu E-mail [email protected] Website www.iab.gov.tr
PAGE 93
ISTANBUL GOLD EXCHANGE
FEDERATION OF EURO-ASIAN STOCK EXCHANGES ANNUAL REPORT JUNE 2010
I. PRECIOUS METALS MARKET
Members 2008 2009 Change (%) Banks 20 21 1Precious Metals Brokerage Houses 11 21 10Foreign Exchange Offices 22 32 10PM Producing & Marketing Companies 8 8 -Total 61 82 21
2008-2009 GOLD IMPORT FIGURES(kg)
J F M A M J J A S O N D0
5,00010,00015,00020,00025,00030,00035,00040,00045,00050,000
2008 2009
2008-2009 GOLD TRADING VOLUMES(kg)
J F M A M J J A S O N D0
10,000
20,000
30,000
40,000
50,000
60,000
2008 2009
2008-2009 SILVER IMPORT VOLUME(kg)
J F M A M J J A S O N D0
2,000
4,000
6,000
8,000
10,000
12,000
14,000
16,000
18,000
2008 2009
2008-2009 SILVER TRADING VOLUME(kg)
J F M A M J J A S O N D0
5,00010,00015,00020,00025,00030,00035,00040,00045,00050,000
2008 2009
* Please refer to page 96 for the Turkey country report.

ISTANBUL STOCK EXCHANGE
It is worth noting that the ISE ranked thirdamong the world markets in terms ofperformance on local currency basis.
Following a period of two years filled withdifficulties in the global economy, the worstseems to be over and a global economicrecovery is under way. The exceptional stepsthat were taken by policy makers in bothdeveloped and emerging countries after thecollapse of Lehman Brothers in September2008 have gone a long way toward taking thefinancial markets under control and restoringcapital flows to developing countries. Theimmediate outflow of international capital fromdeveloping countries to safe havens in theaftermath of the crisis has more or lessreversed itself. As a result, interbank liquidity indollar markets seems to revert to its pre-crisisrange, a large number of emerging-marketexchange rates have recovered their pre-crisislevels against the U.S. dollar, equity marketshave recovered much of their initial losses,and capital flows to developing countries haveresumed. Borrowing costs for emergingmarket borrowers, although still high, havestabilized over the last few quarters. The realsector recovery is also under way. Globalindustrial production, although 5 percentbelow its level compared to a year earlier inOctober 2009, improved in the third quarter of2009. On the other hand, in addition to beingfragile, the recovery is expected to decelerate
in the second half of 2010 as the effect offiscal and monetary measures fade. Whilerecovery dominates all sectors, the negativeimpact of the Dubai World event and the creditrating downgrades of Greece and Mexico atthe end of 2009 should not be overlooked.Especially the developments in the Euro zoneshould be followed closely.
In this atmosphere, the Istanbul StockExchange has got its share from the recovery.The ISE 100 Index, the main indicator of theISE, increased by 101 percent in US$ terms in2009, compared to the value at end-2008. It isworth noting that the ISE ranked third amongthe world markets in terms of performance onlocal currency basis. The Stock Market totaltraded value maintained its vivacity, with a totaltrading volume amounting to US$ 316 billionfor the year as a whole. The average dailytraded value stood at US$ 1.3 billion duringthe same period. As of end-2009, the marketcapitalisation of 315 companies traded on theIstanbul Stock Exchange, increased by 97percent compared to end-2008, reaching US$ 236 billion. The share of foreign portfolioinvestors in the free-floating shares of the ISEstood at 67 percent as of end-2009, up from66 per cent as of end-2008.
The average daily trading volume on the ISEBonds and Bills Market, on the other hand,showed a slight decrease of 12 percent during2009. During the year, the total trading volumeof the Outright Purchases and Sales Marketincreased by 13 percent to US$ 270 billion,while the total trading volume of theRepo/Reverse Repo Market decreased by 15 percent to almost US$ 2 trillion as of end-2009.
Included in the ISE’s plans for 2010, is theestablishment of the “Emerging CompaniesMarket” with a view to offering new tradingopportunities for small and medium sizedcompanies (SMEs). The main purpose that liesbehind this initiative is to allow SMEs to haveconvenient access to the capital markets fortheir financing needs. Another importantinitiative that we are taking this year is theorganization of the “Initial Public Offering (IPO)Turkey Summit” in Istanbul in May. The Summitwill bring together some 1,350 sizeable Turkishcompanies that are not yet traded on the ISE, as well as the leading companies in the financial circles and we expect thisorganization to be instrumental in bringing new companies to the ISE.
HISTORY AND DEVELOPMENT
In 1981, the Capital Market Law was enactedand one year later, the Capital Markets Boardwas established. In October 1983, theParliament approved the Regulations for theEstablishment and Operations of SecuritiesExchanges, which paved the way for theestablishment of the ISE, formally inauguratedin 1985.
The ISE provides a fair and transparentenvironment for trading of a wide variety ofsecurities namely, stocks, exchange tradedfunds, warrants, government bonds, Treasurybills, corporate bonds, money marketinstruments (repo/reverse repo), foreignsecurities etc. Currently, there are four marketsoperating at the ISE; the Stock Market, the Bondsand Bills Market and the Foreign SecuritiesMarket and Emerging Companies Market.
In 1989, the foreign exchange regime wasamended to allow non-residents to invest inTurkish securities, making the Turkish securitiesmarkets open to foreign investors without anyrestrictions on the repatriation of capital andprofits.
The ISE was recognized as a “DesignatedOffshore Securities Market” by the U.S.
Securities and Exchange Commission in 1993and was designated as an “appropriate foreigninvestment market for private and institutionalJapanese investors” by the Japan SecuritiesDealers Association in 1995. Likewise, the ISEhas been approved by the Austrian Ministry ofFinance as a regulated market in accordancewith the regulations of the Austrian InvestmentFund Act in 2000. As a result of all thesedevelopments, foreign investors now accountfor a substantial volume of daily trading andhold around 67 percent of the publicly-heldstocks in their portfolios amounting to US$ 55.6billion, as of end-2009.
The ISE currently owns 32.62% of the ISESettlement and Custody Bank, 30% of theCentral Registry Agency and 18% of the TurkishDerivatives Exchange. On the internationallevel, the ISE has participations in the KyrgyzStock Exchange and Baku Stock Exchangewith stakes of 24.51% and 5.26%, respectively.
FUTURE OUTLOOK
• The ISE plans to establish the “EmergingCompanies Market” with an aim to offer adifferent application procedure to small andmedium sized companies (SMEs) for tradingon the Istanbul Stock Exchange. The ideabehind the facilitation of the application
procedures is to give these companies theopportunity to raise funds through publicofferings, as a long term and low costfinancing alternative. Furthermore, in order tocontribute to price formation and liquidity,trading on the Emerging Companies Market,different from the continuous auction systemon the Stock Market, will be through acombination of single price method andcontinuous auction with market maker system.The companies traded on the Market,demonstrating progressive performance intime, will have the opportunity to be transferredto any of the submarkets of the ISE StockMarket.
• As part of its efforts towards increasing thenumber of public offerings, the ISE willorganize “Initial Public Offering (IPO) TurkeySummit” in Istanbul on May 6-7, 2010. TheSummit aims to bring together around 1,350leading Turkish companies that are yet nottraded on the Istanbul Stock Exchange andfinancial intermediaries, audit firms, law firms,consultancy firms, sectorial associations aswell as domestic and international privateequity funds, investment banks and otherinstitutional investors, which are considered tobe important constituents of public offerings.
Huseyin ErkanChairman & CEO
FEDERATION OF EURO-ASIAN STOCK EXCHANGES ANNUAL REPORT JUNE 2010
PAGE 94

ISTANBUL STOCK EXCHANGE
FEDERATION OF EURO-ASIAN STOCK EXCHANGES ANNUAL REPORT JUNE 2010
PAGE 95
OFFICIAL 6 MONTH STATISTICS
US$ millions # Shares millionsTotal Volume Average Daily Volume Total Volume Average Daily Volume
StocksJul-09 29,581.02 1,286.13 18,981.53 825.28
Aug-09 35,060.79 1,669.56 20,599.87 980.95Sep-09 26,910.20 1,345.51 15,177.86 758.89Oct-09 34,769.27 1,655.68 18,459.30 879.01Nov-09 28,096.27 1,478.75 15,523.23 817.02Dec-09 33,122.00 1,440.09 19,240.69 836.55TOTAL 187,539.55 1,479.29 107,982.48 849.62
BondsJul-09 29,079.68 1,264.33 0.045 0.002
Aug-09 22,567.19 1,074.63 0.0333 0.0016Sep-09 22,963.86 1,148.19 0.0341 0.0017Oct-09 24,287.11 1,156.53 0.0345 0.0016Nov-09 18,619.94 980.00 0.0272 0.0014Dec-09 17,872.77 777.077 0.0255 0.0011TOTAL 135,390.55 1,066.79 0.20 0.002
OtherJul-09 162,807.93 7,078.61 0.0627 0.0027
Aug-09 163,013.62 7,762.55 0.0605 0.0029Sep-09 143,762.49 7,188.12 0.0544 0.0027Oct-09 167,632.01 7,982.48 0.0622 0.003Nov-09 153,852.41 8,097.50 0.0565 0.003Dec-09 179,375.75 7,798.95 0.0675 0.0029TOTAL 970,444.21 7,651.37 0.36 0.003
0
5,000
10,000
15,000
20,000
25,000
30,000
35,000
40,000
MONTHLY STOCK VOLUME VS INDEX(US$ millions)
MONTHLY MARKET CAPITALIZATION(US$ millions)
0
50,000
100,000
150,000
200,000
250,000
Stocks Index
Jul Aug Sep Oct Nov Dec Jul Aug Sep Oct Nov Dec0
500
1,000
1,500
2,000
2,500
Market Capitalization(US$ millions) Index
Jul-09 196,795.71 1,690.17Aug-09 209,607.42 1,812.43Sep-09 217,560.15 1,888.85Oct-09 213,486.19 1,853.22Nov-09 204,750.13 1,781.28Dec-09 235,996.15 2,068.18
CONTACT INFORMATION
Contact Name Mr. Eralp Polat E-mail [email protected] Website www.ise.org

FEDERATION OF EURO-ASIAN STOCK EXCHANGES ANNUAL REPORT JUNE 2010
PAGE 96
ISTANBUL STOCK EXCHANGE
ECONOMIC AND POLITICAL DEVELOPMENTS
Economic and Political EnvironmentThe recent subprime mortgage crisis andfinancial crisis, increasing unemployementincreased the threats of a recession in theworld economy. The crisis in the worldeconomy has an impact on Turkish economy.But Turkish economy has not been affected bythe global crisis severely due to Turkey hasimproved its macroeconomic situation with adetermined fiscal discipline, prudent monetarypolicy, political stability, social security reform,large privatizations and structural reforms.
Turkey has implemented a range of economic,political and social reforms in an effort to meetEU requirements. The ongoing process of EUaccession and the signing of a new stand-byagreement with the IMF covering the period of2005-2008 have created two strong anchorsfor increasing Turkey’s growth potential andimproving a better functioning marketeconomy.
Rehabilitating the business environment,diminishing unrecorded economy,strengthening financial system, promotingcommunication and information technologiesare among the targets of the economymanagement for the upcoming years in orderto lift Turkey onto a significantly higher growthtrajectory.
Economic PerformanceFollowing the GNP growth rate of 4.6%achieved in 2007, the Turkish economy grewby 3% in the first three quarters of 2008. Theconsumption expenditure of residenthouseholds grew by 3.3% in the same periodof 2008. The investment expenditures of thepublic sector grew by 1.2% and the privatesector investment expenditures grew by 0.8%in the same period of 2008.
In the January-November period of 2008,exports and imports reached US$ 124.3 billionand US$ 190.5 billion, respectively, exportsregistering an increase of 27.4% and importsregistering an increase of 23.8% compared tothe same period of 2007. Accordingly, the rateof imports covered by exports stood at 65.2%as of November 2008.
As of December 2008, the year-on-yearconsumer price index increased by 10.06%and the year-on-year producer price indexincreased by 8.11% compared to the samemonth of the previous year.
The consolidated budget registered a deficit ofYTL 4.9 billion as of October 2008 bringing theprimary surplus to YTL 38.5 billion. Totalrevenues increased by 12.7% to YTL 175.8billion and total expenditures increased by7.4% to YTL 180.7 billion in the January-October period 2008 compared to the sameperiod of 2007.
The gross privatization revenues in 2008 wererecorded as US$ 6.3 billion. The breakdown ofthe privatization revenues is as follows; US$ 2billion as block sale, US$ 1.9 billion as publicoffering and US$ 2.3 billion as asset sale.
In 2008, the ISE National-100 Index, the mainindex on the Istanbul Stock Exchange, showeda decrease of 51.6% in YTL terms and 63.2%in US$ terms as compared to the values at theend of 2008. The stock market yearly totaltraded value decreased to US$ 261.3 billion by13.2% in US$ terms in 2008 compared to2007. The average daily traded value ofequities stood at US$ 1.04 billion in 2008.
The market capitalization of 317 ISE tradedcompanies decreased to a level of US$ 119.7billion at the end of 2008 from US$ 290 billionat the end of 2007. Nine ETFs (ExchangeTraded Fund) are traded on the ISE ETFsMarket in 2008.
The net equity investments within the free floatof the ISE traded companies by foreignportfolio investors has been registered ataround US$ 27.5 billion at the end of 2008representing 67.5% of the total value stocks incustody.
The turnover in public debt securitiestransacted on the Outright Purchases and Sales Market decreased by 14.2% to US$ 239.4 billion in 2008 compared to 2007.The Repo/Reverse Repo Market turnoverincreased by 14.1% to US$ 2,274 billion in thesame period. The average daily traded valuein Outright Purchases and Sales Market andthe Repo/Reverse Repo Market, stood at US$10 billion at the end of 2008.
In 2008, two companies and one ExchangeTraded Fund (ETFs) offered their stocks for thefirst time to public and started to be traded onthe ISE Stock Market. The amount of fundsraised by the IPOs of two companies was US$ 1.9 billion.
All brokerage houses (104 brokerage houses)have been provided with remote access to thestock market trading system. In 2008, thenumber of orders sent by members via Ex-API(Express Application Programming Interface)terminals reached 92% of all orders. Tradingon the Bonds and Bills Market is alreadycarried out remotely.*
* Information provided by the Istanbul Stock Exchange
Key Information ContactsCapital Markets Board of Turkey www.cmb.gov.trISE Settlement and Custody Bank Inc.(Takasbank) www.takasbank.com.trCentral Registry Agency Inc. www.mkk.com.trThe Association of Capital Market Intermediary Institutions of Turkey www.tspakb.org.trThe Turkish Derivatives Exchange (TurkDEX) www.turkdex.org.tr
0
20
40
60
80
100
120
REAL GDP(TRY millions)
CONSUMER PRICES (% CHANGE PA; AV)(%)
6.0
6.5
7.0
7.5
8.0
8.5
9.0
9.5
10.0
10.5
2005 2006 2007 2008 2009 2010 2005 2006 2007 2008 2009 2010
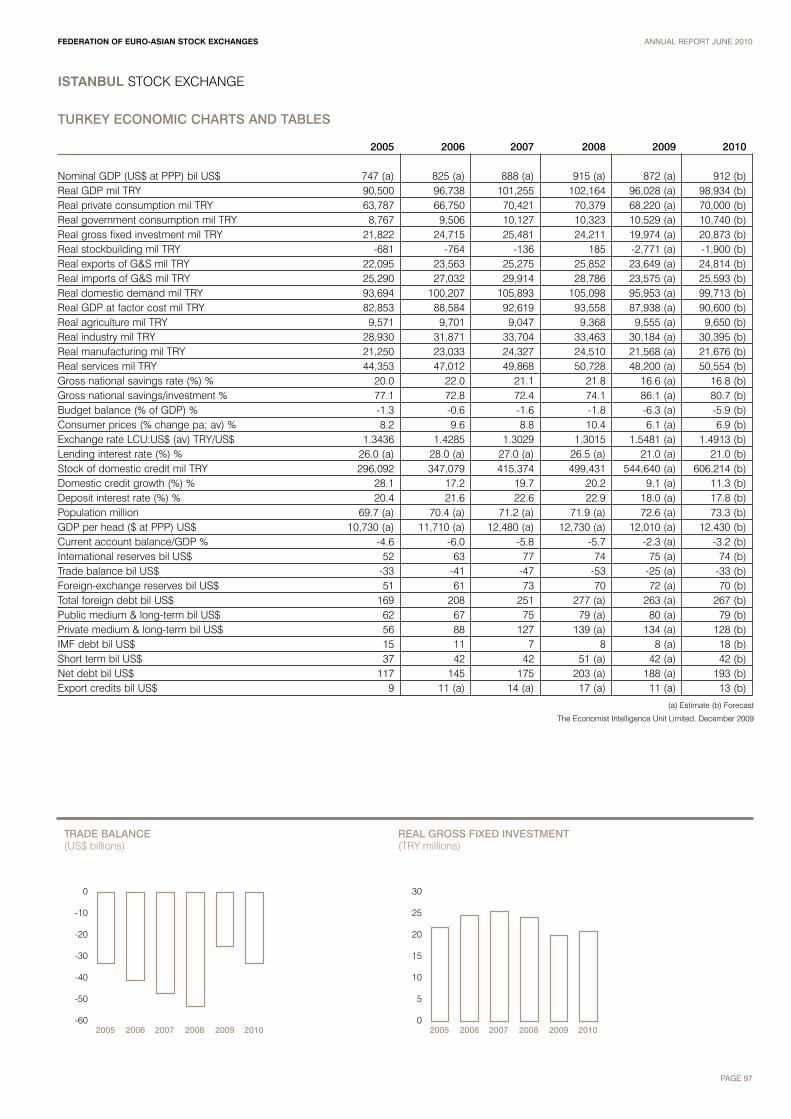
FEDERATION OF EURO-ASIAN STOCK EXCHANGES ANNUAL REPORT JUNE 2010
PAGE 97
ISTANBUL STOCK EXCHANGE
TURKEY ECONOMIC CHARTS AND TABLES
2005 2006 2007 2008 2009 2010
Nominal GDP (US$ at PPP) bil US$ 747 (a) 825 (a) 888 (a) 915 (a) 872 (a) 912 (b)Real GDP mil TRY 90,500 96,738 101,255 102,164 96,028 (a) 98,934 (b)Real private consumption mil TRY 63,787 66,750 70,421 70,379 68,220 (a) 70,000 (b)Real government consumption mil TRY 8,767 9,506 10,127 10,323 10,529 (a) 10,740 (b)Real gross fixed investment mil TRY 21,822 24,715 25,481 24,211 19,974 (a) 20,873 (b)Real stockbuilding mil TRY -681 -764 -136 185 -2,771 (a) -1,900 (b)Real exports of G&S mil TRY 22,095 23,563 25,275 25,852 23,649 (a) 24,814 (b)Real imports of G&S mil TRY 25,290 27,032 29,914 28,786 23,575 (a) 25,593 (b)Real domestic demand mil TRY 93,694 100,207 105,893 105,098 95,953 (a) 99,713 (b)Real GDP at factor cost mil TRY 82,853 88,584 92,619 93,558 87,938 (a) 90,600 (b)Real agriculture mil TRY 9,571 9,701 9,047 9,368 9,555 (a) 9,650 (b)Real industry mil TRY 28,930 31,871 33,704 33,463 30,184 (a) 30,395 (b)Real manufacturing mil TRY 21,250 23,033 24,327 24,510 21,568 (a) 21,676 (b)Real services mil TRY 44,353 47,012 49,868 50,728 48,200 (a) 50,554 (b)Gross national savings rate (%) % 20.0 22.0 21.1 21.8 16.6 (a) 16.8 (b)Gross national savings/investment % 77.1 72.8 72.4 74.1 86.1 (a) 80.7 (b)Budget balance (% of GDP) % -1.3 -0.6 -1.6 -1.8 -6.3 (a) -5.9 (b)Consumer prices (% change pa; av) % 8.2 9.6 8.8 10.4 6.1 (a) 6.9 (b)Exchange rate LCU:US$ (av) TRY/US$ 1.3436 1.4285 1.3029 1.3015 1.5481 (a) 1.4913 (b)Lending interest rate (%) % 26.0 (a) 28.0 (a) 27.0 (a) 26.5 (a) 21.0 (a) 21.0 (b)Stock of domestic credit mil TRY 296,092 347,079 415,374 499,431 544,640 (a) 606,214 (b)Domestic credit growth (%) % 28.1 17.2 19.7 20.2 9.1 (a) 11.3 (b)Deposit interest rate (%) % 20.4 21.6 22.6 22.9 18.0 (a) 17.8 (b)Population million 69.7 (a) 70.4 (a) 71.2 (a) 71.9 (a) 72.6 (a) 73.3 (b)GDP per head ($ at PPP) US$ 10,730 (a) 11,710 (a) 12,480 (a) 12,730 (a) 12,010 (a) 12,430 (b)Current account balance/GDP % -4.6 -6.0 -5.8 -5.7 -2.3 (a) -3.2 (b)International reserves bil US$ 52 63 77 74 75 (a) 74 (b)Trade balance bil US$ -33 -41 -47 -53 -25 (a) -33 (b)Foreign-exchange reserves bil US$ 51 61 73 70 72 (a) 70 (b)Total foreign debt bil US$ 169 208 251 277 (a) 263 (a) 267 (b)Public medium & long-term bil US$ 62 67 75 79 (a) 80 (a) 79 (b)Private medium & long-term bil US$ 56 88 127 139 (a) 134 (a) 128 (b)IMF debt bil US$ 15 11 7 8 8 (a) 18 (b)Short term bil US$ 37 42 42 51 (a) 42 (a) 42 (b)Net debt bil US$ 117 145 175 203 (a) 188 (a) 193 (b)Export credits bil US$ 9 11 (a) 14 (a) 17 (a) 11 (a) 13 (b)
-60
-50
-40
-30
-20
-10
0
TRADE BALANCE(US$ billions)
2005 2006 2007 2008 2009 20100
5
10
15
20
25
30
REAL GROSS FIXED INVESTMENT(TRY millions)
2005 2006 2007 2008 2009 2010
(a) Estimate (b) Forecast
The Economist Intelligence Unit Limited, December 2009

KARACHI STOCK EXCHANGE
The KSE 100 index registered a growth of60% in 2009.
The year 2009 was a year of consolidation andrecovery. Pakistan’s economic growth ratedeclined to just over 2% compared to an averagegrowth rate of almost 7% over the 5 year period2004-08. A weak global economy, high levels ofpolitical uncertainty and a poor law and ordersituation all played a role in the decline in thecountry’s economic activity.
Despite being a slow year, the reduction ininflation, relative macro-stability, strongremittances and gradual monetary easing by theState Bank of Pakistan led to encouragingcorporate performance. The capital markets haverebounded albeit with low volumes and theirperformance remains highly correlated with thepolitical and security situation in the country. TheKSE 100 index registered a growth of 60% in 2009
which is especially impressive against thebackdrop of militant activity in the country. It isalso encouraging to note that companies are onceagain beginning to show a keen interest in raisingcapital and towards the end of 2009 a significantincrease in IPOs has been witnessed whichsignals a path to recovery in market activity for thenext year.
During 2009, the Karachi Stock Exchange re-introduced Deliverable Futures Contracts andadopted the global FIX protocol allowing DirectMarket access for global traders. The KarachiStock Exchange, also introduced the Debt Market;now trading in corporate bonds is beingconducted through the Bonds Automated TradingSystem (BATs). We are hopeful that with continuedsupport from the State Bank of Pakistan and
active participation from asset managementorganizations, and banks, this market will beextended to include public debt as well. In linewith our commitment to investors we continued toupgrade our risk management capabilities – theKSE introduced Client Level Margining on October1, 2009. The objective of this mechanism was tobring about a shift from broker level margining tothe Client/UIN level margining. All relatedtrading/exposure capital is now available on thebasis of UIN wise collateral positions in terms ofrespective sub-accounts.
Moving forward, we remain committed toenhancing our risk management and surveillancemeasures to further increase transparency and toensure a level playing field for all investors.
HISTORY AND DEVELOPMENT
The KSE is the biggest and most liquid exchangeamongst the three exchanges of Pakistan. It cameinto existence on 18 September 1947. It was laterconverted and registered as a company limited byguarantee on 10 March 1949. Initially, only fivecompanies were listed with a paid-up capital of Rs.37 million (US$ 0.62 million).
The year 2009 was year of consolidation andrecovery. The KSE 100 Index registered a growthof 60% and close at 9386.92 points. As of Dec 31,2009, ordinary shares of 651 companies werelisted having listed capital of Rs. 814.48 billion(US$ 9.66 billion) with the market capitalization ofRs.2,705.88 billion (US$ 32.10 billion).
In 1991 the secondary market was opened toforeign investors on an equal basis with localparticipants. This measure, along with a policy ofprivatization, has resulted in rapid growth of themarket since 1991.
ManagementThe KSE has an independent Board of Directors(10 directors) with representation from theMembers of the Exchange & from the CorporateCommunity. Five directors are elected fromamongst the 200 members of the Exchange andfour non member directors are nominated byRegulator i.e., SECP the Chairman is elected byBoard from amongst non member Directorswhereas, Managing Director is ex-officio memberof the board KSE is in process of demutualization,it is presently a company limited by guarantee, willbe converted into a company limited by shares.
Automation of the Exchange KSE has a fully automated trading system withT+2 settlement system whereby all trades settle onthe second day after the trade. Internet basedtrading system was also launched in December,2004 to provide an additional facility for investors
to enter their orders. KSE has also launched asingle exchange-traded market for tradingcorporate bonds in Pakistan using BATS. KSE’sBATS provide live system based, on screenelectronic Trading Platform which offer, marketparticipants a transparent and efficient tradingsystem features and facilities crucial for the Debtmarket Securities Trading. KSE also launchedStock Index Futures Contract. This marks amomentous achievement for the KSE.
Unique Identification Number was introduced toprovide a traceable link between every orderentered at the trading system of the Exchange.VaR based margining system was also introducedin place of a slab based Risk managementsystem. The new RMS included, amongst others, anew netting regime; a margining system based onValue at Risk (VaR) and Capital Adequacy. KSEhas also adopted the FIX protocol (FinancialInformation Exchange) for both trading and marketdata. Due to this technology, KSE will be able toattract local, regional and global liquidity byproviding KSE members to seamlessly interactwith their automated trading platform and offeraccess to their international trading partners.
ACCOMPLISHMENTS 2009
• Introduction of Corporate Bonds AutomatedTrading System• Data Vending and Launch of Mobile KSEAutomated Trading System (mKats)•Implementation of internationally acceptedindustry classification Benchmark a jointlydeveloped classification system launched by FTSEGroup and Dow Jones Index.
RISK MANAGEMENT
• Introduction of Client Level Margining Regime• Restructuring of Net Capital Balance requirement• Pre-settlement mechanism in Ready &Deliverable Future Contract Market
• Introduction of Exposure Dropout Facility duringTrading Hours•Introduction of Client wise cash depositsallocation against exposure margin and losses• Change in Penalty requirements on Net CapitalBalance Certificate.
The National Clearing & Settlement Company hasalready been established. The company handlesclearing and settlement of three exchanges of thecountry under one roof. Physical settlement toonline real-time book-entry settlement of thesecurities through Central Depository System hasalso been introduced to eliminate the opportunitiesfor forgery, fraud and delay in transfer.Transparency of the listed companies has beenenhanced with the introduction of quality audits,quarterly financial reports and timely dividendpayouts. Corporate governance is also now thepart of the KSE’s listing regulation.
FUTURE OUTLOOK
KSE is determined to remain one of the growinginvestment institutions not only within the countrybut globally as well.
• Corporatization and Demutualization of stockExchange:National Assembly has passed the StockExchange (Corporatization, Demutualization andIntegration) Bill and this will now be tabled in theSenate for its approval and afterward, will benotified in the official Gazette for its promulgationas Stock Exchanges (Corporatization,Demutualization and Integration) Act.
• Introduction of New Products and NewMeasures:KSE plans to introduce new products into themarket, to further cater to the growing needs of itsinvestors and help develop Pakistan’s capitalmarkets. KSE will be introducing: Exchange TradedFunds, Sector Based Index, new derivativeproducts.
Adnan Afridi Managing Director
FEDERATION OF EURO-ASIAN STOCK EXCHANGES ANNUAL REPORT JUNE 2010
PAGE 98

KARACHI STOCK EXCHANGE
FEDERATION OF EURO-ASIAN STOCK EXCHANGES ANNUAL REPORT JUNE 2010
PAGE 99
OFFICIAL 6 MONTH STATISTICS
US$ millions # Shares millionsTotal Volume Average Daily Volume Total Volume Average Daily Volume
StocksJul-09 2,061.71 89.64 3,944.22 171.49
Aug-09 2,090.59 104.53 3,233.25 161.66Sep-09 3,135.99 165.05 5,133.08 270.16Oct-09 2,922.89 132.86 4,959.20 225.42Nov-09 1,502.60 83.48 2,449.39 136.08Dec-09 1,354.58 64.50 2,753.11 131.10TOTAL 13,068.37 106.68 22,472.25 182.65
BondsJul-09 0.00 0.00 0.00 0.00
Aug-09 0.00 0.00 0.00 0.00Sep-09 0.00 0.00 0.00 0.00Oct-09 0.00 0.00 0.00 0.00Nov-09 3.28 0.18 0.07 0.00Dec-09 1.11 0.05 0.02 0.00TOTAL 4.39 0.04 0.09 0.00
OtherJul-09 0.00 0.00 0.00 0.00
Aug-09 0.00 0.00 0.00 0.00Sep-09 0.00 0.00 0.00 0.00Oct-09 0.00 0.00 0.00 0.00Nov-09 0.00 0.00 0.00 0.00Dec-09 0.00 0.00 0.00 0.00TOTAL 0.00 0.00 0.00 0.00
0
500
1,000
1,500
2,000
2,500
3,000
3,500
MONTHLY STOCK VOLUME VS INDEX(US$ millions)
MONTHLY MARKET CAPITALIZATION(US$ millions)
0
5,000
10,000
15,000
20,000
25,000
30,000
35,000
Stocks Index
Jul Aug Sep Oct Nov Dec Jul Aug Sep Oct Nov Dec01,0002,0003,0004,0005,0006,0007,0008,0009,00010,000
Market Capitalization(US$ millions) Index
Jul-09 27,382.07 7,720.93Aug-09 30,565.29 8,675.67Sep-09 32,719.78 9,349.68Oct-09 31,747.86 9,159.18Nov-09 31,816.81 9,206.21Dec-09 32,098.22 9,386.62
CONTACT INFORMATION
Contact Name Mr. Haroon Askari E-mail [email protected] Website www.kse.com.pk
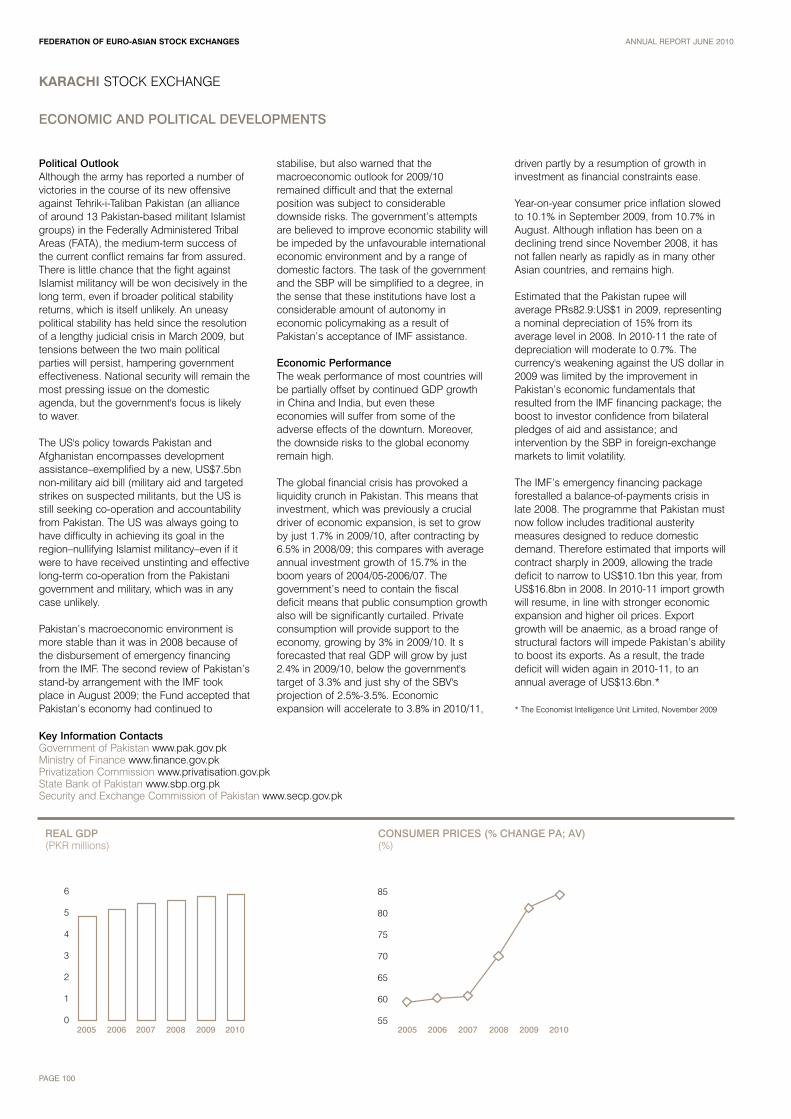
FEDERATION OF EURO-ASIAN STOCK EXCHANGES ANNUAL REPORT JUNE 2010
PAGE 100
KARACHI STOCK EXCHANGE
ECONOMIC AND POLITICAL DEVELOPMENTS
Political OutlookAlthough the army has reported a number ofvictories in the course of its new offensiveagainst Tehrik-i-Taliban Pakistan (an allianceof around 13 Pakistan-based militant Islamistgroups) in the Federally Administered TribalAreas (FATA), the medium-term success ofthe current conflict remains far from assured.There is little chance that the fight againstIslamist militancy will be won decisively in thelong term, even if broader political stabilityreturns, which is itself unlikely. An uneasypolitical stability has held since the resolutionof a lengthy judicial crisis in March 2009, buttensions between the two main politicalparties will persist, hampering governmenteffectiveness. National security will remain themost pressing issue on the domesticagenda, but the government's focus is likelyto waver.
The US's policy towards Pakistan andAfghanistan encompasses developmentassistance–exemplified by a new, US$7.5bnnon-military aid bill (military aid and targetedstrikes on suspected militants, but the US isstill seeking co-operation and accountabilityfrom Pakistan. The US was always going tohave difficulty in achieving its goal in theregion–nullifying Islamist militancy–even if itwere to have received unstinting and effectivelong-term co-operation from the Pakistanigovernment and military, which was in anycase unlikely.
Pakistan’s macroeconomic environment ismore stable than it was in 2008 because ofthe disbursement of emergency financingfrom the IMF. The second review of Pakistan’sstand-by arrangement with the IMF tookplace in August 2009; the Fund accepted thatPakistan’s economy had continued to
stabilise, but also warned that themacroeconomic outlook for 2009/10remained difficult and that the externalposition was subject to considerabledownside risks. The government’s attemptsare believed to improve economic stability willbe impeded by the unfavourable internationaleconomic environment and by a range ofdomestic factors. The task of the governmentand the SBP will be simplified to a degree, inthe sense that these institutions have lost aconsiderable amount of autonomy ineconomic policymaking as a result ofPakistan’s acceptance of IMF assistance.
Economic PerformanceThe weak performance of most countries willbe partially offset by continued GDP growthin China and India, but even theseeconomies will suffer from some of theadverse effects of the downturn. Moreover,the downside risks to the global economyremain high.
The global financial crisis has provoked aliquidity crunch in Pakistan. This means thatinvestment, which was previously a crucialdriver of economic expansion, is set to growby just 1.7% in 2009/10, after contracting by6.5% in 2008/09; this compares with averageannual investment growth of 15.7% in theboom years of 2004/05-2006/07. Thegovernment’s need to contain the fiscaldeficit means that public consumption growthalso will be significantly curtailed. Privateconsumption will provide support to theeconomy, growing by 3% in 2009/10. It sforecasted that real GDP will grow by just2.4% in 2009/10, below the government'starget of 3.3% and just shy of the SBV'sprojection of 2.5%-3.5%. Economicexpansion will accelerate to 3.8% in 2010/11,
driven partly by a resumption of growth ininvestment as financial constraints ease.
Year-on-year consumer price inflation slowedto 10.1% in September 2009, from 10.7% inAugust. Although inflation has been on adeclining trend since November 2008, it hasnot fallen nearly as rapidly as in many otherAsian countries, and remains high.
Estimated that the Pakistan rupee willaverage PRs82.9:US$1 in 2009, representinga nominal depreciation of 15% from itsaverage level in 2008. In 2010-11 the rate ofdepreciation will moderate to 0.7%. Thecurrency's weakening against the US dollar in2009 was limited by the improvement inPakistan’s economic fundamentals thatresulted from the IMF financing package; theboost to investor confidence from bilateralpledges of aid and assistance; andintervention by the SBP in foreign-exchangemarkets to limit volatility.
The IMF’s emergency financing packageforestalled a balance-of-payments crisis inlate 2008. The programme that Pakistan mustnow follow includes traditional austeritymeasures designed to reduce domesticdemand. Therefore estimated that imports willcontract sharply in 2009, allowing the tradedeficit to narrow to US$10.1bn this year, fromUS$16.8bn in 2008. In 2010-11 import growthwill resume, in line with stronger economicexpansion and higher oil prices. Exportgrowth will be anaemic, as a broad range ofstructural factors will impede Pakistan’s abilityto boost its exports. As a result, the tradedeficit will widen again in 2010-11, to anannual average of US$13.6bn.*
* The Economist Intelligence Unit Limited, November 2009
Key Information ContactsGovernment of Pakistan www.pak.gov.pkMinistry of Finance www.finance.gov.pkPrivatization Commission www.privatisation.gov.pkState Bank of Pakistan www.sbp.org.pkSecurity and Exchange Commission of Pakistan www.secp.gov.pk
0
1
2
3
4
5
6
REAL GDP(PKR millions)
CONSUMER PRICES (% CHANGE PA; AV)(%)
55
60
65
70
75
80
85
2005 2006 2007 2008 2009 2010 2005 2006 2007 2008 2009 2010

FEDERATION OF EURO-ASIAN STOCK EXCHANGES ANNUAL REPORT JUNE 2010
PAGE 101
KARACHI STOCK EXCHANGE
PAKISTAN ECONOMIC CHARTS AND TABLES
2005 2006 2007 2008 2009 2010
Nominal GDP (US$ at PPP) bil US$ 340 373 406 423 (a) 444 (a) 459 (b)Real GDP bil PKR 4,882 5,183 5,478 5,587 5,796 5,906 (b)Real private consumption bil PKR 3,671 3,708 3,883 3,832 4,032 4,117 (b)Real government consumption bil PKR 397 589 532 740 640 664 (b)Real gross fixed investment bil PKR 701 841 955 992 927 943 (b)Real stockbuilding bil PKR 79 83 88 92 89 90 (b)Real exports of G&S bil PKR 879 966 988 935 1,020 1,017 (b)Real imports of G&S bil PKR 845 1,003 968 1,003 911 925 (b)Real domestic demand bil PKR 4,848 5,221 5,458 5,655 5,687 5,814 (b)Real GDP at factor cost bil PKR 4,593 4,860 5,192 5,404 5,512 5,617 (b)Real agriculture bil PKR 1,027 1,092 1,137 1,149 1,203 1,250 (b)Real industry bil PKR 1,207 1,257 1,368 1,391 1,341 1,344 (b)Real manufacturing bil PKR 781 846 919 963 926 935 (b)Real services bil PKR 2,359 2,512 2,687 2,864 2,968 3,023 (b)Gross national savings rate (%) % 15.7 16.7 16.7 10.1 17.5 (a) 14.7 (b)Gross national savings/investment % 82.7 75.9 74.2 52.0 92.4 (a) 82.4 (b)Budget balance (% of GDP) % -3.2 -4.2 -4.5 -7.6 (a) -5.2 (a) -5.8 (b)Consumer prices (% change pa; av) % 9.1 7.9 7.6 20.3 13.7 (a) 9.9 (b)Exchange rate LCU:US$ (av) PKR/US$ 59.5145 60.2713 60.7385 70.4080 81.6400 (a) 84.7500 (b)Lending interest rate (%) % 8.2 9.9 10.2 (a) 12.4 (a) 13.3 (a) 12.5 (b)Stock of domestic credit bil PKR 2,853 3,268 3,982 4,719 (a) 5,340 (a) 6,093 (b)Domestic credit growth (%) % 23.2 14.5 21.9 18.5 (a) 13.1 (a) 14.1 (b)Deposit interest rate (%) % 1.9 2.9 4.0 (a) 5.2 (a) 6.0 (a) 4.5 (b)Population million 165.9 169.5 173.3 (a) 177.3 (a) 181.4 (a) 185.5 (b)GDP per head ($ at PPP) US$ 2,051 2,201 2,340 (a) 2,380 (a) 2,450 (a) 2,480 (b)Current account balance/GDP % -3.3 -5.3 -5.8 -9.3 -1.4 (a) -3.2 (b)International reserves bil US$ 11 13 16 9 15 (a) 16 (b)Trade balance bil US$ -6 -10 -11 -17 -10 (a) -13 (b)Foreign-exchange reserves bil US$ 10 12 14 7 13 (a) 14 (b)Total foreign debt bil US$ 33 36 41 46 (a) 51 (a) 56 (b)Public medium & long-term bil US$ 29 32 36 37 (a) 38 (a) 39 (b)Private medium & long-term bil US$ 1 1 1 1 1 (a) 1 (b)IMF debt bil US$ 1 1 1 4 8 12 (b)Short term bil US$ 1 1 2 4 4 (a) 4 (b)Net debt bil US$ 22 23 25 37 (a) 36 (a) 39 (b)Export credits bil US$ 6 8 (a) 8 (a) 11 (a) 9 (a) 10 (b)
-18
-16
-14
-12
-10
-8
-6
-4
-2
0
TRADE BALANCE(US$ billions)
2005 2006 2007 2008 2009 20100
100200300400500600700800900
1,000
REAL GROSS FIXED INVESTMENT(PKR millions)
2005 2006 2007 2008 2009 2010
(a) Estimate (b) Forecast
The Economist Intelligence Unit Limited, December 2009.
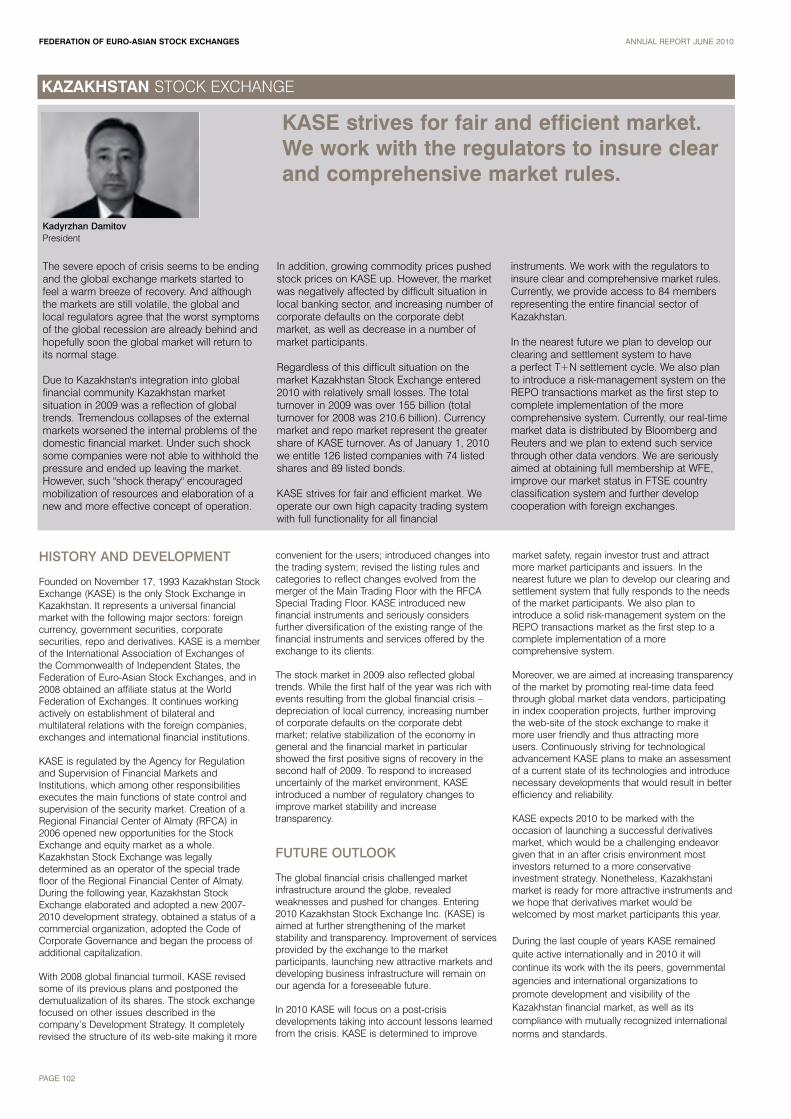
KAZAKHSTAN STOCK EXCHANGE
KASE strives for fair and efficient market.We work with the regulators to insure clearand comprehensive market rules.
The severe epoch of crisis seems to be endingand the global exchange markets started tofeel a warm breeze of recovery. And althoughthe markets are still volatile, the global andlocal regulators agree that the worst symptomsof the global recession are already behind andhopefully soon the global market will return toits normal stage.
Due to Kazakhstan's integration into globalfinancial community Kazakhstan marketsituation in 2009 was a reflection of globaltrends. Tremendous collapses of the externalmarkets worsened the internal problems of thedomestic financial market. Under such shocksome companies were not able to withhold thepressure and ended up leaving the market.However, such "shock therapy" encouragedmobilization of resources and elaboration of anew and more effective concept of operation.
In addition, growing commodity prices pushedstock prices on KASE up. However, the marketwas negatively affected by difficult situation inlocal banking sector, and increasing number ofcorporate defaults on the corporate debtmarket, as well as decrease in a number ofmarket participants.
Regardless of this difficult situation on themarket Kazakhstan Stock Exchange entered2010 with relatively small losses. The totalturnover in 2009 was over 155 billion (totalturnover for 2008 was 210.6 billion). Currencymarket and repo market represent the greatershare of KASE turnover. As of January 1, 2010we entitle 126 listed companies with 74 listedshares and 89 listed bonds.
KASE strives for fair and efficient market. Weoperate our own high capacity trading systemwith full functionality for all financial
instruments. We work with the regulators toinsure clear and comprehensive market rules.Currently, we provide access to 84 membersrepresenting the entire financial sector ofKazakhstan.
In the nearest future we plan to develop ourclearing and settlement system to havea perfect T+N settlement cycle. We also planto introduce a risk-management system on theREPO transactions market as the first step tocomplete implementation of the morecomprehensive system. Currently, our real-timemarket data is distributed by Bloomberg andReuters and we plan to extend such servicethrough other data vendors. We are seriouslyaimed at obtaining full membership at WFE,improve our market status in FTSE countryclassification system and further developcooperation with foreign exchanges.
HISTORY AND DEVELOPMENT
Founded on November 17, 1993 Kazakhstan StockExchange (KASE) is the only Stock Exchange inKazakhstan. It represents a universal financialmarket with the following major sectors: foreigncurrency, government securities, corporatesecurities, repo and derivatives. KASE is a memberof the International Association of Exchanges ofthe Commonwealth of Independent States, theFederation of Euro-Asian Stock Exchanges, and in2008 obtained an affiliate status at the WorldFederation of Exchanges. It continues workingactively on establishment of bilateral andmultilateral relations with the foreign companies,exchanges and international financial institutions.
KASE is regulated by the Agency for Regulationand Supervision of Financial Markets andInstitutions, which among other responsibilitiesexecutes the main functions of state control andsupervision of the security market. Creation of aRegional Financial Center of Almaty (RFCA) in2006 opened new opportunities for the StockExchange and equity market as a whole.Kazakhstan Stock Exchange was legallydetermined as an operator of the special tradefloor of the Regional Financial Center of Almaty.During the following year, Kazakhstan StockExchange elaborated and adopted a new 2007-2010 development strategy, obtained a status of acommercial organization, adopted the Code ofCorporate Governance and began the process ofadditional capitalization.
With 2008 global financial turmoil, KASE revisedsome of its previous plans and postponed thedemutualization of its shares. The stock exchangefocused on other issues described in thecompany’s Development Strategy. It completelyrevised the structure of its web-site making it more
convenient for the users; introduced changes intothe trading system; revised the listing rules andcategories to reflect changes evolved from themerger of the Main Trading Floor with the RFCASpecial Trading Floor. KASE introduced newfinancial instruments and seriously considersfurther diversification of the existing range of thefinancial instruments and services offered by theexchange to its clients.
The stock market in 2009 also reflected globaltrends. While the first half of the year was rich withevents resulting from the global financial crisis –depreciation of local currency, increasing numberof corporate defaults on the corporate debtmarket; relative stabilization of the economy ingeneral and the financial market in particularshowed the first positive signs of recovery in thesecond half of 2009. To respond to increaseduncertainly of the market environment, KASEintroduced a number of regulatory changes toimprove market stability and increasetransparency.
FUTURE OUTLOOK
The global financial crisis challenged marketinfrastructure around the globe, revealedweaknesses and pushed for changes. Entering2010 Kazakhstan Stock Exchange Inc. (KASE) isaimed at further strengthening of the marketstability and transparency. Improvement of servicesprovided by the exchange to the marketparticipants, launching new attractive markets anddeveloping business infrastructure will remain onour agenda for a foreseeable future.
In 2010 KASE will focus on a post-crisisdevelopments taking into account lessons learnedfrom the crisis. KASE is determined to improve
market safety, regain investor trust and attractmore market participants and issuers. In thenearest future we plan to develop our clearing andsettlement system that fully responds to the needsof the market participants. We also plan tointroduce a solid risk-management system on theREPO transactions market as the first step to acomplete implementation of a morecomprehensive system.
Moreover, we are aimed at increasing transparencyof the market by promoting real-time data feedthrough global market data vendors, participatingin index cooperation projects, further improving the web-site of the stock exchange to make itmore user friendly and thus attracting more users. Continuously striving for technologicaladvancement KASE plans to make an assessmentof a current state of its technologies and introducenecessary developments that would result in betterefficiency and reliability.
KASE expects 2010 to be marked with theoccasion of launching a successful derivativesmarket, which would be a challenging endeavorgiven that in an after crisis environment mostinvestors returned to a more conservativeinvestment strategy. Nonetheless, Kazakhstanimarket is ready for more attractive instruments andwe hope that derivatives market would bewelcomed by most market participants this year.
During the last couple of years KASE remainedquite active internationally and in 2010 it willcontinue its work with the its peers, governmentalagencies and international organizations topromote development and visibility of theKazakhstan financial market, as well as itscompliance with mutually recognized internationalnorms and standards.
Kadyrzhan DamitovPresident
FEDERATION OF EURO-ASIAN STOCK EXCHANGES ANNUAL REPORT JUNE 2010
PAGE 102

KAZAKHSTAN STOCK EXCHANGE
FEDERATION OF EURO-ASIAN STOCK EXCHANGES ANNUAL REPORT JUNE 2010
PAGE 103
OFFICIAL 6 MONTH STATISTICS
US$ millions # Shares millionsTotal Volume Average Daily Volume Total Volume Average Daily Volume
StocksJul-09 40.47 1.84 17.86 0.81
Aug-09 177.52 8.88 20.02 1.00Sep-09 90.87 4.13 178.45 8.11Oct-09 172.12 7.82 198.79 9.04Nov-09 2,635.25 131.76 140.05 7.00Dec-09 199.97 9.52 67.05 3.19TOTAL 3,316.19 27.33 622.21 4.86
BondsJul-09 1,336.70 60.759 15,525.65 705.71
Aug-09 1,173.29 58.6647 6,361.80 318.09Sep-09 1,039.59 47.2543 7,154.61 325.21Oct-09 955.338 43.4245 12,627.99 574.00Nov-09 1,020.00 50.9998 6,747.42 337.37Dec-09 1,490.71 70.9861 11,036.79 525.56TOTAL 7,015.63 55.35 59,454.27 464.32
OtherJul-09 10,954.66 497.9391 0.00 0.00
Aug-09 11,179.80 558.9898 0.00 0.00Sep-09 10,136.36 460.7438 0.00 0.00Oct-09 10,022.15 455.5522 0.00 0.00Nov-09 12,039.20 601.9598 0.00 0.00Dec-09 11,499.63 547.6014 0.00 0.00TOTAL 65,831.79 3,122.79 0.00 0.00
MONTHLY STOCK VOLUME VS INDEX(US$ millions)
MONTHLY MARKET CAPITALIZATION(US$ millions)
Stocks Index
0
500
1,000
1,500
2,000
2,500
3,000
0
10,000
20,000
30,000
40,000
50,000
60,000
Jul Aug Sep Oct Nov Dec Jul Aug Sep Oct Nov Dec02004006008001,0001,2001,4001,6001,8002,000
Market Capitalization(US$ millions) Index
Jul-09 45,619.43 1,191.74Aug-09 49,510.64 1,394.47Sep-09 51,160.22 1,512.84Oct-09 56,096.32 1,681.20Nov-09 58,059.71 1,837.76Dec-09 57,296.49 1,768.26
CONTACT INFORMATION
Contact Name Mr. Bolat Babenov E-mail [email protected] Website www.kase.kz

FEDERATION OF EURO-ASIAN STOCK EXCHANGES ANNUAL REPORT JUNE 2010
PAGE 104
KAZAKHSTAN STOCK EXCHANGE
ECONOMIC AND POLITICAL DEVELOPMENTS
Economic and Political EnvironmentPolitical climate in Kazakhstan remains stable.2010 is the year of Kazakhstan chairmanshipin the Organization for Security and Co-operation in Europe (OSCE). This puts moreemphasis on the importance of internalpolitical stability to ensure successfulimplementation of the country's foreign policyand Kazakhstan's OSCE agenda for 2010which among other things includes: conflictmanagement measures in Nagorny Karabakh,recovery of Afghanistan, as well as fightagainst drug-trafficking. Greece and Finlandjoined Kazakhstan in the Troika of Chairmen ofthe OSCE. Global political experts believe thatKazakhstan’s chairmanship will bring “freshair” to the organization and hope for positivechanges in the international political climate.
Kazakhstan continues its path towardsdemocracy. To guarantee proper functioningof democratic processes in the country thirtylegislative amendments were approved.During the next elections of the Lower Houseof Parliament of Kazakhstan which will takeplace in 2011, the amended legislation willapply. The amendments simplify the processof registration of foreign observers of theelections process. Freedom of access toinformation is also thoroughly assessed and inthe future sittings some tangible changes areexpected. The National Human Rights ActionPlan 2009-2012 furthers democratization ofthe country. By adopting this Plan Kazakhstanemphasizes its commitment to human rightsand a stable democratic society.
By improving domestic political stability theGovernment of Kazakhstan emphasizes theimportance of positive investment climate thateliminates potential political risks. In 2009 thegovernment reviewed and revised its
legislation and improved its rating in the WorldBank Doing Business rating creating betterconditions for foreign and domestic investors.The year of 2010 is when the development ofthe Customs Union with Russia and Belarus iscoming into force. The Union allows freecapital movement and opens new markets toforeign and local corporations and investors.The country requires resources for sustainabledevelopment and therefore attraction offoreign resources is one of the public policypriorities.
Economic PerformanceDespite of forecasts in 2009 KazakhstanGross Domestic Product (GDP) grew by 1.2%and amounted to KZT15.9 trln (US$107.3 bn)and turned out to be higher than thegovernment GDP growth prediction of 1%. At the same time the International MonetaryFund (IMF) forecasted decline of KazakhstanGDP by 2%. In 2009 the industrial productionvolume grew by 1.7%.
Among significant reasons that positivelyinfluenced the economy growth in 2009 wereimplementation of the large-scale governmentprograms in the banking sector along withsmall and medium size businesses, and realestate sector support. In order to carry out theprogram of financial sector stabilization theNational Welfare Fund “Samruk-Kazyna”acquired control of two major banks inFebruary.
Regardless of the defaults of the mosttroubled banks in the first half of 2009, thegovernment measures aimed at the economicand financial sectors stimulation resulted inrelative stabilization in the banking sector inthe second half of the year.
As a result of price reduction on the mainexport products of Kazakhstan in the secondhalf of 2008, the export operations volume atthe beginning of 2009 considerably declined.In order to support the US dollar rate stability,the National Bank actively intervened in thecurrency market that resulted in decrease ofthe gold and foreign currency reserves volumeby more than 10% by February from thebeginning of the year.
Consequently the National Bank devaluatedthe local currency Tenge by 25% on February5 and set the currency rate at KZT150 per USdollar +/- 3%, along with the Russian rubledevaluation of 56%. As a result the netinternational reserves (NIR) grew by 1.7% andamounted to US$47.6 bn by the end of theyear. In spite of the growth of prices onimported goods the inflation in Kazakhstanreached 6.2% in 2009, compared with 9.5% in2008.
According to Kazakhstan governmentforecasts the economy of Kazakhstan willcontinue its recovery in 2010. The forecastedgrowth of GDP is in the range of 1.5-2.0%range, and the inflation rate of 6 - 8%. At thesame time the targeted currency rate for 2010is set around KZT150 per US dollar with thepossible strengthening trend.*
* Information provided by KSE.
Key Information ContactsFinancial Institutions’ Association of Kazakhstan www.afk.kz/eng/National Bank of Kazakhstan www.nationalbank.kzMinistry of Finance of the Republic of Kazakhstan www.minfin.kzCentral Securities Depository www.csd.kzKazakhstan Agency for Financial Market and Financial Organizations Regulation and Supervision www.afn.kz
0
20
40
60
80
100
120
140
REAL GDP(US$ billions)
INFLATION (CHANGE PA; AV)(%)
6
8
10
12
14
16
18
20
2005 2006 2007 2008 2009 2005 2006 2007 2008 2009

FEDERATION OF EURO-ASIAN STOCK EXCHANGES ANNUAL REPORT JUNE 2010
PAGE 105
KAZAKHSTAN STOCK EXCHANGE
KAZAKHSTAN ECONOMIC CHARTS AND TABLES
2005 2006 2007 2008 2009GDP, bn US$ 56.12 81.01 104.86 132.48 107.02GDP growth, %* +9.7 +10.7 +8.9 +3.3 +1.2Unemployment rate, % 8.1 7.8 7.3 6.6 6.3Budget balance, in % to GDP 0.6 0.8 -1.7 -2.1 -3.1Inflation, % 7.6 8.4 18.8 9.5 6.2US$/KZT 132.88 126.09 122.55 120.3 147.5EUR/KZT 165.4 158.3 167.8 177.0 205.7Net international reserves, bn US$ 7.065 19.123 17.626 19.844 22.653Gross external debt, bn US$ 43.4 74.0 96.9 108.1 111.3**Trade balance, bn US$ 10.1 14.59 14.68 33.12 15.2External payments current account surplus, bn US$ -1.06 -2.00 -8.23 6.60 -3.93**
* - real GDP growth in Kazakhstan tenge
** - the data as of the end of the third quarter of 2009
0
5
10
15
20
25
30
35
TRADE BALANCE(US$ billions)
0
5
10
15
20
25
NET INTERNATIONAL RESERVES(US$ billions)
2005 2006 2007 2008 2009 2005 2006 2007 2008 2009

KYRGYZ STOCK EXCHANGE
In 2009 trading volume of the Kyrgyz StockExchange (KSE) has decreased 29.4% incomparison with 2008.
In 2009 trading volume of the Kyrgyz StockExchange (KSE) has decreased by 29.4% incomparison with 2008 and the volume totaled2,95 billion KG Som (about US$ 66 million).The total quantity of the transactions hasdecreased by 72.8% represented by 926transactions.
In listing sector trading volume has increasedon 41.3% in comparison with 2008 andtotaled 842.8 million KG Som (about US$ 19,1million).
In non listing sector trading volume hasdecreased by 41,2% in comparison with 2008and totaled 2,1 billion KG Som (about US$46.9 million).
Trading volume of primary market totaled 1,52billion KG Som (about US$ 34,7 million), incomparison with volume of 2008 it hasincreased by 69,0%.
Trading volume of secondary market totaled1.43 billion KG Som (about US$ 31,3 million),in comparison with volume of 2008 it hasdecreased by 56,6%.
HISTORY AND DEVELOPMENT
The KSE was founded in 1994. The officialopening and the first trade in stocks tookplace in May 1995, while the privatizationprocess was in full swing in our country.
At the initial stage of its existence and up until2000, the KSE had functioned as a non-profitorganization with a total membership of 16. InMay 2000 the KSE was transformed into ajoint-stock company; simultaneously weacquired one of the largest shareholders anda reliable partner the Istanbul StockExchange, which has actively assisted us inimproving our activities. In 2001 theKazakhstan Stock Exchange became ashareholder allowing the KSE to significantlyincrease its technical software potential. Atpresent the KSE is a closed-type non-profitjoint-stock company with 17 shareholders.
A significant contribution has been made bythe US Agency on International Development(USAID) for the sake of our continueddevelopment. Thanks to the USAID, the KSEhas obtained powerful financial support thathas allowed our Exchange becomeindependent.
FUTURE OUTLOOK
Priorities for the KSE in 2010 are:
• Transfer of government treasury bills’circulation of the trade area of KSE• Circulation of securities of «blue chips»• Development of corporate equity marketand capital formation by domestic companies• Development of listing and market making• Development of municipal equity market • Integration with the cross markets andinternational exchanges.
Aibek TolubaevPresident
FEDERATION OF EURO-ASIAN STOCK EXCHANGES ANNUAL REPORT JUNE 2010
PAGE 106

KYRGYZ STOCK EXCHANGE
FEDERATION OF EURO-ASIAN STOCK EXCHANGES ANNUAL REPORT JUNE 2010
PAGE 107
OFFICIAL 6 MONTH STATISTICS
US$ millions # Shares millionsTotal Volume Average Daily Volume Total Volume Average Daily Volume
StocksJul-09 19.57 0.85 323.44 14.06
Aug-09 0.70 0.03 5.53 0.28Sep-09 2.32 0.11 0.05 0.00Oct-09 9.16 0.42 0.87 0.04Nov-09 1.89 0.09 0.72 0.03Dec-09 7.80 0.34 8.03 0.35TOTAL 41.45 0.31 338.65 2.46
BondsJul-09 0.18 0.01 0.01 0.00
Aug-09 0.00 0.00 0.00 0.00Sep-09 0.02 0.00 0.00 0.00Oct-09 0.00 0.00 0.00 0.00Nov-09 0.00 0.00 0.00 0.00Dec-09 0.00 0.00 0.00 0.00TOTAL 0.21 0.00 0.01 0.00
OtherJul-09 0.00 0.00 0.00 0.00
Aug-09 0.00 0.00 0.00 0.00Sep-09 0.00 0.00 0.00 0.00Oct-09 0.00 0.00 0.00 0.00Nov-09 0.00 0.00 0.00 0.00Dec-09 0.00 0.00 0.00 0.00TOTAL 0.00 0.00 0.00 0.00
02468
101214161820
MONTHLY STOCK VOLUME VS INDEX(US$ millions)
MONTHLY MARKET CAPITALIZATION(US$ millions)
0
10
20
30
40
50
60
70
80
Stocks Index
Jul Aug Sep Oct Nov Dec Jul Aug Sep Oct Nov Dec0102030405060708090100
Market Capitalization(US$ millions) Index
Jul-09 69.82 94.67Aug-09 61.07 89.12Sep-09 61.60 89.12Oct-09 70.40 88.32Nov-09 69.36 87.42Dec-09 71.84 90.90
CONTACT INFORMATION
Contact Name Mr. Aibek Tolubev E-mail [email protected] Website www.kse.kg

FEDERATION OF EURO-ASIAN STOCK EXCHANGES ANNUAL REPORT JUNE 2010
KYRGYZ STOCK EXCHANGE
ECONOMIC AND POLITICAL DEVELOPMENTS
Economic and Political EnvironmentIt is likely that the president, KurmanbekBakiyev, will exploit the administrativeresources at his disposal to ensure his re-election in July 2009. Opposition forces havebeen unable to agree on a unified presidentialcandidate, making Mr Bakiyev's re-electionmore likely. The sidelining of the opposition bythe presidential administration in the electionin 2007—a poll that was criticised byinternational observers—will continue to castdoubt on the legitimacy of parliament, with thepro-presidential Ak Jol (True Path) partyholding almost 80% of the seats. Theopposition will attempt to rally the publicbehind it by concentrating on the resonantissues of harsh economic conditions andcontroversial privatisations. Public protests onsuch issues are likely in the context of highinflation and a forecast rapid slowdown ineconomic growth, and will have an increasingpotential to turn violent as economic hardshipdeepens. However, the government is likely tobe able to contain them.
The authorities have tended to try to pursue amulti-vectoral foreign policy—that is, one thatseeks to maintain good relations with all themain powers in the region. However, followingthe announcement of the closure of the USairbase at Manas, Russia has become a muchmore prominent partner. Although the militarybase provided the authorities with much-needed revenue, this was dwarfed by a loanpackage agreed with Russia in February.Nevertheless, ties with the US will not suffer acomplete rupture, given that the uncertainsecurity situation in Afghanistan is expected tolead to a certain degree of tolerance on thepart of Russia to a US presence in the region,at least in the immediate term.
Policy trends in 2009-10 will be predominantlybased on limiting the impact of externaleconomic shocks. The Kyrgyz Republic hasdeveloped a policy programme with the IMF,having agreed an 18-month arrangementunder the Fund's exogenous shocks facility(ESF). Nevertheless, the goal of meeting theFund's criteria will have to be balancedagainst preventing a rise in social instability,particularly in a context in which inflation is stillhigh and a rapid downturn in growth isforecast. The government's medium-termpolicy emphasis is on cutting inflation,sustaining growth and reducing poverty.Financial support from Russia will enable thegovernment to run larger budget deficits thanoriginally planned in 2009-10.
Economic PerformanceExpected that the economies of two of theKyrgyz Republic's most important economicpartners, Kazakhstan and Russia, to contractin 2009, given the impact of global financialturbulence and a slowdown in growthworldwide. The two countries are importantdestinations for Kyrgyz non-gold exports, aswell as the main host countries for Kyrgyzmigrant labour. In addition, Kazakh bankscontrol a significant proportion of the Kyrgyzbanking sector. Prices for oil will fall sharply in2009, before increasing in 2010. This will helpto offset the impact on the Kyrgyz Republic'simport bill of a doubling in gas import prices.Prices for other commodities and food arealso expected to decline markedly in 2009,before recovering slightly in 2010. The price ofgold, the country's main export commodity, isforecast to stabilise in 2009-10.
Real GDP growth slowed from 8.5% in 2007 to7.6% in 2008. A downturn in the Russian andKazakh economies will have a knock-on effecton growth in 2009, in terms of reduced
demand for Kyrgyz exports and a fall ininflows of remittances to fund privateconsumption.
Continuing power shortages and a doubling inthe cost of gas imports in 2009 will exertsignificant upward pressure on prices. It isforecast a sharp fall in international oil pricesin 2009, which will ease imported inflationarypressures. Forecast falls of over 25% inaverage food prices and over 40% in theprices of industrial raw materials will alsocontribute to a slowdown in Kyrgyz inflationcompared with 2008. A slowdown inconsumer demand will also curtail pricegrowth for domestically produced goods andfor services, although utilities prices are likelyto continue to rise. We now forecast averageannual inflation at 7.5% in 2009, comparedwith 24.5% in 2008, and expect furtherdisinflation, to an average of 5.5%, in 2010.
The som saw a sharp reversal in a trend ofslow nominal appreciation in September 2008,and has fallen by around 20% since then, asinvestors withdraw from perceived higher riskin emerging-market currencies. The NationalBank of the Kyrgyz Republic (NBKR, thecentral bank) has been selling foreign-currency reserves to support the som, so thatforeign-exchange reserves, which had stoodat US$1.2bn at the end of 2008, had fallen toUS$1.05bn by end-March 2009.
The Kyrgyz Republic has been recalculatingits current-account data to take account ofunrecorded remittance inflows and shuttletrade re-exports. Until this process iscomplete, year-on-year comparisons willremain problematic.*
* The Economist Intelligence Unit Limited, May 2009
Key Information ContactsNational Bank of the Kyrgyz Republic www.nbkr.kgMinistry of Finance www.minfin.kgThe Service of Supervision and Regulations of Financial Market of Kyrgyz Republic www.nsc.kgMinistry of Foreign Trade and Industry of the Kyrgyz Republic www.mvtp.kg
0
5
10
15
20
25
30
35
REAL GDP(KGS millions)
CONSUMER PRICES (% CHANGE PA; AV)(%)
0
5
10
15
20
25
2005 2006 2007 2008 2009 20102005 2006 2007 2008 2009 2010
PAGE 108

FEDERATION OF EURO-ASIAN STOCK EXCHANGES ANNUAL REPORT JUNE 2010
KYRGYZ STOCK EXCHANGE
KYRGYZSTAN ECONOMIC CHARTS AND TABLES
2005 2006 2007 2008 2009 2010
Nominal GDP (US$ at PPP) bil US$ 9 9 (a) 11 (a) 12 (a) 12 (a) 13 (b)Real GDP bil KGS 26 26 29 31 31 (a) 32 (b)Real private consumption bil KGS 20 24 25 29 26 (a) 28 (b)Real government consumption bil KGS 4 4 4 4 5 5 (b)Real gross fixed investment bil KGS 3 5 5 5 5 5 (b)Real stockbuilding bil KGS 0 -0 -1 -3 -1 (a) -2 (b)Real exports of G&S bil KGS 6 7 8 10 9 9 (b)Real imports of G&S bil KGS 8 11 13 15 13 (a) 13 (b)Real domestic demand bil KGS 28 33 33 35 34 (a) 35 (b)Real GDP at factor cost bil KGS 24 24 26 28 29 (a) 30 (b)Real agriculture bil KGS 11 11 11 11 12 (a) 12 (b)Real industry bil KGS 4 3 4 4 3 3 (b)Real manufacturing bil KGS 2 2 2 3 2 2 (b)Real services bil KGS 9 10 11 13 14 (a) 15 (b)Gross national savings rate (%) % 14.0 13.6 19.7 11.3 (a) 21.5 (a) 20.0 (b)Gross national savings/investment % 85.1 56.4 74.1 45.7 (a) 100.6 (a) 92.1 (b)Budget balance (% of GDP) % 0.2 -0.2 0.1 0.8 -0.6 (a) -0.3 (b)Consumer prices (% change pa; av) % 4.4 5.6 10.2 24.5 7.1 (a) 9.3 (b)Exchange rate LCU:US$ (av) KGS/US$ 41.0118 40.1529 37.3163 36.5746 43.0647 (a) 45.7872 (b)Lending interest rate (%) % 21.7 23.3 24.6 23.3 22.3 (a) 23.0 (b)Stock of domestic credit bil KGS 9 13 20 21 (a) 26 (a) 28 (b)Domestic credit growth (%) % 19.6 39.8 49.8 5.1 (a) 23.9 (a) 9.1 (b)Deposit interest rate (%) % 5.3 5.8 5.5 5.5 5.5 (a) 4.6 (b)Population million 5.1 5.2 5.2 5.3 (a) 5.3 (a) 5.3 (b)GDP per head ($ at PPP) US$ 1,730 (a) 1,830 (a) 2,020 (a) 2,210 (a) 2,260 (a) 2,350 (b)Current account balance/GDP % -2.4 -10.6 -6.9 -13.4 (a) 0.1 (a) -1.7 (b)International reserves bil US$ 1 1 1 1 2 1 (b)Trade balance bil US$ -0 -1 -1 -2 -1 (a) -1 (b)Foreign-exchange reserves bil US$ 1 1 1 1 1 1 (b)Total foreign debt bil US$ n/a n/a n/a n/a n/a n/aPublic medium & long-term bil US$ n/a n/a n/a n/a n/a n/aPrivate medium & long-term bil US$ n/a n/a n/a n/a n/a n/aIMF debt bil US$ n/a n/a n/a n/a n/a n/aShort term bil US$ n/a n/a n/a n/a n/a n/aNet debt bil US$ n/a n/a n/a n/a n/a n/aExport credits bil US$ n/a n/a n/a n/a n/a n/a
(a) Estimate (b) Forecast
The Economist Intelligence Unit Limited, September 2009
-2.0-1.8-1.6-1.4-1.2-1.0-0.8-0.6-0.4-0.20.0
TRADE BALANCE(US$ billions)
2005 2006 2007 2008 2009 20100.00.51.01.52.02.53.03.54.04.55.0
REAL GROSS FIXED INVESTMENT(KGS millions)
2005 2006 2007 2008 2009 2010
PAGE 109

LAHORE STOCK EXCHANGE
The Exchange is well positioned in anenabling environment with the cooperationof the regulators to capitalize all availableopportunities with its distinct performanceto restore the confidence of investors.
Pakistan has made significant efforts to stayon the course of stabilization and structuralreforms against the backdrop of weak externaldemand and difficult security and politicalenvironment. Privatization process was almostredundant and FDI’S were markedly low andthe market witnessed unprecedented outflowof the portfolio investments.
LSE witnessed one of its most volatile tradingyears. LSE-25 Index was 1450.57 points onJanuary 1st and after touches the bottom of1300.94 points on January 26, 2009 started toincrease gradually and touch the height of3061.57 points on September 24, 2009.
LSE-25 Index is placed at 2893.88 points onDecember 31, 2009 with market capitalizationof US$ 30.621 billion. The average dailyturnover of shares remained 17.128 millionshares with an average daily value of sharestraded of US$ 8.189 million. LSE listed 5 newcompanies 10 Open-end Mutual Funds and 1Preference Share during the period underreview. The Exchange is well positioned in anenabling environment with the cooperation ofthe regulators to capitalize all availableopportunities with its distinct performance torestore the confidence of investors and to tapthe potential listing opportunities.
LSE has embarked on the Information SecurityManagement System program and in order toachieve this goal, LSE has established asecurity organizational structure in its workingenvironment. The emphasis of this project is to keep pace with the technologicaladvancements of the modern era and toimprove the security level in its informationsystem.
Mian Shakeel AslamCEO/Managing Director
FEDERATION OF EURO-ASIAN STOCK EXCHANGES ANNUAL REPORT JUNE 2010
PAGE 110
HISTORY AND DEVELOPMENT
Lahore Stock Exchange (LSE) wasincorporated on 05 October 1970 in Lahore,the provincial capital of Punjab, Pakistan, underthe Securities and Exchange Ordinance in1969, as a company limited by guarantee. The activities of the Exchange have increasedin all areas since inception. LSE introducedautomated trading in 1996 and became thefirst fully automated Stock Exchange ofPakistan. LSE has become a key institution in the financial sector of Pakistan and has amembership of 152 brokerage houses. As of December 31, 2009 there were 512 listed companies, having a listed Capital ofUS$ 8.988 billion with a market capitalization ofUS$ 30.621 billion, besides 42 Open-endFunds and 12 Term Finance Certificates(corporate debt instruments) of companies arealso listed at LSE.
The Exchange is fully committed to providing atransparent, efficient, fair and investor friendlyenvironment for the benefit of investors andissuers. The goal is to bring LSE up tointernational standards in operational,technical, regulatory and quality managementareas and to ensure that not only domestic butalso foreign investors are attracted to theExchange for the development of the country.
FUTURE OUTLOOK
LSE would continue with its efforts to increaseits trading volumes through increasing itsoutreach and collaboration with otherexchanges in this regard. It would alsocontinue to look after the interest of all itsstakeholders including the investors, issuersand intermediaries as well as fulfill its role asthe front-line regulator to make LSE as theexchange of choice for all the participants.
A major challenge lying ahead for theexchange is its demutualization. This will havea major role to play in the overall reformation ofthe capital markets of Pakistan and through itssuccessful implementation will enhancegovernance standards, transparency andultimately investor’s confidence. TheDemutualization Committee and Managementof the exchange through consultation with theSECP will be working tirelessly in its efforts toensure a swift and timely transition. With LSE’svoluntary adoption of the Code of CorporateGovernance, its innovative strength in softwaredevelopment and enhancement of itsgeographical outreach, the new managementteam is well positioned to capitalize all theavailable opportunities with its distinctperformance.

LAHORE STOCK EXCHANGE
FEDERATION OF EURO-ASIAN STOCK EXCHANGES ANNUAL REPORT JUNE 2010
PAGE 111
OFFICIAL 6 MONTH STATISTICS
US$ millions # Shares millionsTotal Volume Average Daily Volume Total Volume Average Daily Volume
StocksJul-09 195.34 8.49 362.67 15.77
Aug-09 162.48 8.12 272.45 13.62Sep-09 264.38 13.91 450.81 23.73Oct-09 239.75 10.90 433.97 19.73Nov-09 94.47 5.25 168.57 9.37Dec-09 97.21 4.63 236.11 11.24TOTAL 1,053.62 8.55 1,924.59 15.58
BondsJul-09 0.00 0.00 0.00 0.00
Aug-09 0.00 0.00 0.00 0.00Sep-09 0.00 0.00 0.00 0.00Oct-09 0.00 0.00 0.00 0.00Nov-09 0.00 0.00 0.00 0.00Dec-09 0.00 0.00 0.00 0.00TOTAL 0.00 0.00 0.00 0.00
OtherJul-09 0.00 0.00 0.00 0.00
Aug-09 0.00 0.00 0.00 0.00Sep-09 0.00 0.00 0.00 0.00Oct-09 0.00 0.00 0.00 0.00Nov-09 0.00 0.00 0.00 0.00Dec-09 0.00 0.00 0.00 0.00TOTAL 0.00 0.00 0.00 0.00
MONTHLY STOCK VOLUME VS INDEX(US$ millions)
MONTHLY MARKET CAPITALIZATION(US$ millions)
0
5,000
10,000
15,000
20,000
25,000
30,000
35,000
Stocks Index
0
50
100
150
200
250
300
Jul Aug Sep Oct Nov Dec Jul Aug Sep Oct Nov Dec0
500
1,000
1,500
2,000
2,500
3,000
Market Capitalization(US$ millions) Index
Jul-09 25,935.68 2,314.09Aug-09 28,987.09 2,737.28Sep-09 30,447.56 2,886.45Oct-09 29,951.56 2,802.32Nov-09 30,211.72 2,827.88Dec-09 30,621.51 2,893.88
CONTACT INFORMATION
Contact Name Mr. Amir Razakhan E-mail [email protected] Website www.lahorestock.com
* Please refer to page 100 for the Pakistan country report.

MACEDONIAN STOCK EXCHANGE
In 2009 the MSE continued to upgrade itsoperations and rules and procedures toprovide improved service to marketparticipants, exchange members andinvestors.
The repercussions of the world economiccrisis continued to affect the Macedonianeconomy and subsequently the Macedoniancapital market in 2009.
The conditions of the Macedonian capitalmarket in 2009 were very complex. The totalturnover in 2009 was reduced for 45%comparing with 2008. Even the main MSEindex MBI10 registered annual growth of 31%the stock prices were at the level of June2006. The average daily turnover in the BESTsystem in December 2009 was around273,000 euros and was at the same level ason June 2005 and the market capitalization ofthe listed companies has fallen more than 72%compared to record levels in 2007. Theparticipation of foreigners in the purchase sideof the turnover in 2009 was about 15%.
Considering these numbers, we can stressseveral main characteristics of the events ofthe Macedonian Stock Exchange in 2009 such
as reduced liquidity in the market, withdrawalor passivity of foreign portfolio investors,change of the market structure in terms oftypes of investors, making the stock marketwith a pronounced domination of the localretail investors.
In 2009 the MSE continued to upgrade itsoperations and rules and procedures toprovide improved service to marketparticipants, exchange members andinvestors. MSE implemented changes in theListing Rules by which new higher standardsfor disclosure for the companies on theExchange Listings were introduced(appointment and publishing an investor’srelations person; more précised obligations forannouncing the buying/selling of shares by themembers of the Management and Supervisoryboard; the issuers are obliged to publish theSemi Annual Balance, the Annual report andthe financial plan for the ongoing period). MSEestablished a new version of the trading
system based on the new technologies. Thenew version will support FIX Protocol.
Within the framework of the Memorandum ofPartnership signed between the exchanges inSoutheast Europe during the 2009 two roadshows took place (in Belgrade and in Vienna)where the top issuers and the capital marketsfrom the region were promoted in order toincrease the visibility of the regional capitalmarkets and to attract international investors.
In the forthcoming period, the MSE focus will be on the further development of theMacedonian Secondary Market to the extentthat it will be comparable to the modern andwell organized markets worldwide, as well ason increasing of its attractiveness, by creatingmechanisms, procedures and projects that willenhance the quality and the competitivenessof MSE services.
HISTORY AND DEVELOPMENT
The Macedonian Stock Exchange was foundedon September 13, 1995 and commencedtrading on March 28, 1996, as a centralmarketplace for trading in securities and thefirst organized stock exchange in the history ofthe Republic of Macedonia. Its mission is toprovide attractive, efficient, transparent andsecure functioning of the organized secondarysecurities market in the Republic ofMacedonia. For its 13 year history, theMacedonian Stock Exchange has managed toestablish a sound market and informationinfrastructure and a cohesive legal andregulatory framework, as well as solid expertiseupon which the functioning of the Macedoniansecurities market is based.
The MSE was founded as a not-for-profit jointstock company with founding capital of500,000 Euros. According to the legislation thatwas in force in 1996 the only eligible foundersof the MSE were banks and other financialinstitutions (saving houses and insurancecompanies). MSE initially had 19 members: 13 banks, 3 saving houses and 3 insurancecompanies. Starting from June 20, 2001 (withthe amendments of the Securities Law), MSEstarted to operate on a for-profit basis, with afounding capital of 500,000 EUROs. MSEshareholders may be any legal and privatedomestic and foreign entity. Shareholdings per
entity are limited up to 10% of the MSEoutstanding shares. All MSE members must belicensed for trading in securities by theMacedonian SEC. Only brokers, authorized bythe MSE members may trade in securities atMSE. MSE currently has 25 members - 18brokerage houses and 7 banks. Currently MSEhas 35 shareholders (brokerage houses,banks, legal entities and private investors).
FUTURE OUTLOOK
In the forthcoming period, the MSE focus willbe on the further development of theMacedonian Secondary Market to the extentthat it will be comparable to the modern andwell organized markets worldwide, as well ason increasing of its attractiveness, by creatingmechanisms, procedures and projects that willenhance the quality and the competitiveness ofMSE services.
The MSE plans for 2010:
• Modernizing the Trading System -introduction of FIX Protocol;• Attraction of new listings on the OfficialMarket;• To increase visibility of the Macedonian StockExchange by providing more data-feeds tomore data vendors;• Either alone or through various forms ofcooperation with other regional exchanges
MSE will be involved in the processes ofpromotion of its market and issuers andproducts in order to attract international as wellas regional investors.• Development and promotion of a newInternet Services for investors, financialanalysts and financial intermediaries, calledBESTNET ANALITICS which contains threemodules: Technical Analysis, FundamentalAnalysis and My Portfolio; • MSE will continue to increase the knowledgeof capital market participants, institutional as well as retail investors, issuers and mediafor exchange traded products, trading,transparency, investor protection and corporategovernance – creating a special training center.
Ivan SterievCEO
FEDERATION OF EURO-ASIAN STOCK EXCHANGES ANNUAL REPORT JUNE 2010
PAGE 112

MACEDONIAN STOCK EXCHANGE
FEDERATION OF EURO-ASIAN STOCK EXCHANGES ANNUAL REPORT JUNE 2010
PAGE 113
OFFICIAL 6 MONTH STATISTICS
US$ millions # Shares millionsTotal Volume Average Daily Volume Total Volume Average Daily Volume
StocksJul-09 3.51 0.15 2.98 0.13
Aug-09 3.20 0.17 0.19 0.01Sep-09 6.12 0.31 0.27 0.01Oct-09 13.02 0.65 0.46 0.02Nov-09 5.84 0.28 0.26 0.01Dec-09 5.27 0.25 0.32 0.02TOTAL 36.95 0.30 0.75 0.03
BondsJul-09 2.19 0.10 1.55 0.07
Aug-09 1.64 0.09 1.41 0.07Sep-09 2.40 0.12 2.02 0.10Oct-09 3.41 0.17 2.76 0.14Nov-09 2.86 0.14 2.26 0.11Dec-09 0.89 0.04 0.71 0.03TOTAL 13.38 0.11 10.70 0.09
OtherJul-09 0.00 0.00 0.00 0.00
Aug-09 0.00 0.00 0.00 0.00Sep-09 0.00 0.00 0.00 0.00Oct-09 0.00 0.00 0.00 0.00Nov-09 0.00 0.00 0.00 0.00Dec-09 0.00 0.00 0.00 0.00TOTAL 0.00 0.00 0.00 0.00
0
2
4
6
8
10
12
14
MONTHLY STOCK VOLUME VS INDEX(US$ millions)
MONTHLY MARKET CAPITALIZATION(US$ millions)
0
200
400
600
800
1,000
1,200
Stocks Index
Jul Aug Sep Oct Nov DecJul Aug Sep Oct Nov Dec0
500
1,000
1,500
2,000
2,500
3,000
3,500
Market Capitalization(US$ millions) Index
Jul-09 782.67 2,435.36Aug-09 837.83 2,607.58Sep-09 996.84 3,101.88Oct-09 1,168.65 3,497.59Nov-09 1,023.95 2,964.98Dec-09 922.20 2,751.88
CONTACT INFORMATION
Contact Name Ms. Elena Jakimovska E-mail [email protected] Website www.mse.com.mk
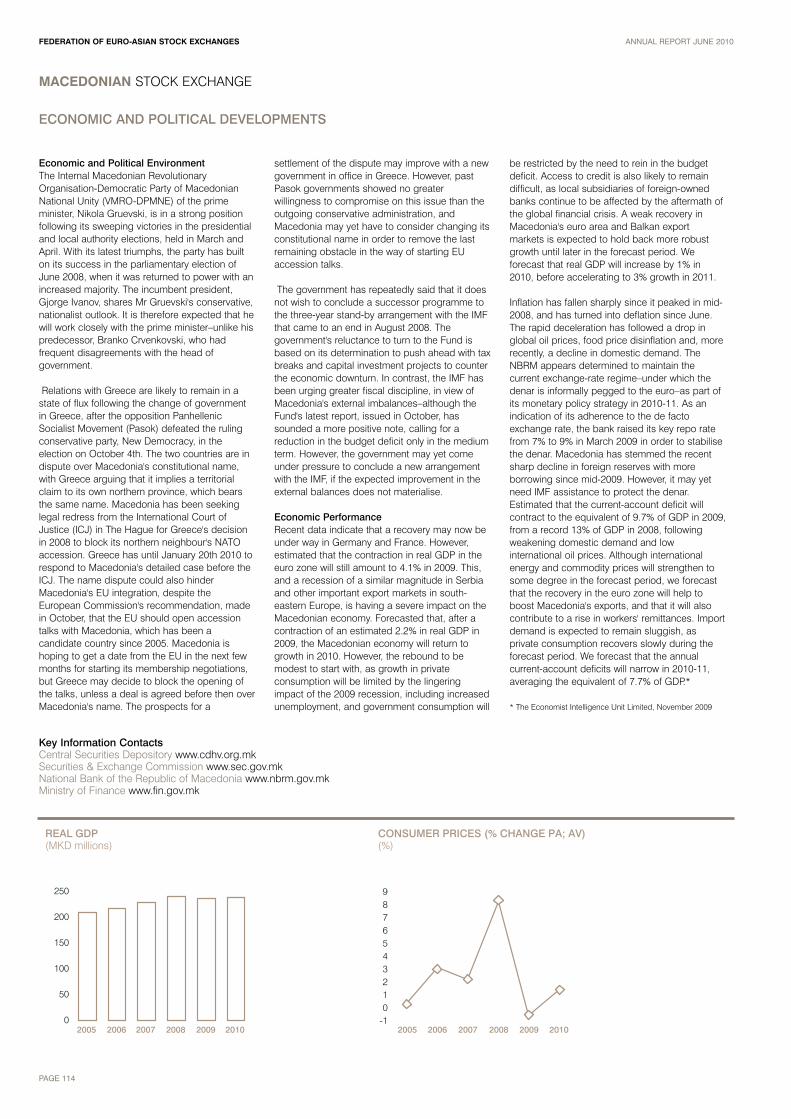
FEDERATION OF EURO-ASIAN STOCK EXCHANGES ANNUAL REPORT JUNE 2010
PAGE 114
MACEDONIAN STOCK EXCHANGE
ECONOMIC AND POLITICAL DEVELOPMENTS
Economic and Political EnvironmentThe Internal Macedonian RevolutionaryOrganisation-Democratic Party of MacedonianNational Unity (VMRO-DPMNE) of the primeminister, Nikola Gruevski, is in a strong positionfollowing its sweeping victories in the presidentialand local authority elections, held in March andApril. With its latest triumphs, the party has builton its success in the parliamentary election ofJune 2008, when it was returned to power with anincreased majority. The incumbent president,Gjorge Ivanov, shares Mr Gruevski's conservative,nationalist outlook. It is therefore expected that hewill work closely with the prime minister–unlike hispredecessor, Branko Crvenkovski, who hadfrequent disagreements with the head ofgovernment.
Relations with Greece are likely to remain in astate of flux following the change of governmentin Greece, after the opposition PanhellenicSocialist Movement (Pasok) defeated the rulingconservative party, New Democracy, in theelection on October 4th. The two countries are indispute over Macedonia's constitutional name,with Greece arguing that it implies a territorialclaim to its own northern province, which bearsthe same name. Macedonia has been seekinglegal redress from the International Court ofJustice (ICJ) in The Hague for Greece's decisionin 2008 to block its northern neighbour's NATOaccession. Greece has until January 20th 2010 torespond to Macedonia's detailed case before theICJ. The name dispute could also hinderMacedonia's EU integration, despite theEuropean Commission's recommendation, madein October, that the EU should open accessiontalks with Macedonia, which has been acandidate country since 2005. Macedonia ishoping to get a date from the EU in the next fewmonths for starting its membership negotiations,but Greece may decide to block the opening ofthe talks, unless a deal is agreed before then overMacedonia's name. The prospects for a
settlement of the dispute may improve with a newgovernment in office in Greece. However, pastPasok governments showed no greaterwillingness to compromise on this issue than theoutgoing conservative administration, andMacedonia may yet have to consider changing itsconstitutional name in order to remove the lastremaining obstacle in the way of starting EUaccession talks.
The government has repeatedly said that it doesnot wish to conclude a successor programme tothe three-year stand-by arrangement with the IMFthat came to an end in August 2008. Thegovernment's reluctance to turn to the Fund isbased on its determination to push ahead with taxbreaks and capital investment projects to counterthe economic downturn. In contrast, the IMF hasbeen urging greater fiscal discipline, in view ofMacedonia's external imbalances–although theFund's latest report, issued in October, hassounded a more positive note, calling for areduction in the budget deficit only in the mediumterm. However, the government may yet comeunder pressure to conclude a new arrangementwith the IMF, if the expected improvement in theexternal balances does not materialise.
Economic PerformanceRecent data indicate that a recovery may now beunder way in Germany and France. However,estimated that the contraction in real GDP in theeuro zone will still amount to 4.1% in 2009. This,and a recession of a similar magnitude in Serbiaand other important export markets in south-eastern Europe, is having a severe impact on theMacedonian economy. Forecasted that, after acontraction of an estimated 2.2% in real GDP in2009, the Macedonian economy will return togrowth in 2010. However, the rebound to bemodest to start with, as growth in privateconsumption will be limited by the lingeringimpact of the 2009 recession, including increasedunemployment, and government consumption will
be restricted by the need to rein in the budgetdeficit. Access to credit is also likely to remaindifficult, as local subsidiaries of foreign-ownedbanks continue to be affected by the aftermath ofthe global financial crisis. A weak recovery inMacedonia's euro area and Balkan exportmarkets is expected to hold back more robustgrowth until later in the forecast period. Weforecast that real GDP will increase by 1% in2010, before accelerating to 3% growth in 2011.
Inflation has fallen sharply since it peaked in mid-2008, and has turned into deflation since June.The rapid deceleration has followed a drop inglobal oil prices, food price disinflation and, morerecently, a decline in domestic demand. TheNBRM appears determined to maintain thecurrent exchange-rate regime–under which thedenar is informally pegged to the euro–as part ofits monetary policy strategy in 2010-11. As anindication of its adherence to the de factoexchange rate, the bank raised its key repo ratefrom 7% to 9% in March 2009 in order to stabilisethe denar. Macedonia has stemmed the recentsharp decline in foreign reserves with moreborrowing since mid-2009. However, it may yetneed IMF assistance to protect the denar. Estimated that the current-account deficit willcontract to the equivalent of 9.7% of GDP in 2009,from a record 13% of GDP in 2008, followingweakening domestic demand and lowinternational oil prices. Although internationalenergy and commodity prices will strengthen tosome degree in the forecast period, we forecastthat the recovery in the euro zone will help toboost Macedonia's exports, and that it will alsocontribute to a rise in workers' remittances. Importdemand is expected to remain sluggish, asprivate consumption recovers slowly during theforecast period. We forecast that the annualcurrent-account deficits will narrow in 2010-11,averaging the equivalent of 7.7% of GDP. *
* The Economist Intelligence Unit Limited, November 2009
Key Information ContactsCentral Securities Depository www.cdhv.org.mkSecurities & Exchange Commission www.sec.gov.mkNational Bank of the Republic of Macedonia www.nbrm.gov.mk Ministry of Finance www.fin.gov.mk
0
50
100
150
200
250
REAL GDP(MKD millions)
CONSUMER PRICES (% CHANGE PA; AV)(%)
-10123456789
2005 2006 2007 2008 2009 20102005 2006 2007 2008 2009 2010
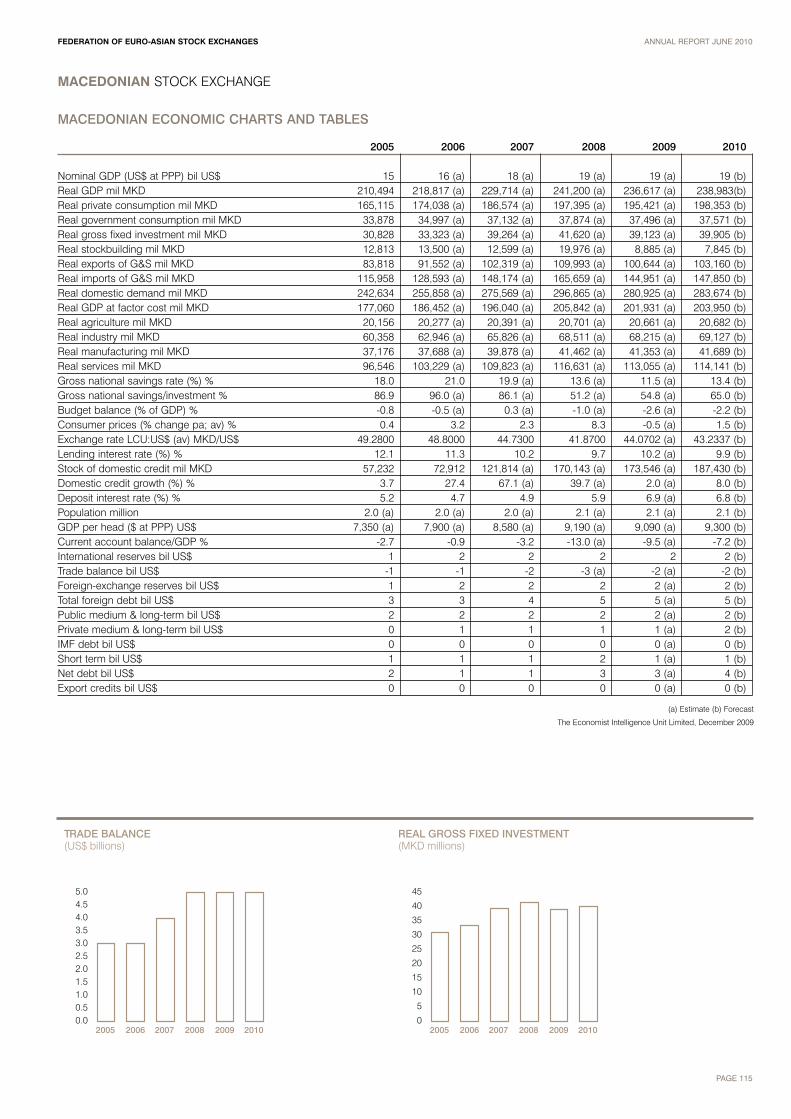
FEDERATION OF EURO-ASIAN STOCK EXCHANGES ANNUAL REPORT JUNE 2010
PAGE 115
MACEDONIAN STOCK EXCHANGE
MACEDONIAN ECONOMIC CHARTS AND TABLES
2005 2006 2007 2008 2009 2010
Nominal GDP (US$ at PPP) bil US$ 15 16 (a) 18 (a) 19 (a) 19 (a) 19 (b)Real GDP mil MKD 210,494 218,817 (a) 229,714 (a) 241,200 (a) 236,617 (a) 238,983(b)Real private consumption mil MKD 165,115 174,038 (a) 186,574 (a) 197,395 (a) 195,421 (a) 198,353 (b)Real government consumption mil MKD 33,878 34,997 (a) 37,132 (a) 37,874 (a) 37,496 (a) 37,571 (b)Real gross fixed investment mil MKD 30,828 33,323 (a) 39,264 (a) 41,620 (a) 39,123 (a) 39,905 (b)Real stockbuilding mil MKD 12,813 13,500 (a) 12,599 (a) 19,976 (a) 8,885 (a) 7,845 (b)Real exports of G&S mil MKD 83,818 91,552 (a) 102,319 (a) 109,993 (a) 100,644 (a) 103,160 (b)Real imports of G&S mil MKD 115,958 128,593 (a) 148,174 (a) 165,659 (a) 144,951 (a) 147,850 (b)Real domestic demand mil MKD 242,634 255,858 (a) 275,569 (a) 296,865 (a) 280,925 (a) 283,674 (b)Real GDP at factor cost mil MKD 177,060 186,452 (a) 196,040 (a) 205,842 (a) 201,931 (a) 203,950 (b)Real agriculture mil MKD 20,156 20,277 (a) 20,391 (a) 20,701 (a) 20,661 (a) 20,682 (b)Real industry mil MKD 60,358 62,946 (a) 65,826 (a) 68,511 (a) 68,215 (a) 69,127 (b)Real manufacturing mil MKD 37,176 37,688 (a) 39,878 (a) 41,462 (a) 41,353 (a) 41,689 (b)Real services mil MKD 96,546 103,229 (a) 109,823 (a) 116,631 (a) 113,055 (a) 114,141 (b)Gross national savings rate (%) % 18.0 21.0 19.9 (a) 13.6 (a) 11.5 (a) 13.4 (b)Gross national savings/investment % 86.9 96.0 (a) 86.1 (a) 51.2 (a) 54.8 (a) 65.0 (b)Budget balance (% of GDP) % -0.8 -0.5 (a) 0.3 (a) -1.0 (a) -2.6 (a) -2.2 (b)Consumer prices (% change pa; av) % 0.4 3.2 2.3 8.3 -0.5 (a) 1.5 (b)Exchange rate LCU:US$ (av) MKD/US$ 49.2800 48.8000 44.7300 41.8700 44.0702 (a) 43.2337 (b)Lending interest rate (%) % 12.1 11.3 10.2 9.7 10.2 (a) 9.9 (b)Stock of domestic credit mil MKD 57,232 72,912 121,814 (a) 170,143 (a) 173,546 (a) 187,430 (b)Domestic credit growth (%) % 3.7 27.4 67.1 (a) 39.7 (a) 2.0 (a) 8.0 (b)Deposit interest rate (%) % 5.2 4.7 4.9 5.9 6.9 (a) 6.8 (b)Population million 2.0 (a) 2.0 (a) 2.0 (a) 2.1 (a) 2.1 (a) 2.1 (b)GDP per head ($ at PPP) US$ 7,350 (a) 7,900 (a) 8,580 (a) 9,190 (a) 9,090 (a) 9,300 (b)Current account balance/GDP % -2.7 -0.9 -3.2 -13.0 (a) -9.5 (a) -7.2 (b)International reserves bil US$ 1 2 2 2 2 2 (b)Trade balance bil US$ -1 -1 -2 -3 (a) -2 (a) -2 (b)Foreign-exchange reserves bil US$ 1 2 2 2 2 (a) 2 (b)Total foreign debt bil US$ 3 3 4 5 5 (a) 5 (b)Public medium & long-term bil US$ 2 2 2 2 2 (a) 2 (b)Private medium & long-term bil US$ 0 1 1 1 1 (a) 2 (b)IMF debt bil US$ 0 0 0 0 0 (a) 0 (b)Short term bil US$ 1 1 1 2 1 (a) 1 (b)Net debt bil US$ 2 1 1 3 3 (a) 4 (b)Export credits bil US$ 0 0 0 0 0 (a) 0 (b)
0.00.51.01.52.02.53.03.54.04.55.0
TRADE BALANCE(US$ billions)
2005 2006 2007 2008 2009 20100
5
10
15
20
25
30
35
40
45
REAL GROSS FIXED INVESTMENT(MKD millions)
2005 2006 2007 2008 2009 2010
(a) Estimate (b) Forecast
The Economist Intelligence Unit Limited, December 2009

MOLDOVA STOCK EXCHANGE
In 2009 the total exchange volumeamounted to 13.0 million US$.
The past year has been difficult not only forour country, but for the entire worldcommunity. Financial and economic crisis,as well as the unstable political situation inthe country significantly affected both thereal and the financial sector. The stockmarket is no exception and although lastyear according to the horoscope was theyear of the ox, still on the securities marketmore “bearish atmosphere” prevailed. Thestagnation in the market, lack of liquidity,there are more sellers than buyers on themarket, and investors waiting better times –these are characteristics of the pass year.
At the end of the year on the StockExchange registered 1,019 issuers, of whichin Listing - 13 and in non-listing - 1006. Thereare 22 accredited members of the stockexchange. In 2009 the total exchange volume amountedto 13.0 million US$ and, on the backgroundof the past years’ indicators, it decreased.Reducing of the stock exchange indicatorsrelated to:
- Changing of the price conjuncture (thetendency of prices has declined).
- Reducing of the volume of public offerings,which in 2009 were consequence of thepurchase of important packages in previousyears.- Lack of sales of government securities,which in 2008 amounted to almost 50% ofexchange volume.
At year-end, the Government approved theProgram of stabilization and economicregeneration of the Republic of Moldova for2009-2011, which presented measures toregenerate the national economy, andrespectively the capital market in Moldova.
HISTORY AND DEVELOPMENT
In 1993 the Law on securities circulation andstock exchanges was enacted and from thispoint in time the institutional infrastructure ofstock market in Moldova began to develop. In December 1994 the non-profit institution,Moldova Stock Exchange was established asjoint-stock close company. 34 promoters – thesecurities market professional participantstook part in its establishment. The firsttransactions were made on June 26, 1995,and this date is accepted as the birthday ofthe Moldova Stock Exchange.
In June 1998 the Moldova Stock Exchangeestablished the National Securities Depositaryand a new trading system were integrated with the depositary system which allowstransactions to be carried out. According tothe changes made in the law «On Securitiesmarket» which came into effect on January 1,2008, Moldova Stock Exchange has the rightto own up to 75% shares of National SecuritiesDepositary.
In April 2000 Moldova Stock Exchangereceived the status of a self-regulating non-commercial organization. In July 2000 newMoldova Stock Exchange’s Regulations wereintroduced which qualitatively changed themechanism of transactions.
In July 2007 the Mega regulator – NationalCommission of Financial Market was created.According to the legislation the Mega regulatorregulates and determines state policy of thenonbank financial market.
According to the new requirement of the law«On Securities market» from January 1, 2009,Moldova Stock Exchange is a public company,a for profit organization.
At the present Moldova Stock Exchange is adeveloping stock market, which continues tocooperate with other stock exchanges andfinancial organizations. Besides the fact that MSE is a member of FEAS from 1995, in 2008 became the member of InternationalAssociation of the CIS Exchanges, which has the aim to coordinate the effort ondevelopment of organized financial markets inaccordance with international standards.
FUTURE OUTLOOK
The priority directions of the Moldova StockExchange for 2010 are:• Increase the quality and quantity of theservices and products (consulting services,diversification the products, introducing newtrading instruments).• Attraction of more companies in listing.• Development of the IT infrastructure.• Modernizing the website of the MoldovaStock Exchange.• Modernizing trading system of the stockexchange.• Development a new database of issuersregistered on the Moldova Stock Exchange.• Cooperation with regional and internationalorganizations.
Dr. Corneliu DoduPresident
FEDERATION OF EURO-ASIAN STOCK EXCHANGES ANNUAL REPORT JUNE 2010
PAGE 116

MOLDOVA STOCK EXCHANGE
FEDERATION OF EURO-ASIAN STOCK EXCHANGES ANNUAL REPORT JUNE 2010
PAGE 117
OFFICIAL 6 MONTH STATISTICS
US$ millions # Shares millionsTotal Volume Average Daily Volume Total Volume Average Daily Volume
StocksJul-09 0.42 0.0193 0.9494 0.0432
Aug-09 0.04 0.002 0.1013 0.0053Sep-09 0.56 0.0253 0.4239 0.0193Oct-09 0.51 0.0241 1.2858 0.0612Nov-09 0.38 0.0183 0.4876 0.0232Dec-09 0.37 0.016 0.9631 0.0419TOTAL 2.28 0.02 4.21 0.03
BondsJul-09 0.00 0.00 0.00 0.00
Aug-09 0.00 0.00 0.00 0.00Sep-09 0.00 0.00 0.00 0.00Oct-09 0.00 0.00 0.00 0.00Nov-09 0.00 0.00 0.00 0.00Dec-09 0.00 0.00 0.00 0.00TOTAL 0.00 0.00 0.00 0.00
OtherJul-09 0.00 0.00 0.00 0.00
Aug-09 0.00 0.00 0.00 0.00Sep-09 0.00 0.00 0.00 0.00Oct-09 0.00 0.00 0.00 0.00Nov-09 0.00 0.00 0.00 0.00Dec-09 0.00 0.00 0.00 0.00TOTAL 0.00 0.00 0.00 0.00
0.0
0.1
0.2
0.3
0.4
0.5
0.6
MONTHLY STOCK VOLUME(US$ millions)
5-YEAR STOCK VOLUME(US$ millions)
0
20
40
60
80
100
120
140
160
2008 20092005 2006Jul Aug Sep Oct Nov Dec 2007
Market Capitalization*(US$ millions) Index
Jul-09 n/a n/aAug-09 n/a n/aSep-09 n/a n/aOct-09 n/a n/aNov-09 n/a n/aDec-09 n/a n/a
CONTACT INFORMATION
Contact Name Ms. Valeria Gaina E-mail [email protected] Website www.moldse.md
* MSE recalculated its market cap. data is not available

FEDERATION OF EURO-ASIAN STOCK EXCHANGES ANNUAL REPORT JUNE 2010
PAGE 118
MOLDOVA STOCK EXCHANGE
ECONOMIC AND POLITICAL DEVELOPMENTS
Total basic policy of 2009 is the cardinalchange of power in the country, which hascaused essential changes in state policy bothinternal and external.
The four parties (Liberal Democratic Party,Liberal Party, Democratic Party, and OurMoldova Alliance) founded the Alliance forEuropean Integration. The Alliance forEuropean Integration became the rulingcoalition and the communists - opposition. Thenew governing coalition in Moldova has setEuropean integration as its main priority offoreign policy.
In 2009, in the capital of our country took placeCIS summit in which representatives of the newgovernment met with the politicians fromneighboring countries. The theme of thesummit was the economic crisis and thestruggle with its consequences.
The crisis came from abroad, and for thecountry vulnerable to external shocks, such asthe Republic of Moldova, recession economyhas became a crucial factor which has causedthe change of the economic growth’s trendsince the end of 2008. But despite the fact thatsince the second half of 2009 seen the firstsigns of global economic recovery thanks tothe efforts undertaken by world’s governments,the beneficial effects of these global trends onthe economy of the Republic of Moldovabecomes apparent later.
The European Union and Moldova launchedofficially negotiations on a new AssociationAgreement. These negotiations reflect thepositive evolution of political and economicrelations between the EU and Moldova, andthe opportunity to widen and deepencooperation under the Eastern Partnership.The future agreement will deepen the politicalassociation and economic integration ofMoldova and the EU. These negotiations takeplace against the background of increasingbilateral trade over the past years and asignificant increase of EU assistance toMoldova.
Moldova and International Monetary Fund (IMF)officials have signed an agreement for a loanthat will help to cover the budget deficit.Involvement in the national economy ofstrategic investment, particularly foreign directinvestment in sectors characterized by highlevels of competitiveness and oriented onexport, including through the development ofrelated infrastructure (industrial parks, freeeconomic zones) is one of the prioritiesestablished by the Ministry of Economy for2010. The other priorities are: beginning theprocess of negotiating a new regime with theEU concerning free trade agreement, thedevelopment of a legislative framework forconsumer protection and supervision over themarket, harmonized with European legislation,improving the system of business regulation,development of credit guarantee schemes forsmall and medium-sized enterprises,promotion of the small and medium-sizedenterprises to provide new opportunities andachievement of a greater ability of theeconomic system to adapt to the currentrequirements of a market economy.*
* Information provided by Moldova SE.
Key Information ContactsGovernment of the Republic of Moldova www.gov.mdMinistry of Economy www.mec.gov.mdPublic Property Agency www.app.gov.mdNational Bank of Moldova www.bnm.orgNational Commission of Financial Market www.cnpf.mdChamber of Commerce and Industry www.chamber.mdNational Bureau of Statistics www.statistica.md
0
5
10
15
20
25
30
REAL GDP(MDL millions)
CONSUMER PRICES (% CHANGE PA; AV)(%)
0
2
4
6
8
10
12
14
2005 2006 2007 2008 2009 20102005 2006 2007 2008 2009 2010
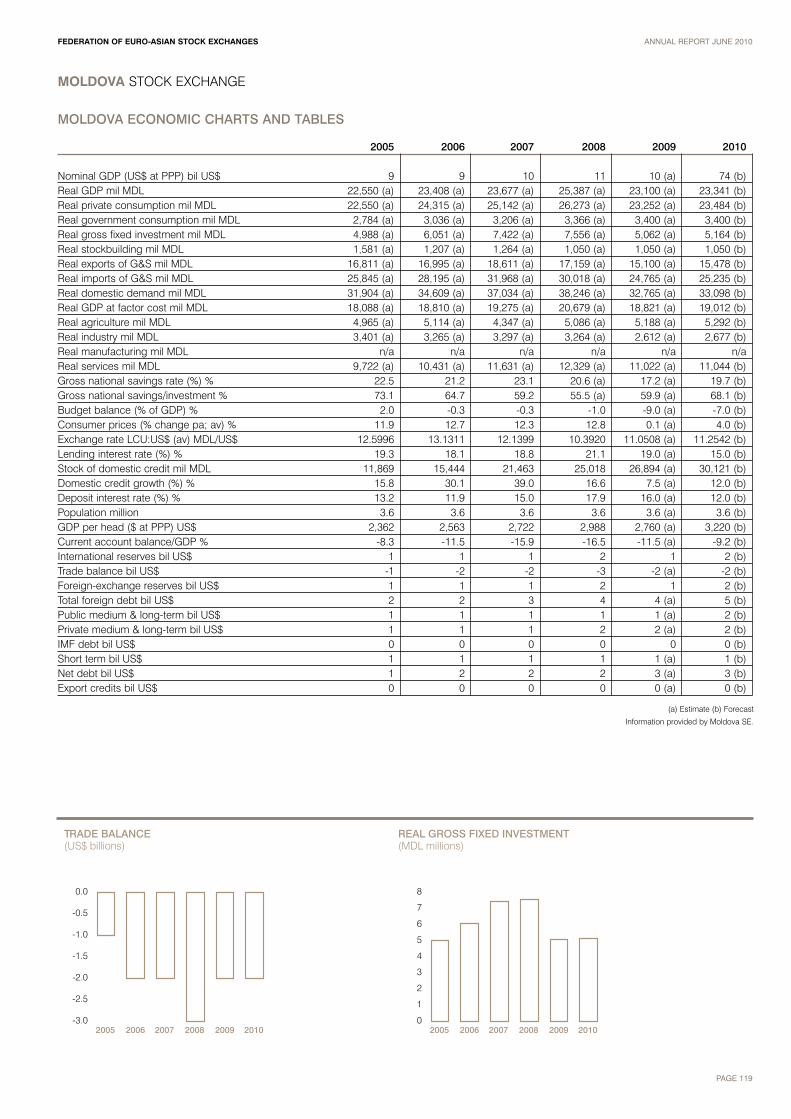
FEDERATION OF EURO-ASIAN STOCK EXCHANGES ANNUAL REPORT JUNE 2010
PAGE 119
MOLDOVA STOCK EXCHANGE
MOLDOVA ECONOMIC CHARTS AND TABLES
2005 2006 2007 2008 2009 2010
Nominal GDP (US$ at PPP) bil US$ 9 9 10 11 10 (a) 74 (b)Real GDP mil MDL 22,550 (a) 23,408 (a) 23,677 (a) 25,387 (a) 23,100 (a) 23,341 (b)Real private consumption mil MDL 22,550 (a) 24,315 (a) 25,142 (a) 26,273 (a) 23,252 (a) 23,484 (b)Real government consumption mil MDL 2,784 (a) 3,036 (a) 3,206 (a) 3,366 (a) 3,400 (a) 3,400 (b)Real gross fixed investment mil MDL 4,988 (a) 6,051 (a) 7,422 (a) 7,556 (a) 5,062 (a) 5,164 (b)Real stockbuilding mil MDL 1,581 (a) 1,207 (a) 1,264 (a) 1,050 (a) 1,050 (a) 1,050 (b)Real exports of G&S mil MDL 16,811 (a) 16,995 (a) 18,611 (a) 17,159 (a) 15,100 (a) 15,478 (b)Real imports of G&S mil MDL 25,845 (a) 28,195 (a) 31,968 (a) 30,018 (a) 24,765 (a) 25,235 (b)Real domestic demand mil MDL 31,904 (a) 34,609 (a) 37,034 (a) 38,246 (a) 32,765 (a) 33,098 (b)Real GDP at factor cost mil MDL 18,088 (a) 18,810 (a) 19,275 (a) 20,679 (a) 18,821 (a) 19,012 (b)Real agriculture mil MDL 4,965 (a) 5,114 (a) 4,347 (a) 5,086 (a) 5,188 (a) 5,292 (b)Real industry mil MDL 3,401 (a) 3,265 (a) 3,297 (a) 3,264 (a) 2,612 (a) 2,677 (b)Real manufacturing mil MDL n/a n/a n/a n/a n/a n/aReal services mil MDL 9,722 (a) 10,431 (a) 11,631 (a) 12,329 (a) 11,022 (a) 11,044 (b)Gross national savings rate (%) % 22.5 21.2 23.1 20.6 (a) 17.2 (a) 19.7 (b)Gross national savings/investment % 73.1 64.7 59.2 55.5 (a) 59.9 (a) 68.1 (b)Budget balance (% of GDP) % 2.0 -0.3 -0.3 -1.0 -9.0 (a) -7.0 (b)Consumer prices (% change pa; av) % 11.9 12.7 12.3 12.8 0.1 (a) 4.0 (b)Exchange rate LCU:US$ (av) MDL/US$ 12.5996 13.1311 12.1399 10.3920 11.0508 (a) 11.2542 (b)Lending interest rate (%) % 19.3 18.1 18.8 21.1 19.0 (a) 15.0 (b)Stock of domestic credit mil MDL 11,869 15,444 21,463 25,018 26,894 (a) 30,121 (b)Domestic credit growth (%) % 15.8 30.1 39.0 16.6 7.5 (a) 12.0 (b)Deposit interest rate (%) % 13.2 11.9 15.0 17.9 16.0 (a) 12.0 (b)Population million 3.6 3.6 3.6 3.6 3.6 (a) 3.6 (b)GDP per head ($ at PPP) US$ 2,362 2,563 2,722 2,988 2,760 (a) 3,220 (b)Current account balance/GDP % -8.3 -11.5 -15.9 -16.5 -11.5 (a) -9.2 (b)International reserves bil US$ 1 1 1 2 1 2 (b)Trade balance bil US$ -1 -2 -2 -3 -2 (a) -2 (b)Foreign-exchange reserves bil US$ 1 1 1 2 1 2 (b)Total foreign debt bil US$ 2 2 3 4 4 (a) 5 (b)Public medium & long-term bil US$ 1 1 1 1 1 (a) 2 (b)Private medium & long-term bil US$ 1 1 1 2 2 (a) 2 (b)IMF debt bil US$ 0 0 0 0 0 0 (b)Short term bil US$ 1 1 1 1 1 (a) 1 (b)Net debt bil US$ 1 2 2 2 3 (a) 3 (b)Export credits bil US$ 0 0 0 0 0 (a) 0 (b)
-3.0
-2.5
-2.0
-1.5
-1.0
-0.5
0.0
TRADE BALANCE(US$ billions)
2005 2006 2007 2008 2009 20100
1
2
3
4
5
6
7
8
REAL GROSS FIXED INVESTMENT(MDL millions)
2005 2006 2007 2008 2009 2010
(a) Estimate (b) Forecast
Information provided by Moldova SE.
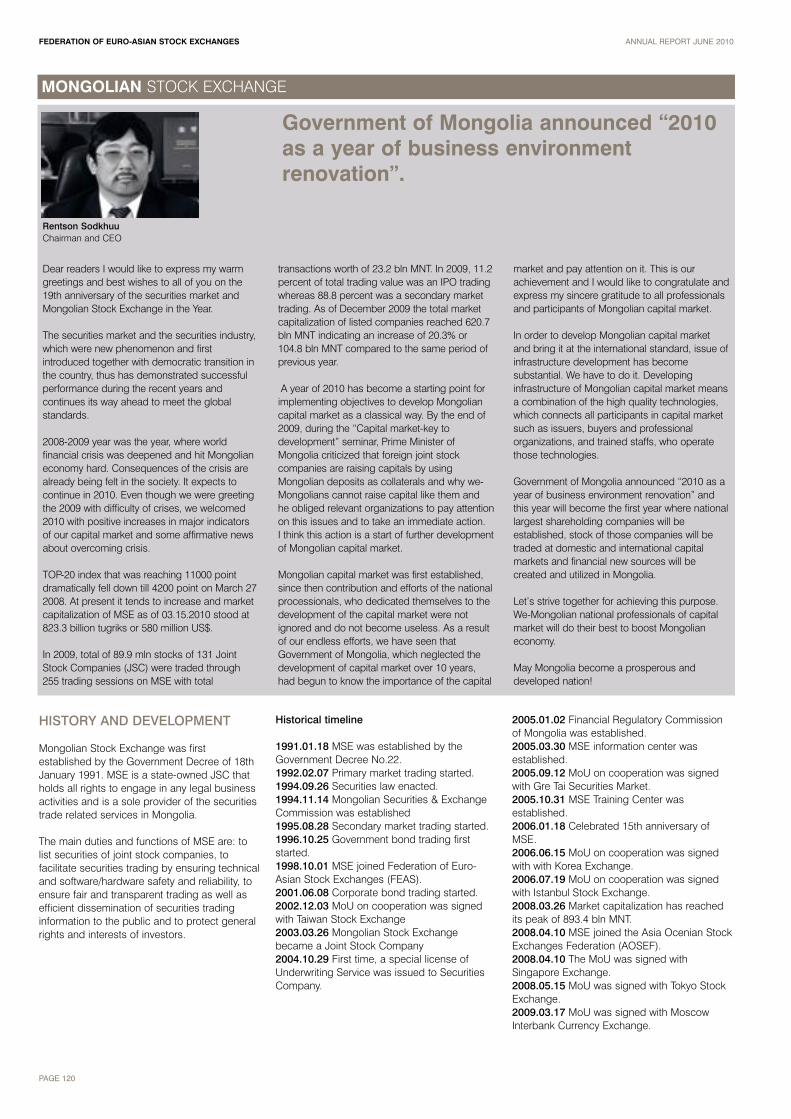
MONGOLIAN STOCK EXCHANGE
Government of Mongolia announced “2010as a year of business environmentrenovation”.
Dear readers I would like to express my warmgreetings and best wishes to all of you on the19th anniversary of the securities market andMongolian Stock Exchange in the Year.
The securities market and the securities industry,which were new phenomenon and firstintroduced together with democratic transition inthe country, thus has demonstrated successfulperformance during the recent years andcontinues its way ahead to meet the globalstandards.
2008-2009 year was the year, where worldfinancial crisis was deepened and hit Mongolianeconomy hard. Consequences of the crisis arealready being felt in the society. It expects tocontinue in 2010. Even though we were greetingthe 2009 with difficulty of crises, we welcomed2010 with positive increases in major indicatorsof our capital market and some affirmative newsabout overcoming crisis.
TOP-20 index that was reaching 11000 pointdramatically fell down till 4200 point on March 272008. At present it tends to increase and marketcapitalization of MSE as of 03.15.2010 stood at823.3 billion tugriks or 580 million US$.
In 2009, total of 89.9 mln stocks of 131 JointStock Companies (JSC) were traded through255 trading sessions on MSE with total
transactions worth of 23.2 bln MNT. In 2009, 11.2percent of total trading value was an IPO tradingwhereas 88.8 percent was a secondary markettrading. As of December 2009 the total marketcapitalization of listed companies reached 620.7bln MNT indicating an increase of 20.3% or104.8 bln MNT compared to the same period ofprevious year.
A year of 2010 has become a starting point forimplementing objectives to develop Mongoliancapital market as a classical way. By the end of2009, during the “Capital market-key todevelopment” seminar, Prime Minister ofMongolia criticized that foreign joint stockcompanies are raising capitals by usingMongolian deposits as collaterals and why we-Mongolians cannot raise capital like them and he obliged relevant organizations to pay attentionon this issues and to take an immediate action. I think this action is a start of further developmentof Mongolian capital market.
Mongolian capital market was first established,since then contribution and efforts of the nationalprocessionals, who dedicated themselves to thedevelopment of the capital market were notignored and do not become useless. As a resultof our endless efforts, we have seen thatGovernment of Mongolia, which neglected thedevelopment of capital market over 10 years,had begun to know the importance of the capital
market and pay attention on it. This is ourachievement and I would like to congratulate andexpress my sincere gratitude to all professionalsand participants of Mongolian capital market.
In order to develop Mongolian capital marketand bring it at the international standard, issue ofinfrastructure development has becomesubstantial. We have to do it. Developinginfrastructure of Mongolian capital market meansa combination of the high quality technologies,which connects all participants in capital marketsuch as issuers, buyers and professionalorganizations, and trained staffs, who operatethose technologies.
Government of Mongolia announced “2010 as ayear of business environment renovation” andthis year will become the first year where nationallargest shareholding companies will beestablished, stock of those companies will betraded at domestic and international capitalmarkets and financial new sources will becreated and utilized in Mongolia.
Let’s strive together for achieving this purpose.We-Mongolian national professionals of capitalmarket will do their best to boost Mongolianeconomy.
May Mongolia become a prosperous anddeveloped nation!
HISTORY AND DEVELOPMENT
Mongolian Stock Exchange was firstestablished by the Government Decree of 18thJanuary 1991. MSE is a state-owned JSC thatholds all rights to engage in any legal businessactivities and is a sole provider of the securitiestrade related services in Mongolia.
The main duties and functions of MSE are: tolist securities of joint stock companies, tofacilitate securities trading by ensuring technicaland software/hardware safety and reliability, toensure fair and transparent trading as well asefficient dissemination of securities tradinginformation to the public and to protect generalrights and interests of investors.
Historical timeline
1991.01.18 MSE was established by theGovernment Decree No.22.1992.02.07 Primary market trading started. 1994.09.26 Securities law enacted.1994.11.14 Mongolian Securities & ExchangeCommission was established 1995.08.28 Secondary market trading started. 1996.10.25 Government bond trading firststarted. 1998.10.01 MSE joined Federation of Euro-Asian Stock Exchanges (FEAS). 2001.06.08 Corporate bond trading started.2002.12.03 MoU on cooperation was signedwith Taiwan Stock Exchange2003.03.26 Mongolian Stock Exchangebecame a Joint Stock Company2004.10.29 First time, a special license ofUnderwriting Service was issued to SecuritiesCompany.
2005.01.02 Financial Regulatory Commissionof Mongolia was established.2005.03.30 MSE information center wasestablished.2005.09.12 MoU on cooperation was signedwith Gre Tai Securities Market.2005.10.31 MSE Training Center wasestablished. 2006.01.18 Celebrated 15th anniversary ofMSE.2006.06.15 MoU on cooperation was signedwith with Korea Exchange.2006.07.19 MoU on cooperation was signedwith Istanbul Stock Exchange.2008.03.26 Market capitalization has reachedits peak of 893.4 bln MNT.2008.04.10 MSE joined the Asia Ocenian StockExchanges Federation (AOSEF).2008.04.10 The MoU was signed withSingapore Exchange. 2008.05.15 MoU was signed with Tokyo StockExchange.2009.03.17 MoU was signed with MoscowInterbank Currency Exchange.
Rentson SodkhuuChairman and CEO
FEDERATION OF EURO-ASIAN STOCK EXCHANGES ANNUAL REPORT JUNE 2010
PAGE 120

MONGOLIAN STOCK EXCHANGE
FEDERATION OF EURO-ASIAN STOCK EXCHANGES ANNUAL REPORT JUNE 2010
PAGE 121
OFFICIAL 6 MONTH STATISTICS
US$ millions # Shares millionsTotal Volume Average Daily Volume Total Volume Average Daily Volume
StocksJul-09 0.59 0.03 2.06 0.09
Aug-09 0.80 0.04 2.63 0.13Sep-09 1.32 0.06 7.18 0.33Oct-09 2.32 0.11 3.78 0.17Nov-09 3.54 0.18 23.24 1.16Dec-09 0.40 0.02 1.13 0.05TOTAL 8.97 0.07 40.02 0.32
BondsJul-09 0.03 0.03 0.00 0.00
Aug-09 0.00 0.00 0.00 0.00Sep-09 0.00 0.00 0.00 0.00Oct-09 0.00 0.00 0.00 0.00Nov-09 0.00 0.00 0.00 0.00Dec-09 0.00 0.00 0.00 0.00TOTAL 0.03 0.03 0.00 0.00
OtherJul-09 0.00 0.00 0.00 0.00
Aug-09 0.00 0.00 0.00 0.00Sep-09 0.00 0.00 0.00 0.00Oct-09 0.00 0.00 0.00 0.00Nov-09 0.00 0.00 0.00 0.00Dec-09 0.00 0.00 0.00 0.00TOTAL 0.00 0.00 0.00 0.00
0.0
0.5
1.0
1.5
2.0
2.5
3.0
3.5
4.0
MONTHLY STOCK VOLUME VS INDEX(US$ millions)
MONTHLY MARKET CAPITALIZATION(US$ millions)
050
100150200250300350400450500
Stocks Index
Jul Aug Sep Oct Nov Dec Jul Aug Sep Oct Nov Dec0
1,000
2,000
3,000
4,000
5,000
6,000
7,000
8,000
Market Capitalization(US$ millions) Index
Jul-09 313.40 4,780.14Aug-09 355.78 5,060.98Sep-09 491.68 6,890.75Oct-09 483.79 7,557.60Nov-09 414.31 6,501.97Dec-09 430.20 6,010.03
CONTACT INFORMATION
Contact Name Mr. Temuulel Lkhagva E-mail [email protected] Website www.mse.mn

FEDERATION OF EURO-ASIAN STOCK EXCHANGES ANNUAL REPORT JUNE 2010
PAGE 122
MONGOLIAN STOCK EXCHANGE
ECONOMIC AND POLITICAL DEVELOPMENTS
GDP real growth accelerated over the 2ndquarter of 2008, reaching 11.3% over thelast 12 months. The main engines of growthwere services and agriculture, contributing 4.2and 3.8 percentage points respectively to GDPgrowth. Although the direct contribution ofmining to economic growth is small or evennegative, this remains Mongolia’s main foreignexchange earner, with large export revenuesfrom high world metals prices and sustainedFDI flowing into the sector over the first half ofthe year.
Copper prices fell recently on weakdemand, especially from sagging globalconstruction activity and higher inventories,with prices plunging sharply in early Octoberon concerns about global growth. FromAugust to early October, the total dropexceeded 40%.
Wages and salaries are increasing in all partsof the economy and showed a rapid increaseof 69% in the first semester of 2008 (year-on-year), and of 119% over the last 2 years.Public sector wages were increased by 129%over the same period. The share of wages andsalaries in household incomes has increasedrapidly, from 40% in the 3rd quarter of 2007 to46% in the 2nd quarter of 2008.
General Government budgetFor the preliminary result of 2008, totalrevenue and grants of General Governmentbudget totaled 2,156.4 billion togrogs, totalexpenditure and net lending 2,462.0 billiontogrogs and General Government budget
overall balance was a deficit 305.7 billiontogrogs, which were representing 35.2%,40.2% and 5.0%of the GDP, respectively.
Current revenue of General Governmentamounted to 2,136.1 billion togrogs andcurrent expenditure 1,749.5 billion togrogs.The budget current balance was a surplus386.6 billion togrogs.
Compared to 2007, tax revenue increased by25.7% or 386.6 billion togrogs, taxes onforeign trade increased by 47.2% or 48.4billion togrogs, excise tax increased by 33.4%or 44.7 billion togrogs and value added taxincreased by 33.9% or 90.0 billion togrogs,accordingly.
Money, loanAccording to the report of the Bank ofMongolia, at the end of December of 2008money supply (broad money or M2) increasedby 4.4% or 99.6 billion togrogs over theNovember of 2008, reaching 2341.4 billiontogrogs and decreased by 2.5% or 59.9 billiontogrogs compared to December of 2007.
At the end of November of 2008, the reverseassets reached to US$ 606.3 million whichequals with the import needs of 8.7 weeks or2.2 months.
The nominal rate of togrog against US dollar is1,267.51 togrog at the end of December 2008.Compared with December of 2007, rate oftogrog weaken by 8.3%.
Consumer price indexIn December 2008, the national consumerprices increased by 0.04% compared withprevious month and by 22.1% from the end ofprevious year. CPI increase by 22.1% washigher 3.6 times than the objective in the MainGuidelines of Socio-Economic Development ofMongolia for 2008 which CPI shall be kept at6.0%. Annual average CPI for 2008 was28.0%, the highest growth over the lastdecade.
External tradeFor the preliminary estimates of 2008, totalexternal trade turnover equaled US$ 6,155.1million. of which exports US$ 2,539.3 millionand imports US$ 3,615.8 million. Total externaltrade balance turned a deficit of US$ 1,076.5million. The deficit is increased by US$ 855.6million compared with the 2007. External tradedeficit has been influenced by the importgrowth of products and materials of fuelswhich is 36.3 point higher than export growth.As compared with the 2007, total externaltrade turnover increased by 49.4%, exports by30.3% and imports by 66.6% respectively.
In the Main Guidelines of Socio-EconomicDevelopment 2008, there have special goalssuch as to improve external trade surplus, toraise net official reserves. But the total externaltrade balance deficit was US$ 1,076.5 millionand it is increased by US$ 855.6 million or 4.9times compared with the 2007.*
* National Statistical Office (www.nso.mn)World Bank Country Report(http://go.worldbank.org/D8H9DQNLZ0)
Key Information ContactsParliament of Mongolia www.parl.gov.mnState Property Commission www.spc.gov.mnMinistry of Finance www.mof.pmis.gov.mnFinancial Regulatory Commission www.frc.mnThe Central Bank of Mongolia www.mongolbank.mnMongolian Chamber of Commerce & Industry www.mongolchamber.mnNational Statistical Office of Mongolia www.nso.mnMinistry of Foreign Affairs www.mfa.gov.mn
0.0
0.5
1.0
1.5
2.0
2.5
3.0
REAL GDP*(MNT millions)
CONSUMER PRICES (% CHANGE PA; AV)**(%)
0
5
10
15
20
25
2005 2006 2007 2008 2009 2005 2006 2007 2008 2009

FEDERATION OF EURO-ASIAN STOCK EXCHANGES ANNUAL REPORT JUNE 2010
PAGE 123
MONGOLIAN STOCK EXCHANGE
PAGE 123
MONGOLIA ECONOMIC CHARTS AND TABLES
2006 2007 2008 2009 2010
Nominal GDP (US$ at PPP) bil US$ 2.28 3.19 3.93 4.75 4.20Real GDP bil MNT* 2.28 2.59 2.84 2.86 2.47Budget balance (% of GDP) % 2.64 3.35 2.22 -5.08 -5.43Consumer prices (% change pa; av) %** 9.54 4.83 14.02 23.2 1.88Exchange rate LCU:US$ (av) AMD/US$ 1,205.00 1,179.62 1,169.85 1,166.06 1,437.91Lending interest rate (%) % 28.30 24.50 19.90 20.40 20.82Stock of domestic credit bil MNT 859.85 1.223.29 2,056.06 2,635.55 2,655.00Domestic credit growth (%) % 41.70 42.27 68.08 28.18 0.74Deposit interest rate (%) % 13.56 12.90Population million 2,547.8 2,578.6 2,615.0 2,659.3 2,736.8GDP per head ($ at PPP) US$ 893.53 1,236.65 1,503.37 1,818.68Current account balance/GDP % 3.84 11.67 4.37 -15.20 -9.10International reserves bil US$ 0.43 0.93 1.20 0.59 1.17Trade balance bil US$ -0.12 0.06 -0.23 -0.71 -0.25Foreign-exchange reserves bil US$*** 0.30 0.69 0.98 0.64 1.15IMF debt bil US$ 0.04 0.03 0.03 0.02 0.18
* at 2005 constant prices
**CPI of Ulaanbaatar
***NIR
-0.8
-0.7
-0.6
-0.5
-0.4
-0.3
-0.2
-0.1
0.0
0.1
TRADE BALANCE(US$ billions)
0200400600800
1,0001,2001,4001,6001,8002,000
GDP PER HEAD($ at PPP) US$
2005 2006 2007 20082005 2006 2007 2008 2009
MONTENEGRO STOCK EXCHANGE
Continuous development of our market isthe basis of the future of the MSE, a futurein which the MSE strongly believes.
Actual events that marked the previous yearsuch as the global financial crisis, showedthat the strongest economy, at firstdeveloped and stable market can beunpredictable and directly affected byunforeseeable repercussions that areprogressive, breakneck speed reflect on allbranches of the economy including thesecurities market. The key to success of anyactivity, in our case, recovery of financialmarkets lies in the synergy of allstakeholders who participate in it, andsynchronized activities restore confidence ofdomestic and foreign investors. Continuedimplementation and further development oflegislation pursuant EU and developed
markets through further tax relief andbenefits for participants in the financialmarkets, particularly in the area of fundgroups (pension and investment funds), theconstant promotion of the domestic marketas the individual performances, and withinregion will choose back investors. The periodof stagnation stock activity should certainlybe used in the further implementation andconstruction of corporate culture within thecompany and market introduction of newmaterials, derivatives and short-termsecurities, which will be the first and crucialstep in the return of foreign investors in ourmarket. The period of recovery is not, andwill not be easy and fast, but according to
earlier experience, a proven, that after eachrain, the sun again in sight. From this crisisshould draw lessons not to repeat mistakes,and take as long as possible with a positivebalance. The market will always exist, tradersalso, long-term or short-term securities,futures options, swaps, market and othermaterial.
Montenegro Stock Exchange will continue tobe a locomotive for further development ofthe Montenegrian securities market, itspromoter, and active participant ofinternational integration.
HISTORY AND DEVELOPMENT
The MSE was set up in June 1993 pursuantto the Act on Money and Capital Markets(1989). The first founding members were thefour Montenegrin banks: Montenegrobankaa.d. Podgorica, Pljevaljska banka a.d.Pljevlja, Beranska banka a.d. Berane,Hipotekarna banka a.d. Podgorica, and theRepublic of Montenegro, i.e. MontenegrinAgency for Economic Restructuring andForeign Investments.
During the constitutional meeting held on 7 July 1997, the MSE harmonized itsoperations with the Exchange through theexchange operations and exchangeintermediaries Act. Another three banks andtwo insurance companies joined thefounding–members of the Exchange:Podgoriaka banka a.d. Podgorica,Jugobanka a.d. Podgorica, Niksicka bankaa.d. Niksic, Lovcen osiguranje a.d.Podgorica and Swiss osiguranje a.d.Podgorica.
In order to increase its capital share, theMSE issued additional shares, upon theapproval of the Federal Commission forSecurities and Financial Markets. The shareswere subscribed and paid for by severalYugoslav banks, as well as the FederalGovernment.
In order to comply with The Law onSecurities of the Republic of Montenegro,the MSE issued a third issue of shares. Theimportance of this issue which was soldsuccessfully with 100% subscription wasinstrumental in the further development ofthe capital market of Montenegro becausewith the sale of this issue 10 newshareholders emerged as owners of theMSE from banking sector, insurancecompanies and private companies from allspheres of economy. As of today, the MSEhas 23 shareholders.
The MSE moved to its new premises in thenew business district of the city.
FUTURE OUTLOOK
In 2010, Montenegro Stock Exchange hasfollowing Plans:
• To get first short term securities issued bycompanies;• To start with implementation of Projectinvolving Derivative securities onMontenegrian stock market;• To organize the Third Annual Conference, • To organize several Training Programmerelated to the Corporate Governance Code,together with IFC;• Following the Decision of the GeneralShareholders meeting, the MNSE will mergewith another Montenegrin exchange.
Dejana Suskavcevic, MACEO
FEDERATION OF EURO-ASIAN STOCK EXCHANGES ANNUAL REPORT JUNE 2010
PAGE 124

MONTENEGRO STOCK EXCHANGE
FEDERATION OF EURO-ASIAN STOCK EXCHANGES ANNUAL REPORT JUNE 2010
PAGE 125
OFFICIAL 6 MONTH STATISTICS
US$ millions # Shares millionsTotal Volume Average Daily Volume Total Volume Average Daily Volume
StocksJul-09 22.13 1.05 7.52 0.36
Aug-09 15.52 0.74 14.94 0.71Sep-09 11.34 0.52 12.65 0.58Oct-09 14.14 0.64 18.50 0.84Nov-09 11.97 0.57 6.51 0.31Dec-09 41.01 1.78 6.70 0.29TOTAL 116.11 0.88 66.82 0.51
BondsJul-09 1.29 0.06 1.86 0.09
Aug-09 0.70 0.03 0.89 0.04Sep-09 2.04 0.09 2.19 0.10Oct-09 0.36 0.02 0.53 0.02Nov-09 0.38 0.02 0.42 0.02Dec-09 0.31 0.01 0.38 0.02TOTAL 5.08 0.04 6.26 0.05
OtherJul-09 0.00 0.00 0.00 0.00
Aug-09 0.00 0.00 0.00 0.00Sep-09 0.00 0.00 0.00 0.00Oct-09 0.00 0.00 0.00 0.00Nov-09 0.00 0.00 0.00 0.00Dec-09 0.00 0.00 0.00 0.00TOTAL 0.00 0.00 0.00 0.00
MONTHLY STOCK VOLUME VS INDEX(US$ millions)
MONTHLY MARKET CAPITALIZATION(US$ millions)
0
1,000
2,000
3,000
4,000
5,000
6,000
Stocks Index
0
5
10
15
20
25
30
35
40
45
Jul Aug Sep Oct Nov Dec Jul Aug Sep Oct Nov Dec01002003004005006007008009001,000
Market Capitalization(US$ millions) Index
Jul-09 4,242.43 802.59Aug-09 5,047.28 890.88Sep-09 5,932.63 948.97Oct-09 4,588.65 740.34Nov-09 3,980.67 651.09Dec-09 4,289.22 638.99
CONTACT INFORMATION
Contact Name Mr. Nedeljko Suskavcevic E-mail [email protected] Website www.montenegroberza.com

FEDERATION OF EURO-ASIAN STOCK EXCHANGES ANNUAL REPORT JUNE 2010
PAGE 126
MONTENEGRO STOCK EXCHANGE
ECONOMIC AND POLITICAL DEVELOPMENTS
Political HistoryOn 21 May 2006 Montenegro organised areferendum on independence, in line with theprovisions of Article 60 of the ConstitutionalCharter of Serbia and Montenegro. Themodalities for referendum were agreed bypolitical parties following a mediation missionof Mr Miroslav Lajcak, the personalrepresentative of the High Representative forCFSP Javier Solana. The referendum wasconducted in line with OSCE and Council ofEurope commitments. On 31 May 2006 theRepublic Referendum Commissionconfirmed the results, according to which55.5% of voters expressed their support forindependence. On 3 June 2006 theMontenegrin Parliament adopted the“Declaration of Independence”.Recognising legitimacy of the whole processthe EU Council adopted on 12 June 2006Conclusions where the EU and its MemberStates decided to develop further theirrelations with the Republic of Montenegro asa sovereign, independent state.In the Declaration of Independence,Montenegro confirmed that it applies andadheres to international treaties andagreements to which the State Union ofSerbia and Montenegro was a party andwhich are relevant for Montenegro.Montenegro started the process of joininginternational organisations. In June 2006 itbecame a member of the UN and of theOSCE. In July and August it acceded to anumber of organisations including ILO, ITU,ICRC et al. Since May 2007, Montenegro isalso a member of the Council of Europe.
Bilateral discussions on settling pendingissues between Serbia and Montenegro arebeing held in a constructive atmosphere andagreements have been reached on keyissues, notably on financial assets andmembership in IFIs.
Since independence Montenegro has beenputting in place the legal and institutional set-up required by its new competences as anindependent state. On 19 October 2007Montenegro adopted a Constitution that isbroadly in line with international standardsand the recommendations of the Council ofEurope and its Venice Commission. TheConstitution was adopted by the Parliamentwith the required qualified majority.
Economic situationEconomic growth remained strong in 2008,expanding well above 8% in real terms,boosted by strong inflows of FDI and robustdomestic demand. Services, notably tourism,financial intermediation and real estate,remained the main driver of growth,generating some 70% of gross value added(GVA). Around 20% of total growth wasattributable to industrial output andconstruction. On the demand side,consumption remained solid as retail salesgrew by around 10% in real terms in 2008.Exports of goods decreased in 2008,reflecting the weak competitiveness of localproducts but also the volatile internationalprice of aluminium, which accounts foralmost half of total exports. FDI inflowscombined with a robust domestic demand
induced a widening of the trade deficit to62% of GDP.
The stagnation on the domestic capitalmarket resulted in a significant outflow ofportfolio investments. Overall, the currentaccount deficit widened, driven by a stronginflow of imports while its coverage by netFDI declined, increasing vulnerability toexternal shocks.
Montenegro unilaterally uses the Euro aslegal tender, without participating in the Euroarea. Consequently, its monetary policy islimited to operation of liquidity management.To counter the international financial crisisthe Montenegrin authorities have taken aseries of measures, including higher capitaladequacy requirements for domestic banks,an unlimited coverage for deposits insuranceas well as a guarantee scheme for intra-banking lending. Public Debt expanded to33.6% of GDP in 2008, as the share ofdomestic debt rose in the total.
The WTO accession process will requirefurther reforms. To that end the Montenegrinauthorities established new centres formetrology, standardisation and intellectualproperty, which should also serve thepurpose of alignment of Montenegro'sforeign trade regime and customs policy withthe EU requirements.*
* Information provided by MSE.
Key Information ContactsSecurities Commission of Montenegro www.scmn.cg.yuCentral Depository Agency www.cda.cg.yuCentral Bank of Montenegro www.cb-cg.orgMinistry of Finance www.ministarstvo-finansija.cg.yuMontenegro Statistical Office www.monstat.cg.yu
0.0
0.5
1.0
1.5
2.0
2.5
3.0
3.5
GDP IN CURRENT PRICES(EUR billions)
INFLATION(%)
02 03 04 05 06 07 08 090123456789
10
02 03 04 05 06 07 08 09
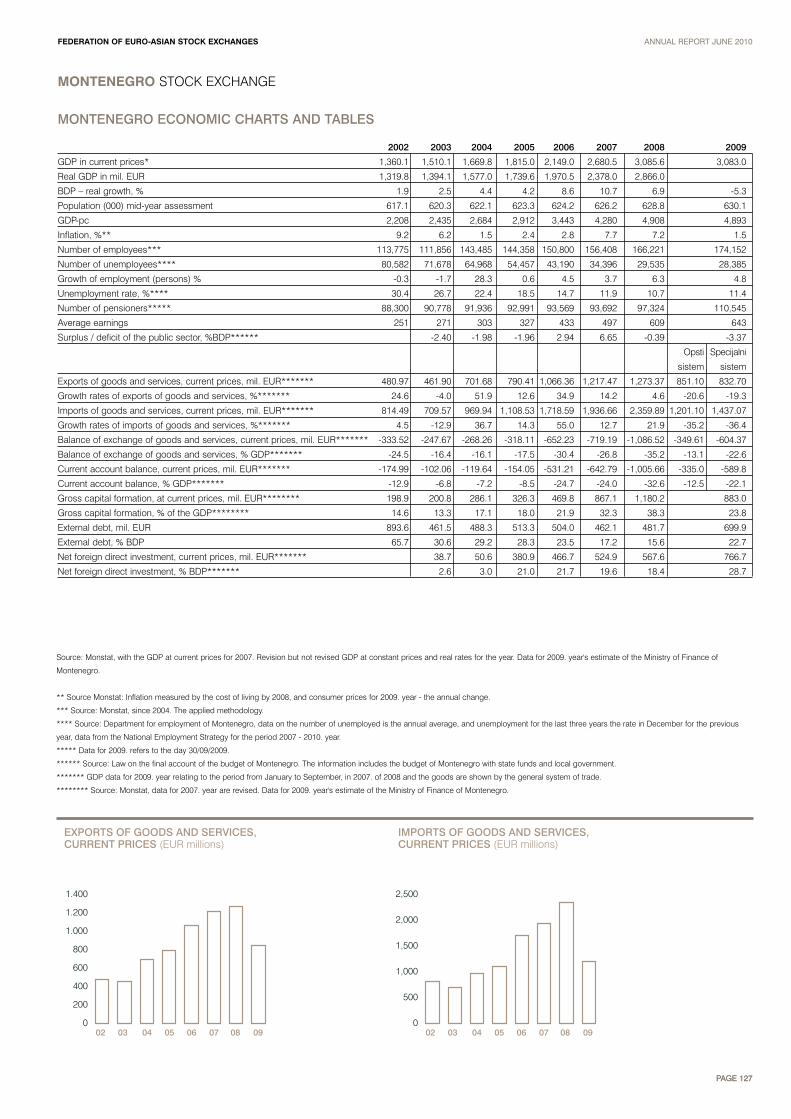
MONTENEGRO ECONOMIC CHARTS AND TABLES
2002 2003 2004 2005 2006 2007 2008 2009
GDP in current prices* 1,360.1 1,510.1 1,669.8 1,815.0 2,149.0 2,680.5 3,085.6 3,083.0
Real GDP in mil. EUR 1,319.8 1,394.1 1,577.0 1,739.6 1,970.5 2,378.0 2,866.0
BDP – real growth, % 1.9 2.5 4.4 4.2 8.6 10.7 6.9 -5.3
Population (000) mid-year assessment 617.1 620.3 622.1 623.3 624.2 626.2 628.8 630.1
GDP-pc 2,208 2,435 2,684 2,912 3,443 4,280 4,908 4,893
Inflation, %** 9.2 6.2 1.5 2.4 2.8 7.7 7.2 1.5
Number of employees*** 113,775 111,856 143,485 144,358 150,800 156,408 166,221 174,152
Number of unemployees**** 80,582 71,678 64,968 54,457 43,190 34,396 29,535 28,385
Growth of employment (persons) % -0.3 -1.7 28.3 0.6 4.5 3.7 6.3 4.8
Unemployment rate, %**** 30.4 26.7 22.4 18.5 14.7 11.9 10.7 11.4
Number of pensioners***** 88,300 90,778 91,936 92,991 93,569 93,692 97,324 110,545
Average earnings 251 271 303 327 433 497 609 643
Surplus / deficit of the public sector, %BDP****** -2.40 -1.98 -1.96 2.94 6.65 -0.39 -3.37
Opsti Specijalni
sistem sistem
Exports of goods and services, current prices, mil. EUR******* 480.97 461.90 701.68 790.41 1,066.36 1,217.47 1,273.37 851.10 832.70
Growth rates of exports of goods and services, %******* 24.6 -4.0 51.9 12.6 34.9 14.2 4.6 -20.6 -19.3
Imports of goods and services, current prices, mil. EUR******* 814.49 709.57 969.94 1,108.53 1,718.59 1,936.66 2,359.89 1,201.10 1,437.07
Growth rates of imports of goods and services, %******* 4.5 -12.9 36.7 14.3 55.0 12.7 21.9 -35.2 -36.4
Balance of exchange of goods and services, current prices, mil. EUR******* -333.52 -247.67 -268.26 -318.11 -652.23 -719.19 -1,086.52 -349.61 -604.37
Balance of exchange of goods and services, % GDP******* -24.5 -16.4 -16.1 -17.5 -30.4 -26.8 -35.2 -13.1 -22.6
Current account balance, current prices, mil. EUR******* -174.99 -102.06 -119.64 -154.05 -531.21 -642.79 -1,005.66 -335.0 -589.8
Current account balance, % GDP******* -12.9 -6.8 -7.2 -8.5 -24.7 -24.0 -32.6 -12.5 -22.1
Gross capital formation, at current prices, mil. EUR******** 198.9 200.8 286.1 326.3 469.8 867.1 1,180.2 883.0
Gross capital formation, % of the GDP******** 14.6 13.3 17.1 18.0 21.9 32.3 38.3 23.8
External debt, mil. EUR 893.6 461.5 488.3 513.3 504.0 462.1 481.7 699.9
External debt, % BDP 65.7 30.6 29.2 28.3 23.5 17.2 15.6 22.7
Net foreign direct investment, current prices, mil. EUR******* 38.7 50.6 380.9 466.7 524.9 567.6 766.7
Net foreign direct investment, % BDP******* 2.6 3.0 21.0 21.7 19.6 18.4 28.7
Source: Monstat, with the GDP at current prices for 2007. Revision but not revised GDP at constant prices and real rates for the year. Data for 2009. year's estimate of the Ministry of Finance of
Montenegro.
** Source Monstat: Inflation measured by the cost of living by 2008, and consumer prices for 2009. year - the annual change.
*** Source: Monstat, since 2004. The applied methodology.
**** Source: Department for employment of Montenegro, data on the number of unemployed is the annual average, and unemployment for the last three years the rate in December for the previous
year, data from the National Employment Strategy for the period 2007 - 2010. year.
***** Data for 2009. refers to the day 30/09/2009.
****** Source: Law on the final account of the budget of Montenegro. The information includes the budget of Montenegro with state funds and local government.
******* GDP data for 2009. year relating to the period from January to September, in 2007. of 2008 and the goods are shown by the general system of trade.
******** Source: Monstat, data for 2007. year are revised. Data for 2009. year's estimate of the Ministry of Finance of Montenegro.
FEDERATION OF EURO-ASIAN STOCK EXCHANGES ANNUAL REPORT JUNE 2010
PAGE 127
MONTENEGRO STOCK EXCHANGE
PAGE 127
EXPORTS OF GOODS AND SERVICES,CURRENT PRICES (EUR millions)
IMPORTS OF GOODS AND SERVICES,CURRENT PRICES (EUR millions)
0
200
400
600
800
1.000
1.200
1.400
02 03 04 05 06 07 08 090
500
1,000
1,500
2,000
2,500
02 03 04 05 06 07 08 09

MUSCAT SECURITIES MARKET
We believe that exchanges that adhere togood governance, greater transparency andgreater accountability, are able to fosterinvestors’ confidence as well as creatingattractive investment environment.
We are continuously working on developingand operating an efficient and transparentsecurities market to the best standardexpected by our local and foreign investors.We believe that exchanges that adhere togood governance, greater transparency andgreater accountability, are able to fosterinvestors` confidence as well as creatingattractive investment environment.
We at Muscat Securities Market (MSM),however, have devised a comprehensive roadmap that enables us to build capacity andpromote sustainable capital marketdevelopment strategy specifically aimed atimproving access to the regional andinternational capital markets.
In view of the above MSM recently revised itslegislation with respect to listing, trading andclearance and settlement regulations to enableMSM to cater for what our market demands.
We are endeavoring to strengthen ourexperience for a more scientifically built stockmarket.
HISTORY AND DEVELOPMENT
The Muscat Securities Market passed throughtwo stages; the first started when the exchangefirst established as independent governmentalentity in 1988 up to 1998.
In the beginning of this first stage there were48 public shareholding companies listed andsix brokers; the market cap was around R.O.414.7 millions (One Rial=2.59781 US$).However, the government encouraged theestablishment of new public companiesthrough various incentives especially in theindustrial sector. This resulted in rapid growthin the exchange in terms of the number ofstocks listed reaching the peak at the end of1996 with 97 listed companies. Thus themarket cap scored R.O. 1.62 billion during thisperiod.
The second stage from 1998 till today duringwhich the MSM has been re-restructured uponthe establishment of three independent organsthe Capital Market Authority (Regulatory) theMSM for listing and trading and the MuscatDepository Company as a central depository.Many reformatory measures have been made,
administratively, technically and legislatively. Ineffect the market continued movingprogressively.
The MSM 30 Index posted the bestperformance amongst Arab Capital Marketsduring the last two successive years 2006 and2007. It closed higher by 62% to register9035.48 points. It was the only Gulf index,which did not retract during 2006.
During the last view years the MSM crossedthe regional boarders to enhance moreprofessionalism in securities industry when itsigned an agreement for the issuance of
composite indices with Dow Jonesinternational. The agreement stipulates for theissuance of two indices the first, DJ MSMComposite Index, relates to measuring theperformance of listed companies, while theother, DJ MSM Chip Index, relates to the mostactive companies.
At the regional level the Muscat SecuritiesMarket is a member of the Arab Union ofExchanges and participated in severalmeetings of the Arab, regional conferences,and forums.
At the international level the MSM is aneffective member at the Federation of Euro -Asian Stock Exchanges. Our Exchange is nowchairing the Task Force Committee forInformation and Awareness at FEAS and ithosted the FEAS general Assembly on the year2006.
The MSM is a correspondent member at theIOSCO and an affiliate member at the WFEand there is an ongoing process for obtainingfull membership in this latter internationalorganization.
FUTURE OUTLOOK
Development of procedures and rulesgoverning the activity of market makers.Updating the MSM regulations andorganizational structure. Working to satisfy the requirements of theWorld Federation of Exchanges for obtainingfull membership.
The MSM is currently working to be certified onthe following fields:-
• ISO 9001 - Quality Management• ISO 27001 - Information Security• BCM 25999 - Business Continuity Plan
Installing new screens in the investors tradinghall and a tape ticker for displaying sharesprices outside the building.
Continue working with Muscat Depository forthe installation of new systems for the CentralDepository.
Implementing procedures for updating theelectronic trading system and its accessories.Providing Technical Training to manage Linuxsystem, which is used in the operation of newissues of the electronic trading system.
Developing the Market Internet Website.Providing instantaneous news broadcastingservice for companies using RSS.
Linking brokerage companies with the MPLSnetwork of Omantel.
Maintaining all the annual reports of the marketsince inception and until 2009 in (PDF) files forinjecting them at MSM website.
Creating a database for Gulf, Arabic, Asian andEuropean exchanges with the reports andconducting comparisons between the stockexchange.
Translating the necessary regulations andorganizational structure of the market.
In 2009 were assigned the design work and theestablishment of the site for a host of e-commerce is expected to be completed in2010, and will be marketing the site throughvarious marketing channels.
Ahmed Saleh Al-MarhoonDirector General
FEDERATION OF EURO-ASIAN STOCK EXCHANGES ANNUAL REPORT JUNE 2010
PAGE 128

MUSCAT SECURITIES MARKET
FEDERATION OF EURO-ASIAN STOCK EXCHANGES ANNUAL REPORT JUNE 2010
PAGE 129
OFFICIAL 6 MONTH STATISTICS
US$ millions # Shares millionsTotal Volume Average Daily Volume Total Volume Average Daily Volume
StocksJul-09 453.64 21.60 426.35 20.30
Aug-09 557.90 25.36 562.21 25.56Sep-09 631.11 37.12 697.68 41.04Oct-09 78.12 3.72 57.59 2.74Nov-09 263.67 13.18 246.57 12.33Dec-09 286.55 15.08 334.94 17.63TOTAL 2,270.99 19.35 2,325.33 19.93
BondsJul-09 1.87 0.00 0.73 0.00
Aug-09 0.49 0.00 1.29 0.00Sep-09 2.49 0.00 0.98 0.00Oct-09 19.12 0.00 1.31 0.00Nov-09 7.86 0.39 2.96 0.15Dec-09 5.58 0.29 2.37 0.12TOTAL 37.41 0.11 9.63 0.05
OtherJul-09 0.00 0.00 0.00 0.00
Aug-09 0.00 0.00 0.00 0.00Sep-09 0.00 0.00 0.00 0.00Oct-09 0.00 0.00 0.00 0.00Nov-09 0.00 0.00 0.00 0.00Dec-09 0.00 0.00 0.00 0.00TOTAL 0.00 0.00 0.00 0.00
0
100
200
300
400
500
600
700
MONTHLY STOCK VOLUME VS INDEX(US$ millions)
MONTHLY MARKET CAPITALIZATION(US$ millions)
0
5,000
10,000
15,000
20,000
25,000
Stocks Index
Jul Aug Sep Oct Nov Dec Jul Aug Sep Oct Nov Dec0
1,000
2,000
3,000
4,000
5,000
6,000
7,000
Market Capitalization(US$ millions) Index
Jul-09 22,509.83 5,846.22Aug-09 23,424.80 6,345.06Sep-09 24,053.37 6,572.25Oct-09 23,705.52 6,354.92Nov-09 23,580.77 6,357.23Dec-09 23,615.96 6,368.80
CONTACT INFORMATION
Contact Name Mr. Al Taib Shaigoog E-mail [email protected] Website www.msm.gov.om

FEDERATION OF EURO-ASIAN STOCK EXCHANGES ANNUAL REPORT JUNE 2010
PAGE 130
MUSCAT SECURITIES MARKET
ECONOMIC AND POLITICAL DEVELOPMENTS
Yearbook reportThe Omani economy continued to witnessrobust growth for the five consecutive years in2008 with its GDP at current market pricesrising by 44 percent supported by acceleratedactivities in both oil and non- oil sectors. In2008 there was a turnaround in crude oilproduction which rose by 6.8 percent to 277million barrels over the previous year. Briskactivities in the petroleum sector not onlyovershadowed on diversification but alsoimproved its share in GDP to 51.3 percent in2008 from an average share of 46.3 percent inthe previous four years. Non-petroleumactivities also recorded a robust growth of27.2 percent in 2008 as against an averagegrowth of 16.5 percent in the previous fouryears. Manufacturing sector witnessed animpressive growth of 40.5 percent in 2008 andits share in total GDP was maintained at littleover 10 percent. In 2008, value added in theservice sector grew at a higher rate of 22.5percent compared to an average growth of14.4 percent in the previous four years.
The year 2009 was an exceptionally difficultyear with large contraction of world GDPreduction in employment, sharp decline inglobal trade volumes and above all associatedloss of economic welfare for the mankind as awhole. Nevertheless investors were moreoptimistic as deterioration in economicconditions was less rapid in the more recentperiod than before or stabilizing in somesectors.
Like many other countries of the region Omaneconomy has been impacted by theinternational financial crisis. The slump in oilprices since the last quarter of 2008 and theweak international demand for good willcontribute to significant decline in Oman’seconomic growth.
In view of the adverse internationaldevelopment sustaining high rate of growththe Omani government emerged a majorchallenging policy in 2009. Although fiscalposition will be under pressure, it will not posea near –term financing problem as thegovernment has accumulated large amount offoreign reserve out of fiscal surpluses duringthe recent years. The investment stability fundcreated by the government would support theunexpected downturn in the local stockmarket.
As for Muscat Securities Market, it is worthmentioning that trading volume reachedUS$9.51 billion in 2008 compared withUS$6.91 billion in 2007, thus posting a recordand unprecedented increase of 36.1% sinceits establishment in 1989. Meanwhile, the MSMprice index fell from 9035 points at the end of2007 to the level of 5441 points at the end of2008, registering a drop of 39%. This is thelowest rate of fall amongst other Gulf financialmarkets.
The MSM witnessed traded volume of 6,091billion shares during the year 2009 recordingan increase of 37.17% compared with 4,441billion traded shares as on 2008. During theyear 2009 the value of the traded shares wasUS$ 5380 billion with a decrease of 37.61%compared with US$ 9511 billion during theyear 2008. The Market capitalization increasedin 2009 recording US$ 23.4 billion comparedwith US$15 billion during 2008.
The MSM index rose from 5441.12 points,during 2008, recording 6368 points in 2009with an increase of 17%. During 2009, theMuscat Securities Market scored the secondgrade from among the GCC exchanges.*
* Information provided by MSM.
Key Information ContactsMinistry of National Economy www.moneoman.gov.omCapital Market Authority www.cma-oman.gov.omOman Chamber of Commerce and Industry www.cbo-oman.orgFinancial Corporation www.fincorp.orgNational Bank of Oman www.nbo.co.om
0123456789
10
REAL GDP(OMR millions)
CONSUMER PRICES (% CHANGE PA; AV)(%)
0
2
4
6
8
10
12
14
2005 2006 2007 2008 2009 2010 2005 2006 2007 2008 2009 2010

FEDERATION OF EURO-ASIAN STOCK EXCHANGES ANNUAL REPORT JUNE 2010
PAGE 131
MUSCAT SECURITIES MARKET
OMAN ECONOMIC CHARTS AND TABLES
2005 2006 2007 2008 2009 2010
Nominal GDP (US$ at PPP) bil US$ 51 57 62 (a) 67 (a) 70 (a) 74 (b)Real GDP mil OMR 7,081 7,609 8,054 (a) 8,567 (a) 8,799 (a) 9,142 (b)Real private consumption mil OMR 4,202 5,084 5,465 (a) 5,892 (a) 6,127 (a) 6,409 (b)Real government consumption mil OMR 2,095 2,182 2,313 (a) 2,459 (a) 2,581 (a) 2,729 (b)Real gross fixed investment mil OMR 1,765 1,941 2,076 (a) 2,226 (a) 2,293 (a) 2,407 (b)Real stockbuilding mil OMR n/a n/a n/a n/a n/a n/aReal exports of G&S mil OMR 2,657 2,633 2,620 (a) 2,646 (a) 2,686 (a) 2,740 (b)Real imports of G&S mil OMR 3,638 4,231 4,421 (a) 4,655 (a) 4,888 (a) 5,142 (b)Real domestic demand mil OMR 8,062 9,206 9,854 (a) 10,576 (a) 11,001 (a) 11,545 (b)Real GDP at factor cost mil OMR 6,957 7,609 8,054 (a) 8,567 (a) 8,799 (a) 9,142 (b)Real agriculture mil OMR 178 177 181 (a) 184 (a) 186 (a) 189 (b)Real industry mil OMR 2,765 2,891 2,986 (a) 3,090 (a) 3,194 (a) 3,313 (b)Real manufacturing mil OMR 572 657 716 (a) 766 (a) 812 (a) 862 (b)Real services mil OMR 4,013 4,541 4,887 (a) 5,294 (a) 5,419 (a) 5,640 (b)Gross national savings rate (%) % 38.9 41.9 37.1 (a) 38.8 (a) 32.5 (a) 35.2 (b)Gross national savings/investment % 175.8 158.0 120.1 (a) 135.2 (a) 103.5 (a) 115.9 (b)Budget balance (% of GDP) % 2.5 0.3 0.3 1.3 (a) 0.7 (a) 2.2 (b)Consumer prices (% change pa; av) % 1.2 3.0 5.9 12.5 5.3 (a) 3.0 (b)Exchange rate LCU:US$ (av) OMR/US$ 0.3845 0.3845 0.3845 0.3845 0.3845 (a) 0.3845 (b)Lending interest rate (%) % 7.1 7.4 7.3 7.1 7.2 (a) 7.2 (b)Stock of domestic credit mil OMR 3,318 3,941 5,273 6,776 7,589 (a) 8,651 (b)Domestic credit growth (%) % 1.7 18.8 33.8 28.5 12.0 (a) 14.0 (b)Deposit interest rate (%) % 3.3 4.0 4.1 4.5 4.5 (a) 4.5 (b)Population million 2.5 2.6 2.7 2.9 (a) 3.0 (a) 3.1 (b)GDP per head ($ at PPP) US$ 20,398 22,035 22,560 (a) 23,350 (a) 23,490 (a) 23,860 (b)Current account balance/GDP % 16.8 15.4 6.2 10.1 (a) 1.1 (a) 4.8 (b)International reserves bil US$ 4 5 10 12 13 (a) 14 (b)Trade balance bil US$ 11 12 10 17 11 (a) 16 (b)Foreign-exchange reserves bil US$ 4 5 10 12 13 (a) 14 (b)Total foreign debt bil US$ 4 5 6 8 8 (a) 8 (b)Public medium & long-term bil US$ 1 1 1 1 1 (a) 1 (b)Private medium & long-term bil US$ 2 2 2 3 3 (a) 3 (b)IMF debt bil US$ 0 0 0 0 0 0 (b)Short term bil US$ 2 2 3 4 4 (a) 4 (b)Net debt bil US$ -0 -0 -4 (a) -4 (a) -5 (a) -6 (b)Export credits bil US$ 0 0 (a) 0 (a) 1 0 (a) 1 (b)
(a) Estimate (b) Forecast
Provided by MSM.
0
2
4
6
8
10
12
14
16
18
TRADE BALANCE(US$ billions)
2005 2006 2007 2008 2009 20100.0
0.5
1.0
1.5
2.0
2.5
REAL GROSS FIXED INVESTMENT(OMR millions)
2005 2006 2007 2008 2009 2010

NASDAQ OMX ARMENIA
2009 was a challenging but still quitesuccessful year for NASDAQ OMX Armenia.
Bringing difficult times to most businesses acrossthe world, 2009 was a challenging but still quitesuccessful year for NASDAQ OMX Armenia. Whiletrading in equities remained low throughout theyear, trading in other exchange markets grewsignificantly. Thus, corporate bonds, the bestperforming market of the year, was up 4.7 timesto US$ 27.6 million. Government bonds tradingwas also active demonstrating growth in valuetraded of 43% and in the number of trades of135%, and the repurchase agreements (repo)market showed an activity exceeding US$ 13million during its first year after launch inDecember 2008. Currency trading remainedtraditionally high at nearly US$ 1.1 billion.
Even though fears of uncertainty and reducedinvestor interest did not fade globally throughoutthe year, 2009 nevertheless saw the first ever IPOin Armenia, carried out by Artsakh HydroPowerPlant, which is now listed on NASDAQ OMXArmenia. In addition, during the year theexchange listed four new issues of corporatebonds and expects more to come in 2010. At theyear-end exchange market capitalization stood atthe equivalent of around US$ 140 milliondeclining by only 1.7% since the end of 2008 – arelatively good performance considering thelingering effects of the global financial crisis.
Positive were also the developments on NASDAQOMX Armenia membership side: nine newmembers were admitted during the year bringingthe total number of members to 27.
In 2009, NASDAQ OMX Armenia was also activein organizing many different kinds of events,including seminars, trainings, and study tours.These were targeted to various stakeholdergroups – investment companies and banks, listedcompanies, journalists – and aimed at sharinginternational expertise and implementing state-of-the-art standards of respective activities inArmenia. General public and especially youngeraudiences were also in focus, with initiativespromoting awareness about capital markets andtheir importance in building a strong nationaleconomy.
Becoming the full owner of the Central Depositoryof Armenia in June 2009, NASDAQ OMX Armeniakept concentrating on improving the depositoryand clearing services – primarily throughcontinued automation and optimization ofbusiness processes. The Depository also workedclosely with the Government of Armenia to designand prepare the implementation in 2011 of themandatory fully funded pension system, acooperation that will continue this year. The
launch of this new second pillar pension systemis expected to boost the activity in the capitalmarket promoting the issue of new financialinstruments and bringing in institutional investors.
In 2010, as the recovery gets underway bothglobally and locally, NASDAQ OMX Armenia willcontinue to be proactive in its relations with thecapital market stakeholders. One area of focuswill be to introduce new technology for both theexchange and the central depository business, toput in place the foundation for continued growth.There will also be continuous efforts to increaseawareness of the capital market in Armenia andsupport market participants in meeting theawakening demand for quality financialintermediation and capital market services.Through such processes NASDAQ OMX Armeniarealizes its primary objective – to maintain a fairand effective marketplace where good companiescan raise capital and where investors can makewell-informed decisions while being properlyprotected. Our commitment for 2010 is tocontinuously and consistently strive to achievethis objective.
HISTORY AND DEVELOPMENT
NASDAQ OMX Armenia (formerly ArmenianStock Exchange, Armex, renamed on 27January 2009) is the only stock exchangecurrently operating in Armenia. Armex was thesuccessor of the Association of SecuritiesMarket Participants, which was established inArmenia in 1997, and was initially registeredthe Securities Commission of the RA on 13February 2001, as a self-regulatoryorganization. In November 2007, according tothe newly adopted “Law on Securities Market”,Armex was reorganized into an open jointstock company.
Until 1 January 2006, Securities Commission ofRA was the competent state authority toregulate the activities of capital marketincluding the stock exchange in Armenia.However, with the enactment of a new lawintroducing unified regulatory authority for thefinancial market, the regulatory and supervisorypowers of the Commission were transferred tothe CBA.
Since 15 November 2005, foreign currencytrading was introduced on Armex, whichproved to be in demand: volumes of FX tradingto date greatly exceed those of otherinstruments. On 14 December 2005, the firstpublicly traded corporate bonds were listed atArmex, and as of December 2008, 13 bondissues were traded on the stock exchange –most of them having market makers. In early2008 government bonds trading was launched,as well as status of market-maker forgovernment bonds was introduced. By the endof 2008, Armex introduced new market forREPO (repurchase agreements), as well as amechanism for manual trades.
NASDAQ OMX Armenia is currently part of theNASDAQ OMX Group. In November 2007members of CDA and Armex transferred theirshares to the CBA, and OMX Group acquired100% thereof. After in late February 2008,NASDAQ completed its combination with OMX,NASDAQ OMX Armenia became an entity fullyowned by NASDAQ OMX. On 5 June 2009,NASDAQ OMX Armenia became the owner ofthe 100% of the shares of the CentralDepository of Armenia.
FUTURE OUTLOOK
In 2010, NASDAQ OMX Armenia plans to: • continue improving the technicalinfrastructure of the stock exchange and thecentral depository; • continue expanding the range of servicesprovided to listed companies and tradingmembers; • carry on with efforts to promote initial publicofferings of equities in the Armenian market; • launch T+3 settlement mechanism, whichwill enable exchange trading without pre-deposition of securities and cash; • establish a Guarantee Fund to increaseinvestor protection;• organize study tours for investmentcompanies and banks to facilitate introductionof international best practices in Armenia;• conduct study tours and seminars forjournalists covering financial market; • continue efforts towards increasing publicawareness of the Armenian securities market.
Armen MelikyanChief Executive Officer
FEDERATION OF EURO-ASIAN STOCK EXCHANGES ANNUAL REPORT JUNE 2010
PAGE 132

NASDAQ OMX ARMENIA
FEDERATION OF EURO-ASIAN STOCK EXCHANGES ANNUAL REPORT JUNE 2010
PAGE 133
OFFICIAL 6 MONTH STATISTICS
US$ millions # Shares millionsTotal Volume Average Daily Volume Total Volume Average Daily Volume
StocksJul-09 0.22 0.01 0.08 0.00
Aug-09 0.00 0.00 0.00 0.00Sep-09 0.00 0.00 0.00 0.00Oct-09 0.00 0.00 0.00 0.00Nov-09 0.03 0.00 0.00 0.00Dec-09 0.00 0.00 0.00 0.00TOTAL 0.25 0.00 0.08 0.00
BondsJul-09 0.69 0.03 0.91 0.04
Aug-09 1.74 0.08 1.32 0.06Sep-09 3.68 0.18 10.28 0.49Oct-09 6.30 0.29 5.90 0.27Nov-09 0.75 0.04 0.37 0.02Dec-09 2.08 0.09 1.05 0.05TOTAL 15.24 0.12 19.83 0.15
OtherJul-09 27.75 1.21 27.74 1.21
Aug-09 15.27 0.73 0.00 0.00Sep-09 117.88 5.61 0.00 0.00Oct-09 49.13 2.23 0.00 0.00Nov-09 79.33 3.78 78.77 3.75Dec-09 148.31 6.45 148.14 6.44TOTAL 437.67 3.33 254.64 1.90
MONTHLY STOCK VOLUME VS INDEX(US$ millions)
MONTHLY MARKET CAPITALIZATION(US$ millions)
0.00
0.05
0.10
0.15
0.20
0.25
0
20
40
60
80
100
120
140
160
Jul Aug Sep Oct Nov Dec Jul Aug Sep Oct Nov Dec
Market Capitalization(US$ millions) Index
Jul-09 135.93 n/aAug-09 134.28 n/aSep-09 131.00 n/aOct-09 130.78 n/aNov-09 144.90 n/aDec-09 140.22 n/a
CONTACT INFORMATION
Contact Name Mr. Armen Melikyan E-mail [email protected] Website www.nasdaqomx.am

FEDERATION OF EURO-ASIAN STOCK EXCHANGES ANNUAL REPORT JUNE 2010
PAGE 134
NASDAQ OMX ARMENIA
ECONOMIC AND POLITICAL DEVELOPMENTS
Political and Economic PerformanceThe political scene will remain tense. The newpresident, Serzh Sarkisian, formed a four-partycoalition government and appointed TigranSarkisian (no relation) as prime minister. Theappointment of the non-party-affiliated andrespected Mr Sarkisian (who was formerlychairman of the Central Bank of Armenia)indicates the president's desire to appease hiscritics and reduce the polarization of thepolitical scene.
Despite strong Western criticism of theconduct of the presidential election, Armenia'said programs with the US and EU appear onlyto have been delayed, rather than suspended,as had been threatened. The US had warnedthat the disbursement of US$236m from theUS Millennium Challenge Account could beterminated altogether in the light of theimposition of the state of emergency in March.However, given the political capital alreadyinvested in these programs (in the case of theEU, the European Neighborhood Policy), itseems likely that Armenia will continue tobenefit both financially and from technicalassistance through participation in theseprograms.
Economic policy under Serzh Sarkisian willdiffer little from that of his predecessor, giventhat Mr Sarkisian has long been at the heart ofthe political scene. With a respected formerCentral Bank governor leading thegovernment, prospects for greater progress intackling corruption within the tax and customsadministrations, strengthening the rule of law,and ensuring fair business competition haveimproved. However, given the close linksbetween political and business circles inArmenia, vested interests will still present anobstacle to more transparent policies.
Economic PerformanceThe global economy is set to slow significantlyand the downside risks to the world economicoutlook remain elevated. This reflects not justcontinued problems in the US and Europeanfinancial sectors, but also higher globalinflationary pressures, which are erodingcorporate competitiveness, crimpingconsumers' spending power and casting ashadow over growth prospects in manycountries. As well as fluctuations in commodityprices, Armenia's growth prospects would bevulnerable to any downturn in its main exportpartners, such as Germany and Russia.
A booming construction sector continues todrive economic growth which was 10.3% yearon year in the first half of 2008 owing toresidential and office development andongoing improvements to energy andtransport infrastructure. The financial servicessector is also growing strongly, expanding by22.8% in January-June 2008, as robustdemand for consumer credit supports bankingsector activity. With favorable fruit andvegetable harvests contributing to positivegrowth in the agriculture sector, real GDPgrowth forecast is of 10% in 2008. The strongbase period and real currency appreciation arelikely to push growth down to around 7% in2009.
Year-on-year inflation reached its highest levelfor a decade in July 2008, of 10.9%. Highprices for imports such as wheat and mineralproducts, together with the rapid expansion ofmonetary aggregates, will continue to exertpressure on prices. The effect of theappreciating dram on prices has been smallerthan expected, owing to the monopoly statusof importers of several staple goods. Thesefactors will keep annual average inflation high
in 2008, at around 9%. Falling global foodprices should encourage disinflation, to anannual average rate of inflation of around 5.5%in 2009.
The dram has begun to appreciate againagainst the US dollar, owing both to the UScurrency's weakness worldwide, andcontinued robust inflows of overseasremittances and other private transfers.However, a widening current-account deficitwill reduce the rate of nominal appreciationcompared with 2007. This nominalappreciation, in conjunction with a slightlyhigher rate of inflation in Armenia than in manyof its most important trading partners, willtranslate into a strong real effectiveappreciation. Average annual exchange rate ofDram 302.5:US$1 this year, followed by a rateof Dram279.7:US$1 in 2009 is forecasted.The metallurgy, machine-building and mineralproducts sub-sectors will become increasinglyimportant sources of export revenue. However,growth in import expenditure will continue tooutpace that of export earnings. Inflows ofremittances, reflected in surpluses in thecurrent transfers and income accounts, willcontinue to offset some of the effect that thewidening trade deficit has on the currentaccount. Nevertheless, the current-accountdeficit is expected to widen from US$571m in2007 to around US$950m per year in 2008-09.*
* The Economic Intelligence Unit Ltd., August 2008.
Key Information ContactsNASDAQ OMX www.nasdaqomx.comThe Central Bank of Armenia www.cba.amThe Central Depository of Armenia www.nasdaqomx.am
0.00.20.40.60.81.01.21.41.61.82.0
REAL GDP(AMD millions)
CONSUMER PRICES (% CHANGE PA; AV)(%)
0
1
2
3
4
5
6
7
8
9
2005 2006 2007 2008 2009 2010 2005 2006 2007 2008 2009 2010

FEDERATION OF EURO-ASIAN STOCK EXCHANGES ANNUAL REPORT JUNE 2010
PAGE 135
NASDAQ OMX ARMENIA
ARMENIAN ECONOMIC CHARTS AND TABLES
2005 2006 2007 2008 2009 2010
Nominal GDP (US$ at PPP) bil US$ 13 15 17 19 (a) 16 (a) 17 (b)Real GDP bil AMD 1,427 1,616 1,839 1,964 1,665 (a) 1,690 (b)Real private consumption bil AMD 1,109 1,201 1,414 1,585 (a) 1,297 (a) 1,352 (b)Real government consumption bil AMD 119 135 155 193 (a) 187 (a) 181 (b)Real gross fixed investment bil AMD 434 580 678 760 (a) 622 (a) 648 (b)Real stockbuilding bil AMD -5 3 2 0 (a) 2 (a) 1 (b)Real exports of G&S bil AMD 499 463 446 416 (a) 279 (a) 297 (b)Real imports of G&S bil AMD 739 767 867 997 (a) 729 (a) 800 (b)Real domestic demand bil AMD 1,657 1,917 2,246 2,537 (a) 2,107 (a) 2,183 (b)Real GDP at factor cost bil AMD 1,302 1,471 (a) 1,649 (a) 1,756 (a) 1,489 (a) 1,512 (b)Real agriculture bil AMD 381 383 (a) 422 (a) 428 (a) 432 (a) 445 (b)Real industry bil AMD 506 593 (a) 664 (a) 680 (a) 599 (a) 611 (b)Real manufacturing bil AMD 258 252 (a) 260 (a) n/a n/a n/aReal services bil AMD 414 495 (a) 562 (a) 648 (a) 459 (a) 456 (b)Gross national savings rate (%) % 29.4 34.1 30.8 (a) 28.5 (a) 28.8 (a) 31.2 (b)Gross national savings/investment % 96.5 94.9 82.8 71.5 72.8 (a) 74.8 (b)Budget balance (% of GDP) % -1.9 -1.5 -0.8 -1.2 -5.7 (a) -5.6 (b)Consumer prices (% change pa; av) % 0.6 2.9 4.4 9.0 4.2 (a) 4.9 (b)Exchange rate LCU:US$ (av) AMD/US$ 457.6883 416.0408 342.0792 305.9692 365.0234 (a) 409.5878 (b)Lending interest rate (%) % 18.0 16.5 17.5 17.1 19.1 (a) 18.5 (b)Stock of domestic credit bil AMD 197 214 382 607 517 (a) 543 (b)Domestic credit growth (%) % 54.6 8.7 78.4 58.9 -15.0 (a) 5.1 (b)Deposit interest rate (%) % 5.8 5.8 6.3 6.6 8.5 (a) 7.1 (b)Population million 3.1 3.1 3.1 3.1 3.1 (a) 3.1 (b)GDP per head ($ at PPP) US$ 4,104 4,782 5,616 6,110 (a) 5,230 (a) 5,380 (b)Current account balance/GDP % -1.1 -1.8 -6.4 -11.4 -10.7 (a) -10.5 (b)International reserves bil US$ 1 1 2 1 1 1 (b)Trade balance bil US$ -1 -1 -2 -3 -2 (a) -2 (b)Foreign-exchange reserves bil US$ 1 1 2 1 1 1 (b)Total foreign debt bil US$ n/a n/a n/a n/a n/a n/aPublic medium & long-term bil US$ n/a n/a n/a n/a n/a n/aPrivate medium & long-term bil US$ n/a n/a n/a n/a n/a n/aIMF debt bil US$ n/a n/a n/a n/a n/a n/aShort term bil US$ n/a n/a n/a n/a n/a n/aNet debt bil US$ n/a n/a n/a n/a n/a n/aExport credits bil US$ n/a n/a n/a n/a n/a n/a
(a) Estimate (b) Forecast
The Economist Intelligence Unit Limited, September 2009.
-3.0
-2.5
-2.0
-1.5
-1.0
-0.5
0.0
TRADE BALANCE(US$ billions)
2005 2006 2007 2008 2009 20100
100
200
300
400
500
600
700
800
REAL GROSS FIXED INVESTMENT(AMD millions)
2005 2006 2007 2008 2009 2010

PALESTINE SECURITIES EXCHANGE
In 2009, the PSE recovered from the impactof the global financial crisis with a goodperformance relative to other MENAcountries.
Over more than thirteen years, the PSE hasconsistently met challenges of a difficulteconomic and political reality with a high levelof commitment to its goals and to thedevelopment of an enabling investmentenvironment.
In 2009, the PSE recovered from the impact of the global financial crisis with a goodperformance relative to other MENA countries:The Al-Quds index increased by 11.62% by theend of the year, ranked the eighth among Arabexchanges in terms of index growth rate. ThePSE is financially sound, and well capitalized tomaintain a steady business in a volatile world.
The year 2009 witnessed continuous attentionby the PSE to strengthening its prominentpresence on many levels; The PSE was able toenhance its role locally by reinforcing principlesof transparency, investment culture and good
governance. In terms of surveillance, the PSEand Palestine Capital Market Authority (PCMA)signed an agreement with Smarts Group ofAustralia, to utilize Smarts on Line System forinstant supervision over securities trading.
The PSE convened the “Third AnnualPalestinian Capital Market Forum” in October2009 discussing the priorities and opportunitiesof emerging markets post the global financialcrisis.
Two companies were listed in 2009. Today, thePSE has 39 listed companies across five maineconomic sectors; including banking,insurance, investments, industry and services.30 companies out of 39 achieved profits during2009 with 100% compliance with disclosurerequirements.
The year 2009 also witnessed distinctivedevelopments in terms of the InvestorEducation Program; The Stock SimulationProgram was launched targeting universitystudents in Palestine to educate them on howto invest in the securities market.
The PSE also strengthened its IT infrastructureby implementing a hot disaster recoverybackup site with high availability for allNetworks, systems and services.
Today we see a locally, regionally andinternationally recognized institution thatcompetes with many other stock exchangeswith more conducive working environments.Our common values will always be goodgovernance, transparency, efficiency, fairness &equal opportunities.
HISTORY AND DEVELOPMENT
• 1996: Established as a private shareholdingcompany to promote investment in Palestine.• February 18, 1997: First trading session.• 2009: a well established exchange with turnoverin 2009 of US$ 500,393,398 and a marketcapitalization of US$ 2.37 billion.• February 2010: became a public shareholdingcompany responding to principles of transparencyand good governance. • Listed Companies: 39 Palestinian companiesas of 31/12/2009 across five main sectors:banking, industry, insurance, investment &services.• Member Brokerage Firms: 10 firms as of31/12/2009 with offices and branches in most ofthe Palestinian cities.• 2005: the Al-Quds Index had increased by306% compared to 2004, recording the highestamongst the world Stock Exchanges.• 2006: Launched the Investor EducationProgram.• E-trading: Launched in April 2007.• In 2009: the PSE was ranked 33rd amongstInternational Stock Exchanges and regionallycomes 2nd in terms of investor protection.• Only equities are currently traded on the PSE.
2009 ACCOMPLISHMENTS
• Convened the Third Annual Palestinian CapitalMarket Forum in November 2009. The Forumdiscussed priorities and opportunities of emergingmarkets post the global financial crisis. The Forumwas attended by local, regional & internationalbusinessmen, investors and experts, in addition to
the Chairman of IOSCO Emerging MarketsCommittee, and a Chilean-Palestinianbusinessmen delegation.• Organized promotional Road Show to Santiago,Chile in May 2009 to attract new investments tothe PSE. • Listing of two new Companies: GlobalcomTelecommunications Company in October 2009 &The Palestine Islamic Bank in July 2009. The PSEnow has 39 listed companies on the exchangeworking in 5 main sectors; banking, investment,services, industry & insurance.• PSE and Capital Market Authority (CMA) signedan agreement with Smarts Group of Australia, toutilize Smarts on Line System for instantsupervision over securities trading.• Implemented a Hot Backup site and highavailability for all Networks and systems andservices, in addition to new infrastructure forTechnologies and Telecommunications, newSecurity systems, new trading surveillance systemusing SMARTS system, the Stock Simulationsystem.• Developed new portal and a new DataDissemination System.• Run two rounds of Stock Simulation competitionin five national universities in Palestine with theparticipation of 180 students. • Published five new issues of Souk Al-MalMagazine (a specialized magazine in capitalmarkets).• Held the Accredited Broker Course in December2009 with the participation of 19 employees ofmember brokerage firms at the PSE.• Announced the approval on the Arab InvestmentGroup Membership. the PSE has now 10 memberbrokerage firms.
• Issued the investor number (IN) for shareholdersat the PSE.• Attained a membership of the Association ofNational Numbering Agenda (ANNA) that qualifiedthe PSE to issue the ISIN (International SecuritiesIdentification Number).• Issued & distributed multiple studies,newsletters and statistical reports.
FUTURE OUTLOOK
• Develop domestic institutional investors andattract Palestinian Diaspora and foreign capitalthrough local, regional & international road showsto attract new investments to the exchange;• Reaching an agreed division of labor onregulatory matters between PSE and CapitalMarket Authority;• Expand on investor education programs mainlyfor students at all academic levels.• Target public shareholding companies to belisted on the PSE. • Target private shareholding companies to gopublic and be listed on the PSE.• Perform all preparations that are needed interms of managerial and technical requirementsfor a projected independent Central SecurityDepository (CSD);• The PSE will additionally dedicate more effort tothe improvement of the legal environment,disclosure, transparency, enhancement of listingrules, and keeping up with the latestdevelopments together with investmentawareness, communication and state of the artICT environment.
Ahmad AweidahCEO
FEDERATION OF EURO-ASIAN STOCK EXCHANGES ANNUAL REPORT JUNE 2010
PAGE 136

PALESTINE SECURITIES EXCHANGE
FEDERATION OF EURO-ASIAN STOCK EXCHANGES ANNUAL REPORT JUNE 2010
PAGE 137
OFFICIAL 6 MONTH STATISTICS
US$ millions # Shares millionsTotal Volume Average Daily Volume Total Volume Average Daily Volume
StocksJul-09 19.94 0.95 11.92 0.57
Aug-09 27.94 1.27 12.00 0.55Sep-09 32.68 1.82 26.90 1.49Oct-09 29.98 1.43 14.85 0.71Nov-09 21.07 1.17 8.68 0.48Dec-09 34.22 1.63 18.66 0.89TOTAL 165.83 1.38 93.00 0.78
BondsJul-09 0.00 0.00 0.00 0.00
Aug-09 0.00 0.00 0.00 0.00Sep-09 0.00 0.00 0.00 0.00Oct-09 0.00 0.00 0.00 0.00Nov-09 0.00 0.00 0.00 0.00Dec-09 0.00 0.00 0.00 0.00TOTAL 0.00 0.00 0.00 0.00
OtherJul-09 0.00 0.00 0.00 0.00
Aug-09 0.00 0.00 0.00 0.00Sep-09 0.00 0.00 0.00 0.00Oct-09 0.00 0.00 0.00 0.00Nov-09 0.00 0.00 0.00 0.00Dec-09 0.00 0.00 0.00 0.00TOTAL 0.00 0.00 0.00 0.00
0
5
10
15
20
25
30
35
MONTHLY STOCK VOLUME VS INDEX(US$ millions)
MONTHLY MARKET CAPITALIZATION(US$ millions)
0
500
1,000
1,500
2,000
2,500
Stocks Index
Jul Aug Sep Oct Nov Dec Jul Aug Sep Oct Nov Dec0
100
200
300
400
500
600
Market CapitalizationUS$ millions Index
Jul-09 2,286.88 488.77Aug-09 2,333.74 498.45Sep-09 2,363.95 498.92Oct-09 2,391.19 500.18Nov-09 2,397.05 502.12Dec-09 2,375.37 493.00
CONTACT INFORMATION
Contact Name Mr. Ahmad Aweidah E-mail [email protected] Website www.p-s-e.com

FEDERATION OF EURO-ASIAN STOCK EXCHANGES ANNUAL REPORT JUNE 2010
PAGE 138
PALESTINE SECURITIES EXCHANGE
ECONOMIC AND POLITICAL DEVELOPMENTS
Political DevelopmentsGovernment Reforms: The PNA has madesubstantial progress towards improving its fiscalposition since 2007. In January 2010, the PNAlaunched a plan of priority interventions for 2010comprising 201 projects identified by PNAministries. They have a total estimated budget ofUS$5.5bn. Projects for 2010 require US$667m.Infrastructure projects account for 67% of therequested funding and include: a railway network,a commercial port, at least one internationalairport, desalination plants and wastewatertreatment facilities.
The PNA has also focused on developing theinstitutional and legal framework in recent years.A priority has been the comprehensive reform ofthe tax system. A new income tax law has beenadopted and the VAT rate has been reduced.
The Ministry of National Economy is makingefforts to develop public-private sectorpartnership. Regulations in the Palestinianfinancial markets are also continuing to improve,with, for example, a new ‘Code of CorporateGovernance’ which private sector companies areexpected to follow.
Closure obstacles in the West Bank and GazaStrip numbered 619 in August 2009 (OCHA data).The Gaza Strip is completely isolated with allexists sealed. Two-thirds of the 723.3 kmseparation wall between Israel and the PalestinianTerritories is complete complications in thePalestinian territory.
Economic DevelopmentsThe Palestinian economy is robust in its capabilityto function under often harsh conditions. Due tothe political situation, however, it has witnessedmany ups and downs over the years.
GDP growth averaged 6% per year between 1995and 2000 (World Bank) but ground to a halt at theSecond Intifada. The Palestinian economyrebounds when given the chance and withimproved movement and access, GDP forecastsare very positive- the IMF reported that GDP inthe West Bank could increase by 7% in 2009.Unfortunately, restrictions in 2009 did notsignificantly improve so more modest growth isexpected.
The contribution of major economic sectors toGDP has varied little over the past year. In Q32009, public administration and defencecontributed 14% of value added, wholesale andretail trade 10%, manufacturing 10%, transportstorage and communications 9%, real estate,renting and businesses services 9%, agricultureand fishing 3% and construction 6%.
CPI: Inflation in Palestine is comparable to ratesin Western countries and below the MENA regionaverage. It increased by 2.75% between 2008 and2009.
Foreign Trade: has been severely hindered byIsrael’s control over Palestinian borders. Tradeindicators have recovered considerably since2002. Israel is the main trading partner of thePalestinians.
The PNA has concluded free trade agreementswith the European Union, the European FreeTrade Association (EFTA), the US, Canada andTurkey.
Total imports were US$3.8bn in 2008 (up 20%since 2007) and total exports were US$0.5bn (up3% since 2007). 72% of imports came from Israel,an increase of 20% since 2007. In 2008, exportsto Arab countries, US and EU increased by 38%,35% and 25% respectively. There were noticeableincreases in the export levels of agricultural, food,metal and plastics products.
The trade deficit in 2008 increased to US$3.2bn,up 27% from 2007. The deficit is covered mainlyby external assistance and worker’s remittances.
Labour ForcePerhaps the greatest asset to the Palestinianeconomy is its human resources. The level ofeducation is the highest in the region, with theexception of Israel. There is well developedentrepreneurial capacity, good language skillsand strong social and economic networks. LocalPalestinian demand and labour force areexpected to grow over the next decades as morethan half of the population is below the age of 18.unemployment in the West Bank has been on adownward trend over the past five years. Theunemployment rate for the Third quarter of theyear 2009 reached to 25.8% recorded an increaseby 16.2% compared with the Second quarter of
the year 2009. The unemployment rate recordedan decrease by6.18% during the Third quarter2009 compared with the similar quarter of theprevious year 2008. The unemployment rate forthe full year 2008 was 26.0% compared with21.5% in 2007.
Impact of the economical situation on the PSEDespite the political and economicaldeteriorations, the PSE stands on solid ground,as it is better on both directions; improving theperformance of the market, and improving theinvestment environment in securities market,which enables the PSE to achieve outstandingresults in 2009, as Al Quds Index increase by11.62% compared to 2008.
During 2009 PSE held 246 trading sessions withapproximately 89 thousand transactions wereexecuted with a value that goes around US$ 500million decreasing by 57.78% compared to 2008.While Al-Quds Index was increased by 11.62during the same period compared with 2008, allindicators show that at any positive developmentin the political situation in Palestine will bereflected immediately in the economicalcircumstances and the PSE.
Financial CrisisThe impact of the global financial crisis on thePalestinian economy was fairly limited. Localbanks are conservative in regard to foreignactivities and the Palestinian mortgage market isvery small. The stock market was mildly affectedby foreign investors who became reluctant totrade in the PSE. In 2008, the Al-Quds indexdropped 16%, which compared well with otherArab markets. Since mid 2009, the Palestinianindex has been stable, (around the 500 mark) andby the end of the year, had increased by11.62%.*
* Information provided by PSE.
Key Information ContactsPalestine Capital Market Authority: www.cma.gov.psMinistry of Finance: www.mof.gov.psMinistry of National Economy: www.met.gov.psPalestinian Investment Promotion Agency: www.pipa.gov.psPalestine Monetary Authority: www.pma-palestine.orgPalestinian Central Bureau of Statistics: www.pcbs.org.psPalestinian Economic Council for Development and Reconstruction: www.pecdar.orgPalestine Institute for Financial & Banking Studies: www.pifbs.comPalestine Media Center: www.palestine-pmc.comCustodian Bank - HSBC Bank Middle East: www.middleeast.hsbc.comSettlement Bank - Arab Bank Palestine: www.arabbank.ps

FEDERATION OF EURO-ASIAN STOCK EXCHANGES ANNUAL REPORT JUNE 2010
PAGE 139
PALESTINE SECURITIES EXCHANGE
Source: Palestinian Central Bureau of Statistics, 2010. National Accounts Statistics, 2005-2010. Ramallah- Palestine.
PALESTINE ECONOMIC CHARTS AND TABLES
2005 2006 2007 2008 2009 2010
Real GDP bil US$ 4,559.5 4,322.3 4,554.1 4,820.9 5,147.2 (a) 5,636.6 (b)Real private consumption bil US$ 4,664.2 4,386.5 4,777.10 5,049.1 4,416.8 (a) 4,4484.8 (b)Real government consumption bil US$ 833.3 870.4 892.7 963.4 1,828.9 (a) 1,967.7 (b)Real exports of G&S bil US$ 597.7 629.0 700.2 777.3 829.9 (a) 858.2 (b)Real imports of G&S bil US$ 2,801.4 2,910.8 2,938.8 3,284.0 3,369.7 (a) 3,448.8 (b)Real domestic demand bil US$ 10,626.6 10,115.0 10,327.1 11,251.4 - -Real agriculture bil US$ 236.2 240.3 252.2 286.1 - -Real industry bil US$ 774.9 648.6 695.6 717.5 - -Real manufacturing bil US$ 591.8 505.4 527.8 539.3 - -Real services bil US$ 1,047.5 849.3 931.1 1,007.0 - -Consumer prices (% change pa; av) % 4.11% 3.84% 1.86% 9.89% 2.75% (a) -Current account balance/GDP % -24.9 -19.8 -8.1 8.8 - -
(a) Estimate (b) Forecast
0
1,000
2,000
3,000
4,000
5,000
6,000
REAL GDP(US$ millions)
CONSUMER PRICES (% CHANGE PA; AV)(%)
1
2
3
4
5
6
7
8
9
10
2005 2006 2007 2008 2009 2010 2005 2006 2007 2008 2009
0
100
200
300
400
500
600
700
800
900
REAL EXPORTS OF G&S(US$ billions)
2005 2006 2007 2008 2009 20100
500
1,000
1,500
2,000
2,500
3,000
3,500
REAL IMPORTS OF G&S(US$ billions)
2005 2006 2007 2008 2009 2010

SARAJEVO STOCK EXCHANGE
In 2009, we have analyzed all investor’sobstacles and started removing them.Above all we wanted to adequately showinvestors that our capital market is worthyfor them and offers substation returns ontheir investments.
In its eight year of operation the SarajevoStock Exchange (SASE) has accomplishedlower trading results than in previous year. Themost illustrative example is the total turnover in2009 with the amount of 112 million Euros was54% lower than in 2008.
However in 2009, we have analyzed allinvestor’s obstacles and started removingthem. Above all we wanted to adequatelyshow investors that our capital market isworthy for them and offers substation returnson their investments. The access to the greaternumber of information was enabled with newdata available on new Capital Market of
Federation of Bosnia and Herzegovina webportal, joint project of SASE, SecuritiesCommission and Central Registry. Ouropenness to investors drew their attention andgave incite and confidence to the capitalmarket in the Federation of Bosnia andHerzegovina.
We had three more IPO done on SASE whereit was collected more than 1.82 million Euros.There was one more mutual fund founded in2009, with several others currently inpreparation. Also we expect the pensionreform to bring additional demand to themarket. We hope that the adoption of the new
Security Market Law will give the market moreoptions for further expansion. One morereason for greater investor’s interest in capitalmarket in the Federation of Bosnia andHerzegovina is the announcement forinfrastructure projects especially in energy,telecommunication and road constructionsectors, and announcement for privatization ofcompanies who are pillars of Bosnianeconomy. All these factors will ensure pastsuccess to continue into 2010 where SASE willagain exceed all expectation.
HISTORY AND DEVELOPMENT
The Sarajevo Stock Exchange (SASE) wasfounded in September of 2001 by eightbrokerage houses and commenced trading onApril 12 of 2002. The SASE is a centralmarketplace for securities trading in theFederation of Bosnia and Herzegovina. TheSASE is a joint-stock company which originallyhad eight founding members.
The SASE currently has 17 members, whoseheadquarters are spread around theFederation of Bosnia and Herzegovina, themajority being in the capital, Sarajevo. Allmembers of SASE must be licensed for tradingin securities by the Securities Commission ofthe Federation of Bosnia and Herzegovina.
Trading on the SASE is performedelectronically through an order driven electronictrading system BTS (Stock Exchange System).BTS is a computer assisted information andtrading system, which enables remote entry,modification, halt and removal of orders,automated matching of orders and concludingtrades, supervision of orders and trades, aswell as survey of information on trading and onlisted securities.
At the beginning of 2004, trading at the SASEOfficial Market started and all 11 PrivatizationInvestment Funds were listed there. The OfficialMarket is a higher level market where onlysecurities that meet special conditions and areapproved by the Securities Commission andSASE’s addition board can be listed there. Alsoin 2004, after two years of trading with only callauction trading system, continuous trading hasbeen introduced at the SASE under the nameMulti Fixing Trading Schedule (MFTS). Only themost liquid securities on the SASE have beentransferred to MFTS. In 2006 anothersignificant milestone was achieved with listingsof the first three companies on the SASEOfficial Market. From the 500 issuers which arelisted on the Sarajevo Stock Exchange,currently 14 are on the Official Market. Turnoveron SASE has risen substantially, which can beillustrated by the fact that in 2007 it rose up to961.5 million US$ - more than in 2005 and2006 combined. There were 4 mutual fundsfounded in 2007, and more are currently inpreparation. In 2009 as a result of globalfinancial crisis sharp decrease in turnoveraffected SASE where we finished the year with153.7 million US$.
FUTURE OUTLOOK
In 2009 global financial crisis affected theSarajevo Stock Exchange where we finishedthe year with decrease in turnover from 2008.However 2010 promises better results togetherwith accomplishment of greater efficiency andtransparency of the Capital Market in theFederation of Bosnia and Herzegovina. SASEfuture outlook for 2010 includes followingactivities:
• Issuance of first municipal bonds whichwould increase trading on the bond market.• Continue to list strategic companies currentlyon SASE Free Market to SASE Official Market.• In cooperation with regional stock exchangesdevelopment of South-eastern European Index • Continuation of privatization of the Stateowned capital through the Sarajevo StockExchange.• Attract new issuers through Initial PublicOffers.• Increase public and investor relationstogether with new educational projects.
Zlatan DedicGeneral Manager
FEDERATION OF EURO-ASIAN STOCK EXCHANGES ANNUAL REPORT JUNE 2010
PAGE 140
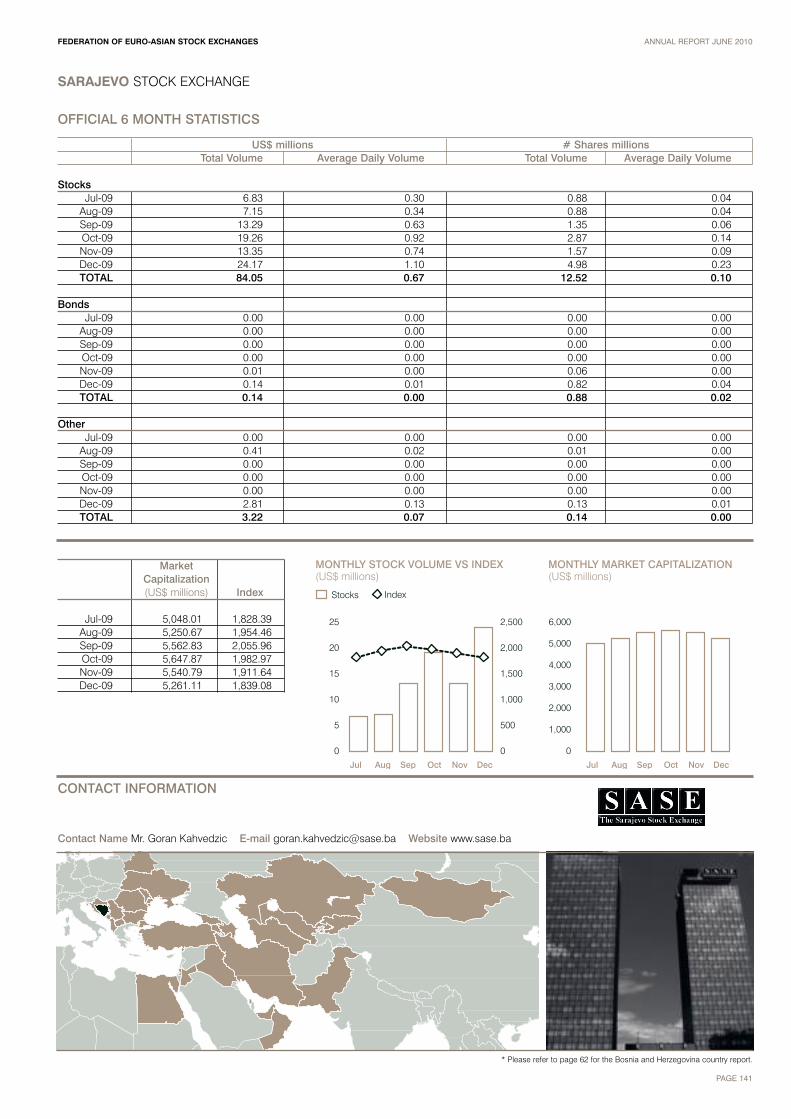
SARAJEVO STOCK EXCHANGE
FEDERATION OF EURO-ASIAN STOCK EXCHANGES ANNUAL REPORT JUNE 2010
PAGE 141
OFFICIAL 6 MONTH STATISTICS
US$ millions # Shares millionsTotal Volume Average Daily Volume Total Volume Average Daily Volume
StocksJul-09 6.83 0.30 0.88 0.04
Aug-09 7.15 0.34 0.88 0.04Sep-09 13.29 0.63 1.35 0.06Oct-09 19.26 0.92 2.87 0.14Nov-09 13.35 0.74 1.57 0.09Dec-09 24.17 1.10 4.98 0.23TOTAL 84.05 0.67 12.52 0.10
BondsJul-09 0.00 0.00 0.00 0.00
Aug-09 0.00 0.00 0.00 0.00Sep-09 0.00 0.00 0.00 0.00Oct-09 0.00 0.00 0.00 0.00Nov-09 0.01 0.00 0.06 0.00Dec-09 0.14 0.01 0.82 0.04TOTAL 0.14 0.00 0.88 0.02
OtherJul-09 0.00 0.00 0.00 0.00
Aug-09 0.41 0.02 0.01 0.00Sep-09 0.00 0.00 0.00 0.00Oct-09 0.00 0.00 0.00 0.00Nov-09 0.00 0.00 0.00 0.00Dec-09 2.81 0.13 0.13 0.01TOTAL 3.22 0.07 0.14 0.00
0
5
10
15
20
25
MONTHLY STOCK VOLUME VS INDEX(US$ millions)
MONTHLY MARKET CAPITALIZATION(US$ millions)
0
1,000
2,000
3,000
4,000
5,000
6,000
Stocks Index
Jul Aug Sep Oct Nov DecJul Aug Sep Oct Nov Dec
0
500
1,000
1,500
2,000
2,500
Market Capitalization(US$ millions) Index
Jul-09 5,048.01 1,828.39Aug-09 5,250.67 1,954.46Sep-09 5,562.83 2,055.96Oct-09 5,647.87 1,982.97Nov-09 5,540.79 1,911.64Dec-09 5,261.11 1,839.08
CONTACT INFORMATION
Contact Name Mr. Goran Kahvedzic E-mail [email protected] Website www.sase.ba
* Please refer to page 62 for the Bosnia and Herzegovina country report.

STATE COMMODITY & RAW MATERIALS EXCHANGE OF TURKMENISTAN
The exchange is one of the most important domestic economicinstitutions to date and acts as the main body for import andexport operations in the country as well as a governmentregulator.
HISTORY AND DEVELOPMENT
The State Commodity and Raw MaterialsExchange of Turkmenistan (SC&RME) wascreated by decree of the President ofTurkmenistan, Saparmurat Turkmenbashi, in 29July 1994. The Exchange is one of the mostimportant domestic economic institutions todate and acts as the main body for import andexport operations in the country as well as agovernmental regulator.
There are many indicators of activity regardingthe Exchange. During 2004, 1,071 exportcontracts for the sum of US$ 677,577.3thousand were registered. These figures areindicative of the favorable political andeconomic situation in Turkmenistan, its richnatural resources, and of utmost importance,the reliability and stability of stateorganizational structures to attract businessfrom all over the world. SC&RME hasrelationships with more than 45 countries.
Business people from Turkey, Russia, the USA,the UAE, Germany, Great Britain, buy oilproducts, liquefied gas, cotton fiber, cottonyarn, handmade Turkmen carpets, hides andknitwear from Turkmenistan.
An information and analytical system wascreated for the SC&RME to enable directoperational control of contract execution aswell as for information retrieval. The InfoBasedatabase will be developed to allow theretrieval of world quotations on significantcommodities in real time and to facilitatepotential marketing outlets for domesticcommodity production.
FUTURE OUTLOOK
The following plans are currently underway:• further development of external economiclinks with foreign trade companies;• streamlining the uses of PR companies andthe services they provide in terms of massmedia disclosure;• expansion of external contacts withinternational and regional organizations;• simplification of the contract registrationprocedure; and• increasing the level of skill and experience ofExchange staff through interactions betweenorganizations.
FEDERATION OF EURO-ASIAN STOCK EXCHANGES ANNUAL REPORT JUNE 2010
PAGE 142
CONTACT INFORMATION
Contact Name Mr. Shaberdi Meredov E-mail [email protected] Website www.turkmenbusiness.org
Shaberdi MeredovCEO

FEDERATION OF EURO-ASIAN STOCK EXCHANGES ANNUAL REPORT JUNE 2010
PAGE 143
STATE COMMODITY & RAW MATERIALS EXCHANGE OF TURKMENISTAN
ECONOMIC AND POLITICAL DEVELOPMENTS
Politic and Economic EnvironmentMr Berdymukhamedov has presided oversome modest reforms, taking steps to redresssome of the more damaging policiesimplemented by his predecessor, SaparmuradNiyazov. However, prospects for afundamental shift towards a more liberalpolitical system seem remote. Reforms are notexpected to result in a more transparent ordemocratic political process. The number ofdeputies in the Mejles (parliament) wasincreased, ostensibly to ensure betterrepresentation of the population, but it enjoysno greater authority than its predecessor.Crucial to Mr Berdymukhamedov's survival inoffice will be rewarding officials and balancingcompeting interests–ensuring the flow of gasexports, and hence inflows of foreignexchange–which underpin the patronagenetwork. This will require a resolution to thedispute with Russia stemming from theshutdown (due to an explosion in early April)of the main gas export pipeline to Russia,halting most Turkmen gas exports for at leastthree months, and evolving into a dispute overthe price of Turkmen gas exports to Russia.The administration is considering takingTurkmenistan some way along the pathfollowed by Kazakhstan: making the countrymore welcoming to foreign investment, butkeeping political liberalisation to a minimum.
Although Russia will remain Turkmenistan'slargest gas export market in 2009-10, it willface growing competition from China, the EUand, potentially, the Middle East. However, withglobal energy prices set to remain depressedfor some time, doubts over the commercialviability of such projects will persist, and willmake it more difficult to find the necessaryfinancing, particularly given that many of theEU's larger economies are expected to postnegative growth in 2009. For this reason,Russia is expected to remain Turkmenistan'slargest gas export market for the foreseeablefuture. China and Turkmenistan areconstructing a gas pipeline that will connect
the two countries. Turkmenistan says that it willbe ready to start pumping gas at end-2009,with China eventually expected to import up to30bn cu metres annually from Turkmenistanalong this route. Turkmenistan will alsopromote closer links with countries in theMiddle East, such as Jordan, which will give itfurther leverage.
Economic PerformanceThe IMF has praised the authorities' "prudent"macroeconomic policies, but the loss of asizeable part of gas export revenue is likely tobe placing serious strains on the budget. Despite Mr Berdymukhamedov's statedwillingness to contemplate economic reforms,he has in practice presided over few reformistmeasures in his two years in office. The stateretains a dominant role in all sectors of theeconomy, and relies on subsidies, pricecontrols, and the free provision of utilities, tokeep the economy afloat. State control overthe leading economic sectors remains tight,the public finances remain opaque, andmonetary policy remains rudimentary. Somepolicy changes are possible in thehydrocarbons sector; recognising the country'stechnological and financial limitations indevelopment of the sector, the president hasbeen more receptive to foreign oil and gascompanies wishing to invest in the industry.Companies from countries such as Russia andChina, having greater experience of operatingin Turkmenistan, will be well prepared to workwithin existing constraints. Serious restrictionson liquidity, especially in 2009, are likely to limitRussian investment. Owing to likely losses tobudget revenue from the disruption to gasexports from early April, it is forecast a deficitequivalent to 1% of GDP in 2009, up from ourprevious forecast of 0.1%. The deficit isexpected to decline moderately in 2010, to0.5% of GDP.
Despite evidence that the global economy isstabilising, the outlook remains extremelysubdued.
After posting estimated growth of 3% in 2008,the economy is expected to contract by 5% in2009. Russian investment will be lower than inrecent years. Chinese investment into theTurkmen hydrocarbons sector will providesome support for the economy, but investmentfrom other sources will remain minimal.Agricultural output should improve from 2009owing to the weak base established in 2007-08, but the sector will continue to experienceserious difficulties because of the lack ofreform.
Estimated inflation in 2008 accelerated to 13%due to large increases in prices of fuel andpublic transport, as well as higher prices forimported foodstuffs. The rate is expected toaccelerate further in 2009, to 15%; althoughglobal non-oil commodity prices are forecastto fall, the price of imported goods will bepushed upwards by the devaluation andredenomination of the manat. Base effectsshould allow consumer price inflation todecelerate to around 12% in 2010.
A current-account surplus was estimated atUS$4.7bn in 2008, equivalent to more than50% of GDP, and is expected to continue topost substantial, although smaller, surplusesthroughout the forecast period. Price trends forimports of capital goods are favourable, andthe devaluation of the official exchange rateand restrictions on access to foreignexchange, in conjunction with tariff and non-tariff barriers, will keep import growth muted.Export revenue will be lower. Reliance onimported services in sectors such asconstruction and hydrocarbons will result inmoderate growth in services debits. Transittrade will provide only limited services credits,ensuring that the services deficit remainsrelatively large. Gas exports will keep theoverall current account in strong surplus—albeit substantially lower than previouslyforecast.*
* The Economist Intelligence Unit Limited, July 2009
0
5
10
15
20
25
REAL GDP(TMM millions)
CONSUMER PRICES (% CHANGE PA; AV)(%)
6
7
8
9
10
11
12
13
2005 2006 2007 2008 2009 2010 2005 2006 2007 2008 2009 2010

FEDERATION OF EURO-ASIAN STOCK EXCHANGES ANNUAL REPORT JUNE 2010
PAGE 144
STATE COMMODITY & RAW MATERIALS EXCHANGE OF TURKMENISTAN
TURKMENISTAN ECONOMIC CHARTS AND TABLES
2005 2006 2007 2008 2009 2010
Nominal GDP (US$ at PPP) bil US$ 5 6 (a) 7 (a) 7 7 (a) 7 (b)Real GDP bil TMM 20 (a) 21 (a) 23 (a) 23 (a) 22 (a) 23 (b) Real private consumption bil TMM n/a n/a n/a n/a n/a n/aReal government consumption bil TMM n/a n/a n/a n/a n/a n/aReal gross fixed investment bil TMM n/a n/a n/a n/a n/a n/aReal stockbuilding bil TMM n/a n/a n/a n/a n/a n/aReal exports of G&S bil TMM 14 (a) 14 (a) 16 (a) 15 (a) 11 (a) 13 (b)Real imports of G&S bil TMM 15 (a) 16 (a) 21 (a) 20 (a) 14 (a) 16 (b)Real domestic demand bil TMM 11 (a) 13 (a) 17 (a) 18 (a) 14 (a) 16 (b)Real GDP at factor cost bil TMM 0 0 (a) 0 (a) 0 0 (a) 0 (b)Real agriculture bil TMM 0 0 (a) 0 (a) 0 0 (a) 0 (b)Real industry bil TMM 0 0 (a) 0 (a) 0 0 (a) 0 (b)Real manufacturing bil TMM n/a n/a n/a n/a n/a n/aReal services bil TMM 0 0 (a) 0 (a) 0 0 (a) 0 (b)Gross national savings rate (%) % 48.2 (a) 60.6 (a) 47.5 (a) 58.8 (a) 22.8 (a) 36.1 (b)Gross national savings/investment % 166.3 (a) 803.7 (a) 666.1 (a) -1,309.9 (a) 243.3 (a) 294.1 (b)Budget balance (% of GDP) % 0.8 (a) 5.3 (a) 3.9 (a) 3.2 (a) -2.0 (a) 1.0 (b)Consumer prices (% change pa; av) % 10.7 (a) 8.2 (a) 6.3 (a) 13.0 (a) 10.0 (a) 12.0 (b)Exchange rate LCU:US$ (av) TMM/US$ 2.2030 (a) 2.1764 (a) 2.1380 (a) 2.6120 (a) 2.8500 (a) 2.8500 (b)Lending interest rate (%) % 17.3 17.2 (a) 17.0 (a) 17.0 (a) 15.0 (a) 17.5 (b)Stock of domestic credit bil TMM 3 3 4 5 5 (a) 6 (b)Domestic credit growth (%) % -3.5 -6.7 30.7 (a) 38.9 (a) -5.2 (a) 15.4 (b)Deposit interest rate (%) % 8.6 9.0 (a) 11.0 (a) 10.0 (a) 8.0 (a) 9.5 (b)Population million 4.7 4.7 4.8 4.8 (a) 4.9 (a) 4.9 (b)GDP per head ($ at PPP) US$ 1 1 (a) 1 (a) 1 (a) 1 (a) 1 (b)Current account balance/GDP % 19.2 (a) 53.0 (a) 40.4 (a) 63.3 (a) 13.4 (a) 23.9 (b)International reserves bil US$ 4 8 13 (a) 14 (a) 9 (a) 11 (b)Trade balance bil US$ 2 5 4 7 3 (a) 4 (b)Foreign-exchange reserves bil US$ 4 8 13 (a) 14 (a) 9 (a) 11cTotal foreign debt bil US$ n/a n/a n/a n/a n/a n/aPublic medium & long-term bil US$ n/a n/a n/a n/a n/a n/aPrivate medium & long-term bil US$ n/a n/a n/a n/a n/a n/aIMF debt bil US$ n/a n/a n/a n/a n/a n/aShort term bil US$ n/a n/a n/a n/a n/a n/aNet debt bil US$ n/a n/a n/a n/a n/a n/aExport credits bil US$ n/a n/a n/a n/a n/a n/a
0
1
2
3
4
5
6
7
TRADE BALANCE(US$ billions)
2005 2006 2007 2008 2009 20100
100
200
300
400
500
600
700
800
REAL GROSS FIXED INVESTMENT(TMM millions)
2005 2006 2007 2008 2009 2010
(a) Estimate (b) Forecast
The Economist Intelligence Unit Limited, December 2009

EMIRATES
Emirates airline flies to more than 100 destinations in over 60 countries with 10,000 cabin crew from 120 countries, speaking 55 languages.
One of the fastest growing airline companiesin the world Emirates has been established asthe official international airline of the UnitedArab Emirates just over 20 years ago.Emirates airline flies to more than 100destinations in over 60 countries with 10,000cabin crew from 120 countries, speaking 55languages.
Emirates operates with 147 aircrafts with anaverage fleet age of 69 months; one of theyoungest commercial fleet in skies. In a yearwhere the aviation industry was rocked by theeconomic downturn, Emirates Airline reportedits 22nd year of profit, up 416 percent toclose at US$ 964 million with almost 27.5million passengers choosing Emirates overother airlines.
Emirates aiming to become one of the largestairlines in the world, fly between Istanbul andDubai 11 times per week with wide bodyaircrafts. For European countries, Romania,Macedonia, Bulgaria, Serbia, Montenegro,Bosnia and Herzegovina, Slovenia,Belorussia, Ukraine and Moldavia which stilldo not have Emirates services, Istanbul actsas a connecting hub where passengers canconnect to Emirates services to Dubai andbeyond across six continents...
Main elements that make up the Emiratesdifference, on and off the ground is its serviceexcellence, comfort and superior technology.
Comfort of connecting atDubai Airport
Terminal 3 at Dubai Airport which is dedicatedonly to Emirates airline, holds the finestwaiting lounges for Emirates passengers. The sumptuous First Class Lounge featuresan extensive selection of internationalgourmet dishes, a Wine Cellar where you cantaste and purchase exclusive labels andTimeless Spa where you can indulge intosome luxurious pampering when you mostneed it.
Business Class lounge designed to meet thedemands of discerning customers alsoprovides a soothing and enjoyable ambience.The lounge not only serves a gourmetselection of hot and cold delicacies but also awide range of signature treatments fromTimeless Spa with nominal fees. At theBusiness Lounge it is also possible to useshower facilities before your flight to freshenup.
When work cannot wait, both of the loungesprovide fully-equipped Business Centers withconference rooms, internet enabled-computers, printers, WIFI access andrecharging facilities for laptops and mobilephones.
Staying connected throughyour flight
Emirates’ inflight system, ice, which isavailable almost in all of the Emiratesaircrafts, allows passengers to stay in touchwhile flying with live business, news and sportheadlines from BBC News. With “ice” it isalso possible to phone, SMS or email theworld below direct from your seat duringflight.
The system also offers a staggering choice ofup to 1200 channels of entertainmentincluding 230 movies from around the worldwhich are available in over 20 languages. AllEmirates passengers in all classes enjoy thewide selection of entertainment andinformation on all Emirates flights and onevery passenger seat with a personal videoscreen.
Super-jumbo A380 aircraft
The Emirates A380 promises customers in allclasses a whole new travel experience.Designed to transport passengers on long-haul journeys in unmatched comfort, theEmirates A380 boasts First Class ShowerSpas, a spacious onboard Lounge andprivate suites.
Emirates, being the first airline to order AirbusA380 aircraft now has 80 Airbus 380 orderand looks forward to expanding the list ofdestinations at more than 100 airports aroundthe world as A380s become ready.
Emirates currently flies to London Heathrow,Toronto, Paris, Jeddah, Bangkok, Seoul,Sydney and Auckland with the super-jumboaircraft.
For more information: www.emirates.com
FEDERATION OF EURO-ASIAN STOCK EXCHANGES ANNUAL REPORT JUNE 2010
PAGE 145
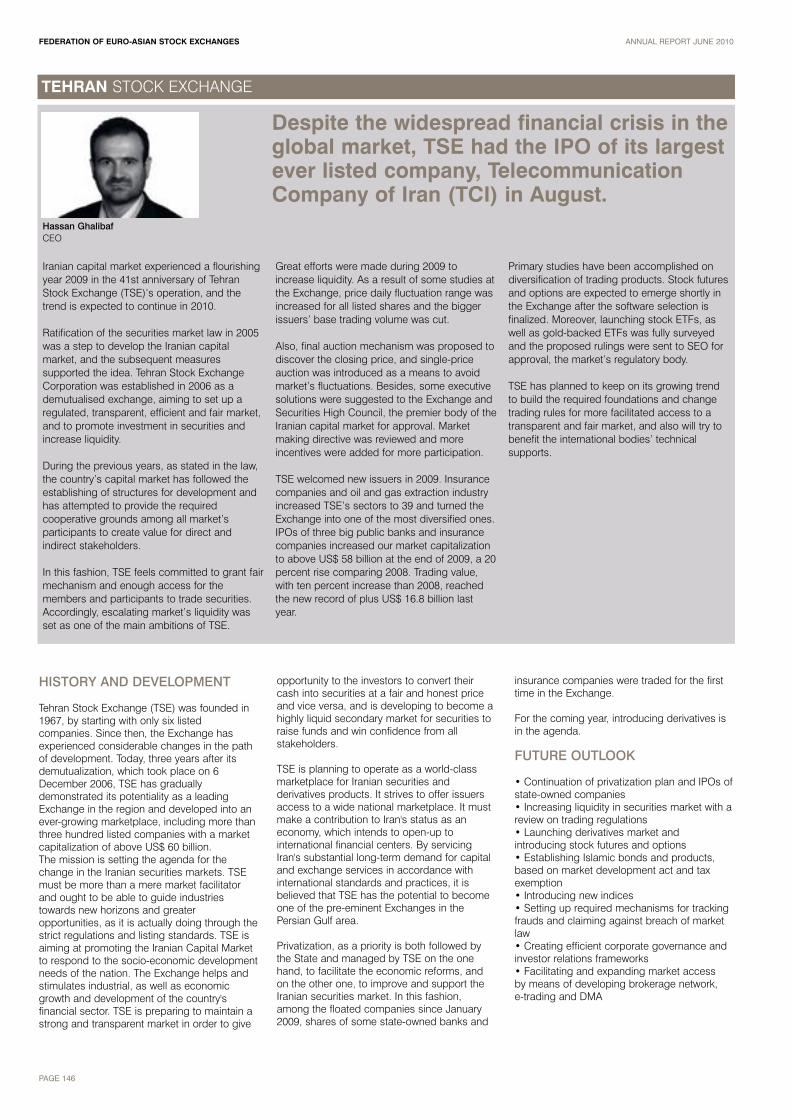
TEHRAN STOCK EXCHANGE
Despite the widespread financial crisis in theglobal market, TSE had the IPO of its largestever listed company, TelecommunicationCompany of Iran (TCI) in August.
Iranian capital market experienced a flourishingyear 2009 in the 41st anniversary of TehranStock Exchange (TSE)’s operation, and thetrend is expected to continue in 2010.
Ratification of the securities market law in 2005was a step to develop the Iranian capitalmarket, and the subsequent measuressupported the idea. Tehran Stock ExchangeCorporation was established in 2006 as ademutualised exchange, aiming to set up aregulated, transparent, efficient and fair market,and to promote investment in securities andincrease liquidity.
During the previous years, as stated in the law,the country’s capital market has followed theestablishing of structures for development andhas attempted to provide the requiredcooperative grounds among all market’sparticipants to create value for direct andindirect stakeholders.
In this fashion, TSE feels committed to grant fairmechanism and enough access for themembers and participants to trade securities.Accordingly, escalating market’s liquidity wasset as one of the main ambitions of TSE.
Great efforts were made during 2009 toincrease liquidity. As a result of some studies atthe Exchange, price daily fluctuation range wasincreased for all listed shares and the biggerissuers’ base trading volume was cut.
Also, final auction mechanism was proposed todiscover the closing price, and single-priceauction was introduced as a means to avoidmarket’s fluctuations. Besides, some executivesolutions were suggested to the Exchange andSecurities High Council, the premier body of theIranian capital market for approval. Marketmaking directive was reviewed and moreincentives were added for more participation.
TSE welcomed new issuers in 2009. Insurancecompanies and oil and gas extraction industryincreased TSE’s sectors to 39 and turned theExchange into one of the most diversified ones.IPOs of three big public banks and insurancecompanies increased our market capitalizationto above US$ 58 billion at the end of 2009, a 20percent rise comparing 2008. Trading value,with ten percent increase than 2008, reachedthe new record of plus US$ 16.8 billion lastyear.
Primary studies have been accomplished ondiversification of trading products. Stock futuresand options are expected to emerge shortly inthe Exchange after the software selection isfinalized. Moreover, launching stock ETFs, aswell as gold-backed ETFs was fully surveyedand the proposed rulings were sent to SEO forapproval, the market’s regulatory body.
TSE has planned to keep on its growing trendto build the required foundations and changetrading rules for more facilitated access to atransparent and fair market, and also will try tobenefit the international bodies’ technicalsupports.
HISTORY AND DEVELOPMENT
Tehran Stock Exchange (TSE) was founded in1967, by starting with only six listedcompanies. Since then, the Exchange hasexperienced considerable changes in the pathof development. Today, three years after itsdemutualization, which took place on 6December 2006, TSE has graduallydemonstrated its potentiality as a leadingExchange in the region and developed into anever-growing marketplace, including more thanthree hundred listed companies with a marketcapitalization of above US$ 60 billion.The mission is setting the agenda for thechange in the Iranian securities markets. TSEmust be more than a mere market facilitatorand ought to be able to guide industriestowards new horizons and greateropportunities, as it is actually doing through thestrict regulations and listing standards. TSE isaiming at promoting the Iranian Capital Marketto respond to the socio-economic developmentneeds of the nation. The Exchange helps andstimulates industrial, as well as economicgrowth and development of the country'sfinancial sector. TSE is preparing to maintain astrong and transparent market in order to give
opportunity to the investors to convert theircash into securities at a fair and honest priceand vice versa, and is developing to become ahighly liquid secondary market for securities toraise funds and win confidence from allstakeholders.
TSE is planning to operate as a world-classmarketplace for Iranian securities andderivatives products. It strives to offer issuersaccess to a wide national marketplace. It mustmake a contribution to Iran's status as aneconomy, which intends to open-up tointernational financial centers. By servicingIran's substantial long-term demand for capitaland exchange services in accordance withinternational standards and practices, it isbelieved that TSE has the potential to becomeone of the pre-eminent Exchanges in thePersian Gulf area.
Privatization, as a priority is both followed bythe State and managed by TSE on the onehand, to facilitate the economic reforms, andon the other one, to improve and support theIranian securities market. In this fashion,among the floated companies since January2009, shares of some state-owned banks and
insurance companies were traded for the firsttime in the Exchange.
For the coming year, introducing derivatives isin the agenda.
FUTURE OUTLOOK
• Continuation of privatization plan and IPOs ofstate-owned companies• Increasing liquidity in securities market with areview on trading regulations• Launching derivatives market andintroducing stock futures and options• Establishing Islamic bonds and products,based on market development act and taxexemption• Introducing new indices• Setting up required mechanisms for trackingfrauds and claiming against breach of marketlaw• Creating efficient corporate governance andinvestor relations frameworks• Facilitating and expanding market access by means of developing brokerage network, e-trading and DMA
Hassan GhalibafCEO
FEDERATION OF EURO-ASIAN STOCK EXCHANGES ANNUAL REPORT JUNE 2010
PAGE 146

TEHRAN STOCK EXCHANGE
FEDERATION OF EURO-ASIAN STOCK EXCHANGES ANNUAL REPORT JUNE 2010
PAGE 147
OFFICIAL 6 MONTH STATISTICS
US$ millions # Shares millionsTotal Volume Average Daily Volume Total Volume Average Daily Volume
StocksJul-09 1,862.88 98.05 20,256.68 1,066.14
Aug-09 1,239.49 53.89 5,746.93 249.87Sep-09 753.49 35.88 4,202.53 200.12Oct-09 1,133.96 56.70 4,669.29 233.46Nov-09 9,162.29 436.30 26,675.42 1,270.26Dec-09 382.40 20.13 1,547.39 81.44TOTAL 14,534.50 116.82 63,098.25 516.88
BondsJul-09 0.02 0.00 0.00 0.00
Aug-09 0.02 0.00 0.00 0.00Sep-09 0.00 0.00 0.00 0.00Oct-09 0.00 0.00 0.00 0.00Nov-09 0.00 0.00 0.00 0.00Dec-09 0.00 0.00 0.00 0.00TOTAL 0.04 0.00 0.00 0.00
OtherJul-09 0.00 0.00 0.00 0.00
Aug-09 0.00 0.00 0.00 0.00Sep-09 0.00 0.00 0.00 0.00Oct-09 0.00 0.00 0.00 0.00Nov-09 0.00 0.00 0.00 0.00Dec-09 0.00 0.00 0.00 0.00TOTAL 0.00 0.00 0.00 0.00
01,0002,0003,0004,0005,0006,0007,0008,0009,000
10,000
MONTHLY STOCK VOLUME VS INDEX(US$ millions)
MONTHLY MARKET CAPITALIZATION(US$ millions)
0
10,000
20,000
30,000
40,000
50,000
60,000
70,000
Stocks Index
Jul Aug Sep Oct Nov Dec Jul Aug Sep Oct Nov Dec0
10,000
20,000
30,000
40,000
50,000
60,000
Market Capitalization(US$ millions) Index
Jul-09 51,392.36 39,732.00Aug-09 61,640.44 47,554.00Sep-09 60,921.49 46,934.00Oct-09 65,479.00 50,785.00Nov-09 63,101.08 48,680.00Dec-09 63,298.81 45,598.00
CONTACT INFORMATION
Contact Name Mr. M. E. Jahandoost E-mail [email protected] Website www.tse.ir

FEDERATION OF EURO-ASIAN STOCK EXCHANGES ANNUAL REPORT JUNE 2010
PAGE 148
TEHRAN STOCK EXCHANGE
ECONOMIC AND POLITICAL DEVELOPMENTS
Economic and Political EnvironmentThe president, Mahmoud Ahmadinejad, who wasinaugurated for a second term in August 2009,will continue to implement an unorthodox andpopulist conservative agenda over the forecastperiod that appears increasingly at odds withother powerful forces in Iran. In his first term, MrAhmadinejad ensured that any opposition to hishardline conservative policies from both withinand outside government was dealt with firmly.Such robustness, at the expense of political unity,is expected to continue in his next government.
Despite the hardening of Iran's nuclear stance, itsleadership remains sensitive to popular opinion,which appears to want a peaceful resolution ofthe nuclear dispute. The Iranian administrationseems to be testing the diplomatic waters withthe US, with which Iran has had an exceptionallydifficult relationship since the 1979 Islamicrevolution. Following the election of BarackObama as US president, Iran appears morereceptive to the idea of direct diplomatic talkswith the US. Despite Mr Obama's apparentwillingness to engage with and reach out to theIranian leadership and people, the depth ofanimosity between the two countries, and theinternal pressures not to concede too much tothe other, is likely to mean that there will be onlyhalting progress towards rapprochement.
Economic PerformanceThe new Ahmadinejad government will be understrong economic pressure to encourage foreigninvestment, after the sharp fall in international oilprices in early 2009 and because of the nearimpossibility of attracting project financing as aresult of sanctions and the global financialmeltdown. Lower oil prices mean that Iran can nolonger rely on its own resources for the majorinvestments needed to sustain oil production andmeet increased domestic demand for gas andelectricity. However, the combination of sanctions(imposed in response to Iran's ongoing nuclear
programme) and the drying up of internationalcredit markets means that Iran has few viablealternatives. Owing to its nationalist stance, thegovernment will continue to seek to be self-reliant, favouring local firms where possible,especially in the energy and petrochemicalssectors. Given the concerns over futureinvestment, Iran's oil production capacity target of5.6m barrels/day (b/d) by 2010, up from anestimated 4m b/d at present, will not be metwithout outside help. Despite having pushed forand won a significant cut in OPEC output inresponse to a sharp decline in international oilprices, Iran's domestic economic situation willadd pressure on it to maintain its own productionlevels (which are nevertheless estimated to havedeclined marginally in 2009) to help to cushionitself against a significant fall in oil prices. If thenuclear dispute worsens markedly–leading to aneventual embargo on Iranian oil exports or anIranian cessation of output, or worse, militaryaction–the impact on economic policymakingwould be severe. Cutbacks in governmentspending would be required, and the ability ofIranian industries to source capital goods or rawmaterials from abroad would be disrupted.
Iranian real GDP growth is forecast to strengthenslightly over the forecast period as a result ofhigher oil prices and rising oil output. Weestimate that real GDP growth will haveweakened in 2009/10 to just 0.5%, owing to thedrop in oil earnings over the year, which will haveaffected the rate of private consumption andinvestment growth. Although these trends will bereversed–especially in 2010—THE expected netoil export growth is to be held back by a lack ofrefining capacity in 2010-11, which is largely aresult of political interference and subduedforeign investor interest. This will continue toleave Iran increasingly reliant on fuel imports,which have been rising despite the imposition ofpetrol rationing in 2007. Despite this, Iranian realGDP is forecast to pick up steadily to 2.9% in
2010/11, and further to 3.5% in 2011/12.With fiscal policy likely to remain expansionary,albeit not to the extent it was in previous years,concerns over inflation are set to persist in 2010-11. However, with international non-oil commodityprices remaining relatively low over the forecastperiod, annual inflation is expected to fall quitesharply to an average of 13.8% in 2010 and 12%in 2011. Latest official data show that consumerprice growth eased to 13.1% year on year inAugust 2009–its lowest level for almost threeyears.
Bank Markazi (the central bank) has hithertoallowed the Iranian rial to weaken in nominalterms in order to support the competitiveness ofnon-oil exports. The rial will have depreciated onaverage by around 5% in nominal terms in 2009,with the currency averaging IR9,928:US$1 for theyear.
The decline in oil export revenue will haveoutstripped the drop in import spending in2009/10, owing to the sharp fall in average oilprices. Overall, it is forecast that the trade surpluswill have shrunk considerably in 2009/10, to US$13bn, from over US$31bn in the previous year.However, because of a rise in global oil prices in2010, the trade surplus is expected to widen, toUS$24bn in 2010/11, before narrowing again in2011/12, to US$23bn, as oil prices drop slightly.The non-merchandise deficit is expected to fall alittle on average in 2010-11, as income andcurrent transfers surpluses offset an increase inthe services deficit. The rise in international oilprices will also have a positive impact on thecurrent-account surplus, which we forecast willwiden to over 3% of GDP in 2010/11, from anestimated surplus of just 0.6% of GDP in2009/10, before narrowing again to 2.7% of GDPin 2011/12.*
* The Economist Intelligence Unit Limited, November 2009
Key Information ContactsTehran Stock Exchange Corporation; http://www.iranbourse.comSecurities and Exchange Organization; http://www.seo.irIranian Privatization Organization; http://www.en.ipo.irTSE’s Technology Management Company; http://english.tsetmc.comCentral Bank of the Islamic Republic of Iran; http://www.cbi.irIranian Chamber of Commerce, Industries and Mines (ICCIM); http://www.iccim.comOrganization for Investment, Economic & technical Assistance (OIETAI) a division of the Ministry of Finance; http://www.investiniran.ir
0
100
200
300
400
500
600
REAL GDP(IRR millions)
CONSUMER PRICES (% CHANGE PA; AV)(%)
10
12
14
16
18
20
22
24
26
2005 2006 2007 2008 2009 2010 2005 2006 2007 2008 2009 2010

FEDERATION OF EURO-ASIAN STOCK EXCHANGES ANNUAL REPORT JUNE 2010
PAGE 149
TEHRAN STOCK EXCHANGE
IRAN ECONOMIC CHARTS AND TABLES
2005 2006 2007 2008 2009 2010
Nominal GDP (US$ at PPP) bil US$ 635 694 769 837 (a) 852 (a) 888 (b)Real GDP bil IRR 423,208 447,962 483,013 514,611 (a) 517,221 (a) 532,313 (b)Real private consumption bil IRR 235,816 250,324 273,060 296,270 (a) 305,454 (a) 315,534 (b)Real government consumption bil IRR 49,644 53,337 51,027 53,578 (a) 55,186 (a) 56,565 (b)Real gross fixed investment bil IRR 151,685 156,730 166,129 175,764 (a) 180,686 (a) 186,106 (b)Real stockbuilding bil IRR 8,970 (a) 12,992 (a) 22,203 (a) 25,372 (a) 23,689 (a) 29,255 (b)Real exports of G&S bil IRR 79,917 (a) 81,515 (a) 86,406 (a) 89,862 (a) 86,268 (a) 86,958 (b)Real imports of G&S bil IRR 102,824 (a) 106,937 (a) 115,812 (a) 126,236 (a) 134,062 (a) 142,106 (b)Real domestic demand bil IRR 446,115 (a) 473,383 (a) 512,419 (a) 550,985 (a) 565,015 (a) 587,461 (b)Real GDP at factor cost bil IRR 420,928 446,880 477,683 508,933 (a) 511,513 (a) 526,439 (b)Real agriculture bil IRR 59,602 62,386 66,235 68,222 (a) 70,132 (a) 72,938 (b)Real industry bil IRR 150,119 160,409 173,011 180,796 (a) 188,028 (a) 196,114 (b)Real manufacturing bil IRR 80,328 88,112 95,782 103,445 (a) 110,168 (a) 118,431 (b)Real services bil IRR 215,969 230,077 245,758 259,914 (a) 253,353 (a) 257,388 (b)Gross national savings rate (%) % 40.4 (a) 39.1 (a) 40.5 (a) 35.7 (a) 30.5 (a) 33.2 (b)Gross national savings/investment % 128.4 (a) 130.7 (a) 141.9 (a) 125.0 (a) 102.2 (a) 111.7 (b)Budget balance (% of GDP) % -3.6 -7.2 -3.6 -3.5 (a) -4.9 (a) -3.0 (b)Consumer prices (% change pa; av) % 13.4 11.6 17.1 25.6 15.8 (a) 13.8 (b)Exchange rate LCU:US$ (av) IRR/US$ 8,964 9,171 9,281 9,429 9,928 (a) 10,127 (b)Lending interest rate (%) % 16.2 14.0 12.5 12.0 (a) 12.0 (a) 12.5 (b)Stock of domestic credit bil IRR 601,340 719,374 1,018,630 1,359,871 (a) 1,706,638 (a) 2,187,910 (b)Domestic credit growth (%) % 17.0 19.6 41.6 33.5 (a) 25.5 (a) 28.2 (b)Deposit interest rate (%) % 13.0 11.0 11.5 11.7 (a) 11.7 (a) 11.9 (b)Population million 70.8 71.6 72.4 73.3 74.2 (a) 75.1 (b)GDP per head ($ at PPP) US$ 8,967 9,689 10,619 11,420 (a) 11,490 (a) 11,830 (b)Current account balance/GDP % 8.8 9.2 11.9 7.1 (a) 0.7 (a) 3.4 (b)International reserves bil US$ 45 (a) 58 (a) 82 (a) 97 (a) 81 (a) 75 (b)Trade balance bil US$ 21 26 41 32 13 (a) 24 (b)Foreign-exchange reserves bil US$ 45 (a) 58 (a) 82 (a) 96 (a) 81 (a) 75 (b)Total foreign debt bil US$ 21 20 21 21 (a) 19 (a) 18 (b)Public medium & long-term bil US$ 10 11 11 10 (a) 10 (a) 9 (b)Private medium & long-term bil US$ 0 0 0 0 0 (a) 0 (b)IMF debt bil US$ 0 0 0 0 0 0 (b)Short term bil US$ 11 9 9 11 (a) 9 (a) 10 (b)Net debt bil US$ -24 -38 -61 -75 (a) -62 (a) -57 (b)Export credits bil US$ 4 4 4 5 4 (a) 3 (b)
(a) Estimate (b) Forecast
The Economist Intelligence Unit Limited, September 2009.
0
5
10
15
20
25
30
35
40
45
TRADE BALANCE(US$ billions)
2005 2006 2007 2008 2009 20100
20406080
100120140160180200
REAL GROSS FIXED INVESTMENT(IRR millions)
2005 2006 2007 2008 2009 2010

TIRANA STOCK EXCHANGE
The development of a reliable andtransparent securities market according tointernational standards will be one of themain tasks of the Tirana Stock Exchange.
The development of a transparent capitalmarket according to international standards,and activation of the capital market as atrading platform for various financialinstruments, remains the main objective of theTSE.
During 2009, for the first time in Albania waspromoted The Albanian Manual of CorporateGovernance. The manual was part of theProgram on Corporate Governance in EasternEurope implemented by IFC, and funded bySECO, in collaboration with Tirana StockExchange. The manual sets the stagereference in the field of corporate governancein Albania, being a referent guide forbusinesses in Albania, for their good corporate
governance. Good governance will meanrecognition, observance and enforcement oflaws and a culture of high society, governanceand management. The manual will help jointstock companies paying particular attention tocapital market in Albania, which may offer thelatter with new ways of investment.
Activation of the capital market will makebusinesses understand the benefits that bringsthis market, will bring increased access tofunding, increased performance andtransparency of companies, will help theirshareholders in their decision making withrespect to ownership actions and how theymay be using the capital market and trading insecurities. Although stock companies are few
in number in our country, compared with othercountries in the region, they constitute thedynamic part of Albanian businesses. As such,it is time to request stock companies to followthe principles for good governance of theirown, given the separation of ownership frommanagement of the company, the quality of theBoard of Directors, the responsibility onstakeholders, and other important relatedissues. Good corporate governance reinforcesthe safety, integrity and efficiency of themarket, thus making possible the growth andfinancial stability of the country, and makingAlbania a country always more attractive toinvestors.
HISTORY AND DEVELOPMENT
TSE is the first and the only stock exchange inAlbania, established in 1996 originally as adepartment of Bank of Albania (BoA). The activityat hand, at that time, was the trading of the T-Billswith 12 months-to-maturity, five series ofgovernment bonds and privatization vouchers. Italso held out the primary auctions for Treasury Billsuntil August 1st, 1998, than this market moved toMonetary Operations Department, at BoA. In March 2002, TSE was structured as a joint-venture company and a state – owned one, withthe only shareholder Minister of Finance (100% ofthe shares). It’s authorized and subscribed Capitalis equal to 20,000,000 lek (~EUR163,000) with ano. of shares of 20,000. On 07.13.2007, afterseveral periodical - limited licenses since 2002, theAlbanian Financial Authority, granted Tirana StockExchange with an infinite validity license. Thelicense empowers TSE “To operate as a securitiesmarket for the trading of Government / CorporateDebt Securities and Capital securities” with no timerestriction.
Market Structure -TradingTSE is an order-driven “open outcry – call market”which uses a manual trading system with physicalpresence of licensed commissioners (members)on the trading floor. There is no electronic tradingsystem so far. Securities’ prices on the tradingsessions are set according to “single pricemethod”, while trading is held:
- every Monday and Wednesday, from 10.00 -12.00,for the official market.- every Friday for trading in the parallel market.
The eligible tradable instruments are: shares,government papers and corporate bonds. In orderto trade, TSE commissioners should be physicallypresented in the trading sessions. Each tradingsession is conducted in two rounds. Organized asan auction market, TSE calculates a single pricefor each tradable instrument, at the end of eachtrading day.
Clearing and settlement for every type of securitiestraded at TSE, is done on a net basis within T+3,in full accordance with “Delivery Versus Payment –DVP” principle. Clearing and settlement fortransactions executed at TSE is done incooperation with second tier commercial banksand Albanian Share Registrar for joint-stockcompany shares.
MembershipUp to now, TSE records 4 licensed members, twocommercial banks and two private companies,which offer brokerage services for investors.
FUTURE OUTLOOK
Activating the securities market as a commontrading platform for several financial instruments,will be the strategic objective of the TSE.Achievement of such an important goal shall becarried out through:
• Working closely with and assisting in thecontinuance of domestic top level businesses, TSEmembers, etc. to make them aware of advantagesthe securities market may offer them as well asproviding these stockholders with necessaryinformation, in order to be listed at TSE,
• Bilateral negotiations with Albanian Governmenttowards the inclusion of TSE in the privatizationprocess of the state-owned enterprises (SOEs).These negotiations will cover identification ofpotential strategic and non-strategic state ownedcompanies, which can be privatized through IPO,
• Negotiations both with the Albanian Governmentand the Ministry of Finance towards theassignment of TSE, by Ministry of Finance (MoF),as Government’s agent in organizing primaryauction for long-term public debt securities,
• Negotiation and cooperation with both, MoF andAFSA towards the compilation of legal and fiscalincentives, which are deemed necessary toencourage private companies to raise their capitalthrough IPOs and TSE listing,
• Performance of a marketing campaign, in fullcompliance with the marketing program compiledby TSE with a final objective to attract domesticbusiness at exchange listing;
• In cooperation with AFSA, carrying out of acontinued public education & informationcampaign regarding the securities market andadvantages that provides its use;
• Improvement of information technology at TSE inorder to make it possible to provide the market withan appropriate Electronic Trading System forsecurities;
• Keeping fruitful cooperation with institutions inthe region, regarding the exchange of experiencesand staff training, targeting further improvement ofhuman resources capacity within the filed ofsecurities market.
Anila FurerajGeneral Manager
FEDERATION OF EURO-ASIAN STOCK EXCHANGES ANNUAL REPORT JUNE 2010
PAGE 150
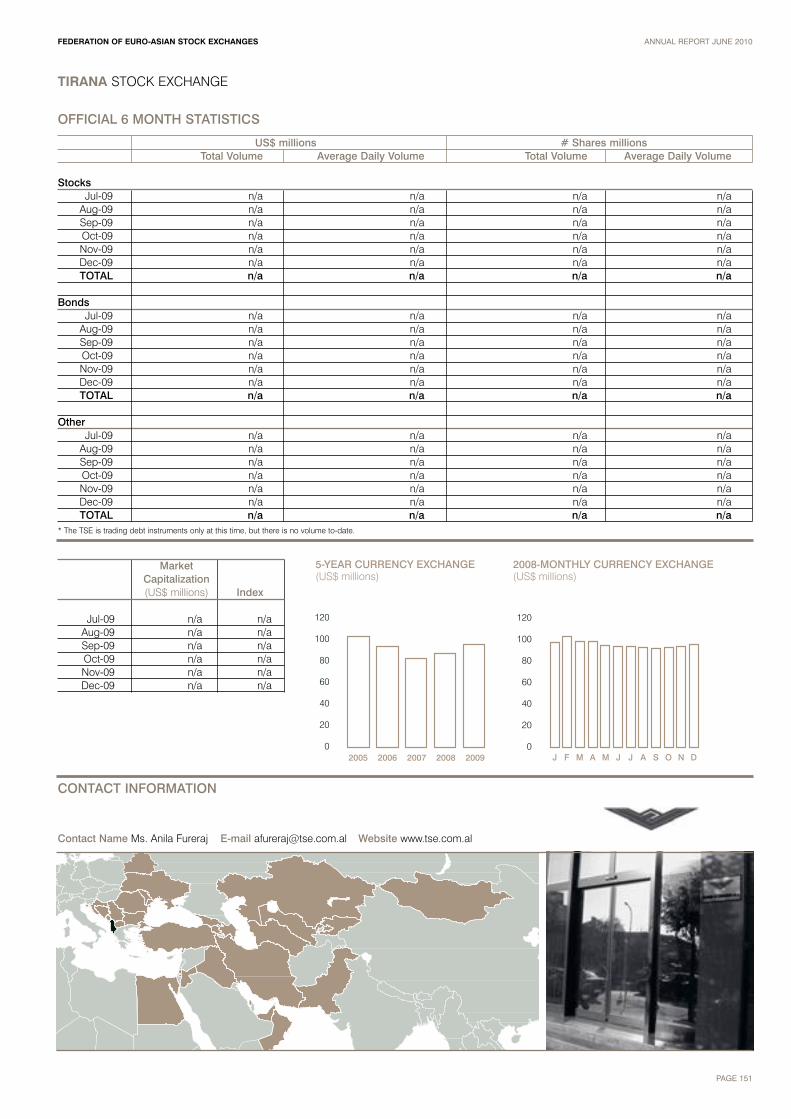
TIRANA STOCK EXCHANGE
FEDERATION OF EURO-ASIAN STOCK EXCHANGES ANNUAL REPORT JUNE 2010
PAGE 151
CONTACT INFORMATION
Contact Name Ms. Anila Fureraj E-mail [email protected] Website www.tse.com.al
OFFICIAL 6 MONTH STATISTICS
US$ millions # Shares millionsTotal Volume Average Daily Volume Total Volume Average Daily Volume
StocksJul-09 n/a n/a n/a n/a
Aug-09 n/a n/a n/a n/aSep-09 n/a n/a n/a n/aOct-09 n/a n/a n/a n/aNov-09 n/a n/a n/a n/aDec-09 n/a n/a n/a n/aTOTAL n/a n/a n/a n/a
BondsJul-09 n/a n/a n/a n/a
Aug-09 n/a n/a n/a n/aSep-09 n/a n/a n/a n/aOct-09 n/a n/a n/a n/aNov-09 n/a n/a n/a n/aDec-09 n/a n/a n/a n/aTOTAL n/a n/a n/a n/a
OtherJul-09 n/a n/a n/a n/a
Aug-09 n/a n/a n/a n/aSep-09 n/a n/a n/a n/aOct-09 n/a n/a n/a n/aNov-09 n/a n/a n/a n/aDec-09 n/a n/a n/a n/aTOTAL n/a n/a n/a n/a
5-YEAR CURRENCY EXCHANGE(US$ millions)
0
20
40
60
80
100
120
20092005 2006
2008-MONTHLY CURRENCY EXCHANGE(US$ millions)
0
20
40
60
80
100
120
2007 J F M A M J J A S O N D2008
Market Capitalization(US$ millions) Index
Jul-09 n/a n/aAug-09 n/a n/aSep-09 n/a n/aOct-09 n/a n/aNov-09 n/a n/aDec-09 n/a n/a
* The TSE is trading debt instruments only at this time, but there is no volume to-date.

FEDERATION OF EURO-ASIAN STOCK EXCHANGES ANNUAL REPORT JUNE 2010
PAGE 152
TIRANA STOCK EXCHANGE
ECONOMIC AND POLITICAL DEVELOPMENTS
Political EnvironmentAlbania is Parliamentary Republic with 140deputies (political representatives) electedfrom sovereign once in four years with generalelections. Main powers are legislative andexecutive. On 28 June 2009 Parliamentaryelections were held. After a lengthy countingprocess Albania's Central ElectoralCommission (CEC) confirmed the poll waswon by incumbent PM and DP Berisha.Berisha’s right-wing ‘Alliance for Change’coalition had secured 70 seats in Parliament,while the SP gained 65 seats.
Economic PerformanceThe development of the Albanian economyhas, since the fall of Communism, been fueledprimarily by the service and constructionindustries. Tourism, of late, has played anincreasing role in the Albanian economy, andis growing rapidly. Many people are curious toexplore a country whose borders were closedto travel for many years.
The country is rich in natural resourcesincluding petroleum, natural gas, coal,bauxite, chromium, copper, iron ore, nickel,limestone, salt, timber, and hydro-electricpower.
Albania's macroeconomic performance hasbeen impressive since 1998. During the last 8years the economy has enjoyed virtuallyuninterrupted rapid growth in a low inflationenvironment. In recent years the growth ratehas averaged close to 6%: the provisionalEconomic growth over this period took placein a climate of growing macroeconomicequilibrium, evidenced by stable monetaryindicators, low and stable inflation rates andthe reduction of the budget deficit and publicdebt. The inflation rate during the past threeyears has been anchored within the 2% - 4%target range. During this period, the rate ofAlbania's economic growth has been higherthan that of other SE European countries. TheAlbanian government has approved a flat taxregime of 10%. This move is considered to be
a fiscal revolution for Albania which nowallegedly features one of the lowest tax ratesin the world. This is believed to be a strongweapon in the fight against the informal sector,a carrot for increased FDI penetration andabove all a magic bullet for economicprosperity, to generate double-digit economicgrowth rates. Investors choosing Albania findthat they benefit from ‘the Albanian advantage’which comes from investing in a politicallystable, fast-growing, low cost, Europeaneconomy that is today’s gateway for Europeanmanufacturers into southern Europe.*
* Information provided by the Tirana Stock Exchange.
Key Information ContactsBank of Albania www.bankofalbania.orgMinistry of Finance www.minfin.gov.alAlbanian Institute of Statistics www.instat.gov.alAlbanian Financial Supervisory Authority www.amf.gov.alMinistry of Economy www.mete.gov.al
0
100
200
300
400
500
600
700
REAL GDP(ALL millions)
CONSUMER PRICES (% CHANGE PA; AV)(%)
2.0
2.2
2.4
2.6
2.8
3.0
3.2
3.4
2005 2006 2007 2008 2009 2010 2005 2006 2007 2008 2009 2010

ALBANIA ECONOMIC CHARTS AND TABLES
2005 2006 2007 2008 2009 2010
Nominal GDP (US$ at PPP) bil US$ 17 18 (a) 20 (a) 22 (a) 23 (a) 24 (b) Real GDP bil ALL 491 518 (a) 551 (a) 587 (a) 601 (a) 622 (b)Real private consumption bil ALL 514 539 (a) 647 (a) 687 (a) 679 (a) 701 (b)Real government consumption bil ALL 45 47 (a) 49 (a) 58 (a) 63 (a) 64 (b)Real gross fixed investment bil ALL 122 135 (a) 152 (a) 161 (a) 159 (a) 165 (b)Real stockbuilding bil ALL 10 (a) 18 (a) 20 (a) 16 (a) 18 (a) 18 (b)Real exports of G&S bil ALL 163 172 (a) 185 (a) 198 (a) 188 (a) 195 (b)Real imports of G&S bil ALL 364 392 (a) 503 (a) 533 (a) 506 (a) 522 (b)Real domestic demand bil ALL 690 (a) 739 (a) 869 (a) 921 (a) 919 (a) 948 (b)Real GDP at factor cost bil ALL 459 467 (a) 492 (a) 551 (a) 601 (a) 622 (b)Real agriculture bil ALL 105 108 (a) 108 (a) 111 (a) 113 (a) 115 (b)Real industry bil ALL 98 100 (a) 104 (a) 107 (a) 103 (a) 106 (b)Real manufacturing bil ALL n/a n/a n/a n/a n/a n/a Real services bil ALL 259 491 (a) 518 (a) 551 (a) 601 (a) 622 (b)Gross national savings rate (%) % 16.8 (a) 17.7 (a) 18.8 (a) 44.5 (a) 19.1 (a) 21.7 (b)Gross national savings/investment % 71.1 70.7 (a) 62.6 (a) 150.2 (a) 66.2 (a) 74.0 (b)Budget balance (% of GDP) % -3.6 -3.2 -3.5 -3.9 -6.4 -4.7 (b)Consumer prices (% change pa; av) % 2.4 2.4 2.5 2.6 2.8 2.9 (b)Exchange rate LCU:US$ (av) ALL/US$ 99.88 98.12 90.51 83.89 94.97 94.2004 (b) Lending interest rate (%) % 13.1 12.9 14.1 13.0 (a) 12.2 (a) 12.0 (b)Stock of domestic credit bil ALL 406 488 601 719 (a) 730 (a) 787 (b)Domestic credit growth (%) % 16.7 20.1 23.0 19.7 (a) 1.5 (a) 7.9 (b)Deposit interest rate (%) % 5.1 5.2 5.7 6.8 (a) 6.8 (a) 6.5 (b)Population million 3.2 3.2 3.2 3.3 3.1 (a) 3.2 (b)GDP per head ($ at PPP) US$ 5,402 5,870 (a) 6,400 (a) 6,930 (a) 7,180 (a) 7,520 (b)Current account balance/GDP % -6.8 -7.2 -8.5 -7.9 -9.8 (a) -7.6 (b)International reserves bil US$ 1 2 2 2 2 (a) 2 (b)Trade balance bil US$ -2 -2 -3 -4 (a) -3 (a) -3 (b)Foreign-exchange reserves bil US$ 1 2 2 2 2 (a) 2 (b)Total foreign debt bil US$ n/a n/a n/a n/a n/a n/aPublic medium & long-term bil US$ n/a n/a n/a n/a n/a n/aPrivate medium & long-term bil US$ n/a n/a n/a n/a n/a n/aIMF debt bil US$ n/a n/a n/a n/a n/a n/aShort term bil US$ n/a n/a n/a n/a n/a n/aNet debt bil US$ n/a n/a n/a n/a n/a n/aExport credits bil US$ n/a n/a n/a n/a n/a n/a
FEDERATION OF EURO-ASIAN STOCK EXCHANGES ANNUAL REPORT JUNE 2010
PAGE 153
TIRANA STOCK EXCHANGE
-4.0
-3.5
-3.0
-2.5
-2.0
-1.5
-1.0
-0.5
0.0
TRADE BALANCE(US$ billions)
2005 2006 2007 2008 2009 20100
20
40
60
80
100
120
140
160
180
REAL GROSS FIXED INVESTMENT(ALL millions)
2005 2006 2007 2008 2009 2010
(a) Estimate (b) Forecast
The Economist Intelligence Unit Limited, December 2009

“TOSHKENT” REPUBLICAN STOCK EXCHANGE
In 2006 the TRSE plans to increase the volume of trade withsecurities. Most importantly, we will carry out technicalmodernization of the system of electronic exchange trades.
As a result of all of the hard work of the staffof the “Toshkent” Republican Stock Exchange(TRSE) in 2005, the TRSE has achievedcertain positive results. In year 2005, 5814transactions with the shares of 643 joint-stockcompanies and 9 transactions with corporatebonds have been carried out on the tradingplatforms of the TRSE.
• Trade with corporate bonds accounted for1%;• Shares of the privatized state enterprisesaccounted for 30.5%;• Shares of the privatized state enterprisesobtained by foreign investors for the hardcurrency accounted for 1.2%;• IPOs and other additional issued shares ofthe joint-stock companies for nationalcurrency as well as for the hard currencyaccounted for 4.1%; • Shares in the secondary market accountedfor 38.7%; and• Shares in the secondary market obtained byforeign investors for hard currency accountedfor 24.5% of the total volume.
Although in comparison with thecorresponding period of 2004, the tradingvolume of shares has increased slightly, thetrading volume of shares for hard currencyhas increased 7.4%. Our efforts about theincrease of the secondary market have beenproving themselves. In the year 2005 tradevolume with shares in the secondary marketincreased 15%.
We expect that the further development of thesecondary market will keep this pace.Currently, there are securities of 700companies in circulation in the secondarymarket, which should considerably increasethe share of securities in the secondarymarket.
In 2006 the TRSE plans to increase thevolume of trade with securities. Mostimportantly, we will carry out technicalmodernization of the system of electronicexchange trades:
1. Perfection of the technology of exchangetrades:First, the TRSE will create of a platform for thesecondary circulation of shares in thesecondary market, working on technologybased on simple auction. Second, the TRSEwill create a special platform on fulfillment oftransactions.
2. Modernization by updating the equipment.The TRSE will complete modernization ofequipment in all branches and in theexchange itself.
3. Modernization of trading system of the TRSE.
The TRSE will translate into a newtechnological platform the whole tradingsystem of the Stock Exchange and create auniform database. Further the TRSE willendeavor to open facilities for regional brokeroffices to access the trading system fromdistance and implement maintenance of aclosed network of data transmission for allregional branches.
HISTORY AND DEVELOPMENT
A stock department was established in 1991,which became a pioneer of Uzbekistan’ssecurities market, and was eventuallytransformed in 1994 into the “Toshkent”Republican Stock Exchange (TRSE), a closedjoint-stock company. The TRSE became anopen joint-stock company in 1998.Establishment of the TRSE was closelyconnected to its market performance and apolicy of establishing public joint-stockcompanies on the basis of privatizedgovernment enterprises. Currently, the TRSEhas 39 shareholders.
Throughout its development, the TRSEcompleted a complex infrastructure, a centraloffice in Tashkent, and branches and brokerageoffices in all regions nationwide. In 1994, 12brokerage offices were members of theExchange and as of the 1 July 2005, thisnumber had increased to 61.
On 1 February 1998, a listing procedure wasintroduced. On 1 September 1998, shares ofthe first listed company began trading on the
TRSE. A specialized trading platform, for thepurpose of selling shares of privatizedenterprises to foreign investors for hardcurrency, was launched on 1 January 1999.
In 2001, work on Exchange information andelectronic trading systems continued. Thewebsite www.uzse.uz started operations in2001, and today the TRSE continues work on atransition to modern web-technology trading. Inaddition, the website reflects daily informationon IPOs and other JSCs. Investors may followall the current changes and information onlisted companies, share price and amountsstanding out.
In 2003 new listing procedures were adopted atthe TRSE where the requirements for the officialas well as unofficial listing were stated.Currently the four largest companies ofUzbekistan are listed in Class “A” of the officiallisting.
Founded 12 years ago as Uzbekistan’s firststock exchange, the TRSE is actively takingpart, always keeping in mind its major role, inthe development of the Uzbek capital market.
FUTURE OUTLOOK
The priority directions of the development of theTRSE in 2006 will become the opening of anadditional trade sections on transactions forshares of unlisted companies.
Additionally, the TRSE is planning to change thesoftware system and bring it to standards inaccordance with Rules of the Stock Exchange,as well as prepare new, more complexsoftware, in particular:• development of the module on conclusion ofturnip-deals, based on technology of continualdouble auction; • modernization of software system, based ontechnologies of the simple auction; and• full modernization of software system of theTRSE, with transition on new technical platform.
Maximilian KhvanChairman
FEDERATION OF EURO-ASIAN STOCK EXCHANGES ANNUAL REPORT JUNE 2010
PAGE 154

“TOSHKENT” REPUBLICAN STOCK EXCHANGE
FEDERATION OF EURO-ASIAN STOCK EXCHANGES ANNUAL REPORT JUNE 2010
PAGE 155
CONTACT INFORMATION
Contact Name Mr. Maximilian Khvan E-mail [email protected] Website www.uzse.uz
0
200
400
600
800
1,000
1,200
1,400
1,600
TRADING VOLUME(UZS millions)
Jan Feb Mar0
100
200
300
400
500
600
TRADING VOLUME(US$ millions)
Jan Feb Mar
J F M A M J J A S O N D
TASIX INDEX 2009
0
100
200
300
400
500
600
700
FEDERATION OF EURO-ASIAN STOCK EXCHANGES ANNUAL REPORT JUNE 2010
PAGE 156
“TOSHKENT” REPUBLICAN STOCK EXCHANGE
ECONOMIC AND POLITICAL DEVELOPMENTS
Economic and Political EnvironmentMr Karimov dominates the political scene, andthere is little prospect of democratisation overthe forecast period. Mr Karimov, who was lastelected for a seven-year term in December2007, is expected to maintain a firm grip onpower, as there seems to be no co-ordinatedopposition to his rule from within the politicalhierarchy. Furthermore, years of repressionhave prevented the emergence of anopposition figure capable of challenging himsuccessfully. Most of his opponents are livingin exile.
Relations with the US and the EU haveimproved from a low in 2005, driven by anti-terrorist initiatives, the regional securityagenda, the small steps taken by the Uzbekauthorities towards tackling human rightsconcerns, and the desire of some EU states tolook for alternative energy sources in CentralAsia in order to reduce their reliance onRussia. The EU has dropped its sanctionsregime against Uzbekistan, but human rightsorganisations will continue to press for atougher stance. The West will continue to haveonly limited leverage over Uzbekistan in thisarea, in part because the country does not relyon substantial support from Westernmultilateral financial institutions, and haslimited trade with the region. Most Westerninvestors will remain deterred by the difficultbusiness environment, and Chinese andRussian firms are likely to provide the bulk ofany foreign investment. The US is set tobecome a more prominent partner in anti-terrorism measures, following an agreement toallow US non-munitions supplies toAfghanistan to transit Uzbek territory. Relationswith Russia and with Uzbekistan's immediateneighbours in Central Asia will be tense,particularly in view of recent violent incidentson the border with the Kyrgyz Republic andbecause of Uzbek anger over Kyrgyzagreement to host a second Russian militarybase, possibly close to the Uzbek border.There is also a serious risk that insurgents inAfghanistan–among them significant numbersof ethnic Uzbeks–could expand their activitiesto include Uzbekistan. Ongoing disputes overwater and energy supplies will also exacerbatetensions between Uzbekistan and itsneighbours.
Over the forecast period the government willmake greater efforts to support growth in acontext of external shocks, by expandingpublic investment into infrastructure andindustry, and by increasing public-sectorwages and social payments. Althoughimportant advances have been made in somepolicy areas–notably, Treasury reform, areduction in the tax burden and increasedcapitalisation of banks–the pace of structuralreform remains slow.
Economic PerformanceAlthough Uzbekistan is relatively immune tothe turmoil on global financial markets, it isbeing affected by the global economicslowdown. The chief external factors affectingeconomic performance are trends incommodity prices. Following an estimated riseof 10% on average in 2009, gold prices are setto rise by 9% in 2010, before falling by 6.5% in2011. In 2010 demand for cotton will rebound,following the end of the global recession, withprices expected to rise by 15%. The remittanceinflows on which many Uzbek households relywill decline, owing to slower economic growthin Russia and Kazakhstan, the maindestinations for Uzbek migrant labour.
Official data continue to be highly suspect andinternally contradictory, and the authorities'sanguine view of the economy is underminedby the continuing policy emphasis on "anti-crisis measures". officially reported growthrates will continue to exaggerate the true rateof economic expansion, and that theauthorities will report headline full-year GDPgrowth rates of close to the official target. Theauthorities expect real GDP to expand by 7-8%in 2009, and have reported growth of around8% in the first half of the year–a slowdowncompared with the year-earlier period. Growthis forecast to pick up to 8.1% in 2010 and8.3% in 2011 as export markets recover. Theeconomy will also be assisted by risinginvestment, mainly funded by governmentexpenditure, as well as by some FDI fromChina and Russia. Private consumption willsuffer from a moderate decline in remittances,but will be sustained by government efforts toincrease wages and social payments.
Based on historical inflation figures from theIMF, annual average inflation is expected at8.6% in 2009. The authorities will continue toattempt to limit inflation by the imposition ofprice controls on basic foodstuffs and energy.Lower global commodity prices brought downinflation in 2009, but this trend will be reversedin 2010-11. A continuing depreciation of thelocal currency will also boost importedinflation. Robust money supply growth–aseconomic growth picks up, and as thegovernment increases wages and benefitsfurther–will also fuel inflation over the forecastperiod.
The authorities will continue to target a slowpace of nominal depreciation in order tosupport export competitiveness, particularly inview of weakening demand for Uzbek exportsas the Russian and Kazakh economies slowsharply. However, the pace of depreciation willbe faster than in recent years. A globalweakening of emerging-market currenciesagainst the US dollar since October 2008,owing to greater risk aversion, resulted in anacceleration of the trend of som depreciation.The Uzbek currency was also affected bycontagion from the steep falls in the Russianrouble and Kazakh tenge. By end-September2009 the som had depreciated by 12% sincethe end of September 2008. Downwardpressure on the currency will remain becauseof lower inflows of foreign exchange fromexport receipts and remittances.
The current-account surplus is in 2009 atUS$4.6bn, or 15.6% of GDP, smaller than thesurplus of US$6.3bn (22.4% of GDP) recordedin 2008, owing to a downturn in exportrevenue. The State Statistics Committeereports lower figures for the current account(for example, it reported a surplus of US$4.1bnin 2008), but uncertainty surrounds officialfigures for the services account and for inflowson current transfers.*
* The Economist Intelligence Unit Limited, November 2009
Key Information ContactsState Property Committee www.spc.gov.uzMinistry of Finance www.mf.uz/engNational Bank of Uzbekistan http://eng.nbu.com/about/history/index.phpState Central Securities Depository www.deponet.uz/english.shtmlPortal of the State Authority www.gov.uz/en
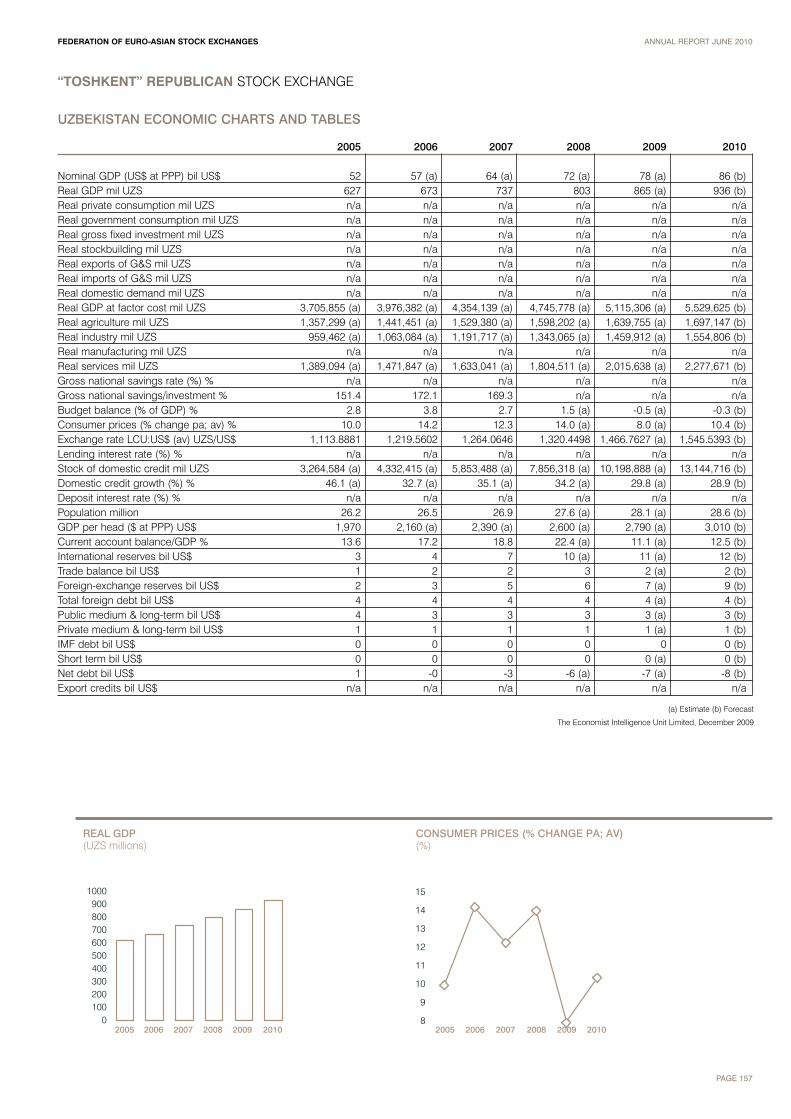
FEDERATION OF EURO-ASIAN STOCK EXCHANGES ANNUAL REPORT JUNE 2010
PAGE 157
“TOSHKENT” REPUBLICAN STOCK EXCHANGE
UZBEKISTAN ECONOMIC CHARTS AND TABLES
2005 2006 2007 2008 2009 2010
Nominal GDP (US$ at PPP) bil US$ 52 57 (a) 64 (a) 72 (a) 78 (a) 86 (b)Real GDP mil UZS 627 673 737 803 865 (a) 936 (b)Real private consumption mil UZS n/a n/a n/a n/a n/a n/aReal government consumption mil UZS n/a n/a n/a n/a n/a n/aReal gross fixed investment mil UZS n/a n/a n/a n/a n/a n/aReal stockbuilding mil UZS n/a n/a n/a n/a n/a n/aReal exports of G&S mil UZS n/a n/a n/a n/a n/a n/aReal imports of G&S mil UZS n/a n/a n/a n/a n/a n/aReal domestic demand mil UZS n/a n/a n/a n/a n/a n/aReal GDP at factor cost mil UZS 3,705,855 (a) 3,976,382 (a) 4,354,139 (a) 4,745,778 (a) 5,115,306 (a) 5,529,625 (b)Real agriculture mil UZS 1,357,299 (a) 1,441,451 (a) 1,529,380 (a) 1,598,202 (a) 1,639,755 (a) 1,697,147 (b)Real industry mil UZS 959,462 (a) 1,063,084 (a) 1,191,717 (a) 1,343,065 (a) 1,459,912 (a) 1,554,806 (b)Real manufacturing mil UZS n/a n/a n/a n/a n/a n/aReal services mil UZS 1,389,094 (a) 1,471,847 (a) 1,633,041 (a) 1,804,511 (a) 2,015,638 (a) 2,277,671 (b)Gross national savings rate (%) % n/a n/a n/a n/a n/a n/aGross national savings/investment % 151.4 172.1 169.3 n/a n/a n/aBudget balance (% of GDP) % 2.8 3.8 2.7 1.5 (a) -0.5 (a) -0.3 (b)Consumer prices (% change pa; av) % 10.0 14.2 12.3 14.0 (a) 8.0 (a) 10.4 (b)Exchange rate LCU:US$ (av) UZS/US$ 1,113.8881 1,219.5602 1,264.0646 1,320.4498 1,466.7627 (a) 1,545.5393 (b)Lending interest rate (%) % n/a n/a n/a n/a n/a n/aStock of domestic credit mil UZS 3,264,584 (a) 4,332,415 (a) 5,853,488 (a) 7,856,318 (a) 10,198,888 (a) 13,144,716 (b)Domestic credit growth (%) % 46.1 (a) 32.7 (a) 35.1 (a) 34.2 (a) 29.8 (a) 28.9 (b)Deposit interest rate (%) % n/a n/a n/a n/a n/a n/aPopulation million 26.2 26.5 26.9 27.6 (a) 28.1 (a) 28.6 (b)GDP per head ($ at PPP) US$ 1,970 2,160 (a) 2,390 (a) 2,600 (a) 2,790 (a) 3,010 (b)Current account balance/GDP % 13.6 17.2 18.8 22.4 (a) 11.1 (a) 12.5 (b)International reserves bil US$ 3 4 7 10 (a) 11 (a) 12 (b)Trade balance bil US$ 1 2 2 3 2 (a) 2 (b)Foreign-exchange reserves bil US$ 2 3 5 6 7 (a) 9 (b)Total foreign debt bil US$ 4 4 4 4 4 (a) 4 (b)Public medium & long-term bil US$ 4 3 3 3 3 (a) 3 (b)Private medium & long-term bil US$ 1 1 1 1 1 (a) 1 (b)IMF debt bil US$ 0 0 0 0 0 0 (b)Short term bil US$ 0 0 0 0 0 (a) 0 (b)Net debt bil US$ 1 -0 -3 -6 (a) -7 (a) -8 (b)Export credits bil US$ n/a n/a n/a n/a n/a n/a
0100200300400500600700800900
1000
REAL GDP(UZS millions)
CONSUMER PRICES (% CHANGE PA; AV)(%)
8
9
10
11
12
13
14
15
2005 2006 2007 2008 2009 2010 2005 2006 2007 2008 2009 2010
(a) Estimate (b) Forecast
The Economist Intelligence Unit Limited, December 2009

UKRAINIAN STOCK EXCHANGE
The USE activity throughout the year wasfocused on improvement of tradingtechnology, widening the number of marketinstruments and supplementing the marketinformation.
Trading value of the Ukrainian StockExchange (USE) in 2007 amounted to US$16.8 million. If we analyze trading structureby market instrument, we can see thattrading value for derivatives increased to15.5% from 0.05% in 2006, but tradingvalue for corporate bonds decreased to17.3% in 2007 from 53% in 2006. The mosttraded instrument was state-owned shares.
The USE activity throughout the year wasfocused on improvement of trading
technology, widening the number of marketinstruments and supplementing the marketinformation.
The USE also provides educational activity.The USE is a co-founder of the KievSlavonic University continued its work withstudents, through the Securities Chair.Starting from 2002 there has been aStudent Stock Exchange at the USE. Everystudent has an opportunity to become anexchange specialist and then a broker.
Through gaining theoretical and practicalknowledge and accumulating experience,students realize the importance of capitalmarkets and can better make their choice offuture professions.
It is our belief that the USE has chosen astrategy that will gradually result intransparent, liquid, investment and anattractive capital market.
HISTORY AND DEVELOPMENT
The USE is a pioneer in the capital market ofUkraine, created according to “Law onSecurities and the Stock Exchange”, andregistered by decision of the Cabinet ofMinisters on 29 October 1991. The USE is aclosed joint-stock company with anauthorized capital divided into 288 ordinarynominal shares belonging to legal entities. In1997, according to the Law “On StateRegulation of Securities Market in Ukraine”,the Securities and Stock Market StateCommission re-registered the USE. SinceJune 1998 the USE has been a self-regulated organization. There are 100registered brokerage companies as USEmembers. The USE has 3 branches in thelargest Ukrainian regions.
The USE is a member of the CoordinatingCouncil for the functioning of securitiesmarket charged by the President of Ukraine.It’s also a member of the Consulting &Experts Council in the SSMSC, the UkrainianChamber of Commerce and Industry, theAcademy of Economic Science and theAcademy of Engineering Science of Ukraine,the Board of Ukrainian Council on Economic
Education and the Ukrainian Community“Intelligence of the Nation”. Chairman of theBoard of USE Mr. Valentin Oskolsky is alsoPresident of Union of Economists of Ukraineand President of Article NumberingAssociation “GS1 Ukraine”.
The USE has created many educationalprograms in association with the KievSlavonic University.
The official publication, “Hermes”, can befound in the daily newspaper “Ukraine-Business”.
FUTURE OUTLOOK
Plans for the USE in 2008 include:• expansion through the System of ElectronicTrading (SELT USE) secondary securitiesturnover and trading the internal state loanbonds;• creation of the conditions and basis forformation and development of a derivativesmarket; • taking actions to attract new members tooperate in SELT USE;
• participation in the privatization processesplanned to be implemented by the StatePrivatization Program and the Law of Ukraine“On State Budget of Ukraine for 2008”;• improvement of technologies for tradingState-owned shares of privatized companies; • promotion for the attraction of directnational and foreign investments to developstrategically important industry companiesduring the process of its privatization;• development of the electronicdocumentation turnover and electronic digitalsignature according to new Ukrainianlegislation;• development of Exchange informationareas, expansion of publishing, scientific,methodical and educational activities in orderto prepare specialists for national capitalmarket; and• strengthening the international cooperationwith foreign stock exchanges andinternational financial organizations.
Valentin OskolskyChairman of the Board
FEDERATION OF EURO-ASIAN STOCK EXCHANGES ANNUAL REPORT JUNE 2010
PAGE 158

UKRAINIAN STOCK EXCHANGE
FEDERATION OF EURO-ASIAN STOCK EXCHANGES ANNUAL REPORT JUNE 2010
PAGE 159
OFFICIAL 6 MONTH STATISTICS
US$ millions # Shares millionsTotal Volume Average Daily Volume Total Volume Average Daily Volume
StocksJul-09 0.00 0.00 0.01 0.01
Aug-09 1.95 0.49 103.68 25.92Sep-09 0.04 0.01 1.81 0.60Oct-09 0.04 0.01 1.22 0.41Nov-09 0.07 0.02 9.26 2.32Dec-09 0.01 0.00 1.55 0.52TOTAL 2.11 0.09 117.53 4.96
BondsJul-09 0.00 0.00 0.00 0.00
Aug-09 0.00 0.00 0.00 0.00Sep-09 0.00 0.00 0.00 0.00Oct-09 0.00 0.00 0.00 0.00Nov-09 0.00 0.00 0.00 0.00Dec-09 0.00 0.00 0.00 0.00TOTAL 0.00 0.00 0.00 0.00
OtherJul-09 0.00 0.00 0.00 0.00
Aug-09 0.00 0.00 0.00 0.00Sep-09 0.00 0.00 0.00 0.00Oct-09 0.00 0.00 0.00 0.00Nov-09 0.01 0.00 0.02 0.00Dec-09 4.75 1.19 0.01 0.00TOTAL 4.76 0.59 0.03 0.00
0.00.20.40.60.81.01.21.41.61.82.0
MONTHLY STOCK VOLUME VS INDEX(US$ millions)
MONTHLY MARKET CAPITALIZATION(US$ millions)
0
50
100
150
200
250
300
350
Jul Aug Sep Oct Nov Dec Jul Aug Sep Oct Nov Dec
Market Capitalization(US$ millions) Index
Jul-09 197.95 n/aAug-09 311.65 n/aSep-09 313.53 n/aOct-09 322.30 n/aNov-09 219.94 n/aDec-09 219.94 n/a
CONTACT INFORMATION
Contact Name Mrs. Hanna Yatsyuk E-mail [email protected] Website www.ukrse.kiev.ua

FEDERATION OF EURO-ASIAN STOCK EXCHANGES ANNUAL REPORT JUNE 2010
PAGE 160
UKRAINIAN STOCK EXCHANGE
ECONOMIC AND POLITICAL DEVELOPMENTS
General Political EnvironmentOn December 26 2004, the so-called OrangeRevolution brought President ViktorYushchenko and his Our Ukraine (NU) party topower in coalition with other liberal democraticparties, in particular the Bloc Yulia Tymoshenko(BYuT) led by Mr. Yushchenko’s ally andprincipal rival Yulia Tymoshenko. Since thattime Ukraine has experienced profoundpolitical instability characterised by the bitterrivalries within the former Orange forces.
Ukrainian politics are dominated by regionalinterests including oligarchs who enjoy politicaland economic power. The 2004 electionchanged the balance of power in the countryby shifting power away from these easternoligarchs. With Mr. Yushchenko, a more pro-Western leader in place, the governmentbegan to tackle corruption, however it has notbeen entirely successful in these efforts.Reform has been uncoordinated, especially atthe level of institutions which has contributedto instability and the present deadlock inUkrainian politics. The current political climatein Ukraine is one that moves from crisis tocrisis. The profoundly vitriolic relationship thathas developed over the past four yearsbetween President Yushchenko, his allies andclose advisors, and PM Tymoshenko and herallies is a key factor behind the current politicalcrisis which closely parallels the country’scurrent economic crisis.
In early April 2007, Mr. Yushchenko issued apresidential decree to dissolve the Rada andforce parliamentary elections in mid-May toostensibly solidify his position. This was initiallythwarted by Mr. Yanukovich and members ofthe Rada allied with the PoR. Elections wereheld on 30 September 2007 resulting in thePoR being returned with the largest number ofseats (175). However, an agreement betweenNU and the BYuT to form a renewed coalitionwith their combined 228 seats brought afractious Tymoshenko-Yushchenko coalitionback to power. BYuT was the dominant party inthe coalition and Yulia Tymoshenko wasreturned as PM following a very narrowconfirmation vote in the Rada in which severalNU deputies failed to back her candidacy. Thedeep personal animosity between Mr.Yushchenko and Mrs. Tymoshenko bredinstability in the coalition and led to policyparalysis. This paralysis led to the collapse ofthe coalition in mid-September 2008 and thesubsequent dissolution of the Rada andcalling of snap elections by PresidentYushchenko. These were put off and a new(though old) coalition of BYuT, NU-NS, and theVolodymyr Lytvyn Bloc with some new cabinetmembers took office in Dec. 2008. As theglobal economic crisis took hold in Ukraine thedegree of political instability and weakleadership was exposed. The current politicalsituation in Ukraine reveals a country in deepcrisis. The seriousness of the economicsituation is reflected through the depreciatingcurrency; the IMF’s intervention to shore up acollapsing banking sector and provide fiscalsupport; depressed commodity prices’ impacton the steel sector; and anticipated privatesector defaults.
Investment EnvironmentThe government is committed to attractingforeign investment to Ukraine. Most sectorsare fully open to FDI, however somerestrictions remain in key sectors includingbanking and telecoms. There is widespreadcorruption at all levels of the system, aidedand abetted by an unwieldy Soviet-erabureaucracy where vested interests can stifleinvestment. The risk of FDI being challengedby oligarchic interests and their political alliesis a continuing challenge. Given the desire ofthe government and the political parties toaddress governance issues there has beenconspicuously little attention directed towardsregulating investors, thus the investmentenvironment continues to function with little byway of encumbrances. Ukraine acceded tomembership in the WTO in February 2008 andis currently negotiating a free trade agreementwith the EU; its largest trading partner. Muchneeded reforms to the judicial system are onhold at present contributing to somedeficiencies in the rule of law in Ukraine.*
* http://www.edc.ca/english/docs/gukraine_e.pdf
Key Information ContactsSecurities and Stock Market State Commission www.ssmsc.gov.uaMinistry of Finance www.minfin.gov.uaState Property Fund of Ukraine www.spfu.gov.uaState Committee of Financial Monitoring www.sdfm.gov.uaState Commission for Regulation of Financial Services’ Market in Ukraine www.dfp.gov.ua
0
100
200
300
400
500
600
700
800
REAL GDP(UAH millions)
CONSUMER PRICES (% CHANGE PA; AV)(%)
5
10
15
20
25
30
2005 2006 2007 2008 2009 2010 2005 2006 2007 2008 2009 2010

FEDERATION OF EURO-ASIAN STOCK EXCHANGES ANNUAL REPORT JUNE 2010
PAGE 161
UKRAINIAN STOCK EXCHANGE
UKRAINE ECONOMIC CHARTS AND TABLES
2005 2006 2007 2008 2009 2010
Nominal GDP (US$ at PPP) bil US$ 263 291 (a) 323 (a) 338 (a) 290 (a) 297 (b)Real GDP bil UAH 622 668 720 737 624 (a) 630 (b)Real private consumption bil UAH 318 367 430 473 411 (a) 399 (b)Real government consumption bil UAH 122 127 129 130 131 (a) 132 (b)Real gross fixed investment bil UAH 132 159 198 202 107 (a) 111 (b)Real stockbuilding bil UAH 4 1 5 16 -17 (a) -5 (b)Real exports of G&S bil UAH 334 315 323 341 276 (a) 286 (b)Real imports of G&S bil UAH 271 294 364 426 284 (a) 292 (b)Real domestic demand bil UAH 576 654 762 821 632 (a) 636 (b)Real GDP at factor cost bil UAH 269 286 (a) 310 (a) 318 (a) 269 (a) 272 (b)Real agriculture bil UAH 35 36 (a) 34 (a) 38 (a) 39 (a) 40 (b)Real industry bil UAH 93 99 (a) 110 (a) 104 (a) 79 (a) 81 (b)Real manufacturing bil UAH 57 (a) 62 (a) 70 (a) 68 (a) 48 (a) 50 (b)Real services mil UAH 141 151 (a) 167 (a) 176 (a) 152 (a) 151 (b)Gross national savings rate (%) % 25.6 23.3 24.5 (a) (a) 21.8 (a) 20.2 (a) 21.1 (b)Gross national savings/investment % 113.0 93.9 86.9 79.5 94.3 (a) 94.7 (b)Budget balance (% of GDP) % -1.7 -0.6 -1.1 -1.5 -9.0 (a) -5.5 (b)Consumer prices (% change pa; av) % 13.5 9.1 12.8 25.2 16.0 (a) 12.0 (b)Exchange rate LCU:US$ (av) UAH/US$ 5.1247 5.0500 5.0500 5.2672 7.7977 (a) 8.0437 (b)Lending interest rate (%) % 16.2 15.2 13.9 17.5 20.5 (a) 17.0 (b)Stock of domestic credit mil UAH 146,752 248,631 440,027 778,432 900,347 (a) 979,831 (b)Domestic credit growth (%) % 34.3 69.4 77.0 76.9 15.7 (a) 8.8 (b)Deposit interest rate (%) % 8.6 7.6 8.1 9.9 13.5 (a) 12.0 (b)Population million 46.7 46.5 46.2 46.0 45.7 (a) 45.5 (b)GDP per head ($ at PPP) US$ 5,625 6,270 (a) 7,000 (a) 7,360 (a) 6,350 (a) 6,530 (b)Current account balance/GDP % 2.9 -1.5 -3.7 -7.1 -1.2 (a) -1.2 (b)International reserves bil US$ 19 22 32 32 25 (a) 24 (b)Trade balance bil US$ -1 -5 -11 -16 -4 (a) -4 (b)Foreign-exchange reserves bil US$ 19 22 32 31 25 (a) 23 (b)Total foreign debt bil US$ 33 50 74 96 (a) 92 (a) 95 (b)Public medium & long-term bil US$ 10 10 11 12 (a) 12 (a) 12 (b)Private medium & long-term bil US$ 10 24 40 54 (a) 52 (a) 49 (b)IMF debt bil US$ 1 1 0 5 11 (a) 16 (b)Short term bil US$ 12 15 23 26 (a) 17 (a) 18 (b)Net debt bil US$ 14 28 41 64 (a) 67 (a) 71 (b)Export credits bil US$ 1 1 1 (a) 1 1 (a) 1 (b)
-16
-14
-12
-10
-8
-6
-4
-2
0
TRADE BALANCE(US$ billions)
2005 2006 2007 2008 2009 20100
50
100
150
200
250
REAL GROSS FIXED INVESTMENT(UAH millions)
2005 2006 2007 2008 2009 2010
(a) Estimate (b) Forecast
The Economist Intelligence Unit Limited, December 2009

ZAGREB STOCK EXCHANGE
Zagreb Stock Exchange remains confidentabout the ready and efficient response tofuture challenges.
Despite the demanding trading environment,Zagreb Stock Exchange remains confidentabout the ready and efficient response tofuture challenges and will continue its work onimplementation of new products and services.
Year 2010 will test the capabilities of marketand stock exchange flexibility.
As in 2009, narrowing the targets and carefullyselecting priorities to stabilize the system, andregain the investors’ confidence are theprimary tasks.
HISTORY AND DEVELOPMENT
The ZSE was incorporated in 1991 as a joint-stock company with 25 commercial banks andinsurance companies. From the initial 25members (brokerage companies), thanks tothe trade growth and development the numberof members has climbed to some forty-oddactive traders today: banks and privatebrokerage companies, and 43 shareholders. Atthe very beginning, trading took place at bigauctions held at the Exchange head office withall brokers actually physically present and in1994, an electronic trading system wasintroduced.
In 2007, the Croatian financial marketconsolidated as the Varazdin Stock Exchangemerged with the Zagreb Stock Exchange.These new circumstances, resulting in a largernumber of listed securities and greater tradingvolume, along with a natural development ofthe financial market that saw the investmentclimate improve and gave rise to a strongerinterest of all market participants in newfinancial products, highlighted the need for theimplementation of a new system that would beable to meet the needs of the small, butextremely fast-growing Croatian market.
The new trading platform, launched in autumn2007 after several months of preparations,represents an unprecedented technologicalenhancement.
Zagreb Stock Exchange annual tradingreport 2009:Year 2009 was the very challenging for theCroatian capital market and its participants –Zagreb Stock Exchange was also not able tododge the effects of the global financial marketcrisis: regular turnover was cut in half regardingthe 2008 and the CROBEX index went throughdrastic oscillations of 90% between his lowestand his highest point (between 1.079 and2.318 points).
Nevertheless, the prices of the majority of themost liquid stocks where increased (HT +37%,Atalntska plovidba +40%, ADRIS +34,5%, INA
+40%, Atlantic grupa + 47,7% etc.) and thebiggest price gainer was JANAF with +117,2%.
There was significant decline in theconstruction sector (IGH -29%, Dalekovod -15,2%, INGRA -46,8%, Tehnika -24,7%).
The liquidity was consolidated into a smallgroup of stocks - the most liquid stocks (HT,Atlantska, IGH and Dalekovod) altogethergained the bigger turnover than all the other279 listed stocks.
Despite the difficult capital market conditions,Zagreb Stock Exchange continued to raise thequality of the services and in 2009 had threenew listings in the highest quotation, theOfficial Market.
Also, new index of blue-chip issues,CROBEX10, was launched in September 2009.The new CROBEX10 index provides a set oftools for investors to benchmark the blue-chipcompanies of the Zagreb Stock Exchange. Italso opens potential for the development ofinnovative investment products, such as index-linked funds and index certificates.
The new CROBEX10 index tracks 10 leadingcompanies at the ZSE in term of free-floatmarket capitalization and liquidity. CROBEX10components are selected from the CROBEXindex.
The Market Making facility was also introduced.
The new Capital Markets Law was introducedin the beginning of 2009 and offeredpossibilities to restructure the market, introducethe MTF, modify the shareholders structure etcand was generally a step toward the greaterharmonization with the European capitalmarkets practice. Following the new CapitalMarket Law, the new Stock Exchange ruleswere implemented in July 2009. The newlegislative changes introduced new types ofmarket stabilizers and investment tools,facilitated the access to market to anyinterested party and expanded the supply ofinstruments, while also raising transparency
standards and the requirements of informationquality for the candidates seeking a listing inthe prime market.
Despite the demanding trading environment in2009, Zagreb Stock Exchange remainsconfident about the ready and efficientresponse to future challenges.
FUTURE OUTLOOK
The slow recovery is ahead the globaleconomy but the concern still remains andglobal investors fear could affect domesticcapital market, liquidity and stock prices.
Further policy actions, especially in thefinancial sector, will be essential to induce therecovery. We anticipate further governmentaction as well as the use of other tools tostimulate growth. Equity market valuationsacknowledge the recessionary environment.The consensus view of market participants isthat stocks are cheap, but it is possible equityvaluations could re-test lows given the pendingweakness in future corporate earnings. Positive moments undoubtedly persist butcertain risks remain, challenging sustainablemarket recovery.
The Zagreb Stock Exchange will carefullyobserve global as well as regional economyand equity market trends and remain in linewith market expectations.
Year 2010 will test the capabilities of marketand stock exchange flexibility. Narrowing thetargets and carefully selecting priorities tostabilize the system, and regain the investors’confidence are the primary tasks.
Trading conditions for the 2010 will probablyremain challenging and the economic outlookfor 2010 is uncertain but we believe that ourleading regional position leaves us well placedfor the eventual recovery.
Ivana GazicGeneral Manager
FEDERATION OF EURO-ASIAN STOCK EXCHANGES ANNUAL REPORT JUNE 2010
PAGE 162

ZAGREB STOCK EXCHANGE
FEDERATION OF EURO-ASIAN STOCK EXCHANGES ANNUAL REPORT JUNE 2010
PAGE 163
OFFICIAL 6 MONTH STATISTICS
US$ millions # Shares millionsTotal Volume Average Daily Volume Total Volume Average Daily Volume
StocksJul-09 125.55 5.46 2.69 0.12
Aug-09 78.21 3.91 1.77 0.09Sep-09 142.79 6.49 3.42 0.16Oct-09 123.58 6.18 2.57 0.13Nov-09 117.80 5.61 2.83 0.13Dec-09 81.03 3.68 2.29 0.10TOTAL 668.96 5.22 15.57 0.12
BondsJul-09 11.19 0.49 43.22 1.88
Aug-09 9.51 0.48 18.29 0.91Sep-09 64.25 2.92 184.01 8.36Oct-09 70.55 3.53 292.50 14.62Nov-09 70.64 3.36 312.64 14.89Dec-09 48.29 2.20 154.61 7.03TOTAL 274.43 2.16 1,005.27 7.95
OtherJul-09 0.00 0.00 0.00 0.00
Aug-09 0.34 0.02 0.95 0.05Sep-09 0.12 0.01 0.48 0.02Oct-09 0.01 0.00 0.05 0.00Nov-09 0.00 0.00 0.00 0.00Dec-09 0.00 0.00 0.00 0.00TOTAL 0.47 0.01 1.47 0.04
MONTHLY STOCK VOLUME VS INDEX(US$ millions)
MONTHLY MARKET CAPITALIZATION(US$ millions)
0
5,000
10,000
15,000
20,000
25,000
30,000
0
20
40
60
80
100
120
140
160
Stocks Index
Jul Aug Sep Oct Nov Dec Jul Aug Sep Oct Nov Dec0
500
1,000
1,500
2,000
2,500
Market Capitalization(US$ millions) Index
Jul-09 25,245.80 1,878.90Aug-09 27,093.30 2,009.00Sep-09 29,997.70 2,197.40Oct-09 28,589.90 2,144.80Nov-09 27,859.20 2,066.90Dec-09 26,598.60 2,004.10
CONTACT INFORMATION
Contact Name Mr. Zeljko Kardum E-mail [email protected] Website www.zse.hr

FEDERATION OF EURO-ASIAN STOCK EXCHANGES ANNUAL REPORT JUNE 2010
PAGE 164
ZAGREB STOCK EXCHANGE
ECONOMIC AND POLITICAL DEVELOPMENTS
Politic and Economic EnvironmentThe centre-right government led by the HDZfaces serious challenges in 2010-11. Theunblocking of the stalled EU accessionnegotiations is a boost for the government, but itmust now make rapid progress with the requiredreforms for accession, get results in the fightagainst corruption and organised crime, andimplement policies to help the economy to getthrough the current crisis. In addition, the HDZfaces the challenge of maintaining its direction,following the surprise resignation as primeminister of Ivo Sanader, the party's leader since2000, in July. Jadranka Kosor has assumed theparty leadership and received support from theHDZ's coalition partners. However, the transitionhas given rise to a degree of discord within theHDZ, and Mrs Kosor's attempts over the comingmonths to cement her position and support basepresent some risk to the stability of thegovernment. It is necessary for Mrs Kosor to dothis, as the HDZ lags the Social Democratic Party(SDP) in the latest opinion polls, and unless theHDZ can unite and lead an effective governmentin 2010-11, the SDP will become the favorite togain the most support in the parliamentaryelection due in 2011.
Although opinion polls suggest that the Croatianpublic remain less than enthusiastic about theEU, Croatian politicians will pursue EUmembership as their main foreign policy goal.Croatian accession negotiations were held upthrough most of 2009, owing to the borderdispute with Slovenia. However, following abreakthrough in talks, Slovenia removed its defacto block on Croatian accession negotiations inSeptember. Croatia now has a realistic chance ofcompleting negotiations in the first half of 2010.Croatia's EU aspirations also received a massiveboost from the Irish "yes" vote to the Lisbon treaty.However, much ground still needs to be coveredin accession negotiations, and 2011 is the earliestlikely date for EU entry.
Given the broad-based support for EU integrationamong political parties, the government willcontinue to adhere to an agenda of EU-mandatedreforms. Control of the main economic ministrieshas helped the HDZ to avert attempts by thealliance of the Croatian Peasants' Party (HSS) and the Croatian Social Liberal Party (HSLS) toimpede reform. The government will aim tocomplete the technical phase of the negotiationsby the middle of 2010. Owing to the economicdownturn, the previous and new HDZgovernments have been forced to revise the 2009 budget. The government would still like tointroduce further expenditure cuts in the form ofreduced salaries to employees of state-ownedcompanies, but is likely to face significantopposition to this. The vexed privatization of the shipyards could yet stretch the governmentfinances further in 2009-10, as well as hold up EU accession and put the government underpressure of social unrest.
In January 2010. opposition Social Democrat IvoJosipovic, the 52-year-old law professor andclassical music composer, has won Croatia'spresidential election by a wide margin andsucceeds Stipe Mesic after 10 years as president.Although the presidential function is mainlyceremonial with limited powers on foreign policy,defense and the intelligence services, MrJosipovic has pledged to lead a fight againstcorruption and to help the government completeEU membership talks this year.
Economic PerformanceEuro area GDP is estimated to have contractedby 4.1% in 2009, and the recovery in 2010 is stillexpected to be modest, with world growth pickingup to 3.2% at purchasing power parity (PPP)exchange rates (previously forecast at 2.9%) andthe euro zone economy growing by just 0.8%(previously 0.5%). The weakness of demand inthe EU will continue to curtail Croatian exports ofgoods and services. We estimate the averageprice for dated Brent Blend crude oil to reachUS$62/barrel in 2009, rising to US$74/b in 2010,
before slipping to US$70/b in 2011, when weexpect US growth to dip slightly. We forecast thatthe US dollar will depreciate mildly in 2010 as riskaversion diminishes.
Real GDP contracted by 6.3% year on year in the second quarter of 2009, after a first-quarterdrop of 6.7%. Although this may signal that therecession has stabilised for now, it does notsuggest that a speedy recovery is likely. In Augustand September, data for retail sales and industrialoutput did not indicate a clear recovery, andcredit growth remained minimal. Reflecting acombination of depressed consumption, reducedinvestment activity and gloomy trading conditionsaffecting Croatian exports and tourism, we estimatereal GDP to have contracted by 5.4% in 2009.
Owing to the drop in international oil prices and the moderation of food prices, together withthe sharp contraction in domestic demand, weestimate that average annual inflation is decliningto an average of 2.5% in 2009 from 6.1% in 2008.We forecast that inflation will remain low in 2010-11, at an average of 2.5%, as domestic demandremains subdued, wage growth remains limitedand oil prices grow only slowly. The CroatianNational Bank (CNB, the central bank) iscommitted to using a stable exchange rate as anominal anchor for monetary policy. Although thekuna is likely to depreciate slightly against theeuro and the US dollar in the final quarter afterthe end of the tourism season, the currency willnot weaken so much as to make importedinflation a significant problem.
If necessary, the CNB will continue to intervene in the currency market to minimize the volatility of the kuna. The slow recovery in domesticdemand in Croatia will allow the current accountto continue to correct, owing to limited importgrowth and stronger tourism revenue. Thecurrent-account deficit is expected to moderate to an average of 5.1% in 2010-11.*
* The Economist Intelligence Unit Limited, November 2009
Key Information ContactsCroatian Agency for Supervision of Financial Services www.hanfa.hrMinistry of Finance www.mfin.hrCroatian Government www.vlada.hr
0
50
100
150
200
250
REAL GDP(HRK millions)
CONSUMER PRICES (% CHANGE PA; AV)(%)
2.0
2.5
3.0
3.5
4.0
4.5
5.0
5.5
6.0
6.5
2005 2006 2007 2008 2009 2010 2005 2006 2007 2008 2009 2010
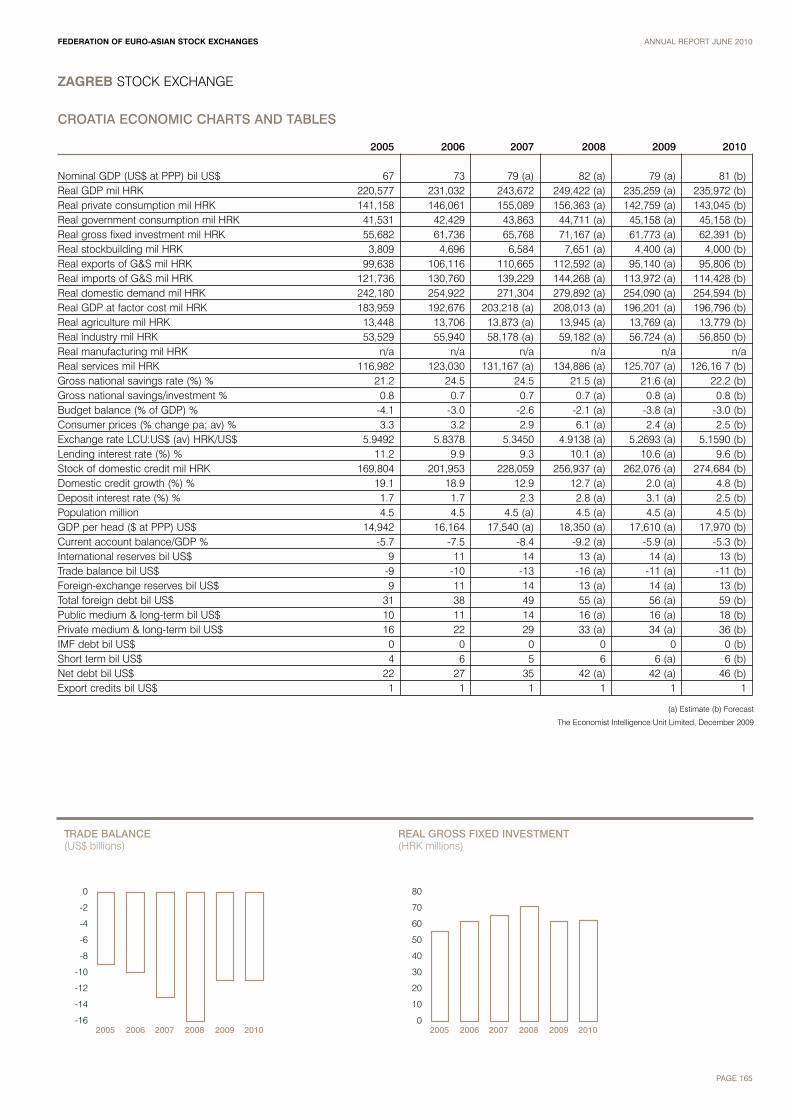
FEDERATION OF EURO-ASIAN STOCK EXCHANGES ANNUAL REPORT JUNE 2010
PAGE 165
ZAGREB STOCK EXCHANGE
CROATIA ECONOMIC CHARTS AND TABLES
2005 2006 2007 2008 2009 2010
Nominal GDP (US$ at PPP) bil US$ 67 73 79 (a) 82 (a) 79 (a) 81 (b)Real GDP mil HRK 220,577 231,032 243,672 249,422 (a) 235,259 (a) 235,972 (b)Real private consumption mil HRK 141,158 146,061 155,089 156,363 (a) 142,759 (a) 143,045 (b)Real government consumption mil HRK 41,531 42,429 43,863 44,711 (a) 45,158 (a) 45,158 (b)Real gross fixed investment mil HRK 55,682 61,736 65,768 71,167 (a) 61,773 (a) 62,391 (b)Real stockbuilding mil HRK 3,809 4,696 6,584 7,651 (a) 4,400 (a) 4,000 (b)Real exports of G&S mil HRK 99,638 106,116 110,665 112,592 (a) 95,140 (a) 95,806 (b)Real imports of G&S mil HRK 121,736 130,760 139,229 144,268 (a) 113,972 (a) 114,428 (b)Real domestic demand mil HRK 242,180 254,922 271,304 279,892 (a) 254,090 (a) 254,594 (b)Real GDP at factor cost mil HRK 183,959 192,676 203,218 (a) 208,013 (a) 196,201 (a) 196,796 (b)Real agriculture mil HRK 13,448 13,706 13,873 (a) 13,945 (a) 13,769 (a) 13,779 (b)Real industry mil HRK 53,529 55,940 58,178 (a) 59,182 (a) 56,724 (a) 56,850 (b)Real manufacturing mil HRK n/a n/a n/a n/a n/a n/aReal services mil HRK 116,982 123,030 131,167 (a) 134,886 (a) 125,707 (a) 126,16 7 (b)Gross national savings rate (%) % 21.2 24.5 24.5 21.5 (a) 21.6 (a) 22.2 (b)Gross national savings/investment % 0.8 0.7 0.7 0.7 (a) 0.8 (a) 0.8 (b)Budget balance (% of GDP) % -4.1 -3.0 -2.6 -2.1 (a) -3.8 (a) -3.0 (b)Consumer prices (% change pa; av) % 3.3 3.2 2.9 6.1 (a) 2.4 (a) 2.5 (b)Exchange rate LCU:US$ (av) HRK/US$ 5.9492 5.8378 5.3450 4.9138 (a) 5.2693 (a) 5.1590 (b)Lending interest rate (%) % 11.2 9.9 9.3 10.1 (a) 10.6 (a) 9.6 (b)Stock of domestic credit mil HRK 169,804 201,953 228,059 256,937 (a) 262,076 (a) 274,684 (b)Domestic credit growth (%) % 19.1 18.9 12.9 12.7 (a) 2.0 (a) 4.8 (b)Deposit interest rate (%) % 1.7 1.7 2.3 2.8 (a) 3.1 (a) 2.5 (b)Population million 4.5 4.5 4.5 (a) 4.5 (a) 4.5 (a) 4.5 (b)GDP per head ($ at PPP) US$ 14,942 16,164 17,540 (a) 18,350 (a) 17,610 (a) 17,970 (b)Current account balance/GDP % -5.7 -7.5 -8.4 -9.2 (a) -5.9 (a) -5.3 (b)International reserves bil US$ 9 11 14 13 (a) 14 (a) 13 (b)Trade balance bil US$ -9 -10 -13 -16 (a) -11 (a) -11 (b)Foreign-exchange reserves bil US$ 9 11 14 13 (a) 14 (a) 13 (b)Total foreign debt bil US$ 31 38 49 55 (a) 56 (a) 59 (b)Public medium & long-term bil US$ 10 11 14 16 (a) 16 (a) 18 (b)Private medium & long-term bil US$ 16 22 29 33 (a) 34 (a) 36 (b)IMF debt bil US$ 0 0 0 0 0 0 (b)Short term bil US$ 4 6 5 6 6 (a) 6 (b)Net debt bil US$ 22 27 35 42 (a) 42 (a) 46 (b)Export credits bil US$ 1 1 1 1 1 1
-16
-14
-12
-10
-8
-6
-4
-2
0
TRADE BALANCE(US$ billions)
2005 2006 2007 2008 2009 20100
10
20
30
40
50
60
70
80
REAL GROSS FIXED INVESTMENT(HRK millions)
2005 2006 2007 2008 2009 2010
(a) Estimate (b) Forecast
The Economist Intelligence Unit Limited, December 2009

FEDERATION OF EURO-ASIAN STOCK EXCHANGES ANNUAL REPORT JUNE 2010
PAGE 166
AFFILIATE MEMBER PROFILES
Central Registry Agency Inc. 167
Central Securities Depository of Iran 168
Macedonian Central Securities Depository 169
National Depository Center of Azerbaijan 170
Misr for Clearing, Settlement & Central Depository 171
Securities and Exchange Brokers Association of Iran (SEBA) 172
Securities Depository Center (SDC) of Jordan 173
Takasbank - ISE Settlement and Custody Bank, Inc. 174
Tehran Securities Exchange Technology Management Company (TSETMC) 175
The Association of Capital Market Intermediary Institutions of Turkey 176

FEDERATION OF EURO-ASIAN STOCK EXCHANGES ANNUAL REPORT JUNE 2010
CENTRAL REGISTRY AGENCY INC. AFFILIATE MEMBER
Over the past four years since thedematerialization process for equities andmutual funds began CRA has been workingto extend the range of assets held in itselectronic book-keeping system.
The adverse effects of the global financial crisisthat heavily hit the world markets by the lastquarter of 2008 were mostly felt in last year. We believe that ensuring a trusted post-tradeinfrastructure will be one of the crucial elementsto constitute investor confidence towards a fulleconomic recovery.
Through the crisis capital markets regulators allover the world emphasized the role of safe andsecure financial infrastructures to prevent furthercrisis in the future. It is now widely accepted thatcountries should review and adapt theirinfrastructures to reflect the new risk managementrequirements. CRA’s efforts in this framework toimplement an information security system atglobal standards has been awarded with theprestigious ISO/IEC 27001:2005 certification bySGS United Kingdom in 2009.
Over the past four years since thedematerialization process for equities and mutual funds began CRA has been working toextend the range of assets held in its electronicbook-keeping system. In this regard, the issue ofthe first dematerialized bank bills was one of thehighlights of 2009 for us. Other asset types,including warrants, are expected to be added tothe depository held securities this year.
In 1 June 2009 we have finalized the first phase of the SWIFT Integration Project in cooperationwith Takasbank which will allow CRA todisseminate corporate action information viaSWIFT by ISO compliant messages based oninformation provided by issuers through oursystem. This project will take us one step closerto the full automization of corporate actionsprocesses which will bring dramatic reductions incosts and operational risk.
Aside from managing the Investors ProtectionFund investor services that are targeted tominimize any viable risks and/or operationalerrors has been one of the primary businessconcentration areas of CRA. To this end, weintroduced the new Electronic Customer AlertSystem (e-CAS 2.0) which will send accountmovement notifications to investors through SMSand e-mail messages, even without such aninvestor request. In its later phases the systemwill prevent specific account activities forunsubscribed investors and restrict sometransactions conditional on investor confirmation.
We are looking forward to react to the challengesof a new era in the global financial system andthe post-trade industry We will be working closelywith our stakeholders to assist in achieving suchan immense goal.
History and DevelopmentCRA was established in accordance with the Article10/A of the Turkish Capital Markets Law in 2001 as thecentral depository for and registrar of dematerializedcapital market instruments comprising equities, mutualfunds, exchange traded funds, corporate bonds andcommercial papers and rights affixed thereon withrespect to issuers, intermediary institutions, andbeneficial owners.
In November of 2005, all stock certificates traded atthe Istanbul Stock Exchange, including the certificatesformerly kept at Takasbank (ISE Settlement andCustody Bank), were dematerialized. Between April2005 and March 2006, all mutual fund certificateswere dematerialized on the CRA platform. In August2006, after approximately 5 years, first corporate bondin Turkish Capital Markets was issued through CRA. InSeptember 2009 first dematerialized bank bills wereissued.
All depository operations regarding dematerializedcapital market instruments (e.g. opening of investoraccounts, corporate actions, securities issues) areconducted by CRA participants via the CentralDematerialization System software, CDS, a proprietarysoftware developed in-house. CRA also acts as thesecurities agent for on-exchange settlements ofequities traded at the ISE and real time DVPsettlements of equities for Securities Lending andBorrowing facility of Takasbank through the integratedsystem with Takasbank.
CRA also manages and represents the InvestorsProtection Fund, an investor protection scheme against
obligations arising from equities transactions ofintermediary institutions and banks for which aliquidation or bankruptcy decision is made byregulatory authorities.
Form of SecuritiesDematerialized.
Legal StatusJoint stock company.
Type of Commercial EntityFor-profit, user-owned joint stock company.
Regulated byCRA’s overall functions are subject to the oversight andapproval of the CMB.
Size of the Investors ProtectionFundUS$ 119 million.(as of year end)
Ownership30% Istanbul Stock Exchange (ISE)64.9% ISE Settlement and Custody Bank (Takasbank)5% The Association of Capital Market IntermediaryInstitutions of Turkey (TSPAKB) 0.1% Istanbul Gold Exchange (IGE)
Board of Directors: 7 MembersThe Capital Markets Board of Turkey (CMB): 1 (Chairman)ISE: 2Takasbank: 2TSPAKB: 1CRA: 1 (CEO of CRA)
Memberships to InternationalOrganizationsEuropean Central Securities Depositories Association(ECSDA)International Securities Services Association (ISSA)
Future OutlookCRA and Takasbank's integrated SWIFT system wentlive on 1 June 2009, and has allowed CRA todisseminate corporate action information via SWIFT byISO compliant messages based on informationprovided by issuers through the CDS. The servicewhich mainly targets foreign institutional investors is thefirst phase of Takasbank and CRA’s SWIFT integrationproject.
CRA also finalized a number of projects whichimproved the level of investor services provided by thedepository. CRA’s Web Investor page through whichinvestors can get information and apply investorblockages on their securities holdings has beenrevamped. The new interface now allows investors toget visual data on their portfolios.
Furthermore, CRA’s Electronic Customer Alert System(e-CAS), which was developed as a precaution againstany errors or misusages concerning investors’securities, has been upgraded last year. The new e-CAS 2.0 will now send account movement notificationsthrough SMS and e-mail messages, even without aninvestor request, to minimize or remove viable risks.
CRA was also awarded with ISO 27001 informationsecurity certification by SGS United Kingdom in 2009.
Dr. Yakup ErgincanCEO
CONTACT INFORMATION
Address Askerocagi Cad. Suzer Plaza No: 15 Kat: 3 34367 Elmadag/IstanbulTel +90 (212) 334 57 00 Fax +90 (212) 334 57 57Contact Name Mr. Ozgur Uysal E-mail [email protected] Website www.mkk.com.tr
* Please refer to page 96 for the Turkey country report.
PAGE 167

Contact Name Mr. Alireza Hajinorouzi E-mail [email protected], [email protected] Website www.csdiran.com Address 14, Azhari St., Hafez Ave., Tehran 1134844413Phone +9821 667 49 180 Fax +9821 667 49 257
Our objective is to guarantee the securityand efficiency of Iran’s stock marketthrough developing and improving thesettlement procedure of the securitiestrades via concentrating on increasing theefficiency and reducing the risk and costs.
Alireza Hajinorouzi CEO
FEDERATION OF EURO-ASIAN STOCK EXCHANGES ANNUAL REPORT JUNE 2010
Objectives:The objectives for which the company isestablished are:
1– Opening and custody of funds/securitiesaccounts related to stock exchange, over thecounter market, commodity exchangebelonging to brokers, shareholders and otherfinancial institutions, real or legal persons.
2– Registration, encoding, custody, clearingand settlement of trade transactions on stockexchange, commodity exchange and otherfinancial tools
3– Depositing different kind of securities incompany’s operating system
4– Depositing Pledged securities for real andlegal entities and release of the pledge on thebeneficiaries demands
5– Borrowing, lending and exchange ofsecurities as a mediator
6– Providing and performing latest essentialinformation for shareholders and brokers
7– Applying suitable electronic systems onclearing and settlements
8– Handling corporate actions for joint stockcompanies including:
A– Registration and custody of shareholders’names and records and give necessaryservices to the issuers of securities
B– Prepare and present necessaryinformation to the listed companies and theirshareholders
C– Holding general meetings for membercompanies and over the counter (OTC)market companies
D– Receiving information about generalmeetings and informing their investors
E– Receiving information about dividend,bonus share, right issues and deliver theseinformation to the shareholders
9– Settlement of funds, Clearing andDepositing of the foreign securities
10– Presenting professional necessaryservices to stock exchanges, over the countermarket, commodity exchange, the issuer ofsecurities, brokers and other marketparticipants
11– Providing necessary authorized financialactivities also services, consulting andcommercial activities in relation with stockexchange, commodity exchange and over thecounter market
12– Cooperating with regional exchanges andrelated institutions
13– Changing the method of settlement fromthe current semi mechanized system to a fullmechanized, efficient system through usingReal Time Gross Settlement (RTGS)
14– Establishing and managing settlementguarantee funds, also accepting the role ofCCP
15– Providing warehouses and managingtheir activities for better performance ofcommodity exchange services
16– and regulation – Performing other dutieswhich have been or shall be assigned to thecompany by law
CSDI CENTRAL SECURITIES DEPOSITORY OF IRAN AFFILIATE MEMBER
CONTACT INFORMATION
* Please refer to page 148 for the Iran country report.
PAGE 168

FEDERATION OF EURO-ASIAN STOCK EXCHANGES ANNUAL REPORT JUNE 2010
PAGE 169
* Please refer to page 114 for the Macedonian country report.
MACEDONIAN CENTRAL SECURITIES DEPOSITORY (MCSD) AFFILIATE MEMBER
The main goal of MCSD is to helpgovernment to keep economic stability, andalso to help investors, custodian banks andissuers by providing fast and reliableservices.
General InformationThe purpose of the Macedonian Central SecuritiesDepository (MCSD) is to establish central securitiesregister comprising all active shares, bonds andother financial instruments in Republic ofMacedonia. This will lead to better access anddistribution of information about the issuers andsecurities to:• Investors • Foreign investors• Holders of restrictive rights• Issuers• Brokers• Macedonian Stock Exchange (MSE)• Pledge Register• Other authorized institutions in accordance withthe law.
Regulatory EnvironmentThe MCSD is Self Regulatory Organization, underauthority of Security Exchange Commission.
ParticipantsAt present time, there are 22 participants, banksand brokerage houses.
Services ProvidedThe MCSD is providing the following services to theparticipants in the operations, issuers and holderssecurities: • recording of the securities in the Depository; • notification of the issuers and holders of securitiesabout the condition on their accounts; • clearing and settlement of the liabilities arisingfrom the transactions with securities; • rendering services connected with the corporateactivities; • other services that arise from the ownership andtransactions with securities, arising from the scopeof its operations.
Form of SecuritiesAll securities are registered and dematerialized.
Depository ProceduresRecords are kept in the Depository of the issuedsecurities and ownership positions, rights of thesecurities holders, the unique identification of the
securities and their holders, possible limitations inthe exercise of such rights, rights of third partiesconnected with the securities and other datareferring to such rights, transfer to the securitiesaccounts shall be made and other servicesconnected with keeping records of the securitiesshall be provided. All securities shall be recorded inthe Depository in a procedure, on conditions and ina manner determined with these Rules and with theguidelines of the Depository.
ISIN is allocated to all securities upon theirregistration in the Depository. ISIN shall contain dataon the issuer, rights arising for the holders of thosesecurities and other elements of the securities. Theprocedure, conditions and manner of allocating ISINis determined by the guidelines of the Depository.
The securities are recorded in special accounts withthe Depository. With the purpose of recording thesecurities, the Depository is opening accounts forthe issuers and holders of the securities.
The opening and closing of the securities accounts,recording, changes and deletion of the ownershippositions in the accounts of the securities holders,as well as other actions connected with the changesoccurred in the accounts maintained in theDepository are performed by a sole accountoperator. The manner and procedure of openingand closing an account and the types of accountswith the Depository is prescribed within theguidelines of the Depository.
Principles of Clearing & SettlementMain principle of clearing and settlement is deliveryversus payment.
Settlement CycleSettlement cycle is usually T+3, but it is possible tosettle transactions from T+1, to T+n
Clearing & Settlement Procedures• CSD performs the clearing and settlement of thetransactions with securities that were concluded onthe MSE. • The clearing and the settlement of thetransactions are performed in accordance with the
principle “delivery versus payment”, i.e. the transferof securities related to the transactions withsecurities is performed through a simultaneousexchange of securities and payment. The settlementis performed on gross basis.• In MCSD frame the subject of clearing andsettlement are all the transactions with securitiesconcluded on the MSE.• The MCSD performs the clearing and settlementof the transactions with securities based on the datareceived from the MSE on the trading day. The datareceived from the MSE contains elementsnecessary for clearing and settlement of thematched transactions.• After the MCSD receives the matched trades fromthe MSE, the transaction is obligatory for both sidesincluded in the stated transaction.• The transactions received from the MSE are finaland cannot be unilaterally canceled by theparticipant in the clearing (the broker). Only theMCSD is allowed, by request from the MSE andwith a special purpose for correction of errors, toperform some changes or to cancel thetransactions. • Before the settlement, the participant in theclearing–the seller, is obliged to provide securitieson his/on his client the securities account, and theparticipant in the clearing–the buyer, is obliged toprovide cash on his account for cash settlement foreach transaction.
Macedonian CSD Future Outlook 2009These are the main issues on which MacedonianCSD will focus during 2009:
In Progress• Start of Securities Lending System in practice• Updating of Business Continuity Plan• Developing value added services for Issuers ofsecurities• Maintenance of Government securities• Developing electronic system for Custodian banks
Planned• Distributed system for account holders• Change of trades processing and pre-clearing• Change of by-laws and instructions according tochange of trade processing
Stevan SapceskiExecutive Director
CONTACT INFORMATION
Contact Name Ms. Sofija Vidovic E-mail [email protected] Website www.cdhv.org.mk
Macedonian Central Securities Depository is oneof the central links in Capital Market structure,and as such plays a big role in development ofMacedonian Capital Market.
Macedonian economy is small and is under biginfluence of surrounding economies and worldeconomic crisis. The main goal in suchenvironment for Macedonian Central Securities
Depository as one of the main financialinstitutions is to help government in its efforts tokeep economic stability, and also to helpinvestors, custodian banks and issuers byproviding fast and reliable services. In year tocome, Macedonian Central Securities Depositorywill focus on ongoing development of newservices.
In year 2008, Macedonian Central SecuritiesDepository was helping investors by reducing thecost of settlement of trade transactions by 27%and is hoping that this is good effort in providinga suitable ground to increase market tradevolume.

FEDERATION OF EURO-ASIAN STOCK EXCHANGES ANNUAL REPORT JUNE 2010
PAGE 170
Secure, stable and encouraging investmentenvironment is the goal of MCDR.
MCDR was established at the end of 1994 tocomplete the infra structure of the Egyptiancapital market. In time, MCDR has become thebiggest central registry firm among the majorand emerging markets in the world. MCDR’sstaff never spare any efforts to maintain thehighest standard of services provided to theEgyptian market. As a result of its qualifiedperformance, MCDR was awardedInternational Star Award for Quality WQC in theDiamond for the Quality standardscommitment applied through MCDR onNovember 26, 2007 in the Concorde LaFayette in Paris with the ISO in Management
(QC100), the International Gold Star for Qualityin Geneva in 2001 for significant contributionto the business world, for high standing andprofessionalism demonstrated by prestigiousperformance, B.I.D. (Business InitiativeDirections) presented its special recognitionaward to MCDR. Also MCDR was granted thehighest level of efficiency, following the resultsof an assessment panel of depositorycompanies conducted by JPMorgan–Chase,with a score of 1.25 points on a scale of 1 to 3where depository that closely resemble thebest practice is rated 1, meet some of therequirements but not fully meet the preferred
practice rated 2 and finally depositories thatare deficient are rated 3.
The assessment revealed that MCDR hasabided by all the rules and high standards setby the SEC in Rule 17f-5 which even havebeen developed to be more tough byamendments in Rule 17f-7 to secure Americanforeign investments. Secure, stable andencouraging investment environment is thegoal of MCDR. This is never enough as MCDRwill proceed its stable steps towards the top ofelite depositories.
Mohamed S. Abdel Salam Chairman & Managing Director
Role of the DepositoryMCDR is the sole Egyptian CSD providingclearing and settlement services to the Cairoand Alexandria Stock Exchanges (CASE).MCDR operates as both the depository andthe clearing house. It is a not for-profit privatecompany owned by the stock exchanges,local banks and its participants. It wasincorporated under the Capital Market Law No95 of 1992, commenced operations in October1996 and is currently governed by theDepository and Central Registry Law No 93 of2000. It is regulated by the Capital MarketsAuthority (CMA).
Use of the central depository in the market forsettlement and safekeeping is compulsory bylaw, where securities in the depository are heldin certificated form. Equities are held via book-entry, with certificates immobilized in MCDR’svaults. All securities are treated as fungibleand may be transferred or pledged bybookkeeping entry without actual physicaldelivery.
MCDR’s authorized capital is EGP250 million issued and paid capitalis EGP 140 million. MCDR Main Activities & Services 1. Clearing and settlement of operationsexecuted at the Egyptian Exchange.2. Central depository and registry of all listedand unlisted securities3. Management of securities accounts forcustodian banks and issuers.
4. Handling corporate actions (cash and stockdividends etc.) according to the issuers’assemblies’ decisions.5. Management of the Settlement GuaranteeFund to eliminate suspended movements dueto brokers’ defaults (securities and/or cash).6. Management of a pledge system for allsecurities lodged into the central depository.7. Repatriation of international investors’ funds.8. Customer servicing through the MCDR’sfront office, the call center, the Internet, theSMS and finally through direct phones or faxes
Legal StatusPrivate Joint-Stock Company
Type of Commercial EntityNot for-profit company
Regulated byDepository and Registry law number 93 of year 2000
Form of SecuritiesImmobilized in the book entry form
Form of SettlementNet cash settlement, gross securitiessettlement
Settlement DatesT+0 Same Day Trading Settlement T+1 Treasury BondsT+2 Dematerialized securitiesT+4 Physical securities
Misr for Central Clearing,Depository & Registry - MCDR'sachievements through year 2009• MCDR was granted A+ in Thomas MurrayDepository Risks assessments.• MCDR signed a NDA with Linkup Markets tobecome a member.• MCDR signed a MoU with JASDEC Japanfor mutual co-operation.• MCDR was granted ISO 27001 which allowsthe company to operate an InformationSecurity Management System• MCDR issued its first Egyptian DepositoryReceipt• MCDR was granted the license by EgyptianFinancial Supervisory Authority - EFSA to actas a Depository Bank.• MCDR opened accounts with Clearstreamand Eurobank for securities and cashsettlements.
MISR FOR CLEARING, DEPOSITORY & REGISTRY AFFILIATE MEMBER
CONTACT INFORMATION
Contact Name Mohamed S. Abdel Salam E-mail [email protected] Website www.mcdr.com.egAddress 70 El-Gomhoria St., P.O. Box 1536 Attaba, Cairo, Egypt Phone +2022 5971 505-506-509 Fax +202 5971 670-523
* Please refer to page 82 for the Egypt country report.
PAGE 170

Brief HistoryThe concept of National Depository System was first introduced in the “State Program ofprivatization of the state ownership in AzerbaijanRepublic 1995-1998”. In accordance with the StateProgram the Depository System was formed forregulated holding of de-/materialized securities,leading of shareholders registers, registration ofowners of securities as well as transactions withthem and also for rendering all other depositoryservices. In order to advance the DepositorySystem and its regulatory framework, thepresidential degrees "On the National DepositorySystem" and "On the Rules on leading of theshareholder's registry of the joint-stock companiescreated during the privatization of the state firmsand specialized check investment funds" wereadopted in 1997. The creation of the NationalDepository Center was stipulated by the provisionsof "On the National Depository System" regulations.
On the 18 September, 1997 The NationalDepository Center was created. The NationalProperty Committee acted as a holder of 100%shares of the National Depository Center. Theshares of NDC were then handed over to the StateCommittee for Securities after its creation in 1999.As a result NDC was newly founded by the StateCommittee for Securities on the 8 September 1999 and passed the national registration on 17September 1999. The National Depository Centerhas a license on depository and registrationalactivities granted by the State Committee forSecurities of the Republic of Azerbaijan.
Since December 22, 2004, the NDC joined theAssociation of Eurasian Central SecuritiesDepositaries (AECSD) as a full member. OnNovember 17, 2006 the NDC came into globalpartnership agreement with the Association ofNational Numbering Agencies (ANNA) and wasappointed as a National Numbering Agency. NDCis also member of International Securities ServicesAssociation (ISSA).
According to the regulations “On the NationalDepository System" the National Depository Centeris the state organization, which plays the main rolein the National Depository System, engaging thedepository activity and carrying records of otherdepositories that are included in depository systemof the country.
Future OutlookOn the early stages of the stock marketdevelopment the National Depository Centrecarried out the function of keeping registry ofshareholders and depositing shares of joint-stockcompanies formed as a result of the stateprivatization program. However, nowadays thecurrent condition of the stock market demandsinfrastructural and systematic advancement of theDepository. Having examined the challengescoming from the today’s stock market andanalyzed internal capabilities, the NDC has workedout a strategic vision and prepared the itemizedaction plan for the depository system conversion.The strategic vision of the NDC aims to achieve thefollowing objectives:
•To stimulate institutional development of the NDCby implementing the globally accepted CorporateGovernance standards; • To launch large-scale clearing operations in orderto ensure the synchronized securities and fundsentitlements settlement;
In order to reach its strategic objectives, the NDCplans to implement the following projects andarrangements:
• To improve the organizational structure of theDepository and to accommodate it to the strategicvision and action plan;• To implement the highest corporate governancestandards;• To refine internal audit and controlling channels;• To arrange systematic Risk Analysis andManagement approach;• To re-regulate internal document managementprocedures;• To create feasible electronic transmission linkswith the Baku Stock Exchange;• To join SWIFT network;• To implement paperless documentation turnoverwith the professional participants of the Market;• To create effective electronic Customers InquiriesManagement network.
FEDERATION OF EURO-ASIAN STOCK EXCHANGES ANNUAL REPORT JUNE 2010
PAGE 171
* Please refer to page 58 for the Azerbaijani country report.
NATIONAL DEPOSITORY CENTER OF AZERBAIJAN AFFILIATE MEMBER
National Depository Center has gonethrough significant functional, structuraland operational reforms during the 2009.
National Depository Center has gone throughsignificant functional, structural and operationalreforms during the 2009. Despite the globaleconomic and financial downturn, NDC not onlyfinished the year with an operating profit, but alsoput a great emphasis on material and technicaladvancement of the organization.
The value of the assets kept in custody by theNational Depository Centre neared AZN 3.3 bln.At present, NDC serves approximately 1300issuers, circa 100 000 investors and 10 brokerorganizations.
In order to ensure proper and transparentregistration of the transactions in accordance withinternationally accepted principles the NDCstarted implementing the International FinancialReporting Standards, including international
financial reporting, accounting and auditingstandards. Under the market’s institutionalstrengthening strategy, the process oftransforming the NDC into the centralizeddepository for the corporate and public securitiesis being closely consulted and guided by anumber of international experts and institutions,and we constantly work on new projects withthem.
Joint projects with the Islamic Development Bank,Turkey’s IMKB Takasbank central depository, EU’sTACIS Project, World Bank etc are just anotherillustrative evidence of the above mentioned.
Measures to advance our technology platformundertaken in 2009, as a constituentelement of our business processes optimizationstrategy in registry keeping, depository services
or any other services rendered, were utterlyefficacious for protecting investors rights as wellas increasing the protection level of kept incustody assets.
One of the ambitious tasks that the NDC sets foritself in 2010 is to start implementing electronicsettlement and clearing services of reciprocalobligations between market participants involvedinto securities trading. This will surely increase notonly transactional responsiveness, but alsotransparency and security of operations.
We believe we can expect an intensive andseminal 2010 ahead and infrastructuraladvancements will be principal mission and thehighest aim for us.
Bakhtiyar AzizovChief Executive Officer
CONTACT INFORMATION
Contact Name Rasim Mammadov E-mail [email protected] Website www.mdm.azAddress 19, Bul-Bul Avenue, Baku AZ1000 Azerbaijan

FEDERATION OF EURO-ASIAN STOCK EXCHANGES ANNUAL REPORT JUNE 2010
PAGE 172
* Please refer to page 148 for the Iran country report.
SECURITIES AND EXCHANGE BROKERS ASSOCIATION OF IRAN (SEBA) AFFILIATE MEMBER
The Securities and Exchange BrokersAssociation was registered in April 2007,and subsequently received its operationlicense from the Securities and ExchangeOrganization.
History and DevelopmentThe Securities and Exchange BrokersAssociation was registered in April 2007, andsubsequently received its operation license fromthe Securities and Exchange Organization.
SEBA's organizational chart includes generalassembly, association's council, executivecommittee and auditor/inspector.
The association is a non-governmental, not forprofit entity, which represents Tehran StockExchange's members.
Objectives1. Assisting the development of a fair,competitive and effective marketplace forsecurities trading in Iran.2. Raising SEBA members' credibility amonginvestors.3. Increasing members' technical knowledge.4. Improving services and adjusting members'interrelations.
Main Activities1. Proposing regulations, and admitting,suspending, as well as annulling memberships.2. Monitoring members' performances andassessing their activities.3. Evaluating members' businessannouncements, in order to prevent anydefective and fraudulent informationdissemination.4. Ratification of professional and disciplinarycodes and standards for SEBA's members.5. Helping brokers, dealers and market makers'reconcile their disputes.6. Facilitating the development of the constantsystematic and technical training for themembers to increase knowledge and servicequality.7. Performing research studies and publishingmagazines and books on the same topics.8. Holding conferences and training courses forthe members and public.
Outlook 20101. Pursuing the bank credits taskforce meetingsto fund the brokerage industry.2. Ongoing monitoring of the brokerage firms'operational risks and designing risk-reductionstrategies.3. Holding at least two virtual courses andmaintaining the common training courses.4. Upholding the professional work groups'studies and activities for brokers rating, issuingcertificates, trade and post-trade solutions,commodities Exchange and export ringdevelopment, absorbing foreign investment, andraising professional ethical codes.5. Boosting SEBA's relations with internationalcapital markets' entities, as well as news andinformation broadcasting agencies.6. Providing a comprehensive insurancepackage for the Iranian brokerage industry.7. Attaching with social responsibilities activitiesand commitments.
Hossein Khezli KharaziGeneral Secretary
CONTACT INFORMATION
Contact Name Mr. Amir Yousefianpour E-mail [email protected] Website www.seba.irAddress Second floor, # 17, Sibouyeh intersection, Shahid Qandi street, Sohrevardi avenue, Tehran Phone 0098 21 88524145-6 Fax 0098 21 88525988
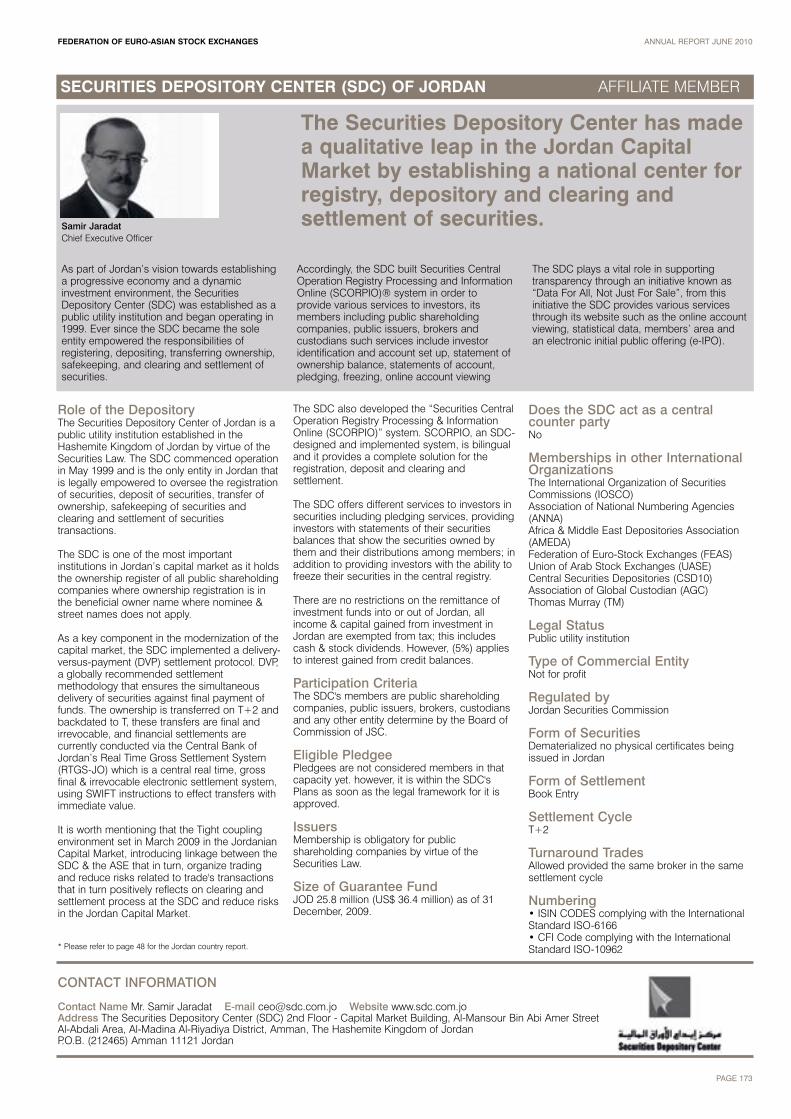
FEDERATION OF EURO-ASIAN STOCK EXCHANGES ANNUAL REPORT JUNE 2010
PAGE 173
* Please refer to page 48 for the Jordan country report.
SECURITIES DEPOSITORY CENTER (SDC) OF JORDAN AFFILIATE MEMBER
The Securities Depository Center has madea qualitative leap in the Jordan CapitalMarket by establishing a national center forregistry, depository and clearing andsettlement of securities.
As part of Jordan’s vision towards establishinga progressive economy and a dynamicinvestment environment, the SecuritiesDepository Center (SDC) was established as apublic utility institution and began operating in1999. Ever since the SDC became the soleentity empowered the responsibilities ofregistering, depositing, transferring ownership,safekeeping, and clearing and settlement ofsecurities.
Accordingly, the SDC built Securities CentralOperation Registry Processing and InformationOnline (SCORPIO)® system in order toprovide various services to investors, itsmembers including public shareholdingcompanies, public issuers, brokers andcustodians such services include investoridentification and account set up, statement ofownership balance, statements of account,pledging, freezing, online account viewing
The SDC plays a vital role in supportingtransparency through an initiative known as“Data For All, Not Just For Sale”, from thisinitiative the SDC provides various servicesthrough its website such as the online accountviewing, statistical data, members’ area andan electronic initial public offering (e-IPO).
Role of the DepositoryThe Securities Depository Center of Jordan is apublic utility institution established in theHashemite Kingdom of Jordan by virtue of theSecurities Law. The SDC commenced operationin May 1999 and is the only entity in Jordan thatis legally empowered to oversee the registrationof securities, deposit of securities, transfer ofownership, safekeeping of securities andclearing and settlement of securitiestransactions.
The SDC is one of the most importantinstitutions in Jordan’s capital market as it holdsthe ownership register of all public shareholdingcompanies where ownership registration is inthe beneficial owner name where nominee &street names does not apply.
As a key component in the modernization of thecapital market, the SDC implemented a delivery-versus-payment (DVP) settlement protocol. DVP,a globally recommended settlementmethodology that ensures the simultaneousdelivery of securities against final payment offunds. The ownership is transferred on T+2 andbackdated to T, these transfers are final andirrevocable, and financial settlements arecurrently conducted via the Central Bank ofJordan’s Real Time Gross Settlement System(RTGS-JO) which is a central real time, grossfinal & irrevocable electronic settlement system,using SWIFT instructions to effect transfers withimmediate value.
It is worth mentioning that the Tight couplingenvironment set in March 2009 in the JordanianCapital Market, introducing linkage between theSDC & the ASE that in turn, organize tradingand reduce risks related to trade's transactionsthat in turn positively reflects on clearing andsettlement process at the SDC and reduce risksin the Jordan Capital Market.
The SDC also developed the “Securities CentralOperation Registry Processing & InformationOnline (SCORPIO)” system. SCORPIO, an SDC-designed and implemented system, is bilingualand it provides a complete solution for theregistration, deposit and clearing andsettlement.
The SDC offers different services to investors insecurities including pledging services, providinginvestors with statements of their securitiesbalances that show the securities owned bythem and their distributions among members; inaddition to providing investors with the ability tofreeze their securities in the central registry.
There are no restrictions on the remittance ofinvestment funds into or out of Jordan, allincome & capital gained from investment inJordan are exempted from tax; this includescash & stock dividends. However, (5%) appliesto interest gained from credit balances.
Participation CriteriaThe SDC's members are public shareholdingcompanies, public issuers, brokers, custodiansand any other entity determine by the Board ofCommission of JSC.
Eligible PledgeePledgees are not considered members in thatcapacity yet. however, it is within the SDC'sPlans as soon as the legal framework for it isapproved.
IssuersMembership is obligatory for publicshareholding companies by virtue of theSecurities Law.
Size of Guarantee FundJOD 25.8 million (US$ 36.4 million) as of 31December, 2009.
Does the SDC act as a centralcounter partyNo
Memberships in other InternationalOrganizationsThe International Organization of SecuritiesCommissions (IOSCO) Association of National Numbering Agencies(ANNA)Africa & Middle East Depositories Association(AMEDA)Federation of Euro-Stock Exchanges (FEAS)Union of Arab Stock Exchanges (UASE)Central Securities Depositories (CSD10) Association of Global Custodian (AGC)Thomas Murray (TM)
Legal StatusPublic utility institution
Type of Commercial EntityNot for profit
Regulated byJordan Securities Commission
Form of SecuritiesDematerialized no physical certificates beingissued in Jordan
Form of SettlementBook Entry
Settlement CycleT+2
Turnaround Trades Allowed provided the same broker in the samesettlement cycle
Numbering• ISIN CODES complying with the InternationalStandard ISO-6166• CFI Code complying with the InternationalStandard ISO-10962
Samir JaradatChief Executive Officer
CONTACT INFORMATION
Contact Name Mr. Samir Jaradat E-mail [email protected] Website www.sdc.com.joAddress The Securities Depository Center (SDC) 2nd Floor - Capital Market Building, Al-Mansour Bin Abi Amer StreetAl-Abdali Area, Al-Madina Al-Riyadiya District, Amman, The Hashemite Kingdom of Jordan P.O.B. (212465) Amman 11121 Jordan

FEDERATION OF EURO-ASIAN STOCK EXCHANGES ANNUAL REPORT JUNE 2010
PAGE 174
CONTACT INFORMATION
Contact Name Ms. Filiz Kaya E-mail [email protected] Website www.takasbank.com.tr
TAKASBANK ISE SETTLEMENT AND CUSTODY BANK INC. AFFILIATE MEMBER
Takasbank has accomplished manyinnovative projects and created newmechanisms in the year 2009.
Takasbank has accomplished many innovativeprojects and created new mechanisms in the year2009 aiming at enhancing market efficiency andupgrading the services provided to the marketparticipants. During the course of the year, althoughdifficulties arising from the sub-prime mortgage crisisincreased its pace, Takasbank, with the knowledge ofthe need for a more reliable and stable technical andoperational infra-structure in crisis times, showedremarkable progress in terms of developing the infra-structure underpinning Turkish capital market clearing& settlement systems.
Takasbank, as the convenor of FEAS Affiliate TaskForce (TF), organized the fifth meeting of the TaskForce (TF) combined with a Workshop and hostedthese meetings in Antalya on 22-23 October 2009together with Central Registry Agency (CRA). In thesemeetings, TF endeavored to increase the number ofmembers of the FEAS Task Force, thereby to shareviews, information and provide more harmonizationon a wider platform in the FEAS region. Post-tradeinstitutions operating in the FEAS region were invitedto be a member of the Task Force in order to createan opportunity to exchange views and experience onthe key issues in the industry and respective markets.
Also TF aimed to express the importance ofharmonization of clearing, settlement and custodyservices in cross border transactions in the FEASregion and emphasized the importance of theintegrity of post-trade systems through effectivebusiness continuity management.
Within this framework, Takasbank, with thecooperation of the Affiliate Task Force Members andFEAS Secretariat prepared the “Business Continuityand Disaster Recovery Standards and Best Practicesfor Post-Trade Institutions” leaflet and distributed toall FEAS members at the fifth meeting of the TF. Itwas also underlined that business contingencystandards advice international best practice inbusiness continuity of the post-trade institutions.These best practices include creation andimplementation of improvements in operational riskmanagement practices, further harmonization ofglobal, legal and regulatory environment andimproved business continuity for providers of post-trade services.
In addition to these, a sub-working group was formedunder the convenorship of Takasbank. This sub-working group aimed to analyze local infrastructures
for interoperability among the post trade institutionsas a vehicle facilitating cross border transactions, toadvise on how to minimize the settlement risk of thebrokerage houses in cross border transactions aswell as to study on the feasibility of establishment ofa link-up among the post trade institutions in theFEAS Region.
In 2009, Takasbank and Muscat Depository &Securities Registration Company (MDSRC) signed aMemorandum of Understanding (MoU) in order toestablish a mutually beneficial relationship betweentwo institutions. This agreement aims to serve thegoal of improving performance and internationalcompetitiveness through mutual exchange ofinformation, know-how and training activities.
In order to enhance its international exposure,Takasbank applied to World Federation of Exchanges(WFE) for membership and granted “AssociateMembership” during the last quarter of 2009. Withthis membership, Takasbank aims to gain access toglobal capital markets and thus, pursue the latestdevelopments for capital markets.
General InformationTakasbank is incorporated as a non-deposit takinginvestment bank and is authorized by the CapitalMarkets Board of Turkey to function as: the Clearingand Settlement Institution for the ISE markets, theClearing House for the Turkish DerivativesExchange, the National Numbering Agency of Turkeyand the Custodian for the Mutual Funds andPension Funds incorporated in Turkey.
Services Provided• Central clearing and settlement for the organizedmarkets of ISE and Turkish Derivatives Exchange(TurkDEX), • Cash settlement and transfer facilities (domesticand cross-border),• Cross-border settlement and custody services,• Real Time Gross DvP settlement (among brokersand custodians) for equities via integration withSWIFT system• Takasbank Money Market,• Securities Lending and Borrowing Market (SLB),• Cash Credits, • Allocation of ISIN for securities issued in Turkey
Brief HistoryTakasbank started as a department within theIstanbul Stock Exchange (ISE) in 1988, and originallydealt with the provision of settlement services forsecurities traded by the members of the ISE. InJanuary 1992, the operations of that departmentwere transferred to an independent company, theISE Settlement and Custody Co. Inc., which was setup under the shareholdership of the ISE and itsmembers. This company was then transformed intoa sector-specific bank and renamed Takasbank (ISESettlement and Custody Bank, Inc.) in 1996.
Form of SecuritiesDematerialized
Form of Settlement and Transfers:Book-entry
Legal StatusJoint stock company
Settlement PeriodEquities: T+2Bonds and Bills: T+0Derivatives: T+1
Type of Commercial EntityPrivate sector for-profit company
Does Takasbank Act as a Central Counter Party?Takasbank acts as a Central Counter Party forTurkDEX, but does not act as a Central CounterParty for ISE markets.
Regulated byCapital Markets Board Banking Regulation and Supervision AgencyCentral Bank of Turkey.
Size of Guarantee Fund (As of December 2009)ISE Equities Market: US$ 35 millionISE Bonds and Bills Market: US$ 42 million
OwnershipIstanbul Stock Exchange (ISE): 32.63%Banks (19): 34.48%Brokerage Houses (66): 32.89%
Board of Directors: 11 MembersIstanbul Stock Exchange: 4Banks: 3Brokerage Houses: 2Capital Markets Board: 1and the President and CEO of Takasbank.
Memberships to International OrganizationsAssociation of National Numbering Agency (ANNA) International Securities Services Association (ISSA)Society for Worldwide Interbank Telecommunications(SWIFT)Association of European Central SecuritiesDepositories (ECSDA)Federation of Euro-Asian Stock Exchange (FEAS)Institute of International Finance (IIF)Organization of Islamic Conference (OIC)World Federation of Exchanges (WFE)
Future OutlookIn 2010, Takasbank intends to:• Continue its efforts to become a CentralCounterparty for equities and establish a centralcollateralization system• Contribute to the development of internationalstandards for securities and implementing thesestandards in Turkey.•Establishment and implementation of ElectronicTrading Platform for Commodities Exchange;•Development and integration of the collateral andrisk management software for Turkdex Optionsmarket;• Development of an Electronic Fund Platform tocreate a larger distribution channel for marketparticipants;•Development of an Options Market Clearing andSettlement infra-structure;•Integration of SWIFT and DvP settlement system forCorporate Action transactions.
Emin CatanaPresident & CEO
* Please refer to page 96 for the Turkey country report.

FEDERATION OF EURO-ASIAN STOCK EXCHANGES ANNUAL REPORT JUNE 2010
PAGE 175
* Please refer to page 148 for the Iran country report.
TEHRAN SECURITIES EXCHANGE TECHNOLOGY MANAGEMENT COMPANY (TSETMC) AFFILIATE MEMBER
The major project for TSETMC is toimplement a new trading solution for theTehran Stock Exchange (TSE) in the year2008.
TSETMC’s activities for the year 2008 are:
The major project at TSETMC is to implement anew trading solution for the Tehran StockExchange (TSE) in the year 2008. The tradingsolution was installed on the purchased hardwarein early April 2007. This Solution is due to comeonline in the winter of 2008 after finalization ofinternal and external User Acceptance Testing(UAT). TSETMC is also assisting the newlyestablished CSD Iran Company for theimplementation of a new post-trade solution.TSETMC has a very close relationship with CSDIran Company since all of the post-trade activities
were the responsibility of TSETMC before theenactment of the Capital Market Act by theIranian Parliament in 2005. CSD Iran Company isalso an Affiliated Member of FEAS.
During the implementation of the new core tradeand post-trade solutions, TSETMC is assistingmajor brokerage firms in Iran for theimplementation of Brokerage Solutions.
The plan is to introduce financial and commodityderivatives markets in TSE and the newlyestablished Iranian Mercantile Exchange (IME) inthe near future. TSETMC is supporting the
introduction of these markets and also their tradeand post-trade processing. TSETMC is an activemember of a consortium with the responsibility toestablish the Iranian Petroleum Exchange.
TSETMC is the main contributor in thedevelopment and implementation of internationalstandards in Iran. TSETMC is helping theimplementation of a DVP Model2 for TSE’s equitymarket. In addition, the new CSD Companywould become a CCP of the equity market by2010. TSETMC is involved with CSD Iran for theprovision of needed infrastructure and riskmanagement mechanisms.
Other ProjectsFinancial Information Processing of Iran (FIPI)TSETMC started a new project titled "FinancialInformation Processing of Iran" (FIPI). The mainobjective of the project is to establish a DataWarehouse to gather and maintain all importantinformation and data in Iranian financial markets.Stored data and information are processed anddelivered via different mediums (such as a website,Decision Support Systems and Standard reports) tovarious users.
Digital Signature CertificateTSETMC defined a new project with Iranian CommerceMinistry to become a Certified Authorization (CA) bodyfor the Iranian Capital Market. Iranian Ministry ofCommerce acts as a root CA in Iran and authorizedTSETMC to provide Digital Signature Certificate tocapital market’s participants. Such certificate has a vitalrule in electronic commerce as both parties couldtransact digitally with very high level integrity, privacy,authentication and none-repudiation.
General InformationTehran Stock Exchange Services Company (TSETMC)is a subsidiary of the Securities and Exchange (SEO) ofIran. SEO regulates and overseas the Iranian capitalmarket. TSETMC was established on June 1994 as anindependent company owned by Tehran StockExchange (TSE) and its members. With theimplementation of the new Capital Market Act by theIranian Parliament, SEO was established and theownership of TSETMC was transferred to SEO. TheTSETMC’s main function is to develop, maintain,operate, and promote systems for all stages of thetrade-cycle services in Iran.
Specifically, TSETMC is responsible to: • maintain all hardware and software used for tradeand post trade activities • develop and enhance existing software applications • provide consultancy and technical advice to mainexchanges in Iran• act as a financial information processor for theIranian financial market.
Services ProvidedTradingMaintain Automated Trading System (ATS)Disseminate trade and financial information tointerested parties
Information and SupportingProvide operational services Manage operational risks
OthersProvide consultancy Manage TSE data centersImplement specialized software
Brief HistoryTSETMC started its operation as a subsidiary of theNational Informatics Corporation (NIC) of Iran in July1984. Originally, TSETMC developed, maintained andoperated the computerized system of TSE used fortrade and post-trade activities. In June 1994, TSETMCwas incorporated as an independent company underthe ownership of the TSE, its members, and NIC.Currently, Securities and Exchange (SEO) of Iran is thesole owners of TSETMC.
Form of SecuritiesDematerialized
Form of Settlement and Transfers:Book-entry
Legal StatusPrivate Joint Stock Company
Settlement PeriodFor TSE Markets:
Equities: T+3Corporate Bonds: T+1
Type of Commercial EntityPrivate sector for-profit company
Does TSETMC act as a central counter party?No.
Regulated BySecurities and Exchange Organization of Iran(www.seo.ir)
OwnershipOwned by the Securities and Exchange Organization(SEO) of Iran
Memberships to International Organizations Affiliate Member of the Federation of Euro-Asian StockExchanges (FEAS)
Board of Directors: 3 MembersRepresentatives of the Securities and Exchange (SEO)of Iran
Future OutlookFrom March 2008 to March 2009, TSETMC intends to:• Lead the implementation of a new trading solution• Assist CSD Iran in the implementation of a post-tradesolution• Assist brokerage firms for implementing totalbrokerage solutions • Lead efforts for implementation of Straight ThroughProcessing (STP)• Contribute in the introduction of new instruments• Assist in the creation of the Iranian PetroleumExchange• Perform studies for creation of a Lending andBorrowing market• Contribute to the development and implementation ofinternational standards• Initiate studies and efforts to introduce CCP at CSDIran• Release the first phase of Financial InformationProcessing project • Continuing the Digital Signature Certificate project
Morteza KhazanedariManaging Director
CONTACT INFORMATION
Contact Name Mr. Houman Farajollahi E-mail [email protected] Website www.tsetmc.com

CONTACT INFORMATION
Contact Name Alparslan Budak E-mail [email protected] Website www.tspakb.org.tr Address Buyukdere Caddesi No 173 1. Levent Plaza A Blok Kat: 4 1. Levent 34394 Istanbul TURKEY Phone +90 (212) 280 8567 Fax +90 (212) 280 8589
THE ASSOCIATION OF CAPITAL MARKET INTERMEDIARY INSTITUTIONS OF TURKEY (TSPAKB) AFFILIATE MEMBER
In Turkey, where the capital markets werenot directly affected by the global crisis,efforts to improve the structure of themarkets were carried on.
The year 2009 was marked by the financial crisisthat evolved into a global recession. In order toprevent the occurrence of similar problems,various studies both on national and internationallevel were conducted. The post crisis era will leadto the restructuring of financial and regulatorylandscape across the world.
In Turkey, where the capital markets were notdirectly affected by the global crisis, efforts toimprove the structure of the markets were carriedon. In this context, new regulations introducingmortgage backed securities, company andcovered warrants were released. Furthermore,regulations regarding existing instruments havebeen revised in order to facilitate new issues.
Another achievement in 2009, was theannouncement of a strategy and action plan formaking Istanbul a global financial centre. OurAssociation was fully engaged in the preparationof the strategy document. Now it is time for allinstitutions in the market to implement the definedmeasures. Our Association assumed several
responsibilities, varying from training toassistance in the development of new financialproducts.
As the Association, we are also involved in theEncouragement of Public Offerings Project,aiming to promote public offerings. We believethat this project will make an importantcontribution to the development of our industry.
We pursued our endeavours to reduceintermediation costs. For example; Istanbul StockExchange and the Turkish Derivatives Exchangegenerously accepted our proposals and reducedthe transaction fees in their relevant markets.
In 2009, we diversified our training programs andstarted to offer courses in a wider number ofcities across Turkey. Nearly 5.000 people haveattended our education programs in 2009. On theother hand, the number of registered marketprofessionals at our Association has reached33.000, while the number of issued licensesreached 19.000.
Our Association serves as the information hub ofthe industry through our unique statistics andvarious publications. Besides our monthly andannual reports in Turkish, we have also increasedthe range of our reports in English.
Moreover, we strengthened our close relationswith international organizations through newmemberships. In addition to our membership tothe Federation of Euro-Asian Stock Exchanges,we also became member of Asia SecuritiesForum and the International Forum for InvestorEducation.
Regarding the latter issue, in 2010 ourAssociation plans to conduct a comprehensivefinancial literacy survey in view of developing aneffective investor education program inassociation with relevant capital marketinstitutions. We are dedicated to continue workingfor the development of the capital markets inTurkey.
E. Nevzat OztangutChairman
* Please refer to page 96 for the Turkey country report.
History and DevelopmentThe Association of Capital Market IntermediaryInstitutions of Turkey has been established in March2001 as the self-regulatory organization in theTurkish capital markets. 103 brokerage firms and 41banks that are authorized for capital marketoperations constitute the members of theAssociation as of end 2009.
The Association aims to: •Contribute to the development of capital marketsand intermediation activities;•Facilitate solidarity among its members; •Safeguard prudent and disciplined conduct ofbusiness by its members; •Prevent unfair competition among members;•Enhance professional know-how in the sector.
The main functions of the Association are to: •Establish professional rules and regulations; •Set safety measures to prevent unfair competition; •Monitor professional developments, changes inrules and regulations and inform members thereof; •Evaluate complaints against its members; •Impose disciplinary action on members, whennecessary; •Assist in the resolution of disputes arising fromoff-exchange transactions among its members orbetween its members and investors; •Appoint arbitrators upon the request of concernedparties;
•Conduct research on Turkish and internationalcapital markets; •Offer training programs; •Issue licenses to capital market professionals whoare required to pass exams organized by the CMB; •Keep records of all capital market professionals;•Cooperate with related foreign institutions.
Future Outlook• Between 9-13 May 2010, TSPAKB will host the 23rdAnnual General Meeting of the International Councilof Securities Associations (ICSA). ICSA representstrade associations and self-regulatory organizationsfor the securities market from around the globe. • In cooperation with the Capital Markets Board,TSPAKB aims to hold the exams for the licensing ofcapital market professionals. Until 2010, the examswere held by the Capital Markets Board, whereas thelicenses were issued by the Association. • TSPAKB aims to conduct a financial literacy surveyin order to develop an effective investor educationprogram to assist investors in making financialdecisions. • TSPAKB will continue to contribute to theEncouragement of Public Offerings Project, incooperation with the Istanbul Stock Exchange andthe Union of Chambers and Commodity Exchangesof Turkey.• TSPAKB will take part in the Istanbul FinanceCentre Project, coordinated by the State PlanningOrganisation.
CalendarInternational Council of Securities Associations’23rd Annual General Meeting, May 9-13, 2010, Ceylan Intercontinental Hotel,Istanbul
Legal StatusNot-for-profit association
Regulated byCapital Markets Board
Board of Directors 7 persons chosen amongst members by theGeneral Assembly every two years.
Memberships to International OrganizationsAFIE (Asia Forum for Investor Education):http://www.afie.asia ASF (Asia Securities Forum):http://www.asiasecuritiesforum09.com FEAS (Federation of Euro-Asian Stock Exchanges)http://www.feas.org/ ICSA (International Council of SecuritiesAssociations): http://www.icsa.bz IFIE (International Forum for Investor Education):http://www.ifie.org IOSCO (International Organization of SecuritiesCommissions): http://www.iosco.org
FEDERATION OF EURO-ASIAN STOCK EXCHANGES ANNUAL REPORT JUNE 2010
PAGE 176

FEDERATION OF EURO-ASIAN STOCK EXCHANGES ANNUAL REPORT JUNE 2010
PAGE 177
MEMBER LIST

PAGE 178
ANNUAL REPORT JUNE 2010
Abu Dhabi Stock Exchange Address: P.O. Box 54500 Abu Dhabi, U.A.E. Phone: (2) 627 7777 Fax: (2) 612 8787 E-mail: [email protected] Address: www.adx.ae Country Code: 971
Company’s Name City Code Telephone Fax E-mail Address Abu Dhabi Islamic Bank 9712 634 30 00 6333316AABAR Petroleum Co. 9712 626 44 66 626 82 28Abu Dhabi Aviation Co. 9712 5758000 5757775Abu Dhabi Co For Building Materials (BILDCO) 9712 6455500 6455544Abu Dhabi Commercial Bank 9712 6962222 677 64 99Abu Dhabi Energy Company (TAQA) 9712 6943662 6943774Abu Dhabi National Hotels Co. 9712 4447228 4448495Abu Dhabi National Insurance Co. (ADNIC) 9712 6264000 6268600Abu Dhabi Ship Bldg (ADSB) 9712 55 10 800 5511067Abu Dhabi Takaful 9712 626 27 27 626 07 77Al Buhaira National Insurance Co. 9716 568 40 00 574 88 55Al Dhafra Insurance Co. 9712 6721444 6729833Al-Ain Ahlia Insurance Co. 9712 4459900 4456685ALDAR Properties 9712 6964444 6417504Al-Khazna Insurance Co. 9712 6767000 6768500Al-Wathba National Insurance Co. 9712 6770566 6776628Arkan Building Materials 9712 24455888 24455282ASMAK 9716 7435727 7432256Bank of Sharjah 9716 569 44 11 568 33 77Commercial Bank International 9717 2227555 2227444Commercial International Bank / Egypt (CIB) 202 747 22 92 / 3 573 15 41 DANA GAS 9716 556 94 44 55 66 522Emirates Driving Company 9712 551 05 44 551 02 27Emirates Foodstuff & Mineral Water (Agthia) 9712 4455221 4463644Emirates Insurance Co. 9712 6440400 6445227Emirates Telecommunications-ETISALAT 9712 6283333 6317000Finance House 9712 621 99 99 619 40 99First Gulf Bank 9712 681 66 66 681 37 27FOODCO Holding Co. 9712 6731000 6732100Fujairah Building Industries 9719 2222051 2227314Fujairah Cement Industries Co. 9719 222 31 11 222 77 18Fujairah National Insurance Co 9719 2233355 2224344Fujairah Trade Center 9719 2222661 2226212Gulf Cement Company 9717 2668222 2668038Gulf Medical Projects Company 9716 561 99 99 561 66 99Gulf Pharmaceutical Industries (Julphar) 9717 2461461 2461462International Fish Farming Company 9716 743 57 27 743 22 56Invest Bank 9716 569 44 40 569 42 12National Bank Of Abu Dhabi 9712 611 11 11 627 58 81National Bank of Fujairah 9719 202 93 12 222 45 16National Bank of Ras Al Khaimah 9717 228 11 27 228 61 06National Bank of Umm Al Qiwan 9716 7066666 765 15 25National Corporation for Tourism & Hotels 9712 4099777 4099778National Marine Dredging Co. 9712 5516000 5516500Oasis International Leasing Co. 9712 6273880 6273990Oman & Emirates Investment Holding Co. 99682 4489458 4489465Palestinian Telecommunication Co. (PALTEL) 9702 2405838 00970 92376227Qatar Telecommunication Co. (Q-tel) 974 4400525 4830112RAK Co. for White Cement & Construction Materials 9717 2668888 2668866RAK National Insurance Co. 9717 227 30 00 228 85 00RAK Properties 9717 233 00 04 227 24 44Ras Al Khaimah Poultry & Feeding Co. 9717 2462222 246222Ras Al-Khaimah Cement Company 9717 2660111 2660006Ras Al-Khaimah Ceramics 9717 2445046 2445270Sharjah Cement & Industrial Dev. Co. 9716 568 46 81 568 31 71Sharjah Insurance Company 9716 568 66 90 568 38 88Sharjah Islamic Bank 9716 568 10 00 568 01 01Sorouh Real Estate 9712 444 00 06 444 00 66 Sudanese Telecommunication Co. ltd 249183 770099 782322Umm Al Qiwain Cement Industries 9716 765 55 22 765 55 20Union Cement Company 9717 2668166 2668635Union Insurance Co. 9716 7466996 7466997Union National Bank 9712 674 31 41 6773482United Arab Bank 9716 5075500 573 39 13United Insurance Co. 9717 2351877 2353250
FEDERATION OF EURO-ASIAN STOCK EXCHANGES

ANNUAL REPORT JUNE 2010
PAGE 179
FEDERATION OF EURO-ASIAN STOCK EXCHANGES
Amman Stock ExchangeAddress: P.O. Box 212466, Amman 11121, Jordan Phone: (6) 566 4109 Fax: (6) 566 4071 E-mail: [email protected] Address: www.exchange.jo Country Code: 962
Company’s Name City Code Telephone Fax E-mail Address Ahli Brokerage Company 6 5624361 5624362 www.ahli.com Ajiad for Securities 6 5622269 5622293 - Al- Shorouq Financial Brokers 6 5695512 5695551 www.alshorouqfb.comAl Wameedh for Financial Services and Investment 6 5681960 5681030 - Al- Yasmeen for Securities & Investment 6 5656645 5656334 [email protected] Financial Investments Co. LTD. 6 5671485 5667993 -Al-Arabi Investment Group 6 5526491 5526492 [email protected] Financial Investments 6 5201450 5653564 - Al-Awael International Securities 6 5633222 - -Al-Bilad For Securities And Investment 6 5105900 5105700 -Aleman Financial Investment 6 5663173 5664988 [email protected] AlFares Financial Investments 6 5658211 5657724 - Al-Hekma Financial Services 6 5654046 5654049 [email protected] AlJazeera for Financial Investments 6 5651611 5651981 - Al-Mawared For Brokerage 6 5688085 5622405 -Al-Nadwa For Financial Services and Investment 6 5105213 - -AlNour For Financial Investments 6 5666690 5656520 -Al-Omana'a Portfolio and Investment 6 5549700 5549702 - Al-Reda For Financial Services 6 5699995 5699995 [email protected] AlSafwa Finincial Investments 6 5201230 5655639 - Al-Sahm International for Investment & Brokerage 6 5691662 5691665 - Al-Salam For Financial Investments 6 5820628 5820630 - Al-Watanieh for Financial Services Co. 6 5663851 5682803 www.watanieh.com.jo Aman for Securities 6 5662362 5662381 [email protected] Amman Investment & Securities 6 5669689 5672572 -Arab Co-operation Financial Investment Co. 6 5629300 5629301 [email protected] Arab Falcon Trading Securities 6 5682225 5623118 [email protected] Stock Brokerage 6 5673086 5676030 - Business Women Trading Securities 6 5828872 5828834 www.al-multaqaa.comCapital Investments 6 5200330 5692872 -Delta Financial Investments 6 02/7254664 02/7254660 - Elite Financial Services 6 5505755 5547878 [email protected] For Financial Investment 6 5600923 5675951 -Experts Financial Services 6 5661608 5663905 - Friends Financial Investment & Brokerage 6 5639088 5680298 - Imcan for Financial Services 6 5604222 5601444 [email protected] Financial Services 6 5802930 5685931 -Industrial Development Bank 6 4642216 4647821 [email protected] International Brokerage & Financial Markets 6 5503300 5855362 - International Financial Advisors 6 5690933 5626665 - International Financial Center 6 5674558 5696720 - Investment House for Financial Services 6 5685525 5685344 - Jordan & Gulf Investment 6 5675617 5675617 [email protected] Jordan Expatriates For Financial Brokerage 6 5653702 5653702 - Jordan River Financial Investment 6 5560023 5530801 [email protected] Saudi Emirates Financial Investment 6 5620011 5620050 [email protected]' for Financial Investment 6 5662440 5668910 - National Portfolio Securities 6 5673101 5688793 www.npsc.com.jo Osool Investment and Financial Services 6 5696377 5696367 - Samir & Sameh Bros. for Investment 6 5671546 5684476 www.aljabari.com Sanabel AlKhair for Financial Investments 6 5653046 5653047 - Selwan Financial Brokers 6 5651546 5651549 [email protected] Shareco Brokerage Co. 6 5673812 5695644 [email protected] Shares House for Financial Securities 6 5694114 5694114 [email protected]'a for Securities Trading and Investments 6 5623006 5623004 - Societe Generale Jordan - Brokerage 6 5681651 5681251 [email protected] Sukook Investment & Brokerage 6 5623997 5623998 -Tadawol For Securities & Financial Services 6 5543200 5543207 www.tadawol.joTanmia Securities Inc. 6 5672460 5683559 www.tanmiainc.com The Arab Financial Investment 6 5692425 5692423 www.arabinvestco.comThe Bankers for Brokerage and Financial Invest 6 5825380 5827590 -The Financial Investment Company for Shares and Bonds 6 5671569 5699626 - Trans Jordan for Financial Services 6 5650287 5672980 [email protected] Union Financial Brokerage 6 5675558 5606996 [email protected] Arabian Jordanian for Investment and Brokerage Services 6 5671578 5696156 - United Co. for Financial Investment 6 5679829 5865870 www.ufico.com

Bahrain Stock Exchange Address: Hedaya Building 2, Government Avenue, Manama, Block: 305 Kingdom of Bahrain, P.O. Box 3203, Phone: (17) 261 260 Fax: (17) 256 362E-mail: [email protected] Web Address: www.bahrainstock.com Country Code: 973
Company’s Name City Code Telephone Fax E-mail Address ABC SECURITIES 17 543149 543758 -ABDULLA ZAIN AL-ABEDIN 17 246661 246661 -AHLI UNITED BANK 17 585824 580549 [email protected] AHLIA SECURITIES 17 207070 250800 -BBK BROKERAGE SERVICES 17 229993 216164 [email protected] INVESTMENT HOUSE 17 210011 210222 www.globalinv.netGULF SECURITIES 17 272579 258780 -INDOGULF FINANCIAL SERVICES CO. 17 227778 215231 -MUBASHER FINANCIAL SERVICES B.S.C 17 556139 556124 -NASSIR ABBAS KHOSROU 17 270130 271267 -SECURITIES & INVESTMENTS CO. 17 515000 530603 [email protected] SECURITIES CO. 17 549499 531213 [email protected] SECURITIES 17 533233 531953 [email protected] AL-AJAJI 17 261006 262948 [email protected]
Baku Interbank Currency Exchange Address: 57, Acad H. Aliyev Str., AZ1110 Baku, Azerbaijan Phone: (12) 465 6314 Fax: (12) 465 6516 E-mail: [email protected] Address: www.bbvb.org Country Code: 994
Company’s Name City Code Telephone Fax E-mail Address AFbank 12 499 16 17 499 10 66 [email protected] 12 4978 862 4978 863 [email protected] 12 4989 437 4984 235 [email protected] Non Bank Credit Organization 12 4380 530 498 15 17 [email protected] 12 497 34 96 4987 447 [email protected] 12 497 69 86 4976 989 [email protected] 12 4958 093 4981 274 [email protected] 12 4986 056 4989 701 [email protected] 12 4402 722 496 09 77 [email protected] Credit Bank 12 5.982.424 5982427 [email protected] 12 4975 017 4989 615 [email protected] 12 493 48 04 4934 804 [email protected] Bank 12 4974 316 4983 702 [email protected] Avrasiya ASC 12 598 85 85 598 03 07 [email protected] of Azerbaijan 12 4980 247 4980 250 [email protected] of Baku 12 4470 055 498 82 78 [email protected] 12 4416 775 441 61 19 [email protected] Investment Bank 12 4934 949 4938 450 [email protected] 12 4936 630 4986 605 [email protected] Caucasian Development Bank 12 4973 272 4971 222 [email protected] 12 4964 551 4974 560 [email protected] 12 4981 157 4981 147 [email protected] 12 4977 455 497 89 07 [email protected] Bank 12 4980 456 4981 439 [email protected] 12 4983 411 4983 511 [email protected] Bank 12 5666 856 498 94 77 [email protected] 12 4972 972 4973 379 [email protected] Joint-Stock Society Kovsar 12 4973 034 4973 029 [email protected] 12 4471 000 4930 882 [email protected] Bank ASC 12 496 50 00 496 50 10 [email protected] 12 498 69 14 498 33 14 [email protected] 12 4926 097 4971 101 [email protected] 12 498 08 00 498 08 80 [email protected] Bank of Baku 12 498 65 88 498 13 19 [email protected] Bank 12 4971 070 4980 778 [email protected] 12 465 36 13 493 08 41 [email protected] Azerbaijan Bank of Microfinancing 12 493 07 26 493 07 96 [email protected] International Bank of the Azerbaijan Republic 12 493 00 91 4989 128 [email protected] National Bank of the Azerbaijan Republic 12 4931 122 4935 541 [email protected] 12 497 25 92 4972 577 [email protected] 12 4982 244 4980 953 [email protected] Credit Bank 12 4900 641 490 05 22 [email protected] bank 12 496 81 52 496 81 57 [email protected] Credit Bank Azerbaijan Ltd. 12 4977 795 4970 276 [email protected] 12 498 81 05 493 41 90 [email protected]
FEDERATION OF EURO-ASIAN STOCK EXCHANGES ANNUAL REPORT JUNE 2010
PAGE 180
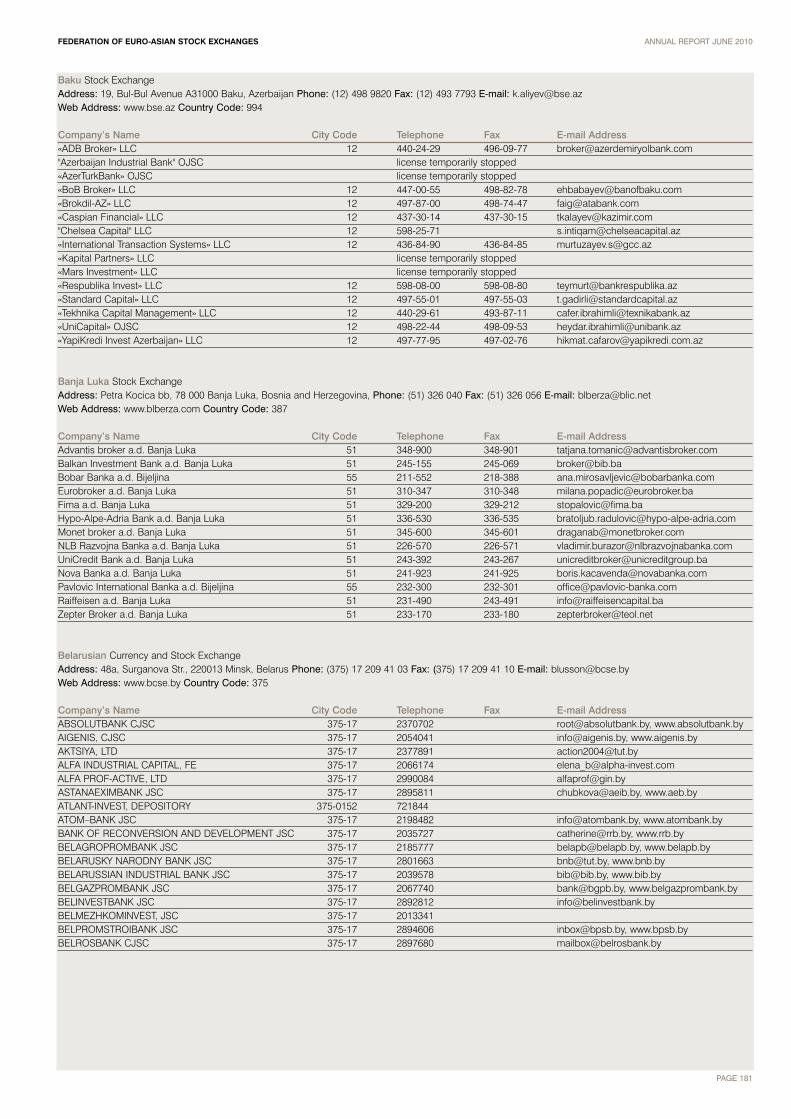
ANNUAL REPORT JUNE 2010
PAGE 181
FEDERATION OF EURO-ASIAN STOCK EXCHANGES
Baku Stock Exchange Address: 19, Bul-Bul Avenue A31000 Baku, Azerbaijan Phone: (12) 498 9820 Fax: (12) 493 7793 E-mail: [email protected] Address: www.bse.az Country Code: 994
Company’s Name City Code Telephone Fax E-mail Address «ADB Broker» LLC 12 440-24-29 496-09-77 [email protected]"Azerbaijan Industrial Bank" OJSC license temporarily stopped «AzerTurkBank» OJSC license temporarily stopped «BoB Broker» LLC 12 447-00-55 498-82-78 [email protected]«Brokdil-AZ» LLC 12 497-87-00 498-74-47 [email protected]«Caspian Financial» LLC 12 437-30-14 437-30-15 [email protected] "Chelsea Capital" LLC 12 598-25-71 [email protected]«International Transaction Systems» LLC 12 436-84-90 436-84-85 [email protected]«Kapital Partners» LLC license temporarily stopped «Mars Investment» LLC license temporarily stopped «Respublika Invest» LLC 12 598-08-00 598-08-80 [email protected] «Standard Capital» LLC 12 497-55-01 497-55-03 [email protected] «Tekhnika Capital Management» LLC 12 440-29-61 493-87-11 [email protected]«UniCapital» OJSC 12 498-22-44 498-09-53 [email protected] «YapiKredi Invest Azerbaijan» LLC 12 497-77-95 497-02-76 [email protected]
Banja Luka Stock ExchangeAddress: Petra Kocica bb, 78 000 Banja Luka, Bosnia and Herzegovina, Phone: (51) 326 040 Fax: (51) 326 056 E-mail: [email protected] Address: www.blberza.com Country Code: 387
Company’s Name City Code Telephone Fax E-mail Address Advantis broker a.d. Banja Luka 51 348-900 348-901 [email protected] Investment Bank a.d. Banja Luka 51 245-155 245-069 [email protected] Banka a.d. Bijeljina 55 211-552 218-388 [email protected] Eurobroker a.d. Banja Luka 51 310-347 310-348 [email protected] a.d. Banja Luka 51 329-200 329-212 [email protected] Bank a.d. Banja Luka 51 336-530 336-535 [email protected] broker a.d. Banja Luka 51 345-600 345-601 [email protected] Razvojna Banka a.d. Banja Luka 51 226-570 226-571 [email protected] Bank a.d. Banja Luka 51 243-392 243-267 [email protected] Banka a.d. Banja Luka 51 241-923 241-925 [email protected] International Banka a.d. Bijeljina 55 232-300 232-301 [email protected] a.d. Banja Luka 51 231-490 243-491 [email protected] Broker a.d. Banja Luka 51 233-170 233-180 [email protected]
Belarusian Currency and Stock ExchangeAddress: 48a, Surganova Str., 220013 Minsk, Belarus Phone: (375) 17 209 41 03 Fax: (375) 17 209 41 10 E-mail: [email protected] Address: www.bcse.by Country Code: 375
Company’s Name City Code Telephone Fax E-mail Address ABSOLUTBANK CJSC 375-17 2370702 [email protected], www.absolutbank.byAIGENIS, CJSC 375-17 2054041 [email protected], www.aigenis.byAKTSIYA, LTD 375-17 2377891 [email protected] ALFA INDUSTRIAL CAPITAL, FE 375-17 2066174 [email protected] ALFA PROF-ACTIVE, LTD 375-17 2990084 [email protected] JSC 375-17 2895811 [email protected], www.aeb.byATLANT-INVEST, DEPOSITORY 375-0152 721844ATOM–BANK JSC 375-17 2198482 [email protected], www.atombank.byBANK OF RECONVERSION AND DEVELOPMENT JSC 375-17 2035727 [email protected], www.rrb.byBELAGROPROMBANK JSC 375-17 2185777 [email protected], www.belapb.byBELARUSKY NARODNY BANK JSC 375-17 2801663 [email protected], www.bnb.byBELARUSSIAN INDUSTRIAL BANK JSC 375-17 2039578 [email protected], www.bib.byBELGAZPROMBANK JSC 375-17 2067740 [email protected], www.belgazprombank.byBELINVESTBANK JSC 375-17 2892812 [email protected] BELMEZHKOMINVEST, JSC 375-17 2013341BELPROMSTROIBANK JSC 375-17 2894606 [email protected], www.bpsb.byBELROSBANK CJSC 375-17 2897680 [email protected]

Belarusian Currency and Stock Exchange (con’t)
Company’s Name City Code Telephone Fax E-mail Address BELSWISSBANK UNITED STOCK COMPANY 375-17 2066933 [email protected], www.bsb.byBELVNESHECONOMBANK JSC 375-17 2092944 [email protected], www.bveb.byBROSTOK, CJSC 375-17 2135859 [email protected], CJSC 375-0232 574357DENIM TRADING, UNITARY ENTERPRISE 375-17 236-9549 [email protected] DERZHAVAINVEST, JSC 375-17 203-8978 [email protected] GENERAL INVESTMENT SYSTEM CJSC 375-17 294-0353 [email protected]–BANK (GOLDEN TALER BANK) 375-17 2266298 [email protected], www.gtbank.netINTERNATIONAL RESERVE BANK JSC 375-17 2996900 [email protected], www.irb.byINTERTRUSTGROUP, JSC 375-17 2373896 [email protected], CJSC 375-17 2064611 [email protected] ITI–BANK (JOINT–STOCK COMMERCIAL INTERNATIONALTRADE AND INVESTEMENT BANK) 375-17 2006880 [email protected], www.itibank.byKASKAD-93-INVEST, LTD 375-17 2985768 [email protected] LIDERINVEST, LTD 375-17 2208353 [email protected] OJSC 375-17 2996901 [email protected] TRANSIT BANK JSC 375-17 2132901 [email protected], www.mtb.byMOSCOW–MINSK FOREIGN BANK 375-17 2886301 [email protected], www.mmbank.byNATIONAL BANK OF THE REPUBLIC OF BELARUS 375-17 2192242 www.nbrb.byNORTHERN INVESTMENT BANK JSC 375-17 2996621 [email protected] OJSC 375-17 2883248 [email protected], www.paritetbank.byPRIORBANK JSC 375-17 2899087 [email protected], www.priorbank.by PROMREESTR, LTD 375-17 200-0272PROMTECHINVESTVEKSEL, UNITARY ENTERPRISE 375-17 2218909REESTR, LTD INVESTMENT COMPANY 375-02161 42862 [email protected] BANK "BELARUSBANK" JSSB 375-17 2188431 [email protected], CJSC 375-17 2162387 [email protected], www.snbank.bySOMBELBANK JSC 375-17 2066569 [email protected], www.sbb.bySOVMEDIA, UNITARY ENTERPRISE 375-17 2135472 [email protected] STOCK ALIANCE, LTD 375-17 2029647 [email protected] STOCK HOUSE, CJSC 375-17 2949170SYNTHESIS INVEST GROUP, LTD 375-17 2112857 [email protected] OJSC 375-17 2832727 [email protected] www.tb.byTRUSTBANK, PRIVATE JSC 375-17 2032467 [email protected] TRUST-WEST, LTD 375-0162 203207 [email protected] WESTERN STOCK BUREAU, CJSC 375-162 230386 [email protected], CJSC 375-17 2064611
Belgrade Stock Exchange Address: 1, Omladinskih Brigada Street, 11000, Belgrade, Serbia Phone: (11) 322 1599 Fax: (11) 138 242 E-mail: [email protected] Address: www.belex.co.yu Country Code: 381
Company’s Name City Code Telephone Fax E-mail Address AB INVEST 11 323 2977 323 2977 [email protected] BROKER 11 313-22-85 313-97-66 [email protected] 11 202 77 00 202 77 00 [email protected] 11 2021-401 2021-152 [email protected] BROKER 11 305 0376 3548 305 [email protected] BROKER 11 311-6276 311-6276 [email protected] BANK SRBIJA 11 3023 971 33 42 349 [email protected] FINANCIAL CENTER 11 262 2266 262 2266 [email protected] CAPITAL 11 2142-442 2142-332 [email protected] BROKER 11 3248-405 3248-309 [email protected] INTESA 11 201 1422 201 1297 [email protected] POSTANSKA ·TEDIONICA 11 3024-329 3376-777 [email protected] INDEPENDENT BROKER 11 322 3227 322 3227 [email protected] MONET 11 30 36 059 30 33 563 [email protected] BROKERSKA KUCA 11 334 5171 334 5080 [email protected] GRUPA 11 30 678 55 30 678 55 [email protected] NIS 18 520 377 520 377 [email protected] POINT 11 262 2439 624 460 [email protected] BANKA 32 320-657 348-146 [email protected] NEZAVISNI BROKERI 32 310-690 341-772 [email protected] BROKER 11 3034-775 3230-474 [email protected] SECURITIES 11 328 4036 628 165 [email protected]
PAGE 182
ANNUAL REPORT JUNE 2010FEDERATION OF EURO-ASIAN STOCK EXCHANGES

PAGE 183
ANNUAL REPORT JUNE 2010FEDERATION OF EURO-ASIAN STOCK EXCHANGES
Belgrade Stock Exchange (con’t)
Company’s Name City Code Telephone Fax E-mail Address CITY BROKER 11 3836-913 3836-915 [email protected] 11 30 89 020 30 89 020 [email protected] 21 455 629 450 595 [email protected] BANKA 34 360 685 331 360 [email protected] SECURITIES 21 472-82-88 472-82-88 [email protected] BROKER 11 201 2690 201 2677 [email protected] BROKER 11 33 47 757 324 5035 [email protected] DUNAV STOCKBROKER 11 3223-764 3223-763 [email protected] INVEST 11 3089 816 3089 429 [email protected] SECURITIES 11 202-31-71 202-31-71 [email protected] BROKER 11 316 5900 316 5900 [email protected] 11 311 5261 311 5312 [email protected] EURO FINEKS BROKER 11 309 6920 309 6920 [email protected] EFG STEDIONICA 11 3027-538 3027-587 [email protected] BROKER 21 47 23 224 47 23 224 [email protected] INTERNATIONAL 11 334 1066 334 0787 [email protected] BROKER 11 339 8768 339 8915 [email protected] GLOBAL BROKERS 11 32 85 184 3282 398 [email protected] BROKER 11 316 2260 219 6572 [email protected] BROKER 11 2129-256 2129-256 [email protected] ALPE-ADRIA-SECURITIES 11 222 6808 222 6896 [email protected] 11 472-8949 472-8949 [email protected] INVESTMENTS 11 330 1000 330 1050 [email protected] TRADE 11 301 6822 301 6822 [email protected] SECURITIES 11 3111-420 222-31-05 [email protected] BROKER 11 308 3130 308 3150 [email protected] BROKER 11 324 8650 303 5006 [email protected] MONET 11 361 5929 361 4148 [email protected] BROKER 11 311 7835 311 7840 [email protected] BROKER 11 311 0275 311 3851 [email protected] SECURITIES 11 2910-696 2910-696 [email protected] BROKER 11 2434 820 2434 820 [email protected] BANKA 11 324 0911 323 9201 [email protected]&V INVESTMENTS 21 6612 788 6612 788 [email protected] INVEST 11 334 5351 334 5351 [email protected] BANK 11 330-64-05 330-63-77 [email protected] 32 222 277 222 277 [email protected] INVEST 11 367 0137 367 0137 [email protected] INVEST 11 330 5876 330 5908 [email protected] BANKA 21 424 121 524 693 [email protected] GROUP 18 521 951 521 925 [email protected] SECURITIES 21 67-28-700 452-895 [email protected] INVEST 11 301 7200 313 3115 [email protected] BANKA SRBIJA 21 47 24 464 47 24 464 [email protected] 11 246 4231 2461 435 [email protected] 11 362 90 30 362 90 31 [email protected] BANKA 11 641 874 264 1894 [email protected] BANKA PANCEVO 13 331-361 354-192 [email protected] STOCK BROKER 11 383-75-99 344-69-27 [email protected] 11 220 71 71 220 71 70 [email protected] MONET 11 382 1002 382 1002 [email protected] BROKER 24 558 275 554 003 [email protected] SINTEZA INVEST GROUP 11 301 8740 3018 749 [email protected] GENERALE YUGOSLAV BANK 11 311 1515 328 2230 [email protected] BROKER 34 303 011 303 021 [email protected] CAPITAL 11 328 4825 262 2784 [email protected] FINANCIAL 21 425 777 425 777 [email protected] BROKER 32 340 610 340 610 [email protected] BROKER 21 443 809 472 1640 [email protected] BROKER 11 2632 346 2632 057 [email protected] BROKER 21 67-921-80 679-21-84 [email protected] NOVCA 11 361 2430 361 2286 [email protected] BANK SRBIJA 11 3204-570 3204-693 [email protected] BANKA 21 488 6731 616 023 [email protected] VOLKSBANK 11 20-17-034 31-32-152 [email protected] BALKAN BROKER 11 344-6957 344-5812 [email protected]

Bucharest Stock Exchange Address: 34-36 Carol I Boulevard, 14th Floor, Sector 2, Bucharest, 020922, Romania Phone: (21) 307 9502 Fax: (21) 307 9519 E-mail: [email protected] Address: www.bvb.ro Country Code: 40
Company’s Name City Code Telephone Fax E-mail Address ACTINVEST 268 470938 411387 [email protected] INTERNATIONAL 21 3076020 3076024 [email protected] FINANCE ROMANIA 21 2092233 2315332 [email protected] 21 4085592 0372-264829 [email protected] SECURITIES 21 2223703 2227404 [email protected] Groupe Societe Generale 21 3016100 3016636 [email protected] SECURITIES 264 430564 431718 431747 [email protected] GLOBAL INVEST 21 3873348 3873349 [email protected] INVEST 269 217781 [email protected] INVEST BUCURESTI 21 3202102 021 3202103 [email protected] EUROPE BANK (ROMANIA) 21 4064629 3107331 [email protected] VALORI MOBILIARE 21 3179244 3179250 [email protected] 3129970 3129962 [email protected] SECURITIES 021 3140892 021 3140892 [email protected] EUROBANK SECURITIES SA (CAPITAL SECURITIES) 21 2062300 3167745 [email protected] SECURITIES (FOST NETINVEST) 021 3135350 021 3135351 [email protected] 236 472113 473393 [email protected] INVEST 3117930 3104362 [email protected] 237 238901 237471 [email protected] ROMANIA 21 3167153 3167269 [email protected] 244 0344-401188 0344-401189 [email protected] SECURITIES S.A. (S.S.I.F. TAILWIND SECURITIES S.A. fost UNICREDIT SECURITIES) 21 3057777 3030858 [email protected] SECURITIES 6664870 6664870 [email protected] INVEST 21 3273151 3273155 [email protected] 265 269195 269195 [email protected] B INVEST 268 542500 542503 [email protected] 250 733898 733898 [email protected] VALORI MOBILIARE 21 3087200 2522483 [email protected] TRUST 21 3130102 3131595 [email protected] FINWEST 257 281611 281611 [email protected] BANK 21 2221600 2221401 [email protected] INVEST 21 2228731 2228731 [email protected] CAPITAL INVEST 264 433212 432266 [email protected] CORPORATION 241 639071 547829 [email protected] 21 3157010 3158222 [email protected] TRUST 251 415287 417658 [email protected] SECURITIES ROMANIA SSIF" SA (FOSTA SWISS) 21 4084200 4084227 [email protected] CAPITAL INVEST MANAGEMENT 21 6500446 6500448 [email protected] Romexterra 21 4051745 4051759 [email protected] GLOBAL INVEST 21 3372279 3370947 [email protected] SECURITIES S.S. (MAXWELL RAND SECURITIES INTERNATIONAL) 21 3374765 3374767 [email protected] INVEST 261 768875 768870 [email protected] GRUP INVEST 251 410502 418215 [email protected] TRANSACTION 21 3224614 3215981 [email protected] CAPITAL & INVESTMENT 21 3061233 2300684 [email protected] CENTROBANK AG 043 1 51520-0 043 1 5134396 [email protected] Bank (Romania) S.A. 21 2020400 3191169 [email protected] BUCOVINA 230 520133 520133 [email protected] SECURITIES 21 3110024 3111038 [email protected] 256 490121 [email protected]. PIRAEUS SECURITIES ROMANIA S.A.(EUROPEAN SECURITIES) 21 3050370 3050375 [email protected]. VIENNA INVESTMENT TRUST (FOST FINANSSECURITIES) 21 2074880 2074897 [email protected] BANK LEUMI ROMANIA SA 21 3120368 3120498 [email protected] VALAHIA CAPITAL SA 31 8241572 8241573 [email protected] DE SERVICII DE INVESTITII FINANCIARE "BROKER" 264 433677 0364 401710 [email protected] SOCIETATEA DE SERVICII DE INVESTITII FINANCIARE ROMINTRADE 268 410605 410592 [email protected]
PAGE 184
ANNUAL REPORT JUNE 2010FEDERATION OF EURO-ASIAN STOCK EXCHANGES

PAGE 185
ANNUAL REPORT JUNE 2010FEDERATION OF EURO-ASIAN STOCK EXCHANGES
Bucharest Stock Exchange (con’t)
Company’s Name City Code Telephone Fax E-mail Address SSIF ESTEURO CAPITAL SA 21 2316882 2316882 [email protected] FORTIUS FINANACE SA (EURO INVEST VISION) 21 3107571 3107570 [email protected] STK TRADING SA 0264 441554 0264 441554 [email protected] GOLD INVEST 248 213417 215862 [email protected] CAPITAL 264 444 500 590775 [email protected] INVESTMENT 232 216562 212744 [email protected] S.A. (VANGUARD) 21 336 93 25 336 92 33 [email protected] CAPITAL 266 206440 206442 [email protected] 234 519346 519346 [email protected] 21 2318992 2318991 [email protected] CAIB ROMANIA SECURITIES (fost CA IB SECURITIES) 21 2064680 2064690 [email protected] INTERMEDIA 248 214661 211476 [email protected] INVESTMENT)fost IFC INVESTITII) 265 268888 261752 [email protected] 251 419342 [email protected] ROMANIA 314 56 87 314 56 89 [email protected] & COMPANY FINANCIAL SERVICES PRAGA 420 2 220 96 111 420 2 220 96 222 [email protected]
Bulgarian Stock Exchange Address: 10 Triushi Str. Floor 5, 1303 Sofia, Bulgaria, 1301, Sofia, Bulgaria Phone: (2) 937 0937 Fax: (2) 937 0946 E-mail: [email protected] Address: www.bse-sofia.bg Country Code: 359
Company’s Name City Code Telephone Fax E-mail Address ABS Finance EAD 359 2 917 05 72 917 04 97 [email protected] Investment EOOD 359 2 930 55 20 955 59 25 [email protected] Capital Partners AD 359 2 489 12 75 422 59 93 [email protected] Bank Bulgaria AD 359 2 921 54 80 980 21 02 [email protected] Invest AD 359 2 931 03 61 931 03 61 [email protected] Investment AD 359 2 801 38 45 801 38 60 [email protected] IN AD 359 2 987 33 60 986 09 11 [email protected] Advisory Company IP EAD 359 2 981 35 59 980 39 54 [email protected] Investment Company AD 359 2 943 92 15 943 47 18 [email protected] Securities EOOD 359 2 42 111 63 42 111 64 -BBG Simex - Bulgaria OOD 359 2 980 75 10 980 93 30 [email protected] Finance AD 359 2 962 54 81 965 16 52 [email protected] Beta Corp AD 359 2 986 55 66 986 55 66 [email protected] ProInvest AD 359 2 989 30 02 981 00 48 [email protected] Paribas S.A. Sofia Branch 359 2 921 86 40 981 69 91 [email protected] EAD 359 2 489 36 40 942 31 20 [email protected] Invest AD 359 52 632 416 609 550 [email protected] Invest AD 359 2 400 11 92 952 11 88 [email protected] American Credit Bank AD 359 2 965 83 58 944 50 10 [email protected] Development Bank 359 2 930 63 33 930 62 61 [email protected] Trend Brokerage OOD 359 2 815 56 65 815 56 66 [email protected] Engineer Project OOD 359 64 800 627 800 637 [email protected] Finance OOD 359 2 981 17 55 980 31 19 [email protected] Markets AD 359 2 933 00 30 933 00 34 [email protected] AD 359 2 810 60 810 60 33 [email protected] Securities AD 359 2 489 49 62 - [email protected] Cooperative Bank AD 359 2 926 62 88 988 81 07 [email protected] AD 359 2 939 92 40 981 25 26 [email protected] Commercial Bank AD 359 2 980 93 62 980 89 48 [email protected] Commerce Bank AD 359 2 989 44 44 989 48 48 [email protected]. Securities AD 359 2 846 55 91 944 60 14 [email protected] Financial Company AD 359 2 987 02 35 988 26 77 [email protected] AD 359 2 811 50 50 73 99 57 [email protected] Bank EAD 359 2 939 12 20 980 64 77 -DZI Investment AD 359 2 988 21 50 988 21 50 [email protected] Securities Bulgaria EAD 359 2 811 66 00 988 81 50 [email protected] Trading AD 359 2 810 00 00 810 00 10 [email protected] Bank Bulgaria AD 359 2 917 17 11 917 11 56 -Euro Finance AD 359 2 980 56 57 981 14 96 [email protected] Eurobank EFG Bulgaria AD 359 2 816 64 92 983 81 04 [email protected] AD 359 56 846 030 846 030 [email protected]
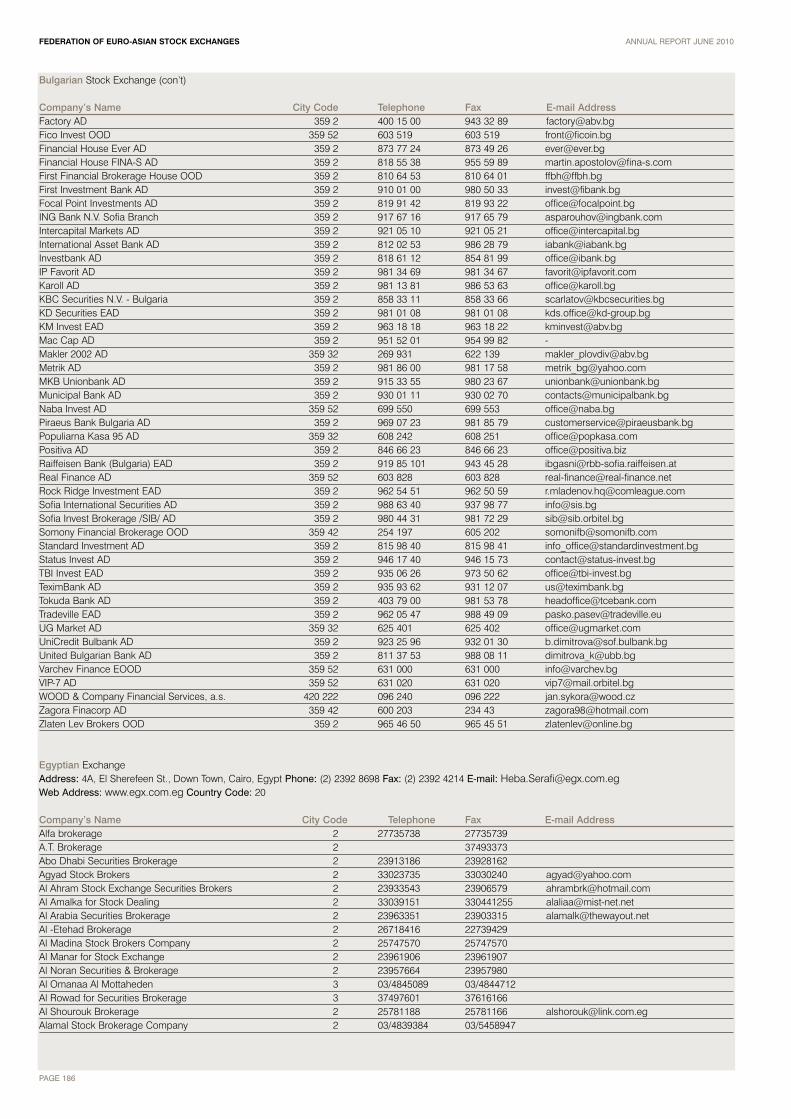
Bulgarian Stock Exchange (con’t)
Company’s Name City Code Telephone Fax E-mail Address Factory AD 359 2 400 15 00 943 32 89 [email protected] Invest OOD 359 52 603 519 603 519 [email protected] House Ever AD 359 2 873 77 24 873 49 26 [email protected] House FINA-S AD 359 2 818 55 38 955 59 89 [email protected] Financial Brokerage House OOD 359 2 810 64 53 810 64 01 [email protected] Investment Bank AD 359 2 910 01 00 980 50 33 [email protected] Point Investments AD 359 2 819 91 42 819 93 22 [email protected] Bank N.V. Sofia Branch 359 2 917 67 16 917 65 79 [email protected] Markets AD 359 2 921 05 10 921 05 21 [email protected] Asset Bank AD 359 2 812 02 53 986 28 79 [email protected] AD 359 2 818 61 12 854 81 99 [email protected] Favorit AD 359 2 981 34 69 981 34 67 [email protected] AD 359 2 981 13 81 986 53 63 [email protected] Securities N.V. - Bulgaria 359 2 858 33 11 858 33 66 [email protected] Securities EAD 359 2 981 01 08 981 01 08 [email protected] Invest EAD 359 2 963 18 18 963 18 22 [email protected] Mac Cap AD 359 2 951 52 01 954 99 82 -Makler 2002 AD 359 32 269 931 622 139 [email protected] AD 359 2 981 86 00 981 17 58 [email protected] Unionbank AD 359 2 915 33 55 980 23 67 [email protected] Bank AD 359 2 930 01 11 930 02 70 [email protected] Invest AD 359 52 699 550 699 553 [email protected] Bank Bulgaria AD 359 2 969 07 23 981 85 79 [email protected] Kasa 95 AD 359 32 608 242 608 251 [email protected] AD 359 2 846 66 23 846 66 23 [email protected] Bank (Bulgaria) EAD 359 2 919 85 101 943 45 28 [email protected] Finance AD 359 52 603 828 603 828 [email protected] Ridge Investment EAD 359 2 962 54 51 962 50 59 [email protected] International Securities AD 359 2 988 63 40 937 98 77 [email protected] Invest Brokerage /SIB/ AD 359 2 980 44 31 981 72 29 [email protected] Financial Brokerage OOD 359 42 254 197 605 202 [email protected] Investment AD 359 2 815 98 40 815 98 41 [email protected] Invest AD 359 2 946 17 40 946 15 73 [email protected] Invest EAD 359 2 935 06 26 973 50 62 [email protected] AD 359 2 935 93 62 931 12 07 [email protected] Bank AD 359 2 403 79 00 981 53 78 [email protected] EAD 359 2 962 05 47 988 49 09 [email protected] Market AD 359 32 625 401 625 402 [email protected] Bulbank AD 359 2 923 25 96 932 01 30 [email protected] Bulgarian Bank AD 359 2 811 37 53 988 08 11 [email protected] Finance EOOD 359 52 631 000 631 000 [email protected] AD 359 52 631 020 631 020 [email protected] & Company Financial Services, a.s. 420 222 096 240 096 222 [email protected] Finacorp AD 359 42 600 203 234 43 [email protected] Lev Brokers OOD 359 2 965 46 50 965 45 51 [email protected]
Egyptian Exchange Address: 4A, El Sherefeen St., Down Town, Cairo, Egypt Phone: (2) 2392 8698 Fax: (2) 2392 4214 E-mail: [email protected] Address: www.egx.com.eg Country Code: 20
Company’s Name City Code Telephone Fax E-mail Address Alfa brokerage 2 27735738 27735739A.T. Brokerage 2 37493373Abo Dhabi Securities Brokerage 2 23913186 23928162Agyad Stock Brokers 2 33023735 33030240 [email protected] Ahram Stock Exchange Securities Brokers 2 23933543 23906579 [email protected] Amalka for Stock Dealing 2 33039151 330441255 [email protected] Arabia Securities Brokerage 2 23963351 23903315 [email protected] -Etehad Brokerage 2 26718416 22739429Al Madina Stock Brokers Company 2 25747570 25747570Al Manar for Stock Exchange 2 23961906 23961907Al Noran Securities & Brokerage 2 23957664 23957980Al Omanaa Al Mottaheden 3 03/4845089 03/4844712Al Rowad for Securities Brokerage 3 37497601 37616166Al Shourouk Brokerage 2 25781188 25781166 [email protected] Stock Brokerage Company 2 03/4839384 03/5458947
PAGE 186
ANNUAL REPORT JUNE 2010FEDERATION OF EURO-ASIAN STOCK EXCHANGES
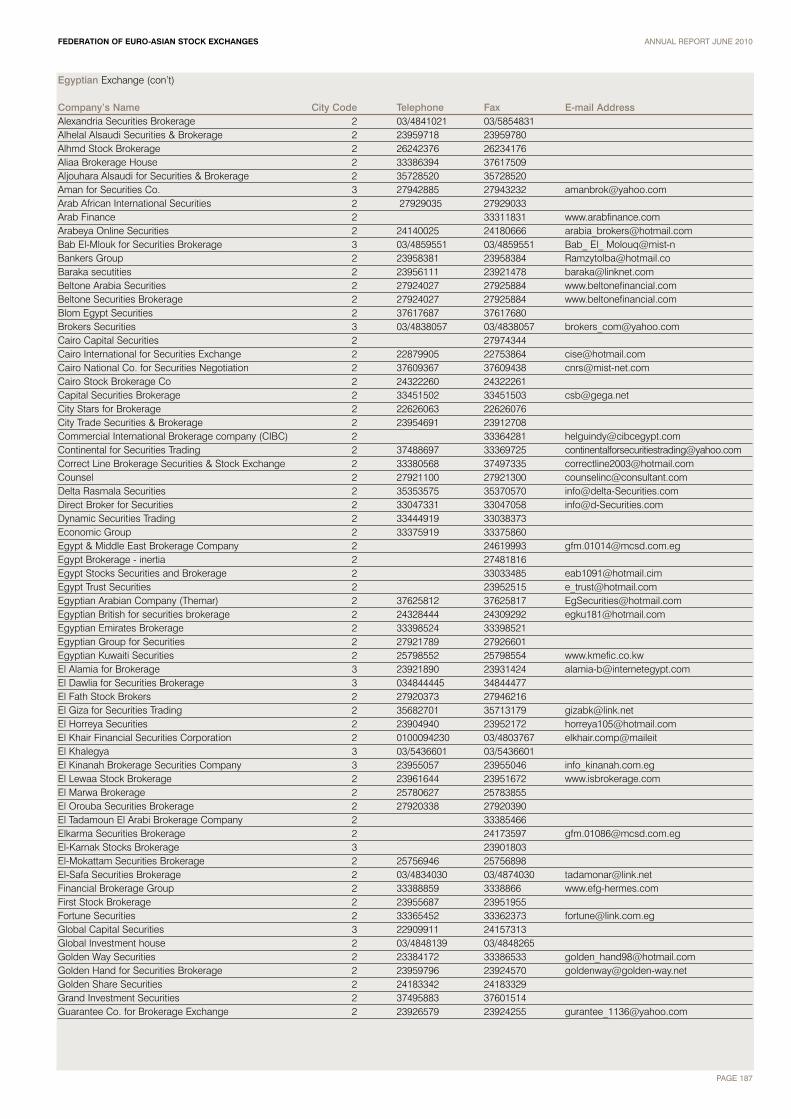
PAGE 187
ANNUAL REPORT JUNE 2010FEDERATION OF EURO-ASIAN STOCK EXCHANGES
Egyptian Exchange (con’t)
Company’s Name City Code Telephone Fax E-mail Address Alexandria Securities Brokerage 2 03/4841021 03/5854831Alhelal Alsaudi Securities & Brokerage 2 23959718 23959780Alhmd Stock Brokerage 2 26242376 26234176Aliaa Brokerage House 2 33386394 37617509Aljouhara Alsaudi for Securities & Brokerage 2 35728520 35728520Aman for Securities Co. 3 27942885 27943232 [email protected] African International Securities 2 27929035 27929033Arab Finance 2 33311831 www.arabfinance.comArabeya Online Securities 2 24140025 24180666 [email protected] El-Mlouk for Securities Brokerage 3 03/4859551 03/4859551 Bab_ El_ Molouq@mist-nBankers Group 2 23958381 23958384 [email protected] secutities 2 23956111 23921478 [email protected] Arabia Securities 2 27924027 27925884 www.beltonefinancial.comBeltone Securities Brokerage 2 27924027 27925884 www.beltonefinancial.comBlom Egypt Securities 2 37617687 37617680Brokers Securities 3 03/4838057 03/4838057 [email protected] Capital Securities 2 27974344Cairo International for Securities Exchange 2 22879905 22753864 [email protected] National Co. for Securities Negotiation 2 37609367 37609438 [email protected] Stock Brokerage Co 2 24322260 24322261Capital Securities Brokerage 2 33451502 33451503 [email protected] Stars for Brokerage 2 22626063 22626076City Trade Securities & Brokerage 2 23954691 23912708Commercial International Brokerage company (CIBC) 2 33364281 [email protected] for Securities Trading 2 37488697 33369725 [email protected] Line Brokerage Securities & Stock Exchange 2 33380568 37497335 [email protected] 2 27921100 27921300 [email protected] Rasmala Securities 2 35353575 35370570 [email protected] Broker for Securities 2 33047331 33047058 [email protected] Securities Trading 2 33444919 33038373Economic Group 2 33375919 33375860Egypt & Middle East Brokerage Company 2 24619993 [email protected] Brokerage - inertia 2 27481816Egypt Stocks Securities and Brokerage 2 33033485 [email protected] Trust Securities 2 23952515 [email protected] Arabian Company (Themar) 2 37625812 37625817 [email protected] British for securities brokerage 2 24328444 24309292 [email protected] Emirates Brokerage 2 33398524 33398521Egyptian Group for Securities 2 27921789 27926601Egyptian Kuwaiti Securities 2 25798552 25798554 www.kmefic.co.kwEl Alamia for Brokerage 3 23921890 23931424 [email protected] Dawlia for Securities Brokerage 3 034844445 34844477El Fath Stock Brokers 2 27920373 27946216El Giza for Securities Trading 2 35682701 35713179 [email protected] Horreya Securities 2 23904940 23952172 [email protected] Khair Financial Securities Corporation 2 0100094230 03/4803767 elkhair.comp@maileitEl Khalegya 3 03/5436601 03/5436601El Kinanah Brokerage Securities Company 3 23955057 23955046 info_kinanah.com.egEl Lewaa Stock Brokerage 2 23961644 23951672 www.isbrokerage.comEl Marwa Brokerage 2 25780627 25783855El Orouba Securities Brokerage 2 27920338 27920390El Tadamoun El Arabi Brokerage Company 2 33385466Elkarma Securities Brokerage 2 24173597 [email protected] Stocks Brokerage 3 23901803El-Mokattam Securities Brokerage 2 25756946 25756898El-Safa Securities Brokerage 2 03/4834030 03/4874030 [email protected] Brokerage Group 2 33388859 3338866 www.efg-hermes.comFirst Stock Brokerage 2 23955687 23951955Fortune Securities 2 33365452 33362373 [email protected] Capital Securities 3 22909911 24157313Global Investment house 2 03/4848139 03/4848265Golden Way Securities 2 23384172 33386533 [email protected] Hand for Securities Brokerage 2 23959796 23924570 [email protected] Share Securities 2 24183342 24183329Grand Investment Securities 2 37495883 37601514Guarantee Co. for Brokerage Exchange 2 23926579 23924255 [email protected]

Egyptian Exchange (con’t)
Company’s Name City Code Telephone Fax E-mail Address H.A. Brokerage 2 33025181HC Brokerage 2 37496009 37496051 [email protected] Brokerage Co. 2 25577945 25576771 [email protected] Securities Brokerage 2 33388859 33388866Honest Brokerage & Book Keeping 2 25190333 25190666Horas Stock Brokers 2 25913638 25889410 [email protected] Securities Brokerage Company 2 25780912HSBC Securities Egypt S.A.E 2 25296093/94 [email protected] Securities Brokerage 2 33041652 33441177 www.ifaegypt.comInternational Brokerage Group 2 25929901 25905195 lbggroup@egypto line.comInternational for Securities 2 24553232 24555273 [email protected] Securities Brokerage 2 25780932 25780933Leaders Securities 2 33472266 [email protected] Securities Brokers 2 25920635 25929072Maadi for Stock Dealing 2 37619351 37619351 [email protected] Securities and Trading 3 4868267 4856665 [email protected] trade 2 33035673 33035689Mediterranean for Brokerage 2 25766859 25767879Mega Investment Securities 2 33388635 37488820Metro Co. for Book Keeping & Stock Dealing 2 25260446 25260447 [email protected] Company Stock Exchange Brokers 2 24193134 24172930Miracle for Securities 2 23921378 23921378 [email protected] Brokerage 2 33026287 33048048 www.miragebrokerage.netNaeem Brokerage 2 33037677 33469287 www.naeembrokerageegy.comNamaa Securities Brokerage 2 33381760 38356100National Securities 2 33382930 33382950 [email protected] Brent Brokerage 2 33362748 33359046Okaz Stockbrokers & Investment Consultants 2 25895321 25891499 [email protected] Securities Brokerage 2 25784725 25784726 optimabrokrage.comOsool Esb for Securities Brokerage 2 24139100 24172295 [email protected] Brokerage Company 2 25756655 [email protected] Securities 2 27393671 27350661Pioneers Securities 2 22726554 [email protected] Securities 2 33369671 37627584Prime Securities Brokerage 2 33005650 33054622 [email protected] Securities 2 37493726 33381810Profit Securities Brokerage 2 23903843 23903843 [email protected] Capital 2 33368781 33368783Regent Securities 2 25296950 25288235 [email protected] for Stock Brokers 2 26395081 26335752 [email protected] Tadawol Misr Brokerage 2 37481464 37624047 www.Sambatadawol.comSaudi Egyptian Co. for Securities Brokerage 2 24605577 24605577Shuaa Securities 2 24619708 24619708Sigma Securities Brokerage 2 33355353 33350066Solidaire Securities Brokerage 2 16650 22903115Standard for Securities 2 24512537 24552850 www.standardbr.comStrategic Securities Group 2 33041280 33041290 [email protected] Group 2 24512030 24535805Takamol Brokerage Co. 3 4848036 4848036Team for Securities Trade 3 4833939 4848926The Financial Arabian for Securities Brokerage 3 24525492 24525494The Roots Co. for Stock Brokerage 3 23953041 23952799Three Way Brokerage 2 27925029 27950213Tiba Brokerage & Bookkeeping 2 23905906 23905906 [email protected] for Brokerage 2 26236941 26236941 www.fabrokerage.comTrend for Securities 2 23922132 23922407 [email protected] A Securities Co. 2 33052140 33052133 TOP_ 4_ [email protected] for Stock Exchange 2 23950015 23950015 [email protected] 2 26908079 26908078 [email protected] Brokerage Corporation 2 37744968 35699108 [email protected] Securities Brokerage 2 23801162 23801173Venex Group 2 29240338 25899330 www.visionmisr.comWallstreet Securities Brokerage 2 37487506 37487505 [email protected] Brokers 3 4856162 4844544Wathika brokerage 2 27984200 27984228Wedian Securities Brokerage 3 23912569 23939235Yasmine Brokerage Company 3 4858444 4844216 [email protected]
PAGE 188
ANNUAL REPORT JUNE 2010FEDERATION OF EURO-ASIAN STOCK EXCHANGES

PAGE 189
ANNUAL REPORT JUNE 2010FEDERATION OF EURO-ASIAN STOCK EXCHANGES
Georgian Stock Exchange Address: 74a Chavchavadze Avenue Tbilisi 0162 Georgia Phone: (32) 220 718 Fax: (32) 251 876 E-mail: [email protected] Address: www.gse.ge Country Code: 995
Company’s Name City Code Telephone Fax E-mail Address AICBERGI 32 914 847 [email protected] 32 230 074 227 447 [email protected] BROKER 32 230 021 251 410 [email protected] CAPITAL GROUP 32 291 457 info@capital,geCAUCASUS FINANCIAL SERVICES 32 559 900 559 903 [email protected] CAPITAL 32 377 724 378 724 [email protected] 32 330906 330906GALT & TAGGART SECURITIES 32 235 800 235 804 [email protected] INVESTMENT GROUP 32 225 907 225 907 [email protected] INVESTMENT GROUP 32 914 999 252 815 [email protected] STOCK COMPANY 32 987 109 999 007 [email protected] 32 250 052 [email protected] 32 294 621 [email protected] BROKER 32 92 15 54 932 710 [email protected] INVESTMENT MANAGEMENT COMPANY 32 555 505 912 269 [email protected] BROKER 32 222 537 27 27 33 [email protected] 32 433 095 [email protected]
Iraq Stock Exchange Address: P.O. Box, 3607 AlAlwiya, Iraq Phone: (790) 148 6733 Fax: (1) 717 4461 E-mail: [email protected] Address: www.isx-iq.net Country Code: 964
Company’s Name City Code Telephone Fax E-mail Address Agricultural Bank 8189083 [email protected] United Company 7170057 [email protected] Ithmar Company 7193010 [email protected] Company 7405237 [email protected] Company 7191313 [email protected] Company 7193413 [email protected] company 7199063 [email protected] Company 7172008 [email protected] Company 7190998 [email protected] Company [email protected] Company 8867171 [email protected] Company 7170542 [email protected] Company 7193038 [email protected] Company 7185885 [email protected] Company 7182136 [email protected] Company 7182002 [email protected] Company 7181839 [email protected] Company 7193476 [email protected] Company 7188809 [email protected] Company 5417146 [email protected] Company 7182240 [email protected]'Company 7180696 [email protected] Bank 7197154 [email protected] Company 7190575 [email protected] Bank 8180088 [email protected] Company 7174052 [email protected] Company 7196472 [email protected] Company 7171313 [email protected] Company 7762103 [email protected] Company 7190057 [email protected]'a Company 7195768 [email protected] Company 8169331 [email protected] Company 7188877 [email protected] Al-Khair Company 7173743 [email protected] company 7191944 [email protected] company 7177703 [email protected] Company 7197159 [email protected] Free Company 5416828 [email protected] Company 7199593 [email protected] Bank 8172183 [email protected] United Company 7171362 [email protected]

Iraq Stock Exchange (con’t)
Company’s Name City Code Telephone Fax E-mail Address Kassab Company 7400284 [email protected] Company 7192952 [email protected] Company 7187885 [email protected] Okadh Company 7174394 [email protected] Company 7173169 [email protected] Rabieain Company 8850208 um_alrabeaen_companyWahat Al-Nakeel Company 7186134 [email protected] Company 7172828 [email protected] Alkhalij Company 7760170 [email protected]
Istanbul Stock Exchange Address: IMKB Building, Resitpasa Mah., Tuncay Artun Cad., Emirgan, 34467 Istanbul, Turkey Phone: (212) 298 2100 Fax: (212) 298 2500E-mail: [email protected] Web Address: www.ise.org Country Code: 90
Company’s Name City Code Telephone FaxABN AMRO BANK N.V. MERKEZI AMSTERDAM IST. SB. 212 3594040 3595050ACAR YATIRIM MENKUL DEGERLER A.S. 212 2162661 2660543ADABANK A.S. 212 2726420 2726446ANADOLUBANK A.S. 212 2969811 2965715ADA MENKUL DEGERLER A.S. 212 3474218 2887863ANADOLU YATIRIM MENKUL KIYMETLER A.S. 212 3687700 2333318AKTIF YATIRIM BANKASI A.S. 212 3408000 3408865AKBANK T.A.S. 212 3855555 2697383AKDENIZ MENKUL DEGERLER TIC.A.S. 216 3561070 3561076AK YATIRIM MENKUL DEGERLER A.S. 212 3349494 2491287ALFA MENKUL DEGERLER A.S. 216 4290807 4290744ALAN MENKUL DEGERLER A.S. 212 3702222 3702223ALTAY YATIRIM MENKUL DEGERLER A.S. 212 2295980 2250135ALTERNATIF YATIRIM A.S. 212 3155800 2313842ALTERNATIFBANK A.S. 212 3156500 2257615ATAONLINE MENKUL KIYMETLER A.S. 212 3106060 2590764ARAP TURK BANKASI A.S. 212 2250500 2249687ATA YATIRIM MENKUL KIYMETLER A.S. 212 3106200 3106210ARTI MENKUL KIYMETLER A.S. 216 5672134 5672135AYBORSA MENKUL DEGERLER TIC.A.S. 212 2200930 2203851B.A.B. MENKUL DEGERLER TICARETI A.S. 212 5036176 5036176BAHAR MENKUL DEGERLER TICARETI A.S. 216 3362953 3478980BGC PARTNERS MENKUL DEGERLER A.S. 212 3394200 3531301BIZIM MENKUL DEGERLER A.S. 216 5471300 5471397BASKENT MENKUL DEGERLER VE YATIRIM A.S. 212 2912121 2240700BIRLESIK FON BANKASI A.S. 212 3401000 3401339CREDIT AGRICOLE CHEUVREUX MENKUL DEGERLER A.S. 212 3711900 3711901CALYON YATIRIM BANKASI TURK A.S. 212 3393700 2826301CAMIS MENKUL DEGERLER A.S. 212 3503002 3505150CITI MENKUL DEGERLER A.S. 212 3194700 3194799CITIBANK A.S. 212 2887700 2887760CENSA MENKUL DEGERLER A.S. 216 5726600 5776868CREDIT SUISSE ISTANBUL MENKUL DEGERLER A.S. 212 3490400 3490409DEUTSCHE BANK A.S. 212 3170100 3170105DEGER MENKUL DEGERLER A.S. 212 3440701 2906491DELTA MENKUL DEGERLER A.S. 212 3100800 2366567DEHA MENKUL KIYMETLER A.S. 212 2527190 2527198DILER YATIRIM BANKASI A.S. 212 2536630 2539454DENIZ TUREV MENKUL DEGERLER A.S. 212 3364296 2118316DENIZBANK A.S. 212 3550800 2672724DARUMA MENKUL DEGERLER A.S. 212 3706060 3706000DEUTSCHE SECURITIES MENKUL DEGERLER A.S. 212 3190319 3190399DUNYA MENKUL DEGERLER A.S. 212 5128434 5272337DENIZ YATIRIM MENKUL KIYMETLER A.S. 212 2753500 2125412ECZACIBASI MENKUL DEGERLER A.S. 212 3195999 3195790EFG ISTANBUL MENKUL DEGERLER A.S. 212 3172727 3172726EKINCILER YATIRIM MENKUL DEG.A.S. 212 2662766 2661607EKSPRES YATIRIM VE MENKUL DEGERLER A.S. 212 3365100 3365101ENTEZ MENKUL DEGERLER TICARETI A.S. 216 3477035 3466343EURO YATIRIM MENKUL DEGERLER A.S. 212 3540700 3562076ETI YATIRIM A.S. 212 3213838 2949393
PAGE 190
ANNUAL REPORT JUNE 2010FEDERATION OF EURO-ASIAN STOCK EXCHANGES

PAGE 191
ANNUAL REPORT JUNE 2010FEDERATION OF EURO-ASIAN STOCK EXCHANGES
Istanbul Stock Exchange (con’t)
Company’s Name City Code Telephone FaxEUROBANK TEKFEN A.S. 212 3570707 3570808EVGIN YATIRIM MENKUL DEGERLER TICARETI A.S. 212 2871628 2638875EGEMEN MENKUL KIYMETLER A.S. 232 4894530 4896130FINANSBANK A.S. 212 3185000 3185578FINANS YATIRIM MENKUL DEGERLER A.S. 212 2821700 2822250FORTIS YATIRIM MENKUL DEGERLER A.S. 212 3580770 3580778FORTIS BANK A.S. 212 3183838 2725278GEDIK YATIRIM MENKUL DEGERLER A.S. 216 4530000 4516364GFC GENERAL FINANS MENKUL DEGERLER A.S. 212 2331010 2968575ING BANK A.S. 212 3351000 2866100GLOBAL MENKUL DEGERLER A.S. 212 2445566 2445567GALATA MENKUL DEGERLER A.S. 212 3933900 2931010GUNEY MENKUL DEGERLER A.S. 212 4413300 4413388ING MENKUL DEGERLER A.S. 212 3677000 3677070GARANTI YATIRIM MENKUL KIYMETLER A.S. 212 3182838 2178470GSD YATIRIM BANKASI A.S. 216 5879000 4899781GUVEN MENKUL DEGERLER A.S. 212 2123270 2885038HAK MENKUL KIYMETLER A.S. 212 2968484 2329823HEDEF MENKUL DEGERLER A.S. 212 2449079 2445372HALK YATIRIM MENKUL DEGERLER A.S. 212 3930303 2929946HSBC BANK A.S. 212 3764000 2674794HSBC YATIRIM MENKUL DEGERLER A.S. 212 3764600 3362472INFO YATIRIM A.S. 212 3192600 3248428IS YATIRIM MENKUL DEGERLER A.S. 212 3502000 3502001J.P. MORGAN MENKUL DEGERLER A.S. 212 3198500 3198668KALKINMA YATIRIM MENKUL DEGERLER A.S. 212 2119797 2119798KAPITAL MENKUL DEGERLER A.S. 212 3300333 3300369KARE YATIRIM MENKUL DEGERLER A.S. 216 5596000 5596060K MENKUL KIYMETLER A.S. 212 2756060 2740991LEHMAN BROTHERS MENKUL DEGERLER A.S. 212 2903795 2903795MED MENKUL DEGERLER A.S. 212 2745444 2744656MERRILL LYNCH YATIRIM BANK A.S. 212 3199500 3199511MERRILL LYNCH MENKUL DEGERLER A.S. 212 3199669 3199512MILLENNIUM BANK A.S. 212 3063500 2163524MIRA MENKUL DEGERLER A.S. 212 3623500 3236394MARBAS MENKUL DEGERLER A.S. 212 2863000 2863050MEKSA YATIRIM MENKUL DEGERLER A.S. 212 3850900 3441121MORGAN STANLEY MENKUL DEGERLER A.S. 212 3555858 2754052METRO YATIRIM MENKUL DEGERLER A.S. 212 3440900 3440913ULUS MENKUL DEGERLER A.S. 212 2824515 2824808NUROL MENKUL KIYMETLER A.S. 212 2868000 2868001NUROL YATIRIM BANKASI A.S. 212 2868000 2868101ONER MENKUL KIYMETLER A.S. 212 2344062 2259892ORION INVESTMENT MENKUL DEGERLER A.S. 212 3199800 3441577OYAK YATIRIM MENKUL DEGERLER A.S. 212 3191200 3510599PAY MENKUL DEGERLER A.S. 212 2751708 2750185PIRAMIT MENKUL KIYMETLER A.S. 212 2939500 2939560POZITIF MENKUL DEGERLER A.S. 216 6813030 6813001PRIM MENKUL DEGERLER A.S. 212 2838888 2838890POLEN MENKUL DEGERLER A.S. 212 2525500 2522005BANKPOZITIF KREDI VE KALKINMA BANKASI A.S. 216 5382525 5384241RAYMOND JAMES YATIRIM MENKUL KIY. A.S. 212 3492000 3492001SEKERBANK T.A.S. 212 3197000 3197079SEKER YATIRIM MENKUL DEGERLER A.S. 212 3343333 3343334SANKO MENKUL DEGERLER A.S. 212 4100500 4100505SOYMEN MENKUL KIYMETLER A.S. 312 4688750 4688101SOCIETE GENERALE PARIS MRK. FRANSA IST. TR. MRK. SB. 212 2821942 2821844SARDIS MENKUL DEGERLER A.S. 212 3460991 3460989STRATEJI MENKUL DEGERLER A.S. 212 3547900 2884811STANDARD UNLU MENKUL DEGERLER A.S. 212 3673636 3461040SAYILGAN MENKUL DEGERLER TICARETI A.S. 212 5204242 5135209TACIRLER MENKUL DEGERLER A.S. 212 3554646 2820998TURKISH BANK A.S. 212 2250330 2250353TURKLAND BANK A.S. 212 3683434 3683535TEB YATIRIM MENKUL DEGERLER A.S. 216 6364444 6314400JPMORGAN CHASE BANK MERKEZI NEW YORK ISTANBUL-TURKIYE SB. 212 3198500 3198664
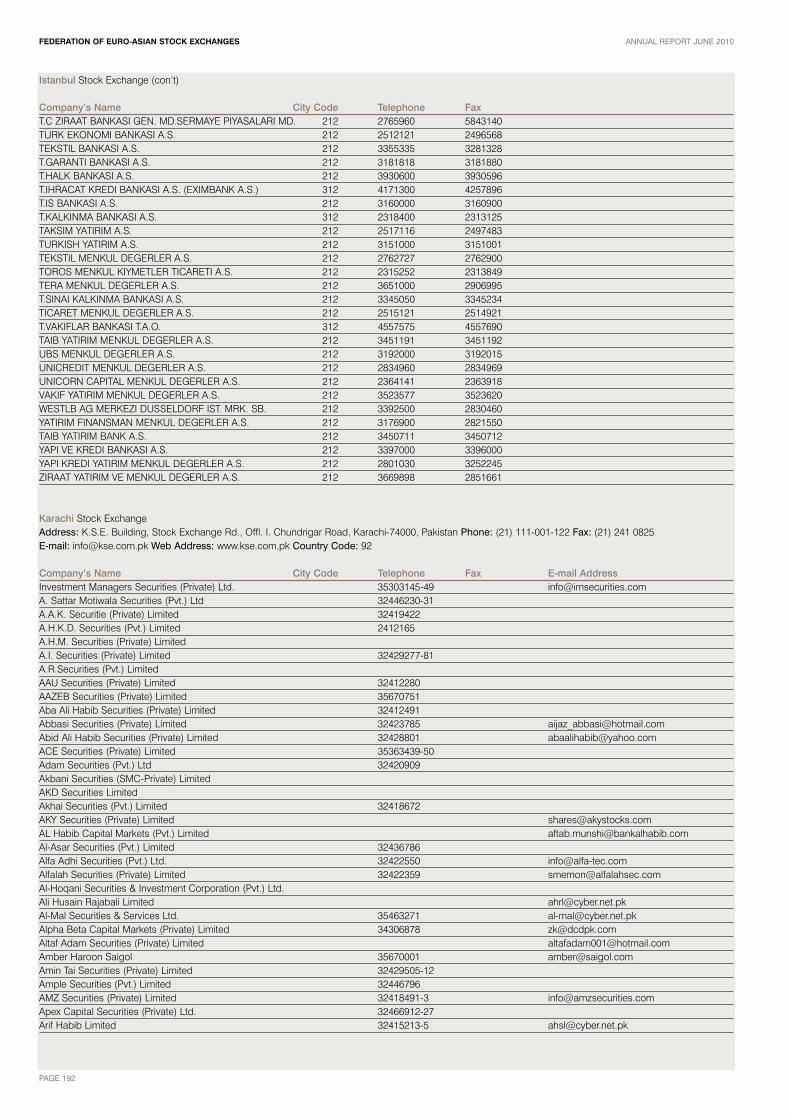
Istanbul Stock Exchange (con’t)
Company’s Name City Code Telephone FaxT.C ZIRAAT BANKASI GEN. MD.SERMAYE PIYASALARI MD. 212 2765960 5843140TURK EKONOMI BANKASI A.S. 212 2512121 2496568TEKSTIL BANKASI A.S. 212 3355335 3281328T.GARANTI BANKASI A.S. 212 3181818 3181880T.HALK BANKASI A.S. 212 3930600 3930596T.IHRACAT KREDI BANKASI A.S. (EXIMBANK A.S.) 312 4171300 4257896T.IS BANKASI A.S. 212 3160000 3160900T.KALKINMA BANKASI A.S. 312 2318400 2313125TAKSIM YATIRIM A.S. 212 2517116 2497483TURKISH YATIRIM A.S. 212 3151000 3151001TEKSTIL MENKUL DEGERLER A.S. 212 2762727 2762900TOROS MENKUL KIYMETLER TICARETI A.S. 212 2315252 2313849TERA MENKUL DEGERLER A.S. 212 3651000 2906995T.SINAI KALKINMA BANKASI A.S. 212 3345050 3345234TICARET MENKUL DEGERLER A.S. 212 2515121 2514921T.VAKIFLAR BANKASI T.A.O. 312 4557575 4557690TAIB YATIRIM MENKUL DEGERLER A.S. 212 3451191 3451192UBS MENKUL DEGERLER A.S. 212 3192000 3192015UNICREDIT MENKUL DEGERLER A.S. 212 2834960 2834969UNICORN CAPITAL MENKUL DEGERLER A.S. 212 2364141 2363918VAKIF YATIRIM MENKUL DEGERLER A.S. 212 3523577 3523620WESTLB AG MERKEZI DUSSELDORF IST. MRK. SB. 212 3392500 2830460YATIRIM FINANSMAN MENKUL DEGERLER A.S. 212 3176900 2821550TAIB YATIRIM BANK A.S. 212 3450711 3450712YAPI VE KREDI BANKASI A.S. 212 3397000 3396000YAPI KREDI YATIRIM MENKUL DEGERLER A.S. 212 2801030 3252245ZIRAAT YATIRIM VE MENKUL DEGERLER A.S. 212 3669898 2851661
Karachi Stock Exchange Address: K.S.E. Building, Stock Exchange Rd., Offl. I. Chundrigar Road, Karachi-74000, Pakistan Phone: (21) 111-001-122 Fax: (21) 241 0825E-mail: [email protected] Web Address: www.kse.com.pk Country Code: 92
Company’s Name City Code Telephone Fax E-mail Address Investment Managers Securities (Private) Ltd. 35303145-49 [email protected]. Sattar Motiwala Securities (Pvt.) Ltd 32446230-31A.A.K. Securitie (Private) Limited 32419422A.H.K.D. Securities (Pvt.) Limited 2412165A.H.M. Securities (Private) LimitedA.I. Securities (Private) Limited 32429277-81A.R.Securities (Pvt.) LimitedAAU Securities (Private) Limited 32412280AAZEB Securities (Private) Limited 35670751Aba Ali Habib Securities (Private) Limited 32412491Abbasi Securities (Private) Limited 32423785 [email protected] Ali Habib Securities (Private) Limited 32428801 [email protected] Securities (Private) Limited 35363439-50Adam Securities (Pvt.) Ltd 32420909Akbani Securities (SMC-Private) LimitedAKD Securities LimitedAkhai Securities (Pvt.) Limited 32418672AKY Securities (Private) Limited [email protected] Habib Capital Markets (Pvt.) Limited [email protected] Securities (Pvt.) Limited 32436786Alfa Adhi Securities (Pvt.) Ltd. 32422550 [email protected] Securities (Private) Limited 32422359 [email protected] Securities & Investment Corporation (Pvt.) Ltd.Ali Husain Rajabali Limited [email protected] Securities & Services Ltd. 35463271 [email protected] Beta Capital Markets (Private) Limited 34306878 [email protected] Adam Securities (Private) Limited [email protected] Haroon Saigol 35670001 [email protected] Tai Securities (Private) Limited 32429505-12Ample Securities (Pvt.) Limited 32446796AMZ Securities (Private) Limited 32418491-3 [email protected] Capital Securities (Private) Ltd. 32466912-27Arif Habib Limited 32415213-5 [email protected]
PAGE 192
ANNUAL REPORT JUNE 2010FEDERATION OF EURO-ASIAN STOCK EXCHANGES

PAGE 193
ANNUAL REPORT JUNE 2010FEDERATION OF EURO-ASIAN STOCK EXCHANGES
Karachi Stock Exchange (con’t)
Company’s Name City Code Telephone Fax E-mail Address Ashfaq Ashraf Securities (Private) LimitedAsian Securities Limited 32426649 [email protected] Capital Markets (Pvt.) Limited 35866919-20 [email protected] Securities (Private) Limited [email protected] Dawood Securities (Private) LimitedAziz Fidahusein & Co. (Pvt.) Limited 32410091-4 [email protected]&B Securities (Pvt.) Ltd.Bawa Securities (Pvt.) Limited 32418253 [email protected] Securities (Private) Limited 32429774-7 [email protected] Capital Management Limited 111-262-262Cassim Investments (Private) Limited 2421626Cedar Capital (Private) LimitedConcordia Securities (Pvt) Ltd. 32424526Continental Capital Management (Pvt) Ltd. 32446723Creative Capital Securities (Private) Limited 32430843 [email protected] Securities Pakistan (Private) LimitedD.J.M. Securities (Pvt.) Limited 32441193-4Dalal Securities (Pvt.) Limited 32467054-61 [email protected] Securities (Private) Limited 32470755-65 [email protected] Securities (Private) Limited 32419713 [email protected] Equities Limited 32271908Dawood Mohammed 32413931Durvesh Securities (Private) Limited 32416059 [email protected] Stars Securities (Private) Limited 32410240Elixir Securities Pakistan (Private) Limited 32401021-28 [email protected] Capital Limited [email protected] Capital Securities (Private) Limited 32429042-46Farooq Abdullah Securities (Private) Limited 35380842Fawad Yusuf Securities (Private) Limited 32444554-5 [email protected] Capital Securities (Pvt.) Limited 32214734 [email protected] Capital Equities Limited 32425698First Choice Securities LimitedFirst Equity Modaraba 35672815-8First National Equities Limited 042-35843721-7 [email protected] Securities (Private) Limited [email protected] Securities Limited [email protected] Securities (Private) Limited [email protected] Securities (Pvt.) Limited 32442174 [email protected] Securities & Services (Pvt.) Limited 32418903 [email protected] Osman Securities (Private) Limited 32470220-29Ghory's Securities (Private) Limited [email protected] Securities Pakistan Limited 32457500GMI Capital Securities (Private) Limited 32417628 [email protected] Securities (Private) LimitedH & H Securities (Private) Limited 34939854H. M. Idrees H. Adam 32425001H.H.K. Securities (Pvt.) Limited 111-633-633 [email protected]. Securities (Private) Limited 32419885Habib Metropolitan Financial Services LimitedHaroon Suleman 32412622HH Misbah Securities (Private) Limited 32429106 [email protected] Securities LimitedHussain Ebrahim (LATE) 32417601-5 [email protected] Finex Securities LimitedIntermarket Securities (Pvt.) LimitedInvest & Finance Securities Limited [email protected] Capital Investmen Bank Limited 111-111-097 [email protected] Securities Limited, (Under Suspension) 32444428-31Invisor Securities (Private) Limited 35611492-5 [email protected] Usman Kodvavi Securities (Pvt.)Ltd. 32432911-12 [email protected] Mazhar Securities (Pvt.) Limited 32446155-56Ismail Iqbal Securities (Pvt.) Ltd. 32470998 [email protected]. Morgan Pakistan Broking (Private) Ltd. 35610861Jahangir Siddiqui & Co. Ltd. [email protected] Mohammed A. Latif Nini & Sons (Pvt) Ltd. 32411284-5 [email protected] Omer Vohra & Co. Ltd. 32410849 [email protected] Zakaria Gulabi Securities (Private) Limited 34911110JS Global Capital Limited
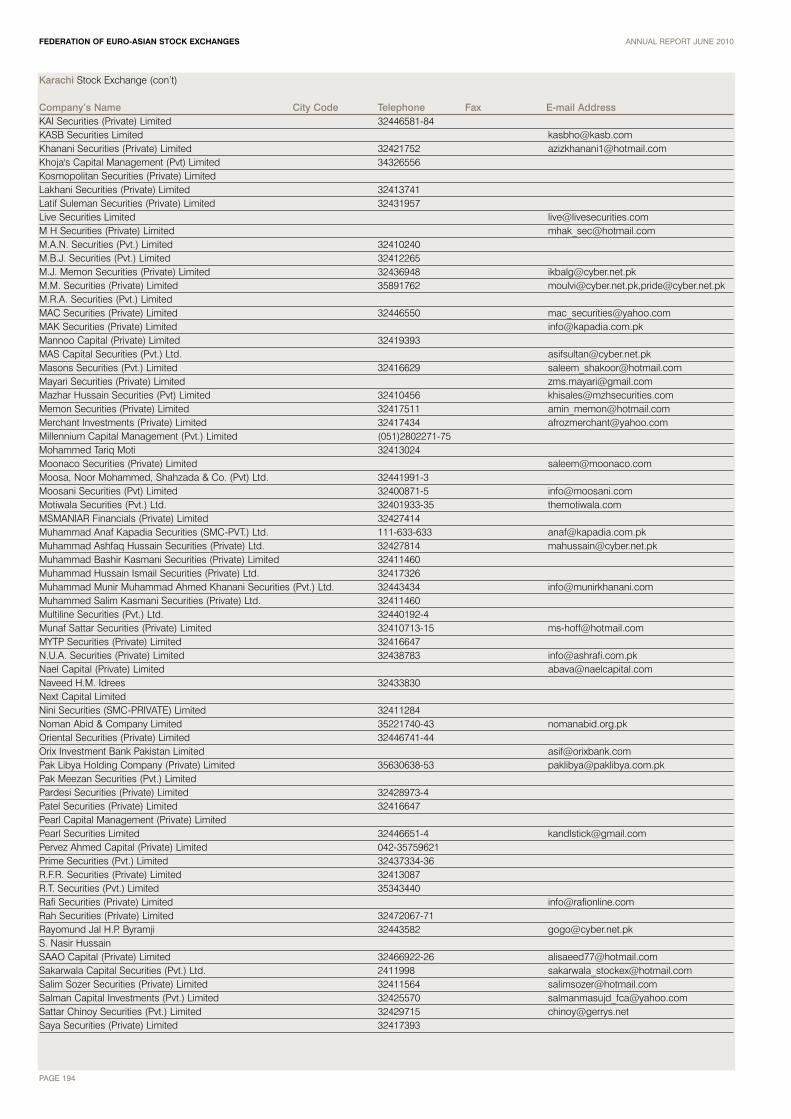
Karachi Stock Exchange (con’t)
Company’s Name City Code Telephone Fax E-mail Address KAI Securities (Private) Limited 32446581-84KASB Securities Limited [email protected] Securities (Private) Limited 32421752 [email protected]'s Capital Management (Pvt) Limited 34326556Kosmopolitan Securities (Private) LimitedLakhani Securities (Private) Limited 32413741Latif Suleman Securities (Private) Limited 32431957Live Securities Limited [email protected] H Securities (Private) Limited [email protected]. Securities (Pvt.) Limited 32410240M.B.J. Securities (Pvt.) Limited 32412265M.J. Memon Securities (Private) Limited 32436948 [email protected]. Securities (Private) Limited 35891762 [email protected],[email protected]. Securities (Pvt.) LimitedMAC Securities (Private) Limited 32446550 [email protected] Securities (Private) Limited [email protected] Capital (Private) Limited 32419393MAS Capital Securities (Pvt.) Ltd. [email protected] Securities (Pvt.) Limited 32416629 [email protected] Securities (Private) Limited [email protected] Hussain Securities (Pvt) Limited 32410456 [email protected] Securities (Private) Limited 32417511 [email protected] Investments (Private) Limited 32417434 [email protected] Capital Management (Pvt.) Limited (051)2802271-75Mohammed Tariq Moti 32413024Moonaco Securities (Private) Limited [email protected], Noor Mohammed, Shahzada & Co. (Pvt) Ltd. 32441991-3Moosani Securities (Pvt) Limited 32400871-5 [email protected] Securities (Pvt.) Ltd. 32401933-35 themotiwala.comMSMANIAR Financials (Private) Limited 32427414Muhammad Anaf Kapadia Securities (SMC-PVT.) Ltd. 111-633-633 [email protected] Ashfaq Hussain Securities (Private) Ltd. 32427814 [email protected] Bashir Kasmani Securities (Private) Limited 32411460Muhammad Hussain Ismail Securities (Private) Ltd. 32417326Muhammad Munir Muhammad Ahmed Khanani Securities (Pvt.) Ltd. 32443434 [email protected] Salim Kasmani Securities (Private) Ltd. 32411460Multiline Securities (Pvt.) Ltd. 32440192-4Munaf Sattar Securities (Private) Limited 32410713-15 [email protected] Securities (Private) Limited 32416647N.U.A. Securities (Private) Limited 32438783 [email protected] Capital (Private) Limited [email protected] H.M. Idrees 32433830Next Capital LimitedNini Securities (SMC-PRIVATE) Limited 32411284Noman Abid & Company Limited 35221740-43 nomanabid.org.pkOriental Securities (Private) Limited 32446741-44Orix Investment Bank Pakistan Limited [email protected] Libya Holding Company (Private) Limited 35630638-53 [email protected] Meezan Securities (Pvt.) LimitedPardesi Securities (Private) Limited 32428973-4 Patel Securities (Private) Limited 32416647Pearl Capital Management (Private) LimitedPearl Securities Limited 32446651-4 [email protected] Ahmed Capital (Private) Limited 042-35759621Prime Securities (Pvt.) Limited 32437334-36R.F.R. Securities (Private) Limited 32413087R.T. Securities (Pvt.) Limited 35343440Rafi Securities (Private) Limited [email protected] Securities (Private) Limited 32472067-71Rayomund Jal H.P. Byramji 32443582 [email protected]. Nasir HussainSAAO Capital (Private) Limited 32466922-26 [email protected] Capital Securities (Pvt.) Ltd. 2411998 [email protected] Sozer Securities (Private) Limited 32411564 [email protected] Capital Investments (Pvt.) Limited 32425570 [email protected] Chinoy Securities (Pvt.) Limited 32429715 [email protected] Securities (Private) Limited 32417393
PAGE 194
ANNUAL REPORT JUNE 2010FEDERATION OF EURO-ASIAN STOCK EXCHANGES
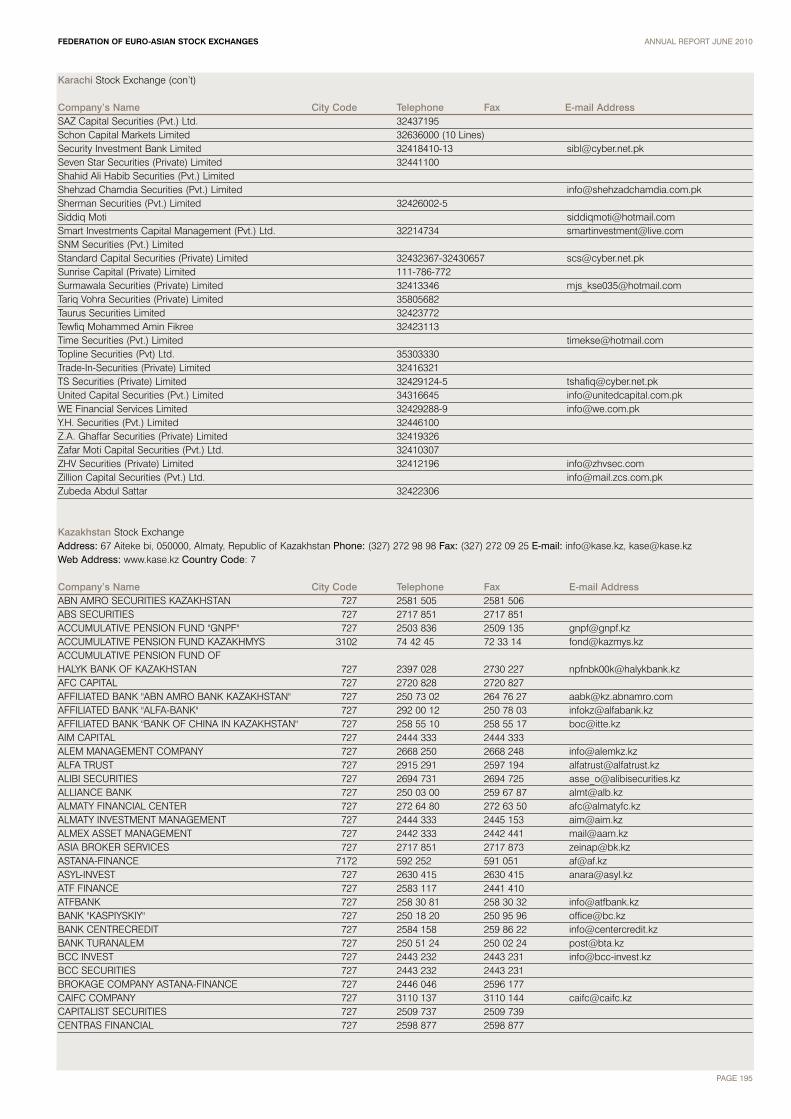
PAGE 195
ANNUAL REPORT JUNE 2010FEDERATION OF EURO-ASIAN STOCK EXCHANGES
Karachi Stock Exchange (con’t)
Company’s Name City Code Telephone Fax E-mail Address SAZ Capital Securities (Pvt.) Ltd. 32437195Schon Capital Markets Limited 32636000 (10 Lines)Security Investment Bank Limited 32418410-13 [email protected] Star Securities (Private) Limited 32441100Shahid Ali Habib Securities (Pvt.) LimitedShehzad Chamdia Securities (Pvt.) Limited [email protected] Securities (Pvt.) Limited 32426002-5Siddiq Moti [email protected] Investments Capital Management (Pvt.) Ltd. 32214734 [email protected] Securities (Pvt.) LimitedStandard Capital Securities (Private) Limited 32432367-32430657 [email protected] Capital (Private) Limited 111-786-772Surmawala Securities (Private) Limited 32413346 [email protected] Vohra Securities (Private) Limited 35805682Taurus Securities Limited 32423772Tewfiq Mohammed Amin Fikree 32423113Time Securities (Pvt.) Limited [email protected] Securities (Pvt) Ltd. 35303330Trade-In-Securities (Private) Limited 32416321TS Securities (Private) Limited 32429124-5 [email protected] Capital Securities (Pvt.) Limited 34316645 [email protected] Financial Services Limited 32429288-9 [email protected]. Securities (Pvt.) Limited 32446100Z.A. Ghaffar Securities (Private) Limited 32419326Zafar Moti Capital Securities (Pvt.) Ltd. 32410307ZHV Securities (Private) Limited 32412196 [email protected] Capital Securities (Pvt.) Ltd. [email protected] Abdul Sattar 32422306
Kazakhstan Stock Exchange Address: 67 Aiteke bi, 050000, Almaty, Republic of Kazakhstan Phone: (327) 272 98 98 Fax: (327) 272 09 25 E-mail: [email protected], [email protected] Address: www.kase.kz Country Code: 7
Company’s Name City Code Telephone Fax E-mail Address ABN AMRO SECURITIES KAZAKHSTAN 727 2581 505 2581 506ABS SECURITIES 727 2717 851 2717 851ACCUMULATIVE PENSION FUND "GNPF" 727 2503 836 2509 135 [email protected] PENSION FUND KAZAKHMYS 3102 74 42 45 72 33 14 [email protected] PENSION FUND OF HALYK BANK OF KAZAKHSTAN 727 2397 028 2730 227 [email protected] CAPITAL 727 2720 828 2720 827AFFILIATED BANK "ABN AMRO BANK KAZAKHSTAN" 727 250 73 02 264 76 27 [email protected] BANK "ALFA-BANK" 727 292 00 12 250 78 03 [email protected] BANK "BANK OF CHINA IN KAZAKHSTAN" 727 258 55 10 258 55 17 [email protected] CAPITAL 727 2444 333 2444 333ALEM MANAGEMENT COMPANY 727 2668 250 2668 248 [email protected] TRUST 727 2915 291 2597 194 [email protected] SECURITIES 727 2694 731 2694 725 [email protected] BANK 727 250 03 00 259 67 87 [email protected] FINANCIAL CENTER 727 272 64 80 272 63 50 [email protected] INVESTMENT MANAGEMENT 727 2444 333 2445 153 [email protected] ASSET MANAGEMENT 727 2442 333 2442 441 [email protected] BROKER SERVICES 727 2717 851 2717 873 [email protected] 7172 592 252 591 051 [email protected] ASYL-INVEST 727 2630 415 2630 415 [email protected] FINANCE 727 2583 117 2441 410ATFBANK 727 258 30 81 258 30 32 [email protected] "KASPIYSKIY" 727 250 18 20 250 95 96 [email protected] CENTRECREDIT 727 2584 158 259 86 22 [email protected] TURANALEM 727 250 51 24 250 02 24 [email protected] INVEST 727 2443 232 2443 231 [email protected] BCC SECURITIES 727 2443 232 2443 231BROKAGE COMPANY ASTANA-FINANCE 727 2446 046 2596 177CAIFC COMPANY 727 3110 137 3110 144 [email protected] SECURITIES 727 2509 737 2509 739CENTRAS FINANCIAL 727 2598 877 2598 877

Kazakhstan Stock Exchange (con’t)
Company’s Name City Code Telephone Fax E-mail Address CENTRAS SECURITIES 727 259 88 77 259 88 87 [email protected] KAZAKHSTAN 727 298 03 91 298 03 99 [email protected] SECURITIS (KAZAKHSTAN) 727 267 10 60 258 16 42 [email protected] BANK 7292 2448 555 2448 557 [email protected] KAZAKHSTAN BANK 727 250 85 50 250 85 25 [email protected] BANK OF KAZAKHSTAN 7172 792 679 792 638 [email protected] CAPITAL 727 3334 020 3334 669 [email protected] BANK 727 250 86 07 250 86 54 [email protected] KAZAKHSTAN 727 2663 093 2663 910 [email protected] COMPANY GREENWICH CAPITAL MANAGEMENT 727 273 98 20 2735 373 [email protected] COMPANY ALLIANCE CAPITAL 727 258 24 16 258 24 15 [email protected] FIRST BROKERAGE HOUSE 727 2717 851 250 61 32 [email protected] INVESTMENT 727 258 70 79 258 29 36 [email protected] ASSET MANAGEMENT 727 291 86 13 293 84 83 [email protected] SECURITIES (KAZAKHSTAN) 727 258 28 88 258 16 61 [email protected] INVEST 727 2980 876 2598 881GRANTUM ASSET MANAGEMENT 727 244 57 44 261 12 59 [email protected] CAPITAL 727 2590 260 2590 022HALYK FINANCE 727 259 00 28 259 05 93 [email protected] HALYK SAVING BANK OF KAZAKHSTAN 727 2590 350 2590 238 [email protected] CONSTRUCTION SAVINGS BANK OF KAZAKHSTAN 727 2793 511 272 34 99 [email protected] KONTINENT 727 2446 929 2446 932 [email protected] CENTRE OF THE PROPERTY AND PRIVATIZATION COMMITTEE OF THE MINISTRY OF FINANCE 717 2320 374 2322 397 [email protected] BANK "ALMA-ATA" 727 250 73 39 503 749 [email protected] FINANCIAL HOUSE "RESMI" 727 266 71 77 266 70 77 [email protected] KAZAKHSTAN FINSERVICE 727 2726 211 2726 001KAZAKHSTAN INNOVATIONAL COMMERCIAL BANK 727 292 60 08 292 01 44 [email protected] KAZAKHSTAN-ZIRAAT INTERNATIONAL BANK 727 250 60 80 250 60 82 [email protected] 7142 511 151 548 544 [email protected] 727 259 88 59 2598 658 [email protected] KAZKOMERTS INVEST RFCA 727 261 00 00 2443 838 [email protected] INVEST 727 261 00 00 2443 838 [email protected] RFCA 727 2588 493 2588 495KAZKOMMERTS SECURITIES 727 258 84 93 258 84 95 [email protected] 727 258 52 25 2509 507 [email protected] 727 259 06 43 259 06 47 [email protected] SECURITIES 7212 410 321 410 332 [email protected] 727 2583 473 249 64 21 [email protected] CAPITAL 727 2445 113 2445 113MAG FINANCE 727 3111 018 3111 018 [email protected] COMPANY INVESTMENT RESOURCES 727 267 12 89 267 12 90 MONEY EXPERTS 727 2502 640 2502 013 [email protected] BANK OF KAZAKHSTAN 727 2596 800 2509 456 [email protected] FINANCE 727 2726 966 2726 966 [email protected] NURBANK 727 250 00 00 250 67 03 [email protected] ACCUMULATIVE PENSION FUND OTAN 727 2503 040 2501 374 [email protected] CAPITAL 7252 545 236 545236 [email protected] ASSETS INVESTMENT MANAGEMENT COMPANY "BAILYK ASSET MANAGEMENT" 727 250 73 81 250 73 82 [email protected] ASSETS INVESTMENT MANAGEMENT COMPANY "PREMIER ASSET MANAGEMENT" 727 2667 177 2667 077 [email protected] ASSETS INVESTMENT MANAGEMENT COMPANY "ZHETUSY" 727 2442 661 2694 347 [email protected] FINANCIAL SOLUTIONS 727 3111 030 3111 031 [email protected] SECURITIES 727 2686 516 2456 242 [email protected] 727 295 21 06 295 21 08 [email protected] RFCA 727 2952 106 2952 108RENESSANCE CAPITAL INVESTMENTS KAZAKHSTAN 727 2441 544 2441 545RESMI INVESTMENT HOUSE ALMATY 727 2667 177 2667 400SENIM-BANK 727 268 10 51 268 18 56 [email protected] RIVERS CAPITAL 727 2739 081 2734 978 [email protected] GROUP 727 2644 899 2954 375 [email protected] BANK "HSBC BANK KAZAKHSTAN" 727 259 69 70 259 69 02 [email protected] 7172 770 201 770 195 [email protected] 727 2587 873 250 77 85 [email protected]
PAGE 196
ANNUAL REPORT JUNE 2010FEDERATION OF EURO-ASIAN STOCK EXCHANGES

PAGE 197
ANNUAL REPORT JUNE 2010FEDERATION OF EURO-ASIAN STOCK EXCHANGES
Kazakhstan Stock Exchange (con’t)
Company’s Name City Code Telephone Fax E-mail AddressTEXAKABANK 727 250 00 87 250 00 63 [email protected] INVEST 727 2378 400 2378 399 [email protected] CAPITAL 727 2584 865 2584 865 [email protected] SECURITIES 727 299 10 50 299 10 25 [email protected] IFC 727 2635 757 2635 761 [email protected] CAPITAL 727 2952 630 2952 637 [email protected] CAPITAL 727 277 77 17 277 77 18 [email protected] INVESTMENT SOLUTIONS 727 259 88 44 259 88 33 [email protected] CAPITAL 727 2500 834 2500 834 [email protected]
Kyrgyz Stock Exchange Address: 172 Moskovskaya St., 720010 Bishkek, Kyrgyz Republic Phone: : (312) 31 14 84 Fax: (312) 31 14 83 E-mail: [email protected] Address: www.kse.kg Country Code: 996
Company’s Name City Code Telephone Fax E-mail Address Aalam 312 48 64 38 48 64 87 [email protected] & Co. 312 59 14 07 59 17 42 [email protected] Finance 312 65 22 34 24 09 22 [email protected] 312 66 35 07 66 35 07 [email protected] Finance 312 62 09 47 62 09 49 [email protected] Finance 312 47 49 30 62 10 57 [email protected] Halyk Bank Kyrgyzstan 312 32 35 99 32 35 98 [email protected] Securities 555 61 16 93 61 16 93Masterfiber 3133 3 37 47 3 37 47 [email protected] 312 91 01 22 91 01 23 [email protected] Capital 312 61 53 99 61 53 99 [email protected] 312 61 45 89 61 00 25 [email protected]
Lahore Stock Exchange Address: 19, Khayaban-e-Aiwan-e-Iqbal, Lahore-54000, Pakistan Phone: (42) 636 8000 Fax: (42) 636 8485 E-mail: [email protected] Address: www.lahorestock.com Country Code: 92
Company’s Name City Code Telephone Fax E-mail Address 128 Securities ( Pvt.) Ltd. 42 35894909 35734501 [email protected] & Company (Pvt.) Ltd. 42 3732 0707 3628 2727 [email protected] Investments (Pvt.) Ltd. 42 35756161-65 3575 3399ABM Securities (Pvt.) Ltd. 42 36310555-56 3631 0557 [email protected] Securities (Pvt) Ltd. 21 244 4316 243 7380 [email protected] Zafar Securities (Pvt ) Ltd. 42 3636 8222 3581 7076 [email protected] & Nadeem Securities (Pvt) Ltd. 42 35781601-5 3578 1660 [email protected] Securities (Pvt.) Ltd. 42 36300101-3 3630 0104 [email protected] Kuli Khan Khattak 21 256 3138 256 4458Ali Usman Stock Brokerage(Pvt ) Ltd. 42 111-254-254 3636 8884 [email protected] Investment & Securities (Pvt) Ltd. 42 36300277-81 3630 0282 [email protected] Bank Limited. 42 3631 1426 3631 1418Allied Securities ( Pvt) Ltd. 42 35894525-26 3589 4527Altaf Adam Securities ( Pvt. ) Ltd. 21 2429541-43 242 9540 [email protected] Securities (Pvt.) Ltd. 42 3636 2010 3636 8782 [email protected] Securities & Investment Corp (Pvt.) Ltd. 21 2275353-56 227 5357AMCAP Securities (Pvt.) Ltd. 42 587 0239 578 7559 [email protected] Securities (Pvt.) Ltd. 42 36309687-89 3630 9690 [email protected] Habib Limited. 21 2415213-15 241 6072 [email protected] Latif 42 36311611-14 3636 0613 [email protected] Majid Chaudhry 42 3631 0412 3631 0401 [email protected] Arsalan Razaque Securities (SMC-Pvt) Ltd. 42 3588 4071 3588 9315 [email protected]. S. Securities (Pvt.) Ltd. 42 36314551-3 3631 4558 [email protected] Capital Markets (Pvt ) Ltd. 42 36366170-74 3630 4092 [email protected] Capital ( Pvt.) Ltd. 42 3587 1058 3568 1296 [email protected] Securities (Pvt.) Ltd. 42 111-253-111 3628 0745 [email protected] Securites ( Pvt.) Ltd. 42 36280884-5 628 0886 [email protected] Capital Vision Securities (Pvt.) Ltd. 42 3637 2456 3636 8466 [email protected] Securities (Pvt.) Ltd. 42 3631 7111 3631 4293 [email protected]'s Securities (Pvt.) Ltd. 42 36375046-49 3636 7999 [email protected] Master Securities (Pvt.) Ltd. 42 36280875-9 3628 0880 [email protected] Capital Limited. 42 36371931-34 3637 5950 [email protected]

Lahore Stock Exchange (con’t)
Company’s Name City Code Telephone Fax E-mail Address F.M. Securities (Pvt.) Ltd. 42 36315135-6 3631 5477 [email protected] Securities ( Pvt.) Ltd. 42 3587 5940 3587 8941 [email protected] Punjab Modaraba 42 3591 3602 3591 3615 [email protected] Pakistan Securities Ltd. 42 3631 1375 3584 3730 [email protected] Harbour (Pvt) Ltd. 42 300843 2358Float Securities (Pvt.) Ltd. 21 583 7657 587 6068 [email protected] Investments (Pvt.) Ltd. 42 5756161-65 575 3399Gazipura Securities & Services (Pvt.) Ltd. 21 2418903 242 2893GPH Securities (Pvt.) Ltd. 42 36310715-16 3766 2939Guardian Securites ( Pvt ) Ltd. 42 35758970-2 3576 3247 [email protected] Dhami Securities (Pvt.) Ltd. 42 36368401-09 [email protected] Securities (Pvt.) Ltd. 42 36309851-54 3630 9855 [email protected] Ullah Sheikh (Pvt.) Ltd. 42 36311383-7 3636 8220 [email protected] Abdul Sattar Securities (Pvt.) Ltd. 42 3636 8963 3721 2072Hameed Mukhtar Chaudhry 42 36375470-71 3636 9088Harvest Smartrend Securities (Pvt.) Ltd. 42 111-800-000 3631 4038 [email protected]. Hatim H. Karim 21 9217084-86 921 2374H.H. Misbah Securities (Pvt) Ltd. 21 2429103-05 242 6938 [email protected] Capital (Pvt.) Ltd. 42 35747820-22 3574 7819 [email protected] Securities (SMC-Pvt) Ltd. 42 3571185-89 3577 1191 [email protected]. Securities (Pvt.) Ltd. 42 36309439-40 3630 9438 [email protected] Saeed Sheikh 42 35837517 36374615 [email protected] Ahmad Malik 42 35716134-36 3571 1530 [email protected] Securities Limited 42 3571 4810 3571 0312IGI Finex Securities Ltd. 42 111-234-234 3530 1772 [email protected] Securities (SMC-Pvt) Ltd. 42 111-135-135 3759 0376INA Securities (Pvt.) Ltd 42 35756953-54 3571 0604Innovative Brokerage (Pvt.) Ltd. 42 35987400-10 3598 7420Integrated Equities (Pvt.) Ltd 42 3589 1516 3575 7590 [email protected] & Finance Securities Ltd. 42 35787732-6 3578 7737 [email protected] & Hassan Securities (Pvt.) Ltd. 42 36371901-3 3631 0154 [email protected] Iqbal Securities (Pvt.) Ltd. 42 36369112-6 3636 9117 [email protected] Ahmed Securities (SMC-Pvt ) Ltd. 42 3575 9621 3571 0312K.H.S. Securities (Pvt.) Ltd. 42 3636 8536 3636 8919 [email protected] Javed Securities (Pvt.) Ltd. 42 36307680-83 3636 9143 [email protected] Securities (Pvt) Ltd. 42 3630 8717 3630 9489 [email protected] Stock Brokerage (Pvt.) Ltd. 42 36316611-4 3637 1868 [email protected] Securities (Pvt.) Ltd. 42 36308000-2 3631 5558 [email protected] Hamid Ali Noon 42 3630 1803 3630 1803 [email protected] Securities (Pvt.) Ltd. 42 36315772-4 3630 9216 [email protected] Hussain Securities (Pvt.) Ltd. 42 3627 8787 3631 7329 [email protected] Securities ( Pvt ) Ltd. 42 36360526-8 36368526 [email protected] Securities (Pvt.) Ltd. 42 36279181-82 3637 2475 [email protected] Brokerage(SMC-Pvt) Ltd. 42 36280771-6 3630 8333 [email protected] Muhammad Saeed (Deceased)Mian Asif Maqbool Sukhera 42 36305663-5 3631 3803 [email protected] Khalid Bashir 42 3576 0379 3576 0376 [email protected] Nusrat-ud-Din 42 36313995-6 3627 9204 [email protected] Sajid Masood (Engr.) 42 36313981-84 3631 3985 [email protected] Shaukat Shafi 42 3568 5231 3568 3662 [email protected] Tajammal Hussain 42 3724 4181 3724 2839 [email protected] Yasin Mahmood 21 586 9398Moosani Securities (Pvt.) Ltd. 21 2400871-75 241 6004 [email protected] Securities (Pvt.) Ltd. 42 36279141-43 3627 9144 [email protected] Securities (Pvt.) Ltd. 21 241 0136 227 4973 [email protected] ( SMC-Pvt) Ltd. 42 3631 2222 3636 8303 [email protected] Securities (Pvt.) Ltd. 42 36369991-8 3627 9101 [email protected] Amer Riaz 42 3631 0441 3631 3960 [email protected] Ayub Chaudhry 42 3636 8422 3636 9096 [email protected] Iqbal Khawaja 42 3637 6808 3631 5803Muhammad Shabbir Malik 42 3766 8188 3766 2303Muhammad Javed 21 111-263-263 263 1021 [email protected] Tauqir Malik 42 36311401-4 3636 0438 [email protected] Enterprises (Pvt.) Ltd. 21 2412145-46 241 6104 [email protected] Securities (Pvt.) Ltd. 21 2212882-89 221 2890 [email protected] Riaz Ghauri 42 3637 5576 3637 1138 [email protected] Securities (Pvt.) Ltd. 21 453 9059
PAGE 198
ANNUAL REPORT JUNE 2010FEDERATION OF EURO-ASIAN STOCK EXCHANGES

PAGE 199
ANNUAL REPORT JUNE 2010FEDERATION OF EURO-ASIAN STOCK EXCHANGES
Lahore Stock Exchange (con’t)
Company’s Name City Code Telephone Fax E-mail Address Nasir Ali Shah Bukhari 42 111-222-000 3587 2640 [email protected] Usman Engr. 42 3576 2494 [email protected] Sheikh Securities (Pvt.) Ltd. 42 36316117-8 3631 6448 [email protected]. Securities (Pvt.) Ltd. 42 37235084-87 3723 5083 [email protected] Securities Ltd. 42 36307701-4 3630 7705 [email protected] Leasing Pakistan Ltd. 21 586 1266 583 1634 [email protected] Brokerage (Pvt.) Ltd. 42 3628 0932 3628 0931 [email protected] Ahmed Securities Ltd. 42 3575 9621 3571 0312Plus Securities (Pvt.) Ltd. 41 3264 7727 3262 9967 [email protected] Securities (Pvt.) Ltd. 42 3631 7049 3631 7048 [email protected] Securities Ltd. 42 3637 5466 3637 5980 [email protected] Mahmood Securities (SMC-Pvt.) Ltd. 42 36372747-50 [email protected] Securities (Pvt) Ltd. 42 3663 9929 3663 9753 [email protected]. F. J. Equity (Pvt.) Ltd. 21 2412265-66 241 6791 [email protected] Securities Ltd. 42 36316208-10 3631 4253 [email protected] Capital (Pvt.) Ltd. 42 35750174 35710972R.S. Equities (Pvt.) Ltd. 42 3574 7905 3574 7904RUC Securities (Pvt.) Ltd. 42 3668 1792 021-5686424Saliha Haroon (Mrs) 42 36311372-74 3631 0245SAFE Securities (Pvt ) Ltd. 42 36316719-22 36316719 [email protected] Qaiser (Ms) 42 37661041 37660212Salman Majeed Securities (SMC-Pvt.) Ltd. 42 36280911 36280915 [email protected]. D. Mirza Securities (Pvt.) Ltd. 42 3636 8748 3636 9108 [email protected] Mubashir (Mrs) 42 37655578-79Sethi Securiities (SMC-Pvt.) Ltd. 42 3636 5756 3636 8113 [email protected] Securities (Pvt.) Ltd. 42 36311458-59 3628 0706 [email protected] Hassan Awan (Suspended) 42 36316383-5 3631 6389Shahid Iqbal 42 3760 4184Shahid Nauman Rana (Suspended)SME Bank Limited. 51 921 4296 921 7001 [email protected] Securities (Pvt.) Ltd. 42 3630 7841Sheikh Muhammad Iqbal 42 3586 2168Sohail Raza Moosani(SMC-Pvt) Ltd. 21 583 5363 241 6004 [email protected] Nisar (Ms)Stock Master Securities (Pvt.) Ltd. 42 3628 0903 3631 6458 [email protected] Securities (Pvt.) Ltd. 42 3584 3721 3586 0497 [email protected] Securities (SMC-PVT)Ltd. 42 3583 1644Syed Sarmad Maqsood (Suspended)S. Z. Securities (Pvt.) Ltd. 42 3627 8973 3628 0731 s.z. [email protected] Majid Chaudhry 42 36280806-9 3628 0810Techno Fundamental Securities (Pvt.) Ltd. 42 3631 7351 3631 7350 [email protected] Capital (Pvt.) Ltd 21 2404714-19 240 4720 [email protected] Securities & Brokerage Ltd. 42 36373041-43 3637 3040 [email protected] Securities (Pvt.) Ltd. 42 300429 4942 [email protected] Equities (Pvt.) Ltd. 42 35940320-25 3584 1222 [email protected] Stock Securities (Pvt.) Ltd. 42 111-111-255 3577 0190 [email protected] Securities (SMC-Pvt) Ltd. 42 36367935-36 3636 0067 [email protected] Mahmood Securities ( Pvt.) Ltd. 42 3631 4141 3631 4488 [email protected]. Securities & Services (Pvt.) Ltd. 42 3631 5889 3631 0186 [email protected] Moti 21 241 0307 244 6536 [email protected] Securities (Pvt.) Ltd. 42 35789500-03 3578 9595 [email protected] Ali Habib 21 2429664-67 2413822 [email protected]
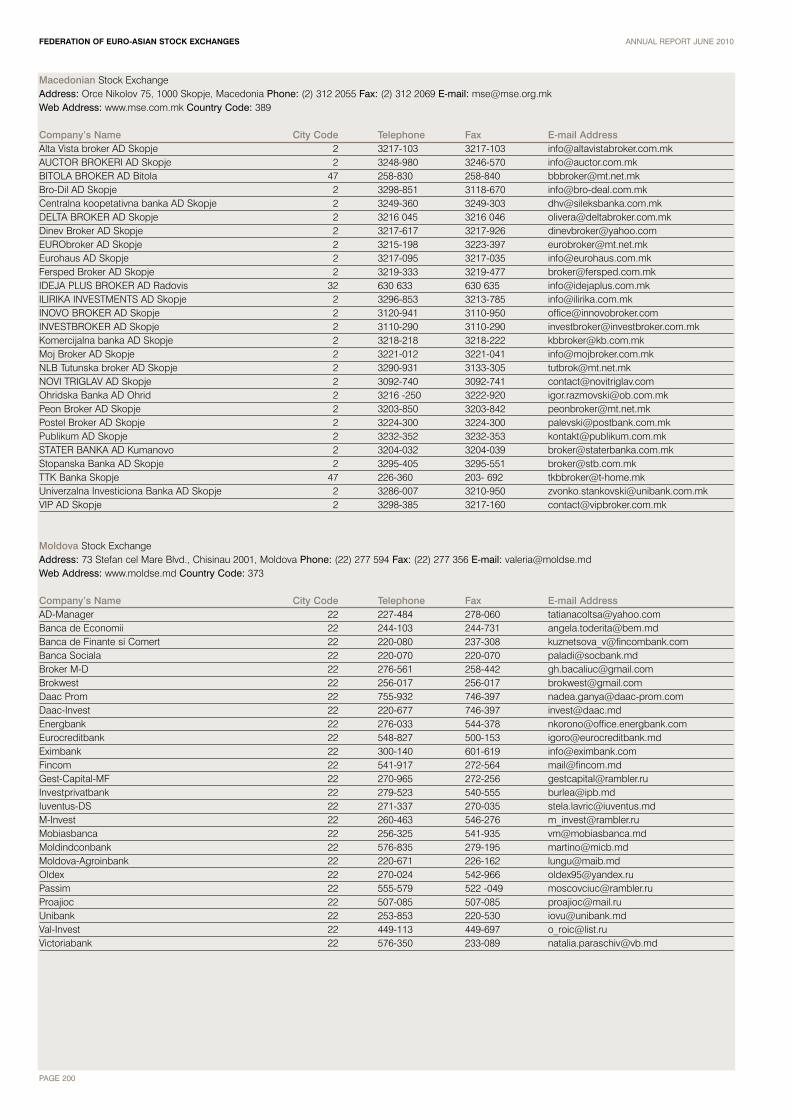
Macedonian Stock Exchange Address: Orce Nikolov 75, 1000 Skopje, Macedonia Phone: (2) 312 2055 Fax: (2) 312 2069 E-mail: [email protected] Address: www.mse.com.mk Country Code: 389
Company’s Name City Code Telephone Fax E-mail Address Alta Vista broker AD Skopje 2 3217-103 3217-103 [email protected] BROKERI AD Skopje 2 3248-980 3246-570 [email protected] BROKER AD Bitola 47 258-830 258-840 [email protected] AD Skopje 2 3298-851 3118-670 [email protected] koopetativna banka AD Skopje 2 3249-360 3249-303 [email protected] BROKER AD Skopje 2 3216 045 3216 046 [email protected] Broker AD Skopje 2 3217-617 3217-926 [email protected] AD Skopje 2 3215-198 3223-397 [email protected] AD Skopje 2 3217-095 3217-035 [email protected] Broker AD Skopje 2 3219-333 3219-477 [email protected] PLUS BROKER AD Radovis 32 630 633 630 635 [email protected] INVESTMENTS AD Skopje 2 3296-853 3213-785 [email protected] BROKER AD Skopje 2 3120-941 3110-950 [email protected] AD Skopje 2 3110-290 3110-290 [email protected] banka AD Skopje 2 3218-218 3218-222 [email protected] Broker AD Skopje 2 3221-012 3221-041 [email protected] Tutunska broker AD Skopje 2 3290-931 3133-305 [email protected] TRIGLAV AD Skopje 2 3092-740 3092-741 [email protected] Banka AD Ohrid 2 3216 -250 3222-920 [email protected] Broker AD Skopje 2 3203-850 3203-842 [email protected] Broker AD Skopje 2 3224-300 3224-300 [email protected] AD Skopje 2 3232-352 3232-353 [email protected] BANKA AD Kumanovo 2 3204-032 3204-039 [email protected] Banka AD Skopje 2 3295-405 3295-551 [email protected] Banka Skopje 47 226-360 203- 692 [email protected] Investiciona Banka AD Skopje 2 3286-007 3210-950 [email protected] AD Skopje 2 3298-385 3217-160 [email protected]
Moldova Stock Exchange Address: 73 Stefan cel Mare Blvd., Chisinau 2001, Moldova Phone: (22) 277 594 Fax: (22) 277 356 E-mail: [email protected] Web Address: www.moldse.md Country Code: 373
Company’s Name City Code Telephone Fax E-mail Address AD-Manager 22 227-484 278-060 [email protected] de Economii 22 244-103 244-731 [email protected] de Finante si Comert 22 220-080 237-308 [email protected] Sociala 22 220-070 220-070 [email protected] M-D 22 276-561 258-442 [email protected] 22 256-017 256-017 [email protected] Prom 22 755-932 746-397 [email protected] 22 220-677 746-397 [email protected] 22 276-033 544-378 [email protected] 22 548-827 500-153 [email protected] 22 300-140 601-619 [email protected] 22 541-917 272-564 [email protected] 22 270-965 272-256 [email protected] 22 279-523 540-555 [email protected] 22 271-337 270-035 [email protected] 22 260-463 546-276 [email protected] 22 256-325 541-935 [email protected] 22 576-835 279-195 [email protected] 22 220-671 226-162 [email protected] 22 270-024 542-966 [email protected] 22 555-579 522 -049 [email protected] 22 507-085 507-085 [email protected] 22 253-853 220-530 [email protected] 22 449-113 449-697 [email protected] 22 576-350 233-089 [email protected]
PAGE 200
ANNUAL REPORT JUNE 2010FEDERATION OF EURO-ASIAN STOCK EXCHANGES
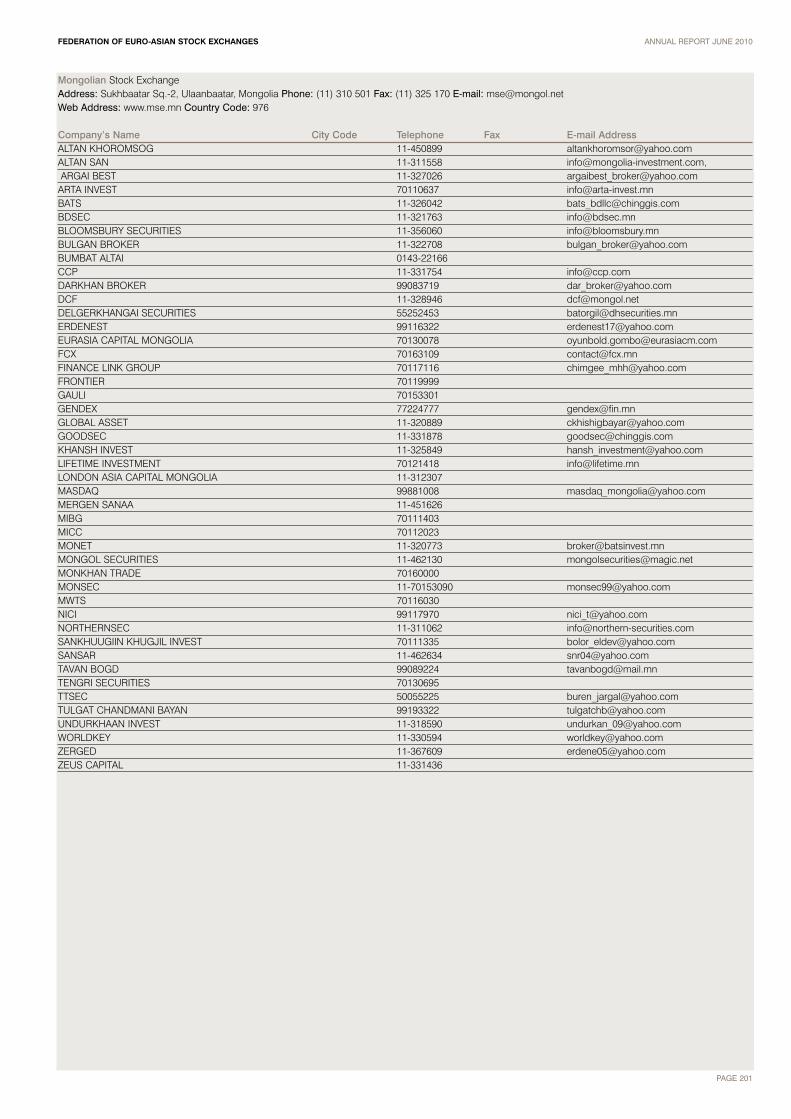
PAGE 201
ANNUAL REPORT JUNE 2010FEDERATION OF EURO-ASIAN STOCK EXCHANGES
Mongolian Stock Exchange Address: Sukhbaatar Sq.-2, Ulaanbaatar, Mongolia Phone: (11) 310 501 Fax: (11) 325 170 E-mail: [email protected] Address: www.mse.mn Country Code: 976
Company’s Name City Code Telephone Fax E-mail Address ALTAN KHOROMSOG 11-450899 [email protected] SAN 11-311558 [email protected],ARGAI BEST 11-327026 [email protected]
ARTA INVEST 70110637 [email protected] 11-326042 [email protected] 11-321763 [email protected] SECURITIES 11-356060 [email protected] BROKER 11-322708 [email protected] ALTAI 0143-22166 CCP 11-331754 [email protected] BROKER 99083719 [email protected] 11-328946 [email protected] SECURITIES 55252453 [email protected] 99116322 [email protected] CAPITAL MONGOLIA 70130078 [email protected] 70163109 [email protected] LINK GROUP 70117116 [email protected] 70119999GAULI 70153301GENDEX 77224777 [email protected] ASSET 11-320889 [email protected] 11-331878 [email protected] INVEST 11-325849 [email protected] INVESTMENT 70121418 [email protected] ASIA CAPITAL MONGOLIA 11-312307MASDAQ 99881008 [email protected] SANAA 11-451626MIBG 70111403MICC 70112023 MONET 11-320773 [email protected] SECURITIES 11-462130 [email protected] TRADE 70160000MONSEC 11-70153090 [email protected] 70116030NICI 99117970 [email protected] 11-311062 [email protected] KHUGJIL INVEST 70111335 [email protected] 11-462634 [email protected] BOGD 99089224 [email protected] SECURITIES 70130695TTSEC 50055225 [email protected] CHANDMANI BAYAN 99193322 [email protected] INVEST 11-318590 [email protected] 11-330594 [email protected] 11-367609 [email protected] CAPITAL 11-331436

Montenegro Stock Exchange Address: Moskovska77, Podgorica 81000, Montenegro Phone: +382 20 228 502 Fax: +382 20 229 711 E-mail: [email protected] Address: www.montenegroberza.com Country Code: 381
Company’s Name City Code Telephone Fax E-mail Address 3M BROKER CO. PODGORICA 81 210 685 210 688 [email protected] BROKER CO. PODGORICA 81 665 695 667 307 [email protected] BROKER CO. PODGORICA 81 664 310 664 310 [email protected] BROKER CO. PODGORICA 81 230 490 230 497 [email protected] BROKER CO. PODGORICA 81 215 230 215 231 [email protected] FINANCIAL BROKER BROKER-DEALER CO. PODGORICA 81 665 780 665 784 [email protected] BROKER-DEALER CO. PODGORICA 81 667 280 667 281 [email protected] BROKER CO. PODGORICA 81 408 105 408 108 [email protected] ALPE ADRIA BROKER-DEALER CO. PODGORICA 81 408 691 408 690 [email protected] BROKER CO. NIKSIC 83 200 220 200 221INVEST BANKA MONTENEGRO CO. PODGORICA 81 407 900 407 956 [email protected] BROKER CO. PODGORICA 81 210 335 210 335 [email protected] BROKER CO. BIJELO POLJE 84 430 360 430 363 [email protected] BROKER CO. PODGORICA 81 210 655 210 685 [email protected] BROKER CO. PODGORICA 81 665 871 665 872 [email protected] BROKER - DEALER CO. PODGORICA 81 205 455 205 456 [email protected] ADRIA BROKER - DEALER CO. PODGORICA 81 231 305 210 640 [email protected] BROKER CO. BERANE 87 230 514 230 515 [email protected] BROKER CO. NIKSIC 83 212 036 212 822 [email protected] BROKER CO. PODGORICA 81 662 622 662 622NK BROKER CO. NIKSIC 83 220 044 220 045 [email protected] BROKER CO. PODGORICA 81 235 146 235 179 [email protected] BROKER CO. PODGORICA 81 664 100 667 711 [email protected] BROKER CO. BUDVA 86 451 816 402 416 [email protected] BROKER CO. PODGORICA 81 232 255 232 266 [email protected]âKI BROKER CO. PODGORICA 81 205 365 205 366 [email protected] BROKER CO. PODGORICA 81 238 410 238 390 [email protected] BROKER CO. PODGORICA 81 205 345 205 346 [email protected] STREET BROKER CO. BUDVA 86 455 097 451 004 [email protected] BROKER-DEALER CO. PODGORICA 81 667 225 667 226 [email protected]
Muscat Securities Market Address: P.O. Box 3265, Ruwi, Postal Code 112 Oman Phone: 2481-2607 Fax: 2481-5776 E-mail: [email protected] Address: www.msm.gov.om Country Code: 968
Company’s Name City Code Telephone Fax E-mail Address AL AMIN SECURITIES 248 13738 15507 [email protected] MADINA FINANCIAL & INVESTMENT SERVICES 248 10859 10772 [email protected] SHUROOQ SECURITIES 247 89113 88882 [email protected] MUSCAT 247 80139 98220 [email protected] CORPORATION 248 116655 16611 [email protected] SERVICES 248 17208 17205 [email protected] FINANCIAL SERVICES 247 00667 00662 [email protected] INVESTMENTS SERVICES 247 90614 90612 [email protected] FINANCIAL SERVICES 247 95186 95188 [email protected] BANK OF OMAN 248 11491 98647 [email protected] SECURITIES CO. 245 71340 68737 [email protected] ARAB BANK 247 97428 93953 [email protected] INVEST 248 15580 17483 [email protected] SECURITIES 247 88647 88671 [email protected] INVESTMENT SERVICES 248 12860 08088 [email protected]
PAGE 202
ANNUAL REPORT JUNE 2010FEDERATION OF EURO-ASIAN STOCK EXCHANGES

FEDERATION OF EURO-ASIAN STOCK EXCHANGES ANNUAL REPORT JUNE 2010
PAGE 203
NASDAQ OMX ArmeniaAddress: 5B M. Mkrtchian Street, Yerevan 375010, Republic of Armenia Phone: (10) 543321 Fax: (10) 543324 E-mail: [email protected] Address: www.armex.am Country Code: 374
Company’s Name City Code Telephone Fax E-mail Address "Alphasecurities" LTD 10 358-707 358-707 [email protected]"Ameria Invest" CJSC 10 524-040 546-800 [email protected]"Ameriabank" CJSC 10 561-111 565-958 [email protected]"Anelik Bank" CJSC 10 227-206 226-581 [email protected]"Ardshininvestbank" CJSC 10 540-404 567-486 [email protected]"Areximbank" CJSC 10 544-387 520-995 [email protected]"Armenbrok" CJSC 10 538-700 528-986 [email protected]"Armenian Development Bank" OJSC 10 591-400 591-405 [email protected]"Armswissbank" CJSC 10 529-593 591-592 [email protected]"Artsakhbank" CJSC 71 43-412 71-249 [email protected]"Capital Asset Management" CJSC 10 501-526 541-528 [email protected]"Cascade Investments" CJSC 10 520-432 583-089 [email protected]"Converse Bank" CJSC 10 511-206 511-212 [email protected]"Future Capital Market" LTD 10 273-357 273-357 [email protected]"Procredit Bank" CJSC 10 514-867 514-853 [email protected]"Prometey Bank" LTD 10 562-036 545-719 [email protected]"Renesa" CJSC 10 548-383 548-383 [email protected]"Tonton" LTD 10 584-614 545-477 [email protected]"Unibank" CJSC 10 521-532 567-046 [email protected]
Palestine Securities Exchange Address: Al Qasr Bldg., Rafidia, P.O. Box 128, Nablus, Palestine Phone: (9) 234 55 55 Fax: (9) 234 13 44 E-mail: [email protected] Address: www.p-s-e.com Country Code: 970 or 972
Company’s Name City Code Telephone Fax E-mail Address Al-Watanieh Securities Company 2 298 0420 298 7277 [email protected] Securities Co. 8 288 6050 288 6055 [email protected] Securities Company 9 238 7880 238 5060 [email protected] & Palestine Financial Investment Company 2 298 7778 298 7779 [email protected] Financial Investments Co. 2 297 1729 297 1727 [email protected] for Financial Investments Co. 2 274 6560 274 6570 [email protected] Trading & Investments Company 2 296 5710 296 5713 [email protected] Investment & Securities Company 9 238 6111 238 6119 [email protected] Securities Company 2 240 3090 240 3091 [email protected]
Sarajevo Stock Exchange Address: Djoke Mazalica 4, 71000 Sarajevo, Bosnia and Herzegovina Phone: (33) 251 460 Fax: (33) 559 460 E-mail: [email protected] Address: www.sase.ba Country Code: 387
Company’s Name City Code Telephone Fax E-mail Address AA Kapital Brokers Bihac 37 228 308 228 309 [email protected] Brokers 33 77 4777 77 4784 [email protected] Auctor BH Mostar 36 355 680 355 689 [email protected] Broker Sarajevo 33 766 666 766 725 [email protected] Invest Mostar 36 334 140 316 612 [email protected] Sarajevo 33 714 370 714 371 [email protected] Sarajevo 33 720 900 710 611 [email protected] International Sarajevo 33 710 840 710 842 [email protected] Broker 33 56 5165 56 5166 [email protected] Hypo Alpe Adria Vrijednosnice Sarajevo 33 755 736 755 790 [email protected] Capital Sarajevo 33 561 600 561 601 [email protected] Sarajevo 33 72 1250 72 1251 [email protected] Bull Sarajevo 33 557 915 557 926 [email protected] Sarajevo 33 555 185 555 186 [email protected] Sarajevo 33 72 1260 72 1261 [email protected] Broker Tuzla 35 362 330 279 434 [email protected] Brokers Sarajevo 33 296 545 296 553 [email protected] Investment Solutions Sarajevo 33 275 650 275 651 [email protected] Sarajevo 33 561 660 561 661 [email protected] Broker Visoko 32 730 540 730 541 [email protected]

Tehran Stock ExchangeAddress: 228, Hafez Avenue, P.O Box 11355-399, IR-11389 Tehran, Iran Phone: (21) 6671 8385 Fax: (21) 6671 0111 E-mail: [email protected] Address: www.tse.ir - www.irbourse.com (Persian Website) Country Code: 98
Company’s Name City Code Telephone Fax E-mail Address Aban 21 88553030 88556080 [email protected] 21 88318884 88313336 [email protected] 21 88674421 88674526 [email protected] Sahm 21 66726227 88713535 [email protected] Bartar 21 8872 1100 88711701 [email protected] 21 88732873 88741582 [email protected] Hooman 21 88736304 88738412 [email protected] Tadbir Naghshe Jahan 311 6615937 6615973 [email protected] Armoon Bourse 21 88718056 88718879 [email protected] bours 21 88756082 88842470 [email protected] novin 21 88323530 88303633Asel 21 88715847 88701890 [email protected] saz 21 66748880 66748881 [email protected] 21 66716285 66701235 [email protected] Saham 21 88711083 88701256Bahman 21 88100434 88724241 [email protected] Eghtessad novin 21 66743848 66744240 [email protected] karafarin 21 88061378 22011514 [email protected] keshavarzi 21 88705580 88728155 [email protected] Maskan 21 88720383 88527063 [email protected] Mellat 21 66709995 66709996 [email protected] Melli Iran 21 88707324 88709698 [email protected] Pasargad 21 88101723 88101723 [email protected] Refah Kargaran 21 88550109 88550109 [email protected] Saderat Iran 21 88707107 88726157 [email protected] Saman 21 88774669 88774689 [email protected] Sanat va madan 21 22925761 22925770 [email protected] Tejarat 21 88702570 88702571 [email protected] Towse-e Saderat Iran 21 88701161 88701160 [email protected] Saham 21 22254127 22254165 [email protected] 21 66724827 66724827 [email protected] Pouya 311 6681745 6681745Bimeh Iran 21 88973529 8896 4040 [email protected] Sahand 21 66719253 66724859Boursiran 21 88832891 88810329 [email protected] Khobreh 21 66724001 66724003 [email protected] Novin 21 66705889 66705889Etminan Sahm 21 66728080 66742381 [email protected] (Omran) 21 88553442 88557278Ganjineye Saham 21 66738588 66724916 [email protected] 21 66743713 [email protected] 21 88729810 88729820 [email protected] Bourse 21 66719920 66705292 [email protected] Sahm 21 88873236 88797940 [email protected] Poya 21 66726443 [email protected] Sahm 21 66726670 66707888 [email protected] 21 22012620 22011514 [email protected] Saham 21 66738604 66717760 [email protected] Mehr Iranian(Bank Sepah) 21 88726057 88725599 [email protected] Sahame Sanayeh 21 66725706 66725788 [email protected] Afarin 21 66743900 66725788 [email protected] Saham 21 66700265 66737679 [email protected] Sarmayeh 21 88329528 88329528Moein sahm 21 88797973 66716945 [email protected] 21 81900 66726499 [email protected] Saham 21 88718406 88719814 [email protected] 21 22224536 22224517Nahayat Negar 21 88601766 88601764 [email protected] Bazar Sarmayeh 21 88739378 84051111 [email protected] Investment Bank (Roshd Paydar) 21 88720933 88720935 [email protected]
FEDERATION OF EURO-ASIAN STOCK EXCHANGES
PAGE 204
ANNUAL REPORT JUNE 2010

FEDERATION OF EURO-ASIAN STOCK EXCHANGES ANNUAL REPORT JUNE 2010
PAGE 205
Tehran Stock Exchange (con’t)
Company’s Name City Code Telephone Fax E-mail AddressOmid Sahm 21 88345220 88345220 [email protected] Fars 21 22600388 22004208Ordibeheshte Iraniyan 21 88737367 88736260 [email protected] Gostar Khobre 511 7640806 7638518 [email protected] Nemoudgar 21 88042053 88601808 [email protected] 21 22909117 22909118 info@pim_co.comRahbord Sarmayegozari 21 66731087 66732394 [email protected] Sarmayegozaran 21 66723355 66726011 [email protected] 21 88670505 88207135 [email protected] Tamin (Kimia sahm) 21 88550662 88550665 [email protected] Barez 21 66731315 66715372 [email protected] Gostaran Sharg 21 66724987 66727235 [email protected] Pajoohan Shayan 21 66717988 66735361 [email protected] Pouya 21 66738142 66724120 [email protected] Andish 21 66743958 66700524 [email protected] Ashena 21 66716891 66717217 [email protected] Azin 21 88515748 88741331 [email protected] Yar 21 88710357 88701631 [email protected] Melli Iran 21 88784215 88784214 [email protected] va Danesh 21 66743087 66716428 [email protected] Saham 21 88797885 88797884 [email protected] 21 66732888 66718808 [email protected] Farda 21 88790821 88798734 [email protected] Sarmaye 21 88882265 88873381 [email protected] Basir 21 66748990 66748994Towse-e Sahand 21 66734189 66725714 [email protected] Sarmaye Donya 21 66729121 66742104 [email protected]
Tirana Stock Exchange Address: Rr. Dora D'lstria, Nr 2, Tirana, Albania Phone: (4) 265 058 Fax: (4) 271 850 E-mail: [email protected] Address: www.tse.com.al Country Code: 355
Company’s Name City Code Telephone Fax E-mail Address Ballkan Group 01 4 272 722 [email protected] Bank (BIA) 4 233 966 225 700 [email protected] Invest 4 280 201 280202 [email protected] Commercial Bank (BKT) 4 228 743 237 570 [email protected] Bank 4 274 910 227 262 [email protected] Group 4 256 081 256 081 [email protected]
“Toshkent” Republican Stock Exchange Address: 10, Bukhoro St., Tashkent 700047, Republic of Uzbekistan Phone: (71) 136 0740 Fax: (71) 133 3231 E-mail: [email protected] Address: www.uzse.uz Country Code: 998
Company’s Name City Code Telephone Fax E-mail Address GALLABANK 71 136 1617 133 4225IPOTEKA BANK 71 136 0388 133 3089PAKHTABANK 71 173 2551 120 8808UZSANOAT QURILISH BANK 71 120 4534 120 4534

Ukrainian Stock Exchange Address:10 Rylsky Provulok, 01025 Kiev, Ukraine Phone: (44) 279 4158 Fax: (44) 278 5140 E-mail: [email protected] Address: www.ukrse.kiev.ua Country Code: 380
Company’s Name City Code Telephone Fax E-mail Address A.I.S.T. INVEST 44 244 9758 244 9758ABSOLUT INVESTMENTS 0322 97 0989 39 5334 [email protected] FOR SECURITIES "KREDO-INVEST" 61 231 49 09 286 15 51AGENCY OF CORPORATE INVESTMENTS 44 2489186 2489160AJKO 522 235 583 236 398AUTOZAZ BANK 612 172 966 172 961 [email protected] BANK 44 290 8888 490 8938 [email protected] BROK 057 720 5945 703 4309AVTOMOBILNAYA FONDOVAYA COMPANY 57 7140 014 7140 014 [email protected] 572 940 951 943 772 [email protected] NRB 44 247 43 22 247 43 23BANK OF REGIONAL DEVELOPMENT 44 494 4847 494 4847 [email protected] 352 55 00 07 55 00 05BROKBUSINESSBANK 44 206 2959 459 6747 [email protected] COMPANY - STOCK MARKETS COMPANY 57 719 41 51 758 79 12BROKERAGE COMPANY "STANISLAV D" 342 554 222 554 222BROOKS 562 341 877 341 271 [email protected] 472 54 06 85 54 06 85CAPITAL MANAGEMENT GROUP 629 343 093 412 853 [email protected] MARKET 57 7198 021 7198 021 [email protected] BANK "UKRAINIAN FINANCIAL GROUP" 44 251 8380 251 8353 [email protected] BANK "VOLODYMYRSKYY" 542 21 54 00 21 54 23DEMARK BANK 4622 164 686 178 055 [email protected] 62 337 0773 332 2595 [email protected] BANK 44 205 4270 205 4270 [email protected] INVESTMENT-INNOVATION CO. 44 229 4088 229 4088 [email protected] 57 759 06 91 759 06 91ENERGOPROEKT 44 456 3479 456 3479 [email protected] BANK 572 282 287 282 006 [email protected] 44 451 5698 451 5698 [email protected] TRADING 564 260 905 260 905 [email protected] COMERZ 57 757 8335 757 8336 [email protected] COMPANY "KUB" 44 296 5228 296 5228 [email protected] COMPANY "STOLICHNYY CAPITAL" 44 235 3243 234 8161 [email protected] GROUP "FONDOVI TECHNOLOGII" 44 417 20 70 417 20 70FINANCOVA COMPANIA "STOCKS" 44 537 43 80 566 93 74 [email protected] TA CREDYT BANK 44 490 6870 484 2571 [email protected] 482 250 202 250 202 [email protected] COMPANIA "DALIZ-FINANCE" 44 285 75 47 285 75 47FONDOVA COMPANIA "EKSPERT" 44 455 6853 240 9783 [email protected] COMPANIA "FAVORIT" 44 458 05 45 458 05 45 [email protected] COMPANIA "OPTSION" 44 486 86 12 455 68 53FONDOVA GRUPA 44 462 0325 462 0319 [email protected] SPILKA 44 538 0979 538 0979 [email protected] AGENT "AVISTA" 44 501 48 33 501 48 33GELIKON 4622 710 15 710 15GENERAL INVESTMENT CO. 44 455 6766 464 5961 [email protected] INVESTMENTS 572 282 264 282 266 [email protected] GATE BUSINESS 44 201 2020 201 2023 [email protected] 571 7578 145 7578 146 [email protected] BANK 44 494 1506 494 1506 [email protected] TRADE 44 416 7113 416 1559 [email protected] COMPANY "STANDARD-INVEST" 44 286 24 73 286 24 73ITT INVEST 44 246 6841 277 2112 [email protected] SECURITIES 44 206 5450 206 5450
FEDERATION OF EURO-ASIAN STOCK EXCHANGES
PAGE 206
ANNUAL REPORT JUNE 2010

FEDERATION OF EURO-ASIAN STOCK EXCHANGES ANNUAL REPORT JUNE 2010
PAGE 207
Ukrainian Stock Exchange (con’t)
Company’s Name City Code Telephone Fax E-mail AddressJOINT-STOCK COMMERSIAL PROMINVEST BANK 44 229 8303 229 1456 [email protected] SECURITIES 44 220 9588 227 7022 [email protected] 44 590 29 52 590 29 50KONKORD CAPITAL LTD. 44 207 50 30 207 50 31KROK-MT 3422 40 056 76 261 [email protected] 44 529 24 51 592 84 15LEGBANK 44 227 9570 227 9519 [email protected] SECURITIES 322 970 668 970 668 [email protected] 057 7140 643 7140 956 [email protected] BANK 692 458 570 458 570 [email protected] 482 301 300 301 301 [email protected] 44 244 6199 216 6543 [email protected] 44 265 0841 265 0841 [email protected] 44 238 8477 205 3011 [email protected] INVEST 57 7005 011 7005 012 [email protected] 3422 311 55 323 20 [email protected] 44 496 0115 496 0115 [email protected] BROK LTD. 44 20612 96 206 12 93POLIKOMBANK 462(2) 74 895 101 513 [email protected] 562 390 718 680 514 [email protected] CAPITAL UKRAINE 44 230 9318 230 9319 [email protected] INVEST GROUP 44 272 42 64 272 42 64RIKA-BROKER 44 416 8352 416 8352 [email protected] INVEST 44 544 5647 544 5647 [email protected] BANK 44 238 67 67 234 63 50SECURITIES TRADER "EAST-MAKLER" 57(2) 712 1848 219 9761 [email protected] INVESTMENT CO. 44 246 4897 234 6037 [email protected] DEPOSITORY 692 48 81 56 48 81 56SIGMA FéND 572 141 180 141 188 [email protected] 532 508 921 508 921 [email protected] SECURITIES 44 244 2887 244 2996 [email protected] OSCHADNY BANK OF UKRAINE 44 247 8450 247 8515 [email protected] 564 260 807 261 561 [email protected] 342(2) 43 033 785 328 [email protected] 57 757 4527 712 3386 [email protected] FONDOVA CO. 44 249 3697 249 3697SYNTEZ 44 461 7930 228 6400 [email protected] BANK 692 2055 983 2055 983 [email protected] INVEST 352 229 086 235 579 [email protected] 44 201 6391 201 6392 [email protected] 44 290 5150 249 3697TRANSFERBUTIK 44 272 1748 272 1708 [email protected] LTD. 512 471 991 471 991UKRAINIAN BANK FOR RECONSTRUCTION & DEVELOPMENT 44 585 24 28 585 28 42UKRAINIAN DEPOSITORY CO. 44 451 4447 451 4447 [email protected] KONZESIYNA COMPANY LTD. 44 244 3222 244 0715 [email protected] SECURITIES 44 253 6863 206 3022 [email protected] KOMUNALNY BANK 642 553 529 420 106 [email protected] PROMYSLOVY BANK 44 537 5154 537 5154 [email protected] 44 247 2182 247 2134 [email protected] 352 235 366 239 9777 [email protected] 44 238 3243 269 1307 [email protected] FONDOVY 44 268 5696 268 5696 [email protected] 44 490 0662 216 0033 [email protected] INVESTMENTS 44 272 14 86 272 14 86VASH VYBOR 652 546 613 546 613 [email protected] STOCK 312 612 181 619 277 [email protected] 44 451 2815 451 2816 [email protected]
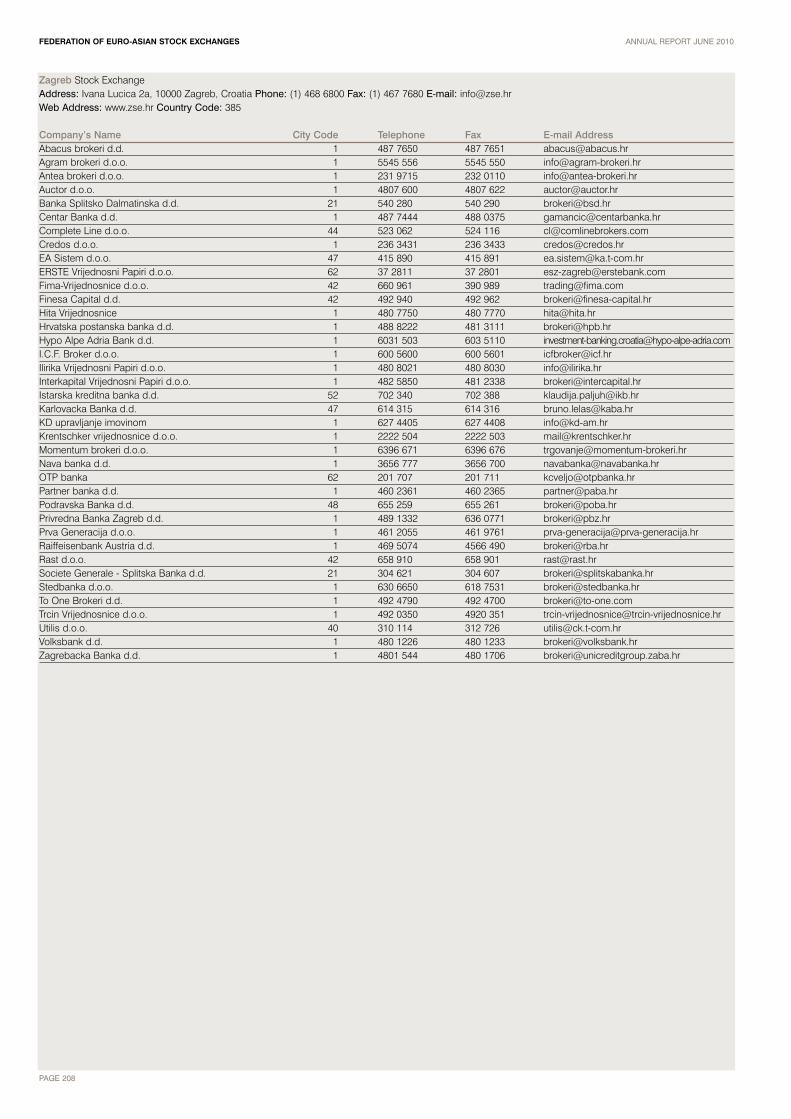
Zagreb Stock Exchange Address: Ivana Lucica 2a, 10000 Zagreb, Croatia Phone: (1) 468 6800 Fax: (1) 467 7680 E-mail: [email protected] Address: www.zse.hr Country Code: 385
Company’s Name City Code Telephone Fax E-mail Address Abacus brokeri d.d. 1 487 7650 487 7651 [email protected] brokeri d.o.o. 1 5545 556 5545 550 [email protected] brokeri d.o.o. 1 231 9715 232 0110 [email protected] d.o.o. 1 4807 600 4807 622 [email protected] Splitsko Dalmatinska d.d. 21 540 280 540 290 [email protected] Banka d.d. 1 487 7444 488 0375 [email protected] Line d.o.o. 44 523 062 524 116 [email protected] Credos d.o.o. 1 236 3431 236 3433 [email protected] Sistem d.o.o. 47 415 890 415 891 [email protected] Vrijednosni Papiri d.o.o. 62 37 2811 37 2801 [email protected] d.o.o. 42 660 961 390 989 [email protected] Capital d.d. 42 492 940 492 962 [email protected] Vrijednosnice 1 480 7750 480 7770 [email protected] postanska banka d.d. 1 488 8222 481 3111 [email protected] Alpe Adria Bank d.d. 1 6031 503 603 5110 [email protected]. Broker d.o.o. 1 600 5600 600 5601 [email protected] Vrijednosni Papiri d.o.o. 1 480 8021 480 8030 [email protected] Vrijednosni Papiri d.o.o. 1 482 5850 481 2338 [email protected] kreditna banka d.d. 52 702 340 702 388 [email protected] Banka d.d. 47 614 315 614 316 [email protected] upravljanje imovinom 1 627 4405 627 4408 [email protected] vrijednosnice d.o.o. 1 2222 504 2222 503 [email protected] brokeri d.o.o. 1 6396 671 6396 676 [email protected] banka d.d. 1 3656 777 3656 700 [email protected] banka 62 201 707 201 711 [email protected] banka d.d. 1 460 2361 460 2365 [email protected] Banka d.d. 48 655 259 655 261 [email protected] Banka Zagreb d.d. 1 489 1332 636 0771 [email protected] Generacija d.o.o. 1 461 2055 461 9761 [email protected] Raiffeisenbank Austria d.d. 1 469 5074 4566 490 [email protected] Rast d.o.o. 42 658 910 658 901 [email protected] Societe Generale - Splitska Banka d.d. 21 304 621 304 607 [email protected] Stedbanka d.o.o. 1 630 6650 618 7531 [email protected] One Brokeri d.d. 1 492 4790 492 4700 [email protected] Vrijednosnice d.o.o. 1 492 0350 4920 351 [email protected] d.o.o. 40 310 114 312 726 [email protected] d.d. 1 480 1226 480 1233 [email protected] Banka d.d. 1 4801 544 480 1706 [email protected]
FEDERATION OF EURO-ASIAN STOCK EXCHANGES
PAGE 208
ANNUAL REPORT JUNE 2010


Related Documents