Identification of Versions of the Same Musical Composition by Processing Audio Descriptions Joan Serrà Julià TESI DOCTORAL UPF / 2011 Director de la tesi: Dr. Xavier Serra i Casals Dept. of Information and Communication Technologies Universitat Pompeu Fabra, Barcelona, Spain

Welcome message from author
This document is posted to help you gain knowledge. Please leave a comment to let me know what you think about it! Share it to your friends and learn new things together.
Transcript
Identification of Versions ofthe Same Musical Composition
by Processing Audio Descriptions
Joan Serrà Julià
TESI DOCTORAL UPF / 2011
Director de la tesi:
Dr. Xavier Serra i CasalsDept. of Information and Communication TechnologiesUniversitat Pompeu Fabra, Barcelona, Spain

Copyright c© Joan Serrà Julià, 2011.
Dissertation submitted to the Deptartment of Information and Communica-tion Technologies of Universitat Pompeu Fabra in partial fulfillment of therequirements for the degree of
DOCTOR PER LA UNIVERSITAT POMPEU FABRA,
with the mention of European Doctor.
Music Technology Group (http://mtg.upf.edu), Dept. of Information and Communica-tion Technologies (http://www.upf.edu/dtic), Universitat Pompeu Fabra (http://www.upf.edu), Barcelona, Spain.


Als meus avis.


Acknowledgements
I remember I was quite shocked when, one of the very first times I went to theMTG, Perfecto Herrera suggested that I work on the automatic identificationof versions of musical pieces. I had played versions (both amateur and pro-fessionally) since I was 13 but, although being familiar with many MIR tasks,I had never thought of version identification before. Furthermore, how couldthey (the MTG people) know that I played song versions? I don’t think I hadtold them anything about this aspect...Before that meeting with Perfe, I had discussed a few research topics withXavier Serra and, after he gave me feedback on a number of research proposalsI had, I decided to submit one related to the exploitation of the temporalinformation of music descriptors for music similarity. Therefore, when Perfesuggested the topic of version identification I initially thought that such asuggestion was not related to my proposal at all. However, subsequent meetingswith Emilia Gómez and Pedro Cano made me realize that I was wrong, up tothe point that if now I had to talk about the work in this thesis I would probablyuse some of the words of my original proposal: “temporal information”, “musicdescriptors”, and “music similarity”.Being in close contact with these people I have mentioned has been extremelyimportant, not only for the work related to this thesis, but also for my educa-tion as a researcher in general (not to mention the personal side!). I am reallyhappy to have met them. And I am specially grateful to Xavier for giving methe opportunity to join the MTG.One day, while talking with Xavier, he mentioned a course on time seriesanalysis given in the UPF by some guy called Ralph, who had quite an un-pronounceable surname (Andrzejak). My research at that time was alreadypivoting around nonlinear time series analysis tools, so I managed to attend toRalph’s course and off-line told him about my research. This turned out to bethe starting point of a very fruitful collaboration between Ralph and myself. Imust confess I have learned A LOT from him.Another day, at Ralph’s office, I saw quite a deteriorated (by use) copy of abook by some guys called Kantz & Schreiber. Ralph told me that this was“the bible”, so I bought it and started reading. It was himself who, after seeingthat my Kantz & Schreiber book was nearly as deteriorated as his, suggesteddoing a research stay abroad. We decided to contact Holger Kantz and, to mysurprise, he agreed on a collaboration. So I went to work at the MPIPKS forfour months under Holger’s supervision. That was a great experience!Some time before, Pedro had invited Massimiliano Zanin to give a talk atthe MTG. I do not remember if we had already had a short conversation at
v
vi
that time, but for the subsequent months he remained being just “the complexnetworks guy with very very long hair”, that is until I had some researchproblem related to complex networks. Then I contacted him and we startedcollaborating (and furthermore became friends). Now “the complex networksguy with very very long hair” has been substantially reduced to “Max”.All the people I have mentioned are just a small part of the relevant inter-actions that have shaped this thesis. There are many more people from theMTG that I would like to acknowledge, and whose work, advice and frien-ship I really appreciate. These are Vincent Akkermans, Eduard Aylon, DmitryBogdanov, Jordi Bonada, Òscar Celma, Graham Coleman, Maarten de Boer,Ferdinand Fuhrmann, Jordi Funollet, Cristina Garrido, Enric Guaus, SalvadorGurrera, Martín Haro, Jordi Janer, Markus Koppenberger, Cyril Laurier, Os-car Mayor, Ricard Marxer, Owen Meyers, Hendrik Purwins, Gerard Roma,Justin Salamon, Mohamed Sordo, and Nicolas Wack (sorry if I am forgettingsomeone!). In addition, I have been in contact with people outside the MTG,specially with Josep Lluís Arcos, Juan Pablo Bello, Mathieu Lagrange, MatijaMarolt, and Meinard Müller. I would also like to acknowledge Jean Arroyo forproofreading this thesis.Last, but not least, I want to mention my friends and my family, who havesupported me in all aspects.

vii
This thesis has been carried out at the Music Technology Group of UniversitatPompeu Fabra (UPF) in Barcelona, Spain from Sep. 2007 to Jan. 2010 and fromJun. 2010 to Dec. 2010, and at the Max Planck Institute for the Physics of Com-plex Systems (MPIPKS) in Dresden, Germany from Feb. 2010 to May 2010.This work has been supported by an R+D+I scholarship from UPF, by theEuropean Commission projects CANTATA (FIT-350205-2007-10), SALERO(IST-2007-0309BSCW) and PHAROS (IST-2006-045035), by the project ofthe Spanish Ministry of Industry, Tourism and Trade MUSIC 3.0 (TSI-070100-2008-318) and by the project of the Spanish Ministry of Science and Innova-tion DRIMS (TIN-2009-14247-C02-01). The research stay at the MPIPKS wasfunded by the German Academic Exchange Service (DAAD; A/09/96235) andthe MPIPKS.


Abstract
Automatically making sense of digital information, and specially of music dig-ital documents, is an important problem our modern society is facing. In fact,there are still many tasks that, although being easily performed by humans,cannot be effectively performed by a computer. In this work we focus on oneof such tasks: the identification of musical piece versions (alternate renditionsof the same musical composition like cover songs, live recordings, remixes,etc.). In particular, we adopt a computational approach solely based on theinformation provided by the audio signal. We propose a system for versionidentification that is robust to the main musical changes between versions,including timbre, tempo, key and structure changes. Such a system exploitsnonlinear time series analysis tools and standard methods for quantitative mu-sic description, and it does not make use of a specific modeling strategy fordata extracted from audio, i.e. it is a model-free system. We report remarkableaccuracies for this system, both with our data and through an internationalevaluation framework. Indeed, according to this framework, our model-freeapproach achieves the highest accuracy among current version identificationsystems (up to the moment of writing this thesis). Model-based approachesare also investigated. For that we consider a number of linear and nonlineartime series models. We show that, although model-based approaches do notreach the highest accuracies, they present a number of advantages, speciallywith regard to computational complexity and parameter setting. In addition,we explore post-processing strategies for version identification systems, andshow how unsupervised grouping algorithms allow the characterization andenhancement of the output of query-by-example systems such as the versionidentification ones. To this end, we build and study a complex network ofversions and apply clustering and community detection algorithms. Overall,our work brings automatic version identification to an unprecedented stagewhere high accuracies are achieved and, at the same time, explores promisingdirections for future research. Although our steps are guided by the nature ofthe considered signals (music recordings) and the characteristics of the task athand (version identification), we believe our methodology can be easily trans-ferred to other contexts and domains.
ix


Resum
Racionalitzar o donar significat de manera automàtica a la informació digital,especialment als documents digitals de música, és un problema important quela nostra societat moderna està afrontant. De fet, encara hi ha moltes tasquesque, malgrat els humans les puguem fer fàcilment, encara no poden ser rea-litzades per un ordinador. En aquest treball ens centrem en una d’aquestestasques: la identificació de versions musicals (interpretacions alternatives d’u-na mateixa composició de música tals com ‘covers’, enregistraments en directe,remixos, etc.). Basant-nos en un enfocamen computacional, i utilitzant única-ment la informació que ens proporciona el senyal d’àudio, proposem un sistemaper a la identificació de versions que és robust als principals canvis musicalsque hi pot haver entre elles, incloent canvis en el timbre, el tempo, la tonalitato l’estructura del tema. Aquest sistema explota eines per a l’anàlisi no linialde sèries temporals i mètodes estàndard per a la descripció quantitativa dela música. A més a més, no utilitza cap estratègia de modelat de les dadesextretes de l’àudio; és un sistema ‘lliure de model’. Amb aquest sistema obte-nim molt bons resultats, tant amb les nostres dades com a través d’un entornd’avaluació internacional. De fet, d’acord amb aquestes últimes avaluacions,el nostre sistema lliure de model obté a dia d’avui els millors resultats d’entretots els sistemes avaluats. També investiguem sistemes basats en models. Atal efecte, considerem un seguit de models de sèries temporals, tant linials comno linials. D’aquesta manera veiem que, encara que els nostres sistemes ba-sats en models no aconsegueixen els millors resultats, aquests presenten certsavantatges relatius a la complexitat computacional i a l’elecció de paràmetres.A més a més, també explorem algunes estratègies de post-processat per a sis-temes d’identificació de versions. Concretament, evidenciem que algoritmesd’agrupament no supervisats permeten la caracterització i la millora dels re-sultats de sistemes que funcionen a través de ‘preguntes per exemple’, tals comels d’identificació de versions. Amb aquest objectiu construim i estudiem unaxarxa complexa de versions i apliquem tècniques d’agrupament i de deteccióde comunitats. En general, el nostre treball porta la identificació automàticade versions a un estadi sense precedents on s’obtenen molt bons resultats i, almateix temps, explora noves direccions de futur. Malgrat que els passos queseguim estan guiats per la natura dels senyals involucrats en el nostre pro-blema (enregistraments musicals) i les característiques de la tasca que volemsolucionar (identificació de versions), creiem que la nostra metodologia es pottransferir fàcilment a altres àmbits i contextos.
xi


Preface
When this thesis started, there had been very few attempts to automaticallyidentify musical piece versions from audio. A quick look at the literature reviewof this thesis for works done before 2007 corroborates this assertion. However,in the course of this thesis, many interesting studies have appeared, changingand shaping the task at hand. This thesis makes a valuable contribution withthe compilation of all this specific literature.Automatic version identification has rapidly evolved from a quite incipienttopic to a well-established and partially solved one, from quite low accuraciesto salient results. We are very proud to say that our work from 2007 to 2010,which is reported in this thesis, jointly with our preliminary work from 2006to 2007, has been essential and key to such a rapid evolution of the topic,developing a leading role within our scientific community. At the same timewe hope that our work will remain inspirational for forthcoming research inboth related and unrelated scientific areas.The outcomes of this research have been published in a number of interna-tional conferences, journals, and a book chapter. Some of these publicationshave been featured in the media. Our approaches have participated in severaleditions of an international evaluation campaign, obtaining the highest accu-racies in each edition where we participated, and the highest accuracies amongall editions up to the moment of writing this thesis. Furthermore, part of thisresearch has been incorporated into a commercial media broadcast monitoringservice, and the author has patented two of his inventions separately.
xiii


Contents
Abstract ix
Contents xv
List of figures xix
List of tables xxi
List of abbreviations and symbols xxiii
1 Introduction 11.1 Motivation . . . . . . . . . . . . . . . . . . . . . . . . . . . . . 1
1.1.1 Automatic version detection . . . . . . . . . . . . . . . . 11.1.2 Music information retrieval . . . . . . . . . . . . . . . . 2
1.2 Versions . . . . . . . . . . . . . . . . . . . . . . . . . . . . . . . 31.2.1 Terms . . . . . . . . . . . . . . . . . . . . . . . . . . . . 31.2.2 Types . . . . . . . . . . . . . . . . . . . . . . . . . . . . 51.2.3 Modifiable characteristics . . . . . . . . . . . . . . . . . 71.2.4 Social interest . . . . . . . . . . . . . . . . . . . . . . . . 91.2.5 Versions in other arts . . . . . . . . . . . . . . . . . . . 10
1.3 Version identification: application scenarios . . . . . . . . . . . 131.4 Objectives and outline of the thesis . . . . . . . . . . . . . . . . 15
2 Literature review 192.1 Introduction . . . . . . . . . . . . . . . . . . . . . . . . . . . . . 192.2 Scientific background . . . . . . . . . . . . . . . . . . . . . . . . 20
2.2.1 Audio-based retrieval . . . . . . . . . . . . . . . . . . . 202.2.2 Symbolic music processing . . . . . . . . . . . . . . . . . 212.2.3 Music cognition . . . . . . . . . . . . . . . . . . . . . . . 22
2.3 Version identification: state-of-the-art . . . . . . . . . . . . . . 242.3.1 Functional blocks . . . . . . . . . . . . . . . . . . . . . . 242.3.2 Pre- and post-processing strategies . . . . . . . . . . . . 352.3.3 Evaluation . . . . . . . . . . . . . . . . . . . . . . . . . 37
3 Model-free version detection 433.1 Introduction . . . . . . . . . . . . . . . . . . . . . . . . . . . . . 433.2 Method . . . . . . . . . . . . . . . . . . . . . . . . . . . . . . . 46
3.2.1 Overview . . . . . . . . . . . . . . . . . . . . . . . . . . 463.2.2 Descriptor extraction . . . . . . . . . . . . . . . . . . . . 47
xv
xvi CONTENTS
3.2.3 Transposition . . . . . . . . . . . . . . . . . . . . . . . . 533.2.4 State space embedding . . . . . . . . . . . . . . . . . . . 553.2.5 Cross recurrence plot . . . . . . . . . . . . . . . . . . . . 563.2.6 Recurrence quantification measures for version identifi-
cation . . . . . . . . . . . . . . . . . . . . . . . . . . . . 583.2.7 Dissimilarity value . . . . . . . . . . . . . . . . . . . . . 61
3.3 Evaluation methodology . . . . . . . . . . . . . . . . . . . . . . 623.3.1 Music collection . . . . . . . . . . . . . . . . . . . . . . 623.3.2 Evaluation measure . . . . . . . . . . . . . . . . . . . . 65
3.4 Results . . . . . . . . . . . . . . . . . . . . . . . . . . . . . . . . 663.4.1 Parameter optimization . . . . . . . . . . . . . . . . . . 663.4.2 Out-of-sample accuracy . . . . . . . . . . . . . . . . . . 693.4.3 Comparison with state-of-the-art: MIREX submissions . 703.4.4 Computation time . . . . . . . . . . . . . . . . . . . . . 723.4.5 Error analysis . . . . . . . . . . . . . . . . . . . . . . . . 73
3.5 Discussion and conclusion . . . . . . . . . . . . . . . . . . . . . 75
4 Characterization and exploitation of version groups 774.1 Introduction . . . . . . . . . . . . . . . . . . . . . . . . . . . . . 774.2 Method . . . . . . . . . . . . . . . . . . . . . . . . . . . . . . . 79
4.2.1 Overview . . . . . . . . . . . . . . . . . . . . . . . . . . 794.2.2 Analysis of the version network . . . . . . . . . . . . . . 804.2.3 Detection of version groups . . . . . . . . . . . . . . . . 824.2.4 Accuracy improvement: from Qmax to Q∗max . . . . . . . 86
4.3 Evaluation methodology . . . . . . . . . . . . . . . . . . . . . . 874.3.1 Music collection . . . . . . . . . . . . . . . . . . . . . . 874.3.2 Evaluation measures . . . . . . . . . . . . . . . . . . . . 87
4.4 Results . . . . . . . . . . . . . . . . . . . . . . . . . . . . . . . . 894.4.1 Analysis of the version network . . . . . . . . . . . . . . 894.4.2 Detection of version sets . . . . . . . . . . . . . . . . . . 894.4.3 Accuracy improvement . . . . . . . . . . . . . . . . . . . 914.4.4 A note on the dissimilarity thresholds . . . . . . . . . . 924.4.5 Computation time . . . . . . . . . . . . . . . . . . . . . 934.4.6 Error analysis . . . . . . . . . . . . . . . . . . . . . . . . 94
4.5 The role of the original song within its versions . . . . . . . . . 954.6 Discussion and conclusion . . . . . . . . . . . . . . . . . . . . . 99
5 Towards model-based version detection 1015.1 Introduction . . . . . . . . . . . . . . . . . . . . . . . . . . . . . 1015.2 Method . . . . . . . . . . . . . . . . . . . . . . . . . . . . . . . 102
5.2.1 Overview . . . . . . . . . . . . . . . . . . . . . . . . . . 1025.2.2 Descriptor extraction and transposition . . . . . . . . . 1045.2.3 State space embedding . . . . . . . . . . . . . . . . . . . 1045.2.4 Time series models . . . . . . . . . . . . . . . . . . . . . 104

CONTENTS xvii
5.2.5 Training and testing . . . . . . . . . . . . . . . . . . . . 1075.2.6 Prediction error . . . . . . . . . . . . . . . . . . . . . . . 108
5.3 Evaluation methodology . . . . . . . . . . . . . . . . . . . . . . 1085.3.1 Music collection and evaluation measure . . . . . . . . . 1085.3.2 Baseline predictors . . . . . . . . . . . . . . . . . . . . . 109
5.4 Results . . . . . . . . . . . . . . . . . . . . . . . . . . . . . . . . 1095.5 Discussion . . . . . . . . . . . . . . . . . . . . . . . . . . . . . . 1125.6 Conclusions and future work . . . . . . . . . . . . . . . . . . . 114
6 Summary and future perspectives 1176.1 Introduction . . . . . . . . . . . . . . . . . . . . . . . . . . . . . 1176.2 Summary of contributions . . . . . . . . . . . . . . . . . . . . . 1186.3 Some future perspectives . . . . . . . . . . . . . . . . . . . . . . 119
Bibliography 125
Appendix A: the system’s demo 149
Appendix B: publications by the author 151


List of figures
1.1 Illustration of automatic version detection . . . . . . . . . . . . . . 31.2 Versions of “Mona Lisa” . . . . . . . . . . . . . . . . . . . . . . . . 121.3 Query match specificity scale . . . . . . . . . . . . . . . . . . . . . 14
2.1 Building blocks of a version identification system . . . . . . . . . . 252.2 PCP example . . . . . . . . . . . . . . . . . . . . . . . . . . . . . . 272.3 “Happy birthday” song score . . . . . . . . . . . . . . . . . . . . . . 292.4 Dynamic programming example . . . . . . . . . . . . . . . . . . . . 332.5 Accuracies depending on the size of the music collection . . . . . . 39
3.1 General block diagram of the model-free approach . . . . . . . . . 463.2 HPCP computation . . . . . . . . . . . . . . . . . . . . . . . . . . 483.3 Example of an HPCP time series . . . . . . . . . . . . . . . . . . . 503.4 Example of a TC time series . . . . . . . . . . . . . . . . . . . . . 513.5 Example of an HC time series . . . . . . . . . . . . . . . . . . . . . 523.6 Circular shift of a PCP time series . . . . . . . . . . . . . . . . . . 533.7 Cross recurrence plot examples . . . . . . . . . . . . . . . . . . . . 583.8 Cross recurrence plot examples . . . . . . . . . . . . . . . . . . . . 593.9 Examples of recurrence quantification matrices . . . . . . . . . . . 613.10 Tag cloud of versioned artists . . . . . . . . . . . . . . . . . . . . . 633.11 Tag cloud of versioned titles . . . . . . . . . . . . . . . . . . . . . . 643.12 Cardinality and original artist histograms . . . . . . . . . . . . . . 653.13 Accuracy for different number of transposition indices O . . . . . . 673.14 Accuracies for different state space reconstruction parameters . . . 683.15 Accuracy for different gap penalties . . . . . . . . . . . . . . . . . 693.16 In-sample and out-of-sample accuracies . . . . . . . . . . . . . . . 70
4.1 Inferring item relations by group detection . . . . . . . . . . . . . . 804.2 The version network . . . . . . . . . . . . . . . . . . . . . . . . . . 814.3 Example of proposed method 2 . . . . . . . . . . . . . . . . . . . . 854.4 Metrics for the version network . . . . . . . . . . . . . . . . . . . . 904.5 Qmax histograms for two different music collections . . . . . . . . . 934.6 Time performance . . . . . . . . . . . . . . . . . . . . . . . . . . . 944.7 Versions network with a strong threshold . . . . . . . . . . . . . . 974.8 Link weights distribution . . . . . . . . . . . . . . . . . . . . . . . 98
5.1 General block diagram of the model-based approach . . . . . . . . 1035.2 Model-based accuracy in dependence of the prediction horizon . . 1105.3 Transition matrices at different prediction horizons . . . . . . . . . 111
xix

xx List of figures
1 Snapshot of the online demo . . . . . . . . . . . . . . . . . . . . . . 1492 Detail of a version network . . . . . . . . . . . . . . . . . . . . . . 150

List of tables
1.1 Musical changes and version-related tags . . . . . . . . . . . . . . . 91.2 Indicators from Second Hand Songs . . . . . . . . . . . . . . . . . 11
2.1 System summary table . . . . . . . . . . . . . . . . . . . . . . . . . 362.2 Evaluation’s summary table . . . . . . . . . . . . . . . . . . . . . . 42
3.1 Effect of different transposition strategies . . . . . . . . . . . . . . 673.2 Accuracies for the different descriptors tested . . . . . . . . . . . . 703.3 MIREX accuracies for the “audio cover song identification task” . . 713.4 Errors depending on the musical change . . . . . . . . . . . . . . . 74
4.1 Experimental setup summary . . . . . . . . . . . . . . . . . . . . . 884.2 Version set detection accuracy . . . . . . . . . . . . . . . . . . . . 914.3 Accuracy improvements . . . . . . . . . . . . . . . . . . . . . . . . 924.4 Confusions due to shared chord progressions . . . . . . . . . . . . . 954.5 Accuracy for the original detection task . . . . . . . . . . . . . . . 99
5.1 Parameter values for grid search . . . . . . . . . . . . . . . . . . . 1075.2 Accuracy for model-based version retrieval . . . . . . . . . . . . . . 112
xxi


List of abbreviations andsymbols
Abbreviations
Abbreviation DescriptionAR AutoregressiveCA Clustering algorithmCL Complete linkageCRP Cross recurrence plotDP Dynamic programmingDTW Dynamic time warpingFFT Fast Fourier transformHC Harmonic changeHMM Hidden Markov modelHPCP Harmonic pitch class profileIDF Inverse document frequencyIR Information retrievalKM K-medoidsMAP Mean of average precisionsMC Music collectionMIDI Musical instrument digital interfaceMIR Music information retrievalMIREX Music information retrieval evaluation exchangeMLSS Most likely sequence of statesMO Modularity optimizationMST Minimum spanning treeNCD Normalized compression distanceOTI Optimal transposition indexPBFV Polyphonic binary feature vectorPCP Pitch class profilePM Proposed methodRBF Radial basis functionRP Recurrence plotRQA Recurrence quantification analysisSL Single linkageSTFT Short-time Fourier transformTAR Threshold autoregressive
xxiii

xxiv LIST OF ABBREVIATIONS AND SYMBOLS
Abbreviation DescriptionTC Tonal centroidTF Term frequencyUPGMA Group average linkageWPGMA Weighted average linkage
Mathematical symbols
General
Example Symbol type DescriptionA,B, C Calligraphy letters Matrices, bidimensional arrays.A,B,C Uppercase letters Single numbers: constants, fixed values,
etc.a,b, c Bold lowercase let-
tersVectors, unidimensional arrays.
a, b, c Lowercase letters Single numbers: indices, variables, etc.
Specific
Symbol DescriptionA Model coefficients’ matrixa Model’s coefficient. Element of Ab Cluster centerb Cluster center component. Element of bC Sequence of tonal centroidsC Sequence of downsampled tonal centroidsC Cardinalityc Tonal centroid. Element of Cc Downsampled tonal centroid. Element of Cc Tonal centroid component. Element of cD Dissimilarity matrixD′ Symmetrized dissimilarity matrixD Refined dissimilarity matrixd Dissimilarity value. Element of Dd Refined dissimilarity value. Element of DdTh Distance thresholdF F-measurefk Frequency (in bins) of the k-th spectral peakg Sequence of harmonic changesg Sequence of downsampled harmonic changesg Harmonic change. Element of g

xxv
Symbol Descriptiong Downsampled harmonic change. Element of gH Sequence of pitch class profilesH Sequence of normalized pitch class profilesH Sequence of downsampled pitch class profilesh Pitch class profile. Element of Hh Normalized pitch class profile. Element of Hh Downsampled pitch class profile. Element of Hh Transposed pitch class profile.h Pitch class magnitude. Element of hi Indexj IndexK Number of clustersk Indexk′Th Ranking thresholdL Cumulative recurrence matrixLmax Maximum value found in matrix Ll Cumulative recurrence value. Element of LM Constantm Embedding dimensionN Total number of descriptors in a time seriesN Total number of descriptors in an embedded time seriesNT Number of trials in a testNF- Number of false negativesNF+ Number of false positivesNT+ Number of true positivesN5 Number of complete trianglesN∨ Number of incomplete trianglesn Indexo Transposition index arrayo Sorted array of transposition indicesO Number of (optimal) transposition indiceso Magnitude of a transposition indexP Probability matrix (transition matrix)P Precision (version groups)p Probability. Element of PQ Cummulative recurrence matrixQmax Maximum value found in matrix QQ∗max Post-processed version of Qmax
q Cumulative recurrence value. Element of QR Cross recurrence plotR Recall (version groups)r Recurrence. Element of R

xxvi LIST OF ABBREVIATIONS AND SYMBOLS
Symbol DescriptionS Cumulative recurrence matrixSmax Maximum value found in matrix Ss Cumulative recurrence value. Element of St Time step for predictions (prediction horizon)U Total number of songsUN Number of (unrelated) added songs in a music collectionUS Number of version sets in a music collectionu Song indexv Song index2W Total number of elements of the windowing functionw Windowing functionw Element of wX Time series of descriptorsX Embedded time series of descriptorsx Descriptor. Element of Xx Embedded descriptor. Element of Xx Descriptor component. Element of xx Embedded descriptor componentY SpectrogramY Total number of windows of the spectrogramy Magnitude spectrum. Element of Yy Magnitude of the spectrum. Element of yy(fk) Magnitude of the k-th spectral peaky(fk) Whitened magnitude of the k-th spectral peakZ Total number of samples of the audio signalz Audio signalz Audio sample. Element of zαA, αB Constantsβ Constantγo, γe Gap penaltiesε Arbitrary distanceε Distance thresholdζ Support variableη Minimum number of neighborsθ Model’s parameterι Constantκ Percentage of nearest neighborsλ Embedding windowµ Mean valueµ Mean vectorν Averaging factorξ Normalized mean squared error (prediction error)

xxvii
Symbol Descriptionρ Distance% Objective functionσ Varianceς Constantτ Time delayυ Logarithmic mapping functionχ Random valueψ Precision (query-by-example)ψ Average precision⟨ψ⟩
Mean of average precisionω Cosine weighting functionΓ Relevance function∆ Relative accuracy increaseΘ Heaviside step functionΛ Ranked list of candidatesφ Radial basis functionΦ Transformation matrixΦ Vector basis. Element of ΦΩ Set of nearest neighbors


CHAPTER 1Introduction
1.1 Motivation
1.1.1 Automatic version detection
To relate and compare musical pieces is a very complex task. Musical piecesusually collapse multiple information sources (e.g. multiple instruments) andexhibit several degrees of inner structure (e.g. syntactic structure; Lerdahl& Jackendorff, 1983). Moreover, a number of complex multifaceted interac-tions can be established between pieces (e.g. concept-sharing; Zbikowski, 2002).However, in spite of such degrees of complexity, we humans are outstandinglygood at performing certain musical judgments, some of them requiring verylittle conscious effort (Dowling & Harwood, 1985). A prominent example is theability to assess whether or not two audio renditions correspond to the sameunderlying musical piece.Think for instance in the song1 “Happy birthday to you”2. If somebody sings itsmelody, even if some parts are out of tune, we can easily recognize this musicalpiece. This recognition ability is present in any listener, provided that he/sheis familiar with the piece, and it could grow with increased exposure to music(Bailes, 2010; Dalla Bella et al., 2003). Moreover, this ability is not restrictedto human beings. In particular, research has been conducted with whales(Frankel, 1998) and birds (Comins & Genter, 2010; Marler & Slabbekoorn,2004), showing that certain species present comparable capabilities.Neither is the recognition of a musical piece is restricted to a specific audiorendition. In fact, we group together variations of the same musical composi-tion. This grouping is inherent in our music experiences and can be explained
1In this thesis we loosely employ the term song to refer to any rendition of a musicalpiece, independently of the fact of whether there is any singing or not. Strictly speaking, asong is “a piece of music for voice or voices, whether accompanied or unaccompanied, or theact or art of singing” (Chew et al., 2010).
2http://en.wikipedia.org/wiki/Happy_birthday_song (all Internet links were checkedat the time of submission of this thesis).
1

2 CHAPTER 1. INTRODUCTION
in terms of categorization (Zbikowski, 2002). Returning to the example above,the fact of whether it is Marylin Monroe’s or The Ramones’ performance3
does not prevent us identifying the “Happy birthday” song. Notice howeverthat there are numerous objective differences between the two performances.The first one is sung ‘a cappella’, with a slow and varying tempo. The sec-ond one is rendered in punk style, including electric guitars, bass and drums,and has a fast and strict tempo. Despite these important differences, we areable to tell unequivocally that the two performances correspond to the samemusical piece. In other words, we recognize that the two songs are versions.Furthermore, we group them under the category versions of Happy Birthday,where other performances of this particular musical piece may also be found(in the case of knowing more of them).An interesting way to investigate version recognition is through computationalresources. Even before Turing (1950), researchers had already been interestedin determining whether a computer can imitate a human (Saygin et al., 2000).This question is an essential concept in artificial intelligence (Russell & Norvig,2003). Indeed, relevant knowledge can be gained from such imitations, bothwith theoretical and practical consequences. Our research, framed in the con-text of machine listening and music computing (Polotti & Rocchesso, 2008)also follows this approach.Think of a computer that could make decisions as a human would. In partic-ular, imagine that you provide a computer with a pair of music items and ittells you if they are the same or not. Moreover, imagine that the two items donot correspond to the same interpretation, but to two different versions of thesame underlying musical piece, such as our “Happy birthday” example. If weadd the fact that the machine should perform such a judgment without anyprior information of the music items, just by analyzing two audio waveformsat a time, we are facing quite a challenging task (Fig. 1.1). This thesis dealswith such a task.
1.1.2 Music information retrieval
In what regards to research around music and computers, developments withinthe music information retrieval (MIR) community have a fundamental role.MIR is an interdisciplinary research field that aims at automatically under-standing, describing, retrieving and organizing musical contents (Casey et al.,2008b; Downie, 2008; Lesaffre, 2005; Orio, 2006). In particular, the MIR com-munity has invested much effort in automatically assessing music similarityfrom an audio content-based perspective (e.g. Berenzweig et al., 2004; Pam-palk, 2006; Pohle et al., 2009; West & Lamere, 2007). Music similarity is a keyfeature for searching and organizing today’s million-track digital music collec-
3Due to copyright issues we cannot provide a link to listen to music items. In case thereader may be interested in listening to the cited items we suggest searching for them byartist and title on the web, e.g. in YouTube (http://www.youtube.com).

1.2. VERSIONS 3
Figure 1.1: Illustration of automatic version detection from the audio signal.
tions (Pachet, 2005), and developing automatic ways to quantify it addressespart of a more general problem our modern society is facing: making sense ofdigital information (Ratzan, 2004).Music similarity, however, is an ambiguous term. Apart from involving dif-ferent musical facets such as timbre, tonality or rhythm, it also depends oncultural (or contextual) and personal (or subjective) aspects (Harwood, 1976;Lynch et al., 1990). There are many factors involved in music similarity judg-ments, and some of them, maybe the most relevant ones, are difficult to mea-sure (Berenzweig et al., 2004). Therefore, it is not surprising that currentefforts to develop a computational music similarity measure based on the au-dio content crash against the so-called “glass ceiling” (Aucouturier & Pachet,2004). Indeed, average user scores4 for such current approaches for music sim-ilarity do not surpass a value of 6 in a scale from 0 to 10.To further proceed in assessing the similarity between music documents, someMIR researchers have devoted their efforts to the related task of version identi-fication. Remarkably, and in contrast to music similarity, the relation betweenversions is context-independent and can be qualitatively defined and objec-tively measured. In addition, research on this task can yield valuable clues onhow music similarity can be modeled. As Downie et al. (2008) indicate, consid-ering the task of version identification “motivates MIR researchers to expandtheir notions of similarity beyond acoustic similarity to include the impor-tant idea that musical works retain their identity notwithstanding variationsin style, genre, orchestration, rhythm or melodic ornamentation, etc”.
1.2 Versions
1.2.1 Terms
In previously published work (e.g. Serrà et al., 2010a) we pragmatically usedthe term cover songs to refer to “different renditions of the same underlying
4http://www.music-ir.org/mirex/wiki/2010:Audio_Music_Similarity_and_Retrieval_Results
4 CHAPTER 1. INTRODUCTION
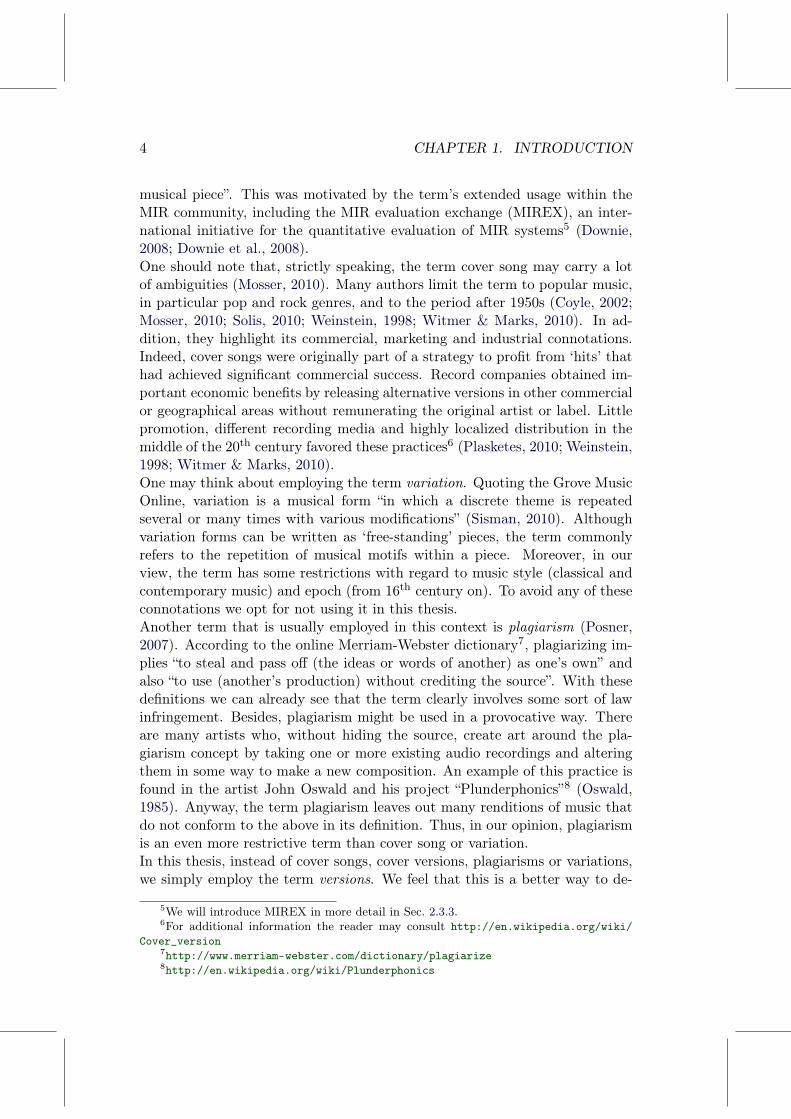
musical piece”. This was motivated by the term’s extended usage within theMIR community, including the MIR evaluation exchange (MIREX), an inter-national initiative for the quantitative evaluation of MIR systems5 (Downie,2008; Downie et al., 2008).One should note that, strictly speaking, the term cover song may carry a lotof ambiguities (Mosser, 2010). Many authors limit the term to popular music,in particular pop and rock genres, and to the period after 1950s (Coyle, 2002;Mosser, 2010; Solis, 2010; Weinstein, 1998; Witmer & Marks, 2010). In ad-dition, they highlight its commercial, marketing and industrial connotations.Indeed, cover songs were originally part of a strategy to profit from ‘hits’ thathad achieved significant commercial success. Record companies obtained im-portant economic benefits by releasing alternative versions in other commercialor geographical areas without remunerating the original artist or label. Littlepromotion, different recording media and highly localized distribution in themiddle of the 20th century favored these practices6 (Plasketes, 2010; Weinstein,1998; Witmer & Marks, 2010).One may think about employing the term variation. Quoting the Grove MusicOnline, variation is a musical form “in which a discrete theme is repeatedseveral or many times with various modifications” (Sisman, 2010). Althoughvariation forms can be written as ‘free-standing’ pieces, the term commonlyrefers to the repetition of musical motifs within a piece. Moreover, in ourview, the term has some restrictions with regard to music style (classical andcontemporary music) and epoch (from 16th century on). To avoid any of theseconnotations we opt for not using it in this thesis.Another term that is usually employed in this context is plagiarism (Posner,2007). According to the online Merriam-Webster dictionary7, plagiarizing im-plies “to steal and pass off (the ideas or words of another) as one’s own” andalso “to use (another’s production) without crediting the source”. With thesedefinitions we can already see that the term clearly involves some sort of lawinfringement. Besides, plagiarism might be used in a provocative way. Thereare many artists who, without hiding the source, create art around the pla-giarism concept by taking one or more existing audio recordings and alteringthem in some way to make a new composition. An example of this practice isfound in the artist John Oswald and his project “Plunderphonics”8 (Oswald,1985). Anyway, the term plagiarism leaves out many renditions of music thatdo not conform to the above in its definition. Thus, in our opinion, plagiarismis an even more restrictive term than cover song or variation.In this thesis, instead of cover songs, cover versions, plagiarisms or variations,we simply employ the term versions. We feel that this is a better way to de-
5We will introduce MIREX in more detail in Sec. 2.3.3.6For additional information the reader may consult http://en.wikipedia.org/wiki/
Cover_version7http://www.merriam-webster.com/dictionary/plagiarize8http://en.wikipedia.org/wiki/Plunderphonics

1.2. VERSIONS 5
nominate the music material we consider for our experiments. Moreover, wethink it is the best term to be associated with the motivations that drive ourresearch (Sec. 1.1). With this term we aim to get rid of the economical, geo-graphical, historical and social connotations outlined previously. In particular,we would like to stress that our research is not particularly focused nor biasedto cover songs or plagiarisms.We think about music versions as a term that globally encompasses any rendi-tion or recording of the same musical piece, independently of the motivationsfor performing it, the historical period or whether it is sung or not. Reuseof music material has been a common practice for centuries, or even sincethe beginning of human history (Mithen, 2007). An example of an ancientreuse practice is the traditional Gregorian melody of “Dies Irae”, which hasbeen used as a ‘musical quotation’ in requiems and a number of other classicalcompositions9 (see Caldwell & Boyd, 2010, and references therein). In gen-eral, musicians can play versions simply as a homage or tribute to the originalperformer, composer or band. But there are many more reasons to play aversion (c.f. Plasketes, 2010; Solis, 2010): to translate a song to another lan-guage, to adapt a musical piece to a particular country or regional tastes, tocontemporize an old piece, to introduce a new artist, to parody or just for thesimple pleasure of playing a familiar song. In addition, one must not forgetthat versions represent the opportunity for beginners and consolidated artiststo perform a radically different interpretation of a musical piece, incorporatingthen a large amount of ‘creativity’ and ‘originality’.Plasketes (2010) summarizes the last paragraph in one (long) sentence: “stan-dardization, interpretation, incorporation, adaptation, appropriation and ap-preciation have been manifest in a multitude of musical manners and methods,including retrospectives and reissues, the emergence of rap and sampling ascommercially dominant pop styles, karaoke, and a steady flow, if not stream,of cover compilations and tribute recordings which revisit a significant crosssection of musical periods, styles, genre and artists and their catalogs of com-positions”.
1.2.2 Types
Many distinctions between versions can be made. The majority of these comefrom musicology (e.g. Coyle, 2002; Mosser, 2010; Plasketes, 2010), althoughfew have been made from an MIR perspective (Gómez, 2006; Tsai et al., 2008;Yang, 2001). In general, but specially true for the MIR-based ones, thesedistinctions aim at identifying different situations where a song was performedin the context of mainstream popular music. In this context, one can find ahuge amount of tags, terms and labels related to versions, many of them beingjust buzzwords for commercial purposes.
9For a list the reader may consult http://en.wikipedia.org/wiki/Dies_irae

6 CHAPTER 1. INTRODUCTION
In Serrà et al. (2010a) we provided some examples of tags associated to versions,which we now briefly extend.
Remaster Creating a new master for an album or song generally implies somesort of sound enhancement to a previously existing product (e.g. com-pression, equalization, different endings or fade-outs).
Instrumental Sometimes, versions without any sung lyrics are released. Thesemight include karaoke versions to sing or play along with, alternative ver-sions for different record-buying public segments (e.g. classical versionsof pop songs, children versions, etc.) or rare instrumental takes of a songin CD-box editions specially made for collectors.
Mashup It is a song or composition created by blending two or more pre-recorded songs, usually by overlaying the vocal track of one song seam-lessly over the instrumental track of another.
Live performance A recorded track from live performances. This can cor-respond to a live recording of the original artist who previously releasedthe song in a studio album or to other performers.
Acoustic The piece is recorded with a different set of acoustical instrumentsin a more intimate situation. Sometimes “unplugged” is used as synonym.
Demo It is a way for musicians to approximate their ideas on tape or disc,and to provide an example of those ideas to record labels, producers orother artists. Musicians often use demos as quick sketches to share withband mates or arrangers. In other cases, a music publisher may need asimplified recording for publishing or copyright purposes, or a songwritermight make a demo in order to be sent to artists in the hope of havingthe song professionally recorded.
Standard In jazz music, there are compositions that are widely known, per-formed and recorded. Musicians usually maintain the main melodicand/or harmonic structure but adapt other musical characteristics totheir convenience. There is no definitive list of jazz standards thoughthis might change over time. Songs that can be considered standardsmay be found in the fake book (Kernfeld, 2006) or the real book10 (HalLeonard Corp., 2004).
Medley Mostly in live recordings, and in the hope of catching listeners’ at-tention, a band performs a set of songs without stopping between themand linking several themes. Usually just the more memorable parts ofthe music work are included.
10See also http://www.myrealbook.com/home.htn or http://www.realbook.us

1.2. VERSIONS 7
Remix This word can be very ambiguous. From a ‘traditionalist’ perspective,a remix implies an alternate master of a song, adding or subtracting el-ements or simply changing the equalization, dynamics, pitch, tempo,playing time or almost any other aspect of the various musical compo-nents. But some remixes involve substantial changes to the arrangementof a recorded work and barely resemble the original one. A remix mayalso refer to a re-interpretation of a given work such as a hybridizingprocess simultaneously combining fragments of two or more works.
Quotation The incorporation of a relatively brief segment of existing musicin another work, in a manner akin to quotation in speech or literature.Quotation usually means melodic quotation, although the whole musi-cal texture may be incorporated. The borrowed material is presentedexactly or nearly so, but is not part of the main substance of the work.Incorporating samples of other songs into one’s own song would fall intothis category.
Of course all this terminology is defined in the context of (mainstream, com-mercial, popular) Western music. However, the near-duplicate repetition ofmusical items and phrases is a global phenomena. Each culture might labelnear-duplicate repetitions in a different manner and might apply different cri-teria to distinguish between them. For instance, in the Japanese culture thereis a long and continuing tradition in enka, a sentimental ballad form thatthrough patterned repetition derives authenticity over time (Yano, 2005). Ingeneral, one should be cautious in finding versions in other cultures becausemany misinterpretations could arise. For example, it would be misleading toconsider two performances to be versions just because they are part of thesame raga11 (Bor, 2002; Daniélou, 1968).
1.2.3 Modifiable characteristics
According to our definition of the term version, we advocate a distinction basedon musical characteristics instead of using geographical, commercial, subjectiveor situational tags like the ones above. The main musical characteristics thatcan change in a version are listed below. For completeness we also include anadditional characteristic not strictly related to ‘musical variations’. Noticeably,many of the listed characteristics may occur simultaneously in the same version.
1. Timbre: many variations changing the general color or texture of soundsmight be included in this category. Two predominant groups are:
11Quoting Bor (2002), “a raga is far more precise and much richer than a scale or mode,and much less fixed than a particular tune”. It can be regarded as a “tonal framework forcomposition and improvisation” that has “a particular scale and specific melodic movements”.

8 CHAPTER 1. INTRODUCTION
a) Production techniques: different sound recording and processingtechniques introduce texture variations in the final audio rendition(e.g. equalization, microphones or dynamic compression).
b) Instrumentation: the fact that the new performers can be usingdifferent instruments, configurations or recording procedures canconfer different timbres to the version.
2. Tempo: as it is not as common to strictly control the tempo in a concert,this characteristic can change or fluctuate even in a live performance ofa given song by its original artist. In fact, strictly following a predefinedbeat or tempo might become detrimental for expressiveness and con-textual feedback. Even in classical music, small tempo fluctuations areintroduced for different renditions of the same piece. In general, tempochanges abound, sometimes on purpose, with different performers.
3. Timing: in addition to tempo, the rhythmical structure of the piece mightchange depending on the performer’s intention or feeling. Not only bymeans of changes in the drum section, but also including more subtleexpressive deviations by means of swing, syncopation, accelerandos, ri-tardandos or pauses.
4. Structure: it is quite common to change the structure of the song. Thismodification can be as simple as skipping a short introduction, repeatingthe chorus where there was no such repetition, introducing an instru-mental section or shortening one. On the other hand, such modificationscan be very elaborated, usually implying a radical change in the musicalsection ordering.
5. Key: the piece can be transposed to a different key or main tonality.This is usually done to adapt the pitch range to a different singer orinstrument, for aesthetic reasons or to induce some mood changes in thelistener. Transposition is usually applied to the whole song, although itcan be restricted just to a single musical section.
6. Harmonization: independently of the main key, the chord progressionmight change (e.g. adding or deleting chords, substituting them by rela-tives, modifying the chord types or adding tensions). The main melodymight also change some note durations or pitches. Such changes are verycommon in introduction and bridge passages. Also, in instrumental soloparts, the lead instrument voice is practically always different from theoriginal one.
7. Lyrics and language: one purpose for recording a version is to translateit to other languages. This is commonly done by high-selling artists tobecome better known in large speaker communities.

1.2. VERSIONS 9
Tag Timbre Tempo Timing Struct. Key Harm. Lyrics NoiseRemaster
√ √
Instrumental√ √ √
Mashup√ √ √ √
Live√ √ √ √
Acoustic√ √ √ √ √ √
Demo√ √ √ √ √ √ √ √
Standard√ √ √ √ √ √ √ √
Medley√ √ √ √ √ √
Remix√ √ √ √ √ √ √ √
Quotation√ √ √ √ √ √ √ √
Table 1.1: Musical changes that can be usually observed within different versiontags. The ‘
√’ mark indicates that the change is possible, but not necessary.
8. Noise: in this category we consider other audio manifestations that mightbe present in a recording. Examples include audience manifestations suchas claps, shouts or whistles, speech and audio compression and encodingartifacts.
We can of course relate music characteristics with the version-related ‘types’ ortags presented above (Table 1.1). In spite of the qualitative difference betweenboth, music characteristics and version-related tags nowadays coexist. As anexample, consider Beethoven’s 5th symphony. If we randomly choose two clas-sical music versions of it, we may see that one is tagged as, e.g. “instrumental”and “acoustic”, while the other is only tagged as “live”. However, none of thesetags provide effective musical information for comparison. Indeed, when listen-ing to such versions we may notice several musical variations (usually changesin instrument configurations, overall equalization, reverberation, tempo andloudness are noticeable). If we then listen, e.g. to the also “instrumental” Yng-wie Malmsteen version, we will easily spot more changes (e.g. employing a fullrock instrument set, a faster tempo, some structure changes, etc.). Finally, ifwe take a hip-hop remix by, e.g. 50 Cent, we may realize that nearly all originalcharacteristics of the song are gone, except a lick or a phrase that is in thebackground. It is in this scenario where version identification becomes a verychallenging task.
1.2.4 Social interest
‘Versioning’ is a phenomenon that clearly captures social attention. Peoplehave an increasing interest in versions of musical pieces, specially in versionsof popular pieces. We can get an impression of this interest by having a look atthe Internet. For instance, we can search for videos in YouTube that contain

10 CHAPTER 1. INTRODUCTION
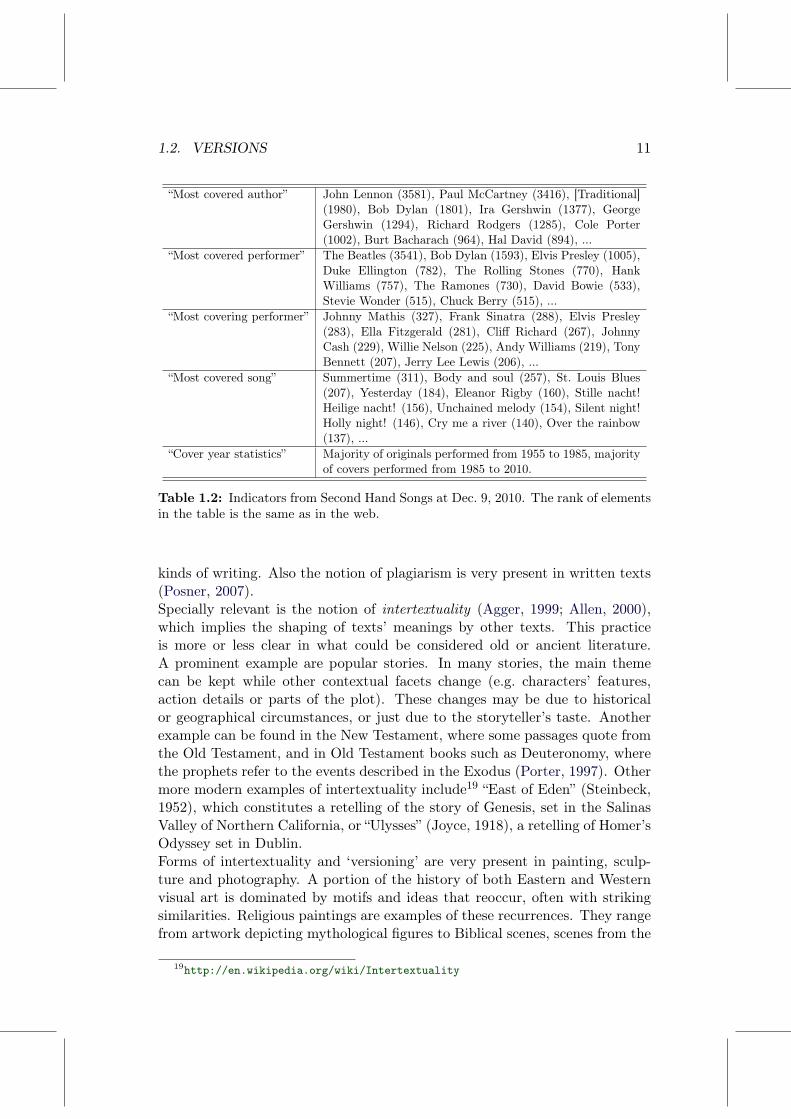
song version related terms. The result is a list of around 380000 videos12,some of them having a play-count in the range of millions. These videos arenot only from more or less consolidated artists, but also from amateurs andsemi-professional bands.If we perform the same search with Google we obtain around 3.5 million pages.These web pages range from comprehensive editorial or metadata collections(e.g. Second Hand Songs13) to social community portals where users can up-load, listen and chat about their own song versions (e.g. Midomi14); frompodcasts and radio programs (e.g. Coverville15) to news portals (e.g. BBC16);from personal blogs (e.g. Cover Me17) to research pages (e.g. LabROSA18).One of these web pages, Second Hand Songs, provides some statistics that,although being “heavily biased by the preferences of the editors and visitors”13
(popular music, from 1950 on), give interesting indicators such as the “mostcovered songs”, “most covered authors”, “year statistics” or the “longest coverchain” (some of these indicators are highlighted in Table 1.2). To the present,their metadata collection contains “32009 works, 126427 performances, 2347samples and 38629 artists (performers and songwriters)”.Social interest in versions is not only visible in the Internet. Song versionsfeature in many radio shows and even some of these shows are completely ded-icated to them. Documentaries in musical television channels discuss or high-light different aspects of music versioning. Bands play versions in any kind ofevent: from weddings to big concerts. Amateur musicians perform versions.Indeed, nowadays easy access to music, instruments and recording techniqueshas greatly facilitated the repetition and modification of musical themes (Kot-ska, 2005), reaching a volume of version material that was unthinkable somedecades ago.
1.2.5 Versions in other arts
The action of performing the same underlying ‘production’ despite numerousrelevant changes in its characteristics is not restricted to the music nor the au-dio domains. Interestingly, we can straightforwardly draw some close analogieswithin other artistic domains. The most obvious domain where ‘versions’ arepresent is in literature (and, in general, in almost all kinds of writing activities).In fact, the term quotation we have introduced before is directly borrowed fromthere. Furthermore, if we think of a restatement of a text giving the meaningin another form, we talk about a paraphrase, another common practice in all
12The data was obtained on Sep. 13, 2010, by searching for "cover song" OR "coversongs" OR "cover version" OR "cover versions" OR "song version" OR "song versions" .
13http://www.secondhandsongs.com14http://www.midomi.com15http://coverville.com16http://news.bbc.co.uk/2/hi/7468837.stm17http://www.covermesongs.com18http://labrosa.ee.columbia.edu/projects/coversongs
1.2. VERSIONS 11
“Most covered author” John Lennon (3581), Paul McCartney (3416), [Traditional](1980), Bob Dylan (1801), Ira Gershwin (1377), GeorgeGershwin (1294), Richard Rodgers (1285), Cole Porter(1002), Burt Bacharach (964), Hal David (894), ...
“Most covered performer” The Beatles (3541), Bob Dylan (1593), Elvis Presley (1005),Duke Ellington (782), The Rolling Stones (770), HankWilliams (757), The Ramones (730), David Bowie (533),Stevie Wonder (515), Chuck Berry (515), ...
“Most covering performer” Johnny Mathis (327), Frank Sinatra (288), Elvis Presley(283), Ella Fitzgerald (281), Cliff Richard (267), JohnnyCash (229), Willie Nelson (225), Andy Williams (219), TonyBennett (207), Jerry Lee Lewis (206), ...
“Most covered song” Summertime (311), Body and soul (257), St. Louis Blues(207), Yesterday (184), Eleanor Rigby (160), Stille nacht!Heilige nacht! (156), Unchained melody (154), Silent night!Holly night! (146), Cry me a river (140), Over the rainbow(137), ...
“Cover year statistics” Majority of originals performed from 1955 to 1985, majorityof covers performed from 1985 to 2010.
Table 1.2: Indicators from Second Hand Songs at Dec. 9, 2010. The rank of elementsin the table is the same as in the web.
kinds of writing. Also the notion of plagiarism is very present in written texts(Posner, 2007).Specially relevant is the notion of intertextuality (Agger, 1999; Allen, 2000),which implies the shaping of texts’ meanings by other texts. This practiceis more or less clear in what could be considered old or ancient literature.A prominent example are popular stories. In many stories, the main themecan be kept while other contextual facets change (e.g. characters’ features,action details or parts of the plot). These changes may be due to historicalor geographical circumstances, or just due to the storyteller’s taste. Anotherexample can be found in the New Testament, where some passages quote fromthe Old Testament, and in Old Testament books such as Deuteronomy, wherethe prophets refer to the events described in the Exodus (Porter, 1997). Othermore modern examples of intertextuality include19 “East of Eden” (Steinbeck,1952), which constitutes a retelling of the story of Genesis, set in the SalinasValley of Northern California, or “Ulysses” (Joyce, 1918), a retelling of Homer’sOdyssey set in Dublin.Forms of intertextuality and ‘versioning’ are very present in painting, sculp-ture and photography. A portion of the history of both Eastern and Westernvisual art is dominated by motifs and ideas that reoccur, often with strikingsimilarities. Religious paintings are examples of these recurrences. They rangefrom artwork depicting mythological figures to Biblical scenes, scenes from the
19http://en.wikipedia.org/wiki/Intertextuality

12 CHAPTER 1. INTRODUCTION
Figure 1.2: Examples of different versions of the “Mona Lisa” painting (see text).
life of Buddha or other scenes of Eastern religious origin.Alternative renditions of existing paintings may be done as a homage, or moti-vated by important conceptual or technical changes. Furthermore, sometimesa painting may strongly influence other paintings. That would be the case of,for instance, “Las Meninas” (Velázquez, 1656), which has led to a number of‘versions’ from the most famous artists, among them Picasso, who produced44 interpretations of the painting20. Another example of a highly replicatedpainting is the “Mona Lisa” (Da Vinci, 1519). A simple search through theInternet can serve us to compile several renditions of it (Fig. 1.2). Some ofthem vary in small details (Fig. 1.2a-d), while others constitute a more radicalreinterpretation of the picture (Fig. 1.2e-j). A few may even be a forgery or aparody (e.g. Fig. 1.2b-d,h).Still in the visual domain, we find another avenue for versioning: movies.Of course here we find the obvious movie versions and remakes but, behindthese, it is worth noticing that many movies make small ‘references’ to oldermovies. These references can be somewhat hidden or readily obvious, andreveal influences, imitations or restatements of other authors’ works. Impor-tantly, these references can go beyond textual phrases21. Such is the case withentire sequences that remind the viewer of a previous film. These sequences areusually ‘versioned’ on purpose, even within current mainstream films. We canfind some examples in many of Tarantino’s movies, where characters, scenes
20http://www.museupicasso.bcn.cat/meninas/index_en.htm21For a compilation of quoted textual phrases see http://en.wikipedia.org/wiki/AFI%
27s_100_Years%E2%80%A6100_Movie_Quotes
1.3. VERSION IDENTIFICATION: APPLICATION SCENARIOS 13
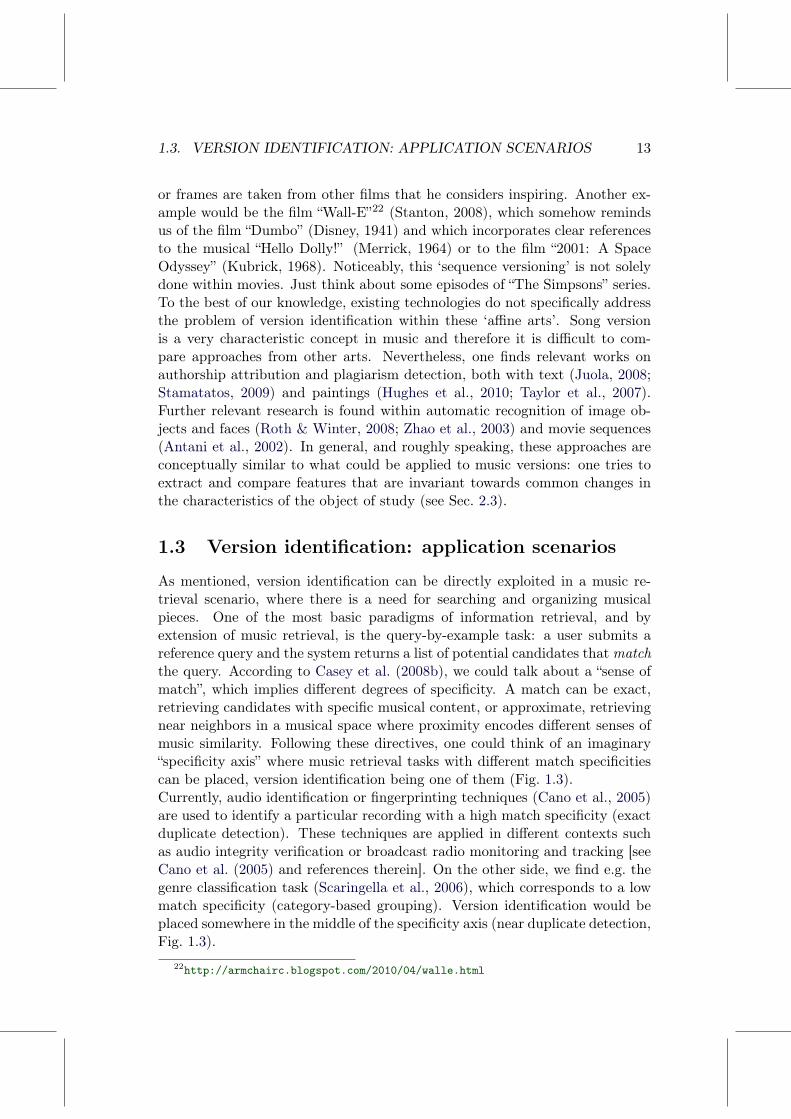
or frames are taken from other films that he considers inspiring. Another ex-ample would be the film “Wall-E”22 (Stanton, 2008), which somehow remindsus of the film “Dumbo” (Disney, 1941) and which incorporates clear referencesto the musical “Hello Dolly!” (Merrick, 1964) or to the film “2001: A SpaceOdyssey” (Kubrick, 1968). Noticeably, this ‘sequence versioning’ is not solelydone within movies. Just think about some episodes of “The Simpsons” series.To the best of our knowledge, existing technologies do not specifically addressthe problem of version identification within these ‘affine arts’. Song versionis a very characteristic concept in music and therefore it is difficult to com-pare approaches from other arts. Nevertheless, one finds relevant works onauthorship attribution and plagiarism detection, both with text (Juola, 2008;Stamatatos, 2009) and paintings (Hughes et al., 2010; Taylor et al., 2007).Further relevant research is found within automatic recognition of image ob-jects and faces (Roth & Winter, 2008; Zhao et al., 2003) and movie sequences(Antani et al., 2002). In general, and roughly speaking, these approaches areconceptually similar to what could be applied to music versions: one tries toextract and compare features that are invariant towards common changes inthe characteristics of the object of study (see Sec. 2.3).
1.3 Version identification: application scenarios
As mentioned, version identification can be directly exploited in a music re-trieval scenario, where there is a need for searching and organizing musicalpieces. One of the most basic paradigms of information retrieval, and byextension of music retrieval, is the query-by-example task: a user submits areference query and the system returns a list of potential candidates thatmatchthe query. According to Casey et al. (2008b), we could talk about a “sense ofmatch”, which implies different degrees of specificity. A match can be exact,retrieving candidates with specific musical content, or approximate, retrievingnear neighbors in a musical space where proximity encodes different senses ofmusic similarity. Following these directives, one could think of an imaginary“specificity axis” where music retrieval tasks with different match specificitiescan be placed, version identification being one of them (Fig. 1.3).Currently, audio identification or fingerprinting techniques (Cano et al., 2005)are used to identify a particular recording with a high match specificity (exactduplicate detection). These techniques are applied in different contexts suchas audio integrity verification or broadcast radio monitoring and tracking [seeCano et al. (2005) and references therein]. On the other side, we find e.g. thegenre classification task (Scaringella et al., 2006), which corresponds to a lowmatch specificity (category-based grouping). Version identification would beplaced somewhere in the middle of the specificity axis (near duplicate detection,Fig. 1.3).
22http://armchairc.blogspot.com/2010/04/walle.html
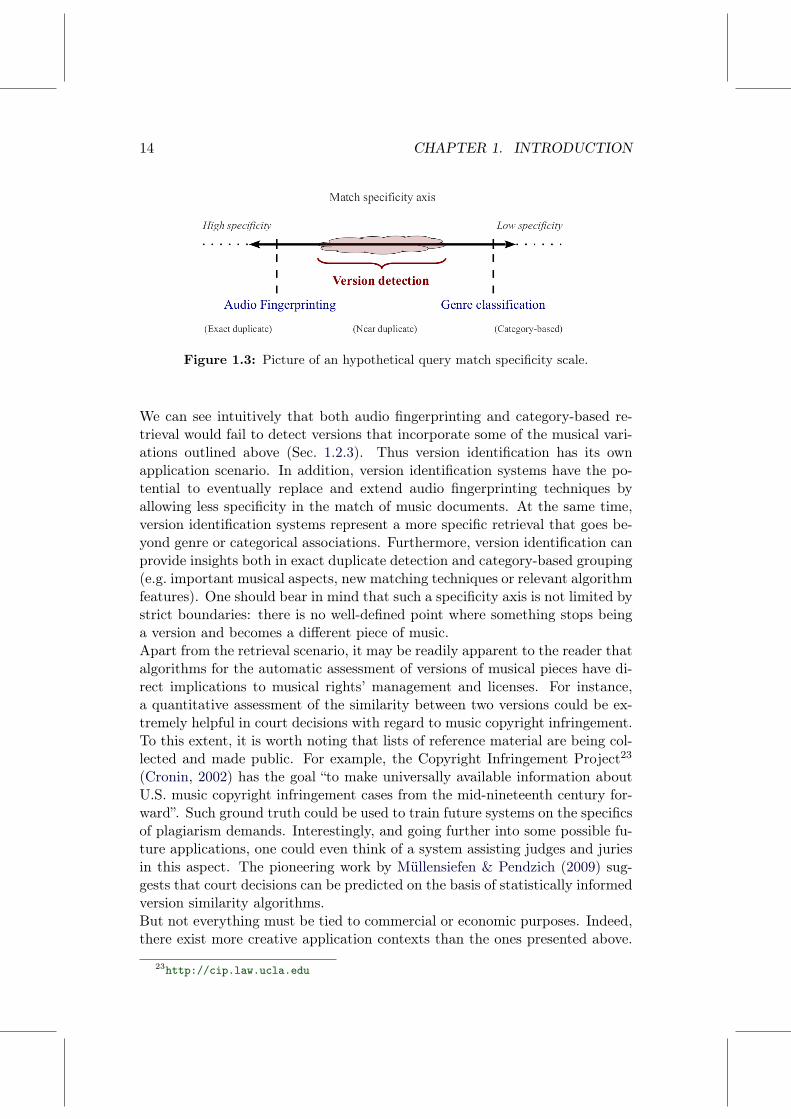
14 CHAPTER 1. INTRODUCTION
Figure 1.3: Picture of an hypothetical query match specificity scale.
We can see intuitively that both audio fingerprinting and category-based re-trieval would fail to detect versions that incorporate some of the musical vari-ations outlined above (Sec. 1.2.3). Thus version identification has its ownapplication scenario. In addition, version identification systems have the po-tential to eventually replace and extend audio fingerprinting techniques byallowing less specificity in the match of music documents. At the same time,version identification systems represent a more specific retrieval that goes be-yond genre or categorical associations. Furthermore, version identification canprovide insights both in exact duplicate detection and category-based grouping(e.g. important musical aspects, new matching techniques or relevant algorithmfeatures). One should bear in mind that such a specificity axis is not limited bystrict boundaries: there is no well-defined point where something stops beinga version and becomes a different piece of music.Apart from the retrieval scenario, it may be readily apparent to the reader thatalgorithms for the automatic assessment of versions of musical pieces have di-rect implications to musical rights’ management and licenses. For instance,a quantitative assessment of the similarity between two versions could be ex-tremely helpful in court decisions with regard to music copyright infringement.To this extent, it is worth noting that lists of reference material are being col-lected and made public. For example, the Copyright Infringement Project23
(Cronin, 2002) has the goal “to make universally available information aboutU.S. music copyright infringement cases from the mid-nineteenth century for-ward”. Such ground truth could be used to train future systems on the specificsof plagiarism demands. Interestingly, and going further into some possible fu-ture applications, one could even think of a system assisting judges and juriesin this aspect. The pioneering work by Müllensiefen & Pendzich (2009) sug-gests that court decisions can be predicted on the basis of statistically informedversion similarity algorithms.But not everything must be tied to commercial or economic purposes. Indeed,there exist more creative application contexts than the ones presented above.
23http://cip.law.ucla.edu
1.4. OBJECTIVES AND OUTLINE OF THE THESIS 15
We can think for example of a musician who is composing a new piece. Aversion similarity algorithm could assess him on the originality of his ideas,providing a more informed compositional process. Musicologists can take ad-vantage of such algorithms too. Automatic similarity measures could be used,among other things, to facilitate the analysis of related compositions, to tracethe evolution of a musical piece, to establish relationships between perfor-mances, to compare passages or to quantify tempo deviations. From a simpleuser perspective, finding versions of a musical piece can be valuable and fun.This is easy to anticipate given the current interest in song versions (Sec. 1.2.4).
1.4 Objectives and outline of the thesis
The main goal of this thesis is to develop methods for automatically assessingwhether two recordings are versions of the same musical piece. Our mainstarting point is the audio signal (e.g. an MP3 file), which we use as theunique source of information. Therefore most of the techniques we employand propose are placed within the fields of signal processing and time seriesanalysis. However, other techniques such as the ones derived from complexnetworks are also used. As general guidelines for our research we strive forsimplicity, accuracy and generality. We focus overall on simple yet powerfulapproaches that can yield outstanding accuracies and that furthermore can beapplied to signals and sources of a distinct nature. A further consideration withregard to the present work is that we aim at using unsupervised techniques,in the sense that no explicit learning is done on the basis of a pool of labeledexamples.In Chapter 2 we proceed with a comprehensive literature review focused onthe specific topic of version identification. Since this topic is relatively new,we first position it within the wider context of MIR research. In particular,we place the task of version identification within both audio and symbolicmusic processing scenarios (Secs. 2.2.1 and 2.2.2). Some words about relevantresearch in music cognition are also given (Sec. 2.2.3). The remainder of thechapter is devoted to reviewing approaches specifically designed for versionidentification (Sec. 2.3). This review is organized around what we consider themain functional blocks of a version identification system (Sec. 2.3.1), which seekto tackle the aforementioned musical variations between song versions. Apartfrom functional blocks, we review some pre- and post-processing strategies forthese systems (Sec. 2.3.2). The evaluation of version identification systems isalso reviewed, with emphasis on the music material, the evaluation measuresand the efforts to develop a common framework for the accuracy assessmentof such systems (Sec. 2.3.3).In Chapter 3 we present our main approach for version identification. We fol-low the major trend in the literature and devise a model-free approach, i.e. nostrong assumptions are made about the nature of the signals involved in the

16 CHAPTER 1. INTRODUCTION
process of identifying a version. The approach goes from the raw audio signalto a single measure reflecting version similarity. First, tonality-based descrip-tors are computed from audio using a state-of-the-art methodology (Sec. 3.2.2).Importantly, at this early stage we deal with timbre, noise and language in-variance, three important characteristics that can change in versions (recall wehave presented them previously in Sec. 1.2.3). Next, we propose a novel strat-egy for tackling different transpositions (Sec. 3.2.3). The two previous stepsyield time series of music descriptors, which are then compared on a pairwisebasis in order to obtain a version similarity measure. For that, nonlinear timeseries analysis concepts are employed. First, cross recurrences between a pairof songs are assessed in order to see which parts of the corresponding time seriesmatch (Sec. 3.2.5). Then, these cross recurrences are quantified (Sec. 3.2.6)and a dissimilarity measure is obtained (Sec. 3.2.7). These two stages speciallyfocus on achieving structure, tempo as well as timing invariance. The approachis evaluated with a large in-house music collection and a common informationretrieval methodology (Sec. 3.3). As a main result, we show that our approachyields a high accuracy with such a music collection (Sec. 3.4.2). This high accu-racy is confirmed through an independent international evaluation frameworkallowing the comparison between existing approaches (Sec. 3.4.3).Chapter 4 is devoted to post-processing stages for version identification sys-tems. In particular, we explore the relation between songs that are inferredfrom such a system. To this end, we first study the network of version simi-larities obtained with our approach and show that different groups (clusters orcommunities) of songs are formed (Sec. 4.2.2). Such groups are detected in anunsupervised way (Sec. 4.2.3) and this information is subsequently exploitedto enhance the accuracy of the original system (Sec. 4.2.4). Results prove thefeasibility and effectiveness of this idea (Sec. 4.4). To close the chapter, wepresent a pioneer study on the role of the original song within its versions(Sec. 4.5). In particular, we show that the original song tends to occupy acentral position within the group containing all possible versions of a musicalpiece.In Chapter 5 we return to the development of dissimilarity measures for ver-sion identification. However, this time we take a radically different approachand explicitly model descriptor time series. More specifically, we study howcommon linear and nonlinear time series models can be used for the task athand (Sec. 5.2.4). A prediction-based framework is proposed in order to obtaina suitable dissimilarity measure (Sec. 5.2.5). We base such a measure on thepredictions of the models and evaluate them through a standard error measure(Sec. 5.2.6). Although the results for the model-based strategy are worse thanthe ones for the model-free strategy (Sec. 5.4), we show that such a model-based approach is very promising, specially with reference to computationalcosts and user parameter settings (Sec. 5.5). We also comment on further de-velopments that could lead to a very competitive version identification system(Sec. 5.6).

1.4. OBJECTIVES AND OUTLINE OF THE THESIS 17
Chapter 6 concludes this thesis. It provides a summary of contributions anddiscusses future perspectives for version identification.


CHAPTER 2Literature review
2.1 Introduction
This literature review is divided into two main sections. The first briefly high-lights the scientific background around automatic version detection. In par-ticular, we focus on three areas of research: audio-based retrieval, symbolicmusic processing and music cognition. In audio-based retrieval, we place thetask of version identification within music retrieval, focusing on audio content-based approaches. With the section on symbolic music processing we stress theimportance of research done in the symbolic domain1 and briefly discuss itsapplicability to the problem at hand. In the section devoted to music cognitionwe review relevant knowledge for version detection coming from this discipline.The second provides a comprehensive summary of version identification sys-tems. The summary is based on a functional block decomposition of thesesystems. Apart from the core blocks, some pre- and post-processing strategiesare relevant. We therefore give an outline of those that have been applied toversion identification. Finally, the evaluation of version identification systemsis discussed. In this second main section we only focus on methods that work inthe audio domain and explicitly consider versions of musical pieces as primarymusic material. We furthermore restrict the review to methods specificallydesigned to achieve invariance to the characteristic musical changes amongversions2 (Sec. 1.2.3).
1As symbolic domain we refer to the approach to music content processing that uses,as starting raw data, symbolic representations of musical content (e.g. data extracted fromprinted scores). In contrast, the audio domain processes the raw audio signal (e.g. data fromreal-time recordings).
2Even considering these criteria, it is difficult to present the complete list of methods andalternatives. We apologize for any possible omissions/errors and, in any case, we assert thatthese have not been intentional.
19

20 CHAPTER 2. LITERATURE REVIEW
2.2 Scientific background
2.2.1 Audio-based retrieval
Approaches for music retrieval can use multiple information sources, e.g. theraw audio signal, symbolic music representations, audio metadata, tags pro-vided by users or experts or music and social networks data (Lesaffre, 2005;Orio, 2006). In the case of version identification, a metadata or tag-basedapproach would become trivial and would separate us from our initial moti-vation, namely that the computer ‘hears’ two musical pieces and determinesif they are versions of the same composition3. Therefore, in our work we se-lect an approach with the raw audio signal as its primary and only source ofinformation.In general, music retrieval is organized around use cases defined through thetype of query, the sense of match and the form of the output (Casey et al.,2008b; Downie, 2008). In particular, in Sec. 1.3 we discussed that the senseof match implies different degrees of specificity and that version identificationwould be positioned somewhere in the middle of an hypothetical match speci-ficity axis (near-duplicate detection, Fig 1.3). However, it must be noted thatsome systems that do not strictly focus on song versions approximate this in-termediate match specificity region. This section provides a brief overview ofthese systems.In audio content-based MIR, much effort has been focused on extracting infor-mation from the raw audio signal to represent certain musical aspects such astimbre, melody, main tonality, chords or tempo. This information is commonlycalled music description or descriptors. The computation of these descriptorsis usually done in a short-time moving window either from a temporal, spectralor cepstral representation of the audio signal. The result is a descriptor timeseries (or sequence) reflecting the temporal evolution of a given musical aspect.The introduction and refinement of tonality descriptors, i.e. numeric quantitiesreflecting the tonal content of the signal, has broadened the match specificityof some music retrieval systems, specially those which can be placed near thetwo extremes of high and low match specificity. Indeed, a common extension ofaudio fingerprinting algorithms for achieving a lower match specificity consistsof using tonal descriptors instead of the more routinely employed timbral ones4
(e.g. Casey et al., 2008a; Miotto & Orio, 2008; Riley et al., 2008; Unal & Chew,2007). The adoption of tonal descriptors adds an extra degree of timbre/noiseinvariance to audio fingerprinting algorithms, which are usually invariant withrespect to song structure changes. Despite this, many of these fingerprintingalgorithms may still have a low recall in a version identification task. One
3Furthermore, in the case of versions that completely change the title and the lyrics,there might be no clues to identifying them using only textual information.
4These approaches may also be termed audio identification, audio matching, or simply,polyphonic audio retrieval.
2.2. SCIENTIFIC BACKGROUND 21
reason for this could be that, since these systems focus on retrieval speed, theyusually employ some kind of descriptor quantization. This quantization maybe excessively coarse for version identification (Riley et al., 2008). Anotherreason for a low version recall could come from the lack of invariance withrespect to tempo variations or to key transpositions, which are frequent musicalchanges between song versions. The importance of these and other invariancecharacteristics in a version identification scenario may become evident throughthe thesis. Further evidence was shown as work prior to this document (Serràet al., 2008b).Like audio fingerprinting algorithms, many systems stemming from category-based grouping or from music similarity may also fall into the aforementionedregion of intermediate match specificity. These systems, in general, differ fromtraditional systems of their kind in the sense that they also incorporate tonalinformation (e.g. Mardirossian & Chew, 2006; Pickens, 2004; Tzanetakis, 2002;Yu et al., 2008). However, they can fail in identifying recordings with a dif-ferent key or with strong structure modifications. Furthermore, since thesesystems focus on timbre and this feature can radically change between versions(Sec. 1.2.3), wrong groupings could be made. In general, they do not considerfull sequences of musical events, but just statistical summarizations of them,which might blur and distort valuable information for version retrieval.
2.2.2 Symbolic music processing
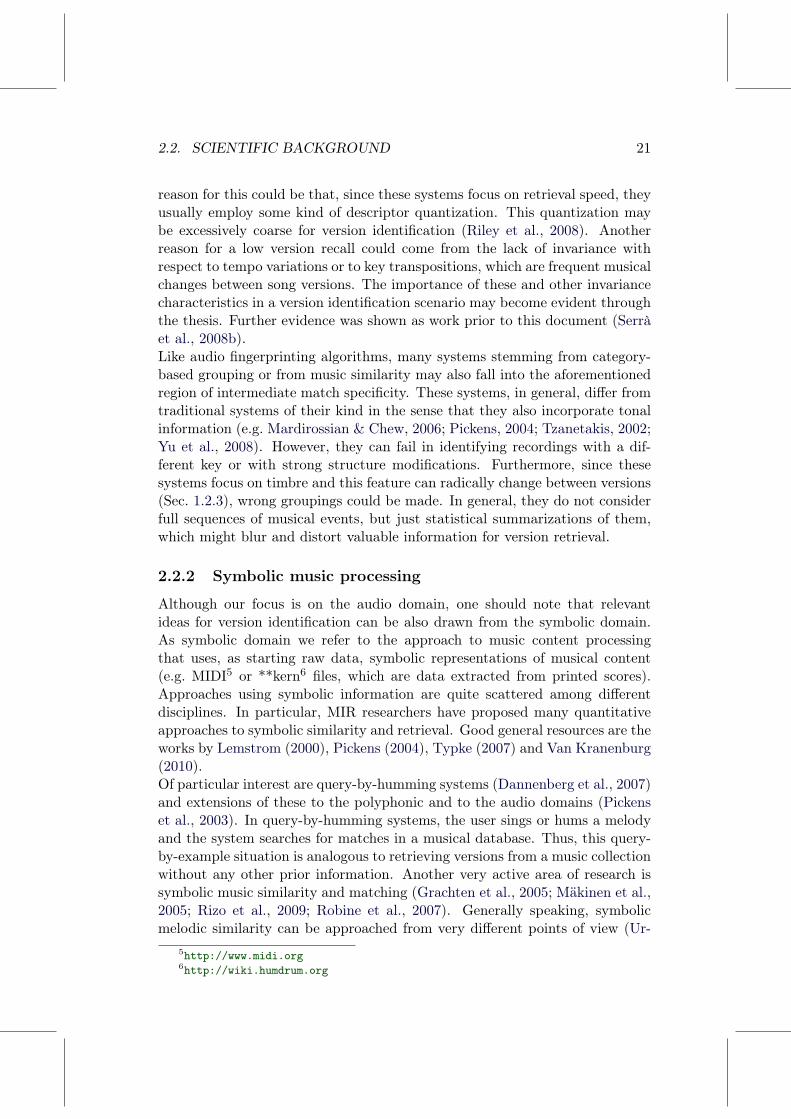
Although our focus is on the audio domain, one should note that relevantideas for version identification can be also drawn from the symbolic domain.As symbolic domain we refer to the approach to music content processingthat uses, as starting raw data, symbolic representations of musical content(e.g. MIDI5 or **kern6 files, which are data extracted from printed scores).Approaches using symbolic information are quite scattered among differentdisciplines. In particular, MIR researchers have proposed many quantitativeapproaches to symbolic similarity and retrieval. Good general resources are theworks by Lemstrom (2000), Pickens (2004), Typke (2007) and Van Kranenburg(2010).Of particular interest are query-by-humming systems (Dannenberg et al., 2007)and extensions of these to the polyphonic and to the audio domains (Pickenset al., 2003). In query-by-humming systems, the user sings or hums a melodyand the system searches for matches in a musical database. Thus, this query-by-example situation is analogous to retrieving versions from a music collectionwithout any other prior information. Another very active area of research issymbolic music similarity and matching (Grachten et al., 2005; Mäkinen et al.,2005; Rizo et al., 2009; Robine et al., 2007). Generally speaking, symbolicmelodic similarity can be approached from very different points of view (Ur-
5http://www.midi.org6http://wiki.humdrum.org

22 CHAPTER 2. LITERATURE REVIEW
bano et al., 2010): some techniques are based on geometric representations ofmusic, others rely on classic n-gram representations to calculate similaritiesand others use editing distances and alignment algorithms.All these techniques are relevant for version identification. However, the kindof musical information that the systems above manage is symbolic (usuallyMIDI files). Therefore, if considering audio, the query, as well as the musicmaterial, must be transcribed into the symbolic domain. This would have theadditional advantage of removing some expressive trends from the performer(c.f. Arcos et al., 1997; Juslin et al., 2002; Molina-Solana et al., 2010; Todd,1992), thus potentially benefiting version detection systems. Unfortunately,transcription systems of this kind do not yet achieve a significantly high ac-curacy on real-world music signals. Current state-of-the-art algorithms forpolyphonic transcription yield overall accuracies below 75%, and melody es-timation approaches are within the same accuracy range7. Consequently, weargue that research in the symbolic domain cannot be directly applied to au-dio domain systems without incurring several estimation errors in the earlyprocessing stages of these systems. These errors, in turn, may have dramaticconsequences in the final systems’ accuracy.
2.2.3 Music cognition
Identification
The problem of version identification is also challenging from the point of viewof music cognition, but apparently it has not attracted much attention by itself.Intuitively, in order to recognize versions, each individual needs to rely on someinvariant representation of the whole song or, at least, its critical features.Currently we have little knowledge of which are the specific mechanisms thatgive rise to this level of abstraction.One might hypothesize that abstract representations are grounded on physicalneural templates that are shared across individuals (Schaefer et al., 2010). Butwe still do not know what is the essential information that our brains encodefor solving this particular problem. Some knowledge has been gained about therelevance of melody statistics for music similarity (Eerola et al., 2001) and thesensitivity or insensitivity to certain melodic and rhythmic transformations(Dalla Bella et al., 2003; Kuusi, 2009; Schulkind et al., 2003). Timbre cuesmight provide important information, even from very short snippets of audio(Schellenberg et al., 1999), but recent studies with noise excerpts suggest that arapid formation of auditory memories could be perfectly independent of timbre(Agus et al., 2010).In this quest to know the essential information that is preserved, one mighthypothesize that such ‘essence’ is not the same for all versions of a musical
7Recent results for these tasks can be found at the MIREX wiki: http://www.music-ir.org/mirex/wiki/2010:MIREX2010_Results

2.2. SCIENTIFIC BACKGROUND 23
piece. From a perceptual or cognitive point of view, a musical work or songcan be considered as a category (Zbikowski, 2002), one of the basic devices torepresent knowledge either by humans or by machines (Rogers & McClelland,2004). Usually, categories are taken to rely on features that are common toall items covered by them. Sometimes, a prototype for the whole categorycan be established (prototype-based categorization). This way, all members ofthe category can be compared against the prototype (Rosch & Mervis, 1975).However, we usually see that abstraction can still take place in the absenceof a single common feature. This can be justified by the concept of familyresemblance (Wittgenstein, 1953). The concept states that things which maybe thought to be connected by one essential common feature may, in fact, beconnected by a series of overlapping similarities. Therefore, in the end, it caneasily happen that no one feature is common to all these connected entities.A widely used example is with family members8: all of them share some traitsbut maybe a common denominator does not exist.Besides knowing which essential information to retain, there is the additionalissue of the memory representation of songs in humans. It could either bethe case that the similarity between two musical pieces is computed in theirencoding step, or that all the songs are stored in memory and their similarityis computed at the retrieval phase. For example, Levitin (2007) discusses thepossibility of absolute and detailed coding of song-specific information. On theother hand, Deliege (1996) discussed the possibility of encoding processes thatabstract and group certain musical cues by similarity.Furthermore, music is a sequential process, and as such, it poses the questionof storage and retrieval of serial-order information in human working memory.And again we find some controversies, specially with regard to the use of ab-solute (hierarchically structured) or relative (associatively structured) positioninformation. Two general theoretical frameworks exist: chaining models (Hen-son, 2001), which propose that individual items are coded in association withtheir preceding and/or succeeding elements, and ordinal position models (Con-rad, 1965), which suggest that each individual item is coded by its absolute orrelative position within a sequence.
Some insights from version identification
In general, version identification systems rarely pay attention to cognitive as-pects (nor cognitive scientists pay attention to MIR systems). However, ifone draws intuitive cross-domain analogies, some interesting reasonings can bemade.We find a first example with the essential information that we as humans needto encode in order to recognize a song. We have seen that studies on musiccognition have put much emphasis on melodies. However, automatic versionidentification systems may use other tonal representations such as chords or
8Wittgenstein (1953) also used games as an example.

24 CHAPTER 2. LITERATURE REVIEW
the so-called tonal profiles (see forthcoming Sec. 2.3.1). The fact that versionidentification systems are able to perform their task in a reliable manner sug-gests that the melody is not the only essential property to retain, and thatother tonal representations as well could be useful for song recognition in thehuman brain.A second example is found with regard to categorization aspects. If we con-sider a group of versions forming a category, family resemblance mechanismsmay apply (in the sense of getting abstractions in the absence of a single com-mon feature). However, from our point of view, some characteristic must beretained by all versions in the category. We believe that tonal sequences areso powerful that, in the case of song recognition, hardly any other boundarybetween version groups can be established. Therefore, in such a scenario wheresome feature is common to all items in the category, prototype-based catego-rization may take place. We provide evidence for that in Chapter 4 when webriefly study the relationships between versions and their originals.A third example can be given with regard to the issue of memory representa-tion. In this aspect, all version identification systems advocate the same: songrepresentations are stored in memory and their similarities are computed atthe retrieval stage. This might be due to pragmatic reasons, since similaritycomputation at the encoding step intuitively seems hard to implement.Finally, with regard to absolute and relative encoding of sequential elements,we see that version identification systems use both strategies (Sec. 2.3.1). Im-portantly, by looking at version identification systems, the usage of these en-codings seems to be independent of the song representation. Although onehas to note that maybe the best performing systems are based on absoluteencodings.
2.3 Version identification: state-of-the-art
2.3.1 Functional blocks
The standard approach to version identification is essentially to exploit themusical facets that are shared between multiple renditions of the same piece.We have seen that several important characteristics are subject to variationamong versions: timbre, key, harmonization, tempo, timing, structure and soforth (Sec. 1.2.3). An ideal version identification system must be robust againstthese variations.Usually, extracted music descriptors are in charge of overcoming the majorityof musical changes outlined above. However, special emphasis is put on achiev-ing tempo, key or structure invariance, as these are very frequent changes thatare not usually managed by music descriptors themselves. Therefore, one cangroup the elements of existing version identification systems into five basicfunctional blocks (Fig. 2.1): descriptor extraction, key invariance, tempo in-variance, structure invariance and similarity computation. We now elaborate

2.3. VERSION IDENTIFICATION: STATE-OF-THE-ART 25
Figure 2.1: Building blocks of a version identification system. The vertical arrows inthe intermediate blocks do not necessarily imply the sequential application of these,except for the feature extraction and the similarity computation blocks, which areusually at the beginning and end of the chain, respectively.
on these blocks based on Serrà et al. (2010a). A summary table for severalstate-of-the-art approaches and the different strategies they follow in each func-tional block is provided at the end of the section (Table 2.1).
Descriptor extraction
In general, one assumes that versions of the same piece preserve the mainmelodic line and/or the harmonic progression, regardless of its main key.Therefore, tonal or harmonic content is the most employed characteristic inversion identification. The term tonality is commonly used to denote a systemof relationships between a series of pitches, which can form melodies and har-

26 CHAPTER 2. LITERATURE REVIEW
monies, having a tonic or central pitch class as its most important or stableelement (Hyer, 2010). In its broadest possible sense, the term refers to thearrangements of pitch phenomena. Tonality is ubiquitous in Western music,and most listeners, whether musically trained or not, can identify the moststable pitch while listening to tonal music (Dalla Bella et al., 2003). Further-more, this process is continuous and remains active throughout the sequentiallistening experience (Schulkind et al., 2003).A tonal sequence can be understood, in a broad sense, as a sequentially-playedseries of different note combinations. These notes can be unique for each timeslot (a melody) or can be played jointly with others (chord or harmonic pro-gressions). That temporal and sequential information is important for retrievalis also evident in many other fields such as speech recognition (Nadeu et al.,2001) or string matching (Baeza-Yates & Perleberg, 1996). From an MIR pointof view, clear evidence on the importance of tonal sequences for music simi-larity and retrieval exists (Casey & Slaney, 2006; Ellis et al., 2008; Hu et al.,2003). In fact, almost all version identification systems exploit tonal sequencerepresentations extracted from the raw audio signals. More specifically, theyeither estimate the main melody, the chord sequence or the harmonic pro-gression. Only what would be considered early version identification systemsare an exception. For instance, Foote (2000a) worked with the audio signal’senergy and Yang (2001) worked with spectral-based timbral features.Melody is a salient musical descriptor of a piece of music (Selfridge-Field,1998). Therefore, a number version identification systems use melody repre-sentations as a main descriptor (Marolt, 2006, 2008; Sailer & Dressler, 2006;Tsai et al., 2005, 2008). As a first processing step, these systems need to ex-tract the predominant melody from the raw audio signal (Gómez et al., 2006b;Poliner et al., 2007). Melody extraction is strongly related to pitch percep-tion and fundamental frequency tracking, both having a long and continuinghistory (De Cheveigne, 2005; De Cheveigne & Kawahara, 2001). However, inthe context of complex mixtures, the perception and tracking issues becomefurther complicated because, although multiple fundamental frequencies maybe present at the same time, at most just one of them will be the melody. Thisand many other facets make melody extraction from real-world audio signalsa difficult task.To refine the obtained melody representation, version identification systemsusually need to combine a melody extractor with, e.g. a singing voice detector,or other post-processing modules in order to achieve a more reliable represen-tation (Sailer & Dressler, 2006; Tsai et al., 2005, 2008). Another possibilityis to generate a so-called ‘mid-level’ representation for these melodies. Theemphasis then is not only on melody extraction, but also on the feasibility todescribe audio in a way that facilitates retrieval (Marolt, 2006, 2008). The levelof abstraction (or smoothing) of a representation is an important issue thatcompromises the discriminatory power (see e.g. Grachten et al., 2004; Serràet al., 2008b).

2.3. VERSION IDENTIFICATION: STATE-OF-THE-ART 27
C C# D D# E F F# G G# A A# B0
0.2
0.4
0.6
0.8
1
Pitch class
Rel
ativ
e en
erg
y
Figure 2.2: Example of a PCP descriptor. This may correspond to a C minor chordenvironment (it mostly contains C, D# and G pitch classes), where the root pitchclass (C) is predominant.
Alternatively, version identification can be assessed by harmonic sequences,rather than melodic ones. Harmonic sequences, as they are nowadays es-timated in MIR, might already incorporate melody information. The moststraightforward way to carry out such an estimation is by means of so-calledpitch class profiles (PCP) or chroma descriptors (Fujishima, 1999; Gómez,2006; Leman, 1995; Purwins, 2005). These mid-level descriptors can providea more complete, reliable and straightforward representation than melody es-timation, as they do not need to tackle the pitch selection and tracking issuesoutlined above. PCP-based descriptors are widely used in the MIR community(Bartsch & Wakefield, 2005; Gómez & Herrera, 2004; Goto, 2006; Lee, 2008;Müller, 2007; Müller & Ewert, 2008; Ong, 2007; Sheh & Ellis, 2003).PCP descriptors are derived from the energy found within a given frequencyrange (usually from 50 to 5000 Hz) in short-time spectral representations (typ-ically 100 ms) of audio signals extracted on a frame-by-frame (or window)basis. This energy is usually collapsed into a 12-bin octave-independent his-togram representing the relative intensity of each of the 12 semitones of anequal-tempered chromatic scale (the 12 pitch classes, Fig. 2.2). According toGómez (2006), reliable PCP descriptors should, ideally, (a) represent the pitchclass distribution of both monophonic and polyphonic signals, (b) consider thepresence of harmonic frequencies, (c) be robust to noise and non-tonal sounds,(d) be independent of timbre and instruments played, (e) be independent ofloudness and dynamics and (f) be independent of tuning, so that the referencefrequency can be different from the standard A 440 Hz.This degree of invariance with respect to several musical characteristics makePCP descriptors very attractive for version identification systems. Hence, themajority of systems use a PCP-based descriptor the primary source of infor-mation (Di Buccio et al., 2010; Egorov & Linetsky, 2008; Ellis & Cotton, 2007;Ellis & Poliner, 2007; Gómez & Herrera, 2006; Gómez et al., 2006a; Jensenet al., 2008a,b; Kim & Narayanan, 2008; Kim et al., 2008; Kim & Perelstein,2007; Kurth & Müller, 2008; Müller et al., 2005; Nagano et al., 2002; Serràet al., 2008b, 2010c, 2009a). Enhanced PCP information might also be consid-
28 CHAPTER 2. LITERATURE REVIEW
ered, either with relative (or delta9) representations (Kim & Narayanan, 2008;Kim et al., 2008), or directly including multiple frame values in the analysis[e.g. the state space reconstruction in Serrà et al. (2010c, 2009a) that we willexplain in the next chapter]. Distances between successive PCP vectors canalso be considered, as well as adding information of the strongest pitch class(Ahonen, 2010).An interesting variation of using raw PCP descriptors for characterizing thetonal content of song versions is proposed by Casey & Slaney (2006). In thiswork, PCP sequences are collapsed into symbol sequences using vector quanti-zation, i.e. summarizing several PCP vectors by 8, 16, 32 or 64 representativesymbols via the K-means algorithm (Xu & Wunsch II, 2009). Nagano et al.(2002) perform vector quantization by computing binary PCP vector compo-nents in such a way that, with 12 dimensional vectors, a codebook of 212 = 4096symbols is generated (named polyphonic binary feature vectors). On the otherhand, Di Buccio et al. (2010) use a hashing function of the rank of the elementsin a PCP vector. Sometimes, the lack of interpretability of the produced se-quences and symbols makes the addition of some musical knowledge to thesesystems rather difficult. This issue is addressed by Kurth & Müller (2008)who, instead of quantizing in a totally unsupervised way, generate a codebookof PCP descriptors based on musical knowledge (with a size of 793 symbols).In general, vector quantization, indexing and hashing techniques result inhighly efficient algorithms for music retrieval (e.g. Casey et al., 2008a; Di Buc-cio et al., 2010; Kurth & Müller, 2008; Nagano et al., 2002; Riley et al., 2008),even though their accuracy has never been formally assessed for the specific ver-sion identification task. It would be very interesting to see how these systemsperform on a well-established benchmark collection in comparison to specifi-cally designed approaches. More specifically, it is still an issue if PCP quantiza-tion strongly degrades version retrieval (see below). Some preliminary resultssuggest that this is the case (Riley et al. 2008; c.f. Di Buccio et al. 2010).Depending on how we look at it, another form of PCP quantization consists ofusing chord or key template sequences (Ahonen & Lemstrom, 2008; Bello, 2007;Izmirli, 2005; Lee, 2006). Estimating chord sequences from audio data has beena very active research area in recent years (Bello & Pickens, 2005; Cho et al.,2010; Fujishima, 1999; Lee, 2008; Papadopoulos & Peeters, 2007; Sheh & Ellis,2003). The common process for chord estimation consists of two steps: pre-processing the audio into a descriptor vector representation, usually a PCP, andapproximating the most likely chord sequence from these vectors, usually donevia template-matching or expectation-maximization trained hidden Markovmodels (Rabiner, 1989).Usually, 12 major and 12 minor chords are used, although some studies incor-porate more complex chord types, such as 7th, 9th, augmented and diminished
9By delta representations we mean the component-wise differences between consecutivedescriptors.

2.3. VERSION IDENTIFICATION: STATE-OF-THE-ART 29
Figure 2.3: “Happy birthday” song score. Retrieved from http://www.piano-play-it.com.
chords (Fujishima, 1999; Harte & Sandler, 2005). This way, the obtainedstrings have a straightforward musical interpretation. Ahonen (2010) experi-ments with a 12-symbol representation, i.e. what would correspond to a ‘powerchord’ representation10. He reports some accuracy increase with the additionof this reduced-symbol codebook to the standard 24-chord one.In general, chord-based representations may be too coarse for version detection,and are also error-prone. Think for instance in the chord progression of theexample we used in the previous chapter, the “Happy birthday” song (Fig. 2.3).There are just three chords, these being C, G and F (tonic, dominant andsub-dominant, respectively). If one makes a query with this specific chordprogression, the answer would contain not only versions of “Happy birthday”,but also lots of other songs that can be substantially different in terms ofmelody and arrangements. Thus, behind potential errors in their estimation,we conjecture that chord representations alone might be too ambiguous forversion retrieval. Analogous reasonings may be derived for alternative ‘tonalquantizations’ in the case they do not use enough representative symbols.
Key invariance
As stated in Sec. 1.2.3, versions may be transposed to different keys. Trans-posed versions are equivalent to most listeners, as pitches are perceived relativeto each other rather than in absolute categories (Dowling, 1978). Transposi-tion to a common key has been elucidated as a very important feature for anyversion identification system, providing a deep impact on final system’s accu-racy [e.g. up to 17% difference in standard evaluation measures, depending onthe method chosen, see Serrà et al. (2008a,b)]. In spite of being a commonchange between versions, some systems do not consider transposition. Thisis the case for systems that do not specifically focus on versions, or that donot use a tonal representation (Foote, 2000a; Izmirli, 2005; Müller et al., 2005;Yang, 2001).
10The so-called power chord is a chord with just its fundamental and the fifth, with possiblemultiple octaves of these pitches.
30 CHAPTER 2. LITERATURE REVIEW
Several strategies can be followed to tackle transposition, and their suitabilitymay depend on the chosen descriptor. In general, transposition invariancecan be achieved by relative descriptor encoding, by key estimation, by shift-invariant transformations or by applying different transpositions. We nowbriefly comment on them.The most straightforward way to achieve key invariance is to test all possibletranspositions (Ellis & Cotton, 2007; Ellis & Poliner, 2007; Jensen et al., 2008a;Kim & Narayanan, 2008; Kim et al., 2008; Kurth & Müller, 2008; Marolt, 2008;Nagano et al., 2002). In the case of an octave-independent tonal representation,this implies the computation of a similarity measure for all possible circular orring-shifts in the ‘pitch axis’ for each test song. This strategy usually guaran-tees a maximal retrieval accuracy (Serrà et al., 2008a) but, on the other hand,it increases the time and the size of the database to search in.Instead of testing all possible transpositions, one can select certain ‘preferred’transpositions (Ahonen, 2010; Egorov & Linetsky, 2008; Serrà et al., 2008b,2010c, 2009a). This way, version identification approaches can be computa-tionally faster. The trick consists in computing a sort of probability index forall possible relative transpositions and testing just those that are more likelyto produce a good match. This technique corresponds to the so-called optimaltransposition indices (Serrà et al., 2008a). The process for computing theseindices is very fast, since a pre-computed global representation of the signal’stonal content is used (e.g. a simple averaging of the PCP features over thewhole song, therefore reducing the whole PCP series to just a vector of num-bers). Our results suggest that, for 12 bin PCP representations, a near-optimalaccuracy can be reached with just two shifts, thus reducing the computationalload by six (further details on this strategy are presented in the next chapter).It should be mentioned that some systems do not follow the aforementionedstrategy, although they predefine a certain number of transpositions to com-pute. In these cases, the number and the transpositions themselves are choseneither arbitrarily (Tsai et al., 2005, 2008), or based on some musical and em-pirical knowledge (Bello, 2007; Di Buccio et al., 2010). Decisions of this kindare very specific for each system and, most of all, for the specific descriptorbeing used.A further approach is to off-line estimate the main key of the song and thenapply transposition accordingly (Gómez & Herrera, 2006; Gómez et al., 2006a;Marolt, 2006). In this case, errors propagate faster and can dramaticallyworsen retrieval accuracy (e.g. if the key for the original song is not correctlyestimated, no versions will be retrieved as they might have been estimated inthe correct one). However, it must be noted that a similar procedure to choos-ing the most probable transpositions could be employed: one could computean optimal key transposition index.In the case of using a more symbolic representation such as chords or melodies,one can usually modify it in order to describe relative information changes, suchas pitch or chord intervals (Ahonen & Lemstrom, 2008; Lee, 2006; Sailer &

2.3. VERSION IDENTIFICATION: STATE-OF-THE-ART 31
Dressler, 2006). This way, a key-independent descriptor sequence is obtained.This idea, which is grounded in existing research on symbolic music processing(Sec. 2.2.1), has been recently extended to PCP sequences (Kim & Narayanan,2008; Kim & Perelstein, 2007) by encoding such sequences using the optimal(or minimizing) transposition indices introduced above (see also Müller, 2007).A very interesting approach to achieving transposition invariance is to use atwo-dimensional power spectrum (Marolt, 2008) or a two-dimensional auto-correlation function (Jensen et al., 2008b). Autocorrelation is a well-knownoperator for converting signals into a delay or shift-invariant representation(Oppenheim et al., 1999). Therefore, the power spectrum, which is formallydefined as the Fourier transform of the autocorrelation, is also shift-invariant.As Marolt (2008) notes, other two-dimensional transforms could be also used,specially shift-invariant operators derived from higher-order spectra (Heikkila,2004). Such transforms are very common in the image processing domain(Chandran et al., 1997; Klette & Zamperoni, 1996), and one can easily foreseea future usage of them in the audio domain.
Tempo invariance
Different renditions of the same piece may vary in the speed they have beenplayed (Sec. 1.2.3), and any frame-based descriptor sequence will reflect thisvariation. For instance, in case of doubling the tempo, frames i, i+1, i+2, i+3might correspond to frames j, j, j + 1, j + 1, respectively. As a consequence,extracted sequences cannot be directly compared.Some version identification systems do not include a specific module to tackletempo fluctuations (Ahonen, 2010; Ahonen & Lemstrom, 2008; Di Buccio et al.,2010; Kim & Narayanan, 2008; Kim et al., 2008; Yu et al., 2008). The major-ity of these systems generally focus on retrieval efficiency and treat descriptorsequences as statistical random variables. Thus, they discard much of thesequential information that a given representation can provide (e.g. a repre-sentation consisting of a 4-symbol pattern like ABABCD, would yield the samestatistical values as AABBCD or ABCABD, which is indeed a misleading over-simplification of the original data).A first option for achieving tempo invariance is again relative encoding. Asymbolic descriptor sequence can be encoded by considering the ratio of dura-tions between two consecutive notes (Sailer & Dressler, 2006). This strategy iscommonly employed in query-by-humming systems (Dannenberg et al., 2007)and, combined with the relative pitch encoding of the previous section, leads toa representation that is key and tempo-independent. However, for the reasonsoutlined above, extracting a symbolic descriptor sequence is not straightfor-ward and may lead to important estimation errors. Therefore, one needs tolook at alternative tempo-invariance strategies.Another way of achieving tempo invariance is to first estimate the tempo andthen aggregate the information contained within comparable units of time. In

32 CHAPTER 2. LITERATURE REVIEW
this manner, the usual strategy is to estimate the beat (Gouyon et al., 2006)and then to aggregate the descriptor information corresponding to the samebeat. This can be done independently of the descriptor used. Some versionidentification systems based on PCP descriptors (Ellis & Poliner, 2007; Naganoet al., 2002) or melody estimations (Marolt, 2006, 2008) use this strategy, andextensions with chords or other types of information could be easily workedout. If the beat does not provide enough temporal resolution, a finer represen-tation might be employed (e.g. half-beat or quarter-beat; Ellis & Cotton, 2007).However, several studies suggest that systems using beat-averaging strategiescan be outperformed by others (see below).An alternative to beat induction is to do temporal compression and expansion(Kurth & Müller, 2008; Müller et al., 2005). This straightforward strategyconsists of re-sampling the descriptor sequence into several musically plausiblecompressed and expanded versions, and then comparing all of them in orderto discover the correct re-sampling empirically. Another interesting way toachieve tempo independence is again the two-dimensional power spectrum orthe two-dimensional autocorrelation function (Jensen et al., 2008a,b; Marolt,2008). These functions are usually designed for achieving both tempo as wellas key independence (Sec. 2.3.1).If one wants to perform direct comparisons of descriptors, a sequence alignmentor similarity algorithm must be used to determine the correspondences betweentwo distinct frame-based representations. Several alignment algorithms forMIR have been proposed (e.g. Adams et al., 2004; Dixon & Widmer, 2005;Grachten et al., 2004; Müller, 2007) which, sometimes, are derivations fromgeneral string and sequence alignment/similarity algorithms (Baeza-Yates &Perleberg, 1996; Gusfield, 1997; Rabiner & Juang, 1993; Sankoff & Kruskal,1983).In version identification, dynamic programming (Gusfield, 1997) is a routinelyemployed technique for aligning two representations and automatically discov-ering their local correspondences (Bello, 2007; Egorov & Linetsky, 2008; Foote,2000a; Gómez & Herrera, 2006; Gómez et al., 2006a; Izmirli, 2005; Lee, 2006;Marolt, 2006; Nagano et al., 2002; Serrà et al., 2008b, 2009a; Tsai et al., 2005,2008; Yang, 2001). Overall, one reiteratively constructs a cumulative distancematrix (Fig. 2.4) considering the optimal alignment paths that can be derivedby following some neighboring constraints or patterns (Myers, 1980; Rabiner& Juang, 1993). These neighboring constraints determine the allowed localtemporal deviations and they have been shown to be an important parameterin the system’s final accuracy (Myers, 1980; Serrà et al., 2008b). One mighthypothesize that this importance relies on the ability to track local timingvariations between small parts of the performance.A number of studies suggest that systems using dynamic programming canoutperform those following a beat-averaging strategy (Bello, 2007; Liem &Hanjalic, 2009; Serrà et al., 2008b). The most typical algorithms for dynamicprogramming alignment and similarity are dynamic time warping algorithms

2.3. VERSION IDENTIFICATION: STATE-OF-THE-ART 33
Figure 2.4: Example of a cumulative distance matrix, computed with dynamic pro-gramming, and its optimal alignment path.
(Rabiner & Juang, 1993; Sankoff & Kruskal, 1983) and edit distance variants(Gusfield, 1997). Their main drawback is that they are computationally ex-pensive (quadratic in the length of the song representations), although severalfast implementations may be derived (Gusfield, 1997; Mäkinen et al., 2005;Ukkonen et al., 2003).
Structure invariance
The difficulties that a different song structure may pose in the detection of mu-sical piece versions are very often neglected. However, this has been demon-strated to be a key factor (Serrà et al., 2008b) and, in fact, recent versionidentification systems thoughtfully consider this aspect, specially many of thebest-performing ones.A classic approach to structure invariance consists in summarizing a song intoits most repeated or representative parts (Gómez et al., 2006a; Marolt, 2006).In this case, song structure analysis is performed in order to segment sectionsfrom the song’s representation used (Chai, 2005; Goto, 2006; Müller & Kurth,2006b; Ong, 2007; Peeters, 2007). Usually, the most repetitive patterns arechosen and the remaining ones are disregarded. This strategy might be proneto errors since structure segmentation algorithms still leave much room forimprovement (see references above). Furthermore, sometimes the most identi-fiable or salient segment of a musical piece is not the most repeated one, butthe introduction, the bridge and so forth.It must be noted that some dynamic programming algorithms are able to
34 CHAPTER 2. LITERATURE REVIEW
deal with song structure changes. These algorithms are basically the so-calledlocal alignment algorithms (Gusfield, 1997). In particular, they have beensuccessfully applied to the task of version identification (Egorov & Linetsky,2008; Serrà et al., 2008b, 2009a; Yang, 2001). These algorithms solely considerthe best11 subsequence alignment found between two tonal representations forsimilarity assessment, what has been evidenced to yield very satisfactory results(e.g. Serrà et al., 2008b). This is the approach followed in this thesis.However, the most common strategy for achieving structure invariance consistsof windowing the descriptors representation (so-called sequence windowing;Di Buccio et al., 2010; Kurth & Müller, 2008; Marolt, 2008; Müller et al.,2005; Nagano et al., 2002). The whole descriptor sequence is cut into shortsegments and the similarity measure is computed based on matches betweenthese. Sequence windowing can be performed with a small hop size in orderto faithfully represent any possible offset in the representations. However,this hop size has not been found to be a critical parameter for accuracy, asnear-optimal values are found for a considerable hop size range (Marolt, 2008).Sequence windowing is also used by many audio fingerprinting algorithms usingtonality-based descriptors (e.g. Casey et al., 2008a; Miotto & Orio, 2008; Rileyet al., 2008).
Similarity computation
The final objective of a version identification system is, given a query, to re-trieve a list of versions from a music collection. This list is usually rankedaccording to some similarity measure so that the topmost songs are the mostsimilar to the query. Therefore, version identification systems output a similar-ity (or dissimilarity12) measure between pairs of songs. This similarity measureoperates on the obtained representation after the main building blocks of fea-ture extraction, key invariance, tempo invariance and structure invariance.Common dynamic programming techniques used for achieving tempo invari-ance already provide a similarity measure as an output (Gusfield, 1997; Rabiner& Juang, 1993; Sankoff & Kruskal, 1983). Accordingly, the majority of systemsfollowing a dynamic programming approach use the similarity measure thesemethods provide. This is the case for systems using edit distances (Bello, 2007;Sailer & Dressler, 2006) or dynamic time warping algorithms (Foote, 2000a;Gómez & Herrera, 2006; Gómez et al., 2006a; Izmirli, 2005; Lee, 2006; Tsaiet al., 2005, 2008). These similarity measures usually contain an implicit nor-malization depending on the lengths of the representations, which can generatesome conflicts with versions of very different durations. In the case of the localalignment techniques, the similarity measure usually corresponds to the length
11By “best” we mean the longest most stable aligned subsequence.12For the sake of generality, we use the term similarity to refer to both the similarity
and the dissimilarity. In general, a distance measure can also be considered a dissimilaritymeasure, which, in turn, can be converted into a similarity measure.

2.3. VERSION IDENTIFICATION: STATE-OF-THE-ART 35
of the found subsequence match (Egorov & Linetsky, 2008; Nagano et al., 2002;Serrà et al., 2008b, 2009a; Yang, 2001). This is the approach favored in thisthesis, jointly with the new approach based on tonal sequence modeling (Serràet al., 2010c). In the latter, a similarity measure is obtained by means of theprediction error made by a model trained on the query song when predictingthe candidate song’s tonal sequence.Conventional similarity measures are also used, in particular cross-correlation(Ellis & Cotton, 2007; Ellis & Poliner, 2007; Marolt, 2006), the Frobenius norm(Jensen et al., 2008a), the Euclidean distance (Jensen et al., 2008b; Marolt,2008), set intersection (Di Buccio et al., 2010) or the dot product (Kim &Narayanan, 2008; Kim et al., 2008; Kurth & Müller, 2008; Müller et al., 2005).These similarity measures are sometimes normalized depending on comparedlengths of representations. In the case of adopting a sequence windowing strat-egy for dealing with structure changes, these similarity measures are usuallycombined with multiple subsequent steps such as threshold definition (Kurth& Müller, 2008; Marolt, 2008; Müller et al., 2005), TF-IDF13 weights (Marolt,2008), term pruning (Di Buccio et al., 2010) or mismatch ratios (Kurth &Müller, 2008). Less conventional similarity measures include the normalizedcompression distance (Ahonen, 2010; Ahonen & Lemstrom, 2008), and thehidden Markov model-based most likely sequence of states (Kim & Perelstein,2007).A summary table for several state-of-the-art approaches and the differentstrategies they follow in each functional block is provided in the next page(Table 2.1). A similar table with evaluation issues and results is given in thenext section (Table 2.2).
2.3.2 Pre- and post-processing strategies
In Sec. 1.1.2 we mentioned the existence of a “glass ceiling” in the accuracy ofmusic similarity approaches. However, the truth is that one can observe suchphenomenon in many other MIR tasks (Downie, 2008). Depending on the task,several research directions can be considered for tackling this issue. Here wefocus on the version detection task but, as noted in Lagrange & Serrà (2010),“most of the argumentation may be transferred to more general similarity tasksinvolving a query-by-example system”.One option to boost the accuracy of current query-by-example systems is to usean enhanced description of the musical stream using the segregation principle(Bregman, 1990). Intuitively, much can be gained if an audio signal is availablefor each instrument. This way, one can easily focus on the stream of interestfor each MIR task. In this line, Foucard et al. (2010) show that consideringa dominant melody removal algorithm as a pre-processing step is a promising
13The TF-IDF weight (term frequency-inverse document frequency) is a weight often usedin information retrieval and text mining. For more details we refer to Baeza-Yates & Ribeiro-Neto (1999).

36 CHAPTER 2. LITERATURE REVIEWReference(s)
Extracted
featureKey
invarianceTem
poinvariance
Structureinvariance
Similarity
computation
Foote(2000a)
Energy
+Spectral
DP
DTW
Yang
(2001)Spectral
DP
Linearityfiltering
Match
lengthNagano
etal.(2002)
PBFV
Alltransp.
Beat
+DP
Seq.window
ing+
DP
Match
lengthIzm
irli(2005)Key
templates
DP
DTW
Müller
etal.(2005)
PCP
Tem
poralcomp./exp.
Sequencewindow
ingDot
productTsaiet
al.(2005,2008)Melodic
Ktransp.
DP
DTW
Góm
ez&
Herrera
(2006)PCP
Key
estim.
DP
DTW
Góm
ezet
al.(2006a)PCP
Key
estim.
DP
Repeated
patternsDTW
Lee(2006)
Chords
Key
estim.
DP
DTW
Marolt
(2006)Melodic
Key
estim.
DP
Repeated
patternsCross-correlation
Sailer&
Dressler
(2006)Melodic
Relative
Edit
distanceBello
(2007)Chords
Ktransp.
DP
Edit
distanceEllis
&Cotton
(2007);Ellis
&Poliner
(2007)PCP
Alltransp.
Beat
Cross-correlation
Kim
&Perelstein
(2007)PCP
Relative
HMM
MLSS
Ahonen
&Lem
strom(2008)
Chords
Relative
NCD
Egorov
&Linetsky
(2008)PCP
OTI
DP
DP
Match
lengthJensen
etal.(2008a)
PCP
Alltransp.
Fouriertransform
Frobeniusnorm
Jensenet
al.(2008b)PCP
2Dautocorr.
2Dautocorrelation
Euclidean
distanceKim
&Narayanan
(2008);Kim
etal.(2008)
PCP
+Delta
PCP
Alltransp.
Dot
product
Kurth
&Müller
(2008)PCP
Alltransp.
Tem
poralcomp./exp.
Sequencewindow
ingDot
productMarolt
(2008)Melodic
2Dspectrum
Beat
+2D
spectrumSequence
window
ingEuclidean
distanceSerrà
etal.(2008b,2009a)
PCP
OTIs
DP
DP
Match
lengthAhonen
(2010)Chords
+Other
OTI
NCD
Serràet
al.(2010c)PCP
OTIs
Prediction
errorDiB
uccioet
al.(2010)PCP
Ktransp.
Sequencewindow
ingSet
intersection
Tab
le2.1:
Summary
table.Version
identificationmethods
andtheir
ways
ofovercom
ingchanging
musical
characteristics.A
blankspace
denotesno
specifictreatm
entfor
thesechanges.
Abbreviations
forextracted
featuresare
PBFV
forpolyphonic
binaryfeature
vector,andPCPfor
pitchclass
profile.Abbreviation
forkey
invarianceisOTIfor
optimaltransposition
index.Abbreviations
fortem
poinvariance
areDPfor
dynamic
programming,and
HMM
forHidden
Markov
Models.
Abbreviations
forsim
ilaritycom
putationare
DTW
fordynam
ictim
ewarping,M
LSSfor
most
likelysequence
ofstates,and
NCD
fornorm
alizedcom
pressiondistance.

2.3. VERSION IDENTIFICATION: STATE-OF-THE-ART 37
approach for observing more robustly the harmonic progression and, in thisway, achieve a higher accuracy in the version identification task. However, itmay be a long time until such pre-processing based on segregation is beneficialfor managing medium to large-scale music collections.Related to the option of considering different streams is the consideration ofdifferent descriptors extracted from the same song. In this context, a firststep has been done by Ahonen (2010). He extends the usual chord-based PCPquantization (24 symbols, Sec. 2.3.1) by including ‘power chord’ information(12 symbols), distances between successive PCP representations and the indexof the strongest pitch class. The similarity measures obtained by these featuresseparately are combined by averaging. This process may be computationallycostly but shows some improvement in overall accuracy.Regarding post-processing strategies, an efficient alternative is to consider ap-proaches exploiting the regularities found in the results of a query-by-examplesystem for a given music collection. Indeed, music collections are usually orga-nized and structured at multiple levels. In the case of version detection, songsnaturally cluster into so-called version sets14 (Serrà et al., 2009b). Therefore,if those version sets can be approximately estimated, one can gain significantretrieval accuracy (Egorov & Linetsky, 2008; Serrà et al., 2010d, 2009b). Adifferent and very interesting post-processing alternative is the general clas-sification scheme proposed by Ravuri & Ellis (2010), where they employ theoutput of different version detection algorithms and a z-score normalizationscheme to classify pairs of songs. In general, we believe that the combina-tion of supervised and unsupervised methods could yield the most interestingapproach for music retrieval (c.f. Baeza-Yates et al., 2006).
2.3.3 Evaluation
Music collection
A relevant issue when dealing with the evaluation of MIR systems is the musicmaterial considered. In the case of version identification, both the complexityof the problem and the selected approach largely depend on the studied musiccollection and the types of versions we want to identify. These might rangefrom remastered tracks to radically different songs (Sec. 1.2.2). In this sense,it is very difficult to compare two systems evaluated in different conditions anddesigned to solve different problems.Some works solely analyze classical music (Izmirli, 2005; Kim & Narayanan,2008; Kim et al., 2008; Kurth & Müller, 2008; Müller et al., 2005), and itis the case that all of them obtain very high accuracies. However, classicalmusic versions might not present strong timbral, structural or tempo variations.Therefore, one might hypothesize that, when only classical music is considered,the complexity of the version identification task decreases. Other works use a
14We originally termed it cover sets in Serrà et al. (2009b).

38 CHAPTER 2. LITERATURE REVIEW
more variated style distribution in their music collections, but it is often stillunclear which types of versions are used. These are usually mixed and mayinclude remastered tracks (which might be easier to detect), medleys (whereinvariance towards song structure changes may be a central aspect), demos(with substantial variations with respect to the finally released song), remixesor quotations (which might constitute the most challenging scenario due totheir potentially short duration and distorted harmonicity). In our view, alarge variety in genres and version types is the only way to ensure the generalapplicability of the method being developed.Besides the qualitative aspects of the music material considered, one shouldalso take care with the quantitative aspects of it. The total number of songsand the distribution of these can strongly influence final accuracy values. Tostudy this influence, one can decompose a music collection into version sets(i.e. each original song is assigned to a separate song set). Then, their cardi-nality (number of versions per set, i.e. the number of versions for each originalsong) becomes an important parameter.In Serrà et al. (2010a) we performed a simple test with the system describedin this thesis in order to assess the influence of these two parameters (numberof version sets and their cardinality) on the system’s final accuracy. Based ona collection of 2135 songs, 30 random selections of songs were carried out for anumber of combinations of the previous two parameters. Then, an average forthe mean average precision of all runs was computed and plotted (Fig. 2.5a).We can see that considering less than 50 version sets, or even just a cardinalityof 2, yields unrealistically high results. Higher values for these two parametersat the same time all fall within a stable accuracy region15. This effect can alsobe seen if we plot the standard deviations of the evaluation measure acrossall runs (Fig. 2.5b). In particular, it can be observed that using less than50 version sets introduces a high variability in the evaluated accuracy, whichmay then depend on the chosen subset. This variability becomes lower as thenumber of version sets and their cardinality increase.With this small experiment we can see that an insufficient size or particularconfigurations of the music collection could potentially lead to abnormally highaccuracies, as well as to parameter overfitting (in the case that the system re-quired a training procedure). Unfortunately, many reported studies use lessthan 50 version sets (Foote, 2000a; Gómez & Herrera, 2006; Gómez et al.,2006a; Izmirli, 2005; Nagano et al., 2002; Tsai et al., 2005, 2008). There-fore, one cannot be confident about the reported accuracies. This could evenhappen with the so-called covers80 dataset16 (Ellis & Cotton, 2007), a freelyavailable dataset composed of 80 version sets with a cardinality of 2 that manyresearchers use to test system’s accuracy and to tune their parameters (Aho-
15It is not the aim of the experiment to provide explicit accuracy values. Instead, we aimat illustrating the effects that different configurations of the music collection might have forfinal system’s accuracy.
16http://labrosa.ee.columbia.edu/projects/coversongs/covers80

2.3. VERSION IDENTIFICATION: STATE-OF-THE-ART 39
Figure 2.5: Mean accuracy (a) and accuracy variability (b) of a version identificationsystem depending on the number of version sets, and the number of versions per set.
nen, 2010; Ahonen & Lemstrom, 2008; Ellis & Cotton, 2007; Ellis & Poliner,2007; Jensen et al., 2008a,b).When the music collection is not large enough, one may try to compensate thepotential variability in final accuracies by adding so-called ‘noise’ or ‘control’songs (Bello, 2007; Downie et al., 2008; Egorov & Linetsky, 2008; Marolt, 2006,2008). The inclusion of these songs in the retrieval collection might provide anextra dose of difficulty to the task, as the probability of getting relevant itemswithin the first ranked elements becomes then very low (numbers are given byDownie et al., 2008).
Evaluation measures
A further issue to be considered when evaluating the quantitative aspects ofversion identification is the evaluation measure to employ. In general, the quan-titative evaluation of version identification systems is usually set up as a typicalinformation retrieval ‘query and answer’ or query-by-example task, where onesubmits a query song and the system returns a ranked list of answers retrievedfrom a given collection (Baeza-Yates & Ribeiro-Neto, 1999; Voorhees & Har-man, 2005). Therefore, several standard information retrieval measures havebeen employed for evaluating the accuracy of version identification systems:the R-precision (Bello, 2007; Izmirli, 2005), variants of precision or recall atdifferent rank levels (Ellis & Cotton, 2007; Ellis & Poliner, 2007; Foote, 2000a;Jensen et al., 2008a,b; Kim & Narayanan, 2008; Kim et al., 2008; Kurth &Müller, 2008; Tsai et al., 2005, 2008; Yang, 2001), the average of precision andrecall (Nagano et al., 2002), the F-measure (Gómez & Herrera, 2006; Gómezet al., 2006a; Serrà et al., 2008b) and the mean of average precisions (Ahonen,2010; Ahonen & Lemstrom, 2008; Egorov & Linetsky, 2008; Serrà et al., 2010c,2009a).Since each of these evaluation measures focus on specific aspects of the retrieval

40 CHAPTER 2. LITERATURE REVIEW
task (c.f. Serrà, 2007b), the quantitative comparison between systems of thesame kind becomes difficult. In addition, the above measures only providean overall accuracy for each system. A valuable improvement would be toimplement independent evaluations for the different functional blocks outlinedin this chapter, in order to analyze their contributions to the global systembehavior.
MIREX
The only existing attempt to find a common methodology for the evaluation ofMIR systems is the music information retrieval evaluation exchange (MIREX)initiative. MIREX is an international community-based framework for theformal evaluation of MIR systems and algorithms (Downie, 2008). Amongother tasks, MIREX allows the comparison of different algorithms for artistidentification, genre classification or music transcription17.Since 2006, MIREX allows for an objective assessment of the accuracy of dif-ferent version identification algorithms (the so-called “audio cover song identi-fication task”; Downie et al., 2008). For that purpose, participants can submittheir algorithms and the MIREX organizers determine and publish the algo-rithms’ accuracies and runtimes. The underlying music collections are neverpublished or disclosed to the participants, either before or after the contest.Therefore, participants cannot tune their algorithms to the music collectionsused in the evaluation process.The main MIREX test collection is composed of 30 version sets, each set beingof cardinality 11. Accordingly, the total collection contains 330 songs. Another670 individual songs, i.e. version sets of cardinality 1, are added to make theidentification task more difficult. This music collection is meant to include“a wide variety of genres” (e.g. classical, jazz, gospel, rock, folk-rock), and asufficient “variety of styles and orchestrations” (Downie et al., 2008). How-ever, beyond this general description, no further information about the testcollection is published or disclosed to the participants. In particular, only theMIREX organizers know what actual musical pieces are contained in the testcollections. Since 2006, the same music collection has been used (so-called‘mixed collection’).For obtaining an accuracy value, each of the collection’s versions are used asqueries, and the submitted algorithms are required to return a distance matrixwith one row for each query (i.e. a 330 × 1000 matrix must be returned forthe ‘mixed collection’). From this distance matrix, a number of evaluationmeasures are computed by the MIREX organizers. A number of evaluationmeasures have been computed for all editions of the MIREX version identifi-cation task (Downie et al., 2008): the total number of identified versions, themean number of identified versions, the mean of maxima, the mean reciprocal
17http://www.music-ir.org/mirex/wiki/MIREX_HOME
2.3. VERSION IDENTIFICATION: STATE-OF-THE-ART 41
rank and the mean of average precisions. Among all of these, the mean of av-erage precisions is used as the principal accuracy measure for reporting results(Downie, 2008).In 2009 a new music collection was introduced (the so-called ‘mazurka col-lection’). This collection consists of 539 pieces corresponding to 11 selectedversions from 49 Chopin mazurkas from the Mazurka Project18. Strictly speak-ing, this collection is a version compilation. However, the variability of the setis very reduced. All of them are Chopin’s mazurkas, all of them are classi-cal versions, and none of them present important variations with regard tosong structure. Furthermore, the recordings that conform the entire MazurkaProject’s collection are known. Therefore, one could overfit a system to it19.Overall, one might consider the mazurka collection as more of a “music identi-fication” collection rather than a representative version collection. It is worthnoting that all the systems submitted to MIREX that have been evaluated withthe mazurka collection have achieved particularly high accuracies (e.g. the sys-tem we present in this thesis achieved a mean average precision of 0.96). Withthis view, high accuracies highlight the good performance that version iden-tification algorithms can have in tasks such as music identification or audiofingerprinting (Sec. 1.3).A summary table of the evaluation strategies and accuracies reported for theversion identification systems outlined in the previous sections is shown in nextpage (Table 2.2).
18http://www.mazurka.org.uk19However, the specific 539 pieces that are used for the MIREX evaluation are not known.

42 CHAPTER 2. LITERATURE REVIEWReference(s)
Version
setsCard.
Total
Musicalstyles
Types
ofversions
Eval.m
eas.Accuracy
MIR
EX
MAP
Foote(2000a)
2882
C,P
A,I,L,
P@3
0.80Yang
(2001)120
C,P,R
P@2
0.99Nagano
etal.(2002)
827~^
216L
Avg
PR
0.89Izm
irli(2005)12
125C
R-P
rec0.93
Müller
etal.(2005)
1167C
P@15
0.93Tsaiet
al.(2005,2008)47
2794
P@1
0.77Góm
ez&
Herrera
(2006)30
3.1~90
Fmeas
0.39Góm
ezet
al.(2006a)30
3.1~90
Fmeas
0.41Lee
(2006)0.13
Marolt
(2006)8
4.5~1820
P,RP@5
0.22Sailer
&Dressler
(2006)0.07^
Bello
(2007)36
4.4~3208
P,R,
L,R-P
rec0.25
0.27Ellis
&Cotton
(2007);Ellis
&Poliner
(2007)80
2160
B,C
O,M
,P,RA,D
U,I,L
P@1
0.680.33
Kim
&Perelstein
(2007)0.06
Ahonen
&Lem
strom(2008)
802
160B,C
O,M
,P,RA,D
U,I,L
MAP
0.18Egorov
&Linetsky
(2008)30
111000
C,C
O,E
,HH,M
T,P,R
A,D
U,I,L,R
R,
MAP
0.720.55
Jensenet
al.(2008a)80
2160
B,C
O,M
,P,RA,D
U,I,L
P@1
0.380.24
Jensenet
al.(2008b)80
2160
B,C
O,M
,P,RA,D
U,I,L
P@1
0.480.23
Kim
&Narayanan
(2008);Kim
etal.(2008)
1000^2~
2000C
P@1
0.79
Kurth
&Müller
(2008)1167
CR@1
0.97Marolt
(2008)34
4.3~2424
P,RMAP
0.40Serrà
etal.(2008b,2009a)
5234.1~
2125B,C
,CO,E
,J,M,P,R
,WA,D
E,D
U,I,L,M
,RX,Q
MAP
0.660.66
Ahonen
(2010)25
6600
C,M
,P,R,E
,WL,R
XMAP
0.41Serrà
etal.(2010c)
5234.1~
2125B,C
,CO,E
,J,M,P,R
,WA,D
E,D
U,I,L,M
,RX,Q
MAP
0.44DiB
uccioet
al.(2010)70
7.1~10000
LMAP
0.320.15
Tab
le2.2:
Summary
table.Version
identificationmethods
andtheir
evaluationstrategies.
Accuracies
(includingMIR
EX)correspond
tobest
resultachieved.
Blank
space,‘^’
and‘~’
denoteunknow
n,approxim
ateand
averagevalues,
respectively.Key
forgenres
is(B
)blues,(C
)classical,(C
O)country,(E
)electronic,(J)
jazz,(HH)hip-hop,(M
)metal,(P
)pop,(R
)rock
and(W
)world.
Key
fortypes
ofversions
is(A
)acoustic,
(DE)dem
o,(D
U)duet,
(I)instrum
ental,(L)
live,(M
)medley,
(RR)rem
aster,(R
X)rem
ixand
(Q)quotation.
Key
forevaluation
measures
is(M
AP)mean
ofaverage
precisions,(R
-Prec)
R-precision,
(P@X)precision
atrank
X,(R
@X)recall
atrank
X,(Fm
eas)F-m
easureand
(Avg
PR)average
precision-recall.
CHAPTER 3Model-free version detection
3.1 Introduction
In our literature review we realize that, if there is a general shared characteris-tic among version identification systems, this is the lack of a model of the songor its descriptor sequences. This is specially true for the similarity computa-tion stage, since all approaches simply try to ‘match’ or align data of some sortwithout making strong assumptions on the model that could generate or rep-resent such data1 (Sec. 2.3.1). In this chapter we propose an approach whichalso follows this outline, hence the “model-free” term in the title. We exploremodeling strategies in Chapter 5.Before we enter into the details of our model-free approach, it is convenient tocontextualize the research done within this thesis, in particular with regard toour publications and our submissions to the MIREX “audio cover song identi-fication task” (Sec. 2.3.3). In 2007, prior to the work of this thesis, we madea MIREX submission that we subsequently described in Serrà et al. (2008b).This 2007 algorithm, which used a specifically designed similarity measure forPCP features and a local alignment method, yielded the highest accuracy ofall algorithms submitted in 2007 or in earlier editions. For the 2008 edition wesubmitted a qualitatively novel approach. The version identification measurethat we derived from this approach (Qmax) and a composition of this measurewith a simple post-processing step (Q∗max) yielded the two highest accuraciesof all algorithms submitted in 2008 or in earlier editions. In particular, theaccuracy of both Qmax and Q∗max clearly surpassed our earlier 2007 submis-sion. Remarkably, the accuracies obtained by these two approaches remainthe highest accuracies in the MIREX “audio cover song identification task” todate (this includes the 2008, 20092 and 2010 editions).
1The only exception is the approach by Kim & Perelstein (2007), who use hidden Markovmodels.
2In 2009 we resubmitted the same algorithm in order to see how it performed in a new testcollection (Sec. 2.3.3). This new submission just included some minor software modificationsand parameter adjustments, but the method remained exactly the same.
43

44 CHAPTER 3. MODEL-FREE VERSION DETECTION
The work in this thesis started right after the MIREX 2007 submission3. There-fore Qmax and Q∗max are direct products of this work. The remainder of thechapter provides a complete explanation of the Qmax measure and it is mostlybased on our publications Serrà et al. (2008a) and Serrà et al. (2009a). Detailsabout Q∗max, its post-processed version, are given in Chapter 4, which is mostlybased on our publications Serrà et al. (2009b) and Serrà et al. (2010d).The Qmax algorithm shares some pre-processing steps with the MIREX 2007submission (Serrà et al., 2008b). However, the crucial difference is that it in-volves techniques derived from nonlinear time series analysis (Kantz & Schreiber,2004). More specifically, Qmax is a recurrence quantification analysis (RQA;Marwan et al., 2002b; Webber Jr. & Zbilut, 1994; Zbilut & Webber Jr., 1992)measure that is extracted from cross recurrence plots (CRP; Zbilut et al.,1998), which are the bivariate generalization of classical recurrence plots (RP;Eckmann et al., 1987).Repetition, or recurrence, is an important feature of music (Patel, 2008), andis also a key property of complex dynamical systems and of a wide varietyof data series (Marwan et al., 2007). The framework of nonlinear time seriesanalysis offers a number of techniques to quantify similarities and recurrencesbetween signals measured from dynamical systems. Among these techniques,the CRP seems to be the most suitable to analyze pairs of music descriptor timeseries since it is defined for pairs of signals of different lengths and can easilycope with variations in the time scale and non-stationarities of the dynamics(Facchini et al., 2005; Marwan et al., 2002a). CRPs are constructed using delaycoordinates (Takens, 1981), a tool routinely employed in nonlinear time seriesanalysis (Kantz & Schreiber, 2004) that we will formally introduce in Sec. 3.2.4.For obtaining quantitative information of the structures present in a CRP, oneuses RQA measures. These are actually measures of complexity that assessthe number and duration of the recurrences (Marwan et al., 2007). Intuitively,when comparing two songs, we are specially interested in the duration of theirshared recurrences.CRPs and RQA measures are known as very intuitive and powerful tools invarious disciplines such as astrophysics, earth sciences, engineering, biology,cardiology or neuroscience [see Marwan et al. (2007) and references therein].However, to the best of our knowledge, there are no previous applications ofCRPs and RQA measures to music-related signals. In general, only a few stud-ies apply nonlinear time series analysis to these signals. Gerhard (1999) andReiss & Sandler (2003) apply delay coordinates to raw audio signals with re-gard to audio analysis and visualization. Mierswa & Morik (2005) and Mörchenet al. (2006a,b) apply delay coordinates to music descriptor time series withregard to genre classification, user preferences and timbre modeling. Heggeret al. (2000) apply delay coordinates to human speech signals for the purposeof local projective noise reduction. Subsequently, Matassini et al. (2002) de-
3Specifically in September 2007. The MIREX submission was in August.

3.1. INTRODUCTION 45
fined an RQA measure to automatically adjust the best neighborhood size forthis local projection.It should be noted that RPs and CRPs have certain analogies with commonlyused MIR methods. In particular, it is worth recalling the so-called self similar-ity matrix, introduced by Foote (1999), to visualize music and audio tracks. Itwas later used by Foote (2000b) for song structure segmentation and by Casey& Westner (2000) for identifying components of an audio piece. Currently, selfsimilarity matrices are used for diverse tasks such as song structure analysis(see references in Sec. 2.3.1) or music meter detection (Gainza, 2009). Crosssimilarity matrices are used, either directly or indirectly, in audio matchingand synchronization algorithms (Müller, 2007), a task closely related to ver-sion identification (Sec 2.2.1). However, in contrast to CRPs, these similaritymatrices do not apply any delay coordinate state space representation and are,in general, not thresholded. Although the quantification of structures in self orcross similarity matrices has received some attention from the MIR community(the references cited in this paragraph provide some examples), the usage ofRQA measures as such is, to the best of the author’s knowledge, unprecedentedwithin the MIR literature.On a more musical side, we can draw some analogies between the application ofdelay coordinates and the smoothing of self-similarity matrices in MIR. Delaycoordinates allow us to bring together the information about both current andprevious samples. In addition, by evaluating vectors of sample sequences, delaycoordinates allow one to assess recurrences of systems more reliably than byusing only the scalar samples (Marwan et al., 2007). Noticeably, the use of notesequences rather than isolated notes is essential in music (Huron, 2006) andis important for melody perception and recognition (Schulkind et al., 2003).Indeed, the concept of delay coordinates recalls some strategies that have beenused in MIR4. In particular, the smoothing of self-similarity matrices alongthe main diagonal, sometimes referred to as the “incorporation of contextualinformation”, has been used by Foote (2000b), Peeters et al. (2002), Peeters(2007), Bartsch & Wakefield (2005) and Müller & Kurth (2006a). In addition,Casey & Slaney (2006) discuss the importance of sequences, and use this fact intheir “shingling” framework (Casey et al., 2008a). Evidence about the benefitsof smoothing for self-similarity matrices has been reported within some MIRtasks other than version identification, in particular in the context of structureanalysis (Müller & Kurth, 2006b) and partial music synchronization (Müller &Appelt, 2008). Notably, Müller & Appelt (2008) also applied some thresholdingto their matrices.
4The author thanks M. Müller for providing insight on this aspect (M. Müller, personalcommunication, September 2010).
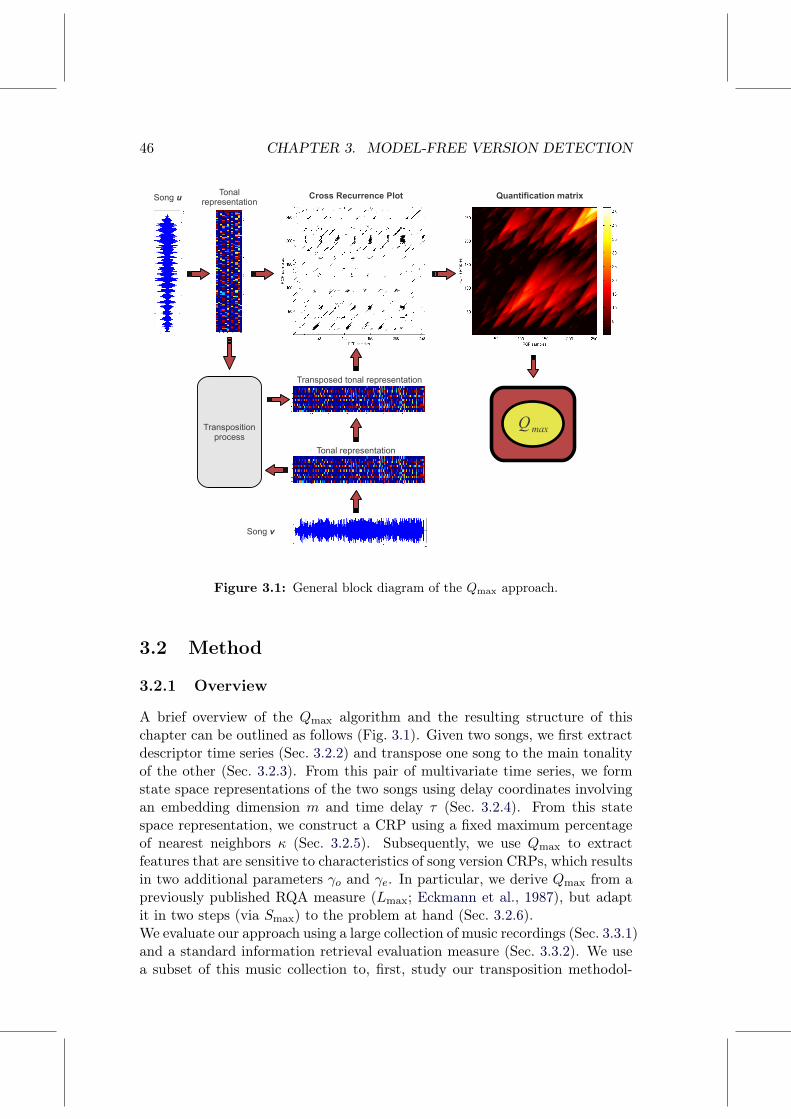
46 CHAPTER 3. MODEL-FREE VERSION DETECTION
Qmax
Song u
Song v
Tonal representation
Tonal representation
Cross Recurrence Plot Quantification matrix
Transpositionprocess
Transposed tonal representation
Figure 3.1: General block diagram of the Qmax approach.
3.2 Method
3.2.1 Overview
A brief overview of the Qmax algorithm and the resulting structure of thischapter can be outlined as follows (Fig. 3.1). Given two songs, we first extractdescriptor time series (Sec. 3.2.2) and transpose one song to the main tonalityof the other (Sec. 3.2.3). From this pair of multivariate time series, we formstate space representations of the two songs using delay coordinates involvingan embedding dimension m and time delay τ (Sec. 3.2.4). From this statespace representation, we construct a CRP using a fixed maximum percentageof nearest neighbors κ (Sec. 3.2.5). Subsequently, we use Qmax to extractfeatures that are sensitive to characteristics of song version CRPs, which resultsin two additional parameters γo and γe. In particular, we derive Qmax from apreviously published RQA measure (Lmax; Eckmann et al., 1987), but adaptit in two steps (via Smax) to the problem at hand (Sec. 3.2.6).We evaluate our approach using a large collection of music recordings (Sec. 3.3.1)and a standard information retrieval evaluation measure (Sec. 3.3.2). We usea subset of this music collection to, first, study our transposition methodol-

3.2. METHOD 47
ogy, and then, to perform an in-sample optimization of parameters m, τ , κ, γoand γe (Sec. 3.4.1). We subsequently report the out-of-sample accuracy withoptimized parameters of Lmax, Smax and Qmax (Sec. 3.4.2). All these stepswere carried out before we submitted the resulting algorithm to MIREX as afurther out-of-sample validation. We review results of all MIREX editions todate (Sec. 3.4.3) and provide an error analysis of our system (Sec. 3.4.5) beforewe draw some conclusions on the work presented in this chapter (Sec. 3.5).
3.2.2 Descriptor extraction
Pitch class profiles
Tonal information, and specially tonal hierarchies, are at the basis of humanmusical conception (Krumhansl, 1990; Lerdahl, 2001). Moreover, there is evi-dence that tonal hierarchies are primarily involved in important tasks relatedto music understanding such as music prediction, memorization or interpreta-tion (Huron, 2006). Therefore, it seems reasonable to think that tonal infor-mation is one of the characteristics (if not the only one) that remains moreor less invariant among different versions. The majority of version detectionsystems extract quantitative information related to this musical characteristic(Sec. 2.3.1).In order to exploit the tonal information that is present in the audio signal weuse pitch class profile (PCP) descriptors. In general, PCPs are robust againstnon-tonal components (e.g. ambient noise or percussive sounds) and indepen-dent of timbre and the specific instruments used (Gómez, 2006). Furthermore,they are usually independent of the loudness fluctuations in a musical piece.PCPs are derived from the frequency dependent energy in a given range (typ-ically from 50 to 5000 Hz) in short-time spectral representations (e.g. 100 ms)of audio signals computed in a moving window. This energy is usually mappedinto an octave-independent histogram representing the relative intensity of eachof the 12 semitones of the Western music chromatic scale (12 pitch classes).To normalize with respect to loudness, this histogram can be divided by itsmaximum value, thus leading to values between 0 and 1, or by the sum of itselements, thus leading to probability values for each pitch. A PCP examplehas been depicted in Fig. 2.2.In our method we use an enhanced PCP descriptor: the so-called harmonicpitch class profile (HPCP; Gómez, 2006). HPCPs share the aforementionedPCP properties, but are based only on the peaks of the spectrum within acertain frequency band, thereby diminishing the influence of noisy spectralcomponents. Furthermore, HPCPs are tuning independent, so that the refer-ence tone can be different from the standard tone A at 440 Hz. In addition,they take into account the presence of harmonic frequencies. A general blockdiagram of the HPCP extraction process is provided in Fig. 3.2.We now explain the process for obtaining HPCP descriptors, although some
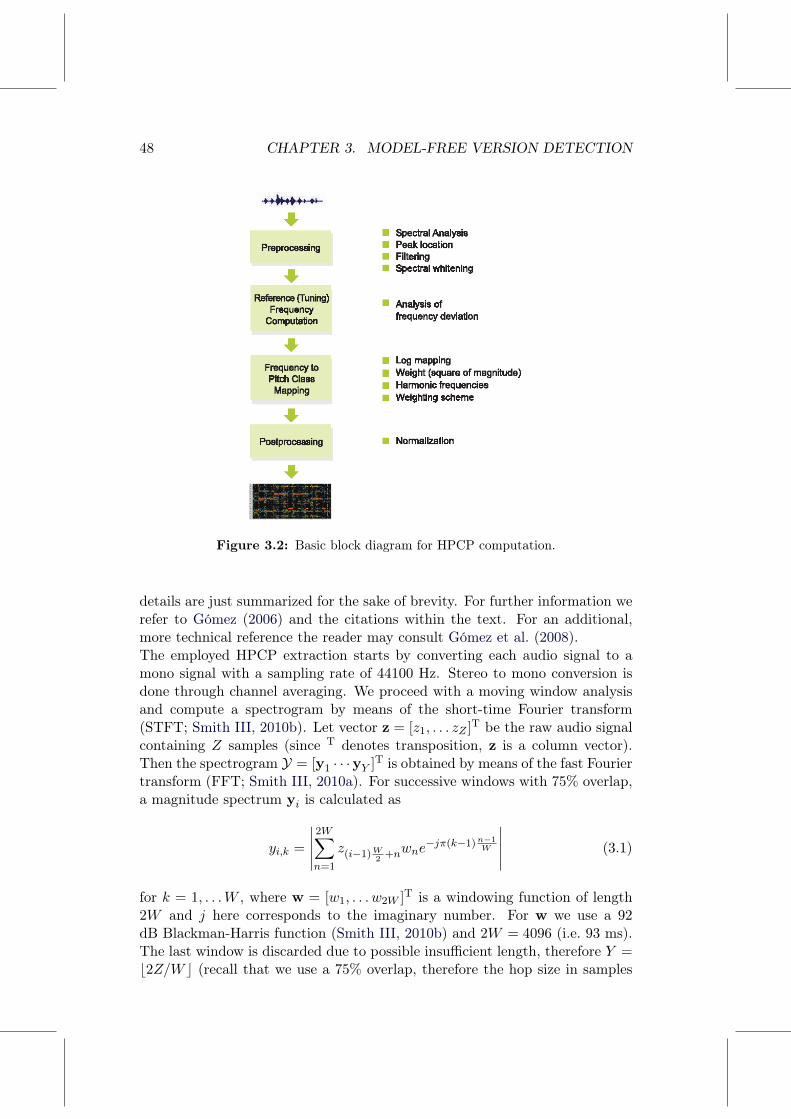
48 CHAPTER 3. MODEL-FREE VERSION DETECTION
Figure 3.2: Basic block diagram for HPCP computation.
details are just summarized for the sake of brevity. For further information werefer to Gómez (2006) and the citations within the text. For an additional,more technical reference the reader may consult Gómez et al. (2008).The employed HPCP extraction starts by converting each audio signal to amono signal with a sampling rate of 44100 Hz. Stereo to mono conversion isdone through channel averaging. We proceed with a moving window analysisand compute a spectrogram by means of the short-time Fourier transform(STFT; Smith III, 2010b). Let vector z = [z1, . . . zZ ]T be the raw audio signalcontaining Z samples (since T denotes transposition, z is a column vector).Then the spectrogram Y = [y1 · · ·yY ]T is obtained by means of the fast Fouriertransform (FFT; Smith III, 2010a). For successive windows with 75% overlap,a magnitude spectrum yi is calculated as
yi,k =
∣∣∣∣∣2W∑n=1
z(i−1)W2+nwne
−jπ(k−1)n−1W
∣∣∣∣∣ (3.1)
for k = 1, . . .W , where w = [w1, . . . w2W ]T is a windowing function of length2W and j here corresponds to the imaginary number. For w we use a 92dB Blackman-Harris function (Smith III, 2010b) and 2W = 4096 (i.e. 93 ms).The last window is discarded due to possible insufficient length, therefore Y =b2Z/W c (recall that we use a 75% overlap, therefore the hop size in samples

3.2. METHOD 49
is W/2 = 1024). Notice that Eq. (3.1) takes the magnitude of the result of theFFT and that therefore discards phase information. Spectrum symmetries arealso discarded (k = 1, . . .W ).Once the spectrogram Y is computed, a peak detection process is applied,i.e. the local maxima of all spectra yi are extracted. The same procedure ofparabola fitting used in sinusoidal modeling synthesis is followed (Serra, 1997)and only the 30 highest peaks found between 40 and 5000 Hz are taken. Weindicate these peaks as y(fk)i , fk being the frequency of the k-th peak found inthe i-th window.With all y(fk)i for i = 1, . . . Y and k = 1, . . . 30, a reference tuning frequencyfref is computed for the whole song. First, a reference frequency is estimatedfor each window i by analyzing the deviations of y(fk)i , for k = 1, . . . 30, withrespect to the frequencies of an equal-tempered chromatic scale with A4 tunedat 440 Hz. Then, a histogram incorporating the deviations found in all windowsi = 1, . . . Y is used to estimate fref. Our approach is the same as the oneemployed by Gómez (2006).An important part of the HPCP extraction is the spectral whitening processapplied to each peak y(fk)i . In particular, each y(fk)i value is normalized withrespect to the corresponding value of the i-th spectral envelope at frequencyfk. The spectral envelope represents a crude approximation of the timbreinformation. Therefore, with such a timbre normalization, notes on high oc-taves contribute equally to the final HPCP vector as those on the low pitchrange. This way, one gains robustness to different instrument configurationsand equalization procedures (Gómez, 2006). To estimate a spectral envelopewe use the same approach as Röbel & Rodet (2005).After obtaining whitened peak magnitudes y(fk)i , we add their contributionsto an octave-independent histogram hi representing the relative intensity ofthe 12 semitones of the Western chromatic scale. Not only the contributionsfrom peak values y(fk)i are considered, but also the contributions of the fre-quencies having fk as harmonic frequency. Apart from fk, we consider 7 suchfrequencies, i.e. fn = fk, fk/2, . . . fk/8.Developing from Gómez (2006), and considering the aforementioned 30 peaks,12 semitones and 8 harmonics, the computation of an HPCP vector hi =[hi,1, . . . hi,12]
T can be expressed as
hi,j =
30∑k=1
8∑n=1
αAn−1
[ω
(j,fkn
)y(fk)i
]2, (3.2)
where αA is a constant, αAn−1 is a harmonic weighting term, and ω (j, fn) isa cosine weighting function such that
ω (j, fn) =
cos(π2υ(j,fn)αB
)if |υ (j, fn) | ≤ αB,
0 otherwise,(3.3)

50 CHAPTER 3. MODEL-FREE VERSION DETECTION
Time [windows]
Pit
ch c
lass
50 100 150 200 250 300 350
C
D
EF
G
A
B
0.2
0.4
0.6
0.8
Figure 3.3: Example of an HPCP time series extracted using a moving window fromthe song “Day Tripper”, as performed by The Beatles.
where αB is a constant and
υ (j, fn) = 12
[log2
(fn
fref2j12
)+ β
], (3.4)
β being the integer that minimizes |υ(j, fn)|. Constants αA and αB are bothexperimentally set to 2/3. The HPCP of a given window is normalized by itsmaximum value such that
hi =hi
max (hi). (3.5)
We denote a multidimensional time series of normalized HPCP vectors byH = [h1 · · · hY ]T. An example is depicted in Fig. 3.3.The HPCP extraction procedure employed here is the same that has beenused in Gómez & Herrera (2004, 2006); Gómez et al. (2006a); Serrà et al.(2008c) and Serrà et al. (2008b), and the parameters mentioned in this sectionhave been proven to work well for key estimation, chord extraction, tonalprofile determination and version identification, respectively, in the previouslycited references. Exhaustive comparisons between ‘standard’ PCP featuresand HPCPs have been presented in Gómez (2006), Ong et al. (2006) and Serràet al. (2008c).
Tonal centroid
From a PCP representation it is quite straightforward to derive other tonal rep-resentations. Of particular interest is the tonal centroid (TC) representationproposed by Harte et al. (2006). In the line of Chew (2000), and inspired byother well-known representations of pitch relations such as the tonnetz (Cohn,1997), Harte et al. (2006) proposed an equal-tempered model for pitch spacethat is specially suitable for data derived from audio. In their implementation,PCP features are mapped to the interior space of a 6-dimensional polytope,where perceptually close harmonic relations appear as small Euclidean dis-tances. Then, in the same manner that Chew (2000) defines her “center of

3.2. METHOD 51
Time [windows]
TC
com
ponen
t
200 400 600 800 1000 1200 1400 1600 1800 2000
2
4
6
-0.5
0
0.5
Figure 3.4: Example of a TC time series extracted using a moving window from thesong “All along the watchtower”, as performed by Jimi Hendrix.
effect” on the spiral array model, the coordinates inside the proposed polytopecorrespond to the actual TC descriptor. Since a 6-dimensional model is nearlyimpossible to visualize, Harte et al. (2006) proposed imagining it “as a projec-tion onto the three circularities in the equal tempered tonnetz: the circle offifths, the circle of minor thirds and the circle of major thirds”. For the sakeof brevity, here we only provide the explicit formulae of the TC descriptor.Further details, including explanatory pictures, are given in the cited work.Given the i-th analysis window, the TC descriptor ci = [ci,1, . . . ci,6]
T is ob-tained by multiplying the PCP vector hi by a suitable transformation matrixΦ and then normalizing such that
ci,j =1
‖hi‖1
12∑k=1
φj,khi,k, (3.6)
where ‖ · ‖1 is the L1 norm. The transformation matrix Φ represents the basisof the 6-dimensional space and is defined as Φ = [Φ1 . . . Φ12]
T, where eachcolumn vector
Φj =
φj,1φj,2φj,3φj,4φj,5φj,6
=
sin((j − 1)7π6
)cos((j − 1)7π6
)sin((j − 1)3π2
)cos((j − 1)3π2
)12 sin
((j − 1)2π3
)12 cos
((j − 1)2π3
)
. (3.7)
We denote a multidimensional time series of TC vectors as C = [c1 · · · cY ]T.An example is depicted in Fig. 3.4.
Harmonic change
Harte et al. (2006) also define the harmonic change (HC) descriptor: a mea-sure “for detecting changes in the harmonic content of music audio signals”.This descriptor is simply computed as the Euclidean distance between pairs ofconsecutive TC samples. Therefore, it yields a unidimensional descriptor time

52 CHAPTER 3. MODEL-FREE VERSION DETECTION
200 400 600 800 1000 1200 1400 1600 1800 20000
1
2
Time [windows]
HC
Figure 3.5: Example of an HC time series extracted using a moving window fromthe song “All along the watchtower”, as performed by Jimi Hendrix.
series g = [0, g2, . . . gY ]T, gi = ‖ci − ci−1‖2, where ‖ · ‖2 is the L2 or Euclideannorm. An example of g is depicted in Fig. 3.5.
Downsampling
After the extraction process above, we are left with a descriptor time series(or sequence) of length Y . The HC descriptor is a unidimensional time seriesg. The TC and PCP descriptors are multidimensional time series C and H of6 and 12 components, respectively. For further processing, these three timeseries are downsampled according to a pre-specified averaging factor ν suchthat the new length N = bY/νc. The downsampled time series H, C and g arecomputed as
hn =
∑νi=1 hi+ν(n−1)
max(∑ν
i=1 hi+ν(n−1)) , (3.8)
cn =
∑νi=1 ci+ν(n−1)
ν, (3.9)
and
gn =
∑νi=1 gi+ν(n−1)
ν, (3.10)
for n = 1, . . . N , respectively. Alternatively to Eqs. (3.8)-(3.10), the median canbe taken. Preliminary analysis shows that it leads to a marginal improvement.The downsampling above obviously favors computational speed since less win-dows are used for further processing (N < Y ). Moreover, and for particularvalues of ν, such downsampling has been proven to be beneficial for versionretrieval (Serrà, 2007a; Serrà et al., 2008b). According to these references,we empirically set ν = 20. Since the previous hop size of Y was 23.2 ms[W/2 = 1024 samples with a sampling rate of 44100 Hz, Eq. (3.1)] we nowobtain a hop size of 464 ms. Therefore, our resulting descriptor time serieshave a sampling rate of approximately 2.1 Hz (e.g. a song of 4 minutes yieldsa music descriptor time series of 516 samples). The resulting window size is534 ms [2W + (ν − 1)W/2 samples, see also Eq. (3.1)].
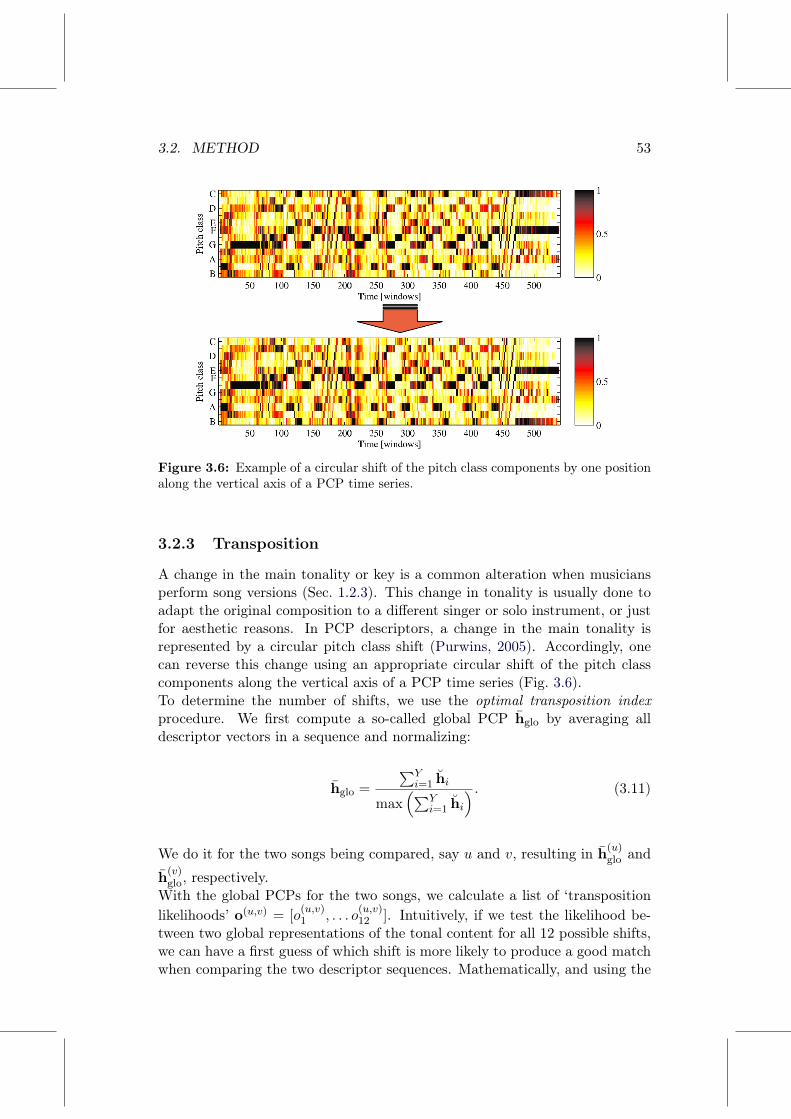
3.2. METHOD 53
Figure 3.6: Example of a circular shift of the pitch class components by one positionalong the vertical axis of a PCP time series.
3.2.3 Transposition
A change in the main tonality or key is a common alteration when musiciansperform song versions (Sec. 1.2.3). This change in tonality is usually done toadapt the original composition to a different singer or solo instrument, or justfor aesthetic reasons. In PCP descriptors, a change in the main tonality isrepresented by a circular pitch class shift (Purwins, 2005). Accordingly, onecan reverse this change using an appropriate circular shift of the pitch classcomponents along the vertical axis of a PCP time series (Fig. 3.6).To determine the number of shifts, we use the optimal transposition indexprocedure. We first compute a so-called global PCP hglo by averaging alldescriptor vectors in a sequence and normalizing:
hglo =
∑Yi=1 hi
max(∑Y
i=1 hi) . (3.11)
We do it for the two songs being compared, say u and v, resulting in h(u)glo and
h(v)glo, respectively.
With the global PCPs for the two songs, we calculate a list of ‘transpositionlikelihoods’ o(u,v) = [o
(u,v)1 , . . . o
(u,v)12 ]. Intuitively, if we test the likelihood be-
tween two global representations of the tonal content for all 12 possible shifts,we can have a first guess of which shift is more likely to produce a good matchwhen comparing the two descriptor sequences. Mathematically, and using the

54 CHAPTER 3. MODEL-FREE VERSION DETECTION
dot product (·) as a measure of likelihood,
o(u,v)k = ok
(h(u)
glo , h(v)glo
)= h(u)
glo ·[h(v)
glo (k − 1)], (3.12)
for k = 1, . . . 12. The operation h k implies the application of k circularshifts to the right to vector h. For example, a circular shift to the right of oneposition is a permutation of the entries in a vector where the last componentbecomes the first one and all the other components are shifted to the right.More formally, for an arbitrary shift k, h k = h = [h1, . . . h12]
T, where eachhi for i = 1, . . . 12 is obtained using the modulo operation:
h(i+k)−12b i+k12 c = hi. (3.13)
Notice that, instead of 12, any number of components could be used in Eqs. (3.12)and (3.13). Notice also that the aforementioned operations can be performedby means of the circular convolution properties of the FFT, as we demonstratedin Serrà (2007a). This option is interesting in that which regards computa-tional speed, specially when more than 12 PCP bins are considered.Once we have o(u,v), we sort its elements in descending order and obtain
o(u,v) = argsort([o(u,v)1 , . . . o
(u,v)12
]). (3.14)
With this ordered list, one can choose transposition indices in a more informedway. In particular, indices that are more likely to produce a good match of thePCP sequences might occupy the first positions of o(u,v). Thus, the preferredoptions would be o(u,v)1 , then o(u,v)2 , then o(u,v)3 and so forth. Moreover, suppos-ing that indices close to 12 yield a poor match, some of these transpositionsmay be skipped. We denote with O the maximum number of transposition in-dices considered. In our experiments we use O = 2, thus reducing 6 times thecomputational costs of the overall system. The effect of parameter O is studiedin Sec. 3.4.1. A comparison with a key normalization strategy (Sec. 2.3.1) isalso presented. Insights on the internal organization of o(u,v) were provided inSerrà et al. (2008a).To effectively transpose the PCPs of song v to the k-th most likely transpositionwe do
h(v)i = h(v)
i o(u,v)k (3.15)
for i = 1, . . . N . In case of using the TC or HC descriptors, the above proce-dure is done for the corresponding PCP time series and then TC and HC arecomputed, i.e. we do it with H before Eq. (3.6).To close the section, we should highlight that the above procedure [Eqs. (3.12)-(3.14)] has also been used as part of a PCP binary similarity measure, termedoptimal transposition index (OTI) similarity. Basically, one considers two PCPdescriptors to be similar if the index o(i,j)1 corresponds to a shift smaller thana semitone (e.g. in the case of 12-bin PCPs, o(i,j)1 must be zero in order to

3.2. METHOD 55
consider that PCPs i and j are the same). The OTI similarity measure hasbeen employed in a number of studies in the context of version detection (e.g.Foucard et al., 2010; Liem & Hanjalic, 2009; Ravuri & Ellis, 2010), includingour previous system (Serrà et al., 2008b). Furthermore, it has been used inother studies not strictly related to version identification (e.g. Müller & Ewert,2010).
3.2.4 State space embedding
The preceding steps yield a descriptor sequence which reflects the temporalevolution of a given song’s musical aspect, in our case tonality aspects. Suchsequence can be viewed as a multidimensional time series5 X . From this per-spective, one can resort to the existing literature on time series analysis in orderto exploit the information contained in X (e.g. Box & Jenkins, 1976; Lütke-pohl, 1993). In particular, we resort to techniques from nonlinear time seriesanalysis (Kantz & Schreiber, 2004). “Nonlinear time series analysis is a practi-cal spin-off from complex dynamical systems theory and chaos theory. Amongothers, it comprises a variety of techniques to characterize the nonlinearitiesthat give rise to a complex temporal evolution” (Andrzejak, 2010).We consider a time series X to be a representation of a succession of systemstates (for our purposes, the system might be associated to the musical com-position and the states to a particular musical quality, e.g. instantaneous tonalcharacteristics). In general, the information about a concrete state is not fullycontained in a single sample from a time series (Sauer, 2006). Therefore, toachieve a more comprehensive characterization of such state, one can take intoaccount samples from the recent past6. This is formalized by the concept oftime delay embedding (Takens, 1981), also termed delay coordinate state spaceembedding.The construction of a state space by means of delay coordinates technicallysolves the problem of the reconstruction of a succession of system states froma single time series measured from this succession (Hughes, 2006). In particu-lar, it specifies a vector space “such that specifying a point in this space specifies
5Many of the procedures below are not specific for tonal descriptor time series or se-quences, but can be applied to any time series. Therefore, to emphasize this generality, a newvariable is introduced: we denote a multidimensional time series as a matrix X = [x1 · · ·xN ]T,where N is the total number of samples and xi is a column vector with X components rep-resenting an X-dimensional sample at window i. In particular, X may indistinctly refer totime series of descriptors H, H, C, C, g or g. Element xi,k of X represents the magnitude ofthe k-th descriptor component of the i-th window.
6The previous sentences can be illustrated as follows: think of a discrete (sufficientlysampled) sinusoidal signal whose amplitude is between -1 and 1, and suppose we are toldthat, at a certain moment of time, the signal has an amplitude of 0.85. If this is the onlyinformation we have, we are unable to tell if the next sample will be higher or lower than 0.85,i.e. we are unable to tell if we are in the ascending or the descending part of the sinusoidal(ascending or descending state). However, if we know the value of the previous sample, thesolution becomes straightforward.

56 CHAPTER 3. MODEL-FREE VERSION DETECTION
the state of the system, and vice versa” (Kantz & Schreiber, 2004). Thus wecan then “study the dynamics of the system by studying the dynamics of thecorresponding [vector/state] space points”. Most commonly, the constructionof delay coordinate state space vectors is done from a unidimensional signal.Nevertheless, extensions to multidimensional signals can be derived [see Vla-chos & Kugiumtzis (2008) and references therein].In our case, for multidimensional samples xi, we straightforwardly constructdelay coordinate state space vectors xi by vector concatenation such that
xi =[xTi xT
i−τ · · · xTi−(m−1)τ
]T, (3.16)
where m is the embedding dimension and τ is the time delay. The sequence ofthese reconstructed samples yields again a multidimensional time series X =[xλ+1 . . . xN ] of N = N − λ− 1 elements, where λ = (m− 1)τ corresponds tothe so-called embedding window. Notice that Eq. (3.16) still allows for the useof the raw time series samples (i.e. if m = 1 then X = X ).For nonlinear time series analysis, an appropriate choice ofm and τ is crucial toextract meaningful information from noisy signals of finite length. Recipes forthe estimation of optimal fixed values of m and τ exist, e.g. the false nearestneighbors method and the use of the auto-correlation function decay time(Kantz & Schreiber, 2004). However, here we opt to first study the accuracyof the proposed approach under variation of these parameters and then selectthe best combination (Sec. 3.4.1).One should note that the concept of delay coordinates has originally been de-veloped for the reconstruction of stationary deterministic dynamical systemsfrom single variables measured from them (Takens, 1981). Certainly, a musicdescriptor time series does not represent a signal measured from a station-ary dynamical system which could be described by some equation of motion.Nonetheless, delay coordinates, a tool that is routinely used in nonlinear timeseries analysis (Kantz & Schreiber, 2004), can be pragmatically employed tofacilitate the extraction of information contained in descriptor time series X(c.f. Hegger et al., 2000; Matassini et al., 2002). Analogies between music, MIRand delay coordinates have been discussed in Sec. 3.1.
3.2.5 Cross recurrence plot
A recurrence plot (RP) is a straightforward way to visualize characteristics ofsimilar system states attained at different times (Eckmann et al., 1987). Forthis purpose, two discrete time axes span a square matrix which is filled withzeros and ones, typically visualized as white and black cells, respectively. Eachblack cell at coordinates (i, j) indicates a recurrence, i.e. a state at time i whichis similar to a state at time j. Thereby, the main diagonal line is black.A cross recurrence plot (CRP) allows one to highlight equivalences of statesbetween two systems attained at different times. CRPs are constructed in the

3.2. METHOD 57
same way as RPs, but now the two axes span a rectangular, not necessarilysquare matrix (Zbilut et al., 1998). When a CRP is used to characterizedistinct systems, the main diagonal is, in general, not black, and any diagonalpath of connected black cells represents similar state sequences exhibited byboth systems (Marwan et al., 2007).Let X (u) and X (v) be two different signals representing two songs u and v oflengths N (u) and N (v), respectively. To analyze dependencies between thesetwo signals we compute a CRP R from
ri,j = Θ(ε(u)i −
∥∥∥x(u)i − x(v)
j
∥∥∥)Θ(ε(v)j −
∥∥∥x(u)i − x(v)
j
∥∥∥) (3.17)
for i = 1, . . . N (u) and j = 1, . . . N (v), where x(u)i and x(v)
j are state spacerepresentations of songs u and v at windows i and j, respectively, Θ(·) is theHeaviside step function [Θ(ζ) = 0 if ζ < 0 and Θ(ζ) = 1 otherwise], ε(u)i andε(v)j are two different threshold distances and ‖ · ‖ is any norm. Here we usethe Euclidean (L2) norm.The thresholds ε(u)i and ε(v)j are adjusted such that a maximum percentage of
neighbors κ is used for x(u)i and x(v)
j . In this way, the total number of non-zeroentries in each row and column never exceeds κN (u) and κN (v), respectively.In-line with studies on the identification of deterministic signals in noisy en-vironments (Zbilut et al., 1998), in pre-analysis we found the use of a fixedpercentage of neighbors κ to yield superior accuracies compared to the use ofa fixed threshold ε. We study the influence of the parameter κ in Sec. 3.4.1.Notice that by Eq. (3.17) ri,j = 1 if and only if x(u)
i is a neighbor of x(v)j and
at the same time x(v)j is a neighbor of x(u)
i . When dealing with multiple CRPs,a fixed threshold ε is difficult to choose. This is specially true when we havedata at different scales. Contrastingly, using a fixed percentage of neighborscan connect points on different scales. However, with a fixed percentage ofneighbors, regions with a high density of points are usually connected withregions of low density (c.f. Von Luxburg, 2007). The mutual nearest neighborstrategy of Eq. 3.17 tends to connect points within regions of constant densitybut, at the same time, does not connect regions of different densities with eachother. Therefore, this strategy can be considered as being ‘in between’ a fixedabsolute threshold and a fixed percentage of neighbors. For a similar discussionin the context of spectral clustering see Von Luxburg (2007).In general, pairs of unrelated songs result in CRPs that exhibit no evidentstructure (Fig. 3.7b), while CRPs constructed for two song versions show dis-tinct extended patterns (Fig. 3.7a). These extended patterns usually corre-spond to similar sections, phrases or progressions between both music pieces uand v.

58 CHAPTER 3. MODEL-FREE VERSION DETECTION
Time [windows]
Tim
e [
win
dow
s]
(a)
50 100 150 200 250 300 350
50
100
150
200
250
300
350
400
450
500
550
Time [windows]T
ime [
win
dow
s]
(b)
50 100 150 200 250 300 350
50
100
150
200
250
300
350
400
Figure 3.7: CRPs for the song “Day Tripper” as performed by The Beatles, taken assong u, versus two different songs, taken as song v. These are a version made by thegroup Ocean Colour Scene (a) and the song “I’ve got a crush on you” as performed byFrank Sinatra (b). Black dots represent recurrences (see text). Parameters are m = 9,τ = 1 and κ = 0.08.
3.2.6 Recurrence quantification measures for versionidentification
Given a CRP representation of two songs, we need a quantitative criterionto determine whether they are versions or not. In pre-analysis, we testeddifferent measures for recurrence quantification analysis (RQA; Marwan et al.,2007) as input for binary classifiers such as trees or support vector machines incombination with several feature selection algorithms7 (Witten & Frank, 2005).This analysis showed that the maximal length of diagonal lines (Lmax) featureyielded by far the highest discriminative power between CRPs from versionsand non-versions. All other RQA measures that we tried were found to have noor very low discriminative power. In particular, we tried with the recurrencerate, determinism, average diagonal length, entropy, ratio, laminarity, trappingtime, maximal length of horizontal or vertical lines and combinations of them(Marwan et al., 2007).Despite not being the standard way to compute it, the Lmax measure intro-duced by Eckmann et al. (1987) can be expressed as the maximum value of acumulative matrix L computed from the CRP. We initialize l1,j = li,1 = 0 fori = 1, . . . N (u) and j = 1, . . . N (v), and then recursively apply
li,j =
li−1,j−1 + 1 if ri,j = 1,0 if ri,j = 0,
(3.18)
7For that we used the data mining software Weka (Hall et al., 2009): http://www.cs.waikato.ac.nz/ml/weka

3.2. METHOD 59
Time [windows]
Tim
e [
win
dow
s]
(a)
100 200 300 400 500 600
100
200
300
400
500
Time [windows]T
ime [
win
dow
s]
(b)
100 200 300 400 500 600
100
200
300
400
500
600
Time [windows]
Tim
e [
win
dow
s]
(c)
100 200 300 400 500 600
100
200
300
400
Figure 3.8: CRPs for the song “Gimme, gimme, gimme” as performed by the groupABBA, taken as song u (horizontal axis), versus three different songs, taken as song v(vertical axis). These three different songs are a version made by the group A-Teens(a), a techno performance of the song “Hung up” by Madonna (b) and the song “Therobots” by Kraftwerk (c). In (a) Lmax = 43 starting at windows (118,121), in (b)Lmax = 34 starting at windows (176,130) and in (c) Lmax = 16 starting at windows(373,245). Parameters are the same as in Fig. 3.7.
for i = 2, . . . N (u) and j = 2, . . . N (v) [recall that ri,j was defined in Eq. (3.17)].Then we can define Lmax = maxli,j for i = 1, . . . N (u) and j = 1, . . . N (v).To understand why Lmax performs so well we depict some example CRPs(Fig. 3.8), where we use the same song for u (horizontal axis) and three differentsongs for v (vertical axis). A high Lmax value is obtained when u and vare versions (Fig. 3.8a), whereas a low value is obtained when that is notthe case (Fig. 3.8c). An intermediate value is obtained for two songs thatshare a common tonal progression, but only for brief periods (Fig. 3.8b). Itturns out that this particular example of Fig. 3.8b is a border case where onecould consider the two songs to be versions or not. The two songs are verydifferent even in terms of main melody and tonality, but still they share a verycharacteristic (short) sample featuring a flute hook that forms the basis of bothsongs8.Diagonal patterns are clearly discernible in Figs. 3.8a and 3.8b, and the longestof these diagonals corresponds to the maximum time that u and v evolve to-gether without disruptions, i.e. the maximal length of their continuously sharedtonal sequence (Lmax). Notice that only in Fig. 3.8a the longest diagonal isfound close to the main diagonal. However, that is not a necessary criterion ofv being a version of u (e.g. Fig. 3.8b). In general, this depends on the musicalstructure of the versions. Often, new performers add, delete or change theintroduction, solo sections, endings, verses and so forth (Sec. 1.2.3). Thus, toaccount for structure changes, it is necessary to consider any diagonal regard-less of its position in the CRP. This allows one to detect passages of a recordingthat have been inserted in any part of another recording.However, while Lmax can account for such structural changes, it cannot accountfor tempo changes. When versioning a music piece, musicians often adapt the
8http://news.bbc.co.uk/2/hi/entertainment/4354028.stm

60 CHAPTER 3. MODEL-FREE VERSION DETECTION
tempo to their needs and, even in a live performance of the original artist, thisfeature can change with respect to the original recording (Sec. 1.2.3). Tempodeviations between two song versions result in the curving of CRP diagonaltraces.To quantify the length of curved traces we therefore extend Eq. (3.18) andcompute a cumulative matrix S from the CRP. We initialize s1,j = s2,j =si,1 = si,2 = 0 for i = 1, . . . N (u) and j = 1, . . . N (v), and then recursively apply
si,j =
max ([si−1,j−1, si−2,j−1, si−1,j−2]) + 1 if ri,j = 1,0 if ri,j = 0,
(3.19)
for i = 3, . . . N (u) and j = 3, . . . N (v). Here, the maximum value Smax =maxSi,j for i = 1, . . . N (u) and j = 1, . . . N (v) corresponds to the length ofthe longest curved trace in the CRP. This formulation is inspired by commonalignment algorithms (Gusfield, 1997; Rabiner & Juang, 1993), but constrainsthe possible alignments by excluding horizontal and vertical paths. We shouldnote that these particular path connections (si−1,j−1, si−2,j−1, si−1,j−2), whichare only one aspect of Eq. (3.19), were used before in the available literature.They were found to work well for speech recognition in application to distancematrices (Myers et al., 1980), and for version identification in application to theso-called optimal transposition index-based binary similarity matrices (Serràet al., 2008b).Apart from tempo deviations, musicians might skip some chords or part of themelody when performing song versions (Sec. 1.2.3). This practice leads to shortdisruptions in otherwise coherent traces (see e.g. Fig. 3.7a). Moreover, suchdisruptions can also be caused by the fact that the considered tonal descriptorsmight contain some energy not directly associated to tonal content.To account for disruptions, we therefore extend Eq. (3.19) and compute acumulative matrix Q from the CRP. We initialize q1,j = q2,j = qi,1 = qi,2 = 0for i = 1, . . . N (u) and j = 1, . . . N (v), and then recursively apply
qi,j =
max ([qi−1,j−1, qi−2,j−1, qi−1,j−2]) + 1 if ri,j = 1,max([0, qi−1,j−1 − γ(ri−1,j−1),
qi−2,j−1 − γ(ri−2,j−1),
qi−1,j−2 − γ(ri−1,j−2)]) if ri,j = 0,
(3.20)
for i = 3, . . . N (u) and j = 3, . . . N (v), with
γ(r) =
γo if r = 1,γe if r = 0.
(3.21)
Hence γo is a penalty for a disruption onset and γe is a penalty for a disrup-tion extension. The zero inside the second max clause in Eq. (3.20) is usedto prevent that these penalties lead to negative entries of Q. Notice that for

3.2. METHOD 61
Time [windows]
Tim
e [
win
do
ws]
(a)
100 200 300
100
200
300
400
500
10
20
30
Time [windows]T
ime [
win
do
ws]
(b)
100 200 300
100
200
300
400
500
20
40
60
Time [windows]
Tim
e [
win
do
ws]
(c)
100 200 300
100
200
300
400
500
20
40
60
80
100
120
Figure 3.9: “Day Tripper” as performed by The Beatles, taken as song u (horizontalaxis), versus an Ocean Colour Scene performance, taken as song v (vertical axis).Example plots of L (a), S (b) and Q (c). Notice the increase in the maximum values(color scales). In (a) Lmax = 33 starting at windows (140,232), in (b) Smax = 79starting at windows (216,142) and in (c) Qmax = 136 starting at windows (14,118).CRP parameters are the same as in Fig. 3.7. Parameters for (c) are γo = 3 and γe = 7.
γo, γe → ∞, Eq. (3.20) becomes Eq. (3.19). For γo = γe = 0, qi,j becomesa cumulative value indicating global similarity between two time series start-ing at sample 0 and ending at samples i and j, respectively. Note that thishas certain analogies with classical dynamic time warping algorithms (Myers,1980; Rabiner & Juang, 1993). Instead of setting γo and γe a priori, we studytheir influence on the accuracy of our version identification system (Sec. 3.4.1).Analogously to Lmax and Smax, we take Qmax = maxQi,j for i = 1, . . . N (u)
and j = 1, . . . N (v) to quantify the length of the longest curved and potentiallydisrupted trace in the CRP.For illustration we depict some examples for the three quantification measuresdiscussed in this section (Fig. 3.9). The Lmax measure (Fig. 3.9a) characterizesstraight diagonals regardless of their position. The Smax measure can accountfor tempo fluctuations resulting in curved traces (Fig. 3.9b). Furthermore, theQmax measure allows for disruptions of the tonal progression (Fig. 3.9c).
3.2.7 Dissimilarity value
At the end of the process, we are interested in a notion of dissimilarity betweensong versions. To obtain a dissimilarity value du,v between songs u and v wesimply take the inverse of Qmax,
du,v =1
max([
1, Q(u,v)max
]) , (3.22)
where Q(u,v)max denotes the maximal Qmax value for songs u and v after O trans-
positions have been applied (Sec. 3.2.3). Optionally, one can weight Qmax by

62 CHAPTER 3. MODEL-FREE VERSION DETECTION
the length of the candidate song:
du,v =
√N (v)
max([
1, Q(u,v)max
]) . (3.23)
Such a weighting scheme is motivated by traditional information retrieval ap-proaches (Baeza-Yates & Ribeiro-Neto, 1999; Manning et al., 2008) and it isintuitively justified by the fact that Qmax is dependent on the length of thedescriptor time series. Therefore, one might compensate this dependency bymultiplying by a value proportional to the length of one of them. In the casewhere a symmetric measure is needed,
√min(N (v), N (v)) or
√N (v) +N (v)
may be used. Nevertheless, in pre-analysis, all normalizations turned out tobe somehow equivalent, leading to very similar accuracies. In our experimentswe employ Eq. (3.23), which provided a marginal accuracy increment. Fur-ther justification of length weighting terms can be found in our previous work(Serrà, 2007a).
3.3 Evaluation methodology
3.3.1 Music collection
To test the effectiveness of the implemented approach, we analyze a musiccollection comprising a total of 2125 commercial recordings. In particular,we use an arbitrarily selected compilation of versions. This music collectionincludes 523 version sets, where version set refers to a group of versions ofthe same piece. The average cardinality of these version sets (i.e. the numberof performances per set) is 4.06, ranging from 2 to 18. To the best of ourknowledge, this is the largest version collection ever employed in MIR versionidentification experiments. A complete list of the recordings in this musiccollection can be downloaded from the author’s website9.The collection spans a variety of genres, with their corresponding sub-genresand styles: pop/rock (1226 songs), electronic (209), jazz/blues (196), worldmusic (165), classical music (133) and miscellaneous (196). The recordingshave an average length of 3.6 minutes, ranging from 0.5 to 8 minutes. Apartfrom genre, additional editorial information has been compiled. A tag cloudof the versioned artists and the 100 most versioned titles has been rendered(Figs. 3.10 and 3.11, respectively). Quantitative information is provided inFig. 3.12.The histogram of cardinalities has a very fast decay from 2 to 8 (Fig. 3.12a).The versions with higher cardinalities are “Here comes the sun” (18 versions),originally performed by The Beatles, “A forest” and “Boys don’t cry” (18 ver-sions), originally performed by The Cure, “Stairway to heaven” (17 versions),
9http://mtg.upf.edu/files/personal/songList.pdf

3.3. EVALUATION METHODOLOGY 63
Figure 3.10: Tag cloud of versioned artists in our music collection. The tag cloudswere rendered with http://tagcrowd.com.
originally performed by Led Zeppelin, “Eleanor Rigby”, “We can work it out”and “Yesterday” (16 versions), originally performed by The Beatles, and “Lovesong” (16 versions), originally performed by The Cure. In the histogram ofmost versioned artists we see that, on one hand, there are few artists withmore than 10 originals in our collection (Fig. 3.12b). These are The Beatles(121 originals), Pink Floyd (52 originals), The Cure (51 originals), DepecheMode (36 originals), Kraftwerk (21 originals) and Genesis (15 originals). Onthe other hand, in Fig. 3.12b we also see that there is a large number of artistswho are just represented by one original version in the collection.
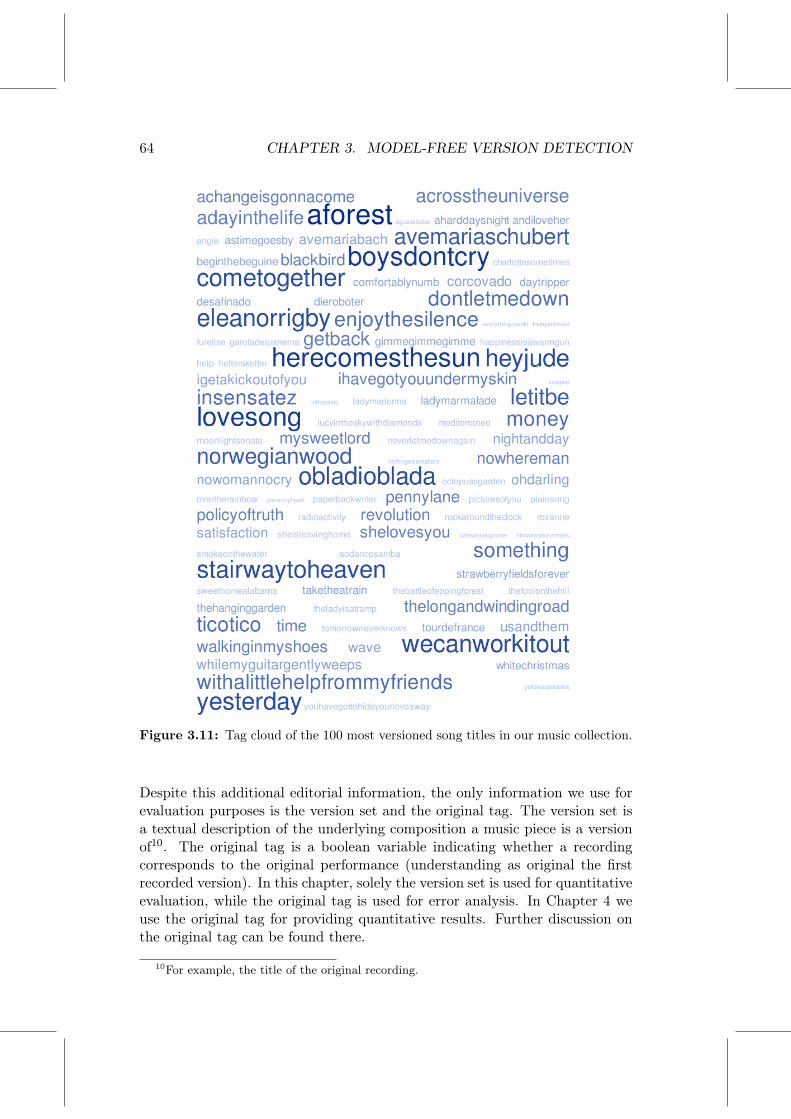
64 CHAPTER 3. MODEL-FREE VERSION DETECTION
Figure 3.11: Tag cloud of the 100 most versioned song titles in our music collection.
Despite this additional editorial information, the only information we use forevaluation purposes is the version set and the original tag. The version set isa textual description of the underlying composition a music piece is a versionof10. The original tag is a boolean variable indicating whether a recordingcorresponds to the original performance (understanding as original the firstrecorded version). In this chapter, solely the version set is used for quantitativeevaluation, while the original tag is used for error analysis. In Chapter 4 weuse the original tag for providing quantitative results. Further discussion onthe original tag can be found there.
10For example, the title of the original recording.

3.3. EVALUATION METHODOLOGY 65
2 4 6 8 10 12 14 16 180
50
100
150
200
250
Cu
Nu
mb
er
of
sets
(a)
0 20 40 60 80 100 1200
20
40
60
80
100
120
Number of originals by the same artist
Nu
mb
er o
f ar
tist
s
(b)
Figure 3.12: Cardinality (a) and original artist (b) histograms. In the cardinalityhistogram (a) we can see the distribution of version sets as a function of their cardi-nality. In the original artist histogram (b) we can see the distribution of the numberof artists as a function of the original songs in the collection.
For training purposes (parameter optimization), a music collection composed of17 version sets with cardinality 6 is used. For testing purposes (report of out-of-sample accuracies), another music collection of 30 version sets with cardinality11 is used. These collections are taken as subsets of the whole collection withno particular preference for specific version sets. Furthermore, both collectionsare non-overlapping, i.e. there are no version sets shared between them. Wedenote each music collection by their total number of songs. This way, thefirst subset is denoted as MC-102, the second subset as MC-330 and the wholecollection as MC-2125.
3.3.2 Evaluation measure
To evaluate the accuracy in identifying song versions we proceed as follows.Given a music collection with U songs, we calculate du,v [Eq. (3.23)] for allU × U possible pairwise combinations and then create a dissimilarity matrixD. Once D is computed, we can use standard information retrieval measuresto evaluate the discriminative power of this information. We use the mean ofaverage precision measure (MAP), which we denote as
⟨ψ⟩.
To calculate⟨ψ⟩, the rows of D are used to compute a list Λu of U − 1 songs
sorted in ascending order with regard to their dissimilarity to the query songu. Suppose that the query song u belongs to a version set with cardinalityCu + 1 (i.e. the set comprises Cu + 1 songs). Then, the average precision ψu isobtained as
ψu =1
Cu
U−1∑k=1
ψu(k)Γu(k), (3.24)
where ψu(k) is the precision of the sorted list Λu at rank k,
ψu(k) =1
k
k∑i=1
Γu(i), (3.25)

66 CHAPTER 3. MODEL-FREE VERSION DETECTION
and Γu(j) is the so-called relevance function: Γu(j) = 1 if the song with rankj in the sorted list is a version of song u, and Γu(j) = 0 otherwise. Hence ψuranges between 0 and 1. If the Cu versions of song u take the first Cu ranks,we get ψu = 1. If all versions are found towards the end of Λu, we get ψu ≈ 0.The mean of average precision
⟨ψ⟩is calculated as the mean of ψu across all
queries u = 1, . . . U . Using Eqs. (3.24) and (3.25) has the advantage of takinginto account the whole sorted list where correct items with low rank receivethe largest weights.In addition to the reported results, we estimate the accuracy level expectedunder the null hypothesis that the dissimilarity matrix D has no discrimina-tive power with regard to the assignment of versions. For this purpose, weseparately permute Λu for all u and keep all other steps the same. We re-peat this process 99 times, corresponding to a significance level of 0.01 of thisMonte Carlo null hypothesis test (Robert & Casella, 2004), and take the av-erage, resulting in
⟨ψ⟩null. This
⟨ψ⟩null is used to estimate the accuracy of all
considered approaches under the specified null hypothesis.
3.4 Results
3.4.1 Parameter optimization
Number of transpositions
Before testing the approach presented here we experimented with transpositionand the previous approach of Serrà et al. (2008b). In particular, we compareddifferent transposition strategies. These strategies consisted of (i) transpos-ing with the optimal transposition index as done in Serrà et al. (2008b), (ii)trying all possible transpositions and (iii) transposing by key normalization.Furthermore we tested (iv) the effect of no transposition and (v) the effect ofa random transposition. Notice that (i) implies taking only the most likelytransposition index and (ii) implies taking all possible indices, i.e. O = 1 andO = 12 in Eq. (3.14), respectively. Transposing by key normalization (iii)consists in using a key estimation algorithm and then transposing the songto a predefined key (C major or A minor). Then, no further processing stepneeds to be done when comparing descriptor time series (Sec. 2.3.1). To auto-matically estimate the key we use the algorithm by Gómez & Herrera (2004),also explained in Gómez (2006), which had an accuracy of 75% for real audiopieces, and scored among the first classified algorithms in the MIREX 2005 keyestimation contest11, with an accuracy of 86% with synthesized MIDI files.In Table 3.1 we show the general accuracies for the different transpositionvariants tested. We can appreciate that all transposition methods improvethe accuracy of the version identification system up to relative values higher
11http://www.music-ir.org/mirex/2005/index.php/Audio_and_Symbolic_Key_Finding

3.4. RESULTS 67
Transposition method⟨ψ⟩
Random transposition 0.16No transposition 0.51Key estimation 0.53O = 1 0.69O = 12 0.73
Table 3.1: Effect of different transposition strategies with MC-102 and the algorithmby Serrà et al. (2008b).
Figure 3.13: Accuracy⟨ψ⟩(MAP) for different number of transposition indices O
with MC-102 and the algorithm by Serrà et al. (2008b). Not applying any transpositionis depicted as O = 0. An additional evaluation measure (recall at rank 5) is shown forcompleteness.
than 40% compared with simply not considering any transposition. The keyestimation method performs the worst among the three transposition methodstested (i-iii). This might be due to the fact that automatic key estimationalgorithms are not completely reliable, which, surely, introduces errors in theversion identification system. Furthermore, as we query all songs against all,these errors might be propagated among queries. For example, if we fail indetermining the key of one song, we will neither retrieve its versions nor re-trieve it as a version of others. As expected, trying all possible transpositionspresents the best accuracy, followed by the method based on the first optimaltransposition index (i.e. with O = 1).Additionally, we tested the possibility of considering multiple transposition in-dices, i.e. O ∈ [1, 12] (Fig. 3.13). Note that just considering two transpositions(O = 2), we are able to achieve the same accuracy as with all of them (O = 12).This implies that, instead of computing all possible CRPs and Q matrices, weonly have to compute those corresponding to the two most probable or opti-mal transposition indices. This is quite remarkable as we decrease by a factorof 6 the number of operations carried out by the system. For the remainingexperiments we set O = 2.

68 CHAPTER 3. MODEL-FREE VERSION DETECTION
0 15 30 45 600
0.2
0.4
0.6
0.8
1
(m−1)τ
Ψ
(a)
τ = 1
τ = 10
0 15 30 45 600
0.2
0.4
0.6
0.8
1
(m−1)τ
Ψ
(d)
m = 1
m = 20
0 15 30 45 600
0.2
0.4
0.6
0.8
1
(m−1)τ
Ψ
(b)
τ = 1
τ = 10
0 15 30 45 600
0.2
0.4
0.6
0.8
1
(m−1)τ
Ψ
(e)
m = 1
m = 20
0 15 30 45 600
0.2
0.4
0.6
0.8
1
(m−1)τ
Ψ
(c)
τ = 1
τ = 10
0 15 30 45 600
0.2
0.4
0.6
0.8
1
(m−1)τ
Ψ
(f)
m = 1
m = 20
Figure 3.14: Accuracies⟨ψ⟩for different state space reconstruction parameters:
Qmax iso-τ (a-c) and iso-m (d-f) curves for κ = 0.05 (a,d), κ = 0.1 (b,e) and κ = 0.15(c,f).
State space reconstruction
We also use the MC-102 collection to study the influence of the embeddingparameters m and τ and the percentage of nearest neighbors κ on our accu-racy measure
⟨ψ⟩. Results for Qmax (Fig. 3.14) illustrate that the use of an
embedding (m > 1) improves the accuracy of the algorithm as compared to noembedding (m = 1). A broad peak of near-maximal
⟨ψ⟩values is established
for a considerable range of embedding windows λ [approximately 7 < λ < 17,recall that λ = (m − 1)τ , Sec. 3.2.4]. From these near-maximal values,
⟨ψ⟩
decreases slightly upon further increasing of the embedding window. Opti-mal κ values are found between 0.05 and 0.15. Therefore, within these broadranges of the embedding window λ and κ values, no fine tuning of any of theparameters is required to yield near-optimal accuracies. In the following weuse m = 10, τ = 1 and κ = 0.1.
Gap penalties
While accuracies shown in Fig. 3.14 are computed for a disruption onset γo =2 and disruption extension γe = 2 penalties, the influence of these penaltyparameters is further studied in Fig. 3.15. Recall that γo and γe are introduced

3.4. RESULTS 69
0
2
4
6
0
2
4
6
0
0.2
0.4
0.6
0.8
1
γo
γe
Ψ
Figure 3.15: Accuracy for different gap penalties:⟨ψ⟩Qmax
depending on γo and γevalues.
only in the definition of Qmax and that for γo, γe → ∞, the measure Qmax
[Eq. (3.20)] reduces to Smax [Eq. (3.19)]. Using finite values of these termsgenerally increases the accuracy, revealing the advantage of Qmax over Smax.Optimal Qmax accuracy values are found for γo = 5 and γe = 0.5.
3.4.2 Out-of-sample accuracy
The same parameter optimization for state space reconstruction describedabove for Qmax was carried out separately for Lmax and Smax and m = 10,τ = 1 and κ = 0.1 yielded near-optimal accuracies as well. Furthermore, nofine tuning was needed since iso-τ and iso-m curves for different κ values hadsimilar shapes as the ones depicted for Qmax in Fig. 3.14. For the MC-102collection, this in-sample parameter optimization leads to the following ac-curacies:
⟨ψ⟩Lmax
= 0.64,⟨ψ⟩Smax
= 0.73 and⟨ψ⟩Qmax
= 0.83 (Fig. 3.16a).The accuracy for MC-330 using the parameters determined by the optimiza-tion on MC-102 is shown in Fig. 3.16b. The exact values are
⟨ψ⟩Lmax
= 0.48,⟨ψ⟩Smax
= 0.61 and⟨ψ⟩Qmax
= 0.74.The good out-of-sample accuracies achieved with MC-330 indicate that ourresults cannot be explained by parameter over-optimization. The accuracyincrease gained through the derivation from Lmax via Smax to Qmax is sub-stantial. Most importantly, this increase in accuracy is reflected in the testcollection as well. Moreover, all values for Lmax, Smax and Qmax are outsidethe range of
⟨ψ⟩null. Therefore, our accuracy values are not consistent with
the null hypothesis that the dissimilarity matrices D have no discriminativepower.

70 CHAPTER 3. MODEL-FREE VERSION DETECTION
0
0.2
0.4
0.6
0.8
1Ψ
(a)
Null
L max
Sm
ax
Qm
ax
0
0.2
0.4
0.6
0.8
1
Ψ
(b)
Null
L max
Sm
ax
Qm
ax
Figure 3.16: Mean average precision⟨ψ⟩for the MC-102 (a) and the MC-330 (b)
collections. Error margins in the leftmost bars correspond to the randomizationsdescribed in Sec. 3.3.2.
Collection⟨ψ⟩null Descriptor
PCP TC HCMC-102 0.18 0.83 0.77 0.30MC-330 0.08 0.74 0.72 0.22MC-2125 <0.01 0.70 0.64 0.13
Table 3.2: Accuracies⟨ψ⟩Qmax
for the different descriptors tested.
The same procedure of in-sample optimization has been carried out for theother two descriptors introduced in Sec. 3.2.2, namely the TC and HC descrip-tors. Again, no important differences for m, τ , κ, γo and γe were observed.The final in-sample and out-of-sample accuracies for the three descriptors arereported in Table 3.2. We see that the PCP descriptor performs best, followedby the TC descriptor. We see that the HC descriptor is much less powerful thanthe other two. This is to be expected, since HC compresses tonal informationto a univariate value. Furthermore, tonal change might be less informativethan tonal values themselves, which already contain the change information intheir temporal evolution. However, the HC accuracy is still higher than therandom baseline
⟨ψ⟩null.
3.4.3 Comparison with state-of-the-art: MIREX submissions
As stated in the introduction of this chapter, the Qmax algorithm was submit-ted12 to MIREX, as well as our previous approach of Serrà et al. (2008b) anda post-processed version of Qmax that will be explained in the next chapter(we denote the latter as Q∗max). We now report on the results for all sub-missions to the “audio cover song identification task” (Table 3.3). These are
12For MIREX submissions we only used PCP descriptors, as these were found performthe best (Table 3.2).

3.4. RESULTS 71
Edition Method Accuracy Accuracy(absolute)
⟨ψ⟩
2006 Sailer & Dressler (2006) 211 -Lee (2006)-2 314 -Lee (2006)-1 365 -Ellis & Poliner (2007) 761 -
2007 Kim & Perelstein (2007) 190 0.06Lee (2007)-2, unpublished 291 0.09Lee (2007)-1, unpublished 425 0.13Jensen et al. (2008a) 762 0.24Bello (2007) 869 0.27Ellis & Cotton (2007) 1207 0.33Serrà et al. (2008b) 1653 0.52
2008 Jensen et al. (2008b) 763 0.23Cao & Li (2008)-1, unpublished 1056 0.34Cao & Li (2008)-2, unpublished 1073 0.34Egorov & Linetsky (2008)-1 1762 0.55Egorov & Linetsky (2008)-3 1778 0.56Egorov & Linetsky (2008)-2 1781 0.56Serrà et al. (2009a)-Qmax 2116 0.66Serrà et al. (2009a, 2010d)-Q∗max 2422 0.75
2009 Ahonen & Lemstrom (2008) 646 0.20Ravuri & Ellis (2010) 2046 0.66Serrà et al. (2009a, 2010d)-Q∗max 2426 0.75
2010 Di Buccio et al. (2010) 471 0.15Martin et al. (2010), unpublished 780 0.24Rocher et al. (2010), unpublished 908 0.29
Table 3.3: MIREX accuracies for the “audio cover song identification task” from 2006(first edition) to 2010. For completeness, and because the mean of average precisions⟨ψ⟩was not used in 2006, we also report the absolute number of identified versions
in top 10 ranks (it ranges from 0, worst case, to 3300, best case). Furthermore, wehave skipped 2006 submissions that were not specifically designed for the task (theyobtained even lower accuracies than those reported here). The numbers behind thereferences indicate different algorithmic variants. The term unpublished means that, tothe author’s knowledge, the algorithm has not been published nor disclosed previously.
comprised from the first edition of 2006 until 2010. All this data is availablein the MIREX wiki13 and, for editions before 2008, also in Downie (2008) orDownie et al. (2008).By looking at the table, we see that our previous algorithm of Serrà et al.(2008b) was found to be the most accurate in the 2007 edition. However, the
13http://www.music-ir.org/mirex/wiki/MIREX_HOME

72 CHAPTER 3. MODEL-FREE VERSION DETECTION
two most accurate algorithms in all editions to date are based on Qmax. Theraw Qmax algorithm as presented here reached an accuracy of
⟨ψ⟩Qmax
= 0.66.It was only outperformed by another algorithm from us which included Qmax asdescribed here, plus one additional post-processing step applied to the dissim-ilarity matrix derived from Qmax, which we denote as Q∗max (
⟨ψ⟩Q∗max
= 0.75).The post-processing step consists of detecting version sets instead of isolatedsongs, and will be explained in detail in the next chapter. The approach byRavuri & Ellis (2010) also achieves a similar accuracy to Qmax, although witha smaller number of identified versions (Table 3.3). Notice however that thisapproach is not based on a single dissimilarity measure but on a compositionof them, one being our previous approach of Serrà et al. (2008b). Furthermore,it uses a supervised train/test post-processing step (Sec. 2.3.2), therefore beingmore comparable to Q∗max than to Qmax. The approach by Egorov & Linetsky(2008) is also based on Serrà et al. (2008b).Importantly, the
⟨ψ⟩Qmax
value obtained for the MIREX music collection isvery close to the
⟨ψ⟩Qmax
values reported for the testing collections used here(0.66 and 0.70, respectively). This provides evidence that the out-of-sampleaccuracy values reported in Sec. 3.4.2 are not related to any hidden in-sampleoptimization or overfitting which could have been introduced involuntarily, forexample, by a biased selection of songs for the testing collections.
3.4.4 Computation time
The average time spent in the dissimilarity assessment of two recordings isaround 0.34 s on an Intel(R) Pentium(R) 4 CPU 2.40GHz with 512M RAM.The Qmax algorithm is quadratic in the length N of the descriptor time series,with an execution speed that also depends on m. If we consider a descriptordimensionality of X, the algorithm is basically O
(N2mX
). Such figure could
potentially be improved by considering fast methods for searching in metricspaces (Andoni & Indyk, 2008; Chávez et al., 2001) or by approximating thealignment step (Baeza-Yates & Perleberg, 1996; Ukkonen et al., 2003). Oneshould note that N is not very large, since a downsampling step is applied tothe time series (Sec. 3.2.2). Such downsampling, in turn, has been shown tobe beneficial for version retrieval (Serrà et al., 2008b).The primary focus of this thesis was on accuracy (Sec. 1.4). Therefore, exe-cution speed was not one of the main objectives of our research. In general,there seems to be an important trade-off between accuracy and speed. Best-performing approaches are computationally expensive, while computationallycheap ones do not achieve competitive accuracies. This trade-off can be easilyseen by studying the approaches submitted to MIREX and their accuracies(Table 3.3). In Chapter 5 we propose an alternative strategy that results insubstantially faster algorithms with competitive accuracies.
3.4. RESULTS 73
3.4.5 Error analysis
It is always interesting to analyze the errors of an information retrieval system.However, an exhaustive analysis of this kind is, in many cases, unfeasible dueto the amount of data and the complexity of the task. In our case, we optfor a general non-exhaustive analysis, which can nevertheless provide valuableinformation both about the task at hand and our specific approach.The intended error analysis has two aims: assessing the main characteristics ofmisidentified versions, and assessing the algorithmic reasons for this misiden-tification. To narrow down the scope in the search for misidentifications inMC-2125, we concentrate on a particular use-case consisting of querying forthe original song u and looking at the retrieved answer Λu. Furthermore, wefocus on what we call outstanding false negatives, i.e. versions that are notdetected to be close to the first Cu positions of Λu. This approach is moti-vated by the fact that in the majority of cases we do not observe outstandingfalse positives, i.e. there are no important misidentifications found between thefirst Cu retrieved items. We only performed the error analysis with the systemusing the PCP descriptors, as these were found to perform the best in theprevious section.Following the above criteria and restrictions resulted in the manual analysis of198 false negatives. Such analysis was done with the help of an online demoof the system (see Appendix A). For each of the false negatives, we carriedout an assessment of which “type of version” was involved (Sec. 1.2.2), whichthe musical variations with respect to the original song were (Sec. 1.2.3) andwhich stage of the system which was, most probably, providing an unreliableoutput (Sec. 3.2). With these data and the correlations between them we canqualitatively derive some conclusions.Firstly, we correlate the abovementioned data with the versions’ genre infor-mation and normalize with respect to the total number of items of each genre.With this process we see that one third (relative) of the analyzed errors corre-spond to the electronic genre. We hypothesize that this is due to song remixesand quotations that are usually done within the electronic context. Indeed, alook at the version types present in our false negative analysis confirms thishypothesis. Remixes and quotations are intuitively the most difficult versionsto detect due to the large amount of musical changes involved and the reducedpresence of the essential element of the underlying musical piece (Table 1.1),and this was confirmed by our observations. Another third of the analyzederrors are split between the classical and jazz/blues genres. A possible rea-son for this is that some of the classical versions in our music collection arehighly arranged pieces with much ornamentation, therefore making the matchbetween tonal descriptors more difficult. With regard to jazz/blues genres,we see that these are usually versions of jazz standards, which inherently in-clude improvisation and important changes in both melodies and harmonies(Table 1.1).
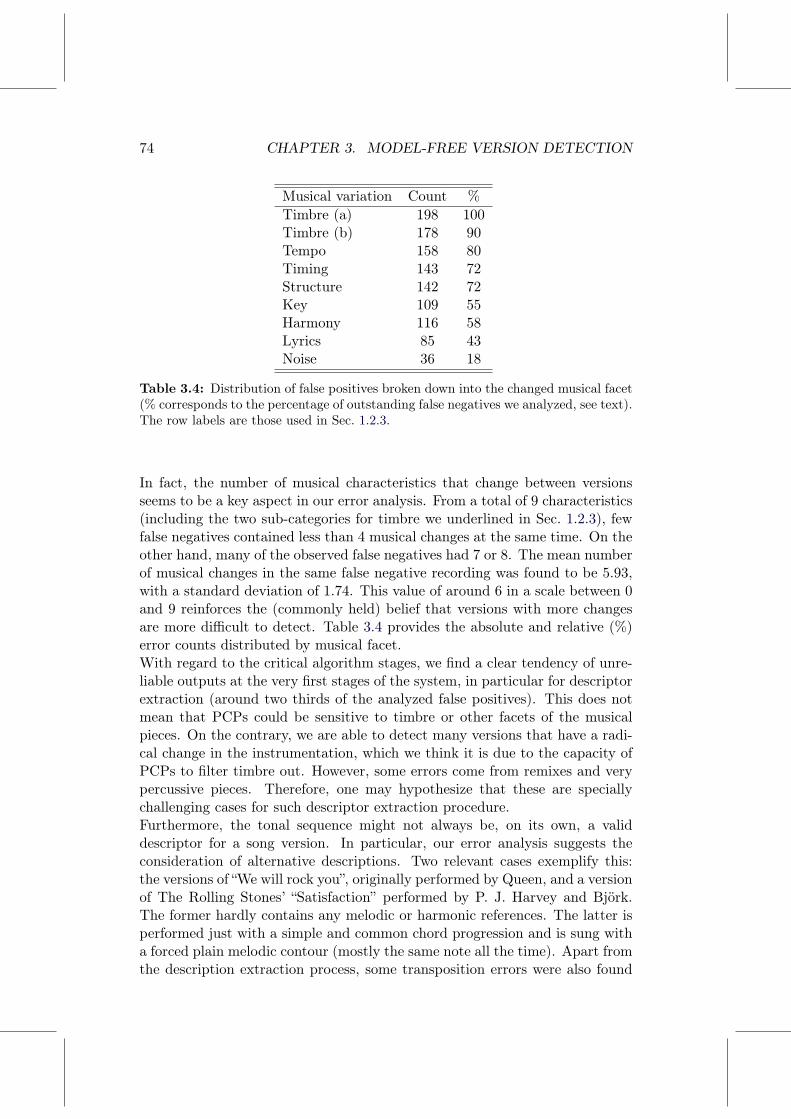
74 CHAPTER 3. MODEL-FREE VERSION DETECTION
Musical variation Count %Timbre (a) 198 100Timbre (b) 178 90Tempo 158 80Timing 143 72Structure 142 72Key 109 55Harmony 116 58Lyrics 85 43Noise 36 18
Table 3.4: Distribution of false positives broken down into the changed musical facet(% corresponds to the percentage of outstanding false negatives we analyzed, see text).The row labels are those used in Sec. 1.2.3.
In fact, the number of musical characteristics that change between versionsseems to be a key aspect in our error analysis. From a total of 9 characteristics(including the two sub-categories for timbre we underlined in Sec. 1.2.3), fewfalse negatives contained less than 4 musical changes at the same time. On theother hand, many of the observed false negatives had 7 or 8. The mean numberof musical changes in the same false negative recording was found to be 5.93,with a standard deviation of 1.74. This value of around 6 in a scale between 0and 9 reinforces the (commonly held) belief that versions with more changesare more difficult to detect. Table 3.4 provides the absolute and relative (%)error counts distributed by musical facet.With regard to the critical algorithm stages, we find a clear tendency of unre-liable outputs at the very first stages of the system, in particular for descriptorextraction (around two thirds of the analyzed false positives). This does notmean that PCPs could be sensitive to timbre or other facets of the musicalpieces. On the contrary, we are able to detect many versions that have a radi-cal change in the instrumentation, which we think it is due to the capacity ofPCPs to filter timbre out. However, some errors come from remixes and verypercussive pieces. Therefore, one may hypothesize that these are speciallychallenging cases for such descriptor extraction procedure.Furthermore, the tonal sequence might not always be, on its own, a validdescriptor for a song version. In particular, our error analysis suggests theconsideration of alternative descriptions. Two relevant cases exemplify this:the versions of “We will rock you”, originally performed by Queen, and a versionof The Rolling Stones’ “Satisfaction” performed by P. J. Harvey and Björk.The former hardly contains any melodic or harmonic references. The latter isperformed just with a simple and common chord progression and is sung witha forced plain melodic contour (mostly the same note all the time). Apart fromthe description extraction process, some transposition errors were also found

3.5. DISCUSSION AND CONCLUSION 75
in medleys and versions that incorporated one or several key modulations thatwere not in the original piece.Finally, we correlated the three parameters of our error analysis (version type,musical variation and algorithm stage) on a pairwise basis, i.e. version typevs. musical variation, version type vs. algorithm stage and musical variationvs. algorithm step. Nevertheless, no remarkable correlation was obtained. Thisreveals that, for instance, no particular version type causes problems in aconcrete algorithm stage, or that no particular variation seriously affects analgorithm stage. Marginal and quite low correlations (around 0.15) were foundbetween remixes and jazz standards and the descriptor extraction process, andbetween structure and key changes and the transposition process. Overall,these correlations corroborate what has been said in the rest of the presentsection.
3.5 Discussion and conclusion
In the present chapter we combine concepts from music signal processing, non-linear time series analysis, machine learning and information retrieval to builda system that successfully identifies versions of musical pieces. The composi-tion of concepts from these different disciplines naturally results in a modularorganization of our model-free approach. Given two audio signals we, at first,use techniques from music signal processing to extract descriptor time seriesrepresenting their tonal progression. These time series are then used for mul-tivariate embedding by means of delay coordinates. To assess equivalencesof states between both systems attained at different times, we use cross re-currence plots and recurrence quantification measures derived from them. Inpre-analysis, existing recurrence quantification measures were evaluated usingmachine learning techniques. The obtained result motivated us to introducenew cross recurrence quantification measures Smax and Qmax. Using standardinformation retrieval evaluation measures we quantify the accuracy for the taskat hand. A qualitative error analysis is also done.We show here that our algorithm leads to a high accuracy for a version identi-fication task on a comprehensive music collection compiled prior to and inde-pendently from the study we did in Serrà et al. (2009a). This music collectionis divided into non-overlapping testing and training collections. We adjust theparameters on the training collection and then determine the accuracy out-of-sample on a testing collection. Nonetheless, in such a study design, one couldstill overestimate the true accuracy of the algorithm by involuntarily introduc-ing biases in the compilation of the music collection. However, the close matchof accuracy reported here for our music collection and the one obtained in theMIREX campaigns support the generality of the reported results (the musiccollection used here was compiled prior to and independently from our par-ticipation in MIREX). Furthermore, the proposed algorithm has reached the
76 CHAPTER 3. MODEL-FREE VERSION DETECTION
highest accuracies in the MIREX “audio cover song identification task” up tothe moment of writing these lines. It has only been surpassed by further devel-opments based on Qmax (details in the forthcoming chapter). This illustratesits superiority in respect to current state-of-the-art algorithms, including ourprevious approach of Serrà et al. (2008b).One should note that the concept of delay coordinates has originally been devel-oped for the reconstruction of stationary deterministic dynamical systems fromsingle variables measured from them (Kantz & Schreiber, 2004; Takens, 1981).Also, the identification of coherent traces within the cross recurrence plot isconnected to the notion of deterministic dynamics [see Marwan et al. (2007)and references therein]. Certainly, music pieces do not represent the output ofa stationary deterministic dynamical system, and therefore, one could arguethat applying concepts developed for deterministic systems to such signals isinappropriate. However, if we consider a song as the output of some ‘compli-cated system’ evolving in time and a descriptor sequence as a multivariate timeseries measured from it, we can use the method of delay coordinates to facil-itate the extraction of the information characterizing the underlying system.In fact, we find that the accuracy of our version identification system is signifi-cantly improved using an embedding, compared to not using it. In conclusion,our work provides a further example for an application of nonlinear time seriesanalysis methods to experimental time series where the assumption of someunderlying deterministic dynamics is not fulfilled in a strict sense, but whichnonetheless allows one to successfully characterize the system underlying thetime series.In closing, we would like to indicate that the Smax and Qmax measures are notrestricted to MIR nor to the particular application of version identification.In Serrà et al. (2009a) we provided evidence for that. Curved structures havebeen reported in RPs and CRPs of artificial and experimental signals. Artifi-cial signals include frequency modulated periodic signals (Facchini et al., 2005;Groth, 2005; Marwan et al., 2002a) or time series derived from Rössler dy-namics with bidirectional couplings close to the onset of phase synchronization(Groth, 2005). Experimental data include signals with nonlinearly re-scaledor distorted time axes such as geophysical data of sediment cores subjected todifferent compressions (Marwan et al., 2002a), symbolic dynamic representa-tions of electroencephalographic recordings from the onsets of epileptic seizures(Groth, 2005) or acoustic signals from calls of primates (Facchini et al., 2005).Far beyond these particular examples, it can be conjectured that important fea-tures of further experimental signals, e.g. from bioinformatics (Aach & Church,2001), physiology (Webber Jr. & Zbilut, 1994), human speech processing (Ra-biner & Juang, 1993) or climatology (Marwan & Kurths, 2002), are reflectedin curved and disrupted traces in RPs and CRPs. A quantitative assessment ofthese traces by means of the proposed measures can thus help to characterizea multitude of systems from different scientific disciplines.

CHAPTER 4Characterization and
exploitation of version groups
4.1 Introduction
Traditionally, version identification has been set up as a standard informa-tion retrieval task based on the query-by-example framework (Sec. 2.3.3). Inthis framework, the user submits an example query (a song u) and receivesan answer (a list of songs Λu, ranked by their relevance to the query). Sucha setup has remarkably conditioned the way of implementing and evaluatingversion identification systems. This assertion can be contrasted by looking atthe literature review of Sec. 2.3. In particular, with regard to the implementa-tion of version identification systems, we have seen that the efforts have beenconcentrated in achieving a metric that faithfully captures pairwise versionsimilarities (Sec. 2.3.1). With regard to the evaluation of version identifica-tion systems, we have seen that the cited references always resort to commonmeasures from information retrieval that serve to quantify the accuracies ofquery-by-example systems (Sec. 2.3.3). In fact, we ourselves have also usedthe query-by-example framework in the previous chapter for evaluating oursystem (Sec. 3.3.2).In this chapter we consider a new approach that goes beyond query-by-exampleto achieve a more complete characterization of a music collection composed ofsong versions. In particular, instead of isolated songs, our approach focuseson groups1 of songs. Therefore we identify, given a music collection, coherentgroups of versions of the same piece. This way one can exploit the regularitiesfound in the results of a query-by-example system for a given music collection.Indeed, music collections are usually organized and structured at multiple lev-els. In the case of version detection, songs naturally cluster into so-called
1Throughout the chapter we will use the words group, set, community or cluster inter-changeably.
77
78CHAPTER 4. CHARACTERIZATION AND EXPLOITATION OF
VERSION GROUPS
version sets (we have already used this terminology in the presentation of ourevaluation framework, Sec. 3.3.2).For automatically identifying the versions sets of a music collection we employa number of grouping algorithms on top of the Qmax measure explained in theprevious chapter. As grouping algorithms we consider unsupervised clustering(Jain et al., 1999; Xu & Wunsch II, 2009) and community detection algorithms(Danon et al., 2005; Fortunato, 2010). Notice that the task of version set detec-tion can naturally be placed within a typical clustering framework. Accordingto Jain & Dubes (1988) and Jain et al. (1999), the “typical pattern cluster-ing activity involves the following steps: (1) pattern representation, optionallyincluding feature extraction and/or selection, (2) definition of a pattern prox-imity measure appropriate to the data domain, (3) clustering or grouping”and, if needed, “(4) data abstraction” and “(5) assessment of output”. We nowobserve that steps 1 and 2 have already been performed to obtain Qmax inthe previous chapter. Therefore, only step 3, the grouping step, remains to bemade. This is the main focus of this chapter. Nevertheless, we also exploresteps 4 and 5 with the detected groups of versions. In particular, we studythe version ‘prototypes’ found within a group and their relation to the originalpiece.Apart from the typical clustering framework above, the detection of version setscan be formulated from a complex network perspective. Complex networks2
are a well-established way to represent the interactions between a number ofelements (Boccaletti et al., 2006; Costa et al., 2008; Newman, 2003; Strogatz,2001), from proteins (Jeong et al., 2001) to web pages (Baeza-Yates et al.,2007). The interaction between elements usually gives rise to certain struc-tures in the network. In fact, one of the most relevant features of networks iscommunity structure (or clustering), i.e. the organization of vertices in clus-ters, with many edges joining vertices of the same cluster and comparativelyfew edges joining vertices of different clusters (Danon et al., 2005; Fortunato &Castellano, 2009). Thus, detecting communities is of enormous importance indisciplines where interacting elements are represented through networks, andmany successful approaches for community detection have been proposed, spe-cially in biology, sociology and computer science [for an overview see Fortunato(2010)].The reader may easily see the resemblance between the detection of versionsets and a more classical community detection task. This way, a set of verticesu ≡ u1, . . . uU represents the U recordings being analyzed, and the elementsof the U×U weight matrix D represent the dissimilarity between any couple ofnodes. Provided that the weights of this matrix are assigned with the help ofa suitable version dissimilarity metric (recall that D was obtained from Qmax,Sec. 3.2.7), communities inside this complex network will represent version
2In this thesis we use the terms network and graph interchangeably. Node and vertex,and link and edge are also used interchangeably.

4.2. METHOD 79
sets. Although complex networks and community detection algorithms havebeen used in many problems involving complex systems (Boccaletti et al., 2006;Costa et al., 2008), and more specifically in studying musical networks (Buldúet al., 2007; Cano et al., 2006; Teitelbaum et al., 2008), to the best of ourknowledge they have never been applied to a retrieval task before. We also usethe framework of complex networks to study the characteristics of associationsbetween song versions, in particular to assess their clustering properties andtheir relationships.As we have noted in Serrà et al. (2009b), and subsequently in Serrà et al.(2010d), there are many intuitive advantages behind the aforementioned changeof paradigm, namely going from specific query answers Λu to the detection ofcoherent groups of items. Importantly, one should bear in mind that theseadvantages are not specific for the version detection task, and that they holdfor any information retrieval (IR) system operating through query-by-example(Baeza-Yates & Ribeiro-Neto, 1999), including analogous systems such as rec-ommendation systems (Resnick & Varian, 1997). First, given that currentsystems provide a suitable metric to quantify the similarity between singlequery items, several well-researched options exist to exploit this informationin order to detect inherent groups of items (we have outlined them above andpresent specific ones below). Second, focusing on groups of items may help thesystem in retrieving more coherent answers for isolated queries. In particular,the answers to any query belonging to a given group would coherently containthe other songs in the group, an advantage that is not guaranteed by query-by-example systems alone. Third, music collections are usually organized andstructured on multiple levels (e.g. the version sets in our case). Thus we can in-fer and exploit these regularities to increase the overall accuracy of traditionalversion identification systems. Note that the two previous advantages specifi-cally aim to achieve higher user satisfaction and confidence in IR systems, asthey can be perceived as rational or intelligent agents or assistants (Russell &Norvig, 2003). Finally, once groups of coherent items are correctly detected,one can study these groups in order to retrieve new information, either fromthe individual communities or from the relations between these.
4.2 Method
4.2.1 Overview
In this chapter, we use the Qmax measure and our version collection (MC-2125,Sec. 3.3.1) in order to build a complex network. More specifically, the dissimi-larity matrix D is used as a weighted adjacency matrix for a complex network.First, this complex network is analyzed in order to confirm that communitiesof versions are present (Sec. 4.2.2). We study both the topology of the networkand the characteristics of the percolation process, i.e. how the network proper-ties change with the threshold used to define the links. Subsequently, several

80CHAPTER 4. CHARACTERIZATION AND EXPLOITATION OF
VERSION GROUPS
S6
S12
S10
S1
S2
S3
S5
S4
S8
S9
S11
S7
Figure 4.1: Example of the idea of inferring version similarities by exploiting groupdetection. In the top row the relation between S1 and S4 is inferred (red broken arrow)from the results of querying S1 (directed black arrows) and S2 (directed blue arrows).In the bottom row all queries are available, allowing the detection of a coherent groupof items (red cloud) and to infer new relationships between the elements of this group(red broken arrows).
strategies to correctly detect groups of versions are presented (Sec. 4.2.3). Inparticular, we consider 4 clustering algorithms and 4 community detection ap-proaches. Three of the community detection approaches are original ideas. Inaddition, we show how the Qmax measure can be post-processed to includethe information gained by a group detection algorithm (Sec. 4.2.4, Fig. 4.1 ex-emplifies these ideas). This yields Q∗max, a measure that improves the resultsof a query-by-example system by exploiting the information obtained throughthe detection of groups of versions. Finally, we investigate the organizationof these groups of versions (Sec. 4.5). In particular, we present a study onthe role that original songs play within a group of versions. To the author’sknowledge, this work constitutes the first reported attempt in this direction.
4.2.2 Analysis of the version network
As mentioned, the consideration of elements du,v of D as link weights betweenvertices representing the songs of MC-2125 results in a complex network repre-

4.2. METHOD 81
Figure 4.2: Graphical representation of the version network when a threshold of 0.2is applied. Original songs are drawn in blue, while versions are in black. In Sec. 4.5,the role of original songs inside each community will be further studied.
sentation. This resulting network is depicted in Fig. 4.2. A threshold has beenapplied so that only links with du,v ≤ 0.2 are drawn. Some clusters, i.e. sets ofversions, are already visible, especially in the external zones of the network.In order to understand how the network evolves when the threshold is modified,we study six different classical metrics as a function of the threshold (Boccalettiet al., 2006; Costa et al., 2007):

82CHAPTER 4. CHARACTERIZATION AND EXPLOITATION OF
VERSION GROUPS
1. Graph density: the number of existing edges, normalized by the totalnumber of possible edges between all vertices.
2. Number of independent components: alternatively called number of con-nected components. A connected component of a graph is a sub-graphin which any two vertices are connected, and which is connected to noadditional vertices [a directed sub-graph is called (strongly) connected ifthere is a path from each vertex in the graph to every other vertex].
3. Size of the strong giant component: a giant component is the connectedcomponent that contains the majority of the entire graph’s nodes. Thereported value corresponds to the proportion of nodes that belong to thiscomponent.
4. Number of isolated nodes: the number of nodes that do not have any link.We report the proportion of these nodes relative to the total number ofnodes.
5. Efficiency (Latora & Marchiori, 2001): the harmonic mean of geodesiclengths, where geodesic length corresponds to the number of edges inthe shortest path connecting two nodes. Efficiency is an indicator of thetraffic capacity of a network.
6. Clustering coefficient: the fraction of connected triples of nodes (triads)which also form triangles3 (three nodes that are fully connected). Clus-tering coefficient is a measure of degree to which nodes in a graph tendto cluster together.
4.2.3 Detection of version groups
We assess the detection of version groups by evaluating several methods eitherbased on clustering or on complex networks. Since standard implementations ofclustering algorithms do not operate with an asymmetric dissimilarity measure,in this and in the subsequent section we use a symmetric dissimilarity matrixD′. This matrix is obtained by simply taking the new values d′u,v = d′u,v =(du,v + dv,u) /2.
K-medoids
K-medoids (KM) is a classical technique to group a set of objects inside apreviously known number of K clusters (Theodoridis & Koutroumbas, 2006;Xu & Wunsch II, 2009). The most common realization of KM clustering is asfollows (Theodoridis & Koutroumbas, 2006):
1. Randomly select K data points as the medoids.3To calculate this value we removed the directionality of the links.

4.2. METHOD 83
2. Associate each data point to the closest medoid (in our case this closenessis determined using D′).
3. For each medoid uM:
a) For each non-medoid data point uD:
i. Swap uM and uD and compute the total cost of the configura-tion.
4. Select the configuration with the lowest cost.
5. Repeat steps 2 to 4 until there is no change in the medoid or a suitablenumber of iterations has been reached.
The K-medoids algorithm is a common choice when the computation of meansis unavailable (as it solely operates on pairwise distances). Such is the case thatfits better with the version identification task. Furthermore, the K-medoidsalgorithm can exhibit some advantages compared to the standard K-meansalgorithm, in particular when dealing with noisy samples (Xu & Wunsch II,2009). The main drawback for its application is that, as well as with theK-means algorithm, the K-medoids algorithm needs to set K, the number ofexpected clusters. However, several heuristics can be used for that purpose(Theodoridis & Koutroumbas, 2006).In our experiments we employ the K-medoids implementation of the TAMOpackage4, which incorporates several heuristics to achieve an optimal K value5.We use the default parameters and try all possible heuristics provided in theimplementation.
Hierarchical clustering
Hierarchical clustering creates a hierarchy of clusters which may be representedin a tree structure called a dendrogram (Jain et al., 1999; Xu & Wunsch II,2009). The root of the tree consists of a single cluster containing all obser-vations, and the leaves correspond to individual observations. Hierarchicalclusterings can be agglomerative (bottom-up, each observation starts in itsown cluster) or divisive (top-down, all observations start in one cluster). Ageneric realization of an agglomerative hierarchical clustering algorithm is asfollows (Jain et al., 1999):
1. Compute the dissimilarity matrix containing the distance between eachpair of observations (in our case the observations are recordings and weuse the dissimilarity matrix D′). Treat each observation as a cluster.
4http://fraenkel.mit.edu/TAMO5http://fraenkel.mit.edu/TAMO/documentation/TAMO.Clustering.Kmedoids.html

84CHAPTER 4. CHARACTERIZATION AND EXPLOITATION OF
VERSION GROUPS
2. Find the most similar pair of clusters using the dissimilarity matrix andmerge these two clusters into one cluster.
3. Update the dissimilarity matrix to reflect this merge operation. A linkagecriterion is used to determine the distance between sets of observationsas a function of the pairwise distances between observations. Commonlinkage criteria are single linkage (the minimum distance in a set of ob-servations is taken), complete linkage (the maximum is taken) or meanaverage linkage (a linear combination of the distances in a set of obser-vations is done).
4. Repeat steps 2 and 3 until all patterns are in one cluster.
In our experiments we consider four representative agglomerative hierarchicalclustering methods: single linkage (SL), complete linkage (CL), group aver-age linkage (UPGMA) and weighted average linkage (WPGMA). We use theHCLUSTER implementation6 with the default parameters and, in order to cutthe dendrogram at a suitable layer we try different cluster validity criteria suchas checking descendants for inconsistent values or considering the maximal orthe average inter-cluster cophenetic distance7. In the end, all clustering al-gorithms rely only on the definition of a distance threshold d′Th, which is setexperimentally.
Modularity optimization
This method (MO), as well as the next three algorithms, is designed to ex-ploit a complex network collaborative approach. In particular, MO extractsthe community structure from large networks based on the optimization ofthe network modularity (Danon et al., 2005; Fortunato, 2010; Fortunato &Castellano, 2009). The modularity of a partition is a scalar value between-1 and 1 that measures the density of links inside communities as comparedto links between communities. Although it may have some shortcomings, themaximization of the network modularity is, by far, the most popular way to de-tect communities in graphs (Fortunato, 2010). The standard implementationfor optimizing modularity as proposed by Clauset et al. (2003) consists of re-cursively merging communities that optimize the production of such quantity(analogously to hierarchical clustering algorithms). To merge links betweennodes of the same community one usually sums their weights.In our experiments we use the method proposed by Blondel et al. (2008), withthe implementation by Aynaud8. This method first looks for ‘small’ commu-nities by optimizing modularity in a local way and then aggregates nodes of
6http://code.google.com/p/scipy-cluster7http://www.soe.ucsc.edu/~eads/cluster.html8http://perso.crans.org/~aynaud/communities/index.html

4.2. METHOD 85
Figure 4.3: Example of the process of reinforcing the triangular coherence of thenetwork. The sub-network on the left (A) can be improved by either deleting a link(B) or by adding a third link between the two nodes that were not originally connected(C).
the same community and builds a new network whose nodes are the communi-ties. These steps are repeated reiteratively until a maximum of modularity isattained. The method proposed by Blondel et al. (2008) is reported to outper-form all other known community detection algorithms in terms of computa-tional time while still maintaining a high accuracy. Importantly, this methodhas the capacity to manage networks containing millions of nodes and links.
Proposed method 1
Our first proposed method (PM1) applies a threshold to each network link inorder to create an unweighted network where two nodes are connected only iftheir weight (dissimilarity) is less than a certain value d′Th. In addition, foreach row of D′ (each node), we only allow a maximum number of connections,considering only the lowest values of the thresholded row as valid links. Thatis, we only consider the first k′Th nearest neighbors for each node, where k′Th isa threshold rank (i.e. top k′Th items). Values d′Th and k′Th are set experimen-tally. Finally, each connected component is assigned to be a group of versions.Although this is a very naïve approach, it will be shown that, given the con-sidered network and dissimilarity measure, it achieves a high accuracy level atlow computational costs.
Proposed method 2
The previous approach could be further improved by reinforcing triangularconnections in the complex network before the last step of checking for con-nected components. In other words, proposed method 2 (PM2) tries to reducethe ‘uncertainty’ generated by triplets of nodes connected by two edges and toreinforce coherence in a triangular sense. This idea can be illustrated by thefollowing example (Fig. 4.3).

86CHAPTER 4. CHARACTERIZATION AND EXPLOITATION OF
VERSION GROUPS
Suppose that three vertices in the network, e.g. ui, uj and uk, were versions:the resulting subnetwork should be triangular, so that every vertex is connectedwith the two remaining ones. On the other hand, if ui, uj and uk were notversions, no edge should exist between them. If couples ui, uj and ui, uk arerespectively connected (Fig. 4.3A), we can induce more coherence by eitherdeleting one of the existing edges (Fig. 4.3B), or by creating a connectionbetween uj and uk (i.e. forcing the existence of a triangle, Fig. 4.3C). Thiscoherence can be measured through an objective function % which considerscomplete and incomplete triangles in the whole network. We define % as aweighted difference between the number of complete triangles N5 and thenumber of incomplete triangles N∨ (three vertices connected by only two links)that can be computed from a pair of vertices:
%(N5, N∨) = N5 − ιN∨. (4.1)
The constant ι, which weights the penalization for having incomplete triangles,is set experimentally.The implementation of this idea sequentially analyzes each pair of verticesui, uj by calculating the value of % for two situations: (i) when an edge betweenui and uj is artificially created and (ii) when such an edge is deleted. Then, theoption which maximizes % is preserved and the adjacency matrix is updated asnecessary. The process of assigning version sets is the same as with PM1.
Proposed method 3
The computation time of the previous method can be substantially reducedby considering for the computation of % only those vertices whose connectionsseem to be uncertain. This is what proposed method 3 (PM3) does: if thedissimilarity between two songs is extremely high or low, this means thatthe version identification system has clearly detected a match or a mismatch.Accordingly, we only consider for % the pairs of vertices whose edge weight isclose to d′Th (a closeness margin is empirically set).
4.2.4 Accuracy improvement: from Qmax to Q∗max
Once a coherent group of versions is detected by means of the methods ex-plained above, we can straightforwardly improve the overall accuracy of aquery-by-example system. The idea is to modify the original dissimilarity mea-sure of the system by means of the information obtained through the detectionof version sets.Given the dissimilarity matrix D and a solution for the cluster or communitydetection problem, one can calculate a refined dissimilarity matrix D by settingits elements
du,v =du,v
max(D)+ ςu,v (4.2)

4.3. EVALUATION METHODOLOGY 87
for u, v = 1, . . . U , where ςi,j = 0 if songs u and v are estimated to be inthe same community and ςi,j = M otherwise. To ensure that the songs inthe same community have du,v ≤ 1 and the others have du,v > 1 we use aconstant M > 1. Importantly, this refined matrix D can be used to rank thequery answers Λu again and, consequently, to evaluate the achieved accuracyimprovement (for that we only have to compare the accuracies achieved withD and D, see below). The resulting measure from this process has previouslybeen denoted as Q∗max, in contraposition to Qmax.
4.3 Evaluation methodology
4.3.1 Music collection
For the evaluation of the approaches in this chapter we use the results ob-tained by query-by-example for PCP descriptors (matrix D). Furthermore, weemploy the MC-2125 music collection (Sec. 3.3.1) and its different (possiblyoverlapping) subsets. These subsets are organized into different setups. Eachsetup is defined by different parameters: the total number of songs U , thenumber of version sets US the collection includes, the cardinality C of the ver-sion sets (i.e. the number of songs in the set) and the number of added noisesongs UN (i.e. songs that do not belong to any version set, which are includedto add difficulty to the task). Because some setups can lead to wrong accuracyestimations (Sec. 2.3.3), it is safer to consider several of them, including fixedand variable cardinalities.In our experiments we use the setups summarized in Table 4.1. The whole MC-2125 collection corresponds to setup 3. For other setups we randomly sampleversion sets from setup 3 and repeat the experiments NT times (number oftrials, average accuracies reported). We either sample version sets with aconstant cardinality (C = 4, the expected cardinality of setup 3, Sec. 3.3.1) orwith a variable cardinality (C = χ, a random value between 2 and 18 takenfrom an exponential distribution9 with an expected mean of 4).
4.3.2 Evaluation measures
To quantitatively evaluate version set detection we resort to the classical F-measure with even weighting (Baeza-Yates & Ribeiro-Neto, 1999),
F =2P R
P + R, (4.3)
which goes from 0 (worst case) to 1 (best case). In Eq. (4.3), P and R cor-respond to precision and recall, respectively. For this evaluation, we compute
9We found the exponential function to be the best candidate to model the distributionof version set cardinalities shown in Sec. 3.3.1.

88CHAPTER 4. CHARACTERIZATION AND EXPLOITATION OF
VERSION GROUPS
Setup ParametersUS C UN U NT
1.1 25 4 0 100 201.2 25 χ 0 〈100〉 201.3 25 4 100 200 201.4 25 χ 100 〈200〉 202.1 125 4 0 500 202.2 125 χ 0 〈500〉 202.3 125 4 400 900 202.4 125 χ 400 〈900〉 203 523 χ 0 2125 1
Table 4.1: Experimental setup summary. The 〈·〉 delimiters denote expected value.
Pu and Ru independently for each song u and average afterwards with all Usongs. Unlike other clustering evaluation measures, F is not computed on aper-cluster basis, but on a per-song basis through the averaging of Pu andRu across all songs. This way, and in contrast with the typical clusteringF-measure or other clustering evaluation measures like Purity, Entropy or F-Score (e.g. Sahoo et al., 2006; Zhao & Karypis, 2002), we do not have to blindlychoose which cluster represents a given version set.The process for obtaining F is as follows. For each song u, we count the numberof true positives NT+
i (i.e. the number of actual versions of song u estimatedto belong to the the same community as u), the number of false positives NF+
i
(i.e. the number of songs estimated to belong to the same group as u thatare not actual versions of u) and the number of false negatives NF-
i (i.e. thenumber of actual versions of u that are not detected as belonging to the samegroup as u). Then we define
Pu =NT+i
NT+i +NF+
i
(4.4)
and
Ru =NT+i
NT+i +NF-
i
. (4.5)
These two quantities [Eqs. (4.4) and (4.5)] are finally averaged across all Usongs (u = 1, . . . U) to obtain P and R, respectively.To quantitatively evaluate the improvements in retrieval accuracy we again usethe mean of average precision measure
⟨ψ⟩[Eqs. (3.24) and (3.25), Sec. 3.3.2].
We define the relative improvement in mean average precision as
∆ = 100
⟨ψ(D)
⟩⟨ψ(D)
⟩ − 1
, (4.6)

4.4. RESULTS 89
where⟨ψ(D)
⟩denotes the mean of average precisions for a dissimilarity matrix
D. Notice that⟨ψ(D)
⟩∈ [0, 1]. Therefore, it could be the case that ∆ would
be undetermined or tending towards infinity. However, in our experiments,⟨ψ⟩never reaches a value of zero. For that to happen, the list Λu should not
contain any version at all [see Eqs. (3.24) and (3.25)].
4.4 Results
4.4.1 Analysis of the version network
In order to understand how the network evolves when the threshold is modi-fied, we represent six different classical metrics as a function of the threshold(Fig. 4.4). In the same plots, we also draw the values for the last five measuresas expected in random networks with the same number of vertices and links(i.e. with the same graph density).By looking at the evolution of these metrics, some interesting knowledge aboutthe network and its structure can be inferred. Notice that, by reducing thethreshold (and therefore increasing the deleted links), the network splits intoa higher number of clusters than expected, which represents the formation ofversion communities (Fig. 4.4, top right plot). This process begins around athreshold of 0.5 (see for instance the evolution of the size of the strong giantcomponent, Fig. 4.4, middle left). When these communities are formed, theymaintain a high clustering coefficient, i.e. sub-networks of versions tend to befully connected, with triangular coherence (Fig. 4.4, bottom right plot, between0.3 and 0.5). It is also interesting to note that the number of isolated nodesremains lower than expected, except for high thresholds (Fig. 4.4, middle rightplot). This suggests that most of the songs are connected to some cluster whilea small group of them are different, with unique musical features. Overall,the above analysis reports evidence for the formation of version sets from theoutput of Qmax, and suggests a successful detection of these through someclustering or community detection algorithm such as the ones presented above.
4.4.2 Detection of version sets
To assess the grouping algorithms accuracy we independently optimized thehighlighted parameters for each algorithm on setups 1.1 to 1.4. Within thisoptimization phase, we saw that the definition of a threshold d′Th was, in gen-eral, the only critical parameter for all algorithms (for our proposed methodswe used k′Th between 1 and 3). The different heuristics used for the clusteringalgorithms were found to yield equivalent accuracies. Besides d′Th, all otherparameters turned out to be uncritical for obtaining near-optimal accuracies.Methods that had specially broad ranges of these near-optimal accuracies wereKM, PM2 and all hierarchical clustering algorithms considered.

90CHAPTER 4. CHARACTERIZATION AND EXPLOITATION OF
VERSION GROUPS
Figure 4.4: (Black solid lines) Evolution of six metrics of the network as a functionof the threshold. These metrics are, from top left to bottom right: graph density,number of independent components, size of the strong giant component, number ofisolated nodes, efficiency and clustering coefficient. (Red broken lines) Expected valuein a random network with the same number of nodes and links.
We report the accuracies for setups 2.1 to 3 in Table 4.2. We see that accuraciesfor PM1 and PM3 are comparable to those achieved by the other algorithmsand, in some setups, even better. The high values obtained (above 0.8 in themajority of cases, some of them nearly reaching 0.9) indicate that the consid-ered approaches are able to effectively detect groups of versions. This allowsthe possibility of enhancing the answer of a query-based retrieval system byreporting these detected groups and thus reinforcing coherence within answers.
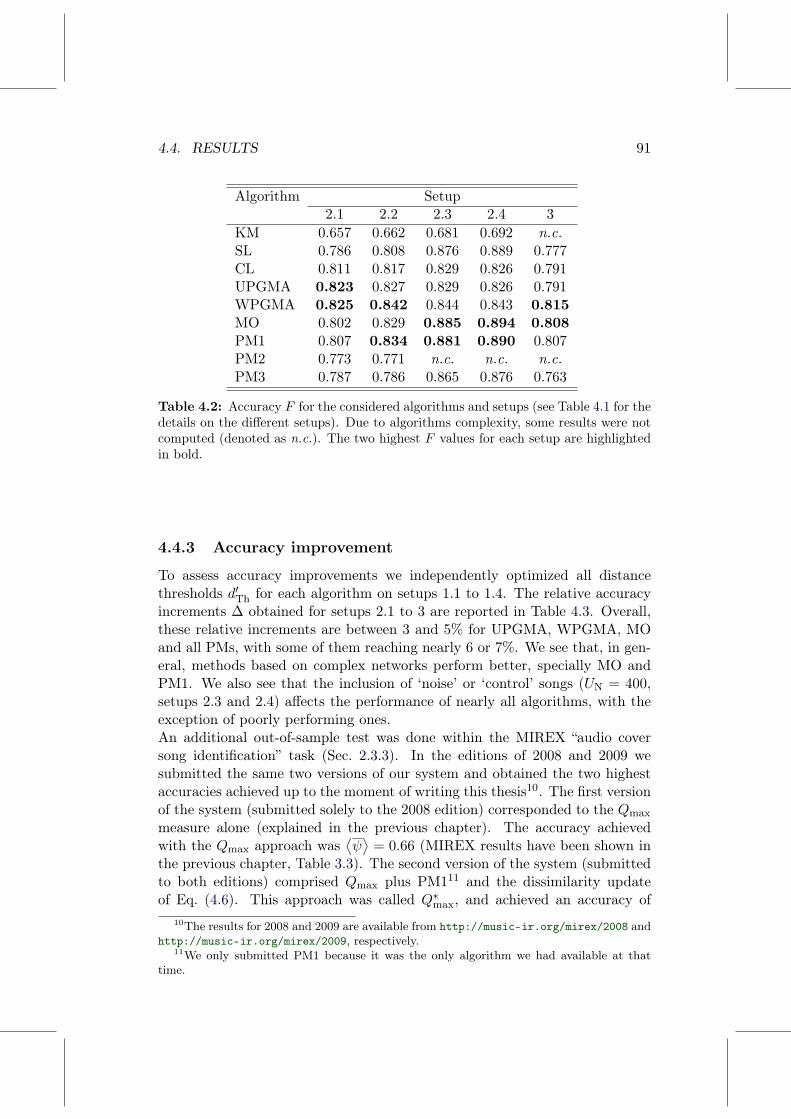
4.4. RESULTS 91
Algorithm Setup2.1 2.2 2.3 2.4 3
KM 0.657 0.662 0.681 0.692 n.c.SL 0.786 0.808 0.876 0.889 0.777CL 0.811 0.817 0.829 0.826 0.791UPGMA 0.823 0.827 0.829 0.826 0.791WPGMA 0.825 0.842 0.844 0.843 0.815MO 0.802 0.829 0.885 0.894 0.808PM1 0.807 0.834 0.881 0.890 0.807PM2 0.773 0.771 n.c. n.c. n.c.PM3 0.787 0.786 0.865 0.876 0.763
Table 4.2: Accuracy F for the considered algorithms and setups (see Table 4.1 for thedetails on the different setups). Due to algorithms complexity, some results were notcomputed (denoted as n.c.). The two highest F values for each setup are highlightedin bold.
4.4.3 Accuracy improvement
To assess accuracy improvements we independently optimized all distancethresholds d′Th for each algorithm on setups 1.1 to 1.4. The relative accuracyincrements ∆ obtained for setups 2.1 to 3 are reported in Table 4.3. Overall,these relative increments are between 3 and 5% for UPGMA, WPGMA, MOand all PMs, with some of them reaching nearly 6 or 7%. We see that, in gen-eral, methods based on complex networks perform better, specially MO andPM1. We also see that the inclusion of ‘noise’ or ‘control’ songs (UN = 400,setups 2.3 and 2.4) affects the performance of nearly all algorithms, with theexception of poorly performing ones.An additional out-of-sample test was done within the MIREX “audio coversong identification” task (Sec. 2.3.3). In the editions of 2008 and 2009 wesubmitted the same two versions of our system and obtained the two highestaccuracies achieved up to the moment of writing this thesis10. The first versionof the system (submitted solely to the 2008 edition) corresponded to the Qmax
measure alone (explained in the previous chapter). The accuracy achievedwith the Qmax approach was
⟨ψ⟩
= 0.66 (MIREX results have been shown inthe previous chapter, Table 3.3). The second version of the system (submittedto both editions) comprised Qmax plus PM111 and the dissimilarity updateof Eq. (4.6). This approach was called Q∗max, and achieved an accuracy of
10The results for 2008 and 2009 are available from http://music-ir.org/mirex/2008 andhttp://music-ir.org/mirex/2009, respectively.
11We only submitted PM1 because it was the only algorithm we had available at thattime.

92CHAPTER 4. CHARACTERIZATION AND EXPLOITATION OF
VERSION GROUPS
Algorithm Setup2.1 2.2 2.3 2.4 3
KM 2.26 2.40 2.06 2.29 n.c.SL 2.26 2.40 1.16 2.29 2.05CL 1.93 1.19 1.43 1.10 1.28UPGMA 5.87 5.22 3.96 3.49 4.37WPGMA 4.91 3.58 3.83 2.67 3.60MO 6.84 5.37 5.14 2.94 5.54PM1 6.15 5.70 4.95 3.28 5.49PM2 5.98 4.85 n.c. n.c. n.c.PM3 6.05 5.10 3.81 2.97 4.73
Table 4.3: Relative accuracy increase ∆ for the considered setups (see Table 4.1for the details on the different setups). Due to algorithms complexity, some resultswere not computed (denoted as n.c.). The two highest ∆ values for each setup arehighlighted in bold.
⟨ψ⟩
= 0.75 (Table 3.3). This corresponds to a relative increment ∆ = 13.64.Such an increment is substantially higher than those achieved here with ourdata, most probably because the setup for the MIREX task is UC = 30, C = 11and UN = 770. This specific setup might capitalize the effects that versionset detection can have in improving the accuracy. In particular, when highcardinalities are considered, one can think of the techniques presented in thischapter to achieve more dramatic impacts in final accuracies.As a further example, it may also be interesting to also see the results inabsolute terms based on the collection subsets presented in Sec. 3.3.1 andPM1. With this setting we can compare the accuracies achieved by Qmax andQ∗max in the same way as in the previous paragraph. We have that for MC-2125(setup 3 here) we go from
⟨ψ⟩
= 0.70 to⟨ψ⟩
= 0.74 (∆ = 5.71), for MC-330we go from
⟨ψ⟩
= 0.75 to⟨ψ⟩
= 0.82 (∆ = 9.33) and for MC-102 we go from⟨ψ⟩
= 0.82 to⟨ψ⟩
= 0.91 (∆ = 10.98).
4.4.4 A note on the dissimilarity thresholds
In the parameter optimization stages reported for the two previous sections wehave stated that the dissimilarity threshold d′Th seems to be a critical parameterfor all approaches. We should notice that alternative approaches for reducingthe dependency to d′Th were presented in Lagrange & Serrà (2010). In the samereference, we also provided evidence that d′Th was more or less independent ofthe music collection (Fig. 4.5). For that we used MC-2125 and the “covers80”dataset12 (Ellis & Cotton, 2007), a version collection commonly used in the
12http://labrosa.ee.columbia.edu/projects/coversongs/covers80

4.4. RESULTS 93
0 0.5 1 1.5 2 2.5 3 3.5 40
0.05
0.1
0.15
0.2
0.25
Dissimilarity Measure
Covers (Serra)Not Covers (Serra)
Covers (Ellis)Not Covers (Ellis)
Figure 4.5: Normalized histograms for the dissimilarity measure d′u,v [plot obtainedfrom Lagrange & Serrà (2010); the vertical axis represents the probability of d′u,v].The plot compares the d′u,v values obtained with the MC-2125 collection (solid lineswith crosses, denoted in the legend as “Serra”) and with the “covers80” collection (solidlines with triangles, denoted as “Ellis”, see text). Values for versions and not versionsare reported (denoted as “covers” and “not covers”, respectively). A threshold estimatecan be obtained visually.
MIR community13. In spite of this collection independence, we neverthelesshypothesize that d′Th may still vary depending on the version identificationapproach, i.e. each approach might need its own d′Th.
4.4.5 Computation time
In the application of these techniques to big real-world music collections, com-putational complexity is of great importance. To qualitatively evaluate this as-pect, we report the average amount of time spent by the algorithms to achievea solution for each setup (Fig. 4.6). We see that KM and PM2 are completelyinadequate for processing collections with more than 2000 songs (e.g. setup 3).The steep rise in the time spent by hierarchical clustering algorithms to finda cluster solution for setup 3 also raises some doubts as to the usefulness ofthese algorithms for huge music collections [O(U2 logU), Jain et al. (1999)].Furthermore, hierarchical clustering algorithms, as well as the KM algorithm,take the full pairwise dissimilarity matrix as input. Therefore, with a mu-sic collection of, for instance, 10 million songs, this distance matrix might bedifficult to handle.In contrast, algorithms based on complex networks show a better performance(with the aforementioned exception of PM2). More specifically, MO, PM1and PM3 use local information (i.e. at most the nearest r′Th neighbors of thequeries), while PM3 furthermore acts on a small subset of the links. It shouldalso be noticed that the resulting network is very sparse, i.e. the number of
13Some remarks on this dataset have been made in Sec. 2.3.3.

94CHAPTER 4. CHARACTERIZATION AND EXPLOITATION OF
VERSION GROUPS
1.1 1.2 1.3 1.4 2.1 2.2 2.3 2.4 3−1
0
1
2
3
Setup
Tim
e [l
og
10(s
ec)]
KM
SL
CL
UPGMA
WPGMA
PM1
PM2
PM3
MO
Figure 4.6: Average time performance for each considered setup. Algorithms wererun with an Intel(R) Pentium(R) 4 CPU 2.40GHz with 512M RAM.
links is much lower than U2 (Boccaletti et al., 2006) and, therefore, calculationson such graphs can be strongly optimized both in memory requirements andcomputational costs [as demonstrated, for instance, by Blondel et al. (2008),who have applied their method to networks of millions of nodes and links].
4.4.6 Error analysis
With the information about the identified version groups we can perform afurther error analysis. In particular, it is interesting to look at the most out-standing ‘confusions’. For instance, it could be interesting to look at groupsof versions that are in fact composed of two or more real groups, i.e. two ormore version groups that share a single detected cluster. Leaving behind a fewcases which we are not able to explain in an intuitive manner, we find thatthe abovementioned ‘cluster sharing’ phenomenon usually has a musicologi-cal explanation. Indeed, the major source for this kind of ‘confusions’ seemsto be the strong similarities between harmonic progressions of different songs(Table 4.4). Inside this category we can highlight some subgroups.The first and primary source of confusion is the fact of sharing a chord pro-gression. Indeed, there are many songs that can share their tonal or chordprogression. However, by considering PCP descriptors instead of chords, andthus using a finer, more detailed characterization, one should presumably haveless confusions of this kind. Nonetheless, the usage of tempo, transposition andstructure invariance strategies again dramatically boost the number of possibleconfusions. That is, if there is a harmonically equivalent sequence of PCPs,the system sometimes detects it in spite of tempo and transposition changes,no matter its location within the piece.A second source of confusions are the songs that have a chord progressioninvolving just dominant and sub-dominant chords (I, IV and V, sometimes

4.5. THE ROLE OF THE ORIGINAL SONG WITHIN ITS VERSIONS 95
Version sets Original performer Chord progression“All along the watchtower” Bob Dylan C]m, B, A“Stairway to heaven” Led Zeppelin Am, G, F“Boys don’t cry” The Cure A, Bm, C]m, D“Here there and everywhere” The Beatles G, Am, Bm, C“Canon in D major” Pachelbel D, A, Bm, G“Let it be” The Beatles C, G, Am, F“No woman no cry” Bob Marley C, G, Am, F“Go west” Pet Shop Boys C, G, Am, Em, F“A whiter shade of pale” Procol Harum C, Em/G, Am, C, F“Help me make it through the night” Kris Kristofferson D, D, G, G, D, D, E, E, A“Oh darling” The Beatles A, D, A, B, E“Imagine” John Lennon C, F, C, F, C, F, G, G“Watching the weels” John Lennon C, F, C, F, C, F, Dm, G, G“Take the A train” Duke Ellington C, C, D, D, Dm, G, C, Dm, G, C“The lady is a tramp” Mitzi Green C, C, Dm, G, G, Cm, Dm, G, C“O amor em paz” Joao Gilberto Bm, E, Am, D, G“Mr. Sandman” The Chordettes B, E, A, D, G“I’ll survive” Gloria Gaynor Am, Dm, G, C, F“Over the rainbow” Judy Garland Csus4, Dm, G, C, F
Table 4.4: Some examples of version group confusions due to shared chord progres-sions.
substituting I by its minor relative VIm). One example employing a chordprogression based on I, IV and V degrees is the common blues progression (I,IV, I, V, IV, I, V). Other examples are the song “Knocking on heaven’s door” (I,V, IV), originally performed by Bob Dylan, “Just like heaven” (V, IV, VIm, I),originally performed by The Cure or “No woman no cry”, originally performedby Bob Marley (I, V, VIm, IV, I). In fact, these songs, jointly with a few othersthat also combine the I, IV and V degrees, form a single compact cluster afterour group detection stage.A third example of confusions between version groups is found with songs thatjust have a one or two-chord progression. In this case, the tonal progressionis barely definitive of the song and one should look at more detailed elementssuch as the melody and ornamentations.Finally, we find some confusions with typical cadences or bass-lines. In par-ticular when there is a dominant/tonic chain with the same root or predomi-nant/fundamental notes. This is the case for example with the last group ofsongs in Table 4.4. All the confusions we have highlighted in this section werevisible in the online demo of the system (see Appendix A).
4.5 The role of the original song within its versions
Following the “typical pattern clustering activity” we outlined in the intro-duction (Sec. 4.1), we now introduce the concepts of “cluster assessment” and“data abstraction” to clusters of versions. That is, assuming that we are able
96CHAPTER 4. CHARACTERIZATION AND EXPLOITATION OF
VERSION GROUPS
to correctly detect coherent groups of versions, we study the relationships be-tween the songs inside these groups. In particular, we focus on the issues ofprototype determination and compactness description.It could be relevant to note that, in a data clustering context, many applica-tions exploit compact cluster descriptions (Jain et al., 1999; Xu & Wunsch II,2009). These compact descriptions are usually given in terms of representativepatterns such as the centroid or, if we want to restrict ourselves to existingelements within the cluster, the medoid. In the context of version networks,one could also be interested in finding a compact representative description ofa group of versions. Indeed, analogously to the clustering context, the cen-troids and medoids of version groups can be effectively estimated. This way,the centroid and the medoid of a group of versions would correspond to the‘average realization’ and the ‘best example’ of the underlying musical piece,respectively (in other words, to the prototype).From the point of view of music perception and cognition, a musical work orsong can be considered as a category (Zbikowski 2002; see also Sec. 2.2.3). Cat-egories are one of the basic devices to represent knowledge, either by humansor by machines (Rogers & McClelland, 2004). According to existing empiricalevidence, some authors postulate that our brain builds categories around pro-totypes, which encapsulate the statistically most-prevalent category features,and against which potential category members are compared (Rosch & Mervis,1975). With this view, after listening to several song versions, a prototype forthe underlying musical piece would be abstracted by listeners. This prototypemight encapsulate features such as the presence of certain motives, chord pro-gressions or contrasts among different musical elements. In this scenario, newitems will be then judged in relation to the prototype, forming gradients ofcategory membership (Rosch & Mervis, 1975).In the context of version communities, we hypothesize that the aforementionedgradients of category membership, in most cases, may point to the originalsong, i.e. the one which was released first14. In particular, we conjecture that,in one way or another, all song versions inherit some characteristics from this‘original prototype’. This feature, combined with the fact that new versionsmay also be inspired by other renditions, leads us to infer that the original songoccupies a central position within a version community, being a referential or‘best example’.To evaluate this hypothesis we manually check for original versions in setup 3and discard the sets that do not have an original, i.e. the ones where the oldestsong we have was not performed by the original artist. We find 426 originals outof 523 version sets. Throughout this section, we employ the directed weightedgraph defined by the asymmetric matrix D (Sec. 4.2.2).Initial supporting evidence that the original song is central within its commu-
14We want to avoid making subjective judgments about a song’s popularity with regardto its versions.

4.5. THE ROLE OF THE ORIGINAL SONG WITHIN ITS VERSIONS 97
Figure 4.7: Graphical representation of the versions network with a strong thresholdof 0.1. Original songs are drawn in blue, while other versions are in black.
nity is given by Figs. 4.7 and 4.8. In Fig. 4.7, we depict the resulting networkafter the application of a strong threshold (only using du,v ≤ 0.1). We seethat communities are well defined and also that many of the original songs areusually ‘the center’ of their communities. In Fig. 4.8, two cumulative distribu-tions have been calculated: one for the weights of links exiting an original song(performed by the original artist, black solid line), and one for links exitingversions (performed by the original or another artist a posteriori from the origi-nal recording, blue broken line). The plotting of these cumulative distributionsindicates that original songs tend to be connected to other nodes through linkswith smaller weights, that is, shorter distances (or higher similarities). Thefact that the original song occupies a central position can be also observedqualitatively with the online demo of the system (Appendix A).To evaluate the aforementioned hypothesis in a more formal way, we proposea study of the ability to automatically detect the original version within acommunity of versions. To this extent, we consider an ideal community detec-tion algorithm (i.e. an algorithm detecting version communities with no false

98CHAPTER 4. CHARACTERIZATION AND EXPLOITATION OF
VERSION GROUPS
Figure 4.8: Cumulative weights distributions for links in the network, divided be-tween links outgoing from an original song (black solid line) and from a song version(blue broken line) songs.
positives and no false negatives) and propose two different methods. Thesemethods are based on the structure of weights of the obtained sub-networkafter the ideal community detection algorithm has been applied.
Closeness centrality This algorithm estimates the centrality of a node bycalculating the mean path length between that node, and any other nodein the sub-network (Barrat et al., 2004; Boccaletti et al., 2006). Notethat the sub-network is fully connected, as no threshold has been ap-plied in this phase. Therefore, the shortest path is usually the directone. Mathematically, let D(k) denote the sub-network containing the k-th community. Then the index i of the original (or prototype) song v(k)i
of the k-th community corresponds to
i = arg min1≤u≤Ck
Ck∑v=1v 6=i
d(k)u,v
, (4.7)
where Ck is the cardinality of the k-th community. Notice that a similarmethodology is employed in the clustering context to infer the medoid ofa cluster (Jain et al., 1999; Xu & Wunsch II, 2009). Indeed, this was theinitial strategy we followed in Serrà et al. (2009b).
MST centrality In this second algorithm we reinforce the role of centralnodes. First, we calculate the minimum spanning tree (MST) for thesub-network under analysis (Costa et al., 2007). After that, we applythe previously described closeness centrality [Eq. (4.7)] to the resultinggraph.
The results in Table 4.5 show the percentage of hits and misses for the de-tection of original songs in dependence of the cardinality Ck of the considered
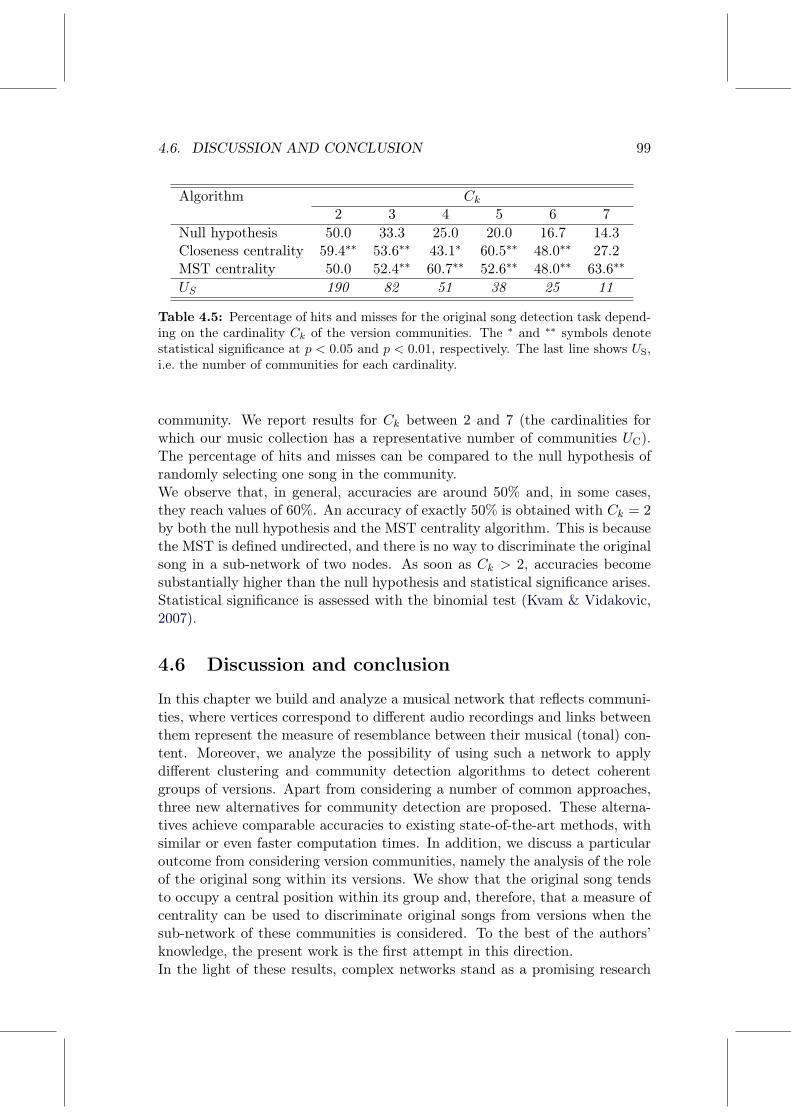
4.6. DISCUSSION AND CONCLUSION 99
Algorithm Ck2 3 4 5 6 7
Null hypothesis 50.0 33.3 25.0 20.0 16.7 14.3Closeness centrality 59.4∗∗ 53.6∗∗ 43.1∗ 60.5∗∗ 48.0∗∗ 27.2MST centrality 50.0 52.4∗∗ 60.7∗∗ 52.6∗∗ 48.0∗∗ 63.6∗∗
US 190 82 51 38 25 11
Table 4.5: Percentage of hits and misses for the original song detection task depend-ing on the cardinality Ck of the version communities. The ∗ and ∗∗ symbols denotestatistical significance at p < 0.05 and p < 0.01, respectively. The last line shows US,i.e. the number of communities for each cardinality.
community. We report results for Ck between 2 and 7 (the cardinalities forwhich our music collection has a representative number of communities UC).The percentage of hits and misses can be compared to the null hypothesis ofrandomly selecting one song in the community.We observe that, in general, accuracies are around 50% and, in some cases,they reach values of 60%. An accuracy of exactly 50% is obtained with Ck = 2by both the null hypothesis and the MST centrality algorithm. This is becausethe MST is defined undirected, and there is no way to discriminate the originalsong in a sub-network of two nodes. As soon as Ck > 2, accuracies becomesubstantially higher than the null hypothesis and statistical significance arises.Statistical significance is assessed with the binomial test (Kvam & Vidakovic,2007).
4.6 Discussion and conclusion
In this chapter we build and analyze a musical network that reflects communi-ties, where vertices correspond to different audio recordings and links betweenthem represent the measure of resemblance between their musical (tonal) con-tent. Moreover, we analyze the possibility of using such a network to applydifferent clustering and community detection algorithms to detect coherentgroups of versions. Apart from considering a number of common approaches,three new alternatives for community detection are proposed. These alterna-tives achieve comparable accuracies to existing state-of-the-art methods, withsimilar or even faster computation times. In addition, we discuss a particularoutcome from considering version communities, namely the analysis of the roleof the original song within its versions. We show that the original song tendsto occupy a central position within its group and, therefore, that a measure ofcentrality can be used to discriminate original songs from versions when thesub-network of these communities is considered. To the best of the authors’knowledge, the present work is the first attempt in this direction.In the light of these results, complex networks stand as a promising research

100CHAPTER 4. CHARACTERIZATION AND EXPLOITATION OF
VERSION GROUPS
line within the specific task of version detection; but, at the same time, theproposed approach can be applied to any query-by-example system (Baeza-Yates & Ribeiro-Neto, 1999; Manning et al., 2008), and specially to otherquery-by-example MIR systems (Casey et al., 2008b; Downie, 2008).In order to mitigate the confusions found in Sec. 4.4.6 we feel that the post-processing strategy we propose should be combined with some pre-processingones. In particular, we hypothesize that, by considering descriptions of differ-ent musical facets, one could partition communities of more than one versionset. We have seen that, for example, a common chord progression was the mostremarkable musical facet between the elements of big communities joining twoor more version sets. Therefore, the consideration of, for example, melodiesor tempo-invariant rhythm descriptions could provide some informed ways ofbreaking down these communities of multiple sets. Such new descriptions couldalso be exploited in the case of incomplete communities, i.e. communities thatdo not contain the entire set of versions of the same piece. In general, moreresearch is needed with regard to the combination of pre- and post-processingstrategies. We have discussed individual pre- and post-processing strategies inSec. 2.3.2. However, their combination still remains an open issue.Finally, we should notice that some of the optimal thresholds for accuracyincrements do not necessarily need to be the same as the ones used in versionset detection. This therefore implies that the best performing methods forversion set detection do not necessarily correspond with those achieving thehighest accuracy increments (Secs. 4.4.2 and 4.4.3). In particular, the roleof false positives becomes important due to the definition of D [Eq. (4.2)]:false positives will be ranked higher than false negatives independently of theirprevious rank (see below). Furthermore, due to the use of different evaluationmetrics, small changes in the optimal parameters could take place.To illustrate the above reasoning, namely that the role of false positives deter-mines different accuracies in the tasks of group detection and accuracy incre-ment, consider the following example. Suppose the first items of the rankedanswer to a concrete query ui are Λu = vj , vk, vl, vm, . . ., where v indicateseffective membership to the same version group. Now suppose that clusteringalgorithm CA1 selects songs ui, vj , vk and vm as belonging to the same clus-ter, and that clustering algorithm CA2 selects ui, vj and vm. Both clusteringalgorithms would have the same recall R but CA2 will have a higher precisionP , and therefore higher accuracy value F [Eqs. (4.3-4.5)]. On the other hand,when evaluating ∆ [Eq. (4.6)], CA2 will take a lower
⟨ψ(D)
⟩value than CA1
(and thus a lower ∆) since vm will be ranked higher than vl [Eq. (4.2)]. Insummary: the clustering and community detection algorithms giving bettercommunity detection and more suitable false positives will achieve the highestincrements.
CHAPTER 5Towards model-based version
detection
5.1 Introduction
A major characteristic that is largely shared among state-of-the-art approachesfor version detection is the lack of specific modeling strategies for descriptortime series (Sec. 2.3). This is somehow surprising since, apart from benefitsrelated to the generality and the compactness of the description, a modelingstrategy could bring some light to the underlying dynamics of descriptor timeseries. In the present chapter we proceed in this direction by introducing amodel-based system for version detection. In particular, we study a model-based forecasting approach, where we employ the concept of cross-predictionerror. We now elaborate on this aspect based on Serrà et al. (2010b) and Serràet al. (2010c).Our approach essentially consists of first training a model to learn the charac-teristics of a query song’s descriptor time series, and then assessing the predic-tions of the model when a target time series of a candidate song is considered.Intuitively, once a model has learned the patterns found in the time series of agiven query song, one would expect the average prediction error to be relativelysmall when the time series of a candidate version is used as input. Otherwise,i.e. when an unrelated (non-version) candidate song is considered, the predic-tion error should be higher (provided that we use a suitable descriptor).Although music descriptor time series are commonplace within the MIR com-munity, little research has been done with regards to music modeling andforecasting using these time series as a starting point (bottom-up or data-driven approaches; Dubnov, 2006; Dubnov et al., 2007; Hazan et al., 2009).In fact, many strategies start from musical knowledge and test whether theobserved data are consistent with the models (top-down or knowledge-drivenapproaches). In general, these top-down approaches are basically probabilis-tic (Abdallah & Plumbey, 2009; Eerola et al., 2002; Pachet, 2002; Paiementet al., 2009) and only consider melodic, simple, synthetic and/or few musical
101

102 CHAPTER 5. TOWARDS MODEL-BASED VERSION DETECTION
examples (Abdallah & Plumbey, 2009; Eerola et al., 2002; Paiement et al.,2009). Furthermore, they usually focus on scores or symbolic data (Abdallah& Plumbey, 2009; Eerola et al., 2002; Pachet, 2002), thus leaving aside manyimportant aspects of the musical context and the specific rendition that canbe captured by the music descriptor time series. For a quantitative charac-terization of descriptor time series, simple statistical moments, autoregressivemodeling, or nonlinear time series analysis techniques have been used (Joderet al., 2009; Meng et al., 2007; Mierswa & Morik, 2005; Mörchen et al., 2006b;Serrà et al., 2009a).In this chapter we take a bottom-up (data-driven) approach starting from mu-sic descriptor time series. Thereby we implicitly consider music recordings asthe output of dynamical systems from which corresponding descriptor timeseries are recorded. We explore a number of popular modeling strategies fromthe linear and nonlinear time series analysis fields (Box & Jenkins, 1976; Kantz& Schreiber, 2004; Lütkepohl, 1993; Van Kampen, 2007; Weigend & Gershen-feld, 1993). We assess the out-of-sample cross-prediction capabilities of thesestrategies by training with one song’s descriptor time series and testing againstother songs with potentially similar musical content (a potential version).We see that a model characterizing music descriptor time series allows for a sim-plified but still useful image of what is sequentially happening in a song’s mu-sical facet. In particular, we demonstrate that the concept of cross-predictionerror can be effectively used for version detection. We show that the ap-proach is very promising in the sense that it achieves competitive accuraciesand furthermore provides additional advantages when compared to state-of-the-art approaches (such as lower computational complexities and potentiallyless storage requirements). Perhaps the most interesting aspect of the proposedapproach is that no parameters need to be adjusted. More specifically, models’parameters and coefficients are automatically learned for each song and eachdescriptor time series individually (no intervention of the user is needed). Ac-cordingly, the system can be readily applied to different music collections ordescriptor time series.
5.2 Method
5.2.1 Overview
A brief overview of the model-based approach and the resulting structure ofthis chapter can be outlined as follows (Fig. 5.1). First, we extract tonal de-scriptor time series and perform transposition (Sec. 5.2.2). Then, a model istrained on the samples of a query song u. To do so we preliminarily performstate space embedding (Sec. 5.2.3). We study several time series models, bothlinear and nonlinear (Sec. 5.2.4). For each model, a number of parameter com-binations are tested and the combination that achieves a lower in-sample (self-)prediction error is kept (Sec. 5.2.5). Indeed, by choosing the best parameter

5.2. METHOD 103
Song u
Modelof u
Error?
Song v
Transposed tonal representation v
Prediction of v based on u
Transposition
Tonal representation u
Tonal representation v
(“Normalization” stage)
Model of tonal representation u
Cross-prediction error
Figure 5.1: General block diagram of the model-based approach.
combination for each time series of each individual piece, we are already per-forming a partial modeling of the time series1. Next, we test the out-of-samplecross-prediction capabilities of the learned model (the model of query songu) on the samples of a candidate song v and compute the error done in thisprediction (Sec. 5.2.6). This cross-prediction error is finally regarded as anindicator of version similarity.We evaluate the approach following a similar methodology than the one ex-plained in Chapter 3 (Sec. 5.3) and report the out-of-sample version retrievalaccuracies for each model (Sec. 5.4). A brief discussion section is included inorder to weigh the advantages of the proposed model-based approach (Sec. 5.5).In closing, we briefly summarize the achievements and propose some lines forfurther research (Sec. 5.6).
1We believe that the modeling of a time series is not only determined by the actualcoefficients that we learn, but also by the parameters of the model themselves. We explainthis aspect in detail in Sec. 5.2.5.

104 CHAPTER 5. TOWARDS MODEL-BASED VERSION DETECTION
5.2.2 Descriptor extraction and transposition
The descriptor time series used in this chapter are the same as the ones ex-plained in Chapter 3 (Sec. 3.2.2). We use PCP, TC and HC time series, whichwere denoted as H, C and g, respectively. The only difference is that now thedownsampling factor of these time series is lower, thus we have more samplesto train our models. Specifically, we use a downsampling factor ν = 5, whichimplies that the hop and frame sizes become 117 and 186 ms, respectively (seeSec. 3.2.2).The way to achieve transposition invariance is again the same as explained inChapter 3 (Sec. 3.2.3). We transpose PCP time series before obtaining TC andHC descriptors and test the O = 2 most probable transposition indices. Fromnow on we also employ the notation X = [x1 · · ·xN ]T introduced in Sec. 3.2.4to refer to a time series of descriptors.
5.2.3 State space embedding
All the models described hereafter aim at predicting the future states of dy-namical systems based on their present states (Kantz & Schreiber, 2004). Sincean isolated sample xi may not contain the necessary information for a reliableprediction at some future time step t, one could consider information from pastsamples. As a notational representation of the present and recent past of atime series we use the concept of delay coordinate state space embedding, atool which is routinely employed in nonlinear time series analysis and whichwe already used in Sec. 3.2.4 [Eq. (3.16)]. Therefore, following the same stepsof that section, we obtain a reconstructed time series X =
[xλ+1 . . . xN
]. Re-
call that λ = (m − 1)τ denotes the embedding window, with m and τ beingthe embedding dimension and the time delay, respectively. If each columnvector xi has X components, representing the X-dimensional sample of thei-th frame, the embedding operation produces column vectors xi, representing(mX)-dimensional samples.
5.2.4 Time series models
To model and predict music descriptor time series we employ popular, simple,yet flexible time series models; both linear and nonlinear (Box & Jenkins,1976; Kantz & Schreiber, 2004; Lütkepohl, 1993; Van Kampen, 2007; Weigend& Gershenfeld, 1993). Since we do not have a good and well-established modelfor music descriptor prediction, we try a number of standard tools in orderto identify the most suitable one. All modeling approaches we employ haveclearly different features. Therefore they are able to exploit, in a forecastingscenario, different structures that might be found in the data. In particular, inthe case of music, we could expect them to exploit repetitions and transitions atmultiple levels (notes, motifs, phrases, sections, etc.). As a linear approach we

5.2. METHOD 105
consider autoregressive models. Nonlinear approaches include locally constant,locally linear, globally nonlinear and probabilistic predictors.
Autoregressive models
A widespread way to model linear time series data is through an autoregres-sive (AR) process, where predictions are based on a linear combination of mprevious measurements (Box & Jenkins, 1976). We here employ a multivariateAR model (Lütkepohl, 1993). In particular, we first construct delay coordinatestate space vectors xi and then express the forecast xi+t at t steps ahead fromthe i-th sample xi as
xi+t = A xi, (5.1)
where A is the X ×mX coefficient matrix of the multivariate AR model. Byconsidering samples i = λ+ 1, . . . N − t, one obtains an overdetermined system
XT = A XT (5.2)
which, by ordinary least squares fitting, allows the estimation of A (Press et al.,1992).
Threshold autoregressive models
Threshold autoregressive (TAR) models generalize AR models by introducingnonlinearity (Tong & Lim, 1980). A single TAR model consists of a collectionof AR models where each single one is valid only in a certain domain of thereconstructed state space (separated by the “thresholds”). This way, pointsin state space are grouped into patches, and each of these patches is used todetermine the coefficients of a single AR model (piecewise linearization).For determining all TAR coefficients we partition the reconstructed spaceformed by X into K non-overlapping clusters with a K-medoids algorithm(Parka & Jun, 2009) and determine, independently for each partition, ARcoefficients as above [Eqs. (5.1) and (5.2)]. Importantly, each of the K ARmodels is associated to the corresponding cluster. When forecasting, we againconstruct delay coordinate state space vectors xi from each input sample xi,calculate their squared Euclidean distance to all k = 1, . . .K cluster medoidsand forecast
xi+t = A(k′) xi, (5.3)
where A(k′) is the X × mX coefficient matrix of the multivariate AR modelassociated to the cluster whose medoid is closest to xi.
Radial basis functions modeling
A very flexible class of global nonlinear models are commonly called radialbasis functions (RBF; Broomhead & Lowe, 1988). As with TAR models, one

106 CHAPTER 5. TOWARDS MODEL-BASED VERSION DETECTION
partitions the reconstructed state space into K clusters but, in contrast, ascalar RBF function φ is used for forecasting such that
xi+t = a0 +K∑k=1
ak φ (‖xi − bk‖) , (5.4)
where ak are coefficient vectors, bk are the cluster centers and ‖ ‖ is a norm.In our case we use the cluster medoids for bk, the Euclidean norm for ‖ ‖ anda Gaussian RBF function
φ (‖xi − bk‖) = e−‖xi−bk‖2
2θρk . (5.5)
We partition the space formed by X with the K-medoids algorithm as above,set ρk to the mean distance found between the elements inside the k-th clusterand leave θ as a parameter. Notice that for fixed centers bk and parameters ρkand θ, determining the model coefficients becomes a linear problem that can beresolved again by ordinary least squares minimization. Indeed, a particularlyinteresting remark about RBF models is that they can be viewed as a (non-linear, layered, feed-forward) neural network where a globally optimal solutionis found by linear fitting (Broomhead & Lowe, 1988; Weigend & Gershenfeld,1993). In our case, for samples i = λ+ 1, . . . N − t, we are left with
XT = A Φ, (5.6)
where A = [a0a1 . . .aK ] is now an X × (K + 1) coefficient matrix and Φ =[Φλ+1 . . . ΦN−t
]is a transformation matrix formed by column vectors
Φi = (1, φ (‖xi − b1‖) , . . . φ (‖xi − bK‖))T . (5.7)
Locally constant predictors
A zeroth-order approximation to the time series is given by a locally constantpredictor (Farmer & Sidorowich, 1987). With this predictor, one first deter-mines a neighborhood Ωi of radius ε around each point xi of the reconstructedtime series X . Then forecasts
xi+t =1
|Ωi|∑
xj∈Ωi
xj+t, (5.8)
where |Ωi| denotes the number of elements in Ωi. Notice that the unrecon-structed versions xj of the neighbors of xi are used.In our experiments, ε is set to a percentage εκ of the mean distance betweenall state space points X (we use the squared Euclidean norm). In addition, werequire |Ωi| ≥ η, i.e. a minimum of η neighbors is always included indepen-dently of their distance to xi. Notice that this is almost a model-free approachwith no coefficients to be learned: one just needs to set parameters m, τ , εκand η.

5.2. METHOD 107
Model Parameter ValuesAll m 1, 2, 3, 5, 7, 9, 12, 15All τ 1, 2, 6, 9, 15TAR & RBF K 1, 2, 3, 4, 5, 6, 7, 8, 10, 12, 15, 20, 30, 40, 50RBF θ 0.5, 0.75, 1, 1.25, 1.5, 2, 2.5, 3, 3.5, 4, 5, 7, 9Locally constant εκ 0.01, 0.025, 0.05, 0.1, 0.2, 0.3, 0.4, 0.5, 0.6, 0.7, 0.8Locally constant η 2, 5, 10, 15, 25, 50Naïve Markov Ki 8, 15, 30, 40, 50, 60, 70Naïve Markov Ko 5, 10, 20, 30, 40, 50
Table 5.1: Parameter values used for grid search.
Naïve Markov models
This approach is based on grouping inputs X and outputs X into Ki andKo clusters, respectively (Van Kampen, 2007). Given this partition, we fillin a Ki × Ko transition matrix P, whose elements pki,ko correspond to theprobability of going from cluster ki of X to cluster ko of X (i.e. the rows ofP sum up to 1). Then, when forecasting, a state space reconstruction xi ofthe input xi is formed and the distance towards all Ki input cluster medoidsis calculated.In order to evaluate the performance of the Markov predictor in the same wayas the other predictors, we use P to construct a deterministic output in thefollowing way:
xi+t =
Ko∑ko=1
pk′i ,ko bko , (5.9)
where bko denotes the medoid of (output) cluster ko and k′i is the index of the(input) cluster whose medoid is closest to xi.
5.2.5 Training and testing
All previous models are completely described by a series of parameters (m,τ , K, θ, εκ, η, Ki, or Ko) and coefficients (A, A(k), P, bk, or ρk). In ourexperiments, these values are learned independently for each song and de-scriptor using the entire time series as training set. This learning is done inan unsupervised way, with no prior information about parameters and coeffi-cients. More specifically, for each song and descriptor time series we calculatethe corresponding model coefficients for different parameter configurations andthen select the solution that leads to the best in-sample approximation of thedata. We perform a grid search for each possible combination that results fromTable 5.1 on each model.Since we aim at obtaining compact descriptions of our data and we want toavoid overfitting, we limit the total number of model parameters and coeffi-cients to be less than 10% of the total number of values of the time series data.

108 CHAPTER 5. TOWARDS MODEL-BASED VERSION DETECTION
This implies that parameter combinations leading to models with more than(N×X)/10 values are automatically discarded at the training phase2. We alsoforce an embedding window λ < N/20.Intuitively, with such a search for the best parameter combination for a specificsong’s time series, part of the time series modeling is also done through theappropriate parameter setting, since m, τ and K are parameters that alsodefine time series’ characteristics (Kantz & Schreiber, 2004). Notice that theprediction horizon t cannot be optimized in-sample since best approximationswould always correspond to t = 1 due to inherent sample correlations. Theimpact of t can only be assessed on the out-of-sample prediction, when themodel is applied to the candidate song.
5.2.6 Prediction error
To evaluate prediction accuracy we use a normalized mean squared error mea-sure (Weigend & Gershenfeld, 1993), both when training our models (to selectthe best parameter combination) and when retrieving versions based on cross-prediction. We define this error as
ξ =1
N − t− λ
N−t∑i=λ+1
1
X
X∑j=1
(xi+t,j − xi+t,j)2
σj2, (5.10)
where σj2 is the variance of the j-th descriptor component over all samplesi = λ + t + 1, . . . N of the target time series X . We use the notation ξu,uwhen a model trained on song u is used to forecast further frames of song u(self-prediction, in-sample error) and ξu,v when a model trained on song u isused to forecast frames of song v (cross-prediction, out-of-sample error).
5.3 Evaluation methodology
5.3.1 Music collection and evaluation measure
The music collection we employ here is the same used in the other parts of thethesis (Sec. 3.3.1). In particular we use MC-102 and MC-2125. To evaluatethe accuracy in identifying song versions we proceed exactly as in Chapter 3.Given a music collection with U songs, we calculate ξu,v for all U ×U possiblepairwise combinations and then create a symmetric dissimilarity matrix D,whose elements are du,v = ξu,v + ξv,u. Once D is computed, we use the meanof average precisions measure
⟨ψ⟩to evaluate version retrieval (Sec. 3.3.2).
2Of course this does not apply to the locally constant predictor, which, as already said,is an almost model-free approach.
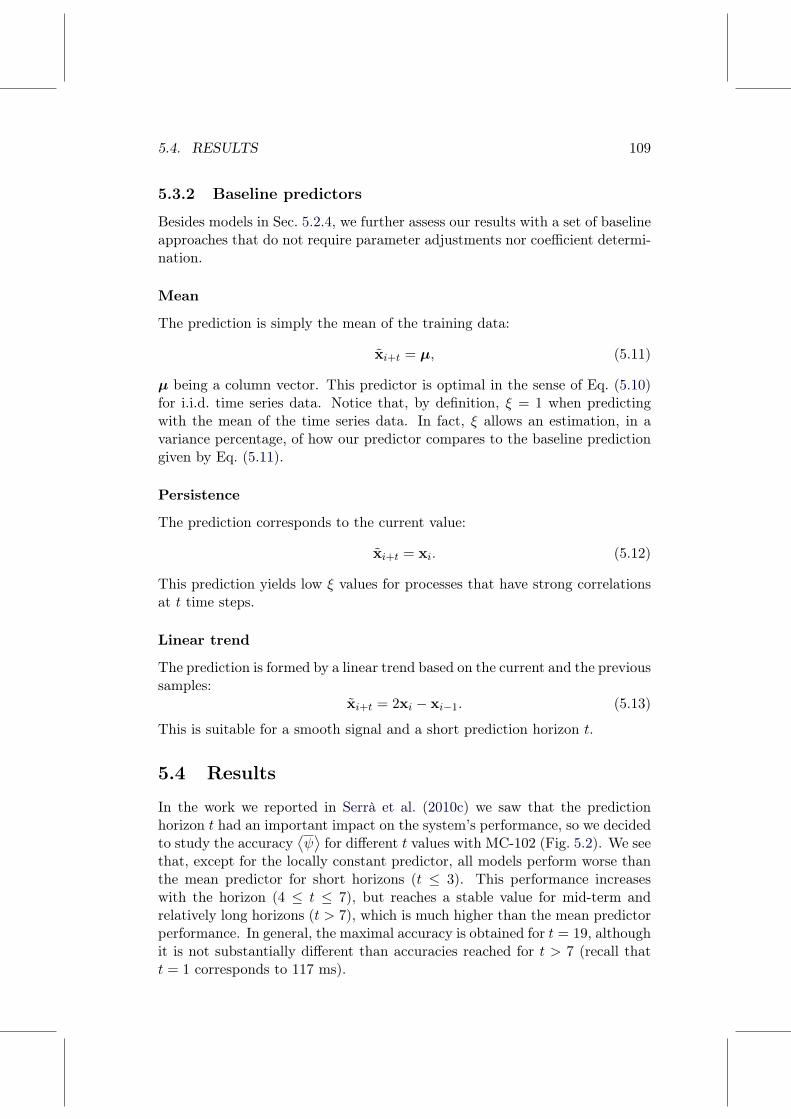
5.4. RESULTS 109
5.3.2 Baseline predictors
Besides models in Sec. 5.2.4, we further assess our results with a set of baselineapproaches that do not require parameter adjustments nor coefficient determi-nation.
Mean
The prediction is simply the mean of the training data:
xi+t = µ, (5.11)
µ being a column vector. This predictor is optimal in the sense of Eq. (5.10)for i.i.d. time series data. Notice that, by definition, ξ = 1 when predictingwith the mean of the time series data. In fact, ξ allows an estimation, in avariance percentage, of how our predictor compares to the baseline predictiongiven by Eq. (5.11).
Persistence
The prediction corresponds to the current value:
xi+t = xi. (5.12)
This prediction yields low ξ values for processes that have strong correlationsat t time steps.
Linear trend
The prediction is formed by a linear trend based on the current and the previoussamples:
xi+t = 2xi − xi−1. (5.13)
This is suitable for a smooth signal and a short prediction horizon t.
5.4 Results
In the work we reported in Serrà et al. (2010c) we saw that the predictionhorizon t had an important impact on the system’s performance, so we decidedto study the accuracy
⟨ψ⟩for different t values with MC-102 (Fig. 5.2). We see
that, except for the locally constant predictor, all models perform worse thanthe mean predictor for short horizons (t ≤ 3). This performance increaseswith the horizon (4 ≤ t ≤ 7), but reaches a stable value for mid-term andrelatively long horizons (t > 7), which is much higher than the mean predictorperformance. In general, the maximal accuracy is obtained for t = 19, althoughit is not substantially different than accuracies reached for t > 7 (recall thatt = 1 corresponds to 117 ms).

110 CHAPTER 5. TOWARDS MODEL-BASED VERSION DETECTION
0 5 10 15 20 25 30
0
0.1
0.2
0.3
0.4
0.5
0.6
0.7
0.8
t
⟨ ψ
⟩
|
Mean
Persistence
Lin. Trend
N. Markov
Loc. Const.
RBF
AR
TAR
Figure 5.2: Mean of average precisions⟨ψ⟩depending on the prediction horizon t.
Results for the TC descriptor with all considered models (MC-102). PCP and HCtime series yield qualitatively similar plots.
The ability to perform reliable cross-predictions at long horizons is, of course,related to the ability of the learned model to perform (self-) predictions at sucha time span. To assess this latter ability we studied the self-prediction errorξu,u as a function of the forecast horizon t (Serrà et al., 2010c). In general, wesaw that ξu,u increased rapidly for t ≤ 4 but, surprisingly, it reached a stableplateau with all descriptors for t > 10, i.e. for prediction horizons of more than1 s. Notably, in this plateau, ξu,u < 1. This indicated that, on average, therewas a certain capability for the models to still perform predictions at relativelylong horizons, and that these predictions were better than predicting with themean. Overall, the previous fact reveals that descriptor time series are far frombeing i.i.d. data (even at relatively long t) and that models are capturing partof the long-term structures and repetitions found in our collection’s recordings.We conjecture that these two facts play a crucial role in the cross-predictionscenario, allowing the correct detection of versions. For more details concerningthe in-sample self-prediction capabilities of the considered models we refer thereader to Serrà et al. (2010c).The fact that we detect versions better at mid-term and relatively long horizonscould also have a musicological explanation. To see this we study matricesquantifying the transition probabilities between states separated by a timeinterval corresponding to the prediction horizon t. We first cluster a time seriesX into, for instance, 10 clusters and compute the medoids. We subsequentlyfill a transition matrix P, with elements pi,j . Here i and j correspond to theindices of the medoids to which respectively xi and xi+t are closest. Thistransition matrix is normalized so that each row adds up to 1. In Fig. 5.3we show P for three different horizons (t = 1 in the first column, t = 7 in

5.4. RESULTS 111
(a)
2 4 6 8 10
2
4
6
8
10
(d)
2 4 6 8 10
2
4
6
8
10
(b)
2 4 6 8 10
2
4
6
8
10
(e)
2 4 6 8 10
2
4
6
8
10
(c)
2 4 6 8 10
2
4
6
8
10
(f)
2 4 6 8 10
2
4
6
8
10
Figure 5.3: Transition matrices P for two versions (top) and two unrelated songs(bottom) using 10 input and 10 output clusters (see text). These transition matricesare computed for t = 1 (a,d), t = 7 (b,e) and t = 15 (c,f). Bright colors correspond tohigh transition probabilities (white and yellow patches).
the second column and t = 15 in the third column). Two unrelated songs areshown (one row each). The musical piece that provided the cluster medoidsto generate P is a version of the first song (top row) but not of the second(bottom row).We see that, for t = 1, P is highly dominated by persistence to the same cluster,both for the version (Fig. 5.3a) and the non-version (Fig. 5.3d) pair. Thisfact was also corroborated with the self-prediction results of the persistence-based predictor (Serrà et al., 2010c). Once t increases, characteristic transitionpatterns arise, but the similarity between matrices in Fig. 5.3b and 5.3e showthat these patterns are not characteristic enough to define a musical piece.Compare for example the high values obtained for both matrices (b) and (e)at p7,6, p9,8, p2,4, p1,9, or p3,10. We conjecture that these transitions definegeneral musical features that are shared among a large number of subsets ofrecordings, not necessarily just the versions. For example, it is clear thatthere are general rules with regard to chord transitions, with some particulartransitions being more likely than others (Krumhansl, 1990). Only when t > 7transitions that discriminate between the dynamics of songs start to becomeapparent (see the distinct patterns in Figs. 5.3c and 5.3f). This distinctivenesscan then be exploited to differentiate between versions and non-versions.Results for version retrieval with MC-2125 indicate that the best model is theTAR model; although notable accuracies are achieved with the RBF method(Table 5.2). The AR and the naïve Markov models come next. Persistenceand linear trend predictors perform at the level of the random baseline
⟨ψ⟩null.
This is to be expected since no learning is performed for these predictors.

112 CHAPTER 5. TOWARDS MODEL-BASED VERSION DETECTION
Methods DescriptorsPCP TC HC
Linear trend <0.01 <0.01 <0.01Persistence <0.01 <0.01 <0.01Mean 0.15 0.09 0.01Locally constant 0.25 0.28 0.05Naïve Markov 0.37 0.38 0.05AR 0.37 0.41 0.04RBF 0.38 0.44 0.05TAR 0.39 0.44 0.06
Table 5.2: Mean of average precisions⟨ψ⟩for the version identification task (MC-
2125). A prediction horizon of t = 19 was used. The maximum of the random baseline⟨ψ⟩null was found to be 0.008 within 99 runs.
In addition, we see that the HC descriptor is much less powerful than theother two. This is to be expected, since HC compresses tonal information toa univariate value. Furthermore, HC might be less informative than PCP orTC values themselves, which already contain the change information in theirtemporal evolution. Apart from this, we see that TC descriptors perform betterthan PCP descriptors. This does not necessarily imply that TC descriptorsprovide a better representation of the tonal information that is present in arecording, but that TAR models are better in capturing the essence of theirtemporal evolution.
5.5 Discussion
Even though the considered models yield a significant accuracy increase whencompared to the baselines, it might still seem that a value of
⟨ψ⟩around 0.4
in an evaluation measure that ranges between 0 and 1 is not a big success fora version identification approach. To properly asses this accuracy one has tocompare it against the accuracies of state-of-the-art approaches.According to MIREX, the best accuracy achieved until the moment of writingthis thesis for the version identification task was obtained with the previousmodel-free system of Chapter 3. This system, without any post-processingstep, reaches
⟨ψ⟩
= 0.66 with the MIREX dataset and yields⟨ψ⟩
= 0.70with MC-2125 (Sec. 3.4.2). A former method by Serrà et al. (2008b) scored⟨ψ⟩
= 0.55 with the MIREX data. Thus the cross-prediction approach does notoutperform these methods. However, the cited methods were specifically de-signed for the task of identifying versions, while the cross-prediction approachis a general schema that does not incorporate all the specific modifications thatcould be beneficial for such a task (e.g. it does note take into account tempo or
5.5. DISCUSSION 113
structural changes between versions, Sec. 2.3). To make further comparisons(at least qualitatively), one should note that
⟨ψ⟩values around 0.4 are in line
with other state-of-the-art accuracies, or even better if we consider comparablemusic collections (see e.g. Table 2.2 in Sec. 2.3.3).Beyond accuracy comparisons, some other aspects can be discussed. Indeed,another reason for appraising the solution obtained here comes from the con-sideration of storage capacities and computational complexities at the queryretrieval stage. Since we limit our models to a size of 10% of the total numberof training data (Sec. 5.2.5), they require 10% of the storage that would beneeded for saving the entire time series (state-of-the-art systems usually storethe full time series for each song). This fact could be exploited in a single-queryretrieval scenario. In this setting, it would be sufficient to determine a dissim-ilarity measure ξ (Eq. 5.2.6) from the application of all candidates’ models tothe query song. Hence, only the models rather than the raw data would berequired. Regarding computational complexity, many approaches for versionidentification are quadratic in the length of the time series, requiring at leastan Euclidean distance calculation for every pair of sample points3 (Sec. 2.3).Contrastingly, the approaches presented here are linear in the length of thetime series. For example, with TAR models, we just need to do a pairwisedistance calculation between the samples and the K medoids, plus a matrixmultiplication and subtraction (notice that the former is not needed with ARmodels). If we compare the model-free approach of Chapter 3 with the TAR-based strategy by considering an average time series length N , we have thatthe former is roughly O
(N2mX
), while the latter is O
(N(K +X)mX
), with
K+X N . To illustrate this with specific numbers: with N = 2304 (approx-imately 4 min of music), descriptor dimensionality X = 12 (the largest amongPCP, TC and HC) and K = 50 (the maximum allowed, Table 5.1), we obtaina minimal relative speed improvement of 2304/(50 + 12) ≈ 37.A further and very interesting advantage of using the approaches consideredin this chapter is that no parameters need to be adjusted by the user. Morespecifically, models’ parameters and coefficients are automatically learned foreach song and descriptor time series individually by the minimization of the in-sample training error ξu,u. Usually, version identification algorithms have mul-tiple parameters that can be dependent, for instance, on the music collection,the music descriptor time series, or the types of versions under consideration(Sec. 2.3). The model-free approach of Chapter 3 and our previous method ofSerrà et al. (2008b) were not an exception: as there was no way to a priori settheir specific parameters, these were set by trial and error with a representative(ideally out-of-sample) music collection. Since for the current approaches nosuch manual parameter optimization is required, their application to versionidentification is robust and straightforward.
3As examples we can mention the model-free approach of Chapter 3, or our previousmethod of Serrà et al. (2008b).

114 CHAPTER 5. TOWARDS MODEL-BASED VERSION DETECTION
5.6 Conclusions and future work
In this chapter we explore a number of modeling strategies for version retrieval.In particular, we test a number of routinely employed time series models. Theseinclude linear and nonlinear predictors such as AR, TAR, RBF, locally con-stant and naïve Markov. These models are automatically trained for each songand descriptor time series individually. Training is done in an unsupervisedway, performing a grid search over a set of parameter combinations and auto-matically determining the corresponding coefficients. We perform an in-sampleself-prediction of the descriptor time series in order to assess which parametercombination gives the best approximation to the time series.With the experiments above we demonstrate both the capacity of generaliza-tion of the considered models and the real-world applicability of out-of-samplecross-prediction errors. More specifically, we show that cross-predictions atmid-term and relatively long horizons permit the performance of version re-trieval. In particular, AR, TAR and RBF methods achieve competitive accu-racies.In general, we see that considering cross-predictions of time series models leadsto a parameter-free approach for version identification. Furthermore, the ap-proach is fast, allows for reduced storage and still maintains a highly compet-itive accuracy when compared to state-of-the-art systems. Thus, time seriesmodeling strategies stand as a really promising approach for version detectionand, by extension, for music and multimedia retrieval in general.Two important research lines stem from the work in the current chapter. First,it would be interesting to consider further time series models and to see howaccurate they are in the version identification task. This partially points outthe necessity of knowing more about the nature of a descriptor time series,an aspect which was initially assessed in Serrà et al. (2010c). In particu-lar, our findings suggested that the temporal evolution of music descriptorsmight be explained by a concatenation of multiple autoregressive processeswith superimposed noise. Interestingly, AR and TAR models yielded the low-est self-prediction errors (recall that they also reach the highest accuracies inthe case of version retrieval presented in Sec. 5.4 above). In spite of the evi-dence found, we should be cautious since some contradictory evidence on theuse of AR models for music descriptor time series exists. In particular, Menget al. (2007) reported that AR modeling of descriptor time series was beneficialfor genre classification, while Joder et al. (2009) reported that such a strategywas not useful for instrument classification.The second research line to pursue is more practical and it is focused on theversion retrieval task. Indeed, it would be important to see whether the accu-racies achieved by a model-based approach can surpass the ones achieved bythe best model-free approaches. In particular, there have been two importantaspects missing in the formulation of our model-based approach: tempo andstructure invariance. With regard to tempo invariance, we hypothesize that

5.6. CONCLUSIONS AND FUTURE WORK 115
possibly working with tempo-insensitive representations of tonal information,such as the ones used e.g. by Ellis & Cotton (2007), could partially solve theproblem. However, one should be careful in the beat-detection stage, since itcould introduce additional errors to the system (Sec. 2.3). Notice that the in-troduction of a tempo invariant representation is only the most straightforwardoption and that further strategies can be devised, specially with the settingof the prediction horizon t and the time delay τ . With regard to structureinvariance, the easiest way would be to cut the time series into short (maybe30 s) overlapping segments and train different models on each segment. How-ever, this solution would introduce additional computational costs since eacherror for each segment would need to be evaluated. Notice that both trainingand testing (error computation) phases should be appropriately ‘tuned’ in or-der to achieve structure invariance. Therefore, only modifying Eq. (5.2.6) totake the possibility of changes in the song structure into account would notbe sufficient. Preliminary experiments with our data showed that the versionretrieval accuracy was not increased when considering only the latter strategy.An additional issue with the overall structure invariance strategy is that of thenumber of samples that are needed to train a time series model. It could bethe case that the time series samples found in 30 s may not be sufficient for aproper training.


CHAPTER 6Summary and future
perspectives
6.1 Introduction
Can a computer recognize the underlying musical composition behind a giveninterpretation? Can we automatically detect if two songs correspond to thesame music piece despite many important musical variations? These werethe kind of questions that motivated our research (Sec. 1.1). In the light ofthe results presented in this thesis we can now answer: yes. Certainly thesolutions we propose are able to perform such tasks effectively in the majorityof cases. Of course we should give a word of caution since our system is not100% accurate. However, we have shown that part of the errors produced bythe system are explainable from a perceptual and a musicological perspective(Secs. 3.4.5 and 4.4.6). Therefore, we could expect that humans would showsimilar mistakes than those observed in our systems.We started this thesis with an introduction to automatic version identifica-tion, with a special focus on the context of music information retrieval, withsome terminology remarks, and with the common musical variations betweensong versions (Chapter 1). The context of music information retrieval wasfurther reviewed in our literature summary, emphasizing current approachesfor version identification (Chapter 2). We then presented and evaluated ourmain approach for version identification, a model-free system (Chapter 3). Wesubsequently studied and assessed a post-processing strategy for the outputof this system (Chapter 4). Finally, in contraposition to our model-free sys-tem, we presented and evaluated a model-based system which, although notoutperforming the model-free one, had remarkable advantages (Chapter 5).Towards the end of each chapter we have been providing the main conclusionsregarding our work. These conclusions summarize in detail the work reportedwithin each chapter, highlight relevant results and outcomes and comment onconcrete aspects of each specific approach. Alternatively, in this chapter, more
117
118 CHAPTER 6. SUMMARY AND FUTURE PERSPECTIVES
general or global statements are made. We end this dissertation with somebrainstorming on future perspectives.
6.2 Summary of contributions
This thesis contributes to the processing, retrieval, organization and under-standing of digital information, specifically multimedia information. Morespecifically, it strongly contributes to the field of audio content-based musicinformation retrieval:
• It is, to the best of the author’s knowledge, the first thesis entirely de-voted to the topic of automatic audio-based version identification.
• It critically discusses version identification in the context of music in-formation retrieval. This includes a critical assessment of current ap-proaches and evaluation procedures.
• It provides a comprehensive overview of the scattered available literatureon version identification based on the audio content. Specific emphasisis given to the main functional blocks that are needed to build a versionidentification system.
• It proposes a successful model-free approach for version identification.Noticeably, the quantification measures derived from this approach havemany potential applications beyond music information retrieval (see be-low).
• It characterizes and exploits the output of a version identification system.In particular, it is shown that song versions of the same piece naturallycluster together, that these clusters can be effectively detected and thatthis information can be used to enhance the results of existing systems.Again, the application of the developed strategies goes beyond versionretrieval.
• It explores the role that original songs play inside a group of versions,showing that there is a certain tendency for the original song to be centralwithin the group.
• It explores model-based approaches for version identification. These ap-proaches represent a very promising research line with regard to obtainingparameter-free systems that are fast, allow for reduced storage and arestill competitive in accuracy.
In addition, it is worth noticing that the proposed model-free approach (Qmax),together with its post-processed version (Q∗max), reached the two highest accu-racies in the MIREX 2008 and 2009 editions of the “audio cover song identifica-tion task”. At the moment of writing this thesis, the aforementioned accuracies

6.3. SOME FUTURE PERSPECTIVES 119
remain the highest in all MIREX editions of said task (including the one in2010). These accuracies clearly surpass those achieved by current state-of-the-art approaches, including a previous approach by the author which, at its timein 2007, achieved the highest MIREX score (Serrà et al., 2008b).With regard to the general applicability of the proposed methods, it may berelevant to cite the words from the board member’s report after reviewingour paper submitted to New Journal of Physics (Serrà et al., 2009a): “Bothreferees agree that the study is interesting. However the first referee does notthink that the studying music retrieval problem is of interest to the readershipof NJP. I do not agree with this view since much of our physics studies inrecent years are applications of physics methods to multidisciplinary fields. Ithink that developing novel physical methods for automatic classification ofdigital information and in particular automatic identification of cover songs isof much interest. I therefore recommend accepting the paper in NJP”. Timehas shown that the board member was right: the paper was among the 10%most downloaded papers across all Institute of Physics1 journals within thefirst month of publication2.The outcomes of the research carried out in this thesis have been publishedin the form of several papers in international conferences, journals and a bookchapter. Some of these publications have been featured in a number of publicand private communication media3. An online demo of the system was alsopresented at an international conference (Appendix A). Moreover, part of thisresearch has been deployed into a commercial media broadcast monitoringservice4 by the company Barcelona Music and Audio Technologies and theauthor is inventor of two patents applied by the same company. The full listof the author’s publications and patents is provided in an annex to this thesis(Appendix B).
6.3 Some future perspectives
Some new avenues for research have already been advanced in the last chaptersof the thesis. For example, it is clear that further pre- and post-processingtechniques can provide a valuable accuracy increase in current systems. Anadditional issue is that of the simultaneous combination of pre- and post-processing strategies.With regard to pre-processing techniques, we are particularly optimistic aboutthe combination of different sources of information. Indeed, there are differentmusical facets that can be shared within versions. Therefore different methodsfor extracting these ‘essential’ characteristics would be necessary. Although
1http://www.iop.org2Tim Smith, publisher of New Journal of Physics, personal communication, October 2009.3A selection of these appearances can be found in the author’s web page: http:
//joanserra.weebly.com4http://www.bmat.com/vericast
120 CHAPTER 6. SUMMARY AND FUTURE PERSPECTIVES
many of these methods already exist, there still is much room for improve-ment. We are particularly thinking about methods for melody and polyphonicpitch estimation, chord recognition and descriptor extraction in general (Caseyet al., 2008b). Source separation would also be an important tool in versionidentification (Foucard et al., 2010).An important issue arises regarding the combination of these multiple sourcesof information. In particular, one needs to decide where to combine the in-formation and to devise the corresponding strategy for doing so (early andlate-fusion schemes). This is a general problem shared across information sci-ence disciplines (e.g. Ross & Jain, 2003; Tahani & Keller, 1990; Temko et al.,2007). Many strategies exist, however there does not seem to be a clear win-ner. With regard to specific post-processing techniques, we advocate generalclustering and classification techniques. Although these techniques are alreadyincorporated in the state-of-the-art, we think they deserve further exploration.Perhaps a good starting point would be the incorporation of time series insidethe clustering or classification algorithm (e.g. the alignment kernels of Joderet al., 2009).The discussion above leads us to the use of different strategies to model theinformation extracted from audio. Related to this aspect, we believe thatmodel-based approaches for version identification are a promising research di-rection to pursue. We find the reasons presented in the corresponding sectionto be a good indicator of what further research on this aspect can offer. Itwould be particularly interesting to see how hidden Markov models (HMM;Cappé et al., 2005; Rabiner, 1989) can be adapted to version identification.Such models have been very successful within the speech processing commu-nity (Rabiner & Juang, 1993) and thus are well-researched and established (seee.g. Pujol et al., 2005; Wilpon et al., 1990; Woodland & Povey, 2002). How-ever, we conjecture that specific adaptations would be needed, in particularadaptations dealing with tempo and structure invariance (see e.g. Batlle et al.(2002) for some structure invariance adaptations of HMMs in the context ofaudio fingerprinting). In addition, one should use a continuous version of suchmodels, since quantization of observations is not trivial in the case of versionidentification systems. Finally, an important point would be the incorporationof musical knowledge to the model. One way to incorporate such knowledge isby a case-based reasoning approach [Kolodner (1993); c.f. Arcos et al. (1997)].In general, model-based approaches have an important industrial advantageover model-free ones: computational complexity. Indeed, more effort is neededin order to achieve scalable solutions that are able to effectively deal with musiccollections of millions of items. This is not a straightforward task, and currentlow-complexity methods fail to detect many songs when they are submitted toa pure/genuine version identification task (Sec. 2.3). Scalable methods needto achieve comparable (or better) accuracies than current non-scalable ones.Another avenue for research is that of detecting musical quotations (Sec. 1.2.2).In classical music, there is a long tradition of composers citing phrases or

6.3. SOME FUTURE PERSPECTIVES 121
motives from other composers (e.g. Alban Berg quoting Bach’s chorale “Es istgenug” in his “Violin Concerto” or Richard Strauss quoting Beethoven’s “Eroicasymphony” in his “Metamorphosen for 23 solo strings”). In popular music thereare also plenty of quotations (e.g. The Beatles’ ending section of “All you needis love” quotes the French anthem “La Marseillaise” and Glen Miller’s “In themood” or Madonna’s “Hung up” quoting ABBA’s “Gimme, gimme, gimme”),and even modern electronic genres massively borrow loops and excerpts fromany existing recording. As the quoted sections are usually of short duration,special adaptations of the current version identification algorithms would berequired to detect them. In addition to facilitating legal procedures, linkingdiverse musical works this way opens new interesting ways for navigating acrosshuge music collections. A related but different approach is to find, on a large-scale, music audio segments “that are similar not only in feature statistics, butin the relative positioning of those features” in time (Ellis et al., 2008).The role of original songs within a group of versions is a research issue thatdeserves further exploration. In particular, it remains to be seen if some way toquantify the ‘originality’ of recordings exists or, at least, if some trends can beobserved. Not only experiments with groups of versions should be performed,but also with pairwise comparisons. In the latter scenario perhaps one couldmaybe employ some measures of causality (e.g. Granger, 1969) or informationtransfer (e.g. Schreiber, 2000). However, we hypothesize that more informedand precise descriptions of the recordings should be used.In order to identify song versions, the usual approach pays attention solelyto the musical facets that are shared among them. This makes sense if weconsider the task as a pure identification task. However, if we want to gobeyond identification, we cannot suppose that musical changes do not affectthe similarity between versions. With current systems, if two songs are versionsand have the same timbre characteristics and a third song is also a version butdoes not exhibit the same timbre, they will score the same similarity. Futureworks approaching version similarity in a stricter sense (not just identification)might benefit from also considering also differences between music recordingsso that, in the previous example, the third version is less similar than the firsttwo (c.f. Tversky, 1977).Determining version similarity in a stricter sense would have some practicalconsequences and would be a useful feature for music retrieval systems. There-fore, depending on the goals of the listeners, different degrees of similarity couldbe required. Here we have a new scenario where the ill-defined but typical mu-sic similarity problem needs to be addressed (Berenzweig et al., 2004).Finally, on a more general side, automatic version identification calls for ahuman-motivated approach (Sec. 2.2.3). Current methods are constituted bya number of algorithms that do not resemble the ways humans process musicinformation at all. It would be very interesting to devise a version identifica-tion system that performs the task as humans would. Indeed, a perceptually-inspired model for the processing of music signals plus a cognitively-motivated

122 CHAPTER 6. SUMMARY AND FUTURE PERSPECTIVES
way to select and store relevant information items and a psychologically-soundcomparison of such items would be a remarkable outcome.

Joan Serrà, Barcelona, February 9, 2011.


Bibliography
Aach, J. & Church, G. (2001). Aligning gene expression time series with timewarping algorithms. Bioinformatics, 17, 495–508.
Abdallah, S. & Plumbey, M. D. (2009). Information dynamics: patterns ofexpectation and surprise in the perception of music. Connection Science,21 (2), 89–117.
Adams, N. H., Bartsch, N. A., Shifrin, J. B., & Wakefield, G. H. (2004). Timeseries alignment for music information retrieval. In Proc. of the Int. Conf.on Music Information Retrieval (ISMIR), pp. 303–310.
Agger, G. (1999). Intertextuality revisited: dialogues and negotiations in mediastudies. Canadian Journal of Aesthetics, 4. Available online: http://www.uqtr.ca/AE/vol_4/gunhild(frame).htm.
Agus, T. R., Thorpe, S. J., & Pressnitzer, D. (2010). Rapid formation of robustauditory memories: insights from noise. Neuron, 66, 610–618.
Ahonen, T. E. (2010). Combining chroma features for cover version identifi-cation. In Proc. of the Int. Soc. for Music Information Retrieval (ISMIR)Conf., pp. 165–170.
Ahonen, T. E. & Lemstrom, K. (2008). Identifying cover songs using nor-malized compression distance. In Proc. of the Int. Workshop on MachineLearning and Music (MML), 5.
Allen, G. (2000). Intertextuality: the new critical idiom. New York, USA:Routledge, Taylor and Francis.
Andoni, A. & Indyk, P. (2008). Near-optimal hashing algorithms for approx-imate nearest neighbor in high dimensions. Communications of the ACM,51 (1), 117–122.
Andrzejak, R. G. (2010). Nonlinear time series analysis in a nutshell. Tech.rep., Universitat Pompeu Fabra, Barcelona, Spain. Available online: http://www.cns.upf.edu/ralph/teachingM/Kansas3.pdf.
Antani, S., Kasturi, R., & Jain, R. (2002). A survey on the use of patternrecognition methods for abstraction, indexing and retrieval of images andvideo. Pattern Recognition, 35 (4), 945–965.
125

Arcos, J. L., López-de Mantaras, R., & Serra, X. (1997). SaxEx: a case-basedreasoning system for generating expressive musical performances. In Proc.of the Int. Computer Music Conf. (ICMC), pp. 329–336.
Aucouturier, J. J. & Pachet, F. (2004). Improving timbre similarity. How highis the sky? Journal of Negative Results on Speech and Audio Sciences, 1 (1).
Baeza-Yates, R., Calderón-Benavides, L., & González-Caro, C. (2006). Theintention behind web queries. In F. Crestani, P. Ferragina, & M. Sanderson(Eds.) Lecture Notes in Computer Science, SPIRE 2006, pp. 98–109. Berlin,Germany: Springer.
Baeza-Yates, R., Castillo, C., & Efthimiadis, E. N. (2007). Characterizationof national web domains. ACM Trans. on Internet Technology, 7 (2), 9.
Baeza-Yates, R. & Perleberg, C. S. (1996). Fast and practical approximatestring matching. Information Processing Letters, 59, 21–27.
Baeza-Yates, R. & Ribeiro-Neto, B. (1999). Modern information retrieval. NewYork, USA: ACM Press.
Bailes, F. (2010). Dynamic melody recognition: distinctiveness and the role ofmusical expertise. Music and Cognition, 38 (5), 641–650.
Barrat, A., Barthélemy, M., Pastor-Satorras, R., & Vespignani, A. (2004).The architecture of complex weighted networks. Proceedings of the NationalAcademy of Sciences of the USA, 101, 3747.
Bartsch, N. A. & Wakefield, G. H. (2005). Audio thumbnailing of popularmusic using chroma-based representations. IEEE Trans. on Multimedia,7 (1), 96–104.
Batlle, E., Masip, J., & Guaus, E. (2002). Automatic song identification innoisy broadcast audio. In Proc. of the Signal and Image Processing Conf.(SIP), pp. 101–111.
Bello, J. P. (2007). Audio-based cover song retrieval using approximate chordsequences: testing shifts, gaps, swaps and beats. In Proc. of the Int. Conf.on Music Information Retrieval (ISMIR), pp. 239–244.
Bello, J. P. & Pickens, J. (2005). A robust mid-level representation for har-monic content in music signals. In Proc. of the Int. Conf. on Music Infor-mation Retrieval (ISMIR), pp. 304–311.
Berenzweig, A., Logan, B., Ellis, D. P. W., &Whitman, B. (2004). A large scaleevaluation of acoustic and subjective music similarity measures. ComputerMusic Journal, 28 (2), 63–76.

Blondel, V. D., Guillaume, J. L., Lambiotte, R., & Lefebvre, E. (2008). Fastunfolding of communities in large networks. Journal of Statistical Mechanics,10, 10008.
Boccaletti, S., Latora, V., Moreno, Y., Chavez, M., & Hwang, D.-U. (2006).Complex networks: structure and dynamics. Physics Reports, 424 (4), 175–308.
Bor, J. (2002). The raga guide. Monmouth, UK: Nimbus Communications.
Box, G. & Jenkins, G. (1976). Time series analysis: forecasting and control.Oakland, USA: Holden-Day, rev. edn.
Bregman, A. S. (1990). Auditory scene analysis: the perceptual organizationof sound. Cambridge, USA: MIT Press.
Broomhead, D. S. & Lowe, D. (1988). Multivariable functional interpolationand adaptive networks. Complex Systems, 2, 321–355.
Buldú, J. M., Cano, P., Koppenberger, M., Almendral, J., & Boccaletti, S.(2007). The complex network of musical tastes. New Journal of Physics, 9,172.
Caldwell, J. & Boyd, M. (2010). Dies irae. Grove Music Online. OxfordMusic Online. Available online: http://www.oxfordmusiconline.com/subscriber/article/grove/music/40040.
Cano, P., Batlle, E., Kalker, T., & Haitsma, J. (2005). A review of audiofingerprinting. Journal of VLSI Signal Processing Systems, 41 (3), 271–284.
Cano, P., Celma, O., Koppenberger, M., & Buldú, J. M. (2006). Topologyof music recommendation networks. Chaos: an Interdisciplinary Journal ofNonlinear Science, 16 (1), 013107.
Cappé, O., Moulines, E., & Rydén, T. (2005). Inference in hidden Markovmodels. New York, USA: Springer Science.
Casey, M., Rhodes, C., & Slaney, M. (2008a). Analysis of minimum distancesin high-dimensional musical spaces. IEEE Trans. on Audio, Speech andLanguage Processing, 16 (5), 1015–1028.
Casey, M. & Slaney, M. (2006). The importance of sequences in musical sim-ilarity. In Proc. of the IEEE Int. Conf. on Acoustics, Speech and SignalProcessing (ICASSP), vol. 5, pp. V–V.
Casey, M., Veltkamp, R. C., Goto, M., Leman, M., Rhodes, C., & Slaney, M.(2008b). Content-based music information retrieval: current directions andfuture challenges. Proceedings of the IEEE, 96 (4), 668–696.

Casey, M. & Westner, W. (2000). Separation of mixed audio sources by in-dependent subspace analysis. In Proc. of the Int. Computer Music Conf.(ICMC), pp. 154–161.
Chai, W. (2005). Automated analysis of musical structure. Ph.D. thesis, Mas-sachussets Institute of Technology, USA.
Chandran, V., Carswell, B., Boashash, B., & Elgar, S. L. (1997). Patternrecognition using invariants defined from higher order spectra: 2-D imageinputs. IEEE Trans. on Image Processing, 6 (5), 703–712.
Chávez, E., Navarro, G., Baeza-Yates, R., & Marroquín, J. L. (2001). Searchingmetric spaces. ACM Computing Surveys, 33 (3), 273–321.
Chew, E. (2000). Towards a mathematical model of tonality. Ph.D. thesis,Massachussets Institute of Technology, USA. Available online: http://dspace.mit.edu/handle/1721.1/9139.
Chew, G., Mathiesen, T. J., Payne, T. B., & Fallows, D. (2010). Song.Grove Music Online. Oxford Music Online. Available online: http://www.oxfordmusiconline.com/subscriber/article/grove/music/50647.
Cho, T., Weiss, R. J., & Bello, J. P. (2010). Exploring common variations instate of the art chord recognition systems. In Proc. of the Sound and MusicComputing Conf. (SMC), 1.
Clauset, A., Newman, M. E. J., & Moore, C. (2003). Finding communitystructure in very large networks. Physical Review E, 70 (6), 066111.
Cohn, R. (1997). Neo-Riemannian operations, parsimonious trichords and theirtonnetz representations. Journal of Music Theory, 1 (41), 1–66.
Comins, J. A. & Genter, T. Q. (2010). Working memory for patterned se-quences of auditory objects in a songbird. Cognition, 117 (1), 38–53.
Conrad, R. (1965). Order error in immediate recall of sequences. Journal ofVerbal Learning and Verbal Behaviour, 4 (3), 161–169.
Costa, L. d. F., Oliveira, O. N., Travieso, G., Rodrigues, F. A., Villas Boas,P. R., Antiqueira, L., Viana, M. P., & Correa da Rocha, L. E. (2008). Ana-lyzing and modeling real-world phenomena with complex networks: a surveyof applications. Working manuscript, arXiv:0711.3199v2. Available online:http://arxiv.org/abs/0711.3199.
Costa, L. d. F., Rodrigues, F. A., Travieso, G., & Villas Boas, P. R. (2007).Characterization of complex networks: a survey of measurements. Advancesin Physics, 56, 167–242.
Coyle, M. (2002). Hijacked hits and antic authenticity: cover songs, raceand postwar marketing. In R. Beebe, D. Fulbrook, & B. Saunders (Eds.)Rock over the edge: transformations in popular music culture, pp. 133–157.Durham, UK: Duke University Press.
Cronin, C. (2002). The music plagiarism digital archive at Columbia law li-brary: an effort to demystify music copyright infringement. In Proc. of theIEEE Int. Conf. on Web Delivering of Music (WEDELMUSIC), pp. 1–8.
Dalla Bella, S., Peretz, I., & Aronoff, N. (2003). Time course of melody recogni-tion: a gating paradigm study. Perception and Psychophysics, 7 (65), 1019–1028.
Daniélou, A. (1968). Northern Indian Music. London, UK: Barrie & Rockliff.
Dannenberg, R. B., Birmingham, W. P., Pardo, B., Hu, N., Meek, C., &Tzanetakis, G. (2007). A comparative evaluation of search techniques forquery-by-humming using the MUSART testbed. Journal of the AmericanSociety for Information Science and Technology, 58 (5), 687–701.
Danon, L., Díaz-Aguilera, A., Duch, J., & Arenas, A. (2005). Comparing com-munity structure identification. Journal of Statistical Mechanics, 9, 09008.
De Cheveigne, A. (2005). Pitch perception models. In C. J. Plack, A. J.Oxenham, R. R. Fray, & A. N. Popper (Eds.) Pitch: neural coding andperception, chap. 6, pp. 169–233. New York, USA: Springer Science.
De Cheveigne, A. & Kawahara, H. (2001). Comparative evaluation of F0estimation algorithms. In Proc. of the Eurospeech Conf., pp. 2451–2454.
Deliege, I. (1996). Cue abstraction as a component of categorisation processesin music listening. Psychology of Music, 24 (2), 131–156.
Di Buccio, E., Montecchio, N., & Orio, N. (2010). A scalable cover identi-fication engine. In Proc. of the ACM Multimedia Conf. (ACM-MM), pp.1143–1146.
Dixon, S. & Widmer, G. (2005). MATCH: a music alignment tool chest. InProc. of the Int. Conf. on Music Information Retrieval (ISMIR), pp. 492–497.
Dowling, W. J. (1978). Scale and contour: two components of a theory ofmemory for melodies. Psychological Review, 85 (4), 341–354.
Dowling, W. J. & Harwood, D. L. (1985). Music cognition. San Diego, USA:Academic Press.

Downie, J. S. (2008). The music information retrieval evaluation exchange(2005–2007): a window into music information retrieval research. AcousticalScience and Technology, 29 (4), 247–255.
Downie, J. S., Bay, M., Ehmann, A. F., & Jones, M. C. (2008). Audio coversong identification: MIREX 2006-2007 results and analyses. In Proc. of theInt. Conf. on Music Information Retrieval (ISMIR), pp. 468–473.
Dubnov, S. (2006). Spectral anticipations. Computer Music Journal, 30 (2),63–83.
Dubnov, S., Assayag, G., & Cont, A. (2007). Audio oracle: a new algorithm forfast learning of audio structures. Int. Computer Music Conference (ICMC),pp. 224–228.
Eckmann, J. P., Kamphorst, S. O., & Ruelle, D. (1987). Recurrence plots ofdynamical systems. Europhysics Letters, 5, 973–977.
Eerola, T., Järvinen, T., Louhivuori, J., & Toiviainen, P. (2001). Statisticalfeatures and perceived similarity of folk melodies. Music Perception, 18 (3),275–296.
Eerola, T., Toiviainen, P., & Krumhansl, C. L. (2002). Real-time prediction ofmelodies: continuous predictability judgements and dynamic models. Int.Conf. on Music Perception and Cognition (ICMPC), pp. 473–476.
Egorov, A. & Linetsky, G. (2008). Cover song identification with IF-F0 pitchclass profiles. Music Information Retrieval Evaluation eXchange (MIREX)extended abstract.
Ellis, D. P. W. & Cotton, C. (2007). The 2007 LabROSA cover song detec-tion system. Music Information Retrieval Evaluation eXchange (MIREX)extended abstract.
Ellis, D. P. W., Cotton, C., & Mandel, M. (2008). Cross-correlation of beat-synchronous representations for music similarity. In Proc. of the IEEE Int.Conf. on Acoustics, Speech and Signal Processing (ICASSP), pp. 57–60.
Ellis, D. P. W. & Poliner, G. E. (2007). Identifying cover songs with chromafeatures and dynamic programming beat tracking. In Proc. of the IEEEInt. Conf. on Acoustics, Speech and Signal Processing (ICASSP), vol. 4, pp.1429–1432.
Facchini, A., Kantz, H., & Tiezzi, E. (2005). Recurrence plot analysis ofnonstationary data: the understanding of curved patterns. Physical ReviewE, 72, 021915.
Farmer, J. D. & Sidorowich, J. J. (1987). Predicting chaotic time series. Phys-ical Review Letters, 59 (8), 845–848.
Foote, J. (1999). Visualizing music and audio using self-similarity. In Proc. ofthe ACM Int. Conf. on Multimedia, pp. 77–80.
Foote, J. (2000a). ARTHUR: Retrieving orchestral music by long-term struc-ture. In Proc. of the Int. Symp. on Music Information Retrieval (ISMIR),130.
Foote, J. (2000b). Automatic audio segmentation using a measure of audionovelty. In Proc. of the IEEE Int. Conf. on Multimedia and Expo (ICME),vol. 1, pp. 452–455.
Fortunato, S. (2010). Community detection in graphs. Physics Reports, 486 (3),75–174.
Fortunato, S. & Castellano, C. (2009). Community structure in graphs. InR. A. Meyers (Ed.) Encyclopedia of complexity and system science, pp. 1141–1163. Berlin, Germany: Springer.
Foucard, R., Durrieu, J.-L., Lagrange, M., & Richard, G. (2010). Multimodalsimilarity between musical streams for cover version detection. In Proc. ofthe IEEE Int. Conf. on Audio, Speech and Signal Processing (ICASSP), pp.5514–5517.
Frankel, A. S. (1998). Sound production. In W. F. Perrin, B. Wursig, &J. G. M. Thewissen (Eds.) Encyclopedia of Marine Mammals, pp. 1126–1137. San Diego, USA: Academic Press.
Fujishima, T. (1999). Realtime chord recognition of musical sound: a systemusing common lisp music. In Proc. of the Int. Computer Music Conference(ICMC), pp. 464–467.
Gainza, M. (2009). Automatic musical meter detection. In Proc. of the IEEEInt. Conf. on Acoustics, Speech and Signal Processing (ICASSP), pp. 329–332.
Gerhard, D. (1999). Audio visualization in phase space. In Proc. of Bridges99: Mathematical Connections in Art, Music and Science, pp. 137–144.
Gómez, E. (2006). Tonal description of music audio signals. Ph.D. thesis,Universitat Pompeu Fabra, Barcelona, Spain. Available online: http://mtg.upf.edu/node/472.
Gómez, E. & Herrera, P. (2004). Estimating the tonality of polyphonic audiofiles: cognitive versus machine learning modelling strategies. In Proc. of theInt. Conf. on Music Information Retrieval (ISMIR), pp. 92–95.

Gómez, E. & Herrera, P. (2006). The song remains the same: identifyingversions of the same song using tonal descriptors. In Proc. of the Int. Conf.on Music Information Retrieval (ISMIR), pp. 180–185.
Gómez, E., Herrera, P., Cano, P., Janer, J., Serrà, J., Bonada, J., El-Hajj, S.,Aussenac, T., & Holmberg, G. (2008). Music similarity systems and methodsusing descriptors. Patent WO 2009/001202.
Gómez, E., Ong, B. S., & Herrera, P. (2006a). Automatic tonal analysis frommusic summaries for version identification. In Proc. of the Conv. of theAudio Engineering Society (AES), 6902.
Gómez, E., Streich, S., Ong, B. S., Paiva, R. P., Tappert, S., Batke, J. M.,Poliner, G. E., Ellis, D. P. W., & Bello, J. P. (2006b). A quantitativecomparison of different approaches for melody extraction from polyphonicaudio recordings. Tech. rep., Universitat Pompeu Fabra, Barcelona, Spain.Available online: http://mtg.upf.edu/node/460.
Goto, M. (2006). A chorus-section detection method for musical audio signalsand its application to a music listening station. IEEE Trans. on Audio,Speech and Language Processing, 14 (5), 1783–1794.
Gouyon, F., Klapuri, A., Dixon, S., Alonso, M., Tzanetakis, G., Uhle, C.,& Cano, P. (2006). An experimental comparison of audio tempo inductionalgorithms. IEEE Trans. on Speech and Audio Processing, 14 (5), 1832–1844.
Grachten, M., Arcos, J. L., & López-de Mantaras, R. (2004). Melodic similar-ity: looking for a good abstraction level. In Proc. of the Int. Conf. on MusicInformation Retrieval (ISMIR), pp. 210–215.
Grachten, M., Arcos, J. L., & López-de Mantaras, R. (2005). Melody retrievalusing the implication/realization model. Music Information Retrieval Eval-uation eXchange (MIREX) extended abstract.
Granger, C. W. J. (1969). Investigating causal relations by econometric modelsand cross-spectral methods. Econometrica, 37 (3), 424–438.
Groth, A. (2005). Visualization of coupling in time series by order recurrenceplots. Physical Review E, 72 (4), 046220.
Gusfield, D. (1997). Algorithms on strings, trees and sequences: computersciences and computational biology. Cambridge, UK: Cambridge UniversityPress.
Hal Leonard Corp. (2004). The real book. Milwaukee, USA: Hal Leonard Corp.,6th edn.

Hall, M., Frank, E., Holmes, G., Pfahringer, B., Reutemann, P., & Witten,I. H. (2009). The Weka data mining software: an update. ACM SIGKDDExplorations, 1 (1), 10–18.
Harte, C., Sandler, M. B., & Gasser, M. (2006). Detecting harmonic changein musical audio. In Proc. of the ACM Workshop on Audio and MusicComputing Multimedia, pp. 21–26.
Harte, C. A. & Sandler, M. B. (2005). Automatic chord identification usinga quantized chromagram. In Proc. of the Conv. of the Audio EngineeringSociety (AES), pp. 28–31.
Harwood, D. L. (1976). Universals in music: a perspective from cognitivepsychology. Ethomusicology, 20 (3), 521–533.
Hazan, A., Marxer, R., Brossier, P., Purwins, H., Herrera, P., & Serra, X.(2009). What/when causal expectation modelling applied to audio signals.Connection Science, 21 (2), 119–143.
Hegger, R., Kantz, H., & Matassini, L. (2000). Denoising human speech signalsusing chaoslike features. Physical Review Letters, 84 (14), 3197–3200.
Heikkila, J. (2004). A new class of shift-invariant operators. IEEE SignalProcessing Magazine, 11 (6), 545–548.
Henson, R. (2001). Serial order in short term memory. The Psychologist, 14 (2),70–73.
Hu, N., Dannenberg, R. B., & Tzanetakis, G. (2003). Polyphonic audio match-ing and alignment for music retrieval. In Proc. of the IEEE Workshop onApps. of Signal Processing to Audio and Acoustics (WASPAA), pp. 185–188.
Hughes, J. M., Graham, D. J., & Rockmore, D. N. (2010). Quantificationof artistic style through sparse coding analysis in the drawings of PieterBruegel the Elder. Proceedings of the National Academy of Sciences of theUSA, 107 (4), 1279–1283.
Hughes, J. P. (2006). Embedding nonlinear dynamical systems: a guide toTakens’ theorem. Tech. rep., The University of Manchester, Manchester,UK. Available online: http://eprints.ma.man.ac.uk/175.
Huron, D. (2006). Sweet anticipation: music and the psychology of expectation.Cambridge, USA: MIT Press.
Hyer, B. (2010). Tonality. Grove Music Online. Oxford Music Online. Avail-able online: http://www.oxfordmusiconline.com/subscriber/article/grove/music/28102.

Izmirli, Ö. (2005). Tonal similarity from audio using a template based attractormodel. In Proc. of the Int. Conf. on Music Information Retrieval (ISMIR),pp. 540–545.
Jain, A. K. & Dubes, R. C. (1988). Algorithms for clustering data. Advancedreference series. Upper Saddle River, USA: Prentice Hall.
Jain, A. K., Murty, M. N., & Flynn, P. J. (1999). Data clustering: a review.ACM Computing Surveys, 31 (3), 264–323.
Jensen, J. H., Christensen, M. G., Ellis, D. P. W., & Jensen, S. H. (2008a).A tempo-insensitive distance measure for cover song identification based onchroma features. In Proc. of the IEEE Int. Conf. on Acoustics, Speech andSignal Processing (ICASSP), pp. 2209–2212.
Jensen, J. H., Christensen, M. G., Ellis, D. P. W., & Jensen, S. H. (2009).Quantitative analysis of a common audio similarity measure. IEEE Trans.on Audio, Speech and Language Processing, 17 (4), 693–703.
Jensen, J. H., Christensen, M. G., & Jensen, S. H. (2008b). A chroma-based tempo-insensitive distance measure for cover song identification usingthe 2D autocorrelation. Music Information Retrieval Evaluation eXchange(MIREX) extended abstract.
Jeong, H., Mason, S. P., Barábasi, A. L., & Oltvai, Z. N. (2001). Lethality andcentrality in protein networks. Nature, 411, 41–42.
Joder, C., Essid, S., & Richard, G. (2009). Temporal integration for audioclassification with application to musical instrument classification. IEEETrans. on Audio, Speech and Language Processing, 17 (1), 174–186.
Juola, P. (2008). Authorship attribution. Foundations and Trends in Infor-mation Retrieval, 1 (3), 233–334.
Juslin, P. N., Friberg, A., & Bresin, R. (2002). Toward a computational modelof expression in performance: the GERM model. Musicae Scientiae, SpecialIssue 2001-2002, pp. 63–122.
Kantz, H. & Schreiber, T. (2004). Nonlinear time series analysis. Cambridge,UK: Cambridge University Press, 2nd edn.
Kernfeld, B. (2006). The story of fake books: bootlegging songs to musicians.Lanham, USA: The Scarecrow Press.
Kim, S. & Narayanan, S. (2008). Dynamic chroma feature vectors with ap-plications to cover song identification. In Proc. of the IEEE Workshop onMultimedia Signal Processing (MMSP), pp. 984–987.
Kim, S., Unal, E., & Narayanan, S. (2008). Fingerprint extraction for clas-sical music cover song identification. In Proc. of the IEEE Int. Conf. onMultimedia and Expo (ICME), pp. 1261–1264.
Kim, Y. E. & Perelstein, D. (2007). MIREX 2007: audio cover song detec-tion using chroma features and hidden Markov model. Music InformationRetrieval Evaluation eXchange (MIREX) extended abstract.
Klette, R. & Zamperoni, P. (1996). Handbook of image processing operators.New York, USA: John Wiley and Sons.
Kolodner, J. L. (1993). Case-based reasoning. Burlington, USA: Morgan Kauff-mann.
Kotska, S. (2005). Materials and techniques of the 20th century music. UpperSaddle River, USA: Prentice Hall, 3rd edn.
Krumhansl, C. L. (1990). Cognitive foundations of musical pitch. Oxford, UK:Oxford University Press.
Kurth, F. & Müller, M. (2008). Efficient index-based audio matching. IEEETrans. on Audio, Speech and Language Processing, 16 (2), 382–395.
Kuusi, T. (2009). Tune recognition from melody, rhythm and harmony. InProc. of the Conf. of the European Soc. for the Cognitive Sciences of Music(ESCOM), pp. 610–614.
Kvam, P. H. & Vidakovic, B. (2007). Nonparametric statistics with applicationsto science and engineering. Hoboken, USA: John Wiley and Sons.
Lagrange, M. & Serrà, J. (2010). Unsupervised accuracy improvement for coversong detection using spectral connectivity network. In Proc. of the Int. Soc.for Music Information Retrieval Conf. (ISMIR), pp. 595–600.
Latora, V. & Marchiori, M. (2001). Efficient behavior of small-world networks.Physical Review Letters, 87, 198701.
Lee, K. (2006). Identifying cover songs from audio using harmonic representa-tion. Music Information Retrieval Evaluation eXchange (MIREX) extendedabstract.
Lee, K. (2008). A system for acoustic chord transcription and key extractionfrom audio using hidden Markov models trained on synthesized audio. Ph.D.thesis, Stanford University, USA.
Leman, M. (1995). Music and schema theory: cognitive foundations of system-atic musicology. Berlin, Germany: Springer.
Lemstrom, K. (2000). String matching techinques for music retrieval. Ph.D.thesis, University of Helsinki, Finland.
Lerdahl, F. (2001). Tonal pitch space. Oxford, UK: Oxford University Press.
Lerdahl, F. & Jackendorff, R. (1983). A generative theory of tonal music.Cambridge, USA: MIT Press.
Lesaffre, M. (2005). Music Information Retrieval: conceptual framework, an-notation and user behavior. Ph.D. thesis, Ghent University, Belgium.
Levitin, D. J. (2007). This is your brain on music: the science of a humanobsession. London, UK: Atlantic books.
Liem, C. C. S. & Hanjalic, A. (2009). Cover song retrieval: a comparativestudy of system component choices. In Proc. of the Int. Soc. for MusicInformation Retrieval (ISMIR) Conf., pp. 573–578.
Lütkepohl, H. (1993). Introduction to multiple time series analysis. Berlin,Germany: Springer, 2nd edn.
Lynch, M. P., Eilers, R. E., Oller, D. K., & Urbano, R. C. (1990). Innateness,experience and music perception. Psychological Science, 1 (4), 272–276.
Mäkinen, V., Navarro, G., & Ukkonen, E. (2005). Transposition invariantstring matching. Journal of Algorithms, 56 (2), 124–153.
Manning, C. D., Prabhakar, R., & Schutze, H. (2008). An introduction toinformation retrieval. Cambridge, UK: Cambridge University Press.
Mardirossian, A. & Chew, E. (2006). Music summarization via key distribu-tions: analyses of similarity assessment across variations. In Proc. of the Int.Conf. on Music Information Retrieval (ISMIR), 282.
Marler, P. & Slabbekoorn, H. W. (2004). Nature’s music: the science of bird-song. San Diego, USA: Academic Press.
Marolt, M. (2006). A mid-level melody-based representation for calculatingaudio similarity. In Proc. of the Int. Conf. on Music Information Retrieval(ISMIR), pp. 280–285.
Marolt, M. (2008). A mid-level representation for melody-based retrieval inaudio collections. IEEE Trans. on Multimedia, 10 (8), 1617–1625.
Marwan, N. & Kurths, J. (2002). Nonlinear analysis of bivariate data withcross recurrence plots. Physics Letters A, 302 (5), 299–307.
Marwan, N., Romano, M. C., Thiel, M., & Kurths, J. (2007). Recurrence plotsfor the analysis of complex systems. Physics Reports, 438 (5), 237–329.

Marwan, N., Thiel, M., & Nowaczyk, N. R. (2002a). Cross recurrence plotbased synchronization of time series. Nonlinear Processes in Geophysics, 9,325–331.
Marwan, N., Wessel, N., Meyerfeldt, U., Schirdewan, A., & Kurths, J. (2002b).Recurrence-plot-based measures of complexity and its application to heartrate variability data. Physical Review E, 66 (2), 026702.
Matassini, L., Kantz, H., Holyst, J., & Hegger, R. (2002). Optimizing ofrecurrence plots for noise reduction. Physical Review E, 65, 021102.
Meng, A., Ahrendt, P., Larsen, J., & Hansen, L. K. (2007). Temporal featureintegration for music genre classification. IEEE Trans. on Audio, Speech andLanguage Processing, 15 (5), 1654–1664.
Mierswa, I. & Morik, K. (2005). Automatic feature extraction for classifyingaudio data. Machine Learning Journal, 58, 127–149.
Miotto, R. & Orio, N. (2008). A music identification system based on chromaindexing and statistical modeling. In Proc. of the Int. Conf. on Music In-formation Retrieval (ISMIR), pp. 301–306.
Mithen, S. (2007). The singing Neanderthals: the origins of music, language,mind and body. Cambridge, USA: Harvard University Press.
Molina-Solana, M., Arcos, J. L., & Gómez, E. (2010). Identifying violin per-formers by their expressive trends. Intelligent Data Analysis, 14, 555–571.
Mörchen, F., Mierswa, I., & Ultsch, A. (2006a). Understandable models of mu-sic collections based on exhaustive feature generation with temporal statis-tics. In Proc. of the ACM Int. Conf. on Knowledge Discovery and DataMining (SIGKDD), pp. 882–891.
Mörchen, F., Ultsch, A., Thies, M., & Löhken, I. (2006b). Modelling timbredistance with temporal statistics from polyphonic music. IEEE Trans. onSpeech and Audio Processing, 14 (1), 81–90.
Mosser, K. (2010). Cover songs: ambiguity, multivalence, poly-semy. Popular Musicology Online. Available online: http://www.popular-musicology-online.com/issues/02/mosser.html.
Müllensiefen, D. & Pendzich, M. (2009). Court decisions on music plagia-rism and the predictive value of similarity algorithms. Musicae Scientiae,Discussion Forum 4B, pp. 207–238.
Müller, M. (2007). Information Retrieval for Music and Motion. Berlin, Ger-many: Springer.

Müller, M. & Appelt, D. (2008). Path-constrained partial music synchroniza-tion. In Proc. of the IEEE Int. Conf. on Audio, Speech and Signal Processing(ICASSP), pp. 65–68.
Müller, M. & Ewert, S. (2008). Joint structure analysis with applications tomusic annotation and synchronization. In Proc. of the Int. Conf. on MusicInformation Retrieval (ISMIR), pp. 389–394.
Müller, M. & Ewert, S. (2010). Towards timbre-invariant audio features forharmony-based music. IEEE Trans. on Audio, Speech and Language Pro-cessing, 18 (3), 649–662.
Müller, M. & Kurth, F. (2006a). Enhancing similarity matrices for music audioanalysis. In Proc. of the IEEE Int. Conf. on Acoustics, Speech and SignalProcessing (ICASSP), pp. V–V.
Müller, M. & Kurth, F. (2006b). Towards structural analysis of audio record-ings in the presence of musical variations. EURASIP Journal on Advancesin Signal Processing, 2007 (89686), 1–18.
Müller, M., Kurth, F., & Clausen, M. (2005). Audio matching via chroma-based statistical features. In Proc. of the Int. Conf. on Music InformationRetrieval (ISMIR), pp. 288–295.
Myers, C. (1980). A comparative study of several dynamic time warping al-gorithms for speech recognition. Master’s thesis, Massachussets Institute ofTechnology, USA.
Myers, C., Rabiner, L. R., & Rosenberg, A. E. (1980). Performance tradeoffsin dynamic time warping algorithms for isolated word recognition. IEEETrans. on Audio, Speech and Language Processing, 28 (6), 623– 635.
Nadeu, C., Macho, D., & Hernando, J. (2001). Time and frequency filtering offilter-bank energies for robust HMM speech recognition. Speech Comunica-tion, 34, 93–114.
Nagano, H., Kashino, K., & Murase, H. (2002). Fast music retrieval usingpolyphonic binary feature vectors. IEEE Int. Conf. on Multimedia and Expo(ICME), 1, 101–104.
Newman, M. E. J. (2003). The structure and function of complex networks.SIAM Review, 45, 167–256.
Ong, B. S. (2007). Structural analysis and segmentation of music signals.Ph.D. thesis, Universitat Pompeu Fabra, Barcelona, Spain. Available online:http://mtg.upf.edu/node/508.
Ong, B. S., Gómez, E., & Streich, S. (2006). Automatic extraction of musicalstructure using pitch class distribution features. In Proc. of the Workshopon Learning the Semantics of Audio Signals (LSAS), pp. 53–65.
Oppenheim, A. V., Schafer, R. W., & Buck, J. B. (1999). Discrete-Time SignalProcessing. Upper Saddle River, USA: Prentice Hall, 2 edn.
Orio, N. (2006). Music retrieval: a tutorial and review. Foundations andTrends in Information Retrieval, 1 (1), 1–90.
Oswald, J. (1985). Plunderphonics, or audio piracy as a compositional pre-rogative. Wired Society Electro-Acoustic Conference. Available online:http://www.plunderphonics.com/xhtml/xplunder.html.
Pachet, F. (2002). The continuator: musical interaction with style. Journal ofNew Music Research, 31 (1), 1–9.
Pachet, F. (2005). Knowledge management and musical metadata. InD. Schwartz (Ed.) Encyclopedia of Knowledge Management. Harpenden, UK:Idea Group.
Paiement, J. F., Grandvalet, Y., & Benigo, S. (2009). Predictive models formusic. Connection Science, 21 (2), 253–272.
Pampalk, E. (2006). Computational models of music similarity and their ap-plication to music information retrieval. Ph.D. thesis, Vienna University ofTechnology, Vienna, Austria. Available online: http://www.ub.tuwien.ac.at/diss/AC05031828.pdf.
Papadopoulos, H. & Peeters, G. (2007). Large-scale study of chord estimationalgorithms based on chroma representation and HMM. In Proc. of the Int.Conf. on Content-Based Multimedia Information (CBMI), pp. 53–60.
Parka, H. S. & Jun, C. S. (2009). A simple and fast algorithm for K-medoidsclustering. Expert Systems with Applications, 36 (2), 3336–3341.
Patel, A. (2008). Music, language and the brain. Oxford, UK: Oxford Univer-sity Press.
Peeters, G. (2007). Sequence representation of music structure using higher-order similarity matrix and maximum-likelihood approach. In Proc. of theInt. Conf. on Music Information Retrieval (ISMIR), pp. 35–40.
Peeters, G., La Burthe, A., & Rodet, X. (2002). Toward automatic musicaudio summary generation from signal analysis. In Proc. of the Int. Symp.on Music Information Retrieval (ISMIR), pp. 94–100.
Pickens, J. (2004). Harmonic modeling for polyphonic music retrieval. Ph.D.thesis, University of Massachussetts Amherst, USA.

Pickens, J., Bello, J. P., Monti, G., Sandler, M. B., Crawford, T., Dovey, M., &Byrd, D. (2003). Polyphonic score retrieval using polyphonic audio queries:a harmonic modeling approach. Journal of New Music Research, 32 (2),223–236.
Plasketes, G. (2010). Re-flections on the cover age: a collage of continuouscoverage in popular music. Popular Music and Society, 28 (2), 137–161.
Pohle, T., Schnitzer, D., Schedl, M., Knees, P., & Widmer, G. (2009). Onrhythm and general music similarity. In Proc. of the Int. Soc. for MusicInformation Retrieval Conf. (ISMIR), pp. 525–530.
Poliner, G. E., Ellis, D. P. W., Ehmann, A., Gómez, E., Streich, S., & Ong,B. S. (2007). Melody transcription from music audio: approaches and eval-uation. IEEE Trans. on Audio, Speech and Language Processing, 15 (4),1247–1256.
Polotti, P. & Rocchesso, D. (2008). Sound to sense - sense to sound: a stateof the art in sound and music computing. Berlin, Germany: Logos.
Porter, S. E. (1997). The use of the old testament in the new testament: a briefcomment on method and terminology. In C. A. Evans & J. A. Sanders (Eds.)Early christian interpretations of the scriptures of Israel: investigations andproposals, pp. 79–96. Sheffield, UK: Sheffield Academic Press.
Posner, R. A. (2007). The little book of plagiarism. New York, USA: PantheonBooks.
Press, W. H., Flannery, B. P., Tenkolsky, S. A., & Vetterling, W. T. (1992).Numerical recipes. Cambridge, UK: Cambridge University Press, 2nd edn.
Pujol, P., Pol, S., Nadeu, C., Hagen, A., & Bourlard, A. (2005). Comparisonand combination of features in a hybrid HMM/MLP and a HMM/GMMspeech recognition system. IEEE Trans. on Audio, Speech and LanguageProcessing, 13 (1), 14–22.
Purwins, H. (2005). Profiles of pitch classes - circularity of relative pitch andkey: experiments, models, momputational music analysis and perspectives.Ph.D. thesis, Technischen Universität, Berlin, Germany.
Rabiner, L. R. (1989). A tutorial on hidden Markov models and selectedapplications in speech recognition. Proceedings of the IEEE, 77 (2), 257–286.
Rabiner, L. R. & Juang, B. H. (1993). Fundamentals of speech recognition.Upper Saddle River, USA: Prentice Hall.
Ratzan, L. (2004). Understanding information systems: what they do and whywe need them. Chicago, USA: American Library Association.

Ravuri, S. & Ellis, D. P. W. (2010). Cover song detection: from high scores togeneral classification. In Proc. of the IEEE Int. Conf. on Audio, Speech andSignal Processing (ICASSP), pp. 55–58.
Reiss, J. D. & Sandler, M. B. (2003). Nonlinear time series analysis of musicalsignals. In Proc. of the Int. Conf. on Digital Audio Effects (DAFx), pp. 1–5.
Resnick, P. & Varian, H. L. (1997). Recommender systems. Communicationsof the ACM, 40 (3), 56–58.
Riley, M., Heinen, E., & Ghosh, J. (2008). A text retrieval approach to content-based audio retrieval. In Proc. of the Int. Conf. on Music Information Re-trieval (ISMIR), pp. 295–300.
Rizo, D., Lemstrom, K., & Iñesta, J. M. (2009). Ensemble of state-of-the-art methods for polyphonic music comparison. In Proc. of the EuropeanConference on Digital Libraries (ECDL), Workshop on Exploring MusicalInformation Spaces, pp. 46–51.
Röbel, A. & Rodet, X. (2005). Efficient spectral envelope estimation and itsapplication to pitch shifting and envelope preservation. In Proc. of the Int.Conf. on Digital Audio Effects (DAFx), pp. 30–35.
Robert, C. P. & Casella, G. (2004). Monte Carlo statistical methods. Berlin,Germany: Springer, 2nd edn.
Robine, M., Hanna, P., Ferraro, P., & Allali, J. (2007). Adaptation of stringmatching algorithms for identification of near-duplicate music documents.In Proc. of the ACM SIGIR Workshop on Plagiarism Analysis, AuthorshipIdentification and Near-Duplicate Detection (PAN), pp. 37–43.
Rogers, T. T. & McClelland, J. L. (2004). Semantic cognition: a paralleldistributed processing approach. Cambridge, USA: MIT Press.
Rosch, E. & Mervis, C. (1975). Family resemblances: studies in the internalstructure of categories. Cognitive Psychology, 7, 573–605.
Ross, A. & Jain, A. (2003). Information fusion in biometrics. Pattern Recog-nition Letters, 24 (13), 2115–2125.
Roth, P. M. & Winter, M. (2008). Survey of appearance-based methods forobject recognition. Tech. rep. Available online: http://web.mit.edu/~wingated/www/introductions/appearance_based_methods.pdf.
Russell, S. J. & Norvig, P. (2003). Artificial intelligence: a modern approach.Upper Saddle River, USA: Prentice Hall.

Sahoo, N., Callan, J., Krishnan, R., Duncan, G., & Padman, R. (2006). Incre-mental hierarchical clustering of text documents. In Proc. of the ACM Int.Conf. on Information and Knowledge Management, pp. 357–366.
Sailer, C. & Dressler, K. (2006). Finding cover songs by melodic similarity. Mu-sic Information Retrieval Evaluation eXchange (MIREX) extended abstract.Available online: http://www.music-ir.org/mirex/abstracts/2006/CS_sailer.pdf.
Sankoff, D. & Kruskal, J. (1983). Time warps, string edits and macromolecules.Reading, USA: Addison-Wesley.
Sauer, T. D. (2006). Attractor reconstruction. Scholarpedia, 1 (10), 1727.
Saygin, A. P., Cicekli, I., & Akman, V. (2000). Turing test: 50 years later.Minds and Machines, 10 (4), 463–518.
Scaringella, N., Zoia, G., & Mlynek, D. (2006). Automatic genre classificationof music content: a survey. IEEE Signal Processing Magazine, 23 (2), 133–141.
Schaefer, R. S., Farquhar, J., Blokland, Y., Sadakata, M., & Desain, P. (2010).Name that tune: decoding music from the listening brain. NeuroImage. Inpress.
Schellenberg, E. G., Iverson, P., & McKinnon, M. C. (1999). Name that tune:identifying familiar recordings from brief excerpts. Psychonomic Bulletinand Review, 6 (4), 641–646.
Schreiber, T. (2000). Measuring information transfer. Physical Review E, 85,461–464.
Schulkind, M. D., Posner, R. J., & Rubin, D. C. (2003). Musical features thatfacilitate melody identification: how do you know it’s your song when theyfinally play it? Music Perception, 21 (2), 217–249.
Selfridge-Field, E. (1998). Conceptual and representational issues in melodiccomparison. In W. B. Hewlett & E. Selfridge-Field (Eds.)Melodic similarity:concepts, procedures and applications, Computing in Musicology, vol. 11, pp.3–64. Cambridge, USA: MIT Press.
Serrà, J. (2007a). Music similarity based on sequences of descriptors: tonal fea-tures applied to audio cover song identification. Master’s thesis, UniversitatPompeu Fabra, Barcelona, Spain. Available online: http://mtg.upf.edu/node/536.
Serrà, J. (2007b). A qualitative assessment of measures for the evaluationof a cover song identification system. In Proc. of the Int. Conf. on MusicInformation Retrieval (ISMIR), pp. 319–322.

Serrà, J., Gómez, E., & Herrera, P. (2008a). Transposing chroma represen-tations to a common key. In Proc. of the IEEE CS Conf. on The Use ofSymbols to Represent Music and Multimedia Objects, pp. 45–48.
Serrà, J., Gómez, E., & Herrera, P. (2010a). Audio cover song identification andsimilarity: background, approaches, evaluation and beyond. In Z. W. Ras &A. A. Wieczorkowska (Eds.) Adv. in Music Information Retrieval, Studies inComputational Intelligence, vol. 16, chap. 14, pp. 307–332. Berlin, Germany:Springer.
Serrà, J., Gómez, E., Herrera, P., & Serra, X. (2008b). Chroma binary simi-larity and local alignment applied to cover song identification. IEEE Trans.on Audio, Speech and Language Processing, 16 (6), 1138–1152.
Serrà, J., Gómez, E., Herrera, P., & Serra, X. (2008c). Statistical analysisof chroma features in Western music predicts human judgments of tonality.Journal of New Music Research, 37 (4), 299–309.
Serrà, J., Kantz, H., & Andrzejak, R. G. (2010b). Model-based cover songdetection via threshold autoregressive forecasts. In Proc. of the ACM Mul-timedia, Workshop on Music and Machine Learning (MML), pp. 13–16.
Serrà, J., Kantz, H., Serra, X., & Andrzejak, R. G. (2010c). Predictabilityof music descriptor time series and its application to cover song detection.IEEE Trans. on Audio, Speech and Language Processing. Submitted.
Serrà, J., Serra, X., & Andrzejak, R. G. (2009a). Cross recurrence quantifica-tion for cover song identification. New Journal of Physics, 11, 093017.
Serrà, J., Zanin, M., Herrera, P., & Serra, X. (2010d). Characterization andexploitation of community structure in cover song networks. Pattern Recog-nition Letters. Submitted.
Serrà, J., Zanin, M., Laurier, C., & Sordo, M. (2009b). Unsupervised detectionof cover song sets: accuracy increase and original detection. In Proc. of theInt. Soc. for Music Information Retrieval Conf. (ISMIR), pp. 225–230.
Serra, X. (1997). Musical sound modeling with sinusoids plus noise. InC. Roads, S. T. Pope, A. Picialli, & G. De Poli (Eds.) Musical Signal Pro-cessing, Studies on New Music Research, pp. 91–122. London, UK: Swetsand Zeitlinger.
Sheh, A. & Ellis, D. P. W. (2003). Chord segmentation and recognition usingEM-trained Hidden Markov Models. In Proc. of the Int. Conf. on MusicInformation Retrieval (ISMIR), pp. 183–189.

Sisman, E. (2010). Variations. Grove Music Online. Oxford Music On-line. Available online: http://www.oxfordmusiconline.com/subscriber/article/grove/music/29050pg10.
Smith III, J. O. (2010a). Mathematics of the discrete Fourier transform withaudio applications. Center for Computer Research in Music and Acoustics(CCRMA), Stanford University, USA, 2nd edn. Online resource: https://ccrma.stanford.edu/~jos/mdft.
Smith III, J. O. (2010b). Spectral audio signal processing. Center for ComputerResearch in Music and Acoustics (CCRMA), Stanford University, USA. On-line resource: https://ccrma.stanford.edu/~jos/sasp.
Solis, G. (2010). I did it my way: rock and the logic of covers. Popular Musicand Society, 33 (3), 297–318.
Stamatatos, E. (2009). A survey of modern authorship attribution methods.Journal of the American Society for Information Science and Technology,60 (3), 538–556.
Strogatz, S. H. (2001). Exploring complex networks. Nature, 410, 268–276.
Tahani, H. & Keller, J. M. (1990). Information fusion in computer vision usingthe fuzzy integral. IEEE Trans. on Systems, Man and Cybernetics, 20 (3),733–741.
Takens, F. (1981). Detecting strange attractors in turbulence. Lecture Notesin Mathematics, 898, 366–381.
Taylor, R. P., Guzman, R., Martin, T. P., Hall, G. D. R., Micolich, A. P.,Jonas, D., Scannell, B. C., Fairbanks, M. S., & Marlow, C. A. (2007). Au-thenticating Pollock paintings using fractal geometry. Pattern RecognitionLetters, 28 (6), 695–702.
Teitelbaum, T., Balenzuela, P., Cano, P., & Buldú, J. M. (2008). Communitystructures and role detection in music networks. Chaos: an InterdisciplinaryJournal of Nonlinear Science, 18 (4), 043105.
Temko, A., Macho, D., & Nadeu, C. (2007). Fuzzy integral based informationfusion for classification of highly confusable non-speech sounds. PatternRecognition, 41 (5), 1814–1823.
Theodoridis, S. & Koutroumbas, K. (2006). Pattern recognition. San Diego,USA: Academic Press, 3rd edn.
Todd, N. P. (1992). The dynamics of dynamics: a model of musical expression.Journal of the Acoustical Society of America, 91 (6), 3540–3550.

Tong, H. & Lim, K. S. (1980). Threshold autoregression, limit cycles andcyclical data. Journal of the Royal Statistical Society, 42 (3), 245–292.
Tsai, W.-H., Yu, H.-M., & Wang, H.-M. (2005). A query-by-example techniquefor retrieving cover versions of popular songs with similar melodies. In Proc.of the Int. Conf. on Music Information Retrieval (ISMIR), pp. 183–190.
Tsai, W.-H., Yu, H.-M., & Wang, H.-M. (2008). Using the similarity of mainmelodies to identify cover versions of popular songs for music documentretrieval. Journal of Information Science and Engineering, 24 (6), 1669–1687.
Turing, A. (1950). Computing machinery and intelligence. Mind, 59 (254),433–460.
Tversky, A. (1977). Features of similarity. Psychological Review, 84, 327–352.
Typke, R. (2007). Music retrieval based on melodic similarity. Ph.D. thesis,Utrecht University, Netherlands.
Tzanetakis, G. (2002). Pitch histograms in audio and symbolic music infor-mation retrieval. Int. Symp. on Music Information Retrieval (ISMIR), pp.31–38.
Ukkonen, E., Lemstrom, K., & Mäkinen, V. (2003). Sweepline the music!Computer Science in Perspective, pp. 330–342.
Unal, E. & Chew, E. (2007). Statistical modeling and retrieval of polyphonicmusic. In Proc. of the IEEE Workshop on Multimedia Signal Processing(MMSP), pp. 405–409.
Urbano, J., Lloréns, J., Morato, J., & Sánchez-Cuadrado, S. (2010). Usingthe shape of music to compute the similarity between symbolic musicalpieces. In Proc. of the Int. Symp. on Computer Music Modeling and Re-trieval (CMMR), pp. 385–396.
Van Kampen, N. G. (2007). Stochastic processes in physics and chemistry.Amsterdam, The Netherlands: Elsevier, 3rd edn.
Van Kranenburg, P. (2010). A computational approach to content-basedretrieval of folk-song melodies. Ph.D. thesis, Utrecht University, Utrecht,The Netherlands. Available online: http://www.cs.uu.nl/groups/MG/multimedia/publications/art/petervankranenburg-dissertation.pdf.
Vlachos, I. & Kugiumtzis, D. (2008). State space reconstruction for multi-variate time series prediction. Nonlinear Phenomena in Complex Systems,11 (2), 241–249.

Von Luxburg, A. (2007). A tutorial on spectral clustering. Statistics andComputing, 17 (4), 395–416.
Voorhees, E. M. & Harman, D. K. (2005). TREC: experiment and evaluationin information retrieval. Cambridge, USA: MIT Press.
Webber Jr., C. L. & Zbilut, J. P. (1994). Dynamical assessment of physiolog-ical systems and states using recurrence plot strategies. Journal of AppliedPhysiology, 76 (2), 965–973.
Weigend, A. S. & Gershenfeld, N. A. (1993). Time series prediction: forecastingthe future and understanding the past. Boulder, USA: Westwiew Press.
Weinstein, D. (1998). The history of rock’s pasts through rock covers. InT. Swiss, J. Sloop, & A. Herman (Eds.) Mapping the beat: popular musicand contemporary theory, pp. 137–151. Oxford, UK: Blackwell PublishingLtd.
West, K. & Lamere, P. (2007). A model-based approach to constructing mu-sic similarity functions. EURASIP Journal on Applied Signal Processing,2007 (1), 24602.
Wilpon, J. G., Rabiner, L. R., Lee, C. H., & Goldman, E. (1990). Auto-matic recognition of keywords in unconstrained speech using hidden Markovmodels. IEEE Trans. on Acoustics, Speech and Signal Processing, 38 (11),1870–1878.
Witmer, R. & Marks, A. (2010). Cover version. Grove Music Online. Ox-ford Music Online. Available online: http://www.oxfordmusiconline.com/subscriber/article/grove/music/49254.
Witten, I. H. & Frank, E. (2005). Data mining: practical machine learningtools and techniques. Amsterdam, The Netherlands: Elsevier, 2nd edn.
Wittgenstein, L. (1953). Philosophical investigations. Oxford, UK: BlackwellPublishing Ltd.
Woodland, P. C. & Povey, D. (2002). Large scale discriminative training of hid-den Markov models for speech recognition. Computer, Speech and Language,16 (1), 25–47.
Xu, R. & Wunsch II, D. C. (2009). Clustering. Piscataway, USA: IEEE Press.
Yang, C. (2001). Music database retrieval based on spectral similarity. In Proc.of the Int. Symp. on Music Information Retrieval (ISMIR), pp. 37–38.
Yano, C. R. (2005). Covering disclosures: practices of intimacy, hierarchy andauthenticity in a Japanese popular music genre. Popular Music and Society,28 (2), 193–205.

Yu, Y., Downie, J. S., Chen, L., Oria, V., & Joe, K. (2008). Searching musicalaudio datasets by a batch of multi-variant tracks. In Proc. of the ACMMultimedia Conf., pp. 121–127.
Zbikowski, L. M. (2002). Conceptualizing music: cognitive structure, theoryand analysis. Oxford, UK: Oxford University Press.
Zbilut, J. P., Giuliani, A., & Webber Jr., C. L. (1998). Detecting deterministicsignals in exceptionally noisy environments using cross-recurrence quantifi-cation. Physics Letters A, 246 (1), 122–128.
Zbilut, J. P. & Webber Jr., C. L. (1992). Embeddings and delays as derivedfrom quantification of recurrence plots. Physics Letters A, 171 (3), 199–203.
Zhao, W., Chellappa, R., Phillips, P. J., & Rosenfeld, A. (2003). Face recog-nition: a literature survey. ACM Computing Surveys, 35 (4), 399–458.
Zhao, Y. & Karypis, G. (2002). Evaluation of hierarchical clustering algorithmsfor document datasets. In Proc. of the Conf. on Knowledge Discovery in Data(KDD), pp. 515–524.

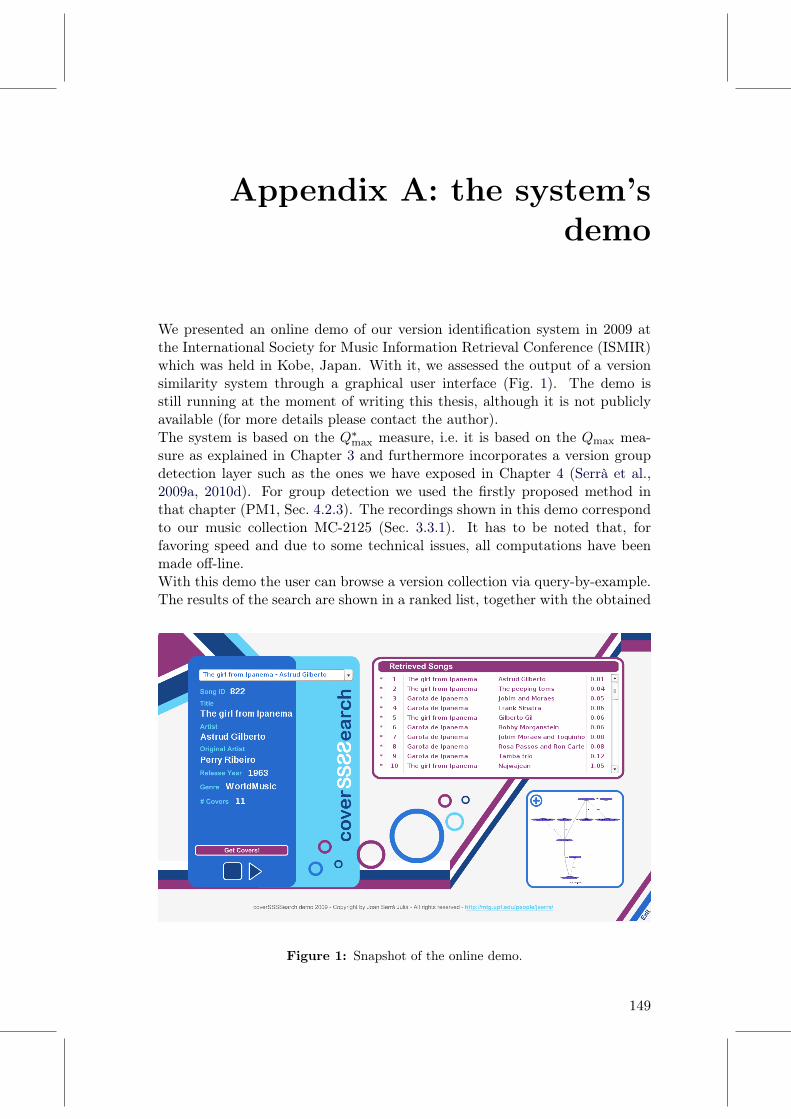
Appendix A: the system’sdemo
We presented an online demo of our version identification system in 2009 atthe International Society for Music Information Retrieval Conference (ISMIR)which was held in Kobe, Japan. With it, we assessed the output of a versionsimilarity system through a graphical user interface (Fig. 1). The demo isstill running at the moment of writing this thesis, although it is not publiclyavailable (for more details please contact the author).The system is based on the Q∗max measure, i.e. it is based on the Qmax mea-sure as explained in Chapter 3 and furthermore incorporates a version groupdetection layer such as the ones we have exposed in Chapter 4 (Serrà et al.,2009a, 2010d). For group detection we used the firstly proposed method inthat chapter (PM1, Sec. 4.2.3). The recordings shown in this demo correspondto our music collection MC-2125 (Sec. 3.3.1). It has to be noted that, forfavoring speed and due to some technical issues, all computations have beenmade off-line.With this demo the user can browse a version collection via query-by-example.The results of the search are shown in a ranked list, together with the obtained
Figure 1: Snapshot of the online demo.
149

Figure 2: Detail of a version network.
distances to the query (Fig. 1, top right). For comparison purposes, metadataand ground truth information are also shown (Fig. 1, left). Furthermore, forexploring and visualizing the results of the system, a graph renderization foreach automatically detected version set is depicted (Fig. 1, bottom right). Azoom on this part can be seen in Fig. 2. In the graph, nodes correspond tomusic recordings and edges reflect the similarity between these recordings.To build such a graph we exploit Q∗max, which is reflected in the thickness ofthe edges (the thicker the edge, the more similar in terms of a tonal progres-sion). Nevertheless, we also incorporate timbral similarity, which is reflectedin the length of the edges (the shorter the edge, the more similar in terms oftimbre). This timbral similarity is computed via the common Kullback-Leiblerdivergence between one-Gaussian mixture models of Mel-frequency cepstral co-efficients extracted on a frame-by-frame basis [see e.g. Jensen et al. (2009) andreferences therein].

Appendix B: publications bythe author
Submitted
Serrà, J., Zanin, M., Herrera, P., & Serra, X. (2010). Characterization and ex-ploitation of community structure in cover song networks. Pattern RecognitionLetters.
Serrà, J., Kantz, H., Serra, X., & Andrzejak, R. G. (2010). Predictability ofmusic descriptor time series and its application to cover song detection. IEEETrans. on Audio, Speech, and Language Processing.
ISI-indexed peer-reviewed journals
Bogdanov, D., Serrà, J., Wack, N., Herrera, P., & Serra, X. (2011). Unifyinglow-level and high-level music similarity measures. IEEE Trans. on Multime-dia. In press.
Laurier, C., Meyers, O., Serrà, J., Blech, M., Herrera, P., & Serra, X. (2010).Indexing music by mood: design and integration of an automatic content-basedannotator. Multimedia Tools and Applications, 48 (1), 161–184.
Serrà, J., Serra, X., & Andrzejak, R. G. (2009). Cross recurrence quantificationfor cover song identification. New Journal of Physics, 11, 093017.
Serrà, J., Gómez, E., Herrera, P., & Serra, X. (2008). Statistical analysisof chroma features in Western music predicts human judgments of tonality.Journal of New Music Research, 37 (4), 299–309.
Serrà, J., Gómez, E., Herrera, P., & Serra, X. (2008). Chroma binary similarityand local alignment applied to cover song identification. IEEE Trans. on Audio,Speech, and Language Processing, 16 (6), 1138–1152.
Other journals
Serrà, J., Zanin, M., & Herrera, P. (2011). Cover song networks: analysis andaccuracy increase. Int. Journal of Complex Systems in Science, 1, 55-59.
151

Invited book chapters
Serrà, J., Gómez, E., & Herrera, P. (2010a). Audio cover song identificationand similarity: background, approaches, evaluation, and beyond. In Z. W.Ras & A. A. Wieczorkowska (Eds.) Advances in Music Information Retrieval,Studies in Computational Intelligence, vol. 16, chap. 14, pp. 307–332. Berlin,Germany: Springer.
Full-article contributions to peer-reviewedconferences
Serrà, J., de los Santos, C. A., & Andrzejak, R. G. (2011). Nonlinear audiorecurrence analysis with application to genre classification. In Proc. of theIEEE Int. Conf. on Acoustics, Speech, and Signal Processing (ICASSP). Inpress.
Serrà, J., Kantz, H., & Andrzejak, R. G. (2010). Model-based cover song detec-tion via threshold autoregressive forecasts. In Proc. of the ACM Multimedia,Workshop on Music and Machine Learning (MML), pp. 13–16.
Lagrange, M. & Serrà, J. (2010). Unsupervised accuracy improvement forcover song detection using spectral connectivity network. In Proc. of the Int.Soc. for Music Information Retrieval Conf. (ISMIR), pp. 595–600.
Bogdanov, D., Serrà, J., Wack, N., & Herrera, P. (2009). From low-levelto high-level: comparative study of music similarity measures. In Proc. of theIEEE Int. Symp. on Multimedia. Workshop on Advances in Music InformationResearch (AdMIRe), pp. 453–458.
Serrà, J., Zanin, M., Laurier, C., & Sordo, M. (2009). Unsupervised detectionof cover song sets: accuracy increase and original detection. In Proc. of theInt. Soc. for Music Information Retrieval Conf. (ISMIR), pp. 225–230.
Laurier, C., Sordo, M., Serrà, J., & Herrera, P. (2009). Music mood repre-sentations from social tags. In Proc. of the Int. Society for Music InformationRetrieval Conf. (ISMIR), pp. 381–386.
Akkermans, V., Serrà, J., & Herrera, P. (2009). Shape-based spectral contrastdescriptor. In Proc. of the Sound and Music Computing Conf. (SMC), pp.143–148.
Laurier, C., Meyers, O., Serrà, J., Blech, M., & Herrera, P. (2009). Musicmood annotator design and integration. In Proc. of the Int. Workshop onContent-Based Multimedia Indexing (CBMI), pp. 156–161.
Serrà, J., Gómez, E., & Herrera, P. (2008). Transposing chroma representa-tions to a common key. In Proc. of the IEEE CS Conf. on The Use of Symbolsto Represent Music and Multimedia Objects, pp. 45–48.

Serrà, J. & Gómez, E. (2008). Audio cover song identification based on se-quences of tonal descriptors. In Proc. of the IEEE Int. Conf. on Acoustics,Speech, and Signal Processing (ICASSP), pp. 61–64.
Serrà, J. (2007). A qualitative assessment of measures for the evaluation of acover song identification system. In Proc. of the Int. Conf. on Music Informa-tion Retrieval (ISMIR), pp. 319–322.
Other contributions to conferences
Wack, N., Laurier, C., Meyers, O., Marxer, R., Bogdanov, D., Serrà, J., Gómez,E., & Herrera, P. (2010). Music classification using high-level models. MusicInformation Retrieval Evaluation eXchange (MIREX) extended abstract.
Serrà, J., Zanin, M., & Herrera, P. (2010). Cover song networks: analysis andaccuracy increase. Net-Works International Conf.
Herrera, P., Serrà, J., Laurier, C., Guaus, E., Gómez, E., & Serra, X. (2009).The discipline formerly known as MIR. Int. Soc. for Music Information Re-trieval Conf. (ISMIR), special session on The Future of MIR.
Serrà, J., Zanin, M., & Andrzejak, R. G. (2009). Cover song retrieval by crossrecurrence quantification and unsupervised set detection. Music InformationRetrieval Evaluation eXchange (MIREX) extended abstract.
Wack, N., Guaus, E., Laurier, C., Meyers, O., Marxer, R., Bogdanov, D.,Serrà, J., & Herrera, P. (2009). Music type groupers (MTG): generic musicclassification algorithms. Music Information Retrieval Evaluation eXchange(MIREX) extended abstract.
Bogdanov, D., Serrà, J., Wack, N., & Herrera, P. (2009). Hybrid similaritymeasures for music recommendation. Music Information Retrieval EvaluationeXchange (MIREX) extended abstract.
Serrà, J. (2009). Assessing the results of a cover song identification systemwith coverSSSSearch. Int. Soc. for Music Information Retrieval Conf. (ISMIR),Demo Session.
Serrà, J., Gómez, E., & Herrera, P. (2008). Improving binary similarity and lo-cal alignment for cover song detection. Music Information Retrieval EvaluationeXchange (MIREX) extended abstract.
Serrà, J. & Gómez, E. (2007). A cover song identification system based onsequences of tonal descriptors. Music Information Retrieval Evaluation eX-change (MIREX) extended abstract.

Theses
Serrà, J. (2007). Music similarity based on sequences of descriptors: tonalfeatures applied to audio cover song identification. Master’s thesis, UniversitatPompeu Fabra, Barcelona, Spain.
Patents
Serrà, J. (2009). Method for calculating measures of similarity between timesignals. Patent application number US 12/764424.
Serrà, J. (2009). Método para calcular medidas de similitud entre señalestemporales. Patent application number P 2009/01057.
Gómez, E., Herrera, P., Cano, P., Janer, J., Serrà, J., Bonada, J., El-Hajj, S.,Aussenac, T., & Holmberg, G. (2008). Music similarity systems and methodsusing descriptors. Patent WO 2009/001202 .
Gómez, E., Herrera, P., Cano, P., Janer, J., Serrà, J., Bonada, J., El-Hajj, S.,Aussenac, T., & Holmberg, G. (2008). Music similarity systems and methodsusing descriptors. Patent US 2008/0300702.
Additional and up-to-date information about the author may be found at theauthor’s web page5.
5http://joanserra.weebly.com

Related Documents