LSHTM Research Online Chemaitelly, H; (2022) Characterizing HIV epidemiology among female sex workers and their clients in the Middle East and North Africa. PhD (research paper style) thesis, London School of Hygiene & Tropical Medicine. DOI: https://doi.org/10.17037/PUBS.04664929 Downloaded from: https://researchonline.lshtm.ac.uk/id/eprint/4664929/ DOI: https://doi.org/10.17037/PUBS.04664929 Usage Guidelines: Please refer to usage guidelines at https://researchonline.lshtm.ac.uk/policies.html or alternatively contact [email protected]. Available under license. To note, 3rd party material is not necessarily covered under this li- cense: http://creativecommons.org/licenses/by-nc-nd/4.0/ https://researchonline.lshtm.ac.uk

Welcome message from author
This document is posted to help you gain knowledge. Please leave a comment to let me know what you think about it! Share it to your friends and learn new things together.
Transcript

LSHTM Research Online
Chemaitelly, H; (2022) Characterizing HIV epidemiology among female sex workers and their clientsin the Middle East and North Africa. PhD (research paper style) thesis, London School of Hygiene &Tropical Medicine. DOI: https://doi.org/10.17037/PUBS.04664929
Downloaded from: https://researchonline.lshtm.ac.uk/id/eprint/4664929/
DOI: https://doi.org/10.17037/PUBS.04664929
Usage Guidelines:
Please refer to usage guidelines at https://researchonline.lshtm.ac.uk/policies.html or alternativelycontact [email protected].
Available under license. To note, 3rd party material is not necessarily covered under this li-cense: http://creativecommons.org/licenses/by-nc-nd/4.0/
https://researchonline.lshtm.ac.uk

1
Characterizing HIV epidemiology among female sex workers and their clients
in the Middle East and North Africa
HIAM CHEMAITELLY
Thesis submitted in accordance with the requirements for the degree of
Doctor of Philosophy
University of London
October 2021
Department of Infectious Disease Epidemiology
Faculty of Epidemiology and Population Health
LONDON SCHOOL OF HYGIENE & TROPICAL MEDICINE,
UNIVERSITY OF LONDON
No funding received
Research group affiliation(s): MRC International Statistics and Epidemiology Group
2
Dedicated to the best family I could have ever wished for and to my soul ‘Aya’

3
DECLARATION
I, Hiam Chemaitelly, confirm that the work presented in this thesis is my own. I have developed
the methodology for the different studies presented here and led the conduct of analyses and
communication of research findings through scientific peer-reviewed publications and
presentation in international conferences of relevance. Where information has been derived from
other sources, I confirm that this has been indicated in the thesis. I have read and understood the
School’s definition of plagiarism and cheating given in the Research Degrees Handbook.
Hiam Chemaitelly
October 2021
4
ACKNOWLEDGEMENTS
This PhD would not have been possible without the support of wonderful people that I was lucky
to have around during this journey.
I would like to specially thank my supervisor, Professor Helen Weiss, for her enlightening
mentorship, the stimulating and enriching discussions and perspectives, her instant availability,
her accommodation of timely reviews of research work and of unconventional follow-up plans,
her patience and positive attitude and feedback throughout this PhD, as well as her understanding
and support particularly during the SARS-CoV-2 pandemic. I also would like to extend my
deepest gratitude and recognition to my co-supervisor, mentor, and role model, Professor Laith
Abu-Raddad, for providing me with the opportunity to complete this PhD as part of my research
work at the Infectious Disease Epidemiology Group (IDEG), and for unleashing my potential
through his outstanding mentorship, capacity building, support, and patience over the past 11
years.
I also would like to thank members of my advisory committee, Dr. Sara Thomas and Dr. Clara
Calvert for their technical advice and guidance, as well as Ms. Jenny Fleming and Ms. Lauren
Dalton, for their kind administrative support throughout this PhD.
Special thanks to my colleague, Dr. Houssein Ayoub, for his support with the mathematical
modelling work including accommodation of late night and weekend calls, to Ms. Adona Canlas
for her support on multiple fronts well beyond her assigned administrative tasks, to Dr. Ghina
Mumtaz for sharing her PhD experience and for providing valuable advice throughout this
journey, and to my wider IDEG family.

5
No words can describe my gratitude to Mom, Dad, and Sousou, for always being there for me
with unconditional love and monumental support. None of what I have achieved would have
been possible or enjoyable without you.
I am also very thankful to my husband, Bachir, for his patience and support over the years
including accommodation of my long working hours and tolerance of many quick, redundant,
and burnt meals.
Last, I am very grateful to my blessing and my soul, Aya, whose smile and laughter drive my
motivation to do my best every day.
6
TABLE OF CONTENTS
DECLARATION ............................................................................................................................ 3
ACKNOWLEDGEMENTS ............................................................................................................ 4
LIST OF TABLES .......................................................................................................................... 9
LIST OF FIGURES ...................................................................................................................... 13
LIST OF ABBREVIATIONS ....................................................................................................... 15
COVID-19 IMPACT STATEMENT ............................................................................................ 17
ABSTRACT .................................................................................................................................. 25
CHAPTER 1. BACKGROUND ................................................................................................... 28
1. The global epidemiology of HIV in heterosexual sex work networks .............................. 28
1.1. The global context ...................................................................................................... 28
1.2. Global burden of HIV and other sexually transmitted infections (STIs) among FSWs
30
1.3. Role of HSWNs in the HIV epidemic .......................................................................... 32
1.4. HIV prevention interventions among FSWs ............................................................... 32
2. HIV epidemiology in MENA............................................................................................. 36
2.1. MENA definition ......................................................................................................... 36
2.2. Status of HIV epidemic and response in MENA ......................................................... 38
2.3. Thesis rationale and scope ......................................................................................... 41
CHAPTER 2. THESIS OBJECTIVES AND STRUCTURE ....................................................... 48
1. Overall aim......................................................................................................................... 48
2. Thesis structure and research papers outline ..................................................................... 52
3. The role of the candidate.................................................................................................... 55
CHAPTER 3. RESEARCH PAPER 1-HIV EPIDEMIOLOGY AMONG FSWS AND CLIENTS
IN MENA...................................................................................................................................... 58
1. Preamble ............................................................................................................................ 61
2. Summary of findings.......................................................................................................... 93
CHAPTER 4. RESEARCH PAPER 2-SEXUALLY TRANSMITTED INFECTIONS AMONG
FSWS IN MENA .......................................................................................................................... 95
1. Preamble ............................................................................................................................ 98
2. Summary of findings........................................................................................................ 120
CHAPTER 5. RESEARCH PAPER 3-HSV-2 AS A BIOMARKER OF HIV EPIDEMIC
POTENTIAL AMONG FSWS ................................................................................................... 122

7
1. Preamble .......................................................................................................................... 125
2. Summary of findings........................................................................................................ 137
CHAPTER 6. RESEARCH PAPER 4-HIV INCIDENCE AND IMPACT OF
INTERVENTIONS AMONG FSWS AND CLIENTS IN MENA ............................................ 139
1. Preamble .......................................................................................................................... 141
2. Summary of findings........................................................................................................ 181
CHAPTER 7. DISCUSSION ...................................................................................................... 183
1. A pattern of emerging HIV epidemics among FSWs and clients but still limited
transmission in half of HSWNs ............................................................................................... 183
2. A critical role for male circumcision in limiting HIV transmission in MENA ............... 184
3. A sizable contribution of HSWNs to total HIV incidence ............................................... 186
4. Most of HIV incidence in HSWNs does not occur among FSWs, but among clients and
client spouses........................................................................................................................... 187
5. HIV epidemic potential in HSWNs remains uncertain .................................................... 189
6. Neglected burden of STIs among FSWs, clients, and client spouses .............................. 191
7. HIV response is lagging behind, but interventions have much potential for reducing HIV
incidence.................................................................................................................................. 193
Appendix I .................................................................................................................................. 211
International Organizations’ definitions for the Middle East and North Africa region .......... 211
Appendix II ................................................................................................................................. 213
Supplementary material for Research paper 1- ....................................................................... 213
HIV Epidemiology among FSWs and clients in MENA ..................................................... 213
Appendix III ................................................................................................................................ 284
Supplementary material for Research paper 1- ....................................................................... 284
Search criteria ...................................................................................................................... 284
1. Conceptual framework ................................................................................................. 285
2. Systematic review of systematic reviews of studies of FSWs and clients globally ..... 285
Appendix IV................................................................................................................................ 294
Supplementary material for Research paper 1- ....................................................................... 294
Study selection criteria ........................................................................................................ 294
Appendix V ................................................................................................................................. 296
Supplementary material for Research paper 1- ....................................................................... 296
Screening of available quality assessment tools .................................................................. 296

8
Appendix VI................................................................................................................................ 303
Supplementary material for Research paper 2- ....................................................................... 303
Sexually transmitted infections among FSWs in MENA .................................................... 303
Appendix VII .............................................................................................................................. 326
Supplementary material for Research paper 3- ....................................................................... 326
HSV-2 as a biomarker of HIV epidemic potential among FSWs ........................................ 326
Appendix VIII ............................................................................................................................. 353
Supplementary material for Research paper 4- ....................................................................... 353
HIV incidence and impact of interventions among FSWs and clients in MENA ............... 353

9
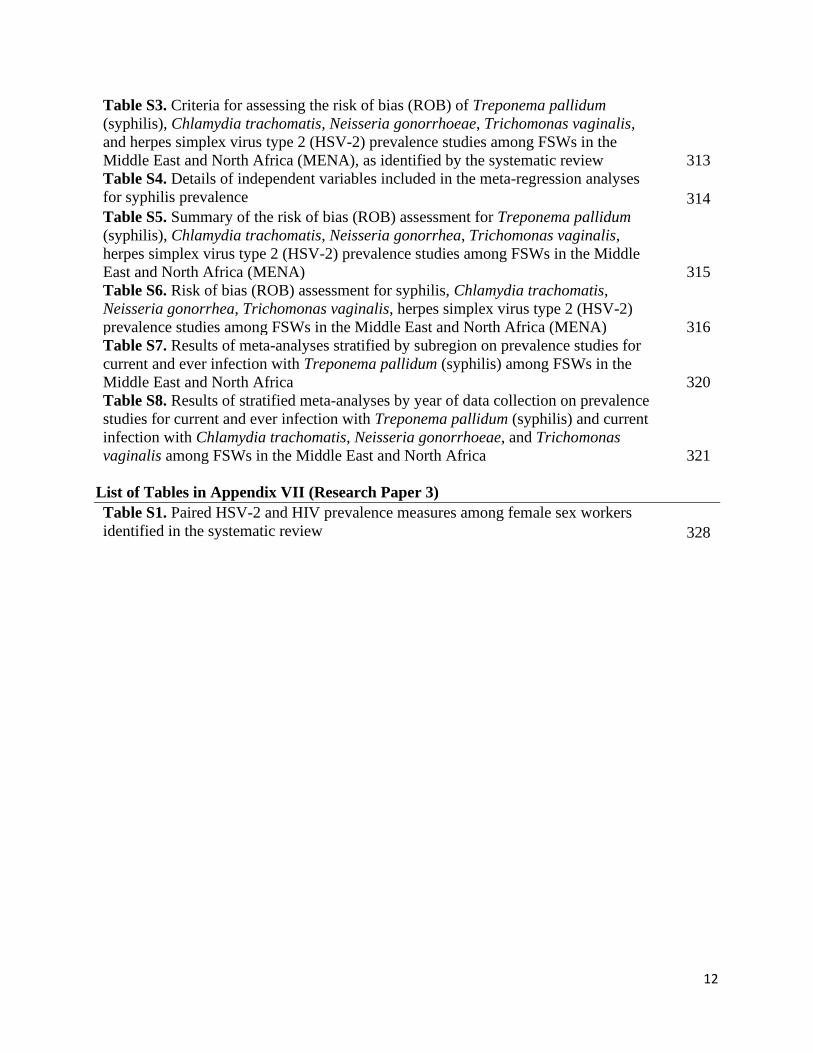
LIST OF TABLES
Chapter 2
Table 1. Specific objectives, methodology, and research questions for understanding
HIV epidemiology in heterosexual sex work networks (HSWNs) in the Middle East
and North Africa (MENA) 50
Chapter 3
List of Tables in Research Paper 1
Table 1. Estimates of some national representation for the number and population
proportion of FSWs, and the number and population proportion of clients of FSWs,
in the Middle East and North Africa (MENA) reported by identified studies 67
Table 2. HIV prevalence in FSWs in the Middle East and North Africa (MENA), as
reported in studies using probability-based sampling 70
Table 3. Table 3 HIV prevalence in FSWs in the Middle East and North Africa
(MENA), as reported in studies using non-probability sampling 75
Table 4. HIV prevalence in clients of FSWs (or proxy populations of clients of
FSWs such as male STI clinic attendees), in the Middle East and North Africa
(MENA) 77
Table 5. Results of meta-analyses on studies reporting HIV prevalence in FSWs and
their clients (or proxy populations of clients such as male STI clinic attendees), in the
Middle East and North Africa (MENA) by epidemic type 81
Table 6. Results of meta-regression analyses to identify associations with HIV
prevalence, sources of between-study heterogeneity, and trend in HIV prevalence in
FSWs in the Middle East and North Africa (MENA) 83
Chapter 4
List of Tables in Research Paper 2
Table 1. Prevalence of syphilis among FSWs in the Middle East and North Africa 105
Table 2. Prevalence of Chlamydia trachomatis, Neisseria gonorrhoeae, and
Trichomonas vaginalis among FSWs in the Middle East and North Africa 108
Table 3. Prevalence of herpes simplex virus type 2 (HSV-2) immunoglobulin G
(IgG) sero-markers among FSWs in the Middle East and North Africa 110
Table 4. Results of meta-analyses on prevalence studies for Treponema pallidum
(syphilis), Chlamydia trachomatis, Neisseria gonorrhoeae, Trichomonas vaginalis,
and herpes simplex virus type 2 (HSV-2) among FSWs in the Middle East and North
Africa 112
Table 5. Results of meta-regression analyses to identify associations and sources of
between-study heterogeneity in syphilis prevalence in the Middle East and North
Africa (MENA) 113
Chapter 5
List of Tables in Research Paper 3

10
Table 1. Results of meta-analyses on studies reporting HIV prevalence among
female sex workers stratified by HSV-2 prevalence levels 130
Table 2. Results of meta-regression analyses assessing the association between HIV
prevalence and HSV-2 prevalence among female sex workers globally 131
Table 3. Results of meta-regression analyses assessing the association between HIV
prevalence and HSV-2 prevalence among female sex workers globally but excluding
the African Region 132
Chapter 6
List of Tables in Research Paper 4
Table 1. Values of model parameters 166
Table 2. HIV epidemiological measures for FSWs, clients, and client spouses in
MENA and the contribution of sex work to total HIV incidence in the population in
2020, in countries with no significant HIV transmission through injecting drug use
among FSWs. The table includes measures based on empirical data for model input,
as well as measures estimated using the model 168
Table 3. HIV epidemiological measures among FSWs, clients, and client spouses in
MENA and the contribution of sex work to total HIV incidence in the population in
2020, in countries with significant HIV transmission through injecting drug use
among FSWs 170
Table 4. Select modelled HIV prevention intervention packages to control the HIV
epidemic among FSWs and clients in MENA 172
Table 5. Estimates of the number and proportion of HIV infections averted over 10
years by increasing the coverage of select interventions among FSWs in MENA 173
Table 6. Estimates of numbers and proportions of HIV infections averted over 10
years by increasing the coverage of select interventions among FSWs in MENA 175
List of Tables in Appendix I
Table S1. The World Health Organization’s Regional Office for the Eastern
Mediterranean (WHO-EMRO), Joint United Nations Programme on HIV/AIDS
(UNAIDS), and World Bank definitions for the Middle East and North Africa region
(MENA) 212
List of Tables in Appendix II (Research Paper 1)
Table S1. Preferred Reporting Items for Systematic Reviews and Meta-analyses
(PRISMA) checklist 217
Table S2. Quality assessment criteria for size estimation and HIV prevalence studies
in FSWs and their clients (or proxy populations of clients) in the Middle East and
North Africa, as identified in the systematic review 224
Table S3. Details of variables and subcategories included in the meta-regression
analyses 225
Table S4. Estimates of subnational representation for the number and population
proportion of FSWs and of their clients in the Middle East and North Africa (MENA)
reported by identified studies 226

11
Table S5. HIV point-prevalence measures in FSWs as extracted or obtained from
various sources including the US Census Bureau database, the WHO-EMRO, and the
UNAIDS epidemiological fact sheets databases, among other sources of data 236
Table S6. Summary of the risk of bias (ROB) assessment of size estimation and HIV
prevalence studies in FSWs and their clients (or proxy populations of clients), in the
Middle East and North Africa (MENA) 245
Table S7. Risk of bias (ROB) assessment of estimates of national and subnational
representation for the number and population proportion of FSWs and of their clients,
in the Middle East and North Africa 246
Table S8. Risk of bias (ROB) assessment of HIV prevalence studies in FSWs in the
Middle East and North Africa 251
Table S9 Risk of bias (ROB) assessment of HIV prevalence studies in clients of
FSWs (or proxy populations of clients) in the Middle East and North Africa 254
Table S10. Results of meta-regression analyses to identify associations with HIV
prevalence, sources of between-study heterogeneity, and trend in HIV prevalence in
clients of FSWs (or proxy populations of clients such as male STI clinic attendees),
in the Middle East and North Africa (MENA) 255
Table S11 Condom use among FSWs and their clients in the Middle East and North
Africa 256
Table S12. Measures of injecting drug use and overlap with people who inject drugs
(PWID) among FSWs in the Middle East and North Africa 263
Table S13. HIV/AIDS knowledge among FSWs in the Middle East and North Africa 267
Table S14. Perception of risk among FSWs in the Middle East and North Africa 268
Table S15. HIV testing among FSWs in the Middle East and North Africa 269
List of Tables in Appendix III
Table S2. Search criteria for other systematic reviews on FSWs and their clients 286
List of Tables in Appendix IV
Table S3. Eligibility criteria for inclusion of studies in the systematic review of
female sex workers (FSWs) and their clients in MENA 295
List of Tables in Appendix V
Table S4. Summary of available quality assessment tools and their applicability to
the systematic review of FSWs and their clients in MENA 298
List of Tables in Appendix VI (Research Paper 2)
Table S1. Preferred Reporting Items for Systematic Reviews and Meta-analyses
(PRISMA) checklist 305
Table S2. Definitions of types of infection and classification of results of diagnostic
methods for Treponema pallidum (syphilis), Chlamydia trachomatis, Neisseria
gonorrhoeae, Trichomonas vaginalis, and herpes simplex virus type 2 (HSV-2) in
studies identified by the systematic review into current, recent, and ever infection 312
12
Table S3. Criteria for assessing the risk of bias (ROB) of Treponema pallidum
(syphilis), Chlamydia trachomatis, Neisseria gonorrhoeae, Trichomonas vaginalis,
and herpes simplex virus type 2 (HSV-2) prevalence studies among FSWs in the
Middle East and North Africa (MENA), as identified by the systematic review 313
Table S4. Details of independent variables included in the meta-regression analyses
for syphilis prevalence 314
Table S5. Summary of the risk of bias (ROB) assessment for Treponema pallidum
(syphilis), Chlamydia trachomatis, Neisseria gonorrhea, Trichomonas vaginalis,
herpes simplex virus type 2 (HSV-2) prevalence studies among FSWs in the Middle
East and North Africa (MENA) 315
Table S6. Risk of bias (ROB) assessment for syphilis, Chlamydia trachomatis,
Neisseria gonorrhea, Trichomonas vaginalis, herpes simplex virus type 2 (HSV-2)
prevalence studies among FSWs in the Middle East and North Africa (MENA) 316
Table S7. Results of meta-analyses stratified by subregion on prevalence studies for
current and ever infection with Treponema pallidum (syphilis) among FSWs in the
Middle East and North Africa 320
Table S8. Results of stratified meta-analyses by year of data collection on prevalence
studies for current and ever infection with Treponema pallidum (syphilis) and current
infection with Chlamydia trachomatis, Neisseria gonorrhoeae, and Trichomonas
vaginalis among FSWs in the Middle East and North Africa 321
List of Tables in Appendix VII (Research Paper 3)
Table S1. Paired HSV-2 and HIV prevalence measures among female sex workers
identified in the systematic review 328
13
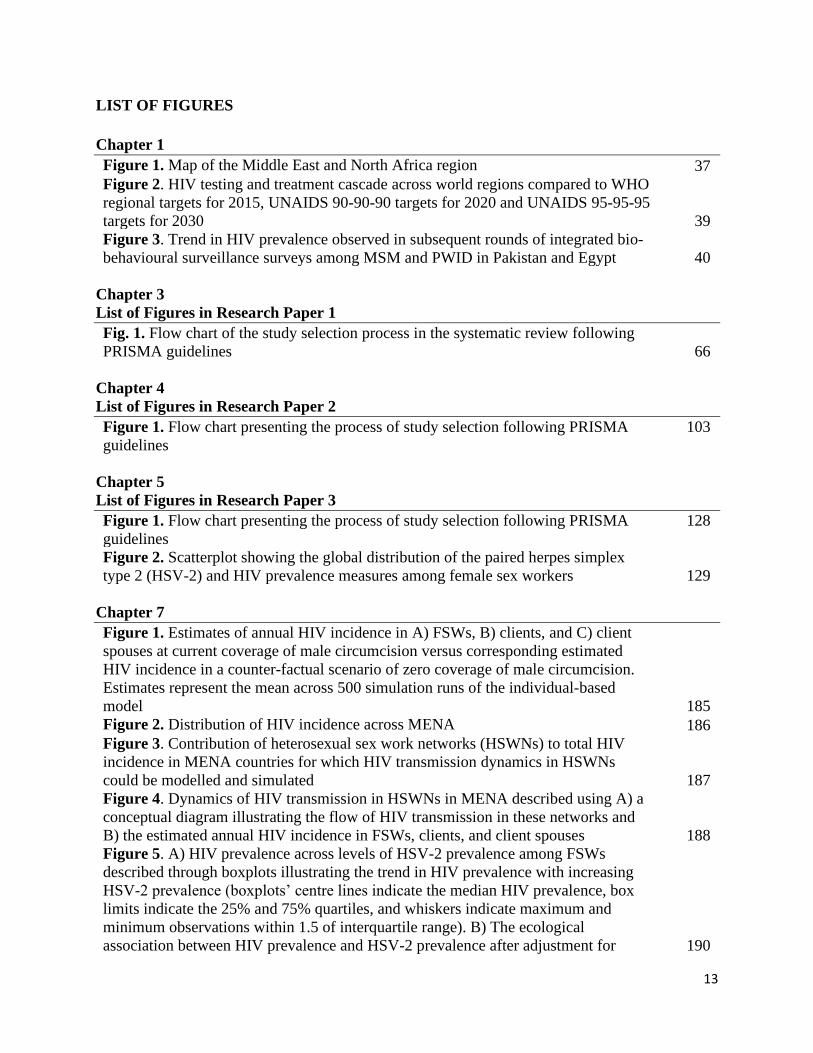
LIST OF FIGURES
Chapter 1
Figure 1. Map of the Middle East and North Africa region 37
Figure 2. HIV testing and treatment cascade across world regions compared to WHO
regional targets for 2015, UNAIDS 90-90-90 targets for 2020 and UNAIDS 95-95-95
targets for 2030 39
Figure 3. Trend in HIV prevalence observed in subsequent rounds of integrated bio-
behavioural surveillance surveys among MSM and PWID in Pakistan and Egypt 40
Chapter 3
List of Figures in Research Paper 1
Fig. 1. Flow chart of the study selection process in the systematic review following
PRISMA guidelines 66
Chapter 4
List of Figures in Research Paper 2
Figure 1. Flow chart presenting the process of study selection following PRISMA
guidelines
103
Chapter 5
List of Figures in Research Paper 3
Figure 1. Flow chart presenting the process of study selection following PRISMA
guidelines
128
Figure 2. Scatterplot showing the global distribution of the paired herpes simplex
type 2 (HSV-2) and HIV prevalence measures among female sex workers 129
Chapter 7
Figure 1. Estimates of annual HIV incidence in A) FSWs, B) clients, and C) client
spouses at current coverage of male circumcision versus corresponding estimated
HIV incidence in a counter-factual scenario of zero coverage of male circumcision.
Estimates represent the mean across 500 simulation runs of the individual-based
model 185
Figure 2. Distribution of HIV incidence across MENA 186
Figure 3. Contribution of heterosexual sex work networks (HSWNs) to total HIV
incidence in MENA countries for which HIV transmission dynamics in HSWNs
could be modelled and simulated 187
Figure 4. Dynamics of HIV transmission in HSWNs in MENA described using A) a
conceptual diagram illustrating the flow of HIV transmission in these networks and
B) the estimated annual HIV incidence in FSWs, clients, and client spouses 188
Figure 5. A) HIV prevalence across levels of HSV-2 prevalence among FSWs
described through boxplots illustrating the trend in HIV prevalence with increasing
HSV-2 prevalence (boxplots’ centre lines indicate the median HIV prevalence, box
limits indicate the 25% and 75% quartiles, and whiskers indicate maximum and
minimum observations within 1.5 of interquartile range). B) The ecological
association between HIV prevalence and HSV-2 prevalence after adjustment for 190
14
regional, temporal, and behavioural (consistent condom use) differences among
FSWs expressed in terms of adjusted odds ratios through meta-regression analyses
(excluding the African Region)
Figure 6. Prevalence of curable STIs among FSWs in MENA 192
Figure 7. Temporal trend in syphilis prevalence among FSWs in MENA over the last
three decades 193
Figure 8. Impact of expanding coverage of prevention and treatment interventions
among FSWs on HIV incidence in HSWNs in MENA 195
Figure 9. Contribution of injecting drug use versus sexual transmission to HIV
incidence among FSWs in countries where injecting drug use is a main mode of HIV
transmission among FSWs 199
List of Figures in Appendix II (Research Paper 1)
Fig. S1. Map of the Middle East and North Africa region 219
List of Figures in Appendix III
Figure S1. Conceptual framework informing the development of the search strategy
for the systematic review
285
List of Figures in Appendix VI (Research Paper 2)
Figure S1. Scatter plots showing the time trend for the prevalence of A) current and
B) ever infection with Treponema pallidum (syphilis) among FSWs in the Middle
East and North Africa 322
List of Figures in Appendix VII (Research Paper 3)
Figure S1. Regional maps illustrating countries’ data contribution in terms of the
total number of studies and the total number of FSWs participating in those studies 334
Figure S2. Forest plot showing the results of meta-analyses on studies reporting HIV
prevalence among female sex workers stratified by HSV-2 prevalence level in A)
Africa, B) other world regions, and C) globally. Forest plots were generated using R
v.3.4.2 337

15
LIST OF ABBREVIATIONS
AIDS Acquired immunodeficiency syndrome
AMR Antimicrobial resistance
ART Anti-retroviral therapy
C. trachomatis Chlamydia trachomatis
COVID-19 Coronavirus disease 2019
FSW Female sex worker
GARPR Global AIDS Response Progress Reporting
HIV Human immunodeficiency virus
HSV-2 Herpes simplex virus type 2
HSWN Heterosexual sex work networks
IBBSS Integrated bio-behavioural surveillance survey(s)
LMIC Low- and middle-income countries
MENA Middle East and North Africa
MoT Modes of Transmission
MSM Men who have sex with men
N. gonorrhoeae Neisseria gonorrhoeae
NGO Non-governmental organizations
NPRP National Priorities Research Program
PEPFAR President's Emergency Plan for AIDS Relief
PLHIV People living with HIV/AIDS
PrEP Pre-exposure prophylaxis
PWID People/person who inject(s) drugs
RCT Randomized controlled trials
ROB Risk of bias
RR Relative risk
SAPPH-IRe Sisters' Antiretroviral Programme for Prevention of HIV: an
Integrated Response
SARS-CoV-2 Severe acute respiratory syndrome coronavirus 2

16
SDG Sustainable Development Goals
STI Sexually transmitted infection
T. pallidum Treponema pallidum
T. vaginalis Trichomonas vaginalis
UNAIDS Joint United Nations Programme on HIV/AIDS
WHO World Health Organization
WHO/EMRO WHO Regional Office for the Eastern Mediterranean
17
COVID-19 IMPACT STATEMENT
Coronavirus Disease 2019 (COVID-19) for me was a challenge that delayed my PhD by one
year, but also an opportunity of a lifetime. With the onset of the COVID-19 epidemic in Qatar in
February 2020, I was assigned to be the lead statistician and epidemiologist supporting Qatar’s
COVID-19 national response. This entailed conduct of numerous analyses to characterize the
epidemic throughout three epidemic waves, manage the mega national databases of polymerase
chain reaction testing, antibody testing, vaccination, hospitalization (infection severity
classification), and death in Qatar, and support the mathematical modelling work aimed at
forecasting the healthcare needs and evolution of the epidemic.
This engagement also entailed conduct of studies commissioned by the Ministry of Public Health
in Qatar to inform the national response, or suggested or requested by the World Health
Organization and the United States Centers for Disease Control and Prevention. I was the lead
statistician for all of these studies [1-30], and for most of these, I also designed or co-designed
the study and wrote or co-wrote the first draft of the manuscript. Some of these studies were
published in prestigious journals such as the New England Journal of Medicine, Nature
Medicine, JAMA, Clinical infectious Diseases, Journal of Travel Medicine, and Emerging
infectious Diseases. In several of these published papers, I was the first author [1-3,18,21-23]. I
also contributed to other studies conducted by colleagues [31-37]. This major engagement led to
significant, yet unavoidable, delay in progressing with the last study of my PhD, leading to a
one-year extension in completing this thesis.
Involvement in COVID-19 research and national response complemented the set of skills
acquired throughout my PhD with additional skills developed through hands-on training on
designing and analyzing epidemiological studies such as matched and unmatched cohort
18
(including cross-over) designs and case-control study designs. Moreover, I also co-designed and
analyzed cross-sectional surveys using probability sampling, in addition to the application of a
wide range of statistical techniques for analyzing epidemiologic studies such as conditional
logistic regression, Poisson and cox regressions, survival analysis, competing hazards/Fine-Gray
model analysis, design and use of sampling weights, in addition to conventional statistical
methods. Additional experience was gained through validation of analyses using different
analytical approaches, triangulation of evidence, and sensitivity analyses. Discussions with
colleagues enhanced my in-depth understanding of the epidemic dynamics and reinforced
infectious disease epidemiology concepts. Importantly, all of these engagements provided me
with insights on the type of evidence needed to characterize and monitor the epidemic and to
effectively inform the response. This has been the richest and most intense and demanding
scientific experience in my career.

19
References
Articles with major contribution
Published articles
1. Chemaitelly, H., P. Tang, M.R. Hasan, S. AlMukdad, H.M. Yassine, F.M. Benslimane,
H.A. Al Khatib, P. Coyle, H.H. Ayoub, Z.A. Kanaani, E.A. Kuwari, A. Jeremijenko,
A.H. Kaleeckal, A.N. Latif, R.M. Shaik, H.F. Abdul Rahim, G.K. Nasrallah, M.G. Al
Kuwari, H.E. Al Romaihi, A.A. Butt, M.H. Al-Thani, A.A. Khal, R. Bertollini, and L.J.
Abu-Raddad, Waning of BNT162b2 vaccine protection against SARS-CoV-2 infection in
Qatar. N Engl J Med, 2021. doi: 10.1056/NEJMoa2114114.
2. Chemaitelly, H., H.M. Yassine, F.M. Benslimane, H.A. Al Khatib, P. Tang, M.R. Hasan,
J.A. Malek, P. Coyle, H.H. Ayoub, Z. Al Kanaani, E. Al Kuwari, A. Jeremijenko, A.H.
Kaleeckal, A.N. Latif, R.M. Shaik, H.F. Abdul Rahim, G.K. Nasrallah, M.G. Al Kuwari,
H.E. Al Romaihi, M.H. Al-Thani, A. Al Khal, A.A. Butt, R. Bertollini, and L.J. Abu-
Raddad, mRNA-1273 COVID-19 vaccine effectiveness against the B.1.1.7 and B.1.351
variants and severe COVID-19 disease in Qatar. Nat Med, 2021. doi:10.1038/s41591-
021-01446-y: p. Epub ahead of print.
3. Tang, P.*, M.R. Hasan*, H. Chemaitelly*, H.M. Yassine, F.M. Benslimane, H.A.A.
Khatib, S. AlMukdad, P. Coyle, H.H. Ayoub, Z.A. Kanaani, E. Al Kuwari, A.
Jeremijenko, A.H. Kaleeckal, A.N. Latif, R.M. Shaik, H.F. Abdul Rahim, G.K.
Nasrallah, M.G. Al Kuwari, H.E. Al Romaihi, A.A. Butt, M.H. Al-Thani, A.A. Khal, R.
Bertollini, and L.J. Abu-Raddad, BNT162b2 and mRNA-1273 COVID-19 vaccine
effectiveness against the Delta (B.1.617.2) variant in Qatar. Nat Med (in press).
*Co-first auhtor
4. Abu-Raddad, L.J., H. Chemaitelly, A.A. Butt, and National Study Group for Covid-
Vaccination, Effectiveness of the BNT162b2 Covid-19 vaccine against the B.1.1.7 and
B.1.351 variants. N Engl J Med, 2021. 385(2): p. 187-189.
5. Bertollini, R., H. Chemaitelly, H.M. Yassine, M.H. Al-Thani, A. Al-Khal, and L.J. Abu-
Raddad, Associations of vaccination and of prior infection with positive PCR test results
for SARS-CoV-2 in airline passengers arriving in Qatar. JAMA, 2021. 326(2): p. 185-
188.
6. Abu-Raddad, L.J., H. Chemaitelly, H.M. Yassine, F.M. Benslimane, H.A. Al Khatib, P.
Tang, J.A. Malek, P. Coyle, H.H. Ayoub, Z. Al Kanaani, E. Al Kuwari, A. Jeremijenko,
A.H. Kaleeckal, A.N. Latif, R.M. Shaik, H.F. Abdul Rahim, G.K. Nasrallah, M.G. Al
Kuwari, H.E. Al Romaihi, M.H. Al-Thani, A. Al Khal, A.A. Butt, and R. Bertollini,
Pfizer-BioNTech mRNA BNT162b2 Covid-19 vaccine protection against variants of
concern after one versus two doses. J Travel Med, 2021. doi:10.1093/jtm/taab083: p.
Epub ahead of print.
7. Abu-Raddad, L.J., H. Chemaitelly, P. Coyle, J.A. Malek, A.A. Ahmed, Y.A.
Mohamoud, S. Younuskunju, H.H. Ayoub, Z. Al Kanaani, E. Al Kuwari, A.A. Butt, A.
Jeremijenko, A.H. Kaleeckal, A.N. Latif, R.M. Shaik, H.F. Abdul Rahim, G.K.
Nasrallah, H.M. Yassine, M.G. Al Kuwari, H.E. Al Romaihi, M.H. Al-Thani, A. Al Khal,
20
and R. Bertollini, SARS-CoV-2 antibody-positivity protects against reinfection for at
least seven months with 95% efficacy. EClinicalMedicine, 2021. 35: p. 100861.
8. Jeremijenko, A., H. Chemaitelly, H.H. Ayoub, M. Alishaq, A.B. Abou-Samra, J. Al
Ajmi, N.A.A. Al Ansari, Z. Al Kanaani, A. Al Khal, E. Al Kuwari, A. Al-Mohammed,
N.H.A. Al Molawi, H.M. Al Naomi, A.A. Butt, P. Coyle, R.A. El Kahlout, I. Gillani,
A.H. Kaleeckal, N.A. Masoodi, A.G. Thomas, H. Nafady-Hego, A.N. Latif, R.M. Shaik,
N.B.M. Younes, H.F.A. Rahim, H.M. Yassine, M.G. Al Kuwari, H.E. Al Romaihi, M.H.
Al-Thani, R. Bertollini, and L.J. Abu-Raddad, Herd immunity against severe acute
respiratory syndrome coronavirus 2 infection in 10 communities, Qatar. Emerg Infect
Dis, 2021. 27(5): p. 1343-1352.
9. Abu-Raddad, L.J., H. Chemaitelly, J.A. Malek, A.A. Ahmed, Y.A. Mohamoud, S.
Younuskunju, H.H. Ayoub, Z. Al Kanaani, A. Al Khal, E. Al Kuwari, A.A. Butt, P.
Coyle, A. Jeremijenko, A.H. Kaleeckal, A.N. Latif, R.M. Shaik, H.F.A. Rahim, H.M.
Yassine, M.G. Al Kuwari, H.E. Al Romaihi, M.H. Al-Thani, and R. Bertollini,
Assessment of the risk of SARS-CoV-2 reinfection in an intense re-exposure setting. Clin
Infect Dis, 2020. doi:10.1093/cid/ciaa1846: p. Epub ahead of print.
10. Butt A.A., H. Chemaitelly, A. Al Khal, P.V. Coyle, H. Saleh, A.H. Kaleeckal, A.N.
Latif, R. Bertollini, A.-B. Abou-Samra, and L.J. Abu-Raddad. SARS-CoV-2 vaccine
effectiveness in preventing confirmed infection in pregnant women. J Clin Invest, 2021.
doi: 10.1172/JCI153662.
11. Al-Thani, M.H., E. Farag, R. Bertollini, H.E. Al Romaihi, S. Abdeen, A. Abdelkarim, F.
Daraan, A.I.H. Elhaj Ismail, N. Mostafa, M. Sahl, J. Suliman, E. Tayar, H.A. Kasem,
M.J.A. Agsalog, B.K. Akkarathodiyil, A.A. Alkhalaf, M. Alakshar, A. Al-Qahtani,
M.H.A. Al-Shedifat, A. Ansari, A.A. Ataalla, S. Chougule, A. Gopinathan, F.J.
Poolakundan, S.U. Ranbhise, S.M.A. Saefan, M.M. Thaivalappil, A.S. Thoyalil, I.M.
Umar, Z. Al Kanaani, A. Al Khal, E. Al Kuwari, A.A. Butt, P. Coyle, A. Jeremijenko,
A.H. Kaleeckal, A.N. Latif, R.M. Shaik, H.F. Abdul Rahim, H.M. Yassine, G.K.
Nasrallah, M.G. Al Kuwari, O. Chaghoury, H. Chemaitelly, L.J. Abu-Raddad, and
Group for the Craft and Manual Workers Seroprevalence Study, SARS-CoV-2 infection
Is at herd immunity in the majority segment of the population of Qatar. Open Forum
Infect Dis, 2021. 8(8): p. ofab221.
12. Coyle, P.V., H. Chemaitelly, M.A. Ben Hadj Kacem, N.H. Abdulla Al Molawi, R.A. El
Kahlout, I. Gilliani, N. Younes, G. Al Anssari, Z. Al Kanaani, A. Al Khal, E. Al Kuwari,
A.A. Butt, A. Jeremijenko, A.H. Kaleeckal, A.N. Latif, R.M. Shaik, H.F. Abdul Rahim,
G.K. Nasrallah, H.M. Yassine, M.G. Al Kuwari, H.E. Al Romaihi, M.H. Al-Thani, R.
Bertollini, and L.J. Abu-Raddad, SARS-CoV-2 seroprevalence in the urban population of
Qatar: An analysis of antibody testing on a sample of 112,941 individuals. iScience,
2021. 24(6): p. 102646.
13. Abu-Raddad, L.J., H. Chemaitelly, H.H. Ayoub, Z. Al Kanaani, A. Al Khal, E. Al
Kuwari, A.A. Butt, P. Coyle, A. Jeremijenko, A.H. Kaleeckal, A.N. Latif, R.C. Owen,
H.F.A. Rahim, S.A. Al Abdulla, M.G. Al Kuwari, M.C. Kandy, H. Saeb, S.N.N. Ahmed,
H.E. Al Romaihi, D. Bansal, L. Dalton, M.H. Al-Thani, and R. Bertollini, Characterizing
the Qatar advanced-phase SARS-CoV-2 epidemic. Sci Rep, 2021. 11(1): p. 6233.
21
14. Abu-Raddad, L.J., H. Chemaitelly, J.A. Malek, A.A. Ahmed, Y.A. Mohamoud, S.
Younuskunju, Z. Al Kanaani, A. Al Khal, E. Al Kuwari, A.A. Butt, P. Coyle, A.
Jeremijenko, A.H. Kaleeckal, A.N. Latif, R.M. Shaik, H.F. Abdul Rahim, H.M. Yassine,
M.G. Al Kuwari, H.E. Al Romaihi, M.H. Al-Thani, and R. Bertollini, Two prolonged
viremic SARS-CoV-2 infections with conserved viral genome for two months. Infect
Genet Evol, 2021. 88: p. 104684.
15. Ayoub, H.H., H. Chemaitelly, M. Makhoul, Z. Al Kanaani, E. Al Kuwari, A.A. Butt, P.
Coyle, A. Jeremijenko, A.H. Kaleeckal, A.N. Latif, R.M. Shaik, H.F. Abdul Rahim, G.K.
Nasrallah, H.M. Yassine, M.G. Al Kuwari, H.E. Al Romaihi, M.H. Al-Thani, R.
Bertollini, A. Al Khal, and L.J. Abu-Raddad, Epidemiological impact of prioritising
SARS-CoV-2 vaccination by antibody status: mathematical modelling analyses. BMJ
Innov, 2021. 7(2): p. 327-336.
16. Ayoub, H.H., H. Chemaitelly, G.R. Mumtaz, S. Seedat, S.F. Awad, M. Makhoul, and
L.J. Abu-Raddad, Characterizing key attributes of COVID-19 transmission dynamics in
China's original outbreak: model-based estimations. Glob Epidemiol, 2020. 2: p. 100042.
17. Ayoub, H.H., H. Chemaitelly, S. Seedat, M. Makhoul, Z.A. Kanaani, A. Al Khal, E.A.
Kuwari, A.A. Butt, P. Coyle, A. Jeremijenko, A.H. Kaleeckal, A.N. Latif, R.M. Shaik,
H.A. Rahim, H.M. Yassine, M.G.A. Kuwari, H.E.A. Romaihi, M.H. Al-Thani, R.
Bertollini, and L.J. Abu-Raddad, Mathematical modeling of the SARS-CoV-2 epidemic
in Qatar and its impact on the national response to COVID-19. J Glob Health, 2021. 11:
p. 05005.
18. Ayoub, H.H.*, H. Chemaitelly*, S. Seedat, G.R. Mumtaz, M. Makhoul, and L.J. Abu-
Raddad, Age could be driving variable SARS-CoV-2 epidemic trajectories worldwide.
PLOS ONE, 2020. 15(8): p. e0237959.
*Co-first author
19. Makhoul, M., H.H. Ayoub, H. Chemaitelly, S. Seedat, G.R. Mumtaz, S. Al-Omari, and
L.J. Abu-Raddad, Epidemiological Impact of SARS-CoV-2 vaccination: mathematical
modeling analyses. Vaccines (Basel), 2020. 8(4).
20. Makhoul, M., H. Chemaitelly, H.H. Ayoub, S. Seedat, and L.J. Abu-Raddad,
Epidemiological differences in the impact of COVID-19 vaccination in the United States
and China. Vaccines (Basel), 2021. 9(3): p. 223.
21. Seedat, S.*, H. Chemaitelly*, H. Ayoub, M. Makhoul, G.R. Mumtaz, Z.A. Kanaani,
A.A. Khal, E.A. Kuwari, A.A. Butt, P. Coyle, A. Jeremijenko, A.H. Kaleeckal, A.N.
Latif, R.M. Shaik, H.M. Yassine, M.G. Al Kuwari, H.E. Al Romaihi, M.H. Al-Thani, R.
Bertollini, and L.J. Abu-Raddad, SARS-CoV-2 infection hospitalization, severity,
criticality, and fatality rates. Sci Rep, 2021. 11(1):18182. doi: 10.1038/s41598-021-
97606-8.
*Co-first auhtor
Articles under review or preprints
22. Chemaitelly H., R. Bertollini, and Abu-Raddad, L.J., and the National Study Group for
COVID-19 Epidemiology. Reinfections with the SARS-CoV-2 B.1.351 variant and
efficacy of natural immunity against reinfection. N Engl J Med (under review).
22
23. Chemaitelly, H., S. AlMukdad, J.P. Joy, H.H. Ayoub, H.M. Yassine, F.M. Benslimane,
H.A. Al Khatib, P. Tang, M.R. Hasan, P. Coyle, Z. Al Kanaani, E. Al Kuwari, A.
Jeremijenko, A.H. Kaleeckal, A.N. Latif, R.M. Shaik, H.F. Abdul Rahim, G.K.
Nasrallah, M.G. Al Kuwari, A.A. Butt, H.E. Al Romaihi, M.H. Al-Thani, M.M. Alkadi,
O. Ali, M. Al-Maslamani, R. Bertollini, H. Al Malki, Y. Almaslamani, L.J. Abu-Raddad,
and A. Al Khal, SARS-CoV-2 vaccine effectiveness in immunosuppressed kidney
transplant recipients. Nat Commun (under review), also available at medRxiv, 2021: p.
2021.08.07.21261578.
24. Abu-Raddad, L.J., H. Chemaitelly, H.H. Ayoub, P. Tang, P. Coyle, M.R. Hasan, H.M.
Yassine, F.M. Benslimane, H.A. Al Khatib, Z.A. Kanaani, E.A. Kuwari, A. Jeremijenko,
A.H. Kaleeckal, A.N. Latif, R.M. Shaik, H.F. Abdul Rahim, G.K. Nasrallah, M.G. Al
Kuwari, A.A. Butt, H.E. Al Romaihi, A.A. Khal, M.H. Al-Thani, and R. Bertollini, Effect
of vaccination and of prior infection on infectiousness of vaccine breakthrough infections
and reinfections. Nat Med (under review), also available at medRxiv, 2021: p.
2021.07.28.21261086.
25. Abu-Raddad, L.J., H. Chemaitelly, H.H. Ayoub, H.M. Yassine, F.M. Benslimane, H.A.
Al Khatib, P. Tang, M.R. Hasan, P. Coyle, Z.A. Kanaani, E.A. Kuwari, A. Jeremijenko,
A.H. Kaleeckal, A.N. Latif, R.M. Shaik, H.F. Abdul Rahim, G.K. Nasrallah, M.G. Al
Kuwari, A.A. Butt, H.E. Al Romaihi, M.H. Al-Thani, A.A. Khal, and R. Bertollini,
Protection afforded by the BNT162b2 and mRNA-1273 COVID-19 vaccines in fully
vaccinated cohorts with and without prior infection. JAMA (under review), also available
at medRxiv, 2021: p. 2021.07.25.21261093.
26. Abu-Raddad, L.J., H. Chemaitelly, H.H. Ayoub, H.M. Yassine, P. Coyle, J.A. Malek,
A.A. Ahmed, Y.A. Mohamoud, S. Younuskunju, P. Tang, Z. Al Kanaani, E. Al Kuwari,
A.A. Butt, A. Jeremijenko, A.H. Kaleeckal, A.N. Latif, R.M. Shaik, H.F. Abdul Rahim,
G.K. Nasrallah, H.M. Yassine, M.G. Al Kuwari, H.E. Al Romaihi, M.H. Al-Thani, A. Al
Khal, and R. Bertollini, Epidemiology of introduction and expansion of the SARS-CoV-2
B.1.1.7 variant and its reinfections in a national population. PLOS Med (under review).
27. L.J., Abu-Raddad, H. Chemaitelly, R. Bertollini, and and the National Study Group for
COVID-19 Epidemiology, Severity, criticality, and fatality of SARS-CoV-2 reinfections.
N Engl J Med (under review).
28. Abu-Raddad, L.J., H. Chemaitelly, H.H. Ayoub, H.M. Yassine, F.M. Benslimane, H.A.
Al Khatib, P. Tang, M.R. Hasan, P. Coyle, S. AlMukdad, Z. Al Kanaani, E. Al Kuwari,
A. Jeremijenko, A.H. Kaleeckal, A.N. Latif, R.M. Shaik, H.F. Abdul Rahim, G.K.
Nasrallah, M.G. Al Kuwari, A.A. Butt, H.E. Al Romaihi, M.H. Al-Thani, A. Al Khal,
and R. Bertollini, Severity, criticality, and fatality of the SARS-CoV-2 Beta variant. Clin
Infect Dis (under review), also available at medRxiv, 2021: p. 2021.08.02.21261465.
29. Ayoub, H.H., G.R. Mumtaz, S. Seedat, M. Makhoul, H. Chemaitelly, and L.J. Abu-
Raddad, Estimates of global SARS-CoV-2 infection exposure, infection morbidity, and
infection mortality rates. Glob Epidemiol (under review), also available at medRxiv,
2021: p. 2021.01.24.21250396.
30. Makhoul, M., F. Abou-Hijleh, S. Seedat, G.R. Mumtaz, H. Chemaitelly, H. Ayoub, and
L.J. Abu-Raddad, Analyzing inherent biases in SARS-CoV-2 PCR and serological
23
epidemiologic metrics. BMC Infect Dis (under review), also available at medRxiv, 2020:
p. 2020.08.30.20184705.
Additional articles with minor contribution
31. Mumtaz, G., H.H. Ayoub, M. Makhoul, S. Seedat, H. Chemaitelly, and L.J. Abu-
Raddad, Can the COVID-19 pandemic still be suppressed? Putting essential pieces
together. Journal of Global Health Reports, 2020. 4: p. e2020030.
32. Nasrallah, G.K., S.R. Dargham, F. Shurrab, D.W. Al-Sadeq, H. Al-Jighefee, H.
Chemaitelly, Z. Al Kanaani, A. Al Khal, E. Al Kuwari, P. Coyle, A. Jeremijenko, A.H.
Kaleeckal, A.N. Latif, R.M. Shaik, H.F.A. Rahim, H.M. Yassine, M.G. Al Kuwari, H.
Qotba, H.E. Al Romaihi, P. Tang, R. Bertollini, M.H. Al-Thani, A.A. Althani, and L.J.
Abu-Raddad, Analytic comparison between three high-throughput commercial SARS-
CoV-2 antibody assays reveals minor discrepancies in a high-incidence population. Sci
Rep, 2021. 11(1): p. 11837.
33. Butt, A.A., H. Nafady-Hego, H. Chemaitelly, A.-B. Abou-Samra, A.A. Khal, P.V.
Coyle, Z.A. Kanaani, A.H. Kaleeckal, A.N. Latif, Y.A. Masalmani, R. Bertollini, and
L.J.A. Raddad, Outcomes Among Patients with Breakthrough SARS-CoV-2 Infection
After Vaccination. Int J Inf Dis, 2021. 110: p. 353-358.
34. Hasan, M.R., M.K.R. Kalikiri, F. Mirza, S. Sundararaju, A. Sharma, S. Lorenz, H.
Chemaitelly, R.A. El-Kahlout, K.M. Tsui, H.M. Yassine, P.V. Coyle, A.A. Khal, R.
Bertollini, M.H. Al Thani, L.J. Abu-Raddad, P. Tang, and National Study Group for
COVID-19 Epidemiology in Qatar, Real-Time SARS-CoV-2 Genotyping by High-
Throughput Multiplex PCR Reveals the Epidemiology of the Variants of Concern in
Qatar. Int J Inf Dis, in press.
35. Abu-Raddad, L.J., S. Dargham, H. Chemaitelly, P. Coyle, Z. Al Kanaani, E. Al Kuwari,
A.A. Butt, A. Jeremijenko, A.H. Kaleeckal, A.N. Latif, R.M. Shaik, H.F.A. Rahim, G.K.
Nasrallah, H.M. Yassine, M.G. Al Kuwari, H.E. Al Romaihi, M.H. Al-Thani, A. Al Khal,
and R. Bertollini, COVID-19 risk score as a public health tool to guide targeted testing: A
demonstration study in Qatar. Int J Inf Dis (under review), also available at medRxiv,
2021: p. 2021.03.06.21252601.
36. Bsat, R., H. Chemaitelly, P. Coyle, P. Tang, M.R. Hasan, Z. Al Kanaani, E.A. Kuwari,
A.A. Butt, A. Jeremijenko, A.H. Kaleeckal, A.N. Latif, R.M. Shaik, H.F. Abdul Rahim,
G.K. Nasrallah, F.M. Benslimane, H.A. Al Khatib, H.M. Yassine, M.G. Al Kuwari, H.E.
Al Romaihi, M.H. Al-Thani, A.A. Khal, R. Bertollini, L.J. Abu-Raddad, and H.H.
Ayoub, Characterizing the effective reproduction number during the COVID-19
epidemic: Insights from Qatar’s experience, J Glob Health (under review).
37. Coyle, P.V., R.A.E. Kahlout, S.R. Dargham, H. Chemaitelly, M.A.B.H. Kacem, N.H.A.
Al-Mawlawi, I. Gilliani, N. Younes, Z.A. Kanaani, A.A. Khal, E.A. Kuwari, A.
Jeremijenko, A.H. Kaleeckal, A.N. Latif, R.M. Shaik, H.F.A. Rahim, G.K. Nasrallah,
H.M. Yassine, M.G.A. Kuwari, H.E. Al Romaihi, P. Tang, R. Bertollini, M.H. Al-Thani,
and L.J. Abu-Raddad, Assessing the performance of a serological point-of-care test in
measuring detectable antibodies against SARS-CoV-2. PLOS One (under review), also
available at medRxiv, 2021: p. 2021.02.04.21251126.

24
38. Makhoul M., F.M. Abu-Hijleh, H.H. Ayoub, S. Seedat, H. Chemaitelly, L.J Abu-
Raddad, Modeling the population-level impact of treatment on COVID-19 disease and
SARS-CoV-2 transmission. Epidemics (under review).
25
ABSTRACT
Objectives: This thesis aims to address the evidence gap in understanding HIV epidemiology
among female sex workers (FSWs) in the Middle East and North Africa (MENA) region by 1)
conducting the first comprehensive assessment of HIV epidemic status among FSWs and their
clients, and of other key sexually transmitted infections (STIs) among FSWs, 2) investigating the
utility of herpes simplex virus type 2 (HSV-2) prevalence in predicting HIV epidemic potential
in FSWs, and 3) estimating HIV incidence in heterosexual sex work networks (HSWNs) and
assessing the impact of interventions on epidemiological measures of relevance to HIV response.
Methods: Methodologies include systematic reviews, meta-analyses and meta-regressions of
HIV/STI prevalence data, ecological analysis of global HSV-2/HIV prevalence data among
FSWs, and an individual-based mathematical model simulating HIV transmission dynamics in
HSWNs.
Results: The median proportion of reproductive-age women reporting current/recent sex work
was 0.6% (range: 0.2-2.4%), and of men reporting currently/recently buying sex was 5.7%
(range: 0.3-13.8%). Risk behaviors varied widely within and across countries. The HIV epidemic
was concentrated in Djibouti and South Sudan (prevalence ~20%), of intermediate intensity in
North Africa and Somalia (1-5%), and limited in other countries (<1%). There was steady
growth in odds of HIV prevalence since 2003 at ~15% per year (95% CI: 9-21%).
STI prevalence among FSWs was substantial (relative to general population women), supporting
a key role for HSWNs in STI transmission dynamics. Pooled prevalence of current infection was
12.7% (95% CI: 8.5-17.7%) for T. pallidum (syphilis), 14.4% (95% CI: 8.2-22.0%) for C.
trachomatis, 5.7% (95% CI: 3.5-8.4%) for N. gonorrhoeae, and 7.1% (95% CI: 4.3-10.5%) for T.

26
vaginalis, while that of lifetime infection was 23.7% (95% CI: 10.2-40.4%) for HSV-2. Syphilis
prevalence varied by MENA subregion and has been declining by 7% per year for three decades.
Analysis of 231 global paired HSV-2/HIV measures identified a strong positive association
among FSWs after adjusting for confounders such as region, temporal trend, and condom use.
HIV prevalence was negligible where HSV-2 prevalence was ≤20%, but HIV infection odds
doubled with each 25% increase in HSV-2 prevalence indicating a threshold effect and utility of
HSV-2 in predicting HIV epidemic potential.
The individual-based model was developed, calibrated, tested, and applied to 12 MENA
countries with sufficient input data. The estimated number of new infections in 2020 in these
countries was 3,471 (range: 1,295-10,308) among FSWs, 6,416 (range: 3,144-14,223) among
clients, and 4,717 (range: 3,490-7,288) among client spouses. These infections accounted for
25.1% of total HIV incidence in MENA. Incidence was distributed equally among FSWs, clients,
and client spouses. The contribution of incidence in HSWNs to total incidence ranged from 3.3%
in Pakistan where injecting drug use is prevalent to 71.8% in South Sudan and 72.7% in Djibouti
where sex is the dominant mode of transmission. Scale-up of interventions such as antiretroviral
therapy, condom use, and pre-exposure prophylaxis substantially reduced incidence among
FSWs, clients, and client spouses either directly or indirectly by reducing onward transmission.
Conclusions: HIV epidemics among FSWs in MENA are emerging, and some are already
established. The epidemic has been growing steadily in recent years, but with strong
regionalization and heterogeneity. Integrating testing for HSV-2 in HIV surveillance can be
useful in predicting HIV epidemic potential particularly in countries where HIV among FSWs is
still limited but has potential to grow. Substantial HIV incidence occurs in HSWNs, suggesting

27
the need for rapidly scaling up comprehensive treatment and prevention services at least for
FSWs.

28
CHAPTER 1. BACKGROUND
1. The global epidemiology of HIV in heterosexual sex work networks
1.1. The global context
The HIV pandemic continues to be a leading global health challenge [1]. Since first discovered,
close to 76 million people have been infected with HIV and nearly 33 million have lost their
lives to AIDS-related illnesses [2]. In many settings, epidemics have mostly affected key
populations at increased risk of HIV exposure and transmission, including female sex workers
(FSWs), men who have sex with men (MSM), and people who inject drugs (PWID) [1, 3, 4].
The expansion of HIV treatment and prevention efforts over the last two decades, notably the
increased availability of anti-retroviral therapy (ART), has led to substantial declines in HIV
incidence and mortality globally [4]. These gains have fuelled an ambitious drive towards ending
the HIV/AIDS epidemic as a public health threat by 2030 [5]. To attain this goal, the Joint
United Nations Programme on HIV/AIDS (UNAIDS) formulated the ‘UNAIDS 2016-2021
Strategy’ [6], and more recently the ‘UNAIDS 2021-2026 Strategy’ [7]. The first strategy aimed
to reduce new HIV infections and AIDS-related deaths to fewer than 500,000 by 2020 and to
fewer than 200,000 by 2030, as well as to eliminate HIV-related stigma and discrimination by
2020 [6-8]. The call for action entailed scaling-up HIV response among people living with HIV
(PLHIV) to achieve coverage levels of 90% for HIV testing, treatment, and sustained viral
suppression by 2020 [6], and of 95% by 2030 [6, 8]. A specific emphasis has been placed on
increasing the proportion of HIV-positive and HIV-negative key populations with access to
tailored HIV combination prevention services to reach the global targets [6].
29
Despite progress, the global community fell short of meeting set targets, with 1.7 million new
HIV infections [7] and 680,000 AIDS-related deaths in 2020 [9]. Importantly, 62% of newly
acquired infections among adults were among key populations and their sexual partners [1],
indicating persisting gaps in reaching populations most at-risk [4].
The advent of the severe acute respiratory syndrome coronavirus 2 (SARS-CoV-2) pandemic
presented another challenge to the global HIV response, with a 20% disruption in HIV treatment
services (ART) over six months estimated to yield more than 110,000 additional AIDS-related
deaths [4]. However, recent empirical evidence from seven African countries supported by the
U.S. President's Emergency Plan for AIDS Relief (PEPFAR) suggested overall lower-than-
previously-anticipated interruption to services, although wide variability in rapid adoption of
mitigation measures was observed across countries [10]. The impact on key populations remains
to be fully elucidated but preliminary evidence also suggests widening gaps in increasing these
populations’ accessibility to HIV services. For example, preliminary reports from 86 countries
indicated 40% disruption in delivery of HIV services to FSWs between March-June 2020 [4].
Evidence from Zimbabwe further indicated a lower ability for FSWs to negotiate safer sex and a
higher likelihood for exchanging sex for food during the pandemic given the decline in the
number of clients [11].
With growing consensus that achieving substantial reduction in HIV-related morbidity and
mortality cannot be reached without targeting populations most affected by HIV, a new set of
targets was formulated for 2025 with emphasis on addressing inequalities among PLHIV to get
back on track to reaching the elimination goal by 2030 [7, 12]. The newly-set targets entail
achieving, by 2025, coverage levels of 95% for HIV testing, treatment, and sustained viral
suppression among PLHIV, as well as expanding access of reproductive-age women to HIV,

30
sexual, and reproductive health services, and of populations at risk of HIV to effective
combination prevention interventions by 95% [7, 12]. Additional targets include reducing to
<10% each of the proportion of countries with punitive laws that limit access to HIV services,
the proportion of PLHIV experiencing stigma and discrimination, and the proportion of women,
PLHIV, and key populations experiencing gender inequality and violence [7, 12].
1.2. Global burden of HIV and other sexually transmitted infections (STIs) among FSWs
Tackling the HIV epidemic among FSWs entails first knowing the size of the population that
programs need to cater for. Estimates for the population proportion of FSWs at a national level
(that is the proportion of FSWs among adult women of reproductive age) according to the only
systematic review found in the literature, albeit out of date, range between 0.7-4.3% in sub-
Saharan Africa, 0.2-2.6% in Asia, 0.1-1.5% in Eastern and Central Europe, 0.1-1.4% in West
Europe, and 0.2-7.4% in Latin America [13]. Although proportions may seem small, this
translates to millions of FSWs being at risk of acquiring HIV and in need of HIV prevention or
treatment services.
The mean HIV prevalence among FSWs was estimated globally at 10.4% between the years
2006 and 2017, and regionally at 33.3% (81 datapoints) in Eastern and Southern Africa, 20.1%
(46 datapoints) in West and Central Africa, 8.0% (20 datapoints) in Eastern Europe and Central
Asia, 7.4% (45 datapoints) in Western and Central Europe and North America, 5.7% (183
datapoints) in Asia and the Pacific, 4.2% (56 datapoints) in Latin America and the Caribbean,
and 1.8% (19 datapoints) in the Middle East and North Africa (MENA) [14]. In low- and middle-
income countries (LMICs), the odds of HIV acquisition were 13.5-fold higher among FSWs
compared with women in the general population [15], highlighting the extent of FSWs’
vulnerability to HIV infection.

31
FSWs are also at increased risk of acquiring other sexually transmitted infections (STIs) [16] but
there are few surveillance and epidemiological studies for curable STIs such as Chlamydia
trachomatis, Neisseria gonorrhoeae, Trichomonas vaginalis, and Treponema pallidum (syphilis)
among them [16]. A systematic review of studies between 1995 and 2006 reported global
prevalence among FSWs in the range of 0.6-46.2% (30 datapoints) for Chlamydia trachomatis,
0.5-41.3% (33 datapoints) for Neisseria gonorrhoeae, 0.1-51.0% (20 datapoints) for
Trichomonas vaginalis, and 1.5-60.5% (31 datapoints) for syphilis [17]. Similarly, a systematic
review of studies between 1950 and 2008 contrasting migrant and non-migrant FSWs reported
prevalence in the range of 0-19% (24 datapoints) for Chlamydia trachomatis, 0-27% (32
datapoints) for Neisseria gonorrhoeae, 0-1% (2 datapoints) for Trichomonas vaginalis, and 1-
18% (14 datapoints) for syphilis, with higher prevalence found among migrant FSWs and those
from lower income countries [18]. None of these reviews included data from the MENA region.
More recent estimates (2008-2018) were available only for syphilis through the Global AIDS
Response Progress Reporting (GARPR) system; these ranged from 0.0-52.3% (31 datapoints) in
the African Region, 0.0-18.0% (22 datapoints) in the Region of the Americas, 0.7-17.7% (11
datapoints) in the European Region, and 0.4-17.7% (9 datapoints) in MENA [16].
STIs have been associated with higher sexual risk behaviour [19-24] and increased risk of HIV
acquisition [25-27]. Therefore, theoretically, monitoring of STIs can provide insights onto HIV
epidemic potential. However, given their curable nature, the aforementioned curable STIs may
not be the most reliable markers to this end [28]. An established biological marker of sexual risk
behaviour and HIV epidemic potential is herpes simplex virus type 2 (HSV-2), which is almost
exclusively transmitted through the sexual route, is more transmissible than HIV, and produces
long-lasting antibodies [28-33]. As expected, HSV-2 prevalence levels among FSWs vary across

32
settings based on the structure of heterosexual sex work networks (HSWNs) [30] but are
generally high often exceeding 50% [34-36].
1.3. Role of HSWNs in the HIV epidemic
Precise estimates for the contribution of HIV epidemics in HSWNs to HIV incidence have been
limited by estimation approaches and the dearth of data on HSWNs structure [37, 38]. Classic
methods, using the UNAIDS Modes of Transmission (MoT) model and population attributable
fraction (PAF) measures, fail to capture the dynamics of partnerships’ formation and dissolution
and of HIV transmission within HSWNs including the onward chains of infection transmission
over time, and thus often underestimate the contribution of these networks to HIV incidence [37-
40]. Dynamic mathematical models applied to generalized HIV epidemics in sub-Saharan Africa
estimated the fraction of incident infections attributable to HSWNs over 20 years in the range of
58.3-88.9% in the absence of interventions, and of 13.5-37.6% in countries with medium to high
condom use levels [38]. Similarly, a dynamic model incorporating all key populations attributed
close to half of HIV incidence during 2010-2019 in South Africa to HSWNs, with most new
infections occurring among clients and their sexual partners [41]. Although this approach is yet
to be well investigated in countries with concentrated epidemics, the contribution of HSWNs to
HIV incidence and number of PLHIV is likely to be also considerable given the large size of the
client population and the high potential for onward infection transmission, particularly to stable
partners of clients of FSWs [40, 42, 43].
1.4. HIV prevention interventions among FSWs
HIV testing and linkage to care remain the leading challenges against reaching even the 90-90-90
targets among FSWs [4]. A systematic review of HIV testing among FSWs that included ten
studies from six countries (Benin, Canada, China, Dominican Republic, Iran, and Kenya)

33
between 2000-2017 [44] reported the proportion of FSWs who underwent testing in the past 12
months in the range of 22.0% in China to 76.1% in Canada, with the most commonly reported
barriers being financial or related to stigma and discrimination [44]. The new WHO testing
guidelines recommend the use of HIV self-testing as a complementary approach to standard HIV
testing after recent evidence suggested its association with higher testing uptake but lower
linkage to care among key populations [45, 46]. For instance, a recent systematic review found
that although HIV self-testing was associated with 36% increase in testing uptake among FSWs
compared to standard HIV testing (Relative risk (RR): 1.36; 95%CI: 1.04-1.78), it resulted in a
16% decrease in linkage to ART (RR: 0.84; 95% CI: 0.75-0.94) [47].
The latest UNAIDS Gap Report further highlighted the suboptimal ART coverage among FSWs
compared to general population women in nine out of 12 LMICs with available data for the years
2013-2015 [48]. Inequalities in accessing ART have been also documented among HIV-positive
FSWs with a systematic review conducted in 2014 pointing to 80% of FSWs in high income
countries reporting ever being on ART compared to only 39% of those in LMICs [49]. Despite
limited access to HIV testing and treatment in many settings, considerable levels of adherence to
treatment and of viral suppression have been reported among FSWs. In the previous systematic
review, adherence to ART was estimated at 76% while viral suppression was assessed at 57%
[49]. Recently, a study among HIV-positive FSWs in Iringa, Tanzania revealed that only a third
of FSWs were aware of their HIV sero-status, yet, of those, 70% were on ART with most being
virally suppressed [50]. A study comparing FSWs to general population women in Manicaland,
Zimbabwe further showed that HIV-positive FSWs were 1.6-fold more likely to have been tested
for HIV and 2.3-fold more likely to have initiated ART compared to HIV-positive general
population women whereas ART adherence was comparable between the two groups [51].

34
Interestingly, the higher testing uptake among FSWs was mainly attributed to greater self-
perceived risk and proximity to testing services [51], affirming that structural factors are often
the main hinderance in capturing and retaining HIV-positive FSWs in the HIV testing and
treatment cascade.
Recommended HIV combination prevention interventions among FSWs comprise HIV testing
services and linkages to ART therapy or pre-exposure prophylaxis (PrEP), condoms and
lubricant programming, clinical health services, peer-led outreach services, as well as community
empowerment and violence prevention programming [6, 52]. The effectiveness of this
multifaceted approach on curbing the HIV epidemic has been demonstrated in multiple settings
[52-57]. In Thailand, the nationwide implementation of the ‘100% condom use programme’,
which incorporated empowerment of FSWs to refuse unprotected sex along with STI treatment
in the early 1990s, increased condom use levels among facility-based FSWs to over 90% by
1993 yielding a marked decline in HIV prevalence among this population from 33.2% in 1994 to
2.8% in 2010, and among antenatal clinic attendees from 1.5% in 2000 to 0.9% in 2009 [53]. The
program further resulted in a 95% decline in curable STIs across the country between 1990-2000
[53]. Similar success was observed in Cambodia where the increase in condom use levels among
brothel-based FSWs, from 20% in 1996 to over 90% in 2001, was reflected in declining HIV
incidence trends among this population from 13.2% in 1999 to 6.5% in 2002 [53]. HIV
prevalence also declined among brothel-based FSWs from 42% in 1996 to 14% in 2006, and
among the general population from 2.0% in 1998 to 0.6% in 2011 [53]. These programs
subsequently evolved to accommodate outreach for the increasingly mobile FSW populations
[53]. In India, community-led structural interventions in Calcutta, ‘the Sonagachi project’,
increased condom use among FSWs in this red-light district from 3% in 1992 to 90% in 1999,

35
and were linked to an HIV prevalence of 11% among this population in 2000 compared to
prevalence levels of 50-90% among FSWs in other regions [55]. A trend of declining syphilis
from 25% in 1992 to 0.2% in 1998 in Sonagachi district was also reported [53].
Over the last decade, the large-scale implementation of combination prevention interventions
among key populations including FSWs in six Indian states through the Avahan project was
estimated to have reduced HIV prevalence among the general population by a range of 2.4-
12.7% [56]. A systematic review summarizing the impact of community empowerment
interventions among FSWs in LMICs estimated the reduction in HIV prevalence among them at
32.0%, in Chlamydia trachomatis prevalence at 25.3%, in Neisseria gonorrhoeae prevalence at
38.8%, and in syphilis prevalence at 46.9% [57]. Results further indicated a three-fold increase in
condom use among FSWs’ clients [57]. More recently, a clinical trial conducted among HIV-
positive FSWs in the Dominican Republic highlighted the impact of multi-level interventions on
increasing adherence to ART and engagement in protected sexual intercourse among FSWs as
well as their sexual partners [54]. Similarly, the SAPPH-IRe trial in Zimbabwe showed that a
comprehensive prevention program that includes community mobilization in addition to health
and legal services can achieve substantial gains in terms of HIV testing, treatment coverage, and
viral suppression among FSWs [58]. The effectiveness of the HIV combination prevention
approach has been also demonstrated in mathematical modelling studies [52, 59, 60].
Evidence increasingly suggest that achieving the 90-90-90 targets entails a holistic and extensive
approach that also addresses structural barriers, notably stigma, discrimination, violence,
punitive laws, criminalization, political disengagement, and the scarcity of funding, which are
the main hinderance against FSWs’ inclusion and maintenance in the HIV cascade [14, 61, 62].

36
2. HIV epidemiology in MENA
2.1. MENA definition
The MENA region is defined in this thesis to include countries that featured in the regional
definition of at least two of the three international organizations leading HIV efforts in MENA,
namely UNAIDS, the WHO, and the World Bank (Appendix I) [42]. The definition encompasses
23 countries extending from Morocco in the West to Afghanistan and Pakistan in the East
(Figure 1). This region includes about 10% of the world’s population [63].

37
Figure 1. Map of the Middle East and North Africa region. This defintion covers 23 countries including Afghanistan, Algeria, Bahrain, Djibouti,
Egypt, Iran, Iraq, Jordan, Kuwait, Lebanon, Libya, Morocco, Oman, Pakistan, Palestine, Qatar, Saudi Arabia, Somalia, Sudan, Syria, Tunisia,
United Arab Emirates (UAE), and Yemen. This definition is based on the definitions of the World Health Organization’s Regional Office for the
Eastern Mediterranean, the Joint United Nations Programme on HIV/AIDS, and the World Bank. Countries were eligible for inclusion if they were
part of at least two international organizations’ definition for this region (Appendix I).

38
2.2. Status of HIV epidemic and response in MENA
MENA is a region where HIV incidence and AIDS-related mortality are still rising [4]. The
number of new HIV infections in this region increased by 25% since 2010, while that of AIDS-
related deaths increased by three-fold since the year 2000 [4]. Of all world regions, MENA has
the lowest proportion of PLHIV who are aware of their status, the lowest coverage of ART, and
the lowest proportion for viral suppression, assessed respectively at 61%, 43%, and 37% in 2020
[64], far behind even the WHO regional target of 50% ART coverage that was set to be reached
in 2015 [65], as well as far behind the 90-90-90 UNAIDS targets by 2020 [6] and the 95-95-95
UNAIDS targets by 2025 [7] (Figure 2).
Several factors may have contributed to the region’s poor progress towards set targets. For a long
time, the region has been perceived as ‘a real hole in terms of HIV/AIDS epidemiological data’
[66]. Despite recent progress in HIV research and surveillance [67], including conduct of
integrated bio-behavioural surveillance surveys (IBBSS) [68, 69], many of these data are, at best,
published in country-level reports, or never analysed. The limited availability of a rigorous
scientific base that is grounded on sufficient and quality data to inform response to HIV and
other STIs in many countries, coupled with ongoing political conflicts, political and socio-
cultural sensitivities surrounding sexual activity, and limited resources, have set HIV and STI
surveillance and targeted programming low on MENA countries’ public health agendas [70].
Programs targeting sexual health, where they exist, remain small in scale and mostly geared
towards the general population rather than key populations [70]. The latter continue to be
stigmatized and lacking access to comprehensive and confidential services [42, 71, 72]. Almost
all programming for key populations, whenever available, is provided by non-governmental

39
organizations that often lack the resources or legal coverage to deliver comprehensive services
[42, 72].
Figure 2. HIV testing and treatment cascade across world regions [4] compared to WHO regional targets
for 2015 [65], UNAIDS 90-90-90 targets for 2020 [6] and UNAIDS 95-95-95 targets for 2030.

40
Since 2007, the ‘MENA HIV/AIDS Epidemiology Synthesis Project’ has maintained an active
regional HIV database [42, 73]. The first systematic syntheses of these data documented
concentrated and emerging epidemics among MSM [74] and PWID [75], the majority of which
emerged within the last two decades [74, 75]. This review provided conclusive evidence of an
established HIV epidemic among PWID in Iran among whom HIV prevalence stabilized at 15%
[75]. In Pakistan, findings of consecutive IBBSS [74-77] showed a steady increase in HIV
prevalence among PWID that was followed by an increase in HIV prevalence among hijra
(transgender people)/male sex workers (Figure 3A). In Egypt, the rise in HIV prevalence among
MSM [74] was also followed by a rise in prevalence among PWID [75] (Figure 3B).
Figure 3. Trend in HIV prevalence observed in subsequent rounds of integrated bio-behavioural
surveillance surveys among MSM and PWID in A) Pakistan and B) Egypt.
41
Nascent HIV epidemics were also identified among MSM in Morocco (4.4% in 2008), Tunisia
(4.9% in 2010), Sudan (9.3% in 2005), and Iran (14.8% in 2007) [74]. Emerging HIV epidemics
among PWID were further documented at the subnational level in Afghanistan (range: 0-18.2%)
and Morocco (range: 0-37.8%) [75]. Findings of these first systematic analyses of MENA data
have been key in informing UNAIDS HIV/AIDS epidemic updates for MENA and in identifying
priority countries, populations, and cities for fast-tracking the regional HIV response [6, 78].
2.3. Thesis rationale and scope
This PhD focuses on the second phase of the MENA HIV/AIDS Epidemiology Synthesis
Project, and aims to comprehensively characterize the epidemiology of HIV among FSWs and
their clients in MENA. Although the size of HSWNs in this region is expected to be much larger
than that of MSM or PWID, estimates for the population proportion of FSWs, the volume of
clients they serve, and the geographic and temporal trends in HIV infection burden among these
populations and their direct sexual contacts are poorly characterized. This evidence gap in our
understanding of HIV epidemiology in the MENA region has been highlighted in UNAIDS Gap
report which referred to ‘a lack of data on the burden of HIV among sex workers in the region’
and indicated that ‘the epidemic among them is poorly understood’, while acknowledging that
‘HIV in every country is expected to disproportionately affect sex workers’ [79]. The
contributions of FSWs and their clients to onward infection transmission and population-level
incidence continue to be missing from the regional HIV map and from the strategic and
programmatic directives for HIV response in MENA [6]. The potential impact of scaling-up
interventions among these populations on the course of the HIV epidemic in terms of the number
of new HIV infections and the total number of PLHIV on the short and long runs remains to be
explored.

42
This PhD research was designed to address this evidence gap by improving understanding of the
HIV epidemic in HSWNs in the MENA region, and to identify aspects of the epidemic that
require immediate policy action by stakeholders. The ultimate goal of this work is to support
MENA countries’ progress towards achieving elimination of HIV/AIDS as a public health threat
by 2030.
43
Chapter 1 references
1. The Joint United Nations Programme on HIV/AIDS (UNAIDS), UNAIDS Data 2020.
Available from: https://www.unaids.org/sites/default/files/media_asset/2020_aids-data-
book_en.pdf. Accessed on: January 8, 2021. 2020, UNAIDS: Geneva, Switzerland.
2. The Joint United Nations Programme on HIV/AIDS (UNAIDS), Fact sheet-World AIDS
Day 2020. Available from:
https://www.unaids.org/sites/default/files/media_asset/UNAIDS_FactSheet_en.pdf.
Accessed on: January 8, 2021. 2020.
3. Fettig, J., et al., Global epidemiology of HIV. Infectious disease clinics of North America,
2014. 28(3): p. 323-337.
4. The Joint United Nations Programme on HIV/AIDS (UNAIDS), Global AIDS Update
2020: Seizing the moment. Available from:
https://www.unaids.org/en/resources/documents/2020/global-aids-report. Accessed on
January 8, 2021. 2020: Geneva, Switzerland.
5. United Nations, Transforming our world: the 2030 agenda for sustainable development.
2015.
6. The Joint United Nations Programme on HIV/AIDS (UNAIDS), UNAIDS 2016-2021
Strategy: On the fast-track to end AIDS. 2015: Geneva, Switzerland.
7. The Joint United Nations Programme on HIV/AIDS (UNAIDS), Global AIDS Strategy
2021-2026. End Inequalities. End AIDS. Available from:
https://www.unaids.org/sites/default/files/media_asset/global-AIDS-strategy-2021-
2026_en.pdf. Accessed on: 8 August 2021. 2021, UNAIDS: Geneva, Switzerland.
8. The Joint United Nations Programme on HIV/AIDS (UNAIDS), Understanding fast-
track: Accelerating action to end the AIDS epidemic by 2030. Available from:
https://www.unaids.org/sites/default/files/media_asset/201506_JC2743_Understanding_
FastTrack_en.pdf. Accessed on January 8, 2021. 2020, UNAIDS: Geneva, Switzerland.
9. The Joint United Nations Programme on HIV/AIDS (UNAIDS), Global HIV & AIDS
statistics — Fact sheet. Available from: https://www.unaids.org/en/resources/fact-sheet.
Accessed on: August 15, 2021. 2021.
10. Mehta, N., et al. Impact of COVID-19 on HIV treatment interruption in seven PEPFAR
countries, April'June 2020. in 11th International AIDS Society Conference on HIV
Science. 2021. Berlin.
11. Machingura, F., et al., Potential reduction in female sex workers' risk of contracting HIV
during Covid-19. Aids, 2021.
12. The Joint United Nations Programme on HIV/AIDS (UNAIDS), Prevailing against
pandemics by putting people at the centre. Available from:
https://aidstargets2025.unaids.org/assets/images/prevailing-against-pandemics_en.pdf.
Accessed on: August 8, 2021. 2020, UNAIDS: Geneva, Switzerland.
13. Vandepitte, J., et al., Estimates of the number of female sex workers in different regions
of the world. Sex Transm Infect, 2006. 82 Suppl 3: p. iii18-25.
14. Shannon, K., et al., The global response and unmet actions for HIV and sex workers.
Lancet, 2018. 392(10148): p. 698-710.
15. Baral, S., et al., Burden of HIV among female sex workers in low-income and middle-
income countries: a systematic review and meta-analysis. Lancet Infect Dis, 2012. 12(7):
p. 538-49.

44
16. World Health Organization, Report on global sexually transmitted infection surveillance.
Available from: file:///C:/Users/hsc2001/Downloads/9789241565691-eng%20(1).pdf.
Accessed on: May 22, 2021. 2018.
17. Cwikel, J.G., et al., Sexually transmissible infections among female sex workers: an
international review with an emphasis on hard-to-access populations. Sex Health, 2008.
5(1): p. 9-16.
18. Platt, L., et al., Systematic review examining differences in HIV, sexually transmitted
infections and health-related harms between migrant and non-migrant female sex
workers. Sex Transm Infect, 2013. 89(4): p. 311-9.
19. Abu-Raddad, L.J., et al., Characterizing the HIV/AIDS epidemic in the Middle East and
North Africa: Time for Strategic Action. Middle East and North Africa HIV/AIDS
Epidemiology Synthesis Project. World Bank/UNAIDS/WHO Publication. 2010,
Washington DC: The World Bank Press.
20. Boily, M.C. and B. Masse, Mathematical models of disease transmission: a precious tool
for the study of sexually transmitted diseases. Can J Public Health, 1997. 88(4): p. 255-
65.
21. Brunham, R.C. and F.A. Plummer, A general model of sexually transmitted disease
epidemiology and its implications for control. Med Clin North Am, 1990. 74(6): p. 1339-
52.
22. Yorke, J.A., H.W. Hethcote, and A. Nold, Dynamics and control of the transmission of
gonorrhea. Sex Transm Dis, 1978. 5(2): p. 51-6.
23. Neslon, K., E., and C.M. Williams, Infectious disease Epidemiology: Theory and
Practice. Second Edition ed. 2007, Sudbury, Massachussets: Jones and Bartlett
Publishers.
24. Low, N., et al., Global control of sexually transmitted infections. Lancet, 2006.
368(9551): p. 2001-16.
25. Johnson, L.F. and D.A. Lewis, The effect of genital tract infections on HIV-1 shedding in
the genital tract: a systematic review and meta-analysis. Sex Transm Dis, 2008. 35(11):
p. 946-59.
26. Cohen, M.S., Sexually transmitted diseases enhance HIV transmission: no longer a
hypothesis. Lancet, 1998. 351 Suppl 3: p. 5-7.
27. World Health Organization, Global health sector strategy on sexually transmitted
infections, 2016-2021. 2016, World Health Organization: Geneva, Switzerland. p. 60.
28. Garnett, G.P., et al., Behavioural data as an adjunct to HIV surveillance data. Sex
Transm Infect, 2006. 82 Suppl 1: p. i57-62.
29. Abu-Raddad, L.J., et al., HSV-2 serology can be predictive of HIV epidemic potential and
hidden sexual risk behavior in the Middle East and North Africa. Epidemics, 2010. 2(4):
p. 173-82.
30. Omori, R. and L.J. Abu-Raddad, Sexual network drivers of HIV and herpes simplex virus
type 2 transmission. AIDS, 2017. 31(12): p. 1721-1732.
31. van de Laar, M.J., et al., Prevalence and correlates of herpes simplex virus type 2
infection: evaluation of behavioural risk factors. Int. J. Epidemiol., 1998. 27(1): p. 127-
34.
32. Cowan, F.M., et al., Antibody to herpes simplex virus type 2 as serological marker of
sexual lifestyle in populations. BMJ, 1994. 309(6965): p. 1325-9.
45
33. Obasi, A., et al., Antibody to herpes simplex virus type 2 as a marker of sexual risk
behavior in rural Tanzania. J. Infect. Dis., 1999. 179(1): p. 16-24.
34. Smith, J.S. and N.J. Robinson, Age-specific prevalence of infection with herpes simplex
virus types 2 and 1: a global review. J Infect Dis, 2002. 186 Suppl 1: p. S3-28.
35. Harfouche, M., H. Maalmi, and L.J. Abu-Raddad, Epidemiology of herpes simplex virus
type 2 in Latin America and the Caribbean: systematic review, meta-analyses and
metaregressions. Sex Transm Infect, 2021.
36. Harfouche, M., et al., Epidemiology of herpes simplex virus type 2 in sub-Saharan Africa:
Systematic review, meta-analyses, and meta-regressions. EClinicalMedicine, 2021. 35: p.
100876.
37. Steen, R., et al., Feasible, Efficient and Necessary, without Exception - Working with Sex
Workers Interrupts HIV/STI Transmission and Brings Treatment to Many in Need. PLoS
One, 2015. 10(10): p. e0121145.
38. Mishra, S., et al., Data and methods to characterize the role of sex work and to inform
sex work programs in generalized HIV epidemics: evidence to challenge assumptions.
Ann Epidemiol, 2016. 26(8): p. 557-69.
39. Alary, M. and C.M. Lowndes, The central role of clients of female sex workers in the
dynamics of heterosexual HIV transmission in sub-Saharan Africa. AIDS, 2004. 18(6): p.
945-7.
40. Brown, T. and W. Peerapatanapokin, Evolving HIV epidemics: the urgent need to refocus
on populations with risk. Curr Opin HIV AIDS, 2019. 14(5): p. 337-353.
41. Stone, J., et al., Estimating the contribution of key populations towards HIV transmission
in South Africa. J Int AIDS Soc, 2021. 24(1): p. e25650.
42. Abu-Raddad L, et al., Characterizing the HIV/AIDS epidemic in the Middle East and
North Africa : Time for strategic action. Middle East and North Africa HIV/AIDS
Epidemiology Synthesis Project ed. World Bank/UNAIDS/WHO Publication. 2010,
Washington DC: The World Bank Press.
43. Blanchard, J.F., A. Khan, and A. Bokhari, Variations in the population size, distribution
and client volume among female sex workers in seven cities of Pakistan. Sexually
Transmitted Infections, 2008. 84(SUPPL. 2): p. ii24-ii27.
44. Tokar, A., et al., HIV Testing and Counseling Among Female Sex Workers: A Systematic
Literature Review. AIDS Behav, 2018. 22(8): p. 2435-2457.
45. World Health Organization (WHO), Guidelines on HIV self-testing and partner
notification. Supplement to consolidated guidelines on HIV testing services. Available
from: https://apps.who.int/iris/bitstream/handle/10665/251655/9789241549868-eng.pdf.
Accessed on: August 12, 2021. 2016, WHO: Geneva, Switzerland.
46. World Health Organization (WHO), Policy brief: WHO recommends HIV self-testing –
evidence update and considerations for success. Available from:
file:///C:/Users/hsc2001/Downloads/WHO-CDS-HIV-19.36-eng%20(1).pdf. Accessed on
August 12, 2021. 2019: Geneva, Switzerland.
47. Witzel, T.C., et al., Comparing the effects of HIV self-testing to standard HIV testing for
key populations: a systematic review and meta-analysis. BMC Medicine, 2020. 18(1): p.
381.
48. Joint United Nations Programme on HIV/AIDS (UNAIDS), Prevention gap report. 2016:
Geneva.

46
49. Mountain, E., et al., Antiretroviral therapy uptake, attrition, adherence and outcomes
among HIV-infected female sex workers: a systematic review and meta-analysis. PLoS
One, 2014. 9(9): p. e105645.
50. Kerrigan, D., et al., Project Shikamana: Baseline Findings From a Community
Empowerment-Based Combination HIV Prevention Trial Among Female Sex Workers in
Iringa, Tanzania. J Acquir Immune Defic Syndr, 2017. 74 Suppl 1: p. S60-S68.
51. Rhead, R., et al., Do female sex workers have lower uptake of HIV treatment services
than non-sex workers? A cross-sectional study from east Zimbabwe. BMJ Open, 2018.
8(2): p. e018751.
52. Bekker, L.G., et al., Combination HIV prevention for female sex workers: what is the
evidence? Lancet, 2015. 385(9962): p. 72-87.
53. Steen, R., et al., Halting and reversing HIV epidemics in Asia by interrupting
transmission in sex work: experience and outcomes from ten countries. Expert Rev Anti
Infect Ther, 2013. 11(10): p. 999-1015.
54. Kerrigan, D., et al., Abriendo Puertas: Feasibility and Effectiveness a Multi-Level
Intervention to Improve HIV Outcomes Among Female Sex Workers Living with HIV in
the Dominican Republic. AIDS Behav, 2016. 20(9): p. 1919-27.
55. Jana, S., et al., The Sonagachi Project: a sustainable community intervention program.
AIDS Educ Prev, 2004. 16(5): p. 405-14.
56. Ng, M., et al., Assessment of population-level effect of Avahan, an HIV-prevention
initiative in India. Lancet, 2011. 378(9803): p. 1643-52.
57. Kerrigan, D., et al., A community empowerment approach to the HIV response among sex
workers: effectiveness, challenges, and considerations for implementation and scale-up.
Lancet, 2015. 385(9963): p. 172-85.
58. Cowan, F.M., et al., Targeted combination prevention to support female sex workers in
Zimbabwe accessing and adhering to antiretrovirals for treatment and prevention of HIV
(SAPPH-IRe): a cluster-randomised trial. Lancet HIV, 2018. 5(8): p. e417-e426.
59. Shannon, K., et al., Global epidemiology of HIV among female sex workers: influence of
structural determinants. Lancet, 2015. 385(9962): p. 55-71.
60. Beyrer, C., et al., An action agenda for HIV and sex workers. Lancet, 2015. 385(9964): p.
287-301.
61. Atuhaire, L., et al., Effect of community-based interventions targeting female sex workers
along the HIV care cascade in sub-Saharan Africa: a systematic review and meta-
analysis. Syst Rev, 2021. 10(1): p. 137.
62. Wolf, R.C., et al., Building the evidence base for urgent action: HIV epidemiology and
innovative programming for men who have sex with men in sub-Saharan Africa. J Int
AIDS Soc, 2013. 16 Suppl 3: p. 18903.
63. United Nations Population Division. World population prospects 2017. Available from:
https://esa.un.org/unpd/wpp/. 2017 [cited 2017 29th of July].
64. The Joint United Nations Programme on HIV/AIDS (UNAIDS), Global AIDS Update
2021. Confronting inequalities: Lessons for pandemic responses from 40 years of AIDS.
Available from: https://www.unaids.org/sites/default/files/media_asset/2021-global-aids-
update_en.pdf. Accessed on: 15 September, 2021. 2021, UNAIDS: Geneva, Switzerland.
65. World Health Organization Regional Office for the Eastern Mediterranean Region, From
HIV testing to lifelong care and treatment : access to the continuum of HIV care and
treatment in the Eastern Mediterranean Region : progress report 2014. Available from:
47
https://applications.emro.who.int/dsaf/EMROPUB_2016_EN_18914.pdf. Accessed on
May 8, 2021. 2016: Cairo, Egypt.
66. Bohannon, J., Science in Libya. From pariah to science powerhouse? Science, 2005.
308(5719): p. 182-4.
67. Saba, H.F., et al., Characterising the progress in HIV/AIDS research in the Middle East
and North Africa. Sex Transm Infect, 2013. 89 Suppl 3: p. iii5-9.
68. Bozicevic, I., G. Riedner, and J.M. Calleja, HIV surveillance in MENA: recent
developments and results. Sex Transm Infect, 2013. 89 Suppl 3: p. iii11-16.
69. Mumtaz, G.R., G. Riedner, and L.J. Abu-Raddad, The emerging face of the HIV epidemic
in the Middle East and North Africa. Current Opinion in HIV and AIDS, 2014. 9(2): p.
183-191.
70. Abu-Raddad, L.J., et al., HIV and other sexually transmitted infection research in the
Middle East and North Africa: promising progress?, in Sex Transm Infect. 2013. p. iii1-
iii4.
71. Abu-Raddad, L.J., et al., Epidemiology of HIV infection in the Middle east and North
Africa. Aids, 2010. 24(SUPPL. 2): p. S5-S23.
72. Abu-Raddad, L., et al., Policy Notes. Characterizing the HIV/AIDS epidemic in the
Middle East and North Africa: Time for Strategic Action. Middle East and North Africa
HIV/AIDS Epidemiology Synthesis Project. World Bank/UNAIDS/WHO Publication.
2010, Washington DC: The World Bank Press.
73. Infectious Disease Epidemiology Group at Weill Cornell Medicine-Qatar, The Middle
East and North Africa HIV/AIDS epidemiology synthesis project. Available from:
https://qatar-weill.cornell.edu/research/research-faculty/infectious-disease-
epidemiology-group/research-interests. Accessed on August 12, 2021. 2021.
74. Mumtaz, G., et al., Are HIV epidemics among men who have sex with men emerging in
the middle east and north Africa?: A systematic review and data synthesis. PLoS
Medicine, 2011. 8 (8) (no pagination)(e1000444).
75. Mumtaz, G.R., et al., HIV among people who inject drugs in the Middle East and North
Africa: systematic review and data synthesis. PLoS Med, 2014. 11(6): p. e1001663.
76. National AIDS Control Program, Integrated biological & behavioral surveillance in
Pakistan 2016-17: 2nd generation HIV surveillance in Pakistan round 5. 2017:
Islamabad, Pakistan. p. 159.
77. National AIDS Control Program, HIV second generation surveillance in Pakistan.
National Report Round IV 2011. 2012: Islamabad, Pakistan.
78. Jointed United Nations Programme on HIV/AIDS (UNAIDS), Global AIDS Update
2016. 2016: Geneva, Switzerland.
79. The Joint United Nations Programme on HIV/AIDS (UNAIDS), The gap report. 2014.
48
CHAPTER 2. THESIS OBJECTIVES AND STRUCTURE
1. Overall aim
This thesis aims to fill a gap in our understanding of the HIV epidemic in HSWNs in MENA by
characterizing comprehensively the epidemiology of HIV among FSWs and their clients,
synthesizing evidence on other STIs among FSWs, investigating the utility of HSV-2 as a
predictor of HIV epidemic potential among FSWs, and estimating HIV incidence arising in
HSWNs, its contribution to population-level incidence, and the potential for reducing it by
expanding coverage of select prevention interventions. The goal of the research is to provide the
evidence base necessary to inform HIV response as well as key public health research and policy
priorities in this region.
Objectives
The specific objectives are:
1) To provide a critical appraisal of the epidemiology of HIV among FSWs and their clients
across MENA by systematically reviewing, synthesizing, and summarizing the evidence
for size estimation measures, HIV infection burden, sexual and injecting risk behaviour,
coverage of prevention and treatment interventions, HIV testing and perception of risk, in
addition to identifying sources of heterogeneity, regional variability, and temporal trends
in HIV prevalence.
2) To provide a critical appraisal of the epidemiology of STIs among FSWs in MENA by
systematically reviewing, synthesizing, and summarizing the evidence for Chlamydia
trachomatis, Neisseria gonorrhoeae, Trichomonas vaginalis, syphilis and Herpes

49
Simplex Virus type 2 (HSV-2) incidence and/or prevalence, and identifying sources of
heterogeneity, regional variability, and temporal trends in STI prevalence where possible.
3) To investigate the utility of HSV-2 as a predictor of HIV epidemic potential among
FSWs through an ecological analysis of paired HSV-2 and HIV antibody prevalence data
among FSWs globally and to determine the magnitude of the association between these
infections factoring in regional, temporal, and condom use differences among FSWs.
4) To estimate, using a novel individual-based mathematical model applied to MENA
countries, HIV incidence arising in HSWNs including FSWs, clients, and clients’ stable
sexual partners (spouses/cohabiting partners), the relative contribution of heterosexual
sex versus injecting drug use to incidence among FSWs, the contribution to HIV
incidence in HSWNs to incidence in the total adult population, and the impact of
achieving different coverage targets for prevention interventions among FSWs on HIV
incidence arising in HSWNs.
A brief outline of the research questions and methodology addressing these specific objectives
can be found in Table 1.

50
Table 1. Specific objectives, methodology, and research questions for understanding HIV epidemiology in heterosexual sex work networks
(HSWNs) in the Middle East and North Africa (MENA). Specific objectives Methodology Research questions
1. To provide a critical appraisal of the epidemiology of
HIV among FSWs and their clients across MENA by
systematically reviewing, synthesizing, and
summarizing the evidence for size estimation
measures and for HIV infection burden in these
populations, and identifying sources of heterogeneity,
regional variability, and temporal trends in HIV
prevalence.
Systematic
review, data
synthesis, meta-
analysis, and
meta-regression
Primary research questions:
a. What are the sizes of the FSW and client populations across MENA
countries?
b. What is the incidence and prevalence of HIV among FSWs and their
clients across MENA countries?
c. Is there evidence for regional and temporal variability in HIV
prevalence among FSWs and their clients across MENA?
d. What are the sources of between-study heterogeneity in HIV
prevalence among FSWs and their clients across MENA?
Secondary research questions:
e. What is the scope and quality of available evidence for size estimation
and for HIV incidence and prevalence among FSWs and their clients?
f. What are the characteristics of sexual and injecting risk behaviours
among FSWs and their clients?
2. To provide a critical appraisal of the epidemiology of
STIs among FSWs in MENA by systematically
reviewing, synthesizing, and summarizing the
evidence for Chlamydia trachomatis, Neisseria
gonorrhoeae, Trichomonas vaginalis, syphilis and
HSV-2 incidence and/or prevalence, and identifying
sources of heterogeneity, regional variability, and
temporal trends in STI prevalence where possible.
Systematic
review, data
synthesis, meta-
analysis, and
meta-regression
Primary research questions:
a. What is the incidence and prevalence of STIs (Chlamydia trachomatis,
Neisseria gonorrhoeae, Trichomonas vaginalis, and Treponema
pallidum (syphilis), and HSV-2) among FSWs across MENA
countries?
b. Is there evidence for regional and temporal variability in STI
prevalence among FSWs across MENA?
c. What are the sources of between-study heterogeneity in STI prevalence
among FSWs across MENA?
Secondary research question:
d. What is the scope and quality of available evidence for STI incidence
and prevalence among FSWs?
3. To investigate the utility of HSV-2 as a predictor of
HIV epidemic potential among FSWs through an
ecological analysis of paired HSV-2 and HIV antibody
prevalence data among FSWs globally and determine
the magnitude of the association between these
infections factoring in regional, temporal, and condom
use differences among FSWs.
Systematic
review, meta-
analysis, meta-
regression, and
statistical analysis
Research questions:
a. What is the distribution of paired HSV-2 and HIV prevalence measures
among FSWs across world regions?
b. How is HIV prevalence among FSWs distributed across different cut-
off values for HSV-2 prevalence?

51
Specific objectives Methodology Research questions
c. Is there evidence for an association between HSV-2 and HIV after
adjusting for regional, temporal and condom use differences among
FSWs?
4. To estimate, using a novel individual-based
mathematical model applied to MENA countries,
HIV incidence arising in HSWNs, the relative
contribution of heterosexual sex versus injecting
drug use to incidence among FSWs, the
contribution to HIV incidence in HSWNs to
incidence in the total adult population, and the
impact of achieving different coverage targets for
prevention interventions among FSWs on HIV
incidence arising in HSWNs.
Individual-based
mathematical
model and
statistical analysis
Research questions:
a. What is the current HIV incidence and incidence rate (in the year 2020)
among FSWs, their clients, and clients’ stable sexual partners at
country-level across MENA?
b. What is the relative contribution of heterosexual sex versus injecting
drug use to HIV incidence among FSWs across MENA?
c. What are the contributions of incident HIV infections arising among
FSWs, their clients, and clients’ stable sexual partners over the course
of one year to total HIV incidence in the adult population at country-
level across MENA?
d. What is the impact of achieving different coverage targets for select
interventions among FSWs on HIV incidence in HSWNs (number of
new infections averted) by 2030?

52
2. Thesis structure and research papers outline
This thesis follows the research paper format and includes four research papers, three of which
have been published in peer-reviewed journals [1-3]. The fourth paper is currently submitted [4].
Each research paper was written as a stand-alone manuscript and is presented in a separate
chapter. Consequently, there is overlap between thesis chapters, for example, in the discussion of
the current state of the HIV epidemic and response in MENA.
Research papers are included in their published format. Each paper is preceded by a cover sheet
that provides publication details and highlights my contribution (as first and corresponding
author). The latter is followed by a preamble or introduction to the chapter. A summary of
findings highlighting the take-home messages from each study is included at the end of each
paper/chapter along with ‘linking material’ that describes how each paper logically led to the
subsequent one. Research papers are supported by additional published supplementary material
that includes further details on research methodology and results. The latter was included as a
separate appendix for each paper. The final chapter contains a general discussion and high-level
synthesis of research findings along with recommendations for policy and future research work.
The thesis includes seven chapters structured as follows:
Chapter 1 provides the background for the thesis work. It reviews the global literature on HIV
epidemiology among FSWs and their clients and conveys our current understanding of the HIV
epidemic in key populations in the MENA region while highlighting the gaps that motivated the
design of this thesis.
Chapter 2 describes the thesis overall aim, specific objectives, and structure.

53
Chapter 3 presents Research paper 1, published in BMC Medicine. The paper provided an in-
depth characterization of HIV epidemiology among FSWs and their clients across MENA
countries, and described the sexual and injecting risk environments, through an exhaustive
systematic review complemented with meta-analyses and meta-regressions (objective 1). While
the paper identified established and emerging epidemics among FSWs, it also documented
limited prevalence of <1% in several countries. The latter motivated assessment of STIs as
biological markers of sexual risk behaviour among FSWs (research paper 2), followed by a
demonstration of the utility of HSV-2 as a predictor of HIV epidemic potential in settings where
infection circulation among FSWs is still limited (research paper 3). Findings of this systematic
review were also used towards parameterization of the individual-based mathematical model
constructed to estimate current HIV incidence among FSWs and evaluate the impact of
interventions in different MENA countries (research paper 4).
Chapter 4 presents Research paper 2, published in the Journal of Global Health. The paper
provided the first detailed assessment of the epidemiology of key STIs among FSWs in MENA,
also through a systematic review complemented with meta-analyses and meta-regressions
(objective 2). The study suggested a major role for HSWNs in STI transmission across MENA
and highlighted the need for strengthening STI surveillance and response targeting FSWs, which
continue to be poor in most countries.
Chapter 5 presents Research paper 3, published in Scientific Reports. The paper demonstrated
the utility of HSV-2 as a tool that can predict HIV epidemic potential among FSWs and inform
HIV preparedness efforts, particularly in countries where infection circulation among FSWs is
still limited (objective 3). Given that research paper 2 identified only three studies documenting
HSV-2 among FSWs in the region, an ecological analysis of HSV-2/HIV paired measures with a

54
focus on MENA was not possible. Alternatively, this research paper investigated the ecological
association between HSV-2 and HIV using paired data identified through a global systematic
review of these measures among FSWs.
Chapter 6 presents Research paper 4, submitted to the Lancet HIV, presents a novel individual-
based mathematical model that was constructed to describe HIV transmission dynamics in
HSWNs. The model was parameterized using data on HIV prevalence, sexual and injecting risk
behaviour, and current coverage of prevention and treatment interventions among FSWs and
clients identified in Research paper 1, to estimate, for each MENA country with sufficient data,
HIV incidence and incidence rates arising in HSWNs, the relative contribution of heterosexual
sex versus injecting drug use to HIV incidence among FSWs, the contribution of HSWNs to total
HIV incidence in the adult population, and the impact of select prevention interventions among
FSWs on curbing HIV incidence in HSWNs (objective 4). The study provided current estimates
for HIV incidence data in HSWNs and suggested substantial circulation of HIV in HSWNs along
with sizable onward transmission to stable partners of clients of FSWs. Findings further
suggested that expansion of select prevention interventions among FSWs, even to suboptimal
levels, can yield substantial gains in the number of infections averted in the wider HSWN. Data
provided by the study can be instrumental in informing HIV response and programming and in
assessing progress towards regional and global HIV elimination targets.
Chapter 7 discusses the main findings of this thesis, describes their implications on HIV and
STI policy and programming, and provides recommendations for future research in the region.
This chapter further includes an account of thesis main contributions, strengths, and limitations.

55
3. The role of the candidate
This thesis is part of the second phase of the “MENA HIV/AIDS Epidemiology Synthesis
Project”, which was funded by the Qatar National Research Fund (NPRP grant number 9-040-3-
008), through an award to Dr. Laith Abu-Raddad, my PhD co-supervisor. Additional
infrastructure support was provided by the Biostatistics, Epidemiology, and Biomathematics
Research Core at the Weill Cornell Medicine-Qatar.
I am the first and corresponding author on all research papers given my contributions to the
design, implementation, analysis, interpretation and synthesis of results of these studies, as well
as writing and revision of the first manuscript and subsequent drafts based on co-authors’ and
peer-reviewers’ comments.
For research paper 1, I designed the study and revised it based on feedback from my supervisors
and a PhD committee advisor. Specifically, I devised the search strategy and its conceptual
framework, determined the inclusion and exclusion criteria, devised the methodology for the
quality assessment of studies, conducted the systematic literature review including screening of
articles and extraction, analysis, and synthesis of data, and wrote the first draft of the article and
revised it based on feedback from co-authors and peer-reviewers.
For research paper 2, I conceived and designed the study, conducted all steps of the systematic
literature review as described above, analysed and synthesised the data, wrote the first draft of
the article and revised it based on feedback from co-authors and peer-reviewers.
For research paper 3, I had access to a database of an earlier systematic review examining paired
HSV-2 and HIV prevalence measures in different populations globally, but given the need to
update this database with more recent data for FSWs, differences in methodology in terms of the
56
definition of FSWs as well as variables to be factored in the analysis, I re-implemented all the
steps of the systematic literature review process including data extraction. I analysed and
synthesised the data, wrote the first draft of the article and revised it based on feedback from co-
authors and peer-reviewers.
For research paper 4, I co-conceived the study, designed the study and model, coded the
mathematical model, conducted the model parameterization, generated simulations, wrote the
first draft of the article, and revised it based on feedback from co-authors. This paper included
other co-authors who provided technical programming assistance given the complexity of coding
the structure of sexual networks. The paper is also co-authored by other collaborators from the
WHO Regional Office for the Eastern Mediterranean (EMRO) and UNAIDS who facilitated
access to data and provided insights on policy implications of research findings.
Further details of my contribution and the role of co-authors can be found in the research papers.

57
Chapter 2 references
1. Chemaitelly, H., H.A. Weiss, and L.J. Abu-Raddad, HSV-2 as a biomarker of HIV
epidemic potential in female sex workers: meta-analysis, global epidemiology and
implications. Sci Rep, 2020. 10(1): p. 19293.
2. Chemaitelly, H., et al., Epidemiology of Treponema pallidum, Chlamydia trachomatis,
Neisseria gonorrhoeae, Trichomonas vaginalis, and Herpes simplex virus type 2 among
female sex workers in the Middle East and North Africa: systematic review and meta-
analytics. Journal of Global Health, 2019. 9(2).
3. Chemaitelly H., et al., HIV epidemiology among female sex workers and their clients in
the Middle East and North Africa: systematic review, meta-analyses, and meta-
regressions. BMC Medicine, 2019. 24(17): p. 119.
4. Chemaitelly H., et al., HIV incidence and impact of interventions among female sex
workers and their clients in the Middle East and North Africa: Mathematical modeling
analysis. submitted, 2021.
58
CHAPTER 3. RESEARCH PAPER 1-HIV EPIDEMIOLOGY AMONG FSWS AND
CLIENTS IN MENA

59
60
Retention of copyright evidence
This article is published in an open access format in a journal published by BioMed Central. The
copyright policy is detailed below:
• “Copyright on any open access article in a journal published by BioMed Central is retained
by the author(s).
• Authors grant BioMed Central a license to publish the article and identify itself as the
original publisher.
• Authors also grant any third party the right to use the article freely as long as its integrity is
maintained and its original authors, citation details and publisher are identified.
• The Creative Commons Attribution License 4.0 formalizes these and other terms and
conditions of publishing articles.”
Further details can be found at the following url:
https://bmcmedicine.biomedcentral.com/submission-guidelines/copyright

61
1. Preamble
This chapter provides an in-depth characterization of the status of the HIV epidemic among
FSWs and their clients across MENA through a systematic synthesis of evidence for population-
size estimates and HIV incidence and prevalence data, derivation of summary estimates for HIV
prevalence in these populations, investigation of regional-level associations with prevalence and
sources of heterogeneity between studies, assessment of temporal trends, and synthesis of data
on sexual and injecting risk behaviours among FSWs (addresses objective 1 of thesis). The
study was motivated by evidence of emerging HIV epidemics among MSM [1] and PWID [2] in
MENA over the last two decades [1, 2], and persisting gaps in our knowledge of the status of the
epidemic among FSWs [3] despite the large size of HSWNs relative to those of MSM and
PWID.
The objectives of this study were addressed through a systematic review of evidence for
population-size estimates for FSWs and clients, sex work population proportions, HIV incidence,
and HIV prevalence in FSWs and clients retrieved through searching over ten international,
regional, and country-level databases that incorporated country-level and international
organizations’ reports as well as routine data reporting [4, 5], meta-analyses pooling HIV
prevalence measures at both the country and regional levels, and meta-regression analyses
examining associations with HIV prevalence factoring in regional and temporal heterogeneities
as well as studies’ quality assessment domains.
Further published details on study methodology and results can be found in Appendix II.
Unpublished preparatory work for this study such as the conceptual framework and results of the
systematic review of systematic reviews of studies among FSWs and clients globally that were
used to devise the search strategy can be found in Appendix III, detailed study selection criteria

62
can be found in Appendix IV, and an overview of available quality assessment tools screened to
determine studies’ quality assessment domains can be found in Appendix V.

63

64
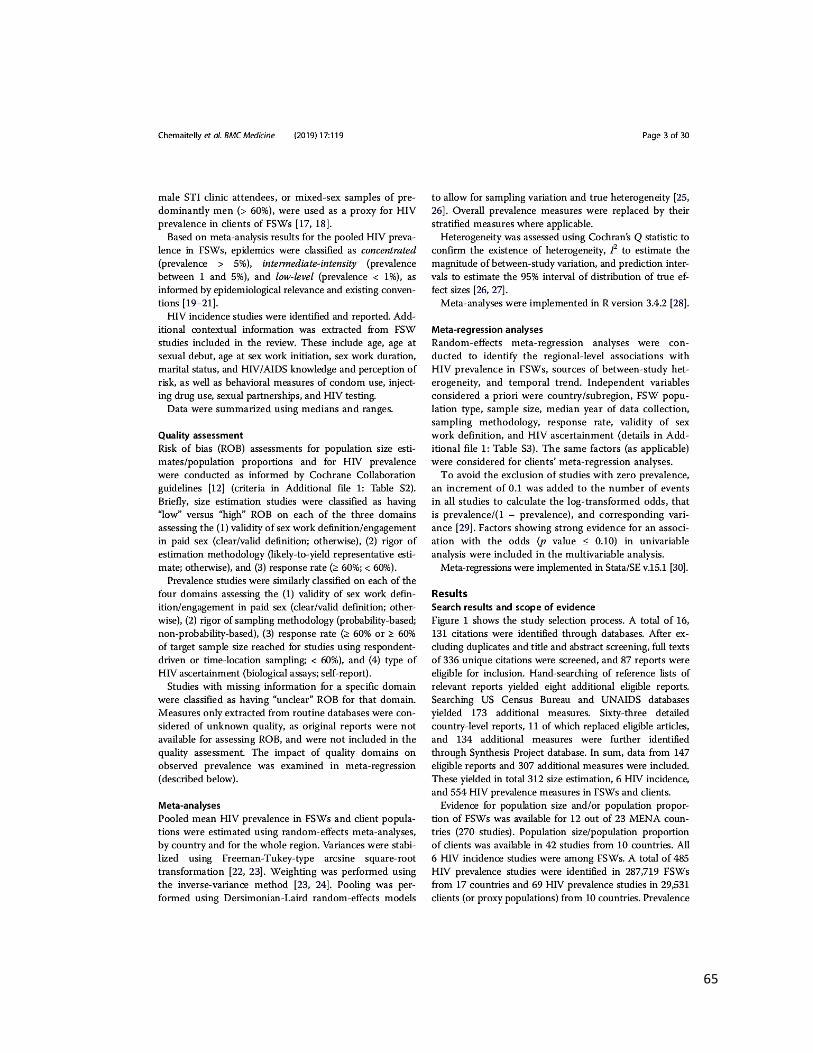
65
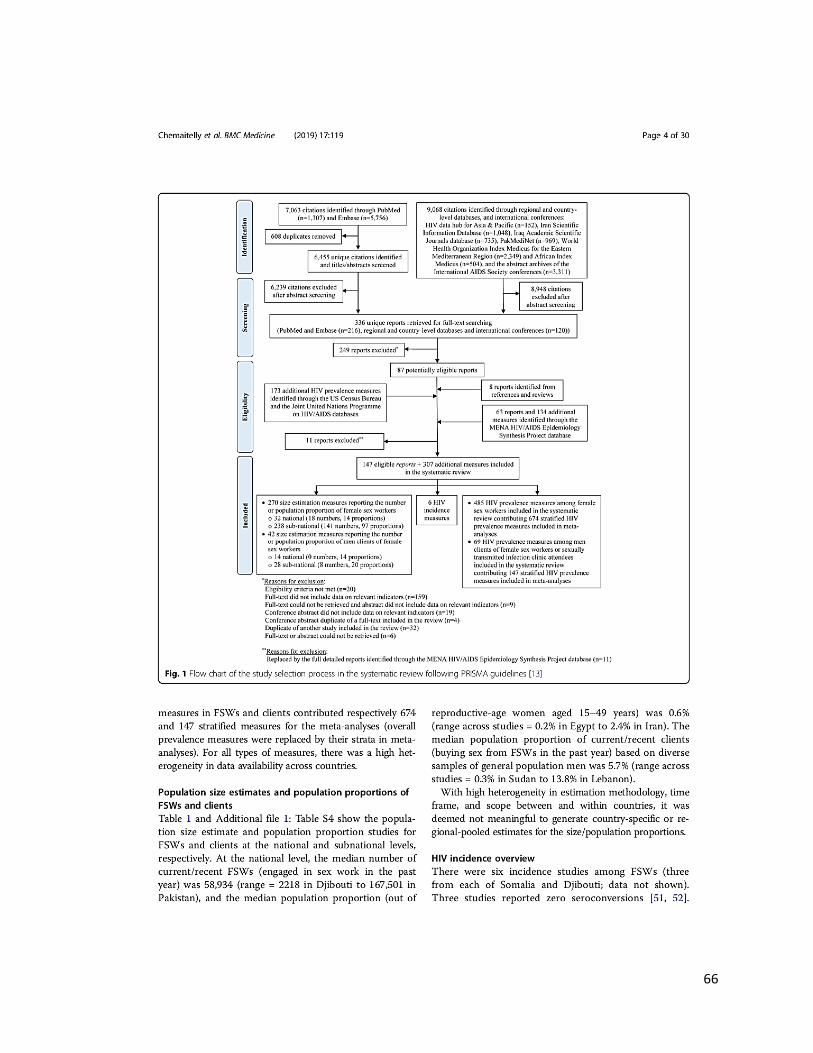
66
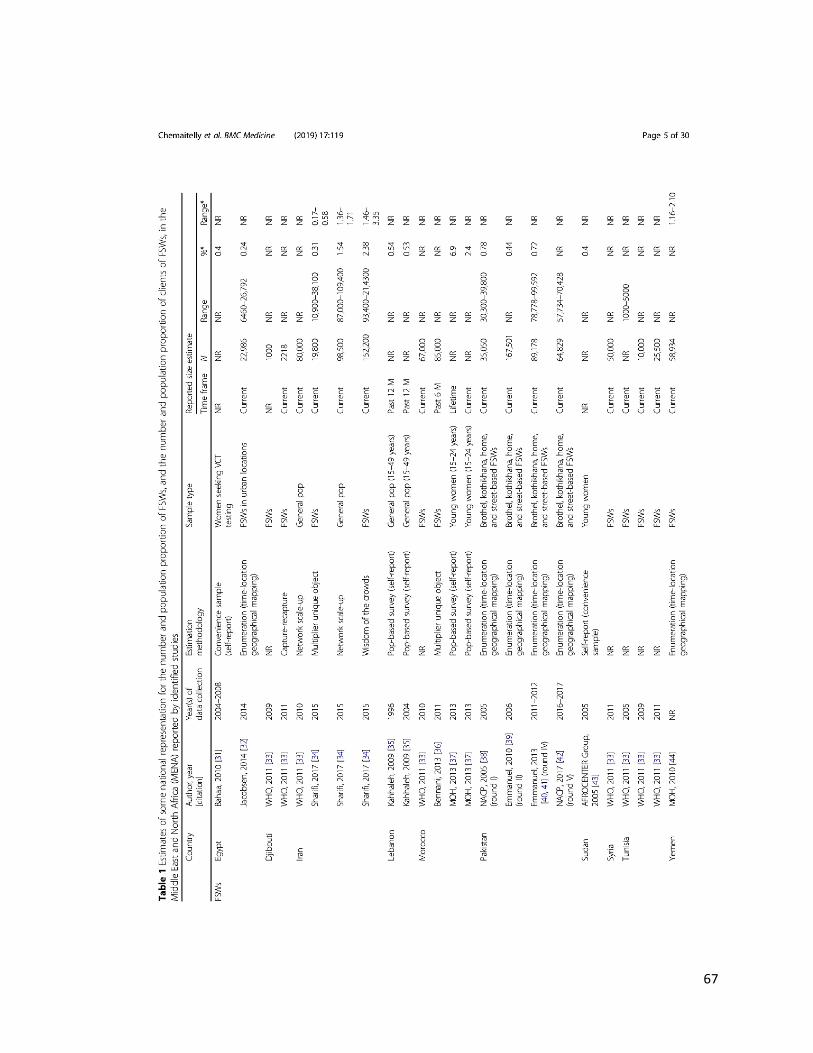
67

68
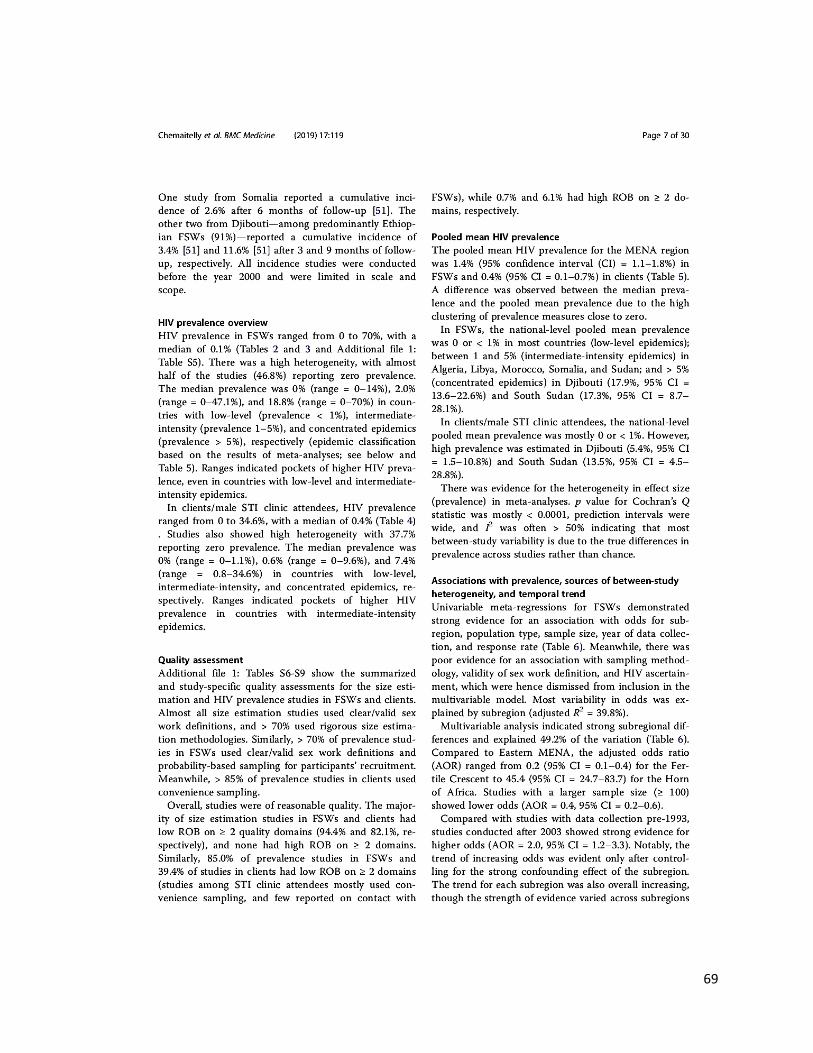
69

70

71
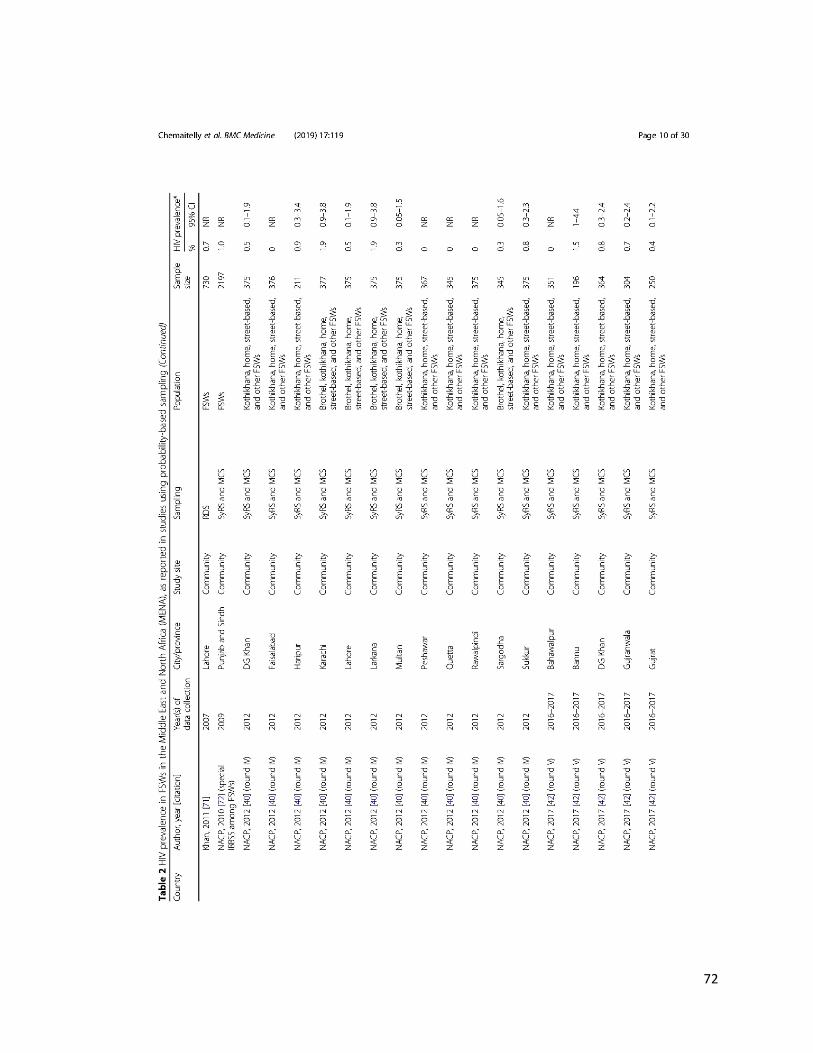
72
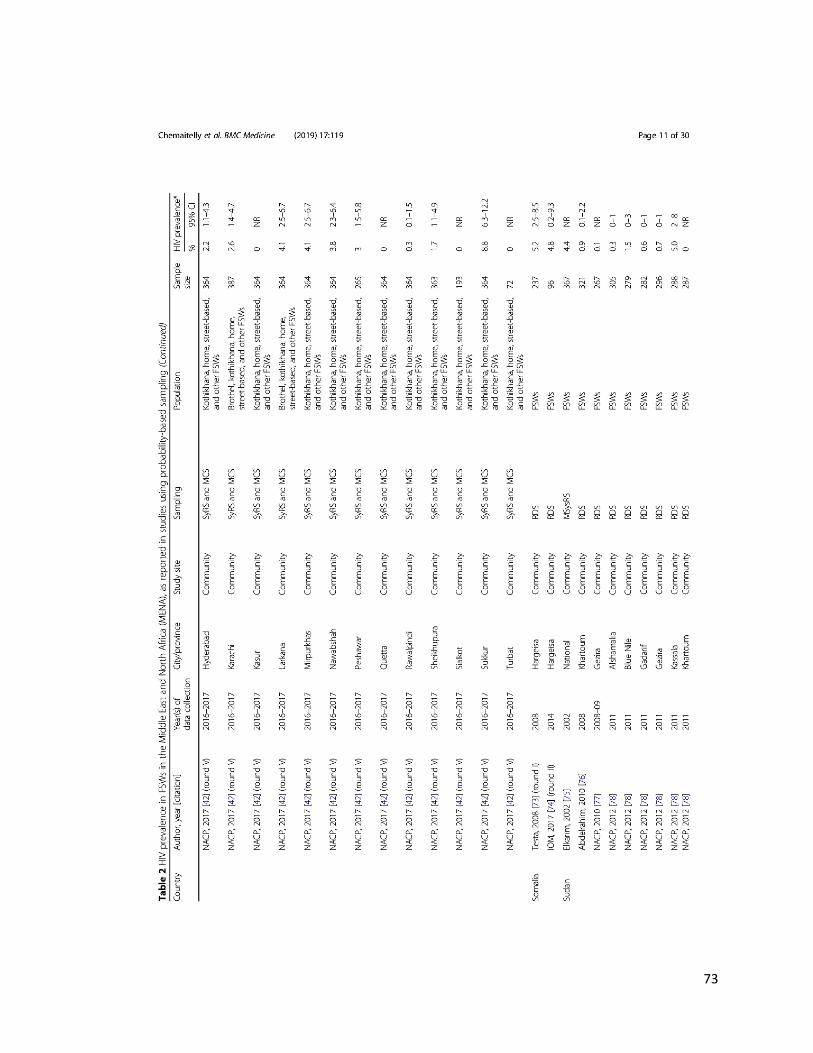
73

74

75

76

77
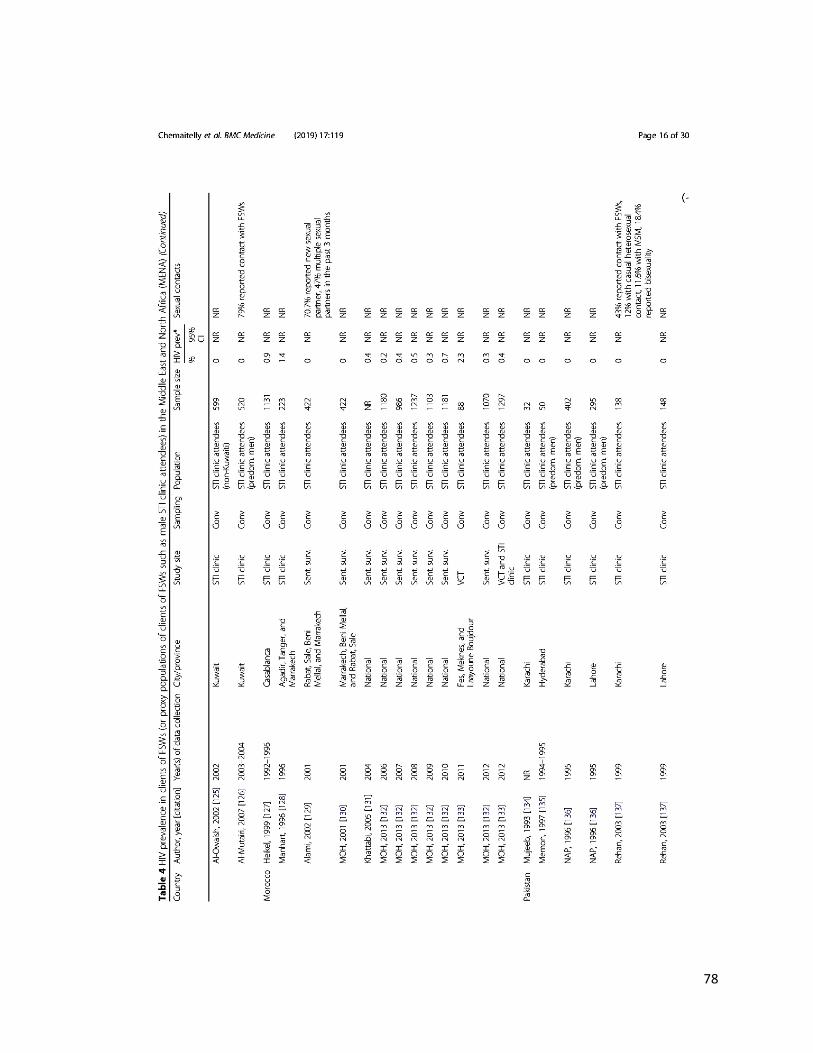
78
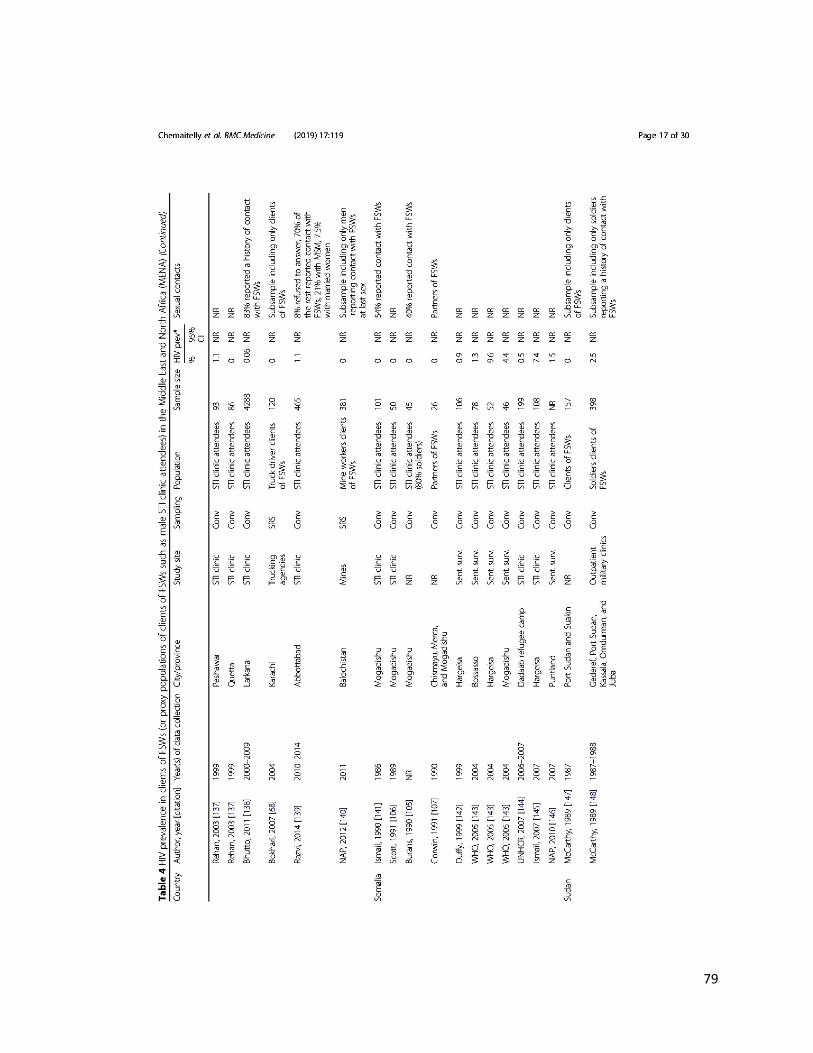
79

80

81
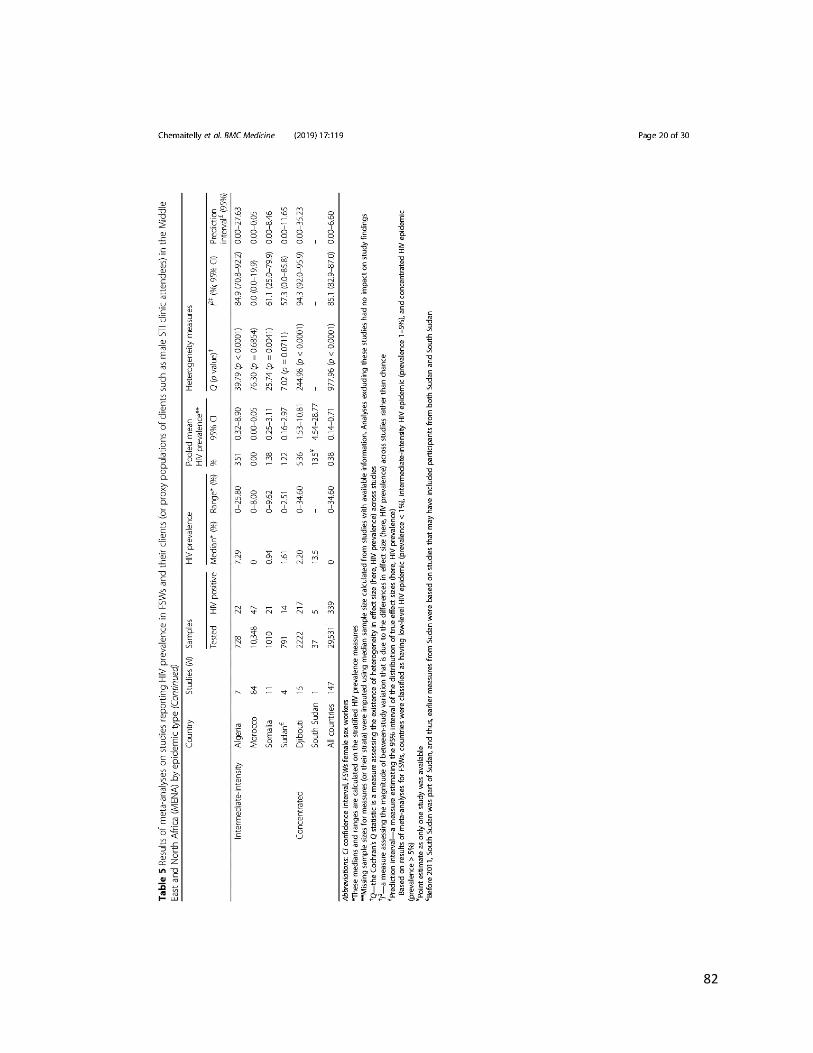
82

83

84

85
86
87
88
89

90

91

92
93
2. Summary of findings
The study identified over 300 size estimation studies for FSWs and clients, in addition to over
500 HIV prevalence measures on close to 300,000 FSWs and 30,000 clients in 17 of the 23
MENA countries. The key finding of public health significance is identifying the emergence of
HIV epidemics among FSWs in the region, with some epidemics already in an established phase.
The study found that the epidemic has been growing in recent years, at a rate of about 15% per
year, but with strong regionalization and heterogeneity. The triangulation of evidence further
suggested the epidemics among MSM and PWID as contributors to epidemic onset and growth
in FSWs. The study documented wide heterogeneity in sexual and injecting risk behaviours
among FSWs within and across countries and found levels of HIV testing among FSWs to be far
below the service coverage target of the ‘UNAIDS 2016-2021 Strategy’.
Notably, despite the growing trend of HIV over the last decade, limited HIV circulation was
found in a number of countries. The latter motivated the design of research paper 2, which aimed
to gain further understanding of the potential for the emergence of HIV epidemics in HSWNs by
assessing the levels of other STIs, commonly used as biomarkers of sexual risk behaviour. This
study also motivated the design of research paper 3 which aimed at demonstrating the utility of
HSV-2 as a predictor of HIV epidemic potential among FSWs, particularly in areas where HIV
prevalence is still limited. Finally, data and results of this study laid the foundation for the design
and conduct of research paper 4 which aimed to estimate and gain further understanding of HIV
incidence arising in HSWNs in MENA.

94
Chapter 3 references
1. Mumtaz, G., et al., Are HIV epidemics among men who have sex with men emerging in
the middle east and north Africa?: A systematic review and data synthesis. PLoS
Medicine, 2011. 8 (8) (no pagination)(e1000444).
2. Mumtaz, G.R., et al., HIV among people who inject drugs in the Middle East and North
Africa: systematic review and data synthesis. PLoS Med, 2014. 11(6): p. e1001663.
3. The Joint United Nations Programme on HIV/AIDS (UNAIDS), The gap report. 2014.
4. Abu-Raddad L, et al., Characterizing the HIV/AIDS epidemic in the Middle East and
North Africa : Time for strategic action. Middle East and North Africa HIV/AIDS
Epidemiology Synthesis Project ed. World Bank/UNAIDS/WHO Publication. 2010,
Washington DC: The World Bank Press.
5. Abu-Raddad, L.J., et al., Epidemiology of HIV infection in the Middle east and North
Africa. Aids, 2010. 24(SUPPL. 2): p. S5-S23.
95
CHAPTER 4. RESEARCH PAPER 2-SEXUALLY TRANSMITTED INFECTIONS
AMONG FSWS IN MENA

96

97
Retention of copyright evidence
This article is published in an open access format. “The Journal of Global Health publishes under
CC BY 4.0 licence, which means that all published articles can be:
• Shared - copy and redistribute the material in any medium or format; and/or
• Adapted - remix, transform and build upon the material for any purpose, even
commercially.
The copyright for all published articles remains with the author(s).”
Further details can be found at the following url:
http://www.jogh.org/contributors.htm

98
1. Preamble
This chapter provides a detailed epidemiological investigation of infection with Treponema
pallidum (syphilis), Chlamydia trachomatis, Neisseria gonorrhoeae, Trichomonas vaginalis, and
herpes simplex virus type 2 (HSV-2) among FSWs in MENA through a systematic synthesis of
evidence for infection levels with these STIs, derivation of summary estimates for current and/or
ever infection prevalence, and investigation of regional-level associations with prevalence (was
only possible for syphilis), temporal trend, and of sources of heterogeneity between studies
(addresses objective 2 of thesis). The study was motivated by i) findings of research paper 1 of
emerging HIV epidemics in HSWNs in several MENA countries, yet still limited HIV
circulation in others and a relatively low level of reported sexual risk behaviour among some
FSWs in some countries, and ii) the utility of STIs as objective proxy biomarkers of sexual risk
behaviour [1, 2] and as a tool for understanding the structure of sexual networks [1, 3]. Further,
the considerable HIV prevalence identified in some of the FSW populations in MENA in
research paper 1 highlighted an evidence gap regarding the STI prevalence among them.
This study aimed to fill this evidence gap and to further our understanding of the broader sexual
health, prevention, and treatment needs of FSWs by providing the first systematic
characterisation of STI epidemiology among FSWs in the region. The objectives were addressed
through a systematic review of evidence for current and/or ever infection with T. pallidum
(syphilis), C. trachomatis, N. gonorrhoeae, T. vaginalis, and HSV-2 in FSWs, retrieved through
searching over ten international, regional, and country-level databases that incorporated country-
level and international organizations’ reports as well as routine data reporting [4], meta-analyses
pooling measures of current and of ever infection for each STI at the regional and subregional

99
levels as well as over different time periods, and meta-regression analyses examining
associations and regional and temporal heterogeneities in syphilis prevalence across MENA.
Further published details on study methodology and results can be found in Appendix VI.

100
101
102

103

104

105

106
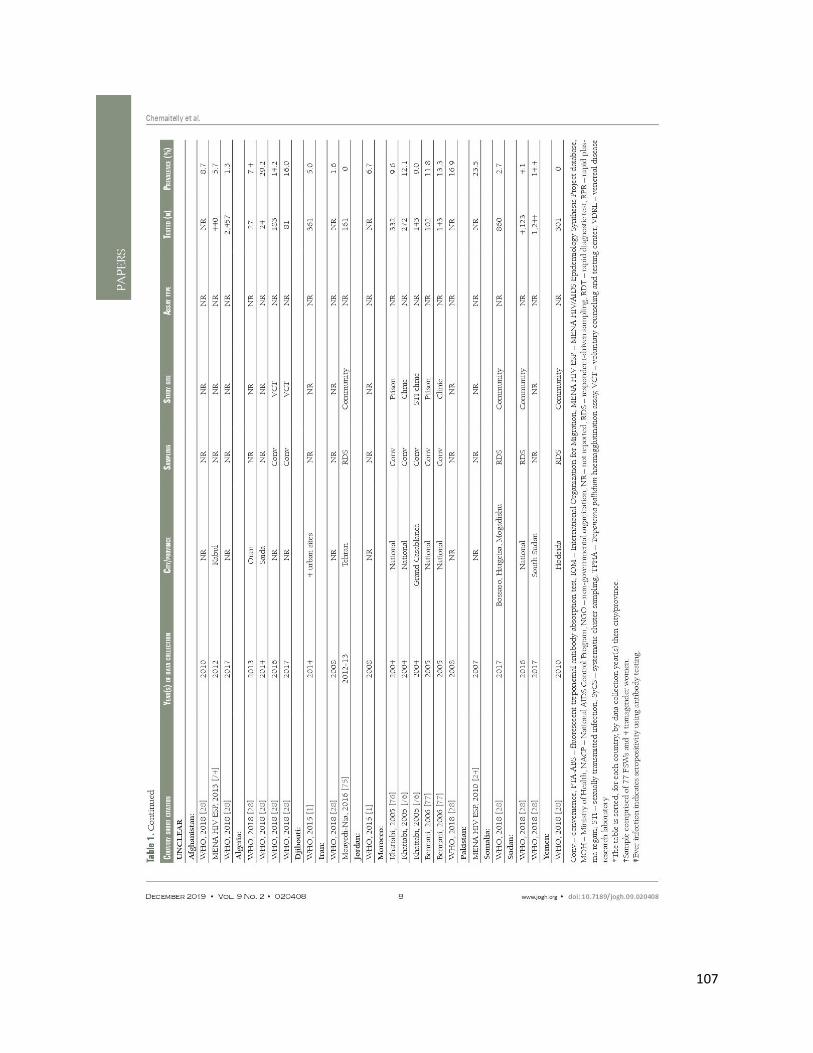
107

108

109

110

111

112
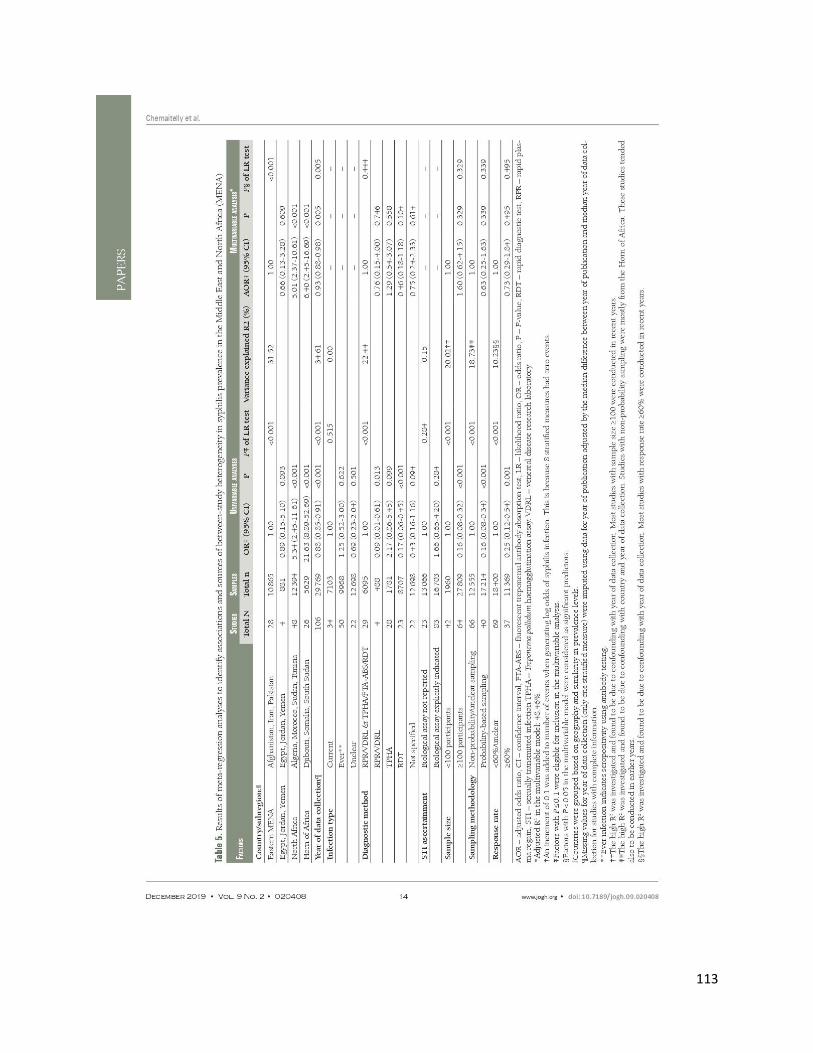
113
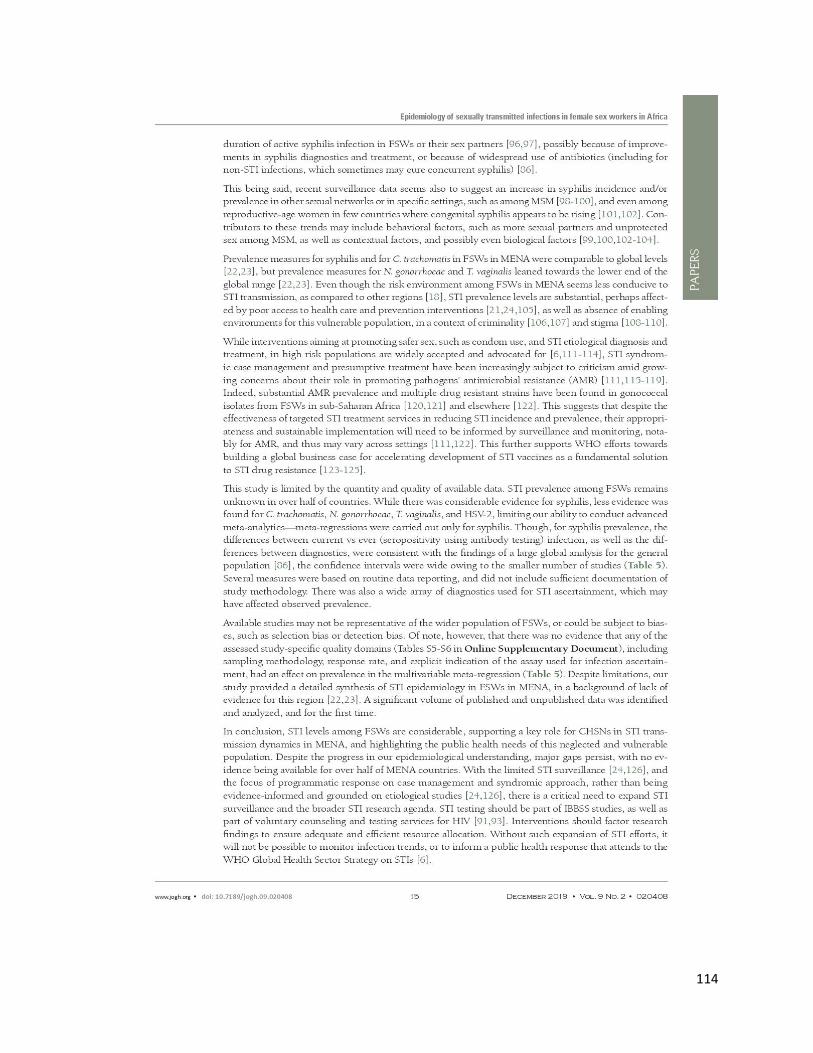
114
115

116
117
118

119
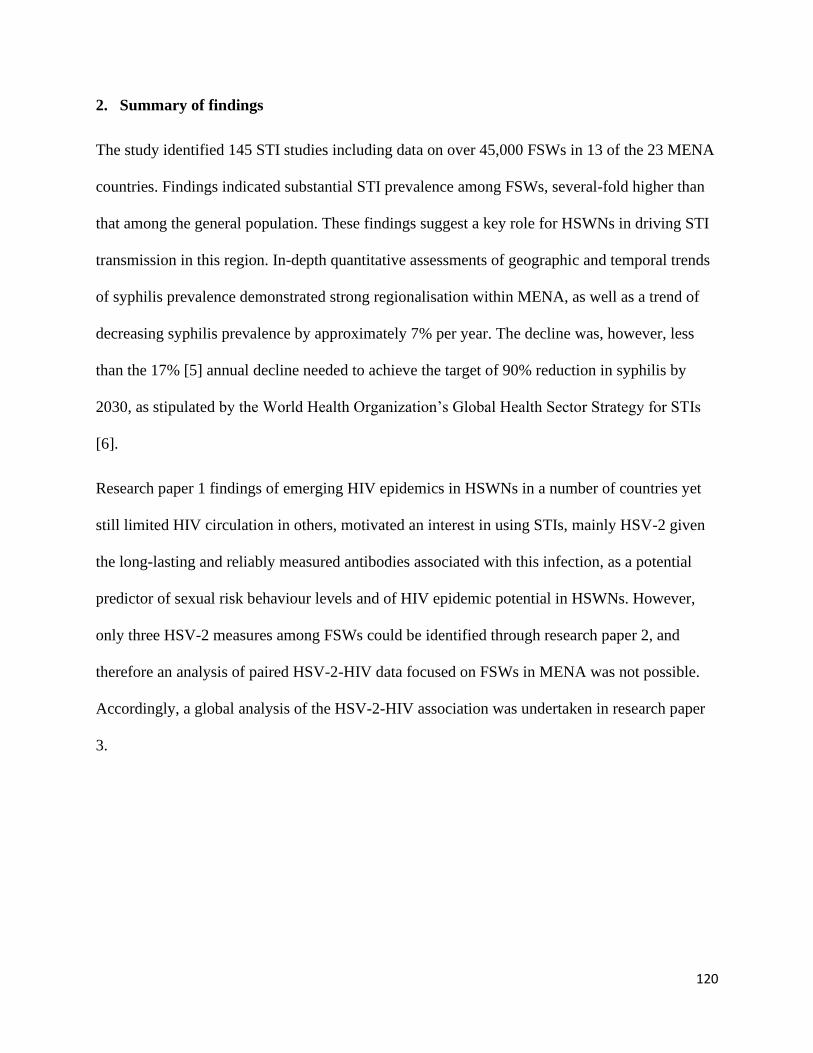
120
2. Summary of findings
The study identified 145 STI studies including data on over 45,000 FSWs in 13 of the 23 MENA
countries. Findings indicated substantial STI prevalence among FSWs, several-fold higher than
that among the general population. These findings suggest a key role for HSWNs in driving STI
transmission in this region. In-depth quantitative assessments of geographic and temporal trends
of syphilis prevalence demonstrated strong regionalisation within MENA, as well as a trend of
decreasing syphilis prevalence by approximately 7% per year. The decline was, however, less
than the 17% [5] annual decline needed to achieve the target of 90% reduction in syphilis by
2030, as stipulated by the World Health Organization’s Global Health Sector Strategy for STIs
[6].
Research paper 1 findings of emerging HIV epidemics in HSWNs in a number of countries yet
still limited HIV circulation in others, motivated an interest in using STIs, mainly HSV-2 given
the long-lasting and reliably measured antibodies associated with this infection, as a potential
predictor of sexual risk behaviour levels and of HIV epidemic potential in HSWNs. However,
only three HSV-2 measures among FSWs could be identified through research paper 2, and
therefore an analysis of paired HSV-2-HIV data focused on FSWs in MENA was not possible.
Accordingly, a global analysis of the HSV-2-HIV association was undertaken in research paper
3.
121
Chapter 4 references
1. Omori, R. and L.J. Abu-Raddad, Sexual network drivers of HIV and herpes simplex virus
type 2 transmission. AIDS, 2017. 31(12): p. 1721-1732.
2. Kouyoumjian, S.P., et al., Global population-level association between herpes simplex
virus 2 prevalence and HIV prevalence. AIDS, 2018. 32(10): p. 1343-1352.
3. Abu-Raddad, L.J., et al., HSV-2 serology can be predictive of HIV epidemic potential and
hidden sexual risk behavior in the Middle East and North Africa. Epidemics, 2010. 2(4):
p. 173-82.
4. Abu-Raddad L, et al., Characterizing the HIV/AIDS epidemic in the Middle East and
North Africa : Time for strategic action. Middle East and North Africa HIV/AIDS
Epidemiology Synthesis Project ed. World Bank/UNAIDS/WHO Publication. 2010,
Washington DC: The World Bank Press.
5. Smolak, A., et al., Trends and Predictors of Syphilis Prevalence in the General
Population: Global Pooled Analyses of 1103 Prevalence Measures Including 136 Million
Syphilis Tests. Clin Infect Dis, 2018. 66(8): p. 1184-1191.
6. World Health Organization, Global health sector strategy on Sexually Transmitted
Infections, 2016-2021. 2016, World Health Organization: Geneva, Switzerland. p. 60.

122
CHAPTER 5. RESEARCH PAPER 3-HSV-2 AS A BIOMARKER OF HIV EPIDEMIC
POTENTIAL AMONG FSWS

123
124
Retention of copyright evidence
This article is published in an open access format and “is licensed under CC BY 4.0 licence,
which permits use, sharing, adaptation, distribution and reproduction in any medium or format,
as long as appropriate credit is given to the original author(s) and the source. Scientific
Reports does not require authors to assign copyright of their published original research papers to
the journal.”
Further details can be found at the following url:
https://www.nature.com/srep/journal-policies/editorial-policies#license-agreement

125
1. Preamble
This chapter provides a demonstration of the utility of HSV-2 seroprevalence as a predictor of
HIV epidemic potential in HSWNs globally, particularly in countries, or settings within
countries, where HIV epidemic potential in these networks remains unknown and where high-
risk populations are hidden and stigmatized, through a global systematic analysis of empirical
paired prevalence measures for HSV-2 and HIV among FSWs (addresses objective 3 of thesis).
The study was motivated by findings of research paper 1 that showed recent emergence and
steady growth of HIV epidemics in HSWNs in several countries or settings, yet limited HIV
circulation in other countries or settings where HIV epidemic potential in HSWNs remains
unknown.
The objectives of this study were addressed through a global systematic review of paired HSV-2
and HIV prevalence measures focused on FSWs, that updated and expanded an earlier systematic
review of these measures in different populations. The resulting database of paired HSV-2-HIV
prevalence measures among FSWs in the different world regions was subsequently used to
conduct meta-analyses that pooled HIV prevalence measures at different HSV-2 prevalence
levels, and meta-regression analyses that quantified the magnitude of the association between
HSV-2 prevalence and HIV prevalence adjusting for regional, temporal, and behavioural
differences among FSWs.
Further published details on study methodology and results can be found in Appendix VII.

126

127

128

129

130

131

132
133

134
135

136
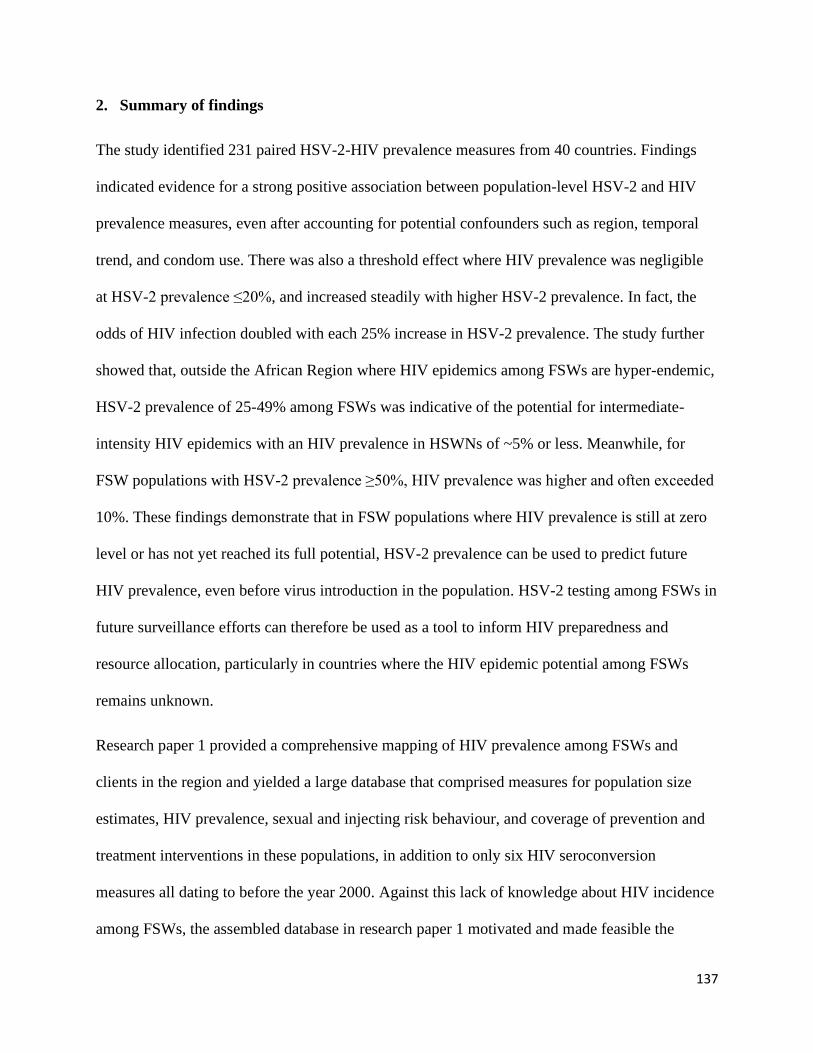
137
2. Summary of findings
The study identified 231 paired HSV-2-HIV prevalence measures from 40 countries. Findings
indicated evidence for a strong positive association between population-level HSV-2 and HIV
prevalence measures, even after accounting for potential confounders such as region, temporal
trend, and condom use. There was also a threshold effect where HIV prevalence was negligible
at HSV-2 prevalence ≤20%, and increased steadily with higher HSV-2 prevalence. In fact, the
odds of HIV infection doubled with each 25% increase in HSV-2 prevalence. The study further
showed that, outside the African Region where HIV epidemics among FSWs are hyper-endemic,
HSV-2 prevalence of 25-49% among FSWs was indicative of the potential for intermediate-
intensity HIV epidemics with an HIV prevalence in HSWNs of ~5% or less. Meanwhile, for
FSW populations with HSV-2 prevalence ≥50%, HIV prevalence was higher and often exceeded
10%. These findings demonstrate that in FSW populations where HIV prevalence is still at zero
level or has not yet reached its full potential, HSV-2 prevalence can be used to predict future
HIV prevalence, even before virus introduction in the population. HSV-2 testing among FSWs in
future surveillance efforts can therefore be used as a tool to inform HIV preparedness and
resource allocation, particularly in countries where the HIV epidemic potential among FSWs
remains unknown.
Research paper 1 provided a comprehensive mapping of HIV prevalence among FSWs and
clients in the region and yielded a large database that comprised measures for population size
estimates, HIV prevalence, sexual and injecting risk behaviour, and coverage of prevention and
treatment interventions in these populations, in addition to only six HIV seroconversion
measures all dating to before the year 2000. Against this lack of knowledge about HIV incidence
among FSWs, the assembled database in research paper 1 motivated and made feasible the
138
design of a mathematical modelling study (research paper 4) to estimate HIV incidence arising in
the context of HSWNs and its contribution to total HIV incidence in the adult population in
MENA.
139
CHAPTER 6. RESEARCH PAPER 4-HIV INCIDENCE AND IMPACT OF
INTERVENTIONS AMONG FSWS AND CLIENTS IN MENA
140

141
1. Preamble
This chapter provides the first detailed epidemiological investigation of HIV incidence occurring
in HSWNs in MENA, of the contribution of these networks to total incidence in the population,
and of the impact of expanding FSWs’ access to prevention interventions on averting new
infections in these networks (addresses objective 4 of thesis). The study was motivated by
research paper 1’s main finding of emerging HIV epidemics among FSWs and their clients in
several MENA countries. Research paper 1 also made this study feasible by providing a
comprehensive database of HIV prevalence, sexual and injecting risk behaviours, risk group size
estimates, and coverage of prevention interventions among FSWs and clients at country-level
across MENA. The latter database served as data input to the mathematical model that was used
to address the gap in our knowledge of HIV incidence in MENA. The study provides essential
statistics that can be used to inform HIV programming and progress monitoring towards
achieving UNAIDS 2030 targets [1-3].
The objectives of this study were addressed by constructing a novel individual-based
mathematical model built to describe HIV transmission dynamics in HSWNs. Statistical methods
were applied to generate, using 500 simulation runs, mean estimates for 1) HIV incidence and
incidence rates for each of FSWs, clients, and client spouses, 2) the relative contribution of
sexual versus injecting HIV acquisitions to HIV incidence among FSWs, 3) the contribution of
HSWNs to total HIV incidence in the adult population, and 4) the number of infections averted
in each of FSWs, clients, and client spouses by expanding coverage of select prevention
interventions among FSWs.
Further details on study methodology and results can be found in the attached manuscript and
associated Appendix VIII.

142
HIV incidence and impact of interventions among female sex
workers and their clients in the Middle East and North Africa:
Mathematical modelling analysis
Hiam Chemaitelly MSc,*1,2,3 Houssein H. Ayoub PhD,4 Ryosuke Omori PhD,5 Shereen El Feki
PhD,6 Joumana G. Hermez MPH,7 Helen A. Weiss PhD,3,8 and Laith J. Abu-Raddad PhD1,2,9,10
1Infectious Disease Epidemiology Group, Weill Cornell Medicine-Qatar, Cornell University,
Qatar Foundation – Education City, Doha, Qatar
2World Health Organization Collaborating Centre for Disease Epidemiology Analytics on
HIV/AIDS, Sexually Transmitted Infections, and Viral Hepatitis, Weill Cornell Medicine–Qatar,
Cornell University, Qatar Foundation–Education City, Doha, Qatar
3Department of Infectious Disease Epidemiology, Faculty of Epidemiology and Population
Health, London School of Hygiene and Tropical Medicine, London, United Kingdom
4Mathematics Program, Department of Mathematics, Statistics, and Physics, College of Arts and
Sciences, Qatar University, Doha, Qatar
5Division of Bioinformatics, Research Center for Zoonosis Control, Hokkaido University,
Sapporo, Hokkaido, Japan 6Regional Support Team for the Middle East and North Africa, The Joint United Nations
Programme on HIV/AIDS, Cairo, Egypt 7Department of Communicable Diseases Prevention and Control (DCD), World Health
Organization Regional Office for the Eastern Mediterranean, Cairo, Egypt.
8MRC International Statistics and Epidemiology Group, London School of Hygiene and Tropical
Medicine, London, United Kingdom
9Department of Population Health Sciences, Weill Cornell Medicine, Cornell University, New
York, New York, USA
10Department of Public Health, College of Health Sciences, QU Health, Qatar University, Doha,
Qatar
Word count: Abstract: 300 words; Text: 4,896 words.
Number of tables: 6.

143
Number of figures: 0.
Running head: HIV incidence in female sex workers in Middle East and North Africa.
*Reprints or correspondence
Hiam Chemaitelly, Weill Cornell Medicine-Qatar, Qatar Foundation - Education City, P.O. Box
24144, Doha, Qatar. Telephone: +(974) 4492-8443. Fax: +(974) 4492-8422. E-mail:
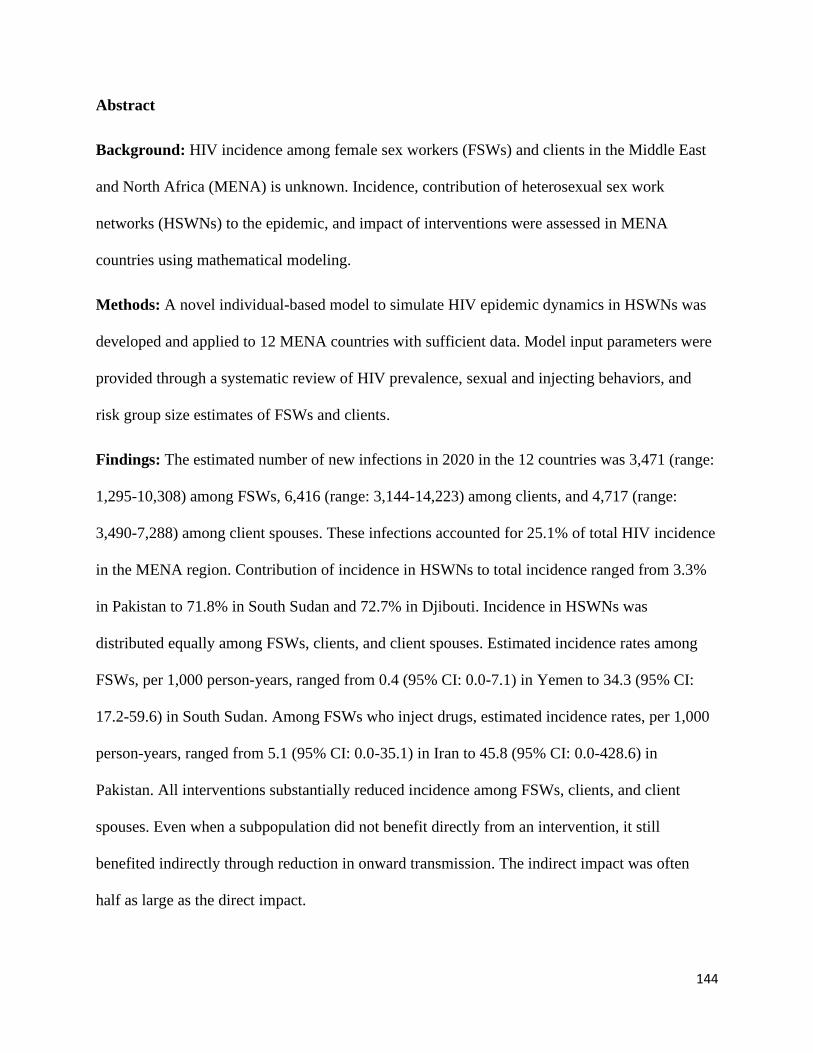
144
Abstract
Background: HIV incidence among female sex workers (FSWs) and clients in the Middle East
and North Africa (MENA) is unknown. Incidence, contribution of heterosexual sex work
networks (HSWNs) to the epidemic, and impact of interventions were assessed in MENA
countries using mathematical modeling.
Methods: A novel individual-based model to simulate HIV epidemic dynamics in HSWNs was
developed and applied to 12 MENA countries with sufficient data. Model input parameters were
provided through a systematic review of HIV prevalence, sexual and injecting behaviors, and
risk group size estimates of FSWs and clients.
Findings: The estimated number of new infections in 2020 in the 12 countries was 3,471 (range:
1,295-10,308) among FSWs, 6,416 (range: 3,144-14,223) among clients, and 4,717 (range:
3,490-7,288) among client spouses. These infections accounted for 25.1% of total HIV incidence
in the MENA region. Contribution of incidence in HSWNs to total incidence ranged from 3.3%
in Pakistan to 71.8% in South Sudan and 72.7% in Djibouti. Incidence in HSWNs was
distributed equally among FSWs, clients, and client spouses. Estimated incidence rates among
FSWs, per 1,000 person-years, ranged from 0.4 (95% CI: 0.0-7.1) in Yemen to 34.3 (95% CI:
17.2-59.6) in South Sudan. Among FSWs who inject drugs, estimated incidence rates, per 1,000
person-years, ranged from 5.1 (95% CI: 0.0-35.1) in Iran to 45.8 (95% CI: 0.0-428.6) in
Pakistan. All interventions substantially reduced incidence among FSWs, clients, and client
spouses. Even when a subpopulation did not benefit directly from an intervention, it still
benefited indirectly through reduction in onward transmission. The indirect impact was often
half as large as the direct impact.
145
Interpretation: Substantial HIV incidence occurs in HSWNs across MENA with client spouses
being heavily affected, in addition to FSWs and clients. Rapidly scaling up comprehensive
treatment and prevention services for FSWs can sizably reduce incidence arising in HSWNs.
Funding:
This publication was made possible by NPRP grant number 9-040-3-008 from the Qatar National
Research Fund (a member of Qatar Foundation). Infrastructure support was provided by the
Biostatistics, Epidemiology, and Biomathematics Research Core at the Weill Cornell Medicine-
Qatar. HHA acknowledges the support of Qatar University. HHA and RO acknowledge the
support of Marubeni M-QJRC2020-5. Salary for HAW was from the UK Medical Research
Council (MRC) and the UK Department for International Development (DFID) under the
MRC/DFID Concordat agreement (K012126/1). The statements made herein are solely the
responsibility of the authors.
Keywords: HIV; sex work; incidence; mathematical model; interventions; Middle East and
North Africa.

146
Research in context
Evidence before this study
The HIV epidemic is steadily growing in the Middle East and North Africa (MENA). Despite
evidence for emerging epidemics among female sex workers (FSWs) in MENA, HIV incidence
among them and their clients is unknown. The large size of heterosexual sex work networks
(HSWNs), relative to those of men who have sex with men and people who inject drugs,
suggests that these networks could be driving much of HIV incidence. Searches of PubMed and
Embase, to September 9, 2021, using broad terms for sex work, HIV, and MENA identified no
regional estimates for HIV incidence among FSWs and their clients.
Added value of this study
A novel individual-based mathematical model was developed to describe HIV transmission
dynamics in HSWNs for any country or region. Benefiting from a comprehensive and current
systematic database of HIV prevalence, sexual and injecting behaviors, and risk group size
estimates of FSWs and clients in MENA, the model was used to estimate HIV incidence and
other epidemiological measures among FSWs, clients, and client spouses, as well as impact of
HIV interventions. HIV incidence in HSWNs was estimated to contribute at least 25% of all HIV
incidence in MENA. However, there were large differences across countries, reflecting
differences in epidemic phase. Yet, even in countries where HIV prevalence among FSWs is
relatively low, substantial incidence is occurring in HSWNs due to their large size. While
incidence of HIV is more likely to be detected among FSWs, it constitutes less than a third of the
incidence in HSWNs—the other two-thirds are split among clients and their spouses, who rarely
access any HIV programmes. HSWNs appear to constitute a major driver of incidence among
women in the general population through unprotected sex with HIV-positive clients. The study
147
demonstrates that clients and their spouses can substantially benefit from expanding coverage of
interventions, even if these interventions are delivered only to FSWs. These estimates inform
HIV programming and monitoring of progress toward achieving UNAIDS targets for 2030.
Implications of all available evidence
With the emergence of HIV epidemics in FSWs in MENA, HIV incidence in HSWNs is likely to
increase. Scale-up of HIV interventions among FSWs should be a priority, and such
interventions will have a substantial impact on reducing infection burden among FSWs and their
clients. A significant proportion of incidence among general population women will also be
averted by HIV interventions among FSWs. Yet, FSWs in this region continue to suffer from
poor coverage of all interventions and MENA is far from achieving UNAIDS and WHO targets.
The situation may have been exacerbated by the COVID-19 pandemic. Strengthening non-
governmental entities working with FSWs to deliver services and programs may assist, as
demonstrated in several countries. Surveillance systems for HIV need to be enhanced among
FSWs, through regular, national, integrated bio-behavioral surveillance surveys, to monitor the
HIV epidemic and progress toward global targets, and to enhance our understanding of HIV
epidemiology in HSWNs.

148
Introduction
To accelerate ending the HIV/AIDS epidemic as a public health threat by 2030,1 the Joint United
Nations Programme on HIV/AIDS (UNAIDS) formulated the ‘UNAIDS 2016-2021 Strategy”,2
and more recently the ‘UNAIDS 2021-2026 Strategy”,3 a call for scaling-up HIV response
among people living with HIV (PLHIV) to achieve 90% coverage for HIV testing, treatment, and
sustained viral suppression by 2020,2 and 95% coverage by 2030.2-4 The strategy emphasized
enhancing access to combination prevention interventions among key populations as a
cornerstone to achieve the goal.2 Targets were set to reduce the global number of persons newly
acquiring HIV and of AIDS-related deaths to fewer than 500,000 by 2020, and fewer than
200,000 by 2030.2,4
Despite progress, the global community has not met the 2020 targets, with 1.5 million new HIV
infections and 680,000 AIDS-related deaths estimated in 2020.5 Over half of newly-acquired
infections occurred among key populations and their sexual partners,6 indicating persistent gaps
in reaching populations most at risk.7,8
The Middle East and North Africa (MENA), a region including approximately 10% of the
world’s population,9 continues to lag behind in HIV prevention and treatment.7 ART coverage in
MENA, as defined by UNAIDS, is only 43%, the lowest across all world regions,8 and HIV
incidence appears to be increasing since 2010.7,8 HIV epidemics have emerged in the last two
decades among female sex workers (FSWs),10 men who have sex with men (MSM),11 and people
who inject drugs (PWID).12 Yet, HIV surveillance remains limited in scale and scope,10-16 with
scarce data on incidence among marginalized and hard-to-reach populations.10-12,17,18 Although
heterosexual sex work networks (HSWNs) may be driving a large proportion of HIV incidence
in MENA owing to their large size10,19,20 relative to those of PWID12 and MSM,11 levels of

149
incidence among FSWs and their clients remains unknown.10 This evidence gap is hampering
HIV programming and monitoring of progress toward UNAIDS targets.
To address this evidence gap, we developed a novel individual-based mathematical model to
simulate HIV transmission dynamics in HSWNs, and applied it to estimate for each MENA
country: 1) current HIV incidence and incidence rate among FSWs, their clients, and client stable
sexual partners/spouses; 2) relative contribution of heterosexual sex intercourse versus injecting
drug use to incidence among FSWs; 3) contribution of HSWNs to incidence in the total adult
population; and 4) impact of various targets for interventions on incidence in HSWNs.
Methods
Overview of mathematical model
An individual-based Monte Carlo simulation model was developed to simulate sexual networks
of FSWs and clients and HIV transmission dynamics in these networks, and to estimate current
and future HIV incidence, factoring in both current intervention coverage and potential future
scale-up. Model structure was informed by earlier individual-based models for sexually
transmitted infections (STIs).21-23 The model simulates cohorts of FSWs and clients (regular and
non-regular/one-time) in each country over time as they engage in sexual (and injecting for
FSWs) behaviors and acquire or transmit HIV.
Parameterization of the model with current data was primarily based on a recently completed
comprehensive systematic review of HIV prevalence and sexual and injecting behaviors among
FSWs and clients in MENA, and size estimates of these populations.10 The review identified 485
HIV prevalence measures on 287,719 FSWs and 69 measures on 29,531 clients/proxy

150
populations, along with detailed sexual and injecting behavior data, in addition to >300
population-size estimates in these populations.10
Heterosexual sex work network
In the model, each FSW or client in the network enters/exits the sexual network, forms/dissolves
sexual partnerships, or acquires HIV through sex or by injecting drugs at event-specific
probabilities at each time step in each simulation run. The sexual network is constructed
assuming that the number of sexual partnerships formed by each regular or non-regular client
with FSWs follows a gamma distribution, reflecting sexual network and behavior studies.10,21,24-
27 The mean and variance of these distributions were informed by country-level data on sexual
behavior in HSWNs—the variance was set at 25% of the mean.10 Each month, every regular or
non-regular client may form a new partnership with one or more FSWs, based on a random
probability drawn from these distributions. Existing partnerships may also dissolve stochastically
assuming an exponential distribution at a rate of inverse of duration of partnerships, which varies
based on whether they involve a regular or non-regular client. Accordingly, in such sexual
networks, each client randomly selects FSW partners, but clients may have different propensities
to form partnerships, a situation known as proportionate mixing.21,28
FSWs exit the HSWN if they cease to practice sex work, and for clients if they cease seeking sex
with FSWs, or through natural and AIDS-related mortality (Table 1). Lower HIV transmission,
slower AIDS disease progression, and higher life expectancy were assumed for individuals on
antiretroviral therapy (ART; Table 1). Those who exit the HSWN are replaced by susceptible
persons, thus maintaining a fixed cohort size for FSWs and clients.
While the model assumes that HIV acquisition among FSWs can occur through sex with a client
or through injecting drug use with an injecting partner, HIV acquisition among clients was

151
assumed to occur only through sex with an HIV-positive FSW. Other sources of infection, such
as the client’s spouse, other heterosexual partners, male same-sex partners, and injecting drug
use were not considered. Evidence suggests that the risk of HIV infection through these modes of
exposure among clients is probably substantially smaller than the risk of infection through sex
with a FSW in most MENA countries.10,18-20
HIV sexual transmission in FSW-client partnerships
Probability of HIV sexual transmission in an HIV sero-discordant partnership, that includes an
HIV-positive FSW/client and a susceptible counterpart, was determined from the probability of
transmission per coital act per HIV stage of infection, number of coital acts per partnership,
which varied based on whether partnerships were with regular or non-regular clients, and
interventions that affect HIV transmission.
These interventions included ART in the FSW or client, condom use in the partnership, male
circumcision in the client, and pre-exposure prophylaxis (PrEP) in the FSW. Coverage of these
interventions for FSWs and clients was based on data for each country and was implemented in
the model by random assignment.
HIV transmission through drug injection
Proportions of FSWs who inject drugs were based on data for each country. HIV acquisition
through injecting drug use was modeled through an external hazard rate (force of infection) that
depended on whether the FSW was on PrEP and whether her injecting partner was on ART.
Otherwise, a constant hazard rate was assumed and was derived by fitting model output to
country-level data on HIV prevalence among FSWs who inject drugs,10 or alternatively if such
data were not available, to HIV prevalence among PWID.12 FSWs who inject were assumed to

152
inject for a specific duration, set at 10 years,12 which differed from the duration of sex work set
at 35 years.10
HIV sexual transmission from clients to their spouses
HIV sexual transmission from clients to their spouses was modeled using a separate
deterministic model, but using the individual-based model output as input (Supplementary
Material). Numbers of HIV transmissions from clients to spouses were estimated using the
proportion of clients in spousal partnerships, HIV prevalence among clients, numbers of
susceptible spouses, and probability of HIV transmission per partnership. The latter was
estimated using the probability of transmission per coital act per HIV stage of infection, numbers
of coital acts per partnership, condom use, and ART coverage among clients. It was assumed that
all HIV incidence among spouses occurs through transmission from the HIV-positive client to
the susceptible spouse, as other sources of exposure are likely limited in the MENA context.10,18-
20
HIV natural history
HIV natural history was based on established empirical epidemiological measures (Table 1).
Progression through each of HIV infection stages was modeled assuming an exponential
distribution through rates derived as the inverse of duration of each HIV stage and implemented
through a stochastic process.
Data sources and model parameters
The primary data source for this modeling study was the recently completed systematic review of
HIV, sexual and injecting behavior, and population size estimates in FSWs and clients in
MENA.10 Countries were included in the present study if they had sufficient input data to
153
simulate the HIV epidemic in the HSWN and HIV prevalence among FSWs was ≥0.5%.
Otherwise, it was not feasible to conduct the simulations. Twelve of the 23 MENA countries
were included: Algeria, Bahrain, Djibouti, Iran, Libya, Morocco, Pakistan, Somalia, South
Sudan, Sudan, Tunisia, and Yemen. Injecting drug use among FSWs was modelled in countries
in which evidence suggested a significant role for injecting drug use in the HIV epidemic.10
These included Bahrain, Iran, Libya, and Pakistan.
Country-specific parameter values were selected based on the most recent representative studies
identified through the aforementioned systematic review.10 Priority was given to studies with
rigorous sampling methodologies, such as integrated bio-behavioral surveillance surveys
(IBBSS). Where several nationally representative estimates based on IBBSS were available,10
the mean of these estimates was considered. Otherwise, data collected after the year 2000 were
pooled using random-effects meta-analysis. This methodology used Freeman-Tukey type arcsine
square-root transformation to stabilize variances29,30 before weighting measures using the
inverse-variance method,30,31 followed by pooling using DerSimonian-Laird random-effects
models to account for sampling variation and true heterogeneity.32,33 Data for coverage of
interventions were primarily based on findings of the systematic review,10 or alternatively, on
UNAIDS compilations,34 or imputed using the regional median for these parameters.10
Demographic and Health Survey data on men in the general population were used to derive, for
each country, the proportion of clients in spousal partnerships (defined as a marital/cohabiting
partnership for ≥1 year) and the proportion of sexual acts protected by condom use in these
partnerships.35 For countries with missing information, measures were imputed by pooling
regional data using random-effects meta-analysis.

154
The population size of FSWs and clients in each country was based on country-level data.10
Other model parameters, such as for HIV transmission and efficacy of interventions, were based
on current evidence in the literature (Tables 1-3).
Model simulations
The model-generated sexual network was established with a “burn-in” of 50 years to ensure
equilibrium of network structure prior to HIV introduction. Subsequently, HIV infection was
seeded and the model was run for an additional “burn-in” of 300 years to ensure epidemic
equilibrium in each country by 2020. Since epidemiological measures of interest, such as HIV
incidence, were estimated over a short time horizon of one year, and in absence of quality
country-level trend data for HIV prevalence in FSWs and clients in nearly all MENA countries,10
analyses were implemented starting from this epidemic equilibrium.
Model predictions for each country were based on the mean and 95% uncertainty intervals (UIs)
of distributions of outcome measures generated by 500 simulation runs. UIs were generated after
excluding runs with HIV stochastic extinction. For computational efficiency, simulations were
performed using a cohort of 600 FSWs and 6,000 clients (one-third of which are regular and
two-thirds are non-regular/one-time clients), as informed by MENA data,10 with outcome
measures subsequently scaled-up to reflect the actual population sizes in each country.10
Model fitting
Model fitting to HIV prevalence data among FSWs and HIV prevalence among FSWs who inject
drugs was performed to estimate the overall rate of sexual partnership formation and the baseline
hazard rate of acquiring HIV through injecting drug use in each included country. Nonlinear
least-square fitting using the Nelder-Mead simplex algorithm36 was implemented iteratively to

155
generate a set of 50 best model fits. A best model fit was defined as a relative error of <5%
between model predictions and empirical data. The final best model fit was the most probable
value for the sexual partnership rate and injecting hazard rate among the 50 best model fits.
Outcome measures
HIV epidemiological measures
HIV incidence was defined as the number of new infections per year and was calculated by
summing new infections occurring among FSWs (or clients) at each time-step (1 month) during
the year. HIV incidence rate was defined as the number of new infections per susceptible person
per 1,000 person-years and was calculated by dividing the number of incident infections among
FSWs, clients, and client spouses by the respective numbers of susceptible individuals in these
populations at the start of that year. The relative contribution of sexual versus injecting HIV
acquisitions to total incidence among FSWs was estimated by dividing the number of incident
infections resulting from each of sexual and injecting transmission during one year by all
incident infections during that year. The relative contribution of HSWNs to HIV incidence in the
total adult population was estimated by dividing the sum of incident infections arising among
FSWs, clients, and client spouses over the duration of a year, by the total HIV incidence in the
population (15-49 years) during that year, as estimated by UNAIDS.34
Impact of interventions
The impact of expanding HIV interventions among FSWs on HIV incidence arising in HSWNs
was assessed by estimating, using 500 simulation runs, the mean number of infections that would
be averted over a 10-year duration after implementing the interventions, and the proportional
decrease in incidence during this time (Table 4).
156
Role of the funding source
The funder of the study had no role in study design, data collection, data analysis, data
interpretation, or writing of the article. The corresponding author had full access to all the data in
the study and had the final responsibility for the decision to submit for publication.
Results
Estimated HIV incidence (number of new infections) in 2020 in the 12 countries combined was
3,471 (range: 1,295-10,308) among FSWs, 6,416 (range: 3,144-14,223) among clients, and 4,717
(range: 3,490-7,288) among client spouses (total: 14,604; Tables 2 and 3). The total incidence
among FSWs, clients, and spouses constituted 28.1% of overall incidence among adults
estimated by UNAIDS34 in these 12 countries combined (total: 51,995) , and 25.1% of incidence
estimated for all 23 countries of MENA (total: 58,189).34
In countries in which HIV acquisition through injecting drug use among FSWs is negligible,
estimated numbers of new infections among FSWs in 2020 ranged between 21 in Djibouti and
2,345 in South Sudan (Table 2). Meanwhile, estimated numbers of new infections in clients
ranged from 25 in Tunisia to 5,167 in South Sudan, whereas that among spouses ranged from 18
in Tunisia to 3,978 in South Sudan.
While the estimated number of incident infections by country varied owing to HSWN size
differences, in each of these countries, total incidence in HSWNs was distributed roughly equally
among FSWs, clients, and spouses (Table 2). The only exception was South Sudan, the only
country in this region with low male circumcision coverage (23.6%),37 where incidence in clients
and their spouses was twice as large as that among FSWs. Also, apart from South Sudan, HIV
prevalence among clients was approximately 25% of that among FSWs. HSWN contributions to

157
total incidence in the population ranged from 6.4% in Tunisia to 71.8% in South Sudan and
72.7% in Djibouti. Incidence rate among FSWs ranged from 0.4 (95% CI: 0.0-7.1) per 1,000
person-years in Yemen to 34.3 (95% CI: 17.2-59.6) per 1,000 person-years in South Sudan.
In countries where HIV acquisition through injecting drug use creates significant exposure for
FSWs, estimated numbers of new infections among FSWs in 2020 ranged from 1 in Bahrain to
339 in Pakistan (Table 3). Meanwhile, numbers of new infections among clients and their
spouses ranged from <1 in Bahrain to 301 and 114, respectively, in Pakistan. Incidence among
FSWs out of total incidence in HSWNs was higher in these countries (Table 3) compared to
countries with limited drug injection transmission (Table 2), as many FSWs were infected
through drug injection in addition to those being infected through sex. Still, sexual transmission
contributed most HIV incidence among FSWs; 67.6% in Pakistan, 68.0% in Iran, and 75.0% in
Libya. Also, as a consequence of the role of injecting, incidence among clients out of total
incidence in HSWN, and especially incidence among spouses, was relatively smaller.
In these countries, HIV prevalence among clients was only ~10% of that among FSWs (Table 3).
The contribution of HSWNs to total incidence in the population was also relatively low in these
countries, ranging from 3.3% in Pakistan to 14.4% in Libya. Incidence rate per 1,000 person-
years among all FSWs (including those who inject drugs) ranged from 0.5 (95% CI: 0.0-3.4) in
Bahrain to 2.6 (95% CI: 0.0-8.8) in Libya. However, FSWs who inject drugs were
disproportionately affected with higher incidence rates per 1,000 person-years ranging from 5.1
(95% CI: 0.0-35.1) in Iran to 45.8 (95% CI: 0.0-428.6) in Pakistan.
Models showed that all considered interventions, whether individually or in combination,
substantially reduced incidence among FSWs, clients, and client spouses (Tables 5 and 6).
However, the interventions affected the three subpopulations differently. Increasing ART

158
coverage and improving adherence to treatment among FSWs resulted in major reductions in
incidence with clients benefiting the most, as they benefited directly from viral suppression in
HIV-positive FSWs. Meanwhile, FSWs and client spouses benefited only indirectly through
reduction in the pool of HIV-positive clients. Still, the number of averted infections among
FSWs and spouses was substantial, and as much as half of that among clients in countries where
HIV transmission through injecting drug use is negligible (Table 5). In countries where HIV
transmission through injecting drug use is a significant mode of HIV exposure, FSWs
additionally benefited directly from this intervention, as it increased viral suppression among
their injecting partners (Table 6).
Increased condom use considerably reduced incidence for both FSWs and clients, as both
benefited directly from this intervention (Tables 5 and 6). Though client spouses did not benefit
directly from this intervention, still the estimated number of averted infections among them was
about half of that among clients (Tables 5 and 6), as a consequence of the reduction in the pool
of HIV-positive clients.
Expanding coverage of PrEP among FSWs, which remains very limited in MENA,6 considerably
reduced incidence, with FSWs benefiting most, as they directly experienced diminished risk of
HIV acquisition (Tables 5 and 6). Meanwhile, clients benefited only indirectly by reducing the
pool of HIV-positive FSWs. Still, the number of averted infections among clients was substantial
and as much as half of that among FSWs. Even client spouses had significantly reduced
incidence, although they benefited from the already indirect benefits among clients that resulted
from increasing PrEP coverage among FSWs. Numbers of averted infections among spouses
were often close to half that among clients (Table 5).
159
Expanding voluntary medical male circumcision (VMMC) coverage in South Sudan, the only
country in MENA where this intervention is needed, led to major reductions in HIV incidence
among clients, spouses, and FSWs (Table 5). The number of averted infections was particularly
high for clients and their spouses (about half that among clients).
Packages of combined interventions also considerably reduced incidence. A moderately
optimistic combination of interventions led to ≤60% reduction in incidence among FSWs and
clients, and half this reduction in client spouses (Tables 5 and 6). The most optimistic scenario
for combined interventions led to ≤90% reduction in incidence among FSWs and clients, and
half as much among spouses (Tables 5 and 6).
Discussion
HIV transmission in HSWNs is a major source of incident cases in MENA and contributes at
least 25% of the annual number of HIV infections in this region. The contribution of HSWNs to
incidence varied among countries from 3% in Pakistan to over 70% in South Sudan and Djibouti.
This variation reflected large differences in epidemic phase (recent or established epidemic) and
HIV prevalence among FSWs. It is remarkable that even in countries where HIV prevalence
among FSWs is relatively low, substantial incidence occurs in HSWNs due to their relatively
large size compared to networks of MSM and PWID. For example, HIV prevalence among
FSWs in Morocco is only 2%, but HSWNs represent 24% of all incident cases in this country.
HIV incidence is more likely to be detected among FSWs than among clients and their spouses
due to some HIV testing and prevention programs,10,18,38 and our findings highlight that this is
less than a third of the actual incidence that occurs in HSWNs. The other two-thirds are split
among clients and their spouses, who rarely access HIV response programming. It is striking that
one-third of incidence in HSWNs occurs among spouses of clients, although they do not engage
160
in sexual risk behavior and do not normally benefit from any HIV intervention, but are exposed
to infection by their husbands. This finding and vulnerability is consistent with evidence in
MENA indicating that for the vast majority of HIV infections among women, the source of the
infection is an HIV-positive spouse.17-20,39-41
Although HIV incidence in HSWNs in MENA is substantial, it presently contributes only about
1% of total incidence worldwide. Relatively nascent HIV epidemics in MENA FSWs, with only
a few national epidemics reaching a concentrated level, have limited the extent of HIV incidence.
Indeed, the recent systematic review of HIV prevalence in MENA found that of all 485
prevalence measures among FSWs, 46.8% were at zero prevalence,10 demonstrating the limited
extent of the epidemic thus far in most countries, and perhaps the window of opportunity to
prevent the epidemic from expanding. This window of opportunity may close with time, as the
same review found that HIV prevalence in FSWs is increasing at ~15% per year.10 Any major
increase in HIV prevalence in FSWs would entail a major increase in HIV incidence in HSWNs,
as these results demonstrate for countries such as Djibouti and South Sudan, where HIV
prevalence is already at a concentrated level.
These results indicate that structural factors have curtailed HIV incidence in HSWNs. While
condom use is still far from universal, roughly half of sexual acts in MENA between FSWs and
clients are condom-protected,10 thereby preventing a proportion of HIV transmissions. The
importance of condom use in reducing transmission can be seen in the impact of increasing
condom use coverage on incidence (Tables 5 and 6). Since this intervention directly protects
both FSWs and clients at the same time, it has a major impact. Increasing access to and coverage
of condom use in HSWNs should be a priority for HIV programming in MENA.
161
Another factor that reduced incidence is male circumcision, which is essentially universal in
MENA.37 This is best demonstrated in South Sudan, the only country in this region with low
male circumcision coverage (Table 2). Unlike other countries, HIV incidence there in clients and
their spouses was twice that among FSWs. For all other countries, it was similar to that among
FSWs. The role of male circumcision can also be seen in the impact of increasing VMMC
coverage on HIV incidence in this country (Table 5). VMMC has particularly reduced HIV
incidence among clients and their spouses, thus, onward transmission of HIV to the wider
population. This is also supported by numerous modelling studies of the impact of VMMC in
settings with similar HIV epidemiology to that of South Sudan, such as Zambia42 and
Zimbabwe.43 Given that most of HIV incidence in South Sudan occurs among clients and their
spouses, expanding coverage of VMMC should become a priority for this country.
Against a background of expanding epidemics in HSWNs, the results indicate that interventions
can significantly reduce incidence and prevent expansion of epidemics. A modest package of
interventions reduced incidence by as much as 60% among both FSWs and clients (Tables 5 and
6). However, the results highlighted that with the low coverage of interventions at present,
achieving the UNAIDS elimination target will require scale-up not only of single interventions,
but of combination of interventions.
The type of intervention determines whether its impact is most beneficial to FSWs, clients, or
spouses. Nonetheless, even when a subpopulation does not benefit directly from an intervention,
it still benefits indirectly by reducing the pool of infected persons in the HSWN. Increasing
condom use reduces incidence equally among both FSWs and clients. Meanwhile, increasing
ART coverage for FSWs living with HIV, aside from benefiting them for their own health and
well-being, also benefits primarily the clients, as it reduces onward transmission from FSWs.

162
Expanding PrEP coverage among FSWs benefits primarily FSWs as it reduces their acquisition
of the infection, and hence the possibility of transmission within the HSWN. Notably, indirect
effects on onward transmission were large and often about half as large as the direct effects. This
is best seen for the impact of the interventions on incidence among client spouses. None of the
interventions targeted spouses. However, the reduction in incidence among them was often as
large as half the reduction seen in clients or FSWs.
Despite substantial incidence arising in HSWNs, the HIV response in MENA remains limited in
scope and scale.38 Our systematic review of HIV among FSWs showed that only 18% of FSWs
in the region report ever being tested for HIV,10 lower than that found in other regions44 and far
below the 90% target of the ‘UNAIDS 2016-2021 Strategy’.2 ART coverage among PLHIV in
MENA is the lowest of all world regions,6,8 and far behind the WHO regional target of 50%
coverage by 2015.45 No data on viral suppression among FSWs affected by HIV in MENA can
be located, but only a minority of PLHIV are virally suppressed.6,8 The situation may have
worsened with the advent of COVID-19 due to interruptions in the provision of prevention and
treatment services.46 The results also demonstrate an additional vulnerability for FSWs who
inject drugs, where as much as a third of HIV incidence among FSWs was due to drug injection
in countries such as Iran and Pakistan. Gender-sensitive harm reduction services for FSWs who
inject drugs need to be available wherever a significant proportion of FSWs inject drugs.
Reaching FSWs and their clients in MENA continues to be a challenge given punitive laws7,38,47
and stigma48-50 associated with sex work. Diverse typologies and increased mobility of
FSWs47,51,52 are additional barriers. Programs and services, where they exist, are exclusively the
realm of non-governmental organizations, which are often inadequately resourced or under legal
restrictions preventing provision of comprehensive intervention packages to FSWs.18,38

163
This study has limitations. Analyses were possible for only 12 of 23 MENA countries with
sufficient HIV prevalence, behavioral, and risk group size estimate data to apply the model.
However, these 12 countries constituted 65% of the total population of MENA and included all
countries where current evidence suggests significant epidemics in HSWNs.10 Some of the input
data, such as for HIV prevalence, originated from IBBSS surveys conducted in specific settings
or cities, and may not represent the total FSW population in a given country, thereby possibly
affecting the estimates. Some model input data were global rather than MENA-specific such as
the real-world effectiveness in achieving viral suppression among FSWs.53
The model did not simulate further onward HIV transmission beyond FSWs, clients, and client
spouses; thus, this study may underestimate the contribution of HSWNs to total HIV incidence in
the population. In the absence of country-level trend data for HIV prevalence,10 estimates were
generated assuming endemic equilibrium. This may not have had an appreciable effect on
estimated epidemiological measures such as incidence, as they were generated over only one
year, but may have underestimated the impact of interventions if HIV prevalence is increasing, as
suggested for the MENA region.10
HSWNs are large and it is not feasible computationally to simulate the entire HSWN in each
country using such a fine-grained, individual-based modelling approach. For computational
feasibility and efficiency, simulations were performed using sub-cohorts of FSWs and clients
that are representative of the full cohorts of FSWs and clients. Results were subsequently scaled-
up to reflect actual population sizes of FSWs and clients. This reduction in simulated cohort sizes
made it difficult to simulate HSWNs and sustain HIV epidemics in countries where HIV
prevalence among FSWs is ≤0.5%. These countries were thus excluded from analysis (n=6). This
may also have underestimated HIV incidence in included countries due to finite-network effects
164
and higher likelihood of stochastic extinction. This further resulted in higher stochasticity in
simulations assessing the impact of interventions up to 2030. The impact was thus assessed after
30 years “burn-in” to reduce stochasticity, and then scaled back to a 10-year duration, which may
have overestimated the indirect impact of interventions on onward transmission of infection. The
indirect impact of interventions on incidence is slower to materialize than the direct impact. The
latter, such as for condom use, is immediate the moment a condom is used in a simulated sexual
partnership.
Conclusions
HIV incidence in HSWNs is a major source of incidence in MENA and contributes at least 25%
of the annual number of HIV infections in this region. With the nascency of HIV epidemics
among FSWs, and evidence suggesting a trend of increasing HIV prevalence,10 incidence in
HSWNs is likely to grow. Scale-up of interventions among FSWs should be a priority, and this
study forecasts a substantial impact for these interventions in controlling the epidemic. However,
the region is still far from achieving UNAIDS targets,2,8 and the situation may have worsened
with the advent of COVID-19.46 There is a need to rapidly scale up ART coverage among FSWs
and for programs that improve their retention in the treatment cascade and their access to
comprehensive prevention services. Strengthening the role of non-governmental entities working
with FSWs to lead the delivery of services and programs, supported by the governments, may
prove successful, as demonstrated in Morocco.10,38 Expansion of surveillance systems, including
conduct of regular national IBBSS surveys, is warranted to monitor the epidemic and to track
progress toward UNAIDS goals.

165
Contributors
HC co-conceived the study, designed the study and model, coded the mathematical model,
conducted the model parameterization, generated the simulations, and wrote the first draft of the
article. HHA contributed to coding of the model and generation of simulations. RO contributed
to model development. HAW contributed to study design and drafting of the article. LJA co-
conceived the study and contributed to study design, simulations, and drafting of the article. All
authors contributed to discussion and interpretation of the results and to writing of the
manuscript. All authors have read and approved the final manuscript.
Declaration of interests
The authors have no competing interests to declare.
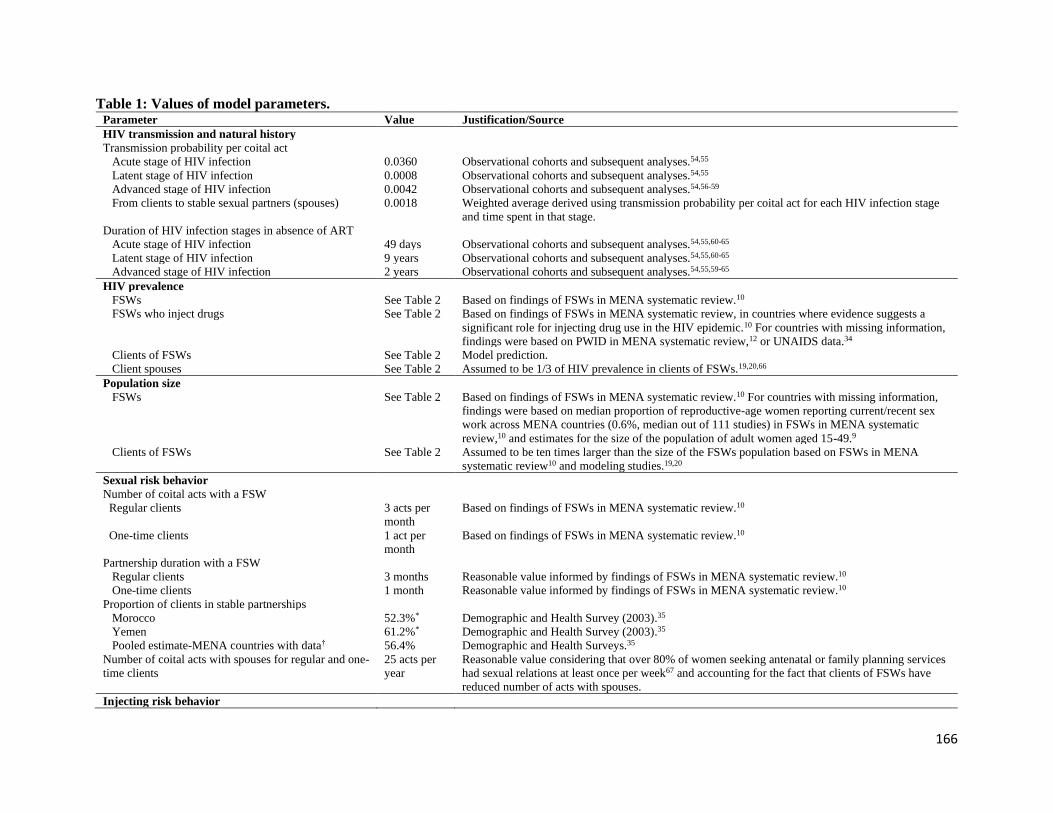
166
Table 1: Values of model parameters. Parameter Value Justification/Source
HIV transmission and natural history
Transmission probability per coital act
Acute stage of HIV infection 0.0360 Observational cohorts and subsequent analyses.54,55
Latent stage of HIV infection 0.0008 Observational cohorts and subsequent analyses.54,55
Advanced stage of HIV infection 0.0042 Observational cohorts and subsequent analyses.54,56-59
From clients to stable sexual partners (spouses) 0.0018 Weighted average derived using transmission probability per coital act for each HIV infection stage
and time spent in that stage.
Duration of HIV infection stages in absence of ART
Acute stage of HIV infection 49 days Observational cohorts and subsequent analyses.54,55,60-65
Latent stage of HIV infection 9 years Observational cohorts and subsequent analyses.54,55,60-65
Advanced stage of HIV infection 2 years Observational cohorts and subsequent analyses.54,55,59-65
HIV prevalence
FSWs See Table 2 Based on findings of FSWs in MENA systematic review.10
FSWs who inject drugs See Table 2 Based on findings of FSWs in MENA systematic review, in countries where evidence suggests a
significant role for injecting drug use in the HIV epidemic.10 For countries with missing information,
findings were based on PWID in MENA systematic review,12 or UNAIDS data.34
Clients of FSWs See Table 2 Model prediction.
Client spouses See Table 2 Assumed to be 1/3 of HIV prevalence in clients of FSWs.19,20,66
Population size
FSWs See Table 2 Based on findings of FSWs in MENA systematic review.10 For countries with missing information,
findings were based on median proportion of reproductive-age women reporting current/recent sex
work across MENA countries (0.6%, median out of 111 studies) in FSWs in MENA systematic
review,10 and estimates for the size of the population of adult women aged 15-49.9
Clients of FSWs See Table 2 Assumed to be ten times larger than the size of the FSWs population based on FSWs in MENA
systematic review10 and modeling studies.19,20
Sexual risk behavior
Number of coital acts with a FSW
Regular clients 3 acts per
month
Based on findings of FSWs in MENA systematic review.10
One-time clients 1 act per
month
Based on findings of FSWs in MENA systematic review.10
Partnership duration with a FSW
Regular clients 3 months Reasonable value informed by findings of FSWs in MENA systematic review.10
One-time clients 1 month Reasonable value informed by findings of FSWs in MENA systematic review.10
Proportion of clients in stable partnerships
Morocco 52.3%* Demographic and Health Survey (2003).35
Yemen 61.2%* Demographic and Health Survey (2003).35
Pooled estimate-MENA countries with data† 56.4% Demographic and Health Surveys.35
Number of coital acts with spouses for regular and one-
time clients
25 acts per
year
Reasonable value considering that over 80% of women seeking antenatal or family planning services
had sexual relations at least once per week67 and accounting for the fact that clients of FSWs have
reduced number of acts with spouses.
Injecting risk behavior
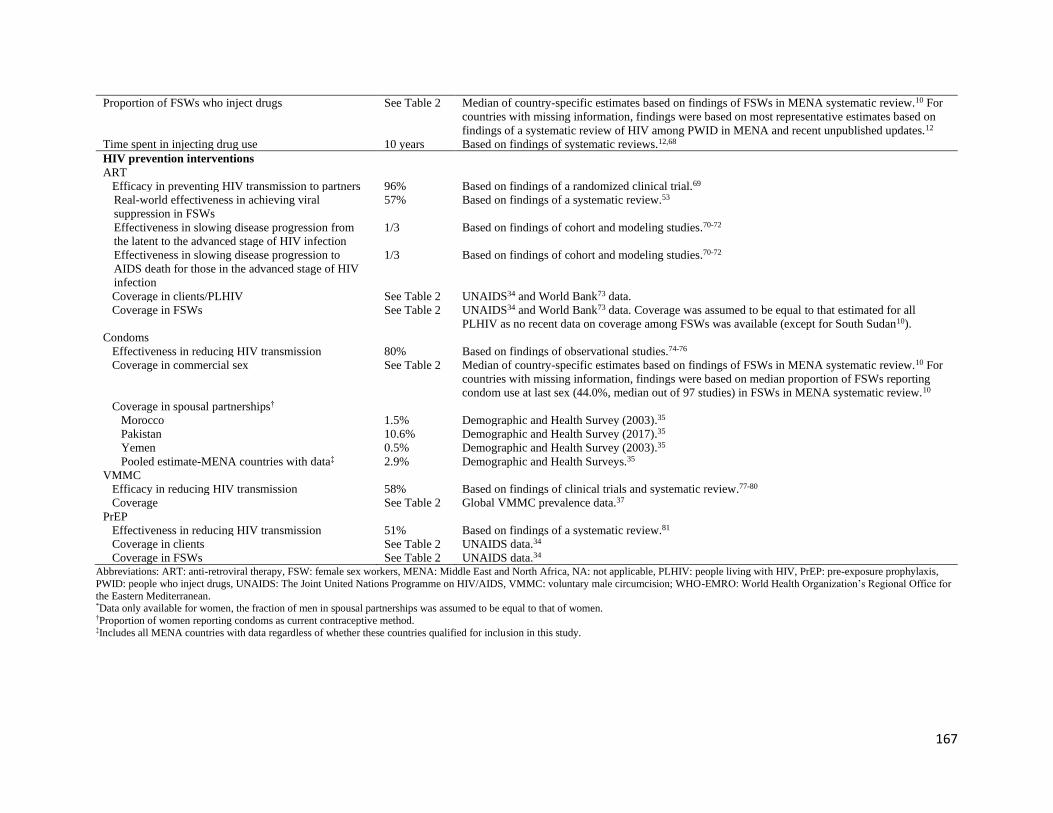
167
Proportion of FSWs who inject drugs See Table 2 Median of country-specific estimates based on findings of FSWs in MENA systematic review.10 For
countries with missing information, findings were based on most representative estimates based on
findings of a systematic review of HIV among PWID in MENA and recent unpublished updates.12
Time spent in injecting drug use 10 years Based on findings of systematic reviews.12,68
HIV prevention interventions
ART
Efficacy in preventing HIV transmission to partners 96% Based on findings of a randomized clinical trial.69
Real-world effectiveness in achieving viral
suppression in FSWs
57% Based on findings of a systematic review.53
Effectiveness in slowing disease progression from
the latent to the advanced stage of HIV infection
1/3 Based on findings of cohort and modeling studies.70-72
Effectiveness in slowing disease progression to
AIDS death for those in the advanced stage of HIV
infection
1/3 Based on findings of cohort and modeling studies.70-72
Coverage in clients/PLHIV See Table 2 UNAIDS34 and World Bank73 data.
Coverage in FSWs See Table 2 UNAIDS34 and World Bank73 data. Coverage was assumed to be equal to that estimated for all
PLHIV as no recent data on coverage among FSWs was available (except for South Sudan10).
Condoms
Effectiveness in reducing HIV transmission 80% Based on findings of observational studies.74-76
Coverage in commercial sex See Table 2 Median of country-specific estimates based on findings of FSWs in MENA systematic review.10 For
countries with missing information, findings were based on median proportion of FSWs reporting
condom use at last sex (44.0%, median out of 97 studies) in FSWs in MENA systematic review.10
Coverage in spousal partnerships†
Morocco 1.5% Demographic and Health Survey (2003).35
Pakistan 10.6% Demographic and Health Survey (2017).35
Yemen 0.5% Demographic and Health Survey (2003).35
Pooled estimate-MENA countries with data‡ 2.9% Demographic and Health Surveys.35
VMMC
Efficacy in reducing HIV transmission 58% Based on findings of clinical trials and systematic review.77-80
Coverage See Table 2 Global VMMC prevalence data.37
PrEP
Effectiveness in reducing HIV transmission 51% Based on findings of a systematic review.81
Coverage in clients See Table 2 UNAIDS data.34
Coverage in FSWs See Table 2 UNAIDS data.34 Abbreviations: ART: anti-retroviral therapy, FSW: female sex workers, MENA: Middle East and North Africa, NA: not applicable, PLHIV: people living with HIV, PrEP: pre-exposure prophylaxis,
PWID: people who inject drugs, UNAIDS: The Joint United Nations Programme on HIV/AIDS, VMMC: voluntary male circumcision; WHO-EMRO: World Health Organization’s Regional Office for
the Eastern Mediterranean. *Data only available for women, the fraction of men in spousal partnerships was assumed to be equal to that of women. †Proportion of women reporting condoms as current contraceptive method. ‡Includes all MENA countries with data regardless of whether these countries qualified for inclusion in this study.

168
Table 2: HIV epidemiological measures for FSWs, clients, and client spouses in MENA and the contribution of sex work to total HIV
incidence in the population in 2020, in countries with no significant HIV transmission through injecting drug use among FSWs. The table
includes measures based on empirical data for model input, as well as measures estimated using the model. Epidemiological measures Algeria Djibouti Morocco Somalia South Sudan Sudan Tunisia Yemen
Model input
Population
FSWs (n) 65,969 4,481 72,000 36,174 110,968 212,500 25,500 58,934
FSWs (population proportion; %)* 0.6% 1.7% 0.8% 1.0% 4.1% 2.0% 0.9% 1.6%
Clients of FSWs (n) 659,690 44,810 720,000 361,740 1,109,680 2,125,000 255,000 589,340
HIV prevalence (%)
Empirical data
All FSWs 4.9% 9.3% 2.2% 4.5% 37.9% 1.5% 1.2% 0.8%
HIV incidence in the total adult population per year
as estimated by UNAIDS† (n) 2,000 <100 <1,000 <500 16,000 2,900 <1,000 1,000
Current HIV interventions’ coverage (%)
Condom use (empirical data) 65.3% 59.6% 52.3% 31.5% 72.4% 26.0% 58.3% 46.0%
Male circumcision (empirical data) 97.9% 96.5% 99.9% 93.5% 23.6% 90.7% 99.8% 99.0%
ART (empirical data)
FSWs 32.0% 30.0% 57.0% 28.0% 9.4% 15.0% 31.0% 21.0%
Clients/People living with HIV 32.0% 30.0% 57.0% 28.0% 16.0% 15.0% 31.0% 21.0%
PrEP (empirical data)
FSWs 0.0% 0.0% 0.0% 0.0% 0.0% 0.0% 0.0% 0.0%
Clients 0.0% 0.0% 0.0% 0.0% 0.0% 0.0% 0.0% 0.0%
Model estimates for 2020
HIV prevalence
All FSWs (%) 4.9% 9.2% 2.2% 4.6% 38.2% 1.5% 1.4% 0.7%
95% uncertainty interval (%) 0.8-12.8% 3.3-16.0% 0.5-8.0% 0.8-13.1% 32.2-43.5% 0.3-9.7% 0.2-8.3% 0.2-6.0%
Clients of FSWs (%) 1.3% 2.4% 0.5% 1.1% 16.9% 0.3% 0.4% 0.2%
95% uncertainty interval (%) 0.2-3.3% 0.8-4.3% 0.1-1.9% 0.2-3.0% 14.0-19.2% 0.07-2.3% 0.07-2.1% 0.1-1.7%
Client spouses 0.4% 0.8% 0.2% 0.4% 5.6% 0.1% 0.1% 0.06%
95% uncertainty interval (%) 0.1-1.1% 0.3-1.4% 0.03-0.6% 0.1-1.0% 4.7-6.4% 0.02-0.8% 0.02-0.7% 0.0-0.6%
HIV incidence in HSWNs per year
All FSWs (n) 179 21 83 93 2,345 163 21 26
95% uncertainty interval (n) 0-770 0-60 0-600 0-422 1,295-3,884 0-1,771 0-170 0-393
Clients of FSWs (n) 234 29 100 113 5,167 213 25 30
95% uncertainty interval (n) 0-770 0-67 0-600 0-422 3,144-7,398 0-2,125 0-213 0-393
Client spouses (n) 173 22 61 84 3,978 166 18 26
95% uncertainty interval (n) 31-431 7-39 11-217 15-266 3,330-4,484 32-1,082 4-108 10-235
HIV incidence rate‡ (per 1,000 person-years)
All FSWs 2.9 5.1 1.2 2.8 34.3 0.8 0.9 0.4
95% uncertainty interval 0.0-13.2 0.0-14.8 0.0-8.7 0.0-12.5 17.2-59.6 0.0-8.8 0.0-7.3 0.0-7.1
Clients of FSWs 0.2 0.3 0.07 0.2 2.5 0.05 0.05 0.03

169
Epidemiological measures Algeria Djibouti Morocco Somalia South Sudan Sudan Tunisia Yemen
95% uncertainty interval 0.0-0.6 0.0-0.8 0.0-0.4 0.0-0.6 1.5-3.6 0.0-0.5 0.0-0.4 0.0-0.3
Client spouses 0.5 0.9 0.2 0.4 6.7 0.1 0.1 0.07
95% uncertainty interval 0.08-1.2 0.3-1.6 0.03-0.6 0.07-1.1 5.6-7.7 0.03-0.9 0.02-0.8 0.03-0.7
Contribution to total HIV incidence in the
population (%)
All FSWs 9.0% 21.2% 8.3% 18.6% 14.7% 5.6% 2.1% 2.6%
Clients of FSWs 11.7% 29.3% 10.0% 22.6% 32.3% 7.3% 2.5% 3.0%
Client spouses 8.7% 22.2% 6.1% 16.8% 24.9% 5.7% 1.8% 2.6%
Heterosexual sex work networks 29.3% 72.7% 24.4% 58.1% 71.8% 18.7% 6.4% 8.2% Abbreviations: ART: antiretroviral therapy; FSWs: female sex workers; HSWNs: heterosexual sex work networks; PrEP: pre-exposure prophylaxis: UNAIDS: The Joint United Nations Programme on
HIV/AIDS. *Proportion of FSWs out of total reproductive-age women aged 15-49 years. †Estimates for the number of new infections occurring in the population per year were provided by UNAIDS.34 Assumed to be 99 where incidence is reported as “<100”, 499 where incidence is reported
as “<500”, and 999 where incidence is reported as “<1,000”. ‡Numbers of new HIV infections per susceptible person per 1,000 person-years. Numbers are rounded to the first decimal unless the number was <0.1%.

170
Table 3: HIV epidemiological measures among FSWs, clients, and client spouses in MENA and the
contribution of sex work to total HIV incidence in the population in 2020, in countries with
significant HIV transmission through injecting drug use among FSWs. The table includes measures
based on empirical data for model input, as well as measures estimated using the model. Epidemiological measures Bahrain Iran Libya Pakistan
Model input
Population
FSWs (n) 2,143 91,500 11,459 228,800
FSWs (population proportion; %)* 0.6% 1.4% 0.6% 0.4%
Clients of FSWs (n) 21,430 915,000 114,590 2,288,000
Proportion of FSWs who inject drugs (%) 3.9% 13.6% 2.9% 2.0%
HIV prevalence (%)
Empirical
All FSWs 0.8% 3.3% 4.9% 2.3%
FSWs who inject drugs 21.0% 9.9% 44.0% 38.4%
HIV incidence in the total adult population per year
as estimated by UNAIDS† (n) Unknown 4,000 <500 23,000
Current HIV interventions’ coverage (%)
Condom use (empirical data) 44.0% 57.1% 80.0% 50.5%
Male circumcision (empirical data) 81.2% 99.7% 96.6% 96.4%
ART (empirical data)
FSWs 45.0% 20.0% 44.0% 8.0%
Clients/People living with HIV 45.0% 20.0% 44.0% 8.0%
PrEP (empirical data)
FSWs 0.0% 0.0% 0.0% 0.0%
Clients 0.0% 0.0% 0.0% 0.0%
Model estimates for 2020
HIV prevalence
All FSWs 0.9% 3.3% 4.6% 2.4%
95% uncertainty interval (%) 0.3-1.8% 1.3-6.3% 1.8-8.3% 0.7-5.0%
FSWs who inject drugs 20.2% 9.9% 44.8% 37.8%
95% uncertainty interval (%) 8.0-37.0% 3.4-17.8% 21.1-68.8% 11.1-66.7%
Clients of FSWs (%) 0.03% 0.3% 0.5% 0.2%
95% uncertainty interval (%) 0.0-0.08% 0.1-0.6% 0.2-1.0% 0.05-0.6%
Client spouses 0.01% 0.1% 0.2% 0.08%
95% uncertainty interval (%) 0.0-0.03% 0.03-0.2% 0.07-0.3% 0.02-0.2%
HIV incidence in HSWNs per year
All FSWs (n) 1 172 28 339
95% uncertainty interval (n) 0-7 0-610 0-96 0-1,525
FSWs who inject drugs (n) 1 55 7 110
95% uncertainty interval (n) 0-7 0-305 0-38 0-763
Clients of FSWs (n) <1 171 33 301
95% uncertainty interval (n) 0-4 0-610 0-96 0-1,525
Client spouses (n) <1 64 11 114
95% uncertainty interval (n) 0-1 20-127 5-20 25-278
HIV incidence rate‡ (per 1,000 person-years)
All FSWs 0.5 2.0 2.6 1.5
95% uncertainty interval 0.0-3.4 0.0-7.1 0.0-8.8 0.0-6.9
FSWs who inject drugs 15.2 5.1 43.4 45.8
95% uncertainty interval 0.0-117.6 0.0-35.1 0.0-300.0 0.0-428.6
Clients of FSWs 0.02 0.2 0.3 0.1
95% uncertainty interval 0.0-0.2 0.0-0.7 0.0-0.8 0.0-0.7
Client spouses 0.01 0.1 0.2 0.09
95% uncertainty interval 0.0-0.03 0.04-0.3 0.07-0.3 0.02-0.2
Contribution to HIV incidence in FSWs (%)‡‡
Sexual transmission 14.5% 68.0% 75.0% 67.6%
Injecting drug use 85.5% 32.0% 25.0% 32.4%
Contribution to total HIV incidence in the
population (%)
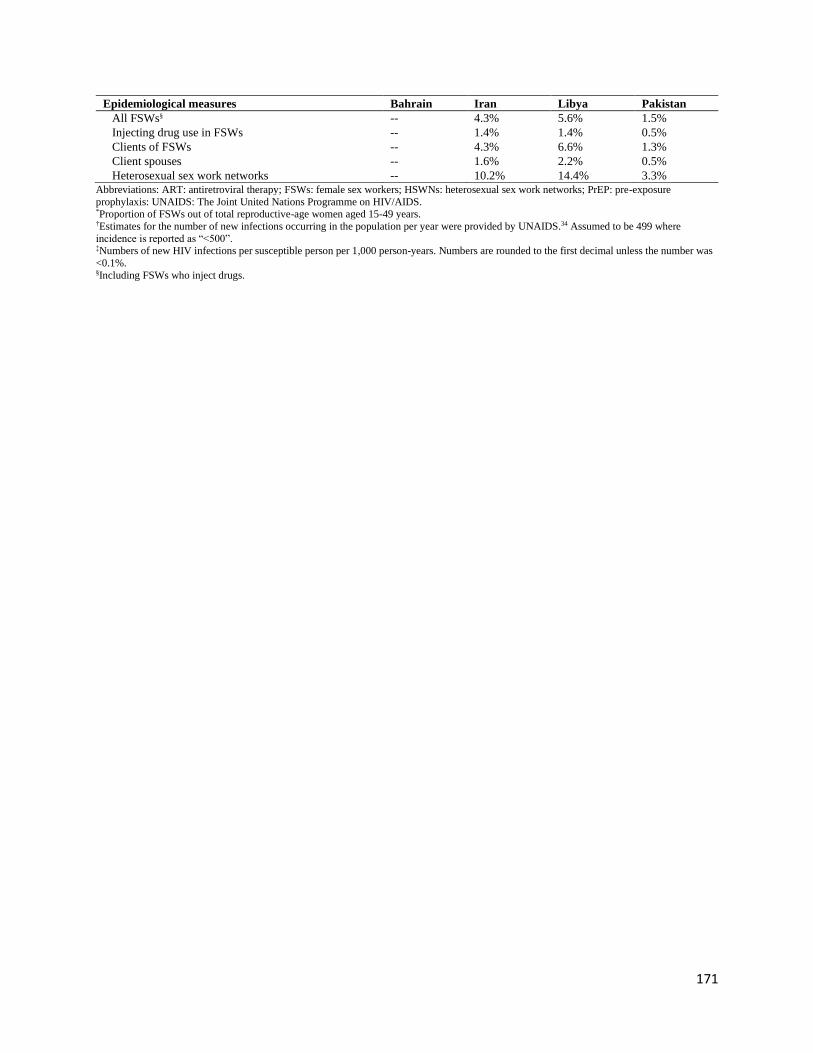
171
Epidemiological measures Bahrain Iran Libya Pakistan
All FSWs§ -- 4.3% 5.6% 1.5%
Injecting drug use in FSWs -- 1.4% 1.4% 0.5%
Clients of FSWs -- 4.3% 6.6% 1.3%
Client spouses -- 1.6% 2.2% 0.5%
Heterosexual sex work networks -- 10.2% 14.4% 3.3% Abbreviations: ART: antiretroviral therapy; FSWs: female sex workers; HSWNs: heterosexual sex work networks; PrEP: pre-exposure
prophylaxis: UNAIDS: The Joint United Nations Programme on HIV/AIDS. *Proportion of FSWs out of total reproductive-age women aged 15-49 years. †Estimates for the number of new infections occurring in the population per year were provided by UNAIDS.34 Assumed to be 499 where
incidence is reported as “<500”. ‡Numbers of new HIV infections per susceptible person per 1,000 person-years. Numbers are rounded to the first decimal unless the number was
<0.1%. §Including FSWs who inject drugs.

172
Table 4: Select modelled HIV prevention intervention packages to control the HIV epidemic among
FSWs and clients in MENA. Baseline coverage was used whenever it was higher than that set in the
investigated scenario. Intervention Coverage level
1. Expanding ART coverage in FSWs assuming real-world ART effectiveness in
achieving viral suppression of 57% (real-world adherence to ART)53
1. Increase to 25%
2. Increase to 50%
3. Increase to 81% (global target)7
2. Expanding ART coverage in FSWs assuming ART efficacy in preventing HIV
transmission to partners of 96% (optimal adherence to ART)69
1. Increase to 25%
2. Increase to 50%
3. Increase to 81% (global target)7
3. Increasing condom use coverage 1. Increase to 50%
2. Increase to 80%
4. Expanding VMMC coverage in clients (only applicable to South Sudan)37 1. Increase to 50%
2. Increase to 80%
5. Expanding PrEP coverage in FSWs 1. Increase to 25%
2. Increase to 50%
6. Moderately optimistic scenario
a) Expanding ART coverage in FSWs assuming ART efficacy in preventing
HIV transmission to partners of 96%
1. Increase to 50%
b) Increasing condom use coverage 2. Increase to 50%
c) Expanding VMMC coverage in clients (only applicable to South Sudan) 3. Increase to 50%
d) Expanding PrEP coverage in FSWs 4. Increase to 25%
7. Most optimistic scenario
a) Expanding ART coverage in FSWs assuming ART efficacy in preventing
HIV transmission to partners of 96%
1. Increase to 81%
b) Increasing condom use coverage 2. Increase to 80%
c) Expanding VMMC in clients (only applicable to South Sudan) 3. Increase to 80%
d) Expanding PrEP coverage in FSWs 4. Increase to 50% Abbreviations: ART: antiretroviral therapy; FSWs: female sex workers; PrEP: pre-exposure prophylaxis; VMMC: voluntary medical male
circumcision.
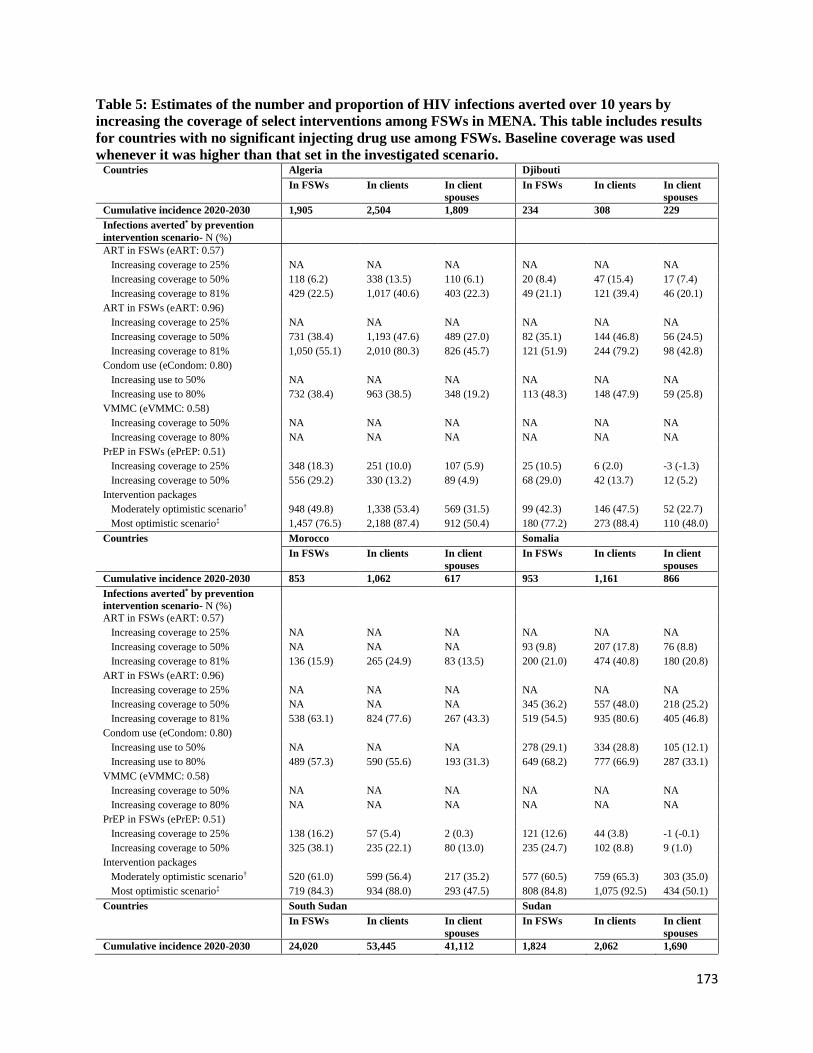
173
Table 5: Estimates of the number and proportion of HIV infections averted over 10 years by
increasing the coverage of select interventions among FSWs in MENA. This table includes results
for countries with no significant injecting drug use among FSWs. Baseline coverage was used
whenever it was higher than that set in the investigated scenario. Countries Algeria Djibouti
In FSWs In clients In client
spouses
In FSWs In clients In client
spouses
Cumulative incidence 2020-2030 1,905 2,504 1,809 234 308 229
Infections averted* by prevention
intervention scenario- N (%)
ART in FSWs (eART: 0.57)
Increasing coverage to 25% NA NA NA NA NA NA
Increasing coverage to 50% 118 (6.2) 338 (13.5) 110 (6.1) 20 (8.4) 47 (15.4) 17 (7.4)
Increasing coverage to 81% 429 (22.5) 1,017 (40.6) 403 (22.3) 49 (21.1) 121 (39.4) 46 (20.1)
ART in FSWs (eART: 0.96)
Increasing coverage to 25% NA NA NA NA NA NA
Increasing coverage to 50% 731 (38.4) 1,193 (47.6) 489 (27.0) 82 (35.1) 144 (46.8) 56 (24.5)
Increasing coverage to 81% 1,050 (55.1) 2,010 (80.3) 826 (45.7) 121 (51.9) 244 (79.2) 98 (42.8)
Condom use (eCondom: 0.80)
Increasing use to 50% NA NA NA NA NA NA
Increasing use to 80% 732 (38.4) 963 (38.5) 348 (19.2) 113 (48.3) 148 (47.9) 59 (25.8)
VMMC (eVMMC: 0.58)
Increasing coverage to 50% NA NA NA NA NA NA
Increasing coverage to 80% NA NA NA NA NA NA
PrEP in FSWs (ePrEP: 0.51)
Increasing coverage to 25% 348 (18.3) 251 (10.0) 107 (5.9) 25 (10.5) 6 (2.0) -3 (-1.3)
Increasing coverage to 50% 556 (29.2) 330 (13.2) 89 (4.9) 68 (29.0) 42 (13.7) 12 (5.2)
Intervention packages
Moderately optimistic scenario† 948 (49.8) 1,338 (53.4) 569 (31.5) 99 (42.3) 146 (47.5) 52 (22.7)
Most optimistic scenario‡ 1,457 (76.5) 2,188 (87.4) 912 (50.4) 180 (77.2) 273 (88.4) 110 (48.0)
Countries Morocco Somalia
In FSWs In clients In client
spouses
In FSWs In clients In client
spouses
Cumulative incidence 2020-2030 853 1,062 617 953 1,161 866
Infections averted* by prevention
intervention scenario- N (%)
ART in FSWs (eART: 0.57)
Increasing coverage to 25% NA NA NA NA NA NA
Increasing coverage to 50% NA NA NA 93 (9.8) 207 (17.8) 76 (8.8)
Increasing coverage to 81% 136 (15.9) 265 (24.9) 83 (13.5) 200 (21.0) 474 (40.8) 180 (20.8)
ART in FSWs (eART: 0.96)
Increasing coverage to 25% NA NA NA NA NA NA
Increasing coverage to 50% NA NA NA 345 (36.2) 557 (48.0) 218 (25.2)
Increasing coverage to 81% 538 (63.1) 824 (77.6) 267 (43.3) 519 (54.5) 935 (80.6) 405 (46.8)
Condom use (eCondom: 0.80)
Increasing use to 50% NA NA NA 278 (29.1) 334 (28.8) 105 (12.1)
Increasing use to 80% 489 (57.3) 590 (55.6) 193 (31.3) 649 (68.2) 777 (66.9) 287 (33.1)
VMMC (eVMMC: 0.58)
Increasing coverage to 50% NA NA NA NA NA NA
Increasing coverage to 80% NA NA NA NA NA NA
PrEP in FSWs (ePrEP: 0.51)
Increasing coverage to 25% 138 (16.2) 57 (5.4) 2 (0.3) 121 (12.6) 44 (3.8) -1 (-0.1)
Increasing coverage to 50% 325 (38.1) 235 (22.1) 80 (13.0) 235 (24.7) 102 (8.8) 9 (1.0)
Intervention packages
Moderately optimistic scenario† 520 (61.0) 599 (56.4) 217 (35.2) 577 (60.5) 759 (65.3) 303 (35.0)
Most optimistic scenario‡ 719 (84.3) 934 (88.0) 293 (47.5) 808 (84.8) 1,075 (92.5) 434 (50.1)
Countries South Sudan Sudan
In FSWs In clients In client
spouses
In FSWs In clients In client
spouses
Cumulative incidence 2020-2030 24,020 53,445 41,112 1,824 2,062 1,690

174
Infections averted* by prevention
intervention scenario- N (%)
ART in FSWs (eART: 0.57)
Increasing coverage to 25% 964 (4.0) 5,188 (9.7) 2,073 (5.0) 1 (0.04) 51 (2.5) -16 (-1.0)
Increasing coverage to 50% 2,714 (11.3) 14,151 (26.5) 5,799 (14.1) 339 (18.6) 583 (28.3) 248 (14.7)
Increasing coverage to 81% 5,006 (20.8) 24,367 (45.6) 9,936 (24.2) 453 (24.8) 928 (45.0) 351 (20.8)
ART in FSWs (eART: 0.96)
Increasing coverage to 25% 3,491 (14.5) 12,418 (23.2) 4,985 (12.1) 474 (26.0) 615 (29.8) 311 (18.4)
Increasing coverage to 50% 6,401 (26.6) 26,315 (49.2) 10,797 (26.3) 891 (48.8) 1,257 (61.0) 698 (41.3)
Increasing coverage to 81% 10,476 (43.6) 42,507 (79.5) 17,745 (43.2) 919 (50.4) 1,673 (81.1) 757 (44.8)
Condom use (eCondom: 0.80)
Increasing use to 50% NA NA NA 747 (40.9) 809 (39.2) 331 (19.6)
Increasing use to 80% 4,600 (19.2) 11,178 (20.9) 4,372 (10.6) 1,359 (74.5) 1,501 (72.8) 710 (42.0)
VMMC (eVMMC: 0.58)
Increasing coverage to 50% 1,959 (8.2) 10,331 (19.3) 4,235 (10.3) NA NA NA
Increasing coverage to 80% 4,422 (18.4) 21,626 (40.5) 8,904 (21.7) NA NA NA
PrEP in FSWs (ePrEP: 0.51)
Increasing coverage to 25% 2,796 (11.6) 3,038 (5.7) 1,042 (2.5) 294 (16.1) 172 (8.3) 54 (3.2)
Increasing coverage to 50% 5,715 (23.8) 6,238 (11.7) 2,134 (5.2) 557 (30.5) 290 (14.1) 118 (7.0)
Intervention packages
Moderately optimistic scenario† 9,604 (40.0) 32,672 (61.1) 13,302 (32.4) 1,131 (62.0) 1,428 (69.2) 625 (37.0)
Most optimistic scenario‡ 16,084 (67.0) 48,583 (90.9) 20,591 (50.1) 1,556 (85.3) 1,924 (93.3) 867 (51.3)
Countries Tunisia Yemen
In FSWs In clients In client
spouses
In FSWs In clients In client
spouses
Cumulative incidence 2020-2030 210 261 189 257 302 265
Infections averted* by prevention
intervention scenario- N (%)
ART in FSWs (eART: 0.57)
Increasing coverage to 25% NA NA NA 48 (18.7) 54 (17.8) 43 (16.2)
Increasing coverage to 50% 4 (2.0) 27 (10.3) 1 (0.5) 45 (17.6) 81 (26.7) 37 (14.0)
Increasing coverage to 81% 6 (2.9) 67 (25.8) 3 (1.6) 62 (24.1) 126 (41.8) 63 (23.8)
ART in FSWs (eART: 0.96)
Increasing coverage to 25% NA NA NA 69 (26.7) 82 (27.3) 55 (20.8)
Increasing coverage to 50% 77 (36.8) 120 (46.1) 40 (21.2) 85 (33.1) 151 (49.9) 76 (28.7)
Increasing coverage to 81% 106 (50.3) 205 (78.4) 77 (40.7) 128 (49.7) 240 (79.5) 110 (41.5)
Condom use (eCondom: 0.80)
Increasing use to 50% NA NA NA 68 (26.5) 77 (25.6) 49 (18.5)
Increasing use to 80% 98 (46.4) 119 (45.4) 37 (19.6) 178 (69.4) 208 (69.1) 120 (45.3)
VMMC (eVMMC: 0.58)
Increasing coverage to 50% NA NA NA NA NA NA
Increasing coverage to 80% NA NA NA NA NA NA
PrEP in FSWs (ePrEP: 0.51)
Increasing coverage to 25% 24 (11.2) -2 (-0.8) -14 (-7.4) 57 (22.0) 50 (16.6) 25 (9.4)
Increasing coverage to 50% 57 (27.0) 24 (9.0) -3 (-1.6) 133 (51.8) 122 (40.4) 86 (32.5)
Intervention packages
Moderately optimistic scenario† 92 (43.8) 129 (49.5) 44 (23.3) 139 (53.9) 180 (59.5) 92 (34.7)
Most optimistic scenario‡ 164 (78.0) 232 (88.8) 91 (48.1) 214 (83.3) 276 (91.6) 140 (52.8)
Abbreviations: ART: antiretroviral therapy; FSWs: female sex workers; e: effectiveness; NA: not applicable; PrEP: pre-exposure prophylaxis;
VMMC: voluntary medical male circumcision. *Estimates for the number of averted infections have been rounded to the nearest digit and may not exactly match the corresponding proportion of
averted infections. †Includes expanding ART coverage to 50% with efficacy in preventing HIV transmission to partners of 96%, increasing condom use to 50%, and increasing PrEP to 25%. Baseline coverage was used whenever it was higher than that set in the investigated scenario. For South Sudan only, this
package also included increasing VMMC to 50%. ‡Includes expanding interventions to the highest modelled coverage levels including expanding ART coverage to 81% with efficacy of 96%, increasing condom use to 80%, and increasing PrEP to 50%. For South Sudan only, this package also included increasing VMMC to 80%.

175
Table 6: Estimates of numbers and proportions of HIV infections averted over 10 years by
increasing the coverage of select interventions among FSWs in MENA. This table includes results
for countries with significant injecting drug use among FSWs. Baseline coverage was used
whenever it was higher than that set in the investigated scenario. Countries Bahrain Iran
In FSWs In clients In client
spouses
In FSWs In clients In client
spouses
Cumulative incidence 2020-2030 11 4 2 1,748 1,710 669
Infections averted* by prevention
intervention scenario- N (%)
ART in FSWs & PWID partners (eART: 0.57)
Increasing coverage to 25% NA NA NA 19 (1.1) 36 (2.1) 1 (0.1)
Increasing coverage to 50% <1 (4.5) <1 (6.9) <1 (4.4) 261 (14.9) 408 (23.9) 74 (11.1)
Increasing coverage to 81% 3 (25.4) 2 (39.3) <1 (20.7) 556 (31.8) 838 (49.0) 180 (26.9)
ART in FSWs & PWID partners (eART: 0.96)
Increasing coverage to 25% NA NA NA 273 (15.6) 304 (17.8) 49 (7.3)
Increasing coverage to 50% 3 (29.3) 2 (42.8) <1 (24.3) 664 (38.0) 879 (51.4) 181 (27.1)
Increasing coverage to 81% 7 (66.6) 3 (81.6) 1 (50.0) 989 (56.6) 1,403 (82.1) 287 (42.9)
Condom use (eCondom: 0.80)
Increasing use to 50% <1 (3.9) <1 (7.4) <1 (2.6) NA NA NA
Increasing use to 80% 1 (9.8) 2 (47.9) 1 (27.8) 532 (30.5) 711 (41.6) 133 (19.9)
PrEP in FSWs (ePrEP: 0.51)
Increasing coverage to 25% 1 (11.4) <1 (6.7) <1 (1.7) 206 (11.8) 48 (2.8) -13 (-1.9)
Increasing coverage to 50% 3 (24.4) <1 (11.1) <1 (5.3) 496 (28.4) 258 (15.1) 35 (5.2)
Intervention packages
Moderately optimistic scenario† 4 (38.1) 2 (46.7) <1 (23.7) 820 (46.9) 946 (55.3) 201 (30.0)
Most optimistic scenario‡ 9 (76.6) 4 (91.1) 1 (52.2) 1,368 (78.2) 1,545 (90.4) 325 (48.6)
Countries Libya Pakistan
In FSWs In clients In client
spouses
In FSWs In clients In client
spouses
Cumulative incidence 2020-2030 295 340 115 3,162 3,055 1,183
Infections averted* by prevention
intervention scenario- N (%)
ART in FSWs & PWID partners (eART: 0.57)
Increasing coverage to 25% NA NA NA 204 (6.5) 392 (12.8) 53 (4.5)
Increasing coverage to 50% 11 (3.6) 15 (4.5) 2 (1.7) 634 (20.1) 1,019 (33.4) 232 (19.6)
Increasing coverage to 81% 52 (17.6) 112 (32.9) 20 (17.4) 961 (30.4) 1,579 (51.7) 318 (26.9)
ART in FSWs & PWID partners (eART: 0.96)
Increasing coverage to 25% NA NA NA 492 (15.6) 792 (25.9) 160 (13.5)
Increasing coverage to 50% 100 (34.0) 140 (41.3) 23 (20.0) 1,066 (33.7) 1,609 (52.7) 303 (25.6)
Increasing coverage to 81% 172 (58.3) 268 (78.9) 49 (42.6) 1,820 (57.6) 2,538 (83.1) 568 (48.0)
Condom use (eCondom: 0.80)
Increasing use to 50% NA NA NA NA NA NA
Increasing use to 80% NA NA NA 1,257 (39.8) 1,541 (50.4) 326 (27.6)
PrEP in FSWs (ePrEP: 0.51)
Increasing coverage to 25% 36 (12.1) 14 (4.1) 1 (0.9) 501 (15.8) 306 (10.0) 76 (6.4)
Increasing coverage to 50% 75 (25.3) 35 (10.2) 4 (3.5) 908 (28.7) 525 (17.2) 110 (9.3)
Intervention packages
Moderately optimistic scenario† 128 (43.3) 153 (44.9) 26 (22.6) 1,457 (46.1) 1,804 (59.0) 393 (33.2)
Most optimistic scenario‡ 202 (68.6) 274 (80.5) 51 (44.3) 2,514 (79.5) 2,820 (92.3) 628 (53.1)
Abbreviations: ART: antiretroviral therapy; FSWs: female sex workers; e: effectiveness; NA: not applicable; PrEP: pre-exposure prophylaxis;
PWID: people who inject drugs. *Estimates for the number of averted infections have been rounded to the nearest digit and may not exactly match the corresponding proportion of averted infections. †Includes expanding ART coverage to 50% with efficacy in preventing HIV transmission to partners of 96%, increasing condom use to 50%, and
increasing PrEP to 25%. Baseline coverage was used whenever it was higher than that set in the investigated scenario. ‡Includes expanding interventions to the highest modelled coverage levels including expanding, ART coverage to 81% with efficacy of 96%,
increasing condom use to 80%, and increasing PrEP to 50%.

176
References
1. United Nations. Transforming our world: the 2030 agenda for sustainable development,
2015.
2. The Joint United Nations Programme on HIV/AIDS (UNAIDS). UNAIDS 2016-2021
Strategy: On the fast-track to end AIDS. Geneva, Switzerland, 2015.
3. The Joint United Nations Programme on HIV/AIDS (UNAIDS). Global AIDS Strategy
2021-2026. End Inequalities. End AIDS. Available from:
https://www.unaids.org/sites/default/files/media_asset/global-AIDS-strategy-2021-2026_en.pdf.
Accessed on: 8 August 2021. Geneva, Switzerland: UNAIDS, 2021.
4. The Joint United Nations Programme on HIV/AIDS (UNAIDS). Understanding fast-
track: Accelerating action to end the AIDS epidemic by 2030. Available from:
https://www.unaids.org/sites/default/files/media_asset/201506_JC2743_Understanding_FastTrac
k_en.pdf. Accessed on January 8, 2021. Geneva, Switzerland: UNAIDS, 2020.
5. The Joint United Nations Programme on HIV/AIDS (UNAIDS). Global HIV & AIDS
statistics — Fact sheet. Available from: https://www.unaids.org/en/resources/fact-sheet.
Accessed on: August 15, 2021. 2021.
6. The Joint United Nations Programme on HIV/AIDS (UNAIDS). UNAIDS Data 2020.
Available from: https://www.unaids.org/sites/default/files/media_asset/2020_aids-data-
book_en.pdf. Accessed on: January 8, 2021. Geneva, Switzerland: UNAIDS, 2020.
7. The Joint United Nations Programme on HIV/AIDS (UNAIDS). Global AIDS Update
2020: Seizing the moment. Available from:
https://www.unaids.org/en/resources/documents/2020/global-aids-report. Accessed on January 8,
2021. Geneva, Switzerland, 2020.
8. The Joint United Nations Programme on HIV/AIDS (UNAIDS). Global AIDS Update
2021. Confronting inequalities: Lessons for pandemic responses from 40 years of AIDS.
Available from: https://www.unaids.org/sites/default/files/media_asset/2021-global-aids-
update_en.pdf. Accessed on: 15 September, 2021. Geneva, Switzerland: UNAIDS, 2021.
9. United Nations Population Division. World population prospects 2019 Available from:
https://esa.un.org/unpd/wpp/. 2019 (accessed 25 January 2021 2019).
10. Chemaitelly H, Weiss HA, Calvert C, Harfouche M, Abu-Raddad LJ. HIV epidemiology
among female sex workers and their clients in the Middle East and North Africa: systematic
review, meta-analyses, and meta-regressions. BMC Medicine 2019; 17(1).
11. Mumtaz G, Hilmi N, McFarland W, et al. Are HIV epidemics among men who have sex
with men emerging in the middle east and north Africa?: A systematic review and data synthesis.
PLoS Medicine 2011; 8 (8) (no pagination)(e1000444).
12. Mumtaz GR, Weiss HA, Thomas SL, et al. HIV among people who inject drugs in the
Middle East and North Africa: systematic review and data synthesis. PLoS medicine 2014; 11(6):
e1001663.
13. Mumtaz GR, Riedner G, Abu-Raddad LJ. The emerging face of the HIV epidemic in the
Middle East and North Africa. Current Opinion in HIV and AIDS 2014; 9(2): 183-91.
14. Bozicevic I, Riedner G, Haghdoost A. HIV case reporting in the countries of North
Africa and the Middle East. Journal of the International AIDS Society 2014; 17 (no
pagination)(18962).
15. Bozicevic I, Riedner G, Calleja JM. HIV surveillance in MENA: recent developments
and results. Sexually transmitted infections 2013; 89 Suppl 3: iii11-6.

177
16. Ayoub HH, Awad SF, Abu-Raddad LJ. Use of routine HIV testing data for early
detection of emerging HIV epidemics in high-risk subpopulations: A concept demonstration
study. Infect Dis Model 2018; 3: 373-84.
17. Abu-Raddad LJ, Hilmi N, Mumtaz G, et al. Epidemiology of HIV infection in the Middle
east and North Africa. Aids 2010; 24(SUPPL. 2): S5-S23.
18. Abu-Raddad L, Akala FA, Semini I, Riedner G, Wilson D, Tawil O. Characterizing the
HIV/AIDS epidemic in the Middle East and North Africa : Time for strategic action. Washington
DC: The World Bank Press; 2010.
19. Kouyoumjian SP, El Rhilani H, Latifi A, et al. Mapping of new HIV infections in
Morocco and impact of select interventions. International journal of infectious diseases : IJID :
official publication of the International Society for Infectious Diseases 2018; 68: 4-12.
20. Mumtaz GR, Kouyoumjian SP, Hilmi N, et al. The distribution of new HIV infections by
mode of exposure in Morocco. Sexually transmitted infections 2013; 89 Suppl 3: iii49-56.
21. Omori R, Abu-Raddad LJ. Sexual network drivers of HIV and herpes simplex virus type
2 transmission. AIDS 2017; 31(12): 1721-32.
22. Ghani AC, Garnett GP. Risks of acquiring and transmitting sexually transmitted diseases
in sexual partner networks. Sex Transm Dis 2000; 27(10): 579-87.
23. Ghani AC, Swinton J, Garnett GP. The role of sexual partnership networks in the
epidemiology of gonorrhea. Sex Transm Dis 1997; 24(1): 45-56.
24. Hamilton DT, Handcock MS, Morris M. Degree distributions in sexual networks: a
framework for evaluating evidence. Sex Transm Dis 2008; 35(1): 30-40.
25. Handcock MS, Jones JH. Likelihood-based inference for stochastic models of sexual
network formation. Theor Popul Biol 2004; 65(4): 413-22.
26. Cuadros DF, Crowley PH, Augustine B, Stewart SL, Garcia-Ramos G. Effect of variable
transmission rate on the dynamics of HIV in sub-Saharan Africa. BMC Infect Dis 2011; 11: 216.
27. Omori R, Chemaitelly H, Abu-Raddad LJ. Dynamics of non-cohabiting sex partnering in
sub-Saharan Africa: a modelling study with implications for HIV transmission. Sexually
transmitted infections 2015; 91(6): 451-7.
28. Garnett GP, Anderson RM. Factors controlling the spread of HIV in heterosexual
communities in developing countries: patterns of mixing between different age and sexual
activity classes. Philos Trans R Soc Lond B Biol Sci 1993; 342(1300): 137-59.
29. Freeman MF, Tukey JW. Transformations Related to the Angular and the Square Root.
1950: 607-11.
30. Miller JJ. The Inverse of the Freeman – Tukey Double Arcsine Transformation. The
American Statistician 1978; 32(4): 138-.
31. Barendregt JJ, Doi SA, Lee YY, Norman RE, Vos T. Meta-analysis of prevalence.
Journal of epidemiology and community health 2013; 67(11): 974-8.
32. DerSimonian R, Laird N. Meta-analysis in clinical trials. Controlled clinical trials 1986;
7(3): 177-88.
33. Borenstein M. Introduction to meta-analysis. Chichester, U.K.: John Wiley & Sons;
2009.
34. The Joint United Nations Programme on HIV/AIDS (UNAIDS). Country fact sheets.
Available from: http://www.unaids.org/en/regionscountries/countries/. Accessed on: August 26,
2021. 2021.

178
35. The United States Agency for International Development (USAID). The Demographic
and Health Surveys Program. Available from: https://dhsprogram.com/data/available-
datasets.cfm. Accessed on: August 26, 2021. 2021.
36. Lagarias JC, Reeds JA, Wright MH, Wright PE. Convergence properties of the Nelder--
Mead simplex method in low dimensions. SIAM Journal on optimization 1998; 9(1): 112-47.
37. Morris BJ, Wamai RG, Henebeng EB, et al. Estimation of country-specific and global
prevalence of male circumcision. Popul Health Metr 2016; 14: 4.
38. Abu-Raddad L.J., Akala F.A., Semini I., Riedner G., Wislon D., Tawil O. Policy notes.
Characterizing the HIV/AIDS epidemic in the Middle East and North Africa: time for strategic
action. Middle Wast and North Africa HIV/AIDS Epidemiology Synthesis Project. World
Bank/UNAIDS/WHO publication. Washington (D.C.): The World Bank Press; 2010.
39. Al-Thani A, Abdul-Rahim H, Alabsi E, et al. Prevalence of Chlamydia trachomatis
infection in the general population of women in Qatar. Sexually transmitted infections 2013; 89
Suppl 3(Suppl 3): iii57-60.
40. Alrajhi AA, Halim MA, Al-Abdely HM. Mode of transmission of HIV-1 in Saudi Arabia.
Aids 2004; 18(10): 1478-80.
41. Ramezani A, Mohraz M, Gachkar L. Epidemiologic situation of human
immunodeficiency virus (HIV/AIDS patients) in a private clinic in Tehran, Iran. Archives of
Iranian medicine 2006; 9(4): 315-8.
42. Awad SF, Sgaier SK, Tambatamba BC, et al. Investigating Voluntary Medical Male
Circumcision Program Efficiency Gains through Subpopulation Prioritization: Insights from
Application to Zambia. PLoS One 2015; 10(12): e0145729.
43. Awad SF, Sgaier SK, Ncube G, et al. A Reevaluation of the Voluntary Medical Male
Circumcision Scale-Up Plan in Zimbabwe. PLoS One 2015; 10(11): e0140818.
44. Tokar A, Broerse JEW, Blanchard J, Roura M. HIV Testing and Counseling Among
Female Sex Workers: A Systematic Literature Review. AIDS and behavior 2018; 22(8): 2435-
57.
45. World Health Organization Regional Office for the Eastern Mediterranean Region. From
HIV testing to lifelong care and treatment : access to the continuum of HIV care and treatment in
the Eastern Mediterranean Region : progress report 2014. Available from:
https://applications.emro.who.int/dsaf/EMROPUB_2016_EN_18914.pdf. Accessed on May 8,
2021. Cairo, Egypt, 2016.
46. Iversen J, Sabin K, Chang J, et al. COVID-19, HIV and key populations: cross-cutting
issues and the need for population-specific responses. Journal of the International AIDS Society
2020; 23(10): e25632.
47. Jenkins C., Robalino D.A. HIV/AIDS in the Middle East and North Africa: The costs of
inaction. Washigton, D.C.: The World Bank; 2003.
48. Mohebbi MR. Female sex workers and fear of stigmatisation [2]. Sexually Transmitted
Infections 2005; 81(2): 180-1.
49. Dejong J, Mortagy I. The struggle for recognition by people living with HIV/AIDS in
Sudan. Qual Health Res 2013; 23(6): 782-94.
50. DeJong J, Mahfoud Z, Khoury D, Barbir F, Afifi RA. Ethical considerations in
HIV/AIDS biobehavioral surveys that use respondent-driven sampling: illustrations from
Lebanon. American journal of public health 2009; 99(9): 1562-7.
179
51. Emmanuel F, Thompson LH, Athar U, et al. The organisation, operational dynamics and
structure of female sex work in Pakistan. Sexually Transmitted Infections 2013; 89(SUPPL. 2):
ii29-ii33.
52. Hawkes S, Collumbien M, Platt L, et al. HIV and other sexually transmitted infections
among men, transgenders and women selling sex in two cities in Pakistan: A cross-sectional
prevalence survey. Sexually Transmitted Infections 2009; 85(SUPPL. 2): ii8-ii16.
53. Mountain E, Mishra S, Vickerman P, Pickles M, Gilks C, Boily MC. Antiretroviral
therapy uptake, attrition, adherence and outcomes among HIV-infected female sex workers: a
systematic review and meta-analysis. PLoS One 2014; 9(9): e105645.
54. Wawer MJ, Gray RH, Sewankambo NK, et al. Rates of HIV-1 transmission per coital act,
by stage of HIV-1 infection, in Rakai, Uganda. J Infect Dis 2005; 191(9): 1403-9.
55. Pinkerton SD. Probability of HIV transmission during acute infection in Rakai, Uganda.
AIDS and behavior 2008; 12(5): 677-84.
56. Hollingsworth TD, Anderson RM, Fraser C. HIV-1 transmission, by stage of infection. J
Infect Dis 2008; 198(5): 687-93.
57. Awad SF, Abu-Raddad LJ. Could there have been substantial declines in sexual risk
behavior across sub-Saharan Africa in the mid-1990s? Epidemics 2014; 8: 9-17.
58. Abu-Raddad LJ, Patnaik P, Kublin JG. Dual infection with HIV and malaria fuels the
spread of both diseases in sub-Saharan Africa. Science 2006; 314(5805): 1603-6.
59. Abu-Raddad LJ, Longini IM, Jr. No HIV stage is dominant in driving the HIV epidemic
in sub-Saharan Africa. AIDS 2008; 22(9): 1055-61.
60. Stover J, Brown T, Marston M. Updates to the Spectrum/Estimation and Projection
Package (EPP) model to estimate HIV trends for adults and children. Sexually transmitted
infections 2012; 88 Suppl 2: i11-6.
61. UNAIDS. UNAIDS Reference Group on Estimates, Modelling and Projections. 2007.
62. UNAIDS/WHO. AIDS epidemic update 2007. 2007.
63. UNAIDS/WHO. AIDS epidemic update 2010: UNAIDS fact sheet (available at
http://www.unaids.org/documents/20101123_FS_SSA_em_en.pdf, accessed 23 July 2012),
2010.
64. UNAIDS/WHO. Epidemiological data, HIV estimates 1990-2009 (available at
http://www.unaids.org/en/dataanalysis/epidemiology/), 2010.
65. Ghys PD, Zaba B, Prins M. Survival and mortality of people infected with HIV in low
and middle income countries: results from the extended ALPHA network. AIDS 2007; 21 Suppl
6: S1-4.
66. Mumtaz GR, Awad SF, Feizzadeh A, Weiss HA, Abu-Raddad LJ. HIV incidence among
people who inject drugs in the Middle East and North Africa: mathematical modelling analysis.
Journal of the International AIDS Society 2018; 21(3): e25102.
67. Ministère de la Santé au Maroc. Etude de prévalence des IST chez les femmes
consultantes en SMI/PF al Wilaya de Rabat-Sale.
68. Feelemyer J, Des Jarlais D, Arasteh K, Uuskula A. Adherence to antiretroviral
medications among persons who inject drugs in transitional, low and middle income countries:
an international systematic review. AIDS and behavior 2015; 19(4): 575-83.
69. Cohen MS, Chen YQ, McCauley M, et al. Antiretroviral Therapy for the Prevention of
HIV-1 Transmission. N Engl J Med 2016; 375(9): 830-9.
180
70. Bhatta DN, Adhikari R, Karki S, Koirala AK, Wasti SP. Life expectancy and disparities
in survival among HIV-infected people receiving antiretroviral therapy: an observational cohort
study in Kathmandu, Nepal. BMJ Glob Health 2019; 4(3): e001319.
71. Nakagawa F, May M, Phillips A. Life expectancy living with HIV: recent estimates and
future implications. Curr Opin Infect Dis 2013; 26(1): 17-25.
72. Teeraananchai S, Kerr SJ, Amin J, Ruxrungtham K, Law MG. Life expectancy of HIV-
positive people after starting combination antiretroviral therapy: a meta-analysis. HIV medicine
2017; 18(4): 256-66.
73. The World Bank. Antiretroviral therapy coverage. Available from:
https://data.worldbank.org/indicator/SH.HIV.ARTC.ZS. 2017 (accessed August 04, 2019).
74. Weller S, Davis K. Condom effectiveness in reducing heterosexual HIV transmission.
Cochrane Database Syst Rev 2001; (3): CD003255.
75. Hughes JP, Baeten JM, Lingappa JR, et al. Determinants of per-coital-act HIV-1
infectivity among African HIV-1-serodiscordant couples. J Infect Dis 2012; 205(3): 358-65.
76. Pinkerton SD, Abramson PR, Turk ME. Updated estimates of condom effectiveness. J
Assoc Nurses AIDS Care 1998; 9(6): 88-9.
77. Auvert B, Taljaard D, Lagarde E, Sobngwi-Tambekou J, Sitta R, Puren A. Randomized,
controlled intervention trial of male circumcision for reduction of HIV infection risk: the ANRS
1265 Trial. PLoS Med 2005; 2(11): e298.
78. Bailey RC, Moses S, Parker CB, et al. Male circumcision for HIV prevention in young
men in Kisumu, Kenya: a randomised controlled trial. The Lancet 2007; 369(9562): 643-56.
79. Gray RH, Kigozi G, Serwadda D, et al. Male circumcision for HIV prevention in men in
Rakai, Uganda: a randomised trial. The Lancet 2007; 369(9562): 657-66.
80. Weiss HA, Quigley MA, Hayes RJ. Male circumcision and risk of HIV infection in sub-
Saharan Africa: a systematic review and meta-analysis. AIDS 2000; 14(15): 2361-70.
81. Fonner VA, Dalglish SL, Kennedy CE, et al. Effectiveness and safety of oral HIV
preexposure prophylaxis for all populations. AIDS 2016; 30(12): 1973-83.

181
2. Summary of findings
The study estimated HIV incidence and related epidemiological measures in HSWNs of 12 of the
23 MENA countries that had sufficient input data to feasibly simulate the HIV epidemic in
HSWNs. HSWNs were identified as a major source of incidence, contributing at least 25% of all
HIV incidence in MENA. Although HSWNs’ contribution to incidence varied across countries
depending on the HIV epidemic phase, the large size of these networks resulted in substantial
incidence even in countries with low HIV prevalence among FSWs. Two-thirds of this incidence
was equally divided between clients and their spouses suggesting that HSWNs are an important
driver of HIV incidence among general population women in this region. The study further
demonstrated that expanding coverage of treatment and prevention interventions among FSWs
alone can substantially reduce HIV incidence among clients and client spouses, and that even a
moderate package of combination prevention interventions targeting only FSWs could avert
~60% of new HIV infections among them and their clients. The study findings provide a basis to
empower advocacy for strengthening HIV programming targeting FSWs, in line with UNAIDS
recently endorsed strategy for achieving the HIV elimination goal [3, 4]. Findings also stress the
need for expanding HIV surveillance among FSWs to monitor the HIV epidemic and progress
towards global targets.

182
Chapter 6 references
1. The Joint United Nations Programme on HIV/AIDS (UNAIDS), UNAIDS 2016-2021
Strategy: On the fast-track to end AIDS. 2015: Geneva, Switzerland.
2. The Joint United Nations Programme on HIV/AIDS (UNAIDS), Understanding fast-
track: Accelerating action to end the AIDS epidemic by 2030. Available from:
https://www.unaids.org/sites/default/files/media_asset/201506_JC2743_Understanding_
FastTrack_en.pdf. Accessed on January 8, 2021. 2020, UNAIDS: Geneva, Switzerland.
3. The Joint United Nations Programme on HIV/AIDS (UNAIDS), Global AIDS Strategy
2021-2026. End Inequalities. End AIDS. Available from:
https://www.unaids.org/sites/default/files/media_asset/global-AIDS-strategy-2021-
2026_en.pdf. Accessed on: 8 August 2021. 2021, UNAIDS: Geneva, Switzerland.
4. The Joint United Nations Programme on HIV/AIDS (UNAIDS), Prevailing against
pandemics by putting people at the centre. Available from:
https://aidstargets2025.unaids.org/assets/images/prevailing-against-pandemics_en.pdf.
Accessed on: August 8, 2021. 2020, UNAIDS: Geneva, Switzerland.

183
CHAPTER 7. DISCUSSION
In this chapter, I discuss the key findings from the thesis which have extended our understanding
of the epidemiology of HIV among FSWs, their clients, and client spouses in the MENA region.
This discussion aims to integrate the different findings of each of the studies completed in this
thesis to build a coherent and broad understanding of the epidemiology of HIV infection in
HSWNs in MENA.
1. A pattern of emerging HIV epidemics among FSWs and clients but still limited
transmission in half of HSWNs
A key finding is identifying patterns of emerging HIV epidemics among FSWs and clients in
several MENA countries, some of which are still at low to intermediate intensity while others are
already established at high incidence (research paper 1; [1]). A related finding is the trend of
growing HIV prevalence among FSWs over the last two decades with increasing prevalence
odds of infection of about 15% per year (research paper 1; [1]). The emerging epidemics among
FSWs and clients in MENA have often been preceded by large epidemics among PWID [2] and
MSM [3], suggesting recent bridging of the infection from these key populations to HSWNs.
This being said, and although HIV has been circulating in the region for few decades, the
infection is still not established in many HSWNs. Nearly half of the studies (46.8%) among
FSWs reported zero HIV prevalence, and seven out of 18 countries with data had zero or nearly
zero pooled mean HIV prevalence among FSWs (research paper 1; [1]). Possible explanations
for this are that i) HIV has not yet been effectively introduced or bridged to many of these
networks, ii) networks’ structure is characterized by low connectivity and thus not conducive for
sustainable HIV transmission, iii) the risk environment, in terms of number of partners, lack of
184
condom use, sex with PWID, and injecting drug use, is not conducive enough for sustainable
HIV transmission (research paper 1; [1]), and/or iv) male circumcision had an important impact
in reducing HIV heterosexual transmission.
2. A critical role for male circumcision in limiting HIV transmission in MENA
With an RCT-demonstrated effectiveness of ~60% [4-7] and long-term observed effectiveness of
~70% [8, 9] against heterosexual HIV acquisition, male circumcision, which is at universal
coverage in nearly all MENA countries, has been a critical factor in limiting HIV transmission in
HSWNs. An illustration of the effect of male circumcision can be seen in Figure 1. This figure
compares HIV incidence as estimated in research paper 4 [10], that is at current universal
coverage for male circumcision in all countries except in South Sudan where the coverage is low
at 23.6% [11], to HIV incidence estimated by the model of research paper 4, but applying an
extreme counter-factual scenario that assumes zero male circumcision in all countries.
The reduction in incidence due to male circumcision exceeded the 60-70% reduction expected
assuming the direct reduction in HIV acquisition among clients of FSWs. In addition to the direct
protection among male clients, FSWs and client spouses also benefited indirectly from the
reduced onward transmission, in line with findings of other observational [12-14] and
mathematical modelling studies [15, 16]. The combined direct and indirect effects of male
circumcision indicate an important role for this biological cofactor in curtailing the sustainability
of HIV transmission chains in HSWNs in MENA. This is further demonstrated in the singular
nature of the epidemiology of HIV in the HSWNs of South Sudan, the only MENA country at
low male circumcision coverage (23.6% [11]; research paper 4; [10]).
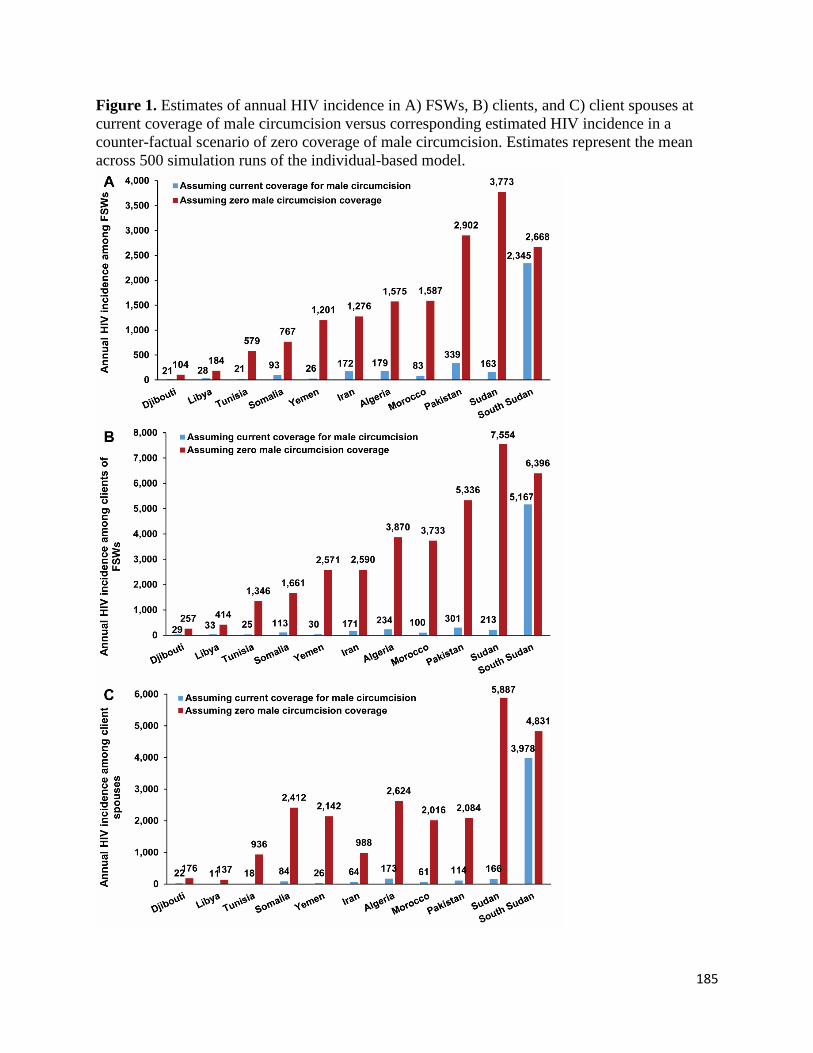
185
Figure 1. Estimates of annual HIV incidence in A) FSWs, B) clients, and C) client spouses at
current coverage of male circumcision versus corresponding estimated HIV incidence in a
counter-factual scenario of zero coverage of male circumcision. Estimates represent the mean
across 500 simulation runs of the individual-based model.

186
3. A sizable contribution of HSWNs to total HIV incidence
The results in the thesis indicate that HIV incidence in HSWNs contributes a quarter of the
annual HIV incidence occurring in MENA (Figure 2). This is a conservative estimate
considering that incidence in HSWNs could be estimated for only 12 of the 23 MENA countries
(research paper 4; [10]) and that zero incidence was assumed for the remaining countries with no
data or with HIV prevalence in FSWs of <0.5%. In the 12 assessed countries combined, HSWNs
account for a third of total HIV incidence (research paper 4; [10]).
Figure 2. Distribution of HIV incidence across MENA
In several of these countries, such as Morocco, Sudan, and Yemen, the large size of these
networks translated into substantial HIV incidence, and thus a sizable contribution to total
incidence in the population ranging from 8.2% to 24.4%, even when HIV prevalence among
FSWs was low in the range of 0.8% to 2.2% (Figure 3; research paper 4; [10]).
However, with an estimated 14,600 incident infections annually, HSWNs in MENA still
contribute only about 1% to total HIV incidence worldwide (research paper 4; [10]). This is
mainly because, except for Djibouti and South Sudan where the epidemic is established at a high
level, many of the epidemics among FSWs in the region have only emerged within the last two
decades and are mostly of low to intermediate intensity (prevalence among FSWs <5%)

187
(research paper 1; [1]). Growth in HIV incidence remains slow as HIV prevalence among FSWs
and clients remains low (research paper 1; [1])
Figure 3. Contribution of heterosexual sex work networks (HSWNs) to total HIV incidence in
MENA countries for which HIV transmission dynamics in HSWNs could be modelled and
simulated [10].
4. Most of HIV incidence in HSWNs does not occur among FSWs, but among clients and
client spouses
Figure 4 illustrates HIV transmission dynamics in HSWNs in MENA. FSWs mostly acquire HIV
through sexual transmission rather than injecting drug use; the latter contributes only 5% of new
HIV infections among FSWs (research paper 4; [10]). Meanwhile, with the large size of the
client population and most of them being susceptible to the infection (HIV prevalence among
clients is only 25% of that among FSWs (research papers 1 & 4; [1, 10])), prevalent infections
among FSWs result in substantial incidence among clients, which in turn translates into
substantial incidence among client spouses who are also largely susceptible. Indeed, two-thirds
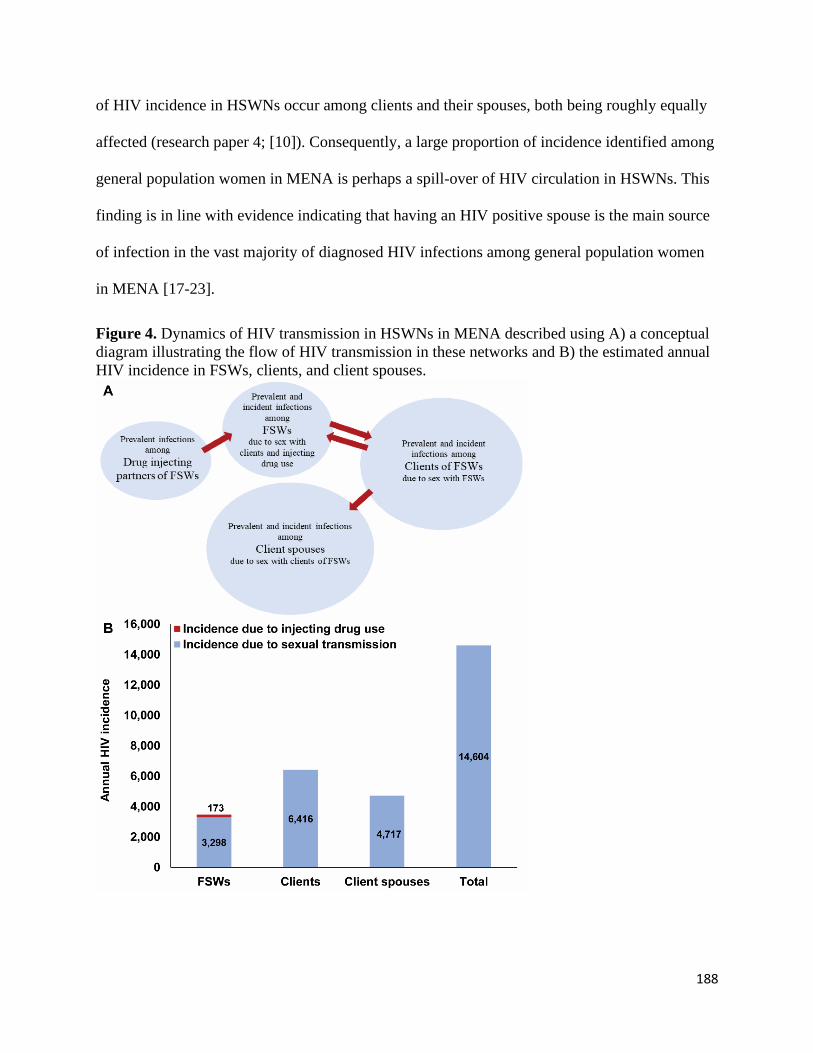
188
of HIV incidence in HSWNs occur among clients and their spouses, both being roughly equally
affected (research paper 4; [10]). Consequently, a large proportion of incidence identified among
general population women in MENA is perhaps a spill-over of HIV circulation in HSWNs. This
finding is in line with evidence indicating that having an HIV positive spouse is the main source
of infection in the vast majority of diagnosed HIV infections among general population women
in MENA [17-23].
Figure 4. Dynamics of HIV transmission in HSWNs in MENA described using A) a conceptual
diagram illustrating the flow of HIV transmission in these networks and B) the estimated annual
HIV incidence in FSWs, clients, and client spouses.

189
Despite the substantial HIV incidence among clients and their spouses, this incidence is less
likely to be detected compared to incidence among FSWs, as FSWs are more likely to be
targeted by HIV testing and prevention programs than clients or their spouses [1, 17, 24].
5. HIV epidemic potential in HSWNs remains uncertain
While the pattern of emerging HIV epidemics in HSWNs suggests significant potential for
further epidemic growth as well as expansion into new HSWNs not yet affected by HIV, this
potential cannot be ascertained with certainty. Findings of research paper 1 showed that FSWs
generally have a considerable number of sexual partners with close to half of sexual acts being
unprotected by condom use, suggestive of a high-risk environment in a large proportion of FSW
populations. Yet, half of HSWNs still do not appear to be affected by HIV (research paper 1;
[1]).
Will HIV epidemics in HSWNs grow substantially in the future? While possible, this may not
necessarily materialise in many HSWNs. With the almost universal coverage of male
circumcision in the region (Figure 1) and little evidence of high connectivity in the sexual
networks [17, 25, 26], the potential for large HIV epidemics may be limited. It is therefore not
evident that MENA will experience in the future the kind of large HIV epidemics in HSWNs that
have been seen in other global regions [27]. MENA’s HIV experience is rather comparable to
that of West Africa where early evidence demonstrated a role for the universal coverage of male
circumcision and lack of ulcerative STIs such as HSV-2 and syphilis in limiting HIV spread [28].
In this part of Africa, HIV has always been below 5% in the general population, even before
ART availability, in contrast to prevalence exceeding 25% in the general population in East
Africa where male circumcision is limited [29].

190
One approach to assess HIV epidemic potential is through the use of other STIs as proxy
biomarkers of HIV epidemic potential [30]. HSV-2 in particular has been demonstrated as an
effective proxy for HIV epidemic potential in HSWNs, as a consequence of a strong ecological
association between HIV prevalence and HSV-2 prevalence among FSWs (research paper 3;
[30]). Indeed, findings of research paper 3 showed an increasing trend of HIV prevalence with
increasing HSV-2 prevalence (Figure 5A). After adjustment for regional, temporal, and
behavioural (consistent condom use) differences among FSWs, there was an evident ecological
association between HIV prevalence and HSV-2 prevalence, with higher HIV prevalence
significantly associated with higher HSV-2 prevalence (Figure 5B).
Unfortunately, the systematic review of STIs presented in research paper 2 identified only three
paired HSV-2-HIV prevalence measures [31], too few to statistically power an analysis that can
predict HIV epidemic potential among FSWs in MENA. All three studies also reported zero HIV
prevalence. Of these studies, two reported surprisingly lower HSV-2 prevalence among FSWs
than seen elsewhere [32, 33], assessed at 4.7% [34] in Abbottabad and 8.0% [34] in Rawalpindi,
Pakistan, while the third study reported an HSV-2 prevalence of 55.5% among FSWs attending
sexual health clinics in Gabes, Sousse, and Tunis in Tunisia [35]. Incorporating HSV-2
surveillance in HIV surveillance efforts is an important step towards gaining a better
understanding of HIV epidemic potential in the region.
Figure 5. A) HIV prevalence across levels of HSV-2 prevalence among FSWs described through
boxplots illustrating the trend in HIV prevalence with increasing HSV-2 prevalence (boxplots’
centre lines indicate the median HIV prevalence, box limits indicate the 25% and 75% quartiles,
and whiskers indicate maximum and minimum observations within 1.5 of interquartile range). B)
The ecological association between HIV prevalence and HSV-2 prevalence after adjustment for
regional, temporal, and behavioural (consistent condom use) differences among FSWs expressed
in terms of adjusted odds ratios through meta-regression analyses (excluding the African
Region).

191
6. Neglected burden of STIs among FSWs, clients, and client spouses
The burden of STIs among FSWs, clients and client spouses in this region continues to be poorly
assessed and monitored, more so than HIV. Only 144 prevalence measures among FSWs were
identified for syphilis, C. trachomatis, N. gonorrhoeae, T. vaginalis, and HSV-2 combined
(research paper 2), compared with 485 prevalence measures for HIV (research paper 1). HIV
surveillance efforts in MENA, such as through IBBSS, rarely incorporate an assessment of STIs
[31], highlighting a missed opportunity for STI surveillance and prevention despite considerable
infection levels (Figure 6; research paper 2; [31]). Similar to HIV (research paper 4; [10]), STI
infection levels among FSWs may also translate into sizable infection levels and STI-related
morbidity among clients and client spouses [17, 36, 37], but this disease burden remains largely
neglected and poorly characterized [31].
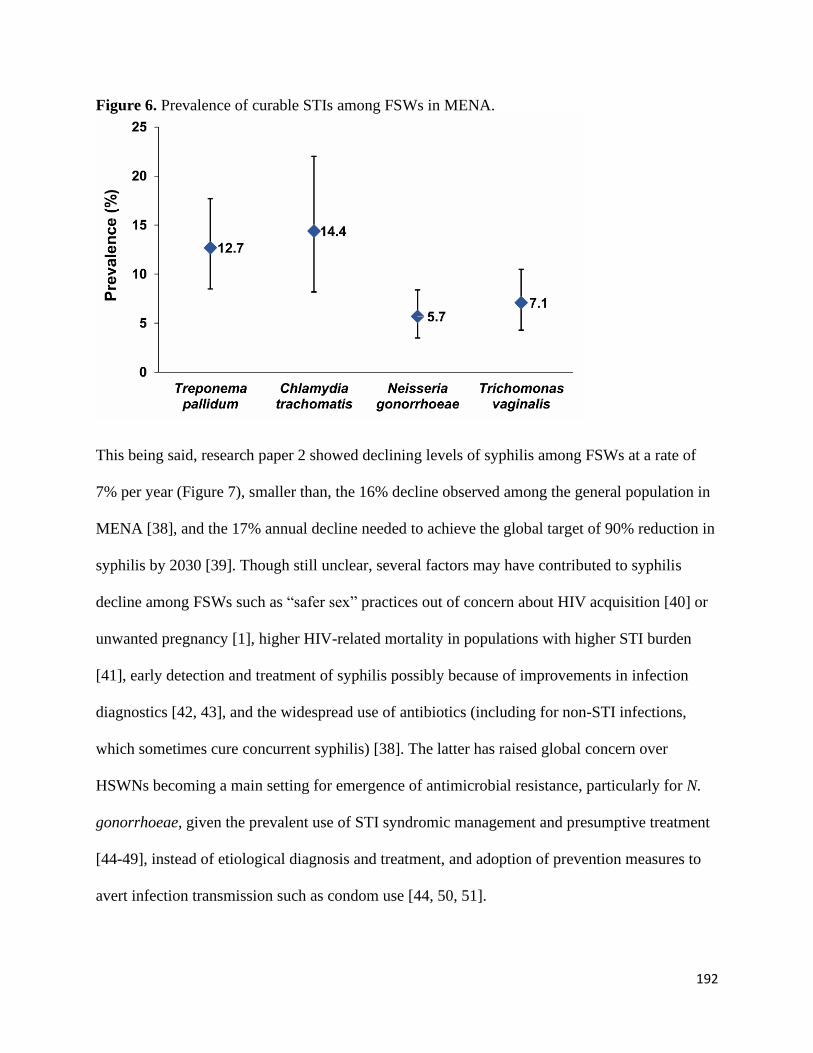
192
Figure 6. Prevalence of curable STIs among FSWs in MENA.
This being said, research paper 2 showed declining levels of syphilis among FSWs at a rate of
7% per year (Figure 7), smaller than, the 16% decline observed among the general population in
MENA [38], and the 17% annual decline needed to achieve the global target of 90% reduction in
syphilis by 2030 [39]. Though still unclear, several factors may have contributed to syphilis
decline among FSWs such as “safer sex” practices out of concern about HIV acquisition [40] or
unwanted pregnancy [1], higher HIV-related mortality in populations with higher STI burden
[41], early detection and treatment of syphilis possibly because of improvements in infection
diagnostics [42, 43], and the widespread use of antibiotics (including for non-STI infections,
which sometimes cure concurrent syphilis) [38]. The latter has raised global concern over
HSWNs becoming a main setting for emergence of antimicrobial resistance, particularly for N.
gonorrhoeae, given the prevalent use of STI syndromic management and presumptive treatment
[44-49], instead of etiological diagnosis and treatment, and adoption of prevention measures to
avert infection transmission such as condom use [44, 50, 51].

193
Figure 7. Temporal trend in syphilis prevalence among FSWs in MENA over the last three
decades.
7. HIV response is lagging behind, but interventions have much potential for reducing
HIV incidence
Although a large proportion of incident infections arise in HSWNs, HIV response remains far
from reaching optimal levels [24]. The region ranks lowest globally on several indicators for
HIV response such as coverage for HIV testing, linkage to care, and sustained viral suppression
in PLHIV [27, 52]. MENA is also far from achieving global targets for HIV testing and linkage
to care among FSWs [53]. Research paper 1 indicated that only 18% of FSWs in the region
reported ever testing for HIV [1]. The proportion of FSWs testing in the past 12 months is even
lower, at 12% (research paper 1; [1]), far below the 90% target of the ‘UNAIDS 2016-2021
Strategy’ [53], and the 95% target of the ‘UNAIDS 2021-2026 Strategy’ [54]. There is hardly
any data on linkage to care among HIV-positive FSWs in MENA [10], but only 43% of PLHIV
in MENA are on ART, which is the lowest coverage globally [52]. In 2020, MENA still has not
achieved the WHO regional target of 50% coverage which was set to be reached in the year 2015

194
(Figure 2B in Chapter 1) [55]. No data could be identified on viral suppression among HIV-
positive FSWs with access to care, but only 37% of PLHIV are virally suppressed [52]. With
such poor performance on HIV response indicators, MENA is unlikely to fulfil the Sustainable
Development Goal (SDG) target of ending the AIDS epidemic by 2030 [56, 57].
The situation may have worsened with the advent of COVID-19 due to interruptions in the
provision of prevention and treatment services [58]. Although no data could be located for
MENA, preliminary reports from 86 countries globally indicated 40% disruption in the delivery
of HIV services to FSWs between March-June 2020, mainly due to facilities and road closures
[27, 59]. More generally, the latest UNAIDS update reported a decline of 41% in HIV testing
and of 37% in treatment uptake among PLHIV in 32 African and Asian countries during
lockdowns, a 16% decline in PrEP prescriptions in the US, and 31% and 40% decline in PrEP
initiation in the US and South Africa, respectively [52]. A time-series analysis of data from 65
primary care clinics in South Africa further indicated a 47.6% decrease in use of HIV testing
services and a 46.2% decrease in ART initiation in PLHIV during the lockdown [60]. There was
also evidence for FSWs refraining from seeking HIV prevention and treatment services out of
fear of contracting COVID-19 at a health facility [59]. Disruptions were exacerbated by political
decisions to shift resources towards control of COVID-19 [61]. For example, in South Africa,
28,000 HIV community healthcare workers were re-allocated to COVID-19 testing and care
[52].
Lockdowns also affected delivery of essential sexual and reproductive health services [62]
including supply chains of condoms [63, 64]. In Kenya, a survey among FSWs revealed that
65% had no access to condoms and HIV medications during COVID-19 lockdown [65]. Limited
social and economic protection schemes were available for FSWs to alleviate financial hardship

195
during the pandemic [59, 62, 66]. The latter increased FSWs’ risk of homelessness due to
defaults in rental payments [59, 62, 66], and therefore their willingness to engage in riskier
sexual practices to raise income [59]. Evidence from Zimbabwe pointed to a lower ability for
FSWs to negotiate safer sex and a higher likelihood for exchanging sex for food during the
pandemic given the decline in the number of clients [67]. Despite introduction of alternative
modes of delivery for HIV testing and medications, as well as use of telemedicine, coverage
remains unknown given FSWs’ mobility, fear of being identified by local authorities, and poor
access to advanced technological solutions [52, 68].
Even before the COVID-19 pandemic, only half of sexual acts between FSWs and clients in
MENA were protected by condom use (research paper 1; [1]). Research paper 4 shows that
increasing coverage of condom use to 80% can alone avert a third of infections among each of
FSWs and their clients as both benefit directly from the intervention, and also indirectly benefit
client spouses by averting 15% of infections among them (Figure 8) [10]. Being an inexpensive
intervention, increasing access to and coverage of condom use in HSWNs should be a priority
for HIV programming, especially in MENA’s low-and-middle income countries.
Figure 8. Impact of expanding coverage of prevention and treatment interventions among FSWs
on HIV incidence in HSWNs in MENA. Arrows indicate the proportional decrease in incidence
due to expanding coverage of PrEP to 50% (efficacy of 51%), condom use to 80% (efficacy of
80%), ART to 81% (efficacy factoring adherence of 57%), or implementing a moderately
optimistic scenario that includes expanding PrEP to 25%, condom use to 50%, ART to 50%
(assuming efficacy of 96%, that is optimal adherence), and voluntary male circumcision to 50%
in South Sudan, or implementing a most optimistic scenario that includes expanding PrEP to
50%, condom use to 80%, ART to 81% (assuming efficacy of 96%, that is optimal adherence),
and voluntary male circumcision to 80% in South Sudan.
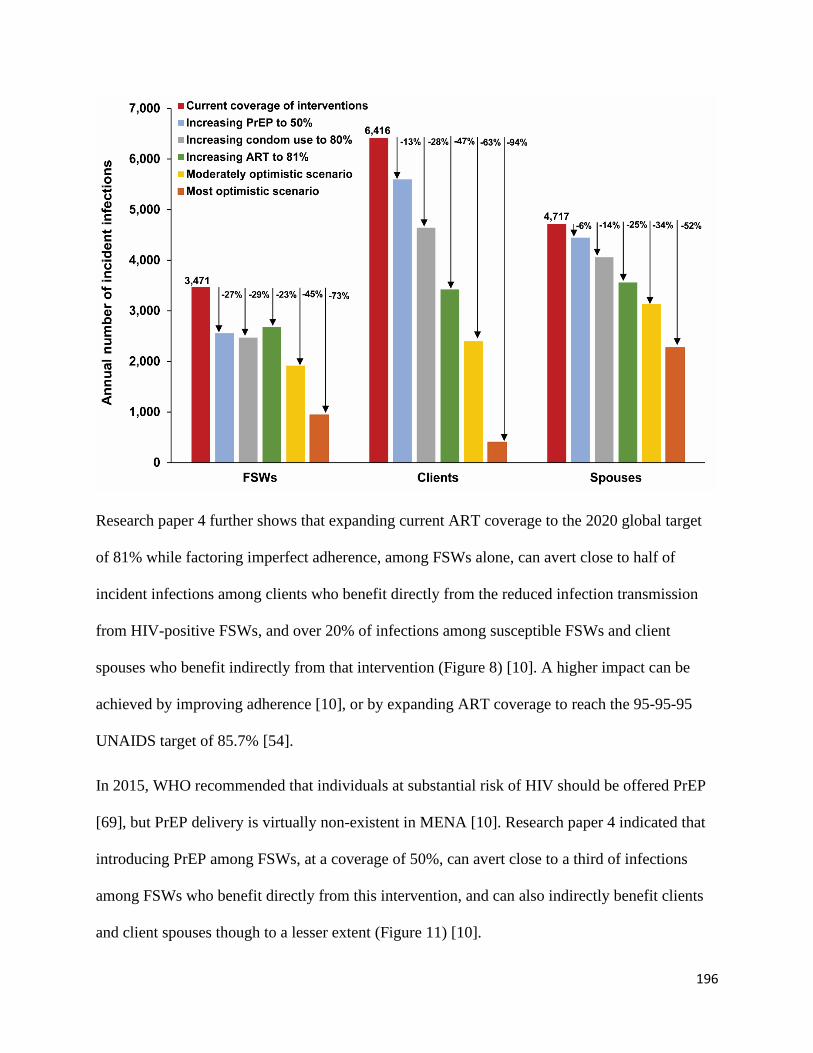
196
Research paper 4 further shows that expanding current ART coverage to the 2020 global target
of 81% while factoring imperfect adherence, among FSWs alone, can avert close to half of
incident infections among clients who benefit directly from the reduced infection transmission
from HIV-positive FSWs, and over 20% of infections among susceptible FSWs and client
spouses who benefit indirectly from that intervention (Figure 8) [10]. A higher impact can be
achieved by improving adherence [10], or by expanding ART coverage to reach the 95-95-95
UNAIDS target of 85.7% [54].
In 2015, WHO recommended that individuals at substantial risk of HIV should be offered PrEP
[69], but PrEP delivery is virtually non-existent in MENA [10]. Research paper 4 indicated that
introducing PrEP among FSWs, at a coverage of 50%, can avert close to a third of infections
among FSWs who benefit directly from this intervention, and can also indirectly benefit clients
and client spouses though to a lesser extent (Figure 11) [10].
197
These findings suggest that getting back on track towards achieving the 95-95-95 UNAIDS
targets in MENA [54], and eventually the sustainable development goal target of ending the
AIDS epidemic by 2030 [56, 57], is not possible without the implementation of combination
prevention interventions. Research paper 4 showed that even an intervention package with
modest coverage that targets only FSWs can avert over two-thirds of incident infections among
clients, close to half of infections among FSWs, and over a third of infections among client
spouses (Figure 11). An important outcome of this thesis is quantifying the benefit that the wider
population can incur from programs targeting only FSWs, but whose benefit extends beyond
FSWs to include bridging populations such as clients and general population women who are
spouses of clients—a point that should be considered by policymakers.
Recommendations for policy
Criminality [24, 70] and stigma [71-73] associated with sex work are barriers against addressing
the HIV epidemic in MENA. A recent UNAIDS report revealed that eighteen of the 23 MENA
countries have punitive laws against sex work with the exception of one country, Lebanon, while
the rest have no data [27]. In some instances, there is even resistance to acknowledging the
existence of sex work [74] and a strong reluctance among policymakers to allocate resources for
HIV programming among FSWs out of concern over socio-cultural sensitivities [17, 75]. These
structural factors exacerbated the increased mobility and diverse typologies of FSWs who try to
evade incarceration [34, 70, 76], thus making this population harder to reach. This also resulted
in programs and services, where they exist, being exclusively the realm of non-governmental
organizations (NGOs), which are often inadequately resourced or under legal restrictions that
limit provision of comprehensive intervention packages to FSWs [17, 24].
198
Surveillance efforts for HIV, and more so other STIs, remain largely passive and based on case
notifications with variable reporting quality [75, 77-79], thus presenting a real challenge for early
infection detection and linkage to care. The latter is compounded by a very limited capacity for
STI prevention and treatment and broader sexual health programs [37, 75]. In many instances,
possession of condoms is criminalised and treated as evidence for sex work [70, 80], thus
discouraging their use despite their established effectiveness in reducing HIV transmission [10]
and in offering a harm-free alternative to STI syndromic case management and presumptive
treatment, thus potentially slowing down AMR [31].
The impact of these factors can be seen in the rising course of the HIV epidemic in different
populations the region [2, 3, 27], the pattern of emerging HIV epidemics among FSWs (research
paper 1; [1]), as well as in the burden of STIs among FSWs (research paper 2; [31]) and general
population women [36, 37]. However, the resulting disease burden and associated social and
economic implications continue to be underappreciated [81].
While there is a need for decriminalisation of sex work and for programs aimed at alleviating
socio-cultural sensitivities related to sex work and HIV in general, such initiatives are difficult to
materialise in the short term. One successful model for enacting on these challenges in the
immediate term is the example of Morocco. While punitive laws remain unaltered, the
government formulated an evidence-informed national strategy and channelled its HIV response
through close partnerships with NGOs, who played the leading role in implementing
interventions [24]. Within this framework, voluntary counselling and testing and sentinel
surveillance centres were established nationwide, with FSWs estimated to constitute about a
quarter of attendees in 2007 (a more recent estimate could not be attained) [82, 83].
Comprehensive services for at-risk populations, including outreach peer-education programs as
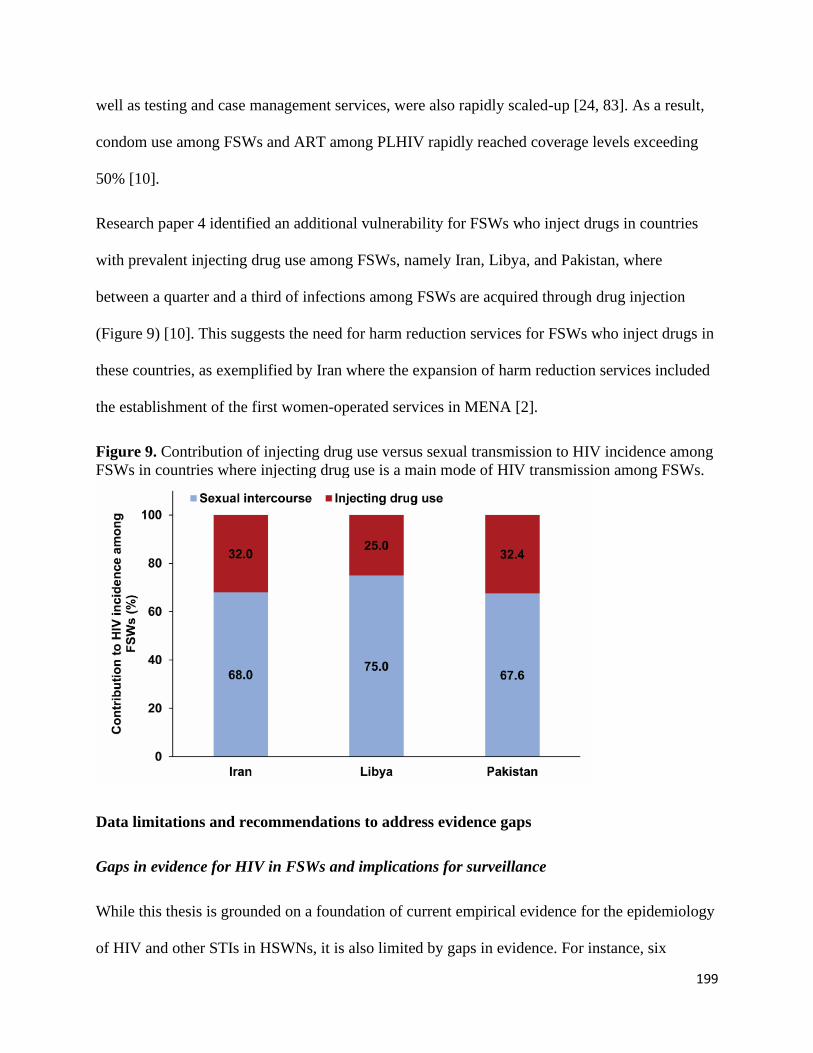
199
well as testing and case management services, were also rapidly scaled-up [24, 83]. As a result,
condom use among FSWs and ART among PLHIV rapidly reached coverage levels exceeding
50% [10].
Research paper 4 identified an additional vulnerability for FSWs who inject drugs in countries
with prevalent injecting drug use among FSWs, namely Iran, Libya, and Pakistan, where
between a quarter and a third of infections among FSWs are acquired through drug injection
(Figure 9) [10]. This suggests the need for harm reduction services for FSWs who inject drugs in
these countries, as exemplified by Iran where the expansion of harm reduction services included
the establishment of the first women-operated services in MENA [2].
Figure 9. Contribution of injecting drug use versus sexual transmission to HIV incidence among
FSWs in countries where injecting drug use is a main mode of HIV transmission among FSWs.
Data limitations and recommendations to address evidence gaps
Gaps in evidence for HIV in FSWs and implications for surveillance
While this thesis is grounded on a foundation of current empirical evidence for the epidemiology
of HIV and other STIs in HSWNs, it is also limited by gaps in evidence. For instance, six

200
countries had no data on HIV among FSWs, others had limited data to warrant a meaningful
characterization of the epidemic (research paper 1; [1]). For these countries, the status of the
epidemic remains unknown, pointing to an urgent need for establishing and/or strengthening
HIV surveillance. There were also limited HIV prevalence data available for FSWs who inject
drugs (research paper 1; [1]). The lack of segregation of this population in HIV surveillance
activities further complicates understanding of the interplay between the sexual versus injecting
modes of transmission in HSWNs (research paper 4; [10]).
The quality of HIV data varied across and within countries. Twelve of the 23 MENA countries
reported data collected using probability-based sampling, 11 of which based on IBBSS with
eight having multiple rounds (research paper 1; [1]). Still, a sizable fraction of data was collected
using convenience sampling or had limited geographical representation, restricting data
generalizability to HSWNs at the national level (research paper 1; [1]). With the recent
emergence of HIV epidemics in several HSWNs and the potential for epidemic growth or
epidemic emergence in other HSWNs, effort should be made to expand surveillance including
establishment of voluntary counselling and testing centres and conduct of rounds of IBBSS with
national coverage to identify hidden epidemics in different HSWNs, monitor epidemic trends,
facilitate generation of more precise modelling estimates of HIV incidence in HSWNs including
among FSWs who inject drugs, evaluate programs’ effectiveness, monitor progress towards
UNAIDS 2030 targets, as well as to inform HIV policy and programming.
Gaps in evidence for STIs in FSWs and implications for monitoring of HIV and antimicrobial
resistance
Data gaps for STIs (other than HIV) among FSWs are even more pronounced with no evidence
identified for over half of MENA countries (research paper 2; [31]). This dearth in evidence
hindered in-depth regional and temporal analyses for C. trachomatis, N. gonorrhoeae, T.
201
vaginalis, and HSV-2, and therefore assessment of progress towards achieving the WHO Global
Health Sector Strategy on STIs [31, 39]. Furthermore, with only three HSV-2 and HIV paired
prevalence measures identified for the entire region, analyses using HSV-2 as a tool to predict
HIV epidemic potential among FSWs could not be performed for MENA (research paper 3;
[30]). The latter represents a missed opportunity for this region, especially considering the recent
emergence of epidemics and potential for their expansion to other HSWNs within a country, or
for bridging of the infection from other key populations among whom large HIV epidemics are
found [2, 3]. Importantly, the neglected burden of STIs among FSWs appears to lead to a
considerable disease burden in the wider population [36, 37]. This disease burden is often being
recklessly managed through case syndromic management and presumptive treatment, thus
posing a risk for growing AMR (research paper 2; [31]). There is therefore a critical need for
strengthening STI surveillance including monitoring of drug resistance across MENA. Countries
may benefit from the established infrastructure for HIV surveillance including incorporation of
testing for STIs in IBBSS [84, 85], which is seldom performed [31].
There were no studies assessing HIV or STI prevalence among clients of FSWs (research paper
1; [1]). Instead, male STI clinic attendees were used as a proxy population since a significant
proportion of them reported contact with FSWs (research paper 1; [1]). Although suboptimal,
analysis of this proxy population presented an opportunity for gaining insights into the
epidemiology of HIV among clients of FSWs—probably the most hidden and hardest-to-reach
population because of social desirability, especially that clients have limited interest in being
identified to access services. Feasibility studies are needed to determine whether clients could be
included in future IBBSS.
Gaps in evidence on HIV continuum of care among FSWs

202
There were limited data on HIV testing (research paper 1; [1]), hardly any data on linkage to care
(research paper 4; [10]), and no data on viral suppression among FSWs in MENA. Consequently,
controlling for ART was not possible in several analyses presented within the scope of this
thesis. A second-best approach relying on data for ART among PLHIV had to be implemented in
estimating HIV incidence arising in HSWNs, which may have resulted in underestimation of
incidence among FSWs, clients, and client spouses (research paper 4; [10]). There is therefore an
urgent need to establish surveillance for FSWs along the HIV continuum of care including
monitoring of HIV testing, linkage to care, adherence, CD4 levels, and retention in the testing
and treatment cascade. The latter is best implemented through NGOs working closely with
FSWs.
Gaps in evidence on population size estimates in FSWs
Over half of MENA countries had no data on FSWs’ population size estimates, and for several,
data were outdated or lacked national representation (research paper 1; [1].) The data collection
methodology, as well as the time frame and type of estimate (number versus proportion)
provided also varied across countries (research paper 1; [1]). Mapping studies are needed to
obtain more precise estimates for population size of FSWs, as well as to gain further insights into
the typology of these FSWs and connectivity of sexual networks. Such estimates will promote
our understanding of HIV transmission dynamics in HSWNs and inform mathematical modelling
efforts aimed at estimating infection burden and the need for prevention and treatment services.
Gaps in evidence on sexual and injecting risk behaviours in FSWs
Although abundant, sexual risk behaviour data are difficult to interpret or incorporate in analyses
given the lack of standardized and validated data collection tools (research paper 1; [1]). For
example, not all studies report measures of central tendency for the number of sexual
203
partnerships or sexual acts, and many report only aggregate data using different cut-offs and
different time frames [1], which complicates their synthesis and limits their use in mathematical
modelling studies. Denominators for reported proportions may lack clarity rendering them
useless for future analyses [1]. Stratified data by type of sexual partnership are often not included
[1]. Data availability for several parameters may also vary across countries [1]. Similarly, data
characterizing injecting risk behaviour among FSWs also varies between studies, across
countries, and over time (research paper 1; [1]). For example, there were no data on current
injecting risk behaviour among FSWs who inject drugs in Iran despite availability of lifetime
data [1]. The time frame for current/recent injecting drug use also varied for other countries [1].
Data on access to harm reduction services were also largely lacking [1]. Improvements in
behavioural research among FSWs would allow for better estimation of HIV incidence and
evidence-informed programming of interventions among them.
Strengths and main conclusions of the thesis
In conclusion, this thesis was instrumental in filling a gap in our understanding of HIV
epidemiology among FSWs and clients in MENA by synthesizing a large volume of evidence,
some of which appeared for the first time in the published scientific literature. Various
epidemiological aspects were investigated using different methodologies including systematic
reviews, meta-analyses, meta-regression analyses, a novel individual-based mathematical model,
and multiple statistical analyses. The thesis provided detailed analyses and summary measures
for population size estimates, HIV and STI prevalence and incidence, and key behavioural
indicators among FSWs. The thesis also identified a pattern of emerging HIV epidemics, perhaps
because of bridging from other key populations, but also a window of opportunity for preventing
HIV epidemics or detecting them at nascence in settings with still limited HIV circulation in

204
HSWNs. The thesis further demonstrated the utility of HSV-2 as a tool in predicting HIV
epidemic potential in these networks.
Lasting scientific contributions of this thesis include introduction and building of a novel
individual-based mathematical model for HIV transmission in HSWNs that can be adapted and
used to answer different research questions for both HIV and STI epidemiology and assessment
of impact of interventions. The thesis promoted our understanding of HIV transmission
dynamics in HSWNs, and provided for the first time in MENA, baseline regional estimates of
HIV incidence arising in HSWNs, an evaluation of the role of injecting drug use versus sexual
transmission in driving HIV incidence, and an assessment of the potential impact of interventions
on infection burden in these networks. The thesis unveiled the sizable contribution of HSWNs to
HIV infection burden in the wider population, a fact that is often overlooked by policymakers
when allocating resources for HIV programming. The thesis identified a trend of declining
syphilis in FSWs, but also a serious lag in achieving targets of WHO Global Health Sector
Strategy on STIs among FSWs. Gaps and serious lags were also noted in relation to indicators
used for monitoring progress towards achieving UNAIDS 2030 targets for HIV.
Findings of this thesis provide the evidence-base necessary for informing HIV and STI policy
and programming, advocating for a reconsideration of the criminalisation of sex work,
advocating for a new framework of action that strengthens the role of NGOs in providing sexual
health services and comprehensive prevention interventions and treatment packages for FSWs,
and demonstrating the need for further research to improve on the limitations of this thesis in
understanding HIV and STI dynamics in HSWNs in MENA.

205
Chapter 7 references
1. Chemaitelly H., et al., HIV epidemiology among female sex workers and their clients in
the Middle East and North Africa: systematic review, meta-analyses, and meta-
regressions. BMC Medicine, 2019. 24(17): p. 119.
2. Mumtaz, G.R., et al., HIV among people who inject drugs in the Middle East and North
Africa: systematic review and data synthesis. PLoS Med, 2014. 11(6): p. e1001663.
3. Mumtaz, G., et al., Are HIV epidemics among men who have sex with men emerging in
the middle east and north Africa?: A systematic review and data synthesis. PLoS
Medicine, 2011. 8 (8) (no pagination)(e1000444).
4. Auvert, B., et al., Randomized, controlled intervention trial of male circumcision for
reduction of HIV infection risk: the ANRS 1265 Trial. PLoS Med, 2005. 2(11): p. e298.
5. Bailey, R.C., et al., Male circumcision for HIV prevention in young men in Kisumu,
Kenya: a randomised controlled trial. The Lancet, 2007. 369(9562): p. 643-656.
6. Gray, R.H., et al., Male circumcision for HIV prevention in men in Rakai, Uganda: a
randomised trial. The Lancet, 2007. 369(9562): p. 657-666.
7. Weiss, H.A., M.A. Quigley, and R.J. Hayes, Male circumcision and risk of HIV infection
in sub-Saharan Africa: a systematic review and meta-analysis. AIDS, 2000. 14(15): p.
2361-70.
8. Gray, R., et al., The effectiveness of male circumcision for HIV prevention and effects on
risk behaviors in a posttrial follow-up study. AIDS, 2012. 26(5): p. 609-15.
9. Farley, T.M., et al., Impact of male circumcision on risk of HIV infection in men in a
changing epidemic context – systematic review and meta-analysis. Journal of the
International AIDS Society, 2020. 23(6): p. e25490.
10. Chemaitelly H., et al., HIV incidence and impact of interventions among female sex
workers and their clients in the Middle East and North Africa: Mathematical modeling
analysis. submitted, 2021.
11. Morris, B.J., et al., Estimation of country-specific and global prevalence of male
circumcision. Popul Health Metr, 2016. 14: p. 4.
12. Davis, S., et al., Does voluntary medical male circumcision protect against sexually
transmitted infections among men and women in real-world scale-up settings? Findings
of a household survey in KwaZulu-Natal, South Africa. BMJ Glob Health, 2019. 4(3): p.
e001389.
13. Baeten, J.M., et al., Male circumcision and risk of male-to-female HIV-1 transmission: a
multinational prospective study in African HIV-1-serodiscordant couples. AIDS
(London, England), 2010. 24(5): p. 737-744.
14. Grund, J.M., et al., Association between male circumcision and women's biomedical
health outcomes: a systematic review. The Lancet Global Health, 2017. 5(11): p. e1113-
e1122.
15. Williams, B.G., et al., The Potential Impact of Male Circumcision on HIV in Sub-
Saharan Africa. PLOS Medicine, 2006. 3(7): p. e262.
16. Hallett, T.B., et al., Will circumcision provide even more protection from HIV to women
and men? New estimates of the population impact of circumcision interventions. Sex
Transm Infect, 2011. 87(2): p. 88-93.
17. Abu-Raddad L, et al., Characterizing the HIV/AIDS epidemic in the Middle East and
North Africa : Time for strategic action. Middle East and North Africa HIV/AIDS
206
Epidemiology Synthesis Project ed. World Bank/UNAIDS/WHO Publication. 2010,
Washington DC: The World Bank Press.
18. Abu-Raddad, L.J., et al., Epidemiology of HIV infection in the Middle east and North
Africa. Aids, 2010. 24(SUPPL. 2): p. S5-S23.
19. Al-Thani, A., et al., Prevalence of Chlamydia trachomatis infection in the general
population of women in Qatar. Sex Transm Infect, 2013. 89 Suppl 3(Suppl 3): p. iii57-
60.
20. Mumtaz, G.R., et al., The distribution of new HIV infections by mode of exposure in
Morocco. Sex Transm Infect, 2013. 89 Suppl 3: p. iii49-56.
21. Kouyoumjian, S.P., et al., Mapping of new HIV infections in Morocco and impact of
select interventions. Int J Infect Dis, 2018. 68: p. 4-12.
22. Alrajhi, A.A., M.A. Halim, and H.M. Al-Abdely, Mode of transmission of HIV-1 in Saudi
Arabia. Aids, 2004. 18(10): p. 1478-1480.
23. Ramezani, A., M. Mohraz, and L. Gachkar, Epidemiologic situation of human
immunodeficiency virus (HIV/AIDS patients) in a private clinic in Tehran, Iran. Arch
Iran Med, 2006. 9(4): p. 315-8.
24. Abu-Raddad L.J., et al., Policy notes. Characterizing the HIV/AIDS epidemic in the
Middle East and North Africa: time for strategic action. Middle Wast and North Africa
HIV/AIDS Epidemiology Synthesis Project. World Bank/UNAIDS/WHO publication.
2010, Washington (D.C.): The World Bank Press.
25. Family Health International and Implementing AIDS Prevention and CAre Project
(IMPACT), Egypt's Final Report April 1999-September 2007 for USAID's Implementing
AIDS Prevention and Care (IMPACT) Project. 2007: Arlington, USA.
26. Mishwar, An integrated bio-behavioral surveillance study among four vulnerable groups
in lebanon: men who have sex with men; prisoners, commercial sex workers and
intravenous drug users. Mid-term Report. 2008, American University of Beirut and
World Bank.
27. The Joint United Nations Programme on HIV/AIDS (UNAIDS), Global AIDS Update
2020: Seizing the moment. Available from:
https://www.unaids.org/en/resources/documents/2020/global-aids-report. Accessed on
January 8, 2021. 2020: Geneva, Switzerland.
28. Buvé, A., et al., The multicentre study on factors determining the differential spread of
HIV in four African cities: summary and conclusions. Aids, 2001. 15 Suppl 4: p. S127-
31.
29. Asamoah-Odei, E., J.M.G. Calleja, and J.T. Boerma, HIV prevalence and trends in sub-
Saharan Africa: no decline and large subregional differences. The Lancet, 2004.
364(9428): p. 35-40.
30. Chemaitelly, H., H.A. Weiss, and L.J. Abu-Raddad, HSV-2 as a biomarker of HIV
epidemic potential in female sex workers: meta-analysis, global epidemiology and
implications. Sci Rep, 2020. 10(1): p. 19293.
31. Chemaitelly, H., et al., Epidemiology of Treponema pallidum, Chlamydia trachomatis,
Neisseria gonorrhoeae, Trichomonas vaginalis, and Herpes simplex virus type 2 among
female sex workers in the Middle East and North Africa: systematic review and meta-
analytics. Journal of Global Health, 2019. 9(2).

207
32. Harfouche, M., et al., Epidemiology of herpes simplex virus type 2 in sub-Saharan Africa:
Systematic review, meta-analyses, and meta-regressions. EClinicalMedicine, 2021. 35: p.
100876.
33. Harfouche, M., H. Maalmi, and L.J. Abu-Raddad, Epidemiology of herpes simplex virus
type 2 in Latin America and the Caribbean: systematic review, meta-analyses and
metaregressions. Sex Transm Infect, 2021.
34. Hawkes, S., et al., HIV and other sexually transmitted infections among men,
transgenders and women selling sex in two cities in Pakistan: A cross-sectional
prevalence survey. Sexually Transmitted Infections, 2009. 85(SUPPL. 2): p. ii8-ii16.
35. Znazen, A., et al., Sexually transmitted infections among female sex workers in Tunisia:
High prevalence of Chlamydia trachomatis. Sexually Transmitted Infections, 2010.
86(7): p. 500-505.
36. Chemaitelly, H., et al., Global epidemiology of Neisseria gonorrhoeae in infertile
populations: systematic review, meta-analysis and metaregression. Sex Transm Infect,
2021. 97(2): p. 157-169.
37. Smolak, A., et al., Epidemiology of Chlamydia trachomatis in the Middle East and north
Africa: a systematic review, meta-analysis, and meta-regression. Lancet Glob Health,
2019. 7(9): p. e1197-e1225.
38. Smolak, A., et al., Trends and Predictors of Syphilis Prevalence in the General
Population: Global Pooled Analyses of 1103 Prevalence Measures Including 136 Million
Syphilis Tests. Clin Infect Dis, 2018. 66(8): p. 1184-1191.
39. World Health Organization, Global health sector strategy on Sexually Transmitted
Infections, 2016-2021. 2016, World Health Organization: Geneva, Switzerland. p. 60.
40. Awad, S.F. and L.J. Abu-Raddad, Could there have been substantial declines in sexual
risk behavior across sub-Saharan Africa in the mid-1990s? Epidemics, 2014. 8(0): p. 9-
17.
41. Kenyon, C.R., et al., The changing relationship between bacterial STIs and HIV
prevalence in South Africa - an ecological study. Int J STD AIDS, 2015. 26(8): p. 556-
64.
42. Osbak, K.K., et al., The Prevalence of Syphilis from the Early HIV Period is Correlated
With Peak HIV Prevalence at a Country Level. Sex Transm Dis, 2016. 43(4): p. 255-7.
43. Kenyon, C.R., K. Osbak, and A. Tsoumanis, The Global Epidemiology of Syphilis in the
Past Century - A Systematic Review Based on Antenatal Syphilis Prevalence. PLoS Negl
Trop Dis, 2016. 10(5): p. e0004711.
44. Mayaud, P. and D. Mabey, Approaches to the control of sexually transmitted infections in
developing countries: old problems and modern challenges. Sex Transm Infect, 2004.
80(3): p. 174-82.
45. Wi, T., et al., Antimicrobial resistance in Neisseria gonorrhoeae: Global surveillance
and a call for international collaborative action. PLoS Med, 2017. 14(7): p. e1002344.
46. Lewis, D.A., Global resistance of Neisseria gonorrhoeae: when theory becomes reality.
Curr Opin Infect Dis, 2014. 27(1): p. 62-7.
47. Bolan, G.A., P.F. Sparling, and J.N. Wasserheit, The emerging threat of untreatable
gonococcal infection. N Engl J Med, 2012. 366(6): p. 485-7.
48. Kirkcaldy, R.D., et al., Neisseria gonorrhoeae Antimicrobial Susceptibility Surveillance -
The Gonococcal Isolate Surveillance Project, 27 Sites, United States, 2014. MMWR
Surveill Summ, 2016. 65(7): p. 1-19.

208
49. Suay-Garcia, B. and M.T. Perez-Gracia, Future Prospects for Neisseria gonorrhoeae
Treatment. Antibiotics (Basel), 2018. 7(2).
50. Grund, J.M., et al., Association between male circumcision and women's biomedical
health outcomes: a systematic review. Lancet Glob Health, 2017. 5(11): p. e1113-e1122.
51. Morris, B.J. and C.A. Hankins, Effect of male circumcision on risk of sexually
transmitted infections and cervical cancer in women. Lancet Glob Health, 2017. 5(11): p.
e1054-e1055.
52. The Joint United Nations Programme on HIV/AIDS (UNAIDS), Global AIDS Update
2021. Confronting inequalities: Lessons for pandemic responses from 40 years of AIDS.
Available from: https://www.unaids.org/sites/default/files/media_asset/2021-global-aids-
update_en.pdf. Accessed on: 15 September, 2021. 2021, UNAIDS: Geneva, Switzerland.
53. The Joint United Nations Programme on HIV/AIDS (UNAIDS), UNAIDS 2016-2021
Strategy: On the fast-track to end AIDS. 2015: Geneva, Switzerland.
54. The Joint United Nations Programme on HIV/AIDS (UNAIDS), Global AIDS Strategy
2021-2026. End Inequalities. End AIDS. Available from:
https://www.unaids.org/sites/default/files/media_asset/global-AIDS-strategy-2021-
2026_en.pdf. Accessed on: 8 August 2021. 2021, UNAIDS: Geneva, Switzerland.
55. World Health Organization Regional Office for the Eastern Mediterranean Region, From
HIV testing to lifelong care and treatment : access to the continuum of HIV care and
treatment in the Eastern Mediterranean Region : progress report 2014. Available from:
https://applications.emro.who.int/dsaf/EMROPUB_2016_EN_18914.pdf. Accessed on
May 8, 2021. 2016: Cairo, Egypt.
56. United Nations, Transforming our world: the 2030 agenda for sustainable development.
2015.
57. United Nations, The Sustainable Development Goals Report 2020. Available from:
https://sdgs.un.org/sites/default/files/2020-09/The-Sustainable-Development-Goals-
Report-2020.pdf. Accessed on October 2, 2021. 2020.
58. Iversen, J., et al., COVID-19, HIV and key populations: cross-cutting issues and the need
for population-specific responses. J Int AIDS Soc, 2020. 23(10): p. e25632.
59. Gichuna, S., et al., Access to Healthcare in a time of COVID-19: Sex Workers in Crisis in
Nairobi, Kenya. Global Public Health, 2020. 15(10): p. 1430-1442.
60. Dorward, J., et al., The impact of the COVID-19 lockdown on HIV care in 65 South
African primary care clinics: an interrupted time series analysis. The Lancet HIV, 2021.
8(3): p. e158-e165.
61. FHI360, Meeting targets and maintaining epidemic control (EpiC). Strategic
considerations for mitigating the impact of COVID-19 on key-population-focused HIV
programs. Durham (NC). Available from:
https://www.fhi360.org/sites/default/files/media/documents/epic-kp-strategic-
considerations-covid-19.pdf. Accessed on October 2, 2021. 2020.
62. Surang, J., et al., Protecting sex workers in Thailand during the COVID-19 pandemic:
opportunities to build back better. WHO South-East Asia Journal of Public Health, 2020.
9(2): p. 100-103.
63. Kumar, N., COVID 19 era: a beginning of upsurge in unwanted pregnancies, unmet need
for contraception and other women related issues. The European Journal of
Contraception & Reproductive Health Care, 2020. 25(4): p. 323-325.

209
64. Howard, S., Covid-19: Health needs of sex workers are being sidelined, warn agencies.
BMJ, 2020. 369: p. m1867.
65. Nyabeze, K., et al., The Resilience of Female Sex Workers in the Wake of COVID-19 in
Zimbabwe. Journal of Asian and African Studies. 0(0): p. 00219096211013411.
66. Platt, L., et al., Sex workers must not be forgotten in the COVID-19 response. The Lancet,
2020. 396(10243): p. 9-11.
67. Machingura, F., et al., Potential reduction in female sex workers' risk of contracting HIV
during Covid-19. Aids, 2021.
68. Shareck, M., et al., Double Jeopardy: Maintaining Livelihoods or Preserving Health?
The Tough Choices Sex Workers Faced during the COVID-19 Pandemic. Journal of
Primary Care & Community Health, 2021. 12: p. 21501327211031760.
69. World Health, O., Policy brief: pre-exposure prophylaxis (PrEP): WHO expands
recommendation on oral pre-exposure prophylaxis of HIV infection (PrEP). 2015, World
Health Organization: Geneva.
70. Jenkins C. and Robalino D.A., HIV/AIDS in the Middle East and North Africa: The costs
of inaction. Orientations in Development Series. 2003, Washigton, D.C.: The World
Bank.
71. Mohebbi, M.R., Female sex workers and fear of stigmatisation [2]. Sexually Transmitted
Infections, 2005. 81(2): p. 180-181.
72. Dejong, J. and I. Mortagy, The struggle for recognition by people living with HIV/AIDS
in Sudan. Qual Health Res, 2013. 23(6): p. 782-94.
73. DeJong, J., et al., Ethical considerations in HIV/AIDS biobehavioral surveys that use
respondent-driven sampling: illustrations from Lebanon. Am J Public Health, 2009.
99(9): p. 1562-7.
74. Ministry of Health-Kingdom of Saudi Arabia, Global AIDS response progress report
2015. 2015.
75. Abu-Raddad, L.J., et al., HIV and other sexually transmitted infection research in the
Middle East and North Africa: promising progress? Sex Transm Infect, 2013. 89 Suppl
3: p. iii1-4.
76. Emmanuel, F., et al., The organisation, operational dynamics and structure of female sex
work in Pakistan. Sexually Transmitted Infections, 2013. 89(SUPPL. 2): p. ii29-ii33.
77. Bozicevic, I., G. Riedner, and J.M. Calleja, HIV surveillance in MENA: recent
developments and results. Sex Transm Infect, 2013. 89 Suppl 3: p. iii11-16.
78. Bozicevic, I., G. Riedner, and A. Haghdoost, HIV case reporting in the countries of
North Africa and the Middle East. Journal of the International AIDS Society, 2014. 17
(no pagination)(18962).
79. Shawky, S., et al., HIV surveillance and epidemic profile in the Middle East and North
Africa. J Acquir Immune Defic Syndr, 2009. 51 Suppl 3: p. S83-95.
80. Stulhofer, A. and I. Bozicevic, HIV bio-behavioural survey among FSWs in Aden, Yemen.
2008.
81. Zurayk, H., et al., Women's health problems in the Arab World: a holistic policy
perspective. International Journal of Gynecology & Obstetrics, 1997. 58(1): p. 13-21.
82. El-Rhilani H., National voluntary counseling and testing database. 2010: Rabat,
Morocco.

210
83. Kouyoumjian, S.P., et al., The epidemiology of HIV infection in Morocco: Systematic
review and data synthesis. International Journal of STD and AIDS, 2013. 24(7): p. 507-
516.
84. World Health Organization, Strategies and laboratory methods for strengthening
surveillance of sexually transmitted infections 2012. 2012, World Health Organization:
Geneva, Switzerland.
85. Reintjes, R. and L. Wiessing, 2nd-generation HIV surveillance and injecting drug use:
Uncovering the epidemiological ice-berg. Int J Public Health, 2007. 52(3): p. 166-72.
211
Appendix I
International Organizations’ definitions for the Middle
East and North Africa region
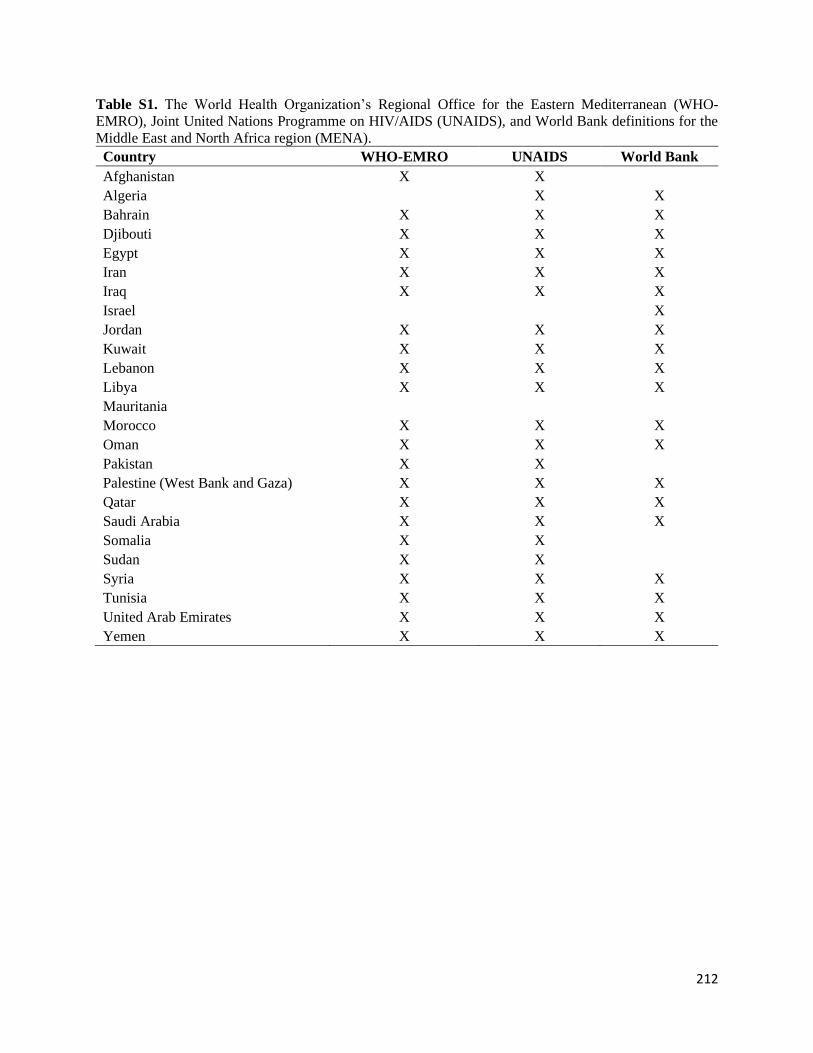
212
Table S1. The World Health Organization’s Regional Office for the Eastern Mediterranean (WHO-
EMRO), Joint United Nations Programme on HIV/AIDS (UNAIDS), and World Bank definitions for the
Middle East and North Africa region (MENA).
Country WHO-EMRO UNAIDS World Bank
Afghanistan X X
Algeria X X
Bahrain X X X
Djibouti X X X
Egypt X X X
Iran X X X
Iraq X X X
Israel X
Jordan X X X
Kuwait X X X
Lebanon X X X
Libya X X X
Mauritania
Morocco X X X
Oman X X X
Pakistan X X
Palestine (West Bank and Gaza) X X X
Qatar X X X
Saudi Arabia X X X
Somalia X X
Sudan X X
Syria X X X
Tunisia X X X
United Arab Emirates X X X
Yemen X X X
213
Appendix II
Supplementary material for Research paper 1-
HIV Epidemiology among FSWs and clients in MENA

214
Supplementary Information
HIV epidemiology among female sex workers and their clients in the Middle
East and North Africa: Systematic review, meta-analyses, and meta-
regressions
Hiam Chemaitelly MSc,*1,3 Helen A. Weiss PhD,2,3 Clara Calvert PhD,3 Manale Harfouche
MPh,1 and Laith J. Abu-Raddad PhD1,4,5
1Infectious Disease Epidemiology Group, Weill Cornell Medicine-Qatar, Cornell University,
Qatar Foundation – Education City, Doha, Qatar
2MRC Tropical Epidemiology Group, London School of Hygiene and Tropical Medicine,
London, United Kingdom
3Department of Infectious Disease Epidemiology, Faculty of Epidemiology and Population
Health, London School of Hygiene and Tropical Medicine, London, United Kingdom
4Department of Healthcare Policy & Research, Weill Cornell Medicine, Cornell University, New
York, New York, USA
5College of Health and Life Sciences, Hamad bin Khalifa University, Doha, Qatar

215
*Reprints or correspondence
Hiam Chemaitelly, Weill Cornell Medicine-Qatar, Qatar Foundation - Education City, P.O. Box
24144, Doha, Qatar. Telephone: +(974) 4492-8443. Fax: +(974) 4492-8422. E-mail:

216
Table of Contents
Table S1 Preferred Reporting Items for Systematic Reviews and Meta-analyses (PRISMA) checklist ...... 3
Fig. S1 Map of the Middle East and North Africa region ............................................................................. 5
Box S1 Search criteria for the systematic review of size estimation, HIV incidence, and HIV prevalence
studies in FSWs and their clients, in the Middle East and North Africa....................................................... 6
Box S2 List of extracted variables for the systematic review of HIV epidemiology among FSWs and their
clients in the Middle East and North Africa ................................................................................................. 9
Table S2 Quality assessment criteria for size estimation and HIV prevalence studies in FSWs and their
clients (or proxy populations of clients) in the Middle East and North Africa, as identified in the
systematic review ........................................................................................................................................ 10
Table S3 Details of variables and subcategories included in the meta-regression analyses ...................... 11
Table S4 Estimates of subnational representation for the number and population proportion of FSWs and
of their clients in the Middle East and North Africa reported by identified studies ................................... 12
Table S5 HIV point-prevalence measures in FSWs as extracted or obtained from various sources
including the US Census Bureau database, the WHO-EMRO, and the UNAIDS epidemiological fact
sheets databases, among other sources of data ........................................................................................... 22
Table S6 Summary of the risk of bias assessment of size estimation and HIV prevalence studies in FSWs
and their clients (or proxy populations of clients), in the Middle East and North Africa .......................... 31
Table S7 Risk of bias assessment of estimates of national and subnational representation for the number
and population proportion of FSWs and of their clients, in the Middle East and North Africa ................. 32
Table S8 Risk of bias assessment of HIV prevalence studies in FSWs in the Middle East and North
Africa .......................................................................................................................................................... 37
Table S9 Risk of bias assessment of HIV prevalence studies in clients of FSWs (or proxy populations of
clients) in the Middle East and North Africa .............................................................................................. 40
Table S10 Results of meta-regression analyses to identify associations with HIV prevalence, sources of
between-study heterogeneity, and trend in HIV prevalence in clients of FSWs (or proxy populations of
clients such as male STI clinic attendees), in the Middle East and North Africa ....................................... 41
Table S11 Condom use among FSWs and their clients in the Middle East and North Africa ................... 42
Table S12 Measures of injecting drug use and overlap with people who inject drugs among FSWs in the
Middle East and North Africa ..................................................................................................................... 49
Table S13 HIV/AIDS knowledge among FSWs in the Middle East and North Africa ............................. 53
Table S14 Perception of risk among FSWs in the Middle East and North Africa ..................................... 54
Table S15 HIV testing among FSWs in the Middle East and North Africa ............................................... 55
References .................................................................................................................................................. 57

217
Table S1 Preferred Reporting Items for Systematic Reviews and Meta-analyses (PRISMA) checklist [1] Section/topic # Checklist item Reported in main text
Title 1 Identify the report as a systematic review, meta-analysis, or both. p. 1
Structured summary 2 Provide a structured summary including, as applicable: background; objectives; data sources; study eligibility criteria,
participants, and interventions; study appraisal and synthesis methods; results; limitations; conclusions and implications of key findings; systematic review registration number.
p. 2-3
Rationale 3 Describe the rationale for the review in the context of what is already known. p. 4 Objectives 4 Provide an explicit statement of questions being addressed with reference to participants, interventions, comparisons,
outcomes, and study design (PICOS).
p. 4-5
Protocol and registration 5 Indicate if a review protocol exists, if and where it can be accessed (e.g., Web address), and, if available, provide registration
information including registration number.
NA
Eligibility criteria 6 Specify study characteristics (e.g., PICOS, length of follow-up) and report characteristics (e.g., years considered, language, publication status) used as criteria for eligibility, giving rationale.
p. 5-6
Information sources 7 Describe all information sources (e.g., databases with dates of coverage, contact with study authors to identify additional
studies) in the search and date last searched.
p. 5 & Box S1 in SI
Search 8 Present full electronic search strategy for at least one database, including any limits used, such that it could be repeated. Box S1 in SI
Study selection 9 State the process for selecting studies (i.e., screening, eligibility, included in systematic review, and, if applicable, included in
the meta-analysis).
p. 5-6
Data collection process 10 Describe method of data extraction from reports (e.g., piloted forms, independently, in duplicate) and any processes for
obtaining and confirming data from investigators.
p. 6-7
Data items 11 List and define all variables for which data were sought (e.g., PICOS, funding sources) and any assumptions and simplifications made.
p. 6-7 & Box S2 in SI
Risk of bias in individual
studies
12 Describe methods used for assessing risk of bias of individual studies (including specification of whether this was done at the
study or outcome level), and how this information is to be used in any data synthesis.
p. 7-8 & Table S2 in SI
Summary measures 13 State the principal summary measures (e.g., risk ratio, difference in means). p. 8
Synthesis of results 14 Describe the methods of handling data and combining results of studies, if done, including measures of consistency (e.g., I2) for each meta-analysis.
p.6-8 & Table 5
Risk of bias across studies 15 Specify any assessment of risk of bias that may affect the cumulative evidence (e.g., publication bias, selective reporting
within studies).
p. 7-8 & Table S2 in SI
Additional analyses 16 Describe methods of additional analyses (e.g., sensitivity or subgroup analyses, meta-regression), if done, indicating which
were pre-specified.
p. 8-9 & S3 Table in SI
Study selection 17 Give numbers of studies screened, assessed for eligibility, and included in the review, with reasons for exclusions at each
stage, ideally with a flow diagram.
p. 9-10 & Fig. 1
Study characteristics 18 For each study, present characteristics for which data were extracted (e.g., study size, PICOS, follow-up period) and provide the citations.
p.10-11, Tables 1-4, and Tables S4 & S5in SI
Risk of bias within studies 19 Present data on risk of bias of each study and, if available, any outcome-level assessment (see Item 12). p. 12 & Tables S6-S9 in SI
Results of individual studies 20 For all outcomes considered (benefits or harms), present, for each study: (a) simple summary data for each intervention group and (b) effect estimates and confidence intervals, ideally with a forest plot.
p. 10-11, Tables 1-4 & Tables S4-S5 in SI
Synthesis of results 21 Present results of each meta-analysis done, including confidence intervals and measures of consistency. p.12-13 & Table 5
Risk of bias across studies 22 Present results of any assessment of risk of bias across studies (see Item 15). p. 12 & Tables S6-S9 in SI Additional analysis 23 Give results of additional analyses, if done (e.g., sensitivity or subgroup analyses, meta-regression [see Item 16]). p. 13-17, Table 6, & Tables
S10-S15 in SI
DISCUSSION
Summary of evidence 24 Summarize the main findings including the strength of evidence for each main outcome; consider their relevance to key
groups (e.g., health care providers, users, and policy makers).
p. 18-22

218
Section/topic # Checklist item Reported in main text
Limitations 25 Discuss limitations at study and outcome level (e.g., risk of bias), and at review level (e.g., incomplete retrieval of identified research, reporting bias).
p. 22-23
Conclusions 26 Provide a general interpretation of the results in the context of other evidence, and implications for future research. p. 23-24
Funding 27 Describe sources of funding for the systematic review and other support (e.g., supply of data); role of funders for the
systematic review.
p. 26
Abbreviations: NA not applicable, P page(s), SI Supporting information
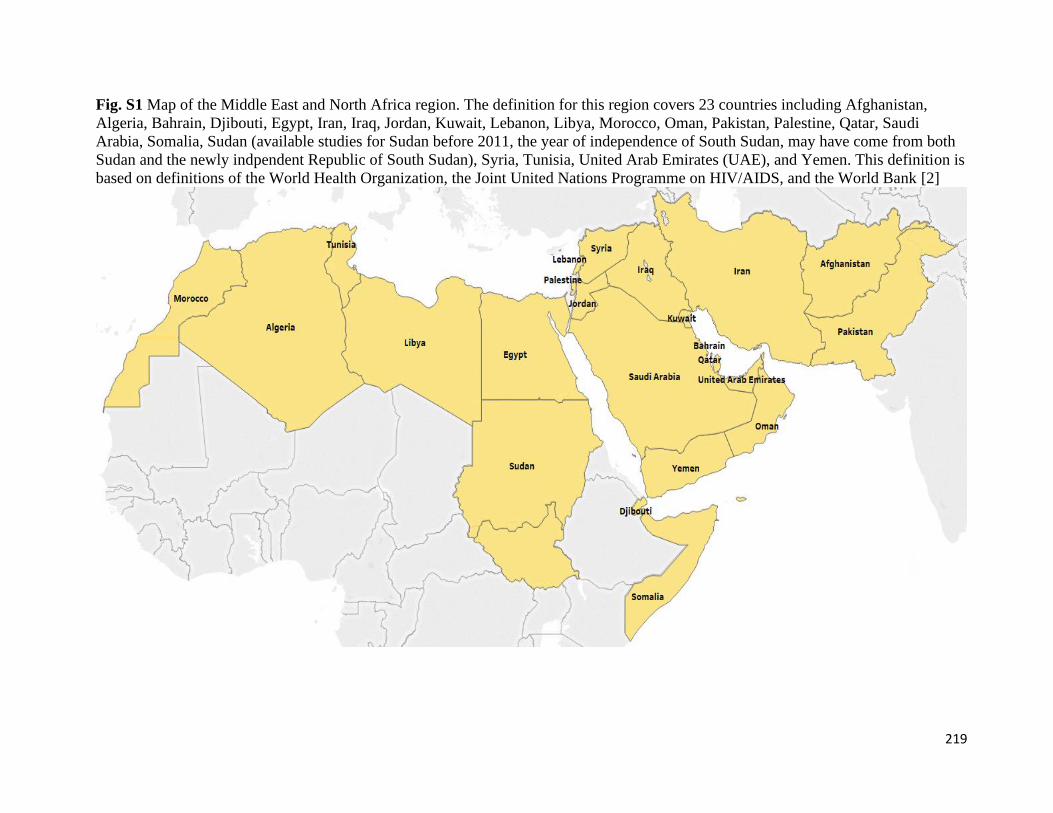
219
Fig. S1 Map of the Middle East and North Africa region. The definition for this region covers 23 countries including Afghanistan,
Algeria, Bahrain, Djibouti, Egypt, Iran, Iraq, Jordan, Kuwait, Lebanon, Libya, Morocco, Oman, Pakistan, Palestine, Qatar, Saudi
Arabia, Somalia, Sudan (available studies for Sudan before 2011, the year of independence of South Sudan, may have come from both
Sudan and the newly indpendent Republic of South Sudan), Syria, Tunisia, United Arab Emirates (UAE), and Yemen. This definition is
based on definitions of the World Health Organization, the Joint United Nations Programme on HIV/AIDS, and the World Bank [2]

220
Box S1 Search criteria for the systematic review of size estimation, HIV incidence, and HIV
prevalence studies in FSWs and their clients, in the Middle East and North Africa (MENA) PubMed (July 29, 2018)
Sex work
"Extramarital Relations"[Mesh] OR “Sex Work*”[Mesh] OR "Sex/analysis"[Mesh] OR "Sex/statistics and numerical
data"[Mesh] OR "Sexual partners"[Mesh] OR "Sex Trafficking/epidemiology"[Mesh] OR "Sex Trafficking/statistics and
numerical data"[Mesh] OR Sex work*[Text] OR Sexual work*[Text] OR Sexwork*[Text] OR Sex-work*[Text] OR Sexual
partner*[Text] OR Sex partner*[Text] OR Sexual contact*[Text] OR FSW[Text] OR FSWs[Text] OR CSW[Text] OR
CSWs[Text] OR SW[Text] OR SWs[Text] OR TSW[Text] OR TSWs[Text] OR TS[Text] OR Travailleuse* sexe[Text] OR
Travailleuse* sex[Text] OR Bar girl*[Text] OR Callgirl*[Text] OR Call girl*[Text] OR Escort*[Text] OR Masseuse*[Text] OR
Hostess*[Text] OR ((Premarital[Text] OR Pre-marital[Text] OR Pre marital[Text] OR Extramarital[Text] OR Extra-
marital[Text] OR Extra marital[Text] OR Illicit[Text] OR Illegal[Text]) AND (Sex[Text] OR Sexual[Text] OR
Relation*[Text])) OR Outside marriage[Text] OR Out of marriage[Text] OR “Illegal social behavior”[Text] OR “Illegal social
behaviour”[Text] OR Adultery[Text] OR Prostitut*[Text] OR Promiscu*[Text] OR Female entertain*[Text] OR Sex
entertain*[Text] OR Sexual* entertain*[Text] OR Entertainment work*[Text] OR Sex industr*[Text] OR Sex
establishment*[Text] OR Brothel*[Text] OR Red light[Text] OR Red-light[Text] OR Red district*[Text] OR Nightclub*[Text]
OR Pimp[Text] OR ((Intergenerational[Text] OR Cross-generation*[Text] OR Cross-generational[Text] OR Recreational[Text]
OR Commercial[Text] OR Transaction*[Text] OR Casual[Text] OR Group[Text] OR Informal[Text] OR Street[Text] OR
Migrant*[Text] OR Survival[Text] OR Occupational[Text] OR Tourism[Text]) AND (Sex[Text] OR Sexual*[Text])) OR Sex
seeking[Text] OR Sex-seeking[Text] OR Solicit*[Text] OR ((Provision*[Text] OR Provider*[Text] OR Provid*[Text] OR
Sell*[Text] OR Sold[Text] OR Exchang*[Text] OR Trad*[Text] OR Favor*[Text] OR Consum*[Text] OR Commodi*[Text]
OR Paid[Text] OR Paying[Text] OR Pay[Text] OR Payer*[Text] OR Buying[Text] OR Buy[Text] OR Buyer*[Text] OR
Charg*[Text] OR Engag*[Text] OR Service*[Text] OR Money[Text] OR Cash[Text] OR Drug*[Text] OR Goods[Text] OR
Gift*[Text]) AND (Sex[Text] OR Sexual*[Text])) OR Hidden population*[Text] OR Hard to reach population*[Text] OR
Hard-to-reach population*[Text] OR Core group*[Text] OR Core risk group*[Text] OR Vulnerable women[Text] OR
Vulnerable population*[Text] OR Vulnerable female*[Text] OR Most-at-risk population*[Text] OR Most at risk
population*[Text] OR High risk population*[Text] OR High-risk population*[Text] OR Population* at high risk[Text] OR
Population* at high-risk[Text] OR ((Traffick*[Text] OR Slave*[Text] OR Coerc*[Text] OR Abduct*[Text] OR Exploit*[Text]
OR Abuse*[Text] OR Violence[Text]) AND (Sex[Text] OR Sexual*[Text]))
MENA
"Middle East"[Mesh] OR "Islam"[Mesh] OR "Arabs"[Mesh] OR "Arab World"[Mesh] OR "Africa, Northern"[Mesh] OR
"Sudan"[Mesh] OR "Somalia"[Mesh] OR "Djibouti"[Mesh] OR "Pakistan"[Mesh] OR “South Sudan”[Mesh] OR "Middle
East*"[Text] OR "Middle-East"[Text] OR "North Africa*"[Text] OR "North-Africa"[Text] OR "EMRO"[Text] OR "Eastern
Mediterranean"[Text] OR “Arab*”[Text] OR “Arab World”[Text] OR "Islam*"[Text] OR "Afghanistan"[Text] OR
"Afghan*"[Text] OR "Algeria*"[Text] OR "Bahrain*"[Text] OR "Djibouti"[Text] OR "Egypt*"[Text] OR "Jordan*"[Text] OR
"Kuwait*"[Text] OR "Lebanon"[Text] OR "Leban*"[Text] OR "Libya*"[Text] OR "Iran*"[Text] OR "Iraq*"[Text] OR
"Morocco"[Text] OR “Moroccan*”[Text] OR "Oman*"[Text] OR "Pakistan*"[Text] OR "Qatar*"[Text] OR "Saudi*"[Text] OR
"Somalia"[Text] OR "Somal*"[Text] OR "Sudan*"[Text] OR "Syria*"[Text] OR "Tunisia*"[Text] OR "United Arab
Emirates"[Text] OR "Emirat*"[Text] OR "West Bank"[Text] OR "Ghaza*"[Text] OR "Gaza*"[Text] OR "Palestine"[Text] OR
"Palestinian*"[Text] OR "Yemen*"[Text] OR “UAE”[Text] OR “KSA”[Text]
Women
"Female/analysis"[Mesh] OR "Female/statistics and numerical data"[Mesh] OR “Women/epidemiology”[Mesh] OR
“Women/statistics and numerical data”[Mesh] OR Women[Text] OR Girl*[Text] OR Female*[Text]
Clients/Men
“Male/complications"[Mesh] OR "Male/diagnosis"[Mesh] OR "Men/statistics and numerical data"[Mesh] OR Men[Text] OR
Male[Text] OR Males[Text] OR Client*[Text] OR Paying partner*[Text] OR Sugar daddy[Text] OR Sugar daddies[Text]
FINAL PUBMED SEARCH
(“Sex work” AND “MENA” AND “Women”) OR (“Sex work” AND “MENA” AND “Clients/Men”)
Embase (July 29, 2018)
Sex work
exp prostitution/ or exp casual sex/ or exp transactional sex/ or exp group sex/ or exp sex tourism/ or exp sexual promiscuity/ or
exp extramarital sex/ or exp premarital sex/ or exp sexual relation/ or exp sexual partners/ or ((exp sex trafficking/ or exp sexual
exploitation/ or exp sexual coercion/) NOT Child) or (sex* work* or sexwork* or sex-work* or sex partner* or sexual partner*
or sexual contact* or premarital sex or premarital sexual or premarital relation* or pre-marital sex or pre-marital sexual or pre-
marital relation* or pre marital sex or pre marital sexual or pre marital relation* or extramarital sex or extramarital sexual or
extramarital relation* or extra-marital sex or extra-marital sexual or extra-marital relation* or extra marital sex or extra marital
sexual or extra marital relation* or illicit sex or illicit sexual or illicit relation* or illegal sex or illegal sexual or illegal relation*
or (out* ADJ1 marriage) or illegal social behavio?r or adultery or prostitut* or promiscu* or FSW or FSWs or CSW or CSWs or
SW or SWs or TSW or TSWs or TS or (women ADJ4 sex*) or (Travailleuse* ADJ1 sex*) or bar girl* or call girl* or callgirl*
or escort* or masseuse* or hostess* or female entertain* or sex entertain* or sexual entertain* or entertainment work* or sex

221
industr* or sex establishment* or brothel* or red light or red-light or (red ADJ1 district*) or nightclub* or pimp or recreation*
sex* or intergenerational sex* or cross-generation sex* or cross-generational sex* or commercial sex* or transactional sex* or
sex* transaction* or casual sex* or informal sex* or group sex* or street sex* or (migra* ADJ4 sex*) or (sex* ADJ4 migra*) or
survival sex* or occupational sex* or sex* tourism or sex seeking or sex-seeking or solicit* or (consum* ADJ4 sex*) or (sex*
ADJ 4 consumer) or (sex* ADJ4 consumers) or (sex* ADJ4 provi*) or (provi* ADJ4 sex*) or (sell* ADJ4 sex*) or (sex* ADJ4
sell*) or sold sex* or (exchang* ADJ4 sex*) or (sex* ADJ4 exchange) or (trading ADJ4 sex*) or (trade* ADJ4 sex*) or sex*
trade or sex* favor* or (commodi* ADJ4 sex*) or (sex* ADJ4 commodi*) or (paid ADJ4 sex*) or (pay* ADJ4 sex*) or (sex*
ADJ4 pay*) or (buy* ADJ4 sex*) or (sex* ADJ4 buy*) or (charg* ADJ4 sex*) or (sex* ADJ4 charg*) or (engag* ADJ4 sex*)
or (sex* ADJ4 engage*) or (sex* ADJ4 service*) or (service* ADJ4 sex*) or (money ADJ4 sex*) or (sex* ADJ4 money) or
(cash ADJ4 sex*) or (sex* ADJ4 cash) or (sex* ADJ4 drug*) or (drug* ADJ4 sex*) or (sex* ADJ4 goods) or (goods ADJ4
sex*) or (sex* ADJ4 gift*) or (gift* ADJ4 sex*) or hidden population* or hard to reach population* or hard-to-reach
population* or (core ADJ1 group*) or vulnerable women or vulnerable female*).mp. or ((vulnerable population* or most-at-risk
population* or most at risk population* or high risk population* or high-risk population* or population* at high risk or
population* at high-risk).mp. AND (sex* or infection* or STI or STIs or STD or STDs or human immunodeficiency virus or
HIV* or AIDS* or acquired immune deficiency syndrome or acquired immunodeficiency syndrome).mp.) or ((sex trafficking or
sexual trafficking or (traffick* ADJ4 sex*) or sex* slave* or sex* coerc* or sex* abduct* or sex* exploit* or sex* abuse* or
sex* violence) NOT Child).mp. or ((women ADJ4 traffick*) or (girls ADJ4 traffick*) or (female* ADJ4 traffick*) or (traffick*
ADJ4 women) or (traffick* ADJ4 girls) or (traffick* ADJ4 female*)).mp.
MENA
exp Middle East/ or exp North Africa/ or exp Arab/ or exp Afghanistan/ or exp Djibouti/ or exp Pakistan/ or exp Somalia/ or exp
Sudan/ or exp South Sudan/ or Middle East.mp. or North Africa.mp. or EMRO.mp. or Eastern Mediterranean.mp. or Arab.mp.
or Arabs.mp. or Arab World.mp. or Islam.mp. or Afghanistan.mp. or Afghan*.mp. or Algeria*.mp. or Bahrain*.mp. or
Djibouti.mp. or Egypt*.mp. or Jordan*.mp. or Kuwait*.mp. or Leban*.mp. or Libya*.mp. or Iran*.mp. or Iraq*.mp. or
Morocc*.mp. or Oman*.mp. or Pakistan*.mp. or Qatar*.mp. or Saudi*.mp. or Somal*.mp. or Sudan*.mp. or Syria*.mp. or
Tunisia*.mp. or United Arab Emirates.mp. or Emirat*.mp. or West Bank.mp. or Ghaza*.mp. or Gaza*.mp. or Palestin*.mp. or
Yemen*.mp. or UAE.mp. or KSA.mp.
Women
exp female/ or (women or girl* or female*).mp.
Clients/Men
exp male/ or (client* or (paying ADJ1 partner*) or sugar dadd* or men or male*).mp.
FINAL EMBASE SEARCH
(“Sex work” AND “MENA” AND “Women”) OR (“Sex work” AND “MENA” AND “Clients/Men”)
Regional databases
HIV and AIDS Asia Pacific Research Statistical Data Information (May 27, 2018)
Keyword search for: “Afghanistan” and “Pakistan”
Iran Scientific Information Database (July 23, 2018)
Keyword search for: “HIV”, “AIDS”, “Human immunodeficiency virus”, “Acquired immune deficiency syndrome”, “sex
work”, “prostitute”, “size estim”, and “sexually transmitted infection”
Iraq Academic Scientific Journals database (July 23, 2018)
Keyword search for: “HIV OR AIDS”, “HIV”, “Human immunodeficiency virus”, “Acquired immune deficiency syndrome”,
“sex work”, “prostitute”, “commercial sex”, “size estimation”, and “sexually transmitted infection”
MENA HIV/AIDS Epidemiology Synthesis Project database (June 01, 2018)
Hand search of all documents in the database
PakMediNet (July 23, 2018)
Keyword search for: “HIV”, “AIDS”, “Human immunodeficiency virus”, “Acquired immune deficiency syndrome”, “sex
work”, “prostitute”, “commercial”, “size estimation”, and “sexually transmitted infection”
US Census Bureau (July 17, 2018)
Keyword search using each MENA country name
World Health Organization Index Medicus for the Eastern Mediterranean Region (July 23, 2018)
Keyword search for: “HIV OR AIDS”, “Human AND immunodeficiency AND virus”, “Acquired AND immune AND
deficiency AND syndrome”, “prostitute”, and “sex AND worker”
World Health Organization Index Medicus for the Eastern Mediterranean Region (July 27, 2018)
Keyword search for: “Algeria”, “Algerie”, “Djibouti”, “Egypt”, “Egypte”, “Libya”, “Libie”, “Maroc”, “Morocco”, “Tunisia”,
“Tunisie”, “Somalia”, “Somalie”, “Sudan”, and “Soudan”
222
Abstract archives of the International AIDS Society conferences (July 28, 2018)
Keyword search using each MENA country name Abbreviations: FSWs female sex workers

223
Box S2 List of extracted variables for the systematic review of HIV epidemiology among FSWs
and their clients in the Middle East and North Africa (MENA) Report characteristics
Author(s), year of publication, full citation, type of publication, and source of data
General study characteristics
Study population and its characteristics, year(s) of data collection, country of origin, country of survey, city, study site, study
design, sampling methodology, estimation methodology, sample size, population definition, eligibility criteria, and participation
rate
Studies/outcome measures
Population-size estimates and population proportions of FSWs and clients
HIV incidence (including number followed-up, follw-up time, sero-conversion risk, incidence rate, and details related to
outcome ascertainment)
HIV prevalence (including number tested, number antibody positive, and details related to outcome ascertainment)
Sexual and injecting risk behaviours and contextual measures
Socio-demographic charcateristics and sex work context (age, age at sexual debut, age at sex work intiation, and marital status),
Condom use with clients and partners (over different time frames, types of sexual partnerships-regular/occasional/paying/non-
paying, and sexual acts-vaginal/anal)
Types of sexual partnerships (over different time frames)
Injecting risk behaviour (current/recent/history of drug use, injecting drug use, sex with people who inject drugs, and substance
use before or during sex)
Knowledge of HIV/AIDS (knowledge of sexual and injecting modes of transmission, and of condom as HIV prevention
method)
Perception of risk of exposure to HIV infection
HIV testing (ever, during the past 12 months, received results) Abbreviations: FSWs female sex workers

224
Table S2 Quality assessment criteria for size estimation and HIV prevalence studies in FSWs and their clients (or proxy populations of
clients) in the Middle East and North Africa, as identified in the systematic review Quality domain ROB
assessment
Criteria Size
estimation
HIV
prevalence
1. Validity of sex work definition Low ROB Clear and valid sex work definition/engagement in paid sex clearly established X X
High ROB Sex work/engagement in paid sex not well-defined/not clearly established
Unclear Sex work definition/information on engagement in paid sex not provided
2. Rigor of estimation
methodology
Low ROB Method likely to yield representative estimate for the number or population proportion of
FSWs or clients such as multiplier unique object, time-location geographical mapping,
capture-recapture, and network scale-up, among others
X NA
High ROB Method unlikely to yield representative estimate for the number or population proportion
of FSWs or clients such as self-report based on convenience sampling
Unclear Information not reported
3. Rigor of sampling methodology Low ROB Studies using probability-based sampling NA X
High ROB Studies using non-probability sampling
Unclear Information not reported
4. Response rate Low ROB ≥60% or ≥60% of target sample size reached in studies using RDS or TLS X X
High ROB <60% or <60% of target sample size reached in studies using RDS or TLS
Unclear Information not reported
5. HIV ascertainment Low ROB HIV ascertainment using biological assays NA X
High ROB HIV ascertainment based on self-report
Unclear Information not reported
Abbreviations: FSWs female sex workers, NA not applicable, RDS respondent-driven sampling, ROB risk of bias assessment, TLS time-location sampling
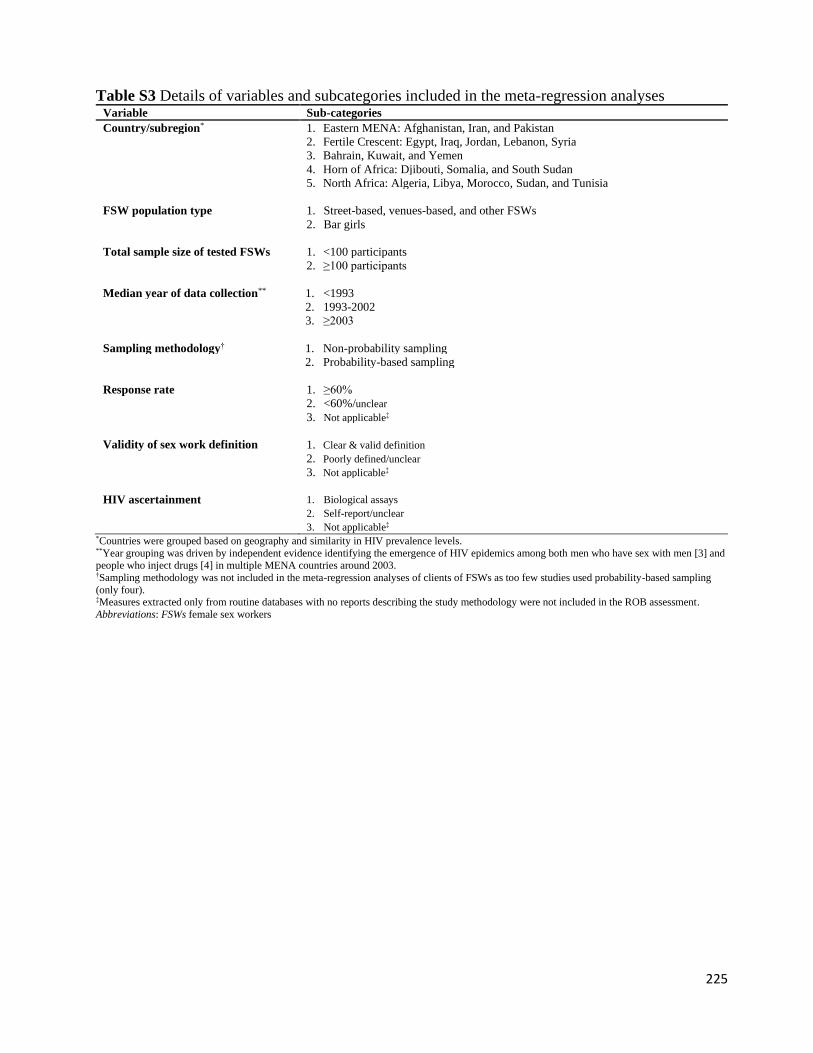
225
Table S3 Details of variables and subcategories included in the meta-regression analyses Variable Sub-categories
Country/subregion* 1. Eastern MENA: Afghanistan, Iran, and Pakistan
2. Fertile Crescent: Egypt, Iraq, Jordan, Lebanon, Syria
3. Bahrain, Kuwait, and Yemen
4. Horn of Africa: Djibouti, Somalia, and South Sudan
5. North Africa: Algeria, Libya, Morocco, Sudan, and Tunisia
FSW population type 1. Street-based, venues-based, and other FSWs
2. Bar girls
Total sample size of tested FSWs 1. <100 participants
2. ≥100 participants
Median year of data collection** 1. <1993
2. 1993-2002
3. ≥2003
Sampling methodology† 1. Non-probability sampling
2. Probability-based sampling
Response rate 1. ≥60%
2. <60%/unclear
3. Not applicable‡
Validity of sex work definition 1. Clear & valid definition
2. Poorly defined/unclear 3. Not applicable‡
HIV ascertainment 1. Biological assays
2. Self-report/unclear
3. Not applicable‡ *Countries were grouped based on geography and similarity in HIV prevalence levels. **Year grouping was driven by independent evidence identifying the emergence of HIV epidemics among both men who have sex with men [3] and
people who inject drugs [4] in multiple MENA countries around 2003. †Sampling methodology was not included in the meta-regression analyses of clients of FSWs as too few studies used probability-based sampling
(only four). ‡Measures extracted only from routine databases with no reports describing the study methodology were not included in the ROB assessment.
Abbreviations: FSWs female sex workers
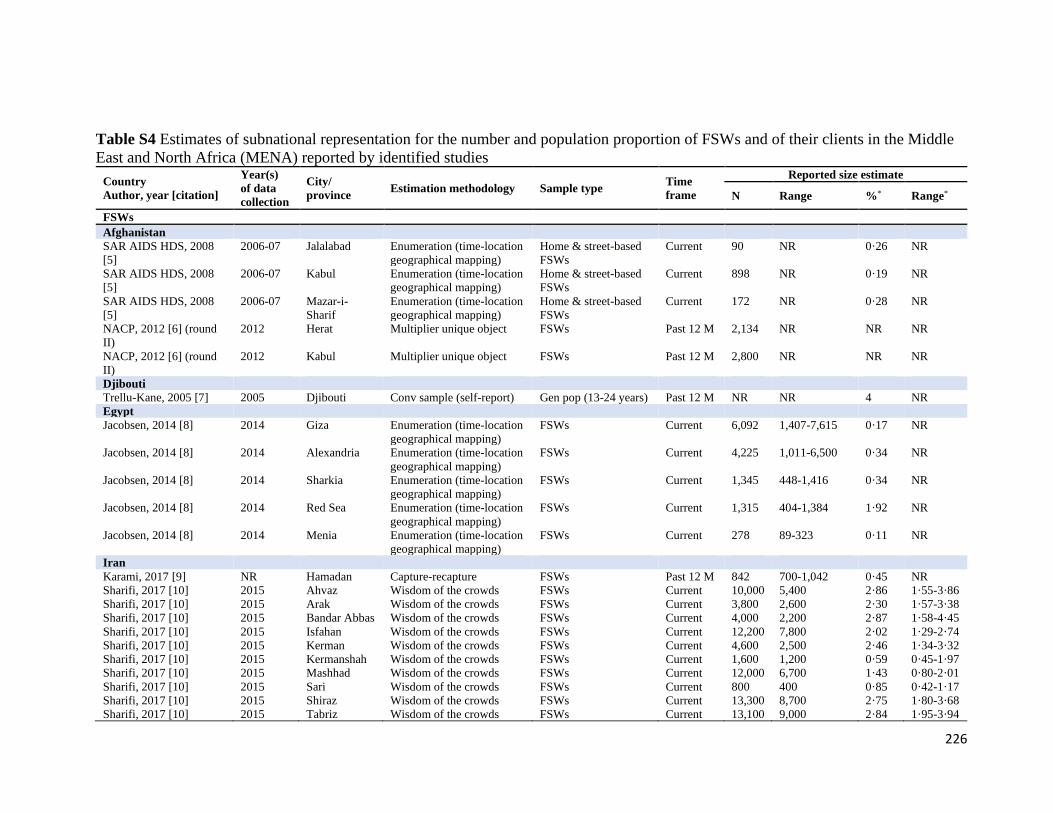
226
Table S4 Estimates of subnational representation for the number and population proportion of FSWs and of their clients in the Middle
East and North Africa (MENA) reported by identified studies
Country
Author, year [citation]
Year(s)
of data
collection
City/
province Estimation methodology Sample type
Time
frame
Reported size estimate
N Range %* Range*
FSWs
Afghanistan
SAR AIDS HDS, 2008
[5]
2006-07 Jalalabad Enumeration (time-location
geographical mapping)
Home & street-based
FSWs
Current 90 NR 0·26 NR
SAR AIDS HDS, 2008
[5] 2006-07 Kabul Enumeration (time-location
geographical mapping)
Home & street-based
FSWs
Current 898 NR 0·19 NR
SAR AIDS HDS, 2008
[5] 2006-07 Mazar-i-
Sharif
Enumeration (time-location
geographical mapping)
Home & street-based
FSWs
Current 172 NR 0·28 NR
NACP, 2012 [6] (round
II)
2012 Herat Multiplier unique object FSWs Past 12 M 2,134 NR NR NR
NACP, 2012 [6] (round
II) 2012 Kabul Multiplier unique object FSWs Past 12 M 2,800 NR NR NR
Djibouti
Trellu-Kane, 2005 [7] 2005 Djibouti Conv sample (self-report) Gen pop (13-24 years) Past 12 M NR NR 4 NR
Egypt
Jacobsen, 2014 [8] 2014 Giza Enumeration (time-location
geographical mapping)
FSWs Current 6,092 1,407-7,615 0·17 NR
Jacobsen, 2014 [8] 2014 Alexandria Enumeration (time-location
geographical mapping)
FSWs Current 4,225 1,011-6,500 0·34 NR
Jacobsen, 2014 [8] 2014 Sharkia Enumeration (time-location
geographical mapping)
FSWs Current 1,345 448-1,416 0·34 NR
Jacobsen, 2014 [8] 2014 Red Sea Enumeration (time-location
geographical mapping)
FSWs Current 1,315 404-1,384 1·92 NR
Jacobsen, 2014 [8] 2014 Menia Enumeration (time-location
geographical mapping)
FSWs Current 278 89-323 0·11 NR
Iran
Karami, 2017 [9] NR Hamadan Capture-recapture FSWs Past 12 M 842 700-1,042 0·45 NR
Sharifi, 2017 [10] 2015 Ahvaz Wisdom of the crowds FSWs Current 10,000 5,400 2·86 1·55-3·86
Sharifi, 2017 [10] 2015 Arak Wisdom of the crowds FSWs Current 3,800 2,600 2·30 1·57-3·38
Sharifi, 2017 [10] 2015 Bandar Abbas Wisdom of the crowds FSWs Current 4,000 2,200 2·87 1·58-4·45
Sharifi, 2017 [10] 2015 Isfahan Wisdom of the crowds FSWs Current 12,200 7,800 2·02 1·29-2·74
Sharifi, 2017 [10] 2015 Kerman Wisdom of the crowds FSWs Current 4,600 2,500 2·46 1·34-3·32
Sharifi, 2017 [10] 2015 Kermanshah Wisdom of the crowds FSWs Current 1,600 1,200 0·59 0·45-1·97
Sharifi, 2017 [10] 2015 Mashhad Wisdom of the crowds FSWs Current 12,000 6,700 1·43 0·80-2·01
Sharifi, 2017 [10] 2015 Sari Wisdom of the crowds FSWs Current 800 400 0·85 0·42-1·17
Sharifi, 2017 [10] 2015 Shiraz Wisdom of the crowds FSWs Current 13,300 8,700 2·75 1·80-3·68
Sharifi, 2017 [10] 2015 Tabriz Wisdom of the crowds FSWs Current 13,100 9,000 2·84 1·95-3·94
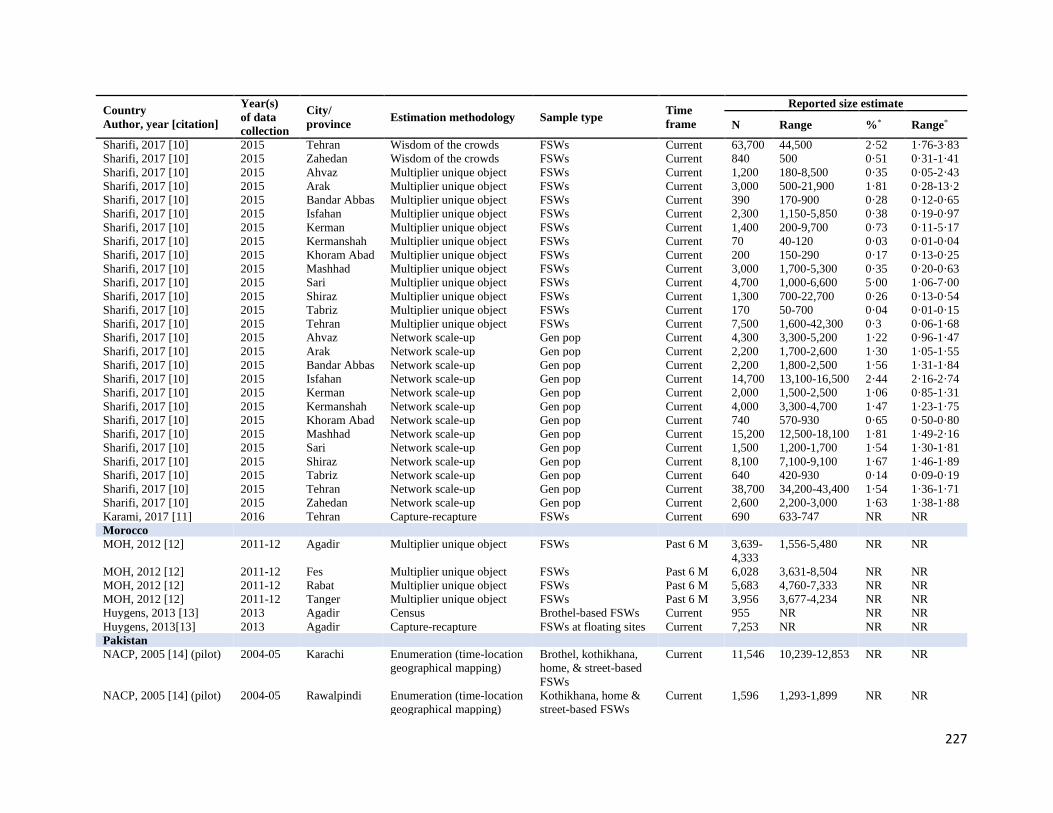
227
Country
Author, year [citation]
Year(s)
of data
collection
City/
province Estimation methodology Sample type
Time
frame
Reported size estimate
N Range %* Range*
Sharifi, 2017 [10] 2015 Tehran Wisdom of the crowds FSWs Current 63,700 44,500 2·52 1·76-3·83
Sharifi, 2017 [10] 2015 Zahedan Wisdom of the crowds FSWs Current 840 500 0·51 0·31-1·41
Sharifi, 2017 [10] 2015 Ahvaz Multiplier unique object FSWs Current 1,200 180-8,500 0·35 0·05-2·43
Sharifi, 2017 [10] 2015 Arak Multiplier unique object FSWs Current 3,000 500-21,900 1·81 0·28-13·2
Sharifi, 2017 [10] 2015 Bandar Abbas Multiplier unique object FSWs Current 390 170-900 0·28 0·12-0·65
Sharifi, 2017 [10] 2015 Isfahan Multiplier unique object FSWs Current 2,300 1,150-5,850 0·38 0·19-0·97
Sharifi, 2017 [10] 2015 Kerman Multiplier unique object FSWs Current 1,400 200-9,700 0·73 0·11-5·17
Sharifi, 2017 [10] 2015 Kermanshah Multiplier unique object FSWs Current 70 40-120 0·03 0·01-0·04
Sharifi, 2017 [10] 2015 Khoram Abad Multiplier unique object FSWs Current 200 150-290 0·17 0·13-0·25
Sharifi, 2017 [10] 2015 Mashhad Multiplier unique object FSWs Current 3,000 1,700-5,300 0·35 0·20-0·63
Sharifi, 2017 [10] 2015 Sari Multiplier unique object FSWs Current 4,700 1,000-6,600 5·00 1·06-7·00
Sharifi, 2017 [10] 2015 Shiraz Multiplier unique object FSWs Current 1,300 700-22,700 0·26 0·13-0·54
Sharifi, 2017 [10] 2015 Tabriz Multiplier unique object FSWs Current 170 50-700 0·04 0·01-0·15
Sharifi, 2017 [10] 2015 Tehran Multiplier unique object FSWs Current 7,500 1,600-42,300 0·3 0·06-1·68
Sharifi, 2017 [10] 2015 Ahvaz Network scale-up Gen pop Current 4,300 3,300-5,200 1·22 0·96-1·47
Sharifi, 2017 [10] 2015 Arak Network scale-up Gen pop Current 2,200 1,700-2,600 1·30 1·05-1·55
Sharifi, 2017 [10] 2015 Bandar Abbas Network scale-up Gen pop Current 2,200 1,800-2,500 1·56 1·31-1·84
Sharifi, 2017 [10] 2015 Isfahan Network scale-up Gen pop Current 14,700 13,100-16,500 2·44 2·16-2·74
Sharifi, 2017 [10] 2015 Kerman Network scale-up Gen pop Current 2,000 1,500-2,500 1·06 0·85-1·31
Sharifi, 2017 [10] 2015 Kermanshah Network scale-up Gen pop Current 4,000 3,300-4,700 1·47 1·23-1·75
Sharifi, 2017 [10] 2015 Khoram Abad Network scale-up Gen pop Current 740 570-930 0·65 0·50-0·80
Sharifi, 2017 [10] 2015 Mashhad Network scale-up Gen pop Current 15,200 12,500-18,100 1·81 1·49-2·16
Sharifi, 2017 [10] 2015 Sari Network scale-up Gen pop Current 1,500 1,200-1,700 1·54 1·30-1·81
Sharifi, 2017 [10] 2015 Shiraz Network scale-up Gen pop Current 8,100 7,100-9,100 1·67 1·46-1·89
Sharifi, 2017 [10] 2015 Tabriz Network scale-up Gen pop Current 640 420-930 0·14 0·09-0·19
Sharifi, 2017 [10] 2015 Tehran Network scale-up Gen pop Current 38,700 34,200-43,400 1·54 1·36-1·71
Sharifi, 2017 [10] 2015 Zahedan Network scale-up Gen pop Current 2,600 2,200-3,000 1·63 1·38-1·88
Karami, 2017 [11] 2016 Tehran Capture-recapture FSWs Current 690 633-747 NR NR
Morocco
MOH, 2012 [12] 2011-12 Agadir Multiplier unique object FSWs Past 6 M 3,639-
4,333
1,556-5,480 NR NR
MOH, 2012 [12] 2011-12 Fes Multiplier unique object FSWs Past 6 M 6,028 3,631-8,504 NR NR MOH, 2012 [12] 2011-12 Rabat Multiplier unique object FSWs Past 6 M 5,683 4,760-7,333 NR NR MOH, 2012 [12] 2011-12 Tanger Multiplier unique object FSWs Past 6 M 3,956 3,677-4,234 NR NR Huygens, 2013 [13] 2013 Agadir Census Brothel-based FSWs Current 955 NR NR NR Huygens, 2013[13] 2013 Agadir Capture-recapture FSWs at floating sites Current 7,253 NR NR NR Pakistan
NACP, 2005 [14] (pilot) 2004-05 Karachi Enumeration (time-location
geographical mapping)
Brothel, kothikhana,
home, & street-based
FSWs
Current 11,546 10,239-12,853 NR NR
NACP, 2005 [14] (pilot) 2004-05 Rawalpindi Enumeration (time-location
geographical mapping)
Kothikhana, home &
street-based FSWs
Current 1,596 1,293-1,899 NR NR
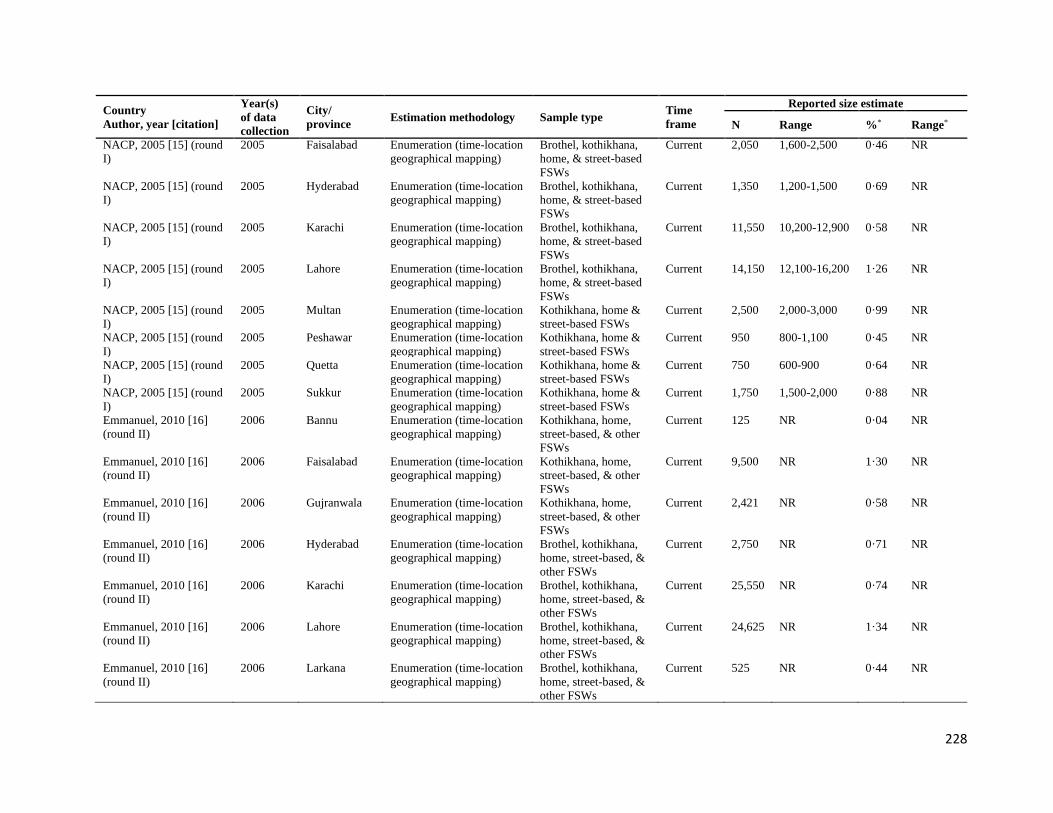
228
Country
Author, year [citation]
Year(s)
of data
collection
City/
province Estimation methodology Sample type
Time
frame
Reported size estimate
N Range %* Range*
NACP, 2005 [15] (round
I)
2005 Faisalabad Enumeration (time-location
geographical mapping)
Brothel, kothikhana,
home, & street-based
FSWs
Current 2,050 1,600-2,500 0·46 NR
NACP, 2005 [15] (round
I) 2005 Hyderabad Enumeration (time-location
geographical mapping)
Brothel, kothikhana,
home, & street-based
FSWs
Current 1,350 1,200-1,500 0·69 NR
NACP, 2005 [15] (round
I) 2005 Karachi Enumeration (time-location
geographical mapping)
Brothel, kothikhana,
home, & street-based
FSWs
Current 11,550 10,200-12,900 0·58 NR
NACP, 2005 [15] (round
I) 2005 Lahore Enumeration (time-location
geographical mapping)
Brothel, kothikhana,
home, & street-based
FSWs
Current 14,150 12,100-16,200 1·26 NR
NACP, 2005 [15] (round
I) 2005 Multan Enumeration (time-location
geographical mapping)
Kothikhana, home &
street-based FSWs
Current 2,500 2,000-3,000 0·99 NR
NACP, 2005 [15] (round
I) 2005 Peshawar Enumeration (time-location
geographical mapping)
Kothikhana, home &
street-based FSWs
Current 950 800-1,100 0·45 NR
NACP, 2005 [15] (round
I) 2005 Quetta Enumeration (time-location
geographical mapping)
Kothikhana, home &
street-based FSWs
Current 750 600-900 0·64 NR
NACP, 2005 [15] (round
I) 2005 Sukkur Enumeration (time-location
geographical mapping)
Kothikhana, home &
street-based FSWs
Current 1,750 1,500-2,000 0·88 NR
Emmanuel, 2010 [16]
(round II)
2006 Bannu Enumeration (time-location
geographical mapping)
Kothikhana, home,
street-based, & other
FSWs
Current 125 NR 0·04 NR
Emmanuel, 2010 [16]
(round II)
2006 Faisalabad Enumeration (time-location
geographical mapping)
Kothikhana, home,
street-based, & other
FSWs
Current 9,500 NR 1·30 NR
Emmanuel, 2010 [16]
(round II)
2006 Gujranwala Enumeration (time-location
geographical mapping)
Kothikhana, home,
street-based, & other
FSWs
Current 2,421 NR 0·58 NR
Emmanuel, 2010 [16]
(round II)
2006 Hyderabad Enumeration (time-location
geographical mapping)
Brothel, kothikhana,
home, street-based, &
other FSWs
Current 2,750 NR 0·71 NR
Emmanuel, 2010 [16]
(round II)
2006 Karachi Enumeration (time-location
geographical mapping)
Brothel, kothikhana,
home, street-based, &
other FSWs
Current 25,550 NR 0·74 NR
Emmanuel, 2010 [16]
(round II)
2006 Lahore Enumeration (time-location
geographical mapping)
Brothel, kothikhana,
home, street-based, &
other FSWs
Current 24,625 NR 1·34 NR
Emmanuel, 2010 [16]
(round II)
2006 Larkana Enumeration (time-location
geographical mapping)
Brothel, kothikhana,
home, street-based, &
other FSWs
Current 525 NR 0·44 NR
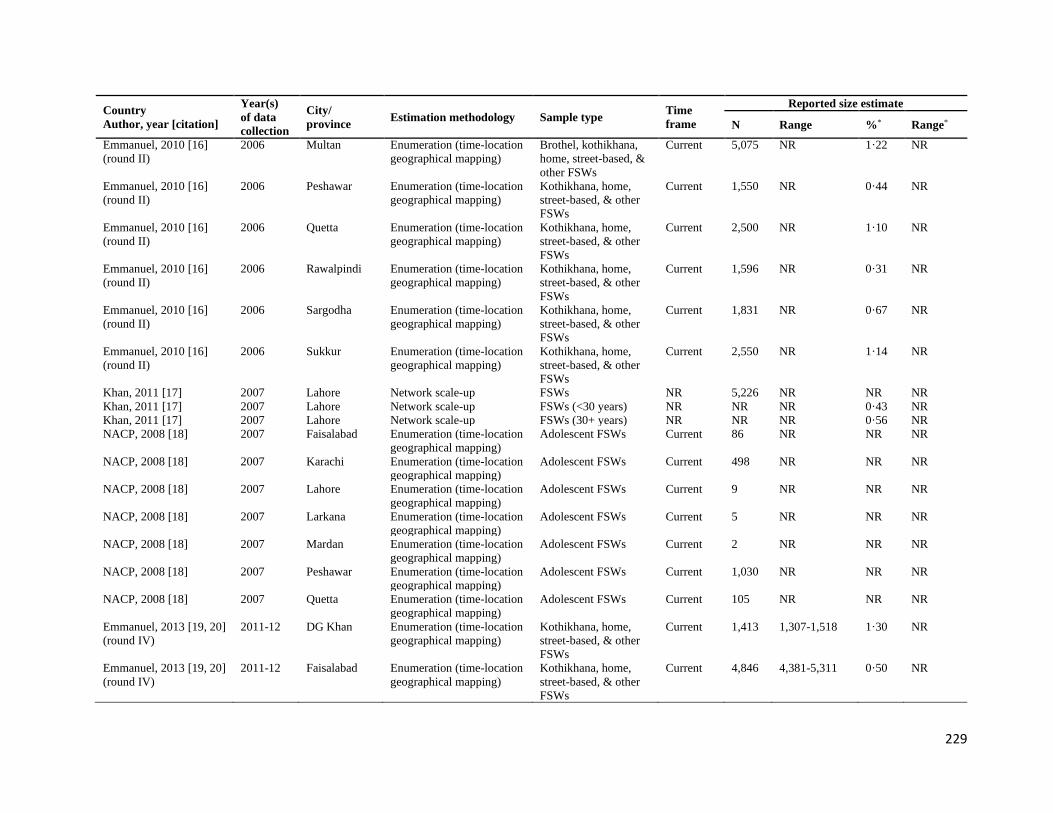
229
Country
Author, year [citation]
Year(s)
of data
collection
City/
province Estimation methodology Sample type
Time
frame
Reported size estimate
N Range %* Range*
Emmanuel, 2010 [16]
(round II)
2006 Multan Enumeration (time-location
geographical mapping)
Brothel, kothikhana,
home, street-based, &
other FSWs
Current 5,075 NR 1·22 NR
Emmanuel, 2010 [16]
(round II)
2006 Peshawar Enumeration (time-location
geographical mapping)
Kothikhana, home,
street-based, & other
FSWs
Current 1,550 NR 0·44 NR
Emmanuel, 2010 [16]
(round II)
2006 Quetta Enumeration (time-location
geographical mapping)
Kothikhana, home,
street-based, & other
FSWs
Current 2,500 NR 1·10 NR
Emmanuel, 2010 [16]
(round II)
2006 Rawalpindi Enumeration (time-location
geographical mapping)
Kothikhana, home,
street-based, & other
FSWs
Current 1,596 NR 0·31 NR
Emmanuel, 2010 [16]
(round II)
2006 Sargodha Enumeration (time-location
geographical mapping)
Kothikhana, home,
street-based, & other
FSWs
Current 1,831 NR 0·67 NR
Emmanuel, 2010 [16]
(round II)
2006 Sukkur Enumeration (time-location
geographical mapping)
Kothikhana, home,
street-based, & other
FSWs
Current 2,550 NR 1·14 NR
Khan, 2011 [17] 2007 Lahore Network scale-up FSWs NR 5,226 NR NR NR Khan, 2011 [17] 2007 Lahore Network scale-up FSWs (<30 years) NR NR NR 0·43 NR Khan, 2011 [17] 2007 Lahore Network scale-up FSWs (30+ years) NR NR NR 0·56 NR NACP, 2008 [18] 2007 Faisalabad Enumeration (time-location
geographical mapping)
Adolescent FSWs Current 86 NR NR NR
NACP, 2008 [18] 2007 Karachi Enumeration (time-location
geographical mapping)
Adolescent FSWs Current 498 NR NR NR
NACP, 2008 [18] 2007 Lahore Enumeration (time-location
geographical mapping)
Adolescent FSWs Current 9 NR NR NR
NACP, 2008 [18] 2007 Larkana Enumeration (time-location
geographical mapping)
Adolescent FSWs Current 5 NR NR NR
NACP, 2008 [18] 2007 Mardan Enumeration (time-location
geographical mapping)
Adolescent FSWs Current 2 NR NR NR
NACP, 2008 [18] 2007 Peshawar Enumeration (time-location
geographical mapping)
Adolescent FSWs Current 1,030 NR NR NR
NACP, 2008 [18] 2007 Quetta Enumeration (time-location
geographical mapping)
Adolescent FSWs Current 105 NR NR NR
Emmanuel, 2013 [19, 20]
(round IV)
2011-12 DG Khan Enumeration (time-location
geographical mapping)
Kothikhana, home,
street-based, & other
FSWs
Current 1,413 1,307-1,518 1·30 NR
Emmanuel, 2013 [19, 20]
(round IV)
2011-12 Faisalabad Enumeration (time-location
geographical mapping)
Kothikhana, home,
street-based, & other
FSWs
Current 4,846 4,381-5,311 0·50 NR

230
Country
Author, year [citation]
Year(s)
of data
collection
City/
province Estimation methodology Sample type
Time
frame
Reported size estimate
N Range %* Range*
Emmanuel, 2013 [19, 20]
(round IV)
2011-12 Haripur Enumeration (time-location
geographical mapping)
Kothikhana, home,
street-based, & other
FSWs
Current 2,994 2,850-3,138 1·19 NR
Emmanuel, 2013 [19, 20]
(round IV)
2011-12 Hyderabad Enumeration (time-location
geographical mapping)
Brothel, kothikhana,
home, street-based, &
other FSWs
Current 4,566 4,018-5,113 0·85 NR
Emmanuel, 2013 [19, 20]
(round IV)
2011-12 Karachi Enumeration (time-location
geographical mapping)
Brothel, kothikhana,
home, street-based, &
other FSWs
Current 25,399 21,794-29,004 0·55 NR
Emmanuel, 2013 [19, 20]
(round IV)
2011-12 Lahore Enumeration (time-location
geographical mapping)
Brothel, kothikhana,
home, street-based, &
other FSWs
Current 23,766 21,109-26,422 1·15 NR
Emmanuel, 2013 [19, 20]
(round IV)
2011-12 Larkana Enumeration (time-location
geographical mapping)
Brothel, kothikhana,
home, street-based, &
other FSWs
Current 1,114 969-1,258 0·82 NR
Emmanuel, 2013 [19, 20]
(round IV)
2011-12 Mirpurkhas Enumeration (time-location
geographical mapping)
Kothikhana, home,
street-based, & other
FSWs
Current 884 852-915 0·85 NR
Emmanuel, 2013 [19, 20]
(round IV)
2011-12 Multan Enumeration (time-location
geographical mapping)
Brothel, kothikhana,
home, street-based, &
other FSWs
Current 5,308 4,767-5,847 0·80 NR
Emmanuel, 2013 [19, 20]
(round IV)
2011-12 Nawabshah Enumeration (time-location
geographical mapping)
Brothel, kothikhana,
home, street-based, &
other FSWs
Current 2,011 1,672-2,352 1·42 NR
Emmanuel, 2013 [19, 20]
(round IV)
2011-12 Peshawar Enumeration (time-location
geographical mapping)
Kothikhana, home,
street-based, & other
FSWs
Current 3,317 2,897-3,736 0·42 NR
Emmanuel, 2013 [19, 20]
(round IV)
2011-12 Quetta Enumeration (time-location
geographical mapping)
Kothikhana, home,
street-based, & other
FSWs
Current 3,710 3,271-4,149 1·07 NR
Emmanuel, 2013 [19, 20]
(round IV)
2011-12 Rawalpindi Enumeration (time-location
geographical mapping)
Kothikhana, home,
street-based, & other
FSWs
Current 3,635 3,263-4,021 0·34 NR
Emmanuel, 2013 [19, 20]
(round IV)
2011-12 Sargodha Enumeration (time-location
geographical mapping)
Brothel, kothikhana,
home, street-based, &
other FSWs
Current 3,898 3,597-4,198 1·25 NR
Emmanuel, 2013 [19, 20]
(round IV)
2011-12 Sukkur Enumeration (time-location
geographical mapping)
Kothikhana, home,
street-based, & other
FSWs
Current 2,317 2,031-2,610 1·05 NR
Punjab ACP, 2015 [21] 2014 Faisalabad Enumeration (time-location
geographical mapping)
Kothikhana, home,
street-based, & other
FSWs
Current 7,556 5,500-9,612 NR NR

231
Country
Author, year [citation]
Year(s)
of data
collection
City/
province Estimation methodology Sample type
Time
frame
Reported size estimate
N Range %* Range*
Punjab ACP, 2015 [21] 2014 Lahore Enumeration (time-location
geographical mapping)
Brothel, kothikhana,
home, street-based, &
other FSWs
Current 25,716 21,685-29,746 NR NR
Punjab ACP, 2015 [21] 2014 Multan Enumeration (time-location
geographical mapping)
Brothel, kothikhana,
home, street-based, &
other FSWs
Current 6,561 4,272-8,850 NR NR
Punjab ACP, 2015 [21] 2014 Sargodha Enumeration (time-location
geographical mapping)
Brothel, kothikhana,
home, street-based, &
other FSWs
Current 4,327 2,987-5,667 NR NR
NACP, 2017 [22] (round
V)
2016-17 Bahawalpur Enumeration (time-location
geographical mapping)
Brothel, kothikhana,
home, street-based, &
other FSWs
Current 6,201 5,522-6,737 NR NR
NACP, 2017 [22] (round
V)
2016-17 Bannu Enumeration (time-location
geographical mapping)
Brothel, kothikhana,
home, street-based, &
other FSWs
Current 192 171-209 NR NR
NACP, 2017 [22] (round
V)
2016-17 DG Khan Enumeration (time-location
geographical mapping)
Kothikhana, home,
street-based, & other
FSWs
Current 1,349 1,201-1,466 NR NR
NACP, 2017 [22] (round
V)
2016-17 Gujranwala Enumeration (time-location
geographical mapping)
Brothel, kothikhana,
home, street-based, &
other FSWs
Current 4,069 3,624-4,420 NR NR
NACP, 2017 [22] (round
V)
2016-17 Gujrat Enumeration (time-location
geographical mapping)
Brothel, kothikhana,
home, street-based, &
other FSWs
Current 317 282-344 NR NR
NACP, 2017 [22] (round
V)
2016-17 Hyderabad Enumeration (time-location
geographical mapping)
Brothel, kothikhana,
home, street-based, &
other FSWs
Current 4426 3,942-4,808 NR NR
NACP, 2017 [22] (round
V)
2016-17 Karachi Enumeration (time-location
geographical mapping)
Brothel, kothikhana,
home, street-based, &
other FSWs
Current 25,191 22,434-27,367 NR NR
NACP, 2017 [22] (round
V)
2016-17 Kasur Enumeration (time-location
geographical mapping)
Brothel, kothikhana,
home, street-based, &
other FSWs
Current 1,739 1,549-1,889 NR NR
NACP, 2017 [22] (round
V)
2016-17 Larkana Enumeration (time-location
geographical mapping)
Brothel, kothikhana,
home, street-based, &
other FSWs
Current 4,593 4,090-4,990 NR NR
NACP, 2017 [22] (round
V)
2016-17 Mirpurkhas Enumeration (time-location
geographical mapping)
Kothikhana, home,
street-based, & other
FSWs
Current 2,084 1,856-2,264 NR NR
NACP, 2017 [22] (round
V)
2016-17 Nawabshah Enumeration (time-location
geographical mapping)
Brothel, kothikhana,
home, street-based, &
other FSWs
Current 1,690 1,505-1,836 NR NR

232
Country
Author, year [citation]
Year(s)
of data
collection
City/
province Estimation methodology Sample type
Time
frame
Reported size estimate
N Range %* Range*
NACP, 2017 [22] (round
V)
2016-17 Peshawar Enumeration (time-location
geographical mapping)
Kothikhana, home,
street-based, & other
FSWs
Current 765 681-831 NR NR
NACP, 2017 [22] (round
V)
2016-17 Rawalpindi Enumeration (time-location
geographical mapping)
Kothikhana, home,
street-based, & other
FSWs
Current 2,465 2,195-2,678 NR NR
NACP, 2017 [22] (round
V)
2016-17 Quetta Enumeration (time-location
geographical mapping)
Kothikhana, home,
street-based, & other
FSWs
Current 4,121 3,670-4,477 NR NR
NACP, 2017 [22] (round
V)
2016-17 Sheikhupura Enumeration (time-location
geographical mapping)
Brothel, kothikhana,
home, street-based, &
other FSWs
Current 6,252 5,568-6,792 NR NR
NACP, 2017 [22] (round
V)
2016-17 Sialkot Enumeration (time-location
geographical mapping)
Brothel, kothikhana,
home, street-based, &
other FSWs
Current 2,031 1,809-2,206 NR NR
NACP, 2017 [22] (round
V)
2016-17 Sukkur Enumeration (time-location
geographical mapping)
Kothikhana, home,
street-based, & other
FSWs
Current 3,307 2,945-3,593 NR NR
NACP, 2017 [22] (round
V)
2016-17 Turbat Enumeration (time-location
geographical mapping)
Brothel, kothikhana,
home, street-based, &
other FSWs
Current 523 466-568 NR NR
Somalia
WHO, 2011[23] 2011 Berbera &
Bossaso
NR FSWs Current 614 NR NR NR
MOH, 2016 [24] 2016 Bossaso Enumeration (time-location
geographical mapping)
FSWs Past 12 M 911 736-1,079 NR NR
MOH, 2016 [24] 2016 Hargeisa Enumeration (time-location
geographical mapping)
FSWs Past 12 M 1,126 842-1,409 NR NR
MOH, 2016 [24] 2016 Mogadishu Multiplier unique object FSWs Past 12 M 963 NR NR NR Sudan
NACP, 2002 [25] 2002 Khartoum,
Gezira,
Kassala
Pop-bsd survey (self-report) Refugees (predom.
women)
Past 12 M NR NR 0·83 NR
NACP, 2002 [25] 2002 Khartoum,
Gezira,
Kassala
Conv sample (self-report) ANC attendees Past 12 M NR NR 0·5 NR
NACP, 2005 [26] 2005 South Darfur Conv sample (self-report) Tea and food sellers Lifetime NR NR 3·00 NR UNHCR, 2007 [27] 2006 Juba, South
Sudan
Pop-bsd survey (self-report) Gen pop (15-49 years) Lifetime NR NR 0·4 NR
UNHCR, 2007 [27] 2006 Juba, South
Sudan
Pop-bsd survey (self-report) Gen pop (15-49 years) Past 12 M NR NR 0·2 NR

233
Country
Author, year [citation]
Year(s)
of data
collection
City/
province Estimation methodology Sample type
Time
frame
Reported size estimate
N Range %* Range*
NAP, 2015 [28] 2008 Juba, South
Sudan
Conv sample (self-report) Gen pop Past 12 M NR NR 10 NR
NAP, 2015 [28] 2008 Morobo,
South Sudan
Conv sample (self-report) Gen pop Past 12 M NR NR 13 NR
WHO, 2011 [23] 2012 Juba, South
Sudan
NR FSWs Current 2,511 NR NR NR
WHO, 2011 [23] 2012 Yambio,
South Sudan
NR FSWs Current 375 NR NR NR
NAP, 2016 [29] 2015 Juba, Yei, &
Nimule,
South Sudan
NR FSWs NR 4,700 NR NR NR
MOH, 2016 [30] 2015-16 Juba, South
Sudan Multiplier unique object FSWs Past 6 M 5,800 4,927-6,673 NR NR
MOH, 2016 [30] 2015-16 Juba, South
Sudan Capture-recapture FSWs Past 6 M 5,306 4,673-5,939 NR NR
Tunisia
Hsairi, 2012 [31] 2011 Tunis Multiplier unique object Street-based FSWs Current 541 447-681 NR NR Hsairi, 2012 [31] 2011 Sfax Multiplier unique object Street-based FSWs Current 596 477-795 NR NR Hsairi, 2012 [31] 2011 Sousse Multiplier unique object Street-based FSWs Current 291 250-350 NR NR Yemen
MOH, 2010 [32] NR Aden Enumeration (time-location
geographical mapping)
FSWs Current NR 1,875-4,260 NR 1·16-2·64
MOH, 2010 [32] NR Hodeida Enumeration (time-location
geographical mapping)
FSWs Current NR 1,580-1,759 NR 1·89-2·10
MOH, 2010 [32] NR Mukallah Enumeration (time-location
geographical mapping)
FSWs Current NR 1,488-1,786 NR 2·07-2·49
MOH, 2010 [32] NR Sanaa Enumeration (time-location
geographical mapping)
FSWs Current NR 3,092-4,495 NR 0·64-2·10
MOH, 2010 [32] NR Taiz Enumeration (time-location
geographical mapping)
FSWs Current NR 1,050-1,835 NR 0·80-1·40
Clients of FSWs
Afghanistan
Mansoor, 2008[33] 2007 Balkh, Herat,
Kabul, &
Nangahar
Pop-bsd survey (self-report) Freshmen students Past 12 M NR NR 5·2 NR
Djibouti
Trellu-Kane, 2005[7] 2005 Djibouti Conv sample (self-report) Gen pop (13-24 years) Past 12 M NR NR 17 NR Iran
Shokoohi, 2012[34] NR Kerman Network scale-up,
(probability method) based
on conv sample
Gen pop Past 12 M 9,314 7,710-10,916 7·0 5·8-8·2

234
Country
Author, year [citation]
Year(s)
of data
collection
City/
province Estimation methodology Sample type
Time
frame
Reported size estimate
N Range %* Range*
Shokoohi, 2012 [34] NR Kerman Network scale-up,
(frequency method) based
on conv sample
Gen pop Past 12 M 3,203 1,704-5,130 2·4 1·3-3·9
Khalajabadi, 2018 [35] 2013-14 Tehran Pop-bsd survey (self-report) University students Last sex NR NR 1·3 NR Khalajabadi, 2018 [35] 2013-14 Tehran Pop-bsd survey (self-report) University students Lifetime NR NR 6·6 NR Lebanon
Melikian, 1954 [36] 1952 Beirut Conv sample (self-report) University students in
a liberal and
comparatively
Western college
student environment
Past 12 M NR NR 59·3 NR
Melikian, 1967[37] 1963 Beirut Conv sample (self-report) University students in
a liberal and
comparatively
Western college
student environment
Past 12 M NR NR 40·6 NR
Ghandour, 2014[38] 2012 Beirut Pop-bsd survey (self-report) University students
(18-30 years)
Lifetime
paid sex
NR NR 20·1 NR
Pakistan
Faisel, 2005 [39] 2004-05 Lahore Pop-bsd survey (self-report) Migrant workers Past 12 M NR NR 6·8 NR Minhas, 2005 [40] 2005 NR Self-report (conv sample) Students Current NR NR 7 NR Somalia
Ismail, 1990[41] 1986 Mogadishu Self-report (conv sample) Healthcare workers
and medical students
NR NR NR 48 NR
Ismail, 1990 [42] 1987 Jambaluul
village
Conv sample (self-report;
take all)
Gen pop Lifetime NR NR 29 NR
MOH, 2016 [24] 2016 Bossaso Enumeration (time-location
geographical mapping)
Secondary key
informants
Past 12 M 3,469 2,480-4,453 NR NR
MOH, 2016 [24] 2016 Bossaso Wisdom of the crowds Gen pop Past 12 M 3,530 NR NR NR MOH, 2016 [24] 2016 Hargeisa Enumeration (time-location
geographical mapping)
Secondary key
informants
Past 12 M 1,828 1,301-2,353 NR NR
MOH, 2016 [24] 2016 Hargeisa Wisdom of the crowds Gen pop Past 12 M 1,559 NR NR NR MOH, 2016 [24] 2016 Mogadishu Enumeration (time-location
geographical mapping)
Secondary key
informants
Past 12 M 2,599 1,801-3,395 NR NR
MOH, 2016 [24] 2016 Mogadishu Wisdom of the crowds Gen pop Past 12 M 2,202 NR NR NR Sudan
McCarthy, 1989[43] 1987-88 Port Sudan,
Kassala,
Gederef, Juba
& Omdurman
Conv sample (self-report) Soldiers attending
outpatient military
clinics
Lifetime NR NR 51·6 NR
Holt, 2003 [44] 1992 Dimma
refugee camp
Conv sample (self-report) Sudanese refugees Lifetime NR NR 46·0 39·0-53·0

235
Country
Author, year [citation]
Year(s)
of data
collection
City/
province Estimation methodology Sample type
Time
frame
Reported size estimate
N Range %* Range*
Holt, 2003 [44] 1992 Dimma
refugee camp
Conv sample (self-report) Sudanese refugees Past 3 M NR NR 31·0 25·0-38·0
NACP, 2002 [25] 2002 Blue Nile &
Equatoria
Conv sample (self-report) Military personnel Past 12 M NR NR 11·7 NR
UNHCR, 2007 [27] 2006 Juba, South
Sudan
Pop-bsd survey (self-report) Gen pop (15-49 years) Lifetime NR NR 1·7 NR
UNHCR, 2007 [27] 2006 Juba, South
Sudan
Pop-bsd survey (self-report) Gen pop (15-49 years) Past 12 M NR NR 1·4 NR
United Arab Emirates
MOH, 2014 [45] 2010-11 NR Conv sample (self-report) University students Lifetime NR NR 0·07 NR The table is sorted by year(s) of data collection or year of publication if year of data collection was not reported. *The decimal places of the population proportion figures are as reported in the original reports.
Abbreviations: ACP AIDS Control Program, ANC antenatal clinic, Conv convenience, DG Khan Dera Ghazi Khan, Gen general, FSWs female sex workers, M months, MOH ministry of Health, NACP National AIDS Control Programme, NAP National AIDS Program, NR not reported, Pop population, Pop-bsd population-based, SAR AIDS HDS South Asia Region AIDS Human Development Sector,
UNHCR United Nations Higher Commission for Refugees, WHO World Health Organization

236
Table S5 HIV point-prevalence measures in FSWs as extracted or obtained from various sources including the US Census Bureau database,
the WHO-EMRO, and the UNAIDS epidemiological fact sheets databases, among other sources of data
Country
Author, year [citation]
Year(s) of data
collection City/province Study site Sampling Population
Sample
size
HIV
prev*
(%)
Afghanistan
MENA HIV ESP, 2013[46] 2011-12 National NR NR FSWs 487 0
MENA HIV ESP, 2013 [46] 2012 National NR NR FSWs 1039 0·3
Algeria
Abu-Raddad, 2010 [2] 2004 NR NR NR FSWs NR 3·0
Abu-Raddad, 2010 [2] 2004 NR NR NR FSWs NR 4·0
Jenkins, 2003 [47] 1988 NR NR NR FSWs NR 1·2
MOH, 1990 [48] 1988 Oran NR Conv FSWs 52 1·9
MOH, 1990 [48] 1988 Blida NR Conv FSWs 34 0
MOH, 1990 [48] 1988 Tlemcen NR Conv FSWs 43 0
MOH, 1990 [48] 1988 Ghardaia NR Conv FSWs 19 0
MOH, 1990 [48] 1988 Biskra NR Conv FSWs 13 7·7
MOH, 1990 [48] 1988 Constantine NR Conv FSWs 237 0·4
MOH, 1990 [48] 1988 Tindouf NR Conv FSWs 11 0
Addad, 1993 [49] 1991 NR NR NR FSWs NR 0
Jenkins, 2003 [47] 2000 NR NR NR FSWs 20 10
MOH, 2009 [50] 2000 Tamanrasset & Oran Sentinel surveillance Conv FSWs 139 2·9
UNAIDS, 2008 [51] 2000 Tamanrasset NR NR FSWs NR 20
Abu-Raddad, 2010 [2] 2004 NR NR NR FSWs NR 2·0
MOH, 2009 [50] 2004 National Sentinel surveillance Conv FSWs 185 3·8
MOH, 2009 [50] 2007 National Sentinel surveillance Conv FSWs 380 4·0
MOH, 2016 [52] 2008 Tamanrasset Sentinel surveillance Conv FSWs 161 1·2
MOH, 2016 [52] 2012 Tamanrasset Sentinel surveillance Conv FSWs 109 4·6
MOH, 2014 [53] 2014 Saida Sentinel surveillance Conv FSWs 78 5·1
MOH, 2017 [54] 2017 NR NR NR FSWs NR 5·5
MOH, 2018 [55] 2018 NR NR NR FSWs NR 4·2
Bahrain
MOH, 2012 [56] 2010-11 National Detainment center Conv FSWs tested at detainment 724 0·8
Djibouti
Jenkins, 2003 [47] 1987 NR NR NR Street-based FSWs NR 3·9
UNAIDS, 2008 [51] 1987 Djibouti NR NR FSWs NR 2·1
Bailly, 1988 [57] 1987-88 NR NR NR FSWs 251 2·8
UNAIDS, 2008 [51] 1988 Djibouti NR NR FSWs NR 4·2
MENA HIV ESP, 2010 [2] 1989 NR Sentinel surveillance Conv FSWs 560 5·2
MENA HIV ESP, 2010 [2] 1989 NR Sentinel surveillance Conv Bar girls 476 2·1
MENA HIV ESP, 2010 [2] 1990 NR Sentinel surveillance Conv Bar girls 190 5·8
UNAIDS, 2008 [51] 1990 Djibouti (Major urban areas) NR NR FSWs NR 19·5
Jenkins, 2003 [47] 1991 NR NR NR Bar girls NR 14·2
MENA HIV ESP, 2010 [2] 1991 NR Sentinel surveillance Conv FSWs 449 31·4
MENA HIV ESP, 2010 [2] 1991 NR Sentinel surveillance Conv Bar girls 618 13·1

237
Country
Author, year [citation]
Year(s) of data
collection City/province Study site Sampling Population
Sample
size
HIV
prev*
(%)
OMS, 2001 [58] 1991 NR NR NR FSWs NR 39·8
UNAIDS, 2008 [51] 1991 Djibouti (Major urban areas) NR NR FSWs NR 26·0
MENA HIV ESP, 2010 [2] 1992 NR Sentinel surveillance Conv FSWs 400 43·0
MENA HIV ESP, 2010 [2] 1992 NR Sentinel surveillance Conv Bar girls 724 12·4
MOH, 1993[59] 1992 NR NR NR Street-based FSWs NR 51·4
MOH, 1993 [59] 1992 NR NR NR Bar girls NR 21·7
UNAIDS, 2008[51] 1992 Djibouti (Major urban areas) NR NR FSWs NR 36·6
Jenkins, 2003 [47] 1993 NR NR NR Bar girls NR 25·6
Jenkins, 2003 [47] 1993 NR NR NR Street-based FSWs NR 55·8
MOH, 1993 [59] 1993 NR NR NR Bar girls 411 23·4
MOH, 1993 [59] 1993 NR NR NR Street-based FSWs 313 56·5
OMS, 2001 [58] 1993 NR NR NR Bar girls NR 27·0
Shrestha, 1999 [60] 1993 NR Bars NR Bar girls 1039 14·7
Shrestha, 1999 [60] 1993 NR NR NR FSWs 571 47·5
UNAIDS, 2008 [51] 1993 Djibouti (Major urban areas) NR NR FSWs NR 37·7
UNAIDS, 2008 [51] 1993 Outside major urban areas NR NR FSWs NR 26·3
UNAIDS, 2008 [51] 1993 Outside major urban areas NR NR FSWs NR 0·1
Shrestha, 1999 [60] 1994 NR Bars NR Bar girls 852 12·2
Shrestha, 1999 [60] 1994 NR NR NR FSWs 573 45·4
UNAIDS, 2008 [51] 1994 Outside major urban areas NR NR FSWs NR 25·5
UNAIDS, 2008 [51] 1994 Outside major urban areas NR NR FSWs NR 0
Shrestha, 1999 [60] 1995 NR Bars NR Bar girls 68 11·8
UNAIDS, 2008 [51] 1995 Outside major urban areas NR NR FSWs NR 36·8
UNAIDS, 2008 [51] 1995 Outside major urban areas NR NR FSWs NR 0·1
Shrestha, 1999 [60] 1995 NR NR NR FSWs 364 41·5
US Dep. of State, 2000 [61] 1995 NR NR NR FSWs NR 57·0
Shrestha, 1999 [60] 1996 NR NR NR FSWs 294 32·7
UNAIDS, 2008 [51] 1996 Outside major urban areas NR NR FSWs NR 0
Shrestha, 1999 [60] 1997 NR NR NR FSWs 327 32·7
UNAIDS, 2008 [51] 1997 Outside major urban areas NR NR FSWs NR 0
Bahdon, 1998 [62] 1998 NR NR NR FSWs 117 28·2
MOH, 1999 [63] 1998 NR NR NR FSWs 142 27·5
UNAIDS, 2008 [51] 1998 Outside major urban areas NR NR FSWs NR 0
MENA HIV ESP, 2010 [2] 1999 NR Sentinel surveillance Conv FSWs 42 38·1
UNAIDS, 2008 [51] 1999 Outside major urban areas NR NR FSWs NR 0
UNAIDS, 2008 [51] 1999 Outside major urban areas NR NR FSWs NR 0
MENA HIV ESP, 2010 [2] 2000 NR Sentinel surveillance Conv FSWs 34 20·6
MOH, 2008 [64] 2007 NR NR NR FSWs 66 19·7
MOH, 2010 [65] 2007 NR Sentinel surveillance Conv FSWs NR 18·0
MOH, 2008 [64] 2008 NR NR NR FSWs 52 17·3
WHO, 2011 [23] 2008 NR Clinics Conv FSWs 79 20·3
MOH, 2010 [65] 2009 NR Sentinel surveillance Conv FSWs NR 15·3

238
Country
Author, year [citation]
Year(s) of data
collection City/province Study site Sampling Population
Sample
size
HIV
prev*
(%)
MENA HIV ESP, 2013 [46] 2012 Djibouti Clinical center Conv FSWs 718 13·1
Egypt
MENA HIV ESP, 2010 [2] 1989 NR Sentinel surveillance Conv FSWs 347 0
Mourad, 1992 [66] 1990-91 Cairo NR NR FSWs 154 0
MOH, 2001 [67] 1992 NR NR Conv FSWs 160 0
MOH, 2001 [67] 1993 NR NR Conv FSWs 221 0
Murugasampillay, 1995[68] 1993 Alexandria NR Conv FSWs 42 0
MOH, 2001 [67] 1994 NR NR Conv FSWs 194 0
MOH, 2001 [67] 1995 NR NR Conv FSWs 129 0
MENA HIV ESP, 2010 [2] 1996 NR Sentinel surveillance Conv FSWs 145 0·7
MOH, 2001 [67] 1996 NR NR Conv FSWs 112 0·9
MENA HIV ESP, 2010 [2] 1997 NR Sentinel surveillance Conv FSWs 79 0
MOH, 2001 [67] 1997 NR NR Conv FSWs 179 1·1
MENA HIV ESP, 2010 [2] 1998 NR Sentinel surveillance Conv FSWs 69 0
MOH, 2001 [67] 1998 NR NR Conv FSWs 269 1·5
MENA HIV ESP, 2010 [2] 1999 NR Sentinel surveillance Conv FSWs 172 0·6
MOH, 2001 [67] 1999 NR NR Conv FSWs 183 1·1
MOH, 2001 [67] 2000 NR NR Conv FSWs 129 0
MOH, 2001 [67] 2001 NR NR Conv FSWs 65 0
MENA HIV ESP, 2010 [2] 2002 NR Sentinel surveillance Conv FSWs 203 0
MENA HIV ESP, 2010 [2] 2003 NR Sentinel surveillance Conv FSWs 265 0
MENA HIV ESP, 2010 [2] 2003 NR Sentinel surveillance Conv Bar girls 181 0
MENA HIV ESP, 2010 [2] 2004 NR Sentinel surveillance Conv FSWs 345 0
US Census Bureau, 2017
[69] 2004 NR Sentinel surveillance Conv FSWs 308 0
MENA HIV ESP, 2010 [2] 2005 NR Sentinel surveillance Conv FSWs 192 0
MENA HIV ESP, 2010 [2] 2006 National NR NR FSWs & bar girls 975 0
Arafa, 2007 [70] 2006-07 Alexandria Clinic Conv FSWs NR 0
NAP, 2014 [71] 2010 Cairo NGO Conv FSWs 137 0
NAP, 2014 [71] 2013 NR VCT Conv FSWs 188 0·5
NAP, 2017 [72] 2016 NR Sentinel surveillance Conv FSWs 249 1·2
Iran
NACP, 1994 [73] 1987-91 NR Sentinel surveillance Conv FSWs 3596 0·03
MENA HIV ESP, 2010 [2] 1990 NR Sentinel surveillance Conv FSWs 708 0·1
MENA HIV ESP, 2010 [2] 1991-92 NR Sentinel surveillance Conv FSWs 2897 0
NACP, 1994 [73] 1993-94 Evin Sentinel surveillance Conv FSWs 400 0
Eltayeb, 1995 [74] 1994 NR Rehab. centers Conv FSWs 31 0
Shrestha, 1999 [60] 1995 NR NR NR FSWs 505 0
Shrestha, 1999 [60] 1996 NR NR NR FSWs 120 0
Shrestha, 1999 [60] 1997 NR NR NR FSWs 220 0
Shrestha, 1999 [60] 1998 NR NR NR FSWs 1605 0
MENA HIV ESP, 2010 [2] 1999 NR Sentinel surveillance Conv FSWs 800 0

239
Country
Author, year [citation]
Year(s) of data
collection City/province Study site Sampling Population
Sample
size
HIV
prev*
(%)
Feizzadeh, 2010 [75] 2000 Charmanhal Prison Conv Incarcerated FSWs NR 14
MENA HIV ESP, 2010 [2] 2000-01 NR Sentinel surveillance Conv FSWs 404 0
MENA HIV ESP, 2010 [2] 2002 NR Sentinel surveillance Conv FSWs 309 0
MENA HIV ESP, 2010 [2] 2003-05 NR Sentinel surveillance Conv FSWs 44 2·3
MENA HIV ESP, 2010 [2] 2005 Isfahan Sentinel surveillance Conv FSWs 258 0
MOH, 2006 [76] 2005 Tehran NR Conv FSWs 50 0
MENA HIV ESP, 2010 [2] 2006 Q1 & Q3 National NR NR FSWs & bar girls 301 2·7
MENA HIV ESP, 2010 [2] 2006 Isfhan Sentinel surveillance Conv FSWs 281 0
Feizzadeh, 2010 [75] 2007 Kermanshah PHC Conv FSWs attending clinics NR 3
Feizzadeh, 2010 [75] 2007 Kohkilouye Prison Conv Incarcerated FSWs NR 11
Iraq
MENA HIV ESP, 2010 [2] 1989 NR Sentinel surveillance Conv Bar girls 300 0
MENA HIV ESP, 2010 [2] 1989 NR Sentinel surveillance Conv FSWs 420 0
MENA HIV ESP, 2010 [2] 1990 NR Sentinel surveillance Conv Bar girls 429 0
MENA HIV ESP, 2010 [2] 1990 NR Sentinel surveillance Conv FSWs 678 0
MENA HIV ESP, 2010 [2] 1991 NR Sentinel surveillance Conv Bar girls 334 0
MENA HIV ESP, 2010 [2] 1991 NR Sentinel surveillance Conv FSWs 225 0
MENA HIV ESP, 2010 [2] 1992 NR Sentinel surveillance Conv Bar girls 369 0
MENA HIV ESP, 2010 [2] 1992 NR Sentinel surveillance Conv FSWs 14 0
Shrestha, 1999 [60] 1993 NR NR NR Bar girls 1337 0
Shrestha, 1999 [60] 1993 NR NR NR FSWs 987 0
Shrestha, 1999 [60] 1994 NR NR NR Bar girls 1083 0
Shrestha, 1999 [60] 1994 NR NR NR FSWs 1084 0
Shrestha, 1999 [60] 1995 NR NR NR Bar girls 876 0
Shrestha, 1999 [60] 1995 NR NR NR FSWs 1408 0
Shrestha, 1999 [60] 1996 NR NR NR Bar girls 472 0
Shrestha, 1999 [60] 1996 NR NR NR FSWs 1272 0·07
Shrestha, 1999 [60] 1997 NR NR NR Bar girls 582 0
Shrestha, 1999 [60] 1997 NR NR NR FSWs 475 0
Shrestha, 1999 [60] 1998 NR NR NR Bar girls 1027 0
Shrestha, 1999 [60] 1998 NR NR NR FSWs 12 0
Shrestha, 1999 [60] 1998 NR NR NR Bar girls 33 0
MENA HIV ESP, 2010 [2] 1999 NR Sentinel surveillance Conv Bar girls 98 0
MENA HIV ESP, 2010 [2] 1999 NR Sentinel surveillance Conv FSWs 1255 0
MENA HIV ESP, 2010 [2] 2000 NR Sentinel surveillance Conv Bar girls 87 0
MENA HIV ESP, 2010 [2] 2000 NR Sentinel surveillance Conv FSWs 199 0
MENA HIV ESP, 2010 [2] 2001 NR Sentinel surveillance Conv Bar girls 153 0
MENA HIV ESP, 2010 [2] 2001 NR Sentinel surveillance Conv FSWs 253 0
MENA HIV ESP, 2010 [2] 2002 NR Sentinel surveillance Conv Bar girls 96 0
MENA HIV ESP, 2010 [2] 2002 NR Sentinel surveillance Conv FSWs 294 0
Jordan
El-Tayeb, 1995 [77] 1990 NR NR NR FSWs 40 0
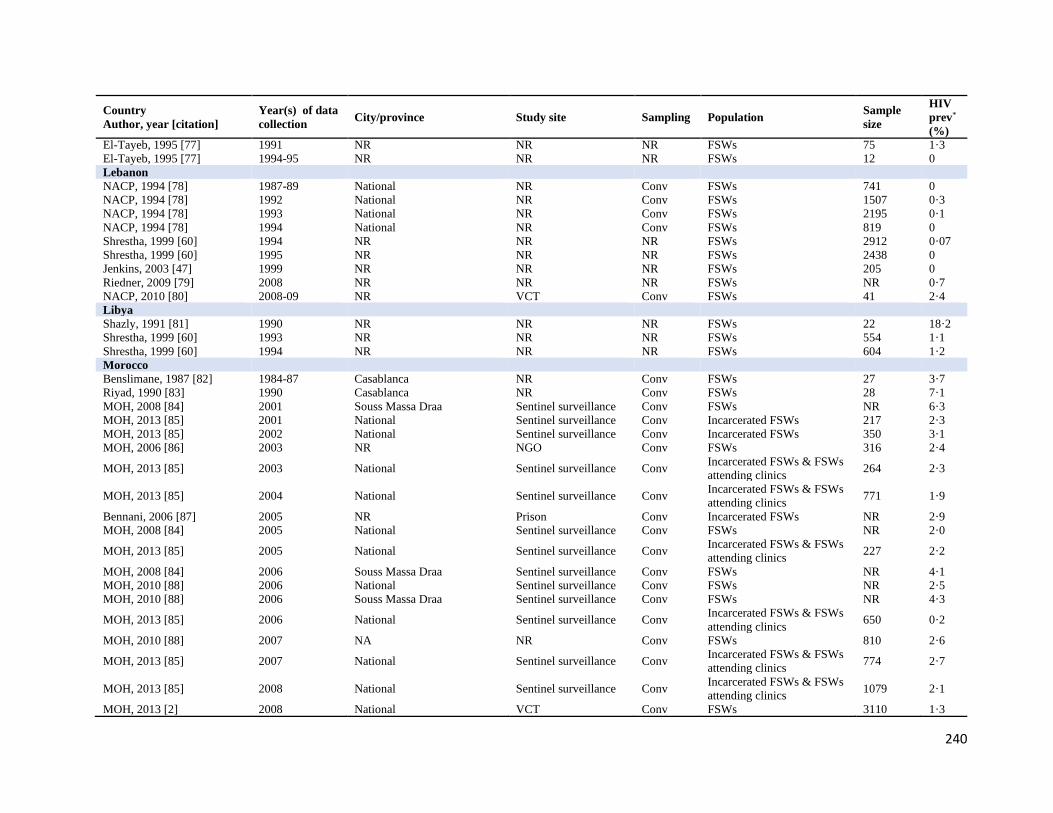
240
Country
Author, year [citation]
Year(s) of data
collection City/province Study site Sampling Population
Sample
size
HIV
prev*
(%)
El-Tayeb, 1995 [77] 1991 NR NR NR FSWs 75 1·3
El-Tayeb, 1995 [77] 1994-95 NR NR NR FSWs 12 0
Lebanon
NACP, 1994 [78] 1987-89 National NR Conv FSWs 741 0
NACP, 1994 [78] 1992 National NR Conv FSWs 1507 0·3
NACP, 1994 [78] 1993 National NR Conv FSWs 2195 0·1
NACP, 1994 [78] 1994 National NR Conv FSWs 819 0
Shrestha, 1999 [60] 1994 NR NR NR FSWs 2912 0·07
Shrestha, 1999 [60] 1995 NR NR NR FSWs 2438 0
Jenkins, 2003 [47] 1999 NR NR NR FSWs 205 0
Riedner, 2009 [79] 2008 NR NR NR FSWs NR 0·7
NACP, 2010 [80] 2008-09 NR VCT Conv FSWs 41 2·4
Libya
Shazly, 1991 [81] 1990 NR NR NR FSWs 22 18·2
Shrestha, 1999 [60] 1993 NR NR NR FSWs 554 1·1
Shrestha, 1999 [60] 1994 NR NR NR FSWs 604 1·2
Morocco
Benslimane, 1987 [82] 1984-87 Casablanca NR Conv FSWs 27 3·7
Riyad, 1990 [83] 1990 Casablanca NR Conv FSWs 28 7·1
MOH, 2008 [84] 2001 Souss Massa Draa Sentinel surveillance Conv FSWs NR 6·3
MOH, 2013 [85] 2001 National Sentinel surveillance Conv Incarcerated FSWs 217 2·3
MOH, 2013 [85] 2002 National Sentinel surveillance Conv Incarcerated FSWs 350 3·1
MOH, 2006 [86] 2003 NR NGO Conv FSWs 316 2·4
MOH, 2013 [85] 2003 National Sentinel surveillance Conv Incarcerated FSWs & FSWs
attending clinics 264 2·3
MOH, 2013 [85] 2004 National Sentinel surveillance Conv Incarcerated FSWs & FSWs
attending clinics 771 1·9
Bennani, 2006 [87] 2005 NR Prison Conv Incarcerated FSWs NR 2·9
MOH, 2008 [84] 2005 National Sentinel surveillance Conv FSWs NR 2·0
MOH, 2013 [85] 2005 National Sentinel surveillance Conv Incarcerated FSWs & FSWs
attending clinics 227 2·2
MOH, 2008 [84] 2006 Souss Massa Draa Sentinel surveillance Conv FSWs NR 4·1
MOH, 2010 [88] 2006 National Sentinel surveillance Conv FSWs NR 2·5
MOH, 2010 [88] 2006 Souss Massa Draa Sentinel surveillance Conv FSWs NR 4·3
MOH, 2013 [85] 2006 National Sentinel surveillance Conv Incarcerated FSWs & FSWs
attending clinics 650 0·2
MOH, 2010 [88] 2007 NA NR Conv FSWs 810 2·6
MOH, 2013 [85] 2007 National Sentinel surveillance Conv Incarcerated FSWs & FSWs
attending clinics 774 2·7
MOH, 2013 [85] 2008 National Sentinel surveillance Conv Incarcerated FSWs & FSWs
attending clinics 1079 2·1
MOH, 2013 [2] 2008 National VCT Conv FSWs 3110 1·3

241
Country
Author, year [citation]
Year(s) of data
collection City/province Study site Sampling Population
Sample
size
HIV
prev*
(%)
MOH, 2013 [85] 2009 National Sentinel surveillance Conv Incarcerated FSWs & FSWs
attending clinics 965 2·4
MOH, 2013 [2] 2009 National VCT Conv FSWs 3484 2·1
MOH, 2013 [85] 2010 National Sentinel surveillance Conv Incarcerated FSWs & FSWs
attending clinics 1158 2·7
MOH, 2013 [2] 2010 National VCT Conv FSWs 4380 2·4
MOH, 2013 [89] 2011 National Sentinel surveillance Conv FSWs 1432 1·8
MOH, 2013 [2] 2011 National VCT Conv FSWs 4895 1·8
Loudyi, 2013[90] 2012 Fes VCT Conv FSWs 927 0·9
MOH, 2013 [85] 2012 National Sentinel surveillance Conv FSWs attending clinics 643 2·0
MOH, 2013 {Abu-Raddad L,
2010 #43} 2012 National VCT Conv FSWs 10355 1·6
Pakistan
Girgis, 1990 [91] 1986-90 NR NR NR FSWs 84 0
MENA HIV ESP, 2010 [2] 1989 NR Sentinel surveillance Conv FSWs 84 0
MENA HIV ESP, 2010 [2] 1991-92 NR Sentinel surveillance Conv FSWs 17 0
Shrestha, 1999 [60] 1993 NR NR NR FSWs 649 1·2
Shrestha, 1999 [60] 1994-95 NR NR NR FSWs 142 0·7
UNAIDS, 2008 [51] 1995 Karachi NR NR FSWs NR 0
Shrestha, 1999 [60] 1996 NR NR NR FSWs 104 0
Rizvi, 1999 [92] 1997 Multan Red-light district Conv FSWs 577 0·5
MENA HIV ESP, 2010 [2] 1999-00 NR Sentinel surveillance Conv FSWs 186 3·8
MENA HIV ESP, 2010 [2] 2001 NR Sentinel surveillance Conv FSWs 103 0
Shah, 2001 [93] 2001 Sindh VCT Conv FSWs 60 1·7
MENA HIV ESP, 2010 [2] 2002-04 NR Sentinel surveillance Conv FSWs 24 8·3
Pasha, 2008 [94] 2007 Quetta NR NR FSWs 92 0
Riedner, 2009 [79] 2008 NR NR NR FSWs NR 0·2
Pasha, 2009 [95] 2009 Faisalabad NR NR FSWs 92 7
Pasha, 2011 [96] 2011 NR NR NR FSWs NR 1·2
Mir, 2013 [97] 2013 NR NR NR FSWs NR 0·6
Somalia
Omar, 1988 [98] 1986-87 Mogadishu Community (urban
areas) Conv FSWs 287 0·4
Jenkins, 2003 [47] 1990 NR NR NR FSWs NR 2
Jenkins, 2003 [47] 1990 NR NR NR FSWs NR 4
Duffy, 1999 [99] 1999 Somaliland NR NR FSWs 17 47·1
Sudan
Ahmed, 1990 [100] 1989 South Sudan NR NR FSWs 1027 2·8
Ahmed, 1990 [100] 1989 East Equatoria, South Sudan NR NR FSWs 171 7·6
Ahmed, 1990 [100] 1989 West Equatoria, South Sudan NR NR FSWs 70 24·3
MENA HIV ESP, 2010 [2] 1989 NR Sentinel surveillance Conv FSWs 920 2·7
Basha, 2006 [101] 2006 NR NR NR FSWs NR 1·6

242
Country
Author, year [citation]
Year(s) of data
collection City/province Study site Sampling Population
Sample
size
HIV
prev*
(%)
Abu-Raddad, 2010 [2] 2007 NR NR NR FSWs NR 1·7
Elrashied, 2009 [102] 2009 Khartoum NR NR FSWs 345 2·7
NAP, 2015 [28] 2011 NR NR NR FSWs NR 12
NAP, 2015 [28] 2014 NR NR NR FSWs 764 28·9
NAP, 2016 [29] 2015 South Sudan NGO Conv FSWs 2204 21
Syria
El-Tayeb, 1995 [103] 1987-89 NR Sentinel surveillance Conv FSWs 294 0
El-Tayeb, 1995 [103] 1990 NR Sentinel surveillance Conv FSWs 369 0
El-Tayeb, 1995 [103] 1991 NR Sentinel surveillance Conv FSWs 650 0
El-Tayeb, 1995 [103] 1992 NR Sentinel surveillance Conv FSWs 502 0
El-Tayeb, 1995 [103] 1992 NR Sentinel surveillance Conv Bar girls 1043 0
El-Tayeb, 1995 [103] 1993 NR Sentinel surveillance Conv FSWs 794 0
El-Tayeb, 1995 [103] 1993 NR Sentinel surveillance Conv Bar girls 697 0
El-Tayeb, 1995 [103] 1994 NR Sentinel surveillance Conv FSWs 555 0
El-Tayeb, 1995 [103] 1994 NR Sentinel surveillance Conv Bar girls 1825 0
Shrestha, 1999 [60] 1994 NR NR NR FSWs 525 0 Shrestha, 1999 [60] 1994 NR NR NR Bar girls 1901 0 El-Tayeb, 1995 [103] 1995 NR Sentinel surveillance Conv FSWs 59 0
El-Tayeb, 1995 [103] 1995 NR Sentinel surveillance Conv Bar girls 158 0
Shrestha, 1999 [60] 1995 NR NR NR FSWs 1289 0 Shrestha, 1999 [60] 1995 NR NR NR Bar girls 1269 0 Shrestha, 1999 [60] 1996 NR NR NR FSWs 1526 0 Shrestha, 1999 [60] 1996 NR NR NR Bar girls 1507 0 Shrestha, 1999 [60] 1997 NR NR NR FSWs 1707 0 Shrestha, 1999 [60] 1997 NR NR NR Bar girls 1717 0 Shrestha, 1999 [60] 1998 NR NR NR FSWs 1628 0·1
Shrestha, 1999 [60] 1998 NR NR NR Bar girls 2313 0·03
MENA HIV ESP, 2010 [2] 1999 NR Sentinel surveillance Conv FSWs 2688 0
MENA HIV ESP, 2010 [2] 1999 NR Sentinel surveillance Conv Bar girls 2278 0
Shrestha, 1999 [60] 1999 NR NR NR FSWs 1408 0 Shrestha, 1999 [60] 1999 NR NR NR Bar girls 1166 0 MENA HIV ESP, 2010 [2] 2000 NR Sentinel surveillance Conv Bar girls 2274 0
MENA HIV ESP, 2010 [2] 2000 NR Sentinel surveillance Conv FSWs 2188 0
MENA HIV ESP, 2010 [2] 2001 NR Sentinel surveillance Conv Bar girls 3304 0·1
MENA HIV ESP, 2010 [2] 2001 NR Sentinel surveillance Conv FSWs 2281 0
MENA HIV ESP, 2010 [2] 2002 NR Sentinel surveillance Conv Bar girls 2688 0·04
MENA HIV ESP, 2010 [2] 2002 NR Sentinel surveillance Conv FSWs 1846 0
MENA HIV ESP, 2010 [2] 2003 NR Sentinel surveillance Conv Bar girls 2653 0·04
MENA HIV ESP, 2010 [2] 2003 NR Sentinel surveillance Conv FSWs 1019 0
MENA HIV ESP, 2010 [2] 2004 NR Sentinel surveillance Conv Bar girls 4784 0·02
MENA HIV ESP, 2010 [2] 2004 NR Sentinel surveillance Conv FSWs 1324 0
MENA HIV ESP, 2010 [2] 2005 NR Sentinel surveillance Conv Bar girls 2673 0

243
Country
Author, year [citation]
Year(s) of data
collection City/province Study site Sampling Population
Sample
size
HIV
prev*
(%)
MENA HIV ESP, 2010 [2] 2005 NR Sentinel surveillance Conv FSWs 680 0·2
MOH, 2005 [104] 2005 Damascus Sentinel surveillance Conv FSWs 400 0·2
MENA HIV ESP, 2010 [2] 2006, Q1 National NR NR FSWs 197 0
MENA HIV ESP, 2010 [2] 2006, Q1 National NR NR Bar girls 1528 0
MENA HIV ESP, 2010 [2] 2006, Q2 National NR NR FSWs 311 0
MENA HIV ESP, 2010 [2] 2006, Q2 National NR NR Bar girls 1354 0
MENA HIV ESP, 2010 [2] 2006, Q3 National NR NR FSWs 121 0
MENA HIV ESP, 2010 [2] 2006, Q3 National NR NR Bar girls 2001 0
MENA HIV ESP, 2010 [2] 2006, Q4 National NR NR FSWs 345 0
MENA HIV ESP, 2010 [2] 2006, Q4 National NR NR Bar girls 1197 0
MENA HIV ESP, 2010 [2] 2007, Q2 National NR NR FSWs 596 0
MENA HIV ESP, 2010 [2] 2007, Q2 National NR NR Bar girls 3570 0
MENA HIV ESP, 2010 [2] 2007, Q3 National NR NR FSWs 526 0
MENA HIV ESP, 2010 [2] 2007, Q3 National NR NR Bar girls 3421 0
NACP, 2008 [105] 2007 NR Sentinel surveillance Conv FSWs 1288 0
NACP, 2008 [105] 2007 NR Sentinel surveillance Conv Bar girls 7024 0
Al-Sayed, 2010 [106] 2009 National Sentinel surveillance Conv FSWs 878 0
Al-Sayed, 2010 [106] 2009 National Sentinel surveillance Conv Bar girls 8479 0
MENA HIV ESP, 2013 [46] 2011 National NR NR FSWs 108 0
MENA HIV ESP, 2013 [46] 2011 National NR NR Bar girls 6145 0
Tunisia
Van de Perre, 1988 [107] 1985 NR NR NR FSWs 108 1·9
Giraldo, 1988 [108] 1985-87 NR NR NR FSWs 373 1·9
Gharbi, 1987 [109] 1987 Tunis NR NR FSWs 198 0
Taibi, 1989 [110] 1987 Sfax NR NR FSWs 36 0
MOH, 1990 [111] 1988-89 NR NR NR FSWs 970 0·6
MENA HIV ESP, 2010 [2] 1989 NR Sentinel surveillance Conv FSWs 523 0
MENA HIV ESP, 2010 [2] 1989 NR Sentinel surveillance Conv Bar girls 447 1·3
Fekih, 1991 [112] 1990 NR Sentinel surveillance Conv FSWs 273 0
MENA HIV ESP, 2010 [2] 1991 NR Sentinel surveillance Conv FSWs 374 0·3
MENA HIV ESP, 2010 [2] 1992 NR Sentinel surveillance Conv FSWs 778 0
MENA HIV ESP, 2010 [2] 1992 NR Sentinel surveillance Conv Bar girls 88 2·3
NAP, 2005 [113] 1992 NR NR Conv Street-based FSWs NR 2·3
Shrestha, 1999 [60] 1993 NR NR NR FSWs 402 0·3
Shrestha, 1999 [60] 1994 NR NR NR FSWs 880 0·1
Shrestha, 1999 [60] 1995 NR NR NR FSWs 1091 0
Shrestha, 1999 [60] 1996 NR NR NR FSWs 1020 0·4
NAP, 2005 [113] 1997 NR NR Conv Street-based FSWs NR 0
Shrestha, 1999 [60] 1997 NR NR NR FSWs 992 0·1
Shrestha, 1999 [60] 1998 NR NR NR FSWs 694 0
MENA HIV ESP, 2010 [2] 1999 NR Sentinel surveillance Conv FSWs 996 0
Shrestha, 1999 [60] 1999 NR NR NR FSWs 570 0
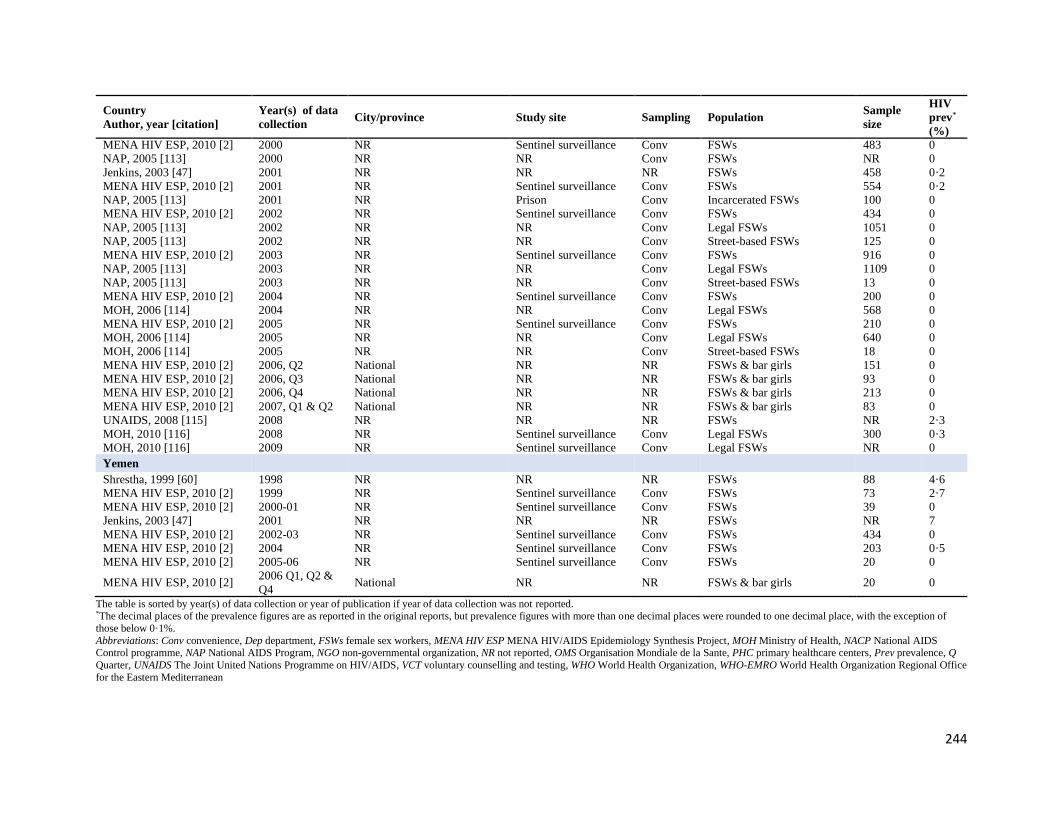
244
Country
Author, year [citation]
Year(s) of data
collection City/province Study site Sampling Population
Sample
size
HIV
prev*
(%)
MENA HIV ESP, 2010 [2] 2000 NR Sentinel surveillance Conv FSWs 483 0
NAP, 2005 [113] 2000 NR NR Conv FSWs NR 0
Jenkins, 2003 [47] 2001 NR NR NR FSWs 458 0·2
MENA HIV ESP, 2010 [2] 2001 NR Sentinel surveillance Conv FSWs 554 0·2
NAP, 2005 [113] 2001 NR Prison Conv Incarcerated FSWs 100 0
MENA HIV ESP, 2010 [2] 2002 NR Sentinel surveillance Conv FSWs 434 0
NAP, 2005 [113] 2002 NR NR Conv Legal FSWs 1051 0
NAP, 2005 [113] 2002 NR NR Conv Street-based FSWs 125 0
MENA HIV ESP, 2010 [2] 2003 NR Sentinel surveillance Conv FSWs 916 0
NAP, 2005 [113] 2003 NR NR Conv Legal FSWs 1109 0
NAP, 2005 [113] 2003 NR NR Conv Street-based FSWs 13 0
MENA HIV ESP, 2010 [2] 2004 NR Sentinel surveillance Conv FSWs 200 0
MOH, 2006 [114] 2004 NR NR Conv Legal FSWs 568 0
MENA HIV ESP, 2010 [2] 2005 NR Sentinel surveillance Conv FSWs 210 0
MOH, 2006 [114] 2005 NR NR Conv Legal FSWs 640 0
MOH, 2006 [114] 2005 NR NR Conv Street-based FSWs 18 0
MENA HIV ESP, 2010 [2] 2006, Q2 National NR NR FSWs & bar girls 151 0
MENA HIV ESP, 2010 [2] 2006, Q3 National NR NR FSWs & bar girls 93 0
MENA HIV ESP, 2010 [2] 2006, Q4 National NR NR FSWs & bar girls 213 0
MENA HIV ESP, 2010 [2] 2007, Q1 & Q2 National NR NR FSWs & bar girls 83 0
UNAIDS, 2008 [115] 2008 NR NR NR FSWs NR 2·3
MOH, 2010 [116] 2008 NR Sentinel surveillance Conv Legal FSWs 300 0·3
MOH, 2010 [116] 2009 NR Sentinel surveillance Conv Legal FSWs NR 0
Yemen
Shrestha, 1999 [60] 1998 NR NR NR FSWs 88 4·6
MENA HIV ESP, 2010 [2] 1999 NR Sentinel surveillance Conv FSWs 73 2·7
MENA HIV ESP, 2010 [2] 2000-01 NR Sentinel surveillance Conv FSWs 39 0
Jenkins, 2003 [47] 2001 NR NR NR FSWs NR 7
MENA HIV ESP, 2010 [2] 2002-03 NR Sentinel surveillance Conv FSWs 434 0
MENA HIV ESP, 2010 [2] 2004 NR Sentinel surveillance Conv FSWs 203 0·5
MENA HIV ESP, 2010 [2] 2005-06 NR Sentinel surveillance Conv FSWs 20 0
MENA HIV ESP, 2010 [2] 2006 Q1, Q2 &
Q4 National NR NR FSWs & bar girls 20 0
The table is sorted by year(s) of data collection or year of publication if year of data collection was not reported. *The decimal places of the prevalence figures are as reported in the original reports, but prevalence figures with more than one decimal places were rounded to one decimal place, with the exception of
those below 0·1%.
Abbreviations: Conv convenience, Dep department, FSWs female sex workers, MENA HIV ESP MENA HIV/AIDS Epidemiology Synthesis Project, MOH Ministry of Health, NACP National AIDS Control programme, NAP National AIDS Program, NGO non-governmental organization, NR not reported, OMS Organisation Mondiale de la Sante, PHC primary healthcare centers, Prev prevalence, Q
Quarter, UNAIDS The Joint United Nations Programme on HIV/AIDS, VCT voluntary counselling and testing, WHO World Health Organization, WHO-EMRO World Health Organization Regional Office
for the Eastern Mediterranean

245
Table S6 Summary of the risk of bias (ROB) assessment of size estimation and HIV prevalence
studies in FSWs and their clients (or proxy populations of clients), in the Middle East and North
Africa (MENA). Measures only extracted from routine databases with no reports describing the
study methodology were not included in the ROB assessment
ROB quality domains
Size estimation studies HIV prevalence studies
FSWs Clients FSWs Clients
n % n % n % n %
Sex work definition
Low ROB 153 95·0 39 100·0 116 78.9 12 36·4
High ROB 0 0·0 0 0·0 0 0.0 1 3·0
Unclear 8 5·0 0 0·0 31 21.1 20 60·6
Estimation methodology
Low ROB 156 96·9 27 69·2 NA NA NA NA
High ROB 5 3·1 12 30·8 NA NA NA NA
Unclear 0 0·0 0 0·0 NA NA NA NA
Rigor of sampling methodology
Low ROB NA NA NA NA 101 68.7 4 12·1
High ROB NA NA NA NA 43 29.3 29 87·9
Unclear NA NA NA NA 3 2.0 0 0·0
Response rate
Low ROB 86 53·4 19 48·7 92 62.6 4 12·1
High ROB 4 2·5 1 2·5 8 5.4 1 3·0
Unclear 71 44·1 19 48·7 47 32.0 28 84·9
HIV ascertainment
Low ROB NA NA NA NA 146 99.3 33 100·0
High ROB NA NA NA NA 1 0.7 0 0·0
Unclear NA NA NA NA 0 0.0 0 0·0
Total number of studies 161 100·0 39 100·0 147 100.0 33 100·0
Summary
Low ROB
At least 1 domain 161 100·0 39 100·0 147 100.0 33 100·0
At least 2 domains 152 94·4 32 82·1 125 85.0 13 39·4
At least 3 domains 82 50·9 14 35·9 79 53.7 2 6·1
High ROB
At least 1 domain 9 5·6 13 33·3 51 34.7 29 87·9
At least 2 domains 0 0·0 0 0·0 1 0.7 2 6·1
At least 3 domains 0 0·0 0 0·0 0 0.0 0 0·0
Abbreviations: FSWs female sex workers, NA not applicable
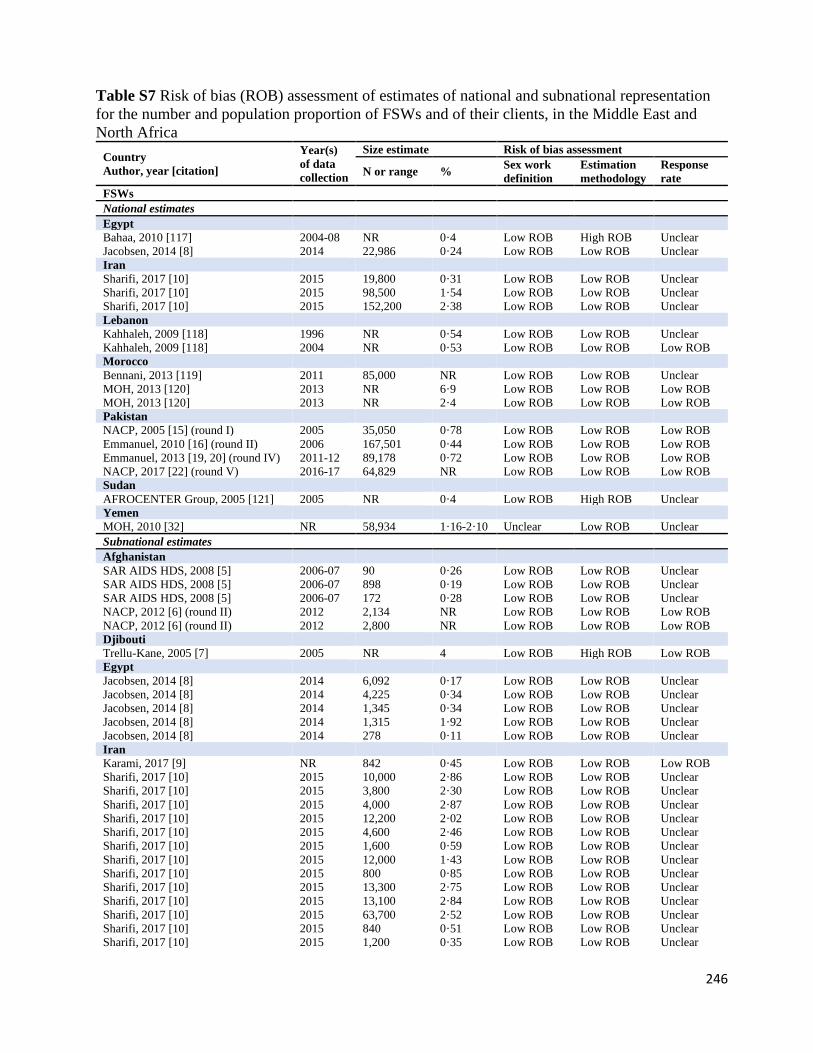
246
Table S7 Risk of bias (ROB) assessment of estimates of national and subnational representation
for the number and population proportion of FSWs and of their clients, in the Middle East and
North Africa
Country
Author, year [citation]
Year(s)
of data
collection
Size estimate Risk of bias assessment
N or range % Sex work
definition
Estimation
methodology
Response
rate
FSWs
National estimates
Egypt
Bahaa, 2010 [117] 2004-08 NR 0·4 Low ROB High ROB Unclear
Jacobsen, 2014 [8] 2014 22,986 0·24 Low ROB Low ROB Unclear
Iran
Sharifi, 2017 [10] 2015 19,800 0·31 Low ROB Low ROB Unclear
Sharifi, 2017 [10] 2015 98,500 1·54 Low ROB Low ROB Unclear
Sharifi, 2017 [10] 2015 152,200 2·38 Low ROB Low ROB Unclear
Lebanon
Kahhaleh, 2009 [118] 1996 NR 0·54 Low ROB Low ROB Unclear
Kahhaleh, 2009 [118] 2004 NR 0·53 Low ROB Low ROB Low ROB
Morocco
Bennani, 2013 [119] 2011 85,000 NR Low ROB Low ROB Unclear
MOH, 2013 [120] 2013 NR 6·9 Low ROB Low ROB Low ROB
MOH, 2013 [120] 2013 NR 2·4 Low ROB Low ROB Low ROB
Pakistan
NACP, 2005 [15] (round I) 2005 35,050 0·78 Low ROB Low ROB Low ROB
Emmanuel, 2010 [16] (round II) 2006 167,501 0·44 Low ROB Low ROB Low ROB
Emmanuel, 2013 [19, 20] (round IV) 2011-12 89,178 0·72 Low ROB Low ROB Low ROB
NACP, 2017 [22] (round V) 2016-17 64,829 NR Low ROB Low ROB Low ROB
Sudan
AFROCENTER Group, 2005 [121] 2005 NR 0·4 Low ROB High ROB Unclear
Yemen
MOH, 2010 [32] NR 58,934 1·16-2·10 Unclear Low ROB Unclear
Subnational estimates
Afghanistan
SAR AIDS HDS, 2008 [5] 2006-07 90 0·26 Low ROB Low ROB Unclear
SAR AIDS HDS, 2008 [5] 2006-07 898 0·19 Low ROB Low ROB Unclear
SAR AIDS HDS, 2008 [5] 2006-07 172 0·28 Low ROB Low ROB Unclear
NACP, 2012 [6] (round II) 2012 2,134 NR Low ROB Low ROB Low ROB
NACP, 2012 [6] (round II) 2012 2,800 NR Low ROB Low ROB Low ROB
Djibouti
Trellu-Kane, 2005 [7] 2005 NR 4 Low ROB High ROB Low ROB
Egypt
Jacobsen, 2014 [8] 2014 6,092 0·17 Low ROB Low ROB Unclear
Jacobsen, 2014 [8] 2014 4,225 0·34 Low ROB Low ROB Unclear
Jacobsen, 2014 [8] 2014 1,345 0·34 Low ROB Low ROB Unclear
Jacobsen, 2014 [8] 2014 1,315 1·92 Low ROB Low ROB Unclear
Jacobsen, 2014 [8] 2014 278 0·11 Low ROB Low ROB Unclear
Iran
Karami, 2017 [9] NR 842 0·45 Low ROB Low ROB Low ROB
Sharifi, 2017 [10] 2015 10,000 2·86 Low ROB Low ROB Unclear
Sharifi, 2017 [10] 2015 3,800 2·30 Low ROB Low ROB Unclear
Sharifi, 2017 [10] 2015 4,000 2·87 Low ROB Low ROB Unclear
Sharifi, 2017 [10] 2015 12,200 2·02 Low ROB Low ROB Unclear
Sharifi, 2017 [10] 2015 4,600 2·46 Low ROB Low ROB Unclear
Sharifi, 2017 [10] 2015 1,600 0·59 Low ROB Low ROB Unclear
Sharifi, 2017 [10] 2015 12,000 1·43 Low ROB Low ROB Unclear
Sharifi, 2017 [10] 2015 800 0·85 Low ROB Low ROB Unclear
Sharifi, 2017 [10] 2015 13,300 2·75 Low ROB Low ROB Unclear
Sharifi, 2017 [10] 2015 13,100 2·84 Low ROB Low ROB Unclear
Sharifi, 2017 [10] 2015 63,700 2·52 Low ROB Low ROB Unclear
Sharifi, 2017 [10] 2015 840 0·51 Low ROB Low ROB Unclear
Sharifi, 2017 [10] 2015 1,200 0·35 Low ROB Low ROB Unclear
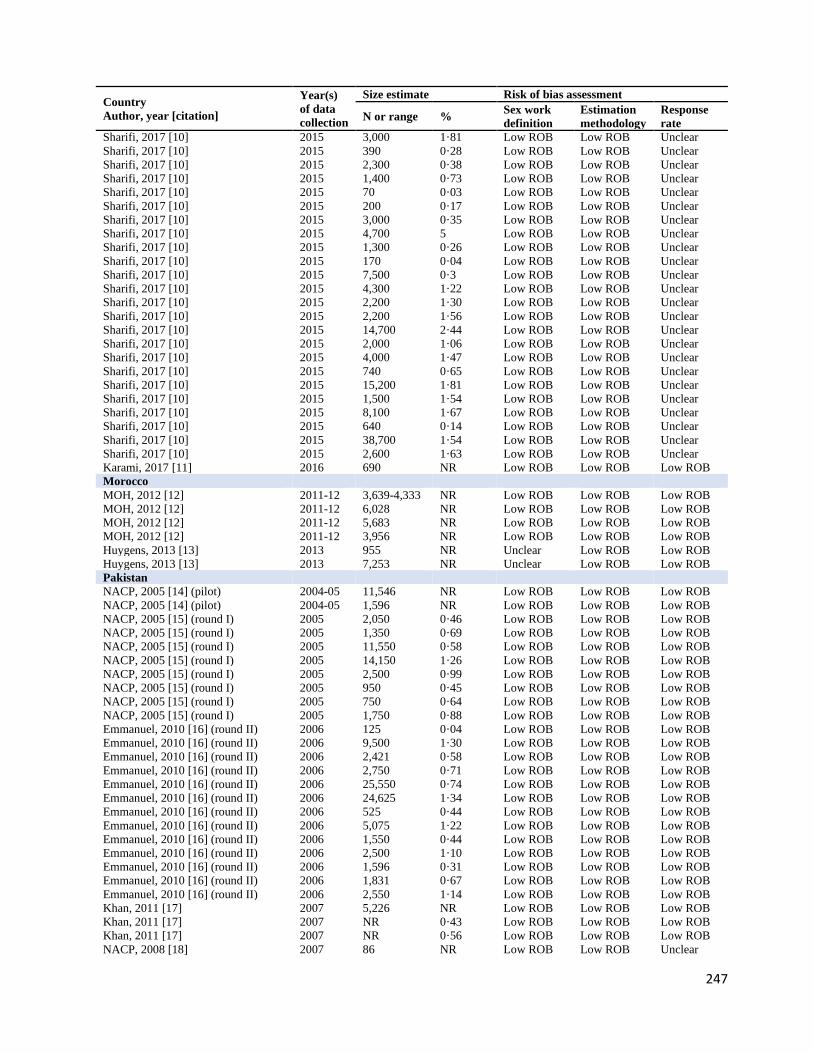
247
Country
Author, year [citation]
Year(s)
of data
collection
Size estimate Risk of bias assessment
N or range % Sex work
definition
Estimation
methodology
Response
rate
Sharifi, 2017 [10] 2015 3,000 1·81 Low ROB Low ROB Unclear
Sharifi, 2017 [10] 2015 390 0·28 Low ROB Low ROB Unclear
Sharifi, 2017 [10] 2015 2,300 0·38 Low ROB Low ROB Unclear
Sharifi, 2017 [10] 2015 1,400 0·73 Low ROB Low ROB Unclear
Sharifi, 2017 [10] 2015 70 0·03 Low ROB Low ROB Unclear
Sharifi, 2017 [10] 2015 200 0·17 Low ROB Low ROB Unclear
Sharifi, 2017 [10] 2015 3,000 0·35 Low ROB Low ROB Unclear
Sharifi, 2017 [10] 2015 4,700 5 Low ROB Low ROB Unclear
Sharifi, 2017 [10] 2015 1,300 0·26 Low ROB Low ROB Unclear
Sharifi, 2017 [10] 2015 170 0·04 Low ROB Low ROB Unclear
Sharifi, 2017 [10] 2015 7,500 0·3 Low ROB Low ROB Unclear
Sharifi, 2017 [10] 2015 4,300 1·22 Low ROB Low ROB Unclear
Sharifi, 2017 [10] 2015 2,200 1·30 Low ROB Low ROB Unclear
Sharifi, 2017 [10] 2015 2,200 1·56 Low ROB Low ROB Unclear
Sharifi, 2017 [10] 2015 14,700 2·44 Low ROB Low ROB Unclear
Sharifi, 2017 [10] 2015 2,000 1·06 Low ROB Low ROB Unclear
Sharifi, 2017 [10] 2015 4,000 1·47 Low ROB Low ROB Unclear
Sharifi, 2017 [10] 2015 740 0·65 Low ROB Low ROB Unclear
Sharifi, 2017 [10] 2015 15,200 1·81 Low ROB Low ROB Unclear
Sharifi, 2017 [10] 2015 1,500 1·54 Low ROB Low ROB Unclear
Sharifi, 2017 [10] 2015 8,100 1·67 Low ROB Low ROB Unclear
Sharifi, 2017 [10] 2015 640 0·14 Low ROB Low ROB Unclear
Sharifi, 2017 [10] 2015 38,700 1·54 Low ROB Low ROB Unclear
Sharifi, 2017 [10] 2015 2,600 1·63 Low ROB Low ROB Unclear
Karami, 2017 [11] 2016 690 NR Low ROB Low ROB Low ROB
Morocco
MOH, 2012 [12] 2011-12 3,639-4,333 NR Low ROB Low ROB Low ROB
MOH, 2012 [12] 2011-12 6,028 NR Low ROB Low ROB Low ROB
MOH, 2012 [12] 2011-12 5,683 NR Low ROB Low ROB Low ROB
MOH, 2012 [12] 2011-12 3,956 NR Low ROB Low ROB Low ROB
Huygens, 2013 [13] 2013 955 NR Unclear Low ROB Low ROB
Huygens, 2013 [13] 2013 7,253 NR Unclear Low ROB Low ROB
Pakistan
NACP, 2005 [14] (pilot) 2004-05 11,546 NR Low ROB Low ROB Low ROB
NACP, 2005 [14] (pilot) 2004-05 1,596 NR Low ROB Low ROB Low ROB
NACP, 2005 [15] (round I) 2005 2,050 0·46 Low ROB Low ROB Low ROB
NACP, 2005 [15] (round I) 2005 1,350 0·69 Low ROB Low ROB Low ROB
NACP, 2005 [15] (round I) 2005 11,550 0·58 Low ROB Low ROB Low ROB
NACP, 2005 [15] (round I) 2005 14,150 1·26 Low ROB Low ROB Low ROB
NACP, 2005 [15] (round I) 2005 2,500 0·99 Low ROB Low ROB Low ROB
NACP, 2005 [15] (round I) 2005 950 0·45 Low ROB Low ROB Low ROB
NACP, 2005 [15] (round I) 2005 750 0·64 Low ROB Low ROB Low ROB
NACP, 2005 [15] (round I) 2005 1,750 0·88 Low ROB Low ROB Low ROB
Emmanuel, 2010 [16] (round II) 2006 125 0·04 Low ROB Low ROB Low ROB
Emmanuel, 2010 [16] (round II) 2006 9,500 1·30 Low ROB Low ROB Low ROB
Emmanuel, 2010 [16] (round II) 2006 2,421 0·58 Low ROB Low ROB Low ROB
Emmanuel, 2010 [16] (round II) 2006 2,750 0·71 Low ROB Low ROB Low ROB
Emmanuel, 2010 [16] (round II) 2006 25,550 0·74 Low ROB Low ROB Low ROB
Emmanuel, 2010 [16] (round II) 2006 24,625 1·34 Low ROB Low ROB Low ROB
Emmanuel, 2010 [16] (round II) 2006 525 0·44 Low ROB Low ROB Low ROB
Emmanuel, 2010 [16] (round II) 2006 5,075 1·22 Low ROB Low ROB Low ROB
Emmanuel, 2010 [16] (round II) 2006 1,550 0·44 Low ROB Low ROB Low ROB
Emmanuel, 2010 [16] (round II) 2006 2,500 1·10 Low ROB Low ROB Low ROB
Emmanuel, 2010 [16] (round II) 2006 1,596 0·31 Low ROB Low ROB Low ROB
Emmanuel, 2010 [16] (round II) 2006 1,831 0·67 Low ROB Low ROB Low ROB
Emmanuel, 2010 [16] (round II) 2006 2,550 1·14 Low ROB Low ROB Low ROB
Khan, 2011 [17] 2007 5,226 NR Low ROB Low ROB Low ROB
Khan, 2011 [17] 2007 NR 0·43 Low ROB Low ROB Low ROB
Khan, 2011 [17] 2007 NR 0·56 Low ROB Low ROB Low ROB
NACP, 2008 [18] 2007 86 NR Low ROB Low ROB Unclear

248
Country
Author, year [citation]
Year(s)
of data
collection
Size estimate Risk of bias assessment
N or range % Sex work
definition
Estimation
methodology
Response
rate
NACP, 2008 [18] 2007 498 NR Low ROB Low ROB Unclear
NACP, 2008 [18] 2007 9 NR Low ROB Low ROB Unclear
NACP, 2008 [18] 2007 5 NR Low ROB Low ROB Unclear
NACP, 2008 [18] 2007 2 NR Low ROB Low ROB Unclear
NACP, 2008 [18] 2007 1,030 NR Low ROB Low ROB Unclear
NACP, 2008 [18] 2007 105 NR Low ROB Low ROB Unclear
Emmanuel, 2013 [19, 20] (round IV) 2011-12 1,413 1·30 Low ROB Low ROB Low ROB
Emmanuel, 2013 [19, 20] (round IV) 2011-12 4,846 0·50 Low ROB Low ROB Low ROB
Emmanuel, 2013 [19, 20] (round IV) 2011-12 2,994 1·19 Low ROB Low ROB High ROB
Emmanuel, 2013 [19, 20] (round IV) 2011-12 4,566 0·85 Low ROB Low ROB Low ROB
Emmanuel, 2013 [19, 20] (round IV) 2011-12 25,399 0·55 Low ROB Low ROB Low ROB
Emmanuel, 2013 [19, 20] (round IV) 2011-12 23,766 1·15 Low ROB Low ROB Low ROB
Emmanuel, 2013 [19, 20] (round IV) 2011-12 1,114 0·82 Low ROB Low ROB Low ROB
Emmanuel, 2013 [19, 20] (round IV) 2011-12 884 0·85 Low ROB Low ROB Low ROB
Emmanuel, 2013 [19, 20] (round IV) 2011-12 5,308 0·80 Low ROB Low ROB Low ROB
Emmanuel, 2013 [19, 20] (round IV) 2011-12 2,011 1·42 Low ROB Low ROB Low ROB
Emmanuel, 2013 [19, 20] (round IV) 2011-12 3,317 0·42 Low ROB Low ROB Low ROB
Emmanuel, 2013 [19, 20] (round IV) 2011-12 3,710 1·07 Low ROB Low ROB Low ROB
Emmanuel, 2013 [19, 20] (round IV) 2011-12 3,635 0·34 Low ROB Low ROB Low ROB
Emmanuel, 2013 [19, 20] (round IV) 2011-12 3,898 1·25 Low ROB Low ROB Low ROB
Emmanuel, 2013 [19, 20] (round IV) 2011-12 2,317 1·05 Low ROB Low ROB Low ROB
Punjab ACP, 2015 [21] 2014 7,556 NR Low ROB Low ROB Low ROB
Punjab ACP, 2015 [21] 2014 25,716 NR Low ROB Low ROB Low ROB
Punjab ACP, 2015 [21] 2014 6,561 NR Low ROB Low ROB Low ROB
Punjab ACP, 2015 [21] 2014 4,327 NR Low ROB Low ROB Low ROB
NACP, 2017 [22] (round V) 2016-17 6,201 NR Low ROB Low ROB Low ROB
NACP, 2017 [22] (round V) 2016-17 192 NR Low ROB Low ROB High ROB
NACP, 2017 [22] (round V) 2016-17 1,349 NR Low ROB Low ROB Low ROB
NACP, 2017 [22] (round V) 2016-17 4,069 NR Low ROB Low ROB Low ROB
NACP, 2017 [22] (round V) 2016-17 317 NR Low ROB Low ROB Low ROB
NACP, 2017 [22] (round V) 2016-17 4,426 NR Low ROB Low ROB Low ROB
NACP, 2017 [22] (round V) 2016-17 25,191 NR Low ROB Low ROB Low ROB
NACP, 2017 [22] (round V) 2016-17 1,739 NR Low ROB Low ROB Low ROB
NACP, 2017 [22] (round V) 2016-17 4,593 NR Low ROB Low ROB Low ROB
NACP, 2017 [22] (round V) 2016-17 2,084 NR Low ROB Low ROB Low ROB
NACP, 2017 [22] (round V) 2016-17 1,690 NR Low ROB Low ROB Low ROB
NACP, 2017 [22] (round V) 2016-17 765 NR Low ROB Low ROB Low ROB
NACP, 2017 [22] (round V) 2016-17 2,465 NR Low ROB Low ROB Low ROB
NACP, 2017 [22] (round V) 2016-17 4,121 NR Low ROB Low ROB Low ROB
NACP, 2017 [22] (round V) 2016-17 6,252 NR Low ROB Low ROB Low ROB
NACP, 2017 [22] (round V) 2016-17 2,031 NR Low ROB Low ROB High ROB
NACP, 2017 [22] (round V) 2016-17 3,307 NR Low ROB Low ROB Low ROB
NACP, 2017 [22] (round V) 2016-17 523 NR Low ROB Low ROB High ROB
Somalia
MOH, 2016 [24] 2016 911 NR Low ROB Low ROB Unclear
MOH, 2016 [24] 2016 1,126 NR Low ROB Low ROB Unclear
MOH, 2016 [24] 2016 963 NR Low ROB Low ROB Unclear
Sudan
NACP, 2002 [25] 2002 NR 0·83 Low ROB Low ROB Low ROB
NACP, 2002 [25] 2002 NR 0·5 Low ROB High ROB Low ROB
NACP, 2005 [26] 2005 NR 3 Low ROB High ROB Low ROB
UNHCR, 2007 [27] 2006 NR 0·4 Low ROB Low ROB Low ROB
UNHCR, 2007 [27] 2006 NR 0·2 Low ROB Low ROB Low ROB
MOH, 2016 [30] 2015-16 5,800 NR Low ROB Low ROB Low ROB
MOH, 2016 [30] 2015-16 5,306 NR Low ROB Low ROB Low ROB
Tunisia
Hsairi, 2012 [31] 2011 541 NR Low ROB Low ROB Low ROB
Hsairi, 2012 [31] 2011 596 NR Low ROB Low ROB Low ROB
Hsairi, 2012 [31] 2011 291 NR Low ROB Low ROB Low ROB
Yemen

249
Country
Author, year [citation]
Year(s)
of data
collection
Size estimate Risk of bias assessment
N or range % Sex work
definition
Estimation
methodology
Response
rate
MOH, 2010 [32] NR 1,875-4,260 1·16-2·64 Unclear Low ROB Unclear
MOH, 2010 [32] NR 1,580-1,759 1·89-2·10 Unclear Low ROB Unclear
MOH, 2010 [32] NR 1,488-1,786 2·07-2·49 Unclear Low ROB Unclear
MOH, 2010 [32] NR 3,092-4,495 0·64-2·10 Unclear Low ROB Unclear
MOH, 2010 [32] NR 1,050-1,835 0·80-1·40 Unclear Low ROB Unclear
Clients of FSWs
National estimates
Afghanistan
Todd, 2007 [122] 2005-06 NR 3·57 Low ROB Low ROB Unclear
Todd, 2012 [123] 2010-11 NR 12·5 Low ROB Low ROB Low ROB
Egypt
Bahaa, 2010 [117] 2004-08 NR 0·9 Low ROB High ROB Unclear
Lebanon
Kahhaleh, 2009 [118] 1996 NR 9·7 Low ROB Low ROB Unclear
Adib, 2002 [124] 1999 NR 13·84 Low ROB Low ROB Low ROB
Kahhaleh, 2009 [118] 2004 NR 5·65 Low ROB Low ROB Low ROB
Morocco
MOH, 2007 [125] 2007 NR 35·3 Low ROB Low ROB Unclear
MOH, 2007 [125] 2007 NR 2 Low ROB Low ROB Unclear
MOH, 2013 [120] 2013 NR 10·5 Low ROB Low ROB Low ROB
MOH, 2013 [120] 2013 NR 0·3 Low ROB Low ROB Low ROB
Pakistan
Mir, 2013 [126] 2007 NR 11·9 Low ROB Low ROB Low ROB
Mir, 2013 [126] 2007 NR 5·8 Low ROB Low ROB Low ROB
Sudan
NACP, 2004 [127] 2004 NR 0·3 Low ROB High ROB Unclear
AFROCENTER Group, 2005 [121] 2005 NR 0·5 Low ROB High ROB Unclear
Subnational estimates
Afghanistan
Mansoor, 2008 [33] 2007 NR 5·2 Low ROB Low ROB Low ROB
Djibouti
Trellu-Kane, 2005 [7] 2005 NR 17 Low ROB High ROB Low ROB
Iran
Shokoohi, 2012 [34] NR 9,314 7·0 Low ROB Low ROB Unclear
Shokoohi, 2012 [34] NR 3,203 2·4 Low ROB Low ROB Unclear
Khalajabadi, 2018 [35] 2013-14 NR 1·3 Low ROB Low ROB Low ROB
Khalajabadi, 2018 [35] 2013-14 NR 6·6 Low ROB Low ROB Low ROB
Lebanon
Melikian, 1954 [36] 1952 NR 59·3 Low ROB High ROB Unclear
Melikian, 1967 [37] 1963 NR 40·6 Low ROB High ROB Low ROB
Ghandour, 2014 [38] 2012 NR 20·1 Low ROB Low ROB High ROB
Pakistan
Faisel, 2005 [39] 2004-05 NR 6·8 Low ROB Low ROB Low ROB
Minhas, 2005 [40] 2005 NR 7 Low ROB High ROB Unclear
Somalia
Ismail, 1990 [41] 1986 NR 48 Low ROB High ROB Unclear
Ismail, 1990 [42] 1987 NR 29 Low ROB Low ROB Low ROB
MOH, 2016 [24] 2016 3,469 NR Low ROB Low ROB Unclear
MOH, 2016 [24] 2016 3,530 NR Low ROB Low ROB Unclear
MOH, 2016 [24] 2016 1,828 NR Low ROB Low ROB Unclear
MOH, 2016 [24] 2016 1,559 NR Low ROB Low ROB Unclear
MOH, 2016 [24] 2016 2,599 NR Low ROB Low ROB Unclear
MOH, 2016 [24] 2016 2,202 NR Low ROB Low ROB Unclear
Sudan
McCarthy, 1989 [43] 1987-88 NR 51·6 Low ROB High ROB Unclear
Holt, 2003 [44] 1992 NR 46·0 Low ROB High ROB Low ROB
Holt, 2003 [44] 1992 NR 31·0 Low ROB High ROB Low ROB
NACP, 2002 [25] 2002 NR 11·7 Low ROB High ROB Low ROB
UNHCR, 2007 [27] 2006 NR 1·7 Low ROB Low ROB Low ROB

250
Country
Author, year [citation]
Year(s)
of data
collection
Size estimate Risk of bias assessment
N or range % Sex work
definition
Estimation
methodology
Response
rate
UNHCR, 2007 [27] 2006 NR 1·4 Low ROB Low ROB Low ROB
The table is sorted by year(s) of data collection or year of publication if year of data collection was not reported. Abbreviations: ACP AIDS Control Program, FSWs female sex workers, MOH Ministry of Health, NACP National AIDS Control Programme, NAP
National AIDS Program, NR not reported, SAR AIDS HDS South Asia Region AIDS Human Development Sector, UNHCR United Nations Higher
Commission for Refugees

251
Table S8 Risk of bias (ROB) assessment of HIV prevalence studies in FSWs in the Middle East
and North Africa Country
Author, year [citation]
Year(s) of
data
collection
Sample
size
HIV
prev
(%)
Sex work
definition
Sampling
methodology
Response
rate
HIV
ascertainment
Studies using probability-based sampling
Afghanistan
SAR AIDS HDS, 2008 [5] 2006-07 45 0 Low ROB Low ROB Unclear Low ROB
SAR AIDS HDS, 2008 [5] 2006-07 87 0 Low ROB Low ROB Unclear Low ROB
NACP, 2010 [128] (round I) 2009 368 0 Low ROB Low ROB Low ROB Low ROB
NACP, 2012 [6] (round II) 2012 344 0·9 Low ROB Low ROB Low ROB Low ROB
NACP, 2012 [6] (round II) 2012 333 0 Low ROB Low ROB Low ROB Low ROB
NACP, 2012 [6] (round II) 2012 355 0 Low ROB Low ROB Low ROB Low ROB
Egypt
MOH, 2006 [129] (round I) 2006 118 0·8 Unclear High ROB High ROB Low ROB
MOH, 2010 [130] (round II) 2010 200 0 Low ROB High ROB Low ROB Low ROB
Iran
Navadeh, 2012 [131] 2010 139 0 Low ROB Low ROB Low ROB Low ROB
Sajadi, 2013 [132] (round I) 2010 817 4·5 Low ROB Low ROB Low ROB Low ROB
Kazerooni, 2014 [133] 2010-11 278 4·7 Low ROB Low ROB Low ROB Low ROB
Moaeyedi-Nia [134] 2012-13 161 5 Low ROB Low ROB Unclear Low ROB
Mirzazadeh, 2016 [135] (round
II) 2015 1,337 2·1 Low ROB High ROB Unclear Low ROB
Karami, 2017 [11] 2016 369 4·6 Low ROB Low ROB Low ROB High ROB
Jordan
WHO, 2011 [23] (round I) 2009 225 0 Unclear Low ROB Unclear Low ROB
MOH, 2014 [136] (round II) 2013 358 0·6 Low ROB Low ROB Unclear Low ROB
MOH, 2014 [136] (round II) 2013 102 0 Low ROB Low ROB Unclear Low ROB
MOH, 2014 [136] (round II) 2013 212 0·5 Low ROB Low ROB Unclear Low ROB
Lebanon
Mahfoud, 2010 [137] 2007-08 95 0 Low ROB Low ROB High ROB Low ROB
Libya
Valadez, 2013 [138] (round I) 2010-11 69 15·7 Low ROB Low ROB High ROB Low ROB
Morocco
MOH, 2012 [12] 2011-12 364 5·1 Low ROB Low ROB Low ROB Low ROB
MOH, 2012 [12] 2011-12 359 1·8 Low ROB Low ROB Low ROB Low ROB
MOH, 2012 [12] 2011-12 392 0 Low ROB Low ROB Low ROB Low ROB
MOH, 2012 [12] 2011-12 319 1·4 Low ROB Low ROB Low ROB Low ROB
Pakistan
Bokhari, 2007 [139] 2004 378 0·5 Low ROB Low ROB Low ROB Low ROB
NACP, 2005 [15] (round I) 2005 400 0 Low ROB Low ROB Low ROB Low ROB
NACP, 2005 [15] (round I) 2005 400 0 Low ROB Low ROB Low ROB Low ROB
NACP, 2005 [15] (round I) 2005 400 0·8 Low ROB Low ROB Low ROB Low ROB
NACP, 2005 [15] (round I) 2005 400 0 Low ROB Low ROB Low ROB Low ROB
NACP, 2005 [15] (round I) 2005 400 0 Low ROB Low ROB Low ROB Low ROB
NACP, 2005 [15] (round I) 2005 359 0 Low ROB Low ROB Low ROB Low ROB
NACP, 2005 [15] (round I) 2005 411 0·7 Low ROB Low ROB Low ROB Low ROB
NACP, 2005 [15] (round I) 2005 368 0 Low ROB Low ROB Low ROB Low ROB
NACP, 2007 [140] (round II) 2006 194 0 Low ROB Low ROB Low ROB Low ROB
NACP, 2007 [140] (round II) 2006 400 0 Low ROB Low ROB Low ROB Low ROB
NACP, 2007 [140] (round II) 2006 400 0 Low ROB Low ROB Low ROB Low ROB
NACP, 2007 [140] (round II) 2006 398 0·3 Low ROB Low ROB Low ROB Low ROB
NACP, 2007 [140] (round II) 2006 403 0 Low ROB Low ROB Low ROB Low ROB
NACP, 2007 [140] (round II) 2006 425 0·02 Low ROB Low ROB Low ROB Low ROB
NACP, 2007 [140] (round II) 2006 400 0 Low ROB Low ROB Low ROB Low ROB
NACP, 2007 [140] (round II) 2006 400 0 Low ROB Low ROB Low ROB Low ROB
NACP, 2007 [140] (round II) 2006 423 0 Low ROB Low ROB Low ROB Low ROB
NACP, 2007 [140] (round II) 2006 398 0 Low ROB Low ROB Low ROB Low ROB
NACP, 2007 [140] (round II) 2006 400 0 Low ROB Low ROB Low ROB Low ROB
NACP, 2007 [140] (round II) 2006 400 0 Low ROB Low ROB Low ROB Low ROB
Hawkes, 2009 [141] 2007 107 0 Low ROB Low ROB Low ROB Low ROB
Hawkes, 2009 [141] 2007 426 0 Low ROB Low ROB Unclear Low ROB

252
Country
Author, year [citation]
Year(s) of
data
collection
Sample
size
HIV
prev
(%)
Sex work
definition
Sampling
methodology
Response
rate
HIV
ascertainment
Khan, 2011 [17] 2007 730 0·7 Low ROB Low ROB Unclear Low ROB
NACP, 2010 [142] (special
IBBSS among FSWs) 2009 2,197 1·0 Unclear Unclear Unclear Low ROB
NACP, 2012 [20] (round IV) 2012 375 0·5 Low ROB Low ROB Low ROB Low ROB
NACP, 2012 [20] (round IV) 2012 376 0 Low ROB Low ROB Low ROB Low ROB
NACP, 2012 [20] (round IV) 2012 211 0·9 Low ROB Low ROB Low ROB Low ROB
NACP, 2012 [20] (round IV) 2012 377 1·9 Low ROB Low ROB Low ROB Low ROB
NACP, 2012 [20] (round IV) 2012 375 0·5 Low ROB Low ROB Low ROB Low ROB
NACP, 2012 [20] (round IV) 2012 375 1·9 Low ROB Low ROB Low ROB Low ROB
NACP, 2012 [20] (round IV) 2012 375 0·3 Low ROB Low ROB Low ROB Low ROB
NACP, 2012 [20] (round IV) 2012 367 0 Low ROB Low ROB Low ROB Low ROB
NACP, 2012 [20] (round IV) 2012 345 0 Low ROB Low ROB Low ROB Low ROB
NACP, 2012 [20] (round IV) 2012 375 0 Low ROB Low ROB High ROB Low ROB
NACP, 2012 [20] (round IV) 2012 345 0.3 Low ROB Low ROB Low ROB Low ROB
NACP, 2012 [20] (round IV) 2012 375 0.8 Low ROB Low ROB Low ROB Low ROB
NACP, 2017 [22] (round V) 2016-17 351 0 Low ROB Low ROB Low ROB Low ROB
NACP, 2017 [22] (round V) 2016-17 196 1.5 Low ROB Low ROB High ROB Low ROB
NACP, 2017 [22] (round V) 2016-17 364 0.8 Low ROB Low ROB Low ROB Low ROB
NACP, 2017 [22] (round V) 2016-17 304 0.7 Low ROB Low ROB Low ROB Low ROB
NACP, 2017 [22] (round V) 2016-17 250 0.4 Low ROB Low ROB Low ROB Low ROB
NACP, 2017 [22] (round V) 2016-17 364 2.2 Low ROB Low ROB Low ROB Low ROB
NACP, 2017 [22] (round V) 2016-17 387 2.6 Low ROB Low ROB Low ROB Low ROB
NACP, 2017 [22] (round V) 2016-17 364 0 Low ROB Low ROB Low ROB Low ROB
NACP, 2017 [22] (round V) 2016-17 364 4.1 Low ROB Low ROB Low ROB Low ROB
NACP, 2017 [22] (round V) 2016-17 364 4.1 Low ROB Low ROB Low ROB Low ROB
NACP, 2017 [22] (round V) 2016-17 364 3.8 Low ROB Low ROB Low ROB Low ROB
NACP, 2017 [22] (round V) 2016-17 265 3 Low ROB Low ROB Low ROB Low ROB
NACP, 2017 [22] (round V) 2016-17 364 0 Low ROB Low ROB Low ROB Low ROB
NACP, 2017 [22] (round V) 2016-17 364 0.3 Low ROB Low ROB Low ROB Low ROB
NACP, 2017 [22] (round V) 2016-17 363 1.7 Low ROB Low ROB Low ROB Low ROB
NACP, 2017 [22] (round V) 2016-17 364 8.8 Low ROB Low ROB Low ROB Low ROB
NACP, 2017 [22] (round V) 2016-17 193 0 Low ROB Low ROB High ROB Low ROB
NACP, 2017 [22] (round V) 2016-17 72 0 Low ROB Low ROB High ROB Low ROB
Somalia
Testa, 2008 [143] (round I) 2008 237 5.2 Low ROB Low ROB Low ROB Low ROB
IOM, 2017 [144] (round II) 2014 96 4.8 Low ROB Low ROB High ROB Low ROB
Sudan
Elkarim, 2002 [145] 2002 367 4.4 Low ROB Low ROB Unclear Low ROB
Abdelrahim, 2010 [146] 2008 321 0.9 Low ROB Low ROB Low ROB Low ROB
NACP, 2010 [147] 2008-09 267 0.1 Unclear Low ROB Unclear Low ROB
NACP, 2012 [148] 2011 305 0.3 Low ROB Low ROB Low ROB Low ROB
NACP, 2012 [148] 2011 279 1.5 Low ROB Low ROB Low ROB Low ROB
NACP, 2012 [148] 2011 282 0.6 Low ROB Low ROB Low ROB Low ROB
NACP, 2012 [148] 2011 296 0.7 Low ROB Low ROB Low ROB Low ROB
NACP, 2012 [148] 2011 288 5.0 Low ROB Low ROB Low ROB Low ROB
NACP, 2012 [148] 2011 287 0 Low ROB Low ROB Low ROB Low ROB
NACP, 2012 [148] 2011 303 0.7 Low ROB Low ROB Low ROB Low ROB
NACP, 2012 [148] 2011 296 1 Low ROB Low ROB Low ROB Low ROB
NACP, 2012 [148] 2011 293 7.7 Low ROB Low ROB Low ROB Low ROB
NACP, 2012 [148] 2011 291 0.7 Low ROB Low ROB Low ROB Low ROB
NACP, 2012 [148] 2011 303 0.7 Low ROB Low ROB Low ROB Low ROB
NACP, 2012 [148] 2011 299 0.2 Low ROB Low ROB Low ROB Low ROB
NACP, 2012 [148] 2011 284 1 Low ROB Low ROB Low ROB Low ROB
NACP, 2012 [148] 2011 288 1.3 Low ROB Low ROB Low ROB Low ROB
MOH, 2016 [30] 2015-16 835 37.9 Low ROB Low ROB Low ROB Low ROB
Tunisia
Hsairi, 2012 [31] 2009 703 0.4 Low ROB Low ROB Unclear Low ROB
Hsairi, 2012 [31] 2011 357 0.6 Low ROB Low ROB Low ROB Low ROB
Hsairi, 2012 [31] 2011 284 0 Low ROB Low ROB Low ROB Low ROB
Hsairi, 2012 [31] 2011 347 1.2 Low ROB Low ROB Low ROB Low ROB

253
Country
Author, year [citation]
Year(s) of
data
collection
Sample
size
HIV
prev
(%)
Sex work
definition
Sampling
methodology
Response
rate
HIV
ascertainment
Yemen
Stulhofer, 2008 [149] (round I) 2008 244 1.3 Unclear Low ROB Unclear Low ROB
MOH, 2014 [150] (round I) 2010-11 301 0 Unclear Low ROB Unclear Low ROB
Studies using non-probability sampling
Afghanistan
Todd, 2010 [151] 2006-08 520 0.2 Low ROB High ROB Unclear Low ROB
Djibouti
Rodier, 1993 [152] 1987 66 4.6 Low ROB High ROB Unclear Low ROB
Rodier, 1993 [152] 1987 221 1.4 Low ROB High ROB Unclear Low ROB
Constantine, 1992 [153] 1988 33 18.2 Unclear High ROB Unclear Low ROB
Rodier, 1993 [152] 1988 78 9.0 Low ROB High ROB Unclear Low ROB
Rodier, 1993 [152] 1988 255 2.7 Low ROB High ROB Unclear Low ROB
Rodier, 1993 [152] 1990 116 41.7 Low ROB High ROB Unclear Low ROB
Rodier, 1993 [152] 1990 180 5.0 Low ROB High ROB Unclear Low ROB
Couzineau, 1991 [154] 1991 300 43 Unclear High ROB Unclear Low ROB
Couzineau, 1991 [154] 1991 397 13.1 Unclear High ROB Unclear Low ROB
Rodier, 1993 [152] 1991 292 36.0 Low ROB High ROB Unclear Low ROB
Rodier, 1993 [152] 1991 360 15.3 Low ROB High ROB Unclear Low ROB
Philippon, 1997 [155] 1995 176 49 Unclear High ROB Unclear Low ROB
Marcelin, 2002 [156] 1998-99 43 70 Unclear High ROB Unclear Low ROB
Marcelin, 2002 [156] 1998-99 123 7 Unclear High ROB Unclear Low ROB
Egypt
Sheba, 1988 [157] 1986-87 87 0 Unclear High ROB Unclear Low ROB
Watts, 1993[158] 1986-90 349 0 Unclear High ROB Unclear Low ROB
Kabbash, 2012 [159] 2009-10 431 0 Unclear High ROB Low ROB Low ROB
Iran
Jahani, 2005 [160] 2002 149 0 Unclear High ROB Unclear Low ROB
Kassaian, 2012 [161] 2009-10 91 0 Low ROB High ROB Low ROB Low ROB
Taghizadeh, 2015 [162] 2014 184 4 Unclear High ROB Low ROB Low ROB
Asadi-Ali, 2018 [163] 2015 133 1.5 Low ROB High ROB Low ROB Low ROB
Lebanon
Naman, 1989 [164] 1985-87 291 0.3 Unclear High ROB Unclear Low ROB
Morocco
MOH, 2008 [165] 2007 141 1.4 Unclear High ROB Low ROB Low ROB
Pakistan
Iqbal, 1996 [166] 1987-94 21 0 Unclear High ROB Unclear Low ROB
Baqi, 1998 [167] 1993-94 77 0 Low ROB High ROB Low ROB Low ROB
Anwar, 1998 [168] NR 103 1.9 Unclear Unclear Unclear Low ROB
Bokhari, 2007 [139] 2004 421 0 Low ROB High ROB Low ROB Low ROB
Shah, 2004 [169] 2004 157 0 Unclear High ROB Unclear Low ROB
Shah, 2004 [170] 2004 163 1.2 Unclear High ROB Unclear Low ROB
Akhtar, 2008 [171] 2007 246 0 Unclear Unclear Unclear Low ROB
Raza, 2015 [172] 2014 NR 0 Unclear High ROB Unclear Low ROB
Somalia
Jama, 1987 [173] 1985-86 85 0 Unclear High ROB Unclear Low ROB
Burans, 1990 [174] NR 89 0 Unclear High ROB Low ROB Low ROB
Scott, 1991 [175] 1989 57 0 Unclear High ROB Unclear Low ROB
Corwin, 1991 [176] 1990 302 3 Unclear High ROB Unclear Low ROB
Jama Ahmed, 1991 [177] 1991 155 0.6 Unclear High ROB Unclear Low ROB
Sudan
Burans, 1990 [178] 1987 203 0 Low ROB High ROB Unclear Low ROB
McCarthy, 1995 [179] NR 50 16 Unclear High ROB Low ROB Low ROB
Tunisia
Bchir, 1988 [180] 1987 42 0 Low ROB High ROB Unclear Low ROB
Hassen, 2003 [181] NR 51 0 Low ROB High ROB Low ROB Low ROB
Znazen, 2010 [182] 2007 183 0 Low ROB High ROB Low ROB Low ROB
The table is sorted by year(s) of data collection.
Abbreviations: FSWs female sex workers, IBBSS integrated bio-behavioural surveillance survey, IOM International Organization for Migration,
MOH Ministry of Health, NACP National AIDS Control Programme, NAP National AIDS Program, NR not reported, Prev prevalence, SAR AIDS HDS South Asia Region AIDS Human Development Sector, WHO World Health Organization

254
Table S9 Risk of bias (ROB) assessment of HIV prevalence studies in clients of FSWs (or proxy
populations of clients) in the Middle East and North Africa
Country
Author, year [citation]
Year(s)
of data
collection
Sample
size
HIV
prev
(%)
Sex work
definition
Sampling
method
Response
rate
HIV
ascertainment
Djibouti
Rodier, 1993 [152] 1987 252 0.8 Unclear High ROB Unclear Low ROB
Rodier, 1993 [152] 1988 249 0.8 Unclear High ROB Unclear Low ROB
Fox, 1989 [183] NR 105 1.0 High ROB High ROB Unclear Low ROB
Rodier, 1993 [152] 1990 106 1.9 Unclear High ROB Unclear Low ROB
Rodier, 1993 [152] 1991 193 10.4 Unclear High ROB Unclear Low ROB
Egypt
Sheba, 1988 [157] 1986-87 302 0 Unclear High ROB Unclear Low ROB
Kuwait
Al-Owaish, 2000 [184] 1996-97 617 0 Low ROB Low ROB Unclear Low ROB
Al-Owaish, 2000 [184] 1996-97 1,367 0 Low ROB Low ROB Unclear Low ROB
Al-Owaish, 2002 [185] 2002 599 0 Unclear High ROB Unclear Low ROB
Al-Mutairi, 2007 [186] 2003-04 520 0 Low ROB High ROB High ROB Low ROB
Morocco
Heikel, 1999 [187] 1992-96 1,131 0.9 Unclear High ROB Unclear Low ROB
Manhart, 1996 [188] 1996 223 1.4 Unclear High ROB Unclear Low ROB
Alami, 2002 [189] 2001 422 0 Unclear High ROB Unclear Low ROB
Pakistan
Mujeeb, 1993 [190] NR 32 0 Unclear High ROB Unclear Low ROB
Memon, 1997 [191] 1994-95 50 0 Unclear High ROB Unclear Low ROB
NAP, 1996 [192] 1995 402 0 Unclear High ROB Unclear Low ROB
NAP, 1996 [192] 1995 295 0 Unclear High ROB Unclear Low ROB
Rehan, 2003 [193] 1999 138 0 Unclear High ROB Unclear Low ROB
Rehan, 2003 [193] 1999 148 0 Unclear High ROB Unclear Low ROB
Rehan, 2003 [193] 1999 93 1.1 Unclear High ROB Unclear Low ROB
Rehan, 2003 [193] 1999 86 0 Unclear High ROB Unclear Low ROB
Bhutto, 2011 [194] 2000-09 4,288 0.06 Low ROB High ROB Unclear Low ROB
Bokhari, 2007 [139] 2004 120 0 Low ROB Low ROB Low ROB Low ROB
Razvi, 2014 [195] 2010-14 465 1.1 Low ROB High ROB Unclear Low ROB
NAP, 2012 [196] 2011 381 0 Low ROB Low ROB Low ROB Low ROB
Somalia
Ismail, 1990 [41] 1986 101 0 Low ROB High ROB Unclear Low ROB
Scott, 1991 [175] 1989 50 0 Unclear High ROB Unclear Low ROB
Burans, 1990 [174] NR 45 0 Low ROB High ROB Low ROB Low ROB
Corwin, 1991 [176] 1990 26 0 Unclear High ROB Unclear Low ROB
Ismail, 2007 [197] 2007 NR 7.4 Unclear High ROB Low ROB Low ROB
Sudan
McCarthy, 1989 [198] 1987 157 0 Low ROB High ROB Unclear Low ROB
McCarthy, 1989 [43] 1987-88 398 2.5 Low ROB High ROB Unclear Low ROB
McCarthy, 1995 [179] NR 37 13.5 Low ROB High ROB Unclear Low ROB
The table is sorted by year(s) of data collection or year of publication if year of data collection was not reported.
Abbreviations: FSWs female sex workers, MOH Ministry of Health, NAP National AIDS Program, NR not reported, Prev prevalence

255
Table S10 Results of meta-regression analyses to identify associations with HIV prevalence, sources of between-study heterogeneity,
and trend in HIV prevalence in clients of FSWs (or proxy populations of clients such as male STI clinic attendees), in the Middle East
and North Africa (MENA) Studies Samples Univariable analyses Multivariable analysis
Sources of
heterogeneity*
Total
N Total N OR (95% CI)
LR test
p-value‡
Variance
explained R2£ (%) AOR (95% CI) p-value
LR test
p-value¥
Country/subregion**
Pakistan Pakistan 12 6,498 1.00 <0.001 29.0 1.00 <0.001 Egypt Egypt 6 1,362 1.34 (0.28-6.30) 1.56 (0.32-7.53) 0.581
Kuwait & Yemen Kuwait & Yemen† 7 6,535 0.24 (0.06-1.06) 0.26 (0.06-1.13) 0.072
Horn of Africa Djibouti, Somalia, South Sudan 27 3,269 19.58 (6.69-57.36) 17.85 (6.02-52.87) <0.001 North Africa Algeria, Morocco, Sudan 95 11,867 3.00 (1.16-7.76) 2.77 (0.95-8.05) 0.062
Total sample size of
tested clients/male
STI clinic attendees
<100 18 502 1.00 0.021 3.0 1.00 0.271
≥100 129 29,029 0.34 (0.14-0.84)
0.63 (0.28-1.44) 0.271
Median year of data
collection⁑
<2003 42 13,889 1.00 0.506 0 1.00 0.588
≥2003 105 15,642 1.25 (0.64-2.46) 1.24 (0.57-2.72) 0.588 *Only country, sample size, and year of data collection had sufficient number of studies to warrant conduct of meta-regression analyses. **Countries were grouped based on geography and similarity in HIV prevalence levels. Given the large fraction of studies with zero HIV prevalence, particularly in the Fertile Crescent, an increment of 0.1 was added to number of events in all studies when generating log odds, and Eastern MENA was thus used also as a statistically better reference. While this choice of increment was arbitrary, other
increments yielded the same findings, though some of the effect sizes changed in scale. ⁑Year grouping was driven by independent evidence identifying the emergence of HIV epidemics among both men who have sex with men[3] and people who inject drugs[4] in multiple MENA countries
around 2003. Missing values for year of data collection (only four stratified measures) were imputed using data for year of publication adjusted by the median difference between year of publication and
median year of data collection (for studies with complete information). †Only one study was from Yemen. ‡Predictors with p-value ≤0.1 were considered as showing strong evidence for an association with (prevalence) odds, and were hence included in the multivariable analysis. Median year was also included
in the multivariable model given its importance. £Adjusted R-squared in the final multivariable model=28.78% ¥Predictors with p-value ≤0.1 in the multivariable model were considered as showing strong evidence for an association with (prevalence) odds.
Abbreviations: AOR adjusted odds ratio, CI confidence interval, Coll collection, FSWs female sex workers, LR likelihood ratio, OR odds ratio, STI sexually transmitted infection
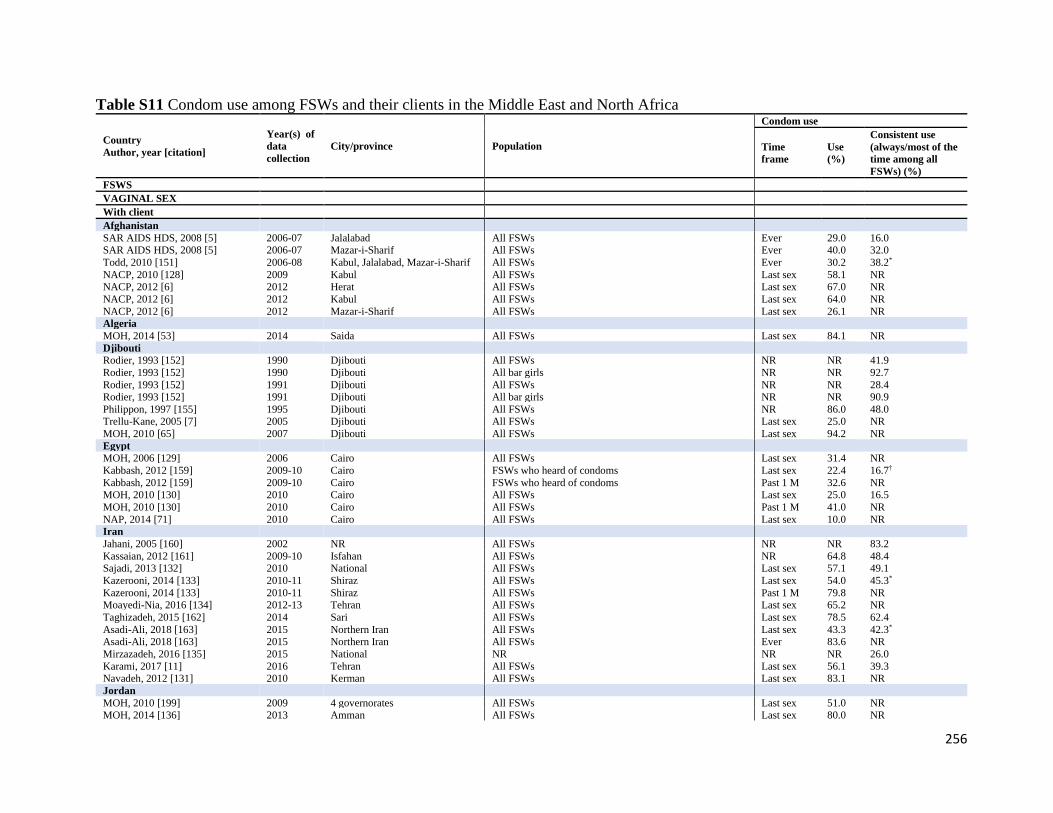
256
Table S11 Condom use among FSWs and their clients in the Middle East and North Africa
Country
Author, year [citation]
Year(s) of
data
collection
City/province Population
Condom use
Time
frame Use
(%)
Consistent use
(always/most of the
time among all
FSWs) (%)
FSWS
VAGINAL SEX
With client
Afghanistan
SAR AIDS HDS, 2008 [5] 2006-07 Jalalabad All FSWs Ever 29.0 16.0 SAR AIDS HDS, 2008 [5] 2006-07 Mazar-i-Sharif All FSWs Ever 40.0 32.0
Todd, 2010 [151] 2006-08 Kabul, Jalalabad, Mazar-i-Sharif All FSWs Ever 30.2 38.2*
NACP, 2010 [128] 2009 Kabul All FSWs Last sex 58.1 NR NACP, 2012 [6] 2012 Herat All FSWs Last sex 67.0 NR
NACP, 2012 [6] 2012 Kabul All FSWs Last sex 64.0 NR
NACP, 2012 [6] 2012 Mazar-i-Sharif All FSWs Last sex 26.1 NR Algeria
MOH, 2014 [53] 2014 Saida All FSWs Last sex 84.1 NR
Djibouti Rodier, 1993 [152] 1990 Djibouti All FSWs NR NR 41.9
Rodier, 1993 [152] 1990 Djibouti All bar girls NR NR 92.7
Rodier, 1993 [152] 1991 Djibouti All FSWs NR NR 28.4 Rodier, 1993 [152] 1991 Djibouti All bar girls NR NR 90.9
Philippon, 1997 [155] 1995 Djibouti All FSWs NR 86.0 48.0 Trellu-Kane, 2005 [7] 2005 Djibouti All FSWs Last sex 25.0 NR MOH, 2010 [65] 2007 Djibouti All FSWs Last sex 94.2 NR Egypt
MOH, 2006 [129] 2006 Cairo All FSWs Last sex 31.4 NR
Kabbash, 2012 [159] 2009-10 Cairo FSWs who heard of condoms Last sex 22.4 16.7†
Kabbash, 2012 [159] 2009-10 Cairo FSWs who heard of condoms Past 1 M 32.6 NR MOH, 2010 [130] 2010 Cairo All FSWs Last sex 25.0 16.5
MOH, 2010 [130] 2010 Cairo All FSWs Past 1 M 41.0 NR
NAP, 2014 [71] 2010 Cairo All FSWs Last sex 10.0 NR Iran
Jahani, 2005 [160] 2002 NR All FSWs NR NR 83.2
Kassaian, 2012 [161] 2009-10 Isfahan All FSWs NR 64.8 48.4 Sajadi, 2013 [132] 2010 National All FSWs Last sex 57.1 49.1
Kazerooni, 2014 [133] 2010-11 Shiraz All FSWs Last sex 54.0 45.3*
Kazerooni, 2014 [133] 2010-11 Shiraz All FSWs Past 1 M 79.8 NR Moayedi-Nia, 2016 [134] 2012-13 Tehran All FSWs Last sex 65.2 NR
Taghizadeh, 2015 [162] 2014 Sari All FSWs Last sex 78.5 62.4
Asadi-Ali, 2018 [163] 2015 Northern Iran All FSWs Last sex 43.3 42.3* Asadi-Ali, 2018 [163] 2015 Northern Iran All FSWs Ever 83.6 NR
Mirzazadeh, 2016 [135] 2015 National NR NR NR 26.0
Karami, 2017 [11] 2016 Tehran All FSWs Last sex 56.1 39.3 Navadeh, 2012 [131] 2010 Kerman All FSWs Last sex 83.1 NR
Jordan
MOH, 2010 [199] 2009 4 governorates All FSWs Last sex 51.0 NR MOH, 2014 [136] 2013 Amman All FSWs Last sex 80.0 NR

257
MOH, 2014 [136] 2013 Irbid All FSWs Last sex 67.0 NR Morocco
MOH, 2006 [86] 2003 NR All FSWs Last sex 37.3 NR
MOH, 2008 [165] 2007 Agadir, Rabat Sale, Tanger Al FSWs NR 83.0 40.4 MOH, 2012 [12] 2011-12 Agadir All FSWs Last sex 42.0 28.7
MOH, 2012 [12] 2011-12 Fes All FSWs Last sex 49.5 26.3
MOH, 2012 [12] 2011-12 Rabat All FSWs Last sex 51.1 34.6 MOH, 2012 [12] 2011-12 Tanger All FSWs Last sex 63.1 58.3
MOH, 2013 [120] 2013 National All FSWs Past 12 M 61.0 6.4
Lebanon
Mahfoud, 2010 [137] 2007-08 Greater Beirut All FSWs Past 1 M 97.7 95.2
Pakistan
Baqi, 1998 [167] 1993-94 Karachi All FSWs Ever 9.8 0
NACP, 2005[200] 2004 Karachi All FSWs Last sex 25.0 NR
NACP, 2005 [200] 2004 Lahore All FSWs Last sex 53.0 NR
NACP, 2005 [14] 2004-05 Karachi All FSWs Last sex 36.7 18.1 NACP, 2005 [14] 2004-05 Rawalpindi All FSWs Last sex 49.3 16.7
NACP, 2005 [15] 2005 Faisalabad All FSWs Last sex 19.0 3.0
NACP, 2005 [15] 2005 Hyderabad All FSWs Last sex 17.0 13.0 NACP, 2005 [15] 2005 Karachi All FSWs Last sex 50.0 30.0
NACP, 2005 [15] 2005 Lahore All FSWs Last sex 68.0 42.0
NACP, 2005 [15] 2005 Multan All FSWs Last sex 35.0 14.0 NACP, 2005 [15] 2005 Peshawar All FSWs Last sex 23.0 11.0
NACP, 2005 [15] 2005 Quetta All FSWs Last sex 40.0 16.0
NACP, 2005 [15] 2005 Sukkur All FSWs Last sex 17.0 13.0 NACP, 2007 [140] 2006 National All FSWs Last sex 45.0 23.0
NACP, 2007 [140] 2006 Bannu All FSWs NR NR 5.0
NACP, 2007 [140] 2006 Faisalabad All FSWs NR NR 16.0
NACP, 2007 [140] 2006 Gujranwala All FSWs NR NR 12.0
NACP, 2007 [140] 2006 Hyderabad All FSWs NR NR 36.0 NACP, 2007 [140] 2006 Karachi All FSWs NR NR 44.0
NACP, 2007 [140] 2006 Lahore All FSWs NR NR 31.0
NACP, 2007 [140] 2006 Larkana All FSWs NR NR 28.0 NACP, 2007 [140] 2006 Multan All FSWs NR NR 5.0
NACP, 2007 [140] 2006 Peshawar All FSWs NR NR 33.0
NACP, 2007 [140] 2006 Quetta All FSWs NR NR 33.0 NACP, 2007 [140] 2006 Rawalpindi All FSWs NR NR 31.0
NACP, 2007 [140] 2006 Sargodha All FSWs NR NR 12.0
NACP, 2007 [140] 2006 Sukkur All FSWs NR NR 7.0 Hawkes, 2009 [141] 2007 Abbottabad, Rawalpindi All FSWs Last sex 38.0 12.0
Khan, 2011 [17] 2007 Lahore All FSWs NR NR 65.0
NACP, 2010 [142] 2009 Punjab All FSWs Last sex 43.3 NR
NACP, 2012 [20] 2011 DG Khan All FSWs Last sex 32.0 8.0
NACP, 2012 [20] 2011 Faisalabad All FSWs Last sex 43.0 30.0
NACP, 2012 [20] 2011 Karachi All FSWs Last sex 67.0 48.0 NACP, 2012 [20] 2011 Haripur All FSWs Last sex 44.0 24.0
NACP, 2012 [20] 2011 Lahore All FSWs Last sex 46.0 31.0
NACP, 2012 [20] 2011 Larkana All FSWs Last sex 58.0 53.0 NACP, 2012 [20] 2011 Multan All FSWs Last sex 48.0 24.0
NACP, 2012 [20] 2011 Peshawar All FSWs Last sex 43.0 27.0
NACP, 2012 [20] 2011 Quetta All FSWs Last sex 57.0 38.0

258
NACP, 2012 [20] 2011 Rawalpindi All FSWs Last sex 14.0 8.0 NACP, 2012 [20] 2011 Sargodha All FSWs Last sex 35.5 14.0
NACP, 2012 [20] 2011 Sukkur All FSWs Last sex 21.0 5.0
Punjab NACP, 2015 [201] 2014 Faisalabad All FSWs Last sex 71.2 38.2 Punjab NACP, 2015 [201] 2014 Lahore All FSWs Last sex 66.2 32.4
Punjab NACP, 2015 [201] 2014 Multan All FSWs Last sex 68.4 34.6
Punjab NACP, 2015 [201] 2014 Sargodha All FSWs Last sex 74.4 37.2 NACP, 2017 [22] 2016-17 Bahawalpur All FSWs Last sex 58.0 39.8
NACP, 2017 [22] 2016-17 Bannu All FSWs Last sex 74.0 46.4
NACP, 2017 [22] 2016-17 DG Khan All FSWs Last sex 65.1 29.4 NACP, 2017 [22] 2016-17 Gujranwala All FSWs Last sex 65.8 65.5
NACP, 2017 [22] 2016-17 Gujrat All FSWs Last sex 31.0 16.7
NACP, 2017 [22] 2016-17 Hyderabad All FSWs Last sex 59.9 37.9
NACP, 2017 [22] 2016-17 Larkana All FSWs Last sex 11.8 11.3
NACP, 2017 [22] 2016-17 Karachi All FSWs Last sex 61.5 45.5
NACP, 2017 [22] 2016-17 Kasur All FSWs Last sex 29.4 23.6 NACP, 2017 [22] 2016-17 Mirpurkhas All FSWs Last sex 28.8 17.3
NACP, 2017 [22] 2016-17 Nawabshah All FSWs Last sex 14.8 4.7
NACP, 2017 [22] 2016-17 Peshawar All FSWs Last sex 67.9 46.8 NACP, 2017 [22] 2016-17 Quetta All FSWs Last sex 89.8 75.0
NACP, 2017 [22] 2016-17 Rawalpindi All FSWs Last sex 4.1 1.1
NACP, 2017 [22] 2016-17 Sheikhupura All FSWs Last sex 74.4 72.7 NACP, 2017 [22] 2016-17 Sialkot All FSWs Last sex 94.8 93.3
NACP, 2017 [22] 2016-17 Sukkur All FSWs Last sex 61.4 55.8
NACP, 2017 [22] 2016-17 Turbat All FSWs Last sex 45.8 12.5 Somalia
Testa, 2008 [143] 2008 Hargeisa All FSWs Last sex 25.6 6.0
IOM, 2017 [144] 2014 Hargeisa All FSWs Last sex 31.5 17.5
Sudan
Elkarim, 2002 [145] 2002 National All FSWs Last sex 1.2 0.9 Abdelrahim, 2010 [146] 2008 Khartoum All FSWs Last sex 45.0 35.9
Elhadi, 2013 [202] 2011 Alshamalia All FSWs Last sex 41.0 24.1
Elhadi, 2013 [202] 2011 Blue Nile All FSWs Last sex 4.7 23.9 Elhadi, 2013 [202] 2011 Gadarif All FSWs Last sex 16.2 12.4
Elhadi, 2013 [202] 2011 Gezira All FSWs Last sex 8.2 5.0
Elhadi, 2013 [202] 2011 Kassala All FSWs Last sex 55.1 0.7 Elhadi, 2013 [202] 2011 Khartoum All FSWs Last sex 30.3 18.5
Elhadi, 2013 [202] 2011 North Darfur All FSWs Last sex 23.0 11.4
Elhadi, 2013 [202] 2011 North Kodofan All FSWs Last sex 15.8 8.9 Elhadi, 2013 [202] 2011 Red Sea All FSWs Last sex 18.7 13.7
Elhadi, 2013 [202] 2011 River Nile All FSWs Last sex 28.8 18.6
Elhadi, 2013 [202] 2011 Sinnar All FSWs Last sex 8.4 3.1
Elhadi, 2013 [202] 2011 South Darfur All FSWs Last sex 21.6 24.5
Elhadi, 2013 [202] 2011 West Darfur All FSWs Last sex 14.6 7.6
Elhadi, 2013 [202] 2011 White Nile All FSWs Last sex 12.5 5.0 MOH, 2016 [30] 2015-16 Juba, South Sudan All FSWs Last sex 72.4 72.4
Syria
MOH, 2005 [104] 2005 NR All FSWs NR 84.8 33.8 Tunisia
Znazen, 2010 [182] 2007 Gabes, Sousse, Tunis All FSWs NR NR 60.6
Hassen, 2003 [181] NR Sousse All FSWs NR 65.0 36.8
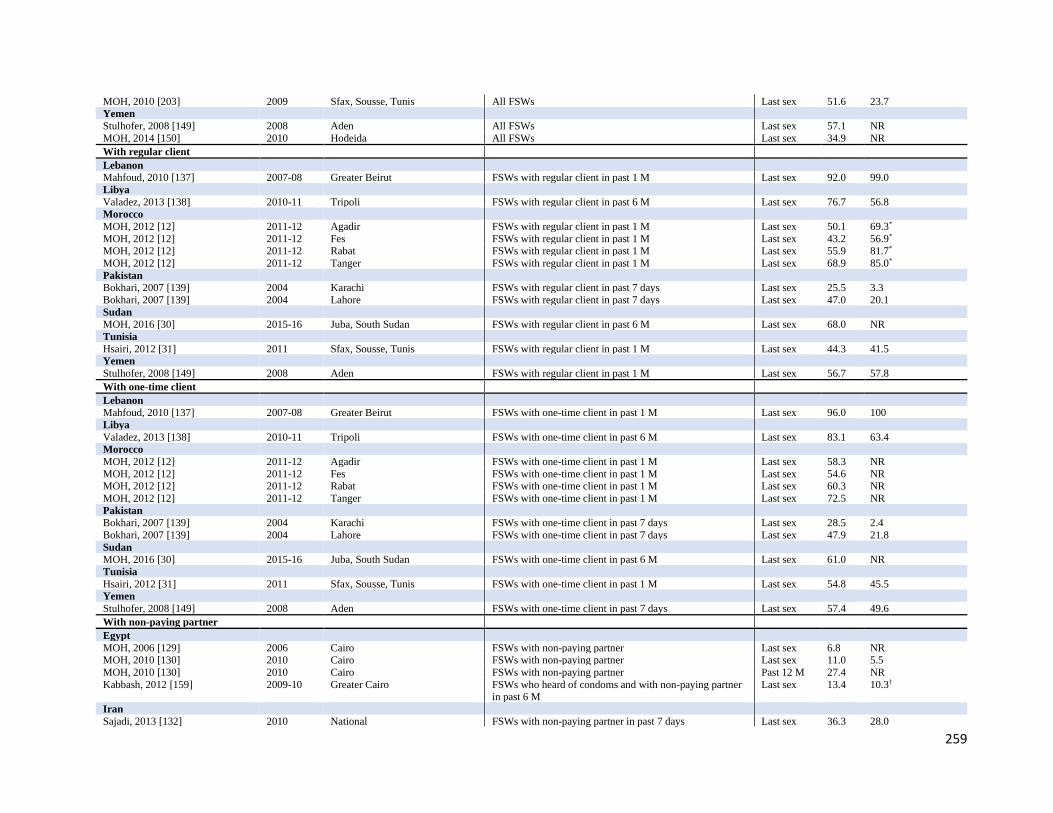
259
MOH, 2010 [203] 2009 Sfax, Sousse, Tunis All FSWs Last sex 51.6 23.7 Yemen
Stulhofer, 2008 [149] 2008 Aden All FSWs Last sex 57.1 NR
MOH, 2014 [150] 2010 Hodeida All FSWs Last sex 34.9 NR
With regular client
Lebanon Mahfoud, 2010 [137] 2007-08 Greater Beirut FSWs with regular client in past 1 M Last sex 92.0 99.0
Libya
Valadez, 2013 [138] 2010-11 Tripoli FSWs with regular client in past 6 M Last sex 76.7 56.8 Morocco
MOH, 2012 [12] 2011-12 Agadir FSWs with regular client in past 1 M Last sex 50.1 69.3*
MOH, 2012 [12] 2011-12 Fes FSWs with regular client in past 1 M Last sex 43.2 56.9* MOH, 2012 [12] 2011-12 Rabat FSWs with regular client in past 1 M Last sex 55.9 81.7*
MOH, 2012 [12] 2011-12 Tanger FSWs with regular client in past 1 M Last sex 68.9 85.0*
Pakistan Bokhari, 2007 [139] 2004 Karachi FSWs with regular client in past 7 days Last sex 25.5 3.3
Bokhari, 2007 [139] 2004 Lahore FSWs with regular client in past 7 days Last sex 47.0 20.1
Sudan
MOH, 2016 [30] 2015-16 Juba, South Sudan FSWs with regular client in past 6 M Last sex 68.0 NR
Tunisia
Hsairi, 2012 [31] 2011 Sfax, Sousse, Tunis FSWs with regular client in past 1 M Last sex 44.3 41.5 Yemen
Stulhofer, 2008 [149] 2008 Aden FSWs with regular client in past 1 M Last sex 56.7 57.8
With one-time client
Lebanon Mahfoud, 2010 [137] 2007-08 Greater Beirut FSWs with one-time client in past 1 M Last sex 96.0 100
Libya
Valadez, 2013 [138] 2010-11 Tripoli FSWs with one-time client in past 6 M Last sex 83.1 63.4 Morocco
MOH, 2012 [12] 2011-12 Agadir FSWs with one-time client in past 1 M Last sex 58.3 NR MOH, 2012 [12] 2011-12 Fes FSWs with one-time client in past 1 M Last sex 54.6 NR MOH, 2012 [12] 2011-12 Rabat FSWs with one-time client in past 1 M Last sex 60.3 NR MOH, 2012 [12] 2011-12 Tanger FSWs with one-time client in past 1 M Last sex 72.5 NR Pakistan Bokhari, 2007 [139] 2004 Karachi FSWs with one-time client in past 7 days Last sex 28.5 2.4
Bokhari, 2007 [139] 2004 Lahore FSWs with one-time client in past 7 days Last sex 47.9 21.8
Sudan
MOH, 2016 [30] 2015-16 Juba, South Sudan FSWs with one-time client in past 6 M Last sex 61.0 NR Tunisia
Hsairi, 2012 [31] 2011 Sfax, Sousse, Tunis FSWs with one-time client in past 1 M Last sex 54.8 45.5 Yemen
Stulhofer, 2008 [149] 2008 Aden FSWs with one-time client in past 7 days Last sex 57.4 49.6
With non-paying partner
Egypt
MOH, 2006 [129] 2006 Cairo FSWs with non-paying partner Last sex 6.8 NR MOH, 2010 [130] 2010 Cairo FSWs with non-paying partner Last sex 11.0 5.5
MOH, 2010 [130] 2010 Cairo FSWs with non-paying partner Past 12 M 27.4 NR
Kabbash, 2012 [159] 2009-10 Greater Cairo FSWs who heard of condoms and with non-paying partner in past 6 M
Last sex 13.4 10.3†
Iran
Sajadi, 2013 [132] 2010 National FSWs with non-paying partner in past 7 days Last sex 36.3 28.0

260
Navadeh, 2012 [131] 2010 Kerman All FSWs Last sex 78.3 NR Kazerooni, 2014 [133] 2010-11 Shiraz All FSWs Last sex 45.8 27.1*
Kazerooni, 2014 [133] 2010-11 Shiraz All FSWs Past 1 M 77.4 NR
Lebanon Mahfoud, 2010 [137] 2007-08 Greater Beirut FSWs with non-paying partner in past 1 M Last sex 48.0 64.0
Pakistan
Bokhari, 2007 [139] 2004 Karachi FSWs with non-paying partner in past 7 days Last sex 22.5 8.3 Bokhari, 2007 [139] 2004 Lahore FSWs with non-paying partner in past 7 days Last sex 21.8 8.0
NACP, 2005 [14] 2004-05 Karachi FSWs with non-paying partner Last sex 22.2 NR NACP, 2005 [14] 2004-05 Rawalpindi FSWs with non-paying partner Last sex 13.3 NR NACP, 2005 [14] 2004-05 Karachi FSWs with non-paying partner in past 1 M Past 1 M 48.6 19.1
NACP, 2005 [14] 2004-05 Rawalpindi FSWs with non-paying partner in past 1 M Past 1 M 26.7 4.8
Hawkes, 2009 [141] 2007 Abbottabad, Rawalpindi FSWs with non-paying partner NR 49.0 NR Punjab NACP, 2015 [201] 2014 Punjab FSWs with non-paying partner Past 1 M NR 15.1
NACP, 2017 [22] 2016-17 National FSWs with non-paying partner Last sex NR 10.9
Somalia
Testa, 2008 [143] 2008 Hargeisa FSWs with non-paying partner Last sex 4.9 8.3 IOM, 2017 [144] 2014 Hargeisa All FSWs Last sex 18.8 18.7
Sudan
MOH, 2016 [30] 2015-16 Juba, South Sudan FSWs with non-paying partner Last sex 75.0 71.0
Syria
MOH, 2005 [104] 2005 NR FSWs with non-paying partner NR 68.6 28.2 Tunisia
MOH, 2010 [203] 2009 Sfax, Sousse, Tunis All FSWs NR NR 19.2
Hsairi, 2012 [31] 2011 Sfax, Sousse, Tunis FSWs with non-paying partner in past 1 M Last sex 12.1 11.6 Yemen
Stulhofer, 2008 [149] 2008 Aden FSWs with non-paying partner Last sex 28.8 25.7
With regular non-paying partner
Iran Moayedi-Nia, 2016 [134] 2012-13 Tehran FSWs with a stable partner NR 49.0 NR
Morocco
MOH, 2012 [12] 2011-12 Agadir FSWs with regular partner in past 1 M Last sex 20.3 48.7* MOH, 2012 [12] 2011-12 Fes FSWs with regular partner in past 1 M Last sex 36.9 60.8*
MOH, 2012 [12] 2011-12 Rabat FSWs with regular partner in past 1 M Last sex 23.8 82.8*
MOH, 2012 [12] 2011-12 Tanger FSWs with regular partner in past 1 M Last sex 43.3 60.6* Pakistan
Hawkes, 2009 [141] 2007 Abbottabad, Rawalpindi FSWs with regular non-paying partner Last sex 46.0 15.0
NACP, 2012 [20] 2011 National FSWs with regular non-paying partner NR NR 20.6 Sudan
MOH, 2016 [30] 2015-16 Juba, South Sudan FSWs with regular partner in past 6 M Last sex NR 40
With occasional non-paying partner
Morocco
MOH, 2012 [12] 2011-12 Agadir FSWs with occasional partner in past 1 M Last sex 59.0 2.7*
MOH, 2012 [12] 2011-12 Fes FSWs with occasional partner in past 1 M Last sex 43.8 46.3*
MOH, 2012 [12] 2011-12 Rabat FSWs with occasional partner in past 1 M Last sex 64.8 50.0* MOH, 2012 [12] 2011-12 Tanger FSWs with occasional partner in past 1 M Last sex 80.1 64.1*
ANAL SEX
With clients
Iran
Kazerooni, 2014 [133] 2010-11 Shiraz All FSWs Past 1 M 66.7 NR
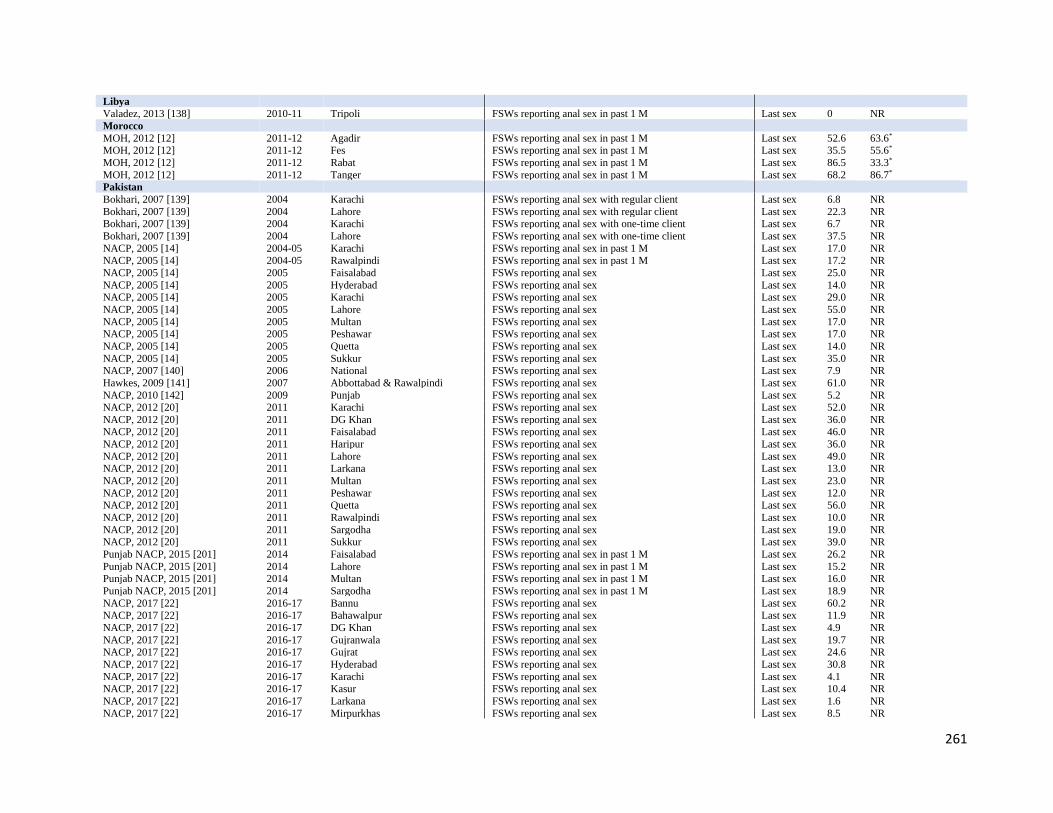
261
Libya
Valadez, 2013 [138] 2010-11 Tripoli FSWs reporting anal sex in past 1 M Last sex 0 NR
Morocco
MOH, 2012 [12] 2011-12 Agadir FSWs reporting anal sex in past 1 M Last sex 52.6 63.6* MOH, 2012 [12] 2011-12 Fes FSWs reporting anal sex in past 1 M Last sex 35.5 55.6*
MOH, 2012 [12] 2011-12 Rabat FSWs reporting anal sex in past 1 M Last sex 86.5 33.3*
MOH, 2012 [12] 2011-12 Tanger FSWs reporting anal sex in past 1 M Last sex 68.2 86.7* Pakistan
Bokhari, 2007 [139] 2004 Karachi FSWs reporting anal sex with regular client Last sex 6.8 NR
Bokhari, 2007 [139] 2004 Lahore FSWs reporting anal sex with regular client Last sex 22.3 NR Bokhari, 2007 [139] 2004 Karachi FSWs reporting anal sex with one-time client Last sex 6.7 NR Bokhari, 2007 [139] 2004 Lahore FSWs reporting anal sex with one-time client Last sex 37.5 NR NACP, 2005 [14] 2004-05 Karachi FSWs reporting anal sex in past 1 M Last sex 17.0 NR NACP, 2005 [14] 2004-05 Rawalpindi FSWs reporting anal sex in past 1 M Last sex 17.2 NR NACP, 2005 [14] 2005 Faisalabad FSWs reporting anal sex Last sex 25.0 NR NACP, 2005 [14] 2005 Hyderabad FSWs reporting anal sex Last sex 14.0 NR NACP, 2005 [14] 2005 Karachi FSWs reporting anal sex Last sex 29.0 NR NACP, 2005 [14] 2005 Lahore FSWs reporting anal sex Last sex 55.0 NR NACP, 2005 [14] 2005 Multan FSWs reporting anal sex Last sex 17.0 NR NACP, 2005 [14] 2005 Peshawar FSWs reporting anal sex Last sex 17.0 NR NACP, 2005 [14] 2005 Quetta FSWs reporting anal sex Last sex 14.0 NR NACP, 2005 [14] 2005 Sukkur FSWs reporting anal sex Last sex 35.0 NR NACP, 2007 [140] 2006 National FSWs reporting anal sex Last sex 7.9 NR Hawkes, 2009 [141] 2007 Abbottabad & Rawalpindi FSWs reporting anal sex Last sex 61.0 NR NACP, 2010 [142] 2009 Punjab FSWs reporting anal sex Last sex 5.2 NR NACP, 2012 [20] 2011 Karachi FSWs reporting anal sex Last sex 52.0 NR NACP, 2012 [20] 2011 DG Khan FSWs reporting anal sex Last sex 36.0 NR NACP, 2012 [20] 2011 Faisalabad FSWs reporting anal sex Last sex 46.0 NR NACP, 2012 [20] 2011 Haripur FSWs reporting anal sex Last sex 36.0 NR NACP, 2012 [20] 2011 Lahore FSWs reporting anal sex Last sex 49.0 NR NACP, 2012 [20] 2011 Larkana FSWs reporting anal sex Last sex 13.0 NR NACP, 2012 [20] 2011 Multan FSWs reporting anal sex Last sex 23.0 NR NACP, 2012 [20] 2011 Peshawar FSWs reporting anal sex Last sex 12.0 NR NACP, 2012 [20] 2011 Quetta FSWs reporting anal sex Last sex 56.0 NR NACP, 2012 [20] 2011 Rawalpindi FSWs reporting anal sex Last sex 10.0 NR NACP, 2012 [20] 2011 Sargodha FSWs reporting anal sex Last sex 19.0 NR NACP, 2012 [20] 2011 Sukkur FSWs reporting anal sex Last sex 39.0 NR Punjab NACP, 2015 [201] 2014 Faisalabad FSWs reporting anal sex in past 1 M Last sex 26.2 NR Punjab NACP, 2015 [201] 2014 Lahore FSWs reporting anal sex in past 1 M Last sex 15.2 NR Punjab NACP, 2015 [201] 2014 Multan FSWs reporting anal sex in past 1 M Last sex 16.0 NR Punjab NACP, 2015 [201] 2014 Sargodha FSWs reporting anal sex in past 1 M Last sex 18.9 NR NACP, 2017 [22] 2016-17 Bannu FSWs reporting anal sex Last sex 60.2 NR NACP, 2017 [22] 2016-17 Bahawalpur FSWs reporting anal sex Last sex 11.9 NR NACP, 2017 [22] 2016-17 DG Khan FSWs reporting anal sex Last sex 4.9 NR NACP, 2017 [22] 2016-17 Gujranwala FSWs reporting anal sex Last sex 19.7 NR NACP, 2017 [22] 2016-17 Gujrat FSWs reporting anal sex Last sex 24.6 NR NACP, 2017 [22] 2016-17 Hyderabad FSWs reporting anal sex Last sex 30.8 NR NACP, 2017 [22] 2016-17 Karachi FSWs reporting anal sex Last sex 4.1 NR NACP, 2017 [22] 2016-17 Kasur FSWs reporting anal sex Last sex 10.4 NR NACP, 2017 [22] 2016-17 Larkana FSWs reporting anal sex Last sex 1.6 NR NACP, 2017 [22] 2016-17 Mirpurkhas FSWs reporting anal sex Last sex 8.5 NR
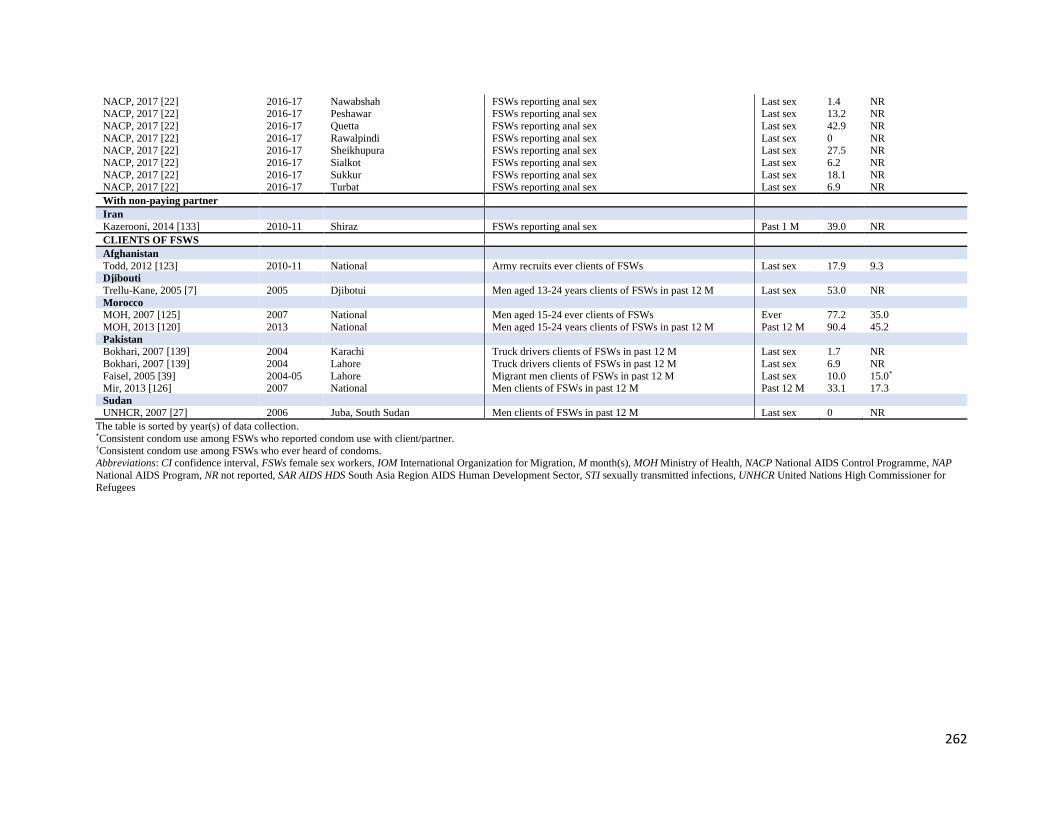
262
NACP, 2017 [22] 2016-17 Nawabshah FSWs reporting anal sex Last sex 1.4 NR NACP, 2017 [22] 2016-17 Peshawar FSWs reporting anal sex Last sex 13.2 NR NACP, 2017 [22] 2016-17 Quetta FSWs reporting anal sex Last sex 42.9 NR NACP, 2017 [22] 2016-17 Rawalpindi FSWs reporting anal sex Last sex 0 NR NACP, 2017 [22] 2016-17 Sheikhupura FSWs reporting anal sex Last sex 27.5 NR NACP, 2017 [22] 2016-17 Sialkot FSWs reporting anal sex Last sex 6.2 NR NACP, 2017 [22] 2016-17 Sukkur FSWs reporting anal sex Last sex 18.1 NR NACP, 2017 [22] 2016-17 Turbat FSWs reporting anal sex Last sex 6.9 NR With non-paying partner
Iran
Kazerooni, 2014 [133] 2010-11 Shiraz FSWs reporting anal sex Past 1 M 39.0 NR CLIENTS OF FSWS
Afghanistan
Todd, 2012 [123] 2010-11 National Army recruits ever clients of FSWs Last sex 17.9 9.3 Djibouti
Trellu-Kane, 2005 [7] 2005 Djibotui Men aged 13-24 years clients of FSWs in past 12 M Last sex 53.0 NR Morocco MOH, 2007 [125] 2007 National Men aged 15-24 ever clients of FSWs Ever 77.2 35.0
MOH, 2013 [120] 2013 National Men aged 15-24 years clients of FSWs in past 12 M Past 12 M 90.4 45.2
Pakistan
Bokhari, 2007 [139] 2004 Karachi Truck drivers clients of FSWs in past 12 M Last sex 1.7 NR
Bokhari, 2007 [139] 2004 Lahore Truck drivers clients of FSWs in past 12 M Last sex 6.9 NR
Faisel, 2005 [39] 2004-05 Lahore Migrant men clients of FSWs in past 12 M Last sex 10.0 15.0* Mir, 2013 [126] 2007 National Men clients of FSWs in past 12 M Past 12 M 33.1 17.3
Sudan
UNHCR, 2007 [27] 2006 Juba, South Sudan Men clients of FSWs in past 12 M Last sex 0 NR
The table is sorted by year(s) of data collection. *Consistent condom use among FSWs who reported condom use with client/partner. †Consistent condom use among FSWs who ever heard of condoms.
Abbreviations: CI confidence interval, FSWs female sex workers, IOM International Organization for Migration, M month(s), MOH Ministry of Health, NACP National AIDS Control Programme, NAP
National AIDS Program, NR not reported, SAR AIDS HDS South Asia Region AIDS Human Development Sector, STI sexually transmitted infections, UNHCR United Nations High Commissioner for
Refugees

263
Table S12 Measures of injecting drug use and overlap with people who inject drugs (PWID) among FSWs in the Middle East and
North Africa Country
Author, year [citation]
Year(s)
of data
collection
City/
province
Drug use Injecting drug use Sex with PWID
Pop Time
frame
Proportion
(%) Pop
Time
frame
Proportion
(%) Pop
Time
frame
Proportion
(%)
FSWS
Afghanistan
Todd, 2010 [151] 2006-08 Jalalabad, Kabul,
Mazar-i-Sharif
All FSWs Ever 6.9 All FSWs Ever 0.4 NR NR NR
NACP, 2010 [128] 2009 Kabul All FSWs Ever 1.9 All FSWs Ever 0 All FSWs Past 1 M 0.5 NACP, 2012 [6] 2012 Kabul All FSWs Ever 1.7 All FSWs Ever 0.1 All FSWs Past 12 M 3.8
NACP, 2012 [6] 2012 Herat All FSWs Ever 11.7 All FSWs Ever 7.1 All FSWs Past 12 M 13.6
NACP, 2012 [6] 2012 Mazar-i-Sharif All FSWs Ever 5.5 All FSWs Ever 0 All FSWs Past 12 M 6.5 Egypt
MOH, 2006 [129] 2006 Cairo All FSWs Ever 78.8 All FSWs Past 12 M 9.3 NR NR NR
Kabbash, 2012 [159] 2009-10 Cairo All FSWs Ever 49.0 All FSWs Past 12 M 5.6 NR NR NR MOH, 2010 [130] 2010 Cairo All FSWs Ever 51.5 All FSWs Past 12 M 6.0 NR NR NR
Iran
Kassaian, 2012 [161] 2009-10 Isfahan All FSWs Ever 61.3 All FSWs NR 19.0 NR NR NR Kassaian, 2012 [161] 2009-10 Isfahan NR NR NR Ever DU Ever 24.1 NR NR NR
Sajadi, 2013 [132] 2010 National All FSWs Ever 73.8 Ever DU Ever 20.5 NR NR NR
Sajadi, 2013 [132] 2010 National NR NR NR Ever IDU Active IDU 26.6 NR NR NR Mirzazadeh, 2016 [135] 2010 National NR NR NR All FSWs Ever 13.6 NR NR NR
Navadeh, 2012 [131] 2010 Kerman NR NR NR All FSWs Ever 18.0 NR NR NR Kazerooni, 2014 [133] 2010-11 Shiraz All FSWs Ever 69.9 Ever DU Ever 16.4 NR NR NR
Moayedi-Nia, 2016 [134] 2012-13 Tehran All FSWs Ever 90.7 NR NR NR NR NR NR
Moayedi-Nia, 2016 [134] 2012-13 Tehran Ever DU Current 50.9 Active DU Ever 25.5 NR NR NR Taghizadeh, 2015 [162] 2014 Sari All FSWs Current 59.0 Active DU Current 1.1 NR NR NR
Asadi-Ali, 2018 [163] 2015 Northern Iran All FSWs Past 12 M 39.7 All FSWs NR NR NR NR NR
Mirzazadeh, 2016 [135] 2015 National All FSWs Ever 59.8 All FSWs Ever 6.1 NR NR NR Karami, 2017 [11] 2016 Tehran NR NR NR NR NR NR All FSWs NR 23.6
Lebanon
Naman, 1989 [164] 1985-87 NR NR NR NR All FSWs NR 1.4 NR NR NR Mahfoud, 2010 [137] 2007-08 Beirut NR NR NR All FSWs Ever 0 NR NR NR Libya
Valadez, 2013 [138] 2010-11 Tripoli All FSWs Past 6 M 1.2 All FSWs Ever 0 NR NR NR Morocco
MOH, 2012 [12] 2011-12 Agadir All FSWs Ever 13.2 Ever DU Ever 0.3 NR NR NR MOH, 2012 [12] 2011-12 Fes All FSWs Ever 17.7 Ever DU Ever 6.8 NR NR NR MOH, 2012 [12] 2011-12 Rabat All FSWs Ever 8.1 Ever DU Ever 0 NR NR NR MOH, 2012 [12] 2011-12 Tanger All FSWs Ever 7.9 Ever DU Ever 11.8 NR NR NR MOH, 2012 [12] 2011-12 Agadir Ever DU Past 6 M 81.6 NR NR NR NR NR NR MOH, 2012 [12] 2011-12 Fes Ever DU Past 6 M 95.0 NR NR NR NR NR NR MOH, 2012 [12] 2011-12 Rabat Ever DU Past 6 M 85.8 NR NR NR NR NR NR MOH, 2012 [12] 2011-12 Tanger Ever DU Past 6 M 79.4 NR NR NR NR NR NR Pakistan
Baqi, 1998 [167] 1993-94 Karachi All FSWs Current 1.2 All FSWs Ever 0 NR NR NR
Bokhari, 2007 [139] & NACP, 2005 [14]
2004 Karachi NR NR NR All FSWs Past 12 M 4.4 All FSWs NR 18.2
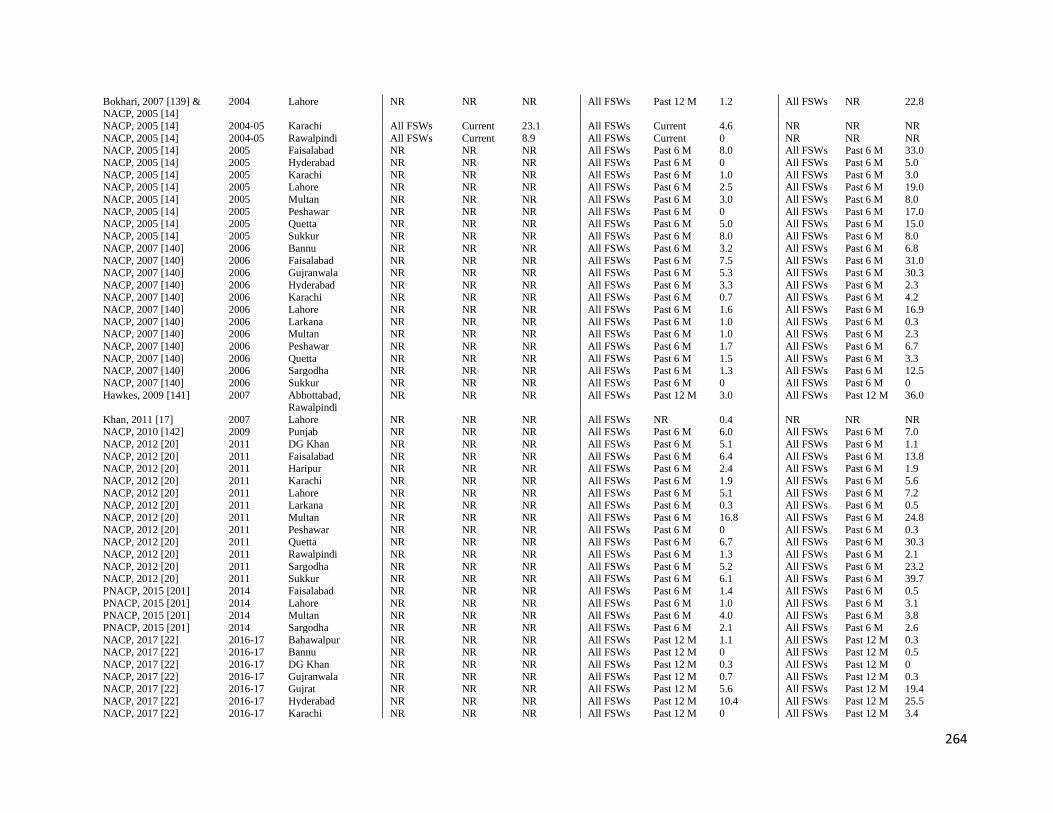
264
Bokhari, 2007 [139] & NACP, 2005 [14]
2004 Lahore NR NR NR All FSWs Past 12 M 1.2 All FSWs NR 22.8
NACP, 2005 [14] 2004-05 Karachi All FSWs Current 23.1 All FSWs Current 4.6 NR NR NR NACP, 2005 [14] 2004-05 Rawalpindi All FSWs Current 8.9 All FSWs Current 0 NR NR NR NACP, 2005 [14] 2005 Faisalabad NR NR NR All FSWs Past 6 M 8.0 All FSWs Past 6 M 33.0
NACP, 2005 [14] 2005 Hyderabad NR NR NR All FSWs Past 6 M 0 All FSWs Past 6 M 5.0
NACP, 2005 [14] 2005 Karachi NR NR NR All FSWs Past 6 M 1.0 All FSWs Past 6 M 3.0 NACP, 2005 [14] 2005 Lahore NR NR NR All FSWs Past 6 M 2.5 All FSWs Past 6 M 19.0
NACP, 2005 [14] 2005 Multan NR NR NR All FSWs Past 6 M 3.0 All FSWs Past 6 M 8.0
NACP, 2005 [14] 2005 Peshawar NR NR NR All FSWs Past 6 M 0 All FSWs Past 6 M 17.0 NACP, 2005 [14] 2005 Quetta NR NR NR All FSWs Past 6 M 5.0 All FSWs Past 6 M 15.0
NACP, 2005 [14] 2005 Sukkur NR NR NR All FSWs Past 6 M 8.0 All FSWs Past 6 M 8.0
NACP, 2007 [140] 2006 Bannu NR NR NR All FSWs Past 6 M 3.2 All FSWs Past 6 M 6.8
NACP, 2007 [140] 2006 Faisalabad NR NR NR All FSWs Past 6 M 7.5 All FSWs Past 6 M 31.0
NACP, 2007 [140] 2006 Gujranwala NR NR NR All FSWs Past 6 M 5.3 All FSWs Past 6 M 30.3
NACP, 2007 [140] 2006 Hyderabad NR NR NR All FSWs Past 6 M 3.3 All FSWs Past 6 M 2.3 NACP, 2007 [140] 2006 Karachi NR NR NR All FSWs Past 6 M 0.7 All FSWs Past 6 M 4.2
NACP, 2007 [140] 2006 Lahore NR NR NR All FSWs Past 6 M 1.6 All FSWs Past 6 M 16.9
NACP, 2007 [140] 2006 Larkana NR NR NR All FSWs Past 6 M 1.0 All FSWs Past 6 M 0.3 NACP, 2007 [140] 2006 Multan NR NR NR All FSWs Past 6 M 1.0 All FSWs Past 6 M 2.3
NACP, 2007 [140] 2006 Peshawar NR NR NR All FSWs Past 6 M 1.7 All FSWs Past 6 M 6.7
NACP, 2007 [140] 2006 Quetta NR NR NR All FSWs Past 6 M 1.5 All FSWs Past 6 M 3.3 NACP, 2007 [140] 2006 Sargodha NR NR NR All FSWs Past 6 M 1.3 All FSWs Past 6 M 12.5
NACP, 2007 [140] 2006 Sukkur NR NR NR All FSWs Past 6 M 0 All FSWs Past 6 M 0
Hawkes, 2009 [141] 2007 Abbottabad, Rawalpindi
NR NR NR All FSWs Past 12 M 3.0 All FSWs Past 12 M 36.0
Khan, 2011 [17] 2007 Lahore NR NR NR All FSWs NR 0.4 NR NR NR NACP, 2010 [142] 2009 Punjab NR NR NR All FSWs Past 6 M 6.0 All FSWs Past 6 M 7.0
NACP, 2012 [20] 2011 DG Khan NR NR NR All FSWs Past 6 M 5.1 All FSWs Past 6 M 1.1
NACP, 2012 [20] 2011 Faisalabad NR NR NR All FSWs Past 6 M 6.4 All FSWs Past 6 M 13.8 NACP, 2012 [20] 2011 Haripur NR NR NR All FSWs Past 6 M 2.4 All FSWs Past 6 M 1.9
NACP, 2012 [20] 2011 Karachi NR NR NR All FSWs Past 6 M 1.9 All FSWs Past 6 M 5.6
NACP, 2012 [20] 2011 Lahore NR NR NR All FSWs Past 6 M 5.1 All FSWs Past 6 M 7.2 NACP, 2012 [20] 2011 Larkana NR NR NR All FSWs Past 6 M 0.3 All FSWs Past 6 M 0.5
NACP, 2012 [20] 2011 Multan NR NR NR All FSWs Past 6 M 16.8 All FSWs Past 6 M 24.8
NACP, 2012 [20] 2011 Peshawar NR NR NR All FSWs Past 6 M 0 All FSWs Past 6 M 0.3 NACP, 2012 [20] 2011 Quetta NR NR NR All FSWs Past 6 M 6.7 All FSWs Past 6 M 30.3
NACP, 2012 [20] 2011 Rawalpindi NR NR NR All FSWs Past 6 M 1.3 All FSWs Past 6 M 2.1
NACP, 2012 [20] 2011 Sargodha NR NR NR All FSWs Past 6 M 5.2 All FSWs Past 6 M 23.2 NACP, 2012 [20] 2011 Sukkur NR NR NR All FSWs Past 6 M 6.1 All FSWs Past 6 M 39.7
PNACP, 2015 [201] 2014 Faisalabad NR NR NR All FSWs Past 6 M 1.4 All FSWs Past 6 M 0.5
PNACP, 2015 [201] 2014 Lahore NR NR NR All FSWs Past 6 M 1.0 All FSWs Past 6 M 3.1
PNACP, 2015 [201] 2014 Multan NR NR NR All FSWs Past 6 M 4.0 All FSWs Past 6 M 3.8
PNACP, 2015 [201] 2014 Sargodha NR NR NR All FSWs Past 6 M 2.1 All FSWs Past 6 M 2.6
NACP, 2017 [22] 2016-17 Bahawalpur NR NR NR All FSWs Past 12 M 1.1 All FSWs Past 12 M 0.3 NACP, 2017 [22] 2016-17 Bannu NR NR NR All FSWs Past 12 M 0 All FSWs Past 12 M 0.5
NACP, 2017 [22] 2016-17 DG Khan NR NR NR All FSWs Past 12 M 0.3 All FSWs Past 12 M 0
NACP, 2017 [22] 2016-17 Gujranwala NR NR NR All FSWs Past 12 M 0.7 All FSWs Past 12 M 0.3 NACP, 2017 [22] 2016-17 Gujrat NR NR NR All FSWs Past 12 M 5.6 All FSWs Past 12 M 19.4
NACP, 2017 [22] 2016-17 Hyderabad NR NR NR All FSWs Past 12 M 10.4 All FSWs Past 12 M 25.5
NACP, 2017 [22] 2016-17 Karachi NR NR NR All FSWs Past 12 M 0 All FSWs Past 12 M 3.4

265
NACP, 2017 [22] 2016-17 Kasur NR NR NR All FSWs Past 12 M 0.3 All FSWs Past 12 M 5.5 NACP, 2017 [22] 2016-17 Larkana NR NR NR All FSWs Past 12 M 0.5 All FSWs Past 12 M 0.5
NACP, 2017 [22] 2016-17 Mirpurkhas NR NR NR All FSWs Past 12 M 0.5 All FSWs Past 12 M 4.9
NACP, 2017 [22] 2016-17 Nawabshah NR NR NR All FSWs Past 12 M 9.3 All FSWs Past 12 M 3.8 NACP, 2017 [22] 2016-17 Peshawar NR NR NR All FSWs Past 12 M 1.1 All FSWs Past 12 M 14.0
NACP, 2017 [22] 2016-17 Quetta NR NR NR All FSWs Past 12 M 9.3 All FSWs Past 12 M 54.9
NACP, 2017 [22] 2016-17 Rawalpindi NR NR NR All FSWs Past 12 M 0.3 All FSWs Past 12 M 4.9 NACP, 2017 [22] 2016-17 Sheikhupura NR NR NR All FSWs Past 12 M 5.5 All FSWs Past 12 M 45.2
NACP, 2017 [22] 2016-17 Sialkot NR NR NR All FSWs Past 12 M 0 All FSWs Past 12 M 0
NACP, 2017 [22] 2016-17 Sukkur NR NR NR All FSWs Past 12 M 5.5 All FSWs Past 12 M 16.5 NACP, 2017 [22] 2016-17 Turbat NR NR NR All FSWs Past 12 M 2.8 All FSWs Past 12 M 25.0
Somalia
Burans, 1990 [174] NR Mogadishu All FSWs Current 13.5 All FSWs NR 0 NR NR NR Testa, 2008 [143] 2008 Hargeisa All FSWs Past 1 M 0.6 All FSWs Past 12 M 0 NR NR NR IOM, 2017 [144] 2014 Hargeisa All FSWs Ever 85.2 All FSWs Past 12 M 0.6 NR NR NR IOM, 2017 [144] 2014 Hargeisa All FSWs Past 1 M 4.7 NR NR NR NR NR NR Sudan
Elhadi, 2013 [202] 2011 Alshamalia NR NR NR All FSWs Ever 1.5 NR NR NR Elhadi, 2013 [202] 2011 Blue Nile NR NR NR All FSWs Ever 0.9 NR NR NR Elhadi, 2013 [202] 2011 Gadarif NR NR NR All FSWs Ever 0.5 NR NR NR Elhadi, 2013 [202] 2011 Gezira NR NR NR All FSWs Ever 0.4 NR NR NR Elhadi, 2013 [202] 2011 Kassala NR NR NR All FSWs Ever 0.9 NR NR NR Elhadi, 2013 [202] 2011 Khartoum NR NR NR All FSWs Ever 2.3 NR NR NR Elhadi, 2013 [202] 2011 North Darfur NR NR NR All FSWs Ever 5.0 NR NR NR Elhadi, 2013 [202] 2011 North Kodofan NR NR NR All FSWs Ever 0.1 NR NR NR Elhadi, 2013 [202] 2011 Red Sea NR NR NR All FSWs Ever 0 NR NR NR Elhadi, 2013 [202] 2011 River Nile NR NR NR All FSWs Ever 0.6 NR NR NR Elhadi, 2013 [202] 2011 Sinnar NR NR NR All FSWs Ever 1.0 NR NR NR Elhadi, 2013 [202] 2011 South Darfur NR NR NR All FSWs Ever 2.6 NR NR NR Elhadi, 2013 [202] 2011 West Darfur NR NR NR All FSWs Ever 1.6 NR NR NR Elhadi, 2013 [202] 2011 White Nile NR NR NR All FSWs Ever 1.6 NR NR NR MOH, 2016 [30] 2015-16 Juba, South Sudan All FSWs Past 6 M 14.0 NR NR NR NR NR NR Syria
MOH, 2005 [104] 2005 NR NR NR NR All FSWs Ever 10.0 NR NR NR Tunisia
MOH, 2010 [203] 2009 Sfax, Sousse, Tunis All FSWs Ever 31.3 NR NR NR NR NR NR Hsairi, 2012 [31] 2011 Sfax All FSWs Ever 29.2 Ever DU Past 12 M 0 NR NR NR Hsairi, 2012 [31] 2011 Sousse All FSWs Ever 24.8 Ever DU Past 12 M 4.7 NR NR NR Hsairi, 2012 [31] 2011 Tunis All FSWs Ever 18.8 Ever DU Past 12 M 8.8 NR NR NR Yemen
Stulhofer, 2008 [149] 2008 Aden All FSWs Past 1 M 2.4 All FSWs Past 1 M 2.1 NR NR NR CLIENTS OF FSWS
Afghanistan
Todd, 2012 [123] 2010-11 National Army recruits-
clients
Ever 32.9 NR NR NR NR NR NR
Somalia
Burans, 1990 [174] NR Mogadishu NR NR NR STI clinic
attendees
NR 0 NA NA NA
Rehan, 2003 [193] 1999 Lahore, Karachi, Peshawar, Quetta
STI clinic attendees
NR 10.5 NR NR NR NA NA NA
266
The table is sorted by year(s) of data collection. Abbreviations: DU drug users, FSWs female sex workers, IDU injecting drug users, IOM International Organization for Migration, M month(s), MOH Ministry of Health, NA not applicable, NACP
National AIDS Control Programme, NR not reported, PNACP Punjab National AIDS Control Programme, Prp proportion, PWID people who inject drugs

267
Table S13 HIV/AIDS knowledge among FSWs in the Middle East and North Africa
Abbreviations: FSWs female sex workers
Afghanistan Egypt Iran Lebanon Morocco Pakistan Somalia Sudan Syria Tunisia Yemen
Aware of HIV/AIDS
Ever heard of
HIV/AIDS (%)
25.4 [6], 32.4
[128], 37.8 [6], 39.9 [6], 54.0 [5],
75.0 [5]
100.0
[129], 89.0 [130]
92.7
[132], 98.7 [162]
84.3 [12],
99.0 [12], 99.6 [12],
100.0 [12]
35.0 [141], 64.1
[15], 68.4 [139], 66.9 [22], 68.7
[140], 75.2 [139],
80.3 [14], 80.4 [20], 80.7 [14],
83.0 [17], 87.3
[201]
64.9
[176], 96.2
[143],
97.3 [144]
98.4 [146] 97.5 [204] 94.2 [31],
95.0 [203]
Aware of sex as a mode of HIV transmission
In all FSWs (%) 59.0 [5], 72.0 [5] 72.0 [86] 50.8 [22], 63.8
[14], 68.6 [14]
78.5 [30], 85.4
[146]
94.9 [204]
In FSWs who ever
heard of HIV (%)
68.9 [140], 70.2
[140], 71.9 [140],
74.0 [140], 75.5 [140], 75.9 [140],
81.7 [15], 84.6
[140], 84.8 [201], 86.5 [140], 86.6
[140], 87.1 [140],
87.3 [140], 93.7 [140], 94.3 [20]
Aware of HIV transmission through unprotected sex
In all FSWs (%) 14.1 [128], 24.2 [6], 32.0 [5], 34.7
[6], 34.8 [6], 47.0
[5]
89.8 [132] 88.0 [137]
50.6 [12], 58.4 [12],
59.8 [12],
61.0 [12], 72.0 [86]
15.4 [14], 26.0 [139], 39.7 [142],
45.3 [14], 46.8
[22], 54.5 [139], 75.8 [20]
51.6 [144],
70.6
[143]
57.9 [30] 76.6 [204] 77.9 [149]
In FSWs who ever
heard of HIV (%)
49.4 [130] 38.6 [140], 44.0
[140], 44.9 [140],
47.6 [140], 47.8 [140], 60.4 [15],
68.5 [140], 71.7
[140], 72.9 [140], 73.2 [20], 78.2
[140], 78.8 [140], 81.2 [140], 86.3
[201], 86.8 [140]
66.1 [31],
78.9 [203],
83.1 [31], 86.7 [31]
Aware of sharing needles as a mode of HIV transmission
In all FSWs (%) 30.7 [128] 95.4 [132] 91.0
[137]
84.9 [12],
93.4 [12],
95.3 [12], 99.6 [12]
11.5 [14], 18.9
[22], 57.0[14],
63.3 [139], 72.1 [139]
95.8
[143],
99.5 [144]
91.3 [146]
86.4 [104]
In FSWs who ever
heard of HIV (%)
88.2 [130] 32.6 [20], 37.3
[140], 42.4 [15],
67.1 [201]
92.4 [31],
92.9 [31],
96.4 [31]

268
Table S14 Perception of risk among FSWs in the Middle East and North Africa Perception of being at risk of HIV Iran Lebanon Pakistan Sudan Syria Yemen
No risk (%) 4.9 [148], 7.0 [200], 11.2 [30], 12.5 [148], 14.3 [148], 15.1 [148],
15.9 [146], 21.4 [148], 22.7 [148], 23.7 [148], 25.8 [148], 26.9 [148], 27.6 [148], 29.0 [200], 34.2 [148], 35.8 [148], 37.8 [148],
44.4 [148]
16.1 [204]
At risk
Among all FSWs (%) 48.5 [132] 44.0 [137] 22.8 [22], 23.0 [14], 25.2 [14], 45.0 [17]
Among FSWs who ever heard of
HIV (%)
28.0 [15], 38.0 [140],
45.1 [20], 65.9 [201]
Low risk (%) 7.1 [148], 8.6 [148], 8.8 [148], 11.6 [148], 12.1 [148], 12.1 [148], 12.4 [148], 13.7 [148], 18.3 [148], 19.8 [148], 24.1 [148], 27.0
[146], 27.3 [148], 31.5 [148], 32.1 [148], 46.9 [30]
46.2 [104]
Medium risk (%) 5.3 [148], 5.5 [148], 9.1 [148], 10.6 [148], 11.2 [148], 11.4 [148], 15.3 [148], 16.3 [148], 16.4 [148], 19.9 [148], 20.2 [148], 22.9
[148], 23.5 [148], 27.3 [30], 32.9 [148], 36.1 [146]
High risk (%) 5.9 [148], 6.6 [148], 7.4 [148], 8.6 [148], 9.6 [148], 10.9 [148],
13.8 [148], 14.3 [148], 14.5 [148], 14.6 [30], 15.5 [148], 15.8[148], 20.7 [148], 21.0 [146], 21.4 [148], 32.0 [148]
18.7 [204] 14.1 [149]
Abbreviations: FSWs female sex workers

269
Table S15 HIV testing among FSWs in the Middle East and North Africa HIV testing Afg Alg Egypt Iran Leb Lib Mor Pakistan Somal Sudan Syria Tunisia Yemen
Ever tested
Ever tested among all
FSWs (%)
4.0 [5],
4.3 [128],
12.0 [5],
21.7 [6], 93.2 [6],
96.2 [6]
45.0
[205], 80.6
[205],
99.4 [162]
79.0
[137]
24.3 [12],
33.5 [12], 34.8 [12],
36.0 [12]
4.9 [14], 6.0
[141], 8.5 [14], 17.2 [22]
5.0
[143], 29.6
[144]
4.4 [148], 5.2 [148], 5.4
[148], 8.0 [148], 8.6 [148], 9.4 [148], 10.4
[148], 12.2 [148], 14.4
[148], 14.6 [148], 17.6 [148], 17.9 [148], 22.0
[148], 23.9 [148], 78.7
[30]
45.0
[104]
20.1
[149]
Ever tested among
FSWs who ever
heard of HIV (%)
3.4 [130] 0.5 [140], 0.5
[140], 1.5 [140],
2.8 [140], 2.8 [140], 3.3 [140],
4.1 [140], 6.2
[15], 8.3 [140], 8.5 [140], 14.4
[140], 15.7 [20],
15.8 [140], 16.5 [140], 55.9 [201]
21.8 [31],
27.7 [31],
38.0 [31], 15.5 [203]
Ever received results
among FSWs who
ever tested for HIV (%)
78.6 [6],
81.0 [6],
96.9 [6]
99.0
[137]
91.9 [12],
95.5 [12],
96.0 [12], 96.7 [12]
60.0 [201] 75.8
[104]
87.2 [31]
Ever tested and
received results among all FSWs (%)
0.7 [139], 0.9
[139]
4.0 [143] 8.8 [203]
Tested in past 12 M
Tested in past 12
months among all
FSWs (%)
35.9 [206] 13.4 [12],
17.9 [12],
20.3 [12], 25.3 [12]
0.9 [148], 2.5 [148], 3.1
[148], 4.5 [148], 5.2
[148], 6.2 [148], 8.1 [148], 8.5 [148], 9.6
[148], 11.1 [148], 12.1
[148], 12.4 [148], 12.7 [148], 19.1 [148]
38.0
[204]
14.3 [31]
Tested in past 12
months among FSWs who ever tested for
HIV (%)
43.1 [6],
57.1 [6], 75.0 [6]
33.3 [130] 82.0
[137]
58.9 [12],
59.4 [12], 65.1 [12],
71.7 [12]
47.7
[143], 77.2
[144]
38.9
[149]
Received results in
past 12 M among all FSWs (%)
0.4 [148], 1.7 [148], 2.4
[148], 4.1 [148], 5.4 [148], 6.0 [148], 7.8
[148], 8.3 [148], 9.2
[148], 10.0 [148], 10.8 [148], 11.5 [148], 11.6
[148], 18.4 [148]
Received results among FSWs who
79.0 [206] 86.7 [144],
38.5 [148], 51.8 [148], 86.0 [148], 89.8 [148],
91.6 [148], 93.3 [148],

270
tested for HIV in past 12 M (%)
100.0 [143]
93.5 [148], 93.5 [148], 93.8 [148], 93.9 [148],
96.0 [148]¸96.4 [148],
99.3 [148], 100.0 [148]
Tested & received results in past 12 M
among all FSWs (%)
20.0 [53],
29.5
[53]
1.1 [71, 130], 100
[71]
(identified by NGO)
27.5 [205],
32.9
[134], 70.4 [205]
38.6 [138]
14.2 [12], 16.3 [12],
18.5 [12],
25.0 [12]
14.1 [142], 15.5 [142]
7.0 [146] 13.4 [31], 14.1 [203]
6.0 [150]
Abbreviations: Afg Afghanistan, Alg Algeria, FSWs female sex workers, Leb Lebanon, Lib Libya, M month(s), Mor Morocco, Somal Somalia

271
References
1. Moher D, Liberati A, Tetzlaff J, Altman DG, Group P: Preferred reporting items for
systematic reviews and meta-analyses: the PRISMA statement. PLoS medicine 2009,
6(7):e1000097.
2. Abu-Raddad L, Akala FA, Semini I, Riedner G, Wilson D, Tawil O: Characterizing the
HIV/AIDS epidemic in the Middle East and North Africa : Time for strategic action.
Washington DC: The World Bank Press; 2010.
3. Mumtaz G, Hilmi N, McFarland W, Kaplan RL, Akala FA, Semini I, Riedner G, Tawil
O, Wilson D, Abu-Raddad LJ: Are HIV epidemics among men who have sex with men
emerging in the middle east and north Africa?: A systematic review and data
synthesis. PLoS Medicine 2011, 8 (8) (no pagination)(e1000444).
4. Mumtaz GR, Weiss HA, Thomas SL, Riome S, Setayesh H, Riedner G, Semini I, Tawil
O, Akala FA, Wilson D et al: HIV among people who inject drugs in the Middle East
and North Africa: systematic review and data synthesis. PLoS medicine 2014,
11(6):e1001663.
5. SAR AIDS Human Development Sector-The World Bank: Mapping and situation
assessment of key populations at high risk of HIV in three cities of Afghanistan. In.,
vol. 23; 2008.
6. National AIDS Control Program, Johns Hopkins University Bloomberg School of Public
Health HIV Surveillance Project: Integrated biological & behavioral surveillance
(IBBS) in selected cities of Afghanistan: findings of 2012 IBBS survey and
comparison to 2009 IBBS survey. In. Kabul, Afghanistan; 2012.
7. Trellu-Kane M.: Étude sur les Connaissances, Attitudes et Pratiques des jeunes
djiboutiens In.; 2005.
8. Jacobsen J.O. STJ, Loo V.,: Estimating the size of key affected populations at elevated
risk for HIV in Egypt. In. Cairo, Egypt; 2014.
9. Karami M, Mirzaei M, Khazaei S, Bathaei SJ: Estimating the population of female sex
workers in Hamadan, Western iran, 2014. International Journal of High Risk
Behaviors and Addiction 2017, 6(4):e63195.
10. Sharifi H, Karamouzian M, Baneshi MR, Shokoohi M, Haghdoost A, McFarland W,
Mirzazadeh A: Population size estimation of female sex workers in Iran: Synthesis of
methods and results. PLoS One 2017, 12(8):e0182755.
11. Karami M, Khazaei S, Poorolajal J, Soltanian A, Sajadipoor M: Estimating the
population size of female sex worker population in Tehran, Iran: Application of
direct capture-recapture method. AIDS and behavior 2017, 21:2394-2400.
12. Ministry of Health-Morocco, The Joint United Nations Programme on HIV/AIDS
(UNAIDS), THe Global Fund: HIV integrated behavioral and biological surveillance
surveys-Morocco 2011: Female sex workers in Agadir, Fes, Rabat and Tanger. In.
Morocco; 2012.
13. Huygens P, Mellakh K: Cartographie des professionnelles du sexe et des hommes
ayant des relations sexuelles avec des hommes au Maroc: Agadir, Inezgane, Ait
Melloul. In.: Fonds Mondial; 2013.
14. National AIDS Control Program-Ministry of Health: Integrated biological &
behavioral surveillance: a pilot study in Karachi & Rawalpindi. In. Pakistan; 2005.

272
15. National AIDS Control Program: HIV second generation surveillance in Pakistan:
National report round I. In. Pakistan: Canada-Pakistan HIV/AIDS Surveillance Project;
2005.
16. Emmanuel F, Blanchard J, Zaheer HA, Reza T, Holte-McKenzie M: The HIV/AIDS
Surveillance Project mapping approach: an innovative approach for mapping and
size estimation for groups at a higher risk of HIV in Pakistan. Aids 2010, 24 Suppl
2:S77-84.
17. Khan MS, Unemo M, Zaman S, Lundborg CS: HIV, STI prevalence and risk
behaviours among women selling sex in Lahore, Pakistan. BMC Infectious Diseases
2011, 11 (no pagination)(119).
18. National AIDS Control Programme Pakistan: Mapping and behavioural study of
adolescents in 7 districts of Pakistan: Karachi, Larkana, Quetta, Faisalabad,
Lahore, Mardan, and Peshawar. In. Islamabad, Pakistan; 2008.
19. Emmanuel F, Thompson LH, Athar U, Salim M, Sonia A, Akhtar N, Blanchard JF: The
organisation, operational dynamics and structure of female sex work in Pakistan.
Sexually Transmitted Infections 2013, 89(SUPPL. 2):ii29-ii33.
20. National AIDS Control Program: HIV second generation surveillance in Pakistan.
National Report Round IV 2011. In. Islamabad, Pakistan; 2012.
21. Punjab AIDS Control Program, AP Consultancies, Bridge Consultants Foundation:
Mapping of most at risk populations-Punjab 2014. In. Lahore, Pakistan; 2015.
22. National AIDS Control Program: Integrated biological & behavioral surveillance in
Pakistan 2016-17: 2nd generation HIV surveillance in Pakistan round 5. In.
Islamabad, Pakistan; 2017: 159.
23. World Health Organization: HIV Surveillance Systems: Regional update 2011. In.;
2011.
24. Somalia Ministry of Health: Mapping and size estimation of key populations in
Somalia. In. Somalia; 2016.
25. Sudan National AIDS Control Program: Situation analysis: Behavioral &
epidemiological surveys and response analysis. In. Khartoum, Sudan; 2002.
26. Sudan National AIDS Control Program: Mapping and behavioural survey of tea
sellers and female sex workers in South Darfur State. In. Khartoum, Sudan; 2005.
27. United Nations High Commissioner for Refugees (UNHCR): HIV Behavioural
Surveillance Survey Juba Municipality, South Sudan. In.; 2007.
28. South Sudan HIV/AIDS Commission: South Sudan Global AIDS Response Progress
Report 2016. In. South Sudan; 2015.
29. South Sudan HIV/AIDS Commission: South Sudan Global AIDS Response Progress
Report 2016. In. South Sudan; 2016
30. Government of the Republic of South Sudan-Ministry of Health: A Bio-Behavioral HIV
Survey of Female Sex Workers in South Sudan. In. South Sudan; 2016.
31. Hsairi M., Ben Abdallah S.: Enquête sérocomportementale du VIH auprès des
travailleuses du sexe clandestines en Tunisie. In. Tunis, Tunisia; 2012.
32. Ministry of Health-Republic of Yemen: Population size estimates among most at risk
populations in five major cities in Yemen. In. Yemen; 2010.
33. Mansoor AB, Fungladda W, Kaewkungwal J, Wongwit W: Gender differences in kap
related to HIV/AIDS among freshmen in Afghan Universities. Southeast Asian
Journal of Tropical Medicine and Public Health 2008, 39(3):404-418.

273
34. Shokoohi M, Baneshi MR, Haghdoost AA: Size estimation of groups at high risk of
HIV/AIDS using network scale up in Kerman, Iran. International Journal of
Preventive Medicine 2012, 3(7):471-476.
35. Khalajabadi Farahani F, Akhondi MM, Shirzad M, Azin A: Hiv/Sti Risk-Taking Sexual
Behaviours and Risk Perception among Male University Students in Tehran:
Implications for Hiv Prevention among Youth. Journal of biosocial science 2018,
50(1):86-101.
36. Melikian L, Prothro ET: Sexual behavior of university students in the Arab Near
East. J Abnorm Psychol 1954, 49(1):59-64.
37. Melikian LH: Social change and sexual behavior of Arab university students. The
Journal of social psychology 1967, 73(2):169-175.
38. Ghandour LA, Mouhanna F, Yasmine R, El Kak F: Factors associated with alcohol
and/or drug use at sexual debut among sexually active university students: cross-
sectional findings from Lebanon. BMC public health 2014, 14:671.
39. Faisel A., Cleland J.: Study of the sexual behaviours and prevalence of STIs among
migrant men in Lahore, Pakistan. In.; 2005.
40. Minhas M.R., Haider K.: Frequency of risk factors for acquiring HIV/AIDS among
hostellers of professional institutes in Pakistan. In: International AIDS Society,
MoPe1110C26: 2005; 2005.
41. Ismail SO, Ahmed HJ, Grillner L, Hederstedt Issa BA, Bygdeman S: Sexually
transmitted diseases in men in Mogadishu, Somalia. International Journal of STD and
AIDS 1990, 1(2):102-106.
42. Ismail SO, Ahmed HJ, Jama MA, Omer K, Omer FM, Brundin M, Olofsson MB, Grillner
L, Bygdeman S: Syphilis, gonorrhoea and genital chlamydial infection in a Somali
village. Genitourin Med 1990, 66(2):70-75.
43. McCarthy MC, Hyams KC, El-Tigani El-Hag A, El-Dabi MA, El-Sadig El-Tayeb M,
Khalid IO, George JF, Constantine NT, Woody JN: HIV-1 and hepatitis B transmission
in Sudan. Aids 1989, 3(11):725-729.
44. Holt BY, Brady W, Belay E, Toole M, Effler P, Friday J, Parker K: Planning STI/HIV
prevention among refugees and mobile populations: Situation assessment of
Sudanese refugees. Disasters 2003, 27(1):1-15.
45. Ministry of Health-United Arab Emirates: United Arab Emirates – Global AIDS
Response Progress Report 2014. In. United Arab Emirates; 2014.
46. Additional country-level data provided through the MENA HIV/AIDS
Epidemiology Synthesis Project database by the World Health Organization
Regional Office for the Eastern Mediterranean. 2013.
47. Jenkins C., Robalino D.A.: HIV/AIDS in the Middle East and North Africa: The costs
of inaction. Washigton, D.C.: The World Bank; 2003.
48. Ministere de la Sante et de la Population et de la Reforme Hospitaliere, Programme
National de Lutte Contre les MST et le SIDA: Plan a Moyen Terme: 3 ans. In. Geneva,
Switzerland; 1990.
49. Addad B, S. Hamdi, A. Bouguermauh,: Prevalence des MST en Consultation de
Gynecologie - Obstetrique et dans le Milieu Carceral de la Prostitution. In: VIII
International Conference on AIDS in Africa, Marrakech, Morocco, 12/12-16, Abstract
WPC076: 1993; 1993.
274
50. Ministere de la Sante et de la Population et de la Reforme Hospitaliere, Direction de la
Prevention Comite National de Lutte contre les IST/VIH/SIDA: Plan national
strategique de lutte contre les IST/VIH/Sida 2008-2012. In. Geneva, Switzerland;
2009.
51. The Joint United Nations Programme on HIV/AIDS (UNAIDS), World Health
Organization, The United Nations Children's Fund (UNICEF):
UNAIDS/WHO/UNICEF Epidemiological Fact Sheets on HIV and AIDS, 2008
update. In.
52. Ministere de la Sante et de la Population et de la Reforme Hospitaliere, Direction de la
Prevention Comite National de Lutte contre les IST/VIH/SIDA: Plan national
strategique de lutte contre les IST/VIH/SIDA 2013-2015. In. Geneva, Switzerland;
2016.
53. Ministere de la Sante et de la Population et de la Reforme Hospitaliere: Rapport
d'activite sur la riposte nationale au VIH/SIDA, Algerie 2014. In. Algerie; 2014.
54. Ministere de la Sante et de la Population et de la Reforme Hospitaliere: Rapport narratif
de la riposte au VIH/SIDA. In. Algerie; 2017.
55. Ministere de la Sante et de la Population et de la Reforme Hospitaliere: Country
progress report- Algeria: Global AIDS monitoring 2018. In. Algeria; 2018.
56. Ministry of Health-Kingdom of Bahrain: UNGASS Country Progress Report -
Kingdom of Bahrain: January 2010 - December 2011. In.; 2012.
57. Bailly C, M. Santiago, M. Abbate, et al.: Situation in Djibouti: Sero Epidemiological
Survey. In: III International Conference: AIDS and Associated Cancers in Africa, Sept
14-16, Poster. 1988.
58. Organisation Mondiale pour la Sante-Djibouti: Etudes epidemiologiques sur le
VIH/SIDA et les IST a Djibouti de 1986 a 2001. Bulletin Epidémiologique
Hebdomadaire de l’OMS 2001, 49.
59. Ministry of Health-Djibouti: Rapport de la Surveillance de l'Infection a VIH par
Pasles Sentinelles en Republique de Djibouti, juillet - octobre 1993. In.; 1993.
60. Shrestha PN: Forthcoming WER Global Update of AIDS Cases Reported to the
World Health Organization (WHO). In.; 1999.
61. U.S. Department of State: HIV/AIDS-- Recipe for Crisis: Djibouti's Mobile
Population, Lack of Resources and Social Conservatism Equal World's 12th.
Unclassified Cable, November, Djibouti, 001995 2000.
62. Bahdon DG: Situation de L'Infection a VIH/SIDA et des Maladies Sexuellement
Transmissibles en Republique de Djibouti. In.; 1998.
63. Ministere de la Sante Publique et des Affaires Sociales- Programme National de Lutte
Contre le SIDA: Rapport Epidemiologique de la Situation de L'Infection a
VIH/SIDA du 4eme Trimestre 1998, Djibouti. In.; 1999.
64. Ministry of Health- Djibouti, Programme de Lutte contre le SIDA: Seroprevalence du
VIH Chez les Femmes Travailleuses du Sexe a Djibouti. In.; 2008.
65. Comite Technique Intersectoriel de Lutte contre le SIDA le PALUDISME et la
Tuberculose (CTILSPT): Rapport de suivi de la declaration d'engagement sur le
VIH/SIDA-UNGASS 2010. In. Djibouti; 2010.
66. Mourad A, S. Mostafa, D. Watts: Low Prevalence of HIV Infection in Egyptian
Nationals. In: VIII International Conference on AIDS, Amsterdam, 7/19-24, Abstract
PuC 8147: 1992; 1992.

275
67. Egypt Ministry of Health and Population, World Health Organization (WHO): HIV/
AIDS Surveillance in Egypt: 2001. In: Eleventh Inter-Country Meeting of National
AIDS Programme Managers, 7/23-26, Casablanca, Morocco: 2001; 2001.
68. Murugasampillay S: Epidemiology and Surveillance of Human Immunodeficiency
Virus (HIV), Acquired Immunodeficiency Syndrome (AIDS) and Sexually
Transmitted Infections. In. Geneva, Switzerland; 1995: 1-45.
69. United States Census Bureau: HIV/AIDS surveillance database. In. Washington, DC;
2017.
70. Arafa M., Sallam S.: Epidemiologic study of HIV/AIDs among high risk groups in
Alexandria, Egypt. In: International AIDS Conference, CDB400: 2007; 2007.
71. National AIDS Program-Egypt: UNGASS country progress report. In. Cairo, Egypt;
2014.
72. National AIDS Program-Egypt: Country progress report-Egypt: Global AIDS
monitoring 2017. In. Egypt; 2017.
73. Iran National AIDS Control Programme: Results of HIV Tests. In. Iran; 1994.
74. Eltayeb EM: HIV Surveillance in the Islamic Republic of Iran. In. Geneva,
Switzerland; 1995.
75. Feizzadeh A, Nedjat S, Asghari S, Keshtkar A, Heshmat R, Setayesh H, Majdzadeh R:
Evidence-based approach to HIV/AIDS policy and research prioritization in the
Islamic Republic of Iran. Eastern Mediterranean health journal = La revue de sante de
la Mediterranee orientale = al-Majallah al-sihhiyah li-sharq al-mutawassit 2010,
16(3):259-265.
76. Office of Deputy Minister of Health in Health Affairs-Center for Disease Management,
The Joint United Nations Programme on HIV/AIDS (UNAIDS), The Iranian Center for
AIDS Research: Islamic Republic of Iran country report on UNGASS declaration of
commitment. In. Iran; 2006.
77. El-Tayeb E.M.: Strengthening AIDS/HIV Surveillance in Jordan: 17-31 October
1994. In.; 1995.
78. Lebanon National AIDS Programme, World Health Organization: Republic of Lebanon
National AIDS Programme - Strategic Plan: 1995 - 1999. In. Beirut, Lebanon; 1994.
79. Riedner G: HIV Surveillance among Key Populations at Risk in MENA Region:
Recent Developments. In: 2nd Global HIV/AIDS Surveillance Meeting, Bangkok,
Thailand, 3/2-5, Tuesday Session VI, presentation no 1: 2009; 2009.
80. National AIDS Control Program-Lebanon: UNGASS country progress report 2010. In.
Lebanon; 2010.
81. Shazly M.: Strengthening of HIV/AIDS Surveillance in the Libyan Arab
Jamahiriya: 20 December 1990 - 19 January 1991. In.; 1991.
82. Benslimane A, Rivjad M., Sekkat S. ea: Incidence of HIV Infections in Morocco. In: II
International Symposium: AIDS and Associated Cancers in Africa: 1987; Naples,
Italy,10/7-9, Abstract TH-84.; 1987.
83. Riyad M, Serrhini O, Sekkat S, al. e: Transmission Sexuelle du HIV au Maroc. In: V
International Conference: AIDS in Africa: 1990; Kinshasa, Zaire, Oct. 10-12, Poster
T.P.C.5.; 1990.
84. Royaume du Maroc Ministere de la Sante: Situation Epidemiologique des IST et VIH-
SIDA au Maroc. In. Morocco; 2008.
276
85. Ministere de la Sante-Royaume du Maroc: Historique de la surveillance sentinelle VIH
1999-2012 Maroc. 2013.
86. Ministry of Health-Morocco: Implementation of the Declaration of Commitment on
HIV/AIDS: 2006 national report. In. Morocco; 2006.
87. Bennani A., Alami K.: Surveillance sentinelle du VIH: Resultats 2005 et tendances de
la seroprevalence du VIH. In.; 2006.
88. Royaume du Maroc Ministere de la Sante: Mise en oeuvre de la declaration
d'engagement sur le VIH/SIDA: Rapport national 2010. 2010.
89. Ministere de la Sante-Royaume du Maroc: Rapport sur les estimations de l'epidemie
du VIH/sida au Maroc. In.; 2013.
90. Loudyi B, A. B. Moussa, F. Barodi, et al.,: Utilisation du Preservatif Chez les
Professionnelles dd Sexe dans la Region de Fes. In: 17th International Conference on
AIDS and STIs in Africa, Cape Town, South Africa, 12/7-11, Poster, p 173: 2013; 2013.
91. Girgis TH: Strengthening of HIV/AIDS Surveillance Activities in Pakistan. In.; 1990.
92. Rizvi AA, A. Ali Shah, S. Sheikh, et al.: To Develop Changed Sex Behaviour in
CSWs. In: 5th International Congress on AIDS in Asia and the Pacific, Kuala Lumpur,
Malaysia, 10/20-27, Abstract SCD02-02: 1999; 1999.
93. Shah SA, A. K. Ghauri, M. A. Memon, et al.: Voluntary HIV Counseling and Testing
in a Peer Outreach Program for Female and Male Sex Workers in Sindh Province,
Pakistan. In: 6th International Congress on AIDS in Asia and the Pacific, Melbourne,
Australia, 10/5-10, Abstract Mo0572: 2001; 2001.
94. Pasha MSK, Qazi M. S.,: Women's Health and HIV/AIDS: Researching with Home
Based Sex Workers in Quetta, Pakistan. In: XVII International AIDS Conference,
Mexico City, Mexico, 8/3-8, Abstract ThPe0326: 2008; 2008.
95. Pasha MSK, Malik, M., Gull S.,: HIV/STIs Epidemiology among Female Sex
Workers: Faisalabad, Pakistan. In: 9th International Congress on AIDS in Asia and the
Pacific, Bali, Indonesia, 8/9-13, Abstract TuPA020: 2009; 2009.
96. Pasha MSK, Baig M. A.,: Anal Sex, among Female Sex Workers & Their Clients -
Karachi, Pakistan. In: 10th International Congress on AIDS in Asia and the Pacific,
Busan, Korea, 8/26-30, Session SaOA04-05: 2011; 2011.
97. Mir AS, Malick N. Z.,: A Holistic Integrated Approach to HIV Prevention and
Harm Reduction in among Female Sex Workers. In: 11th International Congress on
AIDS in Asia and the Pacific, Bangkok, Thailand, 11/18-22, Abstract 1977: 2013; 2013.
98. Omar M. GA, Burans J., et al.,: Ongoing Surveillance for HIV Amongst STD Patients
in Somalia. In: IV International Conference on AIDS, Stockholm, 6/15-16, Poster 5557:
1988; 1988.
99. Duffy G: Report on STD/HIV Prevalence Study in Somaliland: Part 2. In.; 1999.
100. Ahmed S.M., Kheir E.H.H.M. : Sudanese Sexual Behaviour in the Context of Socio-
Cultural Norms and the Transmission of HIV. In: Anthropological Studies Relevant to
the Sexual Transmission of HIV. Volume 11, edn. Sonderborg, Denmark; 1990: 19-22.
101. Basha H.M.: Vulnerable Population Research in Darfur. In.; 2006.
102. Elrashied S. M.: HIV Sero-Prevalence and Related Risky Sexual Behaviours among
Female Sex Workers (FSWs) in Khartoum State, Sudan. In: 5th International AIDS
Society Conference on HIV Pathogenesis, Treatment and Prevention, Cape Town, South
Africa, 7/19-22, Online Session WEPEC103: 2009; 2009.
277
103. El-Tayeb E. M.: HIV/STD Surveillance in the Syrian Arab Republic: 20 May - 19
June 1995. In. Damascus, Syria; 1995.
104. Ministry of Health-Syria: National strategy for HIV/AIDS control. In. Damascus,
Syria; 2005.
105. Syria National AIDS Control Program: HIV and AIDS situation epidemic in Syria. In.
Damascus, Syria; 2008.
106. Al Sayed S.: Syrian Arab Republic UNGASS country progress report 2010. In.
Damascus, Syria; 2010.
107. Van de Perre P. CM: HIV Infection in Prostitutes in Africa. In: AIDS in Children,
Adolescents and Heterosexual Adults. edn.: Elsevier Science Publishing Company, Inc.;
1988: 166-167.
108. Giraldo G. SD, Mugerwa R., et al.,: Seroepidemiologic Analyses on Populations from
Uganda and Tunisia-High and Low Risk African Regions for HIV Infections In: IV
International Conference on AIDS, Stockholm, 6/13-14, Poster 5038: 1988; 1988.
109. Gharbi Y. GM, Blibech R., et al.: Epidemiology of HIV Infection in Tunisia. In: II
International Symposium: AIDS and Associated Cancers in Africa, Naples, Italy, 10/7-9,
Abstract TH-49: 1987; 1987.
110. Taibi J: Statistics on AIDS Cases Reported. Joint Publication Research Service:
Epidemiology, 1989, 10:15.
111. Tunisia Ministere de la Sante Publique: Plan a Moyen Terme 1990-1993. In.; 1990.
112. Fekih Z. LF, Sidhom M.: The Profile of HIV-Infected Tunisians Results of 5 Years
Surveillance: 1986-1990. In. Tunisia; 1991.
113. Programme de Lutte contre les IST/SIDA: Analyse de la situation et de la reponse au
VIH/SIDA en Tunisie. In. Tunisia; 2005.
114. Ministere de la Sante Publique-Tunisie: Appui au partenariat et renforcement de la
riposte a la menace d'extension du VIH/SIDA en Tunisie. In. Tunisie; 2006.
115. The Joint United Nations Programme on HIV/AIDS (UNAIDS): Notes on AIDS in the
Middle East and North Africa. In. RST, MENA; 2008.
116. Ministere de la Sante Publique-Tunisie: Rapport de situation national a l'intention de
l'UNGASS 2010. In. Tunisie; 2010.
117. Bahaa T., Elkamhawi S., Abdel Rahman I., Moustafa M., Shawky S., Kabore I., Soliman
C.: Gender influence on VCT seeking in Egypt. In: International AIDS Society,
WEPE0255: 2010; 2010.
118. Kahhaleh JG, El Nakib M, Jurjus AR: Knowledge, attitudes, beliefs and practices in
Lebanon concerning HIV/AIDS, 1996-2004. Eastern Mediterranean Health Journal
2009, 15(4):920-933.
119. Bennani A., El Rhilani H., El Kettani A., Latifi A., El Omari B., Alami K., Johnston
L.G.: Estimates of the size of key populations at risk for HIV infection: female sex
workers and men who have sex with men, injecting drug users in Morocco in 2013.
In: International AIDS COnference, WEPE180: 2014; 2014.
120. Royaume du Maroc-Ministere de la Sante: Enquete connaissances, attitudes et
pratiques des jeunes en matiere d'IST et VIH/SIDA. In.; 2013.
121. Projects and Research Department (AFROCENTER GROUP): Baseline study on
knowledge, attitudes, and practices on sexual behaviors and HIV/AIDS prevention
amongst young people in selected states in Sudan. In. Sudan; 2005.

278
122. Todd CS, Barbera-Lainez Y, Doocy SC, Ahmadzai A, Delawar FM, Burnham GM:
Prevalence of human immunodeficiency virus infection, risk behavior, and HIV
knowledge among tuberculosis patients in Afghanistan. Sexually Transmitted
Diseases 2007, 34(11):878-882.
123. Todd CS, Nasir A, Mansoor GF, Sahibzada SM, Jagodzinski LL, Salimi F, Khateri MN,
Hale BR, Barthel RV, Scott PT: Cross-sectional assessment of prevalence and
correlates of blood-borne and sexually-transmitted infections among Afghan
National Army recruits. BMC Infectious Diseases 2012, 12 (no pagination)(196).
124. Adib SM, Akoum S, El-Assaad S, Jurjus A: Heterosexual awareness and practices
among Lebanese male conscripts. Eastern Mediterranean Health Journal 2002,
8(6):765-775.
125. Royaume du Maroc-Ministere de la Sante, Cooperation Technique Allemande/GTZ:
Enquete connaissances, attitudes et pratiques des jeunes concernant les IST et le
SIDA. In.; 2007.
126. Mir AM, Wajid A, Pearson S, Khan M, Masood I: Exploring urban male non-marital
sexual behaviours in Pakistan. Reproductive Health 2013, 10 (1) (no pagination)(22).
127. Sudan National AIDS Control Programme-Federal Ministry of Health: HIV/AIDS/STIs
knowledge attitude behavioural and practice among university students and
military personnel, Sudan 2004. In. Khartoum, Sudan; 2004.
128. National AIDS Control Program, Johns Hopkins University Bloomberg School of Public
Health HIV Surveillance Project: Integrated behavioral & biological surveillance
(IBBS) in Afghanistan: Year 1 report. In. Kabul, Afghanistan; 2010.
129. Ministry of Health, National AIDS Program, Family Health International: HIV/AIDS
biological & behavioral surveillance survey round I: Summary report. In. Cairo,
Egypt; 2006.
130. Ministry of Health, National AIDS Program, Family Health International, Center for
Development Services: HIV/AIDS biological & behavioral surveillance survey round
II: Summary report. In. Egypt; 2010.
131. Navadeh S, Mirzazadeh A, Mousavi L, Haghdoost A, Fahimfar N, Sedaghat A: HIV,
HSV2 and Syphilis Prevalence in Female Sex Workers in Kerman, South-East Iran;
Using Respondent-Driven Sampling. Iran J Public Health 2012, 41(12):60-65.
132. Sajadi L, Mirzazadeh A, Navadeh S, Osooli M, Khajehkazemi R, Gouya MM, Fahimfar
N, Zamani O, Haghdoost AA: HIV prevalence and related risk behaviours among
female sex workers in Iran: results of the national biobehavioural survey, 2010.
Sexually transmitted infections 2013, 89 Suppl 3:iii37-40.
133. Kazerooni PA, Motazedian N, Motamedifar M, Sayadi M, Sabet M, Lari MA, Kamali K:
The prevalence of human immunodeficiency virus and sexually transmitted
infections among female sex workers in Shiraz, South of Iran: By respondent-driven
sampling. International Journal of STD and AIDS 2014, 25(2):155-161.
134. Moayedi-Nia S, Bayat Jozani Z, Esmaeeli Djavid G, Entekhabi F, Bayanolhagh S,
Saatian M, Sedaghat A, Nikzad R, Jahanjoo Aminabad F, Mohraz M: HIV, HCV, HBV,
HSV, and syphilis prevalence among female sex workers in Tehran, Iran, by using
respondent-driven sampling. AIDS Care 2016, 28(4):487-490.
135. Mirzazadeh A, M. Shokoohi, R. Khajehkazemi, et al.: HIV and sexually transmitted
infections among female sex workers in Iran: Findings from the 2010 and 2015
279
national surveillance surveys. In: 21st International AIDS Conference, Durban, South
Africa, 7/18-22, ePoster, Abstract TUPEC175: 2016; 2016.
136. Ministry of Health-Hashemite Kingdom of Jordan: Report to the Secretary General of
the United Nations on the United Nations General Assembly Special Session on
HIV/AIDS. In.; 2014.
137. Mahfoud Z, Afifi R, Ramia S, Khoury DE, Kassak K, Barbir FE, Ghanem M, El-Nakib
M, Dejong J: HIV/AIDS among female sex workers, injecting drug users and men
who have sex with men in Lebanon: Results of the first biobehavioral surveys. Aids
2010, 24(SUPPL. 2):S45-S54.
138. Valadez JJ, Berendes S, Jeffery C, Thomson J, Ben Othman H, Danon L, Turki AA,
Saffialden R, Mirzoyan L: Filling the Knowledge Gap: Measuring HIV Prevalence
and Risk Factors among Men Who Have Sex with Men and Female Sex Workers in
Tripoli, Libya. PLoS ONE 2013, 8 (6) (no pagination)(e66701).
139. Bokhari A, Nizamani NM, Jackson DJ, Rehan NE, Rahman M, Muzaffar R, Mansoor S,
Raza H, Qayum K, Girault P et al: HIV risk in Karachi and Lahore, Pakistan: an
emerging epidemic in injecting and commercial sex networks. International journal
of STD & AIDS 2007, 18(7):486-492.
140. National AIDS Control Program-Ministry of Health: HIV second generation
surveillance in Pakistan: national report round II. In. Pakistan; 2007.
141. Hawkes S, Collumbien M, Platt L, Lalji N, Rizvi N, Andreasen A, Chow J, Muzaffar R,
Ur-Rehman H, Siddiqui N et al: HIV and other sexually transmitted infections among
men, transgenders and women selling sex in two cities in Pakistan: A cross-sectional
prevalence survey. Sexually Transmitted Infections 2009, 85(SUPPL. 2):ii8-ii16.
142. National AIDS Control Program-Pakistan Ministry of Health: Progress report on the
Declaration of Commitment on HIV/AIDS for the United Nations General Assembly
Special Session on HIV/AIDS. In. Islamabad, Pakistan; 2010.
143. Testa A, Kriitmaa K: HIV & Syphilis bio-behavioural surveillance survey (BSS)
among female transactional sex workers in Hargeisa, Somaliland. In. Somalia; 2008.
144. International Organization for Migration (IOM): Integrated biological and behavioural
surveillance survey among vulnerable women in Hargeisa, Somaliland. In. Geneva,
Switzerland; 2017.
145. Elkarim M.A.A. AHA, Ahmed S.M., et al.,: Situation Analysis: Behavioral &
Epidemiological Surveys & Response Analysis - HIV/AIDS Strategic Planning
Process. In.; 2002.
146. Abdelrahim MS: HIV prevalence and risk behaviors of female sex workers in
Khartoum, north Sudan. Aids 2010, 24(SUPPL. 2):S55-S60.
147. Sudan National AIDS Control Programme: UNGASS report 2008-2009, North Sudan.
In.; 2010.
148. Sudan National AIDS Control Program: Integrated bio-behavioral HIV surveillance
(IBBS) among female sex workers and men who have sex with men in 15 states of
Sudan, 2011-2012. In.; 2012.
149. Stulhofer A, Bozicevic I: HIV bio-behavioural survey among FSWs in Aden, Yemen.
In.; 2008.
150. Ministry of Health-Republic of Yemen: UNGASS Country Progress Report 2013. In.
Yemen.; 2014.
280
151. Todd CS, Nasir A, Stanekzai MR, Bautista CT, Botros BA, Scott PT, Strathdee SA,
Tjaden J: HIV, hepatitis B, and hepatitis C prevalence and associated risk behaviors
among female sex workers in three Afghan cities. Aids 2010, 24 Suppl 2:S69-75.
152. Rodier GR, Couzineau B, Gray GC, Omar CS, Fox E, Bouloumie J, Watts D: Trends of
human immunodeficiency virus type-1 infection in female prostitutes and males
diagnosed with a sexually transmitted disease in Djibouti, East Africa. American
Journal of Tropical Medicine and Hygiene 1993, 48(5):682-686.
153. Constantine NT, Fox E, Rodier G, Abbatte EA: Monitoring for HIV-1, HIV-2, HTLV-I
sero-progression and sero-conversion in a population at risk in east Africa. The
Journal of the Egyptian Public Health Association 1992, 67(5-6):535-547.
154. Couzineau B, Bouloumie J, Hovette P, Laroche R: Prevalence of AIDS infection in
target people of the Republic of Djibouti. [French]. Medecine Tropicale 1991,
51(4):485-486.
155. Philippon M, Saada M, Kamil MA, Houmed HM: Attendance at a health center of
clandestine prostitutes in Djibouti. [French]. Cahiers Sante 1997, 7(1):5-10.
156. Marcelin AG, Grandadam M, Flandre P, Nicand E, Milliancourt C, Koeck JL, Philippon
M, Teyssou R, Agut H, Dupin N et al: Kaposi's sarcoma herpesvirus and HIV-1
seroprevalences in prostitutes in Djibouti. Journal of Medical Virology 2002,
68(2):164-167.
157. Sheba MF, Woody JN, Zaki AM, Morrill JC, Burans J, Farag I, Kashaba S, Madkour S,
Mansour M: The prevalence of HIV infection in Egypt. Transactions of the Royal
Society of Tropical Medicine and Hygiene 1988, 82(4):634.
158. Watts DM, Constantine NT, Sheba MF, Kamal M, Callahan JD, Kilpatrick ME:
Prevalence of HIV infection and AIDS in Egypt over four years of surveillance
(1986-1990). The Journal of tropical medicine and hygiene 1993, 96(2):113-117.
159. Kabbash IA, Abdul-Rahman I, Shehata YA, Omar AA: HIV infection and related risk
behaviours among female sex workers in greater Cairo, Egypt. Eastern
Mediterranean health journal = La revue de sante de la Mediterranee orientale = al-
Majallah al-sihhiyah li-sharq al-mutawassit 2012, 18(9):920-927.
160. Jahani MR, Alavian SM, Shirzad H, Kabir A, Hajarizadeh B: Distribution and risk
factors of hepatitis B, hepatitis C, and HIV infection in a female population with
"illegal social behaviour". Sexually transmitted infections 2005, 81(2):185.
161. Kassaian N, Ataei B, Yaran M, Babak A, Shoaei P, Ataie M: HIV and other sexually
transmitted infections in women with illegal social behavior in Isfahan, Iran. Adv
Biomed Res 2012, 1:5.
162. Taghizadeh H, Taghizadeh F, Fathi M, Reihani P, Shirdel N, Rezaee SM: Drug use and
high-risk sexual behaviors of women at a drop-in center in mazandaran province,
Iran, 2014. Iranian Journal of Psychiatry and Behavioral Sciences 2015, 9(2):49-55.
163. Asadi-Ali Abadi M, Abolghasemi J, Rimaz S, Majdzadeh R, Shokoohi M, Rostami-
Maskopaee F, Merghati-Khoei E: High-Risk Behaviors Among Regular and Casual
Female Sex Workers in Iran: A Report from Western Asia. Iran J Psychiatry Behav
Sci 2018, In Press(In Press):e9744.
164. Naman RE, Mokhbat JE, Farah AE, Zahar KL, Ghorra FS: Seroepidemiology of the
human immunodeficiency virus in Lebanon. Preliminary evaluation. Le Journal
medical libanais 1989, The Lebanese medical journal. 38(1):5-8.

281
165. Royaume du Maroc-Ministere de la Sante: Etude de prevalence des IST ches les
femmes qui consultent pour pertes vaginales et/ou douleurs du bas ventre. In:
Programme National de lutte contre les IST/SIDA. Rabat, Maroc; 2008.
166. Iqbal J, Rehan N: Sero-prevalence of HIV: six years' experience at Shaikh Zayed
Hospital, Lahore. Jpma 1996, The Journal of the Pakistan Medical Association.
46(11):255-258.
167. Baqi S, Nabi N, Hasan SN, Khan AJ, Pasha O, Kayani N, Haque RA, Haq IU, Khurshid
M, Fisher-Hoch S et al: HIV antibody seroprevalence and associated risk factors in
sex workers, drug users, and prisoners in Sindh, Pakistan. Journal of acquired
immune deficiency syndromes and human retrovirology : official publication of the
International Retrovirology Association 1998, 18(1):73-79.
168. Anwar M, Jaffery G, Rasheed S: Serological Screening of Female Prostitutes for Anti-
HIV and Hepatitis B Surface Antigen. Pak J Health 1998, 35(3-4):69-73.
169. Shah A.S., Memon M.A., Soomro S., Kazi N., Kristensen S.: Seroprevelance of HIV,
Syphilis, Hepatitis B and Hepatitis C among female commercial sex workers in
Hyderabad, Pakistan. In: International AIDS Conference, C12368: 2004; 2004.
170. Shah A.S., Ghauri A.K., Memon M.A., Shaikh S.A., Abbas S.Q., Kristensen S.: HIV
infection trends in the Sindh Province of Pakistan. In: International AIDS Conference,
C12336: 2004; 2004.
171. Akhtar A., Aslam M., Arif M., Rehman K.: Safer sex knowledge and attitude of female
sex workers in Pakistan. In: International AIDS Conference, THPE0334: 2008; 2008.
172. Raza M, Ikram N, Saeed N, Waheed U, Kamran M, Iqbal R, Bakar M: HIV/AIDS and
Syphilis Screening Among High Risk Groups. J Rawal Med Coll 2015, 19(1):11-14.
173. Jama H, Grillner L, Biberfeld G, Osman S, Isse A, Abdirahman M, Bygdeman S:
Sexually transmitted viral infections in various population groups in Mogadishu,
Somalia. Genitourinary Medicine 1987, 63(5):329-332.
174. Burans JP, Fox E, Omar MA, Farah AH, Abbass S, Yusef S, Guled A, Mansour M, Abu-
Elyazeed R, Woody JN: HIV infection surveillance in Mogadishu, Somalia. East
African medical journal 1990, 67(7):466-472.
175. Scott DA, Corwin AL, Constantine NT, Omar MA, Guled A, Yusef M, Roberts CR,
Watts DM: Low prevalence of human immunodeficiency virus-1 (HIV-1), HIV-2,
and human T cell lymphotropic virus-1 infection in Somalia. American Journal of
Tropical Medicine and Hygiene 1991, 45(6):653-659.
176. Corwin AL, Olson JG, Omar MA, Razaki A, Watts DM: HIV-1 in Somalia: Prevalence
and knowledge among prostitutes Aids 1991, 5(7):902-904.
177. Jama Ahmed H, Omar K, Adan SY, Guled AM, Grillner L, Bygdeman S: Syphilis and
human immunodeficiency virus seroconversion during a 6-month follow-up of
female prostitutes in Mogadishu, Somalia. International Journal of STD and AIDS
1991, 2(2):119-123.
178. Burans JP, McCarthy M, el Tayeb SM, el Tigani A, George J, Abu-Elyazeed R, Woody
JN: Serosurvey of prevalence of human immunodeficiency virus amongst high risk
groups in Port Sudan, Sudan. East African medical journal 1990, 67(9):650-655.
179. McCarthy MC, Khalid IO, El Tigani A: HIV-1 infection in Juba, southern Sudan.
Journal of Medical Virology 1995, 46(1):18-20.

282
180. Bchir A, Jemni L, Saadi M, Milovanovic A, Brahim H, Catalan F: Markers of sexually
transmitted diseases in prostitutes in central Tunisia. Genitourinary medicine 1988,
64(6):396-397.
181. Hassen E, Chaieb A, Letaief M, Khairi H, Zakhama A, Remadi S, Chouchane L:
Cervical human papillomavirus infection in Tunisian women. Infection 2003,
31(3):143-148.
182. Znazen A, Frikha-Gargouri O, Berrajah L, Bellalouna S, Hakim H, Gueddana N,
Hammami A: Sexually transmitted infections among female sex workers in Tunisia:
High prevalence of Chlamydia trachomatis. Sexually Transmitted Infections 2010,
86(7):500-505.
183. Fox E, Haberberger Jr RL, Abbatte EA, Said S, Polycarpe D, Constantine NT:
Observations on sexually transmitted diseases in promiscuous males in Djibouti. The
Journal of the Egyptian Public Health Association 1989, 64(5-6):561-569.
184. Al-Owaish RA, Anwar S, Sharma P, Shah SF: HIV/AIDS prevalence among male
patients in Kuwait. Saudi medical journal 2000, 21(9):852-859.
185. Alowaish R, Anwar S.: Sexually transmitted diseases among bachelor community in
Kuwait. In: International AIDS Conference, C11000: 2002; 2002.
186. Al-Mutairi N, Joshi A, Nour-Eldin O, Sharma AK, El-Adawy I, Rijhwani M: Clinical
patterns of sexually transmitted diseases, associated sociodemographic
characteristics, and sexual practices in the Farwaniya region of Kuwait.
International Journal of Dermatology 2007, 46(6):594-599.
187. Heikel J, Sekkat S, Bouqdir F, Rich H, Takourt B, Radouani F, Hda N, Ibrahimy S,
Benslimane A: The prevalence of sexually transmitted pathogens in patients
presenting to a Casablanca STD clinic. European journal of epidemiology 1999,
15(8):711-715.
188. Manhart LE, A. Zidouh, K. Holmes, et al.: Sexually Transmitted Disease (STD) in
Three Types of Health Clinics in Morocco: Prevalence, Risk Factors, and
Syndromic Management. In: XI International Conference on AIDS, Vancouver, 7/7-14,
Poster MoC1627: 1996; 1996.
189. Alami K, Mbarek Ait N, Akrim M, Bellaji B, Hansali A, Khattabi H, Sekkat A, El Aouad
R, Mahjour J: Urethral discharge in Morroco: Prevalence of microorganisms and
susceptibility of gonococcos. Eastern Mediterranean Health Journal 2002, 8(6):794-
804.
190. Mujeeb SA, Hafeez A: Prevalence and pattern of HIV infection in Karachi. Jpma
1993, The Journal of the Pakistan Medical Association. 43(1):2-4.
191. Memon GM: Serosurveillance of HIV infection in people at risk in Hyderabad
Sindh. JPMA The Journal of the Pakistan Medical Association 1997, 47(12):302-304.
192. National AIDS Programme: HIV seroprevalence surveys in Pakistan. AIDS 1996,
10(8):926-927.
193. Rehan N: Profile of men suffering from sexually transmitted infections in Pakistan.
Journal of Ayub Medical College, Abbottabad : JAMC 2003, 15(2):15-19.
194. Bhutto AM, Shah AH, Ahuja DK, Solangi AH, Shah SA: Pattern of sexually
transmitted infections in males in interior Sindh: a 10-year-study. Journal of Ayub
Medical College, Abbottabad : JAMC 2011, 23(3):110-114.

283
195. Razvi SK, Najeeb S, Nazar HS: Pattern of sexually transmitted diseases in patients
presenting at Ayub teaching hospital, Abbottabad. Journal of Ayub Medical College,
Abbottabad : JAMC 2014, 26(4):582-583.
196. National AIDS Control program, Balochistan AIDS Control program, Canada Pakistan
HIV/AIDS Surveillance Project: Bio behavioral survey among mine workers in
Balochistan, Pakistan. In. Islamabad, Pakistan; 2012.
197. Ismail A., Ekanem E., Deq S., Arube P., Gboun M.: Somaliland 2007 HIV/Syphilis
sero-prevalence survey: A technical report. In.; 2007.
198. McCarthy MC, Burans JP, Constantine NT, El-Tigani El-Hag AA, El-Saddig El-Tayeb
M, El-Dabi MA, Fahkry JG, Woody JN, Hyams KC: Hepatitis B and HIV in Sudan: A
serosurvey for hepatitis B and human immunodeficiency virus antibodies among
sexually active heterosexuals. American Journal of Tropical Medicine and Hygiene
1989, 41(6):726-731.
199. Hashemite Kingdom of Jordan: Report to the Secretary General of the United Nations
on the United Nations General Assembly Special Session on HIV/AIDS. In.; 2010.
200. Ministry of Health-Pakistan National AIDS Control Program: National study of
reproductive tract and sexually transmitted infections: a survey of high risk groups
in Lahore and Karachi, Pakistan. In.; 2005.
201. Punjab AIDS Control Program, AP Consultancies, Bridge Consultants Foundation:
Integrated behavioural & biological surveillance among most at-risk population,
IBBS study-Punjab 2014. In. Lahore, Pakistan; 2015.
202. Elhadi M, Elbadawi A, Abdelrahman S, Mohammed I, Bozicevic I, Hassan EA,
Elmukhtar M, Ahmed S, Abdelraheem MS, Mubarak N et al: Integrated bio-
behavioural HIV surveillance surveys among female sex workers in Sudan, 2011-
2012. Sexually transmitted infections 2013, 89 Suppl 3:iii17-22.
203. Ministere de la Sante Publique-Tunisie: Synthese des enquetes de seroprevalence et
serocomportementales aupres de trois populations vulnerables au VIH: Les usages
de drogues injectables, les hommes ayant des rapports sexuels avec des hommes, et
les travailleuses dy sexe clandestines en Tunisie. In. Tunisia; 2010.
204. Syria National AIDS Control Program: HIV/AIDS female sex wrokers KABP survey
in Syria. In. Damascus, Syria; 2004.
205. Shokoohi M, Noori A, Karamouzian M, Sharifi H, Khajehkazemi R, Fahimfar N,
Hosseini-Hooshyar S, Kazerooni PA, Mirzazadeh A: Remaining Gap in HIV Testing
Uptake Among Female Sex Workers in Iran. AIDS and behavior 2017, 21(8):2401-
2411.
206. Mirzazadeh A, Nedjat S, Navadeh S, Haghdoost A, Mansournia MA, McFarland W,
Mohammad K: HIV and related risk behaviors among female sex workers in Iran:
bias-adjusted estimates from the 2010 National Bio-Behavoral Survey. AIDS and
behavior 2014, 18 Suppl 1:S19-24.

284
Appendix III
Supplementary material for Research paper 1-
Search criteria

285
1. Conceptual framework
The search strategy is informed by the interaction between three main spheres: 1) context: sex
work, 2) setting: MENA, and 3) populations: a. female and b. male. The conceptual framework
guiding the development of the search strategy is illustrated in Figure S1.
Figure S1. Conceptual framework informing the development of the search strategy for the
systematic review.
2. Systematic review of systematic reviews of studies of FSWs and clients globally
Any systematic review focused on FSWs or clients of FSWs regardless of geographic area was
eligible for inclusion. Search was conducted in PubMed and Embase using broad search terms
for sex work:
PubMed (22 Feb 2017)
“Sex Work”[Mesh] OR "Sex workers"[Mesh] OR Sex work*[Text] OR Prostitut*[Text] OR
Female sex work*[Text] OR FSW*[Text] OR CSW*[Text] OR Sex worker* client*[Text] OR
Sex client*[Text] OR female sex work* client*[Text] OR Client* of female sex work*[Text] OR
Client of sex work*[Text] OR Commercial sex*[Text] OR Transactional sex*[Text]
N= 62 citations retrieved after limiting to Humans and Systematic reviews.
Embase (22 Feb 2017)
((exp prostitution/ or exp sexual promiscuity/ or exp sex trafficking/ or exp sexual exploitation/
or exp transactional sex/) OR (prostitut* or sex work* or female sex work* or FSW* or CSW*
or sex work* client* or sex client* or female sex work* client* or client* of sex* or client* of
female sex work* or commercial sex* or transactional sex*)) AND (exp "systematic review"/)
286
N=178 citations retrieved after limiting to Humans.
The search identified a total of 240 citations, of which 195 were unique. Screening of these
citations identified 40 relevant, 21 potentially relevant and 134 not relevant citations.
The detailed extraction of the search strategies from relevant and potentially relevant systematic
reviews can be found in Table S2.
Table S2. Search criteria for other systematic reviews on FSWs and their clients.
Citation Research
area/Theme
Region/Country Search terms
Relevant articles
Abad, N., et al., A review of HIV/STD
behavioral prevention interventions for
female sex workers in the United States. Sexually Transmitted Diseases, 2014.
41: p. S114.
Behavioral
interventions
US Commercial sex, sex trade, prostitution, paying
partners (Conference abstract)
Baral, S., et al., High and
disproportionate burden of HIV among female sex workers in low-and middle-
income countries: A systematic review
and meta-analysis. Journal of the International AIDS Society, 2012. 15: p.
90-91.
HIV prevalence Low and middle
income countries
Could not be retreived
Baral, S., et al., Burden of HIV among female sex workers in low-income and
middle-income countries: A systematic
review and meta-analysis. The Lancet
Infectious Diseases, 2012. 12(7): p. 538-
549.
HIV incidence Low and middle income countries
MeSH terms for HIV or AIDS, and terms associated with sex work (prostitute [MeSH]
or “sex work” or “sex work*” or “female sex
worker” or “commercial sex worker”)
Buzdugan, R., S.S. Halli, and F.M.
Cowan, The female sex work typology in India in the context of HIV/AIDS. Trop
Med Int Health, 2009. 14(6): p. 673-87.
Typology of FSW India Text words: ‘India’ AND (‘sex work’ OR
‘prostitution’ OR ‘sex worker’ OR ‘prostitute’) Google: ‘India’ AND (‘sex work typology’ OR
‘typology of sex work’ OR ‘typologies of sex work’ OR ‘sex work typologies’ OR ‘sex work
type’ OR ‘type of sex work’ OR ‘types of sex
work’ OR ‘form of sex work’)
Chersich, M.F., et al., Priority interventions to reduce HIV
transmission in sex work settings in sub-
Saharan Africa and delivery of these services. Journal of the International
AIDS Society, 2013. 16 (no
pagination)(17980).
Interventions Africa Search terms were: prosti (or any term with this word) or ‘‘sex work’’ or ‘‘sex worker’’
or ‘‘sex workers’’, and Africa (MeSH term or any
field)
Chow, E.P., et al., Risk behaviours
among female sex workerin China: a
systematic review and data synthesis. PLoS One, 2015. 10(3): p. e0120595.
Risk behaviors among
FSWs
China (“China [MeSH]” OR “Chinese [MeSH]”) AND
(“sex workers [MeSH]” OR “prostitute” OR
“women who sell sex” OR “sex industry” OR “commercial sex”) AND (“risk behaviour”
OR “risk behavior” OR “condom” OR “HIV test”
OR “drug use” OR “unprotected sex”)
Chow, E.P., et al., Behavioral Interventions Improve Condom Use and
HIV Testing Uptake Among Female Sex
Workers in China: A Systematic Review and Meta-Analysis. AIDS Patient Care
STDS, 2015. 29(8): p. 454-60.
Behavioral interventions (impact)
China The search was conducted using free-text terms and MeSH terms: (‘human immunodeficiency
virus’ OR ‘HIV’ OR ‘Acquired immune
deficiency syndrome’ OR ‘AIDS’) AND (‘prevention’ OR ‘intervention’ OR ‘control’)
AND (‘female sex workers’ OR ‘commercial sex
workers’ OR ‘women who sell sex’ OR ‘FSW’ or ‘CSW’) AND (‘China’ OR ‘Chinese’).

287
Dhana, A., et al., Systematic review of facility-based sexual and reproductive
health services for female sex workers in
Africa. Globalization and Health, 2014. 10 (1) (no pagination)(46).
Facility-based
prevention and care
services for FSWs
Low and middle
income countries
in Africa
combined MeSH and free text terms for low- and
middle-income countries [9] together with sex
work. In Web of Science, we used text search
terms to locate all articles that included Africa or India, and sex work or high-risk populations.
Footer, K.H.A., et al., Policing practices
as a structural determinant for HIV
among sex workers: A systematic review of empirical findings. Journal of the
International AIDS Society, 2016. 19
(no pagination)(20883).
Structural
determinants of HIV
among sex workers (policing)
Global PubMed: "Sex Workers"[Mesh] OR
"Prostitution"[Mesh] OR sex work*[tw] OR
sexual work*[tw] OR sexwork*[tw] OR prostitut*[tw] OR commercial sex*[tw] OR
transactional sex*[tw] OR trading sex*[tw] OR
traded sex*[tw] OR sex transaction*[tw] OR sexual transaction*[tw] OR exchanging sex*[tw]
OR exchanged sex*[tw] OR sexual favor*[tw] OR
trade sex*[tw] OR exchange sex*[tw] Embase: 'prostitution'/exp OR 'transactional
sex'/exp OR ((sex NEXT/1 work*) OR (sexual
NEXT/1 work*) OR sexwork* OR prostitut* OR (commercial NEXT/1 sex*) OR (transaction*
NEXT/1 sex*) OR (trading NEXT/1 sex*) OR
(trade* NEXT/1 sex*) OR (sex* NEXT/1 transaction*) OR (exchang* NEXT/1 sex*) OR
(sex* NEXT/1 favor*)):ab,ti text terms only
searched in tile/abstract
Harcourt, C. and B. Donovan, The many
faces of sex work. Sexually Transmitted
Infections, 2005. 81(3): p. 201-206.
Typology of CSW 15 countries ‘‘prostitution’’
Hong, Y. and X. Li, Behavioral studies
of female sex workers in China: a
literature review and recommendation for future research. AIDS Behav, 2008.
12(4): p. 623-36.
Behavioral studies of
FSWs
China China, sex workers, prostitutes, entertainment
workers, prostitution, commercial sex, and HIV
risks
Hong, Y., A.N. Poon, and C. Zhang,
HIV/STI prevention interventions targeting FSWs in China: a systematic
literature review. AIDS Care, 2011. 23
Suppl 1: p. 54-65.
HIV/STI prevention
interventions among FSWs
China China, female sex workers, prostitutes
(prostitution), entertainment workers, commercial sex, STI(STD), sexual behavior, prevention,
condom use, sexual risks, intervention, and
HIV/AIDS
Jeal, N., et al., Systematic review of
interventions to reduce illicit drug use in
female drug-dependent street sex workers. BMJ Open, 2015. 5 (11) (no
pagination)(e009238).
Interventions to
reduce drug use
among FSWs
UK Medline on Ovid
1. prostitution
2. prostitut*.tw 3. sex adj1 work*.tw
4. substance-related disorders
5. amphetamine-related disorders 6. cocaine-related disorders
7. crack cocaine
8. heroin dependence 9. morphine dependence
10. opioid-related disorders
11. street drugs 12. substance abuse, intravenous
Kerrigan, D., et al., A community
empowerment approach to the HIV response among sex workers:
Effectiveness, challenges, and
considerations for implementation and scale-up. The Lancet, 2015. 385(9963):
p. 172-185.
Interventions among
sex workers
Low and middle
income countries
(“sex work*” OR prostitut*) AND (empower* OR
power OR mobiliz* OR mobilis* OR “community development” OR “community led”
OR “community-led” OR collective OR
solidarity OR “social cohesion” OR “social capital” OR “social vulnerability” OR “social
inclusion” OR “social exclusion” OR “social
environment” OR participat* OR rights OR
environmental OR structural OR peer) AND (HIV
OR AIDS OR STI OR STD OR “condom
use”)
Lancaster, K.E., et al., HIV care and treatment experiences among female sex
workers living with HIV in sub-Saharan
Africa: A systematic review. African Journal of AIDS Research, 2016. 15(4):
p. 377-386.
HIV care and treatment among
FSWs
Sub-Saharan Africa
((‘HIV-positive’ OR ‘HIV positive’ OR ‘HIV seropositive’ OR ‘living with HIV’ OR ‘living
with AIDS’ OR PLWH OR PLWA OR PLWHA
OR PLHIV) AND (‘sex work’ OR ‘sex worker’ OR ‘sex workers’ OR prostitute*) AND
(female* OR women)).
Li, Q., X. Li, and B. Stanton, Alcohol use among female sex workers and male
clients: an integrative review of global
Alcohol use among FSWs and clients
Global ‘female’, ‘women’, ‘sex workers’, ‘prostitutes’, ‘entertainment workers’, ‘prostitution’,
‘commercial sex’, ‘sex work’, ‘sex industry’, ‘sex

288
literature. Alcohol Alcohol, 2010. 45(2):
p. 188-99.
trade’, ‘sell sex’, ‘exchange sex’, ‘alcohol’,
‘drinking’, ‘drunk’, ‘drunkenness’ and
‘intoxication’
MacAllister, J., et al., A comprehensive
review of available epidemiologic and HIV service data for female sex workers,
men who have sex with men, and people
who inject drugs in select West and Central African countries. Journal of
Acquired Immune Deficiency
Syndromes, 2015. 68: p. S83-S90.
HIV epidemiology,
treatment and size estimation of key
populations
Central Africa:
Cameroon, Chad, Cote d'Ivoire,
Democratic
Republic of Congo, Ghana,
Guinea-Bissau,
Niger, and Nigeria
“sex worker*”[tw] OR “sex workers”[Mesh] OR
“FSW” [tw] OR “SW” [tw] OR “prostitute*”[tw] OR “prostitution” [tw] OR “commercial sex” [tw]
OR “commercial sex worker*”[tw] OR “CSW”
[tw] OR “transactional sex” [tw] OR “transactional sex worker*”[tw] OR “TSW” [tw]
OR “travailleuse du sexe”[tw] OR “TS”[tw] OR
“intravenous drug user”[tw] OR “IVDU”[tw] OR “IDU”[tw] OR “drug user”[tw] OR “men who
have sex with men”[tw] OR “MSM”[tw] OR
“males who have sex with males”[tw] OR “bisexual men”[tw] OR “bisexual male”[tw] OR
“bisexual males”[tw] OR “HSH”[tw] OR
“Hommes ayant des rapports Sexuels avec des Hommes”[tw] OR "Homosexuality, Male"[Mesh]
OR “male homosexual*”[tw] OR “gay men”[tw]
OR “gay man”[tw] OR “gay male*”[tw] OR “homosexual male*”[tw] OR “homosexual
males”[tw] OR “homosexual man”[tw] OR
“homosexual men” OR “sex for money”[tw] OR “transgender”[tw] OR “trans”[tw]
Malta, M., et al., HIV prevalence among
female sex workers, drug users and men who have sex with men in Brazil: a
systematic review and meta-analysis.
BMC Public Health, 2010. 10: p. 317.
HIV prevalence
among key populations
Brazil This search combined standardized search terms
(keywords and medical subject heading terms ? MESH) that reflect key domains: (a) HIV/AIDS,
(b) prevalence or incidence, (c) location (Brazil),
and (d) target populations (i.e., FSW, MSM, IDU or non-injection drug users).
McLaughlin, M.M., et al., Sexually
transmitted infections among heterosexual male clients of female sex
workers in China: a systematic review
and meta-analysis. PLoS One, 2013. 8(8): p. e71394.
STIs among clients of
FSWs
China china[mesh] AND "china"[tw] prostitution[mesh]
OR "sex work"[tiab] OR "sex worker"[tiab] OR "sex workers"[tiab] OR "sex workers"[tiab] OR
"prostitution"[tiab] OR "prostitutes"[tiab] OR
"prostitute"[tiab] OR “commercial sex"[tiab] Sexually Transmitted Diseases"[Mesh] OR
"STD"[tiab] OR "STDs"[tiab] OR "STI"[tiab] OR
"STIs"[tiab] OR "sexually transmitted
infection"[tiab] OR "sexually transmitted
infections"[tiab] OR "sexually transmitted
diseases"[tiab] OR "sexually transmitted disease"[tiab] OR "venereal disease"[tiab] OR
"venereal diseases"[tiab] OR aids[sb] OR
"chlamydia"[tiab] OR "gonorrhea"[tiab] OR "syphilis"[tiab] OR "hepatitis"[tiab] OR
"herpes"[tiab] OR "HPV"[tiab] OR "human
papillomavirus"[tiab] OR "genital warts"[tiab] OR "chancroid"[tiab] OR "trichomoniasis"[tiab]
Moore, L., et al., Community
empowerment and involvement of female
sex workers in targeted sexual and reproductive health interventions in
Africa: A systematic review. Globalization and Health, 2014. 10 (1)
(no pagination)(47).
Interventions among
female sex workers
Africa Search terms used in Medline were: “prostit*” or
“sex work” or “sex worker” or “sex workers”, and
all low- and middle-income countries (MeSH term or any field). Articles were located in Web of
Science using the terms “sex work” or “prostitution”
Mountain, E., et al., Antiretroviral
therapy uptake, attrition, adherence and
outcomes among hiv-infected female sex
workers: A systematic review and meta-
analysis. PLoS ONE, 2014. 9 (9) (no
pagination)(e105645).
ART among HIV
positive FSWs
Global ‘‘FSW’’ OR ‘‘FSWs’’ OR ‘‘CSW’’ OR ‘‘CSWs’’
OR ‘‘commercial sex’’ OR ‘‘female sex worker*’’
OR ‘‘commercial sex work*’’ OR ‘‘sex-work*’’
OR ‘‘sexwork*’’ OR ‘‘sex work*’’ OR
‘‘prostitute*’’ OR ‘‘prostitution’’ OR ‘‘transactional sex’’ OR ‘‘paid sex’’ OR ‘‘money
for sex’’ OR ‘‘sex for money’’ OR ‘‘paid for sex’’
OR ‘‘sex in exchange for money’’ OR ((‘‘core group’’ OR ‘‘high risk’’ OR ‘‘high-risk’’ OR
highrisk’’) AND (‘‘female*’’ OR ‘‘women’’ or
‘‘woman’’))
Muldoon, K.A., A systematic review of
the clinical and social epidemiological
research among sex workers in Uganda. BMC Public Health, 2015. 15: p. 1226.
HIV epidemiology
among FSWs
Uganda Sex work terms included:
“sex work” or “sex workers” or prostitut* or
brothel* or escort or “sex adj3 buy*” or “commercial adj3 sex*” or “sex adj3 industry.”

289
Ota, E., et al., Behavioral interventions to reduce the transmission of HIV
infection among sex workers and their
clients in high-income countries. Cochrane Database Syst Rev, 2011(12):
p. Cd006045.
Behavioural
interventions among
FSws and their clients
High income
countries
PubMed: prostitute[tiab] OR prostitutes[tiab] OR
sex worker[tiab] OR sex workers[tiab] OR
prostitution[mh] OR prostitution[tiab]
Embase: ’prostitute’/de OR prostitute OR
prostitutes OR’prostitution’/de OR prostitution
OR ’sex worker’ OR ’sex workers’ OR ’callgirl’/de OR callgirl OR callgirls
Owen, B.N., et al., Lifetime prevalence
of anal intercourse among sexually
active female youth and young female sex workers: A comparative systematic
review and meta-analysis. Sexual
Health, 2013. 10 (6): p. 585.
Anal sex among
FSWs
Global Not available- conference abstract
Papworth, E., et al., Epidemiology of
HIV among female sex workers, their
clients, men who have sex with men and people who inject drugs in West and
Central Africa. J Int AIDS Soc, 2013. 16
Suppl 3: p. 18751.
HIV epidemiology
among key
populations
West and Central
Africa
“female sex worker” OR “sex worker” OR “FSW”
OR “SW” OR “prostitute” OR “prostitution” OR
“commercial sex” OR “commercial sex worker” OR “CSW” OR “transactional sex” OR
“transactional sex worker” OR “TSW” OR
“travailleuse du sexe” OR “TS”
Peng, R.R., et al., Prevalence and genotype distribution of cervical human
papillomavirus infection among female
sex workers in Asia: A systematic literature review and meta-analysis.
Sexual Health, 2012. 9(2): p. 113-119.
HPV among FSWs Asia ‘female sex workers’, ‘commercial sex workers’, or ‘prostitutes’
Pitpitan, E.V., et al., HIV/STI risk among venue-based female sex workers
across the globe: a look back and the
way forward. Curr HIV/AIDS Rep, 2013. 10(1): p. 65-78.
Typology of sex work and STI prevalence
among venue-based
FSWs
Global “female sex work,” “commercial sex,” “sex industry,” “sell sex,” “exchange sex,” “sex
trafficked,” “prostitution,” with “HIV risk,” “HIV
infection,” “HIV prevalence,” “sexually transmitted infection”
Platt, L., et al., Systematic review
examining differences in HIV, sexually transmitted infections and health-related
harms between migrant and non-
migrant female sex workers. Sex Transm Infect, 2013. 89(4): p. 311-9.
STI prevalence
among migrant and non-migrant FSWs
Global MESH terms “sex worker” and “prostitute”
with the free words “sex work*” “prostitut*”, “entertainment worker*”, “(exchang* adj3 sex)”,
“(sell* adj3 sex)”, “(sold* adj3 sex)”, “(sex adj3
money)”, “(transaction* adj3 sex)”, “(commerc adj3 sex)”, “(surviv* adj3 sex)”, “(sex adj3
drug*)”, “sex trade”, “sex industry”,
“(sex* servic*)”, “ brothel*”, “red-light”, “solicit*”, “bar girl*”, “hostess*”, “ escort*”, “
masseu*” with “OR”.
Platt, L., et al., Factors mediating HIV
risk among female sex workers in Europe: A systematic review and
ecological analysis. BMJ Open, 2013. 3
(7) (no pagination)(e002836).
STI epidemiology and
structural determinants of STIs
among FSWs
Europe MESH terms “sex worker” and “prostitute”
with the free words “sex work*” “prostitut*”, “entertainment worker*”, “(exchang* adj3 sex)”,
“(sell* adj3 sex)”, “(sold* adj3 sex)”, “(sex adj3
money)”, “(transaction* adj3 sex)”, “(commerc adj3 sex)”, “(surviv* adj3 sex)”, “(sex adj3
drug*)”, “sex trade”, “sex industry”,
“(sex* servic*)”, “ brothel*”, “red-light”, “solicit*”, “bar girl*”, “hostess*”, “ escort*”, “
masseu*” with “OR”.
Poon, A.N., et al., Review of HIV and other sexually transmitted infections
among female sex workers in China.
AIDS Care - Psychological and Socio-Medical Aspects of AIDS/HIV, 2011.
23(SUPPL. 1): p. 5-25.
STI epidemiology among FSWs
China female sex worker (FSW), commercial sex worker (CSW), commercial sex, sex work, prostitution,
prostitute, China, HIV, sexually transmitted
infections/ diseases (STI/STD), prevalence, and incidence.
Ross, M.W., et al., Occupational health and safety among commercial sex
workers. Scandinavian Journal of Work,
Environment and Health, 2012. 38(2): p. 105-119.
Occupational health among FSWs
Global “sex work” and “prostitution”, and “occupational health” and “safety”
Shahmanesh, M., et al., Effectiveness of
interventions for the prevention of HIV
and other sexually transmitted infections in female sex workers in resource poor
setting: A systematic review. Tropical
Medicine and International Health, 2008. 13(5): p. 659-679.
Prevention
interventions among
FSWs
Resource-poor
settings
Mesh terms and text words (in italics):
(Prostitution OR prostitut* OR ‘sex work*’) AND
(HIV OR HIV infection OR HIV seroprevalence OR HIV OR sexually transmitted disease OR
‘sexually transmitted infection’).
290
Steen, R., et al., Periodic presumptive treatment of curable sexually
transmitted infections among sex
workers: a systematic review. Aids, 2012. 26(4): p. 437-45.
STI treatment among
FSWs
Global MEDLINE was searched using the following
search terms: prostitution or prostitut_ or ‘sex
work_’ and HIV or STI or STD or ‘sexually
transmitted disease’ or ‘sexually transmitted infection’ or syphilis or ‘chlamydia’ or gonor_.
Stoebenau, K., et al., Revisiting the
understanding of "transactional sex" in
sub-Saharan Africa: A review and synthesis of the literature. Social
Science and Medicine, 2016. 168: p.
186-197.
Context of FSW Sub-Saharan
Africa
[“transactional sex” or “survival sex” or
“consumption sex” or “intergenerational sex” or
“commodified sex” or “cross-generational sex” or “informal sex”, or “sex* exchange”, or “sex*
trade” or “sugar daddy*”, or “globalization and
sex*” or “modernity and sex*” and Africa]
Su, S., et al., Sustained high prevalence
of viral hepatitis and sexually
transmissible infections among female sex workers in China: A systematic
review and meta-analysis. BMC
Infectious Diseases, 2016. 16 (1) (no
pagination)(2).
Hepatitis and STIs
among FSWs
China China’, ‘Chinese’, ‘CSW (commercial sex
workers)’, ‘FSW’, ‘hepatitis’, ‘sexually
transmitted diseases’ and ‘sexually transmitted infections’, and other keywords associated with
each STI: ‘chlamydia’, ‘Chlamydia trachomatis’,
‘gonorrhoea’, ‘Neisseria gonorrhoea’, ‘syphilis’, ‘genital warts’, ‘hepatitis’, ‘HBV’, ‘hepatitis B’,
‘HCV’, ‘hepatitis C’, ‘HSV’, ‘herpes simplex
virus’, ‘HPV’, ‘human papillomavirus’ and ‘trichomonas vaginitis’.
Tan, S.Y. and G.J. Melendez-Torres, A
systematic review and metasynthesis of
barriers and facilitators to negotiating consistent condom use among sex
workers in Asia. Cult Health Sex, 2016. 18(3): p. 249-64.
Barriers or facilitators
of consistent condom
use among FSWs
Asia (‘sex work*’ OR prostitut* OR ‘sex-work’) AND
(‘condom use’ OR ‘condom bargain*’ OR
‘condom negotiat*’) AND (qualitative OR focus group OR focus-group OR interview OR ‘semi-
structured interview’ OR ‘unstructured interview’ OR ‘qualitative research’ OR ‘thematic analysis’
OR ethnograph* OR ‘grounded theory’ OR
‘mixed-method’ OR ‘mixed method’).
Tao, F., et al., Effects of condom use before and after AIDS behaviour
intervention among Chinese unlicensed
prostitutes: A meta-analysis. [Chinese]. Chinese Journal of Evidence-Based
Medicine, 2015. 15(1): p. 69-74.
Behavioral intervention among
FSWs
China Could not be retreived
Wariki, W.M., et al., Behavioral interventions to reduce the transmission
of HIV infection among sex workers and
their clients in low- and middle-income countries. Cochrane Database Syst Rev,
2012(2): p. Cd005272.
Behavioral intervention among
FSWs
Low and middle income countries
PubMed: Search prostitute[tiab] OR prostitutes[ tiab] OR sex worker[tiab] OR sex
workers[tiab] OR prostitution[mh] OR
prostitution[tiab] Embase: ’prostitute’/de OR prostitute OR prostitutes OR ’prostitution’/de OR
prostitution OR ’sex worker’ OR ’sex workers’
OR ’callgirl’/de OR callgirl OR callgirls
Yuen, W.W.Y., et al., Psychological health and HIV transmission among
female sex workers: a systematic review
and meta-analysis. AIDS Care - Psychological and Socio-Medical
Aspects of AIDS/HIV, 2016. 28(7): p.
816-824.
Mental Health an HIV among FSWs
Global “sex workers”, “prostitutes”, “prostitution” AND “risk factors” or “correlates”, AND “HIV”
or “condom use” or “safe sex”
Zhang, L., et al., A systematic review
and meta-analysis of the prevalence,
trends, and geographical distribution of HIV among Chinese female sex workers
(2000-2011): Implications for
preventing sexually transmitted HIV. International Journal of Infectious
Diseases, 2015. 39: p. 76-86.
HIV epidemiology
among FSWs
China (‘‘HIV’’ OR ‘‘AIDS’’ OR ‘‘human
immunodeficiency virus’’ OR ‘‘acquired
immunodeficiency syndrome’’) AND (‘‘FSW’’ OR ‘‘female sex worker’’ OR ‘‘CSW’’ OR
‘‘commercial sex worker’’ OR ‘‘sex worker’’ OR
‘‘prostitute’’ OR ‘‘women who sell sex’’ OR ‘‘sex industry’’) AND (‘‘China’’ OR ‘‘Chinese’’) AND
(‘‘prevalence’’ OR ‘‘infection’’ OR ‘‘associated
risk’’ OR ‘‘infection status’’ OR ‘‘epidemic status’’ OR ‘‘surveillance’’)
Potentially relevant articles
Awasthi, K.R., K. Adefemi, and M.
Tamrakar, HIV/AIDS: A persistent health issue for women and children in
mid and far Western Nepal. Kathmandu
University Medical Journal, 2015. 13(49): p. 88-93.
Risk factors for HIV
among male migrants
Nepal HIV/ AIDS, Nepal, India, South East Asia,
migration, sex workers, conflict and social stigma
Baral, S., et al., Enhancing benefits or
increasing harms: Community responses for HIV among men who have sex with
Structural
determinants of HIV
Low and middle
income countries
“sex worker*”[tw] OR “sex workers”[Mesh] OR
“FSW” [tw] OR “SW” [tw] OR “prostitute*”[tw] OR “prostitution” [tw] OR “commercial sex” [tw]

291
men, transgender women, female sex workers, and people who inject drugs.
Journal of Acquired Immune Deficiency
Syndromes, 2014. 66(SUPPL.3): p. S319-S328.
among populations at
risk
OR “commercial sex worker*”[tw] OR “CSW”
[tw] OR “transactional sex” [tw] OR
“transactional sex worker*”[tw] OR “TSW” [tw]
OR “travailleuse du sexe”[tw] OR “TS”[tw] OR “intravenous drug user”[tw] OR “IVDU”[tw] OR
“IDU”[tw] OR “drug user”[tw] OR “men who
have sex with men”[tw] OR “MSM”[tw] OR “males who have sex with males”[tw] OR
“bisexual men”[tw] OR “bisexual male”[tw] OR
“bisexual males”[tw] OR “HSH”[tw] OR “Hommes ayant des rapports Sexuels avec des
Hommes”[tw] OR "Homosexuality, Male"[Mesh]
OR “male homosexual*”[tw] OR “gay men”[tw] OR “gay man”[tw] OR “gay male*”[tw] OR
“homosexual male*”[tw] OR “homosexual
males”[tw] OR “homosexual man”[tw] OR “homosexual men” OR “sex for money”[tw] OR
“transgender”[tw] OR “trans”[tw]
Barros, A.B., S.F. Dias, and M.R.O.
Martins, Hard-to-reach populations of men who have sex with men and sex
workers: A systematic review on
sampling methods. Systematic Reviews, 2015. 4 (1) (no pagination)(141).
Sampling methods
(could include population
proportion)
Global Men who have Sex with Men, Sex Work, Sex
Workers, recruit, recruited, participants, enrol, enrolled, sample, sampling.
Boily, M. and S. Mishra, Examining the
population-level impact of scaling-up ART for FSWs across epidemic context.
Sexually Transmitted Infections.
Conference: STI and AIDS World Congress, 2013. 89(no pagination).
Interventions (ART)-
modeling but includes link to systematic
review of FSWs
India Not available- conference abstract
Chen, L., et al., Sexual risk factors for HIV infection in early and advanced
HIV epidemics in sub-Saharan Africa:
systematic overview of 68 epidemiological studies. PLoS One,
2007. 2(10): p. e1001.
Sexual risk factors for HIV hetrosexual
transmission (may
include population proportion of FSWs
and their clients)
Africa ‘HIV’, ‘HIV-1’or ‘delta retrovirus’, ‘horizontal transmission’, ‘risk factor’, ‘sexually-transmitted
infections or disease’, ‘herpes’ or ‘HSV’, and
‘Africa’ (exploded to include countries within Africa
Doherty, S., et al., Suitability of
measurements used to assess mental health outcomes in men and women
trafficked for sexual and labour
exploitation: A systematic review. The Lancet Psychiatry, 2016. 3(5): p. 464-
471.
Mental health
assessment tools for women and men
trafficked for sexual
exploitation
Global trafficked AND people, sex AND traffick*, sexual
AND exploitation AND health, sex AND traffick* AND health, traffick* AND mental AND health,
human trafficking AND health AND mental,
trafficking, human trafficking AND health, human AND traffick* AND health.
Foss, A.M., et al., A systematic review of published evidence on intervention
impact on condom use in sub-Saharan
Africa and Asia. Sex Transm Infect, 2007. 83(7): p. 510-6.
Impact of interventiosn
(condom use)
Sub-Saharan Africa, Asia
PubMed, MEDLINE and the Cochrane Library were searched using the MeSH terms:
“condoms[MeSH] AND (intervention studies OR
program evaluation OR randomized controlled trials OR observation)[MeSH]”.
PubMed was also searched using MeSH terms: “condoms[MAJR]a AND (HIV[MAJR] OR HIV
infections[MAJR] OR sexually transmitted
diseases[MAJR]) AND (education[MeSH] OR prevention and control[Subheading] OR
preventive health services[MeSH:NoExp]b OR
safe sex[MeSH] OR counseling[MeSH:NoExp]
OR health promotion[MeSH:NoExp] OR program
evaluation[MeSH:NoExp]) AND (sexual
behavior[MeSH:NoExp] OR sexual partners[MeSH]) AND (developing
countries[MeSH] OR Africa[MeSH] OR
Asia[MeSH])”, and a free-text search using: “condom* AND (HIV OR AIDS OR human
immunodeficiency syndrome OR acquired
immunodeficiency syndrome OR sexually transmit* OR STD OR STDs OR STI OR STIs)
AND (promot* OR educat* OR counsel* OR
prevent* OR control* OR safe* sex) AND (sex*

292
behaviour OR sex* behavior OR sex* partner*)
AND (Africa* OR Asia*)” in Title/abstract.
Furber, A.S., J.N. Newell, and M.M.
Lubben, A systematic review of current
knowledge of HIV epidemiology and of sexual behaviour in Nepal. Trop Med Int
Health, 2002. 7(2): p. 140-8.
HIV and sexual
behavior
Nepal Hiv*, aids, sexual behaviour and nepal*
Hampton, M.D. and K. Shade, The experience of adolescent victims of
commercial sexual exploitation in the
United States: A qualitative systematic review protocol. JBI Database of
Systematic Reviews and Implementation
Reports, 2015. 13(8): p. 110-119.
Commercial sexual exploitation of
adolescents
US Commercial sexual exploitation, sex trafficking, human trafficking, prostitution, and sexual slavery
in combination with adolescent, teen, youth,
juvenile or minor.
Hoffmann, O., T. Boler, and B. Dick, Achieving the global goals on HIV
among young people most at risk in
developing countries: Young sex workers, injecting drug users and men
who have sex with men. 2006, World
Health Organization: 20 Ave. Appia, Geneva 27 CH-1211, Switzerland. p.
287-315.
Evaluations among young people at high
risk
Global Not mentioned in the book
Liu, H., S. Li, and M.W. Feldman, Forced bachelors, migration and HIV
transmission risk in the context of
China's gender imbalance: a meta-analysis. AIDS Care, 2012. 24(12): p.
1487-95.
Male migrants and sexual risk
China ‘‘migrants,’’ ‘‘floating population,’’ ‘‘HIV,’’ and ‘‘sexual risk.’’
McAlpine, A., M. Hossain, and C. Zimmerman, Sex trafficking and sexual
exploitation in settings affected by
armed conflicts in Africa, Asia and the Middle East: systematic review. BMC
International Health and Human Rights,
2016. 16(1): p. 1-16.
Sex trafficking Armed-conflict settings (Africa,
Asia, and Middle
East)
[(sex* adj3 traffick*) or sex* trade or (sex* adj3 exploit*) or (sex* adj3 abduct*) or
(sex* adj3 slave*) or forced prostitute* or child*
prostitute* or arranged marriage or early marriage or forced marriage or child* bride or child* soldier
or kidnap* or brothel] AND [armed conflict* or
war* or combat* or refugee or (complex adj3 emergency) or terroris* or military* or (rebel adj3
group) or genocide or army or soldier]
Ojo, O., et al., Behavioural interventions
for reducing HIV infection in workers in occupational settings, a cochrane
systematic review. Sexually Transmitted
Infections, 2011. 87: p. A247.
Sexual risk behavior
among workers
Global Not available- conference abstract
Oldenburg, C.E., et al., Global burden of
HIV among men who engage in
transactional sex: a systematic review and meta-analysis. PLoS One, 2014.
9(7): p. e103549.
HIV among men who
engage in
transactional sex
Global ‘‘commercial sex’’, ‘‘sex work*’’, ‘‘male sex
worker*’’, ‘‘prostitution’’, ‘‘exchange sex’’, and
‘‘transactional sex’’
Omare, D. and A. Kanekar,
Determinants of HIV/AIDS in armed conflict populations. Journal of Public
Health in Africa, 2011. 2(1): p. 34-37.
Social determinants of
HIV among displaced populations
Global Search terms not available.
Oram, S., et al., Prevalence and risk of violence and the physical, mental, and
sexual health problems associated with
human trafficking: Systematic review. PLoS Medicine, 2012. 9 (5) (no
pagination)(e1001224).
HIV among women trafficked for sexual
exploitation
Global (human trafficking.mp OR people trafficking.mp OR trafficking in people.mp OR sex
trafficking.mp OR woman trafficking.mp OR
child trafficking.mp OR trafficked people.mp OR trafficked women.mp OR trafficked men.mp OR
trafficked children.mp OR forced labour.mp OR
forced labor.mp OR forced prostitution.mp OR sexual slavery.mp) AND (health/ OR well-
being.mp OR wellbeing.mp OR ill-health.mp OR
illness.mp OR “Wounds and injuries/” OR wound.mp OR injur$.mp OR disease/ OR
disability.mp OR infection/ OR symptom.mp OR
trauma.mp OR “mental illness”/ OR “mental disorder”/ OR anxiety/ OR depression/ OR fear/
OR guilt/ OR hostility/ OR suicide/ OR
“Behavioral symptom”/ OR “Self-injurious behaviour”/ OR “Reproductive behavior” OR

293
“Risk taking”/ OR “Sexual behavior”/ OR “Social
behavior”/ OR violence/ OR rape/ OR “sexually
transmitted diseases”/ OR HIV/ OR pregnancy/
OR “abortion, induced”/)
Ottisova, L., et al., Prevalence and risk of violence and the mental, physical and
sexual health problems associated with
human trafficking: An updated systematic review. Epidemiology and
Psychiatric Sciences, 2016. 25(4): p.
317-341.
Sexual health among trafficked populations
Global 1. human trafficking.mp 2. people trafficking.mp
3. trafficking in people.mp
4. sex trafficking.mp 5. woman trafficking.mp
6. child trafficking.mp
7. trafficked people.mp 8. trafficked women.mp
9. trafficked men.mp
10. trafficked children.mp 11. trafficking in persons.mp
12. trafficking of men.mp
13. post-trafficking.mp 14. labour exploitation.mp
15. domestic workers.mp
16. forced labour.mp 17. forced labor.mp
18. forced prostitution.mp
19. sexual slavery.mp
Wondergem, P., et al., A short history of
HIV prevention programs for female sex
workers in Ghana: Lessons learned over 3 decades. Journal of Acquired Immune
Deficiency Syndromes, 2015. 68: p.
S138-S145.
Context of FSW,
interventions and
epidemiology (historical review)
among FSWs
Ghana “female sex worker” or “prostitute,” or
“transactional sex” or “sex trade” or “sexual
exchange,” and “HIV” or “AIDS” or “STI,” and “Ghana.”
Yang, H., et al., Heterosexual
transmission of HIV in China: a
systematic review of behavioral studies in the past two decades. Sex Transm
Dis, 2005. 32(5): p. 270-80.
Behavioral risk
factors promoting
heterosexual transmission
China China, HIV, AIDS, STD, sexual behavior, and
drug use
Yang, Z., et al., A decline in HIV and
syphilis epidemics in Chinese female sex workers (2000-2011): A systematic
review and meta-analysis. PLoS ONE,
2013. 8 (12) (no pagination)(e82451).
STIs among FSWs China “Prostitution”[Mesh], prostitution, “Sex
Workers”[Mesh], sex worker, sex work sex work*, female sex worker, commercial sex
worker
294
Appendix IV
Supplementary material for Research paper 1-
Study selection criteria

295
Table S3. Eligibility criteria for inclusion of studies in the systematic review of female sex workers (FSWs) and their clients in MENA. Inclusion criteria Exclusion criteria
Country • Afghanistan • Algeria • Bahrain • Cyprus (not part of WHO, World Bank, or UNAIDS definition)
• Djibouti • Egypt • Iran • Israel (part of only World Bank definition)
• Iraq • Jordan • Kuwait • Mauritania (not part of WHO, World Bank, or UNAIDS definitions)
• Lebanon • Libya • Morocco • Turkey (not part of WHO, World Bank, or UNAIDS definitions)
• Oman • Pakistan • Qatar • Western Sahara (part of only WHO definition)
• Saudi Arabia • Somalia • Sudan Note: Countries were eligible for inclusion if they were part of at least 2
international organizations’ definition for the Middle East and North
Africa (MENA). • Syria • Tunisia • UAE
• West Bank & Gaza • Yemen
Year • All years.
Language All languages. Data from the region are normally published in
English, French, Arabic, or Farsi. These will be extracted from
full texts.
Type of
publication • Original research
• Letters to editor (may contain primary unpublished data)
• Editorials
• Commentaries/ authors’ reply
Study design • Cross sectional
• Cohort (retrospective, prospective)
• Case-control
• Randomized controlled trials
• Reviews
• Case reports
• Case series
Methodology • Quantitative • Qualitative only
Study
Population(s) • FSWs defined as women who exchange sex for money/goods.
• Clients of FSWs defined as men who “buy” sex from FSWs
using money/goods. STI clinic attendees were included as
proxy. Mixed samples of STI patients were considered if
≥70% were males.
• Casual sex
Reported
outcomes • The proportion of FSWs or clients of FSWs in the population
(size estimation of both populations)
• HIV incidence among FSWs or clients of FSWs
• HIV prevalence among FSWs or clients of FSWs
• Paper presents contradictory/unclear numbers on the relevant
outcomes that could not be verified.
Other • Paper presents unique findings on relevant outcomes.
• For HIV prevalence, sample size ≥10 (prevalence measures
based on very small samples are not informative)
• Paper has the same dataset as another included study and does not
provide any additional data point (selecting the study with the larger
sample size).
• Conference abstracts for which there are full text articles.
HIV
prevalence
ascertainment
• Self-report or using biological assay
*Abbreviations: FSWs: female sex workers; UNAIDS: the Joint United Nations Programme on HIV/AIDS; WHO: World Health Organization.
296
Appendix V
Supplementary material for Research paper 1-
Screening of available quality assessment tools

297
1. Assessment of the risk of bias (ROB)
The ROB for studies included in the review will be evaluated and reported using a domain-based
approach where each criterion/domain is assessed separately as per Cochrane Collaboration
handbook guidelines [6]. Scales attributing weights to different quality measures and checklists
yielding a summary estimate for the quality of identified studies will be avoided. This is because
of the lack of adequate justification of weights to be used and of validated tools that can tailor for
populations’ and settings’ specificities, thus limiting the ability of a single tool to produce an
objective and valid summary measure for quality [6]. Quality domains were developed following
a careful evaluation of available quality assessment tools summarized in Table S4.

298
Table S4. Summary of available quality assessment tools and their applicability to the systematic review of FSWs and their clients in MENA. Tool Items Rating Decision Justification Relevant and potentially relevant items
Revised
Cochrane risk of bias tool for
randomized
trials (RoB 2.0) [7]
5 domains “Low risk of
bias”, “Some concerns”, and
“High risk of
bias”
No • Designed for different types of randomized controlled trials
(RCTs)
• Items are not applicable:
o Bias arising from randomization o Bias due to deviations from intended interventions
o Bias due to missing outcome data
• Bias in the measurement of the outcome
(ascertainment)
• Bias in the selection of reported result
Cochrane approach [8]
6 domains “Yes (low risk of bias)”, “No (high
risk of bias)”, and
“Unclear”
No • Suitable for RCTs
• Items that are not applicable:
o Sequence generation o Allocation concealment
o Blinding of participants personnel and outcome assessors
o Incomplete outcome data o Selective reporting
NIH Quality
assessment tool [9]
14 “Good”, “Fair”,
and “Poor”
No (also not
recommended by Cochrane)
• Combines items for quality of reporting and ROB.
• Items for ROB assessment that are not applicable:
o Blinding of assessors
o Measure adjusted for confounding factors
• Study population specified and defined
• Participation rate >=50%
• Outcome clearly defined, valid and reliable
• Loss to follow-up <=20%
• Time frame sufficient to see an association
between exposure and outcome
The GRACE
checklist [10]
11 Items rated
individually as “sufficient” or
“insufficient”, no
summary
quantitative
measure for the
entire checklist
No • Checklist for observational studies of comparative effectiveness
(of treatments)
• Combines items for quality of reporting and ROB.
• Most items for ROB assessment are not applicable:
o Equivalent assessment of primary outcome across
intervention and comparison groups o Study participants newly infected vs. living with the disease
o Effect size adjusted for confounders and effect modifiers
o Length of follow-up time appropriate for exposed and unexposed
o Meaningful analyses conducted to test key assumptions
• Primary outcome validated against a gold
standard for diagnosis
• Clinical outcome measured objectively and not
subject to expert opinion
STROBE
checklist for cross-sectional
studies [11, 12]
22 Rating individual
criteria as “Met criterion”, “Did
not meet
criterion”, and “Not applicable”
No • Useful to assess quality of reports describing studies (of HIV
prevalence/incidence/size estimation). Does not assess ROB.
STROBE
checklist for
cohort studies
[11, 12]
22 Rating individual
criteria as “Met
criterion”, “Did
not meet
criterion”, and “Not applicable”
No • Useful to assess quality of reports describing studies (of HIV
prevalence/incidence/size estimation). Does not assess ROB.
The Newcastle-
Ottawa Scale
[13]
8 items
assessing 3
domains
Rating individual
criteria using a
star system (a star indicates that a
criterion was met)
No • Designed to assess the quality of case-control and of cohort
studies and not of cross-sectional studies
• One of the three domains was not relevant:
o Comparability of study groups
• Selection of study groups
o Representativeness of study population (participation rate, sampling methodology)
o Outcome not present at the start of the
study (for cohort studies)

299
• Outcome
o Assessment of outcome (blinded,
ascertainment, self-report...)
o Appropriate length of follow-up time o Loss to follow-up specified
Methodological
Evaluation of Observational
Research
(MORE) [14]
13 (2
general, 6 assessing
external
validity, and 5
assessing
internal
validity)
Rating individual
criterion as having a “majot flaw”,
“minor flaw”, or
“poor reporting” if no information
is available
No • The scale yielded poor interrater reliability
• Combines items for quality of reporting and ROB
• Many items are overlapping such as:
o Subject flow, Response rate, and Exclusion rate: Subject
flow (Reported number screened, number eligible, number
enrolled); Exclusion rate from the analysis (<10%); Source to measure outcomes and validation of outcome measure
• Items assessing ROB that are not relevant:
o Measurement of outcomes (severity of disease, frequency of symptoms, reliability of measure assessed)
o Study design specified (cross-sectional studies are the most suitable for assessing prevalence, cohort studies/RCTs are
the best for assessing incidence)
• Sampling method
• Response rate
• Sampling bias addressed (weighting of results)
• Source to measure outcomes (self-reported
proxy...)
Loney, 1998
[15]
8 items 1 point assigned
to each item
No • Combines items for quality of reporting and ROB
• Items assessing ROB that are not relevant:
o Outcome measured by unbiased assessors
o Study design appropriate (cross-sectional studies are adequate for assessing prevalence and cohort studies are
adequate for assessing incidence)
• Sampling frame appropriate
• Outcome measures objective
• Response rate adequate and refusals described
RoBANS [16] 6 domains Rating individual criterion as “Low
ROB”, “High
ROB”, and “Unclear”
No • Items assessing ROB that are not relevant:
o Confounding variables considered
o Exposure measurement (inadequate)
o Blinding of outcome assessment
o Selective outcome reporting
• Selection of participants (that is the sampling
method)
• Incomplete outcome data (attrition bias)
Downs and
Black Checklist [17]
27 Rating individual
criterion as “yes”, “no”, and “unable
to determine”
No • Combines items for quality of reporting and ROB
• Items assessing ROB that are not applicable:
o Treatment venues are representative of were the source population normally gets treated
o Blinding study participants to interventions
o Blinding of investigators measuring outcomes o Equal lengths of follow-up in intervention and control groups
o Reliability in adherence to treatment
o Selection of participants equal across cases and controls. o Participants from comparative groups recruited from the
same source (hospital)
o Participants from comparative groups recruited over the same
time period
o Randomization of intervention
o Assignment of randomized intervention concealed o Adjustment for confounding
o Adjustment for loss to follow-up
• Characteristics of patients lost to follow-up
described
• Representativeness of eligible population
(sampling method)
• Representativeness of participants (response
rate)
• Accuracy of outcome measure (ascertainment)
The Trend
checklist [18]
22 Rating individual
criterion
No • Useful to assess quality of reports describing studies (of HIV
prevalence/incidence/size estimation). Does not assess ROB.
MOOSE [19] No These are guidelines for reporting systematic reviews

300
Quality assessment
checklist for
observational studies (QATSO
score) [20]
5 Rating individual studies as “Bad”
(0-33%),
“Satisfactory” (33-66%), and
“Good” (67-
100%)
Scoring method:
Total score divided by total
number of
applicable items
No • Some items are not applicable:
o Control of confounding
• Sampling method representative
• Outcome measurement objective
• Response rate (>=60%)
• Privacy or sensitivity of the nature of
outcome(HIV) considered
GRADE [21] “High”, “Moderate”,
“Low”, and “Very
low”.
No • More suitable for assessing interventions’ effects
• Items assessing ROB that are not applicable:
o Study design (observational studies are normally rated as
having low quality)
o Assessing quality of interventions (randomization, allocation concealment, blinding...)
o Indirectness that is use of surrogates to measure outcome
• Upgrading of studies is based on 3 criteria (all of which are not
applicable):
o Large magnitude of effect
o Evidence of a dose-response effect o Plausible confounding taken into account

301
Appendix V references
1. Mumtaz, G., et al., Are HIV epidemics among men who have sex with men emerging in
the middle east and north Africa?: A systematic review and data synthesis. PLoS
Medicine, 2011. 8 (8) (no pagination)(e1000444).
2. Mumtaz, G.R., et al., HIV among people who inject drugs in the Middle East and North
Africa: systematic review and data synthesis. PLoS Med, 2014. 11(6): p. e1001663.
3. The Joint United Nations Programme on HIV/AIDS (UNAIDS), The gap report. 2014.
4. Abu-Raddad L, et al., Characterizing the HIV/AIDS epidemic in the Middle East and
North Africa : Time for strategic action. Middle East and North Africa HIV/AIDS
Epidemiology Synthesis Project ed. World Bank/UNAIDS/WHO Publication. 2010,
Washington DC: The World Bank Press.
5. Abu-Raddad, L.J., et al., Epidemiology of HIV infection in the Middle east and North
Africa. Aids, 2010. 24(SUPPL. 2): p. S5-S23.
6. Higgins, J.P.T., S. Green, and Cochrane Collaboration., Cochrane handbook for
systematic reviews of interventions. Cochrane book series. 2008, Chichester, England ;
Hoboken, NJ: Wiley-Blackwell. xxi, 649 p.
7. Higgins JPT, S.J., Savović J, Page MJ, Hróbjartsson A, Boutron I, Reeves B, Eldridge
S.,, A revised tool for assessing risk of bias in randomized trials. Cochrane Methods.
Cochrane Database of Systematic Reviews ed. M.J. Chandler J, Boutron I, Welch V
(editors),. Vol. Issue 10 (Suppl 1). 2016.
8. Higgins, J.P.T., S. Green, and Cochrane Collaboration., Cochrane handbook for
systematic reviews of interventions. Cochrane book series. 2015, Chichester, England ;
Hoboken, NJ: Wiley-Blackwell. xxi, 649 p.
9. National Institute of Health. Quality assessment tool for observational cohort and crosss-
sectional studies. 2014 March 2014 [cited 2017 May 25]; Available from:
https://www.nhlbi.nih.gov/health-pro/guidelines/in-develop/cardiovascular-risk-
reduction/tools/cohort.
10. Dreyer, N.A., et al., The GRACE checklist for rating the quality of observational studies
of comparative effectiveness: a tale of hope and caution. J Manag Care Spec Pharm,
2014. 20(3): p. 301-8.
11. von Elm, E., et al., The Strengthening the Reporting of Observational Studies in
Epidemiology (STROBE) statement: guidelines for reporting observational studies.
Lancet, 2007. 370(9596): p. 1453-7.
12. STROBE Statement: Strengthening the reporting of observational studies in
epidemiology. 2007 [cited 2017 May 25]; Available from: https://strobe-
statement.org/index.php?id=available-checklists.
13. Stang, A., Critical evaluation of the Newcastle-Ottawa scale for the assessment of the
quality of nonrandomized studies in meta-analyses. Eur J Epidemiol, 2010. 25(9): p. 603-
5.
14. Shamliyan, T.A., et al., Development quality criteria to evaluate nontherapeutic studies
of incidence, prevalence, or risk factors of chronic diseases: pilot study of new checklists.
J Clin Epidemiol, 2011. 64(6): p. 637-57.
15. Loney, P.L., et al., Critical appraisal of the health research literature: prevalence or
incidence of a health problem. Chronic Dis Can, 1998. 19(4): p. 170-6.

302
16. Park J, L.Y., Seo H, Jang B, Son H, Kim SY, Shin S, Hahn S,. Risk of Bias Assessment
tool for Non-randomized Studies (RoBANS): Development and Validation of a New
Instrument. in 19th Cochrane Colloquium & VI International Conference on Patient
Safety. 2011. Madrid.
17. Downs, S.H. and N. Black, The feasibility of creating a checklist for the assessment of the
methodological quality both of randomised and non-randomised studies of health care
interventions. J Epidemiol Community Health, 1998. 52(6): p. 377-84.
18. Des Jarlais, D.C., et al., Improving the reporting quality of nonrandomized evaluations of
behavioral and public health interventions: the TREND statement. Am J Public Health,
2004. 94(3): p. 361-6.
19. Stroup, D.F., et al., Meta-analysis of observational studies in epidemiology: a proposal
for reporting. Meta-analysis Of Observational Studies in Epidemiology (MOOSE) group.
JAMA, 2000. 283(15): p. 2008-12.
20. Wong, W.C., C.S. Cheung, and G.J. Hart, Development of a quality assessment tool for
systematic reviews of observational studies (QATSO) of HIV prevalence in men having
sex with men and associated risk behaviours. Emerg Themes Epidemiol, 2008. 5: p. 23.
21. Guyatt, G.H., et al., GRADE guidelines: a new series of articles in the Journal of Clinical
Epidemiology. J Clin Epidemiol, 2011. 64(4): p. 380-2.

303
Appendix VI
Supplementary material for Research paper 2-
Sexually transmitted infections among FSWs in MENA

304

305
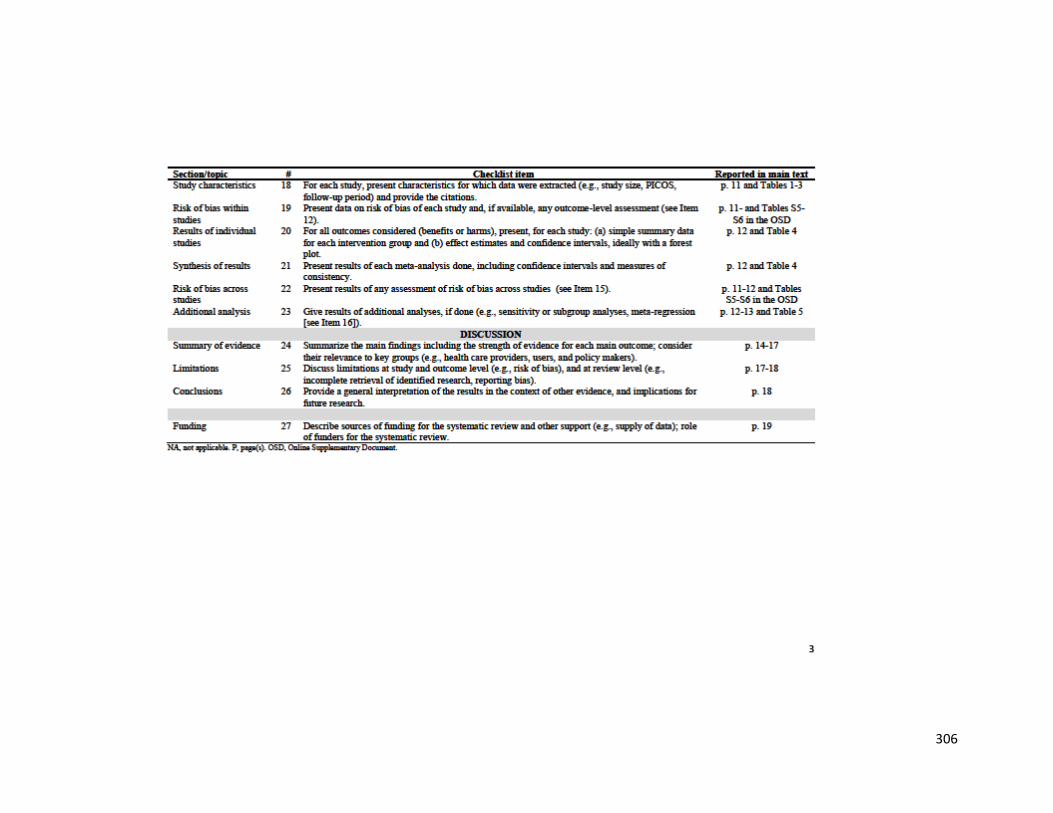
306
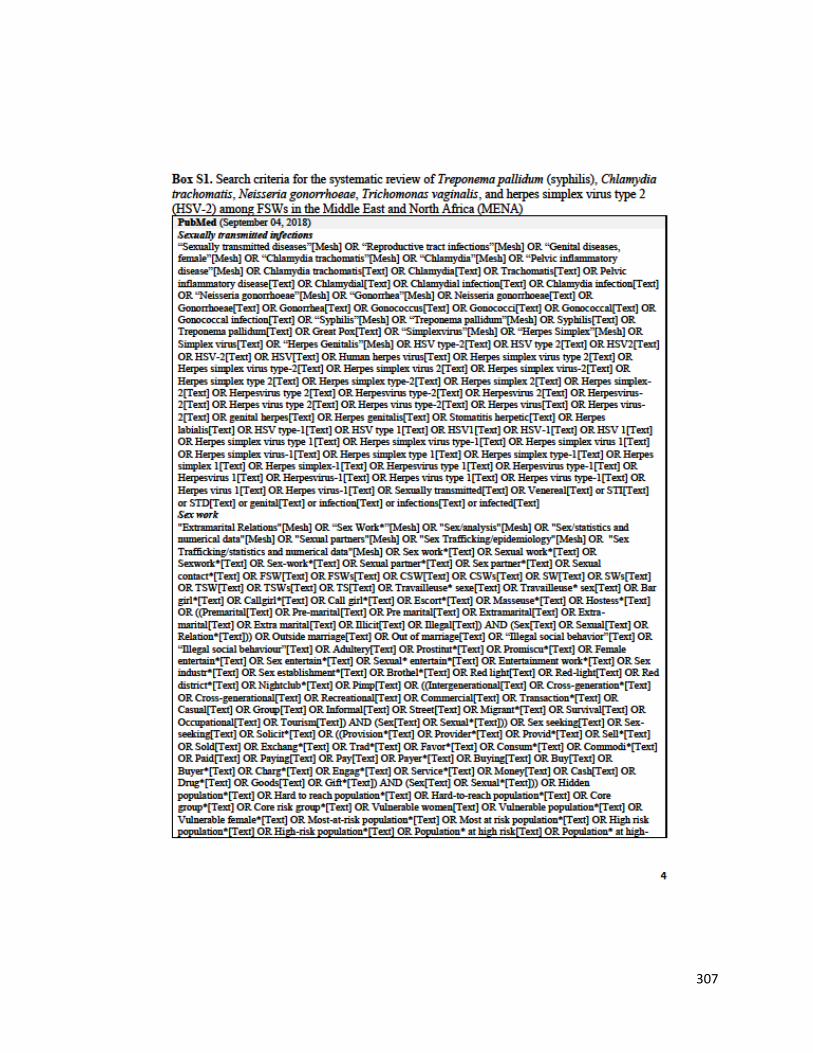
307
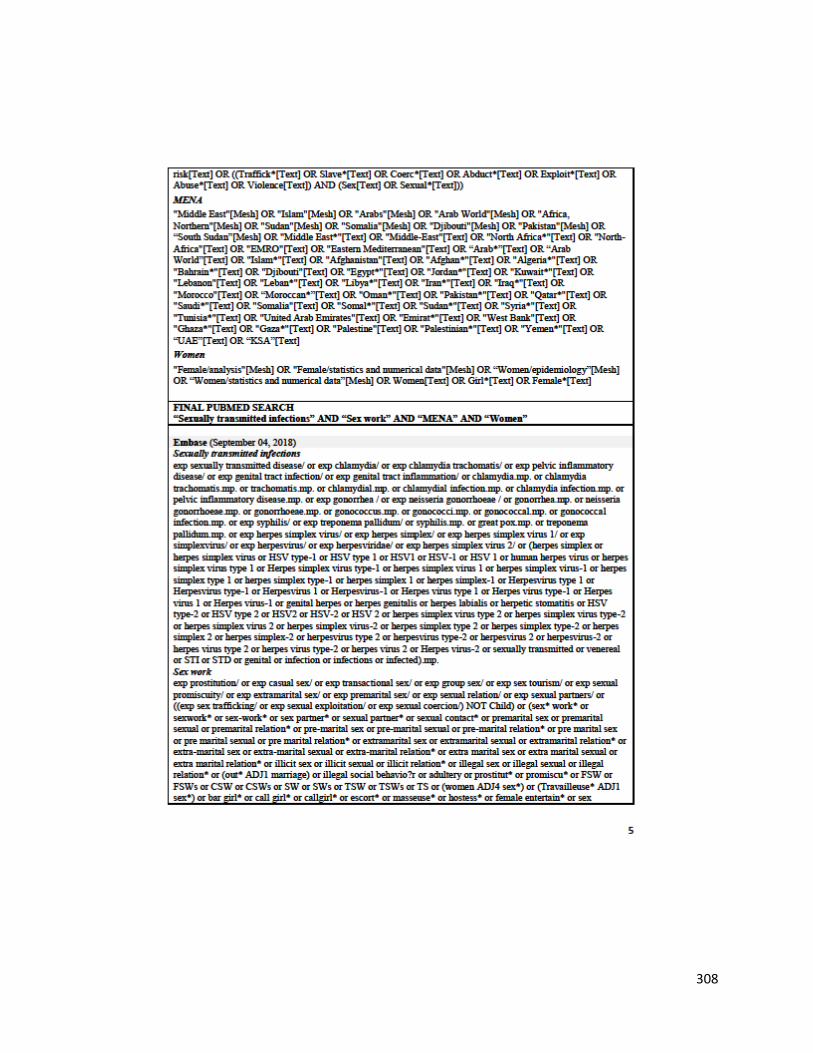
308
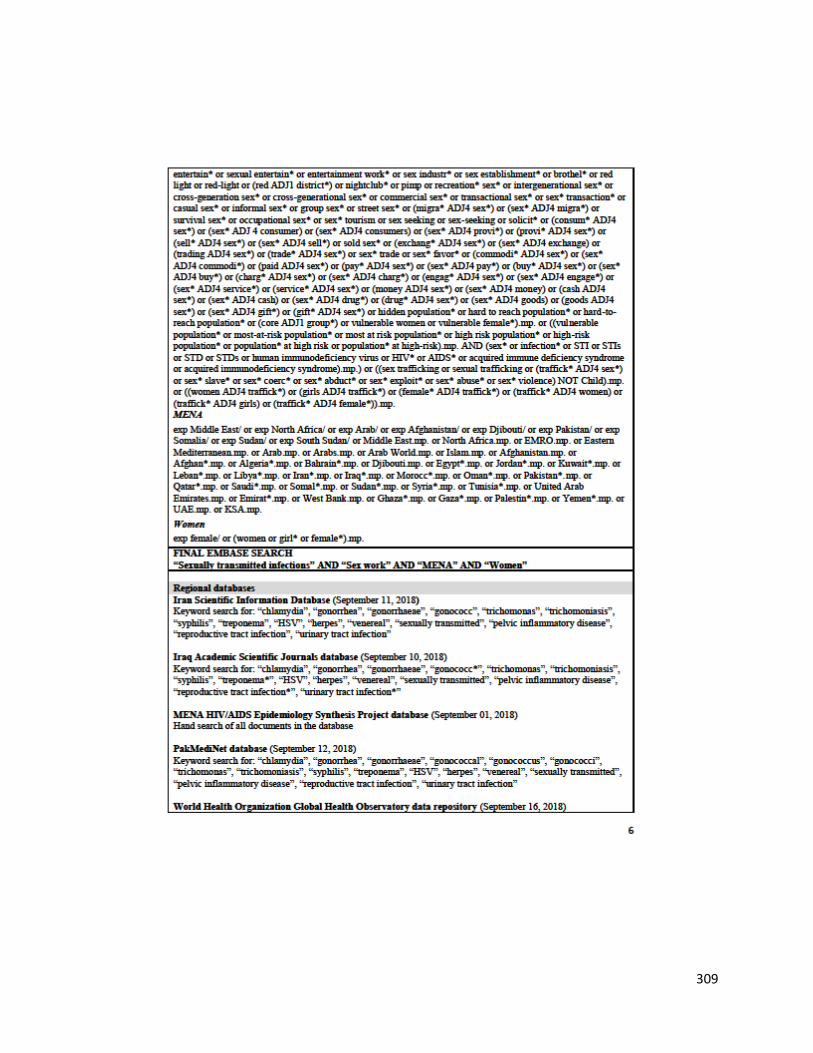
309
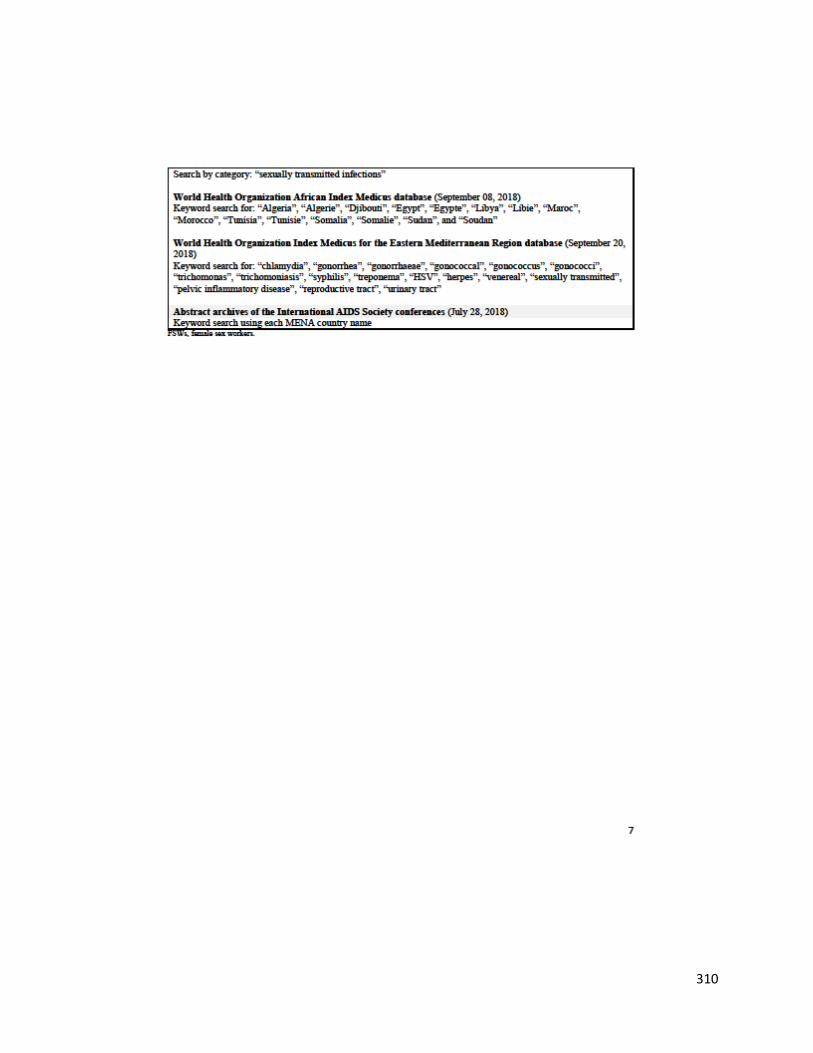
310

311
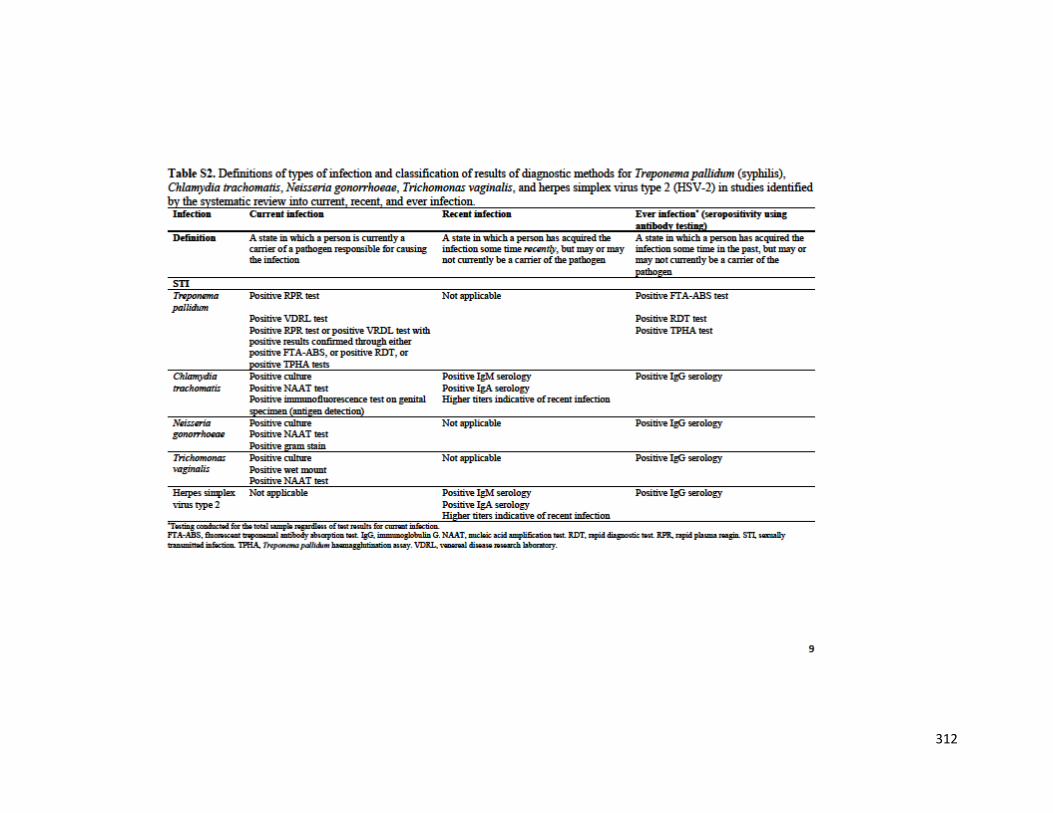
312

313
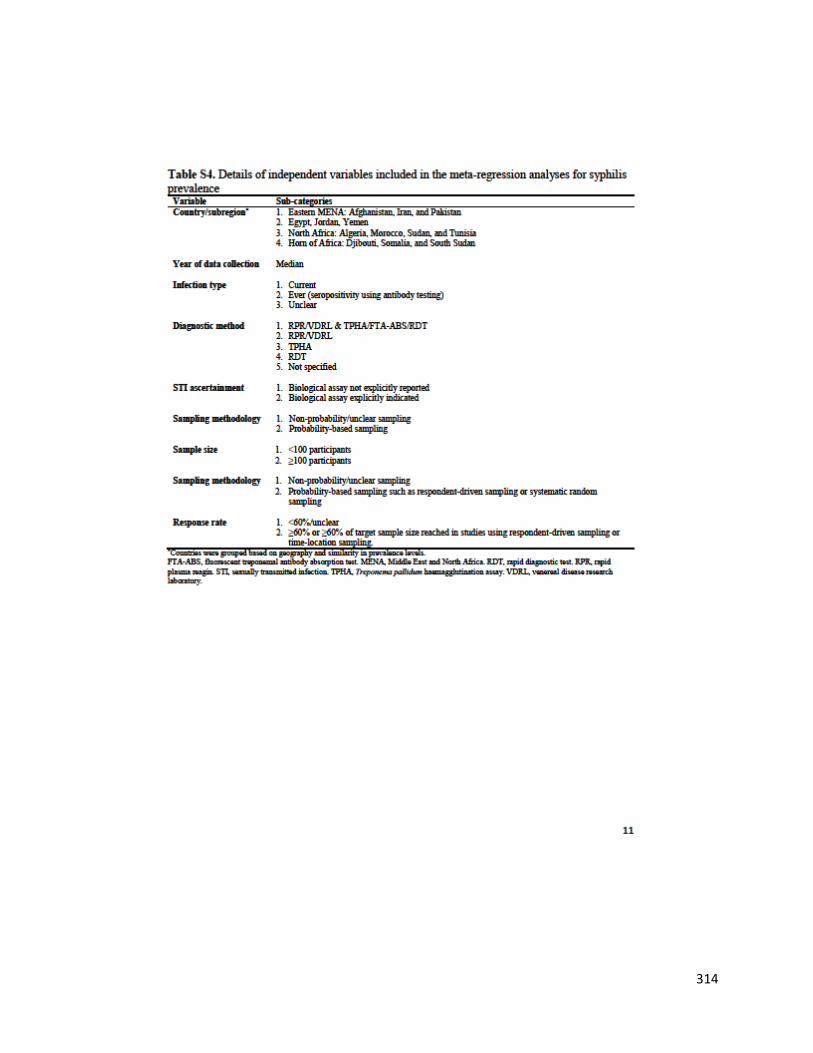
314
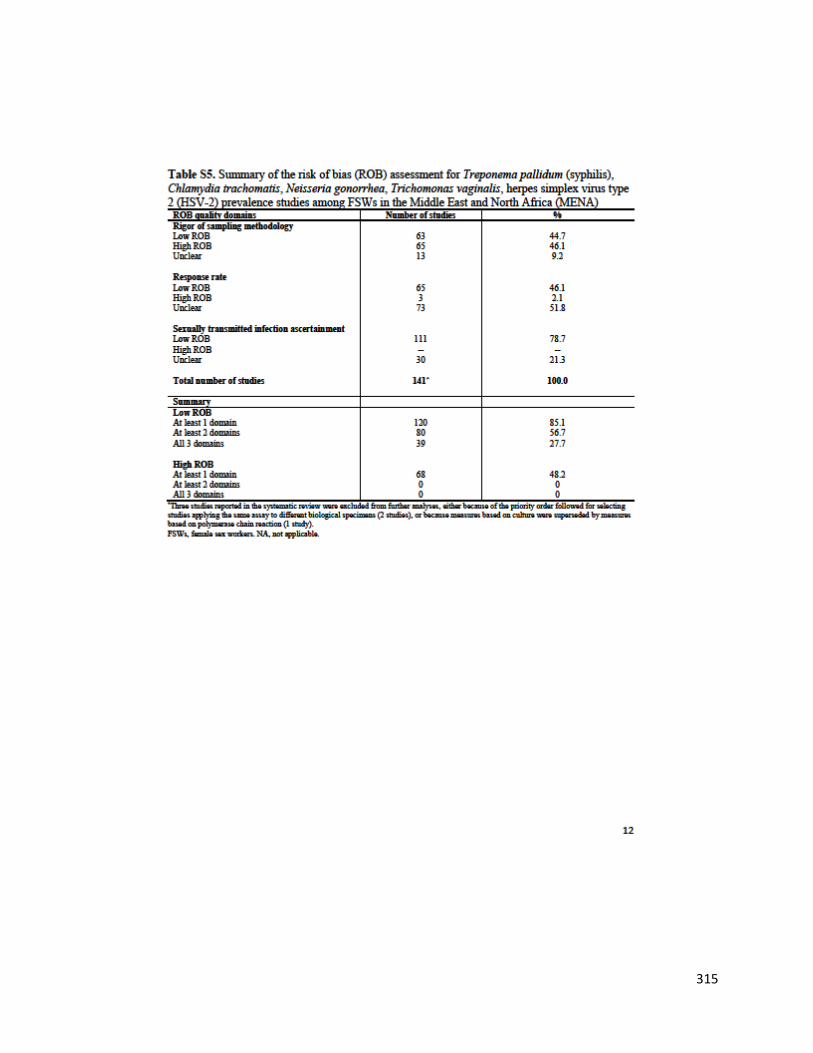
315

316
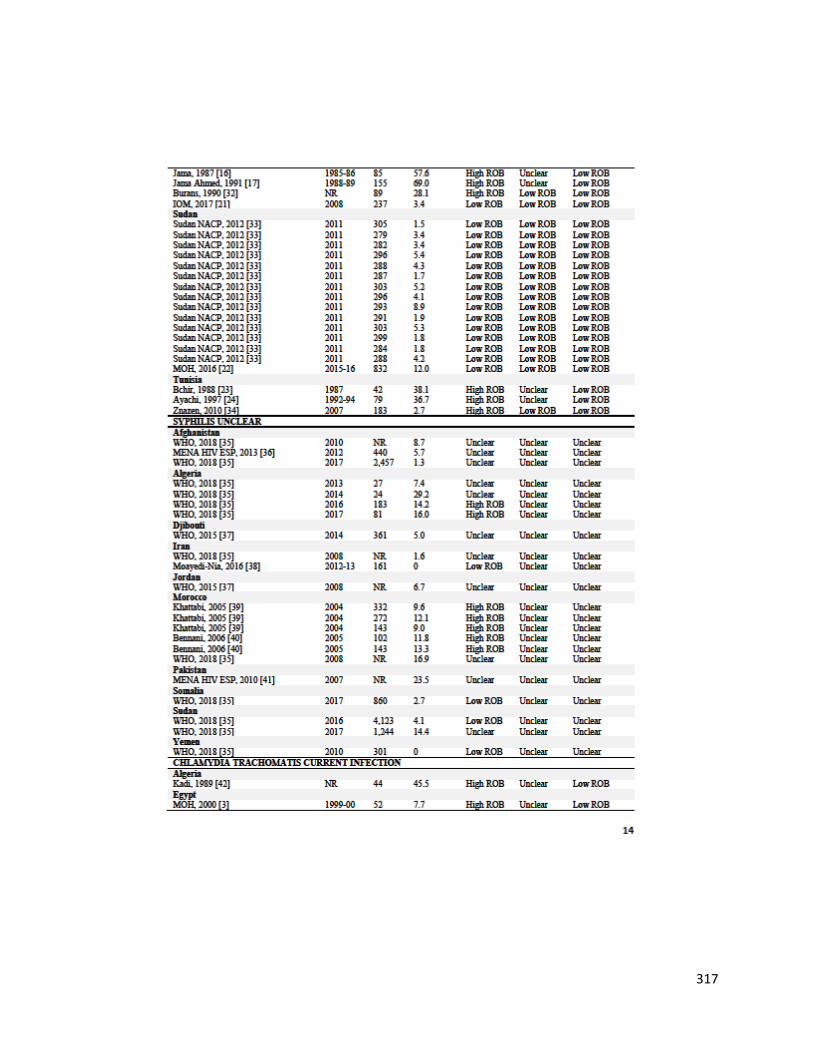
317
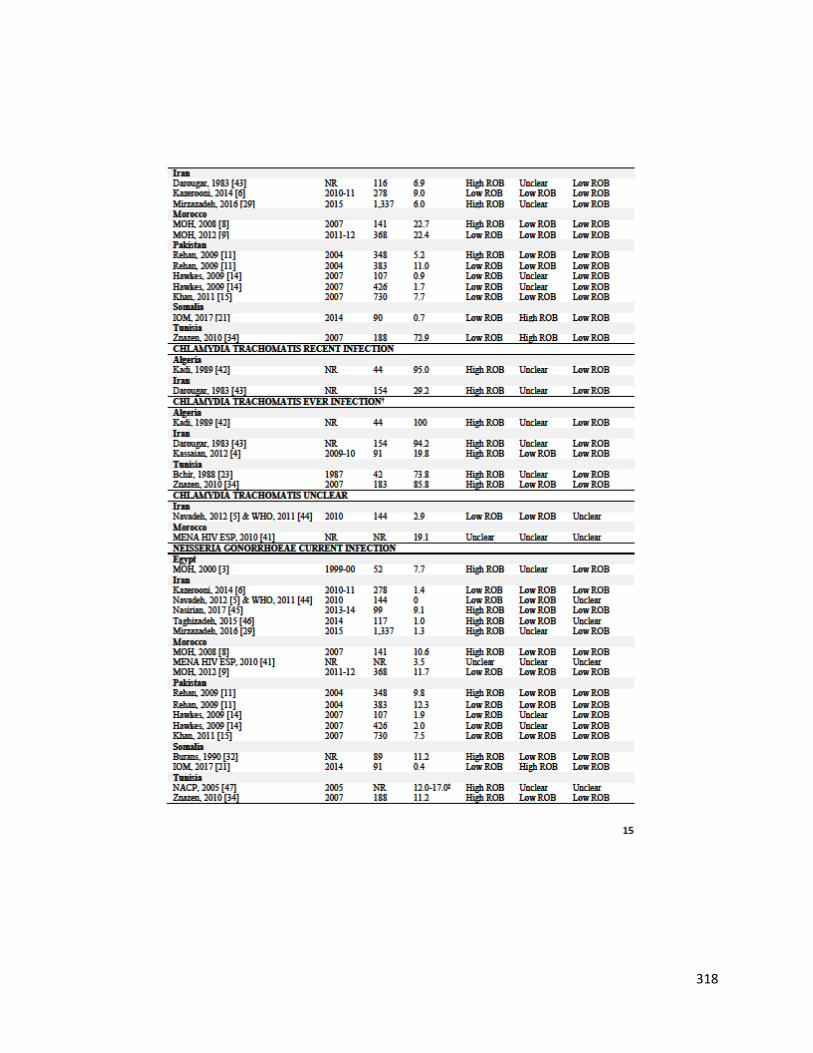
318
319

320

321

322
323

324

325
326
Appendix VII
Supplementary material for Research paper 3-
HSV-2 as a biomarker of HIV epidemic potential among
FSWs

327
Supplementary Information
HSV-2 as a biomarker of HIV epidemic potential in female sex
workers: meta-analysis, global epidemiology and implications
Hiam Chemaitelly1,2,3*, Helen A. Weiss4, Laith J. Abu-Raddad1,2,5
1 Infectious Disease Epidemiology Group, Weill Cornell Medicine-Qatar, Cornell University,
Qatar Foundation – Education City, Doha, Qatar
2 World Health Organization Collaborating Centre for Disease Epidemiology Analytics on
HIV/AIDS, Sexually Transmitted Infections, and Viral Hepatitis, Weill Cornell Medicine–Qatar,
Cornell University, Qatar Foundation – Education City, Doha, Qatar
3 Department of Infectious Disease Epidemiology, Faculty of Epidemiology and Population
Health, London School of Hygiene and Tropical Medicine GB, London, United Kingdom
4 MRC Tropical Epidemiology Group, London School of Hygiene and Tropical Medicine,
London, United Kingdom
5 Department of Healthcare Policy & Research, Weill Cornell Medicine, Cornell University, New
York, New York, USA
* Corresponding author: Hiam Chemaitelly, Weill Cornell Medicine-Qatar, Qatar Foundation-
Education City, P.O. Box 24144, Doha, Qatar. Telephone: +(974) 4492-8443. Fax: +(974) 4492-
8422. E-mail: [email protected]
328
Table S1. Paired HSV-2 and HIV prevalence measures among female sex workers identified in the systematic review. Country Short citation Data
collect.
year(s)
Population characteristics Site Tested
HSV-2
(n)
HSV-2
prev
(%)
Tested
HIV
(n)
HIV
prev
(%)
ART
cov
(%)
Consistent
condom
usea (%)
Prop
who
inject
drugs
(%)
AFRO (n=42)
Burkina Faso Low, 20111 2003-05 Professional FSWs Community 689 62.4 765 35.7 9.5 64.0 --
Burkina Faso Nagot, 20032 1998-02 FSWs in Bobo-Dioulasso Community 540 66.0 562 34.0 -- -- -- Burkina Faso Nagot, 20073 2002-03 FSWs in Bobo-Dioulasso STI clinic 273 70.1 273 31.5 -- 100.0 --
Congo Nzila, 19914 1988 Hotel/home/street-based FSWs in Kinshasa Community 265 82.3 1226 35.0 -- 8.0 --
Congo Vandepitte, 20075 2002 Hotel-based FSWs STI clinic 17 76.5 17 11.8 -- -- --
Congo Vandepitte, 20075 2002 Home-based FSWs STI clinic 146 74.7 146 24.0 -- -- --
Congo Vandepitte, 20075 2002 Street-based FSWs STI clinic 10 50.0 10 20.0 -- -- --
Congo Vandepitte, 20075 2002 Homeless FSWs STI clinic 40 52.5 40 10.0 -- -- -- Congo Vandepitte, 20075 2002 Clandestine FSWs STI clinic 289 50.2 289 6.6 -- -- --
Eritrea Ghebrekidan, 19996 1995 Registered FSWs in Massawa Health center 107 80.0 107 29.0 -- -- --
Ethiopia Holt, 20037 1992 FSWs from Fandinka and Amon Community 203 65.0 209 40.0 -- -- -- Guinea Aho, 20148 2005-06 FSWs in Conakry Health center 201 84.1 223 35.3 -- 98.7 --
Guinea Diakite, 20069 -- FSWs in Conakry Unclear 416 72.1 417 38.1 -- -- --
Kenya Vandenhoudt, 201310 1997 FSWs recruited at workplace in Kisumu Community 286 93.4 296 74.7 -- 49.8 -- Kenya Vandenhoudt, 201310 2008 FSWs recruited through RDS in Kisumu Community 479 83.8 479 56.5 -- 75.5 --
Mozambique Lafort, 200811 -- FSWs at a reproductive health clinic in Tete Health center 350 83.1 350 49.7 -- 92.5 --
Nigeria Dada, 199812 1990-91 Low class FSWs (low fee) Community 84 64.3 84 17.0 -- 0.0c -- Nigeria Dada, 199812 1990-91 Middle class FSWs (medium fee) Community 624 58.7 624 12.0 -- 0.0c --
Nigeria Dada, 199812 1990-91 Upper class FSWs (hotels/clubs) Community 88 56.8 88 8.0 -- 0.0c --
Nigeria Eltom, 200213 1991-94 FSWs from brothels or hotels in Lagos Brothel/hotel 863 60.60 863 15.6 -- -- --
Rwanda Braunstein, 201114 -- FSWs in Kigali Community 800 59.80 800 24.0 -- 74.0 --
Senegal Kane, 200915 2006 FSWs in Dakar aged <20 years Unclear 12 25.0 12 0.0b -- -- --
Senegal Kane, 200915 2006 FSWs in Dakar aged 20-24 years Unclear 54 61.1 54 11.1 -- -- -- Senegal Kane, 200915 2006 FSWs in Dakar aged 25-29 years Unclear 88 85.2 88 13.6 -- -- --
Senegal Kane, 200915 2006 FSWs in Dakar aged ≥30 years Unclear 450 94.0 450 23.1 -- -- --
South Africa Malope, 200816 2001 FSWs in a mining town in Carletonville Community 95 95.8 95 76.8 -- -- -- South Africa Ramjee, 200517 -- FSWs near truck stops in Kwazulu Natal Health center 416 84.0 416 50.0 -- 11.2 --
Tanzania Riedner, 200718 2000 FSWs in entertainment venues in Mbeya Community 753 88.8 753 66.9 -- -- --
Tanzania Vu, 201819 2013 FSWs in Dar es Salaam, Tanzania Community 324 53.1 324 32.0 -- 30.0c -- Tanzania Vu, 201819 2013 FSWs in Iringa, Tanzania Community 220 21.8 220 32.9 -- 30.0c --
Tanzania Vu, 201819 2013 FSWs in Mbeya, Tanzania Community 244 53.7 244 29.2 -- 30.0c --
Tanzania Vu, 201819 2013 FSWs in Mwanza, Tanzania Community 350 51.7 350 19.0 -- 30.0c -- Tanzania Vu, 201819 2013 FSWs in Shinyanga, Tanzania Community 320 70.0 320 37.5 -- 30.0c --
Tanzania Vu, 201819 2013 FSWs in Tabora, Tanzania Community 228 61.4 228 14.0 -- 30.0c --
Tanzania Vu, 201819 2013 FSWs in Mara, Tanzania Community 205 61.5 205 17.8 -- 30.0c -- Uganda Vandepitte, 201120 2009 FSWs from red-light district in Kampala Red-light
district
1026 80.0 1027 37.0 -- 60.0 --
Zimbabwe Cowan, 200521 -- FSWs aged ≤20 years near mines & farms Community 54 46.3 54 33.3 -- -- -- Zimbabwe Cowan, 200521 -- FSWs aged 21-25 years near mines & farms Community 90 78.9 90 56.7 -- -- --
Zimbabwe Cowan, 200521 -- FSWs aged 26-30 years near mines & farms Community 85 82.4 85 62.4 -- -- --
Zimbabwe Cowan, 200521 -- FSWs aged 31-35 years near mines & farms Community 47 97.9 47 70.2 -- -- -- Zimbabwe Cowan, 200521 -- FSWs aged 36-40 years near mines & farms Community 50 96.0 50 58.0 -- -- --
Zimbabwe Cowan, 200521 -- FSWs aged 41-45 years near mines & farms Community 30 100.0 30 50.0 -- -- --

329
Country Short citation Data
collect.
year(s)
Population characteristics Site Tested
HSV-2
(n)
HSV-2
prev
(%)
Tested
HIV
(n)
HIV
prev
(%)
ART
cov
(%)
Consistent
condom
usea (%)
Prop
who
inject
drugs
(%)
AMRO (n=57)
Belize Alvarez Rodriguez,
201322
-- FSWs in Belize Community 220 51.8 220 0.9 -- 81.3 --
Domin. Rep. Koenig, 200723 2004-05 FSWs in Santo Domingo Community 482 76.3 482 3.9 -- 14.0 --
El Salvador Creswell, 201024 2008 FSWs in San Salvadore Community 663 82.6 663 5.7 -- 74.5 --
El Salvador Soto, 200725 2001-02 Brothel & mobile FSWs Community 130 95.7 484 3.2 -- 72.9 0.5 Guatemala Soto, 200725 2001-02 Brothel & mobile FSWs Community 522 88.6 511 4.3 -- 82.5 1.3
Honduras Morales-Miranda26 2006 FSWs in 4 cities Community 808 61.4 811 2.3 -- 80.0 --
Honduras Soto, 200725 2001-02 Brothel & mobile FSWs Community 416 91.1 493 9.6 -- 93.8 3.3 Mexico Uribe-Salas, 199927 1993 FSWs working in massage parlors Community 72 44.4 76 0.0b -- 80.6c --
Mexico Uribe-Salas, 199927 1993 FSWs working in bars Community 339 55.5 364 0.3 -- 80.6c --
Mexico Uribe-Salas, 199927 1993 Street-based FSWs Community 346 78.9 362 1.1 -- 80.6c -- Mexico Uribe-Salas, 200328 1998 FSWs working in bars from Guatemala Community 191 89.5 195 1.0 -- -- 0.8de
Mexico Uribe-Salas, 200328 1998 FSWs working in bars from El Salvador Community 75 90.7 76 0.0b -- -- 0.8de
Mexico Uribe-Salas, 200328 1998 FSWs working in bars from Honduras Community 85 70.6 86 0.0b -- -- 0.8de Mexico Uribe-Salas, 200328 1998 FSWs working in bars from Mexico Community 109 88.1 121 0.8 -- -- 0.8de
Nicaragua Delgado, 201129 2001-09 FSWs in Managua Community 613 75.7 613 1.8 -- 89.9c --
Nicaragua Delgado, 201129 2001-09 FSWs in Chinandega Community 212 83.5 211 2.4 -- 89.9c -- Nicaragua Soto, 200725 2001-02 Brothel & mobile FSWs Community 454 82.1 460 0.2 -- 56.6 1.2
Panama Hakre, 201330 2009-10 FSWs in Panama (≥50% registered) Community 455 71.2 455 0.70 -- 95.0c --
Panama Hakre, 201330 2009-10 FSWs in Cocle (≥50% registered) Community 64 84.4 64 0.0b -- 95.0c -- Panama Hakre, 201330 2009-10 FSWs in Colon (≥50% registered) Community 150 76.7 150 1.30 -- 95.0c --
Panama Hakre, 201330 2009-10 FSWs in Chiriqui (≥50% registered) Community 155 72.3 155 0.0b -- 95.0c --
Panama Hakre, 201330 2009-10 FSWs in Herrera & Los Santos (≥50% reg.) Community 52 75.0 52 0.0b -- 95.0c -- Panama Hakre, 201330 2009-10 FSWs in Bocas del Toro (≥50% unregistered) Community 95 77.9 95 2.10 -- 80.0c --
Panama Hakre, 201330 2009-10 FSWs in Veraguas (≥50% unregistered) Community 28 82.1 28 0.0b -- 80.0c --
Panama Soto, 200725 2001-02 Brothel & mobile FSWs Community 409 73.0 418 0.2 -- 94.1 5.7 Peru Caceres, 200631 2003-05 Low income FSWs in 3 cities Community 295 48.8 295 0.30 -- 62.7 --
Peru Carcamo, 201232 2002-03 FSWs in Barranca Community 18 77.8 168 0.0b -- -- --
Peru Carcamo, 201232 2002-03 FSWs in Chimbote Community 36 88.9 199 1.0 -- -- -- Peru Carcamo, 201232 2002-03 FSWs in Chincha and Ica Community 15 73.3 399 1.0 -- -- --
Peru Carcamo, 201232 2002-03 FSWs in Ilo and Pisco Community 18 44.4 348 0.3 -- -- --
Peru Carcamo, 201232 2002-03 FSWs in Piura Community 11 72.7 193 2.1 -- -- -- Peru Carcamo, 201232 2002-03 FSWs in Sullana Community 27 51.9 200 0.0b -- -- --
Peru Carcamo, 201232 2002-03 FSWs in Tacna Community 10 60.0 205 0.5 -- -- --
Peru Carcamo, 201232 2002-03 FSWs in Talara Community 12 41.7 143 1.4 -- -- -- Peru Carcamo, 201232 2002-03 FSWs in Tumbes Community 12 83.3 74 2.7 -- -- --
Peru Carcamo, 201232 2002-03 FSWs in Arequipa Community 10 40.0 201 0.5 -- -- --
Peru Carcamo, 201232 2002-03 FSWs in Ayacucho Community 15 60.0 147 0.7 -- -- -- Peru Carcamo, 201232 2002-03 FSWs in Cajamarca Community 12 75.0 184 0.0b -- -- --
Peru Carcamo, 201232 2002-03 FSWs in Cerro de Pasco Community 17 17.7 199 0.0b -- -- --
Peru Carcamo, 201232 2002-03 FSWs in Cusco Community 17 58.8 208 0.0b -- -- -- Peru Carcamo, 201232 2002-03 FSWs in Huancayo Community 10 50.0 196 0.0b -- -- --
Peru Carcamo, 201232 2002-03 FSWs in Huaraz Community 11 72.7 140 0.7 -- -- --
Peru Carcamo, 201232 2002-03 FSWs in Juliaca Community 11 9.1 197 0.0b -- -- --

330
Country Short citation Data
collect.
year(s)
Population characteristics Site Tested
HSV-2
(n)
HSV-2
prev
(%)
Tested
HIV
(n)
HIV
prev
(%)
ART
cov
(%)
Consistent
condom
usea (%)
Prop
who
inject
drugs
(%)
Peru Carcamo, 201232 2002-03 FSWs in Puno Community 14 28.6 201 0.0b -- -- --
Peru Carcamo, 201232 2002-03 FSWs in Huanuco Community 21 76.2 202 0.5 -- -- --
Peru Carcamo, 201232 2002-03 FSWs in Iquitos Community 26 100.0 200 1.5 -- -- -- Peru Carcamo, 201232 2002-03 FSWs in Pucallpa Community 32 96.9 200 1.5 -- -- --
Peru Carcamo, 201232 2002-03 FSWs in Tarapoto Community 26 88.5 159 1.9 -- -- --
Peru Golenbock, 198833 1986 FSWs in Callao Community 140 91.0 140 0.0b -- 1.4 -- Peru Gotuzzo, 199434 1991-92 FSWs at governmental health clinic STI clinic 399 82.20 400 0.8 -- 54.1 --
Peru Perla, 201235 2002-03 Clandestine FSWs in Lima Community 211 80.10 211 2.4 -- 73.0 --
Peru Sanchez, 199836 1991-92 Registered FSWs attending an STI clinic STI clinic 283 82.0 284 0.7 -- 77.0 -- Peru Sanchez, 199836 1991-92 Unregistered FSWs attending an STI clinic STI clinic 116 82.8 116 0.9 -- 81.4 --
USA Cohan, 200537 1996-98 Women with sex work history in California Community 226 72.9 226 0.3 -- -- 19.7d
USA Jones, 199838 1991-92 FSWs who are cocaine users (non-injecting) Community 303 73.4 303 25.4 -- 46.0c -- USA Jones, 199838 1991-92 FSWs who are cocaine users (injecting) Community 34 65.4 34 23.5 -- 46.0c --
USA Lutnick, 200839 -- FSWs in San Francisco Community 250 82.0 250 4.1 -- 48.6 51.6
EURO (n=6)
Greece Papadogeorgaki, 200640 2005 Greek FSWs Health center 240 74.6 240 0.0b -- -- -- Greece Papadogeorgaki, 200640 2005 Non-Greek FSWs Health center 59 49.2 59 0.0b -- -- --
Israel Linhart, 200841 -- Brothel-based FSWs Brothel 300 60.0 300 0.3 -- 90.70 --
Russia Khromova, 200242 -- Juvenile and homeless detainee FSWs Prison 400 29.2 400 2.8 -- -- -- Slovakia Bystricka, 200343 -- FSWs attending a health center in Bratislava Health center 18 50.0 18 5.6 -- -- --
Turkey Gul, 200844 2005 Brothel-based FSWs in Ankara Brothel 130 80.0 130 0.0b -- 70.0 0.0
EMRO (n=4)
Pakistan Hawkes, 200945 2007 FSWs in Rawalpindi Community 426 8.0 426 0.0b -- 38.0c 3.0e
Pakistan Hawkes, 200945 2007 FSWs in Abbottabad Community 107 4.7 107 0.0b -- 38.0c 3.0e
Tunisia Znazen, 201046 2007 FSWs engaged in sex work for <5years Health center 63 47.6 63 0.0b -- 73.0 -- Tunisia Znazen, 201046 2007 FSWs engaged in sex work for ≥5years Health center 120 59.2 125 0.0b -- 54.4 --
SEARO (n=71)
Bangladesh Qutub, 200347 -- Brothel-based FSWs in Bangladesh Brothel 463 94.6 463 0.0b -- 0.0 --
East Timor Pisani, 200648 2003 East Timorese & Indonesian FSWs in Dili Community 98 60.2 100 3.0 -- 36.0 -- India Mishra, 200949 2004 FSWs in Mysore, Karnataka Community 393 64.4 393 25.2 -- -- --
India National Rep., 201150 2006 FSWs in Chittoor, Round 1 Community 40 80.0 401 8.0 -- 85.0 --
India National Rep., 201150 2009 FSWs in Chittoor, Round 2 Community 40 52.5 398 10.5 -- 99.0 -- India National Rep., 201150 2006 FSWs in East Godavari, Round 1 Community 42 81.4 422 26.3 -- 93.0 --
India National Rep., 201150 2009 FSWs in East Godavari, Round 2 Community 40 78.0 401 23.3 -- 99.0 --
India National Rep., 201150 2006 FSWs in Guntur, Round 1 Community 41 82.9 405 21.3 -- 95.0 -- India National Rep., 201150 2009 FSWs in Guntur, Round 2 Community 41 70.7 405 8.4 -- 100.0 --
India National Rep., 201150 2006 FSWs in Hyderabad, Round 1 Community 40 77.5 399 14.3 -- 95.0 --
India National Rep., 201150 2009 FSWs in Hyderabad, Round 2 Community 40 87.8 401 9.6 -- 96.0 -- India National Rep., 201150 2005 FSWs in Karimnagar, Round 1 Community 41 65.1 412 21.1 -- 91.0 --
India National Rep., 201150 2009 FSWs in Karimnagar, Round 2 Community 40 65.9 402 6.5 -- 95.0 --
India National Rep., 201150 2006 FSWs in Prakasham, Round 1 Community 40 53.7 404 11.1 -- 81.0 -- India National Rep., 201150 2009 FSWs in Prakasham, Round 2 Community 41 61.0 408 13.4 -- 96.0 --
India National Rep., 201150 2006 FSWs in Visakhapatnam, Round 1 Community 41 57.1 411 14.2 -- 94.0 --
India National Rep., 201150 2009 FSWs in Visakhapatnam, Round 2 Community 41 58.5 409 18.2 -- 97.0 -- India National Rep., 201150 2006 FSWs in Warangal, Round 1 Community 42 61.9 417 10.8 -- 89.0 --

331
Country Short citation Data
collect.
year(s)
Population characteristics Site Tested
HSV-2
(n)
HSV-2
prev
(%)
Tested
HIV
(n)
HIV
prev
(%)
ART
cov
(%)
Consistent
condom
usea (%)
Prop
who
inject
drugs
(%)
India National Rep., 201150 2009 FSWs in Warangal, Round 2 Community 40 39.0 401 15.0 -- 99.0 --
India National Rep., 201150 2006 FSWs in Bangalore, Round 1 Community 67 68.6 673 12.7 -- 92.0 --
India National Rep., 201150 2005 FSWs in Belgaum, Round 1 Community 36 83.8 360 33.9 -- 96.0 -- India National Rep., 201150 2005 FSWs in Bellary, Round 1 Community 42 70.8 420 15.7 -- 83.0 --
India National Rep., 201150 2005 FSWs in Shimoga, Round 1 Community 39 59.7 390 9.7 -- 75.0 --
India National Rep., 201150 2006 FSWs in Kolhapur, Round 1 Community 12 83.3 115 33.0 -- 88.0 -- India National Rep., 201150 2009 FSWs in Kolhapur, Round 2 Community 19 75.0 190 27.4 -- 100.0 --
India National Rep., 201150 2006 FSWs bar girls in Mumbai, Round 1 Community 34 50.0 338 5.9 -- 93.0 --
India National Rep., 201150 2009 FSWs bar girls in Mumbai, Round 2 Community 41 63.0 405 3.1 -- 96.3 -- India National Rep., 201150 2006 Brothel-based FSWs in Mumbai, Round 1 Community 41 87.8 407 28.1 -- 97.0 --
India National Rep., 201150 2009 Brothel-based FSWs in Mumbai, Round 2 Community 40 86.6 395 34.9 -- 100.0 --
India National Rep., 201150 2006 Street-based FSWs in Mumbai, Round 1 Community 39 70.2 394 19.2 -- 97.0 -- India National Rep., 201150 2009 Street-based FSWs in Mumbai, Round 2 Community 39 85.0 385 32.3 -- 100.0 --
India National Rep., 201150 2006 FSWs in Parbhani, Round 1 Community 37 52.2 367 16.1 -- 93.0 --
India National Rep., 201150 2009 FSWs in Parbhani, Round 2 Community 30 80.6 303 14.9 -- 99.0 -- India National Rep., 201150 2006 Brothel-based FSWs in Pune, Round 1 Community 40 80.9 404 38.7 -- 98.0 --
India National Rep., 201150 2009 Brothel-based FSWs in Pune, Round 2 Community 40 65.8 403 20.3 -- 100.0 --
India National Rep., 201150 2006 Non-brothel-based FSWs in Pune, Round 1 Community 26 96.2 257 37.0 -- 97.0 -- India National Rep., 201150 2009 Non-brothel-based FSWs in Pune, Round 2 Community 27 88.9 266 21.8 -- 98.0 --
India National Rep., 201150 2006 Brothel-based FSWs in Thane, Round 1 Community 40 35.9 401 18.6 -- 99.0 -- India National Rep., 201150 2009 Brothel-based FSWs in Thane, Round 2 Community 38 81.5 384 33.1 -- 100.0 --
India National Rep., 201150 2006 Street-based FSWs in Thane, Round 1 Community 39 58.3 394 7.0 -- 98.0 --
India National Rep., 201150 2009 Street-based FSWs in Thane, Round 2 Community 40 74.4 395 11.8 -- 99.0 -- India National Rep., 201150 2006 FSWs in Yevatmal, Round 1 Community 15 100.0 153 37.3 -- 96.0 --
India National Rep., 201150 2009 FSWs in Yevatmal, Round 2 Community 16 87.5 157 26.8 -- 99.0 --
India National Rep., 201150 2006 FSWs in Chennai, Round 1 Community 41 31.7 410 2.2 -- 96.0 -- India National Rep., 201150 2009 FSWs in Chennai, Round 2 Community 40 37.5 397 2.4 -- 99.0 --
India National Rep., 201150 2006 FSWs in Coimbatore, Round 1 Community 41 56.1 410 6.3 -- 93.0 --
India National Rep., 201150 2009 FSWs in Coimbatore, Round 2 Community 40 58.9 400 6.3 -- 99.0 -- India National Rep., 201150 2006 FSWs in Dharmapuri, Round 1 Community 41 75.6 408 12.4 -- 95.0 --
India National Rep., 201150 2009 FSWs in Dharmapuri , Round 2 Community 41 48.2 406 8.8 -- 91.0 --
India National Rep., 201150 2006 FSWs in Madurai, Round 1 Community 40 48.8 402 4.3 -- 84.0 -- India National Rep., 201150 2009 FSWs in Madurai, Round 2 Community 40 58.2 396 8.3 -- 100.0 --
India National Rep., 201150 2006 FSWs in Salem, Round 1 Community 40 72.5 402 12.5 -- 93.0 --
India National Rep., 201150 2009 FSWs in Salem, Round 2 Community 41 53.6 407 6.7 -- 99.0 -- India National Rep., 201150 2006 FSWs in Dimapur, Round 1 Community 43 52.6 426 11.6 -- 36.0 --
India National Rep., 201150 2009 FSWs in Dimapur, Round 2 Community 42 44.7 417 11.4 -- 72.0 --
India Sarna, 201351 2010 FSWs in Nellore Community 529 60.7 529 5.3 -- 47.2 -- India Shahmanesh, 200952 2004-05 FSWs in Goa Community 326 57.2 326 25.7 -- 74.4 --
India Uma, 200553 2004 FSWs bacterial vaginosis positive Community 260 73.5 260 5.3 -- -- --
India Uma, 200553 2004 FSWs bacterial vaginosis intermediate Community 92 67.4 92 11.0 -- -- -- India Uma, 200553 2004 FSWs bacterial vaginosis negative Community 230 56.1 230 1.3 -- -- --
Indonesia Davies, 200754 1999-00 FSWs in Kupang STI clinic 176 86.9 176 0.0b -- 4.0 --
Thailand Limpakarnjanarat, 199955 1991-94 Brothel-based FSWs at Chiang province STI clinic 280 78.2 280 47.1 -- 32.8c -- Thailand Limpakarnjanarat, 199955 1991-94 Non-brothel-based FSWs at Chiang province STI clinic 220 72.3 220 12.7 -- 32.8c --

332
Country Short citation Data
collect.
year(s)
Population characteristics Site Tested
HSV-2
(n)
HSV-2
prev
(%)
Tested
HIV
(n)
HIV
prev
(%)
ART
cov
(%)
Consistent
condom
usea (%)
Prop
who
inject
drugs
(%)
Vietnam Vu Thuong, 200756 2002 FSWs in Lai Chau Community 100 5.0 100 2.0 -- 45.3c 3.9de
Vietnam Vu Thuong, 200756 2002 FSWs in Quang Tri Community 101 20.8 101 1.0 -- 45.3c 3.9de
Vietnam Vu Thuong, 200756 2002 FSWs in Dong Thap Community 149 32.2 149 4.7 -- 45.3c 3.9de Vietnam Vu Thuong, 200756 2002 FSWs in An Giang Community 300 33.3 300 7.0 -- 45.3c 3.9de
Vietnam Vu Thuong, 200756 2002 FSWs in Kien Giang Community 253 30.0 253 4.0 -- 45.3c 3.9de
Vietnam Vu Thuong, 200756 2004 FSWs in Lai Chau Community 99 20.2 99 2.0 -- 52.8c 3.1d Vietnam Vu Thuong, 200756 2004 FSWs in Quang Tri Community 100 33.0 100 1.0 -- 52.8c 2.0d
Vietnam Vu Thuong, 200756 2004 FSWs in Dong Thap Community 199 25.1 199 2.6 -- 52.8c 0.0d
Vietnam Vu Thuong, 200756 2004 FSWs in An Giang Community 285 23.5 285 5.3 -- 52.8c 2.1d Vietnam Vu Thuong, 200756 2004 FSWs in Kien Giang Community 298 24.2 298 4.1 -- 52.8c 2.7d
WPRO (n=49)
Cambodia Saphonn, 200657 2000-02 FSWs first-time STI clinic attendees STI clinic 938 38.8 938 27.4 -- -- --
China Chen, 199858 1993-94 FSWs in massage parlors in Taiwan Mass. parlors 206 2.9 287 0.0b -- 94.0c -- China Chen, 199858 1994-96 FSWs in massage parlors in Taiwan Mass. parlors 81 1.2 242 0.0b -- 94.0c --
China Chen, 199858 1993-94 FSWs in karaoke bars in Taiwan Karaoke bars 557 7.5 557 0.4 -- -- --
China Chen, 199858 1993-94 Brothel-based FSWs in Taiwan Brothel 159 1.3 159 0.0b -- 45.2c -- China Chen, 199858 1994-96 Brothel-based FSWs in Taiwan Brothel 142 4.9 156 0.0b -- 45.2c --
China Chen, 200559 1999-00 FSWs aged 15-19 years in Kunming STI clinic 70 4.3 70 84.3 -- 45.2c --
China Chen, 200559 1999-00 FSWs aged 20-24 years in Kunming STI clinic 204 9.8 204 86.8 -- 45.2c -- China Chen, 200559 1999-00 FSWs aged 25-29 years in Kunming STI clinic 144 13.2 144 79.9 -- 45.2c --
China Chen, 200559 1999-00 FSWs aged 30-34 years in Kunming STI clinic 62 9.7 62 85.5 -- 45.2c -- China Chen, 200559 1999-00 FSWs aged 35-39 years in Kunming STI clinic 25 16.0 25 88.0 -- 45.2c --
China Chen, 201360 2009 FSWs in Wuzhou and Hezhou in Guangxi Community 2453 54.9 2,453 0.7 -- 79.2 --
China Fu, 201461 -- Low fee FSWs in Guangdong Community 196 57.1 196 1.0 -- 21.1 -- China Fu, 201461 -- Medium fee FSWs in Guangdong Community 379 16.9 379 0.0b -- 9.6 --
China Han, 201662 2012 Low fee FSWs Community 417 31.7 417 0.7 -- 42.3 4.8
China Han, 201662 2012 Medium fee FSWs Community 1,070 26.4 1,070 0.3 -- 55.5 1.3 China Jing, 201763 1994 Vietnamese FSWs in Hekou (June 2014) Community 219 57.1 219 3.2 -- -- --
China Jing, 201763 1994 Vietnamese FSWs in Hekou (Dec 2014) Community 245 58.4 245 2.0 -- -- --
China Jing, 201763 1995 Vietnamese FSWs in Hekou (May 2015) Community 265 38.1 265 1.9 -- -- -- China Jing, 201763 1995 Vietnamese FSWs in Hekou (Nov 2015) Community 329 51.1 329 1.8 -- -- --
China Li, 201464 2013 FSWs from multiple venues Community 460 43.0 460 0.2 -- -- --
China Luo, 201565 2012 FSWs not using vaginal douching in Yunnan Community 134 56.0 134 5.2 -- 71.9 6.7 China Luo, 201565 2012 FSWs using vaginal douching in Yunnan Community 699 70.8 699 11.0 -- 78.9 9.6
China Ngo, 200866 2004 FSWs in Kunming STI clinic 310 45.2 310 3.9 -- 11.6 --
China Remis, 201067 2009 FSWs in Shanghai Community 750 3.1 750 0.1 -- -- -- China Wang, 200668 2005 FSWs in a mining township Community 327 63.7 237 20.7 -- -- --
China Wang, 201269 2006 FSWs in Kaiyuan (Fall 2006) Community 741 67.3 741 10.2 -- -- --
China Wang, 201269 2006 FSWs from Kaiyuan (Spring 2006) Community 748 67.9 748 11.9 -- -- -- China Wang, 201269 2007 FSWs from Kaiyuan (Fall 2007) Community 705 70.8 705 13.1 -- -- --
China Wang, 201269 2007 FSWs from Kaiyuan (Spring 2007) Community 440 62.7 440 11.4 -- -- --
China Wang, 201269 2008 FSWs from Kaiyuan (Fall 2008) Community 587 68.1 587 11.2 -- -- -- China Wang, 201269 2008 FSWs from Kaiyuan (Spring 2008) Community 558 71.2 558 12.2 -- -- --
China Wang, 201269 2009 FSWs from Kaiyuan (Fall 2009) Community 548 71.3 548 16.2 -- -- --
China Wang, 201269 2009 FSWs from Kaiyuan (Spring 2009) Community 548 70.4 548 15.5 -- -- --

333
Country Short citation Data
collect.
year(s)
Population characteristics Site Tested
HSV-2
(n)
HSV-2
prev
(%)
Tested
HIV
(n)
HIV
prev
(%)
ART
cov
(%)
Consistent
condom
usea (%)
Prop
who
inject
drugs
(%)
China Wang, 201570 2009 Vietnamese FSWs in China Community 233 60.9 233 7.7 -- 90.1 --
China Wang, 201570 2009 Chinese FSWs Community 112 52.7 112 0.9 -- 100.0 -- China Wei, 200471 1999 Sex- hospitality girls in Wuhan Community 101 29.7 147 0.0b -- 51.7 8.2
China Xu, 200872 2006 FSWs from entertainment venues Community 96 70.8 96 8.3 -- 54.2 7.3
China Xu, 201273 2007 FSWs drug users (Mar-Jul 2007) Community 150 86.7 150 43.3 -- 84.7 -- China Xu, 201273 2007 FSWs non-drug users (Mar-Jul 2007) Community 555 66.8 555 4.9 -- 86.7 --
China Xu, 201374 2006-07 FSWs drug users (Mar 2006-Apr 2007) Community 261 86.6 261 39.1 -- 84.7 7.4e
China Xu, 201374 2006-07 FSWs non-drug users (Mar 2006-Apr 2007) Community 1,381 66.8 1,381 4.8 -- 86.7 7.4e
China Yang, 201175 2008 FSWs in entertainment establishments Community 411 45.5 411 0.0b -- 78.7 --
China Yang, 201175 2009 FSWs in entertainment establishments Community 411 50.1 411 0.0b -- 82.0 --
China Yao, 201276 2007 FSWs drug users (Sep-Oct 2007) Community 94 92.6 94 38.3 -- -- 81.9f China Yao, 201276 2007 FSWs non-drug users (Sep-Oct 2007) Community 305 59.7 305 4.0 -- -- --
China Zhang, 201477 2011 FSWs aged 18-25 years in Shanghai Community 336 46.4 336 0.0b -- 49.3c --
China Zhang, 201477 2011 FSWs aged 26-35 years in Shanghai Community 196 59.2 196 0.0b -- 49.3c -- China Zhang, 201477 2011 FSWs aged ≥36 years in Shanghai Community 68 60.3 68 0.0b -- 49.3c --
AFRO, African Region; AMRO, Region of the Americas; ART, antiretroviral therapy; Collect, collection; Cov, coverage; Domin Rep, Dominican Republic; EMRO, Eastern Mediterranean Region;
EURO, European Region; FSWs, female sex workers; HIV, human immunodeficiency virus; HSV-2, herpes simplex virus type 2; Mass, massage; National Rep, National Report; Prev, prevalence; Prop,
proportion; RDS, respondent-driven sampling; Reg, registered; SEARO, South-East Asia Region; STI, sexually transmitted infection; USA, United States of America; WPRO, Western Pacific Region. aConsistent condom use measures were based on self-reported condom use at last sex with client, or alternatively on self-reported “consistent/regular” condom use, or condom use “all the time” during
commercial sex acts. bStudies reporting zero HIV prevalence were excluded from subsequent analysis. cStrata were considered to have the same level of consistent condom use as the overall sample. dProportion of FSWs who reported ever injecting drugs. eStrata were considered to have the same level of injecting drug use as the overall sample. fProportion of drug-using FSWs who reported injecting drug use.

334
Figure S1. Regional maps illustrating countries’ data contribution in terms of the total number of studies and the total number of
FSWs participating in those studies. Map showing data contribution from A) Africa, B) Americas, and C) Other world regions. Maps
were created using Tableau Desktop v.10.178.
A) Africa
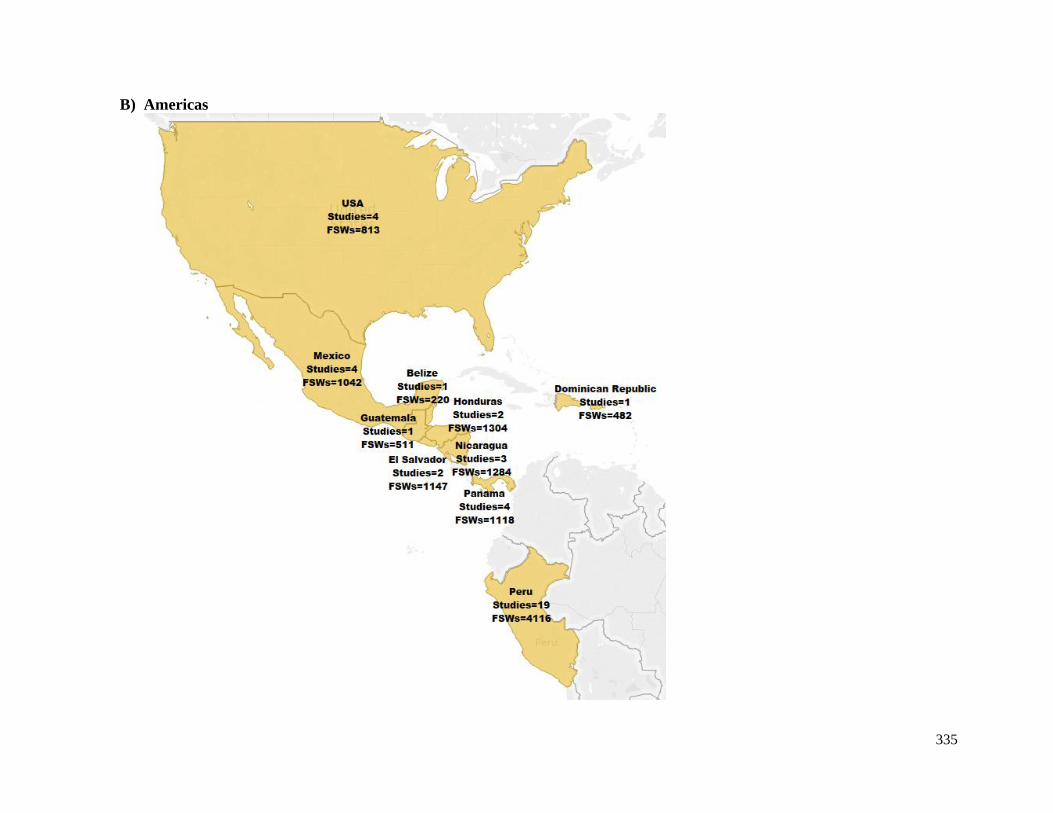
335
B) Americas

336
C) Other world regions

337
Figure S2. Forest plot showing the results of meta-analyses on studies reporting HIV prevalence
among female sex workers stratified by HSV-2 prevalence level in A) Africa, B) other world
regions, and C) globally. Forest plots were generated using R v.3.4.279.
A) Africa
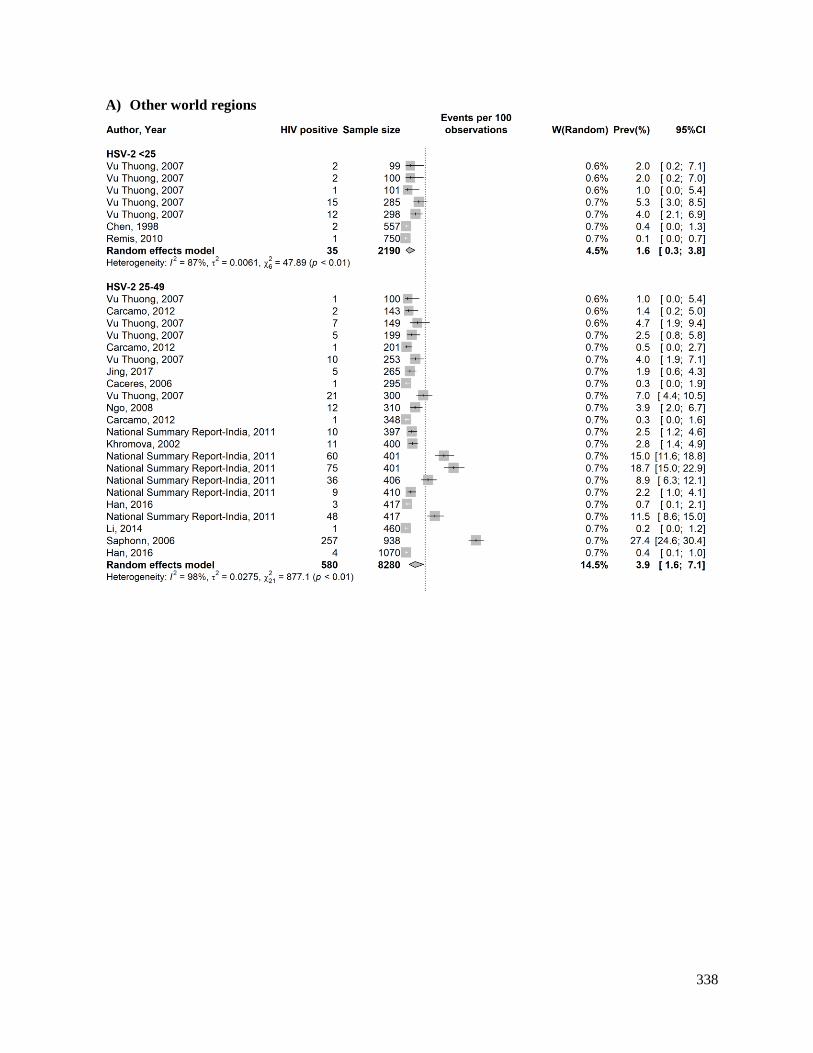
338
A) Other world regions
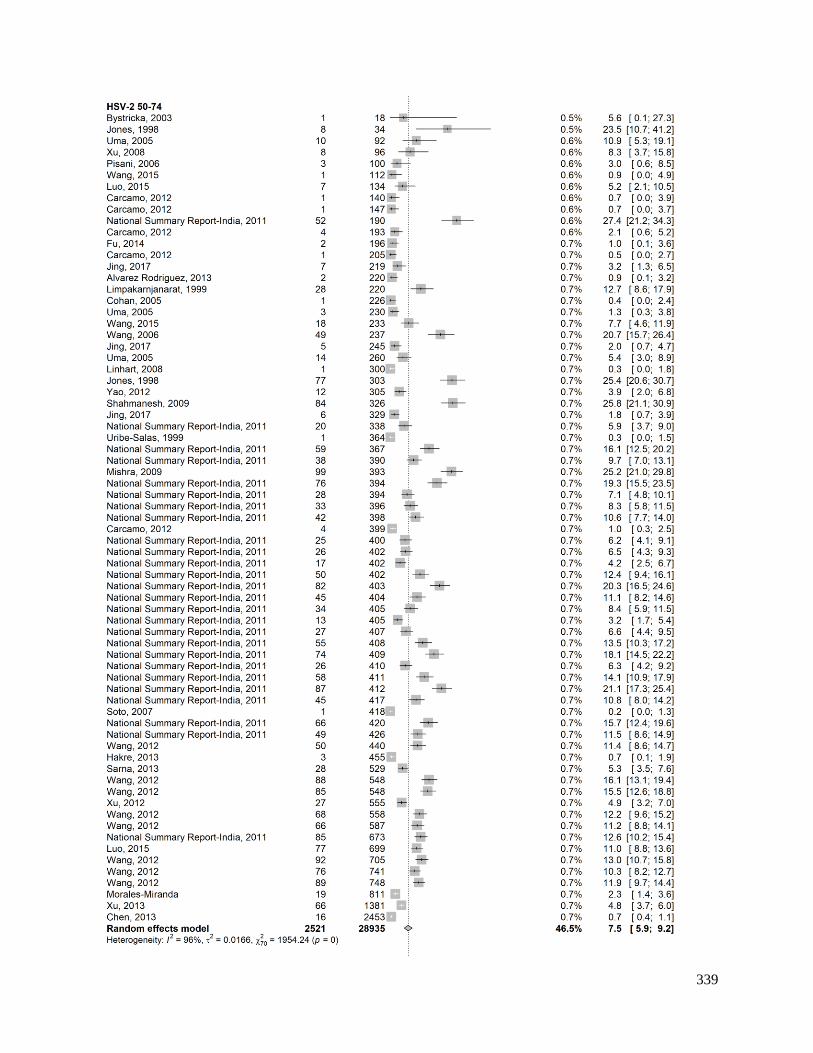
339

340

341
C) Global

342

343

344
Box S1. Search criteria for the systematic review of the global association of herpes simplex
virus type 2 (HSV-2) and HIV prevalence measures among female sex workers. PubMed (September 3rd, 2019)
Sex work
"Extramarital Relations"[Mesh] OR “Sex Work*”[Mesh] OR "Sex/analysis"[Mesh] OR "Sex/statistics and numerical
data"[Mesh] OR "Sexual partners"[Mesh] OR "Sex Trafficking/epidemiology"[Mesh] OR "Sex Trafficking/statistics and
numerical data"[Mesh] OR Sex work*[Text] OR Sexual work*[Text] OR Sexwork*[Text] OR Sex-work*[Text] OR Sexual
partner*[Text] OR Sex partner*[Text] OR Sexual contact*[Text] OR FSW[Text] OR FSWs[Text] OR CSW[Text] OR
CSWs[Text] OR SW[Text] OR SWs[Text] OR TSW[Text] OR TSWs[Text] OR TS[Text] OR Travailleuse* sexe[Text] OR
Travailleuse* sex[Text] OR Bar girl*[Text] OR Callgirl*[Text] OR Call girl*[Text] OR Escort*[Text] OR Masseuse*[Text]
OR Hostess*[Text] OR ((Premarital[Text] OR Pre-marital[Text] OR Pre marital[Text] OR Extramarital[Text] OR Extra-
marital[Text] OR Extra marital[Text] OR Illicit[Text] OR Illegal[Text]) AND (Sex[Text] OR Sexual[Text] OR
Relation*[Text])) OR Outside marriage[Text] OR Out of marriage[Text] OR “Illegal social behavior”[Text] OR “Illegal
social behaviour”[Text] OR Adultery[Text] OR Prostitut*[Text] OR Promiscu*[Text] OR Female entertain*[Text] OR Sex
entertain*[Text] OR Sexual* entertain*[Text] OR Entertainment work*[Text] OR Sex industr*[Text] OR Sex
establishment*[Text] OR Brothel*[Text] OR Red light[Text] OR Red-light[Text] OR Red district*[Text] OR
Nightclub*[Text] OR Pimp[Text] OR ((Intergenerational[Text] OR Cross-generation*[Text] OR Cross-generational[Text] OR
Recreational[Text] OR Commercial[Text] OR Transaction*[Text] OR Casual[Text] OR Group[Text] OR Informal[Text] OR
Street[Text] OR Migrant*[Text] OR Survival[Text] OR Occupational[Text] OR Tourism[Text]) AND (Sex[Text] OR
Sexual*[Text])) OR Sex seeking[Text] OR Sex-seeking[Text] OR Solicit*[Text] OR ((Provision*[Text] OR Provider*[Text]
OR Provid*[Text] OR Sell*[Text] OR Sold[Text] OR Exchang*[Text] OR Trad*[Text] OR Favor*[Text] OR Consum*[Text]
OR Commodi*[Text] OR Paid[Text] OR Paying[Text] OR Pay[Text] OR Payer*[Text] OR Buying[Text] OR Buy[Text] OR
Buyer*[Text] OR Charg*[Text] OR Engag*[Text] OR Service*[Text] OR Money[Text] OR Cash[Text] OR Drug*[Text] OR
Goods[Text] OR Gift*[Text]) AND (Sex[Text] OR Sexual*[Text])) OR Hidden population*[Text] OR Hard to reach
population*[Text] OR Hard-to-reach population*[Text] OR Core group*[Text] OR Core risk group*[Text] OR Vulnerable
women[Text] OR Vulnerable population*[Text] OR Vulnerable female*[Text] OR Most-at-risk population*[Text] OR Most
at risk population*[Text] OR High risk population*[Text] OR High-risk population*[Text] OR Population* at high risk[Text]
OR Population* at high-risk[Text] OR ((Traffick*[Text] OR Slave*[Text] OR Coerc*[Text] OR Abduct*[Text] OR
Exploit*[Text] OR Abuse*[Text] OR Violence[Text]) AND (Sex[Text] OR Sexual*[Text]))
Herpes simplex virus-2
(Simplexvirus[MeSH] OR Herpes Simplex[MeSH] OR Herpes Hominis[Text] OR HSV type-2[Text] OR HSV type 2[Text]
OR HSV2[Text] OR HSV-2[Text] OR HSV 2[Text] OR HHV2[Text] OR HHV-2[Text] OR HHV 2[Text] OR Herpes
simplex virus type 2[Text] OR Herpes simplex virus type-2[Text] OR herpes simplex virus 2[Text] OR herpes simplex virus-
2[Text] OR herpes simplex type 2[Text] OR herpes simplex type-2[Text] OR herpes simplex 2[Text] OR herpes simplex-
2[Text] OR Herpesvirus type 2[Text] OR Herpesvirus type-2[Text] OR Herpesvirus 2[Text] OR Herpesvirus-2[Text] OR
Herpes virus type 2[Text] OR Herpes virus type-2[Text] OR Herpes virus 2[Text] OR Herpes virus-2[Text] OR genital
herpes[Text] OR Human herpes virus[Text] OR Herpes virus[Text] OR Herpes Genitalis[Text] OR Herpes Labialis[Text])
HIV
("HIV"[Mesh] OR "HIV Seropositivity"[Mesh] OR "HIV Antibodies"[Mesh] OR "HIV Infections"[Mesh] OR "HIV
Seroprevalence"[Mesh] OR HIV[Text] or "Human immunodeficiency virus"[Text])
Women
"Female/analysis"[Mesh] OR "Female/statistics and numerical data"[Mesh] OR “Women/epidemiology”[Mesh] OR
“Women/statistics and numerical data”[Mesh] OR Women[Text] OR Girl*[Text] OR Female*[Text]
FINAL PUBMED SEARCH
(“Sex work” AND “Herpes simplex virus-2” AND “HIV” AND “Women”)
Total citations: 748
Embase (September 3rd, 2019)
Sex work
exp prostitution/ or exp casual sex/ or exp transactional sex/ or exp group sex/ or exp sex tourism/ or exp sexual promiscuity/
or exp extramarital sex/ or exp premarital sex/ or exp sexual relation/ or exp sexual partners/ or ((exp sex trafficking/ or exp
sexual exploitation/ or exp sexual coercion/) NOT Child) or (sex* work* or sexwork* or sex-work* or sex partner* or sexual
partner* or sexual contact* or premarital sex or premarital sexual or premarital relation* or pre-marital sex or pre-marital
sexual or pre-marital relation* or pre marital sex or pre marital sexual or pre marital relation* or extramarital sex or
extramarital sexual or extramarital relation* or extra-marital sex or extra-marital sexual or extra-marital relation* or extra
marital sex or extra marital sexual or extra marital relation* or illicit sex or illicit sexual or illicit relation* or illegal sex or
illegal sexual or illegal relation* or (out* ADJ1 marriage) or illegal social behavio?r or adultery or prostitut* or promiscu* or
FSW or FSWs or CSW or CSWs or SW or SWs or TSW or TSWs or TS or (women ADJ4 sex*) or (Travailleuse* ADJ1
sex*) or bar girl* or call girl* or callgirl* or escort* or masseuse* or hostess* or female entertain* or sex entertain* or sexual
entertain* or entertainment work* or sex industr* or sex establishment* or brothel* or red light or red-light or (red ADJ1
district*) or nightclub* or pimp or recreation* sex* or intergenerational sex* or cross-generation sex* or cross-generational

345
sex* or commercial sex* or transactional sex* or sex* transaction* or casual sex* or informal sex* or group sex* or street
sex* or (migra* ADJ4 sex*) or (sex* ADJ4 migra*) or survival sex* or occupational sex* or sex* tourism or sex seeking or
sex-seeking or solicit* or (consum* ADJ4 sex*) or (sex* ADJ 4 consumer) or (sex* ADJ4 consumers) or (sex* ADJ4 provi*)
or (provi* ADJ4 sex*) or (sell* ADJ4 sex*) or (sex* ADJ4 sell*) or sold sex* or (exchang* ADJ4 sex*) or (sex* ADJ4
exchange) or (trading ADJ4 sex*) or (trade* ADJ4 sex*) or sex* trade or sex* favor* or (commodi* ADJ4 sex*) or (sex*
ADJ4 commodi*) or (paid ADJ4 sex*) or (pay* ADJ4 sex*) or (sex* ADJ4 pay*) or (buy* ADJ4 sex*) or (sex* ADJ4 buy*)
or (charg* ADJ4 sex*) or (sex* ADJ4 charg*) or (engag* ADJ4 sex*) or (sex* ADJ4 engage*) or (sex* ADJ4 service*) or
(service* ADJ4 sex*) or (money ADJ4 sex*) or (sex* ADJ4 money) or (cash ADJ4 sex*) or (sex* ADJ4 cash) or (sex* ADJ4
drug*) or (drug* ADJ4 sex*) or (sex* ADJ4 goods) or (goods ADJ4 sex*) or (sex* ADJ4 gift*) or (gift* ADJ4 sex*) or
hidden population* or hard to reach population* or hard-to-reach population* or (core ADJ1 group*) or vulnerable women or
vulnerable female*).mp. or ((vulnerable population* or most-at-risk population* or most at risk population* or high risk
population* or high-risk population* or population* at high risk or population* at high-risk).mp. AND (sex* or infection* or
STI or STIs or STD or STDs or human immunodeficiency virus or HIV* or AIDS* or acquired immune deficiency syndrome
or acquired immunodeficiency syndrome).mp.) or ((sex trafficking or sexual trafficking or (traffick* ADJ4 sex*) or sex*
slave* or sex* coerc* or sex* abduct* or sex* exploit* or sex* abuse* or sex* violence) NOT Child).mp. or ((women ADJ4
traffick*) or (girls ADJ4 traffick*) or (female* ADJ4 traffick*) or (traffick* ADJ4 women) or (traffick* ADJ4 girls) or
(traffick* ADJ4 female*)).mp.
Herpes simplex virus-2
(exp Herpes simplex virus/ or exp herpes simplex/ or exp Simplexvirus/ or exp Herpesvirus/ or exp Herpesviridae/ or exp
Herpes simplex virus 2/) OR (Herpes simplex or Herpes simplex virus or HSV type-2 or HSV type 2 or HSV2 or HSV-2 or
HSV 2 or HHV2 or HHV-2 or HHV 2 or human herpes virus or herpes virus or Herpes simplex virus type 2 or Herpes
simplex virus type-2 or herpes simplex virus 2 or herpes simplex virus-2 or herpes simplex type 2 or herpes simplex type-2 or
herpes simplex 2 or herpes simplex-2 or Herpesvirus type 2 or Herpesvirus type-2 or Herpesvirus 2 or Herpesvirus-2 or
Herpes virus type 2 or Herpes virus type-2 or Herpes virus 2 or Herpes virus-2 or genital herpes or Herpes Genitalis or Herpes
Labialis).mp.
HIV
(exp Human immunodeficiency virus/ or Human immunodeficiency virus.mp. or HIV.mp.)
Women
exp female/ or (women or girl* or female*).mp.
FINAL EMBASE SEARCH
(“Sex work” AND “Herpes simplex virus-2” AND “HIV” AND “Women”)
Total citations: 1512
Abstract archives of the International AIDS Society conferences (October 27, 2019)
“HIV” AND “HSV”
Total citations: 63
“HSV”
Total citations: 496
“Herpes”
Total citations: 567

346
Box S2. List of extracted variables. Report characteristics
Author(s)
Year of publication
Full citation
Publication type
Data source
General study characteristics
Study population and its characteristics
Year(s) of data collection
Region
Country of origin
Country of survey
City
Study site
Study design
Sampling methodology
Eligibility criteria
HIV prevalence
Number tested for HIV antibody
Number positive for HIV antibody
Reported HIV antibody prevalence
Diagnostic test used for HIV infection ascertainment
Herpes simplex virus type 2 (HSV-2) prevalence
Number tested for HSV-2 antibody
Number positive for HSV-2 antibody
Reported HSV-2 antibody prevalence
Diagnostic test used for HSV-2 infection ascertainment
Population characteristics
Proportion who inject drugs
Proportion on antiretroviral therapy
Proportion reporting consistent condom use

347
Box S3. Countries covered under the different World Health Organization regions80. World Health Organization region Countries
African Region (AFRO) Algeria, Angola, Benin, Botswana, Burkina Faso, Burundi, Cameroon, Cabo
Verde, Central African Republic, Chad, Comoros, Congo, Côte d'Ivoire,
Democratic Republic of the Congo, Equatorial Guinea, Eritrea, Ethiopia, Gabon,
Gambia, Ghana, Guinea, Guinea-Bissau, Kenya, Lesotho, Liberia, Madagascar,
Malawi, Mali, Mauritania, Mauritius, Mozambique, Namibia, Niger, Nigeria,
Rwanda, Sao Tome and Principe, Senegal, Seychelles, Sierra Leone, South Africa,
South Sudan, Swaziland, Togo, Uganda, United Republic of Tanzania, Zambia,
Zimbabwe.
Region of the Americas (AMRO) Antigua and Barbuda, Argentina, Bahamas, Barbados, Belize, Bolivia
(Plurinational State of), Brazil, Canada, Chile, Colombia, Costa Rica, Cuba,
Dominica, Dominican Republic, Ecuador, El Salvador, Grenada, Guatemala,
Guyana, Haiti, Honduras, Jamaica, Mexico, Nicaragua, Panama, Paraguay, Peru,
Saint Kitts and Nevis, Saint Lucia, Saint Vincent and the Grenadines, Suriname,
Trinidad and Tobago, United States of America, Uruguay, Venezuela (Bolivarian
Republic of).
Eastern Mediterranean Region (EMRO) Afghanistan, Bahrain, Djibouti, Egypt, Iran (Islamic Republic of), Iraq, Jordan,
Kuwait, Lebanon, Libya, Morocco, Oman, Pakistan, Qatar, Saudi Arabia, Somalia,
Sudan, Syrian Arab Republic, Tunisia, United Arab Emirates, Yemen.
European Region (EURO) Albania, Andorra, Armenia, Austria, Azerbaijan, Belarus, Belgium, Bosnia and
Herzegovina, Bulgaria, Croatia, Cyprus, Czech Republic, Denmark, Estonia,
Finland, France, Georgia, Germany, Greece, Hungary, Iceland, Ireland, Israel,
Italy, Kazakhstan, Kyrgyzstan, Latvia, Lithuania, Luxembourg, Malta, Monaco,
Montenegro, Netherlands, Norway, Poland, Portugal, Republic of Moldova,
Romania, Russian Federation, San Marino, Serbia, Slovakia, Slovenia, Spain,
Sweden, Switzerland, Tajikistan, The former Yugoslav Republic of Macedonia,
Turkey, Turkmenistan, Ukraine, United Kingdom, Uzbekistan.
South-East Asia Region (SEARO) Bangladesh, Bhutan, Democratic People's Republic of Korea, India, Indonesia,
Maldives, Myanmar, Nepal, Sri Lanka, Thailand, Timor-Leste.
Western Pacific Region (WPRO) Australia, Brunei Darussalam, Cambodia, China, Cook Islands, Fiji, Japan,
Kiribati, Lao People's Democratic Republic, Malaysia, Marshall Islands,
Micronesia (Federated States of), Mongolia, Nauru, New Zealand, Niue, Palau,
Papua New Guinea, Philippines, Republic of Korea, Samoa, Singapore, Solomon
Islands, Tonga, Tuvalu, Vanuatu, Viet Nam.

348
References
1. Low, A. J. et al. Genital warts and infection with human immunodeficiency virus in high-
risk women in Burkina Faso: a longitudinal study. BMC Infect. Dis. 11, 20-29;
10.1186/1471-2334-11-20 (2011).
2. Nagot, N. et al. Prevalence, incidence and risk factors of HSV2 infection among a high-
risk popilation in West Africa. Poster 999 in International AIDS Conference (2003).
3. Nagot, N. et al. Association between bacterial vaginosis and Herpes simplex virus type-2
infection: Implications for HIV acquisition studies. Sex. Transm. Infect. 83, 365-368;
10.1136/sti.2007.024794 (2007).
4. Nzila, N. et al. HIV and other sexually transmitted diseases among female prostitutes in
Kinshasa. Aids 5, 715-721 (1991).
5. Vandepitte, J. M. et al. HIV and other sexually transmitted infections among female sex
workers in Kinshasa, Democratic Republic of Congo, in 2002. Sex Transm Dis 34, 203-
208; 10.1097/01.olq.0000233743.57334.6a (2007).
6. Ghebrekidan, H., Ruden, U., Cox, S., Wahren, B. & Grandien, M. Prevalence of herpes
simplex virus types 1 and 2, cytomegalovirus, and varicella-zoster virus infections in
Eritrea. J. Clin. Virol. 12, 53-64 (1999).
7. Holt, B. Y. et al. Planning STI/HIV prevention among refugees and mobile populations:
situation assessment of Sudanese refugees. Disasters 27, 1-15 (2003).
8. Aho, J., Koushik, A., Coutlee, F., Diakite, S. L. & Rashed, S. Prevalence of HIV, human
papillomavirus type 16 and herpes simplex virus type 2 among female sex workers in
Guinea and associated factors. Int. J. STD AIDS 25, 280-288;
10.1177/0956462413500242 (2014).
9. Diakite, S. et al. HIV transmission in a cohort of sex workers in Conakry, Guinea: HSV-2
baseline prevalence, characteristics of and its associations with HIV, other STIs and
behavioural variables. CDC0197 in International AIDS Conference (2006).
10. Vandenhoudt, H. M. et al. Prevalence of HIV and Other Sexually Transmitted Infections
among Female Sex Workers in Kisumu, Western Kenya, 1997 and 2008. PLoS ONE 8;
10.1371/journal.pone.0054953 (2013).
11. Lafort Y., Sambola F., Joaquim F. & Temmerman M. Low prevalence rates of STI among
high-risk groups benefiting from improved reproductive health services in Tete province,
Mozambique. Poster THPE0308 in International AIDS Conference (2008).
12. Dada, A. J. et al. A serosurvey of Haemophilus ducreyi, syphilis, and herpes simplex
virus type 2 and their association with human immunodeficiency virus among female sex
workers in Lagos, Nigeria. Sex. Transm. Dis. 25, 237-242 (1998).
13. Eltom, M. A., Mbulaiteye, S. M., Dada, A. J., Whitby, D. & Biggar, R. J. Transmission
of human herpesvirus 8 by sexual activity among adults in Lagos, Nigeria. Aids 16, 2473-
2478 (2002).
14. Braunstein, S. L. et al. High burden of prevalent and recently acquired HIV among
female sex workers and female HIV voluntary testing center clients in Kigali, Rwanda.
PLoS ONE 6; 10.1371/journal.pone.0024321 (2011).
15. Kane, C. T. et al. Concentrated and linked epidemics of both HSV-2 and HIV-1/HIV-2
infections in Senegal: public health impacts of the spread of HIV. Int. J. STD AIDS 20,
793-796; 10.1258/ijsa.2008.008414 (2009).

349
16. Malope, B. I. et al. No evidence of sexual transmission of Kaposi's sarcoma herpes virus
in a heterosexual South African population. Aids 22, 519-526;
10.1097/QAD.0b013e3282f46582 (2008).
17. Ramjee, G. et al. The impact of incident and prevalent herpes simplex virus-2 infection
on the incidence of HIV-1 infection among commercial sex workers in South Africa. J.
Acquir. Immune Defic. Syndr. 39, 333-339 (2005).
18. Riedner, G. et al. Possible reasons for an increase in the proportion of genital ulcers due
to herpes simplex virus from a cohort of female bar workers in Tanzania. Sex. Transm.
Infect. 83, 91-96; 10.1136/sti.2006.021287 (2007).
19. Vu, L. & Misra, K. High Burden of HIV, Syphilis and HSV-2 and Factors Associated
with HIV Infection Among Female Sex Workers in Tanzania: Implications for Early
Treatment of HIV and Pre-exposure Prophylaxis (PrEP). AIDS Behav. 22, 1113-1121;
10.1007/s10461-017-1992-2 (2018).
20. Vandepitte, J. et al. HIV and other sexually transmitted infections in a cohort of women
involved in high-risk sexual behavior in Kampala, Uganda. Sex. Transm. Dis. 38, 316-
323 (2011).
21. Cowan, F. M. et al. The appropriateness of core group interventions using presumptive
periodic treatment among rural Zimbabwean women who exchange sex for gifts or
money. J. Acquir. Immune Defic. Syndr. 38, 202-207 (2005).
22. Alvarez Rodriguez, B., Manzanero, M. & Morales Miranda, S. Results of the first HIV
prevalence and risk behaviour study among female sex workers, Belize, 2012. Sex.
Transm. Infect. 89; 10.1136/sextrans-2013-051184.0566 (2013).
23. Koenig, E. et al. Characterization of a cohort of female sex workers in the Dominican
Republic at risk for HIV and other STIs: implications for inclusion in future HIV-1
vaccine efficacy trials. Poster TUPDC04 in 4th IAS Conference on HIV Pathogenesis,
Treatment and Prevention. (2007).
24. Creswell, J., Guardado Escobar, M. E., Armero, J. & Paz-Bailey, G. HIV, STD and risk
behaviors among female sex worker in El Salvador. Poster CDC0622 in International
AIDS Conference (2010).
25. Soto, R. J. et al. Sentinel surveillance of sexually transmitted infections/HIV and risk
behaviors in vulnerable populations in 5 Central American countries. J. Acquir. Immune
Defic. Syndr. 46, 101-111 (2007).
26. Morales-Miranda, S. et al. HIV, STD and risk behaviors among men who have sex with
men, female sex workers, and indigenous Garífuna population in Honduras. WEAX0305
in International AIDS Conference (2008).
27. Uribe-Salas, F., Hernandez-Avila, M., Juarez-Figueroa, L., Conde-Glez, C. J. & Uribe-
Zuniga, P. Risk factors for herpes simplex virus type 2 infection among female
commercial sex workers in Mexico City. Int. J. STD AIDS 10, 105-111 (1999).
28. Uribe-Salas, F., Conde-Glez, C. J., Juarez-Figueroa, L. & Hernandez-Castellanos, A.
Sociodemographic dynamics and sexually transmitted infections in female sex workers at
the Mexican-Guatemalan border. Sex. Transm. Dis. 30, 266-271 (2003).
29. Delgado, S. et al. Central american surveillance survey of sexual behaviour and
prevalence of HIV/STIS in vulnerable populations: Female sex workers, Nicaragua,
2009. Sex. Transm. Infect. 1; 10.1136/sextrans-2011-050109.46 (2011).
350
30. Hakre, S. et al. Prevalence of HIV and other sexually transmitted infections and factors
associated with syphilis among female sex workers in Panama. Sex. Transm. Infect. 89,
156-164; 10.1136/sextrans-2012-050557 (2013).
31. Caceres, C. F. et al. High risk for STIs among vulnerable populations in the Peruvian
coast: the NIMH HIV/STI collaborative prevention trial. Poster TUPE0293 in
International AIDS Conference (2006).
32. Carcamo, C. P. et al. Prevalences of sexually transmitted infections in young adults and
female sex workers in Peru: a national population-based survey. Lancet Infect. Dis. 12,
765-773 (2012).
33. Golenbock, D. T. et al. Absence of infection with human immunodeficiency virus in
Peruvian prostitutes. AIDS Research and Human Retroviruses 4, 493-499 (1988).
34. Gotuzzo, E. et al. Human T cell lymphotropic virus type I infection among female sex
workers in Peru. J. Infect. Dis. 169, 754-759 (1994).
35. Perla, M. E. et al. Genital tract infections, bacterial vaginosis, HIV, and reproductive
health issues among Lima-based clandestine female sex workers. Infect. Dis. Obstet.
Gynecol. 2012, 739624; 10.1155/2012/739624 (2012).
36. Sanchez, J. et al. Sexually transmitted infections in female sex workers: reduced by
condom use but not by a limited periodic examination program. Sex. Transm. Dis. 25, 82-
89; 10.1097/00007435-199802000-00005 (1998).
37. Cohan, D. L. et al. Health indicators among low income women who report a history of
sex work: the population based Northern California Young Women's Survey. Sex.
Transm. Infect. 81, 428-433; 10.1136/sti.2004.013482 (2005).
38. Jones, D. L. et al. The high-risk sexual practices of crack-smoking sex workers recruited
from the streets of three American cities. Sex. Transm. Dis. 25, 187-193 (1998).
39. Lutnick A., C. D. Working conditions, HIV, STIs and hepatitis C among female sex
workers in San Francisco, CA. Poster WEPE0773 in International ADIS Conference
(2008).
40. Papadogeorgaki, H. et al. Prevalence of sexually transmitted infections in female sex
workers in Athens, Greece - 2005. Eur. J. Dermatol. 16, 662-665 (2006).
41. Linhart, Y. et al. Sexually transmitted infections among brothel-based sex workers in
Tel-Aviv area, Israel: high prevalence of pharyngeal gonorrhoea. Int. J. STD AIDS 19,
656-659; 10.1258/ijsa.2008.008127 (2008).
42. Khromova, Y. Y. et al. High rates of sexually transmitted diseases (STDs), HIV and risky
behaviors among female detainees in Moscow, Russia. Poster ThPeC7600 in
International AIDS Conference (2002).
43. Bystricka, M. et al. Sexually transmitted infections among prostitutes in Bratislava,
Slovakia. Acta Virol. 47, 167-172 (2003).
44. Gul, U. et al. Magnitude of sexually transmitted infections among female sex workers in
Turkey. J. Eur. Acad. Dermatol. Venereol. 22, 1123-1124 (2008).
45. Hawkes, S. et al. HIV and other sexually transmitted infections among men, transgenders
and women selling sex in two cities in Pakistan: a cross-sectional prevalence survey. Sex.
Transm. Infect. 85, ii8-16 (2009).
46. Znazen, A. et al. Sexually transmitted infections among female sex workers in Tunisia:
high prevalence of Chlamydia trachomatis. Sex. Transm. Infect. 86, 500-505 (2010).
47. Qutub, M. & Akhter, J. Epidemiology of genital herpes (HSV-2) among brothel based
female sex workers in Bangladesh. Eur. J. Epidemiol. 18, 903-905 (2003).

351
48. Pisani, E. et al. Basing policy on evidence: Low HIV, STIs, and risk behaviour in Dili,
East Timor argue for more focused interventions. Sex. Transm. Infect. 82, 88-93;
10.1136/sti.2005.015602 (2006).
49. Mishra, S. et al. Sex work, syphilis, and seeking treatment: an opportunity for
intervention in HIV prevention programming in Karnataka, South India. Sex. Transm.
Dis. 36, 157-164; 10.1097/OLQ.0b013e31818d64e6 (2009).
50. National Summary Report - India. Integrated Behavioural and Biological Assessment,
Round 2 (2009-2010). (2011).
51. Sarna, A. et al. Sexually transmitted infections and reproductive health morbidity in a
cohort of female sex workers screened for a microbicide feasibility study in Nellore,
India. Glob. J. Health. Sci. 5, 139-149; 10.5539/gjhs.v5n3p139 (2013).
52. Shahmanesh, M. et al. The burden and determinants of HIV and sexually transmitted
infections in a population-based sample of female sex workers in Goa, India. Sex.
Transm. Infect. 85, 50-59; 10.1136/sti.2008.030767 (2009).
53. Uma, S. et al. Bacterial vaginosis in female sex workers in Chennai, India. Sex. Health 2,
261-262; 10.1071/SH05025 (2005).
54. Davies, S. C. et al. Prevalence and risk factors for herpes simplex virus type 2 antibodies
among low- and high-risk populations in Indonesia. Sex. Transm. Dis. 34, 132-138
(2007).
55. Limpakarnjanarat, K. et al. HIV-1 and other sexually transmitted infections in a cohort of
female sex workers in Chiang Rai, Thailand. Sex. Transm. Infect. 75, 30-35 (1999).
56. Vu Thuong, N. et al. Impact of a community sexually transmitted infection/HIV
intervention project on female sex workers in five border provinces of Vietnam. Sex.
Transm. Infect. 83, 376-382 (2007).
57. Saphonn, V. et al. HSV-2 infection among female sex workers in Sihanoukville,
Cambodia: high prevalence and strong association with HIV infection. Poster
TUPE0294 in International AIDS Conference (2006).
58. Chen, Y. M., Yu, P. S., Lin, C. C. & Jen, I. Surveys of HIV-1, HTLV-I, and other
sexually transmitted diseases in female sex workers in Taipei City, Taiwan, from 1993 to
1996. J. Acquir. Immune Defic. Syndr. Hum. Retrovirol. 18, 299-303 (1998).
59. Chen, X. S. et al. Sexually transmitted infections among female sex workers in Yunnan,
China. AIDS Patient Care STDS 19, 853-860; 10.1089/apc.2005.19.853 (2005).
60. Chen, S. et al. Seropositivity and risk factors for herpes simplex virus type 2 infection
among female sex workers in Guangxi, China. PLoS ONE 8
10.1371/journal.pone.0069697 (2013).
61. Fu, X. et al. Prevalence of HIV and sexually transmitted diseases as well as related
associated risk factors among middle/low level female sex workers in a city in
Guangdong province. [Chinese]. Zhonghua Liu Xing Bing Xue Za Zhi 35, 510-513
(2014).
62. Han, L. et al. Differences in risk behaviours and HIV/STI prevalence between low-fee
and medium-fee female sex workers in three provinces in China. Sex. Transm. Infect. 92,
309-315 (2016).
63. Jing, Z. et al. Consecutive cross-sectional survey of prevalence of HIV infection/STD
and related factors in Vietnamese female sex workers at a China-Vietnam border area,
2014-2015. [Chinese]. Chinese Journal of Endemiology 38, 638-642 (2017).
352
64. Li, Z. et al. Study on the prevalence and associated risk factors related to HIV, syphilis,
herpes simplex virus-2 among female sex workers in Jiaozhou, Shandong province.
[Chinese]. Zhonghua Liu Xing Bing Xue Za Zhi 35, 1099-1104 (2014).
65. Luo, L. et al. Vaginal douching and association with sexually transmitted infections
among female sex workers in a prefecture of Yunnan Province, China. Int. J. STD AIDS
27, 560-567 (2015).
66. Ngo, T. D. et al. Herpes simplex virus type 2 infection among commercial sex workers in
Kunming, Yunnan Province, China. Int. J. STD AIDS 19, 694-697 (2008).
67. Remis, R. S. et al. Prevalence of HIV infection and STI among female entertainment
workers (FEWs) in Shanghai, China. Poster TUPE0361 in International AIDS
Conference (2010).
68. Wang N., Y. Z., Gao H., Duan Q., Zhao R., Lu L., Pu Y., Ni W., Wu Z.,. HIV infection
and other sexually transmitted infections among female sex workers in a mining township
in Yunnan, China. Poster TUPE0297 in International AIDS Conference (2006).
69. Wang, J. J. et al. Estimation of population-size changes and HIV prevalence among
female sex workers from 2006 to 2009 in Kaiyuan, Yunnan, China. Biomed. Environ. Sci.
25, 489-494 (2012).
70. Wang, J., Ding, G., Zhu, Z., Zhou, C. & Wang, N. Analysis of HIV correlated factors in
Chinese and Vietnamese female sex workers in Hekou, Yunnan Province, a Chinese
Border Region. PLoS ONE 10; 10.1371/journal.pone.0129430 (2015).
71. Wei, S. B. et al. A study of commercial sex and HIV/STI-related risk factors among
hospitality girls in entertainment establishments in Wuhan, China. Sex. Health 1, 141-144
(2004).
72. Xu, J. J. et al. HIV and STIs in clients and female sex workers in mining regions of Gejiu
City, China. Sex. Transm. Dis. 35, 558-565 (2008).
73. Xu, J. J. et al. Dynamics of the HIV epidemic in southern China: sexual and drug-using
behaviours among female sex workers and male clients in Yunnan. Int. J. STD AIDS 23,
670-675 (2012).
74. Xu, J. et al. Drug use and sex work: Competing risk factors for newly acquired HIV in
Yunnan, China. PLoS ONE 8; 10.1371/journal.pone.0059050 (2013).
75. Yang, Y. et al. Herpes simplex virus type 2 infection among female sex workers in
Shanghai, China. AIDS Care 23, 37-44 (2011).
76. Yao, Y. et al. Associations between drug use and risk behaviours for HIV and sexually
transmitted infections among female sex workers in Yunnan, China. Int. J. STD AIDS 23,
698-703 (2012).
77. Zhang, T. et al. Kaposi`s sarcoma associated herpesvirus infection among female sex
workers and general population women in Shanghai, China: a cross-sectional study. BMC
Infect. Dis. 14; 10.1186/1471-2334-14-58 (2014).
78. Tableau. Tableau v. 10.1. Available at:
https://www.tableau.com/support/releases/desktop/10.1. (2016).
79. R Core Team. R: A language and environment for statistical computing. v.3.4.2. (R
Foundation for Statistical Computing, 2017).
80. World Health Organization. WHO regional offices. Available at:
http://www.who.int/about/regions/en/. (2020).
353
Appendix VIII
Supplementary material for Research paper 4-
HIV incidence and impact of interventions among FSWs and
clients in MENA
354
Supplementary Material
HIV incidence and impact of interventions among female sex
workers and their clients in the Middle East and North Africa:
Mathematical modeling analysis
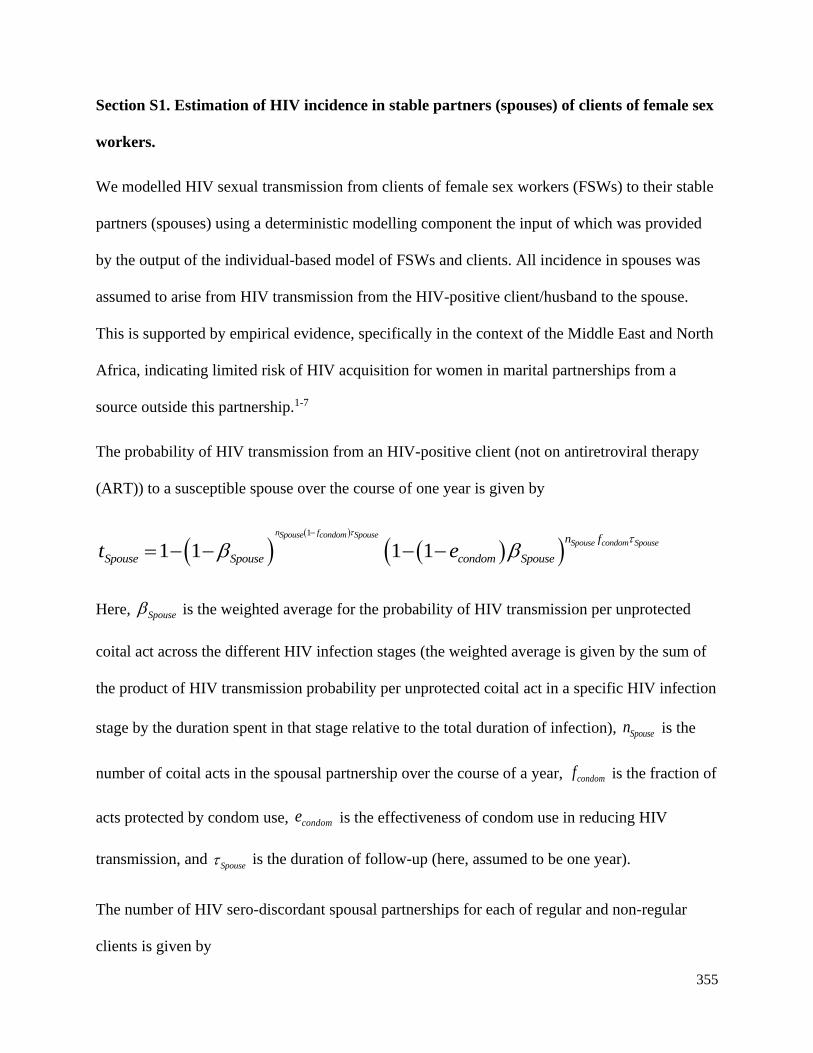
355
Section S1. Estimation of HIV incidence in stable partners (spouses) of clients of female sex
workers.
We modelled HIV sexual transmission from clients of female sex workers (FSWs) to their stable
partners (spouses) using a deterministic modelling component the input of which was provided
by the output of the individual-based model of FSWs and clients. All incidence in spouses was
assumed to arise from HIV transmission from the HIV-positive client/husband to the spouse.
This is supported by empirical evidence, specifically in the context of the Middle East and North
Africa, indicating limited risk of HIV acquisition for women in marital partnerships from a
source outside this partnership.1-7
The probability of HIV transmission from an HIV-positive client (not on antiretroviral therapy
(ART)) to a susceptible spouse over the course of one year is given by
( )( )
( )( )1
1 1 1 1n fSpouse condom Spouse
Spouse condom Spousen f
Spouse Spouse condom Spouset e
−
= − − − −
Here, Spouse is the weighted average for the probability of HIV transmission per unprotected
coital act across the different HIV infection stages (the weighted average is given by the sum of
the product of HIV transmission probability per unprotected coital act in a specific HIV infection
stage by the duration spent in that stage relative to the total duration of infection), Spousen is the
number of coital acts in the spousal partnership over the course of a year, condomf is the fraction of
acts protected by condom use, condome is the effectiveness of condom use in reducing HIV
transmission, and Spouse is the duration of follow-up (here, assumed to be one year).
The number of HIV sero-discordant spousal partnerships for each of regular and non-regular
clients is given by
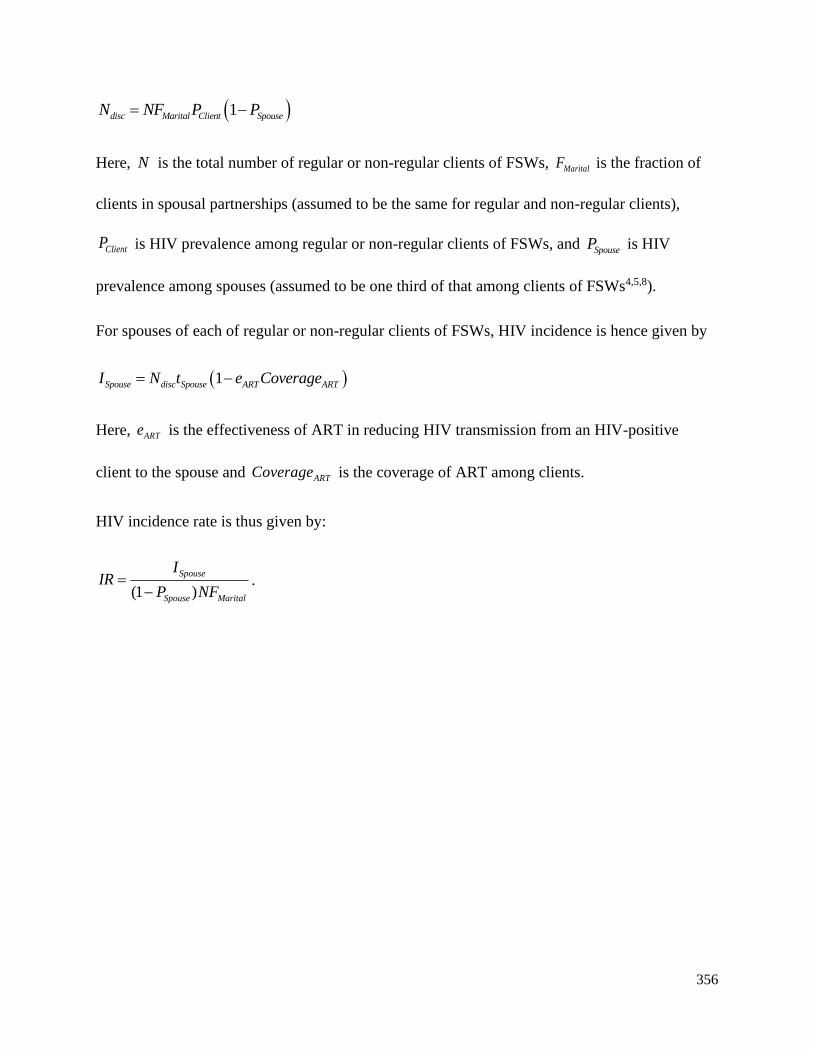
356
( )1disc Marital Client SpouseN NF P P= −
Here, N is the total number of regular or non-regular clients of FSWs, MaritalF is the fraction of
clients in spousal partnerships (assumed to be the same for regular and non-regular clients),
ClientP is HIV prevalence among regular or non-regular clients of FSWs, and SpouseP is HIV
prevalence among spouses (assumed to be one third of that among clients of FSWs4,5,8).
For spouses of each of regular or non-regular clients of FSWs, HIV incidence is hence given by
( )1Spouse disc Spouse ART ARTI N t e Coverage= −
Here, ARTe is the effectiveness of ART in reducing HIV transmission from an HIV-positive
client to the spouse and ARTCoverage is the coverage of ART among clients.
HIV incidence rate is thus given by:
(1 )
Spouse
Spouse Marital
IIR
P NF=
−.

357
References
1. Abu-Raddad L, Akala FA, Semini I, Riedner G, Wilson D, Tawil O. Characterizing the
HIV/AIDS epidemic in the Middle East and North Africa : Time for strategic action. Washington
DC: The World Bank Press; 2010.
2. Abu-Raddad LJ, Hilmi N, Mumtaz G, et al. Epidemiology of HIV infection in the Middle
east and North Africa. Aids 2010; 24(SUPPL. 2): S5-S23.
3. Al-Thani A, Abdul-Rahim H, Alabsi E, et al. Prevalence of Chlamydia trachomatis
infection in the general population of women in Qatar. Sexually transmitted infections 2013; 89
Suppl 3(Suppl 3): iii57-60.
4. Mumtaz GR, Kouyoumjian SP, Hilmi N, et al. The distribution of new HIV infections by
mode of exposure in Morocco. Sexually transmitted infections 2013; 89 Suppl 3: iii49-56.
5. Kouyoumjian SP, El Rhilani H, Latifi A, et al. Mapping of new HIV infections in
Morocco and impact of select interventions. International journal of infectious diseases : IJID :
official publication of the International Society for Infectious Diseases 2018; 68: 4-12.
6. Alrajhi AA, Halim MA, Al-Abdely HM. Mode of transmission of HIV-1 in Saudi Arabia.
Aids 2004; 18(10): 1478-80.
7. Ramezani A, Mohraz M, Gachkar L. Epidemiologic situation of human
immunodeficiency virus (HIV/AIDS patients) in a private clinic in Tehran, Iran. Archives of
Iranian medicine 2006; 9(4): 315-8.
8. Mumtaz GR, Awad SF, Feizzadeh A, Weiss HA, Abu-Raddad LJ. HIV incidence among
people who inject drugs in the Middle East and North Africa: mathematical modelling analysis.
Journal of the International AIDS Society 2018; 21(3): e25102.
Related Documents