Welcome message from author
This document is posted to help you gain knowledge. Please leave a comment to let me know what you think about it! Share it to your friends and learn new things together.
Transcript

ED I T O R I A L
The changing of the guard
This will be my last Editorial as I step down as Editor inChief after 16 years. It has been an honour and a privi-lege to lead the teams that have brought the journal tothe members of the Dietitians Association of Australia(DAA), to our New Zealand colleagues and indeed acrossthe globe. It is no coincidence the September issuefocused on the Millennial Dietitian,1 marking our moveto embrace and celebrate generational change, a keycomponent of a successful and sustainable profession.Please join me in welcoming Judi Porter PhD FDAA asthe new Editor in Chief. Like me, Judi had previouslyserved as Associate Editor, and later took on the special-ist editor role managing Systematic Literature Reviewsand then Editor. We have enjoyed working together thelast couple of years enabling this smooth transition.
There is much to ponder over scientific publications,particularly in recent years. The Editorial in the Februaryissue2 provided an historical account of Nutrition andDietetics, which was originally entitled Food and Nutri-tion Notes and Reviews through the Australian Instituteof Anatomy.3 It marked the celebration of the journal's75 year history and noted the significance of researchinforming policy and practice. Today, research publishedin Nutrition and Dietetics is undertaken across a broadplatform. The related policies and practices take manyshapes and forms, but the core value remains as a com-mitment to publications that address the nutritionalhealth of individuals and populations.
Research is an international enterprise, and protectinghealth is a universal challenge. Standards for conductingand reporting on health research are set at the globallevel. These standards have special significance whereresearch is taken up in decisions on policy and practice.Peer review underpins publication, and in many areasnow, groups of peers have developed standards to assistcolleagues in this process. Our guidelines to authors4 dem-onstrate our commitment to quality reporting in healthresearch. We reference international biomedical reportingstandards as outlined by the EQUATOR network.5 Thejournal is a member of the Committee on PublicationEthics (COPE)6 and is listed on Medline. Given their sig-nificance in contributing to evidence review, some studydesigns require special attention. Reports on RandomisedControlled Trails that provide direct evidence of effectsrequire trial pre-registration and scientific reporting
according to the CONSORT statement.7 Likewise epidemi-ological studies reporting associations need to meetSTROBE requirements, which have also undergonereview for nutrition evidence specifically.8 As with RCTs,reports providing systematic review of evidence and meta-analysis also require prospective registration and interna-tional standards of reporting.9 The move by Nutrition andDietetics to have specialist editors to cover these areasreflects our commitment to high quality publication in thenutrition sciences. Sharing expertise in these areas alsohelps build capacity within the profession (and here I rec-ognise the long standing contribution from our statisticseditor, Marijka Batterham PhD MMed Stat Adv APD.)10
These standards set the tone for the journal but do notdetract from other research that is more translational innature, and closer to practice. Smaller contextual studiesthat report local observations, evaluations of models ofcare or aspects of health services, in depth analyses ofsocial and environmental conditions, dietary methodologystudies and research into professional education are allhighly relevant. These studies add to the understanding ofhow to address nutrition related health problems. Stan-dards for publishing still apply, including considerationsof the sampling, methods of data collection, methods andrigour in analytical techniques, and overall reporting.
That said, research is fundamentally a creative and verythoughtful exercise. Like a good story, written publicationsaddress a line of intrigue. In addition to scientific rigour, itneeds the attention of the reader. The topic should presenta novel concept or be a significant addition to somethingalready known. This presents a challenge to the profession,to think deeply on the issues that matter and master themethodologies that enable a valid line of argument to bemade. Moving forward in the discipline involves looking inthe mirror. It means defending an identity that is wellrespected in broader scientific circles and is reflected inquality research. Our journal, Nutrition and Dietetics pro-vides an important conduit. It has a proud history, full ofthe commitment of a great many authors, reviewers, edi-tors, publishers and administrators. It behoves the profes-sion, and in particular its senior members, to identify withthis quality professional resource, actively engaging tomaintain its heritage and ensure an effective future.
Nutrition and Dietetics remains a quiet achiever in anexpansive field, where the business side of scientific
Received: 5 November 2019 Accepted: 5 November 2019
DOI: 10.1111/1747-0080.12599
Nutrition & Dietetics. 2019;76:499–500. wileyonlinelibrary.com/journal/ndi © 2019 Dietitians Association of Australia 499
publishing has become all the more apparent. Metrics suchas Impact Factors and Citations,11 combined with expecta-tions of fast tracked publication and open access have cre-ated a significantly challenging environment. Issues arisesuch as the volunteer nature of peer review, the linkbetween practice and research, and the relevance and pur-pose of the journal content. This has to do with how knowl-edge is generated and by whom, and how it is utilised indeveloping health policies and practices. The journal pro-vides a tool for the profession to move on and have an influ-ence. A perfect challenge for the next generation!
I would like to recognise and thank all those whohave gone before me and all those who have travelledwith me on the journal team so far. In particular I wouldlike to thank the Australian, New Zealand and interna-tional members of the Editorial Board, key staff at Wileypublishers and the various members of the DAA manage-ment teams for all their efforts over the years. Finally, aspecial best wish goes to Judi Porter for taking on theleadership role now.
FUNDINGNo funding was received for the writing of this editorial.
CONFLICT OF INTERESTAt the time of publication the author was the Editor inChief of the journal, Nutrition and Dietetics.
AUTHORSHIPThe author is solely responsible for the content of thispaper.
Linda C Tapsell PhD FDAA FNSA AM, Editor in Chief,Nutrition and Dietetics, Senior Professor
School of Medicine and Illawarra Health and MedicalResearch institute, University of Wollongong,
Australia
REFERENCES1. Collins J. Generational change in nutrition and dietetics: The
millennial dietitian. Nutr Diet. 2019;76:369-372.2. Tapsell L. Inter-professional, interdisciplinary and inter-
sectoral dietetic practice. Nutr Diet. 2019;76:3-5.3. National Library of Australia. Food and Nutrition Notes and
Reviews. (Available from: https://trove.nla.gov.au/work/5680977,accessed November 5, 2019)
4. Nutrition and Dietetics. Journal of the Dietitians Association ofAustralia. Author Guidelines. (Available at https://onlinelibrary.wiley.com/page/journal/17470080/homepage/ForAuthors.html,accessed 5 November, 2019)
5. Equator Network. Enhancing the quality and transparency ofhealth research (Available at http://www.equator-network.org,accessed % November, 2019)
6. Committee on Publication Ethics (COPE) (Available fromhttps://publicationethics.org/, accessed November 5, 2019)
7. CONSORT: Transparent reporting of trials. (Available at http://www.consort-statement.org/, accessed 5 November, 2019)
8. Lachat C et al Strengthening the Reporting of ObservationalStudies in Epidemiology—Nutritional Epidemiology (STROBE-nut): An Extension of the STROBE Statement PloS one, 2016;13(6):e1002036.
9. PROSPERO. International prospective register of systematicreviews. National Institute for Health Research. (Available fromhttps://www.crd.york.ac.uk/PROSPERO/, accessed 5 November,2019)
10. Batterham M, Neale E, Martin A, Tapsell L. Data mining:Potential applications in research on nutrition and health. NutrDiet. 2017;74:3-10.
11. Lo KKH, Wong AHC, Tam WWS. Ho SC Citation classics inthe nutrition and dietetics literature: 50 frequently cited arti-cles. Nutr Diet. 2016;73:356-368.
500 EDITORIAL
Editor in ChiefLinda Tapsell, PhD, MHPEd, DipNutrDiet, BSc, AdvAPD, FDAA, AM University of Wollongong, Australia
EditorJudi Porter, PhD, MHSc, MCFSM, GCHPE, GDipNutDiet, BAppSc, FDAA Eastern Health/Monash University, Australia
Statistics EditorMarijka Batterham, PhD, MMedStat, MSc, BSc, GStat, AdvAPD, AN University of Wollongong, Australia
Systematic Literature Review EditorElizabeth Neale, PhD, BND (Hons), APD University of Wollongong, Australia
Clinical Trials EditorSharleen O’Reilly, PhD, GCHPE, BSc(Hons), APD University College Dublin, Ireland
Qualitative Research EditorDianne Reidlinger, PhD, RD, APDBond University, Australia
Editorial Board MembersAndrea Braakhuis, PhD, RD The University of Auckland, New ZealandKatrina Campbell, PhD, AdvAPD Bond University, AustraliaWei Chen, PhD, Zhejiang University, ChinaClare Corish, PhD, FINDI, RDUniversity College Dublin, IrelandKacie Dickinson, PhD, BNutrDiet (Hons), APDFlinders University, AustraliaJane Elmslie, PhD, GDipSci, DipHSc, NZRD Christchurch School of Medicine, New ZealandSuzie Ferrie, PhD, CNSC, AdvAPDRoyal Prince Alfred Hospital, AustraliaVicki Flood, PhD, MPH, APD University of Sydney, AustraliaJanelle Gifford, PhD, MSc, BSc, BBus, Adv APD, Adv Sports DietitianCore Nutrition, AustraliaRebecca Golley, PhD, BND, BSc(Hons), APD, AN University of South Australia, AustraliaKathryn Hart, PhD, BSc(Hons), DipADP, RD University of Surrey, United KingdomIngrid Hickman, PhD, BHSc, AdvAPD, AN Princess Alexandria Hospital, AustraliaVasant Hirani, PhD, DDiet, MSc, BSc(Hons), APD University of Sydney, AustraliaTilakavati Karupaiah, PhD, APD, AN Taylor’s University, Malaysia
Nicole Kiss, PhD, MNutDiet, BSc, AdvAPD Deakin University, AustraliaJimmy Louie, PhD, MNutrDiet, BSc(Hons), APD, AN University of Hong Kong, Hong KongEvangeline Mantzioris, PhD, BND, BSc, Grad Cert High Educ, APD, AN, SDA University of South Australia, AustraliaAndrew McAinch, PhD, MNutrDiet, BApplSc, BSc(Hons), APD, ANVictoria University, AustraliaClaire Palermo, PhD, MPH, MNutDiet, BSc, AdvAPDMonash University, AustraliaKirrilly Pursey, PhD, APD University of Newcastle, AustraliaAnna Rangan, PhD, GDipNutrDiet, BSc, APD University of Sydney, AustraliaLynda Ross, PhD, BND (Hons Class 1), AdvAPDGriffi th University, AustraliaJane Scott, PhD, MPH, Grad Dip Diet, BSc, AdvAPD, FDAA Curtin University, Perth, AustraliaNerissa Soh, PhD, BMedSc, MNutrDiet, APD, AN University of Sydney, AustraliaSze-Yen Tan, PhD, MSc, APD, AN Deakin University, AustraliaHelen Truby, PhD, M.Hum Nutr, AdvAPD Monash University, AustraliaRobin M. Tucker, PhD, RDMichigan State University, United States of AmericaCarol Wham, PhD, MSc, BHSc, DipEd, NZRD Massey University, New ZealandSerene Yoong, PhD, BNutrDiet(Hons), APD, AN Hunter New England Local Health District, AustraliaJo Zhou, PhD, MNutDiet, BSc, DipMed, APD Women’s and Children’s Hospital Adelaide, Australia
Journal Strategic Planning CommitteeKatrina Campbell (DAA Director Responsible)Marijka BatterhamJudy BauerElizabeth NealeSharleen O’ReillyJudi PorterDianne ReidlingerLinda Tapsell (Chairperson)
Cover image courtesy of iStock (metamorworks)
Address for Editorial Correspondence:Editor, Nutrition & Dietetics1/8 Phipps CloseDeakin ACT 2600AustraliaEmail: [email protected]
NDI.JEB.Nov19
Disclaimer: The Publisher, the Dietitians Association of Australia and Editors cannot be held responsible for errors or any consequences arising from the use of information contained in this journal; the views and opinions expressed do not necessarily refl ect those of the Publisher, the Dietitians Association of Australia and Editors, neither does the publication of advertisements constitute any endorsement by the Publisher, the Dietitians Association of Australia and Editors of the products advertised.
For submission instructions, subscription and all other information visit http://wileyonlinelibrary.com/journal/ndi
COPYRIGHT AND COPYING (IN ANY FORMAT)
Copyright © 2019 Dietitians Association of Australia. All rights reserved. No part of this publication may be reproduced, stored or transmitted in any form
or by any means without the prior permission in writing from the copyright holder. Authorization to copy items for internal and personal use is granted by the copyright holder for libraries and other users registered with their local Reproduction Rights Organisation (RRO), e.g. Copyright Clearance Center (CCC), 222 Rosewood Drive, Danvers, MA 01923, USA (www.copyright.com), provided the appropriate fee is paid directly to the RRO. This consent does not extend to other kinds of copying such as copying for general distribution, for advertising or promotional purposes, for republication, for creating new collective works or for resale. Permissions for such reuse can be obtained using the RightsLink “Request Permissions” link on Wiley Online Library. Special requests should be addressed to: [email protected]
Volume 76 Number 5 November 2019 ISSN 1446-6368
EditorialThe changing of the guard 499
Linda C Tapsell
Invited EditorialDietary intake in health and disease, challenges in measuring and reporting diet-disease relationships 501
Rebecca Haslam, Rachael M. Taylor, Megan Whatnall and Clare E. Collins
Health Services ResearchHealth-e mums: Evaluating a smartphone app design for diabetes prevention in women with previous gestational diabetes 507
Sharleen L. O’Reilly and Rachel Laws
Development of text messages targeting healthy eating for children in the context of parenting partnerships 515Li K. Chai, Chris May, Clare E. Collins and Tracy L. Burrows
Dietary MethodologyEstimating plate-based model food proportions in adults living in Scotland using short dietary assessment questionnaires 521
Jenna L. Hollis, Stephen Whybrow, Leone C.A. Craig, Heather Clark, Leanne Garden and Geraldine McNeill
Development and relative validity of a self-administered semi-quantitative drinks frequency questionnaire, validated in a population of university students 532
Georgios Marakis, Lamprini Kontopoulou, Gorgias Garofalakis, Eleni Vasara, Georgios Vasiliadis and Maria G. Grammatikopoulou
Waist to height ratio is the anthropometric index that most appropriately mirrors the lifestyle and psychological risk factors of obesity 539Željka Tomas, Tatjana Škaric-Juric, Matea Zajc Petranovic, Marta Jalšovec, Petra Rajic Šikanjic and Nina Smolej Narancic
Prevalence and characteristics of energy intake under-reporting among Australian adults in 1995 and 2011 to 2012 546King W. Tam and Jacob L. Veerman
Dietary underreporting in women affected by polycystic ovary syndrome: A pilot study 560Rachele De Giuseppe, Valentina Braschi, David Bosoni, Ginevra Biino, Fatima C. Stanford, Rossella E. Nappi and Hellas Cena
Development of a diabetes-related nutrition knowledge questionnaire for individuals with type 2 diabetes mellitus in Singapore 567Chad Y. Han, Xiaomei Zheng, Lin F. Lee, Cherie G.B. Chan, Yi Q. Lee, Nani A. Zailani, Karin Ng and Kalpana Bhaskaran
Validation and impact of paediatric malnutrition screening tool in hospitalised children on awareness of medical staff and health-related outcomes 574
Luba Marderfeld, Gal Rub, Gavriel Hodik, Irit Poraz, Corina Hartman, Shai Ashkenazi and Raanan Shamir
Nutritional and Clinical EpidemiologyAssociation of the Elderly Dietary Index with cardiovascular disease risk factors in elderly men: A cross-sectional study 580
Manije Darooghegi Mofrad, Nazli Namazi, Bagher Larijani, Pamela J. Surkan and Leila Azadbakht
Association of a plant-based dietary pattern in relation to gestational diabetes mellitus 589Behzad Zamani, Alireza Milajerdi, Hatav Tehrani, Nick Bellissimo, Neil R. Brett and Leila Azadbakht
The relationship between pre-pregnancy dietary patterns adherence and risk of gestational diabetes mellitus in Iran: A case–control study 597
Maryam Asadi, Maedeh Shahzeidi, Azadeh Nadjarzadeh, Hadiseh Hashemi Yusefabad and Anahita Mansoori
Factors associated with sarcopenia and undernutrition in older adults 604Ana Rita Sousa-Santos, Cláudia Afonso, Nuno Borges, Alejandro Santos, Patrícia Padrão, Pedro Moreira and Teresa F. Amaral
Anthropometric measures associated with sarcopenia in outpatients with liver cirrhosis 613Lívia A.A. Santos, Talles B. Lima, Marjorie do Val Ietsugu, Hélio R. de Carvalho Nunes, Xingshun Qi and Fernando G. Romeiro
Defining and quantifying preventable and non-preventable hospital-acquired malnutrition—A cohort study 620Joyce Cheng, Kiah Witney-Cochrane, Michelle Cunich, Suzie Ferrie and Sharon Carey
Educational ResearchObservations on the relationship between the dietetic objective structured clinical examination and placement outcome 628
Tracey Parkin and Avril Collinson
Changes in nutrition and dietetic research: A content analysis of the past decade of Dietitians Association of Australia conference abstracts 634Judi Porter, Claire Bristow, Karen Charlton, Linda Tapsell and Tammie Choi
Letters to the EditorValidation testing of a short food-group-based questionnaire to assess dietary risk in preschoolers aged 3–5 years 642
Lucinda K. Bell, Rebecca K. Golley, Chelsea E. Mauch, Suja M. Mathew and Anthea M. Magarey
Is body mass index the real issue here? Analysis of delegate questions from the ‘weighty’ discussion 646Natalie B. Lister and Stephanie R. Partridge
There is an urgent need for a consistent definition of the metabolically healthy but obese phenotype 650Emily Calton
I N V I T E D ED I T O R I A L
Dietary intake in health and disease, challenges inmeasuring and reporting diet-disease relationships
1 | INTRODUCTION
Understanding dietary patterns of population groups andhow these are impacted by limitations related to accu-rately estimating food and beverage intake is central tointerpreting relationships between nutrition, health, mor-bidity and mortality, and moving the field forward.1 Thisissue of Nutrition & Dietetics brings together a collectionof papers that examine the validity of self-reported die-tary intake, impact of dietary patterns on health out-comes, development of dietary interventions, impact ofeHealth technologies on healthcare, and assessment ofnutritional status.
This issue of the journal includes descriptions of char-acteristics of mis-reporters of total energy intake from theprevious two national nutrition surveys,2 as well as in thecontext of a clinical population of women with polycysticovary syndrome (PCOS).3 These papers highlight thatenergy intake under-reporting is substantial, with popula-tion level prevalence of under-reporting of total energyintake of 32% in 1995 (n = 1196) and 41% in 2012(n = 5332) using 24-hour recalls to assess intake and twovariants of the Goldberg cut-off.4,5 Under-reporters wereidentified using both a constant cut-off and a variablecut-off based on grouped physical activity levels (PAL).Both surveys were administered face-to-face by inter-viewers and although 1995 was “pen and paper”, youwould not expect this increase to be attributed to theinterviewer's use of a computer to administer the recall in2011-12. Of note was that the increase in under-reportingwas largely in men, rising from 24% to 41%, in contrast towomen where it remained constant at around 40%.2
By comparison in a small sample of women withPCOS (n = 36) and control women (n = 37) energyunder-reporting was identified for 47.2% of women withPCOS vs 2.7% among controls.3 Women kept a 3-day fooddiary and individual level PAL factors were applied toidentify mis-reporters using the Goldberg cut-offmethod.5 Of interest is the relatively low prevalence ofunder-reporting in the control women.3 Given the
differences in both demographic characteristics and die-tary patterns reported between these groups, furtherresearch is clearly needed to better understand factorsthat influence under-reporting, how to better estimateforgotten food items and which contextual factors influ-ence items that are more likely to not be recalled andhow this differs by sex. The study by De Giusepper et al.3
in this issue also highlights the importance of using die-tary intake assessment methods validated in the popula-tion in which they are intended for use.
2 | VALIDATION STUDIES
Accurate measurement of dietary intake is crucial tomonitor dietary intake trends over time, and understand-ing relationships between dietary intake and chronic dis-ease development.6 However, accurately measuring andinterpreting dietary intake is challenging, and at a popu-lation level, some methods such as 24-hour recalls andweighed food records are time and resource intensive.7
Dietary questionnaires, including food frequency ques-tionnaires (FFQs) and brief tools can be less resourceintensive to implement on a large scale but come withtheir own limitations. These include being less compre-hensive, potentially only appropriate for use in the con-text for which they were originally validated and the needto apply calibration equations or sensitivity analyses.8 Inthis issue, two articles report on validation studies ofshort dietary questionnaires. Bell et al.9 presented thePreschooler Dietary Questionnaire (PDQ) (11-items) foruse in 3-5 year old children (n = 74).9 Compared with avalidated FFQ, the PDQ demonstrated moderate relativevalidity, as dietary risk scores were highly correlated fornutrient-dense or ‘core’ foods and bread and beveragesand total risk scores (all r ≥ 0.80), but not for energy-dense nutrient-poor or “non-core” foods (r = 0.67).
The authors concluded that the PDQ is a usefulscreening tool for identifying dietary risk among pre-schoolers. In another paper, Marakis et al.7 demonstrated
DOI: 10.1111/1747-0080.12595
Nutrition & Dietetics. 2019;76:501–506. wileyonlinelibrary.com/journal/ndi © 2019 Dietitians Association of Australia 501
moderate/fair validity of a drinks frequency question-naire (41-items) compared with 7-day weighed foodrecords in a Greek young adult population (n = 59).7 Theauthors concluded that the questionnaire is a valid andpractical monitoring and surveillance tool for measuringhabitual drink intake in adults. Han et al.,10 in an addi-tional study in this issue, described the three stage devel-opment and validation of a diabetes-related nutritionknowledge questionnaire among a sample of Singaporeanadults with type 2 diabetes. Internal consistency, con-struct validity and test-retest reliability ranged from fairto good after editing, rephrasing and removing items.The authors determined that the questionnaire is a validand reliable measure of nutrition knowledge in the popu-lation group. While these tools offer a valuable alterna-tive to more comprehensive dietary assessment methods,the population that the tool was developed for should betaken into account before deciding to use them in othercontexts.
3 | DIET PATTERNS AND HEALTHOUTCOMES
Globally, dietary patterns have shifted towards a “Western-style” eating pattern, characterised by a low consumptionof nutrient-dense or “core” foods (eg, vegetables, fruit) andexcessive consumption of energy-dense nutrient-poorfoods, termed discretionary or non-core foods.11,12
Over time, there has been a concurrent increase in chronicdisease prevalence, linked to these changes in dietary pat-terns. In this issue of the journal a number of papers exam-ine the health implications of various dietary patterns.
In a Lancet series, Imamura et al.13 systematicallyreviewed studies which explored the characteristics ofdietary patterns across 187 countries. The authors identi-fied trends including differences in diet quality by agegroup and sex and also between high- and low-incomecountries.13 Older adults, females and high-income coun-tries were reported to have higher diet quality scores,characterised by higher intakes of ‘core’ food groups andlower intakes of non-core foods.13 Other articles in thisissue examined the link between dietary patterns andchronic disease.
Evidence indicates that Western-style dietary patternsare associated with the development of chronic dis-eases.14,15 Given that Western-style diets are typically lowin plant-based foods, the study reported in this issue byZamani et al.16 investigated the link between a plant-based diet and gestational diabetes mellitus (GDM) inIranian women, finding a 53% reduced risk of developingGDM among those consuming a diet high in plant-basedfoods. In contrast, Asadi et al.17 study examined the
association between pre-pregnancy dietary patterns andthe risk of GDM in Iranian women. This study found thata prudent dietary pattern characterised by a high con-sumption of fruits, low-fat dairy, potato, egg, fish, poul-try, nuts, organ meat and red meat, was associated with areduced risk of GDM, but no significant relationship wasfound between Western-style dietary patterns and GDMrisk. Also from Iran, Darooghegi Mofrad et al.18 devel-oped the Elderly Dietary Index (EDI), a modified versionof the Mediterranean Dietary Score, to explore the linkbetween diet and cardiovascular disease (CVD) risk fac-tors in Iranian Men. Higher EDI scores were associatedwith a 51% lower risk of overweight and obesity and an81% lower risk of having high low-density lipoprotein(LDL-C).18 These papers in the journal highlight that eat-ing habits are distinct to particular populations and thecomposition of food items or food groups consumed willvary between populations. This means that the local con-text of the dietary patterns needs to be considered beforecomparison can be made. As noted in other sections ofour editorial, the interpretation of findings within thecontext of the original study is key to ensuring high qual-ity, evidence-based nutrition advice is delivered.
4 | DEVELOPING INTERVENTIONCOMPONENTS
Sub-optimal dietary intakes relative to national recommen-dations is the current population norm, hence the risingglobal prevalence of chronic diseases and associated riskfactors should be expected.13,19 Effective interventions toimprove dietary intake are critically needed. To advance thefield in terms of developing and replicating effective inter-ventions, researchers are encouraged to publish full detailsof intervention development and content.20 In this issue,Chai et al.21 detailed the three-stage development of a bankof text messages targeted to parents of primary school-agedchildren, designed to support improvement in child eatingbehaviours.21 After evaluation by health experts andparents based on clarity, usefulness and relevance, a bankof 48 text messages were retained for use as a component ofa future family-based nutrition intervention.22 Lombardet al.23 previously reported in this journal the protocol forthe Communicating Health (CH) study, which focused onusing social media for health communication in youngadults. CH was a four phase, iterative study aimed at under-standing young adults use of social media for obtainingdietary health information, co-creating healthy eating mes-sages and communication strategies, evaluating the mes-sages, and developing tools and resources for use bystakeholders and researchers in this field. The developmentof effective, translatable, evidence-based interventions is
502 INVITED EDITORIAL
crucial to achieving improvement in population dietaryintake. Papers such as these are important as they providepractical guides and examples for other researchers andpractitioners to utilise.
5 | eHEALTH
Global healthcare challenges include the aging popula-tion, escalating costs of healthcare, shortage of medicalprofessionals and patient demands for greater access tohealth information.24,25 Electronic health (eHealth) tech-nologies including web-based programs, mobile phoneapplications and video conferencing, are increasinglybeing adopted to address these challenges.26,27 For exam-ple, during the post-partum period, women find it difficultto seek health advice in-person due to a lack of time andaccess to childcare.28 In this issue, O'Reilly et al.29 con-ducted a series of focus groups to evaluate a pilot diabetesprevention smartphone app for women with a history ofGDM. Women found the app more accessible and usefulcompared to traditional printed health information andthe app made it easier for the women to initiate changesin lifestyle health behaviours, and to regularly screen fortype 2 diabetes.29 In another study, McCampley et al.30
reported the benefits of electronic medical records forimproving the delivery of dietetics services in anAustralian hospital. Electronic medical records increasedaccessibility and legibility of documentation as well astime efficiency. These findings provide a strong rationalefor the inclusion of eHealth technologies in clinical set-tings.30 The collection of papers on this topic in this issueof the journal highlight the benefits of eHealth technolo-gies as well as the capacity to provide tailored, accessibleinformation to specific population groups, while improv-ing the quality of care provided to patients. eHealth inter-ventions are not without limitations and risks can includesubstantial costs associated with the set-up and mainte-nance. Further, current evidence regarding the benefits ofeHealth technologies is inconsistent,31 highlighting theneed for more robust, well-designed eHealth interventionstailored to specific populations which will better informthe strategic direction of future eHealth policies.
The adoption of innovations such as eHealth technolo-gies, is determined by pre-existing stages of readiness at anindividual or organisational level according to Roger's “Dif-fusion of Innovation Theory”.32 In her paper, Maunderet al.33 indicated that Australian dietitians are not ready forthe changes associated with eHealth technologies-based onthe perceptions of Nutrition Informatics Experts (n = 10).The most common barriers identified for dietitian eHealthreadiness were a lack of knowledge, awareness, confidenceand informatics expertise.33 Eight key strategies were
identified for improving readiness for eHealth technologiesincluding collaboration and representation, education, offer-ing incentives, mentoring, develop a national strategy, pro-vide active leadership, appoint nutrition informaticschampions and provide a supportive environment.33 Maun-der et al.33 highlighted that forming collaborations across theprofession will be essential for successfully implementingeHealth strategies to optimise nutrition management.
6 | MALNUTRITION
The final papers in this issue focus on anthropometricindices, sarcopenia and malnutrition in the context of theaging population and the rising prevalence of overweight,obesity34,35 and the global burden of disease.34,36 Effectivedetection of chronic disease risk factors is vital for pri-mary and secondary prevention. The challenge for dietet-ics is to implement quick and cost-effective methods forscreening diet-related chronic disease risk.
Anthropometry measures are commonly used duringnutrition assessment to identify overweight or obesity. Inboth clinical and epidemiological settings, body mass index(BMI) may be calculated. However, common criticismsinclude an inability to distinguish between lean body massand fat mass and the difference across ethnic groups andby age, highlighting the need for more sensitive methods.37
In this issue, Tomas et al.38 reported a cross-sectionalcomparison of obesity indices, including BMI, waist-to-hipratio (WHR), waist-to-height ratio (WHtR), sum of skinfoldthicknesses (biceps, triceps, subscapular, suprailiac andabdominal) and body fat mass percentage (FAT) estimatedusing bioelectrical impedance, to evaluate the most sensi-tive instrument for detecting the influences of various riskfactors on obesity. They report WHtR as a more sensitiveindicator of obesity than BMI and more strongly related tobody composition and risk factors related to overweight/obesity, such as diet, lifestyle and psychological factors.38
Reducing disability secondary to chronic disease byprolonging mobility and self-care is key to lowering costs oflong-term care to families and society and requires earlydetection of chronic disease risk factors.35 Sarcopenia, a skel-etal muscle disorder commonly associated with aging, isassociated with adverse outcomes including falls, functionaldecline, frailty, mortality and prolonged hospital admission.39
This issue includes two studies investigating the roleof nutrition assessment in screening for sarcopenia in atrisk populations. Sousa-Santos et al.40 focus on the agingpopulation and the need to streamline methods of screen-ing for sarcopenia in older adults. They examined the co-existence of sarcopenia and undernutrition to try anddelineate the most efficient and cost-effective screeningtools to detect sarcopenia using nutritional status. Santos
INVITED EDITORIAL 503
et al.41 focus on screening for sarcopenia in patients diag-nosed with chronic liver disease. Their goal was to find acost-effective way of evaluating the risk of sarcopenia inless advanced liver disease patients to avoid or conservethe use of costly diagnostic methods (eg, computedtomography (CT), dual-energy x-ray absorptiometry(DXA)). While the assessment of nutritional status andanthropometry may provide a cost-effective measure ofhealth status and sarcopenia, both studies identified vari-able results in terms of the optimal sites for anthropome-try measurement. Further research is required beforenutritional status or anthropometry can be used as soleindependent measures of sarcopenia.
Malnutrition among hospitalised adult and paediatricpatients remains underdiagnosed and undertreated.42
Prevalence of the debilitating condition in an acute caresetting has been documented between 20% and 50%,depending on the patient population and diagnosiscriteria and is associated with adverse health outcomesincluding, increased length of stay and healthcare costs.42
This issue includes two studies by Cheng et al.43 andMarderfeld et al.,44 which explore timely and accuratemalnutrition screening in acute care settings.
Cheng et al.43 conducted a retrospective audit of elec-tronic medical records to define and quantify hospital-acquired malnutrition, including prevalence and causesof preventable vs non-preventable malnutrition. Whilethe majority of hospital-acquired malnutrition casesincluded a preventable component, the authors proposean alternative costing model to the recent IndependentHospital Pricing Authority (IHPA) cost model. They rec-ommend that hospitals only be penalised for preventablehospital-acquired malnutrition to allow hospitals to focuson addressing preventable causes of hospital-acquiredmalnutrition to improve patient health and addresspotential cost-savings to hospitals.
Marderfeld et al.44 evaluated the use of the previouslydeveloped Screening Tool for the Assessment of Malnutri-tion in Paediatrics (STAMP) among an inpatient paediatricpopulation sample. The study assessed the impact of thetool on staff awareness of nutritional status of admitted chil-dren and health outcomes on discharge. Key findings indi-cated that screening tools such as STAMP are valid formalnutrition screening. However, use of the tool does notincrease staff awareness of the nutrition status of patients,nor improve health outcomes at discharge. The authorsconcluded that further action is needed to raise awarenessamong medical staff about the nutritional status of patients.
This issue of Nutrition & Dietetics provides a range ofstudies that highlight the importance of nutritional statusand dietary intake assessment across a range of popula-tion groups and settings however, there is still muchwork to be done to move this field of research forward.
AUTHORSHIP DECLARATION
The content in this manuscript is the original work ofall authors involved. The manuscript is not under consid-eration nor published elsewhere in the same or in a simi-lar form. All authors have read and approved themanuscript.
FUNDINGThis manuscript did not receive any specific grant fromfunding agencies in the public, commercial, or not-for-profit sectors.
Clare E Collins is supported by a National Health andMedical Research Council of Australia Senior ResearchFellowship, and a Gladys M Brawn Senior Research Fel-lowship from the Faculty of Health and Medicine, theUniversity of Newcastle, Australia.
CONFLICT OF INTERESTThere are no conflicts of interest to declare.
Rebecca Haslam PhD, BND (Hons), APD1,2
Rachael M. Taylor PhD, BND, APD1,2
Megan Whatnall PhD, BND (Hons), APD1,2
Clare E. Collins PhD, BSci, Dip Nutr&Diet, Dip Clin Epi,FDAA, Director of Research, School of Health Sciences1,2
1Priority Research Centre for Physical Activity andNutrition, University of Newcastle, Newcastle, New South
Wales 2308, Australia2School of Health Sciences, Faculty of Health and
Medicine, University of Newcastle, Newcastle, New SouthWales 2308, Australia
CorrespondenceClare E. Collins, Nutrition and Dietetics, Priority
Research Centre for Physical Activity and Nutrition, TheUniversity of Newcastle, Level 3 ATC Building,
University Drive, Callaghan, New South Wales 2308,Australia. Tel.: +61 2 49215646 Fax: +61 2 49217053.
Email: [email protected]
REFERENCES1. Subar AF, Freedman LS, Tooze JA, et al. Addressing Current
Criticism Regarding the Value of Self-Report Dietary Data.J Nutr. 2015;145(12):2639-2645.
2. Tam KW, Veerman JL. Prevalence and characteristics of energyintake under-reporting among Australian adults in 1995 and2011 to 2012. Nutr Diet. 2019;76(5):546-559. https://doi.org/10.1111/1747-0080.12565.
3. De Giuseppe R, Braschi V, Bosoni D, et al. Dietary underre-porting in women affected by polycystic ovary syndrome: Apilot study. Nutr Diet. 2019;76(5):560-566. https://doi.org/10.1111/1747-0080.12460.
504 INVITED EDITORIAL
4. Livingstone MB, Black AE. Markers of the validity of reportedenergy intake. J Nutr. 2003;133 Suppl 3:895s-920s.
5. Goldberg GR, Black AE, Jebb SA, et al. Critical evaluation ofenergy intake data using fundamental principles of energyphysiology: 1. Derivation of cut-off limits to identify under-recording. Eur J Clin Nutr. 1991;45(12):569-581.
6. World Health Organization (WHO). Diet, nutrition and theprevention of chronic diseases: report of a joint WHO/FAOexpert consultation. 2002.
7. Marakis G, Kontopoulou L, Garofalakis G, Vasara E,Vasiliadis G, Grammatikopoulou MG. Development and relativevalidity of a self-administered semi-quantitative drinks frequencyquestionnaire, validated in a population of university students.Nutr Diet. 2019;76(5):532-538. https://doi.org/10.1111/1747-0080.12494.
8. Subar AF, Kushi LH, Lerman JL, Freedman LS. Invited Com-mentary: The Contribution to the Field of Nutritional Epidemi-ology of the Landmark 1985 Publication by Willett et al.Am J Epidemiol. 2017;185(11):1124-1129.
9. Bell LK, Golley RK, Mauch CE, Mathew SM, Magarey AM.Validation testing of a short food-group-based questionnaire toassess dietary risk in preschoolers aged 3–5 years. Nutr Diet.2019;76(5):642-645. https://doi.org/10.1111/1747-0080.12412.
10. Han CY, Zheng X, Lee LF, et al. Development of a diabetes-related nutrition knowledge questionnaire for individuals withtype 2 diabetes mellitus in Singapore. Nutr Diet. 2019;76(5):567-573. https://doi.org/10.1111/1747-0080.12513.
11. Ronto R, Wu JHY, Singh GM. The global nutrition transition:trends, disease burdens and policy interventions. Public HealthNutr. 2018;21(12):2267-2270.
12. Popkin BM. Global changes in diet and activity patterns asdrivers of the nutrition transition. Nestle Nutr Workshop SerPediatr Program. 2009;63:1–10; discussion 10–14, 259–268.
13. Imamura F, Micha R, Khatibzadeh S, et al. Dietary qualityamong men and women in 187 countries in 1990 and 2010: asystematic assessment. Lancet Glob Health. 2015;3(3):e132-e142.
14. Vingeliene S, Chan DSM, Vieira AR, et al. An update of theWCRF/AICR systematic literature review and meta-analysis ondietary and anthropometric factors and esophageal cancer risk.Ann Oncol. 2017;28(10):2409-2419.
15. Fung TT, Willett WC, Stampfer MJ, Manson JE, Hu FB. Die-tary Patterns and the Risk of Coronary Heart Disease inWomen. JAMA Intern Med. 2001;161(15):1857-1862.
16. Zamani B, Milajerdi A, Tehrani H, Bellissimo N, Brett NR,Azadbakht L. Association of a plant-based dietary pattern inrelation to gestational diabetes mellitus. Nutr Diet. 2019;76(5):589-596. https://doi.org/10.1111/1747-0080.12512.
17. Asadi M, Shahzeidi M, Nadjarzadeh A, Hashemi Yusefabad H,Mansoori A. The relationship between pre-pregnancy dietarypatterns adherence and risk of gestational diabetes mellitus inIran: A case–control study. Nutr Diet. 2019;76(5):597-603.https://doi.org/10.1111/1747-0080.12514.
18. Darooghegi Mofrad M, Namazi N, Larijani B, Surkan PJ,Azadbakht L. Association of the Elderly Dietary Index withcardiovascular disease risk factors in elderly men: A cross-sectional study. Nutr Diet. 2019;76(5):580-588. https://doi.org/10.1111/1747-0080.12574
19. World Health Organization (WHO). Global status report: onnoncommunicable diseases In. Geneva, Switzerland WHO 2014
20. Hoddinott P. A new era for intervention development studies.Pilot Feasibility Stud. 2015;1(1):36.
21. Chai LK, May C, Collins CE, Burrows TL. Development of textmessages targeting healthy eating for children in the context ofparenting partnerships. Nutr Diet. 2019;76(5):515-520. https://doi.org/10.1111/1747-0080.12498.
22. Chai LK, Collins CE, May C, Ashman A, Holder C, Brown LJ,Burrows TL Feasibility and efficacy of a web-based familytelehealth nutrition intervention to improve child weight statusand dietary intake: A pilot randomised controlled trial. J TelemedTelecare 2019. https://doi.org/10.1177/1357633X19865855.
23. Lombard C, Brennan L, Reid M, et al. Communicating health-Optimising young adults' engagement with health messagesusing social media: Study protocol. Nutr Diet. 2018;75(5):509-519.
24. Armstrong BK, Gillespie JA, Leeder SR, Rubin GL, Russell LM.Challenges in health and health care for Australia. Med J Aust.2007;187(9):485-489.
25. Nambiar R, Bhardwaj R, Sethi A, Vargheese R. A look at chal-lenges and opportunities of Big Data analytics in healthcare.Paper presented at: 2013 IEEE International Conference on BigData; 6–9 Oct. 2013, 2013.
26. Eysenbach G. What is e-health? J Med Internet Res. 2001;3(2):e20.27. Eysenbach G. Consumer health informatics. BMJ. 2000;320
(7251):1713-1716.28. Nicklas JM, Zera CA, Seely EW, Abdul-Rahim ZS, Rudloff ND,
Levkoff SE. Identifying postpartum intervention approaches toprevent type 2 diabetes in women with a history of gestationaldiabetes. BMC Pregnancy Childb. 2011;11(1):23.
29. O'Reilly SL, Laws R. Health-e mums: Evaluating a smartphoneapp design for diabetes prevention in women with previousgestational diabetes. Nutr Diet. 2019;76(5):507-514. https://doi.org/10.1111/1747-0080.12461.
30. McCamley J, Vivanti A, Edirippulige S. Dietetics in the digitalage: The impact of an electronic medical record on a tertiaryhospital dietetic department. Nutr Diet. 2019;76(4):480-485.
31. Black AD, Car J, Pagliari C, et al. The impact of eHealth on thequality and safety of health care: a systematic overview. PLoSMed. 2011;8(1):e1000387.
32. Rogers EM. Diffusion of Innovations. 4th ed. New York; US:The Free Press/Simon & Schuster; 1995.
33. Maunder K, Walton K, Williams P, Ferguson M, Beck E. Strate-gic leadership will be essential for dietitian eHealth readiness:A qualitative study exploring dietitian perspectives of eHealthreadiness. Nutr Diet. 2019;76(4):373-381.
34. Nyberg ST, Batty GD, Pentti J, et al. Obesity and loss of disease-free years owing to major non-communicable diseases: a multi-cohort study. Lancet Pub Health. 2018;3(10):e490-e497.
35. World Health Organization (WHO). World report on ageingand health 2015. World Health Organization (WHO). Geneva,Switzerland: World Health Organization; 2015.
36. Chang AY, Skirbekk VF, Tyrovolas S, Kassebaum NJ,Dieleman JL. Measuring population ageing: an analysis of theGlobal Burden of Disease Study 2017. Lancet Public Health.2019;4(3):e159-e167.
37. Adab P, Pallan M, Whincup PH. Is BMI the best measure ofobesity? BMJ. 2018;360:k1274.
38. Tomas Z, Skaric-Juric T, Zajc Petranovic M, Jalsovec M, RajicSikanjic P, Smolej Narancic N. Waist to height ratio is theanthropometric index that most appropriately mirrors the
INVITED EDITORIAL 505
lifestyle and psychological risk factors of obesity. Nutr Diet.2019;76(5):539-545. https://doi.org/10.1111/1747-0080.12520.
39. Cruz-Jentoft AJ, Sayer AA. Sarcopenia. Lancet. 2019;393(10191):2636-2646.
40. Sousa-Santos AR, Afonso C, Borges N, et al. Factors associated withsarcopenia and undernutrition in older adults. Nutr Diet. 2019;76(5):604-612. https://doi.org/10.1111/1747-0080.12542.
41. Santos LAA, Lima TB, MdV I, HRdC N, Qi X, Romeiro FG.Anthropometric measures associated with sarcopenia in outpa-tients with liver cirrhosis. Nutr Diet. 2019;76(5):613-619.https://doi.org/10.1111/1747-0080.12523.
42. Barker LA, Gout BS, Crowe TC. Hospital malnutrition:prevalence, identification and impact on patients and thehealthcare system. Int J Environ Res Public Health. 2011;8(2):514-527.
43. Cheng J, Witney-Cochrane K, Cunich M, Ferrie S, Carey S.Defining and quantifying preventable and non-preventable
hospital-acquired malnutrition-A cohort study. Nutr Diet. 2019;76(5):620-627. https://doi.org/10.1111/1747-0080.12553.
44. Marderfeld L, Rub G, Hodik G, et al. Validation and impact ofpaediatric malnutrition screening tool in hospitalised childrenon awareness of medical staff and health-related outcomes.Nutr Diet. 2019;76(5):574-579. https://doi.org/10.1111/1747-0080.12529.
How to cite this article: Haslam R, Taylor RM,Whatnall M, Collins CE. Dietary intake in healthand disease, challenges in measuring and reportingdiet-disease relationships. Nutrition & Dietetics.2019;76:501–506. https://doi.org/10.1111/1747-0080.12595
506 INVITED EDITORIAL
ORIGINAL RESEARCH
Health-e mums: Evaluating a smartphone app designfor diabetes prevention in women with previousgestational diabetes
Sharleen L. O’REILLY and Rachel LAWSInstitute of Physical Activity and Nutrition, Deakin University, Burwood, Victoria, Australia
AbstractAim: Women with prior gestational diabetes have increased risk for developing type 2 diabetes postpartum. Whilediabetes prevention programs are effective in reducing a woman’s risk, the reach of traditional face-to-face programsis poor in this population and using a mHealth approach appears to be promising. We aimed to evaluate a pilotsmartphone app developed from an evidence-based diabetes prevention program specifically for women with previ-ous gestational diabetes mellitus using a series of focus groups to explore the app functionality and messaging.Methods: The Health-e Mums app underwent an iterative, three-phase development: initial development, wireframedevelopment and pilot testing. Twenty-six women participated in four focus groups during the pilot-testing phase.The focus group transcripts were analysed thematically to evaluate the app functionality and user-experience.Results: Focus group participants identified diabetes screening confusion and a need for personalisation as sub-themes within the app functionality theme. The user-experience exploration found generally positive findings butparticipants had mixed responses to the utility of video segments and applying milestones relating to diabetes pre-vention guidelines.Conclusions: A user-centred approach was taken to develop a diabetes prevention program app for women withprior gestational diabetes. Women were predominantly satisfied with the overall app design, how it functioned andwhat the user experience would be like when fully developed.
Key words: diabetes prevention, e-health, lifestyle modification, maternal health, mobile application, postnatal.
Introduction
Gestational diabetes mellitus (GDM) is becoming anincreasingly common complication of pregnancy and is esti-mated to affect 13% of pregnancies in Australia.1 GDM isthe single strongest population predictor of developing type2 diabetes (T2DM) in women2 and while rates of GDM willvary within racial and ethnic minority populations, the five-year cumulative incidence rate can be over 50%.3,4 In addi-tion, women with previous GDM are at increased risk ofcardiovascular disease, metabolic syndrome and furtherGDM pregnancies.5 Even the women’s offspring bear theburden of GDM, they are at increased risk of obesity, insu-lin resistance, higher blood pressure, renal disease, cardio-vascular disease and T2DM.6–8 Women who have hadGDM in one pregnancy have 30–50% risk of developing
GDM in subsequent pregnancies9,10 and they are atincreased risk of birth-related complications.5 MoreoverGDM increases risk for a woman’s offspring, who are atgreater risk of developing obesity and diabetes.11,12 All ofwhich means the impact of GDM extends much furtherthan the pregnancy and expands the cycle of diabeteswithin families over time.
Importantly, we know a woman’s risk of developingT2DM can be reduced by 58% through lifestyle modifica-tion.13 The issue remains how to deliver the lifestyle modi-fication in the real world because we know that womenwith GDM are not being followed up for diabetes screeningin general practice14,15 and are not receiving consistent dia-betes prevention support to modify their lifestyles forimproved health outcomes.16 Both the USA and Australiahave issued calls to action specifically asking primary careproviders to better meet the needs of this group ofwomen—particularly women under 40.17,18 Online tech-nology was cited as a future avenue for low-cost preventionprograms.19 However, engaging in healthy lifestyle behav-iours is challenging with the most commonly cited barriersfor this population being a lack of time, energy or both.20
Women’s other barriers include: a scarcity of childcare sup-port; emotional distress; financial barriers; low knowledge
S.L. O’Reilly, PhD, AdvAPD, RD, Senior LecturerR. Laws, PhD, Senior LecturerCorrespondence: S. O’Reilly, School of Agriculture and Food Science,University College Dublin, Belfield, Dublin 4, Ireland. Tel:+35317167138.Email: [email protected]
Accepted July 2018
© 2018 Dietitians Association of Australia 507
AA AA
DDD
ieti
tian
s As
soci
atio
nofof
Aus
tral
ia
Nutrition & Dietetics 2019; 76: 507–514 DOI: 10.1111/1747-0080.12461
levels; a lack of motivation and social support; competingfamily and work demands; fatigue; isolation; and the beliefthat they are too young to be concerned about chronic dis-ease.20 It is clearly important that opportunities to supportwomen to prioritise their own health must address thesebarriers.
Mothers increasingly rely on electronic resources to accesshealth related instant information 24 hours a day.21,22 A sur-vey of 116 perinatal women identified online resources astheir primary source of lifestyle information23 and stated theywanted credible, evidence-based and ‘parent-focused’ infor-mation relevant to their individual issues using self-assessment tools and progress trackers in a smartphone appthey could use anywhere, any time.23 While we know life-style modification programs do work in women who havehad GDM, it is clear that engaging and sustaining their inter-est in lifestyle modification is hugely challenging. Telephonecoaching,24,25 web-based,26 short message service (SMS) andprint materials have all been effective in small studies ofwomen. Recently published studies25,27,28 have not soughtto deliver personalised communication that ties recall to gen-eral practice with lifestyle behaviour change.27 To be effectivein reducing a woman with GDM’s risk of developing T2DM,we must address the translational barriers (lack of a coherentsystem for follow-up care and early childhood presentingnumerous challenges for mothers) and develop an effectiveevidence-based program that delivers the right care at theright time in a way that is acceptable to mothers. Developinga smartphone app appears to be a highly suitable method forbridging that gap.
The Health-e Mums app was designed to be the conduitto supporting a woman’s engagement in best practice diabe-tes prevention (lifestyle modification and engaging in diabe-tes screening). While evidence exists to support theindividual components of the app,25,27,29 exactly howwomen with previous GDM actually perceive the app aswell as the core messages the app would deliver remainunknown. Therefore, our objective was to evaluate a pilotsmartphone app developed from an evidence-based diabe-tes prevention program specifically for women with previ-ous GDM using a series of focus groups to explore the appfunctionality and messaging.
Methods
The Health-e Mums app used an evidence-based interven-tion based on the Finnish diabetes prevention study30 thatsubsequently informed the Mothers After Gestational Diabe-tes in Australia (MAGDA) study, which was a diabetes pre-vention program designed for the first year postnatalperiod.27 The MAGDA materials were then redevelopedinto a health coaching format so that they could be deliv-ered using the telephone and they were found to increaseengagement.25 The Health-e Mums app was developed usingan iterative three-phase process: initial development, wire-frame development and pilot testing. The initial develop-ment phase involved taking previously developed healthcoaching print materials and adapting their look and feel
for smartphone delivery. Diabetes screening remindersaimed at increasing a mother’s engagement in regularscreening were developed and added to this initial develop-ment phase. The focus of Health-e Mum was to encourageself-efficacy and enable women to modify their lifestylebehaviours through structured goal setting; personalisedautomated feedback on body weight, diet and physicalactivity progress; and support self-monitoring and buildingof social support. The wireframe development phase of theapp saw the following aspects developed: (i) virtual healthcoach guiding women through seven modules on diabetesprevention; (ii) diabetes screening reminders and informa-tion about screening tests; (iii) self-monitoring trackers forweight, diabetes screening test results, exercise and fooddiaries; (iv) regular personalised push notifications (pushnotifications allow the app to notify users of new messageseven when the app is not actively being used with messagesappearing in the notification centre, lock screen (iOS) orstatus section (Android)) or SMSs; (v) links to the app’sFacebook community page; (vi) diabetes risk assessmenttool; and (vii) additional resources links. The pilot app wasdeveloped as a hybrid model to enable greater flexibility ofuse across different mobile phone platforms once tested.
Women with previous GDM were recruited from aresearch database27 where women had provided consent forfurther research contact. Previous research with this popu-lation indicated that roughly 50% would be interested inparticipating and that three to four focus groups would beneeded to achieve saturation. As a result, a total of65 women from specified postcodes were contacted consec-utively until each focus group had 10 participants. A femaleresearch assistant interested in women’s health with nutri-tion qualifications and qualitative research experience(SR) contacted the women via telephone to ascertain theirinterest in participating in the focus groups. Forty-onewomen agreed to participate but only 26 attended in thefocus groups for a variety of reasons (infant illness, issueswith transport and competing priorities were the main rea-sons for not attending). The study was approved by DeakinUniversity’s Health Ethics Advisory Group as a low riskproject (HEAG-H 77_2015).
We conducted four focus groups with an average of fourto six participants per group between August and October2015 in community health centres. The research assistantwho contacted the women for participation performedevery focus group but no relationship was established priorto or conducting the groups. The focus groups continueduntil saturation of themes was achieved. In fact, saturationwas achieved by the third focus group and the fourth groupwas conducted to confirm themes. Participant mean agewas 33.9 years; 85% had tertiary education; 41% had onechild, 38% had two children, 21% had three or more; andall had GDM for a single pregnancy except for one woman.The characteristics of those that participated versus thosethat agreed to participate but were unable to attend werenot significantly different. The focus groups were 79 � 19minutes in duration. The focus groups were conductedusing a semi-structured question format (Appendix I, focus
S. L. O’Reilly and R. Laws
508 © 2018 Dietitians Association of Australia
group schedule) and were digitally audio recorded, aftereach woman read the plain language statement and pro-vided signed consent. The facilitator used reflective probesto encourage greater discussion on short comments. Eachfocus group had two distinct parts. The first part was awalk-through of the Health-e Mums app’s functionality,where women provided specific feedback on the layout/structure of the app, colours, pictures, key topics covered,etc. The second part of the focus group each participantranked examples of push notifications for different compo-nents of the app (Appendix I, push notifications and rat-ings). Participants were provided with a table withexamples of messages that would come through on theuser’s phone as push notifications and a selection of trafficlight coloured stickers (red, orange and green). Participantswere instructed to place a coloured sticker against eachnotification to indicate their interest in the notification(green = acceptable/useful, orange = unsure, red = notacceptable/useful). Following the ranking activity, messageswere grouped by traffic light colour and discussed. The dis-cussion focussed on identifying the components that madecertain messages appealing and how to improve unappeal-ing ones. Each focus group was professionally transcribedverbatim and checked for accuracy by the facilitator. Thesedata were supplemented with focus group notes taken bythe facilitator on any activity performed. Two independentresearch assistants trained in qualitative analysis performedthe manual thematic analysis (SR, JE). The transcript wasread through several times and coded on the final readthrough. The codes were then ordered and grouped intosalient themes with supporting quotes associated. Followingthe independent coding of the transcripts, a consensusmeeting was held between the research assistants and aninvestigator (SOR) to refine themes and resolve any discrep-ancies between coders by consensus discussions.31
Results
Under the theme of functionality, most women saw theHealth-e Mums app as being a comprehensive source of rele-vant, credible, and reliable information. This was importantfor the functionality of the app as participants felt thatwomen like them wanted to access up-to-date informationat times that suited them and was from experts.
‘…if new tests are introduced […] if that wasn’t aroundwhen we had our babies, […] they could put it on hereand say, “Okay, update.” You know, “This is the newtest. Go get it done.” You at least know then, so go talkto your doctor, get this booked in’ (Woman 2, Group 1)
Some women felt that people apportioned blame to themfor developing GDM and that the information would notonly help them to understand It better but would also assistwhen they wanted to explain it to others.
‘...gestational’s so different to what people know, andother people probably being told lots of things by theirfriends and their family […] “Aww but you’ve got to do
this” or “Aww it’s because you ate this” […] at leastthere’s this that has actual - proper - information that isspecific to gestational diabetes and stuff...’ (Woman2, Group 3)
Participants in the focus groups deemed the app highlyacceptable, based on the exposure they had during thefocus groups. There was unanimous agreement that the appwas something mothers would download and use if madeavailable. The virtual health coach functionality was seen asa useful education tool. They contrasted the potential prac-tical nature of the app with that of the printed informationthey received after the birth of their child.
‘…wish I had this when I had [baby]. That leaflet justdidn’t help me do anything’ (Woman 4, Group 1)
The participants highlighted that the app needed todeliver high levels of functionality, responsiveness and per-sonalisation features because they felt it was the gap Health-e Mums could fill in an already crowded health-related appmarketplace.
‘I started using one [diet and exercise app] a monthago…, I’d say it’s really helpful. Like I’ve lost 6kg in amonth… but it’s just a general app… This one would befor mums, for diabetes! Yeah, so it would be kind of niceto have it tailored for our group’. (Woman 3, Group 1)
The potential for Health-e Mums to provide social sup-port through Facebook was seen as positive feature, thesocial connection with other women who experiencedGDM and ability to establish local exercise groups were thedrivers of this interest.
‘…[knowing] who’s in your area, you know, who wantsto be contacted for exercise… the option is there if youwant to be part of the community’. (Woman 2, Group 1)
Personalisation was a strong sub-theme within function-ality. Participants wanted a seamless, efficient experiencetailored to their needs where app tools have to be customi-sable for the user to motivate and support behaviourchange. For example, helping with realistic goal setting.
‘[if I have] low weight or really high weight… [I] wantguidance to set the target […] and know we are realisti-cally going the right way’ (Woman 4, Group 2)
Diabetes screening and risk assessment was sub-themeidentified. The ability of the app to provide support aroundannual diabetes screening was well accepted. Women foundthe functionality for setting appointment reminders, keep-ing records of results and setting future screening remindersuseful and novel. The discussion on the diabetes screeningfunctionality revealed that screening, more broadly, wasquite confusing and frustrating for women as they wereunsure on its purpose, which test they should be doing andhow often they should be screening.
Diabetes prevention mobile app evaluation
© 2018 Dietitians Association of Australia 509
‘…what the test is testing, and just a simple explanation,the process and stuff. What to expect’. (Woman 3, Group3)
The oral glucose tolerance test was singled out for being‘bloody brutal’ (Woman 3, Group 3) and repeatedly givenas the reason women chose to avoid screening.
The app functionality on screening was positivelyacknowledged by the participants for providing ‘just intime’ information on how to prepare for each screening testtype and practical tips for making the process easier.Women were only moderately interested in the diabetesrisk assessment tool initially. However, they were interestedto know their own diabetes risk and found the informationuseful once they engaged with it.
‘…working out the risk of diabetes ... was the most moti-vating factor… getting healthy and like realising that I’mactually doing something about it. It was just so dra-matic… a 75% drop… I just dropped off about 3.5kilos’. (Woman 3, Group 1)
The other main theme was the user experience. Whilethere was general consensus that the Health-e Mums appfunctionality flowed in a usable and effective manner, par-ticipants were not always clear on how they should navigatepages.
‘I’m not technology literate on those kinds of things. I’malways like, “where’s the menu?” “How do I push this?”’(Woman 1, Group 4)
The home screen was universally thought to bestraightforward. The health tracker dashboard was wellreceived across the focus groups; it summarised each ofthe health tracking tools in one place and its tabs pro-vided quick access to other important features. Thewomen wanted graphs and other visual aides to improvethe app user experience but stated they needed to beconsistent in terms of style and types of informationbeing represented.
Within the user experience, a strong theme was onaccessing the food diary and nutritional information. Manyof the women want to be able to use the app to assist themto make better food choices by being able to look at thenutritional information for foods they were interested inand potentially use that information in their food diary.This was an improvement they felt would meet an unmetneed in the app marketplace. Traffic light colour codingwas another popular suggested improvement particularlyfor making food choices easier on the go:
‘…a green circle with an F can come up, for […] anapple, you know then that comes up next to the kilo-joules to tell you that that is high in fibre […] It doesn’tnecessarily have to show the amount but whether, yesthat’s a green light’. (Woman 2, Group 3)
The ability to directly print or email information withinthe app was an additional user feature that was desired by a
number of women. This would enable them to share infor-mation with healthcare providers or use a printed recipe orexercise plan.
The push notifications provided were well accepted byevery focus group (Appendix II). However participantsmade it clear that the user needed to be able to personalisewhat they did and did not want to receive. The reminderpush notifications were seen as useful when linked to keyactivities within the app but women felt they needed to beused judiciously. The push notifications within the virtualhealth coach component for the narrative videos and check-ing a woman’s understanding of module content receivedmixed feedback and generated the most discussion. Thenarrative videos are where the stories of real women withprevious GDM describe situations and how they dealt withthem and are an evidence-based approach to behaviourchange education.32 These proposed videos received mixedresponses
‘…it’s not something I’d be interested in watching’.(Woman 3, Group 2)
‘Me, personally, I probably wouldn’t click on it. But Ithink it’s probably a helpful thing’. (Woman 3, Group 3)
The women were asked their thoughts about the appbeing developed so that the user would be taken on a vir-tual coaching ‘journey’ where milestones would be setthroughout the first two years after their baby was born thataligned with postpartum gestational diabetes guidelines.However, this received mixed feedback with mothers refer-encing it being detrimental to taking a long-term view oftheir health
‘I think if you do that, people might stop it, like they’llget to the end and like, “Oh, well I’m done now”, like“my risk is finished.”’ (Woman 3, Group 3)
Improvements were suggested for most app componentsto enhance the visual appearance and user experience. Thefocus group participants were already familiar with, or hadused, other widely known health and fitness apps so therewas an expectation among participants that if the app wasto succeed in the marketplace, it would need to have all thefeedback features of the leading apps and the additionalfunctionality of the Health-e Mums one. The app’s foodrecord was an area that women provided suggestions toincorporate including: being able select breastfeeding statuswithin the profile section to adapt daily energy calculations;providing a progressive tally of energy balance to enablebetter decision making; using a comprehensive Australianfood database; and the ability to add homemade recipes.Areas of the app that women thought could be improved toinclude more comprehensive information were: purposeand results of dietary quizzes; the weight tracking tool;explaining body mass index; and providing external linksfor relevant recipes and exercises that could be done athome or with the children.
S. L. O’Reilly and R. Laws
510 © 2018 Dietitians Association of Australia
Discussion
We found that the development of an evidence-based dia-betes prevention smartphone app specifically for womenwith previous GDM was seen addressing an unmet need forthis population. For the women participating in our focusgroups, the Health-e Mums app was found to be functionaland provided an acceptable user experience for womenwith previous GDM. While a plethora of health-focusedapps exist, few are evidence-based and even fewer are basedon rigorously evaluated behaviour change theory or rando-mised controlled trial program evidence.33 Health-e Mumsis novel and differs from the available GDM apps34–37
because of its postnatal focus on diabetes prevention andscreening, which makes it all the more pressing to evaluateit as a means to addressing a large public health issue.
Overall, the app performed well on its functionality andthe user-experience, the focus group participants perceivedthat the app would make it easier to engage in lifestylebehaviour change and regular diabetes screening. They val-ued the app providing information on diabetes screeningand practical support and feedback on healthy eating andphysical activity, which contrasted with the usefulness ofthe printed information they were provided with followingthe birth of their children. The ability for mobile applica-tions to provide tailored, accessible information comparedwith more traditional printed forms seems to be one of theuniversal benefits of mHealth technology that busy mothersvalue.34,38 Other key traits of effective apps identifiedthrough systematic review are time efficiency, health profes-sional involvement, personalisation, ease of use, provisionof real-time feedback and detailed information.39 Thesefindings align with those found for the Health-e Mums focusgroups.
Previous research has shown that the main challenge formHealth programs is delivering a robust app that producescontinued user engagement over time.39 A lack of engage-ment will result in participants gaining limited exposure tothe intervention and the behaviour change strategies thatunderpin it. This is a real issue for diabetes prevention pro-grams for women with previous gestational diabetes deliv-ered in face-to-face modes.25,27,40 Health-e Mums took amore user-centred design approach by applying learningsfrom previous programs on the unique needs of postnatalwomen with previous GDM and how those needs mightinfluence the app design and user experience.41 This is anapproach taken in other apps designed to support healthinfant feeding practices38 or diabetes in pregnancy care35
and the impact of this approach has been borne out in appengagement data.38
The present study has a number of limitations. Whilethe use of qualitative methods yields in-depth informationon what women with previous gestational diabetes thinkabout the Health-e Mums app functionality, participation infocus groups can result in social desirability and participa-tion bias. Social desirability bias could result in overly posi-tive responses towards the app and its functionality as aresult of participants being keen to please researchers.
However, the participants were encouraged to provide theirhonest assessment and feedback throughout the focusgroup and they were informed about the usefulness of pro-viding such feedback to help improve the apps develop-ment. It is possible that participation bias may have beenpresent because people who volunteered for the focusgroups may be more likely to be engaged in improvingtheir health or heavy mHealth users. However, the partici-pant sociodemographic characteristics collected are similarto the broader population of women who have previouslyhad GDM.27
Our findings suggest that the Health-e Mums app is suit-able and appears to meet the needs of women with previ-ous GDM looking for a diabetes prevention program. Thekey features identified as useful were the tailored informa-tion adapted for women with young families; bringing dia-betes screening together with lifestyle modification; andbehaviour change support tools in the form of trackers anddiaries. Areas for improvement were food diaries beingbacked with relevant Australian food data and contextualinformation on functional components to aid understand-ing on why each element or tool was useful. The women inthe present study were positive about the potential for theHealth-e Mums app to support them to improve diet andphysical activity levels and improve screening practices.
Funding source
This work was funded by Deakin University’s Institute ofPhysical Activity and Nutrition through a seed fundingprogram.
Conflict of interest
The authors have no conflicts of interest to disclose.
Authorship
SOR and RL conceived and designed the evaluation struc-ture. SOR designed the app materials with substantial inputfrom RL. SOR supervised the data collection and analysis,with significant input from RL. SOR wrote the first draft ofthe manuscript, and with critical input from RL, wasresponsible for the revisions of the manuscript. Bothauthors have read, and confirm that they meet ICMJE cri-teria for authorship and have approved the final version ofthe manuscript. SOR and RL agree to be accountable for allaspects of the work.
The following people provided contributions: Sanae Rob-erts conducted the focus groups; Sanae Roberts and JulieEdgley performed the independent qualitative data analysis;Professor Karen Campbell contributed in the project devel-opment and review of the manuscript; and A/ProfessorKok-Leong Ong and Mr. Jing Zhang developed theapplication.
Diabetes prevention mobile app evaluation
© 2018 Dietitians Association of Australia 511
References
1 Moses RG, Wong VCK, Lambert K, Morris GJ, San Gil F. Theprevalence of hyperglycaemia in pregnancy in Australia. Aust NZ J Obstet Gynaecol 2016; 56: 341–5.
2 Bellamy L, Casas J-P, Hingorani AD, Williams D. Type 2 diabe-tes mellitus after gestational diabetes: a systematic review andmeta-analysis. Lancet 2009; 373: 1773–9.
3 Kim C, Newton KM, Knopp RH. Gestational diabetes and theincidence of type 2 diabetes: a systematic review. Diabetes Care2002; 25: 1862–8.
4 Chamberlain CR, Oldenburg B, Wilson AN et al. Type 2 diabe-tes after gestational diabetes: greater than fourfold risk amongindigenous compared with non-indigenous Australian women.Diabetes Metab Res Rev 2016; 32: 217–27.
5 Shah BR, Retnakaran R, Booth GL. Increased risk of cardiovas-cular disease in young women following gestational diabetesmellitus. Diabetes Care 2008; 31: 1668–9.
6 Vaarasmaki M, Pouta A, Elliot P et al. Adolescent manifesta-tions of metabolic syndrome among children born to womenwith gestational diabetes in a general-population birth cohort.Am J Epidemiol 2009; 169: 1209–15.
7 Boney CM, Verma A, Tucker R, Vohr BR. Metabolic syndromein childhood: association with birth weight, maternal obesity,and gestational diabetes mellitus. Pediatrics 2005; 115: e290–6.
8 Aberg A, Westbom L. Association between maternal pre-existing or gestational diabetes and health problems in chil-dren. Acta Paediatr 2001; 90: 746–50.
9 Almario CV, Ecker T, Moroz LA, Bucovetsky L, Berghella V,Baxter JK. Obstetricians seldom provide postpartum diabetesscreening for women with gestational diabetes. Am J ObstetGynecol 2008; 198: 528.e1–28.e5..
10 Shah BR, Lipscombe LL, Feig DS, Lowe JM. Missed opportuni-ties for type 2 diabetes testing following gestational diabetes: apopulation-based cohort study. BJOG 2011; 118: 1484–90.
11 Metzger BE, Buchanan TA, Coustan DR et al. Summary andrecommendations of the Fifth International Workshop-Conference on Gestational Diabetes Mellitus. Diabetes Care2007; 30: S251–60.
12 Damm P. Future risk of diabetes in mother and child after ges-tational diabetes mellitus. Int J Gynecol Obstet 2009;104: S25–6.
13 Ratner RE, Christophi CA, Metzger BE et al. Prevention of dia-betes in women with a history of gestational diabetes: effects ofmetformin and lifestyle interventions. J Clin Endocrinol Metab2008; 93: 4774–9.
14 Chamberlain C, McLean A, Oats J et al. Low rates of postpar-tum glucose screening among indigenous and non-indigenouswomen in Australia with gestational diabetes. Matern ChildHealth J 2015; 19: 651–63.
15 Keely E. An opportunity not to be missed – how do weimprove postpartum screening rates for women with gesta-tional diabetes? Diabetes Metab Res Rev 2012; 28: 312–6.
16 Pennington A, O’Reilly SL, Young D, Dunbar J. Improvingfollow-up care for women with a history of gestational diabe-tes: perspectives of GPs and patients. Aust J Prim Health 2016;23: 66–74.
17 Gabbe SG, Landon MB, Warren-Boulton E, Fradkin J. Promot-ing health after gestational diabetes: a National Diabetes Educa-tion Program call to action. Obstet Gynecol 2012; 119: 171–6.
18 Wilkinson SA, Lim SS, Upham S et al. Who’s responsible forthe care of women during and after a pregnancy affected bygestational diabetes? Med J Aust 2014; 201: S78–81.
19 Colagiuri S, Johnson G. Case for Action proposal: A Comprehen-sive Type 2 Diabetes Prevention Program. Submitted by theNHMRC Research Translation Faculty Diabetes Mellitus SteeringGroup, September 2014. Canberra: National Health and MedicalResearch Council, 2015.
20 Nielsen KK, Kapur A, Damm P, de Courten M, Bygbjerg IC.From screening to postpartum follow-up - the determinantsand barriers for gestational diabetes mellitus (GDM) services, asystematic review. BMC Pregnancy Childbirth 2014; 14: 41.
21 Hearn L, Miller M, Lester L. Reaching perinatal women online:the healthy you, healthy baby website and app. J Obes 2014;2014: 9.
22 Derbyshire E, Dancey D. Smartphone medical applications forwomen’s health: what is the evidence-base and feedback? Int JTelemed Appl 2013; 2013: 10.
23 Hearn L, Miller M, Fletcher A. Online healthy lifestyle supportin the perinatal period: what do women want and do they useit? Aust J Prim Health 2013; 19: 313–8.
24 Reinhardt JA, van der Ploeg HP, Grzegrzulka R, Timperley JG.Lmplementing lifestyle change through phone-based motiva-tional interviewing in rural-based women with previous gesta-tional diabetes mellitus. Health Promot J Austr 2012; 23: 5–9.
25 Lim S, Dunbar JA, Versace VL et al. Comparing a telephone-and a group-delivered diabetes prevention program: character-istics of engaged and non-engaged postpartum mothers with ahistory of gestational diabetes. Diabetes Res Clin Pract 2017;126: 254–62.
26 Nicklas JM, Zera CA, England LJ et al. A web-based lifestyleintervention for women with recent gestational diabetes melli-tus: a randomized controlled trial. Obstet Gynecol 2014; 124:563–70.
27 O’Reilly SL, Dunbar JA, Versace V et al. Mothers after gesta-tional diabetes in Australia (MAGDA): a randomised controlledtrial of a postnatal diabetes prevention program. PLoS Med2016; 13: e1002092.
28 Ferrara A, Hedderson MM, Brown SD et al. The comparativeeffectiveness of diabetes prevention strategies to reduce post-partum weight retention in women with gestational diabetesmellitus: the gestational diabetes’ effects on moms (GEM) clus-ter randomized controlled trial. Diabetes Care 2016;39: 65–74.
29 O’Reilly S, Dunbar J, Ford D, On behalf of the MAGDA StudyGroup. GooD4Mum: facilitating delivery of diabetes preventioncare to women with previous gestational diabetes in primarycare. Int J Behav Med 2016; 23: S210.
30 Lindström J, Louheranta A, Mannelin M et al. The Finnish Dia-betes Prevention Study (DPS) lifestyle intervention and 3-yearresults on diet and physical activity. Diabetes Care 2003; 26:3230–6.
31 Braun V, Clarke V. Using thematic analysis in psychology. QualRes Psychol 2006; 3: 77–101.
32 Kreuter MW, Holmes K, Alcaraz K et al. Comparing narrativeand informational videos to increase mammography in low-income African American women. Patient Educ Couns 2010;81: S6–S14.
33 McMillan B, Hickey E, Patel MG, Mitchell C. Quality assess-ment of a sample of mobile app-based health behavior changeinterventions using a tool based on the National Institute ofhealth and care excellence behavior change guidance. PatientEduc Couns 2016; 99: 429–35.
34 Chen Q, Carbone ET. Functionality, implementation, impact,and the role of health literacy in mobile phone apps for gesta-tional diabetes: scoping review. JMIR Diabetes 2017; 2: e25.
S. L. O’Reilly and R. Laws
512 © 2018 Dietitians Association of Australia
35 Garnweidner-Holme LM, Borgen I, Garitano I, Noll J,Lukasse M. Designing and developing a mobile smartphoneapplication for women with gestational diabetes mellitusfollowed-up at diabetes outpatient clinics in Norway. Health-care 2015; 3: 310–23.
36 Kennelly MA, Ainscough K, Lindsay K, Gibney E, McCarthy M, McAuliffe FM. Pregnancy, exercise and nutritionresearch study with smart phone app support (pears): studyprotocol of a randomized controlled trial. Contemp Clin Trials2016; 46: 92–9.
37 Borgen I, Garnweidner-Holme LM, Jacobsen AF et al. Smart-phone application for women with gestational diabetes melli-tus: a study protocol for a multicentre randomised controlledtrial. BMJ Open 2017; 7: e013117.
38 Litterbach E-K, Russell CG, Taki S, Denney-Wilson E,Campbell KJ, Laws RA. Factors influencing engagement and
behavioral determinants of infant feeding in an mHealth pro-gram: qualitative evaluation of the growing healthy program.JMIR Mhealth Uhealth 2017; 5: e196.
39 Zhao J, Freeman B, Li M. Can mobile phone apps influencePeople’s health behavior change? An evidence review. J MedInternet Res 2016; 18: e287.
40 Gilinsky AS, Kirk AF, Hughes AR, Lindsay RS. Lifestyle inter-ventions for type 2 diabetes prevention in women with priorgestational diabetes: a systematic review and meta-analysis ofbehavioural, anthropometric and metabolic outcomes. PrevMed Rep 2015; 2: 448–61.
41 Mummah SA, Robinson TN, King AC, Gardner CD, Sutton S.IDEAS (integrate, design, assess, and share): a framework andtoolkit of strategies for the development of more effective digi-tal interventions to change health behavior. J Med Internet Res2016; 18: e317.
A. APPENDIX I
A.1. Focus Group Interview Schedule
General information spoken for each focus group:As you know, we are interested in testing some key messages of the Health-e Mums program, and to see what you think
about the app design for their delivery. I am very interested in your opinions and to hear what you have to say. Any ques-tions before we begin?
I am planning on splitting this focus group into two main parts: discussing the app design first and then going onto thekey messages. Ok let us start on the design part now.
In front of you there is a series of screenshots, let us go through them now starting with screenshot X (these type of ques-tions will be asked for each screenshot):• What do you think of it when you look at it first?• Does the information on-screen make sense to you?• What do you think your reaction would be to having this available within an app?• Do you think it would help you do what it is asking?
Ok let us move on to the second part of the focus group, the key messages. These messages will pop up during the timethe app is on your phone and will be prompts to think about something or do something. You might know them as pushnotifications. In front of you now are a series of messages, can you have a read through and put a green coloured stickerbeside the one’s you think are good, red for those you do not like and orange for those you are not sure about. Once wehave all put our stickers on our sheets, we are going to see who liked which ones and discuss ways we might improve theso-so or disliked ones. Does that sound ok? Ok let us start….
Great—that completes our focus group. I would like to thank you so much again for your time.
Diabetes prevention mobile app evaluation
© 2018 Dietitians Association of Australia 513
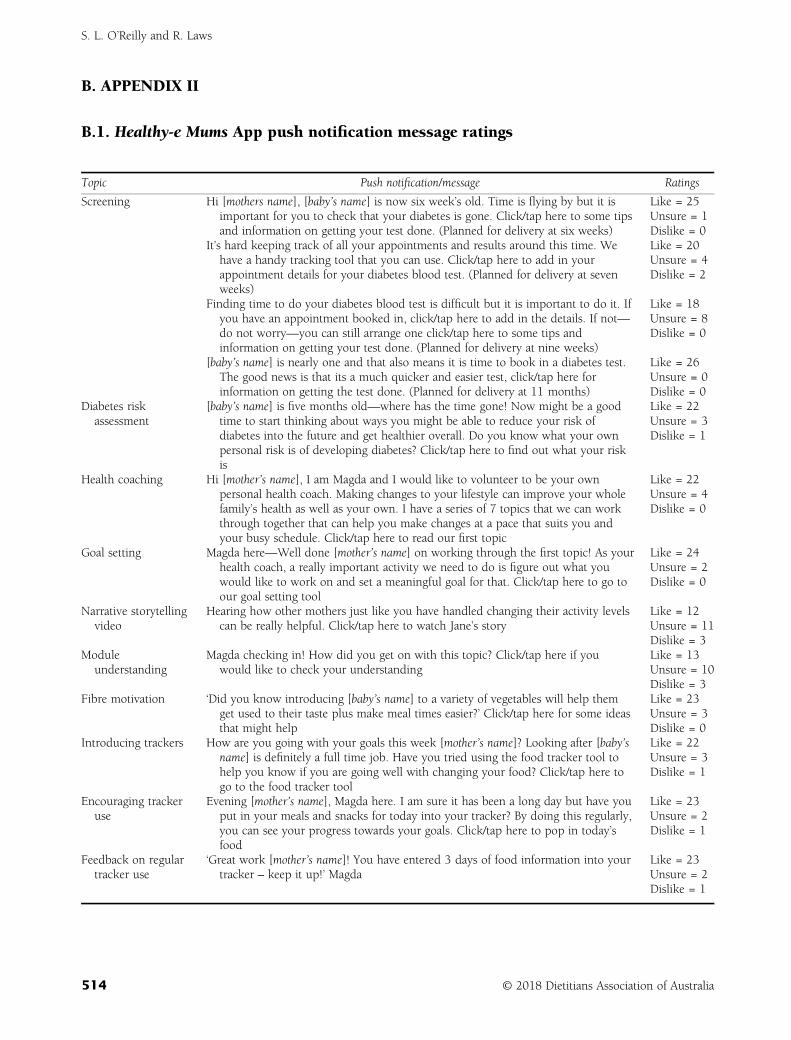
B. APPENDIX II
B.1. Healthy-e Mums App push notification message ratings
Topic Push notification/message Ratings
Screening Hi [mothers name], [baby’s name] is now six week’s old. Time is flying by but it isimportant for you to check that your diabetes is gone. Click/tap here to some tipsand information on getting your test done. (Planned for delivery at six weeks)
Like = 25Unsure = 1Dislike = 0
It’s hard keeping track of all your appointments and results around this time. Wehave a handy tracking tool that you can use. Click/tap here to add in yourappointment details for your diabetes blood test. (Planned for delivery at sevenweeks)
Like = 20Unsure = 4Dislike = 2
Finding time to do your diabetes blood test is difficult but it is important to do it. Ifyou have an appointment booked in, click/tap here to add in the details. If not—do not worry—you can still arrange one click/tap here to some tips andinformation on getting your test done. (Planned for delivery at nine weeks)
Like = 18Unsure = 8Dislike = 0
[baby’s name] is nearly one and that also means it is time to book in a diabetes test.The good news is that its a much quicker and easier test, click/tap here forinformation on getting the test done. (Planned for delivery at 11 months)
Like = 26Unsure = 0Dislike = 0
Diabetes riskassessment
[baby’s name] is five months old—where has the time gone! Now might be a goodtime to start thinking about ways you might be able to reduce your risk ofdiabetes into the future and get healthier overall. Do you know what your ownpersonal risk is of developing diabetes? Click/tap here to find out what your riskis
Like = 22Unsure = 3Dislike = 1
Health coaching Hi [mother’s name], I am Magda and I would like to volunteer to be your ownpersonal health coach. Making changes to your lifestyle can improve your wholefamily’s health as well as your own. I have a series of 7 topics that we can workthrough together that can help you make changes at a pace that suits you andyour busy schedule. Click/tap here to read our first topic
Like = 22Unsure = 4Dislike = 0
Goal setting Magda here—Well done [mother’s name] on working through the first topic! As yourhealth coach, a really important activity we need to do is figure out what youwould like to work on and set a meaningful goal for that. Click/tap here to go toour goal setting tool
Like = 24Unsure = 2Dislike = 0
Narrative storytellingvideo
Hearing how other mothers just like you have handled changing their activity levelscan be really helpful. Click/tap here to watch Jane’s story
Like = 12Unsure = 11Dislike = 3
Moduleunderstanding
Magda checking in! How did you get on with this topic? Click/tap here if youwould like to check your understanding
Like = 13Unsure = 10Dislike = 3
Fibre motivation ‘Did you know introducing [baby’s name] to a variety of vegetables will help themget used to their taste plus make meal times easier?’ Click/tap here for some ideasthat might help
Like = 23Unsure = 3Dislike = 0
Introducing trackers How are you going with your goals this week [mother’s name]? Looking after [baby’sname] is definitely a full time job. Have you tried using the food tracker tool tohelp you know if you are going well with changing your food? Click/tap here togo to the food tracker tool
Like = 22Unsure = 3Dislike = 1
Encouraging trackeruse
Evening [mother’s name], Magda here. I am sure it has been a long day but have youput in your meals and snacks for today into your tracker? By doing this regularly,you can see your progress towards your goals. Click/tap here to pop in today’sfood
Like = 23Unsure = 2Dislike = 1
Feedback on regulartracker use
‘Great work [mother’s name]! You have entered 3 days of food information into yourtracker – keep it up!’ Magda
Like = 23Unsure = 2Dislike = 1
S. L. O’Reilly and R. Laws
514 © 2018 Dietitians Association of Australia
ORIGINAL RESEARCH
Development of text messages targeting healthyeating for children in the context of parentingpartnerships
Li K. CHAI ,1,2,3 Chris MAY,1,2,3,4 Clare E. COLLINS1,2,3 and Tracy L. BURROWS 1,2,3
1School of Health Sciences, Faculty of Health and Medicine, University of Newcastle, 2Priority Research Centre inPhysical Activity and Nutrition, University of Newcastle, 3Hunter Medical Research Institute and 4Family ActionCentre, University of Newcastle, Newcastle, New South Wales, Australia
AbstractAim: There has been an increase in the use of text messaging to deliver and support health interventions. The aimwas to develop a bank of text messages targeting healthy eating for children in the context of parenting partnershipsthat could be used in a family intervention.Methods: Text messages were developed using the Theoretical Domains Framework and Behaviour Change WheelCOM-B model by study investigators using a three-phase approach: (i) initial development of a message bank;(ii) messages were reviewed and evaluated by experts and parents on their clarity, usefulness, and relevance using a5-point Likert scale and open text spaces for additional feedback and (iii) refinement of messages content and fina-lised the message bank.Results: Messages were reviewed for ‘clarity’, ‘usefulness’ and ‘relevance’ by 20 parents and 28 health experts, whowere predominantly female (92%), parents of primary school age children (33%), of low to middle socioeconomic sta-tus (78%), with a mean age of 39 years (SD � 9.87). From an initial set of 97 messages developed, 48 messages wereretained through consultation. Messages were designed to complement the intervention, while engaging bothparents.Conclusions: The three-phase development created a set of text messages acceptable to experts and parents thataim to support improvement in child eating behaviours. The process provides a template and practical guide forresearchers and health providers looking to apply a systematic approach to text messages development. Futureresearch should investigate acceptability and impact of these messages as a component of family-based nutritionintervention.
Key words: children, healthy diet, parenting, text messaging.
Introduction
Parents serve as the gate keepers and role models for afamily’s food intake and have a major influence on childeating habits.1 Family-based behavioural lifestyle interven-tions that include parental involvement lead to better childhealth outcomes, including weight, body mass index(BMI) and other measures of adiposity.2–5 However, infamily-based interventions mothers and fathers are notusually represented equally.6,7 A systematic review on
family-based childhood obesity studies (n = 667 studies)found that only 51% included both mothers and fathers.6
The evidence supporting the efficacy of mothers andfathers within dietary interventions on child health out-comes supports the rationale for increasing parental partic-ipation, as well as targeting both parents in childhoodobesity interventions.8
Parenting partnership or ‘co-parenting’ is the term usedto describe the relationship that both parents share in rais-ing children.9 The quality of the parenting partnership hasbeen shown to positively impact a child’s social and emo-tional development, including impulse control,10–12 whichsuggests that it might influence a child’s lifestyle behaviourand weight status. However, a systematic review of213 studies on childhood obesity interventions found nointerventions that focused on the parenting partnership inrelation to dietary intake or childhood obesity.7 Despitethe importance and evidence for positive co-parenting theknowledge gap indicates that research targeting the
L.K. Chai, BNutrDiet(Hons), APD, PhD CandidateC. May, PhD, Senior ResearcherC.E. Collins, PhD, FDAA, ProfessorT.L. Burrows, PhD, FDAA, Associate ProfessorCorrespondence: T.L. Burrows, School of Health Sciences, Faculty ofHealth and Medicine, University of Newcastle, University Drive,Callaghan, NSW 2308, Australia.Email: [email protected]
Accepted October 2018
© 2018 Dietitians Association of Australia 515
AA AA
DDD
ieti
tian
s As
soci
atio
nofof
Aus
tral
ia
Nutrition & Dietetics 2019; 76: 515–520 DOI: 10.1111/1747-0080.12498
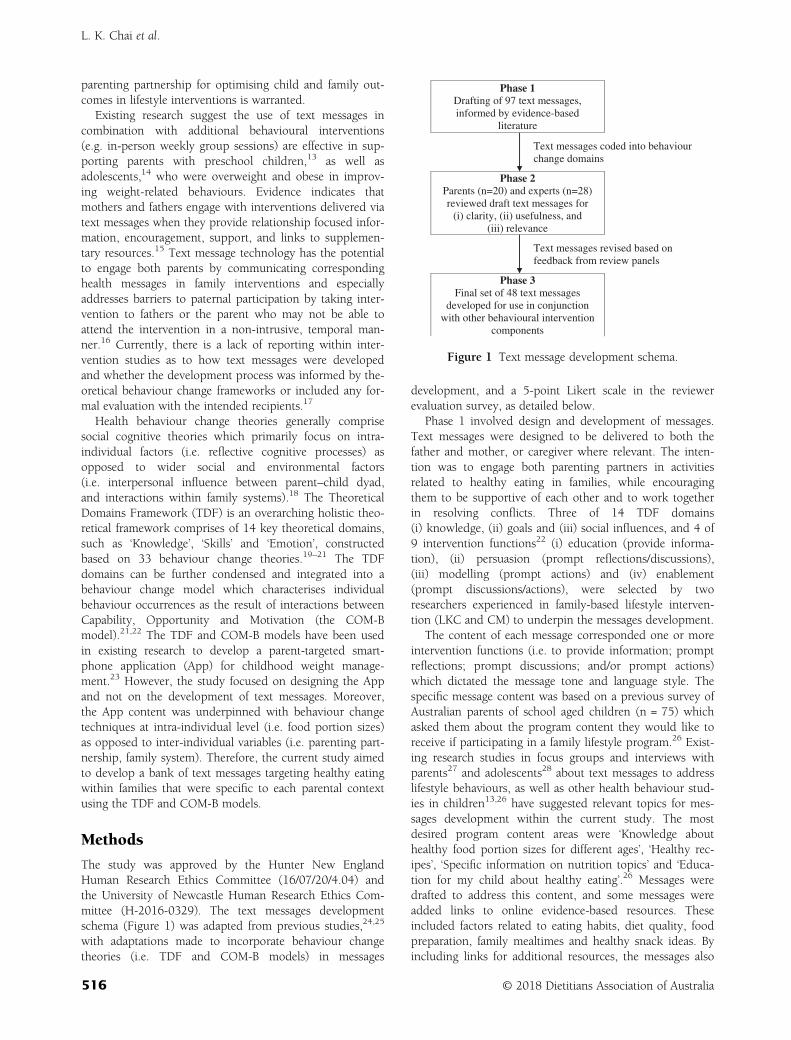
parenting partnership for optimising child and family out-comes in lifestyle interventions is warranted.
Existing research suggest the use of text messages incombination with additional behavioural interventions(e.g. in-person weekly group sessions) are effective in sup-porting parents with preschool children,13 as well asadolescents,14 who were overweight and obese in improv-ing weight-related behaviours. Evidence indicates thatmothers and fathers engage with interventions delivered viatext messages when they provide relationship focused infor-mation, encouragement, support, and links to supplemen-tary resources.15 Text message technology has the potentialto engage both parents by communicating correspondinghealth messages in family interventions and especiallyaddresses barriers to paternal participation by taking inter-vention to fathers or the parent who may not be able toattend the intervention in a non-intrusive, temporal man-ner.16 Currently, there is a lack of reporting within inter-vention studies as to how text messages were developedand whether the development process was informed by the-oretical behaviour change frameworks or included any for-mal evaluation with the intended recipients.17
Health behaviour change theories generally comprisesocial cognitive theories which primarily focus on intra-individual factors (i.e. reflective cognitive processes) asopposed to wider social and environmental factors(i.e. interpersonal influence between parent–child dyad,and interactions within family systems).18 The TheoreticalDomains Framework (TDF) is an overarching holistic theo-retical framework comprises of 14 key theoretical domains,such as ‘Knowledge’, ‘Skills’ and ‘Emotion’, constructedbased on 33 behaviour change theories.19–21 The TDFdomains can be further condensed and integrated into abehaviour change model which characterises individualbehaviour occurrences as the result of interactions betweenCapability, Opportunity and Motivation (the COM-Bmodel).21,22 The TDF and COM-B models have been usedin existing research to develop a parent-targeted smart-phone application (App) for childhood weight manage-ment.23 However, the study focused on designing the Appand not on the development of text messages. Moreover,the App content was underpinned with behaviour changetechniques at intra-individual level (i.e. food portion sizes)as opposed to inter-individual variables (i.e. parenting part-nership, family system). Therefore, the current study aimedto develop a bank of text messages targeting healthy eatingwithin families that were specific to each parental contextusing the TDF and COM-B models.
Methods
The study was approved by the Hunter New EnglandHuman Research Ethics Committee (16/07/20/4.04) andthe University of Newcastle Human Research Ethics Com-mittee (H-2016-0329). The text messages developmentschema (Figure 1) was adapted from previous studies,24,25
with adaptations made to incorporate behaviour changetheories (i.e. TDF and COM-B models) in messages
development, and a 5-point Likert scale in the reviewerevaluation survey, as detailed below.
Phase 1 involved design and development of messages.Text messages were designed to be delivered to both thefather and mother, or caregiver where relevant. The inten-tion was to engage both parenting partners in activitiesrelated to healthy eating in families, while encouragingthem to be supportive of each other and to work togetherin resolving conflicts. Three of 14 TDF domains(i) knowledge, (ii) goals and (iii) social influences, and 4 of9 intervention functions22 (i) education (provide informa-tion), (ii) persuasion (prompt reflections/discussions),(iii) modelling (prompt actions) and (iv) enablement(prompt discussions/actions), were selected by tworesearchers experienced in family-based lifestyle interven-tion (LKC and CM) to underpin the messages development.
The content of each message corresponded one or moreintervention functions (i.e. to provide information; promptreflections; prompt discussions; and/or prompt actions)which dictated the message tone and language style. Thespecific message content was based on a previous survey ofAustralian parents of school aged children (n = 75) whichasked them about the program content they would like toreceive if participating in a family lifestyle program.26 Exist-ing research studies in focus groups and interviews withparents27 and adolescents28 about text messages to addresslifestyle behaviours, as well as other health behaviour stud-ies in children13,26 have suggested relevant topics for mes-sages development within the current study. The mostdesired program content areas were ‘Knowledge abouthealthy food portion sizes for different ages’, ‘Healthy rec-ipes’, ‘Specific information on nutrition topics’ and ‘Educa-tion for my child about healthy eating’.26 Messages weredrafted to address this content, and some messages wereadded links to online evidence-based resources. Theseincluded factors related to eating habits, diet quality, foodpreparation, family mealtimes and healthy snack ideas. Byincluding links for additional resources, the messages also
Phase 1Drafting of 97 text messages,
informed by evidence-based
literature
Text messages coded into behaviour
change domains
Phase 2 Parents (n=20) and experts (n=28)
reviewed draft text messages for
(i) clarity, (ii) usefulness, and
(iii) relevance
Text messages revised based on
feedback from review panels
Phase 3 Final set of 48 text messages
developed for use in conjunction
with other behavioural intervention
components
Figure 1 Text message development schema.
L. K. Chai et al.
516 © 2018 Dietitians Association of Australia
increase opportunity for parents to facilitate behaviourchange. This pool of draft text messages (n = 97) weredeveloped by the research team and independently mappedto one of the three TDF domains and one of the four inter-vention functions by two researchers (LKC and CM). Con-flicts were resolved between the two researchers through aconsensus discussion which acknowledged that some mes-sages were crossing multiple domains and a final decisionwas made on the most appropriate single domain and/orfunction to be mapped to the draft messages. The messageswere limited to 160 characters as the maximum length tobe sent as a single text message. Messages were designed aspassive one-way interaction so that there was no need forthe recipient to reply. However, they can choose to act inresponse to the message prompts and click on the links toview resources.
In Phase 2, the messages were reviewed by experts andparents for construct and content validation. Identified stake-holders from two distinct groups (i) parent, stepparent, orcaregiver of a child aged 18 and below and (ii) experts in thefield of family-based research, health behavioural research, ornutrition and dietetics were invited to review the content ofdraft messages. Experts were family health researchers, healthbehaviour researchers, dietitians or nutrition academics. Theexpert reviewers were invited through mailing lists from aca-demic and health institutions in the Hunter region, NewSouth Wales, Australia, including universities, hospitals andhealth services where staff would have knowledge and expe-rience in developing and implementing family-based inter-vention, and/or clinical services related to healthy eating andweight management. A convenience sample of parents wererecruited through the School of Health Sciences staff email ofthe University of Newcastle which comprises both academicand professional staff, and by snowballing and word ofmouth within the local research network at the PriorityResearch Centre in Physical Activity and Nutrition, whichhas over 100 members.
Both groups were asked to provide feedback via anonline reviewer evaluation survey administered using anonline survey platform (www.qualtrics.com). At the start ofthe survey, reviewers were asked to indicate one or more ofthe following roles that may apply to them: familyresearcher, health behaviour researcher, dietitian, parent orcaregiver of a child. Researchers and/or dietitians who werealso parents were classified as experts. Participants werethen asked demographic information (8 items: gender, age,aboriginal status, education, occupation, postcode, numberand age of children). Postcodes were matched to Socio-Economic Indexes for Areas, Index of Relative Socio-Economic Advantage and Disadvantage for postal areasranking to ascertain socioeconomic statuses (SES; i.e. low,middle and high). Each reviewer of the same role(i.e. expert or parent) was randomly assigned to revieweither 50 messages (set A) or 47 messages (set B). For thepurposes of construct and content validation, reviewerswere asked to evaluate each message on three feedback cat-egories: (i) clarity, (ii) usefulness and (iii) relevance to par-ents of overweight children and respond on a 5-point
Likert scale ranging from ‘1’ (strongly disagree) to ‘5’(strongly agree). Open text spaces were provided for addi-tional feedback or suggestions to improve message content.As an incentive for participation, all parent reviewers wereoffered the option to enter a prize draw to win one of two$50 gift vouchers upon survey completion.
Phase 3 involved refinement of messages content andfinal selection of messages. For each message in Phase 2, amean score was created for each feedback category(i.e. clarity, usefulness, relevance), with a total combinedscore for each message ranging from 3 (minimum) to15 (maximum). Messages were discarded if they scoredbelow 3 for usefulness, and retained without change ifscored 4 or above for all individual categories. The remain-ing messages were refined based on reviewers’ feedback.
Once the key messages were identified, the qualitativecomments from the reviewers were checked by tworesearchers (LKC and CM), in addition to rewording andgrammar, to ensure that the message content and structurewere optimal. The research team then reassessed all remain-ing messages to create an even distribution across TDFdomains, complementary message content, and interventionfunctions. A final set of text messages was selected for dis-tribution over 12 weeks to targeted end users (i.e. mothersand fathers), across 4-weekly rotations of decreasing fre-quency (i.e. 5, 4, 3, then 2 text messages per week), basedon previous evidence on the importance of varying the fre-quency of message delivery.17 The condensed set of mes-sages was recirculated to the research team forconsideration in terms of overall appropriateness. Readabil-ity was checked on the final set of messages using an onlinetool (https://www.webpagefx.com/tools/read-able/) toensure the messages are comprehensible for parents withlow literacy. All reviewers were then asked to review thefinal messages and provide feedback which was used toderive the final message set. A list of the final text messagesare presented in Table S1, Supporting Information.
All analyses were undertaken using Stata version 12 soft-ware (StataCorp, College Station, TX, USA). Results wereconsidered statistically significant with P-values <0.05.Descriptive statistics were conducted to describe demo-graphic characteristics by reviewer roles. Messages scoreswere expressed in median and interquartile range byreviewer roles and message sets (i.e. set A or B).
Results
A total of 51 reviewers completed the survey and allreviewed the final message set. Of these, 20 were parentsand 28 were health experts. Three identified themselves asneither parents nor experts, thus, were excluded from theanalysis. The demographic characteristics of parents andexpert reviewers were presented in Table 1. Overall, theparent and expert reviewers (n = 48) were predominantlyfemale (92%), non-indigenous (100%), parents of primaryschool age children (33%), between low and middle SESclass (73%), reporting having a university degree (48%),and the group mean age were 39 years (SD � 10).
Text messages for healthy eating in children
© 2018 Dietitians Association of Australia 517
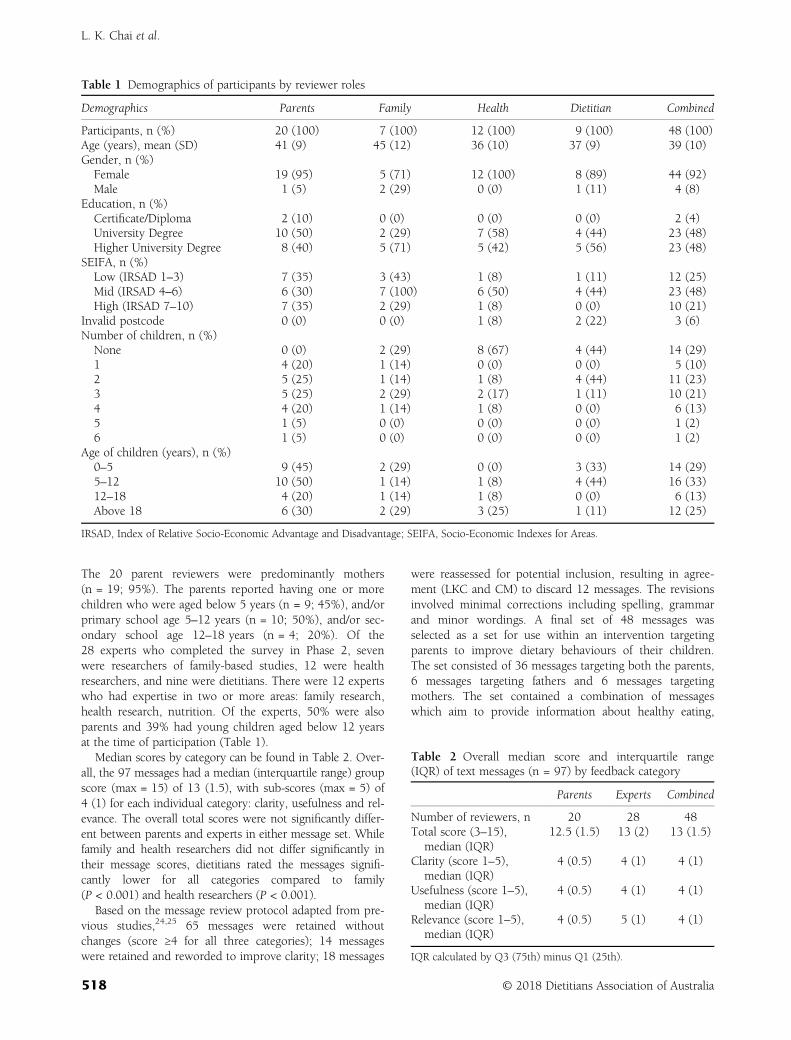
The 20 parent reviewers were predominantly mothers(n = 19; 95%). The parents reported having one or morechildren who were aged below 5 years (n = 9; 45%), and/orprimary school age 5–12 years (n = 10; 50%), and/or sec-ondary school age 12–18 years (n = 4; 20%). Of the28 experts who completed the survey in Phase 2, sevenwere researchers of family-based studies, 12 were healthresearchers, and nine were dietitians. There were 12 expertswho had expertise in two or more areas: family research,health research, nutrition. Of the experts, 50% were alsoparents and 39% had young children aged below 12 yearsat the time of participation (Table 1).
Median scores by category can be found in Table 2. Over-all, the 97 messages had a median (interquartile range) groupscore (max = 15) of 13 (1.5), with sub-scores (max = 5) of4 (1) for each individual category: clarity, usefulness and rel-evance. The overall total scores were not significantly differ-ent between parents and experts in either message set. Whilefamily and health researchers did not differ significantly intheir message scores, dietitians rated the messages signifi-cantly lower for all categories compared to family(P < 0.001) and health researchers (P < 0.001).
Based on the message review protocol adapted from pre-vious studies,24,25 65 messages were retained withoutchanges (score ≥4 for all three categories); 14 messageswere retained and reworded to improve clarity; 18 messages
were reassessed for potential inclusion, resulting in agree-ment (LKC and CM) to discard 12 messages. The revisionsinvolved minimal corrections including spelling, grammarand minor wordings. A final set of 48 messages wasselected as a set for use within an intervention targetingparents to improve dietary behaviours of their children.The set consisted of 36 messages targeting both the parents,6 messages targeting fathers and 6 messages targetingmothers. The set contained a combination of messageswhich aim to provide information about healthy eating,
Table 1 Demographics of participants by reviewer roles
Demographics Parents Family Health Dietitian Combined
Participants, n (%) 20 (100) 7 (100) 12 (100) 9 (100) 48 (100)Age (years), mean (SD) 41 (9) 45 (12) 36 (10) 37 (9) 39 (10)Gender, n (%)
Female 19 (95) 5 (71) 12 (100) 8 (89) 44 (92)Male 1 (5) 2 (29) 0 (0) 1 (11) 4 (8)
Education, n (%)Certificate/Diploma 2 (10) 0 (0) 0 (0) 0 (0) 2 (4)University Degree 10 (50) 2 (29) 7 (58) 4 (44) 23 (48)Higher University Degree 8 (40) 5 (71) 5 (42) 5 (56) 23 (48)
SEIFA, n (%)Low (IRSAD 1–3) 7 (35) 3 (43) 1 (8) 1 (11) 12 (25)Mid (IRSAD 4–6) 6 (30) 7 (100) 6 (50) 4 (44) 23 (48)High (IRSAD 7–10) 7 (35) 2 (29) 1 (8) 0 (0) 10 (21)
Invalid postcode 0 (0) 0 (0) 1 (8) 2 (22) 3 (6)Number of children, n (%)
None 0 (0) 2 (29) 8 (67) 4 (44) 14 (29)1 4 (20) 1 (14) 0 (0) 0 (0) 5 (10)2 5 (25) 1 (14) 1 (8) 4 (44) 11 (23)3 5 (25) 2 (29) 2 (17) 1 (11) 10 (21)4 4 (20) 1 (14) 1 (8) 0 (0) 6 (13)5 1 (5) 0 (0) 0 (0) 0 (0) 1 (2)6 1 (5) 0 (0) 0 (0) 0 (0) 1 (2)
Age of children (years), n (%)0–5 9 (45) 2 (29) 0 (0) 3 (33) 14 (29)5–12 10 (50) 1 (14) 1 (8) 4 (44) 16 (33)12–18 4 (20) 1 (14) 1 (8) 0 (0) 6 (13)Above 18 6 (30) 2 (29) 3 (25) 1 (11) 12 (25)
IRSAD, Index of Relative Socio-Economic Advantage and Disadvantage; SEIFA, Socio-Economic Indexes for Areas.
Table 2 Overall median score and interquartile range(IQR) of text messages (n = 97) by feedback category
Parents Experts Combined
Number of reviewers, n 20 28 48Total score (3–15),
median (IQR)12.5 (1.5) 13 (2) 13 (1.5)
Clarity (score 1–5),median (IQR)
4 (0.5) 4 (1) 4 (1)
Usefulness (score 1–5),median (IQR)
4 (0.5) 4 (1) 4 (1)
Relevance (score 1–5),median (IQR)
4 (0.5) 5 (1) 4 (1)
IQR calculated by Q3 (75th) minus Q1 (25th).
L. K. Chai et al.
518 © 2018 Dietitians Association of Australia
prompt reflections and discussions related to healthy eatinggoals, and promote healthy eating behaviour. Messages witha focus to improve knowledge (n = 14; 29%) were mainlygiving information to impart knowledge. Messages thatfocused on goals (n = 15; 31%) to prompt actions relatedto goal settings and action planning. Messages to addresssocial influences (n = 19; 40%) prompted reflection toinform discussion and subsequent actions. The overarchingform of action was to achieve discussions between parentsabout child health behaviours. The literacy level of the finalset of messages was on average grade 6 level for readability(i.e. readily understood by most 11–12-year-old).
Discussion
The aim of the current study was to develop a set of textmessages that targeted healthy eating behaviours withinfamilies and to leverage the important role that parents andthe parenting partnership plays in determining child andfamily health outcomes. The current study employed areview process involving a range of experts and researchersin family and health behaviour research, nutrition aca-demics, dietitian, and parents as message recipients whoreviewed and provided suggestions to improve messagecontent and clarity. The three phases of the message devel-opment provide a practical guide for researchers and healthproviders looking to apply a systematic approach to textmessages development in the future.
Evidence suggests that children can achieve improvedbehavioural outcomes (e.g. stronger impulse control) whentheir parents report stronger parenting partnerships.10–12
However, there are limited studies utilising parenting part-nerships to address child eating behaviours, hence the cur-rent approach is novel. The messages were designed to beimplemented in combination with additional behaviouralinterventions (e.g. website, face-to-face group sessions) toprompt parents on healthy eating within the family whilesimultaneously leveraging the influence of parenting part-nerships to support lifestyle change. The inclusion of mater-nal and paternal specific text messages was to help engageboth parents in the behaviour change, and to potentiallyovercome only one parent being responsible for change.6,7
Reporting of methods used to develop text message con-tent is currently lacking in the literature. It is commonlyunclear whether the text messages were developed in an adhoc way, informed by behaviour change theoretical frame-works, reviewed by health experts, or co-developed withfeedback from the intended recipients. The current paperoutlines the details of the application of the TDF21 andCOM-B models22 for development of text messages under-pinned by relevant theory and informed by the evidence onefficacious child weight management strategies within thecontext of the parenting partnership. The current studycontributes to the literature gap by presenting a systematicprocess for the development of text messages.20,21 The textmessages developed in the current study were alsogrounded in theory and evidence concerning the
importance of the relationship that parents share in the rais-ing of children, the parenting partnership.
Limitations of the current study include the small sampleof reviewers evaluating the messages who were predomi-nantly female (92%). Despite open recruitment strategieswere used to be inclusive of both mothers and fathers, par-ent participants who responded to invitation to participatewere primarily mothers and well-educated. A systematicreview on 667 family-based childhood obesity studiesfound that only 17% of the total parent participants werefathers.6 Future research involving usability testing withparents and evaluation of the effects of the text messages onchild eating behaviour should actively recruit both parents/caregivers especially fathers. Lastly, the final set of text mes-sages was developed specifically for a parent populationwith school aged children in the context of improving chil-dren’s eating habits. Further research is warranted to applythe developed methodology for other population groupsand health contexts to expand the literature on text mes-sages in specific areas of family intervention.
In conclusion, the text messages development process,which incorporated messages underpinned with the TDFand COM-B models of behaviour change, created a set oftext messages acceptable to experts and parents (primarilymothers) that aim to support improvement in child eatingbehaviours. The consultation process provided assurancethat the text messages were likely to be comprehensible,useful, and relevant to parents seeking to improve theirchildren’s dietary intake.
Funding source
LKC is supported by the University of Newcastle Interna-tional Postgraduate Research Scholarships, Barker PhDAward Top-up Scholarship, and Emlyn and Jennie ThomasPostgraduate Medical Research Scholarship through theHunter Medical Research Institute (HMRI). CEC is sup-ported by an NHMRC Senior Research Fellowship and aFaculty of Health and Medicine, Gladys M Brawn SeniorResearch Fellowship, the University of Newcastle. TLB issupported by a Faculty of Health and Medicine, EarlyCareer Brawn Fellowship, the University of Newcastle.
Conflict of interest
The author(s) declared no potential conflicts of interestwith respect to the research, authorship, and/or publicationof this article.
Authorship
LKC, CM, CEC and TLB contributed to the methodologicaldesign of the study. LKC and CM developed the text mes-sages which were reviewed and revised by CEC and TLB.LKC performed data analysis and prepared the manuscript.LKC, CM, CEC and TLB contributed to the revision of themanuscript and tables. This study forms part of the PhDthesis of LKC at the University of Newcastle, Australia.
Text messages for healthy eating in children
© 2018 Dietitians Association of Australia 519
References
1 Van Der Kruk JJ, Kortekaas F, Lucas C, Jager-Wittenaar H.Obesity: a systematic review on parental involvement in long-term European childhood weight control interventions with anutritional focus. Obes Rev 2013; 14: 745–60.
2 Janicke DM, Steele RG, Gayes LA et al. Systematic review andmeta-analysis of comprehensive behavioral family lifestyleinterventions addressing pediatric obesity. J Pediatr Psychol2014; 39: 809–25.
3 Loveman E, Al-Khudairy L, Johnson RE et al. Parent-only inter-ventions for childhood overweight or obesity in children aged5 to 11 years. Cochrane Database Syst Rev 2015; 12: CD012008.
4 Niemeier BS, Hektner JM, Enger KB. Parent participation inweight-related health interventions for children and adoles-cents: a systematic review and meta-analysis. Prev Med 2012;55: 3–13.
5 Oude Luttikhuis H, Baur L, Jansen H et al. Interventions fortreating obesity in children. Evid Based Child Health CochraneRev J 2009; 4: 1571–729.
6 Gicevic S, Aftosmes-Tobio A, Manganello JA et al. Parentingand childhood obesity research: a quantitative content analysisof published research 2009–2015. Obes Rev 2016; 17: 724–34.
7 Morgan PJ, Young MD, Lloyd AB et al. Involvement of fathersin pediatric obesity treatment and prevention trials: a system-atic review. Pediatrics 2017; 139: e20162635.
8 May C, Chai LK, Burrows T. Parent, partner, co-parent or part-nership? The need for clarity as family systems thinking takeshold in the quest to motivate behavioural change. Children2017; 4: 29.
9 Berge JM, MacLehose RF, Meyer C, Didericksen K, Loth KA,Neumark-Sztainer D. He said, she said: examining parentalconcordance on home environment factors and adolescenthealth behaviors and weight status. J Acad Nutr Diet 2016;116: 46–60.
10 Karreman A, van Tuijl C, van Aken MA, Dekovic M. Parenting,coparenting, and effortful control in preschoolers. J Fam Psy-chol 2008; 22: 30–40.
11 Schoppe-Sullivan SJ, Weldon AH, Cook JC, Davis EF,Buckley CK. Coparenting behavior moderates longitudinal rela-tions between effortful control and preschool children’s exter-nalizing behavior. J Child Psychol Psychiatry 2009; 50:698–706.
12 Schoppe SJ, Mangelsdorf SC, Frosch CA. Coparenting, familyprocess, and family structure: implications for preschoolers’externalizing behavior problems. J Fam Psychol 2001; 15:526–45.
13 Militello L, Melnyk BM, Hekler EB, Small L, Jacobson D. Auto-mated behavioral text messaging and face-to-face interventionfor parents of overweight or obese preschool children: resultsfrom a pilot study. JMIR Mhealth Uhealth 2016; 4: e21.
14 Jensen CD, Duncombe KM, Lott MA, Hunsaker SL,Duraccio KM, Woolford SJ. An evaluation of a smartphone-assisted behavioral weight control intervention for adolescents:pilot study. JMIR Mhealth Uhealth 2016; 4: e102.
15 Whittaker R, Matoff-Stepp S, Meehan J et al. Text4baby: devel-opment and implementation of a national text messaging
health information service. Am J Public Health 2012; 102:2207–13.
16 Eapen ZJ, Peterson ED. Can mobile health applications facili-tate meaningful behavior change?: time for answers. JAMA2015; 314: 1236–7.
17 Head KJ, Noar SM, Iannarino NT, Grant Harrington N. Effi-cacy of text messaging-based interventions for health promo-tion: a meta-analysis. Soc Sci Med 2013; 97: 41–8.
18 Davis R, Campbell R, Hildon Z, Hobbs L, Michie S. Theoriesof behaviour and behaviour change across the social and beha-vioural sciences: a scoping review. Health Psychol Rev 2015; 9:323–44.
19 Gray-Burrows KA, Day PF, Marshman Z, Aliakbari E,Prady SL, McEachan RR. Using intervention mapping todevelop a home-based parental-supervised toothbrushing inter-vention for young children. Implement Sci 2016; 11: 61.
20 Michie S, Johnston M, Abraham C, Lawton R, Parker D,Walker A. Making psychological theory useful for implement-ing evidence based practice: a consensus approach. Qual SafHealth Care 2005; 14: 26–33.
21 Cane J, O’Connor D, Michie S. Validation of the theoreticaldomains framework for use in behaviour change and imple-mentation research. Implement Sci 2012; 7: 37.
22 Michie S, van Stralen MM, West R. The behaviour changewheel: a new method for characterising and designing behav-iour change interventions. Implement Sci 2011; 6: 42.
23 Curtis KE, Lahiri S, Brown KE. Targeting parents for childhoodweight management: development of a theory-driven and user-centered healthy eating App. JMIR Mhealth Uhealth 2015;3: e69.
24 Fletcher R, May C, Wroe J et al. Development of a set ofmobile phone text messages designed for new fathers. J ReprodInfant Psychol 2016; 34: 525–34.
25 Fletcher R, May C, Kay Lambkin F et al. SMS4dads: providinginformation and support to new fathers through mobilephones—a pilot study. Adv Ment Health 2017; 15: 121–31.
26 Burrows T, Hutchesson M, Chai LK, Rollo M, Skinner G,Collins C. Nutrition interventions for prevention and manage-ment of childhood obesity: what do parents want from aneHealth program? Nutrients 2015; 7: 10469–79.
27 Sharifi M, Dryden EM, Horan CM et al. Leveraging text mes-saging and mobile technology to support pediatric obesity-related behavior change: a qualitative study using parent focusgroups and interviews. J Med Internet Res 2013; 15: e272.
28 Hingle M, Nichter M, Medeiros M, Grace S. Texting for health:the use of participatory methods to develop healthy lifestylemessages for teens. J Nutr Educ Behav 2013; 45: 12–9.
Supporting information
Additional Supporting Information may be found in theonline version of this article at the publisher’s web-site:
Table S1 Final set of 48 text messages by TheoreticalDomains Framework domains and intervention functions.
L. K. Chai et al.
520 © 2018 Dietitians Association of Australia
ORIGINAL RESEARCH
Estimating plate-based model food proportions inadults living in Scotland using short dietaryassessment questionnaires
Jenna L. HOLLIS ,1 Stephen WHYBROW,1 Leone C.A. CRAIG,1 Heather CLARK,2 Leanne GARDEN3
and Geraldine McNEILL1,21Rowett Institute of Nutrition and Health, 2Institute of Applied Health Sciences and 3School of Medicine, MedicalScience & Nutrition, University of Aberdeen, Aberdeen, UK
AbstractAim: To determine whether a food frequency questionnaire (FFQ) and a short dietary assessment tool can be used toaccurately estimate the Eatwell Guide proportions (a plate-based food model) of diets of adults living in Scotland.Methods: The cross-sectional study was conducted as a follow up of the 2010 Scottish Health Survey (participantsaged 18–65 years old). Proportions of the Eatwell Guide food groups (starchy carbohydrates, fruits and vegetables(F&V), dairy and alternatives, protein foods and oils and spreads) were calculated from the Scottish Health SurveyEating Habits Module (SHeS EHM), Scottish Collaborative Group FFQ (SCG FFQ) and a seven-day estimated food diary(reference method), and compared using the Aitchison method and Wilcoxon Signed-Rank Test. Bland–Altmananalyses assessed mean difference and 95% limits of agreement between the methods for each food group.Results: Ninety-six adults were included (mean (SD) age = 51.4 (11.1) years; body mass index = 27.1 (4.9) kg/m2;58% female). The SCG FFQ scored a lower median Aitchison distance (1.47) than the SHeS EHM (1.99) (P < 0.001),showing greater agreement with the reference method (P < 0.001). Bland–Altman plots also showed better agree-ment for the SCG FFQ than the SHeS EHM. Poorest agreement was for starchy carbohydrates (both methods), proteinfoods (SHeS EHM) and dairy (SCG FFQ).Conclusions: The SCG FFQ could be used to estimate Eatwell Guide proportions and monitor compliance to theEatwell Guide recommendations and could be improved with small changes. The SHeS EHM is less suitable, butadditional questions on dairy foods, and oils and spreads would improve its ability to estimate the Eatwell Guideproportions.
Key words: diet, health promotion, nutrition policy, public health, surveys and questionnaire.
Introduction
Many countries have national dietary models to guidepeople to make healthier dietary choices such as the UnitedStates Department of Agriculture Human Nutrition Infor-mation Service ‘MyPlate’,1 the Australian Guide to HealthyEating2 and China’s Food Pagoda.3 In the UK, the EatwellPlate4 has been used since 1995 and provides a visualrepresentation of the types and proportions of major food
groups needed for most healthy adults. This was updatedin 2016, and is now called the Eatwell Guide.5 The EatwellGuide is split into five segments representing five foodgroups: (i) potatoes, bread, rice, pasta and other starchycarbohydrate foods (starchy CHO); (ii) fruit and vegetables(F&V) (iii) dairy and alternatives (dairy); (iv) beans, pulses,fish, eggs, meat and other proteins (protein) and (v) oilsand spreads (oils) with the recommended proportions(by weight) being 38, 40, 8, 12 and 1%, respectively5
(Figure 1a). Two additional groups, which are placed out-side the main pie diagram, are foods that are high in fat, saltand sugars (HFSS) and selected fluids (hydration). Norecommended amount is given for the former, other thanthat foods in this category should be consumed infre-quently and in small amounts, if at all. Six to eight glassesof fluid each day are recommended, with a limited contri-bution of 150 ml/day from fruit juices and smoothies.
Dietary assessment tools are valuable in population moni-toring and surveillance activities to measure how well peoplecomply with dietary guidelines, and monitor trends over
J.L. Hollis, PhD, Research FellowS. Whybrow, PhD, Research FellowL.C.A. Craig, PhD, Research FellowH. Clark, Research AssistantL. Garden, Research Co-ordinatorG. McNeill, PhD, Emeritus ProfessorCorrespondence: J. Hollis, Hunter New England Local Health DistrictPopulation Health, Booth Building, Longworth Avenue, Wallsend,NSW 2287, Australia.Email: [email protected].
Accepted May 2018
© 2018 Dietitians Association of Australia 521
AA AA
DDD
ieti
tian
s As
soci
atio
nofof
Aus
tral
ia
Nutrition & Dietetics 2019; 76: 521–531 DOI: 10.1111/1747-0080.12441
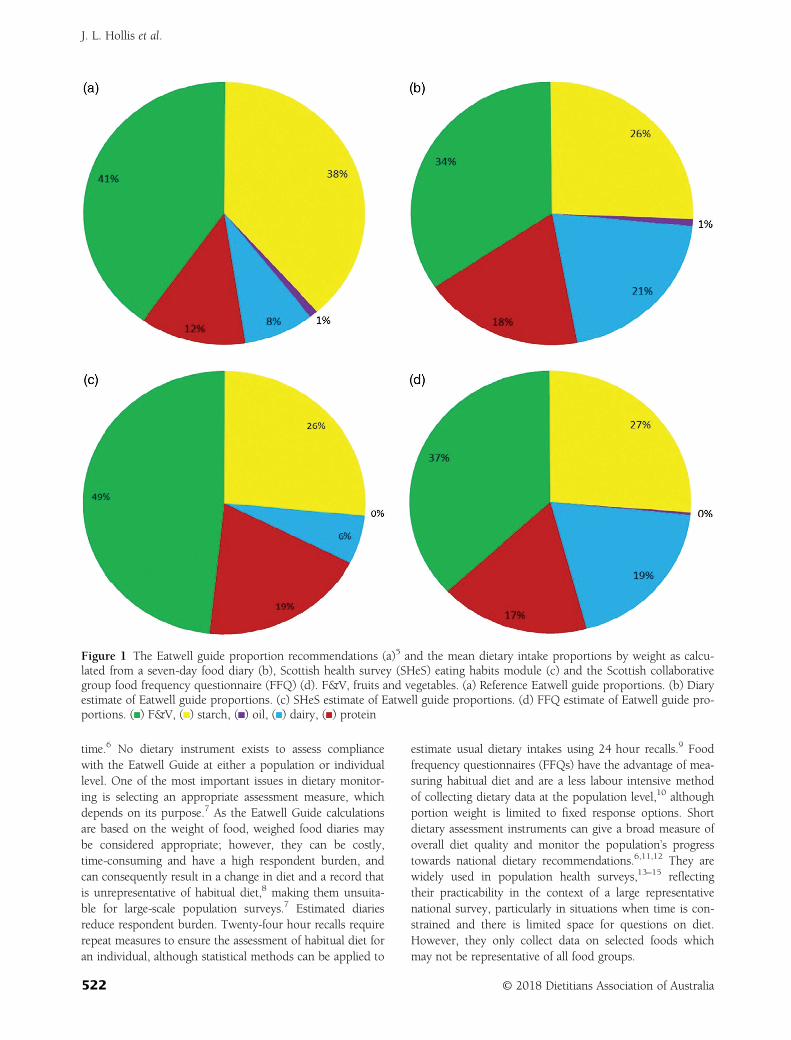
time.6 No dietary instrument exists to assess compliancewith the Eatwell Guide at either a population or individuallevel. One of the most important issues in dietary monitor-ing is selecting an appropriate assessment measure, whichdepends on its purpose.7 As the Eatwell Guide calculationsare based on the weight of food, weighed food diaries maybe considered appropriate; however, they can be costly,time-consuming and have a high respondent burden, andcan consequently result in a change in diet and a record thatis unrepresentative of habitual diet,8 making them unsuita-ble for large-scale population surveys.7 Estimated diariesreduce respondent burden. Twenty-four hour recalls requirerepeat measures to ensure the assessment of habitual diet foran individual, although statistical methods can be applied to
estimate usual dietary intakes using 24 hour recalls.9 Foodfrequency questionnaires (FFQs) have the advantage of mea-suring habitual diet and are a less labour intensive methodof collecting dietary data at the population level,10 althoughportion weight is limited to fixed response options. Shortdietary assessment instruments can give a broad measure ofoverall diet quality and monitor the population’s progresstowards national dietary recommendations.6,11,12 They arewidely used in population health surveys,13–15 reflectingtheir practicability in the context of a large representativenational survey, particularly in situations when time is con-strained and there is limited space for questions on diet.However, they only collect data on selected foods whichmay not be representative of all food groups.
Figure 1 The Eatwell guide proportion recommendations (a)5 and the mean dietary intake proportions by weight as calcu-lated from a seven-day food diary (b), Scottish health survey (SHeS) eating habits module (c) and the Scottish collaborativegroup food frequency questionnaire (FFQ) (d). F&V, fruits and vegetables. (a) Reference Eatwell guide proportions. (b) Diaryestimate of Eatwell guide proportions. (c) SHeS estimate of Eatwell guide proportions. (d) FFQ estimate of Eatwell guide pro-portions. ( ) F&V, ( ) starch, ( ) oil, ( ) dairy, ( ) protein
J. L. Hollis et al.
522 © 2018 Dietitians Association of Australia
The use of short dietary assessment tools and question-naires to measure adherence to national dietary targets hasbeen examined.6,11,16 In Australia, a food habits question-naire and semi-quantitative FFQs have been used to mea-sure adherence to food-based dietary guidelines.6,11
In Scotland, a dietary targets monitor was previously evalu-ated for use in large-scale surveys to assess population foodintake in relation to key dietary targets based on theNational Food and Health Policy.16 Currently, populationadherence to the Scottish Dietary Targets is monitoredthrough a short 24-item questionnaire.15 However, there isa lack of research examining the ability of dietary assessmenttools to estimate the proportions of major food groups(i.e. 40% of intake from fruit and vegetables based onweight, as used in the Eatwell Guide) in comparison to por-tion size food group recommendations (e.g. two serves offruit and five serves of vegetables). The present study aimedto compare the Eatwell Guide proportions calculated usingan FFQ and a short dietary assessment tool to determinewhether they can accurately estimate the Eatwell Guide pro-portions in adults living in Scotland compared with esti-mated food diaries.
Methods
The study was of cross-sectional design carried out betweenJuly and December 2013. As the aim was to recruit a repre-sentative sample of Scottish adults, participants who had pre-viously taken part in a nation-wide health survey (2010Scottish Health Survey) and agreed to be contacted about fur-ther research, were invited to participate. The Scottish HealthSurvey recruited 8473 adults who were randomly selectedusing postcode address files (response rate = 55%).17 For thepresent study, the Scottish Health Survey team randomlyselected 1600 participants from the 2010 survey (800 menand 800 women). Eligible participants were aged 18–65 yearsold, living in Scotland and had complete data for sex, age,height, body weight and Scottish Index of Multiple Depriva-tion Score (SIMD).18 Potential participants received a mailedenvelope containing an invitation letter, a consent form, ageneral questionnaire and a freepost return envelope. Thepresent study was conducted according to the guidelines laiddown in the Declaration of Helsinki, and all proceduresinvolving human subjects were approved by the RowettHuman Studies Ethical Review Panel. The reporting adheresto the Strengthening the Reporting of Observational Studiesin Epidemiology (STROBE) statement.
The present study compared an FFQ, the ScottishCollaborative Group FFQ (SCG FFQ), with a short die-tary assessment tool, the Scottish Health Survey EatingHabits Module (SHeS EHM). Participants completed thesimpler dietary assessment measures first (SHeS EHM,then SCG FFQ and seven-day estimated food diaries (ref-erence method)) to minimise the potential for responsesto influence the subsequent measure. Participants com-pleted estimated instead of weighed food diaries to reduceburden.
Dietary intake is assessed at a population level in Scot-land through the SHeS EHM;15 a component of the annualScottish Health Survey. The EHM is a short 24-iteminterviewer-led questionnaire that assesses consumption offoods relevant to the Scottish Dietary Targets.15 The SHeSEHM collects fruit and vegetable intake data through a24 hour recall using ‘everyday’ food portion terms (such astablespoons, cereal bowls and slices) for the following foodtypes: vegetables (fresh, frozen or canned); salads, pulses,vegetables in composite dishes and fruit (fresh, frozen orcanned), dried fruit and fruit in composite dishes. TheSHeS EHM also includes questions on the consumption ofa variety of other food and drink items, to gather informa-tion on eating habits more generally. The SHeS EHMassesses frequency of consumption and, other than fruitand vegetable intake, was not designed to quantify amountsconsumed.19 A trained researcher administered the SHeSEHM as a telephone interview, following the protocol usedin the SHeS. Prior to the interview, participants were mailedresponse cards (outlining possible consumption amountsand frequencies) required for completing the SHeS EHM.
The SCG FFQ (version 6.6)20 is a validated 169-item,semi-quantitative dietary assessment instrument that hasbeen developed to estimate and rank the dietary intake of awide range of nutrients in large-scale UK epidemiologicalstudies.21,22 The SCG FFQ covers 169 food items groupedinto 21 categories (e.g. breads and breakfast cereals).Possible responses for frequency of consumption range from‘rarely’, to once in a month, to seven days a week, and thenumber of serves (from 1 to 5+ per day) for the amount usu-ally consumed. Standard household measures (e.g. onetablespoon and one teaspoon) or items (e.g. one small cakeand one medium slice) are listed as portion size responses.23
The SCG FFQ was used to describe each participant’s habit-ual diet over the previous two to three months.20 Partici-pants received the paper-based SCG FFQ via mail andreturned the FFQ within one week. Participants received areminder letter if they failed to return the FFQ. Participantswith >10 missing responses were contacted by telephone andasked to clarify responses and provide missing information.
Participants also completed a seven-day estimated fooddiary, starting on different days of the week and completedover consecutive days. Participants recorded all food and bev-erages consumed in a paper-based diary, which includedstandard food portion size photographs24 to help themdescribe the quantities of foods and drinks consumed. Partici-pants could also report weights from packaged food, recordbrand names of commercial products and identify if ‘low-fat’,‘low-sugar’, ‘low-calorie’ or ‘diet’ products were used, to aididentification of the correct food item (or closest substitute)in the food composition tables. Participants received areminder letter if they failed to return their completed diaryand were contacted by telephone to clarify responses andprovide missing information if necessary. Food diary datawere analysed using Wisp 4.0 (Tinuveil Software Ltd, Llanfe-chell, UK, 2013) using the UK food composition tables.25
Food and drinks were categorised to the Eatwell Guidefood groups (based on weight in grams) for the SHeS EHM,
Estimating compliance to plate-based food models
© 2018 Dietitians Association of Australia 523
SCG FFQ and food diary. Because the SHeS EHM does notassess portion size, each food item was assumed to representthe consumption of one average serving of food, as withother non-quantitative surveys.6,11,16 Average serving sizeswere estimated from UK reference food portion sizes.23
For the food diary, foods were categorised according totheir weight after preparation, taking into account cookingweight changes and food preparation losses where neces-sary. If the raw weight of foods (i.e. from recipe compo-nents) were recorded, these food weights were converted to‘as eaten’ weights by adjusting for weight changes using theedible conversion factor in the food composition tables andcooking weight changes.25 For composite dishes that con-tained food items from more than one food group, such aslasagne, the dish was disaggregated and the appropriateproportion was assigned to the applicable Eatwell foodgroup26 using representative recipes from food compositiontables25 (n = 39), internet sources (n = 67) or from the listof ingredients (n = 99).
As recommended, the weights of all liquids (i.e. milkand fruit juices) in the Eatwell Guide were halved to adjustfor their high water content (and therefore weight) having alarge effect on the Eatwell Guide proportions.27,28 Thewater content of soups was removed from the calculations.Similarly, the protocol used for soft drinks in the develop-ment of the Eatwell Guide29 was also applied to the fooddiary, SHeS EHM and SCG FFQ, with calculations per-formed based on sugar content only and assigned to theHFSS food group. Sugar content in soft drinks wasobtained from food composition tables25 or product labels.Alcoholic beverages and miscellaneous foods that are notincluded in the Eatwell Guide (such as sauces, pickles, teaand coffee) were assigned to a miscellaneous food group forcompleteness but were not analysed. The process to calcu-late each participant’s Eatwell Guide proportions involvedfour steps outlined in Appendix I. Basal Metabolic Rate(BMR) was estimated using the equations of Schofield,30
and the ratio of reported energy intakes from the SCG FFQand estimated food diaries to BMR calculated to assess theplausibility of the dietary intakes.31
Data were analysed using SPSS Version 22 (SPSS/IBMCorp, Armonk, New York, NY, USA). Dietary data fromthe study were linked with demographic data collectedduring the 2010 Scottish Health Survey, which includedboth continuous (e.g. age) and categorical variables(e.g. sex, SIMD and area of residence). Anthropometricdata (height and weight) were objectively measured dur-ing a home visit as part of the original data collection.Height was measured in centimetre to the nearest0.02 cm using portable stadiometers (unspecified makeand model). Weight was measured in kilogram to thenearest 100 g (Tanita THD-305 or Seca 870 scales).17
Participants who reported SCG FFQ energy intakes at thehighest and lowest 2.5% of the sample were excluded, inline with the current University of Aberdeen internal SCGFFQ standard operating procedure (SCG FFQ SOP 5:Analysing and interpreting data). The absolute amounts(g/day) of the Eatwell Guide categories by the three
assessment methods were compared using Friedman testsas the data were skewed and the concurrent assessmentmeasures were not independent. Wilcoxon Signed-Ranktests were subsequently performed to test for differencesbetween pairs of assessment measures.
The proportions of the Eatwell Guide categories calcu-lated from the food diary, the SHeS EHM and SCG FFQwere compared using the Aitchison method, which com-putes the distance between two sets of composition data.32
This method measures the distance as multi-axis vectorswhere there are, in the case of the Eatwell Guide, five axes(one for each of the Eatwell Guide food groups that makeup the pie diagram), and calculates the sum of the distancesbetween the two methods. The Aitchison method comparesthe distance between compositional data collected using areference method (x; e.g. food diary) and different testmethods (y; SCG FFQ or SHeS EHM). The minimum Aitch-ison distance value is zero (for perfect agreement betweenthe two methods), and the maximum would be 16.3, asused in these analysis. A Wilcoxon signed-rank test deter-mined whether the SCG FFQ or SHeS EHM had a lower setof Aitchison distance values. Significance levels were set atP < 0.05. Bland–Altman analyses assessed mean differenceand 95% limits of agreement between the SCG FFQ or SHeSEHM and the food diary for each of the five food groups.33
Comparisons between the SHeS EHM and the food diarywere not made for the oils and spreads food group becausethe SHeS EHM contains no questions on these.
Results
One hundred and fifty participants agreed to participate(a response rate of 10%; Appendix II). Forty-nine partici-pants dropped out prior to completing all three dietaryassessment measures, leaving 101 participants (67%) withcomplete data. According to the SCG FFQ protocol, fiveparticipants reporting energy intakes at the highest andlowest 2.5% of the sample were removed from the analysis,with 96 participants in the final sample analysis. The mean(SD) ratio of reported energy intake to BMR was 1.62(0.43) and 1.13 (0.27) for the SCG FFQ and estimated fooddiary methods respectively, with 10 (11%) and 51 (53%)participants being below the method specific cutoff forplausible reports (1.14 × BMR and 1.10 × BMR, respec-tively). The sample had a mean (SD) age of 51.4 (11.1) years,and a body mass index (BMI) of 27.1 (4.9) kg/m2 (AppendixIII). The sex proportion (57% women) and BMI (27.4 kg/m2)of the 2010 SHeS sample34 was similar to the sex distributionand BMI of participants in the current study. However, moreparticipants in the 2010 SHeS sample lived in an urban loca-tion (72%) and there was a more even distribution of partici-pants across the five SIMD quintiles than in the current study(median: Quintile 3).35
Absolute amounts (g/day) of the Eatwell Guide foods asmeasured by the three methods are reported in Table 1.The proportions of food consumed from each of the fiveEatwell Guide categories (according to the food diary) arereported in Figure 1b. In comparison to the Eatwell Guide
J. L. Hollis et al.
524 © 2018 Dietitians Association of Australia
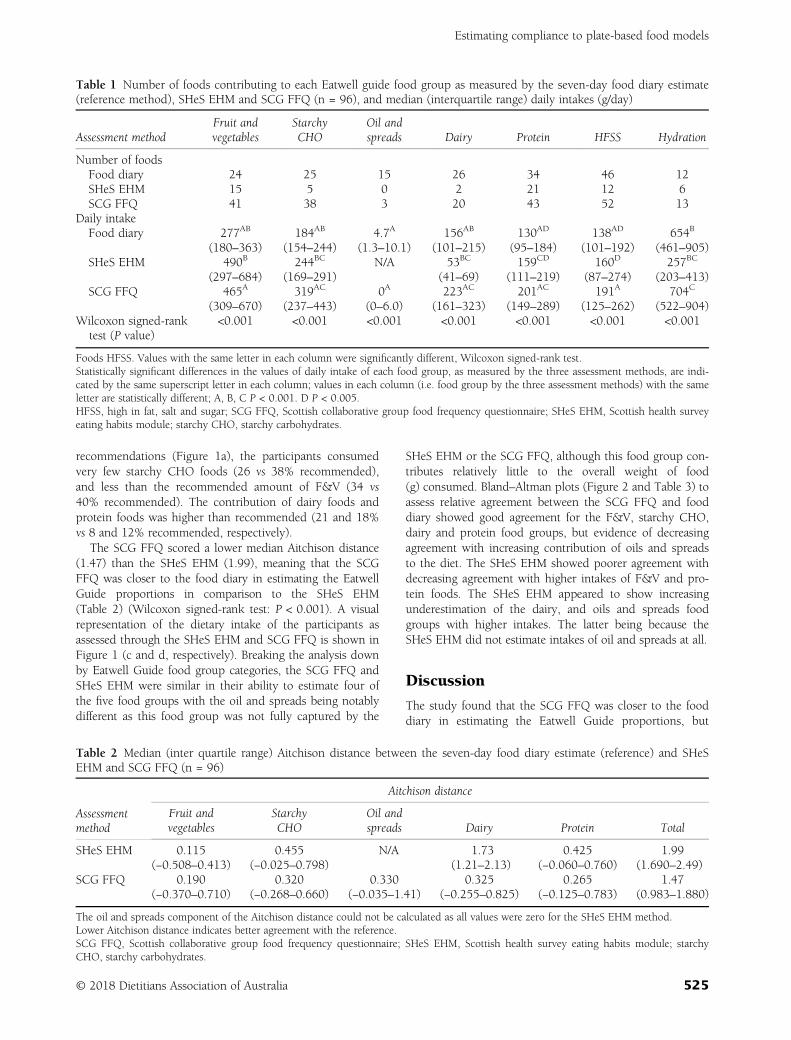
recommendations (Figure 1a), the participants consumedvery few starchy CHO foods (26 vs 38% recommended),and less than the recommended amount of F&V (34 vs40% recommended). The contribution of dairy foods andprotein foods was higher than recommended (21 and 18%vs 8 and 12% recommended, respectively).
The SCG FFQ scored a lower median Aitchison distance(1.47) than the SHeS EHM (1.99), meaning that the SCGFFQ was closer to the food diary in estimating the EatwellGuide proportions in comparison to the SHeS EHM(Table 2) (Wilcoxon signed-rank test: P < 0.001). A visualrepresentation of the dietary intake of the participants asassessed through the SHeS EHM and SCG FFQ is shown inFigure 1 (c and d, respectively). Breaking the analysis downby Eatwell Guide food group categories, the SCG FFQ andSHeS EHM were similar in their ability to estimate four ofthe five food groups with the oil and spreads being notablydifferent as this food group was not fully captured by the
SHeS EHM or the SCG FFQ, although this food group con-tributes relatively little to the overall weight of food(g) consumed. Bland–Altman plots (Figure 2 and Table 3) toassess relative agreement between the SCG FFQ and fooddiary showed good agreement for the F&V, starchy CHO,dairy and protein food groups, but evidence of decreasingagreement with increasing contribution of oils and spreadsto the diet. The SHeS EHM showed poorer agreement withdecreasing agreement with higher intakes of F&V and pro-tein foods. The SHeS EHM appeared to show increasingunderestimation of the dairy, and oils and spreads foodgroups with higher intakes. The latter being because theSHeS EHM did not estimate intakes of oil and spreads at all.
Discussion
The study found that the SCG FFQ was closer to the fooddiary in estimating the Eatwell Guide proportions, but
Table 1 Number of foods contributing to each Eatwell guide food group as measured by the seven-day food diary estimate(reference method), SHeS EHM and SCG FFQ (n = 96), and median (interquartile range) daily intakes (g/day)
Assessment methodFruit andvegetables
StarchyCHO
Oil andspreads Dairy Protein HFSS Hydration
Number of foodsFood diary 24 25 15 26 34 46 12SHeS EHM 15 5 0 2 21 12 6SCG FFQ 41 38 3 20 43 52 13
Daily intakeFood diary 277AB
(180–363)184AB
(154–244)4.7A
(1.3–10.1)156AB
(101–215)130AD
(95–184)138AD
(101–192)654B
(461–905)SHeS EHM 490B
(297–684)244BC
(169–291)N/A 53BC
(41–69)159CD
(111–219)160D
(87–274)257BC
(203–413)SCG FFQ 465A
(309–670)319AC
(237–443)0A
(0–6.0)223AC
(161–323)201AC
(149–289)191A
(125–262)704C
(522–904)Wilcoxon signed-rank
test (P value)<0.001 <0.001 <0.001 <0.001 <0.001 <0.001 <0.001
Foods HFSS. Values with the same letter in each column were significantly different, Wilcoxon signed-rank test.Statistically significant differences in the values of daily intake of each food group, as measured by the three assessment methods, are indi-cated by the same superscript letter in each column; values in each column (i.e. food group by the three assessment methods) with the sameletter are statistically different; A, B, C P < 0.001. D P < 0.005.HFSS, high in fat, salt and sugar; SCG FFQ, Scottish collaborative group food frequency questionnaire; SHeS EHM, Scottish health surveyeating habits module; starchy CHO, starchy carbohydrates.
Table 2 Median (inter quartile range) Aitchison distance between the seven-day food diary estimate (reference) and SHeSEHM and SCG FFQ (n = 96)
Assessmentmethod
Aitchison distance
Fruit andvegetables
StarchyCHO
Oil andspreads Dairy Protein Total
SHeS EHM 0.115(−0.508–0.413)
0.455(−0.025–0.798)
N/A 1.73(1.21–2.13)
0.425(−0.060–0.760)
1.99(1.690–2.49)
SCG FFQ 0.190(−0.370–0.710)
0.320(−0.268–0.660)
0.330(−0.035–1.41)
0.325(−0.255–0.825)
0.265(−0.125–0.783)
1.47(0.983–1.880)
The oil and spreads component of the Aitchison distance could not be calculated as all values were zero for the SHeS EHM method.Lower Aitchison distance indicates better agreement with the reference.SCG FFQ, Scottish collaborative group food frequency questionnaire; SHeS EHM, Scottish health survey eating habits module; starchyCHO, starchy carbohydrates.
Estimating compliance to plate-based food models
© 2018 Dietitians Association of Australia 525
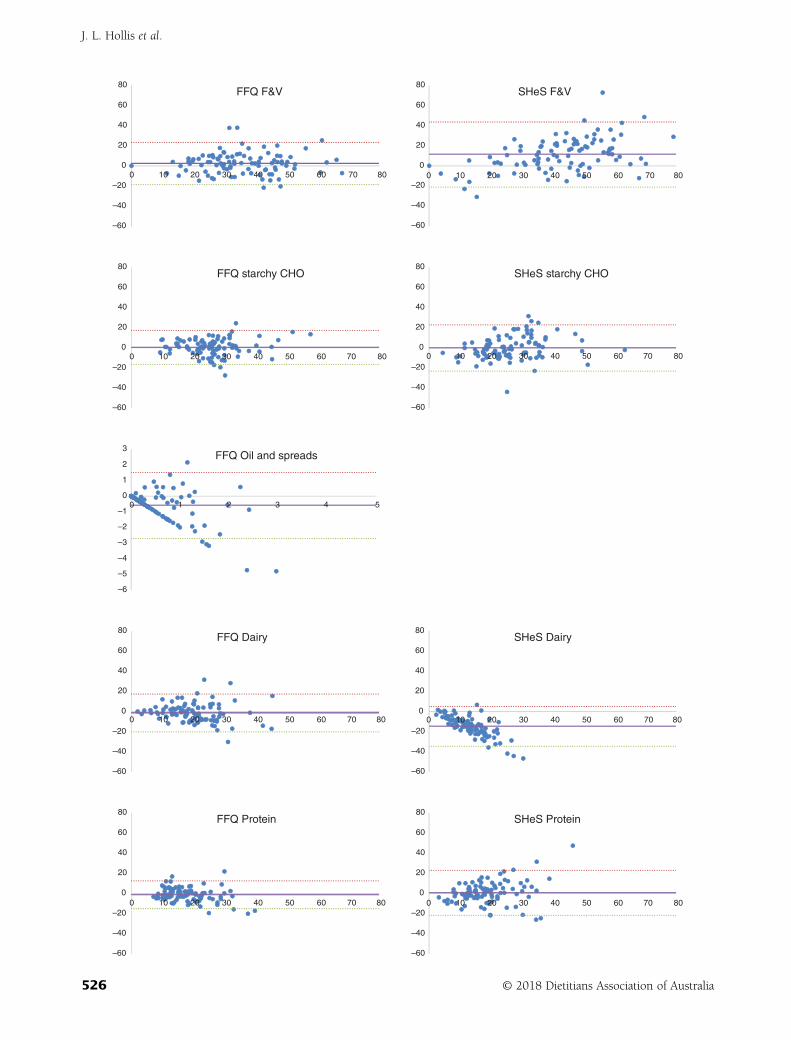
–60
–40
–20
–60
–40
–20
–60
–40
–20
–60
–40
–20
–60
–40
–20
–60
–40
–20
–60
–40
–20
–60
–40
–20
0
20
40
60
80FFQ F&V
0
20
40
60
80SHeS F&V
0
20
40
60
80FFQ starchy CHO
0
20
40
60
80SHeS starchy CHO
–6
–5
–4
–3
–2
–1
0
1
2
3FFQ Oil and spreads
0
20
40
60
80FFQ Dairy
0
20
40
60
80SHeS Dairy
0
20
40
60
80FFQ Protein
0
20
40
60
80SHeS Protein
0 10 20 30 40 50 60 70 80
0
0 1 2 3 4 5
10 20 30 40 50 60 70 80
0 10 20 30 40 50 60 70 80
0 10 20 30 40 50 60 70 80 0 10 20 30 40 50 60 70 80
0 10 20 30 40 50 60 70 80
0 10 20 30 40 50 60 70 80
0 10 20 30 40 50 60 70 80
J. L. Hollis et al.
526 © 2018 Dietitians Association of Australia
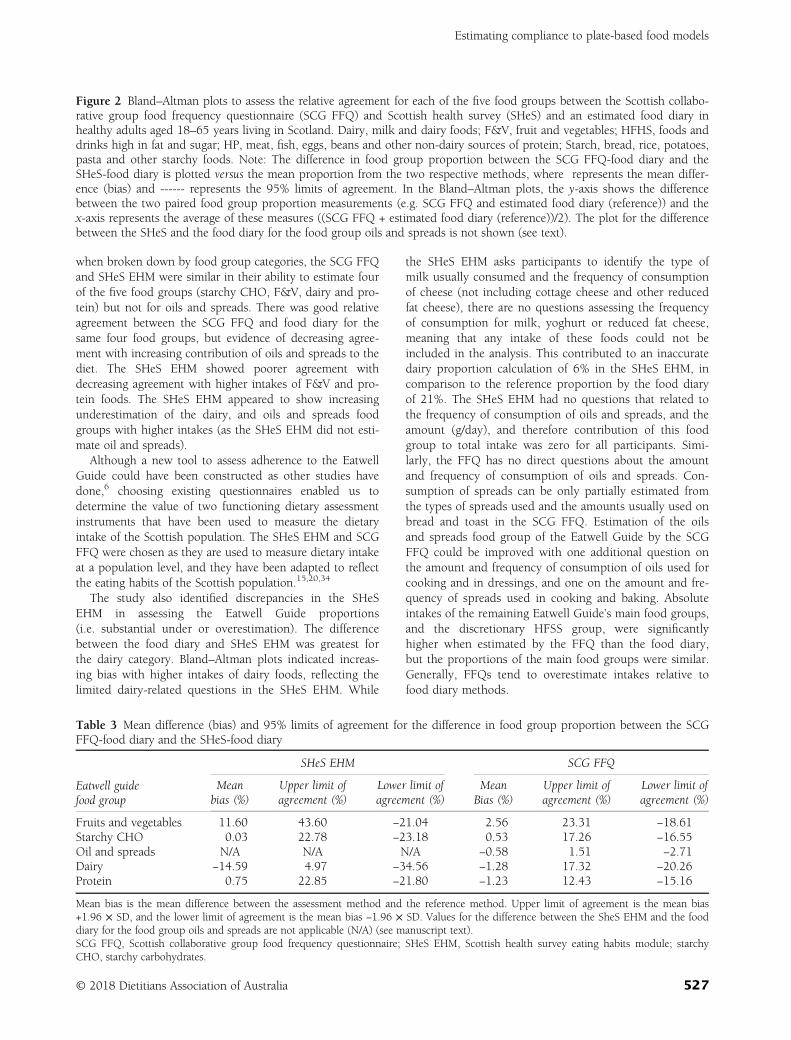
when broken down by food group categories, the SCG FFQand SHeS EHM were similar in their ability to estimate fourof the five food groups (starchy CHO, F&V, dairy and pro-tein) but not for oils and spreads. There was good relativeagreement between the SCG FFQ and food diary for thesame four food groups, but evidence of decreasing agree-ment with increasing contribution of oils and spreads to thediet. The SHeS EHM showed poorer agreement withdecreasing agreement with higher intakes of F&V and pro-tein foods. The SHeS EHM appeared to show increasingunderestimation of the dairy, and oils and spreads foodgroups with higher intakes (as the SHeS EHM did not esti-mate oil and spreads).
Although a new tool to assess adherence to the EatwellGuide could have been constructed as other studies havedone,6 choosing existing questionnaires enabled us todetermine the value of two functioning dietary assessmentinstruments that have been used to measure the dietaryintake of the Scottish population. The SHeS EHM and SCGFFQ were chosen as they are used to measure dietary intakeat a population level, and they have been adapted to reflectthe eating habits of the Scottish population.15,20,34
The study also identified discrepancies in the SHeSEHM in assessing the Eatwell Guide proportions(i.e. substantial under or overestimation). The differencebetween the food diary and SHeS EHM was greatest forthe dairy category. Bland–Altman plots indicated increas-ing bias with higher intakes of dairy foods, reflecting thelimited dairy-related questions in the SHeS EHM. While
the SHeS EHM asks participants to identify the type ofmilk usually consumed and the frequency of consumptionof cheese (not including cottage cheese and other reducedfat cheese), there are no questions assessing the frequencyof consumption for milk, yoghurt or reduced fat cheese,meaning that any intake of these foods could not beincluded in the analysis. This contributed to an inaccuratedairy proportion calculation of 6% in the SHeS EHM, incomparison to the reference proportion by the food diaryof 21%. The SHeS EHM had no questions that related tothe frequency of consumption of oils and spreads, and theamount (g/day), and therefore contribution of this foodgroup to total intake was zero for all participants. Simi-larly, the FFQ has no direct questions about the amountand frequency of consumption of oils and spreads. Con-sumption of spreads can be only partially estimated fromthe types of spreads used and the amounts usually used onbread and toast in the SCG FFQ. Estimation of the oilsand spreads food group of the Eatwell Guide by the SCGFFQ could be improved with one additional question onthe amount and frequency of consumption of oils used forcooking and in dressings, and one on the amount and fre-quency of spreads used in cooking and baking. Absoluteintakes of the remaining Eatwell Guide’s main food groups,and the discretionary HFSS group, were significantlyhigher when estimated by the FFQ than the food diary,but the proportions of the main food groups were similar.Generally, FFQs tend to overestimate intakes relative tofood diary methods.
Figure 2 Bland–Altman plots to assess the relative agreement for each of the five food groups between the Scottish collabo-rative group food frequency questionnaire (SCG FFQ) and Scottish health survey (SHeS) and an estimated food diary inhealthy adults aged 18–65 years living in Scotland. Dairy, milk and dairy foods; F&V, fruit and vegetables; HFHS, foods anddrinks high in fat and sugar; HP, meat, fish, eggs, beans and other non-dairy sources of protein; Starch, bread, rice, potatoes,pasta and other starchy foods. Note: The difference in food group proportion between the SCG FFQ-food diary and theSHeS-food diary is plotted versus the mean proportion from the two respective methods, where represents the mean differ-ence (bias) and ------ represents the 95% limits of agreement. In the Bland–Altman plots, the y-axis shows the differencebetween the two paired food group proportion measurements (e.g. SCG FFQ and estimated food diary (reference)) and thex-axis represents the average of these measures ((SCG FFQ + estimated food diary (reference))/2). The plot for the differencebetween the SHeS and the food diary for the food group oils and spreads is not shown (see text).
Table 3 Mean difference (bias) and 95% limits of agreement for the difference in food group proportion between the SCGFFQ-food diary and the SHeS-food diary
Eatwell guidefood group
SHeS EHM SCG FFQ
Meanbias (%)
Upper limit ofagreement (%)
Lower limit ofagreement (%)
MeanBias (%)
Upper limit ofagreement (%)
Lower limit ofagreement (%)
Fruits and vegetables 11.60 43.60 −21.04 2.56 23.31 −18.61Starchy CHO 0.03 22.78 −23.18 0.53 17.26 −16.55Oil and spreads N/A N/A N/A −0.58 1.51 −2.71Dairy −14.59 4.97 −34.56 −1.28 17.32 −20.26Protein 0.75 22.85 −21.80 −1.23 12.43 −15.16
Mean bias is the mean difference between the assessment method and the reference method. Upper limit of agreement is the mean bias+1.96 × SD, and the lower limit of agreement is the mean bias −1.96 × SD. Values for the difference between the SheS EHM and the fooddiary for the food group oils and spreads are not applicable (N/A) (see manuscript text).SCG FFQ, Scottish collaborative group food frequency questionnaire; SHeS EHM, Scottish health survey eating habits module; starchyCHO, starchy carbohydrates.
Estimating compliance to plate-based food models
© 2018 Dietitians Association of Australia 527
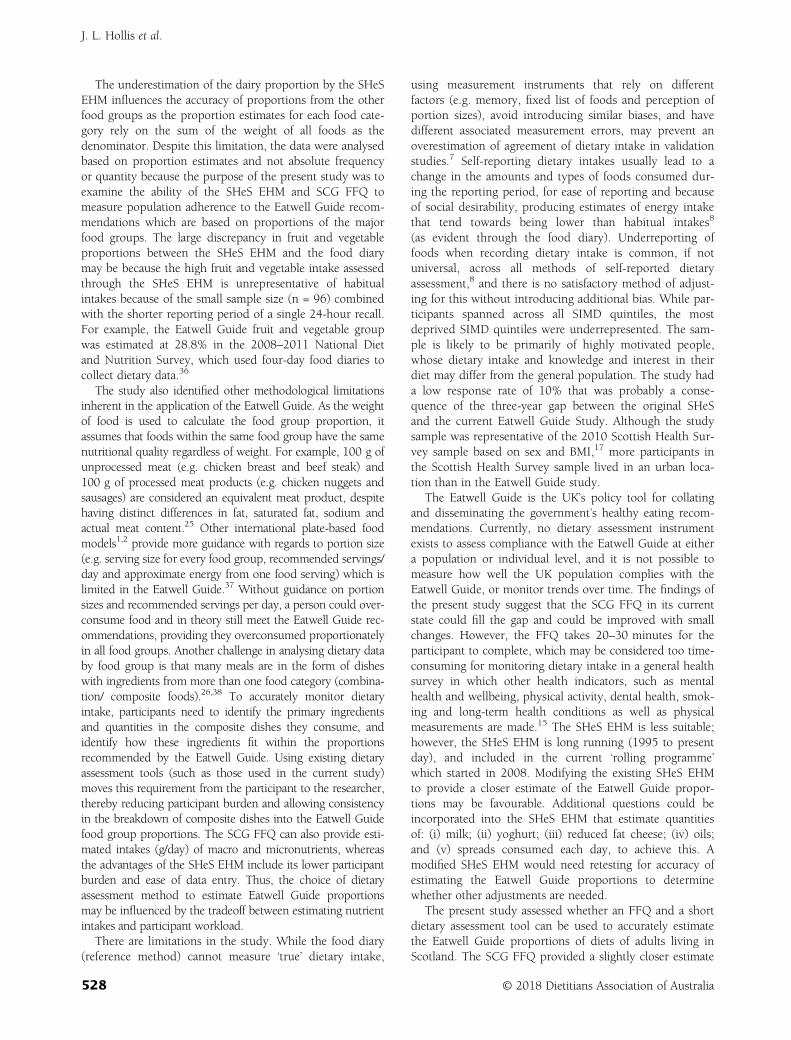
The underestimation of the dairy proportion by the SHeSEHM influences the accuracy of proportions from the otherfood groups as the proportion estimates for each food cate-gory rely on the sum of the weight of all foods as thedenominator. Despite this limitation, the data were analysedbased on proportion estimates and not absolute frequencyor quantity because the purpose of the present study was toexamine the ability of the SHeS EHM and SCG FFQ tomeasure population adherence to the Eatwell Guide recom-mendations which are based on proportions of the majorfood groups. The large discrepancy in fruit and vegetableproportions between the SHeS EHM and the food diarymay be because the high fruit and vegetable intake assessedthrough the SHeS EHM is unrepresentative of habitualintakes because of the small sample size (n = 96) combinedwith the shorter reporting period of a single 24-hour recall.For example, the Eatwell Guide fruit and vegetable groupwas estimated at 28.8% in the 2008–2011 National Dietand Nutrition Survey, which used four-day food diaries tocollect dietary data.36
The study also identified other methodological limitationsinherent in the application of the Eatwell Guide. As the weightof food is used to calculate the food group proportion, itassumes that foods within the same food group have the samenutritional quality regardless of weight. For example, 100 g ofunprocessed meat (e.g. chicken breast and beef steak) and100 g of processed meat products (e.g. chicken nuggets andsausages) are considered an equivalent meat product, despitehaving distinct differences in fat, saturated fat, sodium andactual meat content.25 Other international plate-based foodmodels1,2 provide more guidance with regards to portion size(e.g. serving size for every food group, recommended servings/day and approximate energy from one food serving) which islimited in the Eatwell Guide.37 Without guidance on portionsizes and recommended servings per day, a person could over-consume food and in theory still meet the Eatwell Guide rec-ommendations, providing they overconsumed proportionatelyin all food groups. Another challenge in analysing dietary databy food group is that many meals are in the form of disheswith ingredients from more than one food category (combina-tion/ composite foods).26,38 To accurately monitor dietaryintake, participants need to identify the primary ingredientsand quantities in the composite dishes they consume, andidentify how these ingredients fit within the proportionsrecommended by the Eatwell Guide. Using existing dietaryassessment tools (such as those used in the current study)moves this requirement from the participant to the researcher,thereby reducing participant burden and allowing consistencyin the breakdown of composite dishes into the Eatwell Guidefood group proportions. The SCG FFQ can also provide esti-mated intakes (g/day) of macro and micronutrients, whereasthe advantages of the SHeS EHM include its lower participantburden and ease of data entry. Thus, the choice of dietaryassessment method to estimate Eatwell Guide proportionsmay be influenced by the tradeoff between estimating nutrientintakes and participant workload.
There are limitations in the study. While the food diary(reference method) cannot measure ‘true’ dietary intake,
using measurement instruments that rely on differentfactors (e.g. memory, fixed list of foods and perception ofportion sizes), avoid introducing similar biases, and havedifferent associated measurement errors, may prevent anoverestimation of agreement of dietary intake in validationstudies.7 Self-reporting dietary intakes usually lead to achange in the amounts and types of foods consumed dur-ing the reporting period, for ease of reporting and becauseof social desirability, producing estimates of energy intakethat tend towards being lower than habitual intakes8
(as evident through the food diary). Underreporting offoods when recording dietary intake is common, if notuniversal, across all methods of self-reported dietaryassessment,8 and there is no satisfactory method of adjust-ing for this without introducing additional bias. While par-ticipants spanned across all SIMD quintiles, the mostdeprived SIMD quintiles were underrepresented. The sam-ple is likely to be primarily of highly motivated people,whose dietary intake and knowledge and interest in theirdiet may differ from the general population. The study hada low response rate of 10% that was probably a conse-quence of the three-year gap between the original SHeSand the current Eatwell Guide Study. Although the studysample was representative of the 2010 Scottish Health Sur-vey sample based on sex and BMI,17 more participants inthe Scottish Health Survey sample lived in an urban loca-tion than in the Eatwell Guide study.
The Eatwell Guide is the UK’s policy tool for collatingand disseminating the government’s healthy eating recom-mendations. Currently, no dietary assessment instrumentexists to assess compliance with the Eatwell Guide at eithera population or individual level, and it is not possible tomeasure how well the UK population complies with theEatwell Guide, or monitor trends over time. The findings ofthe present study suggest that the SCG FFQ in its currentstate could fill the gap and could be improved with smallchanges. However, the FFQ takes 20–30 minutes for theparticipant to complete, which may be considered too time-consuming for monitoring dietary intake in a general healthsurvey in which other health indicators, such as mentalhealth and wellbeing, physical activity, dental health, smok-ing and long-term health conditions as well as physicalmeasurements are made.15 The SHeS EHM is less suitable;however, the SHeS EHM is long running (1995 to presentday), and included in the current ‘rolling programme’which started in 2008. Modifying the existing SHeS EHMto provide a closer estimate of the Eatwell Guide propor-tions may be favourable. Additional questions could beincorporated into the SHeS EHM that estimate quantitiesof: (i) milk; (ii) yoghurt; (iii) reduced fat cheese; (iv) oils;and (v) spreads consumed each day, to achieve this. Amodified SHeS EHM would need retesting for accuracy ofestimating the Eatwell Guide proportions to determinewhether other adjustments are needed.
The present study assessed whether an FFQ and a shortdietary assessment tool can be used to accurately estimatethe Eatwell Guide proportions of diets of adults living inScotland. The SCG FFQ provided a slightly closer estimate
J. L. Hollis et al.
528 © 2018 Dietitians Association of Australia
of the Eatwell Guide proportions and better agreement, rel-ative to the food diary, than did the SHeS EHM. However,for the purpose of including in the Scottish Health Surveyand if time is constrained, it may be preferable to modifythe existing SHeS EHM, as suggested above, to provide acloser estimate of the Eatwell Guide proportions. Appropri-ate retesting for accuracy would be needed.
Funding source
This work was supported by funding from the Rural andEnvironment Science and Analytical Services Division(RESAS) programme of the Scottish Government. TheRESAS programme had no role in the design, analysis orwriting of this article.
Conflict of interest: The authors have no conflicts of interestto declare.
Authorship
SW, LCAC and GM were responsible for the design of thestudy. JLH, SW, LCAC and GM formulated the researchquestion. SW and LCAC carried out the study. JLH, LG,SW and HC completed the data entry. JLH, LG and SWconducted the statistical analysis. JLH completed the litera-ture review and drafted the initial paper. All authors wereresponsible for drafting and revising the manuscript andhave approved the final version.
References
1 United States Department of Agriculture.Myplate and historical foodpyramid choices. 2015. (Available from: https://fnic.nal.usda.gov/dietary-guidance/myplate-and-historical-food-pyramid-resources,accessed 5 May 2015).
2 National Health and Medical Research Council. AustralianGuide to Healthy Eating. Canberra: National Health and MedicalResearch Council, 2013.
3 The Chinese Nutrition Society. Dietary Guidelines for ChineseResidents and the Food Guide Pagoda. Beijing: People’s MedicalPublishing House, 1997.
4 Public Health England. From plate to guide: what, why andhow for the Eatwell model. 2016. (Available from: https://assets.publishing.service.gov.uk/government/uploads/system/uploads/attachment_data/file/579388/eatwell_model_guide_report.pdf,accessed 30 April 2018).
5 Public Health England in association with the Welsh Govern-ment. Food Standards Scotland, Food Standards Agency in NorthernIreland. The Eatwell Guide. London: Public Health England, 2016.
6 McNaughton SA, Ball K, Crawford D, Mishra GD. An index ofdiet and eating patterns is a valid measure of diet quality in anAustralian population. J Nutr 2008; 138: 86–93.
7 Willett WC. Nutritional Epidemiology, 3rd edn. New York:Oxford University Press, 2012.
8 Stubbs RJ, O’Reilly LM, Whybrow S et al. Measuring the differ-ence between actual and reported food intakes in the contextof energy balance under laboratory conditions. Brit J Nutr2014; 111: 2032–43.
9 Tooze JA, Midthune D, Dodd KW et al. A new statisticalmethod for estimating the usual intake of episodically con-sumed foods with application to their distribution. J Acad NutrDiet 2006; 106: 1575–87.
10 Ferruzzi M, Coulston AM, Boushey CJ. Nutrition in the Preven-tion and Treatment of Disease (3rd edition). San Diego, CA:Elsevier Science, 2012.
11 Ball K, Mishra GD, Thane CW, Hodge A. How well doAustralian women comply with dietary guidelines? PublicHealth Nutr 2004; 7: 443–52.
12 Rafferty AP, Anderson JV, McGee HB, Miller CE. A healthy dietindicator: quantifying compliance with the dietary guidelinesusing the BRFSS. Prev Med 2002; 35: 9–15.
13 National Cancer Institute Division of Cancern Control and Popula-tion Sciences. Short dietary assessment instruments. (Available from:https://epi.grants.cancer.gov/diet/screeners, accessed 6 February2018).
14 Australian Bureau of Statistics. National Health Survey: Users’Guide 2014–15. 2017. (Available from: http://www.abs.gov.au/ausstats/[email protected]/Lookup/by%20Subject/4363.0~2014-15~Main%20Features~Users’%20Guide~1, accessed 6 February 2018).
15 Corbett J, Day J, Davidson M et al. Scottish executive: TheScottish Health Survey 2012. Technical Report. The ScottishGovernment, Edinburgh, UK, 2012.
16 Lean ME, Anderson AS, Morrison C, Currall J. Evaluation of adietary targets monitor. Eur J Clin Nutr 2003; 57: 667–73.
17 Bromley C, Corbett J, Day J et al. The Scottish Health Survey2010. Vol. 2. Technical Report. The Scottish Government,Edinburgh, UK, 2010.
18 The Scottish Government. Introduction to SIMD 2012. 2012.(Available from: http://simd.scotland.gov.uk/publication-2012/introduction-to-simd-2012/overview-of-the-simd/what-is-the-simd/, accessed 6 August 2015).
19 Wrieden W, Peace H, Armstrong J, Barton K. A short reviewof dietary assessment methods used in National and ScottishResearch Studies. 2003.
20 Scottish Collaborative Group. Scottish collaborative group food fre-quency questionnaire. (Available from: http://www.foodfrequency.org/, accessed 5 May 2015).
21 Masson LF, McNeill G, Tomany JO et al. Statistical approachesfor assessing the relative validity of a food-frequency question-naire: use of correlation coefficients and the kappa statistic.Public Health Nutr 2003; 6: 313–21.
22 Hollis JL, Craig LC, Whybrow S, Clark H, Kyle JA, McNeill G.Assessing the relative validity of the Scottish CollaborativeGroup FFQ for measuring dietary intake in adults. PublicHealth Nutr 2017; 20: 449–55.
23 Crawley H. Food Portion Sizes, 2nd edn. London: MAFF, 1993.24 Nelson M, Atkinson M, Meyer J. Food Portion Sizes: A Users
Guide to the Photographic Atlas. London: Nutritional Epidemiol-ogy Group, Food Standards Agency, 1997.
25 Holland B, Welch AA, Unwin ID, Buss DH, Paul AA,Southgate DAT. McCance & Widdowson’s The Composition ofFoods, 5th edn. Cambridge: Royal Society of Chemistry, 1991.
26 Whybrow S, Macdiarmid JI, Craig L, Clark H, McNeill G. Usingfood intake records to estimate compliance with the Eatwellplate dietary guidelines. J Hum Nutr Diet 2015; 29: 262–8.
27 Hunt P, Gatenby S, Rayner M. The format for the NationalFood Guide: performance and preference studies. J Hum NutrDiet 1995; 8: 335–51.
28 Hunt P, Rayner M, Gatenby S. A national food guide for theUK? Background and development. J Hum Nutr Diet 1995; 8:315–22.
Estimating compliance to plate-based food models
© 2018 Dietitians Association of Australia 529
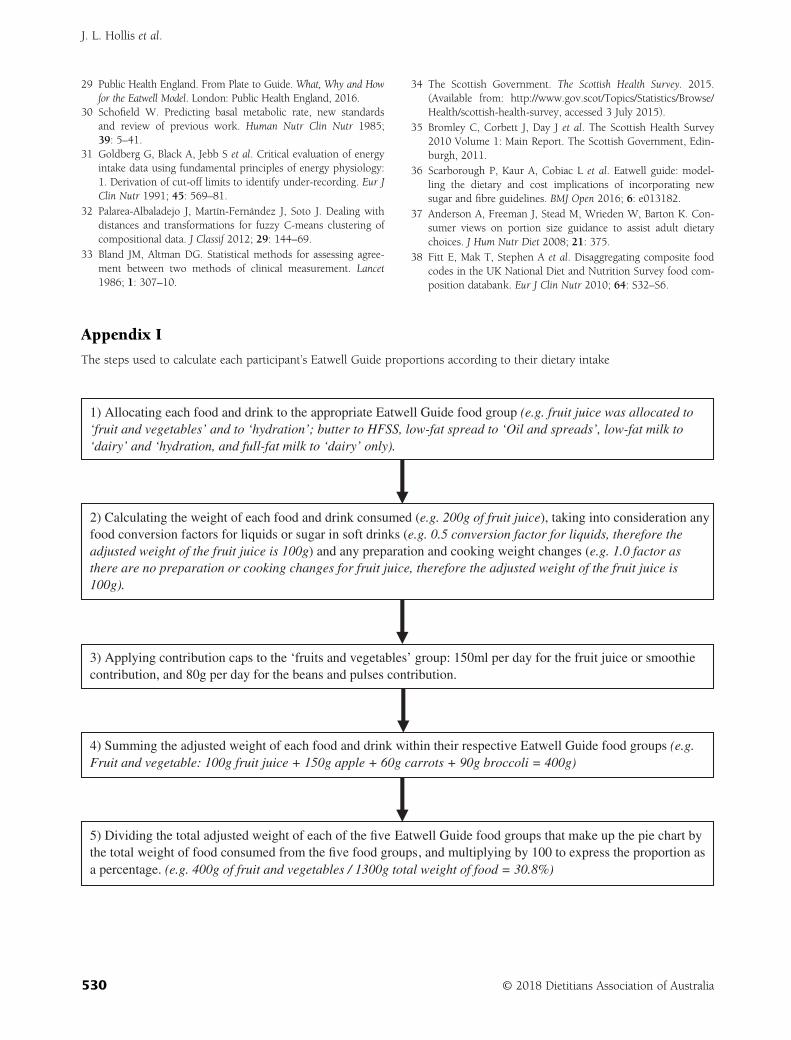
29 Public Health England. From Plate to Guide. What, Why and Howfor the Eatwell Model. London: Public Health England, 2016.
30 Schofield W. Predicting basal metabolic rate, new standardsand review of previous work. Human Nutr Clin Nutr 1985;39: 5–41.
31 Goldberg G, Black A, Jebb S et al. Critical evaluation of energyintake data using fundamental principles of energy physiology:1. Derivation of cut-off limits to identify under-recording. Eur JClin Nutr 1991; 45: 569–81.
32 Palarea-Albaladejo J, Martín-Fernández J, Soto J. Dealing withdistances and transformations for fuzzy C-means clustering ofcompositional data. J Classif 2012; 29: 144–69.
33 Bland JM, Altman DG. Statistical methods for assessing agree-ment between two methods of clinical measurement. Lancet1986; 1: 307–10.
34 The Scottish Government. The Scottish Health Survey. 2015.(Available from: http://www.gov.scot/Topics/Statistics/Browse/Health/scottish-health-survey, accessed 3 July 2015).
35 Bromley C, Corbett J, Day J et al. The Scottish Health Survey2010 Volume 1: Main Report. The Scottish Government, Edin-burgh, 2011.
36 Scarborough P, Kaur A, Cobiac L et al. Eatwell guide: model-ling the dietary and cost implications of incorporating newsugar and fibre guidelines. BMJ Open 2016; 6: e013182.
37 Anderson A, Freeman J, Stead M, Wrieden W, Barton K. Con-sumer views on portion size guidance to assist adult dietarychoices. J Hum Nutr Diet 2008; 21: 375.
38 Fitt E, Mak T, Stephen A et al. Disaggregating composite foodcodes in the UK National Diet and Nutrition Survey food com-position databank. Eur J Clin Nutr 2010; 64: S32–S6.
Appendix I
The steps used to calculate each participant’s Eatwell Guide proportions according to their dietary intake
1) Allocating each food and drink to the appropriate Eatwell Guide food group (e.g. fruit juice was allocated to ‘fruit and vegetables’ and to ‘hydration’; butter to HFSS, low-fat spread to ‘Oil and spreads’, low-fat milk to ‘dairy’ and ‘hydration, and full-fat milk to ‘dairy’ only).
2) Calculating the weight of each food and drink consumed (e.g. 200g of fruit juice), taking into consideration any food conversion factors for liquids or sugar in soft drinks (e.g. 0.5 conversion factor for liquids, therefore the adjusted weight of the fruit juice is 100g) and any preparation and cooking weight changes (e.g. 1.0 factor as there are no preparation or cooking changes for fruit juice, therefore the adjusted weight of the fruit juice is 100g).
4) Summing the adjusted weight of each food and drink within their respective Eatwell Guide food groups (e.g. Fruit and vegetable: 100g fruit juice + 150g apple + 60g carrots + 90g broccoli = 400g)
5) Dividing the total adjusted weight of each of the five Eatwell Guide food groups that make up the pie chart by the total weight of food consumed from the five food groups, and multiplying by 100 to express the proportion as a percentage. (e.g. 400g of fruit and vegetables / 1300g total weight of food = 30.8%)
3) Applying contribution caps to the ‘fruits and vegetables’ group: 150ml per day for the fruit juice or smoothie contribution, and 80g per day for the beans and pulses contribution.
Figure 3
J. L. Hollis et al.
530 © 2018 Dietitians Association of Australia
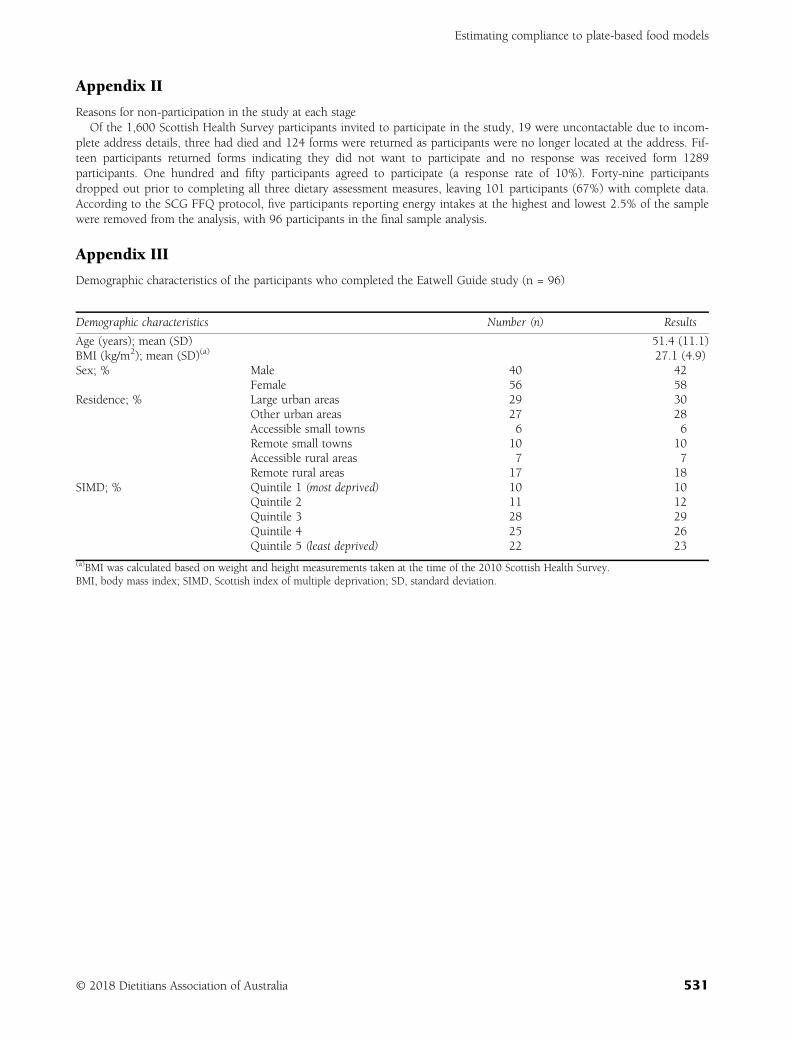
Appendix II
Reasons for non-participation in the study at each stageOf the 1,600 Scottish Health Survey participants invited to participate in the study, 19 were uncontactable due to incom-
plete address details, three had died and 124 forms were returned as participants were no longer located at the address. Fif-teen participants returned forms indicating they did not want to participate and no response was received form 1289participants. One hundred and fifty participants agreed to participate (a response rate of 10%). Forty-nine participantsdropped out prior to completing all three dietary assessment measures, leaving 101 participants (67%) with complete data.According to the SCG FFQ protocol, five participants reporting energy intakes at the highest and lowest 2.5% of the samplewere removed from the analysis, with 96 participants in the final sample analysis.
Appendix III
Demographic characteristics of the participants who completed the Eatwell Guide study (n = 96)
Demographic characteristics Number (n) Results
Age (years); mean (SD) 51.4 (11.1)BMI (kg/m2); mean (SD)(a) 27.1 (4.9)Sex; % Male 40 42
Female 56 58Residence; % Large urban areas 29 30
Other urban areas 27 28Accessible small towns 6 6Remote small towns 10 10Accessible rural areas 7 7Remote rural areas 17 18
SIMD; % Quintile 1 (most deprived) 10 10Quintile 2 11 12Quintile 3 28 29Quintile 4 25 26Quintile 5 (least deprived) 22 23
(a)BMI was calculated based on weight and height measurements taken at the time of the 2010 Scottish Health Survey.BMI, body mass index; SIMD, Scottish index of multiple deprivation; SD, standard deviation.
Estimating compliance to plate-based food models
© 2018 Dietitians Association of Australia 531
ORIGINAL RESEARCH
Development and relative validity of a self-administered semi-quantitative drinks frequencyquestionnaire, validated in a population of universitystudents
Georgios MARAKIS,1 Lamprini KONTOPOULOU,2 Gorgias GAROFALAKIS,1 Eleni VASARA,3
Georgios VASILIADIS4 and Maria G. GRAMMATIKOPOULOU 5,6
1Nutrition Policy and Research Directorate, Hellenic Food Authority, Athens, 2Department of Nutrition & Dietetics,Technological Educational Institute of Thessaly, Karditsa, Departments of 3Biology and 6Medicine, Faculty of HealthSciences, Aristotle University of Thessaloniki and 5Department of Nutrition & Dietetics, Alexander TechnologicalEducational Institute, Thessaloniki and 4Department of Informatics Engineering, Technological Educational Instituteof Western Macedonia, Kastoria, Greece
AbstractAim: Drinks can contribute to energy as well as micro- and macro-nutrient intake. Drink-specific, validated, quickand easy to administer questionnaires are needed to monitor secular trends in beverage consumption for differentpopulations. The aim of the present cross-sectional study was to develop and validate a drink-specific questionnairefor the Greek population.Methods: A 41-item semi-quantitative drinks frequency questionnaire (DFQ) was developed and validated against7-day weighed food records, among young Greek adults. Wilcoxon ranks tests, Kendall tau-b correlations and Bland–Altman plot were used to compare the two methods. Fifty-nine Greek University students (28 males, 31 females)completed both methods.Results: No difference was observed in total drinks intake between the two methods. The Bland–Altman plotshowed that the two methods are likely to agree concerning the total drinks intake. Wilcoxon’s rank test showed nosignificant differences between the two methods, except for the ‘whiskey/vodka/gin’ intake (P < 0.001). ‘Good’agreement (tau-b > 0.61) was observed for most DFQ items, including low-fat and chocolate milk, hot chocolate,Greek/espresso coffee, commercial tea, packaged fruit juices, wine, alcohol-free beer, light cola-type drinks andwater (tap/bottled/sparkling). ‘Low’ agreement (<0.30) was noted for filtered/instant/iced coffee, freshly squeezedorange juice and some alcoholic drinks (beer/whiskey/vodka/gin).Conclusions: The DFQ appears to be an overall valid means of estimating the habitual intake of drinks in large-scaleepidemiological surveys. The study supports the use of DFQ for assessing drinks consumption patterns and seculartrends.
Key words: beverage, diet, food frequency, nutrition, nutritional epidemiology, validation.
Introduction
Drinks can be important sources of nutrients, and othersubstances with physiological effects, including caffeine.Sugar-sweetened and/or alcoholic drinks can increaseenergy intake and obesity risk.1–3 A recent trend of increas-ing intake of sugar-containing drinks among young con-sumers has been observed.4 Most epidemiological studiesagree5 that frequent consumption of sugar-sweeteneddrinks contributes to the onset of metabolic syndrome, byaltering insulin sensitivity, even among young populations.6
In addition, excessive intakes of drinks (in particular softand energy drinks) have been related to a number of otherhealth ailments, such as dental erosions,7 behavioural,8 orbone problems,9 whereas inadequate hydration has been
G. Marakis, PhD, Senior ResearcherL. Kontopoulou, MSc, LecturerG. Garofalakis, PhD, Senior ResearcherE. Vasara, PhD, LecturerG. Vasiliadis, PhD, Assistant ProfessorM.G. Grammatikopoulou, PhD, Senior LecturerCorrespondence: M.G. Grammatikopoulou, Department ofNutrition & Dietetics, Alexander Technological Educational Institute,PO Box 141, Sindos, Greece.Email: [email protected]
Accepted September 2018
© 2018 Dietitians Association of Australia532
AA AA
DDD
ieti
tian
s As
soci
atio
nofof
Aus
tral
ia
Nutrition & Dietetics 2019; 76: 532–538 DOI: 10.1111/1747-0080.12494
associated to reduced cognitive performance, memory andmood.10,11 Thus, monitoring drinks consumption is pivotalin achieving better hydration and correcting unhealthydrinking habits through education.12
Assessment of a population’s consumption patterns isoften difficult, challenging and costly. Dietary surveys usu-ally rely on either multiple 24-hour dietary recalls, or fooddiaries recorded for several days. However, when largepopulations are concerned, these methods can be time-consuming and resource-intensive, as well as burdensomefor participants.13–16 Thus, for monitoring dietary trends,the need for rapid, simple and reliable assessment of foodintake has led to the development and use of valid, rela-tively short, food-frequency questionnaires (FFQs), despitefew limitations.17–19 Specific FFQs have been validated fordifferent purposes including distinct food groups, such assugar snacks,20 or specific nutrients and non-nutrient sub-stances, including caffeine.21 Short drinks FFQs have beendeveloped15,22 and proved useful in detecting changes indrinking behaviour, as well as in assessing compliance tobeverage intake guidelines.23 However, caution is neededwhen using tools developed in other countries and differentpopulations, because of cultural differences and differencesin drinks availability.
In Greece, the prevalence of overweight and obesity hasreached high levels24–26 and the need for frequent monitor-ing has been highlighted.27 Drinks contribute to a quarterof the energy intake of Greeks.28 Moreover, drinks may beimportant sources of other substances in need for periodi-cally safety assessment (e.g. ingredients of energy drinks,additives used in soft drinks, etc.). The lack of specific toolsfor quick and affordable drinks intake assessment amongGreeks is evident. FFQs developed by epidemiological stud-ies exhibit random and systematic measurement errors29
and need to be validated before use,30,31 by comparison tothe intake recorded by a more accurate dietary method.
The aim of the present study was to develop and validatea self-administered semi-quantitative drink-specific FFQ forrecording and monitoring the habitual consumption ofdrinks among young adult Greeks.
Methods
The present study was conducted in two phases (cross-sectional at two time points). Initially, a pilot phase deter-mined face and content validity of the questionnaire,carried out by a team of three experienced nutritionists(GM, LK and MGG), in order to assess whether all majordrinks were incorporated in the version. Drinks selectionwas based on previous studies.24,32,33 This phase was fol-lowed by a larger study determining the relative validity ofthe revised version (test method) against a referencemethod, which was the 7-day weighed-record.
A sample of 60 undergraduate students, aged20–23 years (28 men, 32 women), randomly selected fromthree modules, were recruited at the Technological Educa-tional Institute of Thessaly. Gender balance was sought toeliminate potential bias because of gender differences in
consumption patterns. From the individuals approached,there were no dropouts. A sample size of at least 50 butpreferably 100 or more, has been deemed adequate for vali-dation purposes.30,34 Those with diagnosed chronic disease,pregnant/lactating women were excluded. Data collectionwas carried out between March and May 2016. The dietarytools were completed in spring time, in order to avoid tem-perature extremes (e.g. heat waves) that would affect fluidintakes. The study was approved by the Ethics CommitteeTechnological Educational Institute of Thessaly BioethicsCommittee and participants provided informed consentprior to their voluntary participation. No financial incentivewas offered to participants.
The dietary tool tested was a semi-quantitative drinksfrequency questionnaire (DFQ) (Figure S1, SupportingInformation). Its validity was assessed in comparison with a7-day weighed-record, which represents a gold standardreference method in FFQ validation studies.15–18
The semi-quantitative DFQ (test method): During thedevelopment of the questionnaire, special care was givennot to underestimate drinks consumption variation, withoutit being too long, time and resource consuming, thus plac-ing high burden on the respondent. The questionnaire con-sisted of 41 questions in seven categories: (i) milk ofvarying fat and sugar content (6 items); (ii) tea and coffee(6 items); (iii) fruit juices (3 items); (iv) alcoholic beverages(7 items); (v) soft drinks (6 items); (vi) energy drinks(10 items); (vii) water (3 items) (Figure S1). No brandnames were indicated in the questionnaire, except for caf-feinated energy drinks, in order to minimise confusionbetween energy caffeinated drinks and sports drinks. Partic-ipants were asked to indicate the number of days within atypical week that they consume the specific drink (0–7)and estimate the quantity consumed per day. In order tofacilitate quantity estimation, detailed instructions were pro-vided. Quantification of the amounts consumed was facili-tated with the use of photographs of typical quantities. Themean intake of each item consumed daily was estimatedusing the formula (frequency × portion size)/7. The DFQ isa self-administered tool using the ‘past month’ referenceperiod.
The 7-day weighed food record diary (reference method): Aprinted-template was provided for participants. They wereasked to weigh every food and drink consumed (i.e. weigheach food/drink prior to its consumption, including the left-over) and record as accurately as possible all items, thetime/place of consumption, type of food/drinks with brandnames (where possible) and the volume/quantity. Verbaland written instructions were provided, on how to accu-rately record dietary intake for seven consecutive days.
Participants initially completed the semi-quantitativeDFQ, which was screened for completeness. A week later,they were requested to weigh and record everything theyconsumed, including water, for 7 days. Returned 7-dayweighed-records were checked for completeness. Based onthe information recorded with the 7-day weighed-records,an independent researcher completed the same semi-quantitative DFQ again, for each participant. This
Drinks frequency questionnaire
© 2018 Dietitians Association of Australia 533
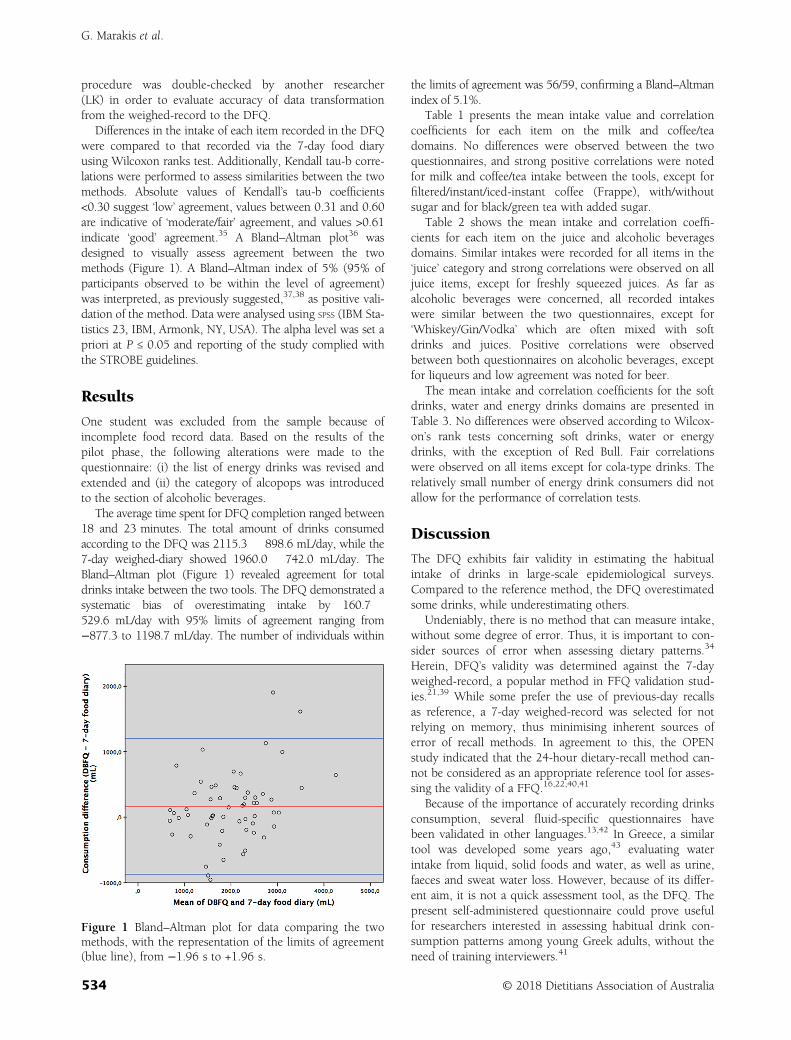
procedure was double-checked by another researcher(LK) in order to evaluate accuracy of data transformationfrom the weighed-record to the DFQ.
Differences in the intake of each item recorded in the DFQwere compared to that recorded via the 7-day food diaryusing Wilcoxon ranks test. Additionally, Kendall tau-b corre-lations were performed to assess similarities between the twomethods. Absolute values of Kendall’s tau-b coefficients<0.30 suggest ‘low’ agreement, values between 0.31 and 0.60are indicative of ‘moderate/fair’ agreement, and values >0.61indicate ‘good’ agreement.35 A Bland–Altman plot36 wasdesigned to visually assess agreement between the twomethods (Figure 1). A Bland–Altman index of 5% (95% ofparticipants observed to be within the level of agreement)was interpreted, as previously suggested,37,38 as positive vali-dation of the method. Data were analysed using SPSS (IBM Sta-tistics 23, IBM, Armonk, NY, USA). The alpha level was set apriori at P ≤ 0.05 and reporting of the study complied withthe STROBE guidelines.
Results
One student was excluded from the sample because ofincomplete food record data. Based on the results of thepilot phase, the following alterations were made to thequestionnaire: (i) the list of energy drinks was revised andextended and (ii) the category of alcopops was introducedto the section of alcoholic beverages.
The average time spent for DFQ completion ranged between18 and 23 minutes. The total amount of drinks consumedaccording to the DFQ was 2115.3 � 898.6 mL/day, while the7-day weighed-diary showed 1960.0 � 742.0 mL/day. TheBland–Altman plot (Figure 1) revealed agreement for totaldrinks intake between the two tools. The DFQ demonstrated asystematic bias of overestimating intake by 160.7 �529.6 mL/day with 95% limits of agreement ranging from−877.3 to 1198.7 mL/day. The number of individuals within
the limits of agreement was 56/59, confirming a Bland–Altmanindex of 5.1%.
Table 1 presents the mean intake value and correlationcoefficients for each item on the milk and coffee/teadomains. No differences were observed between the twoquestionnaires, and strong positive correlations were notedfor milk and coffee/tea intake between the tools, except forfiltered/instant/iced-instant coffee (Frappe), with/withoutsugar and for black/green tea with added sugar.
Table 2 shows the mean intake and correlation coeffi-cients for each item on the juice and alcoholic beveragesdomains. Similar intakes were recorded for all items in the‘juice’ category and strong correlations were observed on alljuice items, except for freshly squeezed juices. As far asalcoholic beverages were concerned, all recorded intakeswere similar between the two questionnaires, except for‘Whiskey/Gin/Vodka’ which are often mixed with softdrinks and juices. Positive correlations were observedbetween both questionnaires on alcoholic beverages, exceptfor liqueurs and low agreement was noted for beer.
The mean intake and correlation coefficients for the softdrinks, water and energy drinks domains are presented inTable 3. No differences were observed according to Wilcox-on’s rank tests concerning soft drinks, water or energydrinks, with the exception of Red Bull. Fair correlationswere observed on all items except for cola-type drinks. Therelatively small number of energy drink consumers did notallow for the performance of correlation tests.
Discussion
The DFQ exhibits fair validity in estimating the habitualintake of drinks in large-scale epidemiological surveys.Compared to the reference method, the DFQ overestimatedsome drinks, while underestimating others.
Undeniably, there is no method that can measure intake,without some degree of error. Thus, it is important to con-sider sources of error when assessing dietary patterns.34
Herein, DFQ’s validity was determined against the 7-dayweighed-record, a popular method in FFQ validation stud-ies.21,39 While some prefer the use of previous-day recallsas reference, a 7-day weighed-record was selected for notrelying on memory, thus minimising inherent sources oferror of recall methods. In agreement to this, the OPENstudy indicated that the 24-hour dietary-recall method can-not be considered as an appropriate reference tool for asses-sing the validity of a FFQ.16,22,40,41
Because of the importance of accurately recording drinksconsumption, several fluid-specific questionnaires havebeen validated in other languages.13,42 In Greece, a similartool was developed some years ago,43 evaluating waterintake from liquid, solid foods and water, as well as urine,faeces and sweat water loss. However, because of its differ-ent aim, it is not a quick assessment tool, as the DFQ. Thepresent self-administered questionnaire could prove usefulfor researchers interested in assessing habitual drink con-sumption patterns among young Greek adults, without theneed of training interviewers.41
Figure 1 Bland–Altman plot for data comparing the twomethods, with the representation of the limits of agreement(blue line), from −1.96 s to +1.96 s.
G. Marakis et al.
534 © 2018 Dietitians Association of Australia
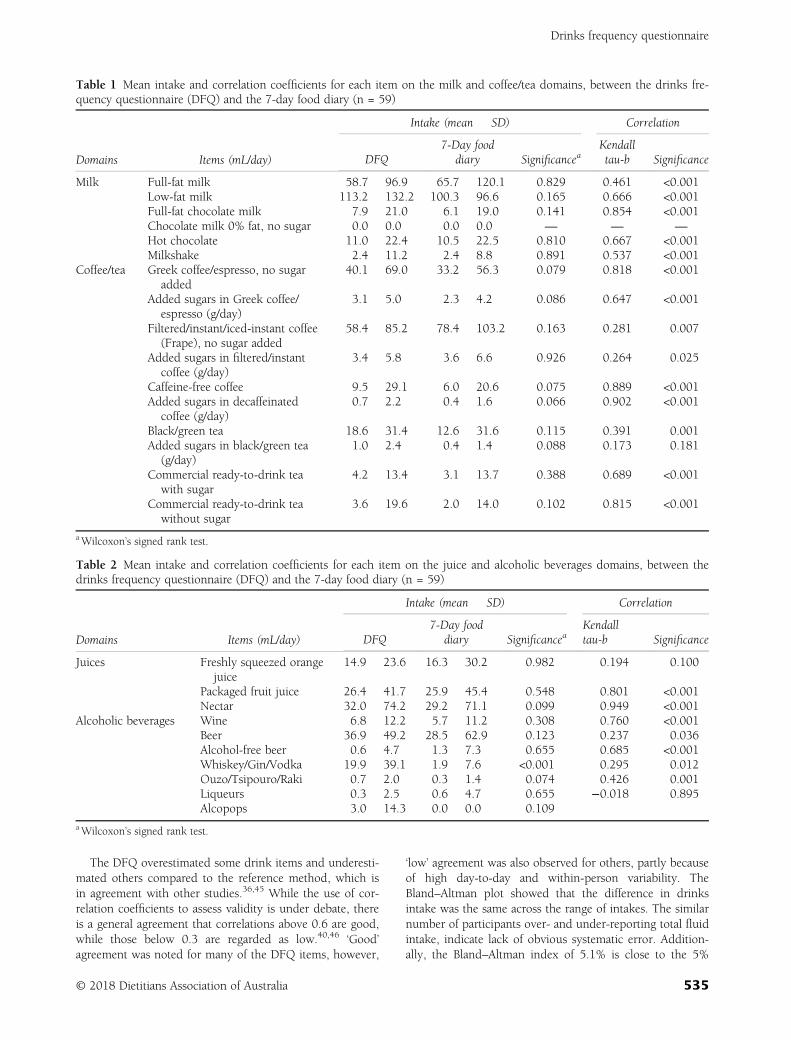
The DFQ overestimated some drink items and underesti-mated others compared to the reference method, which isin agreement with other studies.36,45 While the use of cor-relation coefficients to assess validity is under debate, thereis a general agreement that correlations above 0.6 are good,while those below 0.3 are regarded as low.40,46 ‘Good’agreement was noted for many of the DFQ items, however,
‘low’ agreement was also observed for others, partly becauseof high day-to-day and within-person variability. TheBland–Altman plot showed that the difference in drinksintake was the same across the range of intakes. The similarnumber of participants over- and under-reporting total fluidintake, indicate lack of obvious systematic error. Addition-ally, the Bland–Altman index of 5.1% is close to the 5%
Table 1 Mean intake and correlation coefficients for each item on the milk and coffee/tea domains, between the drinks fre-quency questionnaire (DFQ) and the 7-day food diary (n = 59)
Domains Items (mL/day)
Intake (mean � SD) Correlation
DFQ7-Day food
diary SignificanceaKendalltau-b Significance
Milk Full-fat milk 58.7 � 96.9 65.7 � 120.1 0.829 0.461 <0.001Low-fat milk 113.2 � 132.2 100.3 � 96.6 0.165 0.666 <0.001Full-fat chocolate milk 7.9 � 21.0 6.1 � 19.0 0.141 0.854 <0.001Chocolate milk 0% fat, no sugar 0.0 � 0.0 0.0 � 0.0 — — —
Hot chocolate 11.0 � 22.4 10.5 � 22.5 0.810 0.667 <0.001Milkshake 2.4 � 11.2 2.4 � 8.8 0.891 0.537 <0.001
Coffee/tea Greek coffee/espresso, no sugaradded
40.1 � 69.0 33.2 � 56.3 0.079 0.818 <0.001
Added sugars in Greek coffee/espresso (g/day)
3.1 � 5.0 2.3 � 4.2 0.086 0.647 <0.001
Filtered/instant/iced-instant coffee(Frape), no sugar added
58.4 � 85.2 78.4 � 103.2 0.163 0.281 0.007
Added sugars in filtered/instantcoffee (g/day)
3.4 � 5.8 3.6 � 6.6 0.926 0.264 0.025
Caffeine-free coffee 9.5 � 29.1 6.0 � 20.6 0.075 0.889 <0.001Added sugars in decaffeinated
coffee (g/day)0.7 � 2.2 0.4 � 1.6 0.066 0.902 <0.001
Black/green tea 18.6 � 31.4 12.6 � 31.6 0.115 0.391 0.001Added sugars in black/green tea
(g/day)1.0 � 2.4 0.4 � 1.4 0.088 0.173 0.181
Commercial ready-to-drink teawith sugar
4.2 � 13.4 3.1 � 13.7 0.388 0.689 <0.001
Commercial ready-to-drink teawithout sugar
3.6 � 19.6 2.0 � 14.0 0.102 0.815 <0.001
aWilcoxon’s signed rank test.
Table 2 Mean intake and correlation coefficients for each item on the juice and alcoholic beverages domains, between thedrinks frequency questionnaire (DFQ) and the 7-day food diary (n = 59)
Domains Items (mL/day)
Intake (mean � SD) Correlation
DFQ7-Day food
diary SignificanceaKendalltau-b Significance
Juices Freshly squeezed orangejuice
14.9 � 23.6 16.3 � 30.2 0.982 0.194 0.100
Packaged fruit juice 26.4 � 41.7 25.9 � 45.4 0.548 0.801 <0.001Nectar 32.0 � 74.2 29.2 � 71.1 0.099 0.949 <0.001
Alcoholic beverages Wine 6.8 � 12.2 5.7 � 11.2 0.308 0.760 <0.001Beer 36.9 � 49.2 28.5 � 62.9 0.123 0.237 0.036Alcohol-free beer 0.6 � 4.7 1.3 � 7.3 0.655 0.685 <0.001Whiskey/Gin/Vodka 19.9 � 39.1 1.9 � 7.6 <0.001 0.295 0.012Ouzo/Tsipouro/Raki 0.7 � 2.0 0.3 � 1.4 0.074 0.426 0.001Liqueurs 0.3 � 2.5 0.6 � 4.7 0.655 −0.018 0.895Alcopops 3.0 � 14.3 0.0 � 0.0 0.109
aWilcoxon’s signed rank test.
Drinks frequency questionnaire
© 2018 Dietitians Association of Australia 535
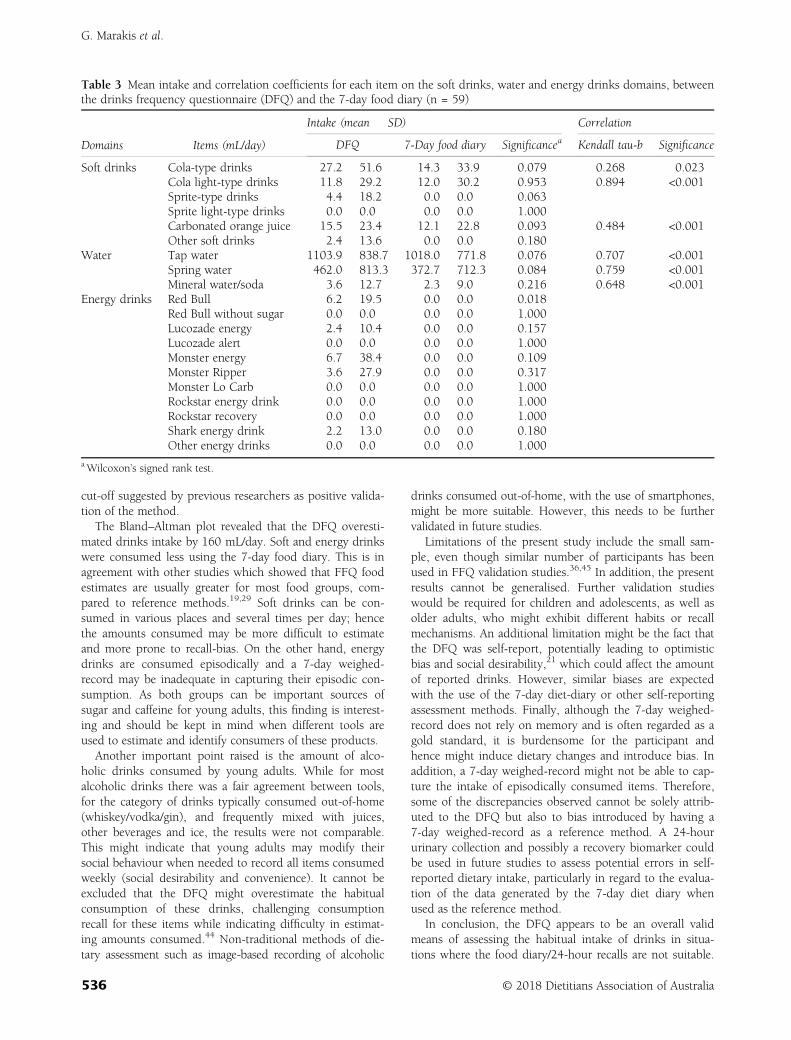
cut-off suggested by previous researchers as positive valida-tion of the method.
The Bland–Altman plot revealed that the DFQ overesti-mated drinks intake by 160 mL/day. Soft and energy drinkswere consumed less using the 7-day food diary. This is inagreement with other studies which showed that FFQ foodestimates are usually greater for most food groups, com-pared to reference methods.19,29 Soft drinks can be con-sumed in various places and several times per day; hencethe amounts consumed may be more difficult to estimateand more prone to recall-bias. On the other hand, energydrinks are consumed episodically and a 7-day weighed-record may be inadequate in capturing their episodic con-sumption. As both groups can be important sources ofsugar and caffeine for young adults, this finding is interest-ing and should be kept in mind when different tools areused to estimate and identify consumers of these products.
Another important point raised is the amount of alco-holic drinks consumed by young adults. While for mostalcoholic drinks there was a fair agreement between tools,for the category of drinks typically consumed out-of-home(whiskey/vodka/gin), and frequently mixed with juices,other beverages and ice, the results were not comparable.This might indicate that young adults may modify theirsocial behaviour when needed to record all items consumedweekly (social desirability and convenience). It cannot beexcluded that the DFQ might overestimate the habitualconsumption of these drinks, challenging consumptionrecall for these items while indicating difficulty in estimat-ing amounts consumed.44 Non-traditional methods of die-tary assessment such as image-based recording of alcoholic
drinks consumed out-of-home, with the use of smartphones,might be more suitable. However, this needs to be furthervalidated in future studies.
Limitations of the present study include the small sam-ple, even though similar number of participants has beenused in FFQ validation studies.36,45 In addition, the presentresults cannot be generalised. Further validation studieswould be required for children and adolescents, as well asolder adults, who might exhibit different habits or recallmechanisms. An additional limitation might be the fact thatthe DFQ was self-report, potentially leading to optimisticbias and social desirability,21 which could affect the amountof reported drinks. However, similar biases are expectedwith the use of the 7-day diet-diary or other self-reportingassessment methods. Finally, although the 7-day weighed-record does not rely on memory and is often regarded as agold standard, it is burdensome for the participant andhence might induce dietary changes and introduce bias. Inaddition, a 7-day weighed-record might not be able to cap-ture the intake of episodically consumed items. Therefore,some of the discrepancies observed cannot be solely attrib-uted to the DFQ but also to bias introduced by having a7-day weighed-record as a reference method. A 24-hoururinary collection and possibly a recovery biomarker couldbe used in future studies to assess potential errors in self-reported dietary intake, particularly in regard to the evalua-tion of the data generated by the 7-day diet diary whenused as the reference method.
In conclusion, the DFQ appears to be an overall validmeans of assessing the habitual intake of drinks in situa-tions where the food diary/24-hour recalls are not suitable.
Table 3 Mean intake and correlation coefficients for each item on the soft drinks, water and energy drinks domains, betweenthe drinks frequency questionnaire (DFQ) and the 7-day food diary (n = 59)
Domains Items (mL/day)
Intake (mean � SD) Correlation
DFQ 7-Day food diary Significancea Kendall tau-b Significance
Soft drinks Cola-type drinks 27.2 � 51.6 14.3 � 33.9 0.079 0.268 0.023Cola light-type drinks 11.8 � 29.2 12.0 � 30.2 0.953 0.894 <0.001Sprite-type drinks 4.4 � 18.2 0.0 � 0.0 0.063Sprite light-type drinks 0.0 � 0.0 0.0 � 0.0 1.000Carbonated orange juice 15.5 � 23.4 12.1 � 22.8 0.093 0.484 <0.001Other soft drinks 2.4 � 13.6 0.0 � 0.0 0.180
Water Tap water 1103.9 � 838.7 1018.0 � 771.8 0.076 0.707 <0.001Spring water 462.0 � 813.3 372.7 � 712.3 0.084 0.759 <0.001Mineral water/soda 3.6 � 12.7 2.3 � 9.0 0.216 0.648 <0.001
Energy drinks Red Bull 6.2 � 19.5 0.0 � 0.0 0.018Red Bull without sugar 0.0 � 0.0 0.0 � 0.0 1.000Lucozade energy 2.4 � 10.4 0.0 � 0.0 0.157Lucozade alert 0.0 � 0.0 0.0 � 0.0 1.000Monster energy 6.7 � 38.4 0.0 � 0.0 0.109Monster Ripper 3.6 � 27.9 0.0 � 0.0 0.317Monster Lo Carb 0.0 � 0.0 0.0 � 0.0 1.000Rockstar energy drink 0.0 � 0.0 0.0 � 0.0 1.000Rockstar recovery 0.0 � 0.0 0.0 � 0.0 1.000Shark energy drink 2.2 � 13.0 0.0 � 0.0 0.180Other energy drinks 0.0 � 0.0 0.0 � 0.0 1.000
aWilcoxon’s signed rank test.
G. Marakis et al.
536 © 2018 Dietitians Association of Australia
It can be used as a practical and affordable tool for monitor-ing drink intakes and consumption trends over time atpopulation level. Additionally, it could capture intakes ofdrinks that are episodically consumed and therefore, canalso be used to supplement data collected with othermethods. Further studies could be carried out in othergroups such as adolescents, who are regarded as a targetpopulation for nutrition intervention programs, and per-form further tests to validate the DFQ with regard tointakes of macro- and micro-nutrients and other drinksingredients.
Funding source
No funding was sought for this research.
Conflict of interest
The authors declared no potential conflicts of interest withrespect to the research, authorship and/or publication ofthis article.
Authorship
GM and LK contributed to the conception and design ofthe research project. LK and EV conducted the research.GV, LK and EV analysed the data. GM and MGG wrote themanuscript. GG provided comments on the paper. GM andMGG had the primary responsibility of final contents. Allauthors read and approved the final manuscript and areresponsible for intellectual content. GM and GG are scien-tific officers at the Hellenic Food Authority. The authorsalone are responsible for the content and views expressedin this publication and they do not necessarily represent thedecisions, policy or views of the Hellenic Food Authority.The authors are grateful to the students of the Technologi-cal Educational Institute of Thessaly who participated inthis study. Additionally, the authors would like to expresstheir gratitude to Professor D. B. Panagiotakos for his usefuladvice on the statistical methodology.
References
1 Fresán U, Gea A, Bes-Rastrollo M, Ruiz-Canela M, Martínez-Gonzalez MA. Substitution models of water for other bever-ages, and the incidence of obesity and weight gain in the SUNcohort. Nutrients 2016; 8: 688.
2 Papandreou D, Andreou E, Heraclides A, Rousso I. Is beverageintake related to overweight and obesity in school children?Hippokratia 2013; 17: 42–6.
3 Wang YC, Bleich SN, Gortmaker SL. Increasing caloric contri-bution from sugar-sweetened beverages and 100% fruit juicesamong US children and adolescents, 1988–2004. Pediatrics2008; 121: e1604–14.
4 Byrne R, Zhou Y, Perry R, Mauch C, Magarey A. Beverageintake of Australian children and relationship with intake offruit, vegetables, milk and body weight at 2, 3.7 and 5 years ofage. Nutr Diet 2018; 75: 159–66.
5 Deshpande G, Mapanga RF, Essop MF. Frequent sugar-sweetened beverage consumption and the onset of cardiometa-bolic diseases: cause for concern? J Endocr Soc 2017; 1:1372–85.
6 Lin W-T, Chan T-F, Huang H-L et al. Fructose-rich beverageintake and central adiposity, uric acid, and pediatric insulinresistance. J Pediatr 2016; 171: 90–6.e1.
7 Al-Dlaigan YH, Al-Meedania LA, Anil S. The influence of fre-quently consumed beverages and snacks on dental erosionamong preschool children in Saudi Arabia. Nutr J 2017;16: 80.
8 Dawodu A, Cleaver K. Behavioural correlates of energy drinkconsumption among adolescents: a review of the literature.J Child Health Care 2017; 21: 446–62.
9 Fung TT, Arasaratnam MH, Grodstein F et al. Soda consump-tion and risk of hip fractures in postmenopausal women in theNurses’ Health study. Am J Clin Nutr 2014; 100: 953–8.
10 Edmonds CJ, Crosbie L, Fatima F, Hussain M, Jacob N,Gardner M. Dose–response effects of water supplementationon cognitive performance and mood in children and adults.Appetite 2017; 108: 464–70.
11 Edmonds CJ, Harte N, Gardner M. How does drinking wateraffect attention and memory? The effect of mouth rinsing andmouth drying on children’s performance. Physiol Behav 2018;194: 233–8.
12 Franks B, Lahlou S, Bottin JH, Guelinckx I, Boesen-Mariani S.Increasing water intake in pre-school children with unhealthydrinking habits: a year-long controlled longitudinal field exper-iment assessing the impact of information, water affordance,and social regulation. Appetite 2017; 116: 205–14.
13 Marshall TA, Eichenberger Gilmore JM, Broffitt B, Levy SM,Stumbo PJ. Relative validation of a beverage frequency ques-tionnaire in children ages 6 months through 5 years using3-day food and beverage diaries. J Am Diet Assoc 2003; 103:714–20; discussion 720.
14 Thomson CA, Giuliano A, Rock CL et al. Measuring dietarychange in a diet intervention trial: comparing food frequencyquestionnaire and dietary recalls. Am J Epidemiol 2003; 157:754–62.
15 Hedrick VE, Comber DL, Estabrooks PA, Savla J, Davy BM.The beverage intake questionnaire: determining initial validityand reliability. J Am Diet Assoc 2010; 110: 1227–32.
16 Naska A, Lagiou A, Lagiou P. Dietary assessment methods inepidemiological research: current state of the art and futureprospects. F1000Research 2017; 6: 926.
17 Byers T. Food frequency dietary assessment: how bad is goodenough? Am J Epidemiol 2001; 154: 1087–8.
18 Kristal AR, Peters U, Potter JD. Is it time to abandon the foodfrequency questionnaire? Cancer Epidemiol Biomarkers Prev2005; 14: 2826–8.
19 Shrestha A, Koju RP, Beresford SAA et al. Reproducibility andrelative validity of food group intake in a food frequency ques-tionnaire developed for Nepalese diet. Int J Food Sci Nutr 2017;68: 605–12.
20 Kiwanuka SN, Astrøm AN, Trovik TA. Sugar snack consump-tion in Ugandan schoolchildren: validity and reliability of afood frequency questionnaire. Community Dent Oral Epidemiol2006; 34: 372–80.
21 Watson EJ, Kohler M, Banks S, Coates AM. Validation andreproducibility of an Australian caffeine food frequency ques-tionnaire. Int J Food Sci Nutr 2017; 68: 617–26.
22 Hedrick VE, Savla J, Comber DL et al. Development of a briefquestionnaire to assess habitual beverage intake (BEVQ-15):
Drinks frequency questionnaire
© 2018 Dietitians Association of Australia 537
sugar-sweetened beverages and total beverage energy intake. JAcad Nutr Diet 2012; 112: 840–9.
23 Hedrick VE, Comber DL, Ferguson KE et al. A rapid beverageintake questionnaire can detect changes in beverage intake. EatBehav 2013; 14: 90–4.
24 Grammatikopoulou MG, Poulimeneas D, Gounitsioti IS et al.Prevalence of simple and abdominal obesity in Greek adoles-cents: the ADONUT study. Clin Obes 2014; 4: 303–8.
25 Patsopoulou A, Tsimtsiou Z, Katsioulis A, Rachiotis G,Malissiova E, Hadjichristodoulou C. Prevalence and risk factorsof overweight and obesity among adolescents and their parentsin central Greece (FETA Project). Int J Environ Res Public Health2015; 13: 83.
26 Poulimeneas D, Vlachos D, Maraki MI et al. Diet quality, over-weight and daily monetary allowance of Greek adolescents. IntJ Adolesc Med Health 2017; doi: 10.1515/ijamh-2017-0019.
27 Grammatikopoulou MG, Poulimeneas D, Maraki MI et al. Geo-graphical distribution of simple and abdominal obesity among17-year-old adolescents in Greece. Obes Med 2016; 2: 31–6.
28 Athanasatou A, Malisova O, Kandyliari A, Kapsokefalou M.Water intake in a sample of Greek adults evaluated with thewater balance questionnaire (WBQ) and a seven-day diary.Nutrients 2016; 8: 559.
29 Subar AF, Thompson FE, Kipnis V et al. Comparative valida-tion of the Block, Willett, and National Cancer Institute foodfrequency questionnaires: the Eating at America’s Table Study.Am J Epidemiol 2001; 154: 1089–99.
30 Steinemann N, Grize L, Ziesemer K, Kauf P, Probst-Hensch N,Brombach C. Relative validation of a food frequency question-naire to estimate food intake in an adult population. Food NutrRes 2017; 61: 1305193.
31 Leventakou V, Georgiou V, Chatzi L, Sarri K. Relative validity ofan FFQ for pre-school children in the mother–child “Rhea” birthcohort in Crete, Greece. Public Health Nutr 2015; 18: 421–7.
32 Van Diepen S, Scholten AM, Korobili C et al. Greater Mediter-ranean diet adherence is observed in Dutch compared withGreek university students. Nutr Metab Cardiovasc Dis 2011; 21:534–40.
33 Theodoridis X, Grammatikopoulou MG, Gkiouras K et al.Food insecurity and Mediterranean diet adherence amongGreek university students. Nutr Metab Cardiovasc Dis 2018; 28:477–85.
34 Cade J, Thompson R, Burley V, Warm D. Development, valida-tion and utilisation of food-frequency questionnaires—areview. Public Health Nutr 2002; 5: 567–87.
35 Kendall MG. A new measure of rank correlation. Biometrika1938; 30: 81–93.
36 Bland JM, Altman DG. Measuring agreement in method com-parison studies. Stat Methods Med Res 1999; 8: 135–60.
37 Głąbska D, Książek A, Guzek D. Development and validationof the brief folate-specific food frequency questionnaire foryoung women’s diet assessment. Int J Environ Res Public Health2017; 14: 1574.
38 Myles PS, Cui J. Using the Bland–Altman method to measureagreement with repeated measures. Br J Anaesth 2007; 99:309–11.
39 Brunner E, Stallone D, Juneja M, Bingham S, Marmot M. Die-tary assessment in Whitehall II: comparison of 7 d diet diaryand food-frequency questionnaire and validity against bio-markers. Br J Nutr 2001; 86: 405–14.
40 Schatzkin A, Kipnis V, Carroll RJ et al. A comparison of a foodfrequency questionnaire with a 24-hour recall for use in an epi-demiological cohort study: results from the biomarker-basedObserving Protein and Energy Nutrition (OPEN) study. Int JEpidemiol 2003; 32: 1054–62.
41 Neuhouser ML, Lilley S, Lund A, Johnson DB. Developmentand validation of a beverage and snack questionnaire for use inevaluation of school nutrition policies. J Am Diet Assoc 2009;109: 1587–92.
42 Ferreira-Pêgo C, Nissensohn M, Kavouras SA et al. Beverageintake assessment questionnaire: relative validity and repeat-ability in a Spanish population with metabolic syndrome fromthe PREDIMED-PLUS Study. Nutrients 2016; 8: 475.
43 Malisova O, Athanasatou A, Pepa A et al. Water intake andhydration indices in healthy European adults: the EuropeanHydration Research Study (EHRS). Nutrients 2016; 8: 204.
44 Livingstone MB, Prentice AM, Strain JJ et al. Accuracy ofweighed dietary records in studies of diet and health. BMJ1990; 300: 708–12.
45 Streppel MT, de Vries JH, Meijboom S et al. Relative validity ofthe food frequency questionnaire used to assess dietary intakein the Leiden Longevity Study. Nutr J 2013; 12: 75.
46 Buch-Andersen T, Pérez-Cueto FJA, Toft U. Relative validityand reproducibility of a parent-administered semi-quantitativeFFQ for assessing food intake in Danish children aged 3–9years. Public Health Nutr 2016; 19: 1184–94.
Supporting information
Additional Supporting Information may be found in theonline version of this article at the publisher’s web-site:
Figure S1 Greek drinks frequency questionnaire (DFQ).
G. Marakis et al.
538 © 2018 Dietitians Association of Australia
ORIGINAL RESEARCH
Waist to height ratio is the anthropometric index thatmost appropriately mirrors the lifestyle andpsychological risk factors of obesity
Željka TOMAS, Tatjana ŠKARI�C-JURI�C , Matea ZAJC PETRANOVI�C, Marta JALŠOVEC,Petra RAJI�C ŠIKANJI�C and Nina SMOLEJ NARAN�CI�CInstitute for Anthropological Research, Zagreb, Croatia
AbstractAim: To determine to what extent the lifestyle and psychological factors influenced the occurrence of obesity in thepopulation of the Mediterranean island of Vis (Croatia); also to relate the examined risk factors to several obesityindicators in order to select the most sensitive one.Methods: Cross-sectional population study included 960 participants of both sexes (18–93 years) in whom the obe-sity was estimated using anthropometric indicators. The factor analysis of 55-item Food Frequency Questionnaire(FFQ) was performed as well as the General Health Questionnaire (GHQ12) for the self-assessment of psychologicalhealth and wellbeing. FFQ and GHQ12 individual factors’ scores, sex, age, physical activity, smoking and socioeco-nomic status were further used as independent variables in the multiple linear regression analyses with five obesityindicators as dependent variables.Results: The examined risk factors explained the highest proportion of variance of the waist to height ratio (WHtR)in comparison with all other indicators of obesity (body mass index (BMI), waist to hip ratio, sum of skinfolds thick-nesses, fat mass percentage). Only the dietary factors showed a significant relation to BMI, while almost all of thetested variables–dietary pattern, psychological structure, smoking habit and physical activity–had a significant asso-ciation with WHtR.Conclusions: WHtR is the most useful indicator of obesity as it had a profiled relation with a number of lifestyle fac-tors as well as with psychological health. The present study also revealed the importance of psychological factors forobesity phenotype, particularly the behavioural pattern which could be described as avoidance of dealing withproblems.
Key words: body mass index, dietary habits, Mediterranean diet, psychological factors, waist to height ratio.
Introduction
Contemporary lifestyle in the developed and developingcountries contributes to the current obesity epidemic; how-ever, there are considerable inter-individual variations inresponse to obesogenic environment and present-day wayof life. These differences are partly a result of a differentenvironmental microstructure surrounding each individual,
and partly a reflection of the interactions between environ-mental changes and a person’s genetic predisposition.1
The most important changes in human environment thatencourage the rise of the prevalence of obesity are anincreasingly common sedentary lifestyle marked by a signif-icant decrease in physical activity, and hence energy expen-diture as well as a considerable shift in diet because ofubiquitous availability of cheap, highly palatable andenergy-dense food.2,3 In addition, present-day lifestyle ischaracterised by elevated stress levels which also contrib-utes to the preference of highly palatable and energy-densefood.4,5
One of the most frequently cited ‘healthy’ diets is theMediterranean diet.6 It is characterised by frequent con-sumption of fruits, vegetables, legumes, nuts, bread andother cereal products, the use of olive oil as the primary fatfor cooking, moderate consumption of fish, poultry, dairyproducts and wine and rare consumption of red meat. Thistype of diet is found to be protective for the developmentof not only obesity but also type 2 diabetes, cardiovascular
Ž. Tomas, PhD, Postdoctoral FellowT. Škari�c-Juri�c, PhD, Associate ProfessorM. Zajc Petranovi�c, PhD, Research FellowM. Jalšovec, BA, StudentP. Raji�c Šikanji�c, PhD, Senior Research FellowN. Smolej Naran�ci�c, PhD, Professor, Team LeaderCorrespondence: T. Škari�c-Juri�c, Institute for AnthropologicalResearch, P.O. Box 290, Ljudevita Gaja 32, 10 000 Zagreb, Croatia.Tel.: +385 (0)1 5535 135; fax: +385 (0)1 5535 105.Email: [email protected]
Accepted January 2019
© 2019 Dietitians Association of Australia 539
AA AA
DDD
ieti
tian
s As
soci
atio
nofof
Aus
tral
ia
Nutrition & Dietetics 2019; 76: 539–545 DOI: 10.1111/1747-0080.12520
disease and related health indicators and cancer.6–9 There-fore, the official guidelines of the American Heart Associa-tion included some of the major principles of theMediterranean diet (2000 revision).10
The Seven Countries Study (Yugoslavia, Finland, Italy,The Netherlands, Greece, USA and Japan)11 was the firstinvestigation that highlighted the possible health benefitsof the Mediterranean diet. Original observations of thesebenefits come from Naples and Crete and the dietary pat-terns found in these two small geographical areas mayhave influenced many attempts to define the Mediterra-nean diet as a unique entity. But even though populationshave common core dietary habits across the Mediterraneanthey are far from homogeneous.12,13 Additionally, a secu-lar trend of changes has been recorded since the secondhalf of the last century in almost all Mediterranean popula-tions, with various elements of Westernisation incorpo-rated in the current dietary habits for each countryspecifically.12,14
In a study that addressed the current adherence to theMediterranean diet in Dalmatia, Mediterranean part of Cro-atia (populations of the city of Split, islands Vis andKor�cula), an overall compliance with crucial elements ofthis type of diet–traditional in those locations–was found tobe low.15 Among the three investigated populations, thehighest prevalence of overweight and obesity was found inthe island of Vis, that is at the same time characterised bythe highest adherence to the Mediterranean diet elements.15
Therefore, this population, in addition to other lifestylechanges brought by globalisation, makes it an interestingmodel for the investigation of the influence of risk factorson the occurrence of obesity.16
In the Mediterranean area of Croatia, the association ofpsychological17 as well as dietary and other lifestyle fac-tors18,19 with obesity has been investigated separately. Nowwe wish to evaluate the relative impact of those factors onobesity phenotype simultaneously. So far, the body massindex (BMI) as obesity indicator has been used in all theabove-mentioned studies. Although it is a widely used indi-cator, we wish to test here an additional set of obesity indi-cators in order to evaluate whether the BMI is truly themost sensitive instrument for detecting the influence of var-ious risk factors on obesity. Namely, it is widely known fora long time that the BMI has a number of shortcomings asan indicator of obesity. Basically, it is a simple screeningtool for a wide spectrum of purposes. However, more sensi-tive indicators are needed for more precise detection ofnutritional status as well as for the assessment of the healthrisks. Therefore, the present study contributes to thispurpose.
The aims of the present study were to (i) determine towhat extent lifestyle and psychological factors influencedthe occurrence of obesity in a Mediterranean island popula-tion and (ii) compare their relation with several anthropo-metric indicators of obesity in order to elucidate the mostuseful one. We expected to find: (i) a positive relation ofobesity with higher frequency of energy-dense food intake,with lower physical activity and a lower level of
psychological health and wellbeing and (ii) the strongestassociation of BMI with lifestyle and psychological riskfactors.
Methods
This cross-sectional population study was performed on thesmall Mediterranean island of Vis, as the reduction of theenvironmental variance enhances the chance of detectingthe factors that are responsible for the inter-individual dif-ferences in the obesity status within a socioeconomicallyhomogeneous community.19 Therefore, all adult inhabitantsof two largest villages were invited to participate in thestudy and the initial sample, encompassing 986 participants,presents the majority of the adult population of the island.After the exclusion of records containing missing data, theanalysed sample included 960 participants of both sexes,between the age of 18 and 93 years, who all gave theirinformed consent. The data were collected during 2003 and2004 after obtaining the approval from the Ethical Commit-tee of the Medical School, University of Zagreb and theMulti-Centre Research Ethics Committee for Scotland, andcomplied with the tenets of the Declaration of Helsinki.
Anthropometry was performed according to the standardInternational Biological Program protocol and included themeasurements of height, weight, waist and hip circumfer-ences and skinfolds.20 Analyses were performed for the fol-lowing indicators of obesity: BMI, waist to hip ratio (WHR),waist to height ratio (WHtR), sum of skinfold thicknesses(biceps, triceps, subscapular, suprailiac and abdominal) andfat mass percentage (FAT) estimated by means of bioelectri-cal impedance.21 The lifestyle factors included the informa-tion on physical activity (sum of the self-estimated physicalactivity during work and leisure time), smoking (cumulativelife-long exposure index: pack/year) and the socioeconomicstatus (self-estimated in comparison with other people).The survey included a 55-item Food Frequency Question-naire (FFQ) developed for this specific population.22 It con-tained six potential answers (every day, 2–3 times a week,once a week, once a month, rarely, never) regarding thefrequency of consumption of various foods (milk anddairy products, meat and meat products, fish and fish prod-ucts, eggs, vegetables, fruit and fruit products, cerealsand cereal products, confectionery, and the type of fat usedin the preparation of meals). The same FFQ was alsoused to evaluate the adherence to the Mediterraneandiet using the Mediterranean Diet Serving Score (MDSS)method described by Monteagudo et al.23 and used byKol�ci�c et al.15 for the three Croatian populations. MDSS isan instrument created to assess the Mediterranean dietadherence based on the consumption of 14 groups of foodsadding 1, 2 or 3 points based on the consumption fre-quency and the relative importance of particular foods. TheMDSS ranges from 0 to 24 points, with the range from14 to 24 points considered as good compliance with theMediterranean diet.
General Health Questionnaire (GHQ12) was used for theself-assessment of psychological health and wellbeing.24 It
Ž. Tomas et al.
540 © 2019 Dietitians Association of Australia
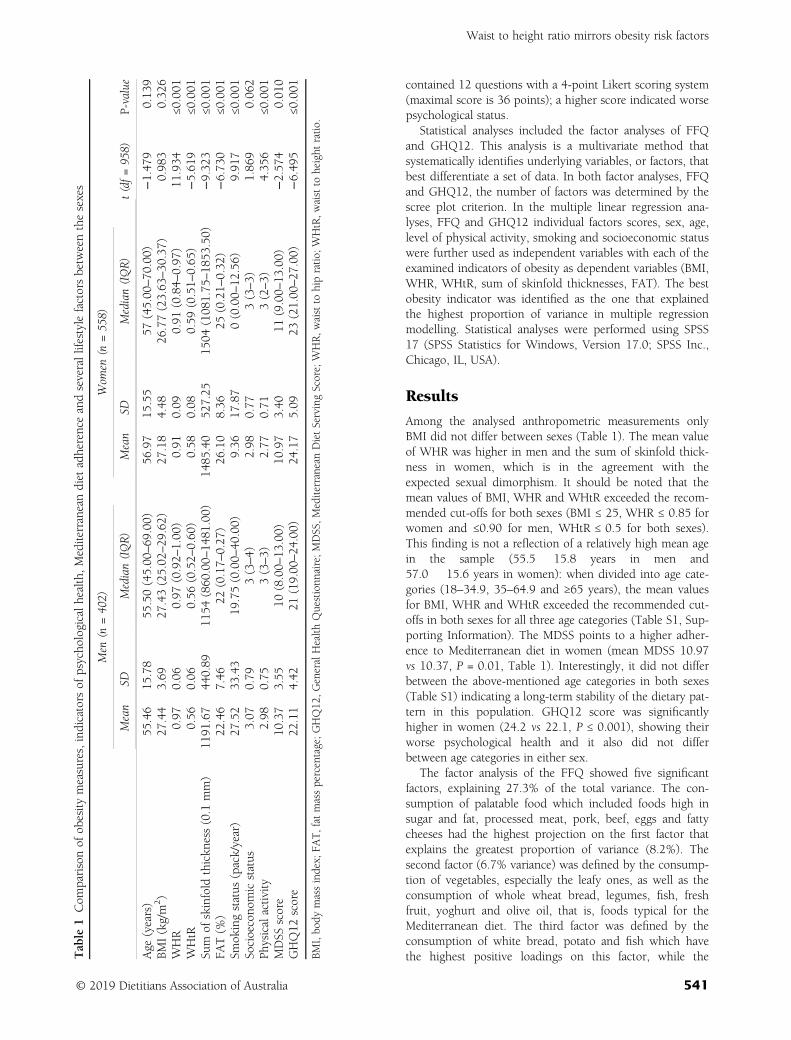
contained 12 questions with a 4-point Likert scoring system(maximal score is 36 points); a higher score indicated worsepsychological status.
Statistical analyses included the factor analyses of FFQand GHQ12. This analysis is a multivariate method thatsystematically identifies underlying variables, or factors, thatbest differentiate a set of data. In both factor analyses, FFQand GHQ12, the number of factors was determined by thescree plot criterion. In the multiple linear regression ana-lyses, FFQ and GHQ12 individual factors scores, sex, age,level of physical activity, smoking and socioeconomic statuswere further used as independent variables with each of theexamined indicators of obesity as dependent variables (BMI,WHR, WHtR, sum of skinfold thicknesses, FAT). The bestobesity indicator was identified as the one that explainedthe highest proportion of variance in multiple regressionmodelling. Statistical analyses were performed using SPSS17 (SPSS Statistics for Windows, Version 17.0; SPSS Inc.,Chicago, IL, USA).
Results
Among the analysed anthropometric measurements onlyBMI did not differ between sexes (Table 1). The mean valueof WHR was higher in men and the sum of skinfold thick-ness in women, which is in the agreement with theexpected sexual dimorphism. It should be noted that themean values of BMI, WHR and WHtR exceeded the recom-mended cut-offs for both sexes (BMI ≤ 25, WHR ≤ 0.85 forwomen and ≤0.90 for men, WHtR ≤ 0.5 for both sexes).This finding is not a reflection of a relatively high mean agein the sample (55.5 � 15.8 years in men and57.0 � 15.6 years in women): when divided into age cate-gories (18–34.9, 35–64.9 and ≥65 years), the mean valuesfor BMI, WHR and WHtR exceeded the recommended cut-offs in both sexes for all three age categories (Table S1, Sup-porting Information). The MDSS points to a higher adher-ence to Mediterranean diet in women (mean MDSS 10.97vs 10.37, P = 0.01, Table 1). Interestingly, it did not differbetween the above-mentioned age categories in both sexes(Table S1) indicating a long-term stability of the dietary pat-tern in this population. GHQ12 score was significantlyhigher in women (24.2 vs 22.1, P ≤ 0.001), showing theirworse psychological health and it also did not differbetween age categories in either sex.
The factor analysis of the FFQ showed five significantfactors, explaining 27.3% of the total variance. The con-sumption of palatable food which included foods high insugar and fat, processed meat, pork, beef, eggs and fattycheeses had the highest projection on the first factor thatexplains the greatest proportion of variance (8.2%). Thesecond factor (6.7% variance) was defined by the consump-tion of vegetables, especially the leafy ones, as well as theconsumption of whole wheat bread, legumes, fish, freshfruit, yoghurt and olive oil, that is, foods typical for theMediterranean diet. The third factor was defined by theconsumption of white bread, potato and fish which havethe highest positive loadings on this factor, while theT
able
1Com
parisonof
obesity
measures,indicators
ofpsycho
logicalhealth,Mediterraneandiet
adherenceandseverallifestylefactorsbetweenthesexes
Men
(n=402)
Wom
en(n
=558)
t(df=958)
P-value
Mean�
SDMedian(IQR)
Mean�
SDMedian(IQR)
Age
(years)
55.46�
15.78
55.50(45.00
–69
.00)
56.97�
15.55
57(45.00
–70
.00)
−1.47
90.13
9BM
I(kg/m
2)
27.44�
3.69
27.43(25.02
–29
.62)
27.18�
4.48
26.77(23.63
–30
.37)
0.98
30.32
6WHR
0.97
�0.06
0.97
(0.92–
1.00
)0.91
�0.09
0.91
(0.84–
0.97
)11
.934
≤0.001
WHtR
0.56
�0.06
0.56
(0.52–
0.60
)0.58
�0.08
0.59
(0.51–
0.65
)−5.61
9≤0
.001
Sum
ofskinfold
thickn
ess(0.1
mm)
1191
.67�
440.89
1154
(860
.00–
1481
.00)
1485
.40�
527.25
1504
(108
1.75
–18
53.50)
−9.32
3≤0
.001
FAT(%
)22
.46�
7.46
22(0.17–
0.27
)26
.10�
8.36
25(0.21–
0.32
)−6.73
0≤0
.001
Smok
ingstatus
(pack/year)
27.52�
33.43
19.75(0.00–
40.00)
9.36
�17
.87
0(0.00–
12.56)
9.91
7≤0
.001
Socioecono
micstatus
3.07
�0.79
3(3–4)
2.98
�0.77
3(3–3)
1.86
90.06
2Ph
ysicalactivity
2.98
�0.75
3(3–3)
2.77
�0.71
3(2–3)
4.35
6≤0
.001
MDSS
score
10.37�
3.55
10(8.00–
13.00)
10.97�
3.40
11(9.00–
13.00)
−2.57
40.01
0GHQ12
score
22.11�
4.42
21(19.00
–24
.00)
24.17�
5.09
23(21.00
–27
.00)
−6.49
5≤0
.001
BMI,bo
dymassindex;
FAT,fatmasspercentage;GHQ12
,GeneralHealth
Questionn
aire;MDSS,M
editerraneanDietServingScore;WHR,w
aistto
hipratio
;WHtR,w
aistto
height
ratio
.
Waist to height ratio mirrors obesity risk factors
© 2019 Dietitians Association of Australia 541
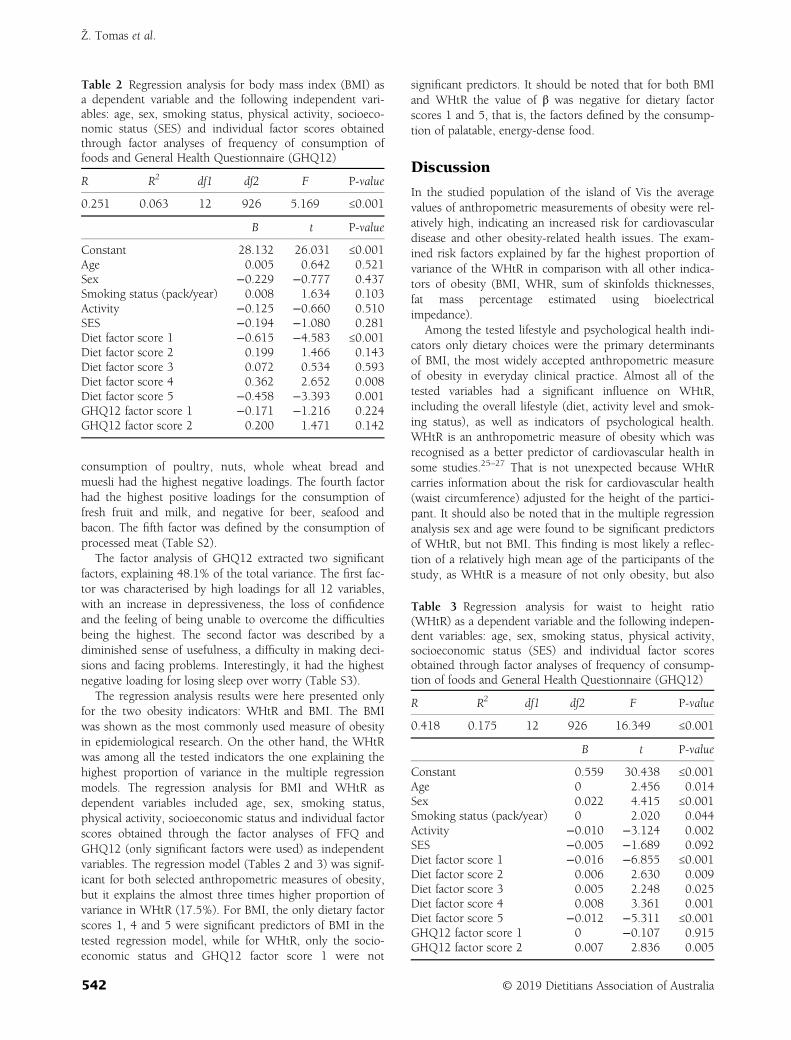
consumption of poultry, nuts, whole wheat bread andmuesli had the highest negative loadings. The fourth factorhad the highest positive loadings for the consumption offresh fruit and milk, and negative for beer, seafood andbacon. The fifth factor was defined by the consumption ofprocessed meat (Table S2).
The factor analysis of GHQ12 extracted two significantfactors, explaining 48.1% of the total variance. The first fac-tor was characterised by high loadings for all 12 variables,with an increase in depressiveness, the loss of confidenceand the feeling of being unable to overcome the difficultiesbeing the highest. The second factor was described by adiminished sense of usefulness, a difficulty in making deci-sions and facing problems. Interestingly, it had the highestnegative loading for losing sleep over worry (Table S3).
The regression analysis results were here presented onlyfor the two obesity indicators: WHtR and BMI. The BMIwas shown as the most commonly used measure of obesityin epidemiological research. On the other hand, the WHtRwas among all the tested indicators the one explaining thehighest proportion of variance in the multiple regressionmodels. The regression analysis for BMI and WHtR asdependent variables included age, sex, smoking status,physical activity, socioeconomic status and individual factorscores obtained through the factor analyses of FFQ andGHQ12 (only significant factors were used) as independentvariables. The regression model (Tables 2 and 3) was signif-icant for both selected anthropometric measures of obesity,but it explains the almost three times higher proportion ofvariance in WHtR (17.5%). For BMI, the only dietary factorscores 1, 4 and 5 were significant predictors of BMI in thetested regression model, while for WHtR, only the socio-economic status and GHQ12 factor score 1 were not
significant predictors. It should be noted that for both BMIand WHtR the value of β was negative for dietary factorscores 1 and 5, that is, the factors defined by the consump-tion of palatable, energy-dense food.
Discussion
In the studied population of the island of Vis the averagevalues of anthropometric measurements of obesity were rel-atively high, indicating an increased risk for cardiovasculardisease and other obesity-related health issues. The exam-ined risk factors explained by far the highest proportion ofvariance of the WHtR in comparison with all other indica-tors of obesity (BMI, WHR, sum of skinfolds thicknesses,fat mass percentage estimated using bioelectricalimpedance).
Among the tested lifestyle and psychological health indi-cators only dietary choices were the primary determinantsof BMI, the most widely accepted anthropometric measureof obesity in everyday clinical practice. Almost all of thetested variables had a significant influence on WHtR,including the overall lifestyle (diet, activity level and smok-ing status), as well as indicators of psychological health.WHtR is an anthropometric measure of obesity which wasrecognised as a better predictor of cardiovascular health insome studies.25–27 That is not unexpected because WHtRcarries information about the risk for cardiovascular health(waist circumference) adjusted for the height of the partici-pant. It should also be noted that in the multiple regressionanalysis sex and age were found to be significant predictorsof WHtR, but not BMI. This finding is most likely a reflec-tion of a relatively high mean age of the participants of thestudy, as WHtR is a measure of not only obesity, but also
Table 2 Regression analysis for body mass index (BMI) asa dependent variable and the following independent vari-ables: age, sex, smoking status, physical activity, socioeco-nomic status (SES) and individual factor scores obtainedthrough factor analyses of frequency of consumption offoods and General Health Questionnaire (GHQ12)
R R2 df1 df2 F P-value
0.251 0.063 12 926 5.169 ≤0.001
B t P-value
Constant 28.132 26.031 ≤0.001Age 0.005 0.642 0.521Sex −0.229 −0.777 0.437Smoking status (pack/year) 0.008 1.634 0.103Activity −0.125 −0.660 0.510SES −0.194 −1.080 0.281Diet factor score 1 −0.615 −4.583 ≤0.001Diet factor score 2 0.199 1.466 0.143Diet factor score 3 0.072 0.534 0.593Diet factor score 4 0.362 2.652 0.008Diet factor score 5 −0.458 −3.393 0.001GHQ12 factor score 1 −0.171 −1.216 0.224GHQ12 factor score 2 0.200 1.471 0.142
Table 3 Regression analysis for waist to height ratio(WHtR) as a dependent variable and the following indepen-dent variables: age, sex, smoking status, physical activity,socioeconomic status (SES) and individual factor scoresobtained through factor analyses of frequency of consump-tion of foods and General Health Questionnaire (GHQ12)
R R2 df1 df2 F P-value
0.418 0.175 12 926 16.349 ≤0.001
B t P-value
Constant 0.559 30.438 ≤0.001Age 0 2.456 0.014Sex 0.022 4.415 ≤0.001Smoking status (pack/year) 0 2.020 0.044Activity −0.010 −3.124 0.002SES −0.005 −1.689 0.092Diet factor score 1 −0.016 −6.855 ≤0.001Diet factor score 2 0.006 2.630 0.009Diet factor score 3 0.005 2.248 0.025Diet factor score 4 0.008 3.361 0.001Diet factor score 5 −0.012 −5.311 ≤0.001GHQ12 factor score 1 0 −0.107 0.915GHQ12 factor score 2 0.007 2.836 0.005
Ž. Tomas et al.
542 © 2019 Dietitians Association of Australia
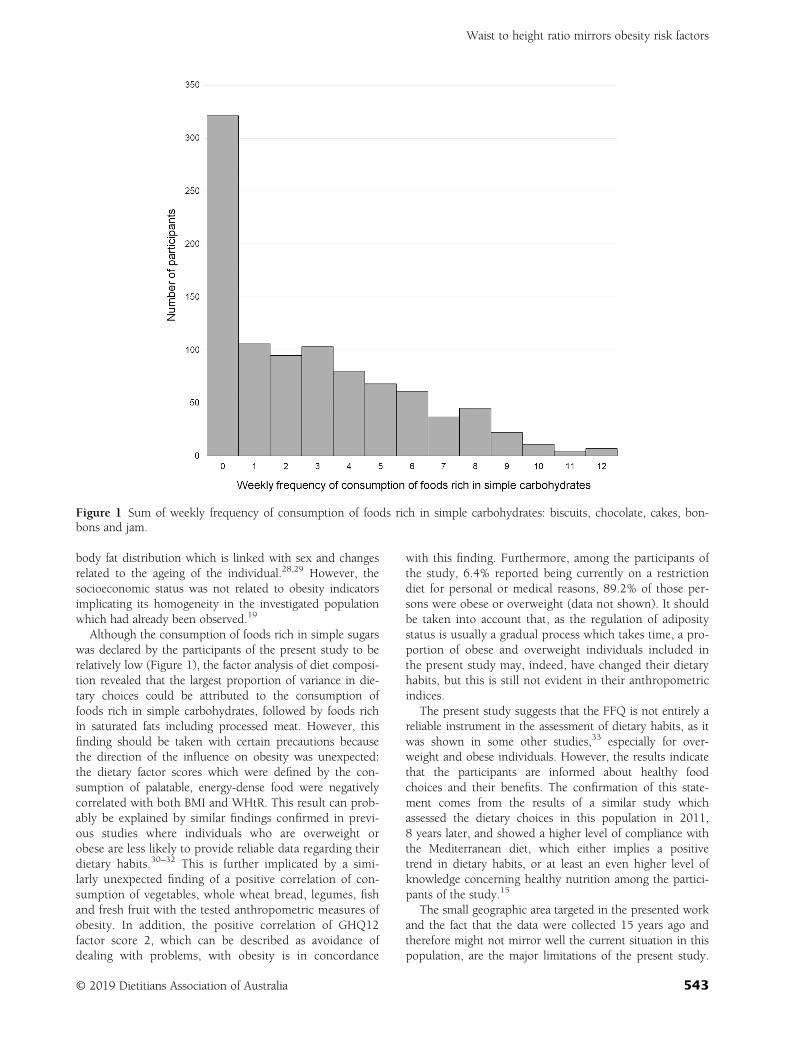
body fat distribution which is linked with sex and changesrelated to the ageing of the individual.28,29 However, thesocioeconomic status was not related to obesity indicatorsimplicating its homogeneity in the investigated populationwhich had already been observed.19
Although the consumption of foods rich in simple sugarswas declared by the participants of the present study to berelatively low (Figure 1), the factor analysis of diet composi-tion revealed that the largest proportion of variance in die-tary choices could be attributed to the consumption offoods rich in simple carbohydrates, followed by foods richin saturated fats including processed meat. However, thisfinding should be taken with certain precautions becausethe direction of the influence on obesity was unexpected:the dietary factor scores which were defined by the con-sumption of palatable, energy-dense food were negativelycorrelated with both BMI and WHtR. This result can prob-ably be explained by similar findings confirmed in previ-ous studies where individuals who are overweight orobese are less likely to provide reliable data regarding theirdietary habits.30–32 This is further implicated by a simi-larly unexpected finding of a positive correlation of con-sumption of vegetables, whole wheat bread, legumes, fishand fresh fruit with the tested anthropometric measures ofobesity. In addition, the positive correlation of GHQ12factor score 2, which can be described as avoidance ofdealing with problems, with obesity is in concordance
with this finding. Furthermore, among the participants ofthe study, 6.4% reported being currently on a restrictiondiet for personal or medical reasons, 89.2% of those per-sons were obese or overweight (data not shown). It shouldbe taken into account that, as the regulation of adipositystatus is usually a gradual process which takes time, a pro-portion of obese and overweight individuals included inthe present study may, indeed, have changed their dietaryhabits, but this is still not evident in their anthropometricindices.
The present study suggests that the FFQ is not entirely areliable instrument in the assessment of dietary habits, as itwas shown in some other studies,33 especially for over-weight and obese individuals. However, the results indicatethat the participants are informed about healthy foodchoices and their benefits. The confirmation of this state-ment comes from the results of a similar study whichassessed the dietary choices in this population in 2011,8 years later, and showed a higher level of compliance withthe Mediterranean diet, which either implies a positivetrend in dietary habits, or at least an even higher level ofknowledge concerning healthy nutrition among the partici-pants of the study.15
The small geographic area targeted in the presented workand the fact that the data were collected 15 years ago andtherefore might not mirror well the current situation in thispopulation, are the major limitations of the present study.
Figure 1 Sum of weekly frequency of consumption of foods rich in simple carbohydrates: biscuits, chocolate, cakes, bon-bons and jam.
Waist to height ratio mirrors obesity risk factors
© 2019 Dietitians Association of Australia 543
The fact that the dietary pattern was measured by a singleinstrument (FFQ) can be seen as an additional limitation,and this issue has already been elaborated in more detail.However, we find that the study has a number of strengthsthat compensate for those limitations and even providesome advantages that are not often seen. One of them is therelatively large sample that encompasses the majority ofadult inhabitants of this island and thus provides a trulyrepresentative population sample. Also the broad age rangeenables this cross-sectional sample to provide large time-scale information and offers an opportunity to test the dif-ferences in measured variables among age groups whichlargely compensates the limitation of the dated information(e.g., no differences in MDSS score among the age groupspoints to a long-term stability of the dietary pattern in thispopulation). The cultural and socioeconomic homogeneityof the population can also be seen as the strength of thestudy. It is partially because of the small geographic area,but also to the high level of social and economic equality inthis population (as revealed in a previous targeted study19
but it also follows from the present result of the socioeco-nomic factors showing no association with obesity). Thesocioeconomic and age-groups’ homogeneity meansreduced environmental variance (‘noise’) in this population.This enabled revealing the influence of other lifestyle andpsychological health factors that showed to be principaldeterminants of inter-individual differences in obesity phe-notype. As a number of anthropometric measurementsrelated to obesity were systematically taken, as well as thebioelectrical impedance measurement, it was possible tocompare the effects of various studied risk factors on thenumber of possible target phenotypes describing obesity.
In conclusion, WHtR proved to be a more useful indica-tor of obesity than BMI as it better reflects the body compo-sition and has a more profiled relation with nutritional andother lifestyle factors as well as with psychological health.In our sample, obesity was related to psychological health,particularly with the component that can be described asavoidance of dealing with problems. Although the Mediter-ranean diet is a well-known healthy dietary habit, a shifttoward Western diet is noted in most Mediterranean popu-lations, including the investigated population of the islandof Vis. However, with public health measures advocacy, ithas a chance to be re-induced in the populations of its orig-inal environment. The influence of psychological healthand wellbeing on dietary choices and obesity should beconsidered in the planning and implementation of suchpublic health interventions.
Funding source
This work was supported by the Croatian Ministry of Sci-ence, Education, and Sports of the Republic of Croatia(through grants 108-1080315-0302 awarded to I. Rudan,and 196-1962766-2747 awarded to NSN). Fieldwork wasdone within the scope of the project ‘Mapping genes under-lying complex quantitative traits in Croatian isolate
population’ supported also by the Medical Research CouncilUK through grants awarded to H. Campbell and I. Rudan.
Conflict of interest
The authors have no conflict of interest to declare.
Authorship
ŽT performed the initial analyses as part of her PhD Thesis,and she was also responsible for the draft of the manu-script. NSN was the principal investigator and the supervi-sor of the PhD Thesis of the ŽT and was responsible for theconception and overall design of the study. TŠJ, MZP andPRŠ participated in data collection and TŠJ, MZP and MJparticipated in data analyses and interpretation of data. Allauthors made critical revision of the manuscript for impor-tant intellectual content. All authors approved the final ver-sion of the manuscript and declared that the content hasnot been published elsewhere.
The authors are grateful to the people of Vis for theirparticipation in the study. We also thank the collaboratorsfrom the Institute for Anthropological Research, Zagreb,Medical Research Council-Human Genetic Unit, and Uni-versity Medical School, University of Edinburgh for theircontribution to the project and therefore this study.
References
1 Ghosh S, Bouchard C. Convergence between biological, beha-vioural and genetic determinants of obesity. Nat Rev Genet2017; 18: 731–48.
2 Swinburn BA, Egger G. Preventive strategies against weightgain and obesity. Obes Rev 2002; 3: 289–301.
3 Bleich S, Cutler D, Murray C, Adams A. Why is the developedworld obese? Annu Rev Public Health 2008; 29: 273–95.
4 Zellner DA, Loaiza S, Gonzalez Z et al. Food selection changesunder stress. Physiol Behav 2006; 87: 789–93.
5 Yau YH, Potenza MN. Stress and eating behaviors. MinervaEndocrinol 2013; 38: 255–67.
6 Thodis A, Itsiopoulos C, Kouris-Blazos A et al. Observationalstudy of adherence to a traditional Mediterranean diet, socio-cultural characteristics and cardiovascular disease risk factorsof older Greek Australians from MEDiterranean ISlands(MEDIS-Australia study): protocol and rationale. Nutr Diet2018; 75: 44–51.
7 Sofi F, Cesari F, Abbate R, Gensini GF, Casini A. Adherence toMediterranean diet and health status: meta-analysis. BMJ 2008;337: a1344.
8 Bosetti C, Turati F, Dal Pont A et al. The role of Mediterraneandiet on the risk of pancreatic cancer. Br J Cancer 2013; 109:1360–6.
9 Couto E, Sandin S, Löf M, Ursin G, Adami HO, Weiderpass E.Mediterranean dietary pattern and risk of breast cancer. PLoSOne 2013; 8: e55374.
10 Krauss RM, Eckel RH, Howard B et al. AHA Dietary Guide-lines: revision 2000—a statement for healthcare professionalsfrom the Nutrition Committee of the American Heart Associa-tion. Circulation 2000; 102: 2284–99.
Ž. Tomas et al.
544 © 2019 Dietitians Association of Australia
11 Keys A. Seven Countries. A Multivariate Analysis of Death andCoronary Heart Disease. Cambridge: Harvard UniversityPress, 1980.
12 Garcia-Closas R, Berenguer A, González CA. Changes in foodsupply in Mediterranean countries from 1961 to 2001. PublicHealth Nutr 2006; 9: 53–60.
13 Ferro-Luzzi A, Sette S. The Mediterranean diet: an attempt todefine its present and past composition. Eur J Clin Nutr 1989;43: 13–29.
14 Missoni S. Nutritional habits of Croatian Island populations—recent insights. Coll Antropol 2012; 36: 1139–42.
15 Kol�ci�c I, Relja A, Gelemanovi�c A et al. Mediterranean diet inthe southern Croatia—does it still exist? Croat Med J 2016; 57:415–24.
16 Tomas Ž. Genome-wide association study of human body fat-ness in the population of the island of Vis [In Croatian] (PhDthesis). Zagreb: Faculty of Science, University ofZagreb, 2014.
17 Peternel L, Sujoldzi�c A. Adolescents eating behavior, bodyimage and psychological well-being. Coll Antropol 2009; 33:205–12.
18 Pucarin-Cvetkovi�c J, Mustajbegovi�c J, Doko Jelini�c J et al. Bodymass index and nutrition as determinants of health and diseasein population of Croatian Adriatic islands. Croat Med J 2006;47: 619–26.
19 Smoljanovi�c A, Vorko-Jovi�c A, Kol�ci�c I, Bernat R, Stojanovi�c D,Polasek O. Micro-scale socioeconomic inequalities and healthindicators in a small isolated community of Vis Island, Croatia.Croat Med J 2007; 48: 734–40.
20 Weiner JS, Lourie JA. Practical Human Biology. New York, NY:Academic Press, 1981.
21 Kyle UG, Genton L, Karsegard L, Slosman DO, Pichard C. Sin-gle prediction equation for bioelectrical impedance analysis inadults aged 20-94 years. Nutrition 2001; 17: 248–53.
22 Senta A, Pucarin-Cvetkovi�c J, Doko Jelini�c J. Quantitativemodels of foodstuffs and meals [In Croatian]. Zagreb: Medi-cinska Naklada, 2004.
23 Monteagudo C, Mariscal-Arcas M, Rivas A, Lorenzo-Tovar ML,Tur JA, Olea-Serrano F. Proposal of a Mediterranean diet serv-ing score. PLoS One 2015; 10: e0128594.
24 Goldberg DP, Hillier VF. A scaled version of the GeneralHealth Questionnaire. Psychol Med 1979; 9: 139–45.
25 Browning LM, Hsieh SD, Ashwell M. A systematic review ofwaist-to-height ratio as a screening tool for the prediction of
cardiovascular disease and diabetes: 0.5 could be a suitableglobal boundary value. Nutr Res Rev 2010; 23: 247–69.
26 Ashwell M, Gunn P, Gibson S. Waist-to-height ratio is a betterscreening tool than waist circumference and BMI for adult car-diometabolic risk factors: systematic review and meta-analysis.Obes Rev 2012; 13: 275–86.
27 Savva SC, Lamnisos D, Kafatos AG. Predicting cardiometabolicrisk: waist-to-height ratio or BMI. A meta-analysis. DiabetesMetab Syndr Obes 2013; 6: 403–19.
28 Goodpaster BH, Krishnaswami S, Harris TB et al. Obesity,regional body fat distribution, and the metabolic syndromein older men and women. Arch Intern Med 2005; 165:777–83.
29 Stevens J, Katz EG, Huxley RR. Associations between gender,age and waist circumference. Eur J Clin Nutr 2010; 64: 6–15.
30 Lichtman SW, Pisarska K, Berman ER et al. Discrepancybetween self-reported and actual caloric intake and exercise inobese subjects. N Engl J Med 1992; 327: 1893–8.
31 Black AE, Cole TJ. Biased over- or under-reporting is character-istic of individuals whether over time or by different assess-ment methods. J Am Diet Assoc 2001; 101: 70–80.
32 Stice E, Palmrose CA, Burger KS. Elevated BMI and male sexare associated with greater underreporting of caloric intake asassessed by doubly labeled water. J Nutr 2015; 145: 2412–8.
33 Hendrie GA, Rebuli MA, Golley RK. Reliability and relativevalidity of a diet index score for adults derived from a self-reported short food survey. Nutr Diet 2017; 74: 291–7.
Supporting information
Additional Supporting Information may be found in theonline version of this article at the publisher’s web-site:
Table S1 Comparison of obesity measures, indicators ofpsychological health, Mediterranean diet adherence andsmoking status between age categories (18–34.9, 35–64.9and ≥65 years).Table S2 Factor loadings for the factor analysis of theweekly consumption of foods.Table S3 Factor loadings for the factor analysis of the Gen-eral Health Questionnaire (GHQ12).
Waist to height ratio mirrors obesity risk factors
© 2019 Dietitians Association of Australia 545
OR I G I N A L R E S E AR CH
Prevalence and characteristics of energy intake under-reportingamong Australian adults in 1995 and 2011 to 2012
King W. Tam MBus, PhD candidate1 | Jacob L. Veerman PhD, Professor of Public Health1,2,3
1School of Public Health, University ofQueensland, Brisbane, Queensland,Australia2School of Medicine, Griffith University,Brisbane, Queensland, Australia3Cancer Council NSW, Sydney, New SouthWales, Australia
CorrespondenceKing W. Tam, School of Public Health,Level 2, Public Health Building (887),288 Herston Road (Corner of Herston Roadand Wyndham Street), The University ofQueensland, Herston, QLD 4006, Australia.Email: [email protected]
Funding informationNHMRC Centre of Research Excellence inHealthy Liveable Communities, Grant/Award Number: APP1061404
AbstractAim: Misreporting of energy intake is a common source of measurement error
found in dietary surveys, resulting in biased estimates and a reduction in statistical
power. The present study aims to refine the conventional cut-off methods and to
examine the extent to which Australian adults misreport their energy intake, and
the characteristics of under-reporters between two time points.
Methods: A revised Goldberg cut-off approach was used to identify those who
reported implausible intake amounts in a secondary analysis of two large cross-
sectional surveys. Identified low energy reporters were then used as the outcome
variable in Poisson regressions to examine association with sex, age, body mass
index (BMI), weight perceptions, education, relative household income, geographic
remoteness and relative socioeconomic disadvantage.
Results: The prevalence of under-reporting increased from 32% in 1995 to 41% in
2012, most of which can be attributed to an increase in men. Under-reporting has a
positive association with BMI and relative socioeconomic disadvantage, but an
inverse association with age, education, relative household income and residence
in inner regional areas.
Conclusions: Under-reporting of energy intake is high in Australian adults, and
appears have worsened over time in men, which could be partly explained by the
upward trend in obesity. The use of conventional Goldberg method to identify
under-reporters can greatly underestimate the prevalence of under-reporting, future
studies should consider selecting a lower critical value to improve accuracy.
KEYWORD S
adults, dietary assessment, dietary intake, dietary intake data, methodology, obesity
1 | INTRODUCTION
In dietary measurement, people tend to report values lowerthan their actual energy intake.1 This under-reporting maybe due to intentional and unintentional reasons includingsocial pressure, inconvenience, poor memory, poor attentionand a lack of comprehension.2 It could also be the result ofdieting or undereating influenced by the dietary assessmentprocess.3 Accounting for sex, age, and body mass, basal
metabolic rate (BMR) prediction equations can be used toestimate a person's baseline rate of metabolism at rest with afair amount of accuracy. One can then statistically determinewhether an individual is likely to be under-reporting by com-paring their energy intake as a multiple of their BMR(Goldberg method)4; or as a multiple of their estimatedenergy requirement (EER).5 Once these individuals are iden-tified, the bias due to under-reporting can be addressed byexcluding these implausible reporters, although exclusion
Received: 19 August 2018 Revised: 13 March 2019 Accepted: 24 May 2019
DOI: 10.1111/1747-0080.12565
546 © 2019 Dietitians Association of Australia Nutrition & Dietetics. 2019;76:546–559.wileyonlinelibrary.com/journal/ndi
may lead to selection bias; or by the use of statistical tech-niques that adjust for total caloric intake, dietary composi-tion, or the energy density of nutrients, for example, byincluding these variables or predictors of them as controlvariables in the regression model.1,6
The monitoring of energy intake and energy expenditurecan be done by instruments or surveys and interviews.Examples of instrument-based monitoring include directobservation and photographic methods for dietary intake7;indirect calorimetry, doubly labelled water (DLW) andaccelerometry for energy expenditure.8 As instrument-basedmeasurements may not be financially feasible on a suffi-ciently large scale, surveys are often used to measure thedietary and physical activity changes in the population forthe development and evaluation of food and nutrition poli-cies and interventions. Non-instrument based methodsinclude food records, food frequency questionnaires, and24-hour recalls for dietary intake; and activity diaries, physi-cal activity questionnaires and interviews for energy expen-diture.8,9 However, self-reporting can introduce bias, andmisreporting of energy intake is a common source of mea-surement error found in dietary surveys.10 While over-reporting is generally less problematic in adults than inchildren,11 bias caused by under-reporting is certainly a con-cern and can be extremely difficult to eliminate without theuse of more expensive means of obtaining instrument-basedmeasures.12
The aim in the present study is to first refine the existingconventional methods to improve accuracy in estimating thelevel of misreporting of food intake in the Australian adultpopulation for 1995 and 2011 to 2012; and second, to exam-ine the characteristics of under-reporters. Few studies havelooked at energy under-reporting in Australia, especiallyadults at the national level.13-16 Understanding the character-istics and predictors of under-reporting will help ascertainwhat makes them different from acceptable reporters (ie, sta-tistically plausible reporters).
2 | METHODS
The 1995 National Nutrition Survey (NNS) and 2011 to2012 National Nutrition and Physical Activity Survey(NNPAS) from the Australian Bureau of Statistics (ABS)were used in the present study, which had a response rate of61% and 77%, respectively.17,18 Due to the use of secondaryconfidentialised data, ethical approval was not required.Households were selected at random using a stratified three-stage area sample. Individuals below 18 years of age andthose who were pregnant were excluded from the analysis.Of these individuals, 11% from 1995 NNS and 67% from2011 to 2012 NNPAS participated in a second 24-hour die-tary recall. The resultant sample used for analysis consisted
of 1196 and 5332 individuals from the from 1995 and 2011to 2012. Energy intake was reported via face-to-face 24-hourdietary recall, with pen and paper in 1995 and computer-based in 2011 to 2012. The interviews were more or lessevenly distributed in all four seasons. In terms of day of theweek, Monday to Thursdays were equally frequent; the fre-quency decreased incrementally from Friday to Sunday. The1995 NNS used a three-pass method whereas and 2011 to2012 NNPAS employed an automated five-pass method,both developed by United States Department of AgricultureAgricultural Research Service.19
In the 2011 to 2012 NNPAS dataset, information onphysical activity in the week before the interview was alsorecorded, which included walking of 10 minutes' duration ormore, moderate activity, and vigorous activity. The ques-tionnaire was based on the Active Australia Survey, whichhas been shown to be reliable and valid.20-22 The durationand intensity level (Metabolic Equivalent of Task, or MET)of an activity were then used to calculate MET minutes.ABS classifies physical activity into four categories, basedon total MET minutes per week and whether respondentshad more than an hour of vigorous activity. It should benoted that no information on physical activity is availablefrom the 1995 NNS data to categorise individuals into vari-ous PAL (physical activity level) groups. There is also dis-similar information on education and geographical areasfrom the two datasets. Education was converted from the dif-ferent levels to number of years, ranging from 8 to 16 years.Certificates III/IV add 1 year to schooling; other certificatesadd half a year; diplomas, Bachelor's degree and postgradu-ate degree are coded as 14, 15 and 16 years of education,respectively. Household income and socioeconomic disad-vantage were categorised into quintiles. Higher quintilesdenote that the individual lives in an area with less socioeco-nomic disadvantage.
Energy misreporters were identified using the two vari-ants of the Goldberg cut-off method—constant cut-off, andvariable cut-offs based on PAL groups.1,4 An alternativemethod based on the ratio of EI to EER was used for com-parison.5 The Goldberg and EER methods can determine sta-tistically whether the reported energy intake of a respondentis more/less than that which is expected of them based onvarious factors—the variation in energy intake, BMR andphysical activity, and the number of days of diet measure-ment for the Goldberg method; the variation in energy intakeand in total energy expenditure, the error in the EER equa-tions, and the number of days of diet measurement for theEER method. The Schofield prediction equations were usedto estimate BMR for each individual based on their age, sex,and weight.23 Schofield equations have been used in theoriginal Goldberg study and have almost been exclusivelyused in the literature since then, therefore they were used
TAM AND VEERMAN 547
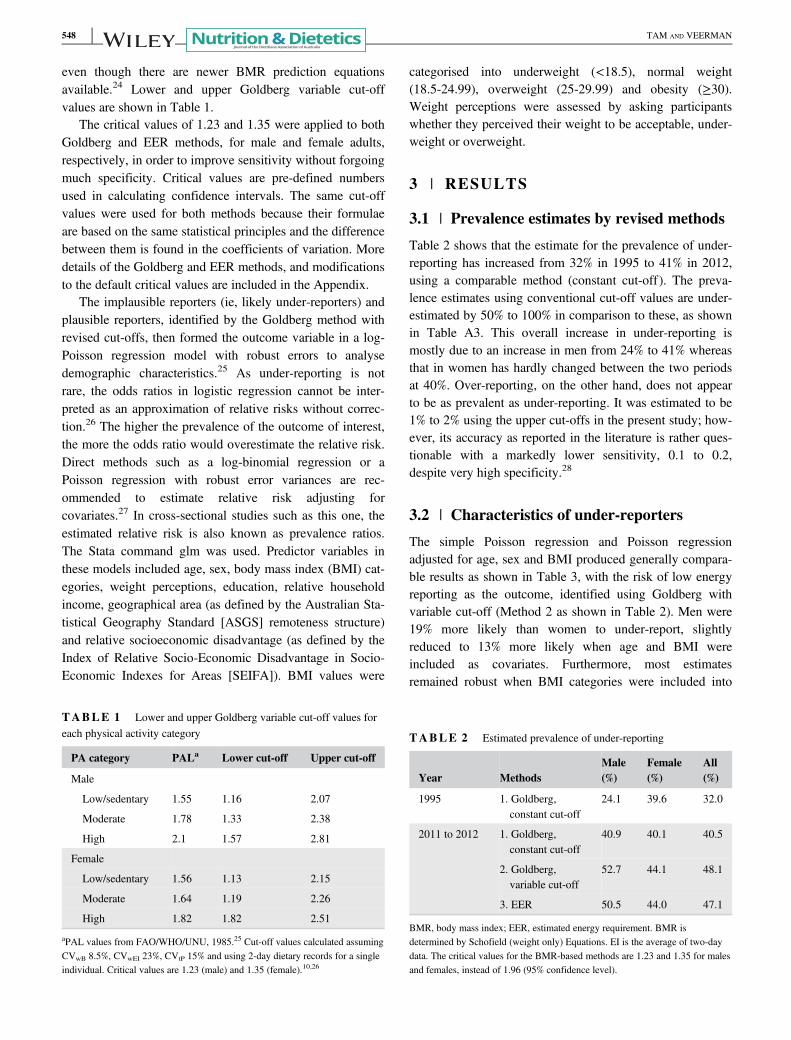
even though there are newer BMR prediction equationsavailable.24 Lower and upper Goldberg variable cut-offvalues are shown in Table 1.
The critical values of 1.23 and 1.35 were applied to bothGoldberg and EER methods, for male and female adults,respectively, in order to improve sensitivity without forgoingmuch specificity. Critical values are pre-defined numbersused in calculating confidence intervals. The same cut-offvalues were used for both methods because their formulaeare based on the same statistical principles and the differencebetween them is found in the coefficients of variation. Moredetails of the Goldberg and EER methods, and modificationsto the default critical values are included in the Appendix.
The implausible reporters (ie, likely under-reporters) andplausible reporters, identified by the Goldberg method withrevised cut-offs, then formed the outcome variable in a log-Poisson regression model with robust errors to analysedemographic characteristics.25 As under-reporting is notrare, the odds ratios in logistic regression cannot be inter-preted as an approximation of relative risks without correc-tion.26 The higher the prevalence of the outcome of interest,the more the odds ratio would overestimate the relative risk.Direct methods such as a log-binomial regression or aPoisson regression with robust error variances are rec-ommended to estimate relative risk adjusting forcovariates.27 In cross-sectional studies such as this one, theestimated relative risk is also known as prevalence ratios.The Stata command glm was used. Predictor variables inthese models included age, sex, body mass index (BMI) cat-egories, weight perceptions, education, relative householdincome, geographical area (as defined by the Australian Sta-tistical Geography Standard [ASGS] remoteness structure)and relative socioeconomic disadvantage (as defined by theIndex of Relative Socio-Economic Disadvantage in Socio-Economic Indexes for Areas [SEIFA]). BMI values were
categorised into underweight (<18.5), normal weight(18.5-24.99), overweight (25-29.99) and obesity (≥30).Weight perceptions were assessed by asking participantswhether they perceived their weight to be acceptable, under-weight or overweight.
3 | RESULTS
3.1 | Prevalence estimates by revised methods
Table 2 shows that the estimate for the prevalence of under-reporting has increased from 32% in 1995 to 41% in 2012,using a comparable method (constant cut-off). The preva-lence estimates using conventional cut-off values are under-estimated by 50% to 100% in comparison to these, as shownin Table A3. This overall increase in under-reporting ismostly due to an increase in men from 24% to 41% whereasthat in women has hardly changed between the two periodsat 40%. Over-reporting, on the other hand, does not appearto be as prevalent as under-reporting. It was estimated to be1% to 2% using the upper cut-offs in the present study; how-ever, its accuracy as reported in the literature is rather ques-tionable with a markedly lower sensitivity, 0.1 to 0.2,despite very high specificity.28
3.2 | Characteristics of under-reporters
The simple Poisson regression and Poisson regressionadjusted for age, sex and BMI produced generally compara-ble results as shown in Table 3, with the risk of low energyreporting as the outcome, identified using Goldberg withvariable cut-off (Method 2 as shown in Table 2). Men were19% more likely than women to under-report, slightlyreduced to 13% more likely when age and BMI wereincluded as covariates. Furthermore, most estimatesremained robust when BMI categories were included into
TABLE 1 Lower and upper Goldberg variable cut-off values foreach physical activity category
PA category PALa Lower cut-off Upper cut-off
Male
Low/sedentary 1.55 1.16 2.07
Moderate 1.78 1.33 2.38
High 2.1 1.57 2.81
Female
Low/sedentary 1.56 1.13 2.15
Moderate 1.64 1.19 2.26
High 1.82 1.82 2.51
aPAL values from FAO/WHO/UNU, 1985.25 Cut-off values calculated assumingCVwB 8.5%, CVwEI 23%, CVtP 15% and using 2-day dietary records for a singleindividual. Critical values are 1.23 (male) and 1.35 (female).10,26
TABLE 2 Estimated prevalence of under-reporting
Year MethodsMale(%)
Female(%)
All(%)
1995 1. Goldberg,constant cut-off
24.1 39.6 32.0
2011 to 2012 1. Goldberg,constant cut-off
40.9 40.1 40.5
2. Goldberg,variable cut-off
52.7 44.1 48.1
3. EER 50.5 44.0 47.1
BMR, body mass index; EER, estimated energy requirement. BMR isdetermined by Schofield (weight only) Equations. EI is the average of two-daydata. The critical values for the BMR-based methods are 1.23 and 1.35 for malesand females, instead of 1.96 (95% confidence level).
548 TAM AND VEERMAN
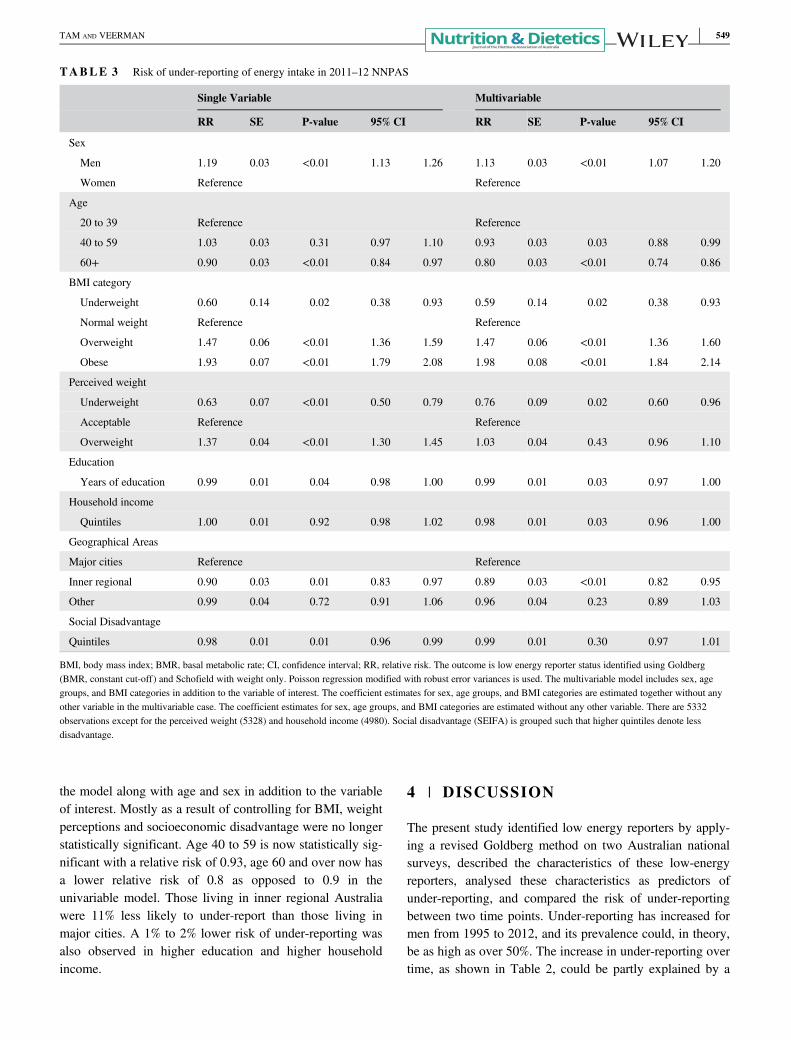
the model along with age and sex in addition to the variableof interest. Mostly as a result of controlling for BMI, weightperceptions and socioeconomic disadvantage were no longerstatistically significant. Age 40 to 59 is now statistically sig-nificant with a relative risk of 0.93, age 60 and over now hasa lower relative risk of 0.8 as opposed to 0.9 in theunivariable model. Those living in inner regional Australiawere 11% less likely to under-report than those living inmajor cities. A 1% to 2% lower risk of under-reporting wasalso observed in higher education and higher householdincome.
4 | DISCUSSION
The present study identified low energy reporters by apply-ing a revised Goldberg method on two Australian nationalsurveys, described the characteristics of these low-energyreporters, analysed these characteristics as predictors ofunder-reporting, and compared the risk of under-reportingbetween two time points. Under-reporting has increased formen from 1995 to 2012, and its prevalence could, in theory,be as high as over 50%. The increase in under-reporting overtime, as shown in Table 2, could be partly explained by a
TABLE 3 Risk of under-reporting of energy intake in 2011–12 NNPAS
Single Variable Multivariable
RR SE P-value 95% CI RR SE P-value 95% CI
Sex
Men 1.19 0.03 <0.01 1.13 1.26 1.13 0.03 <0.01 1.07 1.20
Women Reference Reference
Age
20 to 39 Reference Reference
40 to 59 1.03 0.03 0.31 0.97 1.10 0.93 0.03 0.03 0.88 0.99
60+ 0.90 0.03 <0.01 0.84 0.97 0.80 0.03 <0.01 0.74 0.86
BMI category
Underweight 0.60 0.14 0.02 0.38 0.93 0.59 0.14 0.02 0.38 0.93
Normal weight Reference Reference
Overweight 1.47 0.06 <0.01 1.36 1.59 1.47 0.06 <0.01 1.36 1.60
Obese 1.93 0.07 <0.01 1.79 2.08 1.98 0.08 <0.01 1.84 2.14
Perceived weight
Underweight 0.63 0.07 <0.01 0.50 0.79 0.76 0.09 0.02 0.60 0.96
Acceptable Reference Reference
Overweight 1.37 0.04 <0.01 1.30 1.45 1.03 0.04 0.43 0.96 1.10
Education
Years of education 0.99 0.01 0.04 0.98 1.00 0.99 0.01 0.03 0.97 1.00
Household income
Quintiles 1.00 0.01 0.92 0.98 1.02 0.98 0.01 0.03 0.96 1.00
Geographical Areas
Major cities Reference Reference
Inner regional 0.90 0.03 0.01 0.83 0.97 0.89 0.03 <0.01 0.82 0.95
Other 0.99 0.04 0.72 0.91 1.06 0.96 0.04 0.23 0.89 1.03
Social Disadvantage
Quintiles 0.98 0.01 0.01 0.96 0.99 0.99 0.01 0.30 0.97 1.01
BMI, body mass index; BMR, basal metabolic rate; CI, confidence interval; RR, relative risk. The outcome is low energy reporter status identified using Goldberg(BMR, constant cut-off) and Schofield with weight only. Poisson regression modified with robust error variances is used. The multivariable model includes sex, agegroups, and BMI categories in addition to the variable of interest. The coefficient estimates for sex, age groups, and BMI categories are estimated together without anyother variable in the multivariable case. The coefficient estimates for sex, age groups, and BMI categories are estimated without any other variable. There are 5332observations except for the perceived weight (5328) and household income (4980). Social disadvantage (SEIFA) is grouped such that higher quintiles denote lessdisadvantage.
TAM AND VEERMAN 549
more obese population, as higher BMI categories are consis-tently associated with higher risk of under-reporting regard-less of model specification or time period in the presentstudy. However, it is uncertain why this increase was mostlyfound in men and not women. Furthermore, under-reportingwas associated with other characteristics such as youngerage, lower education, lower relative household income, liv-ing in a socioeconomic disadvantaged area, and residence ina major city as opposed to inner regional areas. Weight per-ceptions were not linked to under-reporting when adjustedfor BMI categories, as was the case in other studies; or therewas a small residual effect in overweight perceptiondepending on the model specification.29,30
Notably, residence in an inner regional Australia as a var-iable has stayed highly statistically significant regardless ofmodel specification. Even including all other predictor vari-ables did not change the association between inner regionalAustralia and lower under-reporting. Individuals who livedin inner regional areas tended to be male, older, heavier, lesseducated, have a lower household income, and live in moresocioeconomically disadvantaged areas, but all these charac-teristics except sex and age were associated with higherunder-reporting. Age and sex were already adjusted for ascovariates. This discrepancy could be explained by a differ-ence in attitude, perhaps due to more social acceptance orless peer pressure, in those living in inner regional areas asopposed to major cities and more remote areas.
The 1995 prevalence estimates for under-reporting inenergy intake in Australian adults were comparable to esti-mates for other countries, such as New Zealand, UnitedStates, Ireland, France, Denmark, Jamaica, and SouthKorea,30-36 between 20% and 35%, as high as over 40% inBritain, Norway and Sweden.37-39 However, these estimateswere expected to underestimate the true prevalence, as theGoldberg method using the default critical value of 1.96 canonly identify up to about two thirds but not all of the under-reporters. The 2011 to 2012 under-reporting prevalence esti-mates were nearly 50% for adults in Australia, but would beabout 30% if default cut-offs were used (eg, 0.96 for seden-tary men instead of 1.16). Likewise, the prevalence estimateswent from 46% to 67% in the Swedish study by shifting thecut-off points from 1.2 to 1.35.39 In terms of the amount ofEI underestimation, the figure of 19.4% is also in line withother studies.10
Under-reporting was more prevalent in women than inmen in 1995, yet under-reporting in men has surpassed thatin women by 2012. It is unlikely that the increase in under-reporting was primarily driven by the differences in dietaryassessment methodology in the two surveys, as men andwomen would likely be affected in the same way. Womenhave been reported to be better than men in estimating solidfood, which might have had an impact.40 While under-
reporting was also observed more frequently in adults com-pared to children and adolescents, there is generally less of agender difference in youth.11 For example, 5% of Australianchildren and adolescents were found to be low-energyreporters in 2007, and there is no apparent differencebetween boys and girls up to 13 years of age.14 It appearsthis gender difference in adults has narrowed considerablybetween 1995 and 2012.
The conventional Goldberg method with variable cut-offs, has previously been shown to be able to identifyapproximately three quarters of the under-reporters while thenumber of false positives remains low. That, coupled withmore “optimal” critical values, in theory, can identify morethan 80% of all under-reporters without compromising muchon false negatives. It is because by reducing the criticalvalue from 1.96 to somewhere between 1 and 1.4, the sensi-tivity of the method is further increased while keeping speci-ficity high, by optimising the trade-off between sensitivityand specificity. However, due to the 1995 NNS data notcontaining information on energy expenditure, the variablecut-off method had to be replaced by the constant cut-offmethod. The constant cut-off method typically yields a lowersensitivity with the default critical value of 1.96, but usingcritical values between 1 and 1.4 has been able to identifysubstantially more under-reporters, albeit still less sensitivethan the variable variant with calibrated critical values. Thefindings with respect to the change in underreporting overtime relied on the use of the constant cut-off in the Goldbergapproach, but as our other results show, this probably under-estimates the proportion of underreporting, which may haveaffected the trend estimates. Additionally, it may not be suf-ficient to establish any trend in under-reporting based ononly two time points, so further investigation in this regardis warranted.
Although NNPAS contains information on physicalactivity, sedentary behaviour, and sleep, deriving PALvalues for each individual is not straightforward becausewalking of duration under 10 minutes is not reported. Ifinformation on physical activity of shorter duration wereavailable, this could potentially further increase the accuracyof the Goldberg approach, by more accurately classifyingthe individual into their corresponding PAL category andthus a more accurate cut-off for the individual. In addition,the coefficients of variation could be updated with valuesmore specific to the Australian adult population, to moreaccurately account for the variation in energy intake, BMRand physical activity.
The present study has made improvement on the identifi-cation of under-reporters by adjusting the critical value usefor calculating the Goldberg and EER cut-offs. It highlightsthe prevalence of under-reporting energy intake in Australiaand the characteristics of under-reporters, which helps
550 TAM AND VEERMAN
understand the limitations of current dietary surveys and theneed for adjustments. The use of conventional Goldbergmethod to identify under-reporters can underestimate theprevalence of under-reporting, future studies should considerselecting a critical value between 1 and 1.4 instead of thedefault z-score for 95% confidence level.
CONFLICT OF INTEREST
The authors declare no conflict of interest.
AUTHOR CONTRIBUTIONS
K.W.T. contributed to the concept and design of the presentstudy, statistical analysis, data interpretation and manuscriptwriting. J.L.V. oversaw supervision of the present study,contributed to the interpretation of the results and criticallyreviewed the manuscript. Both authors approved the finalversion of the manuscript.
K.W.T. and J.L.V. are part of the NHMRC Centre ofResearch Excellence in Healthy Liveable Communities(APP1061404). The authors are grateful to the ABS for sup-plying the datasets for these analyses, and to Dr. Mark Jonesfor his statistical advice and comments.
ENDNOTE
*PAL× ez×Sffiffin
p =PAL× ez×ffiffiffiffiffiffiffiffiffiffiffiffiffiffiffiffiffiffiffiffiffiffiffiffiffiffiffiffiffiffiCVwEI
2
d +CVwB2 +CVtP
2p ffiffi
np =1:55
× e−2×
ffiffiffiffiffiffiffiffiffiffiffiffiffiffiffiffiffiffiffiffiffiffiffiffi23%21 +8:5%2 + 15%2
p ffiffi1
p=0:8723
ORCID
King W. Tam https://orcid.org/0000-0003-1465-6468
REFERENCES
1. Livingstone MBE, Black AE. Markers of the validity of reportedenergy intake. J Nutr. 2003;133:895S-920S.
2. Macdiarmid J, Blundell J. Assessing dietary intake: who, what andwhy of under-reporting. Nutr Res Rev. 1998;11:231-253.
3. Thompson FE, Subar AF. Dietary assessment methodology. Nutri-tion in the Prevention and Treatment of Disease. Thirded. Cambridge, MA: Academic Press; 2013:5-46.
4. Goldberg G, Black A, Jebb S, et al. Critical evaluation of energyintake data using fundamental principles of energy physiology:1. Derivation of cut-off limits to identify under-recording. Eur JClin Nutr. 1991;45:569-581.
5. Huang TTK, Roberts SB, Howarth NC, McCrory MA. Effect ofscreening out implausible energy intake reports on relationshipsbetween diet and BMI. Obesity. 2005;13:1205-1217.
6. Vainik U, Konstabel K, Lätt E, Mäestu J, Purge P, Jürimäe J. Dietmisreporting can be corrected: confirmation of the association
between energy intake and fat-free mass in adolescents. Br J Nutr.2016;116:1425-1436.
7. Sun M, Fernstrom JD, Jia W, et al. A wearable electronic systemfor objective dietary assessment. J am Diet Assoc. 2010;110:45-47.
8. Hills AP, Mokhtar N, Byrne NM. Assessment of physical activityand energy expenditure: an overview of objective measures. FrontNutr. 2014;1:5.
9. Johnson RK. Dietary intake—how do we measure what people arereally eating? Obesity. 2002;10:63S–68S.
10. Poslusna K, Ruprich J, de Vries JHM, Jakubikova M, van'tVeer P. Misreporting of energy and micronutrient intake estimatedby food records and 24 hour recalls, control and adjustmentmethods in practice. Br J Nutr. 2009;101:S73-S85.
11. Forrestal SG. Energy intake misreporting among children and ado-lescents: a literature review. Matern Child Nutr. 2011;7:112-127.
12. Mendez MA, Popkin BM, Buckland G, et al. Alternative methodsof accounting for underreporting and overreporting when measur-ing dietary intake-obesity relations. Am J Epidemiol. 2011;173:448-458.
13. Smith WT, Webb KL, Heywood PF. The implications ofunderreporting in dietary studies. Aust N Z J Public Health. 1994;18:311-314.
14. Rangan AM, Flood VM, Gill TP. Misreporting of energy intake inthe 2007 Australian Children's survey: identification, characteris-tics and impact of misreporters. Nutrients. 2011;3:186-199.
15. Meng X, Kerr DA, Zhu K, et al. Under-reporting of energy intakein elderly Australian women is associated with a higher body massindex. J Nutr Health Aging. 2013;17:112-118.
16. van den Hooven EH, Ambrosini GL, Huang R-C, et al. Identifica-tion of a dietary pattern prospectively associated with bone massin Australian young adults–3. Am J Clin Nutr. 2015;102:1035-1043.
17. Australian Bureau of Statistics. National Nutrition Survey 1995.Basic Confidentialised Unit Record File (CURF), CD-ROM. Find-ings based on the use of ABS Microdata1995; 1995
18. Australian Bureau of Statistics. National Nutrition and PhysicalActivity Survey 2011–2012. Basic Confidentialised Unit RecordFile (CURF), CD-ROM. Findings based on the use of ABSMicrodata2013.
19. Australian Bureau of Statistics. Australian Health Survey: Users'Guide, 2011-13. Canberra: ABS; 2013.
20. Brown WJ, Trost SG, Bauman A, Mummery K, Owen N. Test-retest reliability of four physical activity measures used in popula-tion surveys. J Sci Med Sport. 2004;7:205-215.
21. Brown WJ, Burton NW, Marshall AL, Miller YD. Reliability andvalidity of a modified self-administered version of the activeAustralia physical activity survey in a sample of mid-age women.Aust N Z J Public Health. 2008;32:535-541.
22. Heesch KC, Hill RL, Van Uffelen JGZ, Brown WJ. Are activeAustralia physical activity questions valid for older adults? J SciMed Sport. 2011;14:233-237.
23. Schofield W. Predicting basal metabolic rate, new standards andreview of previous work. Hum Nutr Clin Nutr. 1985;39:5-41.
24. Madden AM, Mulrooney HM, Shah S. Estimation of energyexpenditure using prediction equations in overweight and obeseadults: a systematic review. J Hum Nutr Diet. 2016;29:458-476.
25. Zou G. A modified poisson regression approach to prospectivestudies with binary data. Am J Epidemiol. 2004;159:702-706.
TAM AND VEERMAN 551
26. Zhang J, Yu KF. What's the relative risk?: a method of correctingthe odds ratio in cohort studies of common outcomes. JAMA.1998;280:1690-1691.
27. Dwivedi AK, Mallawaarachchi I, Lee S, Tarwater P. Methods forestimating relative risk in studies of common binary outcomes.J Appl Stat. 2014;41:484-500.
28. Black A. The sensitivity and specificity of the Goldberg cut-off forEI: BMR for identifying diet reports of poor validity. Eur J ClinNutr. 2000;54:395-404.
29. Tyrovolas S, Koyanagi A, Stickley A, Haro JM. Weight percep-tion, satisfaction, control, and low energy dietary reporting in theUS adult population: results from the National Health and Nutri-tion Examination Survey 2007-2012. J Acad Nutr Diet. 2016;116:579-589.
30. Murakami K, Livingstone MBE. Prevalence and characteristics ofmisreporting of energy intake in US adults: NHANES 2003–2012.Br J Nutr. 2015;114:1294-1303.
31. Gemming L, Jiang Y, Swinburn B, Utter J, Mhurchu CN. Under-reporting remains a key limitation of self-reported dietary intake:an analysis of the 2008/09 New Zealand Adult Nutrition Survey.Eur J Clin Nutr. 2014;68:259-264.
32. Lutomski JE, van den Broeck J, Harrington J, Shiely F, Perry IJ.Sociodemographic, lifestyle, mental health and dietary factorsassociated with direction of misreporting of energy intake. PublicHealth Nutr. 2011;14:532-541.
33. Vanrullen IB, Volatier J-L, Bertaut A, Dufour A, Dallongeville J.Characteristics of energy intake under-reporting in French adults.Br J Nutr. 2014;111:1292-1302.
34. Rasmussen LB, Matthiessen J, Biltoft-Jensen A, Tetens I. Charac-teristics of misreporters of dietary intake and physical activity.Public Health Nutr. 2007;10:230-237.
35. Mendez MA, Wynter S, Wilks R, Forrester T. Under- and over-reporting of energy is related to obesity, lifestyle factors and foodgroup intakes in Jamaican adults. Public Health Nutr. 2004;7:9-19.
36. Kye S, Kwon S-O, Lee S-Y, et al. Under-reporting of energyintake from 24-hour dietary recalls in the Korean National Healthand Nutrition Examination Survey. Osong Public Health Res Per-spect. 2014;5:85-91.
37. Murakami K, McCaffrey TA, Livingstone MBE. Associations ofdietary glycaemic index and glycaemic load with food and nutrientintake and general and central obesity in British adults. Br J Nutr.2013;110:2047-2057.
38. Johansson L, Solvoll K, Bjørneboe G-E, Drevon CA. Under- andoverreporting of energy intake related to weight status and lifestylein a nationwide sample. Am J Clin Nutr. 1998;68:266-274.
39. Johansson G, Wikman Å, Åhrén A-M, Hallmans G, Johansson I.Underreporting of energy intake in repeated 24-hour recalls relatedto gender, age, weight status, day of interview, educational level,reported food intake, smoking habits and area of living. PublicHealth Nutr. 2001;4:919-927.
40. Burger KS, Kern M, Coleman KJ. Characteristics of self-selectedportion size in young adults. J am Diet Assoc. 2007;107:611-618.
41. Black AE. Critical evaluation of energy intake using the Goldbergcut-off for energy intake: basal metabolic rate. A practical guide toits calculation, use and limitations. Int J Obes. 2000;24:1119-1130.
42. Thompson D, Batterham AM, Peacock OJ, Western MJ, Booso R.Feedback from physical activity monitors is not compatible with
current recommendations: a recalibration study. Prev Med. 2016;91:389-394.
43. World Health Organization. Energy and protein requirements:report of a joint FAO/WHO/UNU expert consultation (WHOTechnical Report Series, no 724). Geneva: World Health Organi-zation; 1985.
44. Institute of Medicine. Dietary Reference Intakes for Energy, Car-bohydrate, Fiber, Fat, Fatty Acids, Cholesterol, Protein, andAmino Acids. Washington, DC: The National Academies Press;2005.
45. Black A, Coward W, Cole T, Prentice A. Human energy expendi-ture in affluent societies: an analysis of 574 doubly-labelled watermeasurements. Eur J Clin Nutr. 1996;50:72-92.
46. Tooze JA, Krebs-Smith SM, Troiano RP, Subar AF. The accuracyof the Goldberg method for classifying misreporters of energyintake on a food frequency questionnaire and 24-h recalls: compar-ison with doubly labeled water. Eur J Clin Nutr. 2012;66:569-576.
47. Cox DR, Snell EJ. Analysis of Binary Data. New York, NY: CRCPress; 1989.
How to cite this article: Tam KW, Veerman JL.Prevalence and characteristics of energy intake under-reporting among Australian adults in 1995 and 2011to 2012. Nutrition & Dietetics. 2019;76:546–559.https://doi.org/10.1111/1747-0080.12565
APPENDIX
The Goldberg method is a conventional approach used toevaluate energy misreporting in a study population at theindividual level, when non-instrument-based dietary assess-ments are conducted instead of instrument-based measures.It is based on the ratio of EI to basal metabolic rate (BMR),and has two variants—constant cut-off and variable cut-off.For constant cut-off, the entire population was assumed tohave an expected physical activity level (PAL) of 1.55,which is the probable minimum energy requirement for asedentary population.41 For the variable cut-off method, thepopulation was divided into four PAL groups as defined byABS. (ABS defines the PAL groups as follows: sedentary—less than 50 MET minutes a week; low—50 to less than800 MET minutes a week; moderate—800 to 1600 METminutes a week or over 1600 MET minutes but less than1 hour of vigorous physical activity per week; high—over1600 MET minutes a week and at least 1 hour of vigorousphysical activity per week.19) This is to improve the identifi-cation of under-reporters by comparing an individual'sreported energy intake with the expected energy requirementspecific to their PAL level. The PAL values derived usingregression results from Thompson et al42 are by and largeconcordant with the expected PAL values given byFAO/WHO/UNU43 for each PAL category (see Table A1).
552 TAM AND VEERMAN
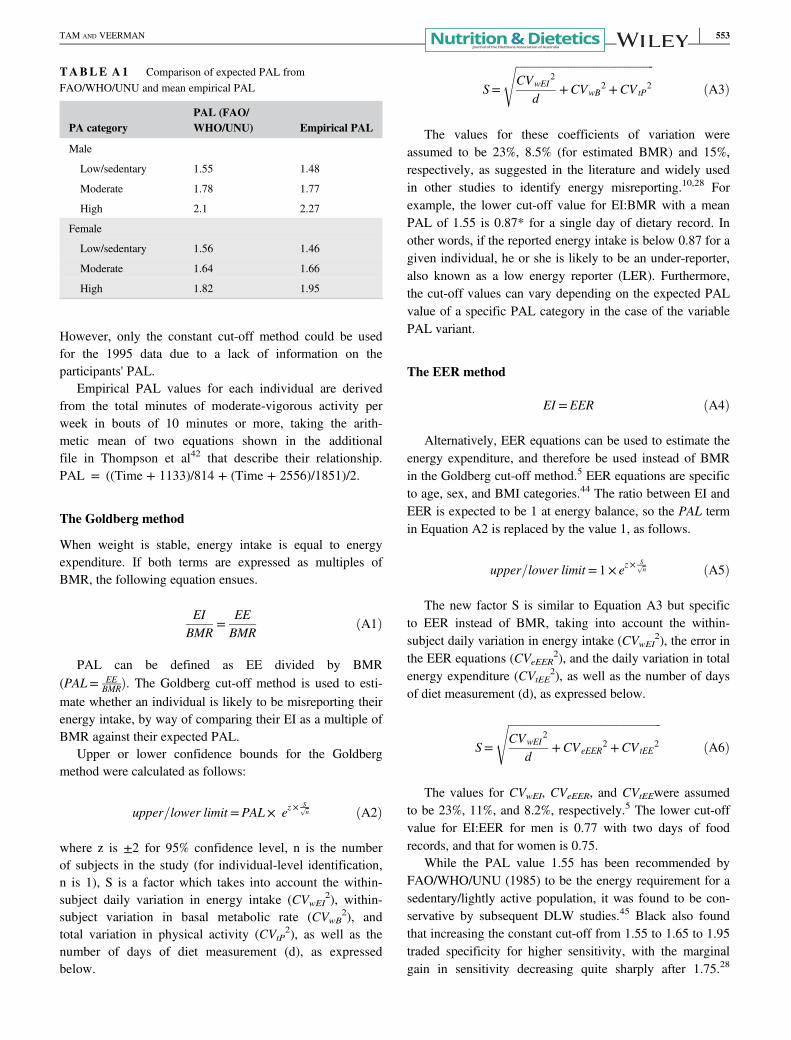
However, only the constant cut-off method could be usedfor the 1995 data due to a lack of information on theparticipants' PAL.
Empirical PAL values for each individual are derivedfrom the total minutes of moderate-vigorous activity perweek in bouts of 10 minutes or more, taking the arith-metic mean of two equations shown in the additionalfile in Thompson et al42 that describe their relationship.PAL = ((Time + 1133)/814 + (Time + 2556)/1851)/2.
The Goldberg method
When weight is stable, energy intake is equal to energyexpenditure. If both terms are expressed as multiples ofBMR, the following equation ensues.
EIBMR
=EEBMR
ðA1Þ
PAL can be defined as EE divided by BMR(PAL= EE
BMRÞ. The Goldberg cut-off method is used to esti-mate whether an individual is likely to be misreporting theirenergy intake, by way of comparing their EI as a multiple ofBMR against their expected PAL.
Upper or lower confidence bounds for the Goldbergmethod were calculated as follows:
upper=lower limit =PAL× ez×Sffiffin
p ðA2Þ
where z is ±2 for 95% confidence level, n is the numberof subjects in the study (for individual-level identification,n is 1), S is a factor which takes into account the within-subject daily variation in energy intake (CVwEI
2), within-subject variation in basal metabolic rate (CVwB
2), andtotal variation in physical activity (CVtP
2), as well as thenumber of days of diet measurement (d), as expressedbelow.
S=
ffiffiffiffiffiffiffiffiffiffiffiffiffiffiffiffiffiffiffiffiffiffiffiffiffiffiffiffiffiffiffiffiffiffiffiffiffiffiffiffiffiffiffiffiffiffiffiffiffiffiCVwEI
2
d+CVwB
2 +CVtP2
sðA3Þ
The values for these coefficients of variation wereassumed to be 23%, 8.5% (for estimated BMR) and 15%,respectively, as suggested in the literature and widely usedin other studies to identify energy misreporting.10,28 Forexample, the lower cut-off value for EI:BMR with a meanPAL of 1.55 is 0.87* for a single day of dietary record. Inother words, if the reported energy intake is below 0.87 for agiven individual, he or she is likely to be an under-reporter,also known as a low energy reporter (LER). Furthermore,the cut-off values can vary depending on the expected PALvalue of a specific PAL category in the case of the variablePAL variant.
The EER method
EI =EER ðA4Þ
Alternatively, EER equations can be used to estimate theenergy expenditure, and therefore be used instead of BMRin the Goldberg cut-off method.5 EER equations are specificto age, sex, and BMI categories.44 The ratio between EI andEER is expected to be 1 at energy balance, so the PAL termin Equation A2 is replaced by the value 1, as follows.
upper=lower limit =1× ez×Sffiffin
p ðA5Þ
The new factor S is similar to Equation A3 but specificto EER instead of BMR, taking into account the within-subject daily variation in energy intake (CVwEI
2), the error inthe EER equations (CVeEER
2), and the daily variation in totalenergy expenditure (CVtEE
2), as well as the number of daysof diet measurement (d), as expressed below.
S=
ffiffiffiffiffiffiffiffiffiffiffiffiffiffiffiffiffiffiffiffiffiffiffiffiffiffiffiffiffiffiffiffiffiffiffiffiffiffiffiffiffiffiffiffiffiffiffiffiffiffiffiffiffiffiffiCVwEI
2
d+CVeEER
2 +CVtEE2
sðA6Þ
The values for CVwEI, CVeEER, and CVtEEwere assumedto be 23%, 11%, and 8.2%, respectively.5 The lower cut-offvalue for EI:EER for men is 0.77 with two days of foodrecords, and that for women is 0.75.
While the PAL value 1.55 has been recommended byFAO/WHO/UNU (1985) to be the energy requirement for asedentary/lightly active population, it was found to be con-servative by subsequent DLW studies.45 Black also foundthat increasing the constant cut-off from 1.55 to 1.65 to 1.95traded specificity for higher sensitivity, with the marginalgain in sensitivity decreasing quite sharply after 1.75.28
TABLE A1 Comparison of expected PAL fromFAO/WHO/UNU and mean empirical PAL
PA categoryPAL (FAO/WHO/UNU) Empirical PAL
Male
Low/sedentary 1.55 1.48
Moderate 1.78 1.77
High 2.1 2.27
Female
Low/sedentary 1.56 1.46
Moderate 1.64 1.66
High 1.82 1.95
TAM AND VEERMAN 553
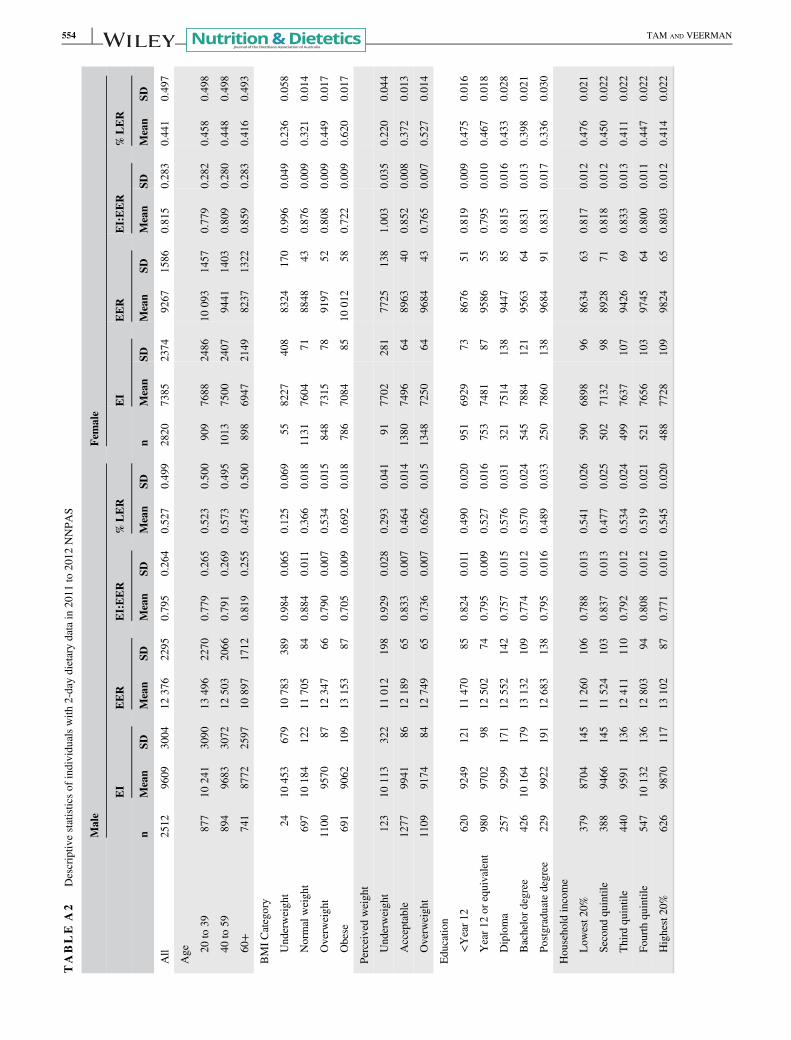
TABLE
A2
Descriptiv
estatisticsof
individualswith
2-daydietarydatain
2011
to2012
NNPA
S
Male
Female
EI
EER
EI:EER
%LER
EI
EER
EI:EER
%LER
nMean
SDMean
SDMean
SDMean
SDn
Mean
SDMean
SDMean
SDMean
SD
All
2512
9609
3004
12376
2295
0.795
0.264
0.527
0.499
2820
7385
2374
9267
1586
0.815
0.283
0.441
0.497
Age 20
to39
877
10241
3090
13496
2270
0.779
0.265
0.523
0.500
909
7688
2486
10093
1457
0.779
0.282
0.458
0.498
40to
59894
9683
3072
12503
2066
0.791
0.269
0.573
0.495
1013
7500
2407
9441
1403
0.809
0.280
0.448
0.498
60+
741
8772
2597
10897
1712
0.819
0.255
0.475
0.500
898
6947
2149
8237
1322
0.859
0.283
0.416
0.493
BMICategory
Underweight
2410
453
679
10783
389
0.984
0.065
0.125
0.069
558227
408
8324
170
0.996
0.049
0.236
0.058
Normalweight
697
10184
122
11705
840.884
0.011
0.366
0.018
1131
7604
718848
430.876
0.009
0.321
0.014
Overw
eight
1100
9570
8712
347
660.790
0.007
0.534
0.015
848
7315
789197
520.808
0.009
0.449
0.017
Obese
691
9062
109
13153
870.705
0.009
0.692
0.018
786
7084
8510
012
580.722
0.009
0.620
0.017
Perceivedweight
Underweight
123
10113
322
11012
198
0.929
0.028
0.293
0.041
917702
281
7725
138
1.003
0.035
0.220
0.044
Acceptable
1277
9941
8612
189
650.833
0.007
0.464
0.014
1380
7496
648963
400.852
0.008
0.372
0.013
Overw
eight
1109
9174
8412
749
650.736
0.007
0.626
0.015
1348
7250
649684
430.765
0.007
0.527
0.014
Edu
catio
n
<Year12
620
9249
121
11470
850.824
0.011
0.490
0.020
951
6929
738676
510.819
0.009
0.475
0.016
Year1
2or
equivalent
980
9702
9812
502
740.795
0.009
0.527
0.016
753
7481
879586
550.795
0.010
0.467
0.018
Diploma
257
9299
171
12552
142
0.757
0.015
0.576
0.031
321
7514
138
9447
850.815
0.016
0.433
0.028
Bachelordegree
426
10164
179
13132
109
0.774
0.012
0.570
0.024
545
7884
121
9563
640.831
0.013
0.398
0.021
Postgraduatedegree
229
9922
191
12683
138
0.795
0.016
0.489
0.033
250
7860
138
9684
910.831
0.017
0.336
0.030
Household
income
Low
est2
0%379
8704
145
11260
106
0.788
0.013
0.541
0.026
590
6898
968634
630.817
0.012
0.476
0.021
Second
quintile
388
9466
145
11524
103
0.837
0.013
0.477
0.025
502
7132
988928
710.818
0.012
0.450
0.022
Third
quintile
440
9591
136
12411
110
0.792
0.012
0.534
0.024
499
7637
107
9426
690.833
0.013
0.411
0.022
Fourth
quintile
547
10132
136
12803
940.808
0.012
0.519
0.021
521
7656
103
9745
640.800
0.011
0.447
0.022
Highest20%
626
9870
117
13102
870.771
0.010
0.545
0.020
488
7728
109
9824
650.803
0.012
0.414
0.022
554 TAM AND VEERMAN
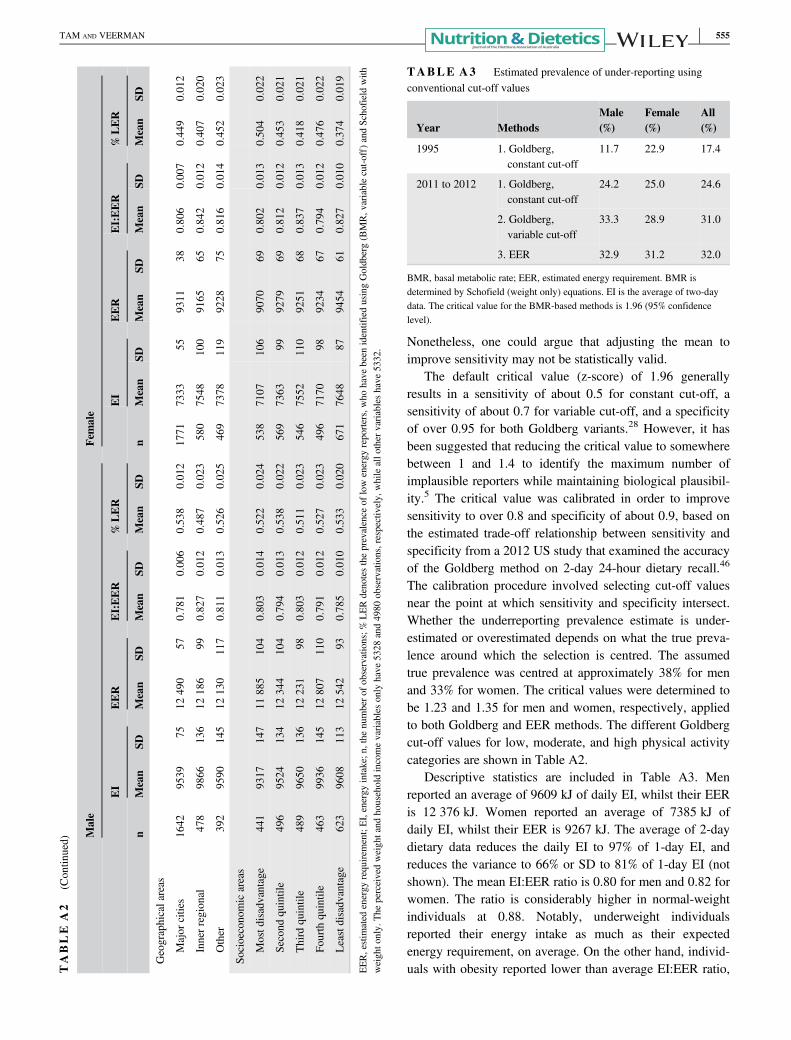
Nonetheless, one could argue that adjusting the mean toimprove sensitivity may not be statistically valid.
The default critical value (z-score) of 1.96 generallyresults in a sensitivity of about 0.5 for constant cut-off, asensitivity of about 0.7 for variable cut-off, and a specificityof over 0.95 for both Goldberg variants.28 However, it hasbeen suggested that reducing the critical value to somewherebetween 1 and 1.4 to identify the maximum number ofimplausible reporters while maintaining biological plausibil-ity.5 The critical value was calibrated in order to improvesensitivity to over 0.8 and specificity of about 0.9, based onthe estimated trade-off relationship between sensitivity andspecificity from a 2012 US study that examined the accuracyof the Goldberg method on 2-day 24-hour dietary recall.46
The calibration procedure involved selecting cut-off valuesnear the point at which sensitivity and specificity intersect.Whether the underreporting prevalence estimate is under-estimated or overestimated depends on what the true preva-lence around which the selection is centred. The assumedtrue prevalence was centred at approximately 38% for menand 33% for women. The critical values were determined tobe 1.23 and 1.35 for men and women, respectively, appliedto both Goldberg and EER methods. The different Goldbergcut-off values for low, moderate, and high physical activitycategories are shown in Table A2.
Descriptive statistics are included in Table A3. Menreported an average of 9609 kJ of daily EI, whilst their EERis 12 376 kJ. Women reported an average of 7385 kJ ofdaily EI, whilst their EER is 9267 kJ. The average of 2-daydietary data reduces the daily EI to 97% of 1-day EI, andreduces the variance to 66% or SD to 81% of 1-day EI (notshown). The mean EI:EER ratio is 0.80 for men and 0.82 forwomen. The ratio is considerably higher in normal-weightindividuals at 0.88. Notably, underweight individualsreported their energy intake as much as their expectedenergy requirement, on average. On the other hand, individ-uals with obesity reported lower than average EI:EER ratio,T
ABLE
A2
(Contin
ued)
Male
Female
EI
EER
EI:EER
%LER
EI
EER
EI:EER
%LER
nMean
SDMean
SDMean
SDMean
SDn
Mean
SDMean
SDMean
SDMean
SD
Geographicalareas
Major
cities
1642
9539
7512
490
570.781
0.006
0.538
0.012
1771
7333
559311
380.806
0.007
0.449
0.012
Innerregional
478
9866
136
12186
990.827
0.012
0.487
0.023
580
7548
100
9165
650.842
0.012
0.407
0.020
Other
392
9590
145
12130
117
0.811
0.013
0.526
0.025
469
7378
119
9228
750.816
0.014
0.452
0.023
Socioeconomicareas
Mostd
isadvantage
441
9317
147
11885
104
0.803
0.014
0.522
0.024
538
7107
106
9070
690.802
0.013
0.504
0.022
Second
quintile
496
9524
134
12344
104
0.794
0.013
0.538
0.022
569
7363
999279
690.812
0.012
0.453
0.021
Third
quintile
489
9650
136
12231
980.803
0.012
0.511
0.023
546
7552
110
9251
680.837
0.013
0.418
0.021
Fourth
quintile
463
9936
145
12807
110
0.791
0.012
0.527
0.023
496
7170
989234
670.794
0.012
0.476
0.022
Leastdisadvantage
623
9608
113
12542
930.785
0.010
0.533
0.020
671
7648
879454
610.827
0.010
0.374
0.019
EER,estim
ated
energy
requirem
ent;EI,energy
intake;n
,the
numbero
fobservations;%
LERdenotestheprevalence
oflowenergy
reporters,who
have
been
identifiedusingGoldberg(BMR,v
ariablecut-off)andSchofieldwith
weighto
nly.
The
perceivedweightand
householdincomevariablesonly
have
5328
and4980
observations,respectively,
whileallo
ther
variableshave
5332.
TABLE A3 Estimated prevalence of under-reporting usingconventional cut-off values
Year MethodsMale(%)
Female(%)
All(%)
1995 1. Goldberg,constant cut-off
11.7 22.9 17.4
2011 to 2012 1. Goldberg,constant cut-off
24.2 25.0 24.6
2. Goldberg,variable cut-off
33.3 28.9 31.0
3. EER 32.9 31.2 32.0
BMR, basal metabolic rate; EER, estimated energy requirement. BMR isdetermined by Schofield (weight only) equations. EI is the average of two-daydata. The critical value for the BMR-based methods is 1.96 (95% confidencelevel).
TAM AND VEERMAN 555
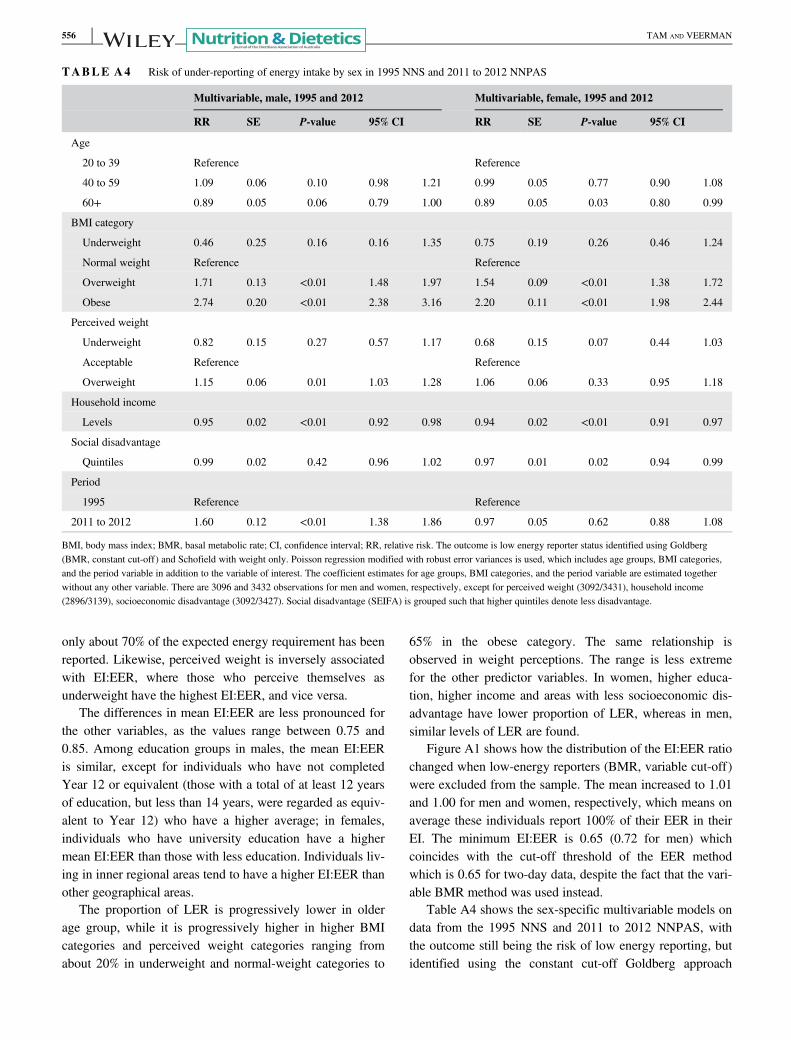
only about 70% of the expected energy requirement has beenreported. Likewise, perceived weight is inversely associatedwith EI:EER, where those who perceive themselves asunderweight have the highest EI:EER, and vice versa.
The differences in mean EI:EER are less pronounced forthe other variables, as the values range between 0.75 and0.85. Among education groups in males, the mean EI:EERis similar, except for individuals who have not completedYear 12 or equivalent (those with a total of at least 12 yearsof education, but less than 14 years, were regarded as equiv-alent to Year 12) who have a higher average; in females,individuals who have university education have a highermean EI:EER than those with less education. Individuals liv-ing in inner regional areas tend to have a higher EI:EER thanother geographical areas.
The proportion of LER is progressively lower in olderage group, while it is progressively higher in higher BMIcategories and perceived weight categories ranging fromabout 20% in underweight and normal-weight categories to
65% in the obese category. The same relationship isobserved in weight perceptions. The range is less extremefor the other predictor variables. In women, higher educa-tion, higher income and areas with less socioeconomic dis-advantage have lower proportion of LER, whereas in men,similar levels of LER are found.
Figure A1 shows how the distribution of the EI:EER ratiochanged when low-energy reporters (BMR, variable cut-off)were excluded from the sample. The mean increased to 1.01and 1.00 for men and women, respectively, which means onaverage these individuals report 100% of their EER in theirEI. The minimum EI:EER is 0.65 (0.72 for men) whichcoincides with the cut-off threshold of the EER methodwhich is 0.65 for two-day data, despite the fact that the vari-able BMR method was used instead.
Table A4 shows the sex-specific multivariable models ondata from the 1995 NNS and 2011 to 2012 NNPAS, withthe outcome still being the risk of low energy reporting, butidentified using the constant cut-off Goldberg approach
TABLE A4 Risk of under-reporting of energy intake by sex in 1995 NNS and 2011 to 2012 NNPAS
Multivariable, male, 1995 and 2012 Multivariable, female, 1995 and 2012
RR SE P-value 95% CI RR SE P-value 95% CI
Age
20 to 39 Reference Reference
40 to 59 1.09 0.06 0.10 0.98 1.21 0.99 0.05 0.77 0.90 1.08
60+ 0.89 0.05 0.06 0.79 1.00 0.89 0.05 0.03 0.80 0.99
BMI category
Underweight 0.46 0.25 0.16 0.16 1.35 0.75 0.19 0.26 0.46 1.24
Normal weight Reference Reference
Overweight 1.71 0.13 <0.01 1.48 1.97 1.54 0.09 <0.01 1.38 1.72
Obese 2.74 0.20 <0.01 2.38 3.16 2.20 0.11 <0.01 1.98 2.44
Perceived weight
Underweight 0.82 0.15 0.27 0.57 1.17 0.68 0.15 0.07 0.44 1.03
Acceptable Reference Reference
Overweight 1.15 0.06 0.01 1.03 1.28 1.06 0.06 0.33 0.95 1.18
Household income
Levels 0.95 0.02 <0.01 0.92 0.98 0.94 0.02 <0.01 0.91 0.97
Social disadvantage
Quintiles 0.99 0.02 0.42 0.96 1.02 0.97 0.01 0.02 0.94 0.99
Period
1995 Reference Reference
2011 to 2012 1.60 0.12 <0.01 1.38 1.86 0.97 0.05 0.62 0.88 1.08
BMI, body mass index; BMR, basal metabolic rate; CI, confidence interval; RR, relative risk. The outcome is low energy reporter status identified using Goldberg(BMR, constant cut-off) and Schofield with weight only. Poisson regression modified with robust error variances is used, which includes age groups, BMI categories,and the period variable in addition to the variable of interest. The coefficient estimates for age groups, BMI categories, and the period variable are estimated togetherwithout any other variable. There are 3096 and 3432 observations for men and women, respectively, except for perceived weight (3092/3431), household income(2896/3139), socioeconomic disadvantage (3092/3427). Social disadvantage (SEIFA) is grouped such that higher quintiles denote less disadvantage.
556 TAM AND VEERMAN
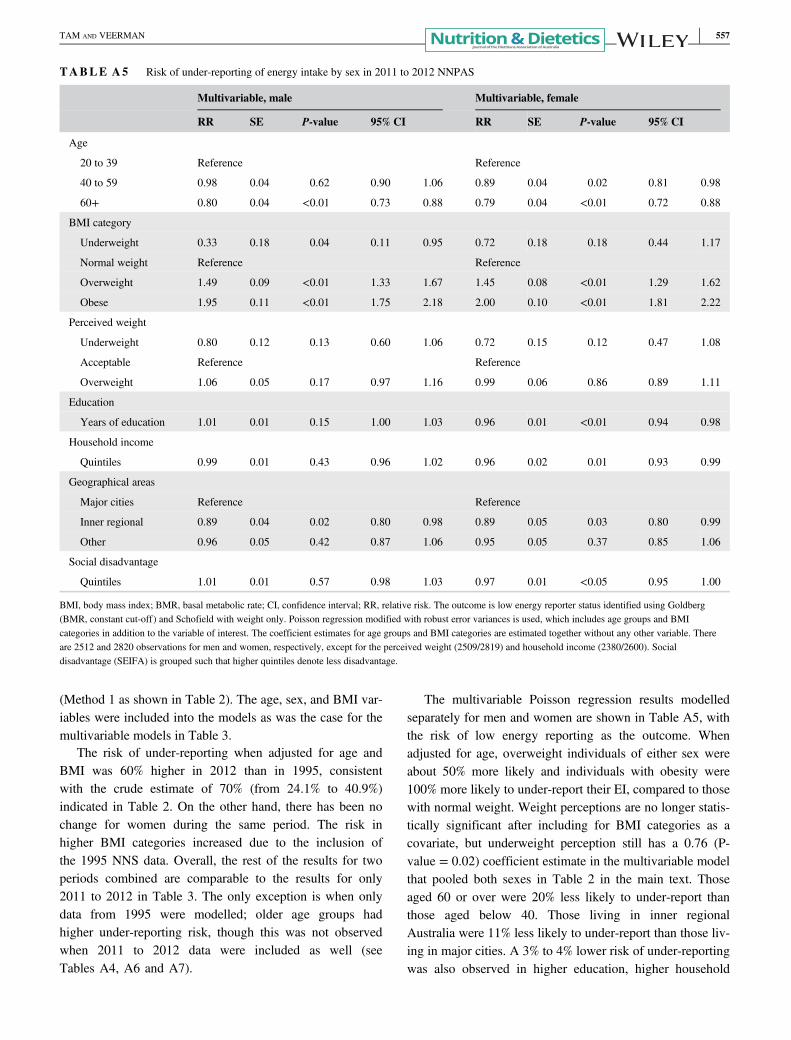
(Method 1 as shown in Table 2). The age, sex, and BMI var-iables were included into the models as was the case for themultivariable models in Table 3.
The risk of under-reporting when adjusted for age andBMI was 60% higher in 2012 than in 1995, consistentwith the crude estimate of 70% (from 24.1% to 40.9%)indicated in Table 2. On the other hand, there has been nochange for women during the same period. The risk inhigher BMI categories increased due to the inclusion ofthe 1995 NNS data. Overall, the rest of the results for twoperiods combined are comparable to the results for only2011 to 2012 in Table 3. The only exception is when onlydata from 1995 were modelled; older age groups hadhigher under-reporting risk, though this was not observedwhen 2011 to 2012 data were included as well (seeTables A4, A6 and A7).
The multivariable Poisson regression results modelledseparately for men and women are shown in Table A5, withthe risk of low energy reporting as the outcome. Whenadjusted for age, overweight individuals of either sex wereabout 50% more likely and individuals with obesity were100% more likely to under-report their EI, compared to thosewith normal weight. Weight perceptions are no longer statis-tically significant after including for BMI categories as acovariate, but underweight perception still has a 0.76 (P-value = 0.02) coefficient estimate in the multivariable modelthat pooled both sexes in Table 2 in the main text. Thoseaged 60 or over were 20% less likely to under-report thanthose aged below 40. Those living in inner regionalAustralia were 11% less likely to under-report than those liv-ing in major cities. A 3% to 4% lower risk of under-reportingwas also observed in higher education, higher household
TABLE A5 Risk of under-reporting of energy intake by sex in 2011 to 2012 NNPAS
Multivariable, male Multivariable, female
RR SE P-value 95% CI RR SE P-value 95% CI
Age
20 to 39 Reference Reference
40 to 59 0.98 0.04 0.62 0.90 1.06 0.89 0.04 0.02 0.81 0.98
60+ 0.80 0.04 <0.01 0.73 0.88 0.79 0.04 <0.01 0.72 0.88
BMI category
Underweight 0.33 0.18 0.04 0.11 0.95 0.72 0.18 0.18 0.44 1.17
Normal weight Reference Reference
Overweight 1.49 0.09 <0.01 1.33 1.67 1.45 0.08 <0.01 1.29 1.62
Obese 1.95 0.11 <0.01 1.75 2.18 2.00 0.10 <0.01 1.81 2.22
Perceived weight
Underweight 0.80 0.12 0.13 0.60 1.06 0.72 0.15 0.12 0.47 1.08
Acceptable Reference Reference
Overweight 1.06 0.05 0.17 0.97 1.16 0.99 0.06 0.86 0.89 1.11
Education
Years of education 1.01 0.01 0.15 1.00 1.03 0.96 0.01 <0.01 0.94 0.98
Household income
Quintiles 0.99 0.01 0.43 0.96 1.02 0.96 0.02 0.01 0.93 0.99
Geographical areas
Major cities Reference Reference
Inner regional 0.89 0.04 0.02 0.80 0.98 0.89 0.05 0.03 0.80 0.99
Other 0.96 0.05 0.42 0.87 1.06 0.95 0.05 0.37 0.85 1.06
Social disadvantage
Quintiles 1.01 0.01 0.57 0.98 1.03 0.97 0.01 <0.05 0.95 1.00
BMI, body mass index; BMR, basal metabolic rate; CI, confidence interval; RR, relative risk. The outcome is low energy reporter status identified using Goldberg(BMR, constant cut-off) and Schofield with weight only. Poisson regression modified with robust error variances is used, which includes age groups and BMIcategories in addition to the variable of interest. The coefficient estimates for age groups and BMI categories are estimated together without any other variable. Thereare 2512 and 2820 observations for men and women, respectively, except for the perceived weight (2509/2819) and household income (2380/2600). Socialdisadvantage (SEIFA) is grouped such that higher quintiles denote less disadvantage.
TAM AND VEERMAN 557
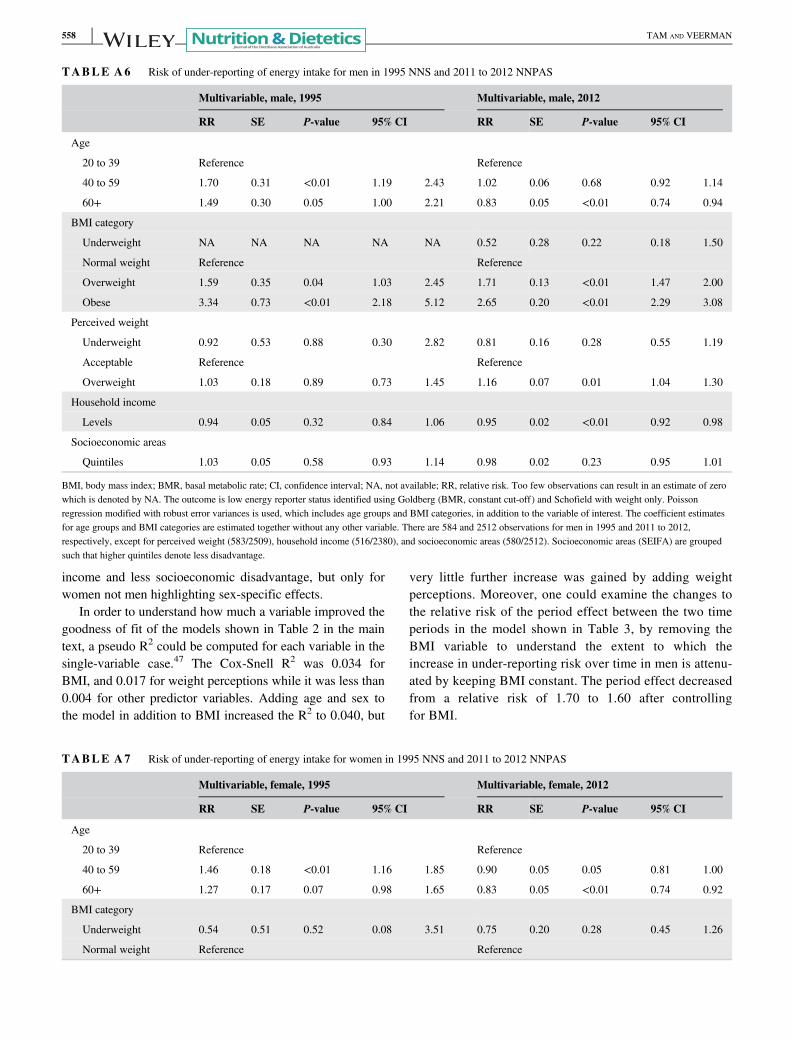
income and less socioeconomic disadvantage, but only forwomen not men highlighting sex-specific effects.
In order to understand how much a variable improved thegoodness of fit of the models shown in Table 2 in the maintext, a pseudo R2 could be computed for each variable in thesingle-variable case.47 The Cox-Snell R2 was 0.034 forBMI, and 0.017 for weight perceptions while it was less than0.004 for other predictor variables. Adding age and sex tothe model in addition to BMI increased the R2 to 0.040, but
very little further increase was gained by adding weightperceptions. Moreover, one could examine the changes tothe relative risk of the period effect between the two timeperiods in the model shown in Table 3, by removing theBMI variable to understand the extent to which theincrease in under-reporting risk over time in men is attenu-ated by keeping BMI constant. The period effect decreasedfrom a relative risk of 1.70 to 1.60 after controllingfor BMI.
TABLE A6 Risk of under-reporting of energy intake for men in 1995 NNS and 2011 to 2012 NNPAS
Multivariable, male, 1995 Multivariable, male, 2012
RR SE P-value 95% CI RR SE P-value 95% CI
Age
20 to 39 Reference Reference
40 to 59 1.70 0.31 <0.01 1.19 2.43 1.02 0.06 0.68 0.92 1.14
60+ 1.49 0.30 0.05 1.00 2.21 0.83 0.05 <0.01 0.74 0.94
BMI category
Underweight NA NA NA NA NA 0.52 0.28 0.22 0.18 1.50
Normal weight Reference Reference
Overweight 1.59 0.35 0.04 1.03 2.45 1.71 0.13 <0.01 1.47 2.00
Obese 3.34 0.73 <0.01 2.18 5.12 2.65 0.20 <0.01 2.29 3.08
Perceived weight
Underweight 0.92 0.53 0.88 0.30 2.82 0.81 0.16 0.28 0.55 1.19
Acceptable Reference Reference
Overweight 1.03 0.18 0.89 0.73 1.45 1.16 0.07 0.01 1.04 1.30
Household income
Levels 0.94 0.05 0.32 0.84 1.06 0.95 0.02 <0.01 0.92 0.98
Socioeconomic areas
Quintiles 1.03 0.05 0.58 0.93 1.14 0.98 0.02 0.23 0.95 1.01
BMI, body mass index; BMR, basal metabolic rate; CI, confidence interval; NA, not available; RR, relative risk. Too few observations can result in an estimate of zerowhich is denoted by NA. The outcome is low energy reporter status identified using Goldberg (BMR, constant cut-off) and Schofield with weight only. Poissonregression modified with robust error variances is used, which includes age groups and BMI categories, in addition to the variable of interest. The coefficient estimatesfor age groups and BMI categories are estimated together without any other variable. There are 584 and 2512 observations for men in 1995 and 2011 to 2012,respectively, except for perceived weight (583/2509), household income (516/2380), and socioeconomic areas (580/2512). Socioeconomic areas (SEIFA) are groupedsuch that higher quintiles denote less disadvantage.
TABLE A7 Risk of under-reporting of energy intake for women in 1995 NNS and 2011 to 2012 NNPAS
Multivariable, female, 1995 Multivariable, female, 2012
RR SE P-value 95% CI RR SE P-value 95% CI
Age
20 to 39 Reference Reference
40 to 59 1.46 0.18 <0.01 1.16 1.85 0.90 0.05 0.05 0.81 1.00
60+ 1.27 0.17 0.07 0.98 1.65 0.83 0.05 <0.01 0.74 0.92
BMI category
Underweight 0.54 0.51 0.52 0.08 3.51 0.75 0.20 0.28 0.45 1.26
Normal weight Reference Reference
558 TAM AND VEERMAN
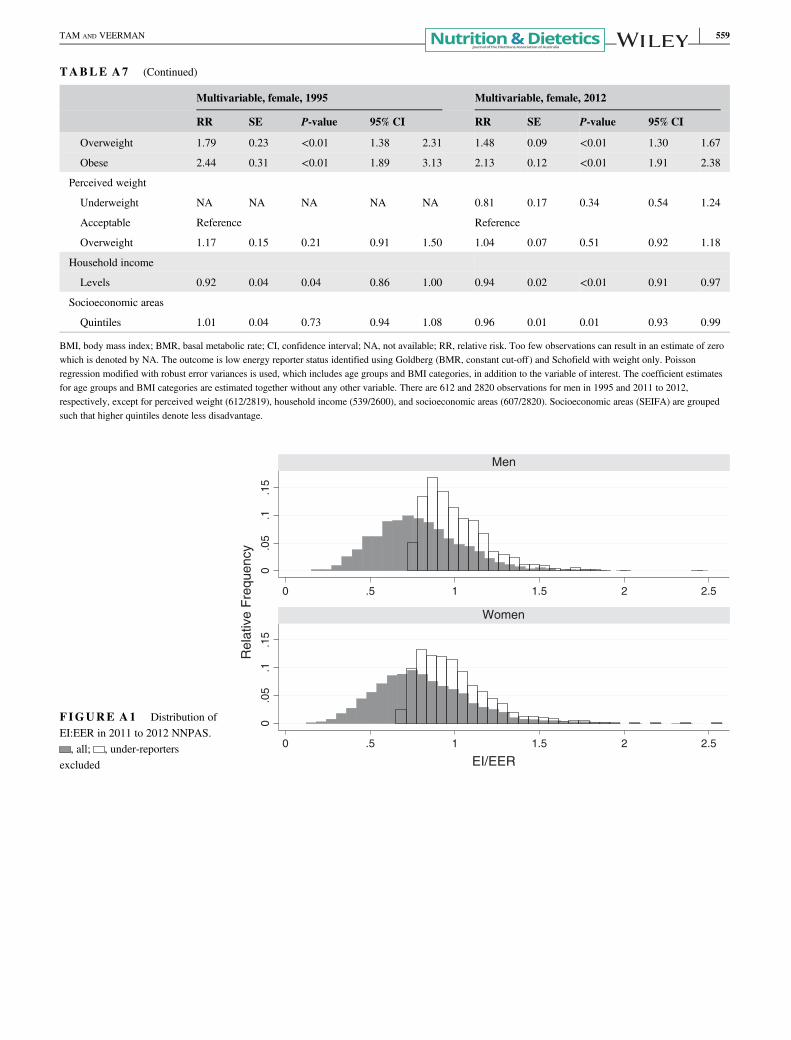
TABLE A7 (Continued)
Multivariable, female, 1995 Multivariable, female, 2012
RR SE P-value 95% CI RR SE P-value 95% CI
Overweight 1.79 0.23 <0.01 1.38 2.31 1.48 0.09 <0.01 1.30 1.67
Obese 2.44 0.31 <0.01 1.89 3.13 2.13 0.12 <0.01 1.91 2.38
Perceived weight
Underweight NA NA NA NA NA 0.81 0.17 0.34 0.54 1.24
Acceptable Reference Reference
Overweight 1.17 0.15 0.21 0.91 1.50 1.04 0.07 0.51 0.92 1.18
Household income
Levels 0.92 0.04 0.04 0.86 1.00 0.94 0.02 <0.01 0.91 0.97
Socioeconomic areas
Quintiles 1.01 0.04 0.73 0.94 1.08 0.96 0.01 0.01 0.93 0.99
BMI, body mass index; BMR, basal metabolic rate; CI, confidence interval; NA, not available; RR, relative risk. Too few observations can result in an estimate of zerowhich is denoted by NA. The outcome is low energy reporter status identified using Goldberg (BMR, constant cut-off) and Schofield with weight only. Poissonregression modified with robust error variances is used, which includes age groups and BMI categories, in addition to the variable of interest. The coefficient estimatesfor age groups and BMI categories are estimated together without any other variable. There are 612 and 2820 observations for men in 1995 and 2011 to 2012,respectively, except for perceived weight (612/2819), household income (539/2600), and socioeconomic areas (607/2820). Socioeconomic areas (SEIFA) are groupedsuch that higher quintiles denote less disadvantage.
0.0
5.1
.15
0.0
5.1
.15
0 .5 1 1.5 2 2.5
0 .5 1 1.5 2 2.5
Men
Women
Rel
ativ
e F
requ
ency
EI/EER
FIGURE A1 Distribution ofEI:EER in 2011 to 2012 NNPAS., all; , under-reporters
excluded
TAM AND VEERMAN 559
ORIGINAL RESEARCH
Dietary underreporting in women affected bypolycystic ovary syndrome: A pilot study
Rachele DE GIUSEPPE ,1 Valentina BRASCHI,1 David BOSONI,2 Ginevra BIINO,3
Fatima C. STANFORD,4 Rossella E. NAPPI2 and Hellas CENA1
1Unit of Human Nutrition and Dietetics, Department of Public Health, Experimental and Forensic Medicine and2Department of Clinical, Surgical, Diagnostic and Paediatric Sciences, Research Centre for Reproductive Medicine,Gynaecological Endocrinology and Menopause, IRCCS San Matteo Foundation, University of Pavia and 3Institute ofMolecular Genetics, National Research Council of Italy, Pavia, Italy; and 4Department of Medicine, Gastroenterologyand Paediatrics, Endocrinology, Massachusetts General Hospital, Harvard Medical School, Boston,Massachusetts, USA
AbstractAim: The first-line therapy for polycystic ovary syndrome (PCOS) is weight loss focussing on diet and regular exer-cise; measurement of diet and energy intake (EI) is important to determine associations between nutrients and healthin women with PCOS. The EI underreporting (UR) is a condition characterised by reports of habitual EI that is implau-sibly low, compared with estimated requirements. This case–control study aims to evaluate UR in women with PCOS.Methods: Thirty-six women with PCOS were enrolled according to the Rotterdam criteria; 37 healthy women wereenrolled as controls. Inclusion criteria: age range 18–45 and body mass index ≥18.5 kg/m2 in subjects without eat-ing disorders and/or diabetes mellitus. Nutritional assessment included: anthropometry, basal metabolic rate (BMR),weight history and physical activity assessment. Subjects completed a non-consecutive three-day dietary diary toidentify energy and macronutrient intake. UR was calculated (Goldberg Index: EI/BMR).Results: Although women with PCOS reported a significantly higher mean BMR than controls (P < 0.0001), their EIwas lower (P < 0.001), suggesting an UR in 47.2% of women with PCOS versus 2.7% of controls (P < 0.0001). The EIfrom simple sugars was lower in women with PCOS than controls (P < 0.01). The protein intake was increased in con-trols than women with PCOS (P < 0.0001). Weight cycling was more frequent in women with PCOS (P < 0.001). Logis-tic regression analysis identified UR associated with PCOS (P = 0.001).Conclusions: Women with PCOS underreport foods rich in simple sugars rather than underreport their total dietaryintake. These results may have implications for the interpretation of diet and health correlations in this patientpopulation.
Key words: basal metabolic rate, dietary underreporting, energy intake, misreporting, polycystic ovarysyndrome.
Introduction
Polycystic ovary syndrome (PCOS) is one of the most com-mon endocrine disorders in women of reproductive age,
with a 5–10% prevalence rate.1 Applying the Rotterdam cri-teria which requires the presence of two or more of the fol-lowing: ovulatory dysfunction (oligo- or amenorrhoea),hyperandrogenism (either biochemical or clinical hirsutism)and polycystic ovarian morphology,2 the rate of PCOS incommunity settings might increase to 18%.3
The pathogenesis of PCOS is multifactorial—a key com-ponent is the association between insulin resistance, com-pensatory hyperinsulinemia and hyperandrogenism.4–7
Clinical manifestations of PCOS frequently include highbody adiposity leading to an increased risk of metabolicsyndrome, type 2 diabetes and cardiovascular disease.8,9
Although weight loss and dietary modifications arerecommended to improve the metabolic status, reduce tes-tosterone and decrease hirsutism in women with PCOS,6,10
they are usually not able to result in sustainable weight losswith scarce results in metabolic and reproductive outcomes.As women with PCOS could experience high body
R. De Giuseppe, MS, PhD, ResearcherV. Braschi, MD, Medical DoctorD. Bosoni, MD, Medical DoctorG. Biino, BS, MS, PhD, StatisticianF.C. Stanford, MD, MPH, MPA, Medical DoctorR.E. Nappi, MD, ProfessorH. Cena, MD, ProfessorR. De Giuseppe and V. Braschi are Joint first authors.Correspondence: R. De Giuseppe, Unit of Human Nutrition andDietetics, Department of Public Health, Experimental and ForensicMedicine, University of Pavia; via Bassi 21, 27100 Pavia, Italy. Tel:+39-0382987553; Fax: +39-0382987191.Email: [email protected]
Accepted June 2018
© 2018 Dietitians Association of Australia560
AA AA
DDD
ieti
tian
s As
soci
atio
nofof
Aus
tral
ia
Nutrition & Dietetics 2019; 76: 560–566 DOI: 10.1111/1747-0080.12460
adiposity8,9 they could feel inadequate and judged for theirweight and eating; therefore, they might disclose dietaryhabits, which reflect counsellor’s expectations rather thanactual consumption. It has been reported that, in this selec-tive misreport, patients affected by obesity omit sociallyundesirable food items high in fat, sugar, alcoholic bever-ages, and underreport portion sizes or snack consump-tion11,12 to align with perceived preferred diet behaviours.
Several variables, grouped into nine distinct categories,seem to influence energy misreporting: demographics(e.g. age, gender), diet (e.g. macronutrient intake), eatingbehaviour (e.g. eating restraint), social desirability, dieting/weight history (e.g. number of previous dieting attempts),body image, psychology (e.g. depression), life status(e.g. socioeconomic status) and physical activity.13
The energy intake (EI) underreporting (UR) occurs whenthe report of habitual EI is implausibly low when comparedwith estimated requirement.14 It has been reported that URtends to be higher among women with obesity.15 Peoplewith obesity often experience weight stigma, as highlightedby Puhl and Suh.16 and at higher body mass indexes(BMIs) frequently correspond higher UR and poorer dietquality.15 Therefore, inaccurate or biased EI reporting mayundermine the validity of research on dietary surveys andhealth outcomes.17
Finally, it has been reported18 that women with PCOS,particularly those with insulin resistance, present a signifi-cantly decreased basal metabolic rate and should restricttheir EI by diet and enhance their energy expenditure byexercise to maintain their body weight.
Based on these considerations, to the best of our knowl-edge, this is the first pilot case–control study, to evaluatethe presence of EI UR in women affected by PCOS, payingattention to insulin resistance as a possible confoundingfactor.
Methods
Subjects with PCOS, according to the Rotterdam consensus,2
attending the Research Centre for Reproductive Medicine,Gynaecological Endocrinology and Menopause, FondazioneIRCCS San Matteo of Pavia (Italy) and not under treatmentfor weight loss, were recruited between January 2015 andNovember 2015.
Exclusion criteria were BMI <18.5 kg/m2, diabetes melli-tus, eating disorders and intentional weight loss in the pre-vious 3 months. Thus 36 women with PCOS were included(age range: 16–43 years) and 37 healthy subjects matchedby age (age range: 18–45 years) were enrolled as controls.
Informed consent and Patient Privacy Consent Form wasobtained from all participants. IRB approval was obtainedper institutional guidelines. All procedures performed inthe study were in accordance with the ethical standards ofthe institutional and/or national research committee andwith the 1964 Helsinki declaration and its later amend-ments or comparable ethical standards.
The study followed the ‘STrengthening the Reporting ofOBservational studies in Epidemiology’ (STROBE)guidelines.
Nutritional assessment was performed, including anthro-pometric measurements (height, weight, waist circumfer-ence (WC)) and biochemical parameters (glucose, insulin,total cholesterol, triglycerides, HDL and LDL cholesterols).Weight, height and WC were measured under standardconditions, as previously described;19 BMI (weight inkg/height in m2) was then calculated.
Homeostasis Model Assessment (HOMA) index was alsoassessed as index of insulin resistance (cut-off value >2.3).20
Moreover, we investigated the history of previous diet-ing, particularly the history of weight cycling with the fol-lowing questions:• Have you ever undergone weight loss dietary treatment
during your life? If yes, how many times?• Have you lost any weight after any weight loss dietary
treatments? If yes, how much?• Have you ever lapsed or relapsed? If yes, how many
times?According to the literature,21 all women reporting a 5 kg
weight loss three or more times in a lifecycle followed by aregain were defined as weight cyclers.
To estimate energy and nutrient intake, subjects wereinstructed to compile a non-consecutive three-day dietaryrecord (food diary).22 The days of recording were rando-mised (1 weekend day and 2 non-consecutive weekdays),to provide a sufficient number of days to measure EI forthe sample size and a good weekly representation of themean dietary habits of the subjects.22 Total EI, the percent-age of energy from carbohydrates, simple sugars, lipids, andproteins, and fibre were estimated using the Food Compo-sition Database for Epidemiological Studies in Italy.23
To investigate physical activity patterns, we administereda section of a previously validated dietary questionnaire.24
The questionnaire was drawn from one originally developedand validated on an Italian youth population24 and thenadapted by two dietitians to our adult population by delet-ing physical activities in the school environment before itsadministration. The new adapted version was previouslypiloted on a sample of 24 subjects and revised accordingly,although its validity and reliability were not formally tested.All answers were structured to quantify the time spentweekly in physical activity: (i) to investigate the activitiesspent during the free time (i.e. walking, watching TV, lis-tening, to music, using the computer, reading a book, prac-ticing a sport and shopping) and (ii) to quantify screen time(i.e. the hours on the computer or watching TV). Eachscore ranged from 0 to 3, with the maximum score assignedto the healthiest habit.24 The total score was divided intotertiles: (i) Low: ‘sedentary’, (ii) Medium: ‘partially moder-ate’ and (iii) High: ‘active’, according to the National Life-style Guidelines.25
To derive cut-off values for EI misreporting, according toGoldberg et al.,26 we applied at individual level, the equa-tions reported in Figure 1 to determine the rate of under-reporters, plausible and over-reporters.27
Dietary underreporting polycystic ovary syndrome
© 2018 Dietitians Association of Australia 561
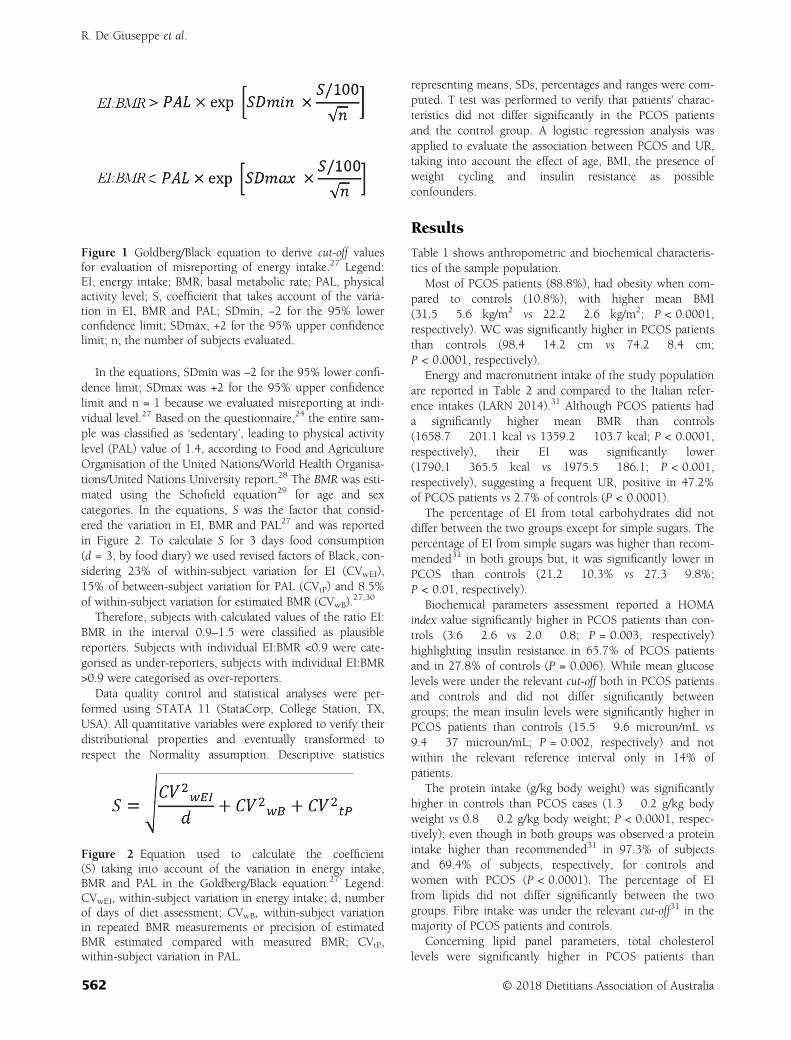
In the equations, SDmin was −2 for the 95% lower confi-dence limit; SDmax was +2 for the 95% upper confidencelimit and n = 1 because we evaluated misreporting at indi-vidual level.27 Based on the questionnaire,24 the entire sam-ple was classified as ‘sedentary’, leading to physical activitylevel (PAL) value of 1.4, according to Food and AgricultureOrganisation of the United Nations/World Health Organisa-tions/United Nations University report.28 The BMR was esti-mated using the Schofield equation29 for age and sexcategories. In the equations, S was the factor that consid-ered the variation in EI, BMR and PAL27 and was reportedin Figure 2. To calculate S for 3 days food consumption(d = 3, by food diary) we used revised factors of Black, con-sidering 23% of within-subject variation for EI (CVwEI),15% of between-subject variation for PAL (CVtP) and 8.5%of within-subject variation for estimated BMR (CVwB).
27,30
Therefore, subjects with calculated values of the ratio EI:BMR in the interval 0.9–1.5 were classified as plausiblereporters. Subjects with individual EI:BMR <0.9 were cate-gorised as under-reporters, subjects with individual EI:BMR>0.9 were categorised as over-reporters.
Data quality control and statistical analyses were per-formed using STATA 11 (StataCorp, College Station, TX,USA). All quantitative variables were explored to verify theirdistributional properties and eventually transformed torespect the Normality assumption. Descriptive statistics
representing means, SDs, percentages and ranges were com-puted. T test was performed to verify that patients’ charac-teristics did not differ significantly in the PCOS patientsand the control group. A logistic regression analysis wasapplied to evaluate the association between PCOS and UR,taking into account the effect of age, BMI, the presence ofweight cycling and insulin resistance as possibleconfounders.
Results
Table 1 shows anthropometric and biochemical characteris-tics of the sample population.
Most of PCOS patients (88.8%), had obesity when com-pared to controls (10.8%), with higher mean BMI(31.5 � 5.6 kg/m2 vs 22.2 � 2.6 kg/m2; P < 0.0001,respectively). WC was significantly higher in PCOS patientsthan controls (98.4 � 14.2 cm vs 74.2 � 8.4 cm;P < 0.0001, respectively).
Energy and macronutrient intake of the study populationare reported in Table 2 and compared to the Italian refer-ence intakes (LARN 2014).31 Although PCOS patients hada significantly higher mean BMR than controls(1658.7 � 201.1 kcal vs 1359.2 � 103.7 kcal; P < 0.0001,respectively), their EI was significantly lower(1790.1 � 365.5 kcal vs 1975.5 � 186.1; P < 0.001,respectively), suggesting a frequent UR, positive in 47.2%of PCOS patients vs 2.7% of controls (P < 0.0001).
The percentage of EI from total carbohydrates did notdiffer between the two groups except for simple sugars. Thepercentage of EI from simple sugars was higher than recom-mended31 in both groups but, it was significantly lower inPCOS than controls (21.2 � 10.3% vs 27.3 � 9.8%;P < 0.01, respectively).
Biochemical parameters assessment reported a HOMAindex value significantly higher in PCOS patients than con-trols (3.6 � 2.6 vs 2.0 � 0.8; P = 0.003, respectively)highlighting insulin resistance in 65.7% of PCOS patientsand in 27.8% of controls (P = 0.006). While mean glucoselevels were under the relevant cut-off both in PCOS patientsand controls and did not differ significantly betweengroups; the mean insulin levels were significantly higher inPCOS patients than controls (15.5 � 9.6 microun/mL vs9.4 � 37 microun/mL; P = 0.002, respectively) and notwithin the relevant reference interval only in 14% ofpatients.
The protein intake (g/kg body weight) was significantlyhigher in controls than PCOS cases (1.3 � 0.2 g/kg bodyweight vs 0.8 � 0.2 g/kg body weight; P < 0.0001, respec-tively); even though in both groups was observed a proteinintake higher than recommended31 in 97.3% of subjectsand 69.4% of subjects, respectively, for controls andwomen with PCOS (P < 0.0001). The percentage of EIfrom lipids did not differ significantly between the twogroups. Fibre intake was under the relevant cut-off31 in themajority of PCOS patients and controls.
Concerning lipid panel parameters, total cholesterollevels were significantly higher in PCOS patients than
Figure 1 Goldberg/Black equation to derive cut-off valuesfor evaluation of misreporting of energy intake.27 Legend:EI, energy intake; BMR, basal metabolic rate; PAL, physicalactivity level; S, coefficient that takes account of the varia-tion in EI, BMR and PAL; SDmin, −2 for the 95% lowerconfidence limit; SDmax, +2 for the 95% upper confidencelimit; n, the number of subjects evaluated.
Figure 2 Equation used to calculate the coefficient(S) taking into account of the variation in energy intake,BMR and PAL in the Goldberg/Black equation.27 Legend:CVwEI, within-subject variation in energy intake; d, numberof days of diet assessment; CVwB, within-subject variationin repeated BMR measurements or precision of estimatedBMR estimated compared with measured BMR; CVtP,within-subject variation in PAL.
R. De Giuseppe et al.
562 © 2018 Dietitians Association of Australia
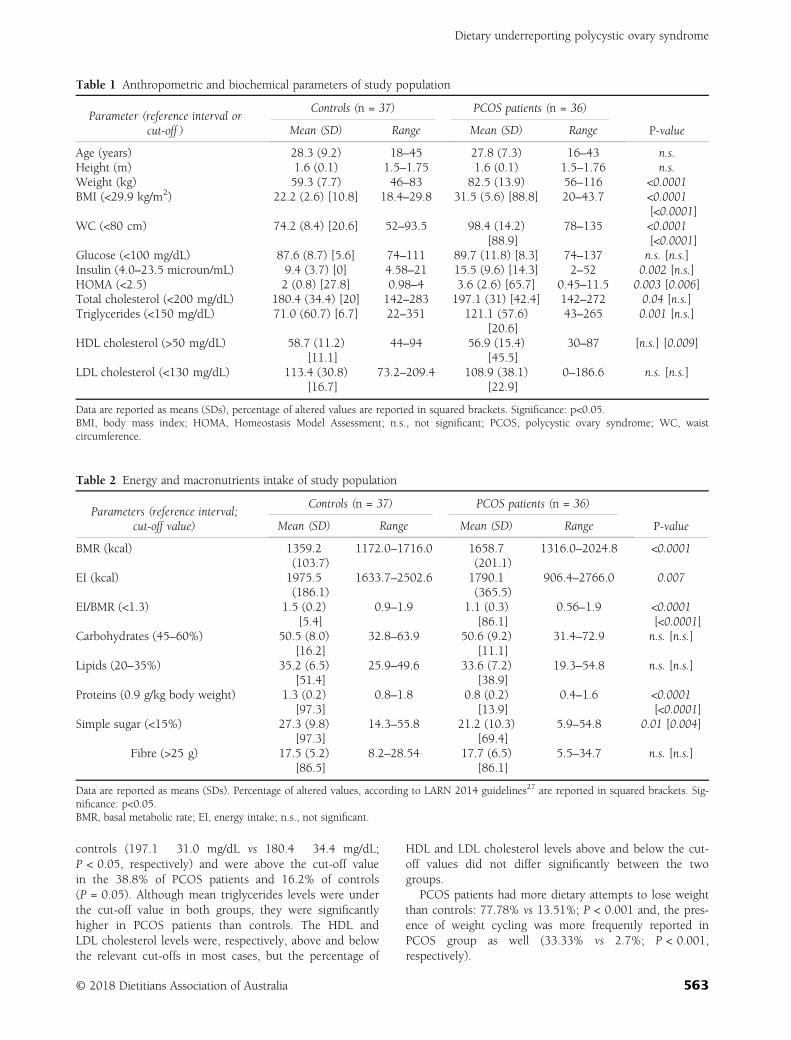
controls (197.1 � 31.0 mg/dL vs 180.4 � 34.4 mg/dL;P < 0.05, respectively) and were above the cut-off valuein the 38.8% of PCOS patients and 16.2% of controls(P = 0.05). Although mean triglycerides levels were underthe cut-off value in both groups, they were significantlyhigher in PCOS patients than controls. The HDL andLDL cholesterol levels were, respectively, above and belowthe relevant cut-offs in most cases, but the percentage of
HDL and LDL cholesterol levels above and below the cut-off values did not differ significantly between the twogroups.
PCOS patients had more dietary attempts to lose weightthan controls: 77.78% vs 13.51%; P < 0.001 and, the pres-ence of weight cycling was more frequently reported inPCOS group as well (33.33% vs 2.7%; P < 0.001,respectively).
Table 1 Anthropometric and biochemical parameters of study population
Parameter (reference interval orcut-off )
Controls (n = 37) PCOS patients (n = 36)
P-valueMean (SD) Range Mean (SD) Range
Age (years) 28.3 (9.2) 18–45 27.8 (7.3) 16–43 n.s.Height (m) 1.6 (0.1) 1.5–1.75 1.6 (0.1) 1.5–1.76 n.s.Weight (kg) 59.3 (7.7) 46–83 82.5 (13.9) 56–116 <0.0001BMI (<29.9 kg/m2) 22.2 (2.6) [10.8] 18.4–29.8 31.5 (5.6) [88.8] 20–43.7 <0.0001
[<0.0001]WC (<80 cm) 74.2 (8.4) [20.6] 52–93.5 98.4 (14.2)
[88.9]78–135 <0.0001
[<0.0001]Glucose (<100 mg/dL) 87.6 (8.7) [5.6] 74–111 89.7 (11.8) [8.3] 74–137 n.s. [n.s.]Insulin (4.0–23.5 microun/mL) 9.4 (3.7) [0] 4.58–21 15.5 (9.6) [14.3] 2–52 0.002 [n.s.]HOMA (<2.5) 2 (0.8) [27.8] 0.98–4 3.6 (2.6) [65.7] 0.45–11.5 0.003 [0.006]Total cholesterol (<200 mg/dL) 180.4 (34.4) [20] 142–283 197.1 (31) [42.4] 142–272 0.04 [n.s.]Triglycerides (<150 mg/dL) 71.0 (60.7) [6.7] 22–351 121.1 (57.6)
[20.6]43–265 0.001 [n.s.]
HDL cholesterol (>50 mg/dL) 58.7 (11.2)[11.1]
44–94 56.9 (15.4)[45.5]
30–87 [n.s.] [0.009]
LDL cholesterol (<130 mg/dL) 113.4 (30.8)[16.7]
73.2–209.4 108.9 (38.1)[22.9]
0–186.6 n.s. [n.s.]
Data are reported as means (SDs), percentage of altered values are reported in squared brackets. Significance: p<0.05.BMI, body mass index; HOMA, Homeostasis Model Assessment; n.s., not significant; PCOS, polycystic ovary syndrome; WC, waistcircumference.
Table 2 Energy and macronutrients intake of study population
Parameters (reference interval;cut-off value)
Controls (n = 37) PCOS patients (n = 36)
P-valueMean (SD) Range Mean (SD) Range
BMR (kcal) 1359.2(103.7)
1172.0–1716.0 1658.7(201.1)
1316.0–2024.8 <0.0001
EI (kcal) 1975.5(186.1)
1633.7–2502.6 1790.1(365.5)
906.4–2766.0 0.007
EI/BMR (<1.3) 1.5 (0.2)[5.4]
0.9–1.9 1.1 (0.3)[86.1]
0.56–1.9 <0.0001[<0.0001]
Carbohydrates (45–60%) 50.5 (8.0)[16.2]
32.8–63.9 50.6 (9.2)[11.1]
31.4–72.9 n.s. [n.s.]
Lipids (20–35%) 35.2 (6.5)[51.4]
25.9–49.6 33.6 (7.2)[38.9]
19.3–54.8 n.s. [n.s.]
Proteins (0.9 g/kg body weight) 1.3 (0.2)[97.3]
0.8–1.8 0.8 (0.2)[13.9]
0.4–1.6 <0.0001[<0.0001]
Simple sugar (<15%) 27.3 (9.8)[97.3]
14.3–55.8 21.2 (10.3)[69.4]
5.9–54.8 0.01 [0.004]
Fibre (>25 g) 17.5 (5.2)[86.5]
8.2–28.54 17.7 (6.5)[86.1]
5.5–34.7 n.s. [n.s.]
Data are reported as means (SDs). Percentage of altered values, according to LARN 2014 guidelines27 are reported in squared brackets. Sig-nificance: p<0.05.BMR, basal metabolic rate; EI, energy intake; n.s., not significant.
Dietary underreporting polycystic ovary syndrome
© 2018 Dietitians Association of Australia 563
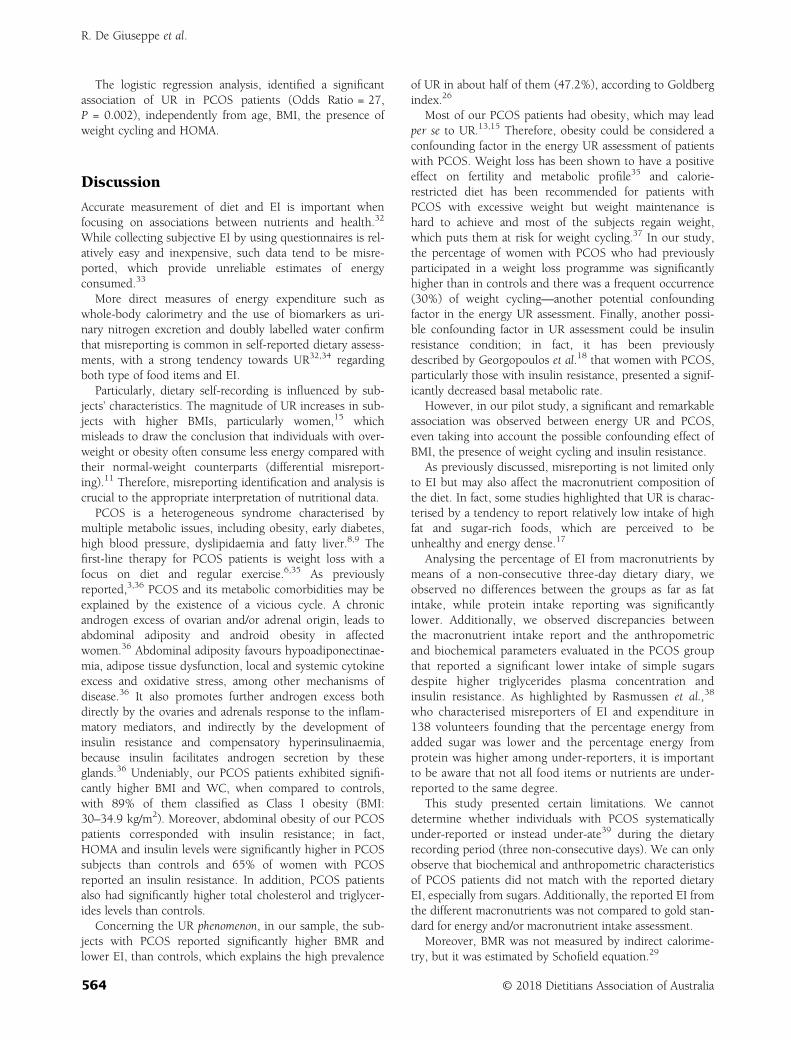
The logistic regression analysis, identified a significantassociation of UR in PCOS patients (Odds Ratio = 27,P = 0.002), independently from age, BMI, the presence ofweight cycling and HOMA.
Discussion
Accurate measurement of diet and EI is important whenfocusing on associations between nutrients and health.32
While collecting subjective EI by using questionnaires is rel-atively easy and inexpensive, such data tend to be misre-ported, which provide unreliable estimates of energyconsumed.33
More direct measures of energy expenditure such aswhole-body calorimetry and the use of biomarkers as uri-nary nitrogen excretion and doubly labelled water confirmthat misreporting is common in self-reported dietary assess-ments, with a strong tendency towards UR32,34 regardingboth type of food items and EI.
Particularly, dietary self-recording is influenced by sub-jects’ characteristics. The magnitude of UR increases in sub-jects with higher BMIs, particularly women,15 whichmisleads to draw the conclusion that individuals with over-weight or obesity often consume less energy compared withtheir normal-weight counterparts (differential misreport-ing).11 Therefore, misreporting identification and analysis iscrucial to the appropriate interpretation of nutritional data.
PCOS is a heterogeneous syndrome characterised bymultiple metabolic issues, including obesity, early diabetes,high blood pressure, dyslipidaemia and fatty liver.8,9 Thefirst-line therapy for PCOS patients is weight loss with afocus on diet and regular exercise.6,35 As previouslyreported,3,36 PCOS and its metabolic comorbidities may beexplained by the existence of a vicious cycle. A chronicandrogen excess of ovarian and/or adrenal origin, leads toabdominal adiposity and android obesity in affectedwomen.36 Abdominal adiposity favours hypoadiponectinae-mia, adipose tissue dysfunction, local and systemic cytokineexcess and oxidative stress, among other mechanisms ofdisease.36 It also promotes further androgen excess bothdirectly by the ovaries and adrenals response to the inflam-matory mediators, and indirectly by the development ofinsulin resistance and compensatory hyperinsulinaemia,because insulin facilitates androgen secretion by theseglands.36 Undeniably, our PCOS patients exhibited signifi-cantly higher BMI and WC, when compared to controls,with 89% of them classified as Class I obesity (BMI:30–34.9 kg/m2). Moreover, abdominal obesity of our PCOSpatients corresponded with insulin resistance; in fact,HOMA and insulin levels were significantly higher in PCOSsubjects than controls and 65% of women with PCOSreported an insulin resistance. In addition, PCOS patientsalso had significantly higher total cholesterol and triglycer-ides levels than controls.
Concerning the UR phenomenon, in our sample, the sub-jects with PCOS reported significantly higher BMR andlower EI, than controls, which explains the high prevalence
of UR in about half of them (47.2%), according to Goldbergindex.26
Most of our PCOS patients had obesity, which may leadper se to UR.13,15 Therefore, obesity could be considered aconfounding factor in the energy UR assessment of patientswith PCOS. Weight loss has been shown to have a positiveeffect on fertility and metabolic profile35 and calorie-restricted diet has been recommended for patients withPCOS with excessive weight but weight maintenance ishard to achieve and most of the subjects regain weight,which puts them at risk for weight cycling.37 In our study,the percentage of women with PCOS who had previouslyparticipated in a weight loss programme was significantlyhigher than in controls and there was a frequent occurrence(30%) of weight cycling—another potential confoundingfactor in the energy UR assessment. Finally, another possi-ble confounding factor in UR assessment could be insulinresistance condition; in fact, it has been previouslydescribed by Georgopoulos et al.18 that women with PCOS,particularly those with insulin resistance, presented a signif-icantly decreased basal metabolic rate.
However, in our pilot study, a significant and remarkableassociation was observed between energy UR and PCOS,even taking into account the possible confounding effect ofBMI, the presence of weight cycling and insulin resistance.
As previously discussed, misreporting is not limited onlyto EI but may also affect the macronutrient composition ofthe diet. In fact, some studies highlighted that UR is charac-terised by a tendency to report relatively low intake of highfat and sugar-rich foods, which are perceived to beunhealthy and energy dense.17
Analysing the percentage of EI from macronutrients bymeans of a non-consecutive three-day dietary diary, weobserved no differences between the groups as far as fatintake, while protein intake reporting was significantlylower. Additionally, we observed discrepancies betweenthe macronutrient intake report and the anthropometricand biochemical parameters evaluated in the PCOS groupthat reported a significant lower intake of simple sugarsdespite higher triglycerides plasma concentration andinsulin resistance. As highlighted by Rasmussen et al.,38
who characterised misreporters of EI and expenditure in138 volunteers founding that the percentage energy fromadded sugar was lower and the percentage energy fromprotein was higher among under-reporters, it is importantto be aware that not all food items or nutrients are under-reported to the same degree.
This study presented certain limitations. We cannotdetermine whether individuals with PCOS systematicallyunder-reported or instead under-ate39 during the dietaryrecording period (three non-consecutive days). We can onlyobserve that biochemical and anthropometric characteristicsof PCOS patients did not match with the reported dietaryEI, especially from sugars. Additionally, the reported EI fromthe different macronutrients was not compared to gold stan-dard for energy and/or macronutrient intake assessment.
Moreover, BMR was not measured by indirect calorime-try, but it was estimated by Schofield equation.29
R. De Giuseppe et al.
564 © 2018 Dietitians Association of Australia
Finally, it should be acknowledged that other factors(increased adiposity or body size, dieting behaviour, eatingrestraint, gender, socioeconomic status, lack of motivationto fill out a dietary diary, social expectations and testingenvironment nature) may influence EI UR and further stud-ies should investigate their relation to UR in subjects withPCOS.40
In conclusion, to the best of our knowledge, this is thefirst pilot study to assess energy UR in PCOS. These resultsdemonstrate that subjects with PCOS tend to underreportfoods rich in simple sugars rather than underreport theirtotal dietary intake. These results may have implications forthe interpretation of diet and health correlations in thispopulation. Moreover, it may be an obstacle to effectivenutritional counselling which requires a multidisciplinaryapproach including psychological, behavioural, sociologicaland physiological skills to achieve meaningful clinicaloutcomes.
Funding source
No funding was received for this study.
Conflict of interest
The authors declare no potential conflict of interests.
Authorship
RD and VB equally contributed to the conception anddesign of the research. HC and DB contributed to thedesign of the research. RD, VB, DB and GB contributed tothe acquisition and analysis of the data. GB, FCS, REN andHC contributed to interpretation of the data. RD, VB, GB,FCS, REN and HC drafted the manuscript. All authors arein agreement with the manuscript and declare that the con-tent has not been published elsewhere. The authors are verygrateful to Dr Fonte, Dr Maffoni, Dr Cossali and Dr Testafor the patients and controls enrolment support.
References
1 Diamanti-Kandarakis E, Kouli CR, Bergiele AT et al. A surveyof the polycystic ovary syndrome in the Greek island of Lesbos:hormonal and metabolic profile. J Clin Endocrinol Metab 1999;84: 4006–11.
2 Rotterdam ESHRE/ASRM-Sponsored PCOS Consensus Work-shop Group. Revised 2003 consensus on diagnostic criteriaand long-term health risks related to polycystic ovary syn-drome. Fertil Steril 2004; 81: 19.
3 March WA, Moore VM, Willson KJ, Phillips DI, Norman RJ,Davies MJ. The prevalence of polycystic ovary syndrome in acommunity sample assessed under contrasting diagnostic cri-teria. Hum Reprod 2010; 25: 544–51.
4 Balen A. The pathophysiology of polycystic ovary syndrome:trying to understand PCOS and its endocrinology. Best PractRes Clin Obstet Gynaecol 2004; 18: 685–706.
5 Carmina E, Azziz R. Diagnosis, phenotype and prevalence ofpolycystic ovary syndrome. Fertil Steril 2006; 86: S7–8.
6 Setji TL, Brown AJ. Polycystic ovary syndrome: update ondiagnosis and treatment. Am J Med 2014; 127: 912–9.
7 Diamanti-Kandarakis E, Argyrakopoulou G, Economou F,Kandaraki E, Koutsilieris M. Defects in insulin signaling path-ways in ovarian steroidogenesis and other tissues in polycysticovary syndrome (PCOS). J Steroid Biochem Mol Biol 2008;109: 242–6.
8 Ehrmann DA, Barnes RB, Rosenfield RL, Cavaghan MK,Imperial J. Prevalence of impaired glucose tolerance and diabe-tes in women with polycystic ovary syndrome. Diabetes Care1999; 22: 141–6.
9 Dokras A. Cardiovascular disease risk factors in polycysticovary syndrome. Semin Reprod Med 2008; 26: 39–44.
10 Sirmans SM, Pate KA. Epidemiology, diagnosis, and managementof polycystic ovary syndrome. Clin Epidemiol 2013; 6: 1–13.
11 Jessri M, Lou WY, L’Abbé MR. Evaluation of different methodsto handle misreporting in obesity research: evidence from theCanadian national nutrition survey. Br J Nutr 2016; 115:147–59.
12 EFSA. Diet-disease associations: Future directions in nutritionalepidemiology research. Am J Epidemiol 2015; 181: 234–6.
13 Maurer J, Taren DL, Teixeira PJ et al. The psychosocial andbehavioral characteristics related to energy misreporting. NutrRev 2006; 64: 53–66.
14 Mendez AM. Invited commentary: dietary misreporting as apotential source of bias in diet-disease associations: futuredirections in nutritional epidemiology research. Am J Epidemiol2015; 181: 234–6.
15 McKenzie DC, Johnson RK, Harvey-Berino J, Gold BC. Impact ofinterviewer’s body mass index on underreporting energy intakein overweight and obese women. Obes Res 2002; 10: 471–7.
16 Puhl R, Suh Y. Health consequences of weight stigma: implica-tions for obesity prevention and treatment. Curr Obes Rep2015; 4: 182–90.
17 Ferrari P, Slimani N, Ciampi A et al. Evaluation of under- andoverreporting of energy intake in the 24-hour diet recalls inthe European Prospective Investigation into Cancer and Nutri-tion (EPIC). Public Health Nutr 2002; 5: 1329–45.
18 Georgopoulos NA, Saltamavros AD, Vervita V et al. Basal meta-bolic rate is decreased in women with polycystic ovary syn-drome and biochemical hyperandrogenemia and is associatedwith insulin resistance. Fertil Steril 2009; 92: 250–5.
19 World Health Organization. Physical status: the use and inter-pretation of anthropometry. Report of the WHO Expert Com-mittee. World Health Organ Technical Report Series, 1995;854: 1–52.
20 Gayoso-Diz P, Otero-González A, Rodriguez-Alvarez MX et al.Insulin resistance (HOMA-IR) cut-off values and the metabolicsyndrome in a general adult population: effect of gender andage: EPIRCE cross-sectional study. BMC Endocr Disord 2013;13: 47.
21 Madigan CD, Pavey T, Daley AJ, Jolly K, Brown WJ. Is weightcycling associated with adverse health outcomes? A cohortstudy. Prev Med 2018; 108: 47–52.
22 Basiotis PP, Welsh SO, Cronin FJ, Kelsay JL, Mertz W. Numberof days of food intake records required to estimate individualand group nutrient intakes with defined confidence. J Nutr1987; 117: 1638–41.
23 Food Composition Database for Epidemiological Studies inItaly. (Available from: http://www.bda-ieo.it/wordpress/en/,accessed 10 January 2018).
24 Turconi G, Celsa M, Rezzani C, Biino G, Sartirana MA,Roggi C. Reliability of a dietary questionnaire on food habits,
Dietary underreporting polycystic ovary syndrome
© 2018 Dietitians Association of Australia 565
eating behavior and nutritional knowledge of adolescents. Eur JClin Nutr 2003; 57: 753–63.
25 Linee guida per un corretto stile di vita. (Available from: http://archivio.pubblica.istruzione.it/essere_benessere/allegati/linee_guida.pdf, accessed 10 January 2018).
26 Goldberg GR, Black AE, Jebb SA et al. Critical evaluation ofenergy intake data using fundamental principles of energyphysiology: 1. Derivation of cut-off limits to identify under-recording. Eur J Clin Nutr 1991; 45: 569–81.
27 Example of a protocol for identification of misreporting(under- and overreporting of energy intake) based on thePILOT-PANEU project. (Available from: http://www.efsa.europa.eu/sites/default/files/efsa_rep/blobserver_assets/3944A-8-2-1.pdf, accessed 10 January 2018).
28 Food and Agriculture Organization of the United Nations/World Health Organizations/United Nations University(FAO/WHO/UNU). Human energy requirements. Report of ajoint FAO/WHO/UNU expert consultation. Food and NutritionTechnical Reports Series No. 1, 2004. Rome: FAO
29 Schofield WB. Predicting basal metabolic rate, new standards andreview of previous work. Hum Nutr Clin Nutr 1985; 39: 5–41.
30 Black AE. Critical evaluation of energy intake using the Gold-berg cut-off for energy intake: basal metabolic rate. A practicalguide to its calculation, use and limitations. Int J Obes RelatMetab Disord 2000; 24: 1119–30.
31 LARN. Livelli di Assunzione di Riferimento di Nutrienti edenergia per la popolazione italiana - IV revisione. SINU, 2014.SICS Editore.
32 Bel-Serrat S, Julián-Almárcegui C, González-Gross M et al. Cor-relates of dietary energy misreporting among European
adolescents: the Healthy Lifestyle in Europe by Nutrition inAdolescence (HELENA) study. Br J Nutr 2016; 115: 1439–52.
33 Vainik U, Konstabel K, Lätt E, Mäestu J, Purge P, Jürimäe J.Diet misreporting can be corrected: confirmation of the associ-ation between energy intake and fat-free mass in adolescents.Br J Nutr 2016; 116: 1425–36.
34 Mullaney L, O’Higgins AC, Cawley S, Doolan A, McCartney D,Turner MJ. An estimation of periconceptional under-reportingof dietary energy intake. J Public Health (Oxf ) 2015; 37:728–36.
35 Williams T, Mortada R, Porter S. Diagnosis and treatment ofpolycystic ovary syndrome. Am Fam Physician 2016; 94:106–13.
36 Escobar-Morreale HF, San Millan JL. Abdominal adiposity andthe polycystic ovary syndrome. Trends Endocrinol Metab 2007;18: 266–72.
37 Strohacker K, Carpenter KC, McFarlin BK. Consequences ofweight cycling: an increase in disease risk? Int J Exerc Sci 2009;2: 191–201.
38 Rasmussen LB, Matthiessen J, Biltoft-Jensen A, Tetens I. Char-acteristics of misreporters of dietary intake and physical activ-ity. Public Health Nutr 2007; 10: 230–7.
39 Sugimoto M, Asakura K, Masayasu S, Sasaki S. Relativelysevere misreporting of sodium, potassium, and protein intakeamong female dietitians compared with nondietitians. Nutr Res2016; 36: 818–26.
40 Abbot JM, Thomson CA, Ranger-Moore J et al. Psychosocialand behavioral profile and predictors of self-reported energyunderreporting in obese middle-aged women. J Am Diet Assoc2008; 108: 114–9.
R. De Giuseppe et al.
566 © 2018 Dietitians Association of Australia
ORIGINAL RESEARCH
Development of a diabetes-related nutritionknowledge questionnaire for individuals withtype 2 diabetes mellitus in Singapore
Chad Y. HAN ,1,2 Xiaomei ZHENG,2 Lin F. LEE,2 Cherie G.B. CHAN,3 Yi Q. LEE,2,4
Nani A. ZAILANI,2,4 Karin NG2,4 and Kalpana BHASKARAN5
1Department of Dietetics, National University Hospital, 2Department of Dietetics and Nutrition and, 3Department ofPsychology, Ng Teng Feng General Hospital and 4Applied Food Science and Nutrition and 5Glycemic Index ResearchUnit, School of Applied Science, Temasek Polytechnic, Singapore
AbstractAim: Diabetes-related nutrition knowledge (DRNK) is essential for the self-care of patients with type 2 diabetes melli-tus (T2DM). A specific tool measuring DRNK can help us to understand awareness levels and tailor structured nutri-tion education programs. Our study aimed to develop a questionnaire to assess DRNK for individuals with T2DM inSingapore.Methods: An expert panel was formed to consolidate in-depth, culturally suitable, and current information on DRNK.A literature review of diabetes self-care knowledge questionnaires was performed to outline the scope of the ques-tionnaire and generate a question pool. User friendliness was tested in the first draft of the questionnaire (n = 21).Then, a second draft was tested for item difficulty, discrimination index, and internal consistency (n = 62). The finaldraft was examined for construct validity and test–retest reliability (n = 100).Results: The final questionnaire (four sections: 27 questions) was found to be consistent and reliable. The item diffi-culty scores of the selected questions ranged from difficult to desirable (2–85). There was fair to good internal con-sistency (Cronbach’s alpha: 0.66, 0.79, 0.56, and 0.78 for Sections 1, 2, 3 and 4, respectively) and construct validity(independent t-test: P < 0.001). Questions in the final questionnaire had an average discrimination index of 0.3 (rea-sonably good). The questionnaire was revealed to have good test–retest reliability (intraclass correlation: 0.82–0.84).Conclusions: The DRNK questionnaire is a valid and reliable measure to complement assessment tools measuringself-efficacy/behaviour in individuals with T2DM living in Singapore.
Key words: knowledge assessment, nutrition knowledge, questionnaire, type 2 diabetes mellitus, validation.
Introduction
Ideal diabetes self-care knowledge includes adequateunderstanding of disease pathophysiology, medication,nutrition and lifestyle management. Nutritional educa-tion is effective in improving nutrition knowledge and
practices in patients with type 2 diabetes mellitus(T2DM), for example, by providing support for foodnutrition label use.1–4 A common goal of dietetic ther-apy and education for patients with T2DM is toempower them with diabetes-related nutrition knowl-edge (DRNK) to facilitate positive dietary practices,including portion control and adherence to alcohollimits. To ensure that nutrition education is deliveredeffectively to individuals with T2DM, it is important tofirst assess the gaps in DRNK.
As nutrition information is widely available from vari-ous sources apart from health-care providers, patientswith T2DM are commonly misinformed and hence,engage in suboptimal dietary practices to manage theirdiabetes.5,6 A DRNK-specific tool can highlight the spe-cific gaps in nutrition-related knowledge as well as iden-tify diet-related misconceptions among patients withT2DM. This will, in turn, allow nutrition education, pro-vided by dietitians or health-care providers, to be moretargeted and effective.
L.F. Lee, Y.Q. Lee, N.A. Zailani and K. Ng are pursuing further studies.C.Y. Han, BSc(Hons), Research DietitianX. Zheng, BSc(Hons), Clinical DietitianL.F. Lee, MSc, Clinical DietitianC.G.B. Chan, PhD, Clinical PsychologistY.Q. Lee, DipSc, Dietetic InternN.A. Zailani, DipSc, Dietetic InternK. Ng, DipSc, Dietetic InternK. Bhaskaran, PhD, Domain Lead/Applied Nutrition and GlycaemicIndex ResearchCorrespondence: C.Y. Han, Department of Dietetics, NationalUniversity Hospital, 5 Lower Kent Ridge Road, Main Building, Level1, S119074 Singapore. Tel.: +65 67724580; fax: +65 67791938.Email: [email protected]; [email protected]
Accepted December 2018
© 2019 Dietitians Association of Australia 567
AA AA
DDD
ieti
tian
s As
soci
atio
nofof
Aus
tral
ia
Nutrition & Dietetics 2019; 76: 567–573 DOI: 10.1111/1747-0080.12513
There are currently three commonly used tools to assessdiabetes self-care knowledge. The first is the DiabetesKnowledge Test (DKT) to measure the diabetes self-careknowledge of adult patients with type 1 diabetes mellitus(T1DM) or T2DM,7–9 validated for Malaysia and Singa-pore.10,11 However, 19 out of 23 items within the DKT arenot related to diet and nutrition, hence precluding adequateassessment of DRNK. The second is the Diabetes KnowledgeAssessment, which comprehensively assesses T2DM patients’level of understanding of diabetic complications, hypergly-caemia, hypoglycaemia, urine testing, and nutrition, butonly contains five questions related to diet and nutrition.12
Finally, the Diabetes Knowledge Questionnaire assesses self-care knowledge ranging from complications to supportservices and sick-day management but only includes onequestion on nutrition.13 Given that the domain of DRNKhas considerable scope and the fact that lack of nutritionalknowledge has been ranked high among the barriers toself-care in people with T2DM,14 these tools are inadequateto comprehensively assess DRNK.
A few DRNK-specific tools have also been developed.Created and validated in UK, the Audit of Diabetes Knowl-edge performs a comprehensive assessment of diabetesknowledge in adult T1DM and T2DM patients.15 Neverthe-less, it may have limited applicability and may require cul-tural and linguistic modifications before it can be usedlocally. This is exemplified by some of its diet andnutrition-related questions, in which less commonly con-sumed food items (e.g. cheese) are included while certainlocal staples (e.g. rice, chapatti) are not. The Type 1 DiabetesNutrition Knowledge Survey was developed specifically toassess general diabetes knowledge and DRNK among youthwith T1DM. However, with its vast array of questions spe-cific to insulin dose adjustment, it may not be relevant toall patients with T2DM.16 The Nutrition and Food-LabelKnowledge Test, validated only for women with T2DM, onlyassesses label reading knowledge.17 Along with the toolsmeasuring general diabetes self-care knowledge, these spe-cific tools measuring DRNK are either culturally unsuitableand/or unable to capture the scope of DRNK for T2DMpatients in Singapore.
Given the increase in T2DM prevalence and the impor-tance of targeted nutrition education, it is essential todevelop a culturally relevant DRNK questionnaire (DRNK-Q) that can assess both the scope and depth of DRNK. Ourstudy aims to develop such a questionnaire for individualswith T2DM in Singapore.
Methods
The process of developing the DRNK-Q comprised fourstages (Figure 1): (i) Questionnaire design and construction,(ii) Refinement of questionnaire items, (iii) Test of psycho-metric properties and (iv) Test–retest study for constructvalidity and test–retest reliability. Ethical approval for this studywas obtained from the Temasek Polytechnic InstitutionalReview Board (Approval number: IRB160802). Informed con-sent was obtained from all participants. The study was
designed based on COnsensus-based Standards for the selec-tion of health status Measurement INstruments checklist.18
Data analyses were performed using SPSS for Windows version21.0 (SPSS Inc., Chicago, IL, USA). The reporting of the pre-sent study fulfils the design and conduct of self-administeredsurveys of clinicians’ checklist in the EQUATOR library ofreporting guidelines.
Content validity is an important aspect in questionnairedevelopment. It refers to how representative the items are incovering the subject matter, usually determined by a focusgroup of subject matter experts.19–21 In the context of the pre-sent study, the questionnaire items had to include importantaspects of DRNK and be phrased unambiguously and in termsthat could be easily understood by patients with T2DM. Thus,an expert panel was formed to consolidate in-depth, culturallysuitable and current information on DRNK. The panel con-sisted of three dietitians experienced in dietary counselling ofSingaporean T2DM patients, an academic experienced in dia-betes research and a psychologist experienced in diabetespatient counselling in the Singaporean context.
First, a literature review of diabetes self-care knowledgequestionnaires was performed to outline the scope of theDRNK-Q. Then, each dietitian, referencing dietary guide-lines, reviewed the questionnaire draft individually and pro-vided written comments before a discussion involving theexpert panel was carried out.22,23 Dietitians made the finaldecision on issues related to DRNK content. Issues pertain-ing to sentence construction and scoring options wereheavily influenced by the psychologist and academic. In theevent of any disagreement, the two disagreeing partiesdeliberated in the presence of an expert, who then refinedthe question until a consensus was reached. All questionswere multiple choice with four answer options and oneoption for ‘I don’t know’. A correct answer received 1 pointwhile a wrong selection or ‘I don’t know’ received 0 points.
Face validity refers to how relevant and appropriaterespondents consider questionnaire items.21,24 It can bejudged by personnel who are familiar and/or have expertisewith the target group.21 To ensure face and content validity,as mentioned in Stage 1, the first draft of the DRNK-Q wasevaluated by the expert panel. The first draft was also evalu-ated for user friendliness by a group of nutrition students(n = 21) who had successfully completed a ‘nutrition indisease’ module at tertiary level. These students were askedto rate the phrasing of questions in terms of clarity. Spacewas provided after each question for them to offer feedback.Individual semistructured interviews were conducted in anenclosed room for each student upon completion of thequestionnaire. They were asked open-ended questionsregarding their opinions on how suitable each of the itemswas in relation to individuals with T2DM in Singapore, andhow items could be improved. Verbal feedback was audiorecorded with consent. Both written and audio feedbackwere consolidated and presented to the expert panel asmaterials for consideration during their discussion.
The questionnaire was further revised to include ques-tions on demographics (age, ethnicity, educational level,personal monthly income and number of years since T2DM
C. Y. Han et al.
568 © 2019 Dietitians Association of Australia
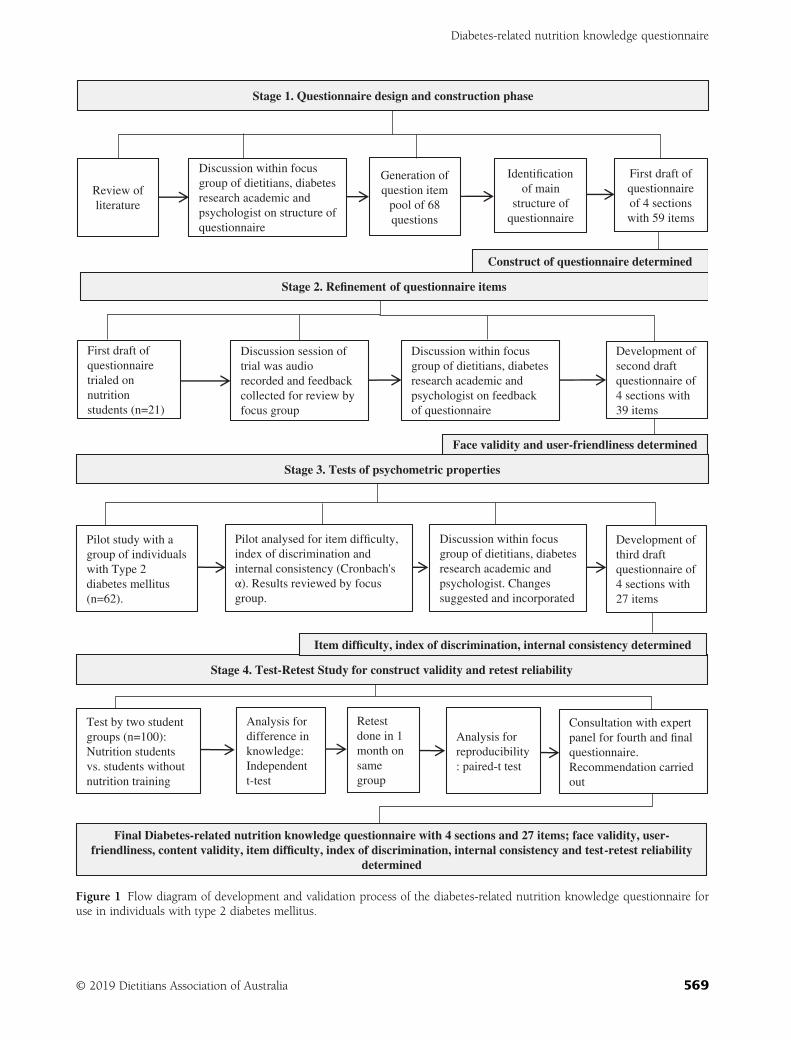
Stage 4. Test-Retest Study for construct validity and retest reliability
First draft of
questionnaire
trialed on
nutrition
students (n=21)
Discussion session of
trial was audio
recorded and feedback
collected for review by
focus group
Development of
second draft
questionnaire of
4 sections with
39 items
Review of
literature
Stage 1. Questionnaire design and construction phase
Generation of
question item
pool of 68
questions
First draft of
questionnaire
of 4 sections
with 59 items
Discussion within focus
group of dietitians, diabetes
research academic and
psychologist on structure of
questionnaire
Stage 2. Refinement of questionnaire items
Pilot study with a
group of individuals
with Type 2
diabetes mellitus
(n=62).
Development of
third draft
questionnaire of
4 sections with
27 items
Stage 3. Tests of psychometric properties
Discussion within focus
group of dietitians, diabetes
research academic and
psychologist. Changes
suggested and incorporated
Consultation with expert
panel for fourth and final
questionnaire.
Recommendation carried
out
Final Diabetes-related nutrition knowledge questionnaire with 4 sections and 27 items; face validity, user-friendliness, content validity, item difficulty, index of discrimination, internal consistency and test-retest reliability
determined
Analysis for
difference in
knowledge:
Independent
t-test
Test by two student
groups (n=100):
Nutrition students
vs. students without
nutrition training
Analysis for
reproducibility
: paired-t test
Retest
done in 1
month on
same
group
Discussion within focus
group of dietitians, diabetes
research academic and
psychologist on feedback
of questionnaire
Identification
of main
structure of
questionnaire
Construct of questionnaire determined
Face validity and user-friendliness determined
Pilot analysed for item difficulty,
index of discrimination and
internal consistency (Cronbach's
α). Results reviewed by focus
group.
Item difficulty, index of discrimination, internal consistency determined
Figure 1 Flow diagram of development and validation process of the diabetes-related nutrition knowledge questionnaire foruse in individuals with type 2 diabetes mellitus.
Diabetes-related nutrition knowledge questionnaire
© 2019 Dietitians Association of Australia 569
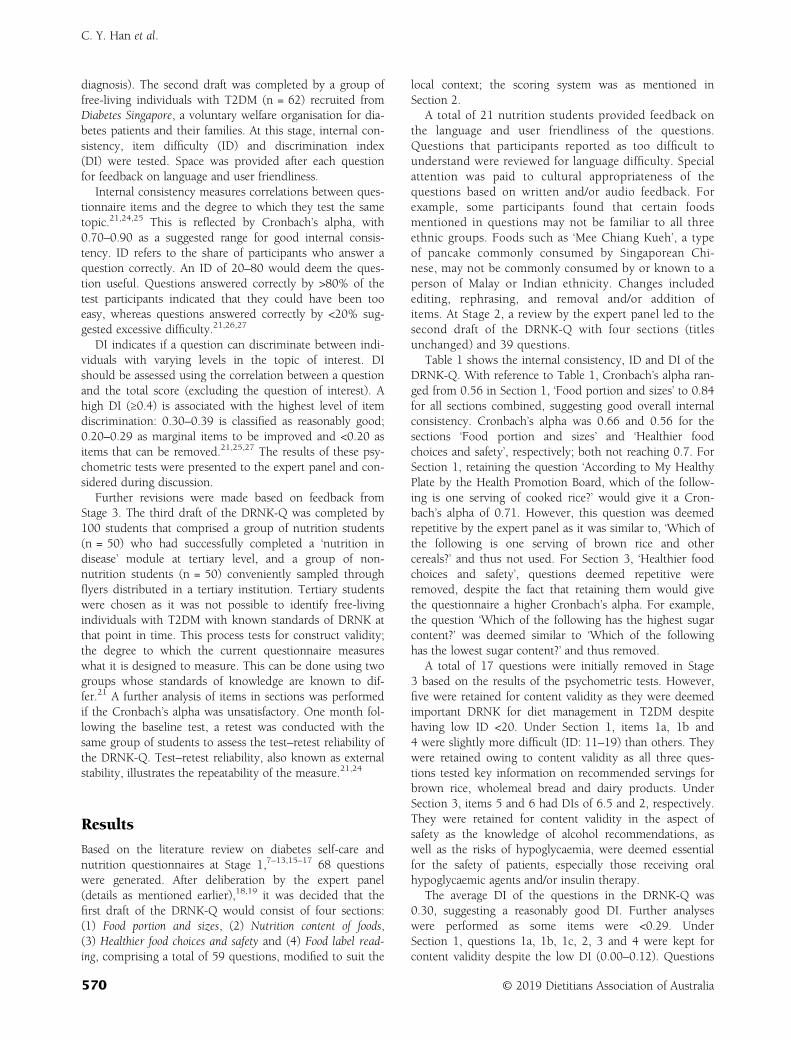
diagnosis). The second draft was completed by a group offree-living individuals with T2DM (n = 62) recruited fromDiabetes Singapore, a voluntary welfare organisation for dia-betes patients and their families. At this stage, internal con-sistency, item difficulty (ID) and discrimination index(DI) were tested. Space was provided after each questionfor feedback on language and user friendliness.
Internal consistency measures correlations between ques-tionnaire items and the degree to which they test the sametopic.21,24,25 This is reflected by Cronbach’s alpha, with0.70–0.90 as a suggested range for good internal consis-tency. ID refers to the share of participants who answer aquestion correctly. An ID of 20–80 would deem the ques-tion useful. Questions answered correctly by >80% of thetest participants indicated that they could have been tooeasy, whereas questions answered correctly by <20% sug-gested excessive difficulty.21,26,27
DI indicates if a question can discriminate between indi-viduals with varying levels in the topic of interest. DIshould be assessed using the correlation between a questionand the total score (excluding the question of interest). Ahigh DI (≥0.4) is associated with the highest level of itemdiscrimination: 0.30–0.39 is classified as reasonably good;0.20–0.29 as marginal items to be improved and <0.20 asitems that can be removed.21,25,27 The results of these psy-chometric tests were presented to the expert panel and con-sidered during discussion.
Further revisions were made based on feedback fromStage 3. The third draft of the DRNK-Q was completed by100 students that comprised a group of nutrition students(n = 50) who had successfully completed a ‘nutrition indisease’ module at tertiary level, and a group of non-nutrition students (n = 50) conveniently sampled throughflyers distributed in a tertiary institution. Tertiary studentswere chosen as it was not possible to identify free-livingindividuals with T2DM with known standards of DRNK atthat point in time. This process tests for construct validity;the degree to which the current questionnaire measureswhat it is designed to measure. This can be done using twogroups whose standards of knowledge are known to dif-fer.21 A further analysis of items in sections was performedif the Cronbach’s alpha was unsatisfactory. One month fol-lowing the baseline test, a retest was conducted with thesame group of students to assess the test–retest reliability ofthe DRNK-Q. Test–retest reliability, also known as externalstability, illustrates the repeatability of the measure.21,24
Results
Based on the literature review on diabetes self-care andnutrition questionnaires at Stage 1,7–13,15–17 68 questionswere generated. After deliberation by the expert panel(details as mentioned earlier),18,19 it was decided that thefirst draft of the DRNK-Q would consist of four sections:(1) Food portion and sizes, (2) Nutrition content of foods,(3) Healthier food choices and safety and (4) Food label read-ing, comprising a total of 59 questions, modified to suit the
local context; the scoring system was as mentioned inSection 2.
A total of 21 nutrition students provided feedback onthe language and user friendliness of the questions.Questions that participants reported as too difficult tounderstand were reviewed for language difficulty. Specialattention was paid to cultural appropriateness of thequestions based on written and/or audio feedback. Forexample, some participants found that certain foodsmentioned in questions may not be familiar to all threeethnic groups. Foods such as ‘Mee Chiang Kueh’, a typeof pancake commonly consumed by Singaporean Chi-nese, may not be commonly consumed by or known to aperson of Malay or Indian ethnicity. Changes includedediting, rephrasing, and removal and/or addition ofitems. At Stage 2, a review by the expert panel led to thesecond draft of the DRNK-Q with four sections (titlesunchanged) and 39 questions.
Table 1 shows the internal consistency, ID and DI of theDRNK-Q. With reference to Table 1, Cronbach’s alpha ran-ged from 0.56 in Section 1, ‘Food portion and sizes’ to 0.84for all sections combined, suggesting good overall internalconsistency. Cronbach’s alpha was 0.66 and 0.56 for thesections ‘Food portion and sizes’ and ‘Healthier foodchoices and safety’, respectively; both not reaching 0.7. ForSection 1, retaining the question ‘According to My HealthyPlate by the Health Promotion Board, which of the follow-ing is one serving of cooked rice?’ would give it a Cron-bach’s alpha of 0.71. However, this question was deemedrepetitive by the expert panel as it was similar to, ‘Which ofthe following is one serving of brown rice and othercereals?’ and thus not used. For Section 3, ‘Healthier foodchoices and safety’, questions deemed repetitive wereremoved, despite the fact that retaining them would givethe questionnaire a higher Cronbach’s alpha. For example,the question ‘Which of the following has the highest sugarcontent?’ was deemed similar to ‘Which of the followinghas the lowest sugar content?’ and thus removed.
A total of 17 questions were initially removed in Stage3 based on the results of the psychometric tests. However,five were retained for content validity as they were deemedimportant DRNK for diet management in T2DM despitehaving low ID <20. Under Section 1, items 1a, 1b and4 were slightly more difficult (ID: 11–19) than others. Theywere retained owing to content validity as all three ques-tions tested key information on recommended servings forbrown rice, wholemeal bread and dairy products. UnderSection 3, items 5 and 6 had DIs of 6.5 and 2, respectively.They were retained for content validity in the aspect ofsafety as the knowledge of alcohol recommendations, aswell as the risks of hypoglycaemia, were deemed essentialfor the safety of patients, especially those receiving oralhypoglycaemic agents and/or insulin therapy.
The average DI of the questions in the DRNK-Q was0.30, suggesting a reasonably good DI. Further analyseswere performed as some items were <0.29. UnderSection 1, questions 1a, 1b, 1c, 2, 3 and 4 were kept forcontent validity despite the low DI (0.00–0.12). Questions
C. Y. Han et al.
570 © 2019 Dietitians Association of Australia
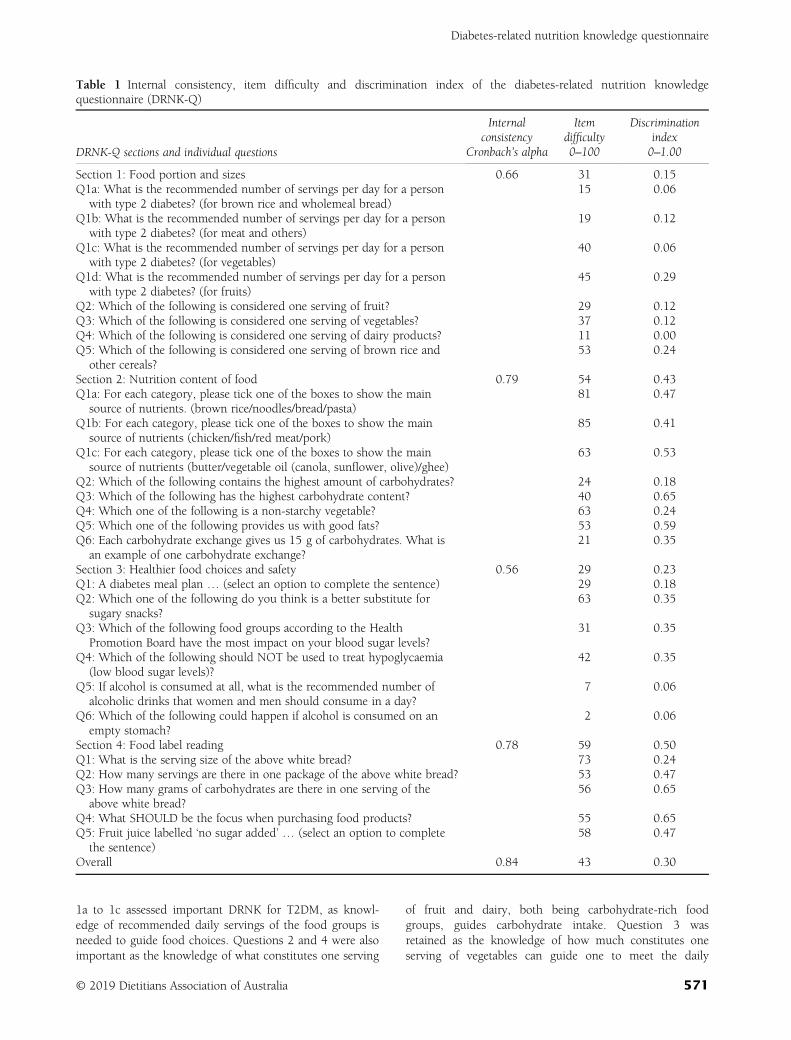
1a to 1c assessed important DRNK for T2DM, as knowl-edge of recommended daily servings of the food groups isneeded to guide food choices. Questions 2 and 4 were alsoimportant as the knowledge of what constitutes one serving
of fruit and dairy, both being carbohydrate-rich foodgroups, guides carbohydrate intake. Question 3 wasretained as the knowledge of how much constitutes oneserving of vegetables can guide one to meet the daily
Table 1 Internal consistency, item difficulty and discrimination index of the diabetes-related nutrition knowledgequestionnaire (DRNK-Q)
DRNK-Q sections and individual questions
Internalconsistency
Itemdifficulty
Discriminationindex
Cronbach’s alpha 0–100 0–1.00
Section 1: Food portion and sizes 0.66 31 0.15Q1a: What is the recommended number of servings per day for a person
with type 2 diabetes? (for brown rice and wholemeal bread)15 0.06
Q1b: What is the recommended number of servings per day for a personwith type 2 diabetes? (for meat and others)
19 0.12
Q1c: What is the recommended number of servings per day for a personwith type 2 diabetes? (for vegetables)
40 0.06
Q1d: What is the recommended number of servings per day for a personwith type 2 diabetes? (for fruits)
45 0.29
Q2: Which of the following is considered one serving of fruit? 29 0.12Q3: Which of the following is considered one serving of vegetables? 37 0.12Q4: Which of the following is considered one serving of dairy products? 11 0.00Q5: Which of the following is considered one serving of brown rice and
other cereals?53 0.24
Section 2: Nutrition content of food 0.79 54 0.43Q1a: For each category, please tick one of the boxes to show the main
source of nutrients. (brown rice/noodles/bread/pasta)81 0.47
Q1b: For each category, please tick one of the boxes to show the mainsource of nutrients (chicken/fish/red meat/pork)
85 0.41
Q1c: For each category, please tick one of the boxes to show the mainsource of nutrients (butter/vegetable oil (canola, sunflower, olive)/ghee)
63 0.53
Q2: Which of the following contains the highest amount of carbohydrates? 24 0.18Q3: Which of the following has the highest carbohydrate content? 40 0.65Q4: Which one of the following is a non-starchy vegetable? 63 0.24Q5: Which one of the following provides us with good fats? 53 0.59Q6: Each carbohydrate exchange gives us 15 g of carbohydrates. What is
an example of one carbohydrate exchange?21 0.35
Section 3: Healthier food choices and safety 0.56 29 0.23Q1: A diabetes meal plan … (select an option to complete the sentence) 29 0.18Q2: Which one of the following do you think is a better substitute for
sugary snacks?63 0.35
Q3: Which of the following food groups according to the HealthPromotion Board have the most impact on your blood sugar levels?
31 0.35
Q4: Which of the following should NOT be used to treat hypoglycaemia(low blood sugar levels)?
42 0.35
Q5: If alcohol is consumed at all, what is the recommended number ofalcoholic drinks that women and men should consume in a day?
7 0.06
Q6: Which of the following could happen if alcohol is consumed on anempty stomach?
2 0.06
Section 4: Food label reading 0.78 59 0.50Q1: What is the serving size of the above white bread? 73 0.24Q2: How many servings are there in one package of the above white bread? 53 0.47Q3: How many grams of carbohydrates are there in one serving of the
above white bread?56 0.65
Q4: What SHOULD be the focus when purchasing food products? 55 0.65Q5: Fruit juice labelled ‘no sugar added’ … (select an option to complete
the sentence)58 0.47
Overall 0.84 43 0.30
Diabetes-related nutrition knowledge questionnaire
© 2019 Dietitians Association of Australia 571
serving requirements of the Health Promotion Board.28
Under Section 2, question 2 was kept for content validity asindividuals with high DRNK should be able to identify ahigh-carbohydrate food in a selection of food items.
ID scores for questions 1a, 1b and 4 from Section 1 were16, 18 and 10, respectively, suggesting that they might betoo difficult, which could also explain the correspondinglower DI.
T2DM patients (n = 62) provided feedback on the lan-guage of the questions. Among the participants, 48% weremales aged 52 � 9.8. The highest level of educationincluded primary (63%), secondary (28%) and ≥graduate(10%). Personal monthly income was categorised as up toSGD3500 (55%), SGD3501-7000 (18%) and aboveSGD7000 (27%). Years since diagnosis ranged between1 and 37 years, with an interquartile range of 13, medianof 7.
All three major ethnicities in Singapore, namely Chinese,Malay and Indian, were included in the present study.Questions participants reported as too difficult to under-stand were reviewed for language difficulty. Special atten-tion was paid to cultural appropriateness based on writtenfeedback, similar to Stage 2. For example, it was proposedthat some food should be expressed in more colloquialterms; describing ‘dried grapes’ as ‘raisins’ instead of ‘sul-tanas’. Changes included editing, rephrasing, and removaland/or addition of items. At Stage 3, the DRNK-Q wasrefined further to the final version consisting of four afore-mentioned sections (titles remained unchanged) and27 questions; the scoring system also remained unchanged.The participants at Stage 3 completed the final question-naire within 10 minutes.
With reference to Table 2, the nutrition student groupscored significantly higher (P < 0.001) than the non-nutrition student group in each individual section and intotality; their total percentage scores were 70 � 11 and43 � 14, respectively. This suggests good construct validityof the DRNK-Q.19,21
The intraclass correlation between the test and retest was0.82 (CI: 0.66–0.91) and 0.84 (CI: 0.69–0.91) for thenutrition and non-nutrition groups, respectively. Thedegree of agreement between a test and retest runs wasfrom 1 to −1.29 A good range of an intraclass correlationcoefficient value would be from 0.70 to 1.20,21 These resultsdemonstrate an acceptable degree of agreement for each of
the test groups after a one-month interval, suggesting goodreliability of the DRNK-Q.20,21,24
Discussion
The DRNK-Q is the first culturally appropriate tool toassess DRNK in a multi-ethnic population with T2DM inSingapore. It can be potentially validated for use in otherSouth-East Asian (SEA) countries with similar multi-ethnicbackgrounds or for studies involving populations of suchethnicities, that is, Chinese, Malays and/or Indians. Thesample size used in our study to evaluate construct validityand test–retest reliability was substantial. The time intervalbetween the test and retest was also deemed appropri-ate.18,21 A good sample size was included for analysis ofinternal consistency.18 The questionnaire can be completedby T2DM patients within 10 minutes, making it an effectivetool for quick assessment of DRNK with minimal respon-dent burden. There are plans for the DRNK-Q to be devel-oped on an online platform for ease of use of moretechnologically savvy T2DM patients and/or health-careprofessionals. The DRNK-Q has also since been used toexamine the association between DRNK and diet quality inanother study (manuscript in preparation).
There were several limitations in the present study. Thefocus on content validity may have influenced the psycho-metric properties of some questions within the DRNK-Q.As explained earlier, that resulted in a handful of questionitems to fall short of the suggested statistical range—a lowerthan ideal range for Cronbach’s alpha and DI. The DRNK-Q is only available in English at the moment and is thuslimited to those literate in English. However, this shortcom-ing is only limited by time as there are plans to translateand validate it in other languages.
The DRNK-Q has good content validity and overall satis-factory psychometric properties. It is an inexpensive andefficient way for health-care practitioners to gauge the nutri-tion knowledge essential to the diet of individuals withT2DM. The DRNK-Q is recommended for use in conjunc-tion with tools measuring attitude and behaviour such asempowerment and/or those that assess stages of change inpatients with T2DM.30,31 Further research is needed totranslate the DRNK-Q and/or validate its use in other SEApopulations.
Table 2 Construct validity of the diabetes-related nutrition knowledge questionnaire
Knowledge section (no. of questions)
Nutrition students (n = 50) Non-nutrition students (n = 50)
Mean � SD
Score % Score %
1. Food portion and sizes(a) (8) 4.7 � 1.4 58 � 18 1.9 � 1.6 24 � 202. Nutrition content of food(a) (8) 5.3 � 1.1 67 � 14 3.9 � 1.3 49 � 173. Healthier food choices and safety(a) (6) 4.0 � 1.2 67 � 20 1.9 � 1.4 32 � 244. Food label reading(a) (5) 4.7 � 0.5 94 � 10 3.8 � 1.5 75 � 31Overall(a) 18.7 � 2.9 70 � 11 12.4 � 4.4 43 � 14
(a) Statistical significance (P < 0.001) of individual sections and total score for the two groups.
C. Y. Han et al.
572 © 2019 Dietitians Association of Australia
Funding source
This study did not receive any specific grant from any com-mercial or not-for-profit sectors or funding agencies.
Conflict of interest
All authors declare no conflicts of interest.
Authorship
CYH and KB conceived of the presented idea, developedthe theory and study design. YQL, NAZ, KN carried out thestages of the development of the Diabetes-Related NutritionKnowledge Questionnaire (DRNK-Q). CYH, XZ, LFL,CGBC and KB contributed to shaping the DRNK-Q. CYH,XZ, LFL, CGBC and KB supervised the project and contrib-uted to the interpretation of the results at all stages. CYHtook the lead in writing the manuscript. All authors pro-vided critical feedback and helped to shape the research,analysis and manuscript. We wish to acknowledge the sup-port of Ms Lee Hee Hoon, Dr Charles Lew and Mr JohnnyWong from Ng Teng Fong General Hospital.
References
1 Persell SD, Keating NL, Landrum MB et al. Relationship ofdiabetes-specific knowledge to self-management activitiesambulatory preventive care, and metabolic outcomes. Prev Med2004; 39: 746–52.
2 Wang H, Song Z, Ba Y, Zhu L, Wen Y. Nutritional and eatingeducation improves knowledge and practice of patients withtype 2 diabetes concerning dietary intake and blood glucosecontrol in an outlying city of China. Public Health Nutr 2014;17: 2351–8.
3 Chapman-Novakofski K, Karduck J. Improvement in knowl-edge, social cognitive theory variables, and movement throughstages of change after a community-based diabetes educationprogram. J Am Diet Assoc 2005; 105: 1613–6.
4 Miller LM, Cassady DL. The effects of nutrition knowledge onfood label use. A review of the literature. Appetite 2015; 92:207–16.
5 Mann DM, Ponieman D, Leventhal H, Halm EA. Misconcep-tions about diabetes and its management among low-incomeminorities with diabetes. Diab Care 2009; 32: 591–3.
6 Miller CK, Probart CK, Achterberg CL. Knowledge and miscon-ceptions about the food label among women with non-insulin-dependent diabetes mellitus. Diabetes Educ 1997; 23: 425–32.
7 Fitzgerald JT, Funnell MM, Hess GE et al. The reliability andvalidity of a brief diabetes knowledge test. Diab Care 1998; 21:706–10.
8 Collins GS, Mughal S, Barnett AH, Fitzgerald J, Lloyd CE.Modification and validation of the revised diabetes knowledgescale. Diabet Med 2011; 28: 306–10.
9 Fitzgerald JT, Funnell MM, Anderson RM, Nwankwo R,Stansfield RB, Piatt GA. Validation of the revised brief diabetesknowledge test (DKT2). Diabetes Educ 2016; 42: 178–87.
10 Al-Qazaz HK, Hassali MA, Shafie AA, Sulaiman SA,Sundram S. The 14-item Michigan diabetes knowledge test:translation and validation study of the Malaysian version. Prac-tical Diabetes 2010; 27: 238.
11 Zainudin SB, Ang DY, Soh AW. Knowledge of diabetes mellitusand safe practices during Ramadan fasting among Muslimpatients with diabetes mellitus in Singapore. Singapore Med J2017; 58: 246–52.
12 Dunn SM, Bryson JM, Hoskins PL, Alford JB, Handelsman DJ,Turtle JR. Development of the diabetes knowledge (DKN) scales:forms DKNA, DKNB, and DKNC. Diab Care 1984; 7: 36–41.
13 Eigenmann CA, Skinner T, Colagiuri R. Development and vali-dation of a diabetes knowledge questionnaire. Practical Diabetes2011; 28: 166–70d.
14 Nagelkerk J, Reick K, Meengs L. Perceived barriers and effectivestrategies to diabetes self-management. J Adv Nurs 2006; 54: 151–8.
15 Speight J, Bradley C. The ADKnowl: identifying knowledgedeficits in diabetes care. Diabet Med 2001; 18: 626–33.
16 Rovner AJ, Nansel TR, Mehta SN, Higgins LA, Haynie DL,Laffel LM. Development and validation of the type 1 diabetesnutrition knowledge survey. Diab Care 2012; 35: 1643–7.
17 Miller CK, Achterberg CL. Reliability and validity of a nutritionand food-label knowledge test for women with type 2 diabetesmellitus. J Nutr Educ 2000; 32: 43–8.
18 Terwee CB, Mokkink LB, Knol DL, Ostelo RW, Bouter LM, deVet HC. Rating the methodological quality in systematicreviews of studies on measurement properties: a scoring systemfor the COSMIN checklist. Qual Life Res 2012; 21: 651–7.
19 Sapp SG, Jensen HH. Reliability and validity of nutritionknowledge and diet-health awareness tests developed from the1989–1991 diet and health knowledge surveys. J Nutr Educ1997; 29: 63–72.
20 Parmenter K, Wardle J. Evaluation and design of nutritionknowledge measures. J Nutr Educ 2000; 32: 269–77.
21 Trakman GL, Forsyth A, Hoye R, Belski R. Developing and val-idating a nutrition knowledge questionnaire: key methods andconsiderations. Public Health Nutr 2017; 20: 2670–9.
22 American Diabetes Association. Standards of medical care indiabetes—2015 abridged for primary care providers. Clin Dia-betes 2015; 33: 97.
23 Health Promotion Board Singapore. My Healthy Plate; 2015.(Available from: https://www.healthhub.sg/programmes/55/my-healthy-plate, accessed 8 January 2015).
24 Talmage H, Rasher SP. Validity and reliability issues in mea-surement instrumentation. J Nutr Educ 1981; 13: 83–5.
25 Kline P. Handbook of Psychological Testing. London: Routle-dge, 2013.
26 Ebel RL, Frisbie DA. Essentials of Educational Measurement, 5thedn. NJ: Prentice-Hall Inc, 1991.
27 Taib F, Yusoff MS. Difficulty index, discrimination index, sen-sitivity and specificity of long case and multiple choice ques-tions to predict medical students’ examination performance.J Taibah Univ Sci 2014; 9: 110–4.
28 Health Promotion Board Singapore. Fruits and Veggies. Singa-pore: Health Promotion Board, 2015. (Available from: https://www.healthhub.sg/programmes/56/fruits-and-veggies, accessed8 January 2015).
29 Henson RK. Understanding internal consistency reliability esti-mates: a conceptual primer on coefficient alpha. Meas EvalCouns Dev 2001; 34: 177.
30 Anderson RM, Funnell MM, Fitzgerald JT, Marrero DG. Thediabetes empowerment scale: a measure of psychosocial self-efficacy. Diab Care 2000; 23: 739–43.
31 Vallis M, Ruggiero L, Greene G et al. Stages of change forhealthy eating in diabetes: relation to demographic, eating-related, health care utilization, and psychosocial factors. DiabCare 2003; 26: 1468–74.
Diabetes-related nutrition knowledge questionnaire
© 2019 Dietitians Association of Australia 573
ORIGINAL RESEARCH
Validation and impact of paediatric malnutritionscreening tool in hospitalised children on awareness ofmedical staff and health-related outcomes
Luba MARDERFELD ,1,2 Gal RUB,2 Gavriel HODIK,3,4 Irit PORAZ,1,5 Corina HARTMAN,2,3
Shai ASHKENAZI3,6 and Raanan SHAMIR2,3
1Nutrition and Dietetics Department, 2Institute of Gastroenterology, Nutrition and Liver Diseases and 6InternalDepartment A, Schneider Children’s Medical Centre of Israel, Petach Tikva and 3Sackler Faculty of Medicine, Tel AvivUniversity, 4Epidemiology & Database Research Department, Maccabi Healthcare Services and 5NationalManagement Office, Clalit Health Services, Tel Aviv, Israel
AbstractAims: This study aimed to evaluate the use of the Screening Tool for the Assessment of Malnutrition in Paediatrics(STAMP) among children admitted in a paediatric hospital, and assess its impact on the nutritional status awarenessamong the medical staff and on health outcomes at discharge.Methods: STAMP performed by nurses on admission was compared with full nutritional assessment performed by adietitian. Area under the receiving operating characteristic (AUROC) curve was used to evaluate validity of the tool.To assess how the tool affected awareness among the staff, information on nutritional status was compared prior toand following the intervention period. Therewith, health outcomes at discharge were compared for the children whohad been screened by STAMP and the children who had not.Results: The analysis was performed for a total of 60 children (38 boys, 63%). The mean age was 7.8 � 4.7 years.Malnutrition was found in 16% of patients, segregating equally between acute and chronic malnutrition. Sensitivity,specificity, positive predictive value and negative predictive value were 95.7% (95% confidence interval,CI = 85.75–98.83%), 76.9% (95% CI = 49.74–91.82%), 93.7 and 83.3, respectively. AUROC was 0.863 (95% CI =0.72–1). There was no difference either in malnutrition awareness among the medical staff before and after the inter-vention period or in health outcomes at discharge.Conclusions: STAMP is a valid tool for malnutrition screening in hospitalised children; however, its use does notinfluence admitted patients’ nutritional status awareness among the medical staff nor their outcomes at discharge.
Key words: children, malnutrition, nutritional assessment, nutritional screening tool.
Introduction
Malnutrition prevalence upon admission to paediatric hos-pitals remains considerably high, ranging from 7.3% to17.9% in the developed world with higher prevalence ratesin infants and toddlers1 and particularly high rates for spe-cific medical conditions.2 Several studies have reported
deterioration of nutritional status during hospitalisation.3,4
Screening children for malnutrition risk is recommendedby a number of international organisations such as theAmerican Society for Parenteral and Enteral Nutrition,5 theEuropean Society for Parenteral and Enteral Nutrition6 andthe European Society for Paediatric Gastroenterology, Hepa-tology and Nutrition.7
An ideal screening tool must be reproducible, have goodsensitivity and specificity regarding health outcome, bequick and easy to use and ensure cost-efficiency.8 There areseveral screening tools developed for assessment of nutri-tional status and risk in hospitalised children, however,none of them is generally accepted for broad use.9 More-over, there is even no single universally accepted definitionof ‘malnutrition’, and therefore it is impossible to define agold standard for the assessment of malnutrition risk.
There is also a vast variety of methods applied to evalu-ate the efficacy of different screening tools. Previously,screening tools according to different factors including
L. Marderfeld, BSc, RD, Senior Research DietitianG. Rub, MSc, RD, Clinical DietitianG. Hodik, PhD, ProfessorI. Poraz, MSc, MHA, RD, Head DietitianC. Hartman, MD, Senior GastroenterologistS. Ashkenazi, MD, MSc, ProfessorR. Shamir, MD, ProfessorCorrespondence: L. Marderfeld, Nutrition and Dietetics Department,Schneider Children’s Medical Centre of Israel, Petach Tikva 4920235,Israel.Email: [email protected]
Accepted February 2019
© 2019 Dietitians Association of Australia574
AA AA
DDD
ieti
tian
s As
soci
atio
nofof
Aus
tral
ia
Nutrition & Dietetics 2019; 76: 574–579 DOI: 10.1111/1747-0080.12529
anthropometric measures (such as the WHO cut-off refer-ences) and results of a nutritional assessment held by a die-titian were compared.
It is argued that screening tools must be evaluatedaccording to the clinical outcome because their usage isaimed to reduce malnutrition-related health outcomes andfurther healthcare-related expenses.9 Nonetheless, there isstill no agreement on the best outcome assessment tool asthere is no agreement on whether anthropometrical mea-sures or clinical outcomes should be predicted by thescreening tools.10
STAMP was chosen for the present study because it ishighly applicable, frequently used by nurses and has shownhigh reproducibility, as well as concurrent and predictivevalidity. The tool was developed by McCarthy et al.11 inEngland. It collects following information to assess nutri-tional risk for a patient: discrepancy between the weightand height percentile weight for the age, expected nutri-tional risk caused by clinical diagnosis, recent changes inthe appetite. The assessment results are used to define ifthere is a need for a referral to a full nutritional assessment.
In the present study we aimed to validate the use ofSTAMP-based assessments performed by nurses on childrenhospitalised in a paediatric tertiary hospital and to assessthe impact of STAMP on awareness of the patients’ nutri-tional status among the medical staff and on further healthoutcomes.
Methods
The present study was conducted at a tertiary medical cen-tre and had been approved by the institutional reviewboard of Helsinki committee Rabin Medical Centre.(Number: 0233-11-RMC). The study comprised of the fol-lowing three phases: STAMP validation phase; assessmentof the nutritional screening influence on awareness of thepatients’ nutritional status among the medical staff andassessment of the patients’ health outcomes at discharge.
Study population: The children eligible for the STAMP vali-dation study were aged 1–17 years, admitted to internalmedicine and surgical medicine wards and hospitalised forover 24 hours. The children were recruited within 24 hoursof admission to the hospital. All the patients admitted forelective purposes were excluded. Standardised techniques forweight and length/height measurements were used by thenurses for STAMP and by dietitians for the full nutritionalassessment. Shekel Electronic Scales (Nitzan, Rosh HaayinIsrael) were used to measure the weight of infants; Seca 232(Hamburg, Germany) was used to measure the length ofinfants and Health O Meter (500KL) Atlanta, USA was usedto measure the height and weight of children above 2 years.All this equipment is used by internal medicine wards in thehospital on regular basis and had been preliminarily cali-brated according to the standards of the medical centre. Allchildren were weighed and measured barefoot, dressed inlight clothing. Measurements were plotted on CDC growthreference charts. Age and sex-specific z scores were calcu-lated using CDC z-score data files.
It should also be mentioned that the study consideredtwo types of malnutrition, that is, acute malnutrition usu-ally caused by an illness and implies 2SDs below meanbody mass index (BMI), and chronic malnutrition that mayoccur in children with underlying chronic diseases definedas 2SDs below mean height for the age.2,12
STAMP validation: after informed consent had beenacquired, children underwent STAMP screening, per-formed by the departments’ nurses in the internal medi-cine and surgical wards. According to the STAMPprocedure, screening assessed three factors, the child’sdiagnosis and its nutritional implications, the child’s nutri-tional intake and their anthropometry. Each factor wasevaluated and scores summed to obtain the total riskscore. A child was classified as being at high risk, if theirtotal risk score was ≥4 points and were advised a suitablecare plan.
Then patients were assessed by a registered dietitianwho performed full nutritional assessment, particularlytook anthropometric measurements and plotted valueson growth charts. The dietitian also held a face-to-faceinterview to obtain detailed information on current andrecent changes in the patients’ dietary intake, and studiedtheir medical files for the personal and clinical informa-tion. The dietitian was blinded to results of the STAMPscreening performed by the departments’ nurses atadmission.
Upon the results of the aforementioned assessment, thechildren were classified as being at high risk, medium riskor low risk of malnutrition. The high risk of malnutritionimplied presence of one or more of the following factors:low weight for the height percentile or low BMI for the age;sub-optimal dietary intake observed over the recent periodand unlikely to improve in the next 3 to 5 days; clinical his-tory or diagnosis that might result in either increased meta-bolic stress; decreased dietary intake or increasednutritional loss.
Impact of STAMP usage on nutritional status awarenessamong medical staff: At the second step the impact of theSTAMP usage on awareness of the patients’ nutritional sta-tus among the medical staff in internal medicine and surgi-cal wards was assessed. For this purpose, nutrition-relateddata and anthropometric measurements were extractedfrom randomly selected medical files before and after theintervention period. We reviewed records documented by aphysician and/or a nurse within the first 24 hours after thepatient’s admission in the Chameleon software applicationused in the hospital. The extracted data included recordson the following: percentile drop; diagnoses of failure tothrive (FTT); malnutrition; overweight and obesity; requestsfor dietitian consultations; records such as ‘below the 5thpercentile’ and ‘above 85 and 95 percentiles of the weightfor the age and height for the age’; reference to and recordsof the laboratory indices such as haemoglobin, transferrin,total lymphocyte count and albumin.
Impact of STAMP usage on health outcomes at discharge:The third part of the study compared health outcomes atdischarge for the children from internal medicine
Paediatric malnutrition screening tool
© 2019 Dietitians Association of Australia 575
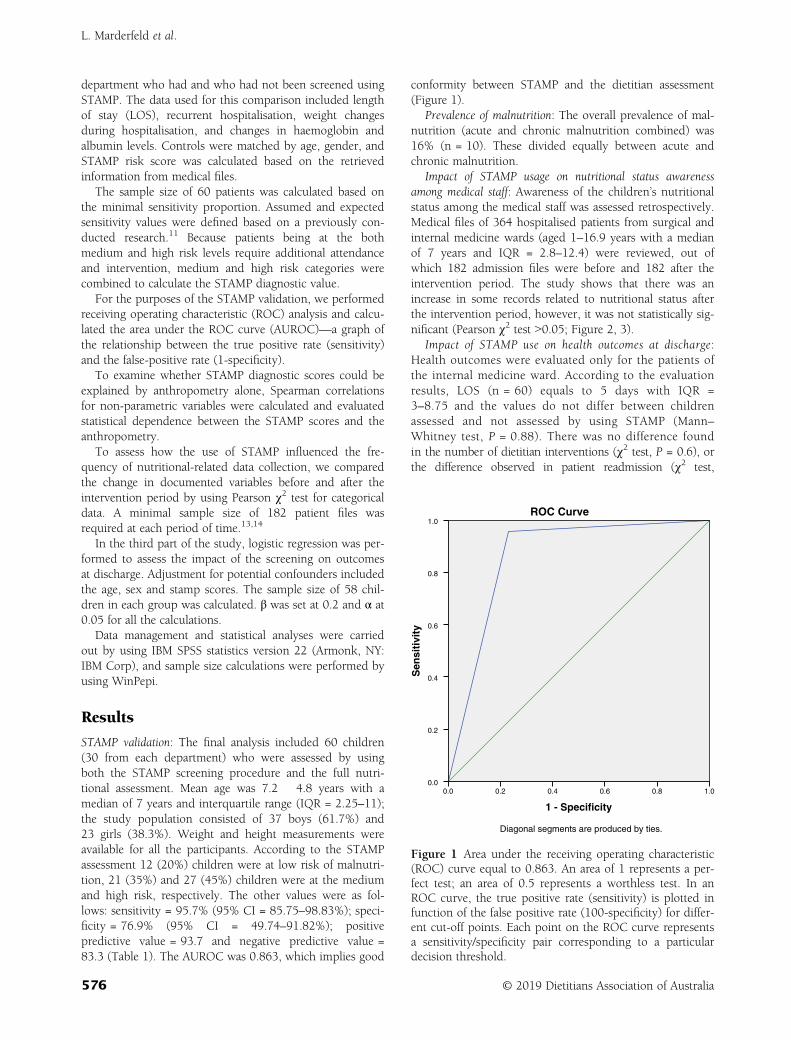
department who had and who had not been screened usingSTAMP. The data used for this comparison included lengthof stay (LOS), recurrent hospitalisation, weight changesduring hospitalisation, and changes in haemoglobin andalbumin levels. Controls were matched by age, gender, andSTAMP risk score was calculated based on the retrievedinformation from medical files.
The sample size of 60 patients was calculated based onthe minimal sensitivity proportion. Assumed and expectedsensitivity values were defined based on a previously con-ducted research.11 Because patients being at the bothmedium and high risk levels require additional attendanceand intervention, medium and high risk categories werecombined to calculate the STAMP diagnostic value.
For the purposes of the STAMP validation, we performedreceiving operating characteristic (ROC) analysis and calcu-lated the area under the ROC curve (AUROC)—a graph ofthe relationship between the true positive rate (sensitivity)and the false-positive rate (1-specificity).
To examine whether STAMP diagnostic scores could beexplained by anthropometry alone, Spearman correlationsfor non-parametric variables were calculated and evaluatedstatistical dependence between the STAMP scores and theanthropometry.
To assess how the use of STAMP influenced the fre-quency of nutritional-related data collection, we comparedthe change in documented variables before and after theintervention period by using Pearson χ2 test for categoricaldata. A minimal sample size of 182 patient files wasrequired at each period of time.13,14
In the third part of the study, logistic regression was per-formed to assess the impact of the screening on outcomesat discharge. Adjustment for potential confounders includedthe age, sex and stamp scores. The sample size of 58 chil-dren in each group was calculated. β was set at 0.2 and α at0.05 for all the calculations.
Data management and statistical analyses were carriedout by using IBM SPSS statistics version 22 (Armonk, NY:IBM Corp), and sample size calculations were performed byusing WinPepi.
Results
STAMP validation: The final analysis included 60 children(30 from each department) who were assessed by usingboth the STAMP screening procedure and the full nutri-tional assessment. Mean age was 7.2 � 4.8 years with amedian of 7 years and interquartile range (IQR = 2.25–11);the study population consisted of 37 boys (61.7%) and23 girls (38.3%). Weight and height measurements wereavailable for all the participants. According to the STAMPassessment 12 (20%) children were at low risk of malnutri-tion, 21 (35%) and 27 (45%) children were at the mediumand high risk, respectively. The other values were as fol-lows: sensitivity = 95.7% (95% CI = 85.75–98.83%); speci-ficity = 76.9% (95% CI = 49.74–91.82%); positivepredictive value = 93.7 and negative predictive value =83.3 (Table 1). The AUROC was 0.863, which implies good
conformity between STAMP and the dietitian assessment(Figure 1).
Prevalence of malnutrition: The overall prevalence of mal-nutrition (acute and chronic malnutrition combined) was16% (n = 10). These divided equally between acute andchronic malnutrition.
Impact of STAMP usage on nutritional status awarenessamong medical staff: Awareness of the children’s nutritionalstatus among the medical staff was assessed retrospectively.Medical files of 364 hospitalised patients from surgical andinternal medicine wards (aged 1–16.9 years with a medianof 7 years and IQR = 2.8–12.4) were reviewed, out ofwhich 182 admission files were before and 182 after theintervention period. The study shows that there was anincrease in some records related to nutritional status afterthe intervention period, however, it was not statistically sig-nificant (Pearson χ2 test ˃0.05; Figure 2, 3).
Impact of STAMP use on health outcomes at discharge:Health outcomes were evaluated only for the patients ofthe internal medicine ward. According to the evaluationresults, LOS (n = 60) equals to 5 days with IQR =3–8.75 and the values do not differ between childrenassessed and not assessed by using STAMP (Mann–Whitney test, P = 0.88). There was no difference foundin the number of dietitian interventions (χ2 test, P = 0.6), orthe difference observed in patient readmission (χ2 test,
1 - Specificity
1.00.80.60.40.20.0
Sen
sit
ivit
y
1.0
0.8
0.6
0.4
0.2
0.0
ROC Curve
Diagonal segments are produced by ties.
Figure 1 Area under the receiving operating characteristic(ROC) curve equal to 0.863. An area of 1 represents a per-fect test; an area of 0.5 represents a worthless test. In anROC curve, the true positive rate (sensitivity) is plotted infunction of the false positive rate (100-specificity) for differ-ent cut-off points. Each point on the ROC curve representsa sensitivity/specificity pair corresponding to a particulardecision threshold.
L. Marderfeld et al.
576 © 2019 Dietitians Association of Australia
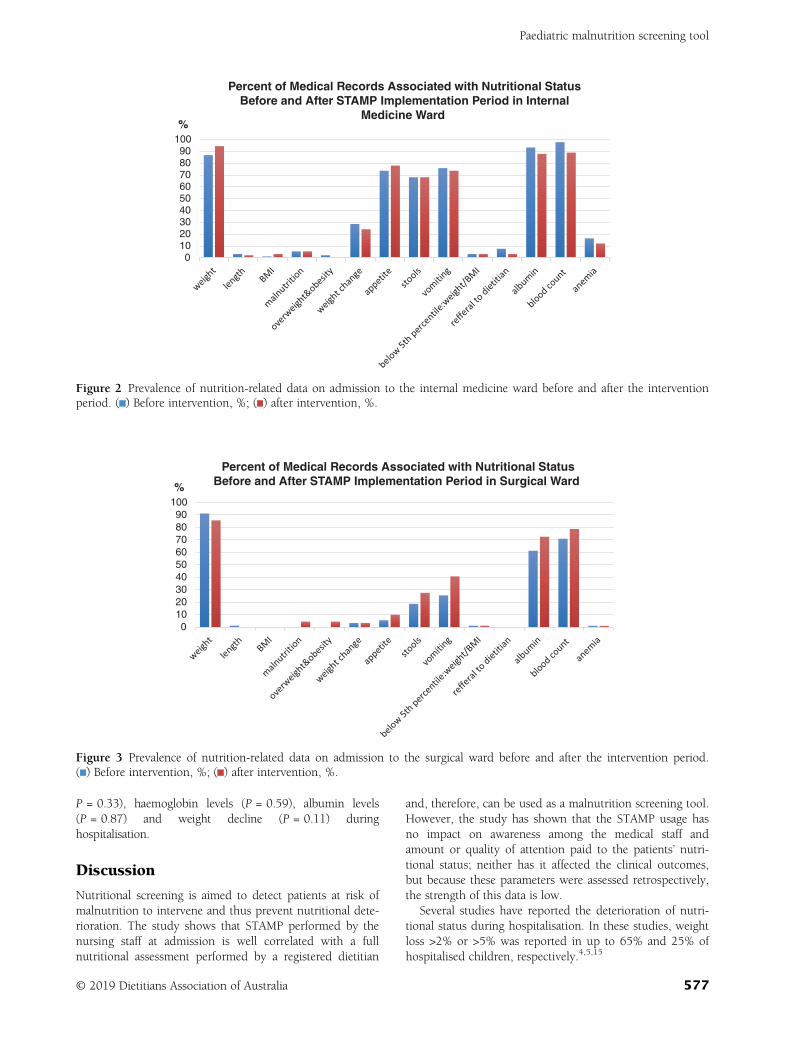
P = 0.33), haemoglobin levels (P = 0.59), albumin levels(P = 0.87) and weight decline (P = 0.11) duringhospitalisation.
Discussion
Nutritional screening is aimed to detect patients at risk ofmalnutrition to intervene and thus prevent nutritional dete-rioration. The study shows that STAMP performed by thenursing staff at admission is well correlated with a fullnutritional assessment performed by a registered dietitian
and, therefore, can be used as a malnutrition screening tool.However, the study has shown that the STAMP usage hasno impact on awareness among the medical staff andamount or quality of attention paid to the patients’ nutri-tional status; neither has it affected the clinical outcomes,but because these parameters were assessed retrospectively,the strength of this data is low.
Several studies have reported the deterioration of nutri-tional status during hospitalisation. In these studies, weightloss >2% or >5% was reported in up to 65% and 25% ofhospitalised children, respectively.4,5,15
0102030405060708090
100%
Percent of Medical Records Associated with Nutritional StatusBefore and After STAMP Implementation Period in Internal
Medicine Ward
Figure 2 Prevalence of nutrition-related data on admission to the internal medicine ward before and after the interventionperiod. ( ) Before intervention, %; ( ) after intervention, %.
0102030405060708090
100%
Percent of Medical Records Associated with Nutritional StatusBefore and After STAMP Implementation Period in Surgical Ward
Figure 3 Prevalence of nutrition-related data on admission to the surgical ward before and after the intervention period.( ) Before intervention, %; ( ) after intervention, %.
Paediatric malnutrition screening tool
© 2019 Dietitians Association of Australia 577
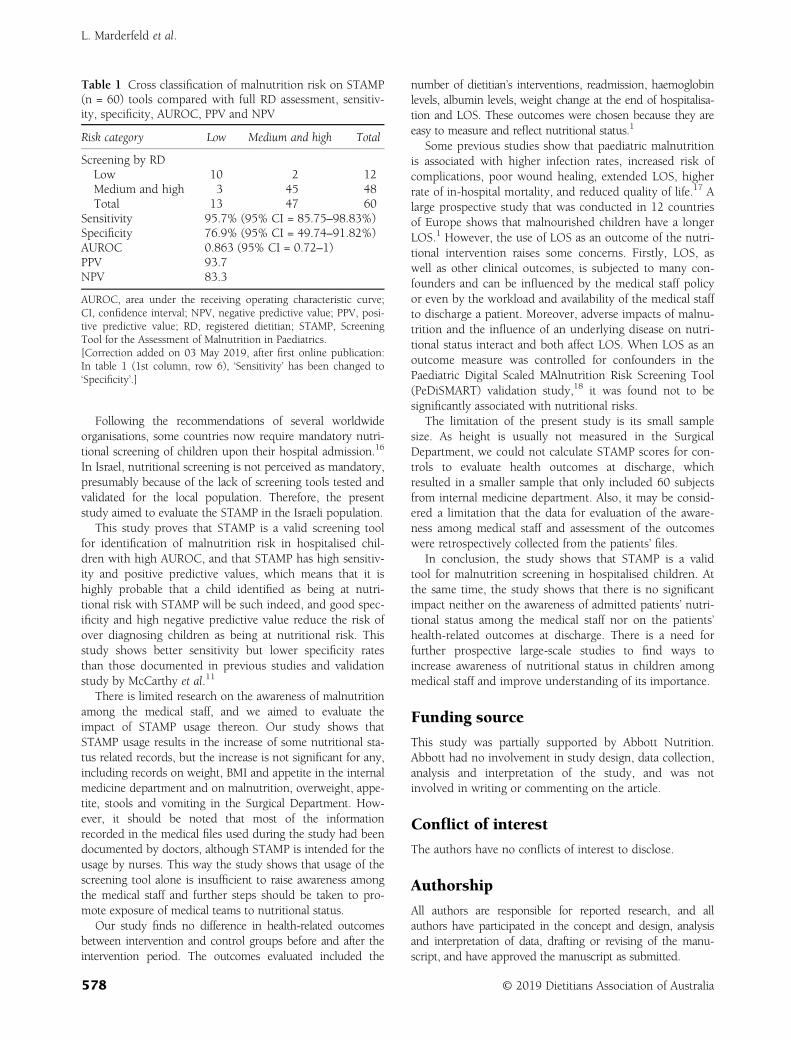
Following the recommendations of several worldwideorganisations, some countries now require mandatory nutri-tional screening of children upon their hospital admission.16
In Israel, nutritional screening is not perceived as mandatory,presumably because of the lack of screening tools tested andvalidated for the local population. Therefore, the presentstudy aimed to evaluate the STAMP in the Israeli population.
This study proves that STAMP is a valid screening toolfor identification of malnutrition risk in hospitalised chil-dren with high AUROC, and that STAMP has high sensitiv-ity and positive predictive values, which means that it ishighly probable that a child identified as being at nutri-tional risk with STAMP will be such indeed, and good spec-ificity and high negative predictive value reduce the risk ofover diagnosing children as being at nutritional risk. Thisstudy shows better sensitivity but lower specificity ratesthan those documented in previous studies and validationstudy by McCarthy et al.11
There is limited research on the awareness of malnutritionamong the medical staff, and we aimed to evaluate theimpact of STAMP usage thereon. Our study shows thatSTAMP usage results in the increase of some nutritional sta-tus related records, but the increase is not significant for any,including records on weight, BMI and appetite in the internalmedicine department and on malnutrition, overweight, appe-tite, stools and vomiting in the Surgical Department. How-ever, it should be noted that most of the informationrecorded in the medical files used during the study had beendocumented by doctors, although STAMP is intended for theusage by nurses. This way the study shows that usage of thescreening tool alone is insufficient to raise awareness amongthe medical staff and further steps should be taken to pro-mote exposure of medical teams to nutritional status.
Our study finds no difference in health-related outcomesbetween intervention and control groups before and after theintervention period. The outcomes evaluated included the
number of dietitian’s interventions, readmission, haemoglobinlevels, albumin levels, weight change at the end of hospitalisa-tion and LOS. These outcomes were chosen because they areeasy to measure and reflect nutritional status.1
Some previous studies show that paediatric malnutritionis associated with higher infection rates, increased risk ofcomplications, poor wound healing, extended LOS, higherrate of in-hospital mortality, and reduced quality of life.17 Alarge prospective study that was conducted in 12 countriesof Europe shows that malnourished children have a longerLOS.1 However, the use of LOS as an outcome of the nutri-tional intervention raises some concerns. Firstly, LOS, aswell as other clinical outcomes, is subjected to many con-founders and can be influenced by the medical staff policyor even by the workload and availability of the medical staffto discharge a patient. Moreover, adverse impacts of malnu-trition and the influence of an underlying disease on nutri-tional status interact and both affect LOS. When LOS as anoutcome measure was controlled for confounders in thePaediatric Digital Scaled MAlnutrition Risk Screening Tool(PeDiSMART) validation study,18 it was found not to besignificantly associated with nutritional risks.
The limitation of the present study is its small samplesize. As height is usually not measured in the SurgicalDepartment, we could not calculate STAMP scores for con-trols to evaluate health outcomes at discharge, whichresulted in a smaller sample that only included 60 subjectsfrom internal medicine department. Also, it may be consid-ered a limitation that the data for evaluation of the aware-ness among medical staff and assessment of the outcomeswere retrospectively collected from the patients’ files.
In conclusion, the study shows that STAMP is a validtool for malnutrition screening in hospitalised children. Atthe same time, the study shows that there is no significantimpact neither on the awareness of admitted patients’ nutri-tional status among the medical staff nor on the patients’health-related outcomes at discharge. There is a need forfurther prospective large-scale studies to find ways toincrease awareness of nutritional status in children amongmedical staff and improve understanding of its importance.
Funding source
This study was partially supported by Abbott Nutrition.Abbott had no involvement in study design, data collection,analysis and interpretation of the study, and was notinvolved in writing or commenting on the article.
Conflict of interest
The authors have no conflicts of interest to disclose.
Authorship
All authors are responsible for reported research, and allauthors have participated in the concept and design, analysisand interpretation of data, drafting or revising of the manu-script, and have approved the manuscript as submitted.
Table 1 Cross classification of malnutrition risk on STAMP(n = 60) tools compared with full RD assessment, sensitiv-ity, specificity, AUROC, PPV and NPV
Risk category Low Medium and high Total
Screening by RDLow 10 2 12Medium and high 3 45 48Total 13 47 60
Sensitivity 95.7% (95% CI = 85.75–98.83%)Specificity 76.9% (95% CI = 49.74–91.82%)AUROC 0.863 (95% CI = 0.72–1)PPV 93.7NPV 83.3
AUROC, area under the receiving operating characteristic curve;CI, confidence interval; NPV, negative predictive value; PPV, posi-tive predictive value; RD, registered dietitian; STAMP, ScreeningTool for the Assessment of Malnutrition in Paediatrics.[Correction added on 03 May 2019, after first online publication:In table 1 (1st column, row 6), ‘Sensitivity’ has been changed to‘Specificity’.]
L. Marderfeld et al.
578 © 2019 Dietitians Association of Australia
References
1 Hecht C, Weber M, Grote V et al. Disease associated malnutri-tion correlates with length of hospital stay in children. ClinNutr 2015; 34: 53–9.
2 Joosten K, Hulst J. Prevalence of malnutrition in pediatric hos-pital patients. Curr Opin Pediatr 2008; 20: 590–6.
3 Joosten K, Zwart H, Hop WC, Hulst JM. National malnutritionscreening days in hospitalized children in Netherlands. ArchDis Child 2010; 95: 141–5.
4 Campanozzi A, Russo M, Catucci A et al. Hospital-acquiredmalnutrition in children with mild clinical conditions. Nutrition2009; 25: 540–7.
5 Mehta N, Corkins M, Lyman B et al. Defining pediatric malnu-trition: a paradigm shift toward etiology-related definitions.J Parenter Enteral Nutr 2013; 37: 460–81.
6 Kondrup J, Allison SP, Elia M, Vellas B, Plauth M, Educationaland Clinical Practice Committee, European Society of Paren-teral and Enteral Nutrition (ESPEN). ESPEN guidelines fornutrition screening. Clin Nutr 2003; 22: 415–21.
7 Agostoni C, Axelson I, Colomb V et al. The need for nutritionsupport teams in pediatric units: a commentary by the ESP-GHAN committee on nutrition. J Pediatr Gastroenterol Nutr2005; 41: 8–11.
8 Elia M, Stratton RS. Considerations for screening tool selectionand role of predictive and concurrent validity. Curr Opin ClinNutr Metab 2011; 14: 425–33.
9 Hartman C, Shamir R, Hecht C, Koletzko B. Malnutritionscreening tools for hospitalized children. Curr Opin Clin NutrMetab 2012; 15: 303–9.
10 Huysentruyt K, Devreker T, Dejockheere J, Schepper J,Vandenplas Y, Cools F. Accuracy of nutritional screening tools
in assessing the risk of undernutrition in hospitalized children.J Pediatr Gastroenterol Nutr 2015; 61: 159–66.
11 McCarthy H, Dixon M, Crabtree I, Eaton-Evans MJ, McNulty H.The development and evaluation of the Screening Tool for theAssessment of Malnutrition in Paediatrics (STAMP) for use byhealthcare staff. J Hum Nutr Diet 2012; 25: 311–8.
12 United Nations International Children’s Fund, WorldHealth Organization, World Bank. Levels and trends inchild malnutrition. Joint child malnutrition estimates.New York, NY: UNICEF; Geneva: WHO; Washington, DC:World Bank; 2012.
13 Gout B, Barker L, Crowe T. Malnutrition identification, diagno-sis and dietetic referrals: are we doing a good enough job? NutrDiet 2009; 66: 206–11.
14 Lazarus C, Hamlyn J. Prevalence and documentation of malnu-trition in hospitals: a case study in a large private hospital set-ting. Nutr Diet 2005; 62: 41–7.
15 Chourdakis M, Hecht C, Gerasimidis K et al. Malnutritionrisk in hospitalized children: use of 3 screening tools in alarge European population. Am J Clin Nutr 2016; 103:1301–10.
16 Geiker NRW, Hørup Larsen SM, Stender S, Astrup A. Poorperformance of mandatory nutritional screening of in-hospitalpatients. Clin Nutr 2012; 31: 862–7.
17 Guest JF, Panca M, Baeyens JP et al. Health economic impactof managing patients following a community-based diagnosisof malnutrition in the UK. Clin Nutr 2011; 30: 422–9.
18 Karagiozoglou-Lampoudi T, Daskalou E, Lampoudis D,Apostolou A, Agakidis C. Computer-based malnutrition riskcalculation may enhance the ability to identify pediatricpatients at malnutrition-related risk for unfavorable outcome.J Parenter Enteral Nutr 2015; 39: 418–25.
Paediatric malnutrition screening tool
© 2019 Dietitians Association of Australia 579
OR I G I N A L R E S E AR CH
Association of the Elderly Dietary Index with cardiovasculardisease risk factors in elderly men: A cross-sectional study
Manije Darooghegi Mofrad BS, Research Dietitian and MS Student1,2 |Nazli Namazi PhD, Assistant Professor3 | Bagher Larijani MD, Professor4 |Pamela J. Surkan PhD, Associate Professor5 | Leila Azadbakht PhD, Professor1,3,6
1Department of Community Nutrition,School of Nutritional Sciences and Dietetics,Tehran University of Medical Sciences,Tehran, Iran2Students' Scientific Research Center(SSRC), Tehran University of MedicalSciences, Tehran, Iran3Diabetes Research Center, Endocrinologyand Metabolism Clinical Sciences Institute,Tehran University of Medical Sciences,Tehran, Iran4Endocrinology and Metabolism ResearchCentre, Endocrinology and MetabolismClinical Sciences Institute, TehranUniversity of Medical Sciences, Tehran, Iran5Department of International Health, JohnsHopkins Bloomberg School of PublicHealth, Baltimore, Maryland6Department of Community Nutrition,School of Nutrition and Food Science,Isfahan University of Medical Science,Isfahan, Iran
CorrespondenceLeila Azadbakht, Department of CommunityNutrition, School of Nutritional Sciencesand Dietetics, Tehran University ofMedical Sciences, PO Box 1416643931,Tehran, Iran.Email: [email protected]
Funding informationNational Institute for Medical ResearchDevelopment (NIMAD), Grant/AwardNumber: 958733; Tehran University ofMedical Sciences
AbstractAim: There is limited evidence regarding the association between the Elderly Die-
tary Index (EDI) and cardiovascular disease (CVD) risk factors. The aim of the
study was to examine how the EDI relates to CVD risk factors in elderly men.
Methods: In this cross-sectional study, we recruited 362 elderly men aged 60 to
80 years old. Diet was measured with a validated and reliable food frequency ques-
tionnaire. The EDI assesses adherence to nutritional recommendations for older
adults based on the Modified MyPyramid for Older Adults. The EDI includes meat,
fish, fruits, vegetables, cereals, legumes, olive oil, bread and dairy products.
Anthropometric indices, biochemical markers and blood pressure were measured
using standard methods. Multivariate logistic regression assessed relationships
between tertiles of EDI scores and CVD risk factors.
Results: The mean age and body mass index of participants were 65.43
± 5.63 years and 25.34 ± 3.17 kg/m2, respectively. After controlling for potential
confounders, the EDI was inversely associated with the risk of obesity and over-
weight (Odds ratio [OR]: 0.49, 95% confidence interval [CI]: 0.27, 0.89; P = .004)
and was associated with a reduced likelihood of elevated low-density lipoprotein
cholesterol (LDL-C) concentrations (OR: 0.19, 95% CI: 0.09, 0.41; P < .001).
Conclusions: Higher EDI was associated with lower risk of overweight and obe-
sity and high LDL-C concentrations. However, there was no significant association
between EDI and other CVD risk factors in elderly men.
KEYWORD S
cardiovascular risk factors, EDI, men
1 | INTRODUCTION
The proportion of elderly people is increasing worldwide.1
Longer lifespans are associated with higher rates of
inflammation that can impact the occurrence of metabolicsyndrome, insulin resistance and cardiovascular disease(CVD).2 In fact, 33.7% of all global deaths are attributableto CVD.3 CVD is also the primary cause of death in Iran.4
Received: 30 March 2018 Revised: 30 June 2019 Accepted: 1 July 2019
DOI: 10.1111/1747-0080.12574
580 © 2019 Dietitians Association of Australia Nutrition & Dietetics. 2019;76:580–588.wileyonlinelibrary.com/journal/ndi
Hypertension (HTN), diabetes, obesity and hyper-cholesterolaemia are the most prominent risk factors forCVD.5 Modifiable risk factors include tobacco use, lowphysical activity and unhealthy dietary patterns.6
Dietary indices can help measure associations betweendiet and illness.7 Some prior studies have reported inverseassociations between dietary factors in relation to CVD riskfactors such as oxidative stress and serum levels of inflam-matory markers.8-10 However, diet quality indices examineboth foods and nutrients, and they require a nutrient databasefor analysis, which may be associated with higher biases.The Elderly Dietary Index (EDI) is a modified version of theMediterranean Dietary Score (MDS) that examines adher-ence to dietary recommendations for the elderly.11While theMDS uses median cut-off values that might not be suitablefor populations with low adherence to the Mediterraneandiet, it uses a 4-point score, capturing a wider intake range.It also takes into account u-shaped associations betweensome foods and disease risk.11-13
This score captures the frequency of consumption of ninespecific foods and food groups, including meat, fish, fruits,vegetables, cereals, legumes, olive oil, bread and dairy prod-ucts. These foods contribute significantly to enable olderadults to meet the recommended dietary allowances and ade-quate intake values for calcium; vitamins D, E and K; potas-sium; protein; and fibre. Fish, meat and legumes areimportant sources of protein. Vegetables and fruits are goodsources of vitamins A, C and K and potassium. Moreover,low-fat dairy consumption is recommended for older adultsto meet their calcium requirements and minimise saturatedfat intake.11
Kourlaba et al11 found the EDI to be a valid tool forassessing dietary intake in the elderly. They showed thathigher EDI was associated with lower CVD risk factors,including obesity and HTN. Diet quality indices that arebased on specific foods or food groups, including the EDI,are better predictors than recommended nutrient intake indi-ces (such as the Healthy Diet Indicator) in predicting chronicheart disease (CHD) events, CVD and all-cause mortality inthe elderly.12
Given the high CVD prevalence among older people, itis important to identify risk factors that can be used toinform strategies to reduce the burden of such preventablechronic diseases. The EDI has not previously been used inthe Iranian population. Therefore, we investigated the EDIin relation to CVD risk factors among elderly men.
2 | METHODS
Participants and sampling: Participants in this cross-sectional study included 362 elderly men in Tehran, Iran. In2017, men aged 60 to 80 years who were referred to health
centres affiliated with Tehran University of Medical Sci-ences (TUMS) were included. As the main dependent vari-able, high-sensitivity C-reactive protein (hs-CRP) was usedto calculate the sample size.14 Multistage sampling was per-formed, and centres affiliated with TUMS were randomlyselected. Men who were referred to these centres, for anyreason, could be included in the present study.
Men who were on a specific diet or suffered from malig-nant diseases (including cancer) or those whose daily energyintakes were not between 800 and 4200 kcal/d wereexcluded. All participants provided written informed con-sent. We followed the guidelines of the Strengthening theReporting of Observational Studies in Epidemiology(STROBE) statement for cross-sectional studies. The proto-col of the study was approved by the National Institute forMedical Research Development (NIMAD) (No. 958733).
Dietary assessment: Dietary intake was assessed using avalid and reliable 168-item, semi-quantitative, food fre-quency questionnaire (FFQ).15 All FFQs were completedthrough face-to-face interviews by a trained nutritionist. Weconverted food portion sizes to grams based on householdmeasures. Mean energy and nutrient intakes from the FFQswere calculated using a modified version of NUTRITION-IST IV software for Iranian foods (version 7.0; N-SquaredComputing, Salem, Oregon).
EDI calculation: The EDI consists of eight componentsextracted from foods in the Modified MyPyramid for OlderAdults16: meat, cereals, fruits, vegetables, legumes, fish,dairy products and bread. Furthermore, olive oil was a com-ponent of the EDI.
We used a scoring system that was slightly modifiedfrom Kourlaba et al.11 Based on Willett,17 food quantity(g/d) is a more precise measure than serving size. Therefore,our score was based on food quantity (g/d), not servings perday. Because of religious restrictions, alcohol consumptionis infrequent or is probably underreported in the Iranian pop-ulation. Alcohol was included as an additional component ofthe EDI for sensitivity analyses. Each component of the EDIcan be assigned up to 4 points based on consumption (in g),resulting in a total score ranging from 9 to 36 (Supplemen-tary Table 1). Higher scores on the EDI represent greateradherence to a healthy diet. Participants were classified intothree tertiles of the EDI.
Biochemical assessment: After 12 hours of fasting, weperformed biochemical tests. We measured fasting bloodsugar (FBS) only on the day of blood sampling. Theremaining serum was maintained at −80 C until the analysiswas performed. Serum levels of FBS, total cholesterol (TC),low-density lipoprotein cholesterol (LDL-C), high-densitylipoprotein cholesterol (HDL-C) and triglyceride (TG) werequantified using commercial enzymatic reagents (ParsAzmoon, Tehran, Iran) adapted to an auto-analyser system
DAROOGHEGI MOFRAD ET AL. 581
(Selectra E, Vitalab, Holliston, the Netherlands). Insulinconcentrations were assessed using the enzyme-linkedimmunosorbent assay method (ELISA; Diagnostic BiochemCanada, Inc., Montreal, Canada). Insulin resistance wasassessed using the homeostasis model assessment-insulinresistance (HOMA-IR) formula.18 The quantitative insulinsensitivity check index (QUICKI) was used to calculateinsulin sensitivity.19
An ultrasensitive, latex-enhanced immunoturbidimetricassay (Randox Laboratory Ltd., Belfast, UK) was used tomeasure hs-CRP. To determine fibrinogen plasma concen-tration, we used the Clauss method that measures the rate offibrinogen conversion to fibrin by adding thrombin.Enzyme-linked immunosorbent assay kits (Boster Bio-logical Technology Co, Hubei, China) were used to deter-mine the plasma concentration of interleukin-6 (IL-6) andtumour necrosis factor-alpha (TNF-α). Serum concentrationsof alanine aminotransferase (ALT) and aspartate aminotrans-ferase (AST) were measured using commercial kits (ParsAzmoon, Iran) with a BT-3000 (Biotechinica; China) auto-analyser.
Anthropometric assessment: Body weight was measuredusing calibrated digital scales to the nearest 100 g. Partici-pants did not wear shoes and wore minimal clothing. Heightwas also measured to the nearest 0.5 cm with shoes removedand with shoulders in a normal position. For waist circum-ference (WC), the narrowest and maximum hip circumfer-ence (precision: 0.5 cm for both) were measured. A trainednutritionist assessed WC and height with a non-stretchabletape. Body mass index (BMI) was calculated as kg/m2.
Assessment of other variables: Blood pressure was mea-sured after 10 minutes of rest. Blood pressure was measuredtwice using a standard mercury sphygmomanometer. Finalblood pressure was obtained using the average of the twomeasurements. Socioeconomic status (SES) was assessedusing a validated and reliable questionnaire (consisting ofquestions about income, education, occupation, householdsize, house or car ownership, having modern furniture, num-ber of trips inside or outside the country during the lastyear).20 A total standardised score for all participants wascomputed (using factor analysis and a summary index); then,its compliance with a normal summary index was also exam-ined using a Kappa test. In the current study, participantSES was described for each tertile of EDI based on the cal-culated total scores. A higher score represents better SES.
Statistical analysis: The distributions of the variableswere checked for normality using the Kolmogorov-Smirnovtest and histogram curves. Variables with normal and non-normal distributions were presented as means ± SD andmedians (25th percentile, 75th percentile), respectively.General characteristics across tertiles of EDI were expressedas means ± SDs for continuous variables and numbers and
percentages for categorical variables. Dietary intakes acrosstertiles of EDI were compared using analysis of covariance,and all values were adjusted for age, energy intake and SES.Both crude and adjusted models (age, energy intake, BMI,SES) were reported in order to examine associationsbetween anthropometric indices, blood pressure and bio-chemical parameters across EDI tertiles. For comparisonsbetween tertiles, we conducted post hoc tests. A chi-squaretest was used to compare categorical variables across tertilesof EDI.
To examine the association between EDI and car-diometabolic risk factors, we used crude and adjusted binarylogistic regression models. In Model 1, we controlled forage, energy intake, BMI and SES. The cut-off points forhigh risk of CVD were based on the diagnostic criteria pro-posed by the National Cholesterol Education Program AdultTreatment Panel III (ATP III)21: overweight and obesity(BMI ≥ 25 kg/m2), high TG (>150 mg/dL), FBS(>100 mg/dL) and LDL-C (>130 mg/dL). All statisticalanalyses were performed using SPSS software (version18, SPSS Inc., Chicago, Illinois). P < .05 was consideredstatistically significant.
3 | RESULTS
We included 362 elderly men with a mean age of 65.43± 5.63 years in our analyses. General characteristics of thestudy participants across tertiles of EDI are shown in Sup-plementary Table 2. Individuals in the highest tertile of EDIwere more likely to have lower BMI (P = .008), higher edu-cation and higher SES (P < .001) compared with those inthe lowest tertile. No significant differences were found forother general participant characteristics.
We compared dietary intakes across tertiles of EDI(Table 1, Supplementary Table 3). After adjustment for age,energy intake and SES, EDI was associated with a higherconsumption of carbohydrates, saturated fatty acid, polyun-saturated fatty acid, mono-unsaturated fatty acid, cholesterol,folate, vitamin B1, vitamin B6, vitamin A, vitamin C, potas-sium and magnesium (P < .05). Participants in the highestEDI tertile consumed significantly more fruits, vegetables,legumes, fish, olive oil, bread, cereal and dairy products andless meat compared with those in the lowest tertile(P < .05). There were no significant differences across EDItertiles for protein, fat, vitamin B12, calcium andzinc (P > .05).
Crude and adjusted models for anthropometric indices,biochemical markers and blood pressure across tertiles ofEDI are summarised in Table 2. Elderly men with higherEDI had lower weight, BMI, WC, serum insulin, HOMA-IR, fibrinogen, ALT, AST and DBP (P < .05). However,they experienced higher FBS, LDL-C, HDL-C, TC
582 DAROOGHEGI MOFRAD ET AL.
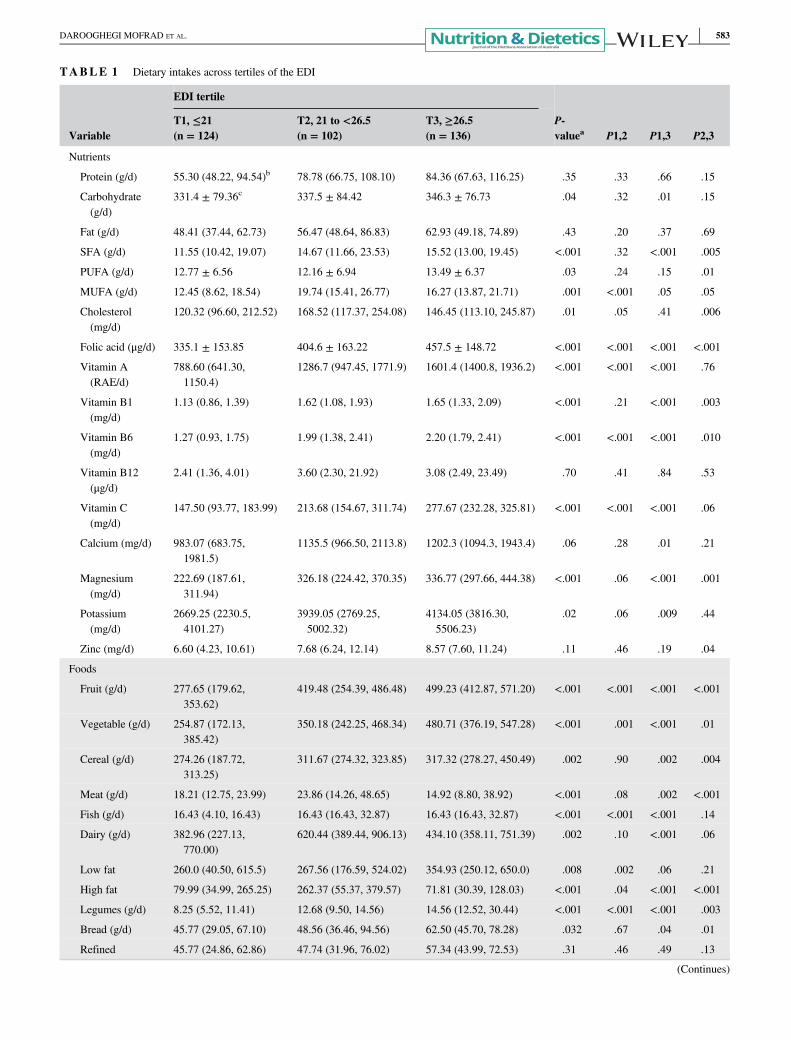
TABLE 1 Dietary intakes across tertiles of the EDI
Variable
EDI tertile
P-valuea P1,2 P1,3 P2,3
T1, ≤21(n = 124)
T2, 21 to <26.5(n = 102)
T3, ≥26.5(n = 136)
Nutrients
Protein (g/d) 55.30 (48.22, 94.54)b 78.78 (66.75, 108.10) 84.36 (67.63, 116.25) .35 .33 .66 .15
Carbohydrate(g/d)
331.4 ± 79.36c 337.5 ± 84.42 346.3 ± 76.73 .04 .32 .01 .15
Fat (g/d) 48.41 (37.44, 62.73) 56.47 (48.64, 86.83) 62.93 (49.18, 74.89) .43 .20 .37 .69
SFA (g/d) 11.55 (10.42, 19.07) 14.67 (11.66, 23.53) 15.52 (13.00, 19.45) <.001 .32 <.001 .005
PUFA (g/d) 12.77 ± 6.56 12.16 ± 6.94 13.49 ± 6.37 .03 .24 .15 .01
MUFA (g/d) 12.45 (8.62, 18.54) 19.74 (15.41, 26.77) 16.27 (13.87, 21.71) .001 <.001 .05 .05
Cholesterol(mg/d)
120.32 (96.60, 212.52) 168.52 (117.37, 254.08) 146.45 (113.10, 245.87) .01 .05 .41 .006
Folic acid (μg/d) 335.1 ± 153.85 404.6 ± 163.22 457.5 ± 148.72 <.001 <.001 <.001 <.001
Vitamin A(RAE/d)
788.60 (641.30,1150.4)
1286.7 (947.45, 1771.9) 1601.4 (1400.8, 1936.2) <.001 <.001 <.001 .76
Vitamin B1(mg/d)
1.13 (0.86, 1.39) 1.62 (1.08, 1.93) 1.65 (1.33, 2.09) <.001 .21 <.001 .003
Vitamin B6(mg/d)
1.27 (0.93, 1.75) 1.99 (1.38, 2.41) 2.20 (1.79, 2.41) <.001 <.001 <.001 .010
Vitamin B12(μg/d)
2.41 (1.36, 4.01) 3.60 (2.30, 21.92) 3.08 (2.49, 23.49) .70 .41 .84 .53
Vitamin C(mg/d)
147.50 (93.77, 183.99) 213.68 (154.67, 311.74) 277.67 (232.28, 325.81) <.001 <.001 <.001 .06
Calcium (mg/d) 983.07 (683.75,1981.5)
1135.5 (966.50, 2113.8) 1202.3 (1094.3, 1943.4) .06 .28 .01 .21
Magnesium(mg/d)
222.69 (187.61,311.94)
326.18 (224.42, 370.35) 336.77 (297.66, 444.38) <.001 .06 <.001 .001
Potassium(mg/d)
2669.25 (2230.5,4101.27)
3939.05 (2769.25,5002.32)
4134.05 (3816.30,5506.23)
.02 .06 .009 .44
Zinc (mg/d) 6.60 (4.23, 10.61) 7.68 (6.24, 12.14) 8.57 (7.60, 11.24) .11 .46 .19 .04
Foods
Fruit (g/d) 277.65 (179.62,353.62)
419.48 (254.39, 486.48) 499.23 (412.87, 571.20) <.001 <.001 <.001 <.001
Vegetable (g/d) 254.87 (172.13,385.42)
350.18 (242.25, 468.34) 480.71 (376.19, 547.28) <.001 .001 <.001 .01
Cereal (g/d) 274.26 (187.72,313.25)
311.67 (274.32, 323.85) 317.32 (278.27, 450.49) .002 .90 .002 .004
Meat (g/d) 18.21 (12.75, 23.99) 23.86 (14.26, 48.65) 14.92 (8.80, 38.92) <.001 .08 .002 <.001
Fish (g/d) 16.43 (4.10, 16.43) 16.43 (16.43, 32.87) 16.43 (16.43, 32.87) <.001 <.001 <.001 .14
Dairy (g/d) 382.96 (227.13,770.00)
620.44 (389.44, 906.13) 434.10 (358.11, 751.39) .002 .10 <.001 .06
Low fat 260.0 (40.50, 615.5) 267.56 (176.59, 524.02) 354.93 (250.12, 650.0) .008 .002 .06 .21
High fat 79.99 (34.99, 265.25) 262.37 (55.37, 379.57) 71.81 (30.39, 128.03) <.001 .04 <.001 <.001
Legumes (g/d) 8.25 (5.52, 11.41) 12.68 (9.50, 14.56) 14.56 (12.52, 30.44) <.001 <.001 <.001 .003
Bread (g/d) 45.77 (29.05, 67.10) 48.56 (36.46, 94.56) 62.50 (45.70, 78.28) .032 .67 .04 .01
Refined 45.77 (24.86, 62.86) 47.74 (31.96, 76.02) 57.34 (43.99, 72.53) .31 .46 .49 .13
(Continues)
DAROOGHEGI MOFRAD ET AL. 583
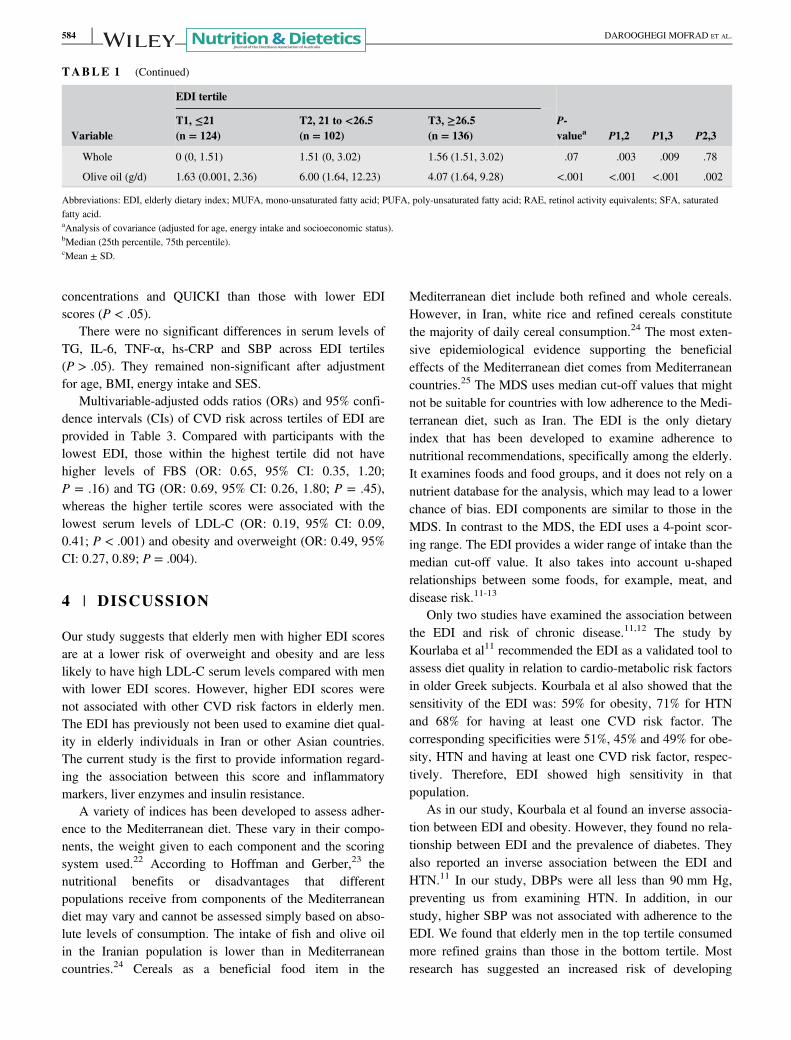
concentrations and QUICKI than those with lower EDIscores (P < .05).
There were no significant differences in serum levels ofTG, IL-6, TNF-α, hs-CRP and SBP across EDI tertiles(P > .05). They remained non-significant after adjustmentfor age, BMI, energy intake and SES.
Multivariable-adjusted odds ratios (ORs) and 95% confi-dence intervals (CIs) of CVD risk across tertiles of EDI areprovided in Table 3. Compared with participants with thelowest EDI, those within the highest tertile did not havehigher levels of FBS (OR: 0.65, 95% CI: 0.35, 1.20;P = .16) and TG (OR: 0.69, 95% CI: 0.26, 1.80; P = .45),whereas the higher tertile scores were associated with thelowest serum levels of LDL-C (OR: 0.19, 95% CI: 0.09,0.41; P < .001) and obesity and overweight (OR: 0.49, 95%CI: 0.27, 0.89; P = .004).
4 | DISCUSSION
Our study suggests that elderly men with higher EDI scoresare at a lower risk of overweight and obesity and are lesslikely to have high LDL-C serum levels compared with menwith lower EDI scores. However, higher EDI scores werenot associated with other CVD risk factors in elderly men.The EDI has previously not been used to examine diet qual-ity in elderly individuals in Iran or other Asian countries.The current study is the first to provide information regard-ing the association between this score and inflammatorymarkers, liver enzymes and insulin resistance.
A variety of indices has been developed to assess adher-ence to the Mediterranean diet. These vary in their compo-nents, the weight given to each component and the scoringsystem used.22 According to Hoffman and Gerber,23 thenutritional benefits or disadvantages that differentpopulations receive from components of the Mediterraneandiet may vary and cannot be assessed simply based on abso-lute levels of consumption. The intake of fish and olive oilin the Iranian population is lower than in Mediterraneancountries.24 Cereals as a beneficial food item in the
Mediterranean diet include both refined and whole cereals.However, in Iran, white rice and refined cereals constitutethe majority of daily cereal consumption.24 The most exten-sive epidemiological evidence supporting the beneficialeffects of the Mediterranean diet comes from Mediterraneancountries.25 The MDS uses median cut-off values that mightnot be suitable for countries with low adherence to the Medi-terranean diet, such as Iran. The EDI is the only dietaryindex that has been developed to examine adherence tonutritional recommendations, specifically among the elderly.It examines foods and food groups, and it does not rely on anutrient database for the analysis, which may lead to a lowerchance of bias. EDI components are similar to those in theMDS. In contrast to the MDS, the EDI uses a 4-point scor-ing range. The EDI provides a wider range of intake than themedian cut-off value. It also takes into account u-shapedrelationships between some foods, for example, meat, anddisease risk.11-13
Only two studies have examined the association betweenthe EDI and risk of chronic disease.11,12 The study byKourlaba et al11 recommended the EDI as a validated tool toassess diet quality in relation to cardio-metabolic risk factorsin older Greek subjects. Kourbala et al also showed that thesensitivity of the EDI was: 59% for obesity, 71% for HTNand 68% for having at least one CVD risk factor. Thecorresponding specificities were 51%, 45% and 49% for obe-sity, HTN and having at least one CVD risk factor, respec-tively. Therefore, EDI showed high sensitivity in thatpopulation.
As in our study, Kourbala et al found an inverse associa-tion between EDI and obesity. However, they found no rela-tionship between EDI and the prevalence of diabetes. Theyalso reported an inverse association between the EDI andHTN.11 In our study, DBPs were all less than 90 mm Hg,preventing us from examining HTN. In addition, in ourstudy, higher SBP was not associated with adherence to theEDI. We found that elderly men in the top tertile consumedmore refined grains than those in the bottom tertile. Mostresearch has suggested an increased risk of developing
TABLE 1 (Continued)
Variable
EDI tertile
P-valuea P1,2 P1,3 P2,3
T1, ≤21(n = 124)
T2, 21 to <26.5(n = 102)
T3, ≥26.5(n = 136)
Whole 0 (0, 1.51) 1.51 (0, 3.02) 1.56 (1.51, 3.02) .07 .003 .009 .78
Olive oil (g/d) 1.63 (0.001, 2.36) 6.00 (1.64, 12.23) 4.07 (1.64, 9.28) <.001 <.001 <.001 .002
Abbreviations: EDI, elderly dietary index; MUFA, mono-unsaturated fatty acid; PUFA, poly-unsaturated fatty acid; RAE, retinol activity equivalents; SFA, saturatedfatty acid.aAnalysis of covariance (adjusted for age, energy intake and socioeconomic status).bMedian (25th percentile, 75th percentile).cMean ± SD.
584 DAROOGHEGI MOFRAD ET AL.
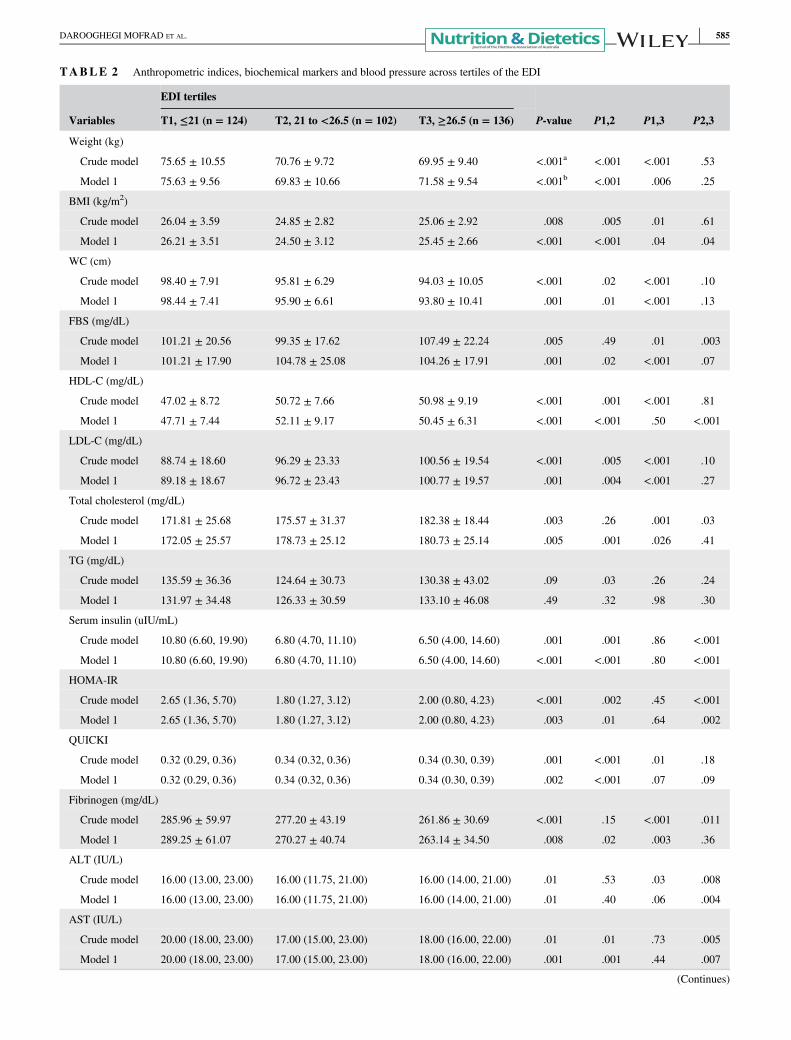
TABLE 2 Anthropometric indices, biochemical markers and blood pressure across tertiles of the EDI
Variables
EDI tertiles
P-value P1,2 P1,3 P2,3T1, ≤21 (n = 124) T2, 21 to <26.5 (n = 102) T3, ≥26.5 (n = 136)
Weight (kg)
Crude model 75.65 ± 10.55 70.76 ± 9.72 69.95 ± 9.40 <.001a <.001 <.001 .53
Model 1 75.63 ± 9.56 69.83 ± 10.66 71.58 ± 9.54 <.001b <.001 .006 .25
BMI (kg/m2)
Crude model 26.04 ± 3.59 24.85 ± 2.82 25.06 ± 2.92 .008 .005 .01 .61
Model 1 26.21 ± 3.51 24.50 ± 3.12 25.45 ± 2.66 <.001 <.001 .04 .04
WC (cm)
Crude model 98.40 ± 7.91 95.81 ± 6.29 94.03 ± 10.05 <.001 .02 <.001 .10
Model 1 98.44 ± 7.41 95.90 ± 6.61 93.80 ± 10.41 .001 .01 <.001 .13
FBS (mg/dL)
Crude model 101.21 ± 20.56 99.35 ± 17.62 107.49 ± 22.24 .005 .49 .01 .003
Model 1 101.21 ± 17.90 104.78 ± 25.08 104.26 ± 17.91 .001 .02 <.001 .07
HDL-C (mg/dL)
Crude model 47.02 ± 8.72 50.72 ± 7.66 50.98 ± 9.19 <.001 .001 <.001 .81
Model 1 47.71 ± 7.44 52.11 ± 9.17 50.45 ± 6.31 <.001 <.001 .50 <.001
LDL-C (mg/dL)
Crude model 88.74 ± 18.60 96.29 ± 23.33 100.56 ± 19.54 <.001 .005 <.001 .10
Model 1 89.18 ± 18.67 96.72 ± 23.43 100.77 ± 19.57 .001 .004 <.001 .27
Total cholesterol (mg/dL)
Crude model 171.81 ± 25.68 175.57 ± 31.37 182.38 ± 18.44 .003 .26 .001 .03
Model 1 172.05 ± 25.57 178.73 ± 25.12 180.73 ± 25.14 .005 .001 .026 .41
TG (mg/dL)
Crude model 135.59 ± 36.36 124.64 ± 30.73 130.38 ± 43.02 .09 .03 .26 .24
Model 1 131.97 ± 34.48 126.33 ± 30.59 133.10 ± 46.08 .49 .32 .98 .30
Serum insulin (uIU/mL)
Crude model 10.80 (6.60, 19.90) 6.80 (4.70, 11.10) 6.50 (4.00, 14.60) .001 .001 .86 <.001
Model 1 10.80 (6.60, 19.90) 6.80 (4.70, 11.10) 6.50 (4.00, 14.60) <.001 <.001 .80 <.001
HOMA-IR
Crude model 2.65 (1.36, 5.70) 1.80 (1.27, 3.12) 2.00 (0.80, 4.23) <.001 .002 .45 <.001
Model 1 2.65 (1.36, 5.70) 1.80 (1.27, 3.12) 2.00 (0.80, 4.23) .003 .01 .64 .002
QUICKI
Crude model 0.32 (0.29, 0.36) 0.34 (0.32, 0.36) 0.34 (0.30, 0.39) .001 <.001 .01 .18
Model 1 0.32 (0.29, 0.36) 0.34 (0.32, 0.36) 0.34 (0.30, 0.39) .002 <.001 .07 .09
Fibrinogen (mg/dL)
Crude model 285.96 ± 59.97 277.20 ± 43.19 261.86 ± 30.69 <.001 .15 <.001 .011
Model 1 289.25 ± 61.07 270.27 ± 40.74 263.14 ± 34.50 .008 .02 .003 .36
ALT (IU/L)
Crude model 16.00 (13.00, 23.00) 16.00 (11.75, 21.00) 16.00 (14.00, 21.00) .01 .53 .03 .008
Model 1 16.00 (13.00, 23.00) 16.00 (11.75, 21.00) 16.00 (14.00, 21.00) .01 .40 .06 .004
AST (IU/L)
Crude model 20.00 (18.00, 23.00) 17.00 (15.00, 23.00) 18.00 (16.00, 22.00) .01 .01 .73 .005
Model 1 20.00 (18.00, 23.00) 17.00 (15.00, 23.00) 18.00 (16.00, 22.00) .001 .001 .44 .007
(Continues)
DAROOGHEGI MOFRAD ET AL. 585
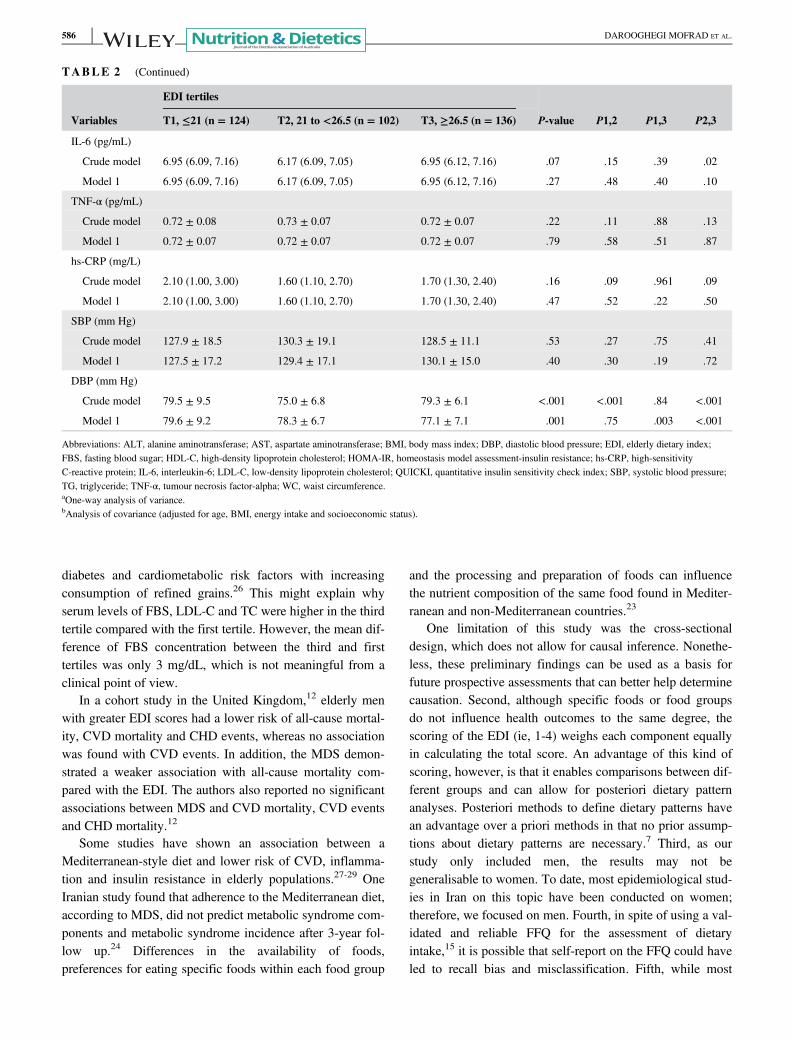
diabetes and cardiometabolic risk factors with increasingconsumption of refined grains.26 This might explain whyserum levels of FBS, LDL-C and TC were higher in the thirdtertile compared with the first tertile. However, the mean dif-ference of FBS concentration between the third and firsttertiles was only 3 mg/dL, which is not meaningful from aclinical point of view.
In a cohort study in the United Kingdom,12 elderly menwith greater EDI scores had a lower risk of all-cause mortal-ity, CVD mortality and CHD events, whereas no associationwas found with CVD events. In addition, the MDS demon-strated a weaker association with all-cause mortality com-pared with the EDI. The authors also reported no significantassociations between MDS and CVD mortality, CVD eventsand CHD mortality.12
Some studies have shown an association between aMediterranean-style diet and lower risk of CVD, inflamma-tion and insulin resistance in elderly populations.27-29 OneIranian study found that adherence to the Mediterranean diet,according to MDS, did not predict metabolic syndrome com-ponents and metabolic syndrome incidence after 3-year fol-low up.24 Differences in the availability of foods,preferences for eating specific foods within each food group
and the processing and preparation of foods can influencethe nutrient composition of the same food found in Mediter-ranean and non-Mediterranean countries.23
One limitation of this study was the cross-sectionaldesign, which does not allow for causal inference. Nonethe-less, these preliminary findings can be used as a basis forfuture prospective assessments that can better help determinecausation. Second, although specific foods or food groupsdo not influence health outcomes to the same degree, thescoring of the EDI (ie, 1-4) weighs each component equallyin calculating the total score. An advantage of this kind ofscoring, however, is that it enables comparisons between dif-ferent groups and can allow for posteriori dietary patternanalyses. Posteriori methods to define dietary patterns havean advantage over a priori methods in that no prior assump-tions about dietary patterns are necessary.7 Third, as ourstudy only included men, the results may not begeneralisable to women. To date, most epidemiological stud-ies in Iran on this topic have been conducted on women;therefore, we focused on men. Fourth, in spite of using a val-idated and reliable FFQ for the assessment of dietaryintake,15 it is possible that self-report on the FFQ could haveled to recall bias and misclassification. Fifth, while most
TABLE 2 (Continued)
Variables
EDI tertiles
P-value P1,2 P1,3 P2,3T1, ≤21 (n = 124) T2, 21 to <26.5 (n = 102) T3, ≥26.5 (n = 136)
IL-6 (pg/mL)
Crude model 6.95 (6.09, 7.16) 6.17 (6.09, 7.05) 6.95 (6.12, 7.16) .07 .15 .39 .02
Model 1 6.95 (6.09, 7.16) 6.17 (6.09, 7.05) 6.95 (6.12, 7.16) .27 .48 .40 .10
TNF-α (pg/mL)
Crude model 0.72 ± 0.08 0.73 ± 0.07 0.72 ± 0.07 .22 .11 .88 .13
Model 1 0.72 ± 0.07 0.72 ± 0.07 0.72 ± 0.07 .79 .58 .51 .87
hs-CRP (mg/L)
Crude model 2.10 (1.00, 3.00) 1.60 (1.10, 2.70) 1.70 (1.30, 2.40) .16 .09 .961 .09
Model 1 2.10 (1.00, 3.00) 1.60 (1.10, 2.70) 1.70 (1.30, 2.40) .47 .52 .22 .50
SBP (mm Hg)
Crude model 127.9 ± 18.5 130.3 ± 19.1 128.5 ± 11.1 .53 .27 .75 .41
Model 1 127.5 ± 17.2 129.4 ± 17.1 130.1 ± 15.0 .40 .30 .19 .72
DBP (mm Hg)
Crude model 79.5 ± 9.5 75.0 ± 6.8 79.3 ± 6.1 <.001 <.001 .84 <.001
Model 1 79.6 ± 9.2 78.3 ± 6.7 77.1 ± 7.1 .001 .75 .003 <.001
Abbreviations: ALT, alanine aminotransferase; AST, aspartate aminotransferase; BMI, body mass index; DBP, diastolic blood pressure; EDI, elderly dietary index;FBS, fasting blood sugar; HDL-C, high-density lipoprotein cholesterol; HOMA-IR, homeostasis model assessment-insulin resistance; hs-CRP, high-sensitivityC-reactive protein; IL-6, interleukin-6; LDL-C, low-density lipoprotein cholesterol; QUICKI, quantitative insulin sensitivity check index; SBP, systolic blood pressure;TG, triglyceride; TNF-α, tumour necrosis factor-alpha; WC, waist circumference.aOne-way analysis of variance.bAnalysis of covariance (adjusted for age, BMI, energy intake and socioeconomic status).
586 DAROOGHEGI MOFRAD ET AL.
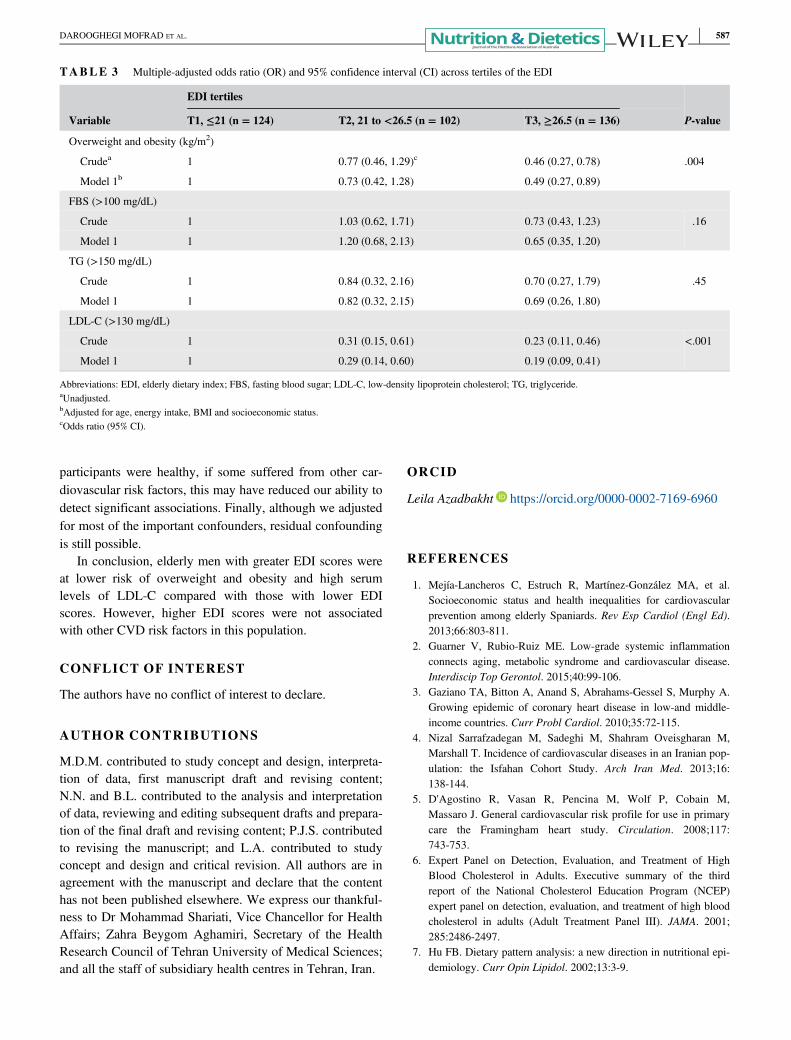
participants were healthy, if some suffered from other car-diovascular risk factors, this may have reduced our ability todetect significant associations. Finally, although we adjustedfor most of the important confounders, residual confoundingis still possible.
In conclusion, elderly men with greater EDI scores wereat lower risk of overweight and obesity and high serumlevels of LDL-C compared with those with lower EDIscores. However, higher EDI scores were not associatedwith other CVD risk factors in this population.
CONFLICT OF INTEREST
The authors have no conflict of interest to declare.
AUTHOR CONTRIBUTIONS
M.D.M. contributed to study concept and design, interpreta-tion of data, first manuscript draft and revising content;N.N. and B.L. contributed to the analysis and interpretationof data, reviewing and editing subsequent drafts and prepara-tion of the final draft and revising content; P.J.S. contributedto revising the manuscript; and L.A. contributed to studyconcept and design and critical revision. All authors are inagreement with the manuscript and declare that the contenthas not been published elsewhere. We express our thankful-ness to Dr Mohammad Shariati, Vice Chancellor for HealthAffairs; Zahra Beygom Aghamiri, Secretary of the HealthResearch Council of Tehran University of Medical Sciences;and all the staff of subsidiary health centres in Tehran, Iran.
ORCID
Leila Azadbakht https://orcid.org/0000-0002-7169-6960
REFERENCES
1. Mejía-Lancheros C, Estruch R, Martínez-González MA, et al.Socioeconomic status and health inequalities for cardiovascularprevention among elderly Spaniards. Rev Esp Cardiol (Engl Ed).2013;66:803-811.
2. Guarner V, Rubio-Ruiz ME. Low-grade systemic inflammationconnects aging, metabolic syndrome and cardiovascular disease.Interdiscip Top Gerontol. 2015;40:99-106.
3. Gaziano TA, Bitton A, Anand S, Abrahams-Gessel S, Murphy A.Growing epidemic of coronary heart disease in low-and middle-income countries. Curr Probl Cardiol. 2010;35:72-115.
4. Nizal Sarrafzadegan M, Sadeghi M, Shahram Oveisgharan M,Marshall T. Incidence of cardiovascular diseases in an Iranian pop-ulation: the Isfahan Cohort Study. Arch Iran Med. 2013;16:138-144.
5. D'Agostino R, Vasan R, Pencina M, Wolf P, Cobain M,Massaro J. General cardiovascular risk profile for use in primarycare the Framingham heart study. Circulation. 2008;117:743-753.
6. Expert Panel on Detection, Evaluation, and Treatment of HighBlood Cholesterol in Adults. Executive summary of the thirdreport of the National Cholesterol Education Program (NCEP)expert panel on detection, evaluation, and treatment of high bloodcholesterol in adults (Adult Treatment Panel III). JAMA. 2001;285:2486-2497.
7. Hu FB. Dietary pattern analysis: a new direction in nutritional epi-demiology. Curr Opin Lipidol. 2002;13:3-9.
TABLE 3 Multiple-adjusted odds ratio (OR) and 95% confidence interval (CI) across tertiles of the EDI
Variable
EDI tertiles
P-valueT1, ≤21 (n = 124) T2, 21 to <26.5 (n = 102) T3, ≥26.5 (n = 136)
Overweight and obesity (kg/m2)
Crudea 1 0.77 (0.46, 1.29)c 0.46 (0.27, 0.78) .004
Model 1b 1 0.73 (0.42, 1.28) 0.49 (0.27, 0.89)
FBS (>100 mg/dL)
Crude 1 1.03 (0.62, 1.71) 0.73 (0.43, 1.23) .16
Model 1 1 1.20 (0.68, 2.13) 0.65 (0.35, 1.20)
TG (>150 mg/dL)
Crude 1 0.84 (0.32, 2.16) 0.70 (0.27, 1.79) .45
Model 1 1 0.82 (0.32, 2.15) 0.69 (0.26, 1.80)
LDL-C (>130 mg/dL)
Crude 1 0.31 (0.15, 0.61) 0.23 (0.11, 0.46) <.001
Model 1 1 0.29 (0.14, 0.60) 0.19 (0.09, 0.41)
Abbreviations: EDI, elderly dietary index; FBS, fasting blood sugar; LDL-C, low-density lipoprotein cholesterol; TG, triglyceride.aUnadjusted.bAdjusted for age, energy intake, BMI and socioeconomic status.cOdds ratio (95% CI).
DAROOGHEGI MOFRAD ET AL. 587
8. Fung TT, McCullough ML, Newby P, et al. Diet-quality scoresand plasma concentrations of markers of inflammation and endo-thelial dysfunction. Am J Clin Nutr. 2005;82:163-173.
9. Heshmati J, Farsi F, Shokri F, et al. A systematic review and meta-analysis of the probiotics and symbiotic effects on oxidative stress.J Funct Foods. 2018;46:66-84.
10. Sepidarkish M, Farsi F, Akbari-Fakhrabadi M, et al. The effect ofvitamin D supplementation on oxidative stress parameters: a sys-tematic review and meta-analysis of clinical trials. Pharmacol Res.2019;139:141-152.
11. Kourlaba G, Polychronopoulos E, Zampelas A, Lionis C,Panagiotakos DB. Development of a diet index for older adultsand its relation to cardiovascular disease risk factors: the elderlydietary index. J Am Diet Assoc. 2009;109:1022-1030.
12. Atkins JL, Whincup PH, Morris RW, Lennon LT, Papacosta O,Wannamethee SG. High diet quality is associated with a lower riskof cardiovascular disease and all-cause mortality in older men.J Nutr. 2014;144:673-680.
13. Trichopoulou A, Orfanos P, Norat T, et al. Modified Mediterra-nean diet and survival: EPIC-elderly prospective cohort study.BMJ. 2005;330:991.
14. Rashidi Pour Fard N, Karimi M, Baghaei MH, et al. Dairy con-sumption, cardiovascular risk factors and inflammation in elderlysubjects. ARYA Atherosclerosis. 2015;11:323-331.
15. Azadbakht L, Mirmiran P, Esmaillzadeh A, Azizi F. Dairy con-sumption is inversely associated with the prevalence of the meta-bolic syndrome in Tehranian adults. Am J Clin Nutr. 2005;82:523-530.
16. Lichtenstein AH, Rasmussen H, Yu WW, Epstein SR, Russell RM.Modified MyPyramid for older adults. J Nutr. 2008;138:5-11.
17. Willett W. Nutritional epidemiology. New York, NY: OxfordUniversity Press; 2012.
18. Matthews D, Hosker J, Rudenski A, Naylor B, Treacher D,Turner R. Homeostasis model assessment: insulin resistance andβ-cell function from fasting plasma glucose and insulin concentra-tions in man. Diabetologia. 1985;28:412-419.
19. Katz A, Nambi SS, Mather K, et al. Quantitative insulin sensitivitycheck index: a simple, accurate method for assessing insulin sensi-tivity in humans. J Clin Endocrinol Metab. 2000;85:2402-2410.
20. Garmaroudi GR, Moradi A. Socio-economic status in Iran: a studyof measurement index. Payesh. 2010;9:137-144.
21. Grundy SM, Cleeman JI, Daniels SR, et al.; American Heart Asso-ciation, National Heart, Lung, and Blood InstituteDiagnosis andmanagement of the metabolic syndrome: an American HeartAssociation/National Heart, Lung, and Blood Institute scientificstatement. Circulation. 2005;112:2735-2752.
22. Milà-Villarroel R, Bach-Faig A, Puig J, et al. Comparison andevaluation of the reliability of indexes of adherence to the Mediter-ranean diet. Public Health Nutr. 2011;14(12A):2338-2345.
23. Hoffman R, Gerber M. Evaluating and adapting the Mediterraneandiet for non-Mediterranean populations: a critical appraisal. NutrRev. 2013;71:573-584.
24. Mirmiran P, Moslehi N, Mahmoudof H, Sadeghi M, Azizi F. Alongitudinal study of adherence to the Mediterranean dietary pat-tern and metabolic syndrome in a non-Mediterranean population.Int J Endocrinol Metab. 2015;13(3):e26128.
25. Kastorini C-M, Milionis HJ, Esposito K, Giugliano D,Goudevenos JA, Panagiotakos DB. The effect of Mediterraneandiet on metabolic syndrome and its components: a meta-analysisof 50 studies and 534,906 individuals. J Am Coll Cardiol. 2011;57:1299-1313.
26. Bahadoran Z, Mirmiran P, Delshad H, Azizi F. White rice con-sumption is a risk factor for metabolic syndrome in Tehrani adults:a prospective approach in Tehran Lipid and Glucose Study. ArchIran Med. 2014;17:435-440.
27. Esposito K, Marfella R, Ciotola M, et al. Effect of aMediterranean-style diet on endothelial dysfunction and markersof vascular inflammation in the metabolic syndrome: a randomizedtrial. JAMA. 2004;292:1440-1446.
28. Tzima N, Pitsavos C, Panagiotakos DB, et al. Mediterranean dietand insulin sensitivity, lipid profile and blood pressure levels, inoverweight and obese people: the Attica Study. Lipids Health Dis.2007;6:22.
29. Hoevenaar-Blom MP, Nooyens AC, Kromhout D, et al. Mediterra-nean style diet and 12-year incidence of cardiovascular diseases:the EPIC-NL Cohort Study. PLoS One. 2012;7(9):e45458.
SUPPORTING INFORMATION
Additional supporting information may be found online inthe Supporting Information section at the end of this article.
How to cite this article: Darooghegi Mofrad M,Namazi N, Larijani B, Surkan PJ, Azadbakht L.Association of the Elderly Dietary Index withcardiovascular disease risk factors in elderly men: Across-sectional study. Nutrition & Dietetics. 2019;76:580–588. https://doi.org/10.1111/1747-0080.12574
588 DAROOGHEGI MOFRAD ET AL.
ORIGINAL RESEARCH
Association of a plant-based dietary pattern in relationto gestational diabetes mellitus
Behzad ZAMANI ,1,2 Alireza MILAJERDI,1 Hatav TEHRANI,3 Nick BELLISSIMO,4 Neil R. BRETT4 andLeila AZADBAKHT 1,5,6
1Department of Community Nutrition, School of Nutritional Sciences and Dietetics and 5Diabetes Research Centre,Endocrinology and Metabolism Clinical Sciences Institute, Tehran University of Medical Sciences and 2Students’Scientific Research Center (SSRC), Tehran University of Medical Sciences (TUMS), Tehran and 3Department ofObstetrics and Gynaecology and 6Food Security Research Centre and Department of Community Nutrition, School ofNutrition and Food Science, Isfahan University of Medical Sciences, Isfahan, Iran; and 4School of Nutrition, RyersonUniversity, Toronto, Ontario, Canada
AbstractAim: The prevalence of gestational diabetes mellitus (GDM), which has adverse effects on mothers and their off-spring, is increasing worldwide. The role of a plant-based dietary pattern as a determinant of GDM is not well under-stood. Therefore, we examined the association between plant-based dietary patterns and the risk of GDM.Methods: We enrolled 460 pregnant women in this case–control study, of them 200 were cases and 260 were con-trols. Dietary intake of participants was evaluated using three 24-hour dietary records. Adherence to the plant-baseddietary patterns was scored using three indices of the overall plant-based dietary index (PDI), healthy plant-baseddiet (hPDI) and unhealthy plant-based diet index (uPDI). The risk of GDM was compared across tertiles of PDI, hPDIand uPDI.Results: After multivariable adjustment, we demonstrated that the high PDI score was inversely associated with riskof GDM (OR = 0.47; 95% CI: 0.28–0.78, P = 0.004), but there was no significant association between hPDI (OR = 1.03;95% CI: 0.64–1.65, P = 0.884) or uPDI (OR = 1.65; 95% CI: 0.98–2.78, P = 0.06) and GDM risk.Conclusions: We found that following an overall plant-based diet was associated with lower risk of GDM. Futurestudies are warranted with longitudinal designs to confirm these findings.
Key words: gestational diabetes mellitus, healthy plant-based diet index, plant-based diet index, pregnantwomen, unhealthy plant-based diet index.
Introduction
Gestational diabetes mellitus (GDM) is often defined as adisturbance in glucose tolerance first detected duringpregnancy.1–5 The prevalence of GDM has increasedsteadily, with 14% of pregnancies in USA, 5.7% of pregnan-cies in Australia, and 5–10% of pregnancies in Asian coun-tries presenting with GDM. In Iran, the prevalence of GDMhas been estimated at 3.4% of all annual pregnancies.3,6–8
GDM is considered as a significant risk factor for severalother comorbidities in both mothers and their newborns.9
Several genetic and environmental factors including ageat pregnancy, family history of diabetes, race or ethnicity,obesity and overweight, and low physical activity are associ-ated with GDM.10–13 In addition, dietary factors are impor-tant determinants of developing GDM.14,15 Higherconsumption of legumes, fish, nuts, fruits and vegetablesare associated with a reduced risk of GDM.11,16–18 How-ever, a diet rich in refined carbohydrates, saturated andtrans-fatty acids, red meat, processed meats and sweetenedbeverages have been associated with an increased risk ofGDM.10,19–23 Moreover, intake of haem iron (found in ani-mal foods), but not non-haem iron has been associatedwith an increased risk of GDM.24–29 Although, investigatingthe association of an individual nutrient with GDM couldhelp to identify important biological mechanisms, consider-ing overall dietary patterns allows for a comprehensiveunderstanding of the interactions between different nutri-ents and GDM. Studies investigating the association of die-tary patterns and GDM are limited. However, higher scoresof alternate Mediterranean Diet, Dietary Approaches to Stop
B. Zamani, MSc StudentA. Milajerdi, PhD CandidateH. Tehrani, MD, PhD, GynaecologistN. Bellissimo, PhD, Associate ProfessorN.R. Brett, PhD, Postdoctoral FellowL. Azadbakht, PhD, ProfessorCorrespondence: L. Azadbakht, Department of Community Nutrition,School of Nutritional Sciences and Dietetics, Tehran University ofMedical Sciences, P. O. Box: 1416643931, Tehran, Iran. Tel.: + 98 218895 556; fax: + 98 218 8984 861.Email: [email protected]
Accepted December 2018
© 2019 Dietitians Association of Australia 589
AA AA
DDD
ieti
tian
s As
soci
atio
nofof
Aus
tral
ia
Nutrition & Dietetics 2019; 76: 589–596 DOI: 10.1111/1747-0080.12512
Hypertension (DASH) and alternate Healthy Eating Indexand lower scores of Western dietary pattern have been asso-ciated with a lowest risk of GDM.3,11,30,31
Although studies are available linking a plant-based die-tary pattern to disease prevention,32 the benefit is based onthe quality of plant-based foods. Intake of, for example,refined and simple carbohydrates and saturated fatty acidsin the diet have been associated with a higher risk ofchronic diseases.33 A prospective cohort study in USAshowed an inverse association between a healthy plant-based diet and type 2 diabetes. However, there was also anassociation between unhealthy plant foods and risk of type2 diabetes.34 In Middle-Eastern countries, there is a dietarypattern of plant-based foods that partially consists of refinedgrains including white rice and bread.35 To the best of ourknowledge, there is no study that has investigated the asso-ciation between plant-based dietary patterns with risk ofGDM, in Middle-Eastern countries. Therefore, the objectivewas to examine the association of a plant-based dietary pat-tern with the risk of GDM in Iranian women.
Methods
This hospital-based case–control study was conducted in460 pregnant women (260 controls and 200 with GDM) inthe nutrition clinic in AL-Zahra and Shahid Beheshti hospi-tals, Isfahan, Iran. Participants (22–44 years of age) werebetween the 25th and 28th week of pregnancy. Cases andcontrols were matched by the weeks of pregnancy. Pregnantwomen with twins, those with type 1 or 2 diabetes mellitus,cancer, and cardiovascular diseases were excluded. In addi-tion, subjects with under or over-reporting of dietaryintakes (<800 or >4200 kcal/day), as well as those withincomplete data on health status or dietary intakes werealso excluded. All participants provided informed writtenconsent. The present study was approved by the ethicsreview committee of the Isfahan University of Medical Sci-ences, Isfahan, Iran. The present study adhered to theStrengthening the Reporting of Observational Studies inEpidemiology (STROBE) statement for case–control studies.
Dietary intake of participants was collected immediatelyafter the diagnosis of GDM by use of three-day food diariesbetween the 25th and 28th week of pregnancy. Womenwere trained on how to record their daily intakes, whichwere completed on two consecutive weekdays and oneweekend day. Finally, a dietitian reviewed the diary withthe participant for accuracy and completeness.
Household measures were used to convert portion sizesto grams per day. Grams were then used to calculatemacro- and micro-nutrients intakes using Nutritionist ӀVsoftware (First Databank Division, the Hearst Corporation,San Bruno, CA, USA, modified for Iranian foods). Theplant-based dietary pattern score was calculated using themethod of Satija et al.34 We calculated three indices includ-ing overall plant-based diet index (PDI), healthful PDI(hPDI) and unhealthful PDI (uPDI) in the present study. Allfood items were categorised into 18 groups similar in nutri-ent components, which consisted of animal and plant foods
including healthy and unhealthy plant-based foods. Healthyplant foods included whole grains, fruits, vegetables, nuts,legumes, vegetable oils and tea/coffee, whereas fruit juices,sugar-sweetened beverages, refined grains, potatoes andsweets/desserts were considered as unhealthy plant foods.In addition, animal food items were animal fat, dairy, egg,fish/seafood, meat and miscellaneous animal-based foods.Food items were classified to a particular group based ontheir nutrient properties. For foods with mixed composi-tion, the classification was based on the most dominantingredient. These food items were then converted to decilesof consumption and a score of 1–10 was considered foreach of them. For PDI, scores of 10 and 1 were given toparticipants at the highest and lowest deciles of plant foodconsumption, respectively. In addition, scores of 1 and10 were given to the subjects in the highest and lowest dec-iles of animal foods consumption, respectively. To calculatehPDI, scores of 10 and 1 were given to subjects with thehighest and lowest consumption of healthy plant foods,respectively. A score of 1 for the highest consumption and10 for the lowest consumption of unhealthy plant foodsand animal food items was also given. To calculate uPDI, ascore between 10 and 1 was given to the highest throughthe lowest consumption of unhealthy plant foods. Further-more, subjects with the highest to lowest consumption ofanimal foods and healthy plant foods were given a scorebetween 1 and 10. Scores were summed up to obtain ascore ranging from 18 to 180 for each PDI, hPDI and uPDIindex. A higher total score for each index indicated higheradherence to that dietary pattern.
Blood samples were obtained after a 12-hour overnightfast. Blood samples were centrifuged within 30–45 minutesof collection for 10 minutes at 500g and at 4�C. An auto-analyser (Selectra 2; Vital Scientific, Spankeren, Netherlands)was used to measure blood samples. Serum concentrations ofalanine aminotransferase, aspartate aminotransferase, high-density lipoprotein cholesterol (HDL-C), low-density lipopro-tein cholesterol (LDL-C), total cholesterol (TC) and fastingblood glucose (FBG) were measured using commerciallyavailable enzymatic kits (Pars Azmmoun, Tehran, Iran). Glu-tathione oxidase was used to measure triacylglycerol (TG).GDM was defined as fasting blood glucose >5.27 mmol/L or1-hour postprandial glucose >7.77 mmol/L duringpregnancy.
Participant weight was measured using a SECA digitalscale to the nearest 100 g. Height was measured to thenearest 1 cm using a measuring tape. Body mass index(BMI) was calculated as weight (kg) divided by squaredheight (m2).
We also measured systolic blood pressure (SBP) and dia-stolic blood pressure (DBP) in duplicate at 5-minute inter-vals in a relaxed seated position. The average of these twomeasurements was used for reporting purposes.
Socioeconomic status (SES) was assessed by asking par-ticipants about their family size (≤4, >4 persons), educationstatus (academic or non-academic), and house ownership(yes, no). A score of 1 was given for having family membersof ≤4, academic educations and house ownership to each
B. Zamani et al.
590 © 2019 Dietitians Association of Australia
subject. If they had family members of >4, had non-academic educations, or were not home owners, they weregiven the score of 0. Finally, the scores were summed and atotal SES score of 0 (poor), 1 (middle class) and 2 (rich)was obtained based on the tertiles of SES.
We classified participants based on tertiles of PDI, hPDIand uPDI. One-way analysis of variance (ANOVA) was usedto compare continuous variables across tertiles of PDI, hPDIand uPDI. We used the chi-squared test to compare the dis-tribution of categorical variables across the tertiles of scores.To determine the contribution of each food group to thePDI, hPDI and uPDI score, linear regression models wereused. Multivariable logistic regression was used in differentmodels to find the relation between plant-based diet scoresand odds of GDM. This association was examined in bothcrude and adjusted models. First, we controlled for age andenergy intake. Additional controls for the number of chil-dren and SES (education, occupation and economic status)were done in the second model. Statistical analyses werecarried out using SPSS for Windows software (version16.0), SPSS Inc, Chicago IL. P < 0.05 was considered statis-tically significant.
Results
General characteristics of study participants across catego-ries of PDI, hPDI and uPDI are presented in Table 1. Partic-ipants with the highest PDI score were significantly younger(P = 0.043) than those with the lowest score. They had alsolower FBG (P = 0.02), TC (P = 0.05), LDL (P = 0.04) andhigher SBP (P = <0.01). There were no significant differ-ences between tertiles of PDI score in terms of BMI, DBP,HDL, TG and HbA1C. In addition, women at the highesttertile of hPDI had significantly lower serum HDL-C incomparison to those in the lowest tertile (P = 0.04). Noadditional differences were seen in general characteristics ofparticipants among tertiles of hPDI. Furthermore, higherscore of uPDI was associated to higher concentrations ofFBG (P < 0.01), TC (P = 0.03) and TG (P < 0.001). How-ever, an association of other variables including age, BMI,SBP, DBP, LDL, HDL and HbA1C with uPDI was not signif-icant. Participants SES did not differ based on tertiles ofPDI and uPDI, while there was a significant differencebetween tertiles of hPDI.
Dietary intakes of participants according to tertiles ofPDI, hPDI and uPDI are shown in Table 2. Participantswith a higher PDI had higher intakes of total energy(P < 0.001), carbohydrate (P < 0.001), sodium (P < 0.001),iron (P < 0.001), potassium (0.019) and vitamin C(P < 0.001), and lower intakes of fat (P < 0.001), choles-terol (P < 0.001), SFA (P < 0.001), zinc (P < 0.001), cal-cium (P < 0.001) and vitamin B12 (P = 0.003).Furthermore, participants at the highest tertile of hPDIscore had significantly higher intakes of carbohydrate(P < 0.001), sodium (P < 0.001), iron (P = 0.007), folic acid(P = 0.001), vitamin C (P < 0.001) and potassium(P = 0.019), and lower intakes of total energy (P < 0.001),fat (P = 0.004), SFA (P < 0.001), cholesterol (P < 0.001),
zinc (P < 0.001), calcium (P < 0.001) and vitamin B12(P = 0.003) than those in the lowest tertile. In addition,lower intakes of total energy (P < 0.001), protein(P < 0.001), fat (P < 0.001), SFA (P < 0.001), cholesterol(P < 0.001), sodium (P < 0.001), iron (P < 0.001), magne-sium (P < 0.001), zinc (P < 0.001), folic acid (P = 0.001),vitamin C (P < 0.001), potassium (P < 0.001), calcium(P < 0.001) and vitamin B12 (P = 0.011) and higher intakesof carbohydrate (P = 0.007) were found in women with thehighest uPDI score than those with the lowest score. Thecontribution of each food group to the PDI, hPDI and uPDIscore is shown in Table S1, Supporting Information.
Multivariable-adjusted odds ratio (OR) and 95% confi-dence intervals (CIs) for GDM according to tertiles of PDI,hPDI and uPDI are presented in Table 3. In the crudemodel before adjusting for confounders, a higher score ofPDI was inversely associated to the risk of GDM (OR: 0.50;95% CI: 0.31–0.80). After adjustment for confounders,including age, energy intake, smoking status, number ofchildren and BMI, the association remained unchanged(OR: 0.47; 95% CI: 0.28–0.78). However, no significantassociation was found between hPDI and risk of GDM (OR:1.07; 95% CI: 0.68–1.67). This association remained non-significant in the third model, after adjustment for thepotential confounders (OR: 1.03; 95% CI: 0.64–1.65). Inaddition, the association between uPDI and odds of GDMwas non-significant before controlling for the potential con-founders (OR: 1.41; 95% CI: 0.89–2.23). However, thisassociation was significant in the second model (OR: 1.71;95% CI: 1.02–2.85), after controlling for age and energyintake. Moreover, a marginally significant direct associationwas found between uPDI and risk of GDM, after furtheradjustment for age, energy intake, smoking status, numberof children and BMI at the final model (OR: 1.65; 95% CI:0.98–2.78).
Discussion
The present study showed that following a plant-based dietwas associated with lower risk of GDM. In contrast, an asso-ciation was found between consumption of an unhealthyplant-based diet and risk of GDM. However, there was nosignificant association between the hPDI and GDM.
In the current study, there was an inverse associationbetween PDI and the risk of GDM. This finding is consis-tent with several previous investigations. First, in a cross-sectional study of 325 women in India, it was reportedthat non-vegetarians had a higher risk of GDM comparedwith those adhering to a vegetarian diet.36 In anotherobservational study which analysed data from 10 countries,the Mediterranean diet was associated with reduced riskof GDM.37 In addition, prudent dietary patterns rich inhealthy vegetarian foods have been shown to be inverselyassociated with the risk of GDM.2,13,17,38 Furthermore, theresults of a meta-analysis showed that DASH diet maydecrease fasting blood glucose in pregnancy.39 However, aWestern diet, or unhealthy dietary patterns, was associatedwith higher odds of GDM.10,31,40 Similarly, another study
Plant-based diet and gestational diabetes
© 2019 Dietitians Association of Australia 591
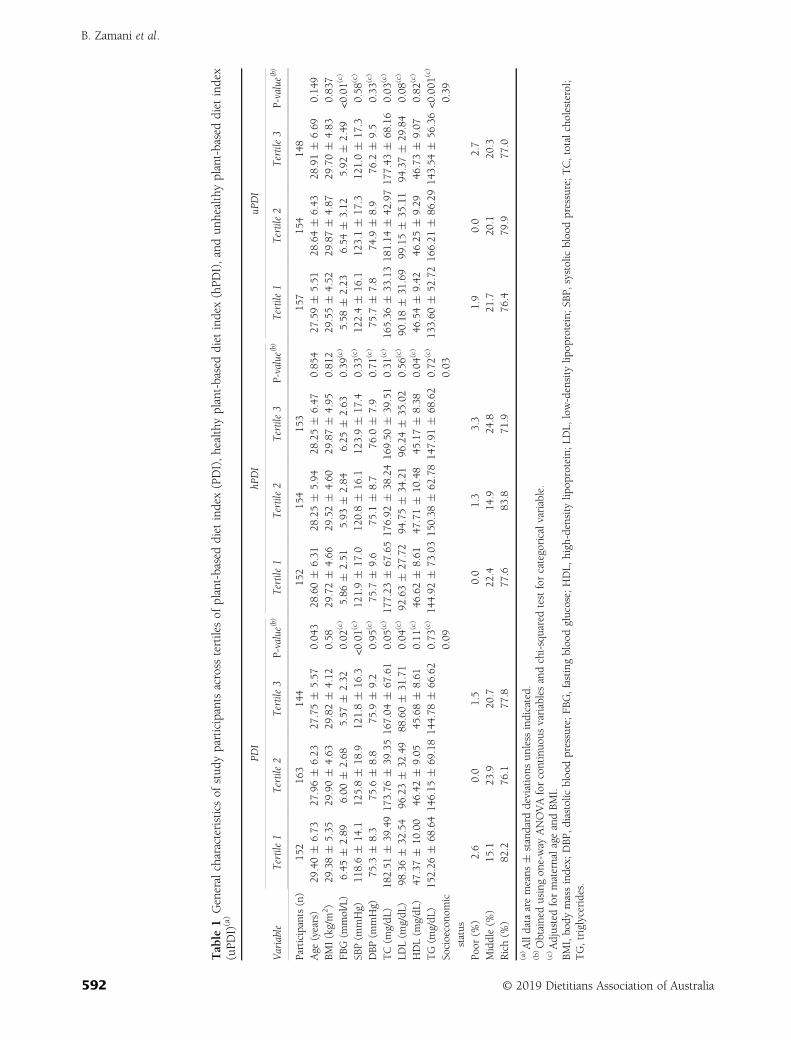
Table
1Generalcharacteristicsof
stud
yparticipantsacross
tertilesof
plant-baseddiet
index(PDI),healthyplant-baseddiet
index(hPD
I),andun
healthyplant-baseddiet
index
(uPD
I)(a)
Variable
PDI
hPDI
uPDI
Tertile1
Tertile2
Tertile3
P-value(b)
Tertile1
Tertile2
Tertile3
P-value(b)
Tertile1
Tertile2
Tertile3
P-value(b)
Participants(n)
152
163
144
152
154
153
157
154
148
Age
(years)
29.40�
6.73
27.96�
6.23
27.75�
5.57
0.04
328
.60�
6.31
28.25�
5.94
28.25�
6.47
0.85
427
.59�
5.51
28.64�
6.43
28.91�
6.69
0.14
9BM
I(kg/m
2)
29.38�
5.35
29.90�
4.63
29.82�
4.12
0.58
29.72�
4.66
29.52�
4.60
29.87�
4.95
0.81
229
.55�
4.52
29.87�
4.87
29.70�
4.83
0.83
7FB
G(m
mol/L)
6.45
�2.89
6.00
�2.68
5.57
�2.32
0.02
(c)
5.86
�2.51
5.93
�2.84
6.25
�2.63
0.39
(c)
5.58
�2.23
6.54
�3.12
5.92
�2.49
<0.01(
c)
SBP(m
mHg)
118.6�
14.1
125.8�
18.9
121.8�
16.3
<0.01(
c)12
1.9�
17.0
120.8�
16.1
123.9�
17.4
0.33
(c)
122.4�
16.1
123.1�
17.3
121.0�
17.3
0.58
(c)
DBP
(mmHg)
75.3
�8.3
75.6
�8.8
75.9
�9.2
0.95
(c)
75.7
�9.6
75.1
�8.7
76.0
�7.9
0.71
(c)
75.7
�7.8
74.9
�8.9
76.2
�9.5
0.33
(c)
TC(m
g/dL
)18
2.51
�39
.4917
3.76
�39
.3516
7.04
�67
.61
0.05
(c)17
7.23
�67
.6517
6.92
�38
.2416
9.50
�39
.51
0.31
(c)
165.36
�33
.1318
1.14
�42
.9717
7.43
�68
.16
0.03
(c)
LDL(m
g/dL
)98
.36�
32.54
96.23�
32.49
88.60�
31.71
0.04
(c)
92.63�
27.72
94.75�
34.21
96.24�
35.02
0.56
(c)
90.18�
31.69
99.15�
35.11
94.37�
29.84
0.08
(c)
HDL(m
g/dL
)47
.37�
10.00
46.42�
9.05
45.68�
8.61
0.11
(c)
46.62�
8.61
47.71�
10.48
45.17�
8.38
0.04
(c)
46.54�
9.42
46.25�
9.29
46.73�
9.07
0.82
(c)
TG(m
g/dL
)15
2.26
�68
.6414
6.15
�69
.1814
4.78
�66
.62
0.73
(c)14
4.92
�73
.0315
0.38
�62
.7814
7.91
�68
.62
0.72
(c)
133.60
�52
.7216
6.21
�86
.2914
3.54
�56
.36<0
.001
(c)
Socioecono
mic
status
0.09
0.03
0.39
Poor
(%)
2.6
0.0
1.5
0.0
1.3
3.3
1.9
0.0
2.7
Middle(%
)15
.123
.920
.722
.414
.924
.821
.720
.120
.3Rich(%
)82
.276
.177
.877
.683
.871
.976
.479
.977
.0
(a)Alldata
aremeans
�standard
deviations
unless
indicated.
(b)Obtainedusingon
e-way
ANOVAforcontinuo
usvariablesandchi-squaredtestforcategoricalvariable.
(c)AdjustedformaternalageandBM
I.BM
I,bo
dymassindex;
DBP
,diastolic
bloodpressure;FB
G,fastingbloodglucose;HDL,
high-density
lipop
rotein;LD
L,low-density
lipop
rotein;SB
P,systolicbloodpressure;TC,totalcholesterol;
TG,triglycerides.
B. Zamani et al.
592 © 2019 Dietitians Association of Australia
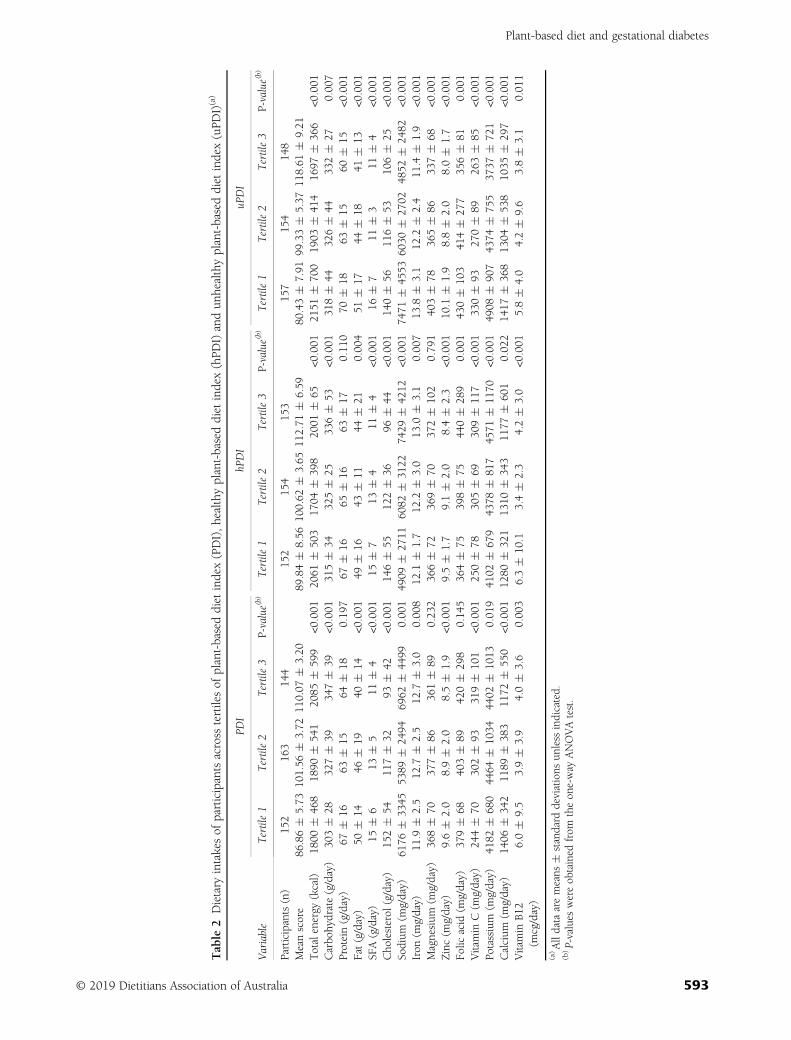
Table
2Dietary
intakesof
participantsacross
tertilesof
plant-baseddiet
index(PDI),healthyplant-baseddietindex(hPD
I)andun
healthyplant-baseddiet
index(uPD
I)(a)
Variable
PDI
hPDI
uPDI
Tertile1
Tertile2
Tertile3
P-value(b)
Tertile1
Tertile2
Tertile3
P-value(b)
Tertile1
Tertile2
Tertile3
P-value(b)
Participants(n)
152
163
144
152
154
153
157
154
148
Meanscore
86.86�
5.73
101.56
�3.72
110.07
�3.20
89.84�
8.56
100.62
�3.65
112.71
�6.59
80.43�
7.91
99.33�
5.37
118.61
�9.21
Totalenergy
(kcal)
1800
�46
818
90�
541
2085
�59
9<0
.001
2061
�50
317
04�
398
2001
�65
<0.001
2151
�70
019
03�
414
1697
�36
6<0
.001
Carbo
hydrate(g/day)
303�
2832
7�
3934
7�
39<0
.001
315�
3432
5�
2533
6�
53<0
.001
318�
4432
6�
4433
2�
270.00
7Protein(g/day)
67�
1663
�15
64�
180.19
767
�16
65�
1663
�17
0.11
070
�18
63�
1560
�15
<0.001
Fat(g/day)
50�
1446
�19
40�
14<0
.001
49�
1643
�11
44�
210.00
451
�17
44�
1841
�13
<0.001
SFA(g/day)
15�
613
�5
11�
4<0
.001
15�
713
�4
11�
4<0
.001
16�
711
�3
11�
4<0
.001
Cho
lesterol
(g/day)
152�
5411
7�
3293
�42
<0.001
146�
5512
2�
3696
�44
<0.001
140�
5611
6�
5310
6�
25<0
.001
Sodium
(mg/day)
6176
�33
4553
89�
2494
6962
�44
990.00
149
09�
2711
6082
�31
2274
29�
4212
<0.001
7471
�45
5360
30�
2702
4852
�24
82<0
.001
Iron
(mg/day)
11.9
�2.5
12.7
�2.5
12.7
�3.0
0.00
812
.1�
1.7
12.2
�3.0
13.0
�3.1
0.00
713
.8�
3.1
12.2
�2.4
11.4
�1.9
<0.001
Magnesium
(mg/day)
368�
7037
7�
8636
1�
890.23
236
6�
7236
9�
7037
2�
102
0.79
140
3�
7836
5�
8633
7�
68<0
.001
Zinc(m
g/day)
9.6�
2.0
8.9�
2.0
8.5�
1.9
<0.001
9.5�
1.7
9.1�
2.0
8.4�
2.3
<0.001
10.1
�1.9
8.8�
2.0
8.0�
1.7
<0.001
Folic
acid
(mg/day)
379�
6840
3�
8942
0�
298
0.14
536
4�
7539
8�
7544
0�
289
0.00
143
0�
103
414�
277
356�
810.00
1Vitamin
C(m
g/day)
244�
7030
2�
9331
9�
101
<0.001
250�
7830
5�
6930
9�
117
<0.001
330�
9327
0�
8926
3�
85<0
.001
Potassium
(mg/day)
4182
�68
044
64�
1034
4402
�10
130.01
941
02�
679
4378
�81
745
71�
1170
<0.001
4908
�90
743
74�
755
3737
�72
1<0
.001
Calcium
(mg/day)
1406
�34
211
89�
383
1172
�55
0<0
.001
1280
�32
113
10�
343
1177
�60
10.02
214
17�
368
1304
�53
810
35�
297
<0.001
Vitamin
B12
(mcg/day)
6.0�
9.5
3.9�
3.9
4.0�
3.6
0.00
36.3�
10.1
3.4�
2.3
4.2�
3.0
<0.001
5.8�
4.0
4.2�
9.6
3.8�
3.1
0.01
1
(a)Alldata
aremeans
�standard
deviations
unless
indicated.
(b)P-values
wereob
tained
from
theon
e-way
ANOVAtest.
Plant-based diet and gestational diabetes
© 2019 Dietitians Association of Australia 593
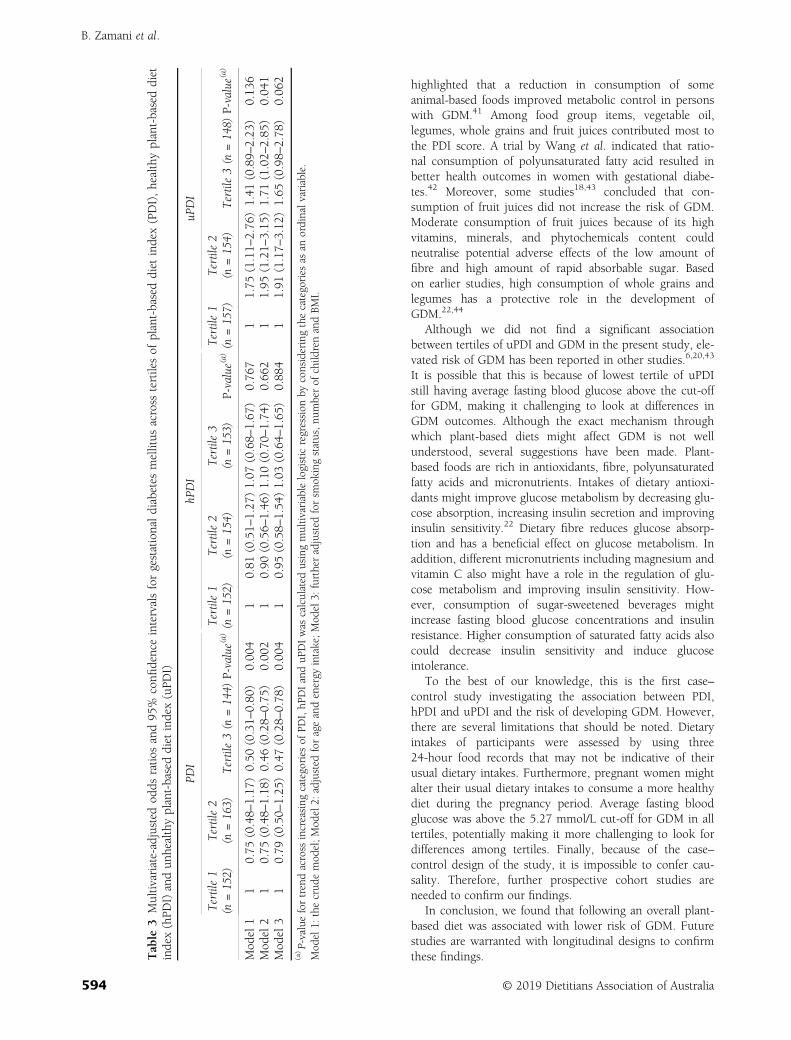
highlighted that a reduction in consumption of someanimal-based foods improved metabolic control in personswith GDM.41 Among food group items, vegetable oil,legumes, whole grains and fruit juices contributed most tothe PDI score. A trial by Wang et al. indicated that ratio-nal consumption of polyunsaturated fatty acid resulted inbetter health outcomes in women with gestational diabe-tes.42 Moreover, some studies18,43 concluded that con-sumption of fruit juices did not increase the risk of GDM.Moderate consumption of fruit juices because of its highvitamins, minerals, and phytochemicals content couldneutralise potential adverse effects of the low amount offibre and high amount of rapid absorbable sugar. Basedon earlier studies, high consumption of whole grains andlegumes has a protective role in the development ofGDM.22,44
Although we did not find a significant associationbetween tertiles of uPDI and GDM in the present study, ele-vated risk of GDM has been reported in other studies.6,20,43
It is possible that this is because of lowest tertile of uPDIstill having average fasting blood glucose above the cut-offfor GDM, making it challenging to look at differences inGDM outcomes. Although the exact mechanism throughwhich plant-based diets might affect GDM is not wellunderstood, several suggestions have been made. Plant-based foods are rich in antioxidants, fibre, polyunsaturatedfatty acids and micronutrients. Intakes of dietary antioxi-dants might improve glucose metabolism by decreasing glu-cose absorption, increasing insulin secretion and improvinginsulin sensitivity.22 Dietary fibre reduces glucose absorp-tion and has a beneficial effect on glucose metabolism. Inaddition, different micronutrients including magnesium andvitamin C also might have a role in the regulation of glu-cose metabolism and improving insulin sensitivity. How-ever, consumption of sugar-sweetened beverages mightincrease fasting blood glucose concentrations and insulinresistance. Higher consumption of saturated fatty acids alsocould decrease insulin sensitivity and induce glucoseintolerance.
To the best of our knowledge, this is the first case–control study investigating the association between PDI,hPDI and uPDI and the risk of developing GDM. However,there are several limitations that should be noted. Dietaryintakes of participants were assessed by using three24-hour food records that may not be indicative of theirusual dietary intakes. Furthermore, pregnant women mightalter their usual dietary intakes to consume a more healthydiet during the pregnancy period. Average fasting bloodglucose was above the 5.27 mmol/L cut-off for GDM in alltertiles, potentially making it more challenging to look fordifferences among tertiles. Finally, because of the case–control design of the study, it is impossible to confer cau-sality. Therefore, further prospective cohort studies areneeded to confirm our findings.
In conclusion, we found that following an overall plant-based diet was associated with lower risk of GDM. Futurestudies are warranted with longitudinal designs to confirmthese findings.T
able
3Multivariate-adjustedod
dsratio
sand95
%confi
denceintervalsforgestationaldiabetes
mellitus
across
tertilesof
plant-baseddiet
index(PDI),healthyplant-baseddiet
index(hPD
I)andun
healthyplant-baseddiet
index(uPD
I)
PDI
hPDI
uPDI
Tertile1
(n=152)
Tertile2
(n=163)
Tertile3(n
=144)
P-value(a)
Tertile1
(n=152)
Tertile2
(n=154)
Tertile3
(n=153)
P-value(a)
Tertile1
(n=157)
Tertile2
(n=154)
Tertile3(n
=148)
P-value(a)
Mod
el1
10.75
(0.48–
1.17
)0.50
(0.31–
0.80
)0.00
41
0.81
(0.51–
1.27
)1.07
(0.68–
1.67
)0.76
71
1.75
(1.11–
2.76
)1.41
(0.89–
2.23
)0.13
6Mod
el2
10.75
(0.48–
1.18
)0.46
(0.28–
0.75
)0.00
21
0.90
(0.56–
1.46
)1.10
(0.70–
1.74
)0.66
21
1.95
(1.21–
3.15
)1.71
(1.02–
2.85
)0.04
1Mod
el3
10.79
(0.50–
1.25
)0.47
(0.28–
0.78
)0.00
41
0.95
(0.58–
1.54
)1.03
(0.64–
1.65
)0.88
41
1.91
(1.17–
3.12
)1.65
(0.98–
2.78
)0.06
2
(a)P-valuefortrendacross
increasing
categories
ofPD
I,hP
DIanduP
DIwas
calculated
usingmultivariablelogisticregression
byconsideringthecategories
asan
ordinalvariable.
Mod
el1:
thecrud
emod
el;Mod
el2:
adjusted
forageandenergy
intake;Mod
el3:
furtheradjusted
forsm
okingstatus,nu
mberof
child
renandBM
I.
B. Zamani et al.
594 © 2019 Dietitians Association of Australia
Funding source
This study was funded by the National Elites Foundation inIran (BN092) and Iran National Science Foundation andSchool of Nutrition and Food Science, Isfahan University ofMedical Sciences (IUMS).
Conflict of interest
The authors declare that they have no conflict of interest.
Authorship
HT and LA conceived, designed and conducted the study,supported by AM and supervised by LA. BZ and LA con-ducted the statistical analysis. BZ drafted the manuscriptwhich was reviewed and approved by all authors forsubmission.
References
1 Asemi Z, Samimi M, Tabassi Z, Sabihi SS, Esmaillzadeh A. Arandomized controlled clinical trial investigating the effect ofDASH diet on insulin resistance, inflammation, and oxidativestress in gestational diabetes. Nutrition 2013; 29: 619–24.
2 He JR, Yuan MY, Chen NN et al. Maternal dietary patterns andgestational diabetes mellitus: a large prospective cohort studyin China. Br J Nutr 2015; 113: 1292–300.
3 Asemi Z, Tabassi Z, Samimi M, Fahiminejad T,Esmaillzadeh A. Favourable effects of the Dietary Approachesto Stop Hypertension diet on glucose tolerance and lipid pro-files in gestational diabetes: a randomised clinical trial. Br JNutr 2013; 109: 2024–30.
4 Bartakova V, Kuricova K, Zlamal F, Belobradkova J,Kankova K. Differences in food intake and genetic variability intaste receptors between Czech pregnant women with and with-out gestational diabetes mellitus. Eur J Nutr 2018; 57: 513–21.
5 Louie JC, Brand-Miller JC, Moses RG. Carbohydrates, glycemicindex, and pregnancy outcomes in gestational diabetes. CurrDiab Rep 2013; 13: 6–11.
6 Shin D, Lee KW, Song WO. Dietary patterns during pregnancyare associated with risk of gestational diabetes mellitus. Nutri-ents 2015; 7: 9369–82.
7 Jafari-Shobeiri M, Ghojazadeh M, Azami-Aghdash S et al. Prev-alence and risk factors of gestational diabetes in Iran: a system-atic review and meta-analysis. Iran J Public Health 2015; 44:1036–44.
8 Chamberlain C, Joshy G, Li H, Oats J, Eades S, Banks E. Theprevalence of gestational diabetes mellitus among Aboriginaland Torres Strait Islander women in Australia: a systematicreview and meta-analysis. Diabetes Metab Res Rev 2015; 31:234–47.
9 Catalano PM, Ehrenberg HM. The short- and long-term impli-cations of maternal obesity on the mother and her offspring.BJOG 2006; 113: 1126–33.
10 Zhang C, Schulze MB, Solomon CG, Hu FB. A prospectivestudy of dietary patterns, meat intake and the risk of gesta-tional diabetes mellitus. Diabetologia 2006; 49: 2604–13.
11 Tobias DK, Zhang C, Chavarro J et al. Prepregnancy adherenceto dietary patterns and lower risk of gestational diabetes melli-tus. Am J Clin Nutr 2012; 96: 289–95.
12 Carolan M, Gill GK, Steele C. Women’s experiences of factorsthat facilitate or inhibit gestational diabetes self-management.BMC Pregnancy Childbirth 2012; 12: 99.
13 Tryggvadottir EA, Medek H, Birgisdottir BE, Geirsson RT,Gunnarsdottir I. Association between healthy maternal dietarypattern and risk for gestational diabetes mellitus. Eur J ClinNutr 2016; 70: 237–42.
14 Reader D, Splett P, Gunderson EP. Impact of gestational diabe-tes mellitus nutrition practice guidelines implemented by regis-tered dietitians on pregnancy outcomes. J Am Diet Assoc 2006;106: 1426–33.
15 Koivusalo SB, Rono K, Klemetti MM et al. Gestational diabetesmellitus can be prevented by lifestyle intervention: the FinnishGestational Diabetes Prevention Study (RADIEL): a randomizedcontrolled trial. Diab Care 2016; 39: 24–30.
16 Bao W, Bowers K, Tobias DK, Hu FB, Zhang C. Prepregnancydietary protein intake, major dietary protein sources, and therisk of gestational diabetes mellitus: a prospective cohort study.Diab Care 2013; 36: 2001–8.
17 Bao W, Bowers K, Tobias DK et al. Prepregnancy low-carbohydrate dietary pattern and risk of gestational diabetesmellitus: a prospective cohort study. Am J Clin Nutr 2014; 99:1378–84.
18 Chen L, Hu FB, Yeung E, Tobias DK, Willett WC, Zhang C.Prepregnancy consumption of fruits and fruit juices and therisk of gestational diabetes mellitus: a prospective cohort study.Diab Care 2012; 35: 1079–82.
19 Bowers K, Yeung E, Williams MA et al. A prospective study ofprepregnancy dietary iron intake and risk for gestational diabe-tes mellitus. Diab Care 2011; 34: 1557–63.
20 Park S, Kim MY, Baik SH et al. Gestational diabetes is associ-ated with high energy and saturated fat intakes and with lowplasma visfatin and adiponectin levels independent of prepreg-nancy BMI. Eur J Clin Nutr 2013; 67: 196–201.
21 Chen L, Hu FB, Yeung E, Willett W, Zhang C. Prospectivestudy of pre-gravid sugar-sweetened beverage consumptionand the risk of gestational diabetes mellitus. Diab Care 2009;32: 2236–41.
22 Zhang C, Ning Y. Effect of dietary and lifestyle factors on therisk of gestational diabetes: review of epidemiologic evidence.Am J Clin Nutr 2011; 94: 1975s–9s.
23 Mari-Sanchis A, Diaz-Jurado G, Basterra-Gortari FJ, de laFuente-Arrillaga C, Martinez-Gonzalez MA, Bes-Rastrollo M.Association between pre-pregnancy consumption of meat, ironintake, and the risk of gestational diabetes: the SUN project.Eur J Nutr 2018; 57: 939–49.
24 Fu S, Li F, Zhou J, Liu Z. The relationship between body ironstatus, iron intake and gestational diabetes: a systematic reviewand meta-analysis. Medicine 2016; 95: e2383.
25 Qiu C, Zhang C, Gelaye B, Enquobahrie DA, Frederick IO,Williams MA. Gestational diabetes mellitus in relation tomaternal dietary heme iron and nonheme iron intake. DiabCare 2011; 34: 1564–9.
26 Darling AM, Mitchell AA, Werler MM. Preconceptional ironintake and gestational diabetes mellitus. Int J Environ Res PublicHealth 2016; 13: 525.
27 Bowers KA, Olsen SF, Bao W, Halldorsson TI, Strom M,Zhang C. Plasma concentrations of ferritin in early pregnancyare associated with risk of gestational diabetes mellitus inwomen in the Danish National Birth Cohort. J Nutr 2016; 146:1756–61.
28 Khambalia AZ, Aimone A, Nagubandi P et al. High maternaliron status, dietary iron intake and iron supplement use in
Plant-based diet and gestational diabetes
© 2019 Dietitians Association of Australia 595
pregnancy and risk of gestational diabetes mellitus: a prospectivestudy and systematic review. Diabet Med 2016; 33: 1211–21.
29 Rawal S, Hinkle SN, Bao W et al. A longitudinal study of ironstatus during pregnancy and the risk of gestational diabetes:findings from a prospective, multiracial cohort. Diabetologia2017; 60: 249–57.
30 Izadi V, Tehrani H, Haghighatdoost F, Dehghan A, Surkan PJ,Azadbakht L. Adherence to the DASH and Mediterranean dietsis associated with decreased risk for gestational diabetes melli-tus. Nutrition 2016; 32: 1092–6.
31 Sedaghat F, Akhoondan M, Ehteshami M et al. Maternal die-tary patterns and gestational diabetes risk: a case–controlstudy. J Diabetes Res 2017; 2017: 5173926.
32 Fardet A, Boirie Y. Associations between food and beveragegroups and major diet-related chronic diseases: an exhaustivereview of pooled/meta-analyses and systematic reviews. NutrRev 2014; 72: 741–62.
33 Payab M, Kelishadi R, Qorbani M et al. Association of junkfood consumption with high blood pressure and obesity inIranian children and adolescents: the CASPIAN-IV Study.J Pediatr (Rio J) 2015; 91: 196–205.
34 Satija A, Bhupathiraju SN, Rimm EB et al. Plant-based dietarypatterns and incidence of type 2 diabetes in US men andwomen: results from three prospective cohort studies. PLoSMed 2016; 13: e1002039.
35 Esmaillzadeh A, Azadbakht L. Major dietary patterns in relationto general obesity and central adiposity among Iranian women.J Nutr 2008; 138: 358–63.
36 Jali MV, Desai BR, Gowda S, Kambar S, Jali SM. A hospitalbased study of prevalence of gestational diabetes mellitus in anurban population of India. Eur Rev Med Pharmacol Sci 2011;15: 1306–10.
37 Karamanos B, Thanopoulou A, Anastasiou E et al. Relation ofthe Mediterranean diet with the incidence of gestational diabe-tes. Eur J Clin Nutr 2014; 68: 8–13.
38 Zhang C, Liu S, Solomon CG, Hu FB. Dietary fiber intake, die-tary glycemic load, and the risk for gestational diabetes melli-tus. Diab Care 2006; 29: 2223–30.
39 Ha V, Bonner AJ, Jadoo JK, Beyene J, Anand SS, de Souza RJ.The effects of various diets on glycemic outcomes during preg-nancy: a systematic review and network meta-analysis. PLoSOne 2017; 12: e0182095.
40 Saraf-Bank S, Tehrani H, Haghighatdoost F, Moosavian SP,Azadbakht L. The acidity of early pregnancy diet and risk ofgestational diabetes mellitus. Clin Nutr 2018; 37: 2054–9.
41 Schoenaker DA, Mishra GD, Callaway LK, Soedamah-Muthu SS. The role of energy, nutrients, foods, and dietarypatterns in the development of gestational diabetes mellitus: asystematic review of observational studies. Diab Care 2016;39: 16–23.
42 Wang H-Y, Jiang H-Y, Yang L-P, Zhang M. Impacts of dietaryfat changes on pregnant women with gestational diabetes melli-tus: a randomized controlled study. Asia Pac J Clin Nutr 2015;24: 58–64.
43 Looman M, Schoenaker DA, Soedamah-Muthu SS, Geelen A,Feskens EJ, Mishra GD. Pre-pregnancy dietary carbohydratequantity and quality, and risk of developing gestational diabe-tes: the Australian Longitudinal Study on Women’s Health. BritJ Nutr 2018; 120: 435–44.
44 Goshtasebi A, Hosseinpour-Niazi S, Mirmiran P, Lamyian M,Moghaddam Banaem L, Azizi F. Pre-pregnancy consumptionof starchy vegetables and legumes and risk of gestational diabe-tes mellitus among Tehranian women. Diabetes Res Clin Pract2018; 139: 131–8.
Supporting information
Additional Supporting Information may be found in theonline version of this article at the publisher’s web-site:
Table S1 Simple linear regression model with beta-coefficients of food groups in plant-based diet index (PDI),healthy plant-based diet index (hPDI) and unhealthy plant-based diet index (uPDI)
B. Zamani et al.
596 © 2019 Dietitians Association of Australia
ORIGINAL RESEARCH
The relationship between pre-pregnancy dietarypatterns adherence and risk of gestational diabetesmellitus in Iran: A case–control study
Maryam ASADI ,1,2 Maedeh SHAHZEIDI,3 Azadeh NADJARZADEH,3,4
Hadiseh HASHEMI YUSEFABAD1 and Anahita MANSOORI21Student Research Committee and 2Nutrition and Metabolic Diseases Research Centre, Ahvaz Jundishapur Universityof Medical Sciences, Ahvaz and 3Nutrition and Food Security Research Center and 4Department of Nutrition, Schoolof Public Health, Shahid Sadoughi University of Medical Sciences and Health Services, Yazd, Iran
AbstractAim: The present study aimed to investigate major dietary patterns and their association with risk of gestational dia-betes mellitus (GDM) in Yazd city located in Iran.Methods: This case–control designed study was conducted at six healthcare centres. Two hundred and seventy-eight pregnant women who referred for GDM screening participated. Dietary assessment was carried out by using a67-item validated food frequency questionnaire to evaluate dietary history of participants during the last year. Princi-pal component analysis was used to identify major food patterns. Multivariable logistic regression model wasemployed to identify the association between dietary patterns and risk of GDM.Results: Two major dietary patterns were detected. The Western dietary pattern was associated with higher intakesof sugar-sweetened beverages, refined grain products, fast foods, salty snacks, sweets and biscuit, mayonnaise andsaturated oils, while the prudent dietary pattern was associated with higher intakes of fruits, low-fat dairy, potato,egg, fish, poultry, nuts, organs meat and red meat. Furthermore, prudent dietary pattern was negatively associatedwith GDM risk (OR = 0.88, 95% CI: 0.44–0.99). However, there was no significant association between adherence ofthe Western dietary pattern and risk of GDM.Conclusions: Pre-pregnancy adherence of the prudent dietary pattern was significantly associated with reduced riskof GDM.
Key words: factor analysis, gestational diabetes mellitus, prudent dietary pattern, Western dietary pattern.
Introduction
Gestational diabetes mellitus (GDM), as a most prevalentpregnancy complication, affects approximately 7% of preg-nancies.1 The prevalence of GDM has been approximately
3.4% in Iran.2,3 GDM prevalence in Yazd is high, approxi-mately 3.7%, with an increasing trend.4 Also, Yazd isranked as a city with the highest prevalence of type 2 diabe-tes in Iran.5 The prevalence of GDM is higher in someraces, such as African, Hispanic, Indian, and Asian womencompared to Caucasian women. Recently, GDM prevalencehas increased to 2–3 fold globally, from 8.9% to 53.4%,parallel with the increase in obesity prevalence and type2 diabetes mellitus (T2DM).6 GDM has a notable adverseeffect on the health of the mother and offspring duringpregnancy, delivery and later in life. Development of type2 diabetes occurs in more than 50% of women with GDMduring 5–10 years after delivery.7 In addition, there is anelevated risk of obesity, diabetes and the metabolic syn-drome in the offspring of women that are affected withGDM.8,9 Several risk factors play role in GDM developmentincluding maternal age, obesity, race, previous history offoetal macrosomia and family history of T2DM.10 Further-more, several studies indicated that maternal circulatingfatty acids (FAs) play main roles in foetal development.However, increased maternal circulating FAs are related to
M. Asadi, MSc, PhD CandidateM. Shahzeidi, MSc, ResearcherA. Najarzadeh, PhD, Associate ProfessorH. Hashemi Yusefabad, MSc StudentA. Mansoori, PhD, Assistant ProfessorCorrespondence: Anahita Mansoori, Nutrition and Metabolic DiseasesResearch Centre, Ahvaz Jundishapur University of Medical Sciences, PO Box61357-15794, Ahvaz, Khuzestan, Iran. Tel.: and fax: +98 61 33738253.Email: [email protected]; [email protected][Correction added on 22 March 2019, after first online publication: Nameof author Azadeh NADJARZADEH has been corrected. Additionally,affiliation 3 has been changed to “Nutrition and Food Security ResearchCenter, Shahid Sadoughi University of Medical Sciences and HealthServices, Yazd, Iran” and affiliation 4 to “Department of Nutrition, School ofPublic Health, Shahid Sadoughi University of Medical Sciences and HealthServices, Yazd, Iran”.]
Accepted December 2018
© 2019 Dietitians Association of Australia 597
AA AA
DDD
ieti
tian
s As
soci
atio
nofof
Aus
tral
ia
Nutrition & Dietetics 2019; 76: 597–603 DOI: 10.1111/1747-0080.12514
enhanced insulin resistance and β-cell dysfunction, whichsupport the promotion of GDM.11 Recently, several studieshave indicated the relationship between dietary patternsand GDM development.10 Obese and overweight womenhave a rather GDM risk than normal weight women.3,12
Additionally, excessive weight gain during pregnancy isassociated with elevated GDM risk.12 Thus, programs andstrategies to prevent GDM could be applied through identi-fication of modifiable risk factors.
Studies investigating the effect of dietary habits on GDMrisk have shown that Western dietary pattern is an importantrisk factor for GDM.10,12 Nutritional transition from tradi-tional to Western dietary pattern (high caloric and low nutri-ent density) may be associated with the development ofmetabolic disorders.13 A systematic review of observationalstudies demonstrated that the Western-style dietary pattern isattributed to higher intake of red meat, egg, processed meat,sweets, refined grains, high-fat dairy products and savourysnacks which is associated with elevated GDM risk. On thecontrary, adherence to the Mediterranean-style dietary pattern(characterised by high consumption of fruits, vegetables,legumes, whole grains and fish) is associated with lowerGDM risk.10 However, limited research has been carried outon the role of dietary pattern and risk of GDM in non-westernised countries. Therefore, this case–control study wasaimed to investigate the association between the major dietarypatterns and risk of GDM in Yazd city located in Iran.
Methods
This case–control designed study was conducted betweenSeptember 2014 and March 2015 among pregnant womanwho referred to healthcare centres in Yazd city. Sixhealthcare centres were randomly selected according tosocioeconomic characteristics. Sampling was done by ran-dom simple sampling method. Fifty pregnant women par-ticipated from each healthcare centre. One hundred forty-eight GDM and 148 non-GDM women aged 19–40 yearswith singleton pregnancy were included. Therefore, theratio of GDM (cases) to non-GDM (controls) was 1:1. Exclu-sion criteria included pre-existing diabetes, multiple pregnan-cies, history of GDM in previous pregnancy/pregnancies,chronic disease (such as liver and kidney disease), smokingand reported daily calorie intake >4000 or <800 kcal/day.This research was supported by the Student Research Com-mittee of Yazd Shahid Sadoughi University of MedicalSciences. All participants signed a consent form. The studyprotocol was confirmed by the ethics committee according tothe ethical guidelines of the 2013 Declaration of Helsinki atShahid Sadoughi hospital of Yazd. In addition, the STROBEstatement for reporting observational studies was followed.
GDM subjects were selected according to GDM diagnosisbetween 24 and 28 weeks of pregnancy. GDM diagnosiswas approved according to the American Diabetic Associa-tion criteria. GDM was confirmed if at least two values ofthe following glucose levels were detected by 75 g oral glu-cose tolerance test (OGTT): fasting ≥92 mg/dL; 1 hour≥180 mg/dL and 2 hours ≥153 mg/dL.14
Individual characteristics including age, physical activity,family history of diabetes, pre-pregnancy body mass index(BMI), educational level, occupational situation, history offoetal macrosomia and daily calorie intake were collectedusing a self-reported questionnaire by trained research assis-tants. Weight was measured with minimum clothes, with-out wearing shoes using a calibrated scale (Seca, Germany)and was reported to the nearest 0.1 kg. Height was mea-sured without shoes, in a standing normal position using acalibrated height measuring tape and was reported to thenearest 0.1 cm. BMI was computed as weight (kg) dividedby square of height (m). Pre-pregnancy BMI was classifiedaccording to the national institutes of health: normalweight, 18.5–24.930 kg/m2; overweight, 25–29.930 kg/m2
and obese, ≥3030 kg/m2.15 Physical activity questionnairewas used to report a list of common activity during the pastyear, including type, duration and frequency of activity perweek.16 Physical activity level were evaluated using theinternational physical activity questionnaire (IPAQ) and wasreported as mean � SD for metabolic equivalent minutesper week (MET-min/week).17
Dietary assessment was done using a 67-item validatedsemi-quantitative food frequency questionnaire (FFQ) toevaluate dietary history of participants during the lastyear.18,19 The FFQ was included a list of common foodsconsumed during last year which was asked through face-to-face interviews by trained dietitians and was reported asdaily, weekly, monthly and annual. Participants reportedconsumption of each food items based on nine-category ofthe time period (<1/month, 2–3/month, 1–2/week, 3–4/week, 6/week, 1/day, 2–3/day, 4–5/day or 6/day). Food fre-quency of each item was reported according to standardhousehold measuring tools and converted to grams.20 Fooditems were summarised into 20 food groups based on thetype of food items. Dietary intakes were analysed by Nutri-tionist IV software version 3.5 (N Squared Computing, SanBruno, CA, USA). Principal component analysis wasemployed for determination of major dietary patterns. Fooditems in the FFQ were classified into 20 food groups basedon their similarity of nutritional characteristics.
Data analysis was undertaken using SPSS statistical soft-ware package (version 20; SPSS Inc., Chicago, IL, USA).Individual characteristics were reported as mean � SD forcontinuous variables using independent t test, and percent-ages for categorical variables using chi-squared test. Multi-variable logistic regression model was used to identify theassociation between tertiles of dietary patterns and risk ofGDM incidence by calculating odds ratio (OR) and estimat-ing of 95% confidence intervals (CIs). Dietary patterns weredetermined by principal component analysis. Suitability forusage factor analysis was assessed by Kaiser–Meyer–Olkin(KMO test) and Bartlett’s test. Sampling sufficiency of com-ponents was confirmed by KMO test >0.63. In addition,inter-correlation of components was approved by Bartlett’stest of sphericity <0.001. Components were determinedbased on eigenvalue >1 for scree plot. The Promax obliquerotation was used with a 4 kappa value to increase interpret-ability while it was assumed that factors were correlated
M. Asadi et al.
598 © 2019 Dietitians Association of Australia
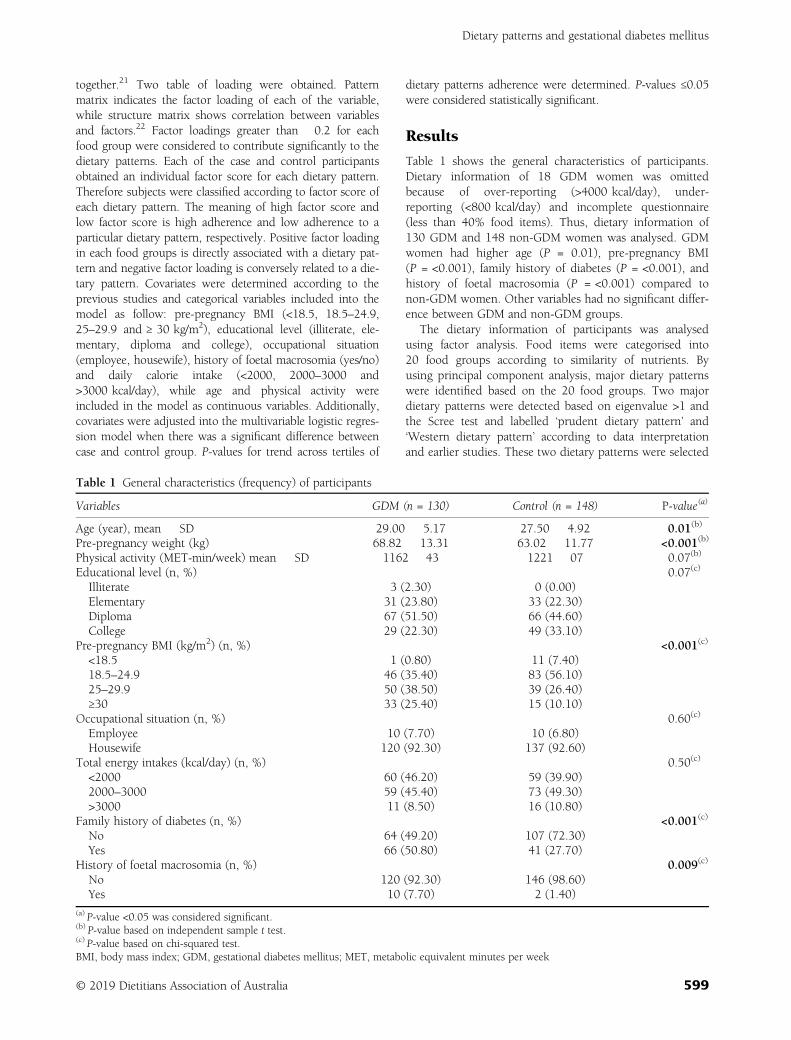
together.21 Two table of loading were obtained. Patternmatrix indicates the factor loading of each of the variable,while structure matrix shows correlation between variablesand factors.22 Factor loadings greater than �0.2 for eachfood group were considered to contribute significantly to thedietary patterns. Each of the case and control participantsobtained an individual factor score for each dietary pattern.Therefore subjects were classified according to factor score ofeach dietary pattern. The meaning of high factor score andlow factor score is high adherence and low adherence to aparticular dietary pattern, respectively. Positive factor loadingin each food groups is directly associated with a dietary pat-tern and negative factor loading is conversely related to a die-tary pattern. Covariates were determined according to theprevious studies and categorical variables included into themodel as follow: pre-pregnancy BMI (<18.5, 18.5–24.9,25–29.9 and ≥ 30 kg/m2), educational level (illiterate, ele-mentary, diploma and college), occupational situation(employee, housewife), history of foetal macrosomia (yes/no)and daily calorie intake (<2000, 2000–3000 and>3000 kcal/day), while age and physical activity wereincluded in the model as continuous variables. Additionally,covariates were adjusted into the multivariable logistic regres-sion model when there was a significant difference betweencase and control group. P-values for trend across tertiles of
dietary patterns adherence were determined. P-values ≤0.05were considered statistically significant.
Results
Table 1 shows the general characteristics of participants.Dietary information of 18 GDM women was omittedbecause of over-reporting (>4000 kcal/day), under-reporting (<800 kcal/day) and incomplete questionnaire(less than 40% food items). Thus, dietary information of130 GDM and 148 non-GDM women was analysed. GDMwomen had higher age (P = 0.01), pre-pregnancy BMI(P = <0.001), family history of diabetes (P = <0.001), andhistory of foetal macrosomia (P = <0.001) compared tonon-GDM women. Other variables had no significant differ-ence between GDM and non-GDM groups.
The dietary information of participants was analysedusing factor analysis. Food items were categorised into20 food groups according to similarity of nutrients. Byusing principal component analysis, major dietary patternswere identified based on the 20 food groups. Two majordietary patterns were detected based on eigenvalue >1 andthe Scree test and labelled ‘prudent dietary pattern’ and‘Western dietary pattern’ according to data interpretationand earlier studies. These two dietary patterns were selected
Table 1 General characteristics (frequency) of participants
Variables GDM (n = 130) Control (n = 148) P-value(a)
Age (year), mean � SD 29.00 � 5.17 27.50 � 4.92 0.01(b)
Pre-pregnancy weight (kg) 68.82 � 13.31 63.02 � 11.77 <0.001(b)
Physical activity (MET-min/week) mean � SD 1162 � 43 1221 � 07 0.07(b)
Educational level (n, %) 0.07(c)
Illiterate 3 (2.30) 0 (0.00)Elementary 31 (23.80) 33 (22.30)Diploma 67 (51.50) 66 (44.60)College 29 (22.30) 49 (33.10)
Pre-pregnancy BMI (kg/m2) (n, %) <0.001(c)
<18.5 1 (0.80) 11 (7.40)18.5–24.9 46 (35.40) 83 (56.10)25–29.9 50 (38.50) 39 (26.40)≥30 33 (25.40) 15 (10.10)
Occupational situation (n, %) 0.60(c)
Employee 10 (7.70) 10 (6.80)Housewife 120 (92.30) 137 (92.60)
Total energy intakes (kcal/day) (n, %) 0.50(c)
<2000 60 (46.20) 59 (39.90)2000–3000 59 (45.40) 73 (49.30)>3000 11 (8.50) 16 (10.80)
Family history of diabetes (n, %) <0.001(c)
No 64 (49.20) 107 (72.30)Yes 66 (50.80) 41 (27.70)
History of foetal macrosomia (n, %) 0.009(c)
No 120 (92.30) 146 (98.60)Yes 10 (7.70) 2 (1.40)
(a) P-value <0.05 was considered significant.(b) P-value based on independent sample t test.(c) P-value based on chi-squared test.BMI, body mass index; GDM, gestational diabetes mellitus; MET, metabolic equivalent minutes per week
Dietary patterns and gestational diabetes mellitus
© 2019 Dietitians Association of Australia 599
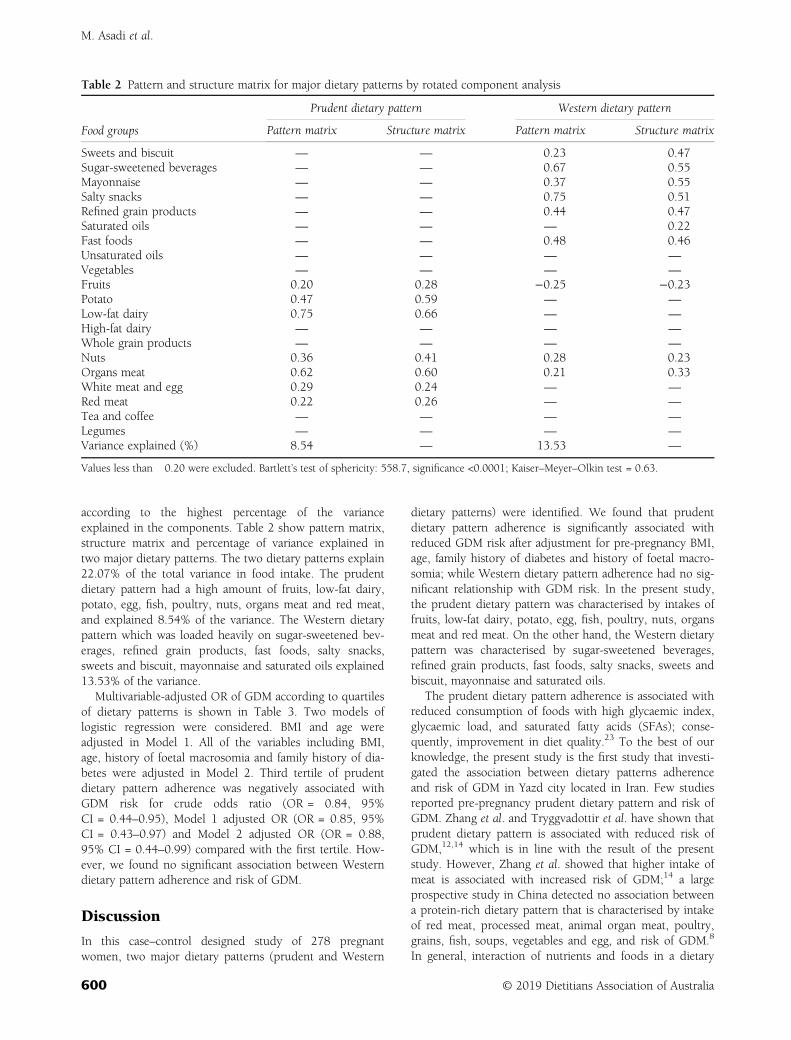
according to the highest percentage of the varianceexplained in the components. Table 2 show pattern matrix,structure matrix and percentage of variance explained intwo major dietary patterns. The two dietary patterns explain22.07% of the total variance in food intake. The prudentdietary pattern had a high amount of fruits, low-fat dairy,potato, egg, fish, poultry, nuts, organs meat and red meat,and explained 8.54% of the variance. The Western dietarypattern which was loaded heavily on sugar-sweetened bev-erages, refined grain products, fast foods, salty snacks,sweets and biscuit, mayonnaise and saturated oils explained13.53% of the variance.
Multivariable-adjusted OR of GDM according to quartilesof dietary patterns is shown in Table 3. Two models oflogistic regression were considered. BMI and age wereadjusted in Model 1. All of the variables including BMI,age, history of foetal macrosomia and family history of dia-betes were adjusted in Model 2. Third tertile of prudentdietary pattern adherence was negatively associated withGDM risk for crude odds ratio (OR = 0.84, 95%CI = 0.44–0.95), Model 1 adjusted OR (OR = 0.85, 95%CI = 0.43–0.97) and Model 2 adjusted OR (OR = 0.88,95% CI = 0.44–0.99) compared with the first tertile. How-ever, we found no significant association between Westerndietary pattern adherence and risk of GDM.
Discussion
In this case–control designed study of 278 pregnantwomen, two major dietary patterns (prudent and Western
dietary patterns) were identified. We found that prudentdietary pattern adherence is significantly associated withreduced GDM risk after adjustment for pre-pregnancy BMI,age, family history of diabetes and history of foetal macro-somia; while Western dietary pattern adherence had no sig-nificant relationship with GDM risk. In the present study,the prudent dietary pattern was characterised by intakes offruits, low-fat dairy, potato, egg, fish, poultry, nuts, organsmeat and red meat. On the other hand, the Western dietarypattern was characterised by sugar-sweetened beverages,refined grain products, fast foods, salty snacks, sweets andbiscuit, mayonnaise and saturated oils.
The prudent dietary pattern adherence is associated withreduced consumption of foods with high glycaemic index,glycaemic load, and saturated fatty acids (SFAs); conse-quently, improvement in diet quality.23 To the best of ourknowledge, the present study is the first study that investi-gated the association between dietary patterns adherenceand risk of GDM in Yazd city located in Iran. Few studiesreported pre-pregnancy prudent dietary pattern and risk ofGDM. Zhang et al. and Tryggvadottir et al. have shown thatprudent dietary pattern is associated with reduced risk ofGDM,12,14 which is in line with the result of the presentstudy. However, Zhang et al. showed that higher intake ofmeat is associated with increased risk of GDM;14 a largeprospective study in China detected no association betweena protein-rich dietary pattern that is characterised by intakeof red meat, processed meat, animal organ meat, poultry,grains, fish, soups, vegetables and egg, and risk of GDM.8
In general, interaction of nutrients and foods in a dietary
Table 2 Pattern and structure matrix for major dietary patterns by rotated component analysis
Food groups
Prudent dietary pattern Western dietary pattern
Pattern matrix Structure matrix Pattern matrix Structure matrix
Sweets and biscuit — — 0.23 0.47Sugar-sweetened beverages — — 0.67 0.55Mayonnaise — — 0.37 0.55Salty snacks — — 0.75 0.51Refined grain products — — 0.44 0.47Saturated oils — — — 0.22Fast foods — — 0.48 0.46Unsaturated oils — — — —
Vegetables — — — —
Fruits 0.20 0.28 −0.25 −0.23Potato 0.47 0.59 — —
Low-fat dairy 0.75 0.66 — —
High-fat dairy — — — —
Whole grain products — — — —
Nuts 0.36 0.41 0.28 0.23Organs meat 0.62 0.60 0.21 0.33White meat and egg 0.29 0.24 — —
Red meat 0.22 0.26 — —
Tea and coffee — — — —
Legumes — — — —
Variance explained (%) 8.54 — 13.53 —
Values less than �0.20 were excluded. Bartlett’s test of sphericity: 558.7, significance <0.0001; Kaiser–Meyer–Olkin test = 0.63.
M. Asadi et al.
600 © 2019 Dietitians Association of Australia
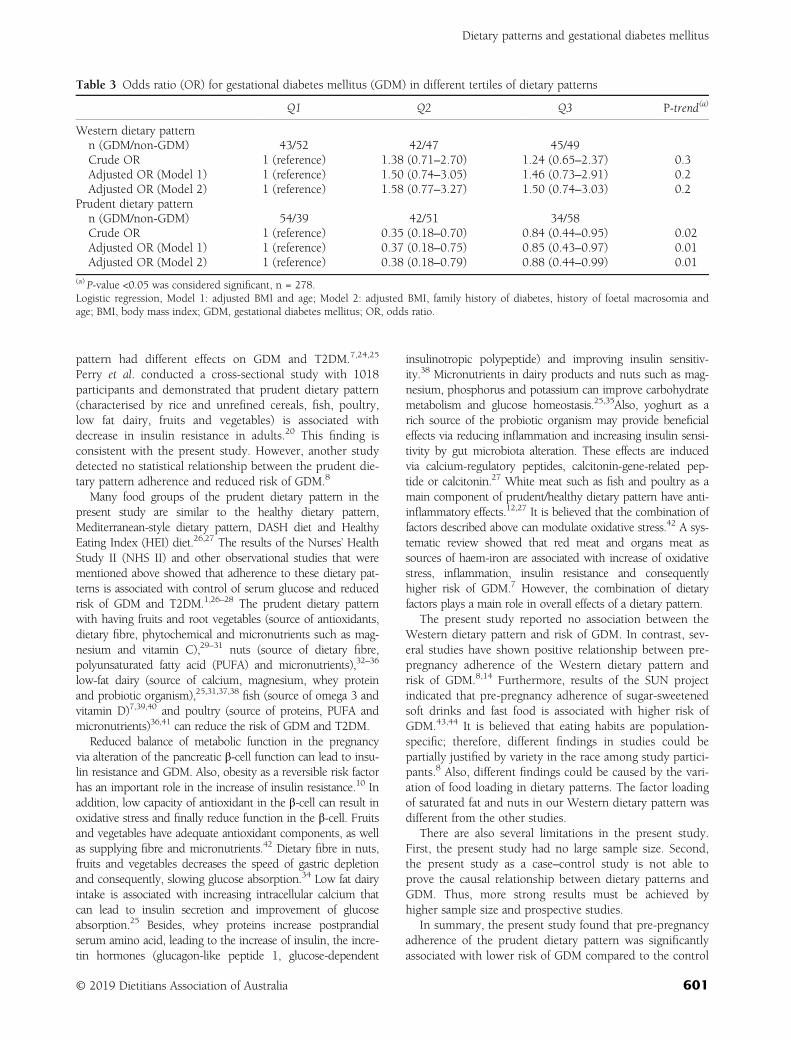
pattern had different effects on GDM and T2DM.7,24,25
Perry et al. conducted a cross-sectional study with 1018participants and demonstrated that prudent dietary pattern(characterised by rice and unrefined cereals, fish, poultry,low fat dairy, fruits and vegetables) is associated withdecrease in insulin resistance in adults.20 This finding isconsistent with the present study. However, another studydetected no statistical relationship between the prudent die-tary pattern adherence and reduced risk of GDM.8
Many food groups of the prudent dietary pattern in thepresent study are similar to the healthy dietary pattern,Mediterranean-style dietary pattern, DASH diet and HealthyEating Index (HEI) diet.26,27 The results of the Nurses’ HealthStudy II (NHS II) and other observational studies that werementioned above showed that adherence to these dietary pat-terns is associated with control of serum glucose and reducedrisk of GDM and T2DM.1,26–28 The prudent dietary patternwith having fruits and root vegetables (source of antioxidants,dietary fibre, phytochemical and micronutrients such as mag-nesium and vitamin C),29–31 nuts (source of dietary fibre,polyunsaturated fatty acid (PUFA) and micronutrients),32–36
low-fat dairy (source of calcium, magnesium, whey proteinand probiotic organism),25,31,37,38 fish (source of omega 3 andvitamin D)7,39,40 and poultry (source of proteins, PUFA andmicronutrients)36,41 can reduce the risk of GDM and T2DM.
Reduced balance of metabolic function in the pregnancyvia alteration of the pancreatic β-cell function can lead to insu-lin resistance and GDM. Also, obesity as a reversible risk factorhas an important role in the increase of insulin resistance.10 Inaddition, low capacity of antioxidant in the β-cell can result inoxidative stress and finally reduce function in the β-cell. Fruitsand vegetables have adequate antioxidant components, as wellas supplying fibre and micronutrients.42 Dietary fibre in nuts,fruits and vegetables decreases the speed of gastric depletionand consequently, slowing glucose absorption.34 Low fat dairyintake is associated with increasing intracellular calcium thatcan lead to insulin secretion and improvement of glucoseabsorption.25 Besides, whey proteins increase postprandialserum amino acid, leading to the increase of insulin, the incre-tin hormones (glucagon-like peptide 1, glucose-dependent
insulinotropic polypeptide) and improving insulin sensitiv-ity.38 Micronutrients in dairy products and nuts such as mag-nesium, phosphorus and potassium can improve carbohydratemetabolism and glucose homeostasis.25,35Also, yoghurt as arich source of the probiotic organism may provide beneficialeffects via reducing inflammation and increasing insulin sensi-tivity by gut microbiota alteration. These effects are inducedvia calcium-regulatory peptides, calcitonin-gene-related pep-tide or calcitonin.27 White meat such as fish and poultry as amain component of prudent/healthy dietary pattern have anti-inflammatory effects.12,27 It is believed that the combination offactors described above can modulate oxidative stress.42 A sys-tematic review showed that red meat and organs meat assources of haem-iron are associated with increase of oxidativestress, inflammation, insulin resistance and consequentlyhigher risk of GDM.7 However, the combination of dietaryfactors plays a main role in overall effects of a dietary pattern.
The present study reported no association between theWestern dietary pattern and risk of GDM. In contrast, sev-eral studies have shown positive relationship between pre-pregnancy adherence of the Western dietary pattern andrisk of GDM.8,14 Furthermore, results of the SUN projectindicated that pre-pregnancy adherence of sugar-sweetenedsoft drinks and fast food is associated with higher risk ofGDM.43,44 It is believed that eating habits are population-specific; therefore, different findings in studies could bepartially justified by variety in the race among study partici-pants.8 Also, different findings could be caused by the vari-ation of food loading in dietary patterns. The factor loadingof saturated fat and nuts in our Western dietary pattern wasdifferent from the other studies.
There are also several limitations in the present study.First, the present study had no large sample size. Second,the present study as a case–control study is not able toprove the causal relationship between dietary patterns andGDM. Thus, more strong results must be achieved byhigher sample size and prospective studies.
In summary, the present study found that pre-pregnancyadherence of the prudent dietary pattern was significantlyassociated with lower risk of GDM compared to the control
Table 3 Odds ratio (OR) for gestational diabetes mellitus (GDM) in different tertiles of dietary patterns
Q1 Q2 Q3 P-trend(a)
Western dietary patternn (GDM/non-GDM) 43/52 42/47 45/49Crude OR 1 (reference) 1.38 (0.71–2.70) 1.24 (0.65–2.37) 0.3Adjusted OR (Model 1) 1 (reference) 1.50 (0.74–3.05) 1.46 (0.73–2.91) 0.2Adjusted OR (Model 2) 1 (reference) 1.58 (0.77–3.27) 1.50 (0.74–3.03) 0.2
Prudent dietary patternn (GDM/non-GDM) 54/39 42/51 34/58Crude OR 1 (reference) 0.35 (0.18–0.70) 0.84 (0.44–0.95) 0.02Adjusted OR (Model 1) 1 (reference) 0.37 (0.18–0.75) 0.85 (0.43–0.97) 0.01Adjusted OR (Model 2) 1 (reference) 0.38 (0.18–0.79) 0.88 (0.44–0.99) 0.01
(a) P-value <0.05 was considered significant, n = 278.Logistic regression, Model 1: adjusted BMI and age; Model 2: adjusted BMI, family history of diabetes, history of foetal macrosomia andage; BMI, body mass index; GDM, gestational diabetes mellitus; OR, odds ratio.
Dietary patterns and gestational diabetes mellitus
© 2019 Dietitians Association of Australia 601
group. This finding emphasises dietary interventions inreproductive age by healthy diet recommendations particu-larly in the women with higher GDM risk factors such asBMI, family history of T2DM and previous history of foetalmacrosomia. However, further research with larger samplesize and controlling for confounders are needed to identifythe major dietary pattern and risk of GDM with regard toculture and lifestyle in Iranian women.
Funding source
The protocol of this research was approved (No. 3072) andfunded by Student Research Committee of Yazd ShahidSadoughi University of Medical Sciences and HealthServices.
Conflict of interest
The authors declare no conflict of interest.
Authorship
MA and AN designed the study. MA, MS and HHY col-lected data. AM and MA analysed data and drafted the man-uscript. All authors reviewed and confirmed the finalmanuscript.
References
1 Schoenaker DA, Soedamah-Muthu SS, Callaway LK,Mishra GD. Pre-pregnancy dietary patterns and risk of gesta-tional diabetes mellitus: results from an Australian population-based prospective cohort study. Diabetologia 2015; 58:2726–35.
2 Wu F, Wills K, Laslett LL, Oldenburg B, Jones G,Winzenberg T. Associations of dietary patterns with bone mass,muscle strength and balance in a cohort of Australian middle-aged women. Br J Nutr 2017; 118: 598–606.
3 Shu L, Shen XM, Li C, Zhang XY, Zheng PF. Dietary patternsare associated with type 2 diabetes mellitus among middle-aged adults in Zhejiang Province, China. Nutr J 2017; 16: 81.
4 Larijani B. A review on the prevalence of gestational diabetesmellitus (GDM) in different regions of Iran. J Diabetes MetabDisord 2009; 8: 7.
5 Lotfi MH, Saadati H, Afzali M. Prevalence of diabetes in peopleaged ≥30 years: the results of screening program of Yazd Prov-ince, Iran, in 2012. J Res Health Sci 2013; 14: 88–92.
6 Alfadhli EM. Gestational diabetes mellitus. Saudi Med J 2015;36: 399–406.
7 Schoenaker DA, Mishra GD, Callaway LK, Soedamah-Muthu SS. The role of energy, nutrients, foods, and dietarypatterns in the development of gestational diabetes mellitus: asystematic review of observational studies. Diabetes Care 2016;39: 16–23.
8 Tayyem RF, Al-Shudifat AE, Johannessen A et al. Dietary pat-terns and the risk of coronary heart disease among Jordanians:a case–control study. Nutr Metab Cardiovasc Dis 2018;28: 262–9.
9 Zhao P, Liu E, Qiao Y et al. Maternal gestational diabetes andchildhood obesity at age 9–11: results of a multinational study.Diabetologia 2016; 59: 2339–48.
10 Mirghani Dirar A, Doupis J. Gestational diabetes from A to Z.World J Diabetes 2017; 8: 489–511.
11 Varraso R, Fung TT, Barr RG, Hu FB, Willett W, Camargo CAJr. Prospective study of dietary patterns and chronic obstruc-tive pulmonary disease among US women. Am J Clin Nutr2007; 86: 488–95.
12 Tryggvadottir EA, Medek H, Birgisdottir BE, Geirsson RT,Gunnarsdottir I. Association between healthy maternal dietarypattern and risk for gestational diabetes mellitus. Eur J ClinNutr 2016; 70: 237–42.
13 Zheng Y, Ceglarek U, Huang T et al. Plasma Taurine, diabetesgenetic predisposition, and changes of insulin sensitivity inresponse to weight-loss diets. J Clin Endocrinol Metab 2016;101: 3820–6.
14 Zhang C, Schulze MB, Solomon CG, Hu FB. A prospectivestudy of dietary patterns, meat intake and the risk of gesta-tional diabetes mellitus. Diabetologia 2006; 49: 2604–13.
15 Bray GA. Clinical guidelines on the identification, evaluation,and treatment of overweight and obesity in adults—The evi-dence report. National Institutes of Health. Obes Res 1998; 6:51S–209S.
16 Kriska AM, Knowler WC, Laporte RE et al. Development ofquestionnaire to examine relationship of physical activity anddiabetes in Pima Indians. Diabetes Care 1990; 13: 401–11.
17 Sharifi N, Jalili L, Khazaeian S, Nia AN. The relationshipbetween physical activity and general health among menopausalwomen in Ahvaz, Iran. Electron Physician 2017; 9: 3639–45.
18 Kafeshani O, Sarrafzadegan N, Nouri F, Mohammadifard N.Major dietary patterns in Iranian adolescents: Isfahan healthyheart program, Iran. ARYA Atheroscler 2015; 11: 61–8.
19 Mohammadifard N, Sajjadi F, Maghroun M, Alikhasi H,Nilforoushzadeh F, Sarrafzadegan N. Validation of a simplifiedfood frequency questionnaire for the assessment of dietaryhabits in Iranian adults: Isfahan healthy heart program, Iran.ARYA Atheroscler 2015; 11: 139–46.
20 Perry IJ, Villegas R, Salim A, Flynn A. Clustering of protectivefactors for glucose intolerance and insulin resistance: a cross-sectional study. Diabet Med 2005; 22: 1091–7.
21 Bountziouka V, Panagiotakos DB. The role of rotation type usedto extract dietary patterns through principal component analysis,on their short-term repeatability. J Data Sci 2012; 10: 19–36.
22 Pallant J. SPSS Survival Manual a Step by Step Guide to DataAnalysis Using SPSS. Australia: Allen & Unwin, 2011.
23 Moran LJ, Flynn AC, Louise J, Deussen AR, Dodd JM. Theeffect of a lifestyle intervention on pregnancy and postpartumdietary patterns determined by factor analysis. Obesity 2017;25: 1022–32.
24 Geiker NRW, Larsen ML, Dyerberg J, Stender S, Astrup A. Eggconsumption, cardiovascular diseases and type 2 diabetes. EurJ Clin Nutr 2017; 72: 44–56.
25 Salas-Salvado J, Guasch-Ferre M, Diaz-Lopez A, Babio N.Yogurt and diabetes: overview of recent observational studies.J Nutr 2017; 147: 1452S–61S.
26 Kollannoor-Samuel G, Segura-Perez S, Shebl FM et al. Nutri-tion facts panel use is associated with diet quality and dietarypatterns among Latinos with type 2 diabetes. Public Health Nutr2017; 20: 2909–19.
27 Tobias DK, Zhang C, Chavarro J et al. Prepregnancy adherenceto dietary patterns and lower risk of gestational diabetes melli-tus. Am J Clin Nutr 2012; 96: 289–95.
M. Asadi et al.
602 © 2019 Dietitians Association of Australia
28 Karamanos B, Thanopoulou A, Anastasiou E et al. Relation ofthe Mediterranean diet with the incidence of gestational diabe-tes. Eur J Clin Nutr 2014; 68: 8–13.
29 Hamer M, Chida Y. Intake of fruit, vegetables, and antioxidantsand risk of type 2 diabetes: systematic review and meta-analy-sis. J Hypertens 2007; 25: 2361–9.
30 Li M, Fan Y, Zhang X, Hou W, Tang Z. Fruit and vegetableintake and risk of type 2 diabetes mellitus: meta-analysis ofprospective cohort studies. BMJ Open 2014; 4: e005497.
31 Schwingshackl L, Hoffmann G, Lampousi AM et al. Food groupsand risk of type 2 diabetes mellitus: a systematic review and meta-analysis of prospective studies. Eur J Epidemiol 2017; 32: 363–75.
32 Bao W, Bowers K, Tobias DK, Hu FB, Zhang C. Prepregnancydietary protein intake, major dietary protein sources, and therisk of gestational diabetes mellitus: a prospective cohort study.Diabetes Care 2013; 36: 2001–8.
33 Josse AR, Kendall CW, Augustin LS, Ellis PR, Jenkins DJ.Almonds and postprandial glycemia—a dose-response study.Metab Clin Exp 2007; 56: 400–4.
34 Kim Y, Keogh JB, Clifton PM. Differential effects of red meat/-refined grain diet and dairy/chicken/nuts/whole grain diet onglucose, insulin and triglyceride in a randomized crossoverstudy. Nutrients 2016; 8: 687.
35 Larsson SC, Wolk A. Magnesium intake and risk of type 2 dia-betes: a meta-analysis. J Intern Med 2007; 262: 208–14.
36 Pan A, Sun Q, Manson JE, Willett WC, Hu FB. Walnut con-sumption is associated with lower risk of type 2 diabetes inwomen. J Nutr 2013; 143: 512–8.
37 Tian S, Xu Q, Jiang R, Han T, Sun C, Na L. Dietary proteinconsumption and the risk of type 2 diabetes: a systematic
review and meta-analysis of cohort studies. Nutrients 2017;9: 982.
38 Turner KM, Keogh JB, Clifton PM. Dairy consumption andinsulin sensitivity: a systematic review of short- and long-termintervention studies. Nutr Metab Cardiovasc Dis 2015;25: 3–8.
39 Bao W, Song Y, Bertrand KA et al. Prepregnancy habitualintake of vitamin D from diet and supplements in relation torisk of gestational diabetes mellitus: a prospective cohort study.J Diabetes 2018; 10: 373–9.
40 Zheng JS, Huang T, Yang J, Fu YQ, Li D. Marine N-3 polyun-saturated fatty acids are inversely associated with risk of type2 diabetes in Asians: a systematic review and meta-analysis.PLoS One 2012; 7: e44525.
41 Marangoni F, Corsello G, Cricelli C et al. Role of poultry meatin a balanced diet aimed at maintaining health and wellbeing:an Italian consensus document. Food Nutr Res 2015; 59:27606.
42 Donazar-Ezcurra M, Lopez-Del Burgo C, Bes-Rastrollo M. Pri-mary prevention of gestational diabetes mellitus through nutri-tional factors: a systematic review. BMC Pregnancy Childbirth2017; 17: 30.
43 Dominguez LJ, Martinez-Gonzalez MA, Basterra-Gortari FJ,Gea A, Barbagallo M, Bes-Rastrollo M. Fast food consumptionand gestational diabetes incidence in the SUN project. PLoSOne 2014; 9: e106627.
44 Donazar-Ezcurra M, Lopez-Del Burgo C, Martinez-Gonzalez MA, Basterra-Gortari FJ, de Irala J, Bes-Rastrollo M.Soft drink consumption and gestational diabetes risk in theSUN project. Clin Nutr 2018; 37: 638–45.
Dietary patterns and gestational diabetes mellitus
© 2019 Dietitians Association of Australia 603
ORIGINAL RESEARCH
Factors associated with sarcopenia and undernutritionin older adults
Ana Rita SOUSA-SANTOS ,1 Cláudia AFONSO,1 Nuno BORGES,1,2 Alejandro SANTOS,1,3
Patrícia PADRÃO,1,4 Pedro MOREIRA1,4,5 and Teresa F. AMARAL1,61FCNAUP—Faculty of Nutrition and Food Science, 3I3S—Institute for Research and Innovation in Health, 4EPIUnit—Institute of Public Health and 5CIAFEL—Research Centre in Physical Activity, Health and Leisure, 6UISPA, LAETA-INEGI—Faculty of Engineering, University of Porto and 2CINTESIS—Centre for Health Technology and ServicesResearch, Porto, Portugal
AbstractAim: The aim of this study was to describe sarcopenia frequency, to identify the factors associated with sarcopeniaand undernutrition, and to evaluate their coexistence.Methods: A total of 1500 Portuguese older adults aged ≥65years from the Nutrition UP 65 study were evaluatedusing a cross-sectional analysis. Sarcopenia was defined according to the European Working Group on Sarcopenia inOlder People (EWGSOP)2 guidelines (2018), using anthropometric measures. Undernutrition status was evaluated byMini-Nutritional Assessment-Short Form.Results: Sarcopenia frequency was 4.4% (n=66). Sarcopenia coexists with undernutrition or undernutrition risk in1.5% of this sample. In the multivariate analysis, sarcopenia was directly associated with age >75years (odds ratio(OR): 2.14; 95% confidence interval (CI): 1.19–3.84), undernutrition or undernutrition risk (OR: 1.86; 95% CI:1.01–3.43) and inversely associated with male gender (OR: 0.52; 95% CI: 0.29–0.97), overweight (OR: 0.24; 95% CI:0.13–0.42) or obesity (OR: 0.02; 95% CI: 0.01–0.09) and moderate alcohol consumption (OR: 0.47; 95% CI:0.24–0.90). Undernutrition or undernutrition risk was associated with a poor or very poor self-perception of healthstatus (OR: 3.53; 95% CI: 2.32–5.37), a low physical activity level (OR: 1.74; 95% CI: 1.23–2.47), sarcopenia (OR:1.85; 95% CI: 1.02–3.36), and being overweight (OR: 0.40; 95% CI: 0.27–0.59) or obese (OR: 0.43; 95% CI:0.28–0.65).Conclusions: The majority of the older adults presented low muscle strength (probable sarcopenia), but only asmall number had concomitantly low muscle quantity or quality (sarcopenia). Coexistence between these conditionsis low which reinforces the need to assess them both individually during geriatric assessment.
Key words: gait speed, handgrip strength, muscle mass, sarcopenia, undernutrition.
Introduction
Sarcopenia and undernutrition are conditions frequentlyrelated with ageing and represent a major threat to olderadults’ health.1 An increased interest in sarcopenia has beenobserved over the years, and this geriatric disorder is
already recognised by the International Classification ofDisease, Tenth Revision, Clinical Modification.2 In 2010, sar-copenia was presented as a geriatric syndrome characterisedby the age-related decline in muscle mass and function(strength and performance).3 In late 2018, the EuropeanWorking Group on Sarcopenia in older people (EWGSOP)2published an updated operational definition of sarcopenia.4
Sarcopenia is defined as ‘a progressive and generalised skele-tal muscle disorder that is associated with increased likeli-hood of adverse outcomes including falls, fractures, physicaldisability, and mortality’. Contrary to the initial EWGSOPconsensus,3 these new guidelines indicate low musclestrength as a primary parameter, as it has proved to be stron-ger than muscle mass in predicting adverse outcomes. Sar-copenia diagnosis is then confirmed by the presence of lowmuscle quantity and quality, and low physical performanceis then used to identify sarcopenia severity.4
The term undernutrition has also evolved and, based inits aetiology, the International Guideline Consensus
A.R. Sousa-Santos, BSc Hons, PhD studentC. Afonso, PhD, Assistant ProfessorN. Borges, PhD, Associate ProfessorA. Santos, PhD, Assistant ProfessorP. Padrão, PhD, Assistant ProfessorP. Moreira, PhD, ProfessorT.F. Amaral, PhD, Associate ProfessorCorrespondence: A.R. Sousa-Santos, Faculdade de Ciências daNutrição e Alimentação, Universidade do Porto, Rua Dr. Roberto Frias,4200-465 Porto, Portugal. Tel.: +351 934 086 409.Email: [email protected][Correction added on 11 June 2019, after first online publication:Affiliations 2, 5 and 6 have been corrected.]
Accepted March 2019
© 2019 Dietitians Association of Australia604
AA AA
DDD
ieti
tian
s As
soci
atio
nofof
Aus
tral
ia
Nutrition & Dietetics 2019; 76: 604–612 DOI: 10.1111/1747-0080.12542
Committee proposed the following three sub-types: starva-tion related, chronic disease-related and acute disease- orinjury-related.5 Regarding undernutrition assessment, theMini-Nutritional Assessment-Short Form (MNA-SF) hasbeen shown to be a rapid and reliable way of assessingundernutrition and undernutrition risk in the commu-nity.6,7 In 2012, a new term to define the occurrence ofboth sarcopenia and undernutrition was suggested, the mal-nutrition sarcopenia syndrome.8 This syndrome wasrecently pointed out as a prognostic indicator for long-termmortality in hospitalised older patients.9
Sarcopenia and undernutrition are both associated withhigher care costs10,11 and several adverse health outcomes,namely poor quality of life,12,13 prolonged length of stay inhospital11,14,15 and mortality.11,16,17 Routine undernutritionidentification is increasing in the clinical practice, but sar-copenia remains poorly identified. To delineate the geriatricassessment, it is essential to know if the same individualsare at higher risk of both sarcopenia and undernutritionand if these conditions share similar risk factors. Indeed, ifthey share similar associated factors, this may be helpful tochoose the best strategy for their management among olderadults. As both conditions are preventable, early interven-tion may promote healthier ageing by improving olderadults’ quality of life and health status. If these potentiallymodifiable risk factors differ between sarcopenia and under-nutrition, independent evaluation of each condition duringgeriatric screening and assessment will be relevant. There-fore, the purpose of the present study is to present theresults of sarcopenia frequency using the updated guide-lines, to investigate the factors associated with sarcopeniaand undernutrition and also to evaluate coexistence of bothconditions among older adults.
Methods
Data from Nutrition UP 65 cross-sectional observationalstudy was used. A cluster sample of 1500 older adults aged≥65 years, representative of the Portuguese older populationin terms of age, sex, education and regional area. In eachregional area, three or more town councils with >250inhabitants were randomly selected, and potentialcommunity-dwelling participants were contacted via homeapproach, telephone or via institutions, such as town coun-cils and parish centres. Individuals presenting any conditionthat precluded the collection of venous blood samples orurine (e.g. dementia or urinary incontinence) were notincluded. Data collection took place between December2015 and June 2016. Trained registered nutritionistsapplied a structured questionnaire and collected all anthro-pometric data. Besides demographic data, informationabout lifestyle practices, self-perception of health status,cognitive function and undernutrition status were gathered.Demographic data, lifestyle practices, such as smoking andalcohol consumption, and self-perception of health statuswere self-reported and ascertained with questions from theNational Health Survey questionnaire.18 A full description
of the methods was published elsewhere.19 This manuscriptwas prepared in accordance with the STROBE statement.
Anthropometric measurements: Anthropometric measure-ments were collected following standard procedures.20
Intra- and inter-rater observer errors were calculated andranged from 0.05 to 0.34% and 0.19 to 1.48%, respec-tively. Standing height was obtained with a calibratedstadiometer (SECA 213, SECA GmbH, Hamburg, Germany)with 0.1 cm resolution. Body weight (in kilograms) wasmeasured with a calibrated portable electronic scale (SECA803, SECA GmbH) with 0.1 kg resolution, with the partici-pants wearing light clothes. When it was not possible toweigh a patient, for the same reasons that prevented stand-ing height measurement, body weight was estimated frommid-upper arm (MAMC) and calf circumferences.21 MAMCand waist circumferences were measured with a metal tape(Lufkin W606 PM, Lufkin, Sparks, MD, USA) with 0.1 cmresolution. Triceps skinfold thickness was obtained using aHoltain Tanner/Whitehouse (Holtain, Ltd., Crosswell, UK)skinfold calliper, with 0.2 mm resolution. Muscle mass wasestimated, as suggested by Landi et al.,22 using MAMC, cal-culated according to the formula suggested by Jelliffe.23
Muscle strength and function: A calibrated Jamar Plus+ DigitalHand Dynamometer (Sammons Preston Inc., Bolingbrook,IL, USA) was used to assess muscle strength. Non-dominant hand grip strength (HGS) was measured withindividuals sitting in a chair without arm rest, with theirshoulders adducted, their elbows flexed 90� and their fore-arms in neutral position, as recommended by the AmericanSociety of Hand Therapists.24 Each participant performedthree measurements with a one-minute pause betweenthem, and the highest value was used for the analysis.When the individual was unable to perform the measure-ment with the non-dominant hand, the dominant handwas used.
Gait speed was quantified over a distance of 4.6 m. Par-ticipants were asked to walk at usual pace along anunobstructed corridor and walking time in seconds wasrecorded by a chronometer (School electronic stopwatch,Dive049, Topgim, Portugal).
Sarcopenia status: Sarcopenia was identified using theEWGSOP2 guidelines, as the presence of low musclestrength measured by HGS, plus low muscle quantity andquality.4 Low muscle strength was classified as grip strength<16 kgf in women and <27 kgf in men,25 Low muscle quan-tity and quality was classified as calf circumference<31 cm,26 and also by MAMC <21.1 and 19.2 cm in menand women, respectively.3,22 Sarcopenia severity was fur-ther determined by low physical performance as measuredby usual gait speed.4 A gait speed of ≤0.8 m/second identi-fied subjects with poorer physical performance.4
Of the 1500 older adults included, it was only possibleto assess sarcopenia using MAMC criterion in 1495,because of missing data. Despite not being mentioned inthe updated consensus, MAMC criterion was mentioned
Sarcopenia and undernutrition in older adults
© 2019 Dietitians Association of Australia 605
previously as a measure to estimate muscle mass.3,22 There-fore, sarcopenia frequency was also studied using this mea-sure and the agreement between definitions.
Undernutrition status: The Portuguese version of the MNA-SF was applied. The MNA-SF consists of six questionstargeting food intake, weight loss, physical and mental sta-tus, and anthropometry through body mass index (BMI) orcalf circumference assessment. A participant scoring ≤7 outof 14 points was classified as undernourished, one thatscores between 8 and 11 is at risk of undernutrition andone scoring between 12 and 14 points was considered well-nourished.27
Cognitive function: Cognitive performance was assessed withthe Portuguese version of the Mini-Mental State Examina-tion (MMSE). Individuals were classified as cognitiveimpaired using the following criteria: individuals with noeducation, ≤15 points; 1–11 years of years of school com-pleted, ≤22 points; and >11 years of school completed, ≤27points.28
Physical activity: The short form of the International PhysicalActivity Questionnaire was used to assess physical activ-ity.29 Information regarding how much time the individualsspent walking or hiking, sitting, in moderate and vigorousactivities, in the previous seven days, was collected. Lowphysical activity was defined as <383 and <270 kcal/week,for men and women, respectively.30
Body mass index: BMI was calculated as (weight (kg)/height2
(m)), and categories were defined according to WorldHealth Organization as underweight for BMI below18.5 kg/m2, as normal weight for BMI between 18.5 and24.9 kg/m2, as overweight for BMI between 25.0 and29.9 kg/m2 and as obese for BMI of 30.0 kg/m2 or above.31
Because of the small number of underweight individuals(n = 4), they were included in the reference group (normalweight).The BMI categories suggested by Lipschitz werealso used for descriptive analysis.32
Ethics: This research was conducted according to the guide-lines established by the Declaration of Helsinki and thestudy protocol was approved by the ethics committee ofthe ‘Department of “Ciências Sociais e Saúde (Social Sci-ences and Health) from the Faculdade de Medicina daUniversidade do Porto” (PCEDCSS – FMUP 15/2015) andby the Portuguese National Commission of Data Protection(9427/2015)’. All study participants (or two representativesif the participant was deemed to be cognitively impaired)signed an informed consent form.
Statistical analyses: Descriptive analyses were conducted toshow the characteristics of the study sample according tosarcopenia and undernutrition status. Results wereexpressed as number of participants (percentage). Differ-ences between the groups were evaluated using chi-squaretest or Fisher’s exact test. Because of the low number ofundernourished individuals identified in this sample,
undernutrition and undernutrition risk were analysed as asingle group. Also, sarcopenic and severe sarcopenic indi-viduals were included in same category (sarcopenia). Agree-ment between sarcopenia definitions, using calfcircumference or MAMC to estimate muscle quantity andquality, was evaluated through Cohen’s kappa coefficient(κ), in 1495 older adults.
In order to handle missing data for the variables alcoholconsumption (n = 2), BMI (n = 4), marital status (n = 1) andself-perception of health status (n = 4), multiple imputationwas performed using a Markov Chain Monte Carloapproach, with five imputation data sets and 10 iterations.Afterwards, bivariate and multivariate logistic regressionswere conducted using sarcopenia and undernutrition statusas dependent variables. Odds ratios (OR) with 95% confi-dence intervals (CI) were calculated as measures of associa-tion. Sex, age, residential status, regional area, educationallevel, marital status, self-perception of health status,smoking status, alcohol consumption, BMI classification,physical activity level, sarcopenia (or undernutrition status)and cognitive function were variables included in themodels.
Confidence intervals were defined at 95% and statisticalsignificance was set at a P < 0.05. All statistical analyses wereperformed using IBM SPSS Statistics 23 (SPSS, Inc., an IBMCompany, Chicago, IL, USA).
Results
A total of 1500 individuals were included in the presentstudy. Women represented 58.1% of the sample and themedian age was 74 years (age range: 65–100 years). Usingthe new algorithm released by EWGSOP2, a large propor-tion (n = 538, 36%) of the sample had the primary parame-ter of sarcopenia (low muscle strength). However,considering the combined presence of low muscle strengthand low muscle quantity or quality, 4.4% (n = 66) wereidentified with sarcopenia, of which 21 (1.4%) presented asevere state.
When MAMC criterion was used, in a sub-sample of1495 older adults, a slightly higher number (n = 93, 6.2%)was identified with sarcopenia. Furthermore, when theagreement between both approaches was explored, and afair agreement (k = 0.336; P < 0.001) was observed, as only29 older adults (1.9%) were considered sarcopenic usingboth calf circumference and MAMC criteria (Table S1,Supporting Information).
The characteristics of the study participants regardingsarcopenia and undernutrition status are displayed inTable 1. Sarcopenic individuals were more likely to bewomen (P = 0.028), over 75 years (P < 0.001), live in a carehome (P = 0.001), being single, divorced or widower(P = 0.025), not drinking alcohol (P < 0.001), have a lowphysical activity level (P = 0.005), placed in a lower BMIcategory (P < 0.001), being undernourished or at undernu-trition risk (P < 0.001) and cognitively impaired (P = 0.001).When comparing not undernourished versus undernour-ished or at undernutrition risk individuals, statistically
A. R. Sousa-Santos et al.
606 © 2019 Dietitians Association of Australia
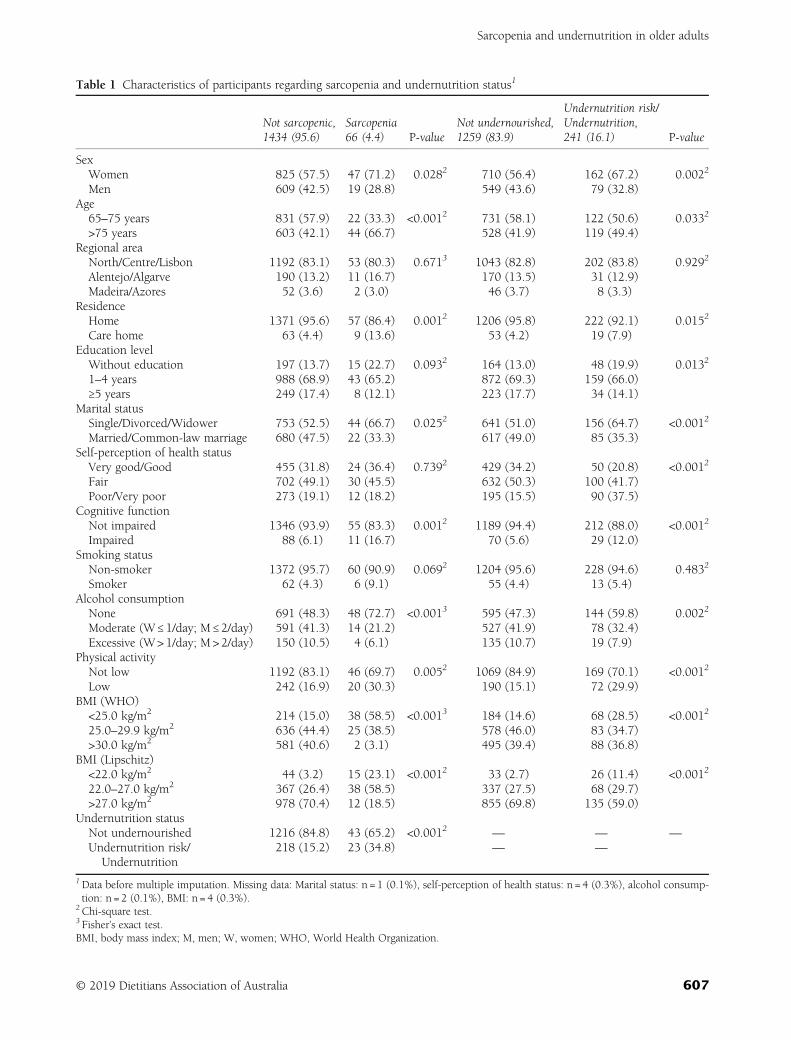
Table 1 Characteristics of participants regarding sarcopenia and undernutrition status1
Not sarcopenic,1434 (95.6)
Sarcopenia66 (4.4) P-value
Not undernourished,1259 (83.9)
Undernutrition risk/Undernutrition,241 (16.1) P-value
SexWomen 825 (57.5) 47 (71.2) 0.0282 710 (56.4) 162 (67.2) 0.0022
Men 609 (42.5) 19 (28.8) 549 (43.6) 79 (32.8)Age
65–75 years 831 (57.9) 22 (33.3) <0.0012 731 (58.1) 122 (50.6) 0.0332
>75 years 603 (42.1) 44 (66.7) 528 (41.9) 119 (49.4)Regional area
North/Centre/Lisbon 1192 (83.1) 53 (80.3) 0.6713 1043 (82.8) 202 (83.8) 0.9292
Alentejo/Algarve 190 (13.2) 11 (16.7) 170 (13.5) 31 (12.9)Madeira/Azores 52 (3.6) 2 (3.0) 46 (3.7) 8 (3.3)
ResidenceHome 1371 (95.6) 57 (86.4) 0.0012 1206 (95.8) 222 (92.1) 0.0152
Care home 63 (4.4) 9 (13.6) 53 (4.2) 19 (7.9)Education level
Without education 197 (13.7) 15 (22.7) 0.0932 164 (13.0) 48 (19.9) 0.0132
1–4 years 988 (68.9) 43 (65.2) 872 (69.3) 159 (66.0)≥5 years 249 (17.4) 8 (12.1) 223 (17.7) 34 (14.1)
Marital statusSingle/Divorced/Widower 753 (52.5) 44 (66.7) 0.0252 641 (51.0) 156 (64.7) <0.0012
Married/Common-law marriage 680 (47.5) 22 (33.3) 617 (49.0) 85 (35.3)Self-perception of health status
Very good/Good 455 (31.8) 24 (36.4) 0.7392 429 (34.2) 50 (20.8) <0.0012
Fair 702 (49.1) 30 (45.5) 632 (50.3) 100 (41.7)Poor/Very poor 273 (19.1) 12 (18.2) 195 (15.5) 90 (37.5)
Cognitive functionNot impaired 1346 (93.9) 55 (83.3) 0.0012 1189 (94.4) 212 (88.0) <0.0012
Impaired 88 (6.1) 11 (16.7) 70 (5.6) 29 (12.0)Smoking status
Non-smoker 1372 (95.7) 60 (90.9) 0.0692 1204 (95.6) 228 (94.6) 0.4832
Smoker 62 (4.3) 6 (9.1) 55 (4.4) 13 (5.4)Alcohol consumption
None 691 (48.3) 48 (72.7) <0.0013 595 (47.3) 144 (59.8) 0.0022
Moderate (W ≤ 1/day; M ≤ 2/day) 591 (41.3) 14 (21.2) 527 (41.9) 78 (32.4)Excessive (W> 1/day; M > 2/day) 150 (10.5) 4 (6.1) 135 (10.7) 19 (7.9)
Physical activityNot low 1192 (83.1) 46 (69.7) 0.0052 1069 (84.9) 169 (70.1) <0.0012
Low 242 (16.9) 20 (30.3) 190 (15.1) 72 (29.9)BMI (WHO)
<25.0 kg/m2 214 (15.0) 38 (58.5) <0.0013 184 (14.6) 68 (28.5) <0.0012
25.0–29.9 kg/m2 636 (44.4) 25 (38.5) 578 (46.0) 83 (34.7)>30.0 kg/m2 581 (40.6) 2 (3.1) 495 (39.4) 88 (36.8)
BMI (Lipschitz)<22.0 kg/m2 44 (3.2) 15 (23.1) <0.0012 33 (2.7) 26 (11.4) <0.0012
22.0–27.0 kg/m2 367 (26.4) 38 (58.5) 337 (27.5) 68 (29.7)>27.0 kg/m2 978 (70.4) 12 (18.5) 855 (69.8) 135 (59.0)
Undernutrition statusNot undernourished 1216 (84.8) 43 (65.2) <0.0012 — — —
Undernutrition risk/Undernutrition
218 (15.2) 23 (34.8) — —
1Data before multiple imputation. Missing data: Marital status: n = 1 (0.1%), self-perception of health status: n = 4 (0.3%), alcohol consump-tion: n = 2 (0.1%), BMI: n = 4 (0.3%).
2Chi-square test.3 Fisher’s exact test.BMI, body mass index; M, men; W, women; WHO, World Health Organization.
Sarcopenia and undernutrition in older adults
© 2019 Dietitians Association of Australia 607
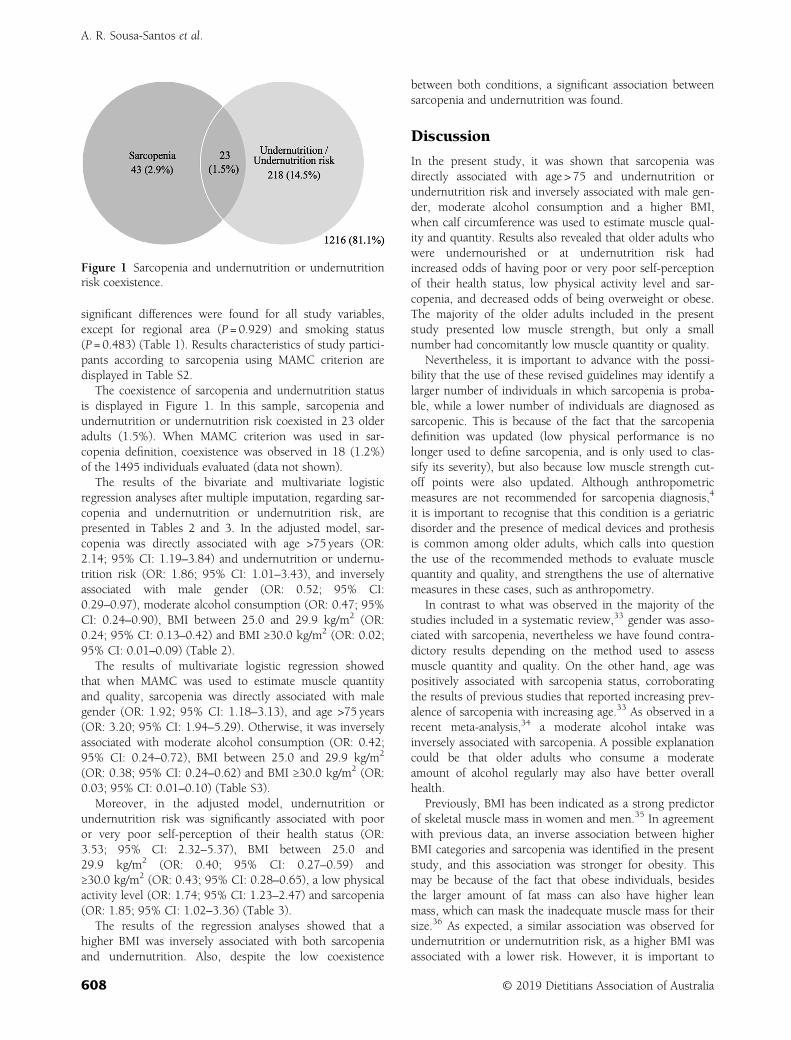
significant differences were found for all study variables,except for regional area (P = 0.929) and smoking status(P = 0.483) (Table 1). Results characteristics of study partici-pants according to sarcopenia using MAMC criterion aredisplayed in Table S2.
The coexistence of sarcopenia and undernutrition statusis displayed in Figure 1. In this sample, sarcopenia andundernutrition or undernutrition risk coexisted in 23 olderadults (1.5%). When MAMC criterion was used in sar-copenia definition, coexistence was observed in 18 (1.2%)of the 1495 individuals evaluated (data not shown).
The results of the bivariate and multivariate logisticregression analyses after multiple imputation, regarding sar-copenia and undernutrition or undernutrition risk, arepresented in Tables 2 and 3. In the adjusted model, sar-copenia was directly associated with age >75 years (OR:2.14; 95% CI: 1.19–3.84) and undernutrition or undernu-trition risk (OR: 1.86; 95% CI: 1.01–3.43), and inverselyassociated with male gender (OR: 0.52; 95% CI:0.29–0.97), moderate alcohol consumption (OR: 0.47; 95%CI: 0.24–0.90), BMI between 25.0 and 29.9 kg/m2 (OR:0.24; 95% CI: 0.13–0.42) and BMI ≥30.0 kg/m2 (OR: 0.02;95% CI: 0.01–0.09) (Table 2).
The results of multivariate logistic regression showedthat when MAMC was used to estimate muscle quantityand quality, sarcopenia was directly associated with malegender (OR: 1.92; 95% CI: 1.18–3.13), and age >75 years(OR: 3.20; 95% CI: 1.94–5.29). Otherwise, it was inverselyassociated with moderate alcohol consumption (OR: 0.42;95% CI: 0.24–0.72), BMI between 25.0 and 29.9 kg/m2
(OR: 0.38; 95% CI: 0.24–0.62) and BMI ≥30.0 kg/m2 (OR:0.03; 95% CI: 0.01–0.10) (Table S3).
Moreover, in the adjusted model, undernutrition orundernutrition risk was significantly associated with pooror very poor self-perception of their health status (OR:3.53; 95% CI: 2.32–5.37), BMI between 25.0 and29.9 kg/m2 (OR: 0.40; 95% CI: 0.27–0.59) and≥30.0 kg/m2 (OR: 0.43; 95% CI: 0.28–0.65), a low physicalactivity level (OR: 1.74; 95% CI: 1.23–2.47) and sarcopenia(OR: 1.85; 95% CI: 1.02–3.36) (Table 3).
The results of the regression analyses showed that ahigher BMI was inversely associated with both sarcopeniaand undernutrition. Also, despite the low coexistence
between both conditions, a significant association betweensarcopenia and undernutrition was found.
Discussion
In the present study, it was shown that sarcopenia wasdirectly associated with age > 75 and undernutrition orundernutrition risk and inversely associated with male gen-der, moderate alcohol consumption and a higher BMI,when calf circumference was used to estimate muscle qual-ity and quantity. Results also revealed that older adults whowere undernourished or at undernutrition risk hadincreased odds of having poor or very poor self-perceptionof their health status, low physical activity level and sar-copenia, and decreased odds of being overweight or obese.The majority of the older adults included in the presentstudy presented low muscle strength, but only a smallnumber had concomitantly low muscle quantity or quality.
Nevertheless, it is important to advance with the possi-bility that the use of these revised guidelines may identify alarger number of individuals in which sarcopenia is proba-ble, while a lower number of individuals are diagnosed assarcopenic. This is because of the fact that the sarcopeniadefinition was updated (low physical performance is nolonger used to define sarcopenia, and is only used to clas-sify its severity), but also because low muscle strength cut-off points were also updated. Although anthropometricmeasures are not recommended for sarcopenia diagnosis,4
it is important to recognise that this condition is a geriatricdisorder and the presence of medical devices and prothesisis common among older adults, which calls into questionthe use of the recommended methods to evaluate musclequantity and quality, and strengthens the use of alternativemeasures in these cases, such as anthropometry.
In contrast to what was observed in the majority of thestudies included in a systematic review,33 gender was asso-ciated with sarcopenia, nevertheless we have found contra-dictory results depending on the method used to assessmuscle quantity and quality. On the other hand, age waspositively associated with sarcopenia status, corroboratingthe results of previous studies that reported increasing prev-alence of sarcopenia with increasing age.33 As observed in arecent meta-analysis,34 a moderate alcohol intake wasinversely associated with sarcopenia. A possible explanationcould be that older adults who consume a moderateamount of alcohol regularly may also have better overallhealth.
Previously, BMI has been indicated as a strong predictorof skeletal muscle mass in women and men.35 In agreementwith previous data, an inverse association between higherBMI categories and sarcopenia was identified in the presentstudy, and this association was stronger for obesity. Thismay be because of the fact that obese individuals, besidesthe larger amount of fat mass can also have higher leanmass, which can mask the inadequate muscle mass for theirsize.36 As expected, a similar association was observed forundernutrition or undernutrition risk, as a higher BMI wasassociated with a lower risk. However, it is important to
Figure 1 Sarcopenia and undernutrition or undernutritionrisk coexistence.
A. R. Sousa-Santos et al.
608 © 2019 Dietitians Association of Australia
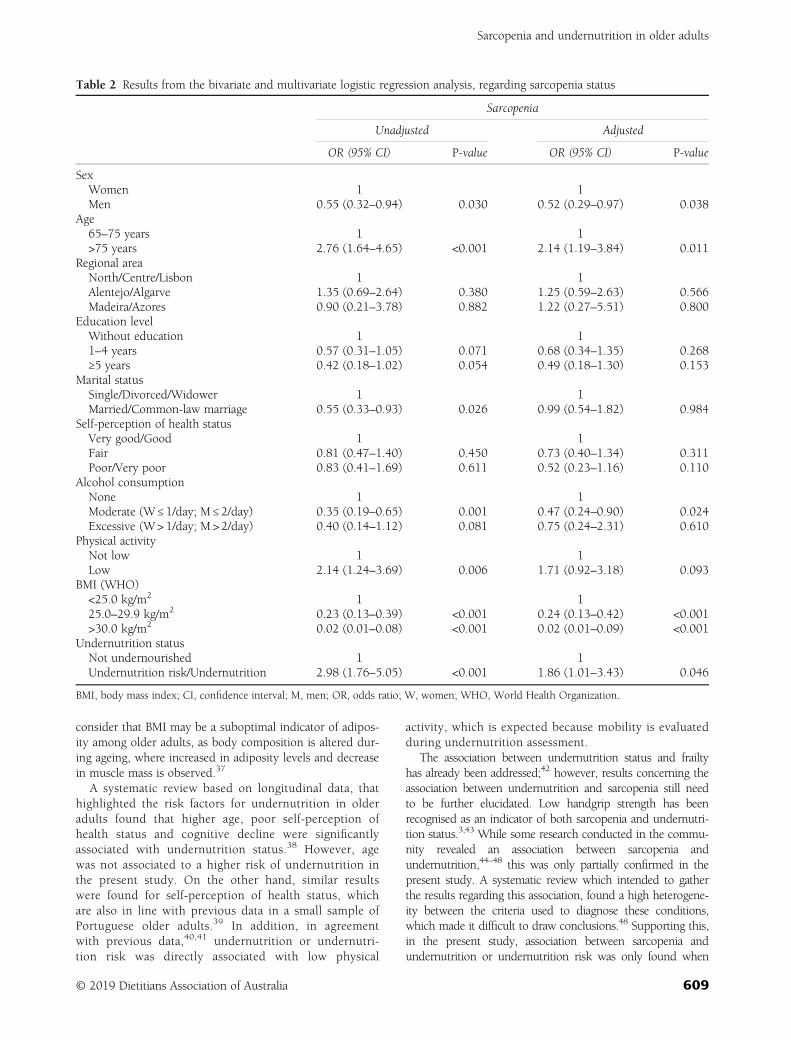
consider that BMI may be a suboptimal indicator of adipos-ity among older adults, as body composition is altered dur-ing ageing, where increased in adiposity levels and decreasein muscle mass is observed.37
A systematic review based on longitudinal data, thathighlighted the risk factors for undernutrition in olderadults found that higher age, poor self-perception ofhealth status and cognitive decline were significantlyassociated with undernutrition status.38 However, agewas not associated to a higher risk of undernutrition inthe present study. On the other hand, similar resultswere found for self-perception of health status, whichare also in line with previous data in a small sample ofPortuguese older adults.39 In addition, in agreementwith previous data,40,41 undernutrition or undernutri-tion risk was directly associated with low physical
activity, which is expected because mobility is evaluatedduring undernutrition assessment.
The association between undernutrition status and frailtyhas already been addressed;42 however, results concerning theassociation between undernutrition and sarcopenia still needto be further elucidated. Low handgrip strength has beenrecognised as an indicator of both sarcopenia and undernutri-tion status.3,43 While some research conducted in the commu-nity revealed an association between sarcopenia andundernutrition,44–48 this was only partially confirmed in thepresent study. A systematic review which intended to gatherthe results regarding this association, found a high heterogene-ity between the criteria used to diagnose these conditions,which made it difficult to draw conclusions.48 Supporting this,in the present study, association between sarcopenia andundernutrition or undernutrition risk was only found when
Table 2 Results from the bivariate and multivariate logistic regression analysis, regarding sarcopenia status
Sarcopenia
Unadjusted Adjusted
OR (95% CI) P-value OR (95% CI) P-value
SexWomen 1 1Men 0.55 (0.32–0.94) 0.030 0.52 (0.29–0.97) 0.038
Age65–75 years 1 1>75 years 2.76 (1.64–4.65) <0.001 2.14 (1.19–3.84) 0.011
Regional areaNorth/Centre/Lisbon 1 1Alentejo/Algarve 1.35 (0.69–2.64) 0.380 1.25 (0.59–2.63) 0.566Madeira/Azores 0.90 (0.21–3.78) 0.882 1.22 (0.27–5.51) 0.800
Education levelWithout education 1 11–4 years 0.57 (0.31–1.05) 0.071 0.68 (0.34–1.35) 0.268≥5 years 0.42 (0.18–1.02) 0.054 0.49 (0.18–1.30) 0.153
Marital statusSingle/Divorced/Widower 1 1Married/Common-law marriage 0.55 (0.33–0.93) 0.026 0.99 (0.54–1.82) 0.984
Self-perception of health statusVery good/Good 1 1Fair 0.81 (0.47–1.40) 0.450 0.73 (0.40–1.34) 0.311Poor/Very poor 0.83 (0.41–1.69) 0.611 0.52 (0.23–1.16) 0.110
Alcohol consumptionNone 1 1Moderate (W ≤ 1/day; M ≤ 2/day) 0.35 (0.19–0.65) 0.001 0.47 (0.24–0.90) 0.024Excessive (W> 1/day; M > 2/day) 0.40 (0.14–1.12) 0.081 0.75 (0.24–2.31) 0.610
Physical activityNot low 1 1Low 2.14 (1.24–3.69) 0.006 1.71 (0.92–3.18) 0.093
BMI (WHO)<25.0 kg/m2 1 125.0–29.9 kg/m2 0.23 (0.13–0.39) <0.001 0.24 (0.13–0.42) <0.001>30.0 kg/m2 0.02 (0.01–0.08) <0.001 0.02 (0.01–0.09) <0.001
Undernutrition statusNot undernourished 1 1Undernutrition risk/Undernutrition 2.98 (1.76–5.05) <0.001 1.86 (1.01–3.43) 0.046
BMI, body mass index; CI, confidence interval; M, men; OR, odds ratio; W, women; WHO, World Health Organization.
Sarcopenia and undernutrition in older adults
© 2019 Dietitians Association of Australia 609
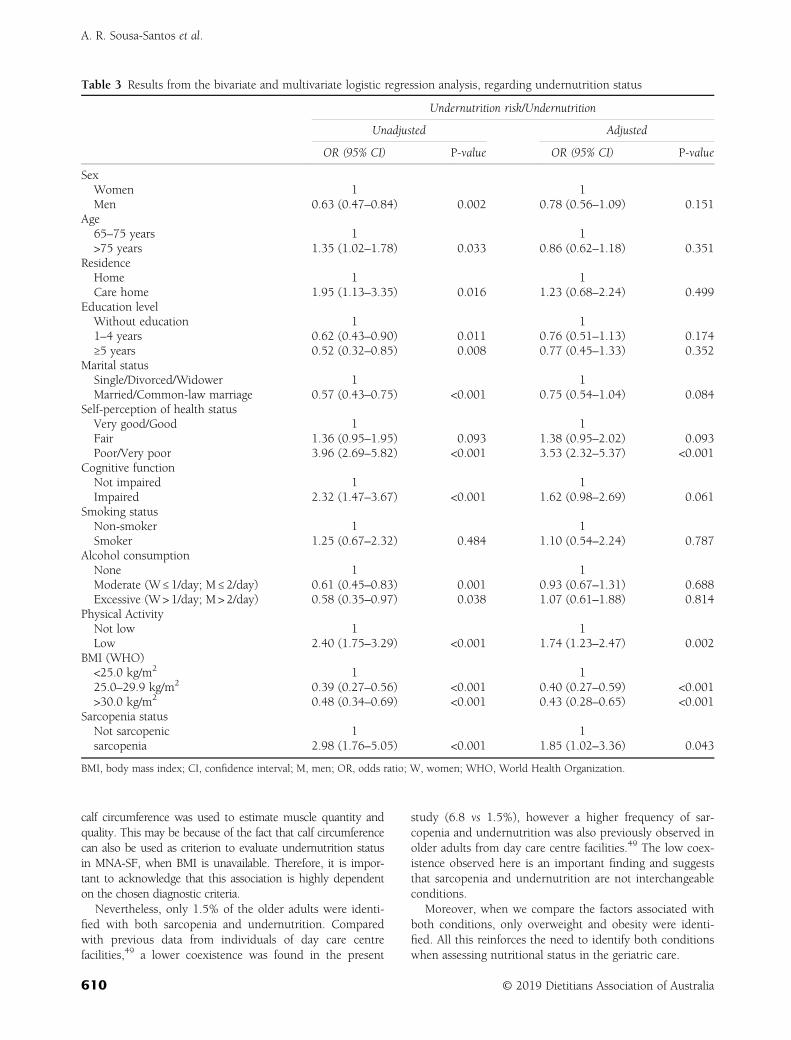
calf circumference was used to estimate muscle quantity andquality. This may be because of the fact that calf circumferencecan also be used as criterion to evaluate undernutrition statusin MNA-SF, when BMI is unavailable. Therefore, it is impor-tant to acknowledge that this association is highly dependenton the chosen diagnostic criteria.
Nevertheless, only 1.5% of the older adults were identi-fied with both sarcopenia and undernutrition. Comparedwith previous data from individuals of day care centrefacilities,49 a lower coexistence was found in the present
study (6.8 vs 1.5%), however a higher frequency of sar-copenia and undernutrition was also previously observed inolder adults from day care centre facilities.49 The low coex-istence observed here is an important finding and suggeststhat sarcopenia and undernutrition are not interchangeableconditions.
Moreover, when we compare the factors associated withboth conditions, only overweight and obesity were identi-fied. All this reinforces the need to identify both conditionswhen assessing nutritional status in the geriatric care.
Table 3 Results from the bivariate and multivariate logistic regression analysis, regarding undernutrition status
Undernutrition risk/Undernutrition
Unadjusted Adjusted
OR (95% CI) P-value OR (95% CI) P-value
SexWomen 1 1Men 0.63 (0.47–0.84) 0.002 0.78 (0.56–1.09) 0.151
Age65–75 years 1 1>75 years 1.35 (1.02–1.78) 0.033 0.86 (0.62–1.18) 0.351
ResidenceHome 1 1Care home 1.95 (1.13–3.35) 0.016 1.23 (0.68–2.24) 0.499
Education levelWithout education 1 11–4 years 0.62 (0.43–0.90) 0.011 0.76 (0.51–1.13) 0.174≥5 years 0.52 (0.32–0.85) 0.008 0.77 (0.45–1.33) 0.352
Marital statusSingle/Divorced/Widower 1 1Married/Common-law marriage 0.57 (0.43–0.75) <0.001 0.75 (0.54–1.04) 0.084
Self-perception of health statusVery good/Good 1 1Fair 1.36 (0.95–1.95) 0.093 1.38 (0.95–2.02) 0.093Poor/Very poor 3.96 (2.69–5.82) <0.001 3.53 (2.32–5.37) <0.001
Cognitive functionNot impaired 1 1Impaired 2.32 (1.47–3.67) <0.001 1.62 (0.98–2.69) 0.061
Smoking statusNon-smoker 1 1Smoker 1.25 (0.67–2.32) 0.484 1.10 (0.54–2.24) 0.787
Alcohol consumptionNone 1 1Moderate (W ≤ 1/day; M ≤ 2/day) 0.61 (0.45–0.83) 0.001 0.93 (0.67–1.31) 0.688Excessive (W> 1/day; M > 2/day) 0.58 (0.35–0.97) 0.038 1.07 (0.61–1.88) 0.814
Physical ActivityNot low 1 1Low 2.40 (1.75–3.29) <0.001 1.74 (1.23–2.47) 0.002
BMI (WHO)<25.0 kg/m2 1 125.0–29.9 kg/m2 0.39 (0.27–0.56) <0.001 0.40 (0.27–0.59) <0.001>30.0 kg/m2 0.48 (0.34–0.69) <0.001 0.43 (0.28–0.65) <0.001
Sarcopenia statusNot sarcopenic 1 1sarcopenia 2.98 (1.76–5.05) <0.001 1.85 (1.02–3.36) 0.043
BMI, body mass index; CI, confidence interval; M, men; OR, odds ratio; W, women; WHO, World Health Organization.
A. R. Sousa-Santos et al.
610 © 2019 Dietitians Association of Australia
The present study has several strengths and some limita-tions. It is the first to explore the associated factors of sar-copenia and undernutrition in the same older adultpopulation. In addition, sarcopenia was defined accordingto the new revised EWGSOP2 definition and undernutri-tion status was evaluated using MNA-SF, which is a reliabletool to assess nutritional status.6,7 The present study hasthe limitation inherent to a cross-sectional design, thereforewe were unable to determine cause–effect relationships.Second, muscle mass was evaluated using calf circumfer-ence and MAMC over dual-energy X-ray absorptiometry,recommended by the EWGSOP2, which could underesti-mate sarcopenia frequency. Third, during gait speed evalua-tion, a distance of 4.6m was used, instead of 4m suggestedby EWGSOP2. Although the velocity would theoretically bethe same, we cannot exclude the possibility that this longerdistance can result in slightly slower or faster walkingspeeds, and therefore influence the frequency of sarcopeniaseverity. Also, the low number of sarcopenic and under-nourished individuals in this sample may hinder the exis-tence of possible associations.
In conclusion, the majority of the older adults includedin the present study presented low muscle strength (proba-ble sarcopenia), but only a small number had concomi-tantly low muscle quantity or quality (sarcopenia). Also, thepresent study shows that a higher BMI is inversely associ-ated with both sarcopenia and undernutrition. Plus, anassociation between sarcopenia and undernutrition wasonly found when calf circumference was used to estimatemuscle quantity and quality, not MAMC. However, thecoexistence between these conditions is low which rein-forces the need to assess them both individually duringgeriatric assessment.
Funding source
The present project was 85% funded by the Public HealthInitiatives Programme (PT06), financed by EEA GrantsFinancial Mechanism 2009–2014 and 15% funded byFaculty of Nutrition and Food Science, University of Porto.
Conflict of interest
The authors declare no conflict of interest.
Authorship
ARSS and TFA designed this research. ARSS and TFAanalysed data. All authors contributed to manuscript prepa-ration and approved the final version of the manuscriptsubmitted for publication.
References
1 Sousa-Santos AR, Afonso C, Borges N et al. Sarcopenia andundernutrition among Portuguese older adults: results fromnutrition UP 65 study. Food Nutr Bull 2018; 39: 487–92.
2 Cao L, Morley JE. Sarcopenia is recognized as an independentcondition by an international classification of disease, tenthrevision, clinical modification (ICD-10-CM) code. J Am MedDir Assoc 2016; 17: 675–7.
3 Cruz-Jentoft AJ, Baeyens JP, Bauer JM et al. Sarcopenia:European consensus on definition and diagnosis: report of theEuropean working group on sarcopenia in older people. AgeAgeing 2010; 39: 412–23.
4 Cruz-Jentoft AJ, Bahat G, Bauer J et al. Sarcopenia: revisedEuropean consensus on definition and diagnosis. Age Ageing2018; 48: 16–31.
5 Jensen GL, Mirtallo J, Compher C et al. Adult starvation anddisease-related malnutrition. J Parenter Enteral Nutr 2010;34: 156–9.
6 Kaiser MJ, Bauer JM, Uter W et al. Prospective validation of themodified mini nutritional assessment short-forms in the com-munity, nursing home, and rehabilitation setting. J Am GeriatrSoc 2011; 59: 2124–8.
7 Phillips MB, Foley AL, Barnard R, Isenring EA, Miller MD.Nutritional screening in community-dwelling older adults: asystematic literature review. Asia Pac J Clin Nutr 2010;19: 440–9.
8 Vandewoude MFJ, Alish CJ, Sauer AC, Hegazi RA. Malnutri-tion-sarcopenia syndrome: is this the future of nutrition screen-ing and assessment for older adults? J Aging Res 2012;2012: 1–8.
9 Hu X, Zhang L, Wang H, Hao Q, Dong B, Yang M. Malnutri-tion-sarcopenia syndrome predicts mortality in hospitalizedolder patients. Sci Rep 2017; 7: 3171.
10 Sousa AS, Guerra RS, Fonseca I, Pichel F, Ferreira S,Amaral TF. Financial impact of sarcopenia on hospitalizationcosts. Eur J Clin Nutr 2016; 70: 1046–51.
11 Lim SL, Ong KCB, Chan YH, Loke WC, Ferguson M,Daniels L. Malnutrition and its impact on cost of hospitaliza-tion, length of stay, readmission and 3-year mortality. Clin Nutr2012; 31: 345–50.
12 Tsekoura M, Kastrinis A, Katsoulaki M, Billis E, Gliatis J. Sar-copenia and its impact on quality of life. GeNeDis Advances inExperimental Medicine and Biology, Vol. 987. 2017; 213–8.
13 Rasheed S, Woods RT. Malnutrition and quality of life in olderpeople: a systematic review and meta-analysis. Ageing Res Rev2013; 12: 561–6.
14 Kruizenga H, van Keeken S, Weijs P et al. Undernutritionscreening survey in 564,063 patients: patients with a positiveundernutrition screening score stay in hospital 1.4 d longer.Am J Clin Nutr 2016; 103: 1026–32.
15 Sousa AS, Guerra RS, Fonseca I, Pichel F, Amaral TF. Sar-copenia and length of hospital stay. Eur J Clin Nutr 2016; 70:595–601.
16 Brown JC, Harhay MO, Harhay MN. Sarcopenia and mortalityamong a population-based sample of community-dwellingolder adults. J Cachexia Sarcopenia Muscle 2016; 7: 290–8.
17 Söderström L, Rosenblad A, Adolfsson ET, Saletti A,Bergkvist L. Nutritional status predicts preterm death in olderpeople: a prospective cohort study. Clin Nutr 2014; 33: 354–9.
18 Instituto Nacional de Saúde Doutor Ricardo Jorge. 1o InquéritoNacional de Saúde Com Exame Físico (INSEF 2015): Estado deSaúde. Lisboa, 2016.
19 Amaral TF, Santos A, Guerra RS et al. Nutritional strategies fac-ing an older demographic: the nutrition UP 65 study protocol.JMIR Res Protoc 2016; 5: e184.
20 Stewart A, Marfell-Jones M, International Society for Advance-ment of Kinanthropometry. International Standards for
Sarcopenia and undernutrition in older adults
© 2019 Dietitians Association of Australia 611
Anthropometric Assessment. Australia: International Society forthe Advancement of Kinanthropometry, 2011.
21 Chumlea WC, Guo S, Roche AF, Steinbaugh ML. Prediction ofbody weight for the nonambulatory elderly from anthropome-try. J Am Diet Assoc 1988; 88: 564–8.
22 Landi F, Liperoti R, Russo A et al. Sarcopenia as a risk factorfor falls in elderly individuals: results from the ilSIRENTEstudy. Clin Nutr 2012; 31: 652–8.
23 Jelliffe D. The Assessment of the Nutritional Status of the Commu-nity. Geneva: World Health Organization 1966.
24 Fess EE. Clinical Assessment Recommendations, 2nd edn. Chi-cago: American Society of Hand Therapists 1992.
25 Dodds RM, Syddall HE, Cooper R et al. Grip strength acrossthe life course: normative data from twelve British studies.PLoS One 2014; 9: e113637.
26 Landi F, Onder G, Russo A et al. Calf circumference, frailtyand physical performance among older adults living in thecommunity. Clin Nutr 2014; 33: 539–44.
27 Nestle Nutrition Institute. MNA Mini Nutritional Assessment,2009. (Available form: http://www.mna-elderly.com/forms/mini/mna_mini_portuguese.pdf, accessed 1 March 2019).
28 Guerreiro M. Testes de rastreio de defeito cognitivo edemência: uma perspectiva prática. Rev Port Clín Geral 2010;26: 46–53.
29 Craig CL, Marshall AL, Sjöström M et al. International physicalactivity questionnaire: 12-country reliability and validity. MedSci Sports Exerc 2003; 35: 1381–95.
30 Fried LP, Tangen CM, Walston J et al. Frailty in older adults:evidence for a phenotype. J Gerontol A Biol Sci Med Sci 2001;56: M146–56.
31 World Health Organization (WHO). Obesity: preventing andmanaging the global epidemic. Report of a WHO ConsultationVol 894; 2000.
32 Lipschitz DA. Screening for nutritional status in the elderly.Prim Care 1994; 21: 55–67.
33 Cruz-Jentoft AJ, Landi F, Schneider SM et al. Prevalence of andinterventions for sarcopenia in ageing adults: a systematicreview. Report of the international sarcopenia initiative(EWGSOP and IWGS). Age Ageing 2014; 43: 748–59.
34 Steffl M, Bohannon RW, Petr M, Kohlikova E, Holmerova I.Alcohol consumption as a risk factor for sarcopenia - a meta-analysis. BMC Geriatr 2016; 16: 99.
35 Iannuzzi-Sucich M, Prestwood KM, Kenny AM. Prevalence ofsarcopenia and predictors of skeletal muscle mass in healthy,older men and women. J Gerontol A Biol Sci Med Sci 2002; 57:M772–7.
36 Newman AB, Kupelian V, Visser M et al. Sarcopenia: alternativedefinitions and associations with lower extremity function.J Am Geriatr Soc 2003; 51: 1602–9.
37 Batsis JA, Mackenzie TA, Bartels SJ, Sahakyan KR, Somers VK,Lopez-Jimenez F. Diagnostic accuracy of body mass index toidentify obesity in older adults: NHANES 1999-2004. Int JObes (Lond) 2016; 40: 761–7.
38 Fávaro-Moreira NC, Krausch-Hofmann S, Matthys C et al. Riskfactors for malnutrition in older adults: a systematic review of
the literature based on longitudinal data. Adv Nutr 2016; 7:507–22.
39 dos Santos ALM, do Amaral TMSPF, Borges NPGFB. Undernu-trition and associated factors in a Portuguese older adult com-munity. Rev Nutr 2015; 28: 231–40.
40 Ji L, Meng H, Dong B. Factors associated with poor nutritionalstatus among the oldest-old. Clin Nutr 2012; 31: 922–6.
41 Nykänen I, Lönnroos E, Kautiainen H, Sulkava R,Hartikainen S. Nutritional screening in a population-basedcohort of community-dwelling older people. Eur J Public Health2013; 23: 405–9.
42 Bollwein J, Volkert D, Diekmann R et al. Nutritional statusaccording to the mini nutritional assessment (MNA®) andfrailty in community dwelling older persons: a close relation-ship. J Nutr Health Aging 2013; 17: 351–6.
43 Guerra RS, Fonseca I, Pichel F, Restivo MT, Amaral TF. Hand-grip strength cutoff values for undernutrition screening at hos-pital admission. Eur J Clin Nutr 2014; 68: 1315–21.
44 da Silva Alexandre T, de Oliveira Duarte YA, FerreiraSantos JL, Wong R, Lebrão ML. Prevalence and associated fac-tors of sarcopenia among elderly in Brazil: findings from theSABE study. J Nutr Health Aging 2014; 18: 284–90.
45 Beaudart C, Reginster JY, Petermans J et al. Quality of life andphysical components linked to sarcopenia: the SarcoPhAgestudy. Exp Gerontol 2015; 69: 103–10.
46 Landi F, Liperoti R, Russo A et al. Association of anorexia withsarcopenia in a community-dwelling elderly population: resultsfrom the ilSIRENTE study. Eur J Nutr 2013; 52: 1261–8.
47 Rubbieri G, Mossello E, Di Bari M. Techniques for the diagnosisof sarcopenia. Clin Cases Miner Bone Metab 2014; 11: 181–4.
48 Eglseer D, Eminovic S, Lohrmann C. Association between sar-copenia and nutritional status in older adults: a systematic lit-erature review. J Gerontol Nurs 2016; 42: 33–41.
49 Bernardo S, Amaral TF. Coexistence of undernutrition withsarcopenia among older adults in Paços de Ferreira. Acta PortNutr 2016; 5: 12–6.
Supporting information
Additional Supporting Information may be found in theonline version of this article at the publisher’s web-site:
Table S1 Agreement between sarcopenia definitions usingcalf circumference and mid-arm muscle circumference(MAMC) to estimate muscle quantity and quality(n = 1495).Table S2 Characteristics of a sub-sample of 1495 olderadults, regarding sarcopenia status using MAMC criterion(n=1495).Table S3 Results from the bivariate and multivariate logisticregression analysis, regarding sarcopenia status usingMAMC criterion (n = 1495).
A. R. Sousa-Santos et al.
612 © 2019 Dietitians Association of Australia
ORIGINAL RESEARCH
Anthropometric measures associated with sarcopeniain outpatients with liver cirrhosis
Lívia A.A. SANTOS,1 Talles B. LIMA,1 Marjorie do Val IETSUGU,1 Hélio R. de Carvalho NUNES,2
Xingshun QI3 and Fernando G. ROMEIRO 1
Departments of 1Internal Medicine, Botucatu Medical School and 2Public Health, Botucatu Medical School,Universidade Estadual Paulista (UNESP), São Paulo, Brazil; and 3General Hospital of Shenyang Military Command,Shenyang, China
AbstractAim: The present study aimed to identify variables associated with sarcopenia in cirrhotic outpatients using clinicaldata, anthropometric measures and lab tests. In a single centre prospective study, 261 cirrhotic outpatients were fol-lowed on average for 2 years. The diagnostic criteria of sarcopenia were applied according to the current guidelines,combining muscle strength and appendicular muscle mass index.Methods: Age, sex, liver disease aetiology and the Model of End-Stage Liver Disease score were included as inde-pendent variables, as well as mid-arm circumference (MAC), body mass index and triceps skinfold. Multiple logisticregression was applied including all independent variables (maximum model). Then, the analysis was performedonly with the variables that were significant in the first analysis (parsimonious model). Once the variable mostrelated to sarcopenia was determined by the two models, the area under the receiver operator characteristic curvewas calculated. Mortality rates were described for patients with and without sarcopenia.Results: Sarcopenia was diagnosed in 14 subjects (5.36%), and the variable best associated with sarcopenia wasMAC (P < 0.01). The 1-year mortality rate of 35.71% found among subjects with sarcopenia was not significantlyhigher (P = 0.07) than the 15.38% observed among those without this condition.Conclusions: Before examinations requiring ionising radiation, patients with cirrhosis can be submitted to simplescreening tools to identify those who have a high risk of sarcopenia, thus promoting a cost-effective assessment.
Key words: body composition, chronic disease management, nutrition screening, nutritional status.
Introduction
For the non-cirrhotic population, the current definitions ofsarcopenia require the presence of both muscle wasting andreduced strength.1,2 Although cirrhosis is a well-known riskfactor for sarcopenia, there is not a specific guideline onthis issue applicable to patients with chronic liver disease,so most studies in cirrhotic populations have used onlymuscle wasting for sarcopenia diagnosis.3–9 Despite affect-ing as much as 40–45% of cirrhotic patients waiting forliver transplantation, in whom sarcopenia is associated with
poor outcomes,10–12 the prevalence and the effects of thiscondition among outpatients without advanced disease arenot well known.13,14 Protein catabolism and amino acidexpenditure are high in liver cirrhosis, leading to loss ofmuscle mass and physical performance, thus increasing therisk for sarcopenia.8,9,15 Despite the possibility of livertransplantation, many patients with chronic liver insuffi-ciency are not submitted to a definite treatment anddevelop sarcopenia, which can be associated with the riskof other complications such as hepatic encephalopathy,ascites and infections.3,16,17
Unfortunately, sarcopenia can be diagnosed only whenthese patients meet diagnostic criteria established fromcomplex examinations often associated with high cost,ionising radiation exposure and patients’ transportation tothe equipment room, thus precluding their usage duringroutine outpatient appointments. Computed tomography(CT) and dual energy X ray absorptiometry (DXA) are thegold-standard methods to diagnose sarcopenia and theirresults have a strong impact on outcome, but the correla-tion between them are not as high as expected. A previousstudy showed through analysing the prevalence of musclewasting in cirrhotic patients on liver transplantation lists,
L.A.A. Santos, MSc, DietitianT.B. Lima, PhD, Medical DoctorM. do Val Ietsugu, PhD, BiologistH.R. de Carvalho Nunes, MSc, StatisticianX. Qi, PhD, Professor of MedicineF.G. Romeiro, PhD, Professor of MedicineCorrespondence: F.G. Romeiro, Mário Rubens GuimarãesMontenegro, s/n, Distrito de Rubião Jr., Zip Code 18 618687, Botucatu, São Paulo, Brazil. Tel.: +55 (14) 3880 1171; fax: +55(14) 3880 1171 or +55 (14) 3882 1667.Email: [email protected]
Accepted February 2019
© 2019 Dietitians Association of Australia 613
AA AA
DDD
ieti
tian
s As
soci
atio
nofof
Aus
tral
ia
Nutrition & Dietetics 2019; 76: 613–619 DOI: 10.1111/1747-0080.12523
that 76% of subjects had muscle depletion by skeletal mus-cle index (SMI) obtained by CT. However, sarcopenia diag-nosed by DXA was present in 42% and 52% of the samepatients by means of the appendicular muscle mass index(AMMI) and fat free mass index, respectively. The authorspointed out that the indexes obtained from CT and DXAare calculated from measures of different muscles, and theyused a CT cut-off derived from obese patients with neopla-sia because of the lack of validated cut-off values for CTexaminations in this population.7
Therefore, the aim of the present study was to find the bestpredictors of sarcopenia in outpatients with liver cirrhosisusing clinical data and anthropometric measures that can beeasily applied, leading to a higher degree of awareness aboutthe risk of sarcopenia in this population. Mortality rates inpatients with and without sarcopenia were also registered.
Methods
This single centre prospective study was approved by theComitê de Ética em Pesquisa Ethics Committee (protocolnumber 4403/12) and carried out according to the Declara-tion of Helsinki and its revisions. The trial registrationnumber and the official institutional review board isREBEC/RBR-76pm35. Informed consent was obtained fromthe subjects prior to their inclusion.
The inclusion criteria were minimal age of 18 years andthe presence of cirrhosis (histologically proven or confirmedby clinical, endoscopic and radiological findings showingsigns of portal hypertension). The exclusion criteria were thepresence of at least one of the following: acquired immuno-deficiency, current alcohol abuse, kidney insufficiency, neo-plastic disease, pregnancy and solid organ transplantation.Initially, 372 outpatients were recruited in the Hepatologyunit where the study was performed, but 111 of them wereexcluded (45 declined to participate, 39 did not completethe examinations, 16 died and 11 presented exclusion cri-teria). Hence, 261 individuals were submitted to the studyprotocol, which included clinical evaluation, nutritionalassessment, lab tests and DXA. They were followed for2 years (�1.33). Clinical evaluation focused on common cir-rhosis complications, grading the patients with ascites andhepatic encephalopathy according to the specific guidelineson these complications.18,19 Lab tests were measured fromvenous blood samples and consisted of albumin, creatinine,international normalised ratio and total bilirubin. All mea-surements were obtained at one timepoint only, during ascheduled research visit, by the same observer (L.A.A.S.).
Anthropometric evaluation was performed according to astrict protocol, which consisted of measuring weight, height,mid-arm circumference (MAC) and triceps skinfold (TSF).Height and weight measurements were acquired on a stadi-ometer coupled with a decimal scale platform (Filizola ID1500, São Paulo, Brazil). The weight values were adjustedaccording to the presence of ascites and/or oedema asrecommended.20 The body mass index (BMI) was obtainedby calculating the dry weight divided by the square of theheight.
To measure the MAC, the subject was kept standing andthe non-dominant arm was flexed at a 90� angle with thehand in supinated position, when the point between the acro-minum and the olecran was found. Then, the arm wasextended with the palm facing the body and the tape was usedto measure the MAC without compressing the skin. At thesame point, the skinfold containing the skin and the adiposetissue was pinched between the first and the second fingers ofthe researcher and measured with the skin fold calliper(Lange, Michigan, USA) set-up at a 90� angle. MAC and TSFwere obtained using tape measure and skin fold calliper(Lange), respectively, according to prior descriptions.21,22
A mechanical dynamometer (Saehan Corporation, Dangjin,South Korea) was employed to measure the handgrip strength(HGS) of the non-dominant hand, while encouraging eachsubject to make the maximum effort during three tests, appliedwith the patient seated and the forearm flexed from the elbowat a 90� angle. The highest value out of these tests was regis-tered, separating each of them by 30 seconds of resting.23
All subjects were submitted to the DXA examination(Discovery QDR Hologic Inc., Massachusetts, USA) toquantify their lean mass. The AMMI was calculated bydividing the skeletal muscle mass of the four limbs by thesquare of the height.24 Therefore, sarcopenia was estab-lished in subjects who had AMMI and HGS lower than thecut-off points given in the current guidelines (AMMI lowerthan 7.26 kg/m2 for men or lower than 5.45 kg/m2 forwomen and HGS lower than 30 kg for men or lower than20 kg for women).1 The sample was followed for 2 years inorder to register the subjects’ mortality.
Considering a significance level of 0.05, simple randomsampling, estimated sensitivity and specificity of the inde-pendent variables as 0.95, error probability as 10% and sar-copenia prevalence as 10% according to a prior study of asimilar population,11 the required sample size was esti-mated as 182 subjects.
Logistic regression analysis was used to evaluate the rela-tionship between sarcopenia and the aforementioned vari-ables. First, all the variables with possible clinicalsignificance were included, according to the principle ofplenitude.25 After this initial analysis, only the significantvariables were evaluated in a second analysis, according tothe principle of parsimony.25 A relevant advantage of thesemodels is that they avoid the usage of univariate analysis,which is based on the principle that the relationshipbetween the dependent variable and each independent vari-able could be set apart of the effect from the others. Oncethe variable related to sarcopenia was determined, the areaunder the receiver operator characteristic curve (AUROC)was calculated, finding the cut-off values with the best sen-sitivity and specificity. The software IBM SPSS Statistics forWindows, version 21.0 (IBM Corp., Armonk, NY, USA)was employed to perform the statistical analysis.
Results
As the study was performed during outpatient medicalappointments, most subjects had low MELD scores. Even
L. A. A. Santos et al.
614 © 2019 Dietitians Association of Australia
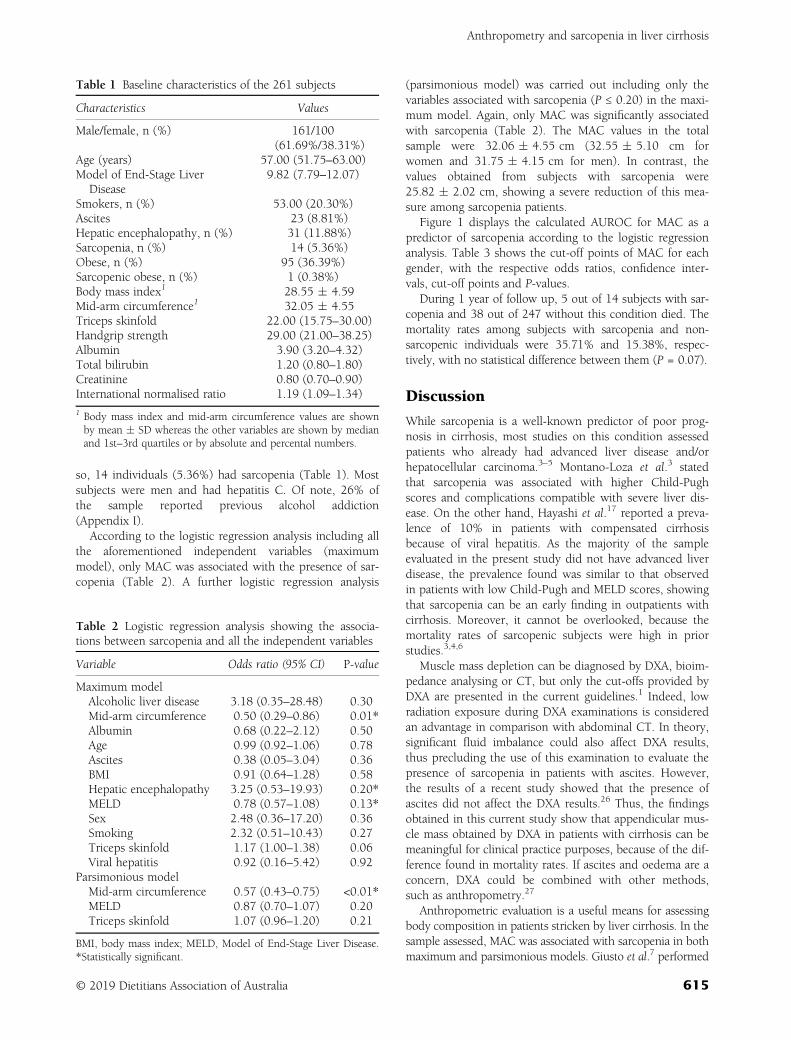
so, 14 individuals (5.36%) had sarcopenia (Table 1). Mostsubjects were men and had hepatitis C. Of note, 26% ofthe sample reported previous alcohol addiction(Appendix I).
According to the logistic regression analysis including allthe aforementioned independent variables (maximummodel), only MAC was associated with the presence of sar-copenia (Table 2). A further logistic regression analysis
(parsimonious model) was carried out including only thevariables associated with sarcopenia (P ≤ 0.20) in the maxi-mum model. Again, only MAC was significantly associatedwith sarcopenia (Table 2). The MAC values in the totalsample were 32.06 � 4.55 cm (32.55 � 5.10 cm forwomen and 31.75 � 4.15 cm for men). In contrast, thevalues obtained from subjects with sarcopenia were25.82 � 2.02 cm, showing a severe reduction of this mea-sure among sarcopenia patients.
Figure 1 displays the calculated AUROC for MAC as apredictor of sarcopenia according to the logistic regressionanalysis. Table 3 shows the cut-off points of MAC for eachgender, with the respective odds ratios, confidence inter-vals, cut-off points and P-values.
During 1 year of follow up, 5 out of 14 subjects with sar-copenia and 38 out of 247 without this condition died. Themortality rates among subjects with sarcopenia and non-sarcopenic individuals were 35.71% and 15.38%, respec-tively, with no statistical difference between them (P = 0.07).
Discussion
While sarcopenia is a well-known predictor of poor prog-nosis in cirrhosis, most studies on this condition assessedpatients who already had advanced liver disease and/orhepatocellular carcinoma.3–5 Montano-Loza et al.3 statedthat sarcopenia was associated with higher Child-Pughscores and complications compatible with severe liver dis-ease. On the other hand, Hayashi et al.17 reported a preva-lence of 10% in patients with compensated cirrhosisbecause of viral hepatitis. As the majority of the sampleevaluated in the present study did not have advanced liverdisease, the prevalence found was similar to that observedin patients with low Child-Pugh and MELD scores, showingthat sarcopenia can be an early finding in outpatients withcirrhosis. Moreover, it cannot be overlooked, because themortality rates of sarcopenic subjects were high in priorstudies.3,4,6
Muscle mass depletion can be diagnosed by DXA, bioim-pedance analysing or CT, but only the cut-offs provided byDXA are presented in the current guidelines.1 Indeed, lowradiation exposure during DXA examinations is consideredan advantage in comparison with abdominal CT. In theory,significant fluid imbalance could also affect DXA results,thus precluding the use of this examination to evaluate thepresence of sarcopenia in patients with ascites. However,the results of a recent study showed that the presence ofascites did not affect the DXA results.26 Thus, the findingsobtained in this current study show that appendicular mus-cle mass obtained by DXA in patients with cirrhosis can bemeaningful for clinical practice purposes, because of the dif-ference found in mortality rates. If ascites and oedema are aconcern, DXA could be combined with other methods,such as anthropometry.27
Anthropometric evaluation is a useful means for assessingbody composition in patients stricken by liver cirrhosis. In thesample assessed, MAC was associated with sarcopenia in bothmaximum and parsimonious models. Giusto et al.7 performed
Table 1 Baseline characteristics of the 261 subjects
Characteristics Values
Male/female, n (%) 161/100(61.69%/38.31%)
Age (years) 57.00 (51.75–63.00)Model of End-Stage Liver
Disease9.82 (7.79–12.07)
Smokers, n (%) 53.00 (20.30%)Ascites 23 (8.81%)Hepatic encephalopathy, n (%) 31 (11.88%)Sarcopenia, n (%) 14 (5.36%)Obese, n (%) 95 (36.39%)Sarcopenic obese, n (%) 1 (0.38%)Body mass index1 28.55 � 4.59Mid-arm circumference1 32.05 � 4.55Triceps skinfold 22.00 (15.75–30.00)Handgrip strength 29.00 (21.00–38.25)Albumin 3.90 (3.20–4.32)Total bilirubin 1.20 (0.80–1.80)Creatinine 0.80 (0.70–0.90)International normalised ratio 1.19 (1.09–1.34)
1 Body mass index and mid-arm circumference values are shownby mean � SD whereas the other variables are shown by medianand 1st–3rd quartiles or by absolute and percental numbers.
Table 2 Logistic regression analysis showing the associa-tions between sarcopenia and all the independent variables
Variable Odds ratio (95% CI) P-value
Maximum modelAlcoholic liver disease 3.18 (0.35–28.48) 0.30Mid-arm circumference 0.50 (0.29–0.86) 0.01*Albumin 0.68 (0.22–2.12) 0.50Age 0.99 (0.92–1.06) 0.78Ascites 0.38 (0.05–3.04) 0.36BMI 0.91 (0.64–1.28) 0.58Hepatic encephalopathy 3.25 (0.53–19.93) 0.20*MELD 0.78 (0.57–1.08) 0.13*Sex 2.48 (0.36–17.20) 0.36Smoking 2.32 (0.51–10.43) 0.27Triceps skinfold 1.17 (1.00–1.38) 0.06Viral hepatitis 0.92 (0.16–5.42) 0.92
Parsimonious modelMid-arm circumference 0.57 (0.43–0.75) <0.01*MELD 0.87 (0.70–1.07) 0.20Triceps skinfold 1.07 (0.96–1.20) 0.21
BMI, body mass index; MELD, Model of End-Stage Liver Disease.*Statistically significant.
Anthropometry and sarcopenia in liver cirrhosis
© 2019 Dietitians Association of Australia 615
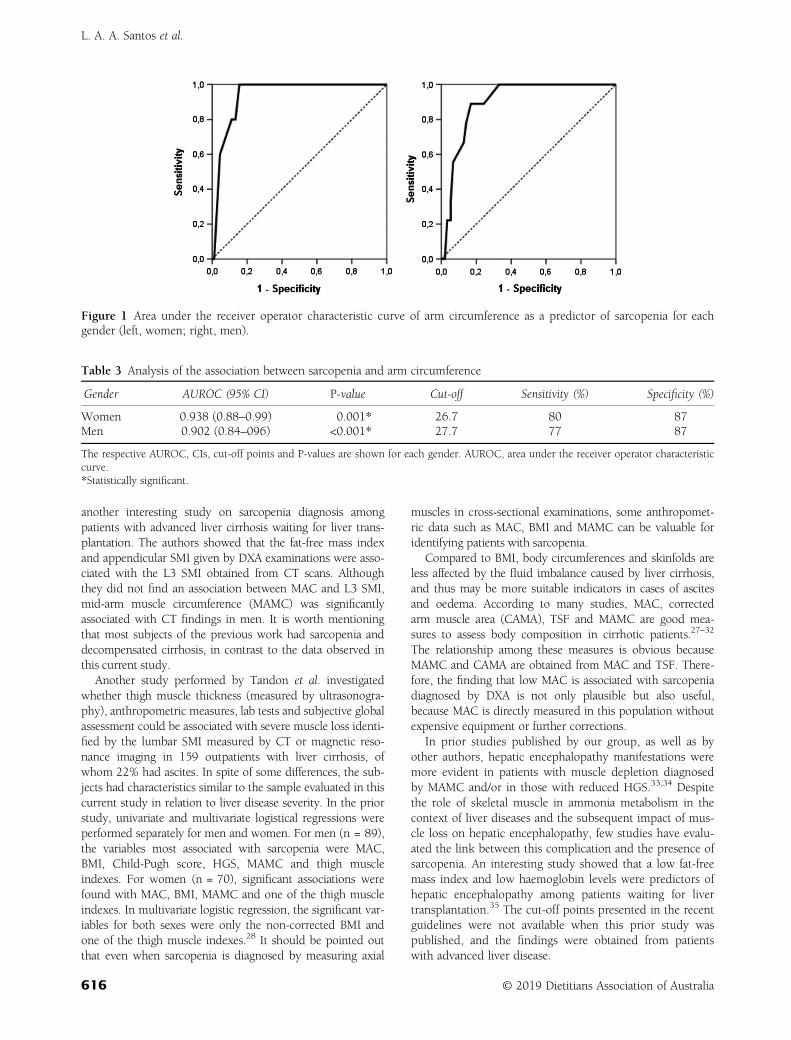
another interesting study on sarcopenia diagnosis amongpatients with advanced liver cirrhosis waiting for liver trans-plantation. The authors showed that the fat-free mass indexand appendicular SMI given by DXA examinations were asso-ciated with the L3 SMI obtained from CT scans. Althoughthey did not find an association between MAC and L3 SMI,mid-arm muscle circumference (MAMC) was significantlyassociated with CT findings in men. It is worth mentioningthat most subjects of the previous work had sarcopenia anddecompensated cirrhosis, in contrast to the data observed inthis current study.
Another study performed by Tandon et al. investigatedwhether thigh muscle thickness (measured by ultrasonogra-phy), anthropometric measures, lab tests and subjective globalassessment could be associated with severe muscle loss identi-fied by the lumbar SMI measured by CT or magnetic reso-nance imaging in 159 outpatients with liver cirrhosis, ofwhom 22% had ascites. In spite of some differences, the sub-jects had characteristics similar to the sample evaluated in thiscurrent study in relation to liver disease severity. In the priorstudy, univariate and multivariate logistical regressions wereperformed separately for men and women. For men (n = 89),the variables most associated with sarcopenia were MAC,BMI, Child-Pugh score, HGS, MAMC and thigh muscleindexes. For women (n = 70), significant associations werefound with MAC, BMI, MAMC and one of the thigh muscleindexes. In multivariate logistic regression, the significant var-iables for both sexes were only the non-corrected BMI andone of the thigh muscle indexes.28 It should be pointed outthat even when sarcopenia is diagnosed by measuring axial
muscles in cross-sectional examinations, some anthropomet-ric data such as MAC, BMI and MAMC can be valuable foridentifying patients with sarcopenia.
Compared to BMI, body circumferences and skinfolds areless affected by the fluid imbalance caused by liver cirrhosis,and thus may be more suitable indicators in cases of ascitesand oedema. According to many studies, MAC, correctedarm muscle area (CAMA), TSF and MAMC are good mea-sures to assess body composition in cirrhotic patients.27–32
The relationship among these measures is obvious becauseMAMC and CAMA are obtained from MAC and TSF. There-fore, the finding that low MAC is associated with sarcopeniadiagnosed by DXA is not only plausible but also useful,because MAC is directly measured in this population withoutexpensive equipment or further corrections.
In prior studies published by our group, as well as byother authors, hepatic encephalopathy manifestations weremore evident in patients with muscle depletion diagnosedby MAMC and/or in those with reduced HGS.33,34 Despitethe role of skeletal muscle in ammonia metabolism in thecontext of liver diseases and the subsequent impact of mus-cle loss on hepatic encephalopathy, few studies have evalu-ated the link between this complication and the presence ofsarcopenia. An interesting study showed that a low fat-freemass index and low haemoglobin levels were predictors ofhepatic encephalopathy among patients waiting for livertransplantation.35 The cut-off points presented in the recentguidelines were not available when this prior study waspublished, and the findings were obtained from patientswith advanced liver disease.
Figure 1 Area under the receiver operator characteristic curve of arm circumference as a predictor of sarcopenia for eachgender (left, women; right, men).
Table 3 Analysis of the association between sarcopenia and arm circumference
Gender AUROC (95% CI) P-value Cut-off Sensitivity (%) Specificity (%)
Women 0.938 (0.88–0.99) 0.001* 26.7 80 87Men 0.902 (0.84–096) <0.001* 27.7 77 87
The respective AUROC, CIs, cut-off points and P-values are shown for each gender. AUROC, area under the receiver operator characteristiccurve.*Statistically significant.
L. A. A. Santos et al.
616 © 2019 Dietitians Association of Australia
Studies using CT to diagnose sarcopenia have shown asignificant association between this condition and poor out-comes. In the study of Tandon et al., sarcopenia was pre-sent in half of the subjects and was associated with survivalrates of 63%, 51% and 51% at 1, 2 and 3 years, respec-tively, whereas non-sarcopenic patients achieved survival of79%, 74% and 70%.4 Montano-Loza et al.3 reported thatthis condition was found in 40% of the subjects enrolledand reported a 1-year probability of survival of 53% and83% in sarcopenic and non-sarcopenic individuals, butfewer patients were followed. Kim et al.6 established a cut-off of 14 mm/m for the right psoas muscle thickness mea-surement divided by height, obtaining 1- and 2-year mor-tality rates of 2.6% and 15.2% for patients above that valueand 41.6% and 66.8% for those below it.
Nevertheless, the data obtained from this current studyadded new information on this matter. In the sample,11.88% of subjects presented overt hepatic encephalopathy.Even in patients with cirrhosis and low MELD scores, liverconversion of ammonia into urea can be insufficient, partic-ularly in patients with portosystemic shunts. While thepatient is not stricken by significant muscle loss, the con-version of ammonia to glutamine could be done predomi-nantly in skeletal muscles, decreasing the rate of thisconversion in the brain, where it causes astrocyte oedemaand hepatic encephalopathy.27
The sample evaluated in the present study had a highproportion of obese patients (95 out of 261). Obesity hasbeen linked to deleterious effects on patients stricken byliver cirrhosis, regardless of liver disease aetiology. In thiscurrent study, only one sarcopenic subject had sarcopenicobesity according to the established criteria.36 A prior studyshowed that obese patients with compensated cirrhosiswere more prone to suffer disease decompensation.37 More-over, a clinical trial found that 16 weeks of diet and exer-cises promoted weight and portal pressure reduction inoverweight and obese cirrhotic patients.38 Future studiesshould investigate the role of sarcopenia among obesepatients with liver cirrhosis, because obesity prevalence hasincreased in this population.
The sensitivity and specificity of MAC were similar tovalues obtained using more expensive predictors. A recentstudy evaluating the role of psoas muscle thickness as afunction of height as a sarcopenia predictor in liver cirrho-sis found sensitivity and specificity of 65.3% and 76.3% formen and 31.2% and 90.6% for women, respectively.39 Itshould be emphasised that the measure proposed wasobtained through ionising radiation examinations. Inanother study aiming to identify sarcopenia predictors byapplying ultrasound-based measurements of peripheralmuscle mass combined with BMI, the model had sensitivityand specificity of 72% and 78% for men and 94% and 76%for women, respectively.28
A limitation of the study was the low prevalence of sar-copenia in the sample, which was lower than in similarworks and cannot be explained by the current data. On theother hand, some advantages can be noted. First, the num-ber of patients included was significantly higher than the
sample size calculated before. Second, the logistic regressionmodels allow avoiding the usage of univariate analysis,which is based on the principle that the relationshipbetween the dependent variable and each independent vari-able could be set apart of the effect from the other ones.Thus, the results were in agreement to other similar studies,showing which anthropometric measures are important andadding cut-off points that can be easily applied in clinicalpractice.
In conclusion, the results presented in the present studyshow that simple clinical information such as a bedsidemeasure can be used as a screening tool to select whichpatients deserve a better assessment of body composition todiagnose sarcopenia as soon as possible. Likewise, the asso-ciations between sarcopenia, hepatic encephalopathy andanthropometric measures provide new information on therole of skeletal muscle in liver disease.
Funding source
The authors wish to acknowledge the financial supportreceived from Coordenação de Aperfeiçoamento de Pessoalde Nível Superior, Pró Reitoria de Pesquisa (PROPe) andSão Paulo Research Foundation (FAPESP), Grant Nos.2014/22572-9, 2016/07117-9 and 2017/25592-9.
Conflict of interest
The authors declare that there is no conflict of interestregarding the publication of this paper.
Authorship
FGR, HRCN and LAAS reviewed the literature, designedthe trial and wrote the study protocol. LAAS, FGR and TBLcollected the data. LAAS, FGR and HRCN performed thestatistical analysis and interpreted the results. LAAS, FGR,MVI, XQ and HRCN drafted the manuscript. LAAS, TBL,MVI, XQ and FGR provided critical comments and revisedthe manuscript. All authors made a significant contributionto the research and the development of the manuscript.
References
1 Cederholm T, Barazzoni R, Austin P et al. ESPEN guidelineson definitions and terminology of clinical nutrition. Clin Nutr2017; 36: 49–64.
2 Landi F, Calvani R, Picca A, Marzetti E. Can muscle strengthbe considered a composite biomarker of sarcopenia? J Am MedDir Assoc 2018; 19: 373–4.
3 Montano-Loza AJ, Meza-Junco J, Prado CM et al. Muscle wast-ing is associated with mortality in patients with cirrhosis. ClinGastroenterol Hepatol 2012; 10: 166–73.
4 Tandon P, Ney M, Irwin I et al. Severe muscle depletion inpatients on the liver transplant wait list: its prevalence andindependent prognostic value. Liver Transpl 2012; 18:1209–16.
5 Montano-Loza AJ, Meza-Junco J, Baracos VE et al. Severe mus-cle depletion predicts postoperative length of stay but is not
Anthropometry and sarcopenia in liver cirrhosis
© 2019 Dietitians Association of Australia 617
associated with survival after liver transplantation. Liver Transpl2014; 20: 640–8.
6 Kim TY, Kim MY, Sohn JH et al. Sarcopenia as a useful predic-tor for long-term mortality in cirrhotic patients with ascites.J Korean Med Sci 2014; 29: 1253–9.
7 Giusto M, Lattanzi B, Albanese C et al. Sarcopenia in liver cir-rhosis: the role of computed tomography scan for the assess-ment of muscle mass compared with dual-energy X-rayabsorptiometry and anthropometry. Eur J Gastroenterol Hepatol2015; 27: 328–34.
8 Lucero C, Verna EC. The role of sarcopenia and frailty inhepatic encephalopathy management. Clin Liver Dis 2015; 19:507–28.
9 Hanai T, Shiraki M, Nishimura K et al. Sarcopenia impairsprognosis of patients with liver cirrhosis. Nutrition 2015;31: 193–9.
10 Kalafateli M, Konstantakis C, Thomopoulos K, Triantos C.Impact of muscle wasting on survival in patients with liver cir-rhosis. World J Gastroenterol 2015; 21: 7357–61.
11 Montano-Loza AJ, Duarte-Rojo A, Meza-Junco J et al. Inclusionof sarcopenia within MELD (MELD-sarcopenia) and the predic-tion of mortality in patients with cirrhosis. Clin Transl Gastro-enterol 2015; 6: e102.
12 Prado CM, Lieffers JR, McCargar LJ et al. Prevalence and clini-cal implications of sarcopenic obesity in patients with solidtumours of the respiratory and gastrointestinal tracts: apopulation-based study. Lancet Oncol 2008; 9: 629–35.
13 Dovjak P. Sarcopenia in cases of chronic and acute illness. ZGerontol Geriatr 2016; 49: 100–6.
14 Santilli V, Bernetti A, Mangone M, Paoloni M. Clinical definitionof sarcopenia. Clin Cases Miner Bone Metab 2014; 11: 177–80.
15 Tsien C, Garber A, Narayanan A et al. Post-liver transplantationsarcopenia in cirrhosis: a prospective evaluation. J GastroenterolHepatol 2014; 29: 1250–7.
16 Dasarathy S. Consilience in sarcopenia of cirrhosis. J CachexiaSarcopenia Muscle 2012; 3: 225–37.
17 Hayashi F, Matsumoto Y, Momoki C et al. Physical inactivityand insufficient dietary intake are associated with the frequencyof sarcopenia in patients with compensated viral liver cirrhosis.Hepatol Res 2013; 43: 1264–75.
18 Vilstrup H, Amodio P, Bajaj J et al. Hepatic encephalopathy inchronic liver disease: 2014 practice guideline by the AmericanAssociation for the Study of Liver Diseases and the European Asso-ciation for the Study of the Liver. Hepatology 2014; 60: 715–35.
19 Vilstrup H, Amodio P, Bajaj J et al. Hepatic encephalopathy inchronic liver disease: 2014 practice guideline by the EuropeanAssociation for the Study of the Liver and the American Associ-ation for the Study of Liver Diseases. J Hepatol 2014; 61:642–59.
20 James R. Nutritional support in alcoholic liver disease: areview. J Hum Nutr 1989; 2: 315–23.
21 Callaway CW, Chumlea WC, Bouchard C et al. Circumfer-ences. In: Lohman TG, Roche AF, Martorell R, eds. Anthropo-metric Standardization Reference Manual. Champaign: HumanKinetics, 1988; 39–54.
22 Harrison GG, Buskirk ER, Carter JEL et al. Skinfold thicknessesand measurements technique. In: Lohman TG, Roche AF,
Martorell R, eds. Anthropometric Standardizing Reference Man-ual. Champaign: Human Kinetics, 1988; 55–80.
23 Alvares-da-Silva MR, Reverbel da Silveira T. Comparisonbetween handgrip strength, subjective global assessment, andprognostic nutritional index in assessing malnutrition and pre-dicting clinical outcome in cirrhotic outpatients. Nutrition2005; 21: 113–7.
24 Jeejeebhoy KN. Malnutrition, fatigue, frailty, vulnerability, sar-copenia and cachexia: overlap of clinical features. Curr OpinClin Nutr Metab Care 2012; 15: 213–9.
25 Baker A. Occam’s Razor in science: a case study from biogeog-raphy. Biol Philos 2007; 22: 193–215.
26 Belarmino G, Gonzalez MC, Sala P et al. Diagnosing sarcopeniain male patients with cirrhosis by dual-energy X-ray absorpti-ometry estimates of appendicular skeletal muscle mass. JPEN JParenter Enteral Nutr 2018; 42: 24–36.
27 Romeiro FG, Augusti L. Nutritional assessment in cirrhoticpatients with hepatic encephalopathy. World J Hepatol 2015; 7:2940–54.
28 Tandon P, Low G, Mourtzakis M et al. A model to identify sar-copenia in patients with cirrhosis. Clin Gastroenterol Hepatol2016; 14: 1473–80.e3.
29 Harrison J, McKiernan J, Neuberger JM. A prospective studyon the effect of recipient nutritional status on outcome in livertransplantation. Transpl Int 1997; 10: 369–74.
30 Alberino F, Gatta A, Amodio P et al. Nutrition and survival inpatients with liver cirrhosis. Nutrition 2001; 17: 445–50.
31 Carvalho L, Parise ER. Evaluation of nutritional status of non-hospitalized patients with liver cirrhosis. Arq Gastroenterol2006; 43: 269–74.
32 Morgan MY, Madden AM, Soulsby CT, Morris RW. Derivationand validation of a new global method for assessing nutritionalstatus in patients with cirrhosis. Hepatology 2006; 44: 823–35.
33 Merli M, Giusto M, Lucidi C et al. Muscle depletion increasesthe risk of overt and minimal hepatic encephalopathy: resultsof a prospective study. Metab Brain Dis 2013; 28: 281–4.
34 Augusti L, Franzoni LC, Santos LA et al. Lower values of hand-grip strength and adductor pollicis muscle thickness are associ-ated with hepatic encephalopathy manifestations in cirrhoticpatients. Metab Brain Dis 2016; 31: 909–15.
35 Kalaitzakis E, Josefsson A, Castedal M et al. Hepatic encepha-lopathy is related to anemia and fat-free mass depletion in livertransplant candidates with cirrhosis. Scand J Gastroenterol2013; 48: 577–84.
36 Eslamparast T, Montano-Loza AJ, Raman M, Tandon P. Sarco-penic obesity in cirrhosis—the confluence of 2 prognostictitans. Liver Int 2018; 38: 1706–17.
37 Berzigotti A, Garcia-Tsao G, Bosch J et al. Obesity is an inde-pendent risk factor for clinical decompensation in patients withcirrhosis. Hepatology 2011; 54: 555–61.
38 Berzigotti A, Albillos A, Villanueva C et al. Effects of an inten-sive lifestyle intervention program on portal hypertension inpatients with cirrhosis and obesity: the SportDiet study. Hepa-tology 2017; 65: 1293–05.
39 Gu DH, Kim MY, Seo YS et al. Clinical usefulness of psoasmuscle thickness for the diagnosis of sarcopenia in patientswith liver cirrhosis. Clin Mol Hepatol 2018; 24: 319–30.
L. A. A. Santos et al.
618 © 2019 Dietitians Association of Australia
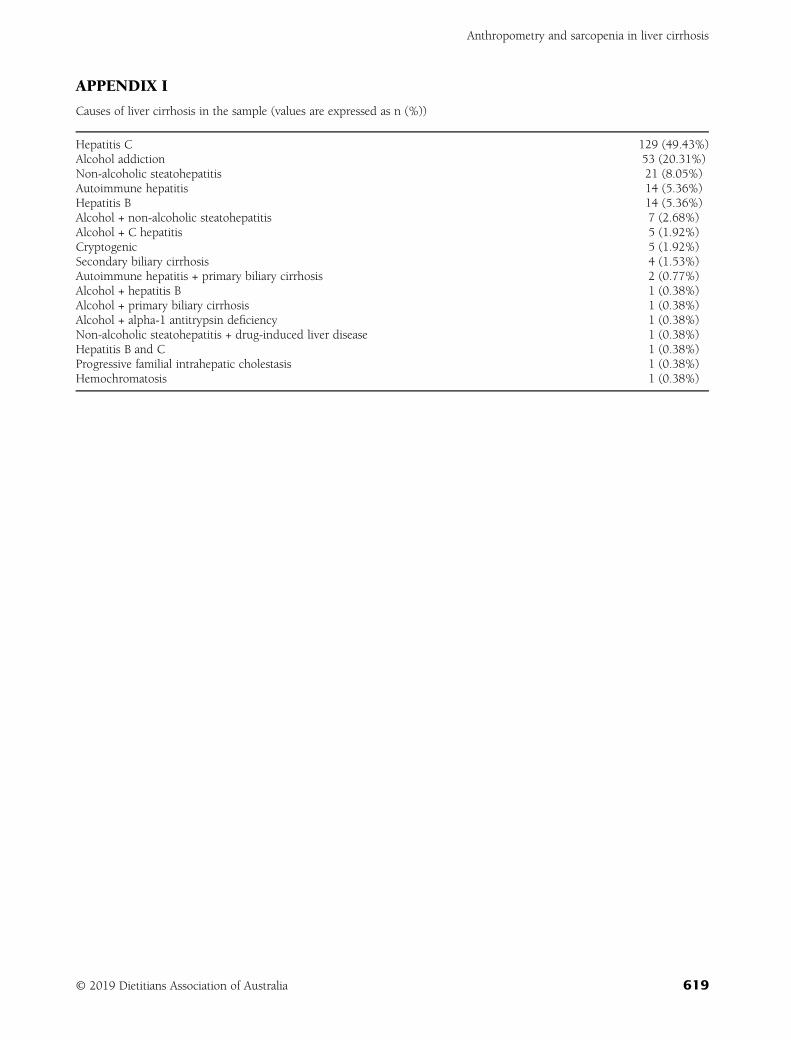
APPENDIX I
Causes of liver cirrhosis in the sample (values are expressed as n (%))
Hepatitis C 129 (49.43%)Alcohol addiction 53 (20.31%)Non-alcoholic steatohepatitis 21 (8.05%)Autoimmune hepatitis 14 (5.36%)Hepatitis B 14 (5.36%)Alcohol + non-alcoholic steatohepatitis 7 (2.68%)Alcohol + C hepatitis 5 (1.92%)Cryptogenic 5 (1.92%)Secondary biliary cirrhosis 4 (1.53%)Autoimmune hepatitis + primary biliary cirrhosis 2 (0.77%)Alcohol + hepatitis B 1 (0.38%)Alcohol + primary biliary cirrhosis 1 (0.38%)Alcohol + alpha-1 antitrypsin deficiency 1 (0.38%)Non-alcoholic steatohepatitis + drug-induced liver disease 1 (0.38%)Hepatitis B and C 1 (0.38%)Progressive familial intrahepatic cholestasis 1 (0.38%)Hemochromatosis 1 (0.38%)
Anthropometry and sarcopenia in liver cirrhosis
© 2019 Dietitians Association of Australia 619
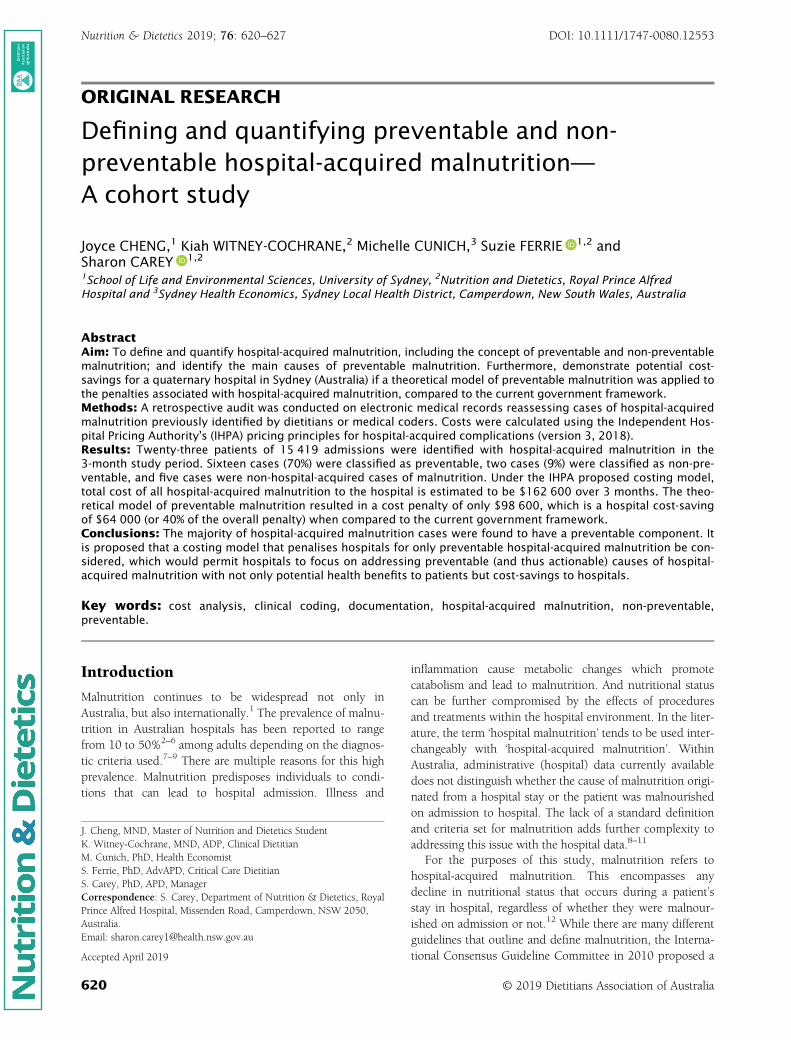
ORIGINAL RESEARCH
Defining and quantifying preventable and non-preventable hospital-acquired malnutrition—A cohort study
Joyce CHENG,1 Kiah WITNEY-COCHRANE,2 Michelle CUNICH,3 Suzie FERRIE 1,2 andSharon CAREY 1,2
1School of Life and Environmental Sciences, University of Sydney, 2Nutrition and Dietetics, Royal Prince AlfredHospital and 3Sydney Health Economics, Sydney Local Health District, Camperdown, New South Wales, Australia
AbstractAim: To define and quantify hospital-acquired malnutrition, including the concept of preventable and non-preventablemalnutrition; and identify the main causes of preventable malnutrition. Furthermore, demonstrate potential cost-savings for a quaternary hospital in Sydney (Australia) if a theoretical model of preventable malnutrition was applied tothe penalties associated with hospital-acquired malnutrition, compared to the current government framework.Methods: A retrospective audit was conducted on electronic medical records reassessing cases of hospital-acquiredmalnutrition previously identified by dietitians or medical coders. Costs were calculated using the Independent Hos-pital Pricing Authority’s (IHPA) pricing principles for hospital-acquired complications (version 3, 2018).Results: Twenty-three patients of 15 419 admissions were identified with hospital-acquired malnutrition in the3-month study period. Sixteen cases (70%) were classified as preventable, two cases (9%) were classified as non-pre-ventable, and five cases were non-hospital-acquired cases of malnutrition. Under the IHPA proposed costing model,total cost of all hospital-acquired malnutrition to the hospital is estimated to be $162 600 over 3 months. The theo-retical model of preventable malnutrition resulted in a cost penalty of only $98 600, which is a hospital cost-savingof $64 000 (or 40% of the overall penalty) when compared to the current government framework.Conclusions: The majority of hospital-acquired malnutrition cases were found to have a preventable component. Itis proposed that a costing model that penalises hospitals for only preventable hospital-acquired malnutrition be con-sidered, which would permit hospitals to focus on addressing preventable (and thus actionable) causes of hospital-acquired malnutrition with not only potential health benefits to patients but cost-savings to hospitals.
Key words: cost analysis, clinical coding, documentation, hospital-acquired malnutrition, non-preventable,preventable.
Introduction
Malnutrition continues to be widespread not only inAustralia, but also internationally.1 The prevalence of malnu-trition in Australian hospitals has been reported to rangefrom 10 to 50%2–6 among adults depending on the diagnos-tic criteria used.7–9 There are multiple reasons for this highprevalence. Malnutrition predisposes individuals to condi-tions that can lead to hospital admission. Illness and
inflammation cause metabolic changes which promotecatabolism and lead to malnutrition. And nutritional statuscan be further compromised by the effects of proceduresand treatments within the hospital environment. In the liter-ature, the term ‘hospital malnutrition’ tends to be used inter-changeably with ‘hospital-acquired malnutrition’. WithinAustralia, administrative (hospital) data currently availabledoes not distinguish whether the cause of malnutrition origi-nated from a hospital stay or the patient was malnourishedon admission to hospital. The lack of a standard definitionand criteria set for malnutrition adds further complexity toaddressing this issue with the hospital data.8–11
For the purposes of this study, malnutrition refers tohospital-acquired malnutrition. This encompasses anydecline in nutritional status that occurs during a patient’sstay in hospital, regardless of whether they were malnour-ished on admission or not.12 While there are many differentguidelines that outline and define malnutrition, the Interna-tional Consensus Guideline Committee in 2010 proposed a
J. Cheng, MND, Master of Nutrition and Dietetics StudentK. Witney-Cochrane, MND, ADP, Clinical DietitianM. Cunich, PhD, Health EconomistS. Ferrie, PhD, AdvAPD, Critical Care DietitianS. Carey, PhD, APD, ManagerCorrespondence: S. Carey, Department of Nutrition & Dietetics, RoyalPrince Alfred Hospital, Missenden Road, Camperdown, NSW 2050,Australia.Email: [email protected]
Accepted April 2019
© 2019 Dietitians Association of Australia620
AA AA
DDD
ieti
tian
s As
soci
atio
nofof
Aus
tral
ia
Nutrition & Dietetics 2019; 76: 620–627 DOI: 10.1111/1747-0080.12553
classification system emphasising the importance of malnu-trition aetiology, as it dictates the type and effectiveness ofnutrition interventions.10 In particular, the catabolism-promoting effects of inflammation are highlighted.
Under this 2010 system, malnutrition may be classi-fied10 as:1. Starvation-related malnutrition: absence of inflammation2. Chronic disease-related malnutrition: presence of mild or
moderate chronic inflammation3. Acute disease or injury-related malnutrition: presence of
severe acute inflammationWhere malnutrition is starvation-related, it can be man-
aged and resolved by nutrition interventions alone10 in con-trast with disease-related malnutrition, where injury orinflammation is contributing to the compromised nutri-tional status.10,11 For example, an increased catabolic stateoccurring due to a disease-state or post-operative surgicalcomplications may cause malnutrition.13 For such cases,adequate nutrition alone may not necessarily prevent orresolve the malnutrition, because metabolic alterations dur-ing the acute phase response affect the patient’s ability toutilise nutrition support. The patient will require a combi-nation of nutrition intervention and treatment to alleviatethe inflammation or injury associated with the underlyingmedical condition10,11 and the patient may still experiencemalnutrition despite receiving optimal nutrition.
Based on this notion, two concepts regarding hospital-acquired malnutrition will be applied in this paper:1. Preventable hospital-acquired malnutrition defined as:
a) decline in nutritional status AND absence of injuryor inflammation (starvation-related malnutrition)OR
b) decline in nutritional status AND presence of injuryor inflammation AND has received inadequate nutri-tion for the condition (disease-related malnutrition)
2. Non-preventable hospital-acquired malnutrition defined as:a) decline in nutritional status AND presence of injury
or inflammation AND has received adequate nutri-tion for the condition (disease-related malnutrition).
More accurate documentation of malnutrition in themedical records may increase the funding hospitalsreceive,3,4 because it allows medical coders to identify com-plications that attract additional funding. As malnutrition isassociated with increased length of stay, increased compli-cations, increased risk of infection, and requires additionaland ongoing treatments (e.g. nutrition supplements), it willinevitably increase the hospital’s financial expenditure7,14,15
and in many cases this is effectively reimbursed if malnutri-tion is identified by the medical coders. Currently fundingfor public hospitals in Australia is determined using a case-mix system, where medical coders categorise clinical condi-tions documented in the medical records into DiagnosticRelated Groups (DRGs). This determines the financial reim-bursement that will be received for each admission.1 Previ-ous Australian studies have observed that the lack ofaccurate documentation of malnutrition by doctors anddietitians resulted in significant loss of funding forhospitals.2–4,6,16 This highlights the importance of accuratemedical record documentation, that fulfils the coders’
requirements, to ensure that hospitals receive the entitledfunding to provide appropriate care for these patients.16
The Independent Hospital Pricing Authority (IHPA),which regulates funding of public hospitals, has recentlyproposed a new costing model (called ‘Risk adjustmentmodel for Hospital Acquired Complications’) that willpenalise hospitals for a variety of hospital-acquired compli-cations, including malnutrition.17 The Australian Commis-sion on Safety and Quality in Health Care has stated that allhospital-acquired complications including malnutrition arepreventable with appropriate strategies12 and this is thebasis upon which the penalties will be applied. As describedabove, it can be argued that some cases of malnutritionmay not be preventable despite adequate nutrition.10,11 Ifthis is the case, hospitals would be unfairly penalised if acost reduction rate were to be applied to all cases ofhospital-acquired malnutrition, including non-preventablecases where ‘appropriate strategies’ may be ineffective. Itcould also become a disincentive to identifying and docu-menting malnutrition in hospital patients. This paper pro-poses a more objective approach where penalty rates areapplied only to the cases of preventable hospital-acquiredmalnutrition according to the definition above, that is, onlycases where the hospital’s preventive strategies could beexpected to be effective.
This paper will present an alternative perspective to thecosting model put forward by the IHPA.17 There were twomain aims to this study. First, to apply these malnutritiondefinitions to a real-life patient cohort, quantifying thenumber of cases of hospital-acquired malnutrition, classify-ing each as preventable or non-preventable, and then iden-tifying the main causes for malnutrition. Secondly, todemonstrate the potential cost-savings for the hospital if thetheoretical penalties were applied only to cases meeting thecriteria for the proposed concept of preventable hospital-acquired malnutrition rather than to all cases. A secondaryaim of this paper was to audit the precision of malnutritiondocumentation undertaken by dietitians in order to makerecommendations about necessary documentation changesin light of the IHPA proposal to penalise hospital-acquiredmalnutrition.
Methods
Study design: A retrospective audit was conducted to reviewpatients diagnosed with hospital-acquired malnutrition asidentified by dietitians and/or medical coders within amajor quaternary hospital in Sydney, Australia. Patientswere included if they had a discharge date between 1 April2018 and 30 June 2018 (inclusive). A decline in nutritionalstatus was defined based on the Subjective Global Assess-ment (SGA)18 rating.
Prior to this audit, the Nutrition and Dietetics Depart-ment at the hospital had developed a logic flowsheet todefine and identify patients with preventable and non-preventable hospital-acquired malnutrition. The logic flo-wsheet was developed based on previous definitations10
and was piloted prior to the study period. Prior to the
Hospital acquired malnutrition
© 2019 Dietitians Association of Australia 621
study period, in-services and interaction workshops wereconducted with the hospital dietitians to ensure they feltcomfortable assessing preventable and non-preventablehospital-acquired malnutrition. This logic flowsheet canbe seen in Supporting Information S1. Dietitians thatidentified patients with preventable and non-preventablehospital-acquired malnutrition during the study periodentered this information separately into the electronicmedical record (eMR) as well as documenting it in thepatient’s notes. For this research each case of malnutri-tion was reviewed by the research team and the diagno-sis of preventable or non-preventable malnutrition wasrevised. Hence, diagnosis of hospital-acquired malnutri-tion may come from the medical coders, which has beenlabelled ‘hospital-identified’ or from the dietitian, labelledas ‘dietitian-identified’.
Cases of ‘hospital-identified’ hospital acquired malnutri-tion were extracted from the ‘Sydney Local Health District(SLHD) Targeted Activity and Reporting System (STARS),which is a software platform that houses all hospital perfor-mance data. These cases were also reviewed by the researchteam and revised for accuracy. Having ‘hospital-identified’and ‘dietitian-identified’ data enabled identification of over-lapping cases. This coding overlap was used to measurehow clearly the dietitians documented malnutrition, andhow well the hospital coded cases appropriately.
Data collection: For each patient, demographic, medicaland admission-related information was recorded based onthe data from the eMR. Demographic information includedage, sex and length of stay; medical information includedpast medical history, reason for admission, and cause ofmalnutrition; and admission-related information includedthe type of admission (emergency, elective or transferredfrom another hospital), and whether the patient had spenttime in the intensive care unit (ICU).
Funding-related information was recorded based on thedata collected from the STARS platform. This included theLength of Stay, DRG, National Weighted Activity Unit(NWAU) and Peer Average Length of Stay (i.e. the stateaverage length of stay for each diagnostic group). TheNWAU is a unit attached to hospital activity which dictatesthe price at which a hospital will be reimbursed.
Data analysis: quantifying hospital-acquired malnutrition:Data analysis was performed using Microsoft Excel 2016.Due to the small sample size and likely skewed nature ofthe data, all data have been presented as a median andrange where appropriate (unless otherwise stated).
The percentage of preventable and non-preventablemalnutrition was calculated for both sets of data (‘hospital-identified’ and ‘dietitian-identified’ classifications). Thisenabled a comparison of the total cost under the proposedcosting model17 versus the total costs of preventablehospital-acquired malnutrition if the alternate approach istaken. For each case, the main reasons for deterioration innutritional status was recorded and then grouped into cat-egories with similar themes. These themes were developedon review of the reasons for deteriorating nutritionalstatus.
Themes included:• ‘Fasting/Nil By Mouth’ (where the patient is not allowed
to eat or enteral/parenteral nutrition support is deliber-ately stopped for a defined period)
• ‘Able to eat, but intake restricted by a defined externalfactor’ (where the patient has been placed on a restrictivediet, for example)
• ‘Able to eat, intake not restricted but is inadequate tomeet the patient’s nutritional needs/losses’ (where thepatient is not eating enough to meet increased require-ments, or where nutritional needs/losses are increasedbeyond what the patient can manage, that is, require-ments are increased beyond a level that the patient canfeasibly tolerate, or utilisation of the nutrition is impaireddue to metabolic alteration such as in critical illness)
• ‘Misinterpretation of documentation.’ (where the patienthas been misclassified on the basis of the dietitian’s med-ical records entry)Data analysis: cost of hospital-acquired malnutrition: The
cost analysis was performed from a hospital perspective incollaboration with a health economist who provided guid-ance as to how to apply the IHPA hospital-acquired compli-cation model17 to the data obtained. The estimationsinvolved calculations for:• Funding = NWAU x set district funding for 1 NWAU
(currently at $4713)• Cost reduction in funding = funding x final adjust-
ment rateThe final adjustment rate was based on the complexity
of each patient’s condition. Patients at a higher risk ofdeveloping hospital-acquired malnutrition received anadjustment (called dampening factor) which woulddecrease the final adjustment rate (i.e. the rate at which thepenalty will be applied). This ensures a fair approach sothat those at a higher risk of hospital-acquired malnutritionare not penalised at the same rate as those with a lowerrisk.17 The adjustment factor is influenced by the CharlsonIndex, which estimates the risk of death associated withcertain comorbid conditions.19 This was calculated for eachpatient. A higher score indicates a higher risk of deathbased on comorbidities. Supplementary case studies withsample costing calculations can be found in SupportingInformation B.
The total costs were re-categorised into preventable,non-preventable and non-hospital-acquired malnutrition forthe ‘hospital-identified’ and ‘dietitian-identified’ data toreflect the total cost which the hospital may theoreticallyincur.
Ethics approval: Ethics approval was obtained from theEthics Review Committee of the Sydney Local HealthDistrict (RPAH Zone Ethics Committee—Protocol NoX18-0145 & LNR/18/RPAH/207).
Results
Figure 1 provides a breakdown of the number of cases andfinancial costs of preventable and non-preventable hospital-acquired malnutrition over the 3-month period. In total,
J. Cheng et al.
622 © 2019 Dietitians Association of Australia
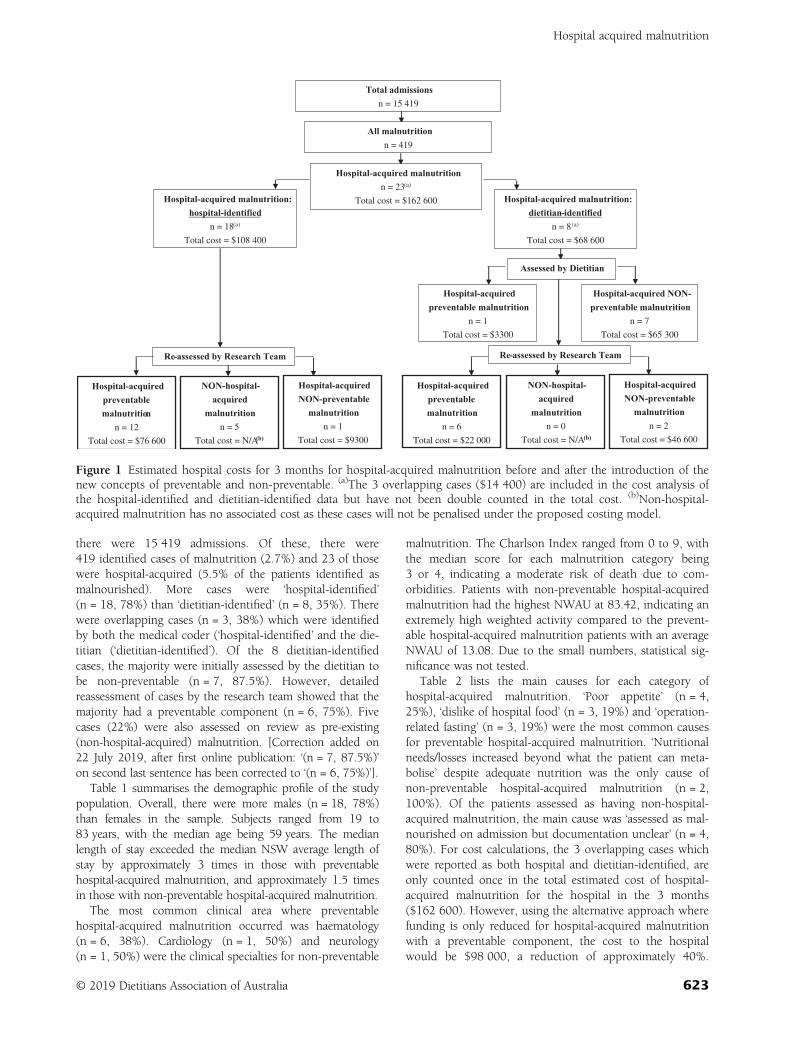
there were 15 419 admissions. Of these, there were419 identified cases of malnutrition (2.7%) and 23 of thosewere hospital-acquired (5.5% of the patients identified asmalnourished). More cases were ‘hospital-identified’(n = 18, 78%) than ‘dietitian-identified’ (n = 8, 35%). Therewere overlapping cases (n = 3, 38%) which were identifiedby both the medical coder (‘hospital-identified’ and the die-titian (‘dietitian-identified’). Of the 8 dietitian-identifiedcases, the majority were initially assessed by the dietitian tobe non-preventable (n = 7, 87.5%). However, detailedreassessment of cases by the research team showed that themajority had a preventable component (n = 6, 75%). Fivecases (22%) were also assessed on review as pre-existing(non-hospital-acquired) malnutrition. [Correction added on22 July 2019, after first online publication: ‘(n = 7, 87.5%)’on second last sentence has been corrected to ‘(n = 6, 75%)’].
Table 1 summarises the demographic profile of the studypopulation. Overall, there were more males (n = 18, 78%)than females in the sample. Subjects ranged from 19 to83 years, with the median age being 59 years. The medianlength of stay exceeded the median NSW average length ofstay by approximately 3 times in those with preventablehospital-acquired malnutrition, and approximately 1.5 timesin those with non-preventable hospital-acquired malnutrition.
The most common clinical area where preventablehospital-acquired malnutrition occurred was haematology(n = 6, 38%). Cardiology (n = 1, 50%) and neurology(n = 1, 50%) were the clinical specialties for non-preventable
malnutrition. The Charlson Index ranged from 0 to 9, withthe median score for each malnutrition category being3 or 4, indicating a moderate risk of death due to com-orbidities. Patients with non-preventable hospital-acquiredmalnutrition had the highest NWAU at 83.42, indicating anextremely high weighted activity compared to the prevent-able hospital-acquired malnutrition patients with an averageNWAU of 13.08. Due to the small numbers, statistical sig-nificance was not tested.
Table 2 lists the main causes for each category ofhospital-acquired malnutrition. ‘Poor appetite’ (n = 4,25%), ‘dislike of hospital food’ (n = 3, 19%) and ‘operation-related fasting’ (n = 3, 19%) were the most common causesfor preventable hospital-acquired malnutrition. ‘Nutritionalneeds/losses increased beyond what the patient can meta-bolise’ despite adequate nutrition was the only cause ofnon-preventable hospital-acquired malnutrition (n = 2,100%). Of the patients assessed as having non-hospital-acquired malnutrition, the main cause was ‘assessed as mal-nourished on admission but documentation unclear’ (n = 4,80%). For cost calculations, the 3 overlapping cases whichwere reported as both hospital and dietitian-identified, areonly counted once in the total estimated cost of hospital-acquired malnutrition for the hospital in the 3 months($162 600). However, using the alternative approach wherefunding is only reduced for hospital-acquired malnutritionwith a preventable component, the cost to the hospitalwould be $98 000, a reduction of approximately 40%.
Hospital-acquired malnutrition: hospital-identified
n = 18(a)
Total cost = $108 400
Hospital-acquired malnutritionn = 23(a)
Total cost = $162 600
Total admissionsn = 15 419
All malnutritionn = 419
Hospital-acquired malnutrition: dietitian-identified
n = 8(a)
Total cost = $68 600
Assessed by Dietitian
Hospital-acquired preventable malnutrition
n = 1
Total cost = $3300
Hospital-acquired NON-preventable malnutrition
n = 7
Total cost = $65 300
Hospital-acquired preventable malnutrition
n = 6
Total cost = $22 000
NON-hospital-acquired
malnutritionn = 0
Total cost = N/A(b)
Hospital-acquired NON-preventable
malnutritionn = 2
Total cost = $46 600
Re-assessed by Research Team
Hospital-acquired preventable malnutrition
n = 12
Total cost = $76 600
NON-hospital-acquired
malnutritionn = 5
Total cost = N/A(b)
Hospital-acquired NON-preventable
malnutritionn = 1
Total cost = $9300
Re-assessed by Research Team
Figure 1 Estimated hospital costs for 3 months for hospital-acquired malnutrition before and after the introduction of thenew concepts of preventable and non-preventable. (a)The 3 overlapping cases ($14 400) are included in the cost analysis ofthe hospital-identified and dietitian-identified data but have not been double counted in the total cost. (b)Non-hospital-acquired malnutrition has no associated cost as these cases will not be penalised under the proposed costing model.
Hospital acquired malnutrition
© 2019 Dietitians Association of Australia 623
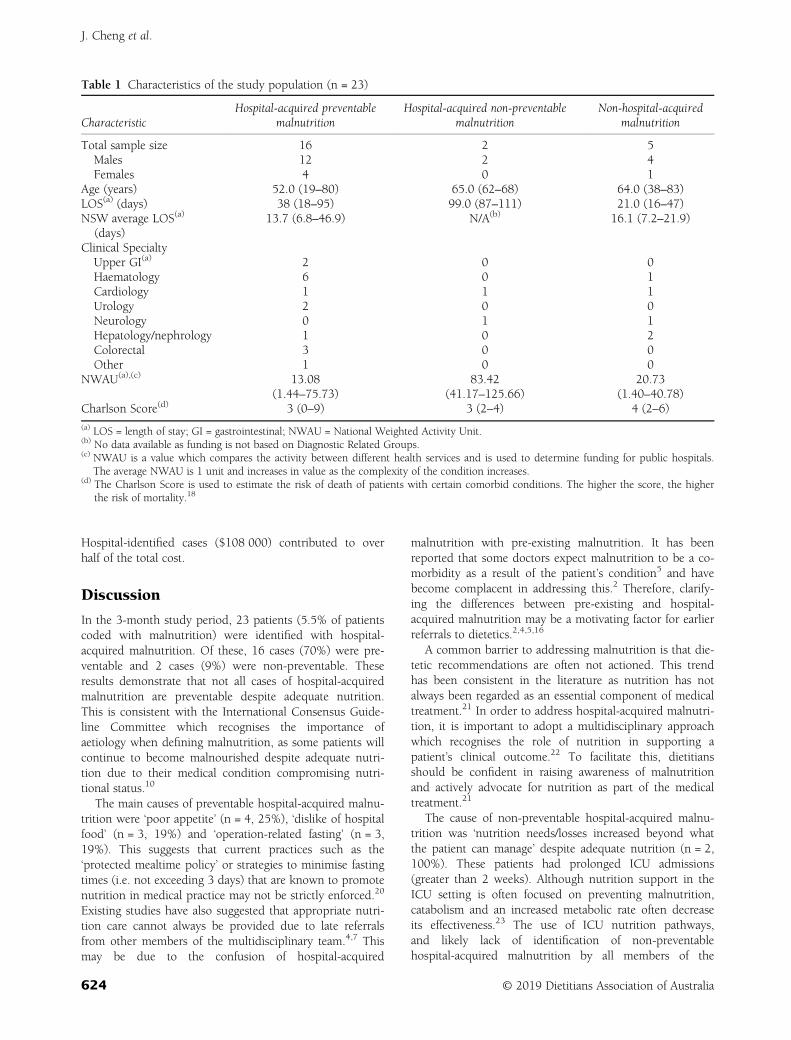
Hospital-identified cases ($108 000) contributed to overhalf of the total cost.
Discussion
In the 3-month study period, 23 patients (5.5% of patientscoded with malnutrition) were identified with hospital-acquired malnutrition. Of these, 16 cases (70%) were pre-ventable and 2 cases (9%) were non-preventable. Theseresults demonstrate that not all cases of hospital-acquiredmalnutrition are preventable despite adequate nutrition.This is consistent with the International Consensus Guide-line Committee which recognises the importance ofaetiology when defining malnutrition, as some patients willcontinue to become malnourished despite adequate nutri-tion due to their medical condition compromising nutri-tional status.10
The main causes of preventable hospital-acquired malnu-trition were ‘poor appetite’ (n = 4, 25%), ‘dislike of hospitalfood’ (n = 3, 19%) and ‘operation-related fasting’ (n = 3,19%). This suggests that current practices such as the‘protected mealtime policy’ or strategies to minimise fastingtimes (i.e. not exceeding 3 days) that are known to promotenutrition in medical practice may not be strictly enforced.20
Existing studies have also suggested that appropriate nutri-tion care cannot always be provided due to late referralsfrom other members of the multidisciplinary team.4,7 Thismay be due to the confusion of hospital-acquired
malnutrition with pre-existing malnutrition. It has beenreported that some doctors expect malnutrition to be a co-morbidity as a result of the patient’s condition5 and havebecome complacent in addressing this.2 Therefore, clarify-ing the differences between pre-existing and hospital-acquired malnutrition may be a motivating factor for earlierreferrals to dietetics.2,4,5,16
A common barrier to addressing malnutrition is that die-tetic recommendations are often not actioned. This trendhas been consistent in the literature as nutrition has notalways been regarded as an essential component of medicaltreatment.21 In order to address hospital-acquired malnutri-tion, it is important to adopt a multidisciplinary approachwhich recognises the role of nutrition in supporting apatient’s clinical outcome.22 To facilitate this, dietitiansshould be confident in raising awareness of malnutritionand actively advocate for nutrition as part of the medicaltreatment.21
The cause of non-preventable hospital-acquired malnu-trition was ‘nutrition needs/losses increased beyond whatthe patient can manage’ despite adequate nutrition (n = 2,100%). These patients had prolonged ICU admissions(greater than 2 weeks). Although nutrition support in theICU setting is often focused on preventing malnutrition,catabolism and an increased metabolic rate often decreaseits effectiveness.23 The use of ICU nutrition pathways,and likely lack of identification of non-preventablehospital-acquired malnutrition by all members of the
Table 1 Characteristics of the study population (n = 23)
CharacteristicHospital-acquired preventable
malnutritionHospital-acquired non-preventable
malnutritionNon-hospital-acquired
malnutrition
Total sample size 16 2 5Males 12 2 4Females 4 0 1
Age (years) 52.0 (19–80) 65.0 (62–68) 64.0 (38–83)LOS(a) (days) 38 (18–95) 99.0 (87–111) 21.0 (16–47)NSW average LOS(a)
(days)13.7 (6.8–46.9) N/A(b) 16.1 (7.2–21.9)
Clinical SpecialtyUpper GI(a) 2 0 0Haematology 6 0 1Cardiology 1 1 1Urology 2 0 0Neurology 0 1 1Hepatology/nephrology 1 0 2Colorectal 3 0 0Other 1 0 0
NWAU(a),(c) 13.08 83.42 20.73(1.44–75.73) (41.17–125.66) (1.40–40.78)
Charlson Score(d) 3 (0–9) 3 (2–4) 4 (2–6)
(a) LOS = length of stay; GI = gastrointestinal; NWAU = National Weighted Activity Unit.(b) No data available as funding is not based on Diagnostic Related Groups.(c) NWAU is a value which compares the activity between different health services and is used to determine funding for public hospitals.
The average NWAU is 1 unit and increases in value as the complexity of the condition increases.(d) The Charlson Score is used to estimate the risk of death of patients with certain comorbid conditions. The higher the score, the higher
the risk of mortality.18
J. Cheng et al.
624 © 2019 Dietitians Association of Australia
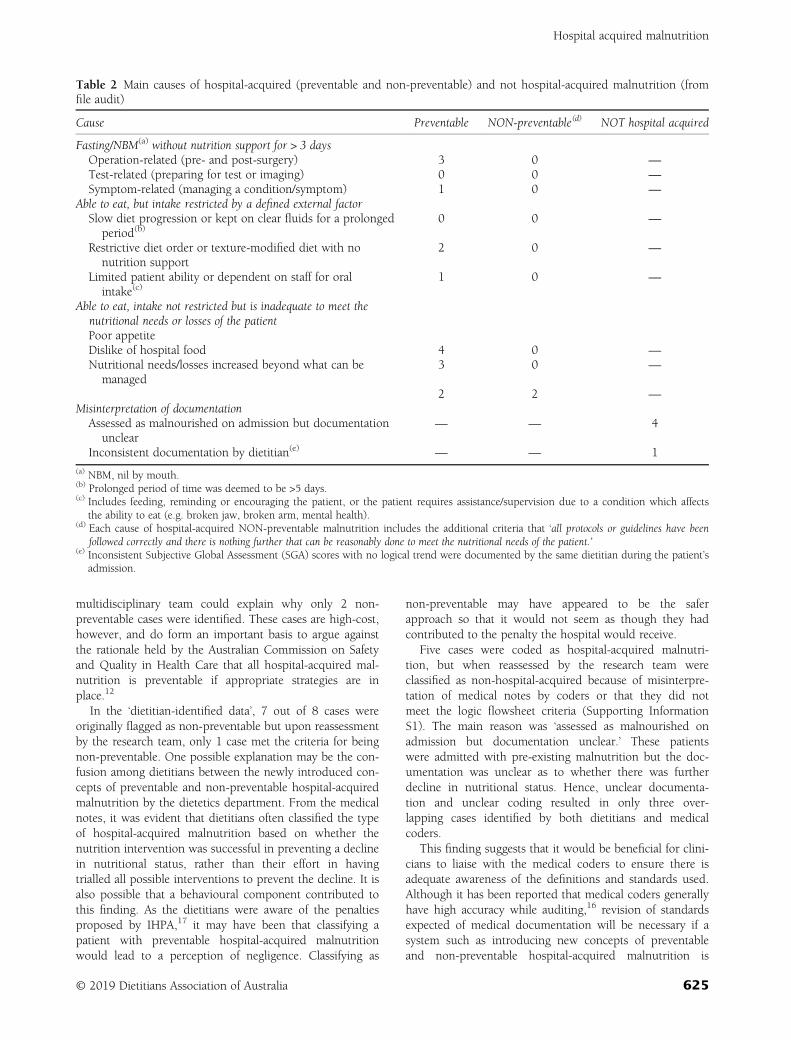
multidisciplinary team could explain why only 2 non-preventable cases were identified. These cases are high-cost,however, and do form an important basis to argue againstthe rationale held by the Australian Commission on Safetyand Quality in Health Care that all hospital-acquired mal-nutrition is preventable if appropriate strategies are inplace.12
In the ‘dietitian-identified data’, 7 out of 8 cases wereoriginally flagged as non-preventable but upon reassessmentby the research team, only 1 case met the criteria for beingnon-preventable. One possible explanation may be the con-fusion among dietitians between the newly introduced con-cepts of preventable and non-preventable hospital-acquiredmalnutrition by the dietetics department. From the medicalnotes, it was evident that dietitians often classified the typeof hospital-acquired malnutrition based on whether thenutrition intervention was successful in preventing a declinein nutritional status, rather than their effort in havingtrialled all possible interventions to prevent the decline. It isalso possible that a behavioural component contributed tothis finding. As the dietitians were aware of the penaltiesproposed by IHPA,17 it may have been that classifying apatient with preventable hospital-acquired malnutritionwould lead to a perception of negligence. Classifying as
non-preventable may have appeared to be the saferapproach so that it would not seem as though they hadcontributed to the penalty the hospital would receive.
Five cases were coded as hospital-acquired malnutri-tion, but when reassessed by the research team wereclassified as non-hospital-acquired because of misinterpre-tation of medical notes by coders or that they did notmeet the logic flowsheet criteria (Supporting InformationS1). The main reason was ‘assessed as malnourished onadmission but documentation unclear.’ These patientswere admitted with pre-existing malnutrition but the doc-umentation was unclear as to whether there was furtherdecline in nutritional status. Hence, unclear documenta-tion and unclear coding resulted in only three over-lapping cases identified by both dietitians and medicalcoders.
This finding suggests that it would be beneficial for clini-cians to liaise with the medical coders to ensure there isadequate awareness of the definitions and standards used.Although it has been reported that medical coders generallyhave high accuracy while auditing,16 revision of standardsexpected of medical documentation will be necessary if asystem such as introducing new concepts of preventableand non-preventable hospital-acquired malnutrition is
Table 2 Main causes of hospital-acquired (preventable and non-preventable) and not hospital-acquired malnutrition (fromfile audit)
Cause Preventable NON-preventable(d) NOT hospital acquired
Fasting/NBM(a) without nutrition support for > 3 daysOperation-related (pre- and post-surgery) 3 0 —
Test-related (preparing for test or imaging) 0 0 —
Symptom-related (managing a condition/symptom) 1 0 —
Able to eat, but intake restricted by a defined external factorSlow diet progression or kept on clear fluids for a prolonged
period(b)0 0 —
Restrictive diet order or texture-modified diet with nonutrition support
2 0 —
Limited patient ability or dependent on staff for oralintake(c)
1 0 —
Able to eat, intake not restricted but is inadequate to meet thenutritional needs or losses of the patientPoor appetiteDislike of hospital food 4 0 —
Nutritional needs/losses increased beyond what can bemanaged
3 0 —
2 2 —
Misinterpretation of documentationAssessed as malnourished on admission but documentation
unclear— — 4
Inconsistent documentation by dietitian(e) — — 1
(a) NBM, nil by mouth.(b) Prolonged period of time was deemed to be >5 days.(c) Includes feeding, reminding or encouraging the patient, or the patient requires assistance/supervision due to a condition which affects
the ability to eat (e.g. broken jaw, broken arm, mental health).(d) Each cause of hospital-acquired NON-preventable malnutrition includes the additional criteria that ‘all protocols or guidelines have been
followed correctly and there is nothing further that can be reasonably done to meet the nutritional needs of the patient.’(e) Inconsistent Subjective Global Assessment (SGA) scores with no logical trend were documented by the same dietitian during the patient’s
admission.
Hospital acquired malnutrition
© 2019 Dietitians Association of Australia 625
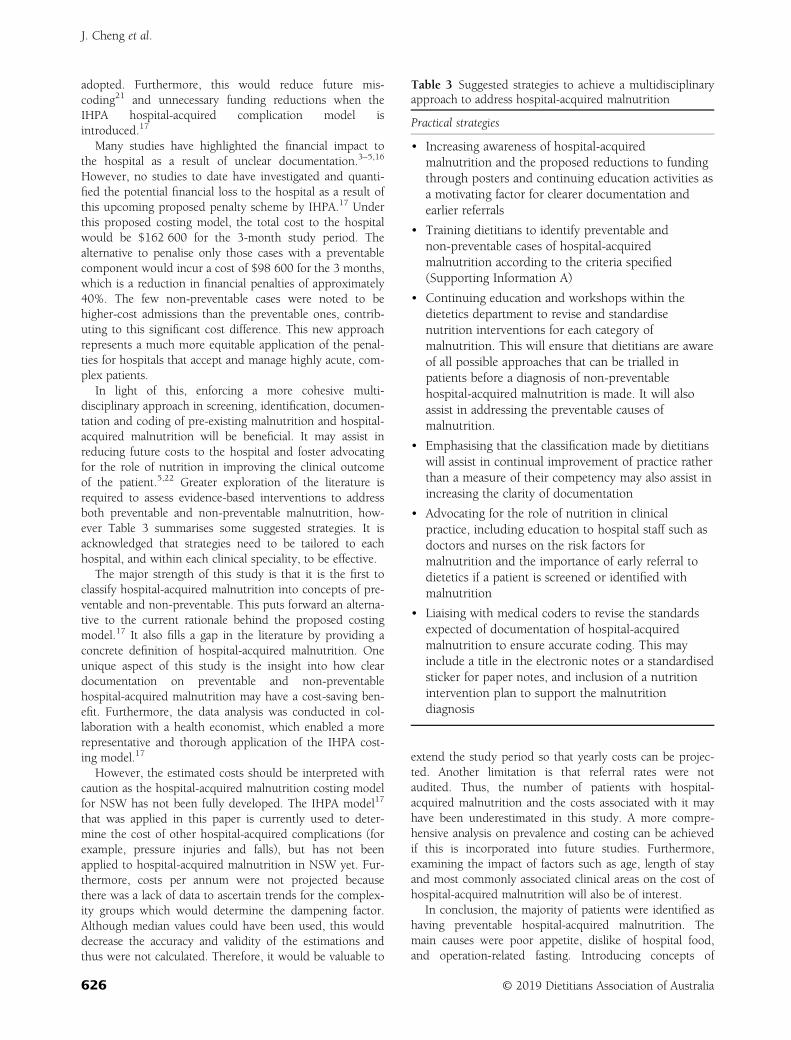
adopted. Furthermore, this would reduce future mis-coding21 and unnecessary funding reductions when theIHPA hospital-acquired complication model isintroduced.17
Many studies have highlighted the financial impact tothe hospital as a result of unclear documentation.3–5,16
However, no studies to date have investigated and quanti-fied the potential financial loss to the hospital as a result ofthis upcoming proposed penalty scheme by IHPA.17 Underthis proposed costing model, the total cost to the hospitalwould be $162 600 for the 3-month study period. Thealternative to penalise only those cases with a preventablecomponent would incur a cost of $98 600 for the 3 months,which is a reduction in financial penalties of approximately40%. The few non-preventable cases were noted to behigher-cost admissions than the preventable ones, contrib-uting to this significant cost difference. This new approachrepresents a much more equitable application of the penal-ties for hospitals that accept and manage highly acute, com-plex patients.
In light of this, enforcing a more cohesive multi-disciplinary approach in screening, identification, documen-tation and coding of pre-existing malnutrition and hospital-acquired malnutrition will be beneficial. It may assist inreducing future costs to the hospital and foster advocatingfor the role of nutrition in improving the clinical outcomeof the patient.5,22 Greater exploration of the literature isrequired to assess evidence-based interventions to addressboth preventable and non-preventable malnutrition, how-ever Table 3 summarises some suggested strategies. It isacknowledged that strategies need to be tailored to eachhospital, and within each clinical speciality, to be effective.
The major strength of this study is that it is the first toclassify hospital-acquired malnutrition into concepts of pre-ventable and non-preventable. This puts forward an alterna-tive to the current rationale behind the proposed costingmodel.17 It also fills a gap in the literature by providing aconcrete definition of hospital-acquired malnutrition. Oneunique aspect of this study is the insight into how cleardocumentation on preventable and non-preventablehospital-acquired malnutrition may have a cost-saving ben-efit. Furthermore, the data analysis was conducted in col-laboration with a health economist, which enabled a morerepresentative and thorough application of the IHPA cost-ing model.17
However, the estimated costs should be interpreted withcaution as the hospital-acquired malnutrition costing modelfor NSW has not been fully developed. The IHPA model17
that was applied in this paper is currently used to deter-mine the cost of other hospital-acquired complications (forexample, pressure injuries and falls), but has not beenapplied to hospital-acquired malnutrition in NSW yet. Fur-thermore, costs per annum were not projected becausethere was a lack of data to ascertain trends for the complex-ity groups which would determine the dampening factor.Although median values could have been used, this woulddecrease the accuracy and validity of the estimations andthus were not calculated. Therefore, it would be valuable to
extend the study period so that yearly costs can be projec-ted. Another limitation is that referral rates were notaudited. Thus, the number of patients with hospital-acquired malnutrition and the costs associated with it mayhave been underestimated in this study. A more compre-hensive analysis on prevalence and costing can be achievedif this is incorporated into future studies. Furthermore,examining the impact of factors such as age, length of stayand most commonly associated clinical areas on the cost ofhospital-acquired malnutrition will also be of interest.
In conclusion, the majority of patients were identified ashaving preventable hospital-acquired malnutrition. Themain causes were poor appetite, dislike of hospital food,and operation-related fasting. Introducing concepts of
Table 3 Suggested strategies to achieve a multidisciplinaryapproach to address hospital-acquired malnutrition
Practical strategies
• Increasing awareness of hospital-acquiredmalnutrition and the proposed reductions to fundingthrough posters and continuing education activities asa motivating factor for clearer documentation andearlier referrals
• Training dietitians to identify preventable andnon-preventable cases of hospital-acquiredmalnutrition according to the criteria specified(Supporting Information A)
• Continuing education and workshops within thedietetics department to revise and standardisenutrition interventions for each category ofmalnutrition. This will ensure that dietitians are awareof all possible approaches that can be trialled inpatients before a diagnosis of non-preventablehospital-acquired malnutrition is made. It will alsoassist in addressing the preventable causes ofmalnutrition.
• Emphasising that the classification made by dietitianswill assist in continual improvement of practice ratherthan a measure of their competency may also assist inincreasing the clarity of documentation
• Advocating for the role of nutrition in clinicalpractice, including education to hospital staff such asdoctors and nurses on the risk factors formalnutrition and the importance of early referral todietetics if a patient is screened or identified withmalnutrition
• Liaising with medical coders to revise the standardsexpected of documentation of hospital-acquiredmalnutrition to ensure accurate coding. This mayinclude a title in the electronic notes or a standardisedsticker for paper notes, and inclusion of a nutritionintervention plan to support the malnutritiondiagnosis
J. Cheng et al.
626 © 2019 Dietitians Association of Australia
preventable and non-preventable hospital-acquired malnu-trition has shown to reduce the financial penalty, with a40% reduction in costs from $162 600 to $98 600 in the3-month period. This alternative and more nuancedapproach will allow and encourage hospitals to focus onaddressing preventable causes of hospital-acquired malnu-trition. It may also influence future health policies dictatingthe allocation of funding for hospital-acquired malnutrition,and potentially other hospital-acquired complications.
Funding source
There was no funding for this project.
Conflict of interest
The authors have no conflicts of interest to declare.
Authorship
JC, SC, KWC and SF contributed to conception/design ofthe research; JC, SC, KWC, MC and SF contributed toacquisition, analysis, or interpretation of the data; JC dra-fted the manuscript. SF, MC, KWC and SC critically revisedthe manuscript; and SC agrees to be fully accountable forensuring the integrity and accuracy of the work. All authorsread and approved the final manuscript.
References
1 Barker LA, Gout BS, Crowe TC. Hospital malnutrition: preva-lence, identification and impact on patients and the healthcaresystem. Int J Environ Res Public Health 2011; 8: 514–27.
2 Adams NE, Bowie AJ, Simmance N, Murrary M, Crowe TC.Recognition by medical and nursing professionals of malnutri-tion in elderly hospitalised patients. Nutr Diet 2008; 65:144–50.
3 Agarwal E, Ferguson M, Banks M, Bauer J, Capra S, Isenring E.Malnutrition coding shortfalls in Australian and New Zealandhospitals. Nutr Diet 2015; 72: 69–73.
4 Gout BS, Barker LA, Crowe TC. Malnutrition identification,diagnosis and dietetic referrals: are we doing a good enoughjob? Nutr Diet 2009; 66: 206–11.
5 Lazarus C, Hamlyn J. Prevalence and documentation of malnu-trition in hospitals: a case study in a large private hospital set-ting. Nutr Diet 2005; 62: 41–7.
6 Middleton MH, Nazarenko G, Nivison-Smith I, Smerdely P.Prevalence of malnutrition and 12-month incidence of mortal-ity in two Sydney teaching hospitals. Intern Med J 2001; 31:455–61.
7 Banks M, Ash S, Bauer J, Deanne G. Prevalence of malnutritionin adults in Queensland public hospitals and residential agedcare facilities. Nutr Diet 2007; 64: 172–8.
8 Kirkland LL, Shaughnessy E. Recognition and prevention ofnosocomial malnutrition: a review and a call to action!Am J Med 2017; 130: 1345–50.
9 White JV, Guenter P, Jensen G et al. Consensus statement:academy of nutrition and dietetics and American Society for
Parenteral and Enteral Nutrition: characteristics recommendedfor the identification and documentation of adult malnutrition(undernutrition). JPEN J Parenter Enteral Nutr 2012; 36:275–83.
10 Jensen GL, Mirtallo J, Compher C et al. Adult starvation anddisease-related malnutrition: a proposal for etiology-based diag-nosis in the clinical practice setting from the International Con-sensus Guideline Committee. JPEN J Parenter Enteral Nutr2010; 34: 156–9.
11 Jensen GL, Bistrian B, Roubenoff R, Heimburger DC. Malnutri-tion syndromes: a conundrum vs continuum. JPEN J ParenterEnteral Nutr 2009; 33: 710–6.
12 Australian Commission on Safety and Quality in Health Care.Hospital-acquired complication-malnutrition. Australian Gov-ernment, 2018. (Available from: https://www.safetyandquality.gov.au, accessed 9 August 2018).
13 Edington J, Kon P, Martyn C. Prevalence of malnutrition aftermajor surgery. J Hum Nutr Diet 1997; 10: 111–6.
14 Naber T, Schermer T, de Bree A et al. Prevalence of malnutri-tion in nonsurgical hospitalised patients and its associationwith disease complications. Am J Clin Nutr 1997; 66: 1232–9.
15 Thibault R, Makhlouf A, Kossovsky M. Healthcare-associatedinfections are associated with insufficient dietary intake: anobservational cross-sectional study. PLos One 2015; 10:e0123695.
16 Kellet J, Kyle G, Itsiopoulos C, Naunton M, Luff N. Malnutri-tion: the importance of identification, documentation, and cod-ing in the acute care setting. J Nutr Metab 2016; 2016: 1–6.
17 Independent Hospital Pricing Authority. Pricing and Funding forSafety and Quality—Risk Adjustment Model for Hospital AcquiredComplications. Sydney, Australia: Independent Hospital PricingAuthority, 2018 (Available from: https://www.ihpa.gov.au/publications, accessed 9 August 2018).
18 Detsky AS, McLaughlin JR, Baker JP, Johnston N, Whittaker S,Mendelson RA. What is subjective global assessment of nutri-tional status? JPEN 1987; 11: 8–13.
19 Charlson M, Pompei P, Ales K, Mackenzie C. A new method ofclassifying prognostic comorbidity in longitudinal studies:development and validation. J Chron Dis 1986; 40: 373–83.
20 Agency for Clinical Innovation. Nutrition Care: NSW Health,2017. (Available from: https://www1.health.nsw.gov.au/pds/ActivePDSDocuments/Forms/All%20Items.aspx, accessed 27Oct 2018).
21 Walton K. Treating malnutrition in hospitals: dietitians in thedriving seat? Nutr Diet 2009; 66: 202–5.
22 Ockenga J, Freudenreich M, Zakonsky R, Norman K,Pirlich M, Lochs H. Nutritional assessment and management inhospitalised patients: implication for DRG-based reimburse-ment and health care quality. Clin Nutr 2005; 24: 913–9.
23 Weimann A, Braga M, Carli F et al. ESPEN guideline: clinicalnutrition in surgery. Clin Nutr 2017; 36: 623–50.
Supporting information
Additional Supporting Information may be found in theonline version of this article at the publisher’s web-site:
Data S1 Supporting Information
Hospital acquired malnutrition
© 2019 Dietitians Association of Australia 627
ORIGINAL RESEARCH
Observations on the relationship between the dieteticobjective structured clinical examination andplacement outcome
Tracey PARKIN and Avril COLLINSONPeninsula Allied Health Centre, School of Health Professions, Plymouth University, Plymouth, UK
AbstractAim: Objective structured clinical examinations (OSCEs) are used extensively in medical education to prepare stu-dents for the clinical setting. Their use in dietetic education is still relatively new, and relationships to placement out-comes are unknown. The aim of this study was to explore 11 years of OSCE and placement data to answer thefollowing questions: Does the OSCE predict dietetic placement outcome? and, What are the student perceptions ofthe benefits of OSCE in preparation for practice?Methods: Data were collected retrospectively from 328 students between 2006 and 2017 who had completed theirfinal year OSCE and placement. Aggregate OSCE marks and mean marks obtained in active and passive OSCE stationswere compared with placement outcome. Evaluation questionnaires completed by students at the end of the OSCEwere collated.Results: Aggregate marks achieved in OSCE stations were significantly different for students who passed (mean =63.24, SD = 7.94), struggled (mean = 58.25, SD = 8.82) or failed (mean = 57.31, SD = 8.28) placement, P < 0.001.Majority of students perceived the OSCE as a meaningful and fair assessment (92%) that helped to prepare them forpractice (82%).Conclusions: The OSCE provides a meaningful assessment of dietetic student skills in preparation for practice.Aggregate OSCE marks provide a consistent indicator of students who are likely to struggle in practice.
Key words: assessment, competence, dietetics, education, evaluation, OSCE.
Introduction
Medical education has utilised objective structured clinicalexaminations (OSCEs) for many years to develop commu-nication and clinical skills1 in preparation for the clinicalsetting.2,3 OSCEs are reported to stimulate learning andgreater achievement of specific clinical competence.4 It iswell documented that the OSCE is labour intensive, timeconsuming and, therefore, an expensive examination torun;5 however, the ability to prepare students for the prac-tice setting has been identified as a key strength of thisexamination,2 as well as its flexibility in design andstructure.6
There is a wealth of data supporting the use of the OSCEto prepare medical students for practice;7 in contrast, OSCEassessments in dietetics are relatively new.8 Consequently,
there is little reported data on whether the OSCE has thesame benefits in preparing dietetic students for placement.8
In addition, the range of skills assessed in a dietetic OSCEmay differ from those assessed in medical, nursing andother professional OSCEs.4,7,8 Although communicationskills are core to all professional assessments, remainingskills tested will vary because of the nature of the workundertaken by the different professions. For example, die-tetic students may be assessed on anthropometric assess-ments, but hands-on examination, use of equipment orclinical procedures as seen in nursing and medical OSCEsis not required.
The design of the dietetic OSCE involves mapping ofspecific skills against the examination format as describedby others.9–11 The OSCE was originally set up as six dis-crete 10-minute stations, consisting of two active and fourpassive stations,10 using a multi-station design12 to test spe-cific clinical skills. Active stations focus on communicationskills, knowledge and application, while passive stationsexplore practical skills around knowledge application,understanding and dietary manipulation.11
Actors using standardised scripts play the part of patientsin the active OSCE stations.13 Experienced academic orclinical examiners assess active stations using a standardised
T. Parkin, PhD, RD, Associate ProfessorA. Collinson, PhD, RD, Associate ProfessorCorrespondence: T. Parkin, Peninsula Allied Health Centre, School ofHealth Professions, Plymouth University, Derriford Road, PlymouthPL6 8BH, UK. Tel.: +44 (0) 17 52 588827; fax: +44 (0) 17 52 588874.Email: [email protected]
Accepted March 2019
© 2019 Dietitians Association of Australia628
AA AA
DDD
ieti
tian
s As
soci
atio
nofof
Aus
tral
ia
Nutrition & Dietetics 2019; 76: 628–633 DOI: 10.1111/1747-0080.12537
scoring sheet, which assesses the knowledge and communi-cation skills utilised by students. Actors and examinersmeet prior to the examination to run through the scripts,discuss standard answers and clarify scoring to ensure con-sistency during the examination. In addition, moderationoccurs at the active stations to ensure consistency withactor’s delivery throughout the examination and markingprocess.
The passive stations assess clinical skills such as assess-ment, implementation and intervention. For example, aclinical scenario and data for planning a dietetic interven-tion, such as biochemistry, growth charts and food diaries,maybe provided, allowing assessment of the student’s abil-ity to interpret provided data and identify areas in the dietrequiring manipulation, addressing issues raised and indi-cating appropriate alternative food choices. Skills requiredto carry out these tasks are developed and practiced inclass, helping to prepare students for both the OSCE andthe final practice.14
Students move from station to station; a system of bellsand buzzers indicates when the student should move to thenext station. Incorporation of feedback from examiners,students and actors10 over the years has resulted in a num-ber of changes. Key skills tested from the initial OSCEdesign of six 10-minute stations were amalgamated intofour 15-minute stations, which included two passive andtwo active stations. The integration of skills into longerOSCE stations more accurately reflects a real-life scenario.14
For example, having more time in the active station withthe actors allows students time to move through the Modeland Process for Nutrition and Dietetic Practice (MPNDP),15
as they would in a real clinical situation, rather than focus-ing on one discrete aspect of the consultation. In addition,integration of skills better reflects the growing competencyand skill development of a final-year student16 and allowsbetter assessment of communication and clinical reasoningskills.17,18 Examiners test clinical reasoning skills further atthe end of the active station by asking a standard question.
Placement assessment requires students to demonstratecompetencies in the following areas: the MPNDP,15 com-munication, reflection, professionalism and time manage-ment. The OSCE therefore specifically tests skills related tothe MPNDP,15 communication, professionalism and timemanagement in preparation for placement.
The use of the OSCE by Australian and UK dietetic stu-dents prior to their first practice experience has indicated apotential for the OSCE to predict those students who mayhave difficulties in their initial placement.8 However, firstplacements or early placements are likely to be the mostchallenging for students as experiences in these settings willall be new, including opportunities for students to startworking with patients and applying theory into practice.Student performance on final-year placement and final-yearOSCE, however, may differ considerably as students willhave a greater knowledge base, prior placement experienceand opportunities to practice and develop skills further.
The present study reports on data collected over the last11 years and will review final-year OSCE marks and the
relationship to dietetic students’ progress on final-yearplacements. It includes an exploration of the relationshipbetween active and passive station marks, student outcomeon the final placement and student’s perception of thisexamination.
Methods
Ethical approval was provided by the Faulty ResearchEthics and Integrity Committee. Data were collected retro-spectively on students from 2006 to 2017, who had com-pleted the final-year OSCE and had undertaken the finalplacement. OSCE marks and placement outcome were col-lated. Student feedback following the OSCE was collatedonto an Excel spreadsheet. Feedback from students follow-ing OSCE is a standard process, with anonymous feedbackfrom student actors and examiners being used annually tomodify OSCE design and delivery. Feedback is collated atthe end of the OSCE; it includes questions that explore per-ception of the OSCE. Questionnaire responses includestrongly agree, agree, neither disagree nor agree, disagree,strongly disagree. Percentage responses were collated foragreement and disagreement, with responses codded as nei-ther agree or disagree coded as disagreement. Achievementon placement was split into three categories:1 Pass, achieved all placement learning outcomes.2 Struggled, required additional support from placement
team before passing placement.Data on students requiring extra time and/or support
from the placement team is routinely recorded at the time ofplacement and were used to code students in this category.3 Failed, did not achieve placement learning outcomes
despite additional support from placement team.Active stations link into placement competencies around
communication and application of the MPNDP15 and pro-fessionalism. Students may receive a food record and gen-eral practitioner (GP) letter to review before starting theconsultation. Information gathered during the consultationguides assessment, diagnosis and appropriate provision ofinformation to the actor in a professional and competentmanner.
Passive stations link into placement competencies relat-ing to the MPNDP15 and involve discriminatory skills,interpretation of data and practical application of foodknowledge skills. Active and passive stations are both timelimited when linking into the placement competencyaround time management.
In 2010, following program redesign, the timing of theOSCE changed from a post- to a pre-placement assessment,and the number of OSCE stations was reduced to four15-minute stations (two active and two passive). Data from2006/2007 to 2009/2010 relate to the OSCE being under-taken after placement, and data from 2010/2011 to2016/2017 relate to the OSCE being undertaken prior toclinical placement.
OSCE station marks are reported as percentages.Descriptive statistics are provided for the aggregate OSCEmark and the mean active and mean passive station marks
OSCE assessment: Placement outcome
© 2019 Dietitians Association of Australia 629
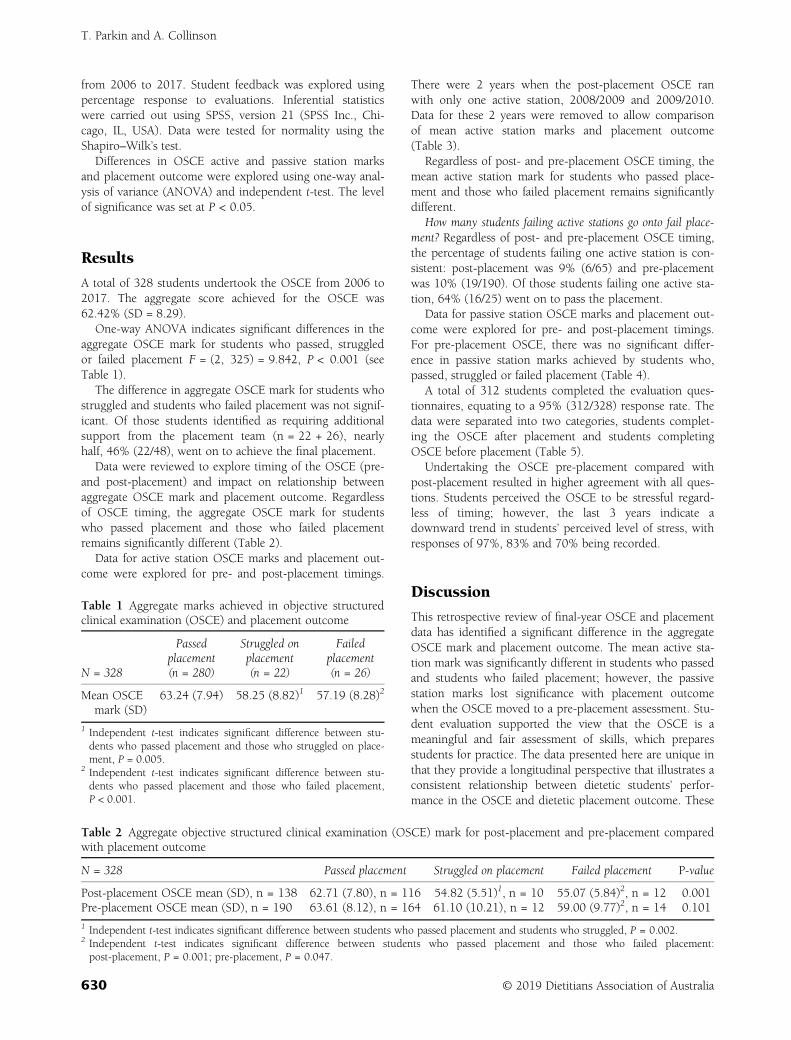
from 2006 to 2017. Student feedback was explored usingpercentage response to evaluations. Inferential statisticswere carried out using SPSS, version 21 (SPSS Inc., Chi-cago, IL, USA). Data were tested for normality using theShapiro–Wilk’s test.
Differences in OSCE active and passive station marksand placement outcome were explored using one-way anal-ysis of variance (ANOVA) and independent t-test. The levelof significance was set at P < 0.05.
Results
A total of 328 students undertook the OSCE from 2006 to2017. The aggregate score achieved for the OSCE was62.42% (SD = 8.29).
One-way ANOVA indicates significant differences in theaggregate OSCE mark for students who passed, struggledor failed placement F = (2, 325) = 9.842, P < 0.001 (seeTable 1).
The difference in aggregate OSCE mark for students whostruggled and students who failed placement was not signif-icant. Of those students identified as requiring additionalsupport from the placement team (n = 22 + 26), nearlyhalf, 46% (22/48), went on to achieve the final placement.
Data were reviewed to explore timing of the OSCE (pre-and post-placement) and impact on relationship betweenaggregate OSCE mark and placement outcome. Regardlessof OSCE timing, the aggregate OSCE mark for studentswho passed placement and those who failed placementremains significantly different (Table 2).
Data for active station OSCE marks and placement out-come were explored for pre- and post-placement timings.
There were 2 years when the post-placement OSCE ranwith only one active station, 2008/2009 and 2009/2010.Data for these 2 years were removed to allow comparisonof mean active station marks and placement outcome(Table 3).
Regardless of post- and pre-placement OSCE timing, themean active station mark for students who passed place-ment and those who failed placement remains significantlydifferent.
How many students failing active stations go onto fail place-ment? Regardless of post- and pre-placement OSCE timing,the percentage of students failing one active station is con-sistent: post-placement was 9% (6/65) and pre-placementwas 10% (19/190). Of those students failing one active sta-tion, 64% (16/25) went on to pass the placement.
Data for passive station OSCE marks and placement out-come were explored for pre- and post-placement timings.For pre-placement OSCE, there was no significant differ-ence in passive station marks achieved by students who,passed, struggled or failed placement (Table 4).
A total of 312 students completed the evaluation ques-tionnaires, equating to a 95% (312/328) response rate. Thedata were separated into two categories, students complet-ing the OSCE after placement and students completingOSCE before placement (Table 5).
Undertaking the OSCE pre-placement compared withpost-placement resulted in higher agreement with all ques-tions. Students perceived the OSCE to be stressful regard-less of timing; however, the last 3 years indicate adownward trend in students’ perceived level of stress, withresponses of 97%, 83% and 70% being recorded.
Discussion
This retrospective review of final-year OSCE and placementdata has identified a significant difference in the aggregateOSCE mark and placement outcome. The mean active sta-tion mark was significantly different in students who passedand students who failed placement; however, the passivestation marks lost significance with placement outcomewhen the OSCE moved to a pre-placement assessment. Stu-dent evaluation supported the view that the OSCE is ameaningful and fair assessment of skills, which preparesstudents for practice. The data presented here are unique inthat they provide a longitudinal perspective that illustrates aconsistent relationship between dietetic students’ perfor-mance in the OSCE and dietetic placement outcome. These
Table 1 Aggregate marks achieved in objective structuredclinical examination (OSCE) and placement outcome
N = 328
Passedplacement(n = 280)
Struggled onplacement(n = 22)
Failedplacement(n = 26)
Mean OSCEmark (SD)
63.24 (7.94) 58.25 (8.82)1 57.19 (8.28)2
1 Independent t-test indicates significant difference between stu-dents who passed placement and those who struggled on place-ment, P = 0.005.
2 Independent t-test indicates significant difference between stu-dents who passed placement and those who failed placement,P < 0.001.
Table 2 Aggregate objective structured clinical examination (OSCE) mark for post-placement and pre-placement comparedwith placement outcome
N = 328 Passed placement Struggled on placement Failed placement P-value
Post-placement OSCE mean (SD), n = 138 62.71 (7.80), n = 116 54.82 (5.51)1, n = 10 55.07 (5.84)2, n = 12 0.001Pre-placement OSCE mean (SD), n = 190 63.61 (8.12), n = 164 61.10 (10.21), n = 12 59.00 (9.77)2, n = 14 0.101
1 Independent t-test indicates significant difference between students who passed placement and students who struggled, P = 0.002.2 Independent t-test indicates significant difference between students who passed placement and those who failed placement:post-placement, P = 0.001; pre-placement, P = 0.047.
T. Parkin and A. Collinson
630 © 2019 Dietitians Association of Australia
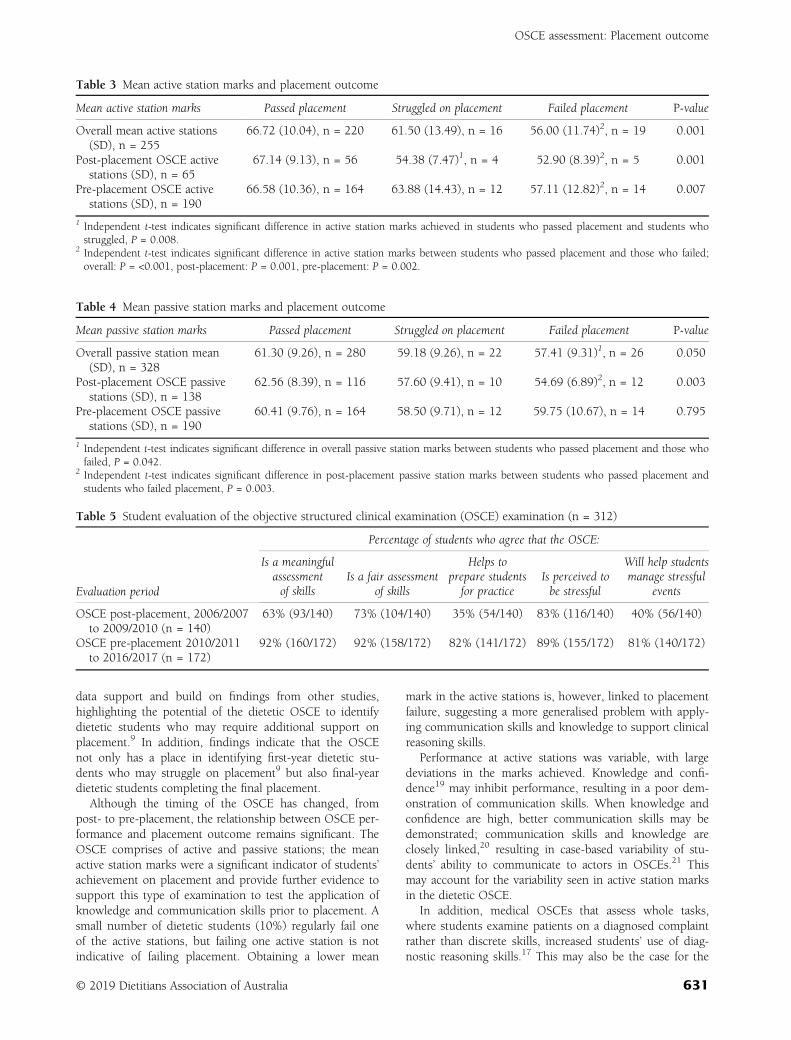
data support and build on findings from other studies,highlighting the potential of the dietetic OSCE to identifydietetic students who may require additional support onplacement.9 In addition, findings indicate that the OSCEnot only has a place in identifying first-year dietetic stu-dents who may struggle on placement9 but also final-yeardietetic students completing the final placement.
Although the timing of the OSCE has changed, frompost- to pre-placement, the relationship between OSCE per-formance and placement outcome remains significant. TheOSCE comprises of active and passive stations; the meanactive station marks were a significant indicator of students’achievement on placement and provide further evidence tosupport this type of examination to test the application ofknowledge and communication skills prior to placement. Asmall number of dietetic students (10%) regularly fail oneof the active stations, but failing one active station is notindicative of failing placement. Obtaining a lower mean
mark in the active stations is, however, linked to placementfailure, suggesting a more generalised problem with apply-ing communication skills and knowledge to support clinicalreasoning skills.
Performance at active stations was variable, with largedeviations in the marks achieved. Knowledge and confi-dence19 may inhibit performance, resulting in a poor dem-onstration of communication skills. When knowledge andconfidence are high, better communication skills may bedemonstrated; communication skills and knowledge areclosely linked,20 resulting in case-based variability of stu-dents’ ability to communicate to actors in OSCEs.21 Thismay account for the variability seen in active station marksin the dietetic OSCE.
In addition, medical OSCEs that assess whole tasks,where students examine patients on a diagnosed complaintrather than discrete skills, increased students’ use of diag-nostic reasoning skills.17 This may also be the case for the
Table 3 Mean active station marks and placement outcome
Mean active station marks Passed placement Struggled on placement Failed placement P-value
Overall mean active stations(SD), n = 255
66.72 (10.04), n = 220 61.50 (13.49), n = 16 56.00 (11.74)2, n = 19 0.001
Post-placement OSCE activestations (SD), n = 65
67.14 (9.13), n = 56 54.38 (7.47)1, n = 4 52.90 (8.39)2, n = 5 0.001
Pre-placement OSCE activestations (SD), n = 190
66.58 (10.36), n = 164 63.88 (14.43), n = 12 57.11 (12.82)2, n = 14 0.007
1 Independent t-test indicates significant difference in active station marks achieved in students who passed placement and students whostruggled, P = 0.008.
2 Independent t-test indicates significant difference in active station marks between students who passed placement and those who failed;overall: P = <0.001, post-placement: P = 0.001, pre-placement: P = 0.002.
Table 4 Mean passive station marks and placement outcome
Mean passive station marks Passed placement Struggled on placement Failed placement P-value
Overall passive station mean(SD), n = 328
61.30 (9.26), n = 280 59.18 (9.26), n = 22 57.41 (9.31)1, n = 26 0.050
Post-placement OSCE passivestations (SD), n = 138
62.56 (8.39), n = 116 57.60 (9.41), n = 10 54.69 (6.89)2, n = 12 0.003
Pre-placement OSCE passivestations (SD), n = 190
60.41 (9.76), n = 164 58.50 (9.71), n = 12 59.75 (10.67), n = 14 0.795
1 Independent t-test indicates significant difference in overall passive station marks between students who passed placement and those whofailed, P = 0.042.
2 Independent t-test indicates significant difference in post-placement passive station marks between students who passed placement andstudents who failed placement, P = 0.003.
Table 5 Student evaluation of the objective structured clinical examination (OSCE) examination (n = 312)
Evaluation period
Percentage of students who agree that the OSCE:
Is a meaningfulassessmentof skills
Is a fair assessmentof skills
Helps toprepare studentsfor practice
Is perceived tobe stressful
Will help studentsmanage stressful
events
OSCE post-placement, 2006/2007to 2009/2010 (n = 140)
63% (93/140) 73% (104/140) 35% (54/140) 83% (116/140) 40% (56/140)
OSCE pre-placement 2010/2011to 2016/2017 (n = 172)
92% (160/172) 92% (158/172) 82% (141/172) 89% (155/172) 81% (140/172)
OSCE assessment: Placement outcome
© 2019 Dietitians Association of Australia 631
dietetic active OSCE stations, with the move from discreteskill testing to longer consultations that reflect real-life sce-narios.22 On placement, students need to demonstrate theirability to apply clinical reasoning skills to work through theMPNDP15 with a variety of patients. Lack of ability to trans-fer these skills from one patient to another and to demon-strate safe clinical reasoning will result in placement failure.Lower mean marks achieved in the active stations are there-fore indicative of poor clinical reasoning skills.
Passive stations test skills against paper exercises; actorsare not involved. Passive station marks lost significancewith placement outcome when the OSCE moved to a pre-placement assessment. Completing the OSCE post-placement allows students time to practice and consolidateskills on placement. The significant association betweenplacement outcome and passive station marks post-placement may therefore reflect poor consolidation of theseskills on placement. Alternatively, the anxiety of undertak-ing the practical exam following a failed placement mayresult in poor performance at passive stations. When pas-sive stations occur prior to placement, the attainment ofskills is more likely to reflect students’ learning and acquisi-tion of skills in university. This may account for the lack ofsignificance between placement outcome and passive sta-tion marks when the OSCE moved from post- to pre-placement assessment. In addition, the resulting lack of sig-nificance between placement outcome and passive stationmarks suggests that the skills examined are different fromthose in active stations. Passive stations test a discrete rangeof skills; patients are not involved, and this may contributeto the lack of association between pre-placement passivestation marks and placement outcome as complex clinicalreasoning skills are not specifically tested.17
Moving the OSCE to pre-placement has altered students’perception of the relevance of this examination, with themajority of students reporting the OSCE to be a moremeaningful and fair assessment of skills. Students increas-ingly see this examination as a way to help them managestressful events. Similar to findings in dental students,23 amajority of dietetic students indicated that they found theOSCE stressful. Interestingly, perceived stress in dental stu-dents did not affect student performance.23 Hong,24 how-ever, has suggested that students’ anxiety about OSCEs mayinfluence their ability to perform during the OSCE. Exami-nation stress may affect their individual working memory,‘the ability to hold in information and manipulate it’,25(p93)
and the combined effect of this could result in a poordemonstration of skills within the active OSCE stations. Innursing students, anxiety has been reduced by providingvideo exemplars prior to the OSCE; however, this did notimpact students’ overall performance,26 suggesting that anx-iety is not the only factor impacting student performance inthe OSCE.
Poor time management and anxiety are commonly citedreasons for students struggling on placement and requiringadditional time.22 Dietetic students use timed sessions todevelop confidence in information retrieval, attainment andperformance ability prior to sitting the OSCE.27 This may
help to improve students’ perception of control and, incombination with techniques to reduce student anxiety,may help to improve performance long term.28 In addition,OSCE briefings allow students to become familiar with theprocess. These measures may have contributed to thedownwards trend in student-reported stress levels with thedietetic OSCE over the last 3 years.
Providing feedback after an OSCE affects the affectivedomain of learning and improves students’ ability to relateOSCE activities to clinical practice.2 Video/audio recordingalso provides a valuable method to further support studentsin reflecting on skill use in preparation for the OSCE andfuture placement.29 Currently, we offer dietetic studentsaudio/video recording as an optional method of supportwhen developing skill use, with audio recording routinelyused for some skill development sessions. Routine use ofsimulation strengthens links between theory and practice,as well as develops confidence30 and self-efficacy31 in theuse of communication skills. Practical sessions also helpsupport knowledge acquisition;32 in preparation for theOSCE, setting the theory exam close to the OSCE helpsstrengthen this area further.
A retrospective review of data does carry some limita-tions as it is unable to relate individual feedback to studentperformance or explore variations in placement perfor-mance and skills utilised with student perceptions. How-ever, despite these drawbacks and the minor changes thathave occurred to the OSCE over the last 11 years, a consis-tent pattern has emerged. The data presented indicate thatthe OSCE provides a successful assessment of dietetic stu-dents’ practical skills required for placement. The OSCEhas a valid role in preparing dietetic students for placementand identifying students likely to struggle and thereforerequire additional support.
In summary, this retrospective review highlights an asso-ciation between the aggregate OSCE mark, particularlymean active station marks and dietetic students who arelikely to fail placement. The OSCE provides a meaningfulassessment of practical clinical skills and is a useful indica-tor of dietetic students’ performance in practice, indicatingstudents who are likely to require additional support onplacement.
Funding source
The authors have no funding to declare.
Conflict of interest
The authors have no conflict of interest to declare.
Authorship
TP collated the retrospective data, conducted the prelimi-nary analysis and drafted the manuscript. AC reviewed dataanalysis and interpretation and revised the manuscript. Allauthors approved the final version of the manuscript forsubmission. The content has not been published elsewhere.
T. Parkin and A. Collinson
632 © 2019 Dietitians Association of Australia
References
1 Harden RM, Stevenson M, Downie WW, Wilson GM. Assess-ment of clinical competence using objective structured exami-nation. Br Med J 1975; 1: 447–51.
2 Casey PM, Goepfert AR, Espey EL et al. To the point: reviewsin medical education—the objective structured clinical exami-nation. Am J Obstet Gynecol 2009; 200: 25–34.
3 Jünger J, Schäfer S, Roth C, Schelberg D, Friedman Ben-David M, Nikendei C. Effects of basic clinical skills training onobjective structured clinical examination performance. MedEduc 2005; 39: 1015–20.
4 Schoonheim-Klein ME, Habets LL, Aartman IH, van derVleuten CP, Hoogstraten J, van der Velden U. Implementingan objective structured clinical examination (OSCE) in dentaleducation: effects on students’ learning strategies. Eur J DentEduc 2006; 10: 226–35.
5 Reznick RK, Smee S, Baumber JS et al. Guidelines for estimat-ing the real cost of an objective structured clinical examination.Acad Med 1993; 68: 513–7.
6 Patrício MF, Julião MF, Carneiro AV. Is the OSCE a feasibletool to assess competencies in undergraduate medical educa-tion? Med Teach 2013; 35: 503–14.
7 Khan KZ, Ramachandran S, Gaunt K, Pushkar P. The objectivestructured clinical examination (OSCE): AMEE guide no. 81.Part I: an historical and theoretical perspective. Med Teach2013; 35: 1437–46.
8 Hawker JA, Walker KZ, Barrington V, Andrianopoulos N. Mea-suring the success of an objective structured clinical examina-tion for dietetic students. J Hum Nutr Diet 2010; 23: 212–6.
9 Hawker J, Walker K. An objective structured clinical examina-tion to assess preclinical skills. Nutr Diet 2010; 67: 102–5.
10 Lambert L, Pattison DJ, de Looy AE. Dietetic students’ perfor-mance of activities in an objective structured clinical examina-tion. J Hum Nutr Diet 2019; 23: 224–9.
11 Pender FT, de Looy AE. The testing of clinical skills in dieteticstudents prior to entering clinical placement. J Hum Nutr Diet2004; 17: 17–24.
12 Rushforth HE. Objective structured clinical examination(OSCE): review of literature and implications for nursing edu-cation. Nurse Educ Today 2007; 27: 481–90.
13 Adamo G. Simulated and standardized patients in OSCEs: achieve-ments and challenges 1992–2003. Med Teach 2003; 25: 262–70.
14 Major DA. OSCEs—seven years on the bandwagon: the pro-gress of an objective structured clinical evaluation programme.Nurse Educ Today 2005; 25: 442–54.
15 British Dietetic Assoication. Model and process for nutrtion anddietetic practice [Internet]. British Dietetic Assocaition, UK,2016. (Available from: https://www.bda.uk.com/publications/professional/model_and_process_for_nutrition_and_dietetic_practice_, accessed 1 November 2017).
16 Ross M, Carroll G, Knight J, Chamberlain M, Fothergill-Bourbonnais F, linton J. Using the OSCE to measure clinicalskills performance in nursing. J Adv Nurs 1988; 13: 45–56.
17 Lafleur A, Côté L, Leppink J. Influences of OSCE design onstudents’ diagnostic reasoning. Med Educ 2015; 49: 203–14.
18 Traynor M, Galanouli D, Rice B, Lynn F. Evaluating the objec-tive structured long examination record for nurse education. BrJ Nurs 2016; 25: 681–7.
19 Lundberg KM. Promoting self-confidence in clinical nursingstudents. Nurse Educ 2008; 33: 86–9.
20 Laidlaw TS, Kaufman DM, Mac Leod H, van Zanten S,Simpson D, Wrixton W. Relationship of resident characteris-tics, attitudes, prior training and clinical knowledge to commu-nication skills performance. Med Educ 2006; 40: 18–25.
21 Guiton G, Hodgson CS, Delanshere G, Wilkerson L. Commu-nication skills in standardized-patient assessment of final-yearmedical students: a psychometric study. Adv Health Sci Educ2004; 9: 179–7.
22 Luhanga FL, Larocque S, MacEwan L, Gwekwerere YN,Danyluk P. Exploring the issue of failure to fail in professionaleducation programs: a multidisciplinary study. J Univ TeachLearn Pract 2014; 11: 3.
23 Brand HS, Schoonheim-Klein M. Is the OSCE more stressful?Examination anxiety and its consequences in different assess-ment methods in dental education. Eur J Dent Educ 2009; 13:147–53.
24 Hong E. Test anxiety, perceived test anxiety, and test perfor-mance: temporal patterns of their effects. Learn Individ Differ1999; 11: 431–47.
25 Owens M, Stevenson J, Hadwin JA, Norgate R. When doesanxiety help or hinder cognitive test performance? The roleof working memory capacity. Br J Psychol 2014; 105:92–101.
26 Massey D, Byrne J, Higgins N et al. Enhancing OSCE pre-paredness with video exemplars in undergraduate nursingstudents. A mixed method study. Nurse Educ Today 2017;54: 56–61.
27 Hicks FD, Coke L, Li S. The Effect of High-Fidelity Simulation onNursing Students’ Knowledge and Performance: A Pilot Study. Chi-cago, IL: National Council of State Boards of Nursing,2009; 40.
28 Putwain DW, Aveyard B. Is perceived control a critical factorin understanding the negative relationship between cognitivetest anxiety and examination performance? Sch Psychol Q 2018;33: 65–74.
29 Paul F. An exploration of student nurses’ thoughts and experi-ences of using a video-recording to assess their performance ofcardiopulmonary resuscitation (CPR) during a mock objectivestructured clinical examination (OSCE). Nurse Educ Pract2010; 10: 285–90.
30 Lendahls L, Oscarsson MG. Midwifery student’s experiences ofsimulation and skills training. Nurse Educ Today 2017;50: 12–6.
31 Kameg K, Howard VM, Clochesy J, Mitchell AM, Suresky JM.The impact of high fidelity human simulation on self-efficacyof communication skills. Issues Ment Health Nurs 2010; 31:315–23.
32 Mitchell ML, Henderson A, Groves M, Dalton M, Nutly D. Theobjective structured clinical examination (OSCE): optimisingits value in the undergraduate nursing curriculum. Nurse EducToday 2009; 29: 398–404.
OSCE assessment: Placement outcome
© 2019 Dietitians Association of Australia 633
OR I G I N A L R E S E AR CH
Changes in nutrition and dietetic research: A content analysisof the past decade of Dietitians Association of Australiaconference abstracts
Judi Porter PhD, FDAA, Associate Professor1,2 |Claire Bristow BNut(Hons), Research Technical Officer1 |Karen Charlton PhD, AdvAPD, Professor3 | Linda Tapsell PhD, FDAA, Professor3 |Tammie Choi PhD, APD, Teaching Associate1
1Department of Nutrition, Dietetics & Food,Monash University, Melbourne, Victoria,Australia2Eastern Health Clinical Research Office,Eastern Health, Melbourne, Victoria,Australia3School of Medicine, Faculty of Science,Medicine and Health, University ofWollongong, Wollongong, New SouthWales, Australia
CorrespondenceJudi Porter, Department of Nutrition,Dietetics & Food, Monash University, Level1, 264 Ferntree Gully Road, Notting Hill,VIC 3128, Australia.Email: [email protected]
AbstractAim: As a sample of research outputs supported by the nutrition and dietetics pro-
fession in Australia, the present study aimed to conduct a content analysis of Dieti-
tians Association of Australia (DAA) conference abstracts to identify themes,
methods and contribution by geographical location over time.
Methods: Conference abstracts published during the period 2008-2018 (excluding
those from the International Congress of Dietetics in 2012) were obtained. Key out-
come data including topics of research and methodological approach were
extracted. Leximancer, a computer-assisted content analysis program, was used in
the development of concept maps. Thematic analysis was undertaken indepen-
dently by two authors and consensus was obtained.
Results: A total of 2246 oral and poster presentation abstracts and 56 plenary
abstracts were imported and synthesised. The most commonly utilised research
designs were cross-sectional studies and evaluation research. There was a signifi-
cant increase in the proportion of systematic literature reviews, and a decreasing
proportion of randomised controlled trials presented across the study period. Out-
put was greatest from authors in Queensland and New South Wales. A clear spike
in abstracts was observed for the host state across all years. Since 2015 concept
maps appeared more interconnected, suggesting a trend for research focus towards
integrated nutrition topics. Overarching themes for emerging research topics
included Indigenous nutrition and the curriculum for dietetics education.
Food/foods emerged as a theme across multiple research methods and in a wide
range of contexts and settings.
Conclusions: The synthesis of findings suggests that research presented at the
DAA conference is largely practice driven.
KEYWORD S
conference, content analysis, dietetics, nutrition, research
Received: 30 December 2018 Revised: 27 April 2019 Accepted: 12 May 2019
DOI: 10.1111/1747-0080.12563
634 © 2019 Dietitians Association of Australia Nutrition & Dietetics. 2019;76:634–641.wileyonlinelibrary.com/journal/ndi
1 | INTRODUCTION
The size of the dietetic workforce in Australia has increasedrapidly in recent decades. There has been more than a 3-foldincrease in membership of the national professional organi-sation, the Dietitians Association of Australia (DAA), from1967 in 20041 to 6813 in 2017.2 Membership rates of DAAare estimated to represent 85% of all dietitians in Australia,when compared to census reports.1 The increase in the sizeof the profession is consistent with recommendations fromthe National Health Workforce Innovation and Reform Stra-tegic Framework for Action 2011-2015.3 Along with otherallied health professions, including physiotherapy, speechtherapy, and occupational therapy, the expansion of the die-tetics profession aligns with strategies to ensure thatAustralia's health workforce can meet increasing servicedemands from a population that is ageing, with a concomi-tant higher prevalence of chronic diseases.3 This increasehas required greater investment of universities in the teach-ing and research capacity provided by academic dietitians.4
Rising academic outputs (including peer-reviewed papersand abstracts) would be expected to follow, however therehas been little investigation of shifts in the research themesthat have been investigated by members of the profession. Arecent mapping review in one area of dietetics research,Australian workforce preparation,5 suggested that increasesin dietetic training capacity have led to increased educationalresearch output. It was estimated that in the last 30 years,more than half of the studies related to research in dieteticseducation were published in the period 2013-2018.5
Nutrition and dietetics research has been driven byadvances in science and the development of new researchmethods, a process that has occurred parallel to the changinghealth-care environment and the context for dietetic prac-tice.6 However, the profile of research topics and methodo-logical approaches employed by dietetic researchers has notpreviously been synthesised.
One way of studying change in research in this area is toapply content analysis to data on dietetic publications. Thismethod has previously been used to describe changes inpublication profiles across a defined period in other disci-plines, including sciences (eg, psychology)7 and the arts (eg,music).8 Content analysis has a presence in nutritionresearch publications across a range of topics, for example,addressing the topics of infant feeding9 and calcium andweight loss messages10 in magazines. Methods for undertak-ing content analysis in the discipline have been summarisedpreviously.11 Important considerations are intent (ie, the pur-pose of the analysis, and desired outcome data), and themethod for undertaking the analysis.11
The annual DAA conference is the largest dietetics-focused conference in Australia and provides a forum for
presentation of scientific research. The conference features arange of presentations, including invited plenary speakers,oral presentations within concurrent sessions and poster pre-sentations, with the number of accepted abstracts varyingfrom year to year, although showing an increase over a time.A double-blind system of peer review is undertaken of allsubmitted oral and poster abstracts, with submission num-bers often exceeding presentation availability. Abstractauthors nominate their preference of oral or poster presenta-tion, with only one oral presentation permitted per pre-senting author in recent years. Where the number ofsubmissions for oral presentations exceeds availability, thosewith lower rankings (or subsequent abstracts by a presentingauthor) may be assigned a poster presentation.
While broad research priorities that support national grantrounds (eg, National Health and Medical Research Council,Australian Research Council, Medical Research FuturesFund) continue to evolve, research themes that exist withinnutrition and dietetics in Australia have not previously beeninvestigated. Although dietitians may attend other specialitynutrition or medical conferences in Australia and overseas,the DAA conference program is likely to reflect changes inboth the areas of research, and methods of choice. As a sam-ple of research outputs supported by the nutrition and dietet-ics profession in Australia, the present study aimed toconduct a content analysis of DAA conference abstracts toidentify themes, methods and contribution by geographicallocation over time.
2 | METHODS
Ethics approval to undertake this analysis was obtained fromthe Monash University Human Ethics Low Risk ReviewCommittee (Project ID 15172). Peer-reviewed abstracts (oraland poster presentations) presented during the period2008-2018 were selected to capture the effect of the incre-mental increase in professional numbers over that time. Con-ference proceedings were obtained, excluding those for 2012where the 16th International Congress of Dietetics (Sydney)replaced the annual DAA conference and the large numberof international delegates reduced the focus on Australianresearch. As such this analysis is a snapshot of this 10-yearperiod, a time when there has been significant growth in thedietetics profession in Australia.2
As the abstracts were published as supplements to thejournal Nutrition & Dietetics, they were accessed in digitalform through the website (https://onlinelibrary.wiley.com/journal/17470080) and transferred to an Excel file for eachyear. Abstracts were included for oral and poster abstracts.The state of the affiliation of the first author was extractedwhile the methodological approach utilised was coded intopre-defined categories. Where research could be coded as
PORTER ET AL. 635
using more than one method, the method with the highestlevel of evidence was chosen. Classifications were thosefrom National Health and Medical Research Council(NHMRC) levels of evidence hierarchy,12 with a codingframework developed for those papers that did not fit withinthe NHMRC definitions. The table of research methods(Table 1) has been presented as closely as possible to theNHMRC levels of evidence hierarchy to provide an indica-tion of methodological rigour. Data extraction from allabstracts was undertaken by one researcher (C.B.).
Data spreadsheets of oral and poster abstracts were impo-rted into Leximancer 4.5 (Leximancer Pty Ltd, Brisbane,2018), a computer-assisted content analysis program oftenemployed in qualitative research, and used in the develop-ment of concept maps for this analysis. The program iden-tifies themes using word frequency statistics and co-occurrences, and generates thematic visualisation of con-cepts using its own algorithms to identify meanings withinpassages of text. The visual concept maps produced byLeximancer are clusters of frequently used terms diagram-matically linked to other clusters of terms identified withinthe same year. It has previously been evaluated for stability(equivalent to intercoder reliability), reproducibility and cor-relative validity.23 Frequently occurring clusters of terms arecategorised as “concepts”/themes and displayed using visualrepresentations of relationships between the themes.24 Theanalysis of findings in the present study was systematic,commencing with initial viewing and exploration of the larg-est themes, then identifying repeated patterns within themesand finally linking to related concepts in their relativeranking.
In the present study, Leximancer was used to prepareconcept maps for each year individually, as well as the entiredata set across the analysis period. Default program settingswere used, with the exception of the sentence length usedfor analysis. This was reduced from two to one sentence dueto the brief abstract length of up to 250 words. Text wasanalysed by Leximancer to develop visual concept maps offindings of research themes for each year. These conceptmaps were prepared using settings of 100% for visible con-cepts, and 33% for theme size. Frequently used words weregrouped together and shown as small grey nodes, clusteredinto themes. The heat-mapping of themes indicated the fre-quency of their use. Thus, the “hottest” or most importanttheme appeared in red, and the next hottest in orange, and soon. Themes that are mapped closely together reflected strongrelationships between the concepts,25 and multiple over-lapping concept-bubbles indicated a complex inter-connectivity between themes. Each of the Leximancer con-cept maps was further explored using the tagging function ofthe state/territory of the affiliation of the first author, and themethodological approach utilised. All Leximancer concept
maps were interpreted independently by two authors (J.P.and T.C.).
Text extracts relating to high frequency keywords werealso generated by Leximancer for manual analysis.Leximancer-generated keywords with the highest frequencywere explored manually to understand the use of the key-word within the broader text. The first 100 text extractslinked to the keyword were analysed. The final phase of dataanalysis was undertaken by two authors (J.P. and T.C.). Toenhance research rigour, investigator triangulation wasapplied. Both authors came together to discuss their findingsuntil consensus was reached. Change in study design overtime was determined using chi-square test (linear by linearassociation), conducted using IBM SPSS (version 24.0; IBMCorp, Armonk, NY).
Plenary session abstracts were analysed separately usingthematic analysis, where the topical concept of plenary ses-sions in each year were summarised for comparison withsubsequent synthesis of themes.
3 | RESULTS
A total of 2246 oral and poster presentation abstracts wereimported and synthesised within the content analysis; and56 plenary abstracts were included in the thematic analysis.Table 1 shows the breakdown of study design over the anal-ysis period. The number of randomised controlled trials andcohort studies reported remained constant (P > .05) leadingto an overall decline in proportion concomitant with increas-ing size of the conference. The number of abstractsreflecting cross-sectional studies increased significantly overtime (P < .05); this was the most frequently reported studydesign. Evaluation research, including evaluation of publichealth programs, process evaluations, and evaluation ofnutrition and dietetics curricula, was also a commonlyreported research method. There was a significant increasein the number and proportion of abstracts reporting system-atic reviews and other review types (eg, narrative and scop-ing reviews; P < .05). The relative proportion of abstractsreporting audits declined with time (P > .05), but this wasmet with an increase in the number of abstracts reflectingqualitative (P < .05) and mixed methods studies (P < .05).
The geographical state/territory of the affiliation of thefirst author is presented in Table 2. The greatest output forthe DAA conference was from authors in Queensland andNew South Wales. As expected, contributions from thelesser populated states had a smaller presence in the confer-ence program, and there was a limited contribution from pre-senters outside Australia. Table 2 also highlights figures ofthe host state for the conference (shown in bold text). A clearspike by percentage of abstract presence can be identifiedfor the state hosting the conference across all years.
636 PORTER ET AL.
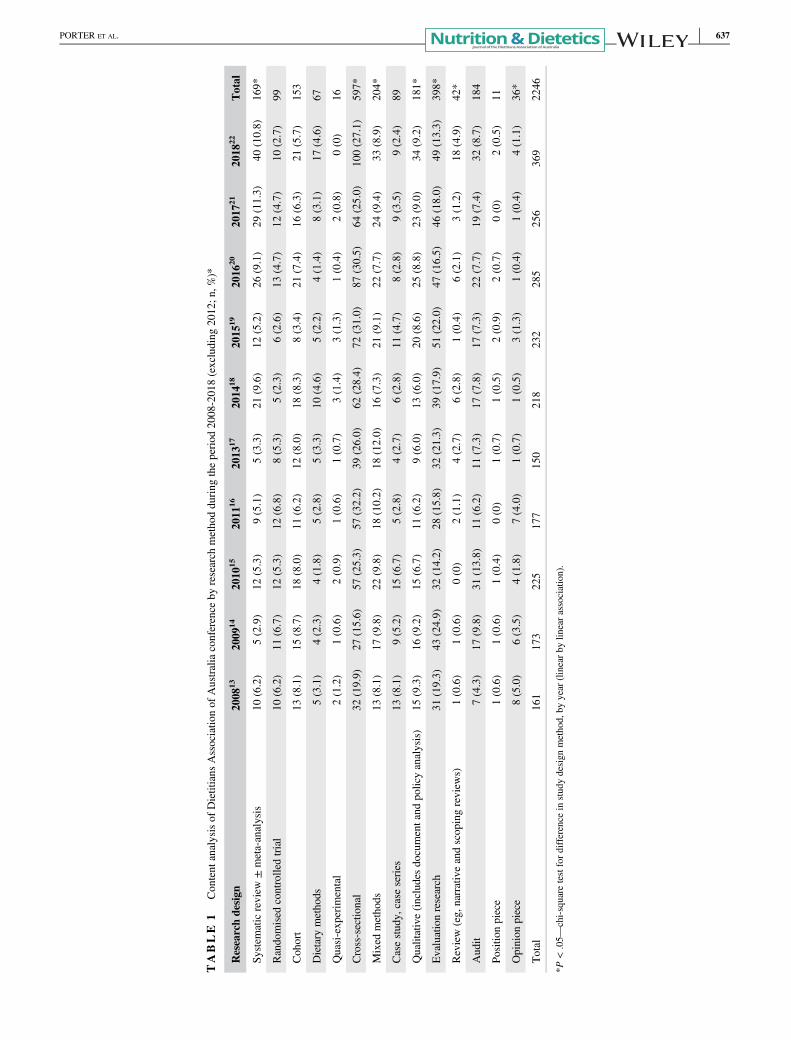
TABLE
1Content
analysisof
Dietitians
Associatio
nof
Australiaconference
byresearch
methodduring
theperiod
2008-2018(excluding
2012;n
,%)*
Researchdesign
2008
132009
142010
152011
162013
172014
182015
192016
202017
212018
22Total
System
aticreview
±meta-analysis
10(6.2)
5(2.9)
12(5.3)
9(5.1)
5(3.3)
21(9.6)
12(5.2)
26(9.1)
29(11.3)
40(10.8)
169*
Randomised
controlledtrial
10(6.2)
11(6.7)
12(5.3)
12(6.8)
8(5.3)
5(2.3)
6(2.6)
13(4.7)
12(4.7)
10(2.7)
99
Cohort
13(8.1)
15(8.7)
18(8.0)
11(6.2)
12(8.0)
18(8.3)
8(3.4)
21(7.4)
16(6.3)
21(5.7)
153
Dietary
methods
5(3.1)
4(2.3)
4(1.8)
5(2.8)
5(3.3)
10(4.6)
5(2.2)
4(1.4)
8(3.1)
17(4.6)
67
Quasi-experim
ental
2(1.2)
1(0.6)
2(0.9)
1(0.6)
1(0.7)
3(1.4)
3(1.3)
1(0.4)
2(0.8)
0(0)
16
Cross-sectio
nal
32(19.9)
27(15.6)
57(25.3)
57(32.2)
39(26.0)
62(28.4)
72(31.0)
87(30.5)
64(25.0)
100(27.1)
597*
Mixed
methods
13(8.1)
17(9.8)
22(9.8)
18(10.2)
18(12.0)
16(7.3)
21(9.1)
22(7.7)
24(9.4)
33(8.9)
204*
Casestudy,
case
series
13(8.1)
9(5.2)
15(6.7)
5(2.8)
4(2.7)
6(2.8)
11(4.7)
8(2.8)
9(3.5)
9(2.4)
89
Qualitative(includesdocumentand
policyanalysis)
15(9.3)
16(9.2)
15(6.7)
11(6.2)
9(6.0)
13(6.0)
20(8.6)
25(8.8)
23(9.0)
34(9.2)
181*
Evaluationresearch
31(19.3)
43(24.9)
32(14.2)
28(15.8)
32(21.3)
39(17.9)
51(22.0)
47(16.5)
46(18.0)
49(13.3)
398*
Review(eg,
narrativeandscopingreview
s)1(0.6)
1(0.6)
0(0)
2(1.1)
4(2.7)
6(2.8)
1(0.4)
6(2.1)
3(1.2)
18(4.9)
42*
Audit
7(4.3)
17(9.8)
31(13.8)
11(6.2)
11(7.3)
17(7.8)
17(7.3)
22(7.7)
19(7.4)
32(8.7)
184
Positio
npiece
1(0.6)
1(0.6)
1(0.4)
0(0)
1(0.7)
1(0.5)
2(0.9)
2(0.7)
0(0)
2(0.5)
11
Opinion
piece
8(5.0)
6(3.5)
4(1.8)
7(4.0)
1(0.7)
1(0.5)
3(1.3)
1(0.4)
1(0.4)
4(1.1)
36*
Total
161
173
225
177
150
218
232
285
256
369
2246
*P<.05—
chi-square
testfordifference
instudydesign
method,
byyear
(linearby
linearassociation).
PORTER ET AL. 637
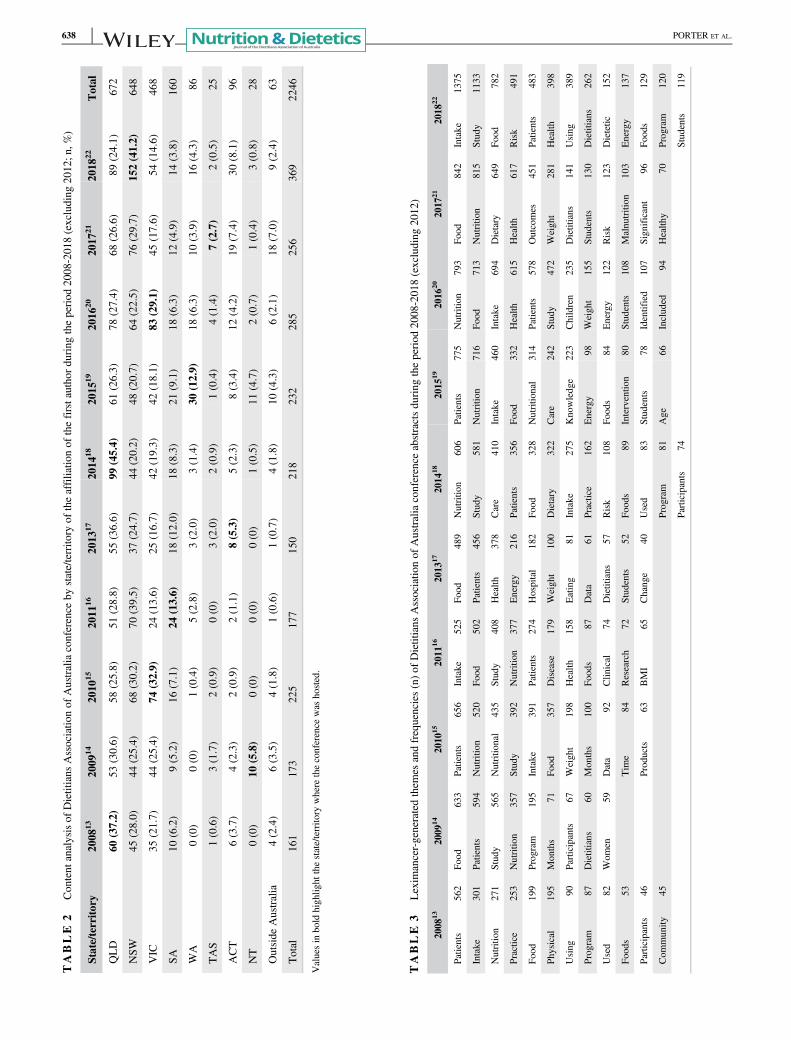
TABLE
2Content
analysisof
Dietitians
Associatio
nof
Australiaconference
bystate/territo
ryof
theaffiliatio
nof
thefirstauthord
uringtheperiod
2008
-2018(excluding
2012;n
,%)
State/territo
ry2008
132009
142010
152011
162013
172014
182015
192016
202017
212018
22Total
QLD
60(37.2)
53(30.6)
58(25.8)
51(28.8)
55(36.6)
99(45.4)
61(26.3)
78(27.4)
68(26.6)
89(24.1)
672
NSW
45(28.0)
44(25.4)
68(30.2)
70(39.5)
37(24.7)
44(20.2)
48(20.7)
64(22.5)
76(29.7)
152(41.2)
648
VIC
35(21.7)
44(25.4)
74(32.9)
24(13.6)
25(16.7)
42(19.3)
42(18.1)
83(29.1)
45(17.6)
54(14.6)
468
SA10
(6.2)
9(5.2)
16(7.1)
24(13.6)
18(12.0)
18(8.3)
21(9.1)
18(6.3)
12(4.9)
14(3.8)
160
WA
0(0)
0(0)
1(0.4)
5(2.8)
3(2.0)
3(1.4)
30(12.9)
18(6.3)
10(3.9)
16(4.3)
86
TAS
1(0.6)
3(1.7)
2(0.9)
0(0)
3(2.0)
2(0.9)
1(0.4)
4(1.4)
7(2.7)
2(0.5)
25
ACT
6(3.7)
4(2.3)
2(0.9)
2(1.1)
8(5.3)
5(2.3)
8(3.4)
12(4.2)
19(7.4)
30(8.1)
96
NT
0(0)
10(5.8)
0(0)
0(0)
0(0)
1(0.5)
11(4.7)
2(0.7)
1(0.4)
3(0.8)
28
Outside
Australia
4(2.4)
6(3.5)
4(1.8)
1(0.6)
1(0.7)
4(1.8)
10(4.3)
6(2.1)
18(7.0)
9(2.4)
63
Total
161
173
225
177
150
218
232
285
256
369
2246
Valuesin
bold
highlig
htthestate/territo
rywhere
theconference
was
hosted.
TABLE
3Lexim
ancer-generatedthem
esandfrequencies(n)of
Dietitians
Associatio
nof
Australiaconference
abstractsduring
theperiod
2008-2018(excluding
2012)
2008
132009
142010
152011
162013
172014
182015
192016
202017
212018
22
Patients
562
Food
633
Patients
656
Intake
525
Food
489
Nutritio
n606
Patients
775
Nutritio
n793
Food
842
Intake
1375
Intake
301
Patients
594
Nutritio
n520
Food
502
Patients
456
Study
581
Nutritio
n716
Food
713
Nutritio
n815
Study
1133
Nutritio
n271
Study
565
Nutritio
nal
435
Study
408
Health
378
Care
410
Intake
460
Intake
694
Dietary
649
Food
782
Practice
253
Nutritio
n357
Study
392
Nutritio
n377
Energy
216
Patients
356
Food
332
Health
615
Health
617
Risk
491
Food
199
Program
195
Intake
391
Patients
274
Hospital
182
Food
328
Nutritio
nal
314
Patients
578
Outcomes
451
Patients
483
Physical
195
Months
71Fo
od357
Disease
179
Weight
100
Dietary
322
Care
242
Study
472
Weight
281
Health
398
Using
90Participants
67Weight
198
Health
158
Eating
81Intake
275
Knowledge
223
Children
235
Dietitians
141
Using
389
Program
87Dietitians
60Months
100
Foods
87Data
61Practice
162
Energy
98Weight
155
Students
130
Dietitians
262
Used
82Wom
en59
Data
92Clin
ical
74Dietitians
57Risk
108
Foods
84Energy
122
Risk
123
Dietetic
152
Foods
53Tim
e84
Research
72Students
52Fo
ods
89Interventio
n80
Students
108
Malnutrition
103
Energy
137
Participants
46Products
63BMI
65Change
40Used
83Students
78Identified
107
Significant
96Fo
ods
129
Com
munity
45Program
81Age
66Included
94Health
y70
Program
120
Participants
74Students
119
638 PORTER ET AL.
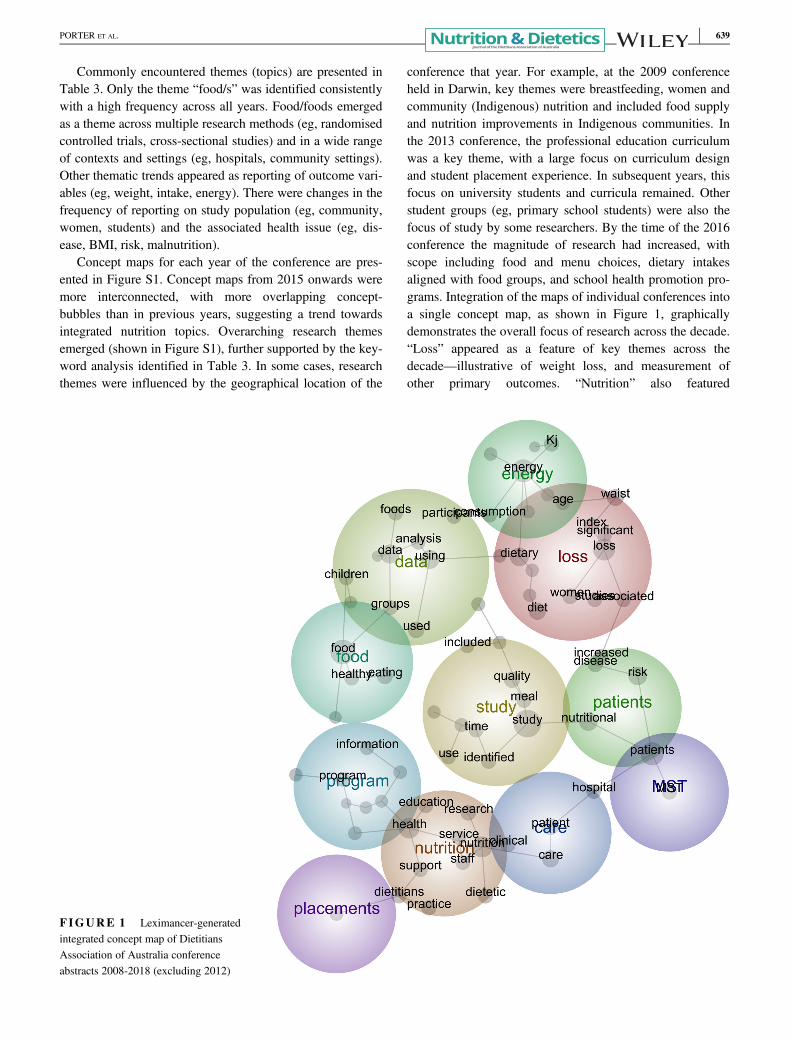
Commonly encountered themes (topics) are presented inTable 3. Only the theme “food/s” was identified consistentlywith a high frequency across all years. Food/foods emergedas a theme across multiple research methods (eg, randomisedcontrolled trials, cross-sectional studies) and in a wide rangeof contexts and settings (eg, hospitals, community settings).Other thematic trends appeared as reporting of outcome vari-ables (eg, weight, intake, energy). There were changes in thefrequency of reporting on study population (eg, community,women, students) and the associated health issue (eg, dis-ease, BMI, risk, malnutrition).
Concept maps for each year of the conference are pres-ented in Figure S1. Concept maps from 2015 onwards weremore interconnected, with more overlapping concept-bubbles than in previous years, suggesting a trend towardsintegrated nutrition topics. Overarching research themesemerged (shown in Figure S1), further supported by the key-word analysis identified in Table 3. In some cases, researchthemes were influenced by the geographical location of the
conference that year. For example, at the 2009 conferenceheld in Darwin, key themes were breastfeeding, women andcommunity (Indigenous) nutrition and included food supplyand nutrition improvements in Indigenous communities. Inthe 2013 conference, the professional education curriculumwas a key theme, with a large focus on curriculum designand student placement experience. In subsequent years, thisfocus on university students and curricula remained. Otherstudent groups (eg, primary school students) were also thefocus of study by some researchers. By the time of the 2016conference the magnitude of research had increased, withscope including food and menu choices, dietary intakesaligned with food groups, and school health promotion pro-grams. Integration of the maps of individual conferences intoa single concept map, as shown in Figure 1, graphicallydemonstrates the overall focus of research across the decade.“Loss” appeared as a feature of key themes across thedecade—illustrative of weight loss, and measurement ofother primary outcomes. “Nutrition” also featured
FIGURE 1 Leximancer-generatedintegrated concept map of DietitiansAssociation of Australia conferenceabstracts 2008-2018 (excluding 2012)
PORTER ET AL. 639
prominently as a theme across many areas of practice. Inclu-sion of the Malnutrition Screening Tool26 and student place-ments that emerged from the integrated concept map reflectsthe prominence of malnutrition risk screening and develop-ment of curricula in the last decade of dietetics research.However, no overarching research themes were evident.
The topics covered by plenary speakers were observed toalign with the conference theme each year. Topics movedfrom dissemination of general public health and clinicalstrategies to improving nutrition for specific conditions inthe early years to translating research evidence to practiceand driving change in the profession in recent years.
4 | DISCUSSION
This content analysis of 2246 abstracts identified changeswithin research themes and methods used by practising dieti-tians over the last 10 years. While the analysis did not cap-ture the full extent of nutrition and dietetics research acrossAustralia and is not representative of the scope or magnitudeof research by dietitians, it did reflect an important area offormal research communications. To the authors' knowledgea similar content analysis of research has not previouslybeen undertaken in other health professions.
Notable changes were measured in research design andthemes over the analysis period. The shift to conduct sys-tematic literature reviews and an increasing number of cross-sectional studies across many aspects of practice indicatesthe broader health issues considered by researching dieti-tians. There was less emphasis on diet-related chronic dis-ease, this specialist research may be preferentially presentedat public health or medical specialty conferences, for exam-ple, the conference of the Australasian Society of Parenteraland Enteral Nutrition. Nevertheless, in 9 of 10 conferences,the word “patients” (used in clinical areas) rather than “par-ticipants” (used in public health research) was more preva-lent, suggesting that the conference may be more alignedwith clinical issues.
The range and changing nature of nutrition and dietet-ics research presented at this conference was highlightedby thematic analysis of abstract text and concepts maps(see Figure S1). While assessment of nutritional statusand nutrition risk were present throughout the 10 years,the shift from identification of the prevalence of malnutri-tion to interventions to reduce and/or treat malnutritionlikely reflected the progress in research by dietitians inthat area.
Plenary presentations were consistent with the overarch-ing conference theme defined by DAA for each conference.Topics may be reflective of strategic areas in dietetics per-ceived by the organisation. The content and methodologicalquality of these abstracts are not subject to peer review
highlighting the importance of a consultation process indefining the conference theme and in the nomination of ple-nary speakers.
While this analysis indicates that the research presentedat the DAA conference is largely practice driven, theresearch is undoubtedly important in developing the evi-dence base that underpins nutrition and dietetic practice.6,27
Limited availability of competitive grant round fundingposes challenges to undertake large and complex high-quality studies that continue to extend the evidence base.28
The ability of our profession to obtain national funding intothe future may be through consultation in the review ofnational funding priorities, and with the development ofnutrition and dietetic research priorities. Another potentialbenefit of such research priority setting is the opportunity tobuild international collaborations. Similar research prioritysetting agendas have been undertaken in other profes-sions29,30 and specialities.31
There are several limitations to the analysis presentedhere. Coding of data was undertaken by one researcher. Themethods employed represent only one approach that may beused for content analysis. Some content analyses may pre-sent more quantitative findings, however the visual imagesprovided by the Leximancer analysis enabled powerful con-nections between themes to be exposed. The thematic analy-sis of the collated results further added to the complexity ofthis analysis. It is also noted that it is unlikely that allchanges in research profile would be reflected in the confer-ence content for a number of reasons, including restrictionson conference program size.
In conclusion, the content analysis of DAA conferenceabstracts over the past 10 years has reflected a growingnumber of and diversity across nutrition and dieteticsresearch. The research focus appears to be movingtowards more integrated nutrition topics and improvedmethodological rigour. While most research reported atDAA conference is practice driven, a coordinated strate-gic approach may focus resources to addressing prioritiesin nutrition and dietetics.
CONFLICT OF INTEREST
J.P. is the Editor of Nutrition & Dietetics; L.T. is the Editor-in-Chief of Nutrition & Dietetics. All other authors report noconflicts of interest.
AUTHOR CONTRIBUTIONS
J.P., K.C. and L.T. conceived this research, C.B. extractedthe data, J.P. and T.C. analysed and interpreted the results.All authors contributed to manuscript development andreview, and approved the manuscript for submission.
640 PORTER ET AL.
ORCID
Judi Porter https://orcid.org/0000-0002-7535-1919Claire Bristow https://orcid.org/0000-0002-0122-9611Karen Charlton https://orcid.org/0000-0002-8044-444XLinda Tapsell https://orcid.org/0000-0002-2546-6507
REFERENCES
1. Brown L, Capra S, Williams L. Profile of the Australian dieteticworkforce: 1991-2005. Nutr Diet. 2006;63:166-178.
2. Dietitians Association of Australia. Annual Report 2017-2018.https://daa.asn.au/wp-content/uploads/2018/10/Annual-Report-2017-June-2018.pdf. Accessed December 1, 2018.
3. Health Workforce Australia. National Health Workforce Innova-tion and Reform Strategic Framework for Action 2011–2015. Ade-laide, Australia: Health Workforce Australia; 2011.
4. Morgan K, Hughes R. Professional attributes of the emerging aca-demic dietetic educator workforce in Australia. Nutr Diet. 2016;73:275-282.
5. Morgan K, Kelly JT, Campbell KL, Hughes R, Reidlinger DP.Dietetics workforce preparation and preparedness in Australia: asystematic mapping review to inform future dietetics educationresearch. Nutr Diet. 2019;76:47-56.
6. Hickson M, Child J, Collinson A. Future dietitian 2025: informingthe development of a workforce strategy for dietetics. J Hum NutrDiet. 2018;31:23-32.
7. Cretchley J, Rooney D, Gallois C. Mapping a 40-year history withLeximancer: themes and concepts in the journal of cross-culturalpsychology. J Cross Cult Psychol. 2010;41:318-328.
8. Goldenberg Y. Journal of music theory over the years: content analy-sis of the articles and related aspects. J Music Theory. 2006;50:25-63.
9. Potter B, Sheeshka J, Valaitis R. Content analysis of infant feedingmessages in a Canadian women's magazine, 1945–1995. J NutrEduc. 2000;32:196-203.
10. Korinis M, Korslund MK, Belli G, Donohue JM, Johnson JM.Comparison of calcium and weight loss information in teen-focused versus women's magazines over two 4 year periods.J Nutr Educ. 1998;30:149-154.
11. Kondracki NL, Wellman NS, Amundson DR. Content analysis:review of methods and their applications in nutrition education.J Nutr Educ Behav. 2002;34:224-230.
12. National Health and Medical Research Council. NHMRC addi-tional levels of evidence and grades for recommendations fordevelopers of guidelines, 2009. https://www.mja.com.au/sites/default/files/NHMRC.levels.of.evidence.2008-09.pdf. AccessedMarch 7, 2019.
13. Dietitians Association of Australia 26th National Conference,Gold Coast. Nutr Diet 2008; 65(S2): i-xii, A1-A50.
14. Dietitians Association of Australia 27th National Conference, Dar-win. Nutr Diet 2009; 66(S1): v-xix, A1-A56.
15. Dietitians Association of Australia 28th National Conference, Mel-bourne. Nutr Diet 2010; 67(S1): v-xxiii, 1-71.
16. Dietitians Association of Australia 29th National Conference, Ade-laide. Nutr Diet 2011; 68(S1): v-xix, 1-55.
17. Dietitians Association of Australia 30th National Conference, Can-berra. Nutr Diet. 2013;70(S1):1-48.
18. Dietitians Association of Australia 31st National Conference, Bris-bane. Nutr Diet. 2014;71(S1):1-75.
19. Dietitians Association of Australia 32nd National Conference,Perth. Nutr Diet. 2015;72(S1):1-73.
20. Dietitians Association of Australia 33rd National Conference, Mel-bourne. Nutr Diet. 2016;73(S1):1-102.
21. Dietitians Association of Australia 34th National Conference,Hobart. Nutr Diet. 2017;74(S1):1-90.
22. Dietitians Association of Australia 35th National Conference, Syd-ney. Nutr Diet. 2018;75(S1):1-126.
23. Smith AE, Humphreys MS. Evaluation of unsupervised semanticmapping of natural language with Leximancer concept mapping.Behav Res Methods. 2006;38:262-279.
24. Stockwell P, Colomb RM, Smith AW, Wiles J. Use of an auto-matic content analysis tool: a technique for seeing both local andglobal scope. Int J Hum Comput Stud. 2009;67:424-436.
25. Campbell C, Pitt L, Parent M, Berthon P. Understanding consumerconversations around ads in a web 2.0 world. J Advert. 2011;40:87-102.
26. Ferguson M, Capra S, Bauer J, Banks M. Development of a validand reliable malnutrition screening tool for adult acute hospitalpatients. Nutrition. 1999;15:458-464.
27. Kicklighter JR, Domer B, Hunter AM, et al. Visioning report2017: a preferred path forward for the nutrition and dietetics pro-fession. J Acad Nutr Diet. 2017;117:110-127.
28. National Health and Medical Research Council. Find Funding. https://www.nhmrc.gov.au/funding/find-funding. Accessed April 27, 2019.
29. The National Nursing and Nursing Education Taskforce. Prioritiesfor nursing and midwifery research in Australia, 2002. http://www.dhs.vic.gov.au/nnnet/downloads/rec8_m_bennett_priorities_report.pdf. Accessed March 1, 2019.
30. The College of Radiographers. The College of RadiographersResearch Priorities for the Radiographic Profession: A DelphiConsensus Study, 2017. https://www.sor.org/system/files/article/201702/research_priorities_170117.pdf. Accessed March 1, 2019.
31. Jaffee EM, van Dang C, Agus DB, et al. Future cancer researchpriorities in the USA: a Lancet Oncology Commission. LancetOncol. 2017;18:PE653-PE706.
SUPPORTING INFORMATION
Additional supporting information may be found online inthe Supporting Information section at the end of this article.
How to cite this article: Porter J, Bristow C,Charlton K, Tapsell L, Choi T. Changes in nutritionand dietetic research: A content analysis of the pastdecade of Dietitians Association of Australiaconference abstracts. Nutrition & Dietetics. 2019;76:634–641. https://doi.org/10.1111/1747-0080.12563
PORTER ET AL. 641
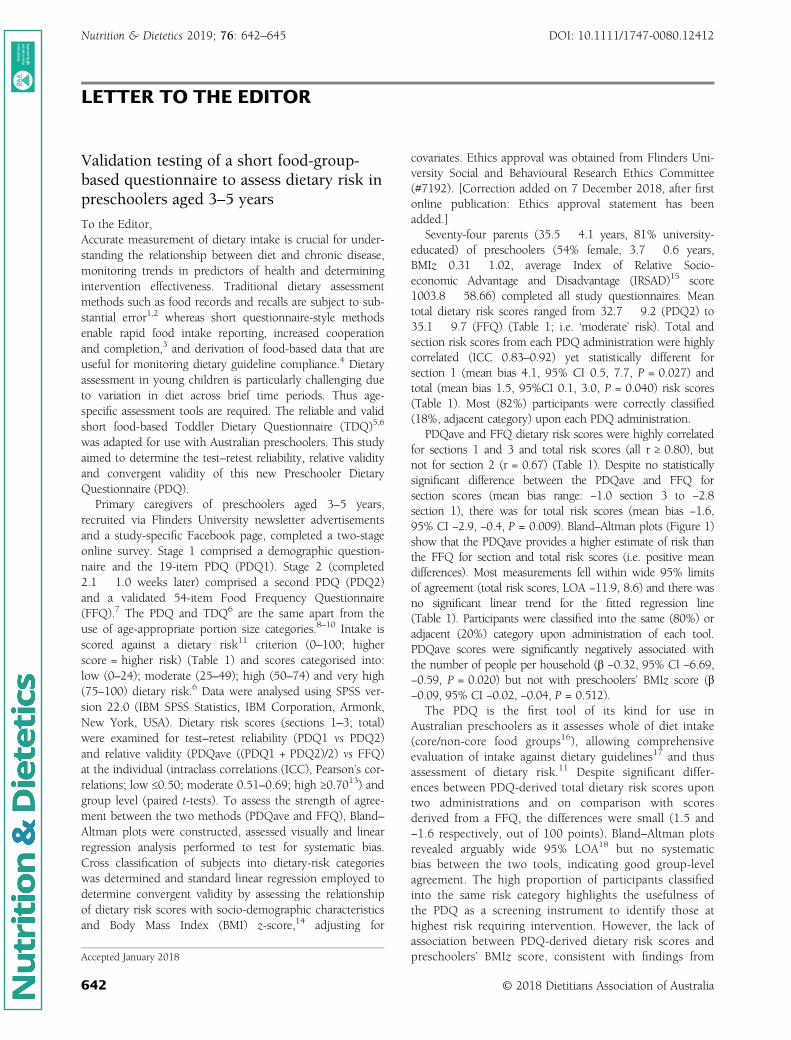
LETTER TO THE EDITOR
Validation testing of a short food-group-based questionnaire to assess dietary risk inpreschoolers aged 3–5 years
To the Editor,Accurate measurement of dietary intake is crucial for under-standing the relationship between diet and chronic disease,monitoring trends in predictors of health and determiningintervention effectiveness. Traditional dietary assessmentmethods such as food records and recalls are subject to sub-stantial error1,2 whereas short questionnaire-style methodsenable rapid food intake reporting, increased cooperationand completion,3 and derivation of food-based data that areuseful for monitoring dietary guideline compliance.4 Dietaryassessment in young children is particularly challenging dueto variation in diet across brief time periods. Thus age-specific assessment tools are required. The reliable and validshort food-based Toddler Dietary Questionnaire (TDQ)5,6
was adapted for use with Australian preschoolers. This studyaimed to determine the test–retest reliability, relative validityand convergent validity of this new Preschooler DietaryQuestionnaire (PDQ).
Primary caregivers of preschoolers aged 3–5 years,recruited via Flinders University newsletter advertisementsand a study-specific Facebook page, completed a two-stageonline survey. Stage 1 comprised a demographic question-naire and the 19-item PDQ (PDQ1). Stage 2 (completed2.1 � 1.0 weeks later) comprised a second PDQ (PDQ2)and a validated 54-item Food Frequency Questionnaire(FFQ).7 The PDQ and TDQ6 are the same apart from theuse of age-appropriate portion size categories.8–10 Intake isscored against a dietary risk11 criterion (0–100; higherscore = higher risk) (Table 1) and scores categorised into:low (0–24); moderate (25–49); high (50–74) and very high(75–100) dietary risk.6 Data were analysed using SPSS ver-sion 22.0 (IBM SPSS Statistics, IBM Corporation, Armonk,New York, USA). Dietary risk scores (sections 1–3; total)were examined for test–retest reliability (PDQ1 vs PDQ2)and relative validity (PDQave ((PDQ1 + PDQ2)/2) vs FFQ)at the individual (intraclass correlations (ICC), Pearson’s cor-relations; low ≤0.50; moderate 0.51–0.69; high ≥0.7013) andgroup level (paired t-tests). To assess the strength of agree-ment between the two methods (PDQave and FFQ), Bland–Altman plots were constructed, assessed visually and linearregression analysis performed to test for systematic bias.Cross classification of subjects into dietary-risk categorieswas determined and standard linear regression employed todetermine convergent validity by assessing the relationshipof dietary risk scores with socio-demographic characteristicsand Body Mass Index (BMI) z-score,14 adjusting for
covariates. Ethics approval was obtained from Flinders Uni-versity Social and Behavioural Research Ethics Committee(#7192). [Correction added on 7 December 2018, after firstonline publication: Ethics approval statement has beenadded.]
Seventy-four parents (35.5 � 4.1 years, 81% university-educated) of preschoolers (54% female, 3.7 � 0.6 years,BMIz 0.31 � 1.02, average Index of Relative Socio-economic Advantage and Disadvantage (IRSAD)15 score1003.8 � 58.66) completed all study questionnaires. Meantotal dietary risk scores ranged from 32.7 � 9.2 (PDQ2) to35.1 � 9.7 (FFQ) (Table 1; i.e. ‘moderate’ risk). Total andsection risk scores from each PDQ administration were highlycorrelated (ICC 0.83–0.92) yet statistically different forsection 1 (mean bias 4.1, 95% CI 0.5, 7.7, P = 0.027) andtotal (mean bias 1.5, 95%CI 0.1, 3.0, P = 0.040) risk scores(Table 1). Most (82%) participants were correctly classified(18%, adjacent category) upon each PDQ administration.
PDQave and FFQ dietary risk scores were highly correlatedfor sections 1 and 3 and total risk scores (all r ≥ 0.80), butnot for section 2 (r = 0.67) (Table 1). Despite no statisticallysignificant difference between the PDQave and FFQ forsection scores (mean bias range: −1.0 section 3 to −2.8section 1), there was for total risk scores (mean bias −1.6,95% CI −2.9, −0.4, P = 0.009). Bland–Altman plots (Figure 1)show that the PDQave provides a higher estimate of risk thanthe FFQ for section and total risk scores (i.e. positive meandifferences). Most measurements fell within wide 95% limitsof agreement (total risk scores, LOA −11.9, 8.6) and there wasno significant linear trend for the fitted regression line(Table 1). Participants were classified into the same (80%) oradjacent (20%) category upon administration of each tool.PDQave scores were significantly negatively associated withthe number of people per household (β −0.32, 95% CI −6.69,−0.59, P = 0.020) but not with preschoolers’ BMIz score (β−0.09, 95% CI −0.02, −0.04, P = 0.512).
The PDQ is the first tool of its kind for use inAustralian preschoolers as it assesses whole of diet intake(core/non-core food groups16), allowing comprehensiveevaluation of intake against dietary guidelines17 and thusassessment of dietary risk.11 Despite significant differ-ences between PDQ-derived total dietary risk scores upontwo administrations and on comparison with scoresderived from a FFQ, the differences were small (1.5 and−1.6 respectively, out of 100 points). Bland–Altman plotsrevealed arguably wide 95% LOA18 but no systematicbias between the two tools, indicating good group-levelagreement. The high proportion of participants classifiedinto the same risk category highlights the usefulness ofthe PDQ as a screening instrument to identify those athighest risk requiring intervention. However, the lack ofassociation between PDQ-derived dietary risk scores andpreschoolers’ BMIz score, consistent with findings fromAccepted January 2018
© 2018 Dietitians Association of Australia642
AA AA
DDD
ieti
tian
s As
soci
atio
nofof
Aus
tral
ia
Nutrition & Dietetics 2019; 76: 642–645 DOI: 10.1111/1747-0080.12412
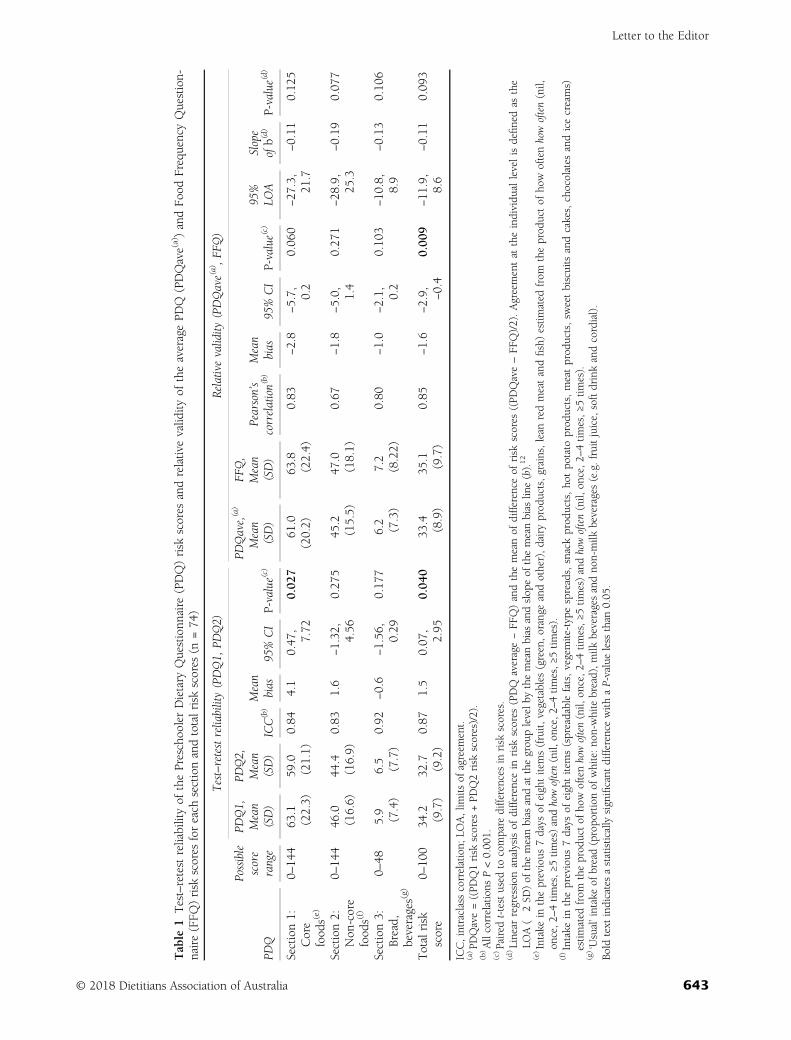
Table
1Test–retestreliabilityof
thePreschoolerDietary
Questionn
aire
(PDQ)risk
scores
andrelativevalid
ityof
theaveragePD
Q(PDQave(a))andFo
odFrequencyQuestion-
naire(FFQ
)risk
scores
foreach
sectionandtotalrisk
scores
(n=74
)
Test–retestreliability(PDQ1,
PDQ2)
Relativevalidity
(PDQave(a),F
FQ)
PDQ
Possible
score
range
PDQ1,
Mean
(SD)
PDQ2,
Mean
(SD)
ICC(b)Mean
bias
95%CI
P-value(c)
PDQave,(a)
Mean
(SD)
FFQ,
Mean
(SD)
Pearson’s
correlation(b)
Mean
bias
95%CI
P-value(c)
95%
LOA
Slope
ofb(d)
P-value(d)
Section1:
Core
food
s(e)
0–14
463
.1(22.3)
59.0
(21.1)
0.84
4.1
0.47
,7.72
0.02
761
.0(20.2)
63.8
(22.4)
0.83
−2.8
−5.7, 0.2
0.06
0−27
.3,
21.7
−0.11
0.12
5
Section2:
Non
-core
food
s(f)
0–14
446
.0(16.6)
44.4
(16.9)
0.83
1.6
−1.32
,4.56
0.27
545
.2(15.5)
47.0
(18.1)
0.67
−1.8
−5.0, 1.4
0.27
1−28
.9,
25.3
−0.19
0.07
7
Section3:
Bread,
beverages(g)
0–48
5.9
(7.4)
6.5
(7.7)
0.92
−0.6
−1.56
,0.29
0.17
76.2
(7.3)
7.2
(8.22)
0.80
−1.0
−2.1, 0.2
0.10
3−10
.8,
8.9
−0.13
0.10
6
Totalrisk
score
0–10
034
.2(9.7)
32.7
(9.2)
0.87
1.5
0.07
,2.95
0.04
033
.4(8.9)
35.1
(9.7)
0.85
−1.6
−2.9, −0.4
0.00
9−11
.9,
8.6
−0.11
0.09
3
ICC,intraclasscorrelation;
LOA,lim
itsof
agreem
ent.
(a)PD
Qave=((PD
Q1risk
scores
+PD
Q2risk
scores)/2).
(b)Allcorrelations
P<0.00
1.(c)Paired
t-testused
tocompare
differences
inrisk
scores.
(d)Linear
regression
analysisof
differencein
risk
scores
(PDQ
average−FF
Q)andthemeanof
differenceof
risk
scores
((PD
Qave–FF
Q)/2).Agreementat
theindividu
allevelisdefinedas
the
LOA(�
2SD
)of
themeanbias
andat
thegrou
plevelb
ythemeanbias
andslop
eof
themeanbias
line(b).12
(e)Intake
intheprevious
7days
ofeightitems(fruit,
vegetables
(green,orange
andother),dairyprod
ucts,grains,lean
redmeatandfish)estim
ated
from
theprod
uctof
how
oftenhowoften(nil,
once,2–
4tim
es,≥5
times)andhowoften(nil,
once,2
–4tim
es,≥
5tim
es).
(f)Intake
intheprevious
7days
ofeightitems(spreadablefats,vegemite-typespreads,snackprod
ucts,ho
tpo
tato
prod
ucts,meatprod
ucts,sw
eetbiscuitsandcakes,chocolates
andicecreams)
estim
ated
from
theprod
uctof
howoftenhowoften(nil,
once,2–
4tim
es,≥5
times)andhowoften(nil,
once,2
–4tim
es,≥
5tim
es).
(g)‘Usual’intake
ofbread(propo
rtionof
white:no
n-whitebread),m
ilkbeveragesandno
n-milk
beverages(e.g.fruitjuice,softdrinkandcordial).
Bold
text
indicatesastatistically
significant
differencewith
aP-valueless
than
0.05
.
Letter to the Editor
© 2018 Dietitians Association of Australia 643
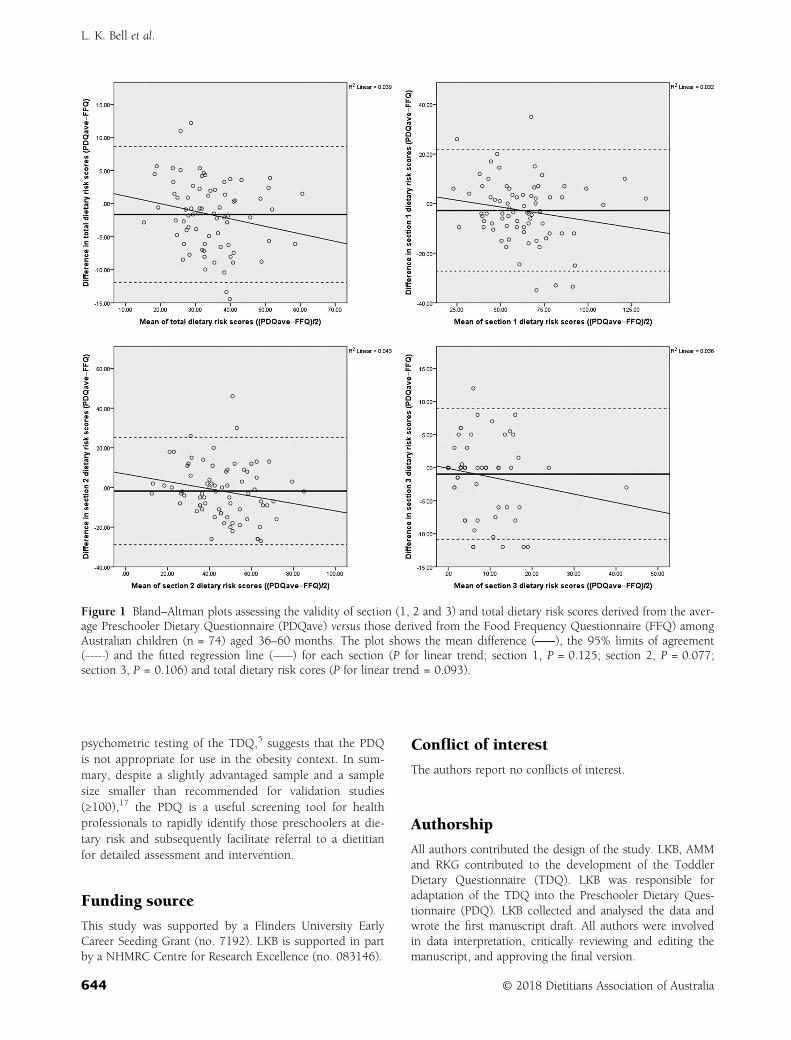
psychometric testing of the TDQ,5 suggests that the PDQis not appropriate for use in the obesity context. In sum-mary, despite a slightly advantaged sample and a samplesize smaller than recommended for validation studies(≥100),17 the PDQ is a useful screening tool for healthprofessionals to rapidly identify those preschoolers at die-tary risk and subsequently facilitate referral to a dietitianfor detailed assessment and intervention.
Funding source
This study was supported by a Flinders University EarlyCareer Seeding Grant (no. 7192). LKB is supported in partby a NHMRC Centre for Research Excellence (no. 083146).
Conflict of interest
The authors report no conflicts of interest.
Authorship
All authors contributed the design of the study. LKB, AMMand RKG contributed to the development of the ToddlerDietary Questionnaire (TDQ). LKB was responsible foradaptation of the TDQ into the Preschooler Dietary Ques-tionnaire (PDQ). LKB collected and analysed the data andwrote the first manuscript draft. All authors were involvedin data interpretation, critically reviewing and editing themanuscript, and approving the final version.
Figure 1 Bland–Altman plots assessing the validity of section (1, 2 and 3) and total dietary risk scores derived from the aver-age Preschooler Dietary Questionnaire (PDQave) versus those derived from the Food Frequency Questionnaire (FFQ) amongAustralian children (n = 74) aged 36–60 months. The plot shows the mean difference ( ), the 95% limits of agreement( ) and the fitted regression line ( ) for each section (P for linear trend; section 1, P = 0.125; section 2, P = 0.077;section 3, P = 0.106) and total dietary risk cores (P for linear trend = 0.093).
L. K. Bell et al.
644 © 2018 Dietitians Association of Australia
Lucinda K. Bell,1,2 PhD, APDResearch Associate
Rebecca K. Golley,2 PhD, APDSenior Lecturer
Chelsea E. Mauch,1 Bsc (Hons), APDResearch Assistant
Suja M. Mathew,3 MBBS, MD, FRACPPaediatrician
Anthea M. Magarey,1 PhD, APD,Associate Professor
1College of Nursing and Health Sciences, FlindersUniversity, 2School of Pharmacy and Medical Sciences
(Nutrition and Food Science), Sansom Institute for HealthResearch, University of South Australia and 3Vaccinology
and Immunology Research Trials Unit, Women’s andChildren’s Hospital, Adelaide, South Australia, Australia
References
1 Shim JS, Oh K, Kim HC. Dietary assessment methods in epide-miologic studies. Epidemiol Health 2014; 36: e2014009.
2 Collins CE, Watson J, Burrows T. Measuring dietary intake inchildren and adolescents in the context of overweight and obe-sity. Int J Obes 2010; 34: 1103–15.
3 Sinkowitz-Cochran RL. Survey design: to ask or not to ask?That is the question. Clin Infect Dis 2013; 56: 1159–64.
4 Golley RK, Bell LK, Hendrie GA et al. Validity of short foodquestionnaire items to measure intake in children and adoles-cents: a systematic review. J Hum Nutr Diet 2017; 30: 36–50.
5 Bell LK, Golley RK, Magarey AM. Dietary risk scores of toddlersare associated with nutrient intakes and socio-demographicfactors, but not weight status. Nutr Diet 2016; 73: 73–80.
6 Bell LK, Golley RK, Magarey AM. A short food-group-baseddietary questionnaire is reliable and valid for assessing toddlers’dietary risk in relatively advantaged samples. Br J Nutr 2014;112: 627–37.
7 Huybrechts I, De Backer G, De Bacquer D, Maes L, De Henauw S.Relative validity and reproducibility of a food-frequency question-naire for estimating food intakes among Flemish preschoolers. Int JEnviron Res Public Health 2009; 6: 382–99.
8 National Health and Medical Research Council. A ModellingSystem to Inform the Revision of the Australian Guide to Healthy
Eating. Canberra: The Council, 2011. (Available from: https://www.eatforhealth.gov.au/sites/default/files/files/public_consult-ation/n55a_dietary_guidelines_food_modelling_111216.pdf,accessed 15 July 2012).
9 Daniels LA, Magarey A, Battistutta D et al. The NOURISH ran-domised control trial: positive feeding practices and food pref-erences in early childhood – a primary prevention program forchildhood obesity. BMC Public Health 2009; 9: 387.
10 Koh GA, Scott JA, Woodman RJ, Kim SW, Daniels LA,Magarey AM. Maternal feeding self-efficacy and fruit and vege-table intakes in infants. Results from the SAIDI study. Appetite2014; 81: 44–51.
11 Committee on Dietary Risk Assessment in the WIC program:Food and Nutrition Board. Dietary Risk Assessment in the WICProgram. Washington, DC: The National Academies Press,2002. (Available from: https://fns-prod.azureedge.net/sites/default/files/WICDietaryRisk.pdf, accessed 23 October 2012).
12 Magarey A, Golley R, Spurrier N, Goodwin E, Ong F. Reliabil-ity and validity of the Children’s Dietary Questionnaire; a newtool to measure children’s dietary patterns. Int J Pediatr Obes2009; 4: 257–65.
13 Pallant J. SPSS Survival Manual: A Step by Step Guide to DataAnalysis Using SPSS, 4th edn. Crows Nest: Allen andUnwin, 2011.
14 World Health Organization. WHO Child Growth Standards:Length/Height-for-Age, Weight-for-Age, Weight-for-Length, Weight-for-Height and Body Mass Index-for-Age: Methods and Develop-ment. Geneva: The Organization, 2006. (Available from: http://www.who.int/childgrowth/standards/technical_report/en/,accessed 26 July 2017).
15 Australian Bureau of Statistics. Information Paper: An Introduc-tion to Socio-Economic Indexes for Areas (SEIFA). Canberra:The Bureau, 2006. (Available from: http://www.abs.gov.au/AUSSTATS/[email protected]/DetailsPage/2039.02006?OpenDocument,accessed 17 August 2017).
16 National Health and Medical Research Council. AustralianDietary Guidelines: Providing the Scientific Evidence for HealthierAustralian Diets. Canberra: The Council, 2013. (Availablefrom: https://www.eatforhealth.gov.au/sites/default/files/files/the_guidelines/n55_australian_dietary_guidelines.pdf, accessed10 August 2017).
17 Bland JM, Altman DG. Measuring agreement in method com-parison studies. Stat Methods Med Res 1999; 8: 135–60.
18 Giavarina D. Understanding Bland Altman analysis. BiochemMed (Zagreb) 2015; 25: 141–51.
Letter to the Editor
© 2018 Dietitians Association of Australia 645
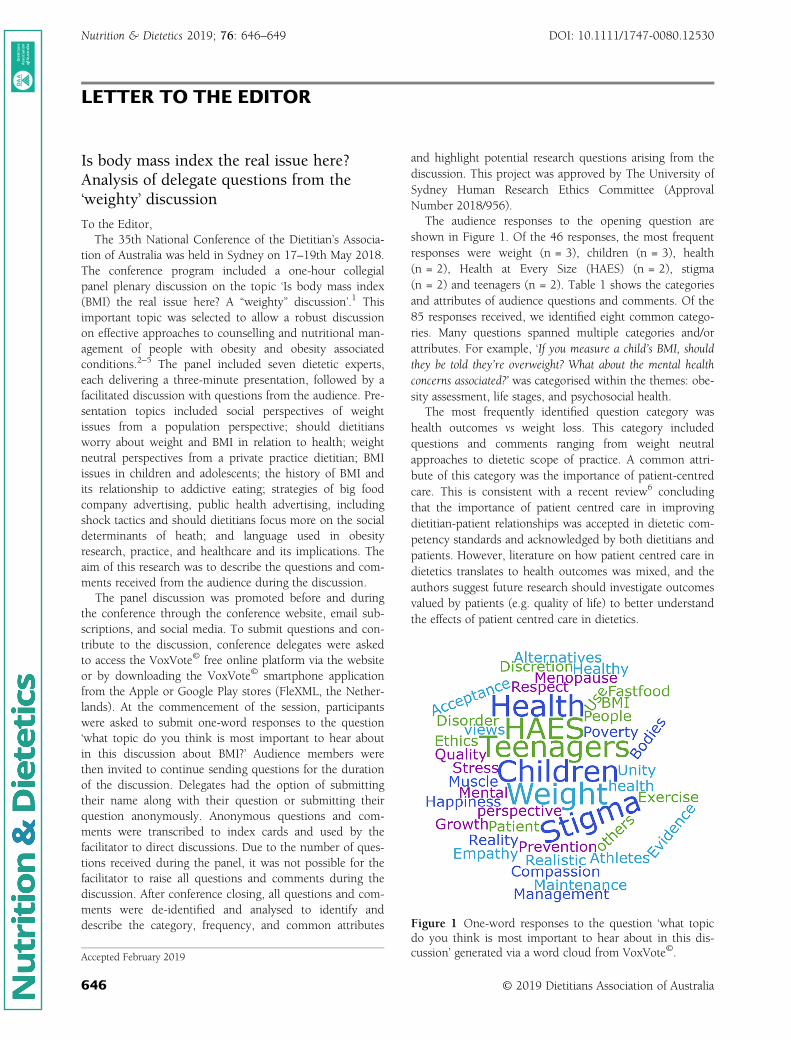
LETTER TO THE EDITOR
Is body mass index the real issue here?Analysis of delegate questions from the‘weighty’ discussion
To the Editor,The 35th National Conference of the Dietitian’s Associa-
tion of Australia was held in Sydney on 17–19th May 2018.The conference program included a one-hour collegialpanel plenary discussion on the topic ‘Is body mass index(BMI) the real issue here? A “weighty” discussion’.1 Thisimportant topic was selected to allow a robust discussionon effective approaches to counselling and nutritional man-agement of people with obesity and obesity associatedconditions.2–5 The panel included seven dietetic experts,each delivering a three-minute presentation, followed by afacilitated discussion with questions from the audience. Pre-sentation topics included social perspectives of weightissues from a population perspective; should dietitiansworry about weight and BMI in relation to health; weightneutral perspectives from a private practice dietitian; BMIissues in children and adolescents; the history of BMI andits relationship to addictive eating; strategies of big foodcompany advertising, public health advertising, includingshock tactics and should dietitians focus more on the socialdeterminants of heath; and language used in obesityresearch, practice, and healthcare and its implications. Theaim of this research was to describe the questions and com-ments received from the audience during the discussion.
The panel discussion was promoted before and duringthe conference through the conference website, email sub-scriptions, and social media. To submit questions and con-tribute to the discussion, conference delegates were askedto access the VoxVote© free online platform via the websiteor by downloading the VoxVote© smartphone applicationfrom the Apple or Google Play stores (FleXML, the Nether-lands). At the commencement of the session, participantswere asked to submit one-word responses to the question‘what topic do you think is most important to hear aboutin this discussion about BMI?’ Audience members werethen invited to continue sending questions for the durationof the discussion. Delegates had the option of submittingtheir name along with their question or submitting theirquestion anonymously. Anonymous questions and com-ments were transcribed to index cards and used by thefacilitator to direct discussions. Due to the number of ques-tions received during the panel, it was not possible for thefacilitator to raise all questions and comments during thediscussion. After conference closing, all questions and com-ments were de-identified and analysed to identify anddescribe the category, frequency, and common attributes
and highlight potential research questions arising from thediscussion. This project was approved by The University ofSydney Human Research Ethics Committee (ApprovalNumber 2018/956).
The audience responses to the opening question areshown in Figure 1. Of the 46 responses, the most frequentresponses were weight (n = 3), children (n = 3), health(n = 2), Health at Every Size (HAES) (n = 2), stigma(n = 2) and teenagers (n = 2). Table 1 shows the categoriesand attributes of audience questions and comments. Of the85 responses received, we identified eight common catego-ries. Many questions spanned multiple categories and/orattributes. For example, ‘If you measure a child’s BMI, shouldthey be told they’re overweight? What about the mental healthconcerns associated?’ was categorised within the themes: obe-sity assessment, life stages, and psychosocial health.
The most frequently identified question category washealth outcomes vs weight loss. This category includedquestions and comments ranging from weight neutralapproaches to dietetic scope of practice. A common attri-bute of this category was the importance of patient-centredcare. This is consistent with a recent review6 concludingthat the importance of patient centred care in improvingdietitian-patient relationships was accepted in dietetic com-petency standards and acknowledged by both dietitians andpatients. However, literature on how patient centred care indietetics translates to health outcomes was mixed, and theauthors suggest future research should investigate outcomesvalued by patients (e.g. quality of life) to better understandthe effects of patient centred care in dietetics.
Figure 1 One-word responses to the question ‘what topicdo you think is most important to hear about in this dis-cussion’ generated via a word cloud from VoxVote©.Accepted February 2019
© 2019 Dietitians Association of Australia646
AA AA
DDD
ieti
tian
s As
soci
atio
nofof
Aus
tral
ia
Nutrition & Dietetics 2019; 76: 646–649 DOI: 10.1111/1747-0080.12530
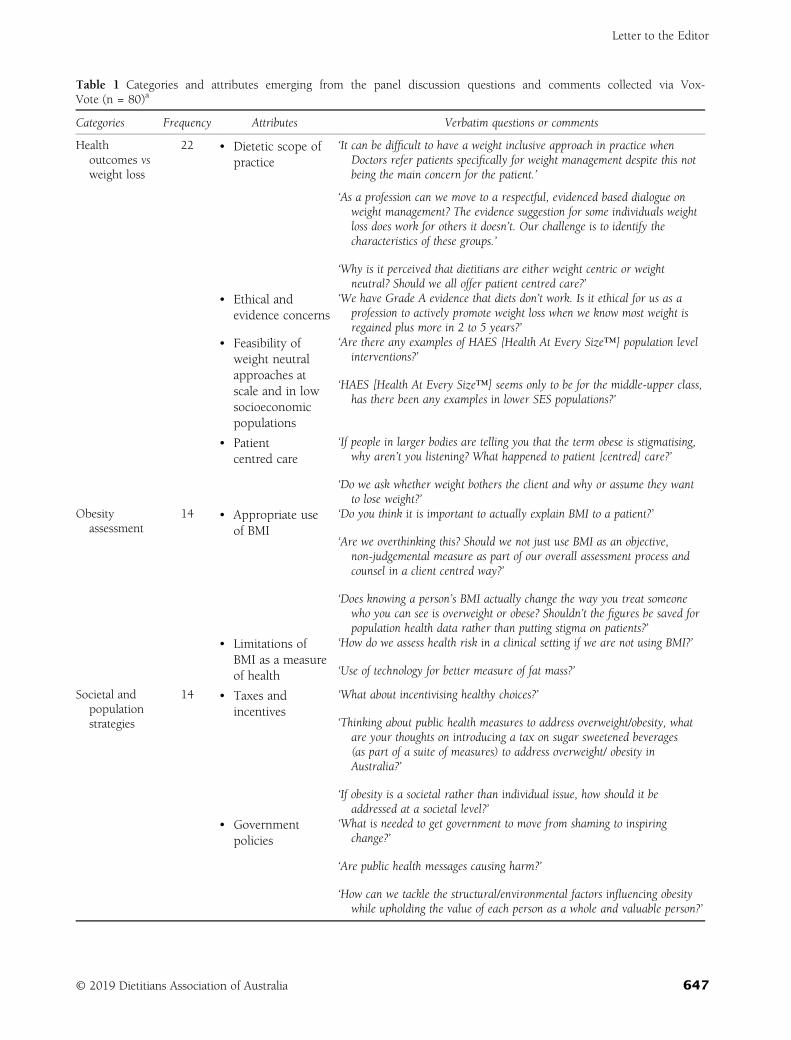
Table 1 Categories and attributes emerging from the panel discussion questions and comments collected via Vox-Vote (n = 80)a
Categories Frequency Attributes Verbatim questions or comments
Healthoutcomes vsweight loss
22 • Dietetic scope ofpractice
‘It can be difficult to have a weight inclusive approach in practice whenDoctors refer patients specifically for weight management despite this notbeing the main concern for the patient.’
‘As a profession can we move to a respectful, evidenced based dialogue onweight management? The evidence suggestion for some individuals weightloss does work for others it doesn’t. Our challenge is to identify thecharacteristics of these groups.’
‘Why is it perceived that dietitians are either weight centric or weightneutral? Should we all offer patient centred care?’
• Ethical andevidence concerns
‘We have Grade A evidence that diets don’t work. Is it ethical for us as aprofession to actively promote weight loss when we know most weight isregained plus more in 2 to 5 years?’
• Feasibility ofweight neutralapproaches atscale and in lowsocioeconomicpopulations
‘Are there any examples of HAES [Health At Every Size™] population levelinterventions?’
‘HAES [Health At Every Size™] seems only to be for the middle-upper class,has there been any examples in lower SES populations?’
• Patientcentred care
‘If people in larger bodies are telling you that the term obese is stigmatising,why aren’t you listening? What happened to patient [centred] care?’
‘Do we ask whether weight bothers the client and why or assume they wantto lose weight?’
Obesityassessment
14 • Appropriate useof BMI
‘Do you think it is important to actually explain BMI to a patient?’
‘Are we overthinking this? Should we not just use BMI as an objective,non-judgemental measure as part of our overall assessment process andcounsel in a client centred way?’
‘Does knowing a person’s BMI actually change the way you treat someonewho you can see is overweight or obese? Shouldn’t the figures be saved forpopulation health data rather than putting stigma on patients?’
• Limitations ofBMI as a measureof health
‘How do we assess health risk in a clinical setting if we are not using BMI?’
‘Use of technology for better measure of fat mass?’
Societal andpopulationstrategies
14 • Taxes andincentives
‘What about incentivising healthy choices?’
‘Thinking about public health measures to address overweight/obesity, whatare your thoughts on introducing a tax on sugar sweetened beverages(as part of a suite of measures) to address overweight/ obesity inAustralia?’
‘If obesity is a societal rather than individual issue, how should it beaddressed at a societal level?’
• Governmentpolicies
‘What is needed to get government to move from shaming to inspiringchange?’
‘Are public health messages causing harm?’
‘How can we tackle the structural/environmental factors influencing obesitywhile upholding the value of each person as a whole and valuable person?’
Letter to the Editor
© 2019 Dietitians Association of Australia 647
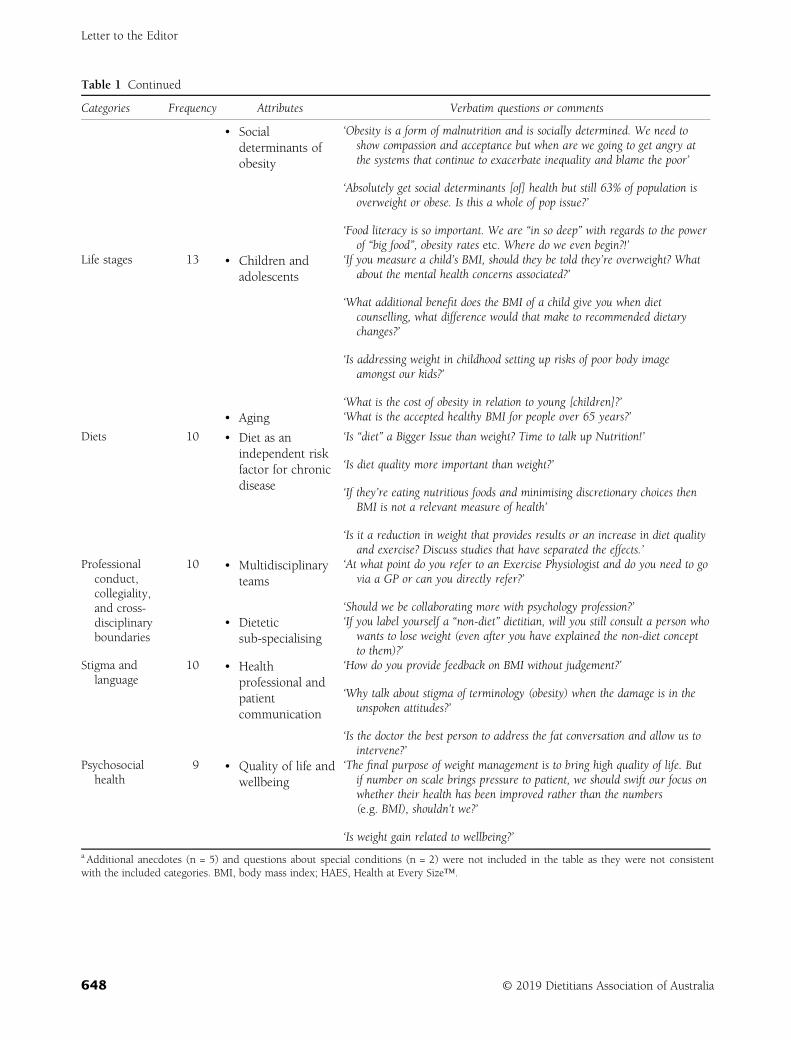
Table 1 Continued
Categories Frequency Attributes Verbatim questions or comments
• Socialdeterminants ofobesity
‘Obesity is a form of malnutrition and is socially determined. We need toshow compassion and acceptance but when are we going to get angry atthe systems that continue to exacerbate inequality and blame the poor’
‘Absolutely get social determinants [of] health but still 63% of population isoverweight or obese. Is this a whole of pop issue?’
‘Food literacy is so important. We are “in so deep” with regards to the powerof “big food”, obesity rates etc. Where do we even begin?!’
Life stages 13 • Children andadolescents
‘If you measure a child’s BMI, should they be told they’re overweight? Whatabout the mental health concerns associated?’
‘What additional benefit does the BMI of a child give you when dietcounselling, what difference would that make to recommended dietarychanges?’
‘Is addressing weight in childhood setting up risks of poor body imageamongst our kids?’
‘What is the cost of obesity in relation to young [children]?’• Aging ‘What is the accepted healthy BMI for people over 65 years?’
Diets 10 • Diet as anindependent riskfactor for chronicdisease
‘Is “diet” a Bigger Issue than weight? Time to talk up Nutrition!’
‘Is diet quality more important than weight?’
‘If they’re eating nutritious foods and minimising discretionary choices thenBMI is not a relevant measure of health’
‘Is it a reduction in weight that provides results or an increase in diet qualityand exercise? Discuss studies that have separated the effects.’
Professionalconduct,collegiality,and cross-disciplinaryboundaries
10 • Multidisciplinaryteams
‘At what point do you refer to an Exercise Physiologist and do you need to govia a GP or can you directly refer?’
‘Should we be collaborating more with psychology profession?’• Dietetic
sub-specialising‘If you label yourself a “non-diet” dietitian, will you still consult a person who
wants to lose weight (even after you have explained the non-diet conceptto them)?’
Stigma andlanguage
10 • Healthprofessional andpatientcommunication
‘How do you provide feedback on BMI without judgement?’
‘Why talk about stigma of terminology (obesity) when the damage is in theunspoken attitudes?’
‘Is the doctor the best person to address the fat conversation and allow us tointervene?’
Psychosocialhealth
9 • Quality of life andwellbeing
‘The final purpose of weight management is to bring high quality of life. Butif number on scale brings pressure to patient, we should swift our focus onwhether their health has been improved rather than the numbers(e.g. BMI), shouldn’t we?’
‘Is weight gain related to wellbeing?’
a Additional anecdotes (n = 5) and questions about special conditions (n = 2) were not included in the table as they were not consistentwith the included categories. BMI, body mass index; HAES, Health at Every Size™.
Letter to the Editor
648 © 2019 Dietitians Association of Australia
The categories of stigma and psychosocial health over-lapped with other categories, especially comments andquestions about obesity management in children and ado-lescents. This may indicate that dietitians attending the con-ference are concerned about weight managementapproaches in this vulnerable population. The issues ofstigma and psychosocial health in weight management areemerging topics of research interest. Our findings indicatedietitians are particularly interested in the evidence andimplications of these topics.
The use of VoxVote (C) allowed us to capture all ques-tions asked and share a summation of the results with thedietetic community. This form of interaction allowed con-ference attendees to participate anonymously, and we spec-ulate the use of such technology may capture a morediverse range of opinions and questions compared to ques-tions taken at a microphone during plenary sessions. Futureconferences should consider the use of technology in dis-cussions to advance the profession. Limitations of this ses-sion were that we were not able to determine the numberor demographics of delegates who engaged through Vox-Vote or understand the reasons that delegates did notengage with the session. This identifies considerations forfuture conference planning.
In conclusion, the collegial panel discussion ‘Is bodymass index the real issue here? A “weighty” discussion’ pro-voked a range of questions from the conference audience,highlighting the diversity of issues concerning weight man-agement and range of opinions within the profession. Thequestions and comments received during the session mayprovide potential future areas of research to advance thedietetic profession.
Funding source
NBL is in receipt of a National Health and Medical ResearchCouncil Peter Doherty Early Career Fellowship and sup-ported by the Sydney Medical School Foundation. SRP is inreceipt of a National Health and Medical Research CouncilAustralian Public Health and Health Services Early CareerFellowship and Heart Foundation Postdoctoral Fellowship.
Conflicts of interest
The authors have no conflict of interest to declare.
Authorship
NBL conceived the idea for the letter. NBL and SRP both ana-lysed the questions, contributed, wrote and reviewed the letterto the editor. Both authors agree with the manuscript anddeclare that the content has not been published elsewhere.Authors thank the panel facilitator and expert panelists.
Natalie B. Lister,1,2 PhD, APD, Research Fellow andStephanie R. Partridge,3,4 PhD, APD, Research Fellow
1The University of Sydney Children’s Hospital WestmeadClinical School, 2The Children’s Hospital at Westmead,Institute of Endocrinology and Diabetes and Faculty of
3Medicine and Health, Prevention Research Collaborationand 4Medicine and Health, Westmead Applied ResearchCentre, The University of Sydney, Sydney, New South
Wales, Australia
References
1 Allman-Farinelli M. Embracing the bigger picture for nutritionand dietetics. Nutr Diet 2018; 75: 5–6.
2 Sun Y, You W, Almeida F, Estabrooks P, Davy B. The effective-ness and cost of lifestyle interventions including nutrition educa-tion for diabetes prevention: a systematic review and meta-analysis. J Acad Nutr Diet 2017; 117: 404–21.
3 MacLean PS, Wing RR, Davidson T et al. NIH working groupreport: innovative research to improve maintenance of weightloss. Obesity (Silver Spring, Md) 2015; 23: 7–15.
4 Thomas JG, Bond DS, Phelan S, Hill JO, Wing RR. Weight-lossmaintenance for 10 years in the National Weight Control Regis-try. Am J Prev Med 2014; 46: 17–23.
5 Tylka TL, Annunziato RA, Burgard D et al. The weight-inclusiveversus weight-normative approach to health: evaluating the evi-dence for prioritizing well-being over weight loss. J Obes 2014;2014: 983495.
6 Sladdin L, Ball L, Bull C, Chaboyer W. Patient-centred care toimprove dietetic practice: an integrative review. J Hum Nutr Diet2017; 30: 453–70.
Letter to the Editor
© 2019 Dietitians Association of Australia 649
L E T T E R TO TH E ED I T OR
There is an urgent need for a consistent definitionof the metabolically healthy but obese phenotype
To the Editor:Current overweight and obesity management guidelines inAustralia1 and elsewhere around the world,2 recommend awidespread one-size fits all treatment approach of prescribedweight loss, suggesting that obesity even without other riskfactors carries health risk. Recently, the concept of a meta-bolically healthy but obese (MHO) phenotype has emergeddescribing obese individuals with normal metabolic featuresdespite their increased adiposity.3 However, this concept iscontroversial with critics arguing that the MHO phenotype ismerely a transitional state that is unstable and such individ-uals will become metabolically obese and unhealthy withtime. The only way to answer this controversy is with longi-tudinal studies; however, results to date have beeninconsistent.3
In a recent issue of Nutrition & Dietetics, Abdurahmanet al4 aimed to determine the prevalence of MHO and meta-bolically unhealthy obese (MUO) phenotypes, and theirassociation with dietary inflammatory index among obeseIranian people. As the authors correctly identified, theMHO phenotype differs from the MUO phenotype by theabsence of metabolic complications despite excessive bodyfatness. However, in the aforementioned study, obese indi-viduals who had up to two metabolic abnormalities werecharacterised as MHO. Clear and obvious issues arise whenindividuals who are in fact not metabolically healthy areincorrectly identified as being so. These issues and theirimplications are discussed below.
Firstly, a clear demonstration of the importance of correctdefinition of metabolic status can be seen from a recentstudy which investigated whether mortality risk was associ-ated with obesity per se or presence of individual metabolicabnormalities.5 It was shown that diabetes, hypertension anddyslipidaemia were independently associated with highermortality risk, even after statistical adjustment for the othermetabolic risk factors. In contrast, the true MHO phenotype,with obesity defined by body mass index and waist circum-ference, characterised by zero metabolic abnormalities wasnot associated with increased mortality. However, when justa single metabolic abnormality was included (as is a frequentapproach within the literature),6,7 obesity became associatedwith mortality risk.
The likely reason for the inclusion of up to two metabolicrisk factors to characterise the MHO phenotype as was theapproach by Abdurahman et al4 is that the prevalence of atrue metabolic healthy but obese phenotype is low in thegeneral population (<10%).5 The implication and way for-ward is that participants need to be selectively recruitedbased on their baseline metabolic status and longitudinalstudy designs will require larger samples.
Further compounding the challenge for studies investigatingthe MHO phenotype is the diversity of potential approachesavailable for assessing metabolic status. Previous studies havemade this classification based on the presence of the metabolicsyndrome components using metabolic syndrome criteria fromthe Adult Treatment Panel III, while others have used thecriteria from the International Diabetes Federation and furtherstudies have included insulin resistance and inflammatorymarkers as part of the assessment of metabolic status.8
In conclusion, there is a widespread inconsistency in thedefinition and subsequent investigation of the impact of theMHO phenotype on health outcomes and association of dietwith the MHO phenotype is frequently inappropriate. Inorder to advance this area, there is an urgent need for a clearconsensus definition of MHO. This will have an impact onaspects of study design including participant recruitment.However, this is a crucial step to produce valid results whichadvance our understanding and validate the existence of theMHO phenotype.
CONFLICT OF INTEREST
The author declares no conflict of interests or funding.
AUTHOR CONTRIBUTIONS
The sole author is responsible for the ideas presented andfinal version of the manuscript.
Emily Calton PhD, APD, Lecturer
Nutrition and Dietetics, School of Public Health, CurtinUniversity, Perth, Western Australia, Australia
Received: 12 April 2019 Accepted: 14 June 2019
DOI: 10.1111/1747-0080.12568
650 © 2019 Dietitians Association of Australia Nutr Diet. 2019;76:650–651.wileyonlinelibrary.com/journal/ndi
REFERENCES
1. National Health and Medical Research Council. Clinical practiceguidelines for the management of overweight and obesity in adults,adolescents and children in Australia. Melbourne, Australia:National Health and Medical Research Council, 2013. https://www.nhmrc.gov.au/about-us/publications/clinical-practice-guidelines-management-overweight-and-obesity. Accessed April 12, 2019.
2. National Institute for Health and Care Excellence. Obesity: identifi-cation, assessment and management. London, UK: National Guide-line Centre (NGC), 2014. https://www.nice.org.uk/guidance/cg189.Accessed April 12, 2019.
3. Mongraw-Chaffin M, Foster MC, Anderson CAM, et al. Metaboli-cally healthy obesity, transition to metabolic syndrome, and cardio-vascular risk. J Am Coll Cardiol. 2018;71:1857-1865.
4. Abdurahman AA, Azadbakhat L, Rasouli M, Chamari M,Qorbani M, Dorosty AR. Association of dietary inflammatory index
with metabolic profile in metabolically healthy and unhealthy obesepeople. Nutr Diet. 2019;76:192-198.
5. Kuk JL, Ardern CI. Are metabolically normal but obese individualsat lower risk for all-cause mortality? Diabetes Care. 2009;32:2297-2299.
6. Kramer CK, Zinman B, Retnakaran R. Are metabolicallyhealthy overweight and obesity benign conditions? A system-atic review and meta-analysis. Ann Intern Med. 2013;159:758-769.
7. Hinnouho GM, Czernichow S, Dugravot A, Batty GD,Kivimaki M, Singh-Manoux A. Metabolically healthy obesity andrisk of mortality: does the definition of metabolic health matter.Diabetes Care. 2013;36:2294-2300.
8. Li H, He D, Zheng D, et al. Metabolically healthy obese phenotypeand risk of cardiovascular disease: results from the China Healthand Retirement Longitudinal Study. Arch Gerontol Geriatr. 2019;82:1-7.
LETTER TO THE EDITOR 651
Related Documents