Management and Conservation Article Dove Habitat Association Based on Remotely Sensed Land Cover Types in South Texas MARGARET L. COLLINS, Wildlife Ecology Program, Department of Biology, Texas State University-San Marcos, San Marcos, TX 78666, USA MICHAEL F. SMALL, 1 Wildlife Ecology Program, Department of Biology, Texas State University-San Marcos, San Marcos, TX 78666, USA JOSEPH A. VEECH, Wildlife Ecology Program, Department of Biology, Texas State University-San Marcos, San Marcos, TX 78666, USA JOHN T. BACCUS, Wildlife Ecology Program, Department of Biology, Texas State University-San Marcos, San Marcos, TX 78666, USA STEPHEN J. BENN, Texas Parks and Wildlife Department, Weslaco, TX 78596, USA ABSTRACT We tested whether presence of white-winged doves (Zenaida asiatica) and mourning doves (Z. macroura) in South Texas, USA, was associated with any of the land cover types recorded in the 2001 National Land Classification Database. We used the point-transect method to conduct presence–absence surveys for both species at 236 points encompassing 744 observations. Within predefined land cover types surrounding each survey point, we used Geographic Information Systems to determine the proportions of each land cover type present. We used randomization tests to compare proportions of land cover types present at points with and without doves. We used Program DISTANCE to estimate dove densities at survey points and to test whether certain land cover types were associated with greater dove densities. Our results indicated white-winged dove occurrence in South Texas was positively associated with urban land and cropland, whereas mourning dove occurrence was positively associated with cropland. For land cover types found to be associated with dove presence, estimated density for each dove species increased as the proportion of associated land cover type increased. These results can assist wildlife biologists in the development of a more efficient and targeted protocol for censusing doves. In addition, our methods can be applied to other species across several geographic areas and landscape scales. KEY WORDS distance sampling, doves, Geographic Information Systems (GIS), land cover, Lower Rio Grande Valley, Texas. Mourning (Zenaida macroura) and white-winged (Zenaida asiatica) doves are hunted in Texas, USA, for recreation and food (Baskett and Sayre 1993, George 2004). Because mourning and white-winged doves are migratory game birds, they are subject to federal oversight (Gregory 1998, Bevill 2004). Responsibility for monitoring and managing populations of these species is delegated to state wildlife agencies, which are tasked with developing accurate and efficient methods for monitoring populations of these 2 species (Eberly and Keating 2006). Mourning doves are monitored as part of the national mourning dove call-count survey (CCS), used to determine breeding population trends. The CCS involves federal and state wildlife agencies conducting annual roadside call-counts and counts of doves seen on established survey routes. In Texas, the Texas Parks and Wildlife Department (TPWD) conducts the CCS. Breeding population numbers, based on these call-counts, are the primary basis for setting hunting seasons and bag limits on doves. White-winged doves in Texas have traditionally been monitored using coo-counts conducted only in the Lower Rio Grande Valley (LRGV) of extreme South Texas (Berger and George 2004). Coo-counts have been used to measure white-winged dove population size in brushlands of the LRGV since 1949 (Uzzell 1949, Cottam and Trefethen 1968). However, such counts are flawed because variances cannot be calculated; thus, sources of error are unmeasurable (Rappole and Waggerman 1986). Recently, TPWD rede- signed and implemented white-winged dove surveys state- wide using distance sampling because of questionable results and unsatisfactory reviews of sampling methodology (Schwertner and Johnson 2006). Recent research suggested that distance sampling of randomly placed point counts in urban areas yielded reliable density estimates and this protocol was instituted as the primary sampling method for white-winged doves in Texas (Schwertner and Johnson 2006). Development of an efficient method for identifying and qualitatively categorizing dove habitats will allow survey resource expenditures to be scaled to density. An association between land cover types and mourning dove and white- winged dove densities would allow field biologists to more efficiently dispense finite resources while maximizing return per effort. Consequently, our objectives were to 1) determine which, if any, land cover categories from an existing Geographic Information Systems (GIS)–linked database are associated with presence or absence of white- winged and mourning doves in the LRGV; 2) quantify habitat affiliations of these 2 dove species in the LRGV; and 3) determine mean dove densities as a function of degree of habitat association and, thus, estimate overall population size. STUDY AREA We conducted our study in the LRGV of Texas. Within this area the Rio Grande River formed an extensive delta at its terminus with the Gulf of Mexico along the United States–Mexico border (Dahm et al. 2005, Dykkesten 2009). The LRGV was comprised of 4 counties (Cameron, Hidalgo, Starr, and Willacy) located at the southernmost 1 E-mail: [email protected] Journal of Wildlife Management 74(7):1568–1574; 2010; DOI: 10.2193/2009-465 1568 The Journal of Wildlife Management N 74(7)

Welcome message from author
This document is posted to help you gain knowledge. Please leave a comment to let me know what you think about it! Share it to your friends and learn new things together.
Transcript
Management and Conservation Article
Dove Habitat Association Based onRemotely Sensed Land Cover Types inSouth Texas
MARGARET L. COLLINS, Wildlife Ecology Program, Department of Biology, Texas State University-San Marcos, San Marcos, TX 78666, USA
MICHAEL F. SMALL,1 Wildlife Ecology Program, Department of Biology, Texas State University-San Marcos, San Marcos, TX 78666, USA
JOSEPH A. VEECH, Wildlife Ecology Program, Department of Biology, Texas State University-San Marcos, San Marcos, TX 78666, USA
JOHN T. BACCUS, Wildlife Ecology Program, Department of Biology, Texas State University-San Marcos, San Marcos, TX 78666, USA
STEPHEN J. BENN, Texas Parks and Wildlife Department, Weslaco, TX 78596, USA
ABSTRACT We tested whether presence of white-winged doves (Zenaida asiatica) and mourning doves (Z. macroura) in South Texas,
USA, was associated with any of the land cover types recorded in the 2001 National Land Classification Database. We used the point-transect
method to conduct presence–absence surveys for both species at 236 points encompassing 744 observations. Within predefined land cover types
surrounding each survey point, we used Geographic Information Systems to determine the proportions of each land cover type present. We
used randomization tests to compare proportions of land cover types present at points with and without doves. We used Program DISTANCE
to estimate dove densities at survey points and to test whether certain land cover types were associated with greater dove densities. Our results
indicated white-winged dove occurrence in South Texas was positively associated with urban land and cropland, whereas mourning dove
occurrence was positively associated with cropland. For land cover types found to be associated with dove presence, estimated density for each
dove species increased as the proportion of associated land cover type increased. These results can assist wildlife biologists in the development of
a more efficient and targeted protocol for censusing doves. In addition, our methods can be applied to other species across several geographic
areas and landscape scales.
KEY WORDS distance sampling, doves, Geographic Information Systems (GIS), land cover, Lower Rio Grande Valley, Texas.
Mourning (Zenaida macroura) and white-winged (Zenaida
asiatica) doves are hunted in Texas, USA, for recreation andfood (Baskett and Sayre 1993, George 2004). Becausemourning and white-winged doves are migratory gamebirds, they are subject to federal oversight (Gregory 1998,Bevill 2004). Responsibility for monitoring and managingpopulations of these species is delegated to state wildlifeagencies, which are tasked with developing accurate andefficient methods for monitoring populations of these 2species (Eberly and Keating 2006). Mourning doves aremonitored as part of the national mourning dove call-countsurvey (CCS), used to determine breeding populationtrends. The CCS involves federal and state wildlife agenciesconducting annual roadside call-counts and counts of dovesseen on established survey routes. In Texas, the Texas Parksand Wildlife Department (TPWD) conducts the CCS.Breeding population numbers, based on these call-counts,are the primary basis for setting hunting seasons and baglimits on doves.
White-winged doves in Texas have traditionally beenmonitored using coo-counts conducted only in the LowerRio Grande Valley (LRGV) of extreme South Texas(Berger and George 2004). Coo-counts have been used tomeasure white-winged dove population size in brushlands ofthe LRGV since 1949 (Uzzell 1949, Cottam and Trefethen1968). However, such counts are flawed because variancescannot be calculated; thus, sources of error are unmeasurable(Rappole and Waggerman 1986). Recently, TPWD rede-signed and implemented white-winged dove surveys state-
wide using distance sampling because of questionable resultsand unsatisfactory reviews of sampling methodology(Schwertner and Johnson 2006). Recent research suggestedthat distance sampling of randomly placed point counts inurban areas yielded reliable density estimates and thisprotocol was instituted as the primary sampling method forwhite-winged doves in Texas (Schwertner and Johnson2006).
Development of an efficient method for identifying andqualitatively categorizing dove habitats will allow surveyresource expenditures to be scaled to density. An associationbetween land cover types and mourning dove and white-winged dove densities would allow field biologists to moreefficiently dispense finite resources while maximizing returnper effort. Consequently, our objectives were to 1)determine which, if any, land cover categories from anexisting Geographic Information Systems (GIS)–linkeddatabase are associated with presence or absence of white-winged and mourning doves in the LRGV; 2) quantifyhabitat affiliations of these 2 dove species in the LRGV; and3) determine mean dove densities as a function of degree ofhabitat association and, thus, estimate overall populationsize.
STUDY AREA
We conducted our study in the LRGV of Texas. Withinthis area the Rio Grande River formed an extensive delta atits terminus with the Gulf of Mexico along the UnitedStates–Mexico border (Dahm et al. 2005, Dykkesten 2009).The LRGV was comprised of 4 counties (Cameron,Hidalgo, Starr, and Willacy) located at the southernmost1 E-mail: [email protected]
Journal of Wildlife Management 74(7):1568–1574; 2010; DOI: 10.2193/2009-465
1568 The Journal of Wildlife Management N 74(7)
tip of Texas (Fig. 1). Ecologically, the LRGV was part ofthe Tamaulipian Biotic Province and contained numerousbiological communities (Blair 1950, Diamond et al. 1987,Jahrsdoerfer and Leslie 1988). The Tamaulipan brushcommunity of the LRGV was not only among the mostbiologically diverse regions in the United States, it was alsoarguably among the most threatened (Mathis and Mastioff2004, TPWD 2005).
Urban and agricultural development during the 20thcentury decimated the Tamaulipan brushland (on both sidesof the Rio Grande) and its associated flora and fauna.Beginning in the 1920s, large scale habitat conversion of theLRGV began as land use changed from ranching to fieldagriculture, urban, and industrial development. By the endof 20th century, an estimated 95% of the original nativebrush was destroyed or converted to other uses (Rappole andWaggerman 1986, Jahrsdoerfer and Leslie 1988, Haysletteet al. 1996). Dove habitat in the LRGV became fragmentedinto isolated remnants of once-contiguous woodlands.
METHODS
We used GIS software ArcGIS v9.2 and the generateregular points feature in Hawth’s tools extension (Hawth’sanalysis tools for ArcGIS, Edmonton, Canada) to produce a
10 3 13 matrix of 130 census points spaced at about 3,200-m intervals. We moved all points to the nearest road toensure maximum accessibility. In 2007 we evenly distributedpoints in a structured random grid mainly in HidalgoCounty with points extending into southern Willacy andeastern Cameron counties (Fig. 2A, B). In 2008 we usedthe same points from 2007 and an additional 158 points(Fig. 2B). We placed new points north of the 2007 samplinggrid linearly east to west using the create points function inArcGIS; points extended further into Willacy County,included Cameron County, spanned Starr County, andincluded southern Kennedy County. These new pointsprovided a more comprehensive longitudinal coverage ofhabitat types in the LRGV. We selectively placed all newpoints approximately 1,600 m apart on accessible roads.
Dove SamplingWe conducted point-transect surveys, beginning with thesouthernmost point on the grid, from 19 May through 25July 2007 and 15 May through 3 July 2008. These surveyperiods corresponded to the breeding season and followedcurrent TPWD methodology (Schwertner and Johnson2006). We did not conduct surveys during inclementweather. Point-transect surveys began 10 minutes afterofficial sunrise and continued no later than 2 hours after
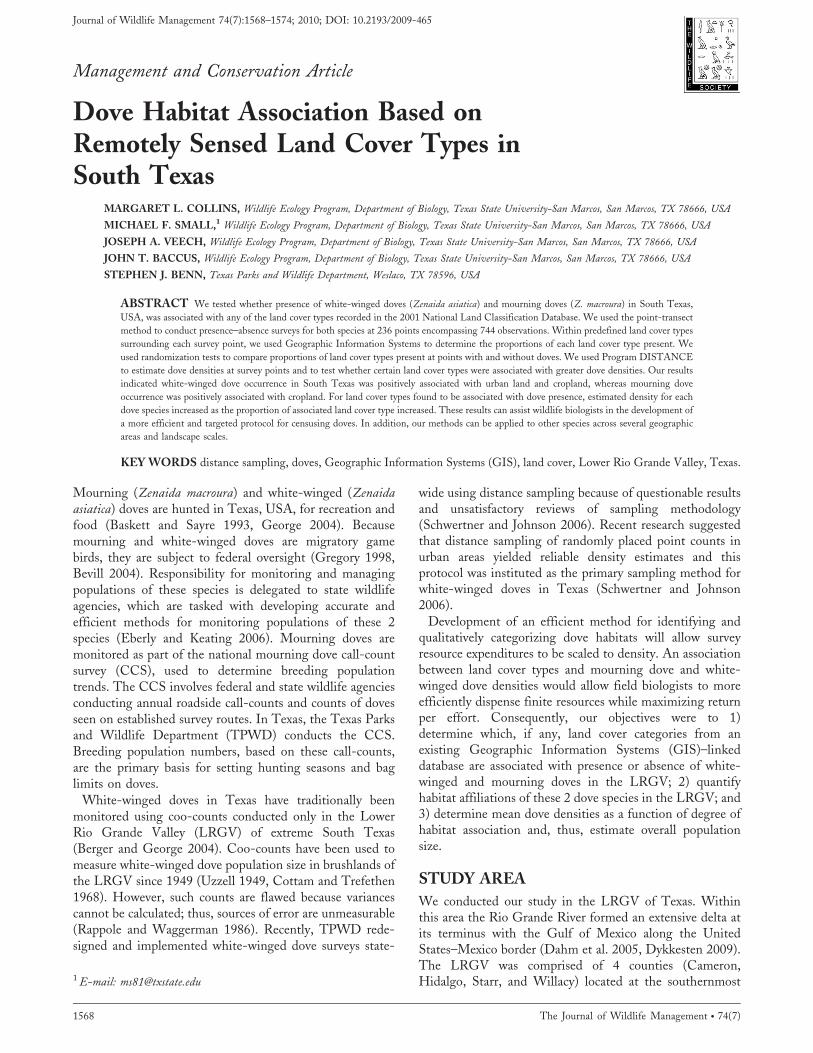
Figure 1. Study area in the Lower Rio Grande Valley, Texas, USA, where we collected white-winged and mourning dove occurrence data during 2007 and2008. The 2001 National Land Cover Database categories are displayed with different colors representing different land cover categories (e.g., red representsurban, brown represents cropland).
Collins et al. N Dove Habitat Association in Texas 1569
official sunrise. Each point was surveyed for 2 minutes by astationary observer. This procedure satisfied the assumptionof Program DISTANCE (see Estimation of Dove Densitiesbelow) that each point is an assumed snapshot in time;hence, our 2-minute survey period allowed us sufficient timeto record the number of doves present at each point but wasshort enough to minimize the chance of duplicate countingof doves leaving and reentering the sampling area (Bucklandet al. 1993). We recorded presence or absence of a white-winged dove or mourning dove at each point during the 2-minute survey and distances to doves (Buckland et al. 1993).We used only visual observations to eliminate possible biasassociated with auditory counts and avoid error inestimating distances to an auditory signal (Simons et al.2007). We determined distances to doves to the nearestmeter using a laser range-finder (Bushnell Yardage ProLegend; Bushnell, Inc., Overland Park, KS). We recognizedclusters when recording distances to doves (Buckland et al.2001). We considered doves clustered (i.e., not indepen-dent) when observed in a flock either flying or in the sametree. We recorded doves foraging on the ground or perchedfar apart on artificial structures (e.g., telephone or powerlines) as individual observations (independent), given that inthese situations presence of a dove was likely not due toother doves (i.e., there was no true flock formation). Inaddition, we assumed the immediate area around each
survey point could potentially contain doves, such that nopoints had a probability of occupancy of zero.
In 2007, after we completed one survey, we initiated asecond survey but terminated it after we surveyed about halfof the points because the primary breeding season was nearits end. In 2008 we conducted sampling as in 2007, exceptafter completion of the southern grid we surveyed theadditional 158 northern transect points. We sampled boththe southern grid and northern transect twice to increaseaccuracy and reduce bias (Buckland et al. 1993, Hostetlerand Main 2001).
Land Cover DelineationWe imported land-cover classification maps of the LGRVfrom the 2001 National Land Cover Dataset (NLCD) intoArcGIS 9.2 to quantify land cover proportions. We thenreclassified the 15 land cover classes represented in theLGRV into 6 grouped categories or cover types (urban,rangeland, pasture, cropland, wetland, and forest) toquantify landscape composition (Table 1). We basedreclassification into these categories on similarities amongthe 15 land cover classes. For example, the reclassifiedcategory urban encompassed the 2001 NLCD classes forhigh-intensity developed, medium-intensity developed,low-intensity developed, and developed open space. Al-though doves may differentiate between these urban land-cover types, it is evident from NLCD 2001 maps that theurban land-cover types were not independent geographicallyand were interspersed. By reducing the number of land coverclasses, we made the data set more manageable. With fewervariables to test, we also decreased the chance of committinga Type I error. In addition, reclassification made land coverclasses more biologically relevant (e.g., it is unlikely dovescan differentiate between intensity of development to anydegree of ecological relevance).
We created circular buffers of 300-m radii around eachsample point to quantify land cover composition at eachpoint. We then extracted pixel counts from each buffer areausing Hawth’s tools thematic raster summary add-in forArcGIS. We excluded cells with a NODATA value from
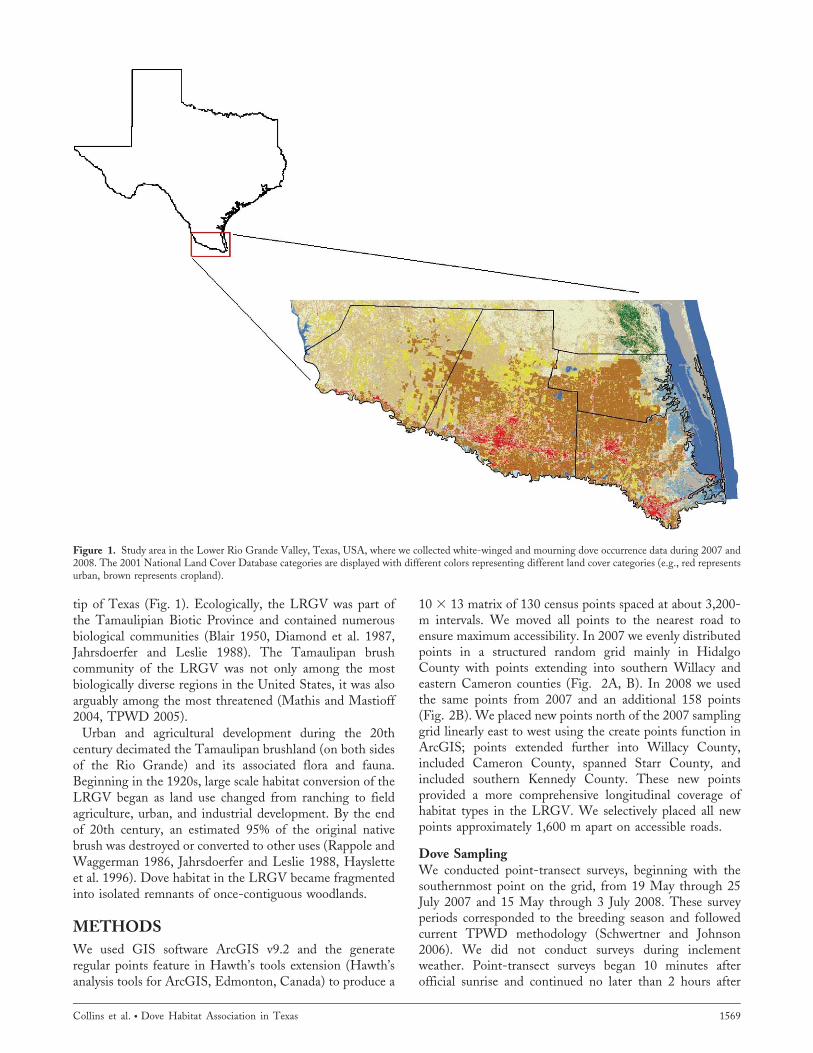
Figure 2. Points where we surveyed white-winged and mourning doves,including the 5-km effective sample area delimited around each point for(A) 2007, and (B) 2008 in the Lower Rio Grande Valley of Texas, USA.
Table 1. National Land Cover Dataset (NLCD) reclassification into 6relevant categories for our study of white-winged and mourning doves inthe Lower Rio Grande Valley, Texas, USA, during 2007 and 2008.
NLCD classification Reclassification
Open water WetlandWoody wetland WetlandHerbaceous wetland WetlandDeveloped, open space UrbanDeveloped, low intensity UrbanDeveloped, medium intensity UrbanDeveloped, high intensity UrbanDeciduous forest ForestEvergreen forest ForestMixed forest ForestBarren land RangelandScrub–shrub RangelandGrassland–herbaceous RangelandPasture–hay PastureCultivated crop Crop
1570 The Journal of Wildlife Management N 74(7)
analysis. We then converted pixel counts into percentage ofland cover type per survey point within the buffer. We useda goodness-of-fit chi-square test to determine whethermean landscapes in the 300-m buffer were proportionallyrepresentative of the entire area (most of the LRGV) westudied. The sampling area consisted of a 5-km bufferaround the cumulative set of survey points (hereafter, theeffective sample area) and was based on home range studiesconducted in Texas (Small et al. 2007, 2009; Fig. 2A, B).
Randomization Test ProtocolWe used a randomization test to compare land cover types atpoints where we observed doves to points where we observedno doves (Veech 2006). We did this because requisiteassumptions for parametric analysis of normally distributedand homoscedastic data were not met because observationsat each survey point were low, with most point surveysconsisting of zero or one observation. The randomizationtest consisted of computing mean proportions of land-coverclassification types at points with doves and comparing themto mean proportions of land-cover classification types atpoints without doves.
We used the statistical package Program R (R version 2.8,,http://www.r-project.org/., accessed 2 Dec 2008) torandomly draw, without replacement, sets of 58 points (no.of points with white-winged doves) from the pool of171 points without white-winged doves. We then calculatedthe mean proportion of each land cover type in each set of58 points. We performed 10,000 iterations to generate a testor null distribution of means for each of the 6 land covercategories. For each land cover type, we then compared themean proportion for points with doves (observed means) todistributions of mean proportions for points without doves.If a value fell within 5% of either end of the distribution, wedeemed it significant (P M0.05). We considered the effectsignificantly small or large depending on which tail of thedistribution contained the observed mean (Veech 2006).
We also applied the randomization test to compare pointswith and without mourning doves. However, mourningdoves were present at more points than they were absent.Consequently, we created a distribution for comparison bydrawing 10,000 random iterations of 75 points (the no. ofpoints without mourning doves) from the pool of pointswith mourning doves present (161). Comparisons of meanproportions of land cover types and subsequent evaluation ofsignificance was the same as with white-winged doves.
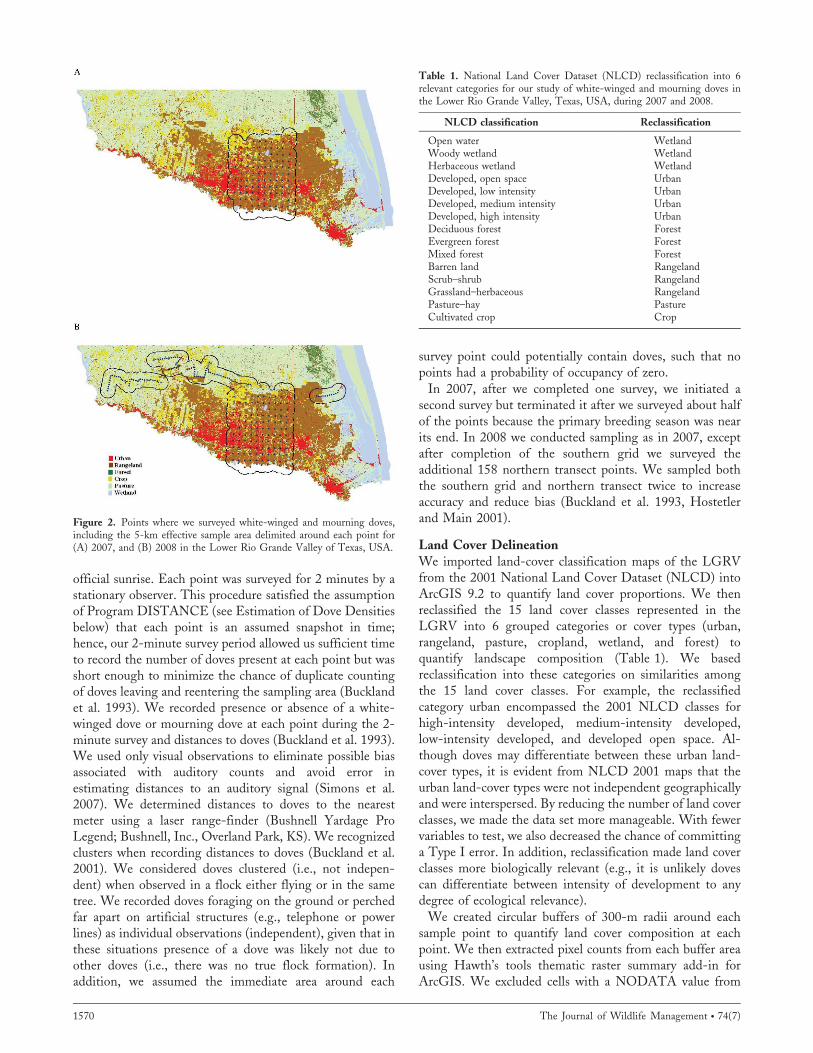
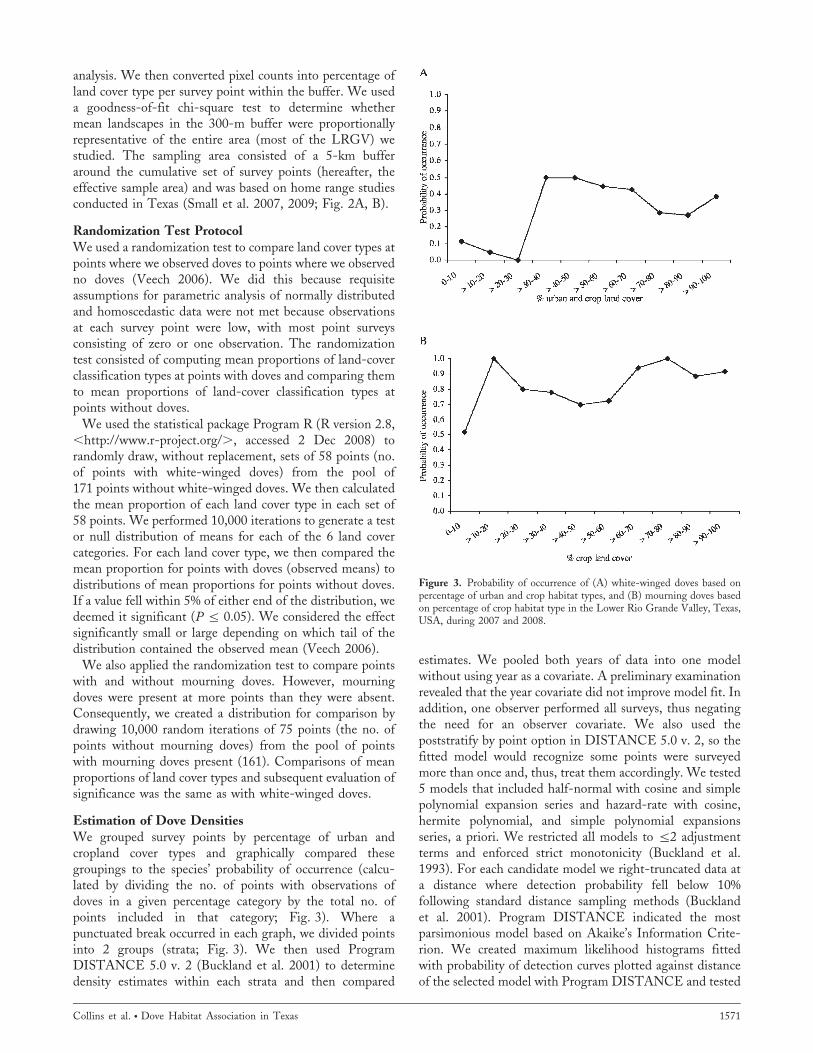
Estimation of Dove DensitiesWe grouped survey points by percentage of urban andcropland cover types and graphically compared thesegroupings to the species’ probability of occurrence (calcu-lated by dividing the no. of points with observations ofdoves in a given percentage category by the total no. ofpoints included in that category; Fig. 3). Where apunctuated break occurred in each graph, we divided pointsinto 2 groups (strata; Fig. 3). We then used ProgramDISTANCE 5.0 v. 2 (Buckland et al. 2001) to determinedensity estimates within each strata and then compared
estimates. We pooled both years of data into one modelwithout using year as a covariate. A preliminary examinationrevealed that the year covariate did not improve model fit. Inaddition, one observer performed all surveys, thus negatingthe need for an observer covariate. We also used thepoststratify by point option in DISTANCE 5.0 v. 2, so thefitted model would recognize some points were surveyedmore than once and, thus, treat them accordingly. We tested5 models that included half-normal with cosine and simplepolynomial expansion series and hazard-rate with cosine,hermite polynomial, and simple polynomial expansionsseries, a priori. We restricted all models to
M
2 adjustmentterms and enforced strict monotonicity (Buckland et al.1993). For each candidate model we right-truncated data ata distance where detection probability fell below 10%following standard distance sampling methods (Bucklandet al. 2001). Program DISTANCE indicated the mostparsimonious model based on Akaike’s Information Crite-rion. We created maximum likelihood histograms fittedwith probability of detection curves plotted against distanceof the selected model with Program DISTANCE and tested
Figure 3. Probability of occurrence of (A) white-winged doves based onpercentage of urban and crop habitat types, and (B) mourning doves basedon percentage of crop habitat type in the Lower Rio Grande Valley, Texas,USA, during 2007 and 2008.
Collins et al. N Dove Habitat Association in Texas 1571
them for fit using a Kolmogorov–Smirnov test. Wecalculated density estimates and 95% confidence intervalsfrom this model for each dove species in strata representingsurvey points with either a high or low percentage of urbanand cropland.
Lastly, to estimate overall population size of each speciesin the LRGV, we multiplied estimated densities by theeffective land area (5-km buffer around sample points)sampled by points in each of the 2 strata. The points in the 2strata were interspersed slightly in a small area of overlap.Thus, we divided the area of overlap based on the relativesize of each stratum, to avoid double-counting in the area ofoverlap. In this way, we obtained the area of each stratum,absent of any overlap with other strata.
RESULTS
Based on the randomization test, landscapes with white-winged doves had significantly greater mean percentages(about twice as much) urban, forest, and crop cover andsignificantly lower percentages (about half as much) rangeand pasture cover than landscapes without doves (Table 2).Landscapes with mourning doves had a significantly greatermean percentage (more than twice as much) of croplandcover and significantly lower percentage (about half asmuch) of range cover than landscapes without doves(Table 3). Other cover types (urban, forest, wetland, andpasture) were not significantly different between landscapeswith and without mourning doves. Thus, white-wingeddoves had a stronger association with urban and forest covertypes than mourning doves. Rangeland was equallyassociated with both species whereas wetland was notsignificantly associated with presence of either species.
In 2007 we surveyed 103 of 130 sample points; 27 pointswere inaccessible. Prior to termination of the breedingseason, we surveyed 22 of these points twice. We recorded153 mourning doves during 118 observations (1.30 doves/observation) and 184 white-winged doves during 84observations (2.19 doves/observation). Also 60 points lackedobservations of mourning doves and 91 points had noobservations of white-winged doves in 2007. During 2008we surveyed 236 of 288 sample points; 52 points wereinaccessible. Therefore, we surveyed all 236 points twice.We recorded 553 mourning doves during 229 observations(2.41 doves/observation) and 203 white-winged dovesduring 59 observations (3.44 doves/observation). Also75 points had no observation of mourning doves and
171 points lacked observations of white-winged doves in2008.
For white-winged doves, probability of occurrence was lowin landscapes with ,25% combined urban and croplandcover (Fig. 3A). Therefore, we placed all points with
L
25%combination of urban and cropland cover in stratum 1(132 points) and remaining points in stratum 2 (103 points).The probability of mourning dove occurrence was low inlandscapes with ,15% cropland cover (Fig. 3B). Therefore,we placed all points with
L
15% cropland cover in stratum 1(117 points) and the rest in stratum 2 (119 points).
The most parsimonious model selected by ProgramDISTANCE for white-winged dove data was a hazard ratewith a hermite polynomial key function and one adjustmentterm (K–S test; D 5 0.03, P 5 0.97) with data truncated at179 m, and for mourning doves the same model was selected(K–S test; D 5 0.02, P 5 0.92) with a truncation distance of161 m.
Estimated mean white-winged dove densities/100 ha forstratum 1 and 2 were 55 (95% CI 5 38–82) and 5 (95% CI5 2–11), respectively. Mourning dove density estimates/100 ha for stratum 1 and 2 were 62 (95% CI 5 51–76) and25 (95% CI 5 19–33), respectively.
Percent of each land cover category within the summed300-m point buffers and the proportion of each land covercategory in the effective sample area (5-km point buffers)were similar for sets of sample points in both years (x2
5 5
3.33, P 5 0.65 and x25 5 1.13, P 5 0.95 for 2007 and 2008,
respectively). Thus, 300-m point buffers were representativeof the effective sample area, which allowed us to use estimateddensities and land area of each strata to extrapolate estimatesof total population size for both species in the effective samplearea. For white-winged doves the area sampled with ,25%combination of urban and crop coverage (stratum 2 in thedistance sampling model) included about 165,000 ha, and theestimated population was about 8,500. The area sampled with
L
25% combination of urban and cropland cover types(stratum 1) included about 283,000 ha, and the estimatedpopulation was about 155,500. Total estimated white-wingeddove population in the effective sample area was about164,000. For mourning doves, the area sampled with ,15%cropland cover (stratum 2) included about 220,000 ha, andthe estimated population was about 55,000. The sampled areawith
L
15% crop coverage (stratum 1) included about228,000 ha, and the estimated population was about141,000. Total estimated mourning dove population in theeffective sample area was about 196,000.
Table 2. Relationships of white-winged dove presence–absence to landcover type in the Lower Rio Grande Valley, Texas, USA, during 2007 and2008. Values shown are mean percentage of the land cover type inlandscapes with and without doves. We obtained P-values from therandomization test.
Parameter Urban Forest Range Pasture Crop Wetland
Mean withdoves 26.02 0.54 15.31 8.98 41.38 2.76
Mean withoutdoves 11.93 0.18 39.43 17.41 29.78 4.03
P-value ,0.001 ,0.001 ,0.001 ,0.001 0.002 0.700
Table 3. Relationships of mourning dove presence–absence to land covertype in the Lower Rio Grande Valley, Texas, USA, during 2007 and 2008.Values shown are mean percentage of the land cover type in landscapes withand without doves. We obtained P-values from the randomization test.
Parameter Urban Forest Range Pasture Crop Wetland
Mean withdoves 14.94 0.27 24.02 14.14 41.23 3.57
Mean withoutdoves 16.51 0.28 50.51 15.26 15.12 2.33
P-value 0.152 0.490 ,0.001 0.277 ,0.001 0.061
1572 The Journal of Wildlife Management N 74(7)
DISCUSSION
We used an existing GIS land-cover database to qualify andquantify habitat affiliation with white-winged and mourningdoves. We derived estimates of white-winged and mourningdove densities using distance sampling and the land coverdatabase and converted these to estimates of population sizein the LRGV of Texas. Our surveys for doves used roads, asdo many avian surveys that traverse long transects withregular sample or stopping points for timed observationperiods. Such surveys may be susceptible to considerable roadbias or mis-estimation of densities if the surveyed bird speciesis either attracted to or avoids roads. Road density in the 300-m buffer areas around sample points was 0.25 km/ha and0.06 km/ha in the effective sample area. Despite thisdifference, we do not believe road bias appreciably affectedour estimates of population size of either dove species in theeffective sample areas. Road surveys in open habitats mayincrease the number of species observed but do not generallyaffect abundance estimates (Dieni and Scherr 2004). Inaddition, 47% of all observations were of doves in flight, anddirection of flights was random with respect to the observer(and subsequently roads). Thus, white-winged doves andmourning doves probably have neither a strong attraction tonor avoidance of roads.
White-winged doves and mourning doves are definitelyassociated with certain land cover types over others. Wedemonstrated the potential use of a national GIS-linkedland-cover database in developing and targeting surveyefforts intended to monitor dove populations (Ma et al.2001). The National Land Cover Dataset is a 15-class land-cover classification system mapped consistently over theUnited States (Homer et al. 2007). The large-scale nature ofthe NLCD makes it difficult to maintain contemporaryinformation; the last revision was in 2001, which updatedand modified the previous 1992 land-cover classificationscheme. Differences in categorization systems of the 1992and 2001 NLCD versions led us to reclassify certain landcover classifications into 6 broader, yet relevant, relatedcategories. Reclassification into these 6 categories made thedata set more manageable and decreased the chance of aType I error.
Previous studies have shown mourning doves select openhabitats and avoid only extensively forested areas andwetlands (Drobney et al. 1998, Emiley and Dewey 2007).However, our randomization test indicated that mourningdoves were associated with cropland and avoided therangeland habitat type. Mourning doves appear to selectcrop habitat types over other habitat types; however,monitoring of mourning dove populations should probablybe conducted across all habitat types to account for thespecies’ large niche breadth.
Not surprisingly, our results show an association betweenwhite-winged dove presence and habitat types classified asurban, forest, and crop. However, we quantified for the firsttime the strength of association between this species, variousland cover types, and prevalence of each land cover type.Associations between land cover types and presence of
white-winged doves will allow wildlife biologists to focusmonitoring of populations in landscapes where white-winged doves are more likely to occur, which will reducetime spent unnecessarily monitoring areas where dovespecies are unlikely to inhabit or occur in low numbers.All habitats should be surveyed for presence or absence ofdove species, but a greater effort should be focused onlandscapes having land cover types associated with presenceof dove species. However, estimated densities (calculatedfrom habitat types with a high degree of association todoves) should not be applied equally across all habitat types,because this would produce a gross overestimation of thepopulation.
MANAGEMENT IMPLICATIONS
Populations of white-winged and mourning doves can bemonitored within large areas by survey efforts focused onland cover types with which doves are most likely toassociate. Such surveys require less time and money thansurveys of cover types not known to be well-associated withdoves. Moreover, surveys based on distance sampling areeasy to conduct for these visually apparent dove species. Theongoing conversion by TPWD from using coo-counts todistance sampling is a positive step in upgrading samplingmethods for white-winged doves. We recommend thatTPWD focus their monitoring efforts on survey routes thattraverse landscapes with substantial amounts of urban,cropland, and rangeland cover. In a wider context, we hopeour study motivates other state wildlife agencies to monitorgame birds and other avifauna by selectively surveying areaswhere species of interest are most likely to occur.
ACKNOWLEDGMENTS
We acknowledge the assistance of the staff of Estero LlanoGrande State Park and Las Palomas Wildlife ManagementArea. T. Simpson, J. Timmons, A. Fronimos, J. Ethridge,M. Frisbie, and B. Pierce contributed to this study.Financial support was provided by the TPWD UplandGame Bird Stamp Fund.
LITERATURE CITED
Baskett, T. S., and M. W. Sayre. 1993. Characteristics and importance.Pages 1–6 in T. S. Baskett, M. W. Sayre, R. E. Tomlinson, and R. E.Mirarchi, editors. Ecology and management of the mourning dove.Stackpole, Harrisburg, Pennsylvania, USA.
Berger, M. E., and R. R. George. 2004. Operational plan: fiscal year 2005,Wildlife Division. Texas Parks and Wildlife Department, Austin, USA.
Bevill, V. 2004. How Texas’ dove season regulations are set. Pages 19–23 inN. J. Silvy and D. Rollins, editors. Dove biology, research, andmanagement in Texas. Texas A&M University Research and ExtensionCenter, San Angelo, USA.
Blair, W. F. 1950. The biotic provinces of Texas. Texas Journal of Science1:93–117.
Buckland, S. T., D. R. Anderson, K. P. Burnham, and J. L. Laake. 1993.Distance sampling: estimating abundance of biological populations.Chapman and Hall, London, United Kingdom.
Buckland, S. T., D. R. Anderson, K. P. Burnham, J. L. Laake, D. L.Borchers, and L. Thomas. 2001. Introduction to distance sampling.Oxford University Press, New York, New York, USA.
Cottam, C., and J. B. Trefethen. 1968. White-wings: the life history, status,and management of the white-winged dove. D. Van Nostrand, Princeton,New Jersey, USA.
Collins et al. N Dove Habitat Association in Texas 1573
Dahm, C. N., R. J. Edwards, and F. P. Gelwick. 2005. Gulf Coast rivers ofthe southwestern United States. Rivers of North America. ElsevierAcademic Press, Amsterdam, Netherlands.
Diamond, D. D., D. H. Riskind, and S. L. Orzell. 1987. A framework forplant community classification and conservation in Texas. Texas Journalof Science 39:203–221.
Dieni, J. S., and P. Scherr. 2004. Roadside bias in point count surveys atArrowwood National Wildlife Refuge, North Dakota. Prairie Naturalist36:203–211.
Drobney, R. D., J. H. Schultz, S. L. Sheriff, and W. J. Fuemmeler. 1998.Mourning dove nesting habitat and nest success in central Missouri.Journal of Field Ornithology 69:299–305.
Dykkesten, D. 2009. The nature of rivers: the Rio Grande. University ofNew Mexico, Albuquerque, USA. ,http://www.unm.edu/,abqteach/rio_grande/curriculum_abstracts.pdf.. Accessed 12 Jun 2009.
Eberly, C., and J. Keating. 2006. Birds and bombs: how bird conservationplanning and the military mission work together. Federal FacilitiesEnvironmental Journal 17:51–65.
Emiley, A., and T. Dewey. 2007. Zenaida macroura. Animal diversity web.,http://animaldiversity.ummz.umich.edu/site/accounts/information/Zenaida_macroura.html.. Accessed 7 May 2009.
George, R. R. 2004. Mourning dove and white-winged dove biology inTexas. Pages 1–7 in N. J. Silvy and D. Rollins, editors. Dove biology,research, and management in Texas. Texas A&M University Researchand Extension Center, San Angelo, USA.
Gregory, D. 1998. The mourning dove. Arkansas Game and FishCommission, 2 Natural Resources Drive, Little Rock, USA. ,http://www.agfc.com/.. Accessed 25 Jul 2009.
Hayslette, S. E., T. C. Tacha, and G. L. Waggerman. 1996. Changes inwhite-winged dove reproduction in southern Texas, 1954–1993. Journalof Wildlife Management 60:298–301.
Homer, C., J. Dewitz, J. Fry, M. Coan, N. Hossain, C. Larson, N. Herold,A. McKerrow, J. N. Van Driel, and J. Wickham. 2007. Completion ofthe 2001 National Land Cover Database for the conterminous UnitedStates. Photogrammetric Engineering and Remote Sensing 73:337–341.
Hostetler, M. E., and M. B. Main. 2001. Florida monitoring program:point count method to survey birds. Wildlife Ecology and ConservationDepartment, Florida Cooperative Extension Service, Institute of Foodand Agricultural Sciences, University of Florida, Gainesville, USA.
Jahrsdoerfer, S. E., and D. M. Leslie, Jr. 1988. Tamaulipan brushland ofthe Lower Rio Grande Valley of South Texas: description, humanimpacts, and management options. U.S. Fish and Wildlife Service,Biological Report 88(36), Washington, D.C., USA.
Ma, Z., M. M. Hart, and R. L. Redmond. 2001. Mapping vegetation acrosslarge geographic areas: integration of remote sensing and GIS to classifymultisource data. Photogrammetric Engineering and Remote Sensing67:295–307.
Mathis, M., and D. Mastioff. 2004. A characterization of ecotourism in theTexas Lower Rio Grande Valley. Valuing nature in Texas: discussionpaper. Houston Advanced Research Center, Houston, Texas, USA.
Rappole, J. H., and G. Waggerman. 1986. Calling males as an index ofdensity for breeding white-winged doves. Wildlife Society Bulletin 14:151–155.
Schwertner, T. W., and K. Johnson. 2006. Using land cover to predictwhite-winged dove occurrence and relative density in the EdwardsPlateau of Texas. Pages 98–102 in J. W. Cain, III, and P. R. Krausman,editors. Managing wildlife in the Southwest. Southwest Section of theWildlife Society, Tucson, Arizona, USA.
Simons, T. R., M. W. Alldredge, K. H. Pollock, and J. M. Wettroth. 2007.Experimental analysis of the auditory detection process on avian pointcounts. Auk 124:986–999.
Small, M. F., J. T. Baccus, T. R. Simpson, and M. C. Frisbie. 2009. Homeranges of two populations of urban-nesting white-winged doves (Zenaidaasiatica) in Texas. Southwestern Naturalist 55:29–34.
Small, M. F., E. S. Taylor, J. T. Baccus, C. L. Schaefer, T. R. Simpson, andJ. A. Roberson. 2007. Nesting home range and movements of an urbanwhite-winged dove population. Wilson Journal of Ornithology 119:467–471.
Texas Parks and Wildlife Department [TPWD]. 2005. Priority ecoregionsfor conservation efforts. Land and Water Resources Conservation andRecreation Plan. ,http://www.tpwd.state.tx.us/.. Accessed 7 May 2009.
Uzzell, P. B. 1949. Status of the white-winged dove in Texas. Performancereport. Texas Parks and Wildlife Department Federal Aid Project W-30-R, Austin, USA.
Veech, J. A. 2006. A comparison of landscapes occupied by increasing anddecreasing populations of grassland bird species. Conservation Biology20:1422–1432.
Associate Editor: Brennan.
1574 The Journal of Wildlife Management N 74(7)
Related Documents