U.S. Department of Transportation Federal Railroad Administration Office of Policy FRA-RRP-90-2 MAR-PORT-830 Double Stack Container Systems: Implications for U.S. Railroads and Ports facie? e U.S. Department of Transportation Maritime Administration Office of Port and Intermodal Development Final Report 90009 June 1990 This document is available for purchase from the National Technical Information Service, Springfield, VA 22161

Welcome message from author
This document is posted to help you gain knowledge. Please leave a comment to let me know what you think about it! Share it to your friends and learn new things together.
Transcript

U.S. Department of Transportation
Federal Railroad Administration
Office of Policy
FRA-RRP-90-2MAR-PORT-830
Double Stack Container Systems: Implications for U.S. Railroads and Ports
facie?eU.S. Department of Transportation
MaritimeAdministration
Office of Port and Intermodal Development
Final Report
90009June 1990 This document is available
for purchase from the National Technical Information Service, Springfield, VA 22161

NOTICEThis document is disseminated under the sponsorship of the Department of Transportation in the interest of information exchange. The United States Government assumes no liability for its contents or use thereof.

Technical Report Documentation Page
1. Report No.
FRA-RRP-90-2 MA-PORT-830-90009
2. Government Accession No. 3. Recipient's Catalog No.
4. T itle and Subtitle
Double Stack Container Systems: Implications for U.S. Railroads and Ports
5. Report Date
Junp 19Q06. Performing Organization Code
8. Performing Organization Report No.7. Authors) Daniel S. Smith, principal author9. Performing Organization Name and Address
Manalytics, Inc.625 Third StreetSan Francisco, California 94107
10. Work Unit No. (TRAIS)
11. Contract or Grant No.
DTFR53-88-C-0002013. Type of Report and Period Covered
Final Report12. Sponsoring Agency Name and Address
Federal Railroad Administration Maritime Administration U.S. Department of Transportation Washington, D.C. 20590 14. Sponsoring Agency Code
15. Supplementary Notes
Project Monitor (s): Marilyn Klein, Federal Railroad Admin.Andrew Reed, Maritime Administration 400 7th St., SW - Washington, D.C. 20590
16. Abstract
This study assesses the potential for domestic double-stack container transportation and the implications of expanded doublestack systems for railroads, ports, and ocean carriers. The study suggests that double-stack service can be fully competitive with trucks in dense traffic corridors of 725 miles or more.There are opportunities to substantially increase double-stack service in existing corridors and to introduce double-stack service in secondary corridors, in outlying areas near major hubs, and for refrigerated commodities. To meet the challenge of providing and marketing a reliable, high quality, door-to-door service, railroads may have to take unaccustomed steps into marketing and customer service, or become strictly line-haul carriers. Ports must accommodate international double-stack growth, but they will be only indirectly affected by domestic containerization. Intermodal affiliates of ocean carriers will retain their leadership role in domestic containerization, while the ocean carriers themselves concentrate on international movements and markets.The products available from this contract include the Executive Summary, the Final Report, and the Bibliography.
17. Key Words
double stack container systems; railroads; ports; ocean carriers; intermodal. domestic containers
18. Distribution Stotement . DoCUment isavailable to the public through the National Technical Information Service, Springfield, Virginia 22161
19. Security C lassif. (of th is report)
unclassified20. Security C lassif. (of thi s page)
unclassified21« No. of P ages
32122. Price
Form DOT F 1700.7 ( 8 - 7 2 ) Reproduction of completed page authorized

TABLE OF CONTENTS
Page
I. BACKGROUND 1
A. STUDY BACKGROUND AND PURPOSE 1B. THE DEVELOPMENT OF DOUBLE-STACK SERVICES 1C. KEY ROLES IN DOUBLE-STACK DEVELOPMENT 7D. STUDY APPROACH 13
II. EXISTING MARKETS AND SERVICES 17
A. RELEVANT 1987 TRAFFIC FLOWS 17B. CURRENT DOUBLE-STACK SERVICES 29C. RAIL DOUBLE-STACK TECHNOLOGY 35
III. CRITERIA FOR DOUBLE-STACK OPERATIONS 39
A. DOUBLE-STACK SERVICE CRITERIA 39B. COST CRITERIA FOR DOUBLE-STACK SERVICES 51
IV. DOUBLE-STACK NETWORKS 70
A. HYPOTHETICAL 1987 DOUBLE-STACK NETWORK 70B. HYPOTHETICAL 1987 DOMESTIC AND INTERNATIONAL
COMPONENTS 73C. HYPOTHETICAL 1987 TRUCK DIVERSIONS 74D. NETWORK OVERVIEW 78E. HYPOTHETICAL 2000 DOUBLE-STACK NETWORK 80
V. IMPLICATIONS FOR RAILROADS 84
A. VOLUME AND DIRECTIONAL BALANCE 84B. RAIL INTERMODAL TERMINAL REQUIREMENTS 86C. RAIL EQUIPMENT NEEDS 89D. ECONOMICAL AND FINANCIAL ISSUES 92E. OPERATIONAL ISSUES 97F. CHANGES IN TECHNOLOGY 107G. MOTOR CARRIER DEVELOPMENTS 111H. CHANGING RAILROAD ROLES 118
VI. IMPLICATIONS FOR PORTS AND OCEAN CARRIERS 121
A. COMPATIBILITY OF DOMESTIC AND INTERNATIONALDOUBLE-STACK SERVICES 121
B. PORT ISSUES 132C. OCEAN CARRIER ISSUES 147

TABLE OF CONTENTS (Continued)
Page
VII. THE INTERMODAL INDUSTRY AND DOMESTIC CONTAINERIZATION 154
A. OVERVIEW 154B. THE RELATIONSHIP BETWEEN PORTS, OCEAN CARRIERS,
AND RAILROADS 154C. TRENDS IN MULTIMODAL OWNERSHIP 159D. MARKETING AND THIRD PARTY ISSUES 162E. INSTITUTIONAL ISSUES 169F. PROSPECTS FOR INDUSTRY-WIDE CONVERSION 175
VIII. OVERALL CONCLUSIONS 183
APPENDIX TABLES 1-9

TABLE OF TABLES
Table Description Follows Page
1 Relevant Truck Traffic 222 1987 Truck and Rail Data by Region 233 1987 Truck and Rail Balance Ratios 244 1987 Import/Export Summary by Inland Region 265 1987 Import/Export Summary by Coast 266 Intermodal Fleet 357 Double-Stack and Spine Comparisons 368 Weight Capacity Comparisons 379 Annual Container Volumes for Double-Stack Services 4210 Rail Line-haul Cost Estimate, Los Angeles-New Orleans 5911 Rail Line-haul Cost Estimate, Los Angeles-Oakland 5912 Drayage Zones and Costs 6313 Total Double-Stack Operating Costs 6414 Truck Repositioning Miles 6615 Rail and Truck Mileages 6716 1987 Major Double-Stack Corridors 7017 1987 Intermediate Points 7218 1987 Domestic Double-Stack Network 7319 International Double-Stack Network 7320 1987 Major Double-Stack Corridors with Truck Diversions 7521 1987 Double-Stack Network with Truck Diversions 7622 1987 Intermediate Points with Truck Diversions 7623 2000 Major Double-Stack Corridors 8224 2000 Intermediate Points 8225 Double-Stack Traffic Sources 8426 Potential Terminal Capacity Shortfall 8827 Rail Equipment Needs 9128 Domestic Container Payload Penalty 9929 International Cargo Flows by Rail, 1987 and 2000 126

TABLE OF FIGURES
Figure Description Follows Page
1 Rail Intermodal Volumes 62 1987 Double-Stack Flows 183 1987 COFC Flows 184 1987T0FC Flows 185 1987 Intermodal Flows 196 1987 Selected Boxcar Flows 207 1987 Intermodal and Boxcar Flows 208 1987 Truck Flows 219 1987 Rail and Truck Flows 2410 Inland Regions' 2911 1989 Actual Double-Stack Netword 2912 Southern California Double-Stack Traffic Patterns 4413 Truckload Transit Time 4914 Truckload and Intermodal Transit Times 4915 Truckload and Intermodal Transit Times and Drayage 5116 Double-Stack Equipment Costs 5417 Truckload Repositioning Miles 6618 Truckload Repositioning Percent 6619 Drayage and Competitive Length of Haul 6820 1987 Hypothetical Double-Stack Network 7021 1987 Hypothetical Double-Stack Volumes 7222 1987 Hypothetical Domestic and International Flows 7323 Geographic Drayage Patterns 7524 Divertible Truck Traffic 7525 Hypothetical Double-Stack Network with Truck Diversions 7626 Northeast Truck Routes 7627 Complete Hypothetical Double-Stack Network 7928 Hypothetical 2000 Double-Stack Network 8229 Hypothetical 2000 Double-Stack Volumes 8230 Net Directional Imbalances 8531 Recent Stack Car Types 12432 Shipper Perceptions of Intermodal vs. Truck 16333 User and Non-user Perceptions of Intermodal 16334 Shippers Preferring Double-Stack to Piggyback 16435 Changing Intermodal Roles 17136 The Emerging Intermodal Industry 172

I. BACKGROUND
A. STUDY BACKGROUND AND PURPOSE
Rapid growth in double-stack container operations has brought the rail indus
try to the verge of large-scale domestic containerization. The container
capacity of the double-stack fleet has increased from 400 container spaces
in 1983 to an estimated 30,000 in 1989, while conventional trailer slots
dropped by over 20,000. In that same period, rail transfer facilities have
been condensed from over 400 ramps into a system of about 215 high-volume
mechanized hubs capable of supporting frequent double-stack service in most
major rail corridors. The necessary infrastructure for a domestic container
system, seemingly unattainable just a decade ago, is largely in place.
Market forces are already in motion to cross that verge and create large-
scale domestic double-stack container services in some markets. Domestic
container services are routinely marketed by railroads, ocean carriers, and
third parties. Yet the wholesale replacement of other intermodal services
with double-stacked containers is not a certainty. There are operational,
economic, and institutional issues to be resolved. The issue is not whether
there will be domestic containerization: it is here. Rather, the issue is
whether there will be an identifiable domestic double-stack network. We
believe the answer is "yes11: the forces are already in motion. The ques
tions are: Under what circumstances? Where? How large? And how do we
get there from here?
This study was undertaken by the Federal Railroad Administration and the
Maritime Administration to assemble a comprehensive picture of double-stack
systems, to determine the potential for domestic double-stack container
transportation, and to identify the implications of expanded double-stack
systems for railroads, ports, and ocean carriers. The study was performed
by Manalytics, Inc. and subcontractors ALK Associates, Transportation Re
search and Marketing, and TF Transportation Consultants. It answers six
major questions:
o What is the status of double-stack container systems?
-1-

o Under what conditions can domestic double-stack container systems be competitive with trucks?
o What, form might a potential double-stack network take?
o What implications would such a network have for railroads?
o What implications would such a network have for ports and oceancarriers?
o Are existing market forces sufficient to bring about an efficient double-stack network?
B. THE DEVELOPMENT OF DOUBLE-STACK SERVICES 1
1. The Growth of Rail-Marine Intermodalism
There were five major factors in the rapid growth of rail-marine
intermodalism:
o the introduction of the international marine container in the 1960's,
which provided a uniform system to carry general cargo in large,
unitized lifts;
o the development of minilandbridge services to the major eastern U.S.
markets for Far East imports, which encouraged the creation of load
centers and the development of rail rather than all water movements;
o the emergence of strong Pacific Rim exporting economies in the 1970's
and 1980's, which provided the transpacific landbridge cargo and led
the ocean carriers to seek domestic backhaul freight;
o the modern rail infrastructure, including "hub and spoke" rail distri
bution and availability of 1ift-on/1ift-off equipment at inland as
well as terminals; and
o the development of powerful computer support systems, which permitted
managers to monitor intermodal equipment and track shipments.
All five factors emerged in pursuit of competitive advantage, and were
accompanied by marketing initiatives and organizations designed to exploit
- 2 -

that advantage. Without these five factors, intermodalism as we now know
it may have developed over time, but it is unlikely that it would have
developed so fast or risen to the current level of operational efficiency
and economic advantage.
The United States waterborne domestic trades, because of relatively expen
sive longshore labor at both ends of the voyage (as compared to only the
U.S. end of most international trades), nurtured the development of the
marine container in the late 1950's and early 1960's. Although previous
ocean-going container systems had been tried, none endured. Sea-Land
Service, in the intercoastal trades on the U.S. Atlantic and Gulf Coasts,
and Matson Navigation Company, in the West Coast/Hawaii trade, nearly
simultaneously developed the modern ocean container.
After becoming established in the U.S. domestic trades, containerization
quickly entered international trade. Grace Lines, then a U.S.-flag carrier
serving South America, converted two break-bulk ships to carry containers
to South America in 1960. Sea-Land introduced the first trans-Atlantic
container service in 1966, and Matson inaugurated a Far East container
service in 1967. Sea-Land began eastbound commercial container operations
from Japan in 1968.
One of the major promises of the container, besides longshore labor cost
reductions, was the development of intermodalism: the ability to transfer
large, secure, unitized lots of cargo between ships and landside transport.
Early in the development of containerization, Sea-Land, Matson, Seatrain
Lines, and Atlantic Container Lines, among others, investigated landbridge
(from a foreign origin to a foreign destination via two U.S. ports, with a
land transport segment connecting the two U.S. ports), minilandbridge (from
a foreign origin to a U.S. port destination, but entering the U.S. at
another U.S. port on another coast, with a land transport segment connect
ing the two ports), and microlandbridge (from a foreign origin to an inland
U.S. location, but entering the U.S. at a port on a more distant coast
closer to the foreign origin). Development of landbridge operations was
slowed more by the regulatory environment than by the transportation
infrastructure. Domestic rail and truck carriers are regulated by the
Interstate Commerce Commission (ICC), while the international ocean carriers
-3-

are regulated by the Federal Maritime Commission (FMC). Tariffs across
jurisdictions were originally prohibited, and through bills of lading and
single factor rates (where the ocean carrier charges for, and takes responsi
bility for, the full intermodal movement, and divides the revenue with the
rail carrier off-tariff) were not legal at the time. Ocean carriers and
domestic carriers had to issue separate bills and charge independently.
Minilandbridge (MLB) services substitute relatively expensive rail service
for more economical water service. However, other factors are involved
than just transport costs when considering the viability of MLB services,
such as:
o the size of the MLB market;
o the size of the local market at the potential intermediate MLB
ports;
o the proportion of high-rated cargoes; and
o the degree of railroad cooperation.
The first MLB tariff was filed in 1972 by Seatrain Lines for Far East
cargoes moving to North Atlantic ports via California ports. This parti
cular market was the biggest in the early 1970's, but, importantly, it also
had a high proportion of high valued cargoes that would benefit from the
faster transit times offered by MLB services. Seatrain chose to serve the
North Atlantic states via California ports, instead of Seattle, because of
the larger local market in California. After the success of this MLB
service, other MLB services proliferated as the economics of the service
improved and the demand for faster transit times increased.
The next variation on landbridge service came with the introduction of
microbridge services. U.S. consumer demand for imports from the Far East
created large containerized cargo flows to the major population centers in
the Midwest. These regional centers were, and still are, served with
minimum rail or truck hauls by all-water services through Atlantic and Gulf
Coast ports, but intermodal services through West Coast ports offered
significantly faster transit times. Microbridge services for Pacific Rim
cargoes have gradually extended eastward, including cities as close to the
Atlantic Coast as Atlanta and Pittsburgh, and now dominate the trade.
-4-

Finally, the Shipping Act of 1984 gave an extra boost to landbridge ser
vices of all kinds by allowing conferences to offer intermodal single
factor rates. With the rapid growth in containerized imports, moving from
the Far East through West Coast ports to Eastern points, the need to
improve efficiency and reduce linehaul costs led to the development of
double-stack container service.
2. Critical Developments in the Advent of Double-Stack Service
Double-stack container services were not created by the actions of any one
party. They emerged instead from a series of actions, each facilitating or
broadening double-stack services in some way. The first critical develop
ment was the development of the double-stack car itself by a team of
Southern Pacific mechanical engineers under the direction of W. E. Thomford.
These cars were specifically intended to reduce linehaul costs on SP's
Sea-Land traffic in the Southern Corridor. A single-platform version was
completed in 1977 by American Car & Foundry (ACF) for Southern Pacific.
Subsequent versions produced in 1979 and 1981 grew to three and five
articulated units, with five units becoming a standard for all subsequent
production.
In July of 1983, American President Lines ran its first experimental
double-stack train from Los Angeles to Chicago. Double-stacking was a
technological improvement over the intermodal flatcars used in APL
Linertrains since 1979. APL sought to maintain and improve on the control
it had achieved over inland operations with its conventional Linertrain
service, and to reduce linehaul costs on that service. Regular APL double
stack service started in 1984, and was followed by double-stack service by
Sea-Land in 1985. Soon thereafter, other ocean carriers, including Maersk,
NYK, "K" Line, and OOCL, started dedicated double-stack trains from the
West Coast.
Another major factor was Trailer Train's decision to create a double-stack
car fleet, which allowed expansion of double-stack services beyond the
dedicated trains of major ocean carriers. In fact, with few exceptions,
the ocean carriers who purchased or leased cars for their initial trains
turned to Trailer Train cars for subsequent expansion. Trailer Train
-5-

thereafter committed heavily to double-stack technology. Further develop
ment of domestic double-stack services is likely to rely on Trailer Train
or other firms to supply and maintain pools of double-stack cars.
As these developments were occurring, railroad regulation was substantially
reduced between 1976 and 1981, permitting railroads to conduct intermodal
business in a much freer environment. In 1976, Congress passed the Rail
road Revitalization and Regulatory Reform (4R) Act, which allowed the ICC
to exempt certain traffic under limited circumstances. The 4R Act also
paved the way for more extensive regulatory reform. The major progress in
railroad deregulation came with the passage of the Staggers Rail Act of
1980, which gave the railroads a considerable amount of latitude in deter
mining and modifying rates without the ICC's interference, and backed up
the earlier ICC ruling on contracts by permitting contract carriage on rail
common carriers. The Interstate Commerce Commission exempted Trailer-on-
Flatcar/Container-on-Flatcar (T0FC/C0FC) service from rate regulation in
1981, and eliminated all remaining T0FC/C0FC rate regulation in 1987. The
railroads' ability to make contracts with their customers proved to be an
important element in the success of the innovative intermodal services
developed during the 1980's.
As Figure 1 shows, intermodal traffic volume grew dramatically in the
1980's, accounting for a growing share of railroad traffic and revenues and
demanding a larger share of management attention.
The dedicated "unit" trains of APL and Sea-Land set the pattern for early
double-stack operations. The introduction of "common-user" service by
Burlington Northern (BN) in 1985 led to far greater flexibility in double
stack operations. The volume contracts offered by BN were more important
than the trains themselves. These contracts had three critical features:
o "tier rates," with unit cost declining in steps as the annual volume
commitment reached a series of thresholds;
o system-wide application, so all traffic between Seattle or Tacoma and
points on the BN system could be combined to meet the volume commit
ment; and
- 6 -

1978 1979 1980 1981 1982 1983 1984 1985 1986 1987 1988
Year
Figure 1: RAIL INTERMODAL VOLUME, 1978-1988
Source: Association of American Railroads (final revised figures)

o flexible backhaul provisions, where the customer could solicit back
hauls, move containers empty, or have BN solicit the backhauls.
These volume contracts have set the pattern for virtually all new rail
contracts, including those for domestic container traffic.
A related development occurred when major double-stack customers began
re-marketing dedicated train capacity, thus taking on the role of third
parties as well as being shippers. Express Systems Intermodal (ESI), then
a subsidiary of SeaPac and OOCL, began soliciting the traffic of other
ocean carriers to fill out its trains on SP. Once APC had set up American
President Intermodal (API) to operate trains for APL, API also began to
solicit traffic from other ocean carrier and domestic third parties,
including its own. These actions increased the flexibility of the
double-stack system, and provided alternate means for other carriers to
take advantage of double-stack economics.
C. KEY ROLES IN DOUBLE-STACK DEVELOPMENT 1
1. The Rail Role
The rail role must be viewed in the context of overall intermodal growth
and a change in the way intermodal traffic has been conducted and per
ceived. All of the early double-stack trains were dedicated services.
Each ocean carrier had a set of double-stack cars, owned, leased, or
assigned by Trailer Train for its use. Each service effectively operated
as a unit train, although the sets of cars may have been broken up and
rearranged from time to time. Thus, for the first year or so, double-stack
trains were viewed as unit trains, and operationally distinct from other
railroad trains. The introduction of common-user services by several
railroads in 1985 and 1986, and the development of multi-destination
trains, quickly ended any such distinction. Railroads mix double-stack
cars with other intermodal cars to achieve the desired capacity and service
frequency. The number of cars and containers on a train will also vary
week to week. Almost none of the double-stack trains now operating are
true unit trains in the sense of having a fixed car consist.
-7-

Despite being occasionally identified as the operators of double-stack
trains, only three ocean carriers actually acquired double-stack cars (APL,
Sea-Land, and Maersk). Railroads acquired a few cars (either leased or
purchased), but the vast majority of double-stack cars has been provided by
Trailer Train. Trailer Train Company was incorporated by the Pennsylvania
Railroad and the Norfolk and Western Railway in 1955. Now owned by 14
railroads and rail systems, Trailer Train operates a fleet of over 44,000
intermodal cars.
Trailer Train has performed a crucial role in facilitating the growth of
double-stack traffic. Once Trailer Train began offering double-stack cars,
it was no longer necessary for either ocean carriers or railroads to commit
capital to a new service. Until this ability was recently curtailed as a
condition of continuing anti-trust immunity, Trailer Train could assign a
group of double-stack cars to a specific railroad for a period of several
years for use by a specific ocean carrier. By permitting ocean carriers
and railroads to start services without the capital outlay for cars,
Trailer Train dramatically reduced the barriers to double-stack service and
diminished the risks borne by individual carriers.
Three railroads developed intermodal facilities to handle containers
exclusively, signalling a new level of commitment to intermodal and double
stack traffic. The Southern Pacific Intermodal Container Transfer Facility
(ICTF) in Los Angeles was a joint effort with the Ports of Los Angeles and
Long Beach. Its proximity to the ports and its efficiency have been
instrumental in attracting the majority of Southern California's container
traffic. BN's Seattle International Gateway (SIG) also was built to
provide exclusive container transfer facilities adjacent to the port, and
has been highly successful in handling BN's common-user traffic. CNW
converted an existing Chicago yard into Global One, the first inland
facility designed to handle double-stack container traffic exclusively. In
each case, the railroad not only responded to an existing need for improved
facilities, but looked forward to double-stack growth.
- 8 -

2. The Ocean Carrier Role
Ocean carriers took the initiative to put the double-stack service package
together. Railroads were reluctant to develop retail intermodal opera
tions, or to invest heavily in a field that has been marginally profitable.
Ocean carriers were willing, for their own reasons, to take the retail role
and make both volume commitments and capital investments. Before the
development of double-stack services, intermodal container services were
usually merged with existing rail TOFC as container-on- flatcar (COFC)
traffic. In 1979, American President Lines determined that it could offer
better service to its intermodal clients if it had more control over the
rail line haul and terminal portions of its system. APL, therefore,
contracted for its own dedicated trains and terminal services, and pur
chased or leased its own railcars. Early in 1984, APL started regularly
scheduled double-stack unit train services between Los Angeles and Chicago.
As the success of APL's trains quickly became apparent, other ocean
carriers established their own services. Sea-Land, like APL, acquired its
own cars for service between Seattle and Little Ferry, New Jersey. Maersk,
using Trailer Train cars, began service between Tacoma and Chicago. NYK,
using Trailer Train cars, and "K" Line, using the original SP cars, began
service between Los Angeles and the Midwest. Intermodal competition forced
foreign-flag steamship lines to establish double-stack train services and
domestic subsidiaries. The Rail-Bridge Corporation, for example, was set
up as a U.S. subsidiary of "K" Line to operate its double-stack services.
The introduction of double-stack service cpincided with strong growth of
import cargoes in the transpacific trade, which created a heavy eastbound
imbalance. Based on Bureau of the Census data, an estimated 1.4 million
TEU of imports passed through the West Coast ports in 1984 and only 0.9
million TEU of exports, an imbalance of 1.6:1. The imbalance grew to
1.9:1 in 1985 and to 2:1 in 1986. Since APL leased or owned its initial
double-stack cars and had full responsibility to fill the cars in both
directions, it had significant incentive to develop additional cargoes to
fill westbound containers. In 1985, APL acquired a shippers agent,
National Piggyback Services (renamed American President Distribution
Services, or APDS) and a distribution service, Intermodal Brokerage
-9-

Services, and formed American President Intermodal to oversee its double
stack services while APDS solicits domestic freight and APL solicits
international cargo.
While Sea-Land and Maersk also purchased double-stack cars, few ocean
carriers made the capital commitment of APL. Most, however, recognized the
need to provide double-stack services, and some recognized the opportunity
to compete for domestic traffic. The roles played by ocean and rail
carriers thus became less clearly defined. Ocean carriers have taken
responsibility for a larger portion of the transportation chain from
shipper to consignee, and a greater portion of the risks and revenues.
3. The Port Role
Ports played a mix of roles in the development of double-stack traffic.
West Coast ports saw double-stack trains as a manifestation of load
centering, and their approach varied from simple encouragement to facility
construction and proposed sponsorship of double-stack trains. East Coast
ports were less involved initially, since the initial thrust of inland
container movements came from the transpacific carriers.
The long development times required to develop new port facilities make it
difficult for ports to react quickly to new trends. Nonetheless, some
ports were able to incorporate provisions for double-stacks in projects
underway. The Port of Tacoma's South Intermodal Yard was completed to
bring double-stack trains on-dock at the new Sea-Land terminal. In Southern
California, plans for the the multi-year ICTF project were altered to
facilitate double-stack operations.
Some ports investigated sponsoring or contracting for double-stack opera
tions to serve smaller ocean carriers who could not individually justify
double-stack trains. The Port of Baltimore joined with the Chessie System
to sponsor (i.e. market) a train. That service has since been melded into
CSL's overall intermodal service. The Port of Seattle announced plans to
sponsor a dedicated train to provide double-stack service to its carriers.
In response, BN began offering the first "common user" trains, with
six-day-per-week double-stack service open to smaller steamship lines and
- 1 0 -

third parties, including the Port. The Port of Seattle thereafter
abandoned plans to sponsor its own trains, and offered a consolidation plan
under BN's tier rates. The Port Authority of New York and New Jersey had
trial trains run by Conrail in late 1988, but did not achieve the hoped-for
response. The Port of Long Beach had periodically discussed sponsoring a
double-stack train for its steamship line clients. By early 1989, with the
advent of common-user service in Southern California by SP, ATSF, ESI, and
API, the idea was dropped. By offering common-user services, the railroads
and multimodal companies have apparently eliminated much of the perceived
need for port-sponsored trains.
The Port of Oakland took what is so far (1990) a unique step in facilita
ting double-stack operations. The Port of Oakland provided about $5
million in a joint effort with UP and API to improve tunnel clearances on
UP's central corridor route serving the Port. Work was completed in 1989.
A more limited tunnel clearance project was under consideration by the Port
of San Francisco in 1989. The San Francisco project would improve
clearances through two Southern Pacific tunnels south of the Port.
4. The Role of Risk
Risk plays a major role in any new venture. One can identify five major
kinds of risk in the development of double-stack services.
o Technological Risk: double-stack cars and the terminal infrastructure
might not have performed as expected.
o Economic Risk: double-stack operations and marketing might have been
more costly than expected.
o Financial Risk: the operating savings and revenues might not have
justified the capital and market development costs.
o Volume Risk: the service might not have attracted, developed, and
retained sufficient volume in both directions.
o Acceptance Risk: double-stack service might not have been accepted
by shippers, consignees, and third parties.
- 1 1 -

As it turned out, double-stack systems did perform as well as expected,
double-stack services appear to be economically and financially sound,
adequate volume has been attracted and retained, and the service has been
enthusiastically accepted by most parties. In the 1970's and early
1980's, however, these risks were real. For double-stack services to
begin, each of these risks had to be eliminated or reduced to acceptable
levels.
5. Implications for Domestic Double-Stack Services
The history of marine containerization and international double-stack
service has useful implications for domestic containerization and
double-stack service. The various risks faced and overcome in the
international sphere have their domestic counterparts. Some of the
critical developments in domestic double-stack service have already
occurred.
One hurdle faced by marine containerization has already been passed
domestically: the development of a standard container. Although it has
not been officially sanctioned by any regulatory body or industry asso
ciation, the 48-foot long, 8-foot 6-inch high, 102-inch wide container is
now a de facto industry standard for domestic use, to match the competitive
truckload standard. (There are small numbers of 45' and 53' domestic
containers for special purposes.)
Of the five major sources of risk -- technological, economic, financial,
volume, and acceptance -- three are still present for domestic double
stacks. The technology clearly works, and the underlying economics have
been amply demonstrated. Financial, volume and acceptance risks remain.
Financial and volume risk are substantially reduced because domestic
containerization and double-stack service began incrementally, as an
extension of international services. The first domestic double-stack
services did not entail separate financial and volume risks, since they are
backhauls to international services. True domestic services — fronthauls
as well as backhauls — were and are added to trains whose existence relies
on an international traffic base.
- 1 2 -

The successful marketing of international containers for domestic back
hauls, and later fronthauls, has greatly advanced the acceptance of the
container itself as a domestic freight vehicle. International operations
have also yielded valuable experience with the superior ride quality and
reduced loss and damage of double-stacks, which have become marketing
points. Acceptance by forwarders, shippers' agents, and other third
parties who were already intermodal users, however, is not the same as
acceptance by shippers who have used trucks exclusively for many years.
Because trucks remain a highly competitive and after more efficient mode,
domestic containerization faces a more difficult challenge, particularly in
market development.
D. STUDY APPROACH
1. Advisory Committee
From the beginning, the study team recognized the critical importance of
industry contacts to the successful completion of this study. In addition
to the ad hoc contacts made during data acquisition and analysis, the study
team assembled an Advisory Committee to review draft reports, suggest
improvements, and maintain a realistic viewpoint. The following indivi
duals served on the Advisory Committee and gave generously of their time
and expertise:
-13-

Donald Cole
Vice President,
Planning & Development
Trailer Train Company
Steven C. Nieman
Vice. President,
Strategic Planning
American President Domestic
David J. DeBoer
Vice President,
Greenbrier Intermodal
Craig F. Rockey
Assistant Vice President,
Economics
Association of American Railroads
Henry T. Domery
General Manager-Intermodal
Pennsylvania Truck Lines
Phillip C. Yeager
Chairman,
The Hub Group, Inc.
James H. McJunkin
Vice President,
American Association of Port Authorities
The advice and participation of these individuals improved the quality and
relevance of the study. The findings of this study, however, do not
represent the positions or policies of these individuals or their organiza
tions, and they bear no responsibility for study content.
2. Assessment of Existing Markets and Services
The first task of this study was to establish the status quo for double
stack container systems. The study team drew data from three major
sources:
o rail data from the 1987 Carload Waybill Sample (CWS);
o truck data from the 1985-87 National Motor Transport Data Base
(NMTDB); and
o maritime data from the 1987 Bureau of the Census foreign trade
database.
These data were processed to create a profile of existing relevant traffic
flows in all three modes. Information on current double-stack operations
and technology was obtained from industry contacts and publications.
-14-

3. Establishment of Service and Cost Criteria
The study team developed service and cost criteria to determine the condi
tions under which domestic double-stack container services could be fully,
competitive with truckload carriers, who constitute the major long-term
competition. Service criteria were based on typical drayage, terminal, and
transit times. Cost criteria were based on engineered cost estimates for
each function in door-to-door double-stack service. Favorable assumptions
were used to gauge the full potential of domestic double-stack container
systems.
4. Estimating Hypothetical 1987 and 2000 Double-Stack Networks
The service and cost criteria, translated into volume and length of haul
requirements, were applied to the relevant traffic data to generate a
hypothetical 1987 core network of truck-competitive double-stack service.
A methodology was developed to identify potentially divertable truck
movements. Published growth forecasts for domestic and international
intermodal traffic were then used to develop a hypothetical year 2000 core network.
5. Implications for Railroads
Implications for railroads were identified in several areas: overall
traffic volume; equipment and capital needs; terminal capacity; marketing;
and changing roles within the intermodal field.
6. Implications for Ports and Ocean Carriers
Implications for ports and ocean carriers were likewise identified,
focussing on the sompatibility of international and domestic container
flows; the impacts on port and ocean carrier operations; effects on
port/ocean carrier/railroad relationships; and the future roles of ports
and ocean carriers.
-15-

7. The Intermodal Industry and Domestic Containerization
Statistics and cost estimates are only part of the story, and the
intermodal field has transcended the traditional roles of railroads, ports,
and ocean carriers. The study team therefore examined the broader
implications of domestic containerization for the emrging intermodal
industry and the ways in which the participants do business.
-16-

II. EXISTING MARKETS AND SERVICES
A. RELEVANT 1987 TRAFFIC FLOWS
1. Rail Traffic Flows
Data Source. The source for rail data for this study is the 1987 Inter
state Commerce Commission Carload Waybill Sample (CWS). The study team
extracted all intermodal data (trailers and containers) from the 1987 CWS,
and selected carload data. The intermodal data were classified as follows:
o Intermodal moves (all trailers and containers, regardless of
car type);
o TOFC moves (trailers only);
o COFC moves (all containers, regardless of car type); and
o Identifiable double-stack moves.
Identification of Intermodal and Double-Stack Traffic. The identification
of intermodal traffic in the CWS is quite reliable. The identification of
current double-stack traffic as a subset of the reliably known intermodal
traffic is not clear cut or reliable. Although railroads are required to
report the actual car initial and number which was used to transport
intermodal equipment, there are two problems with the use of the cartype
field in identifying double-stack traffic. First, if a CWS record covers
the movement of more than one car, only the first car's initial and number
are reported. Since rail waybills tend to cover the movement of similar
goods, this is not a serious problem, as equipment following the first car
is likely to be similar to the reported car. Second, many railroads simply
do not record what actual cars they are hauling. Since the actual waybill
covers the movement of the trailers or containers, and not the cars on
which this equipment was loaded, the waybill and revenue settlement pro
cesses do not capture the actual railcar used. To help alleviate this
problem, the ICC has given permission to railroads to report a representa
tive car initial and number, which in many cases is not a double-stack car.
-17-
The remaining question of how many other similar movements were missed
which are also likely double-stack services by rail is unanswerable from
the Carload Waybill Sample.
Identifiable Double-Stack Flows. Figure 2 shows the 1987 double-stack
traffic flows that could be identified from the Carload Waybill Sample. As
explained, an unknown portion of the other container traffic also moves on
double-stack cars. Nonetheless, the movement pattern shown in Figure 2
closely matches the major 1987 double-stack operations. The three major
western rail corridors each handled substantial double-stack volumes. The
Burlington Northern handled double-stack traffic between Seattle/Tacoma and
Chicago, and to a lesser extent between Seattle/Tacoma and Kansas City or
Memphis. Union Pacific's double-stack traffic from all these west coast
port regions oves through the Central Corridor to Chicago via CNW. South
ern Pacific moves large volumes on the Southern Corridor between Los Angeles
and points in the South, Gulf, and Midwest.
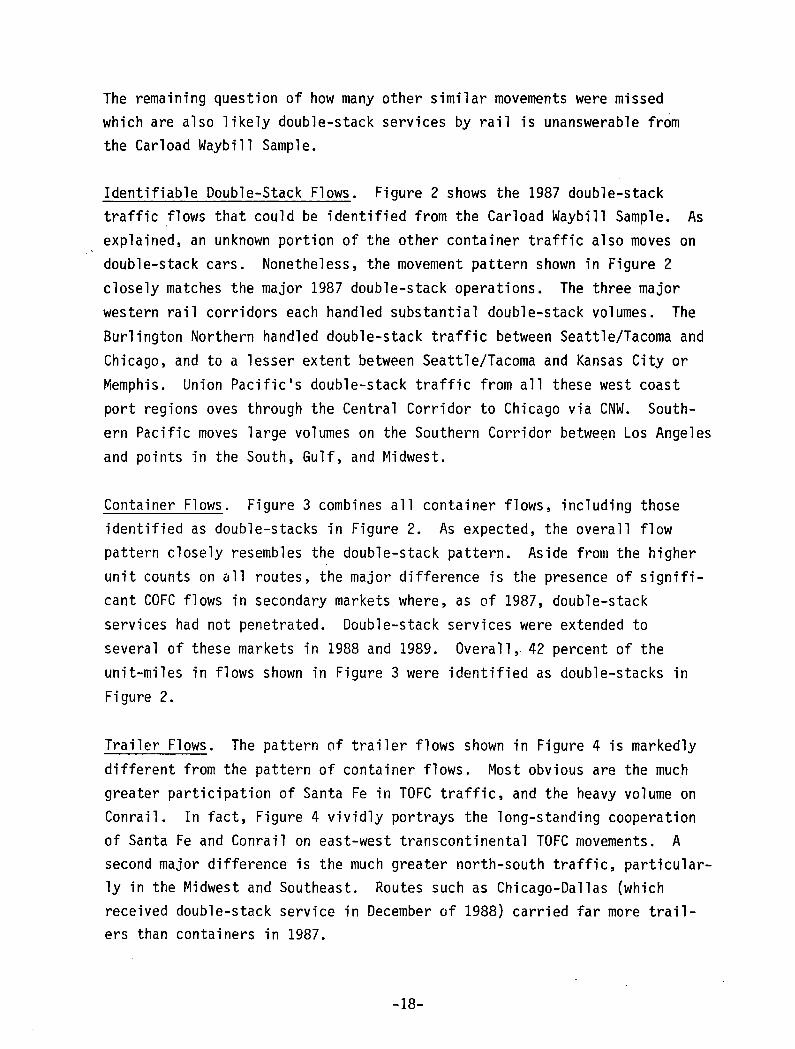
Container Flows. Figure 3 combines all container flows, including those
identified as double-stacks in Figure 2. As expected, the overall flow
pattern closely resembles the double-stack pattern. Aside from the higher
unit counts on all routes, the major difference is the presence of signifi
cant COFC flows in secondary markets where, as of 1987, double-stack
services had not penetrated. Double-stack services were extended to
several of these markets in 1988 and 1989. Overall, 42 percent of the
unit-miles in flows shown in Figure 3 were identified as double-stacks in
Figure 2.
Trailer Flows. The pattern of trailer flows shown in Figure 4 is markedly
different from the pattern of container flows. Most obvious are the much
greater participation of Santa Fe in TOFC traffic, and the heavy volume on
Conrail. In fact, Figure 4 vividly portrays the long-standing cooperation
of Santa Fe and Conrail on east-west transcontinental TOFC movements. A
second major difference is the much greater north-south traffic, particular
ly in the Midwest and Southeast. Routes such as Chicago-Dallas (which
received double-stack service in December of 1988) carried far more trail
ers than containers in 1987.
-18-

Figure 2

I


Total Intermodal Flows. Figure 5 combines the TOFC and COFC data to
illustrate the overall pattern of rail intermodal movement. As expected,
1987 intermodal traffic was concentrated on long hauls between major
population centers and hubs. Figure 5 places the eastern and western
railroads in much different postures. In the East, with the exception of
Conrail's major route, intermodal volumes are diffused over the network.
In the West, intermodal volumes are concentrated on the transcontinental
mainlines, giving the appearance of a tree-like structure. Overall, the
national pattern is hub-and-spoke, with the western spokes being much
longer.
Carload Traffic Data. The first step in selecting the carload traffic of
interest is to define "boxcar" traffic. In contemplating the diversion of
"merchandise" traffic from general-purpose boxcars and refrigerator cars to
general-purpose dry and refrigerator containers, it is desirable to elimi
nate bulk loading, exceptionally heavy or dirty commodities, and some
traffic carried in specialized boxcars. The UMLER/AAR cartype code restric
tions listed in Appendix Table 1 achieve that purpose. Standard transporta
tion commodity code restrictions are given in Appendix Table 2.
It was assumed that all of these commodities would be carried in dry
containers or self-contained refrigerator containers 48 feet long, 102
inches wide, and 9 feet 6 inches high. These are the dimensions of the
48-foot containers used by most companies for domestic traffic. A dry
container of this size has a tare weight of about 8100 pounds and a capa
city of 3450 cubic feet. A notional self-contained (i.e. with generator
set) refrigerator container of this size would weigh about 13,100 pounds
(allowing 5000 pounds for genset and refrigeration equipment, typical of
Canadian self-contained reefers) and would have a capacity of about 2950
cubic feet (losing about 500 cubic feet to refrigeration equipment).
Actual loading of such containers is further restricted by rail and highway
weight limits and by imperfect packing or stowage. Some carriers limit
loading in 48-foot containers to 48,000 pounds to allow for a variety of
chassis weights and to meet highway limits, which are more stringent than
rail limits. The corresponding reefer limit would be 43,000 pounds.
Historic trade data show an average container cubic utilization of 80
-19-


percent, meaning that, on average, 20 percent of the cubic capacity is used
for dunnage or bracing, or is wasted due to an inexact fit of commodity
packages or pallets. Thus, the practical loading limits are as follows:
Only a few commodities are cube-limited: tobacco, furniture, rubber and
plastic goods, glass, pottery, electrical machinery (appliances), instru
ments, and empty containers. Choosing a large domestic container with a
higher tare produced a liberal estimate of container equivalents for
weight-limited commodities. Thus, the estimate of container equivalents
for boxcar commodities tends toward the upper bound.
Selected Boxcar Flows. The commodity-by-commodity selection process
results in the boxcar flows illustrated in Figure 6. The unit-mile total
in 1987 was 3,527,253,072 -- very close to the TOFC total. Figure 6 shows,
however, that the boxcar traffic flows are much more diffuse, particularly
in the lower Midwest and Southeast. The boxcar flows show the importance
of lumber, paper, and auto parts, which move in different corridors than
existing intermodal traffic.
Combined Intermodal and Boxcar Traffic. All of the rail traffic selected
for analysis in this study is shown in Figure 7. This figure can be most
succinctly described as a U.S. rail map with long-haul intermodal flows
highlighted and coal and grain flows deleted. Major origin and destination
hubs that stand out include Seattle, Portland, Oakland, Los Angeles, Kansas
City, St. Louis, Chicago, Dallas, Houston, New Orleans, Memphis, Detroit,
Atlanta, Miami, Philadelphia, New York, and Boston. All of the largest
rail systems are well-represented, but some of the regionals such as S00,
KCS, ICG, and the Guilford System are not. Due to its heavy Jacksonville-
Miami intermodal traffic, the Florida East Coast is quite prominent.
Container
48-foot dry
48-foot reefer
Weight Capacity Cubic Capacity
2760 cu ft.
2360 cu ft.
48.000 lbs.
43.000 lbs.
- 2 0 -


2. Transcontinental Truck Traffic
Data Source. There is only one current database of motor container move
ments: the National Motor Transport Data Base (NMTDB), maintained by
Transportation Research and Marketing (TRAM). For the past 13 years, the
NMTDB has generated two basic data sets: answers to more than 60 questions
asked in one-on-one interviews in selected truckstops; and passing counts
of heavy trucks taken by fleet type and trailer type on interstate highways
at or near interview locations. Each year, TRAM compiles 23,000 to 25,000
in-depth surveys and nearly 800 passing counts.
Interviews are currently being conducted at 19 points. At least 80 inter
city drivers are interviewed each month at each location. At those loca
tions where more than 120,000 passings occur, one interview is completed
for every 1,500 trucks passing. Random interviews are conducted at all
hours of the day and night, and at all times of the month. The NMTDB also
uses 21 four-hour heavy truck passing counts taken randomly over a contin
uous seven-day period twice a year. Each passing truck is counted by type
of carrier operation (private, regular route, or irregular route), by type
of trailing unit (flat, van, refrigerated, drop frame, moving van, etc.)
and by direction. All trailer types are specifically tabulated. The 21
four-hour period counts are then projected to weekly data, and estimated
30-day passing counts are developed.
TRAM selected the most comparable and useful format for 1987 data, and
selected the relevant portions of the NMTDB. In order to maximize the
sample size for this project, TRAM combined the results of the 1985, 1986,
and 1987 interviews. For the initial phase of this study, TRAM identified
that segment of truck traffic for which rail intermodal services are
presently competing with some sign of success. The rail data in Figure 5
show quite clearly that the greatest strength of intermodal service is in
transcontinental east-west traffic.
The truck traffic for which these major intermodal services compete was
selected from the NMTDB. As shown in Figure 8, this includes dry van and
refrigerated (reefer) movements to and from the two westernmost regions:
California and Oregon/Washington. To identify such traffic, passing counts
- 21-


and survey data was used from three sites: Rock Springs, Wyoming (Inter
state 80); Eloy, Arizona (Interstate 10); and Gallup, New Mexico (Inter
state 40). Relevant traffic on the northernmost route (Interstate 90 and
94) was investigated but found to be negligible. To account for north-
south traffic between California and Oregon/Washington, passing count and
interview information from Redding, California (Interstate 5) was also
used.
Initial data compilation was restricted to dry vans of truckload carriers.
Upon review of the data and further investigation, it was determined that
refrigerated (reefer) movements should also be considered because:
o although existing refrigerated container service by rail is
minimal, technical and commercial approaches are being actively
pursued; and
o from NMTDB interview data, it appears that about 50 percent of
the westbound movements (commonly considered to be backhauls)
carry non-temperature-sensitive freight.
The refrigerated freight market therefore appears to be accessible, and is
apparently intertwined with the dry freight market. Accordingly, reefer
passing counts and interviews for reefers from the same sites (Rock
Springs, Eloy, Gallup, and Redding) were compiled.
Table 1 shows annualized estimated dry van and reefer truck flows to and
from west coast states through each of the four sites. As the tables show,
the majority of transcontinental California truck traffic moves over the
southern routes, Interstate 10 and Interstate 40. This concentration of
truck traffic on the southern routes matches the concentration of rail
intermodal traffic on the Southern Corridor. Both traffic concentrations
are attributable to the large Southern California population, the large
amount of foreign trade through Southern California ports, and the massive
agricultural production of the Southern California growing areas. The role
of agricultural commodities is especially apparent in the greater number of
refrigerated trucks. Even within the dry van category, agricultural and
food products account for roughly 20 percent of the eastbound loads. As
- 2 2 -

Table 1
RELEVANT TRANSCONTINENTAL TRUCK TRAFFIC
ANNUAL VOLUME ESTIMATES
TO AND FROM CALIFORNIA:
Via East/Southbound West/Northbound Total
DRY VANS
Rock Springs 86,472 78,960 165,432Eloy 212,748 189,396 402,144Gallup 209,016 286,299 495,315Redding 173,364 201,156 374,520
Subtotal 681,600 755,811 1,437,411
REFRIGERATED VANS
Rock Springs 76,308 95,736 172,044Eloy 277,704 277,500 555,204Gallup 197,256 205,716 402,972Redding 114,420 155,844 270,264
Subtotal 665,688 734,796 1,400,484
CALIFORNIA TOTAL 1,347,288
TO AND FROM OREGON
1,490,607
AND WASHINGTON:
2,837,895
Dry Vans
Rock Springs 67,080 79,128 146,208
Refrigerated Vans
Rock Springs 91,572 68,316 159,888
Subtotal 158,652 147,444 306,096
WEST COAST TOTAL 1,505,940 1,638,051 3,143,991

expected, Oregon/Washington dry van and reefer totals are much smaller than
those for California. For Oregon and Washington dry vans exceed reefers.
The eastbound and westbound (or northbound and southbound) truck traffic
totals are very closely balanced, especially compared to rail intermodal
traffic. For all practical purposes, truckers do not make empty transcon
tinental trips.
3. Rail and Truck Traffic Flows
Rail/Truck Comparisons. The rail and truck data were combined on the same
geographic basis. The rail and truck data are given in Table 2, each in
units and net tons. The rail data include trailers, containers, and
selected boxcar movements. The flows originating in the Northwest and in
California show more total rail tons than truck tons, largely a consequence
of including selected boxcar traffic (namely lumber, paper, and other
forest products). Westbound rail flows from the Upper Midwest (which
includes Chicago) exceed truck flows, and by a large margin to the North
west; the other westbound flows are dominated by trucks. Overall domina
tion by trucks is consistent with national market shares and long-standing
trends. The much greater rail penetration of the Upper^lidwest-to-North-
west market is likely due to the increase in exports through Northwest
ports, and the effectiveness of double-stack backhaul solicitation. Table
2 also shows clearly that refrigerated truck movements would be a major
potential market for double-stack service if a highly reliable and cost-
effective system for double-stack refrigeration can be developed.
Traffic Patterns. Figure 7 showed the rail traffic flows previously
identified as being relevant to the study. Figure 8 showed the long-haul,
inter-regional truck flows, previously identified as likely to be relevant,
allocated to the same rail corridors. (Neither map shows the volumes
associated with individual railroads or their routes.) Some features are
immediately apparent. First, the major intermodal routes in the western
states correspond closely to the major truck flows. Second, relatively
little truck traffic shows up in the eastern rail corridors. Third, rail
intermodal traffic is heavily concentrated in a few midwestern hubs,
notably Chicago, while truck traffic is more diffuse. The truck corridor
between Chicago and New York would be much denser if truck traffic, like
rail traffic, were funneled through the Chicago gateway.
- 23-

ALK ASSOCIATES INC PAGE 1COMPARISON OF TRUCK VERSUS RAIL DATA BY TRAM REGION
TRUCK DATA SOURCE: TRAM MONTHLY SURVEY EXPANDED TO ANNUALIZED VOLUMES RAIL DATA SOURCE: 1987 ICC CARLOAD WAYBILL SAMPLE INTERMODAL AND BOXCAR EQUIVALENTS
------------TRAM TRUCK DATA------------- ---- RAIL DATAO D T r T W DESTINATION
TRAM 12 MO DRY VANS TRAM 12 MO REFERS EXPANDED 1987 WAYBILLREGION REGION UNITS NET TONS UNITS NET TONS UNITS NET TONSNORTHWEST NORTHWEST 0 0 0 0 68,936 1,210,996NORTHWEST CALIFORNIA 135,585 2,420,471 82,240 1,718,670 113,157 2,610,116NORTHWEST MOUNTAIN STATES 13,176 245,514 15,956 311,240 38,173 779,504NORTHWEST LOWER MIDWEST 17,019 291,443 34,759 727,747 67,343 1,342,680NORTHWEST UPPER MIDWEST 23,058 440,471 32,976 665,521 212,520 3,802,870NORTHWEST SOUTHEAST 3,294 60,116 15,061 315,455 33,113 697,000NORTHWEST MID ATLANTIC 8,784 150,100 22,394 444,393 34,559 662,748NORTHWEST NORTHEAST 12,627 231,517 39,785 784,311 57,684 1,202,320NORTHWEST 213,543 3,839,632 243,171 4,967,337 625,485 12,308,234CALIFORNIA NORTHWEST 117,990 1,987,463 96,074 1,948,997 30,084 526,852CALIFORNIA CALIFORNIA 15,934 232,745 7,643 140,277 52,573 1,013,436CALIFORNIA MOUNTAIN STATES 63,174 910,025 47,458 937,810 69,591 1,265,824CALIFORNIA LOWER MIDWEST 194,756 3,008,522 110,758 2,162,383 228,064 3,955,670CALIFORNIA UPPER MIDWEST 121,283 1,972,826 98,915 1,964,981 365,737 6,149,001CALIFORNIA SOUTHEAST 74,350 1,196,358 59,427 1,206,014 56,719 1,028,384CALIFORNIA MID ATLANTIC 55,710 988,916 54,733 1,112,632 67,246 1,175,968CALIFORNIA NORTHEAST 95,494 1,441,512 123,383 2,450,214 78,218 1,447,840CALIFORNIA 738,691 11,738,367 598,391 11,923,308 948,232 16,562,975MOUNTAIN STATES NORTHWEST 9,882 175,436 24,589 488,798 38,040 739,228MOUNTAIN STATES CALIFORNIA 39,138 674,799 62,607 1,245,586 50,123 928,742MOUNTAIN STATES 49,020 850,235 87,196 1,734,384 88,163 1,667,970LOWER MIDWEST NORTHWEST 29,646 421,526 54,779 1,071,046 45,666 721,920LOWER MIDWEST CALIFORNIA 164,085 2,497,525 158,711 3,135,054 240,903 4,391,051LOWER MIDWEST 193,731 2,919,051 213,490 4,206,100 286,569 5,112,971UPPER MIDWEST NORTHWEST 21,960 325,919 36,915 664,213 179,845 2,009,472UPPER MIDWEST CALIFORNIA 153,466 2,290,970 131,264 2,455,447 337,463 5,251,848UPPER MIDWEST 175,426 2,616,889 168,179 3,119,660 517,308 7,261,320SOUTHEAST NORTHWEST 5,490 106,919 12,183 218,805 12,608 225,280SOUTHEAST CALIFORNIA 61,031 984,150 46,856 852,233 38,968 725,373
Table 2

ALK ASSOCIATES INC PAGE 2COMPARISON OF TRUCK VERSUS RAIL DATA BY TRAM REGION
TRUCK DATA SOURCE: TRAM MONTHLY SURVEY EXPANDED TO ANNUALIZED VOLUMES RAIL DATA SOURCE: 1987 ICC CARLOAD WAYBILL SAMPLE INTERMODAL AND BOXCAR EQUIVALENTS
------------TRAM TRUCK DATA------------- ---- RAIL DATAORIGIN DESTINATION
TRAM 12 MO DRY VANS TRAM 12 MO REFERS EXPANDED 1987 WAYBILLREGION REGION UNITS NET TONS UNITS NET TONS UNITS NET TONSSOUTHEAST 1,091,069 59,039 1,071,038 51,576 950,653MID ATLANTIC NORTHWEST 13,725 181,365 25,534 427,429 21,586 285,720MID ATLANTIC CALIFORNIA 94,375 1,454,312 75,508 1,218,668 63,242 1,015,620MID ATLANTIC 1,635,677 101,042 1,646,097 84,828 1,301,340NORTHEAST NORTHWEST 9,333 124,734 26,167 447,267 4,798 76,620NORTHEAST CALIFORNIA 93,738 1,370,624 97,639 1,719,253 37,112 554,040NORTHEAST 1,495,358 123,806 2,166,520 41,910 630,660
26,186,278 1,594,314 30,834,444 2,644,071 45,796,123
Table 2

Figure 9 presents rail and truck traffic volumes on the same scale. The
tunneling of rail traffic and the diffusion of truck traffic are both
immediately apparent. It is also apparent from Figure 9 that rail inter-
modal services have achieved (or could achieve, in the case of relevant
boxcar traffic) a significant share of the transcontinental market in the
western states.
In the northernmost corridor, rail has the major share. This interpreta
tion is consistent with NMTDB information from the field, where relevant
truck traffic on Interstates 90 and 94 was found to be very light. It must
be noted, however, that the Central Corridor serves some of the same
traffic flows. In the Central Corridor, rail has more of the eastbound
market than of the westbound, which may reflect the rail movements of
containerized imports. The Central Corridor branches in Utah (with Union
Pacific lines to Southern California and the Pacific Northwest) and in the
Midwest (with Union Pacific and SP/DRGW routes to Kansas City and St.
Louis), making its flows considerably more complex.
There has also been significant market penetration in the Southern Corri
dor, notably in the Chicago-Los Angeles market. Figure 9 indicates that
rail now carries the majority of the relevant traffic. Work by the AAR's
Intermodal Policy Division has confirmed that double-stack services have
indeed diverted substantial truck traffic in the major corridors. Figure 9
suggests, however, that there are large truck flows moving over Interstate
10 to and from California (and observed at the Eloy, Arizona collection
point) in which there has been relatively little rail intermodal penetra
tion. Both rail and truck flows branch out from this corridor, with the
larger flow serving the Midwest and points east.
The general match between rail and truck flows in Figure 9 confirms the
relevance of the selected truck flows for competition with existing inter
modal services.
Traffic Balance. One recurring issue in intermodal transportation of all
kinds, especially double-stack movements, is traffic balance. Table 3
shows the ratios between eastbound and westbound units for dry vans, reefer
vans, and rail. Ratios near 1.0 (ranging perhaps from 0.8 to 1.2) indicate
- 24-

San
Figure 9

Table 31987 Truck and Rail Traffic Balance Ratios
(Units)
Dry Vans Units
Reefer Vans Units
RailUnits
Northwest Eastbound Westbound Ratio Eastbound Westbound Ratio Eastbound Westbound Ratio
Mountain States 13,176 9,882 1.3 15,956 24,589 0.6 38,173 38,040 1.0Lower Midwest 17,019 29,646 0.6 34,759 54,779 0.6 67,343 45,666 1.5Upper Midwest 23,058 21,960 1.1 32,976 36,915 0.9 212,520 179,845 1.2Southeast 3,294 5,490 0.6 15,061 12,183 1.2 33,113 12,608 2.6Mid Atlantic 8,784 13,725 0.6 22,394 25,534 0.9 34,559 21,586 1.6Northeast 12,627 9,333 1.4 39,785 26,167 1.5 57,684 4,798 12.0
Total 77,958 90,036 0.9 160,931 180,167 0.9 443,392 302,543 1.5
California
Mountain States 63,174 39,138 1.6 47,458 62,607 0.8 69,591 50,123 1.4Lower Midwest 194,756 164,085 1.2 110,758 158,711 0.7 228,064 240,903 0.9Upper Midwest 121,283 153,466 0.8 98,915 131,264 0.8 365,737 337,463 1.1Southwest 71,350 61,031 1,2 59,427 46,856 1.3 56,719 38,968 1.5Mid Atlantic 55,710 94,375 0.6 54,733 75,508 0.7 67,246 63,242 1.1Northeast 95,494 93,738 1.0 123,383 97,639 1.3 78,218 37,112 2.1
Total 601,767 605,833 1.0 494,674 572,585 C . 9 865,575 767,811 1.1

relatively close balance between movements in the two directions. As the
ratios move farther from 1.0, balance becomes a serious issue. At a ratio
of 1.5, 50 percent more units are moving eastbound that are returning
westbound.
The ratios indicate that rail traffic flows often have a worse balance
problem than truck flows. Four of the six Northwest flows follow this
pattern, as does the Northwest total. The California flows are more evenly
balanced for both rail and truck. The rail flows between California and
the Northwest are severely imbalanced, most likely due to the heavy south
bound movements of lumber, paper, and other forest products in boxcars,
which then return empty.
Table 3 illustrates what intermodal operators must confront: rail has
become the mode of imbalance. Within overall traffic flows that one, by
nature, imbalanced, motor carriers have extracted the balanced portion. As
noted earlier, truckers do not make empty transcontinental hauls: railroads
make them.
4. Oceanborne Freight Movements
Methodology. The Bureau of the Census trade data identifies shipments as
being Containerized, Not Containerized, or Unknown (if containerized). For
this study, all shipments identified as being containerized were retained,
and the container!'zable portion of the "Unknown" shipments was estimated
using Manalytics' proprietary containerizability factors. Thus, the data
presented here consist of those shipments reported by the Bureau of the
Census to be containerized, and the portion of unknown shipments estimated
to be containerizable.
TEU and FEU Estimates. The Bureau of the Census data give weight informa
tion in pounds, which were converted to short tons (2000 pounds) for easy
comparison with rail and truck data. The source data do not, however,
include either a container count or an indication of container size, so the
twenty-foot equivalent units (TEU) and forty-foot equivalent units (FEU)
corresponding to the weights reported in the Census data were estimated.
The basis for these estimates is Manalytics1 proprietary database of
- 25-

historical 20-foot and 40-foot container loadings, which gives conversion
factors in tons/TEU and tons/FEU for all of the relevant commodities and
trades. It must be emphasized that the TEU and FEU estimates were separate
ly derived: as the tables will reveal, the FEU estimate is not half the
TEU estimate.
The twenty-foot equivalents (TEU) and forty-foot equivalents (FEU) shown on
the tables should be interpreted as estimates of the number of 20-foot (or ~
40-foot) containers required to carry the total tonnage. Were the entire
movement to be carried in only 20-foot containers (or only 40-foot contain
ers), then the TEU (or FEU) figure would be an estimate of the actual
number of containers. Since, the various commodities and trades are
carried in a mix of container sizes, neither the TEU estimate nor the FEU..
estimate can be expected to correspond to the actual container count, which
would likely fall somewhere between them. No attempt has been made to
account for the variations in size between 35', 40', and 45' containers, or
for the difference in 8', 8'6", 9', and 9'6" container heights.
Ports and port groups are defined in Appendix Tables 3 and 4. Some of the
major ports (such as New York) include adjacent regional ports (such as
Newark, NJ) where the region effectively functions as a single part of
origin or destination. The Appendix tables also give an exhaustive list of
the countries and 3-digit Census Bureau country codes combined in the six
major foreign trade regions used in the table.
Foreign Trade. Appendix Table 5 summarizes the containerized foreign trade
data gathered by the Bureau of the Census for 1986 and 1987, in terms of
short tons (2000 pounds), twenty-foot equivalent units (TEU) and forty-foot
equivalent units (FEU). The first portion aggregates data for the four U.S.
coasts (Atlantic, Gulf, Pacific, and Great Lakes) and Hawaii/Alaska/ Puerto
Rico. As expected, very little containerized liner cargo moves through the
Great Lakes ports. The remaining pages give the traffic volumes at major
ports (such as Boston, New York, and Philadelphia) or among major port
groups (such as Houston/Galveston and Long Beach/Los Angeles). Minor
container ports are grouped into regional categories (such as other Delaware
River Ports). Traffic for each port or region is broken down by foreign
- 26-

T a b le 4
1987 IMPORT/EXPORT SUMMARYBy Coast and Inland Region
Week 1y Week 1yImport Train Export TrainFEUs Equivalents FEUs Equivalents
** Atlantic California 37929 3.8 2657 0.3Lower Midwest 17836 1 .8 7729 0.8Mid Atlantic 81992 8.2 115575 11.6Mountain 4258 0.4 2284 0.2Northeast 571910 57.2 86542 8.7Northwest 4994 0.5 1180 0.1Southeast 89750 9.0 103014 10.3Upper Midwest 87355 8.7 34095 3.4** Subtotal **
896024 89.6 353076 35.3** Great Lakes California 10 0.0 18 0.0Lower Midwest 69 0.0 150 0.0Mid Atlantic 29 0.0 8 0.0Mountain 1 0.0 137 0.0Northeast 275 0.0 26 0.0Northwest 4 0.0 35 0.0Southeast 17 0.0 17 0.0Upper Midwest 885 0. 1 1735 0.2** Subtotal **
1290 0.1 2126 0.2
Source: Bureau of the Census

T a b le 4
1987 IMPORT/EXPORT SUMMARYBy Coast and Inland Region
1mportWeek 1y Train Export
Week 1y Train
FEUs Equivalents FEUs Equ i va1ents4*4® Gu 1 fCa1i forn i a 6741 0.7 6190 0.6Lower Midwest 23824 2.4 92649 9.3Mid Atlantic 2428 0.2 5607 0.6Mountain 2725 0.3 4904 0.5Northeast 30969 3.1 4193 0.4Northwest 801 0 . 1 519 0. 1Southeast 43133 4.3 44156 4.4Upper Midwest 9815 1 .0 4991 0.5** Subtotal **
120436 12.0 163209 16.3
** PacificCa1i forn i a 328976 32.9 161752 16.2Lower Midwest 67382 6.7 53192 5.3Mid Atlantic 34143 3.4 14604 1 .5Mountain 14975 1 . 5 21793 2.2Northeast 294413 29.4 9936 1.0Northwest 34594 3.5 116182 11.6Southeast 24308 2.4 15564 1 .6Upper Midwest 153375 15.3 37972 3.8** Subtotal **
952166 95.2 430995 43.1*** Total ***
1969916 197.0 949406 94.9
Source: Bureau of the Census

T a b le 5
1987 IMPORT/EXPORT SUMMARY By Inland Region and Coast
1mport FEUs
Week 1y Train
Equ ivalentsExport
FEUsWeek 1y Train
Equ i va1ents
** Cali forni aAt 1 ant i c 37929 3.8 2657 0.3Great Lakes 10 0 . 0 18 0.0Gulf 6741 0.7 6190 0.6Pac i f i c 328976 32.9 161752 16.2** Subtotal **
373656 37.4 170617 17.1** Lower MidwestAt 1 ant i c 17836 1.8 7729 0.8Great Lakes 69 0 . 0 150 0 . 0Gulf 23824 2.4 92649 9.3Pac i f i c 67382 6.7 53192 5.3** Subtotal **
109111 10.9 153720 15.4** Mid AtlanticAt 1 ant i c 81992 8.2 1 15575 11.6Great Lakes 29 0 . 0 8 0 . 0Gulf 2428 0 . 2 5607 0.6Pacific 34143 3.4 14604 1 .5
** Subtotal **118592 11.9 135794 13.6
** MountainAt 1 ant i c 4258 0.4 2284 0.2Great Lakes 1 0 . 0 137 0 . 0Gulf 2725 0.3 4904 0.5Pacific 14975 1 .5 21793 2.2
** Subtotal **21959 2.2 29118 2.9
Source: Bureau of the Census

T a b le 5
1987 IMPORT/EXPORT SUMMARYBy Inland Region and Coast
1mportWeeklyTrain Export
WeeklyTrain
FEUs Equ i va1ents FEUs Equ i va1ents** NortheastAt 1 ant i c 571910 57.2 86542 8.7Great Lakes 275 0.0 26 0.0Gulf 30969 3.1 4193 0.4Pac i f i c 294413 29.4 9936 1.0** Subtotal **
897567 89.8 100697 10.1
** NorthwestAt 1 ant i c 4994 0.5 1180 0.1Great Lakes 4 0.0 35 0.0Gulf 801 0.1 519 0.1Pacific 34594 3.5 116182 11.6** Subtotal **
40393 4.0 117916 11.8** SoutheastAt 1 ant i c 89750 9.0 103014 10.3Great Lakes 17 0.0 17 0.0Gulf 43133 4.3 44156 4.4Pacific 24308 2.4 15564 1 .6** Subtotal **
** Upper Midwes157208
t15.7 162751 16.3
At 1 ant i c 87355 8.7 34095 3.4Great Lakes 885 0 . 1 1735 0.2Gulf 9815 1 .0 4991 0.5Paci f i c 153375 15.3 37972 3.8** Subtotal **
251430 25. 1 78793 7.9*** Total ***1969916 197.0 949406 94.9
Source: Bureau of the Census

origin (imports) or destination (exports) within the Import and Export
categories.
Coastal Trade Shares. Container trade is overwhelmingly dominated by the
Atlantic and Pacific coasts, as Appendix Table 5 shows. Atlantic coast
ports handled 43 percent of U.S. containerized tonnage, and Pacific ports
handled 44 percent. In 1987, the Gulf Coast still received major all-water
service from Asia, and handled roughly 12 percent of U.S. containerized
tonnage. Withdrawal of those services in late 1988 means that the Gulf
Coast container ports will handle primarily South American and Caribbean
traffic, with a small flow of European and African cargo. The Great Lakes
ports have never participated heavily in container movements, and handled
just 0.1 percent of the U.S. total.
The average weight of exports means that U.S. trade as a whole is more
strongly imbalanced in containers than in tons:
1987 U.S. Trade
Import Export Ratio
Tons 36,541,819 32,510,919 1.12:1
TEU 4,083,078 2,465,421 1.66:1
FEU 2,206,278 1,539,547 1.43:1
Although the relatively faster growth of exports will eventually balance
the container flow, the historic imbalances will persist in the short term.
The major drive for double-stack system expansion has come from Pacific
Coast container operators in the Far East and Southeast Asia trades which
have traditionally been imbalanced in favor of imports. The initial
impetus for domestic containerization came from the resultant westbound
backhaul capacity.
The overall Coastal FEU balances were as follows:
- 27-

Imports
1987 FEU
Exports Excess Imports
Atlantic 984,237 552,533 431,704
Gulf 145,227 249,490 (104,263)
Pacific 1,044,471 714,216 330,255
Great Lakes 1,694 2,795 (1,101)
Hawaii, etc. 30,649 10,513 20,136
Origin/Destination State Data Coverage. One data issue that must be
addressed is the completeness and accuracy of origin/destination state
information within the Census data. There were many records with no origin
or destination state information at all. The invalid and blank state
information are combined in an unknown ("??") category. Records with
unknown origin or destination states accounted for 22 percent of total U.S.
import and export tonnage. The problem is far more serious for exports:
records comprising more than a third of U.S. export tonnage have no valid
origin state. The biggest problem is exports to East and South Asia, one
of the largest and fastest growing U.S. trades, in which more than 40
percent of the tonnage has records with no valid states of origin. Move
ments via both the Atlantic and Pacific Coasts have similar coverage rates:
about 90 percent for imports but only 61-64 percent for exports.
The problem of identifying the origin state for export tonnage is most
serious at the largest ports: New York (47% coverage); Baltimore (66%
coverage); Charleston (56% coverage); New Orleans (63% coverage); Houston/
Galveston (69% coverage); Long Beach/Los Angeles (59% coverage); Oakland/
San Francisco (66% coverage); and Seattle/Tacoma (60% coverage). In other
words, there is no information on the origin state of one-third to one-half
the export tonnage at major ports.
Besides the coverage issue, census data shares the "headquarters bias" with
other import/export data: the inland origin or destination is often given
as a corporate headoffice rather than the actual point of shipment or
receipt. This bias leads to uncertainty concerning the actual movement
pattern.
- 28-

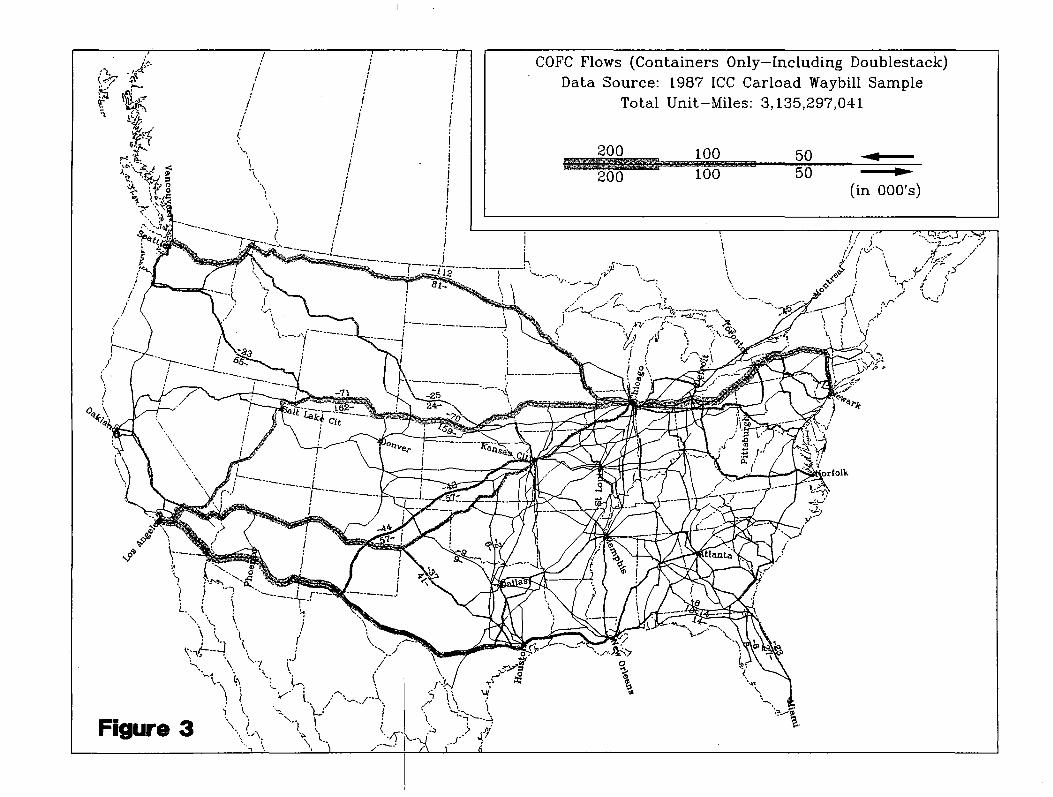
Regional and Coastal Summaries. The observations above suggest that a
regional, rather than state approach to inland origins and destinations may
be useful in understanding the existing pattern and future potential of
double-stack service. The major intermodal hubs in Chicago, Kansas City,
St. Louis, Memphis, Atlanta, Dallas, Houston, New Orleans, New York, and
elsewhere are clearly serving origins and destinations beyond the
boundaries of their states. Accordingly, the regions shown in Figure 10
were defined. Each region, with the exception of California, includes two
or more states and is grouped around major urban clusters with intermodal
hubs. Coast and regional information is summarized in Tables 4 and 5.
These tables use FEU and "Weekly Train Equivalents" of 10,000 annual FEU
(200 FEU per train, 50 trains per year) to display the underlying pattern
of regional and coastal container movements.
B. CURRENT DOUBLE-STACK SERVICES 1
1. Existing Double-Stack Services
As of December, 1989, there were over 100 weekly eastbound double-stack
departures from Southern California, Northern California, and the Pacific
Northwest. Until recently, the role of eastern railroads in double-stack
operations was to carry west coast trains between mid-continent gateways
and eastern destinations. Although continuations of western trains still
account for most eastern double-stack traffic, expansion of the double
stack network has led eastern railroads to establish new double-stack
trains independent of their western counterparts.
Current Double-Stack Network. The current (late 1989) double-stack
network is shown in Figure 11. The combination of routes and hubs shown
in Figure 11 yields very extensive national coverage, enabling double
stack trains to serve all major U.S. markets. As Figure 11 illustrates,
double-stack operations have begun to resemble a network of interlocking
movements rather than a collection of unrelated unit trains. This
development has greatly assisted double-stack operators in competing with
trucks, because it has created the service frequency and traffic density
needed to attract the business of demanding customers. The development
of a network has also extended double-stack service to several hubs that
- 29-
Figure 10Multi-State Inland Regions
Northwest Mountain StatesUpper Midwest
CaliforniaMid Atlantic
Lower Mldwes


could not yet support dedicated hub-to-hub unit trains. In late 1989,
individual railroads operated the following double-stack services.
Burlington Northern. BN operates both dedicated and common-user dou
ble-stack trains to and from the Pacific Northwest ports. The major
client for dedicated trains is Sea-Land, while numerous ocean carriers
use the common-user trains. BN also serves as a Kansas City - Chicago
connection for some SP trains from Southern California, and as a Avard -
Memphis connection for Santa Fe.
Santa Fe. Santa Fe currently operates one dedicated Southern California
double-stack train, for Hyundai. Departures are weekly from Los Angeles,
and Santa Fe moves the train to Chicago. Santa Fe offers several daily
intermodal departures from Los Angeles which can and do carry
double-stacked containers on a common-user basis. Santa Fe's major
traffic lanes are Los Angeles - Chicago and Los Angeles - Houston/Dallas,
with service offered to all major intermediate points, notably Kansas
City. In Northern California, Santa Fe operates a weekly dedicated train
from Richmond for Maersk.
Southern Pacific. SP operates double-stack trains from its Intermodal
Container Transfer Facility (ICTF) in Los Angeles. SP currently
schedules four daily eastbound common-user double-stack train departures
from the ICTF. These trains are destined for Chicago, Memphis, Houston,
and interchange with Conrail at St. Louis. Three daily westbound trains
to Los Angeles depart from Pine Bluff, New Orleans,, and a BN interchange
at Kansas City. SP operates a daily dedicated train for Sea-Land to
Memphis and three weekly trains to New Orleans and Chicago. There are
two dedicated NYK trains from L.A. on SP for St. Louis and Chicago.
Mitsui (MOL) has two dedicated departures on SP to serve Chicago, St.
Louis, and Memphis. SP operates three weekly dedicated trains from the
ICTF for Evergreen for Chicago, New Orleans, and Memphis. On the
Southern Corridor, SP originates six weekly trains for American President
Intermodal: three operate via Houston to New Orleans for interchange with
Norfolk Southern to Atlanta; and three to Memphis via Dallas. SP has
thirteen scheduled weekly eastbound departures for ESI, the domestic
- 30-

subsidiary of OOCL that solicits traffic from other ocean carriers as
well.
SP thus schedules about 57 weekly double-stack departures from the Los
Angeles ICTF. The actual number of trains may vary depending on which
scheduled departures are combined as a single train, and whether heavy
traffic requires extra trains for some schedules. While the dedicated
trains operated for steamship companies generally consist of only dou
ble-stack cars, the SP common-user trains may also carry containers or
trailers on conventional cars as required.
SP is also offering common-user double-stack service to and from Oakland
via the Central Corridor over the Sierra Nevada.
Union Pacific. All double-stack trains on UP are dedicated trains, with
the major customer being API. From Los Angeles, UP operates seven weekly
API trains. Six terminate in Chicago and one goes on to South Kearny via
Conrail. From Oakland, UP originates three weekly API trains to Chicago,
which include pickups at Stockton and Sacramento. Connecting services,
not full trains, are operated from Fresno. From Seattle, UP originates
three weekly API trains, all to Chicago. Altogether there are thirteen
API departures from West Coast ports on UP. Westbound, UP operates seven
weekly multi-destination API trains originating on CNW at Chicago. These
trains serve different mixes of API service points in the West. There
are also three short-distance API movements, not full trains, westbound
from Salt Lake City to Los Angeles on UP. Four weekly API trains move
from Chicago via CNW and UP directly to Los Angeles. From Chicago via
CNW, UP moves API domestic double-stacks to Dallas, Houston, San Antonio,
and Laredo.
UP operates three other weekly double-stack trains. There is a weekly
"K" Line train departing Long Beach to Chicago and New York (via CNW and
CR). Another weekly "K" Line train operates from Tacoma to Chicago and
returns westbound through Portland. The last dedicated UP stack train is
operated for Maersk, departing Tacoma weekly for Chicago and return.
- 31-

Although UP does not offer "common-user" double-stack service as such, UP
does operate daily intermodal trains from Los Angeles, Oakland, and
Seattle that can carry containers on conventional equipment. Moreover,
API solicits traffic from other ocean carriers and third parties for its
double-stack trains operating over UP.
Conrail. Conrail connects with the western railroads at Chicago and East
St. Louis, and interchanges both entire double-stack trains and blocks of
double-stack cars at both points. Solid trains are operated either on
their own schedules or as sections of regular intermodal trains. Blocks
of double-stack cars are added to Conrail's "TrailVan" intermodal trains.
Conrail handles API's traffic between eastern cities and the CNW inter
change at Chicago. API schedules three weekly departures from South
Kearny to Chicago. In Chicago, these trains connect with API's west
coast services via UP/CNW. Eastbound, API schedules just one complete
weekly train between Los Angeles and South Kearny, which travels over
Conrail east of Chicago. Conrail, however, also handles API double-stack
traffic on regular TrailVan trains between Chicago and South Kearny six
days per week. Also from the UP/CNW connection at Chicago, Conrail
handles weekly Chicago-New York trains for Maersk and "K" Line. Conrail
receives weekly NYK and MOL double-stack trains from Soo Line at Chicago.
These trains originate on SP in Southern California.
At East St. Louis, Conrail receives a block of MOL double-stack cars from
SP (SSW). These cars are moved to Columbus, Ohio, to serve the nearby
Honda plant at Marysville. The cars continue on to New York, where they
are combined with the Chicago-New York MOL cars for the trip back west.
CSX. CSX handles the eastern rail operations of Sea-Land trains. The
major movements are 3 weekly trains operating between Chicago (from SP
and BN) and CSL's intermodal terminal at Little Ferry, New Jersey. CSX
actually operates the trains between Chicago and Buffalo, where they are
interchanged with the Delaware & Hudson. The D & H moves the trains to
Binghamton, NY, where they are interchanged with the New York, Susquehana
& Western for the last leg into Little Ferry. CSX also operates several
other routes for Sea-Land: Chicago-Atlanta (2 per week); Chicago-Port
-32-

Covington (Baltimore); New Orleans-Charleston (as part of CSX's daily
Gulfwind); and New Orleans-Jacksonville (with conventional interchange to
FEC for Miami). Besides the Sea-Land traffic, CSX moves a portion of
NYK's weekly east-west train between the SP interchange in East St. Louis
and Cincinnati. CSX's Chicago-Baltimore service was originally begun by
the Chessie System under an arrangement with the State of Maryland.
Norfolk Southern. NS moves API's traffic south of the Chicago-New York
corridor. This includes Chicago-Atlanta service. NS also interchanges
Atlanta-Los Angeles trains with SP at New Orleans, with a connection to
Charlotte. For "K" Line and Maersk, Norfolk Southern presently operates
two weekly round trips between Chicago and Welland, Ontario. For Hanjin,
Norfolk Southern handles a weekly movement between BN at Chicago and NYSW
at Buffalo (destination Secaucus, New Jersey). Maersk added service
between Chicago and Montreal in early 1989, with NS to move the trains
through Buffalo.
Regional Railroads. GTW.moves API double-stack traffic between Chicago
and Woodhaven, 18 miles from Detroit. Chicago and North Western provides
UP and its customers with a vital connection between Fremont, Nebraska
and Chicago. All of UP's dedicated trains for API, Maersk, and "K" Line
use this route. Soo Line provides SP with a Kansas City-Chicago
connection for those clients not using the BN connection. Iowa Interstate
(IAIS) operates a domestic double-stack service for Interdom, Inc., for
which Maytag Appliance provided the original start-up traffic. IAIS
operates over a combination of its own trackage and trackage rights between
Blue Island, Illinois and Council Bluffs, Iowa, providing daily service in
the Chicago-Los Angeles corridor in conjunction with UP and CNW. Montana
Rail Link handles some double-stack trains to or from connecting roads.
The New York, Susquehana & Western (NYSW) was for several years the only
regional railroad involved in double-stack traffic, carrying Sea-Land
trains between Binghamton, New York and Little Ferry, New Jersey on a
combination of NYSW's own trackage and trackage rights over Conrail. The
Delaware-Hudson handles Sea-Land trains between Buffalo and Binghamton.
Kansas City Southern handles a double-stack movement of imported coffee
from New Orleans to the Midwest.
-33-

IC, and the remaining portions of the Guilford System (BM, MEC) do not now
participate in double-stack movements. IC formerly provided a St. Louis-
Chicago link for some SP double-stacks that have since switched to BN or
Soo routes.
None of the other "new" regional railroads carries regular double-stack
traffic. This is not surprising, since these regional railroads were
formed from trackage sold by the Class I carriers, which is unlikely to
include major intermodal corridors or hubs.
2. Backhaul Arrangements
Double-stack service depends, like all transportation services, on utiliza
tion. Utilization in turn depends on the ability to fill equipment with
revenue-producing loads in both directions. Early double-stack services
were based on international traffic, which has had a strong imbalance of
imports over exports that placed a premium on the ability of carriers to
attract westbound domestic or export backhaul freight. Although the
increase in domestic container movements and the growth of exports has
somewhat diminished the importance of backhaul freight, many of the arran
gements made to solicit backhauls are still in place and will play a role
in the further development of double-stack service wherever corridor flows
are imbalanced -- and that means almost all corridors.
There are two basic approaches, the first typified by API's system. The
underlying economies of American President's program are controlled in part
by the terms of API's contract with Union Pacific. Although the actual
terms are proprietary, the key features are:
o pass-through of equipment costs, giving API the incentive for
high utilization;
o. a round-trip rate, obligating API to pay for the movement of
containers in both directions; and
o a relatively low "additive" rate for loads (rather than empties)
in the light direction.
- 34-

It is thus in the interest of both API and UP to fill the containers with
backhaul freight. The "additive" rates give a fixed cost to API above
which any backhaul revenue is net.
A second basic approach was taken by BN, ATSF, and SP. The ocean carriers
from which these railroads were soliciting traffic did not buy domestic
shippers' agents or make comparable investments in their ability to solicit
westhound freight. BN, ATSF, and SP reached various agreements to "buy
back" portions of the westbound capacity of the proposed trains, and to
solicit the freight themselves.
This arrangement is implemented through a charge for moving empty con
tainers, a charge for moving containers with ocean-carrier loads, and a
different "management fee" for returning a container with a railroad-soli
cited load. The "management fee" is usually significantly less than the
charge for moving an empty container, and the railroads typically agree to
return the container to the West Coast within 30 days (which is often
faster than the ocean carriers can get it back by themselves). Ocean
carriers are thus encouraged to solicit exports through their own sales
force, and to turn over the remaining empty containers to the railroad.
C. RAIL DOUBLE-STACK TECHNOLOGY
1. The Intermodal Fleet
The composition of the rail intermodal car fleet is changing rapidly. As
shown in Table 6, there has been a massive increase in the double-stack
fleet but a much smaller increase in the third-generation TOFC car fleet.
The existing fleet of first and second generation TOFC and COFC cars is
dwindling, and a much larger proportion of total intermodal capacity is
devoted to containers, and specifically to double-stacks.
Double-Stack Cars. A dramatic change occurred in intermodal car design
with the introduction of double-stack cars. As noted earlier, between 1977
and 1981 Southern Pacific and ACF developed and built the first double
stack cars. The SP/ACF cars use bulkheads to secure the containers.
- 35-

Table 6
INTERMODAL FLEET
Tota 1 Spaces*
ConventionalCars
1983 110,000 109,000
1984 112,000 109,000
1985 119,000 109,000
1986 118,000 102,000
1987 116,000 93,000
1988 118,000 88,000
1989 120,000 79,000
Th i rd Generation Cars
Trai1er Cars
Doub1e- Stacks
Road- Rai1ers
200 400 300
700 2,000 300
2,900 7,000 300
3,100 13,000 300
4,800 18,000 1,400
5,800 24,000 2,300
9,000 30,000 2,300
* Units are trailer or container spaces or slots.
Source : Greenbrier Intermodal
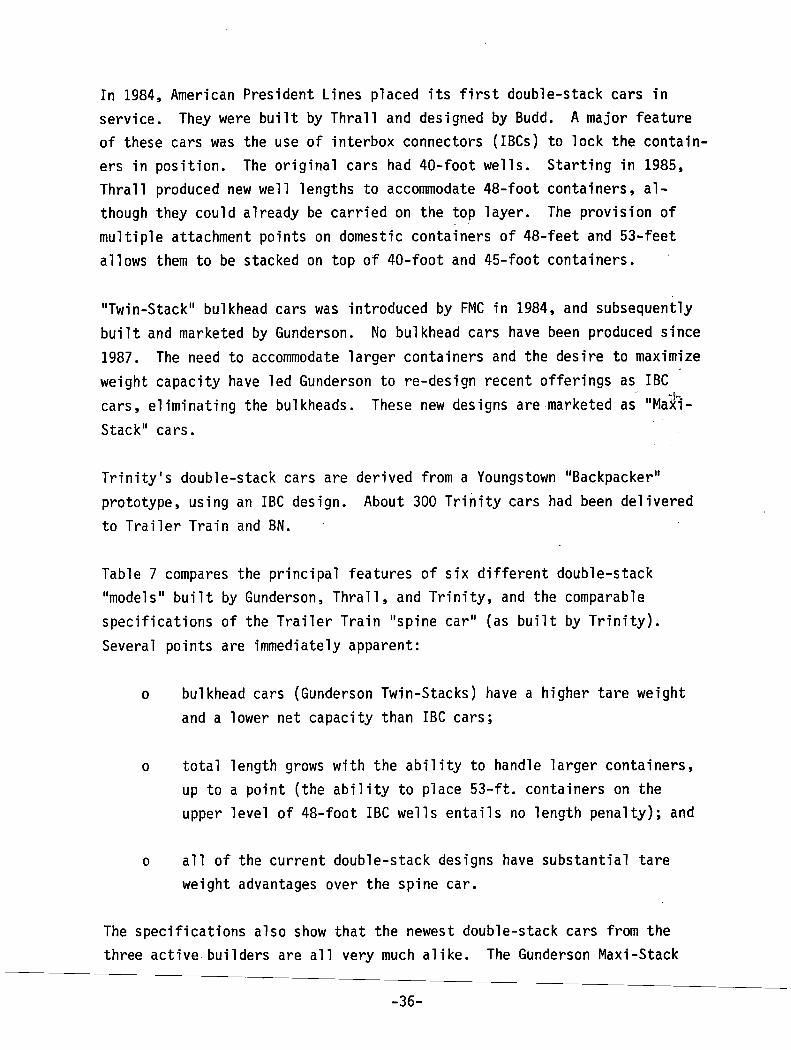
In 1984, American President Lines placed its first double-stack cars in
service. They were built by Thrall and designed by Budd. A major feature
of these cars was the use of interbox connectors (IBCs) to lock the contain
ers in position. The original cars had 40-foot wells. Starting in 1985,
Thrall produced new well lengths to accommodate 48-foot containers, al
though they could already be carried on the top layer. The provision of
multiple attachment points on domestic containers of 48-feet and 53-feet
allows them to be stacked on top of 40-foot and 45-foot containers.
"Twin-Stack" bulkhead cars was introduced by FMC in 1984, and subsequently
built and marketed by Gunderson. No bulkhead cars have been produced since
1987. The need to accommodate larger containers and the desire to maximize
weight capacity have led Gunderson to re-design recent offerings as IBC
cars, eliminating the bulkheads. These new designs are marketed as "Maki-
Stack" cars.
Trinity's double-stack cars are derived from a Youngstown "Backpacker"
prototype, using an IBC design. About 300 Trinity cars had been delivered
to Trailer Train and BN.
Table 7 compares the principal features of six different double-stack
"models" built by Gunderson, Thrall, and Trinity, and the comparable
specifications of the Trailer Train "spine car" (as built by Trinity).
Several points are immediately apparent:
o bulkhead cars (Gunderson Twin-Stacks) have a higher tare weight
and a lower net capacity than IBC cars;
o total length grows with the ability to handle larger containers,
up to a point (the ability to place 53-ft. containers on the
upper level of 48-foot IBC wells entails no length penalty); and
o all of the current double-stack designs have substantial tare
weight advantages over the spine car.
The specifications also show that the newest double-stack cars from the
three active builders are all very much alike. The Gunderson Maxi-Stack
-36-

Table 7
DOUBLE-STACK AND SPINE CAR COMPARISONS
Bottom/Top Tare Pounds Net Pounds Overall
J m . Container Lengths Per Platform Per Platform Length
LO-PAC 2000 IBC 40/14 30,050 100,000 266-1
LO-PAC II IBC 40/48 37,000 122,000 267-5
Twin Stack Bulkhead 40/45 34,000 100,000 265-1
Maxi Stack IBC 40/48 35,400 124,000 265-1
Maxi Stackll IBC 48/53 36,800 122,000 289-8
Backpacker-48 IBC 40/48 32,400 102,500 267-2
Spine Car - 48/— 26,120 67,200 251-7
Source: Trailer Train and Manufacturers.

II, the Thrall LoPac II 40/48, and the Trinity Backpaker-48, are all about
290 feet long, weight 36,000 - 38,000 lbs. per platform, and can accommo
date 48-53 ft. containers.
Table 8 provides weight comparisons between several car types. The double
stack cars offer significant advantages in net/tare ratio and in net tons
per coupled length. Simply put, double-stack cars are a more efficient
intermodal line haul vehicle.
2. Carless Technologies
Carless technologies seek to maximize rail linehaul efficiency by elim
inating the railcar itself. This approach yields additional benefits in
the ease of loading and unloading, and in minimizing the need for facility
investment.
The RoadRailer, in its various forms, is the most common earless technology
and the only one that has seen commercial application. Indeed, "Road
Railer" is sometimes used as a generic term for earless technologies. The
primary advantages of RoadRailers are the reductions in tare weight com
pared to T0FC technology, the elimination of a separate chassis, the
reduction in investment for railcars (although the Mark V requires an
investment in bogies), and greatly reduced facility cost. RoadRailers
themselves are expensive, however, relative to trailers: roughly $40,000
rather than $5,000. (Although the cost difference has been reduced with
RoadRailer's new "SST" model.) This greater capital expense creates
problems with railroad control over equipment that leaves the property, and
utilization becomes critical. RoadRailers are also at a tare weight disad
vantage relative to trailers, although the Mark V version narrows the gap.
As Table 8 indicates earless technologies offer clear net-to-true advan
tages over conventional TTX types, and a mixed comparison with double
stacks.
The differences in terminal requirements can be dramatic. Double-stacks
require mechanical lift equipment and paved terminals capable of handling
long trains. Carless technologies require only a gravel surface and a yard
-37-

Table 8
WEIGHT CAPACITY COMPARISONS
NetWeightCapacity(lbs.)
TotalTare
WeightTTbTT
CoupledLenqth
-J ftT
Net/Tare
Net Lbs. Per Foot
Car Type
Standard TOFC, 2 45-Foot Vans 104,000 93,600 93-8 1.11 1,110
Front Runner 48-Foot Van 50,000 40,000 53-10 1.25 929
Impack5 45-Foot Vans 260,000 190,000 263-2 1.37 988
Standard COFC 116,000 83,800 94-8 1.38 1,225
Spine Car5 48-Foot Containers 295,500 195,000 251-8 1.52 1,174
Double-Stack IBC 5 45-Foot Containers 5 48-Foot Containers 526,800 267,250 289-8 1.97 1,819
Boxcar70-Ton, 50'6" 154,000 66,000 55-7 2.33 2,775
RoadRailer Mark V 48,800 16,200 48-0 2.01 1,017
Source: Manufacturers and Industry Publications

tractor. This difference may give the earless technologies an advantage in
low-volume corridors.
-38-

III. CRITERIA FOR DOUBLE-STACK OPERATIONS
A. DOUBLE-STACK SERVICE CRITERIA
One of the central tasks in this study is the identification of potential
corridors for domestic double-stack service, with and without international
traffic. The double-stack train will travel hub-to-hub, and railroad
involvement will extend gate-to-gate, but double-stack service must extend
door-to-door, and be judged by door-to-door standards. To that end,
criteria were established for each of the major features of double-stack
service (cost being considered separately):
o Dedicated vs. mixed trains;
o Train length;
o Service frequency;
o Transit time;
o Length of haul; and
o Traffic volume;
These criteria are not intended to describe every conceivable double-stack
service, nor to imply that every double-stack service that meets them will
be successful. Rather, they are intended to describe service features
associated with 1ikely corridors for near-term domestic double-stack_______
services, and to provide insight into the competitive nexus between double
stack rail services and truck services.
1. Volume, Train Length, and Service Frequency
Operating Methods. There are three possible operating methods for imple
menting domestic rail container service:
a) as double-stack train service in high-volume corridors;
b) as part of existing intermodal train service, usingi
double-stack cars;
c) as part of existing intermodal train service using standard
-39-

intermodal cars or spine cars (i.e., as COFC service).
In recent years, double-stack operations have been increasingly integrated
with other rail intermodal operations, and a "double-stack train", except
for dedicated trains tied to ship arrivals, may include other car types.
Where sufficient volume is not available to run full double-stack trains,
blocks of double-stack cars are added to existing intermodal trains.
Dedicated Double-stack Trains vs. Mixed Double-stack Service. The first
double-stack services were provided only on dedicated double-stack unit
trains. This image of double-stack service has been reinforced by press
releases announcing new trains and services, and by publicity photographs
showing solid trains of identical double-stack cars and containers. This
image is inaccurate. Beginning with the introduction of common-user trains
and other operations catering' to customers with less-than-trainload volumes,
double-stack cars were mixed with other intermodal cars or even with
non-intermodal freight cars. Railroads continue to mix intermodal car
types to even out traffic peaks and valleys.
Dedicated double-stack trains are not necessary for double-stack service.
A double-stack train is easily defined: a train consisting solely of
double-stack cars and locomotives, with or without a caboose. Double-stack
service is equally easy to define: "regular movement of double-stack
cars," or "the opportunity for rail customers to ship containers on double
stack cars." Neither definition of double-stack service requires the
existence of all-double-stack trains. A distinction must be made, however,
between double-stack services scheduled for ocean carrier traffic (which
may carry some domestic traffic) and double-stack services intended to
compete in the long term for domestic rail and truck traffic. Several
existing intermodal corridors have only 1-2 double-stack trains per week,
each scheduled to complement ocean carrier operations. These trains may
indeed attract some opportunistic domestic traffic, but they will not be
long-term competitors for motor carriers.
Single-Line vs. Interline Service. Single-line service (line-haul move
ments over one railroad, or one commonly owned railroad system) is prefer
red for truck-competitive domestic double-stack service. Single-line
-40-

service places responsibility for service quality squarely on one organiza
tion. Single-line service also eliminates any service delay, operating
cost, or administrative burden from interchanging cars between railroads.
Most double-stack services are single-line services at present. Interline
intermodal services are of three basic types: run-through services,
interchanges, and rubber-tired transfers. They are acceptable for truck-
competitive double-stack service to the degree that they resemble single-
line service.
In run-through service, entire trains are exchanged between railroads. The
best run-through services do not differ substantially from crew changes
taking place in single-line service. Well-managed run-through trains
should be fully competitive with single-line service. Run-through service
should not substantially increase operating costs. There may be some
disadvantage in the area of claims responsibility, since each railroad
would tend to blame the other for damage or delay.
Routine interchanges of individual cars or groups of cars between railroads
are too slow and unreliable for truck-competitive intermodal service.
Delays, additional handling, and fragmented responsibility all adversely
affect service quality. Of particular concern is the al1-too-common case
where minor delays on one railroad become major delays when cars fail to
arrive in time for connecting trains. Although it is technically possible
to have a reliable, expeditious, low-cost interchange, it is rarely achieved
within the standards set for truck-competitive double-stack service.
In rubber-tired transfers, the trailer is unloaded, drayed across to a
second railroad terminal, and re-loaded to continue its trip. This is a
costly means of transfer, but it is often used by third-party shippers to
avoid more lengthy delays for routine interchange of TOFC cars. Rubber-
tired transfer is too costly, too unreliable, and fragments responsibility
too badly to be considered for truck-competitive domestic container ser
vices.
Train Lengths. Maximum train length is primarily an operating decision
(although there are economic and service tradeoffs, which will be addressed
elsewhere). Length per se is a problem when it approaches, let alone
-41-

exceeds, the length of available sidings which are needed to allow double
stacks to meet or pass other trains on the main line.
The first double-stack trains were of fixed length, usually 20 five-plat-
form cars, and were operated on weekly schedules. The shortest regularly
scheduled double-stack trains consist of 15 five-platform cars, carrying a
total of 150 FEU. The longest regularly scheduled double-stack trains
consist of 28 five-platform cars, carrying a total of 280 FEU.
The first production double-stack cars were approximately 265 feet long. A
15-car train therefore, would be roughly 4000 feet long, without locomotives.
This length is well within the siding length common on heavily used main
lines, and would rarely require new trackwork. In comparison, a 75-car
train of conventional C0FC cars (which are 93 feet long over couplers),
which would also carry 150 FEU, would be nearly 7000 feet long. Second-
generation double-stack cars are roughly 290 feet long, and high-capacity
third-generation cars are 305 feet long. These lengths yield 15-car trains
of 4350 feet and 4575 feet, respectively, without locomotives. These
15-car trains would still fit in most existing mainline sidings, which
typically range up to 6000 feet.
With 265-foot cars, a 28-car train is 7400 feet long, exceeding the siding
lengths commonly found on high-density single-track mainlines. With
290-foot and 305-foot cars, 28-car trains would exceed 8100 feet and 8500
feet, respectively, without locomotives. These lengths would require even
greater efforts to extend sidings on single-track mainlines. There is a
discernible trend toward shorter double-stack trains to provide faster,
more frequent service, and to obtain more operating flexibility. Moreover,
many of the larger trains leaving major ports are split at some intermedi
ate point into two shorter trains to serve two different inland destina
tions.
For all of the above reasons, this study employs a 15-car, 150-FEU minimum,
and a 28-car, 280-FEU maximum train length. The annual container volume
required for such trains depends on the service frequency. Table 9 gives
annual one-way container (FEU) volumes corresponding to various service
frequencies for 15-car and 28-car trains.
-42-

ANNUAL CONTAINER VOLUMES FOR
DOUBLE-STACK SERVICES
(FEU per year)
MinimumService Frequency 15-car trai
Weekly 7,800
3 days/week 23,400
5 days/week 39,000
6 days/week 46,800
7 days/week 54,600
11 trains/week 85,800
2 trains/day 109,200
Maximum 28-car trains
14,560
43,680
72,800
87,360
101,920
160,160
203,840

A five-day-per-week schedule would allow double-stack service to compete
effectively for much, but not all, common-carrier truckload freight. Most
industrial customers, and the third parties that serve them, expect to ship
and receive freight five days per week, and they are unlikely to give
regular business to a double-stack service that offered less frequent
departures. Some current and potential intermodal customers require
service six days per week. Such customers include major sources of inter
modal traffic: United Parcel Service, the U.S. Postal Service, and LTL
motor carriers, for example. Six days per week should be considered the
minimum service frequency for a truck-competitive domestic double-stack
service. The minimum annual volume to establish a truck-competitive
double-stack service would then be 46,800 units: the equivalent of a
15-car train, six days per week.
Significant reductions in hub dwell time, overall transit time, and cus
tomer service can be achieved by providing two or more daily trains. Such
improvements are sometimes referred to as "service economies of scale":
overall service improves because the average wait between container arrival
at the origin hub and train departure (and vice versa at destination) is
reduced. In addition, service may be provided to an intermediate hub,
which daily trains do not serve. As Table 9 shows, however, the step from
daily service to twice-daily service is a long one.
Once double-stack service is established in a corridor, it should be
possible to offer double-stack service to and from intermediate points with
lower volumes, as long as the haul length meets other criteria. Such
points would most likely be served by picking up and setting out cars,
rather than by loading or unloading containers while cars remained in the
train. A minimum feasible volume for service to an intermediate point
would therefore be one car, and would have to be provided at least five
days per week to compete for truck traffic, if not for UPS, Postal Service,
and LTL traffic. The minimum annual volume for service to intermediate
points on an established or potential double-stack corridor thus would be
2,600 containers, the volume generated by a single five-platform car per
day, five days per week.
-43-

2. International Versus Domestic Trains
The service criteria contemplate six-day-per-week service with trains of at
least 15 double-stack cars. A review of the likely pattern of
international and domestic traffic indicates that the available mixture
will lead railroads and their major customers to run mixed international
and domestic trains most of the time. There will be few operational
distinctions between international and domestic trains, and few trains will
be purely one or the other. The only trains that will remain purely
international are eastbound trains from the West Coast, and westbound
trains from the East Coast, that are scheduled to receive inbound
containers from specific vessel calls. Other trains from the coasts, even
those run for the domestic subsidiaries of ocean carriers, will carry a mix
of international and domestic containers that fluctuates according to the
daily traffic situation.
Both domestic and international movements follow what has been termed a
"transcontinental calendar". Wherever possible, departures are scheduled
to provide weekday arrivals at destination. Vessel calls in Southern
California, for example, are now clustered between Friday and Monday in
order to position intermodal containers for mid-week delivery in Midwest
markets. Eastbound international movements will therefore peak between
Friday afternoon and Monday morning. Domestic shippers, however, avoid the
weekends: eastbound domestic shipments generally begin Monday morning and
end Friday afternoon. The top half of Figure 12 illustrates this weekly
eastbound traffic pattern for Southern California.
Westbound traffic patterns are different. International export and empty
containers begin arriving at the rail terminal late Wednesday in prepara
tion for Friday vessel calls, and to free up double-stack cars for priority
eastbound imports. Westbound exports and empty container movements taper
off Sunday and Monday, as vessel calls decline. Domestic arrivals increase
on Sunday for local delivery on Monday, and taper off later in the week:
Friday afternoon and evening arrivals would not be delivered until Monday,
and neither the railroads nor the shippers want to store loaded trailers.
The westbound pattern is shown in the bottom half of Figure 12.
-44-


A comparison of the top and bottom of Figure 12 suggests that it would be
inefficient, or even futile, to attempt to segregate international and
domestic linehauls completely in Southern California. To be sure, there
are multiple trains on most days, but those trains are divided between
three railroads. Achieving high utilization and low cost dictates that
arriving westbound cars be unloaded and reloaded with eastbound containers
as quickly as possible.
International and domestic containers generally will not be segregated on
separate trains. It appears much more likely that train operations will be
adapted to minimize transit times and maximize equipment utilization.
3. Start-up Threshold
Railroads are generally willing to start services with less than the volume
required for long-term viability if there is sufficient immediate business
to survive until volume grows, and if the railroad is confident that
business will grow to the long-term minimum within an acceptable length of
time. There are no concise criteria for such a decision, because the
decision to begin a service will depend on subjective assessments of:
o the potential market and potential profitability;
o the availability of capital to start and support the service
until it reaches profitability;
o the actions and likely reactions of competitors; and
o the strategic plans of railroad executives.
With no means to derive an analytical criterion, this study uses a somewhat
arbitrary threshold start-up volume figure of 60 percent. It was judged
unlikely that railroads would routinely begin operations with less than
half of the long-term minimum volume, yet setting a higher threshold might
unduly restrict the analysis of potential network developments and impacts.
For a new corridor, 60 percent of the 46,800-unit annual minimum volume is
28,080 units. For intermediate points, 60 percent of the 2,600-unit annual
minimum volume is 1,560 units.
-45-

4. Double-Stack Stem and Dwell Times
To compete with door-to-door truckload service, a double-stack service must
complete five segments in the same time frame:
o stem time from shipper to origin hub;
o dwell time at origin hub;
o hub-to-hub rail line-haul time;
o dwell time at destination hub; and
o stem time from destination hub to consignee.
Stem time. No hard data exist on the distribution of origin stem (drayage)
times. Some sources indicate that major intermodal hubs can draw traffic
from 250 or more miles away, for which the one-way stem time would be 4-6
hours. Such exceptionally long drayages would be justified only by the
longest line-hauls, and would have to take place in the direction of
travel: "with the grain". One measure of the minimum stem time allowance
for a truck-competitive domestic double-stack service is the time required
to serve the ICC-defined "commercial zone" surrounding major metropolitan
cities. Most major commercial zones are 30 to 60 miles across, and rail
facilities tend to be centrally located. For purposes of estimating a
minimum origin stem time, this study assumes one hour to cross 30 miles of
a commercial zone in moderate traffic and to complete check-in procedures
at the rail facility gate.
Dwell time. The average dwell time at origin can be broken down into two
components:
o the average time between container or trailer arrival at the rail hub
and train cutoff time; and
o the scheduled time between cutoff time and actual departure.
Railroads announce cutoff times for specific train departures to insure
that enough time is consistently available to load the train. The shortest
dwell times can be achieved with dedicated double-stack trains for which
loading plans are provided, and for which containers arrive in a steady
-46-

stream during the day. Railroad sources report that under the best
conditions containers for such trains can be accepted up to one-half hour
before scheduled departure. The longest times between cutoff and departure
are associated with common-user double-stack trains, which handle an
unknown mix of containers arriving randomly from a mix of customers who do
not provide advance loading plans. Railroads reportedly allow as much as
six hours between cutoff and departure for the most troublesome trains.
A domestic double-stack system cannot expect that domestic containers will
be organized as well as international containers from a single ship. On
the other hand, the potential performance of double-stack services should
not be limited to the lower end of existing services. This study assumes
that facility improvements, better communications and documentation from
the shipper, and particularly increased use of Electronic Data Interchange
(EDI) and Automatic Equipment Identification (AEI) will allow railroads to
accept containers up to two hours before departure. This standard is
currently exceeded by some dedicated trains, which have one-hour cutoffs.
Origin stem and dwell time. The minimum typical stem and dwell time of
three hours would correspond to a shipper who finishes loading at 4:00 p.m.
for a 5:00 p.m. cutoff time:
Stem time: 1 hour (4:00 p.m.-5:00 p.m.)
Dwell time: 0 hours (5:00 p.m. cutoff)
Loading time: 2 hours (5:00 p.m. cutoff to 7:00 p.m. departure)
3 hours
Therefore, this study uses a 3-hour minimum for stem-and-dwell time at
origin, corresponding to a high standard for time-sensitive traffic.
Destination stem and dwell time. The dwell time at destination depends on
the rail customer. The railroad notifies the customer when the container
or trailer will be available, and the customer chooses how and when to have
it picked up. An arriving double-stack train can be unloaded immediately
upon arrival, a process that takes up to 6 hours for a 20-car train, less
if multiple lift machines are used. The typical container would therefore
be unloaded and available for pickup three hours after train arrival.
-47-

In trying to assess potential competition with motor carriers, it is the
time-sensitive customers that are relevant. Industry sources indicate that
time-sensitive customers notify their draymen of incoming loads well before
train arrival. Railroads "cherry pick" the train to meet the demands of
such customers, either by using multiple lift machines on the train or by
using sideloaders, which are more mobile than gantries, to unload selected
units. The drayman (and his customer) incurs the cost of an access trip to
the rail yard, but this trip does not add to total transit time because it
overlaps the train arrival and unloading time. This study uses a two-hour
unloading time to reflect priority treatment of time-sensitive loads
without assuming the highest priority for every unit. (The average would be
three hours for a train that took six hours to unload.) The potential
competitive destination stem-and-dwell time would therefore be three hours,
as it is at origin:
Unloading time: 2 hours (0-6 hours range)
Stem time: 1 hour (half commercial zone, 30 miles)
3 hours
The total rail stem-and-dwell time used in this study is therefore six
hours, three hours each at origin and destination. This is a high
standard, met at present by only a few highly efficient operations and
demanded by only the most time-sensitive intermodal customers.
Nonetheless, it appears to be an achievable standard and reflects the
potential performance of rail double-stack service in competition with
motor carriers.
5. Truckload and Double-Stack Transit Times
The principal long-term competitor for rail double-stack service is the
single-driver truckload common carrier. It is generally conceded that rail
intermodal service cannot compete with truckload carriers who use two
drivers (or relay drivers) to provide the fastest possible motor carrier
service. It is also conceded that no intermodal technology available can
compete with multiple-stop truckload carriers. The range of potential
competition between rail intermodal service and LTL motor carrier service
is largely limited to occasions where intermodal service can replace the
-48-

"truckload" haul between LTL terminals. This analysis therefore focuses
exclusively on single-driver truckload competition.
One critical feature of single-driver operations is the need for periodic
rest. Under Federal regulations, drivers are permitted to drive a maximum
of 10 hours before resting at least eight hours. Industry sources indicate
a typical truckload driver travels 540 miles in those 10 hours. The
average of 54 miles per hour includes short rest stops and slower travel,
as well as freeway travel in the 55-65 m.p.h. range. Drivers can actually
remain on duty 15 hours, if the remaining time is spent loading or
unloading. Although in practice drivers will often drive 12 hours or more
to complete a trip in a single stint, this study is predicated on lawful
operation of all modes over the long run. The 10 hours on/8 hours off
driving cycle yields the stepped time-distance function shown in Figure 13.
Actual trip patterns would not be this regular, since drivers adjust to
meet delivery times in distant cities, but Figure 13 gives a useful
abstraction of truckload movements.
Over the linehaul, railroads move at slower average speeds than trucks.
Intermodal trains with adequate power are capable of high speeds where
grades are minimal and track conditions permit. Yet even in the western
states, mountain ranges, urban areas, and other rail traffic slow and stop
even high-priority trains. Train crews must be changed, locomotives
serviced, and cars inspected. Interchanges, even run-throughs, slow
intermodal trains further. The fastest long-distance intermodal schedules
in the West call for average speeds of approximately 40 m.p.h. Trains,
however, need not stop for rest. By changing crews, the railroad keeps a
high-priority train moving while the truc-ker rests. As a result, the rail
intermodal movement can be portrayed graphically as a straight line.
Figure 14 shows a straight line corresponding to an average speed of 40
m.p.h. The line originates at 6 hours and 0 miles, indicating intermodal's
6-hour stem and dwell disadvantage. The 40 m.p.h. average is a high, but
achievable standard for most major rail corridors.
-49-

Hour
*

Hou
rs

6. Length of Haul
At an average of 40 m.p.h., rail intermodal service could overcome the
initial six-hour disadvantage and be reasonably competitive (delivering the
same morning or afternoon) with a single-driver truckload service at any
distance beyond one day's drive, 540 miles. A 700-mile door-to-door trip,
for example, would take the motor carrier roughly 21 hours (10 hours
driving, 8 hours rest, 3 hours driving). The same door-to-door trip would
require about 22 hours by rail (6 hours stem-and-dwell, 16 hours at 40
m.p.h.).
Intermodal service becomes more competitive as the length of haul
increases. Figure 14 shows that intermodal has a small disadvantage in the
540-1080 mile range, is roughly equal to truck in the 1000-1620 mile range,
and has a significant transit time advantage for trips of over 1620 miles.
It also shows clearly why it is difficult to operate competitive intermodal
services for door-to-door trips of 500 miles and under. For all practical
purposes, a single-driver truck does not stop between origin and
destination for such hauls, and the railroad has little opportunity to make
up the stem-and-dwell handicap.
Door-to-door trips between 540 and 1080 miles are the intermodal
battleground. Under the best conditions likely to be encountered,
intermodal operations can compete on service and transit time with
single-driver truckload operations at the shortest distances in this range.
Under less-than-ideal conditions -- circuitry, slow terminals, poor track,
or lack of management commitment — intermodal services will be forced out
of the shorter hauls in this range.. Intermodal market share is almost
negligible in door-to-door hauls of less than 500 miles.
Many of the recently inaugurated premium conventional intermodal services
serve corridors in this distance range, including examples of Burlington
Northern Expediters, Norfolk Southern Triple Crown RoadRailer services,
Santa Fe Quality Service Network trains, and Southern Pacific Track Stars.
These trains, many of which are operated by reduced crews, are explicitly
designed to compete with trucks.
-50-

Figure 15 shows the effect of drayage direction. Drayage "with the grain"
reduces the intermodal disadvantage to four hours (lowering the intermodal
line on the graph). The result is increased competitiveness, but only for
distances of over 540 miles. Drayage "against the grain" reduces
intermodal's competitiveness most markedly for door-to-door trips in the
540-1080 mile range; longer trips are less affected. It is clear, however,
that intermodal operations in the critical 540-1080 mile range could not
support drays of more than an hour or so against the direction of line-haul
travel.
Considering the shaded area in Figure 15 instead of the single 40-m.p.h.
line gives consistent results: rail intermodal operations can be
competitive in the 540-1080 mile range while allowing drayage across
typical commercial zones in all directions. The 540-mile door-to-door haul
thus appears to be the shortest market in which conventional or double
stack operations can offer transit times competitive with single-driver
truckload operations.
B. COST CRITERIA FOR DOUBLE-STACK SERVICES
1. Overview
The second major factor in the potential for double-stack container ser
vices is cost, both operating cost and total cost. The primary emphasis in
this study is on operating cost (including appropriate capital costs),
since operating cost reflects the potential performance of competing
technologies. Total cost depends on organizational policies, marketing
practices, overhead costs, taxes, and other factors independent of double
stack technology.
In keeping with the focus of this study on the potential for double-stack
container service, this analysis seeks to determine the lowest cost at
which regular double-stack service could be expected to operate. This
approach requires that each major factor in double-stack operation be
examined to establish reasonable minimum costs consistent with a high
quality of service. The most complex factor is the rail line haul, for
which this study uses computerized cost simulations. The analyses of other
-51-

Hour
*

factors draw on a variety of industry sources for critical assumptions and
cost estimates.
2. Truckload Operating Costs
For the purposes of this study, the most critical cost comparison is
between double-stack and truck operating costs. Assuming double-stack and
truck rates bear the same relationship to the corresponding operating
costs, truck costs constitute a competitive upper bound on double-stack
costs. Truckload operating costs (exclusive of licenses, taxes, general
and administrative costs, or other overhead) are roughly $.71 per mile,
estimated by TRAM as follows:
Equipment: $40,000 annual ownership and maintenance cost and 129,000
average annual miles yield $.31 per mile.
Fuel: Mid-1988 and mid-1987 costs of approximately $1.05 per gallon,
and average consumption of 5.22 mpg (ATA) yield $.20 per mile.
Labor: Average wages and benefits of $11.00 per hour and average
speed of 55 miles per hour yield $.20 per mile (confirmed by 19,500
NMTDB interviews in 1987).
The most efficient firms are the so-called "advanced truckload firms"
((ATLFs). These firms use sophisticated computer information systems and
communication to maximize service quality, responsiveness, and utilization.
ATLFs reportedly approach $.89 per laden mile, which suggests a utilization
factor of about 80 percent, typical of the industry. These costs do not
include any allowance for overhead (dispatching, billing, management, etc.)
or profit, and thus do not correspond to average system costs, rates, or
revenues.
Double-stack rates must be discounted from truck rates. Customers are not
willing to pay as much for intermodal service as for truck service. For
the immediate future, moreover, double-stack service (in all its many
aspects) will not be as good as the best truck service. The required
discount for T0FC service has been about 15 percent from truck rates; The
-52-

required discount for double-stacks might eventually be reduced, as
double-stack service distinguishes itself from TOFC service and gains a
more truck-competitive reputation with shippers. Yet as recently as
mid-1989, a private shipper survey revealed that customers not only expect
double-stack service to offer a discount from truck rates, but a discount
from TOFC rates as well. Many customers apparently feel "the top container
rides free". This perception was fostered by early publicity on
double-stacks, which emphasized its cost advantages over TOFC, and by
aggressive pricing of domestic backhauls by ocean carriers. A 15 percent
discount may thus be conservative for the near future.
3. Rail Equipment Costs
Double-Stack Cars. Trailer Train is the major source of double-stack
(DTTX) cars. Moreover, railroad and supplier contacts agreed that Trailer
Train's rates serve as a benchmark for the industry. The Trailer Train
rate generally includes a per diem charge and a mileage charge. These are
full-service rates, including both time-based and mileage-based mainte
nance. The most recent Trailer Train double-stack purchases are "heavy
lift" cars, with 125-ton trucks, capable of handling 20-foot to 48-foot
containers in all wells. The current rate for these cars is $69.84 per day
ancf $0,065 per mile, per car (10 wells). This rate equates to a cost of
$6.98 per day and $0.0065 per mile for each platform, well, or 40-foot
container unit.
The table below summarizes these car costs:
Rail Car Costs
$/Unit
Total Mileage
Im . Per Day Per Mile Equivalent
Double-Stack (DTTX) $ 6.98 $ .0065 $ .0138
Conventional (TTWX) $ 5.16 $. 015 $ .0204
Impack (UTTX) $ 8.16 $ .015 $ .0235
*
At 40 mph, 24 hours per day.
Source: Trailer Train
-53-

Mileage rates reflect differences in maintenance expense: both conven
tional and Impack cars have trailer hitches, which are expensive to main
tain. The differences in mileage costs amount to more on the long hauls
typical of intermodal movements. On a 2,000 mile haul, the difference
between $0.0065 per mile and $0,015 per mile comes to $17.00 per unit. The
table also shows a total mileage equivalent, including per diem at 40 mph
for a 24-hour day. The per diem charges for Trailer Train cars apply to
time spent in terminals as well as time spent on the road. If a double
stack car spends 12 hours in the terminal at each end of the line-haul, it
would accumulate 12 hours of terminal time for each one-way trip. For dou
ble-stack cars, this per diem implies a fixed cost of $3.49 per well in
addition to the variable line-haul costs. For conventional and Impack
cars, the fixed terminal cost is $2.68 and $4.08 per unit, respectively.
Figure 16 displays the relationship between equipment costs (cost per unit
mile) and length of haul for double-stack (DTTX), conventional (TTWX), and
Impack (UTTX) cars. The two trailer cars, UTTX and TTWX, have essentially
parallel curves because they have the same unit mileage costs. The double
stack car has an intermediate fixed cost (on the vertical axis)i but
progressively lower per-mile unit costs because of its lower mileage
charge. All three curves drop sharply between 100 and 700 mileis, the
effect of allocating the fixed terminal per diem expense over a progres
sively longer line-haul. Once the length of haul exceeds 700 - 900 miles,
the curves are nearly flat.
Containers and Chassis. Containers or trailers are generally obtained
either from leasing company pools or through long-term leases. The daily
costs can differ significantly, as shown below:
Representative Container and Trailer Costs
$/Day
Breakeven
Pool Lease Utilization
48' x 102" Container $ 6.50 $ 4.90 75%
48' x 102" Trailer $ 12.50 $ 7.25 58%
Source: Greenbrier Intermodal, American President Intermodal.
-54-

$/U
nlt-
Mlle
Source: Trailer Train Company

Pool costs include maintenance and storage. The lease costs shown are
either for full-service leases or include an amount for maintenance, but do
not include storage costs. The greatest difference is in risk and utiliza
tion. The use of pool equipment entails no risk, no management, and no
responsibility when the equipment is not utilized. Long-term leases or
ownership do entail risk, management, and the responsibility for seeing
that the unit achieves acceptable utilization. Large carriers or mul-
ti-modals that can accept risk, manage the equipment, and achieve high
utilization can obtain significant savings by leasing or owning equipment.
This study used the container pool per diem rates: $6.50 per day for 48' x
102' container and $8.00 per day for a chassis. The combined per diem for
a container and chassis used in drayage, $14.50, is higher than for a
comparable trailer. To keep the cost of a container system lower, the
chassis cannot be used in drayage or storage for more than 75 percent of
the total door-to-door time. This limitation could be a problem in the
shortest hauls, where terminal and drayage time together could approach or
exceed 75 percent of the total.
4. Rail Labor Costs
Basis of Pay. Labor costs are the most complex factor in the cost simula
tion, and intermodal operations sometimes have separate labor agreements or
other special provisions. Because this project considered through double
stack trains, there was no need to introduce the additional complexities of
switching between terminals. Arbitraries (crew payments for specific tasks
or delays in terminals) were not simulated, since their presence indicates
either abnormal operations or a conscious decision on the railroad's part
to incur arbitraries in place of some other cost. The three major remain
ing variables are the basis of pay, the crew size, and the length of crew
districts. The following discussion and the labor costs used in the
simulations are based on current agreements for a major railroad in the
Pacific Northwest, considered typical of industry practice. The specific
rates chosen are for "new hires", because such rates will predominate in
the future.
-55-

The basis of pay involves both time and mileage, with the actual pay rate
calculated on a mileage basis. The basic day's work is 8 hours and 108
miles. "Overmileage" is paid for miles exceeding 108. "Overtime" is paid
for time between 8 hours and 12 hours (the absolute limit for on-the-road
time), providing mileage also exceeds 108. The basis of pay is $0.94 per
mile for a "new hire" brakeman, once he or she has reached 100 percent pay
(pay starts at 75 percent on the date of hire). Overmileage is paid at
about $0.85 per mile. All overtime hours are converted to miles, at 1.5
times the basic rate of 13.5 miles per hour (108 miles in 8 hours), or
20.25 mph. The minimum day's pay is 108 miles at $.94 per mile, or $101.52.
The table below compares pay rates for brakemen, conductors, and engineers:
Typical Pay Rates, New Hires
$/Mile
Brakeman Conductor Engineer
Basic Mileage $ 0.94 $ 1.09 $ 1.31
Overmileage $ 0.85 $ .90 $ 1.08
Source: Railroad industry contacts.
Crew Size. The four-person crew, consisting of two brakemen, a conductor,
and an engineer, is still common. As shown below, the aggregate pay for a
four-person crew is about $462.24 per 8-hour/108-mile day, and $3.68 per
mile for overmileage:
Rail Labor Costs
Crew Size
Two Three Four
Basic Day's Pay
Overmileage*
Basic Day's Cost★
Overmileage Cost
$274.94
$1.98/mile
$349.17
$2.51/mile
$384.33 $462.24
$2.83/mile $3.68/mile
$488.10 $587.04
$3.59/mile $4.67/mile
*With 27 percent payroll taxes and benefits.
-56-

Reducing the crew to three persons, as has become practical for many
intermodal trains, usually involves some additional compensation for the
remaining crew members, often called "productivity pay". Typical compensa
tion is about $7.87 per person per trip. Pay rates for a three-person crew
plus productivity pay yield about $384.33 per day and $2.83 per mile for
overmileage. Some expedited intermodal trains and a very few double-stack
trains operate with two-person crews, just a conductor and an engineer.
Pay rates for such a crew, with productivity pay, would be about $274.94
per day and $1.98 per mile for over mileage. The minimum cost estimate
used two-person crews, representing the minimum feasible labor expense.
Recognizing that two-person crews will not be universal in the near future,
each operation was also estimated with three-person and four-person crews.
To the basic pay rates discussed above must be added payroll taxes, bene
fits, and other non-pay labor costs. Various sources, including AAR
summary publications and railroad R-l reports, indicate that such costs
range from 23 percent to 33 percent of wages and salaries for transporta
tion (as opposed to maintenance or administration), with 27 percent being a
typical value for the nation as a whole. The table above applies this 27
percent increase to the pay rates to derive labor costs for each crew size.
These labor cost figures were used in the simulations.
Crew Districts. Railroads, particularly the western railroads, have made
considerable progress on consolidating crew districts to obtain longer runs
between crew changes. For decades, the basis of pay was 100 miles per day,
and crew districts were roughly 100 miles long. Railroads have been
gradually lengthening crew districts, preferring to pay one crew for extra
mileage than to call another crew.
5. Rail Line-Haul Costs
Engineered Costing. Engineered line-haul costs were developed using
Manalytics' Rail Cost Model (RCM), a computerized train performance simu
lator and costing algorithm. Engineered costing allows the researcher to
simulate optimal conditions, thus illustrating the best potential cost
performance that a given technology might deliver.
-57-

Assumptions. Train performance simulation requires numerous assumptions
regarding technical performance factors and unit costs. For this study,
typical values were selected for those factors common to rail operation of
all types, such as locomotive specifications, fuel prices, wage rates, etc.
Factors specific to intermodal operations, such as train length, crew size,
and crew assignments, were tested for sensitivity.
All double-stack simulations used car specifications (weight, cross-sec
tion* etc.) from Gunderson "Maxi-Stack II" 125-ton IBC cars,.typical of the
most recent additions to the double-stack fleet. All trains were assumed
to be carrying 481 x 102" domestic containers, whose specifications follow
those of the APC fleet. Containers were assumed to be loaded to the car
weight limit in both directions. All simulations used high-horsepower,
4-axle locomotives for road power and, where required, for helpers. All
simulations were cabooseless.
No allowance was made for terminal switching. The need for terminal
switching and the associated costs vary widely, depending on terminal size
and configuration, train loading schedule, operating practices, and local
labor agreements. In the optimal case being simulated here, the train is
assumed to be handled intact at a large facility or simply "doubled" (split
into two pieces on adjoining tracks) by the road crew.
Diesel fuel cost was estimated at $.3901 per gallon, the average price
reported by the AAR for 1987, adjusted by the late 1988 AAR cost index.
Incremental maintenance of way and structures is included in the RCM at
$.00120 per gross ton-mile. This figure was derived from regression
analysis performed during development of the RCM, adjusted to a 1988
equivalent using the ARR cost index for materials, supplies, labor, and
supplements, excluding fuel.
Line-Haul Simulations. Simulations of multiple double-stack operating
scenarios were prepared for two representative routes of different lengths:
Los Angeles-New Orleans (2010.2 miles via SP) and Los Angeles-Oakland
(559.4 miles via SP). Both routes cover a variety of terrain and operating
conditions. Various combinations of train length, crew size, and crew
district length were simulated for each route. For both routes, the base
-58-

case simulation was a 20-car double-stack train with a 2-person crew
operating over extended crew districts.
Table 10 gives the estimated 1ine-haul cost per unit-mile (in this case the
units are containers) for the Los Angeles-New Orleans simulation. The base
case cost was estimated to be $0,118 per unit-mile, not including the costs
of cars or containers. Cases 2 and 3 show the effects of train length on
unit cost. Reducing the train to 15 cars did not allow a reduction in the
number of locomotives or crew members, and produced a 15 percent increase
in unit cost. Increasing the train to 28 cars required additional locomo
tives and/or helpers, which kept the net savings down to 4 percent.
Adding a third and fourth crewman increased the unit cost by 5 and 9
percent, respectively. Addition of the fourth crewman resulted in a
smaller incremental cost because lonesome pay was eliminated for the other
three.
Case 6 simulated 2-person crews operating over short districts, typically
100-150 miles. Such operating methods would raise the unit cost by 3
percent over the practice of paying overmileage for fewer crews. Case 7
simulated a 4-person crew operating over short districts, a common practice
not long ago and still prevalent in some areas. The larger crews and
shorter districts would raise the cost by 13 percent over the base case.
The effect is somewhat compounded by the slower schedule and greater fuel
consumption caused by additional stops. Case 8, with a 15-car train,
4-person crews, and short crew districts, produced a unit cost of $0,156
per mile, 32 percent higher than the base case.
Table 11 gives the results of comparable simulations for the 559.4 mile
Los Angeles-Oakland route. The base case, using the same assumptions of 20
cars, 2-person crews, and extended crew districts, yielded an estimate of
$0,138 per unit mile (17 percent greater than the Los Angeles-New Orleans
route).
Cases 2 and 3 simulated 15-car and 28-car trains with 2-person crews and
extended districts, and yielded costs of $0,142 and $0,130 per mile,
respectively. Cases 4 and 5 simulated 3-person and 4-person crews, and
resulted in unit costs of $0,144 and $0,150 respectively. The unit cost
-59-

Table 10
RAIL LINE-HAUL COST ESTIMATES
LOS ANGELES-NEW ORLEANS
2010.2 Miles
Case $/Unit Mile* % Change
1. Base Case:20-car train,2-person crews,extended districts 0.118
2. 15-car Train,2-person crews,extended districts. 0.136 +15
3. 28-Car train,2- person crewsextended districts. 0.113 -4
4. 20-car train,3- person crew,extended districts. 0.124 +5
5. 20-car train,4- person crew,extended districts. 0.129 +9
6. 20-car train,2-person crew,short districts. 0.121 +3
7. 20-car train,4-person crew,short districts. 0.133 +13
8. 15-car train,4-person crew,short districts. 0.156 +32
Not including cars or containers. Source: Manalytics1 Rail Cost Model.

RAIL LINE-HAUL COST ESTIMATES
LOS ANGELES-OAKLAND
559.4 Miles
Case $/Unit Mile* % Change
1. Base Case:20-car train,2-person crews,extended districts 0.138
2. 15-car Train,2-person crews,extended districts. 0.142 +3
3. 28-Car train,2- person crewsextended districts. 0.130 -6
4. 20-car train,3- person crew,extended districts. 0.144 +4
5. 20-car train,4- person crew,extended districts. 0.150 +9
6. 20-car train,2-person crew,short districts. 0.143 +4
7. 20-car train,4-person crew,short districts. 0.157 +14
8. 15-car train,4-person crew,short districts. 0.185 +34
Not including cars nor containers. Source: Manalytics1 Rail Cost Model.

increases, 4 percent and 9 percent, were essentially the same as for the
longer haul. Shortening the crew districts in Cases 6-8 yielded unit costs
ranging from $0,143 to $0,185 per mile, depending on crew size and train
consist. The percentage increases were similar to those obtained for the
Los Angeles-New Orleans simulation.
Line-Haul Cost Findings. The engineered line-haul cost estimates for
double-stack trains range from $0,113, per unit-mile to $0,185 per unit-
mile, depending on route, train size, crew size, and crew districts. The
extreme low cost estimate represents a combination -- very long haul,
28-car train, 2-person crews, extended crew districts -- that is techni
cally feasible but not currently available on any railroad. The extreme
high cost estimate represents a combination -- very short haul, 15-car
train, 4-person crews, short crew districts -- representative of only the
least efficient current operations. Both extremes represent minimums of a
kind, however, since neither allows for empty movements, delays, con
gestion, or other day-to-day variations from optimal performance.
An attainable standard for the near future is likely to resemble the Case 4
simulations on Tables 10 and 11: 20-car trains, 3-person crews, and
extended districts. These simulations produced costs of $0,124 per unit
mile on the long haul and $0,144 per mile on the short haul, 4-5 percent
greater than the base cases and 20-22 percent below the highest cost cases.
Note that even this "attainable" standard assumes 100 percent loaded
movement in both directions, an optimistic assumption for an optimal rail
service. Actual double-stack arrivals in Los Angeles during 1987 had a
reported loaded average of 80 percent westbound. Industry sources indicate
that this number is inflated, however, due to the practice of reporting
entire trains as loaded for billing purposes. Informal estimates put
actual loads at about 60 percent of the westbound movement, but increasing.
The lack of reliable utilization figures suggests that the prudent course
is to simulate optimal performance and to consider the loaded/empty balance
as a target for improvement.
-60-

Drayage Costs. Intermodal containers must be moved by highway between
inland rail hubs and the actual origins or destinations. Performed within
the commercial zone of a city, this function is known as drayage or
cartage, and is often provided by specialized firms. The central issue in
drayage or short-haul trucking costs is stem time; the time required to
pick up the intermodal equipment, move it to the shipper or consignee, load
or unload it, and return it to the intermodal hub.
There are five major elements in the underlying cost of highway movements
(exclusive of overhead or profit). Four of these five cost elements are
based on time, rather than distance:
o annual or hourly cost of tractor ownership;
o annual or hourly cost of tractor maintenance;
o annpal or hourly cost of license and insurance;
o hourly labor cost; and
o mileage-based fuel cost.
Annual ownership cost of a drayage tractor (which is not as elaborately
equipped as a long-haul tractor) is approximately $12,000: $8,000 for the
purchase (an $80,000 purchase price over 10 years, using straight-line
depreciation and allowing for no residual) and $6,000 for interest (at a
15% cost of capital). The typical annual cost of maintenance is
approximately $16,000. Thus, the annual cost of a fully maintained tractor
is about $30,000. Normal yearly usage is about 225 days per tractor (52
weeks, 5 days per week, less 13 holidays and 22 days down time). Daily
tractor cost is then $30,000/225, or $133.33 per day. For a ten-hour day,
this figure equates to $13.33 per hour. Local non-union labor, with fringe
benefits, averages about $11.00 per hour. Although some drayage is
performed by union drivers, the non-union firms tend to set the competitive
rate. Mid-1988 fuel costs were about $1.05 per gallon, and modern tractors
get an average of 5.22 miles per gallon overall, giving a fuel cost of $.20
per mile.
6. Gathering and Distribution Costs
-61-

The general calculation for the cost of drayage -- excluding the cost of
the container and chassis -- would therefore be:
$13.33 (hours) + $11.00 (hours) + $.20 (miles)
This equation yields an over-the highway cost of $34.33, or $.69 per mile,
at 50 miles per hour, nearly the same average as a truckload carrier. But
relatively little of a drayman's time is spent on the highway. Within
urban areas, the costs change. Drayage tractors burns fuel at about 1
gallon per hour while idling, and average mileage drops to about 3.5 miles
per gallon in urban traffic. While idling in a terminal, the drayman's
cost is about $25.38 per hour, and in urban traffic at 30 miles per hour it
is about $33.33 per hour.
Drayage rates are set to recover the costs of mixed urban and highway
movements, for which draymen typically charge a minimum of $35.00 per hour.
The strong relationship between time and drayage costs has been observed
empirically. In Southern California, for example, drayage from the Ports
of Los Angeles or Long Beach to the SP ICTF (4 miles away) is roughly $35,
reflecting time rather than distance. Drayage from the Ports to the UP ar
ATSF facilities (20-25 miles away) is roughly $70, the difference of $35
being an additional hour's travel in urban traffic rather than 20
additional miles (which, by the estimates above, would cost only $13.80 at
highway speeds).
The hours include time spent waiting in terminals, and time spent loading
or unloading. Drayage rates usually allow two hours for loading or
unloading. Delay beyond two hours is typically billed at about $32.50 per
hour. Time in rail terminals can vary from 15 minutes in the newest and
most efficient, to an hour or more in older or congested facilities. Thus,
even the shortest trips are often priced at $70-80 round trip to allow for
up to two hours of ^waiting. The low utilization involved in loading,
unloading, and waiting yields very high cost for each mile travelled.
-62-

7. Double-Stack Terminal Costs
Double-stack services include substantial expenses on both ends of the trip
for terminal transfer operations, chassis supply, and drayage. These costs
are independent of line-haul trip length, but they can vary substantially
between locations.
Lift Costs. Industry representatives provided a wide range of estimates
for terminal costs, and references to other studies widened the range
further. The most representative estimate, and the one chosen for use in
this study, is $26 per lift for an all-inclusive "turnkey" contract
operation (no railroad employees) at a major hub. This cost does not
include amoritization of the underlying railroad assets, which was es
timated at $8.00 to $10.00 per lift for a large, relatively new facility.
The cost criteria use the minimum of $8.00 per lift, giving a minimum total
terminal lift and facility cost of $34.00 per lift.
Chassis Costs. The per chassis costs from most neutral chassis pools range
from $8.00 to $8.50 per day. Chassis on long-term leases can be priced as
Tow as $2.00 per day, but long-term leases make the lessee responsible for
maintenance, storage, and utilization. The growing popularity of neutral
chassis pools suggests that, on balance, the $8.00 to $8.50 range is
attractive to all but the largest customers. The cost criteria use the
$8.00 minimum for one day at each end.
Drayage Costs. The drayage analysis yielded an estimated rate of $35.00
per hour. The length-of-haul analysis assumes a drayage distance of up to
30 miles, about half the width of a commercial zone or a metropolitan area.
In major cities, round-trip drayage, including terminal pickup and loading
or unloading, would require about 4 hours, for a cost of $140 on each end
of the trip.
For purposes of identifying relevant truck traffic, we have defined five
drayage zones, shown on Table 12 as Zone 0 through Zone 4. Zone 0 is the
minimum assumed in the cost analysis. Zones 1 to 4 are one hour's drive,
each way, broader than the previous zone. The additional hour's drive is
assumed to be at 50 mph, being beyond the most congested zone and including
-63-

Table 12
DRAYAGE ZONES AND COSTS
1 -Way Miles
MaxT ime
Zone 0 30 4 hrs
Zone 1 80 6 hr s
Zone 2 130 8 hrs
Zone 3 180 10 hrs
Zone 4 230 12 hrs
Est. Rate*
RatePer
MileRat
500
140 4.667 0.280
210 2.625 0.420
280 2.154 0.560
350 1 . 944 0.700
420 1 .826 0.840
Per Line-Haul Mile1000 1500 2000
0.140 0.093 0.070
0.210 0. 140 0. 105
0.280 0.187 0.140
0.350 0.233 0.175
0.420 0.280 0.210
* At $35 per hour

no loading or terminal time. The cost per one-way mile (which is the
portion that competes with truck carriage) drops as mileage increases, but
the cost burden on the line-haul grows steadily. At the longest drayage
distances, the drayage costs may exceed the line-haul costs.
Total Terminal Costs. Representative terminal costs per container for a
minimum-cost door-to-door operation can be summarized as follows:
Terminal Lift & Facilities
Chassis (1 day each end)
Drayage (30 miles and 4 hours
at each end)
Total
$ 34.00 x 2 = $ 68.00
$ 8.00 x 2 = $ 16.00
$140.00 x 2 = $280.00
$364.00
8. Double-Stack Operating Costs and Length of Haul
Double-Stack Operating Costs. To obtain the total cost of a door-to-door
double-stack movement, one must add terminal costs, linehaul costs, car
costs, and container costs. Table 13 shows such calculations for Case 4
attainable minimums for both routes. Line-haul car costs assume two days
for Los Angeles-New Orleans and one day for Los Angeles-Oakland. Container
costs assumes five days for Los Angeles-New Orleans (1 day load, 2 days
line-haul, 1 day terminal, 1 day unload) and three days for Los Angeles-
Oakland (1 day load, 1 day linehaul and terminal, 1 day unload). The costs
of chassis, terminal lift, and dray are fixed.
Table 13 shows a dramatic total cost difference traceable to length of
haul. Although the unit line-haul costs are slightly higher for shorter
hauls, the big difference is in the division of fixed costs over line-haul
miles. The estimated fixed costs of terminal lift, chassis, and drayage
total $364 per container. Over 2010 miles, this fixed cost averages $.18
per mile. Over 559 miles, this fixed cost averages $.65 per mile.
The total, door-to-door long-haul costs have an attainable value of $.336
per unit-mile. The railroad costs, which usually do not include contain
ers, chassis, or drayage, are about $.17 per unit mile, indicating that
these simulations represent a highly efficient, but feasible, opera-
-64-

TOTAL DOUBLE-STACK OPERATING COSTS $/Unit-Mile
RouteLine Haul
$/unit mileLine Haul Cost
Line Haul Car Cost
Terminal Car Cost
ContainerCost
TerminalLift
ChassisCost Drayage
TotalTotal $/unit mile
L.A.-New Orleans
2010.2 Miles 48 Hours
0.124 249.26 27.03 3.49 32.50 68.00 16.00 280.00 676.28 0.336
L.A.-Oak land
559.4 Miles 15 Hours
0.144 80.55 10.62 3.49 19.50 68.00 16.00 280.00 478.16 0.855

tion below existing average costs. These costs are clearly competitive
with truckload costs, even if a 15 percent rate discount is offered.
Indeed, there is little disagreement that double-stack operations have a
marked cost advantage over trucks for such long hauls.
The Los Angeles-Oakland trip yields an attainable cost of $.855 per unit-
mile, with a railroad-only cost of $.29 per unit-mile. These costs would
be marginally competitive with trucks if a 15 percent rate discount must be
offered from a truckload cost of $1.00 per mile, but not competitive at
lower truck costs.
Costs and Length of Haul. Given these representative line-haul costs and a
truck cost of $.71 per mile, we can examine a general case for the minimum
length of haul over which double-stack trains will be competitive with
truckload carriers.
Rail fixed costs total $393.49, including $68.00 for terminal lift, $16.00
for chassis, $280.00 for drayage, $3.49 for car costs at the terminal, and
$26.00 for four days of container per diem (for a short haul, but more than
the 480 miles that can be travelled in one day). The line-haul cost of
$.144 per unit mile (Los Angeles-Oakland, Case 4) can be considered
representative. Rail car costs include per diem charges of $.0073 per unit
mile ($6.98 per day, divided by 24 hours at 40 mph, or 960 miles) and
mileage charges of $.0065 per unit mile, for a total of $0.0138 per
unit-mile. Total mileage costs are therefore $.144 plus $.0138, or $.158.
An estimated cost function for short-haul double-stack operations (no more
than four days container time) would therefore be:
Total cost = $393.49 + $.158 MR
where MR = Rail line-haul miles
where the rail miles include only the line-haul and the customer is within
30 miles of the rail hub.
-65-

Repositioning and Drayage. Both trucks and domestic containers ordinarily
must be repositioned to secure loads. Carriers are sometimes fortunate
enough to find return loads where they have just unloaded, but the average
repositioning movement is substantial.
Table 14 gives average repositioning distances by mileage blocks for over
7,000 truck hauls in the NMTDB (outlying figures representing unusual
operations were deleted from the data). In the shortest mileage block (700
- 1,000 miles, corresponding to much of the competitive range identified in
the service criteria), trucks travel an average of 154 miles from the last
unloading point to secure the next load. As Figure 17 shows, truckers are
willing to reposition farther on long hauls. But, as Figure 18 shows,
repositioning miles are a declining percentage of line-haul miles. In the
lowest mileage block, truck repositioning averages 18 percent of the
linehaul miles. This unutilized time reflects almost exactly the 80
percent overall utilization for truckload carriers, with a small margin for
other causes.
NMTDB data from truckload carriers who reported unloading in Chicago showed
an average length of haul of 1,730 miles and repositioning of 171 miles,
roughly 10 percent of the line-haul. This percentage corresponds closely
to the relationship shown in Table 14, although industrial traffic sources
in the Chicago area are denser than the national average.
Domestic container repositioning will typically require drayage beyond the
commercial zone (for which was allowed 30 miles and 4 hours as a fixed
terminal cost). At $35 per hour and 50 mph (outside the commercial zone),
drayage costs the double-stack customer $.70 per mile. Adding an "excess"
drayage term to the rail cost formula yields the following:
393.49 + .158 MR + .70(2)D
where MR = rail line-haul, and
D is the drayage beyond 30 miles.
Drayage and Minimum Length of Haul. A relationship between drayage and
minimum length of haul can now be established. Equating door-to-door
- 6 6 -

Table 14
TRUCK REPOSITIONING MILES
Mileage Block Average Haul Average Repositioning
700 - 1,000 840 154
1,000 - 1,500 1,212 208
1,500 - 2,000 1,741 230
2,000+ 2,496 239
Source: National Motor Transport Data Base.

Figure 17: REPOSITIONING MILES Vs. TRUCK LINE-HAULSource: National Motor Transport Data Base
Figure 18: REPOSITIONING MILES / TRUCKLOAD LINE-HAUL (percent)
Source: National Motor Transport Data Base

double-stack costs with 85 percent truckload costs (a 15 percent discount)
yields:
393.49 + .158 MR + .70(2)D = .85(.89) My
where MR = rail line-haul, and
My = truck line-haul
A Caveat: Circuity. Railroad and truck mileages are seldom the same, and
in many instances are far enough apart to affect the ability of railroads
to compete on short hauls. On long hauls, the cost advantage is great
enough, and the transit time long enough, for the railroads to overcome a
significant degree of circuitry. Moreover, circuitry as a percentage of
total distance tends to decline as length of haul increases. The highway
distance between Los Angeles and New Orleans is roughly 1883 miles, 10
percent less than the rail distance. On shorter hauls, however, the
difference can be significant, even decisive. The distance over Southern
Pacific's Central Valley route between Oakland and Los Angeles (used for
SP's priority trains and thus for our cost analysis) is 559 miles. The
highway distance is about 379 miles, 33 percent less. The railroad cannot
be cost-competitive on that route. (SP’s Coast Route is about 470 miles,
still not cost-competitive.)
Table 15 compares rail and truck (highway) distances for some 200 city
pairs representing major intermodal candidates. The rail mileage is
actually shorter in a handful of cases (e.g., Chicago-Memphis or Kansas
City-Detroit). On average, however, rail mileages are about 8 percent
longer (more circuitous) than truck mileages.
Thus, truck mileage is typically about 92.6 percent (the reciprocal of
1.08) of rail mileage. This relationship allows the cost equation to be
expressed in terms of rail line-haul mileage:
393.49 + .158 (MR) + .70(2)D = .85(.89) .926MR
where MR = rail line-haul
and D = drayage beyond 30 miles
-67-

Atlanta
Table 15SELECTED RAIL AND HIGHWAY MILEAGES
DallasChicago
Rail Highway R/H Rail Highway R/H Rail Highway R/HAtlanta Atlanta 734 674 1.09 Atlanta 825 795 1.04Baltimore 676 645 1.05 Baltimore 796 668 1.19 Baltimore 1448 1356 1.07Boston 1091 1037 1.05 Boston 1018 963 1.06 Boston 1864 1748 1.07Chicago 734 674. 1.09 Chicago Chicago 968 917 1.06Cleveland 750 672 1.12 Cleveland 340 335 1.01 Cleveland 1234 1159 1.06Dallas 825 795 1.04 Dallas 968 917 1.06 DallasDenver 1526 1398 1.09 Denver 1026 996 1.03 Denver 835 781 1.07Detroit 748 699 1.07 Detroit 272 266 1.02 Detroit 1200 1143 1.05Houston 856 789 1.08 Houston 1205 1067 1,13 Houston 264 243 1.09Indianapolis 585 493 1.19 Indianapolis 184 181 1.02 Indianapolis 951 865 1.10Jacksonville 350 306 1.14 Jacksonville 1083 980 1.11 Jacksonville 1096 990 1.11Kansas City 890 798 1.12 Kansas City 451 499 0.90 Kansas City 517 489 1.06Los Angeles 2285 2182 1.05 Los Angeles 2227 2054 1.08 Los Angeles 1460 1387 1.05Memphis 420 371 1.13 Memphis 527 530 0.99 Memphis 481 452 1.06Miami 716 655 1.09 Miami 1449 1329 1.09 Miami 1462 1300 1.12New Orleans 493 479 1.03 New Orleans 921 912 1.01 New Orleans 506 496 1.02New York 862 841 1.02 New York 908 802 1,13 New York 1635 1552 1.05Philadelphia 771 741 1.04 Philadelphia 816 738 1.11 Philadelphia 1543 1452 1.06Pittsburgh 806 687 1.17 Pittsburgh 468 452 1.04 Pittsburgh 1291 1204 1.07St Louis 612 541 1.13 St Louis 284 289 0.98 St Louis 711 630 1.13St Paul 1130 1063 1.06 St Paul 396 395 1.00 St Paul 997 938 1.06San Francisco 2718 2496 1.09 San Francisco 2263 2142 1.06 San Francisco 1930 1753 1.10Seattle 2824 2618 1.08 Seattle 2141 2013 1.06 Seattle 2394 2078 1.15AVERAGE RAIL CIRCUITY 1.088 1.053 1.075
Jacksonville Kansas City Los Angeles
Rail Highway R/H Rail Highway R/H Rail Highway R/HAtlanta 350 306 1.14 Atlanta 890 798 1.12 Atlanta 2285 2182 1.05Baltimore 794 763 1,04 Baltimore 1198 1048 1.14 Baltimore 2908 2636 1.10Boston 1210 1155 1.05 Boston 1469 1391 1,06 Boston 3244 2979 1.09Chicago 1083 980 1.11 Chicago 451 499 0.90 Chicago 2227 2054 1.08Cleveland 1100 915 1.20 Cleveland 791 779 1,02 Cleveland 2555 2367 1.08Dallas 1096 990 1.11 Dallas 517 489 1.06 Dallas 1460 1387 1.05Denver 1811 1704 1.06 Denver 636 600 1.06 Denver 1353 1059 1.28Detroit 1098 1003 1.09 Detroit 723 743 0.97 Detroit 2499 2311 1.08Houston 975 889 1.10 Houston 781 710 1.10 Houston 1641 1538 1.07Indianapolis 935 799 1.17 Indianapolis 518 485 1,07 Indianapolis 2272 2073 1.10Jacksonville Jacksonville 1175 1104 1.06 Jacksonville 2578 2377 1.08Kansas City 1175 1104 1.06 Kansas City Kansas City 1776 1589 1.12Los Angeles 2578 2377 1,08 Los Angeles 1776 1589 1.12 Los AngelesMemphis 691 674 1.03 Memphis 484 451 1.07 Memphis 1942 1817 1.07Miami 366 349 1.05 Miami 1541 1448 1.06 Miami 2944 2687 1.10New Orleans 612 555 1.10 New Orleans 873 806 1.08 New Orleans 1966 1883 1.04New York 981 959 1.02 New York 1329 1198 1.11 New York 3082 2786 1.11Philadelphia 890 859 '1.04 Philadelphia 1237 1118 1.11 Philadelphia 2991 2706 1.11Pittsburgh 1052 851 1.24 Pittsburgh 889 838 1.06 Pittsburgh 2643 2426 1.09St Louis 917 847 1,08 St Louis 278 257 1.08 St Louis 2032 1845 1.10St Paul 1479 1369 1.08 St Paul 480 449 1.07 St Paul 2157 1894 1.14San Francisco 2989 2743 1.09 San Francisc 1970 1835 1.07 San Francisco 470 379 1.24Seattle 3129 2924 1,07 Seattle 1954 1839 1.06 Seattle 1370 1131 1.21AVERAGE RAIL CIRCUITY 1.092 1,066 1.108

Table 15SELECTED RAIL AND HIGHWAY MILEAGES
New Orleans New York San Francisco
Rail Highway . R/H Rail Highway R/H Rail Highway R/HAtlanta 493 479 1.03 Atlanta 862 841 1.02 Atlanta 2718 2496 1.09Baltimore 1154 1115 1.03 Baltimore 187 196 0.95 Baltimore 3059 2796 1.09Boston 1569 1507 .1,04 Boston 229 206 1.11 Boston 3281 3095 1.06Chicago 921 912 1.01 Chicago 908 802 1.13 Chicago 2263 2142 1.06Cleveland 1096 1030 1.06 Cleveland 571 473 1,21 Cleveland 2603 2467 1.06Dallas 506 496 1.02 Dallas 1635 1552 1.05 Dallas 1930 1753 1.10Denver 1341 1273 1.05 Denver 1934 1771 1.09 Denver 1374 1235 1.11Detroit 1094 1045 1.05 Detroit 648 637 1.02 Detroit 2535 2399 1.06Houston 363 356 1.02 Houston 1703 1608 1.06 Houston 2111 1912 1.10Indianapolis 858 796 1.08 Indianapolis 811 713 1.14 Indianapolis 2429 2256 1.08Jacksonville 612 555 1.10 Jacksonville 981 959 1,02 Jacksonville 2989 2743 1,09Kansas City 873 806 1.08 Kansas City 1329 1198 1.11 Kansas City 1970 1835 1.07Los Angeles 1966 1883 1.04 Los Angeles 3082 2786 1.11 Los Angeles 470 379 1.24Memphis 394 390 1.01 Memphis 1153 1100 1.05 Memphis 2298 2125 1.08Miami 978 856 1,14 Miami 1347 1308 1.03 Miami 3355 3053 1.10New Orleans New Orleans 1355 1311 1.03 New Orleans 2436 2249 1.08New York 1355 1311 1.03 New York New York 3171 2934 1.08Philadelphia 1264 1211 1.04 Philadelphia 91 100 0.91 Philadelphia 3079 2866 1.07Pittsburgh 1152 1070 1.08 Pittsburgh 439 368 1,19 Pittsburgh 2731 2578 1.06St Louis 699 673 1.04 St Louis 1051 948 1.11 St Louis 2189 2089 1.05St Paul 1273 1209 1.05 St Paul 1304 1197 1,09 St Paul 2123 1945 1.09San Francisco 2436 2249 1.08 San Francisco 3171 2934 1.08 San FranciscoSeattle 2900 2574 1.13 Seattle 2739 2815 0.97 Seattle 900 808 1.11AVERAGE RAIL CIRCUITY 1.056 1.068 1.088
SeattleRail Highway R/H
Atlanta 2824 2613 1.03Baltimore 2937 2681 1.10Boston 3159 2976 1.06Chicago 2141 2013 1.06Cleveland 2481 2348 1.06Dallas 2394 2078 1.15Denver 1554 1307 1.19Detroit 2413 2279 1.06Houston 2656 2274 1.17Indianapolis 2325 2194 1.06Jacksonville 3129 2924 1.07Kansas City 1954 1839 1.06Los Angeles 1370 1131 1.21Memphis 2438 2290 1.06Miami 3495 3273 1.07New Orleans 2900 2574 1.13New York 3049 2815 1.08Philadelphia 2957 2751 1.07Pittsburgh 2610 2465 1.06St Louis 2213 2081 1.06St Paul 1745 1618 1.08San Francisco 900 808 1.11SeattleAVERAGE RAIL CIRCUITY 1,094 OVERALL AVERAGE RAIL CIRCUITY 1.079

This equation simplifies to:
725.30 + 2.58D = MR
Therefore, without drayage beyond the commercial zone, a double-stack train
with a line-haul of 725 miles can compete with a truckload haul of 671
miles (725 x .926). Although railroads may be able to offer competitive
transit times on runs as short as 540 miles, the cost would be prohibitive.
Thus, 725 miles is the minimum length of haul used in this study.
The table below shows the relationship and lengths of haul for drayage
Zones 0 through 4 defined earlier:
Drayage and Length of Haul
For Double-Stack/Truckload Competition
Drayage
Zone
One-Way
Drayage
Range
Miles
Truck
Line-haul
Rail
Line-haul
Zone 0 0- 30 671 725
Zone 1 30- 80 791 854
Zone 2 80-130 910 983
Zone 3 130-180 1,030 1,112
Zone 4 180-230 1,149 1,241
Figure 19 displays the relationship graphically. The area under the line
is subject to competition from double-stacks under favorable assumptions:
highly efficient operations and 100 percent loaded containers and cars in
both directions. Only the most successful double-stack operators now
approach either the cost or utilization assumptions used. These standards
should be approached, however, by double-stack services seeking to be
competitive with trucks on hauls as short as 725 miles.
This finding coincides with the results of the 1977 Census of Transporta
tion, which found little rail market share in hauls of less than 500 miles,
although 83 percent of the intercity merchandise moving by motor carrier
was in such short hauls. Roughly 11 percent of the traffic was found to be
-68-

24-0
220
200
180
160
140
120
100
80
60
40
20
0750 900 1050 1200
Line-Haul Miles
19: COMPETITIVE RAIL LINE-HAUL AT 8% CIRCUITY

in the 500-999 mile range, where this study found double-stack service to
be truck-competitive, and the remaining 6 percent was in hauls of 1,000
miles or more, where double-stacks may have an advantage and where rail
roads have been found to hold a larger market share.
-69-

IV. DOUBLE-STACK NETWORKS
A. HYPOTHETICAL 1987 DOUBLE-STACK NETWORK
1. Major Corridors
Relevant data from the 1987 Carload Waybill Sample were examined to identi
fy rail corridors 725 or more miles in length with sufficient containeriz-
able rail traffic to initiate six-day-per-week double-stack trains of at
least 15 cars each with a star-up threshold of 60 percent: that is, a
minimum of 28,080 annual containers, trailers, or container equivalents.
The corridors thus identified are listed in Table 16, and shown in Figure
20. Corridors were defined as flows between BEA Economic Areas (BEAs),
each consisting of one or more major cities and surrounding territories
defined by the Bureau of Economic Analysis.
In essence, these major corridors consist of eleven routes radiating from
Chicago (Seattle, Portland, San Francisco-Oakland, Fresno-Bakersfield, Los
Angeles, Dallas, Baltimore, Philadelphia, New York, Boston, and Quebec),
and five more radiating from Los Angeles (Kansas City, Memphis, Dallas, New
Orleans, and Houston). This network of hypothetical 1987 double-stack
routes resembles the services actually available in 1989 (Figure 11). Many
of these corridors already had double-stack service in 1987. Moreover, the
same major hubs that have attracted international double-stack service have
long attracted domestic piggyback and boxcar service. _
The similarity between Figure 11 and Figure 20, however, can be misleading.
The corridors shown in Figure 20, and listed in Table 16, are those deter
mined to be potentially capable of initiating six-day-per-week, truck-
competitive, dedicated double-stack service for domestic and international
traffic. Current double-stack services, with only a few exceptions, are
still based on international traffic flows, with the ability to compete
with trucks for domestic flows a secondary consideration.
Routes to the Southeast, notably Atlanta, are conspicuously absent from
Figure 20. The largest single candidate flow for that region, the Chicago-
-70-

RAIL TRAFFIC MEETING ANNUAL VOLUME CRITERIA OF 60 PERCENT OF 46,800 ANNUAL FEUS IN 1987 AND AT LEAST 725 MILES OF RAIL DISTANCE
BY ORIGIN BEA AND DESTINATION BEA UITH RAIL-HIGHWAY CIRCUITY APPENDED SORTED BY ANNUAL FEUS
SOURCE: 1987 ICC CARLOAD WAYBILL SAMPLE
ALK ASSOCIATES INC 11/28/89 PAGE
ORIGIN BEA NUMBER AND NAME DESTINATION BEA NUMBER AND NAMEANNUALFEUS
ANNUAL NET TONS
RAILDIST
HI WAY DIST
RAIL/ HI WAY RATIO
180 LOS ANGELES, CA 83 CHICAGO, IL 187,054 2,668,915 2,199 2,040 1.0883 CHICAGO, IL 180 LOS ANGELES, CA 160,377 2,281,766 2,199 2,040 1.0883 CHICAGO, IL 12 NEW YORK, NY 159,045 2,565,063 904 815 1.1112 NEW YORK, NY 83 CHICAGO, IL 144,595 1,017,056 904 815 1.11171 SEATTLE, WA 83 CHICAGO, IL 113,753 1,733,130 2,166 2,080 1.0483 CHICAGO, IL 171 SEATTLE, WA 103,159 917,272 2,166 2,080 1.0483 CHICAGO, IL 18 PHILADELPHIA, PA 79,559 1,336,916 836 785 1.0683 CHICAGO, IL 176 SAN FRANCISCO-OAKLAND-SAN JOSE, CA 59,385 799,948 2,222 2,120 1.0583 CHICAGO, IL 4 BOSTON, MA 56,220 943,472 1,006 992 1.01176 SAN FRANCISCO-OAKLAND-SAN JOSE, CA 83 CHICAGO, IL 53,234 918,886 2,222 2,120 1.0583 CHICAGO, IL 19 BALTIMORE, MD 49,160 786,084 811 773 1.05122 HOUSTON, TX 180 LOS ANGELES, CA 45,798 870,728 1,630 1,564 1.0483 CHICAGO, IL 125 DALLAS-FORT WORTH, TX 45,016 688,780 992 965 1.03186 QUEBEC 83 CHICAGO, IL 40,220 700,380 835 851 0.984 BOSTON, MA 83 CHICAGO, IL 37,699 400,840 1,006 992 1.0183 CHICAGO, IL 172 PORTLAND, OR 37,439 452,000 2,193 2,122 1.03179 FRESNO-BAKERSFIELD, CA 83 CHICAGO, IL 37,107 774,148 2,301 2,154 1.07180 LOS ANGELES, CA 55 MEMPHIS, TN 34,965 501,730 2,104 1,803 1.1718 PHILADELPHIA, PA 83 CHICAGO, IL 34,806 469,200 836 785 1.06172 PORTLAND, OR 83 CHICAGO, IL 34,333 715,140 2,194 2,122 1.03180 LOS ANGELES, CA 122 HOUSTON, TX 34,324 558,792 1,630 1,564 1.04172 PORTLAND, OR 180 LOS ANGELES, CA 32,390 734,640 1,091 960 1.1419 BALTIMORE, MD 83 CHICAGO, IL 32,147 438,180 811 773 1.05180 LOS ANGELES, CA 125 DALLAS-FORT WORTH, TX 31,753 467,492 1,639 1,438 1.14180 LOS ANGELES, CA 105 KANSAS CITY, MO 29,818 468,400 1,739 1,618 1.07105 KANSAS CITY, MO 180 LOS ANGELES, CA 29,799 493,628 1,739 1,618 1.07180 LOS ANGELES, CA 113 NEW ORLEANS, LA 28,960 482,208 1,990 1,913 1.04
Table 16

Double Stack Network For Year 1987
Figure 20

Atlanta traffic, is adequate in volume, but the distance is slightly short
of the minimum length of haul derived from the operating cost criteria.
Industry contacts indicate that the existing Chicago-Atlanta double-stack
traffic consists largely of international and domestic traffic between
Atlanta and the West Coast that has been rebilled at Chicago: there is
little domestic double-stack traffic actually moving between Chicago and
Atlanta. Intermodal traffic to and from Miami is dominated by the Jackson-
ville-Miami traffic carried by FEC, which, according to the cost criteria,
does not travel far enough by rail to provide truck-competitive double
stack service.
There has, however, been substantial development of double-stack service to
and from the Southeast since 1987. Atlanta is now served from Chicago and
New Orleans, and further expansion seems likely. These services are based
on international flows, but may nonetheless attract some domestic movements
as backhauls.
The listing in Table 16 does not preclude railroads or third-parties from
offering double-stack or mixed intermodal service in other corridors to
attract boxcar traffic, or as a more efficient line-haul technology for
piggyback traffic. It is possible that such services could divert a small
amount of price-sensitive, low-service truck traffic. Such services,
however, are not likely to achieve the volume needed to support truck-
competitive, six-day-per-week service with just domestic traffic.
Other double-stack services will be offered, and several already are. The
major corridors identified here do not include those that may carry weekly
double-stack trains, or small blocks of double-stack cars, for major ocean
carriers or other large customers.
2. Intermediate Points
Within an established service corridor, railroads offer service to, from,
and between intermediate points, as long as each haul is at least 725
miles. A volume of one car (10 containers or equivalents) five days per
week was set as the long-term minimum, and service was assumed to start at
60 percent of that minimum, giving a start-up threshold of 1560 annual
-71-

units for intermediate points. Below this threshold, service would require
the use of shorter cars (technically possible) or partial loading of cars
(technically possible but inefficient and therefore unlikely to persist).
Table 17 lists the intermediate points that could potentially be served
within the major double-stack corridors. Typically, one of the two BEAs is
the end point of a major corridor: there is relatively little potential for
movements between two secondary intermediate points. Figure 21 shows the
increased density of the major double-stack corridors once the intermediate
points are added.
Caveats. The network described for 1987 assumes that all containerizable
traffic on those corridors is converted to double-stack containers. This
assumption was not yet true in 1987, and is not likely to be true for
several years. Some of the corridors shown on Figure 21 may not actually
support frequent double-stack service as long as boxcars remain competitive
in certain market niches. The Portland-Chicago and Fresno-Chicago flows,
in particular, include significant amounts of boxcar traffic that may
resist conversion to containers.
All of the network flows described in the preceding figures implicitly
assume that the entire double-stack volume is available to one railroad in
order to provide at least one service of the desired frequency. In the
densest corridors there is enough traffic to support more than one service.
But in the less dense corridors, every railroad may not be able to justify
a double-stack departure every day.
The apparent position of the Chicago BEA as the preeminent shipper and
receiver of potential double-stack traffic is deceptive. A large quantity
of trailer traffic, and some container traffic, is drayed across Chicago
between eastern and western railroads. Preliminary research by ALK
Assoicates suggests that as much as 40 percent of the trailer traffic that
"terminates" in Chicago is actually "rubber-tired" and becomes Chicago
"originating" traffic within a few days, accounting for up to 1,000
movements per day, five days per week. The apparent West Coast - Chicago
and East Coast - Chicago corridors conceal the existence of a larger
through West Coast - East Coast movement than the Carload Waybill Sample
-72-

ALK ASSOCIATES INC 11/28/89 PAGE 1
RAIL TRAFFIC TRAVELING ENTIRELY WITHIN CORRIDORS DEFINED BY 60 PERCENT OF ANNUAL FEUS IN 1987 AND WITH A RAIL DISTANCE OF AT LEAST 725 MILES
BY ORIGIN BEA AND DESTINATION BEA SORTED BY DESCENDING ANNUAL FEUS
SOURCE: 1987 ICC CARLOAD WAYBILL SAMPLE
RAIL/ANNUAL ANNUAL RAIL HI WAY HI WAY
ORIGIN BEA NUMBER AND NAME DESTINATION BEA NUMBER AND NAME FEUS NET TONS DIST DIST RATIO=== = II II II II II II II II II II II II II II II II II II II II II II II II II II II IIIIIIIIIIII II II II II II II II II II II II II II IIIIIIIIIIIIIIIIIIIIIIIIIIIIIIIIIIIIIIIIIIIIIIIIIIIIIIIIIIIIIIII =====-;=======-====“ IIIIIIIIIIIIIIIIIIIIIIIIII IIIIIIIIIIIIIIIIII II II II II II II II II IIIIIIIIIIII
55 MEMPHIS, TN 180 LOS ANGELES, CA 27,539 417,796 2,104 1,803 1.17173 EUGENE, OR 180 LOS ANGELES, CA 27,371 656,320 966 854 1.1383 CHICAGO, IL 17 HARRISBURG-YORK-LANCASTER, PA 24,701 424,280 729 681 1.07122 HOUSTON, TX 176 SAN FRANCISCO-OAKLAND-SAN JOSE, CA 20,571 354,232 2,060 1,917 1.07180 LOS ANGELES, CA 107 ST. LOUIS, MO 19,258 317,902 2,041 1,854 1.10178 STOCKTON-MODESTO, CA 83 CHICAGO, IL 19,017 428,888 2,182 2,087 1.05107 ST. LOUIS, MO 180 LOS ANGELES, CA 18,645 301,688 2,041 1,854 1.10113 NEW ORLEANS, LA 180 LOS ANGELES, CA 17,840 321,856 1,990 1,913 1.0483 CHICAGO, IL 6 HARTFORD-NEW HAVEN-SPRINGFLD, CT-MA 17,206 289,244 944 931 1.01125 DALLAS-FORT WORTH, TX 83 CHICAGO, IL 16,086 245,996 992 965 1.0383 CHICAGO, IL 165 SALT LAKE CITY-OGDEN, UT 13,933 191,460 1,485 1,405 1.06171 SEATTLE, WA 12 NEW YORK, NY 12,223 166,780 3,071 2,892 1.0683 CHICAGO, IL 162 PHOENIX AZ 12,058 148,752 1,818 1,810 1.00180 LOS ANGELES, CA 172 PORTLAND, OR 11,651 175,056 1,091 960 1.1471 DETROIT, MI 180 LOS ANGELES, CA 11,338 266,480 2,451 2,291 1.0717 HARRISBURG-YORK- LANCASTER , PA 83 CHICAGO, IL 11,267 149,200 729 681 1.07171 SEATTLE, WA 96 MINNEAPOLIS-ST. PAUL, MN 11,188 175,292 1,728 1,663 1.046 HARTFORD-NEW HAVEN-SPRINGFLD, CT-MA 83 CHICAGO, IL 10,508 108,080 944 931 1.01
113 NEW ORLEANS, LA 176 SAN FRANCISCO-OAKLAND-SAN JOSE, CA 10,128 166,928 2,365 2,266 1.04176 SAN FRANCISCO-OAKLAND-SAN JOSE, CA 122 HOUSTON, TX 9,803 151,784 2,060 1,917 1.07172 PORTLAND, OR 176 SAN FRANCISCO-OAKLAND-SAN JOSE, CA 9,347 204,120 739 638 1.16177 SACRAMENTO, CA 83 CHICAGO, IL 9,292 209,760 2,137 2,040 1.05125 DALLAS-FORT WORTH, TX 180 LOS ANGELES, CA 8,997 140,952 1,639 1,438 1.14169 RICHLAND, WA 83 CHICAGO, IL 8,887 205,820 1,996 1,945 1.0371 DETROIT, MI 176 SAN FRANCISCO-OAKLAND-SAN JOSE, CA 8,597 203,400 2,561 2,371 1.0883 CHICAGO, IL 179 FRESNO-BAKERSFIELD, CA 8,418 76,510 2,301 2,154 1.0796 MINNEAPOLIS-ST. PAUL, MN 171 SEATTLE, WA 8,260 104,680 1,728 1,663 1.0471 DETROIT, MI 125 DALLAS-FORT WORTH, TX 7,778 179,780 1,246 1,209 1.0355 MEMPHIS, TN 176 SAN FRANCISCO-OAKLAND-SAN JOSE, CA 7,712 116,380 2,404 2,081 1.16176 SAN FRANCISCO-OAKLAND-SAN JOSE, CA 172 PORTLAND, OR 6,943 128,592 739 638 1.1683 CHICAGO, IL 178 STOCKTON-MODESTO, CA 6,899 110,200 2,182 2,087 1.05165 SALT LAKE CITY-OGDEN, UT 176 SAN FRANCISCO-OAKLAND-SAN JOSE, CA 6,887 111,480 807 719 1.1212 NEW YORK, NY 176 SAN FRANCISCO-OAKLAND-SAN JOSE, CA 6,785 95,880 3,315 2,902 1.14162 PHOENIX AZ 83 CHICAGO, IL 6,676 108,448 1,818 1,810 1.00139 WICHITA, KS 180 LOS ANGELES, CA 6,563 129,016 1,569 1,495 1.05176 SAN FRANCISCO-OAKLAND-SAN JOSE, CA 125 DALLAS-FORT WORTH, TX 5,909 105,992 1,939 1,791 1.08165 SALT LAKE CITY-OGDEN, UT 83 CHICAGO, IL 5,907 105,450 1,485 1,405 1.0683 CHICAGO, IL 168 SPOKANE, WA 5,600 81,240 1,842 1,806 1.0283 CHICAGO, IL 164 RENO, NV 5,434 71,240 1,982 1,904 1.04176 SAN FRANCISCO-OAKLAND-SAN JOSE, CA 113 NEW ORLEANS, LA 5,227 104,480 2,420 2,266 1.07176 SAN FRANCISCO-OAKLAND-SAN JOSE, CA 165 SALT LAKE CITY-OGDEN, UT 4,993 99,640 - 807 719 1.12176 SAN FRANCISCO-OAKLAND-SAN JOSE, CA 12 NEW YORK, NY 4,970 95,432 3,315 2,902 1.14172 PORTLAND, OR 162 PHOENIX AZ 4,847 108,640 1,421 1,308 1.0996 MINNEAPOLIS-ST. PAUL, MN 172 PORTLAND, OR 4,758 66,600 1,770 1,733 1.02172 PORTLAND, OR 179 FRESNO-BAKERSFIELD, CA 4,653 111,440 817 754 1.08125 DALLAS-FORT WORTH, TX 176 SAN FRANCISCO-OAKLAND-SAN JOSE, CA 4,612 75,668 1,939 1,791 1.08173 EUGENE, OR 162 PHOENIX AZ 4,585 109,480 1,351 1,202 1.12
Table 17

ALK ASSOCIATES INC 1 1 /2 8 /8 9 PAGE 2
RAIL TRAFFIC TRAVELING ENTIRELY WITHIN CORRIDORS DEFINED BY 60 PERCENT OF ANNUAL FEUS IN 1987 AND WITH A RAIL DISTANCE OF AT LEAST 725 MILES
BY ORIGIN BEA AND DESTINATION BEA
SORTED BY DESCENDING ANNUAL FEUS SOURCE: 1987 ICC CARLOAD WAYBILL SAMPLE
RAIL/ANNUAL ANNUAL RAIL HIWAY HIWAY
ORIGIN BEA NUMBER AND NAME DESTINATION BEA NUMBER AND NAME FEUS NET TONS DIST DIST RATIO
173 EUGENE, OR 83 CHICAGO, IL 4 ,49 8 107,260 2,319 2,236 1.04105 KANSAS CITY, MO 162 PHOENIX AZ 4,48 2 74,040 1,359 1,362 1.00
71 DETROIT, MI 162 PHOENIX AZ 4,42 2 105,960 2,071 2,060 1.01173 EUGENE, OR 12 NEW YORK, NY 4 ,4 1 8 106,020 3,245 3,01 8 1.08135 AMARILLO, TX 180 LOS ANGELES, CA 4,25 7 85,440 1,219 1,078 1.13172 PORTLAND, OR 96 MINNEAPOLIS-ST. PAUL, MN 4 ,0 4 7 82,060 1,777 1,733 1.03178 STOCKTON-MODESTO, CA 9 ROCHESTER, NY 3,765 90 ,360 2,909 2,666 1 .09178 STOCKTON-MODESTO, CA 125 DALLAS-FORT WORTH, TX 3 ,7 4 6 85 ,992 1,861 1,757 1 .06170 YAKIMA, WA 83 CHICAGO, IL 3 ,6 5 3 80,260 2,074 2,003 1.04178 STOCKTON-MODESTO, CA 12 NEW YORK, NY 3,58 2 85,720 3,22 3 2,869 1.12179 FRESNO-BAKERSFIELD, CA 113 NEW ORLEANS, LA 3 ,5 3 6 76,420 2,161 2,113 1.02111 LITTLE ROCK-N. LITTLE ROCK, AR 180 LOS ANGELES, CA 3,41 9 64 ,576 2,102 1,675 1.25
71 DETROIT, MI 171 SEATTLE, WA 3,333 62,320 2,493 2,360 1.0696 MINNEAPOLIS-ST. PAUL, MN 18 PHILADELPHIA, PA 3 ,2 4 6 75,280 1,253 1,199 1.05
178 STOCKTON-MODESTO, CA 122 HOUSTON, TX 3 ,2 1 8 74,180 1,984 1,883 1.05176 SAN FRANCISCO-OAKLAND-SAN JOSE, CA 162 PHOENIX AZ 3 ,0 6 4 65 ,488 800 713 1.12172 PORTLAND, OR 4 BOSTON, MA 3,06 0 72,260 3,22 2 3,081 1.05171 SEATTLE, WA 18 PHILADELPHIA, PA 3 ,0 3 9 66 ,400 3,003 2,862 1.05154 MISSOULA, MT 96 MINNEAPOLIS-ST. PAUL, MN 3 ,0 3 7 72,800 1,225 1,188 1.03
83 CHICAGO, IL 7 ALBANY-SCHENECTADY-TROY, NY 3,02 5 57,800 817 826 0 .9 9176 SAN FRANCISCO-OAKLAND-SAN JOSE, CA 18 PHILADELPHIA, PA 3 ,0 1 9 70,320 3 ,2 4 7 2,886 1.13
83 CHICAGO, IL 160 ALBUQUERQUE, NM 2,9 7 7 35,600 1,383 1,344 1.0383 CHICAGO, IL 177 SACRAMENTO, CA 2,960 44,640 2,13 7 2,040 1.05
180 LOS ANGELES, CA 133 ELPASO, TX 2,751 49,944 813 802 1.01178 STOCKTON-MODESTO, CA 17 HARRISBURG-YORK-LANCASTER, PA 2,685 64,440 3,04 8 2,752 1.11177 SACRAMENTO, CA 125 DALLAS-FORT WORTH, TX 2,64 8 57,880 2,145 1,802 1.19
19 BALTIMORE, MD 176 SAN FRANCISCO-OAKLAND-SAN JOSE, CA 2,595 39,720 3,033 2,830 1.07171 SEATTLE, WA 71 DETROIT, MI 2,575 46,160 2,493 2,360 1.06173 EUGENE, OR 6 HARTFORD-NEW HAVEN-SPRINGFLD, CT-MA 2,560 61,440 3,285 3,134 1.05180 LOS ANGELES, CA 160 ALBUQUERQUE, NM 2,530 39 ,528 893 796 1.12154 MISSOULA, MT 180 LOS ANGELES, CA 2,520 60,480 1,330 1,243 1 .0 7187 ONTARIO 125 DALLAS-FORT WORTH, TX 2,48 8 59,000 1,483 1,438 1.03187 ONTARIO 180 LOS ANGELES, CA 2,472 55,800 2,734 2,522 1.08
96 MINNEAPOLIS-ST. PAUL, MN 176 SAN FRANCISCO-OAKLAND-SAN JOSE, CA 2,42 8 53,280 2,100 2,016 1.04172 PORTLAND, OR 122 HOUSTON, TX 2,395 49,160 2,683 2,365 1.13133 ELPASO, TX 83 CHICAGO, IL 2,368 40,440 1,386 1,601 0 .8 7187 ONTARIO 105 KANSAS CITY, MO 2,34 8 48,240 946 999 0.95141 TOPEKA, KS 180 LOS ANGELES, CA 2,330 37 ,172 1,673 1,555 1.08178 STOCKTON-MODESTO, CA 70 TOLEDO, OH 2,29 0 54,960 2,552 2,302 1.11187 ONTARIO 107 ST. LOUIS, MO 2,215 41,840 734 768 0 .9 6169 RICHLAND, WA 88 ROCKFORD, IL 2 ,20 9 53,020 1,934 1,868 1.04180 LOS ANGELES, CA 111 LITTLE ROCK-N. LITTLE ROCK, AR 2,190 27,590 2,102 1,675 1.25176 SAN FRANCISCO-OAKLAND-SAN JOSE, CA 55 MEMPHIS, TN 2,18 8 47,570 2,404 2,081 1 .16173 EUGENE, OR 4 BOSTON, MA 2 ,1 0 7 50,440 3 ,3 4 7 3,195 1.05168 SPOKANE, WA 83 CHICAGO, IL 2 ,105 39,800 1,842 1,806 1.02
70 TOLEDO, OH 4 BOSTON, MA 2 ,0 6 7 34 ,280 781 768 1.0271 DETROIT, MI 172 PORTLAND, OR 1,993 43,520 2,511 2,373 1.06
Table 17

ALK ASSOCIATES INC 1 1 /2 8 /8 9 PAGE 3
RAIL TRAFFIC TRAVELING ENTIRELY WITHIN CORRIDORS DEFINED BY 60 PERCENT OF ANNUAL FEUS IN 1987 AND WITH A RAIL DISTANCE OF AT LEAST 725 MILES
BY ORIGIN BEA AND DESTINATION BEA SORTED BY DESCENDING ANNUAL FEUS
SOURCE: 1987 ICC CARLOAD WAYBILL SAMPLE
RAIL/
ANNUAL ANNUAL RAIL HIWAY HIWAYORIGIN BEA NUMBER AND NAME DESTINATION BEA NUMBER AND NAME FEUS NET TONS DIST DIST RATIO
173 EUGENE, OR 18 PHILADELPHIA, PA 1,982 47,480 3 ,1 7 7 3,002 1.06187 ONTARIO 176 SAN FRANCISCO-OAKLAND-SAN JOSE, CA 1,97 7 46,080 2,90 7 2,602 1.12139 WICHITA, KS 176 SAN FRANCISCO-OAKLAND-SAN JOSE, CA 1,960 37,200 1,869 1,751 1.07178 STOCKTON-MODESTO, CA 55 MEMPHIS, TN 1,956 45,060 2,326 2,045 1.14173 EUGENE, OR 20 WASHINGTON, DC 1,872 44,920 3,121 2,941 1.06
12 NEW YORK, NY 105 KANSAS CITY, MO 1,870 35,000 1,333 1,171 1.1412 NEW YORK, NY 171 SEATTLE, WA 1,870 18,360 3,071 2,892 1.06
135 AMARILLO, TX 176 SAN FRANCISCO-OAKLAND-SAN JOSE, CA 1,852 36,944 1,520 1,356 1.12160 ALBUQUERQUE, NM 83 CHICAGO, IL 1,840 32,760 1,383 1,344 1.03154 MISSOULA, MT 83 CHICAGO, IL 1 ,78 7 42,440 1,663 1,605 1.04164 RENO, NV 83 CHICAGO, IL 1,760 37,440 1,982 1,904 1.04178 STOCKTON-MODESTO, CA 4 BOSTON, MA 1,754 41,840 3,325 3,04 6 1.09122 HOUSTON, TX 133 ELPASO, TX 1,745 22,080 817 762 1 .07
71 DETROIT, MI 135 AMARILLO, TX 1,742 41,800 1,270 1,312 0 .9 7169 RICHLAND, WA 180 LOS ANGELES, CA 1,738 41,480 1,198 1,179 1.02
12 NEW YORK, NY 96 MINNEAPOLIS-ST. PAUL, MN 1,725 30,100 1,321 1,228 1.08178 STOCKTON-MODESTO, CA 18 PHILADELPHIA, PA 1,720 41,280 3,155 2,853 1.11105 KANSAS CITY, MO 160 ALBUQUERQUE, NM 1,688 28,120 931 896 1.04178 STOCKTON-MODESTO, CA 113 NEW ORLEANS, LA 1,662 37,080 2,344 2,232 1.05178 STOCKTON-MODESTO, CA 143 OMAHA, NE 1.660 32,240 1,730 1,604 1.08176 SAN FRANCISCO-OAKLAND-SAN JOSE, CA 88 ROCKFORD, IL 1,655 39,720 2,21 7 2,055 1.08143 OMAHA, NE 176 SAN FRANCISCO-OAKLAND-SAN JOSE, CA 1,605 33,080 1,787 1,637 1.09105 KANSAS C ITY , MO 65 CLEVELAND, OH 1,59 8 34,200 748 782 0 .9 6
Table 17


indicates. This practice will have to end if double-stack containers are
to replace the "rubber-tired" trailers and compete successfully with
trucks. The cost and service penalties imposed by rubber-tired
interchanges would seriously handicap domestic double-stack services.
Rubber-tired interchanges and the practice of rebilling rail
("steel-wheeled") interchanges at major gateways such as Chicago and New
Orleans appear to be responsible for the lack of complete data on some
substantial flows. The actual Los Angeles-Atlanta intermodal flow, for
example, is split in the data between Los Angeles-Atlanta, Los Angeles- New
Orleans, and New Orleans-Atlanta figures. Perhaps as a result, the Los
Angeles-Atlanta flow does not have sufficient apparent volume to be
included in the truck-competitive network.
B. HYPOTHETICAL 1987 DOMESTIC AND INTERNATIONAL COMPONENTS
1. 1987 Domestic-Only Corridors
Table 18 lists the corridors that meet the volume and length-of-haul
criteria on the basis of domestic traffic alone (or, more precisely, on the
basis of Carload Waybill Sample data with no indication of being
international). The list is short, much shorter than Table 16, because
many corridors reach the volume required for truck-competitive service
frequencies only by combining domestic and international traffic. The
corridors are shown in Figure 22.
2. 1987 International-Only Corridors
Table 19 lists corridors that meet the volume and length-of-haul criteria
based on Bureau of the Census data, and corridors that meet the same
criteria based on import/export records identified in the Carload Waybill
Sample. It is immediately clear from Table 19 that only a few major flows
that could be identified from the data have sufficient volume to offer
six-day-per-week truck-competitive service. The majority of international
double-stack flows will continue to be driven primarily by import/export
needs, rather than by any strategy of competing for domestic truck
business. It is also clear from Table 19 that the data sources disagree.
-73-

PAGE 1
BEA PAIRS OF ANNUAL DOMESTIC FEU VOLUMES QUALIFYING UNDER LEVEL1 CONDITIONS BY ORIGIN AND DESTINATION BEA
SORTED BY DECREASING TOTAL OF DOMESTIC ANNUAL FEU VOLUMES DATA SOURCE: 1987 ICC CARLOAD WAYBILL SAMPLE
ORIGIN BEA NUMBER AND NAME DESTINATION BEA NUMBER AND NAMERAILDIST
HI WAY DIST
DOMESTICFEUS
IMPORTFEUS
EXPORTFEUS
TOTALFEUS
83 CHICAGO, IL 12 NEW YORK, NY 904 815 159,045 0 0 159,045
12 NEW YORK, NY 83 CHICAGO, IL 904 815 144,595 0 0 144,59583 CHICAGO, IL 18 PHILADELPHIA, PA 836 785 79 ,559 0 0 79,559
180 LOS ANGELES, CA 83 CHICAGO, IL 2,199 2,040 63 ,682 22,101 101,271 187,05483 CHICAGO, IL 180 LOS ANGELES, CA 2,199 2,040 59,301 101,076 0 160,377
171 SEATTLE, UA 83 CHICAGO, IL 2,166 2,080 56,553 56,456 744 113,75383 CHICAGO, IL 4 BOSTON, MA 1,006 992 56,220 0 0 56,22083 CHICAGO, IL 19 BALTIMORE, MD 811 773 49,160 0 0 49,160
186 QUEBEC 83 CHICAGO, IL 835 851 39,820 400 0 40,2204 BOSTON, MA 83 CHICAGO, IL 1,006 992 37 ,699 0 0 37,699
83 CHICAGO, IL 171 SEATTLE, WA 2,166 2,080 37 ,099 0 66,060 103,159172 PORTLAND, OR 180 LOS ANGELES, CA 1,091 960 32 ,390 0 0 32,390
18 PHILADELPHIA, PA 83 CHICAGO, IL 836 785 32 ,206 2,600 0 34,806172 PORTLAND, OR 83 CHICAGO, IL 2,194 2,122 32 ,133 2,200 0 34,333
19 BALTIMORE, MD 83 CHICAGO, IL 811 773 32 ,107 40 0 32 ,147122 HOUSTON, TX 180 LOS ANGELES, CA 1,630 1,564 30 ,430 15,368 0 45,798
Table 18

Figure 22

Table 19IDENTIFIABLE 1987 INTERNATIONAL NETWORK FLOWS
MEETING DISTANCE AND VOLUME CRITERIA
From the 1987 Carload Waybill Sample:
Origin Destination 1mport Export TotalBEA BEA Contai ners Containers Contai ners
Los Angeles Ch i cago 22,101 101,271 123,372Ch i cago Los Angeles 101,076 0 101,076Ch i cago S e a t t 1e 0 66,060 66,060Seatt1e Ch i cago 56,456 744 57,200Ch i cago San Francisco -Oakland 38,068 0 38,068Fresno-Bakersfield Ch i cago 0 35,472 35,471San Francisco-Oak Ch i cago 40 32,116 32,156
From the 1987 Bureau of the Census Data:
Origin Destination 1mport Export TotalBEA BEA Containers Containers Container
Se att1e Buffalo 39,139 1,581 40,720Seatt1e New York 31,921 679 32,600Se att1e Ch i cago 27,697 6,913 34,610Los Angeles Buffalo 66,890 1,822 68,712Los Angeles New York 60,087 1,198 61,285Los Angeles Da 11as-Ft Worth 28,250 26,437 54,687
C. HYPOTHETICAL 1987 TRUCK DIVERSIONS
1. Truck Diversion Methodology
A central issue in this study is the extent to which domestic double-stack
container services might divert traffic from truckload motor carriers.
Competition between truckload motor carriers and conventional piggyback
services is already intense. In the long run, the ability of double-stacks
to compete with trucks will determine not only whether they will be able to
increase their share of the relevant market, but also whether railroads
will be able to retain their present market share.
The service and cost criteria developed in this study were explicitly
designed to identify potentially truck-competitive double-stack services.
The cost criteria were expressed as a relationship between length of rail
haul, length of truck haul, and cost of drayage (expressed as a series of
distance zones). At issue is the total cost of drayage on both ends of the
trip; a short, economical dray at origin will permit a larger dray at
destination, and vice versa. Total cost limitations, however, will not
permit long, expensive drays at both ends of the double-stack line haul.
It is possible under some circumstances for the dray on one end to be very
long indeed: drays of 250 miles or even longer are sometimes observed.
But, it is not currently possible for double-stack operations to incorpor
ate two long drays and still remain within a truck-competitive cost and
service envelope.
To identify the actual traffic that might be affected, these drayage
patterns were converted to geographic equivalents. After considering
several options, it was determined that Metropolitan Statistical Areas
(MSAs) are a workable equivalent to the Zone 0 drayage areas. There are
266 MSAs, each defined by a central city and selected surrounding counties
(except in New England, where they are defined in terms of cities and
towns). The 266 MSAs do not cover the entire nation, but are defined so as
to encompass major population centers. The most workable geographic
equivalents to Drayage Zone 4, with a one-way drayage range of up to 230
miles, are BEA Economic Areas (BEAs). BEAs are defined by clusters of
counties around one or more prominent city. BEAs cover the entire nation,
-74-

and typically incorporate one or more MSAs, together with surrounding
counties.
Double-stack line-haul services can justify drayage over MSAs on both ends,
over an MSA on one end and a BEA on the other, but not over entire BEAs on
both ends (Figure 23). TRAM searched the NMTDB for data on dry and refriger
ated truckload movements corresponding to potential 1987 corridors for truck-
competitive double-stack services (Figure 20). Some flows, such as Chicago-
Dallas, did not show up in the data due to the pattern of truckload movements
or the structure of the data base. The movements thus identified were sorted
into MSA's and BEA's to determine if they fit a feasible drayage pattern.
2. Truck Diversion Results
Appendix Table 6 lists the NMTDB truck movements that met the criteria set
forth above. MSA's have been aggregated into BEA's to yield BEA-to-BEA
flows comparable to the rail flows given in earlier tables. The results
are shown in Figure 24. These results indicate that significant truck
diversions have already taken place in the major, well-established double
stack corridors. We would otherwise expect to see much larger truck vo
lumes in major corridors such as Los Angeles-Chicago. The 1987 truckload
traffic in double-stack corridors is substantially lower than expected.
Accordingly, the 1988 NMTDB data were examined to determine if the 1987
data had yielded an anomaly: the 1988 results verified the 1987 results.
Effects of Truck Diversion on the Double-Stack Network. Table 20 lists the
rail and truck volumes (units) on the major double-stack corridors iden
tified in Table 16. Table 20 provides a second perspective on some of the
major flows. Between Los Angeles and Chicago, over 70 percent of the rele
vant traffic is already on the railroads in the form of container, piggy
back, and containerizable boxcar traffic. To the extent that this body
of traffic can be considered the relevant market, rail is already the
majority mode. Moreover, the rail share is roughly the same in both
directions. The situation between Los Angeles and Houston is markedly
different, with the rail share apparently much higher westbound than
eastbound. These shares suggest that the greatest potential for double
stack share growth between Los Angeles and Houston is the diversion
-75-

Line Haul
Line Haul
rMSA
Dray
MSA
Dray
Dray
GEOGRAPHIC DRAY AGE PATTERNS

Divertible Truck Traffic For 1987 Double Stack Network With Annual Truck VolumesData Source: TRAM Truck Diversions
500
Figure 24

ALK ASSOCIATES INC. PAGE 1
DOUBLE STACK RAIL NETWORK DEFINED BY RAIL HAUL OF AT LEAST 725 MILES AND ANNUAL FEU VOLUME OF AT LEAST 60 PERCENT OF 46 ,800
WITH DIVERTED FEU VOLUMES FROM TRAM DATA SORTED BY DESCENDING ANNUAL FEUS
DATA SOURCE: 1987 ICC CARLOAD WAYBILL SAMPLE AND ANNUALIZED TRAM TRUCK VOLUMES
RAIL/RAIL HIWAY HIWAY
ORIGIN BEA NUMBER AND NAME DESTINATION BEA NUMBER AND NAME DIST DIST RATIO RAIL FEUS TRAM FEUS TOTAL FEUS
180 LOS ANGELES, CA 83 CHICAGO, IL 2 ,199 2,040 1 .08 187,054 67,500 254,55483 CHICAGO, IL 180 LOS ANGELES, CA 2,199 2,040 1 .0 8 160,377 44,352 204,72983 CHICAGO, IL 12 NEW YORK, NY 904 815 1.11 159,045 0 159,04512 NEW YORK, NY 83 CHICAGO, IL 904 815 1.11 144,595 6 144,595
171 SEATTLE, WA 83 CHICAGO, IL 2 ,166 2,080 1 .04 113,753 0 113,75383 CHICAGO, IL 171 SEATTLE, WA 2,166 2,080 1 .04 103,159 0 103,15983 CHICAGO, IL 18 PHILADELPHIA, PA 836 785 1 .0 6 79,559 0 79,55983 CHICAGO, IL 176 SAN FRANCISCO-OAKLAND-SAN JOSE, CA 2 ,222 2,120 1.05 59,385 61,308 120,69383 CHICAGO, IL 4 BOSTON, MA 1,006 992 1.01 56,220 0 56,220
176 SAN FRANCISCO-OAKLAND-SAN JOSE, CA 83 CHICAGO, IL 2,222 2,120 1.05 53,234 0 53,23483 CHICAGO, IL 19 BALTIMORE, MD 811 773 1.05 49,160 0 49,160
122 HOUSTON, TX 180 LOS ANGELES, CA 1,630 1,564 1 .04 45,798 8,664 54,46283 CHICAGO, IL 125 DALLAS-FORT WORTH, TX 992 965 1 .03 45,016 0 45,016
186 UNKNOWN 83 CHICAGO, IL 835 851 0 .9 8 40,220 0 40,2204 BOSTON, MA 83 CHICAGO, IL 1,006 992 1.01 37,699 0 37,699
83 CHICAGO, IL 172 PORTLAND, OR 2,193 2,12 2 1 .03 37 ,439 24,696 62,135179 FRESNO-BAKERSFIELD, CA 83 CHICAGO, IL 2,301 2,154 1 .0 7 37 ,107 8,08 8 45,195180 LOS ANGELES, CA 55 MEMPHIS, TN 2,104 1,803 1 .1 7 34,965 25,872 60 ,837
18 PHILADELPHIA, PA 83 CHICAGO, IL 836 785 1 .0 6 34 ,806 0 34,806172 PORTLAND, OR 83 CHICAGO, IL 2,194 2,12 2 1 .03 34,333 12,348 46,681180 LOS ANGELES, CA 122 HOUSTON, TX 1,630 1,564 1 .04 34,324 68,016 102,340172 PORTLAND, OR 180 LOS ANGELES, CA 1,091 960 1 .14 32,390 63,156 95,546
19 BALTIMORE, MD 83 CHICAGO, IL 811 773 1.05 32 ,147 0 32 ,147180 LOS ANGELES, CA 125 DALLAS-FORT WORTH, TX 1,639 1,438 1 .14 31,753 88,992 120,745180 LOS ANGELES, CA 105 KANSAS CITY , MO 1,739 1,618 1 .0 7 29,818 7,368 37,186105 KANSAS C ITY , MO 180 LOS ANGELES, CA 1,739 1,618 1 .0 7 29,799 0 29,799180 LOS ANGELES, CA 113 NEW ORLEANS, LA 1,990 1,913 1.04 28,960 18,504 47,464
1,732,115 498,864 2 ,23 0 ,979
Table 20

of eastbound truck traffic or the conversion of other eastbound rail
traffic.
Table 21 provides an expanded list of corridors that might support truck
competitive domestic double-stack service if some or all of the potential
truck traffic were added to the rail volume, effectively "boot strapping"
the required volume. The expanded corridor network is shown in Figure 25.
Generally speaking, the additional corridors are incremental extensions of
the basic network: new combinations of BEAs already served, or links to
secondary markets.
Table 22 lists the rail and truck volumes for intermediate points in the ;
network with more than 1560 annual rail units. New combinations result
from the additional corridors shown in Figure 25. The addition of truck
traffic would not add new intermediate points to the basic network, because
if there are less than 1560 units of potential rail intermodal traffic,
there would not be sufficient volume on which to begin a new
truck-competitive service.
Eastern U.S. Truck Data. None of the foregoing tables list relevant truck
traffic on eastern U.S. corridors such as Chicago-Boston or Chicago-New
York. Although such traffic certainly exists, its volume cannot be
reliably determined from any available data.
For truck data, this study relies on the National Motor Transportation Data
Base (NMTDB), which is the only usable source of current data on the
origins, destinations, commodities, types, and volumes of truck
transportation. (The data collected by USDA on truck shipments of fresh
fruits and vegetables are far too narrow; the 1977 Commodity Transportation
Survey is dated and seriously limited in scope.) The NMTDB was created to
identify rail-competitive truck movements of 800 miles or more. However,
the cost criteria developed for this study imply a minimum length of haul
of 725 miles, which is below the design threshold for the NMTDB.
The heavily industrialized portion of the Northeast is largely contained in
a rough rectangle drawn between Boston, Milwaukee, St. Louis, and Baltimore
(Figure 26). The NMTDB was designed to identify truck movements in or out
-76-

ALK ASSOCIATES INC PAGE 1
DOUBLE STACK RAIL NETWORK DEFINED BY RAIL HAUL OF AT LEAST 725 MILES
AND ANNUAL TRAM PLUS WAYBILL FEU VOLUME OF AT LEAST 60 PERCENT OF 46 ,800 WITH DIVERTED FEU VOLUMES FROM TRAM DATA
SORTED BY DESCENDING ANNUAL TOTAL FEUSDATA SOURCE: 1987 ICC CARLOAD WAYBILL SAMPLE AND ANNUALIZED TRAM TRUCK VOLUMES
RAIL/RAIL HI WAY HI WAY
ORIGIN BEA NUMBER AND NAME DESTINATION BEA NUMBER AND NAME DIST DIST RATIO RAIL FEUS TRAM FEUS TOTAL FEUS
180 LOS ANGELES, CA 83 CHICAGO, IL 2,199 2,04 0 1 .08 187,054 67,500 254,55483 CHICAGO, IL 180 LOS ANGELES, CA 2,199 2,040 1 .08 160,377 44 ,352 204,729
125 DALLAS-FORT WORTH, TX 180 LOS ANGELES, CA 1,639 1,438 1.14 8 ,9 9 7 156,084 165,08183 CHICAGO, IL 12 NEW YORK, NY 904 815 1.11 159,045 0 159,04512 NEW YORK, NY 83 CHICAGO, IL 904 815 1.11 144,595 0 - 144,595
180 LOS ANGELES, CA 12 NEW YORK, NY 3,10 6 2,789 1.11 25,983 96,192 122,175180 LOS ANGELES, CA 125 DALLAS-FORT WORTH, TX 1,639 1,438 1.14 31,753 88,992 120,74583 CHICAGO, IL 176 SAN FRANCISCO-OAKLAND-SAN JOSE, CA 2,222 2,120 1.05 59,385 61 ,308 120,693
180 LOS ANGELES, CA 171 SEATTLE, WA 1,274 1,133 1.12 4,141 112,008 116,149171 SEATTLE, WA 83 CHICAGO, IL 2,166 2,080 1.04 113,753 0 113,753
83 CHICAGO, IL 171 SEATTLE, WA 2,166 2,080 1.04 103,159 0 103,159180 LOS ANGELES, CA 122 HOUSTON, TX 1,630 1,564 1.04 34,324 68,016 102,340172 PORTLAND, OR 180 LOS ANGELES, CA 1,091 960 1.14 32,390 63,156 95,546180 LOS ANGELES, CA 172 PORTLAND, OR 1,091 960 1.14 11,651 82,404 94,055
83 CHICAGO, IL 18 PHILADELPHIA, PA 836 785 1.06 79,559 0 79,559125 DALLAS-FORT WORTH, TX 162 PHOENIX, AZ 1,328 1,080 1.23 2,742 71,448 74,190171 SEATTLE, WA 180 LOS ANGELES, CA 1,274 1,133 1.12 6,223 56,940 63,163
83 CHICAGO, IL 172 PORTLAND, OR 2,193 2,122 1.03 37 ,439 24,696 62,135180 LOS ANGELES, CA 55 MEMPHIS, TN 2,104 1,803 1 .1 7 34,965 25,872 60 ,837
12 NEW YORK, NY 176 SAN FRANCISCO-OAKLAND-SAN JOSE, CA 3,315 2,902 1.14 6,785 51,672 58,45783 CHICAGO, IL 4 BOSTON, MA 1,006 992 1.01 56,220 0 56,22018 PHILADELPHIA, PA 180 LOS ANGELES, CA 3,03 8 2,734 1.11 2,022 53,520 55,542
122 HOUSTON, TX 180 LOS ANGELES, CA 1,630 1,564 1.04 45 ,798 8,664 54,462176 SAN FRANCISCO-OAKLAND-SAN JOSE, CA 83 CHICAGO, IL 2,222 2,120 1.05 53,234 0 53,234176 SAN FRANCISCO-OAKLAND-SAN JOSE, CA 171 SEATTLE, WA 923 811 1.14 1,033 50,928 51,96183 CHICAGO, IL 19 BALTIMORE, MD 811 773 1.05 49,160 0 49,160
180 LOS ANGELES, CA 113 NEW ORLEANS, LA 1,990 1,913 1.04 28,960 18,504 47,464180 LOS ANGELES, CA 4 BOSTON, MA 3,221 3,03 4 1.06 6,781 40,476 47 ,257
12 NEW YORK, NY 180 LOS ANGELES, CA 3 ,1 0 6 2,789 1.11 12,463 34,716 47,17971 DETROIT, MI 180 LOS ANGELES, CA 2,451 2,291 1 .0 7 11,338 35,496 46,834
172 PORTLAND, OR 83 CHICAGO, IL 2,194 2,122 1.03 34,333 12,348 46,681179 FRESNO-BAKERSFIELD, CA 83 CHICAGO, IL 2,301 2,154 1 .0 7 37 ,107 8,08 8 45,19583 CHICAGO, IL 125 DALLAS-FORT WORTH, TX 992 965 1.03 45 ,016 0 45,016
178 STOCKTON-MODESTO, CA 125 DALLAS-FORT WORTH, TX 1,861 1,757 1 .0 6 3,74 6 40,080 43,826178 STOCKTON-MODESTO, CA 171 SEATTLE, WA 883 804 1.10 207 43,272 43,479171 SEATTLE, WA 176 SAN FRANCISCO-OAKLAND-SAN JOSE, CA 923 811 1.14 1,797 39,132 40,929180 LOS ANGELES, CA 160 ALBUQUERQUE, NM 893 796 1.12 2,530 38,136 40,666125 DALLAS-FORT WORTH, TX 176 SAN FRANCISCO-OAKLAND-SAN JOSE, CA 1,939 1,791 1 .0 8 4,612 35,688 40,300186 UNKNOWN 83 CHICAGO, IL 835 851 0 .9 8 40,220 0 40,220
55 MEMPHIS, TN 180 LOS ANGELES,.CA 2,104 1,803 1 .1 7 27,539 12,288 39 ,827180 LOS ANGELES, CA 96 MINNEAPOLIS-ST. PAUL, MN 2,143 1,936 1.11 1,508 36,840 38,348176 SAN FRANCISCO-OAKLAND-SAN JOSE, CA 172 PORTLAND, OR 739 638 1 .1 6 6,943 30,852 37,795
4 BOSTON, MA 83 CHICAGO, IL 1,006 992 1.01 37 ,699 0 37 ,699180 LOS ANGELES, CA 105 KANSAS CITY, MO 1,739 1,618 1 .0 7 29 ,818 7,368 37 ,186162 PHOENIX, AZ 125 DALLAS-FORT WORTH, TX 1,328 1,080 1.23 602 35,832 36,434105 KANSAS C ITY , MO 165 SALT LAKE CITY-OGDEN, UT 1,138 1,055 1 .0 8 3 ,5 8 8 32,784 36,372
18 PHILADELPHIA, PA 83 CHICAGO, IL 836 785 1 .0 6 34 ,806 0 34,806
Table 21

ALK ASSOCIATES INC PAGE 2
DOUBLE STACK RAIL NETWORK DEFINED BY RAIL HAUL OF AT LEAST 725 MILES AND ANNUAL TRAM PLUS WAYBILL FEU VOLUME OF AT LEAST 60 PERCENT OF 46 ,800
WITH DIVERTED FEU VOLUMES FROM TRAM DATA SORTED BY DESCENDING ANNUAL TOTAL FEUS
DATA SOURCE: 1987 ICC CARLOAD WAYBILL SAMPLE AND ANNUALIZED TRAM TRUCK VOLUMES
ORIGIN BEA NUMBER AND NAME DESTINATION BEA NUMBER AND NAMERAILDIST
HI WAY DIST
RAIL/ HI WAY RATIO RAIL FEUS TRAM FEUS TOTAL FEUS
83 CHICAGO, IL 164 RENO, NV 1,982 1,904 1.04 5,434 28,524 33,958
19 BALTIMORE, MD 83 CHICAGO, IL 811 773 1.05 32 ,147 0 32,147
176 SAN FRANCISCO-OAKLAND-SAN JOSE, CA 105 KANSAS CITY, MO 2 ,0 1 7 1,770 1.14 7,286 24,696 31,982
180 LOS ANGELES, CA 71 DETROIT, MI 2,451 2,291 1 .0 7 857 30,768 31,625
173 EUGENE, OR 180 LOS ANGELES, CA 966 854 1.13 27,371 4,140 31,511
178 STOCKTON-MODESTO, CA 83 CHICAGO, IL 2,182 2 ,0 8 7 1.05 19,017 12,348 31,365
9 ROCHESTER, NY 180 LOS ANGELES, CA 2,81 9 2 ,6 1 9 1 .0 8 410 30,444 30,854
105 KANSAS C ITY , MO 180 LOS ANGELES, CA 1,739 1,618 1 .0 7 29,799 0 29,799
180 LOS ANGELES, CA 20 WASHINGTON, DC 3,01 0 2,664 1.13 1601,945,881
28,3201,844,892
28,4803 ,79 0 ,773
Table 21

ALK ASSOCIATES INC. PAGE 1
DOUBLE STACK RAIL NETWORK DEFINED BY RAIL HAUL OF AT LEAST 725 MILES WHOLLY WITHIN CORRIDORS DEFINED BY ANNUAL FEU VOLUME OF 60 PERCENT OF 46,800AND ANNUAL FEU VOLUME OF AT LEAST 60 PERCENT OF 2 ,600
WITH DIVERTED FEU VOLUMES FROM TRAM DATA SORTED BY DESCENDING ANNUAL FEUS
DATA SOURCE: 1987 ICC CARLOAD WAYBILL SAMPLE AND ANNUALIZED TRAM TRUCK VOLUMES
RAIL/RAIL HI WAY HI WAY
ORIGIN BEA NUMBER AND NAME DESTINATION BEA NUMBER AND NAME DIST DIST RATIO RAIL FEUS TRAM FEUS TOTAL FEUS
55 MEMPHIS, TN 180 LOS ANGELES, CA 2,104 1,803 1 .1 7 27,539 12,288 39,827173 EUGENE, OR 180 LOS ANGELES, CA 966 854 1.13 27,371 4,140 31,51183 CHICAGO, IL 17 HARRISBURG-YORK-LANCASTER, PA 729 681 1 .0 7 24,701 0 24,701
122 HOUSTON, TX 176 SAN FRANCISCO-OAKLAND-SAN JOSE, CA 2,060 1,917 1 .0 7 20,571 0 20,571180 LOS ANGELES, CA 107 S T. LOUIS, MO 2,041 1,854 1.10 19,258 0 19,258
178 STOCKTON-MODESTO, CA 83 CHICAGO, IL 2,182 2 ,0 8 7 1.05 19,017 12,348 31,365107 S T . LOUIS, MO 180 LOS ANGELES, CA 2,041 1,854 1.10 18,645 8,664 27,309113 NEW ORLEANS, LA 180 LOS ANGELES, CA 1,990 1,913 1.04 17,840 9,840 27,680
83 CHICAGO, IL 6 HARTFORD-NEW HAVEN-SPRINGFLD, CT-MA 944 931 1.01 17,206 0 17,206125 DALLAS-FORT WORTH, TX 83 CHICAGO, IL 992 965 1.03 16,086 0 16,086
83 CHICAGO, IL 165 SALT LAKE CITY-OGDEN, UT 1,485 1,405 1.06 13,933 8,088 22,021171 SEATTLE, WA 12 NEW YORK, NY 3,071 2,89 2 1 .0 6 12,223 0 12,223
83 CHICAGO, IL 162 PHOENIX, AZ 1,818 1,810 1.00 12,058 12,612 24,670180 LOS ANGELES, CA 172 PORTLAND, OR 1,091 960 1.14 11,651 82,404 94,055
71 DETROIT, MI 180 LOS ANGELES, CA 2,451 2,291 1 .0 7 11,338 35,496 46,83417 HARRISBURG-YORK-LANCASTER, PA 83 CHICAGO, IL 729 681 1 .0 7 11,267 0 11,267
171 SEATTLE, WA 96 MINNEAPOLIS-ST. PAUL, MN 1,728 1,663 1.04 11,188 0 11,1886 HARTFORD-NEW HAVEN-SPRINGFLD, CT-MA 83 CHICAGO, IL 944 931 1.01 10,508 0 10,508
113 NEW ORLEANS, LA 176 SAN FRANCISCO-OAKLAND-SAN JOSE, CA 2,365 2,26 6 1.04 10,128 0 10,128176 SAN FRANCISCO-OAKLAND-SAN JOSE, CA 122 HOUSTON, TX 2,060 1,917 1 .0 7 9,803 4,920 14,723172 PORTLAND, OR 176 SAN FRANCISCO-OAKLAND-SAN JOSE, CA 739 638 1.16 9,34 7 8,904 18,251177 SACRAMENTO, CA 83 CHICAGO, IL 2 ,13 7 2,040 1.05 9,292 12,348 21,640125 DALLAS-FORT WORTH, TX 180 LOS ANGELES, CA 1,639 1,438 1.14 8,99 7 156,084 165,081169 RICHLAND, WA 83 CHICAGO, IL 1,996 1,945 1.03 8 ,8 8 7 0 8,887
71 DETROIT, MI 176 SAN FRANCISCO-OAKLAND-SAN JOSE, CA 2,561 2,371 1.08 8 ,5 9 7 0 8,59 783 CHICAGO, IL 179 FRESNO-BAKERSFIELD, CA 2,301 2,154 1 .0 7 8,41 8 0 8,41896 MINNEAPOLIS-ST. PAUL, MN 171 SEATTLE, WA 1,728 1,663 1.04 8,260 0 8,26071 DETROIT, MI 125 DALLAS-FORT WORTH, TX 1,246 1,209 1.03 7,778 0 7,77855 MEMPHIS, TN 176 SAN FRANCISCO-OAKLAND-SAN JOSE, CA 2,404 2,081 1.16 7,712 0 7,712
176 SAN FRANCISCO-OAKLAND-SAN JOSE, CA 172 PORTLAND, OR 739 638 1.16 6,943 30,852 37,79583 CHICAGO, IL 178 STOCKTON-MODESTO, CA 2,182 2,08 7 1.05 6,899 0 6,899
165 SALT LAKE CITY-OGDEN, UT 176 SAN FRANCISCO-OAKLAND-SAN JOSE, CA 807 719 1.12 6,88 7 0 6,88712 NEW YORK, NY 176 SAN FRANCISCO-OAKLAND-SAN JOSE, CA 3,315 2,902 1.14 6,785 51,672 58,457
162 PHOENIX, AZ 83 CHICAGO, IL 1,818 1,810 1.00 6,67 6 4,920 11,596139 WICHITA, KS 180 LOS ANGELES, CA 1,569 1,495 1.05 6,563 7,368 13,931
176 SAN FRANCISCO-OAKLAND-SAN JOSE, CA 125 DALLAS-FORT WORTH, TX 1,939 1,791 1.08 5,909 16,032 21,941165 SALT LAKE CITY-OGDEN, UT 83 CHICAGO, IL 1,485 1,405 1.06 5,90 7 0 5,90783 CHICAGO, IL 168 SPOKANE, WA 1,842 1,806 1.02 5,600 0 5,60083 CHICAGO, IL 164 RENO, NV 1,982 1,904 1.04 5,434 28,524 33,958
176 SAN FRANCISCO-OAKLAND-SAN JOSE, CA 113 NEW ORLEANS, LA 2,420 2,266 1 .0 7 5,22 7 7,692 12,919176 SAN FRANCISCO-OAKLAND-SAN JOSE, CA 165 SALT LAKE CITY-OGDEN, UT 807 719 1.12 4,993 0 4,993176 SAN FRANCISCO-OAKLAND-SAN JOSE, CA 12 NEW YORK, NY 3,315 2,902 1.14 4,970 12,348 17,318172 PORTLAND, OR 162 PHOENIX, AZ 1,421 1,308 1.09 4 ,8 4 7 8,904 13,751
96 MINNEAPOLIS-ST. PAUL, MN 172 PORTLAND, OR 1,770 1,733 1.02 4,75 8 0 4,758172 PORTLAND, OR 179 FRESNO-BAKERSFIELD, CA 817 754 1.08 4,653 4,140 8,793125 DALLAS-FORT WORTH, TX 176 SAN FRANCISCO-OAKLAND-SAN JOSE, CA 1,939 1,791 1 .0 8 4,612 35,688 40,300173 EUGENE, OR 162 PHOENIX, AZ 1,351 1,202 1.12 4,585 0 4,585
Table 22

ALK ASSOCIATES INC PAGE 2
DOUBLE STACK RAIL NETWORK DEFINED BY RAIL HAUL OF AT LEAST 725 MILES WHOLLY WITHIN CORRIDORS DEFINED BY ANNUAL FEU VOLUME OF 60 PERCENT OF 46,800AND ANNUAL FEU VOLUME OF AT LEAST 60 PERCENT OF 2,600
WITH DIVERTED FEU VOLUMES FROM TRAM DATA SORTED BY DESCENDING ANNUAL FEUS
DATA SOURCE: 1987 ICC CARLOAD WAYBILL SAMPLE AND ANNUALIZED TRAM TRUCK VOLUMES
RAIL/RAIL HI WAY HI WAY
ORIGIN BEA NUMBER AND NAME DESTINATION BEA NUMBER AND NAME DIST DIST RATIO RAIL FEUS TRAM FEUS TOTAL FEUS
173 EUGENE, OR 83 CHICAGO, IL 2 ,31 9 2,23 6 1.04 4,498 0 4,49 8
105 KANSAS C ITY , MO 162 PHOENIX, AZ 1,359 1,362 1.00 4,482 0 4,48 2
71 DETROIT, MI 162 PHOENIX, AZ 2,071 2,060 1.01 4,422 0 4,422
173 EUGENE, OR 12 NEW YORK, NY 3,245 3 ,0 1 8 1.08 4,418 0 4,41 8
135 AMARILLO, TX 180 LOS ANGELES, CA 1,219 1,078 1 .13 4,25 7 7,692 11,949
172 PORTLAND, OR 96 MINNEAPOLIS-ST. PAUL, MN 1,777 1,733 1.03 4,04 7 0 4 ,0 4 7
178 STOCKTON-MODESTO, CA 9 ROCHESTER, NY 2,90 9 2,666 1.09 3,765 0 3,765
178 STOCKTON-MODESTO, CA 125 DALLAS-FORT WORTH, TX 1,861 1,757 1 .06 3,746 40,080 43 ,826
170 YAKIMA, WA 83 CHICAGO, IL 2,074 2,003 1.04 3,653 0 3,653
178 STOCKTON-MODESTO, CA 12 NEW YORK, NY 3,223 2,869 1.12 3,582 0 3,58 2
179 FRESNO-BAKERSFIELD, CA 113 NEW ORLEANS, LA 2,161 2,113 1.02 3,536 0 3,53 6
111 LITTLE ROCK-N. LITTLE ROCK, AR 180 LOS ANGELES, CA 2,102 1,675 1.25 3,419 4,920 8,33 9
71 DETROIT, MI 171 SEATTLE, WA 2,493 2,360 1 .06 3,333 0 3,333
96 MINNEAPOLIS-ST. PAUL, MN 18 PHILADELPHIA, PA 1,253 1,199 1.05 3,246 0 3,24 6
178 STOCKTON-MODESTO, CA 122 HOUSTON, TX 1,984 1,883 1.05 3,218 20,952 24,170
176 SAN FRANCISCO-OAKLAND-SAN JOSE, CA 162 PHOENIX, AZ 800 713 1 .12 3,064 4,920 7,984
172 PORTLAND, OR 4 BOSTON, MA 3,22 2 3,081 1.05 3,060 0 3,060
171 SEATTLE, WA 18 PHILADELPHIA, PA 3,003 2,862 1.05 3,039 0 3,03 9
154 MISSOULA, MT 96 MINNEAPOLIS-ST. PAUL, MN 1,225 1,188 1.03 3,03 7 0 3 ,0 3 7
83 CHICAGO, IL 7 ALBANY-SCHENECTADY-TROY, NY 817 826 0 .9 9 3,025 0 3,025
176 SAN FRANCISCO-OAKLAND-SAN JOSE, CA 18 PHILADELPHIA, PA 3 ,2 4 7 2,886 1.13 3,019 4,920 7,939
83 CHICAGO, IL 160 ALBUQUERQUE, NM 1,383 1,344 1.03 2,977 0 2,977
83 CHICAGO, IL 177 SACRAMENTO, CA 2 ,1 3 7 2,040 1.05 2,960 0 2,960
180 LOS ANGELES, CA 133 EL PASO, TX 813 802 1.01 2,751 4,920 7,671
178 STOCKTON-MODESTO, CA 17 HARRISBURG-YORK-LANCASTER, PA 3 ,0 4 8 2,752 1.11 2,685 0 2,685
177 SACRAMENTO, CA 125 DALLAS-FORT WORTH, TX 2,145 1,802 1 .19 2,648 0 2,64 8
19 BALTIMORE, MD 176 SAN FRANCISCO-OAKLAND-SAN JOSE, CA 3,03 3 2,830 1 .0 7 2,595 0 2,595
171 SEATTLE, WA 71 DETROIT, MI 2 ,493 2,360 1 .06 2,575 0 2,575
173 EUGENE, OR 6 HARTFORD-NEW HAVEN-SPRINGFLD, Cl -MA 3,285 3,134 1.05 2,560 0 2,560
180 LOS ANGELES, CA 160 ALBUQUERQUE, NM 893 796 1.12 2,530 38,136 40,666
154 MISSOULA, MT 180 LOS ANGELES, CA 1,330 1,243 1 .0 7 2,520 0 2,520
187 UNKNOWN 125 DALLAS-FORT WORTH, TX 1,483 1,438 1.03 2,488 0 2,488
187 UNKNOWN 180 LOS ANGELES, CA 2,734 2,522 1 .08 2,472 0 2,472
96 MINNEAPOLIS-ST. PAUL, MN 176 SAN FRANCISCO-OAKLAND-SAN JOSE, CA 2,100 2,01 6 1.04 2,428 0 2,428
172 PORTLAND, OR 122 HOUSTON, TX 2,683 2,365 1.13 2,395 0 2,395
133 EL PASO, TX 83 CHICAGO, IL 1,386 1,601 0 .8 7 2,368 0 2,368
187 UNKNOWN 105 KANSAS C ITY , MO 946 999 0.95 2,348 0 2,348
141 TOPEKA, KS 180 LOS ANGELES, CA 1,673 1,555 1 .08 2,330 0 2,330
178 STOCKTON-MODESTO, CA 70 TOLEDO, OH 2,552 2,302 1.11 2,290 0 2,290
187 UNKNOWN 107 S T . LOUIS, MO 734 768 0 .9 6 2,215 0 2,215
169 RICHLAND, WA 88 ROCKFORD, IL 1,934 1,868 1.04 2,209 0 2,209
180 LOS ANGELES, CA 111 LITTLE ROCK-N. LITTLE ROCK, AR 2,102 1,675 1.25 2,190 20,952 23,142
176 SAN FRANCISCO-OAKLAND-SAN JOSE, CA 55 MEMPHIS, TN 2,404 2,081 1 .16 2,188 0 2,188
173 EUGENE, OR 4 BOSTON, MA 3 ,3 4 7 3,195 1.05 2,10 7 0 2 ,1 0 7
168 SPOKANE, WA 83 CHICAGO, IL 1,842 1,806 1.02 2,105 0 2,105
70 TOLEDO, OH 4 BOSTON, MA 781 768 1.02 2,067 0 2 ,0 6 7
71 DETROIT, MI 172 PORTLAND, OR 2,511 2,373 1.06 1,993 0 1,993
Table 22

ALK ASSOCIATES INC PAGE 3
DOUBLE STACK RAIL NETWORK DEFINED BY RAIL HAUL OF AT LEAST 725 MILES WHOLLY WITHIN CORRIDORS DEFINED BY ANNUAL FEU VOLUME OF 60 PERCENT OF 46 ,800AND ANNUAL FEU VOLUME OF AT LEAST 60 PERCENT OF 2 ,600
WITH DIVERTED FEU VOLUMES FROM TRAM DATA SORTED BY DESCENDING ANNUAL FEUS
DATA SOURCE: 1987 ICC CARLOAD WAYBILL SAMPLE AND ANNUALIZED TRAM TRUCK VOLUMES
ORIGIN BEA NUMBER AND NAME DESTINATION BEA NUMBER AND NAMERAILDIST
HI WAY DIST
RAIL/ HI WAY RATIO RAIL FEUS TRAM FEUS TOTAL FEUS
II II II II II II II II II II II II II II II II II II II 1 1 1 1 1 1 1 1 1 1 II II II II II II II II II II II II II II II II II II II II II II II II II II II II II II II II II II II II II II II II II II II II II II II II IIIIIIIIIIIIIIII IIIIIIIIIIIIIIII IIIIIIIIIIIIIIIIII II II II II II II II II II II II II II II II II II II II II II II II II IIIIIIIIIIIIIIIIIIIIIIIIII IIIIIIIIIIIIIIIIIIIIII
173 EUGENE, OR 18 PHILADELPHIA, PA 3 ,1 7 7 3,00 2 1.06 1,982 0 1,982187 UNKNOWN 176 SAN FRANCISCO-OAKLAND-SAN JOSE, CA 2,90 7 2,602 1.12 1,977 0 1,977139 WICHITA, KS 176 SAN FRANCISCO-OAKLAND-SAN JOSE, CA 1,869 1,751 1.07 1,960 0 1,960178 STOCKTON-MODESTO, CA 55 MEMPHIS, TN 2,326 2,045 1.14 1,956 0 1,956173 EUGENE, OR 20 WASHINGTON, DC 3,121 2,941 1.06 1,872 0 1,872
12 NEW YORK, NY 171 SEATTLE, WA 3,071 2,892 1.06 1,870 8,088 9,95 812 NEW YORK, NY 105 KANSAS C ITY , MO 1,333 1,171 1.14 1,870 0 1,870
135 AMARILLO, TX 176 SAN FRANCISCO-OAKLAND-SAN JOSE, CA 1,520 1,356 1.12 1,852 0 1,852160 ALBUQUERQUE, NM 83 CHICAGO, IL 1,383 1,344 1.03 1,840 0 1,840154 MISSOULA, MT 83 CHICAGO, IL 1,663 1,605 1.04 1,787 0 1,787164 RENO, NV 83 CHICAGO, IL 1,982 1,904 1.04 1,760 0 1,760178 STOCKTON-MODESTO, CA 4 BOSTON, MA 3,325 3 ,0 4 6 1.09 1,754 7,692 9,44 6122 HOUSTON, TX 133 EL PASO, TX 817 762 1 .0 7 1,745 0 1,745
71 DETROIT, MI 135 AMARILLO, TX 1,270 1,312 0 .9 7 1,742 0 1,742169 RICHLAND, WA 180 LOS ANGELES, CA 1,198 1,179 1.02 1,738 4,140 5,878
12 NEW YORK, NY 96 MINNEAPOLIS-ST. PAUL, MN 1,321 1,228 1.08 1,725 0 1,725178 STOCKTON-MODESTO, CA 18 PHILADELPHIA, PA 3,155 2,853 1.11 1,720 8,088 9,80 8105 KANSAS C ITY , MO 160 ALBUQUERQUE, NM 931 896 1.04 1,688 0 1,688178 STOCKTON-MODESTO, CA 113 NEW ORLEANS, LA 2,344 2,232 1.05 1,662 0 1,662178 STOCKTON-MODESTO, CA 143 OMAHA, NE 1,730 1,604 1.08 1,660 8,088 9,74 8176 SAN FRANCISCO-OAKLAND-SAN JOSE, CA 88 ROCKFORD, IL 2 ,21 7 2,055 1.08 1,655 0 1,655143 OMAHA, NE 176 SAN FRANCISCO-OAKLAND-SAN JOSE, CA 1,787 1,637 1.09 1,605 8,08 8 9,693105 KANSAS C ITY , MO 65 CLEVELAND, OH 748 782 0 .9 6 1,598 0 1,598
Table 22

' 7 ' '
K ifyt ... ...../ 7/7
Doable Stack Network Including Truck DiversionsWith Annual FEU Volumes
Data Source: 1987 ICC Carload Waybill SampleAnd TRAM Truck Diversions
ll:±ll Level 1 Volumes H I Level 2 Volumes
500 ^c o 125...... ’**
250500 (in 000's)
Jo**5
Figure 25

1-80
W ALC
1-70
HARRISBURG
EFFINGHAM 1-71/75 1-95
NMTDB Data Collection Site Figure 26 NORTHEAST TRUCK ROUTES

of this area via major Interstate highways. As Figure 26 shows, NMTDB data
collection points are at Portage, WI (1-90, 1-94); Walcot, IA (1-80);
Effingham, IL (1-70); Covington, KY (1-75 1-71); Harrisburg, PA (1-81); and
Doswell, VA (1-95). The only collection point within this critical
industrial rectangle is near Toledo, on I-90/I-94. Exhaustive examination
of multi-year NMTDB data for this point yielded insufficient data for
reliable statistical inference on flows within the Northeast.
There appear to be two principal reasons for this lack of truck data.
First, there are multiple highway routes in the Northeast. Second,
information from industry contacts suggests that pavement and bridge
deterioration and traffic congestion on significant portions of Interstate
80 has led truckers to prefer other routes, specifically Interstate 70.
3. Corroborative Results
Confidence in these findings is increased, despite the limitations of the
available data, because they correspond closely to the findings of other
studies and analyses covering state and U.S. highways as well as
Interstates.
o AAR Study. In a multi-year analysis of NMTDB data, the AAR found
that truckload highway traffic had grown only slightly in major
double-stack corridors while it had grown strongly overall.
(Intermodal Trends, Volume I, Number 8, AAR Intermodal Policy
Division, April 14, 1989)
o Trailer Train Transloadirig Study. A survey by Trailer Train
showed that double-stack loadings in Southern California had
outpaced import growth. Upon investigation, Trailer Train found
that the former practice of transloading containerized imports
into highway trailers for movement east had declined sharply in
favor of through rail movement of import containers. (Intermodal
Market Survey, Trailer Train Company, 1989)
o ATLF Regional Emphasis. J.B. Hunt Transport, Schneider National,
and other Advanced Truckload Firms have reduced their activity in
- 7 7 -

major double-stack corridors, emphasizing regional trucking
markets instead. (Industry publications)
o Agricultural Truck Rate Shifts. USDA data on refrigerated truck
rates shows that in 1988, long-haul truck rates for California
growing regions within drayage reach of Los Angeles were
depressed relative to other California truck rates, and that
regional rates to Denver were likewise depressed. This rate
shift suggests an underlying shift of truckload carriers out of
the double-stack corridors and into refrigerated and regional
trucking, depressing rates in those corridors. (Fruit and
Vegetable Rate and Cost Summary, Office of Transportation, USDA,
1987 and 1988.)
Each of these studies suggests a similar conclusion: rail intermodal
service, specifically double-stacks, has diverted a significant amount of
truckload traffic in the most susceptible markets, and motor carriers have
shifted some of their activity to less-susceptible markets. It is also
reasonable to conclude that double-stack services will divert additional
truckload traffic in the most susceptible markets.
D. NETWORK OVERVIEW
The network described in the preceding tables and figures includes
corridors where, according to the service and cost criteria derived
herein and the traffic data available from 1987, double-stack services
could be fully competitive with truckload service. It should come as no
surprise that this network includes the long-distance, high-volume
double-stack services now operating, and most of the high-volume trailer
flows. This network, however, is focused on the ability to attract
domestic truck traffic. Accordingly, it does not include some existing
double-stack movements of domestic or international containers,
especially those that developed between 1987 and 1990.
The flows developed here could be described as a "core network" of
services able to hold their own in direct competition with truckload
carriers. Of course, there is no guarantee that every corridor that
- 7 8 -

matches the general criteria will be a commercial success. The service
and cost criteria both embody assumptions about double-stack operations
that are not yet consistently met in day-to-day operations.
The inclusion of intermediate points anticipates a maturation of the
network, and an integration of double-stack services into overall rail
operations, that is now just beginning. The train system that American
President Intermodal superimposes on the railroads offers service to and
from some intermediate points such as Salt Lake City and Fresno. The
presence of major customers has also led to double-stack service to
Modesto, California, Newton, Iowa, and Marysville, Ohio. Much of the
traffic generated at intermediate points is still carried in boxcars, and
presents a real challenge to marketers of domestic container service.
The data processing performed for this study did not distinguish among
different railroads or routes serving the same endpoints. Yet service to
some intermediate points depends on through service to major hubs on the
same railroad: if the railroad in question does not offer fully competi
tive service to the major hubs, service to intermediate points may not
develop.
Counterbalancing this uncertainly is the possibility that creative
operations planners could combine end-to-end flows to create higher
service frequencies at midpoints. Moreover, by combining traffic to and
from several sources, railroad operations planners may be able to justify
frequent domestic double-stack services that are not identifiable from
the Carload Waybill Sample alone.
Figure 27 combines the network shown in Figure 25 with the additional
double-stack services being offered in late 1989 (shown on Figure 11) to
display a more complete hypothetical double-stack network. This more
complete network thus includes routes that will or already have
double-stack service because:
o double-stack service can be fully truck-competitive (the core
network);
- 7 9 -

Seattle
Figure 27COMPLETE HYPOTHETICAL
Note: Lines ind icate serv ice co rr ido rs , not spec ific ra ilroad routes

0 double-stack service is being provided for international flows,
or
o double-stack service is being provided under contract for
specific domestic shippers, regardless of its ability to compete
for common carriage.
E. HYPOTHETICAL 2000 DOUBLE-STACK NETWORK
1. Forecasts
As this study progressed, it became clear that the 1987 data above were not
sufficient to determine:
o whether domestic double-stack service would spread throughout the
rail network;
o whether existing and planned terminal capacity would be able to
accommodate growth; or
o what additional equipment would be required.
Accordingly, available intermodal forecasts were used to determine, very
roughly, what a domestic and international double-stack network might look
like in 2000.
Several projections for near-term overall intermodal growth have been
published:
o Data Resources, Inc.:
4 percent average annual growth 1988 - 1993
o Economic Consulting and Planning, Inc:
+3 percent 1989 - 1990
-2.5 percent 1990 - 1991
o Richard Telofski, Consultant:
+4.6 percent 1989 - 1990
-80-

0 Trailer Train:
2 - 4 percent annual growth through early 1990's
An average 4 percent annual growth through 1995 appears to be in reasonable
agreement with the above selection of announced projections. As of
September, 1989, intermodal traffic was running about 3 percent ahead of
1988.
Growth of international container traffic will continue to increase double
stack container flows. The introduction of double-stack service coincided
with a period of strong growth in international container cargo flows,
particularly in imports. According to DRI world trade data, tonnage of
containerizable imports grew at an average of 11.2 percent annually between
1983 and 1987; exports grew at an average of 6.3 percent. According to
DRI's forecasts, containerizable liner import tonnage is expected to grow
by an average of 3.7 percent annually between 1988 and 1992, and the
1991-1992 growth is expected to be 5.1 percent. Export tonnage is expected
to grow faster, at an average annual rate of 7.3 percent between 1988 and
1992, with 5.8 percent annual grow in 1991 - 1992. Extrapolating these
forecasts for the period 1987 - 1995 (using the 1991-1992 forecast growth
rates for 1992 - 1995) yields overall annual average growth rates of 3.8
percent for containerizable liner import tonnage and 7.5 percent for
containerizable liner export tonnage. In applying DRI's growth rates to
estimated 1987 international rail container movements, it is implicitly
assumed that:
o Average annual growth between 1992 arid 1995 will be at the
same rates as the forecast growth of imports and exports between
1991 and 1992;
o These same growth rates will apply to all U.S. international
containerizable trade on all four coasts; and
o Estimated import and export international container flows moving
by rail will grow at the same rate as total U.S. import and
export containerizable liner tonnage.
-81-

2 . Year 2000 Network with 4 Percent Growth
Under an assumption of uniform 4 percent annual intermodal growth, the
hypothetical 1987 network described earlier would expand into a number of
additional major corridors. Table 23 lists twelve major corridors for the
year 2000, in addition to those listed for 1987. The additional corridors
shown in Figure 28, fall into four groups:
o new corridors between Chicago and Hartford, Norfolk, Houston,
Denver, and Stockton;
o new corridors between Los Angeles and Portland, Eugene,
St. Louis, and Atlanta;
o a new corridor between San Francisco-Oakland and Houston; and
o two new corridors radiating east from St. Louis to Philadelphia
and New York.
In other words, traffic growth would support two new major hubs, San
Francisco-Oakland and St. Louis, by the year 2000.
Care must be taken in interpreting these findings, especially with regard
to containerizable flows that are largely boxcar traffic at present.
Eugene, Oregon is a case in point. A potential Eugene-Los Angeles
double-stack corridor is shown in Table 23 for the year 2000, yet as of
1990 there is no direct intermodal service to Eugene, and no intermodal
yard there. The emergence of a Eugene-Los Angeles double-stack corridor
depends almost entirely on the conversion of boxcar traffic, in this case
primarily lumber and paper products.
Table 24 lists the intermediate points that could be served by the uniform
growth year 2000 network. The list expands two ways: by the traffic
increase on major 1987 corridors, and by the addition of intermediate
points on new corridors. Figure 29 illustrates this expansion.
-82-

ALK ASSOCIATES INC 1 1 /2 8 /8 9 PAGE
RAIL TRAFFIC MEETING ANNUAL VOLUME CRITERIA OF 60 PERCENT OF 46 ,800 ANNUAL FEUS IN 2000
AND AT LEAST 725 MILES OF RAIL DISTANCE BY ORIGIN BEA AND DESTINATION BEA WITH RAIL-HIGHWAY CIRCUITY APPENDED
SORTED BY ANNUAL FEUSSOURCE: 1987 ICC CARLOAD WAYBILL SAMPLE WITH ASSUMED 4 PERCENT ANNUAL GROWTH TO YEAR 2000
RAIL/
ANNUAL ANNUAL RAIL HI WAY HI WAYORIGIN BEA NUMBER AND NAME DESTINATION BEA NUMBER AND NAME FEUS NET TONS DIST DIST RATIO
180 LOS ANGELES, CA 83 CHICAGO, IL 311,459 4 ,4 4 3 ,9 4 0 2,199 2,040 1.08
83 CHICAGO, IL 180 LOS ANGELES, CA 267,039 3 ,7 9 9 ,3 0 8 2,199 2,040 1.0883 CHICAGO, IL 12 NEW YORK, NY 264,822 4 ,2 7 1 ,0 1 8 904 815 1.11
12 NEW YORK, NY 83 CHICAGO, IL 240,761 1 ,69 3,473 904 815 1.11171 SEATTLE, WA 83 CHICAGO, IL 189,407 2 ,8 8 5 ,7 8 9 2,166 2,080 1.04
83 CHICAGO, IL 171 SEATTLE, WA 171,767 1,527,325 2,166 2,080 1.0483 CHICAGO, IL 18 PHILADELPHIA, PA 132,472 2 ,2 2 6 ,0 6 3 836 785 1.06
83 CHICAGO, IL 176 SAN FRANCISCO-OAKLAND-SAN JOSE, CA 98 ,880 1 ,33 1,972 2,222 2,120 1.0583 CHICAGO, IL 4 BOSTON, MA 93 ,610 1 ,57 0,950 1,006 992 1.01
176 SAN FRANCISCO-OAKLAND-SAN JOSE, CA 83 CHICAGO, IL 88 ,639 1 ,53 0,013 2,222 2,120 1.0583 CHICAGO, IL 19 BALTIMORE, MD 81,855 1 ,30 8 ,888 811 773 1.05
122 HOUSTON, TX 180 LOS ANGELES, CA 76 ,257 1 ,44 9 ,826 1,630 1,564 1.0483 CHICAGO, IL 125 DALLAS-FORT WORTH, TX 74,955 1 ,14 6 ,869 992 965 1.03
186 QUEBEC 83 CHICAGO, IL 66 ,969 1 ,16 6,184 835 851 0.984 BOSTON, MA 83 CHICAGO, IL 62 ,772 667,428 1,006 992 1.01
83 CHICAGO, IL 172 PORTLAND, OR 62 ,339 752,613 2,193 2,122 1.03179 FRESNO-BAKERSFIELD, CA 83 CHICAGO, IL 61 ,786 1 ,28 9,013 2,301 2,154 1.07180 LOS ANGELES, CA 55 MEMPHIS, TN 58 ,219 835,417 2,104 1,803 1.17
18 PHILADELPHIA, PA 83 CHICAGO, IL 57,955 781,252 836 785 1.06172 PORTLAND, OR 83 CHICAGO, IL 57 ,167 1,190,761 2,194 2,122 1.03180 LOS ANGELES, CA 122 HOUSTON, TX 57,152 930,430 1,630 1,564 1.04
172 PORTLAND, OR 180 LOS ANGELES, CA 53,932 1 ,22 3 ,230 1,091 960 1.1419 BALTIMORE, MD 83 CHICAGO, IL 53 ,527 729,602 811 773 1.05
180 LOS ANGELES, CA 125 DALLAS-FORT WORTH, TX 52,871 778,409 1,639 1,438 1.14180 LOS ANGELES, CA 105 KANSAS CITY, MO 49 ,649 779,920 1,739 1,618 1 .07105 KANSAS CITY, MO 180 LOS ANGELES, CA 49 ,618 821,927 1,739 1,618 1 .07180 LOS ANGELES, CA 113 NEW ORLEANS, LA 48,221 802,912 1,990 1,913 1.04
55 MEMPHIS, TN 180 LOS ANGELES, CA 45,854 695,661 2,104 1,803 1.17173 EUGENE, OR 180 LOS ANGELES, CA 45,575 1,092,821 966 854 1.13180 LOS ANGELES, CA 12 NEW YORK, NY 43 ,264 582,223 3,10 6 2,789 1.1183 CHICAGO, IL 17 HARRISBURG-YORK-LANCASTER, PA 41 ,129 706,457 729 681 1.07
107 S T. LOUIS, MO 12 NEW YORK, NY 38 ,423 674,901 1,058 939 1.1383 CHICAGO, IL 157 DENVER, CO 36 ,092 532,131 1,020 1,023 1.00
122 HOUSTON, TX 176 SAN FRANCISCO-OAKLAND-SAN JOSE, CA 34 ,252 589,822 2,060 1,917 1.07180 LOS ANGELES, CA 107 ST. LOUIS, MO 32 ,066 529,330 2,041 1,854 1.10178 STOCKTON-MODESTO, CA 83 CHICAGO, IL 31 ,665 714,130 2,182 2,087 1.05107 S T . LOUIS, MO 180 LOS ANGELES, CA 31,045 502,333 2,041 1,854 1.10
180 LOS ANGELES, CA 36 ATLANTA, GA 30,581 471,822 2,478 2,224 1.11113 NEW ORLEANS, LA 180 LOS ANGELES, CA 29,705 535,914 1,990 1,913 1.04
83 CHICAGO, IL 6 HARTFORD-NEW HAVEN-SPRINGFLD, CT -MA 28 ,649 481,613 944 931 1.01107 S T. LOUIS, MO 18 PHILADELPHIA, PA 28 ,566 511,511 990 885 1.12
122 HOUSTON, TX 83 CHICAGO, IL 28,551 562,650 1,094 1,091 1.0023 NORFOLK-VIRGINIA BCH-NEWPT NEWS, VA 83 CHICAGO, IL 28 ,539 498,390 1,050 956 1.10
Table 23

Double Stack Network For Year 2000

ALK ASSOCIATES INC 1 1 /2 8 /8 9 PAGE 1
RAIL TRAFFIC TRAVELING ENTIRELY UITHIN CORRIDORS DEFINED BY 60 PERCENT OF ANNUAL FEUS IN 2000 AND WITH A RAIL DISTANCE OF AT LEAST 725 MILES
BY ORIGIN BEA AND DESTINATION BEA SORTED BY DESCENDING ANNUAL FEUS
SOURCE: 1987 ICC CARLOAD WAYBILL SAMPLE WITH ASSUMED 4 PERCENT ANNUAL GROWTH TO YEAR 2000
RAIL/ANNUAL ANNUAL RAIL HI WAY HI WAY
ORIGIN BEA NUMBER AND NAME DESTINATION BEA NUMBER AND NAME FEUS NET TONS DIST DIST RATIO
36 ATLANTA, GA 180 LOS ANGELES, CA 27,154 459,960 2,478 2,224 1.11125 DALLAS-FORT WORTH, TX 83 CHICAGO, IL 26 ,784 409,601 992 965 1.03
83 CHICAGO, IL 23 NORFOLK-VIRGINIA BCH-NEWP1 NEWS, VA 26,083 378,045 1,050 956 1.1083 CHICAGO, IL 165 SALT LAKE CITY-OGDEN, UT 23 ,199 318,795 1,485 1,405 1.0683 CHICAGO, IL 122 HOUSTON, TX 21 ,296 301,718 1,067 1,091 0 .9 812 NEW YORK, NY 180 LOS ANGELES, CA 20,752 268,943 3,10 6 2,789 1.11
171 SEATTLE, WA 12 NEW YORK, NY 20,352 277,701 3,071 2,892 1.0683 CHICAGO, IL 162 PHOENIX AZ 20 ,0 77 247,683 1,818 1,810 1.00
180 LOS ANGELES, CA 172 PORTLAND, OR 19,400 291,481 1,091 960 1.1471 DETROIT, MI 180 LOS ANGELES, CA 18,879 443,709 2,451 2,291 1.0717 HARRISBURG-YORK-LANCASTER,, PA 83 CHICAGO, IL 18,760 248,429 729 681 1.07
171 SEATTLE, WA 96 MINNEAPOLIS-ST. PAUL, MN 18,629 291,874 1,728 1,663 1.0412 NEW YORK, NY 107 ST. LOUIS, MO 18,028 193,948 1,058 939 1.13
6 HARTFORD-NEW HAVEN-SPRINGFLD, CT-MA 83 CHICAGO, IL 17 ,497 179,961 944 931 1.01122 HOUSTON, TX 107 ST. LOUIS, MO 17,117 342,672 828 852 0 .9 7113 NEW ORLEANS, LA 176 SAN FRANCISCO-OAKLAND-SAN JOSE, CA 16,864 277,947 2,365 2,266 1.04176 SAN FRANCISCO-OAKLAND-SAN JOSE, CA 122 HOUSTON, TX 16,323 252,732 2,060 1,917 1.07172 PORTLAND, OR 176 SAN FRANCISCO-OAKLAND-SAN JOSE, CA 15,563 339,875 739 638 1.16157 DENVER, CO 83 CHICAGO, IL 15,530 301,458 1,020 1,023 1.00177 SACRAMENTO, CA 83 CHICAGO, IL 15,472 349,266 2,13 7 2,040 1.05125 DALLAS-FORT WORTH, TX 180 LOS ANGELES, CA 14,981 234,695 1,639 1,438 1.14169 RICHLAND, WA 83 CHICAGO, IL 14 ,798 342,705 1,996 1,945 1.03107 ST. LOUIS, MO 19 BALTIMORE, MD 14,578 266,612 987 829 1.19
71 DETROIT, MI 176 SAN FRANCISCO-OAKLAND-SAN JOSE, CA 14,315 338,676 2,561 2,371 1.0883 CHICAGO, IL 179 FRESNO-BAKERSFIELD, CA 14,017 127,395 2,301 2,154 1.0796 MINNEAPOLIS-ST. PAUL, MN 171 SEATTLE, WA 13,754 174,300 1,728 1,663 1.04
107 S T. LOUIS, MO 122 HOUSTON, TX 13,152 222,587 828 852 0 .9 712 NEW YORK, NY 125 DALLAS-FORT WORTH, TX 13,109 184,856 1,777 1,524 1 .1 771 DETROIT, MI 125 DALLAS-FORT WORTH, TX 12,951 299,347 1,246 1,209 1.0355 MEMPHIS, TN 176 SAN FRANCISCO-OAKLAND-SAN JOSE, CA 12,841 193,781 2,404 2,081 1.16
176 SAN FRANCISCO-OAKLAND-SAN JOSE, CA 172 PORTLAND, OR 11,561 214,115 739 638 1.1683 CHICAGO, IL 178 STOCKTON-MODESTO, CA 11,487 183,491 2,182 2,08 7 1.05
165 SALT LAKE CITY-OGDEN, UT 176 SAN FRANCISCO-OAKLAND-SAN JOSE, CA 11,467 185,622 807 719 1.1212 NEW YORK, NY 176 SAN FRANCISCO-OAKLAND-SAN JOSE, CA 11,298 159,647 3,315 2,902 1.14
162 PHOENIX AZ 83 CHICAGO, IL 11,116 180,574 1,818 1,810 1.00139 WICHITA, KS 180 LOS ANGELES, CA 10,928 214,821 1,569 1,495 1.05107 ST. LOUIS, MO 17 HARRISBURG-YORK-LANCASTER, PA 10,348 186,755 883 784 1.13
18 PHILADELPHIA, PA 107 S T. LOUIS, MO 9 ,9 0 9 147,392 990 885 1.12176 SAN FRANCISCO-OAKLAND-SAN JOSE, CA 125 DALLAS-FORT WORTH, TX 9 ,8 3 9 176,484 1,939 1,791 1.08165 SALT LAKE CITY-OGDEN, UT 83 CHICAGO, IL 9 ,8 3 6 175,582 1,485 1,405 1.06180 LOS ANGELES, CA 66 COLUMBUS, OH - 9 ,3 4 6 132,973 2,488 2,261 1.1083 CHICAGO, IL 168 SPOKANE, WA 9,3 2 4 135,271 1,842 1,806 1.0283 CHICAGO, IL 164 RENO, NV 9 ,0 4 8 118,620 1,982 1,904 1.04
176 SAN FRANCISCO-OAKLAND-SAN JOSE, CA 113 NEW ORLEANS, LA 8,70 3 173,967 2,420 2,266 1 .0 771 DETROIT, MI 122 HOUSTON, TX 8 ,5 8 8 205,803 1,330 1,391 0 .9 6
176 SAN FRANCISCO-OAKLAND-SAN JOSE, CA 165 SALT LAKE CITY-OGDEN, UT 8 ,3 1 4 165,908 807 719 1.12176 SAN FRANCISCO-OAKLAND-SAN JOSE, CA 12 NEW YORK, NY 8,27 5 158,901 3,315 2,902 1.14
Table 24

ALK ASSOCIATES INC 1 1 /2 8 /8 9 PAGE 2
RAIL TRAFFIC TRAVELING ENTIRELY WITHIN CORRIDORS DEFINED BY 60 PERCENT OF ANNUAL FEUS IN 2000AND WITH A RAIL DISTANCE OF AT LEAST 725 MILES
BY ORIGIN BEA AND DESTINATION BEA SORTED BY DESCENDING ANNUAL FEUS
SOURCE: 1987 ICC CARLOAD WAYBILL SAMPLE WITH ASSUMED 4 PERCENT ANNUAL GROWTH TO YEAR 2000
ANNUAL ANNUAL RAIL HI WAY
ORIGIN BEA NUMBER AND NAME DESTINATION BEA NUMBER AND NAME FEUS NET TONS DIST DIST
172 PORTLAND, OR 162 PHOENIX AZ 8,071 180,894 1,421 1,308
96 MINNEAPOLIS-ST. PAUL, MN 172 PORTLAND, OR 7,922 110,894 1,770 1,733
172 PORTLAND, OR 179 FRESNO-BAKERSFIELD, CA 7,74 8 185,556 817 754
125 DALLAS-FORT WORTH, TX 176 SAN FRANCISCO-OAKLAND-SAN JOSE, CA 7,67 9 125,993 1,939 1,791
173 EUGENE, OR 162 PHOENIX AZ 7,634 182,292 1,351 1,202
173 EUGENE, OR 83 CHICAGO, IL 7,490 178,596 2,31 9 2,236
105 KANSAS CITY, MO 162 PHOENIX AZ 7,463 123,282 1,359 1,362
71 DETROIT, MI 162 PHOENIX AZ 7,363 176,431 2,071 2,060
173 EUGENE, OR 12 NEW YORK, NY 7,35 6 176,531 3,245 3,018
135 AMARILLO, TX 180 LOS ANGELES, CA 7,08 8 142,264 1,219 1,078
172 PORTLAND, OR 96 MINNEAPOLIS-ST. PAUL, MN 6,73 9 136,636 1,777 1,733
121 BEAUMONT-PORT ARTHUR, TX 83 CHICAGO, IL 6,545 147,559 1,027 1,108
178 STOCKTON-MODESTO, CA 9 ROCHESTER, NY 6,26 9 150,456 2,909 2,666
178 STOCKTON-MODESTO, CA 125 DALLAS-FORT WORTH, TX 6 ,2 3 7 143,183 1,861 1,757
170 YAKIMA, WA 83 CHICAGO, IL 6 ,08 3 133,639 2,074 2,003
178 STOCKTON-MODESTO, CA 12 NEW YORK, NY 5,964 142,730 3,223 2,869
179 FRESNO-BAKERSFIELD, CA 113 NEW ORLEANS, LA 5,88 8 127,245 2,161 2,113
111 LITTLE ROCK-N. LITTLE ROCK, AR 180 LOS ANGELES, CA 5,693 107,524 2,102 1,675
71 DETROIT, MI 171 SEATTLE, WA 5,550 103,767 2,493 2,360
96 MINNEAPOLIS-ST. PAUL, MN 18 PHILADELPHIA, PA 5,405 125,347 1,253 1,199
178 STOCKTON-MODESTO, CA 122 HOUSTON, TX 5,35 8 123,515 1,984 1,883
18 PHILADELPHIA, PA 125 DALLAS-FORT WORTH, TX 5,202 93 ,444 1,709 1,456
66 COLUMBUS, OH 180 LOS ANGELES, CA 5,16 2 77 ,126 2,48 8 2,261
176 SAN FRANCISCO-OAKLAND-SAN JOSE, CA 162 PHOENIX AZ 5,102 109,042 800 713
172 PORTLAND, OR 4 BOSTON, MA 5,095 120,318 3,22 2 3,081
19 BALTIMORE, MD 107 ST. LOUIS, MO 5,062 87 ,1 17 987 829
171 SEATTLE, WA 18 PHILADELPHIA, PA 5,060 110,561 3,00 3 2,862
154 MISSOULA, MT 96 MINNEAPOLIS-ST. PAUL, MN 5,05 7 121,217 1,225 1,188
83 CHICAGO, IL 7 ALBANY-SCHENECTADY-TROY, NY 5 ,0 3 7 96,241 817 826
176 SAN FRANCISCO-OAKLAND-SAN JOSE, CA 18 PHILADELPHIA, PA 5 ,0 2 7 117,088 3 ,2 4 7 2,886
83 CHICAGO, IL 160 ALBUQUERQUE, NM 4,9 5 7 59 ,277 1,383 1,344
83 CHICAGO, IL 177 SACRAMENTO, CA 4 ,9 2 9 74,329 2 ,1 3 7 2,040
180 LOS ANGELES, CA 18 PHILADELPHIA, PA 4,681 96,361 3 ,0 3 8 2,734
180 LOS ANGELES, CA 133 ELPASO, TX 4,581 83,160 813 802
71 DETROIT, MI 157 DENVER, CO 4,541 108,696 1,315 1,274
178 STOCKTON-MODESTO, CA 17 HARRISBURG-YORK-LANCASTER, PA 4,471 107,297 3 ,0 4 8 2,752
177 SACRAMENTO, CA 125 DALLAS-FORT WORTH, TX 4,40 9 96,374 2,145 1,802
17 HARRISBURG-YORK-LANCASTER, PA 107 ST. LOUIS, MO 4,32 9 62,540 883 784
19 BALTIMORE, MD 176 SAN FRANCISCO-OAKLAND-SAN JOSE, CA 4,321 66 ,1 37 3,03 3 2,830
83 CHICAGO, IL 120 TYLER-LONGVIEW, TX 4,321 54,814 921 928
171 SEATTLE, WA 71 DETROIT, MI 4 ,2 8 8 76,860 2,493 2,360
173 EUGENE, OR 6 HARTFORD-NEW HAVEN- SPRINGFLD, CT -MA 4,26 3 102,302 3,285 3,13 4180 LOS ANGELES, CA 160 ALBUQUERQUE, NM 4,21 3 65 ,817 893 796
154 MISSOULA, MT 180 LOS ANGELES, CA 4 ,1 9 6 100,704 1,330 1,243111 LITTLE ROCK-N. LITTLE ROCK, AR 12 NEW YORK, NY 4 ,1 8 8 99,838 1,385 1,209
187 ONTARIO 125 DALLAS-FORT WORTH, TX 4,14 3 98 ,239 1,483 1,438
187 ONTARIO 180 LOS ANGELES, CA 4 ,1 1 6 92,911 2,734 2,522
RAIL/ HI WAY RATIO
1.09 1.02 1.08 1.08 1.12 1.04 1.00 1.01 1.081.131.03 0.931.09 1.061.04 1.12 1.02 1.25 1.061.051.05 1.171.10 1.121.051.191.051.03 0 .991.131.031.05 1.11 1.011.031.111.191.131.07 0.991.06 1.05 1.121.07 1.151.031.08
Table 24

ALK ASSOCIATES INC 1 1 /2 8 /8 9 PAGE 3
RAIL TRAFFIC TRAVELING ENTIRELY WITHIN CORRIDORS DEFINED BY 60 PERCENT OF ANNUAL FEUS IN 2000 AND WITH A RAIL DISTANCE OF AT LEAST 725 MILES
BY ORIGIN BEA AND DESTINATION BEA SORTED BY DESCENDING ANNUAL FEUS
SOURCE: 1987 ICC CARLOAD WAYBILL SAMPLE WITH ASSUMED 4 PERCENT ANNUAL GROWTH TO YEAR 2000
RAIL/ANNUAL ANNUAL RAIL HI WAY HI WAY
ORIGIN BEA NUMBER AND NAME DESTINATION BEA NUMBER AND NAME FEUS NET TONS DIST DIST RATIO
96 MINNEAPOLIS-ST. PAUL, MN 176 SAN FRANCISCO-OAKLAND-SAN JOSE, CA 4,043 88,715 2,100 2,016 1.04172 PORTLAND, OR 122 HOUSTON, TX 3,98 8 81,855 2,683 2,365 1.13
12 NEW YORK, NY 79 INDIANAPOLIS, IN 3,94 6 46 ,689 833 703 1.18133 ELPASO, TX 83 CHICAGO, IL 3 ,943 67,336 1,386 1,601 0 .8 7187 ONTARIO 105 KANSAS CITY, MO 3,910 80,323 946 999 0.95141 TOPEKA, KS 180 LOS ANGELES, CA 3,88 0 61,894 1,673 1,555 1.08120 TYLER-LONGVIEW, TX 83 CHICAGO, IL 3 ,863 73,463 921 928 0 .9 9180 LOS ANGELES, CA 19 BALTIMORE, MD 3,82 6 60,009 3,035 2,678 1.13178 STOCKTON-MODESTO, CA 70 TOLEDO, OH 3,813 91,512 2,552 2,302 1.11125 DALLAS-FORT WORTH, TX 12 NEW YORK, NY 3 ,7 4 6 63,539 1,746 1,524 1.15187 ONTARIO 107 ST. LOUIS, MO 3,68 8 69 ,667 734 768 0 .9 6169 RICHLAND, WA 88 ROCKFORD, IL 3 ,67 8 88,282 1,934 1,868 1.04180 LOS ANGELES, CA 111 LITTLE ROCK-N. LITTLE ROCK, AR 3 ,6 4 7 45,939 2,102 1,675 1.25176 SAN FRANCISCO-OAKLAND-SAN JOSE, CA 55 MEMPHIS, TN 3,643 79,208 2,404 2,081 1.16
36 ATLANTA, GA 125 DALLAS-FORT WORTH, TX 3,563 88,882 950 785 1.21173 EUGENE, OR 4 BOSTON, MA 3,50 8 83,986 3 ,3 4 7 3,195 1.05168 SPOKANE, WA 83 CHICAGO, IL 3,505 66,270 1,842 1,806 1.02
51 CHATTANOOGA, TN 180 LOS ANGELES, CA 3,48 8 51,351 2,482 2,146 1.16111 LITTLE ROCK-N. LITTLE ROCK, AR 18 PHILADELPHIA, PA 3 ,4 5 8 82,854 1,317 1,141 1.15
70 TOLEDO, OH 4 BOSTON, MA 3,44 2 57,079 781 768 1.02179 FRESNO-BAKERSFIELD, CA 18 PHILADELPHIA, PA 3,43 0 78,658 3 ,1 4 7 2,848 1.10
18 PHILADELPHIA, PA 180 . LOS ANGELES, CA 3 ,3 6 7 48,354 3,03 8 2.734 1.1171 DETROIT, MI 172 PORTLAND, OR 3,31 8 72,464 2,511 2,373 1.06
173 EUGENE, OR 18 PHILADELPHIA, PA 3,30 0 79,058 3 ,1 7 7 3,002 1.06187 ONTARIO 176 SAN FRANCISCO-OAKLAND-SAN JOSE, CA 3,29 2 76,727 2,90 7 2,602 1.12
19 BALTIMORE, MD 180 LOS ANGELES, CA 3,27 2 75,794 3,035 2,678 1.13139 WICHITA, KS 176 SAN FRANCISCO-OAKLAND-SAN JOSE, CA 3,26 4 61,941 1,869 1,751 1.07178 STOCKTON-MODESTO, CA 55 MEMPHIS, TN 3 ,2 5 7 75,028 2,326 2,045 1.14179 FRESNO-BAKERSFIELD, CA 12 NEW YORK, NY 3,15 0 68,401 3,215 2,902 1.11173 EUGENE, OR 20 WASHINGTON, DC 3 ,1 1 7 74,795 3,121 2,941 1.06
12 NEW YORK, NY 105 KANSAS CITY, MO 3,11 4 58,278 1,333 1,171 1.1412 NEW YORK, NY 171 SEATTLE, WA 3,11 4 30,571 3,071 2,892 1.06
135 AMARILLO, TX 176 SAN FRANCISCO-OAKLAND-SAN JOSE, CA 3,08 4 61,514 1,520 1,356 1.12160 ALBUQUERQUE, NM 83 CHICAGO, IL 3 ,06 4 54,548 1,383 1,344 1.03154 MISSOULA, MT 83 CHICAGO, IL 2,975 70,666 1,663 1,605 1.04
79 INDIANAPOLIS, IN 19 BALTIMORE, MD 2,931 34 ,367 762 593 1.28164 RENO, NV 83 CHICAGO, IL 2,931 62,340 1,982 1,904 1.04178 STOCKTON-MODESTO, CA 4 BOSTON, MA 2,921 69 ,667 3,325 3,046 1.09
65 CLEVELAND, OH 23 NORFOLK-VIRGINIA BCH-NEWPT NEWS, VA 2 ,9 1 7 44,691 788 560 1.41122 HOUSTON, TX 133 ELPASO, TX 2,90 6 36,765 817 762 1 .0 7
71 DETROIT, MI 135 AMARILLO, TX 2,901 69,600 1,270 1,312 0 .9 7169 RICHLAND, WA 180 LOS ANGELES, CA 2,894 69 ,067 1,198 1,179 1.02
12 NEW YORK, NY 96 MINNEAPOLIS-ST. PAUL, MN 2,872 50,119 1,321 1,228 1.08121 BEAUMONT-PORT ARTHUR, TX 107 ST. LOUIS, MO 2,864 66,670 779 869 0 .9 0178 STOCKTON-MODESTO, CA 18 PHILADELPHIA, PA 2,864 68,734 3,155 2,853 1.11176 SAN FRANCISCO-OAKLAND-SAN JOSE, CA 36 ATLANTA, GA 2,851 58,278 2,79 8 2,576 1.09105 KANSAS C ITY , MO 160 ALBUQUERQUE, NM 2,811 46,822 931 896 1.04
Table 24
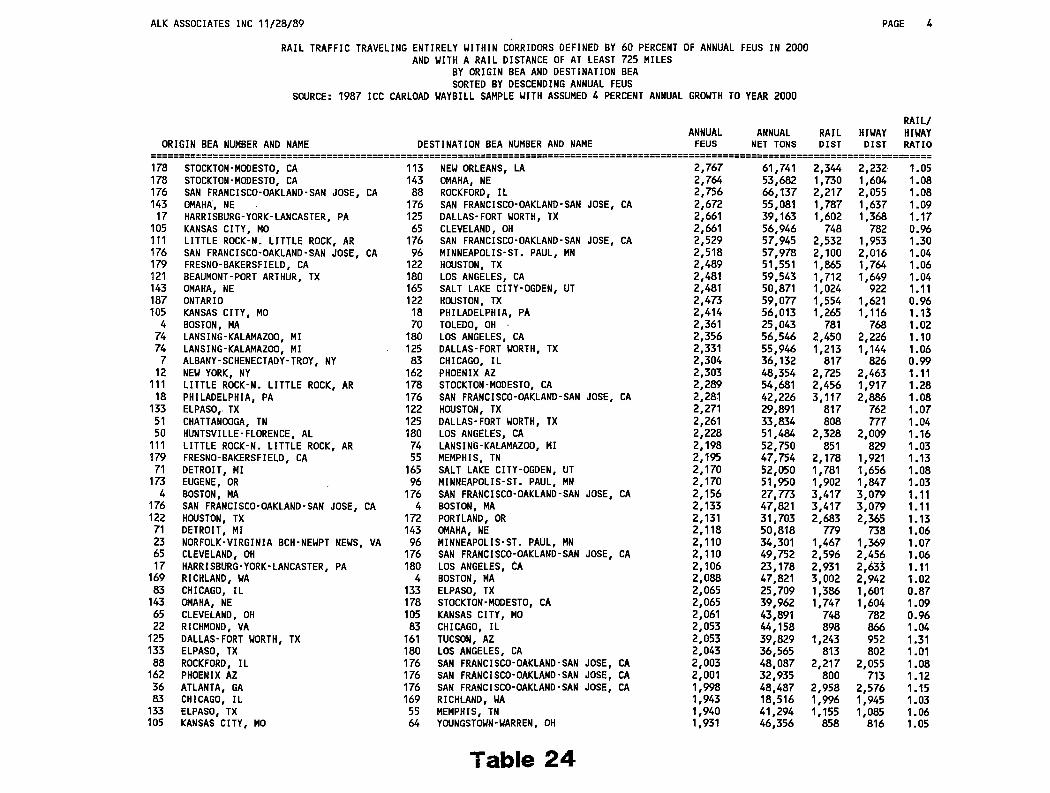
ALK ASSOCIATES INC 1 1 /2 8 /8 9 PAGE 4
RAIL TRAFFIC TRAVELING ENTIRELY WITHIN CORRIDORS DEFINED BY 60 PERCENT OF ANNUAL FEUS IN 2000 AND WITH A RAIL DISTANCE OF AT LEAST 725 MILES
BY ORIGIN BEA AND DESTINATION BEA SORTED BY DESCENDING ANNUAL FEUS
SOURCE: 1987 ICC CARLOAD WAYBILL SAMPLE WITH ASSUMED 4 PERCENT ANNUAL GROWTH TO YEAR 2000
ORIGIN BEA NUMBER AND NAME
178 STOCKTON-MODESTO, CA178 STOCKTON-MODESTO, CA176 SAN FRANCISCO-OAKLAND-SAN JOSE, CA 143 OMAHA, NE
17 HARRISBURG-YORK-LANCASTER, PA105 KANSAS CITY, MO111 LITTLE ROCK-N. LITTLE ROCK, AR176 SAN FRANCISCO-OAKLAND-SAN JOSE, CA179 FRESNO-BAKERSFIELD, CA121 BEAUMONT-PORT ARTHUR, TX143 OMAHA, NE187 ONTARIO105 KANSAS CITY, MO
4 BOSTON, MA74 LANSING-KALAMAZOO, MI74 LANSING-KALAMAZOO, MI
7 ALBANY-SCHENECTADY-TROY, NY 12 NEW YORK, NY
111 LITTLE ROCK-N. LITTLE ROCK, AR18 PHILADELPHIA, PA
133 ELPASO, TX51 CHATTANOOGA, TN50 HUNTSVILLE-FLORENCE, AL
111 LITTLE ROCK-N. LITTLE ROCK, AR 179 FRESNO-BAKERSFIELD, CA
71 DETROIT, MI173 EUGENE, OR
4 BOSTON, MA176 SAN FRANCISCO-OAKLAND-SAN JOSE, CA122 HOUSTON, TX
71 DETROIT, MI23 NORFOLK-VIRGINIA BCH-NEWPT NEWS, VA 65 CLEVELAND, OH17 HARRISBURG-YORK-LANCASTER, PA
169 RICHLAND, WA83 CHICAGO, IL
143 OMAHA, NE65 CLEVELAND, OH22 RICHMOND, VA
125 DALLAS-FORT WORTH, TX133 ELPASO, TX
88 ROCKFORD, IL162 PHOENIX AZ36 ATLANTA, GA83 CHICAGO, IL
133 ELPASO, TX105 KANSAS CITY, MO
DESTINATION BEA NUMBER AND NAME
113 NEW ORLEANS, LA143 OMAHA, NE
88 ROCKFORD, IL176 SAN FRANCISCO-OAKLAND-SAN JOSE, CA125 DALLAS-FORT WORTH, TX
65 CLEVELAND, OH176 SAN FRANCISCO-OAKLAND-SAN JOSE, CA
96 MINNEAPOLIS-ST. PAUL, MN122 HOUSTON, TX180 LOS ANGELES, CA165 SALT LAKE CITY-OGDEN, UT122 HOUSTON, TX
18 PHILADELPHIA, PA70 TOLEDO, OH ■
180 LOS ANGELES, CA125 DALLAS-FORT WORTH, TX
83 CHICAGO, IL162 PHOENIX AZ178 STOCKTON-MODESTO, CA176 SAN FRANCISCO-OAKLAND-SAN JOSE, CA122 HOUSTON, TX125 DALLAS-FORT WORTH, TX180 LOS ANGELES, CA
74 LANSING-KALAMAZOO, MI55 MEMPHIS, TN
165 SALT LAKE CITY-OGDEN, UT96 MINNEAPOLIS-ST. PAUL, MN
176 SAN FRANCISCO-OAKLAND-SAN JOSE, CA4 BOSTON, MA
172 PORTLAND, OR143 OMAHA, NE
96 MINNEAPOLIS-ST. PAUL, MN176 SAN FRANCISCO-OAKLAND-SAN JOSE, CA180 LOS ANGELES, CA
4 BOSTON, MA133 ELPASO, TX178 STOCKTON-MODESTO, CA105 KANSAS CITY, MO
83 CHICAGO, IL161 TUCSON, AZ180 LOS ANGELES, CA176 SAN FRANCISCO-OAKLAND-SAN JOSE, CA176 SAN FRANCISCO-OAKLAND-SAN JOSE, CA176 SAN FRANCISCO-OAKLAND-SAN JOSE, CA169 RICHLAND, WA
55 MEMPHIS, TN64 YOUNGSTOWN-WARREN, OH
RAIL/ANNUAL ANNUAL RAIL HI WAY HI WAY
FEUS NET TONS DIST DIST RATIO
2 ,7 6 7 61,741 2,344 2,232 1.052,764 53,682 1,730 1,604 1.082,75 6 66 ,137 2,21 7 2,055 1.082,672 55,081 1,787 1,637 1.092,661 39,163 1,602 1,368 1.172,661 56,946 748 782 0.962,52 9 57,945 2,532 1,953 1.302,51 8 57,978 2,100 2,016 1.042,48 9 51,551 1,865 1,764 1.062,481 59,543 1,712 1,649 1.042,481 50,871 1,024 922 1.112,473 59 ,077 1,554 1,621 0 .962,414 56,013 1,265 1,116 1.132,361 25,043 781 768 1.022,35 6 56,546 2,450 2,226 1.102,331 55,946 1,213 1,144 1.062,304 36,132 817 826 0 .992,303 48 ,354 2,725 2,463 1.112,28 9 54,681 2,456 1,917 1.282,281 42 ,226 3 ,1 1 7 2,886 1.082,271 29,891 817 762 1 .072,261 33,834 808 777 1.042,22 8 51,484 2,328 2,009 1.162,198 52,750 851 829 1.032,195 47,754 2,178 1,921 1.132,170 52,050 1,781 1,656 1.082,170 51,950 1,902 1,847 1.032,15 6 27,773 3 ,4 1 7 3,07 9 1.112,133 47,821 3 ,4 1 7 3 ,0 7 9 1.112,131 31,703 2,683 2,365 1.132,11 8 50,818 779 738 1.062,110 34,301 1,467 1,369 1.072,110 49,752 2,596 2,456 1.062,10 6 23,178 2,931 2,633 1.112,088 47,821 3,00 2 2,942 1.022,065 25,709 1,386 1,601 0 .8 72,065 39,962 1,747 1,604 1.092,061 43,891 748 782 0 .9 62,053 44 ,158 898 866 1.042,053 39,829 1,243 952 1.312,043 36,565 813 802 1.012,003 48 ,087 2,21 7 2,055 1.082,001 32,935 800 713 1.121,998 48 ,487 2,95 8 2,57 6 1.151,943 18,516 1,996 1,945 1.031,940 41,294 1,155 1,085 1.061,931 46,356 858 816 1.05
Table 24

ALK ASSOCIATES INC 1 1 /2 8 /8 9 PAGE 5
RAIL TRAFFIC TRAVELING ENTIRELY WITHIN CORRIDORS DEFINED BY 60 PERCENT OF ANNUAL FEUS IN 2000
AND WITH A RAIL DISTANCE OF AT LEAST 725 MILES BY ORIGIN BEA AND DESTINATION BEA SORTED BY DESCENDING ANNUAL FEUS
SOURCE: 1987 ICC CARLOAD WAYBILL SAMPLE WITH ASSUMED 4 PERCENT ANNUAL GROWTH TO YEAR 2000
ORIGIN BEA NUMBER AND NAME
105 KANSAS CITY, MO105 KANSAS CITY, MO179 FRESNO-BAKERSFIELD, CA119 TEXARKANA, TX
70 TOLEDO, OH12 NEW YORK, NY
178 STOCKTON-MODESTO, CA169 RICHLAND, WA172 PORTLAND, OR116 LAKE CHARLES, LA
74 LANSING-KALAMAZOO, MI105 KANSAS C ITY , MO177 SACRAMENTO, CA169 RICHLAND, WA176 SAN FRANCISCO-OAKLAND-SAN JOSE, CA177 SACRAMENTO, CA
83 CHICAGO, IL107 ST. LOUIS, MO133 ELPASO, TX179 FRESNO-BAKERSFIELD, CA165 SALT LAKE CITY-OGDEN, UT83 CHICAGO, IL99 DAVENPORT-ROCK ISLAND-MOLINE, IA -IL23 NORFOLK-VIRGINIA BCH-NEWPT NEWS, VA18 PHILADELPHIA, PA
165 SALT LAKE CITY-OGDEN, UT179 FRESNO-BAKERSFIELD, CA
55 MEMPHIS, TN173 EUGENE, OR105 KANSAS CITY, MO172 PORTLAND, OR
79 INDIANAPOLIS, IN170 YAKIMA, WA178 STOCKTON-MODESTO, CA
18 PHILADELPHIA, PA116 LAKE CHARLES, LA
DESTINATION BEA NUMBER AND NAME
4 BOSTON, MA 10 BUFFALO, NY
125 DALLAS-FORT WORTH, TX 180 LOS ANGELES, CA176 SAN FRANCISCO-OAKLAND-SAN JOSE, CA157 DENVER, CO
36 ATLANTA, GA 19 BALTIMORE, MD 12 NEW YORK, NY
180 LOS ANGELES, CA176 SAN FRANCISCO-OAKLAND-SAN JOSE, CA
12 NEW YORK, NY122 HOUSTON, TX
18 PHILADELPHIA, PA19 BALTIMORE, MD
113 NEW ORLEANS, LA 119 TEXARKANA, TX 133 ELPASO, TX107 S T . LOUIS, MO
36 ATLANTA, GA143 OMAHA, NE
22 RICHMOND, VA17 HARRISBURG-YORK-LANCASTER, PA 65 CLEVELAND, OH88 ROCKFORD, IL88 ROCKFORD, IL
105 KANSAS C ITY , MO178 STOCKTON-MODESTO, CA 113 NEW ORLEANS, LA187 ONTARIO113 NEW ORLEANS, LA
12 NEW YORK, NY18 PHILADELPHIA, PA
165 SALT LAKE CITY-OGDEN, UT 79 INDIANAPOLIS, IN
83 CHICAGO, IL
RAIL/
ANNUAL ANNUAL RAIL HI WAY HI WAY
FEUS NET TONS DIST DIST RATIO
1,910 45 ,556 1,418 1,417 1.00
1,878 40 ,428 931 966 0 .96
1,878 41,960 1,735 1,638 1.06
1,862 40,361 1,897 1,616 1.17
1,853 43 ,159 2,472 2,335 1.06
1,848 44,358 1,924 1,768 1.09
1,837 43,625 2,720 2,446 1.11
1,830 43,425 2,806 2,693 1.04
1,825 41,860 3,120 2,904 1.07
1,820 27,920 1,773 1,712 1.04
1,815 43,558 2,462 2,306 1.07
1,793 43,025 1,333 1,171 1.14
1,777 39 ,562 2,029 1,928 1.05
1,763 41,360 2,832 2,749 1.031,760 36 ,898 3,222 2,830 1.14
1,753 39,562 2,389 2,277 1.051,732 27 ,507 777 793 0 .9 8
1,732 19,581 1,235 1,207 1.021,732 31 ,237 1,235 1,207 1.02
1,732 39,362 2,593 2,322 1.121,728 36,232 1,024 922 1.11
1,695 37 ,298 898 866 1.041,690 40,561 922 851 1.08
1,677 26,974 788 560 1.41
1,652 39 ,629 924 871 1.06
1,652 39 ,629 1,480 1,340 1.10
1,652 34,334 1,874 1,732 1.08
1,628 22,179 2,326 2,045 1.14
1,627 38,830 2,918 2,755 1.06
1,623 31 ,636 960 999 0 .961,623 36,765 2,881 2,685 1.07
1,618 29,305 833 703 1.18
1,608 38,163 2,910 2,806 1.04
1,605 35,066 768 686 1.121,562 18,316 765 649 1.18
1,562 36 ,299 967 1,045 0.93
Table 24

Figure 29

3. Major Trends and Data Adequacy
The purpose of this study task was to identify the broad pattern of
domestic double-stack service development, and the scope of potential
diversions from truckload carriers. The tables and figures incorporated
in this section portray the potential truck-competitive network in
considerable detail. Despite some shortcomings of the data that have
been cited, the broad pattern of domestic double-stack development is
apparent, and it is also apparent that there is great, although not
unlimited scope for attraction of truckload traffic.
More complete and exact findings could be presented were better data
available. The three primary data sources used in this study -- the ICC
Carload Waybill Sample, the Bureau of the Census Import/Export data, and
the National Motor Transport Database were designed before the advent of
double-stack operations, and were not designed to be combined for this
purpose. Any bias introduced by current data shortcomings is probably
conservative: more flows would likely qualify for inclusion in the network
if better data were available.
To the extent that detailed public or private planning for double-stack
container transportation depends on such issues, the adequacy of publicly
available data must be examined. For the purpose of understanding the
major trends in double-stack service and domestic containerization, the
data presented herein appear suuficient. With some few exceptions noted in
the text, the criteria and network configurations developed herein corres
pond to the major development observable in the marketplace.
- 83-
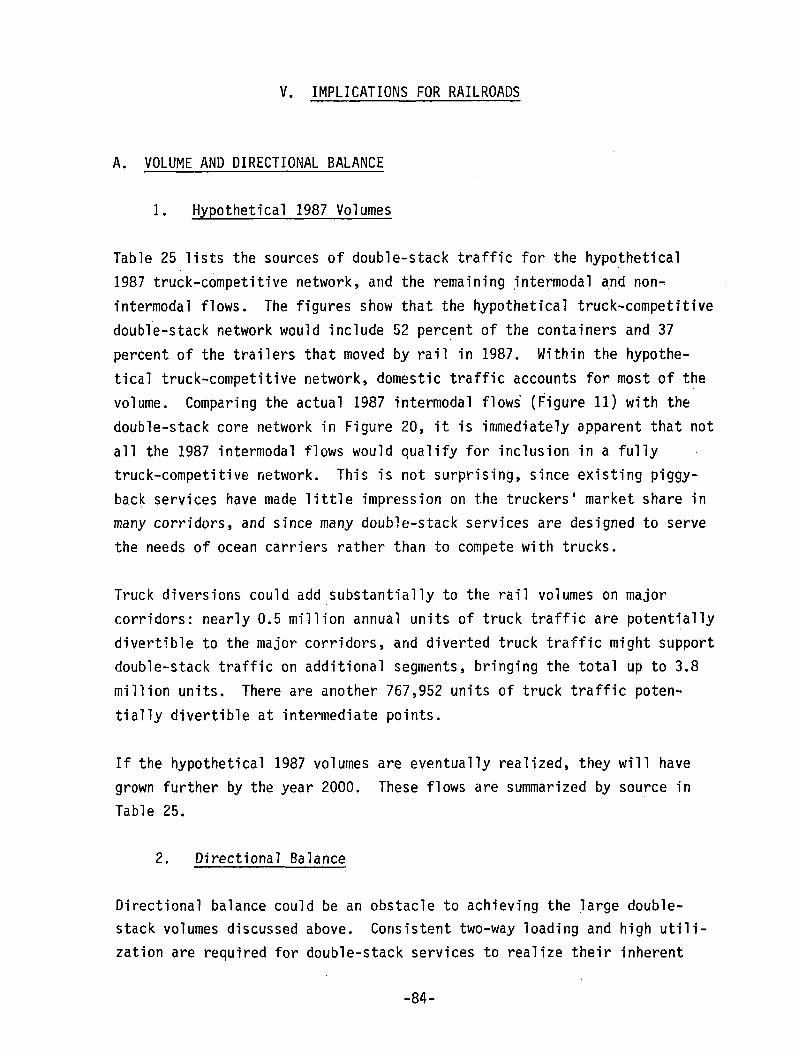
V. IMPLICATIONS FOR RAILROADS
A. VOLUME AND DIRECTIONAL BALANCE
1. Hypothetical 1987 Volumes
Table 25 lists the sources of double-stack traffic for the hypothetical
1987 truck-competitive network, and the remaining intermodal and non-
intermodal flows. The figures show that the hypothetical truck-competitive
double-stack network would include 52 percent of the containers and 37
percent of the trailers that moved by rail in 1987. Within the hypothe
tical truck-competitive network, domestic traffic accounts for most of the
volume. Comparing the actual 1987 intermodal flows (Figure 11) with the
double-stack core network in Figure 20, it is immediately apparent that not
all the 1987 intermodal flows would qualify for inclusion in a fully
truck-competitive network. This is not surprising, since existing piggy
back services have made little impression on the truckers' market share in
many corridors, and since many double-stack services are designed to serve
the needs of ocean carriers rather than to compete with trucks.
Truck diversions could add substantially to the rail volumes on major
corridors: nearly 0.5 million annual units of truck traffic are potentially
divertible to the major corridors, and diverted truck traffic might support
double-stack traffic on additional segments, bringing the total up to 3.8
million units. There are another 767,952 units of truck traffic poten
tially divertible at intermediate points.
If the hypothetical 1987 volumes are eventually realized, they will have
grown further by the year 2000. These flows are summarized by source in
Table 25.
2. Directional Balance
Directional balance could be an obstacle to achieving the large double
stack volumes discussed above. Consistent two-way loading and high utili
zation are required for double-stack services to realize their inherent
- 84-

Table 25
1987 DOUBLE-STACK NETWORK TRAFFIC SOURCES
Relevant 1987 Total Major Corridors
Intermediate ; Points
NetworkTotal
OtherIntermodal Non-Intermodal
Containers 2,277,484 995,322 196,362 1,191,684 1,085,800 —
Trailers 2,972,591 763,290 345,374 1,108,664 1,863,927 —
Boxcars (Ctr Eqv) 3,107,496 187,269 220,292 407,561 — 2,699,935
Trucks 4,105,104 1,844,892 1,391,712 3,236,604 — 868,500
TOTAL 12,462,675 3,790,773 2,153,740 5,944,513 2,949,727 3,568,435
★Near-term conversion to double--stacked containers is not expected for this traffic.
Sources: Tables 34-42, Additional Data from ALK Associates

line-haul cost advantages. The problem can be especially significant in
attempting to divert traffic from trucks. Truckload common carriers
usually move loaded in both directions, and attempt to minimize reposition
ing. The greater flexibility and market penetration of truckload carriers
has left rail as the unbalanced mode. Because the total relevant traffic
is typically unbalanced in any single corridor, railroads as a whole can
become balanced double-stack operators only by forcing some other mode —
truck or rail piggyback — to assume the imbalanced traffic. It is more
likely that individual railroads and double-stack services will vary in the
extent to which they achieve balanced flows.
Figure 30 illustrates the pattern of net imbalances implicit in the major
1987 double-stack network segments (southbound traffic is treated as
westbound). It is apparent that some corridors would be seriously imbal
anced were all the traffic shown actually carried. Some corridors, such as
Los Angeles-Chicago and Seattle-Chicago, are imbalanced partly because of
imbalanced international traffic. Others, such as Fresno-Chicago and
Portland-Los Angeles, are imbalanced because they connect a highly popu
lated consuming area with a much less populated producing area. The
overall balance is reasonable -- the westbound flow is 86 percent of the
eastbound -- but no railroad carries "overall" traffic.
Some limited triangulation could mitigate the imbalance. For example, the
Seattle-Chicago flow has an eastbound imbalance and the Portland-chicago
flow as a westbound imbalance, which suggests empty repositioning between
Portland and Seattle. The Los Angeles-Chicago flow has an eastbound
imbalance and the San Francisco/Oakland-Chicago flow has a westbound
imbalance, which suggests empty reposition between San Francisco/Oakland
and Chicago. NYK and American President intermodal are currently operating
triangulated rail services to achieve such repositioning.
It is tempting to assume that double-stack services could divert just
enough truck traffic to achieve balanced flows, but such is not the case.
Diverting only one half of a two-way loaded truck movement would leave
excess truck capacity seeking a backhaul at low rates. Unless trucks
reposition to alter their own movement and balance pattern, it will be
- 85-


difficult for double-stack services to "skim the cream" and achieve
balanced movements at the expense of truckload common carriers.
B. RAIL INTERMODAL TERMINAL REQUIREMENTS
1. Terminal Requirements •'
In expanding double-stack services, railroads wi11: typically use existing
terminal facilities and equipment as long as possible/ Unlike ports,
railroads rarely build much in advance of demand; Once new operating needs
and volumes have been established, terminal expansion will be undertaken.
An intermodal terminal that will be handling double-stack trains has these
general requirements: ; ;
o Loading and unloading tracks of adequate length to handle .15-28 car
double-stack trains with a minimum of switching;
o Sufficient storage tracks to hold empty cars, bad order cars, and
overflow equipment;
o Mechanical lift equipment capable of serving double-stack cars;
o Hostling equipment sufficient to shuttle chassis with arid without
containers between various locations within the terminal;
o Parking capacity for incoming containers unloaded from trains, for
outgoing containers received through the gate, for empty containers
awaiting loads, and for the terminal's chassis pool; and
o Modern entry/exit gates with a significant degree of automation and
administrative support.
Any one of these requirements could constitute the limiting factor for a
given facility. Some factors, however, such as the supply of lift or
hostling equipment, can be changed more rapidly and less expensively than
more fundamental factors such as the supply of land. When faced with
capacity constraints, railroads typically identify the least expensive
- 8 6 -

means of alleviating bottlenecks. Usually, new mobile equipment or gate
modifications are tried before the terminal itself is expanded.
All of the Class I railroads were contacted regarding their current inter-
modal terminal operations as well as their future terminal development
plans. The results indicated that the majority of the intermodal terminals
handling double-stack containers will have sufficient capacity for some
years to come without making significant investments. No new terminals are
currently envisioned specifically for domestic double-stack operations
beyond those currently in place or in progress (ie, CNW's Global II and the
expansion of SP's ICTF). All railroads expect that their intermodal mix
will include, but not be limited to, containers. It is thus difficult for
them to plan for specialized double-stack terminals.
2. Traffic Volumes and Capacity at Major Hubs
The development and expansion of double-stack networks implies an increase
in traffic at major hubs. For the hypothetical 1987 network, growth would
come from two sources: conversion of boxcar traffic, and diversion of
truckload traffic. Conversion of domestic piggyback traffic to containers
will not increase terminal traffic volumes. Existing intermodal traffic
outside the domestic double-stack network must, however, be included in any
estimates of hub traffic volume. Appendix Table 7 gives consolidated
traffic volumes -- double-stack, other intermodal, converted boxcar, and
diverted trucks -- for the major hub BEA's. By the year 2000, intermodal
traffic is expected to grow substantially. Appendix Table 8 gives hub
volume estimates based on 4 percent annual growth of the intermodal por
tion. No attempt was made to predict the growth of diverted truck traffic.
Because the intermodal growth projection already incorporates some truck
diversions, a separate projection for further growth would risk double
counting.
The major railroads were contacted to update existing information on the
capacities of railroad intermodal terminals. Appendix Table 9 shows
present and potential intermodal terminal capacity.
- 87-

3. Potential Terminal Shortfalls
Table 26 compares the hub volume estimates from Appendix Tables 7 and 8
with the capacity estimates from Appendix Table 9 to determine the extent
of any shortfalls and the rough cost of construction or expansion to
alleviate those shortfalls. Construction or expansion costs for rail
intermodal terminals vary widely, depending on:
o the local cost of land and construction labor;
o The need for pre-surfacing, demolition, trackage, and paving;
o the need for construction or expansion of gates, administrative
facilities, or shops; and
o the need for terminal equipment and electronic information
systems.
The cost of land alone might range from $15,000 per acre in undeveloped
rural areas to $250,000 or more in major cities.
To derive a rough average of the costs for construction at major hubs,
where capacity shortfalls are more likely, published cost and acreage
information for three recently constructed double-stack facilities were
examined:
o The SP ICTF in Los Angeles, which according to SP originally
covered 150 acres and cost $80 million.
o The BN Seattle International Gateway, which covers 29 acres and
cost $10.6 million.
o The south on-dock double-stack facility in Tacoma, which covers
40 acres and cost $20 million.
These three facilities together aggregated 219 acres (as originally built),
and cost a total of $10.6 million, an average of $505,000 per acre.
Although this figure would almost certainly not apply to any specific
facility construction or expansion plan, it is a usable figure to assess
the rough magnitude of capital investment required to alleviate a general
shortfall.
- 8 8 -

Table 26POTENTIAL TERMINAL CAPACITY SHORTFALL
198/ 2000 1387 2000Hypothetical Hypothetical Surplus Surplus Expansion Expansion
HubEstimatedCapacity
1987Volume
2000Volume
orShortfall
orShortfall
Cost($)
Cost($)
LA/LB 3,026,735 2,659,382 3,364,201 367,353 (337,466) 13,847,698Seattle 1,080,141 844,907 1,144,784 235,234 (64,643) 2,652,584Portland 584,687 594,863 768,158 (10,176) (183,471) 417,566 7,528,613Chicago 7,423,814 2,660,493 4,232,317 4,763,321 3,191,437St Paul 120,016 225,548 327,672 (105,532) (207,656) 4,330,437 8,521,029Detroit 569,673 246,806 334,942 322,867 234,73!Kansas City 672,403 400,771 613,703 471,632 258,700Denver 644,962 141,245 235,191 503,717 403,771Houston 948,416 412,381 619,449 535,435 328,367.St Louis 878,163 362,198 597,337 515,965 280,826Columbus 240,031 75,379 126,515 164,052 113,516New York 1,215,485 791,433 1,131,262 424,052 84,223Baltimore 418,591 184,255 278,501 234,336 140,030New Orleans 395,173 316,849 497,857 78,324 (102,684) 4,213,571Atlanta 790,473 263,756 439,172 526,71? 351,301Memphis 453,718 343,797 536,416 103,921 (82,633) 3,393,459Dallas-Ft 'North i NC.DATA 800,277 1,013,483SF-Oakland INC,DATA 827,151 1,054,579Philadelphia INC,DATA 343,545 489,552Boston INC.DATA 225,841 322,769Stockton-Modesto UNKNOWN 344,721 396,251Phoenix UNKNOWN 338,19? 392,406Albuquerque UNKNOWN 66,492 75,554Salt Lake City UNKNOWN 181,884 232,055Fresno-Bakerstield UNKNOWN 213,101 263,549
TOTAL 19,862,481 13,866,472 19,487,685 9,137,218 4,415,004 4,748,003 40,156,955

From Table 26 it is immediately clear that there are two classes of short
falls:
o existing hubs requiring expansion; and
o points without intermodal facilities requiring new construction.
The second class of shortfalls raises a serious chicken-and-egg question:
Will the railroads be willing to build new intermodal facilities with the
expectation of diverting boxcar and truck traffic? Points like Eugene,
which are not within drayage range of existing hubs, pose a special problem
in attempting to start a domestic double-stack service from scratch. One
possible solution is the use of contracts to establish a traffic base large
enough to mitigate the risks of facility investment.
In the long run, the railroads may shift some of the domestic double-stack
train activity to private terminals. As an example, GTW is leasing a
terminal 18 miles outside of Detroit to API. On the East Coast, some major
steamship lines have established their own terminals. It is likely that
more joint ventures and partnerships will be formed to meet the terminal
requirements of domestic double-stack service operated for non-railroad
entities, thus reducing the railroads' financial commitments and the impact
on existing railroad terminals.
C. RAIL EQUIPMENT NEEDS * 53
1. Domestic Containers
All indications are that international double-stack traffic will continue
to move in international (ISO) containers 20, 40, or 45 feet long and 96
inches wide for the foreseeable future. Domestic double-stack traffic will
travel in a mixture of these ISO sizes and domestic containers 45, 48, and
53 feet long and 102 inches wide. Thus far, the 48 x 102 size predominates
in the domestic container fleet. The 45 x 102 size has been built in small
numbers, and is favored by some industry participants as an ideal size for
domestic refrigerated service. The 53 x 102 size has thus far been built
- 89-

only for American President, and is limited in its use by highway
restrictions.
Growth in domestic containerization will require expansion of this fleet to
accommodate conversions from piggyback trailers, boxcars, and trucks, and
growth of existing domestic container traffic. Growth of international
trade will require expansion of the international container fleet
regardless of how many of these containers move on double-stack trains.
Most domestic container traffic still travels in international containers
due to the persistent imbalance of trade. Exports are predicted to grow
faster than imports, gradually improving the overall balance of container
ized imports and exports. An improved balance will reduce the incentive of
ocean carriers to make ISO boxes available for domestic traffic, and
thereby require the domestic fleet to handle a larger share of the total.
Domestic movements in ISO containers will not disappear, even if imports
and exports balance. An overall balance does not mean that the traffic of
individual carriers and trades will be balanced, nor does it imply an even
stream of traffic over the year. Idle ISO containers will continue to be
available for revenue loads, domestic or international.
The current proportions of domestic and ISO containers in domestic container
traffic cannot be determined directly from the available data, and so must
be inferred. An analysis by Trailer Train (Intermodal Market Survey, 1989)
inferred that domestic container loadings in 1988 accounted for 5-7 percent
of total intermodal traffic, or approximately 270,000-300,000 loads. Of
that total, approximately 100,000 loads were carried in domestic contain
ers, and the remainder (200,000-300,000 loads) in ISO containers. With a
fleet of about 8,500 domestic containers in 1988, the average container
carried about 12 annual loads. This is relatively low overall utilization,
since a common industry benchmark for good utilization is 10-12 annual
two-way trips, with 18-24 annual loads. Some of this lower utilization,
however, is due to the containers not being available for the entire year.
For purposes of estimating minimum total fleet requirements, a utilization
average of 10 annual round trips with 18 annual loads would be more
representative.
- 90-

Table 25 shows that the hypothetical 1987 double-stack network would
include 1,191,684 units of existing container traffic, 1,108,664 units of
existing trailer traffic, 407,561 container equivalents of boxcar traffic,
and 3,236,604 units of truckload traffic. Of the 5,944,513 total annual
loads, 4,752,829 (all but the existing container traffic) would require new
domestic containers (assuming none were carried in surplus ISO containers.
At 18 annual loads per container, this traffic volume would require 264,046
new domestic containers (Table 27).
Growth to the year 2000 would increase the existing rail portion by about
4 percent annually, or 67 percent over the 13 year period. Applying this
to the 1987 trailers and boxcar equivalents suggests a need for 56,437
domestic containers by the year 2000.
In 1989 dollars, a new 48 x 102 domestic container costs roughly $8,000.
The additional cost of containers needed to serve the hypothetical 1987
network, including all the truck diversions, would be approximately
$2,112 million. The additional cost for the year 2000 is $451 million.
Chassis. Major intermodal ocean carriers such as American President
Lines and Sea-Land Service own approximately one chassis for each two
containers. This ratio can be used as a rough guideline for estimating
the total chassis fleet required to support the hypothetical 1987 and
2000 double-stack networks. Approximately 132,023 additional chassis
would have been required in 1987, and another 28,219 by 2000. 1989 costs
were roughly $8,500 for an extendable 40/45/48 chassis. With standardiza
tion of domestic containers at 48 feet, however, extendable chassis may not
be needed. A 48-foot fixed-length chassis would cost closer to $6,500,
making the cost about $858 million, and the 2000 cost about $183 million
(Table 27).
Double-Stack Cars. In 1988 there were approximately 2,400,000 rail
container loadings. The majority were apparently on double-stack cars,
of which there were about 2,400 (24,000 container spaces). The suggests
that double-stack cars were making up to 100 loaded trips per year, on
about one round-trip per week. This estimate implies a very high
utilization, which in fact is being achieved. A five-unit double-stack
- 91-

Table 27
RAIL EQUIPMENT NEEDS
1987
Units
NETWORK
1987 Price Cost Units
2000 ADDITIONAL
1987 Price Cost
($) ($ M) ($) ($ M)
48* x 102" Domestic Containers
For existing trailer traffic 61,592 8,000 493 41,267 8,000 330
For converted boxcar traffic 22,642 8,000 181 15,170 8,000 121
For diverted truck traffic 179,811 8,000 1,438 - - -
SUBTOTAL 264,046 8,000 2,112 56,437 8,000 451
48' Chassis 132,023 6,500 858 28,219 6,500 183
Double-Stack Cars 5,281 180,000 951 1,129 180,000 203
TOTAL 3,921 837

car is therefore capable of carrying 1,000 annual container (100 trips at
10 containers each). If one container makes 10 annual round trips
(loaded or empty), each double-stack cars can support a fleet of
approximately 50 containers. The additional containers listed in Table
27 would therefore require an additional 5,281 double-stack cars for the
1987 network, and 1,129 additional cars for the 2000 network. At a current
cost of approximately $180,000 per car, the total cost would be $951
million for the 1987 network, and an additional $203 million for the 2000
network (Table 27).
Total Equipment Needs. Table 27 summarizes the needs for domestic
containers, chassis, and double-stack cars. The total investment need is
roughly $3.9 billion for the hypothetical 1987 network, and an additional
$0.8 billion by the year 2000. The total investment for the 13 year period
is about $4.8 billion, or $366 million per year. Although high, this
figure is not unattainable: the railroad industry made a similar total
investment during the coal boom of the late 1970's and early 1980's, when
the industry was not as prosperous as it is now. Such investments can draw
on many sources, including Trailer Train and the leasing companies, and it
seems likely that the railroads themselves would bear only part of the
investment burden.
To the extent that container and trailer traffic outside the truck-
competitive network is also converted to double-stacked containers, there
will be additional equipment investment needs.
D. ECONOMIC AND FINANCIAL ISSUES * 10
1. Profitability
Commencing in 1980 with deregulation, and accelerating with the introduc
tion of double-stack capabilities, intermodal traffic has accounted for an
increasing share of railroad revenues. For some railroads it now accounts
for 40 percent of their total revenue. For others, it is still less than
10 percent. Now, however, attention is being focused more on profitability
than on gross revenue.
- 92-

While the average profitability of double-stack trains is perceived to be
better than that of TOFC trains, many railroads do not yet consider it
satisfacory. The rate cap imposed by trucks, the need for terminals and
terminal labor, and the fierce competition have all tended to restrict the
profitability of TOFC traffic. From time to time, some railroads officials
have questioned the underlying profitability of TOFC. The cost advantages
of double-stack service and the large volumes of international traffic have
led most railroads to regard double-stack traffic as more profitable than
TOFC. Some railroads, such as BN and CNW, regard intermodal profits as a
whole to be adequate. Many railroads, however, believe intermodal profita
bility must increase to justify further investment.
Rates. The first constraint on profitability, as discussed in the cost
criteria, is the constraint that truckload service imposes on double-stack
rates. At present, customers consider intermodal service -- including
double-stack service -- inferior to truckload service, and they expect a
discount from truckload rates.
The comparison applies to the total intermodal transportation bill, of
which the railroad linehaul rate is only one part. The third-party fee,
the drayage expense, the chassis and container per diem, the terminal
contractor lift charge, and the Trailer Train or leasing company equipment
charges must be deducted from a total price that is already below the
truckload rate before railroad revenues can be set against operating and
overhead costs.
LTL and truckload carriers have announced 3-5 percent rate increases for
the first quarter of 1990, giving some room for raising double-stack rates.
Southern Pacific has announced intermodal rate increases of about 7
percent, indicating SP's faith in intermodal's long-term ability to reduce
the discount currently offered.
Costs. Reducing the costs of double-stack service is a difficult task.
Many of the costs of double-stack service are outside expenses. While one
railroad can negotiate for the lowest terminal contractor costs and the
lowest equipment costs, so can all other railroads. Other costs, such as
motive power, diesel fuel, and maintenance, are also common to all railroad
- 93-

operations and all railroads. The costs specific to intermodal and double
stack service, such as marketing and customer service, have already been
cut and cut again. As discussed in the cost criteria, some reductions are
possible in labor costs. But cost reductions of any kind, if they become
industry-wide, may lead only to further rate reductions in response to
competitive pressure.
The intermodal transaction is inherently more complex than truckload ser
vice. A domestic double-stack movement may involve:
o one or more railroads;
o two terminal contractors;
o two draymen;
o two chassis pools;
o a container leasing company; and
o a third party agent.
By comparison, a truckload movement typically involves.only a single truck
ing company and perhaps a third-party agent or broker. There are fewer
operating functions and fewer people to manage in truckload carriage. The
complexity of intermodal movements also creates more opportunities for
costly errors and inefficiencies: the overall profitability of intermodal
business can be significantly harmed by poor equipment utilization, low
labor productivity, and high claims ratios, to name just a few.
2. Capital Needs
Clearances. Double-stack cars require greater clearances than any other
type of railcar if loaded with two 9'6" high-cube containers up to 102"
wide. Rail routes that have historically restricted piggyback or tri-level
auto-rack traffic will likely be closed to double-stacks unless substantial
sums are spent to increase clearances in tunnels and under bridges or over
passes. These problems are more serious for domestic traffic than for
international traffic because of the greater existing and anticipated use
of 9'6" high and 102" wide containers. When high-cube containers are
- 94-

stacked two high they require more than 20 feet of clearance over the
rails, and a width of nearly 10 feet at that height. The short-term net
revenue from a railroad's double-stack train service would seldom cover the
required expensive clearance modifications. Without significant commit
ments for long-term volume, the railroad cannot realistically fund these
modifications. Strategic partnerships, discussed later, will encourage the
required long-term commitments.
One near-term approach to clearance problems is the use of spine cars,
which achieve some of the line-haul economies of double-stacks. CSL In-
termodal has recently announced a container service using spine cars be
tween Chicago and Baltimore, where there are long-standing clearance prob
lems. The use of spine cars also allows the railroad to start a premium
domestic container service at a lower minimum volume, and consider clear
ance improvements as traffic volumes rise.
Overall, it appears that restricted clearances may delay, but not prevent,
the development of a domestic double-stack network. Matching high-cubes
with shorter containers and the use of spine cars will allow railroads to
introduce domestic container service in restricted corridors without making
an all-or-nothing decision on expensive tunnel and bridge modifications.
It may be several years before two high-cube domestic containers can travel
together over the whole network, and there may be some routes into metro
politan areas that will always have clearance restrictions. The routes
with the greatest potential for domestic container movements will probably
be cleared first, with lower-volume routes to follow. This process may
lead to uneven network development, particularly in the Northeast, and may
reduce near-term profitability.
Management Systems. Most discussions of capital needs in transportation
focus on equipment and facilities. The biggest shortcomings in existing
intermodal and double-stack services, however, are operational reliability,
fragmentation of responsibility, and customer service. Addressing those
shortcomings requires improved management systems, calling for capital
investment in computerized information systems and advanced communications
technologies. Information and communications systems play a central role
in coordinating the activities of decentralized organizations such as rail
- 95-

roads. Properly implemented, they can also assist in coordinating activ
ities between two or more firms, thus reducing fragmentation. With careful
design, such systems can greatly improve customer service and
responsiveness by giving marketing, sales, and traffic personnel the infor
mation they need, or even making direct connections with the customers'
computers. Because intermodal marketing and operations often have
different information needs than other railroad departments, those needs
may be poorly served by corporate information systems. For example, most
railroad operations require a system capable of tracing cars, while the
intermodal operating personnel and their customers need to trace trailers
and containers.
The provision of improved information and communications systems may be
less an issue of capital needs than one of institutional will. Railroads
have repeatedly demonstrated their willingness to invest in systems and
software that promise concrete productivity improvements or marketing ad
vantages. The question is whether the railroads are willing to make a
comparable investment in systems to support a potential net revenue pro
ducer, intermodal, and an intangible function, customer service.
3. Labor Issues
The central labor issues in the railroad industry are crew consist and work
rules, which affect all rail operations. Railroads and rail unions have
cooperated in running "sprint" trains and other "new" rail business with
reduced crews (two crewmen instead of three or four). In some respects,
double-stack container business is "new". The cost requirements for
successful penetration of the truck market will determine whether reduced
crews are necessary for a viable domestic container service, or for an
already viable service to expand its market share and profitability.
Train Crew Costs. Most carriers operating in the heavy intermodal cor
ridors have three-person crew arrangements for at least part of their op
erations, with productivity pay. In a few instances, the Class I railroads
have negotiated two-person crews (who generally receive productivity pay
ments) for certain intermodal service. The prospects in current labor
negotiations for expanding the use of two-person crews in intermodal
- 96-

service seem good. A recent Santa Fe agreement calls for longer mileages
and other marked improvements. Pricing competitiveness with trucks could
be improved if operations could be,implemented with two-person crews paid
for 8 hours work rather than a set mileage. The labor unions, however, may
not wish to set what they consider a dangerous precedent, but have also
stated in the past that other costs should be pared down to attract this
business. As the operating cost criteria illustrate, issues of pay and
work rules are very complex, and defy simple solutions.
Terminal and Drayage Labor Costs. Because of the historic truck line ex
clusion from the Railroad Retirement and Railway Labor Act provisions, many
railroads have operated their intermodal terminals with personnel from
their truck subsidiaries (often Teamster labor). Others have engaged
outside contractors with low overall wage and benefit costs. Thus, the
ability of the railroads to lower terminal labor costs still further is
marginal. Similarly, most drayage is done by outside trucking companies,
and it has been difficult for railroad-owned truck lines to compete. The
railroads do have an opportunity to reduce terminal and drayage labor costs
by increasing terminal efficiency and reducing the labor time per unit,
regardless of the labor pay rate. The critical problem is gate inspections
and documentation, which use up the time of both terminal personnel and
draymen. Both the costs and the delays involved in gate operations are
significant factors in the ability of railroads to compete with truckers.
E. OPERATIONAL ISSUES 1
1. Highway and Street Access
A more complex, and perhaps more intractable infrastructure problem is
highway and street access to rail intermodal yards and ports. Drayage is a
major factor in the ability of double-stacks to compete with trucks, and a
major source of delay and unreliability. Where drayage is impeded by poor
access and traffic congestion, costs rise and reliability drops. The
problem is most serious in major metropolitan areas (which are often port
cities as well) and at inland cities where "rubber-tired" interchange takes
place (particularly Chicago, but also Memphis and New Orleans).
- 97-

The intermodal access problem in port cities is complicated by the con
tainer drayage peaks associated with the arrival of large container ships,
some of which may discharge and load upwards of 2,000 containers in a sin
gle call. Intermodal containers have to compete with local customers for
drayage service, and compete with other port and urban traffic for highway
access. At peak periods, the intermodal volume can strain the system. Dur
ing the worst traffic conditions in Southern California, ocean carriers pay
as much as $120 for the 20-25 mile dray to UP and Santa Fe facilities.
The true extent of the urban congestion problems traceable to rubber-tired
interchange is unknown, although those in the intermodal field regard it as
serious in Chicago and potentially serious elsewhere. A preliminary
estimate by ALK Associates indicates that as many as 1,000 trailers and
containers are drayed through the streets of Chicago every weekday. Most
railroad-to-railroad interchange on through bills of lading are "steel
wheeled" interchanges: the containers or trailers remain on the railcars,
and the cars themselves are interchanged. Rubber-tired interchanges, where
the containers or trailers are unloaded, drayed, and reloaded, result in
large part from third-party movements that are billed separately over two
rail segments.
The highway and urban access problem is beyond the authority of the
railroads, even if they had the required funds. Some observers feel that
government participation may be required. Suggestions range from exclusive
drayage roads on abandoned rail rights-of-way, to improved highway exits
and entrances for intermodal yards. The upcoming renewal of the Highway
Trust Fund is seen as a forum for discussion of urban infrastructure
problems, as well as a potential source of funds.
2. Payload Penalties and Overweight Containers
While a container may have a listed capacity greater than a piggyback
trailer, when the weights of the container and the chassis are combined it
will generally be more than that of a piggyback trailer or a highway
trailer. This raises two issues: the "payload penalty" associated with
the use of containers rather than trailers, and the potential aggravation
of overweight problems.
- 98-

As Table 28 demonstrates, a 48-foot long 102-inch wide domestic container
on its chassis can weigh 16,700 pounds, 21 percent more than a comparable
trailer, and 40-45 percent more than a highway trailer. This payload
penalty will affect shippers of heavier goods that reach the weight capa
city before filling the space ("weighing out" before "cubing out"). If
priced on a containerload or trailerload basis, containers will be able to
move about 6 percent less freight, raising the equivalent unit rate by 6
percent. With existing technology, this payload penalty is inescapable,
and it must be dealt with in pricing and marketing.
The payload penalty may aggravate the overweight problem. There were prob
lems with overweight trailers and trucks long before domestic containers
were introduced, and there is little reason that overweight containers
should be more prevalent. If container customers overload the container to
get the same payload as a trailer, however, there may be a more widespread
problem with overweight domestic containers.
3. Equipment Balance and Logistics
Equipment Balance. One operating issue created by specialized equipment
such as the double-stack car is equipment balance. Heavy peak demand often
requires repositioning of containers and cars. It can also create the need
for chassis repositioning. The cost criteria assumed 100 percent util
ization of containers and double-stack cars, a standard that is now ap
proached by only the most effective and efficient intermodal operators.
Double-stack utilization is somewhat higher than conventional piggyback
cars: Trailer Train double-stacks average 360 miles per day, versus 225
miles per day for T0FC cars. If extensive empty equipment repositioning is
required, equipment utilization and the economies of double-stack service
will be significantly reduced.
Intermodal has been the mode of imbalance. Several strategies have been
tried to overcome imbalances, but none is easy to implement or highly
profitable when implemented. One strategy is to seek "backhaul" movements
by offering low rates in the light direction. This strategy has been
vigorously pursued by intermodal operators, but some observers note a
long-term profitability problem once the lower rates become accepted as
- 99-

DOMESTIC CONTAINER PAYLOAD PENALTY
48' x 102" Container
48' x 102" TOFC Trailer
48' x 102" Highway Trailer
Highway Weight Limit 80,000 lbs. 80,000 lbs. 80,000 lbs.
Tare Weight 8,100 13,800 12,000
Chassis Weight 8,600 - - —
Tractor Weight 15,000 15,000 15,000
Payload Limit 48,300 lbs. 51,200 lbs. 53,000 lbs.
Container/TOFC Payload Penalty 2,900 _____ - _
Container/Highway Payload Penalty 4,700
Source: Official Intermodal Equipment Register, September 20, 1989Tractor weight is representative.

"standard." Many shippers have institutionalized low backhaul rates and
used them to penetrate markets that would not be accessible at full cost.
As carriers come closer to balancing international and domestic flows,
aggressive backhaul pricing is disappearing, and shippers and consignees
who used low backhaul rates will have to adjust. A second strategy is
"cream skimming," attempting to carry only balanced, high-value freight.
Cream-skimming, however, is an open invitation to aggressive competitors,
and it is difficult to maintain for extended periods. A third strategy is
"triangulation," where the return movement goes to a different destination
and a short repositioning movement is accepted to gain an improved overall
balance. Truck is an inherently more flexible mode and has an advantage in
attempting to triangulate movements, accounting for part of the trucking
industy's better overall traffic balance.
There has been a resurgence of ocean carrier interest in triangular double
stack services; e.g., Los Angeles to Chicago, Chicago to Oakland, and then
repositioning to Los Angeles. Triangular services require chassis and
containers in three locations, not just two. Multiple intermodal terminals
can increase the administrative, inventory control, and maintenance manage
ment costs as well as the capital costs necessary to ensure adequate equip
ment availability.
Chassis Logistics. Chassis logistics can be a potential operating problem
if it is not solved through contracting or other institutional means. For
efficient operation, a rail terminal must always have chassis available for
incoming containers (to avoid grounding and rehandling), but at the same
time valuable terminal space and capital cannot be consumed by empty chas
sis. Unless a neutral chassis pool is used, containers must also be
matched with the correct firm's chassis. This is a significant problem
even when one train contains containers from several different ocean car
riers; it will become a much larger problem if the railroad has to match
chassis for several shippers or third parties as well.
Neutral chassis pools appear to be a workable solution to chassis logistics
problems. Although they are not universally accepted, and pool chassis
utilization could still be improved, there are over 50 railroad and port
chassis pools with over 15,000 chassis in service. Strick Leasing has the
- 1 0 0 -

most pools in operation, with over 20 at rail terminals and ports. The
largest single international pool, and the oldest railroad pool, is the BN
pool in Cicero (Chicago) operated by Transamerica ICS; this pool, started
in 1985, now has over 1,500 chassis of all types, available for use by any
BN customer. There are also several port and marine terminal chassis pools
that serve local traffic as well as drayage. The pool at Maher Terminal,
in New Jersey, is the largest of these with over 2,000 chassis. Some
resistance to using chassis pools has come from the few major ocean carri
ers whose traffic volume can support their own chassis fleets.
4. Double-Stack Car Supply
Since Trailer Train began acquiring its fleet of double-stack cars in 1985,
many of those cars have been assigned to specific railroads for periods of
three to five years. Those railroads guarantee all per diem and mileage
charges for the assignment period, and they manage those cars essentially
as though they were their own. Railroads could, in turn, reserve those
cars for the use of specific customers, principally the major steamship
lines and their intermodal subsidiaries. Under this system, both the
railroads and their customers could obtain the cars they needed without a
direct capital investment and without a long-term obligation. This car
supply mechanism reduced the risk of starting new double-stack services and
encouraged expansion of the double-stack network.
The recent ICC decision extending Trailer Train's anti-trust immunity
prohibited Trailer Train from assigning cars in this manner. In the
future, Trailer Train's double-stack cars will be in a free-running pool.
If railroads and ocean carriers deem it necessary to have a supply of
double-stack cars under their own control, they will have to acquire cars
(via purchase or long-term lease), use cars from leasing companies, or
devise an alternative to the previous assignment system.
Since the early days of double-stacks some railroads and ocean carriers
have acquired small numbers of cars. Railroads and ocean carriers are
likely, however, to conserve their capital wherever possible. Railroads
might follow the same strategy with double-stack cars that they have with
other specialized types: acquire enough cars to protect the core traffic
-101-

of long-term, high-volume customers, and use leased, pool, or off-line cars
for the remaining traffic. Among the car leasing companies, only
Greenbrier Intermodal (the leasing arm of car manufacturer Gunderson, Inc.)
currently offers double-stack cars. This situation could change rapidly,
however, as there are three manufacturers eager to sell cars, and a number
of leasing companies with access to capital. Some small double-stack
operators, such as Interdom, regularly use leasing company cars.
Trailer Train is likely to provide the majority of the double-stack cars,
just as it provides the majority of the intermodal flat cars. The rail
roads themselves will have to take more responsibility for the management
and control of the Trailer Train cars they are Using. Cars in a free-
running poolcan stay on the same railroad or in the same service indefin
itely as long as they are in active use. Once pool cars are idled for
some specified period, however, they can be redistributed for use by other
carriers. It will thus be incumbent on the railroads to utilize pool cars
fully, rather than treating them as a reserve.
To achieve this end, specific cars may be "dedicated" to specific customers
or services. This mechanism is widely used to create pools of cars for
major shippers of commodities as diverse as automobiles and beer. By using
this well-established control mechanism, railroads may be able to create a
stable supply of cars for the principle double-stack customers and corri
dors. Creation and management of a dedicated car system for single-line
movements poses no special difficulties; it is essentially the same as any
internal car management task. Interline service, however, can create
problems. Under pressure for timely departures and while coping with
traffic surges, one interline partner may be tempted to divert dedicated
cars to its own single-line services. When car supply is short, those
pressures can be intense -- witness an isolated, but verified instance of
containers moving in coal hoppers in 1988. The maintenance of dedicated
double-stack car pools for services involving multiple railroads will
require bilateral agreements or other arrangements among the partners.
Such agreements could also form the basis for purchasing or leasing de
cisions by the railroads involved. The most critical issues in such bilat
eral agreements will likely be the provisions for car tracing and informa
tion flow. Under the assignment system, individual railroads could trace
-102-

their assigned cars through UMLER and TRAIN II (for the near future, they
will have to rely on Trailer Train to trace dedicated Trailer Train cars).
Management of dedicated car pools may require some railroads to refine
their own systems and communications links.
5. Domestic Container Supply
The supply of containers for domestic traffic does not appear to be any
barrier to the expansion of domestic double-stack service. Ownership of
the domestic container fleet will be mixed, just as ownership of the
piggyback trailer and international container fleets is mixed. The major
sources of containers for domestic service will be intermodal operators,
such as API and CSL, and major leasing companies, such as Itel. Railroads,
notably BN and ATSF, have acquired a small number of domestic containers
and will continue to do so. The decision on whether to acquire containers
through purchase or long-term lease will depend, like any such decision, on
financial and tax considerations rather than on operating criteria. If
operators do not acquire containers, they will have the options of
short-term leases or using pool containers on a per-diem basis. Domestic
shippers are unlikely to acquire general purpose containers in any signifi
cant number; any shipper acquisitions would probably be specialized equip
ment.
6. The Operational Challenge
Current Operating Performance. There is a large gap between what is
technologically possible in intermodal operations and what is now being
reliably achieved. Double-stack operations have improved on piggyback
operations in many areas, including transit time, schedule reliability, and
damage prevention. Double-stacks have been more successful than piggyback
in attracting and retaining truck traffic. Intermodal operations of all
kinds, however, generally fall short of the operational standard set by
trucks. Every marketing survey taken in this field has determined that
service characteristics, not cost, are the primary basis of modal choice.
Unless the railroads and their intermodal partners achieve and maintain a
substantially higher standard of performance, domestic double-stack service
-103-

will achieve only a tenuous market share, subject to constant erosion from
improved truck economics.
One instructive example of what is possible is the Florida East Coast Rail
road, which offers a highly successful TOFC/COFC service between
Jacksonville and Miami. The route is roughly 350 miles long, much shorter
than estimates of the minimum distance required for intermodal success, yet
the route carried 419,354 units in 1988, ranking it among the ten largest
intermodal corridors. FEC schedules seven daily departures from Miami,
plus extra trains as needed. The railroad stresses flexibility to meet
customer needs: FEC has a 3:00 a.m. departure from Miami to allow UPS to
deliver trailers at 5:00 p.m. in Atlanta. The 350-mile trip is usually
non-stop: the intermediate points of West Palm Beach and Fort Lauderdale
are served separately. All trains are cabooseless, and are operated by
two-person crews. FEC performs several functions that other railroads do
not. FEC deliberately makes yard space available to store empty trailers
and containers. FEC has invested in a substantial trailer fleet, including
a recent purchase of specialized trailers for building materials and lumber
(commodities not generally considered prime candidates for intermodal). It
not only calls customers in advance of train arrival, but it has tractors
waiting for high-priority trailers or containers. FEC also provides
drayage through a subsidiary that contracts with some 35 owner-operators.
The result is that FEC has successfully attracted large volumes of truck
traffic from parallel highways. Long-haul truckers give trailers to FEC at
Jacksonville for the movement to Miami, and the railroad returns empties
north because there is little backhaul freight from Miami. Despite the
short haul, FEC has substantial business from UPS. The success of the
Florida East Coast demonstrates that precise, flexible, and responsive
intermodal operations are not inherently impossible for railroads, even
with conventional equipment. Some of FEC1s success can no doubt be
attributed to its flexible work rules and the unique features of the
Jacksonville-Miami corridor, but much more of it is attributable to
initiative and a strong customer orientation.
Door-to-Door Reliability. The biggest shortcoming in current intermodal
and double-stack operations is the lack of door-to-door reliability. Not
-104-

coincidentally, poor door-to-door transit time and reliability are the
reasons most often cited by shippers for using trucks rather than inter-
modal. Railroads monitor on-time performance of ramp-to-ramp train move
ments. Industry and shipper sources indicate that double-stacks have a
better record than piggyback trains in this regard, although there is still
room for improvement. Performance monitoring and service quality control
drops off in the terminal however, and stops entirely at the terminal gate.
Some railroads have taken tentative steps to monitor what goes on in and
beyond the terminal. BN surveyed Seattle-Chicago movements and found that
a consistent 2.5 day ramp-to-ramp movement frequently produced 12-15 day
door-to-door times because of long dwell times at terminals and drayage * 95
delays. While service-sensitive customers leave trailers or containers for
just a few hours, others sat in the'terminal for days.
Rail intermodal transportation is a complex process involving, at a mini
mum, five steps:
o Origin drayage;
o Origin terminal handling;
o Rail line-haul;
o Destination terminal handling; and
o Destination drayage.
Each party responsible for a step may have achieved 95 percent on-time
performance, comparable to truckload carriers. But 95 percent reliability
in each of five steps yields only 78 percent reliability for the system
(.95 x .95 x .95 x .95 x .95), so more than one in five shipments will be
early, or, more often, late. If more steps are required for railroad in
terchanges or equipment positioning, reliability drops further. To achieve
95 percent overall reliability, a five-step process has to average
99 percent reliability in each step.
Lapses in reliability can be magnified by the coping mechanisms of third
parties and shippers. In order to maintain overall reliability, rail cus
tomers pad schedules. If a container needs to depart on a train by Friday,
-105-

a third party or shipper may have it drayed on Tuesday or Wednesday to make
sure it gets out in time. If a container is due to arrive at the rail
terminal on Sunday, the customer may not plan to pick it up until Tuesday.
Thus, a 3-day Friday-Sunday rail linehaul quickly becomes a 6-day
Wednesday-Tuesday door-to-door trip.
Getting There From Here. Railroads know how to make operations more
reliable, but it requires sustained management commitment and cooperation
from both carrier and outside employees. Terminal operations and drayage
are the best near-term target for improving reliability.
The newest rail intermodal terminals, notable SP's ICTF in Los Angeles,
have set new standards for terminal operations. The differences have rela
tively little to do with lift equipment or track configuration, and a great
deal to do with computer support, training, and management commitment.
Railroads can also learn from the best marine terminals, such as Mitsui's
TRAPAC terminal in Los Angeles, which face similar issues of reliability
and efficiency, and have generated numerous innovative responses.
Drayage would appear to be a prime candidate for application of the "sup
plier partnership" concept. The essence of the concept is a mutual com
mitment between a supplier of services and a purchaser/re-seller, and a
recognition that they have a common interest in superior performance in the
marketplace. Most railroads have sold their trucking operations, and un
less they establish partnerships with drayage operators they will have no
influence on a critical portion of their intermodal service. Simply put, a
shipper does not care about on-time train performance, only about
door-to-door reliability.
7. Overweight Containers
The issue of overweight containers has, in recent years, occasioned several
studies and a great deal of finger pointing among shippers and carriers.
TOFC, truck, and carload movements are all affected. Besides the immediate
safety hazard to the railcar, overloading can lead to premature wear on the
cars and the track structure, accidents in terminals, and hazardous train
dynamics on the linehaul.
-106-

From the perspective of double-stack operations, there are two unique
issues:
1. The possibility of overloading double-stack cars; and
2. The use of double-stacks to convey overweight containers that
must ultimately be delivered over the highway.
By using cars with greater capacity or matching heavy and light containers
in the wells, railroads can safely move containers that would exceed
highway limits. Such carefully controlled loading, however, requires that
loaded container weights be accurately documented. The first double-stack
cars had platform or well capacities of 100,000-102,000 lbs. Current
second and third generation cars have capacities of 120,000-125,000 lbs.
The 125,000 capacity well, however, cannot handle two fully loaded 401-481
containers. Good information exchange between rail customers, railroads,
and rail terminal operators will be essential to avoid overloading contain
ers and railcars, and will probably require Automatic Equipment Identifica
tion (AEI) and Electronic Data Interchange (EDI) technologies for both
efficiency and reliability. The issues involved in overweight containers
are currently being addressed by all parties involved.
F. CHANGES IN TECHNOLOGY
1. Lightweight Drayage Tractors
As shown in Table 28, a domestic container on a chassis is heavier than
either a piggyback trailer or a highway trailer of similar cubic capacity.
This extra weight handicaps domestic containers in competing for heavy
freight, and may increase the likelihood that a loaded container, with
chassis and tractor, will exceed highway weight limits. Most discussions
of weight differences focus on the container and chassis. The highway
weight limit, however, includes the weight of the tractor. Accordingly,
the possibility of reducing drayage tractor weight was investigated.
Tractors used in drayage operate over short hauls, primarily in
metropolitan areas, and do not require the horsepower, fuel capacity,
-107-

traction, accommodations, or streamlining of.modern over-the-road
tractors. Drayage tractors today are often former highway tractors, and
many run out their days with sleeper bunks, 250-gallon fuel tanks, wind
deflectors and fairings, and all.the other trappings of a long-distance,
over-the-road tractor.
The weight disadvantage of a container on a chassis could be reduced if
the tractors used for drayage were stripped. For drayage purposes, used
highway tractors should be purchased, .when possible, without a bunk* or
with a cab design where tfyq sleeper can be removed, saving 800-2,000
pounds. One fuel tank at least could be removed, saving 1,500 pounds
with fuel, or 300 pounds without. The drive train could be converted to
a "puller tag axle" operation, saving 400 to 500 pounds and one-half
gallon of fuel a mile. All other non-essential weight, such as wind
deflectors and fairings, can be removed.
A newly ordered drayage tractor should have no sleeper bunk, a smaller
fuel tank, a non-powered third "tag" axle which would save the weight of
one differential and a power divider, and.no wind deflector or fairings.
A custom-designed new drayage tractor with a tag axle, a 290-horsepower
engine, 70-gallon fuel tank, no sleeper, and no wind devices would weigh
(with fuel) 4000 to 5000 pounds less than a standard tandem drive,
sleeper cab, 250-gallon, fairing^equipped, 350-horsepower line-haul
tractor. This difference is comparable to the weight disadvantage of a
chassis and container relative to a highway trailer with the same cubic
capacity.
There is no reason for drayage firms not to order special drayage
tractors or not to strip used tractors of excess weight. Even small
firms, including owner-operators, have the small amount of capital
necessary to remove unneeded components.. Firms engaged in both drayage
and lorig-haul trucking, however, may not want a single-purpose tractor.
The greatest benefits would accrue to larger, single-purpose drayage
firms, or to larger firms (including railroads) with a drayage
subsidiary. A few drayage firms have already ordered lighter tractors.
-108-

The most promising means of encouraging the use of specialized drayage
tractors and of capturing the benefits is a long-term contractual
relationship between a drayage firm and a railroad, steamship line, or
third-party drayage customer. Guaranteed minimum annual volumes and
predictable rates would reduce the risk drayage firms would otherwise run
by investing in special-purpose equipment, just as similar contracts have
encouraged the railroad industry to invest in double-stack cars.
The use of lightweight drayage tractors could also be one means of
reducing drayage costs and extending drayage reach from intermodal hubs.
2. RoadRailer Operations
At present, predicting the future of RoadRailer or other earless op
erations is chancy, even impossible. Of several RoadRailer operations
that were started, only one survives: Norfolk Southern's Triple Crown
service. That operation, however, is more extensive than all the pre
vious efforts combined, and is still expanding. Moreover, Norfolk South
ern reports that Triple Crown's profitability has improved.
Whether or not RoadRailer or other earless services endure, it is un
likely that they will ever serve as feeders to a double-stack network.
One of the major advantages of earless technology is the low cost of ter
minals and terminal operations. This advantage would be offset, if not
eliminated, were a container on RoadRailer chassis transferred to a dou
ble-stack car. Although RoadRailers may be more effective than double
stack trains at penetrating shorter hauls, once the RoadRailers are on
the rails there is little or no point in incurring additional costs and
delays by transferring their loads to double-stacks for a longer haul.
Moreover, the use of RoadRailers as a feeder would be likely to introduce
additional circuity, already identified as a significant constraint on
the ability of railroads to compete with trucks.
The Trailer Railer system in use by the Iowa Interstate Railroad consists
of a series of short platforms, each carrying the front end of one trailer
(or container) and the rear end of the next. It is not technically a
earless system like RoadRailers, yet it has some of the same advantages,
-109-

namely a reduced need for expensive terminals or terminal equipment. As
a feeder system for double-stacks, however, it would face the same
obstacles: the need for a third transfer, and the added circuity and
delay. As the earlier analyses indicated, terminal costs, the time
required for terminal activities, and the circuity of non-highway
movements are major factors restricting the ability of double-stacks to
compete with trucks on service and cost.
Any combined earless and double-stack operations are more likely to con
sist of simply adding earless equipment to stack trains, following BN!s
current experiments with compatible hitches (used to attach RoadRailers
to the standard coupler at the end of a train of double-stack cars). BN
sees this as a possible means of serving shorter, less dense corridors.
The commercial history of earless technology has been mixed, and there is
no means of confidently predicting either its success or its failure.
Thus far, the strength of earless technologies has been in tightly
controlled, intensively marketed servies over shorter distances. It
would appear, then, that the future of earless and double-stack
technologies will be separate. It must be pointed out, however, that
earless technology is currently competing in the 540-1080-mile
"intermodal battleground" with the same management methods as will likely
be required for double-stack success.
3. Domestic Refrigerated Containers
There is one major market segment that has not been penetrated at all by
domestic containerization: refrigerated or insulated commodities. Re
frigerated containers are well established in international trades, but
they seldom move far inland. Until the railroads can provide or support
a domestic refrigerated double-stack container system, that market will
remain in the hands of refrigerated trucks and piggyback trailers.
There are a number of obstacles to a domestic refrigerated container ser
vice, and many of them correspond closely to the reasons why internation
al refrigerated containers do not usually move inland by rail. The first
and most obvious obstacle to be overcome is the need for electrical power
- 1 1 0 -

aboard trains. Marine "integral" refrigerated containers incorporate
refrigeration units, but they still require an external power source.
There are three basic approaches to supplying power, all of which have
been tested with some degree of success:
o large power supplies capable of supporting nine or more con
tainers, which would be carried in one well of a stack car;
o smaller power supplies capable of supporting five to ten con
tainers, which would be temporarily or permanently mounted on
the end platform of a stack car; and
o the use of fully self-sustaining containers.
The second obstacle is the need for electrical power from chassis-mounted
or nose-mounted "gensets" once refrigerated containers are taken off the
train. Gensets and compatible chassis would have to be available at inland
terminals. Gensets are probably not a problem in port cities, where they
are available for international containers, but they may be expensive to
stock at inland points.
Third, refrigerated containers require monitoring, and perhaps servicing,
in transit to ensure consistent performance and product quality. Truckers
can and do monitor the temperature and condition of a refrigerated load,
and take corrective action if needed. It is far more difficult to monitor
loads on a double-stack train, and more costly.
G. MOTOR CARRIER DEVELOPMENTS
1. Sensitivity of Double-Stack Traffic
The cost criteria yielded a relationship between truckload operating costs,
double-stack operating costs, drayage distance, and the minimum length of
haul over which double-stacks could be price-competitive with truckload
carriers. This relationship is, of course, sensitive to changes in
truckload operating costs, which in turn could be affected by industry
trends or public policy decisions. The major motor carrier developments
-111-

that could significantly affect the emerging network of double-stack
services are:
o changes in truck size and weight limits;
o changes in truck labor and fuel costs; and
o changes in LTL motor carrier operations.
2. Truck Size and Weight
The major potential development from the view of double-stack operations
would be substantial increases in truck size and weight limits. At issue
is, first, the permissible configuration of truck combinations moving
over interstate highways; second, the gross vehicle weight limit, and
related axle loading limits and bridge formulae; and third, the access
such larger vehicles will have to cities and roads off the Interstate
highway system.
Proposals for increases in truck sizes mainly concern Large Combination
Vehicles (LCVs). The most attractive combinations to truckload carriers,
and the greatest threat to railroads, are twin 48-foot trailers.
Increases in the gross vehicle weight from the present 80,000 pounds would
also be of concern to the railroads. The boxcar traffic considered
potentially containerizable and divertable to double-stacks includes a
number of such commodities. Even if truck sizes were not increased, an
increase in the gross vehicle weight limit would increase the ability of
truckload carriers to compete for such traffic.
Access questions for LCVs are serious: ordinary highways and streets,
particularly the intersections, cannot handle the largest combinations.
Where triple 281s are legal, they are operated as triples only on selec
ted routes, and moved as doubles or singles over other highways. The
access problem may be more serious for truckload operators trying to
provide door-to-door service with twin 48's.
Truck size and weight issues are inescapably linked to the condition of
the highway infrastructure. Controversy has raged for years over the
-112-

motor carriers' "proper" share of highway construction and maintenance
expense. That controversy is not likely to be resolved, but it is likely
that any increase in truck size, truck weight, or truck access, will be
accompanied by increases in fuel taxes, user fees, or other governmental-
ly imposed costs. The amount and incidence of such cost increases will
be an outcome of the political process,
Impact on Railroad Traffic. At least two studies have been done of the
potential effects of LCVs on railroad traffic. The first study, by the
U.S. DOT Transportation Systems Center, was completed in May, 1986.
Using an elaborate modeling methodology, that study found that a 1990 LCV
network would divert'rail traffic worth $5.1 billion in annual rail reve
nues, and reduce rail revenues on other rail traffic by $1.8 billion
annually.. The second study, by the Association of American Railroads
(AAR), was released in June, 1989. It considered the impact of a nation
wide network of twin 481s on railroad traffic, both .traffic diverted and
revenues reduced because rates would have to be held down to prevent
further diversions. The AAR study concluded that a nationwide network of
twin 48‘s would have reduced 1986 revenues by $3.7 billion from a total
of $26.2 billion. Moreover, the AAR study estimated that net operating
revenues would decline by $1.6 billion from a base of only $3.1 billion,
a 52' percent loss of net revenue. Of the revenue loss estimated by AAR,
$156 million was in intermodal traffic.
Effect on Length of Haul. The AAR undertook an analysis of the estimated
1986 operating costs of a 134,000. lb, twin 48-foot truck combination (the
so-called Bridge Formula B truck). Applying the percentage increases
estimated by the AAR for the three truck operating cost categories used
in the cost criteria yields an estimate is $.98 per mile for the 1989
operating costs of twin 48's.
-113-

Estimated 1989 Operating Costs Per Mile Twin 48-Foot Trailers
1989 Percent* 1989One 48-Foot Increase Twin 48-Foot
Equipment $ .31 50.6 $ .47Fuel .20 36.7 . .27Labor .20 22.2 .24
TOTAL $ .71 38.5 $ .98
"Analysis of Truck Size and Weight Increases", Intermodal Trends, Association of American Railroads, Volume I,Number 12, June 30, 1989.
Assuming the same utilization as was employed in our cost criteria (80
percent), the cost per loaded mile would be $1.23 for the combination, or
$.62 per mile per trailer, versus $.89 per mile for a single trailer at
present.
The result of the operating cost difference alone would increase the
minimum competitive rail haul from 725 miles to 1,212 miles. Numerous
double-stack network links and volumes that would be jeopardized. For
all practical purposes, there would be no double-stack operations in the
eastern United States, except trains to and from the West Coast.
Unless the economics of twin 48-foot trailers are offset by substantial
increases in fuel costs, labor cots, fuel taxes, or other costs, double
stack services will find it very difficult to compete with twin 48's on
any but the largest transcontinental routes and still offer shippers the
discount they have come to expect.
The reason that railroad double-stack services are so vulnerable to re
ductions in motor carrier costs is that they compete on price. If dou
ble-stack services could charge the same prices as average motor carriers
using twin 48's, the minimum rail length of haul would drop from 1,212 to
995 miles.
-114-

3. Driver Shortages and Labor Costs
After a long period in which real trucking labor costs declined, due in
part to reduced union representation, they have begun to rise. A report
by Data Resources, Inc. in the first half of 1989 found that the trucking
labor costs rose 7 percent over the 1988 averages. The recent increase in
real labor costs has been attributed to a nationwide shortage of qualified
truck drivers. Not only have trucking firms had to pay higher wages, but
their recruitment and training expenses have risen as well.
The reasons for driver shortages are complex, and beyond the scope of
this study. An ongoing shortage of drivers would definitely increase
truck labor costs, although it is not possible to say by how much. One
indication of the possible impact is the difference that truck labor cost
increases would have in the minimum length of competitive double-stack
haul. Each additional penny per mile in truck labor costs drops the
minimum length of a competing double-stack haul by 11 miles.
4. Fuel Costs and Fuel Taxes
Over the last decade, diesel fuel costs have defied most attempts at
forecasting, but there seems to be a consensus that fuel prices will
increase in the long run. The current cost is roughly $1.12 per gallon.
Factors other than oil prices can also affect diesel fuel costs to truck
ers. Truck emissions standards for 1994 are expected to require a
"cleaner" fuel at an additional cost of 3-4 cents per gallon, as well as
increasing other operating and maintenance costs. Fuel consumption in
the truckload segment now stands at about 5.6 miles per gallon. An
increase of 4 cents per gallon would raise the estimated fuel cost per
mile from $.20 to $.21. As with a penny per mile labor cost increase,
this increased fuel cost would reduce the minimum length of haul for
double-stacks by 11 miles.
A more dramatic change would result from increased fuel taxes, which have
been proposed as a means of reducing the federal deficit. The range of
increase under consideration runs from 5 cents to 25 cents per gallon.
The table below shows the effect of various taxes, with and without the
-115-

effect of emission standards, on the minimum length of haul for a competi
tive double-stack service.
Impact of Fuel Tax Increases
and Emissions Standards
on Minimum Competitive Double-Stack
Length of Haul
With
Without Emission
Emission Standards
Fuel Tax Increase Standards (4~/gal.)(Miles) (Miles)
None 725 717
$ .05 715 707
.10 705 697
.15 656 683
.20 686 678
.25 676 668
The most drastic increase, a 25 cent per gallon tax and a 4 cent per
gallon emissions cost, would increase trucking costs by 5 cents per mile,
and reduce the competitive length of haul for double-stacks by 55 miles,
from 725 to 670.
5. LTL Trucking
The potential of double-stack services to provide economical linehauls
for Less-Than-Truckloaa (LTL) truckers rnay be limited by institutional
constraints within the motor carrier industry, or between motor carriers
and railroads. Despite numerous public proclamations of "partnership"
over the years, only a few railroads and LTL motor carriers (other than
UPS) have substantial cooperative traffic. One approach to eliminating
intermodal barriers has been taken by Union Pacific in its acquisition of
Overnite Transportation Company. The question remains, however, whether
multi-modal ownership or other measures can achieve the full potential of
double-stack operations for cooperative rail/truck service.
-116-

The intermodal share of LTL truck traffic is small, but growing: 2.66
percent in 1986, and 3.64 percent in 1988. Some of the largest LTL firms
use intermodal services significantly more often: Roadway currently
moves about 8.7 percent of its traffic intermodally. The use of inter
modal service by LTL firms is not well publicized, because those firms do
not want to share in intermodal's poor service reputation among shippers.
Rail intermodal service in any form, however, is not likely to supplant
highway carriage for the bulk of the LTL business. In 1987, the average
length of haul for Class I and Class II motor carriers was just 489 miles,
well below the estimated competitive range for double-stacks.
Class I LTL motor carriers use intermodal service, almost always piggy
back, as:
o a substitute or supplementary service in main corridors, often
when the supply of drivers is tight:
o a means of penetrating new markets, especially where backhauls
are difficult to obtain; or
o a separate service provided through subsidiaries.
For the most part, however, LTL (and truckload) motor carriers seem to
consider cooperation with the railroads on intermodal traffic to be a
necessary evil. The tight control that LTL carriers maintain over their
operations will require real, functioning partnerships with the railroads,
not merely a public relations handshake, if a substantial part of their
traffic is ever to move intermodally.
One barrier to the use of domestic double-stack container service by LTL
motor carriers is the container itself. Many LTL carriers have stan
dardized on 28-foot "pup" trailers, which, when run on the highways in
pairs, maximize the cubic capacity for a "go anywhere" truck combination
while also maximizing flexibility. These same 28-foot trailers are used
intermodally. LTL carriers may be reluctant to introduce another size or
type of equipment, such as a 48-foot domestic container, into their op
erations. Railroads or stack-train operators would have to provide LTL
-117-

motor carriers with a powerful incentive, and a high standard of service,
to attract significant portions of LTL traffic.
H. CHANGING RAILROAD ROLES
Until the 1980's, railroad intermodal functions were neatly categorized in
a series of TOFC/COFC "Plans." Now, railroad intermodal contracts can
cover any conceivable combination of service and equipment, and can
therefore be tailored to the needs of individual customers. As contracts
and service offerings have evolved, railroad roles have changed.
Railroads have been withdrawing from intermodal ownership since the growth
of Trailer Train. Railroad-owned trailer fleets have declined, with only a
few recent orders, and are not being replaced with large fleets of domestic
containers. Railroads are also relying on ocean carrier chassis and
neutral chassis pools run by leasing companies rather than acquiring
chassis. There are exceptions to these general trends. Santa Fe has
maintained its trailer fleet and its commitment to trailer traffic. CSL
has also recently replaced part of the former CSX trailer fleet. Other
railroads have acquired small numbers of trailers or containers for
particular customers or traffic segments.
Traditionally, railroad operating departments had responsibility for
intermodal terminals. In the 1970's and 1980's, however, some railroads
began turning intermodal terminal operations over to subsidiaries or going
outside to contract for terminal operations. This trend has gathered
momentum because:
o railroads recognized that intermodal terminal operations were spec
ialized, and vastly different from other terminal operations;
o intense competition in the deregulated market put pressure on both
costs and performance;
o smaller facilities had to be upgraded, consolidated, or closed; and
o double-stack services put a greater burden on intermodal terminals.
-118-

Ocean carriers, their subsidiaries, and multimodal companies have begun
to operate inland rail terminals. Perhaps the most prominent example is
APC's terminal in South Kearny, New Jersey. Although near the New York-
New Jersey ports, this yard functions as an inland terminal for API's
double-stack train service. "K" Line's subsidiary Rail Bridge Terminals
Corporation also has its own East Coast terminal, E-Rail, in Elizabeth,
New Jersey. Railroads have entered into partnerships with ports (SP's
ICTF) arid multimodals (API's Woodhaven terminal served by Grand Trunk
Western) to build and operate facilities devoted exclusively to container
traffic. It seems unlikely that any uniform pattern will appear in the
near future, since the solution for a given terminal depends on the
customers, the facility, and the operating and commercial philosophies of
the railroad.
The roles of regional railroads in double-stack operations and domestic
containerization range from substantial and growing, to none and static.
Where they do have a role, regional railroads either serve as final links
in longer movements, or as originators or terminators of specific traffic
flows.
In the first category are large and established Class 1 regionals such as
Soo Line, New York, Susquehana & Western, and Grand Trunk Western. Each
of these carriers originates and terminates double-stack trains that are
interchanged with transcontinental railroads. Florida East Coast
participates in interchange traffic as well as operating its own busy
Jacksonville-Miami intermodal traffic, but does not yet operate
double-stacks. Illinois Central at one time carried Southern Pacific
double-stack trains between St. Louis and Chicago, but the current
routing uses wither BN or Soo Line from Kansas City instead. Kansas City
Southern has begun a unique dedicated double-stack operation to move
imported coffee inland from Gulf ports, using high-capacity Type 3 dou
ble-stack cars capable of carrying 20-foot containers in each well.
Other regionals such as Iowa Interstate and Toledo Peoria & Western, and
even short lines, such as Stockton Terminal & Eastern or Modesto & Empire
Traction, originate or terminate double-stack and other domestic container
movements for specific major customers.
-119-

Overall, the railroad role in domestic double-stack service is still
centered on the provision of line-haul transportation and terminal
services, marketed wholesale to third parties and other non-railroad
intermodal operators. Retail marketing and control of the container
fleet is largely in the hands of those third parties and other intermodal
operators.
As the double-stack network expands, railroads have come up against the
limitations of their own systems: they cannot offer single-line service
to all the hubs their customers would like to reach. This has been
overcome by three different means. The first is merger or purchase:
extension of intermodal service played a major part in the SP/DRGW
merger, the SP purchase of Soo Line and CMW line segments, and the Santa
Fe service into St. Louis. The second is interline coordination,
typified by the Sant Fe-Burlington Northern "Voluntary Coordination
Agreement" to jointly market inermodal traffic through Avard, Oklahoma.
The third, and most ambitious approach, is the creation of a national
network by non-railroad intemodal operators through contracting for
line-haul service and/or terminals. API and CSL Intermodal have taken
this approach, and have come the closest to achieving a true national
network.
-120-
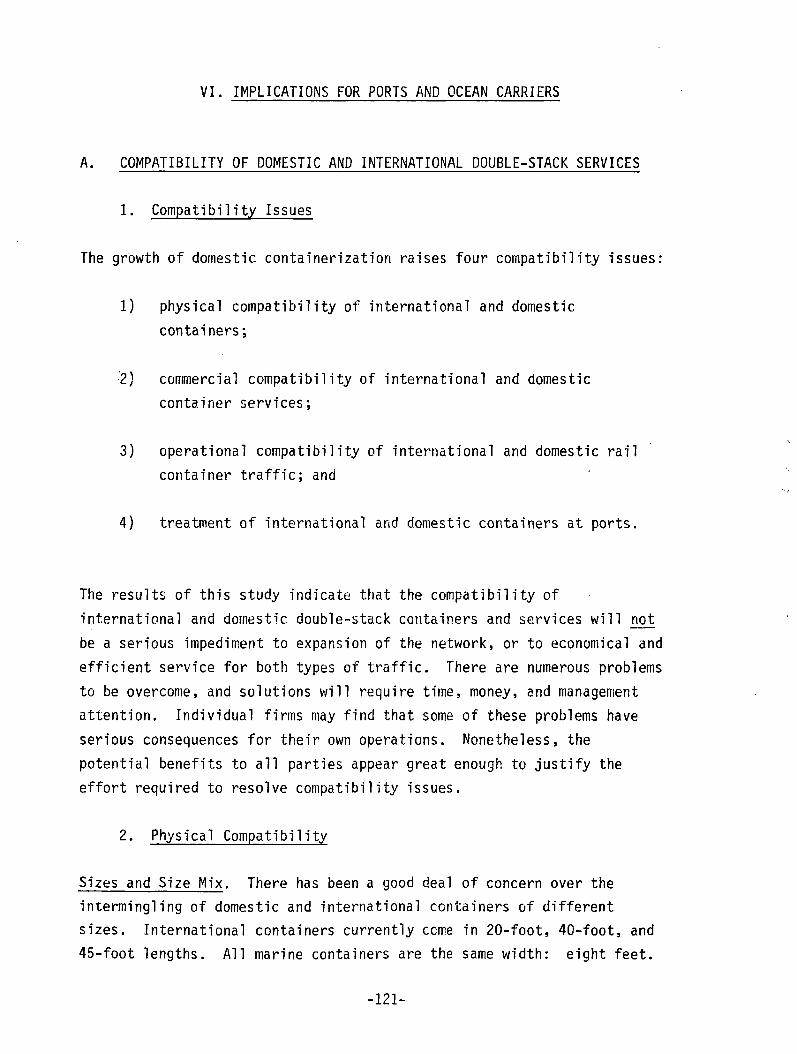
VI. IMPLICATIONS FOR PORTS AND OCEAN CARRIERS
A. COMPATIBILITY OF DOMESTIC AND INTERNATIONAL DOUBLE-STACK SERVICES
1. Compatibility Issues
The growth of domestic containerization raises four compatibility issues:
1) physical compatibility of international and domestic
containers;
2) commercial compatibility of international and domestic
container services;
3) operational compatibility of international and domestic rail
container traffic; and
4) treatment of international and domestic containers at ports.
The results of this study indicate that the compatibility of
international and domestic double-stack containers and services will not
be a serious impediment to expansion of the network, or to economical and
efficient service for both types of traffic. There are numerous problems
to be overcome, and solutions will require time, money, and management
attention. Individual firms may find that some of these problems have
serious consequences for their own operations. Nonetheless, the
potential benefits to all parties appear great enough to justify the
effort required to resolve compatibility issues.
2. Physical Compatibility
Sizes and Size Mix. There has been a good deal of concern over the
intermingling of domestic and international containers of different
sizes. International containers currently come in 20-foot, 40-foot, and
45-foot lengths. All marine containers are the same width: eight feet.
-121-

The heights range from 8 feet to 9 feet 6 inches (high cube). Containers
built especially for domestic service come in 45-foot, 48-foot, and
53-foot lengths, with the 48-foot length predominant. Burlington
Northern has introduced a small number of 24-foot domestic flatrack
containers, primarily for forest products. All of these containers are 9
feet 6 inches high, and 102 inches (8 feet 6 inches) wide.
Among the international sizes, the 40-foot container predominates. As
shown below, 40-foot containers account for 71 percent of the containers
passing through, for example, Southern California.
The mix varies only slightly by direction. In Southern California,
40-foot containers accounted for 69 percent of the imports and 73 percent
of the exports. The mix of international containers is changing,
although slowly. Since there are roughly 5.5 million TEU in service
worldwide, new purchases make only a marginal difference in the fleet.
But the major purchasers of new 45-foot containers are APL, Maersk, NYK,
"K" Line, and Sea-Land, so the new containers will show up in
double-stack operations more often than their overall prevalence would
suggest. Industry estimates indicate that roughly 40,000 such containers
will be in service by the end of 1989, including additions to the carrier
fleets mentioned above and leasing company fleets.
The marine fleet is also getting taller, as the number of "high cube"
containers (9 feet or 9 feet 6 inches) grows. By the end of 1989, high
1988 Container Size Mix
Size Los Angeles/Long Beach
20
40
45
Source: 1988 PIERS Data.
-122-

cube containers are expected to account for roughly 7 percent of the 5
million TEU in the world fleet. New 45-foot containers are normally also
high-cube containers. Like the 45-foot containers, high-cube containers
are being deployed most rapidly by the steamship companies most involved
in double-stack services.
Ocean carriers do not presently use 48-foot or larger containers in
regular international service, nor do they use containers with outside
widths greater than 8 feet. The ability of ocean carriers to use larger
containers is limited by the configuration of cellular containers hips.
The fleet of domestic containers has grown rapidly, but it is still very
small compared to the volume of marine containers moving inland. The
vast majority of domestic containers are 48 feet long, 102 inches (8 feet
6 inches) wide, and 9 feet 6 inches high. The so-called "48 x 102" size
also accounts for virtually all domestic containers on order (except for
the small number of 24-foot containers ordered by BN). Since domestic
containers are not meant for international shipments, there is no
requirement to build them to international standards. They do, however,
have standard corner castings located at 40-foot positions on the bottom
to permit stacking on marine containers.
The International Standards Organization (ISO) is considering a new
standard for not only longer, but wider marine containers, the so-called
"wide body" containers. The proposed 49-foot ISO container has a width
of 8 feet 6 inches and a height of 9 feet 6 inches. If a new "wide body"
container standard would provide for castings to match 40-foot containers
(as has been done with other large containers), a 49-foot, 102-inch
marine container could be handled on the top tier of IBC cars.
Subsequent orders of double-stack cars would likely provide for any ISO
standard that stack-train customers plan to use. There is, however,
strong opposition to the adoption of the "wide body" standard in the
U.S. from commercial interests. Whether it will be adopted as an ISO
standard is problematical at present.
Moving and Stacking. In order to integrate domestic and marine
containers into a common intermodal network, two physical attributes of
-123-

domestic containers must be accommodated: size (length and width), and
strength (stacking height). The size incompatibility has been addressed
in the double-stack arena by increasing the well length on new
double-stack cars to accommodate larger containers on the bottom tier,
and by installing compatible corner castings with 40-foot spacing on
containers that exceed the traditional 40-foot length, permitting IBC
cars to accommodate the larger containers on the upper tier. A 45-foot,
48-foot, or 53-foot container (above a 48-foot well) can be stacked on a
40-foot container and linked to the lower 40-foot container by latching
devices positioned on 40-foot spacing. In response to the proliferation
in container lengths, builders are providing new double-stack cars that
can handle all container lengths in the wells: 20, 24, 40, 45, and 48
feet (Figure 31). On the top tier, the cars can handle up to 53-foot
containers. Although many existing cars have some loading restrictions,
the loading problem will be reduced as the fleet expands. The problems
of loading a mixed fleet of double-stacks will be no worse than loading
the existing and more varied mix of TOFC/COFC cars.
Marine containers can be stacked six high aboard ship or in the terminal,
but domestic containers are usually stacked only two or three high in the
terminal. This disparity could be a problem in a marine terminal if both
types were handled together, but domestic containers will rarely come to
rest in a marine terminal. In the rail yard, operations are geared to
prompt loading of the container to the car or prompt drays from the car;
there is little room for container storage, and seldom any equipment for
stacking containers more than three high.
The current or anticipated mix of international and domestic container
sizes will not create significant physical compatibility problems for
double-stacks as long as new, larger containers have attachment points in
compatible locations. The IBC car can take virtually any combination of
containers, and terminal stacking differences are both minimal and
avoidable. Indeed, Gunderson advertises its Type 3 "MaxiStack II11 car as
the "terminal manager's car". The mix of container sizes and types
coming through the rail terminal gate will continue to command management
and clerical attention, regardless of whether the containers are domestic
or international, but it would more accurately be regarded as an inconven-
-124-

4 0 ’- 4 8 ’ 4 0 - 4 8 ’ 4 0 - 4 8 ’ | 4 0 s- 4 8 ’ 4 0 ’- 4 8 ’
2 0 ’-4 0 ’
01nOCM 2 0 ’-4 0 ’ | 2 0 ’- 4 0 ’
• 1
2 0 ’-4 0 ’
Type 1
4 0 - 5 3 ’ 4 0 ,- 5 3 s 4 0 ’- 5 3 ’ 4 0 ’- 5 3 s 4 0 ’“ 5 3 ’
2 0 ’- 4 0 ’ 4 0 - 4 8 ’ 4 0 - 4 8 ’ 4 0 - 4 8 ’ 2 0 ’“4 0 ’
Type 2
4 0 - 5 3 ’ 4 0 ,“ 5 3 ’ 4 0 ’- 5 3 ’ | 4 0 ’- 5 3 ’ 4 0 ’-5 3 ’
2 0 ’- 4 8 5 2 0 ’- 4 8 ’ 2 0 ’- 4 8 ’ | 2 0 ’- 4 8 ’ 2 0 ’“4 8 s
Type 3
Figure 31RECENT 125-TON IBC STACK CAR TYPES
Source: Greenbrier Intermoba!

ience to be dealt with rather than a stumbling block to development of a
double-stack network.
One source of relief may be the further development of Automation Equip
ment Identification (AEI), which permits computerized equipment to
ascertain the identity (serial number and reporting initials) of passing
equipment, and of Electronic Data Interchange (EDI), which enables
railroads, ocean carriers, and other intermodal participants to exchange
information in advance of the movement, enabling operating personnel to
plan accordingly.
3. Commercial Compatibility
Marketing and Backhaul Solicitation. Once APL and Union Pacific started
regular double-stack operations in 1984, other ocean carriers and other
railroads pursued double-stack traffic with varying degrees of enthusiasm.
One critical issue for both ocean carriers and railroads was backhaul
solicitation. Double-stack services were begun during a period of strong
import imbalances, leaving a large volume of containers to be returned
empty unless westbound backhaul freight could be found.
Were the railroads to attempt large scale retail marketing of domestic
container service, there could be a serious conflict with the backhaul
marketing of their ocean carrier clients to domestic third parties.
There are, however, mitigating factors. Railroad plans for retail
marketing of domestic container services directly to shippers and
receivers are extremely limited. Many railroads have always marketed
intermodal services directly to the largest industrial customers, and
marketing domestic container services that way will not disrupt existing
relationships.
Retail marketing will remain in the hands of third parties for the
immediate future. Ocean carrier and multimodal subsidiaries will figure
prominently in that third party activity.
Customers or Competitors? Perhaps the most important change is the
growing inland presence of ocean carrier subsidiaries and multimodal
-125-

companies. The formation of intermodal transportation companies has
blurred traditional demarcations. Today, a railroad's major customer on
one intermodal rail corridor may be one of that railroad's bigger
competitors on another intermodal rail corridor. For some
railroad/customer relationships, there ceases to be a distinction between
international and domestic movements: in many if not most cases,
railroads do not know or care whether a given shipment is domestic or
international, only where it is to be loaded or unloaded from the
railcar.
The proliferation of intermodal transportation companies has exacerbated
this "competitor or customer" problem for the railroads. At least five
steamship lines have U.S. subsidiaries that can compete with the rail
roads. The issue of commercial compatibility is less an issue of the
type of cargo, domestic vs. international, than of the complex
interaction of railroads, intermodal transportation companies, and
third-party vendors. This is not a new problem: it began with the first
shippers agent who tendered a TOFC trailer that the railroad could have
solicited directly. The competition for the same market has since gone
in two opposite directions: some railroads have giver, up direct
solicitation to work exclusively with third party vendors, while other
railroads have started direct sales efforts (e.g., Conrail Mercury).
4. Operational Compatibilityj
The demand for rail carriage of international containers adds significant
new cargo volumes, and thus trains, to the U.S. rail corridors, particu
larly the major mainline routes that connect West Coast ports with
Midwest and Eastern intermodal hubs. Minilandbridge between Los Angeles
and New York is new cargo for the railroads, because it moved by water
prior to 1972. Microlandbridge between Los Angeles and Chicago is
partially new; a relatively short New York to Chicago movement is
replaced by a longer Los Angeles to Chicago move.
Table 29 shows actual 1987 and projected year 2000 import, export, and
total international container flows, in thousands of FEU, between nine
port regions and eight destination regions (Southern and Northern
-126-

Table 29INTERNATIONAL IMPORT CARGO FLOWS
BY RAIL CORRIDOR (000’s FEU)
Destination Region LikelyLower Intermodal Local
CaliforniaTotal
Import Port Region Year: 1937
PacificNorthwest
MountainStates
UpperMidwest
Midwest & Gulf
Northeast Mid-Atlantic
Southeast Total Share(%)
Share(30
So. California 261 6 9 99 60 185 27 2 0 667 60.9% 39.1%No, California 67 2 4 8 3 v . 32 2 2 1 2 0 44.2 55.8
Pacific Northwest 26 30 4 60 1 0 103 9 4 246 87,8 1 2 . 2Mtn. States 0 0 C 0 ■ 0 0 0 0 0 n/a n/aUpper liJ. 0 0 0 1 . 0 . - '0 ■ 0 0 1 . . 0 . 0 1 0 0 . 0
Lower M.Vf. & Gulf 7 1 3 10 37 32 2 15 1 0J 70.1 29,9Northeast 24 3 1 53 ■ 9 504 16 1 1 621 18.8 8 1 , 2
Mid-Atlantic 8 L 3 ■ 3! 5 63 53 ! V 186 6 6 . 1 33.9Southeast 9 0 0 1 2 6 52 15 1 0 1 195 48.2 51.8
TOTAL 402 44 24 274 130' 971 ! 129 169 2,143
Year: 2000
So. California 441 1 1 15 • 167 ■ 1 0 1 ' 312 45 33 1.125 60.8% 39.2%No. California 113 4 6 13 5 54 3 4 2 0 2 44.1 55,9
Pacific Northwest 44 50 7 1 0 1 17 • -17A 15 7 415 8 8 . 0 1 2 . 0Mtn. States 0 0 , . 0 ■ : 0 0 •0 0 0 0 . n/a n/aUpper M.W. 0 u 0 1 0 0 0 0 1 0.0 1 0 0 . 0
Lower M.W. 8 Gulf 7 1 3 10 35 30 2 14 1 0 2 70.6 29.4Northeast 40 4 2 89 16 839 27 18 1,035 18.9 81.1
Mid-Atlantic 13 4 5 52 8 105 96 26 309 6 6 , 0 34.0Southeast 15 1 19 9 ' 85 25 146 .301 51.5 48.5
TOTAL 673 75 39 452 191 1,599 213 248 3,480
Source: Bureau of the Census

Table 29INTERNATIONAL EXPORT CARGO FLOWS
BY RAIL CORRIDOR (000's FEU)
Origin Region - Likely
California Pacific Mountain UpperLower
Midwest Northeast Mid- Southeast TotalIntermodal
ShareLocalShare
Total Northwest States Midwest 4 Gulf Atlantic (*) . (91)
Export Port Region Year: 1981
So. California 153 4 7 30 55 8' 13 15 285 46.391 53.7$No, California 105 3 4 9 24 'Y
L 4 7 158 33.5 . 56.5Pacific Northwest ■ 4 184 25 24 9 6 8 4 264 30.3 69.7
Mtn. States 0 0 0 0 0 0 0 0 0 n/a n/aUpper M.W, 0 0 0 2 0 0 0 0 2 • 0.0 - 100.0
Lower M.W. 4 Gulf 9 1 71 T 132 5 7 59 227 41.9 58.1Northeast 2 2 3 34 3 139 17 2 202 31.2 68.8
Mid-Atlantic 1 0 1 13 3 11 130 45 204 36.3 63.7Southeast 1 0 1I 6 8 6 24 114 160 28,8 71,3
TOTAL 275. 194 48 125 234 177 203 246 1,502
Year: 2000
So, California 321 8 14 65 116 17 27 32 606 46.0$ 54.0$No. California 225 6 8 18 50 5 8 14 334 32.6 67.4
Pacific Northwest 8 392 53 51 20 13 1? 9 563 30.4 69.6Mtn, States 0 ;j 0 L 0 0 0 0 0 n/a n/aUpper M.W, 0 0 0 7 i 0 0 0 8 12.5 87.5
Lower M.W. 4 Gulf 2T 2 22 22 391 14 21 176 675 42.1 57.9Northeast 4 4 6 73 6 296 36 5 430 31.2 68.8
Mid-Atlantic 2 0 i 29 7 24 278 36 437 36.4 63,6Southeast 3 0 1 13 20 14 53 252 356 29.2 70.8
TOTAL 596 412 105 2T8 611 383 440 584 3,409
Source: Bureau of the Census

California being combined into one destination region). The two
right-hand columns of the table give the likely intermodal share (i.e.,
those containers destined outside the local hinterland) and the local
share (i.e. those cargoes consumed within the local region, or
distributed by the consignees outside the local region independently of
the ocean carriers). Table 29 incorporates projected annual growth rates
of 4 percent for imports and 6 percent for exports, derived from the
Manalytics/WEFA Bilateral World Trade Forecast.
Imports on the four top intermodal corridors are projected to grow
significantly in the next decade: Southern California, to 684,000 FEU;
Pacific Northwest, to 365,000 FEU; Mid-Atlantic, to 204,000; and North
east, to 196,000. The rail corridors with the greatest demand are east-
bound from Southern California and the Pacific Northwest, westbound and
southbound from the Northeast, and northbound and westbound from the
Mid-Atlantic ports.
The major export port regions are Southern California (19 percent of 1987
exports), Pacific Northwest (17.6 percent), and the Lower Midwest and
Gulf Coast (15.1 percent). The three port regions are projected to
experience significant export growth, with the lower Midwest and Gulf
growing the fastest; from 227,000 FEU in 1987 to 675,000 FEU in 2000, a
compound annual rate of 8.7 percent. About 42 percent of this year 2000
traffic is expected to be intermodal, although its exact routing cannot
be predicted.
One crucial observation is that many of the flows in Table 29 are, and
will remain, discretionary. The inland regions of origin and destination
are fixed, but the exact rail hubs are not. The coastal ranges may be
fixed, but the ports are not. For example, a container from Japan now
moving via the Port of Los Angeles, a double-stack train to St. Louis,
and a dray to a consignee in Indianapolis, could easily be shifted to the
Port of Seattle and a double-stack train to Chicago, and drayed from
Chicago instead. Likewise, an exporter in St. Louis could choose any of
several rail routes and Atlantic Coast ports for a shipment to Europe.
Because the flows are discretionary, their final routing will depend on
-127-

the business strategies of the carriers. The tables reflect the current
proportions.
International container flows may therefore have much more flexibility
than domestic flows to adjust traffic balance and avoid heavily traf
ficked corridors. Some examples have already surfaced in the form of
"triangle" routes, whereby eastbound containers originate at one port
region (e.g. Southern California) and westbound containers arrive at a
different port region (e.g. Northern California) to match the vessel's
port rotation. In this arrangement, double-stack cars with or without
containers are repositioned the relatively short distance between port
regions.
5. Treatment at Ports
Potential Port Congestion. Until very recently, virtually all double
stack services originated or terminated at port cities, and were operated
primarily to serve international traffic. The growing volume of domestic
traffic carried by those services and the prospect of extensive domestic
services have led to some concern over the handling of international and
domestic containers in port-area facilities. The development of on-dock
rail facilities prompts even stronger concerns that such facilities could
be congested by an influx of domestic containers. Congestion on port-
area highways and streets is also a matter for concern, particularly in
Southern California.
The compatibility of domestic and international containers at ports is an
issue because of the diverse distribution requirements of the two contain
er services. Railyards serving domestic shippers and consignees are not
usually adjacent to the port. Domestic container traffic between the
railyard and the domestic customers is not congruent with the internation
al container flows between the port serving customers in the local
hinterland. If the domestic containers arrived at the port (i.e., at an
on-dock or near-dock facility), their volume would necessarily increase
congestion at the port, increase delivery time to the domestic consignees
and increase cost for the domestic consignees or shippers. Just as the
ocean carrier does not want to dray international containers long dis
- 1 2 8 -

tances to and from an intermodal ramp, the domestic shipper does not want
to dray domestic containers long distances from and to the port, or pay
for longshore labor.
As earlier portions of this study have established, there are three
sources of traffic for a domestic container service: rail piggyback
traffic, other rail (boxcar) traffic, and truck traffic. Existing rail
piggyback traffic will most likely be the largest short-term source with
relatively less boxcar traffic being converted. Truck traffic will take
longer to convert. The immediate effect on most rail facilities would be
conversion from trailers to containers, rather than an influx of new
traffic.
In the many ports served by existing rail intermodal yards that also
handle trailer traffic, the conversion from trailers to containers would
not add traffic. Few intermodal yards are facing capacity constraints at
present, and those that do are being expanded. There seems little risk
of a short-term congestion problem so severe that it would impede the
growth of either international or domestic double-stack services. The
long-term outlook for facilities depends on profitability: if domestic
double-stack service .is profitable, railroads can and will invest in the
necessary facilities.
On-dock facilities, however, cannot be expanded significantly in most
cases without impinging on land required for marine terminal operations.
Moreover, on-dock facilities are usually built with port funds to provide
efficient, expeditious rail service for ocean carriers' international
containers. An influx of domestic containers might defeat the purpose of
on-dock facilities.
Incentives and Control,. Fortunately, there is little incentive for any
participant in domestic container traffic to send containers with
domestic freight to crowded on-dock facilities. Domestic freight taken
by rail to on-dock facilities would have to be drayed back out to
domestic destinations at a substantial additional cost for drayage and
gate fees. With railroad-owned facilities in the same area, domestic
shippers would have every reason to avoid costly trucking into port
-129-

facilities. Thus far, railroads typically regard service to on-dock
facilities as more costly than handling traffic in their own yards,
especially when the customer is paying for the drayage. Railroads thus
have no incentive to bring domestic containers to on-dock facilities.
There are only a few on-dock rail transfer facilities now handling
significant traffic at U.S. ports: Tacoma (two facilities), Portland,
Seattle, Long Beach, and New York/New Jersey. None is yet regarded as
congested. In the course of this study it was found that only two, those
in Tacoma, regularly handle any domestic containers. With ample current
capacity, Maersk and Sea-Land use their on-dock terminals to handle some
domestic backhaul movements intermingled with their international cargo.
It is anticipated that this practice will end when the rise in exports
balances the import flows, or when the on-dock transfer facility nears
capacity and priority is given to international traffic.
One cause for concern is the double-stack unit trains operated under the
control of ocean carriers or multimodal companies. If such trains
carried a mix of international and domestic containers into crowded
on-dock facilities, the domestic containers would have to be drayed back
out. But, true unit train operations are no longer the rule: almost all
double-stack trains are broken up and reassembled as needed. Further
more, much — perhaps most — domestic traffic carried under the auspices
of ocean carriers or multimodal companies moves on a mix of trains and
schedules separate from the dedicated trains scheduled to coincide with
ship arrivals.
Beyond the overall volume of domestic intermodal traffic and the ability
of railroad facilities to handle it, there is a question of control: who
controls the routing and destination of domestic intermodal traffic, and
can or will that party keep it out of crowded marine terminals and
on-dock or port area transfer facilities?
Ultimately, the railroad customer controls selection of the railroad and
the routing and destination of the traffic. Customers tender traffic at
a specific point for movement to a specific point. A rail intermodal
yard is a different point than an on-dock terminal in the same port city,
-130-

and a steamship line would direct its traffic either to the intermodal
yard, or to the marine terminal. The general answer to the question of
control, then, is that both international and domestic traffic will be
originated, routed, and terminated where the customer wants it.
Some rail customers, principally ocean carriers or their subsidiaries,
tender both international and domestic traffic for movement via dedicated
cars or a solid dedicated train. The loading and routing of dedicated
trains or dedicated cars is, by definition, up to the customer, in this
case the ocean carrier. To put it simply, if the ocean carrier wants to
load or unload domestic containers under its control at on-dock or
near-dock facilities, it will do so (as Maersk and Sea-Land presently do
in Tacoma). If the containers are travelling on dedicated cars or in
dedicated trains, the railroad will simply load, move, and unload the
cars according to the customer's instructions. Traffic moving in
common-user or other non-dedicated trains and cars, on the other hand,
will be loaded, blocked, and unloaded in accordance with the railroad's
preferences. Domestic movements would not be handled in on-dock
facilities unless specifically directed by the customer.
In general terms, domestic container traffic, like all traffic, can be
controlled by either the rail customer (a shipper or third party) or the
railroad, depending on whether the rail customer chooses to exert control
and on the terms under which the movement is made. Where the railroads
can identify domestic movements and have choice, they can and will keep
the bulk of such traffic out of on-dock facilities. Where an ocean
carrier or third party controls the movement, and railroads cannot
identify domestic movements, the rail customer and the traffic will
follow economic and logistic incentives. It will be up to each port, and
the operator of any on-dock transfer facilities, to ensure that incen
tives for rail customers to route domestic containers into marine facili
ties are not inadvertently created.
Minimal Domestic Port Impact. From the preceding discussion, it appears
that the impact of domestic container traffic on port facilities will be
minimal. The spectre of port congestion from domestic boxes has been
raised, but this study located no reports of actual congestion from that
-131-

source. Since ocean carriers, ports, railroads, marine terminal
operators, and customers all have incentives to keep domestic containers
out of the ports wherever congestion is likely, any influx of domestic
containers in port facilities is likely to be small and sporadic unless
local conditions encourage counter-intuitive routing practices.
Where there is only one intermodal yard in a city, the routing question
is moot; the issue becomes the adequacy of that facility to handle both
kinds of traffic. Where there is a choice of railroad facilities, the
railroad is most likely to segregate traffic by handling type, i.e.,
trailers versus containers. BN makes this distinction in Seattle, CNW in
Chicago, and SP in Los Angeles. Were substantial amounts of trailer
traffic converted to containers, the railroad would more likely convert
the trailer yard or add container-handling capability, rather than allow
one facility to go under-used while the other is overburdened. Railroads
have demonstrated their willingness to expand and change facilities as,
intermodal traffic itself expands and changes: witness CNW's plans for
Global Two in Chicago, and SP's plans for expansion of the ICTF in Los
Angeles.
Although port planners remain uneasy, we have found no reason to expect a
substantial influx of domestic containers that would congest port-related
facilities. The operational concern is how international containers will
be brought to the marine terminals from mixed international and domestic
double-stack trains. Where containers are drayed, there is no problem in
sorting containers (other than occasional mixups). Where containers are
brought by rail to on-dock terminals, railroads and their customers will
have to cooperate in loading and blocking trains to facilitate separation
at destination of those cars bound for the on-dock yard.
B. PORT ISSUES
1. Introduction
Increased ocean carrier control of international container routings to
and from inland regions beyond the boundaries of the ports has irrevoc
ably modified the traditional relationships between port authorities,
-132-

ocean carriers, and railroads. Container ports are highly competitive,
both between regions and within regions. Ports compete for vessel calls
and for cargoes; they cannot create either. Thus, strategies intended to
increase vessel calls and container cargoes can succeed only at the
expense of other ports. An obstacle to one port or region is often an
opportunity for another. Ports have little control over the two major
factors that influence the routing of international intermodal containers
through their terminals: the discretionary nature of international
intermodal container movements; and the size of the local population that
attracts both international and domestic cargoes.
Discretionary Container Movements. One of the most important
characteristics of international intermodal container transportation is
the discretion ocean carriers have in the routing of containers through
U.S. coasts, coastal regions, and ports. Reportedly, discretionary flows
amount to as much as 80 percent of the container traffic at some major
intermodal ports, such as Seattle.
While ports have little control over discretionary container movements,
they can influence a carrier's routing decision through development of
state-of-the-art facilities (notably including intermodal rail access);
through provision of ancillary services; and through increased coopera
tion with ocean and rail carriers -- but generally not through price cuts
in basic port charges. Port charges are a decreasing share of a car
rier's total costs, and they are of decreasing importance in a carrier's
deployment decisions (except, perhaps, in choosing between adjacent ports
in the same region).
Local Market. The size of a port's local market is a major consideration
in a carrier's deployment of intermodal equipment. As their domestic
business grew and became profitable in its own right, the intermodal
ocean carriers expanded their domestic activities. Now, for the major
participants, international and domestic operations have became so
interwoven that those carriers must achieve an overall balance of
domestic arid international movements to avoid repositioning both empty
containers and empty double-stack railcars. The large local population
that leads ocean carriers to call at a port with oceanborne international
-133-

containers also leads those same carriers to serve the port region with
railborne domestic containers.
A change in the distribution practices of major U.S. importers, however,
is causing a shift from local to intermodal traffic at West Coast ports.
Until recently, up to 50 percent of the shipments imported by firms such
as Sears and K-Mart were treated as local cargo. The containers were
drayed to transloading facilities near the ports, especially in Southern
California, and the goods were re-sorted into truck trailers for delivery
to inland warehouses. Much of this traffic is now transloaded in Asia,
moving thereafter via double-stack trains directly to inland distribution
centers. This trend has contributed to the growth of eastbound
double-stack import traffic over and above the actual growth in imports.
From the ports' perspective, this traffic has changed from captive local
cargo to discretionary intermodal cargo, which can now be routed without
regard to the availability of local warehousing or transloading facili
ties .
2. Changing Port Roles
A generation ago, ports were faced with the conversion from break-bulk to
container facilities. Now, their role has expanded from simply providing
waterfront facilities to expediting container movements between ocean and
domestic carriers (rail and truck) through the provision of intermodal
container transfer facilities. These facilities are sometimes on-dock
but they must be at least near dock for efficient and economic transfer.
Accommodating Future Containerships. It is not just the facility that
has to be provided. As ship sizes increase to post-panamax dimensions to
take advantage of economies of scale in order to reduce unit costs, all
terminal functions are affected. The changes required in each function
put pressure on ports for both capital and land — and both are becoming
scarce. There are five major issues facing ports in accommodating future
containership operations:
-134-

1) berth size and number;
2) ship/apron transfer rate;
3) apron/storage transfer rate and storage capability;
4) storage/inland transfer rate; and
5) gate processing.
Every one of these issues represents a demand for capital, land, and
management attention that conflicts with the equally pressing needs for
container transfer facilities and related initiatives. The supply of
land adjacent to deep water is very limited, and very desirable for other
uses as well/ Ports are facing demands for more on-dock rail facilities
at the same time new marine terminals are growing to 40 or 50 acres.
Capital, never plentiful, is being stretched thin by these intermodal
requirements and in some cases by post-panamax ship operators who want up
to four automated, dual-hoist container cranes per terminal at a cost of
$7 million each.
The continuous decline in the actual number of major container operators,
through bankruptcies, mergers and service rationalization, has placed a
larger percentage of international cargoes into the hands of fewer carri
ers. The rationalization of ocean carrier services has evolved fewer, if
larger, ocean carriers that require significant terminal capacity and
intermodal access. For container ports competing for these carriers,
this evolution offers fewer opportunities and greater risks: the
participants in the market are fewer, but they require more investment in
land, facilities and equipment. Moreover, the rise of discretionary
cargoes, which can be handled at any of a number of container ports, puts
heavy pressure on the competing ports to offer dedicated marine
terminals, dedicated on-dock rail transfer, and other dedicated options
at attractive rates, even before they have cargo commitments.
Facility Initiatives. Current intermodal container transfer facilities
range from "on-dock" facilities in the marine terminal, to "near-dock"
facilities within a short dray of the marine terminal, to "off-dock"
facilities miles away from the terminal. In the off-dock scenario, the
container typically passes from the ocean carrier's jurisdiction to a
-135-

drayman (trucker's jurisdiction) at the marine terminal gate, and from
the drayman to the railroad (railroad's jurisdiction) at the railyard
gate. Two inspections are performed in this procedure, with two sets of
documents and attendant delays. The objective of on-dock transfer is to
reduce the cost, time, and administrative effort required to shift
containers between the ship and the railcar. In the "on-dock" scenario,
the container passes directly from the ocean carrier to the railroad,
with only one inspection and only one set of paperwork. A port's ability
to provide on-dock intermodal transfer can be a competitive advantage for
discretionary cargo. On-dock container transfers now take place in
Tacoma, Portland, San Francisco, Long Beach, Baltimore, and New York/New
Jersey.
On-dock transfer: 1) reduces two interchange processes to one simplified
procedure; 2) avoids the use of highway licensed and equipped drayage
equipment; and 3) avoids highway weight limits, which prevent containers
from being loaded to their full weight capacities. This last feature may
merely shift the problem inland if containers that exceed highway weight
limits are to be moved over the road from railyards to their ultimate
destination.
On-dock transfer, therefore, is not a technological or operational
innovation, but an organizational and institutional one. There are other
ways in which most of the benefits of on-dock transfer can be obtained:
public highway easements, streamlined paperwork and administration, and
simplified work rules. In some cases, such accommodations make
"near-dock" the practical equivalent of "on-dock."
Labor jurisdiction may be a serious institutional issue for some on-dock
initiatives. Simply put, will on-dock rail transfer facilities be
operated by marine union (longshore) labor, rail union labor, other union
labor, or non-union labor? The problem is real and can be serious: the
opening of Baltimore's Seagirt on-dock facility was delayed by labor
jurisdiction disputes.
There have been several significant recent port facility initiatives
ranging from on-dock transfers to remote inland terminals. : Each of these
-136-

projects represents an effort on the part of the port to attract a share
of the discretionary cargo market, and all of these projects represent a
new and more aggressive role for ports.
Port Roles in Domestic Containerization. Ports will not have significant
roles in domestic containerization, or in the development of domestic
double-stack networks. In fact, ports appear prepared to resist any such
role, and to reserve their resources for waterborne trade. The
involvement of ports in domestic container movements, if any, will be
incidental to international movements. It is possible, for example, that
a port acting as a shipper agent might coordinate a domestic backhaul for
an ocean carrier client, but such activities would likely be sporadic.
The role of ports may change because of domestic containerization. If
the rail facilities now serving both international and domestic traffic
cannot be expanded to handle the growing volumes of both, ports may be
induced to provide, or participate in joint ventures to provide, new
facilities dedicated to international traffic. The ICTF in Los Angeles
is a prime example of a joint venture between the Ports of Los Angeles
and Long Beach and Southern Pacific.
3. Port Issues
Increased Port Competition. The advent and growth of double-stack con
tainer services has created new forms of competition between ports, and
extended port competition into new markets. Historically, the East
Coast, West Coast, Gulf Coast, and Great Lakes regions were considered
separate markets, with little competition between ports on different
coasts. Ports competed almost exclusively with other ports serving the
same hinterland or local service area. Since well defined hinterlands
did not extend far inland, such competition tended to be ijitra-regional
rather than inter-regional.
Until the advent of inland intermodal services, which can be dated rough
ly by the introduction of MLB (mini-land bridge) tariffs in 1972, neither
ports nor their ocean carrier clients had much control or even influence
over container transportation beyond port boundaries. Inland transporta-
-137-

tion for both imports and exports was typically arranged by the shipper,
the consignee, or a third party. Under those circumstances, ports had
neither means nor incentives to compete for cargo beyond their immediate
hinterland.
The increased participation of ocean carriers in inland transportation,
accelerated by the introduction of double-stack services, brought aggres
sive inter-regional port competition. Boston, New York, Philadelphia,,
Baltimore, and Norfolk can all compete for a container shipment between;
Europe and the Midwest. The same development placed ports on different
coasts in competition: Los Angeles can compete with New Orleans for a
container shipment between Asia and Memphis, for example, and it can
compete with New York for a shipment between Asia and Pittsburgh.
The growth of international container traffic, by itself, is expected to
engender regular double-stack service to additional inland points. Do
mestic container traffic will further increase the number of double-stack
hubs. The combined effect will be to extend the competitive hinterland
for major ports, and raise the stakes in both inter-regional and intra-
regional port competition. Ports will effectively have two hinterlands:
a local region in which they compete with neighboring ports; and an ex
tended inland region, nearly national in scope, in which they compete
with most major container ports.
The extended inland reach of the major ocean carriers, including carriage
of their own traffic and third-party carriage of other carriers' traffic,
will further concentrate control over routing decisions on both the water
and land sides of the ports. The resulting market power and bargaining
leverage of the major ocean carriers has already shifted, and will in
creasingly shift, the primary goals of port competition toward obtaining
long-term commitments from these carriers and encouraging them, through
port investments in non-traditional facilities and services, to route as
much traffic as possible through the port. As more inland traffic comes
under ocean carrier control, the stakes in that competition will increa
se: the loss of a port client will be more severe, the gain of a newclient more beneficial. At the same time, ports face additional demands
on their finite financial and land resources.
-138-

Increasing competition between ports will draw many port strategies to
ward a more active operating role, away from the "landlord" style of port
development. Landlord ports typically develop facilities but do not par
ticipate in terminal operations or offer much in the way of ancillary
services. Formerly, "operating ports" were narrowly defined as those
that provided stevedoring services at their terminals. The current em
phasis for operating ports, however, is not on terminal operations (which
are increasingly the province of ocean carriers), but on ancillary ser
vices of all kinds.
One major ancillary service directly related to the expansion of double
stack services is the provision of a neutral chassis pool. By replacing
several ocean carrier and terminal pools with one centralized operation,
a neutral chassis pool is intended to increase chassis utilization and to
reduce cost and congestion. The Ports of New York, Baltimore,
Charleston, Jacksonville, and Portland, Oregon, have recently established
neutral chassis pools. Neutral chassis pools are growing in popularity
at ports, multi-user terminals, and rail facilities, and may become the
norm for all but the largest ocean carriers.
Numerous ports and regional port groups are working to create local or
regional cargo release systems to interface with automated systems being
implemented by the Customs Service. One program of note is the Regional
Automated Cargo Expediting and Release System (RACERS) being developed by
the Golden Gate Ports Association. With partial sponsorship from MARAD,
RACERS will become not only a working electronic interface between Bay
Area ports, carriers, brokers and Customs, but also a generic template
for development and implementation of such systems at other U.S. ports.
Major competitive strategies by container ports are likely to require
innovation and expenditure well beyond the previous scale of competition.
The Virginia Inland Port is a dramatic example, as the Virginia Ports
Authority has built an "upstream" intermodal satellite facility to
attract discretionary traffic from the local hinterland of competing
ports.
-139-

Rail Access and Container Transfer Facilities. If there is one potential
obstacle to obtaining port benefits from the growing double-stack net
work, it is rail access and associated container transfer facilities.
Rail access for containers was rarely considered before the advent of
discretionary intermodal container cargoes. Now, rail access is an
important competitive issue. Container ports have found their roles
evolving to include facilitation of intermodal transfer in order to
improve or maintain their competitive positions. Only a few ports were
fortunate enough to have rail access on or near their container
terminals. In most cases, new or improved intermodal, container transfer
facilities at or near the ports were necessary for efficient and economic
intermodal container transfer.
The ideal situation, from the ports' point of view, is to have direct,
unimpeded services from two or more major competing railroads with
on-dock or near-dock facilities adequate for future growth, frequent
arrivals and departures, and line clearances for double-stacked high-cube
containers. Railroads, of course, prefer exclusive access, resist
building excess capacity, schedule trains to suit the traffic, and invest
in increased line clearances only when justified by potential revenues.
The vast differences in the physical characteristics of ports, railroads,
and port cities virtually guarantee that each port will face different ,
circumstances, with different institutional and operational barriers to
be overcome. On-dock (or at least near-dock) rail facilities figure
prominently in the strategies of most major container ports. Unlike the
relatively standardized double-stack trains themselves, there will be no
standardized on-dock rail facilities. The right solution for one port
may resemble the right solution for another port only in principle and
function.
Rail access also has a vertical dimension: line clearance. Double-stack
cars carrying two high-cube containers require about 20 feet of clearance
over the rails. In many places, particularly in railroad tunnels and in
the infrastructure of older cities such as Boston, rail lines leading to
major ports do not have adequate clearances. Correcting these problems
is costly, and the railroads cannot always justify the expense for the
-140-

potential incremental traffic. So far, only one port, the Port of Oak
land, has actually participated in funding tunnel clearance improvements.
The Port of San Francisco has agreed to participate in planned tunnel
improvements on the SP line serving the port. East Coast ports face
greater obstacles to resolving such clearance problems, since clearance
problems are much more pervasive in the area between East Coast ports and
the eastern rail network. The State of Pennsylvania has reportedly ap
proved some $32 million to support tunnel clearance improvements for the
Ports of Philadelphia, Pittsburgh and Erie. High-cube containers are not
yet common in the transatlantic trade, but more East Coast ports may have
to follow Oakland's example in the future.
The prospect of legislative or regulatory action on rail access has been
raised, akin to proposals for "competitive access" amendments to the
Staggers Act. The American Association of Port Authorities, in its com
ments to DOT regarding national transportation policy, argued for a fed
eral role in creating intermodal corridors through urban areas. It is
not clear that rail access for on-dock facilities is universally neces
sary. The Department of Transportation has recently established an
interagency working group to address the rail access problem.
"Port Trains". One result of the expansion of the double-stack network
will be a reduced perceived need for "port trains." The initial phase of
double-stack service was dominated by the dedicated trains of a few major
carriers at a few major ports, leading to concerns over the fate of
smaller carriers and smaller ports. This concern, in turn, led to pro
posals for "port trains": regular double-stack services with ports
providing volume commitments and marketing efforts. There were several
proposals for such operations, and a few short-lived trials.
On-going developments, particularly the expansion of the double-stack
network, will effectively eliminate any long-term role for the ports in
initiating double-stack services. The ports should therefore be able to
avoid competing with their own tenants whose subsidiaries also solicit
the traffic of smaller carriers. Equally important, the financial and
managerial resources of the ports can be reserved to meet other pressing
needs.
-141-

In the short term, there may still be a role for port-sponsored projects
to demonstrate the viability of common-user trains, especially where some
railroad resistance remains, and to attract additional containers to new
double-stack services. Although it is not clear that it was planned that
way, the proposal by the Port of Seattle to sponsor trains was unques
tionably effective in encouraging BN to start common-user trains.
Whether such a strategy would be effective, or even necessary, to promote
common-user services at other ports would depend on the individual
circumstances.
Development Impediments. Ports are faced with a continuous need to ex
pand and upgrade their facilities. Being public agencies and working in
a highly visible social and political arena, they encounter more obsta
cles to intermodal development than either ocean carriers or railroads.
There are three major obstacles to port intermodal development, none of
which is unique to the intermodal function: (1) limited fiscal or physi
cal resources; (2) lengthy and expensive approval processes; and (3)
competing demands for increasingly expensive facilities.
A port, in its most literal sense, is a collection of facilities for the
exchange of cargo between sea and land. But a port, in the modern con
text, has become a high-tech, multi-commodity, multi-modal operator; a
real-estate and recreation manager; a tool for regional development; and
a focal point for environmental concerns. Each of these roles requires
money and land, and there is not enough of either. The public backing of
ports to fulfill traditional community objectives, such as providing
employment or facilities to support local exports, has diminished, yet
the public expectations regarding the objectives have not diminished.
Today, ports are increasingly expected to turn a profit on a commercial
basis.
Technological advances and inflationary pressures have increased equip
ment prices significantly, and ports are expected to finance expansion of
their infrastructures beyond the wharf gate to include intermodal facil
ities. To accommodate this growth, ports are turning more to long-term
contracts with ocean carriers to fix and guarantee revenue streams for
existing or newly developed marine terminals. This approach, however,
-142-

tends to lead to the development of dedicated marine terminals, thereby
exacerbating the problem of allocating limited physical resources.
Ocean carriers are forming their own stevedoring subsidiaries to operate
their own terminals. More and more, these carriers will want exclusive
terminals under their own control, and they will be willing to pay for
them. Most terminals will be on long-term lease to major container
operators, with third-tier operators being secondary users of the
terminals.
In order to keep up with the demand for marine terminal acreage, assuming
adequate financing has been secured, ports are upgrading existing
facilities or creating new land by landfill. In this era of high
environmental awareness and public participation, the development cycle
can take as long as seven years from project concept to implementation.
That time frame is simply unacceptable for carriers introducing or ex
panding intermodal operations.
Competing Demands. Besides trying to provide efficient rail transfer
facilities, ports must continue to build and improve their marine termin
als, the equipment and operations within the terminals, and other pro
jects demanded by port clients or by political constituencies. Dou
ble-stack operations account for only a part of containerized foreign
trade, and containerized trade accounts for only, a part of the import and
export cargoes ports must accommodate. All of the pressures for facil
ities lead to a shortage of both capital and land at most major ports.
Indeed, the shortage of land aggravates the capital problem, as the cost
of adding land increases. The escalation in container ship size and cost
increases the pressure on terminal operators to turn those ships rapidly,
and increases the pressure on ports to provide the latest, fastest, and
most expensive terminal equipment. Commodity-specific developments in
transportation and distribution usually add to the demands placed on the
ports. Land along the waterfronts of major cities is scarce and expen
sive, and there are many competing uses. Ports are under ongoing revenue
pressures, and their own non-cargo developments often yield more revenue
than marine terminals.
-143-

European Cargoes. Much of the transpacific Asian trade formerly handled
at East Coast and Gulf Coast ports has shifted to the West Coast. There
has not yet been a comparable shift of European cargoes to the East
Coast: substantial volumes are still carried in all-water services to
the West Coast. As the double-stack network expands, it is highly likely
that much of the container traffic between Europe and the West Coast will
shift to MLB rail services, and be handled through East Coast ports.
Much of the demand for European imports lies east of the Mississippi,
where the distances from East Coast ports are often too short for effi
cient stack-train service, and the volumes are not sufficiently concen
trated. The traffic data developed in this study suggest that it would
be difficult for individual ocean carriers to generate full stack trains
of European cargo to individual cities west of the Mississippi. Even
though the majority of the estimated total annual imports to California
through Northeast ports of 24,000 FEU (not just European) — or the equi
valent of three 15-car stack-trains per week -- is bound to the
Los Angeles Basin, one ocean carrier would need a very large market share
to bring enough traffic under single control for a weekly train.
Westbound carriage by stack-train operators who are otherwise oriented
towards eastbound Asian traffic may provide the means to convert European
cargoes to MLB. Full trainloads would not be required, nor would all the
containers have to share a single major destination, since stack trains
from the East Coast return to all the West Coast ports several times per
week with a mix of international, domestic, and empty containers. Three
transpacific MLB operators, APL, "K" Line, and Sea-Land (which also oper
ates in the Atlantic), have established their own East Coast rail facili
ties in New Jersey to handle stack trains. Through subsidiaries, these
stack-train operators (and others, without their own yards) solicit west
bound traffic that could include European cargoes bound for the West
Coast.
There is one important obstacle: European cargoes could not serve as
backhauls to balance Asian imports. Empty containers from Asian imports
might accumulate in the Eastern states waiting for backhaul cargo, while
European import containers would arrive from transatlantic carriers.
-144-

Operators such as Sea-Land, Maersk, and Evergreen, who operate in both
trades, may be able to achieve some world-wide balancing. But for the
most part, the transatlantic container flows would be separate from the
transpacific.
The integration of European cargoes into domestic container flows may
prove to be a solution. Indeed, for stack-train operators such as API or
Rail-Bridge, a movement from their New Jersey terminal to a Midwest or
West Coast city would effectively be a domestic shipment, albeit in an
international container that may have to return to the East Coast.
4. Issues for Gulf Coast and Great Lakes Ports
The issues described above concern primarily the East Coast and West
Coast ports, which have had the largest increases in intermodal container
traffic and the greatest need to cope with it. Some of those increases
have come at the expense of Gulf and Great Lakes ports, where former
all-water services have been dropped in favor of MLB moves. While the
Gulf and Great Lakes ports face many of the same issues — port competi
tion, rail access, competing demands, etc. -- on the container traffic
they still carry, they also face other issues relating to their market
and how it will be served.
The Gulf and Florida ports, particularly Houston, New Orleans, Tampa, and
Miami, are looking to Latin American, African, Caribbean, and Mediter
ranean trades for their long-term market niche. The major issue facing
the Gulf ports is whether they will be significant participants in the
combined international and domestic double-stack network. There are
several obstacles to their participation. First, while there are numer
ous double-stack services between Houston or New Orleans and the East and
West Coasts, there are as yet few north-south services connecting the
Gulf ports with Midwestern markets. Among the few is a double-stack
movement of coffee beans from Houston to Kansas City via Kansas City
Southern. Second, substantial portions of Gulf general cargoes are not
yet containerized, and most are carried on Ro-Ro, breakbulk, or refriger
ated vessels. Although it is conceivable that some of these cargoes
could be stuffed into domestic containers rather than truck trailers for
-145-

the trip inland, it seems more likely that these cargoes,will become
intermodal only after they are routinely containerized at origin. Third,
a relatively large fraction of the Gulf inbound container cargoes, es
pecially bananas and other fruits, are refrigerated. Double-stack move
ment of these cargoes is not yet practical, as there are only a few stack
cars capable of supplying power to refrigerated containers. Fourth,
distances from Gulf ports to Midwestern markets are relatively short,
near the minimum distance for the most efficient possible double-stack
trains. Thus, movements to those cities are more difficult to convert
from truck to rail. Fifth, as shown below, Gulf Coast traffic volumes to
regions other than the Lower Midwest are low relative to that required
for double-stack trains.
1987 Container Volumes
Through Lower Midwest/Gulf Ports
Gulf Ports Import Export
To/From FEU FEU
California 7,021 26,715
Northwest 842 2,330
Mountain States 3,088 21,820
Upper Midwest 9,933 21,614
Northeast 30,203 13,929
Mid-Atlantic 2,191 21,466
Lower Midwest 37,234 132,296
Source: Task IV Report, Appendix IV D.
The fourth and fifth obstacles may be easier to overcome.as the influx of
domestic containers makes intermodal container service between the Gulf
and Midwest more feasible. Just as increased service frequency and
broader coverage are expected to benefit smaller transatlantic and trans
pacific ocean carriers, they can be expected to benefit Gulf ports and
carriers whose present container volumes are neither large enough nor
concentrated enough to justify dedicated train service. Although pro-
-146-

vision of more double-stack services to the Gulf would encourage the
further containerization of Gulf trades, there are too many other factors
to conclude that more train service would be decisive.
Container traffic at the Great Lakes ports has never been substantial,
and it is unlikely to become a major force in the future. First, the
navigation locks in the St. Lawrence Seaway prohibit the use of modern,
wider container ships, and the longer voyage to Great Lakes ports would
negate some of the advantages of landbridge movement. A second factor
limiting Great Lakes container activity is the annual closure of the St.
Lawrence Seaway. In April and May of 1989, The St. Lawrence Seaway De
velopment Corp. participated in meetings regarding intermodal rail ser
vice during the winter closure. The general idea is that double-stack
trains could ferry containers from open East Coast ports to the Great
Lakes ports, a true minilandbridge movement. If an efficient service
could be developed, it would allow use of Great Lakes port facilities
twelve months a year, significantly improve utilization, and reduce unit
costs. The Port of Quebec has reportedly investigated similar alterna
tives, as has at least one terminal operator at the Port of Chicago.
C. OCEAN CARRIER ISSUES 1
1. Different Implications
The largest ocean carriers are carrying more of the transpacific cargoes,
and are committed to intermodalism. Many smaller carriers, however, have
yet to make that commitment. The implications of domestic double-stack
service are different for each group. The intermodal ocean carriers view
domestic container traffic as a new market, with its own revenue poten
tial but also with significant impact on existing markets. Domestic
containerization allows these carriers to expand their double-stack
networks, which in turn generates new opportunities for efficient
carriage of both domestic and international containers. Smaller con
tainer carriers with limited or no intermodal operations have neither the
organization nor the capital to compete in the domestic market, the
benefits of domestic containerization that accrue to the smaller carriers
are mostly indirect, though potentially considerable. The increase in
-147-

double-stack departures from the smaller carriers' port cities, by inter-
modal operators or railroads responding to the domestic market, allows
these carriers to increase the scope of their international intermodal
business without the need for significant organizational change or
capital investment in intermodal operations.
The issues raised by double-stack domestic operations are somewhat dif
ferent for the ocean carriers than for the ports. This is not to say
that some issues, such as the development impediments faced by the ports,
do not also affect the carriers. Some issues, however, are more specific
to the carriers.
2. Changing Ocean Carrier Roles
Expanded Responsibilities. Before containerization, carriers generally
accepted cargo at the pier, loaded the cargo aboard ship, sailed the ship
to another port, discharged the cargo, and, finally, turned the cargo
over to the consignee or his agent at the pier. The initial stages of
containerization expanded the scope of services provided by the ocean
carrier to include local pickup and delivery and container stuffing/
unstuffing of less than and full container load shipments at off-terminal
container freight stations (CFS). Today, the ocean carrier role is
significantly expanded. Carriers now offer single-factor rates between
foreign and domestic inland points. Accordingly, ocean carriers must
provide: rail transport to/from the principle rail hubs throughout the
country; long distance trucking between the principle rail hubs and
customers located in secondary cities; load pick-up and delivery as well
as consolidation (CFS) services at major points; and container and
chassis pools throughout the country. Ocean carrier marketing efforts
are now spread throughout the country. The marketing staffs are not only
soliciting international cargoes but domestic cargoes as well -- either
directly or through a subsidiary — to maximize equipment utilization.
The scope of management responsibilities has increased almost geometri
cally with the increase in services. Equipment control systems, for
example, must now be able to cope with the fact that perhaps a half a
dozen land carriers will be responsible for a given container before it
is returned to the carrier.
-148-

The degree of participation in intermodal service varies significantly
throughout the country. Some of the larger participants have established
large multimodal companies; other participants depend on agents of some
sort -- ports and railroads, as well as the more traditional third party
agents.
Future Role. How will the ocean carrier's role change in the future?
Intermodal operations will expand to the point where the major carriers
serving the United States will be able to carry, on a single bill of
lading, international cargo to and from any inland point. The carrier
will also be heavily involved in the carriage of domestic goods in order
to maximize the efficiency of their international operations. Management
responsibilities will continue to expand with the expansion of services.
The North American subsidiaries and affiliates of major ocean carriers
are likely to maintain their major role in domestic containerization,
while the ocean carriers themselves concentrate on international
movements. The growing volume of domestic business has led numerous
ocean carriers to establish subsidiaries or affiliates with separate
management structures and profit centers. Those that contract for
double-stack service and let third parties market the service will only
be passive providers of containers, however large the volume. Those that
take a more direct role in operating and marketing double-stack services
are more likely to enter the ranks of multi-modals.
Increased Carrier Competition. The advent of inland intermodal service
has increased, and will continue to increase, the scope of ocean carrier
competition. The economic benefits of balanced double-stack movements
have led the carriers to compete just as fiercely for domestic backhauls,
either through subsidiaries or by making their container capacity
available to railroads or third-party agents.
As international container flows increase and domestic container flows
are added to the double-stack network, that network will expand in two
ways. First, improvements in service frequency and market access will
broaden and intensify the competition among ocean carriers or ocean
carrier subsidiaries. As smaller carriers gain access to the double-
-149-

stack network through common-user trains, their containers will increase
the total capacity available for domestic loads, and they will become
direct rather than indirect competitors. Second, The increased
availability of common-user and third-party services to more inland hubs
will be of particular value to smaller ocean carriers. The common-user
trains and the third-party activities of major intermodal operators such
as API and CSL allow smaller carriers to negotiate for favorable rates
based on their full annual intermodal volume, rather than on their volume
in just one corridor. Reportedly, railroads and third parties have
offered contract rates for as little as 1,000 annual units (although such
rates would not be as low as those for greater volumes).
It is important to note that even large steamship lines are "smaller car
riers" in secondary corridors. With the added volume of domestic con
tainers, regular double-stack service may be offered to hubs not now
served by dedicated ocean carrier trains. Further integration of
double-stack operations into the railroad network is likely to result in
service to intermediate points between the largest hubs.
Technology spreads rapidly in the intermodal field. Suppliers and opera
tors are quick to incorporate successful innovations in their own prod
ucts and systems. The focus of competition is therefore likely to shift
to customer service and provision of high-quality, door-to-door
transportation. Any enduring market advantage must be based on some
factor that is not easily imitated and cannot be leased on short notice
with minimal capital investment. What might be called "management
technology" — knowledgeable managers, information systems, customer
communications, quality controls, etc. -- cannot be bought off the shelf;
nor for that matter, can a reputation for high customer service. Leading
intermodal firms have reorganized frequently in the last few years in an
attempt to adapt existing organizational forms and personnel to a new and
highly competitive endeavor.
Increased Market Concentration. The increased competition between carri
ers and the greater emphasis on service quality will work to the advan
tage of the large intermodal operators, who can control door-to-door
movements across the country. That control, and the provision of consis-
-150-

tent, high-quality service, requires substantial financial resources and
a large revenue base, both of which will likely be beyond the reach of
medium-sized ocean carriers. The big ocean carriers will get bigger.
The smaller ocean carriers will find it easier to use the services of the
intermodals, railroads, or third parties.
In an increasingly competitive intermodal market, ocean carriers will be
faced with a choice between making a full-scale commitment to interna
tional and domestic intermodal operations, or becoming a customer of the.
larger intermodals who have made that commitment. As the scale of com
mitment grows, the industry will tend to bifurcate, and those companies
with a medium commitment to intermodal operations may be squeezed out.
Reduced competitiveness of ISO containers. The 40- or 45-foot ISO con
tainer will face a serious challenge from the 48-foot 102-inch domestic
container in domestic markets. The 48-foot domestic box offers 13
percent more cubic feet than its 45-foot ISO counterpart, and 28 percent
more than the 40-foot ISO box (assuming all are high-cube containers).
Not every domestic commodity requires the extra space, but many shippers
can make use of it, and few if any would reject a box for being too
large.
As 48-foot, 102-inch high-cube domestic containers become more commonly
available, ocean carriers will either have to offer discounts for smaller
ISO containers or somehow market them to shippers of heavier goods. ISO
boxes may even be at some disadvantage when it comes to heavier goods,
because a steel 45-foot ISO high-cube container (up to 10,140 lbs.) out
weighs an aluminum 48-foot domestic container (8,100 lbs.), thus offering
reduced weight capacity as well as reduced cube capacity.
Overweight Containers. The problem of overweight containers is likely to
affect ocean carriers and their intermodal subsidiaries more than it will
affect railroads or ports. Ocean carriers or their intermodal subsidia
ries are generally the parties who accept loaded containers from the
actual shippers, and who are in a position to check container weight and
enforce weight limits. With regulatory and legislative efforts to narrow
responsibility for overweight containers now being considered, it appears
-151-

that ocean carriers may find an enforcement role thrust on them if they
do not perform it willingly.
Several regulatory or legislative approaches to the overweight problem
have been proposed:
o holding overweight import containers at the terminal, just as
is done for those owing Customs duties;
o weighing all import containers before releasing them to truc
kers;
o reducing the issuance of special permits for overweight boxes;
o changing tariffs to weight-based rates within highway limits;
and
o standardization and simplification of weight and length limits
and formulas.
The first two proposals would not deal with overweight export containers,
which, as FHWA's March 1989 report demonstrates, are a large part of the
problem. The last proposal may make compliance easier, but does not dir
ectly force compliance. The remaining suggestions would both affect
ocean carrier operations and marketing.
Fleet Capacity and Price Pressure. The first few years of double-stack
service were characterized by aggressive pricing to secure domestic back
hauls. The operating economies of double-stacks were widely discussed in
industry publications, and often overstated. As a result, domestic ship
pers were led to expect a substantial discount on double-stack container
movements, not only below truck rates but below piggyback rates as well.
Shippers and third-party agents are wooed by numerous ocean carriers,
intermodal subsidiaries, and railroads. The former backhaul discount has
become the market price, much to the chagrin of intermodal companies
seeking to establish a fairly priced, profitable, premium service.
-152-

Some industry observers have predicted overall excess capacity in the
double-stack fleet in the near future. Excess capacity throughout the
system, should it develop and persist, would seriously reduce double
stack profitability, which many see as marginal already. It would
exacerbate the long-standing practice of discounting westbound domestic
movements, and it could lead to a rate war on traffic in both directions.
Only a few ocean carriers subsidiaries have any financial obligations for
the intermodal equipment, and such obligations account for only a small
part of the fleet. The direct effect of decreased utilization might
therefore be felt more by the railroads and Trailer Train than by the
ocean carriers.
-153-

VII. THE INTERMODAL INDUSTRY AND DOMESTIC CONTAINERIZATION
A. OVERVIEW
The future of double-stack container services, both domestic and interna
tional, depends on much more than technological developments and cost
comparisons. The greatest challenges to the the emerging intermodal
industry are not likely to be technical or economic, but managerial and .
institutional.
If the intermodal industry can meet those challenges, the rewards will be
substantial. Intermodal traffic is the fastest growing segment of the
railroad industry. Double-stack technology holds the potential to handle
this growth more efficiently and profitably than conventional systems.
The largest source of growth, however, is the vast amount of intercity
freight traffic moving by truck. In Task II, it was estimated that up to
3.2 million annual truckloads would be divertible to a nation-wide
double-stack network under favorable assumptions.
If it is to succeed, large-scale domestic double-stack container service
must prosper in a shipping community whose standard of service is the
motor carrier. According to NMTDB and ICC data compiled by the AAR,
intermodal service accounts for only 15-16 percent of the domestic
traffic moving over 500 miles (exclusive of private carriage and team
drivers). Intermodal service now accounts for up to 70 percent of those
markets in which it is most successful (i.e., dry van truckload traffic
between major cities more than 700 miles apart). Nonetheless, much of
the shipping community remains openly skeptical of intermodal service.
To reach its full potential, domestic double-stack service will have to
offer customers more than just cheaper piggyback.
B. THE RELATIONSHIP BETWEEN PORTS, OCEAN CARRIERS, AND RAILROADS
The Emerging Need For Cooperation. Until the recent growth in intermodal-
ism, there was little need for close, three-way cooperation between
ports, ocean carriers, and railroads. Three factors have intensified the
-154-

need for cooperation between ports, ocean carriers, and railroads. The
first factor is the discretionary nature of inland container cargo, which
has increased competition between ports and between railroads. The
second factor is deregulation, specifically the increased use of multi
year contracts that enable ocean carriers and railroads to make long-term
commitments to container services. The third factor is increased competi
tion within the intermodal industry, which has increased the pressure on
all three parties.
The routing of container cargo bound to or from rail-served inland
destinations has become discretionary because intermodal operations can
move cargo efficiently to major inland points from more than one
competing port, and because extension of ocean carrier services inland
has shifted routing responsibility from ocean shipper to ocean carrier.
Ocean carriers in the transpacific trade can reach mid-continent gateways
and hubs such as Chicago, Kansas City, St. Louis, or Memphis with
competitive cost and service from any major West Coast port. Ocean
carriers in the Atlantic trades can do the same from several East Coast
ports. This ability gives ocean carriers the flexibility to shift
between competing ports to take advantage of better intermodal
facilities, lower transfer costs, or a better price/service offer from a
different railroad. This flexibility in turn places the ports, and the
railroads that serve them, in more intense competition than ever before.
Deregulation and regulatory exemption of intermodal traffic have had
numerous effects, but perhaps the most relevant change is the shift from
published tariffs to negotiated contracts. The :,use of contracts rather
than tariffs allows ocean carriers and railroads to enter into multi-year
commitments regarding volume, rates, and service. Once such a commitment
is in place, both parties can make plans and investments to handle a
specific minimum volume of traffic tendered at a specific port.
Conversely, competitive contract offers may depend on plans for
cost-saving operations or investments. In either case, the contract
commitment directs traffic through a specific port for a period of up to
five years, and may require the cooperation of that port for success.
-155-

The factors described above, and others as well, have intensified competi
tion on land, at sea, and between ports. Third-party intermodal partici
pation has also tended to intensify competition, because, third parties
themselves are highly competitive and often have sufficient traffic
volume to negotiate favorable contracts. In the container trades, recent
large increases in capacity have given ocean carriers incentives for
aggressive pricing. Changes in the conference system, notably the
increased latitude for "independent action", have brought much the same
competitive pressure on the sea as deregulation has on land. Load
centering, the practice of funnelling vast local and inland traffic
through a small number of container ports, has; raised the stakes in port
competition.
The Ocean Carrier-Railroad Relationship. The major interchanges of
traffic between ocean carriers and railroads are confined to contractual
relationships. Ocean carrier-railroad contracts can take several forms,
the first of which is a dedicated double-stack train operation, the form
in which double-stack operations were popularized. In such a contract,
the railroad operates a double-stack train on a fixed route for the
exclusive use of the ocean carrier. This is often a "take or pay"
contract: the ocean carrier pays for the round-trip railcar movement,
whether or not there are any containers aboard. A second contract type
dedicates a number of cars for use of the ocean carrier, but.they operate
as part of a regularly scheduled train rather than as a dedicated train
by themselves. This type of contract is relatively uncommon, as; it has
been largely superceded by "common user" volume contracts. The third and
perhaps most numerous type of contract is the "common user" volume
agreement. In such a contract, the ocean carrier agrees to ship a
minimum annual volume of containers over the railroad in exchange for
favorable rates. The low rates are typically offered in corridors where
common-user double-stack trains are operated, although in some cases the
commitment is system-wide. It is critical to note that the low rates are
based on the expected use of double-stack cars, but in lesser corridors
or where double-stack cars are in short supply, the containers may
actually move on conventional equipment.
-156-

The Railroad-Port Relationship. The railroad-port relationship centers
around facilities and infrastructure. The issue of rail transfer
facilities became germane for intermodal business as competitive
pressures led ocean carriers and railroads to seek transfer cost savings.
The elimination of over-the-road drayage through the provision of
"on-dock" transfer facilities can confer a competitive advantage to the
railroad-port-ocean carrier combination, and force competing carrier and
port combinations to seek comparable improvements. The issue, however,
is not as simple as "on-dock" versus "off-dock." Each major container
port has a unique configuration of terminals andrail facilities. While
there is a trend toward more on-dock facilities, several ports have
examined alternatives designed to reduce transfer costs between existing
facilities.
Ports would prefer to be served directly by several railroads, in order
to offer their clients the benefits of rail competition. Each port,
however, would prefer that the railroads serving it would not also serve
other ports or solicit traffic at other ports. The railroads have
opposing preferences: to serve as many ports as possible, and to be the
only railroad at each. It is therefore to be expected that proposals to
provide competitive port access to additional railroads would be
supported by the port and the new railroad, and opposed by other ports
and the existing railroad.
The Ocean Carrier-Port Relationship. As explained above, inland
intermodal cargo is fundamentally discretionary, giving ocean carriers
substantial freedom in the choice of a principal intermodal port. This
freedom has fueled greater competition between ports in different
regions, as well as between ports iri the same region. As the number of
large ocean carriers is reduced by merger, service rationalizations, and
joint ventures, each remaining carrier acquires greater importance.
Moreover, the nature of discretionary cargo and the competitive efforts
of neighboring ports make a carrier's threat to switch ports very
credible. To remain competitive, ports are compelled to invest in
container cranes, terminal improvements, electronic gates and information
systems, and on-dock or near-dock rail transfer facilities. Ports seek
multi-year ocean carrier commitments to secure these investments.
-157-

Ports can be roughly classified as "landlord" ports (those that build and
equip terminals but leave the actual operation to tenants) or "operating"
ports (those that operate terminals with port employees). The distinc
tion between landlord and operating ports, never sharp, is now breaking
down further as ports take on additional service functions. Several
major ports have shipper's agent authority, and can consolidate ocean
carrier volumes under a rail contract rate. Virtually all major con
tainer ports are operating or developing automated cargo clearance
systems in conjunction with the Customs Service. Several container ports
also operate or lease port-area consolidation or distribution facilities
to attract major importers, exporters, and their cargo. Finally, major
intermodal projects underway or in development are typically multi-user
facilities designed to capture economies of scale, and typically antici
pate a higher level of port operating involvement than the historical
pattern of single-user terminals.
Railroad Clearances. One current issue that unites all three parties is
the issue of railroad line clearances. Double-stack cars require greater
overhead clearances, and greater width at those heights, than other types
of railroad freight cars, and there are many rail routes where tunnels,
bridges, overpasses, or other structures do not have sufficient clearance.
The problem is more common in the eastern states, where the older rail
and road infrastructure has for many years limited the use of conven
tional piggyback cars and tri-level autoracks. The problem reaches its
greatest dimensions when 53-feet long, 102-inch-wide domestic containers
are placed on top, increasing the lateral clearance requirements at the
greatest height. Few railroad tunnels were built with such clearances,
and potential clearance problems with the largest domestic containers are
common throughout the rail system.
Ocean carriers, railroads, and ports have a common interest in improved
clearances and unrestricted double-stack access. The situation, however,
is often described as a chicken-and-egg problem: railroads are generally
willing to invest in clearance improvements if traffic to justify that
investment is committed, but ocean carriers are unwilling to commit
traffic unless clearances are improved. In at least one case, a
railroad, an ocean carrier, and a port have jointly funded tunnel
-158-

clearance improvements: Union Pacific, American President, and the Port
of Oakland are jointly funding tunnel-clearance improvements in the
Feather River Canyon. This cooperative action has encouraged other
railroads and ports to explore the possibilities of joint endeavors, and
at least two similar projects are currently under consideration.
C. TRENDS IN MULTIMODAL OWNERSHIP
1. . Multimodal Versus Intermodal
Within the intermodal environment is a small, but growing number of
"multimodal" companies. The critical feature that sets multimodal
companies apart from single-mode companies is their operating responsi
bility for more parts of the intermodal movement than heretofore typical
of steamship lines, railroads, or third parties. Ownership of assets in
more than one mode does not necessarily yield multimodal transportation,
nor does multimodal ownership necessarily yield "one-stop shopping" or
"total transportation."
The crucial issue is management and coordination. Multimodal ownership
is not the unique answer to the problem of coordinating intermodal
functions. If managed well, multimodals would indeed be highly competi
tive. If not managed well, multimodals may lose in flexibility more than
they gain in coordination.
2. Multimodal Companies
American President Companies (APC). The first ocean carrier to make the
commitment to become a multimodal transportation company was American
President Lines. In 1983, as part of the merger agreement between the
Natomas Company and the Diamond Shamrock Corporation, APL became part of
a publicly traded corporation known as American President Companies. APC
acquired its own shipper's agent, National Piggyback Service, from the
Brae Corporation in 1985. American President Intermodal (API) was formed
in 1985 to operate the double-stack train network. Early in 1987,
American President Domestic (APD) was established as a peer to American
President Lines (APL) to provide overall management of domestic
-159-

transportation services. National Piggyback, renamed American President
Distribution Services (APDS); Intermodal Brokerage Services, renamed
American President Automotive Distribution (APAD); and API were all
placed under APD. The recent formation of American President Trucking
(APT) has given APC an operational footing in the highway mode and
spurred the creation of "Red Eagle" dor-to-door service.
CSL Intermodal (CSL). CSX/Sea-Land Intermodal came into being through
acquisition and merger. The CSX portion of the name is the result of a
merger between the Chessie System railroad and the Seaboard Coast Line in
1980. The Sea-Land portion came through the acquisition by CSX of
Sea-Land in 1987.
Prior to acquiring Sea-Land, CSX Corporation had split the railroad into
three quasi-autonomous functional groups under CSX Transportation: CSX
Distribution Services to handle marketing, CSX Rail Transport for op
erations, and CSX Equipment to manage rolling stock. All of CSX
Distribution Services' intermodal activities (which were an amalgamation
of Chessie's and Seaboard's intermodal operations) and Sea-Land's inland
intermodal services group were brought together in January, 1988 as
CSX/Sea-Land Intermodal (known as CSL Intermodal). Also placed under CSL
Intermodal was CMX Trucking, Chessie's former trucking subsidiary.
NYK/Centex. Like other foreign-flag ocean carriers, NYK Lines estab
lished a North American subsidiary to manage double-stack train
operations. NYK's subsidiary is called Centennial Express, or Centex.
Centex is a wholly-owned subsidiary responsible for negotiating and
overseeing intermodal contract operations on NYK's behalf, specifically
NYK's double-stack commitments. What makes NYK and Centex of particular
interest is NYK's recent purchase of GST Corporation (formerly Greater
South Traffic), one of the largest and most complete U.S. shipper agents.
To date, GST and Centex have been operated separately, in parallel.
"K" Line/Rail-Bridge. "K" line, Kerr Steamship Company, and
International Transportation Services have a complex ownership pattern.
Rail-Bridge is effectively a joint venture of partners who are otherwise
-160-

related. Rail-Bridge serves as "K" Line's intermodal subsidiary,
responsible for managing and marketing "K" Line's inland operations,
specifically its double-stack trains. In this respect Rail-Bridge
operates much like Centex. Rather than purchasing a shipper agent,
however, "K" Line added a second subsidiary, Rail-Bridge Terminals
Corporation (RBTC), to manage rail double-stack terminals in Elizabeth,
New Jersey and in Lacolle, Quebec. Rail-Bridge and RBTC are parallel
subsidiaries. r
3. Multi-Modal Strategies
Ownership Versus Control. A major distinction can be made between
companies that have chosen to own assets and entities in more than one
mode, and companies that have chosen to control service in more, than one
mode through contractual or other non-ownership means. This distinction
results in a spectrum rather than a bifurcation. In fact, every .
multimodal company uses a combination of ownership and control to move
its traffic. Although CSX Corp. owns a railroad, a steamship line, and a
trucking subsidiary, many of its double-stack trains use Trailer Train
cars, and CSL's services to the West Coast are provided by other
railroads under contractual interchange agreements. Although ARC owns a
steamship 1ine, containers, some stack cars, a trucking company, a
shipper's agent, and terminals, it does not own any of the railroads that
operate its trains.
The customer generally does not care who actually owns equipment or
facilities. The customer does demand that the system work smoothly, and
that someone accepts responsibility when it breaks down. Either
ownership or control can provide that capability jf control is carefully
arranged and managed. The vast majority of intermodal movements involve,
contractual and other other control arrangements to supplement the assets
actually owned, and that practice is likely to continue for at least the
near future.
One-Stop Shopping and Seamless Service. Two terms in current use,
"one-stop shopping" and "seamless service," describe the goal of offering
the customer a complete intermodal service through one organization. The
-161-

object is to overcome one of the most serious obstacles to successful
double-stack service, or to intermodal service of any kind:
fragmentation.
Double-stack operations require successful performance and coordination
of numerous functions. Few customers are willing to do all their own
management and coordination, and one of the major roles of third party
shippers is to relieve the ultimate customer of that burden. The goal of
"one-stop shopping" is to allow the customer to use intermodal
transportation wi.th no more effort than is required to use a motor
carrier. "One-stop shopping" necessitates a multimodal approach, whether
implemented by ownership or control.
Regardless of the name given to the concept, "one-stop shopping" or
"seamless" transportation" appears to be a prerequisite for successful
domestic containerization, and for the long-run success of intermodal
transportation in general.
Legal and Regulatory Issues. Many of the potential legal and regulatory
issues in multimodal ism were put to rest when CSX Corp. was permitted to
acquire Sea-Land Services. Other prohibitions against the ownership or
control of both railroads and motor carriers were effectively dismissed
with the deregulation of the motor carrier industry. In both the Motor
Carrier Act of 1980 and the Staggers Rail Act of 1980, Congress
emphasized the importance of intermodal coordination. In 1984, the ICC
removed most barriers to intermodal ownership, finding that the expansion
of railroad-owned motor carrier operations was not likely to lead to rail
domination of the mature motor carrier industry. The Commission now
reviews such mergers on a case-by-case basis, and it is relatively easy
for railroads to obtain motor carrier operating authority.
D. MARKETING AND THIRD-PARTY ISSUES 1
1. Marketing Issues
Customer Perceptions; Perception may be one of the biggest obstacles to
domestic double-stack growth. From the perspective of many potential
-162-

customers, rail intermodal services suffer from association with bad
experiences those shippers have had with other rail services. TOFC ser
vice, in particular, suffers from customers' memories of the higher loss
and damage, unreliable service, and poor organization that plagued
piggyback operations a decade and more ago. Marketing efforts by Ameri
can President Intermodal and other double-stack operators have encoun
tered resistance from shippers who had bad experiences with intermodal
service in years past and are reluctant to try it again.
The consulting firm of Temple, Barker & Sloane has undertaken periodic
surveys of shipper attitudes towards intermodal transportion. The
results of the most recent survey, taken in 1989, confirm the existence
of serious perception problems. Figure 32 shows that shippers rate
intermodal transportation well below trucks on eight key aspects of
service. Less than half of the respondents rated intermodal excellent or
nearly excellent in any service category. In contrast, at least 60
percent of the respondents rated trucks excellent or nearly excellent in
every service category, and most categories were rated highly by more
than 75 percent. Intermodal transportation was even rated lower than
truck on price, indicating that truck rates are actually lower in some
markets, or shippers are implicitly taking quality into account, or truck
service reduces other costs, or all three.
The perceptions of non-users are particularly critical, since non-users
account for most of the potential market. Figure 33 shows points of
agreement and disagreement between users (40 percent) and non-users (60
percent). There is some good news for intermodal operators: users con
sistently rate intermodal service higher than non-users. But intermodal
operators have r.ot gotten their message across on some very basic points:
non-users rate intermodal price, equipment availability, and service
reliability much lower than do users. The better rating that users give
intermodal on the ease of doing business may reflect their greater pro
gress up a "learning curve" that constitutes a barrier to non-users. The
top half of Figure 33 illustrates the "halo" problem, the areas in which
intermodal service has improved, but still suffers from a bad reputation
earned in the past. The existence of this negative "halo" has been
-163-

a<u
1 0 0c
_a>"aiaxLd 80
cJD~a5oX
cr>c
60
40o
oc
c<daCD
CL
20
0
Intermodal W
Price Low Responsive Equipment Service Ease of Equipment Claims Door—to—DoorDamage Customer Size Reliability Doing Quality Payment Transit
Service Business Time
Figure 32: Shipper Perceptions of Intermodal vs. Truck
Source: Temple, Barker & SloaneTraffic Management. June 19B9

100c<L><uS sooQ>
cQ>.Voi2ChC
*-Motrca>ok_Q>Q_
60
40
20
0
UsersNon-Users H I
71%
™ 1 Disagreement: The Halo Effect
Availability of Ease of Doing ServiceEquipment Business Reliablity
100c
k-o0>z
cVa5oX
laJ
aic■-Pocr
60
40
c0)EVQl
20
0
Users m i Non-Users H I
Agreement
48% 52% 47% 4 8 %
Equipment Payment of Low Likelihood Door~to~Door Responsiveness Dimension Damage Claims of Damage Transit Time ° f Customer or Size Service
Figure 33
User and Non-User Perceptions of Intermodal
Source: Temple, Barker & SloaneTraffic Management, June 1939

demonstrated repeatedly by market surveys and in focus group discussions
sponsored by major intermodal operators.
The bottom half of Figure 33 contains some sobering findings: non-users
rate intermodal poorly on five major aspects of service, and users agree
with them. The responses on damages and claims are particularly striking.
Intermodal operators have congratulated themselves publically on the re
duction in loss and damage achieved by articulated cars, but a large por
tion of intermodal traffic still travels on conventional cars, and it is
still damaged too often. Moreover, prompt handling of damage claims re
mains a serious failing of intermodal transportation, reflecting both the
poor historical performance of railroads in handling claims and the frag
mentation of intermodal responsibility.
Both users and non-users have low opinions of intermodal door-to-door
transit time, and the survey found that poor door-to-door transit times
were the reason most often given for not using intermodal service, or not
using it more. As stated earlier, intermodal operators have seldom
tracked door-to-door transit time in any organized way.
Double-stacks, as a line-haul technology, have improved on the image of
piggyback in some key operational areas. Figure 34 shows that many
shippers view double-stacks as superior to conventional piggyback in
price, damage control, reliability, transit time, and equipment. Dou
ble-stacks have little or no perceived advantage, however, in customer
service, ease of doing business, and claims payment, three areas where
intermodal transportation in general is handicapped.
Marketing Efforts. Domestic containerization presents railroads with a
major marketing challenge. For many years, the main target for railroad
intermodal marketing has been the intermodal traffic of other railroads.
Railroads market intermodal services to ocean carriers with some success.
But ocean carriers constitute a small number of high-volume customers,
with well-organized, concentrated traffic. The success of domestic dou
ble-stack service lies with an enormous number of potential domestic
container shippers, whose traffic is unorganized and diffuse. Railroads
can justify substantial marketing and sales expenses to pursue major
-164-

Source: Temple, Barker &. SloaneTraffic Management, June 19S9

ocean carrier accounts. Few domestic accounts, other than UPS and the
largest third parties, could justify the same level of effort, especially
when railroads are trying to minimize overhead. Who will undertake the
required marketing effort for domestic double-stacks, and what will it
cost?
As in railroad intermodal organizations, railroad roles in marketing have
evolved differently on different railroads, and are likely to remain
divergent for some time. Common practice in the recent past has been for
railroads to market intermodal services to third parties, to ocean
carriers, and to a few large national shipper accounts. Some railroads,
such as Southern Pacific and Santa Fe, continue to market intermodal
service on that basis. Union Pacific, which competes in many of the same
markets, has effectively turned over much of the marketing and sales
function to ocean carriers and multimodals with whom UP has "hook and
haul" contracts.
Norfolk Southern's RoadRailer subsidiary, Triple Crown, engages in some
retail marketing to shippers. Ccnrail's Mercury program will also
incorporate some retail marketing, although details are not yet
available. CSL markets to domestic and international customers of all
kinds: shippers, third parties, and ocean carriers.
As in so many areas of the intermodal field, railroad marketing seems to
be moving away from the middle ground. Railroads are either launching
broader or more intensive marketing efforts (sometimes through subsid
iaries), or simply marketing linehaul and terminal services under "hook
and haul" contracts.
2. The Role of Third Parties
Over the last decade, railroads have increasingly relied on third parties
such as shippers' agents, brokers, and shipper associations as their
primary intermodal customers. The railroads have effectively been sel
ling services wholesale. Only the very largest intermodal shippers, such
as UPS or major retail chains, deal directly with the railroads to any
appreciable extent. The railroads no longer have large intermodal sales
-165-
forces, and their geographical coverage is limited. The railroads have
allowed, and even encouraged, the third parties to become dominant.
Third parties freight forwarders, consolidators, shipper associations,
shippers' agents, and licensed property brokers. The ocean carrier
subsidiaries are a new generation of third parties. Each has a somewhat
different role, but all serve as middlemen between the shipper and the
railroad.
The licensed property brokers, commonly known as transportation brokers,
have been one of the fastest growing segments on the intermodal scene.
There were only a few licensed brokers before the Motor Carrier Act of
1980. By 1983 there were approximately 4,000, and today there are over
8,000. Licensed by the ICC, the brokers perform a variety of services
that overlap those of the freight forwarder and the shippers' agent. A
distinct difference is that a forwarder assumes liability and respon
sibility for the intermodal move, while a shippers' agent or broker lets
the shippers and carriers work out liability among themselves. The rapid
increase in the number of transportation brokers has increased the
likelihood that some may be unqualified. Poor services from unqualified
brokers would hurt the reputation of intermodal transportation in gener
al, especially when the unqualified brokers blame other parties.
The various types of third parties have had a dramatic effect on domestic
containerization in the U.S. Much of their success has been due to their
ability to make the intermodal concept work more effectively than the
rail carriers could. In 1988, Inbound Logistics magazine published a
reader survey and concluded that "third party service providers heavily
influence at least half of transportation buying decisions for almost
one-fifth of the freight buyers." For domestic shipments, the survey
found that "14.5% use third parties for 76% or more of domestic moves."
Third party participation, however, is by no means universal: by 1990
"48.4% will still resist using third parties for even 10% of their ship
ments."
Third parties taking advantage of deregulation entered into agreements
with the rail carriers and ocean carriers to use the ocean containers to
-166-

move domestic cargoes back to port cities. This intermediation between
rail and ocean carriers by third parties led to further expansion of the
railroads' TOFC and COFC business. Third parties were later able to
contract directly with the railroads for volume container moves of marine
containers from ports of entry to inland destinations.
The third parties have taken on the full management obligations for door-
to-door service. Starting with the pickup at the shipper's door, the
third party provides the container (or a truck to handle the less-than-
container shipments), and monitors the service. The shipment may be
moved to a terminal for transloading from a truck or trailer into an
ocean container, or moved directly to the rail yard. To this point, all
the labor involved has been for the account of the shipper (loading the
container or pickup vehicle) and the third party (terminal handling,
drayage, etc.). On the other end of the rail movement, the third party
retrieves the container at the rail terminal and delivers the loaded con
tainer either to the consignee, or to the third party's destination ter
minal where it is broken down and the individual consignments delivered
to the consignees. Every segment other than the rail haul, but includ
ing obtaining the empty container to be loaded and the return of the
empty container to the ocean carrier, has been managed by the third par
ty.
Truckload and containerload transportation is a buyer's market. Third
parties that want to grow faster than intermodal transportation itself
has grown have been adding truck brokerage and cargo insurance to their
activities to offer their customers a full range of competitive options.
Management of third party companies has been strengthened to the point
where major third parties are now effective marketing and operational
organizations. Computerization, improved handling methods and better
terminal facilities are now the norm rather than, the exception.
Competitive or Cooperative? The issue of third party competition with
carriers has been debated for as long as third parties have been working
between shippers and carriers, and it will never be resolved to every
one's satisfaction. Third parties compete for domestic freight both
among themselves and with railroads and ocean carriers who solicit
-167-

freight directly from shippers. The cooperation between third parties
and the railroads seems complete in those markets where the railroad has
not marketed its intermodal service with much success and the third party
business is both large and profitable.
The third parties who structure their service to meet the demands of the
shipper will be a major participant in domestic containerization. But
the third parties will also have to have a strong marketing program to
direct volume from the motor carrier industry to domestic container
ization. Marketing of this type of service does not start and stop with
the domestic shippers. Even before the service Could be marketed to the
shipper, the idea has to be accepted by the three entities necessary to
make the service viable: the railroads, the truckers, and the steamship
companies.
For many years, the railroads' relationship with third parties was sim
ple: the railroads issued price sheets and expected third parties to
sell the service. Railroads have begun to talk of partnerships. The
growing sophistication of third parties and the increasingly formal rela
tionship with the railroads has led to a few pioneering three-party ser
vice agreements between a railroad, an agent, and a shipper. One example
is a recent 5-year agreement involving Hub City and Nabisco, including
guaranteed rate and service levels, and management reports for the
shipper.
Third parties will remain a strong influence in domestic
containerization. Many shippers are not convinced that dealing with a
single railroad or ocean carrier produces the best price/service packages
available. On the other hand, there are still a lot of shippers that
prefer to deal directly with the railroad for service, price, perfor
mance, etc. Each railroad will create a marketing strategy for dealing
with both shippers and third parties; few will go all one way or the
other.
-168-

E. INSTITUTIONAL ISSUES
1. intermodal Functions
The functions that must be performed in intermodal transportation have
not changed with the introduction of double-stacks. In the long run, the
potential customer will judge the attractiveness of intermodal transpor
tation -- double-stack or other — according to how well those functions
are performed, regardless of who performs them.
The intermodal market will not tolerate mediocrity. Each participant
must determine which functions it can perform efficiently, competitively,
and profitably. Functions that cannot be performed efficiently will be
neither competitive nor profitable, and the provider is unlikely to en
dure in that function. The better alternative is cooperation with effi
cient providers of that function, even if with sometime competitors.
It is not necessary, and it may not always be desirable, for one firm to
perform every function. The crucial point is that each firm must be a
part of a chain of firms, or a succession of partnerships, that performs
all the functions efficiently, competitively, and profitably. Such ar
rangements have been termed "strategic partnerships" to denote the need
for a long-term, structured relationship in pursuit of a common goal. The
relationship between API and UP, in which API is assuming much of the
responsibility for marketing the intermodal line-hauls performed by UP,
is one example of a strategic partnership.
Some participants, especially the railroads and ocean carriers, may have
to form multiple strategic partnerships to serve different markets. For
example, Santa Fe has a long-standing working relationship with Conrail
for piggyback service between Los Angeles and New York. But Conrail also
handles API's double-stack business in the same corridor in conjunction
with UP and CNW, and Santa Fe recently entered a voluntary coordination
agreement with BN for service between Los Angeles arid Memphis.
Some participants may not choose to form partnerships because their role
is best performed as a neutral provider of services to all. Equipment
-169-

manufacturers and leasing companies, for example, are not likely to re
strict their potential market by working more closely with some customers
than with others. Terminal operating contractors may successfully serve,
carriers that compete with one another; some contractors already do so.
The success of these strategic partnerships will rest largely on the
effectiveness of coordination and communication. The need for coordina
tion in intermodal operations is obvious, as coordination is imperative
for efficiency and reliability. The need for coordination in marketing,
contract terms, and customer service is less obvious, but just as crucial
if the resulting product is to appear "seamless" to the customers. Dis
putes among the partners on claims resolution, customer billing, rate
making, or shipment tracing will quickly and permanently alienate cus
tomers who can obtain superior service from other intermodal operators --
or from truckers.
2. Institutional Issues: Emergence of an Intermodal Industry
Rail Intermodal Organization. There is a definite trend within the
railroad industry to recognize intermodal traffic as a separate line of
business, and to reorganize accordingly. No two railroad organizations
are alike, but most share some common features:
o specific responsibility for intermodal at a high level, usually vice
president;
o a tendency to combine several intermodal functions -- sales, market
ing, operations, terminals -- in a single department;
o treatment of intermodal transportation as a separate profit center,
with at least some separate accounts; and
o the emergence of intermodal as a separate business group or entity.
A prime example is CNW's Global One Transportation, which has
responsibility for intermodal operations, marketing, sales, equipment,
and terminals. Global One is treated as a separate business group, with
-170-

its own profit and loss statement. The most publicized example is
CSX/Sea-Land Intermodal (CSL Intermodal, or CSL) which is responsible for
the combined inland intermodal businesses of the CSX railroads and
Sea-Land Services.
Union Pacific has taken an entirely different approach. UP1s major
double-stack customers, API, Maersk, and "K" Line, have "hook and haul"
contracts that do not involve UP in ongoing marketing or buyback roles.
Burlington Northern has taken still another approach with the creation of
BN America (BNA), a domestic container business group. Norfolk Southern
has a dual intermodal organization: Piggyback and double-stack services
are offered through NS1s marketing and operating departments; RoadRailer
service is offered by NS's Triple Crown subsidiary.
Industry Organization. From one perspective, organization of the
intermodal marketplace has become confusing and complex. There is no
longer a single, well-defined railroad role. Ocean carrier roles are
just as diverse, and range far inland from the ship. Ports have
undergone a radical change in their scope of action, and find themselves
involved in everything from computers to railroad tunnels. The firms
involved range from small shipper agents and local draymen to major ocean
carriers, railroads, third parties, and multimodals. Even within
categories, there are vast differences: no two major railroads are
organized quite alike, and the same can be said of ocean carriers and
their subsidiaries.
Figure 35 illustrates the changing roles. As recently as 1980, the roles
were relatively stable and well-defined. There were only small dif
ferences among the range of services offered by the various railroads,
and the "menus" of competing ocean carriers and third parties were like
wise similar to one another. In 1989, all the roles are changing, not
only between modes but within modes. No two major railroads offer the
same menu of services, and the only completely stable function has been
the railroads' performance of the actual rail line-haul. Ocean carriers
and their subsidiaries vary even more than the railroads.
-171-

RAILROADS
OCEANCARRIERSAGENTS
EQUIPMENTLESSORS
1 9 8 0 -Static Rolea
RAILROADS
OCEANCARRIERSAGENTS
EQUIPMENTLESSORS
1989 - Changing Roles
Figure 35Changing Intermodal Roles

Despite the progress made thus far, both international and domestic dou
ble-stack services remain limited by fragmentation. The TBS survey found
that 40 percent of intermodal users, and 43 percent of non-users, cited
fragmentation as a major reason for not using intermodal transportation
more, or not using it at all. Double-stack transportation has developed,
and continues to develop, despite its fragmentation. But double-stack
transportation cannot attain its ultimate potential unless the necessary
functions are successfully integrated in the eyes of the customer.
From a purely intermodal perspective, however, these developments make
sense, and they are part of a single trend: the emergence of an inter
modal industry. Intermodal transportation, with double-stack service as
its most prominent manifestation, is becoming an industry within an in
dustry. In railroads, ocean carriers, and ports, intermodal transporta
tion is being recognized as a separate, specialized line of business.
Double-stack container transportation is the most vivid illustration,
since it involves different equipment, functions, and participants than
piggyback or earless technologies.
Figure 36 illustrates this point. Each of the participating groups, by
one strategy or another, is distinguishing a subset of its activities in
volved in intermodal transportation. These subsets may just be depart
ments or individual employees, or they may be organized as business
groups or subsidiaries. Intermodal business groups may have more in
common and more need to communicate with other intermodal business groups
than with their parent organizations. Relationships between intermodal
business groups and parent organizations are likely to involve capital
allocation, financing, budgeting, and planning. Relationships among dif
ferent intermodal business groups are more likely to involve day-to-day
operations, changing market conditions, short-term leases, or contract
negotiations. Increasingly, double-stack customers will be dealing with
the "intermodal industry," not with the parent organization.
In the long run, domestic double-stack service might best be regarded as
an offering of the intermodal industry rather than a function of either
railroads or ocean carrier subsidiaries. No one firm by itself can
develop and operate a nationwide, door-to-door, double-stack network.
-172-

The Emerging Intermodal Industry

The intermodal industry as a whole, however, has the means to do so, and
to realize the potential of domestic containerization.
3. Strategic Alliances
Strategic alliances are forming within the emerging intermodal industry.
One of the major motivations for forming strategic alliances between
players is to achieve the same "seamless" "one stop shopping" or "total
transportation" that multimodals are trying to achieve. Indeed, the
multimodals themselves have their limits, and some have formed strategic
alliances to overcome those limits. For example, the relationship
between API and UP can be termed a strategic alliance. As multimodal as
APC may be, it does not operate trains, and UP does. UP, in return,
relies on API for much of its domestic intermodal marketing effort.
Strategic alliances will likely function as less formal, less capi
tal-intensive, and less risky alternatives to multimodal organizations
for many intermodal firms. Moreover, strategic alliances can overcome
some of the institutional barriers to intermodal expansion: Burlington
Northern need not purchase Santa Fe to obtain access to Southern
California, and UP need not purchase a third party to enlist the help of
a retail marketer. Srategic alliances may therefore also extend the
multimodal organization in ways that would otherwise be legally or
financially difficult.
4. Value-Added Double-Stack Strategies and Product Differentiation
Every historical and current development points toward increased competi
tive pressures on intermodal transportation in general, and on double
stacks in specific. The pressure has made it increasingly difficult for
carriers or third parties to prosper by merely providing generic dou
ble-stack transportation or double-stack equipment. In such an
environment, unadorned linehaul double-stack transportation becomes a
commodity, and it can achieve only the low unit revenues and profits
typical of price-sensitive commodities. The same observation applies to
the supply of double-stack cars, containers, and chassis, all of which
have become undifferentiated commodities.
-173-

The physical elements of double-stack operations are relatively straight
forward, and the intermodal industry has expertise in all categories:
cars, containers, trailers, chassis, tractors, ramps, and lift equipment.
The nexus of the problem is how to organize the operation to provide a
flexible, differentiated, and profitable intermodal product. There may
be more than one way to conceive a differentiated product, more than one
approach to a profitable package, and more than one end result. It is
not necessary to determine a single, optimal mix of services: the opti
mal mix will vary with different circumstances. It jj> necessary to focus
on long-term profitability, and to adjust the mix of services to match.
The implication is a need for what has been called "value-added"
transportation. Value-added transportation incorporates any or all of
the functions required to complete the door-to-door intermodal package,
including some functions that were traditionally performed by shippers.
Customers are willing to pay higher rates to carriers who accept risks,
or closely manage the movement on the customer's behalf. Customers are
not willing to pay higher rates if they must perform such functions them
selves.
Railroads have recently launched several attempts at creating
"brand-name" intermodal services:
o ATSF's Quality Service Network and Quality Stack Service;
o BN1s Expediters;
o CSL's Frequent Flyer and Select Service;
o NS's Triple Crown;
o SP's Trackstar and DRGW's Railblazer; and
o UP's BulkTainer.
The actual services behind these names vary widely. Some are high-service
short-haul piggyback trains (Quality Service Network, Expeditors, Track-
-174-

stars, and Railblazers). Others are double-stack services that have been
singled out for special promotional attention (Quality Stack Service,
Frequently Flyer). Three are door-to-door services (Select Service, Triple
Crown, and BulkTainer), but only one includes door-to-door domestic double
stack service (Select Service, combining CSL Intermodal and CMX for
drayage).
Railroads have begun to offer the beginnings of value-added services.
Conrail's Mercury System incorporates computer-aided dispatching.' Conrail
also has begun to provide truck-competitive cargo insurance. SP has
introduced Container Bridge, a chassis pool and drayage system, in support
of its Los Angeles ICTF. BN provides its customers with ShipSmart,. a
logistics software package. UP has two value-added subsidiaries: UP
Logistics and UP Technologies.
Unfortunately, railroads start from a "no frills" or "value-subtracted"
position relative to motor carriers, and many of the innovations now being
tried simply move railroads closer to the motor carrier standard. Yet such
efforts may perform the vital function of germinating genuine service com
petition among the railroads and their partners.
F. PROSPECTS FOR INDUSTRY-WIDE CONVERSION 1
1. Market Forces and Incentives
Two closely related questions have to be addressed in any consideration of
industry-wide conversion of rail intermodal traffic to containers:
o Is it probable that existing market forces will bring about a
large-scale network of domestic double-stack operations?
o If not, is some coordinating or policy-making effort required
to create a domestic double-stack system?
The progress of domestic containerization thus far and the history of mari
time containerization, suggest that market forces will indeed achieve a
substantial degree of domestic containerization.
-175-

All the findings of this study indicate that market forces presently at
work will lead to the development of an effective double-stack network for
international and domestic containers. This network may not be optimal in
the near future: there are a number of operational and marketing
shortcomings and some institutional obstacles identified in this study that
may hinder the intermodal industry in realizing the full potential of
double-stack intermodal service. Moreover, until railroads, third parties
and intermodal operators begin to offer a differentiated product --
brand-name transportation or value-added services -- they will continue to
compete on price and remain highly vulnerable to improvements in truckload
economics. Profitability and traffic incentives exist for the railroads
and other participants to form partnerships or strategic alliances in
pursuit of higher service quality, improved customer service, and a premium
transportation product. The formation of partnerships and alliances will
be facilitied by the emergence of the "intermodal industry".
There still exist some areas where the creation of industry standards would
hasten progress. Although container sizes are not a major issue, the
industry would benefit from early resolution of the ISO "wide body" con
tainer controversy. The industry would certainly benefit from agreements
on standards for Automatic Equipment Identification, Advanced Train Control
Systems, and Electronic Data Interchange.
Some physical impediments still exist. The railroads have made substantial
progress on removing clearance restrictions, with significant help from
state and local government agencies in some areas. The industry itself
appears able to maintain adequate terminal capacity and equipment fleets.
Urban terminal and port access, rather than rail access, may be a growing
problem that cannot be solved from within the intermodal industry.
The critical issue, if it can be narrowed to one, is institutional: rail
road and intermodal industry commitment to intermodal business,
specifically double-stacks. The highly competitive market for intermodal
transportation will not tolerate mediocrity, and, overall, railroad op
erations, marketing, and customer service have been mediocre. Double-stack
service started and grew because some ocean carriers were willing to make a
commitment and assume some risks. In order for the railroads to realize
-176-

the full potential of domestic and international double-stack service, they
will have to do the same.
2. The Trailer-to-Container Conversion
There has been considerable speculation regarding the extent to which
piggyback trailer traffic will be converted to domestic containers, and the
time required for such a conversion. There are several key factors in the
trailer conversion issue:
o the extent to which some of the largest intermodal customers
are willing to convert to containers;
o the relative ability of double-stacks and piggyback to compete
in short-haul and niche markets;
o the prospects for replacement or retirement of the existing
piggyback trailer fleet;
o the ability of refrigerated domestic containers to compete with
refrigerated trailers for perishable commodities; and
o the lifetime of the current piggyback railcar fleet.
Current data suggest that the conversion of trailers to containers is pro
ceeding slowly. Over the first 36 weeks of 1989, trailer ton-miles were
down by 1.2 percent compared to 1988, and container ton-miles were up by
9.6 percent. Trailers, however, accounted for 60 percent of the total, and
at the present rate of change trailers would still account for 48 percent
after five years.
Less-than-truckload (LTL) motor carriers are emerging as a significant
source of domestic intermodal traffic, and their operations rely on trail
ers. They will be hesitant to convert to containers unless the containers
served a distinct market niche. The 28-foot trailers LTL carriers use do
not readily convert to any existing container size, but they can be
-177-

accommodated on conventional TOFC flatcars (notably in SP's Triple Trax
service).
Some major intermodal customers, notably, United Parcel Service (UPS) and
the U.S. Postal Service, used trailers almost exclusively until very re
cently. APC's Chicago-Dallas domestic container route has attracted some
UPS and Postal Service traffic, but that traffic is still a tiny part of
the amount that still moves by trailer.
The existing piggyback trailer fleet.is many times larger than the existing
domestic container fleet. Replacements have not kept pace with retirements
in recent years, however, so the trailer fleet has been aging and shrink
ing. The result is that a substantial portion of the trailer fleet is at
or near the end of its expected life. Absent more extensive replacement or
refurbishment programs, the piggyback fleet will begin to decline rapidly
within the next few years, speeding the conversion to containers. Some
observers have expressed concern that the lack of replacements will keep
older trailers active too long, exacerbating the TOFC image problem. Some
major leasing companies have announced substantial purchasing or re
furbishing programs for 1989, but the TOFC trailer fleet will probably
continue to shrink overall.
Refrigerated piggyback trailers have a small, but well-established market
share in perishable commodities. Their use has not totally stemmed the
tide of diversion from rail to truck, but refrigerated piggyback trailers
have captured much of the fresh produce previously handled in refrigerated
boxcars. Until refrigerated container service is well established and
accepted by shippers of perishables, this traffic segment will stay in
trailers.
Some in the intermodal field believe that massive trailer retirements and
the superior performance of double-stacks will virtually eliminate trailers
within 5-10 years. The mitigating factors discussed above, however,
suggest that trailers will still be an important part of the intermodal
business through most of the 1990's. If trailers are not replaced and
refrigerated domestic containers are successful, the conversion will be
hastened and might be largely complete within the 10-year time frame.
-178-

In summary, it appears that TOFC services, will still be offered for some
time. They are most likely to persist where major trailer shippers (such
as UPS) require premium service, and in those shorter, less-dense corridors
where RoadRailer services do not emerge.
3. The Potential For Diversions From Boxcars
Commodities that can be carried in boxcars can generally be carried in
containers. Containers are physically capable of carrying most of the
remaining boxcar traffic, but whether they can do so economically is an
open question.
Boxcars are used primarily in inter-plant or factory-to-warehouse movements
of goods for further processing or subsequent distribution. Many of the
boxcars in use are far more than plain metal boxes on wheels. Food
products, such as canned goods or beer, require insulated cars with
load-restraining devices. Auto parts require specialized racks and
bracing, or oversize cars up to 90 feet long. Moreover, some of these cars
have become effectively integrated into the production process, as in the
case of paper plants with conveyors that extend into the boxcar. As with
any piece of specialized equipment, specially equipped or sized boxcars are
difficult to fill with backhaul freight.
Boxcars have poor utilization relative to intermodal equipment, in terms of
both the portion of time spent loaded and the cycle time between loads.
The general lack of backhauls and the need for repositioning means that
boxcars typically travel only a little more than half their miles with
revenue loads. A report completed in 1988 for the ICC Office of
Transportation Analysis found that boxcars made, on average, 11-12 trips
per year in 1979. By 1982, with a recession and a boxcar surplus, the
average had declined to about 8 trips per year. Utilization rose gradually
thereafter, and now stands at about 11 trips per year.
Boxcars can survive financially under such conditions because, at present,
they are plentiful and cheap. Most observers consider that the net revenue
potential of much existing boxcar traffic is too slim to justify fleet
-179-

replacement. Much of the boxcar fleet is relatively new, however, and is
likely to be serviceable through the 1990's.
It may be difficult for double-stacked domestic containers to compete in
boxcar niches, so long as both the boxcars and the niches still exist.
Double-stacks have to achieve high utilization and frequent backhauls to
keep the cost down, and may not survive in the economic environment of the
boxcar. Many major boxcar shippers and receivers, such as lumber mills,
paper mills, or packing plants, are located away from major intermodal
hubs, and containers would incur large drayage costs to serve them.
According to a Southern Pacific spokesman, a significant number of such
customers do not even have good connections to major highways. 5
Boxcar niches endure because of cost advantages over other modes. For the
Boxcar Exemption report, Reebie Associates surveyed boxcar shippers and
found that one-half expected their boxcar use to remain the same over the
next five years, one-third expected their boxcar use to decline, and
one-sixth expected their boxcar use to increase. A study completed by
Rail box in December, 1988, concluded, "...over 50 percent of existing
boxcar traffic cannot be converted to double-stack containers without
increased transportation costs." An assumption that boxcar shippers would
be willing to pay extra for current double-stack services does not seem
warranted.
Another near-term obstacle may be the profitability of boxcar traffic to
the railroads. Boxcar traffic, although smaller in aggregate, is markedly
more profitable to the railroads than intermodal traffic. Even if, as
The ICC's Boxcar Exemption Report notes, the comparison in Figure 47 is
somewhat overstated, the disparity in profitability conforms to
conventional wisdom in the railroad industry. There is thus an incentive
for railroads to keep the traffic in boxcars as long as possible, and to
encourage conversion to domestic containers only as a means of avoiding
reinvestment in boxcars or loss of the traffic to trucks.
Despite these obstacles, double-stack containers will eventually penetrate
some boxcar niches. In one area, auto parts, they have already done so.
- 1 8 0 -

Detroit-Chicago-Texas-Mexico double-stack services established by API, UP,
and SP are based largely on movements of domestic auto parts.
In order to convert the majority of boxcar traffic, domestic container
services will have to offer boxcar shippers some advantage that surpasses
the cost difference. Shippers have almost invariably been willing to pay
more for more timely, reliable, and convenient services that mesh with
their distribution systems. Changing production and distribution practices
in other industry segments may open other boxcar niches and yield
additional opportunities for domestic double-stack service.
4. Potential Further Truck Diversions
Further, substantial truck diversions to double-stacks will require service
improvements, innovations, and expansions to reach new customers. In order
to attract and serve the remaining relevant truckload traffic, double-stack
services will have to:
o provide competitive refrigerated service;
o extend the competitive drayage range;
o strengthen services and service reputation in lightly served
corridors; and
o .... extend truck-competitive service to secondary corridors.
Data on the entire relevant truck market suggest that the potential is
great. The challenge presented to railroads and other double-stack
participants is substantial. There are two major caveats to this
discussion of. possible truck diversions.
The first caveat is a reiteration of the assumptions made in developing the
rail cost criteria. These criteria assumed 100 percent utilization of
double-stack cars and containers, perfectly balanced traffic, and minimum
attainable operating costs (including three-person crews). _ These assump
tions are clearly optimistic, and exceed the current abilities of the rail
-181-

double-stack system. As pointed out earlier, the balance and utilization
issues are critical and interdependent.
Taking the truck flows between Seattle and Los Angeles as an example, the
balance problem is clear:
Seattle - Los Angeles Traffic Flows
Rail Units Truck Units Total
Northbound 4,141 112,008 116,149
Southbound 6,223 56,940 63,163
Total 10,364 168,948 179,312
How can a double-stack service attract over 112,008 northbound truckloads
while carrying only about half that number southbound, when very high
equipment utilization is required to compete with trucks? The answer is
that it cannot. The reason that the truck totals appear to be imbalanced
is that the truck movements are frequently triangulated: northbound from
Los Angeles to Seattle; repositioned to points such as Bellingham,
Wenatchee, Walla Walla, Pasco or Okanogan; and reloaded to Los Angeles.
Double-stack service cannot be triangulated in the same manner: the
drayage and repositioning costs would be prohibitive. Thus, although the
truck traffic shown in earlier tables is, in theory, accessible to
double-stack services, in practice double-stacks may not be able to divert
all of it.
The second major caveat is a reiteration of the earlier discussion of truck
rates. As pointed out, the truck rates considered in this study have been
declining since 1980, and may be at historic lows in real terms. Likely
increases in truck rates due to factors such as increased safety
requirements, higher fuel taxes, or driver shortages and higher labor costs
that do not similarly affect rail rates, would make significantly more
truckload traffic accessible to double-stacks.
-182-

VIII. OVERALL CONCLUSIONS
The results of the study confirm the enormous growth potential of double-stack
container systems, particularly in domestic freight. The results suggest that
double-stack services can be fully competitive with trucks in dense traffic
corridors of 725 miles or longer. In such corridors, there is sufficient rail
and truckload traffic to multiply the existing domestic double-stack traffic
several times over. Beyond these major corridors, the results suggest the
existence of further opportunities in secondary corridors, in outlying areas
near major hubs, and in refrigerated commodities.
This study identifies several obstacles to achieving that potential. None is
insurmountable, but all will require substained commitment of resources and
management attention to one objective: provision of improved, reliable,
door-to-door service. Some obstacles are technical, involving the features of
double-stack cars and containers, the efficiency and reliability of
operations, and the accommodation of new traffic patterns. The more serious
obstacles, and those requiring the most immediate attention, tend to involve
marketing, management, and organization.
Full realization of the double-stack potential may require the railroad
industry to take unaccustomed steps into marketing, sales, and customer
service. The alternative is to become strictly line-haul contract carriers,
and rely on third parties or ocean carrier affiliates for marketing, customer
service, door-to-door management, and perhaps even terminal operations.
For ports and ocean carriers, the implications are mixed. Ports will be under
continuous competitive pressure to accommodate international double-stack
growth, but will be only indirectly affected by domestic containerization.
Ocean carriers, too, will be subject to competitive pressure, but may find new
opportunities in meshing their international container movements with a
growing domestic double-stack service.
The advent of double-stack container systems has dramatically altered
intermodal transportation. New firms have entered the field, most prominently
the ocean carriers and their affiliates. Existing firms have new roles, and
-183-

have come together in new alliances. A distinct intermodal industry is
emerging. Underlying all of this activity is a belief in the potential growth
of domestic and international double-stack services and traffic. The
technical characteristics of double-stack container systems yield lower
line-haul costs and an improved ride relative to conventional piggyback. The
intermodal industry is striving to turn these advantages into competitive
rates, improved profitability, drastically improved service, and a larger
share of the nation's freight.
The study concludes that existing market forces will bring about the
development of an efficient double-stack network to serve both domestic and
international traffic. There are some areas, notably in line clearances and
highway/rail access, where public sector involvement may be helpful. The
degree to which double-stack container services attain their potential,
however, depends on the ability of intermodal industry to meet the technical
marketing, managerial, and organizational challenges it faces.
-184-

APPENDIX TABLES
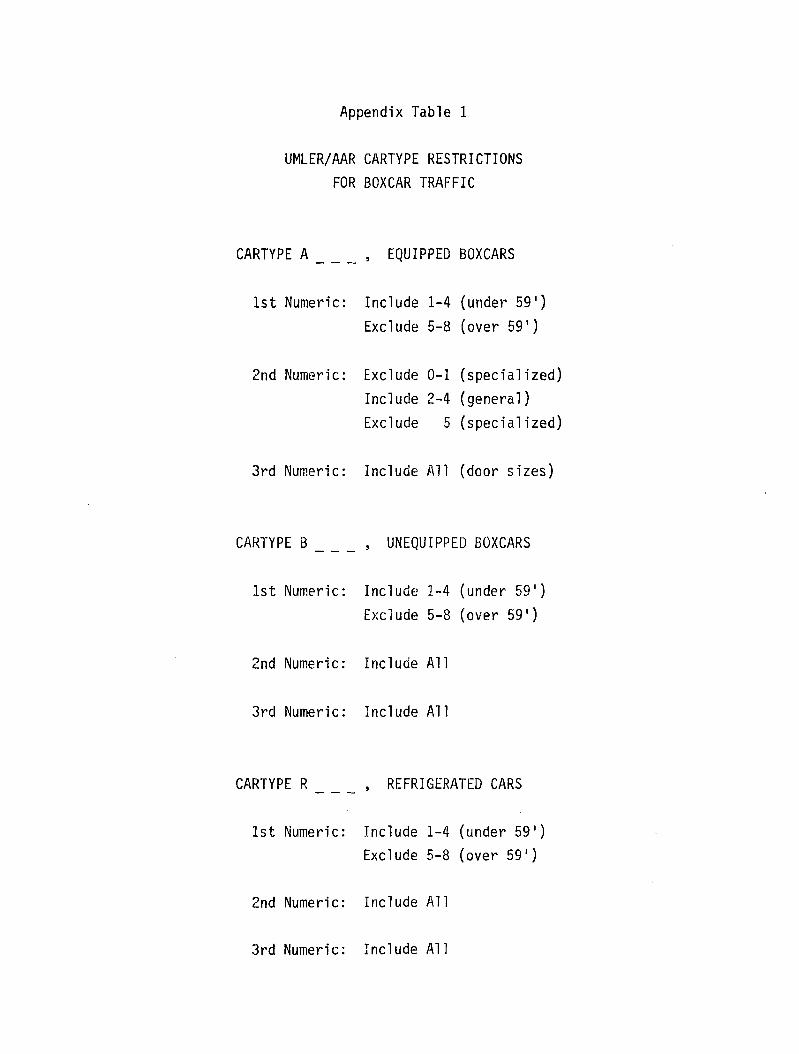
Appendix Table 1
UMLER/AAR CARTYPE RESTRICTIONS
FOR BOXCAR TRAFFIC
CARTYPE A ____ , EQUIPPED BOXCARS
1st Numeric: Include 1-4 (under 59')
Exclude 5-8 (over 59')
2nd Numeric: Exclude 0-1 (specialized)
Include 2-4 (general)
Exclude 5 (specialized)
3rd Numeric: Include All (door sizes)
CARTYPE B ____ _ , UNEQUIPPED BOXCARS
1st Numeric: Include 1-4 (under 59')
Exclude 5-8 (over 59')
2nd Numeric: Include All
3rd Numeric: Include All
CARTYPE R ____ _ , REFRIGERATED CARS
1st Numeric: Include 1-4 (under 59')
Exclude 5-8 (over 59')
2nd Numeric: Include All
3rd Numeric: Include All

Appendix Table 2
01 -
08 -
09 -
10 -
11 -
13 -
14 -
19 -
20 -
21 -
STCC COMMODITY CODE RESTRICTIONS
FOR BOXCAR TRAFFIC
Farm Products:Include: 0112 - Cotton
01191 - Fodder or Hay01194 - Sweet Potatoes01195 - Other Potatoes012 - Fresh Fruits013 - Fresh Vegetables
Exclude: All others, since bulk grains or feeds would be poorcandidates.
Forest Products:Exclude: Since primary barks, logs and gums would be poor
candidates.
Fresh Fish: Exclude
Metallic Ores: Exclude
Coal: Exclude
Crude Petroleum, Natural Gas: Exclude
Non-metal lie Minerals: Exclude
Ordinance or Accessories: Exclude
Food or Kindred Products:Include: 2012 - Meat, frozen
2013 - Meat Products(Exception: 20139 - Meat Products, NEC; a dirty commodity)
2023 - Condensed or Evaporated Milk2025 - Cheese or Special Dairy Products203 - Canned Foods20431 - Cooked Cereals2047 - Pet Food205 - Bakery Products206 - Sugar207 - Confectionary or Related Products208 - Beverages209 - Misc. Food Preparations
Exclude: All Others, mostly bulk or highly perishable products.
Tobacco Products: Include
22 - Textile Mill Products: Include

Appendix Table 2
STCC COMMODITY CODE RESTRICTIONS FOR BOXCAR TRAFFIC
(Continued)
24 - Lumber or Wood Products:Include: 24214 - Hardwood Stock or Parts
24215 - Hardwood Flooring 24219 - Lumber or Dimension Stock, NEC 2429 - Mi sc. Mill Products243 - Millwork, Plywood, Veneer
Exclude: All Others. Most dimension lumber, as opposed tohigh-value specialties, is more likely to stay in boxcars or shift to center-beam cars.
25 - Furniture or Fixtures: Include
26 - Paper, Pulp, or Allied Products:Include: 262 - Paper
(Exception: 26211 - Newsprint, which requires special handling)263 - Fibreboard, Paperboard264 - Paper Products265 - Containers or Boxes266 - Building Paper or Building Board
Exclude: All Others, such as pulp.
27 - Printed Matter: Include
28 - Industrial Chemicals:Include, under the assumption that chemicals packaged to ship in boxcars can also travel in containers.
29 - Petroleum or Coal Products:Include, under the same assumption.
30 - Rubber or Misc. Plastic Products: Include
31 - Leather or Leather Products: Include
32 - Clay, Concrete, Glass, or Stone Products:Include: 322 - Glass or Glassware
326 - Misc. Pottery329 - Abrasives, Asbestos, or Misc. Non-metal lie
Mineral ProductsExclude: All Others, such as flat glass, brick, or cement
blocks.
33 - Primary Metal Products:Exclude, since these are heavy-loading commodities and poor candidates for regular containerization. 34
34 - Fabricated Metal Products: Include

Appendix Table 2
35 -
36 -
37 -
39 -
40 -
41 -
42 -
43 -
44 -
45 -
46 -
47 -
STCC COMMODITY CODE RESTRICTIONS FOR BOXCAR TRAFFIC
(Continued)
Machinery:Include, assuming that most such products that are shipped in boxcars, rather than on flat cars, can be containerized.
Electrical Machinery, Equipment, or Supplies:Include, on the same assumption, and knowing that Maytag regularly ships appliances in containers.
Transportation Equipment:Include: 37112 - Set-up (assembled) Autos
37115 - Knocked-down (disassembled or unassembled Autos3712 - Auto Bodies3714 Auto Parts and Accessories375 - Motorcycles, Bicycles, and parts379 - Misc. Transportation Equipment38 - Instruments, Photographic Goods, etc.
Exclude: All Others.
Misc. Products of Manufacture: Include
Waste or Scrap:Include, under the same packaging and fit assumptions made in other categories. Containers regularly carry waste and scrap as exports.
Misc. Freight Shipments: Include
Containers, Carriers, or Devices, Shipping, Returned Empty: Include, since we have by equipment choice eliminated marine containers on flatcars.
Mail or Express: Include
Freight Forwarder: Include
Shipper Association: Include
Misc. Mixed Shipments: Include
Small Packaged Freight: Include

APPENDIX TABLE 3

U S P O R T .L S T 11/17/88 22:31 P a g e 1
— North Atlantic11 Boston12 New York13 Philadelphia14 Other Delaware River Ports15 Baltimore16 Other Chesapeake Bay Ports17 Norfolk18 Other Hampton Roads Ports19 Other North Atlantic Ports
— South Atlantic21 Wilmington, NC22 Charleston23 Savannah24 Jacksonville25 Miami26 Other South Florida Ports27 Puerto Rico/Virgin Islands28 Other South Atlantic Ports
— Gulf31 Tampa/St. Petersburg32 Mobile33 Other Central Gulf Ports34 New Orleans35 Mississippi River System Ports36 Lake Charles/Beaumont/Port Arthur37 Houston/Galveston38 Corpus Christ!39 Other West Gulf Ports
— Great Lakes41 Lake Michigan Ports42 Lake Erie Ports43 Other Great Lakes Ports
— Pacific Southwest51 Long Beach/Los Angeles52 Other Southern California Ports53 Oakland/San Francisco54 Other San Francisco Bay/Sacramento55 Other Northern California Ports56 Honolulu/Hawaii Ports
— Pacific Northwest61 Portland, OR62 Other Columbia River Ports63 Seattle/Tacoma64 Other Puget Sound Ports65 Other Pacific Northwest Ports66 Alaska Ports

U S P O R T.M A P 11/17/88 22:31 Page 1
— 11 Boston0401 11 Boston, Mass.0417 11 Logan Airport, Mass.
■ 12 New York1000 12 New York, NY CD1001 12 New York, NY1003 12 Newark, NJ1004 12 Perth Amboy, NJ1012 12 John F. Kennedy Airport, NY
— 13 Philadelphia1101 13 Philadelphia, PA1108 13 Philadelphia Airport , PA
— 14 Other Delaware River Ports1100 14 Philadelphia, PA CD1102 14 Chester, PA1103 14 Wilming ton, Del.1105 14 Paulsboro, NJ1107 14 Camden, NJ1113 14 Gloucester City, NJ1118 14 Marcus Hook, PA
- ■ 15 Baltimore1303 15 Baltimore, MD
— 16 Other Chesapeake Bay Ports1300 16 Baltimore, MD CD1301 16 Annapolis, MD1302 16 Cambridge, MD1304 16 Crisfield, MD1305 16 Washington, DC1405 16 Alexandria, VA1406 16 Cape Charles City, VA1407 16 Reedville, VA5400 16 Washington, DC CD5401 16 Washington, DC5402 16 Alexandria, VA
,--. 17 Norfolk1401 17 Norfolk, VA
.. —- — 18 Other Hampton Roads Ports1400 18 Norfolk, VA CD1402 18 Newport News, VA1403 18 Petersburg, VA1404 18 Richmono-Petersburg, VA1408 18 Hopewell, VA
— 19 Other North Atlantic Ports0100 19 Portland, Maine CD0101 19 Portland, Maine0103 19 Eastport, Maine0111 19 Bath, Maine0112 19 Bar Harbor, Maine0115 19 Calais, Maine0121 19 Rockland, Maine

U S P O R T.M A P 11/17/88 22:31 Page 2
0122 19 Jonesport, Maine0131 19 Portsmouth, NH0132 19 Belfast, Maine0152 19 Searsport, Maine0400 19 Boston, Mass. CD0402 19 Springfield, Mass.0403 19 Worcester, Mass.0404 19 Gloucester, Mass.0405 19 Mew Bedford, Mass.0406 19 Plymouth, Mass.0407 19 Fall River, Mass.0408 19 Salem, Mass.0409 19 Provincetown, Mass.0416 19 Lawrence, Mass.0500 19 Providence, RI CD0501 19 Newport, RI0502 19 Providence, RI0503 19 Mellville, RI0600 19 Bridgeport, Conn. CD0601 19 Bridgeport, Conn.0602 19 Hartford, Conn.0603 19 New Haven, Conn.0604 19 New London, Conn.1002 19 Albany, NY
— 21 Wilmington, NC1501 21 Wilmington, NC
22 Charleston1601 22 Charleston, SC
■ ■ 23 Savannah1703 23 Savannah, GA
24 Jacksonville1803 24 Jacksonville, Fla.
- - -- 25 Miami5201 25 Miami, Fla.5206 25 Miami Airport, Fla.
26 Other South Florida Ports5200 26 Miami, Fla. CD5203 26 Port Everglades, Fla.5204 26 West Palm Beach, Fla.5205 26 Fort Pierce, Fla.5202 26 Key West, Fla.
27 Puerto Rico/Virgin Islands4900 27 San Juan, PR CD4901 27 Aguadilla, PR4904 27 Fajardo, PR4905 27 Guanica, PR4906 27 Humacao, PR4907 27 Mayaguez, PR4908 27 Ponce, PR4909 27 San Juan, PR4911 27 Jobos, PR4912 27 Guayanilla, PR

U S P O R T.M A P 11/17/88 22:31 Page 3
4913 27 San Juan Airport, PR5100 27 Charlotte Amalie, VI CD5101 27 Charlotte Amalie, VI5102 27 Cruz Bay, VI5103 27 Coral Bay, VI5104 27 Christiansted, VI5105 27 Frederiksted, VI
---- 28 Other South Atlantic Ports1500 28 Wilmington, NC CD 1600 28 Charleston, SC CD1700 28 Savannah, GA CD1502 28 Winston-Salem, NC1503 28 Durham, NC 1506 28 Reidsville, NC 1508 28 Elizabeth City, NC1510 28 Elkin, NC1511 28 Beaufort-Morhead City, NC1512 28 Charlotte, NC1602 28 Georgetown, SC1603 28 Greenville, SC1604 28 Columbia, SC1701 28 Brunswick, GA 1704 28 Atlanta, GA1805 28 Fernandina Beach, Fla.1808 28 Orlando, Fla.1809 28 St. Augustine, Fla.1816 28 Port Canaveral, Fla.
---- 31 Tampa/St. Petersburg1800 31 Tampa, Fla. CD1801 31 Tampa, Fla.1807 31 Bocagrande, Fla.1814 31 St. Petersburg, Fla.
---- 32 Mobile1901 32 Mobile, Ala.
---- 33 Other Central Gulf Ports1806 33 Carabelle, Fla.1817 33 Apalachicola, Fla.1818 33 Panama City, Fla.1819 33 Pensacola, Fla.1820 33 Port St. Joe, Fla.1900 33 Mobile, Ala. CD1902 33 Gulfport, Miss.1903 33 Pascagoula, Miss.1904 33 Birmingham, Ala.1905 33 Apalachicola, Fla.1906 33 Carrabelle, Fla.1907 33 Panama City, Fla.1908 33 Pensacola, Fla.1909 33 Port St. Joe, Fla.

USPORT.MAP 11/17/88 22:31 Page 4
---- 34 New Orleans2002 34 New Orleans, LA
---- 35 Mississippi River System Ports2000 35 New Orleans, LA CD2001 35 Morgan City, LA2003 35 Little Rock, Ark.2004 35 Baton Rouge, LA2005 35 Port Sulphur, LA2006 35 Memphis, Tenn.2007 35 Nashville, Tenn.2008 35 Chattanooga, Tenn.2009 35 Destrehan, LA2010 35 Gramercy, LA2011 35 Greenville, Miss.2012 35 Avondale, LA2013 35 St. Rose, LA2014 35 Good Hope, LA2015 35 Vicksburg, Miss.2016 35 Knoxville, Tenn.3500 35 Minneapolis, Minn. CD3501 35 St. Paul, Minn.4102 35 Cincinnati Ohio 4113 35 Evansville, Ind.4115 35 Louisville, Kentucky4116 35 Owensboro-Evansville, Ind.4500 35 St. Louis, Mo. CD4501 35 Kansas City, Mo.4502 35 St Joseph, Mo.4503 35 St. Louis, Mo.4504 35 Witchita, Kan.
---- 36 Lake Charles/Beaumont/Port Arthur2017 36 Lake Charles, LA2100 36 Port Arthur, Texas CD2101 36 Port Arthur, Texas2102 36 Sabine, Texas2103 36 Orange, Texas2104 36 Beaumont, Texas2105 36 Lake Charles, LA
---- 37 Houston/Galveston2200 37 Galveston, Texas CD2201 37 Galveston, Texas 2206 37 Texas .City, Texas5300 37 Houston, Texas CD5301 37 Houston, Texas5310 37 Galveston, Texas
---- 38 Corpus Christi2205 38 Corpus Christi, Texas5312 38 Corpus Christi, Texas
---- 39 Other West Gulf Ports2204 39 Freeport, Texas 2208 39 Port Lavaca, Texas 2301 39 Brownsville, Texas5311 39 Freeport, Texas5313 39 Port Lavaca, Texas

U S P O R T .M A P 11/17/88 22:31 Page 5
---- 41 Lake Michigan Ports3700 41 Milwaukee, Wis. CD3701 41 Milwaukee, Wis.3702 41 Marinette, Wis.3703 41 Green Bay, Wis.3706 41 Manitowoc, Wis.3707 41 Sheboygan, Wis.3708 41 Racine, Wis.3806 41 Grand Rapids, Ml 3808 41 Escanaba, MI3815 41 Muskegon, Ml3816 41 Grand Haven, MI 3822 41 South Haven, MI 3844 41 Ferrysburg, MI3900 41 Chicago, 111. CD3901 41 Chicago, 111.3904 41 East Chicago, Ind.3905 41 Gary, Ind.3906 41 O'Hare Airport, 111.
---- 42 Lake Erie Ports3800 42 Detroit, MI CD3801 42 Detroit, MI4100 42 Cleveland, Ohio CD4101 42 Cleveland, Ohio4105 42 Toledo, Ohio4106 42 Erie, PA4107 42 Sandusky, Ohio4108 42 Ashtabula, Ohio4109 42 Conneaut, Ohio 4111 42 Fairport, Ohio 4114 42 Lawrenceburg, Ind.4117 42 Huron, Ohio4121 42 Lorain, Ohio4122 42 Ashtabula/Conneaut, Ohio
---- 43 Other Great Lakes Ports0700 43 Ogdensburg, NY CD0701 43 Ogdensburg, NY0704 43 Massena, NY0705 43 Fort Covington, NY0706 43 Cape Vincent, NY0707 43 Morristown, NY0708 43 Alexandria Bay, NY0711 43 Chateaugay, NY0712 43 Champlain - Rouses Point, NY0713 43 Waddington, NY0714 43 Clayton, NY0715 43 Trout River, NY0900 43 Buffalo-Niagara Falls, NY CD0901 43 Buffalo, NY0903 43 Rochester, NY0904 43 Oswego, NY0905 43 Sodus Point, NY0906 43 Syracuse, NY0907 43 Utica, NY3600 43 Duluth, Minn. CD3601 43 Duluth, Minn.

USPORT.MAP 11/17/88 22:31 Page 6
3602 A3 Ashland, Wis.3608 A3 Superior, Wis.3613 A3 Grand Portage, Minn.361A A3 Silver Bay, Minn.3802 A3 Port Huron, MI3803 A3 Sault Ste. Marie, MI 380A A3 Saginaw-Bay Cty-Flint, MI 3805 A3 Battle Creek, MI3809 A3 Marquette, MI 381A A3 Algonac, MI3818 A3 Rogers City, MI3819 A3 De Tour, MI3820 A3 Mackinac Island, MI 38A2 A3 Presque Isle, MI 38A3 A3 Alpena, MI
---- 51 Long Beach/Los Angeles2700 51 Los Angeles, Calif. CD 27.0A 51 Los Angeles, Calif.2709 51 Long Beach, Calif.2720 51 Los Angeles Airport, Calif.
---- 52 Other Southern California Ports2500 52 San Diego, Calif. CD2501 52 San Diego, Calif.250A 52 San Isidro, Calif.2707 52 Port San Luis, Calif.2711 52 El Segundo, Calif.2712 52 Ventura, Calif.2713 52 Port Rueneme, Calif.2719 52 Morro, Calif.
---- 53 Oakland/San Francisco2801 53 San Francisco Airport, Calif.2809 53 San Francisco, Calif.2811 53 Oakland, Calif.
---- 5A Other San Francisco Bay2800 5A San Francisco, Calif. CD2810 5A Stockton, Calif.2812 5A Richmond, Calif.2813 5A Alameda, Calif.2815 5A Crockett, Calif.2816 5A Sacramento, Calif.2820 5A Martinez, Calif.2821 5A Redwood City, Calif.2827 5A Selby, Calif.2828 5A San Joaquin River, Calif.2829 5A San Pablo Bay, Calif.2830 5A Carquinez Strait, Calif.2831 5A Suisun Bay, Calif.
---- 55 Other Northern California Ports2802 55 Eureka, Calif.2805 55 Monterey, Calif.

U S P O R T.M A P 11/17/88 22:31 Page 7
---- 36 Honolulu/Hawaii Ports3200 56 Honolulu, Hawaii CD3201 56 Honolulu, Hawaii3202 56 Hilo, Hawaii3203 56 Kahului, Hawaii3204 56 Nawilili-Pt Allen, Hawaii3205 56 Honolulu Airport, Hawaii
---- 61 Portland, OR2904 61 Portland, Oregon
---- 62 Other Columbia River Ports2900 62 Portland, Oregon CD2901 62 Astoria, Oregon2905 62 Longview, Wash.2908 62 Vancouver, Wash.2909 62 Kalama, Wash.
---- 63 Seattle/Tacoma3001 63 Seattle, Wash.3002 63 Tacoma, Wash.3029 63 Seattle Airport, Wash.
---- 64 Other Puget Sound Ports3000 64 Seattle, Wash. CD3004 64 Blaine, Wash.3005 64 Bellingham, Wash.3006 64 Everett, Wash.3007 64 Port Angeles, Wash.3008 64 Port Townsend, Wash.3010 64 Anacortes, Wash.3014 64 Friday Harbor, Wash.3017 64 Point Roberts, Wash.3026 64 Olympia, Wash.
---- 65 Other Pacific Northwest Ports2902 65 Newport, Oregon2903 65 Coos Bay, Oregon3003 65 Aberdeen-Hoquiam, Wash.3021 65 South Bend-Raymond, Wash3027 65 Neah Bay, Wash.
---- 66 Alaska Ports3100 66 Anchorage, Alaska CD3101 66 Juneau, Alaska3102 66 Ketchikan, Alaska3103 66 Skagway, Alaska3104 66 Alcan, Alaska3105 66 Wrangell, Alaska3106 66 Dalton Cache, Alaska3107 66 Valdez, Alaska3111 66 Fairbanks, Alaska3112 66 Petersburg, Alaska 3115 66 Sitka, Alaska3124 66 Pelican, Alaska3125 66 Sand Point, Alaska3126 66 Anchorage, Alaska3127 66 Kodiak, Alaska

USPORT.MAP 11/17/88 22:31 Page 8
---- 99 Land-L6cked Ports - Ignore if Encountered0102 99 Bangor, Maine0104 99 Jackman, Maine0105 99 Vanceboro, Maine0106 99 Houlton, Maine0107 99 Fort Fairfield, Maine0108 99 Van Buren, Maine0109 99 Madawaska, Maine0110 99 Fort Kent, Maine 0118 99 Limestone, Maine 0127 99 Bridgewater, Maine0200 99 St. Albans, Vermont CD0201 99 St. Albans, Vermont0202 99 Newport,. Vermont0203 99 Richford, Vermont0204 99 Island Pond, Vermont0205 99 Alburg, Vermont0206 99 Beecher Falls, Vermont0207 99 Burlington, Vermont0208 99 North Troy, Vermont0209 99 Derby Line, Vermont0210 99 Highgate Springs, Vermont0211 99 Norton, Vermont 1104 99 Pittsburg, PA1106 99 Wilkes-Barre/Scranton, PA 1109 99 Harrisburg, PA 1409 99 Charleston, WV 2300 99 Laredo, Texas CD2302 99 Del Rio, Texas2303 99 Eagle Pass, Texas2304 99 Laredo, Texas2305 99 Hidalgo, Texas2307 99 Rio Grande City, Texas2308 99 San Antonio, Texas2309 99 Progresso, Texas2310 99 Roma, Texas2400 99 El Paso, Texas CD2402 99 El Paso, Texas2403 99 Presidio, Texas2404 99 Fabens, Texas2405 99 Denver, Colo.2406 99 Columbus, NM2407 99 Albuquerque, NM2502 99 Andrade, Calif.2503 99 Calexico, Calif.2505 99 Tecate, Calif.2715 99 Capitan, Calif.2600 99 Nogales, AZ CD2601 99 Douglas, AZ2602 99 Lukeville, AZ2603 99 Naco, AZ2604 99 Nogales, AZ2605 99 Phoenix, AZ2606 99 Sasabe, AZ 2608 99 San Luis, AZ 2722 99 Las Vegas, NV 2803 99 Fresno, Calif.2832 99 Salt Lake City, Utah2833 99 Reno, NV

USPORT.MAP 11/17/88 22:31 Page 9
2907 99 Boise, ID3009 99 Sumas, Wash.3011 99 Nighthawk Wash.3012 99 Danville Wash.3013 99 Ferry, Wash.3015 99 Boundary, Wash.3016 99 Laurier, Wash.3019 99 Oroville, Wash.3020 99 Frontier, Wash.3022 99 Spokane, Wash.3023 99 Lynden, Wash.3025 99 Metaline Falls, Wash.3300 99 Great Falls, Montana CD3301 99 Raymond, Montana3302 99 Eastport, Idaho3303 99 Salt Lake City, Utah3304 99 Great Falls, Montana3305 99 Butte, Montana3306 99 Turner, Montana3307 99 Denver, Colorado3308 99 Porthill, Idaho3309 99 Scobey, Montana3310 99 Sweetgrass, Montana3312 99 Whitetail, Montana3316 99 Piegan, Montana3317 99 Opheim, Montana3318 99 Roosville, Montana3319 99 Morgan, Montana3321 99 Whitlash, Montana3322 99 Del Bonita, Montana3400 99 Pembina, ND CD3401 99 Pembina, ND3402 99 Noyes, Minn.3403 99 Portal, ND3404 99 Neche, ND3405 99 St John, ND3406 99 Northgate, ND3407 99 Walhalla, ND3408 99 Hannah, ND3409 99 Sarles, ND3410 99 Ambrose, ND3413 99 Antler, ND3414 99 Sherwood, ND3415 99 Hansboro, ND3416 99 Maida, ND3417 99 Fortuna, ND3419 99 Westhope, ND3420 99 Noonan, ND3421 99 Carbury, ND3422 99 Dunseith, ND3423 99 Warroad, Minn.3424 99 Baudette, Minn.3425 99 Pinecreek, Minn.3426 99 Roseau, Minn.3604 99 Inti. Falls-Ranier, Minn.3902 99 Peoria, 111.3903 99 Omaha, Neb.3907 99 Des Moires, Iowa4103 99 Columbus, Ohio

USPORT.MAP 11/17/88 22:31 Page 104104 99 Dayton, Ohio 4110 99 Indianapolis, Ind.4112 99 Akron, Ohio5302 99 Dallas, Texas5303 99 Fort Worth, Texas5304 99 Oklahoma City, Okla.5305 99 Tulsa, Okla.5306 99 Dallas-Fort Worth, Texas5307 99 Amarillo, Texas5308 99 Lubbock, Texas5500 99 Dallas/Fort Worth, Texas CD

APPENDIX TABLE 4

COUNTRY.MAP 11/17/88 22:32 Page 1
--- 01 Europe101 01 Greenland400 01 Iceland401 01 Sweden 403 01 Norway 405 01 Finland 409 01 Denmark412 01 United Kingdom418 01 Northern Ireland419 01 Ireland 421 01 Netherlands423 01 Belgium/Luxembourg427 01 France428 01 West Germany429 01 German Dem. Republic430 01 Monaco 433 01 Austria435 01 Czechoslovakia 437 01 Hungary 441 01 Switzerland 447 01 Estonia 449 01 Latvia 451 01 Lithuania 455 01 Poland 461 01 Soviet Union 467 01 Azores469 01 Spain (obsolete)470 01 Spain471 01 Portugal472 01 Gibraltar473 01 Malta And Gozo 475 01 Italy479 01 Yugoslavia 481 01 Albania484 01 Greece485 01 Romania 487 01 Bulgaria 489 01 Turkey 491 01 Cyprus
--- 02 East and South Asia533 02 India535 02 Pakistan536 02 Nepal538 02 Bangladesh542 02 Sri Lanka (Ceylon)546 02 Burma549 02 Thailand550 02 North Vietnam551 02 South Vietnam552 02 Vietnam553 02 Laos555 02 Cambodia 557 02 Malaysia559 02 Singapore560 02 Indonesia561 02 Brunei565 02 Philippines

C O U N TR Y .M A P 11/17/88 22:32 Page 2
566 02 Macao567 02 Timor & SSE Asia568 02 Southern Asia NEC570 02 China (PRC)574 02 Mongolia579 02 North Korea580 02 Republic Of Korea582 02 Hong Kong583 02 Taiwan588 02 Japan590 02 Nansei Islands
03 Australia/Oceania602 03 Australia604 03 Papua New Guinea614 03 New Zealand615 03 Western Samoa622 03 Southern Pacific Islands631 03 Fiji632 03 Togo633 03 Tonga634 03 Vanuatu641 03 French Pacific Islands684 03 Trust Pacific Islands685 03 Other Pacific Isl. NEC686 03 Other Pacific Isl. NEC931 03 Midway Island933 03 Wake Island935 03 Guam941 03 Canton And Enderbury Isl951 03 American Somoa
— 04 Africa/Middle East502 04 Syria504 04 Lebanon505 04 Iraq507 04 Iran508 04 Israel511 04 Jordan512 04 Gaza Strip513 04 Kuwait517 04 Saudi Arabia518 04 Qatar520 04 United Arab Emirates521 04 Yemen (Sana)522 04 Yemen (Aden)523 04 Oman525 04 Bahrain531 04 Afghanistan714 04 Morocco721 04 Algeria723 04 Tunisia725 04 Libya729 04 Egypt732 04 Sudan733 04 Canary Islands735 04 Spanish Africa NEC736 04 Spanish Africa NEC737 04 Western Sahara

C O U N TR Y.M A P 11/17/88 22:32 Page 3
738 04 Equatorial Guinea741 04 Mauritania742 04 Cameroon744 04 Senegal745 04 Mali746 04 Guinea747 04 Sierra Leone748 04 Ivory Coast749 04 Ghana750 04 Gambia751 04 Niger752 04 Togo753 04 Nigeria754 04 Central African Republic755 04 Gabon756 04 Chad757 04 Western Africa NEC758 04 St. Helena759 04 Madeira Islands760 04 Upper Volta761 04 Benin762 04 Angola763 04 Congo (Brazziville)764 04 Western Africa NEC765 04 Liberia766 04 Zaire767 04 Burundi769 04 Rwanda770 04 Somalia774 04 Ethiopia777 04 Djibouti778 04 Uganda779 04 Kenya780 04 Seychelles781 04 British Indian Ocean782 04 Seychelles (Obsolete)783 04 Tanzania784 04 Mauritius (Obsolete)785 04 Mauritius787 04 Mozambique788 04 Malagasy Republic789 04 Comoros790 04 French Indian Ocean791 04 South Africa792 04 Namibia793 04 Botswana794 04 Zambia795 04 Swaziland796 04 Zimbabwe797 04 Malawi799 04 Lesotho
— 05 Latin America201 05 Mexico205 05 Guatemala208 05 Belize211 05 El Salvador215 05 Honduras219 05 Nicaragua

CO U N TR Y.M A P 11/17/88 22:32 Page 4
223 05 Costa Rica 225 05 Panama 227 05 Canal Zone 232 05 Bermuda 236 05 Bahamas 239 05 Cuba241 05 Jamaica242 05 Jamaica, Caicos And Caymans243 05 Turks And Caicos Isl.244 05 Cayman Islands245 05 Haiti247 05 Dominican Republic248 05 Leeward And Windward Isl.272 05 Barbados274 05 Trinidad And Tobago277 05 Netherlands Antilles283 05 French West Indies301 05 Colombia307 05 Venezuela312 05 Guyana315 05 Surinam317 05 French Guiana331 05 Ecuador333 05 Peru335 05 Bolivia337 05 Chile351 05 Brazil353 05 Paraguay355 05 Uruguay357 05 Argentina372 05 Falkland Islands903 05 Puerto Rico911 05 Virgin Islands
--- 06 Canada122 06 Canada161 06 St. Pierre And Miquelon822 06 U.S. Grain Transshipped Through Canada

A p p e n d i x T a b l e 5
U . S . L I N E R C O N T A I N E R T R A D E S BY (S H O R T T O N S )
--------------------- i M P 0 R T S —1986 1987 1986 1987
U.S. PORT FOREIGN REGION TONS TONS TEUS TEUS
ATLANTIC COAST EUROPE 8968812 8941634 789111 775449ATLANTIC COAST EAST AND SOUTH ASIA 502485T, 4778158 595764 571386ATLANTIC COAST AUSTRAL lA/'OCEANI A 514537 489279 47545 45625ATLANTIC COAST AFRICA/MIDDLE EAST 708210 613219 54752 48975ATLANTIC COAST LATIN AMERICA 2675158 2804489 264183 272048ATLANTIC COAST CANADA 31394 182846 3246 10140ATLANTIC COAST TOTAL 17922968 17809625 1754601 1723623
GULF COAST EUROPE 1331056 1217265 105812 98752GULF COAST EAST AND SOUTH ASIA 180916 135609 13514 12204GULF COAST AUSTRALIA/OCEANIA 37651 43045 3410 3907GULF COAST AFRICA/MIDDLE EAST 174706 109551 12345 8448GULF COAST LATIN AMERICA 867662 1126849 112465 136366GULF COAST CANADA 1080 3124 103 162GULF COAST TOTAL 2593071 2635443 247649 259839
PACIFIC COAST EUROPE 1365792 1529918 115499 123566PACIFIC COAST EAST AND SOUTH ASIA 12167257 12823405 1756967 1830435PACIFIC COAST AUSTRALIA/OCEANIA 464042 558777 42113 49123PACIFIC COAST AFRICA/MIDDLE EAST 107616 170078 7889 11440PACIFIC COAST LATIN AMERICA 226985 342704 18315 25971PACIFIC COAST CANADA 25751 65545 2 1 2 0 . 3958PACIFIC COAST TOTAL 14357443 15490427 1942903 '2044493
Source: Manalytics Waterborne Trade Database
1

MAJOR PORT
1986 1987 1986 1987FEUS FEUS TONS TONS
472595 468401 4157651 4441888315167 301840 4161670 424734625131 23896 196514 25644735168 30850 923930 1000794
145301 150804 1422080 16302001798 8446 6826 9394
995160 984237 10868671 11586069
67443 62125 1773288 22181179058 7424 834932 9585061817 2084 85077 1307258349 5422 776105 853102
54406 68031 1098033 125047360 141 444 257
141133 145227 4567879 5411180
71381 78503 810527 900231871448 911038 11131182 1340413622948 27259 526705 6042335370 8299 124966 160617
11190 16335 163872 1457311285 3037 21973 18036
983622 1044471 12779225 15232984
E X P 0 19 T S —1986 1987 1986 1987TEUS TEUS FEUS FEUS
330493 353891 198326 212987289574 297989 192300 19676415933 20529 9505 1239182214 88440 46362 50207
115828 134107 69438 79752504 661 321 432
834546 895617 516252 552533
127879 162212 82035 10262457215 66566 38031 438095954 8700 3942 6026
53603 59352 35819 3947773741 85365 50533 57542
30 26 19 12318422 382221 210379 249490
65351 73545 38563 43244847152 1019848 519539 62674041561 47366 25039 2875710417 12764 6006 777811468 10865 7605 68371364 1470 1022 860
977313 1165858 597774 714216

U.S. LINER
U.S. PORT
GREAT LAKES GREAT LAKES GREAT LAKES GREAT LAKES GREAT LAKES GREAT LAKES GREAT LAKES-
HAWAIl/ALASKA/PUERTO RICO HAWAIl/ALASKA/PUERTO RICO HAWAIl/ALASKA/PUERTO RICO HAWAI l/ALASKA/PUERTO RICO HAWAI l/ALASKA/PUERTO RICO HAWAI l/ALASKA/PUERTO RICO HAWAIi/ALASKA/PUERTO RICO
BOSTON .BOSTONBOSTON : 'BOSTON •-BOSTON .BOSTON BOSTON •
FOREIGN REGION1986TONS
EUROPE 29457EAST AND SOUTH ASIA 4176AUSTRALIA/OCEANIA 135AFRICA/KIDDLE EAST 1312LATIN AMERICA 1827CANADA 1023TOTAL 37930
EUROPE 203147EAST AND SOUTH ASIA 99577AUSTRALIA/OCEANIA 36653AFRICA/MIDDLE EAST 5590LATIN AMERICA 199145CANAOA 15352TOTAL 559464
EUROPE . 283172EAST:AND SOUTH ASIA 3626AUSTRAL IA/OCEANI A 434AFRICA/MIDDLE EAST 4371LATIN AMERICA 6342CANADA 8 8
TOTAL 298033
Source: Hanalytics Waterborne Trade Database

Appendix Table 5
CONTAINER TRADES BY MAJOR PORT (SHORT TONS)
---IMPORTS......................EXPORTS----1987 1986 1987 1986 1987 1986 1987 1986 1987 1986 1987TONS TEUS TEUS FEUS FEUS TONS TONS TEUS TEUS FEUS FEUS
27739 2199 1849 1451 1316 5376 2943 359 230 258 1383421 329 294 216 179 66920 11931 4379 800 3041 5421594 13 79 6 72 26 70 2 6 1 31427 71 128 59 74 75647 43740 4663 2991 3452 2 0 0 2
32 171 4 83 2 14628 299 950 17 685 • 131 1 1? 57 64 47 51 5834 2139 337 169 265 97
35330 2840 2418 1862 1694 168431 61122 10690 4213 7702 2795
184322 14429 13291 9900 8974 19222 33235 1606 2788 925 1583117439 12962 14702 6617 7637 77640 83878 6648 6518 3726 394429318 2919 2460 1727 ■1403 2367 893 155 103 . 11 0 48872! 451 512 272 402 3980 7713 304 661 187 356
220266 20308 . 20829 10967 •11700 . 120369 91486 9600 7243 5759 445910928 1296 9.11 745 528 1894 2359 130 199 92 123
570994 52365 . 52705 30228 30649 •. 225472 . 219564 ' 18443 17512 10799 10513
298912 25938. .26729 , 15259. .' 15859 - 61775 79639 ! 5264 ; 6687 3001 3848'10627 . 437. 2225 ■ 217 . . 1060 : '1023 .4800 6 8 341 • . 46 219
- 2960 47' ■ ■ 306 . 2 2 154 ■ •' 9 431 1 ' 33 '. , 0 193930 •364: .' . 307 217 ■194 . 1557 2268 163 . 193 . 78 . 1047 9 Q 4 ' ' ■ 661 '621 ■ 370 , 386 , 9 3 8. . . 1170 , 53. 6 6 41 . 52
20 13 ■ - T 6 0 ■■■ o '■ 1 0 0 0 0324353 27460 30189..: 16091 . . 17653 65302 • .88309 5549- 7320' 3166 4242
2

U.S. LINEF
1986U.S. PORT FOREIGN REGION TONS
NEW YORK EUROPE 4289429NEW YORK EAST AND SOUTH ASIA 2688524NEW YORK AUSTRALIA/OCEANIA 26340NEW YORK . AFRICA/MIDDLE EAST 302452NEW.YORK LATIN AMERICA T85523NEW YORK CANADA, 13037NEW YORK TOTAL 8105305
PHILADELPHIA / . EUROPE 234332PHILADELPHIA EAST AND SOUTH ASIA 29242PHILADELPHIA AUSTRALIA/OCEANIA 14T28PHILADELPHIA AFRICA/MIDDLE EAST 63593PHILADELPHIA LATIN AMERICA 171856PHILADELPHIA CANADA 1171PHILADELPHIA TOTAL 514922
OTHER DELAWARE RIVER PORTS EUROPE 86066OTHER DELAWARE RIVER PORTS EAST AND SOUTH ASIA 1 1 0 2
OTHER DELAWARE RIVER PORTS AUSTRALIA/OCEANIA 3304T9OTHER DELAWARE RIVER PORTS AFRICA/MIDDLE EAST 4264OTHER DELAWARE RIVER PORTS LATIN AMERICA 219642OTHER DELAWARE RIVER PORTS CANADA TOTHER DELAWARE RIVER PORTS TOTAL 641560
Source: Manalytics Waterborne Trade Database

Appendix Table 5
* CONTAINER TRADES BY MAJOR PORT (SHORT TONS)
...- IMPORTS..........' ..........EXPORTS1981 1986 1987 1986 1987 1986 1987 1986 , 1987 1986 1987;TONS TEUS TEUS FEUS FEUS TONS TONS, TEUS TEUS FEUS FEUS.
4114158 391470 372245 232188 222476, 872581 768464 73404 65832 42716 378832419236 329031 299412 172320 156557 1211959 1168842 90458 87404 56056 54094
29306 2307 2484 1328- 1460 38560, 47326 3284 3991 1907. 2333232979 24391 20765 15402 12312* 283577: 273849 26272 24892 14331 13704740932• 73093- 69035 41825 39517 320755 287270 26425 23504, 15705 1406254891 1303 3425 705 2574 376 63 25 ■4 18 2 '
7591502 821595 767366 463768 434896 - 2727808 2545814 219868 205627 130733 122078
152933 19660 12914 12019 ' 7806 54635 43913 ■ 3973 3177- 2588 206212866 2516 1098 1502 660 30462 3713 2116 219 1416 1678227 1460 785- 718 396 875 1300 . 81 146 45 76.
53307 4511 3998 2904 2487 3358 1915- 235 137 152- 8 8 .301278 13827 24865 8703- 15137 26177 90928 1773 6930, 1239 4346
31' 76 8 54 4' 662 157 .44- 10 32: . 7 .528702- 42050 43668 25900 26490 116169, 141926 8222 10619: 5472 6746
177133 6848 14742 ' 4356 9193 27368 42768 ■ 2172- 3233 1319 204649320 83 4966 51 2815 1214 20775 6 8 1577 54 946
327743, 31904 30844 16151 15900 35601, 32185 2765- 2350 1757 157364034 329 3341 224 2925 854, ■ 1622 59, 194 38 1 0 0.
258044 33548 35575 15201 16811 8440 1,6735 : 672 . 1367 402 8121117 1 55 0 50 0 3 0 0 0 0
877391 727,13, 89523 , 35983, 47694 73477 114088 5736 8721 3570 5477
3
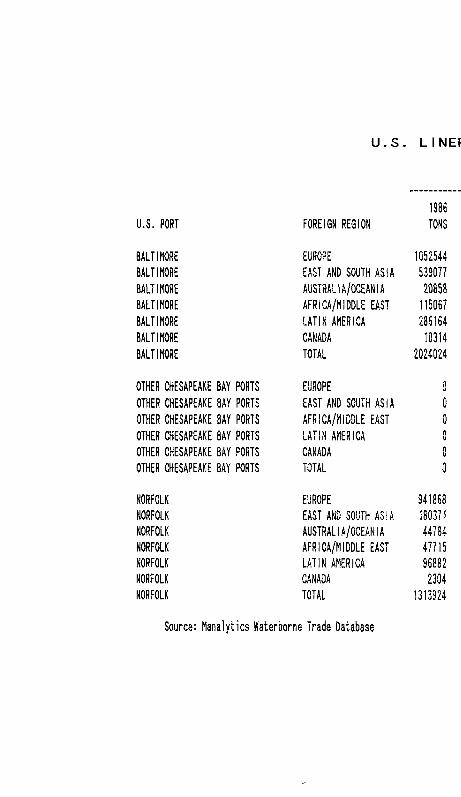
U.S. LINEF
1986U.S. PORT FOREIGN REGION TONS
BALTIMORE EUROPE 1052544BALTIMORE EAST AND SOUTH ASIA 539077BALTIMORE AUSTRAL IA/OCEAHIA 20858BALTIMORE AFRICA/MIDDLE EAST 115067BALTIMORE LATIN AMERICA 286164BALTIMORE CANADA 10314BALTIMORE TOTAL 2024024
OTHER CHESAPEAKE BAY PORTS EUROPE 0OTHER CHESAPEAKE BAY PORTS EAST AND SOUTH ASIA 0OTHER CHESAPEAKE BAY PORTS AFRICA/MIDDLE EAST 0OTHER CHESAPEAKE BAY PORTS LATIN AMERICA 0OTHER CHESAPEAKE BAY PORTS CANADA 0OTHER CHESAPEAKE BAY PORTS TOTAL 0
NORFOLK EUROPE 941868NORFOLK EAST AND SOUTH ASIA 180371NORFOLK AUSTRAL 1A/OCEANIA 44784NORFOLK AFRICA/MIDDLE EAST 47715NORFOLK LATIN AMERICA 96882NORFOLK CANADA 2304NORFOLK TOTAL 1313924
Source: Manalytics Waterborne Trade Database

Appendix Table 5
.... IMPORTS..................... EXPORTS
R CONTAINER TRADES BY MAJOR PORT(SHORT TONS)
1987 1986 1987 1986 1987 1986 1987 1986 1987 1986 1987TONS TEUS TEUS FEUS FEUS TONS TONS TEUS TEUS FEUS FEUS
1084212 91522 92135 54698 56162 624589 695733 47428 52990 29858 33395450349 56324 49327 31521 27031 396842 325511 26674 22615 18308 15117
9095 1075 461 948 413 2743 5252 2 1 0 441 131 26696708 8032 6797 5603 4708 163631 205520 14089 18585 8288 10591
218638 24994 18132 14553 10957 133429 128972 10173 9295 6507 6133
CO
rO 923 10 2 580 72 114 534 7 51 4 24
1860400 182875 166954 107903 99343 1321348 1361522 98581 103977 63096 65526
40 0 2 0 1 0 0 0 0 0 01I 0 0 0 0 0 0 0 0 0 0
98 0 10 0 4 0 0 0 0 0 0
0 0 0 0 0 0 11 0 0 0 0
0 0 0 0 0 0 25 0 1 0 1139 0 12 0 5 0 36 0 1 0 1
966237 81247 83233 47878 48382 666994 759306 56834 64147 32004 36665304804 18675 29083 10366 17037 364948 465466 26112 33995 16999 2172334769 3416 3143 2133 1712 64953 85236 5386 6974 3121 411246760 3974 3774 2379 2343 85536 102947 8167 9824 4401 5320109277 11327 11492 5502 5910 45354 34776 3270 2593 2128 1644
6 6 ! 285 72 136 34 1185 3892 93 282 56 1771462508 118924 130797 68394 75418 1228970 1451623 99862 117815 58709 69641
4

U.S. LINER
U.S. PORT FOREIGN REGION1986TONS
OTHER HAMPTON ROADS PORTS EUROPE 51364OTHER HAMPTON ROADS PORTS EAST AND SOUTH ASIA 1250OTHER HAMPTON ROADS PORTS AUSTRALIA/OCEANIA 21
OTHER HAMPTON ROADS PORTS AFRICA/MIDDLE EAST 4339OTHER HAMPTON ROADS PORTS LATIN AMERICA 6016OTHER HAMPTON ROADS PORTS CANADA 0
OTHER HAMPTON ROADS PORTS TOTAL 63040
OTHER NORTH ATLANTIC PORTS EUROPE 19615OTHER NORTH ATLANTIC PORTS EAST AND SOUTH ASIA 419OTHER NORTH ATLANTIC PORTS AUSTRALIA/OCEANIA 30OTHER NORTH ATLANTIC PORTS AFRICA/MIDDLE EAST 28098OTHER NORTH ATLANTIC PORTS LATIN AMERICA 69917OTHER NORTH ATLANTIC PORTS CANADA 0
OTHER NORTH ATLANTIC PORTS TOTAL 118079
WILMINGTON, NC EUROPE 114928WILMINGTON, NC EAST AND SOUTH ASIA 53775WILMINGTON, NC AUSTRALIA/OCEANIA 19WILMINGTON, NC AFRICA/MIDDLE EAST 2423WILMINGTON, NC LATIN AMERICA 11816WILMINGTON, NC CANADA 3254WILMINGTON, NC TOTAL 186215
Source: Manalytics Waterborne Trade Database

Appendix Table 5
CONTAINER TRADES BY MAJOR PORT (SHORT TONS)I MPORTS EXPORTS
1987 1986 1987 1986 1987 1986 1987 1986 1987 1986 1987TORS TEUS TEUS FEUS FEUS TONS TONS TEUS TEUS FEUS FEUS
65991 418T 5356 2574 3357 103933 99529 8660 9232 5077 50302006 114 242 69 130 4400 8848 336 715 197 405
0 1 0 0 0 89 93 8 9 3 44303 353 403 219 225 38099 13183 3331 1 2 0 2 1884 6632511 765 273 364 139 739 2047 65 123 35 94
33 0 7 0 3 8 0 0 0 0 074-844 5420 6281 3226 3854 147268 123700 12400 11281 7196 6196
26462 1235 2188 907 1291 19089 22814 1445 1678 889 105542 29 4 19 2 1 19 0 1 0 030 •) ",0 1 1 0 0 0 0 0 039 1423 3 1280 r>L 138 1 9 0 5 0
5844 3601 437 3178 284 1759 3433 128 250 78 155ii. 0 0 0 0 251 1224 23 121 11 59
32419 6291 2635 5385 1580 21238 27491 1605 2050 983 1269
89T12 10670 8291 6196 4847 224683 221204 18985 18604 10639 1046062243 7323 8577 3677 4307 153052 152119 11568 1 1 0 1 1 7115 7042
91 1 7 0 4 342 54 36 3 17 2366 188 28 113 18 23597 13518 1802 976 1108 633
26829 1535 3507 729 1632 834 345 62 26 38 1510382 516 702 245 509 2308 205 203 20 109 9
189623 20233 2 1 1 1 2 10960 11317 404816 387445 32656 30640 19026 18161
5

Appendix Table 5
U.S. LINER CONTAINER TRADES BY MAJOR PORT(SHORT TONS)
IMPORTS......... - ..........EXPORTS1986 198T 1986 1987 1986 1987 1986 1987 1986 1987 1986 1987
U.S. PORT FOREIGN REGION TONS TONS TEUS TEUS FEUS FEUS TONS TONS TEUS TEUS FEUS FEUS
CHARLESTON EUROPE 846001 940036 71915 77267 43098 47168 667009 770018 48776 56987 31210 36200CHARLESTON EAST AND SOUTH ASIA 516889 693888 59719 79581 31674 42413 1203971 1335866 79484 8 8 6 6 8 55456 61818CHARLESTON AUSTRALIA/0CEANIA 62151 64328 6031 6373 3119 3225 46209 62767 3651 4881 2194 2966CHARLESTON AFRiCA/MIDDLE EAST 33744 36846 2748 3428 1628 1828 67867 99791 5679 8977 3310 5055CHARLESTON LATIN AMERICA , 54216 10(198 4357 8109 2636 5179 78404 115161 5602 8357 3642 5390CHARLESTON CANADA 142 2588 29 150 13 119 1503 10 75 1 68 0
CHARLESTON TOTAL 1513149 1844864 144799 174908 82168 99932 2064963 2383613 143267 167871 95880 111429
SAVANNAH EUROPE 46931; 440367 40453 3701 1 24450 22741 625336 697171 46637 51908 29104 32626SAVANNAH EAST AND SOUTH ASIA 859T36 576120 102473 70999 53977 36559 743609 671320 48929 44755 34335 31083SAVANNAH AUSTRALIA/0CEANIA 3154 568 2 2 2 41 146 26 6713 20336 471 1584 307 969SAVANNAH AFRICA/MIDDLE EAST 69569 50054 5738 4145 3560 2582 233746 268182 20418 21910 11715 13073SAVANNAH LATIN AMERICA 202401 106901 19407 9105 10931 5489 216025 133504 14313 9288 9989 6182SAVANNAH CANADA 633 85898 49 4300 31 3904 0 3280 0 168 0 149SAVANNAH TOTAL 1604810 1259908 168392 125601 93095 71301 1826429 1793793 130768 129613 85450 84082
JACKSONVILLE EUROPE 50123 48084 3844 3279 2514 2308 132827 150877 10903 11981 6326 7144JACKSONVILLE EAST AND SOUTH ASIA 631 25025 56 4240 32 2 1 2 1 370 17270 24 1303 16 785JACKSONVILLE AUSTRALIA/0CEANIA 0 647 0 72 0 34 33 22 2 1 1 0JACKSONVILLE AFRICA/MIDDLE EAST 9800 192 774 13 484 9 1945 1225 101 90 88 55JACKSONVILLE LATIN AMERICA 204961 313081 23153 33189 11894 17481 78533 152769 6482 11340 3679 7057JACKSONVILLE CANADA 113 24667 20 1240 9 1123 0 0 0 0 0 0JACKSONVILLE TOTAL 265628 411696 27847 42033 14933 23076 213708 322163 17512 24715 1 0 1 1 0 15041
Source: Manalytics Waterborne Trade Database
6

U.S. LINER
MIAMIMIAMIMIAMIMIAMIMIAMIMIAMIMIAMI
OTHER SOUTH FLORIDA PORTS OTHER SOUTH FLORIDA PORTS OTHER SOUTH FLORIDA PORTS OTHER SOUTH FLORIDA PORTS OTHER SOUTH FLORIDA PORTS OTHER SOUTH FLORIDA PORTS OTHER SOUTH FLORIDA PORTS
PUERTO RICO/VIRGIN ISLANDS PUERTO RICO/VIRGIN ISLANDS PUERTO RICO/VIRGIN ISLANDS PUERTO RICO/VIRGIN ISLANDS PUERTO RICO/VIRGIN ISLANDS PUERTO RICO/VIRGIN ISLANDS PUERTO RICO/VIRGIN ISLANDS
U.S. PORT1986
FOREIGN REGION TONS
EUROPE 245372EAST AND SOUTH ASIA 148T66AUSTRALiA/OCEANIA 504AFRICA/MIDDLE EAST 14038LATIN AMERICA 315033CANADA 305TOTAL 724618
EUROPE 281431EAST AND SOUTH ASIA 1390AUSTRALIA/OCEANIA 1 1 0 1 0
AFRICA/MIDDLE EAST 8679LATIN AMERICA 243226CANADA 26TOTAL 545762
EUROPE 201366EAST AND SOUTH ASIA 45641AUSTRALIA/OCEANIA 307AFRICA/MIDDLE EAST 5450LATIN AMERICA 199020CANADA 14320TOTAL 466104
Source: Manalytics Waterborne Trade Database

Appendix Table 5
CONTAINER TRADES BY MAJOR PORT (SHORT TONS)
........ I MPORTS........................................................... EXPORTS1987 1986 1987 1986 1987 1986 1987 1986 1987 1986 1987TONS TEUS TEUS FEUS FEUS TONS TONS TEUS TEUS FEUS FEUS
275959 18403 19627 12395 13740 39743 30262 3157 2446 1836 1423159618 18814 20260 9656 1G4GS 40047 56123 2973 4162 1855 2602
306 49 46 27 2 2 30 893 6 72 3 4112147 1206 1139 733 674 3848 3297 324 365 187 194
331758 29379 30042 16499' 17276 284747 315484 26188 29187 14487 16176766 19 50 13 34 2 1 0 0 11 0 9 0
780554 67870 71164 39329 42155 368685 406059 32659 36232 18377 20436
249111 21394 19379 13903 12434 32917 25934 2593 2836 1606 15571480 157 140 78 76 792 3629 57 301 35 165
11180 1 0 21 1054 531 541 281 552 27 37 14 2311085 663 771 409 510 869 649 66 53 38 30
272748 24470 27562 12857 14526 223342 322454 20396 29639 11337 16373332 tl 23 1 15 209 0 21 0 10 0
545936 47706 48929 27779 28102 258410 353218 23160 32866 13040 18148
181979 14286 12992 3811 8823 18879 31252 1574 2639 908 149156478 6451 7690 3223 3882 4205 15148 237 980 191 690
750 27 71 14 36 7 143 1 15 0 6
8721 443 512 266 402 3715 3328 276 226 173 1552 2 0 2 0 0 20294 20822 10960 11696 118727 91425 9439 7236 5685 4456
8949 1216 762 697 437 47 160 3 10 2 ' 7477077 42717 42849 24971' ■ 25276 145580 141456 11530 11106 6959 6805
1

Appendix Table 5
— .................... . I MPORTS........................................................... EXPORTS
U.S. LINER CONTAINER TRADES BY MAJOR PORT(SHORT TONS)
1986 1987 1986 1987 1986 1987 1986 1987 1986 1987 1986 1987U.S. PORT FOREIGN REGION TONS TONS TEUS TEUS FEUS FEUS TONS TONS TEUS TEUS FEUS FEUS
OTHER SOUTH ATLANTIC PORTS EUROPE 2650 12287 321 1044 154 628 3172 34256 257 2146 148 1586OTHER SOUTH ATLANTIC PORTS EAST AND SOUTH ASIA 59 10533 8 1223 3 658 8930 13045 700 917 407 593OTHER SOUTH ATLANTIC PORTS AUSTRALIA/0CEANIA 13 29 1 2 0 1 16 0 0 0 0 0
OTHER SOUTH ATLANTIC PORTS AFRICA/MiDDLE EAST 8 371 2 47 0 2 2 15308 12827 1493 1035 732 591OTHER SOUTH ATLANTIC PORTS LATIN AMERICA 1163 1546 59 98 52 74 2604 25141 218 2135 124 1255OTHER SOUTH ATLANTIC PORTS TOTAL 3899 24766 391 2414 209 1383 30080 35269 2668 6233 1411 4025
TAMPA/ST. PETERSBURG EUROPE 93 15853 6 1128 4 754 8 6 9269 4 590 3 439TAMPA/ST. PETERSBURG EAST AND SOUTH AS i A 116 860 7 83 5 43 1583 2027 1 1 0 135 72 92TAMPA/ST. PETERSBURG AUSTRALIA/OCEANIA 28T 71 23 6 13 3 0
*j 0 0 0 0
TAMPA/ST. PETERSBURG AFRICA/MIDDLE EAST 26 1559 ? 121 1 71 1479 2 1 2 1 1 2 16 63 9TAMPA/ST. PETERSBURG LATIN AMERICA 12572 17812 1265 n c cu j j 663 880 15177 23102 1149 1738 710 1087TAMPA/ST. PETERSBURG CANADA 0 60 0 3 0 2 2 0 0 0 0 0
TAMPA/ST. PETERSBURG TOTAL 13094 36215 1304 2636 6 8 6 1753 18327 34613 1375 2479 854 1627
MOBILE EUROPE 47196 37720 3232 2875 2236 1826 86736 109791 6012 8375 3974 5031MOBILE EAST AND SOUTH ASIA 3486 9228 293 809 171 441 175 3219 11 267 7 146MOBILE AUSTRALIA/OCEANIA 835 5 81 0 42 0 45 6 6 6 3 50 1 30MOBILE AFRICA/MIDDLE EAST 999 1040 8 ! 80 47 51 8576 10492 562 788 388 483MOBILE LATIN AMERICA 6218 12197 583 961 334 563 22246 7705 1660 498 1029 349MOBILE CANADA 69 0 8 0 3 0 91 0 6 0 3 0MOBILE TOTAL 58863 60190 4278 4725 2833 2881 117869 131873 8254 9978 5402 6039
Source: Manalytics Waterborne Trade Database

U.S. LINER
OTHER CENTRAL GULF PORTS OTHER CENTRAL GULF PORTS OTHER CENTRAL GULF PORTS OTHER CENTRAL GULF PORTS OTHER CENTRAL GULF PORTS OTHER CENTRAL GULF PORTS OTHER CENTRAL GULF PORTS
NEK ORLEANS NEW ORLEANS NEW ORLEANS NEW ORLEANS NEW ORLEANS NEW ORLEANS NEW ORLEANS
MISSISSIPPI RIVER SYSTEM PORTS MISSISSIPPI RIVER SYSTEM PORTS MISSISSIPPI RIVER SYSTEM PORTS MISSISSIPPI RIVER SYSTEM PORTS MISSISSIPPI RIVER SYSTEM PORTS MISSISSIPPI RIVER SYSTEM PORTS
U.S. FORT FOREIGN REGION1986TONS
EUROPE 43611EAST AND SOUTH ASIA 4802AUSTRALIA/OCEANIA 4170AFRICA/MIDDLE EAST 10720LATIN AMERICA 308530CANADA 77TOTAL 371910
EUROPE 368760EAST AND SOUTH ASIA 62395AUSTRALIA/OCEANIA 21638AFRICA/MIDDLE EAST 54635LATIN AMERICA 236594CANADA 62TOTAL 744084
EUROPE 2551EAST AND SOUTH ASIA 380AUSTRALIA/OCEANIA 0
AFRICA/MIDDLE EAST 2183LATIN AMERICA 201
TOTAL 5315
Source: Manalytics Waterborne Trade Database

Appendix Table 5
CONTAINER TRADES BY MAJOR PORT (SHORT TONS)I M P O R T S — - E X P 0 R T S — -
1387 1986 1987 1986 1987 1986 1987 1986 1987 1986 1987IONS TEUS TEUS FEUS FEUS TONS TONS TEUS TEUS FEUS FEUS
38653 3296 2953 2127 1835 61949 139950 4129 10039 2839 63792361 313 172 236 138 10905 3690 772 256 495 1678062 387 743 205 387 148 254 12 13 7 11
6369 700 460 487 316 46762 26015 2680 1619 2133 1188401781 46870 61171 21263 27659 17080 48359 1246 3668 808 2244
0 3 0 0 0 0 4 0 0 0 0458426 51575 65499 24321 30335 136344 218272 8839 15595 6282 9989
328898 23177 26611 18665 16657 721273 680346 52296 50172 33285 3142820293 4319 1783 3038 1089 158087 237631 10391 16784 7207 1082322476 1396 2 0 2 1 1043 1031 22115 42251 1632 2827 1051 197642847 3738 3172 2579 2037 191936 214408 12547 14722 8830 9877
321114 23319 29046 12880 16680 474527 443727 32425 30909 21934 2050735 9 2 4 1 137 232 8 23 5 11
735663 63158 62635 38209 37555 1568075 1618595 109299 115437 72312 74622
1967 191 116 127 91 45722 131642 3329 8496 2078 598393 37 8 20 4 3908 27450 326 1845 177 1246
399 0 40 0 19 344 3531 17 243 15 160399 109 46 39 23 31436 34530 1825 1963 1429 1568
3255 35 163 16 148 32758 14563 2196 1005 1487 6626119 372 373 262 285 114168 211716 7693 13552 5186 9619
9

U.S. LINER
LAKE CHARLES/8EAUM0NT/P0RT ARTHUR LAKE CHARLES/BEAUMONT/PORT ARTHUR LAKE CHARLES/BEAUMONT/PORT ARTHUR LAKE CHARLES/BEAUMONT/PORT ARTHUR LAKE CHARLES/BEAUMONT/PORT ARTHUR LAKE CHARLES/BEAUMONT/PORT ARTHUR
HOUSTON/GALVESTONHOUSTON/GALVESTONHOUSTON/GALVESTONHOUSTON/GALVESTONHOUSTON/GALVESTONHOUSTON/GALVESTONHOUSTON/GALVESTON
CORPUS CHRIST I CORPUS CHRIST I CORPUS CHRIST I CORPUS CHRIST I CORPUS CHRIST I
U.S. PORT1986
FOREIGN REGION TONS
EUROPE 65EAST AND SOUTH ASIA 164AFRICA/MIDOLE EAST 542LATIN AMERICA 3285CANADA 0
TOTAL 4060
EUROPE 86863!EAST AND SOUTH ASIA 33402AUSTRAL lA/'OCEANI A 1066!AFRICA/MIDDLE EAST 105552LATIN AMERICA 98188CANADA 8 T 2
TOTAL 1183306
EUROPE 23EAST AND SOUTH ASIA 0
AFRICA/MIDDLE EAST 49LATIN AMERICA 0
TOTAL 72
Source: Manalytics Waterborne Trade Database

Appendix Table 5
t CONTAINER TRADES BY MAJOR PORT (SHORT TONS)
........... I MPORTS....................... ....................................EXPORTS1987 1986 1987 1986 1987 1986 1987 1986 1987 1986 1987TONS TEUS TEUS FEUS FEUS TONS TONS TEUS TEUS FEUS FEUS
275 7 23 3 13 7494 31747 541 2087 340 1442625 21 91 10 42 7154 ■ 48532 538 3289 325 220536 89 3 43 1 107197 88978 6995 6261 4874 4044
18064 332 1837 166 932 42136 154993 2747 10658 1933 7138313 0 IS 0 14 0 0 0 0 0 0
19313 449 1973 2 2 2 1 0 0 2 163981 324250 10821 22295 7472 14829
793832 6989! 65039 44271 40883 847965 1115364 61402 82450 39421 51919100906 8007 9205 5113 5631 653120 632254 45064 43710 29745 2896012032 921 1095 512 533 62425 84020 4289 5565 2866 384854652 7615 4414 5089 C
Oc--j
CO
C'J 366504 445752 27421 31725 17083 20818
174041 8038 14012 4935 8646 476003 535709 31013 35391 21776 245332716 82 137 49 123 214 21 15 1 9 0
1138179 94554 93902 59969 58694 240623! 2813120 169204 198843 110900 130078
0 1 0 1 0 2053 8 161 0 93 0
0 0 0 0 0 0 3497 0 262 0 1582049 6 150 i
J 92 19198 18107 1237 1182 872 8220 0 0 0 0 4289 13217 260 847 194 600
2049 i 150 4 92 25550 34829 1658 2291 1159 1580
10

U.S. LINER
U.S, PORT FOREIGN REGION1986TONS
OTHER WEST GULF PORTS EUROPE 126OTHER WEST GULF PORTS EAST AND SOUTH ASIA 10171OTHER WEST GULF PORTS AFRICA/MIODLE EAST 0
OTHER WEST GULF PORTS LATIN AMERICA 2020T0OTHER WEST GULF PORTS TOTAL 21236T
LAKE MICHIGAN PORTS EUROPE 8710LAKE MICHIGAN PORTS EAST AND SOUTH ASIA 3530LAKE MICHIGAN PORTS AUSTRALIA/0CEANIA 0
LAKE MICHIGAN PORTS AFRICA/MIDDLE EAST 76LAKE MICHIGAN PORTS LATIN AMERICA 456LAKE MICHIGAN PORTS CANADA 909LAKE MICHIGAN PORTS TOTAL 13731
LAKE ERIE PORTS EUROPE 20140LAKE ERIE PORTS EAST AND SOUTH ASIA 586LAKE ERIE PORTS AUSTRALIA/OCEANIA 135LAKE ERIE PORTS AFRICA/MIDDLE EAST 1236LAKE ERIE PORTS LATIN AMERICA ft
L
LAKE ERIE PORTS CANADA ]LAKE ERIE PORTS TOTAL 2 2 1 0 0
Source: Hanalytics Waterborne Trade Database

Appendix Table 5
CONTAINER TRADES BY MAJOR PORT (SHORT TONS)
■........ I MPORTS........................... ........................... EXPORTS1981 1986 1987 1986 1987 C
Ocr> 1987 1986 1987 1986 1987
TONS TENS TEUS FEUS FEUS TONS TONS TEUS TEUS FEUS FEUS
67 8 3 5 2 0 0 0 0 0 0
637 508 50 462 33 0 206 0 15 0 90 0 0 0 0 3017 14608 221 1070 137 663
178585 31419 27817 14146 12520 13817 9098 1041 647 658 418179289 31935 27870 14613 12555 16834 23912 1262 1732 795 1090
10976 601 638 413 504 3521 1115 182 72 159 502736 249 228 178 144 26140 6621 1805 422 1187 300
0 0 0 0 0 26 6 8 2 5 1 3232 5 30 3 13 63416 43589 3870 2979 2897 1995
10 36 2 21 1 14165 274 919 13 564 1235 46 2 41 1 0 0 • 0 0 0 0
13983 337 900 656 653 107268 51667 6788 3491 4908 2360
16183 1551 1176 1009 785 1670 1691 151 149 90 82685 78 56 37 35 1062 6 53 0 48 01594 13 79 6 72 0 0 0 0 0 0
1195 66 97 55 60 1 0 0 2 31 80 1 44 1
22 0 1 0 0 64 25 4 3 2 1918 A
U 46. 0 41 3 13 0 1 0 020597 1708 ■ 1465 1107 993 3801 1766 288 154 184 84
11

U.S. LINE
OTHER GREAT LAKES PORTS OTHER GREAT LAKES PORTS OTHER GREAT LAKES PORTS OTHER GREAT LAKES PORTS OTHER GREAT LAKES PORTS OTHER GREAT LAKES PORTS OTHER GREAT LAKES PORTS
LONG BEACH/LOS ANGELES LONG BEACH/LOS ANGELES LONG BEACH/LOS ANGELES LONG BEACH/LOS ANGELES LONG BEACH/LOS ANGELES LONG BEACH/LOS ANGELES LONG BEACH/LOS ANGELES
OTHER SOUTHERN CALIFORNIA PORTS OTHER SOUTHERN CALIFORNIA PORTS OTHER SOUTHERN CALIFORNIA PORTS OTHER SOUTHERN CALIFORNIA PORTS OTHER SOUTHERN CALIFORNIA PORTS OTHER SOUTHERN CALIFORNIA PORTS
U.S. PORT FOREIGN REGION1986TONS
EUROPE 607EAST AND SOUTH ASIA 1CAUSTRALIA/OCEANIA CAFRICA/MIDDLE EAST 0
LATIN AMERICA 1369CANADA 113TOTAL 2099
EUROPE 793083EAST AND SOUTH ASIA
O-Jtc>COinCOr—
•
AUSTRALIA/OCEANI A 202915AFRICA/MIDDLE EAST 65914LATIN AMERICA 99241CANADA 15387TOTAL 3838161
EUROPE 66650EAST AND SOUTH ASiA 816AFRICA/MiDDLE EAST 0
LATIN AMERICA 598CANADA 691TOTAL 68755
Source: Manalytics Waterborne Trade Database

Appendix Table 5
R CONTAINER TRADES BY MAJOR PORT (SHORT TONS)
I MPORTS........................................................... EXPORTS1987 1986 1987 1936 1587 1936 1987 1985 1987 1986 1987TONS TEUS TEUS FEUS FEUS TONS TONS TEUS TEUS FEUS FEUS
580 46 33 28 26 185 137 14 7 8 50 1 0 0 0 39718 5304 2520 377 1805 2410 0 0 0 nV 0 2 0 0 0 00 0 nv 0 0 11229 120 712 9 510 5U 134 0 62 0 399 0 27 0 18 0
154 11 15 5 8 5831 2126 336 168 265 97744 ! -Jl 48 CPJv 34 57362 7689 3609 561 2606 348
919472 67682 72524 41843 46959 232943 288987 19191 24289 11411 143858203997 1130645 1195035 556738 591099 4299805 5406536 330034 413082 201057 253976
255662 18164 22335 10012 12481 239187 262318 18921 21113 11515 12724134330 5087 8635 3371 6531 69190 82105 5651 6700 3290 4008151636 6617 11749 5141 7395 49896 41139 3493 3225 2335 1977
11389 1178 747 750 527 1544 1220 113 87 72 569676486 1231373 1311075 517355 664992 4892565 6082305 377403 468496 229680 287126
85585 3424 4691 3029 3920 0 0 0 0 0 0497 173 68 80 35 1551 4467 156 442 75 218
3233 0 222 0 146 0 19 0 1 0 05225 56 29 240 0 0 0 0 0 0
!j 34 0 31 0 0 0 0 0 0 nu94540 3637 5284 3169 4341 1551 4486 156 443 75 218
12

U.S. LINEF
OAKLAND/SAN FRANCISCO OAKLAND/SAN FRANCISCO OAKLAND/SAN FRANCISCO OAKLAND/SAN FRANCISCO OAKLAND/SAN FRANCISCO OAKLAND/SAN FRANCISCO OAKLAND/SAN FRANCISCO
OTHER SAN FRANCISCO BI OTHER SAN FRANCISCO BAY/SACRAMENTO OTHER SAN FRANCISCO BAY/SACRAMENTO OTHER SAN FRANCISCO BAY/SACRAMENTO OTHER SAN FRANCISCO BAY/SACRAMENTO OTHER SAN FRANCISCO BAY/SACRAMENTO
OTHER NORTHERN CALIFORNIA PORTS OTHER NORTHERN CALIFORNIA PORTS OTHER NORTHERN CALIFORNIA PORTS OTHER NORTHERN CALIFORNIA PORTS
U.S. PORT FOREIGN REGION1986TONS
EUROPE 342974EAST AND SOUTH ASIA 1385326AUSTRALIA/OCEANIA 208357AFRICA/MIDDLE EAST 24888LATIN AMERICA 10C140CANADA 6373TOTAL 2068098
EUROPE 677EAST AND SOUTH ASIA ' 53AUSTRALIA/OCEANIA 1098AFRICA/MIDDLE EAST 1781LATIN AMERICA 71< -JTOTAL 3682
EUROPE 2332EAST AND SOUTH ASIA 609LATIN AMERICA 0
TOTAL 3441
Source: Manalytics Waterborne Trade Database

Appendix Table 5
{ CONTAINER TRADES BY MAJOR PORT (SHORT TONS)I MPORTS.........-........................ -..................... EXPORTS
1987 1986 1987 1385 1987 1986 1987 1986 1987 1986 1987TONS TEUS TEUS FEUS FEUS TONS TONS TEUS TEUS FEUS FEUS
J i C.J1 i 30287 32921 18083 19592 306162 358184 24740 29949 14444 169721272830 179820 162460 91348 83512 2238745 2763148 170943 211010 105043 129218
219180 18943 19750 10175 10622 141455 139413 11290 10713 6680 655823372 1626 1710 1161 1100 26733 36379 2170 3097 1281 1772
155587 7518 11596 4689 7255 34432 33216 2454 2551 1606 15754067 574 295 334 189 2567 2332 168 164 116 106
2047708 238768 228732 125790 122270 2753095 3332632 211765 257484 129170 156201
15177 74 955 40 702 1452 5848 114 342 67 266631 9 104 3 48 17889 6210 1227 405 812 281
38 67 3 49 1 82 7020 16 500 7 31810 89 0 80 0 26 501 2 38 1 22
1016 J 72 0 46 20 1607 2 115 0 7216922 244 1134 175 797 19469 21186 1351 1400 887 959
581 252 59 148 31 5409 2066 383 160 245 93281 39 29 28 14 6032 10332 415 711 274 469
19 0 i1 0 0 0 0 0 0 0 0881 291 89 176 45 1144! 12398 798 871 519 562
13

U.S. LINER
U .S . PORT FOREIGN REGION1986TONS
HONOLULU/HAWA11 PORTS EUROPE 1658HONOLULU/HAWAI1 PORTS EAST AND SOUTH AS IA 53581HONOLULU/HAWAII PORTS AUSTR ALIA/OCEANIA 36346HONOLULU/HAWAII PORTS AFRICA/M IDDLE EAST 132HONOLULU/HAWAII PORTS L A T IN AMERICA 125HONOLULU/HAWA11- PORTS CANADA 533HONOLULU/HAWAII PORTS TO TAL 92385
PORTLAND, OR EUROPE 24396PORTLAND, OR EAST AND SOUTH A S IA 148610PORTLAND,- OR AUSTR ALIA/OCEANIA 1842PORTLAND, O R ,- AFR.ICA/MIDDLE EAST 151PORTLAND, OR ■ L A TIN AMERICA 583PORTLAND, OR CANADA 16PORTLAND, OR TO TAL 175598
OTHER COLUMBIA RIVER PORTS EUROPE 795OTHER COLUMBIA RIVER PORTS EAST AND SOUTH AS IA 4484OTHER COLUMBIA RIVER PORTS AUSTRALIA/OCEANIA 2 :0OTHER COLUMBIA RIVER PORTS AFRICA/M IDDLE EAST 1590OTHER COLUMBIA RIVER PORTS L A TIN AMERICA . • 900OTHER COLUMBIA RIVER PORTS TO TAL 7979
Source: Manalytics Waterborne Trade Database

Appendix Table 5
CONTAINER TRADES BY MAJOR PORT (SHORT TONS)
■....... I MPORTS........................................................... EXPORTS1987 1986 1987 1986 1987 1985 1987 1986 1987 1986 1987TONS TEUS TEUS FEUS FEUS TONS TONS TEUS TEUS FEUS FEUS
1816 136 236 83 122 2 325 0 23 0 1460959 6471 7011 3372 3754 46436 46101 3425 3435 2148 214928558 289! 2389 1712 1371 2360 633 154 78 109 37
0 7 nU 5 0 9ff U 9 0 ■4 066 14 6 7 3 45 14 3 1 1 0
843 43 77 .24 38 13.32 1578 125 110 '3 9 7792252 9568 9719 5203 5288 50765 48655 3716 3647 2351 2277
29340 2065 2574 1230 15.10 66834 76691 4488 5364 3109 3575151474 16524 18579 899.1 9275 880137 928188 65431 70055 40555 42917
2137 126 150 87 •99 3754 ■ 3144 294 “ 247 175 143.140 16 ■14 8 ■ 7 1977 2617 170 215 96 1222906 42 208 26 ,1 3 4 2961 ■ 215 207 15 '146 • 9
25140 ; t 1258 0 1142 - - - o ■ 0 ■ 0 : 0 : 0 ■ 0221137 13774 22783 10342 12867 955713 1010355 70590 75896 44081 46766
12 71 1 40 0 14992 30466 886 1865 682 13844273 381 . 321 . . 231 - 210 13700 27679 1396 2097 850 • 12601725 15 89 10 78 11401 12617 687 1007 519 582
300 ■ 36 ■, 16 " v v ■ 73 13 5718 1692 429 128 260 772878 66 2 .1 2 ,, 40 .V 132. .. ,1 4 8 3 7 ,,.. ■. .1.5026 981 982 678 6879188 628 639 394 433 65648 87480 4379 6079 2989 3990
14

U.S. LINEI
SEATTLE/TACOMASEATTLE/TACOMASEATTLE/TACOMASEATTLE/TACOMASEATTLE/TACOMASEATTLE/TACOMASEATTLE/TACOMA
OTHER PUGET- SOUND PORTS OTHER PUGET-SOUND PORTS OTHER PUGET SOUND PORTS OTHER PUGET SOUND PORTS OTHER PUGET SOUND PORTS OTHER PUGET SOUND PORTS OTHER PUGET SOUND PORTS
OTHER P A C IF IC NORTHWEST PORTS OTHER P A C IF IC NORTHWEST PORTS OTHER P A C IF IC NORTHWEST PORTS OTHER P A C IF IC NORTHWEST PORTS OTHER P A C IF IC NORTHWEST PORTS OTHER P A C IF IC NORTHWEST PORTS
U.S. PORT. 1986 •
FOREIGN REGION ■ . -TO N S
EUROPE ' 127680EAST AND SOUTH A S IA 2965578AU S TR ALIA/OCEANIA 49486AFRICA/M1DDLE EAST T31.72L A TIN AMERICA 24907CANADA 351TO TAL
. ■ iEUROPE-
3181774
1397EAST AND SOUTH A S IA OTtO
U 1 w WAUSTRALIA/OCEANI A . 0AFR ICA/M IDOLE EAST . 44L A TIN AMERICA CANADA
5432333
TOTAL 7056
EUROPE 308EAST AND SOUTH AS IA 2421AUSTR ALIA/OCEANIA 94AFRICA/M IDOLE. EAST 76L A TIN AMERICA . - 0.TO TAL 2899
Source: Manalytics Waterborne Trade Database

R CONTAINER TRADES BY MAJOR PORT (SHORT TONS) .
- r . . . . . . . - I H P O R T S - — — r - - - — r x R 0 R -T S - - - - - -
Appendix Table 5
-.1987 .1 9 8 6 . ■ , 198 7 1986 . : 1987.; - - 1 9 8 6 - -• 19 8 7 . 1 9 8 6 1987 1986 1987TOWS TEUS ■ TEUS ' FEUS . FEUS ■ T O N S .. TOWS TEUS TEUS - - FEUS FEUS
105962 .11505 9711 6876 5716 ' 168892 122643' -1 4 4 3 7 -.1 0 4 1 9 7973 58623170045 428907 452943 ■ 213733 225613 ■ - 3645172 4213129 275837 319282 163816 196376
79584 4787 6757 2608 .3954 108263 147373 8580 11246 5116 69608063 968 ' 809 669 469 21216 35432 '1 9 8 4 2436 1071 1689
23225 1971 .1 8 2 0 1235 - 1126 57984 45198 4071 3402 2667 213620950 58 1185 44 964 1791 .2011 93 114 81 91
3407829 448194 473225 225165 237842 4003318 4566786 305002 346893 186724 213114
758 111 83 71 43 7574 9339' 604 694 344 4318852 321 809 176. 507 23150 43723 1709 2706 1055 1988
0 0 0 0 0 977 670 76 46 44 302 3 0 . 1 0 ■0 0 0 0 0 0
112 37 7 24 5 3740 8325 257 573 169 3783999 275 4 7 ! 124 212 15071 12473 989 1104 751 605
13723 747 1370 336 767 51512 74530 3635 5123 2363 3432
459 25 43 16 25 5219 5937 506 459 285 272475 145 33 115 22 0 724 0 53 0 32451 8 37 4 21 21586 31678 1693 2491 980 1438628 3 31 3 28 106 1872 8 146 4 84
0 0 0 . 0 0 2 5 0 0. 0 02 0 1 3 ' 181 144 138 96 27313 40276 2207 3149 1269 1826
15

Appendix Table 5
U.S. LINER CONTAINER TRADES BY MAJOR PORT (SHORT TONS)
U.S. PORT FOREIGN REGION
ALASKA PORTS EUROPEALASKA PORTS EAST AND SOUTH ASIAALASKA PORTS AUSTRALiA/OCEANIAALASKA PORTS AFRICA/M1DDLE EASTALASKA PORTS LATIN AMERICAALASKA PORTS CANADAALASKA PORTS TOTAL
Source: Manalytics Waterborne Trade Database
IMPORTS -1985 1987 1986 1987 1986 1987TONS TONS TEUS TEUS FEUS FEUS
123 527 6 62 5 28345 2 39 0 21 ■ 0
ft.iJ 0 0 0 0 0
8 0 0 0 0 0
0 0 0 U 0 0
499 1136 30 71 23 539T5 1665 75 133 49 81
EXPORTS1985 1987 1986 1987 1986 1987TONS TONS TEUS TEUS FEUS FEUS
341 1658 31 126 17 7726999 22629 '2385 21 01 1386 1105
0 112 0 3 0 5175 4385 18 435 8 20 0
1597 47 157 5 72 2
15 521 11 79 0 3929127 29452 3192 2755 1483 1428
IS

TRAM DATA PRESUMED TO FIT RAIL NETWORK BY BEA ORIGIN AND DESTINATION
Appendix Table 6
FACTORED SITING MONTHLY
ORIGIN BEA DESTINATION BEA COUNT COUNT4 BOSTON, MA 4 BOSTON, MA 4 BOSTON, MA 4 BOSTON, MA6 HARTFORD-NEW HAVEN-SPRINGFLD, 6 HARTFORD-NEW HAVEN-SPRINGFLD,6 HARTFORD-NEW HAVEN-SPRINGFLD,7 ALBANY-SCHENECTADY-TROY, NY 7 ALBANY-SCHENECTADY-TROY, NY7 ALBANY-SCHENECTADY-TROY, NY8 SYRACUSE-UTICA, NY 8 SYRACUSE-UTICA, NY8 SYRACUSE-UTICA, NY9 ROCHESTER, NY 9 ROCHESTER, NY 9 ROCHESTER, NY10 BUFFALO, NY 10 BUFFALO, NY 10 BUFFALO, NY 10 BUFFALO, NY12 NEW YORK, NY 12 NEW YORK, NY 12 NEW YORK, NY 12 NEW YORK, NY 12 NEW YORK, NY 12 NEW YORK, NY 12 NEW YORK, NY15 ERIE, PA
165 SALT LAKE CITY-OGDEN, UT 172 PORTLAND, OR176 SAN FRANCISCO-OAKLAND-SAN JOSE
164 RENO, NV165 SALT LAKE CITY-OGDEN, UT
162 PHOENIX, AZ178 STOCKTON-MODESTO, CA
172 PORTLAND, OR176 SAN FRANCISCO-OAKLAND-SAN JOSE
176 SAN FRANCISCO-OAKLAND-SAN JOSE 180 LOS ANGELES, CA
177 SACRAMENTO, CA178 STOCKTON-MODESTO, CA 180 LOS ANGELES, CA
162 PHOENIX, AZ 164 RENO, NV171 SEATTLE, WA172 PORTLAND, OR176 SAN FRANCISCO-OAKLAND-SAN JOSE 180 LOS ANGELES, CA
162 PHOENIX, AZ
1 1,0291 3451 6743 2,0481 1,0291 6742 1,7031 6411 1,0292 1,6701 6741 1,0292 1,7031 6414 2,5375 3,1781 6741 1,0291 6413 2,3441 6141 1,0291 6741 1,0296 4,3065 2,89315 10,5451 641
PAGE 1
FACTOREDANNUALCOUNT12.348 4,140 8,08824,57612.348 8,08820.4367.69212.348 20,0408,08812.34820.4367.692 30,444 38,1368,08812.3487.692 28,1287,36812.348 8,08812,348.51,67234,716126,5407.692

TRAM DATA PRESUMED TO FIT RAIL NETWORK BY BEA ORIGIN AND DESTINATION
Appendix Table 6 PAGE 2
FACTORED FACTOREDSITING MONTHLY ANNUAL
ORIGIN BEA DESTINATION BEA COUNT COUNT COUNT15 ERIE, PA 1 641 7,69216 PITTSBURGH, PA 165 SALT LAKE CITY-OGDEN, UT 1 674 8,08816 PITTSBURGH, PA 1 674 8,08817 HARRISBURG-YORK-LANCASTER, PA 172 PORTLAND, OR 1 674 8,08817 HARRISBURG-YORK-LANCASTER, PA 1 674 8,08818 PHILADELPHIA, PA 172 PORTLAND, OR * ■■ 1 674 8,08818 PHILADELPHIA, PA 176 SAN FRANCISCO-OAKLAND-SAN JOSE 2 1,282 15,38418 PHILADELPHIA, PA 180 LOS ANGELES, CA 7 4,460 53,52018 PHILADELPHIA, PA 10 6,416 76,99219 BALTIMORE, MD 180 LOS ANGELES, CA 2 1,282 15,38419 BALTIMORE, MD 2 1,282 15,38420 WASHINGTON, DC 169 RICHLAND, WA 1 1,029 12,34820 WASHINGTON, DC 1 1,029 12,34855 MEMPHIS, TN 162 PHOENIX, AZ 2 1,444 17,32855 MEMPHIS, TN 177 SACRAMENTO, CA . 1 614 7,36855 MEMPHIS, TN 178 STOCKTON-MODESTO, CA 1 614 7,368
. 55 MEMPHIS, TN 179 FRESNO-BAKERSFIELD, CA ’• V . '• "' ' ;■ 7, .■ 1' ”/ 722 8,66455 MEMPHIS, TN ; , 180 LOS ANGELES, CA - .. 2 1,024 12,28855 MEMPHIS, TN •v •' • - • • •► • • _ • • • • • • • • • • •' 7 4,418 53,01665 CLEVELAND, OH .. . 176 SAN FRANCISCO-OAKLAND-SAN JOSE 2 7 1,315 15,78065 CLEVELAND, OH - ‘ 180 LOS ANGELES, CA . 2 1,336 16,03265 CLEVELAND, OH • ♦ • •>••••••••••••••••••• •• • • • • •• t • • 4 2,651 31,81270 TOLEDO, OH 172 PORTLAND, OR 1 1,029 12,34870 TOLEDO, OH 180 LOS ANGELES, CA 2 1,363 16,35670 TOLEDO, OH 3 2,392 28,70471 DETROIT, MI 180 LOS ANGELES, - CA 4 2,958 35,496

ALK Appendix Table 6 PAGE 3
ORIGIN BEA * 83 * * * * 88 * * * 92 * * * 96 * * 99 10071 DETROIT, MI76 FORT WAYNE, IN 76 FORT WAYNE, IN83 CHICAGO, IL83 CHICAGO, IL83 CHICAGO, IL83 CHICAGO, IL 83 CHICAGO, IL 83 CHICAGO, IL 83 CHICAGO, IL85 SPRINGFIELD-DECATUR, IL 85 SPRINGFIELD-DECATUR, IL88 ROCKFORD, IL88 ROCKFORD, IL92 EAU CLAIRE, WI92 EAU CLAIRE, WI92 EAU CLAIRE, WI96 MINNEAPOLIS-ST. PAUL, MN96 MINNEAPOLIS-ST. PAUL, MN96 MINNEAPOLIS-ST. PAUL, MN96 MINNEAPOLIS-ST. PAUL, MN99 DAVENPORT-ROCK ISLAND-MOLINE99 DAVENPORT-ROCK ISLAND-MOLINE99 DAVENPORT-ROCK ISLAND-MOLINE 99 DAVENPORT-ROCK ISLAND-MOLINE
100 CEDAR RAPIDS, IA 100 CEDAR RAPIDS, IA
TRAM DATA PRESUMED TO FIT RAIL NETWORK BY BEA ORIGIN AND DESTINATION
FACTORED FACTOREDSITINGr MONTHLY ANNUAL
DESTINATION. BEA COUNT; COUNT COUNT4 2,958 35,496
164 RENO, NV 1 674 8,0881' 674 8,088
162 PHOENIX, AZ 2: 1,051 12,612164 RENO, NV 3 2,377 28,524165 SALT LAKE CITY-OGDEN, UT 1 674 8,088172 PORTLAND, OR 2 2,058 24,696176 SAN FRANCISCO-OAKLAND-SAN JOSE 6 5,109 61,308180 LOS ANGELES, CA 5 3,696 44,352
19 14,965 179,580180 LOS ANGELES, CA 1 722 8,664
1 722 8,664180 LOS ANGELES, CA 1 674 8,088
1 674 8,088162 PHOENIX, AZ 1 614 7,368165 SALT LAKE CITY-OGDEN, UT 1 1,029 12,348
2 1,643 19,716162 PHOENIX, AZ 1 614 7,368165 SALT LAKE CITY-OGDEN, UT 1 1,029 12,348180 LOS ANGELES, CA 1 614 7,368
....... 3 2,257 27,084164 RENO, NV 1 1,029 12,348176 SAN FRANCISCO-OAKLAND-SAN JOSE 1 1,029 12,348180 LOS ANGELES, CA 1 1,029 12,348
3 3,087 37,044179 FRESNO-BAKERSFIELD, CA 1 1,029 12,348
1 1,029 12,348

ALK Appendix Table 6 PAGE 4TRAM DATA PRESUMED TO FIT RAIL NETWORK
BY BEA ORIGIN AND DESTINATION
ORIGIN BEA DESTINATION BEASITINGCOUNT
FACTOREDMONTHLY
COUNTFACTOREDANNUALCOUNT
104 DES MOINES, IA 165 SALT LAKE CITY-OGDEN, UT 1 1,029 12,348104 DES MOINES, IA 173 EUGENE, OR 1 1,029 12,348104 DES MOINES, IA 174 REDDING, CA 1 345 4,140104 DES MOINES, IA 180 LOS ANGELES, CA 3 1,869 22,428104 DES MOINES, IA 6 4,272 51,264105 KANSAS CITY, MO 165 SALT LAKE CITY-OGDEN, UT 3 2,732 32,784105 KANSAS CITY, MO 171 SEATTLE, WA 1 674 8,088105 KANSAS CITY, MO 176 SAN FRANCISCO-OAKLAND-SAN JOSE 1 641 7,692105 KANSAS CITY, MO 5 4,047 48,564107 ST. LOUIS, MO 162 PHOENIX, AZ 1 1,029 12,348107 ST. LOUIS, MO 165 SALT LAKE CITY-OGDEN, UT 1 1,029 12,348107 ST. LOUIS, MO 172 PORTLAND, OR 2 1,703 20,436107 ST. LOUIS, MO 176 SAN FRANCISCO-OAKLAND-SAN JOSE 1 674 8,088107 ST. LOUIS, MO 180 LOS ANGELES, CA 1 722 8,664107 ST. LOUIS, MO 6 5,157 61,884111 LITTLE ROCK-N. LITTLE ROCK, AR 162 PHOENIX, AZ 2 1,132 13,584111 LITTLE ROCK-N. LITTLE ROCK, AR 177 SACRAMENTO, CA 1 614 7,368111 LITTLE ROCK-N. LITTLE ROCK, AR 180 LOS ANGELES, CA 1 410 4,920111 LITTLE ROCK-N. LITTLE ROCK, AR. 4 2,156 25,872113 NEW ORLEANS, LA 172 PORTLAND, OR 1 722 8,664113 NEW ORLEANS, LA 180 LOS ANGELES, CA 2 820 9,840113 NEW ORLEANS, LA 3 1,542 18,504119 TEXARKANA, TX 165 SALT LAKE CITY-OGDEN, UT 1 1,029 12,348119 TEXARKANA, TX 1 1,029 12,348121 BEAUMONT-PORT ARTHUR, TX 180 LOS ANGELES, CA 3 1,230 14,760121 BEAUMONT-PORT ARTHUR, TX 3 1,230 14,760122 HOUSTON, TX 162 PHOENIX, AZ 1 722 8,664

ALK Appendix Table 6 PAGE 5TRAM DATA PRESUMED TO FIT RAIL NETWORK
BY BEA ORIGIN AND DESTINATIONFACTORED FACTORED
SITING MONTHLY ANNUALORIGIN BEA DESTINATION BEA COUNT COUNT COUNT122 HOUSTON, TX 180 LOS ANGELES, CA 1 722 8,664122 HOUSTON, TX 2 1,444 17,328125 DALLAS-FORT WORTH, TX 123 AUSTIN, TX 1 410 4,920125 DALLAS-FORT WORTH, TX 156 CHEYENNE-CASPER, WY 1 674 8,088125 DALLAS-FORT WORTH, TX 161 TUCSON, AZ 1 722 8,664125 DALLAS-FORT WORTH, TX 162 PHOENIX, AZ 13 5,954 71,448125 DALLAS-FORT WORTH, TX 164 RENO, NV 1 614 7,368125 DALLAS-FORT WORTH, TX 165 SALT LAKE CITY-OGDEN, UT 2 1,643 19,716125 DALLAS-FORT WORTH, TX 171 SEATTLE, WA 1 345 4,140125 DALLAS-FORT WORTH, TX 176 SAN FRANCISCO-OAKLAND-SAN JOSE 5 2,974 35,688125 DALLAS-FORT WORTH, TX 177 SACRAMENTO, CA 1 641 7,692125 DALLAS-FORT WORTH, TX 178 STOCKTON-MODESTO, CA 2 959 11,508125 DALLAS-FORT WORTH, TX 180 LOS ANGELES, CA 21 13,007 156,084125 DALLAS-FORT WORTH, TX 49 27,943 335,316132 ODESSA-MIDLAND, TX 180 LOS ANGELES, CA 1 722 8,664132 ODESSA-MIDLAND, TX 1 722 8,664133 EL PASO, TX 171 SEATTLE, WA 1 641 7,692133 EL PASO, TX 172 PORTLAND, OR 1 641 7,692133 EL PASO, TX 178 STOCKTON-MODESTO, CA 1 410 4,920133 EL PASO, TX 3 1,692 20,304135 AMARILLO, TX 162 PHOENIX, AZ 1 410 4,920135 AMARILLO, TX 178 STOCKTON-MODESTO, CA 1 614 7,368135 AMARILLO, TX 180 LOS ANGELES, CA 1 641 7,692135 AMARILLO, TX 3 1,665 19,980139 WICHITA, KS 162 PHOENIX, AZ 1 641 7,692139 WICHITA, KS 171 SEATTLE, WA 1 1,029 12,348139 WICHITA, KS 180 LOS ANGELES, CA 1 614 7,368139 WICHITA, KS 3 2,284 27,408143 OMAHA, NE 162 PHOENIX, AZ 2 1,363 16,356

ALK 6Appendix Table 6TRAM DATA PRESUMED TO FIT RAIL NETWORK
BY BEA ORIGIN AND DESTINATION
ORIGIN BEA DESTINATION BEASITINGCOUNT
FACTOREDMONTHLY
COUNTFACTOREDANNUALCOUNT
143 OMAHA, NE 171 SEATTLE, WA 1 674 8,088143 OMAHA, NE 176 SAN FRANCISCO-OAKLAND-SAN JOSE 1 674 8,088143 OMAHA, NE 180 LOS ANGELES, CA 2 1,288 15,456143 OMAHA, NE 3,999 47,988144 GRAND ISLAND, NE 172 PORTLAND, OR 1 674 8,088144 GRAND ISLAND, NE 674 8,088156 CHEYENNE-CASPER, WY 172 PORTLAND, OR 1 397 4,764156 CHEYENNE-CAS PER, WY 178 STOCKTON-MODESTO, CA 1 1,029 12,348156 CHEYENNE-CASPER, WY 1,426 17,112160 ALBUQUERQUE, NM 162 PHOENIX, AZ 2 1,228 14,736160 ALBUQUERQUE, NM 180 LOS ANGELES, CA 1 614 7,368160 ALBUQUERQUE, NM 1,842 22,104161 TUCSON, AZ 180 LOS ANGELES, CA 1 410 4,920161 TUCSON, AZ 410 4,920162 PHOENIX, AZ 4 BOSTON, MA 1 614 7,368162 PHOENIX, AZ 12 NEW YORK, NY 1 410 4,920162 PHOENIX, AZ 55 MEMPHIS, TN 1 722 8,664162 PHOENIX, AZ 71 DETROIT, MI 3 1,692 20,304162 PHOENIX, AZ 83 CHICAGO, IL 1 410 4,920162 PHOENIX, AZ 122 HOUSTON, TX 1 410 4,920162 PHOENIX, AZ 125 DALLAS-FORT WORTH, TX 5 2,986 35,832162 PHOENIX, AZ 160 ALBUQUERQUE, NM 2 1,228 14,736162 PHOENIX, AZ 161 TUCSON, AZ 1 722 8,664162 PHOENIX, AZ 162 PHOENIX, AZ 1 410 4,920162 PHOENIX, AZ 9,604 115,248164 RENO, NV 168 SPOKANE, WA 1 397 4,764164 RENO, NV 397 4,764165 SALT LAKE CITY-OGDEN, UT 10 BUFFALO, NY 1 1,029 12,348

TRAM DATA PRESUMED TO FIT RAIL NETWORK BY BEA ORIGIN AND DESTINATION
alk Appendix Table 6 page i
FACTORED FACTOREDSITING MONTHLY ANNUAL
ORIGIN BEA DESTINATION BEA COUNT COUNT COUNT165 SALT LAKE CITY-OGDEN, UT 55 MEMPHIS, TN 1 1,029 12,348165 SALT LAKE CITY-OGDEN, UT 125 DALLAS-FORT WORTH, TX 2 1,228 14,736165 SALT LAKE CITY-OGDEN, UT 145 SCOTTSBLUFF, NE 1 1,029 12,348165 SALT LAKE CITY-OGDEN, UT 156 CHEYENNE-CASPER, WY 2 2,058 24,696165 SALT LAKE CITY-OGDEN, UT 174 REDDING, CA 2 690 8,280165 SALT LAKE CITY-OGDEN, UT 9 7,063 84,756168 SPOKANE, WA 176 SAN FRANCISCO-OAKLAND-SAN JOSE 3 1,035 12,420168 SPOKANE, WA 180 LOS ANGELES, CA 2 742 8,904168 SPOKANE, WA 5 1,777 21,324169 RICHLAND, WA 133 EL PASO, TX 1 397 4,764169 RICHLAND, WA 176 SAN FRANCISCO-OAKLAND-SAN JOSE 2 794 9,528169 RICHLAND, WA 177 SACRAMENTO, CA 1 397 4,764169 RICHLAND, WA 178 STOCKTON-MODESTO, CA 1 345 4,140169 RICHLAND, WA 180 LOS ANGELES, CA 1 345 4,140169 RICHLAND, WA 6 2,278 27,336170 YAKIMA, WA 18 PHILADELPHIA, PA 1 674 8,088170 YAKIMA, WA 20 WASHINGTON, DC 1 674 8,088170 YAKIMA, WA 122 HOUSTON, TX 2 1,315 15,780170 YAKIMA, WA 141 TOPEKA, KS 1 1,029 12,348170 YAKIMA, WA 176 SAN FRANCISCO-OAKLAND-SAN JOSE 2 742 8,904170 YAKIMA, WA 177 SACRAMENTO, CA 1 397 4,764170 YAKIMA, WA 178 STOCKTON-MODESTO, CA 1 345 4,140170 YAKIMA, WA 179 FRESNO-BAKERSFIELD, CA 1 397 4,764170 YAKIMA, WA 180 LOS ANGELES, CA 2 742 8,904170 YAKIMA, WA 12 6,315 75,780171 SEATTLE, WA 4 BOSTON, MA 1 674 8,088171 SEATTLE, WA 65 CLEVELAND, OH 2 2,058 24,696171 SEATTLE, WA 125 DALLAS-FORT WORTH, TX 1 1,029 12,348171 SEATTLE, WA 160 ALBUQUERQUE, NM 1 614 7,368171 SEATTLE, WA 162 PHOENIX, AZ 1 345 4,140171 SEATTLE, WA 176 SAN FRANCISCO-OAKLAND-SAN JOSE 9 3,261 39,132

ALK Appendix Table 6 PAGE 8
TRAM DATA PRESUMED TO FIT RAIL NETWORK BY BEA ORIGIN AND DESTINATION
FACTORED SITING MONTHLY
ORIGIN BEA DESTINATION BEA COUNT COUNT171 SEATTLE, WA 177 SACRAMENTO, CA 3 1,035171 SEATTLE, WA 178 STOCKTON-MODESTO, CA 2 794171 SEATTLE, WA 180 LOS ANGELES, CA 13 4,745171 SEATTLE, WA 33 14,555172 PORTLAND, OR 12 NEW YORK, NY 2 2,058172 PORTLAND, OR 83 CHICAGO, IL 1 1,029172 PORTLAND, OR 125 DALLAS-FORT WORTH, TX 1 1,029172 PORTLAND, OR 143 OMAHA, NE 1 1,029172 PORTLAND, OR 162 PHOENIX, AZ 2 742172 PORTLAND, OR 165 SALT LAKE CITY-OGDEN, UT 1 1,029172 PORTLAND, OR 174 REDDING, CA 1 345172 PORTLAND, OR 176 SAN FRANCISCO-OAKLAND-SAN JOSE 2 742172 PORTLAND, OR 177 SACRAMENTO, CA 7 2,415172 PORTLAND, OR 178 STOCKTON-MODESTO, CA 3 1,087172 PORTLAND, OR 179 FRESNO-BAKERSFIELD, CA 1 345172 PORTLAND, OR 180 LOS ANGELES, CA 14 5,263172 PORTLAND, OR 36 17,113173 EUGENE, OR 177 SACRAMENTO, CA 1 345173 EUGENE, OR 180 LOS ANGELES, CA 1 345173 EUGENE, OR 2 690174 REDDING, CA 171 SEATTLE, WA 2 690174 REDDING, CA 176 SAN FRANCISCO-OAKLAND-SAN JOSE 2 690174 REDDING, CA 4 1,380176 SAN FRANCISCO-OAKLAND-SAN JOSE 12 NEW YORK, NY 1 1,029176 SAN FRANCISCO-OAKLAND-SAN JOSE 18 PHILADELPHIA, PA 1 410176 SAN FRANCISCO-OAKLAND-SAN JOSE 96 MINNEAPOLIS-ST. PAUL, MN 1 674176 SAN FRANCISCO-OAKLAND-SAN JOSE 105 KANSAS CITY, MO 2 2,058176 SAN FRANCISCO-OAKLAND-SAN JOSE 113 NEW ORLEANS, LA 1 641176 SAN FRANCISCO-OAKLAND-SAN JOSE 122 HOUSTON, TX 1 410176 SAN FRANCISCO-OAKLAND-SAN JOSE 125 DALLAS-FORT WORTH, TX 2 1,336176 SAN FRANCISCO-OAKLAND-SAN JOSE 162 PHOENIX, AZ 1 410
FACTOREDANNUALCOUNT12,4209,52856,940174,66024.69612.34812.34812.3488.90412.3484.1408.904 28,980 13,0444.140 63,156205,3564.1404.1408,2808,2808,28016,56012.3484.920 8,08824.696 7,6924.920 16,0324.920

ALK Appendix Table 6 PAGE 9TRAM DATA PRESUMED TO FIT RAIL NETWORK
BY BEA ORIGIN AND DESTINATIONFACTORED FACTORED
SITING MONTHLY ANNUALORIGIN BEA DESTINATION BEA COUNT COUNT COUNT176 SAN FRANCISCO-OAKLAND-SAN JOSE 168 SPOKANE, WA 4 1,432 17,184176 SAN FRANCISCO-OAKLAND-SAN JOSE 171 SEATTLE, WA 12 4,244 50,928176 SAN FRANCISCO-OAKLAND-SAN JOSE 172 PORTLAND, OR 7 2,571 30,852176 SAN FRANCISCO-OAKLAND-SAN JOSE 174 REDDING, CA 5 1,777 21,324176 SAN FRANCISCO-OAKLAND-SAN JOSE 180 LOS ANGELES, CA 1 722 8,664176 SAN FRANCISCO-OAKLAND-SAN JOSE 39 17,714 212,568177 SACRAMENTO, CA 12 NEW YORK, NY 1 674 8,088177 SACRAMENTO, CA 18 PHILADELPHIA, PA 1 1,029 12,348177 SACRAMENTO, CA 71 DETROIT, MI 1 1,029 12,348177 SACRAMENTO, CA 83 CHICAGO, IL 1 1,029 . 12,348177 SACRAMENTO, CA 107 ST. LOUIS, MO 1 641 7,692177 SACRAMENTO, CA 139 WICHITA, KS 2 2,058 24,696177 SACRAMENTO, CA 144 GRAND ISLAND, NE 1 i, 029 12,348177 SACRAMENTO, CA 162 PHOENIX, AZ 1 722 8,664177 SACRAMENTO, CA 168 SPOKANE, WA 1 345 4,140177 SACRAMENTO, CA 172 PORTLAND, OR 6 2,070 24,840177 SACRAMENTO, CA 174 REDDING, CA 2 690 8,280177 SACRAMENTO, CA 18 11,316 135,792178 STOCKTON-MODESTO, CA 4 BOSTON, MA 1 641 7,692178 STOCKTON-MODESTO, CA 6 HARTFORD-NEW HAVEN-SPRINGFLD, 1 641 7,692178 STOCKTON-MODESTO, CA 15 ERIE, PA 1 614 7,368178 STOCKTON-MODESTO, CA 18 PHILADELPHIA, PA 1 674 8,088178 STOCKTON-MODESTO, CA 19 BALTIMORE, MD 1 722 8,664178 STOCKTON-MODESTO, CA 83 CHICAGO, IL 1 1,029 12,348178 STOCKTON-MODESTO, CA 98 DUBUQUE, IA 1 1,029 12,348178 STOCKTON-MODESTO, CA 122 HOUSTON, TX 3 1,746 20,952178 STOCKTON-MODESTO, CA 125 DALLAS-FORT WORTH, TX 5 3,340 40,080178 STOCKTON-MODESTO, CA 139 WICHITA, KS 1 674 8,088178 STOCKTON-MODESTO, CA 143 OMAHA, NE 1 674 8,088178 STOCKTON-MODESTO, CA 168 SPOKANE, WA 1 345 4,140178 STOCKTON-MODESTO, CA 170 YAKIMA, WA 1 397 4,764178 STOCKTON-MODESTO, CA 171 SEATTLE, WA 10 3,606 43,272178 STOCKTON-MODESTO, CA 172 PORTLAND, OR 6 2,278 27,336

TRAM DATA PRESUMED TO FIT RAIL NETWORK BY BEA ORIGIN AND DESTINATION
ALK Appendix Table 6 PAGE 10
FACTORED FACTOREDORIGIN BEA DESTINATION BEA
SITINGCOUNT
MONTHLYCOUNT
ANNUALCOUNT
178 STOCKTON-MODESTO, CA 173 EUGENE, OR 1 345 4,140178 STOCKTON-MODESTO, CA 36 18,755 225,060179 FRESNO-BAKERSFIELD, CA 12 NEW YORK, NY 1 641 7,692179 FRESNO-BAKERSFIELD, CA 19 BALTIMORE, MD 2 820 9,840179 FRESNO-BAKERSFIELD, CA 20 WASHINGTON, DC 2 1,282 15,384179 FRESNO-BAKERSFIELD, CA 71 DETROIT, MI 2 1,282 15,384179 FRESNO-BAKERSFIELD, CA 83 CHICAGO, IL 1 674 8,088179 FRESNO-BAKERSFIELD, CA 105 KANSAS CITY, MO 1 674 8,088179 FRESNO-BAKERSFIELD, CA 111 LITTLE ROCK-N. LITTLE ROCK, AR 1 410 4,920179 FRESNO-BAKERSFIELD, CA 125 DALLAS-FORT WORTH, TX i 641 7,692179 FRESNO-BAKERSFIELD, CA 135 AMARILLO, TX l 641 7,692179 FRESNO-BAKERSFIELD, CA 162 PHOENIX, AZ l 410 4,920179 FRESNO-BAKERSFIELD, CA 171 SEATTLE, WA 4 1,484 17,808179 FRESNO-BAKERSFIELD, CA 172 PORTLAND, OR 1 397 4,764179 FRESNO-BAKERSFIELD, CA 173 EUGENE, OR 1 345 4,140179 FRESNO-BAKERSFIELD, CA 19 9,701 116,412180 LOS ANGELES, CA 4 BOSTON, MA 5 3,373 40,476180 LOS ANGELES, CA 7 ALBANY-SCHENECTADY-TROY, NY 1 614 7,368180 LOS ANGELES, CA 10 BUFFALO, NY 1 410 4,920180 LOS ANGELES, CA 12 NEW YORK, NY 12 8,016 96,192180 LOS ANGELES, CA 16 PITTSBURGH, PA 2 1,024 12,288180 LOS ANGELES, CA 17 HARRISBURG-YORK-LANCASTER, PA 1 614 7,368180 LOS ANGELES, CA 18 PHILADELPHIA, PA 2 1,132 13,584180 LOS ANGELES, CA 19 BALTIMORE, MD 1 722 8,664180 LOS ANGELES, CA 20 WASHINGTON, DC 4 2,360 28,320180 LOS ANGELES, CA 55 MEMPHIS, TN 4 2,156 25,872180 LOS ANGELES, CA 65 CLEVELAND, OH 2 1,024 12,288180 LOS ANGELES, CA 70 TOLEDO, OH 1 410 4,920180 LOS ANGELES, CA 71 DETROIT, MI 4 2,564 30,768180 LOS ANGELES, CA 74 LANSING-KALAMAZOO, MI 1 614 7,368180 LOS ANGELES, CA 83 CHICAGO, IL 9 5,625 67,500180 LOS ANGELES, CA 96 MINNEAPOLIS-ST. PAUL, MN 5 3,070 36,840180 LOS ANGELES, CA 104 DES MOINES, IA 2 1,643 19,716

ALK PAGE 1 1
TRAM DATA PRESUMED TO FIT RAIL NETWORK BY BEA ORIGIN AND DESTINATION
Appendix Table 6
ORIGIN BEA DESTINATION BEASITINGCOUNT
FACTOREDMONTHLY
COUNTFACTOREDANNUALCOUNT
180 LOS ANGELES, CA 105 KANSAS CITY, MO 1 614 7,368180 LOS ANGELES, CA 111 LITTLE ROCK-N. LITTLE ROCK, AR 3 1,746 20,952180 LOS ANGELES, CA 113 NEW ORLEANS, LA 3 1,542 18,504180 LOS ANGELES, CA 122 HOUSTON, TX 8 5,668 68,016180 LOS ANGELES, CA 123 AUSTIN, TX 2 1,444 17,328180 LOS ANGELES, CA 125 DALLAS-FORT WORTH, TX 12 7,416 88,992180 LOS ANGELES, CA 133 EL PASO, TX 1 410 4,920180 LOS ANGELES, CA 135 AMARILLO, TX 1 614 7,368180 LOS ANGELES, CA 139 WICHITA, KS 1 614 7,368180 LOS ANGELES, CA 141 TOPEKA, KS 1 614 7,368180 LOS ANGELES, CA ' 160 ALBUQUERQUE, NM 5 3,178 38,136180 LOS ANGELES, CA 161 TUCSON, AZ 8 5,776 69,312180 LOS ANGELES, CA 162 PHOENIX, AZ 7 3,182 38,184180 LOS ANGELES, CA 168 SPOKANE, WA 3 1,139 13,668180 LOS ANGELES, CA 170 YAKIMA, WA 1 397 4,764180 LOS ANGELES, CA 171 SEATTLE, WA 26 9,334 112,008180 LOS ANGELES, CA 172 PORTLAND, OR 19 6,867 82,404180 LOS ANGELES, CA 174 REDDING, CA 2 690 8,280180 LOS ANGELES, CA 176 SAN FRANCISCO-OAKLAND-SAN JOSE 1 345 4,140180 LOS ANGELES, CA 177 SACRAMENTO, CA 1 397 4,764180 LOS ANGELES, CA 179 FRESNO-BAKERSFIELD, CA 1 345 4,140180 LOS ANGELES, CA 180 LOS ANGELES, CA 2 820 9,840180 LOS ANGELES, CA 166 88,523 1,062,276
602 342,092 4,105,104

Appendix Table 7PAGE 1
INTERMODAL HUB VOLUMES FOR YEAR 1987BASED ON COMBINED INTERMODAL, BOXABLE, AND TRAM DIVERSION FEUSDATA SOURCES: 1987 ICC CARLOAD WAYBILL SAMPLE AND TRAM TRUCK DIVERSIONS
BEA NUMBER AND NAME1 BANGOR, ME2 PORTLAND-LEWISTON, ME3 BURLINGTON, VT4 BOSTON, MA6 HARTFORD-NEW HAVEN-SPRINGFLD, CT-MA7 ALBANY-SCHENECTADY-TROY, NY8 SYRACUSE-UTICA, NY9 ROCHESTER, NY10 BUFFALO, NY11 BINGHAMTON-ELMIRA, NY12 NEW YORK, NY14 WILLIAMSPORT, PA15 ERIE, PA16 PITTSBURGH, PA17 HARRISBURG-YORK-LANCASTER, PA18 PHILADELPHIA, PA19 BALTIMORE, MD20 WASHINGTON, DC21 ROANOKE-LYNCHBURG, VA22 RICHMOND, VA23 NORFOLK-VIRGINIA BCH-NEWPT NEWS, VA24 ROCKY MNT-WILSON-GREENVILLE, NC25 WILMINGTON, NC26 FAYETTEVILLE, NC28 GREENSBORO-WINSTON-SALEM-HIGHPNT, NC29 CHARLOTTE, NC30 ASHEVILLE, NC31 GREENVILLE-SPARTANBURG, SC34 CHARLESTON-NORTH CHARLESTON, SC35 AUGUSTA, GA36 ATLANTA, GA37 COLUMBUS, GA38 MACON, GA39 SAVANNAH, GA40 ALBANY, GA41 JACKSONVILLE, FL42 ORLANDO-MELBOURNE-DAYTONA BEACH, FL43 MIAMI-FORT LAUDERDALE, FL44 TAMPA-ST. PETERSBURG, FL46 PENSACOLA-PANAMA CITY, FL47 MOBILE, AL48 MONTGOMERY, AL49 BIRMINGHAM, AL50 HUNTSVILLE-FLORENCE, AL51 CHATTANOOGA, TN52 JOHNSON CTY-KINGSPT-BRISTOL, TN-VA53 KNOXVILLE, TN54 NASHVILLE, TN55 MEMPHIS, TN56 PADUCAH, KY
FEUS FEUS TOTAL FEUORIGINATED TERMINATED VOLUME
440 80 52080 400 480
2,544 2,236 4,78081,891 143,950 225,84137,880 35,905 73,78522,440 15,503 37,94328,136 9,840 37,97644,789 8,525 53,31434,171 29,020 63,191
360 1,000 1,360355,306 436,127 791,433
100 0 1007,692 7,368 15,06015,648 20,416 36,06425,833 48,049 73,882140,837 202,708 343,54571,051 113,204 184,25555,568 117,176 172,7441,000 1,080 2,0802,600 3,640 6,24055,580 55,564 111,1441,400 1,120 2,5205,840 4,920 10,760320 0 320
14,160 13,760 27,92021,980 23,000 44,9802,940 2,160 5,1006,840 5,520 12,36051,228 62,536 113,7642,640 520 3,160
141,684 122,072 263,7561,800 960 2,76020,120 4,960 25,08055,692 59,520 115,2122,280 680 2,960
141,732 152,040 293,77220,920 34,200 55,12083,848 174,068 257,91615,240 38,600 53,840400 180 58026,420 14,652 41,0726,760 2,720 9,48043,300 40,504 83,8045,000 3,320 8,32021,760 11,880 33,64014,880 9,560 24,4403,400 3,960 7,36029,320 23,880 53,200191,356 152,441 343,7971,100 1,380 2,480

PAGE 2Appendix Table 7INTERMODAL HUB VOLUMES FOR YEAR 1987BASED ON COMBINED INTERMODAL, BOXABLE, AND TRAM DIVERSION FEUSDATA SOURCES: 1987 ICC CARLOAD WAYBILL SAMPLE AND TRAM TRUCK DIVERSIONS
BEA NUMBER AND NAME57 LOUISVILLE, KY58 LEXINGTON, KY65 CLEVELAND, OH66 COLUMBUS, OH67 CINCINNATI, OH70 TOLEDO, OH71 DETROIT, MI72 SAGINAW-BAY CITY, MI73 GRAND RAPIDS, MI74 LANSING-KALAMAZOO, MI75 SOUTH BEND, IN76 FORT WAYNE, IN78 ANDERSON-MUNCIE, IN79 INDIANAPOLIS, IN80 EVANSVILLE, IN82 LAFAYETTE, IN83 CHICAGO, IL84 CHAMPAIGN-URBANA, IL85 SPRINGFIELD-DECATUR, IL86 QUINCY, IL87 PEORIA, IL88 ROCKFORD, IL89 MILWAUKEE, WI90 MADISON, WI91 LA CROSSE, WI92 EAU CLAIRE, WI93 WAUSAU, WI94 APLETON-GREEN BAY-OSHKOSH, WI95 DULUTH, MN96 MINNEAPOLIS—ST. PAUL, MN99 DAVENPORT-ROCK ISLAND-MOLINE, IA-IL100 CEDAR RAPIDS, IA101 WATERLOO, IA102 FORT DODGE, IA103 SIOUX CITY, IA104 DES MOINES, IA105 KANSAS CITY, MO107 ST. LOUIS, MO108 SPRINGFIELD, MO110 FORT SMITH, AR111 LITTLE ROCK-N. LITTLE ROCK, AR112 JACKSON, MS113 NEW ORLEANS, LA114 BATON ROUGE, LA116 LAKE CHARLES, LA117 SHREVEPORT, LA118 MONROE, LA119 TEXARKANA, TX120 TYLER-LONGVIEW, TX121 BEAUMONT-PORT ARTHUR, TX
FEUS FEUS TOTAL FEUORIGINATED TERMINATED VOLUME
31,580 26,056 57,636960 1,160 2,120
48,057 55,117 103,17442,775 33,204 75,97955,952 44,436 100,38828,345 15,450 43,795117,439 129,367 246,806
0 100 1002,200 520 2,720
0 7,368 7,368120 100 220
8,968 1,040 10,0080 80 80
5,860 7,938 13,7988,200 4,520 12,7204,436 8,068 12,504
1,402,006 1,258,487 2,660,493280 160 440
8,782 0 8,782120 0 120
17,780 11,132 28,9120 3,904 3,904
10,980 10,200 21,1801,120 200 1,320
80 0 80880 700 1,580700 Is, 100 1,800
9,800 7,920 17,7200 80 80
98,695 126,853 225,54817,468 1,164 18,63213,748 800 14,548
120 0 120480 0 480960 100 1,060
47,036 24,316 71,352213,494 187,277 400,771203,948 158,250 362,1989,960 12,056 22,0166,960 1,200 8,16040,824 34,572 75,3966,780 10,600 17,380144,944 171,905 316,8493,400 440 3,8402,348 2,280 4,6283,380 3,132 6,5120 40 404,180 2,320 6,5009,660 4,080 13,74020,210 400 20,610

Appendix Table 7 PAGE 3INTERMODAL HUB VOLUMES FOR YEAR 1987BASED ON COMBINED INTERMODAL, BOXABLE, AND TRAM DIVERSION FEUSDATA SOURCES: 1987 ICC CARLOAD WAYBILL SAMPLE AND TRAM TRUCK DIVERSIONS
BEA NUMBER AND NAME122 HOUSTON, TX123 AUSTIN, TX124 WACO-KILLEEN-TEMPLE, TX125 DALLAS-FORT WORTH, TX 127 ABILENE, TX129 SAN ANTONIO, TX130 CORPUS CHRISTI, TX131 BROWNSVILLE-MCALLEN-HARLINGEN, TX132 ODESSA-MIDLAND, TX133 ELPASO, TX134 LUBBOCK, TX135 AMARILLO, TX137 OKLAHOMA CITY, OK138 TULSA, OK139 WICHITA, KS141 TOPEKA, KS142 LINCOLN, NE143 OMAHA, NE144 GRAND ISLAND, NE145 SCOTTSBLUFF, NE146 RAPID CITY, SD147 SIOUX FALLS, SD149 FARGO-MOORHEAD, ND-MN150 GRAND FORKS, ND153 GREAT FALLS, MT154 MISSOULA, MT155 BILLINGS, MT156 CHEYENNE-CASPER, WY157 DENVER, CO158 COLORADO SPRINGS-PUEBLO, CO159 GRAND JUNCTION, CO160 ALBUQUERQUE, NM161 TUCSON, AZ162 PHOENIX AZ163 LAS VEGAS, NV164 RENO, NV165 SALT LAKE CITY-OGDEN, UT166 POCATELLO-IDAHO FALLS, ID167 BOISE CITY, ID168 SPOKANE, WA169 RICHLAND, WA170 YAKIMA, WA171 SEATTLE, WA172 PORTLAND, OR173 EUGENE, OR174 REDDING, CA176 SAN FRANCISCO-OAKLAND-SAN JOSE, CA177 SACRAMENTO, CA178 STOCKTON-MODESTO, CA179 FRESNO-BAKERSFIELD, CA
FEUS FEUS TOTAL FEUORIGINATED TERMINATED VOLUME
164,562 248,419 412,981100 17,648 17,748780 600 1,380
409,703 390,574 800,27740 0 40
37,160 30,724 67,884180 920 1,100
3,640 1,744 5,3848,932 40 8,97231,024 21,620 52,6442,388 3,192 5,58029,845 21,394 51,2397,364 18,668 26,03214,764 16,574 . 31,33826,846 16,476 43,3225,575 8,688 14,26310,820 5,308 16,12870,834 68,484 139,318
120 12,348 12,468240 400 640800 0 8000 40 40
4,360 3,640 8,0002,560 200 2,760520 760 1,280
8,304 400 8,7044,960 4,240 9,20014,628 2,000 16,62855,381 85,864 141,245
80 700 780180 1,300 1,480
10,776 55,716 66,4921,220 12,889 14,109
90,687 247,510 338,1971,120 2,520 3,6406,200 72,173 78,373
46,484 135,400 181,8841,360 520 1,8802,320 1,052 3,37233,696 48,502 82,19844,403 19,788 64,19152,993 12,928 65,921395,743 449,164 844,907273,380 321,483 594,86354,993 320 55,31340 40 80316,927 510,224 827,151103,011 61,406 164,417241,973 102,748 344,721165,137 47,964 213,101

PAGE 4INTERMODAL HUB VOLUMES FOR YEAR 1987
BASED ON COMBINED INTERMODAL, BOXABLE, AND TRAM DIVERSION FEUS DATA SOURCES: 1987 ICC CARLOAD WAYBILL SAMPLE AND TRAM TRUCK DIVERSIONS
Appendix table 7
FEUS FEUS TOTAL FEUBEA NUMBER AND NAME ORIGINATED TERMINATED VOLUME180 LOS ANGELES, CA 1,454,438 1,204,944 2,659,382181 SAN DIEGO, CA 4,368 3,008 7,376185 MARITIMES 2,280 0 2,280186 QUEBEC 57,260 0 57,260187 ONTARIO 24,960 11,000 35,960188 MANITOBA 1,500 0 1,500189 SASKATCHEWAN 200 0 200190 ALBERTA 3,840 0 3,840191 BRITISH COLUMBIA 11,920 3,320 15,240192 PUERTO RICO 440 0 440

Appendix Table 8 PAGE 1
INTERMODAL HUB VOLUMES FOR YEAR 2000 BASED ON COMBINED INTERMODAL, BOXABLE, AND TRAM DIVERSION FEUS
DATA SOURCES: 1987 ICC CARLOAD WAYBILL SAMPLE WITH ASSUMED 4 PERCENT ANNUAL GROWTH AND TRAM TRUCK DIVERSIONS
BEA NUMBER AND NAME1 BANGOR, ME2 PORTLAND-LEWISTON, ME3 BURLINGTON, VT4 BOSTON, MA6 HARTFORD-NEW HAVEN-SPRINGFLD, CT-MA7 ALBANY-SCHENECTADY-TROY, NY8 SYRACUSE-UTICA, NY9 ROCHESTER, NY10 BUFFALO, NY11 BINGHAMTON-ELMIRA, NY12 NEW YORK, NY14 WILLIAMSPORT, PA15 ERIE, PA16 PITTSBURGH, PA17 HARRISBURG-YORK-LANCASTER, PA18 PHILADELPHIA, PA19 BALTIMORE, MD20 WASHINGTON, DC21 ROANOKE-LYNCHBURG, VA22 RICHMOND, VA23 NORFOLK-VIRGINIA BCH-NEWPT NEWS, VA24 ROCKY MNT-WILSON-GREENVILLE, NC25 WILMINGTON, NC26 FAYETTEVILLE, NC28 GREENSBORO-WINSTON-SALEM-HIGHPNT, NC29 CHARLOTTE, NC30 ASHEVILLE, NC31 GREENVILLE-SPARTANBURG, SC34 CHARLESTON-NORTH CHARLESTON, SC35 AUGUSTA, GA36 ATLANTA, GA37 COLUMBUS, GA38 MACON, GA39 SAVANNAH, GA40 ALBANY, GA41 JACKSONVILLE, FL42 ORLANDO-MELBOURNE-DAYTONA BEACH, FL43 MIAMI-FORT LAUDERDALE, FL44 TAMPA-ST. PETERSBURG, FL46 PENSACOLA-PANAMA CITY, FL47 MOBILE, AL48 MONTGOMERY, AL49 BIRMINGHAM, AL50 HUNTSVILLE-FLORENCE, AL51 CHATTANOOGA, TN52 JOHNSON CTY-KINGSPT-BRISTOL, TN-VA53 KNOXVILLE, TN54 NASHVILLE, TN55 MEMPHIS, TN
FEUS FEUS TOTAL FEUORIGINATED TERMINATED VOLUME
733 133 866134 669 803
4,236 3,723 7,959120,011 202,758 322,76949,485 54,672 104,15724,037 20,915 44,95233,259 16,388 49,64749,215 14,196 63,41138,192 36,838 75,030
601 1,666 2,267507,453 623,809 1,131,262
167 0 1677,692 7,368 15,06020,678 25,824 46,50237,637 75,109 112,746183,302 306,250 489,552108,076 170,425 278,50184,318 160,663 244,9811,667 1,800 3,4674,330 6,061 10,39192,544 92,520 185,0642,331 1,865 4,1969,725 8,192 17,917533 0 533
23,578 22,915 46,49336,604 38,298 74,9024,897 3,597 8,49411,391 9,196 20,58785,303 104,129 189,4324,396 866 5,262
235,913 203,259 439,1722,999 1,598 4,59733,506 8,264 41,77092,731 99,108 191,8393,799 1,134 4,933
235,996 253,162 489,15834,834 56,947 91,781139,615 289,837 429,45225,378 64,272 89,650
666 301 96743,993 24,399 68,39211,259 4,533 15,79272,096 67,442 139,5388,327 5,529 13,85636,234 19,786 56,02024,776 15,922 40,6985,665 6,597 12,26248,819 39,764 88,583
299,794 236,622 536,416

Appendix Table 8 PAGE 2
INTERMODAL HUB VOLUMES FOR YEAR 2000 BASED ON COMBINED INTERMODAL, BOXABLE, AND TRAM DIVERSION FEUS
DATA SOURCES: 1987 ICC CARLOAD WAYBILL SAMPLE WITH ASSUMED 4 PERCENT ANNUAL GROWTH AND TRAM TRUCK DIVERSIONS
FEUS FEUS TOTAL FEUBEA NUMBER AND NAME ORIGINATED TERMINATED VOLUME56 PADUCAH, KY57 LOUISVILLE, KY58 LEXINGTON, KY65 CLEVELAND, OH66 COLUMBUS, OH67 CINCINNATI, OH70 TOLEDO, OH71 DETROIT, MI72 SAGINAW-BAY CITY, MI73 GRAND RAPIDS, MI74 LANSING-KALAMAZOO, MI75 SOUTH BEND, IN76 FORT WAYNE, IN78 ANDERSON-MUNCIE, IN79 INDIANAPOLIS, IN80 EVANSVILLE, IN82 LAFAYETTE, IN83 CHICAGO, IL84 CHAMPAIGN-URBANA, IL85 SPRINGFIELD-DECATUR, IL86 QUINCY, IL87 PEORIA, IL88 ROCKFORD, IL89 MILWAUKEE, WI90 MADISON, WI91 LA CROSSE, WI92 EAU CLAIRE, WI93 WAUSAU, WI94 APLETON-GREEN BAY-OSHKOSH, WI95 DULUTH, MN96 MINNEAPOLIS-ST. PAUL, MN99 DAVENPORT-ROCK ISLAND-MOLINE, IA-IL100 CEDAR RAPIDS, IA101 WATERLOO, IA102 FORT DODGE, IA103 SIOUX CITY, IA104 DES MOINES, IA105 KANSAS CITY, MO107 ST. LOUIS, MO108 SPRINGFIELD, MO110 FORT SMITH, AR111 LITTLE ROCK-N. LITTLE ROCK, AR112 JACKSON, MS113 NEW ORLEANS, LA114 BATON ROUGE, LA116 LAKE CHARLES, LA117 SHREVEPORT, LA118 MONROE, LA119 TEXARKANA, TX
1,833 2,300 4,13352,585 43,391 95,9761,603 1,934 3,537
58,865 67,179 126,04471,226 55,289 126,51593,172 73,994 167,16638,987 25,729 64,716171,940 163,002 334,942
0 167 1673,664 866 4,530
0 7,368 7,368200 167 367
9,553 1,731 11,2840 134 134
9,760 13,219 22,97913,651 7,529 21,1807,387 13,434 20,821
2,215,015 2,017,302 4,232,317466 267 733
8,860 0 8,860200 0 200
29,610 18,537 48,1470 6,501 6,501
18,287 16,988 35,2751,868 334 2,202133 0 133
1,466 1,166 2,6321,166 1,833 2,99916,321 13,190 29,511
0 134 134146,326 181,346 327,67220,875 1,940 22,81514,681 1,334 16,015
200 0 200799 0 799
1,599 167 1,76655,194 27,378 82,572328,572 285,131 613,703333,829 263,508 597,33716,589 20,075 36,66411,590 1,998 13,58850,770 40,362 91,13211,291 17,654 28,945229,040 268,817 497,8575,664 735 6,3993,910 3,798 7,7085,631 5,216 10,8470 67 676,961 3,864 10,825

Appendix Table 8 PAGE 3INTERMODAL HUB VOLUMES FOR YEAR 2000
BASED ON COMBINED INTERMODAL, BOXABLE, AND TRAM DIVERSION FEUS DATA SOURCES: 1987 ICC CARLOAD WAYBILL SAMPLE WITH ASSUMED 4 PERCENT
ANNUAL GROWTH AND TRAM TRUCK DIVERSIONS
BEA NUMBER AND NAME120 TYLER-LONGVIEW, TX121 BEAUMONT-PORT ARTHUR, TX122 HOUSTON, TX123 AUSTIN, TX124 WACO-KILLEEN-TEMPLE, TX125 DALLAS-FORT WORTH, TX 127 ABILENE, TX129 SAN ANTONIO, TX130 CORPUS CHRISTI, TX131 BROWNSVILLE-MCALLEN-HARLINGEN, TX132 ODESSA-MIDLAND, TX133 ELPASO, TX134 LUBBOCK, TX135 AMARILLO, TX137 OKLAHOMA CITY, OK138 TULSA, OK139 WICHITA, KS141 TOPEKA, KS142 LINCOLN, NE143 OMAHA, NE144 GRAND ISLAND, NE145 SCOTTSBLUFF, NE146 RAPID CITY, SD147 SIOUX FALLS, SD149 FARGO-MOORHEAD, ND-MN150 GRAND FORKS, ND153 GREAT FALLS, MT154 MISSOULA, MT155 BILLINGS, MT156 CHEYENNE-CASPER, WY157 DENVER, CO158 COLORADO SPRINGS-PUEBLO, CO159 GRAND JUNCTION, CO160 ALBUQUERQUE, NM161 TUCSON, AZ162 PHOENIX AZ163 LAS VEGAS, NV164 RENO, NV165 SALT LAKE CITY-OGDEN, UT166 POCATELLO-IDAHO FALLS, ID167 BOISE CITY, ID168 SPOKANE, WA169 RICHLAND, WA170 YAKIMA, WA171 SEATTLE, WA172 PORTLAND, OR173 EUGENE, OR174 REDDING, CA176 SAN FRANCISCO-OAKLAND-SAN JOSE, CA
FEUS FEUS TOTAL FEUORIGINATED TERMINATED VOLUME
16,088 6,796 22,88423,838 667 24,505268,254 351,195 619,449
167 17,861 18,0281,299 999 2,298
488,595 524,888 1,013,48367 0 67
61,877 51,160 113,037301 1,532 1,833
6,062 2,906 8,9689,111 67 9,17838,158 29,559 67,7173,975 5,316 9,29136,407 25,608 62,01512,263 31,085 43,34824,587 27,597 52,18434,685 17,156 51,8419,284 9,566 18,85018,022 8,836 26,858101,688 108,657 210,345
200 12,348 12,548400 666 1,066
1,332 0 1,3320 67 67
7,261 6,063 13,3244,262 333 4,595867 1,267 2,134
13,828 666 14,4948,261 7,060 15,32116,145 3,330 19,47592,215 142,976 235,191
134 1,166 1,300300 2,165 2,465
13,043 62,511 75,5542,031 15,699 17,730102,225 290,181 392,4061,865 4,197 6,06210,329 79,402 89,73169,189 162,876 232,0652,266 866 3,1323,865 1,752 5,61741,928 54,736 96,66455,757 24,740 80,49756,548 15,190 71,738556,373 588,411 1,144,784373,967 394,191 768,15888,817 535 89,35267 67 134406,286 648,293 1,054,579

Appendix Table 8 PAGE 4INTERMODAL HUB VOLUMES FOR YEAR 2000
BASED ON COMBINED INTERMODAL, BOXABLE, AND TRAM DIVERSION FEUS DATA SOURCES: 1987 ICC CARLOAD WAYBILL SAMPLE WITH ASSUMED 4 PERCENT
ANNUAL GROWTH AND TRAM TRUCK DIVERSIONSFEUS FEUS TOTAL FEU
BEA NUMBER AND NAME ORIGINATED TERMINATED VOLUME177 SACRAMENTO, CA 124,782 72,256 197,038178 STOCKTON-MODESTO, CA 282,371 113,880 396,251179 FRESNO-BAKERSFIELD, CA 203,575 59,974 263,549180 LOS ANGELES, CA 1,810,753 1,553,448 3,364,201181 SAN DIEGO, CA 7,273 5,011 12,284185 MARITIMES 3,797 0 3,797186 QUEBEC 95,344 0 95,344187 ONTARIO 41,562 18,321 59,883188 MANITOBA 2,499 0 2,499189 SASKATCHEWAN 333 0 333190 ALBERTA 6,394 0 6,394191 BRITISH COLUMBIA 19,851 5,529 25,380192 PUERTO RICO 733 0 733

Appendix Table 9TERMINAL CAPACITY AT MAJOR HUBS
RR Terminal AcresTrackFeet
Car Capacity Estimated Flat Stack Daily Lift , Cars Cars Capacity
Estimated Lift Machines Annual Lift Side- Overcapacity loaders head Total
Actual1987Lifts
Actual1988Lifts
UP LA 120 21,390 230 70 1,870 673,258 6 6 220,000 255,000ATSF LA n o 34,503 371 113 3,017 1,085,995 9 0 9 395,280 434,778SP LA 76 17,670 190 58 1,545 556,170 4 0 4 142,240 155,769SP Long Beach/ICTF 258 22,599 243 74 1,976 711,312 8 1 9 370,000 395,943
Subtotal 564 96,162 1,034 315 ■ 8,408 3,026,735 21 7 28 1,127,520 1,241,490
UP Seattle 20 11,904 128 39 1,041 374,683 3 3 112,852 118,388BN Seattle 29 11,718 126 38 1,025 368,828 10 195,115 186,187BN Seattle 48 10,695 115 35 935 336,629 3 107,296 99,939
Subtotal 97 34,317 369 113 3,000 1,080,141 3 0 16 415,263 404,514
UP Portland 50 6,300 68 21 551 198,295 2 2 91,236 88,422BN Portland 18 9,951 107 33 870 313,211 4 94,938 99,033SP Portland 22 2,325 25 8 203 73,180 4 0 4 51,280 53,717
Subtotal 90 18,576 200 61 1,624 584,687 6 0 10 237,454 241,172
10 CNN Global One 110 15,624 168 51 1,366 491,771 2 4 6 256,000 330,300UP Chicago 32 10,416 112 34 911 327,848 2 2 83,791 77,443GT Chicago 33 7,161 77 23 626 225,395 3 2 5 59,084 60,247CR Chicago/S Layf N/A 17,577 189 58 1,537 553,243 5 5 298,273 298,007CR Chicago/51st 30 6,696 72 22 585 210,759 3 3 89,846 101,884CR Chicago/4Tth 102 11,160 120 37 976 351,265 2 1 3 165,059 166,914CSX Ch/Forest Hill 22 18,414 198 60 1,610 579,588 2 2 151,380 120,460CSX Ch/Bedford Pk 280 42,700 459 140 3,733 1,343,999 4 3 7 144,000 235,921NS Chicago 1! 11,160 120 37 976 351,265 4 2 6 125,377 135,673SOO Bensenville 47 24,180 260 79 2,114 761,075 3 1 4 104,524 80,737SOO Schiller Pk 45 7,905 85 26 691 248,813 4 4 84,078 78,111ATSF Chicago 128 27,621 297 91 2,415 869,381 2 6 8 498,098 532,673ATSF Galesburg 12 93 1 0 8 2,927 1 1 2 8,566 7,692BN Chicago/Cicero 11 29,016 312 95 2,537 913,290 10 389,602 355,935BN Chicago/S.Ave 9 6,138 66 20 537 193,196 2 48,334 41,359
Subtotal 872 235,861 2,536 773 20,622 7,423,814 33 24 69 2,506,012 2,623,356
SOO St Paul 56 3,813 41 13 333 120,016 3 3 66,747 58,118
GT Detroit 7 4,800 52 16 420 151,082 3 2 5 24,704 49,032CR Detroit 10 7,347 79 24 642 231,250 3 3 33,407 31,166NS Detroit N/A 5,952 64 20 520 187,341 1 1 2 38,904 32,320
Subtotal 17 18,099 195 59 1,582 569,673 7 3 10 97,015 112,518

Appendix Table 9TERMINAL CAPACITY AT MAJOR HUBS
Car Capacity Estimated Estimated Lift Machines Actual ActualTrack Flat Stack Daily Lift Annual Lift Side- Over 1987 1988
RR Terminal Acres Feet Cars Cars Capacity Capacity loaders head Total Lifts Lifts
NS Kansas City 3 2,700 29 9 236 84,984 0 . 0 0 16,125 14,904
UP Kansas City 6 8,370 90 27 732 263,449 1 1 38,408 45,656ATSF Kansas City 40 5,952 64 20 520 187,341 0 3 3 113,399 151,741BN Kansas City 20 7,440 80 24 650 234,177 3 63,464 86,467
Subtotal 84 27,717 298 91 2,423 872,403 3 3 9 282,301 352,381
UP Denver 45 7,750 83 25 678 243,934 1 1 30,270 24,580ATSF Denver 60 4,650 50 15 407 146,361 0 2 2 39,918 53,078BN Denver 26 8,091 87 27 707 254,667 3 95,180 106,000
Subtotal 131 20,491 220 67 1,792 644,962 1 2 6 165,368 183,658
UP Houston 5,952 64 20 520 187,341ATSF Houston 94 7,440 80 24 650 234,177 , 2 2 4 96,055 128,738SP Houston 91 11,253 121 37 984 354,192 3 1 4 132,681 146,600SP Houston/Barb Cut 5 5,487 59 18 480 172,705 2 2 34,450 35,512
Subtotal 190 30,132 324 99 2,634 948,416 5 5 10 263,186 310,850
UP St Louis 30 5,859 63 19 512 184,414 2 2 46,920 57,485CR East St Louis 45 9,951 107 33 870 313,211 4 4 134,000 141,000NS St Louis 20 7,626 82 25 667 240,031 2 2 40,104 29,627BN St Louis 14 4,464 48 15 390 140,506 2 75,819 89,424
Subtotal 109 27,900 300 91 2,439 878,163 8 0 10 296,843 317,536
NS Columbus N/A 2,697 29 9 236 84,889 1 1 N/ACR Columbus 40 4,929 53 16 431 155,142 3 3 82,888 91,422
Subtotal 40 7,626 82 25 667 240,031 4 0 4 82,888 91,422
CR Kearney, NJ . 80 16,833 181 55 1,472 529,825 8 8 343,319 341,660CR North Bergen 38 15,159 163 50 1,325 477,135 4 4 98,000 100,000CSL Little Ferry 18 6,625 71 22 579 208,524 2 2 na 43,788
Subtotal 136 38,617 415 127 3,376 1,215,485 14 0 14 441,319 485,448

Appendix Table 9TERMINAL CAPACITY AT MAJOR HUBS
Car Capacity Estimated Estimated Lift Machines Actual Actual Track ' Flat Stack Daily Lift Annual Lift Side- Over- 1987 1988
RR Terminal Acres Feet Cars Cars
CSX .Baltimore 59 7,998 86 26CR Baltimore 32 5,301 57 17
Subtotal 91 13,299 143 44
CSX New Orleans 6 5,580 60 18NS New Orleans 10 1,488 16 5
UP New Orleans 2 2,325 25 • 8SP New Orleans 34 3,162 34 10
Subtotal 52 12,555 135 . 41
CSX Atlanta 79 15,810 170 52NS Atlanta N/A 9,304 100 31
Subtotal 79 25,114 270 82
NS Memphis 9 1,953 21 6CSL Memphis N/A 1,395 15 5BN Memphis 25 5,580 60 18SP Memphis 55 5,487 59 18
Subtotal 89 14,415 155 47
Capacity Capacity - loaders head Total Lifts Lifts
699 ' 251,740 3 3 69,058 102,469463 166,851 2 2 59,000 71,000
1,163 418,591 5 0 5 128,058 173,469
488 175,633 2 2 54,541 79,827130 46,835. 2 2 25,500 22,000
203 73,180 1 1 26,203 11,367276 99,525 2 . 0 2 63,356 65,484
1,098 395,173 3 4 7 169,600 178,678
1,382 497,626 3 1 4 194,542 202,789813 292,847 2 6 8 146,588 169,727
2,196 - 790,473 5 7 12 341,130 372,516
171 61,47.1 2 2 35,000 35,000122 43,908 2 2 42,883 56,333488 175,633 3 91,860 102,967480 ' 172,705 2 0 2 80,850 82,755
1,260 453,718 4 2 - 9 250,593 277,055
Source: Railroad contacts and published descriptions.
Related Documents