Double Learning and Performance Improvement with the Bal- anced Scorecard – A Simulation Based Experiment Carlos Capelo PhD Student ISCTE Ald. Vale S.Gião, 50, 2665-381 Milharado, Portugal Phone: +351962831740 [email protected] João Ferreira Dias Associate Professor ADETTI/ISCTE Av das Forças Armadas, 1649-026 Lisboa, Portugal Phone: +351938450825 [email protected] Abstract Kaplan and Norton propose a double-loop process that integrates the concepts of Bal- anced Scorecard and Strategy Map to support managers to define and implement the firm strategy more effectively. The BSC is a performance management system based on a set of few and critical indicators. These key performance indicators are linked to- gether in a causal diagram that represents the hypotheses about the strategy. This approach supports what Argyris calls double-loop learning which facilitates the strategic learning of managers and leads to better performance. This type of learning produces changes in manager assumptions about cause-and-effect relationships and leads to a better understanding of the context, what means a process by which manag- ers can explicit and improve their mental models about the business system. This article describes a simulation-based research for testing a system of hypotheses about the influence of the BSC approach on strategic learning and performance, which uses a System Dynamics-based micro world. Key words: Balanced Scorecard, Simulation Experiment, Double Learning, Mental Model, System Dynamics 1. Improving Double-Loop Learning and Performance with the BSC approach The Balanced Scorecard Approach Kaplan and Norton (1992, 1996a) introduced the Balanced Scorecard (BSC) with the aim to overcome some strategic management limitations of the traditional performance measurement systems that were based mainly on financial measures. In this approach a mix of lead (performance drivers) and lag (outcome measures) indicators, and of finan-

Welcome message from author
This document is posted to help you gain knowledge. Please leave a comment to let me know what you think about it! Share it to your friends and learn new things together.
Transcript

Double Learning and Performance Improvement with the Bal-
anced Scorecard – A Simulation Based Experiment
Carlos Capelo PhD Student
ISCTE
Ald. Vale S.Gião, 50, 2665-381 Milharado, Portugal
Phone: +351962831740
João Ferreira Dias
Associate Professor
ADETTI/ISCTE
Av das Forças Armadas, 1649-026 Lisboa, Portugal
Phone: +351938450825
Abstract
Kaplan and Norton propose a double-loop process that integrates the concepts of Bal-
anced Scorecard and Strategy Map to support managers to define and implement the
firm strategy more effectively. The BSC is a performance management system based on
a set of few and critical indicators. These key performance indicators are linked to-
gether in a causal diagram that represents the hypotheses about the strategy.
This approach supports what Argyris calls double-loop learning which facilitates the
strategic learning of managers and leads to better performance. This type of learning
produces changes in manager assumptions about cause-and-effect relationships and
leads to a better understanding of the context, what means a process by which manag-
ers can explicit and improve their mental models about the business system.
This article describes a simulation-based research for testing a system of hypotheses
about the influence of the BSC approach on strategic learning and performance, which
uses a System Dynamics-based micro world.
Key words: Balanced Scorecard, Simulation Experiment, Double Learning, Mental
Model, System Dynamics
1. Improving Double-Loop Learning and Performance with the BSC approach
The Balanced Scorecard Approach
Kaplan and Norton (1992, 1996a) introduced the Balanced Scorecard (BSC) with the
aim to overcome some strategic management limitations of the traditional performance
measurement systems that were based mainly on financial measures. In this approach a
mix of lead (performance drivers) and lag (outcome measures) indicators, and of finan-
cial and non-financial measures, are balanced in four perspectives (financial, customer,
process and, learning and growth) to help managers to simultaneously monitor the fi-
nancial performance, evaluate the results of short-term actions that drive future financial
performance and the progress of the strategy implementation.
According to the authors, the Balanced Scorecard describes top managers a picture of a
possible future (vision), a path for getting there (strategy) and its translation in middle
and short-term objectives and actions. However, formulating the Balanced Scorecard
and linking it consistently to the company’s strategy involves the understanding of the
cause-and-effect relationships between performance drivers and financials in a systemic
perspective of the company’s context.
Since BSC was firstly introduced (Kaplan and Norton, 1992), an enormous number of
books and articles that describe and recommend the BSC implementation have been
published. According to Kaplan and Norton (2001a), many organizations around the
world are using the BSC approach to define, implement and manage strategy. In fact,
recent surveys showed that the BSC was the most popular performance measurement
system, which was adopted by more than 40% of organizations worldwide - 57% in UK,
46% in USA, 28% in German and Austria - (Rigby, 2001; Speckbacher et al., 2003).
To support managers to build a cause-and-effect perspective and to better understand
the business system they are embedded in, some years later, Kaplan and Norton (2000,
2001a) developed the Strategy Map concept as a complementary tool of the BSC ap-
proach. The strategy map links the performance indicators in a causal chain (causal dia-
gram) that helps managers to translate, test and communicate their understanding about
the business system and supports them to implement and review the company’s strat-
egy. Kaplan and Norton (2001a, p10) define a strategy map as "a logical comprehen-
sive architecture for describing strategy. It provides the foundation for designing a Bal-
anced Scorecard that is the cornerstone of a strategic management system."
The BSC approach is consistent with the systemic and dynamical view of business
management and performance measurement (Warren, 2002). This framework recog-
nizes the interconnectedness within the business and the importance of understanding
the cause-and-effect relationships and its dynamics as a consistent basis to infer future
performance and define objectives and action plans. Strategy maps, combined with bal-
anced scorecards, provide an integrated and holistic approach to business management
and performance measurement. The strategy map describes manager perception about
the structure of the business system and the performance measurement information from
BSC captures the essential of system behaviour. In this perspective, Kaplan and Norton
suggested that “the BSC can be captured in a system dynamics model that provides a
comprehensive, quantified model of a business’s value creation process” (Kaplan and
Norton, 1996b, p67).
We can find few literatures that point out some problems and limitations of the BSC
approach. Norreklit (2000, 2003) provide critical examinations of the BSC assumptions
and concepts. The inadequate definition and utilization of the performance indicators
has been pointed out as a main cause of the failure of the BSC adoption (Lingle and
Schiemann, 1996; Stivers et al., 1998; Ittner and Larcker,1998; 2003; Olve et al., 2000).
In particular, Ittner and Larcker (2003) reported that only 23% of 157 organizations sur-
veyed, consistently build and test causal models to support the definition of the per-
formance indicators, but these organizations achieved on average better performance.
Akkermans and van Oorschot (2002) point out some limitations on the BSC conception
and propose a methodology based on System Dynamics tools. Ittner et al.(2003) didn’t
find relevant performance implications of the BSC utilization. Braam and Nijssen
(2004) found that BSC use that complements company strategy positively influenced
the company performance, while the performance effect of a measurement-focused-
BSC use was significantly negative. The results of simulation-based experiments re-
ported by Strohhecker (2004) suggested a negative influence of BSC utilization on perform-
ance.
Empirical research about the performance implications of the BSC process is still
scarce. Companies around the world continue making large investments of money, time
and effort on the development and implementation of BSC systems. Considering that
these investments are based on the hypotheses that the use of BSC has a positive impact
on the performance of the organization, it is important to obtain some evidences
whether these systems lead to an improvement of strategic learning and decision effec-
tiveness.
Mental Models
Mental model is a conceptual representation of the structure of an external system form
by people and they use them to describe, explain and predict system behavior (Craik,
1943, Johnson-Laird, 1983). Mental models have been commonly used in system dy-
namics and system thinking literature (Forrester, 1961; Senge, 1990; Doyle and Ford,
1998, 1999; Sterman, 2000).
Doyle and Ford (1998, 1999) defined this concept as “- a mental model of a dynamic
system is a relatively enduring and accessible, but limited, internal conceptual repre-
sentation of an external system (historical, existing, or projected) whose structure is
analogous to the perceived structure of that system.”
Managers build their mental models as they interact with the business system they are
embedded in. Experimental research has suggested that decision makers perform better
if the structure of their mental models is more similar to the structure of the external
system they imitate (Kieras and Bovair, 1984; Rowe and Cooke, 1995; Wyman and
Randel, 1998; Ritchie-Dunham, 2001, 2002).
Double-loop learning
Managers make decisions and learn in the context of feedback loops (Forrester, 1961).
In the single-loop learning, managers compare information about the state of real sys-
tem to goals, perceive deviations between desired and actual states, and make the deci-
sions they believe will move the system towards the desired state. In this process, the
information about system state is the only input to decision making. But decisions are
the result of applying decision rules and policies that are in turn governed by manager’
mental models (Sterman, 2000).

Business
System
DecisionsInformationFeedback
Strategy,
Decision Rules,Objectives
Mental Models
of BusinessSystem
BusinessSystem
DecisionsInformationFeedback
Single-loop learning Double-loop learning
Figure 1 – Single and Double-loop learning
Source: Adapted from Sterman (2000, p19)
The single-loop learning does not change the managers’ mental models. In the double-
loop learning (Argyris, 1999), information about the business system is not only used to
make decisions within the context of existing frames, but also feeds back to alter man-
agers’ mental models (Sterman, 2000). As their mental models change, managers define
new strategies and policies (figure 1).
Decisions
State of theBusinessSystem
FeedbackInformation
PerceivedState of the
System
Qualitiy ofInformation
Mental ModelFormation
Attention/Scanning
Mental ModelSimulation
CognitiveLimitations
Strategy/Objectives
C2
C1
C4 C3
C5
Figure 2 – Dynamic model of decision-making process
Adapted from Doyle, Ford, Radzicki and Trees (2001, p 22)

Doyle, Ford, Radzicki and Trees (2001) based their work on a dynamic model of deci-
sion-making process based on 5 feedback loops (figure 2: C1 - heuristic decision mak-
ing loop; C2 - attention/scanning loop; C3 - mental model formation/ perception loop;
C4 – strategy/objectives-changing loop; C5 mental model based decision making loop)
where the mental models assume a central role. In that model, managers define strategy
and objectives by mentally simulating their mental models about the business system.
As represented in figure 2, cognitive limitations and quality of feedback information
influence the potential for strategic learning and performance by limiting managers’ un-
derstanding about the real business system. Cognitive limitations are related to the
bounded rationality of human decision-making (Simon, 1999). Due to limitations of
cognitive capabilities, first - the mental models managers use to make their decisions are
deficient – second – even managers form adequate mental models, are unable to cor-
rectly infer the dynamic behaviour of the business system (Sterman, 2000). Strategic
learning process is also strongly influenced by the quality of the feedback information
about the state of the business system. Managers use that information to interact with
business system. Using imperfect feedback information, managers have an incorrect
perception about the impact of their decisions, and so they are unable to build their men-
tal models accurately (Sterman, 2000). Thus, performance measurement systems must
be defined in order to overcome or minimize these barriers to strategic learning.
Improving Double-Loop Learning and Performance with the Balanced Scorecard
approach
In the BSC framework, strategies are seen as hypotheses. Managers should be able to
test, validate, and review these hypotheses. The BSC provides feedback information to
managers in a way that they gain a better understanding of the business system and im-
prove the strategy. Kaplan and Norton (2001a) propose that the BSC approach supports
what Argyris (1999) calls double-loop learning that facilitates the strategic learning of
the managers and leads to better performance.
Kaplan and Norton (2001b, pp152-155) describe that double-loop process of strategic
learning and adapting (figure 3), using three processes, as described in figure 3: (1) Or-
ganizations use the BSC to link strategy to the budgeting process”; (2) Management
meetings to review strategy are introduced; and (3)
“Finally a process for learning and adapting the strategy evolves. The initial BSC repre-
sents hypotheses about the strategy; at time of formulation it is the best estimate of the
actions what would engender long-term financial success. The scorecard design process
makes the cause-and-effect linkages in the strategic hypotheses explicit. As the score-
card is put in action and feedback systems begin their reporting on actual results, an or-
ganizations can test the hypotheses of its strategy.” (Kaplan and Norton, 2001b, p154).

BusinessSystem
Decisions
Strategy
BalancedScorecard
Budget
Strategic LearningLoop
ManagingOperations Loop
Reporting
Test theHypotheses/Update theStrategy
Figure 3 - Double-loop process to manage strategy
Adapted from Kaplan and Norton (2001a, p275)
In a continual process, managers use the BSC and strategy map to reflect on the as-
sumptions that were used in the previous strategy. They review the assumed cause-and-
effect relationships and identify new ones. Then they improve their understanding about
the business system and a new strategy can emerge (Kaplan and Norton, 2001a, p316).
In other words, the BSC approach provides a process by which managers can make ex-
plicit and improve their mental models about the business system. They adapt the com-
pany strategy and define the new short and middle term objectives by simulating their
mental models to infer the future behavior of the business system.
Some simulation-based experiments have been carried out with the aim of testing the
effects of the BSC on performance. Ritchie-Dunham (2001, 2002) in a simulation-based
research where subjects run a firm by interacting with a system dynamics-based micro
world found that the similarity of subject’s mental model positively mediated the influ-
ence between the utilization of the BSC and the performance. It means that the BSC
utilization positively influenced the mental model similarity and it positively influenced
the performance. The results of simulation-based experiments reported by Strohhecker
(2004) suggested a negative influence of BSC utilization on performance.

2. Research Model
This research focuses on how the level of BSC approach used in the process of strategy
review and implementation influences the double-loop learning effectiveness, and how
this type of learning influences the management performance. To conduct the research
we propose these variables and the following model of hypotheses (figure 4):
- Level of Scorecard – This variable represents the intensity or level of BSC usage as a
comprehensive and balanced performance measurement system. We operationalized
this variable by considering two levels. In the low level, subjects run the firm using a
financial scorecard; in the high level a balanced scorecard is used;
- Level of Strategy Map – This variable represents the intensity or level of Strategy Map
utilization as a tool of the BSC approach to support the process of strategy review and im-
plementation. We defined and operationalized this variable by considering two levels.
In the low level, subjects do not use the Strategy Map; in the high level, the Strategy
Map is used;
- Mental Model Similarity – The level of double-loop learning effectiveness due to the
process of strategy review and implementation (Kaplan and Norton, 2001a) is viewed as
the improvement of manager mental models (Argyris, 1999, Sterman, 2000). Partici-
pants in the simulation task develop a mental model of the simulated business system.
As we know the structure of the simulated business system, if we capture the partici-
pants’ mental model, we can evaluate how it fits the simulated reality. This evaluation is
based on the measurement of the similarity between the structure of the elicited mental
models from the participants and the structure of the simulated business system (Rowe
and Cooke, 1995; Ritchie-Dunham, 2002);
- Performance – The performance of this management task consists of the financial
value created by the firm. This value is estimated by summing the yearly discounted
economic profit or EVA (=NOPLAT – Capital Employed x WACC), (Copeland, Koller
and Murrin, 2000, p150).
Level of ScorecardMental ModelSimilarity
Performance
Level of Strategy
Map
H1
H2
H3
Figure 4. Model of Hypotheses

Hypotheses 1:
If managers use the balanced performance measurement system from BSC in the proc-
ess of strategy review and implementation, they have a more effective double-loop
learning. It means that Level of Scorecard utilization positively influences Mental
Model Similarity.
Hypotheses 2: If managers use the strategy map tool of the BSC to support strategy review and imple-
mentation, they have a more effective double-loop learning. It means that Level of
Strategy Map utilization positively influences the Mental Model Similarity.
Hypotheses 3: Mental Model Similarity positively influences Performance (financial value creation).
Hypotheses 4: Mental Model Similarity positively mediates the effect of Level of Scorecard and the
effect of Level of Strategy Map, on Performance.
3.Method
Micro World
Figure 5 – Overview of the simulator model
Source: Ritchie-Dunham (2002, p22)

In this simulation-based experiment, subjects interacted with a system dynamics micro
world (figure 5). We built this micro world by programming the same system dynamics
model that was developed and used by Ritchie-Dunham (2002, pp 89-132), with version
Studio Expert 2003 of the Powersim system dynamics software
(http://www.powersim.com).
Simulation Task
In order to compare some results with those obtained by Ritchie-Dunham (2002), we
designed this experiment by only making adjustments that were needed to carry out our
research. We used the same business case, model’ structure, game interfaces and initial
conditions that were used by Ritchie-Dunham (2002). The text and simulator interfaces
were translated to Portuguese.
The participants run a realistic simulator of a wireless telecommunications firm by mak-
ing strategic decisions every six months for a simulation period of seven years (invest-
ment decisions in infrastructure, information technology and training, and human re-
source decisions) in order to maximize the value creation.
The participants interacted with simulator by two different interfaces: a financial score-
card or a balanced scorecard. The initial conditions and the structure of the model were
the same for all participants. The participants were asked to make strategic decisions in
order maximize the value creation.
Subjects
This research was conducted at ISCTE (a business graduate school in Lisbon) and at
Galp Energia, one of the biggest Portuguese firms (the Portuguese oil company). At the
ISCTE the group consisted of 14 undergraduate students in their last year of Business
Degree. Their age ranged from 22 to 25 and they had no work experience. At Galp En-
ergia the task was performed by a group of 59 managers. Their age ranged from 25 to
54 and they had an average 13 years of work experience. The simulation task was indi-
vidual, anonymous and without rewards.
The participants had no experience with the simulator and they also had no prior spe-
cific knowledge about wireless telecommunications business.
Apparatus
At the ISCTE, the experiment was carried out in a computer laboratory with one par-
ticipant per computer. At Galp Energia, each participant performed the simulation task
in his work place using his computer.
Each participant was provided a full experiment guide with (a) demographics question-
naire; (b) description and objective of the simulation task; (c) case text; (d) instructions
for accessing and starting the simulator in the computer network; (e) instructions for
running the simulator; (f) questionnaire about strategy and objectives; (g) sheets for

strategy map review (only for participants using strategy map); (h) questionnaire about
the relatedness of some simulator variables.
The decisions made on the simulation and its results were automatically stored in a pro-
tected spreadsheet on the participant’s computer. The game stopped automatically when
the stop time of the simulation was reached.
Procedure
There were three different treatments:
A – The participant run the firm by using a financial scorecard
B – The participant run the firm by using a balanced scorecard
C – The participant run the firm by using a balanced scorecard and reviewing a strategy
map
In the simulation experiment, the participants are involved in the following dynamical
decision-making processes:
BusinessSystem
(Simulator)
Decisions
Strategy andObjectivesReview
BusinessSystem
(Simulator)
BalancedScorecard
Strategy andObjectivesReview
FinancialScorecard
Decisions
Strategy andObjectivesReview
Strategy MapReview
BusinessSystem
(Simulator)
BalancedScorecard
Decisions
Treatment
A
Treatment
B
Treatment
C
Figure 6 – Type of treatment and its dynamical decision-making process
As outlined in figures 6 and 7, treatments A and B had the same procedure. Procedure
for treatment C was different from previous as participants reviewed strategy map (fig-
ures 6 and 8).
The experimental procedures had the following steps: (1) The participants are randomly
assigned to one of three treatments (A, B or C); (2) The participants answered some
demographic questions; (3) they read the introduction with the overall description and
the objectives of the simulation task and then they read the business case study; it took
approximately 30 minutes on average.
- treatment A,B – (ab4) they read the instructions for accessing, starting and running the
simulator; (ab5) they ran a first quick simulation to get used to game interfaces and
commands; (ab6) they ran a second and definitive simulation by making strategic deci-

sions every six months for a period of seven years that yields fourteen decisions; during
this simulation, they answered a questionnaire about strategy and objectives every 2
years of simulation time; it lasted approximately 60 minutes on average; (ab7) after the
definitive simulation, the participants answered a questionnaire about their final under-
standing of the relatedness between some strategic variables like resources and deci-
sions; it lasted approximately 30 minutes on average.
DemographicsQuestionnaire
Task Descriptionand Case Text
InstructionsRandom
Assignment
PracticeSimulation
DefinitiveSimulation
Strategy andObjectives
Definition/Review
Questionnaire
Figure 7 – Experimental procedure for participants not using the Strategy Map – Treat-
ments A and B
- treatment C – (c4) the participants filled out the questionnaire of step ab7; this
questionnaire captured their first understanding about business system; they were given
an initial strategy map which was based on the results of that questionnaire (c5) step
ab4; (c6) step ab5; (c7) participants performed the definitive simulation as step ab6 but
in this treatment they reviewed the strategy map as well; (c8) they drafted the final strat-
egy map; this map represented their final understanding about business system.
DefinitiveSimulation
Strategy MapReview
Final Strategy Map
DemographicsQuestionnaire
Task Descriptionand Case Text
QuestionnaireRandom
Assignment
InstructionsInitial Strategy
MapPractice
Simulation
Strategy and
ObjectivesDefinition/Review
Figure 8- Experimental procedure for participants using the Strategy Map - Treatment C

Independent Variables
The research model considers two independent variables, the Level of Scorecard and the
Level of Strategy Map. The Level of Scorecard was operationalized as low – partici-
pants run the simulator using a financial scorecard (figure 9) - or high – balanced score-
card (figure 10).
1,200,000.00 CliNumber of Customers
-5,000 0 5,000
836.11 K Eur/da
EBIT
REVENUES 2,000.00 K Eur/da
1,163.89 K Eur/da
Resource Allocation Decisions
Infrastructure Investments
Information Technology
6.37 M Eur/yr
Human Resources Development
0.20 0.00
Base Stations
328.50 M Eur/yr 3.40 M Eur/yr
Training Annual Hiring Rate Annual Downsize Rate
€ +50.00 per (mo*Cli)Average Monthly Charge perCustomer:
COSTS
Handset Subsidy: 333.33 K Eur/da
Administrative: 500.00 K Eur/da
Other OperationCosts:
50.00 K Eur/da
HR Costs: 188.89 K Eur/da Number ofEmployees
1,700.00 Emp
Number ofStations
2,000.00 BS
Amortizations: 91.67 K Eur/da
EB - EBIT [-5M:5MEur/d]; R - Revenues [0-10MEur/d];
C - Costs [0:10MEur/d]
04 05 06 07 08 09 10
EB
R
C
CL - Customers [0:10M]; RM - Average Monthly Charge per
Customer: [0:100Eur]; NE - Employees [0:20000]
04 05 06 07 08 09 10
CL
RM
NE
CP - HR Costs [0:2,5MEur/d]; PR - Subsidy Costs [0:2,5MEur/d];
CA-Administrative C.[0:2,5MEur/d]; CI-Other Costs[0:2,5MEur/d]
04 05 06 07 08 09 10
CP
PR
CA
CI
Figure 9 – Low Level of Scorecard: simulator interface with financial scorecard
Adapted from: Ritchie-Dunham, 2002, pp162-163

INTERNAL PROCESSES
0 0.2 0.4 0.6 0.8 1
0.20
Marhet Share1,200,000.00 Cli
Number of
Customers:
Retention Rate:
Competitor CustomerSatisfaction:
0.87Customer
Satisfaction:
CUSTOMERS
0 0.2 0.4 0.6 0.8 1
0.68
Perceived Call Quality Network Coverage:
Network Quality:
Base Stations in Process:
Daily Available BuildingCapacity:
Perceived Customer
Service:
0 0.2 0.4 0.6 0.8 1
1.06
RH Service Index1,066.67 Cli/EmpCustomers/
Employee
1,500.00 EmpSkilled Employees:
200.00 EmpObsolete
Employees:
1.20IT Facilitation
Index:
LEARNING AND GROWTH
-2,000 0 2,000
355.33 K Eur/da
EVARevenues:
Taxes:
Capital Charge:
Costs:
FINANCIALS
2,000.00 K Eur/da
284.54 K Eur/da
196.25 K Eur/da
1,163.89 K Eur/da
0.50
0.92
0.00 BS
1.67 BS/da
1.13
0.90
0.97
Resource Allocation Decisions
Infrastructure Investments
Information Technology
6.37 M Eur/yr
Human Resources Development
0.20 0.00
Base Stations
328.50 M Eur/yr 3.40 M Eur/yr
Training Annual Hiring Rate Annual Downsize Rate
CUSTOMER QM - Market Share [0:1]; C - Number Customers [0:10M];RC - Retention Rate [0:2]; SC - Customer Satisfaction [0:2];SCC - Competitor Customer Satisfaction [0:2]
04 05 06 07 08 09 10
QM
CL
RC
SC
SCC
I. PROCESSES QPC - Perceived Call Quality [0:2]; CR - NetworkCoverage [0:2]; QR - Network Quality [0:2]; SCP - Perceived CustomerService [0:2]; CCE - Daily Building Capacity [0:20]
04 05 06 07 08 09 10
QPC
CR
QR
SCP
CCE
FINANCALS EV- EVA [-2:2MEur/d]; R- Revenues [0:10MEur/d];I- Taxes [0:10MEur/d]; CC- Capital Charge [0:10MEur/d]; C- Costs[0:10MEur/d]
04 05 06 07 08 09 10
EV
R
I
CC
C
LEARNING AND GROWTH SRH- RH Service Index [0:2]; CPE-Customers/Employee [0:5000]; EE-Skilled Employees [0:20000]; EO-Obsolete Employees [0:5000]; EF- Training Effectiveness [0:5]
04 05 06 07 08 09 10
SRH
CPE
EE
EO
EF
Figure 10 – High Level of Scorecard: simulator interface with balanced scorecard
Adapted from: Ritchie-Dunham, 2002, pp164-165
The financial scorecard exhibits EBIT and other measures that are directly related to its
calculation (Ritchie-Dunham, 2002, pp162-163). The balanced scorecard interface

graphically separates the four sections related to the four perspectives of BSC approach
(Ritchie-Dunham, 2002, pp164-165).
The Level of Strategy Map was operationalized as low – participants run the simulator
not using strategy map - or high – participants run the simulator by using strategy map
to define and review the strategy and objectives.
Perspective "Financial"
Revenues
TotalOperatingCosts
Capital Cost
EconomicValue Added
Perspective "Customer"
Customer Satisfaction
Perspective "Learning and Growth"
IT FacilitationIndex
IT Investment
Number ofSkilled
Employees
HR - HiringRate
Perspective "Internal Processes"
Number ofBase Stations
Base StationsInvestment
Perceived CallQuality
PerceivedCustomerService
HR TrainingInvestment
Figure 11 – High Level of Strategy Map: Example of causal diagrams participants used
to review their understanding about simulated business system. This diagram also
shows the representative network of the simulated business system
The strategy map (example in figure 11) that was used in this experiment consists of a
causal diagram with the same variables that are considered in the questionnaire regard-
ing to participants’ initial understanding of business system. These variables are spa-
tially organized in four set of indicators respectively related to the four perspectives of
the balanced scorecard.
The answers to the questionnaire about the relatedness of variables yielded a network
diagram by using the Pathfinder procedure (Schvaneveldt, 1990; Rowe and Cooke,
1995). Participants were given an initial strategy map that was drawn from the previous
network diagram. This diagram represents the initial strategy that is expressed as a sys-
tem of causal hypotheses. During the simulation, participants are asked to review the
causal diagram. They cut or insert links so that the causal diagram expresses their last
understanding about the simulated business system.
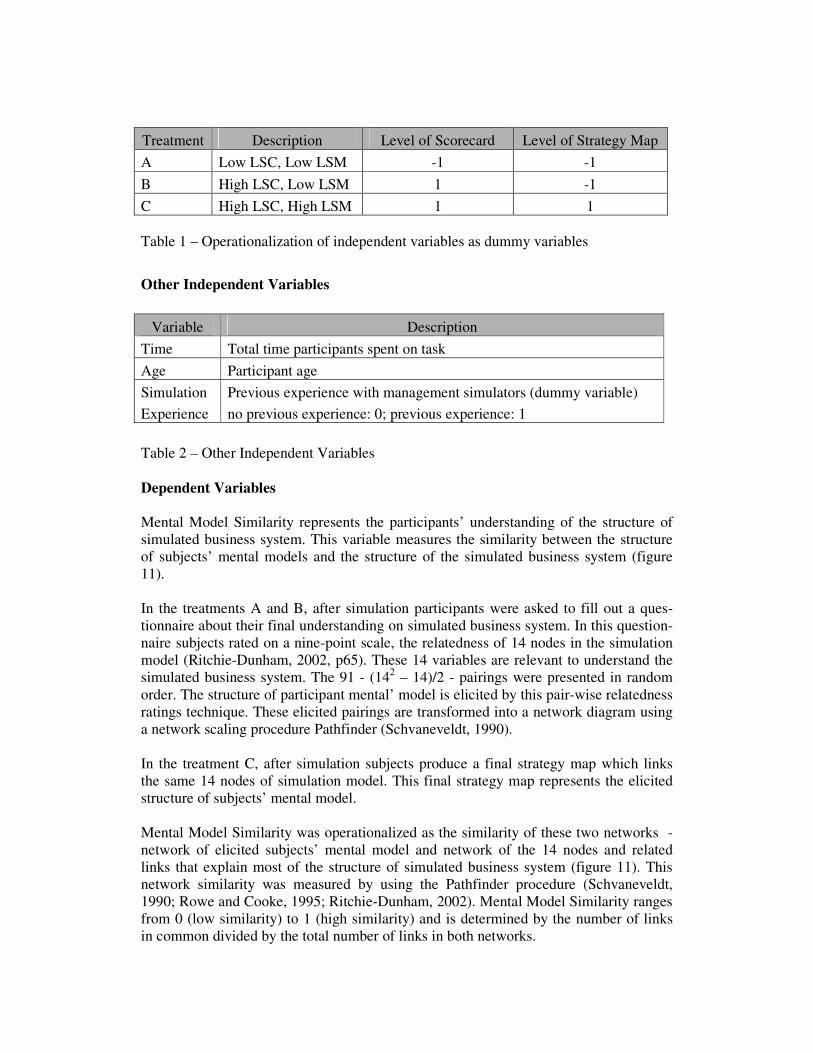
Treatment Description Level of Scorecard Level of Strategy Map
A Low LSC, Low LSM -1 -1
B High LSC, Low LSM 1 -1
C High LSC, High LSM 1 1
Table 1 – Operationalization of independent variables as dummy variables
Other Independent Variables
Variable Description
Time Total time participants spent on task
Age Participant age
Simulation
Experience
Previous experience with management simulators (dummy variable)
no previous experience: 0; previous experience: 1
Table 2 – Other Independent Variables
Dependent Variables
Mental Model Similarity represents the participants’ understanding of the structure of
simulated business system. This variable measures the similarity between the structure
of subjects’ mental models and the structure of the simulated business system (figure
11).
In the treatments A and B, after simulation participants were asked to fill out a ques-
tionnaire about their final understanding on simulated business system. In this question-
naire subjects rated on a nine-point scale, the relatedness of 14 nodes in the simulation
model (Ritchie-Dunham, 2002, p65). These 14 variables are relevant to understand the
simulated business system. The 91 - (142 – 14)/2 - pairings were presented in random
order. The structure of participant mental’ model is elicited by this pair-wise relatedness
ratings technique. These elicited pairings are transformed into a network diagram using
a network scaling procedure Pathfinder (Schvaneveldt, 1990).
In the treatment C, after simulation subjects produce a final strategy map which links
the same 14 nodes of simulation model. This final strategy map represents the elicited
structure of subjects’ mental model.
Mental Model Similarity was operationalized as the similarity of these two networks -
network of elicited subjects’ mental model and network of the 14 nodes and related
links that explain most of the structure of simulated business system (figure 11). This
network similarity was measured by using the Pathfinder procedure (Schvaneveldt,
1990; Rowe and Cooke, 1995; Ritchie-Dunham, 2002). Mental Model Similarity ranges
from 0 (low similarity) to 1 (high similarity) and is determined by the number of links
in common divided by the total number of links in both networks.

Task performance was measured by total financial value creation. This value is esti-
mated by summing the discounted economic profit or economic value added (=Net Op-
erating Profit Less Amortizations and Taxes – WACC x Total Capital Employed) of the
firm over the seven simulated years (Copeland, Koller and Murrin, 2000, p150).
The participants were clearly informed that the performance measurement only took
into account the value added of the firm and so the firm continuing value would not be
taken in consideration. This condition forced participants to better balance decisions in
developing strategic resources.
Specific Variables of Treatment C
Since we have data about initial and final mental model similarity for participants of
group C, we can determine and evaluate their mental model improvement. We can also
measure the effect of these variables on Mental Model Similarity and Performance.
Description
C-IMMS Mental model similarity measured before simulation task
C–MMI Mental model improvement by simulation task = MMS – IMMS
Table 3 – Specific Variables of Treatment C
4. Results
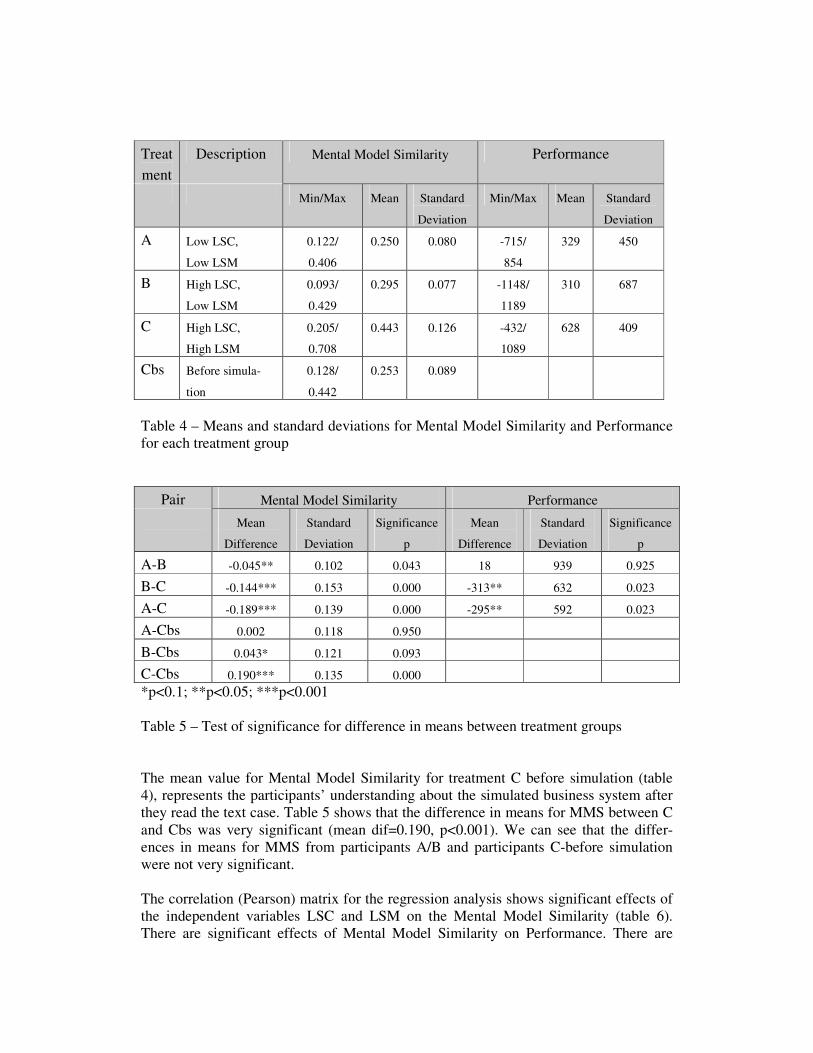
The 73 participants were distributed across the three treatments (treatment A – 24
treatment B – 24 treatment C – 25). Table 4 presents minimum, maximum and mean
values, and standard deviations for the dependent variables for each treatment group.
Table 5 shows the test of significance for difference in means between treatment groups.
The participants of group C - balanced scorecard interface and strategy map review -
showed on average the best MMS (mean=0.443, sd=0.126, min=0.205, max=0.708) and
the best Performance (mean=628, sd=409, min=-432, max=1089). As shown in table 5,
the mean values of MMS and Performance for group C were significantly different from
same values for groups A (mean dif=0.189, p<0.001) and B (mean dif=0.144, p<0.001).
On average, the participants of group B - balanced scorecard interface - showed a better
MMS (mean=0.295, sd=0.077, min=0.093, max=0.429) than participants of group A -
financial scorecard interface - (mean=0.250, sd=0.080, min=0.122, max=0.406). Table
5 shows that such difference was significant at p<0.05 (mean dif=0.045, p=0.043). Par-
ticipants of group A (mean=329, sd=450, min=-715, max=854) and participants B
(mean=310, sd=687, min=-1148, max=1189) showed similar mean value for Perform-
ance (mean dif=18, p=0.925).
Treat
ment
Description Mental Model Similarity Performance
Min/Max Mean Standard
Deviation
Min/Max Mean Standard
Deviation
A Low LSC,
Low LSM
0.122/
0.406
0.250 0.080 -715/
854
329 450
B High LSC,
Low LSM
0.093/
0.429
0.295 0.077 -1148/
1189
310 687
C High LSC,
High LSM
0.205/
0.708
0.443 0.126 -432/
1089
628 409
Cbs Before simula-
tion
0.128/
0.442
0.253 0.089
Table 4 – Means and standard deviations for Mental Model Similarity and Performance
for each treatment group
Pair Mental Model Similarity Performance
Mean
Difference
Standard
Deviation
Significance
p
Mean
Difference
Standard
Deviation
Significance
p
A-B -0.045** 0.102 0.043 18 939 0.925
B-C -0.144*** 0.153 0.000 -313** 632 0.023
A-C -0.189*** 0.139 0.000 -295** 592 0.023
A-Cbs 0.002 0.118 0.950
B-Cbs 0.043* 0.121 0.093
C-Cbs 0.190*** 0.135 0.000
*p<0.1; **p<0.05; ***p<0.001
Table 5 – Test of significance for difference in means between treatment groups
The mean value for Mental Model Similarity for treatment C before simulation (table
4), represents the participants’ understanding about the simulated business system after
they read the text case. Table 5 shows that the difference in means for MMS between C
and Cbs was very significant (mean dif=0.190, p<0.001). We can see that the differ-
ences in means for MMS from participants A/B and participants C-before simulation
were not very significant.
The correlation (Pearson) matrix for the regression analysis shows significant effects of
the independent variables LSC and LSM on the Mental Model Similarity (table 6).
There are significant effects of Mental Model Similarity on Performance. There are

suggestive effects of Simulation Experience on Performance. LSC does not significantly
correlate with Performance. There is not a significant interaction effect of Time and Age
on Mental Model Similarity or Performance.
MMS Performance
Time 0.051 -0.012
Age 0.057 0.008
Simulation
Experience
0.087 0.226*
LSC 0.448*** 0.126
LSM 0.641*** 0.272**
MMS 0.494***
*p<0.1; **p<0.05; ***p<0.001
Table 6 – Correlations (Pearson)
Table 7 shows the correlations (Pearson) for variables Initial Mental Model Similarity,
Mental Model Improvement, MMS and Performance within group C. Unexpectedly,
there does not seem to be a significant effect of Initial Mental Model Similarity on Men-
tal Model Similarity or Performance. It suggests that IMMS, that represents the initial
understanding about the simulated business system, does not significantly influences
Performance. Thus, Performance is mostly driven by MMI, that represents the im-
provement of participant’ understanding about the simulator.
MMS Performance
C - Initial Mental Model Similarity 0.246 -0.033
C - Mental Model Improvement 0.770*** 0.633***
***p<0.001
Table 7 – Correlations (Pearson) for variables Initial Mental Model Similarity, Mental
Model Improvement, MMS and Performance within group C
Table 8 shows the results of multi-regressing Mental Model Similarity and Performance
on the independent variables. The regressions were run on standardized values for all
variables to be able to directly compare the relative effect of each independent variable
on the dependent variable.
As shown in table 8, regressing Mental Model Similarity on the independent variables
(R2adjusted=0.450, p<0.001) showed a very significant effect for LSM (β=0.615,
p<0.001), not very significant effect for LSC (β=0.166, p<0.137) and no significant ef-
fect for other variables. Regression on Performance (R2adjusted =0.195, p=0.004)
showed a significant positive effect for MMS (β=0.550, p<0.001), a suggestive effect
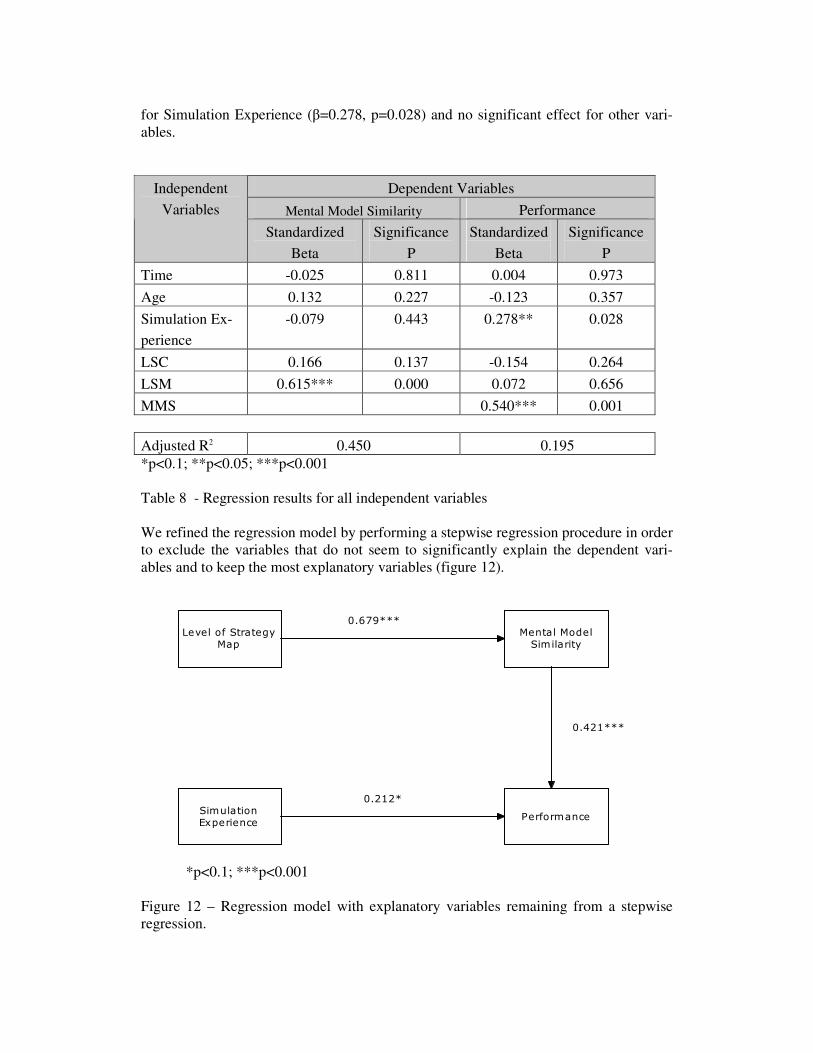
for Simulation Experience (β=0.278, p=0.028) and no significant effect for other vari-
ables.
Dependent Variables
Mental Model Similarity Performance
Independent
Variables
Standardized
Beta
Significance
P
Standardized
Beta
Significance
P
Time -0.025 0.811 0.004 0.973
Age 0.132 0.227 -0.123 0.357
Simulation Ex-
perience
-0.079 0.443 0.278** 0.028
LSC 0.166 0.137 -0.154 0.264
LSM 0.615*** 0.000 0.072 0.656
MMS 0.540*** 0.001
Adjusted R2 0.450 0.195
*p<0.1; **p<0.05; ***p<0.001
Table 8 - Regression results for all independent variables
We refined the regression model by performing a stepwise regression procedure in order
to exclude the variables that do not seem to significantly explain the dependent vari-
ables and to keep the most explanatory variables (figure 12).
Level of StrategyMap
Mental ModelSimilarity
PerformanceSimulationExperience
0.421***
0.679***
0.212*
*p<0.1; ***p<0.001
Figure 12 – Regression model with explanatory variables remaining from a stepwise
regression.

Level ofScorecard
Mental ModelSimilarity
PerformanceLevel of Strategy
Map
0.494***
0.167
0.557***
***p<0.001
Figure 13 – Regression for research model
As shown in figure 12, regressing Mental Model Similarity on the most explanatory in-
dependent variables (R2adjusted=0.453, p<0.001) showed a very strong effect for LSM
(β=0.679, p<0.001). LSC was excluded, as the effect for this variable was not signifi-
cant. Regression on Performance (R2adjusted =0.213 p<0.001) showed a very signifi-
cant effect for MMS (β=0.421, p<0.001) and a suggestive effect for Simulation Experi-
ence (β=0.212, p<0.1).
Figure 13 shows the regression model by considering the main variables that were de-
fined in the research model. Regression on Mental Model Similarity (R2adjusted=0.415,
p<0.001) showed not very significant effect for LSC (β=0.167, p=0.115) and a very sig-
nificant effect for LSM (β=0.557, p<0.001). Regression on Performance (R2adjusted
=0.233, p<0.001) showed a very significant effect for MMS (β=0.494, p<0.001).
On average, the participants of group B - balanced scorecard interface - showed a better
MMS than participants of group A - financial scorecard interface - (table 4), and such
difference were significant (table 5). But the regression results did not point out a sig-
nificant positive effect for LSC on Mental Model Similarity. Thus, the present research
does not provide full support to Hypotheses H1 - the Level of Scorecard positively in-
fluences Mental Model Similarity.
These findings provide support for Hypotheses H2 - The Level of Strategy Map posi-
tively influences Mental Model Similarity and Hypotheses H3 - Mental Model Similar-
ity positively influences Performance.
As shown in table 9, LSM significantly influences MMS. The regression analysis “Per-
formance (1)” shows a significant effect of LSM on Performance (β=0.280, p<0.05).
When MMS is added to the regression analysis “Performance (2)”, MMS significantly
influences Performance (β=0.565, p<0.001) and the influence of LSM on Performance
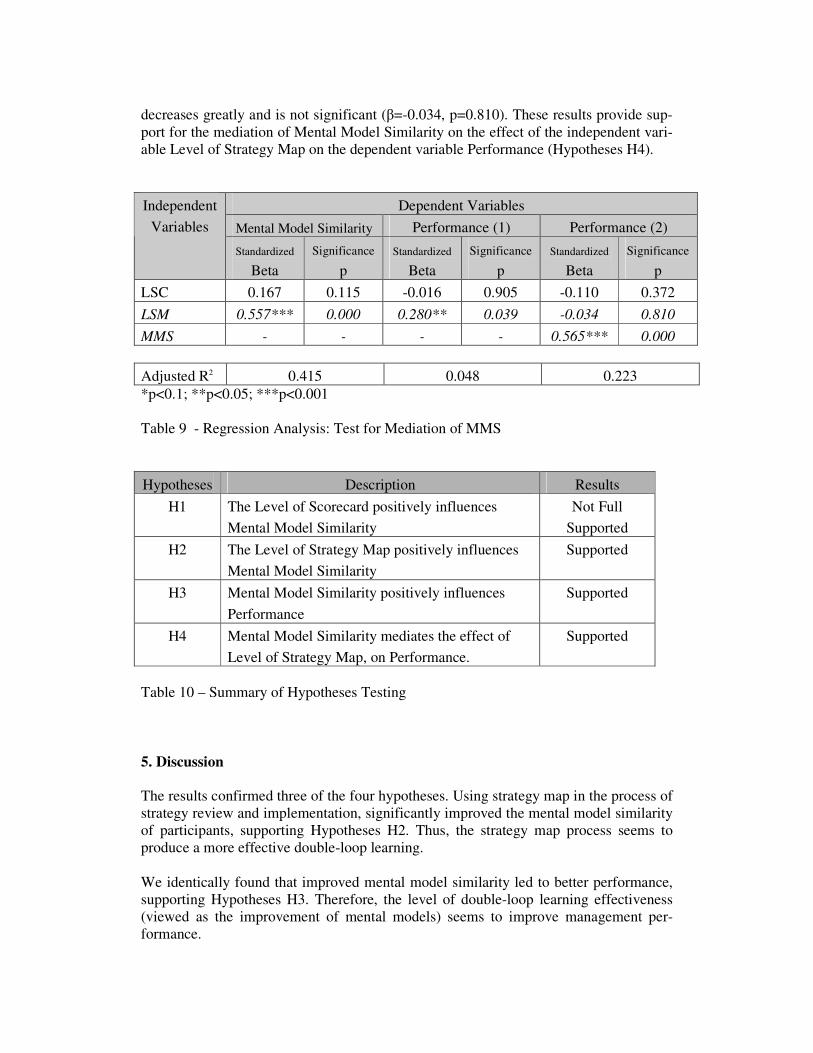
decreases greatly and is not significant (β=-0.034, p=0.810). These results provide sup-
port for the mediation of Mental Model Similarity on the effect of the independent vari-
able Level of Strategy Map on the dependent variable Performance (Hypotheses H4).
Dependent Variables
Mental Model Similarity Performance (1) Performance (2)
Independent
Variables
Standardized
Beta
Significance
p
Standardized
Beta
Significance
p
Standardized
Beta
Significance
p
LSC 0.167 0.115 -0.016 0.905 -0.110 0.372
LSM 0.557*** 0.000 0.280** 0.039 -0.034 0.810
MMS - - - - 0.565*** 0.000
Adjusted R2 0.415 0.048 0.223
*p<0.1; **p<0.05; ***p<0.001
Table 9 - Regression Analysis: Test for Mediation of MMS
Hypotheses Description Results
H1 The Level of Scorecard positively influences
Mental Model Similarity
Not Full
Supported
H2 The Level of Strategy Map positively influences
Mental Model Similarity
Supported
H3 Mental Model Similarity positively influences
Performance
Supported
H4 Mental Model Similarity mediates the effect of
Level of Strategy Map, on Performance.
Supported
Table 10 – Summary of Hypotheses Testing
5. Discussion
The results confirmed three of the four hypotheses. Using strategy map in the process of
strategy review and implementation, significantly improved the mental model similarity
of participants, supporting Hypotheses H2. Thus, the strategy map process seems to
produce a more effective double-loop learning.
We identically found that improved mental model similarity led to better performance,
supporting Hypotheses H3. Therefore, the level of double-loop learning effectiveness
(viewed as the improvement of mental models) seems to improve management per-
formance.

The results also confirmed the Hypotheses H4 (mediation of Mental Model Similarity
on the effect of Level of Strategy Map on Performance).
On average, the participants of group B - balanced scorecard interface - showed a better
MMS than participants of group A - financial scorecard interface - (table 4), and such
difference in means were significant (table 5). It suggested that LSC had a positive ef-
fect on MMS. But the regression results did not point out a significant positive effect for
LSC on Mental Model Similarity. Thus, the present research does not provide full sup-
port to Hypotheses H1 - the Level of Scorecard positively influences Mental Model
Similarity. This inconsistency of results might be due to a small sample size.
The lowest values for variables MMS and Performance were found in participants of
group B - balanced scorecard interface. One can suggest that this is due to the stress be-
tween accessing a lot of information, much more than participants of group A with fi-
nancial scorecard interface, and misunderstand the indicators structure and behaviour.
This stress could have lead to desperation and to earlier giving up.
As we hypothesized, the results suggest that the process of strategy map review gave
participants C a powerful tool that accelerated their learning about the simulated busi-
ness system. However, we did not expect such a great impact of Level of Strategy Map
on Mental Model Similarity. One possible explanation came from an informal debrief-
ing with some participants of group C. It might be that as participants of group C ac-
cessed the initial strategy map just after finishing practice simulation, they tested their
first assumptions more effectively and then they might have taken some advantage by
starting definitive simulation with a better understanding about the simulator. A second
explanation might be that participants with high LSM gave more attention to their men-
tal models eliciting task (by reviewing the strategy map) than participants with low
LSM (by answering the final questionnaire).
The differences in means for MMS from participants A/B and participants C-before
simulation were not very significant (table 5). It suggests that participants from group A
(using financial scorecard) and B (using balanced scorecard without strategy map) on
average did not learn much about the simulated business system.
Interestingly, the results indicated that the total time participants spent on the task did
not influence Mental Model Similarity or Performance.
As we expected, previous experience in business game simulators positively influenced
participant performance.
6. Managerial Implications
This research provides some contributions to the managerial field by showing: (1) how
to use the BSC approach in order to improve double-loop learning and performance; (2)
to what extent managers improve strategic learning by using simple causal diagrams; (3)
how a better understanding of cause-and-effect relationships leads to a performance im-
provement and (4) how managers’ mental models influence organizational performance.
As it happened in some previous research (for example Ittner et al., 2003; Braam and
Nijssen, 2004; Strohhecker, 2004), this work did not find significant evidences that by
using the BSC as a performance measurement system, managers learn more effectively
about the business system and improve organization performance.
The results about the strong impact of the causal diagram review process (strategy map)
on learning and performance, confirms that the feedback process for modeling and re-
viewing manager assumptions about cause-and-effect relationships leads to a better un-
derstanding of the business context and organization performance.
The two previous findings seem to indicate that the BSC usage only leads to improve-
ment of organization performance if managers do understand the cause-and-effect rela-
tionships that link drivers and future financial performance. Our findings seem to con-
firm what Ittner and Larcker (2003) pointed out that many companies failed in using
balanced scorecard because managers made little attempt to model and validate their
understanding about the causal relationships between non-financial indicators and future
financial performance.
As it was suggested by previous research (Ritchie-Dunham, 2002), we identically found
that improved mental model similarity led to better performance. The results also indi-
cate the mediation effect of Mental Model Similarity on the effect of the manner that
BSC approach is used on performance.
In general terms, these findings reinforce the importance of the Mental Model construct
to investigate how managers learn about business systems and its impact on manage-
ment performance in dynamical decision-making processes. In particular, this research
points out that to improve mental models managers should deal with very simple sys-
tems thinking approaches like causal diagrams to model and review their understanding
about the business context.
7. Reference List
ARGYRIS, C. (1999). On Organizational Learning. Blackweel Publishing.
AKKERMANS, Henk and Kim van Oorschot, (2002). Developing a Balanced Score-
card with System Dynamics. Proceedings of the 20th International Conference of
the System Dynamics Society.
BRAAM, G. and E. Nijssen, (2004). Performance Effects of Using the Balanced Score-
card: a Note on the Dutch Experience. Long Range Planning, 37, 335-349.
COPELAND, T, T. Koller and J. Murrin, (2000). Valuation – Measuring and Manage-
ment the Value of Companies. John Wiley & Sons.
CRAIK, K., (1943). The Nature of Explanation. Cambridge Univ. Press.

DOYLE, J. and D. Ford, (1998). Mental Models Concepts for System Dynamics Re-
search. System Dynamics Review, 14 (1), 3-29.
DOYLE, J and D. Ford, (1999). Mental Models Concepts Revisited: Some Clarifica-
tions and a Reply to Lane. System Dynamics Review, 15 (4), 411-415.
DOYLE, J., D. Ford, M. Radzicki, and S. Trees, (2001). Mental Models of Dynamic
Systems. Encyclopedia of Life Support Systems. EOLSS Publishers, September.
At http://www.wpi.edu/Academics/Depts/SSPS/Research/Papers/27.pdf.
FORRESTER, Jay W., (1961). Industrial Dynamics. Pegasus Communications.
ITTNER, C and D. Larcker, (1998). Innovations in performance measurement: Trends
and research implications. Journal of Management Accounting Research (10):
205-238.
ITTNER, C and D. Larcker, (2003). Coming Up Short on Nonfinancial Performance
Measurement. Harvard Business Review, Nov , pp 88-95.
ITTNER, C., D. Larcker and T. Randall, (2003). Performance Implications of Strategic
Performance Measurement in Financial Services Firms. Accounting, Organiza-
tions and Society, 28, pp 715-741.
JOHNSON-LAIRD, P. (1990). Mental Models: Towards a Cognitive Science of Lan-
guage, Inference and Consciousness. Harvard Univ. Press.
KAPLAN, R. S, and D. P. Norton, (1992). The Balanced Scorecard – Measures that
Drive Performance. Harvard Business Review, Jan-Feb, pp 71-79.
KAPLAN, R. S, and D. P. Norton, (1996a). The Balanced Scorecard. Boston, MA,
Harvard Business School Press.
KAPLAN, R. S, and D. P. Norton, (1996b). Linking the Balanced Scorecard to Strat-
egy. Californian Management Review, Fall, Vol 39, 1, pp 53-79.
KAPLAN, R. S, and D. P. Norton, (2000). Having Trouble with Your Strategy ? Then
Map It. Harvard Business Review, Sep-Oct, pp 167-176.
KAPLAN, R. S, and D. P. Norton, (2001a). The Strategy-Focused Organization: How
Balanced Scorecard Companies Thrive in the New Business Environment. Bos-
ton, MA, Harvard Business School Press.
KAPLAN, R. S, and D. P. Norton, (2001b). Transforming the Balanced Scorecard from
Performance Measurement to Strategic Management: Part II. Accounting Hori-
zons, Vol 15, nº 2, June, pp 147-160.
KIERAS, D. E, and S. Bovair, (1984). The Role of Mental Model in Learning to Oper-
ate a Device. Cognitive Science, 8, pp 255-273.
LINGLE, J. and W. Schiemann, (1996). From Balanced Scorecard to Strategic Gauges:
Is Measurement Worth It ?. Management Review, 85(3), pp. 56-61.
NORREKLIT, H., (2000). The Balance of the Balanced Scorecard: A Critical Analysis
of Some of Its Assumptions. Management Accounting Research, Vol 11, 1, Mar.
NORREKLIT, H., (2003). The balanced scorecard: What is the score? A rhetorical
analysis of the balanced scorecard. Accounting, Organizations and Society 28(6):
591-619.
OLVE, N., J. Roy and M. Wetter, (2000). Performance Drivers: A Practical Guide to
Using the Balanced Scorecard. Chichester, John Wiley & Sons.
POWERSIM. Powersim Software AS. http://www.powersim.com/
RITCHIE-DUNHAM, J., (2001). Informing Mental Models for Strategic Decision Mak-
ing with ERPs and the Balanced Scorecard: A Simulation – Based Experiment.
Proceedings of the 19th International Conference of the System Dynamics Soci-
ety, Atlanta, Georgia, USA.
RITCHIE-DUNHAM, J., (2002). Balanced Scorecards, Mental Models, and Organiza-
tional Performance: A Simulation Experiment. Unpublished PhD Dissertation,
University of Texas at Austin, Austin, USA.
ROWE, A.L. and N.J. Cooke, (1995). Measuring Mental Models: Choosing the Right
Tools for the Job. Human Resource Development Quarterly 6 (3), pp 243-255.
RIGBY, D, (2001). Management Tools and Techniques: A Survey. Californian Man-
agement Review, Winter, Vol 43, 2, pp 139-160.
SCHVANEVELDT, R. (1990). Pathfinder Associative Networks: Studies in Knowledge
Organization. Norwood, NJ: Ablex.
SENGE, Peter M, (1990). The Fifth Discipline. New York, Doubleday.
SIMON, H. (1997). Administrative Behaviour. 4ª ed. New York Free Press.
SPECKBACHER, G., J. Bischof and T. Pfeiffer, (2003). A Descriptive Analysis on the
Implementation of Balanced Scorecards in German-speaking Countries. Man-
agement Accounting Research 14, pp 361-387.
STERMAN, J., (2000). Business Dynamics: System Thinking and Modeling for a Com-
plex World. New York, Irwin Mcgraw-Hill.
STIVERS, B. P., T. J. Covin, N. G. Hall and S. W. Smalt, (1998). How nonfinancial
performance measures are used. Management Accounting (Fev), 44, 46-49.
STROHHECKER, J. (2004). Simulation Based Experiments for Testing the Balanced
Scorecard’s Built-in Performance Improvement Theory. Proceedings of the 22th
International Conference of the System Dynamics Society, Oxford, England.
WARREN, Kim, (2002). Competitive Strategy Dynamics. Chichester, John Wiley &
Sons.
WYMAN, B. and J. Randel. (1998). The Relation of Knowledge Organization to Per-
formance of a Complex Cognitive Task. Applied Cognitive Psychology, 12, pp
251-264.
Related Documents