MEDICAL RADIATION PHYSICS STOCKHOLM UNIVERSITY KAROLINSKA INSTITUTET DOSIMETRIC CHARACTERISTICS OF CVD SINGLE CRYSTAL DIAMOND DETECTORS IN RADIOTHERAPY BEAMS. Master of Science Thesis in Medical Radiation Physics Fall 2007 Author: Anna Ärlebrand Supervisor: Camilla Rönnqvist at IBA dosimetry Examiner: Bo Nilsson

Welcome message from author
This document is posted to help you gain knowledge. Please leave a comment to let me know what you think about it! Share it to your friends and learn new things together.
Transcript

MEDICAL RADIATION PHYSICS STOCKHOLM UNIVERSITY KAROLINSKA INSTITUTET
DOSIMETRIC CHARACTERISTICS OF CVD SINGLE CRYSTAL DIAMOND
DETECTORS IN RADIOTHERAPY BEAMS.
Master of Science Thesis in Medical Radiation Physics
Fall 2007
Author: Anna Ärlebrand
Supervisor: Camilla Rönnqvist at IBA dosimetry
Examiner: Bo Nilsson

2

3
CONTENTS 3
ABSTRACT 5
1 INTRODUCTION 7
1.1 A SHORT INTROCUCTION TO THE SOLID STATE
PHYSICS OF INSULATORS 9
1.2 THE BASIC PRINCIPLE OF THE DIAMOND DETECTOR 10
2 MATERIALS AND METHODS 11
2.1 EXPERIMENTAL SET UP 11
2.1.1 The standard set up 12
2.2 DIAMOND DETECTOR SPECIFICATION 13
2.3 METHODS IN THE ANALYSIS AND MEASUREMENTS 13
2.3.1 Priming the detectors 13
2.3.2 Changing the bias 14
2.3.3 Linac stability 14
2.3.4 A measure of the detector dose rate linearity 14
2.4 FINDING A OPTIMIZED BIAS VOLTAGE 14
2.5 TESTING THE SIGNAL STABILITY OF THE DETECTOR 15
2.6 EVALUATING THE DOSE RATE LINEARITY 15
2.7 FINDING A PRIMING DOSE 16
2.8 IRRADIATION WITH ELECTRONS, PHOTONS AND PROTONS 16
2.9 TEMPERATURE DEPENDENCE 17
2.10 DIRECTIONAL DEPENDENCE 18
2.11 RECORDING DEPTH DOSE CURVES AND BEAM PROFILES 18
4
3 RESULTS 19
3.1 THE OPTIMIZED BIAS VOLTAGE 19
3.2 EVALUATION OF THE SIGNAL STABILITY 21
3.3 EVALUATION OF THE DOSE RATE LINEARITY 23
3.4 THE OBTAINED PRIMING DOSE 24
3.5 CHANGES OF THE DETECTOR SENSITIVITY WITH
ACCUMULATED DOSE 27
3.6 EVALUATION OF THE TEMPERATURE DEPENDENCE 31
3.7 EVALUATION OF THE DIRECTIONAL DEPENDENCE 33
3.8 DEPTH DOSE CURVES AND BEAM PROFILES 34
3.8.1 Depth dose curves 34
3.8.2 Beam profiles 37
4 CONCLUSIONS 43
5 ACKNOWLEDGEMENTS 45
6 ABBREVATIONS 45
7 REFERENCES 47

5
ABSTRACT
Dosimetric characteristics of a CVD single crystal diamond detector have been evaluated.
Detector stability, linearity, optimal bias, temperature dependence, directional
dependence, priming and pre-irradiation behaviour, depth dose curves and dose profiles
were investigated.
The optimal bias was determined to be 50 V. The detector stability measurement showed
a too large variation for absolute dosimetry in a day to day measurement, but acceptable
variation during one and the same day. The linearity constant, Δ, in the relation between
signal and dose rate, Δ•
DS ~ (Fowler 1966), was determined to 0.978 and 0.953 for two
detectors. The sub-linearity was also observed in the depth dose curves and could be
eliminated with a correction method. The diamond detector showed smaller temperature
dependence than the EFD silicon diode. The directional dependency was, <1 %, up to at
least ± 15˚ and therefore no angular correction is needed. A priming dose of 0.6 Gy was
determined, which is considerably smaller than for existing detectors on the market. After
pre-irradiation with electrons (8 and 18 MeV) a large and permanent desensitization of up
to 31 % / 500 Gy was detected. This is in contradiction to what previous published
articles claim. 15 MV photons also reduced the sensitivity of the detector, but no
evidence that 5 MV photons do has been found. A 50 Gy dose of 180 MeV protons did
not reduce the sensitivity either. The detector dose rate linearity was improved by
electron pre-irradiation. The dose profile penumbras of the diamond detector were, for
the most part, smaller than the RK ionization chamber, indicating a better spatial
resolution.

6

7
1 INTRODUCTION
Dosimetry of today relies mainly on ion chambers (IC), silicon diodes, film and TLD, all
with their own characteristics, advantages, disadvantages and applications. Overall, the
most desired qualities of a dosimeter is high radiation sensitivity, high spatial resolution,
uniform energy and uniform directional response, radiation hardness, dose rate linearity,
chemical and mechanical stability, tissue equivalency and temperature independence. The
ion chamber is the backbone of dosimetry having the most profound of these qualities but
is insufficient, to some extent, in spatial resolution, sensitivity and directional uniformity
(Rustgi 1995). Furthermore the ion chamber is pressure and humidity dependent. The
silicone diode detector is widely used in applications where the ion chamber is
insufficient. It has good spatial resolution and high sensitivity but comes up short for e.g.
tissue equivalency.
In this work a solid state ion chamber, a diamond detector (DD), has been evaluated for
several detector qualities. Previous investigations of diamond detectors (Cirrone 2003,
Fidanzio 2004, Hoban 1994, Laub 1997 & 1999, Planskoy 1980 and Rustgi 1995) have
concluded that the diamond detector has, or theoretically should have, almost all of the
above mentioned qualities except that it shows a dose rate dependency.
The diamond is almost tissue equivalent. It has an atomic number of six which is close to
that of tissue (Z = 7.4). The mass collision stopping power ratio and mass energy
absorption coefficient ratio tissue to diamond is almost constant for energies used in
clinical applications, as can be seen in Figure 1.1 and 1.2, where the comparable ratio
water to carbon (H2O/C) is used. This is a considerable advantage over the silicon diode
detector (Z = 14), which ratios are compared in the figures (H2O/Si). At the lower
energies (a few hundred kV) the ratio for water/silicon is increasing. This overestimates
the dose at low energies.

8
1,1
1,15
1,2
1,25
1,3
1,35
0,01 0,1 1 10 100
Photon energy [MeV]
Mas
s C
ollis
ion
Stop
ping
Pow
er R
atio
[ ]
H2O/C H2O/Si
Figure 1.1: The mass collision stopping power ratio for water to carbon (diamonds) and water to silicon (triangles). Carbon shows a much better behavior for passing as water equivalent. Data from ICRU 37 (1984).
0
1
2
3
4
5
6
7
0,01 0,1 1 10
Photon energy [MeV]
Mas
s En
ergy
Abs
orpt
ion
coef
f Rat
io [
]
H2O/C H2O/Si
Figure 1.2: The mass energy absorption coefficient ratio for water to carbon (diamonds) and water to silicon (triangles). As can be seen Silicon deviates substantially at low energies. Data from Hubbell (1991).

9
The diamond has high radiation sensitivity and therefore very small detectors can be
manufactured while keeping good count statistics. The small size results in good spatial
resolution and makes the diamond detector suitable for applications with large dose
gradients and/or small fields.
The diamond material is rigid, i.e. molecularly, chemically and mechanically stable
(Fidanzio 2002). The relatively large bandgap of 5.6 eV prevents leakage currents in the
lattice. The material is claimed to have high radiation hardness (Cirrone 2003, Fidanzio
2005, Hoban 1994, Laub 1999, Planskoy 1980).
On the dosimetry market there are only a few diamond detectors at the present. These are
either made from natural diamonds or polycrystalline CVD diamonds. The natural
diamond detectors are of good quality but difficulties in finding suitable specimens with
the right purity makes them expensive. The polycrystalline diamond detector has
problems with leakage currents and non-uniform collection due to boundary and crystal
in-grain effects. With this new single crystalline CVD diamond detector, developed at
IBA, the hope is to fuse control over the material with the simplicity of a single grain,
giving a superior synthetic detector.
1.1 A SHORT INTROCUCTION TO THE SOLID STATE PHYSICS OF
INSULATORS
The periodic lattice of a crystal allows energy bands for electrons to exist. The valence
band is the energy level of the outermost electrons. Above the valence band there is a
conduction band, separated by a bandgap (5.6 eV for diamond). In the conduction band
the electrons can freely move around. Energy levels in-between the valence and
conduction band are forbidden unless the lattice has been distorted by e.g. impurities or
dislocations. These sites can act as traps for electrons or holes because they are
immobilized here for a relatively long period of time. The traps can be either deep (lying
in the middle of the bandgap) or shallow (lying at the edges of the bandgap), giving the
material very different qualities. In figure 1.3 the band principle is imaged. At shallow
traps electrons or holes may jump easily (having a short life time) from the trap site to the

10
conduction/valence band. Even thermal excitation or de-excitation may be enough. This
means that the material can have very unstable behavior, e.g. giving signal only by being
heated.
A separated electron and hole eventually recombine. This commonly takes place at the
trap site, why they are also called recombination centers (Knoll 2000). Too many traps
result in a low mobility and conductivity.
Figure 1.3: The band structure for insulators and semi-conductors. Example of electron jump.
1.2 THE BASIC PRINCIPLE OF THE DIAMOND DETECTOR
The diamond detector is in principle a solid state ionization chamber. When ionizing
radiation is incident upon it ion pairs are created. The electrons can move around in the
conduction band of the lattice. An applied bias voltage secures the collection of charges
by attracting them to the electrodes. For this collection to be linearly related to the
impinged dose rate, a specific impurity concentration has to be induced into the crystal
structure. The impurities work as (temporary) traps for the electrons, obstructing them
from recombining with the holes. If no impurities are present, i.e. if the diamond is pure,
the recombination rate is proportional to the square root of the dose rate. Charge
collection efficiency is thus decreased with increasing dose rate and a non-linear relation
between the induced radiation and output signal is seen. If there, on the other hand, is a
too high concentration of impurities, too many electrons are trapped and the signal will
be insufficient (Hoban 1994).
Trap
5.5 eV bandgap
Valence band with electrons (circles) and hole (dashed circle).
Conduction band
hν

11
Furthermore, the electrons at the traps create space charges which give rise to an electric
field opposite to the applied bias. This concept, called polarization, decreases the
collection efficiency rendering once again a non-linearity of the detector (Hoban 1994).
The polarization can be a problem in experimental work and is seen as a decreasing
detector signal at the start of a measurement session. The increased number of space
charges as the diamond is irradiated causes, as above explained, a decreased bias and thus
a decreased charge collection efficiency, which will give a decreased signal from one
measurement to the next. The signal is stabilized when the amount of space charges are
saturated after a certain dose (the so called priming dose). The actual filling of the traps
can also affect the output signal of the detector. The charges are captured at the traps
instead of going to the electrodes and therefore the signal is smaller than expected. When
the traps are filled (after saturation) all charges go to the electrodes. This process can be
seen as an increase in signal with accumulated dose. Whether a detector has a decreasing
(due to polarization) or an increasing signal (due to filling of traps) depends on which
process that will dominate (Cirrone 2003). The dose needed to reach beyond the
increasing or decreasing signal, where the detector gives a stable (saturated) output, is in
both cases called the priming dose. The process of giving this dose can also be expressed
as priming the detector.
2 MATERIALS AND METHODS
2.1 EXPERIMENTAL SET UP
As radiation source two linear accelerators were used (one Elekta and one Philips) at the
Uppsala University Hospital Radiotherapy Clinic. Available energies were 5, 6 and 15
MV photons and 5 – 20 MeV electrons. A proton beam was also available at the The
Svedberg lab. The radiation from the Philips linac (used in all measurements except to
pre-irradiate the detectors) is given with a pulse repetition frequency of 300 Hz each
pulse being 5 µs long. The linac is set to give ca 260 MU/Gy. Measurements were mainly
made in a PMMA phantom of dimensions 5.4×25×25 cm3. The phantom had several
drilled holes, ca 20 mm apart, where detectors can be placed. The point of measurement
12
was at the dmax depth of 5 MV photons, i.e. 12 mm. Two water phantoms were also used:
a Scanditronix RFA tank and a Scanditronix temperate calibration phantom of
dimensions 5.0×29×29 cm3. In the directional measurement a PMMA rotation board and
a circular (diameter 30 mm) PMMA phantom was used. As reference and comparison
one Scanditronix RK ionization chamber and one Scanditronix EFD silicon diode
detector were available. The bias voltage was supplied by an Oltronic power supply and
available voltages were 0 – 80 V in a continuous scale. The voltage was monitored with a
Fluke multimeter. The detector response was collected with a Therados electrometer with
up to five digits precision down to a 10 pC level. For the RFA tank scans Scanditronix
OmniPro Accept software was used.
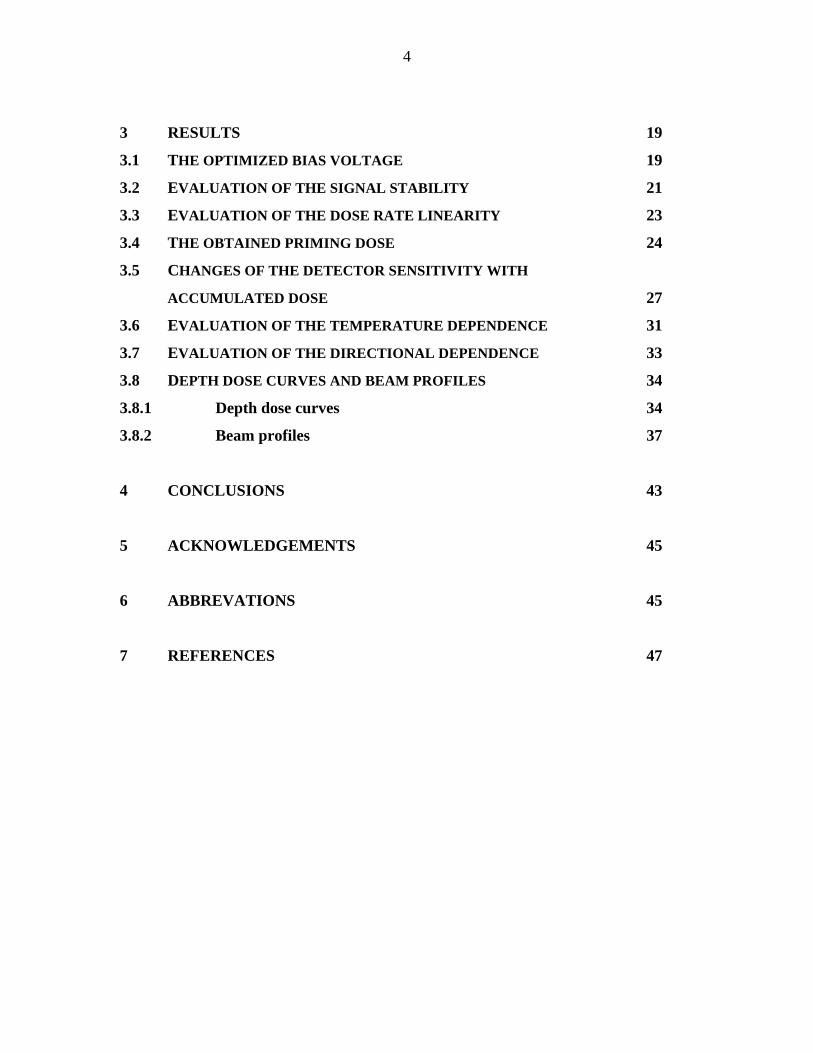
2.1.1 The standard set up
In most of the experiments a standard set up was used. The output from the detector was
recorded at SSD 100 cm and SSD 213 cm with the gantry facing the floor (0 degree
angle). The radiation field was fixed and 10×10 cm2 at SSD 100 cm. 5 MV photons were
used. The detectors were placed at dose max in the PMMA phantom (yellow squares in
figure 2.1.1).
Figure 2.1.1: The standard set up.
SSD 100 SSD 213
Yellow = PMMA phantomFloor
13
2.2 DIAMOND DETECTOR SPECIFICATION
The diamonds were fabricated by Diamond Detectors Ltd., a subsidiary of Element Six.
The detectors were mounted at the IBA Dosimetry facility in Uppsala and consist of a
sandwiched layer of a thin cylindrical single crystal diamond, grown by chemical vapour
deposition, between two circular Niobium contacts (0.5 mm in diameter) attached with
gold wires. The detection unit is put in a PVC cylindrical housing and an epoxy filling
prevents air in-between housing and active volume. The effective measuring point is
approximately 0.5 mm below the detector top surface. The diamond volume is 0.42 mm3
and the crystal thickness is 0.320 mm. Five detectors were used in the measurements (7A,
7D, 10a, Sc 2 and DD1001), all similar except DD1001, which has a slightly different
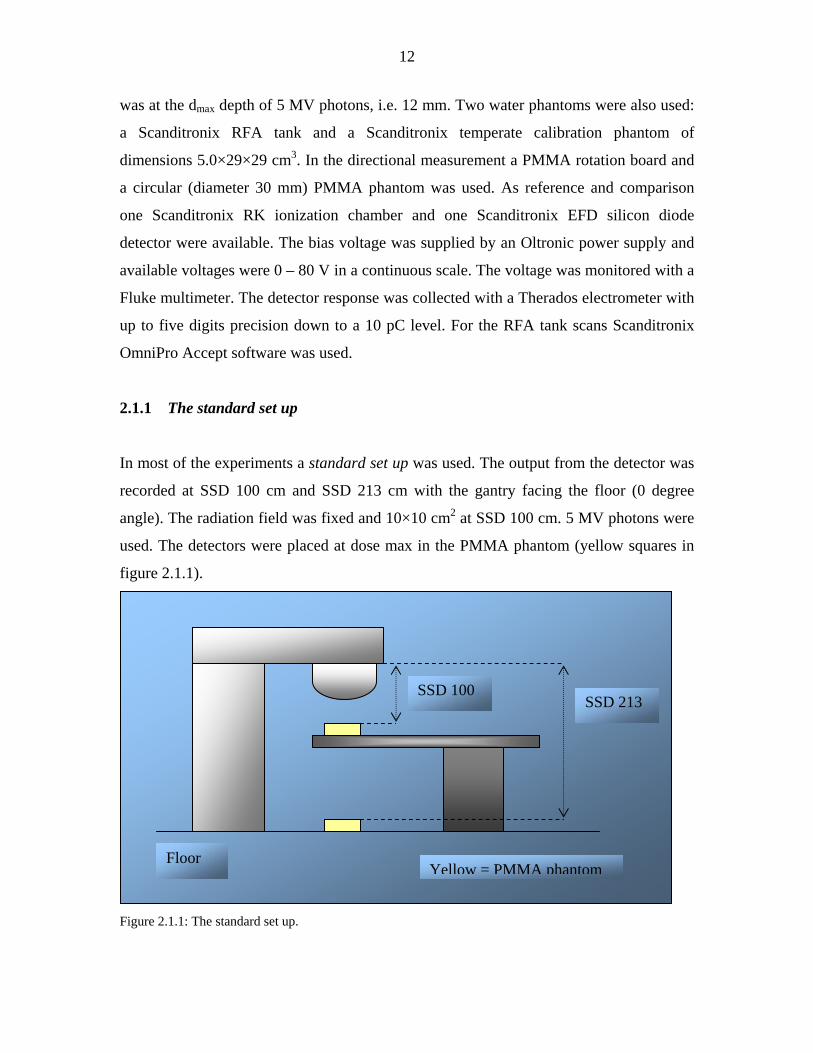
housing. In table 2.2.1 some data of the detectors are presented. The signal varies
between the individual detectors. The dark current was small and undetectable at the time
of experimental read out.
Table 2.2.1: Diamond detector data at SSD 100 cm at dose max of 5 MV photons using 50 V bias. The detector signal was typically thousands of nC/Gy and the dark current was in order of pA. The dark current was measured after a relatively large accumulated dose was reached.
Detector Signal [nC/Gy] Dark current at 50 V 7A 460 7D 2600 50 pA after 13.5 kGy 10a 4500 28 pA after 3.5 kGy Sc 2 2800
DD1001 330 21 pA
2.3 METHODS IN THE ANALYSIS AND MEASUREMENTS
2.3.1 Priming the detectors
As a routine, we always excluded the first value in a series of measurements. We found
that the detector needs a small dose (we used 0.65 Gy, i.e. 50 MU, at SSD 100 in our
exposures) to become primed. The concept of priming is explained at the end of section
1.2 and will be further evaluated in section 2.7.

14
2.3.2 Changing the bias
A waiting period of a few minutes between setting or changing the bias voltage and the
first measurement was always applied since the diamond detector needs a few minutes to
stabilize. The bias voltage was monitored with a digital Fluke multimeter.
2.3.3 Linac stability
To make sure that the linac stability played no or an undetectable role in the variation of a
measurement series we simultaneously carried out measurement with an EFD diode. No
correlation between EFD and diamond detector response fluctuation was observed. We
conclude that the linac is not a factor here. The linac output can vary by ± 1.5 % from day
to day or morning till evening according to the clinic.
2.3.4 A measure of the detector dose rate linearity
A practical and easy way to evaluate the dose rate linearity of a detector is to determine
the signal ratio between two distances (SSD). The inverse square law gives the numerical
value and measurements made with an ion chamber (which is supposed to be linear)
verified the inverse square law ratio within 0.3 %. The ratio between the signals at SSD
100 and SSD 213 cm have been used in some of the experiments for dose rate linearity
investigations. The IC is used as a reference value of the dose rate linearity and has a
ratio of 0.2225. The SSD 213 (or more precisely 213.1 cm) was chosen because it is the
source surface distance when placing the phantom and detector on the treatment room
floor.
2.4 FINDING A OPTIMIZED BIAS VOLTAGE
The optimal bias voltage was chosen by evaluating at which voltage the detector gave the
best dose rate linearity. The detectors were used in the standard set up and the signal was
recorded for voltages in steps of ten volts (10 – 80 V). The diamond detector dose rate

15
dependence (see section 2.3.4) was compared to a diode and ion chamber. Four diamond
detectors were tested.
2.5 TESTING THE SIGNAL STABILITY OF THE DETECTOR
The stability of the diamond detector is a crucial quality. The stability therefore was kept
track of by measuring the signal of detector 7A at the beginning of every laboratory
session, about one week apart, in eight consecutive weeks. The bias was arbitrarily
chosen to be 30 V before the optimal bias had been determined. The response was plotted
against the accumulated dose to see possible trends. Also a series of test were made with
the detector 7A where we waited 2 or 3 hours between measurements. The reason was to
see how the signal changes during one workday. The standard set up was used.
2.6 EVALUATING THE DOSE RATE LINEARITY
Several papers have reported a dose rate dependency of the diamond detector sensitivity.
In 1966 Fowler introduced an expression for the dose rate dependency of the detector
linearity. The detector signal (S) versus the dose rate (•
D ) is expressed by the equation: Δ•
⋅+= DRSS dark . If Δ = 1 the relationship is linear. R is a detector specific constant and
Sdark is the signal due to the dark current of the detector.
In our experiment the linearity was determined by measuring the response at seven
different SSD (80.0, 100, 135, 220, 250, 323.5 and 357 cm). The inverse square law
transforms the SSD to an approximate dose per pulse (0.015 – 0.29 mGy/pulse). The field
size was 10×10 cm2 fixed at SSD 100 cm. The linac gantry was rotated to 90 degrees,
facing the wall of the treatment room. In the experiment the 7A and 7D detectors were
used and as a reference we used a RK ionization chamber, which is linear (Δ = 1)
according to the experiments (se section 2.3.4).

16
2.7 FINDING A PRIMING DOSE
From the start of the project it was noticed that the initial irradiation frequently resulted
in a slightly (few percent) larger (and for one detector smaller) value than the following
ones. This behaviour was explored closer to determine what priming dose the diamond
detectors needs.
The priming was examined at SSD 100 cm in a 10×10 cm2 field of 5 MV photons placing
the detectors 7A and Sc 2 in the PMMA phantom. Bias was 50 V. The series was taken in
steps of 0.20 Gy (15 MU) up to ca 3 Gy. The priming after various resting periods was
evaluated. A weekly resting period (14 and 7 days), a daily measurement (18 hours) and
an hourly measurement (2 or 3 hours, where the bias was both on and off in between)
were applied. This aimed to survey how long the priming lasts.
2.8 IRRADIATION WITH ELECTRONS, PHOTONS AND PROTONS
Four detectors were irradiated with a number of large doses of various qualities. Using
the standard set up, the response at SSD 100 cm and SSD 213 cm was measured before
and after the administration of dose. The dose rate dependency and sensitivity change
(level of radiation damage) could thus be evaluated. The table 2.8.1 summarizes the dose
and beam qualities used.
The detector 7D was first irradiated with 18 MeV electrons in seven 500 Gy doses before
it was sent to Sterigenics Denmark A/S for a 10 kGy dose of 10 MeV electrons. The
detector 10a was also irradiated with 18 MeV electrons in five 500 Gy doses and with 8
MeV electrons in two 180 Gy doses and two 500 Gy doses. A 50 Gy 180 MeV proton
dose was given in-between the electron doses.
The detector 7A was exposed to 674 Gy of 18 MeV electrons and 1 kGy of 15 MV
photons in two doses each. The detector Sc 2 was exposed two 500 Gy doses of 8 MeV
electrons. All detectors were irradiated with the bias unplugged.
17
Table 2.8.1: Summation of the doses and beam qualities given to detector 7A, 7D, 10a and Sc 2. Detector Radiation type Total dose [Gy]
7D 18 MeV e- 3500 10 MeV e- 10000
7A 18 MeV e- 674 15 MV photons 1000
10a 18 MeV e- 2500 8 MeV e- 360 180 MeV p+ 50 8 MeV e- 1000
Sc 2 8 MeV e- 1000
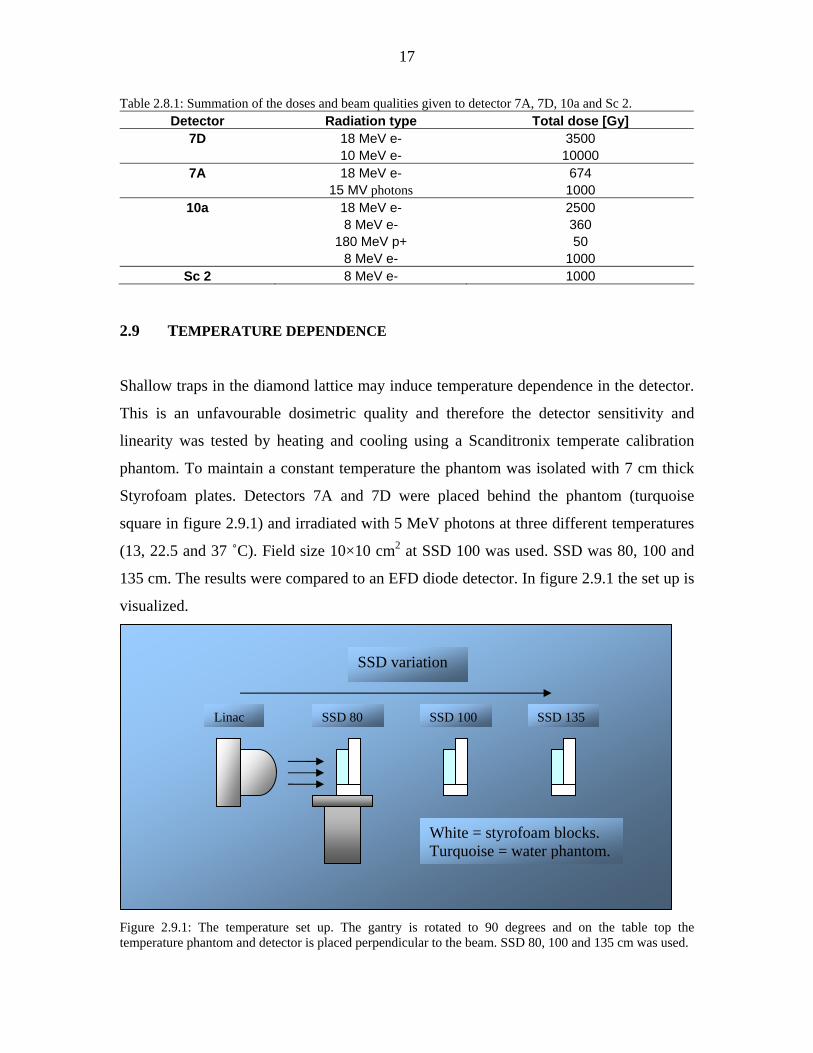
2.9 TEMPERATURE DEPENDENCE
Shallow traps in the diamond lattice may induce temperature dependence in the detector.
This is an unfavourable dosimetric quality and therefore the detector sensitivity and
linearity was tested by heating and cooling using a Scanditronix temperate calibration
phantom. To maintain a constant temperature the phantom was isolated with 7 cm thick
Styrofoam plates. Detectors 7A and 7D were placed behind the phantom (turquoise
square in figure 2.9.1) and irradiated with 5 MeV photons at three different temperatures
(13, 22.5 and 37 ˚C). Field size 10×10 cm2 at SSD 100 was used. SSD was 80, 100 and
135 cm. The results were compared to an EFD diode detector. In figure 2.9.1 the set up is
visualized.
Figure 2.9.1: The temperature set up. The gantry is rotated to 90 degrees and on the table top the temperature phantom and detector is placed perpendicular to the beam. SSD 80, 100 and 135 cm was used.
White = styrofoam blocks. Turquoise = water phantom.
SSD variation
SSD 80 SSD 100 SSD 135 Linac

18
2.10 DIRECTIONAL DEPENDENCE
The diamond detector was placed in a small circular PMMA phantom (build-up thickness
of 15 mm) at iso-center (SSD 100 cm) on top of a graded and routable piece of PMMA.
Figure 2.10.1 shows a schematic picture of the set up. The response was measured in the
[-150˚,150˚] degree interval at SSD 100 cm with the gantry at 90 degrees. Field size was
10×10 cm2 and beam quality 5 MV photons.
Figure 2.10.1: The directional dependence set up. The detector is inserted into a small cylindrical PMMA phantom (dotted circle) and is placed on a rotatable plate (large circle and square).
2.11 RECORDING DEPTH DOSE CURVES AND BEAM PROFILES
The depth dose curves and dose profiles of the diamond detector DD1001 were compared
to those obtained with a Scanditronix RK ionization chamber. A RFA water phantom was
used. Profiles and depth dose curves were taken for 5×5, 10×10 and 30×30 cm2 fields.
The profiles were taken at depths 15, 100 and 200 mm. 6 MV photons were used and
SSD was 100 cm. Data were recorded with the OmniPro Accept software.
Radiation
90˚
-90˚
0˚
19
3 RESULTS
The rareness of CVD single crystal diamond detectors forces a comparison of diamond
detector experimental results to be either against polycrystalline CVD or natural diamond
detectors. Because of the different features of these detectors the comparison may or may
not be correct to make. Natural diamonds are individual and are handpicked from a batch.
Therefore they each should have individual linearity and output signal. Synthetic
polycrystalline diamond have problem with grain effect that makes them individual and
different from the single crystals. All our detectors show very individual linearity and
response, which is interesting considering the fact that they are all made under controlled
and supposedly repeatable conditions. Qualitative comparisons of results are made
against ion chambers or silicon diode detectors.
3.1 THE OPTIMIZED BIAS VOLTAGE
When investigating the bias voltage we found an optimal level to be 50 V (1.56 kV/cm)
based on the results in figure 3.1.1. In the figure four diamond detector curves are plotted
plus the level of the RK ion chamber (0.2225) and the EFD silicon diode (0.2285) (both
without bias relationship of course). The signal ratio at SSD 100 to SSD 213 cm of the
diamond detectors drop to a stable level (although not as low as the RK) above ca 40 V
and is not further improved by higher voltage. In fact, at a too high voltage, above 60 V,
there is a risk of short cut in the detector, which we also experienced at a few occasions.
Other diamond detectors in the published literature have recommended electric field of
23 kV/cm for a polycrystalline CVD (Fidanzio 2004) and 3 kV/cm for a natural PTW
diamond detector (Hoban 1994).

20
0,2
0,21
0,22
0,23
0,24
0,25
0,26
0,27
0,28
0 10 20 30 40 50 60 70 80 90
Bias voltage [V]
Rat
io (S
SD 2
13/ S
SD 1
00)
7A 7D 10a Sc 2 RK EFD
Figure 3.1.1: A measure of dose rate linearity of the diamond detector is the ratio between the signal at SSD 100 and SSD 213. The improved dose rate linearity with increased bias is evident (for the 7A and 7D) and reaches a stable level above 40 V. The RK ion chamber ratio (0.2225) and EFD silicon diode ratio (0.2285) are shown as straight lines.
The relation between the detector signal and the applied bias is illustrated in figure 3.1.2.
This has previously been investigated by Buttar (2000) and Planskoy (1980), who found
this relation to be linear and non-saturating at these voltages. In the figure we can
establish how sensitive the signal is to variations in the voltage and the signal would only
change by ca 1 % if the bias was 70 mV off.

21
0
0,2
0,4
0,6
0,8
1
1,2
1,4
1,6
0 10 20 30 40 50 60 70 80 90
Voltage [V]
Sign
al n
orm
aliz
ed to
50
V
7A 7D 10a Sc 2
Figure 3.1.2: Normalized detector signal vs. bias voltage for four DD. The response is approximately linear with bias and a change of 70 mV would change the signal by ~1%.
3.2 EVALUATION OF THE SIGNAL STABILITY
The eight week measuring period gave a response variation of detector 7A of about ± 2.5
% from an average as is illustrated in figure 3.2.1. In the figure the average series value
(primed detector) is plotted against the detector accumulated dose (large graph) and
against the time (small, inserted, graph) between measurements. The two plots show no
trend for the signal either in the time or accumulated dose perspective. The variation is
probably partly due to the linac variation, which can be, according to the clinic, up to ±
1.5 %. A typical series has an average value of 300.1 nC and a maximum deviation of 0.4
%. In figure 3.2.1 the radiotherapy clinics daily measurement (made with an IC) of the
linac stability is added (triangles) and is normalized to 300 for a calibration value set by
the clinic. There is no correlation with our data points, but we see that there is a large
variation for the linac. The daily control has of course no relation to the accumulated dose
and is plotted in this fashion to correlate the IC values to the diamond points taken on the
same day. This clinic data were measured in the morning and ours were taken in the
afternoon and evening.
22
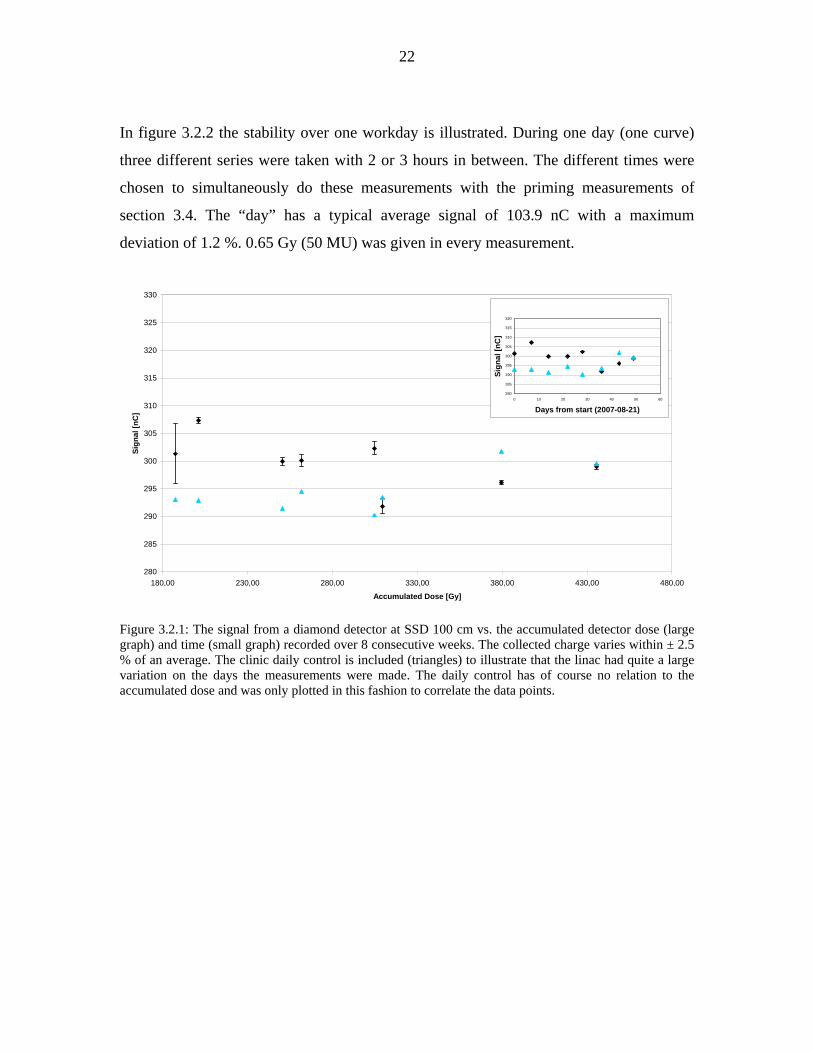
In figure 3.2.2 the stability over one workday is illustrated. During one day (one curve)
three different series were taken with 2 or 3 hours in between. The different times were
chosen to simultaneously do these measurements with the priming measurements of
section 3.4. The “day” has a typical average signal of 103.9 nC with a maximum
deviation of 1.2 %. 0.65 Gy (50 MU) was given in every measurement.
280
285
290
295
300
305
310
315
320
325
330
180,00 230,00 280,00 330,00 380,00 430,00 480,00
Accumulated Dose [Gy]
Sign
al [n
C]
280
285
290
295
300
305
310
315
320
0 10 20 30 40 50 60
Days from start (2007-08-21)
Sign
al [n
C]
Figure 3.2.1: The signal from a diamond detector at SSD 100 cm vs. the accumulated detector dose (large graph) and time (small graph) recorded over 8 consecutive weeks. The collected charge varies within ± 2.5 % of an average. The clinic daily control is included (triangles) to illustrate that the linac had quite a large variation on the days the measurements were made. The daily control has of course no relation to the accumulated dose and was only plotted in this fashion to correlate the data points.

23
100
100,5
101
101,5
102
102,5
103
103,5
104
104,5
105
105,5
0 5 10 15 20 25 30 35 40
Measurement point [#]
Sign
al [n
C]
day 1 day 2 day 9
time: 00:00
time: 00:00
time: 03:00
time: 06:00
time: 04:00
time: 02:00
Figure 3.2.2: Stability over one workday. Three different days with three individual series are shown. The two or three hour pause in between was set to be able to perform this measurement simultaneously as the priming measurements (see section 3.4) As in Figure 3.2.1 the day to day signal varies, but during one day the maximum deviation is 1.2 % from the average.
3.3 EVALUATION OF THE DOSE RATE LINEARITY
In figure 3.3.1 the signal of two diamond detectors are plotted versus the signal of a RK
ionization chamber. The IC is linear, why its signal is proportional to the dose rate and
thus a power fit of the curves will give the diamond detector Δ−value in the equation
presented in section 2.6. The curve fits of the 7A and 7D data give Δ-values equal to
0.978 and 0.953 respectively.
The sub-linearity of the diamonds (Δ < 1) implies that at a high dose rate the response
will be lower than the actual dose, i.e. the detector underestimates the radiation dose. Our
Δ−values are less than unity which is in accordance with published literature. Natural
PTW diamond detectors have been tested by Laub (1997) Planskoy (1980) and Hoban
(1994). Laub found Δ to be 0.962 ± 0.005, Planskoy found an average Δ of 0.91 and
Hoban, who used an experimental set up rather similar to ours and obtained Δ = 0.98.

24
In the field of polycrystalline CVD Fidanzio (2004 and 2005) reports Δ equal to 0.94 and
0.95 - 1.0 respectively. Buttar (2000) found Δ = 0.91 for a polycrystalline CVD diamond
detector.
The cause of this sub-linearity is claimed by Laub (1997) to be due to increased
recombination with dose rate. Polarization of the electric field can also play a role here
since more charges are present at a moment in time. This will decrease the electrical field
and cause the ion pairs to move to the electrodes more slowly.
0
0,2
0,4
0,6
0,8
1
1,2
1,4
1,6
1,8
0,0000 0,2000 0,4000 0,6000 0,8000 1,0000 1,2000 1,4000 1,6000 1,8000
IC signal normated to SSD 100 cm [ ]
DD
sig
nal n
orm
ated
to S
SD 1
00 c
m
7A 7D
Figure 3.3.1: The linearity of the single crystalline CVD diamond detectors, 7A (squares) and 7D (triangles). The x-axis is the normalized IC signal, which is proportional to the dose rate. The corresponding dose rates (estimated with the inverse square law) is 0.15 – 0.29 mGy/pulse.
3.4 THE OBTAINED PRIMING DOSE
Throughout our measurements we found that the first measurement consistently gave a
slightly larger signal than the following in a series (for all detectors but one). As a result,
the first measurement was excluded as mentioned in section 2.3.1.
In figure 3.4.1 the typical priming dose of a diamond detector is illustrated. The first
point(-s) of measurement is higher than the following due to polarization. As can be seen,

25
the longer the detector has been unused, the larger is the signal difference. The amount of
radiation it takes to prime the detector is, on the other hand, independent of resting time.
The signal drops almost directly to the average level after one or two 0.20 Gy doses.
98,00
100,00
102,00
104,00
106,00
108,00
110,00
112,00
114,00
116,00
0 0,5 1 1,5 2 2,5 3 3,5 4 4,5 5
Dose [Gy]
Sign
al n
orm
aliz
ed to
last
val
ue [
]
2 w 18 h 3 h 2 h -1 2 h - 2 7 dy 2 h off -1 2 h off - 2
2 h bias off
2 weeks bias off1 week bias off
3 h bias on2 h bias off2 h bias on
18 h bias off
Figure 3.4.1: Priming of detector 7A. A correlation between resting time and size of deviation can bee seen. The 2 – 3 hour resting time gives (for all but one) a small deviation of 1.5 – 2 %. A pause of one or two weeks gives a ca 11 % deviation. The daily resting period is in-between. Having the bias voltage turned on or off seems to have no effect on the priming.
In figure 3.4.2 another, untypical, shape of the priming is illustrated for the Sc 2 detector.
This curve has to be considered an exception since it is the only one of our detectors that
shows this behaviour. The signal is increasing and does not seem to have grown fully
even after 3 Gy. This behaviour is due to filling of traps. The trend that an increased
resting time gives larger deviation in the curve is consistent with the first curve (figure
3.4.1).

26
95,00
96,00
97,00
98,00
99,00
100,00
101,00
0 0,5 1 1,5 2 2,5 3 3,5 4 4,5 5
Dose [Gy]
Sign
al n
orm
aliz
ed to
last
val
ue
2 weeks 18 h 3 h 2 h - 1 2 h - 2 1 w 2 h off - 1 2 h off - 2
18 h bias off
2 weeks bias off
2 h bias off or on3 h bias on1 week bias off
Figure 3.4.2: Priming of detector Sc 2. The correlation between resting time and deviation of initial signal is evident. A 2 – 3 hour rest gives ca 2.5 % deviation and a two week long pause gives ca 5 % deviation.
The priming dose needed for our detectors can be compared to previous work done with
PTW Riga diamond detectors by for example Hoban (1994) where 15 Gy was needed
after three weeks rest and 3 Gy after a day long rest. Laub (1999) found that 5 Gy was
needed regardless of resting time. Our detector (7A), thus, requires a much smaller dose
to operate satisfactory.
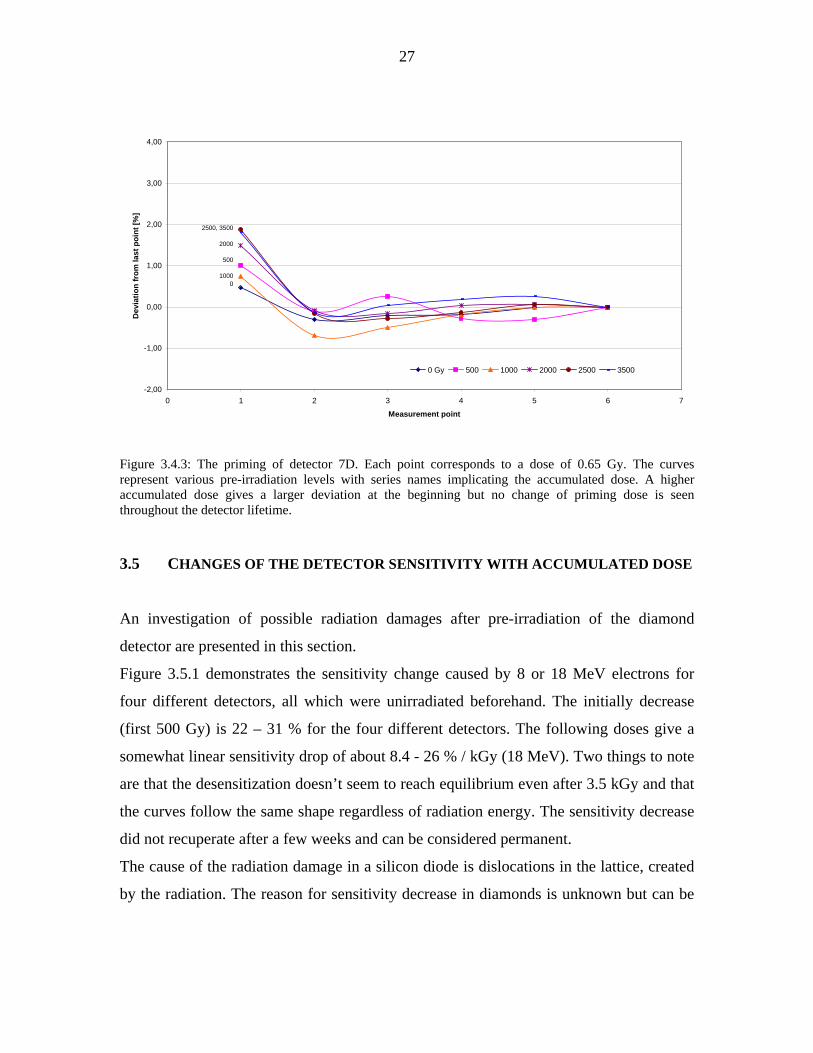
The priming dose after some large accumulated doses is illustrated in figure 3.4.3. The
necessary priming is about the same (0.65 Gy) as in figure 3.4.1 which implies that it is
maintained throughout the lifetime of the detector. The increase at the beginning of the
series, on the other hand, shows a tendency of increasing with accumulated dose. Data
were retrieved from the pre-irradiation tests (se section 2.8) and the series was taken a
few minutes after the large dose irradiation.
27
-2,00
-1,00
0,00
1,00
2,00
3,00
4,00
0 1 2 3 4 5 6 7
Measurement point
Dev
iatio
n fr
om la
st p
oint
[%]
0 Gy 500 1000 2000 2500 3500
2500, 3500
2000
500
1000 0
Figure 3.4.3: The priming of detector 7D. Each point corresponds to a dose of 0.65 Gy. The curves represent various pre-irradiation levels with series names implicating the accumulated dose. A higher accumulated dose gives a larger deviation at the beginning but no change of priming dose is seen throughout the detector lifetime.
3.5 CHANGES OF THE DETECTOR SENSITIVITY WITH ACCUMULATED DOSE
An investigation of possible radiation damages after pre-irradiation of the diamond
detector are presented in this section.
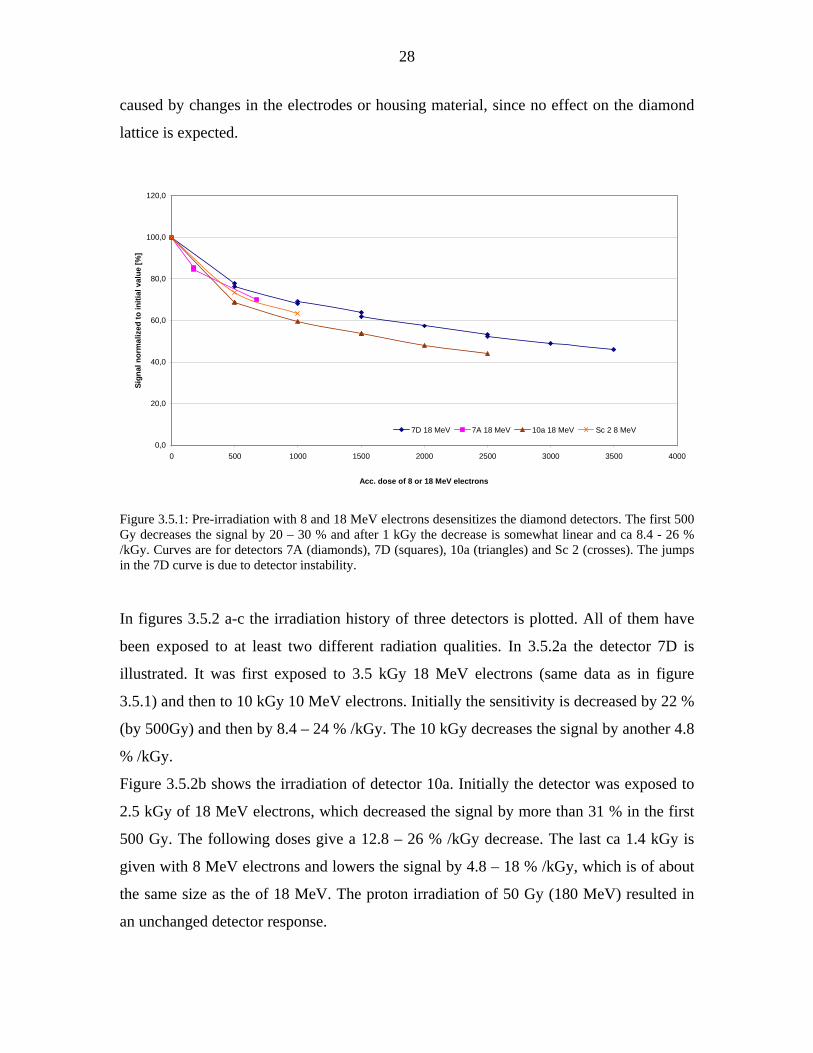
Figure 3.5.1 demonstrates the sensitivity change caused by 8 or 18 MeV electrons for
four different detectors, all which were unirradiated beforehand. The initially decrease
(first 500 Gy) is 22 – 31 % for the four different detectors. The following doses give a
somewhat linear sensitivity drop of about 8.4 - 26 % / kGy (18 MeV). Two things to note
are that the desensitization doesn’t seem to reach equilibrium even after 3.5 kGy and that
the curves follow the same shape regardless of radiation energy. The sensitivity decrease
did not recuperate after a few weeks and can be considered permanent.
The cause of the radiation damage in a silicon diode is dislocations in the lattice, created
by the radiation. The reason for sensitivity decrease in diamonds is unknown but can be
28
caused by changes in the electrodes or housing material, since no effect on the diamond
lattice is expected.
0,0
20,0
40,0
60,0
80,0
100,0
120,0
0 500 1000 1500 2000 2500 3000 3500 4000
Acc. dose of 8 or 18 MeV electrons
Sign
al n
orm
aliz
ed to
initi
al v
alue
[%]
7D 18 MeV 7A 18 MeV 10a 18 MeV Sc 2 8 MeV
Figure 3.5.1: Pre-irradiation with 8 and 18 MeV electrons desensitizes the diamond detectors. The first 500 Gy decreases the signal by 20 – 30 % and after 1 kGy the decrease is somewhat linear and ca 8.4 - 26 % /kGy. Curves are for detectors 7A (diamonds), 7D (squares), 10a (triangles) and Sc 2 (crosses). The jumps in the 7D curve is due to detector instability.
In figures 3.5.2 a-c the irradiation history of three detectors is plotted. All of them have
been exposed to at least two different radiation qualities. In 3.5.2a the detector 7D is
illustrated. It was first exposed to 3.5 kGy 18 MeV electrons (same data as in figure
3.5.1) and then to 10 kGy 10 MeV electrons. Initially the sensitivity is decreased by 22 %
(by 500Gy) and then by 8.4 – 24 % /kGy. The 10 kGy decreases the signal by another 4.8
% /kGy.
Figure 3.5.2b shows the irradiation of detector 10a. Initially the detector was exposed to
2.5 kGy of 18 MeV electrons, which decreased the signal by more than 31 % in the first
500 Gy. The following doses give a 12.8 – 26 % /kGy decrease. The last ca 1.4 kGy is
given with 8 MeV electrons and lowers the signal by 4.8 – 18 % /kGy, which is of about
the same size as the of 18 MeV. The proton irradiation of 50 Gy (180 MeV) resulted in
an unchanged detector response.

29
In figure 3.5.2c the exposure of the 7A detector is presented. It was exposed initially by
674 Gy of 18 MeV and then by 1 kGy of 15 MV photons. The electrons decreased the
signal by ca 30 % in the first 674 Gy. The high energy photons decrease the signal by ca
1.1 and 4.5 % per dose of 500 Gy, which is less than the electrons caused at this level of
accumulated dose (as established above).
0,0
500,0
1000,0
1500,0
2000,0
2500,0
0 2000 4000 6000 8000 10000 12000 14000 16000
Acc. Dose [Gy]
Res
pons
e [n
C/G
y]
1000,0
2000,0
3000,0
4000,0
5000,0
0 500 1000 1500 2000 2500 3000 3500 4000 4500
Acc. Dose [Gy]
Res
pons
e [n
C/G
y]
18 MeV 8 MeV - 1 180 MeV p+ 8 MeV - 2
1500160017001800190020002100
2000 2500 3000 3500 4000 4500Acc. Dose [Gy]
Res
pons
e [n
C/G
y]
8 MeV 180 MeV p+ 8 MeV - 2

30
300,0
350,0
400,0
450,0
500,0
550,0
600,0
0 200 400 600 800 1000 1200 1400 1600 1800
Acc. dose [Gy]
Res
pons
e [n
C/G
y]
18 MeV electrons 15 MV photons
Figure 3.5.2: Pre-irradiation of the detectors a) 7D, b) 10a and c) 7A. The small jumps in the curves is due to detector instability.
For low energy photons (5 MV) no explicit study was made but the stability experiment
in section 2.5 didn’t show any tendency of radiation damage of the detectors. Important
to notice here is that the dose (440 Gy) was given over an 8 week period contrary to the
other irradiations that were given at one time.
Articles presenting results on radiation damage in diamond detectors are scarce. The few
found reports of little or no damage at all. Planskoy (1980) has studied natural diamonds
in 8 MeV electron beams and found no radiation damage after 500 Gy. A photon study
made by Rodriguez (2007) (using an ADII-33 natural diamond) found no radiation
damage even after 85 kGy of Co-60 photons (ca 1.25 MeV). Protons were studied by
Fidanzio (2002), who concludes that their PTW natural diamond detector remains within
0.5 % for a 1 kGy dose of 62 MeV protons.
The dose rate linearity of the detectors was noted in-between irradiation and a tendency
toward improved values is seen in table 3.5.1 where data for three detectors are given.
The detector 7D had a signal ratio between SSD 100 cm and SSD 213 cm (se concept

31
explanation in section 2.3.4) of 0.243 at the start, which is 9.2 % higher than the linear IC
(ratio 0.2225). The ratio was decreased to ca 0.234 (5.2 % above the IC) in the first kGy
of 18 MeV electrons distributed. The large 10 kGy dose of 10 MeV electrons did not
improve the linearity further. The detector Sc 2 starts with a rather high value of 0.254
(14 % higher than the IC) and after 1 kGy of 8 MeV electrons it is improved to 0.240 (7.9
% higher than the IC level). For the detector 10a no improvement could be seen but the
linearity was from the start at a satisfactory level, only 2.5 % higher than the IC and at
about the same level as the silicon diode (ratio 0.2285). The photons (5 or 15 MV) did
not improve the linearity of 7A and neither did the 180 MeV protons subjected on
detector 10a.
Table 3.5.2: The dose rate linearity (ratio of signal at SSD 100 and SSD 213 cm) was improved for the detectors 7D and Sc 2. The deviation from the ion chamber value is clearly decreasing with accumulated dose. The ratio of 10a shows no tendency of improvement but the value was, on the other hand, almost optimal from the start since it lies close to that of the RK (0.2225).
Detector Acc. dose Signal ratio SSD100/SSD213 Deviation from IC value [ Gy ] [ - ] [%]
7D 0 0,243 9,1% 500 0,241 8,2% 1000 0,241 8,1% 1500 0,236 5,9% 2000 0,233 4,8% 2500 0,238 7,0% 3000 0,234 5,2% 3500 0,233 4,8% 13500 0,236 6,2%
Sc 2 0 0,254 14,1% 500 0,244 9,6% 1000 0,240 7,9%
10a 0 0,227 2,0% 500 0,230 3,5% 1000 0,228 2,7% 1500 0,226 1,6% 2000 0,226 1,6% 2500 0,228 2,3%
3.6 EVALUATION OF THE TEMPERATURE DEPENDENCE
The temperature dependence of the diamond detector has been investigated and figure
3.6.1 shows a typical curve of the diamond detector response along side with an EFD
32
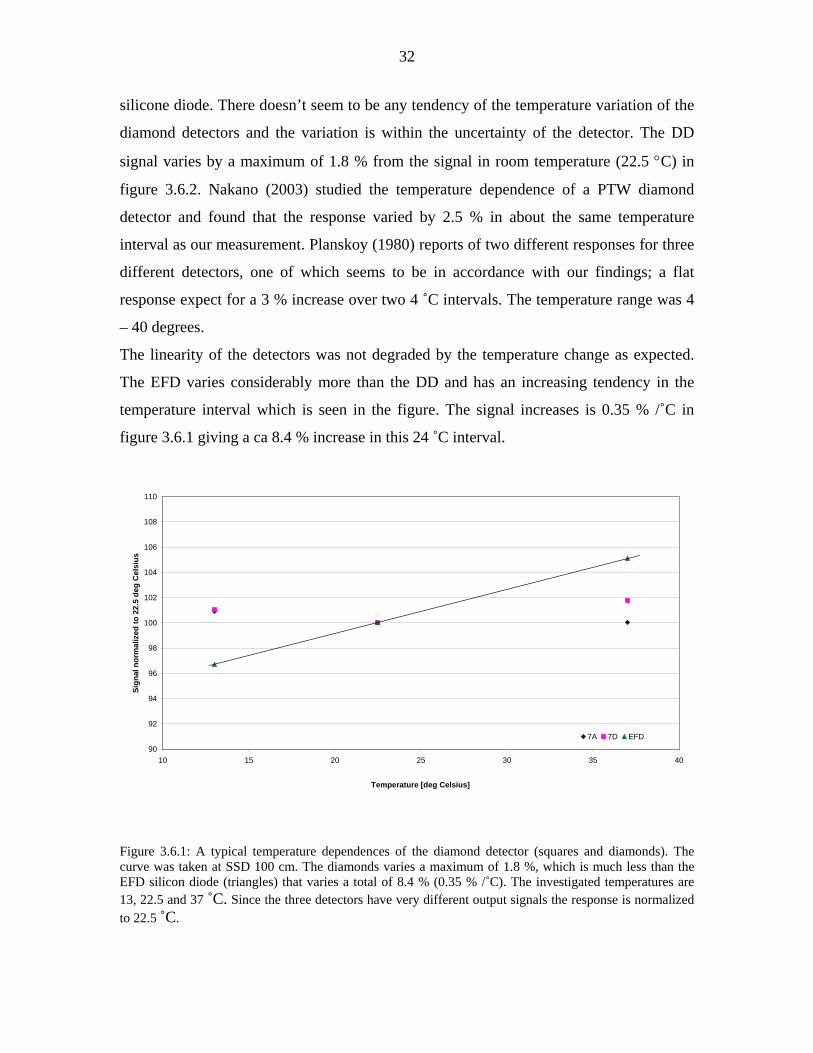
silicone diode. There doesn’t seem to be any tendency of the temperature variation of the
diamond detectors and the variation is within the uncertainty of the detector. The DD
signal varies by a maximum of 1.8 % from the signal in room temperature (22.5 °C) in
figure 3.6.2. Nakano (2003) studied the temperature dependence of a PTW diamond
detector and found that the response varied by 2.5 % in about the same temperature
interval as our measurement. Planskoy (1980) reports of two different responses for three
different detectors, one of which seems to be in accordance with our findings; a flat
response expect for a 3 % increase over two 4 ˚C intervals. The temperature range was 4
– 40 degrees.
The linearity of the detectors was not degraded by the temperature change as expected.
The EFD varies considerably more than the DD and has an increasing tendency in the
temperature interval which is seen in the figure. The signal increases is 0.35 % /˚C in
figure 3.6.1 giving a ca 8.4 % increase in this 24 ˚C interval.
90
92
94
96
98
100
102
104
106
108
110
10 15 20 25 30 35 40
Temperature [deg Celsius]
Sign
al n
orm
aliz
ed to
22.
5 de
g C
elsi
us
7A 7D EFD
Figure 3.6.1: A typical temperature dependences of the diamond detector (squares and diamonds). The curve was taken at SSD 100 cm. The diamonds varies a maximum of 1.8 %, which is much less than the EFD silicon diode (triangles) that varies a total of 8.4 % (0.35 % /˚C). The investigated temperatures are 13, 22.5 and 37 ˚C. Since the three detectors have very different output signals the response is normalized to 22.5 ˚C.

33
3.7 EVALUATION OF THE DIRECTIONAL DEPENDENCE
The directional dependence of the diamond detector was investigated and the result is
shown in figure 3.7.1. The signal deviation from zero degrees is < 1 % for ± 15˚ and <
2.5 % for ± -90˚ and ca 13 % at 150˚. The curve has a moderate asymmetry in the plus
and minus direction which is probably caused by an asymmetry of the detector
construction. Since the curve was taken in two subintervals [0,150] and [0,-150] we got
two values at zero, both normalized to 100 %.
Fidanzio (2004) has tested a polycrystalline CVD diamond detector and found the
directional dependence to be < 1 % up to 120˚ in 6 MV photons.
86
88
90
92
94
96
98
100
102
104
-180 -150 -120 -90 -60 -30 0 30 60 90 120 150 180
Angle [Deg]
Sign
al n
orm
aliz
ed to
zer
o de
g
Figure 3.7.1: Directional dependence of the CVD single crystal diamond detector in the interval [-150,150] degrees. The diamond curve is not symmetric and this is probably caused by an asymmetry in the detector housing.

34
3.8 DEPTH DOSE CURVES AND BEAM PROFILES
3.8.1 Depth dose curves
The diamond detector and ion chamber depth dose profiles in the field sizes 5×5 cm2,
10×10 cm2 and 30×30 cm2 are plotted in figure 3.8.1a-c. The curves are normalized to
depth 100 mm and the diamond doesn’t reach as high percentage at dose max as the IC.
On the far right side the diamond is a few percentage points above the ion chamber (2.0,
2.2 and 3.0 percentage points at 200 mm). This more flat shape of the DD is due to the
detector sub-linearity (see section 3.3), which makes the detectors overestimate the dose
at large depths where there is a lower dose rate. The over-estimation is increasing with
field size since a larger field has a slightly higher dose rate.
Rodriguez (2007) has found that an ADII-33 (natural) diamond detector in 6 MeV
photons, just as our diamond, overestimates the dose by 1.9 % at 180 mm depth in a
10×10 cm2 field. He concludes that the DD can be used down to 140 mm depth.
0,0
20,0
40,0
60,0
80,0
100,0
120,0
140,0
160,0
180,0
-50 0 50 100 150 200 250 300 350
Depth [mm]
Dos
e no
rmal
ized
at 1
00 m
m
DD IC

35
0,0
20,0
40,0
60,0
80,0
100,0
120,0
140,0
160,0
-50 0 50 100 150 200 250 300 350
Depth [mm]
Dos
e no
rmal
ized
at 1
00 m
m
DD IC
0,0
20,0
40,0
60,0
80,0
100,0
120,0
140,0
160,0
-50 0 50 100 150 200 250 300 350
Depth [mm]
Dos
e no
rmal
ized
at 1
00 m
m
DD IC
Figure 3.8.1: Depth dose curves for the diamond detectors (DD1001) compared to a Scanditronix RK ionization chamber in the fields a) 5×5 cm2, b) 10×10 cm2 and c) 30 ×30 cm2. The diamond gives a 2.0, 2.2 and 3.0 percentage points higher response than the RK does for the 5×5 cm2, 10×10 cm2 and 30 ×30 cm2 fields at 200 mm depth (respectively). In figure c) the roughness of the RK curve is due to linac operation problems.

36
An attempt to correct for the sub-linearity has been made in figure 3.8.2 for depths 15 to
310 mm (30×30 cm2 field). The detector DD1001 has a ratio of 0.243 (se section 2.3.4)
between the signal at SSD 100 and 213 cm. For this detector the ratio deviates by 9.2 %
from the RK ionization chamber (0.2225, which is considered linear). An assumption is
made that this error is zero at dose max and increases linearly to 9.2 % at the depth in
water where the signal is 24.3 % (from the detector ratio above). This depth is 409 mm
and was estimated by an exponential extrapolation of the depth dose curve. The
correction is applied by reducing the diamond detector signal by the equation:
mmmm
k
ddkSScorr
/%0233.0409
%2.9)( max
==
−−=
where Scorr is the corrected signal, S is the measured signal (in percent), d is the depth and
dmax is the dose max depth. k is the reduction factor. After the correction is made the
deviation between IC and DD at depth 200 mm is eliminated.
0,0
20,0
40,0
60,0
80,0
100,0
120,0
-50 0 50 100 150 200 250 300 350
Depth [mm]
Dos
e no
rmal
ized
to d
ose
max
RK DD korr
Figure 3.8.2: A corrected DD curve against the IC. The curve is normalized to dose max. The difference between the curves at 200 mm is eliminated.

37
3.8.2 Beam profiles
Several beam profiles were taken with the DD1001 diamond detector and the RK ion
chamber. The curves are plotted in the figures 3.8.3 – 5 and were shifted so that the 50 %
value is symmetric around the y-axis. The curves are normalised to 100 % at the centre.
Each figure shows curves for one field size at two or three different depths. The diamond
gives a comparable, and in most cases, better (narrower) penumbras than the IC, which is
expected due to the better spatial resolution of the DD. The flatness parameter is
comparable and the symmetry of the IC is for the most part better, which also might be
connected to the superior spatial resolution of the DD. The width (50 % - 50 %) of each
diamond curve is consistently wider but within 1.4 % from that of the IC.
The difference of the diamond detector from ion chamber tails is increasing in absolute
value but is constant in relative value for all field sizes with depth. The difference play
little role clinically, since the possible dose miscalculation will only be a few percent.
The diamond detector tail is probably due to an energy dependence of the entire detector
construction (diamond, housing, wires and electrodes) and/or a dose rate dependence of
the diamond. Further investigations is needed to determine the cause. The penumbra (20
– 80 %), flatness and symmetry were calculated by the OmniPro Accept program.

38
0,00
20,00
40,00
60,00
80,00
100,00
120,00
-60,0 -40,0 -20,0 0,0 20,0 40,0 60,0
Distance from center [mm]
Nor
mal
ized
Dos
e
DD IC
PenumbraDD: 5.1/5.0 mmIC: 5.9/5.8 mm
FlatnessDD:3.4 %IC: 4.0 %
Symmetry:DD: 4.7 %IC: 3.5 %
0,0
20,0
40,0
60,0
80,0
100,0
120,0
-60 -40 -20 0 20 40 60
Distance from center [mm]
Nor
mal
ized
Dos
e
DD IC
PenumbraDD: 6.3/6.4 mmIC: 6.9/7.0 mm
FlatnessDD: 4.5 %IC: 4.9 %
Symmetry:DD: 1.0 %IC: 2.2 %

39
0,0
20,0
40,0
60,0
80,0
100,0
120,0
-60 -40 -20 0 20 40 60
Distance from center [mm]
Nor
mal
ized
Dos
e
DD IC
PenumbraDD: 7.4/7.3 mmIC: 8.0/7.9 mm
FlatnessDD: 4.8 %IC: 5.2 %
Symmetry:DD: 4.9 %IC: 0.5 %
Figure 3.8.3: Beam profiles of a RK ion chamber and a diamond detector (DD1001). The field sizes are 5×5 cm2, depths are a) 15 mm (dose max), b) 100 mm and c) 200 mm. Penumbra, symmetry and flatness constants are included in the figure for the ion chamber (IC) and diamond detector (DD).
0,0
20,0
40,0
60,0
80,0
100,0
120,0
-100 -80 -60 -40 -20 0 20 40 60 80 100
Distance from center [mm]
Nor
mal
ized
dos
e
DD IC
PenumbraDD: 5.6/5.2 mmIC: 6.1/5.9 mm
FlatnessDD: 2.6 %IC: 0.9 %
Symmetry:DD: 4.8 %IC: 0.7 %

40
0,0
20,0
40,0
60,0
80,0
100,0
120,0
-100 -80 -60 -40 -20 0 20 40 60 80 100
Distance from center [mm]
Nor
mal
ized
dos
e
DD IC
PenumbraDD: 7.2/7.5 mmIC: 8.0/7.7 mm
FlatnessDD: 3.1 %IC: 2.3 %
Symmetry:DD: 1.8 %IC: 0.7 %
0,0
20,0
40,0
60,0
80,0
100,0
120,0
-100 -80 -60 -40 -20 0 20 40 60 80 100
Distance from center [mm]
Nor
mal
ized
dos
e
DD IC
PenumbraDD: 9.2/9.2 mmIC: 9.0/9.0 mm
FlatnessDD: 3.7 %IC: 3.5 %
Symmetry:DD: 2.3 %IC: 0.8 %
Figure 3.8.4: Beam profiles of a RK ion chamber and a diamond detector (DD1001). The field sizes are 10×10 cm2, depths are a) 15 mm (dosemax), b) 100 mm and c) 200 mm. Penumbra, symmetry and flatness constants are included in the figure for the ion chamber (IC) and diamond detector (DD).

41
0,0
20,0
40,0
60,0
80,0
100,0
120,0
-200 -150 -100 -50 0 50 100 150 200
Distance from center [mm]
Nor
mal
ized
dos
e
DD ICPenumbraDD: 6.0/6.0 mmIC: 6.2/6.1 mm
FlatnessDD: 2.4 %IC: 2.1 %
Symmetry:DD: 2.2 %IC: 0.8 %
0,0
20,0
40,0
60,0
80,0
100,0
120,0
-200 -150 -100 -50 0 50 100 150 200
Distance from center [mm]
Nor
mal
ized
dos
e
DD ICPenumbraDD: 9.4/10.2 mmIC: 7.8/8.7 mm
FlatnessDD: 1.7 %IC: 2.1 %
Symmetry:DD: 1.1 %IC: 1.5 %
Figure 3.8.5: Beam profiles of a RK ion chamber and a diamond detector (DD1001). The field sizes are 30×30 cm2, depths are a) 15 mm (dosemax), b) 100 mm and c) 200 mm. Penumbra, symmetry and flatness constants are included in the figure for the ion chamber (IC) and diamond detector (DD).

42

43
4 CONCLUSIONS
A thorough investigation of the diamond detector in dosimetry applications has been
conducted in this work. An optimal bias voltage has been chosen for the diamond
detector (50 V). The stability of the diamond detector has been investigated but further
work is required in order to distinguish the influence on the diamond detector signal from
the linac instability. This is best done by simultaneously doing measurements with an
ionization chamber. At present, the response of the detector can only be determined
within ± 2.5 %, which is too large for clinical use. In one workday, however, the response
from the detector varied only by a maximum of 1.2 % from the average. The stability of
more than one detector also has to be evaluated.
The dose rate linearity of the diamond detector is a crucial quality and the experiments
show a sub-linearity of 0.978 and 0.953 for two tested detectors. This is in accordance
with previous investigations found in published papers. The sub-linearity plays a role in
the depth dose curves and a successful attempt to correct this has been made. The
difference in signal between the IC and DD was reduced from 3.0 percentage point to
null in the 30 × 30 cm2 field at 200 mm depth.
The size of the priming dose has been the nuisance for many research groups trying to
develop diamond detectors. The evaluated diamond detector only requires a small dose to
be primed. A priming dose of 0.6 Gy is recommended, even though an as small dose as
0.2 Gy might be enough. A practical quality of the detector is that the resting time is
unimportant for the priming dose, although the size of signal deviation increases with
resting time. An hourly resting time (2 or 3 hours) gave an increased dose of only 1.5 – 2
%, which implies that the detector can be used without having to be re-primed after a
short break. A week long pause gave an 11 % increase. Whether the bias is left on or
turned off in the pause doesn’t have any effect on the result. The size of the priming dose
is maintained during the life time of the detector.
The investigation of sensitivity change with accumulated dose has been the individual
most time consuming part of this work, partly because of the extent of the experiments
but also due to the surprising results. Published articles report that radiation doesn’t

44
damage the diamond detector (Fidanzio 2002, Planskoy 1980 and Rodruigez 2007).
Contrary to this, the evaluated diamond detectors were desensitised by as much as 31 %
in one 500 Gy dose (18 MeV electrons).
The first 500 Gy administrated, severely degraded the response of all subjected detectors
(22 – 31 %). The following dose gave a less, but still large, decrease of 8.4 – 24 % /kGy
(18 MeV e-). Interesting is that 8 and 18 MeV electrons affect the detectors in about the
same way, despite there rather large energy difference. High energy photons also
desensitized the detector, but to a less degree than electrons (1.1 and 4.5 % after 500 Gy).
A future study may be to reveal what the desensitization is actually caused by.
A positive feature of the pre-irradiation experiments is that the linearity of the detector
was improved by electron irradiation. If an optimized pre-irradiation procedure is
developed the linearity might be further improved to a clinically acceptable level.
The low energy photons (5 MV) and protons (180 MeV) did not decrease the diamond
charge collection or the linearity ratio. The 15 MV photons did not improve the linearity.
The conclusions made from the photons and protons measurements can not be considered
final and more measurements should be conducted in the future.
The investigation of radiation damages needs to be further evaluated. If the results are
concurrent with these findings a possible field of use for the diamond detector might be at
least in low energy photons and proton fields. If electron and high energy photon
measurements shall be functional a much lower de-sensitivity per Gy must be reached.
The results as they now are, are not at a satisfactory low level (which would be at the
most 1 % per kGy).
The temperature dependence test of the diamond material shows that it has a smaller
variation than the silicon diode. The silicon detector showed an increase in signal with
temperature of 0.35 % /˚C in the range [13˚,37˚]. The diamond detector did not show any
specific tendency of the variation and the largest variation of the two detectors was 1.8
%, which is within the detector uncertainty. The diamond has thus the advantage since it
can be used without special regard for temperature variations. The study also shows that
shallow traps will not effect detector operation when used in room or body temperature.
45
The directional dependence study proved that the DD can be used without any
compensation for small variation in the setup angle (up to ± 15˚ the deviation is < 1 %).
The dose profiles of the IC and DD follow each other to a satisfactory extent and the
penumbras of the diamond detector are narrower than the ion chamber in all cases but
two, i.e. in six out of eight cases. This is as predicted since the DD should have a better
special resolution due to its smaller active volume. Dose profiles and depth dose curves
substantiate all important qualities in clinical dosimetry and will reveal if a detector holds
an acceptable standard. The diamond detector profiles illustrate that this product has the
possibility of becoming a valuable product for quality assurance of IMRT fields.
As a cumulative conclusion, this diamond detector has the potential of becoming a strong
competitor to the silicon diode and ionization chamber, but only after dealing with
instability and finalizing and optimizing the pre-irradiation procedure.
5 ACKNOWLEDGMENTS
Thanks to the staff at the medical physics department at the Uppsala University Hospital.
Special thanks are directed to Erik Grusell and Göran Rikner for their expertise regarding
theoretical and practical matters and to Aldis Tidriks for his instantaneous help when
linac operation failed.
A special acknowledgement is given to Erik Grusell who provided the proton dose.
6 ABBREVATIONS
DD Diamond detector
EFD Electron field detector (silicon detector)
IC Ionization chamber
RFA Radiation field analyzer
SSD Source surface distance

46

47
7 REFERENCES
BUTTAR C MAIREY R, CONWAY J, HILL G, RAMKUMAR S, SCARSBROOK G, SUSSMANN R S, WALKER S, WHITEHEAD A: A study of radiotherapy dosimeters based on diamond grown by chemical vapour deposition. Diamond Related Mater, 6, 965 – 969, 2000. CIRRONE G A P, CUTTONE G, RAFFAELE L, SABINI M G, DEANGELIS C, ONORI S, PACILIO M, BUCCIOLINI M, BRUZZI M, SCIORTINO S: Natural and CVD type diamond detectors as dosimeters in hadrontherapy applications. Nuclear Physics B Proceedings Supplement, 125, 179 – 183, 2003. FIDANZIO A, AZARIO L, DEANGELIS C, PACILLIO M, ONORI S, KACPEREK A, PIERMATTEI A: A correction method for detector signal dependence with proton energy. Med. Phys., 29, 669 – 675, 2002. FIDANZIO A, AZARIO L, VIOLA P, ASCARELLI P, CAPPELLI E, CONTE G, PIERMATTEI A: Photon and electron beam dosimetry with a CVD diamond detector. Nucl. Instr. and Meth. A, 524, 115 – 123, 2004. FIDANZIO A, AZARIO L, KALISH R, AVIGAL Y, CONTE G, ASCARELLI P, PIERMATTEI A: A preliminary dosimetric characterization of chemical vapour deposition diamond detector prototypes in photon and electron radiotherapy beams. Med. Phys. 32, 389 – 395, 2005. FOWLER J F: Solid state electrical conductivity dosimeters. In ATTIX, ROESCH AND TOCHILIN: Radiation dosimetry vol.2. Academic Press, 1966. HAYDARIAN M, HOBAN P W, BECKHAM B A, BEDDOE A H: Evaluation of a PTW diamond detector for electron beam measurements. Phys. Med. Biol., 38, 1035 – 1042, 1993. HOBAN P W, HEYDARIAN M, BECKHAM W A, BEDDOE A H: Dose rate dependence of a PTW diamond detector in the dosimetry of a 6 MV photon beam. Phys. Med. Biol., 39, 1219 – 1229, 1994. HUBBELL J H, HIGGINS P D, ATTIX F H, SELTZER S M, BERGER M J, SIBATA C H: Mass energy transfer and mass energy absorption coefficients, including in-flight positron annihilation for photon energies 1 keV to 100 MeV. NISTIR 4680, 1991. ICRU: Stopping Powers for Electrons and positrons, Report 37 of the International Commission on Radiation Units and Measurements, 1984. KNOLL G F: Radiation detection and measurement. John Wiley & son inc., 3rd edition, 2000.
48
LAUB W U, KAULICH T W, NÜSSLIN F: Energy and dose rate dependence of a diamond detector in the dosimetry of 4 – 25 MeV photon beams. Med. Phys., 24, 535 – 536, 1997. LAUB W U, KAULICH T W, NÜSSLIN F: A diamond detector in the dosimetry of high-energy electron and photon beams. Phys. Med. Biol., 44, 2183 – 2192, 1999. NAKANO T, SUCHOWERSKA N, BILEK M M, MCKENZIE D R, KRON N NG, KRON T: High dose-rate brachytheraphy source localization: positional resolution using a diamond detector. Phys. Med. Biol., 48, 2133 – 2146, 2003. PLANSKOY B: Evaluation of diamond radiation dosemeters. Phys. Med. Biol., 25, 519 – 532, 1980. RODRIGUEZ M, GRIFFIN S, DEWERD L, JERAJ R: Characterization of the ADII-33 diamond detector. Med. Phys., 34, 215 – 220, 2007. RUSTGI S N: Evaluation of the dosimetric characteristics of a diamond detector for photon beam measurements. Med. Phys., 22, 567 – 570, 1995.
Related Documents