Garcia Jill A. Odabashian, Jeanne K. Drinko, L. Leonardo Rodriguez, James D. Thomas and Mario J. Neil L. Greenberg, Michael S. Firstenberg, Peter L. Castro, Michael Main, Agnese Travaglini, Contractility Doppler-Derived Myocardial Systolic Strain Rate Is a Strong Index of Left Ventricular Print ISSN: 0009-7322. Online ISSN: 1524-4539 Copyright © 2002 American Heart Association, Inc. All rights reserved. is published by the American Heart Association, 7272 Greenville Avenue, Dallas, TX 75231 Circulation doi: 10.1161/hc0102.101396 2002;105:99-105 Circulation. http://circ.ahajournals.org/content/105/1/99 World Wide Web at: The online version of this article, along with updated information and services, is located on the http://circ.ahajournals.org//subscriptions/ is online at: Circulation Information about subscribing to Subscriptions: http://www.lww.com/reprints Information about reprints can be found online at: Reprints: document. Permissions and Rights Question and Answer this process is available in the click Request Permissions in the middle column of the Web page under Services. Further information about Office. Once the online version of the published article for which permission is being requested is located, can be obtained via RightsLink, a service of the Copyright Clearance Center, not the Editorial Circulation in Requests for permissions to reproduce figures, tables, or portions of articles originally published Permissions: by guest on June 10, 2013 http://circ.ahajournals.org/ Downloaded from

Welcome message from author
This document is posted to help you gain knowledge. Please leave a comment to let me know what you think about it! Share it to your friends and learn new things together.
Transcript

GarciaJill A. Odabashian, Jeanne K. Drinko, L. Leonardo Rodriguez, James D. Thomas and Mario J. Neil L. Greenberg, Michael S. Firstenberg, Peter L. Castro, Michael Main, Agnese Travaglini,
ContractilityDoppler-Derived Myocardial Systolic Strain Rate Is a Strong Index of Left Ventricular
Print ISSN: 0009-7322. Online ISSN: 1524-4539 Copyright © 2002 American Heart Association, Inc. All rights reserved.
is published by the American Heart Association, 7272 Greenville Avenue, Dallas, TX 75231Circulation doi: 10.1161/hc0102.101396
2002;105:99-105Circulation.
http://circ.ahajournals.org/content/105/1/99World Wide Web at:
The online version of this article, along with updated information and services, is located on the
http://circ.ahajournals.org//subscriptions/
is online at: Circulation Information about subscribing to Subscriptions:
http://www.lww.com/reprints Information about reprints can be found online at: Reprints:
document. Permissions and Rights Question and Answer this process is available in the
click Request Permissions in the middle column of the Web page under Services. Further information aboutOffice. Once the online version of the published article for which permission is being requested is located,
can be obtained via RightsLink, a service of the Copyright Clearance Center, not the EditorialCirculationin Requests for permissions to reproduce figures, tables, or portions of articles originally publishedPermissions:
by guest on June 10, 2013http://circ.ahajournals.org/Downloaded from
Doppler-Derived Myocardial Systolic Strain Rate Is aStrong Index of Left Ventricular Contractility
Neil L. Greenberg, PhD; Michael S. Firstenberg, MD; Peter L. Castro, MD; Michael Main, MD;Agnese Travaglini, MS; Jill A. Odabashian, RDCS; Jeanne K. Drinko, RDCS;
L. Leonardo Rodriguez, MD; James D. Thomas, MD; Mario J. Garcia, MD
Background—Myocardial fiber strain is directly related to left ventricular (LV) contractility. Strain rate can be estimatedas the spatial derivative of velocities (dV/ds) obtained by tissue Doppler echocardiography (TDE). The purposes of thestudy were (1) to determine whether TDE-derived strain rate may be used as a noninvasive, quantitative index ofcontractility and (2) to compare the relative accuracy of systolic strain rate against TDE velocities alone.
Methods and Results—TDE color M-mode images of the interventricular septum were recorded from the apical 4-chamberview in 7 closed-chest anesthetized mongrel dogs during 5 different inotropic stages. Simultaneous LV volume andpressure were obtained with a combined conductance–high-fidelity pressure catheter. Peak elastance (Emax) wasdetermined as the slope of end-systolic pressure-volume relationships during caval occlusion and was used as the goldstandard of LV contractility. Peak systolic TDE myocardial velocities (Sm) and peak (��p) and mean (��m) strain ratesobtained at the basal septum were compared against Emax by linear regression. Emax as well as TDE systolic indicesincreased during inotropic stimulation with dobutamine and decreased with the infusion of esmolol. A strongerassociation was found between Emax and ��p (r�0.94, P�0.01, y�0.29x�0.46) and ��m (r�0.88, P�0.01) than for Sm
(r�0.75, P�0.01).Conclusions—TDE-derived ��p and ��m are strong noninvasive indices of LV contractility. These indices appear to be more
reliable than Sm, perhaps by eliminating translational artifact. (Circulation. 2002;105:99-105.)
Key Words: strain � contractility � hemodynamics � echocardiography
Tissue Doppler echocardiography (TDE) is a noninvasiveimaging modality that allows quantification of myocar-
dial velocities. Pulsed and color Doppler processing havebeen used to evaluate regional velocities from the apex to thebase of the ventricle in either the septum or lateral wall.Systolic wall motion velocities, evaluated using pulsed TDE,have been proposed as a means to assess global left ventric-ular (LV) function and have been compared with the accel-eration of LV pressure (peak dP/dt).1 One limitation of thismethod, however, is that regional TDE velocities are affectedby heart translation and tethering of adjacent myocardialsegments. The myocardial velocity gradient, obtained byanalysis of spatiotemporal distribution of myocardial veloci-ties measured by 2D color TDE, has also been evaluated as anindex of ventricular contraction that is independent of cardiactranslation artifact but is limited to the analysis of circumfer-ential fiber shortening in a few myocardial segments.2–4
Gorcsan et al5 demonstrated that TDE velocities can provideboth segmental and global assessment of ventricularcontractility.
The LV end-systolic pressure-volume relationship(ESPVR), or peak elastance (Emax), is defined by the slope of
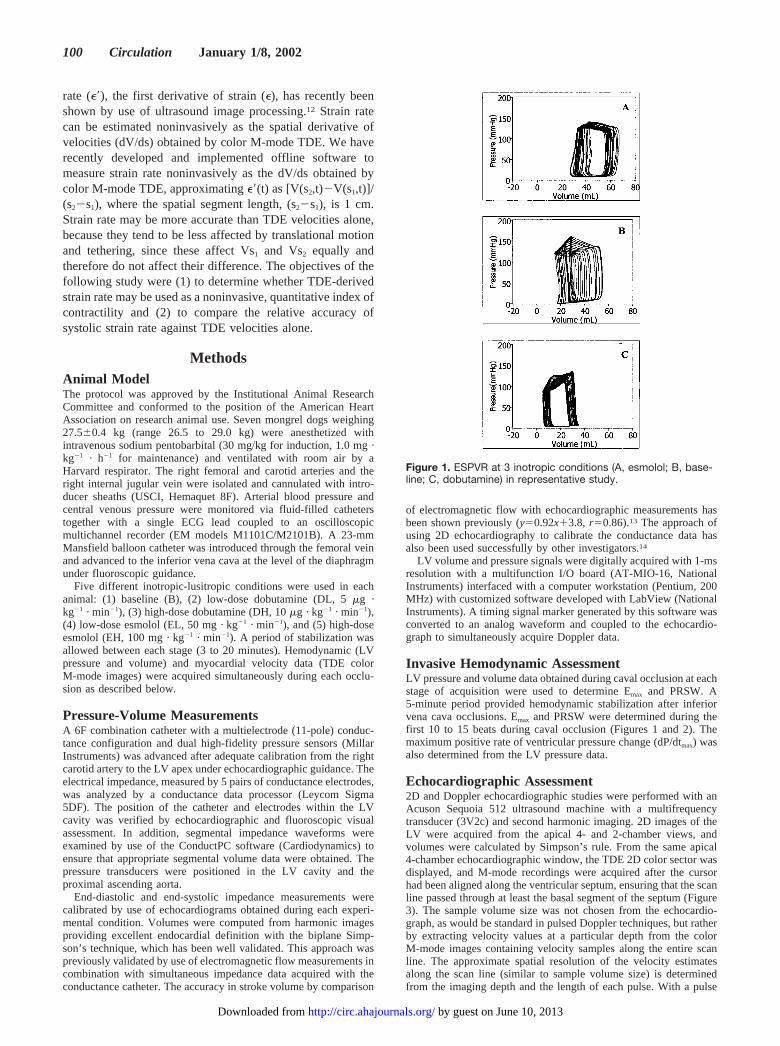
the end-systolic pressure-volume points during preload re-duction maneuvers, such as caval occlusion, and reflects theoperating contractility of the LV.6 Similarly, preload re-cruitable stroke work (PRSW), defined by the slope of thelinear regression between stroke work (area within thepressure-volume loop) and end-diastolic volume during apreload reduction intervention, has also been proposed as aload-independent index of contractile function.7 Myocardialfiber strain is also directly related to LV contractility. Strainis defined as relative deformation, whereas strain rate de-scribes the rate of deformation, or how quickly a tissueshortens or lengthens. Strain rate will be decreased when thetissue changes a specific length more slowly or has adecreased change in length in the same time span.
Myocardial strain and strain rate are optimal descriptors ofcardiac contraction and relaxation, but until recently theyhave been available only in invasive experimental settingswith implanted sonomicrometers8 or tantalum markers.9 Al-though limited by temporal resolution and image acquisitiontime, noninvasive strain assessment has been achieved withMRI tagging techniques.10,11 Real-time assessment of strain
Received June 22, 2001; revision received October 11, 2001; accepted October 19, 2001.From the Cardiovascular Imaging Center, Department of Cardiology, Cleveland Clinic Foundation, Cleveland, Ohio.This work was presented at the 48th Annual Scientific Sessions of the American College of Cardiology, New Orleans, La, March 8, 1999.Correspondence to Neil L. Greenberg, PhD, Department of Cardiology, Desk F15, The Cleveland Clinic Foundation, 9500 Euclid Ave, Cleveland, OH
44195. E-mail [email protected]© 2002 American Heart Association, Inc.
Circulation is available at http://www.circulationaha.org
99 by guest on June 10, 2013http://circ.ahajournals.org/Downloaded from
rate (��), the first derivative of strain (�), has recently beenshown by use of ultrasound image processing.12 Strain ratecan be estimated noninvasively as the spatial derivative ofvelocities (dV/ds) obtained by color M-mode TDE. We haverecently developed and implemented offline software tomeasure strain rate noninvasively as the dV/ds obtained bycolor M-mode TDE, approximating ��(t) as [V(s2,t)�V(s1,t)]/(s2�s1), where the spatial segment length, (s2�s1), is 1 cm.Strain rate may be more accurate than TDE velocities alone,because they tend to be less affected by translational motionand tethering, since these affect Vs1 and Vs2 equally andtherefore do not affect their difference. The objectives of thefollowing study were (1) to determine whether TDE-derivedstrain rate may be used as a noninvasive, quantitative index ofcontractility and (2) to compare the relative accuracy ofsystolic strain rate against TDE velocities alone.
MethodsAnimal ModelThe protocol was approved by the Institutional Animal ResearchCommittee and conformed to the position of the American HeartAssociation on research animal use. Seven mongrel dogs weighing27.5�0.4 kg (range 26.5 to 29.0 kg) were anesthetized withintravenous sodium pentobarbital (30 mg/kg for induction, 1.0 mg ·kg�1 · h�1 for maintenance) and ventilated with room air by aHarvard respirator. The right femoral and carotid arteries and theright internal jugular vein were isolated and cannulated with intro-ducer sheaths (USCI, Hemaquet 8F). Arterial blood pressure andcentral venous pressure were monitored via fluid-filled catheterstogether with a single ECG lead coupled to an oscilloscopicmultichannel recorder (EM models M1101C/M2101B). A 23-mmMansfield balloon catheter was introduced through the femoral veinand advanced to the inferior vena cava at the level of the diaphragmunder fluoroscopic guidance.
Five different inotropic-lusitropic conditions were used in eachanimal: (1) baseline (B), (2) low-dose dobutamine (DL, 5 �g ·kg�1 · min�1), (3) high-dose dobutamine (DH, 10 �g · kg�1 · min�1),(4) low-dose esmolol (EL, 50 mg · kg�1 · min�1), and (5) high-doseesmolol (EH, 100 mg · kg�1 · min�1). A period of stabilization wasallowed between each stage (3 to 20 minutes). Hemodynamic (LVpressure and volume) and myocardial velocity data (TDE colorM-mode images) were acquired simultaneously during each occlu-sion as described below.
Pressure-Volume MeasurementsA 6F combination catheter with a multielectrode (11-pole) conduc-tance configuration and dual high-fidelity pressure sensors (MillarInstruments) was advanced after adequate calibration from the rightcarotid artery to the LV apex under echocardiographic guidance. Theelectrical impedance, measured by 5 pairs of conductance electrodes,was analyzed by a conductance data processor (Leycom Sigma5DF). The position of the catheter and electrodes within the LVcavity was verified by echocardiographic and fluoroscopic visualassessment. In addition, segmental impedance waveforms wereexamined by use of the ConductPC software (Cardiodynamics) toensure that appropriate segmental volume data were obtained. Thepressure transducers were positioned in the LV cavity and theproximal ascending aorta.
End-diastolic and end-systolic impedance measurements werecalibrated by use of echocardiograms obtained during each experi-mental condition. Volumes were computed from harmonic imagesproviding excellent endocardial definition with the biplane Simp-son’s technique, which has been well validated. This approach waspreviously validated by use of electromagnetic flow measurements incombination with simultaneous impedance data acquired with theconductance catheter. The accuracy in stroke volume by comparison
of electromagnetic flow with echocardiographic measurements hasbeen shown previously (y�0.92x�3.8, r�0.86).13 The approach ofusing 2D echocardiography to calibrate the conductance data hasalso been used successfully by other investigators.14
LV volume and pressure signals were digitally acquired with 1-msresolution with a multifunction I/O board (AT-MIO-16, NationalInstruments) interfaced with a computer workstation (Pentium, 200MHz) with customized software developed with LabView (NationalInstruments). A timing signal marker generated by this software wasconverted to an analog waveform and coupled to the echocardio-graph to simultaneously acquire Doppler data.
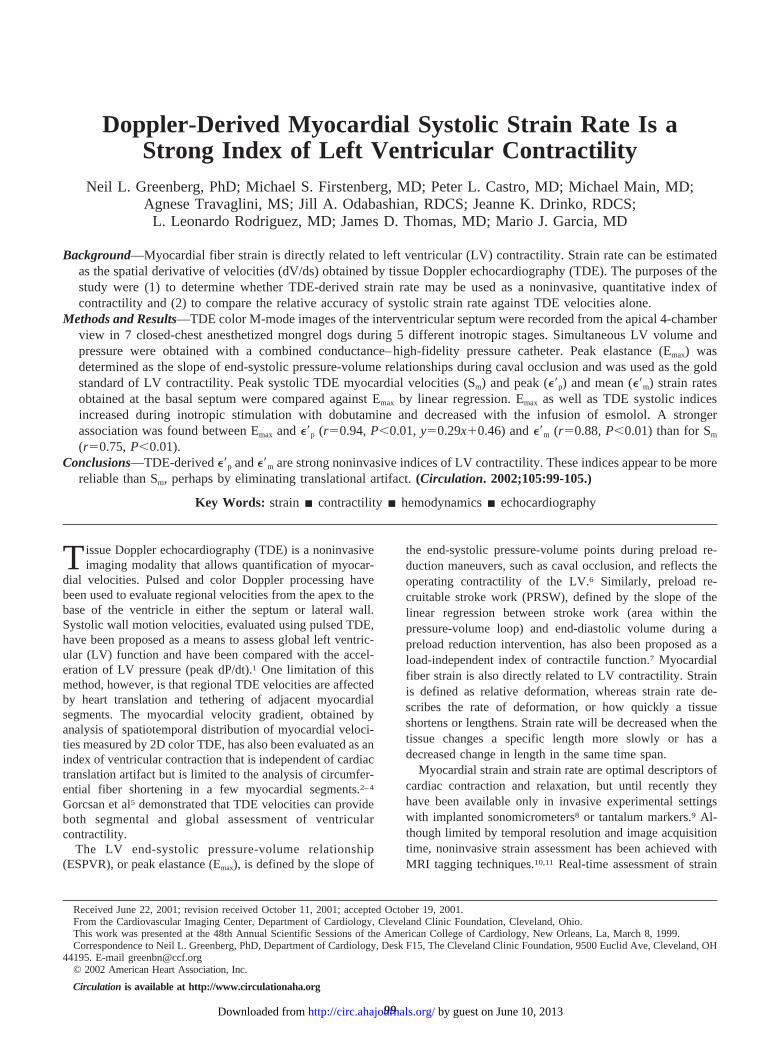
Invasive Hemodynamic AssessmentLV pressure and volume data obtained during caval occlusion at eachstage of acquisition were used to determine Emax and PRSW. A5-minute period provided hemodynamic stabilization after inferiorvena cava occlusions. Emax and PRSW were determined during thefirst 10 to 15 beats during caval occlusion (Figures 1 and 2). Themaximum positive rate of ventricular pressure change (dP/dtmax) wasalso determined from the LV pressure data.
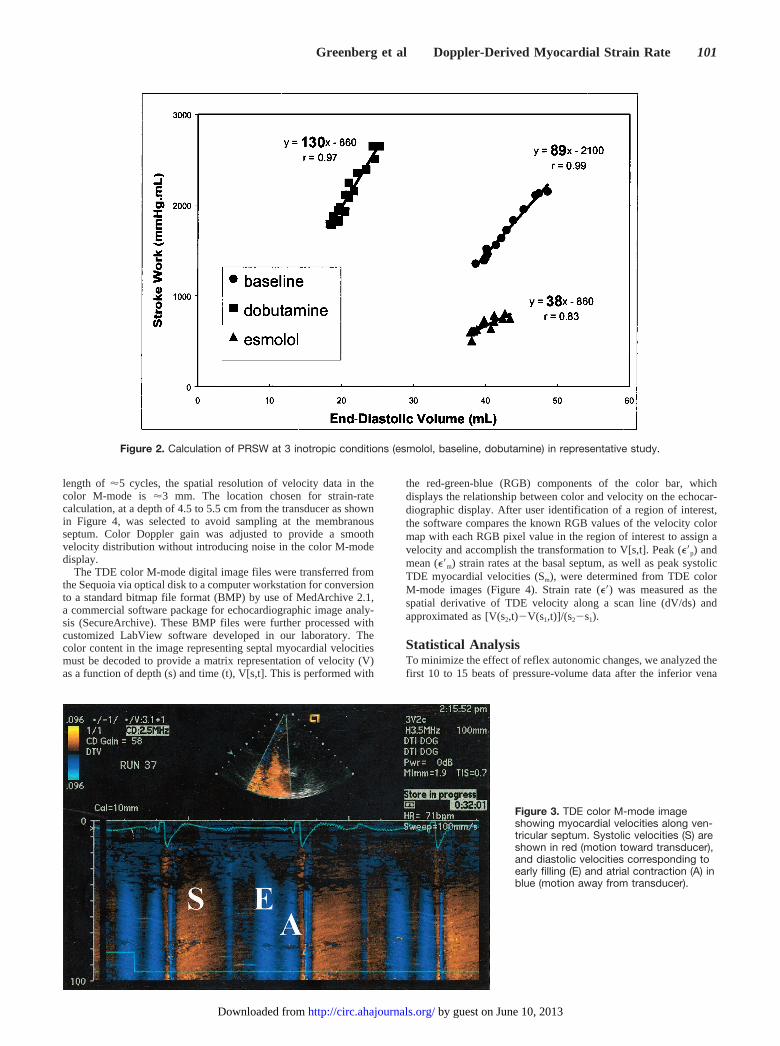
Echocardiographic Assessment2D and Doppler echocardiographic studies were performed with anAcuson Sequoia 512 ultrasound machine with a multifrequencytransducer (3V2c) and second harmonic imaging. 2D images of theLV were acquired from the apical 4- and 2-chamber views, andvolumes were calculated by Simpson’s rule. From the same apical4-chamber echocardiographic window, the TDE 2D color sector wasdisplayed, and M-mode recordings were acquired after the cursorhad been aligned along the ventricular septum, ensuring that the scanline passed through at least the basal segment of the septum (Figure3). The sample volume size was not chosen from the echocardio-graph, as would be standard in pulsed Doppler techniques, but ratherby extracting velocity values at a particular depth from the colorM-mode images containing velocity samples along the entire scanline. The approximate spatial resolution of the velocity estimatesalong the scan line (similar to sample volume size) is determinedfrom the imaging depth and the length of each pulse. With a pulse
Figure 1. ESPVR at 3 inotropic conditions (A, esmolol; B, base-line; C, dobutamine) in representative study.
100 Circulation January 1/8, 2002
by guest on June 10, 2013http://circ.ahajournals.org/Downloaded from
length of �5 cycles, the spatial resolution of velocity data in thecolor M-mode is �3 mm. The location chosen for strain-ratecalculation, at a depth of 4.5 to 5.5 cm from the transducer as shownin Figure 4, was selected to avoid sampling at the membranousseptum. Color Doppler gain was adjusted to provide a smoothvelocity distribution without introducing noise in the color M-modedisplay.
The TDE color M-mode digital image files were transferred fromthe Sequoia via optical disk to a computer workstation for conversionto a standard bitmap file format (BMP) by use of MedArchive 2.1,a commercial software package for echocardiographic image analy-sis (SecureArchive). These BMP files were further processed withcustomized LabView software developed in our laboratory. Thecolor content in the image representing septal myocardial velocitiesmust be decoded to provide a matrix representation of velocity (V)as a function of depth (s) and time (t), V[s,t]. This is performed with
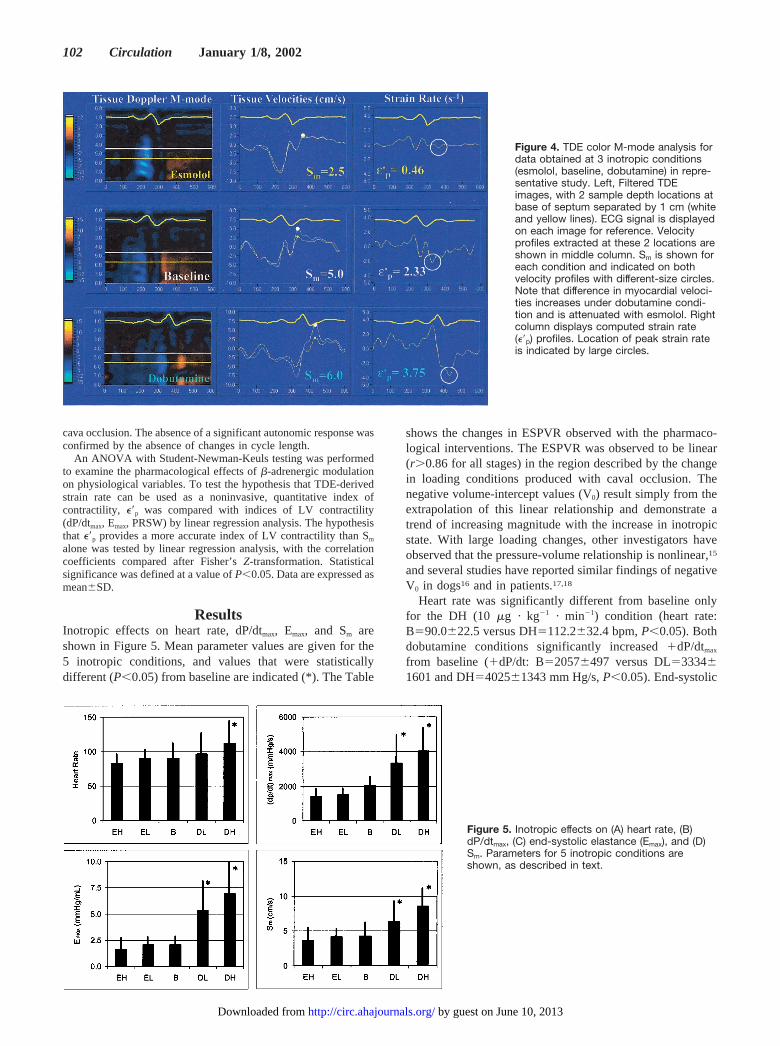
the red-green-blue (RGB) components of the color bar, whichdisplays the relationship between color and velocity on the echocar-diographic display. After user identification of a region of interest,the software compares the known RGB values of the velocity colormap with each RGB pixel value in the region of interest to assign avelocity and accomplish the transformation to V[s,t]. Peak (��p) andmean (��m) strain rates at the basal septum, as well as peak systolicTDE myocardial velocities (Sm), were determined from TDE colorM-mode images (Figure 4). Strain rate (��) was measured as thespatial derivative of TDE velocity along a scan line (dV/ds) andapproximated as [V(s2,t)�V(s1,t)]/(s2�s1).
Statistical AnalysisTo minimize the effect of reflex autonomic changes, we analyzed thefirst 10 to 15 beats of pressure-volume data after the inferior vena
Figure 2. Calculation of PRSW at 3 inotropic conditions (esmolol, baseline, dobutamine) in representative study.
Figure 3. TDE color M-mode imageshowing myocardial velocities along ven-tricular septum. Systolic velocities (S) areshown in red (motion toward transducer),and diastolic velocities corresponding toearly filling (E) and atrial contraction (A) inblue (motion away from transducer).
Greenberg et al Doppler-Derived Myocardial Strain Rate 101
by guest on June 10, 2013http://circ.ahajournals.org/Downloaded from
cava occlusion. The absence of a significant autonomic response wasconfirmed by the absence of changes in cycle length.
An ANOVA with Student-Newman-Keuls testing was performedto examine the pharmacological effects of �-adrenergic modulationon physiological variables. To test the hypothesis that TDE-derivedstrain rate can be used as a noninvasive, quantitative index ofcontractility, ��p was compared with indices of LV contractility(dP/dtmax, Emax, PRSW) by linear regression analysis. The hypothesisthat ��p provides a more accurate index of LV contractility than Sm
alone was tested by linear regression analysis, with the correlationcoefficients compared after Fisher’s Z-transformation. Statisticalsignificance was defined at a value of P�0.05. Data are expressed asmean�SD.
ResultsInotropic effects on heart rate, dP/dtmax, Emax, and Sm areshown in Figure 5. Mean parameter values are given for the5 inotropic conditions, and values that were statisticallydifferent (P�0.05) from baseline are indicated (*). The Table
shows the changes in ESPVR observed with the pharmaco-logical interventions. The ESPVR was observed to be linear(r�0.86 for all stages) in the region described by the changein loading conditions produced with caval occlusion. Thenegative volume-intercept values (V0) result simply from theextrapolation of this linear relationship and demonstrate atrend of increasing magnitude with the increase in inotropicstate. With large loading changes, other investigators haveobserved that the pressure-volume relationship is nonlinear,15
and several studies have reported similar findings of negativeV0 in dogs16 and in patients.17,18
Heart rate was significantly different from baseline onlyfor the DH (10 �g · kg�1 · min�1) condition (heart rate:B�90.0�22.5 versus DH�112.2�32.4 bpm, P�0.05). Bothdobutamine conditions significantly increased �dP/dtmax
from baseline (�dP/dt: B�2057�497 versus DL�3334�1601 and DH�4025�1343 mm Hg/s, P�0.05). End-systolic
Figure 4. TDE color M-mode analysis fordata obtained at 3 inotropic conditions(esmolol, baseline, dobutamine) in repre-sentative study. Left, Filtered TDEimages, with 2 sample depth locations atbase of septum separated by 1 cm (whiteand yellow lines). ECG signal is displayedon each image for reference. Velocityprofiles extracted at these 2 locations areshown in middle column. Sm is shown foreach condition and indicated on bothvelocity profiles with different-size circles.Note that difference in myocardial veloci-ties increases under dobutamine condi-tion and is attenuated with esmolol. Rightcolumn displays computed strain rate(��p) profiles. Location of peak strain rateis indicated by large circles.
Figure 5. Inotropic effects on (A) heart rate, (B)dP/dtmax, (C) end-systolic elastance (Emax), and (D)Sm. Parameters for 5 inotropic conditions areshown, as described in text.
102 Circulation January 1/8, 2002
by guest on June 10, 2013http://circ.ahajournals.org/Downloaded from
elastance and systolic myocardial velocities were also signif-icantly greater than baseline with dobutamine infusions(Emax: B�2.07�0.81 versus DL�5.33�2.81 andDH�6.93�3.03 mm Hg/mL, P�0.05; Sm: B�4.24�1.99versus DL�6.40�2.89 and DH�8.53�2.54 cm/s, P�0.05).
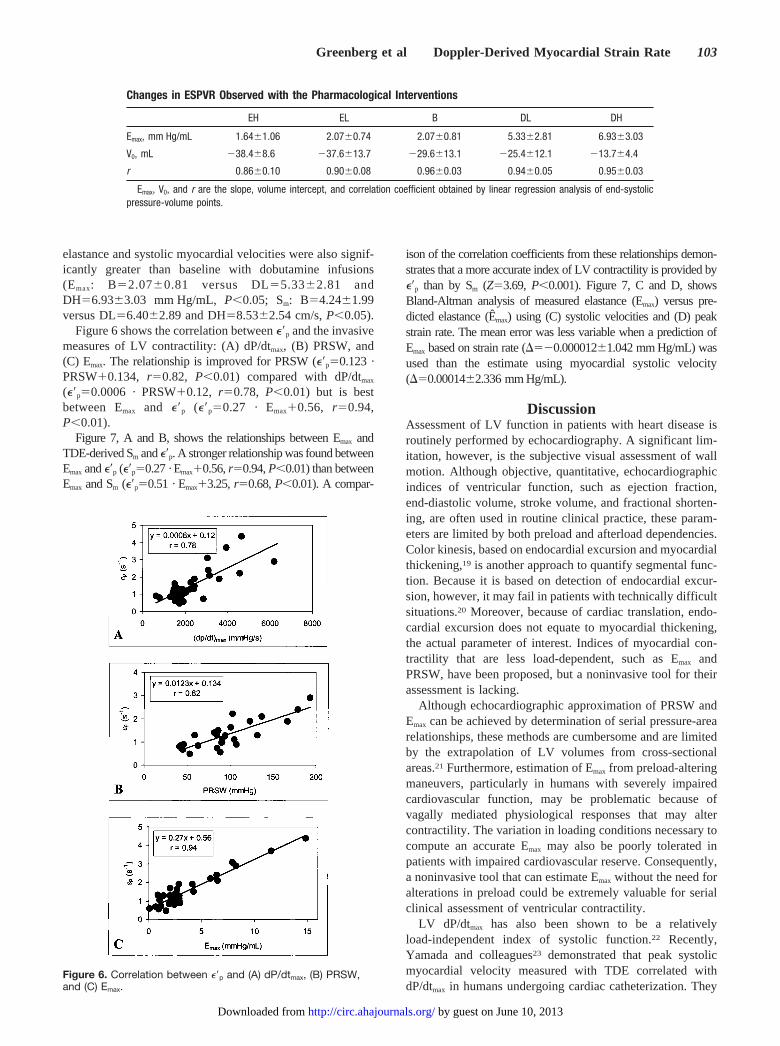
Figure 6 shows the correlation between ��p and the invasivemeasures of LV contractility: (A) dP/dtmax, (B) PRSW, and(C) Emax. The relationship is improved for PRSW (��p�0.123 ·PRSW�0.134, r�0.82, P�0.01) compared with dP/dtmax
(��p�0.0006 · PRSW�0.12, r�0.78, P�0.01) but is bestbetween Emax and ��p (��p�0.27 · Emax�0.56, r�0.94,P�0.01).
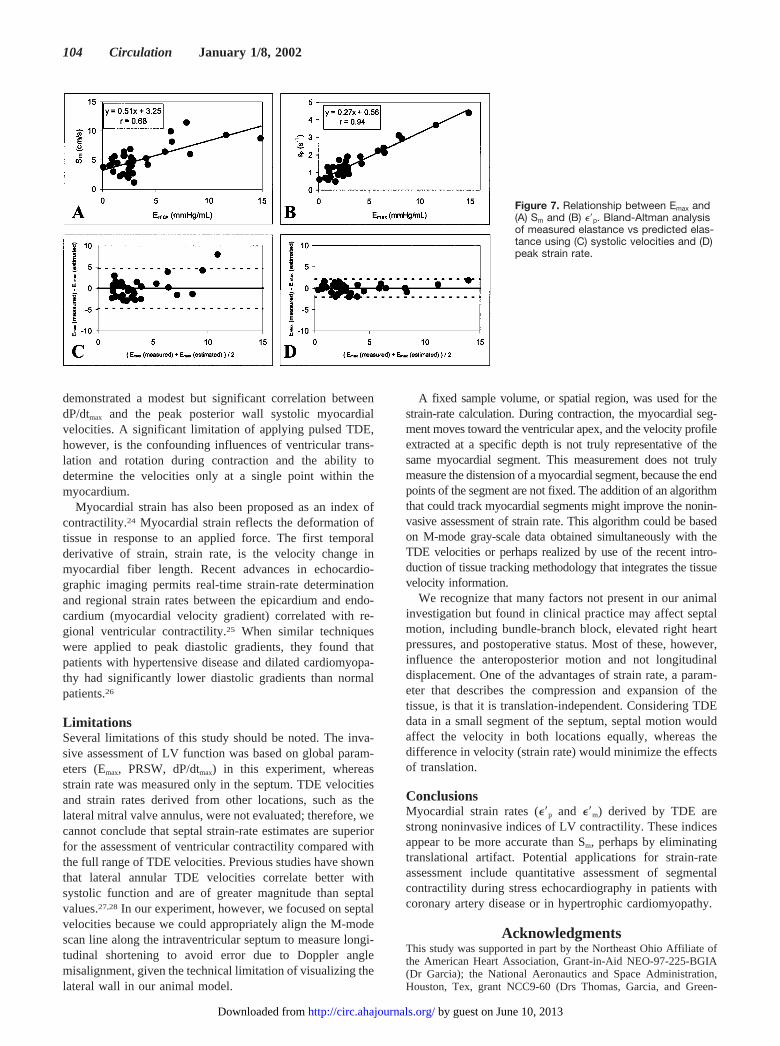
Figure 7, A and B, shows the relationships between Emax andTDE-derived Sm and ��p. A stronger relationship was found betweenEmax and ��p (��p�0.27 · Emax�0.56, r�0.94, P�0.01) than betweenEmax and Sm (��p�0.51 · Emax�3.25, r�0.68, P�0.01). A compar-
ison of the correlation coefficients from these relationships demon-strates that a more accurate index of LV contractility is provided by��p than by Sm (Z�3.69, P�0.001). Figure 7, C and D, showsBland-Altman analysis of measured elastance (Emax) versus pre-dicted elastance (Êmax) using (C) systolic velocities and (D) peakstrain rate. The mean error was less variable when a prediction ofEmax based on strain rate (��0.000012�1.042 mm Hg/mL) wasused than the estimate using myocardial systolic velocity(�0.00014�2.336 mm Hg/mL).
DiscussionAssessment of LV function in patients with heart disease isroutinely performed by echocardiography. A significant lim-itation, however, is the subjective visual assessment of wallmotion. Although objective, quantitative, echocardiographicindices of ventricular function, such as ejection fraction,end-diastolic volume, stroke volume, and fractional shorten-ing, are often used in routine clinical practice, these param-eters are limited by both preload and afterload dependencies.Color kinesis, based on endocardial excursion and myocardialthickening,19 is another approach to quantify segmental func-tion. Because it is based on detection of endocardial excur-sion, however, it may fail in patients with technically difficultsituations.20 Moreover, because of cardiac translation, endo-cardial excursion does not equate to myocardial thickening,the actual parameter of interest. Indices of myocardial con-tractility that are less load-dependent, such as Emax andPRSW, have been proposed, but a noninvasive tool for theirassessment is lacking.
Although echocardiographic approximation of PRSW andEmax can be achieved by determination of serial pressure-arearelationships, these methods are cumbersome and are limitedby the extrapolation of LV volumes from cross-sectionalareas.21 Furthermore, estimation of Emax from preload-alteringmaneuvers, particularly in humans with severely impairedcardiovascular function, may be problematic because ofvagally mediated physiological responses that may altercontractility. The variation in loading conditions necessary tocompute an accurate Emax may also be poorly tolerated inpatients with impaired cardiovascular reserve. Consequently,a noninvasive tool that can estimate Emax without the need foralterations in preload could be extremely valuable for serialclinical assessment of ventricular contractility.
LV dP/dtmax has also been shown to be a relativelyload-independent index of systolic function.22 Recently,Yamada and colleagues23 demonstrated that peak systolicmyocardial velocity measured with TDE correlated withdP/dtmax in humans undergoing cardiac catheterization. They
Changes in ESPVR Observed with the Pharmacological Interventions
EH EL B DL DH
Emax, mm Hg/mL 1.64�1.06 2.07�0.74 2.07�0.81 5.33�2.81 6.93�3.03
V0, mL �38.4�8.6 �37.6�13.7 �29.6�13.1 �25.4�12.1 �13.7�4.4
r 0.86�0.10 0.90�0.08 0.96�0.03 0.94�0.05 0.95�0.03
Emax, V0, and r are the slope, volume intercept, and correlation coefficient obtained by linear regression analysis of end-systolicpressure-volume points.
Figure 6. Correlation between ��p and (A) dP/dtmax, (B) PRSW,and (C) Emax.
Greenberg et al Doppler-Derived Myocardial Strain Rate 103
by guest on June 10, 2013http://circ.ahajournals.org/Downloaded from
demonstrated a modest but significant correlation betweendP/dtmax and the peak posterior wall systolic myocardialvelocities. A significant limitation of applying pulsed TDE,however, is the confounding influences of ventricular trans-lation and rotation during contraction and the ability todetermine the velocities only at a single point within themyocardium.
Myocardial strain has also been proposed as an index ofcontractility.24 Myocardial strain reflects the deformation oftissue in response to an applied force. The first temporalderivative of strain, strain rate, is the velocity change inmyocardial fiber length. Recent advances in echocardio-graphic imaging permits real-time strain-rate determinationand regional strain rates between the epicardium and endo-cardium (myocardial velocity gradient) correlated with re-gional ventricular contractility.25 When similar techniqueswere applied to peak diastolic gradients, they found thatpatients with hypertensive disease and dilated cardiomyopa-thy had significantly lower diastolic gradients than normalpatients.26
LimitationsSeveral limitations of this study should be noted. The inva-sive assessment of LV function was based on global param-eters (Emax, PRSW, dP/dtmax) in this experiment, whereasstrain rate was measured only in the septum. TDE velocitiesand strain rates derived from other locations, such as thelateral mitral valve annulus, were not evaluated; therefore, wecannot conclude that septal strain-rate estimates are superiorfor the assessment of ventricular contractility compared withthe full range of TDE velocities. Previous studies have shownthat lateral annular TDE velocities correlate better withsystolic function and are of greater magnitude than septalvalues.27,28 In our experiment, however, we focused on septalvelocities because we could appropriately align the M-modescan line along the intraventricular septum to measure longi-tudinal shortening to avoid error due to Doppler anglemisalignment, given the technical limitation of visualizing thelateral wall in our animal model.
A fixed sample volume, or spatial region, was used for thestrain-rate calculation. During contraction, the myocardial seg-ment moves toward the ventricular apex, and the velocity profileextracted at a specific depth is not truly representative of thesame myocardial segment. This measurement does not trulymeasure the distension of a myocardial segment, because the endpoints of the segment are not fixed. The addition of an algorithmthat could track myocardial segments might improve the nonin-vasive assessment of strain rate. This algorithm could be basedon M-mode gray-scale data obtained simultaneously with theTDE velocities or perhaps realized by use of the recent intro-duction of tissue tracking methodology that integrates the tissuevelocity information.
We recognize that many factors not present in our animalinvestigation but found in clinical practice may affect septalmotion, including bundle-branch block, elevated right heartpressures, and postoperative status. Most of these, however,influence the anteroposterior motion and not longitudinaldisplacement. One of the advantages of strain rate, a param-eter that describes the compression and expansion of thetissue, is that it is translation-independent. Considering TDEdata in a small segment of the septum, septal motion wouldaffect the velocity in both locations equally, whereas thedifference in velocity (strain rate) would minimize the effectsof translation.
ConclusionsMyocardial strain rates (��p and ��m) derived by TDE arestrong noninvasive indices of LV contractility. These indicesappear to be more accurate than Sm, perhaps by eliminatingtranslational artifact. Potential applications for strain-rateassessment include quantitative assessment of segmentalcontractility during stress echocardiography in patients withcoronary artery disease or in hypertrophic cardiomyopathy.
AcknowledgmentsThis study was supported in part by the Northeast Ohio Affiliate ofthe American Heart Association, Grant-in-Aid NEO-97-225-BGIA(Dr Garcia); the National Aeronautics and Space Administration,Houston, Tex, grant NCC9-60 (Drs Thomas, Garcia, and Green-
Figure 7. Relationship between Emax and(A) Sm and (B) ��p. Bland-Altman analysisof measured elastance vs predicted elas-tance using (C) systolic velocities and (D)peak strain rate.
104 Circulation January 1/8, 2002
by guest on June 10, 2013http://circ.ahajournals.org/Downloaded from
berg); and the National Institutes of Health, Bethesda, Md, grantROI-HL-56688-01A1 (Dr Thomas).
References1. Yamada H, Oki T, Tabata T, et al. Assessment of left ventricular systolic
wall motion velocity with pulsed tissue Doppler imaging: comparisonwith peak dP/dt of the left ventricular pressure curve. J Am Soc Echo-cardiogr. 1998;11:442–449.
2. Fleming D, Xia X, McDicken WN, et al. Myocardial velocity gradientsdetected by Doppler imaging. Br J Radiol. 1994;67:679–688.
3. Uematsu M, Miyatake K, Tanaka N, et al. Myocardial velocity gradientas a new indicator of regional left ventricular contraction: detection by atwo-dimensional tissue Doppler imaging technique. J Am Coll Cardiol.1995;26:217–223.
4. Uematsu M, Nakatani S, Yamagishi M, et al. Usefulness of myocardialvelocity gradient derived from two-dimensional tissue Doppler imagingas an indicator of regional myocardial contraction independent of trans-lational motion assessed in atrial septal defect. Am J Cardiol. 1997;79:237–241.
5. Gorcsan J, Strum DP, Mandarino WA, et al. Quantitative assessment ofalterations in regional left ventricular contractility with color-coded tissueDoppler echocardiography: comparison with sonomicrometry andpressure-volume relations. Circulation. 1997;95:2423–2433.
6. Little WC, Cheng CP, Mumma M, et al. Comparison of measures of leftventricular contractile performance derived from pressure-volume loopsin conscious dogs. Circulation. 1989;80:1378–1387.
7. Glower DD, Spratt JA, Snow ND, et al. Linearity of the Frank-Starlingrelationship in the intact heart: the concept of preload recruitable strokework. Circulation. 1985;71:994–1009.
8. Lima JA, Jeremy R, Guier W, et al. Accurate systolic wall thickening bynuclear magnetic resonance imaging with tissue tagging: correlation withsonomicrometers in normal and ischemic myocardium. J Am CollCardiol. 1993;21:1741–1751.
9. Fann JI, Sarris GE, Ingels NB Jr, et al. Regional epicardial and endo-cardial two-dimensional finite deformations in canine left ventricle. Am JPhysiol. 1991;261:H1402–H1410.
10. Axel L. Noninvasive measurement of cardiac strain with MRI. Adv ExpMed Biol. 1997;430:249–256.
11. Robson MD, Constable RT. Three-dimensional strain-rate imaging. MagnReson Med. 1996;36:537–546.
12. Heimdal A, Stoylen A, Torp H, et al. Real-time strain rate imaging of theleft ventricle by ultrasound. J Am Soc Echocardiogr. 1998;11:1013–1019.
13. Qin JX, Jones M, Shiota T, et al. Validation of real-time three-dimensional echocardiography for quantifying left ventricular volumes inthe presence of a left ventricular aneurysm: in vitro and in vivo studies.J Am Coll Cardiol. 2000;36:900–907.
14. Ratcliffe MB, Wallace AW, Salahieh A, et al. Ventricular volume,chamber stiffness, and function after anteroapical aneurysm plication inthe sheep. J Thorac Cardiovasc Surg. 2000;119:115–124.
15. Kass DA, Beyar R, Lankford E, et al. Influence of contractile state oncurvilinearity of in situ end-systolic pressure-volume relations. Circu-lation. 1989;79:167–178.
16. Karunanithi MK, Feneley MP. Single beat determination of preloadrecruitable stroke work relationship: derivation and evaluation in con-scious dogs. J Am Coll Cardiol. 2000;35:502–513.
17. Senzaki H, Chen C, Kass DA. Single beat estimation of end-systolicpressure-volume relation in humans. Circulation. 1996;94:2497–2506.
18. Kass DA, Midei M, Brinker J, et al. Influence of coronary occlusionduring PTCA on end-systolic and end-diastolic pressure-volume relationsin humans. Circulation. 1990;81:447–460.
19. Vitarelli A, Sciomer S, Penco M, et al. Assessment of left ventriculardyssynergy by color kinesis. Am J Cardiol. 1998;81:86G–90G .
20. Perez JE, Waggoner AD, Barzilai B, 0, et al. On-line assessment ofventricular function by automatic boundary detection and ultrasonic back-scatter imaging. J Am Coll Cardiol. 1992;19:313–320.
21. Little WC, Freeman GL, O’Rourke RA. Simultaneous determination ofleft ventricular end-systolic pressure-volume and pressure-dimensionrelationships in closed-chest dogs. Circulation. 1985;71:1301–1308.
22. Quinones MA, Gaasch WH, Alexander JK. Influence of acute changes inpreload, afterload, and contractile state, and heart rate on ejection andisovolumic indices of myocardial contractility in man. Circulation. 1976;53:292–302.
23. Yamada H, Oki T, Tabata T, et al. Assessment of left ventricular systolicwall motion velocity with pulsed tissue Doppler imaging: comparisonwith peak dP/dt of the left ventricular pressure curve. J Am Soc Echo-cardiogr. 1998;11:442–449.
24. Mirsky I, Parmley WW. Assessment of passive elastic stiffness forisolated heart muscle and the intact heart. Circ Res. 1993;33:233–243.
25. Uematsu M, Miyatake K, Tanaka N, et al. Myocardial velocity gradientas a new indicator of regional left ventricular contraction: detection by atwo-dimensional tissue Doppler imaging technique. J Am Coll Cardiol.1995;26:217–223.
26. Shimizu Y, Uematsu M, Shimizu H, et al. Peak negative myocardialvelocity gradient in early diastole as a noninvasive indicator of leftventricular diastolic function: comparison with transmitral flow velocityindices. J Am Coll Cardiol. 1998;32:1418–1425.
27. Alam M, Wardell J, Andersson E, et al. Characteristics of mitral andtricuspid annular velocities determined by pulsed wave Doppler tissueimaging in healthy subjects. J Am Soc Echocardiogr. 1999;12:618–628.
28. Wilkenshoff UM, Sovany A, Wigström L, et al. Regional mean systolicmyocardial velocity estimation by real-time color Doppler myocardialimaging: a new technique for quantifying regional systolic function. J AmSoc Echocardiogr. 1998;11:683–692.
Greenberg et al Doppler-Derived Myocardial Strain Rate 105
by guest on June 10, 2013http://circ.ahajournals.org/Downloaded from
Related Documents