1 Don’t Let Data Become a Monkey Wrench to Your Outpatient CDI Efforts Laurie Benz, AS, CCS, CDIP, CPC Outpatient CDI Compliance and Education Manager AMN Healthcare Revenue Cycle Solutions Tampa, FL Christine Poleon Director, Business Analytics & Intelligence AMN Healthcare Revenue Cycle Solutions Tampa, FL 2 Learning Objectives At the completion of this educational activity, the learner will be able to: • Develop skills in analyzing commercial and Medicare data to benefit outpatient CDI • Discuss formulas for government and commercial payers to facilitate real‐ time data analysis • Discover how data can justify the creation of an outpatient CDI program 2019 Copyright, HCPro, a division of Simplify Compliance LLC. All rights reserved. These materials may not be copied without written permission.

Welcome message from author
This document is posted to help you gain knowledge. Please leave a comment to let me know what you think about it! Share it to your friends and learn new things together.
Transcript
1
Don’t Let Data Become a Monkey Wrench to Your Outpatient CDI Efforts
Laurie Benz, AS, CCS, CDIP, CPCOutpatient CDI Compliance and Education ManagerAMN Healthcare Revenue Cycle SolutionsTampa, FL
Christine PoleonDirector, Business Analytics & IntelligenceAMN Healthcare Revenue Cycle SolutionsTampa, FL
2
Learning Objectives
At the completion of this educational activity, the learner will be able to:
• Develop skills in analyzing commercial and Medicare data to benefit outpatient CDI
• Discuss formulas for government and commercial payers to facilitate real‐time data analysis
• Discover how data can justify the creation of an outpatient CDI program
2019 Copyright, HCPro, a division of Simplify Compliance LLC. All rights reserved. These materials may not be copied without written permission.
3
Data Analytics: Saboteur or Conservator?
4
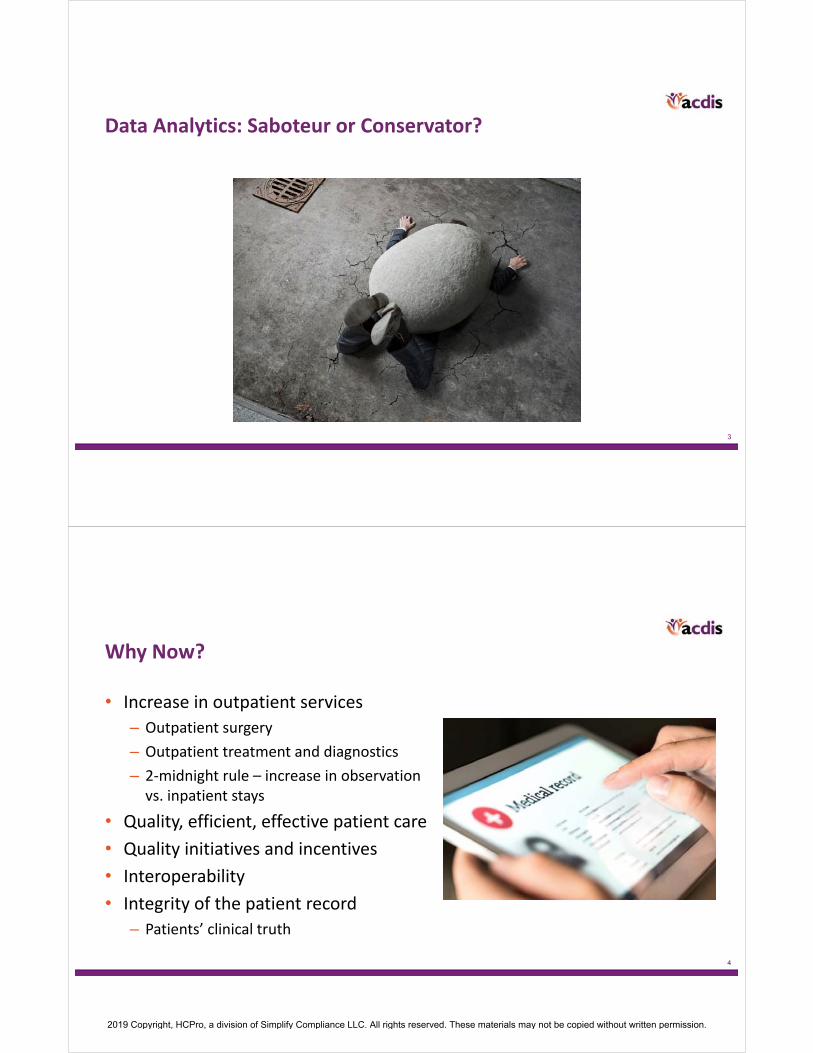
Why Now?
• Increase in outpatient services
– Outpatient surgery
– Outpatient treatment and diagnostics
– 2‐midnight rule – increase in observation vs. inpatient stays
• Quality, efficient, effective patient care
• Quality initiatives and incentives
• Interoperability
• Integrity of the patient record
– Patients’ clinical truth
2019 Copyright, HCPro, a division of Simplify Compliance LLC. All rights reserved. These materials may not be copied without written permission.

5
Why Now? (cont.)
Improper Payment Reason Improper Payment Rate Improper Payment Amount
Insufficient documentation 58% $18,328,000,000
Medical necessity 21.3% $6,730,800,000
No documentation 2.6% $821,600,000
Incorrect coding 11.9% $3,760,400,000
Other 6.3% $1,990,800,000
Totals 100% $31,600,000,000
• Centers for Medicare & Medicaid Services (CMS)
– 41 of 139 RAC‐approved topics are related to outpatient claims
– Over 31 billion dollars recouped in 2018
– 10.47 billion recouped from outpatient Part B providers
6
Data Analytics: Challenges
1. Where do I get it?
2. Is the data quality—meaningful, relevant, accurate?
3. Who will analyze it?
4. Will our systems support data aggregation?
5. How will the organization perceive outcomes?
6. What if I have absolutely no idea?
2019 Copyright, HCPro, a division of Simplify Compliance LLC. All rights reserved. These materials may not be copied without written permission.
7
Data Analytics: Benefits
1. Fraud prevention
2. Cost savings
3. Increase or validation of revenue integrity
4. Better decision‐making
5. Increased efficiency
6. Identifies additional areas of opportunity
8
Data Analytics: Additional Benefits
• Most promising career choice for 2019
– 56% increase in job openings over the last year
• 5,000+ posted in healthcare segment
• Quality outcomes
– Identifying trends, outliers
• Leads to improvements in documentation
2019 Copyright, HCPro, a division of Simplify Compliance LLC. All rights reserved. These materials may not be copied without written permission.

9
Simple First Steps
10
Data Sources for Comparison
1. www.cms.gov
2. https://data.cms.gov
3. https://pepper.cbrpepper.org/Data
4. State resources such as https://oshpd.ca.gov
5. Group purchasing organizations
6. Commercial payers
7. Evidence‐based clinical guidelines applications
8. Your systems/software/applications
9. YOUR DATA
2019 Copyright, HCPro, a division of Simplify Compliance LLC. All rights reserved. These materials may not be copied without written permission.
11
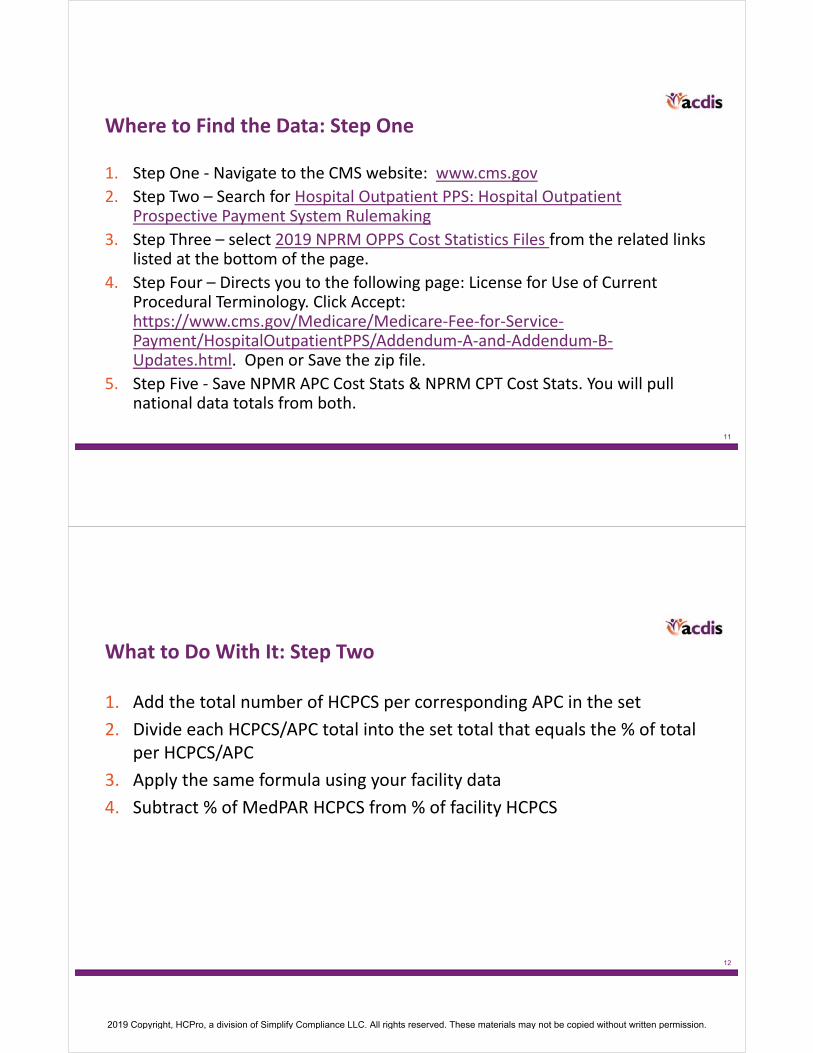
Where to Find the Data: Step One
1. Step One ‐ Navigate to the CMS website: www.cms.gov
2. Step Two – Search for Hospital Outpatient PPS: Hospital Outpatient Prospective Payment System Rulemaking
3. Step Three – select 2019 NPRM OPPS Cost Statistics Files from the related links listed at the bottom of the page.
4. Step Four – Directs you to the following page: License for Use of Current Procedural Terminology. Click Accept: https://www.cms.gov/Medicare/Medicare‐Fee‐for‐Service‐Payment/HospitalOutpatientPPS/Addendum‐A‐and‐Addendum‐B‐Updates.html. Open or Save the zip file.
5. Step Five ‐ Save NPMR APC Cost Stats & NPRM CPT Cost Stats. You will pull national data totals from both.
12
What to Do With It: Step Two
1. Add the total number of HCPCS per corresponding APC in the set
2. Divide each HCPCS/APC total into the set total that equals the % of total per HCPCS/APC
3. Apply the same formula using your facility data
4. Subtract % of MedPAR HCPCS from % of facility HCPCS
2019 Copyright, HCPro, a division of Simplify Compliance LLC. All rights reserved. These materials may not be copied without written permission.
13
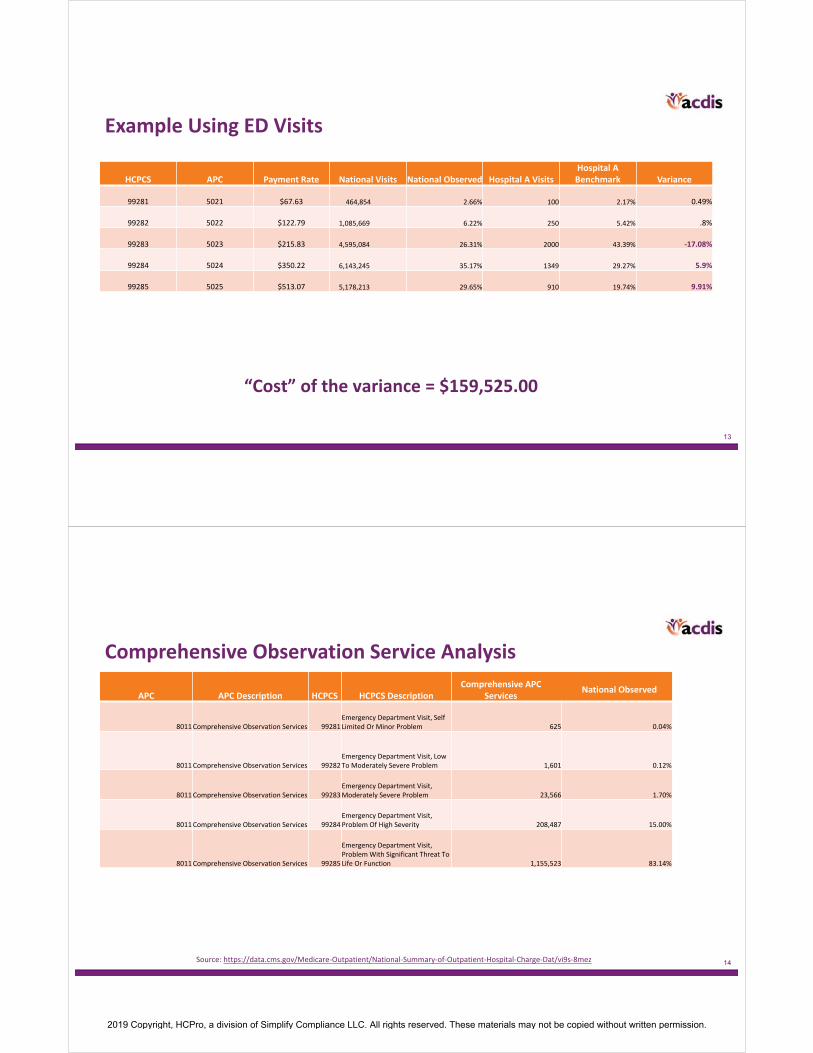
Example Using ED Visits
HCPCS APC Payment Rate National Visits National Observed Hospital A VisitsHospital A Benchmark Variance
99281 5021 $67.63 464,854 2.66% 100 2.17% 0.49%
99282 5022 $122.79 1,085,669 6.22% 250 5.42% .8%
99283 5023 $215.83 4,595,084 26.31% 2000 43.39% ‐17.08%
99284 5024 $350.22 6,143,245 35.17% 1349 29.27% 5.9%
99285 5025 $513.07 5,178,213 29.65% 910 19.74% 9.91%
“Cost” of the variance = $159,525.00
14
Comprehensive Observation Service Analysis
APC APC Description HCPCS HCPCS Description Comprehensive APC
Services
8011Comprehensive Observation Services 99281Emergency Department Visit, Self Limited Or Minor Problem 625 0.04%
8011Comprehensive Observation Services 99282Emergency Department Visit, Low To Moderately Severe Problem 1,601 0.12%
8011Comprehensive Observation Services 99283Emergency Department Visit, Moderately Severe Problem 23,566 1.70%
8011Comprehensive Observation Services 99284Emergency Department Visit, Problem Of High Severity 208,487 15.00%
8011Comprehensive Observation Services 99285
Emergency Department Visit, Problem With Significant Threat To Life Or Function 1,155,523 83.14%
Source: https://data.cms.gov/Medicare‐Outpatient/National‐Summary‐of‐Outpatient‐Hospital‐Charge‐Dat/vi9s‐8mez
National Observed
2019 Copyright, HCPro, a division of Simplify Compliance LLC. All rights reserved. These materials may not be copied without written permission.
15
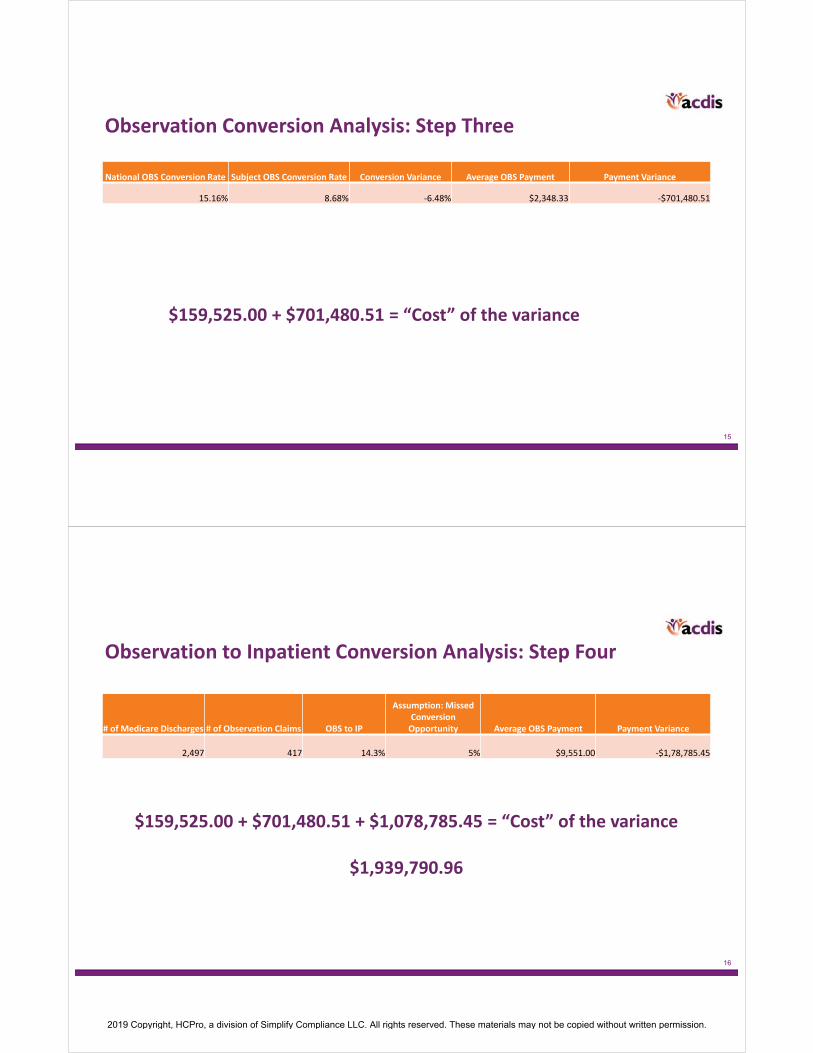
Observation Conversion Analysis: Step Three
National OBS Conversion Rate Subject OBS Conversion Rate Conversion Variance Average OBS Payment Payment Variance
15.16% 8.68% ‐6.48% $2,348.33 ‐$701,480.51
$159,525.00 + $701,480.51 = “Cost” of the variance
16
Observation to Inpatient Conversion Analysis: Step Four
# of Medicare Discharges # of Observation Claims OBS to IP
Assumption: MissedConversion Opportunity Average OBS Payment Payment Variance
2,497 417 14.3% 5% $9,551.00 ‐$1,78,785.45
$159,525.00 + $701,480.51 + $1,078,785.45 = “Cost” of the variance
$1,939,790.96
2019 Copyright, HCPro, a division of Simplify Compliance LLC. All rights reserved. These materials may not be copied without written permission.
17
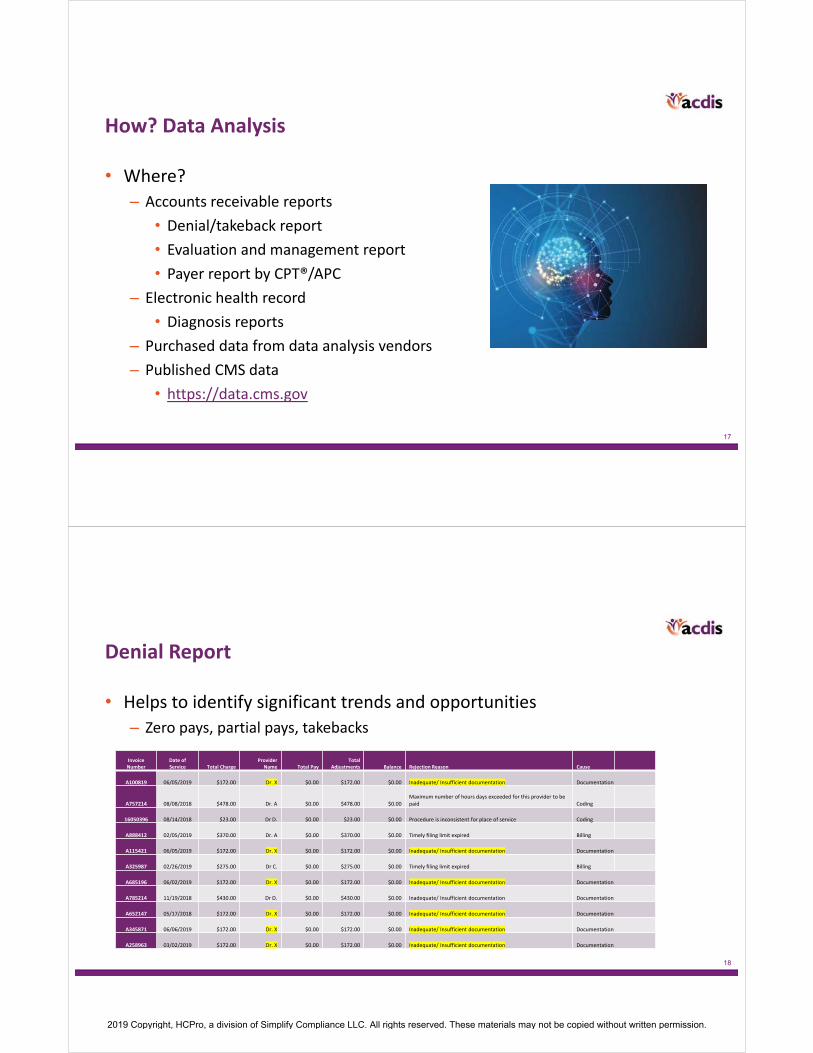
How? Data Analysis
• Where?
– Accounts receivable reports
• Denial/takeback report
• Evaluation and management report
• Payer report by CPT®/APC
– Electronic health record
• Diagnosis reports
– Purchased data from data analysis vendors
– Published CMS data
• https://data.cms.gov
18
Denial Report
• Helps to identify significant trends and opportunities
– Zero pays, partial pays, takebacks
Invoice Number
Date of Service Total Charge
Provider Name Total Pay
Total Adjustments Balance Rejection Reason Cause
A100819 06/05/2019 $172.00 Dr. X $0.00 $172.00 $0.00 Inadequate/ Insufficient documentation Documentation
A757214 08/08/2018 $478.00 Dr. A $0.00 $478.00 $0.00Maximum number of hours days exceeded for this provider to be paid Coding
16050396 08/14/2018 $23.00 Dr D. $0.00 $23.00 $0.00 Procedure is inconsistent for place of service Coding
A888412 02/05/2019 $370.00 Dr. A $0.00 $370.00 $0.00 Timely filing limit expired Billing
A115421 06/05/2019 $172.00 Dr. X $0.00 $172.00 $0.00 Inadequate/ Insufficient documentation Documentation
A325987 02/26/2019 $275.00 Dr C. $0.00 $275.00 $0.00 Timely filing limit expired Billing
A685196 06/02/2019 $172.00 Dr. X $0.00 $172.00 $0.00 Inadequate/ Insufficient documentation Documentation
A785214 11/19/2018 $430.00 Dr D. $0.00 $430.00 $0.00 Inadequate/ Insufficient documentation Documentation
A652147 05/17/2018 $172.00 Dr. X $0.00 $172.00 $0.00 Inadequate/ Insufficient documentation Documentation
A345871 06/06/2019 $172.00 Dr. X $0.00 $172.00 $0.00 Inadequate/ Insufficient documentation Documentation
A258963 03/02/2019 $172.00 Dr. X $0.00 $172.00 $0.00 Inadequate/ Insufficient documentation Documentation
2019 Copyright, HCPro, a division of Simplify Compliance LLC. All rights reserved. These materials may not be copied without written permission.
19
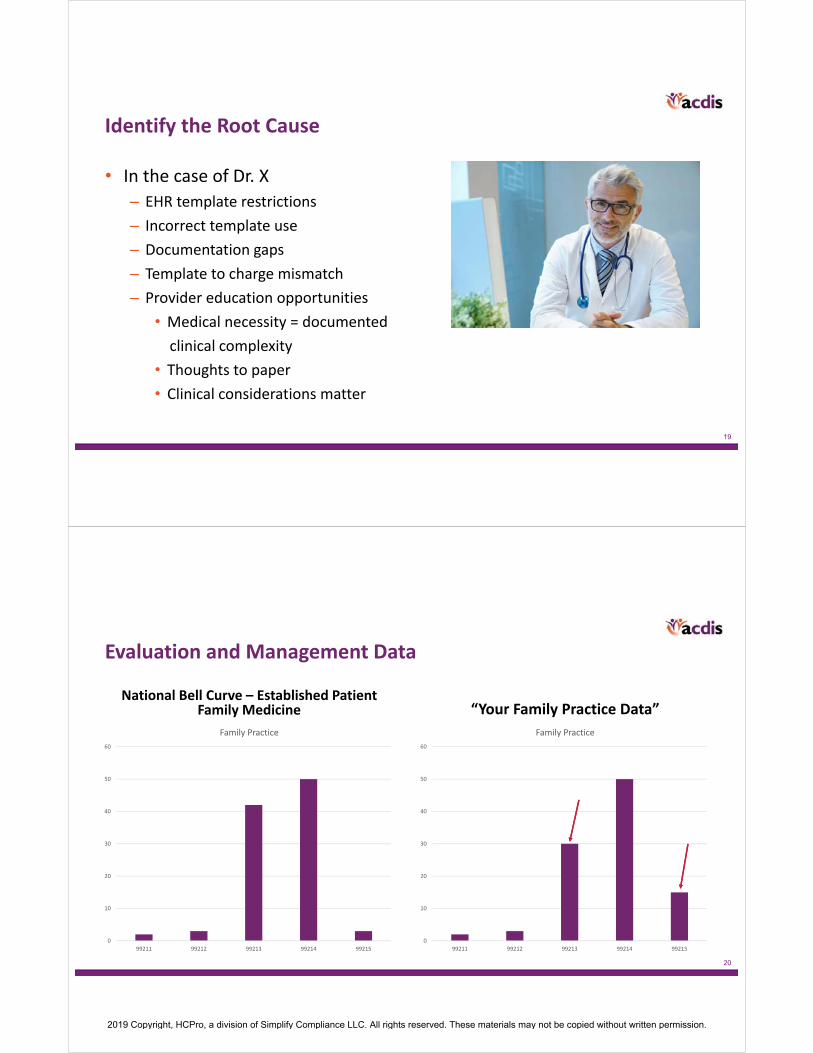
Identify the Root Cause
• In the case of Dr. X
– EHR template restrictions
– Incorrect template use
– Documentation gaps
– Template to charge mismatch
– Provider education opportunities
• Medical necessity = documented
clinical complexity
• Thoughts to paper
• Clinical considerations matter
20
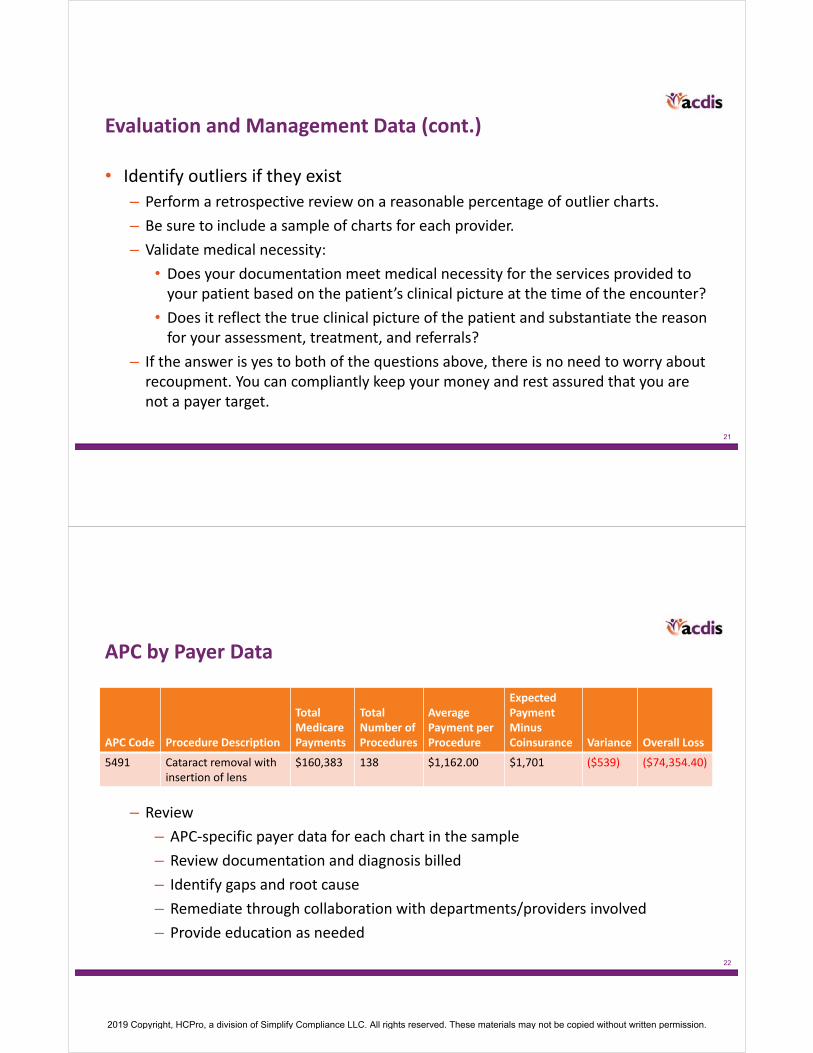
Evaluation and Management Data
National Bell Curve – Established Patient Family Medicine “Your Family Practice Data”
0
10
20
30
40
50
60
99211 99212 99213 99214 99215
Family Practice
0
10
20
30
40
50
60
99211 99212 99213 99214 99215
Family Practice
2019 Copyright, HCPro, a division of Simplify Compliance LLC. All rights reserved. These materials may not be copied without written permission.
21
Evaluation and Management Data (cont.)
• Identify outliers if they exist
– Perform a retrospective review on a reasonable percentage of outlier charts.
– Be sure to include a sample of charts for each provider.
– Validate medical necessity:
• Does your documentation meet medical necessity for the services provided to your patient based on the patient’s clinical picture at the time of the encounter?
• Does it reflect the true clinical picture of the patient and substantiate the reason for your assessment, treatment, and referrals?
– If the answer is yes to both of the questions above, there is no need to worry about recoupment. You can compliantly keep your money and rest assured that you are not a payer target.
22
APC by Payer Data
APC Code Procedure Description
Total Medicare Payments
Total Number of Procedures
Average Payment per Procedure
Expected Payment Minus Coinsurance Variance Overall Loss
5491 Cataract removal with insertion of lens
$160,383 138 $1,162.00 $1,701 ($539) ($74,354.40)
– Review
– APC‐specific payer data for each chart in the sample
– Review documentation and diagnosis billed
– Identify gaps and root cause
– Remediate through collaboration with departments/providers involved
– Provide education as needed
2019 Copyright, HCPro, a division of Simplify Compliance LLC. All rights reserved. These materials may not be copied without written permission.
23
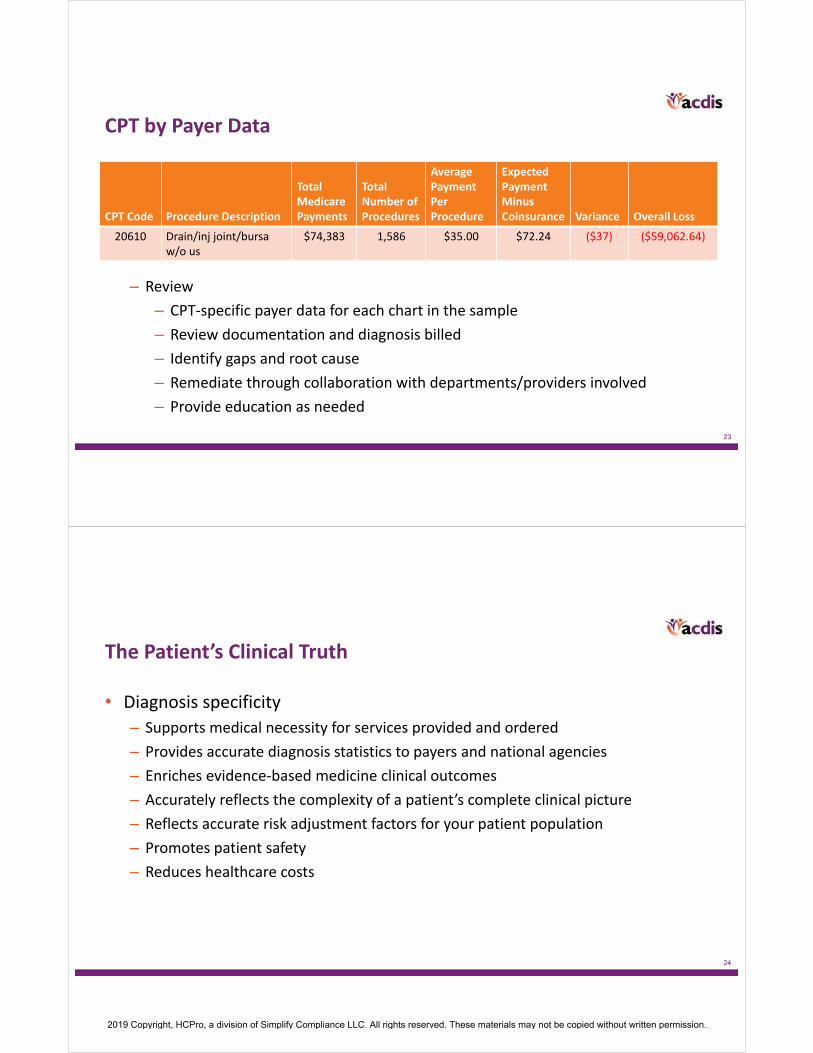
CPT by Payer Data
CPT Code Procedure Description
Total Medicare Payments
Total Number of Procedures
Average PaymentPer Procedure
Expected Payment Minus Coinsurance Variance Overall Loss
20610 Drain/inj joint/bursa w/o us
$74,383 1,586 $35.00 $72.24 ($37) ($59,062.64)
– Review
– CPT‐specific payer data for each chart in the sample
– Review documentation and diagnosis billed
– Identify gaps and root cause
– Remediate through collaboration with departments/providers involved
– Provide education as needed
24
The Patient’s Clinical Truth
• Diagnosis specificity
– Supports medical necessity for services provided and ordered
– Provides accurate diagnosis statistics to payers and national agencies
– Enriches evidence‐based medicine clinical outcomes
– Accurately reflects the complexity of a patient’s complete clinical picture
– Reflects accurate risk adjustment factors for your patient population
– Promotes patient safety
– Reduces healthcare costs
2019 Copyright, HCPro, a division of Simplify Compliance LLC. All rights reserved. These materials may not be copied without written permission.
25
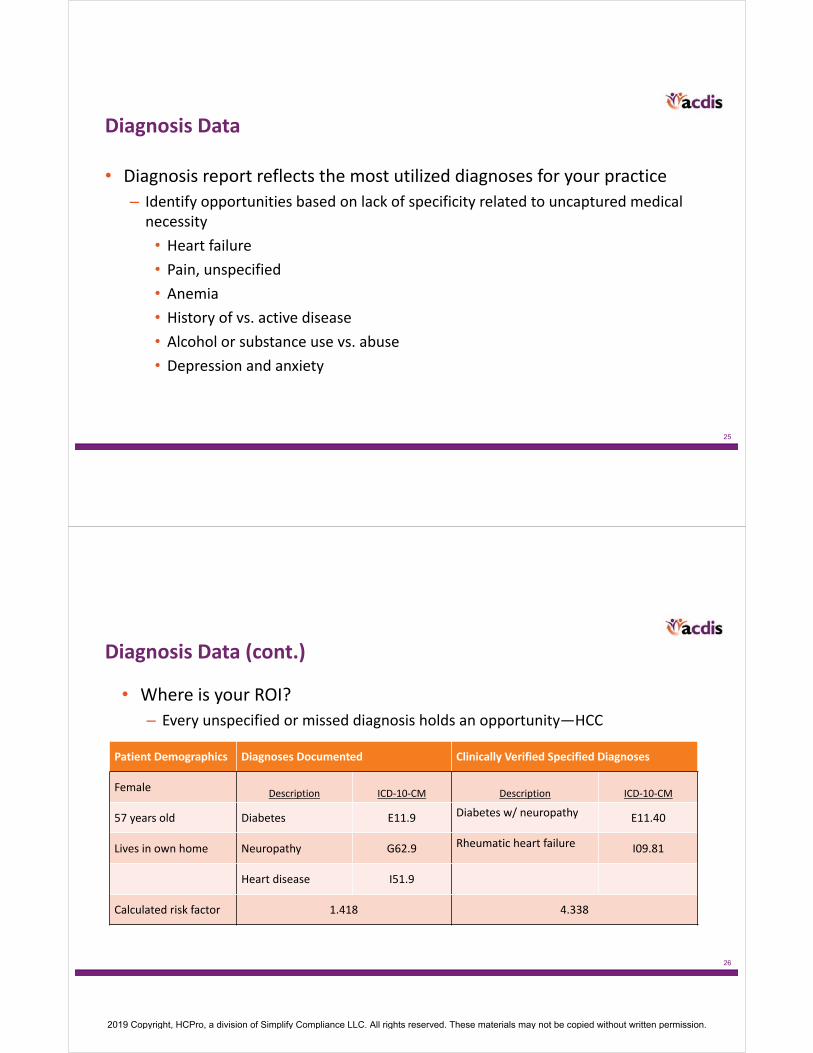
Diagnosis Data
• Diagnosis report reflects the most utilized diagnoses for your practice
– Identify opportunities based on lack of specificity related to uncaptured medical necessity
• Heart failure
• Pain, unspecified
• Anemia
• History of vs. active disease
• Alcohol or substance use vs. abuse
• Depression and anxiety
26
Diagnosis Data (cont.)
Patient Demographics Diagnoses Documented Clinically Verified Specified Diagnoses
FemaleDescription ICD‐10‐CM Description ICD‐10‐CM
57 years old Diabetes E11.9 Diabetes w/ neuropathy E11.40
Lives in own home Neuropathy G62.9 Rheumatic heart failure I09.81
Heart disease I51.9
Calculated risk factor 1.418 4.338
• Where is your ROI?
– Every unspecified or missed diagnosis holds an opportunity—HCC
2019 Copyright, HCPro, a division of Simplify Compliance LLC. All rights reserved. These materials may not be copied without written permission.
27
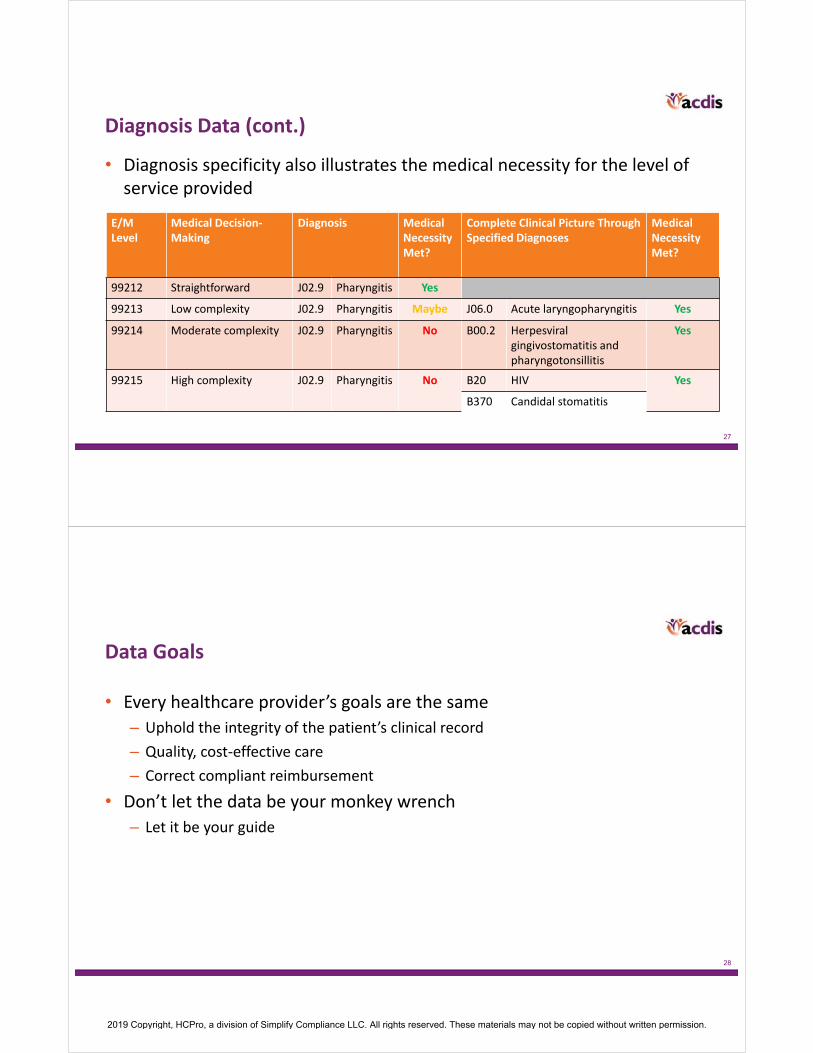
Diagnosis Data (cont.)
E/M Level
Medical Decision‐Making
Diagnosis Medical Necessity Met?
Complete Clinical Picture Through Specified Diagnoses
Medical Necessity Met?
99212 Straightforward J02.9 Pharyngitis Yes
99213 Low complexity J02.9 Pharyngitis Maybe J06.0 Acute laryngopharyngitis Yes
99214 Moderate complexity J02.9 Pharyngitis No B00.2 Herpesviral gingivostomatitis and pharyngotonsillitis
Yes
99215 High complexity J02.9 Pharyngitis No B20 HIV Yes
B370 Candidal stomatitis
• Diagnosis specificity also illustrates the medical necessity for the level of service provided
28
Data Goals
• Every healthcare provider’s goals are the same
– Uphold the integrity of the patient’s clinical record
– Quality, cost‐effective care
– Correct compliant reimbursement
• Don’t let the data be your monkey wrench
– Let it be your guide
2019 Copyright, HCPro, a division of Simplify Compliance LLC. All rights reserved. These materials may not be copied without written permission.
29
References
• https://www.cms.gov/Research‐Statistics‐Data‐and‐Systems/Monitoring‐Programs/Medicare‐FFS‐Compliance‐Programs/CERT/Downloads/2018MedicareFFSSuplementalImproperPaymentData.pdf
• https://data.cms.gov
• https://blog.linkedin.com/2019/january/10/linkedins‐most‐promising‐jobs‐of‐2019
• https://www.nejm.org/doi/full/10.1056/NEJMp1800732
• https://cms.gov
• https://www.cms.gov/Medicare/Medicare‐Fee‐for‐Service‐Payment/HospitalOutpatientPPS/Addendum‐A‐and‐Addendum‐B‐Updates.html
• https://data.cms.gov/Medicare‐Outpatient/National‐Summary‐of‐Outpatient‐Hospital‐Charge‐Dat/vi9s‐8mez
• https://www.cms.gov/Medicare/Medicare‐Fee‐for‐Service‐Payment/HospitalOutpatientPPS/Hospital‐Outpatient‐Regulations‐and‐Notices‐Items/CMS‐1678‐FC.html
30
Thank you. Questions?
[email protected]@amnhealthcare.com
In order to receive your continuing education certificate(s) for this program, you must complete the online evaluation. The link can be found in the continuing education section of the program guide.
2019 Copyright, HCPro, a division of Simplify Compliance LLC. All rights reserved. These materials may not be copied without written permission.
Related Documents