Dominant ionic mechanisms explored in spiking and bursting using local low-dimensional reductions of a biophysically realistic model neuron Robert Clewley, Department of Mathematics and Statistics, Georgia State University, Atlanta, GA 30303. [email protected] Cristina Soto-Treviño, and Department of Mathematical Sciences, New Jersey Institute of Technology, Newark, NJ 07102. [email protected] Farzan Nadim Department of Mathematical Sciences, New Jersey Institute of Technology and Department of Biological Sciences, Rutgers University, Newark, NJ 07102. [email protected] Abstract The large number of variables involved in many biophysical models can conceal potentially simple dynamical mechanisms governing the properties of its solutions and the transitions between them as parameters are varied. To address this issue, we extend a novel model reduction method, based on “scales of dominance,” to multi-compartment models. We use this method to systematically reduce the dimension of a two-compartment conductance-based model of a crustacean pyloric dilator (PD) neuron that exhibits distinct modes of oscillation—tonic spiking, intermediate bursting and strong bursting. A cursory analysis of the scales of dominance in a trajectory of this sixteen-variable model leads to a globally-reduced, nine-variable model. In a finer analysis we divide the trajectory into intervals dominated by a smaller number of variables, resulting in a locally-reduced hybrid model whose dimension varies between two and six in different temporal regimes. Both reduced models exhibit the same modes of oscillation as the sixteen-dimensional model over a comparable parameter range. The reduced models highlight low-dimensional organizing structure in the dynamics of the PD neuron, and the dependence of its oscillations on parameters such as the maximal conductances of calcium currents. Our technique could be used to build hybrid low-dimensional models from any large multi-compartment conductance-based model in order to analyze the interactions between different modes of activity. Keywords model reduction; compartmental modeling; oscillations; stomatogastric; hybrid dynamical system Introduction A major challenge in contemporary computational neuroscience is the analysis of high- dimensional, biophysically realistic models. Mathematical approaches in computational Corresponding Author: Robert Clewley, Correspondence address: Department of Mathematics and Statistics, Georgia State University, 7 th floor COE, 30 Pryor St, Atlanta, GA 30303, Email address: E-mail: [email protected], Telephone: 404-413-6420, Fax: 404-651-2246. NIH Public Access Author Manuscript J Comput Neurosci. Author manuscript; available in PMC 2010 February 1. Published in final edited form as: J Comput Neurosci. 2009 February ; 26(1): 75–90. doi:10.1007/s10827-008-0099-1. NIH-PA Author Manuscript NIH-PA Author Manuscript NIH-PA Author Manuscript

Welcome message from author
This document is posted to help you gain knowledge. Please leave a comment to let me know what you think about it! Share it to your friends and learn new things together.
Transcript
Dominant ionic mechanisms explored in spiking and burstingusing local low-dimensional reductions of a biophysically realisticmodel neuron
Robert Clewley,Department of Mathematics and Statistics, Georgia State University, Atlanta, GA [email protected]
Cristina Soto-Treviño, andDepartment of Mathematical Sciences, New Jersey Institute of Technology, Newark, NJ [email protected]
Farzan NadimDepartment of Mathematical Sciences, New Jersey Institute of Technology and Department ofBiological Sciences, Rutgers University, Newark, NJ 07102. [email protected]
AbstractThe large number of variables involved in many biophysical models can conceal potentially simpledynamical mechanisms governing the properties of its solutions and the transitions between them asparameters are varied. To address this issue, we extend a novel model reduction method, based on“scales of dominance,” to multi-compartment models. We use this method to systematically reducethe dimension of a two-compartment conductance-based model of a crustacean pyloric dilator (PD)neuron that exhibits distinct modes of oscillation—tonic spiking, intermediate bursting and strongbursting. A cursory analysis of the scales of dominance in a trajectory of this sixteen-variable modelleads to a globally-reduced, nine-variable model. In a finer analysis we divide the trajectory intointervals dominated by a smaller number of variables, resulting in a locally-reduced hybrid modelwhose dimension varies between two and six in different temporal regimes. Both reduced modelsexhibit the same modes of oscillation as the sixteen-dimensional model over a comparable parameterrange. The reduced models highlight low-dimensional organizing structure in the dynamics of thePD neuron, and the dependence of its oscillations on parameters such as the maximal conductancesof calcium currents. Our technique could be used to build hybrid low-dimensional models from anylarge multi-compartment conductance-based model in order to analyze the interactions betweendifferent modes of activity.
Keywordsmodel reduction; compartmental modeling; oscillations; stomatogastric; hybrid dynamical system
IntroductionA major challenge in contemporary computational neuroscience is the analysis of high-dimensional, biophysically realistic models. Mathematical approaches in computational
Corresponding Author: Robert Clewley, Correspondence address: Department of Mathematics and Statistics, Georgia State University,7th floor COE, 30 Pryor St, Atlanta, GA 30303, Email address: E-mail: [email protected], Telephone: 404-413-6420, Fax:404-651-2246.
NIH Public AccessAuthor ManuscriptJ Comput Neurosci. Author manuscript; available in PMC 2010 February 1.
Published in final edited form as:J Comput Neurosci. 2009 February ; 26(1): 75–90. doi:10.1007/s10827-008-0099-1.
NIH
-PA Author Manuscript
NIH
-PA Author Manuscript
NIH
-PA Author Manuscript
neuroscience have progressed from analysis of abstract neural systems at steady state (Wilsonand Cowan, 1972 Wilson and Cowan, 1991) to more biologically realistic situations in whichsystems are in rhythmic or chaotic states (Terman, 1991; Kopell and LeMasson, 1994). Afurther increase in the biophysical sophistication of neural models has been driven by theavailability of increasingly detailed electrophysiological and anatomical data about neuronaldynamics. Bifurcation theory (Guckenheimer and Holmes, 1983; Strogatz, 2001) is particularlyhelpful in understanding the qualitative change in the behavior of dynamical systems modelsas parameters are varied. However, the direct application of bifurcation theory becomesprohibitively difficult as the complexity of the model increases beyond a few dynamicalvariables, and heuristic arguments are commonly used to justify restricting analysis to smaller,approximate models (Fitzhugh, 1961; Meunier, 1992; Chow and Kopell, 2000).
In this study, we have two aims. The first is to show how a novel reduction technique (Clewleyet al., 2005) can be extended to apply to multi-compartment biophysical neuron models. Thesecond is to demonstrate that the technique is useful in the analysis of a real neural system thatshows different qualitative behaviors in different parameter regimes. We focus on spiking andbursting behavior in a conductance-based model of the pyloric dilator (PD) neuron, a memberof the pacemaker ensemble of the pyloric network in the well-characterized crustaceanstomatogastric nervous system (Nusbaum and Beenhakker, 2002; Marder and Bucher, 2007).The PD neuron typically spikes tonically when it is synaptically isolated from the network but,in some preparations, is also capable of producing rhythmic bursts of action potentials and canthus be considered a conditional burster (Miller and Selverston, 1982; Marder, 1984).
A recent modeling study by Soto-Treviño et al. (2005) produced a biophysically-realistic multi-compartment model of the PD neuron and its electrically-coupled counterpart, the anteriorburster (AB) neuron. We use the mathematical technique of “dominant scales,” developed byClewley et al. (2005), to analyze this PD neuron model and systematically identify a criticaltime interval within the inter-spike interval, in which the dynamics of only a subset of ioniccurrents govern whether the neuron transitions from tonic spiking to bursting activity.Subsequently, we analyze the interactions among this select subset of ionic currents tocharacterize the differences in tonic and bursting activity. Our analysis elucidates the biologicalmechanisms underlying the change in qualitative behavior of the PD neuron model bydetermining local and low-dimensional approximations to a high-dimensional biophysicalmodel. This methodology also serves as a case study in the context of a multitude of similartransitions in neuronal outputs from other models that could be investigated in a similar fashion.
MethodsThe model PD neuron involves two compartments to provide a spatial segregation of spikeproduction from other ionic properties. These compartments will be referred to as the axonaland the soma/neurite (S/N) compartments. The system of ordinary differential equations(ODEs) describing the dynamics of the PD neuron are given in the Appendix, and their fulldescription can be found in Soto-Treviño et al. (2005). Unless otherwise stated, all numericalsolutions to the ODEs were calculated using the software package PyDSTool(http://pydstool.sourceforge.net).
Full details of the dominant scale method and its implementation in software is given in Clewleyet al. (2005). We summarize it briefly here, and highlight its extension to multi-compartmentneural models. The method applies to any variable of interest in the system, and measures theinfluence of “input” variables on it along a given trajectory. In the present work we focus onthe membrane potential V of the S/N compartment and define its “inputs” to be those variableson which the differential equation for V directly depends. The current balance ODE for V takesthe form
Clewley et al. Page 2
J Comput Neurosci. Author manuscript; available in PMC 2010 February 1.
NIH
-PA Author Manuscript
NIH
-PA Author Manuscript
NIH
-PA Author Manuscript
(1)
where Cm is the membrane capacitance, Iext is an externally-applied direct current, Ii are theionic currents, and Iaxial is the axial current. The current due to an ion channel type i is calculateda conductance multiplied by a driving force: , where Ei denotes thereversal potential of the current. For the purposes of this investigation we found it sufficientto base our analysis only on the activity of activation variables. As a result, it is notationallyconvenient to re-write the conductance gsp as an activation variable s, raised to a power p, andany inactivation variables are absorbed within the maximal conductance to create a non-constant factor g. (Note that the method itself does not preclude explicit analysis of inactivationvariables.) There are no associated activation or inactivation variables for terms representingelectrical coupling. Instead, the membrane potential of the coupled compartment can be treatedas the input variable, and thus provides the basis for extending the dominant scale method tomulti-compartment models.
All 16 ODEs describing the model PD neuron can be written in the form
(2)
The equations for the compartmental membrane potentials take this form after a simplealgebraic rearrangement described in Appendix B, which reflects the conditional linearity ofthe equations in the Hodgkin-Huxley formalism and of first-order kinetic equations in general.This view of the ODEs permits an intuitive comparison of the instantaneous target valuex∞(t) and time scale τx(t) for each variable, which may depend on the state variables.
For the voltage equation, V∞(t) will be referred to as the “instantaneous target voltage” (dottedcurve in Fig. 1; defined in Appendix B). V∞(t) provides structural and organizationalinformation about the vector field, playing a similar role to a slowly varying steady state. Thechannel conductances play the role of non-constant eigenvalue-like quantities that measure therates of attraction toward V∞(t). This can be appreciated by supposing that all inputs to thedifferential equation for V are held constant. Then, by definition, V∞(t) ≡ V∞ = const. andτV(t) ≡ τV = const., so that Eq. (2) for the V variable is an autonomous first-order linear equationwith a steady state at V∞, with which there is associated a single (negative) eigenvalue −1/τV.
Our definition of influence is the sensitivity of V∞ with respect to an input variable s, given by
(3)
This measures how strongly the inputs influence the local structure of the vector field, andprovides predictive information about the response of a compartment to a perturbation. Forconductance-based neuron models, the sensitivity can be defined explicitly (Appendix B). Thisdefinition of influence extends to input terms in Eq. (1) arising from electrical coupling betweencompartments.
Clewley et al. Page 3
J Comput Neurosci. Author manuscript; available in PMC 2010 February 1.
NIH
-PA Author Manuscript
NIH
-PA Author Manuscript
NIH
-PA Author Manuscript
The dominant scale method is applied to one or more known trajectories of the model system,which is typically calculated by numerical integration. The influences of input variables on avariable of focus (here, V) are computed over a trajectory. These values are ranked andnormalized, and those that are larger than some small positive parameter ε ∈ (0,1) at eachmoment in time are classified as inputs that are active; the remaining inputs are consideredinactive. This is shown schematically in Figure 1 (bottom row). The time interval within whichthe set of active variables stays the same is defined to be an “epoch” (a, b and c in Fig. 1).Changes in the set of active inputs through time define epoch boundaries (where changes inranking within a set are ignored). Additionally, active variables are marked “fast” or “slow”relative to V over the duration of an epoch, according to a small time-scale parameter γ ∈(0,1): variables whose time scales are smaller than γτV are considered fast whereas those thatare larger than τV/γ are considered slow. In summary, lower-dimensional reduced modelsapproximate the full dynamics over the duration of an epoch, where the reduced model is aprojection of the full system onto the space of the active variables.
The dominant scale method has been implemented in an open-source Matlab code known asDSSRT (Dominant Scale System Reduction Tool), available athttp://www.cam.cornell.edu/~rclewley/DSSRT.html. DSSRT requires details of the ODEs, theparameter values and a numerically computed trajectory of the system on which the analysisis performed. DSSRT does not fully automate the analysis, and relies on input from the userin order to obtain optimal results. In particular, it requires appropriate values for ε and γ. Theheuristic that we use for choosing the values is that they should lead to a decomposition of theinputs into as few epochs as possible over the course of the trajectory. Additionally, smallchanges in the values should not make a large qualitative difference to the pattern of epochs.DSSRT provides information about the relative influence strengths and time scales of variablesalong a trajectory that can aid in the optimal selection of these values. For the current studywe chose the values ε =1/5 and γ = 2/7, which robustly distinguished the most dominant scalesof influence and time along the trajectories considered. Other values of ε and γ with the sameorder of magnitude produced similar qualitative results.
The present version of DSSRT (v1.32) is unable to analyze differential equations for thecalcium-dependent ion kinetics, although the trajectory used is calculated using the full set ofequations. As a result, in our analysis of the model PD neuron two variables have to beapproximated by constants. These are (1) the reversal potential ECa and (2) the calciumdependence of the steady-state activation of IKCa. These approximations are not disruptivebecause the constants can be chosen differently for the analysis of different sub-regimes of thedynamics within which the true values remain approximately constant. By comparison tosimulations of the full 16-dimensional model we will demonstrate that these approximationsdo not affect the validity of the qualitative low-dimensional models.
The number of epochs that are automatically determined by DSSRT may be large and involvedistinctions in the dynamics that are too fine-grained for our purposes. However, to elucidatethe analysis of the dynamics most intuitively, DSSRT supports a heuristic amalgamation ofcertain epochs into what we will call “sub-regimes.”
ResultsThe two-compartment model of the PD neuron described above will be referred to as the fullmodel (F). We use DSSRT to reduce this model to a sequence of low-dimensional sub-regimesthat can be thought of as a piecewise-local model (L). Our methodological goal will bedemonstrated by the successful reproduction of the distinct tonic spiking and bursting behaviorsby model L. Our scientific goal is to identify the significant factors that contribute to theseintrinsic output modes. We examine the dynamics in the different states of L to elucidate the
Clewley et al. Page 4
J Comput Neurosci. Author manuscript; available in PMC 2010 February 1.
NIH
-PA Author Manuscript
NIH
-PA Author Manuscript
NIH
-PA Author Manuscript
details of interactions between the variables of F. We will also compare the performance andcomplexity of L to make a single, global reduction of the model (G)—this being the traditionalform of model reduction.
The left column in Figure 2 shows experimental evidence of distinct activity patterns fromsynaptically-isolated biological PD neurons, indicating that this neuron can produce a varietyof outputs including tonic spiking (top), weak (middle) or strong (bottom) bursting. Thesebehaviors are captured by the model PD (Fig. 2, right column) as described in Soto-Treviño etal. (2005). For both the biological and model PD neurons a DC current injection cannot inducea bursting state from a tonically spiking state. However, Figure 2 illustrates that the model PDcan produce regular bursting when the maximal conductance of the calcium currents isincreased, for example, by exogenous neuromodulators (Johnson et al., 2003). To uncover thedifferences in the spiking and bursting mechanisms in the model PD we will make use of thedominant scale method (Clewley et al., 2005) and extend it to situations involving twocompartments.
The proper activity of the PD model neuron, both in isolation and as part of the network, iscrucially based on the fact that ionic currents responsible for spike production are spatiallysegregated from other voltage-gated ionic currents. This conductance-based full model consistsof 16 ODEs (see Appendix A) that describe two compartments, one representing the axon, andthe other the soma/primary neurite (S/N). We denote by Vaxon and V the membrane potentialof the respective compartments. The axonal compartment is responsible for spike generationvia the usual fast sodium and potassium currents, INa and IKd, and corresponds to a specificparameter regime of a standard Hodgkin-Huxley compartment. As the interactions betweenthe variables within such a compartment are already well understood (Suckley and Biktashev,2003; Clewley et al., 2005), we will focus on reducing only the S/N compartment.
In the absence of coupling to the axonal compartment the membrane potential of the S/Ncompartment produces large-amplitude (approx. 50mV) slow oscillations, which are generatedby three outward currents, four inward currents and a leak current IL. The outward currents area delayed-rectified potassium current IKd, a calcium-dependent potassium current IKCa and atransient potassium current IA. Two of the inward currents are carried by calcium: ICaT andICaS; the other two are a hyperpolarization-activated IH current and a persistent sodium currentINaP. We denote the total calcium current ICaS + ICaT as ICa. The axonal and S/N compartmentsare intrinsically very different from each other; they interact via an axial current Iaxial withmaximal conductance gaxial. Unless otherwise stated, the values of the calcium current maximalconductances gCaT and gCaS that were used for setting the neuron in a tonic spiking regime are60 and 22.5 μS, respectively. These will be referred to as the “reference values” for theseparameters. We increased these by 54% (to 92 and 35 μS) in order to set the neuron in a burstingregime.
Characterizing the changing roles in the critical sub-regimeIn this section we examine the key quantities that are used by the DSSRT software in its analysisof the S/N compartment: the instantaneous target voltage V∞(t) (Fig. 1) of the membranevoltage V and its characteristic time scale τV(t). Figure 3 shows these quantities, together withVaxon, over one cycle of the periodic orbits for the tonic spiking (Fig. 3(a)) and bursting (Fig.3(b)) regimes. In contrast to its behavior during spiking, τV can be seen to drop fromapproximately 10 ms to almost zero during a burst, corresponding to the neuron entering a“high-conductance regime” (Shelley et al., 2002) in which V is strongly slaved to V∞ (Fig. 3(b), bottom panel).
DSSRT computes the influence strengths Ψs, defined in Eq. (3), over a tonic spiking or burstingtrajectory, using Eq. (1). We note that, due to the strongly dissipative nature of the equations,
Clewley et al. Page 5
J Comput Neurosci. Author manuscript; available in PMC 2010 February 1.
NIH
-PA Author Manuscript
NIH
-PA Author Manuscript
NIH
-PA Author Manuscript
we need only analyze a single periodic orbit for each regime, as qualitatively equivalent orbitswill exhibit the same pattern of changing influences. Here, the inputs s correspond to theactivation variables of the currents in the S/N compartment and the voltage of the axoncompartment, Vaxon. Values of Ψs larger than the small positive parameter ε = 1/5 at eachmoment in time correspond to inputs that are considered “active.”
Figure 4 compares the Ψs values, for the currents CaS, CaT, Kd and the axial current flowingbetween the S/N and Axon compartments, with the corresponding current magnitudes. In boththe tonic spiking and bursting regimes the influence strengths for all other inputs were at alltimes smaller than ε times the largest influence strength. The figure is suggestive of the differentroles being played by the inputs to the S/N compartment. For instance, in the tonic regime (Fig.4(a)), the current magnitudes show that axonal spikes are important for generating largeinstantaneous rates of change in V. In contrast, the corresponding influence strength Ψaxial isrelatively small so that V∞ is insensitive to the axial current during most of the cycle. Thisindicates that axial spikes have a very localized impact on the net change to V over a cycle,whereas the calcium and the delayed rectifier potassium currents ICa and IKd dominate theposition of V∞ for most of the cycle. In the bursting regime (Fig. 4(b)), we observe that ICa andIKd do not fully reset after the first spike (Fig. 4(b)III, middle panel), and quickly build up tolarge levels (with opposite signs). Ψaxial becomes smaller compared to the calcium andrectifying potassium inputs as the burst progresses (Fig. 4(b)II, middle panel), reflected in theplateau nature of V despite receiving strong spikes from the axon compartment. As Ψaxialbecomes smaller during a burst, we see that V exhibits smaller excursions (Fig. 4(b)II, comparetop and bottom panels). In the tonic regime, we also note that IKCa remains negligible in size.Only in the later part of a burst does this current become significant to both the rate of changeof V and the control of V∞.
The second aspect to the dominant scale method considers the characteristic time scales τs ofthe inputs s to the S/N compartment. In Figure 5 we compare the time evolution of these inperiodic orbits of the full model. Three time scales, which have much larger values, are notshown in the figure: the activation of IH (τH ~ 1000 ms), the inactivation of INaP (τNaP,h ~ 550ms), and the inactivation of ICaT (τCaT,h ~ 200 ms). DSSRT defines three time-scale groupsusing the comparative scaling parameter γ = 2/7 (Fig. 5(a), left of the panels). During tonicspiking, the slow group of variables contains K(Ca) and H, whose time scales are larger thanτV/γ ≈ 35 ms. The fast group only exists during a spike event (it consists only of the axonmembrane potential) during which τVaxon < γτV ≈ 2.8 ms. The intermediate group includes theremaining currents and the axon membrane potential between spike events (Fig. 5(a)). Weclassify channels that include inactivation variables according to the faster of the two associatedtime scales. In the bursting regime (Fig. 5(b)) the groupings are the same except during theactive phase of the burst, when the two membrane potentials become comparably fast duringspikes and everything else is much slower (Fig. 5(b)II). This shift is due to the influence of thelarge conductances of CaT and CaS currents that develop during the burst (Fig. 4(b)II, middlepanel).
A globally reduced approximate modelWe begin by determining a global reduction (G) of the PD neuron model F. The passive leakterm was not classified as an influential input at the chosen value of ε. We performedcomparative simulations (not shown) that demonstrated that the leak current has a subtlemodulatory effect on the dynamics during the recovery from a burst. We chose to retain theleak term in G because it helped match the qualitative behavior to F without contributing tomodel complexity or computational cost.
IH has a negligible influence during spiking and the active phase of bursting, but plays a rolein the recovery of the cell between bursts and thus cannot be omitted. However, as noted earlier,
Clewley et al. Page 6
J Comput Neurosci. Author manuscript; available in PMC 2010 February 1.
NIH
-PA Author Manuscript
NIH
-PA Author Manuscript
NIH
-PA Author Manuscript
the influence of the A and NaP currents remain smaller than ε throughout tonic spiking andbursting. Thus, we removed their associated activation (m) and inactivation (h) variables mA,hA, mNaP, and hNaP. Additionally, the observed slow time scale of hCaT and its minimalfluctuation over the tonic and bursting cycles (not shown) leads us to approximate it to aconstant value of 0.65.
The “lumping” of similar variables into a single dynamic variable is a common reductiontechnique, and may require appropriate rescalings to be calculated. However, for a single modelto reproduce different qualitative behaviors a globally appropriate lumping may not bepossible. Figure 6(a) summarizes the most important part of the global reduction by showingthe most dominant activation variables (mCaT, mCaS, and nKd) versus V for one cycle of thetonic spiking (left column) and bursting (right column) regimes, comparing F (top row) and G(bottom row). The dashed line in these figures indicates an effective excitability threshold (θ= 0.14, defined below). Below this threshold, the three crucial currents evolve almostidentically in F, so that the CaS, CaT and Kd currents remain in balance. This situation appliesto the whole of the tonic spiking regime, and for the inter-burst interval in the bursting regime(including the first spike of a burst). As was seen in Figure 4, the K(Ca) current is substantiallymore dominant than the CaS, CaT or Kd currents at the end of a burst, and so it is the up-sweepof the trajectories of mCaT, mCaS, and nKd that is more important to match to the full modelthan the down-sweep.
The similarity in the bursting regime is different and requires rescaling of the variables. Toexplore this, we plotted the steady-state activation curves m∞,CaT, m∞,CaS, and n∞,Kd (Fig. 6(b), left panel) as a function of the S/N compartment’s membrane potential, V. These steady-state activations are comparable in size when V remains in the tonic regime as indicated by thewhite region. In the bursting regime these targets diverge as V depolarizes (left panel, grayregion) as do the time scales (Fig. 6(b), right panel). It is clear that a single lumped variablewill not suffice for both regimes, but as part of our hand-tuned reduction using conventionalmethods we made two state-dependent forms of lumping in the model as described below.
We lump mCaT, mCaS, and nKd together into a single variable x depending on whether x is aboveor below the threshold of “nonlinear activation scaling,” chosen at θ = 0.14 as the observedexcitability threshold: the point where the steady state activations begin to diverge as V isincreased (Fig. 6(b), dashed line in the left panel). Note that our analysis is not sensitive to theprecise value of this threshold. When x <θ, the rescaling is linear and x is described by theequation for mCaT, the most dominant variable for that regime (although mCaS also workssatisfactorily). Above this threshold, mCaT and nKd are nonlinear rescalings of x according toa curve-fitting method (described in Appendix C). In this range, x is described by the equationfor mCaS (which is now most dominant). The result of these reductions is a set of equationswith nine dynamic variables. Although this model is technically “hybrid,” in that its definitioninvolves a discrete change to the vector field as a function of the state (Van Der Schaft andSchumacher, 2000), this change is minor and does not modify the dimension of the system.We contrast this with the more aggressive reduction we perform in the next section.
We examined whether the simplified set of currents is adequate to exhibit the transition fromtonic spiking to bursting. In particular, in the high activation state, can the three activationvariables with similar kinetics be safely approximated by nonlinearly scaled versions of asingle, lumped variable? We evaluated this by comparing qualitative properties of simulatedtrajectories from models F and G. Although our parameter choices do not produce an exact fitto F, they are sufficient for G to exhibit the same types of behaviors (Figure 7(a)). Furthermore,we measured the spiking and bursting periods for G as gCaT and gcas were varied, and founda progression from quiescence to tonic spiking to bursting similar to that for F (Fig. 7(b)).Notably, the intermediate form of bursting (shown in Figure 2) is also found in G, where the
Clewley et al. Page 7
J Comput Neurosci. Author manuscript; available in PMC 2010 February 1.
NIH
-PA Author Manuscript
NIH
-PA Author Manuscript
NIH
-PA Author Manuscript
spike in [Ca2+] only reaches approximately 8 μM, as compared to approximately 4 or 43 μM,respectively, during tonic spiking or a full burst. In both F and G this intermediate form ofbursting is found in a narrow parameter range shortly after the transition from spiking tobursting (Fig. 7(b)).
A piecewise locally-reduced modelThe analysis using DSSRT provides detailed temporal information about the changinginfluence of variables in the dynamics of the neural model. We used this information to buildthe locally reduced hybrid model L by considering the epochs involved in the tonic spikingand bursting regimes. In the tonic regime, DSSRT determined six epochs over one spikingperiod as marked in Figure 8(a). The six epochs were condensed further into two “sub-regimes”based on the methods described in Clewley et al. (2005). The first sub-regime consisted of thefirst two epochs, for which influence from Vaxon is negligible and the S/N compartment iseffectively uncoupled from the axonal compartment. The second sub-regime corresponds tothe last four epochs in which the S/N compartment receives significant input from the axonalcompartment (except in epochs 4 and 5, which are very short in duration and notmechanistically significant). For sub-regime 2, the input from the calcium current ICaT is theleast dominant of the four inputs during epochs 5 and 6, and simulations (not shown) indicatedthat the threshold ε could be increased in this sub-regime to eliminate mCaT and hCaT with noloss of qualitative accuracy in computed trajectories. The two sub-regimes associated withtonic spiking are shown in Fig. 9(a) (left panel).
For the bursting regime we performed a similar analysis to obtain four sub-regimes, the firsttwo of which were identical to those of tonic spiking because they involved the same activevariables. The remaining sub-regimes were drawn from epochs 7–15 in Figure 8(b) accordingto the following criterion: the exact pattern of active variables need not be reproduced perfectlyby the sub-regimes, but a minimal number of sub-regimes were desired. The followingobservations guided this choice. In epochs 7–15 the intracellular calcium concentration[Ca2+] is in its high state (not shown). IKCa becomes active in epochs 12–15, but its slow timescale of activation means that it builds up slowly only when the high state of [Ca2+] is reached.(Note the dominance of ΨKCa at the end of the burst and during the interburst interval as shownin Fig. 4(b) I & II, bottom panels.) This suggests that mKCa should be included in all theremaining sub-regimes in order that it can become a dominant variable at the right time duringa burst, avoiding what can be loosely called a “shadowing error” (Clewley et al., 2005). Despitethe fact that epochs 7 and 8, respectively, have the same active inputs as epochs 1 and 2, thehigh state of [Ca2+] implies that the dynamics for the CaS and CaT activations are not the sameas in epochs 1 and 2. This suggests making a sub-regime that is a high- [Ca2+] analog of thefirst sub-regime. Thus, we chose sub-regime 3 to have the variables present in sub-regime 1and also mKCa and [Ca2+].
The pattern of active variables in epochs 7–12 roughly follows that of epochs 1–6 exceptwithout the axial input. Although the influence of the axial input is not large enough to beconsidered dominant in epochs 7–12, it plays a modulatory role in creating the small S/Nvoltage spikes. We chose sub-regime 4 to be a high- [Ca2+] analog of sub-regime 2, insymmetry with the pattern of epochs condensed into sub-regimes 1 and 2. As we are primarilyinterested in the differences between tonic spiking to bursting, and in the interest of simplicity,we chose not to create a separate sub-regime for the K(Ca)-dominated epochs 13–15, or forthe remainder of the bursting trajectory. The sub-regimes associated with bursting are shownin Fig. 9(a) (right panel).
The four sub-regimes that constitute model L are formally defined in Appendix D.Computationally, they are treated as four smooth vector fields connected by discrete events.In each sub-regime, the dynamics of the model PD neuron is dominated by a different subset
Clewley et al. Page 8
J Comput Neurosci. Author manuscript; available in PMC 2010 February 1.
NIH
-PA Author Manuscript
NIH
-PA Author Manuscript
NIH
-PA Author Manuscript
of the variables. Fig, 9(b) depicts model L as a state transition diagram, in the form of a 2×2grid where each of the four states represents one sub-regime of the vector field. Thearrangement on the grid reflects the suggestion that states 3 and 4 are versions of states 1 and2 (respectively) except with high levels of ICa/IKCa activation. As such, states 3 and 4 requireexplicit dynamics for [Ca2+] whereas, for states 1 and 2, DSSRT suggests that [Ca2+] can setto be a constant low value. The value was set at 3.8 μM, the maximum value of [Ca2+] in thetonic regime and the minimum in the burst regime. The columns of the grid provide a divisionwhereby states 1 and 3 represent the dynamics between axonal spikes, and states 2 and 4represent the dynamics during axonal spiking and the subsequent refractory period.
From the output of DSSRT it can be observed that the transitions to sub-regimes 2 and 4 fromsub-regimes 1 and 3 (respectively) occur when Vaxon depolarizes to approximately 5 mV aboveV. This provides a convenient way to define the transition event in the hybrid systemspecification. In the opposite direction, the transitions back to sub-regimes 1 or 3 occur afterthe spike refractory when V and Vaxon return to within 5 mV of each other. This choice oftransition events reflects the intuition that the axial coupling is most influential when thedifference |V − Vaxon| is sufficiently large. The validity of these transition choices is critical toextending our method to models with two or more compartments. During the rapid changes inVaxon during spiking, dominant scale analysis of the axonal compartment shows that it iseffectively independent of the S/N compartment and therefore can be treated temporarily asan autonomous input (Clewley et al., 2005). This guarantees that after sodium currents becomedominant in the axon, the spike will occur and we will transition from sub-regime 1 to 2 orfrom 3 to 4 and back as described.
Based on observations of model G, the transitions from 1 to 3 and from 2 to 4 are determinedby the increasing of mCaT through θ. In states 3 and 4 (high ICa/IKCa activation), ICa increasessignificantly in a positive feedback loop with V. When the S/N compartment becomespersistently depolarized there is a steady increase in [Ca2+] and consequently the slow IKCabecomes fully activated. This terminates the burst, returning the system to state 1. The returnto low ICa/IKCa activation occurs when mKCa decreases below the threshold θKCa = 0.1, whichhappens later than the fall of mCaT below θ because mKCa decays more slowly. Therefore,mKCa is the more accurate indicator for the return to low ICa/IKCa activation. Note howeverthat the qualitative dynamics of L are insensitive to the precise choices of the event transitionthresholds.
Model L successfully reproduces both the tonic and bursting behaviors seen in experimentsusing different patterns of state (i.e. sub-regime) transitions (Fig. 9(b)) without need for thehand-tuned curve fitting (as in model G). We observe that while tonic spiking, states 3 or 4 arenever entered. In contrast, the bursting regime begins in the same way as the tonic regime butat some point enters state 4 (from states 1 and 2) and continues to oscillate between states 3and 4 until it reverts to state 1 from state 3. As expected, neither the spike nor burst periodswere accurately reproduced as these are influenced by NaP, A and H currents that wereremoved. Model L also produces intermediate bursts when gCaT and gCaS were set to 120%their reference values (inset of Figure 7). The intermediate bursts involved [Ca2+] peaksbetween 8 and 13 μM that were comparable to those in F and G.
Phase plane analysis of the transition from tonic spiking to burstingPhase plane diagrams for analysis of high-dimensional systems have limited usefulnessbecause the diagrams only represent projections of trajectories and cross-sections of the null-surfaces at individual time points. In general, this makes it nullclines intersections of thenullcline (cross-sectional) curves in a non-autonomous phase plane do not correspond to actualequilibria. Nevertheless, one can obtain useful information about transient dynamics from suchdiagrams with careful consideration for the fine structure of the dynamics at different time
Clewley et al. Page 9
J Comput Neurosci. Author manuscript; available in PMC 2010 February 1.
NIH
-PA Author Manuscript
NIH
-PA Author Manuscript
NIH
-PA Author Manuscript
points along a trajectory. We will demonstrate the use of phase-plane analysis in model L tocharacterize the transition to bursting in the PD neuron by comparing hybrid states 2 and 4.The precisely defined domains of analysis for the sub-regimes of model L and the lowerdimensionality compared to models F or G allow greater confidence in the interpretation ofthe phase planes. In particular, they enable us to neglect the effect of dynamics in the remainderof the system.
The top panels in Figure 10 show plots of V and Vaxon over the duration of hybrid states 2 and4 for the tonic (a) and bursting (a) regimes. The instants labeled t0, t1 and t2 respectivelycorrespond to the beginning of the state, the peak of the V spike and the end of the state. Thebottom panels of Figure 10 show the dynamics in the (mCaS, V) phase plane for the V trajectoriesshown in the top panels. The course of the trajectory in this phase plane requires carefulinterpretation, as the V nullcline changes at each instant (marked 0, 1 and 2 for t0, t1 and t2).The V∞ value for a given instant along a trajectory corresponds to the value of the V nullclineat that time. The quasi-steady fixed points of the system are given by the intersection of the Vnullclines and the nullcline m∞,,CaS (V) (closed circles if attracting, open circles if repelling).
In the tonic regime (Figure 10(a)), Iaxial(t) depolarizes V quickly from V(t0) to V(t1) but thisdepolarization is not enough for mCaS to cross its activation threshold θ = 0.14 (dotted line)before Iaxial(t) hyperpolarizes V to V(t2). In contrast, for state 2 in the bursting case (Fig. 14(b1)), the higher value of gCaS modifies the shape of the V nullclines, and therefore the locationof the V∞ values. Together with a decrease in τCaS (V), the axonal compartment spike still actsto depolarize V, allowing mCaS to increase and cross θ. This leads to an early exit from state 2into state 4. In state 4 of the burst regime (Fig. 14(b2)), the V nullclines now additionally dependon nKd, which distorts their shape compared to state 2. In particular, the V nullclines have twocrossings with the mCaS nullcline, and the upper one is repelling. The axonal compartmentspike no longer restores V∞ to a hyperpolarized value. Instead, there is a net increase in V∞during the spike, seen by the V nullcline increasing to the right, and V continues to rise as thestate is exited.
The main difference between states 2 and 4 through the transition to bursting is that the effectof Iaxial is diminished as ICa builds up (see Fig. 4(b)II). The fact that mCaS has a slower timescale than the Vaxon spike rise time means that Iaxial (t) has an asymmetric effect: for everyVaxon spike up-sweep, V quickly depolarizes by an amount roughly controlled by the initialvalue of mCaS (i.e., through ICa), but when the V spike down-sweep starts to hyperpolarize asa response to the Vaxon spike down-sweep, the slower ICa has increased and counters theremainder of the Iaxial(t) peak. This process repeats over each axonal compartment spike, withthe V spike getting smaller each time because of the increasing level of ICa (a phenomenonoften referred to as spike block).
DiscussionIn the past few years there has been an explosion in the number of detailed biophysical modelsof neurons and networks (Hines et al., 2004). Due to the large number of variables involvedin most biophysical models, a mathematical analysis of the dynamics of the solutions or thetransitions between different modes of activity is prohibitively difficult. As a result, suchmodels are often analyzed by simulating the model at various parameter values. This providesan understanding of the roles of different components but produces little insight into how thesecomponents interact to produce specific dynamical outputs. Our focus on local parametervariation and bifurcation is complementary to the broader search for parameter ranges in whichthese behavioral regimes can be found (Prinz et al., 2004a).
Clewley et al. Page 10
J Comput Neurosci. Author manuscript; available in PMC 2010 February 1.
NIH
-PA Author Manuscript
NIH
-PA Author Manuscript
NIH
-PA Author Manuscript
We have shown that the dominant scales method (Clewley et al., 2005) can be extended tomulti-compartment models. We applied the method to the study of tonic spiking and burstingin the two-compartment model PD neuron of Soto-Treviño et al. (2005) (model F), in order todiscover the low-dimensional dominant dynamics in each of the two mechanisms. Guided bythe output of the software tool DSSRT, we first derived a single, globally reduced, model Gthat qualitatively captured the tonic and bursting regimes of F. This was intended as a “besteffort” to use conventional reduction techniques for comparison with our method. For instance,in attempting to minimize the number of dimensions in G, ad hoc approximations were madethat involved hand-fitted rescaling functions. The success of model G affirms the presence ofan effective activation threshold separating low and high [Ca2+] states – corresponding to thetonic and bursting regimes, respectively. We then derived a piecewise low-dimensionaldescription of the dynamical system (model L) by more systematically analyzing the changingpatterns of influence between the variables in the full dynamics. This derivation did not requirethe curve fitting of any functional relationships.
Simulation of model L showed that it was capable of reproducing the various behaviors seenin F despite requiring integration of only 6 to 9 variables. The number or variables can bedecreased by taking into account the results of a prior dominant scale reduction of the 4-dimensional axonal compartment in Clewley et al. (2005), which have been omitted here.
The analysis suggests that it is functionally equivalent to a 1-dimensional integrate-and-firecompartment. Simulations of such a further reduced model are almost indistinguishable to thetrajectories of L (not shown), and involve integrating only between 3 and 6 variables.Furthermore, an increase in gCaT and gCaS in F led to a transition from spiking to bursting viaan intermediate form of bursting. Model L could also reproduce this transitional behavior withsimilar spike levels in [Ca2+] to those observed in F and G, despite the fact that its derivationdid not involve analysis of an intermediate bursting trajectory. These results indicate that ourcharacterization of the tonic and bursting regimes was rich enough to support additionalqualitative states present in the full system.
For a dynamical system near a bifurcation point, asymptotic analysis or other rigorous methodsmay be used to derive an optimal normal form representation of the local dynamics. Althoughwe have not established rigorous theory for our method, the correspondence in the results ofdominant scale analysis applied to the original Hodgkin-Huxley model with those ofasymptotic analysis performed by Suckley and Biktashev (2003) suggests that our methodfocuses on mathematically-significant features in the dynamics and yields parsimonious andappropriate local models. Our method identifies temporal intervals in the dynamics of the fullsystem within which local reductions are derived. Although much faster than doing traditionalasymptotic analysis by hand, the cost of our method lies in the need to compute trajectories forhybrid dynamical systems, which involves accurate determination of zero-crossings of “testfunctions” that define the state transition events between the individual vector fields. Thechanges in the pattern of hybrid states strongly suggest the presence of one or more bifurcationsin the dynamics of the full system, although a rigorous bifurcation analysis is beyond the scopeof this work. We fully expect that studying the hybrid model representation further couldcharacterize other aspects of the original model PD neuron’s dynamics but we did not attemptthis in this study.
The role of the axon in the transition to burstingThe changing pattern of dominant inputs to the two compartments over the course of a spikeshows that axial coupling has a subtler role than to promote synchronized activity. Betweenspikes the S/N compartment restores the axonal compartment towards its spike threshold viathis coupling. Without axial coupling the axonal compartment remains quiescent and thedepolarizing currents of the S/N compartment can build up without the axonal spikes to counter
Clewley et al. Page 11
J Comput Neurosci. Author manuscript; available in PMC 2010 February 1.
NIH
-PA Author Manuscript
NIH
-PA Author Manuscript
NIH
-PA Author Manuscript
their effect. Thus, the high ICa/IKCa state is inevitably entered, and the membrane potential Vin F follows a trajectory that resembles the envelope of a burst without spikes. On the otherhand, if the axial coupling is so strong that the two compartments are effectively unified, thecell only exhibits bursting (Soto-Treviño et al., 2005, Fig. 6).
The finding that axial coupling plays changing roles in the PD neuron supports the view thatcurrent flowing between neural compartments acts in a more complex manner than merely asa co-promoter of activity or as a drive towards synchrony (Sherman and Rinzel, 1992; Chowand Kopell, 2000; Medvedev and Kopell, 2001). For instance, it has been shown that the switchfrom spiking to bursting in pancreatic β-cells can be controlled by the strength of couplingbetween two electrically-coupled cells having similar currents but different parameters (deVries and Sherman, 2001): stronger coupling led to spiking whereas weaker coupling led tobursting. As shown in Soto-Treviño et al. (2005), the PD neuron activity (model F), despiteinvolving two very different compartments, can also switch from bursting to spiking as thestrength of the axial coupling is increased. In light of the results described above, this transitioncan be interpreted as follows: the increase in axial conductance increases the influence of theaxial current into the S/N compartment. The timing of the axonal spikes is such that it preventsthe activation of the calcium currents from reaching the excitability threshold θ, which has theresetting effect on the S/N membrane potential, as described as state 2 of model L.
Our results and interpretations are also consistent with the description of the soma-dendritic“ping-pong” mechanism for the Pinksy-Rinzel model of bursting given by Bose and Booth(2005). The ping-pong mechanism relies on a separation of time scales between the twoelectrotonically-coupled compartments, and a “proper balance in strength or timing ofinteraction” between them. In their analysis of a piecewise reduced model of a two-compartment neuron, Bose and Booth determined that the activation of ICa during the activephase of the burst ultimately causes spike block and disrupts the ping-pong pattern, leading toa transition to the silent phase of the burst.
Relation to other approachesOur method of dominant scales extends the principles of quasi-steady state approximation thatis popularly used in modeling chemical kinetics (Murray, 1989). While the quasi-state methodfocuses on separations in time scale only, our method also incorporates information aboutmultiple scales in terms of a measure of influence of variables over each other. This methodstrives to bring greater objectivity to the process of model reduction through the use of analgorithmic process. However, as it is the case in other reduction methods and in the processof model development and analysis, interpretative steps may still be necessary in determiningan efficient representation for a reduced model.
Kepler et al. (1992) describe a complementary method of systematic reduction known as“equivalent potentials,” which they apply globally to reduce the number of differentialequations representing a system of ODEs. Golomb et al. (1993) applied a variant of this methodto their reduction of an STG model, which took into account calcium dependence and also thesignificant separation of time scales in the activation variables. Their reduced model showedqualitatively similar dynamics and bifurcation structure. The mathematical nature of lumpingusing equivalent potentials is rigorously determined in comparison to the hand-tuned curvefitting used for deriving model G. However, here we attempt to objectively measure whichvariables are dominant in a particular sub-regime before lumping any together, and we retainthe original units for all the variables. As observed by Golomb et al., activation variables whosetime constants were significantly dissimilar over the critical range of membrane potentialvalues could not be lumped together. It was for this reason we pursued the locally reduced,hybrid model L, which makes the use of lumping more powerful. Model L included lumped
Clewley et al. Page 12
J Comput Neurosci. Author manuscript; available in PMC 2010 February 1.
NIH
-PA Author Manuscript
NIH
-PA Author Manuscript
NIH
-PA Author Manuscript
variables in sub-regimes 1 and 2 where their time constants were similar, while the other sub-regimes used individual representations for those variables.
Butera et al. (1996) used a similar technique in their study of low-order reductions of an 11-dimensional bursting model neuron based on a multiple time scale analysis. Their reductionswere most powerful when a heuristically determined interaction between the fast and slow sub-systems was included, making the model effectively hybrid. We also note that our separationof time scales in the reduced analysis of bursting is equivalent to the “effective leak” methodof Guckenheimer et al. (2005).
Experimental testsThe hypothesis that the maximal conductance parameters gCaT and gCaS can control a transitionfrom spiking to bursting (or vice-versa) could be tested by applying neuromodulators that havea specific impact on these conductances, or by using a dynamic clamp protocol (Prinz et al.,2004b) to add or remove calcium conductances. We have explored the variation of otherparameters in order to control similar transitions, and have found qualitatively similardynamics. In this study, we focused on calcium conductances in the S/N compartment, butchanges that affect the effective structure of the axon compartment can also modify the behaviorof both biological and model PD neurons. This would be consistent with experimental resultswhich show that antidromic spiking activity in the axon can disrupt bursting in the de-afferentedPD soma (Bucher et al., 2003), and switch it to tonic activity.
AcknowledgmentsNIH Grant MH-60605 (FN), NSF Grant FIBR 0425878 (RC). We would like to thank the reviewers for their helpfulcomments.
ReferencesAmit DJ, Tsodyks MV. Quantitative study of attractor neural networks retrieving at low spike rates I:
Substrate - spikes, rates, and neuronal gain. Network 1991;2:259–274.Bose, A.; Booth, V. Bursting in two-compartment neurons: A case study of the Pinsky-Rinzel model. In:
Coombes, S.; Bressloff, P., editors. Bursting: The genesis of rhythm in the nervous system. WorldScientific; 2005. p. 123-144.
Bucher D, Thirumalai V, Marder E. Axonal Dopamine Receptors Activate Peripheral Spike Initiation ina Stomatogastric Motor Neuron. J Neuroscience 2003;23:6866–6875.
Butera RJ, Clark JW, Byrne JH, Rinzel J. Dissection and reduction of a modeled bursting neuron. Journalof Computational Neuroscience 1996;3:199–223. [PubMed: 8872701]
Chow CC, Kopell N. Dynamics of spiking neurons with electrical coupling. Neural Computation2000;12:1643–1678. [PubMed: 10935921]
Clewley R, Rotstein HG, Kopell N. A Computational Tool for the Reduction of Nonlinear ODE SystemsPossessing Multiple Scales. Multiscale Modeling and Simulation 2005;4:732–759.
de Vries G, Sherman A. From spikers to bursters via coupling: help from heterogeneity. Bulletin ofMathematical Biology 2001;63:371–391. [PubMed: 11276531]
Fitzhugh R. Impulses and physiological states in theoretical models of nerve membrane. BiophysicsJournal 1961;1:445–466.
Golomb D, Guckenheimer J, Gueron S. Reduction of a Channel-Based Model for a StomatogastricGanglion LP Neuron. Biological Cybernetics 1993;69:129–137.
Guckenheimer, J.; Holmes, P. Nonlinear Oscillations, Dynamical Systems and Bifurcations of VectorFields. New-York: Springer-Verlag; 1983.
Guckenheimer, J.; Tien, JH.; Willms, AR. Bifurcations in the fast dynamics of neurons: implications forbursting. In: Coombes, S.; Bressloff, P., editors. Bursting: The Genesis of Rhythm in the NervousSystem. Singapore: World Scientific; 2005.
Clewley et al. Page 13
J Comput Neurosci. Author manuscript; available in PMC 2010 February 1.
NIH
-PA Author Manuscript
NIH
-PA Author Manuscript
NIH
-PA Author Manuscript
Hines ML, Morse T, Migliore M, Carnevale NT, Shepherd GM. ModelDB: A Database to SupportComputational Neuroscience. Journal of Computational Neuroscience 2004;17:7–11. [PubMed:15218350]
Johnson BR, Kloppenburg P, Harris-Warrick RM. Dopamine modulation of calcium currents in pyloricneurons of the lobster stomatogastric ganglion. J Neurophysiol 2003;90:631–643. [PubMed:12904487]
Kepler TB, Abbott LF, Marder E. Reduction of Conductance-Based Neuron Models. BiologicalCybernetics 1992:66.
Kopell N, LeMasson G. Rhythmogenesis, amplitude modulation, and multiplexing in a corticalarchitecture. Proc Natl Acad Sci USA 1994;91:10586–10590. [PubMed: 7937997]
Marder E. Mechanisms underlying neurotransmitter modulation of neuronal circuit. TINS 1984;7:48–53.
Marder E, Bucher D. Understanding Circuit Dynamics Using the Stomatogastric Nervous System ofLobsters and Crabs. Annual Review of Physiology 2007;69:1–26.
Medvedev GS, Kopell N. Synchronization and transient dynamics in chains of electrically coupledFitzhugh-Nagumo oscillators. Siam J Appl Math 2001;61:1762–1801.
Meunier C. Two and three dimensional reductions of the Hodgkin-Huxley system: separation of timescales and bifurcation schemes. Biological Cybernetics 1992;67:461–468. [PubMed: 1391118]
Miller JP, Selverston AI. Mechanisms underlying pattern generation in lobster stomatogastric ganglionas determined by selective inactivation of identified neurons. II. Oscillatory properties of pyloricneurons. J Neurophysiol 1982;48:1378–1391. [PubMed: 7153798]
Murray, JD. Mathematical Biology. New York: Springer-Verlag; 1989.Nusbaum M, Beenhakker M. A small-systems approach to motor pattern generation. Nature
2002;417:343–350. [PubMed: 12015615]Prinz AA, Bucher D, Marder E. Similar network activity from disparate circuit parameters. Nature
Neuroscience 2004a;7:1345–1353.Prinz AA, Abbott LF, Marder E. The dynamic clamp comes of age. TINS 2004b;27:218–224. [PubMed:
15046881]Shelley M, McLaughlin D, Shapley R, Wielaard J. States of High Conductance in a Large-Scale Model
of the Visual Cortex. Journal of Computational Neuroscience 2002;13:93–109. [PubMed: 12215724]Sherman A, Rinzel J. Rhythmogenic effects of weak electrotonic coupling in neuronal models. Proc Natl
Acad Sci USA 1992;89:2471–2474. [PubMed: 1549611]Soto-Treviño C, Rabbah P, Marder E, Nadim F. A Computational Model of Electrically Coupled,
Intrinsically Distinct Pacemaker Neurons. Journal of Neurophysiology 2005;94:590–604. [PubMed:15728775]
Strogatz, SH. Nonlinear Dynamics and Chaos. Perseus Books; 2001.Suckley R, Biktashev V. The Asymptotic Structure of the Hodgkin-Huxley Equations. International
Journal of Bifurcation and Chaos 2003;13:3805–3826.Terman D. Chaotic spikes arising from a model of bursting in excitable membranes. Siam J Appl Math
1991;51:1418–1450.Van Der Schaft, A.; Schumacher, JM. An Introduction to Hybrid Systems. London: Springer-Verlag;
2000.Wilson HR, Cowan JD. Excitatory and inhibitory interactions in localized populations of model neurons.
Biophysics Journal 1972;12:1–24.
Clewley et al. Page 14
J Comput Neurosci. Author manuscript; available in PMC 2010 February 1.
NIH
-PA Author Manuscript
NIH
-PA Author Manuscript
NIH
-PA Author Manuscript
Appendix
Appendices
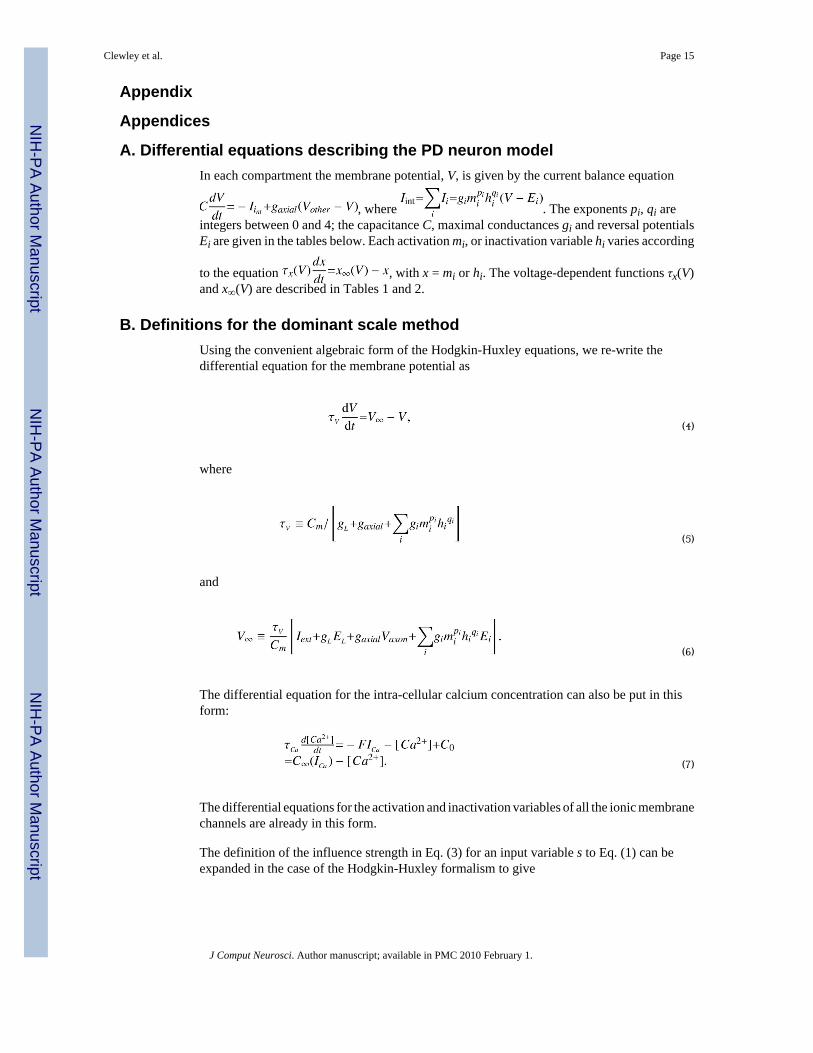
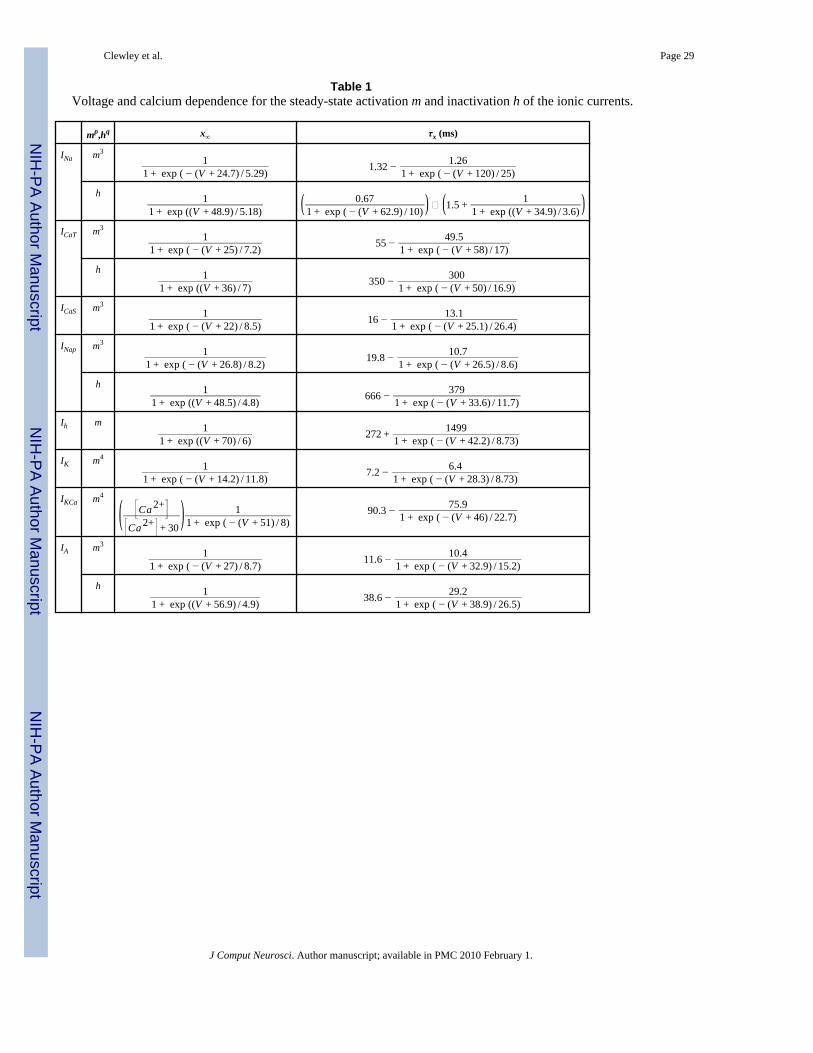
A. Differential equations describing the PD neuron modelIn each compartment the membrane potential, V, is given by the current balance equation
, where . The exponents pi, qi areintegers between 0 and 4; the capacitance C, maximal conductances gi and reversal potentialsEi are given in the tables below. Each activation mi, or inactivation variable hi varies according
to the equation , with x = mi or hi. The voltage-dependent functions τx(V)and x∞(V) are described in Tables 1 and 2.
B. Definitions for the dominant scale methodUsing the convenient algebraic form of the Hodgkin-Huxley equations, we re-write thedifferential equation for the membrane potential as
(4)
where
(5)
and
(6)
The differential equation for the intra-cellular calcium concentration can also be put in thisform:
(7)
The differential equations for the activation and inactivation variables of all the ionic membranechannels are already in this form.
The definition of the influence strength in Eq. (3) for an input variable s to Eq. (1) can beexpanded in the case of the Hodgkin-Huxley formalism to give
Clewley et al. Page 15
J Comput Neurosci. Author manuscript; available in PMC 2010 February 1.
NIH
-PA Author Manuscript
NIH
-PA Author Manuscript
NIH
-PA Author Manuscript
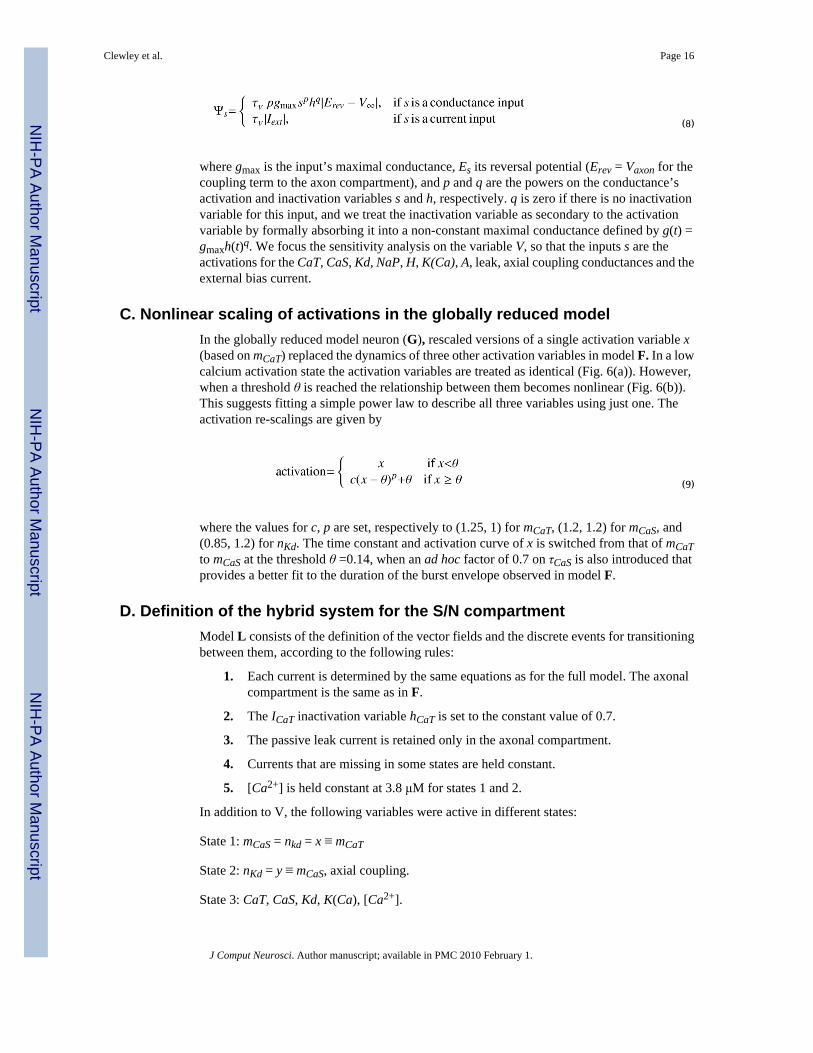
(8)
where gmax is the input’s maximal conductance, Es its reversal potential (Erev = Vaxon for thecoupling term to the axon compartment), and p and q are the powers on the conductance’sactivation and inactivation variables s and h, respectively. q is zero if there is no inactivationvariable for this input, and we treat the inactivation variable as secondary to the activationvariable by formally absorbing it into a non-constant maximal conductance defined by g(t) =gmaxh(t)q. We focus the sensitivity analysis on the variable V, so that the inputs s are theactivations for the CaT, CaS, Kd, NaP, H, K(Ca), A, leak, axial coupling conductances and theexternal bias current.
C. Nonlinear scaling of activations in the globally reduced modelIn the globally reduced model neuron (G), rescaled versions of a single activation variable x(based on mCaT) replaced the dynamics of three other activation variables in model F. In a lowcalcium activation state the activation variables are treated as identical (Fig. 6(a)). However,when a threshold θ is reached the relationship between them becomes nonlinear (Fig. 6(b)).This suggests fitting a simple power law to describe all three variables using just one. Theactivation re-scalings are given by
(9)
where the values for c, p are set, respectively to (1.25, 1) for mCaT, (1.2, 1.2) for mCaS, and(0.85, 1.2) for nKd. The time constant and activation curve of x is switched from that of mCaTto mCaS at the threshold θ =0.14, when an ad hoc factor of 0.7 on τCaS is also introduced thatprovides a better fit to the duration of the burst envelope observed in model F.
D. Definition of the hybrid system for the S/N compartmentModel L consists of the definition of the vector fields and the discrete events for transitioningbetween them, according to the following rules:
1. Each current is determined by the same equations as for the full model. The axonalcompartment is the same as in F.
2. The ICaT inactivation variable hCaT is set to the constant value of 0.7.
3. The passive leak current is retained only in the axonal compartment.
4. Currents that are missing in some states are held constant.
5. [Ca2+] is held constant at 3.8 μM for states 1 and 2.
In addition to V, the following variables were active in different states:
State 1: mCaS = nkd = x ≡ mCaT
State 2: nKd = y ≡ mCaS, axial coupling.
State 3: CaT, CaS, Kd, K(Ca), [Ca2+].
Clewley et al. Page 16
J Comput Neurosci. Author manuscript; available in PMC 2010 February 1.
NIH
-PA Author Manuscript
NIH
-PA Author Manuscript
NIH
-PA Author Manuscript
State 4: CaS, Kd, K(Ca), [Ca2+], axial coupling.
Different states have different sets of lumped or un-lumped variables. Therefore, when a statetransition was made some of these variables required initialization from the available activationvalues of the previous state. Transition event from state 1 to 2 and from 3 to 4: Vaxon − V ≥ E(“axonal spike threshold”) assuming initially that Vaxon −V < E. Transition event from state 2to 1 and from 4 to 3: V − Vaxon ≤ E (“recovery threshold”) assuming initially that V−Vaxon>E. Notice that the left-hand sides of these inequalities are not absolute values, andtherefore these two conditions are not inverses of each other. The first condition is met whenVaxon becomes more depolarized than V by at least an amount equal to E. The second conditionis met when Vaxon depolarizes to become close to V, by an amount less than E. We used E = 5mV. Transition event from state 1 to 3 and from 2 to 4: x ≥ θ. Transition event from state 3 to1 and from 4 to 2: mKCa < θKCa, where θKC = 0.10.
Clewley et al. Page 17
J Comput Neurosci. Author manuscript; available in PMC 2010 February 1.
NIH
-PA Author Manuscript
NIH
-PA Author Manuscript
NIH
-PA Author Manuscript
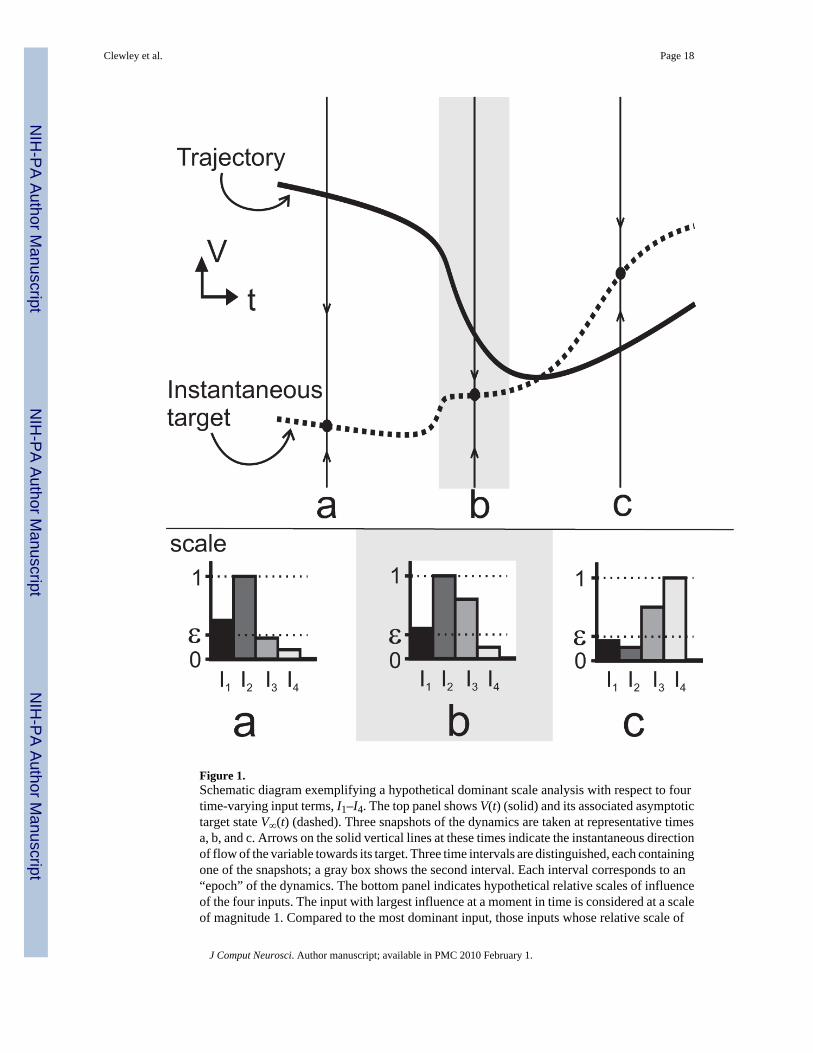
Figure 1.Schematic diagram exemplifying a hypothetical dominant scale analysis with respect to fourtime-varying input terms, I1–I4. The top panel shows V(t) (solid) and its associated asymptotictarget state V∞(t) (dashed). Three snapshots of the dynamics are taken at representative timesa, b, and c. Arrows on the solid vertical lines at these times indicate the instantaneous directionof flow of the variable towards its target. Three time intervals are distinguished, each containingone of the snapshots; a gray box shows the second interval. Each interval corresponds to an“epoch” of the dynamics. The bottom panel indicates hypothetical relative scales of influenceof the four inputs. The input with largest influence at a moment in time is considered at a scaleof magnitude 1. Compared to the most dominant input, those inputs whose relative scale of
Clewley et al. Page 18
J Comput Neurosci. Author manuscript; available in PMC 2010 February 1.
NIH
-PA Author Manuscript
NIH
-PA Author Manuscript
NIH
-PA Author Manuscript
influence is above a pre-defined threshold ε are considered active while the remaining inputsare considered inactive. In this example, the second input is most dominant in the two epochsthat contain snapshots (a) and (b). In epoch (a) I1 shares the same scale of influence and, sodoes I3 in epoch (b). In epoch (c), I3 and I4 are most dominant instead. The dynamics showdifferent qualitative trends in each epoch.
Clewley et al. Page 19
J Comput Neurosci. Author manuscript; available in PMC 2010 February 1.
NIH
-PA Author Manuscript
NIH
-PA Author Manuscript
NIH
-PA Author Manuscript
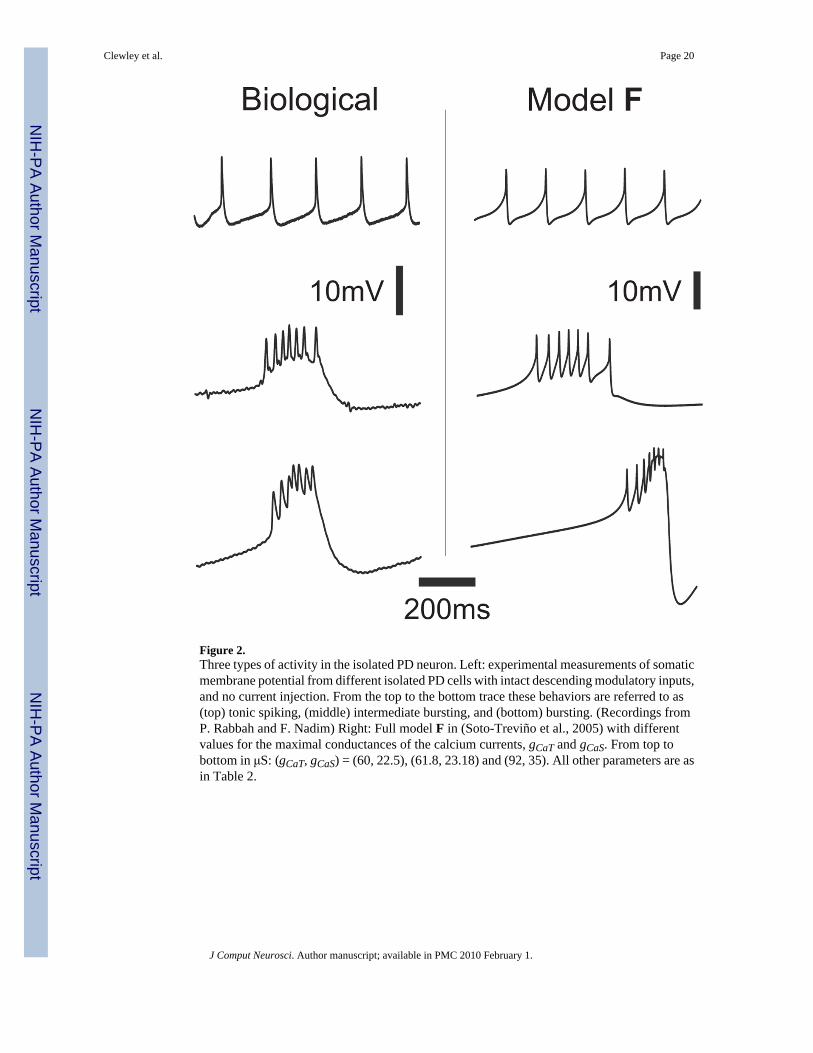
Figure 2.Three types of activity in the isolated PD neuron. Left: experimental measurements of somaticmembrane potential from different isolated PD cells with intact descending modulatory inputs,and no current injection. From the top to the bottom trace these behaviors are referred to as(top) tonic spiking, (middle) intermediate bursting, and (bottom) bursting. (Recordings fromP. Rabbah and F. Nadim) Right: Full model F in (Soto-Treviño et al., 2005) with differentvalues for the maximal conductances of the calcium currents, gCaT and gCaS. From top tobottom in μS: (gCaT, gCaS) = (60, 22.5), (61.8, 23.18) and (92, 35). All other parameters are asin Table 2.
Clewley et al. Page 20
J Comput Neurosci. Author manuscript; available in PMC 2010 February 1.
NIH
-PA Author Manuscript
NIH
-PA Author Manuscript
NIH
-PA Author Manuscript
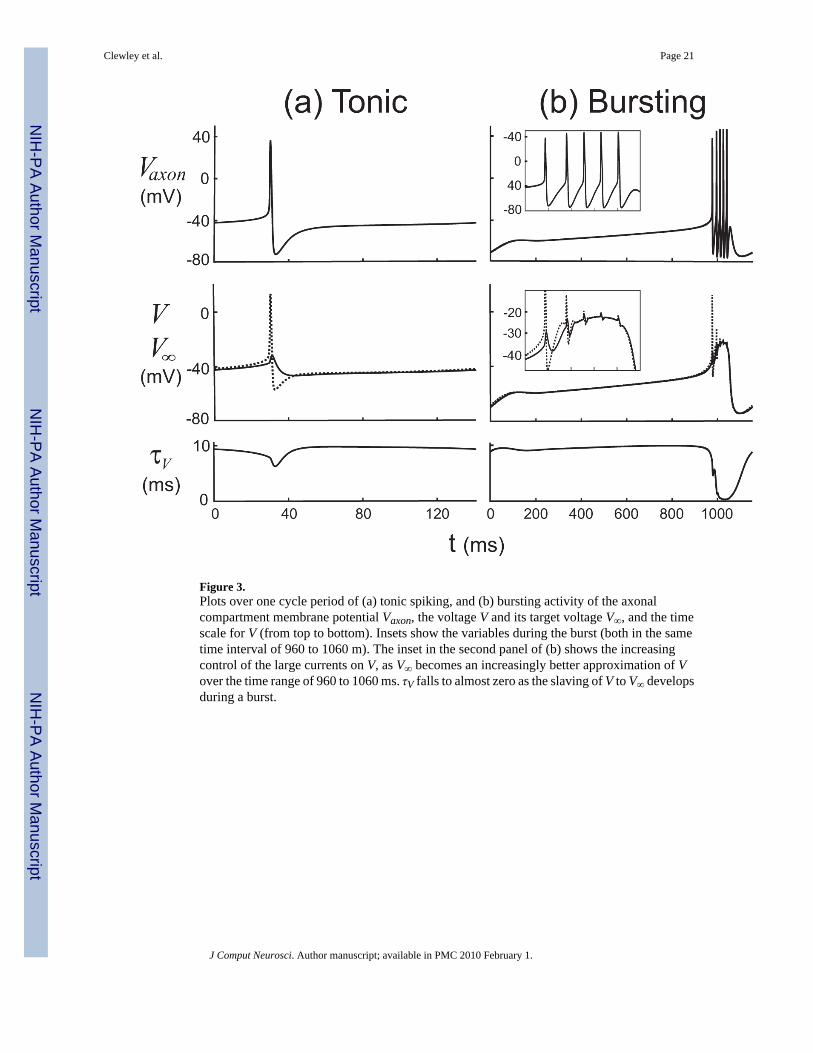
Figure 3.Plots over one cycle period of (a) tonic spiking, and (b) bursting activity of the axonalcompartment membrane potential Vaxon, the voltage V and its target voltage V∞, and the timescale for V (from top to bottom). Insets show the variables during the burst (both in the sametime interval of 960 to 1060 m). The inset in the second panel of (b) shows the increasingcontrol of the large currents on V, as V∞ becomes an increasingly better approximation of Vover the time range of 960 to 1060 ms. τV falls to almost zero as the slaving of V to V∞ developsduring a burst.
Clewley et al. Page 21
J Comput Neurosci. Author manuscript; available in PMC 2010 February 1.
NIH
-PA Author Manuscript
NIH
-PA Author Manuscript
NIH
-PA Author Manuscript
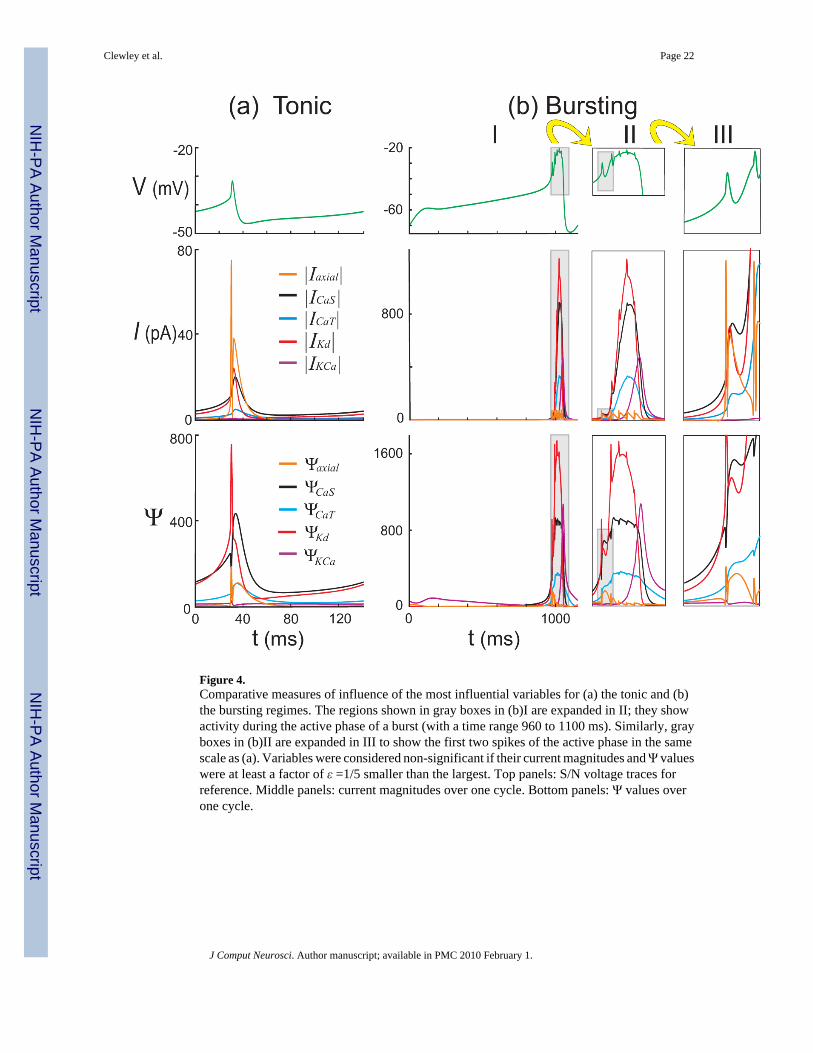
Figure 4.Comparative measures of influence of the most influential variables for (a) the tonic and (b)the bursting regimes. The regions shown in gray boxes in (b)I are expanded in II; they showactivity during the active phase of a burst (with a time range 960 to 1100 ms). Similarly, grayboxes in (b)II are expanded in III to show the first two spikes of the active phase in the samescale as (a). Variables were considered non-significant if their current magnitudes and Ψ valueswere at least a factor of ε =1/5 smaller than the largest. Top panels: S/N voltage traces forreference. Middle panels: current magnitudes over one cycle. Bottom panels: Ψ values overone cycle.
Clewley et al. Page 22
J Comput Neurosci. Author manuscript; available in PMC 2010 February 1.
NIH
-PA Author Manuscript
NIH
-PA Author Manuscript
NIH
-PA Author Manuscript
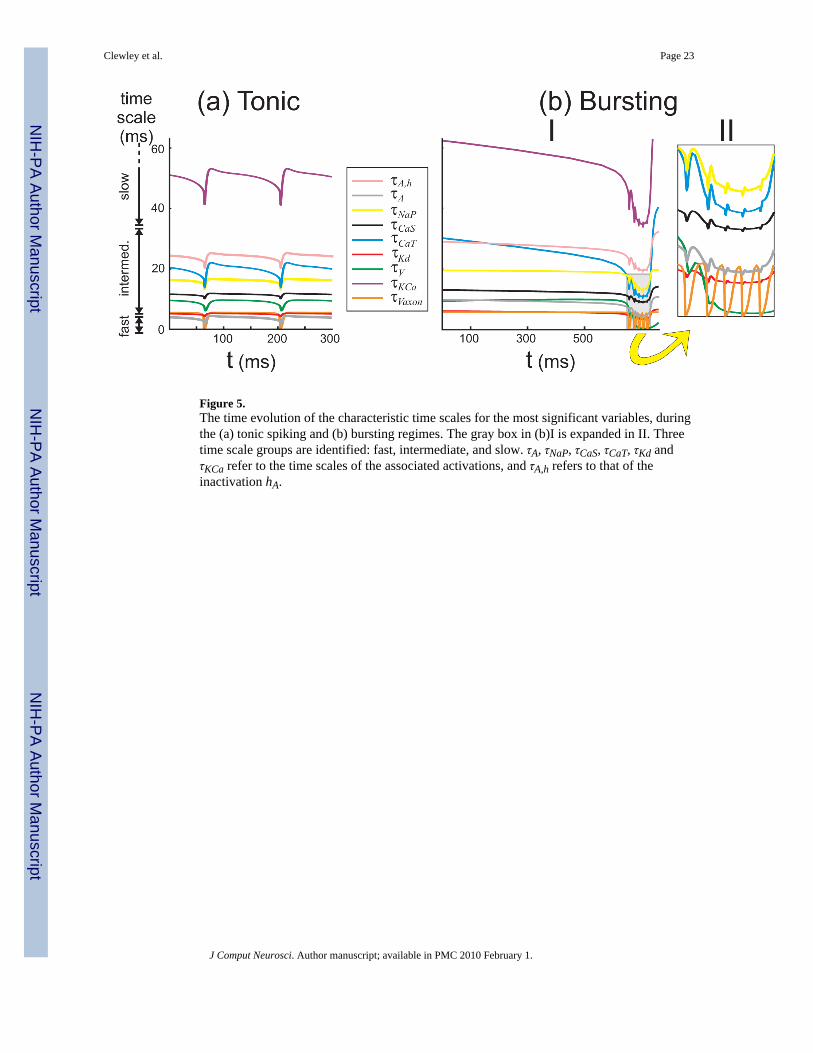
Figure 5.The time evolution of the characteristic time scales for the most significant variables, duringthe (a) tonic spiking and (b) bursting regimes. The gray box in (b)I is expanded in II. Threetime scale groups are identified: fast, intermediate, and slow. τA, τNaP, τCaS, τCaT, τKd andτKCa refer to the time scales of the associated activations, and τA,h refers to that of theinactivation hA.
Clewley et al. Page 23
J Comput Neurosci. Author manuscript; available in PMC 2010 February 1.
NIH
-PA Author Manuscript
NIH
-PA Author Manuscript
NIH
-PA Author Manuscript
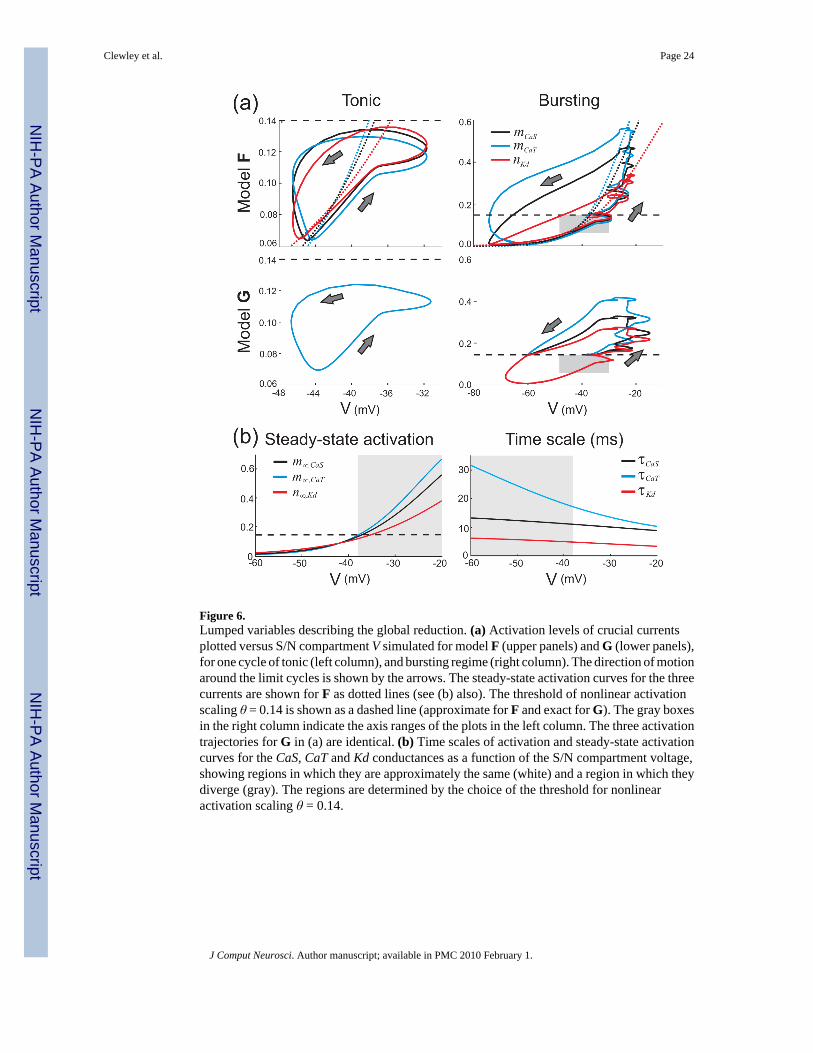
Figure 6.Lumped variables describing the global reduction. (a) Activation levels of crucial currentsplotted versus S/N compartment V simulated for model F (upper panels) and G (lower panels),for one cycle of tonic (left column), and bursting regime (right column). The direction of motionaround the limit cycles is shown by the arrows. The steady-state activation curves for the threecurrents are shown for F as dotted lines (see (b) also). The threshold of nonlinear activationscaling θ = 0.14 is shown as a dashed line (approximate for F and exact for G). The gray boxesin the right column indicate the axis ranges of the plots in the left column. The three activationtrajectories for G in (a) are identical. (b) Time scales of activation and steady-state activationcurves for the CaS, CaT and Kd conductances as a function of the S/N compartment voltage,showing regions in which they are approximately the same (white) and a region in which theydiverge (gray). The regions are determined by the choice of the threshold for nonlinearactivation scaling θ = 0.14.
Clewley et al. Page 24
J Comput Neurosci. Author manuscript; available in PMC 2010 February 1.
NIH
-PA Author Manuscript
NIH
-PA Author Manuscript
NIH
-PA Author Manuscript
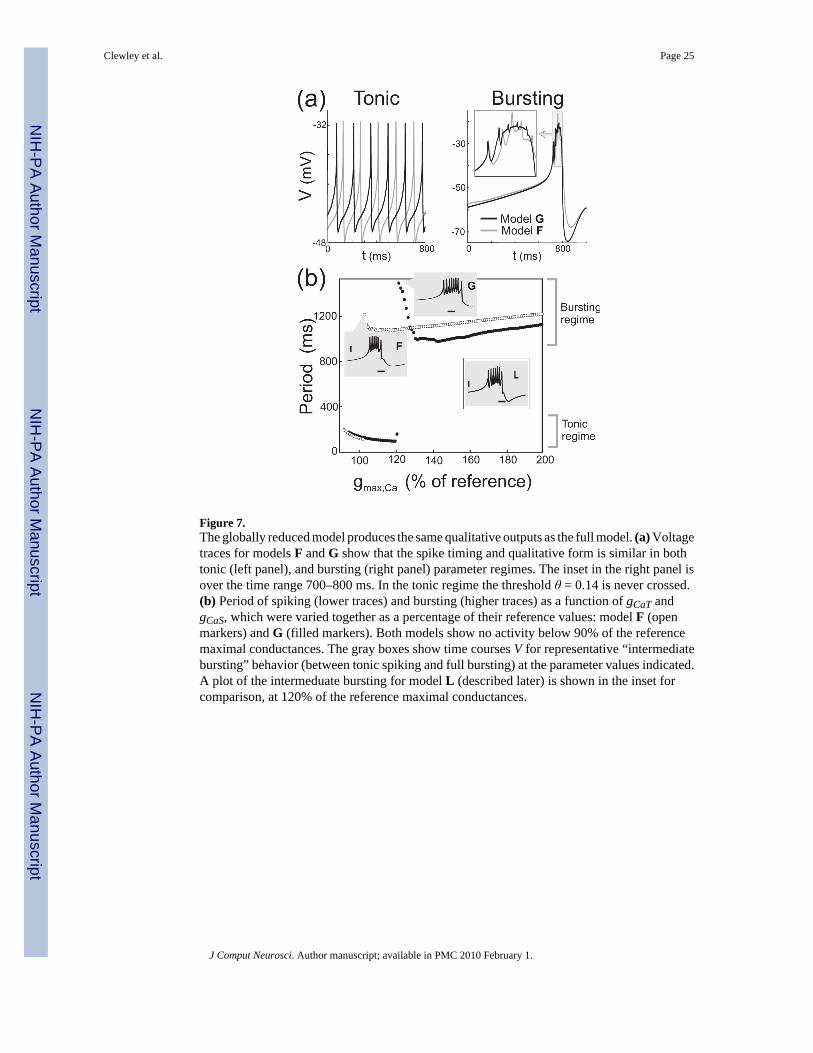
Figure 7.The globally reduced model produces the same qualitative outputs as the full model. (a) Voltagetraces for models F and G show that the spike timing and qualitative form is similar in bothtonic (left panel), and bursting (right panel) parameter regimes. The inset in the right panel isover the time range 700–800 ms. In the tonic regime the threshold θ = 0.14 is never crossed.(b) Period of spiking (lower traces) and bursting (higher traces) as a function of gCaT andgCaS, which were varied together as a percentage of their reference values: model F (openmarkers) and G (filled markers). Both models show no activity below 90% of the referencemaximal conductances. The gray boxes show time courses V for representative “intermediatebursting” behavior (between tonic spiking and full bursting) at the parameter values indicated.A plot of the intermeduate bursting for model L (described later) is shown in the inset forcomparison, at 120% of the reference maximal conductances.
Clewley et al. Page 25
J Comput Neurosci. Author manuscript; available in PMC 2010 February 1.
NIH
-PA Author Manuscript
NIH
-PA Author Manuscript
NIH
-PA Author Manuscript
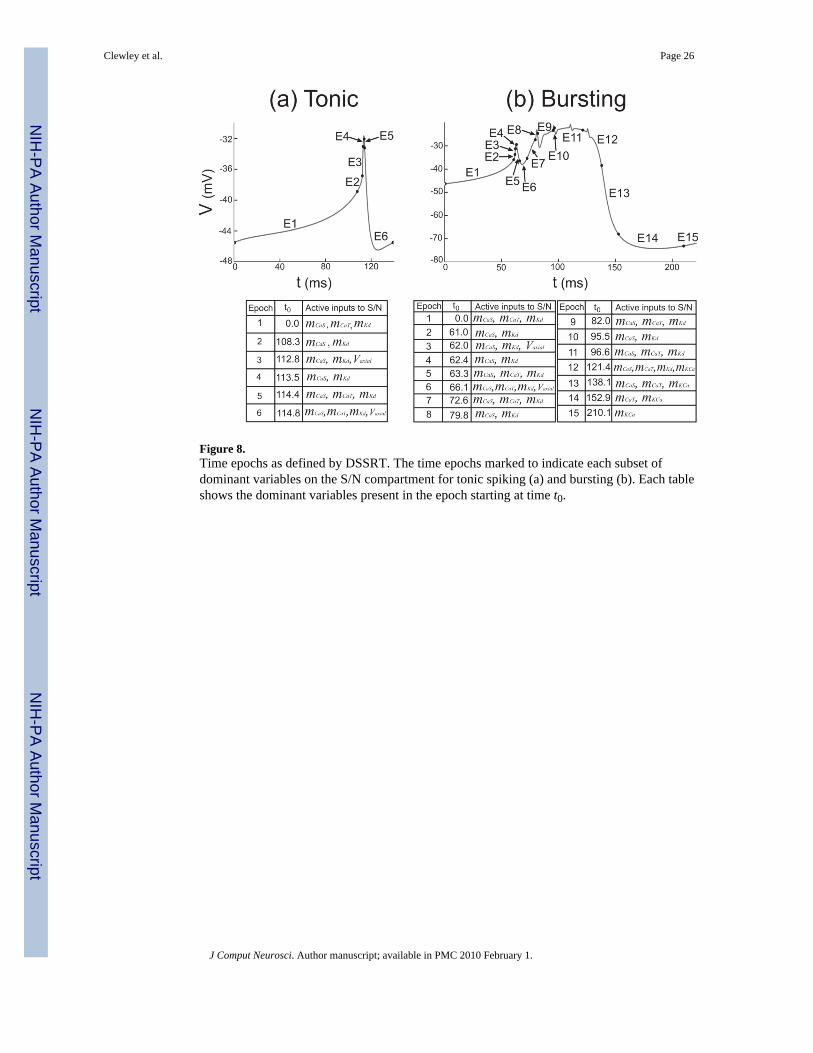
Figure 8.Time epochs as defined by DSSRT. The time epochs marked to indicate each subset ofdominant variables on the S/N compartment for tonic spiking (a) and bursting (b). Each tableshows the dominant variables present in the epoch starting at time t0.
Clewley et al. Page 26
J Comput Neurosci. Author manuscript; available in PMC 2010 February 1.
NIH
-PA Author Manuscript
NIH
-PA Author Manuscript
NIH
-PA Author Manuscript
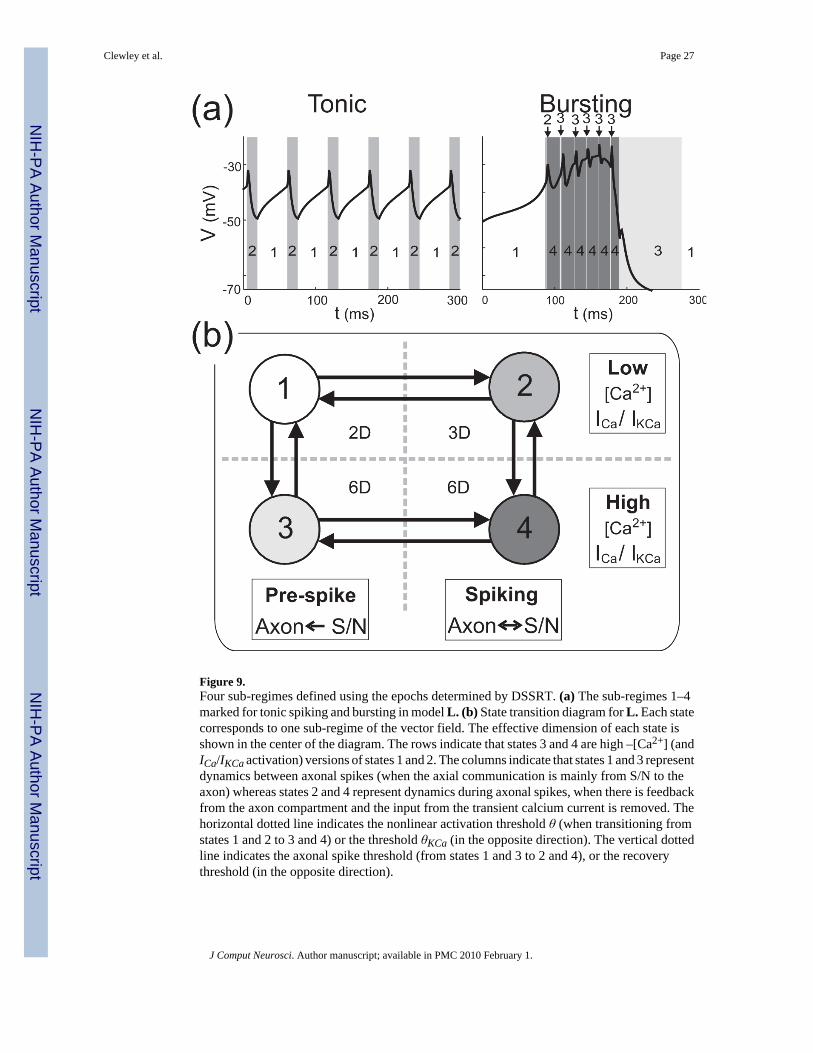
Figure 9.Four sub-regimes defined using the epochs determined by DSSRT. (a) The sub-regimes 1–4marked for tonic spiking and bursting in model L. (b) State transition diagram for L. Each statecorresponds to one sub-regime of the vector field. The effective dimension of each state isshown in the center of the diagram. The rows indicate that states 3 and 4 are high –[Ca2+] (andICa/IKCa activation) versions of states 1 and 2. The columns indicate that states 1 and 3 representdynamics between axonal spikes (when the axial communication is mainly from S/N to theaxon) whereas states 2 and 4 represent dynamics during axonal spikes, when there is feedbackfrom the axon compartment and the input from the transient calcium current is removed. Thehorizontal dotted line indicates the nonlinear activation threshold θ (when transitioning fromstates 1 and 2 to 3 and 4) or the threshold θKCa (in the opposite direction). The vertical dottedline indicates the axonal spike threshold (from states 1 and 3 to 2 and 4), or the recoverythreshold (in the opposite direction).
Clewley et al. Page 27
J Comput Neurosci. Author manuscript; available in PMC 2010 February 1.
NIH
-PA Author Manuscript
NIH
-PA Author Manuscript
NIH
-PA Author Manuscript
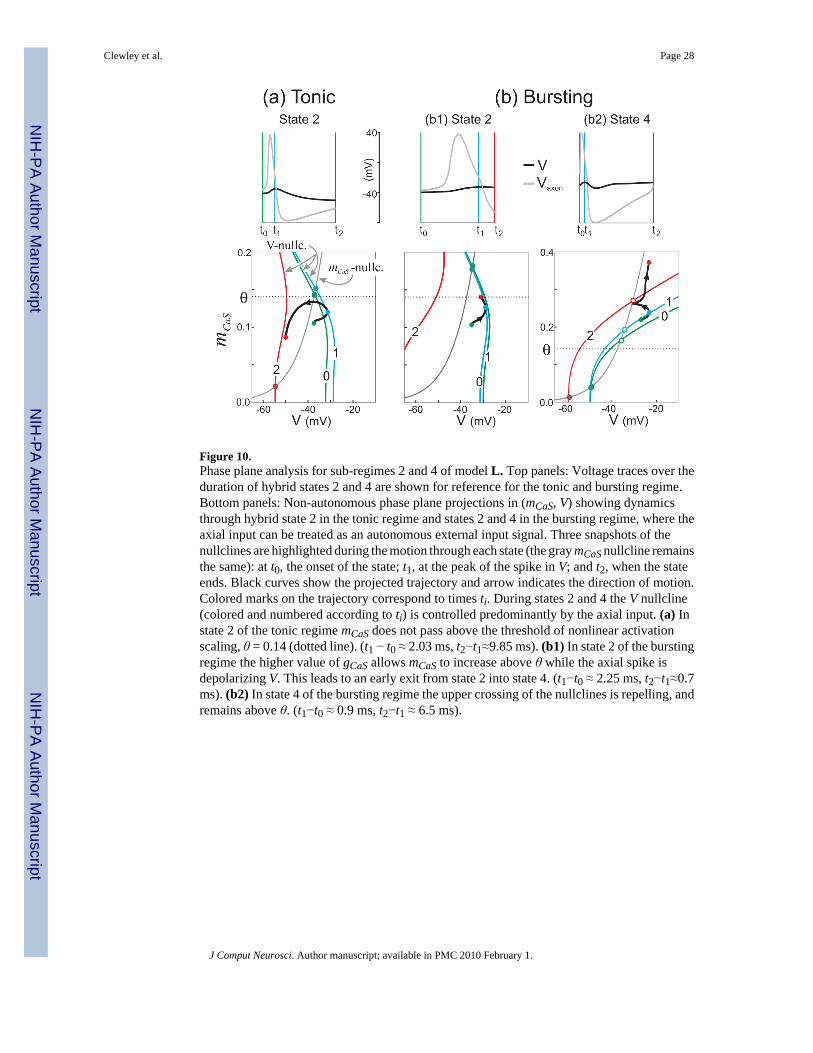
Figure 10.Phase plane analysis for sub-regimes 2 and 4 of model L. Top panels: Voltage traces over theduration of hybrid states 2 and 4 are shown for reference for the tonic and bursting regime.Bottom panels: Non-autonomous phase plane projections in (mCaS, V) showing dynamicsthrough hybrid state 2 in the tonic regime and states 2 and 4 in the bursting regime, where theaxial input can be treated as an autonomous external input signal. Three snapshots of thenullclines are highlighted during the motion through each state (the gray mCaS nullcline remainsthe same): at t0, the onset of the state; t1, at the peak of the spike in V; and t2, when the stateends. Black curves show the projected trajectory and arrow indicates the direction of motion.Colored marks on the trajectory correspond to times ti. During states 2 and 4 the V nullcline(colored and numbered according to ti) is controlled predominantly by the axial input. (a) Instate 2 of the tonic regime mCaS does not pass above the threshold of nonlinear activationscaling, θ = 0.14 (dotted line). (t1 − t0 ≈ 2.03 ms, t2−t1≈9.85 ms). (b1) In state 2 of the burstingregime the higher value of gCaS allows mCaS to increase above θ while the axial spike isdepolarizing V. This leads to an early exit from state 2 into state 4. (t1−t0 ≈ 2.25 ms, t2−t1≈0.7ms). (b2) In state 4 of the bursting regime the upper crossing of the nullclines is repelling, andremains above θ. (t1−t0 ≈ 0.9 ms, t2−t1 ≈ 6.5 ms).
Clewley et al. Page 28
J Comput Neurosci. Author manuscript; available in PMC 2010 February 1.
NIH
-PA Author Manuscript
NIH
-PA Author Manuscript
NIH
-PA Author Manuscript
NIH
-PA Author Manuscript
NIH
-PA Author Manuscript
NIH
-PA Author Manuscript
Clewley et al. Page 29
Table 1Voltage and calcium dependence for the steady-state activation m and inactivation h of the ionic currents.
mp,hq x∞ τx (ms)
INa m31
1 + exp ( − (V + 24.7) / 5.29) 1.32 − 1.261 + exp ( − (V + 120) / 25)
h 11 + exp ((V + 48.9) / 5.18) ( 0.67
1 + exp ( − (V + 62.9) / 10) ) ∗ (1.5 + 11 + exp ((V + 34.9) / 3.6) )
ICaT m31
1 + exp ( − (V + 25) / 7.2) 55 − 49.51 + exp ( − (V + 58) / 17)
h 11 + exp ((V + 36) / 7) 350 − 300
1 + exp ( − (V + 50) / 16.9)
ICaS m31
1 + exp ( − (V + 22) / 8.5) 16 − 13.11 + exp ( − (V + 25.1) / 26.4)
INap m31
1 + exp ( − (V + 26.8) / 8.2) 19.8 − 10.71 + exp ( − (V + 26.5) / 8.6)
h 11 + exp ((V + 48.5) / 4.8) 666 − 379
1 + exp ( − (V + 33.6) / 11.7)
Ih m 11 + exp ((V + 70) / 6) 272 + 1499
1 + exp ( − (V + 42.2) / 8.73)
IK m41
1 + exp ( − (V + 14.2) / 11.8) 7.2 − 6.41 + exp ( − (V + 28.3) / 8.73)
IKCa m4
( Ca 2+
Ca 2+ + 30) 1
1 + exp ( − (V + 51) / 8)90.3 − 75.9
1 + exp ( − (V + 46) / 22.7)
IA m31
1 + exp ( − (V + 27) / 8.7) 11.6 − 10.41 + exp ( − (V + 32.9) / 15.2)
h 11 + exp ((V + 56.9) / 4.9) 38.6 − 29.2
1 + exp ( − (V + 38.9) / 26.5)
J Comput Neurosci. Author manuscript; available in PMC 2010 February 1.
NIH
-PA Author Manuscript
NIH
-PA Author Manuscript
NIH
-PA Author Manuscript
Clewley et al. Page 30
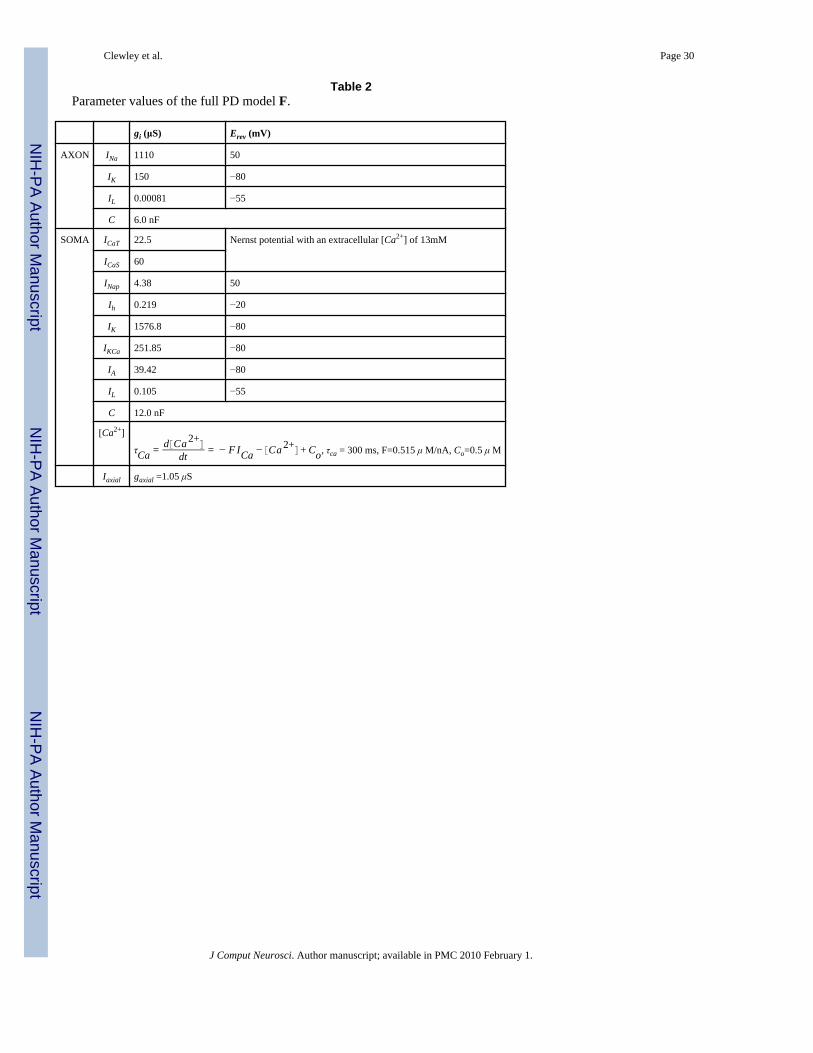
Table 2Parameter values of the full PD model F.
gi (μS) Erev (mV)
AXON INa 1110 50
IK 150 −80
IL 0.00081 −55
C 6.0 nF
SOMA ICaT 22.5 Nernst potential with an extracellular [Ca2+] of 13mM
ICaS 60
INap 4.38 50
Ih 0.219 −20
IK 1576.8 −80
IKCa 251.85 −80
IA 39.42 −80
IL 0.105 −55
C 12.0 nF
[Ca2+]
τCa = d Ca 2+
dt = − F ICa − Ca 2+ + Co, τca = 300 ms, F=0.515 μ M/nA, Co=0.5 μ M
Iaxial gaxial =1.05 μS
J Comput Neurosci. Author manuscript; available in PMC 2010 February 1.
Related Documents


![Transition between Tonic Spiking and Bursting in a Neuron ...geza.kzoo.edu/~erdi/cymb0/cymb3.pdf · the theory of dynamical systems [5–9]. Qualitative de-scription of a transition](https://static.cupdf.com/doc/110x72/5f8aac8f29e0f77d616f2dc0/transition-between-tonic-spiking-and-bursting-in-a-neuron-gezakzooeduerdicymb0cymb3pdf.jpg)


