Domestic Gas Scenario Processing, Distribution & Applications A K Deb Head Business Development &JV Group – ONGC Offshore India – Oil & Gas Summit Hyatt Regency, Mumbai September 22 nd , 2009 Petrofed Industry-Academia Wor kshop PLL LNG Terminal, Dahej October 19 , 2011

Welcome message from author
This document is posted to help you gain knowledge. Please leave a comment to let me know what you think about it! Share it to your friends and learn new things together.
Transcript
7/29/2019 Domestic Gas Scenario Processing, Distribution & Applications
http://slidepdf.com/reader/full/domestic-gas-scenario-processing-distribution-applications 1/48
Domestic Gas Scenario
Processing, Distribution&
Applications
A K Deb
Head Business Development &JV Group –
ONGC
Offshore India – Oil & Gas SummitHyatt Regency, MumbaiSeptember 22nd , 2009
Petrofed Industry-Academia WorkshopPLL LNG Terminal, Dahej
October 19 , 2011
7/29/2019 Domestic Gas Scenario Processing, Distribution & Applications
http://slidepdf.com/reader/full/domestic-gas-scenario-processing-distribution-applications 2/48
Why Natural Gas ?
Lower GHG emissions
Reduced Environment Footprints
amongst energy sources
7/29/2019 Domestic Gas Scenario Processing, Distribution & Applications
http://slidepdf.com/reader/full/domestic-gas-scenario-processing-distribution-applications 3/48
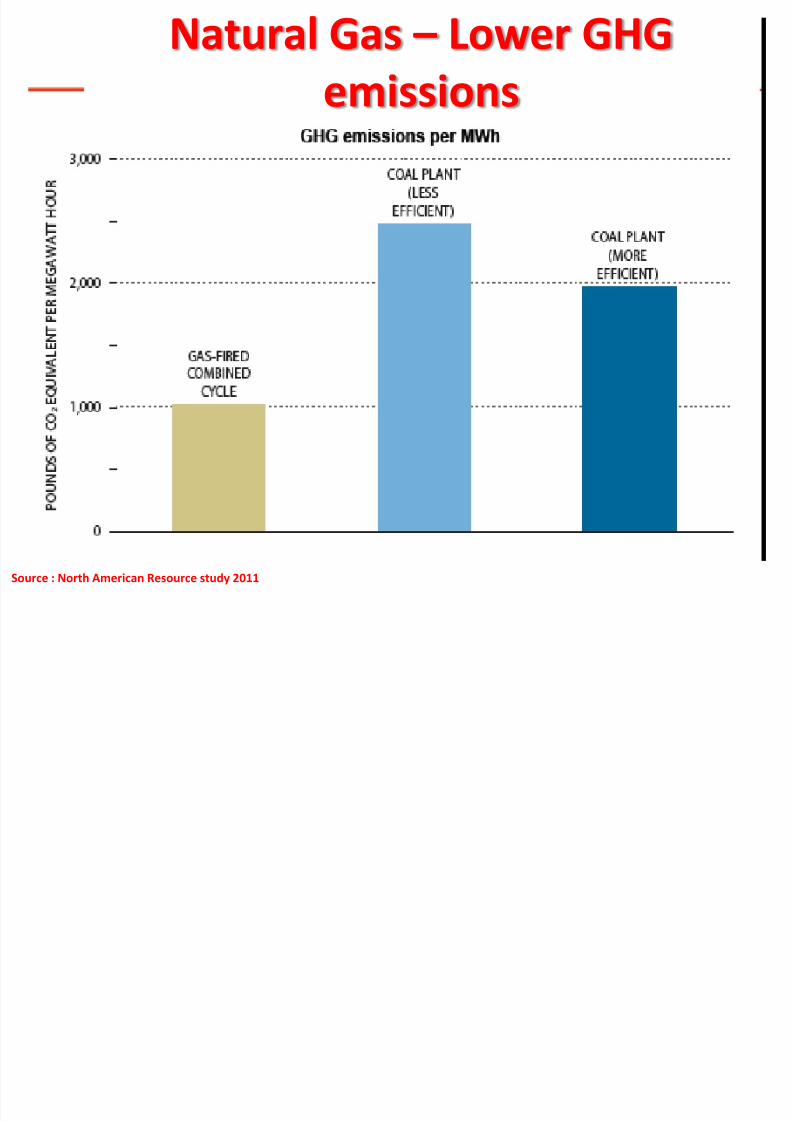
Natural Gas – Lower GHG
emissions
Source : North American Resource study 2011

7/29/2019 Domestic Gas Scenario Processing, Distribution & Applications
http://slidepdf.com/reader/full/domestic-gas-scenario-processing-distribution-applications 4/48
Estimates of Environment Footprints of
Energy sources
7/29/2019 Domestic Gas Scenario Processing, Distribution & Applications
http://slidepdf.com/reader/full/domestic-gas-scenario-processing-distribution-applications 5/48
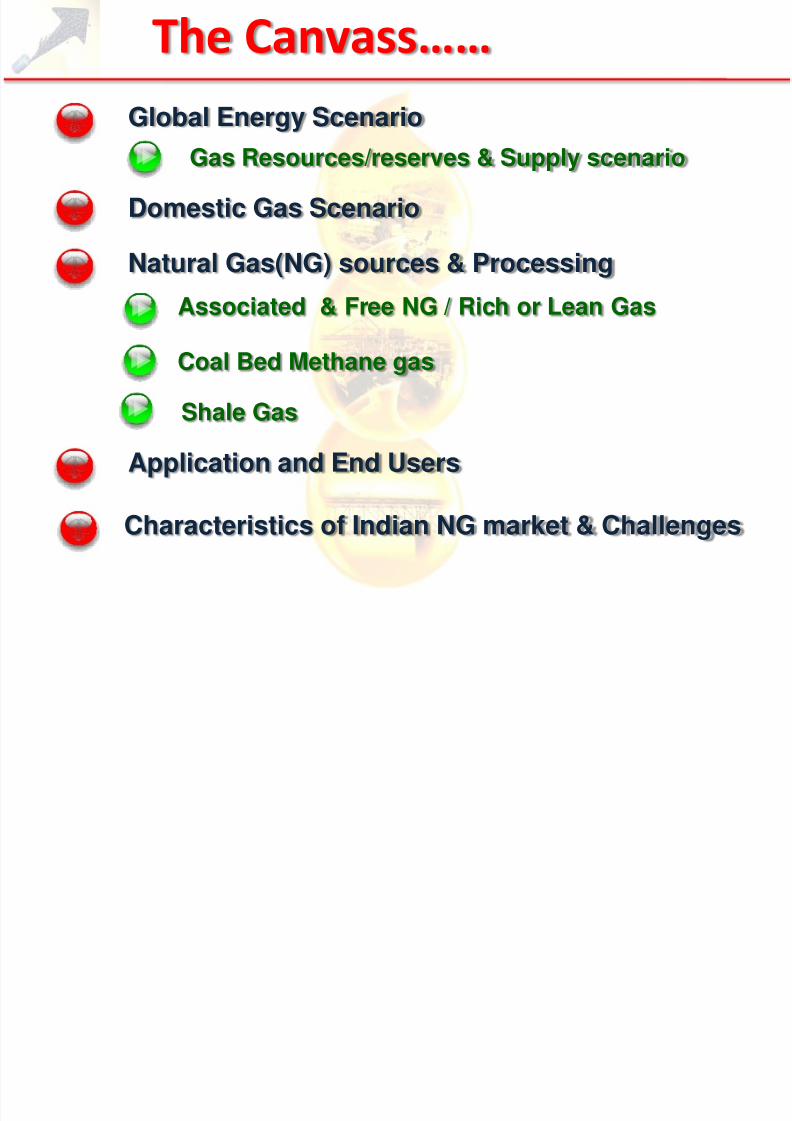
Global Energy Scenario
The Canvass……
Natural Gas(NG) sources & ProcessingAssociated & Free NG / Rich or Lean Gas
Application and End Users
Characteristics of Indian NG market & Challenges
Coal Bed Methane gas
Shale Gas
Gas Resources/reserves & Supply scenario
Domestic Gas Scenario
7/29/2019 Domestic Gas Scenario Processing, Distribution & Applications
http://slidepdf.com/reader/full/domestic-gas-scenario-processing-distribution-applications 6/48
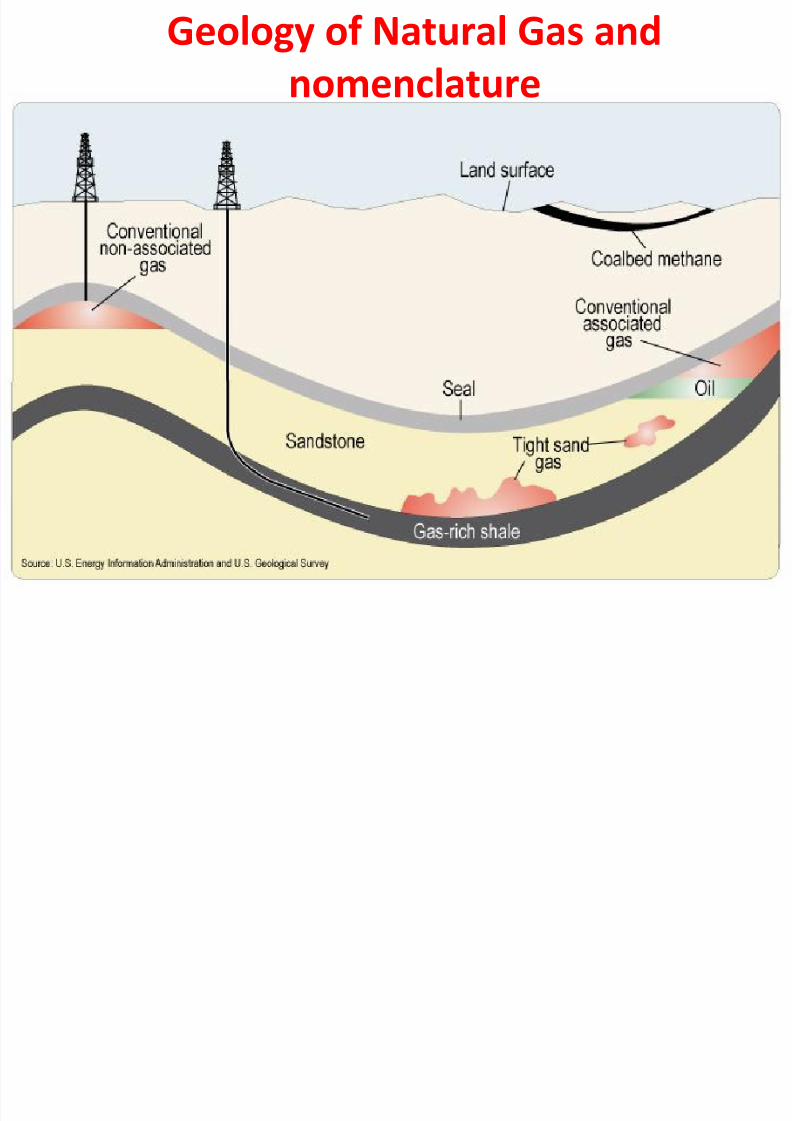
Geology of Natural Gas and
nomenclature
7/29/2019 Domestic Gas Scenario Processing, Distribution & Applications
http://slidepdf.com/reader/full/domestic-gas-scenario-processing-distribution-applications 7/48
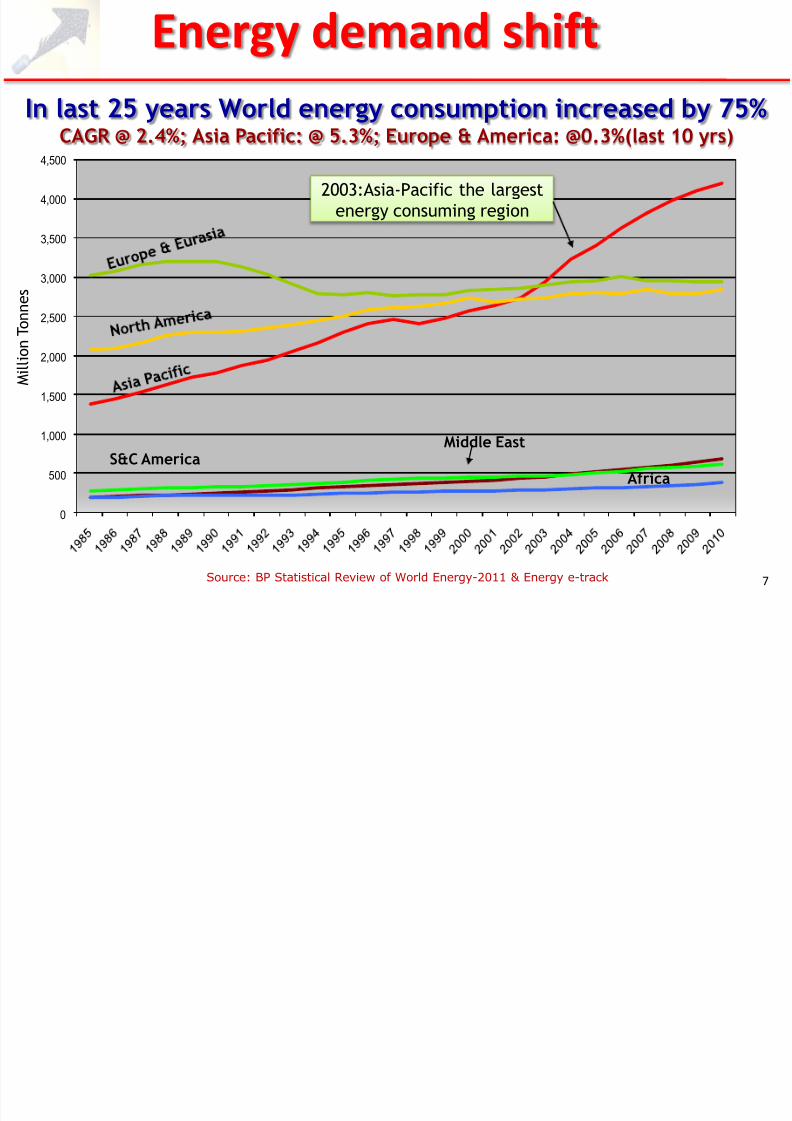
Energy demand shift
0
500
1,000
1,500
2,000
2,500
3,000
3,500
4,000
4,500
Middle EastS&C America
Africa
In last 25 years World energy consumption increased by 75%
CAGR @ 2.4%; Asia Pacific: @ 5.3%; Europe & America: @0.3%(last 10 yrs)
2003:Asia-Pacific the largest
energy consuming region
M i l l i o n T o n n e s
Source: BP Statistical Review of World Energy-2011 & Energy e-track 7
7/29/2019 Domestic Gas Scenario Processing, Distribution & Applications
http://slidepdf.com/reader/full/domestic-gas-scenario-processing-distribution-applications 8/48
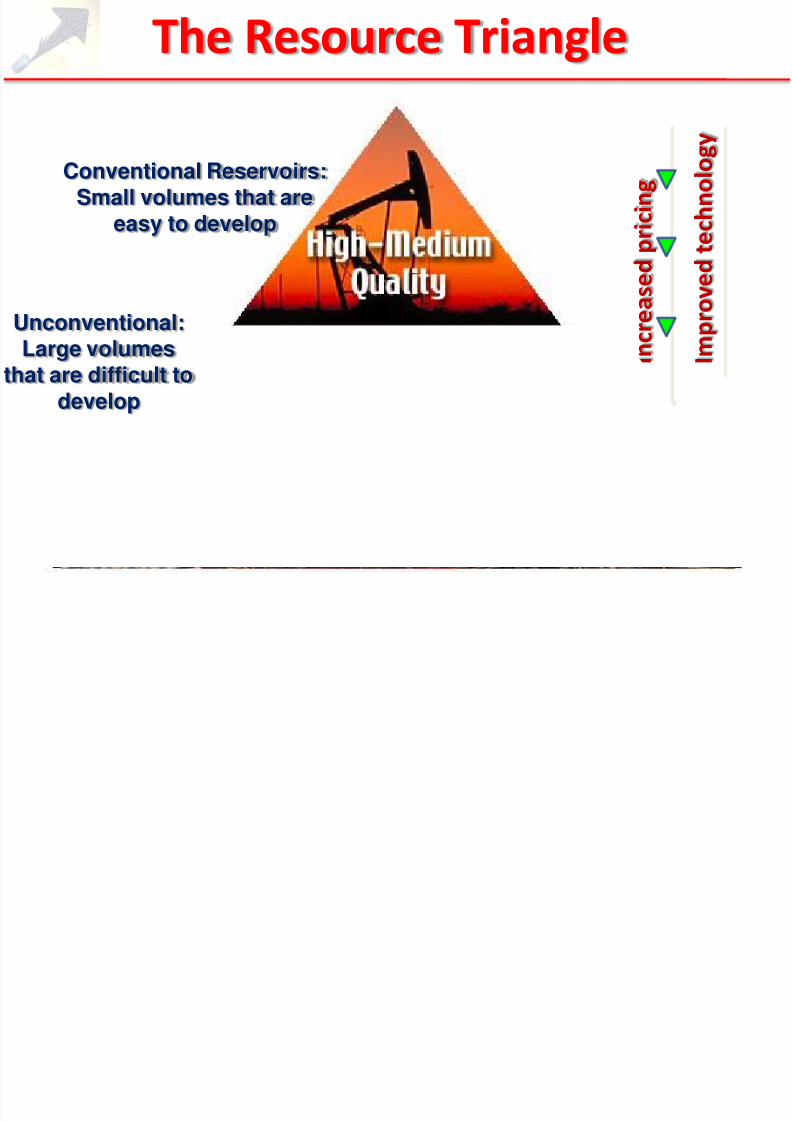
The Resource Triangle
Conventional Reservoirs:Small volumes that are
easy to develop
I m p r o v e d t e c h n o l o g y
I n c r e a s e d p r i c i n g
Unconventional:Large volumes
that are difficult todevelop
7/29/2019 Domestic Gas Scenario Processing, Distribution & Applications
http://slidepdf.com/reader/full/domestic-gas-scenario-processing-distribution-applications 9/48
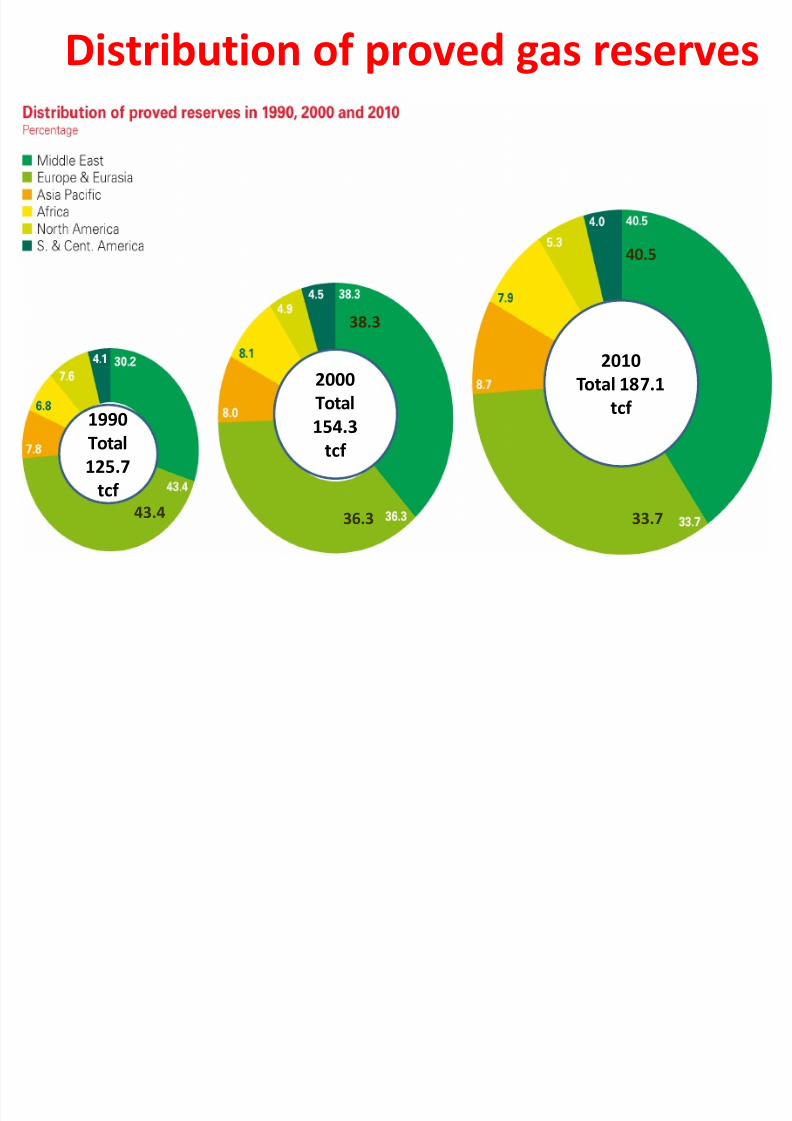
Distribution of proved gas reserves
2010
Total 187.1
tcf
2000
Total
154.3
tcf
1990Total
125.7
tcf
40.5
33.736.343.4
38.3
7/29/2019 Domestic Gas Scenario Processing, Distribution & Applications
http://slidepdf.com/reader/full/domestic-gas-scenario-processing-distribution-applications 10/48
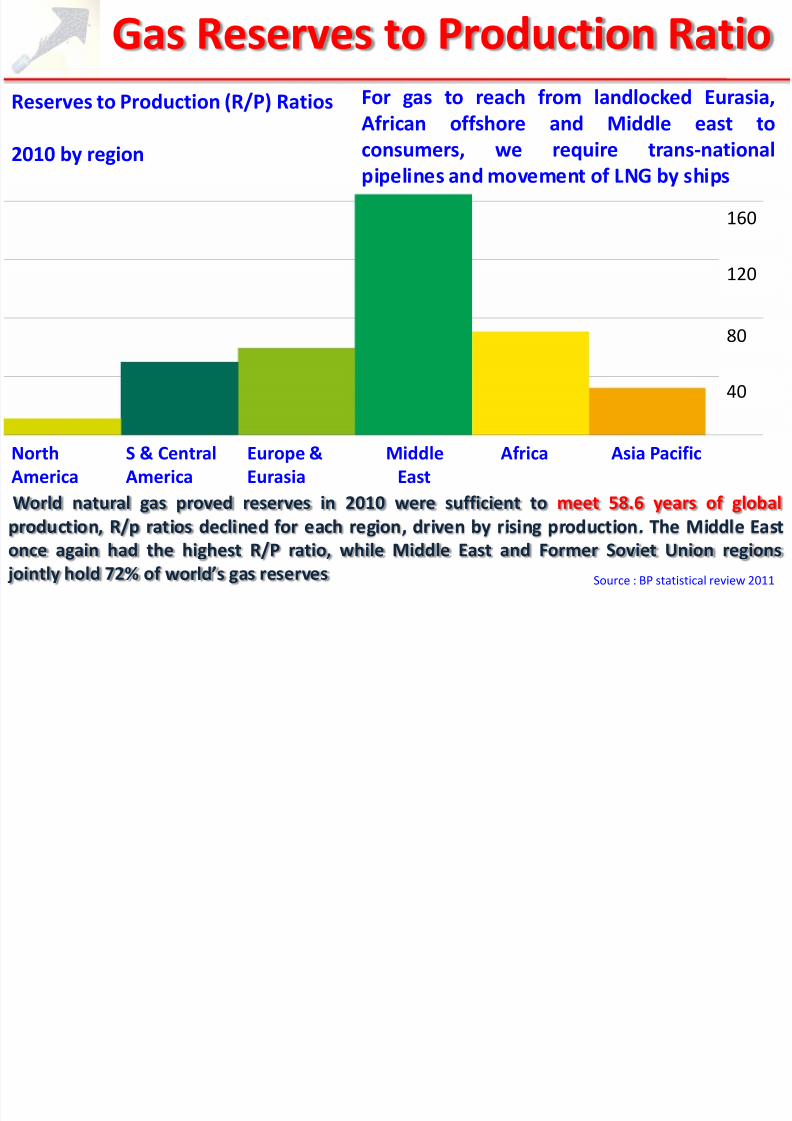
Gas Reserves to Production Ratio
World natural gas proved reserves in 2010 were sufficient to meet 58.6 years of global
production, R/p ratios declined for each region, driven by rising production. The Middle East
once again had the highest R/P ratio, while Middle East and Former Soviet Union regions jointly hold 72% of world’s gas reserves
North S & Central Europe & Middle Africa Asia Pacific
America America Eurasia East
Reserves to Production (R/P) Ratios
2010 by region
40
80
120
160
Source : BP statistical review 2011
For gas to reach from landlocked Eurasia,
African offshore and Middle east to
consumers, we require trans-national
pipelines and movement of LNG by ships
7/29/2019 Domestic Gas Scenario Processing, Distribution & Applications
http://slidepdf.com/reader/full/domestic-gas-scenario-processing-distribution-applications 11/48
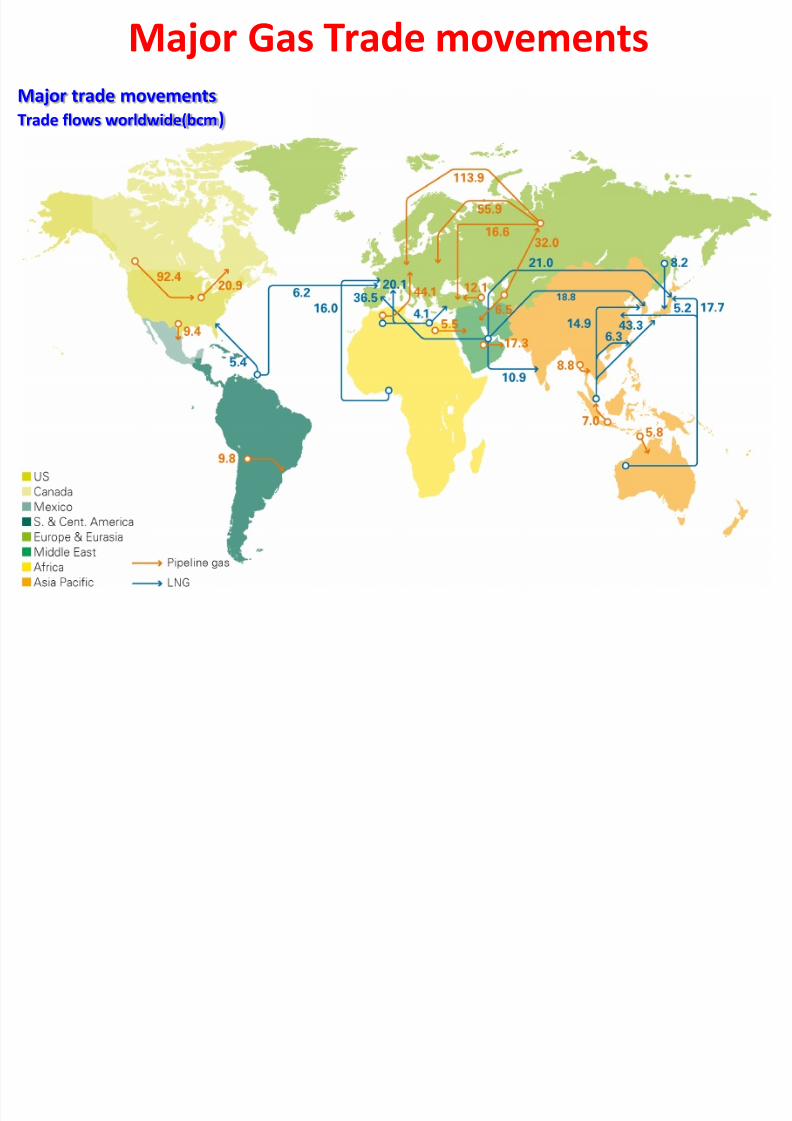
Major Gas Trade movements
Major trade movements
Trade flows worldwide(bcm)
7/29/2019 Domestic Gas Scenario Processing, Distribution & Applications
http://slidepdf.com/reader/full/domestic-gas-scenario-processing-distribution-applications 12/48
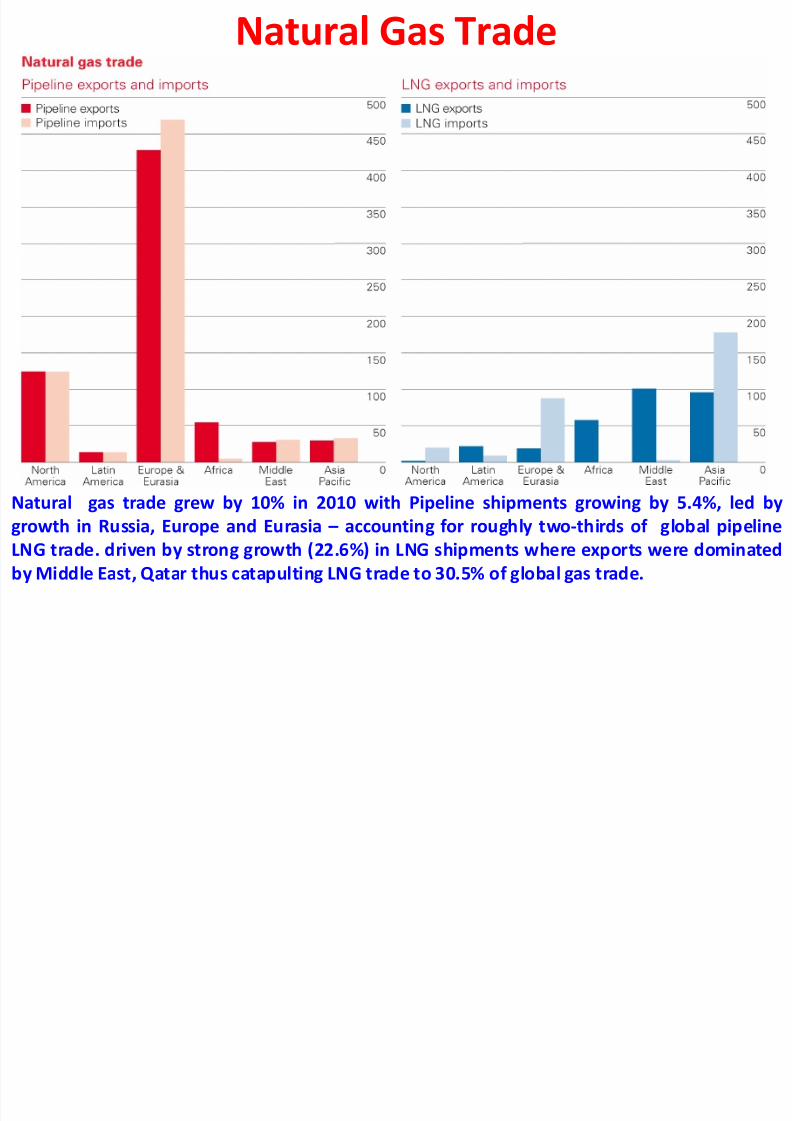
Natural Gas Trade
Natural gas trade grew by 10% in 2010 with Pipeline shipments growing by 5.4%, led by
growth in Russia, Europe and Eurasia – accounting for roughly two-thirds of global pipeline
LNG trade. driven by strong growth (22.6%) in LNG shipments where exports were dominatedby Middle East, Qatar thus catapulting LNG trade to 30.5% of global gas trade.
E l i d
7/29/2019 Domestic Gas Scenario Processing, Distribution & Applications
http://slidepdf.com/reader/full/domestic-gas-scenario-processing-distribution-applications 13/48
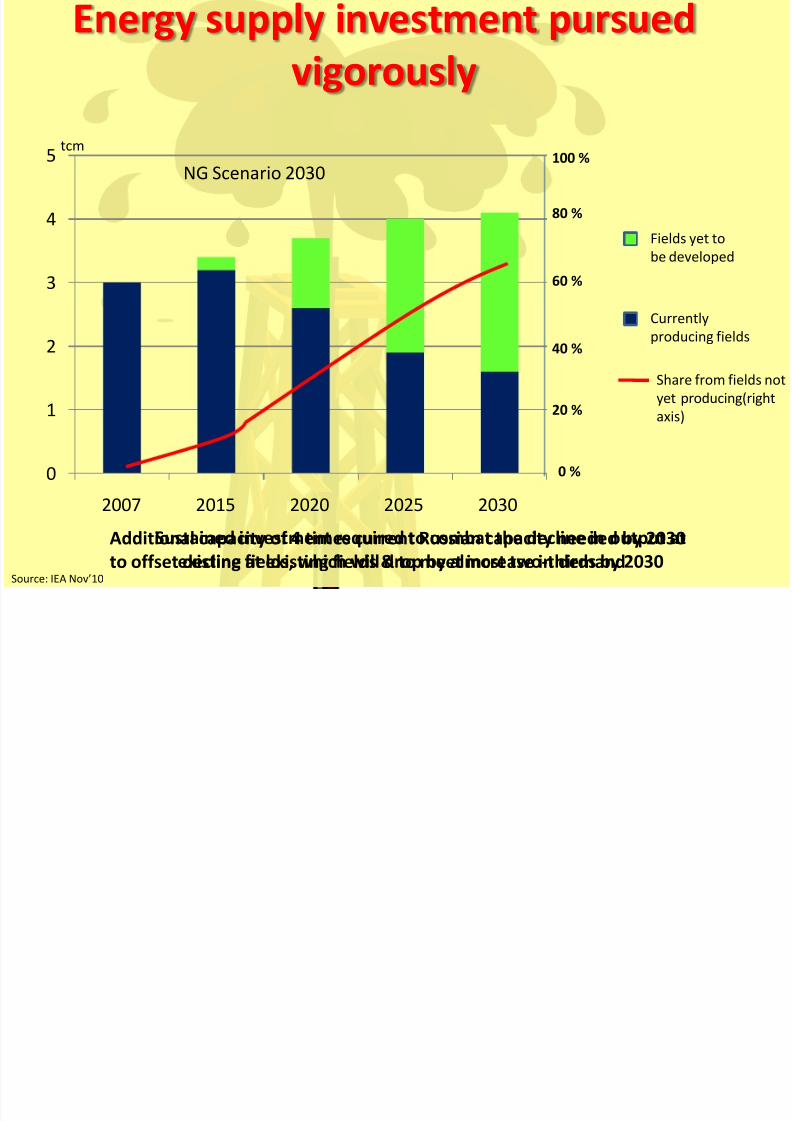
Energy supply investment pursued
vigorously
Sustained investment required to combat the decline in output at
existing fields, which will drop by almost two-thirds by 2030
Additional capacity of 4 times current Russian capacity needed by 2030
to offset decline at existing fields & to meet increase in demand
0
1
2
3
4
5
2007 2015 2020 2025 2030
0 %
20 %
40 %
60 %
80 %
100 %tcm
NG Scenario 2030
Fields yet to
be developed
Currently
producing fields
Share from fields not
yet producing(right
axis)
Source: IEA Nov’10
7/29/2019 Domestic Gas Scenario Processing, Distribution & Applications
http://slidepdf.com/reader/full/domestic-gas-scenario-processing-distribution-applications 14/48
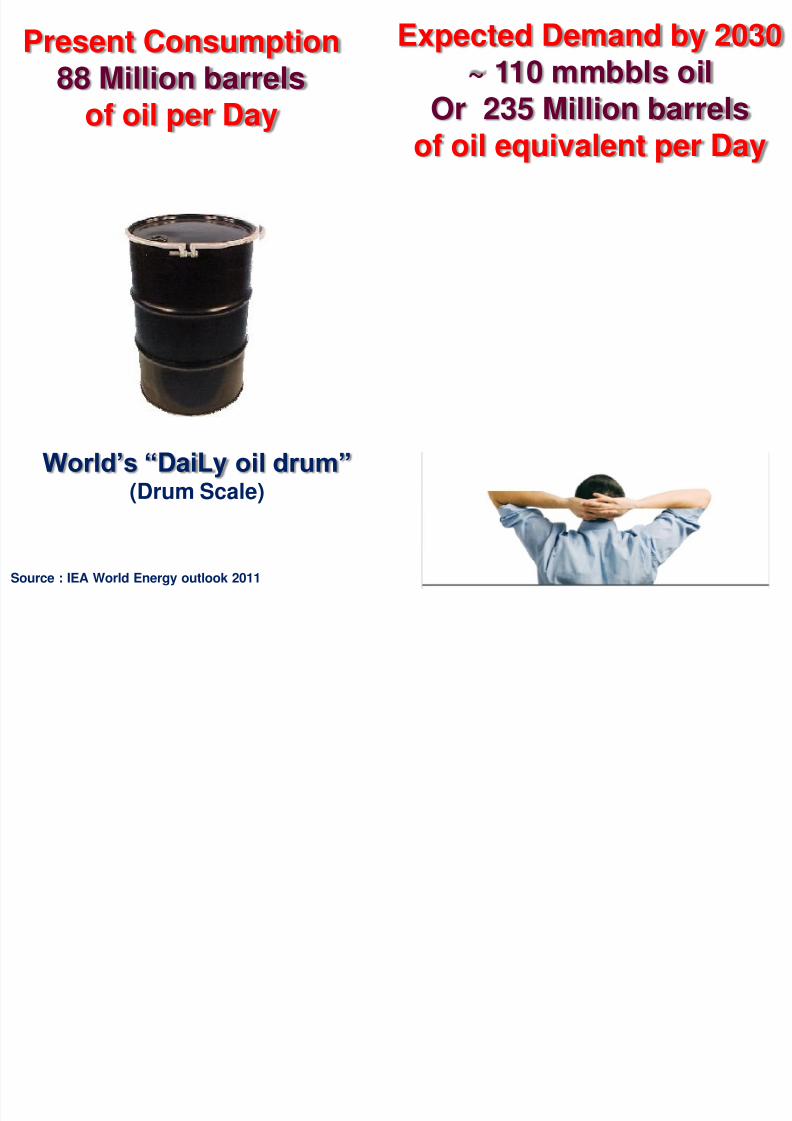
World’s “DaiLy oil drum”
(Drum Scale)
Source : IEA World Energy outlook 2011
Present Consumption88 Million barrels
of oil per Day
Expected Demand by 2030~ 110 mmbbls oil
Or 235 Million barrels
of oil equivalent per Day
f

7/29/2019 Domestic Gas Scenario Processing, Distribution & Applications
http://slidepdf.com/reader/full/domestic-gas-scenario-processing-distribution-applications 15/48
Russia
Extra demand to be met from new
sources of Supply
West Africa
Nigeria
Angola
FSU countries – Kazakistan & Turkmenistan - gas
Oil Sands
Gulf of Mexico
Deepwater – New oil frontier
Brazil offshore

7/29/2019 Domestic Gas Scenario Processing, Distribution & Applications
http://slidepdf.com/reader/full/domestic-gas-scenario-processing-distribution-applications 16/48

7/29/2019 Domestic Gas Scenario Processing, Distribution & Applications
http://slidepdf.com/reader/full/domestic-gas-scenario-processing-distribution-applications 17/48
17
Oil
36%
Gas24%
Coal29%
Nuclear5%
Hydel6%
Source: BP Statistical Review 2008Gas consumption in India increased at a CAGR of >6% (Global:2.6%), next only to China in Asia Pacific(13%) in last ten years
Primary Energy Basket : India Vs Global
Oil32%
Gas10%
Coal51%
Nuclear1%
Hydel7% Oil
26%
Gas20%
Coal51%
Nuclear2%
Hydel2%
Source : BP statistical review 2011
Estimated Energy Basket 2025
7/29/2019 Domestic Gas Scenario Processing, Distribution & Applications
http://slidepdf.com/reader/full/domestic-gas-scenario-processing-distribution-applications 18/4818
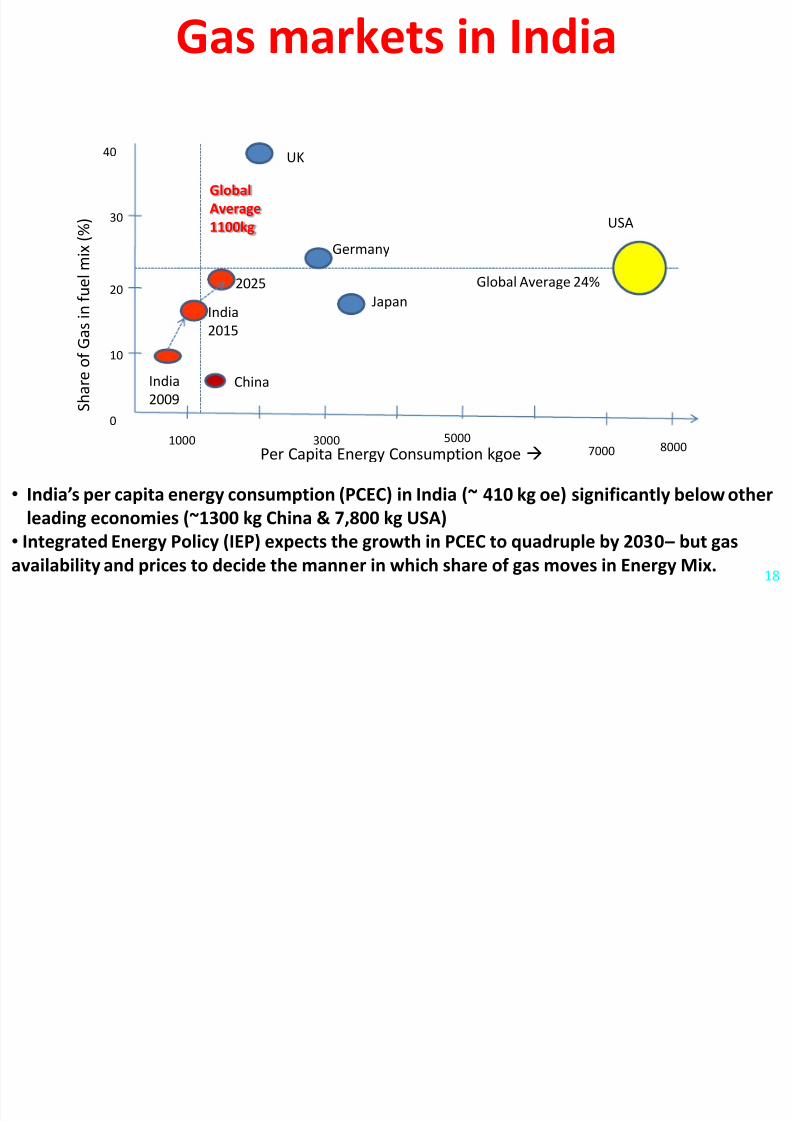
Gas markets in India
0
40
10
20
30
1000 3000 50007000 8000
UK
India
2009
China
India
2015
Japan
Germany
USA
Global Average 24%
Global
Average
1100kg
Per Capita Energy Consumption kgoe
S h a r e o f G a s i n f u e l m i x ( % )
• India’s per capita energy consumption (PCEC) in India (~ 410 kg oe) significantly below other
leading economies (~1300 kg China & 7,800 kg USA)
• Integrated Energy Policy (IEP) expects the growth in PCEC to quadruple by 2030 – but gas
availability and prices to decide the manner in which share of gas moves in Energy Mix.
2025

7/29/2019 Domestic Gas Scenario Processing, Distribution & Applications
http://slidepdf.com/reader/full/domestic-gas-scenario-processing-distribution-applications 19/48
19
For India, with ~16% of global population,
with~ 0.5% of world’s known Hydrocarbon reserves
&
~7 % of Coal reserve,
and 5.82% CAGR (last 10 years) in energy demand
the situation is pretty Challengingfor a
GDP Growth target of 7-9%…
India: Energy ScenarioMeeting Energy Demand
7/29/2019 Domestic Gas Scenario Processing, Distribution & Applications
http://slidepdf.com/reader/full/domestic-gas-scenario-processing-distribution-applications 20/48
FY 09
32.84 bcm
Domestic gas Production
FY 11
52.22 bcm

7/29/2019 Domestic Gas Scenario Processing, Distribution & Applications
http://slidepdf.com/reader/full/domestic-gas-scenario-processing-distribution-applications 21/48
21
Domestic Gas Production and Sectoral Supply
NOC’s production
57.3 mmscmd
LNG (Firm)
~ 47 mmscmd.
PMT & JV
15.26 mmscmd
KG – D640.0 mmscmd
New Discoveries
& Transnational P/L
Total Gas Supply
159.6 mmscmd
End-UserRequirement
166.17*
mmscmd
Power
66.4 mmscmd
Ferilizers
37.74 mmscmd
CGD + CNG
13.97 mmscmd
Petrochemicals
5.67 mmscmd
Refineries
19.77 mmscmd
Sponge iron
7.01 mmscmd
Others
20.59 mmscmd
Source: Global Gas Outlook Aug 2011
7/29/2019 Domestic Gas Scenario Processing, Distribution & Applications
http://slidepdf.com/reader/full/domestic-gas-scenario-processing-distribution-applications 22/48
0
50
100
150
200
250
300
350
2010-11 2011-12P 2012-13 P 2013-14 P 2014-15P 2015-16P LNG 2016 Demand
2016-17
Demand
JVs
CBM
GSPC KG
RIL KG
NOC
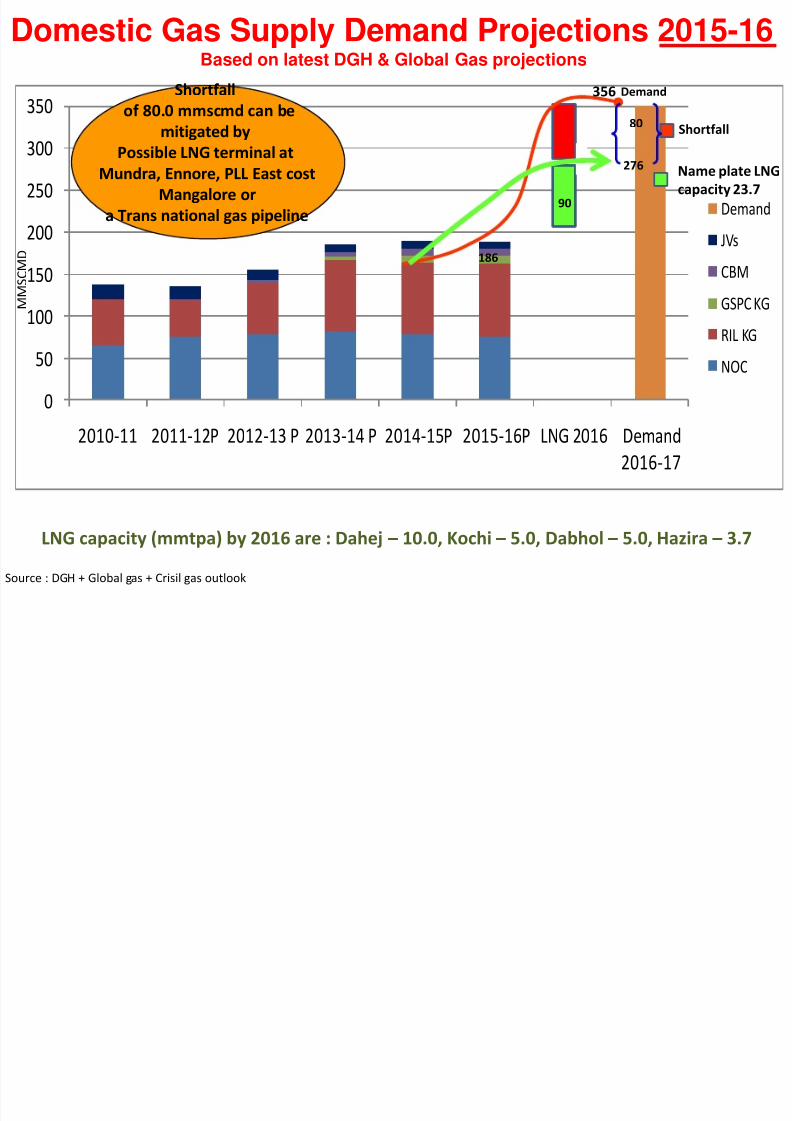
Domestic Gas Supply Demand Projections 2015-16Based on latest DGH & Global Gas projections
LNG capacity (mmtpa) by 2016 are : Dahej – 10.0, Kochi – 5.0, Dabhol – 5.0, Hazira – 3.7
Shortfall
Name plate LNG
capacity 23.7
M M S C M D
276
80
356Shortfall
of 80.0 mmscmd can be
mitigated by
Possible LNG terminal at
Mundra, Ennore, PLL East cost
Mangalore or
a Trans national gas pipeline
Demand
Source : DGH + Global gas + Crisil gas outlook
90
186
i ifi h i ili

7/29/2019 Domestic Gas Scenario Processing, Distribution & Applications
http://slidepdf.com/reader/full/domestic-gas-scenario-processing-distribution-applications 23/48
Power Fertilizers
Current
Installed capacity
2025
150 GW
366 GW
Current
Installed capacity
2025
12
20Nitrogeneous Fertilizer capacity
mtpa of N equivalent
• Hi capacity add’n
• Thrust by GoI to
set up clean fuelPower plants
• Gas preferred
feedstock
• GoI directive to
convert to gas –
subsidy savings
Industrial – fuel & feedstock
CurrentInstalled capacity
2025
41 mtoe
113 mtoe
• Conversion from liquid
fuels
• Industrial growth to fuel
demand
• Gas share to increase
City Gas – PNG & CNG
2025
• Environmental regulations
to drive growth
• GoI encouraging expansion
Significant growth in Power, Fertilizers,
Industrial fuel, CGD, CNG in next 15 years
Close Window Uses of crude oil
7/29/2019 Domestic Gas Scenario Processing, Distribution & Applications
http://slidepdf.com/reader/full/domestic-gas-scenario-processing-distribution-applications 24/48
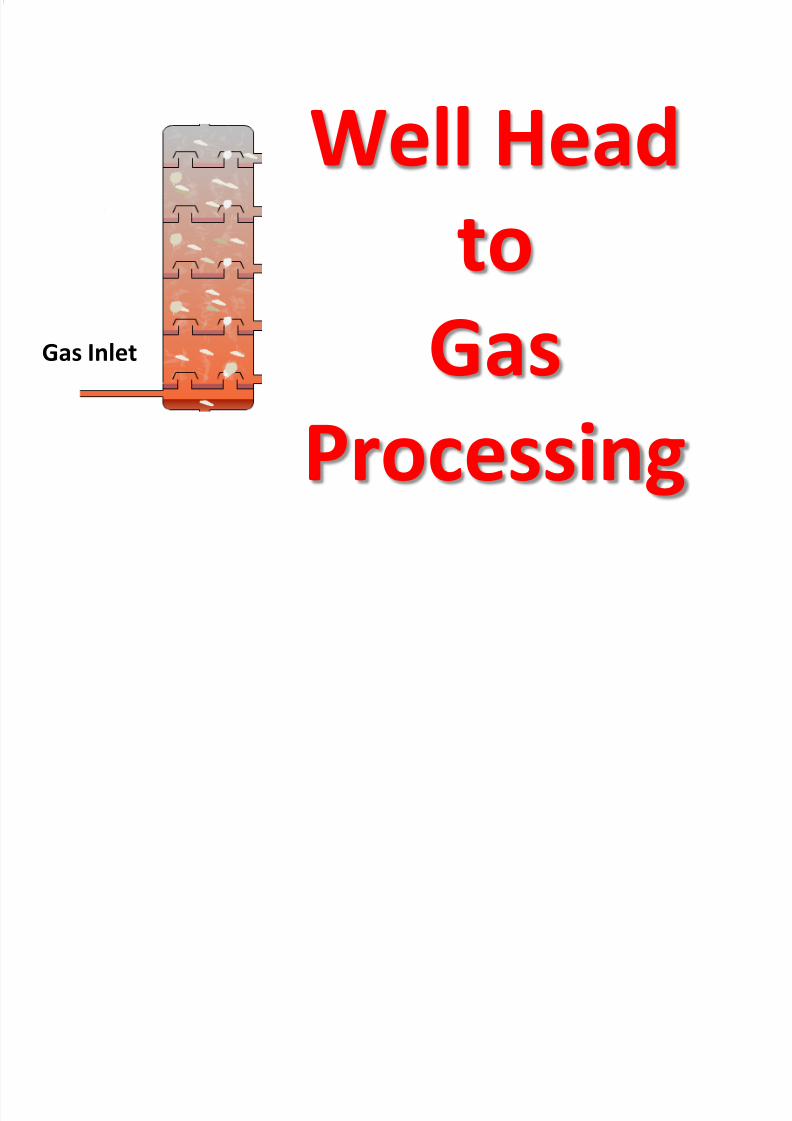
Residue
Gas Inlet
GlycolInletWell Head
toGas
Processing
7/29/2019 Domestic Gas Scenario Processing, Distribution & Applications
http://slidepdf.com/reader/full/domestic-gas-scenario-processing-distribution-applications 25/48
Produced from Rajasthan block, this crude
is a medium API, highly viscous having
abnormally high Pour Point (only 2 crudes
have more pour point) AND
with a very high residue
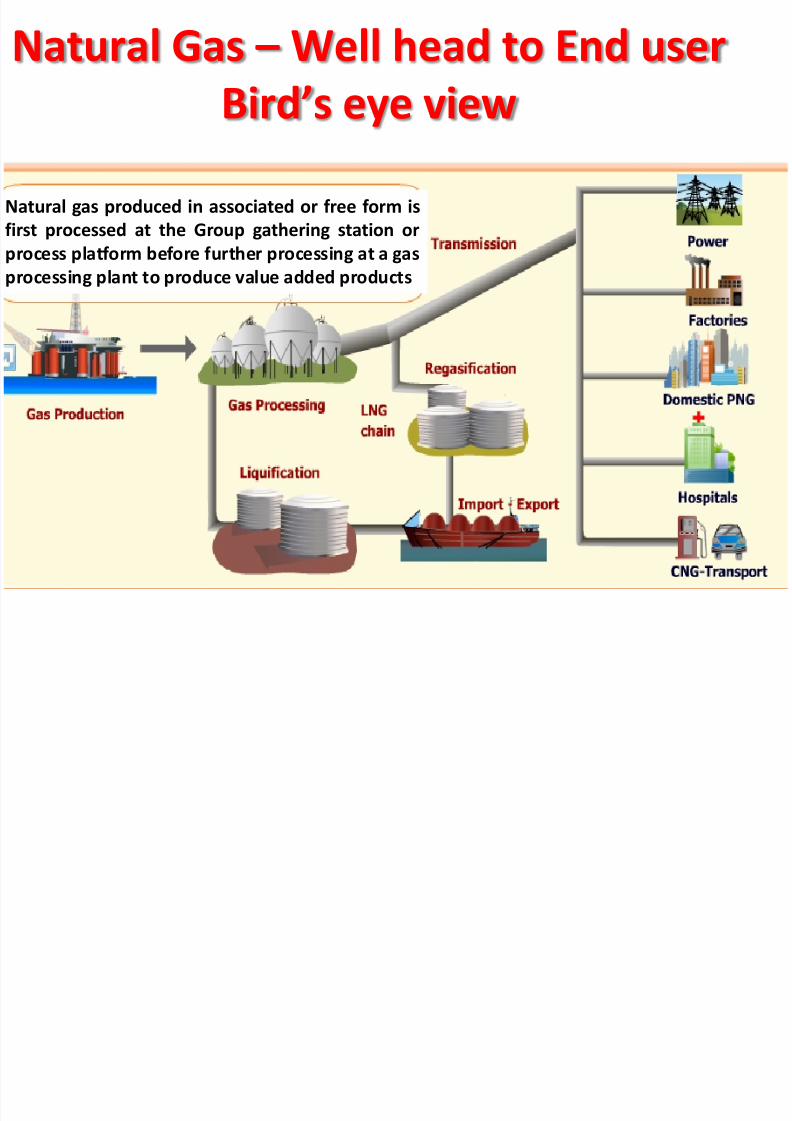
Natural Gas – Well head to End user
Bird’s eye view
Natural gas produced in associated or free form is
first processed at the Group gathering station or
process platform before further processing at a gas
processing plant to produce value added products
7/29/2019 Domestic Gas Scenario Processing, Distribution & Applications
http://slidepdf.com/reader/full/domestic-gas-scenario-processing-distribution-applications 26/48
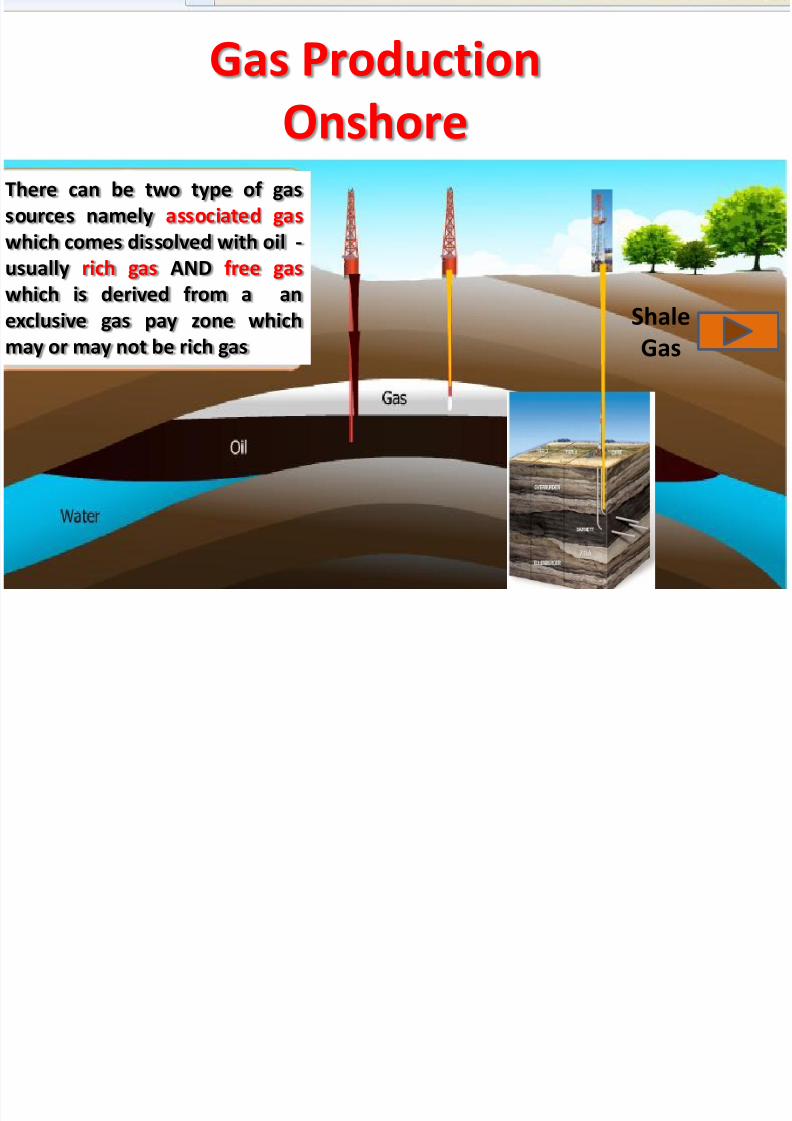
Gas Production
OnshoreThere can be two type of gas
sources namely associated gas
which comes dissolved with oil -
usually rich gas AND free gas
which is derived from a an
exclusive gas pay zone which
may or may not be rich gas
Shale
Gas
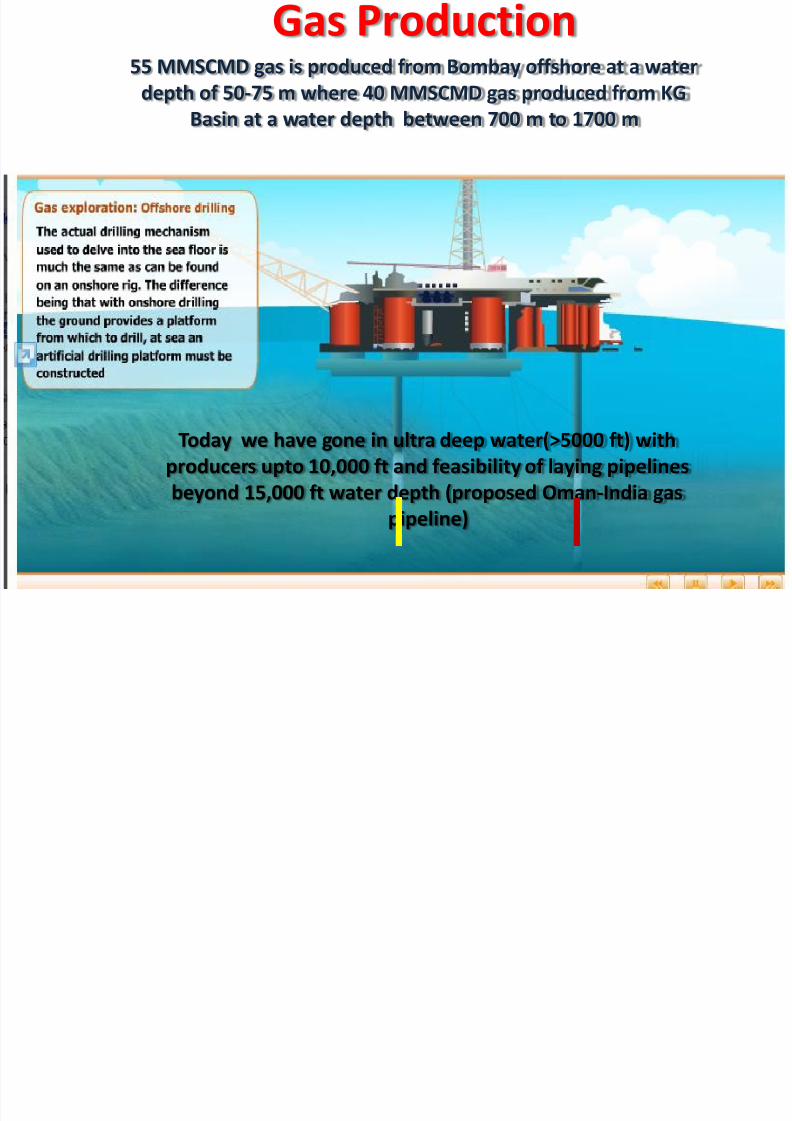
Gas Production
7/29/2019 Domestic Gas Scenario Processing, Distribution & Applications
http://slidepdf.com/reader/full/domestic-gas-scenario-processing-distribution-applications 27/48
Gas Production55 MMSCMD gas is produced from Bombay offshore at a water
depth of 50-75 m where 40 MMSCMD gas produced from KG
Basin at a water depth between 700 m to 1700 m
Today we have gone in ultra deep water(>5000 ft) with
producers upto 10,000 ft and feasibility of laying pipelines
beyond 15,000 ft water depth (proposed Oman-India gas
pipeline)
7/29/2019 Domestic Gas Scenario Processing, Distribution & Applications
http://slidepdf.com/reader/full/domestic-gas-scenario-processing-distribution-applications 28/48
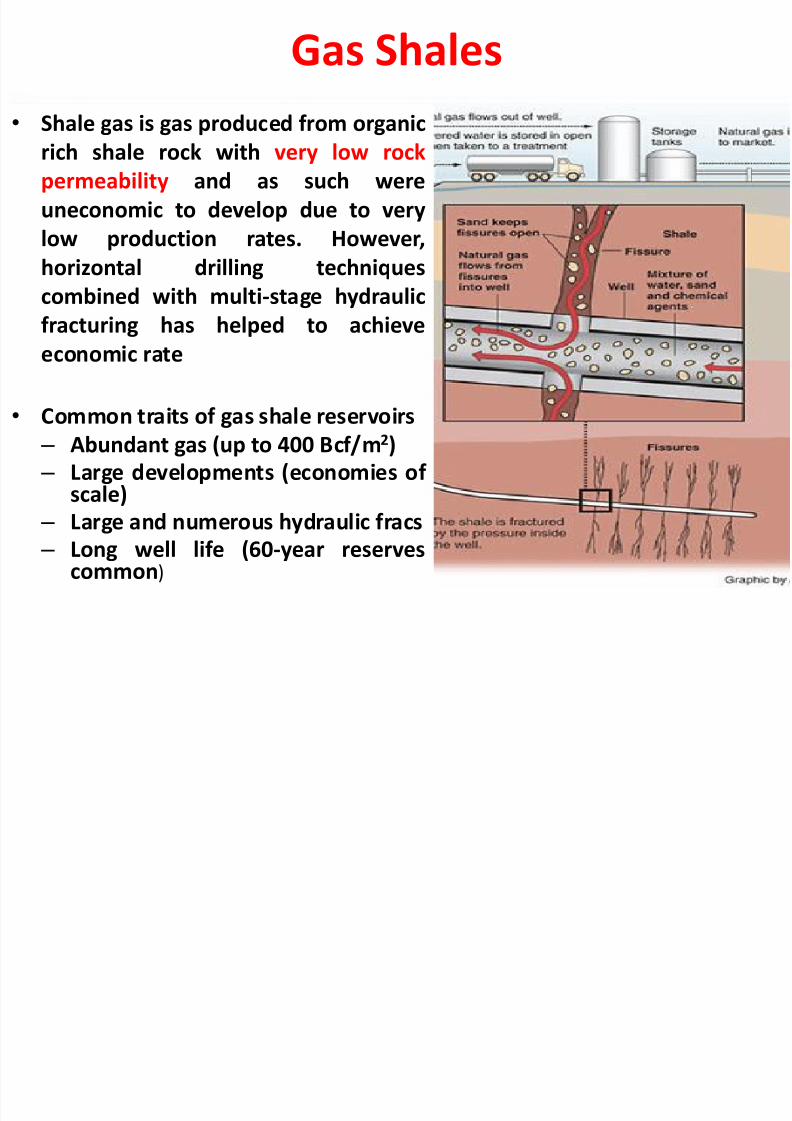
Gas Shales
• Shale gas is gas produced from organic
rich shale rock with very low rock
permeability and as such were
uneconomic to develop due to very
low production rates. However,
horizontal drilling techniques
combined with multi-stage hydraulic
fracturing has helped to achieve
economic rate
•Common traits of gas shale reservoirs – Abundant gas (up to 400 Bcf/m2)
– Large developments (economies of scale)
– Large and numerous hydraulic fracs
–
Long well life (60-year reservescommon)

7/29/2019 Domestic Gas Scenario Processing, Distribution & Applications
http://slidepdf.com/reader/full/domestic-gas-scenario-processing-distribution-applications 29/48
US – Gas supply augmented by Shale Gas
1990-2035
US Sh l G S l t t hi h t
7/29/2019 Domestic Gas Scenario Processing, Distribution & Applications
http://slidepdf.com/reader/full/domestic-gas-scenario-processing-distribution-applications 30/48
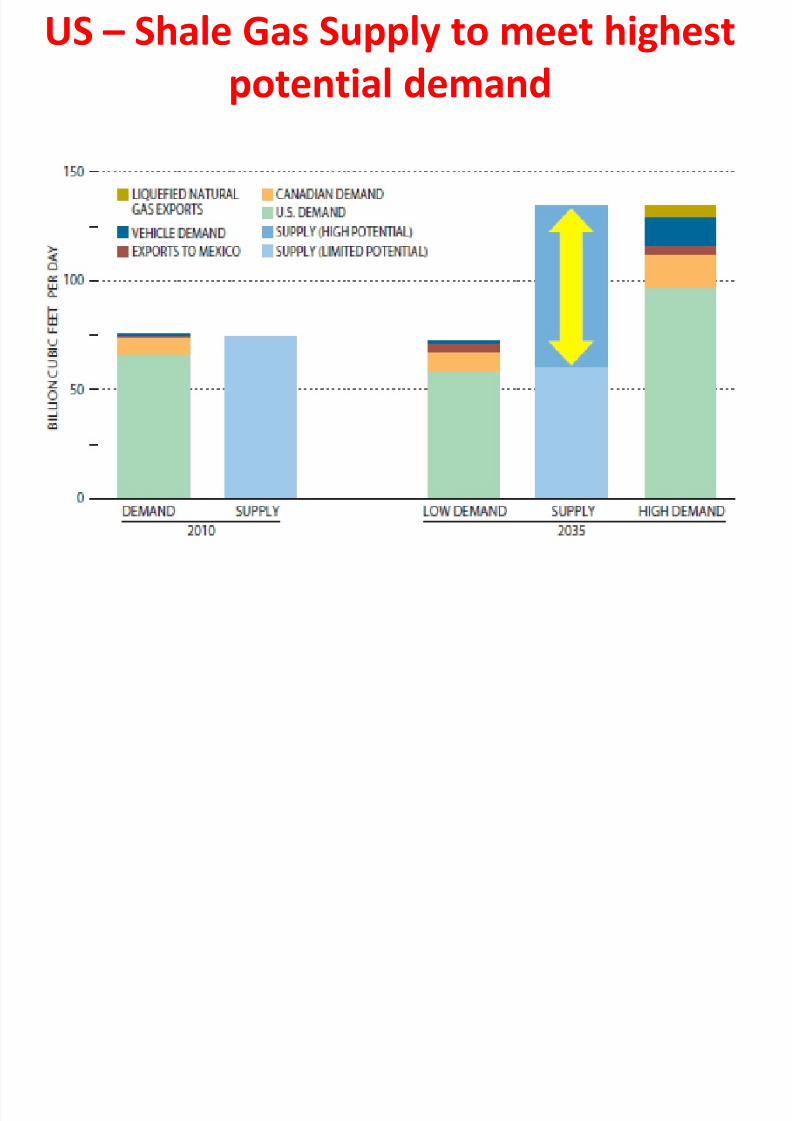
US – Shale Gas Supply to meet highest
potential demand

7/29/2019 Domestic Gas Scenario Processing, Distribution & Applications
http://slidepdf.com/reader/full/domestic-gas-scenario-processing-distribution-applications 31/48
Natural Gas Prices
7/29/2019 Domestic Gas Scenario Processing, Distribution & Applications
http://slidepdf.com/reader/full/domestic-gas-scenario-processing-distribution-applications 32/48
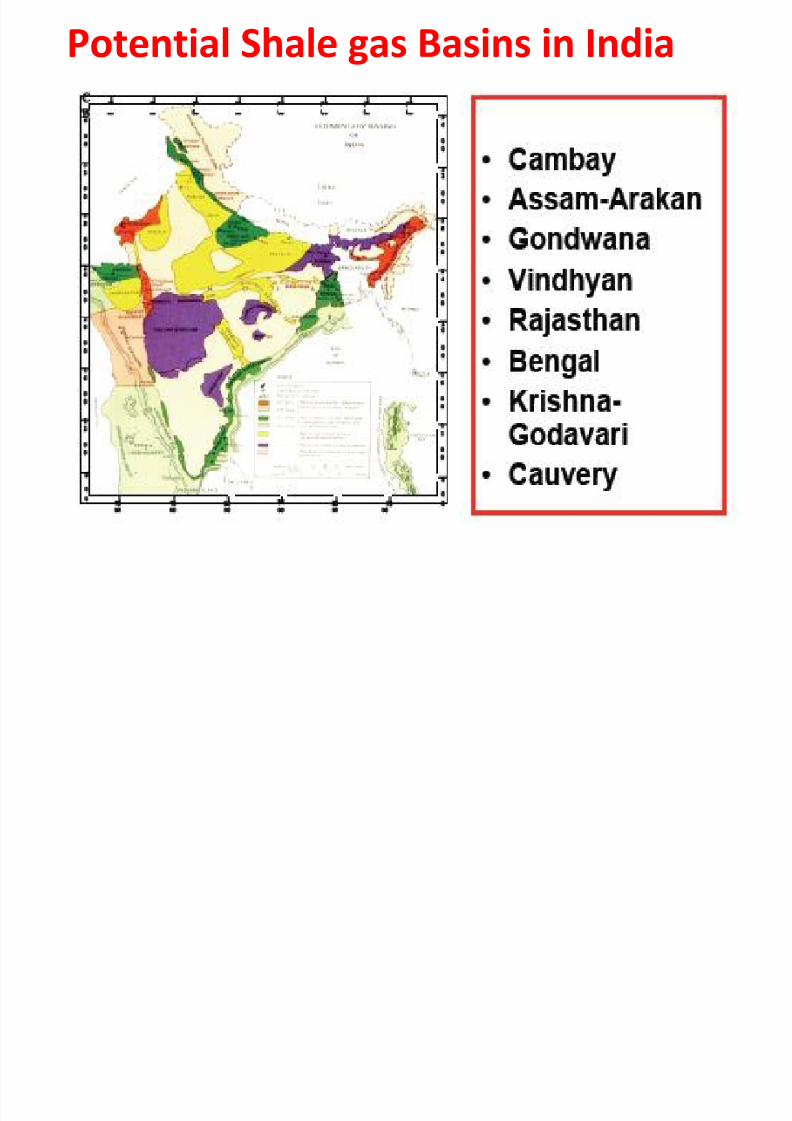
Potential Shale gas Basins in India
Sh l

7/29/2019 Domestic Gas Scenario Processing, Distribution & Applications
http://slidepdf.com/reader/full/domestic-gas-scenario-processing-distribution-applications 33/48
Shale gas – efforts in India
ONGC in collaboration with Schlumberger has undertaken
an integrated pilot project to drill 4 wells, 2 in Raniganj,West Bengal and 2 wells in North Karanpura-Jharkahand to
find potential of Shale gas in Indian basins
First well proved presence of
Shale gas on 25th January 2011
R&D efforts continuing
h l

7/29/2019 Domestic Gas Scenario Processing, Distribution & Applications
http://slidepdf.com/reader/full/domestic-gas-scenario-processing-distribution-applications 34/48
Shale Gas resource Estimations
in India
Oil & Gas Processing
7/29/2019 Domestic Gas Scenario Processing, Distribution & Applications
http://slidepdf.com/reader/full/domestic-gas-scenario-processing-distribution-applications 35/48
35
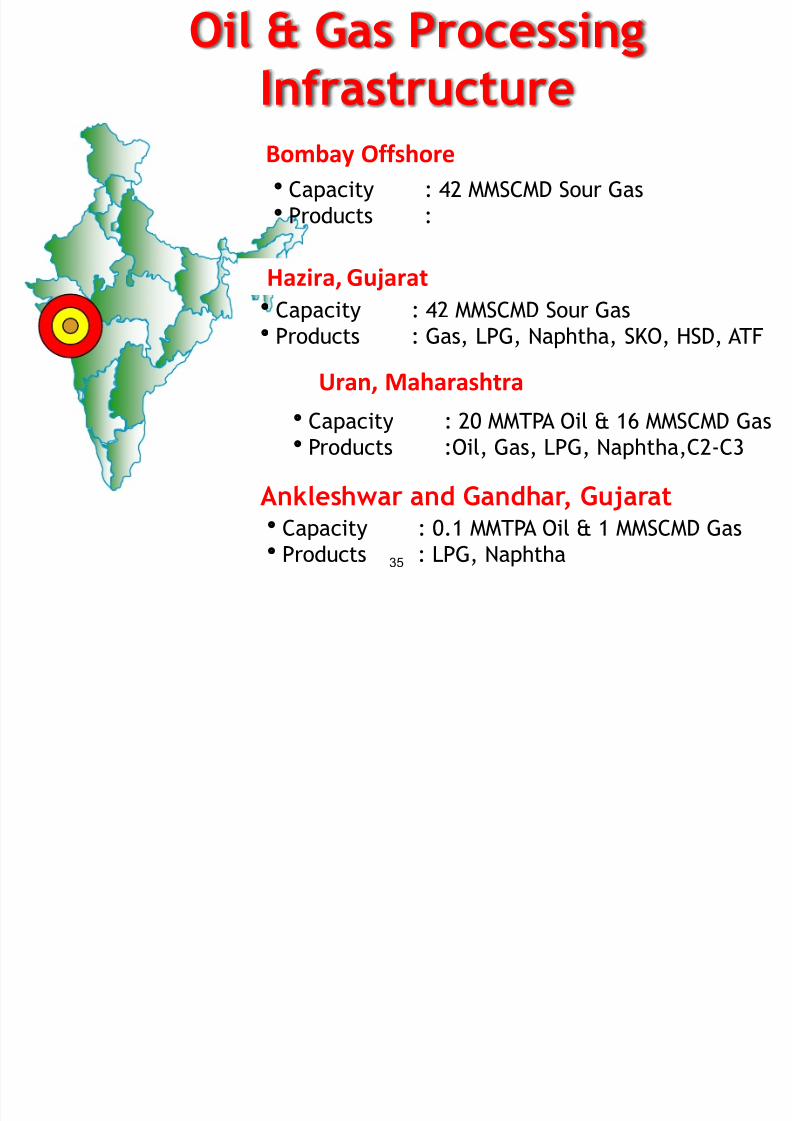
Oil & Gas ProcessingInfrastructure
Capacity : 42 MMSCMD Sour Gas
Products : Gas, LPG, Naphtha, SKO, HSD, ATF
Capacity : 20 MMTPA Oil & 16 MMSCMD GasProducts :Oil, Gas, LPG, Naphtha,C2-C3
Ankleshwar and Gandhar, GujaratCapacity : 0.1 MMTPA Oil & 1 MMSCMD Gas
Products : LPG, Naphtha
Hazira, Gujarat
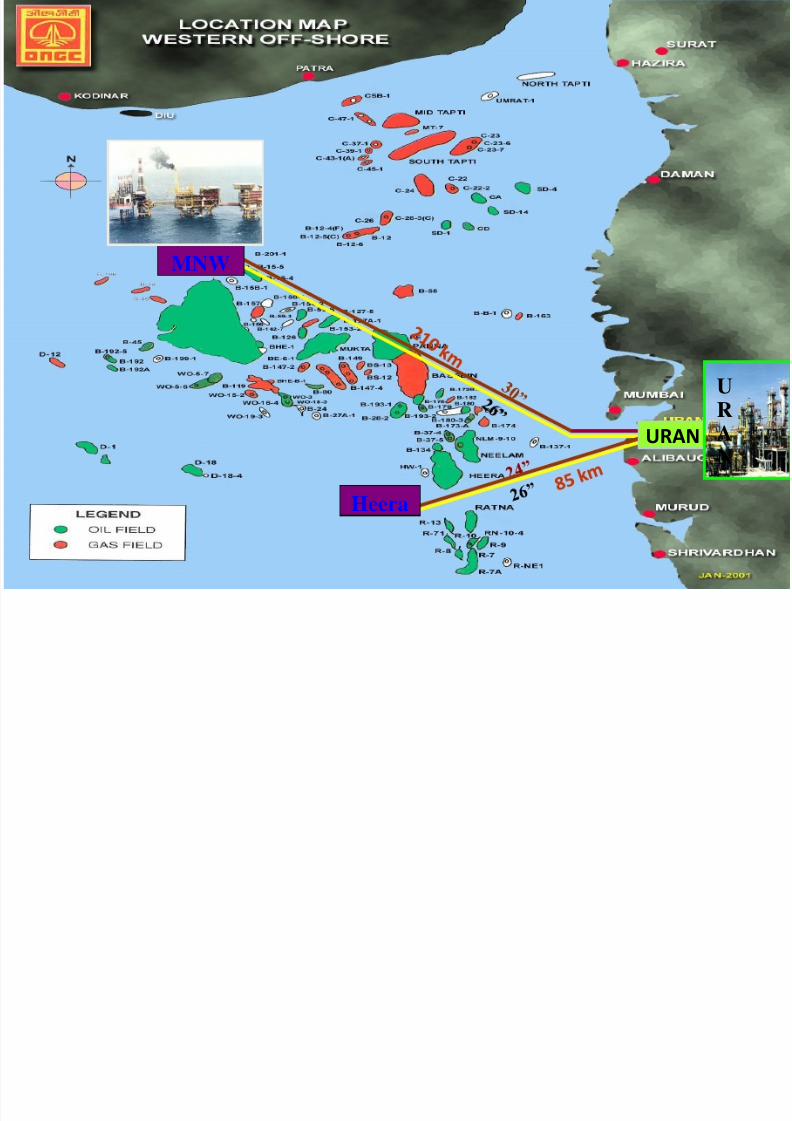
Uran, Maharashtra
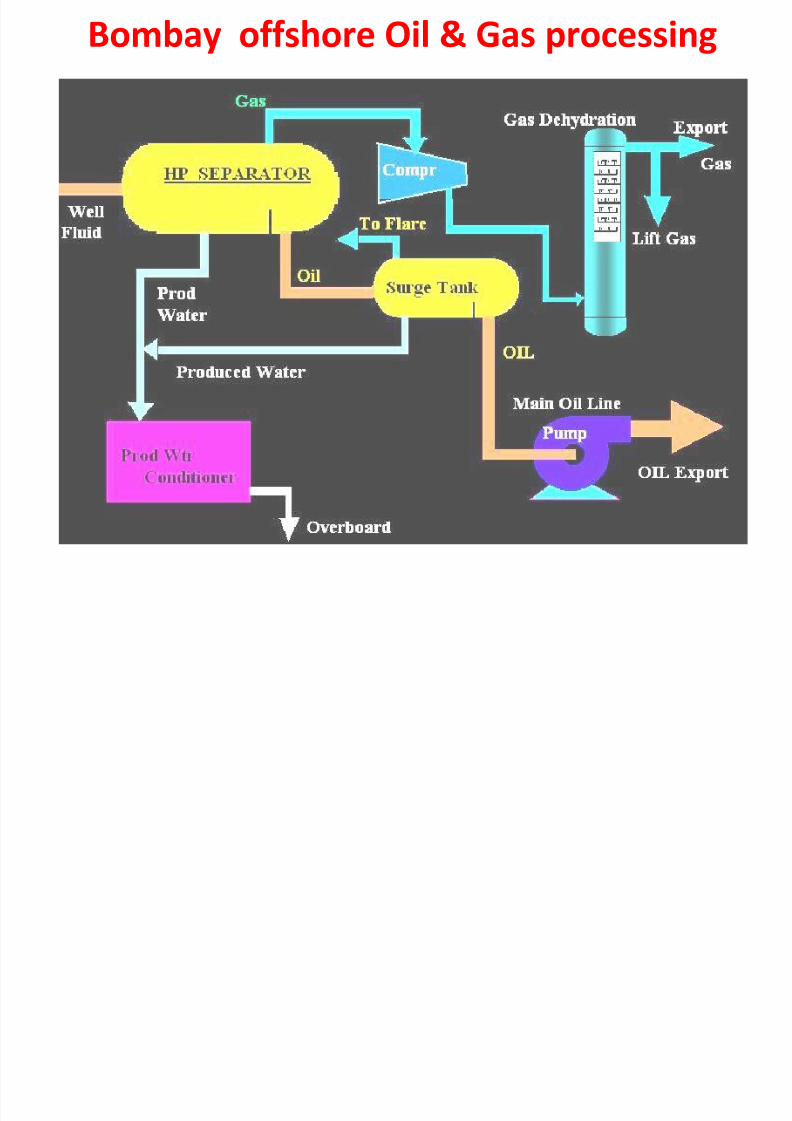
Bombay Offshore
Capacity : 42 MMSCMD Sour Gas
Products :
B b ff h Oil & G i
7/29/2019 Domestic Gas Scenario Processing, Distribution & Applications
http://slidepdf.com/reader/full/domestic-gas-scenario-processing-distribution-applications 36/48
Bombay offshore Oil & Gas processing
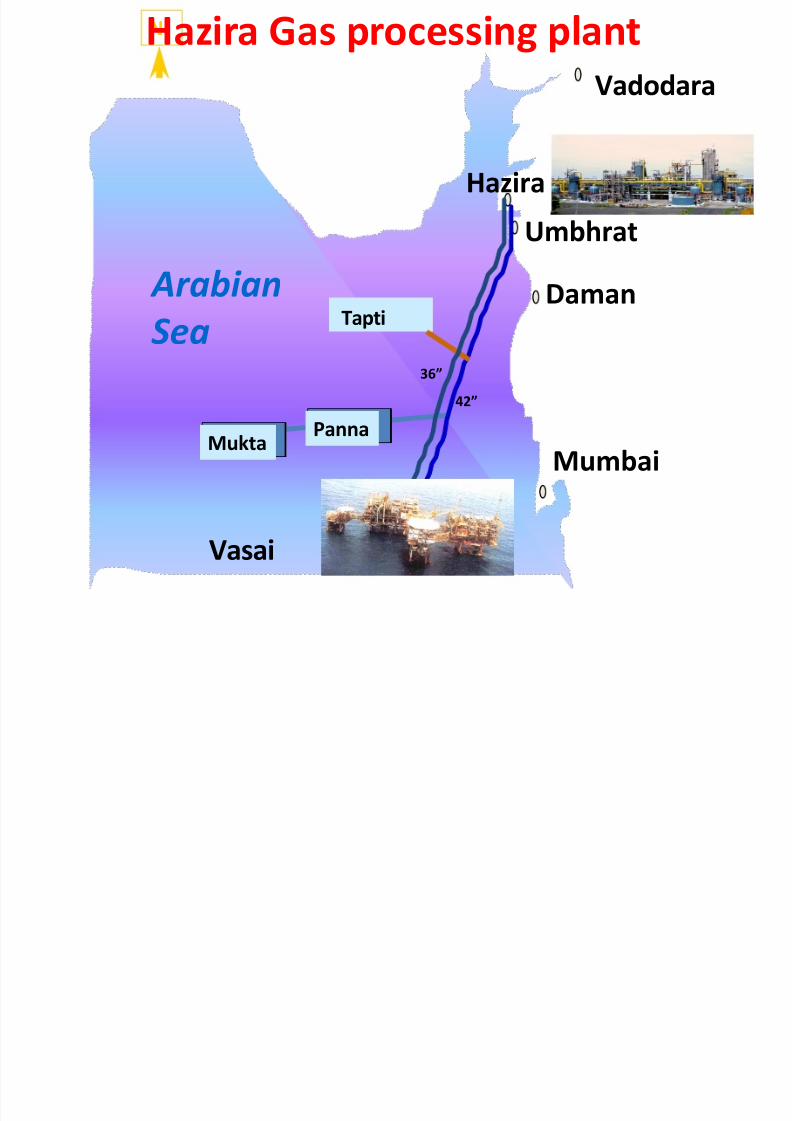
NHazira Gas processing plant
7/29/2019 Domestic Gas Scenario Processing, Distribution & Applications
http://slidepdf.com/reader/full/domestic-gas-scenario-processing-distribution-applications 37/48
Umbhrat
Daman
Mumbai
Vasai
Hazira
Vadodara
N
Arabian
Sea
PannaMukta
Tapti
36”
42”
Hazira Gas processing plant
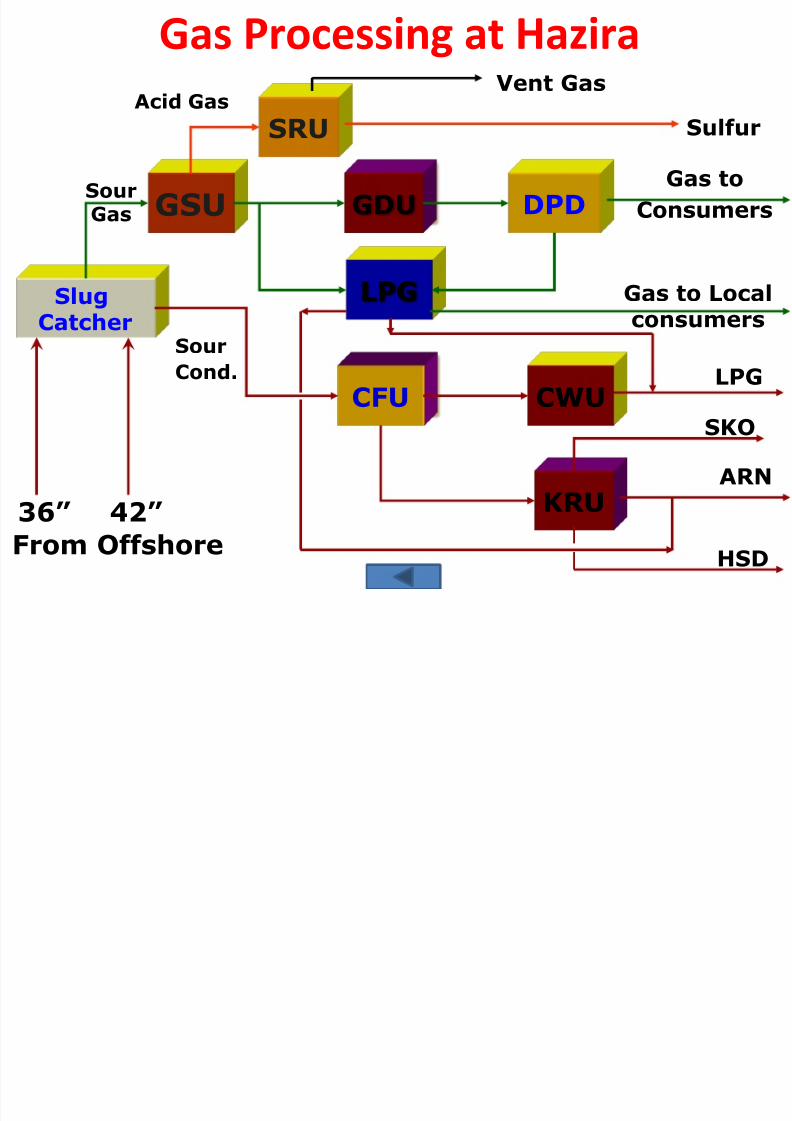
Gas Processing at Ha ira
7/29/2019 Domestic Gas Scenario Processing, Distribution & Applications
http://slidepdf.com/reader/full/domestic-gas-scenario-processing-distribution-applications 38/48
SlugCatcher
GSU DPD
CFU
GDU
LPG
KRU
CWU
SRU
36” 42”
Sulfur
Gas to
Consumers
Gas to Localconsumers
LPG
ARN
SKO
Acid Gas
SourGas
Sour
Cond.
From Offshore
Gas Processing at Hazira
HSD
Vent Gas
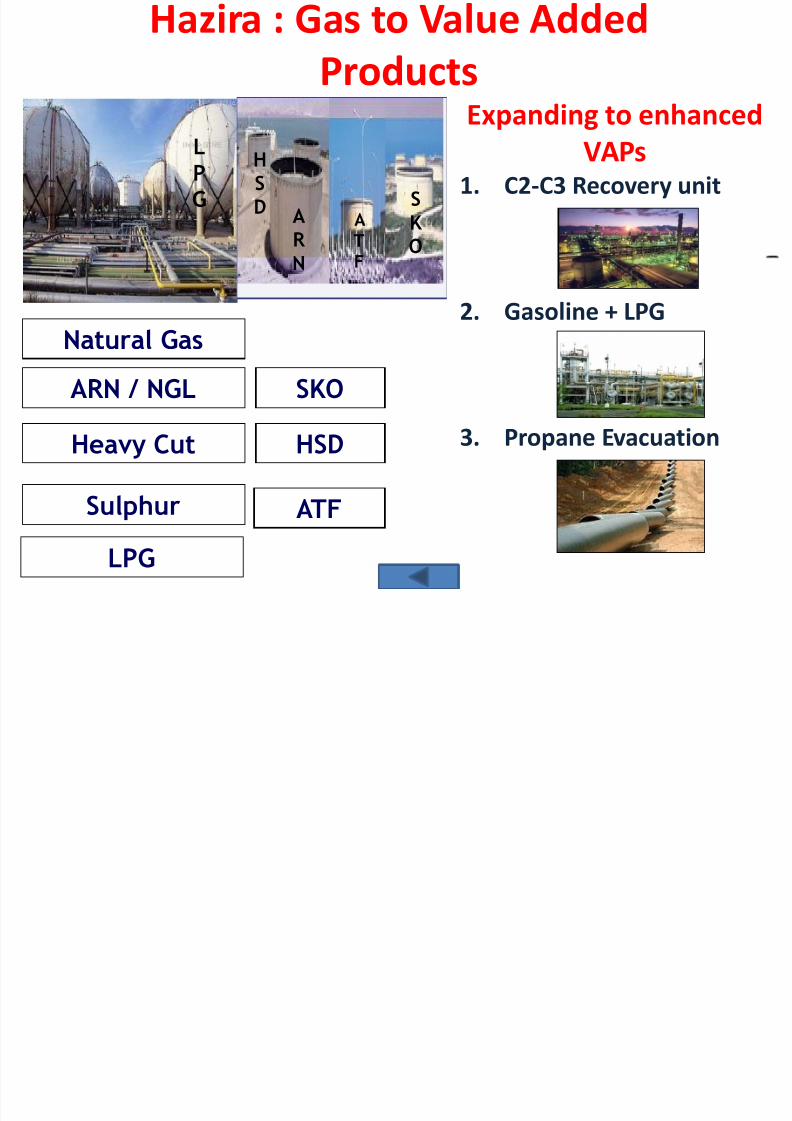
Hazira : Gas to Value Added
7/29/2019 Domestic Gas Scenario Processing, Distribution & Applications
http://slidepdf.com/reader/full/domestic-gas-scenario-processing-distribution-applications 39/48
Natural Gas
LPG
ARN / NGL SKO
Heavy Cut HSD
Sulphur
Hazira : Gas to Value AddedProducts
LPG
AR N
SK O
HSD
ATF
ATF
Expanding to enhanced
VAPs1. C2-C3 Recovery unit
2. Gasoline + LPG
3. Propane Evacuation
7/29/2019 Domestic Gas Scenario Processing, Distribution & Applications
http://slidepdf.com/reader/full/domestic-gas-scenario-processing-distribution-applications 40/48
URAN
MNW
Heera
U
R
A
N
Uran PROCESS

7/29/2019 Domestic Gas Scenario Processing, Distribution & Applications
http://slidepdf.com/reader/full/domestic-gas-scenario-processing-distribution-applications 41/48
GAS
SWEETENINGUNIT
SLUGCATCHER
LPGPLANT
C2C3
PLANT
CONDENSATEFRACTIONATING
UNIT
CSU OFFGASCOMPRESSOR
PRODUCED WATER TOETP - MINAS
CRUDE OIL TO STORAGE
NAPHTHA TO STORAGE
LPG TO STORAGE
SSV
LEF
ACID GAS
GAS TO CONSUMERS
GAS
CRUDE
STABILISATIONUNIT
C2C3 TO
STORAGE
Crude Oil
GAS
Uran PROCESS
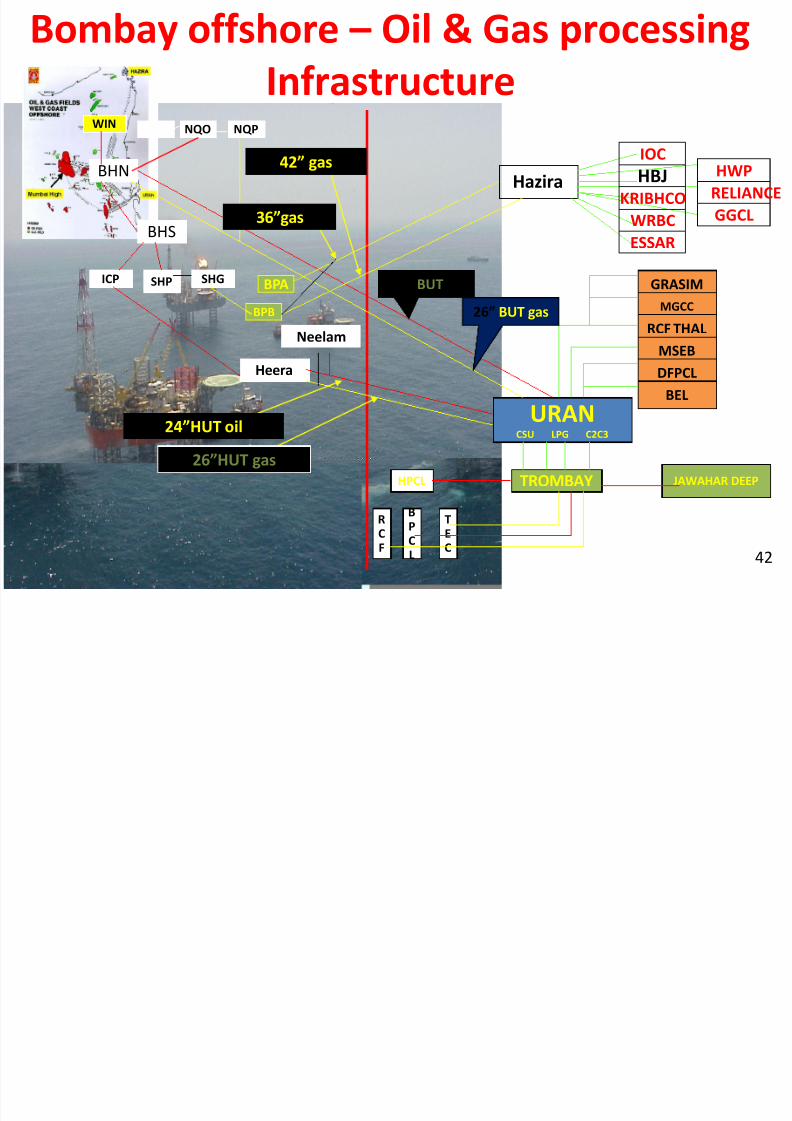
Bombay offshore – Oil & Gas processing
7/29/2019 Domestic Gas Scenario Processing, Distribution & Applications
http://slidepdf.com/reader/full/domestic-gas-scenario-processing-distribution-applications 42/48
42
Bombay offshore – Oil & Gas processing
Infrastructure
GRASIMMGCC
RCF THAL
MSEB
DFPCL
BEL
JAWAHAR DEEP
Hazira
URANCSU LPG C2C3
TROMBAYHPCL
RCF
TEC
BPC
L
BHN
BHS
WIN NQO NQP
ICP SHP SHG
Heera
BPB
BPA
Neelam
30” BUT oil
26” BUT gas
IOC
HBJKRIBHCO
WRBC
ESSAR
HWP
RELIANCE
GGCL
26”HUT gas
24”HUT oil
36”gas
42” gas
G

7/29/2019 Domestic Gas Scenario Processing, Distribution & Applications
http://slidepdf.com/reader/full/domestic-gas-scenario-processing-distribution-applications 43/48
Gas
Transmission
&
End Uses
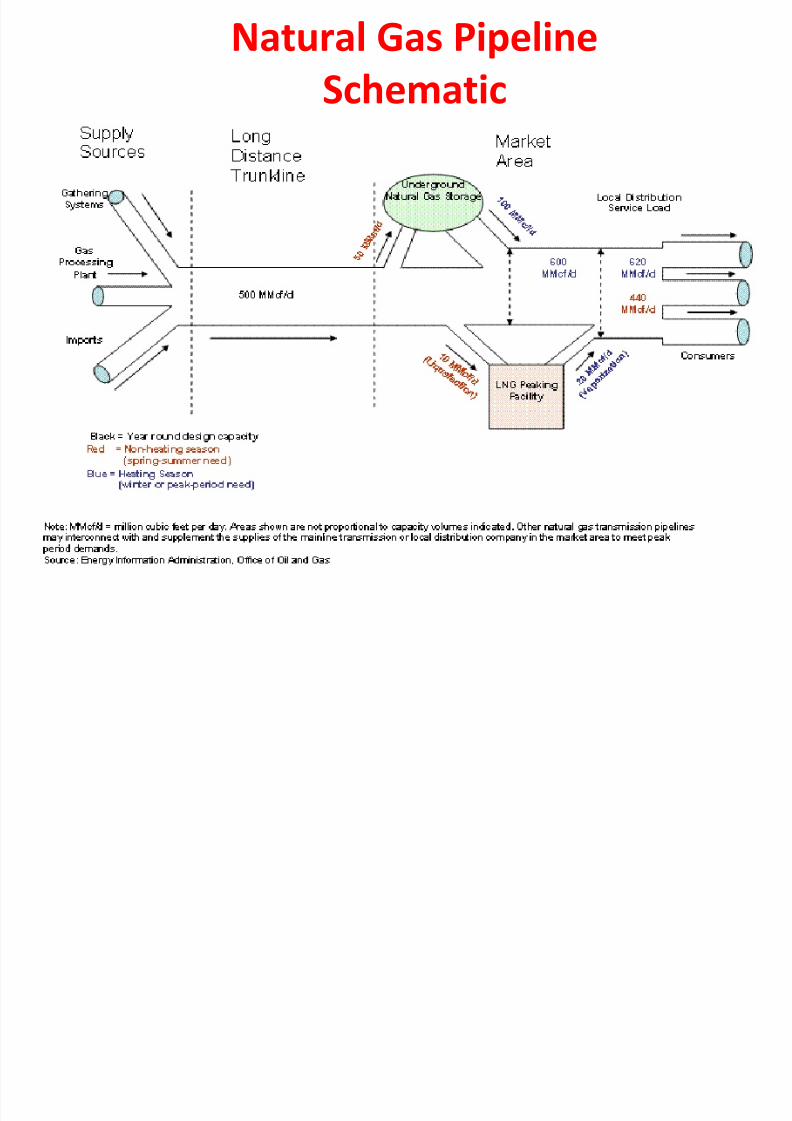
Natural Gas Pipeline
7/29/2019 Domestic Gas Scenario Processing, Distribution & Applications
http://slidepdf.com/reader/full/domestic-gas-scenario-processing-distribution-applications 44/48
Natural Gas Pipeline
Schematic
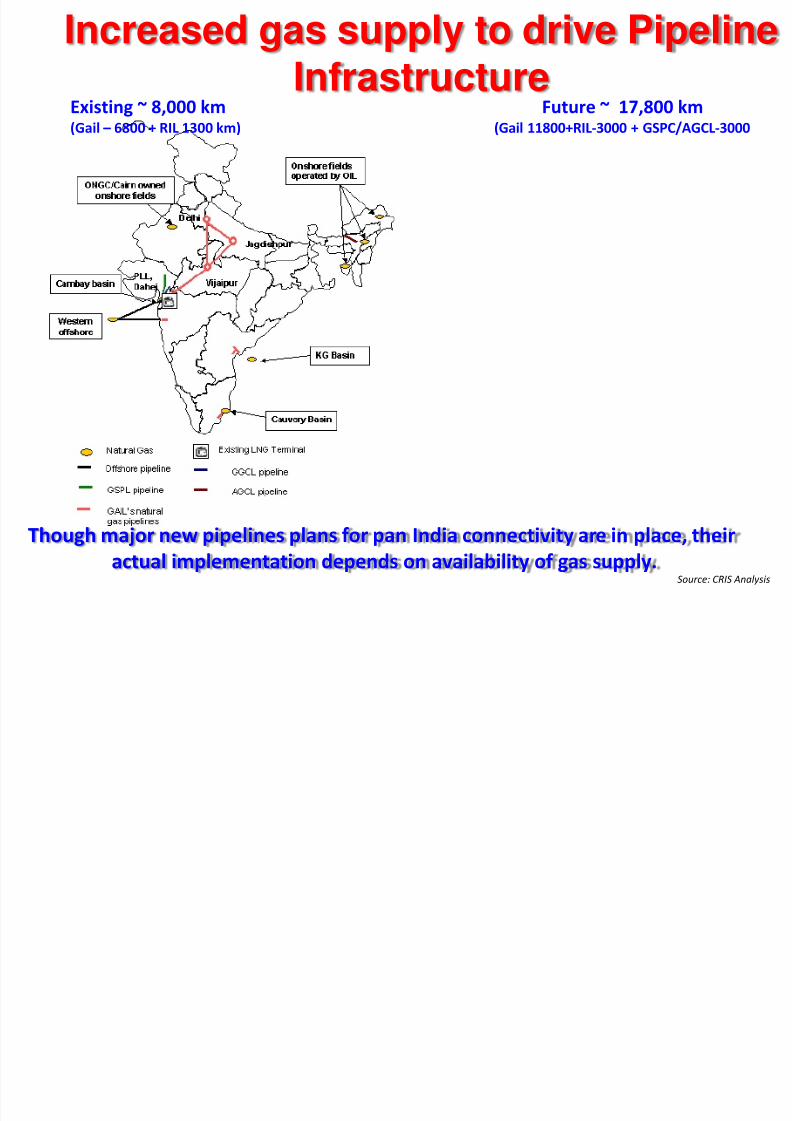
Increased gas supply to drive Pipeline
7/29/2019 Domestic Gas Scenario Processing, Distribution & Applications
http://slidepdf.com/reader/full/domestic-gas-scenario-processing-distribution-applications 45/48
Though major new pipelines plans for pan India connectivity are in place, their
actual implementation depends on availability of gas supply.Source: CRIS Analysis
Increased gas supply to drive PipelineInfrastructure
Existing ~ 8,000 km(Gail – 6800 + RIL 1300 km)
Future ~ 17,800 km(Gail 11800+RIL-3000 + GSPC/AGCL-3000
Gas transmissions
7/29/2019 Domestic Gas Scenario Processing, Distribution & Applications
http://slidepdf.com/reader/full/domestic-gas-scenario-processing-distribution-applications 46/48
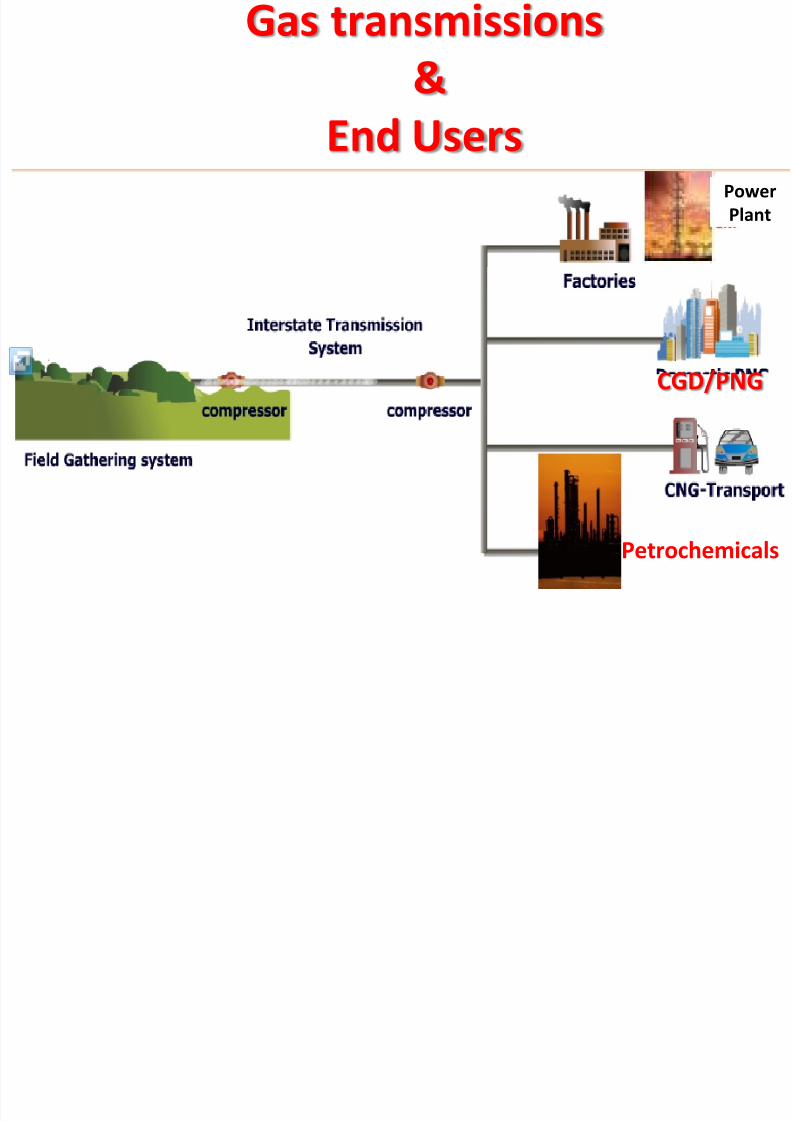
Gas transmissions&
End UsersPower
Plant
CGD/PNG
Petrochemicals
To Conclude
7/29/2019 Domestic Gas Scenario Processing, Distribution & Applications
http://slidepdf.com/reader/full/domestic-gas-scenario-processing-distribution-applications 47/48
To Conclude
Price acceptability of Indian consumer at higher crudeprice linked to present fuel conversion price
Significant potential in growth of per capita energy with
power, fertilizers, CGD(industrial) segments the main driver
Difficult to maintain price protection & gas allocation as itmay affect realization to the producer
Power and Fertilizers to continue to be major consumers –
accounting for 64% of the total demand by 2015
Gas Grid development essential to open new demand areas
Indian consumer to afford higher energy price to satiate the
shortfall in future

7/29/2019 Domestic Gas Scenario Processing, Distribution & Applications
http://slidepdf.com/reader/full/domestic-gas-scenario-processing-distribution-applications 48/48
Questions, Thoughts?
Related Documents