Domain agnostic tools for multi-scale/integrative sensor data analysis Joel Saltz MD, PhD Stony Brook University

Domain agnostic tools for multi- scale/integrative sensor data analysis Joel Saltz MD, PhD Stony Brook University.
Dec 25, 2015
Welcome message from author
This document is posted to help you gain knowledge. Please leave a comment to let me know what you think about it! Share it to your friends and learn new things together.
Transcript

Domain agnostic tools for multi-scale/integrative sensor data
analysis
Joel Saltz MD, PhD
Stony Brook University

Cen
ter
for
Com
pre
hen
sive In
form
ati
cs
Integrative Biomedical Informatics Analysis• Reproducible
anatomic/functional characterization at fine level (Pathology) and gross level (Radiology)
• High throughput multi-scale image segmentation, feature extraction, analysis of features
• Integration of anatomic/functional characterization with multiple types of “omic” information
Radiology
Imaging
Patient Outcome
Pathologic Features
“Omic”
Data
Cen
ter
for
Com
pre
hen
sive In
form
ati
cs
Overview
• Pathology Computer Aided Diagnosis• Integrative analysis of tissue: pathology,
radiology, ‘omics’ and outcome• Management, query, analysis of integrative
data • High end Computing tools for multi-scale
analysis• Electronic health data: analytics, tools for
Clinical phenotype characterization, population health

Pathology Computer Assisted Diagnosis
Gurcan, Shamada, Kong, Saltz

Neuroblastoma Classification
FH: favorable histology UH: unfavorable histologyCANCER 2003; 98:2274-81
<5 yr
SchwannianDevelopment
≥50%Grossly visible
Nodule(s)
absent
present
Microscopic Neuroblastic
foci
absent
present
Ganglioneuroma(Schwannian stroma-dominant)
Maturing subtypeMature subtype
Ganglioneuroblastoma, Intermixed(Schwannian stroma-rich)
FH
FH
Ganglioneuroblastoma, Nodular(composite, Schwannian stroma-rich/stroma-dominant and stroma-poor) UH/FH*
Variant forms*
None to <50%
Neuroblastoma(Schwannian stroma-poor)
Poorly differentiatedsubtype
Undifferentiatedsubtype
Differentiatingsubtype
Any age UH
≥200/5,000 cells
Mitotic & karyorrhectic cells
100-200/5,000 cells
<100/5,000 cells
Any age
≥1.5 yr
<1.5 yr
UH
UH
FH
≥200/5,000 cells
100-200/5,000 cells
<100/5,000 cells
Any age UH
≥1.5 yr
<1.5 yr
≥5 yr
UH
FH
UH
FH

Computerized Classification System for Grading Neuroblastoma
Background Identification Image Decomposition
(Multi-resolution levels) Image Segmentation
(EMLDA) Feature Construction (2nd
order statistics, Tonal Features)
Feature Extraction (LDA) + Classification (Bayesian)
Multi-resolution Layer Controller (Confidence Region)
No
YesImage Tile
InitializationI = L
Background? Label
Create Image I(L)
Segmentation
Feature Construction
Feature Extraction
Classification
Segmentation
Feature Construction
Feature Extraction
Classifier Training
Down-sampling
Training Tiles
Within ConfidenceRegion ?
I = I -1
I > 1?
Yes
Yes
No
No
TRAINING
TESTING


Cen
ter
for
Com
pre
hen
sive In
form
ati
cs INTEGRATIVE ANALYSIS OF TISSUE: PATHOLOGY, RADIOLOGY, ‘OMICS’ AND OUTCOME

Quantitative Feature Analysis in Pathology: Emory In Silico Center for Brain Tumor Research (PI = Dan Brat, PD= Joel Saltz)

Using TCGA Data to Study
Glioblastoma
Diagnostic Improvement
Molecular Classification
Predictors of Progression

Digital Pathology
Neuroimaging
TCGA Network
Cen
ter
for
Com
pre
hen
sive In
form
ati
cs
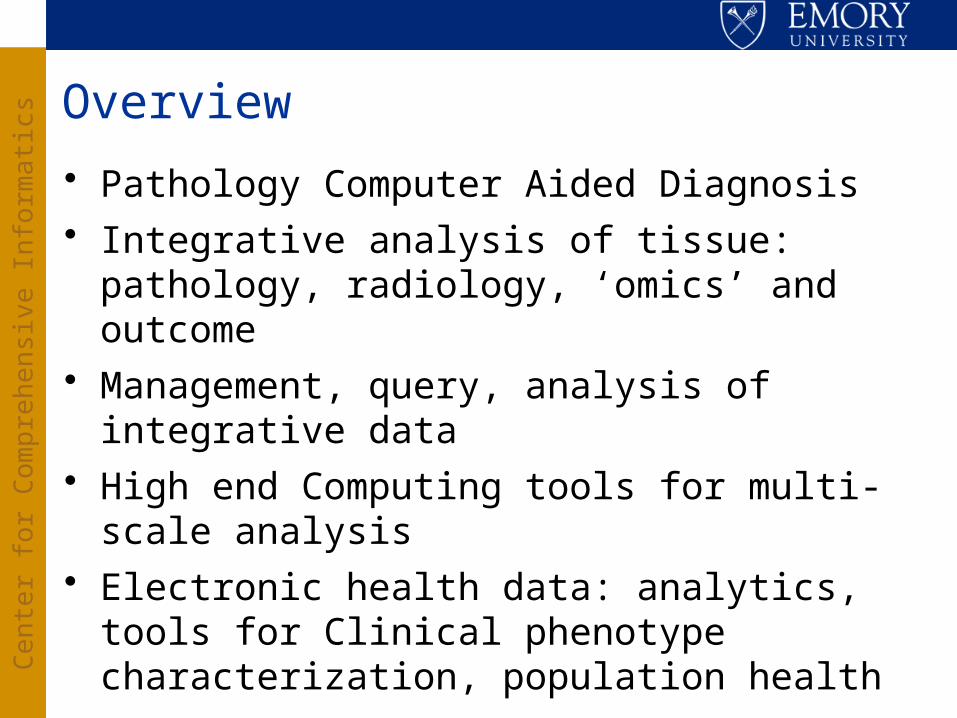
Morphological Tissue Classification
Nuclei Segmentation
Cellular Features
Lee Cooper,Jun Kong
Whole Slide Imaging
Millions of Nuclei Defined by n Features
Top-down analysis: use the features with existing diagnostic constructs

TCGA Whole Slide Images
Jun Kong
Step 1:Nuclei
Segmentation
• Identify individual nuclei and their boundaries

Nuclear Analysis Workflow
• Describe individual nuclei in terms of size, shape, and texture
Step 2:Feature
Extraction
Step 1:Nuclei
Segmentation

Oligodendroglioma Astrocytoma
Nuclear Qualities
1 10
Step 3:Nuclei
Classification

Survival Analysis
Human Machine
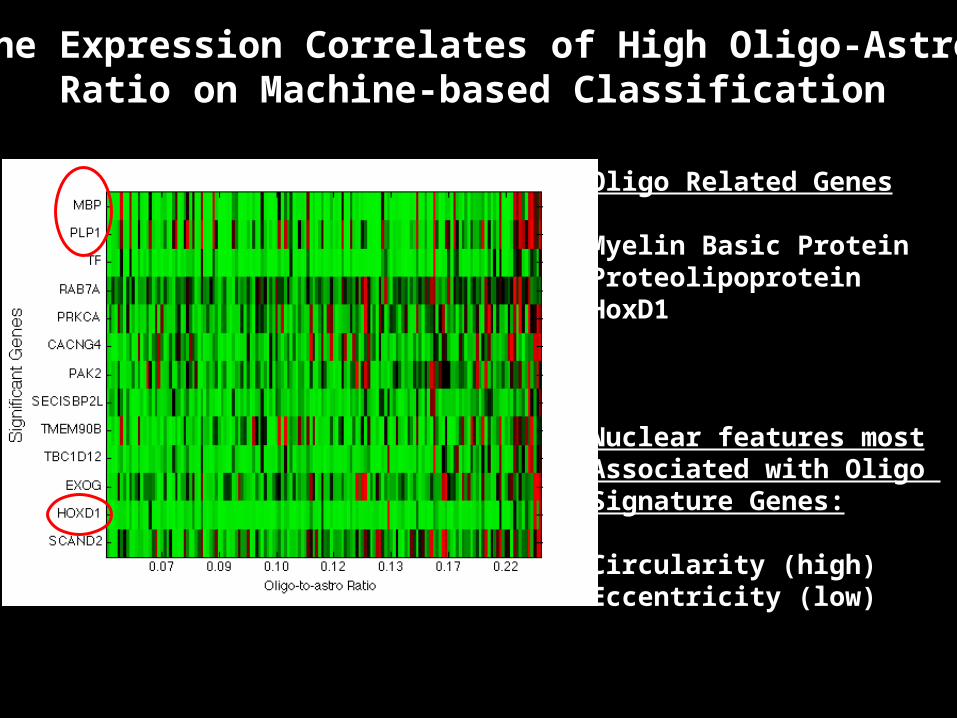
Gene Expression Correlates of High Oligo-Astro Ratio on Machine-based Classification
Oligo Related Genes
Myelin Basic ProteinProteolipoproteinHoxD1
Nuclear features mostAssociated with Oligo Signature Genes:
Circularity (high)Eccentricity (low)
Millions of Nuclei Defined by n Features
Bottom-up analysis: let nuclear features define and drive the analysis

Cen
ter
for
Com
pre
hen
sive In
form
ati
cs
Direct Study of Relationship Between Image Features vs Clinical Outcome, Response to Treatment, Molecular Information
Lee Cooper,Carlos Moreno

Cen
ter
for
Com
pre
hen
sive In
form
ati
cs
Consensus clustering of morphological signatures
Study includes 200 million nuclei taken from 480 slides corresponding to 167 distinct patients
Each possibility evaluated using 2000 iterations of K-means to quantify co-clustering
Nuclear Features Used to Classify GBMs
3 2 1
20 40 60 80 100 120 140 160
20
40
60
80
100
120
140
1602 3 4 5 6 725
30
35
40
45
50
# Clusters
Silh
ouet
te A
rea
0 0.5 1
1
2
3
Silhouette Value
Clu
ster

Cen
ter
for
Com
pre
hen
sive In
form
ati
cs
Clustering identifies three morphological groups• Analyzed 200 million nuclei from 162 TCGA GBMs (462 slides)• Named for functions of associated genes:
Cell Cycle (CC), Chromatin Modification (CM),
Protein Biosynthesis (PB)• Prognostically-significant (logrank p=4.5e-4)
Featu
re I
ndic
es
CC CM PB
10
20
30
40
500 500 1000 1500 2000 2500 3000
0
0.2
0.4
0.6
0.8
1
Days
Sur
viva
l
CC
CM
PB

Cen
ter
for
Com
pre
hen
sive In
form
ati
cs
Associations

Molecular and Pathology Correlates of MR Features Using TCGA Data
MRIs of TCGA GBMs reviewed by 3-6 neuroradiologists using VASARI feature set and In Vivo Imaging tools
MR Features compared to TCGA Transcriptional Classes, Genetic Alterations and Pathology
NCI/in silico group led by Adam Flanders

VASARI Feature Set

26
Principal Investigator and Director: Haian FuCo-Directors: Fadlo R. Khuri, Joel Saltz
Project Manager: Margaret Johns
Aim 1 LeaderYuhong Du
Aim 2 Leader Carlos Moreno
Cancer genomics-
based HT PPI network
discovery & validation
Genomics informatics and data integration
Emory CTD2 Center:
High throughput protein-protein interaction interrogation in cancer
Winship Cancer Institute
Center for Comprehensive
InformaticsEmory Chemical Biology Discovery Center
Emory Molecular Interaction Center for Functional Genomics (MicFG)

Cen
ter
for
Com
pre
hen
sive In
form
ati
cs
MULTI-SCALE IMAGING: INTEGRATED STRUCTURE AND MOLECULAR CHARACTERIZATION
Rich morphological and molecular characterizations of macroscopic tissue samples at microscopic resolution


Quantum Dot Immunohistochemistry, LCM + NGS, Imaging Mass Spec
ImagingExcellent Spatial Resolution
Limited Molecular Resolution
GenomicsExcellent Molecular Resolution
Limited Spatial Resolution
100
0’s
of g
en
es

Cen
ter
for
Com
pre
hen
sive In
form
ati
cs
Integrative Multi-scale Biomedical Informatics
• Quantitative analyses of the interplay between morphology and spatially mapped genetics and molecular data to be used in studies that predict outcome and response to treatment
• Assemble, visualize and quantify detailed, multi-scale descriptions of tissue morphologic changes originating from a wide range of microscopy instruments
• Create/adapt computational and pattern recognition tools to integrate these descriptions with corresponding genomic, proteomic, glycomic, and clinical signatures.

Cen
ter
for
Com
pre
hen
sive In
form
ati
cs
Driving Biomedical Problems
• Human: Lung Cancer Heterogeneity and Targeted Therapy (Khuri, Marcus)
• Human: Gastrointestinal Cancer Risk Stratification and Prevention (Bostick, Baron)
• Human and Mouse model: Glioma Microenvironment and Systems Biology (Brat, Mikkelsen)
• Mouse model: Role of PTEN in the orchestrated sequence of events, leading to tumor initiation (Leone)
• Mouse model: Role of Tn, STn tumor antigens in cancer initiation and progression, the impact of tissue-type specific alternations in Cosmc and the impact of altered expression of T-synthase (Cummings)

Correlating Imaging Phenotypes with Genomic Signatures: Scientific Opportunities
Tumor heterogeneity• Multiple definitions:
• Genetic, epigenetic heterogeneity within tumor
• Differences in microenvironments within tumor
• Phenome differences within tumor
• Heterogeneity involving primary and metastases
• Characterization:
• Imaging phenotype (radiology, pathology, optical…)
• Molecular phenotype
• Spatially characterized molecular phenotype (Laser captured microdissection, imaging mass spec, molecular imaging)
• …

Correlating Imaging Phenotypes with Genomic Signatures: Scientific Opportunities
Clinical Approach and Use• Development of imaging+analysis methods to
characterize heterogeneity• within a tumor at one time point• evolution over time• among different tumor types
• Development of imaging metrics that:• can predict and detect emergence of resistance?• correlates with genomic heterogeneity?• correlates with habitat heterogeneity?• can identify more homogeneous sub-types
Cen
ter
for
Com
pre
hen
sive In
form
ati
cs
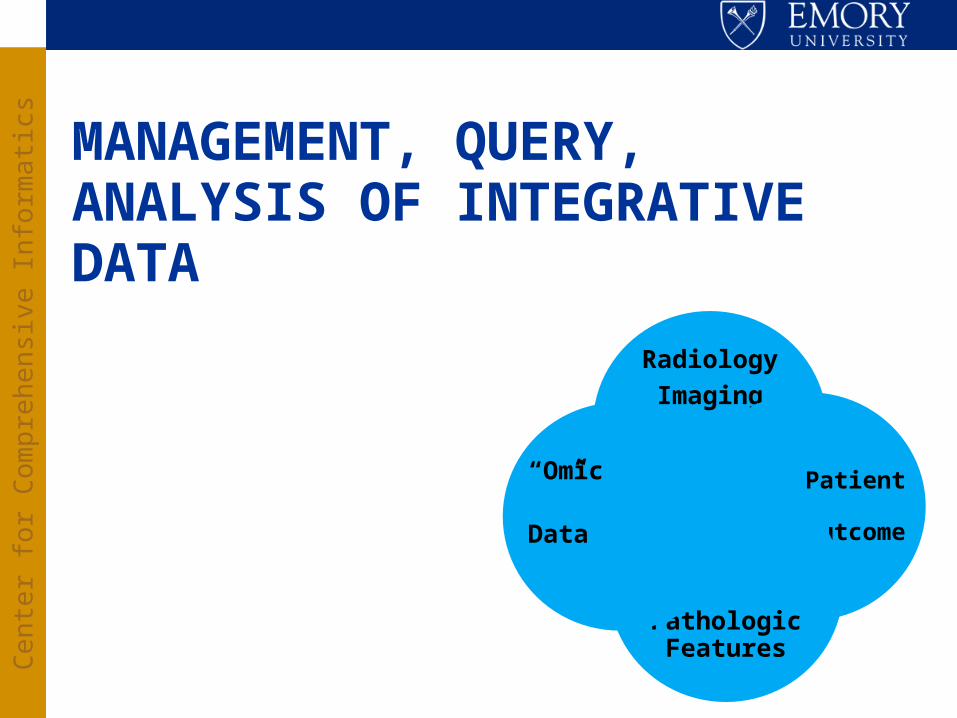
MANAGEMENT, QUERY, ANALYSIS OF INTEGRATIVE DATA
Radiology
Imaging
Patient Outcome
Pathologic Features
“Omic”
Data

Cen
ter
for
Com
pre
hen
sive In
form
ati
cs
Large Scale Spatial Query, Analysis and Data Management
Highly optimized spatial query and analyses Hadoop/HDFS, IBM DB2, optimized CPU/GPU spatial
algorithms Represented by a complex data model capturing
multi-faceted information including markups, annotations, algorithm provenance, specimen, etc.
Support for complex relationships and spatial query: multi-level granularities, relationships between markups and annotations, spatial and nested relationships
Supported by two NLM R01 grants – Saltz/Foran
Cen
ter
for
Com
pre
hen
sive In
form
ati
cs
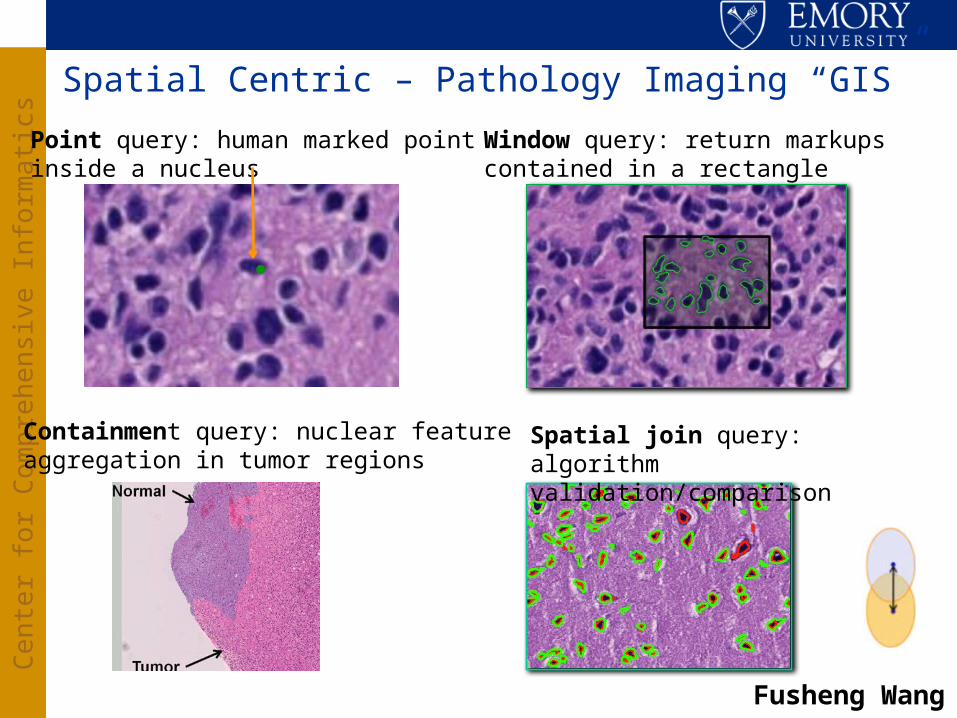
Spatial Centric – Pathology Imaging “GIS”
Point query: human marked point inside a nucleus
.
Window query: return markups contained in a rectangle
Spatial join query: algorithm validation/comparison
Containment query: nuclear featureaggregation in tumor regions
Fusheng Wang

Cen
ter
for
Com
pre
hen
sive In
form
ati
cs
VLDB 2012, 2013
Spatial Query, Change Detection, Comparison, and Quantification

Cen
ter
for
Com
pre
hen
sive In
form
ati
cs
HIGH END COMPUTING TOOLS FOR MULTI-SCALE ANALYSIS
Partnership with Oak Ridge National Laboratory (collaborators -- Scott Klasky, Jeff Vetter )Also, aka Big Data

Macroscopic 3-D Tissue at Micron Resolution: OSU BISTI NBIB Center Big
Data (2005)Associate genotype with
phenotypeBig science experiments on
cancer, heart disease, pathogen host responseTissue specimen -- 1 cm3
0.3 μ resolution – roughly 1013 bytes
Molecular data (spatial location) can add additional significant factor; e.g. 102
Multispectral imaging, laser captured microdissection, Imaging Mass Spec, Multiplex QD
Multiple tissue specimens; another factor of 103
Total: 1018 bytes – exabyte per big science experiment
Cen
ter
for
Com
pre
hen
sive In
form
ati
cs
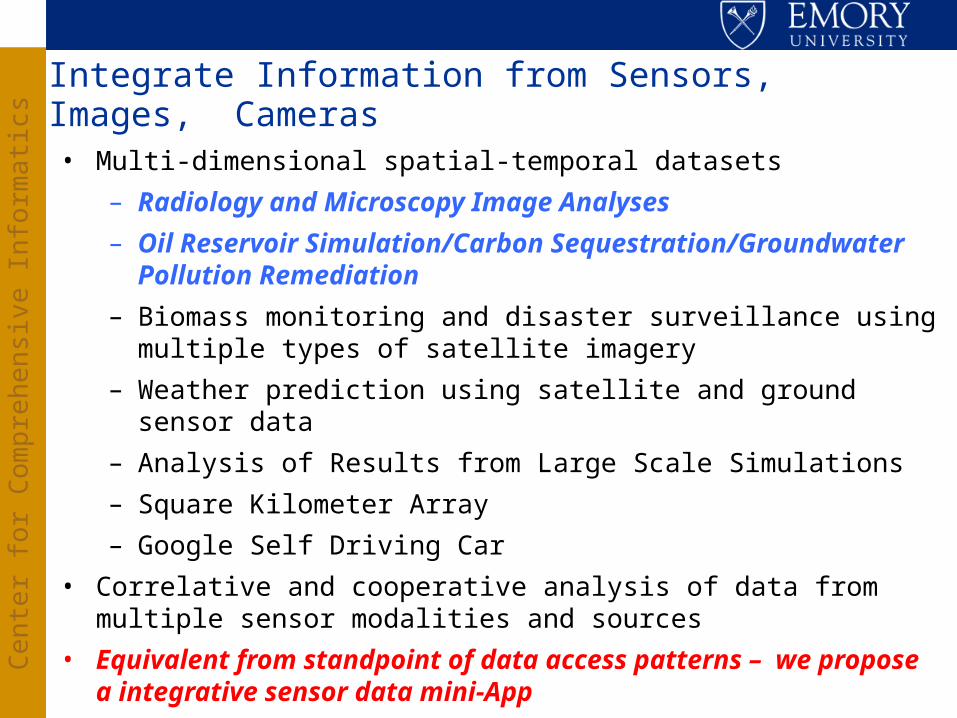
Integrate Information from Sensors, Images, Cameras
• Multi-dimensional spatial-temporal datasets
– Radiology and Microscopy Image Analyses
– Oil Reservoir Simulation/Carbon Sequestration/Groundwater Pollution Remediation
– Biomass monitoring and disaster surveillance using multiple types of satellite imagery
– Weather prediction using satellite and ground sensor data
– Analysis of Results from Large Scale Simulations
– Square Kilometer Array
– Google Self Driving Car
• Correlative and cooperative analysis of data from multiple sensor modalities and sources
• Equivalent from standpoint of data access patterns – we propose a integrative sensor data mini-App

Cen
ter
for
Com
pre
hen
sive In
form
ati
cs
Core Transformations
• Data Cleaning and Low Level Transformations• Data Subsetting, Filtering, Subsampling• Spatio-temporal Mapping and Registration• Object Segmentation • Feature Extraction• Object/Region/Feature Classification• Spatio-temporal Aggregation• Change Detection, Comparison, and Quantification

Cen
ter
for
Com
pre
hen
sive In
form
ati
cs
Runtime Support Objectives - (Similar to what is required for most applications discussed today!)• Coordinated mapping of data and computation to
complex memory hierarchies• Hierarchical work assignment with flexibility
capable of dealing with data dependent computational patterns, fluctuations in computational speed associated with power management, faults
• Linked to comprehensible programming model – model targeted at abstract application class but not to application domain (In the sensor, image, camera case -- Region Templates)
• Software stack including coordinated compiler/runtime support/autotuning frameworks

Cen
ter
for
Com
pre
hen
sive In
form
ati
cs
HPC Segmentation and Feature Extraction Pipeline
Tony Pan, George Teodoro,Tahsin Kurc and Scott Klasky

Cen
ter
for
Com
pre
hen
sive In
form
ati
cs
ELECTRONIC HEALTH DATA: ANALYTICS, TOOLS FOR CLINICAL PHENOTYPE CHARACTERIZATION, POPULATION HEALTH
Andrew Post, Sharath Cholleti, Doris Gao, Joel Saltz, Bill Bornstein EmoryDavid Levine, Sam Hohmann, UHC
Cen
ter
for
Com
pre
hen
sive In
form
ati
cs
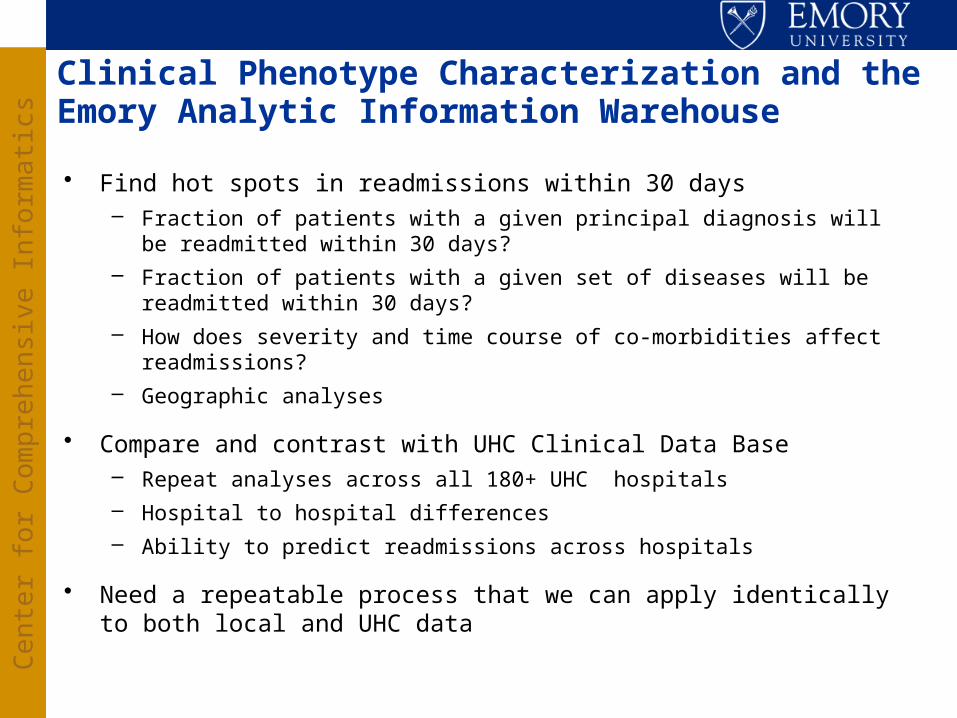
• Find hot spots in readmissions within 30 days– Fraction of patients with a given principal diagnosis will be readmitted
within 30 days?– Fraction of patients with a given set of diseases will be readmitted
within 30 days?– How does severity and time course of co-morbidities affect
readmissions?– Geographic analyses
• Compare and contrast with UHC Clinical Data Base– Repeat analyses across all 180+ UHC hospitals– Hospital to hospital differences– Ability to predict readmissions across hospitals
• Need a repeatable process that we can apply identically to both local and UHC data
Clinical Phenotype Characterization and the Emory Analytic Information Warehouse

Cen
ter
for
Com
pre
hen
sive In
form
ati
cs
5-year Datasets from Emory and University Healthcare Consortium
• EUH, EUHM and WW (inpatient encounters)• Removed encounter pairs with chemotherapy and radiation
therapy readmit encounters (CDW data)
• Encounter location (down to unit for Emory)• Providers (Emory only)• Discharge disposition• Primary and secondary ICD9 codes• Procedure codes• DRGs• Medication orders (Emory only)• Labs (Emory only)• Vitals (Emory only)• Geographic information (CDW only + US Census and American
Community Survey)Analytic Information Warehouse

Cen
ter
for
Com
pre
hen
sive In
form
ati
cs
Geographic AnalysesUHC Medicine General Product Line (#15)
Analytic Information Warehouse

Cen
ter
for
Com
pre
hen
sive In
form
ati
cs
Predictive Modeling for Readmission
• Random forests (ensemble of decision trees)– Create a decision tree using a random subset of the
variables in the dataset– Generate a large number of such trees– All trees vote to classify each test example in a
training dataset– Generate a patient-specific readmission risk for each
encounter
• Rank the encounters by risk for a subsequent 30-day readmission
Analytic Information Warehouse

Cen
ter
for
Com
pre
hen
sive In
form
ati
cs
Emory Readmission Rates for High and Low Risk Groups Generated with Random Forest

Cen
ter
for
Com
pre
hen
sive In
form
ati
cs
Predictive Modeling Applied to 180 UHC HospitalsReadmission fraction of top 10% high risk patients
1 12 23 34 45 56 67 78 89 100 111 122 133 144 155 166 1770
0.1
0.2
0.3
0.4
0.5
0.6
0.7
0.8
0.9
All Hospital Model
Individual Hospital Model

Cen
ter
for
Com
pre
hen
sive In
form
ati
cs
Summary and Perspective
• Large scale integrative data analytic methods and tools to integrate clinical, molecular, Pathology, Radiology data (happy to discuss Radiology aspects off line)
• Characterize new cancer subtypes and biomarkers, predict outcome, treatment response
• Algorithms to quantify Pathology classification• HPC/BIGDATA analysis pipelines• Generate and manage nuanced temporal summary
of patients health status, co-morbidities, treatment, treatment response

Cen
ter
for
Com
pre
hen
sive In
form
ati
cs
Importance:
• Biomedical: generate basic insights into pathophysiology, clues to new treatments, better ways of evaluating existing treatments and core infrastructure needed for comparative effectiveness research studies
• Computer Science: general approaches to analysis and classification of very large datasets from low dimensional spatio-temporal sensors
Cen
ter
for
Com
pre
hen
sive In
form
ati
cs
Thanks to:• In silico center team: Dan Brat (Science PI), Tahsin Kurc, Ashish Sharma,
Tony Pan, David Gutman, Jun Kong, Sharath Cholleti, Carlos Moreno, Chad Holder, Erwin Van Meir, Daniel Rubin, Tom Mikkelsen, Adam Flanders, Joel Saltz (Director)
• caGrid Knowledge Center: Joel Saltz, Mike Caliguiri, Steve Langella co-Directors; Tahsin Kurc, Himanshu Rathod Emory leads
• caBIG In vivo imaging team: Eliot Siegel, Paul Mulhern, Adam Flanders, David Channon, Daniel Rubin, Fred Prior, Larry Tarbox and many others
• In vivo imaging Emory team: Tony Pan, Ashish Sharma, Joel Saltz• Emory ATC Supplement team: Tim Fox, Ashish Sharma, Tony Pan, Edi
Schreibmann, Paul Pantalone• Digital Pathology R01: Foran and Saltz; Jun Kong, Sharath Cholleti, Fusheng
Wang, Tony Pan, Tahsin Kurc, Ashish Sharma, David Gutman (Emory), Wenjin Chen, Vicky Chu, Jun Hu, Lin Yang, David J. Foran (Rutgers)
• NIH/in silico TCGA Imaging Group: Scott Hwang, Bob Clifford, Erich Huang, Dima Hammoud, Manal Jilwan, Prashant Raghavan, Max Wintermark, David Gutman, Carlos Moreno, Lee Cooper, John Freymann, Justin Kirby, Arun Krishnan, Seena Dehkharghani, Carl Jaffe
• ACTSI Biomedical Informatics Program: Marc Overcash, Tim Morris, Tahsin Kurc, Alexander Quarshie, Circe Tsui, Adam Davis, Sharon Mason, Andrew Post, Alfredo Tirado-Ramos
• NSF Scientific Workflow Collaboration: Vijay Kumar, Yolanda Gil, Mary Hall, Ewa Deelman, Tahsin Kurc, P. Sadayappan, Gaurang Mehta, Karan Vahi

Cen
ter
for
Com
pre
hen
sive In
form
ati
cs
The AIW Team
• Stakeholders– Joel Saltz, MD, PhD – CCI Director and ACTSI BIP Director– William Bornstein, MD, PhD – Emory Healthcare Chief Quality Officer– Dee Cantrell, RN – Emory Healthcare CIO– Marc Overcash – Emory Deputy CIO of Research and Health Sciences IT
• Project Team– Andrew Post, MD, PhD – AIW Project Lead & CCI Clinical Informatics Architect– Terry Willey, RN – IS Director of Business Strategy/Planning – Richie Willard – Project Manager– Tahsin Kurc, PhD – CCI Chief Software Architect– Sharath Cholleti, PhD – Research Scientist– Jingjing Gao, PhD – Biostatistician– Michel Mansour – Software Engineer– Himanshu Rathod – Software Engineer– Mike Torian – Data Warehouse Engineer– Michael Brown – Software Engineer– Geoff Milton – Software Engineer– Akshatha Kalsanka Pai – Software Engineer
Analytic Information Warehouse

Thanks!
Related Documents