HAL Id: halshs-00202299 https://halshs.archives-ouvertes.fr/halshs-00202299 Submitted on 4 Jan 2008 HAL is a multi-disciplinary open access archive for the deposit and dissemination of sci- entific research documents, whether they are pub- lished or not. The documents may come from teaching and research institutions in France or abroad, or from public or private research centers. L’archive ouverte pluridisciplinaire HAL, est destinée au dépôt et à la diffusion de documents scientifiques de niveau recherche, publiés ou non, émanant des établissements d’enseignement et de recherche français ou étrangers, des laboratoires publics ou privés. Does Work Pay in France? Monetary Incentives, Hours Constraints and the Guaranteed Minimum Income Marc Gurgand, David Margolis To cite this version: Marc Gurgand, David Margolis. Does Work Pay in France? Monetary Incentives, Hours Constraints and the Guaranteed Minimum Income. Journal of Public Economics, Elsevier, 2008, 92 (7), pp.1669- 1697. 10.1016/j.jpubeco.2007.10.008. halshs-00202299

Welcome message from author
This document is posted to help you gain knowledge. Please leave a comment to let me know what you think about it! Share it to your friends and learn new things together.
Transcript
HAL Id: halshs-00202299https://halshs.archives-ouvertes.fr/halshs-00202299
Submitted on 4 Jan 2008
HAL is a multi-disciplinary open accessarchive for the deposit and dissemination of sci-entific research documents, whether they are pub-lished or not. The documents may come fromteaching and research institutions in France orabroad, or from public or private research centers.
L’archive ouverte pluridisciplinaire HAL, estdestinée au dépôt et à la diffusion de documentsscientifiques de niveau recherche, publiés ou non,émanant des établissements d’enseignement et derecherche français ou étrangers, des laboratoirespublics ou privés.
Does Work Pay in France? Monetary Incentives, HoursConstraints and the Guaranteed Minimum Income
Marc Gurgand, David Margolis
To cite this version:Marc Gurgand, David Margolis. Does Work Pay in France? Monetary Incentives, Hours Constraintsand the Guaranteed Minimum Income. Journal of Public Economics, Elsevier, 2008, 92 (7), pp.1669-1697. �10.1016/j.jpubeco.2007.10.008�. �halshs-00202299�

Does Work Pay in France ?
Monetary Incentives, Hours Constraints
and the Guaranteed Minimum Income
Marc Gurgand∗and David N. Margolis†
September 2007
Abstract
This paper uses a representative sample of individuals on France's mainwelfare program (the Revenu Minimum d'Insertion, or RMI) to estimatemonetary incentives for employment among welfare recipients. Based onthe estimated joint distribution of wages and hours potentially o�ered toeach individual, we compute potential gains from working in a very detailedmanner. Relating these gains to observed employment, we then estimate asimple structural labor supply model. We �nd that potential gains are al-most always positive but very small on average, especially for single mothers,because of the high implicit marginal tax rates embedded in the system. Em-ployment rates are sensitive to incentives with extensive margin elasticitiesfor both men and women usually below one. Conditional on these elastici-ties, simulations indicate that existing policies devoted to reducing marginaltax rates at the bottom of the income distribution, such as the intéressement
earnings top-up program, have little impact in this population due to theirvery limited scope. The recently introduced negative income tax (Prime
pour l'emploi), seems to be an exception.
Keywords: Welfare, labor earnings, transfers, tax-systemJEL Codes: I38, J31, C34
∗Paris School of Economics - Paris-Jourdan Sciences Economiques (joint research unitCNRS-ENS-EHESS-ENPC), CREST and IRES.
†Université Paris 1, CNRS; Paris School of Economics, CREST; IZA. Mailing address:Centre d'Economie de la Sorbonne, Université Paris 1 Panthéon-Sorbonne, 106-112 boule-vard de l'Hôpital, 75647 Paris Cedex 13, France. Telephone: +33 (0)1 44 07 82 62. Fax :+33 (0)1 44 07 82 47. E-mail : [email protected].
1
1 Introduction
Much of the debate surrounding the question of �Making Work Pay� (OECD,2003) turns on two questions: a) how much additional disposable incomewould an individual or household gain by moving from welfare to work andb) what is the elasticity of labor supply at the extensive margin with respectto the monetary gain (or loss) in disposable income that a household wouldexperience by shifting from welfare to work. The vast majority of empiri-cal studies have focused on the North American (and the United States inparticular) labor markets (Mo�tt, 2002), while it seems clear, in a primafacie sense, that an analysis of the policy of a guaranteed minimum incomeis likely to be more relevant for European countries, as the level and ubiquityof these policies is much more important on the eastern shore of the Atlantic.
This paper provides contributions along these two dimensions while adopt-ing a methodological approach that treats job o�ers as wage-hours pairsrather than simple wage o�ers for which the individual can choose hoursfreely. This approach has been adopted by many authors in the past1 andseems particularly appropriate when modeling labor supply in France, thecountry upon which the empirical analysis in this paper is based. In particu-lar, the empirical distribution of hours worked tends to be bimodal (includingfor men in our sample) largely as a result of the numerous institutional con-straints that concern weekly hours.
In this context, we provide a model of labor supply in the presence ofindividual-speci�c wage-hours job o�ers that we take to data on a represen-tative sample of welfare recipients in France in December 1996. We focuson recipients of France's guaranteed minimum income program (the RevenuMinimum d'Insertion, or RMI ) which is central in the country's welfare poli-cies: more than 1 million households receive payments from the RMI system,covering approximately 3% of the population. Among welfare bene�ciaries,these people are in a position to work (in contrast with the handicapped orthe elderly on speci�c welfare programs), and at the same time face high im-plicit marginal tax rates. This population is thus a major target for policiesaimed at making work pay. It must be acknowledged that, except for lowwage workers very close to RMI eligibility, our results either in terms of jobo�er distributions, implicit taxes on labour earnings or working behavior,may not by extended to a larger population potentially exposed to fallinginto welfare. Nevertheless, this analysis requires very detailed data in orderto compute disposable income in a complex setting and such data is notavailable for a wide range of the population although it is available for theRMI recipient population covered by the survey we use.
On the whole, we see the contribution of this paper to the literature
1See, for example, Altonji and Paxson (1988, 1992), Kahn and Lang (1991, 1996),Dickens and Lundberg (1993), Stewart and Swa�eld (1997), Euwals and van Soest (1999),Meyer and Rosenbaum (2001) and Laroque and Salanié (2003).
1

as four-fold. First, we develop a theoretical model in which job o�ers areindividual speci�c wage and hours combinations that we estimate for wel-fare recipients in a parametric but very �exible manner, that encompassesmany institutional settings and �ts the data very closely. Second, througha detailed modeling of France's tax and transfer system, we identify impor-tant discontinuities and conditionalities in the function that translates net(of payroll tax) earnings into disposable income and we quantify its impacton work incentives. Third, we estimate a simple structural labor supplymodel that accommodates many important aspects of France's labor mar-ket. Identi�cation of this model relies on exclusion restrictions in the vectorsof determinants of the job o�er distribution and the utility function (as istypically the case in this literature) and on exploitation of the particularitiesof France's tax and transfer rules. Finally, we simulate several alternativepolicy settings, including policies that were implemented in France severalyears after the data were collected, in order to better evaluate the anticipatedlabor supply response to di�erent sorts of reforms.
Our estimation of the job o�er distribution and our calculations of dis-posable income in the case of work or welfare suggest that the monetary gainin household income when accepting a typical job o�er is positive, but oftenquite small with half the population of welfare recipients experiencing atmost a 21% increase in disposable income relative to their disposable incomeon welfare. These small gains to employment seem driven in large part byhours constraints, in that many welfare recipients can not expect to receivea full-time job o�er. There is substantial variation in gains to employmentacross household types, with childless single-person households experiencingthe largest gains (median gains of 32%) and couples with at least 2 childrenexperiencing much lower gains (median of 11%). A time-limited earningstop-up program (intéressement) is o�ered to welfare recipients with the ob-jective of increasing the monetary gain to employment, however we �nd thatthe associated increase is only marginal, due to the limited scope of thisprogram.
Our simulation studies suggest that the elasticity of labor supply at theextensive margin is quite comparable to levels found in the United Statesand French literature on welfare recipients, with estimates for single menranging from 1.25 to 0.39 and for single women from 1.10 to 0.44 (dependingon the speci�cation). In addition, although we �nd that the main earningstop-up program does not seem to have the ability to induce large changes inlabor supply, certain other policy reforms (such as the Prime Pour l'Emploi
negative income tax adopted in 2001) may help accelerate the transition intoemployment among welfare recipients.
Although there are other studies of the e�ects of welfare receipt on laborsupply in France,2 perhaps the closest work to ours comes from Laroque
2See, for example, Gravel et. al. (2004), Gurgand and Margolis (2001), Hagneré et.
2

and Salanié (2002). They examine the impact of incentives on labor supplyconsidering the whole �scal system and total French population. Laroqueand Salanié (2003) expands upon Laroque and Salanié (2002) by introducingfemale part-time work and indirectly integrating the wage-hours pairs thatwe explicitly model, a dimension neglected from their �rst paper. In thiswork, we analyse more carefully the welfare population. In particular, theyhave incomplete information on household income and do not consider thetime-limited welfare earnings top-up program (intéressement). Furthermore,neither of the Laroque and Salanié papers explicitly models the main publicemployment program (Contrat Emploi Solidarité, or CES ). This programaccounts for one third of all jobs held by welfare recipients a year after theirbeing sampled and imposes very speci�c rules on wages, hours and paymentsunder the intéressement earnings top-up program.
The structure of the rest of this paper is as follows. In section 2, abrief account of the French welfare system is presented with an emphasis onthe RMI. In section 3 we lay out a model and the econometric techniquesemployed for estimating potential labor market earnings conditional on ob-servable characteristics. Section 4 discusses the results of estimating the jobo�er distributions, while section 5 describes the distribution of the size of themonetary incentives implied by the estimates in section 4. Section 6 consid-ers the link between the gains to employment and the observed probabilityof employment, while section 7 concludes.
2 Welfare Income in France
Since some of our identi�cation depends upon exploiting discontinuities andconditionalities in the French tax and transfer system, we begin with aschematic description of the functioning of France's guaranteed minimumincome, the Revenu Minimum d'Insertion (RMI).3 Call sRMI the guaran-teed minimum income threshold and T (w) the net transfers available to ahousehold with labor income w. In the absence of any further incentives, thehousehold bene�ts from the RMI scheme when w + T (w) < sRMI , in whichcase its guaranteed disposable income is set to sRMI . Otherwise, its incomeis w + T (w). As such, the RMI generates a 100% implicit marginal tax rateon earnings such that household income is below the RMI threshold.
The intéressement earnings top-up program, which is designed to increasework incentives, reduces this rate to 50% and extends the range of eligibleearnings. But this is only temporary and lasts for the �rst 750 hours worked.4
When this entitlement to intéressement is exhausted, the household faces the
at. (2003) and Hagneré and Trannoy (2001).3Appendix A provides more detail on the welfare system and the elements on which
we focus in our income simulations.4The 750 hour limit was relevant in 1998, the period covered by our data. Since then,
the time limit has been extended.
3

100% implicit tax rate on earnings below the RMI threshold and the generalincome tax system for earnings above this level.5
Among the housing-based bene�ts, households who rent their lodging (orown it and are paying interest) are eligible for subsidies that apply di�erentlyto the private and public sector housing.6 They depend on taxable income ata decreasing marginal rate, which varies with family composition and on theamount of the rent, and are subject to di�erent thresholds based on the zoneof habitation.7 In the typical situation, when taxable income is zero and therent is below the threshold, the subsidy covers up to 90% of the rent. Allof these transfers are included in the household resources when calculatingeligibility for the RMI.
This complex system gives rise to a characteristic pro�le for the RMIbene�ciaries e�ective marginal tax rate on labor income. Figure 1 depictsmonthly earned labor income versus disposable income for two typical situa-tions using the rules in e�ect in July 1998. For a single person that does notreceive the housing subsidy, the guaranteed income is 325 euros (less thanhalf of earnings from a month long full-time job at the minimum wage). Ifnot entitled to intéressement, earnings are taxed at 100% up to 325 euros.For earnings beyond this amount, labor income is taxed at a marginal rate of0% then 8% after 450 euros and 17% starting at earnings of approximately900 euros. Because RMI recipients are not subject to an income tax, butbecome so as soon as they leave the program, their marginal tax rate is lo-cally in�nity (at 325 euros in the single person example). This decrease indisposable income is even more pronounced for those eligible for a housingsubsidy.8
Insert Figure 1 Around Here
The budget set under intéressement is also presented on �gure 1. Themarginal rate is reduced to 50% and RMI eligibility is extended up to earn-ings of 650 euros. After 750 hours, the budget set drops down to the bottomline. Naturally, under this scheme, the e�ect of taxation and housing bene�tloss after 650 euros is more pronounced under intéressement, as illustratedin the �gure. Under intéressement there is much more incentive to takea 650 euros than, say, a 660 euros job. Such a shift of incentives towardlower wages (or, equivalently, part-time work) is a shared feature of negativeincome tax schedules (Mo�tt, 2003; Saez, 2002).
At the other end of the spectrum, consider a couple with 3 children, one
5This scheme is complicated by several rules that allow the hours counter to be reset tozero when additional transitions to and from employment take place. We do not considerthese complications here.
6Allocation logement and Aide personalisée au logement.7The taxable income considered is that of the previous year, something that we do
not explicitly take into account in the simulations. As we use the current income, orexpected income, for the calculation of tax rates, this is equivalent to imposing a form ofstationarity in the income process.
8This inconsistency has been corrected in recent legislation.
4
below 3, which receives a housing subsidy (�gure 1 again). The programparameters are di�erent due to the additional household members (with anextra bonus for the third child). Incentives are even lower for this family:the 100% marginal tax rate extends to higher earnings (up to 538 euros) andthe discontinuities are stronger as the marginal e�ective tax rate drops toabout 20% on average until labor income reaches 2150 euros. This extendedrange of relatively high marginal e�ective tax rates is due to the importanceof means tested family-related transfers for this type of household.
These examples demonstrate how the French welfare system imposes veryhigh e�ective marginal tax rates on labor income, up to 100% (and locallyin�nity) over a large range of labor earnings, largely due to the accumulationof means-tested transfer schemes.9 This point has often been noted in theliterature (e.g. Laroque and Salanié (1999), among others). In this context,the presence of intéressement has the potential to have some impact onincentives and behavior. Although the entire pro�le of the marginal tax rateis of interest, certain ranges of �gure 1 may be more relevant than othersfor a given household when the jobs proposed by potential employers in theform of wage-hours pairs tend to be disproportionately situated in particularintervals on the labor earnings axis. A key element of this paper is to identifythe points that are relevant to the actual bene�ciaries of RMI, and comparethose potential incomes with their resources on welfare.
2.1 Realized Outcomes of the RMI Recipient Population
Before considering potential gains to employment for the RMI recipient pop-ulation, it is useful to analyze the realized outcomes for those actually em-ployed at a point in time. Of the initial December 1996 sample, one-third areemployed a year later, only 10% of whom are in self-employment. Amongthose in employment, 33% are employed under the CES public employmentprogram. As shown in the appendix tables, the status with respect to thelabor market is very similar for men and women in this population.
Figures 2a and 2b report observed monthly earnings (wage rate timeshours worked, gross of any transfers). They make clear that the earnings ofRMI recipients, once reemployed, are low and concentrated around the half-time and full-time minimum wage. The strong bimodal distribution is veryunusual for the male population. It is also clear that active labor marketpolicy, in the form of CES jobs, plays an important role in this phenomenon.This reinforces the justi�cation for the speci�cation described in section 3.2and appendix B. It also suggests that the gains to employment might becyclically sensitive as well as dependent on the attitude of policy makers
9L'Horty and Anne (2002), using a number of case studies, have shown that additionalprograms independently implemented by local governments, when they exist, tend toincrease further the marginal tax rates. Due to the lack of exhaustive data on theselocal-level programs, they are not considered in this paper.
5
toward active labor market policy.Insert Figures 2a and 2B Around Here
3 The Model Framework
In order to estimate the size of the di�erential between labor market earn-ings and the RMI, and the resulting impacts on labor supply, we need tobe able to impute relevant wages and working hours for those individualswho receive the RMI. This implies the estimation of a model for the jointdistribution of potential wage and hours combinations that are o�ered toindividuals with a given set of observable characteristics, based on data onthe observed earnings of a selected population. The hypothesis that hoursare not freely chosen at a given wage rate has been empirically supported byGaltier (1999), although France is not an isolated case among OECD coun-tries along this dimension (see OECD, 1995, chapter 2). Furthermore, thestructure of French payroll taxes on low earners (Remy, 2005) encourages�rms to o�er part-time jobs and penalizes overtime. Indeed, Roux (2005)�nds results consistent with the idea that French �rms respond to such taxincentives by varying the share and types of part-time jobs they propose.Finally, this approach can also be justi�ed by the importance of certainsorts of employment promotion contracts, notably the CES (Contrat Emploi
Solidarité), that specify particular wage-hours combinations.We make individual draws in the wage-hours distribution (unconditional
on observed employment status) to form the distribution of their potentiallabor incomes and compare it with welfare. We then relate the resultinglabor supply incentives to observed employment status, via a simple staticbehavioral equation.
The huge discontinuities illustrated in �gure 1 would generate ill-behavedlikelihood functions if earnings and labor supply equations were to be esti-mated jointly. Indeed, a marginal change in the wage distribution parame-
ters, for instance, can create a discontinuity in the employment probability.Laroque and Salanié (2002) suggest smoothing the disposable income func-tion, but this is not realistic in our context given the large steps produced byintéressement. Furthermore, such smoothing can remove a potential sourceof non-parametric identi�cation for the the labor supply model. We thusproceed sequentially by �rst estimating the joint wage-hours distributionand then conditioning the structural labor supply model on these impliedgains to employment. As a result, two employment functions are estimated:one in reduced form (as an auxiliary step necessary to control for selectivityin the job o�er distribution estimation) and the other in structural form aspresented below.
6

3.1 The Basic Model
Suppose that employers propose jobs characterized by an hourly wage rate(wd
)and a number of monthly hours worked
(hd
). Given the diversity of
employers and jobs available in the labor market, a large number of(wd, hd
)pairs can be proposed in the economy to a single person. The distribution ofproposed wage-hours pairs forms the labor demand set faced by the individ-ual and is conditional upon his or her productive human capital characteris-tics (X). We assume that demographic characteristics and family status doa�ect labor supply but do not a�ect productive capacities, and are thus notincluded in the vector X that determines labor demand. These additionalvariables, and possibly some elements of X, are grouped into a vector Z thata�ects preferences.
Utility is de�ned with respect to disposable income and hours worked as:
U (D (wh, y0, Z) , h;Z, ε)
where ε captures unobserved characteristics that a�ect preferences on topof Z. U is a classical utility function that depends on disposable incomeand on hours worked. For identi�cation purposes, we will assume that anindividual's education, although it a�ects the set of job o�ers that he or shefaces, does not directly a�ect preferences (conditional on Z). The functionD (·) computes disposable income, based on labor earnings (wh), wealth (y0)and family characteristics relevant to compute taxes and transfers (at most asubset of Z). When not working, utility is therefore U (D (0, y0, Z) , 0;Z, ε)and depends only on y0, Z and ε.
We assume that individuals receive job o�ers from the joint distribution
of(wd, hd|X
). A person will accept any such o�er which provides at least
the utility of not working, that is when:
U(D
(wdhd, y0, Z
), hd;Z, ε
)≥ U (D (0, y0, Z) , 0;Z, ε) (1)
Even if ε is independent from(wd, hd|X
), the distribution of observed wages
and hours is not representative of the distribution of(wd, hd|X
)because
condition 1 restricts the set of observed values. For instance, if U ′D > 0,
observed wages may be on average higher than proposed wages. For thisreason, selectivity must be accounted for when estimating the distribution
of(wd, hd|X
). The existence of variables in Z, such as family composition,
and y0, assumed not to a�ect proposed wages and hours, is su�cient to iden-tify conditional means as in most selectivity models. However, parametricdistributional assumptions are also needed to recover the full distribution.
With an estimate of the distribution of(wd, hd|X
)we can proceed in two
directions. First, we can describe the size of the monetary work incentive
7
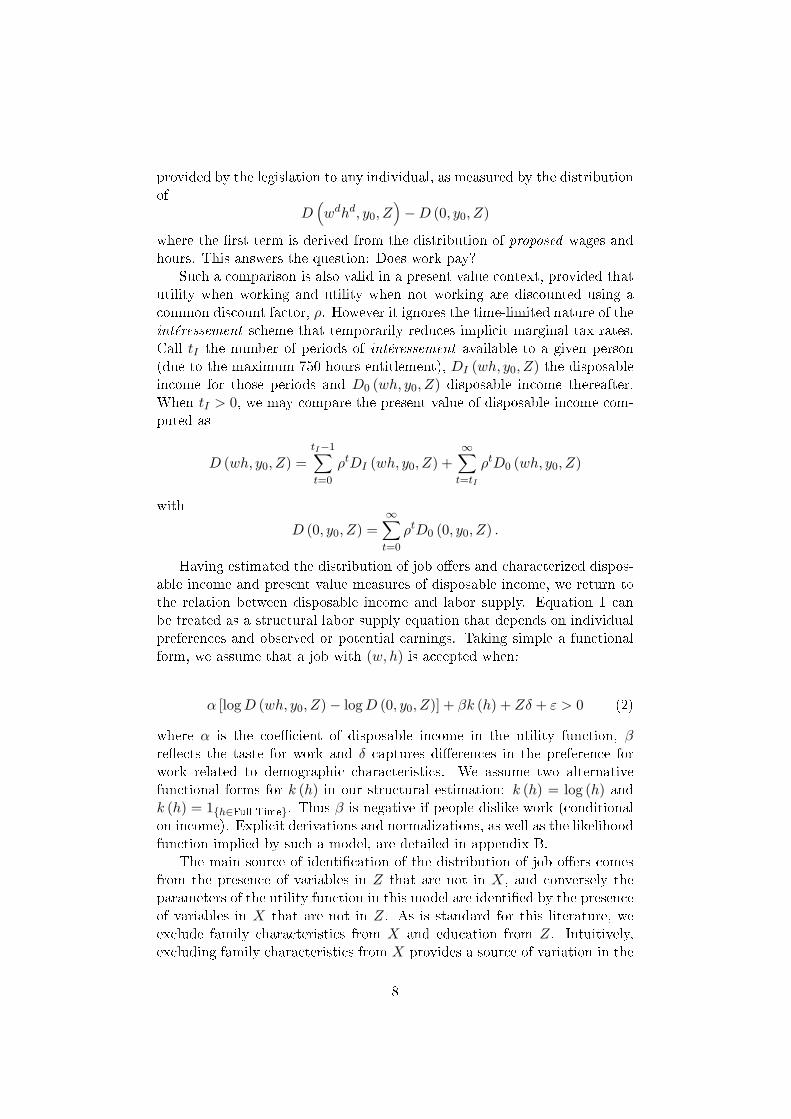
provided by the legislation to any individual, as measured by the distributionof
D(wdhd, y0, Z
)−D (0, y0, Z)
where the �rst term is derived from the distribution of proposed wages andhours. This answers the question: Does work pay?
Such a comparison is also valid in a present value context, provided thatutility when working and utility when not working are discounted using acommon discount factor, ρ. However it ignores the time-limited nature of theintéressement scheme that temporarily reduces implicit marginal tax rates.Call tI the number of periods of intéressement available to a given person(due to the maximum 750 hours entitlement), DI (wh, y0, Z) the disposableincome for those periods and D0 (wh, y0, Z) disposable income thereafter.When tI > 0, we may compare the present value of disposable income com-puted as
D (wh, y0, Z) =tI−1∑t=0
ρtDI (wh, y0, Z) +∞∑
t=tI
ρtD0 (wh, y0, Z)
with
D (0, y0, Z) =∞∑
t=0
ρtD0 (0, y0, Z) .
Having estimated the distribution of job o�ers and characterized dispos-able income and present value measures of disposable income, we return tothe relation between disposable income and labor supply. Equation 1 canbe treated as a structural labor supply equation that depends on individualpreferences and observed or potential earnings. Taking simple a functionalform, we assume that a job with (w, h) is accepted when:
α [log D (wh, y0, Z)− log D (0, y0, Z)] + βk (h) + Zδ + ε > 0 (2)
where α is the coe�cient of disposable income in the utility function, βre�ects the taste for work and δ captures di�erences in the preference forwork related to demographic characteristics. We assume two alternativefunctional forms for k (h) in our structural estimation: k (h) = log (h) andk (h) = 1{h∈Full Time}. Thus β is negative if people dislike work (conditionalon income). Explicit derivations and normalizations, as well as the likelihoodfunction implied by such a model, are detailed in appendix B.
The main source of identi�cation of the distribution of job o�ers comesfrom the presence of variables in Z that are not in X, and conversely theparameters of the utility function in this model are identi�ed by the presenceof variables in X that are not in Z. As is standard for this literature, weexclude family characteristics from X and education from Z. Intuitively,excluding family characteristics from X provides a source of variation in the
8
probability of accepting a job that is not related to the determinants of thejob o�er itself, allowing us to trace the shape of the job o�er distribution fora given X vector . Likewise, excluding education from Z provides a source ofvariation within the set of accepted job o�ers that is not due exclusively tothe observable determinants of preferences across jobs, allowing us to observechanges in employment probabilities for a given Z vector and thus map outpreferences. It should be noted that the parameters of the utility functionwould be (locally) identi�ed even without this latter exclusion restrictiondue to the conditionalities10 and discontinuities in the D (•, •, •) function.Inevitably, the various functional forms that we assume throughout our esti-mation also contribute to the identi�cation of the various model parameters(especially with respect to the job o�er distribution), although we assumeas �exible functional forms as possible throughout in order to minimize therisk that speci�cation error will a�ect our results.
Note also that, given the discrete nature of this model, comparing em-ployed individuals with di�erent earnings would provide no information onpreferences (all of them have preferred observed earnings to no earnings).In contrast to usual continuous labor supply models,11 identi�cation of pref-erences in our model thus relies on the comparison between employed andnon-employed agents along dimensions that determine the particular job of-fers they receive, i.e. the elements of the X vector that are not in Z.
3.2 Econometric Speci�cation and Estimation
There are several important institutional features that need to be accommo-dated in our empirical modeling of the joint wage-hours distribution. First,the RMI levels are set such that a full-time job paid the hourly minimumwage raises income signi�cantly, relative to being on welfare. Part-time workis therefore a central issue, as it is the potential source of incentive problems.Furthermore, the existence of a minimum wage12 generates a mass point inthe distribution of hourly wages that must be taken into account. Thesetwo considerations imply that �exible distributional assumptions, or semi-or non-parametric estimators, are warranted. On another hand, inferring thefull unconditional distribution from the observed distribution that is condi-tional on selection into employment is impossible unless the distribution is
10Examples of such conditionalities include housing allowances that depend on publicor private housing sector, home ownership status and geographic zones.
11In many continuous labor supply models, hours are supposed to be a choice variablefor the individual. Hours variation conditional on wages can thus be used to gatherinformation on preferences. In our setting, hours are not chosen by the individual perse, but rather each person is faced with a take-it-or-leave-it job o�er. In this context, asthe wage-hours pair is set by the employer, hours variation conditional on wages is notsu�cient to infer preferences.
12Much research has been devoted to studying the empirical importance of the minimumwage in France. See, for example, CSERC (1999) and Abowd et. al. (2000).
9
parameterized. As we are interested in characterizing the entire distributionof gains to employment, we use mixtures of normal and logistic distributionsso as to mimic observed distributions within a strictly parametric frame-work.13
One key institutional speci�city is the prevalence of a widespread publicemployment program, the Employment Solidarity Contract (Contrat emploi
solidarité, or CES ), that provides half-time jobs at the minimum wage plusa speci�c top-up income (but no rights to standard intéressement). In ourdata, roughly one third of all RMI recipients in the sample that are ob-served later in employment have CES jobs, which can only be held in thepublic sector.14 Zoyem (1999) shows that this sort of contract is frequentlyproposed to RMI recipients, and is occasionally incorporated into an indi-vidual's �reinsertion contract�.15 The possibility that a CES job o�er, ratherthan a regular market job o�er, may be received is modelled explicitly.
The structure of the wage-hours model consists mainly of four correlatedprobit equations: one for being o�ered a CES or not, one for being o�ered amarket job at the minimum wage vs. above, one for being o�ered a full-timemarket job vs. part-time and one for selectivity into employment. Condi-tional on being o�ered a job above the minimum wage, an equation estimatesthe shape of the truncated wage distribution above it; conditional of beingo�ered a full-time job, an equation estimates the shape of the hours distribu-tion around the full-time mode; a similar equation is estimated for part-time.Although the four main probit equations are estimated conditional on X (orX and Z for the selection equation), the wage and hours distributions forregular jobs are not treated as individual speci�c, i.e. conditional on observ-able characteristics. This constraint, imposed because of a lack of variabilityin the data, can be interpreted as saying that there is screening at entryinto di�erent types of jobs but that the wage and hours distributions areinsensitive to individual characteristics given the set of individuals employed
in each job type. The details of the econometric speci�cation can be foundin appendix B.
Anticipating our estimation results, �gures 3a-3b illustrate the perfor-mance of this statistical model. The observed distributions of wages andhours are compared with their distributions simulated from this model (con-ditional on employment) on the employed population. In spite of its veryparametric nature, the presence of mixtures and proper accounting for trun-
13The distributional assumptions were based purely on goodness-of-�t criteria, as we donot wish to impose any a priori beliefs about any underlying distributions in the economy.
14Private sector employers can exploit a number of other subsidised employment schemesthat may be relevant for RMI recipients; see L'Horty (2006) for a recent survey. Empir-ically, however, none of these other schemes provide as important a destination for RMIrecipients as CES contracts.
15Reinsertion contracts are programs negotiated between the RMI recipient and his orher caseworker, generally intended to help the RMI recipient plan his or her transitionfrom welfare back into work (Zoyem, 1999).
10

cation appear to generate a remarkably good �t. Moreover, the observedshare of employed at the minimum wage is 69.78% and the estimated shareis 69.45%.
Insert Figures 3a and 3b Around here
4 Job O�er Distribution Estimation Results
In this section, we provide some basic descriptive analysis concerning thejobs that RMI recipients obtain when they leave the RMI. We then presentthe results of estimating the proposed wage and hours distributions. Thedata (the Outcomes for RMI Recipients Survey, or L'Enquête sur le devenirdes personnes sorties du RMI ) consists of a representative sample of 2,764RMI recipients surveyed in 1996 and again one year later. The �rst wavede�nes the sample while the second wave is used to describe their labormarket status. The sample is restricted to individuals 17-55 years old at thesecond survey date and, in the structural labor supply model, we furtherrestrict the sample to single persons in order to avoid complicated issues ofcollective labor supply decision making. Single persons comprise two thirdsof the sample and more than half of single women on RMI raise children. Adetailed presentation of the data set and descriptive statistics are providedin appendix C.
4.1 Job O�er Estimation Results
The results of estimating the distribution of job o�ers, as described in sec-tion 3, are presented in table 1. The models were estimated separately formen and women. All continuous variables used in the estimation are stan-dardized to be mean 0 and to have a unit standard deviation, implying thatthe coe�cients are interpretable as the e�ect of a single standard deviationchange in the corresponding variables. Our base regressors include a set ofindicator variables corresponding to the highest degree obtained (the ref-erence is primary education), a quadratic polynomial in age, an indicatorvariable for French nationality and another for living in the Paris region.Disposable income on welfare and other demographic characteristics are in-cluded only in the selection equation and represent our primary exclusionrestrictions. Overall, the explanatory power of the observed variables in ourmodel seems limited, and this is likely related to the fact that we study arelatively homogeneous population, at least in terms of their labor marketprospects.
4.1.1 Selection Into Employment
As the correlation coe�cients between the selection equation and the variousother models make clear, selection bias is an issue for men in the CES equa-
11
tion16 and for women in the minimum wage and working time models. It isclear that the probability of employment increases with education for bothsexes, signi�cantly so for technical or professional education (category 4).Having children, especially young children, reduces the chance that a femalewho was on welfare in 1996 will be employed in January 1998, although thissupply-side mechanism does not appear relevant for men. Women in cou-ples and widows are much less likely to be employed than women who havenever been married (conditional on age), whereas men in couples are signif-icantly more likely to be observed in employment relative to never-marriedmen. The pro�le of employment with respect to age is essentially �at forwomen, whereas the probability of employment decreases with age for menwho received RMI bene�ts in 1996, at least initially.
It is interesting to note that the reduced form coe�cients on disposableincome from welfare (D (0, y0, Z)) are generally positive, and signi�cantly sofor women. This implies that additional income provided by the RMI maynot reduce the probability of an individual being observed in employment; onthe contrary, higher disposable income while on welfare may actually be as-sociated with an increase in subsequent employment among one-time welfarerecipients. That said, the model outlined in section 3.1 has no implicationfor the sign of this e�ect, because D (0, y0, Z) is generally correlated withD (wh, y0, Z) and it is the di�erence between the two that is relevant for jobacceptance.
4.1.2 CES and Regular Jobs
Table 1 suggests that CES jobs are less common in the Paris region thanelsewhere in France, and that the probability that a woman draws a CES
is concave with respect to her age. The correlation coe�cients suggest,especially for men, that the unobserved events that make a person likelyto be employed also increase the chances that the job will be a CES. Thismay suggest �cream-skimming� behavior on behalf of case workers, since thecase worker is the main source of information about these jobs for most RMIrecipients (Zoyem, 1999).
Considering the wage and working time models, the estimated interceptsof the minimum wage model imply that the probability of drawing a mini-mum wage job (for men and women) is roughly 0.85 for a person with meanvalues of all characteristics included in the model. Furthermore, it appearsthat the probability that a female welfare recipient will draw a minimumwage job decreases initially with her age then increases again later in life.Among both men and women who do not draw a CES job o�er, the most
16The tendency of the estimated parameter to head toward the upper bound suggeststhat this correlation coe�cient may be poorly identi�ed. However, this appears to beprimarily a sampling issue (and not a case of the parameter being fundamentally uniden-ti�able), since the same parameter for women behaves much more reasonably.
12
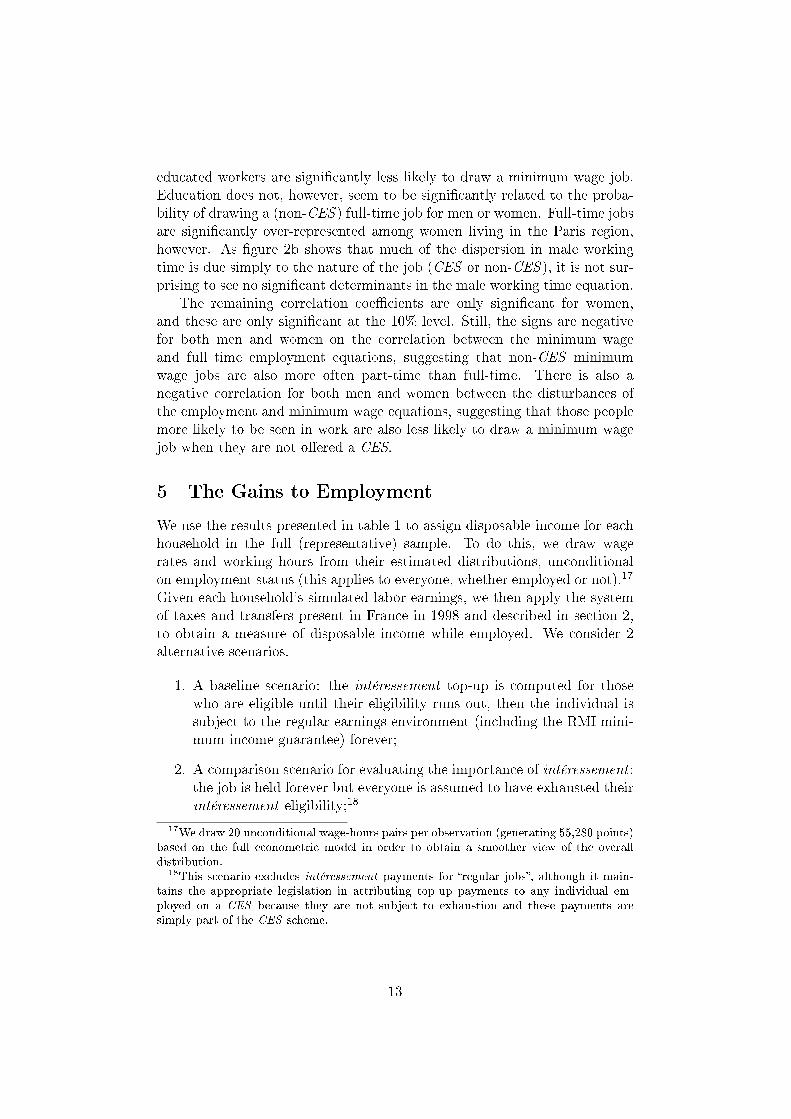
educated workers are signi�cantly less likely to draw a minimum wage job.Education does not, however, seem to be signi�cantly related to the proba-bility of drawing a (non-CES ) full-time job for men or women. Full-time jobsare signi�cantly over-represented among women living in the Paris region,however. As �gure 2b shows that much of the dispersion in male workingtime is due simply to the nature of the job (CES or non-CES ), it is not sur-prising to see no signi�cant determinants in the male working time equation.
The remaining correlation coe�cients are only signi�cant for women,and these are only signi�cant at the 10% level. Still, the signs are negativefor both men and women on the correlation between the minimum wageand full time employment equations, suggesting that non-CES minimumwage jobs are also more often part-time than full-time. There is also anegative correlation for both men and women between the disturbances ofthe employment and minimum wage equations, suggesting that those peoplemore likely to be seen in work are also less likely to draw a minimum wagejob when they are not o�ered a CES.
5 The Gains to Employment
We use the results presented in table 1 to assign disposable income for eachhousehold in the full (representative) sample. To do this, we draw wagerates and working hours from their estimated distributions, unconditionalon employment status (this applies to everyone, whether employed or not).17
Given each household's simulated labor earnings, we then apply the systemof taxes and transfers present in France in 1998 and described in section 2,to obtain a measure of disposable income while employed. We consider 2alternative scenarios.
1. A baseline scenario: the intéressement top-up is computed for thosewho are eligible until their eligibility runs out, then the individual issubject to the regular earnings environment (including the RMI mini-mum income guarantee) forever;
2. A comparison scenario for evaluating the importance of intéressement :the job is held forever but everyone is assumed to have exhausted theirintéressement eligibility;18
17We draw 20 unconditional wage-hours pairs per observation (generating 55,280 points)based on the full econometric model in order to obtain a smoother view of the overalldistribution.
18This scenario excludes intéressement payments for �regular jobs�, although it main-tains the appropriate legislation in attributing top-up payments to any individual em-ployed on a CES because they are not subject to exhaustion and these payments aresimply part of the CES scheme.
13

Under each scenario, we compute the present value of disposable incomeas explained in section 3.2 (to account for changes of income �ows overtime due to the intéressement rules) and convert it to a constant monthly�ow.19 In the case of individuals living in couples, we assume that thespouse/partner provides no additional labor income (modeling the joint laborsupply decision is beyond the scope of this paper). This is compared to themonthly �ow of disposable income from the RMI (i.e. assuming no oneworks) in order to calculate the gain to employment. Table 2 describesthe distribution of these gains for di�erent household types and under thedi�erent scenarios. Figures 4a-4c trace some of the distributions of gains forthe baseline scenario (singles only).
Insert Figures 4a, 4b and 4c Around Here
Our estimates suggest that almost every household gains from work inthe baseline case. This is because the 100% tax rate only applies in a veryparticular circumstance: the household has exhausted its entitlement to in-téressement, it does not get a CES job and earnings are below those of ahalf-time minimum wage job (approximately). This combination happensrarely. On the other hand, the value of the estimated monetary gains aresmall. For comparability between household types, gains are also computedeither per adult equivalent or as a percentage increase over welfare income.The highest gains are for single persons without children, and even then themedian gain is only 103.70 euros per month, while median gains are only30 to 70 euros per person for single parents or couples. It should also benoted that the large di�erence between mean and median gains suggests avery skewed distribution of gains, with a large probability mass at low levels(driven by CES jobs) and several higher gains that serve to pull the meanupward: this is con�rmed by �gures 4a-4c. Figure 4c also shows a smallmode for men around full-time work. For women, the distribution is multi-modal because of the impact of the number of children (compare �gures 4aand 4b).
The results for women, especially single mothers, are potentially worri-some and are due to a combination of factors. These women are found inthe lower tails of the distributions of wage rates and hours and they are sub-ject to high implicit tax rates through the means-testing of family bene�ts.These small monetary gains would likely result in a net loss to single motherswhen child care costs (not measured here) are added in. The French transfersystem includes a special program to subsidize child care, while schooling isfree starting at age 3. But it is unlikely that this assistance at the marginwould be a su�cient complement to the very small estimated potential gainsto employment.
19We apply a monthly discount factor of 0.995, which is equivalent to an annual interestrate of roughly 6%
14

Comparing the baseline to the simulation without intéressement, it ap-pears that the contribution of the intéressement scheme to the distributionof gains is very limited. Intéressement mechanically ensures that 13% addi-tional bene�ciaries will have a strictly positive gain from working (increasingthe percentage with gains from 86% to 99%), but there is practically no vis-ible di�erence in the amounts of the gains to employment. One reason isthat the 13% marginal bene�ciaries are among the lowest paid, and as suchthey contribute small gains.
The other reason for the apparently minor impact of the suppression ofthe intéressement scheme is that the amount of additional gains providedby intéressement is limited on average. Recall that, in this simulation, thesuppression of intéressement payments does not concern CES jobs, as theyare subject to a separate set of rules.20 In addition, the changes relative tothe baseline case do not apply to observations with household income abovetwice the RMI threshold (because then eligibility to both RMI and intéresse-
ment is lost), while the top-up only corresponds to 50% of a small amountwhen wages are small enough to bene�t from the intéressement scheme. Fi-nally, since the top-up is only available for a limited amount of time (750hours of work or less), the present value of the corresponding �wealth� is onlymarginally a�ected by the periods during which the top-up is available, evenif one applies a high discount factor. Overall, the features of the intéresse-ment system, as of 1998, especially its time-limited nature, seem to implythat it may have a very small potential to a�ect incentives to work despitethe relatively large kinks in the disposable income pro�les (see �gure 1).
6 The Relation Between Gains to Work and Em-
ployment
The discussion thus far has been centered on the gains to employment for theentire (representative) population of RMI recipients. However, the possiblemonetary incentive e�ects on labor supply of the RMI, insofar as they havebehavioral consequences, should be visible when comparing the simulatedgains of people actually observed in employment with those of people notobserved employed. In particular, equation 1 implies that those observed inemployment may tend to have larger gains to employment than comparableworkers not observed in employment.
6.1 Gains to Employment and Observed Employment Status
Figures 5a and 5b each compare three distributions of hours. Unconditional(on employment status) distributions are simulated for the employed and
20This is the reason why the median values, which are primarily driven by the prevalenceof CES jobs, remain una�ected.
15
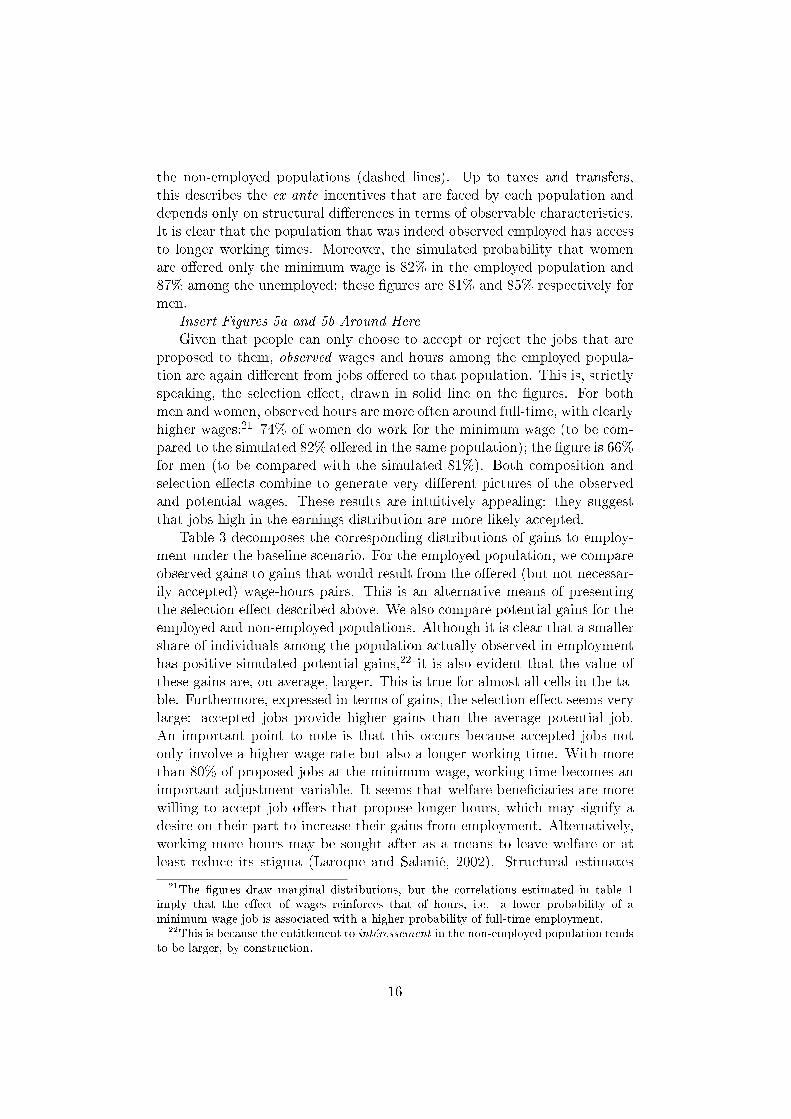
the non-employed populations (dashed lines). Up to taxes and transfers,this describes the ex ante incentives that are faced by each population anddepends only on structural di�erences in terms of observable characteristics.It is clear that the population that was indeed observed employed has accessto longer working times. Moreover, the simulated probability that womenare o�ered only the minimum wage is 82% in the employed population and87% among the unemployed; these �gures are 81% and 85% respectively formen.
Insert Figures 5a and 5b Around Here
Given that people can only choose to accept or reject the jobs that areproposed to them, observed wages and hours among the employed popula-tion are again di�erent from jobs o�ered to that population. This is, strictlyspeaking, the selection e�ect, drawn in solid line on the �gures. For bothmen and women, observed hours are more often around full-time, with clearlyhigher wages:21 74% of women do work for the minimum wage (to be com-pared to the simulated 82% o�ered in the same population); the �gure is 66%for men (to be compared with the simulated 81%). Both composition andselection e�ects combine to generate very di�erent pictures of the observedand potential wages. These results are intuitively appealing: they suggestthat jobs high in the earnings distribution are more likely accepted.
Table 3 decomposes the corresponding distributions of gains to employ-ment under the baseline scenario. For the employed population, we compareobserved gains to gains that would result from the o�ered (but not necessar-ily accepted) wage-hours pairs. This is an alternative means of presentingthe selection e�ect described above. We also compare potential gains for theemployed and non-employed populations. Although it is clear that a smallershare of individuals among the population actually observed in employmenthas positive simulated potential gains,22 it is also evident that the value ofthese gains are, on average, larger. This is true for almost all cells in the ta-ble. Furthermore, expressed in terms of gains, the selection e�ect seems verylarge: accepted jobs provide higher gains than the average potential job.An important point to note is that this occurs because accepted jobs notonly involve a higher wage rate but also a longer working time. With morethan 80% of proposed jobs at the minimum wage, working time becomes animportant adjustment variable. It seems that welfare bene�ciaries are morewilling to accept job o�ers that propose longer hours, which may signify adesire on their part to increase their gains from employment. Alternatively,working more hours may be sought after as a means to leave welfare or atleast reduce its stigma (Laroque and Salanié, 2002). Structural estimates
21The �gures draw marginal distributions, but the correlations estimated in table 1imply that the e�ect of wages reinforces that of hours, i.e. a lower probability of aminimum wage job is associated with a higher probability of full-time employment.
22This is because the entitlement to intéressement in the non-employed population tendsto be larger, by construction.
16
will con�rm this view.
6.2 Structural Labor Supply Estimation
In order to investigate the relation between gains to employment and laborsupply in further detail, we estimate by simulated maximum likelihood thestructural employment model de�ned by equations 3 and 4 in appendix B.23
To avoid the complexities related to joint labor market decisions, table 4presents the results of estimating this employment model on single-adulthouseholds only (70% of the sample).
Although the model speci�cation is reduced to its basics, our estimationpresents some interesting results. As expected from the above discussion,the income and hours variables have a signi�cant in�uence on employmentprobability, although their respective impacts (α and β in equation 2) aredi�cult to distinguish. The coe�cient on disposable income is high andprecisely estimated in the absence of the hours variable, suggesting thatlabor supply is quite sensitive to potential gains in disposable income.
When working time is included, however, the estimated α is typicallyreduced: individuals remain sensitive to disposable income variations whenmaking their labor supply decisions, but it appears that workers look for ex-tra hours as a separate objective. In principle, the two e�ects (preference forincome and preference with respect to working time) can be distinguished.However, the coe�cient α is not always signi�cant. Hours alone explain89% of the variance in gains for men and 78% for women, suggesting thatcollinearity between income and hours may be driving the insigni�cant in-come e�ect when the full-time dummy is included. Nevertheless, we �nd thatthese variables are jointly highly signi�cant (recall that the 99% con�dencelevel for χ2 (2) is 9.21).24
It is worth noting that both men and women are more likely to acceptjobs that o�er more hours of work (for a given income), regardless of whetherhours are measured as a continuous variable or with a dummy. These re-sults are compatible with estimates obtained by Laroque and Salanié (2003)for the whole French female population, which leads us to believe that ourresults are not simply an artifact of the limited variation in the hourly wagevariable.25 In our context, given that we focus on welfare recipients, thestigma-based explanation for preferring additional hours is credible, as maybe explanations in which more monthly hours serve as a �stepping stone� outof welfare and into the mainstream labor market.
23Details of the estimation are provided in appendix B.24When the age variable is not present, there is less collinearity and the results are more
precise, but for a priori labor supply considerations we hesitate to put weight on such aspeci�cation.
25There is much more variation in the wage rate in Laroque and Salanié's (2003) data,implying a more useful second source of identi�cation.
17

Finally, table 4 indicates that older bene�ciaries are less likely to be ob-served working in 1998. This result is robust and very precisely estimatedand may re�ect either discouragement on the part of welfare recipients or dis-crimination on behalf of employers with respect to older workers in general.Women with young children also work less and this e�ect is also strong: onemore child aged below 3 would decrease the probability of a single womanbeing employed by 90% on average. As noted above, this is consistent withthe idea that the very low gains that single women can expect from employ-ment, coupled with the likely high costs of caring for small children, canrender negative the net return to working for a single mother with smallchildren.
The estimates in table 4 can be used to calculate the elasticity of employ-ment with respect to an increase in gross earnings or disposable income. Forexample, consider a small increase in disposable income of θ percent26 andbase earnings of wh. Using the approximation log (1 + θ) = θ, this gives:
e (wh; y0, Z) =dP (Emp)
dD× D
P (Emp)
≈ 1θ
[P (αθ + α [log D (wh, y0, Z)− log D (0, y0, Z)] + βk (h) + Zδ + ε > 0)
P (α [log D (wh, y0, Z)− log D (0, y0, Z)] + βk (h) + Zδ + ε > 0)− 1
]The elasticity parameter that we exploit integrates this expression over theset of available job o�ers for each individual in a population with givencharacteristics, namely:
e (y0, Z) =∫
w
∫he (wh, ; y, Z) dF (w, h|X) .
Given that the function D (•, •, •) is highly nonlinear in its �rst element,we numerically evaluate this double integral with 500 draws from the jointwage-hours job o�er distribution speci�c to each individual. These resultsare then averaged over the full population or over subgroups de�ned by aparticular subset of Z, in particular men versus women.
Table 4 describes our implied elasticities with respect to gross earningsand with respect to disposable income for each of our model speci�cations.Our estimates with respect to disposable income range from 1.25 to 0.39for single men and from 1.10 to 0.44 for single women depending on thespeci�cation. As would be expected, the elasticity with respect to grossearnings is always lower than the elasticity with respect to disposable income,due to the tax and transfer system. The fact that the gap between the twoelasticities is larger in every speci�cation for women than for men re�ects thefact that women face higher implicit tax rates since they are more likely toreceive the RMI or intéressement payments even when working; i.e. single
26In practice, we use θ = 0.01 when calculating the elasticities given below.
18

women are more often on the �atter parts of the earnings-disposable incomepro�les shown in �gure 1 than single men. The elasticities are also lowerwhen controlling for hours worked, as our estimates in table 4 suggest anindependent role for hours in labor supply decisions (as noted above) thatleads the coe�cient in the speci�cation without hours to be biased upward.
These �gures are within the bounds of estimates of the extensive marginelasticities computed in the United States and France found elsewhere inthe literature. For example, Eissa et. al. (2004) survey the literature onlabor supply responses of single mothers to tax changes (in particular thoseassociated with the Earned Income Tax Credit, or EITC) during the 1980sand 1990s in the United States. They �nd almost no response at the intensivemargin (hours adjustment for people already working), but they �nd anelasticity of labor supply at the extensive margin (working or not working)of 0.35 to 1.7. For France, Piketty (1998) �nds elasticities ranging from 0.6to 1 based on a natural experiment, although his sample of women is notlimited to welfare recipients. Laroque and Salanié (2003) use a structuralmodel and estimate an elasticity of 0.97 for women in couples but only 0.36for single women. In all of these cases, our estimates (for single women) arequite comparable to existing estimates in the literature.
It is worth remembering that our present value of income �ows are com-puted using a 6% annual discount rate. Given the complexities of the systemand the possibility of myopia among a population that is somewhat removedfrom regular labor market activity, welfare recipients may tend to discountfuture income much more radically than we have previously assumed. To testthe implications of such behavior, we re-estimated the labour supply modelusing higher discount rates for the income variable. This change is neutralwhen income is constant over time since our speci�cation compares the logsof disposable income. However, when incomes decrease with time (as is thecase for people receiving intéressement payments), increasing the discountrate has the obvious e�ect of scaling up measured gains to work. Althoughthe estimates should not change qualitatively, the estimated elasticities mayadjust downward. For instance, we �nd that the elasticity with respect todisposable income decreases from 0.54 to 0.33 (based on speci�cation (2)) forwomen but remains unchanged for men (who receive intéressement paymentsmuch less often) when we assume a 30% discount rate.
6.3 Policy Simulations Based on the Structural Estimation
Results
The structural model estimated in section 6.2 allows us to simulate the ex-pected labor supply impacts of a number of di�erent policy changes.27 Itshould be remembered, however, that our model is based on partial equilib-
27Labor supply in our simulations is based on speci�cation (2) in table 4.
19

rium and thus large-scale policy experiments that could have macroeconomice�ects can not reasonably be considered in this context. In particular, in allof these simulations we assume that the above-minimum wage distribution,the full and part time hours distributions, the probability of receiving CESo�ers, the probability of receiving a minimum wage job o�er and the proba-bility of receiving a draw from the full time hours distribution are una�ectedby the policy changes that we simulate.
With this in mind, we consider the following alternative scenarios, whichwe compare to our baseline scenario:
• Without intéressement
• With in�nite-duration intéressement
• With the Prime pour l'emploi (PPE) negative income tax
• With an increase in the minimum wage of 10%
For each of these situations, we consider two outcome measures, thechange in the level of employment (relative to the reference scenario) andthe public spending implications of the change.
The former e�ect is evaluated in a straightforward manner (estimatingthe probability of employment for each individual and taking the averageunder each scenario), while the latter is more subtle. One can evaluatethe monthly value of net transfers made by the government, individual byindividual, when an individual works, as E (D (wh, y0, Z))− E (wh) (whichcan be negative when wh exceeds twice the RMI threshold) while the monthlyvalue of net transfers made by the government when the individual is notemployed is E (D (0, y0, Z)) (which is always positive). This implies that thatone can evaluate the total impact of each scenario on government revenuesas:28
NetTransfers =∑
i
{P (Empi) [E (D (wihi, y0,i, Zi))− E (wihi)]}
+ {[1− P (Empi)]D (0, y0,i, Zi)} .
We begin by presenting the baseline simulation in table 5. The baselinescenario presents actual employment rates along with simulated ones usingthe legislative framework actually in place in 1997. We simulate both earn-ings and employment, and table 5 shows that our simulations are very closeto the observed employment rates due to the good �t of the model. Underthe baseline scenario, net government transfers on average amount to 325euros per month for single male welfare recipients and 521 euros for singlewomen. The higher transfers to women re�ect the fact that single womenare more likely to raise children than single men, and child bene�ts representa relatively large transfer amount.
28All probabilities and expectations are taken with respect to the joint distribution ofjob o�ers (wh), conditional on observed characteristics.
20

6.3.1 No Intéressement Simulation
In this simulation, we calculate the disposable income from employment as ifthe individual had exhausted all eligibility for intéressement payments andthus received disposable income from work with no in-work bene�ts. Thisgives rise to a tiny decrease in disposable income on average: as noted above,there are relatively few individuals who receive the earnings top-up and, ina present value computation, the few months of intéressement paymentsreceive little weight. Therefore, the policy has almost no impact. As table 5shows, the average monthly �ow of in-work disposable income falls by only0.09% for men and 0.31% for women. Eliminating the intéressement systemwould thus have very little negative impact on labor supply, with male laborsupply decreasing by 0.10% and female labor supply by 0.18%. However,since the payments are so rarely made and represent such a small amountof in-work disposable income, the e�ect on public �nances of eliminatingintéressement would be essentially nil.
6.3.2 In�nite-Duration Intéressement Simulation
In this simulation we suppose that eligible individuals can receive intéresse-ment in-work bene�ts, according to the rules described in section 2 andappendix A, inde�nitely. Given our method of converting present values tomonthly equivalents, this is the same as considering the case of completemyopia for an individual with at least some rights to intéressement, in whichthe date at which intéressement payments run out is never considered.
As seen in table 5, the average increase in disposable income at workis not high (1.50% for men and 5.80% for women), both because of thelarge share of CES contracts and because most full time workers exceedthe income threshold that renders them eligible for intéressement payments.The employment impacts of extending intéressement bene�ts forever wouldbe larger than those of eliminating the program (due to discounting and thetime-limited nature of these bene�ts): female employment increases by 3.2%and male employment by 1.5%. Such an increase in labor supply comes atthe relatively modest cost of one extra euro per month for single men and tenextra euros per month for single women. These two simulations illustrate,however, the small potential for a�ecting labor supply of a policy instrumentthat is so strongly limited in scope.
21
6.3.3 Negative Income Tax, or Prime Pour l'Emploi (PPE) Sim-
ulation
In this simulation we took the rules governing the PPE program29 at thestart of 2006 (applicable to earnings in 2005), in�ated our 1998 earningsto 2005 levels using purchasing power de�ators, calculated eligibility andamounts of negative income tax payments, de�ated them back to 1998 levelsand added them to disposable income in the absence of intéressement case.Although the value of the transfer remains small overall, it is highest forindividuals earning the equivalent of a full-time minimum wage, in contrastwith intéressement payments (that decline to zero at that point). The PPEalso bene�ts individuals employed on a CES contract.
The net result of all of these changes, as shown by table 5, is that dispos-able income in work increases much more in this simulation, especially formen (+ 10.38%) because they are more often working full-time. Employmentnow increases by 9% for men and 4% for women with respect to the baseline.By contrast, average transfers increase by only 4.9% and 3.5% respectively.This reform thus had the potential to bring about non-negligible changes inlabor supply at relatively little additional cost to the government.
6.3.4 10 Percent Minimum Wage Increase Simulation
This last simulation looks at the impact of increasing the minimum wageby a signi�cant amount, in our case 10 percent.30 The model allows forthree di�erent mechanisms by which such an increase can a�ect labor supply.First, and most straightforwardly, earnings in a minimum wage job increaseby 10 percent (for a given number of hours worked). Second, the truncationpoint of the distribution of above-minimum wage jobs shifts upward, makingexpected earnings on non-minimum wage jobs higher as well. Finally, thevalue of a CES job (which is paid the minimum wage plus a top-up) alsoincreases. The net impact on disposable income is limited, especially for
29The Prime Pour l'Emploi was introduced in 2001, with the objective of providing workincentives at the bottom of the income distribution to a large base of working households.It is not limited in time and is more generous than intéressement, especially for full-time workers. For single persons, the premium represents 6% of labor earnings up to theequivalent of full-time work at the minimum wage; it then decreases linearly to 0 at 1.4times the full-time minimum wage. Parents also receive a lump-sum transfer of 62 euros(in 1997 equivalents) per child. This transfer is cumulative with respect to other incomesources, with few restrictions (a minimum of approximately 50 hour per moth worked and,for couples, a restriction on total household income).
30Our simulation holds constant the probability of receiving a minimum wage job o�erwhen one does not receive a CES o�er. Although there is signi�cant work on the elasticityof employment with respect to movements in the minimum wage in France (Dolado et.al., 1996; Abowd et. al., 2000a; Abowd et. al., 2000b; Kramarz and Philippon, 2001),there is to our knowledge no work on the impact of minimum wage movements on the sizeof the spike at the minimum wage in the earnings distribution for France.
22

women, by the high implicit tax rates on labor earnings and the resultinglow elasticities with respect to wage.
The net result of a 10% increase in the minimum wage is an increase indisposable income of 7.35% for single men and 4.57% for single women inour simulations. The e�ects on the probability of employment are less thanthose of the PPE (a 6% increase for single men and a 2% increase for singlewomen) but more than those of increasing intéressement inde�nitely for mendue to the fact that single men rarely receive intéressement payments. Inter-estingly, increasing the minimum wage also reduces net government transfersby 2.15% for men and by 1.0% for women. This is only partially driven bythe increased employment probability. A secondary implication of minimumwage increases is that the di�erence between earnings when employed andthe RMI threshold is also reduced, which lowers the amount the governmentmust transfer as well. Whereas the former e�ect is more important for singlemen, the fact that women are more likely to have minimum (or low) wagejobs then men means that the second e�ect is likely to be more prevalent forsingle women. It is worth remembering that our simulation does not allow fordemand-side e�ects of a minimum wage increase; as a result, the equilibriumoutcome with respect to the probability of employment is uncertain.
6.4 Discussion
Overall, these structural estimates suggest that monetary incentives do af-fect labor supply in this population. Although potential gains from workingare small on average for the whole population, selection e�ects are observedin the employed population and labor supply elasticities are of comparablesize to those found elsewhere in the literature. That said, the in-work ben-e�t program (intéressement) does not seem to provide particularly strongadditional incentives to work, largely due to its time-limited nature and therelative small range of gross earnings that are eligible for the program.
It must be noted that this is a strict labor supply interpretation of thebasic facts presented in the previous sections, although our estimation ofthe job o�er distribution partially captures demand-side phenomena. In thetheoretical model, we do not allow the possibility that job o�ers may not beproposed at all to certain welfare recipients. It could be argued that indi-viduals with more productive characteristics are also more likely to receiveo�ers. In our speci�cation, the negative values of the intercept (table 4) canbe interpreted as implying that no work is preferred to very poorly paid,short-hours work. If we were to incorporate a probability of receiving a jobo�er into our model at all, it would only be identi�ed separately from thisintercept under strong additional conditions31 that would not be empiricallyrelevant in our data. Our implicit assumption is rather that a job can always
31Laroque and Salanié (2003) use an �ad in�nitum� type of reasoning to justify theiridenti�cation of the probability of receiving a job o�er.
23
be found (and represented by a draw from the distribution (wd, hd|X)), butthat the o�er may be so unattractive that most individuals would be re-luctant to take it. Such an assumption is compatible with sociological �eldanalysis of this population (Benarrosh, 2003).
Finally, note that our likelihood function implicitly assumes that welfarebene�ciaries only make one draw from the job o�er distribution which theymay take or leave. This is very much in line with the static approach tolabor supply. In contrast, Dickens and Lundberg (1993) allow workers tochoose among a random number of o�ers. In such a context, those who hadthe opportunity to choose between a larger number of alternatives wouldselect jobs with higher earnings and would therefore be more often observedin employment. However, for the purpose of estimating the sensitivity ofpreferences to disposable income, assuming (1) that some people have achance to draw a high wage or assuming (2) that some people have a chanceto make a large number of draws, among which there is more often a highwage, are functionally equivalent.
7 Conclusion
The evaluation of potential labor earnings for recipients of a guaranteed min-imum income transfer (such as the French RMI system) is a conceptually andtechnically delicate exercise. It remains, nevertheless, an indispensable pieceof information in the debate concerning the incentive e�ects on labor sup-ply of welfare. Simulations for �representative households� and calculationsbased exclusively on estimated e�ective marginal tax rates are inadequate,in that they do not account for the heterogeneity in labor market conditionsthat RMI recipients face. In this paper, we have considered the interactionbetween the labor market and the system of taxes and transfers in e�ectin France in 1998 (with the exception of local taxes and local transfers) ac-counting for the presence of the supplemental earnings top-up provided bythe welfare system under the name of intéressement. Since RMI recipientstend to be very di�erent from the population as a whole in terms of theirreemployment labor earnings, it is important to use an RMI-centered surveyto obtain reasonable sample sizes of the population of interest. But since thesorts of jobs to which RMI recipients can aspire tend to be rather particu-lar, most notably due to the predominance of active labor market programs(such as France's CES jobs), it becomes essential to specify a model to pre-dict wage and hours o�ers that �ts the observed data on welfare recipientsas well as possible.
We �nd that almost all welfare bene�ciaries would gain from being em-ployed on a job randomly drawn from the distribution of job o�ers, relativeto staying on welfare. But the size of the gains is extremely small. As of1998, the intéressement scheme provided only marginal additional incentives
24

due to its time-limited nature. This may be part of the reasoning behind themodi�cation of the rules governing the intéressement scheme in 1998 and2001 which extend its applicability from 750 hours to about one year andreduce the implicit marginal tax rate from 50% to 0% during the �rst threemonths. Most strikingly, the monetary work incentives for single mothers arevery limited. Were we able to directly integrate child care costs and locallyavailable means-tested assistance policies, we would almost surely �nd a netloss associated with work for French single mothers.
We �nd that the distribution of gains that we estimate for the popu-lation of individuals actually observed in employment di�ers from that ofthose individuals observed out of employment at the time of the follow-upsurvey. We interpret this as a labor supply e�ect and quantify it based on asimple structural employment model, although some of our point estimatesare imprecise, in part due to the high degree of collinearity between dis-posable income and hours worked. Our estimated extensive margin laborsupply elasticities, in the range of 1.25 to 0.39 for men and 1.10 to 0.44 forwomen (depending on the speci�cation) are quite comparable to extensivemargin labor supply elasticities estimated on similar populations elsewherein the United States- and France-based literature, and our policy simula-tions suggest that although the intéressement program may not be the idealmechanism for increasing labor supply among welfare recipients, other policyinstruments (such as the Prime Pour l'Emploi negative income tax, imple-mented in France in 2001) are more promising. Alternatively, the estimatedpreference for full time work suggests that a policy aimed at increasing thesupply of these sorts of jobs might be particularly e�ective.
Overall, it appears that French welfare recipients are relatively sensitiveto monetary incentives when making labor supply decisions, but the existingsystem only provides limited incentives for welfare recipients to work. Ourpolicy simulations suggest that changing the structure of the monetary in-centives has the potential to bring quite a few additional individuals o� ofwelfare and into work, and the cost to the government of providing theseincentives may not be prohibitive.
The authors are grateful to Cédric Afsa for his numerous comments, Thomas
Piketty and two anonymous referees for helpful suggestions and Luc Behaghel for
outstanding research assistance. They would also like to thank Danièle Guillemot
for helping provide access to the data and Cyril Hagneré for help into the French wel-
fare system, as well as Jean-Claude Barbier, Jérôme Gautié, Guy Laroque, Laurence
Rioux, Bernard Salanié, Daniel Szpiro and participants at the DREES workshop,
the �Working Poor en France� conference and seminars at the Centre d'Etudes de
l'Emploi, Université Lille I and Université Catholique de Louvain for their com-
ments. This research was �nanced by a grant from the Ministry of Labour.
25
Bibliography
Abowd, John M., Francis Kramarz, Thomas Lemieux and David N. Mar-golis (2000a). �Minimum Wages and Youth Employment in France and theUnited States,� in David G. Blanch�ower and Richard B. Freeman (eds.),Youth Employment and Joblessness in Advanced Countries, (Cambridge:NBER).
Abowd, John M., Francis Kramarz, David N. Margolis and ThomasPhilippon (2000b). �The Tail of Two Countries: Minimum Wages and Em-ployment in France and the United States,� IZA Discussion Paper, no. 203,September.
Altonji, Joseph G. and Christina H. Paxson (1988). �Labor Supply Pref-erences, Hours Constraints, and Hours-Wage Trade-O�s,� Journal of LaborEconomics, vol. 6, pp. 254-276.
Altonji, Joseph G. and Christina H. Paxson (1992). �Labor Supply, HoursConstraints, and Job Mobility,� Journal of Human Resources, vol. 27, pp.256-278.
Benarrosh, Yolande (2003), �Les trappes d'inactivité - Chômage volon-taire ou chômage de résistance ?�, Travail et emploi, no 95.
CNAF (1996a), 1996, statistiques CAF et tous régimes, Série �Prestationsfamiliales�.
CNAF (1996b), Revenu minimum d'insertion au 31 décembre 1996, Série�Recherche, prévision, statistique�.
CSERC (1999). Le SMIC: Salaire Minimum de Croissance, (Paris: LaDocumentation Française).
Dickens, William and Shelly Lundberg (1993), �Hours Restrictions andLabor Supply�, International Economic Review, vol. 34, pp. 169-192.
Dolado, Juan, Francis Kramarz, Steven Machin, Alan Manning, DavidN. Margolis and Coen Teulings (1996), �The Economic Impact of MinimumWages in Europe,� Economic Policy, October.
Eissa, Nada, Henrik Jacobsen Kleven and Claus Thustrup Kreiner (2004),�Evaluation of Four Tax Reforms in the United States: Labor Supply andWelfare E�ects for Single Mothers,� NBERWorking Paper no. 10935, Novem-ber.
Euwals, Rob and Arthur van Soest (1999), �Desired and Actual LaborSupply of Unmarried Men and Women in the Netherlands�, Labour Eco-
nomics, vol. 6, pp. 95-118.Fougère, Denis and Laurence Rioux (2001), �Le RMI treize ans après:
entre redistribution et incitations�, Economie et statistique, no. 346-347,2001-6/7, pp. 3-12.
Galtier, Bénédicte (1999), �Les temps partiels : entre emplois choisis etemplois 'faute de mieux',� Economie et statistique, no. 321-322, 1999-1/2 ,pp. 57-77.
26
Gautié, Jérôme and Alain Gubian (2000), �Réforme du revenu minimumd'insertion et marché du travail,� Droit social, no. 7-8, juillet-août, pp. 699-707.
Gilles-Simon, Marie-Odile and Michel Legros (1996), �Le non-recourschez les plus pauvres: une approche empirique�, Recherches et prévision,no. 43, pp. 51-58.
Gravel Nicolas, Cyrille Hagneré and Nathalie Picard (2004). �Une estima-tion des conséquences d'une réforme des minima sociaux sur l'o�re de travailà l'aide d'un modèle intertemporel de microsimulation, Economie Publique,no. 14.
Gurgand, Marc and David N. Margolis (2000), �Minima sociaux et revenusdu travail en France,� Document de travail 2000-62, CREST, INSEE.
Gurgand, Marc and David N. Margolis (2002), �A Multiple-State Non-Stationary Model of Welfare Exit�, presented at the 2003 European Associ-ation of Labour Economists Annual Conference, May.
Hagneré, Cyrille, Nathalie Picard, Alain Trannoy and Karine Van derStraeten (2003). �L'importance des incitations �nancières dans l'obtentiond'un emploi est-elle surestimée ?� Economie et Prévision, no. 160-161.
Hagneré, Cyrille and Alain Trannoy (2001). �L'impact de trois ans deréforme sur les trappes à inactivité,� Economie et Statistique no. 346-347,p.161-185.
Hajivassiliou, Vassilis and Paul Ruud (1994), �Classical Estimation Meth-ods for LDV Models using Simulation�, Handbook of Econometrics, vol. 4,(Amsterdam: North-Holland).
Heckman, James J. (1979), �Sample selection bias as a speci�cation er-ror,� Econometrica, vol. 47, pp. 153-161.
Join-Lambert, Marie-Thérèse (1998), Chômage: mesures d'urgence et
minima sociaux, (Paris: La Documentation française).Kahn, Shulamit and Kevin Lang (1991). �The E�ect of Hours Constraints
in Labor Supply Estimates,� Review of Economics and Statistics, vol. 73,pp. 605-611.
Kahn, Shulamit and Kevin Lang (1996). �Hours Constraints and theWage/Hours Locus,� Canadian Journal of Economics, vol. 29, pp. S71-S75.
Kramarz, Francis and Thomas Philippon (2001), �The Impact of Di�er-ential Payroll Tax Subsidies on Minimum Wage Employment,� Journal of
Public Economics, vol. 82, pp. 115-146.Laroque, Guy and Bernard Salanié (1999), �Prélèvements et transferts
sociaux : une analyse descriptive des incitations �nancières au travail,�Economie et statistique, no. 328, 1999-8, pp. 3-19.
Laroque, Guy and Bernard Salanié (2002), �Labour Market Institutionsand Employment in France�, Journal of Applied Econometrics, 17(1), pp.25-48.
Laroque, Guy and Bernard Salanié (2003), Institutions et emploi: Les
femmes et le marché du travail en France, (Paris: Economica).
27
L'Horty, Yannick (2006). Les nouvelles politiques de l'emploi, (Paris:Editions La Découverte).
L'Horty, Yannick and Denis Anne (2002), �Transferts sociaux locaux etretour à l'emploi,� Economie et statistique, no 357-358, pp. 42-71.
Lhommeau, Bertrand (2002), �Les con�gurations familiales des ménagescomptant un allocataire du RMI : du foyer RMI au ménage INSEE,� Economie
et statistique.Liaisons sociales (1998), Barême social périodique , January.Margolis, David N. (1996), �Cohort E�ects and Returns to Seniority in
France,� Annales d'Economie et de Statistique, January/June.Meyer, Bruce D. and Dan T. Rosenbaum (2001), �Welfare, the Earned
Income Tax Credit, and the Labor Supply of Single Mothers,� Quarterly
Journal of Economics, August, pp. 1063-1114.Mo�tt, Robert (2002), �Welfare Programs and Labor Supply�, in Alan
J. Auerbach and Martin Feldstein (eds.), Handbook of Public Economics,volume 4 (Amsterdam: North Holland), pp. 2393-2430.
Mo�tt, Robert (2003), �The Negative Income Tax and the Evolution ofU.S. Welfare Policy�, Journal of Economic Perspectives, Summer, pp. 119-140.
OECD (1995), Employment Outlook: 1995 Edition, OECD, Paris.OECD (2003), Employment Outlook: 2003 Edition, OECD, Paris.Padieu, C. (1997), �RMI et Smic: étude sur l'apport �nancier de l'accès
à l'emploi par types de ménages�, Les Cahiers de l'ODAS, mars.Piketty, Thomas (1998). �L'impact des incitations �nancières au travail
sur les comportements individuels: une estimation pour le cas français,�Economie et prévision, no. 132-133, pp. 1-35.
Piketty, Thomas (2005). �L'impact de l'allocation parentale d'éducationsur l'activité feminine et la fécondité en France, 1982-2002,� in Cécile Lefevre(ed.), Histoires de familles, histoires familiales, Les Cahiers de l'INED, no.156, pp. 79-109.
Rémy, Véronique (2005), �Elements de bilan sur les travaux évaluantl'e�cacité des allègements de cotisations sociales employeurs,� Document
d'études DARES, number 101, juillet.Roux, Sébastien (2005), �L'augmentation du temps partiel est-elle déter-
minée par les entreprises ou par les travailleurs?�, INSEE mimeo, Paris.Saez, Emmanuel (2002), �Optimal Income Transfer Programs: Intensive
versus Extensive Labor Supply Responses,� Quarterly Journal of Economics,vol. 117, pp. 1039-1073.
Stewart, Mark B. and Joanna K. Swa�eld (1997). �Constraints on theDesired Hours of Work of British Men,� Economic Journal, vol. 107, pp.520-534.
Terracol, Antoine (2003), Essais sur la perception des minima sociaux
en France, Ph.D. Dissertation, Université Paris 1 Panthéon-Sorbonne, Paris,France.
28

van Soest, Arthur, (1995), �Structural Models of Family Labor Supply.A Discrete Choice Approach�, Journal of Human Resources, vol. 30, no 1,pp. 63-88.
Zoyem, Jean-Paul (1999), �Contrat d'insertion et sortie du RMI�, Doc-ument de travail G 9909, Direction des études et synthèses économiques,INSEE.
29

A The French Welfare System
The main component of France's welfare system at the national level is theRevenu Minimum d'Insertion (RMI), a guaranteed minimum income pro-gram accessible to any person aged 25 and over,32 provided that the sumof all resources available to his or her household is below a threshold thatdepends on family composition. These take the form of a monetary transferthat brings household resources up to the threshold. Other guaranteed in-come programs (with restricted access) do exist, such as those for the elderly,handicapped, widows and widowers and single parents with children below3.33 These other programs are typically more generous than RMI, and thetransfers for the handicapped and the elderly cover a large number of peo-ple, while the population covered by the widow/widower bene�ts is ratherlimited. However, the role of these transfers in a�ecting the labor market be-havior of those concerned is likely to be quite di�erent from that of the RMI.Finally, the unemployed who have exhausted their unemployment bene�tshave access to a speci�c bene�t whose amount is similar to that of RMI.34
When comparing labor income with welfare income, additional transfersrelated to family composition and housing must be considered. Most familycomposition-based bene�ts are means tested, increase with the number ofchildren, and vary with the presence or absence of children under 3 yearsold.35 We exclude the Allocation parentale d'éducation, or APE,36 which isavailable to every household with at least 2 children of which one is less than3 years old, provided one of the spouses does not work or works part time and
can justify at least 2 years of work over the last 5 or 10 years (dependingon the number of children). This last bene�t was being paid to roughly300,000 French women with 2 children (for which the amount was roughly 365Euros/month) and roughly 180,000 French women with 3 or more children(for which the amount was roughly 450 Euros/month) on December 31, 1997(Piketty, 2005). We cannot consider this bene�t because information onpast employment in the data is insu�cient to determine eligibility. AlthoughPiketty (1998) has shown that this transfer has signi�cant labor supply e�ects(up to half of the recipients of this program may have withdrawn from the
32This age restriction does not apply for people with underage dependents.33This last bene�t, called the Allocation du Parent, or API, cannot be received for more
than 3 years total.34Unfortunately, our data does not allow us to observe individuals who receive the single
parents with young children bene�t or the transfer in the event of unemployment bene�texhaustion.
35In particular, every household responsible for at least 2 children is entitled to a transfer(Allocations familiales). The additional, means-tested, transfers considered in this paperare the Complement familial, Allocation pour jeune enfant and Allocation de rentrée sco-
laire.36A subsidy for children in school which was introduced in 1995 (Aide à la scolarité) is
also not considered here.
30

labor force due to its disincentive e�ects), it is not particularly relevant forour data. First, the transfers are well below the RMI threshold for singlepersons with the corresponding number of children, so that no single shouldclaim it. As a result, the labor supply section of the paper is not sensitive tothis. For couples, this scheme has the potential to increase disincentives, butonly in particular segments of the potential earnings distribution of the wifeand husband. This implies that although we may understate disincentivesin the �gains to employment� computations, this problem is likely to occuronly in what is likely to be a small (but unknowable in our data) share ofcouples in which one of the spouses has su�cient work experience to qualify.
B Econometric Speci�cation
In order to further investigate the link between gains to employment andobserved employment, we estimate the structural model based on equation1. Taking simple functional forms for the utility functions, we set:
U (D (wh, y0, Z) , h;Z, ε) = α log D (wh, y0, Z) + k(h) + Zδ + ε
when working, and:
U (D (0, y0, Z) , 0;Z, ε) = α log D (0, y0, Z) + k(0) + Zδ0 + ε0
if not working. We normalize k(0) = δ0 = ε0 = 0 and var(ε) = 1. Thisimplies that all parameters, but α, must be interpreted as measuring an e�ectrelative to non-working. In practice, function k(h) will be either β log h orβ times an indicator variable for more than 130 monthly hours. Assumingthat ε is independent of (wd, hd|X),37 the contribution to the likelihood forworking individuals is:
P (Employment at w, h|X, Z, y0) = P (ε ≥ α [log D (0, y0, Z)− log D (wh, y0, Z)]
−k(h)− Zδ)×f(w, h|X)
(3)
and for non-working individuals:
P (Non-Employment |X, Z, y0) =∫wd
∫hd P (ε < α [log D (0, y0, Z)
− log D(wdhd, y0, Z
)]−k(hd)− Zδ
)×f(wd, hd|X)dwddhd
(4)
37This technical assumption, also made by van Soest (1995), simpli�es the estimationby allowing us to estimate sequentially the job o�er distribution and labor supply.
31

where the joint distribution f(wd, hd|X) has been estimated as describedbelow. The assumption of independence between ε and (wd, hd|X) meansthat we can just condition on realized (w, h), instead of the full density, whenmaximizing the likelihood function.
B.1 Estimation of the Joint Wage-Hours Distribution
Given the considerations described in section 3.2, we estimate the followingstatistical models.
A CES is proposed when
XβC + uC ≥ 0 (5)
If a CES o�er is not received, a �regular job� wage is drawn. It is paidthe minimum wage, w = w, if
XβS + uS ≥ 0 (6)
Otherwise, the wage is drawn in a truncated wage distribution with density
fw(w|w > w) = fw(w)/P (w > w)
and the underlying density of w is generalized logistic:
fw(w) =exp((w −m)/s)
s (1 + exp((w −m)/s))2
where parameters m and s are estimated.Hours worked can be drawn from a full-time distribution or a part time
distribution. IfXβH + uH ≥ 0 (7)
then hours is drawn from a full-time truncated distribution with density
f1h
(h|h > 0, h ≤ h
)= f1h(h)/P
(h > 0, h ≤ h
)where h is the maximum working time.38 Otherwise, the hours worked are
drawn from the part time density f2h
(h|h > 0, h ≤ h
), de�ned in a similar
manner. The underlying densities are also generalized logistic:
fih(h) =exp ((h−mi) /si)
si (1 + exp ((h−mi) /si))2 , i = 1, 2
38As we have no a priori knowledge of the maximum monthly working time of the setof o�ered jobs, we used the sample maximum for each sex to de�ne h, which is the bestnonparametric estimator of this parameter. For men, h = 312, while for women, h = 333.
32
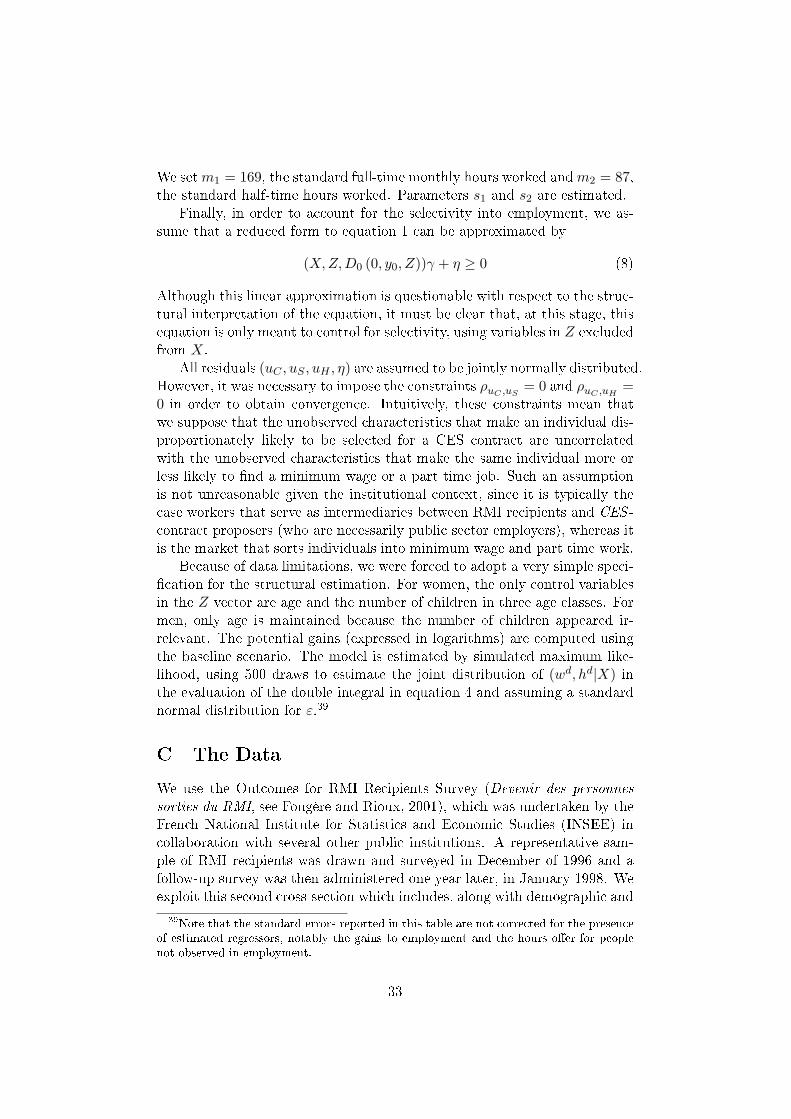
We set m1 = 169, the standard full-time monthly hours worked and m2 = 87,the standard half-time hours worked. Parameters s1 and s2 are estimated.
Finally, in order to account for the selectivity into employment, we as-sume that a reduced form to equation 1 can be approximated by
(X, Z, D0 (0, y0, Z))γ + η ≥ 0 (8)
Although this linear approximation is questionable with respect to the struc-tural interpretation of the equation, it must be clear that, at this stage, thisequation is only meant to control for selectivity, using variables in Z excludedfrom X.
All residuals (uC , uS , uH , η) are assumed to be jointly normally distributed.However, it was necessary to impose the constraints ρuC ,uS
= 0 and ρuC ,uH=
0 in order to obtain convergence. Intuitively, these constraints mean thatwe suppose that the unobserved characteristics that make an individual dis-proportionately likely to be selected for a CES contract are uncorrelatedwith the unobserved characteristics that make the same individual more orless likely to �nd a minimum wage or a part time job. Such an assumptionis not unreasonable given the institutional context, since it is typically thecase workers that serve as intermediaries between RMI recipients and CES -contract proposers (who are necessarily public sector employers), whereas itis the market that sorts individuals into minimum wage and part time work.
Because of data limitations, we were forced to adopt a very simple speci-�cation for the structural estimation. For women, the only control variablesin the Z vector are age and the number of children in three age classes. Formen, only age is maintained because the number of children appeared ir-relevant. The potential gains (expressed in logarithms) are computed usingthe baseline scenario. The model is estimated by simulated maximum like-lihood, using 500 draws to estimate the joint distribution of (wd, hd|X) inthe evaluation of the double integral in equation 4 and assuming a standardnormal distribution for ε.39
C The Data
We use the Outcomes for RMI Recipients Survey (Devenir des personnes
sorties du RMI, see Fougère and Rioux, 2001), which was undertaken by theFrench National Institute for Statistics and Economic Studies (INSEE) incollaboration with several other public institutions. A representative sam-ple of RMI recipients was drawn and surveyed in December of 1996 and afollow-up survey was then administered one year later, in January 1998. Weexploit this second cross-section which includes, along with demographic and
39Note that the standard errors reported in this table are not corrected for the presenceof estimated regressors, notably the gains to employment and the hours o�er for peoplenot observed in employment.
33
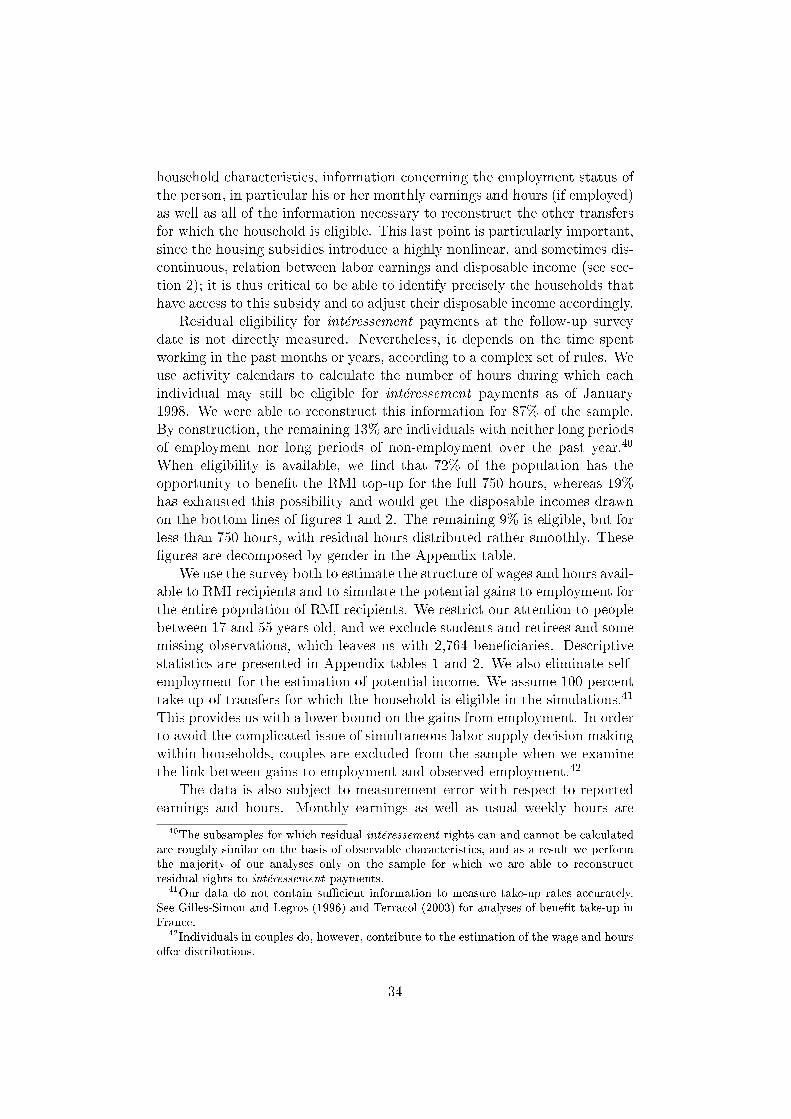
household characteristics, information concerning the employment status ofthe person, in particular his or her monthly earnings and hours (if employed)as well as all of the information necessary to reconstruct the other transfersfor which the household is eligible. This last point is particularly important,since the housing subsidies introduce a highly nonlinear, and sometimes dis-continuous, relation between labor earnings and disposable income (see sec-tion 2); it is thus critical to be able to identify precisely the households thathave access to this subsidy and to adjust their disposable income accordingly.
Residual eligibility for intéressement payments at the follow-up surveydate is not directly measured. Nevertheless, it depends on the time spentworking in the past months or years, according to a complex set of rules. Weuse activity calendars to calculate the number of hours during which eachindividual may still be eligible for intéressement payments as of January1998. We were able to reconstruct this information for 87% of the sample.By construction, the remaining 13% are individuals with neither long periodsof employment nor long periods of non-employment over the past year.40
When eligibility is available, we �nd that 72% of the population has theopportunity to bene�t the RMI top-up for the full 750 hours, whereas 19%has exhausted this possibility and would get the disposable incomes drawnon the bottom lines of �gures 1 and 2. The remaining 9% is eligible, but forless than 750 hours, with residual hours distributed rather smoothly. These�gures are decomposed by gender in the Appendix table.
We use the survey both to estimate the structure of wages and hours avail-able to RMI recipients and to simulate the potential gains to employment forthe entire population of RMI recipients. We restrict our attention to peoplebetween 17 and 55 years old, and we exclude students and retirees and somemissing observations, which leaves us with 2,764 bene�ciaries. Descriptivestatistics are presented in Appendix tables 1 and 2. We also eliminate self-employment for the estimation of potential income. We assume 100 percenttake-up of transfers for which the household is eligible in the simulations.41
This provides us with a lower bound on the gains from employment. In orderto avoid the complicated issue of simultaneous labor supply decision makingwithin households, couples are excluded from the sample when we examinethe link between gains to employment and observed employment.42
The data is also subject to measurement error with respect to reportedearnings and hours. Monthly earnings as well as usual weekly hours are
40The subsamples for which residual intéressement rights can and cannot be calculatedare roughly similar on the basis of observable characteristics, and as a result we performthe majority of our analyses only on the sample for which we are able to reconstructresidual rights to intéressement payments.
41Our data do not contain su�cient information to measure take-up rates accurately.See Gilles-Simon and Legros (1996) and Terracol (2003) for analyses of bene�t take-up inFrance.
42Individuals in couples do, however, contribute to the estimation of the wage and hourso�er distributions.
34

recorded by the survey. It appears that a signi�cant portion (roughly onethird) of the hourly wage rates computed from this information lie below theminimum wage. Most of these inconsistencies are obviously due to roundingerrors and the fact that relatively few individuals in the sample are paidabove from the minimum wage in this population. Thus, whenever reportedhourly wages fall below the minimum wage, we assume that monthly earningsare more reliable than monthly hours, set the hourly wage to the minimumwage and recompute hours based on reported monthly earnings so as to becompatible with existing minimum wage laws.
35

Selection Full-time work
Intercept -0,7140 *** -1,1522 *** 1,0296 ** 0,4126(0,1358) (0,1256) (0,4426) (0,6342)
Age -0,8298 ** -0,2377 0,1595 -1,2293(0,4046) (0,4330) (0,8186) (0,9280)
Age2 0,5179 0,0733 -0,1164 1,2283(0,4093) (0,4369) (0,8226) (0,9378)
French Nationality -0,0811 -0,1623 -0,3367 -0,1594(0,1148) (0,1258) (0,2609) (0,3015)
Paris Region -0,1829 -0,5570 *** -0,2518 0,2077(0,1161) (0,1747) (0,2773) (0,2714)
Education Category 1 (higher) 0,6280 *** -0,1067 -0,6378 * -0,3982(0,1424) (0,1811) (0,3285) (0,3975)
Education Category 2 (upper sec.) 0,3893 *** -0,0841 0,0823 0,0143(0,1470) (0,1825) (0,3527) (0,3892)
Education Category 3 (lower sec.) -0,0645 0,0100 -0,0019 -0,2104(0,1390) (0,1470) (0,3245) (0,3642)
Education Category 4 (vocational) 0,2713 ** 0,1350 -0,2508 0,2018(0,1229) (0,1362) (0,2915) (0,3432)
Log(D 0 (0, y 0 , Z)) 0,0263(0,0750)
Number of Children: 0-2 Years Old -0,0436(0,0427)
Number of Children: 3-14 Years Old -0,0479(0,0530)
Number of Children: 15+ Years Old 0,0782 *
(0,0421)Couple 0,3266 **
(0,1474)Widow 0,2708
(0,4140)Divorced 0,1614
(0,1432)
Wage and hours dist. parametersm 3,3704 ***
(0,1895)s 0,1711 ***
(0,0275)s1 2,8649 ***
(0,2344)s2 60,4063 ***
(8,2833)ρ Employment, CES 0,9981 ***
(0,1608)ρ Minimum Wage, Working Time -0,2146
(0,1865)ρ Employment, Minimum Wage -0,4105
(0,4020)ρ Employment, Working Time -0,1806
(0,5134)
# observations 1303
36
Source: Authors' estimates using the Devenir des personnes sorties du RMI survey. Standard errors are in parentheses. Standarderrors of estimates of constrained parameters (s, s 1 , s 2 and the various ρ ) obtained using the delta method. *** indicates acoefficient significant at the 1% level, ** indicates a coefficient signficant at the 5% level and * indicates a coefficientsignificant at the 10% level.
Table 1 : Results of Selection-Corrected CES and Wage - Working Time Models
Men
CES Min. wage

Selection Full-time work
Intercept -0,7189 *** -0,6495 1,0297 ** -1,2948 **
(0,1650) (0,4596) (0,4738) (0,5563)Age -0,0865 0,9233 *** -1,6578 * -1,0051
(0,3555) (0,1793) (0,9105) (1,1546)
Age2 -0,0259 -1,1507 *** 1,7457 * 0,6519(0,3566) (0,1679) (0,9071) (1,2394)
French Nationality -0,0708 -0,0381 -0,0250 -0,1902(0,1404) (0,2440) (0,3234) (0,4287)
Paris Region -0,0073 -1,0405 *** -0,1011 0,4475 *
(0,1252) (0,2799) (0,2119) (0,2411)Education Category 1 (higher) 0,8201 *** -0,3595 -0,9690 *** 0,6905
(0,1513) (0,3259) (0,3141) (0,4731)Education Category 2 (upper sec.) 0,7031 *** -0,0706 -0,2176 -0,1503
(0,1421) (0,2945) (0,3363) (0,5309)Education Category 3 (lower sec.) 0,2055 0,0654 -0,1392 -0,4740
(0,1252) (0,2337) (0,2872) (0,5223)Education Category 4 (vocational) 0,4135 *** 0,1091 0,1031 -0,1118
(0,1204) (0,2414) (0,3122) (0,5063)Log(D 0 (0, y 0 , Z)) 0,1838 ***
(0,0648)Number of Children: 0-2 Years Old -0,3549 ***
(0,0576)Number of Children: 3-14 Years Old -0,1364 **
(0,0602)Number of Children: 15+ Years Old -0,0501
(0,0446)Couple -0,4618 ***
(0,1133)Widow -0,5580 **
(0,2338)Divorced -0,0740
(0,0986)
Wage and hours dist. parametersm 3,4005 ***
(0,1935)s 0,1981 ***
(0,0349)s1 2,5135 ***
(0,3361)s2 38,6605 ***
(3,1113)ρ Employment, CES 0,4028
(0,2714)ρ Minimum Wage, Working Time -0,3294 *
(0,1767)ρ Employment, Minimum Wage -0,5487 *
(0,2921)ρ Employment, Working Time 0,5592 *
(0,3021)
# observations 1461
37
Table 1 (Continued): Results of Selection-Corrected CES and Wage - Working Time Models
Source: Authors' estimates using the Devenir des personnes sorties du RMI survey. Standard errors are in parentheses. Standarderrors of estimates of constrained parameters (s, s 1 , s 2 and the various ρ ) obtained using the delta method. *** indicates acoefficient significant at the 1% level, ** indicates a coefficient signficant at the 5% level and * indicates a coefficient significant atthe 10% level.
CES Min. wage
Women
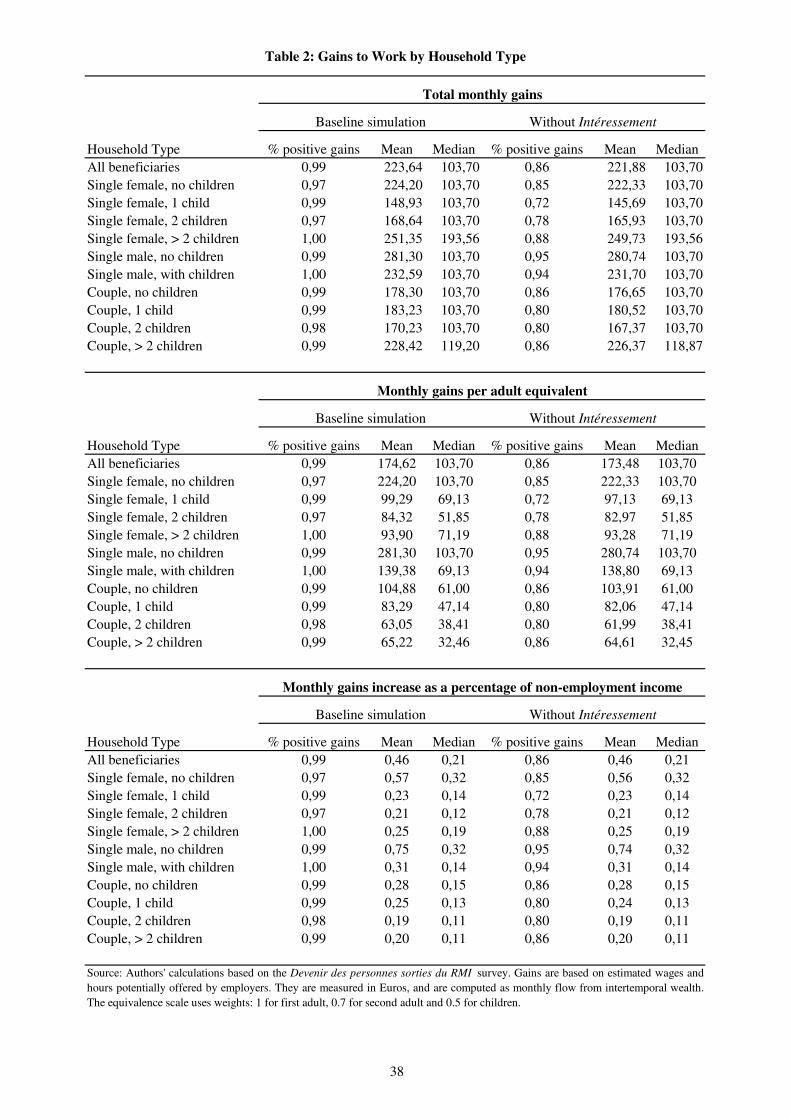
Household Type % positive gains Mean Median % positive gains Mean MedianAll beneficiaries 0,99 223,64 103,70 0,86 221,88 103,70Single female, no children 0,97 224,20 103,70 0,85 222,33 103,70Single female, 1 child 0,99 148,93 103,70 0,72 145,69 103,70Single female, 2 children 0,97 168,64 103,70 0,78 165,93 103,70Single female, > 2 children 1,00 251,35 193,56 0,88 249,73 193,56Single male, no children 0,99 281,30 103,70 0,95 280,74 103,70Single male, with children 1,00 232,59 103,70 0,94 231,70 103,70Couple, no children 0,99 178,30 103,70 0,86 176,65 103,70Couple, 1 child 0,99 183,23 103,70 0,80 180,52 103,70Couple, 2 children 0,98 170,23 103,70 0,80 167,37 103,70Couple, > 2 children 0,99 228,42 119,20 0,86 226,37 118,87
Household Type % positive gains Mean Median % positive gains Mean MedianAll beneficiaries 0,99 174,62 103,70 0,86 173,48 103,70Single female, no children 0,97 224,20 103,70 0,85 222,33 103,70Single female, 1 child 0,99 99,29 69,13 0,72 97,13 69,13Single female, 2 children 0,97 84,32 51,85 0,78 82,97 51,85Single female, > 2 children 1,00 93,90 71,19 0,88 93,28 71,19Single male, no children 0,99 281,30 103,70 0,95 280,74 103,70Single male, with children 1,00 139,38 69,13 0,94 138,80 69,13Couple, no children 0,99 104,88 61,00 0,86 103,91 61,00Couple, 1 child 0,99 83,29 47,14 0,80 82,06 47,14Couple, 2 children 0,98 63,05 38,41 0,80 61,99 38,41Couple, > 2 children 0,99 65,22 32,46 0,86 64,61 32,45
Household Type % positive gains Mean Median % positive gains Mean MedianAll beneficiaries 0,99 0,46 0,21 0,86 0,46 0,21Single female, no children 0,97 0,57 0,32 0,85 0,56 0,32Single female, 1 child 0,99 0,23 0,14 0,72 0,23 0,14Single female, 2 children 0,97 0,21 0,12 0,78 0,21 0,12Single female, > 2 children 1,00 0,25 0,19 0,88 0,25 0,19Single male, no children 0,99 0,75 0,32 0,95 0,74 0,32Single male, with children 1,00 0,31 0,14 0,94 0,31 0,14Couple, no children 0,99 0,28 0,15 0,86 0,28 0,15Couple, 1 child 0,99 0,25 0,13 0,80 0,24 0,13Couple, 2 children 0,98 0,19 0,11 0,80 0,19 0,11Couple, > 2 children 0,99 0,20 0,11 0,86 0,20 0,11
38
Table 2: Gains to Work by Household Type
Baseline simulation Without Intéressement
Monthly gains per adult equivalent
Total monthly gains
Baseline simulation Without Intéressement
Baseline simulation Without Intéressement
Monthly gains increase as a percentage of non-employment income
Source: Authors' calculations based on the Devenir des personnes sorties du RMI survey. Gains are based on estimated wages andhours potentially offered by employers. They are measured in Euros, and are computed as monthly flow from intertemporal wealth.The equivalence scale uses weights: 1 for first adult, 0.7 for second adult and 0.5 for children.
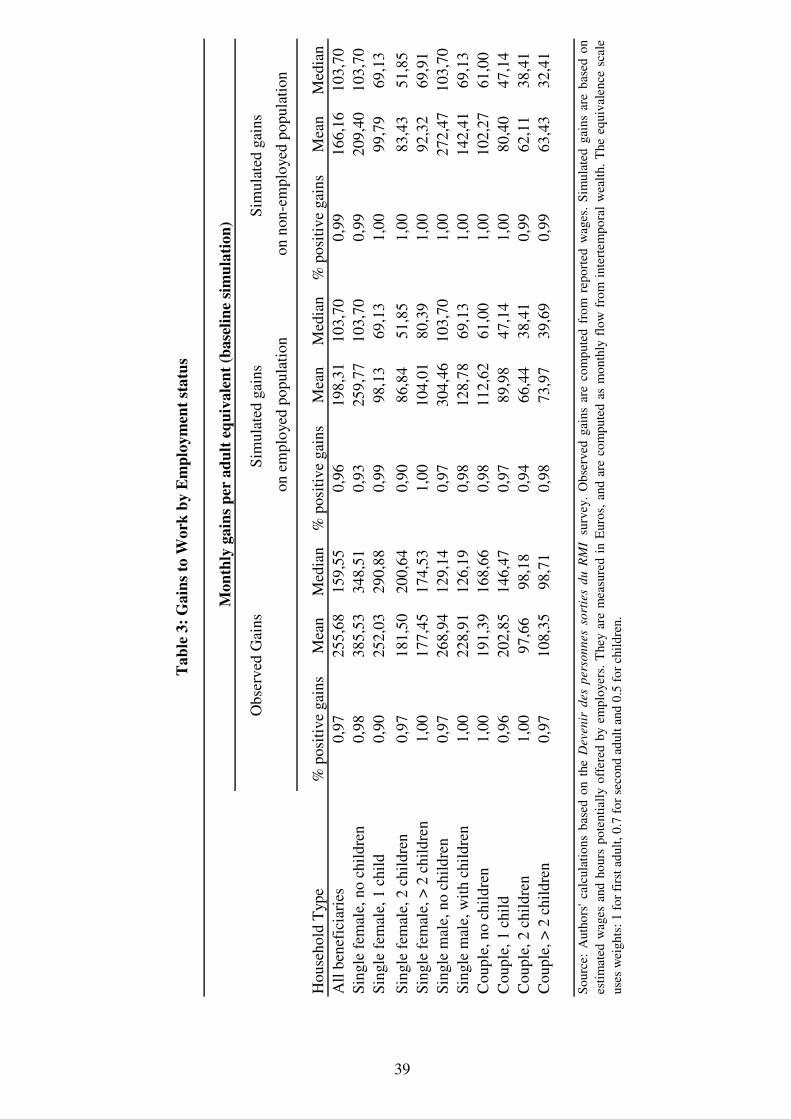
Hou
seho
ld T
ype
% p
ositi
ve g
ains
Mea
nM
edia
n%
pos
itive
gai
nsM
ean
Med
ian
% p
ositi
ve g
ains
Mea
nM
edia
nA
ll be
nefi
ciar
ies
0,97
255,
6815
9,55
0,96
198,
3110
3,70
0,99
166,
1610
3,70
Sing
le fe
mal
e, n
o ch
ildre
n0,
9838
5,53
348,
510,
9325
9,77
103,
700,
9920
9,40
103,
70Si
ngle
fem
ale,
1 c
hild
0,90
252,
0329
0,88
0,99
98,1
369
,13
1,00
99,7
969
,13
39
Sing
le fe
mal
e, 2
chi
ldre
n0,
9718
1,50
200,
640,
9086
,84
51,8
51,
0083
,43
51,8
5Si
ngle
fem
ale,
> 2
chi
ldre
n1,
0017
7,45
174,
531,
0010
4,01
80,3
91,
0092
,32
69,9
1Si
ngle
mal
e, n
o ch
ildre
n0,
9726
8,94
129,
140,
9730
4,46
103,
701,
0027
2,47
103,
70Si
ngle
mal
e, w
ith c
hild
ren
1,00
228,
9112
6,19
0,98
128,
7869
,13
1,00
142,
4169
,13
Cou
ple,
no
child
ren
1,00
191,
3916
8,66
0,98
112,
6261
,00
1,00
102,
2761
,00
Cou
ple,
1 c
hild
0,96
202,
8514
6,47
0,97
89,9
847
,14
1,00
80,4
047
,14
Cou
ple,
2 c
hild
ren
1,00
97,6
698
,18
0,94
66,4
438
,41
0,99
62,1
138
,41
Cou
ple,
> 2
chi
ldre
n0,
9710
8,35
98,7
10,
9873
,97
39,6
90,
9963
,43
32,4
1
Sour
ce:
Aut
hors
'cal
cula
tions
base
don
the
Dev
enir
des
pers
onne
sso
rtie
sdu
RM
Isu
rvey
.O
bser
ved
gain
sar
eco
mpu
ted
from
repo
rted
wag
es.
Sim
ulat
edga
ins
are
base
don
estim
ated
wag
esan
dho
urs
pote
ntia
llyof
fere
dby
empl
oyer
s.T
hey
are
mea
sure
din
Eur
os,a
ndar
eco
mpu
ted
asm
onth
lyflo
wfr
omin
tert
empo
ral
wea
lth.T
heeq
uiva
lenc
esc
ale
uses
wei
ghts
: 1 fo
r fir
st a
dult,
0.7
for s
econ
d ad
ult a
nd 0
.5 fo
r chi
ldre
n.
Sim
ulat
ed g
ains
Si
mul
ated
gai
ns
Tab
le 3
: Gai
ns to
Wor
k by
Em
ploy
men
t sta
tus
Mon
thly
gai
ns p
er a
dult
equi
vale
nt (b
asel
ine
sim
ulat
ion)
Obs
erve
d G
ains
on e
mpl
oyed
pop
ulat
ion
on n
on-e
mpl
oyed
pop
ulat
ion

(1) (2) (3) (4)Intercept -1,1853 -1,9807 -1,1348 -1,5262
(0,0952) (0,7038) (0,0947) (0,6849)Log disposable income 0,9672 0,7974 0,3369 1,1208
(0,1619) (0,2169) (0,2381) (0,2155)Direct effect of hours: 0,1877 0,0737 Log hours worked (0,1643) (0,1604)Direct effect of hours: 0,6484 Full time dummy (>130 monthly hours) (0,1931)Age -0,3886 -0,3963 -0,411
(0,0580) (0,0585) (0,0599)
Joint significance of disposable income and hours variable (Wald test) 37,66 47,12 55,62
Implied elasticity w.r.t. disposable income 1,17 0,96 0,39 1,25Implied elasticity w.r.t. gross earnings 0,53 0,43 0,16 0,59
Number of Observations 820 820 820 820Log Likelihood -424,25 -423,55 -418,55 -448,18
(1) (2) (3) (4)Intercept -0,9537 -2,4075 -0,9245 -2,1995
(0,0782) (0,5088) (0,0783) (0,4975)Log disposable income 0,8903 0,4386 0,3647 0,7331
(0,2160) (0,2629) (0,2967) (0,2534)Direct effect of hours: 0,3499 0,2895 Log hours worked (0,1206) (0,1176)Direct effect of hours: 0,4854 Full time dummy (>130 monthly hours) (0,1999)Age -0,2817 -0,2972 -0,2712
(0,0520) (0,0523) (0,0545)Number of Children: 0-2 Years Old -0,4396 -0,4528 -0,4527 -0,4147
(0,1084) (0,1104) (0,1109) (0,1101)Number of Children: 3-14 Years Old 0,0237 0,0011 -0,0075 0,0548
(0,0577) (0,0731) (0,0784) (0,0582)Number of Children: 15+ Years Old 0,031 0,0173 0,0212 -0,0693
(0,0486) (0,0548) (0,0559) (0,0476)
Joint significance of disposable income and hours variable (Wald test) 25,82 22,16 33,94
Implied elasticity w.r.t. disposable income 1,10 0,54 0,44 0,86Implied elasticity w.r.t. gross earnings 0,36 0,17 0,14 0,31
Number of Observations 952 952 952 952Log Likelihood -514,44 -509,82 -511,36 -526,38
40
Table 4: Results of the Structural Employment Model (single persons)
Source: Authors' estimates using the Devenir des personnes sorties du RMI survey limited to single persons. Simulatedmaximum likelihood. See text for specification and normalizations.
Men
Women

Men Women
Observed employment rate 27,44% 27,42%
Simulated employment rate 27,21% 27,48%
Monthly value of net transfers 325 521
In-work disp inc. Increase -0,09% -0,31%
Simulated employment rate 27,18% 27,43%
Monthly value of net transfers 325 521
In-work disp inc. Increase 1,50% 5,80%
Simulated employment rate 27,63% 28,37%
Monthly value of net transfers 326 531
In-work disp inc. Increase 10,38% 8,37%
Simulated employment rate 29,59% 28,56%
Monthly value of net transfers 341 539
In-work disp inc. Increase 7,35% 4,57%
Simulated employment rate 28,86% 28,06%
Monthly value of net transfers 318 516
41
Table 5: Policy impacts on labour supply
Source: Authors' estimates using the Devenir des personnes sorties du RMI surveylimited to single persons. Results based on estimates presented in Table 4, col. (2). Allvalues are averages over the distribution of potential hours/wages (except "observedemployment rate") and over persons.
Minimum wage increase (+ 10%)
Baseline
No intéressement
Full intéressement
Prime pour l'emploi

Mean s.e. Mean s.e.
Age 37,5687 8,3669 36,6742 8,4803French Nationality 0,8573 0,3499 0,9199 0,2715Paris Region 9,5549 25,0160 7,1355 22,0132Education Category 1 (higher) 0,1527 0,3599 0,1123 0,3158Education Category 2 (upper secondary) 0,1220 0,3274 0,1211 0,3264Education Category 3 (lower secondary) 0,1865 0,3897 0,2416 0,4282Education Category 4 (vocational) 0,3400 0,4739 0,3183 0,4660Education Category 5 (primary) 0,1988 0,3992 0,2067 0,4051Couple 0,2939 0,4557 0,2327 0,4227Widower / Widow 0,0084 0,0915 0,0438 0,2047Divorced 0,1044 0,3059 0,2539 0,4354Number of Children: 0-2 Years Old 0,0837 0,2957 0,1040 0,3229Number of Children: 3-14 Years Old 0,3354 0,8214 0,8172 1,0463Number of Children: 15+ Years Old 0,1051 0,3945 0,2005 0,4940
Employed 0,3331 0,4715 0,3073 0,4615CES contract if employed 0,2880 0,4534 0,3675 0,4827Hourly wage if employed 5,6793 2,9676 5,3923 1,4491Monthly hours if employed 129,8867 46,4072 104,3277 44,9366Proportion at the minimum wage 0,6313 0,4830 0,7216 0,4487
Entitlement to Intéressement available 0,8918 0,3108 0,8652 0,3417Full entitlement to Intéressement if available 0,6867 0,4640 0,7658 0,4237Exhausted entitilement to Intéressement if available 0,2126 0,4093 0,1416 0,3488Partial entitlement to Intéressement if available 0,1007 0,3010 0,0926 0,2899
# observationsSource: Authors' calculations based on the Devenir des personnes sorties du RMI survey.
42
Men Women
Appendix table 1 : Descriptive Statistics, full sample
1303 1461
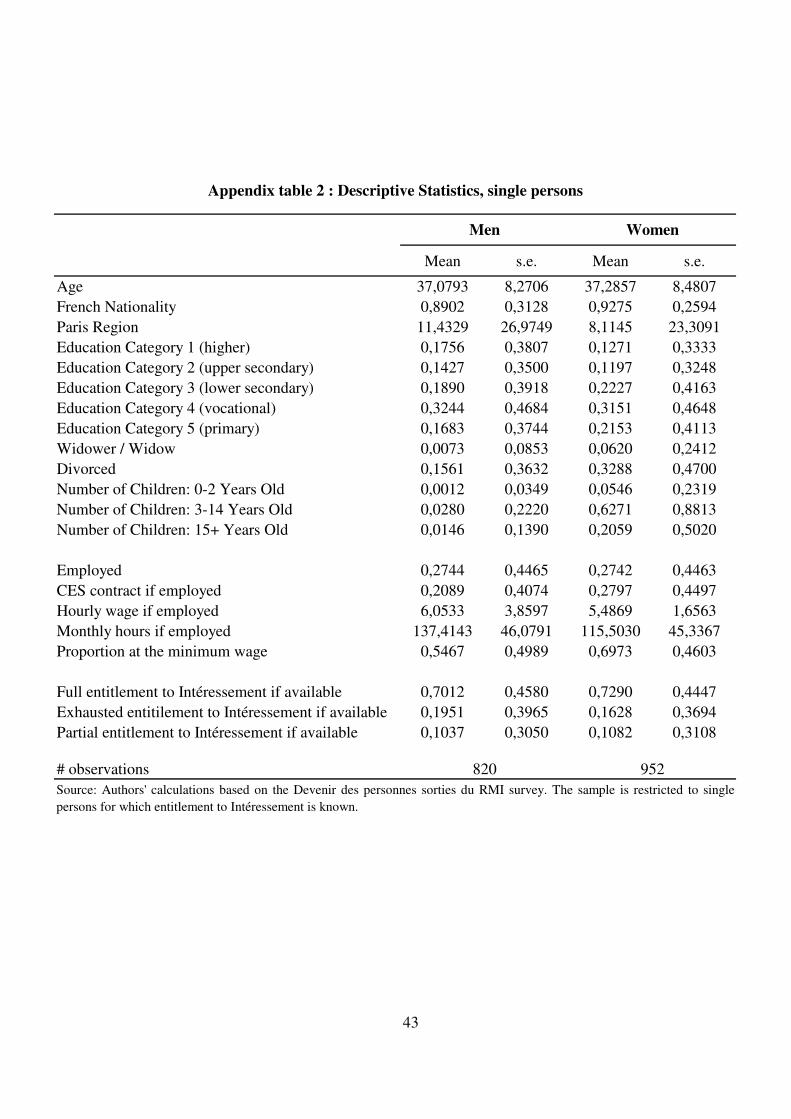
Mean s.e. Mean s.e.
Age 37,0793 8,2706 37,2857 8,4807French Nationality 0,8902 0,3128 0,9275 0,2594Paris Region 11,4329 26,9749 8,1145 23,3091Education Category 1 (higher) 0,1756 0,3807 0,1271 0,3333Education Category 2 (upper secondary) 0,1427 0,3500 0,1197 0,3248Education Category 3 (lower secondary) 0,1890 0,3918 0,2227 0,4163Education Category 4 (vocational) 0,3244 0,4684 0,3151 0,4648Education Category 5 (primary) 0,1683 0,3744 0,2153 0,4113Widower / Widow 0,0073 0,0853 0,0620 0,2412Divorced 0,1561 0,3632 0,3288 0,4700Number of Children: 0-2 Years Old 0,0012 0,0349 0,0546 0,2319Number of Children: 3-14 Years Old 0,0280 0,2220 0,6271 0,8813Number of Children: 15+ Years Old 0,0146 0,1390 0,2059 0,5020
Employed 0,2744 0,4465 0,2742 0,4463CES contract if employed 0,2089 0,4074 0,2797 0,4497Hourly wage if employed 6,0533 3,8597 5,4869 1,6563Monthly hours if employed 137,4143 46,0791 115,5030 45,3367Proportion at the minimum wage 0,5467 0,4989 0,6973 0,4603
Full entitlement to Intéressement if available 0,7012 0,4580 0,7290 0,4447Exhausted entitilement to Intéressement if available 0,1951 0,3965 0,1628 0,3694Partial entitlement to Intéressement if available 0,1037 0,3050 0,1082 0,3108
# observations
43
Men Women
Appendix table 2 : Descriptive Statistics, single persons
Source: Authors' calculations based on the Devenir des personnes sorties du RMI survey. The sample is restricted to singlepersons for which entitlement to Intéressement is known.
820 952

Figure 1: Gross Labor Income versus Disposable Incomewith and without Intéressement
0
500
1000
1500
2000
2500
0 200 399 599 799 999 1198 1398 1598
Gross Labor Income
Dis
posa
ble
Inco
me
Single with No Children andNo Housing Benefit
Couple with 3 Children andHousing Benefit
"Intéressement"
"Intéressement"

Figure 2a: Observed Monthly Earnings - Women
-0,001
0
0,001
0,002
0,003
0,004
0,005
0 214 429 643 857 1071 1286 1500
Euros
Including CES
Excluding CES
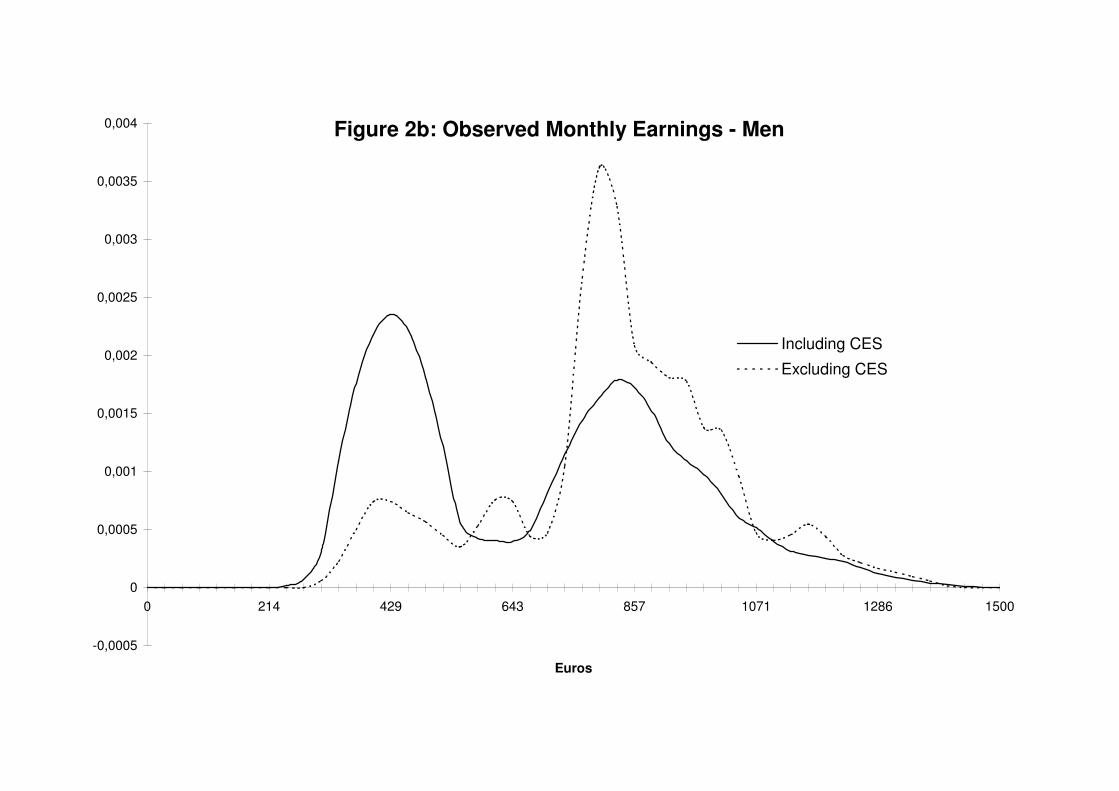
Figure 2b: Observed Monthly Earnings - Men
-0,0005
0
0,0005
0,001
0,0015
0,002
0,0025
0,003
0,0035
0,004
0 214 429 643 857 1071 1286 1500
Euros
Including CES
Excluding CES

Figure 3a: Density of Monthly Hours Worked,Observed and Estimated
-0,002
0
0,002
0,004
0,006
0,008
0,01
0,012
0,014
0,016
0,018
0 14 27 41 55 68 82 96 109
123
136
150
164
177
191
204
218
232
245
259
273
286
300
313
327
Hours
Observed Estimated

Figure 3b: Density of Log Hourly WagesAbove the Minimum Wage,Observed and Estimated
-0,5
0
0,5
1
1,5
2
2,5
3
3,5
1,6 1,7 1,8 1,9 2,0 2,1 2,2 2,2 2,3 2,4 2,5 2,6 2,7 2,8 2,9 3,0 3,1 3,2 3,3 3,4 3,5 3,6 3,7 3,8 3,9
Euros
Observed Estimated

Figure 4a: Distribution of Gains to Employment per adult equivalent - Women
0,00
0,00
0,00
0,00
0,00
0,00
0,01
0,01
0,01
0,01
0,01
0,01
-50
-11 28 66 105
144
183
221
260
299
338
377
415
454
493
532
570
609
648
687
726
764
803
842
881
Monthly Flow of Present Value of Gain (in Euros)

Figure 4b: Distribution of Gains to Employment per adult equivalent - Women
by number of children
-0,002
0
0,002
0,004
0,006
0,008
0,01
0,012
0,014
-50
-24 2 28 54 81 107
133
159
185
211
237
263
290
316
342
368
394
420
446
472
499
525
551
577
Monthly Flow of Present Value of Gain (in Euros)
No child
1 or 2 children
3 children ormore

Figure 4c: Distribution of Gains to Employmentper adult equivalent - Men
0
0,001
0,002
0,003
0,004
0,005
0,006
-40 4 47 91 135
178
222
266
309
353
397
440
484
528
571
615
659
702
746
790
833
877
921
964
1008
Monthly Flow of Present Value of Gain (in Euros)
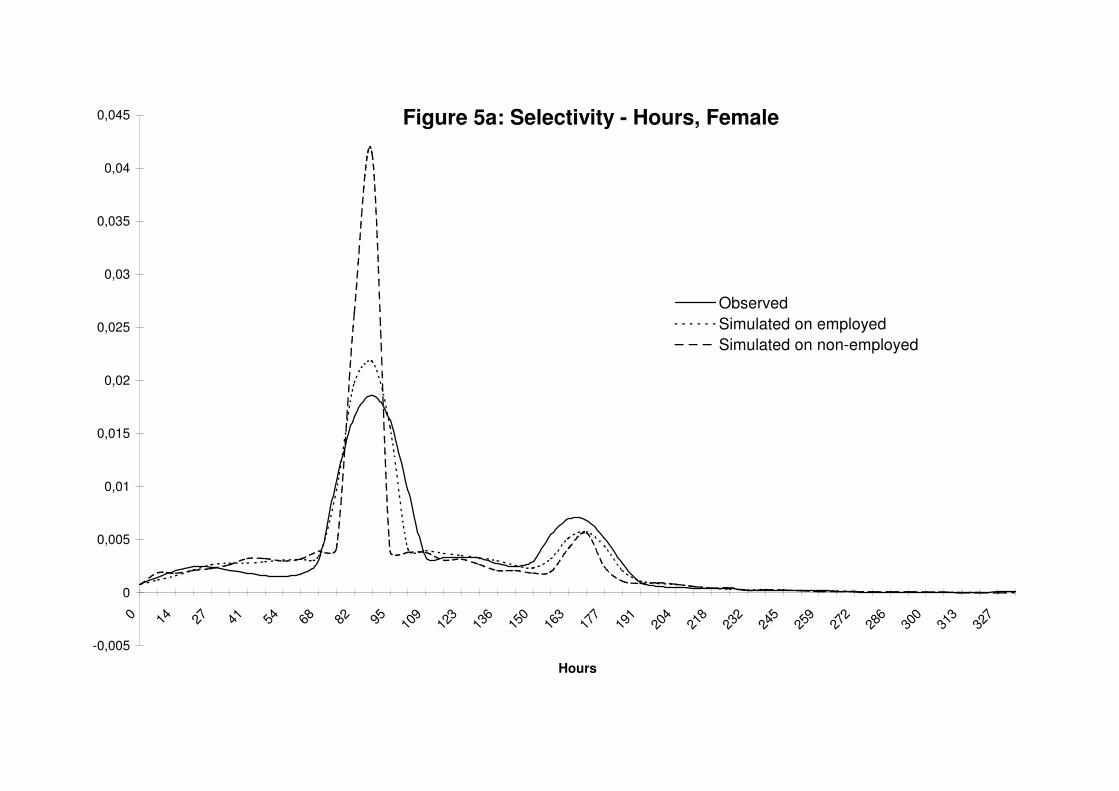
Figure 5a: Selectivity - Hours, Female
-0,005
0
0,005
0,01
0,015
0,02
0,025
0,03
0,035
0,04
0,045
0 14 27 41 54 68 82 95 109
123
136
150
163
177
191
204
218
232
245
259
272
286
300
313
327
Hours
ObservedSimulated on employedSimulated on non-employed
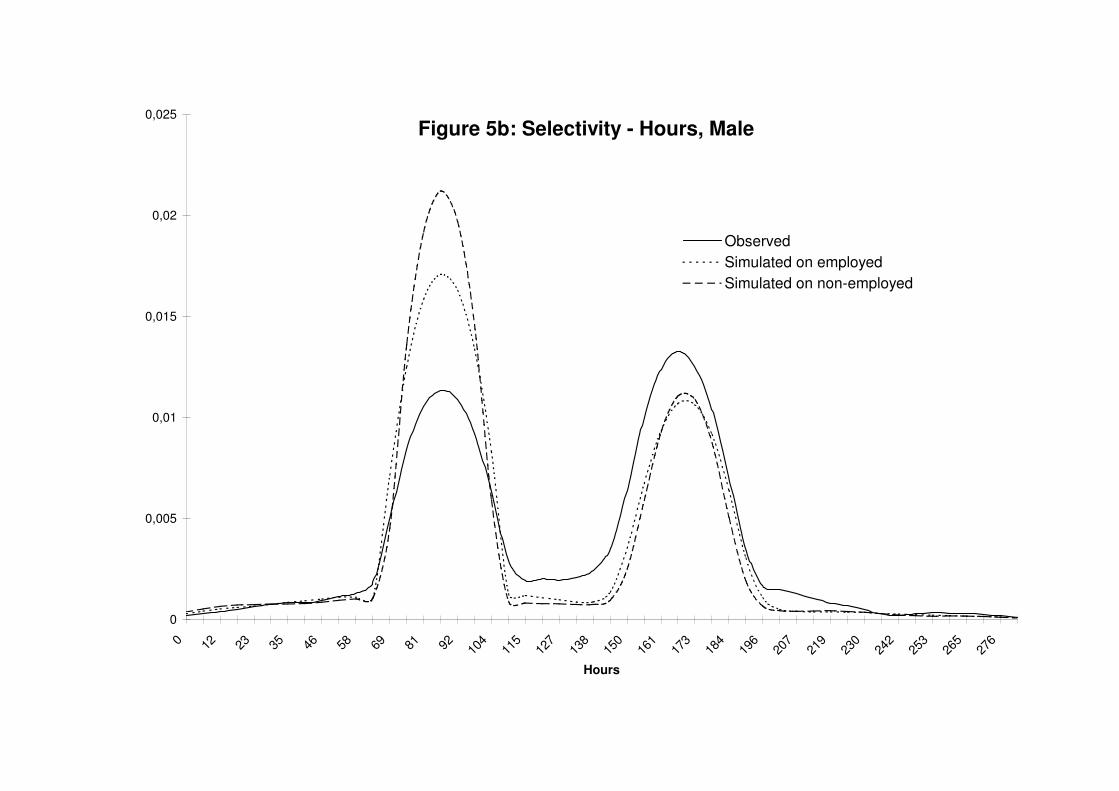
Figure 5b: Selectivity - Hours, Male
0
0,005
0,01
0,015
0,02
0,025
0 12 23 35 46 58 69 81 92 104
115
127
138
150
161
173
184
196
207
219
230
242
253
265
276
Hours
ObservedSimulated on employedSimulated on non-employed
Related Documents


