Does within-bog spatial variability of mercury and lead constrain reconstructions of absolute deposition rates from single peat records? The example of Store Mosse, Sweden Richard Bindler Department of Ecology and Environmental Science, Umea ˚ University, Umea ˚, Sweden Malin Klarqvist Department of Forest Ecology, Swedish University of Agricultural Sciences, Umea ˚, Sweden Jonatan Klaminder and Johannes Fo ¨rster Department of Ecology and Environmental Science, Umea ˚ University, Umea ˚, Sweden Received 25 March 2004; revised 22 June 2004; accepted 14 July 2004; published 24 September 2004. [1] Recent research has recognized the utility of the peat record in ombrotrophic bogs to reconstruct past changes in the atmospheric deposition of, for example, lead and mercury. Frequently, these reconstructions rely only on single peat records to make assessments of regional deposition rates. The surface of a bog is not a uniform feature; rather, vegetation and micro-topography vary over small spatial scales, which can affect the interception and retention of atmospheric deposition, and over relatively short timescales. Analyses of nine hummock cores collected from a 2000 m 2 area on one bog, Store Mosse, show that concentrations and cumulative inventories (past 110 years) of lead and mercury vary by a factor of 2 for lead (0.75 to 1.40 g Pb m 2 , three cores) and 4 for mercury (0.85 to 3.4 mg Hg m 2 , nine cores). The range of values within Store Mosse is greater than the difference between any one core and the metal inventories from either Dumme Mosse (0.95 g Pb m 2 and 2.0 mg Hg m 2 ) or Trollsmosse (1.6 mg Hg m 2 ), each about 60 km distant. Although the general temporal trends are similar in all cores, our data indicate that single reconstructions do not necessarily provide a representative flux for the bog as a whole. To overcome the potential constraints of single records, we suggest incorporating data from multiple sites or at least multiple cores in order to scale up to regionally valid models of past metal deposition. INDEX TERMS: 0345 Atmospheric Composition and Structure: Pollution—urban and regional (0305); 1030 Geochemistry: Geochemical cycles (0330); 1065 Geochemistry: Trace elements (3670); 1615 Global Change: Biogeochemical processes (4805); KEYWORDS: lead, mercury, peat Citation: Bindler, R., M. Klarqvist, J. Klaminder, and J. Fo ¨rster (2004), Does within-bog spatial variability of mercury and lead constrain reconstructions of absolute deposition rates from single peat records? The example of Store Mosse, Sweden, Global Biogeochem. Cycles, 18, GB3020, doi:10.1029/2004GB002270. 1. Introduction [2] Ombrotrophic bogs have long attracted attention in studies of environmental change. The peat record preserved in these rain-fed, raised bogs has been utilized over the past 100 years in Sweden and elsewhere to study, for example, bog development, regional hydrology and climate, and landscape vegetation history through pollen analyses [e.g., von Post, 1913; Granlund, 1931; Almquist-Jacobson and Foster, 1995]. The peat record in these bogs is also considered to be useful for reconstructing past changes in atmospheric chemistry, particularly for the past deposition of trace metals that are of ecotoxicological interest, such as lead [Bra ¨nnvall et al., 1997; Martı ´nez-Cortizas et al., 1997; Shotyk et al., 1998] and mercury [Pheiffer-Madsen, 1981; Martı ´nez-Cortizas et al., 1999; Biester et al., 2002; Roos- Barraclough et al., 2002b; Bindler, 2003; Givelet et al., 2003; Roos-Barraclough and Shotyk, 2003]. Since bogs receive their nutrients as well as pollutants only from the atmosphere, they offer us the potential of reconstructing absolute atmospheric deposition rates. [3] The strength thus far in the use of peat to recon- struct past atmospheric deposition of, for example, lead is the strong agreement in the general trends between bog sites, and also between peat and other natural archives. This applies both to multisite peat studies examining the detailed, short-term changes in lead deposition during the GLOBAL BIOGEOCHEMICAL CYCLES, VOL. 18, GB3020, doi:10.1029/2004GB002270, 2004 Copyright 2004 by the American Geophysical Union. 0886-6236/04/2004GB002270 GB3020 1 of 11

Welcome message from author
This document is posted to help you gain knowledge. Please leave a comment to let me know what you think about it! Share it to your friends and learn new things together.
Transcript
Does within-bog spatial variability of mercury and lead constrain
reconstructions of absolute deposition rates from single peat records?
The example of Store Mosse, Sweden
Richard BindlerDepartment of Ecology and Environmental Science, Umea University, Umea, Sweden
Malin KlarqvistDepartment of Forest Ecology, Swedish University of Agricultural Sciences, Umea, Sweden
Jonatan Klaminder and Johannes ForsterDepartment of Ecology and Environmental Science, Umea University, Umea, Sweden
Received 25 March 2004; revised 22 June 2004; accepted 14 July 2004; published 24 September 2004.
[1] Recent research has recognized the utility of the peat record in ombrotrophic bogs toreconstruct past changes in the atmospheric deposition of, for example, lead and mercury.Frequently, these reconstructions rely only on single peat records to make assessments ofregional deposition rates. The surface of a bog is not a uniform feature; rather,vegetation and micro-topography vary over small spatial scales, which can affect theinterception and retention of atmospheric deposition, and over relatively short timescales.Analyses of nine hummock cores collected from a 2000 m2 area on one bog, Store Mosse,show that concentrations and cumulative inventories (past 110 years) of lead and mercuryvary by a factor of 2 for lead (0.75 to 1.40 g Pb m�2, three cores) and 4 for mercury(0.85 to 3.4 mg Hg m�2, nine cores). The range of values within Store Mosse is greaterthan the difference between any one core and the metal inventories from either DummeMosse (0.95 g Pb m�2 and 2.0 mg Hg m�2) or Trollsmosse (1.6 mg Hg m�2), each about60 km distant. Although the general temporal trends are similar in all cores, our dataindicate that single reconstructions do not necessarily provide a representative flux for thebog as a whole. To overcome the potential constraints of single records, we suggestincorporating data from multiple sites or at least multiple cores in order to scale up toregionally valid models of past metal deposition. INDEX TERMS: 0345 Atmospheric
Composition and Structure: Pollution—urban and regional (0305); 1030 Geochemistry: Geochemical cycles
(0330); 1065 Geochemistry: Trace elements (3670); 1615 Global Change: Biogeochemical processes (4805);
KEYWORDS: lead, mercury, peat
Citation: Bindler, R., M. Klarqvist, J. Klaminder, and J. Forster (2004), Does within-bog spatial variability of mercury and lead
constrain reconstructions of absolute deposition rates from single peat records? The example of Store Mosse, Sweden, Global
Biogeochem. Cycles, 18, GB3020, doi:10.1029/2004GB002270.
1. Introduction
[2] Ombrotrophic bogs have long attracted attention instudies of environmental change. The peat record preservedin these rain-fed, raised bogs has been utilized over the past100 years in Sweden and elsewhere to study, for example,bog development, regional hydrology and climate, andlandscape vegetation history through pollen analyses [e.g.,von Post, 1913; Granlund, 1931; Almquist-Jacobson andFoster, 1995]. The peat record in these bogs is alsoconsidered to be useful for reconstructing past changes inatmospheric chemistry, particularly for the past deposition
of trace metals that are of ecotoxicological interest, such aslead [Brannvall et al., 1997; Martınez-Cortizas et al., 1997;Shotyk et al., 1998] and mercury [Pheiffer-Madsen, 1981;Martınez-Cortizas et al., 1999; Biester et al., 2002; Roos-Barraclough et al., 2002b; Bindler, 2003; Givelet et al.,2003; Roos-Barraclough and Shotyk, 2003]. Since bogsreceive their nutrients as well as pollutants only from theatmosphere, they offer us the potential of reconstructingabsolute atmospheric deposition rates.[3] The strength thus far in the use of peat to recon-
struct past atmospheric deposition of, for example, lead isthe strong agreement in the general trends between bogsites, and also between peat and other natural archives.This applies both to multisite peat studies examining thedetailed, short-term changes in lead deposition during the
GLOBAL BIOGEOCHEMICAL CYCLES, VOL. 18, GB3020, doi:10.1029/2004GB002270, 2004
Copyright 2004 by the American Geophysical Union.0886-6236/04/2004GB002270
GB3020 1 of 11
industrial period (mid-1800s to the present day, which isalso the period covered by 210Pb dating) at smallerregional scales [Weiss et al., 1999] and to studies ofthe long-term trends in atmospheric pollution over thepast 3500 years at regional [Bindler et al., 1999; Renberget al., 2000] and also European scales [Renberg et al.,2001]. The general agreement over larger spatial scalesprovides convincing evidence for both the large-scalenature of past atmospheric pollution, particularly regard-ing the importance of pre-industrial metal pollutionalready seen in lake sediments [Renberg et al., 1994]and glacial ice [Hong et al., 1994], and the utility of peatas an archive of past deposition.[4] Recent peat research has focused particularly on
reconstructing the past deposition of mercury, because ofcontinued concerns over the global extent of atmosphericmercury pollution and human-related health concerns.Although several studies have examined the geochemicalstability of mercury in peat based on analyses of individualpeat records [Roos-Barraclough et al., 2002b] and ongeochemical modeling [Benoit et al., 1998], insufficientattention has been applied to the reliance on single recordsfrom individual sites in terms of their use for ‘‘high-resolution’’ reconstructions of past regional deposition rates.Do single records give us absolute accumulation rates atregional or even local scales or are there constraints onsingle reconstructions?[5] The surface of a bog is not a uniform feature; it
varies in terms of microtopography and plant community atvery small scales, with vegetation often reflecting the site-specific hydrological regime [Malmer, 1962; Svensson,1988b; Malmer and Wallen, 1999]. Major changes in theplant community can occur over short timescales (decades)[Gunnarsson et al., 2002], which might affect the intercep-tion and retention of atmospheric pollutants. Hummocks,though generally considered stable over fairly long timeperiods, can also fluctuate in areal extent or even disappearover longer timescales [Malmer, 1962; Svensson, 1988b].These variations are important in the context both of peatmass balance itself [Ohlson and Økland, 1998; Malmer andWallen, 1999] and also for the accumulation of variousmetals [Norton et al., 1997; Malmer and Wallen, 1999].[6] Here we present and discuss data from nine short peat
cores taken only from hummocks on Store Mosse in southSweden, plus data from another nearby bog, Dumme Mosse,with the emphasis to understand constraints on single coresfor reconstructing past deposition of atmospheric pollutants(mercury and lead).
2. Material and Methods
2.1. Site Description and Sampling
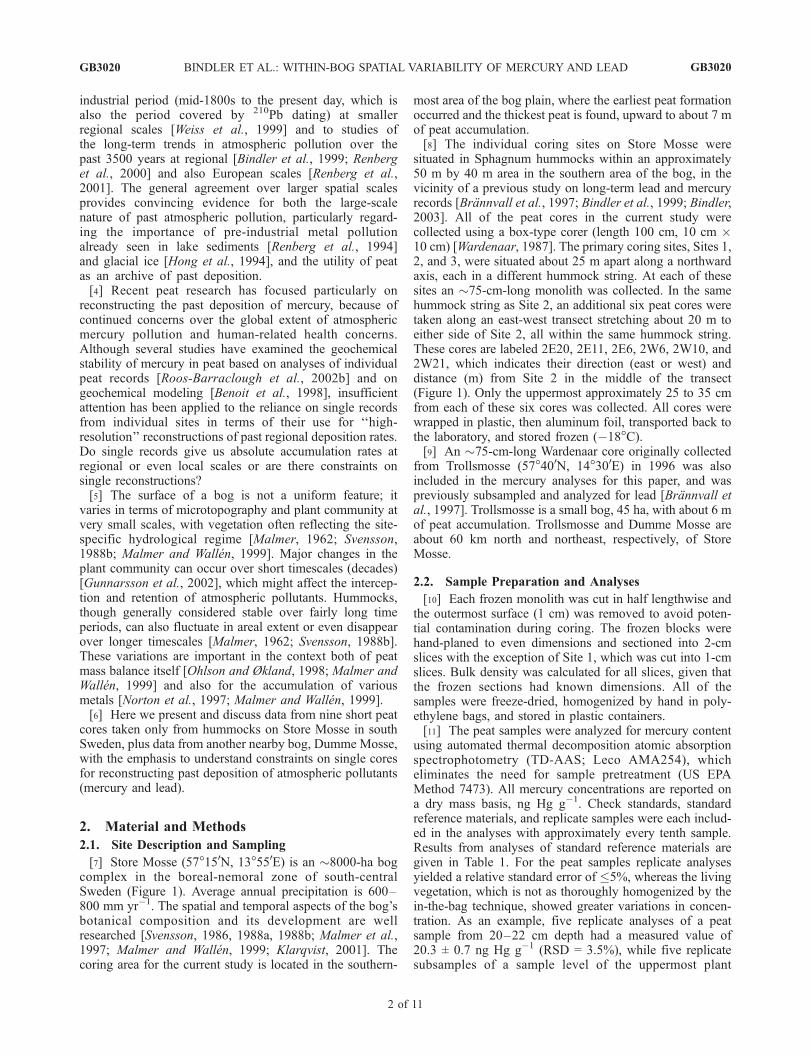
[7] Store Mosse (57�150N, 13�550E) is an �8000-ha bogcomplex in the boreal-nemoral zone of south-centralSweden (Figure 1). Average annual precipitation is 600–800 mm yr�1. The spatial and temporal aspects of the bog’sbotanical composition and its development are wellresearched [Svensson, 1986, 1988a, 1988b; Malmer et al.,1997; Malmer and Wallen, 1999; Klarqvist, 2001]. Thecoring area for the current study is located in the southern-
most area of the bog plain, where the earliest peat formationoccurred and the thickest peat is found, upward to about 7 mof peat accumulation.[8] The individual coring sites on Store Mosse were
situated in Sphagnum hummocks within an approximately50 m by 40 m area in the southern area of the bog, in thevicinity of a previous study on long-term lead and mercuryrecords [Brannvall et al., 1997; Bindler et al., 1999; Bindler,2003]. All of the peat cores in the current study werecollected using a box-type corer (length 100 cm, 10 cm �10 cm) [Wardenaar, 1987]. The primary coring sites, Sites 1,2, and 3, were situated about 25 m apart along a northwardaxis, each in a different hummock string. At each of thesesites an �75-cm-long monolith was collected. In the samehummock string as Site 2, an additional six peat cores weretaken along an east-west transect stretching about 20 m toeither side of Site 2, all within the same hummock string.These cores are labeled 2E20, 2E11, 2E6, 2W6, 2W10, and2W21, which indicates their direction (east or west) anddistance (m) from Site 2 in the middle of the transect(Figure 1). Only the uppermost approximately 25 to 35 cmfrom each of these six cores was collected. All cores werewrapped in plastic, then aluminum foil, transported back tothe laboratory, and stored frozen (�18�C).[9] An �75-cm-long Wardenaar core originally collected
from Trollsmosse (57�400N, 14�300E) in 1996 was alsoincluded in the mercury analyses for this paper, and waspreviously subsampled and analyzed for lead [Brannvall etal., 1997]. Trollsmosse is a small bog, 45 ha, with about 6 mof peat accumulation. Trollsmosse and Dumme Mosse areabout 60 km north and northeast, respectively, of StoreMosse.
2.2. Sample Preparation and Analyses
[10] Each frozen monolith was cut in half lengthwise andthe outermost surface (1 cm) was removed to avoid poten-tial contamination during coring. The frozen blocks werehand-planed to even dimensions and sectioned into 2-cmslices with the exception of Site 1, which was cut into 1-cmslices. Bulk density was calculated for all slices, given thatthe frozen sections had known dimensions. All of thesamples were freeze-dried, homogenized by hand in poly-ethylene bags, and stored in plastic containers.[11] The peat samples were analyzed for mercury content
using automated thermal decomposition atomic absorptionspectrophotometry (TD-AAS; Leco AMA254), whicheliminates the need for sample pretreatment (US EPAMethod 7473). All mercury concentrations are reported ona dry mass basis, ng Hg g�1. Check standards, standardreference materials, and replicate samples were each includ-ed in the analyses with approximately every tenth sample.Results from analyses of standard reference materials aregiven in Table 1. For the peat samples replicate analysesyielded a relative standard error of �5%, whereas the livingvegetation, which is not as thoroughly homogenized by thein-the-bag technique, showed greater variations in concen-tration. As an example, five replicate analyses of a peatsample from 20–22 cm depth had a measured value of20.3 ± 0.7 ng Hg g�1 (RSD = 3.5%), while five replicatesubsamples of a sample level of the uppermost plant
GB3020 BINDLER ET AL.: WITHIN-BOG SPATIAL VARIABILITY OF MERCURY AND LEAD
2 of 11
GB3020
material had a mean value of 41.1 ± 12.9 ng Hg g�1 (RSD =31%). This latter sample was subjectively subsampled forthis test: Stems and coarser plant material had lower con-centrations (20.1 and 37.4 ng g�1) than the fine-grainedplant material, which was derived largely from Sphagnummosses (48.0, 49.6, and 50.6 ng g�1). However, it isimportant to emphasize that for peat samples the homoge-nization procedure is effective and furthermore reduces theoccasions where sample contamination could occur.[12] Three of the Store Mosse peat cores were also
analyzed for lead concentrations and stable lead isotopes(only the 206Pb/207Pb ratio is shown and discussed here);these were the cores from Site 1 and 2E20 and 2W6.Lead concentrations and stable isotopes were determinedusing ICP-MS (Perkin-Elmer model ELAN 6100) after astrong acid digestion (HNO3 + HClO4, 10:1 at 130�C) ofapproximately 0.15–0.25 g dried peat in open Teflonvessels [Renberg et al., 2002]. Lead concentrations wereverified against the certified multielement standard, SPEXICPMS-2 (SPEX CertiPrep Certified Reference materials).The lowest lead concentration measured here was
4.4 mg g�1, which was well above the method detectionlimit of 0.13 ng Pb L�1. Accuracy and precision of thelead concentration analyses were <10%. The lead isotopeanalyses were made using dwell times of 50 ms andvalues were corrected empirically for fractionation byrepeated analysis of the NIST SRM 981 reference leadmaterial (0.000 ± 0.006% per a.m.u.). Within-run accuracyfor the lead isotope analyses was confirmed by analysis ofa reference lake sediment, IAEA SL-1 (Table 1).[13] A chronology can be inferred for the three cores
analyzed for stable lead isotopes based on establishedchanges in the isotopic composition of pollution over timeas determined in other dated archives [Renberg et al., 2001].This inferred timescale is supported by radiometric analysesof one of the Store Mosse cores. Samples from the upper-most 25 cm of the ‘‘master core’’ from Site 1 were analyzedfor 210Pb and 137Cs by direct gamma assay. Radiometricdates were calculated from the 210Pb and 137Cs recordsaccording to the constant rate of supply (CRS) model[Appleby and Oldfield, 1978; Appleby, 1998; Gallagher etal., 2001].
2.3. Peat Macrofossil Analyses
[14] For the six short transect cores in the one hummockstring surrounding Site 2 (cores 2E20, 2E11, 2E6, 2W6,2W10, and 2W21), the other half of the peat monolith wasused for the determination of the peat-forming plant macro-fossils. Each core was divided stratigraphically into severalsections based on the visual variation in botanical compo-sition, color, and structure. A homogenized subsample ofthe peat in each section was analyzed for peat-formingplant macrofossils [Heikurainen and Huikari, 1952; Bohlinet al., 1989]. Peat samples were boiled in a 10% KOHsolution and then rinsed with water in a 0.045-mm sieve.The rinsed peat was embedded in gelatine glycerine onmicroscope slides. Each identified fragment was classifiedinto groups of taxa and was presented as the dominant taxain that sample. The following groups of taxa were used:Sphagnum; Bryales; shrubs; Cyperaceae, Eriophorum spp.;and Cyperaceae, unidentified. The Sphagnum peat constit-uents were further divided into four subgroups (sections:
Figure 1. Location of the coring area on the southern bogplain of Store Mosse, south-central Sweden. The map ofStore Mosse is modified from Svensson [1988a]; S1-3 andTransect E on this map refer to relevant peat stratigraphiesby Svensson. Dumme Mosse and Trollsmosse, mentioned inthe text, are also shown. See color version of this figure atback of this issue.
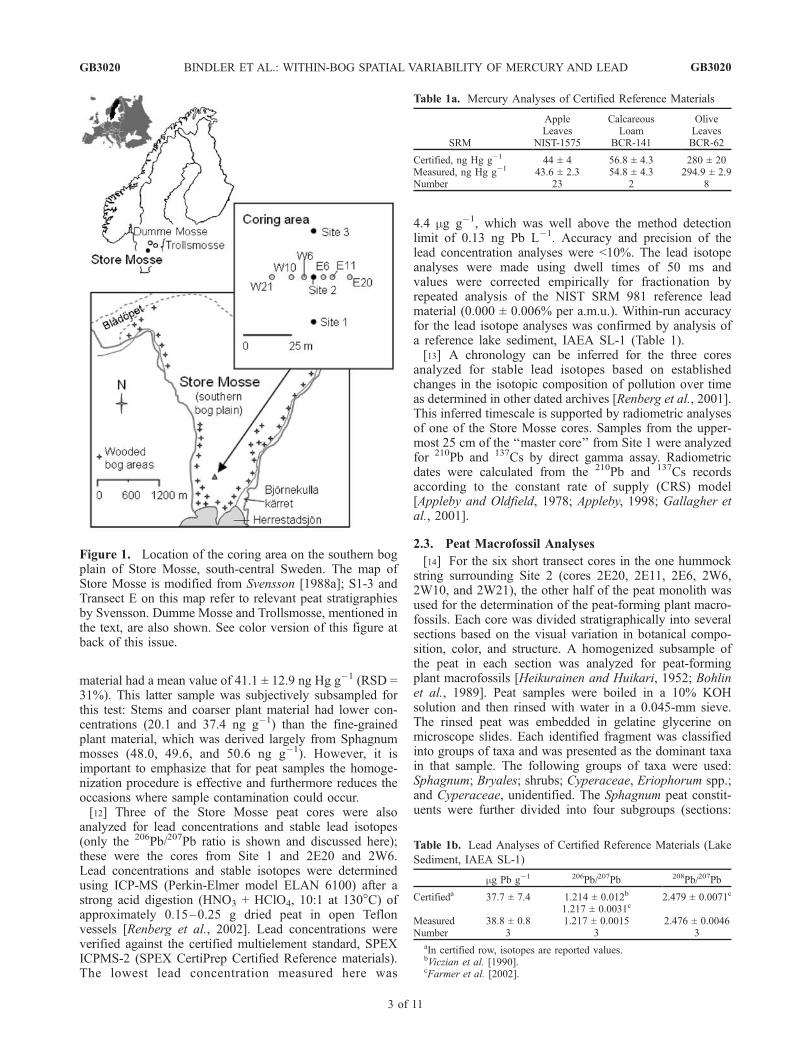
Table 1a. Mercury Analyses of Certified Reference Materials
SRM
AppleLeaves
NIST-1575
CalcareousLoam
BCR-141
OliveLeavesBCR-62
Certified, ng Hg g�1 44 ± 4 56.8 ± 4.3 280 ± 20Measured, ng Hg g�1 43.6 ± 2.3 54.8 ± 4.3 294.9 ± 2.9Number 23 2 8
Table 1b. Lead Analyses of Certified Reference Materials (Lake
Sediment, IAEA SL-1)
mg Pb g�1 206Pb/207Pb 208Pb/207Pb
Certifieda 37.7 ± 7.4 1.214 ± 0.012b 2.479 ± 0.0071c
1.217 ± 0.0031c
Measured 38.8 ± 0.8 1.217 ± 0.0015 2.476 ± 0.0046Number 3 3 3
aIn certified row, isotopes are reported values.bViczian et al. [1990].cFarmer et al. [2002].
GB3020 BINDLER ET AL.: WITHIN-BOG SPATIAL VARIABILITY OF MERCURY AND LEAD
3 of 11
GB3020
Acutifolia, Sphagnum, and Cuspidata). The nomenclatureused follows Lid [1985] for phanerogams and Koponen etal. [1977] for bryophytes.
3. Results and Discussion
3.1. Plant Communities and Macrofossils
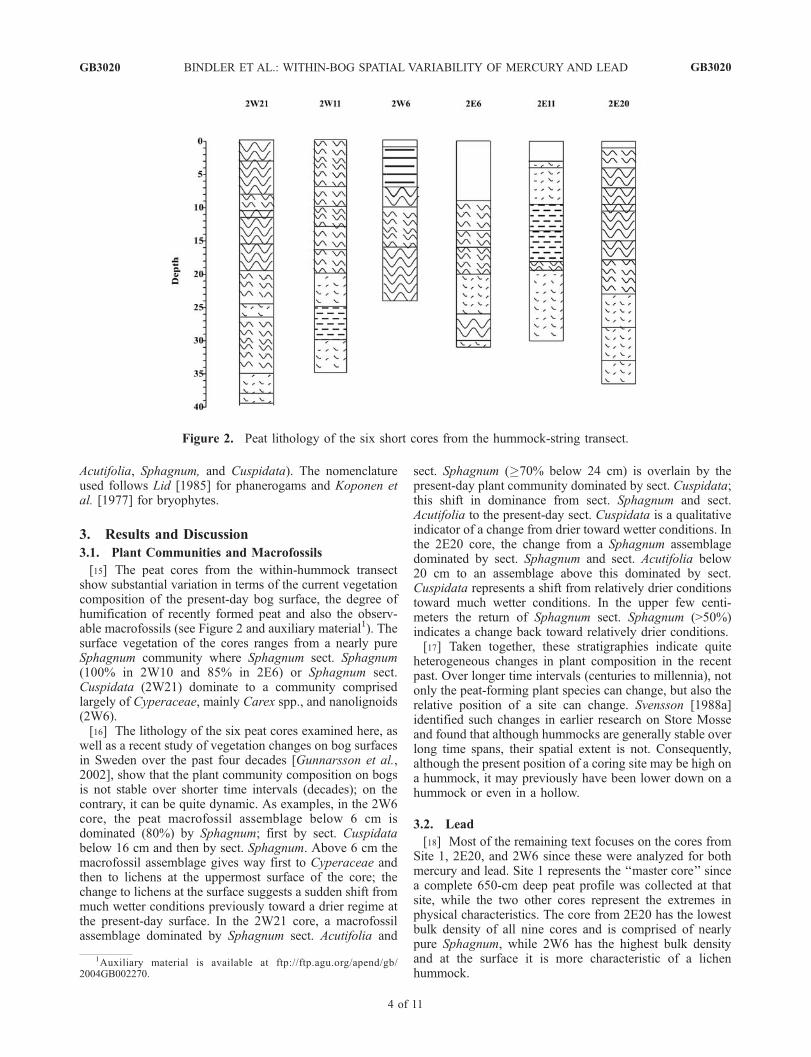
[15] The peat cores from the within-hummock transectshow substantial variation in terms of the current vegetationcomposition of the present-day bog surface, the degree ofhumification of recently formed peat and also the observ-able macrofossils (see Figure 2 and auxiliary material1). Thesurface vegetation of the cores ranges from a nearly pureSphagnum community where Sphagnum sect. Sphagnum(100% in 2W10 and 85% in 2E6) or Sphagnum sect.Cuspidata (2W21) dominate to a community comprisedlargely of Cyperaceae, mainly Carex spp., and nanolignoids(2W6).[16] The lithology of the six peat cores examined here, as
well as a recent study of vegetation changes on bog surfacesin Sweden over the past four decades [Gunnarsson et al.,2002], show that the plant community composition on bogsis not stable over shorter time intervals (decades); on thecontrary, it can be quite dynamic. As examples, in the 2W6core, the peat macrofossil assemblage below 6 cm isdominated (80%) by Sphagnum; first by sect. Cuspidatabelow 16 cm and then by sect. Sphagnum. Above 6 cm themacrofossil assemblage gives way first to Cyperaceae andthen to lichens at the uppermost surface of the core; thechange to lichens at the surface suggests a sudden shift frommuch wetter conditions previously toward a drier regime atthe present-day surface. In the 2W21 core, a macrofossilassemblage dominated by Sphagnum sect. Acutifolia and
sect. Sphagnum (�70% below 24 cm) is overlain by thepresent-day plant community dominated by sect. Cuspidata;this shift in dominance from sect. Sphagnum and sect.Acutifolia to the present-day sect. Cuspidata is a qualitativeindicator of a change from drier toward wetter conditions. Inthe 2E20 core, the change from a Sphagnum assemblagedominated by sect. Sphagnum and sect. Acutifolia below20 cm to an assemblage above this dominated by sect.Cuspidata represents a shift from relatively drier conditionstoward much wetter conditions. In the upper few centi-meters the return of Sphagnum sect. Sphagnum (>50%)indicates a change back toward relatively drier conditions.[17] Taken together, these stratigraphies indicate quite
heterogeneous changes in plant composition in the recentpast. Over longer time intervals (centuries to millennia), notonly the peat-forming plant species can change, but also therelative position of a site can change. Svensson [1988a]identified such changes in earlier research on Store Mosseand found that although hummocks are generally stable overlong time spans, their spatial extent is not. Consequently,although the present position of a coring site may be high ona hummock, it may previously have been lower down on ahummock or even in a hollow.
3.2. Lead
[18] Most of the remaining text focuses on the cores fromSite 1, 2E20, and 2W6 since these were analyzed for bothmercury and lead. Site 1 represents the ‘‘master core’’ sincea complete 650-cm deep peat profile was collected at thatsite, while the two other cores represent the extremes inphysical characteristics. The core from 2E20 has the lowestbulk density of all nine cores and is comprised of nearlypure Sphagnum, while 2W6 has the highest bulk densityand at the surface it is more characteristic of a lichenhummock.
Figure 2. Peat lithology of the six short cores from the hummock-string transect.
1Auxiliary material is available at ftp://ftp.agu.org/apend/gb/2004GB002270.
GB3020 BINDLER ET AL.: WITHIN-BOG SPATIAL VARIABILITY OF MERCURY AND LEAD
4 of 11
GB3020
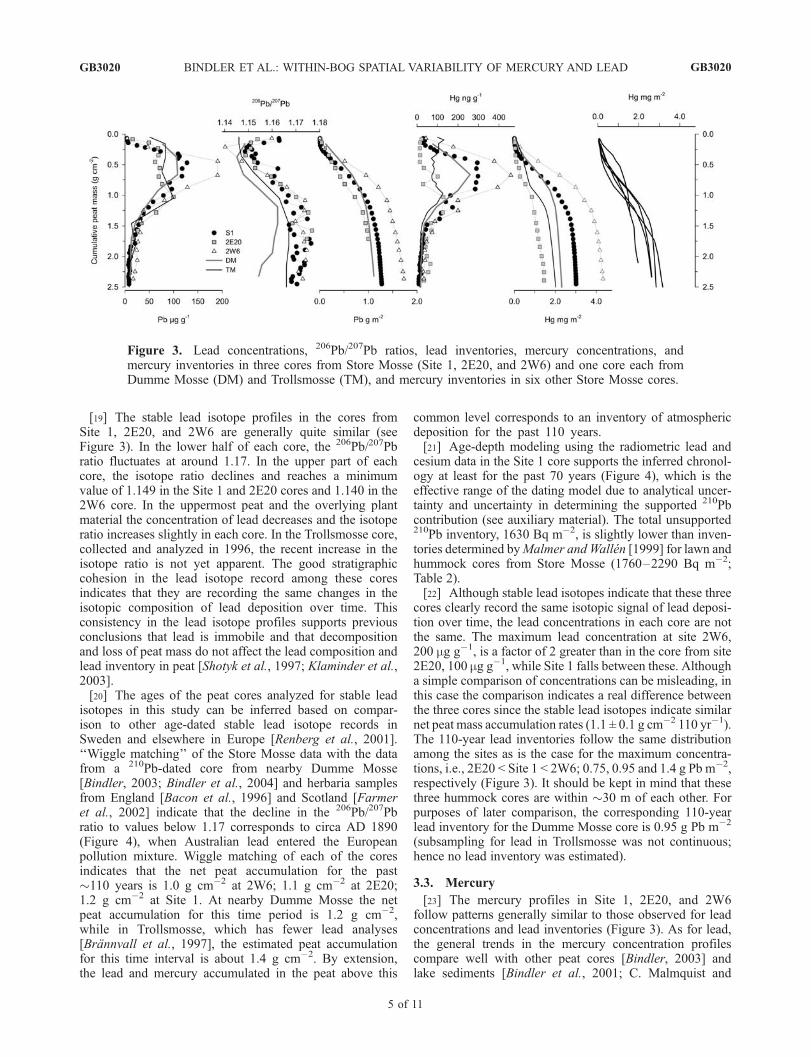
[19] The stable lead isotope profiles in the cores fromSite 1, 2E20, and 2W6 are generally quite similar (seeFigure 3). In the lower half of each core, the 206Pb/207Pbratio fluctuates at around 1.17. In the upper part of eachcore, the isotope ratio declines and reaches a minimumvalue of 1.149 in the Site 1 and 2E20 cores and 1.140 in the2W6 core. In the uppermost peat and the overlying plantmaterial the concentration of lead decreases and the isotoperatio increases slightly in each core. In the Trollsmosse core,collected and analyzed in 1996, the recent increase in theisotope ratio is not yet apparent. The good stratigraphiccohesion in the lead isotope record among these coresindicates that they are recording the same changes in theisotopic composition of lead deposition over time. Thisconsistency in the lead isotope profiles supports previousconclusions that lead is immobile and that decompositionand loss of peat mass do not affect the lead composition andlead inventory in peat [Shotyk et al., 1997; Klaminder et al.,2003].[20] The ages of the peat cores analyzed for stable lead
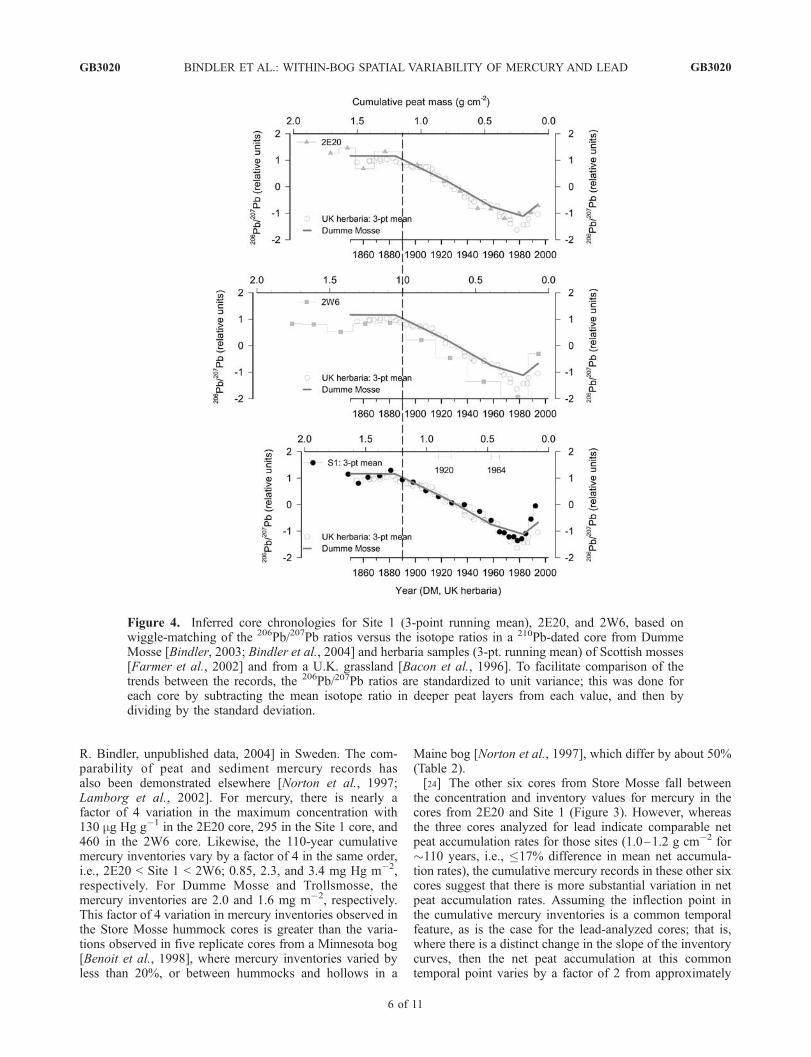
isotopes in this study can be inferred based on compar-ison to other age-dated stable lead isotope records inSweden and elsewhere in Europe [Renberg et al., 2001].‘‘Wiggle matching’’ of the Store Mosse data with the datafrom a 210Pb-dated core from nearby Dumme Mosse[Bindler, 2003; Bindler et al., 2004] and herbaria samplesfrom England [Bacon et al., 1996] and Scotland [Farmeret al., 2002] indicate that the decline in the 206Pb/207Pbratio to values below 1.17 corresponds to circa AD 1890(Figure 4), when Australian lead entered the Europeanpollution mixture. Wiggle matching of each of the coresindicates that the net peat accumulation for the past�110 years is 1.0 g cm�2 at 2W6; 1.1 g cm�2 at 2E20;1.2 g cm�2 at Site 1. At nearby Dumme Mosse the netpeat accumulation for this time period is 1.2 g cm�2,while in Trollsmosse, which has fewer lead analyses[Brannvall et al., 1997], the estimated peat accumulationfor this time interval is about 1.4 g cm�2. By extension,the lead and mercury accumulated in the peat above this
common level corresponds to an inventory of atmosphericdeposition for the past 110 years.[21] Age-depth modeling using the radiometric lead and
cesium data in the Site 1 core supports the inferred chronol-ogy at least for the past 70 years (Figure 4), which is theeffective range of the dating model due to analytical uncer-tainty and uncertainty in determining the supported 210Pbcontribution (see auxiliary material). The total unsupported210Pb inventory, 1630 Bq m�2, is slightly lower than inven-tories determined byMalmer andWallen [1999] for lawn andhummock cores from Store Mosse (1760–2290 Bq m�2;Table 2).[22] Although stable lead isotopes indicate that these three
cores clearly record the same isotopic signal of lead deposi-tion over time, the lead concentrations in each core are notthe same. The maximum lead concentration at site 2W6,200 mg g�1, is a factor of 2 greater than in the core from site2E20, 100 mg g�1, while Site 1 falls between these. Althougha simple comparison of concentrations can be misleading, inthis case the comparison indicates a real difference betweenthe three cores since the stable lead isotopes indicate similarnet peat mass accumulation rates (1.1 ± 0.1 g cm�2 110 yr�1).The 110-year lead inventories follow the same distributionamong the sites as is the case for the maximum concentra-tions, i.e., 2E20 < Site 1 < 2W6; 0.75, 0.95 and 1.4 g Pb m�2,respectively (Figure 3). It should be kept in mind that thesethree hummock cores are within �30 m of each other. Forpurposes of later comparison, the corresponding 110-yearlead inventory for the Dumme Mosse core is 0.95 g Pb m�2
(subsampling for lead in Trollsmosse was not continuous;hence no lead inventory was estimated).
3.3. Mercury
[23] The mercury profiles in Site 1, 2E20, and 2W6follow patterns generally similar to those observed for leadconcentrations and lead inventories (Figure 3). As for lead,the general trends in the mercury concentration profilescompare well with other peat cores [Bindler, 2003] andlake sediments [Bindler et al., 2001; C. Malmquist and
Figure 3. Lead concentrations, 206Pb/207Pb ratios, lead inventories, mercury concentrations, andmercury inventories in three cores from Store Mosse (Site 1, 2E20, and 2W6) and one core each fromDumme Mosse (DM) and Trollsmosse (TM), and mercury inventories in six other Store Mosse cores.
GB3020 BINDLER ET AL.: WITHIN-BOG SPATIAL VARIABILITY OF MERCURY AND LEAD
5 of 11
GB3020
R. Bindler, unpublished data, 2004] in Sweden. The com-parability of peat and sediment mercury records hasalso been demonstrated elsewhere [Norton et al., 1997;Lamborg et al., 2002]. For mercury, there is nearly afactor of 4 variation in the maximum concentration with130 mg Hg g�1 in the 2E20 core, 295 in the Site 1 core, and460 in the 2W6 core. Likewise, the 110-year cumulativemercury inventories vary by a factor of 4 in the same order,i.e., 2E20 < Site 1 < 2W6; 0.85, 2.3, and 3.4 mg Hg m�2,respectively. For Dumme Mosse and Trollsmosse, themercury inventories are 2.0 and 1.6 mg m�2, respectively.This factor of 4 variation in mercury inventories observed inthe Store Mosse hummock cores is greater than the varia-tions observed in five replicate cores from a Minnesota bog[Benoit et al., 1998], where mercury inventories varied byless than 20%, or between hummocks and hollows in a
Maine bog [Norton et al., 1997], which differ by about 50%(Table 2).[24] The other six cores from Store Mosse fall between
the concentration and inventory values for mercury in thecores from 2E20 and Site 1 (Figure 3). However, whereasthe three cores analyzed for lead indicate comparable netpeat accumulation rates for those sites (1.0–1.2 g cm�2 for�110 years, i.e., �17% difference in mean net accumula-tion rates), the cumulative mercury records in these other sixcores suggest that there is more substantial variation in netpeat accumulation rates. Assuming the inflection point inthe cumulative mercury inventories is a common temporalfeature, as is the case for the lead-analyzed cores; that is,where there is a distinct change in the slope of the inventorycurves, then the net peat accumulation at this commontemporal point varies by a factor of 2 from approximately
Figure 4. Inferred core chronologies for Site 1 (3-point running mean), 2E20, and 2W6, based onwiggle-matching of the 206Pb/207Pb ratios versus the isotope ratios in a 210Pb-dated core from DummeMosse [Bindler, 2003; Bindler et al., 2004] and herbaria samples (3-pt. running mean) of Scottish mosses[Farmer et al., 2002] and from a U.K. grassland [Bacon et al., 1996]. To facilitate comparison of thetrends between the records, the 206Pb/207Pb ratios are standardized to unit variance; this was done foreach core by subtracting the mean isotope ratio in deeper peat layers from each value, and then bydividing by the standard deviation.
GB3020 BINDLER ET AL.: WITHIN-BOG SPATIAL VARIABILITY OF MERCURY AND LEAD
6 of 11
GB3020
0.75 to 1.5 g peat cm�2. This variation in net accumulationis consistent with observations elsewhere that show consid-erable spatial variation in peat mass accumulation [Ohlsonand Økland, 1998].
3.4. Spatial Heterogeneity
[25] Since the stable lead isotopes indicate that lead isimmobile in the peat, then differences in lead inventoriesbetween cores must be the result of real differences indeposition. By extension, we also make the initial assump-tion that differences in mercury inventories also representreal differences in deposition, since mercury is consideredto be bound more effectively than lead in peat [Benoit et al.,1998; Lamborg et al., 2002]. However, a long-term effect ofpeat mass loss on mercury concentrations and content hasbeen hypothesized [Biester et al., 2003] and we cannot fullyexclude this possibility.[26] Since the 110-year inventories of lead and mercury
vary in Store Mosse by as much as a factor of 2 and 4,respectively, we can reasonably conclude that averageannual accumulation rates of these metals vary by the samefactors, within only a 2000 m2 area. One important factorfor the heterogeneity in metal inventories must be thesurface structure of the bog, which is not a uniform featurewith its hollows, hummocks, and hummock strings. Surfacestructure is suggested to play an important role in differentaccumulation rates of atmospherically derived parameters,particularly between hummocks and hollows, due toenhanced dry deposition [Oldfield et al., 1979; Norton etal., 1997; Malmer and Wallen, 1999]. Malmer and Wallen[1999] also measured differences (up to �50%) in total210Pb activities between sphagnum lawns, lichen hummocksand sphagnum hummocks from Store Mosse (Table 2).[27] Besides microtopography, another aspect included
within surface structure is the plant community itself, andit is likely that there must be some variation in theinterception capacity of different plants based on their‘‘canopies.’’ For example, in biomonitoring surveys ofatmospheric metal deposition based on forest mosses,Ruhling [1994] found interspecies variations up to 50%,and variations in the mercury content of bog plants are alsoobserved [Roos-Barraclough et al., 2002a]. However, plant
community and surface topography are interrelated and wecannot separate these factors with our data.[28] In the three lead-analyzed Store Mosse cores, we
observed a difference in the minima for 206Pb/207Pb with1.149 in the Site 1 and 2E20 cores, which are Sphagnumdominated, as compared to 1.140 in the 2W6 core. While wecannot explain this difference, we can speculate that it isrelated to plant composition and microtopography, whicheither creates a spatial variation in the interception of wetversus dry deposition or that the more open structure of theSphagnum-dominated cores also allows some downwardwashing of lead in the plant layer; such a slight downwardwashing of recent lead with a higher 206Pb/207Pb ratio(1.154–1.163 in the uppermost vegetation at the top of thethree cores) might explain the slightly higher 206Pb/207Pbminima in these two cores as compared to the 2W6 core.[29] In Figure 5, we compare mercury and lead inventories
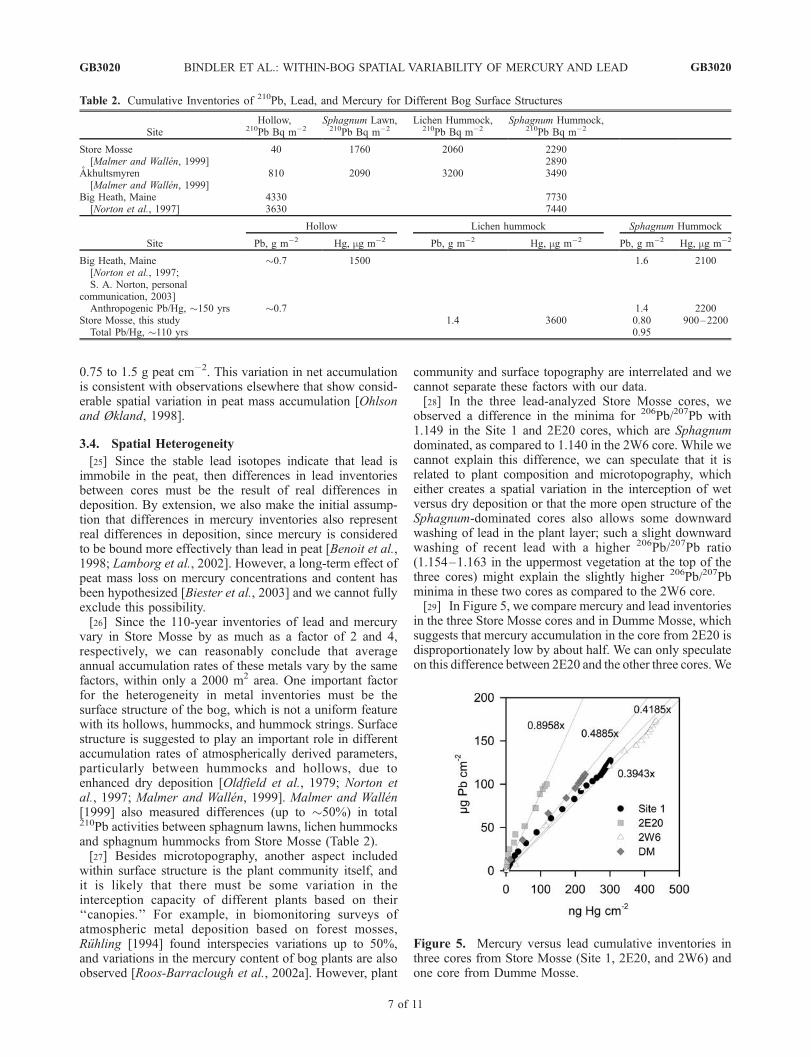
in the three Store Mosse cores and in Dumme Mosse, whichsuggests that mercury accumulation in the core from 2E20 isdisproportionately low by about half. We can only speculateon this difference between 2E20 and the other three cores.We
Table 2. Cumulative Inventories of 210Pb, Lead, and Mercury for Different Bog Surface Structures
SiteHollow,
210Pb Bq m�2Sphagnum Lawn,210Pb Bq m�2
Lichen Hummock,210Pb Bq m�2
Sphagnum Hummock,210Pb Bq m�2
Store Mosse[Malmer and Wallen, 1999]
40 1760 2060 22902890
Akhultsmyren[Malmer and Wallen, 1999]
810 2090 3200 3490
Big Heath, Maine[Norton et al., 1997]
43303630
77307440
Site
Hollow Lichen hummock Sphagnum Hummock
Pb, g m�2 Hg, mg m�2 Pb, g m�2 Hg, mg m�2 Pb, g m�2 Hg, mg m�2
Big Heath, Maine[Norton et al., 1997;S. A. Norton, personal
communication, 2003]
�0.7 1500 1.6 2100
Anthropogenic Pb/Hg, �150 yrs �0.7 1.4 2200Store Mosse, this study 1.4 3600 0.80 900–2200
Total Pb/Hg, �110 yrs 0.95
Figure 5. Mercury versus lead cumulative inventories inthree cores from Store Mosse (Site 1, 2E20, and 2W6) andone core from Dumme Mosse.
GB3020 BINDLER ET AL.: WITHIN-BOG SPATIAL VARIABILITY OF MERCURY AND LEAD
7 of 11
GB3020
suggest this difference arises from real micro-scale differ-ences in atmospheric deposition relating to the differentdepositional velocities for aerosols and gases, where a lowersurface position on a hummock, such as for the 2E20 core,intercepts disproportionately less mercury as Hg0 than lead inthe form of aerosols. Micro-climate may also play a role,where lower topographical positions are snow covered dur-ing a greater part of the winter than higher positions.Although the lithology and humification (�5 on the vonPost scale) do not indicate that the decomposition of peatdiffers in this core as compared to the other cores, we cannotexclude that mercury is less-efficiently retained in this core.
3.5. Constraints on Single Records to ReconstructPast Deposition
[30] The variation in our results indicates that a singlepeat core may not provide a record of absolute atmosphericdeposition rates to the degree generally accepted, just as thevegetation composition of a single core does not character-ize the whole bog surface. An individual peat core onlyrepresents a measurement of past deposition at a singlepoint on the bog surface, and it is not necessarily represent-ative of average deposition rates for the bog area as awhole. From the 110-year cumulative inventories of leadand mercury, we can estimate that the mean deposition ratesover this time period vary from 7 to 13 mg Pb m�2 yr�1 andfrom 8 to 33 mg Hg m�2 yr�1, whereas the mean values are10 mg Pb m�2 yr�1 and 20 mg Hg m�2 yr�1 in DummeMosse and 16 mg Hg m�2 yr�1 in Trollsmosse.
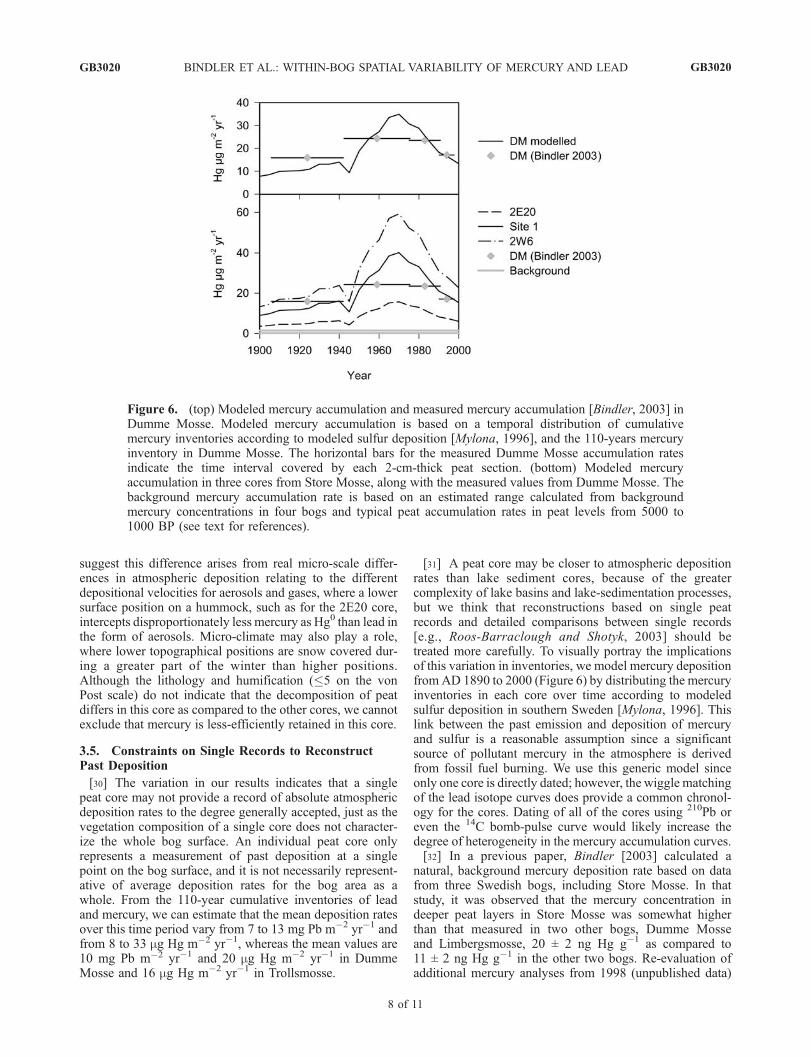
[31] A peat core may be closer to atmospheric depositionrates than lake sediment cores, because of the greatercomplexity of lake basins and lake-sedimentation processes,but we think that reconstructions based on single peatrecords and detailed comparisons between single records[e.g., Roos-Barraclough and Shotyk, 2003] should betreated more carefully. To visually portray the implicationsof this variation in inventories, we model mercury depositionfrom AD 1890 to 2000 (Figure 6) by distributing the mercuryinventories in each core over time according to modeledsulfur deposition in southern Sweden [Mylona, 1996]. Thislink between the past emission and deposition of mercuryand sulfur is a reasonable assumption since a significantsource of pollutant mercury in the atmosphere is derivedfrom fossil fuel burning. We use this generic model sinceonly one core is directly dated; however, the wiggle matchingof the lead isotope curves does provide a common chronol-ogy for the cores. Dating of all of the cores using 210Pb oreven the 14C bomb-pulse curve would likely increase thedegree of heterogeneity in the mercury accumulation curves.[32] In a previous paper, Bindler [2003] calculated a
natural, background mercury deposition rate based on datafrom three Swedish bogs, including Store Mosse. In thatstudy, it was observed that the mercury concentration indeeper peat layers in Store Mosse was somewhat higherthan that measured in two other bogs, Dumme Mosseand Limbergsmosse, 20 ± 2 ng Hg g�1 as compared to11 ± 2 ng Hg g�1 in the other two bogs. Re-evaluation ofadditional mercury analyses from 1998 (unpublished data)
Figure 6. (top) Modeled mercury accumulation and measured mercury accumulation [Bindler, 2003] inDumme Mosse. Modeled mercury accumulation is based on a temporal distribution of cumulativemercury inventories according to modeled sulfur deposition [Mylona, 1996], and the 110-years mercuryinventory in Dumme Mosse. The horizontal bars for the measured Dumme Mosse accumulation ratesindicate the time interval covered by each 2-cm-thick peat section. (bottom) Modeled mercuryaccumulation in three cores from Store Mosse, along with the measured values from Dumme Mosse. Thebackground mercury accumulation rate is based on an estimated range calculated from backgroundmercury concentrations in four bogs and typical peat accumulation rates in peat levels from 5000 to1000 BP (see text for references).
GB3020 BINDLER ET AL.: WITHIN-BOG SPATIAL VARIABILITY OF MERCURY AND LEAD
8 of 11
GB3020
for the 1996 core from Store Mosse lowers this backgroundconcentration slightly to 16 ± 6 ng Hg g�1 (n = 24), whilethe background concentrations in Trolls Mosse, anotherSmaland bog, are 16 ± 5 ng Hg g�1 (n = 30; includingunpublished data). Bindler [2003] suggested that it was notpossible to evaluate the somewhat higher mercury concen-trations in Store Mosse (and here also Trolls Mosse) ascompared to the other two sites, since other factors wouldhave to be evaluated before a difference could be ascer-tained, in particular the issue of the representativity of singlerecords; ‘‘it is possible that the difference in backgroundconcentrations in Store Mosse versus Dumme Mosse . . . isno greater than the potential difference within each of thebogs’’ [Bindler, 2003]. The new data from the multiplesurface peat cores from Store Mosse support this statement.[33] In light of the variations in the modern inventories in
Store Mosse, it seems difficult to interpret the small differ-ences between the four Swedish bogs. Where modern fluxesof lead and mercury vary by a factor of 2 to 4, respectively, inStore Mosse, the less than factor of 2 difference in back-ground flux estimates for mercury in the ombrotrophic bogscannot realistically be treated as site-specific differences; thatis, the mean background accumulation rates in DummeMosse, Store Mosse and Trolls Mosse are 0.6 ± 0.2, 0.8 ±0.4, and 0.9 ± 0.4 mg Hg m�2 yr�1, respectively. Bycomparison, the estimated maximum mercury accumulationrates in recent peat from StoreMosse represent an increase bya factor of 20 to 75. This contrasts with the discussion ofdifferences in themercury record in two Swiss bogs, Etang dela Gruere (EGr) and La Tourbiere de Genevez (TdG), only3.5 km apart, where Roos-Barraclough and Shotyk [2003]discuss the efficiency of one bog to capture/retain mercuryover the other based on a difference in recent maximumaccumulation rates of 30 and 43 mg Hg m�2 yr�1, in EGrand TdG, respectively, and background accumulation ratesof 0.5–1.9 (mean, 1.0 ± 0.3) and 1.0–3.0 (mean, 1.6 ±0.4) mg Hg m�2 yr�1, respectively. They considered theaverage mercury accumulation rates for the anthropogenicperiod in their two bogs to be different, 13 ± 8 and 17 ±13 mg Hg m�2 yr�1, whereas the 110-year average mercuryaccumulation in replicate cores from Store Mosse alonevaries from 8 to 33 mg Hg m�2 yr�1.
3.6. Overcoming Bog Heterogeneity for RegionalReconstructions
[34] The logical step in deriving regionally representativevalues is to employ larger data sets in making reconstruc-tions; for example, Benoit et al. [1998] analyzed sixreplicate cores from a Minnesota peat bog to reconstructmercury deposition rates for the past �200 years. Ratherthan a multicore approach, Bindler et al. [1999] used amultisite approach by combining lead accumulation recordsfrom three bogs to model lead deposition in Sweden overthe past several thousand years. In paleolimnology, theproblem of spatial heterogeneity in lake basins has beenovercome by a combination of multicore and multisiteapproaches. Although it is acknowledged that it is difficultto reconstruct absolute (as opposed to relative) atmosphericdeposition rates from individual lake sediment records,because of factors such as sediment focusing or catchment
area, Swain, Engstrom, and coworkers [Swain et al., 1992;Engstrom et al., 1994] derived an estimate of backgroundand modern mercury atmospheric deposition rates in Min-nesota and Wisconsin by determining whole lake-basinaccumulation histories and correcting for watershed-to-lakearea. Lamborg et al. [2002] simplified this approach bycorrecting replicate cores from two (New Zealand) or three(Nova Scotia) lakes for sediment focusing using 210Pb andalso watershed area to make their regional reconstructions.In both of these examples, calculated rates of recentdeposition agreed well with measured deposition rates.[35] Scaling up to a regional model, there is greater
strength in amalgamating data sets, and we use mercury datafrom Swedish bogs as an example. For deeper layers fromStore Mosse, Dumme Mosse, Trolls Mosse and from otherombrotrophic raised-bogs in southern Sweden, typical peatmass accumulation rates for sections dating to the periodfrom 1000 BP to 5000 BP are 30–50 g m�2 yr�1, with arange from 20 to 70 g m�2 yr�1 [Svensson, 1988a;Malmer etal., 1997; Bindler et al., 1999; Klarqvist, 2001; Bindler,2003; Klaminder et al., 2003]. A comparable averageaccumulation rate can be expected for Limbergsmosse,based on the similarities in ash content with the otherbogs, the thickness of the Sphagnum peat, and the devel-opment history of the bog [Almquist-Jacobson and Foster,1995]. Given background Hg concentrations in the fourSwedish bogs of 10–20 ng Hg g�1, the average Hgaccumulation rate for the period from 1000 BP to 5000 BPis estimated to be 0.5–1 mg Hg m�2 yr�1 (range 0.2 to1.5 mg Hg m�2 yr�1). In contrast, maximum mercuryaccumulation rates in recent peat, circa mid-1970s, are inthe range from 15 to 60 mg Hg m�2 yr�1.[36] Despite the differences observed in our cores, it
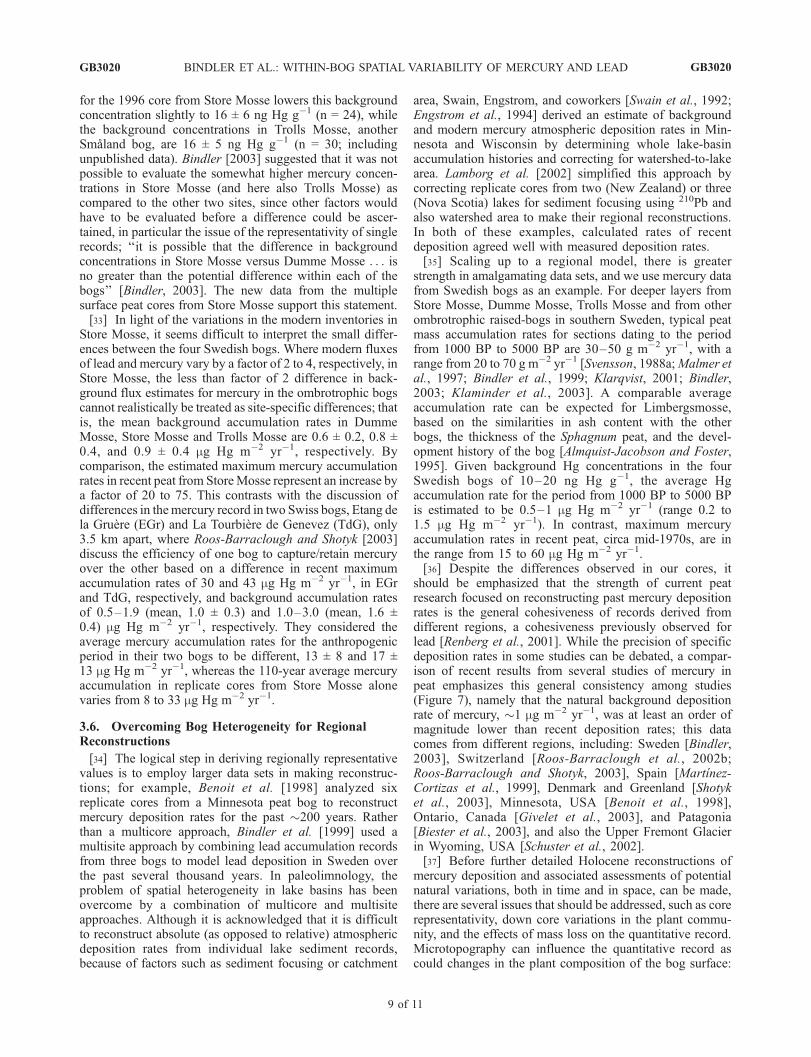
should be emphasized that the strength of current peatresearch focused on reconstructing past mercury depositionrates is the general cohesiveness of records derived fromdifferent regions, a cohesiveness previously observed forlead [Renberg et al., 2001]. While the precision of specificdeposition rates in some studies can be debated, a compar-ison of recent results from several studies of mercury inpeat emphasizes this general consistency among studies(Figure 7), namely that the natural background depositionrate of mercury, �1 mg m�2 yr�1, was at least an order ofmagnitude lower than recent deposition rates; this datacomes from different regions, including: Sweden [Bindler,2003], Switzerland [Roos-Barraclough et al., 2002b;Roos-Barraclough and Shotyk, 2003], Spain [Martınez-Cortizas et al., 1999], Denmark and Greenland [Shotyket al., 2003], Minnesota, USA [Benoit et al., 1998],Ontario, Canada [Givelet et al., 2003], and Patagonia[Biester et al., 2003], and also the Upper Fremont Glacierin Wyoming, USA [Schuster et al., 2002].[37] Before further detailed Holocene reconstructions of
mercury deposition and associated assessments of potentialnatural variations, both in time and in space, can be made,there are several issues that should be addressed, such as corerepresentativity, down core variations in the plant commu-nity, and the effects of mass loss on the quantitative record.Microtopography can influence the quantitative record ascould changes in the plant composition of the bog surface:
GB3020 BINDLER ET AL.: WITHIN-BOG SPATIAL VARIABILITY OF MERCURY AND LEAD
9 of 11
GB3020
There appear to be differences in the efficiency of differentspecies in scavenging Hg [Roos-Barraclough et al., 2002a].The issue of core representativity has not yet been welladdressed in paleo-reconstructions of metal deposition ratesbased on peat, and it can be pointed out as a generalshortcoming in recent peat studies. Some groups have optedto make detailed geochemical analyses to validate singlerecords, others, such as is presented here, look for therepeatability of patterns in multiple cores or sites to validatetheir records. Nonetheless, the data arising from recentstudies of the mercury record in peat using either of theseapproaches, and also studies of lake sediments and glacialice, are generally quite consistent, which indicates thatlarger data sets based on multiple sites could be used todevelop convincing regional models of past mercury depo-sition. A more generalized regional model of past mercurydeposition from peat records may be more useful for appli-cation in studies of contemporary biogeochemical studies,as has been done for lead [Bindler et al., 1999; J. Klaminderet al., Estimating the mean residence time of lead in themor layer of boreal forest soils using 210-lead, stable leadand a soil chronosequence, submitted to Geochimicha etCosmochimica Acta, 2004], and also for mercury in lakesediment studies [Swain et al., 1992; Lamborg et al., 2002],than the current focus on single records.
[38] Acknowledgments. This research was supported by a grant fromthe Stiftelsen Anna och Gunnar Vidfelts fond for biologisk forskning forresearch on Store Mosse. Special thanks go to: Johan Rova, CountyAdministrative Board of Jonkoping, for granting permission for thefieldwork within Store Mosse National Park; John Munthe at IVL forearlier mercury analyses of Store Mosse and Trollsmosse samples; TomHess at the University of Maine for the 210Pb and 137Cs analyses; HaraldBiester for critical comments on an early draft of this manuscript; Bibbi
Olsson and Ove Emteryd for the lead analyses; and Lina Jonsson andFredrik Lindgren for help in the field and lab. We are also grateful to thetwo anonymous reviewers for their constructive comments and suggestions.
ReferencesAlmquist-Jacobson, H., and D. R. Foster (1995), Toward an integratedmodel for raised-bog development: Theory and field evidence, Ecology,76, 2503–2516.
Appleby, P. G. (1998), Dating recent sediments by 210Pb: Problems andsolutions, in 2nd NKS/EKO-1 Seminar, 2-4 April 1997, pp. 7–24, STUK,Helsinki.
Appleby, P. G., and F. Oldfield (1978), The calculation of 210Pb datesassuming a constant rate of supply of unsupported 210Pb to the sediment,Catena, 5, 1–8.
Bacon, J. R., K. C. Jones, S. P. McGrath, and A. E. Johnston (1996),Isotopic character of lead deposited from the atmosphere at a grasslandsite in the United Kingdom since 1860, Environ. Sci. Technol., 30, 2511–2518.
Benoit, J. M., W. M. Fitzgerald, and A. W. H. Damman (1998), Thebiogeochemistry of an ombrotrophic bog: Evaluation of use as an archiveof atmospheric mercury deposition, Environ. Res., 78, 118–133.
Biester, H., R. Kilian, C. Franzen, C. Woda, A. Mangini, and H. F. Scholer(2002), Elevated mercury accumulation in a peat bog of the MagellanicMoorlands, Chile (53�S): An anthropogenic signal from the SouthernHemisphere, Earth Planet. Sci. Lett., 201(3-4), 609–620.
Biester, H., A. Martinez Cortizas, S. Birkenstock, and R. Kilian (2003),Effect of peat decomposition and mass loss on historic mercury records inpeat bogs from Patagonia, Environ. Sci. Technol., 37, 32–39.
Bindler, R. (2003), Estimating the natural background atmospheric deposi-tion rate of mercury utilizing ombrotrophic bogs in south Sweden,Environ. Sci. Technol., 37, 40–46.
Bindler, R., M.-L. Brannvall, I. Renberg, O. Emteryd, and H. Grip (1999),Natural lead concentrations in pristine boreal forest soils and past pollu-tion trends: A reference for critical load models, Environ. Sci. Technol.,33, 3362–3367.
Bindler, R., C. Olofsson, I. Renberg, and W. Frech (2001), Temporal trendsin mercury accumulation in lake sediments in Sweden, Water Air SoilPollut. Focus, 1, 343–355.
Bindler, R., I. Renberg, J. Klaminder, and O. Emteryd (2004), Tree rings asPb pollution archives? A comparison of 206Pb/207Pb isotope ratios in pineand other environmental media, Sci. Total Environ., 319, 173–183.
Figure 7. Comparison of background (open circles) and recent maximum (shaded circles) mercuryaccumulation rates in recent studies of peat bogs in Sweden (background flux, four bogs; maximum flux,five cores from three bogs: this paper, Bindler [2003]); Switzerland (two bogs: Roos-Barraclough andShotyk [2003]), Spain (three bogs: Martınez-Cortizas et al. [1999] and A. Martınez-Cortizas, personalcommunication, 2004), SW Greenland (one bog: Shotyk et al. [2003]), Ontario, Canada (background, onebog; maximum, three bogs: Givelet et al. [2003]), Minnesota (six short cores from one bog: Benoit et al.[1998, Figure 5]) and Patagonia (background, three bogs; maximum, one bog: Biester et al. [2003]) andglacial ice from the Upper Fremont Glacier, Wyoming [Schuster et al., 2002]. Solid squares for Sweden,Switzerland, Spain, and Patagonia represent regional mean values.
GB3020 BINDLER ET AL.: WITHIN-BOG SPATIAL VARIABILITY OF MERCURY AND LEAD
10 of 11
GB3020
Bohlin, E., M. Hamalainen, and T. Sunden (1989), Botanical and chemicalcharacterization of peat using multivariate methods, Soil Sci., 147, 252–263.
Brannvall, M.-L., R. Bindler, O. Emteryd, M. Nilsson, and I. Renberg(1997), Stable isotope and concentration records of atmospheric leadpollution in peat and lake sediments in Sweden, Water Air Soil Pollut.,100, 243–252.
Engstrom, D. R., E. B. Swain, T. A. Henning, M. E. Brigham, and P. L.Brezonik (1994), Atmospheric mercury deposition to lakes and water-sheds, in Environmental Chemistry of Lakes and Reservoirs, edited byL. Baker, pp. 33–66, Am. Chem. Soc., Washington, D. C.
Farmer, J. G., L. J. Eades, H. Atkins, and D. F. Chamberlin (2002), Histor-ical trends in the lead isotopic composition of archival Sphagnum mossesfrom Scotland (1838–2000), Environ. Sci. Technol., 36, 152–157.
Gallagher, D., E. J. McGee, and P. I. Mitchell (2001), A recent history of14C, 137Cs, 210Pb, and 241Am accumulation at two Irish peat bog sites: Aneast versus west coast comparison, Radiocarbon, 43, 517–525.
Givelet, N., W. Shotyk, and F. Roos-Barraclough (2003), Rates and pre-dominant anthropogenic sources of atmospheric mercury accumulation insouthern Ontario recorded by peat cores from three bogs: Comparisonwith natural ‘‘background’’ values (past 8,000 years), J. Environ. Monit.,5, 935–949.
Granlund, E. (1931), Kungshamnsmossens utvecklingshistoria jamtepollenanalytiska aldersbestamningar i Uppland, Sver. Geol. Unders.,Ser. C, 368, 1–53.
Gunnarsson, U., N. Malmer, and H. Rydin (2002), Dynamics or constancyin Sphagnum dominated mire ecosystems?, A 40-year study, Ecography,25, 685–704.
Heikurainen, L., and O. Huikari (1952), Turvelajin mikroskooppinenmaarittaminen (The microscopic determination of peat types), Comm.Inst. For. Fenn., 40, 1–34.
Hong, S. M., J. P. Candelone, C. C. Patterson, and C. F. Boutron (1994),Greenland ice evidence of hemispheric lead pollution 2 millennia ago byGreek and Roman civilizations, Science, 265, 1841–1843.
Klaminder, J., I. Renberg, R. Bindler, and O. Emteryd (2003), Isotopictrends and background fluxes of atmospheric lead deposition inN Europe: Analyses of three ombrotrophic bogs from south Sweden,Global Biogeochem. Cycles, 17, 1019, doi:10.1029/2002GB001921.
Klarqvist, M. (2001), Peat growth and carbon accumulation rates during theHolocene in boreal mires, Ph.D. dissertation, Swedish Univ. of Agric.Sci. (Silvestria 203), Umea.
Koponen, T., P. Isoviita, and T. Lammes (1977), The bryophytes of Finland:An annotated checklist, Flora Fenn., 6, 1–77.
Lamborg, C. H., W. F. Fitzgerald, A. W. H. Damman, J. M. Benoit, P. H.Balcom, and D. R. Engstrom (2002), Modern and historic atmosphericmercury fluxes in both hemispheres: Global and regional mercury cyclingimplications, Global Biogeochem. Cycles, 16(4), 1104, doi:10.1029/2001GB001847.
Lid, J. (1985), Norsk, Svensk, Finsk Flora, Det Norske Samlaget, Oslo.Malmer, N. (1962), Studies on mire vegetation in the archaean area ofsouthwester Gotaland (South Sweden): I. Vegetation and habitat condi-tions on the Akhult mire, Opera Bot., 71, 1–322.
Malmer, N., and B. Wallen (1999), The dynamics of peat accumulation onbogs: Mass balance of hummocks and hollows and its variation through-out a millennium, Ecography, 22, 736–750.
Malmer, N., G. Svensson, and B. Wallen (1997), Mass balance and nitrogenaccumulation in hummocks on a South Swedish bog during the lateHolocene, Ecography, 20, 535–549.
Martınez-Cortizas, A., X. Pontevedra-Pombal, J. C. Novoa Munos, andE. Garcıa-Rodeja (1997), Four thousand years of atmospheric Pb, Cdand Zn deposition recorded by the ombrotrophic peat bog of Penido Vello(northwest Spain), Water Air Soil Pollut., 100, 387–403.
Martınez-Cortizas, A., X. Pontevedra-Pombal, E. Garcıa-Rodeja, J. C.Novoa Munos, and W. Shotyk (1999), Mercury in a Spanish peatbog: Archive of climate change and atmospheric metal pollution,Science, 284, 939–942.
Mylona, S. (1996), Sulphur dioxide emissions in Europe 1880–1991 andtheir effect on sulphur concentrations and depositions, Tellus, Ser. B, 48,662–689.
Norton, S. A., G. C. Evans, and J. S. Kahl (1997), Comparison of Hg andPb fluxes to hummocks and hollows of ombrotrophic Big Heath Bog andto nearby Sargent Mt. Pond, Maine, USA, Water Air Soil Pollut., 100,271–286.
Ohlson, M., and R. H. Økland (1998), Spatial variation in rates of carbonand nitrogen accumulation in a boreal bog, Ecology, 79, 2745–2758.
Oldfield, F., A. Brown, and R. Thompson (1979), The effect of microtopog-raphy and vegetation on the catchment of airborne particles measuredby remnant magnetism, Quat. Res., 12, 326–332.
Pheiffer-Madsen, P. (1981), Peat bog records of atmospheric mercurydeposition, Nature, 293, 127–130.
Renberg, I., M. Wik-Persson, and O. Emteryd (1994), Pre-industrial atmo-spheric lead contamination detected in Swedish lake sediments, Nature,368, 323–326.
Renberg, I., M.-L. Brannvall, R. Bindler, and O. Emteryd (2000), Atmo-spheric lead pollution history during four millennia (2000 BC to2000 AD) in Sweden, Ambio, 29, 150–156.
Renberg, I., R. Bindler, and M.-L. Brannvall (2001), Using the historicalatmospheric lead deposition record as a chronological marker in sedimentdeposits in Europe, Holocene, 11, 511–516.
Renberg, I., M.-L. Brannvall, R. Bindler, and O. Emteryd (2002), Stablelead isotopes and lake sediments—A useful combination for the study ofatmospheric lead pollution history, Sci. Total Environ., 292, 45–54.
Roos-Barraclough, F., and W. Shotyk (2003), Millennial-scale records ofatmospheric mercury deposition obtained from ombrotrophic and miner-otrophic peatlands in the Swiss Jura mountains, Environ. Sci. Technol., 37,235–244.
Roos-Barraclough, F., N. Givelet, A. Martinez-Cortizas, M. E. Goodsite,H. Biester, and W. Shotyk (2002a), An analytical protocol for the deter-mination of total mercury concentrations in solid peat samples, Sci. TotalEnviron., 292, 129–139.
Roos-Barraclough, F., A. Martinez Cortizas, E. Garcia-Rodeja, andW. Shotyk (2002b), A 14500 year record of the accumulation of atmo-spheric mercury in peat: Volcanic signals, anthropogenic influences and acorrelation to bromine accumulation, Earth Planet. Sci. Lett., 6334, 1–18.
Ruhling, A. (1994),Atmospheric heavymetal deposition inEurope—Estima-tions based on moss analyses, report, Nordic Counc. ofMin., Copenhagen.
Schuster, P. F., D. P. Krabbenhoft, D. L. Naftz, L. D. Cecil, M. L. Olson,J. F. Dewild, D. D. Susong, J. R. Green, and M. L. Abbott (2002),Atmospheric mercury deposition during the last 270 years: A glacialice core record of natural and anthropogenic sources, Environ. Sci. Tech-nol., 36, 2303–2310.
Shotyk, W., A. Cheburkin, P. G. Appleby, A. Fankhauser, and J. D.Kramers (1997), Lead in three peat bog profiles, Jura Mountains, Switz-erland: Enrichment factors, isotopic composition, and chronology ofatmospheric deposition, Water Air Soil Pollut., 100, 297–310.
Shotyk, W., D. Weiss, P. G. Appleby, A. K. Cheburkin, R. Frei, M. Gloor,J. D. Kramers, S. Reese, and W. O. Van Der Knaap (1998), History ofatmospheric lead deposition since 12,370 14C yr BP from a peat bog, Juramountains, Switzerland, Science, 281, 1635–1640.
Shotyk, W., M. E. Goodsite, F. Roos-Barraclough, R. Frei, J. Heinemeier,G. Asmund, C. Lohse, and T. S. Hansen (2003), Anthropogenic contribu-tions to atmospheric Hg, Pb and As accumulation recorded by peat coresfrom southern Greenland and Denmark dated using the 14C ‘‘bomb pulsecurve,’’ Geochim. Cosmochim. Acta, 67, 3991–4011.
Svensson, G. (1986), Recognition of peat-forming plant communities fromtheir peat deposits in two south Swedish bog complexes, Vegetatio, 66,95–108.
Svensson, G. (1988a), Bog development and environmental conditions asshown by the stratigraphy of Store Mosse mire in southern Sweden,Boreas, 17, 89–111.
Svensson, G. (1988b), Fossil plant communities and regeneration patternson a raised bog in south Sweden, J. Ecol., 76, 41–59.
Swain, E. B., D. R. Engstrom, M. E. Brigham, T. A. Henning, and P. L.Brezonik (1992), Increasing rates of atmospheric mercury deposition inmidcontinental North America, Science, 257, 784–787.
Viczian, M., A. Laszity, and R. M. Barnes (1990), Identification of potentialenvironmental sources of childhood lead-poisoning by inductivelycoupled plasma mass-spectrometry—Verification and case-studies,J. Anal. Atmos. Spectrom., 5, 293–300.
von Post, L. (1913), Uber stratigraphische Zweigliederung schwedischerHochmoore (The stratigraphy of Swedish raised bogs), Sver. Geol.Unders., Ser. C., 248, 52 pp.
Wardenaar, E. C. P. (1987), A new hand tool for cutting peat profiles, Can.J. Bot.y, 65, 1772–1773.
Weiss, D., W. Shotyk, P. G. Appleby, I. D. Kramers, and A. K. Cheburkin(1999), Atmospheric Pb deposition since the industrial revolutionrecorded by five Swiss peat profiles: Enrichment factors, fluxes, isotopiccomposition, and sources, Environ. Sci. Technol., 33, 1340–1352.
�������������������������R. Bindler, J. Forster, and J. Klaminder, Department of Ecology and
Environmental Science, Umea University, SE-901 87 Umea, Sweden.([email protected]; [email protected]; [email protected])M. Klarqvist, Department of Forest Ecology, Swedish University of Agri-
cultural Sciences, SE-901 87 Umea, Sweden. ([email protected])
GB3020 BINDLER ET AL.: WITHIN-BOG SPATIAL VARIABILITY OF MERCURY AND LEAD
11 of 11
GB3020
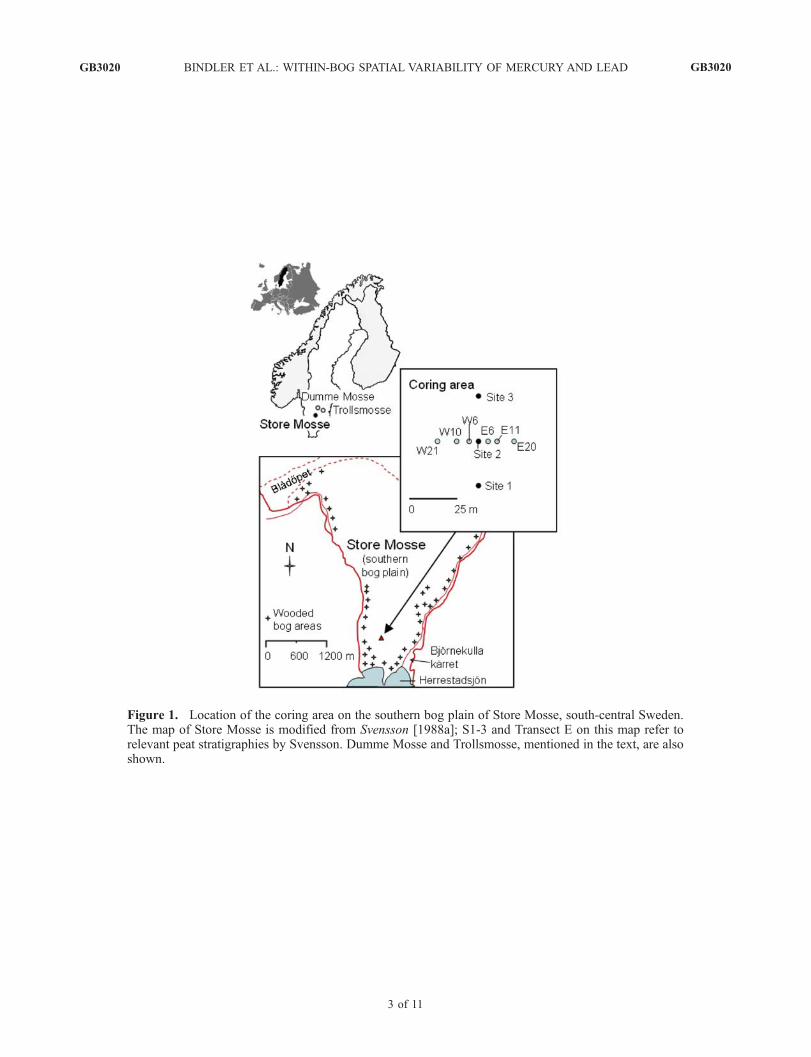
Figure 1. Location of the coring area on the southern bog plain of Store Mosse, south-central Sweden.The map of Store Mosse is modified from Svensson [1988a]; S1-3 and Transect E on this map refer torelevant peat stratigraphies by Svensson. Dumme Mosse and Trollsmosse, mentioned in the text, are alsoshown.
GB3020 BINDLER ET AL.: WITHIN-BOG SPATIAL VARIABILITY OF MERCURY AND LEAD GB3020
3 of 11
Related Documents