REGULAR PAPER Goran Milutinovic ´ • Ulla Ahonen-Jonnarth • Stefan Seipel Does visual saliency affect decision-making? Received: 16 September 2020 / Revised: 9 March 2021 / Accepted: 30 April 2021 / Published online: 11 June 2021 Ó The Author(s) 2021 Abstract In the present study, we explore potential effects of visual saliency on decision quality in context of multi-criteria decision-making (MCDM). We compare two visualization techniques: parallel coordinates (PC) and scatterplot matrices (SPM). We investigate the impact of saliency facilitated by means of either color or size. The saliency and visualization techniques were factors in our analysis, and effects were evaluated in terms of decision quality, attention, time on task, and confidence. Results show that the quality of choice and attention were comparable for all saliency conditions when SPM was used. For PC, we found a positive effect of color saliency both on the quality of choice and on attention. Different forms of saliency led to varying times on task in both PC and SPM; however, those variations were not significant. A comparison of PC and SPM shows, users spent less time on the task, obtained better decision quality, and were more confident with their decision when using PC. To summarize, our findings suggest that saliency can increase attention and decision quality in MCDM for certain visualization techniques and forms of saliency. Another contribution of this work is the novel suggestion of the method to elicit of users’ preferences; its potential benefits are discussed in the end of the paper. Keywords Decision-making Preferences Saliency Visual attention Scatterplot matrices Parallel coordinates 1 Introduction A number of studies (e.g., Jarvenpaa 1990; Glaze et al. 1992; Lohse 1997; Speier 2006; Lurie and Mason 2007) have shown that more vividly presented information is likely to be acquired and processed before the less vividly presented information. Increasing the use of salient information may come at the expense of ignoring other relevant information (Glaze et al. 1992), which may have significant implications in the context of decision-making. As far as we know, though, there are no previous studies where the influence of visual saliency has been evaluated for its impact on the performance, i.e., the quality of choice in multi- criteria decision-making (MCDM). Indeed, this is true not only for visual saliency, but for the impact of almost any aspect of visualization on MCDM. One of the few exceptions is the study by Dimara et al. (2018), where the authors attempt to evaluate three different visualization techniques (scatterplot matrix, parallel coordinates, and tabular visualization) for their ability to support decision-making tasks. They use a G. Milutinovic ´(&) U. Ahonen-Jonnarth S. Seipel Faculty of Engineering and Sustainable Development, University of Ga ¨vle, Ga ¨vle, Sweden E-mail: [email protected] S. Seipel Division of Visual Information and Interaction, Department of Information Technology, Uppsala University, Uppsala, Sweden J Vis (2021) 24:1267–1285 https://doi.org/10.1007/s12650-021-00760-4

Welcome message from author
This document is posted to help you gain knowledge. Please leave a comment to let me know what you think about it! Share it to your friends and learn new things together.
Transcript
REGULAR PAPER
Goran Milutinovic • Ulla Ahonen-Jonnarth • Stefan Seipel
Does visual saliency affect decision-making?
Received: 16 September 2020 / Revised: 9 March 2021 / Accepted: 30 April 2021 / Published online: 11 June 2021� The Author(s) 2021
Abstract In the present study, we explore potential effects of visual saliency on decision quality in contextof multi-criteria decision-making (MCDM). We compare two visualization techniques: parallel coordinates(PC) and scatterplot matrices (SPM). We investigate the impact of saliency facilitated by means of eithercolor or size. The saliency and visualization techniques were factors in our analysis, and effects wereevaluated in terms of decision quality, attention, time on task, and confidence. Results show that the qualityof choice and attention were comparable for all saliency conditions when SPM was used. For PC, we founda positive effect of color saliency both on the quality of choice and on attention. Different forms of saliencyled to varying times on task in both PC and SPM; however, those variations were not significant. Acomparison of PC and SPM shows, users spent less time on the task, obtained better decision quality, andwere more confident with their decision when using PC. To summarize, our findings suggest that saliencycan increase attention and decision quality in MCDM for certain visualization techniques and forms ofsaliency. Another contribution of this work is the novel suggestion of the method to elicit of users’preferences; its potential benefits are discussed in the end of the paper.
Keywords Decision-making � Preferences � Saliency � Visual attention � Scatterplot matrices �Parallel coordinates
1 Introduction
A number of studies (e.g., Jarvenpaa 1990; Glaze et al. 1992; Lohse 1997; Speier 2006; Lurie and Mason2007) have shown that more vividly presented information is likely to be acquired and processed before theless vividly presented information. Increasing the use of salient information may come at the expense ofignoring other relevant information (Glaze et al. 1992), which may have significant implications in thecontext of decision-making. As far as we know, though, there are no previous studies where the influence ofvisual saliency has been evaluated for its impact on the performance, i.e., the quality of choice in multi-criteria decision-making (MCDM). Indeed, this is true not only for visual saliency, but for the impact ofalmost any aspect of visualization on MCDM. One of the few exceptions is the study by Dimara et al.(2018), where the authors attempt to evaluate three different visualization techniques (scatterplot matrix,parallel coordinates, and tabular visualization) for their ability to support decision-making tasks. They use a
G. Milutinovic (&) � U. Ahonen-Jonnarth � S. SeipelFaculty of Engineering and Sustainable Development, University of Gavle, Gavle, SwedenE-mail: [email protected]
S. SeipelDivision of Visual Information and Interaction, Department of Information Technology, Uppsala University, Uppsala,Sweden
J Vis (2021) 24:1267–1285https://doi.org/10.1007/s12650-021-00760-4
novel approach, defining the quality of decisions as the consistency between the choice made and the self-reported preferences for criteria. The authors observed no indication of differences between differentvisualization techniques. This, at least in part, may be due to the shortcomings of the method they used toelicit participants’ preferences.
1.1 Objectives and research questions
The main gal of our study is to investigate potential effects of visual saliency on multi-criteria decision-making. Our first objective was to evaluate the effects of saliency on the outcome of a decision process, i.e.,on the quality of decisions. The second objective was to evaluate in what way visual saliency may affectusers’ attention during the decision process. These objectives are achieved answering the following researchquestions:
1. How do the introduced saliency modes (no saliency, color saliency, size saliency) compare with regardto quality of decisions?
2. How do the introduced saliency modes compare with regard to users’ attention to the most preferredcriterion?
3. How do the introduced saliency modes compare with regard to time spent on decision tasks?4. How do the introduced saliency modes compare with regard to users’ confidence in decisions?
To our knowledge, there are no previous studies on the impact of visual saliency on decision-making. In thatrespect, our study makes an important contribution to the research concerned with the role of visualization inthe context of multi-criteria decision-making. Furthermore, we suggest an alternative method for elicitationof users’ preferences, which we believe improves the reliability of the presumably accurate ranking ofalternatives. We use the same approach as suggested in Dimara et al. (2018) to obtain indicative measure ofthe quality of decisions. However, we use a different method, SWING weighting, to assess participants’preferences for criteria. In SWING weighting, preferences for criteria are obtained considering ranges ofvalues in criteria, instead of rating the importance of criteria without considering the values of actualalternatives.
2 Theoretical background
The terms necessary for understanding the concept of multi-criteria decision-making and decision tasks areexplained in Sect. 2.1. In Sect. 2.2 we give some examples of how visualization is used in in today’sdecision support systems, and in Sect. 2.3 we address relevant issues regarding the evaluation of visualdecision support tools. We explain the concept of visual saliency and give a brief overview of studiesconcerning the impact of saliency on decision-making in Sect. 2.4.
2.1 Multi-criteria decision-making
The central task of multi-criteria decision-making, sometimes referred to as multi-criteria decision analysis(MCDA), is evaluating a set of alternatives in terms of a number of conflicting criteria (Zavadskas et al.2014). Keeney and Raiffa (1993) define MCDA as ‘‘... a methodology for appraising alternatives onindividual, often conflicting criteria, and combining them into an overall appraisal.’’, and summarize theparadigm of decision analysis in a five-step process:
1. Preanalysis. Identify the problem and the viable action alternatives.2. Structural analysis. Create a decision tree to structure the qualitative anatomy of the problem: what are
the choices, how they differ, what experiments can be performed, what can be learned.3. Uncertainty analysis. Assign probabilities to the branches emanating from chance nodes.4. Utility analysis. Assign utility values to consequences associated with paths through the tree.5. Optimization analysis. Calculate the optimal strategy, i.e., the strategy that maximizes expected utility.
Multi-criteria decision-making is often classified as either multi-attribute (MADM) or multi-objective(MODM). Colson and de Bruyn (1989) define MADM as ‘‘...concerned with choice from a moderate/smallsize set of discrete actions (feasible alternatives)’’ and MODM is defined as the method that ‘‘... deals withthe problem of design (finding a Pareto-optimal solution) in a feasible solution space bounded by the set ofconstraints’’. One of the most popular MADM methods is Analytic Hierarchy Process (AHP) (Saaty 1980), a
1268 G. Milutinovic et al.
method based on decomposition of a decision problem into a hierarchy (goal, objectives, criteria,alternatives), pairwise comparisons of the elements on each level of the hierarchy, and synthesis ofpriorities. Ideal point methods, such as Technique for Order of Preference by Similarity to Ideal Solution(TOPSIS) (Hwang and Yoon 1981), evaluate alternatives in relation to a specific target or goal (ideal point).Another frequently used family of methods are outranking methods, such as ELECTRE (Benayoun et al.1966) and PROMETHEE (Brans and Vincke 1985), which are based on pairwise comparison of alternativesfor each criterion. Weighted Linear Combination (WLC) and its extension Ordered Weighting Averaging(OWA) are methods based on the simple additive summation of the products of criteria weights and criteriavalues for each alternative. It is important to emphasize that we in this paper use the term criteria weight forweight coefficients of utility functions of criteria. These criteria weights are scaling constants as described inKeeney and Raiffa (1993). The basis for criteria weights are participants’ preference evaluations of criteriaranges and thus not ranking of criteria or answers to questions of importance of criteria. The calculation ofweight coefficients of utility functions is explained in Sect. 3.7. In this paper, we refer to the criterion withthe highest weight as the most preferred criterion.
In this study we are concerned with visualization as a support for multi-criteria decision-making, wherevisual features are used to represent the alternatives in the attribute space. Regardless of the decision methodused in a particular decision task, visualization can help the decision-maker to get insight into the distri-bution of alternatives, to get better understanding of the relations between criteria and potential trends thatare difficult to detect in raw data, to detect potential outliers which may lead to reassessment of the criteriaweights, etc.
2.2 Use of visualization in decision support systems
Virtually all today’s decision supports systems rely in one way or another on interactive visualizations topresent not only a decision space with available alternatives or outcomes but even more abstract variables,such as criteria weights, utility differences between different outcomes, and decision-maker’s preferences.Dimara et al. (2018) listed a number of decision support tools designed to aid multi-criteria choice usingdifferent visualizations, such as parallel coordinates (Riehmann et al. 2012; Pu and Faltings 2000; Pajeret al. 2017), scatterplots or scatterplot matrices (Pu and Faltings 2000; Ahlberg and Shneiderman 2003;Elmqvist et al. 2008), or tabular visualizations (Carenini and Loyd 2044; Gratzl et al. 2013). Many recentlydeveloped decision support tools use combinations of the mentioned visualizations for different purposes.PriEsT (Siraj et al. 2015), based on Analytical Hierarchy Process (AHP) (Saaty 1980), uses table views andgraph views to show inconsistencies in the decision-maker’s judgments regarding the importance of criteria(judgments which violate the transitive property of ratio judgments are considered inconsistent). ParetoBrowser (Vallerio et al. 2015) uses three-dimensional graphs to visualize the Pareto front, two-dimensionalgraphs for states and controls, scatterplots for visualization of objective functions, and parallel coordinatesfor visualization of Pareto optimal solutions. Visual GISwaps (Milutinovic and Seipel 2018), a domain-specific tool for geo-spatial decision-making, uses interactive maps to visualize alternatives in geographicalspace, a scatterplot to visualize alternatives in attribute space, and a multi-line chart for visual representationof trade-off value functions. Apart from the mentioned visual representations, other visualizations have beenused in the decision-making context. Decision Ball (Li and Ma 2008) is a model based on the even swapsmethod (Hammond et al. 1998); it visualizes a decision process as moving trajectories of alternatives onspheres. VIDEO (Kollat and Reed 2007) uses 3D scatterplot to visualize up to four dimensions, where thefourth dimension is color coded, and in AHP-GAIA (Ishizaka et al. 2016), a n-star graph view is used tovisualize the decision-maker’s preferences.
2.3 Evaluation issues
Regardless what method or tool is used as a support in a decision-making process, the outcome is ultimatelydependent on the decision-maker’s preferences, expectations, and knowledge. The fact that decision tasks bydefinition do not come with an objectively best alternative makes comparative evaluations of these tools andmethods difficult, as there exists no generally best outcome, nor are there reliable metrics for measuringtheir efficiency. Evaluation of visual decision support tools is even more difficult, as evaluating visual-izations in itself is a demanding task. This is one of the main reasons that such non-comparative evaluationsare usually performed through qualitative studies, focusing on user opinion and perception (e.g., Pajer et al.2017; Salter et al. 2009; Andrienko and Andrienko 2003; Jankowski et al. 2001)). Andrienko et al. (2003)
Does visual saliency affect decision-making? 1269
used a process tracing-based approach to evaluate tools and techniques in CommonGIS, observing theparticipants while working with appropriate tools for different tasks. Arciniegas et al. (2011) performed anexperiment to assess usefulness and clarity of tool information in a set of collaborative decision supporttools. The assessment was based on participants’ ratings of the experience with the tool as well as theiranswers to a number of questions related to their understanding of the tool. In Gratzl et al. (2013) anexperimental study was used for qualitative evaluation of LineUp—a visualization technique based on barcharts. The tool was evaluated using a 7-point Likert scale, based on the questionnaire provided to theparticipants.
Use of quantitative evaluation methods is more common in comparative studies. For example in Careniniand Loyd (2044), a quantitative usability study was performed to compare two different versions ofValueCharts based on user performance in terms of the completion time and the quality of choices on lowlevel tasks. Andrienko et al. (2002) performed a quantitative study to test five different geovisualizationtools implemented in CommonGIS for learnability, memorability and user satisfaction.
Even when quantitative methods are used in evaluations of MCDM decision support tools and methods,objective measurement of performance is rarely used to assess the effectiveness of a tool, as there are noobjective metrics for measuring the quality of a choice, and constructing reliable performance metrics isextremely demanding and difficult task. The only study known to us in which such performance metrics wasused to assess the impact of a decision support tool on the quality of decisions was presented in Arciniegaset al. (2013). In their study, the authors measured the impact on decisions of three different decision supporttools. Quality of a choice was used as the metrics to assess the impact on decisions. The quality of a choicewas determined by comparing the made choice with the utility values of different choices based on expertjudgment. However, one obvious problem with this approach is that the participants’ preferences andknowledge were not taken into consideration. Instead, the objective ranking of the different choices, thus theexistence of an objectively best choice, is assumed. It may then be argued that the task performed by theparticipants was not a proper decision-making task; it was de facto to find the best solution, rather than tomake an informed choice.
2.4 Visual saliency
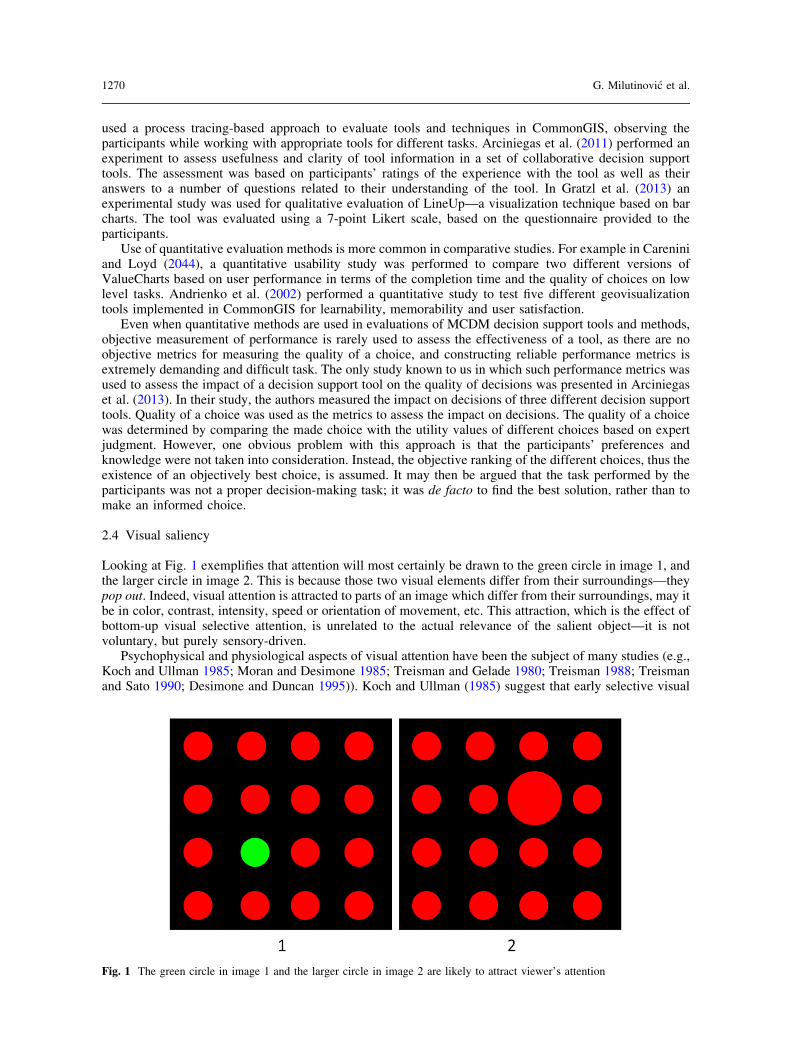
Looking at Fig. 1 exemplifies that attention will most certainly be drawn to the green circle in image 1, andthe larger circle in image 2. This is because those two visual elements differ from their surroundings—theypop out. Indeed, visual attention is attracted to parts of an image which differ from their surroundings, may itbe in color, contrast, intensity, speed or orientation of movement, etc. This attraction, which is the effect ofbottom-up visual selective attention, is unrelated to the actual relevance of the salient object—it is notvoluntary, but purely sensory-driven.
Psychophysical and physiological aspects of visual attention have been the subject of many studies (e.g.,Koch and Ullman 1985; Moran and Desimone 1985; Treisman and Gelade 1980; Treisman 1988; Treismanand Sato 1990; Desimone and Duncan 1995)). Koch and Ullman (1985) suggest that early selective visual
Fig. 1 The green circle in image 1 and the larger circle in image 2 are likely to attract viewer’s attention
1270 G. Milutinovic et al.
attention emerges from selective mapping from the early representation into a non-topographic centralrepresentation. The early representation consists of different topographic maps, in which elementary fea-tures, such as color, orientation, direction of movement, etc., are represented in parallel. At any instant, thecentral representation contains the properties of a single location in the scene—the selected location.
2.4.1 Saliency maps
The concept of the saliency map was first introduced in Koch and Ullman (1985), on the assumption thatconspicuity of a location in a scene determines the level of activity of the corresponding units in theelementary maps. An early model of saliency-based visual attention for rapid scene analysis by Itti et al.(1998) was built on this strict hypothesis of a saliency map, that low-level visual features attract visualattention and determine eye movements in the initial inspection of a scene, regardless of cognitive demands.In Itti and Koch (2001), however, the authors argue that a more advanced attentional control model mustalso include top-down, i.e., cognition-based influences, as a simple architecture based solely on bottom-upselective attention can only describe the deployment of attention within the first few hundreds ofmilliseconds.
A majority of researchers today agree that both top-down and bottom-up processes influence the allo-cation of attention. However, there is no agreement regarding the question of to what extent those processesinfluence attentional selections. The results of the experiment deploying eye-tracking, presented inUnderwood et al. (2006), confirmed that the observer’s goals and expectations do influence the fixationpatterns, and that the task demands can override the saliency map. The study presented in Donk and vanZoest (2008) showed similar results. The authors found that saliency is not persistently represented in thevisual system, but only for the time of a few hundreds of milliseconds. After this interval has passed, thevisual system only holds information concerning object presence, but not information concerning therelative salience of objects, and top-down control overrides bottom-up control. The results of the study byParkhurst et al. (2002) showed different results. Namely, while attention was most stimulus-driven just aftera visual content was presented, it remained stimulus-driven to smaller extent even after the activation of top-down influences. Even the analysis presented in Orquin et al. (2018) showed that bottom-up and top-downprocesses do not operate in different time windows, but are active simultaneously.
2.4.2 Saliency and decision-making
In an early study concerning the impact of visual saliency on decision-making, Glaze et al. (1992) foundthat the vividness of graphic information may increase its use in decision-making, and that components ofdecision-making that are most accessible, i.e., most clearly addressed by the information, are likely to be thefocus of decision-making. The assessment of the impact of framing effects on decision-making presented inLurie and Mason (2007) showed that visual saliency moderates the effect of positive versus negative frameson judgment. An interesting finding presented in this study was that the attraction effect is more likely toinfluence decision-making if the visual representation used display’s information by criteria, rather than ifthe information is displayed by alternative. The influence of criteria saliency in graphical representationswas also demonstrated in Sun et al. (2010). Kelton et al. (2010) found that information presentation canaffect the decision-maker influencing his/her mental representation of the problem, and influencing his/hercharacteristics such as involvement and task knowledge. A study by Orquin et al. (2018) showed that visualbiases such as saliency may lead decision-makers to focus their attention in ways that are arbitrary to theirdecision goals. The results of experiments presented in Lohse (1997) demonstrated the importance ofattention for choice behavior. The authors found that consumers choosing businesses from telephonedirectories viewed color ads 21% longer than non-color ones, and that they viewed 42% more bold listingsthan plain listings, spending on average 54% more time viewing ads for businesses they ended up choosing.Similar results were obtained in Milosavljevic et al. (2012), showing that , when making fast decisions,visual saliency influences choices more than preferences do, and that the bias is particularly strong when thepreferences among the options are weak.
Does visual saliency affect decision-making? 1271
3 Methodology
The study is based on a user performance experiment, carried out in order to obtain data for rigorousquantitative analysis. Participants worked on a simple multi-criteria decision task using a web applicationdeveloped for the purpose. In this section, we present the decision problem (3.1), experiment design (3.2),data sets (3.3), a brief overview of the web application structure and features (3.4), the type of collected data(3.5), the details of visual representations used in the evaluation (3.6), and the explanation of the perfor-mance metrics used to assess choice quality (3.7).
3.1 Decision problem scenario
When choosing a decision task for evaluation studies, it is first and foremost important to provide a task towhich all participants can relate. The decision task we used in this study was to choose a hotel for a holidaystay. Participants were presented with 50 different alternatives, i.e., 50 hotels, and asked to choose the mostpreferred alternative. Regarding the complexity of the task in terms of number of criteria, we opted to keep itlow, as increased complexity is shown to lead to the use of simplifying decision strategies (Timmermans1993). Payne (1976) found that increased complexity often leads to decision-makers resorting to heuristics,such as elimination-by-aspects. In the present study, each alternative was described in terms of five criteria:Price, Distance to city center, Cleanliness, Service and Breakfast.
3.2 Experiment
The experiment was run on the Amazon Mechanical Turk1 crowd-sourcing platform. A total of 153 par-ticipants took part in the experiment. We did not impose any requirements regarding participants’ back-ground, knowledge or skills.
At the beginning of the experiment, participants were presented with the explanation of the process ofassigning the SWING rating values to virtual alternatives (see Sect. 3.7). They were then asked to assignrating values to the virtual alternatives representative to both data sets. Those rating values were then used tocalculate criteria weights based on participants’ preferences. After completing the rating process, partici-pants were presented with the explanation and examples of either parallel coordinates, or scatterplotmatrices, depending on which of the two techniques was randomly assigned first. After getting familiar withthe technique, participants proceeded to the first task. After completing the first task, the participants werefamiliarized with the second technique and then performed the second task. After completing both tasks, theparticipants answered a questionnaire.
The experiment followed a two-factor design with visualization as a within-subject factor and saliency asa between-subject factor. In order to counterbalance the order of the within-factor and to maintain com-parable group sizes across the between-factor, participants were quasi-randomly assigned to one of thefollowing test sequences:
1. PC with no saliency (PC_N) followed by SPM with no saliency (SPM_N)2. SPM with no saliency (SPM_N) followed by PC with no saliency (PC_N)3. PC with color saliency (PC_C) followed by SPM with color saliency (SPM_C)4. SPM with color saliency (SPM_C) followed by PC with color saliency (PC_C)5. PC with size saliency (PC_S) followed by SPM with size saliency (SPM_S)6. SPM with size saliency (SPM_S) followed by PC with size saliency (PC_S)
3.3 Data sets
One potential issue with participants working on the same decision task using different visualizationtechniques is a possible impact of learning bias. In order to avoid it, we used two different data sets. The listof hotels, as well as the relevant information regarding price and location, was obtained through Trivagoweb site. Values in terms of price were stated in Euro (the less, the better), and values in terms of distancewere given in kilometers (the closer, the better). Values in terms of the remaining three criteria, obtainedfrom the TripAdviser web site, were expressed as ratings on the scale from 1 to 10 (the higher, the better).
1 https://www.mturk.com/.
1272 G. Milutinovic et al.
The first data set contained fifty alternatives (hotels) in Berlin, Germany, and it was used when theparticipants worked with parallel coordinates. The second set contained fifty hotels in London, UK, and itwas used when the participants worked with scatterplot matrices. Minor adjustments to the values in thesecond data set were made, in order to fit them into the same ranges of values across the criteria as in the firstdata set.
3.4 Software
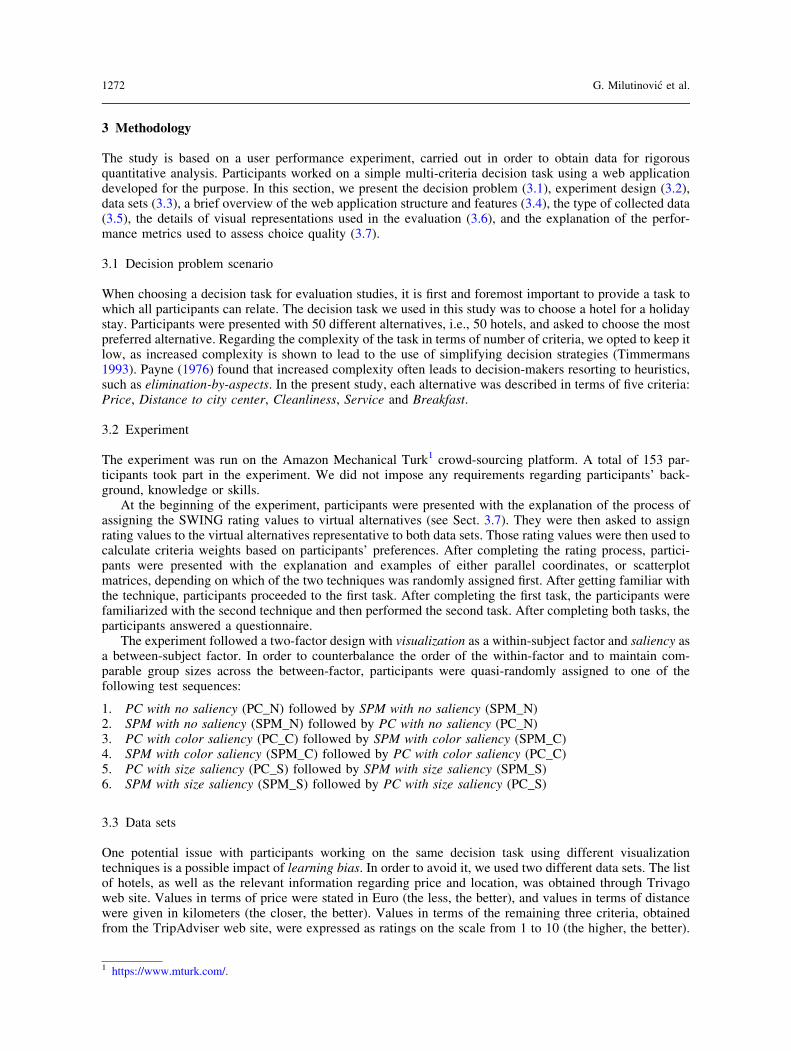
The web application used in this study was implemented using D3.js JavaScript library.2 It consists of threeconceptual units. The first unit is a preference assessment unit, used to elicitate a participant’s preferenceswhich are then used to calculate the weight for each criterion (Fig. 2). These weights are used to calculateutility values for the alternatives (see Sect. 3.7). The decision unit is the main unit, where participants maketheir choices. There are six different visual representations of the decision space: PC, PC with colorsaliency, PC with size saliency, SPM, SPM with color saliency, and SPM with size saliency. Finally, thechoice assessment unit is used to obtain a participant’s own subjective assessment of the made choice.
3.5 Data collection
Saved data for each participants include
– The selected alternative.– Utility values of all alternatives calculated based on the participant’s preference assessment (see
Sect. 3.7).– The time that the participant spent actively choosing the most preferred alternative.– Ordered detail-on-demand sequence, containing all the alternatives on which the participants clicked.– Binary value for each click. For scatterplot matrices: 1 if the click occurred inside a scatterplot
concerning the most preferred criterion; 0 otherwise. For parallel coordinates: 1 if the click occurredcloser to the coordinate representing the most preferred criterion, than to any other coordinate; 0otherwise.
– The technique with which the participant worked first (PC or SPM).
as well as how confident, on a scale 1–10, the participant is that he/she:
– understood the decision task.– understood the process of rating virtual alternatives.– understood parallel coordinates and used them correctly.– understood scatterplot matrices and used them correctly.– made the best possible choice with parallel coordinates.– made the best possible choice with scatterplot matrices.
3.6 Visual representation
In our implementation, we use the full matrix for scatterplot matrices, and Inselbergs (Inselberg 1985)original representation of parallel coordinates, where parallel axes represent criteria (dimensions) andpolylines represent alternatives. The point in which a polyline intersects an axis represents the value of thealternative represented by the polyline in terms of the criterion represented by the axis. To avoid visualclutter and to utilize screen estate, axes were automatically scaled to the value ranges in the dataset, both forscatterplots and parallel coordinates. We used a static layout with no interactive reordering of axes, rows,and columns, not least to minimize biasing factors between subjects. Visual appearance is consistent interms of size and color across all six different visualizations (compare 3.2). The default color for alterna-tives, polylines in PC and dots in SPM, was a medium light yellow with the coordinates [44�, 0.98, 0.55] interms of the HSL color space. In the visualizations where saliency was used to emphasize the most preferredcriterion either deviating color or size were used to mark alternatives along the corresponding criterion axes(both in PC and SPM).
2 https://d3js.org/.
Does visual saliency affect decision-making? 1273
3.6.1 Salient color
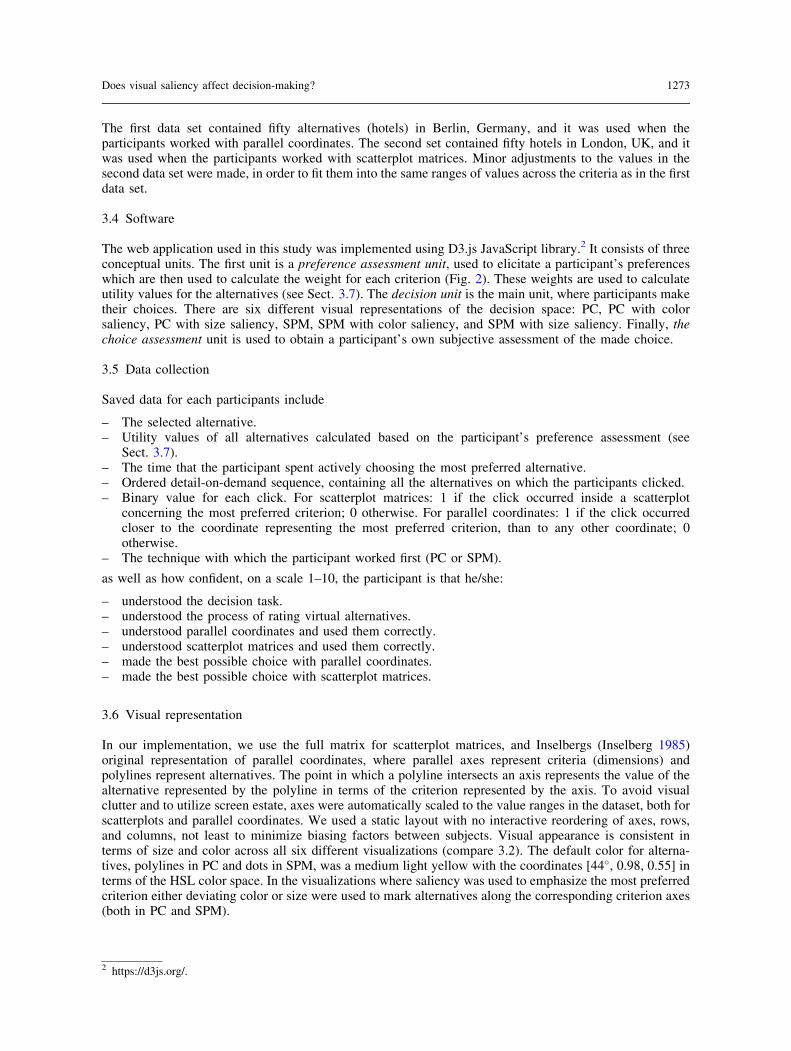
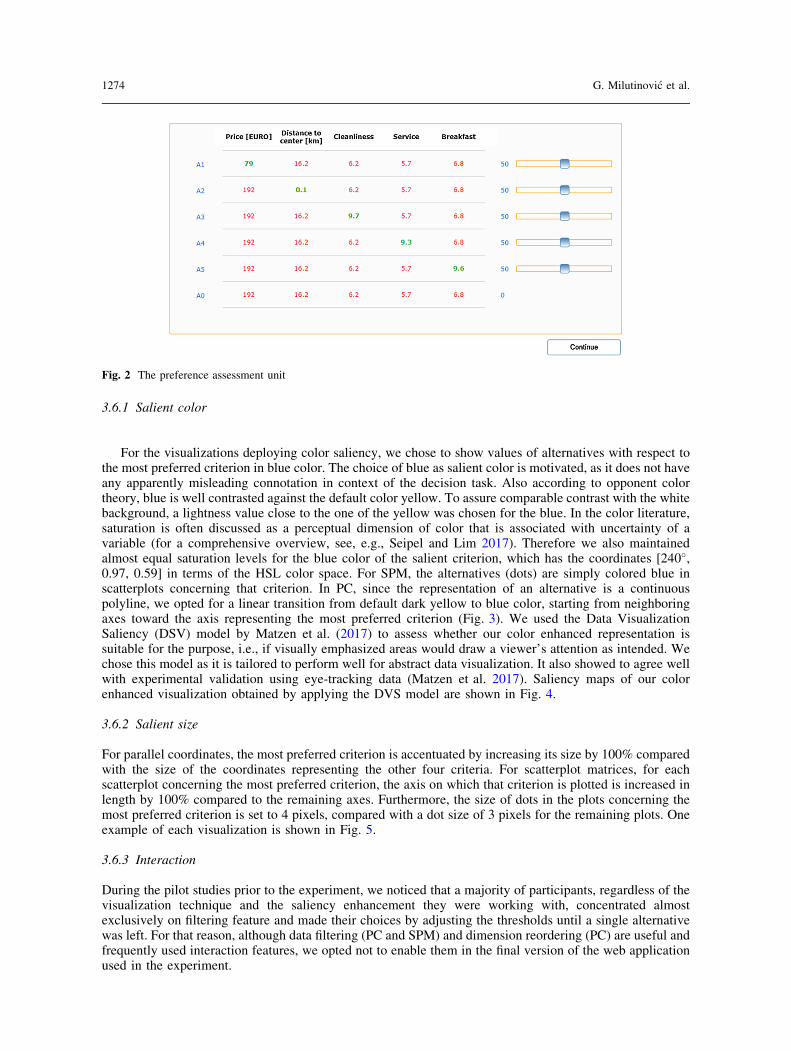
For the visualizations deploying color saliency, we chose to show values of alternatives with respect tothe most preferred criterion in blue color. The choice of blue as salient color is motivated, as it does not haveany apparently misleading connotation in context of the decision task. Also according to opponent colortheory, blue is well contrasted against the default color yellow. To assure comparable contrast with the whitebackground, a lightness value close to the one of the yellow was chosen for the blue. In the color literature,saturation is often discussed as a perceptual dimension of color that is associated with uncertainty of avariable (for a comprehensive overview, see, e.g., Seipel and Lim 2017). Therefore we also maintainedalmost equal saturation levels for the blue color of the salient criterion, which has the coordinates [240�,0.97, 0.59] in terms of the HSL color space. For SPM, the alternatives (dots) are simply colored blue inscatterplots concerning that criterion. In PC, since the representation of an alternative is a continuouspolyline, we opted for a linear transition from default dark yellow to blue color, starting from neighboringaxes toward the axis representing the most preferred criterion (Fig. 3). We used the Data VisualizationSaliency (DSV) model by Matzen et al. (2017) to assess whether our color enhanced representation issuitable for the purpose, i.e., if visually emphasized areas would draw a viewer’s attention as intended. Wechose this model as it is tailored to perform well for abstract data visualization. It also showed to agree wellwith experimental validation using eye-tracking data (Matzen et al. 2017). Saliency maps of our colorenhanced visualization obtained by applying the DVS model are shown in Fig. 4.
3.6.2 Salient size
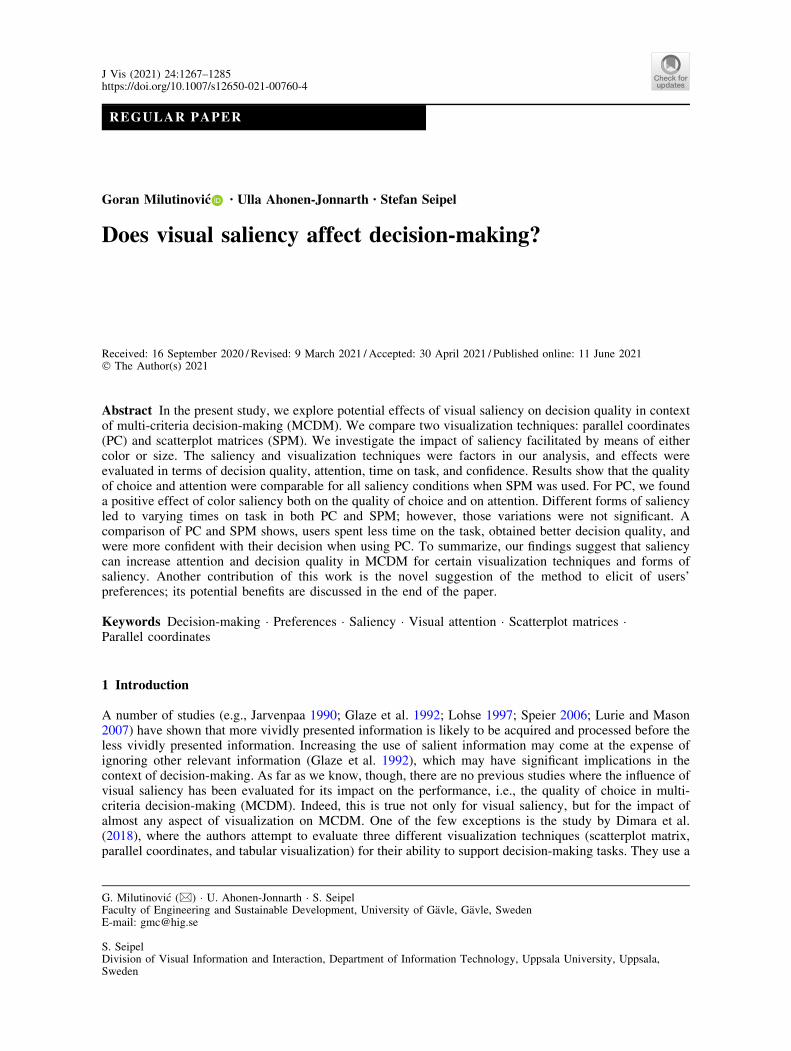
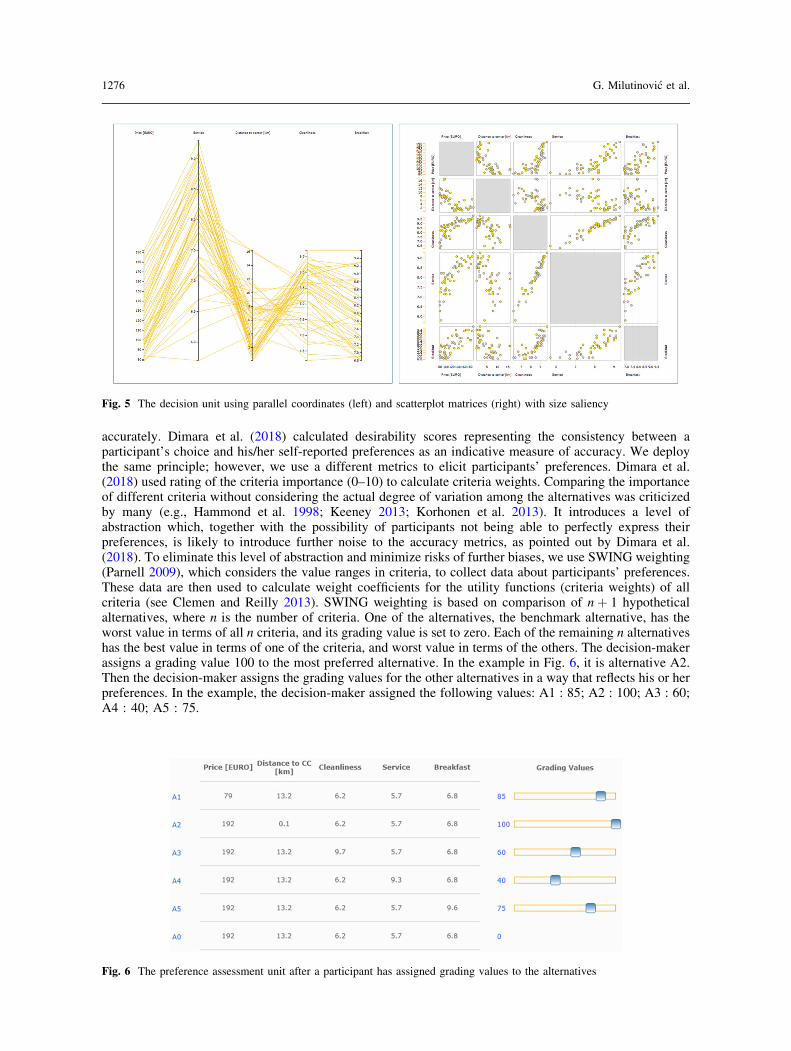
For parallel coordinates, the most preferred criterion is accentuated by increasing its size by 100% comparedwith the size of the coordinates representing the other four criteria. For scatterplot matrices, for eachscatterplot concerning the most preferred criterion, the axis on which that criterion is plotted is increased inlength by 100% compared to the remaining axes. Furthermore, the size of dots in the plots concerning themost preferred criterion is set to 4 pixels, compared with a dot size of 3 pixels for the remaining plots. Oneexample of each visualization is shown in Fig. 5.
3.6.3 Interaction
During the pilot studies prior to the experiment, we noticed that a majority of participants, regardless of thevisualization technique and the saliency enhancement they were working with, concentrated almostexclusively on filtering feature and made their choices by adjusting the thresholds until a single alternativewas left. For that reason, although data filtering (PC and SPM) and dimension reordering (PC) are useful andfrequently used interaction features, we opted not to enable them in the final version of the web applicationused in the experiment.
Fig. 2 The preference assessment unit
1274 G. Milutinovic et al.
3.7 Performance metrics
Due to the subjective nature of decision-making, there is never an objectively best outcome, i.e., an outcomewhich would be best for every decision-maker. In addition, the quality of a choice is difficult to assess
Fig. 3 The decision unit using parallel coordinates (left) and scatterplot matrices (right) with color saliency. Blue marks themost preferred criterion
Fig. 4 Saliency maps for parallel coordinates and scatterplot matrices using color saliency
Does visual saliency affect decision-making? 1275
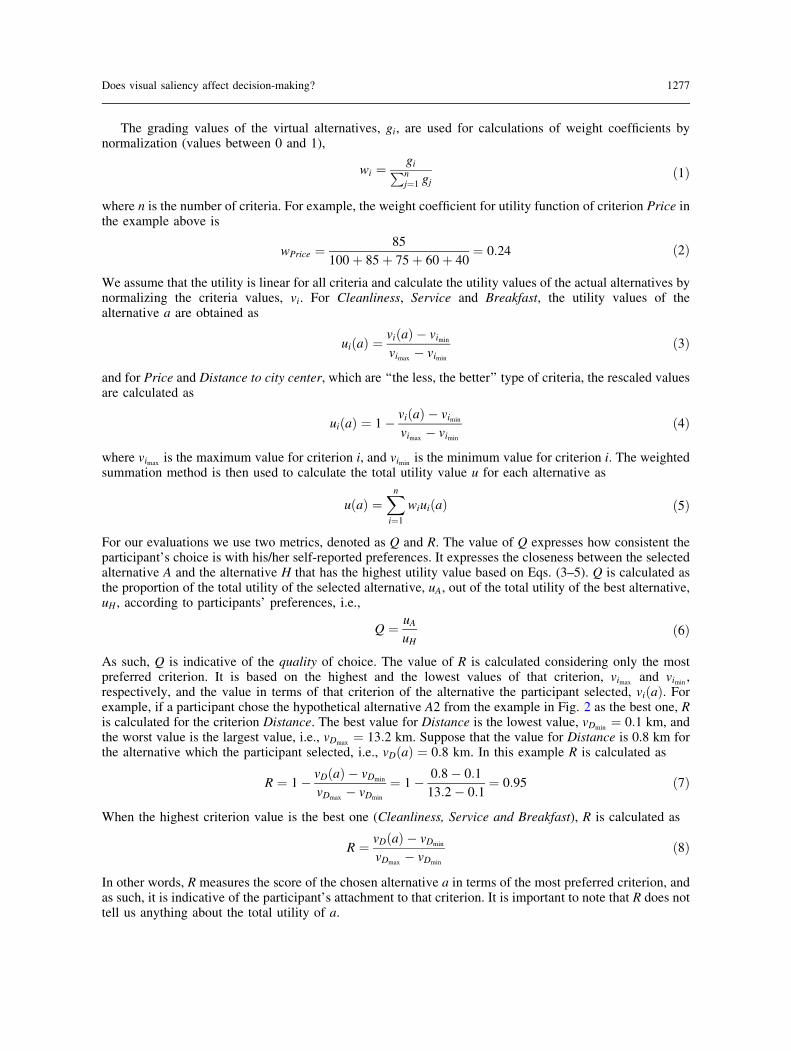
accurately. Dimara et al. (2018) calculated desirability scores representing the consistency between aparticipant’s choice and his/her self-reported preferences as an indicative measure of accuracy. We deploythe same principle; however, we use a different metrics to elicit participants’ preferences. Dimara et al.(2018) used rating of the criteria importance (0–10) to calculate criteria weights. Comparing the importanceof different criteria without considering the actual degree of variation among the alternatives was criticizedby many (e.g., Hammond et al. 1998; Keeney 2013; Korhonen et al. 2013). It introduces a level ofabstraction which, together with the possibility of participants not being able to perfectly express theirpreferences, is likely to introduce further noise to the accuracy metrics, as pointed out by Dimara et al.(2018). To eliminate this level of abstraction and minimize risks of further biases, we use SWING weighting(Parnell 2009), which considers the value ranges in criteria, to collect data about participants’ preferences.These data are then used to calculate weight coefficients for the utility functions (criteria weights) of allcriteria (see Clemen and Reilly 2013). SWING weighting is based on comparison of nþ 1 hypotheticalalternatives, where n is the number of criteria. One of the alternatives, the benchmark alternative, has theworst value in terms of all n criteria, and its grading value is set to zero. Each of the remaining n alternativeshas the best value in terms of one of the criteria, and worst value in terms of the others. The decision-makerassigns a grading value 100 to the most preferred alternative. In the example in Fig. 6, it is alternative A2.Then the decision-maker assigns the grading values for the other alternatives in a way that reflects his or herpreferences. In the example, the decision-maker assigned the following values: A1 : 85; A2 : 100; A3 : 60;A4 : 40; A5 : 75.
Fig. 5 The decision unit using parallel coordinates (left) and scatterplot matrices (right) with size saliency
Fig. 6 The preference assessment unit after a participant has assigned grading values to the alternatives
1276 G. Milutinovic et al.
The grading values of the virtual alternatives, gi, are used for calculations of weight coefficients bynormalization (values between 0 and 1),
wi ¼giPnj¼1 gj
ð1Þ
where n is the number of criteria. For example, the weight coefficient for utility function of criterion Price inthe example above is
wPrice ¼85
100þ 85þ 75þ 60þ 40¼ 0:24 ð2Þ
We assume that the utility is linear for all criteria and calculate the utility values of the actual alternatives bynormalizing the criteria values, vi. For Cleanliness, Service and Breakfast, the utility values of thealternative a are obtained as
uiðaÞ ¼viðaÞ � vimin
vimax� vimin
ð3Þ
and for Price and Distance to city center, which are ‘‘the less, the better’’ type of criteria, the rescaled valuesare calculated as
uiðaÞ ¼ 1� viðaÞ � vimin
vimax� vimin
ð4Þ
where vimaxis the maximum value for criterion i, and vimin
is the minimum value for criterion i. The weightedsummation method is then used to calculate the total utility value u for each alternative as
uðaÞ ¼Xn
i¼1
wiuiðaÞ ð5Þ
For our evaluations we use two metrics, denoted as Q and R. The value of Q expresses how consistent theparticipant’s choice is with his/her self-reported preferences. It expresses the closeness between the selectedalternative A and the alternative H that has the highest utility value based on Eqs. (3–5). Q is calculated asthe proportion of the total utility of the selected alternative, uA, out of the total utility of the best alternative,uH , according to participants’ preferences, i.e.,
Q ¼ uAuH
ð6Þ
As such, Q is indicative of the quality of choice. The value of R is calculated considering only the mostpreferred criterion. It is based on the highest and the lowest values of that criterion, vimax
and vimin,
respectively, and the value in terms of that criterion of the alternative the participant selected, viðaÞ. Forexample, if a participant chose the hypothetical alternative A2 from the example in Fig. 2 as the best one, Ris calculated for the criterion Distance. The best value for Distance is the lowest value, vDmin
¼ 0:1 km, andthe worst value is the largest value, i.e., vDmax
¼ 13:2 km. Suppose that the value for Distance is 0.8 km forthe alternative which the participant selected, i.e., vDðaÞ ¼ 0:8 km. In this example R is calculated as
R ¼ 1� vDðaÞ � vDmin
vDmax� vDmin
¼ 1� 0:8� 0:1
13:2� 0:1¼ 0:95 ð7Þ
When the highest criterion value is the best one (Cleanliness, Service and Breakfast), R is calculated as
R ¼ vDðaÞ � vDmin
vDmax� vDmin
ð8Þ
In other words, R measures the score of the chosen alternative a in terms of the most preferred criterion, andas such, it is indicative of the participant’s attachment to that criterion. It is important to note that R does nottell us anything about the total utility of a.
Does visual saliency affect decision-making? 1277
4 Results
Prior to the experiment, we carried out a pilot study. The results of the pilot study and post-experimentconversations with those pilots indicated that the minimum time needed to complete a task was twentyseconds per decision scenario. Based on that, we decided that the results for 20 out of 153 participants whospent less than twenty second working on any of the two tasks could not be considered reliable and shouldbe discarded. Of the remaining participants, 44 participants worked with plain representation, 45 partici-pants worked with representation with color saliency, and 44 participants worked with representation withscale saliency.
Statistical analysis of results was carried out using an estimation approach instead of commonly usednull hypothesis significance testing, offering nuanced interpretations of results (see Cumming 2014;Dragicevic 2016). Our estimations are based on confidence intervals and effect sizes. We followed rec-ommendations by Cumming (2014), based partly on Coulson et al. (2010), and neither reported nor madeany conclusions based on p values.
We used R for inferential statistics, with the bootES package (Kirby and Gerlanc 2013) for calculation ofbootstrap confidence intervals. For calculations and plotting, we used modified R code developed by Dimaraet al. (2018), available at https://aviz.fr/dm. Inferential statistics with regard to the decision quality are givenin Sect. 4.1, with regard to participants’ attention in Sect. 4.2, with regard to time in Sect. 4.3, and withregard to participants’ perception of the techniques and confidence in Sect. 4.4.
4.1 Decision quality
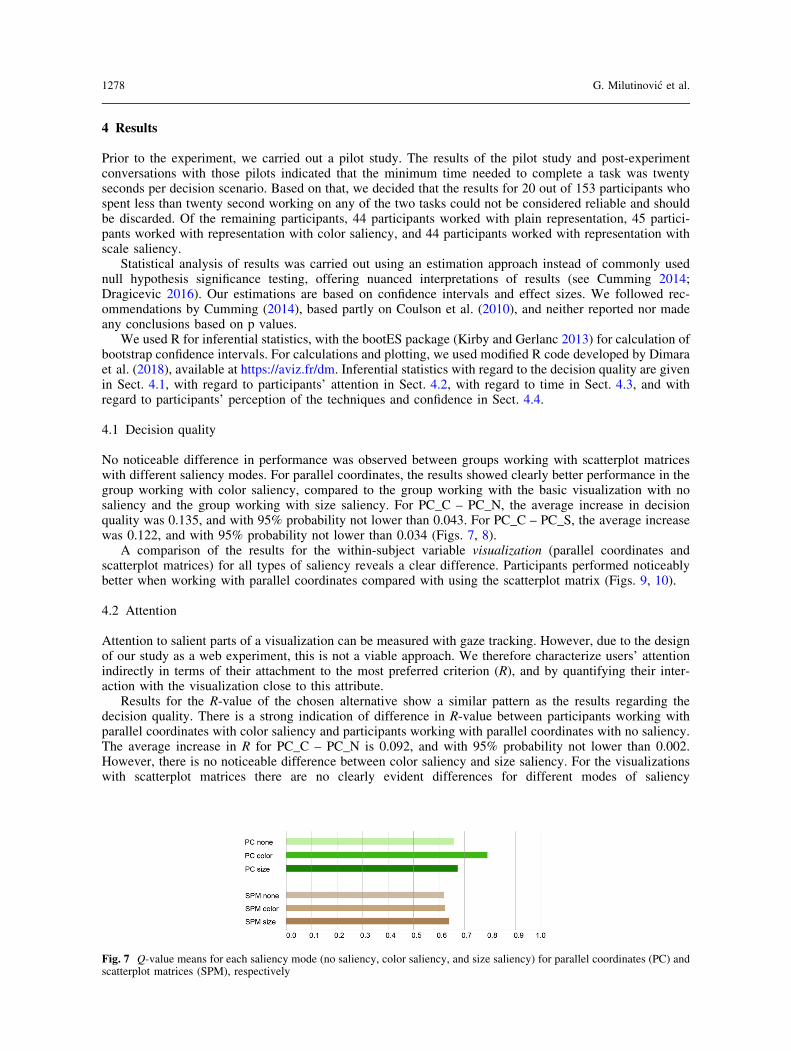
No noticeable difference in performance was observed between groups working with scatterplot matriceswith different saliency modes. For parallel coordinates, the results showed clearly better performance in thegroup working with color saliency, compared to the group working with the basic visualization with nosaliency and the group working with size saliency. For PC_C – PC_N, the average increase in decisionquality was 0.135, and with 95% probability not lower than 0.043. For PC_C – PC_S, the average increasewas 0.122, and with 95% probability not lower than 0.034 (Figs. 7, 8).
A comparison of the results for the within-subject variable visualization (parallel coordinates andscatterplot matrices) for all types of saliency reveals a clear difference. Participants performed noticeablybetter when working with parallel coordinates compared with using the scatterplot matrix (Figs. 9, 10).
4.2 Attention
Attention to salient parts of a visualization can be measured with gaze tracking. However, due to the designof our study as a web experiment, this is not a viable approach. We therefore characterize users’ attentionindirectly in terms of their attachment to the most preferred criterion (R), and by quantifying their inter-action with the visualization close to this attribute.
Results for the R-value of the chosen alternative show a similar pattern as the results regarding thedecision quality. There is a strong indication of difference in R-value between participants working withparallel coordinates with color saliency and participants working with parallel coordinates with no saliency.The average increase in R for PC_C – PC_N is 0.092, and with 95% probability not lower than 0.002.However, there is no noticeable difference between color saliency and size saliency. For the visualizationswith scatterplot matrices there are no clearly evident differences for different modes of saliency
Fig. 7 Q-value means for each saliency mode (no saliency, color saliency, and size saliency) for parallel coordinates (PC) andscatterplot matrices (SPM), respectively
1278 G. Milutinovic et al.
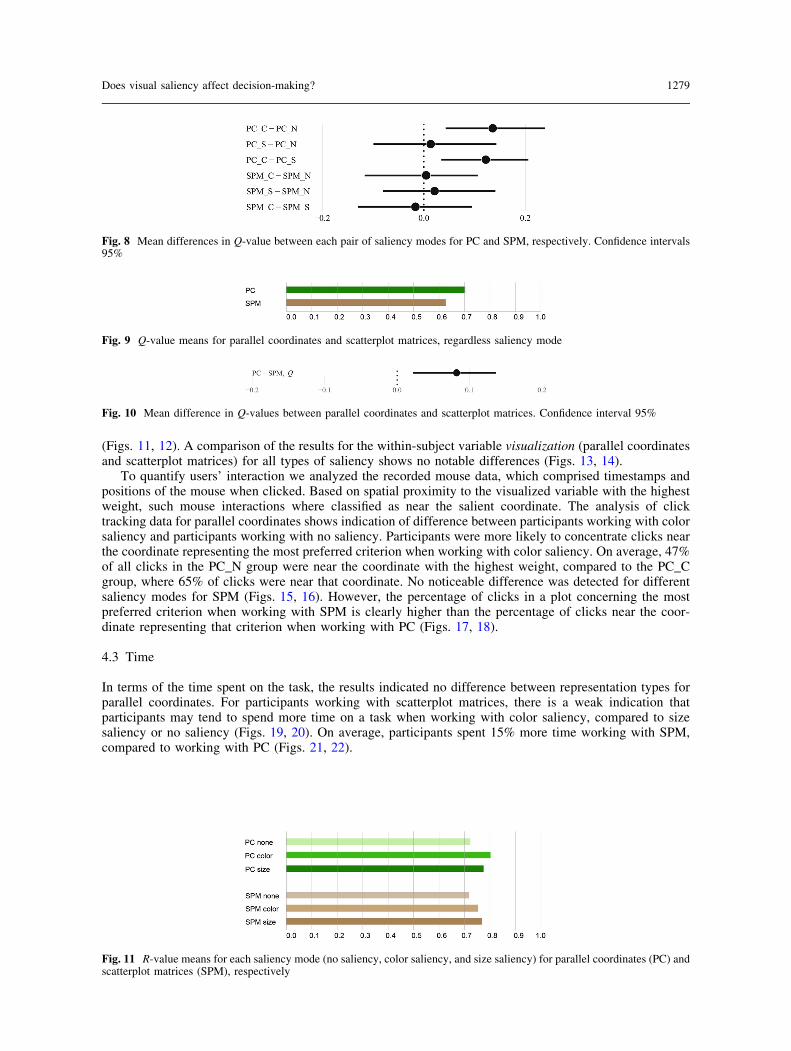
(Figs. 11, 12). A comparison of the results for the within-subject variable visualization (parallel coordinatesand scatterplot matrices) for all types of saliency shows no notable differences (Figs. 13, 14).
To quantify users’ interaction we analyzed the recorded mouse data, which comprised timestamps andpositions of the mouse when clicked. Based on spatial proximity to the visualized variable with the highestweight, such mouse interactions where classified as near the salient coordinate. The analysis of clicktracking data for parallel coordinates shows indication of difference between participants working with colorsaliency and participants working with no saliency. Participants were more likely to concentrate clicks nearthe coordinate representing the most preferred criterion when working with color saliency. On average, 47%of all clicks in the PC_N group were near the coordinate with the highest weight, compared to the PC_Cgroup, where 65% of clicks were near that coordinate. No noticeable difference was detected for differentsaliency modes for SPM (Figs. 15, 16). However, the percentage of clicks in a plot concerning the mostpreferred criterion when working with SPM is clearly higher than the percentage of clicks near the coor-dinate representing that criterion when working with PC (Figs. 17, 18).
4.3 Time
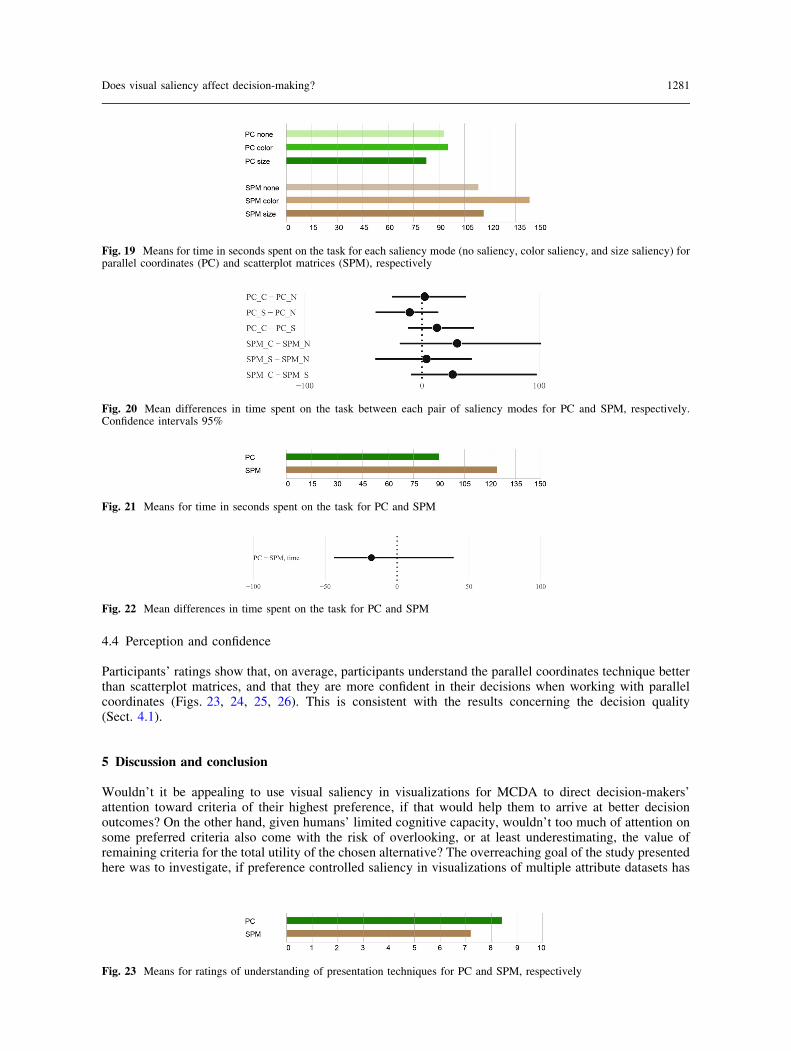
In terms of the time spent on the task, the results indicated no difference between representation types forparallel coordinates. For participants working with scatterplot matrices, there is a weak indication thatparticipants may tend to spend more time on a task when working with color saliency, compared to sizesaliency or no saliency (Figs. 19, 20). On average, participants spent 15% more time working with SPM,compared to working with PC (Figs. 21, 22).
Fig. 8 Mean differences in Q-value between each pair of saliency modes for PC and SPM, respectively. Confidence intervals95%
Fig. 9 Q-value means for parallel coordinates and scatterplot matrices, regardless saliency mode
Fig. 10 Mean difference in Q-values between parallel coordinates and scatterplot matrices. Confidence interval 95%
Fig. 11 R-value means for each saliency mode (no saliency, color saliency, and size saliency) for parallel coordinates (PC) andscatterplot matrices (SPM), respectively
Does visual saliency affect decision-making? 1279
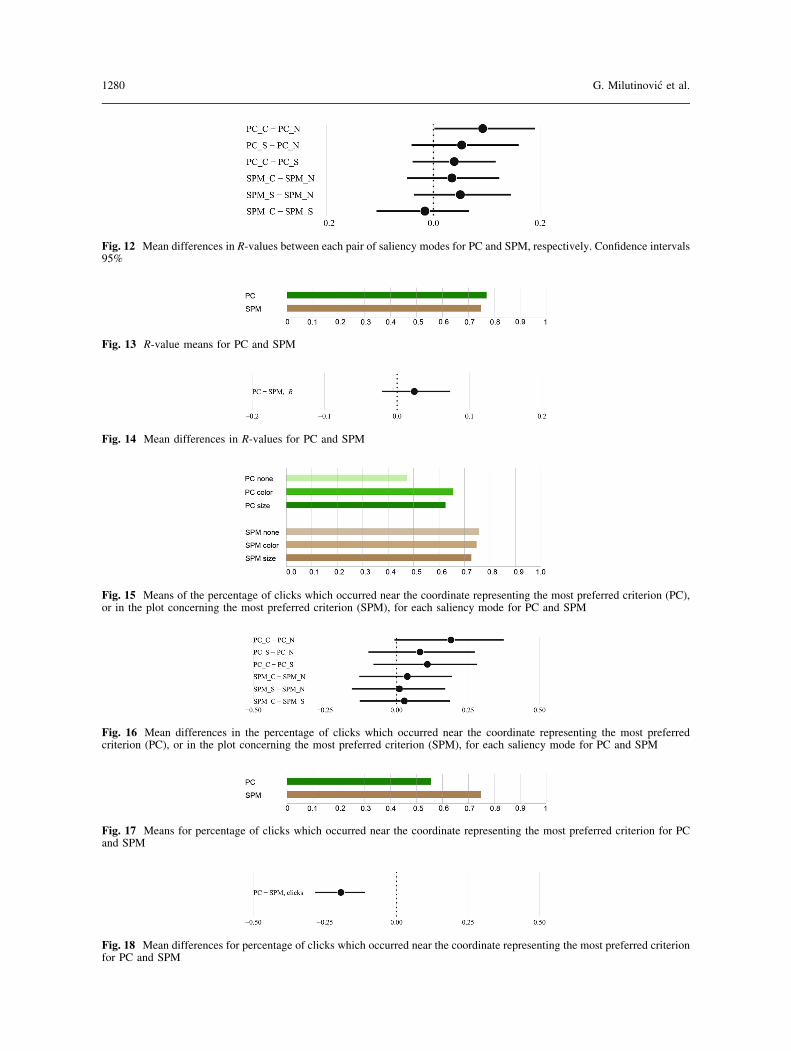
Fig. 12 Mean differences in R-values between each pair of saliency modes for PC and SPM, respectively. Confidence intervals95%
Fig. 13 R-value means for PC and SPM
Fig. 14 Mean differences in R-values for PC and SPM
Fig. 15 Means of the percentage of clicks which occurred near the coordinate representing the most preferred criterion (PC),or in the plot concerning the most preferred criterion (SPM), for each saliency mode for PC and SPM
Fig. 16 Mean differences in the percentage of clicks which occurred near the coordinate representing the most preferredcriterion (PC), or in the plot concerning the most preferred criterion (SPM), for each saliency mode for PC and SPM
Fig. 17 Means for percentage of clicks which occurred near the coordinate representing the most preferred criterion for PCand SPM
Fig. 18 Mean differences for percentage of clicks which occurred near the coordinate representing the most preferred criterionfor PC and SPM
1280 G. Milutinovic et al.
4.4 Perception and confidence
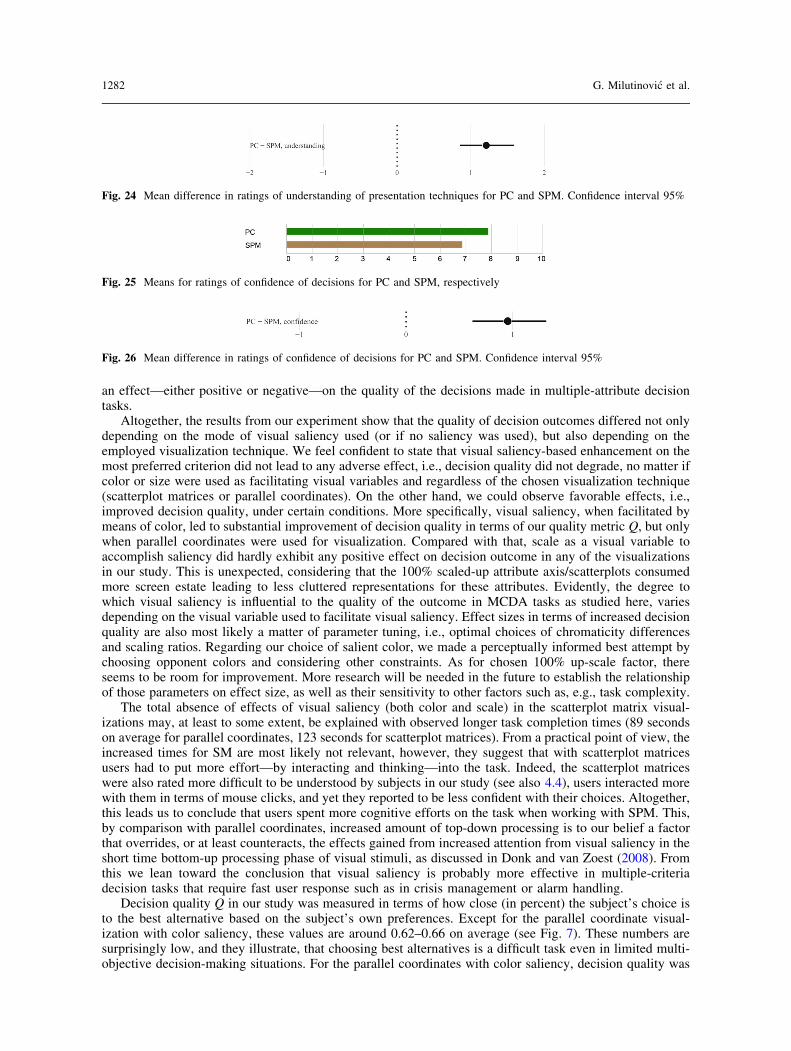
Participants’ ratings show that, on average, participants understand the parallel coordinates technique betterthan scatterplot matrices, and that they are more confident in their decisions when working with parallelcoordinates (Figs. 23, 24, 25, 26). This is consistent with the results concerning the decision quality(Sect. 4.1).
5 Discussion and conclusion
Wouldn’t it be appealing to use visual saliency in visualizations for MCDA to direct decision-makers’attention toward criteria of their highest preference, if that would help them to arrive at better decisionoutcomes? On the other hand, given humans’ limited cognitive capacity, wouldn’t too much of attention onsome preferred criteria also come with the risk of overlooking, or at least underestimating, the value ofremaining criteria for the total utility of the chosen alternative? The overreaching goal of the study presentedhere was to investigate, if preference controlled saliency in visualizations of multiple attribute datasets has
Fig. 19 Means for time in seconds spent on the task for each saliency mode (no saliency, color saliency, and size saliency) forparallel coordinates (PC) and scatterplot matrices (SPM), respectively
Fig. 20 Mean differences in time spent on the task between each pair of saliency modes for PC and SPM, respectively.Confidence intervals 95%
Fig. 21 Means for time in seconds spent on the task for PC and SPM
Fig. 22 Mean differences in time spent on the task for PC and SPM
Fig. 23 Means for ratings of understanding of presentation techniques for PC and SPM, respectively
Does visual saliency affect decision-making? 1281
an effect—either positive or negative—on the quality of the decisions made in multiple-attribute decisiontasks.
Altogether, the results from our experiment show that the quality of decision outcomes differed not onlydepending on the mode of visual saliency used (or if no saliency was used), but also depending on theemployed visualization technique. We feel confident to state that visual saliency-based enhancement on themost preferred criterion did not lead to any adverse effect, i.e., decision quality did not degrade, no matter ifcolor or size were used as facilitating visual variables and regardless of the chosen visualization technique(scatterplot matrices or parallel coordinates). On the other hand, we could observe favorable effects, i.e.,improved decision quality, under certain conditions. More specifically, visual saliency, when facilitated bymeans of color, led to substantial improvement of decision quality in terms of our quality metric Q, but onlywhen parallel coordinates were used for visualization. Compared with that, scale as a visual variable toaccomplish saliency did hardly exhibit any positive effect on decision outcome in any of the visualizationsin our study. This is unexpected, considering that the 100% scaled-up attribute axis/scatterplots consumedmore screen estate leading to less cluttered representations for these attributes. Evidently, the degree towhich visual saliency is influential to the quality of the outcome in MCDA tasks as studied here, variesdepending on the visual variable used to facilitate visual saliency. Effect sizes in terms of increased decisionquality are also most likely a matter of parameter tuning, i.e., optimal choices of chromaticity differencesand scaling ratios. Regarding our choice of salient color, we made a perceptually informed best attempt bychoosing opponent colors and considering other constraints. As for chosen 100% up-scale factor, thereseems to be room for improvement. More research will be needed in the future to establish the relationshipof those parameters on effect size, as well as their sensitivity to other factors such as, e.g., task complexity.
The total absence of effects of visual saliency (both color and scale) in the scatterplot matrix visual-izations may, at least to some extent, be explained with observed longer task completion times (89 secondson average for parallel coordinates, 123 seconds for scatterplot matrices). From a practical point of view, theincreased times for SM are most likely not relevant, however, they suggest that with scatterplot matricesusers had to put more effort—by interacting and thinking—into the task. Indeed, the scatterplot matriceswere also rated more difficult to be understood by subjects in our study (see also 4.4), users interacted morewith them in terms of mouse clicks, and yet they reported to be less confident with their choices. Altogether,this leads us to conclude that users spent more cognitive efforts on the task when working with SPM. This,by comparison with parallel coordinates, increased amount of top-down processing is to our belief a factorthat overrides, or at least counteracts, the effects gained from increased attention from visual saliency in theshort time bottom-up processing phase of visual stimuli, as discussed in Donk and van Zoest (2008). Fromthis we lean toward the conclusion that visual saliency is probably more effective in multiple-criteriadecision tasks that require fast user response such as in crisis management or alarm handling.
Decision quality Q in our study was measured in terms of how close (in percent) the subject’s choice isto the best alternative based on the subject’s own preferences. Except for the parallel coordinate visual-ization with color saliency, these values are around 0.62–0.66 on average (see Fig. 7). These numbers aresurprisingly low, and they illustrate, that choosing best alternatives is a difficult task even in limited multi-objective decision-making situations. For the parallel coordinates with color saliency, decision quality was
Fig. 24 Mean difference in ratings of understanding of presentation techniques for PC and SPM. Confidence interval 95%
Fig. 25 Means for ratings of confidence of decisions for PC and SPM, respectively
Fig. 26 Mean difference in ratings of confidence of decisions for PC and SPM. Confidence interval 95%
1282 G. Milutinovic et al.
close to 80% on average. This means for the chosen alternative an improvement, which in practice indeedcan make a considerable difference in terms of criteria values. Therefore, and in light of the fact that none ofthe visualizations with saliency introduced any adverse effects on decision quality, we consider it a rationaldesign choice, to employ preference-controlled visual saliency in visual tools for multi-criteria decision-making.
Another result of our study relates to how visual saliency affects users’ attention to the most preferredcriterion. Due to the design of our experiment as a web-based experiment, the use of gaze-tracking forvalidation of users’ attention was not a viable option. Instead, we first used Data Visualization Saliency(DSV) model by Matzen et al. (2017) to qualitatively assess if the intended visual saliency is maintained inour visualizations. For the experimental evaluation, we devised two indirect measures to capture users’attention on their most preferred criterion. The R-value describes the chosen alternative’s score only withrespect to this criterion. In addition, we analyzed how much users interacted with visual elements repre-senting this criterion by determining the percentage of mouse clicks nearby those elements. We note thatvisual saliency, regardless of the visualization method, led users to choices, which are in favor (in terms ofhigh R-values) of the most preferred criterion, which is consistent with a strategy of maximizing score onthis criterion. Significantly increased scores were, however, only observed for the parallel coordinatesvisualization with color saliency (see Fig. 12), which is consistent with the pattern already found fordecision quality. Increased attention on the most preferred criterion under the use of visual saliency becamealso evident in terms of percentage mouse-clicks nearby that attribute. However, although differences are onaverage as large as 20% (see Fig. 16) they are not significant in terms of a 95% confidence interval.
Assessing decision quality in MCDA tasks in an objective way is a delicate undertaking due to theinherent subjective nature of individuals’ preferences. The approach chosen by Dimara et al. (2018) whosuggested a metric based on subjects’ compliance with their own preferences is a very appealing approach tothis problem. In their work the authors used rating on a normalized scale for direct elicitation of userpreferences, and they point out the risks of bias caused by user’s difficulties to express their criteriapreferences. We highly agree with their discourse and we strongly believe that some of these difficultiesarise from the abstraction induced by direct criteria ranking using standardized (abstract) scales. To alleviatethis, we suggested to use an alternative approach, SWING weighting, as a method to elicit users’ criteriapreferences, whereby users had to relate to the real value ranges (and units) of the attributes. By that, webelieve to reduce one level of abstraction and thus to reduce inherent bias in the preference elicitation phase.Albeit, based on the results of our study, we cannot preclude that participants in the study, knowingly or not,did have difficulties to use SWING weighting correctly to express their preferences. More work is needed,rather in the field of MCDA than within visualization, to study the sensitivity of alternative preferenceelicitation methods in the context of assessment of decision quality. Another critical aspect to ourmethodology is the potential risk that participants, knowingly or not, would reassess significantly theirpreferences if the visualizations they worked on would reveal unanticipated patterns in the data, which isusually the case in a real application. To prevent this, we designed decision scenarios, which exhibited nounanticipated relations or trends between criteria, nor clear outliers in the data sets. This ensures ourassumption that participants acted in agreement with their preferences, which is our quality metric.
Revisiting the questions in the beginning of this section, we conclude that in our study no adverse effectsof using visual saliency in form of color or size were observed, neither in terms of reduced decision qualitynor in terms of efficiency (notably longer time on task). Instead, specific combinations of saliency form andvisualization method seem to be favorable in terms of gained decision quality and attribute attachment.Without drawing too far-reaching conclusions, we consider the results very encouraging, and we assert thatit is relevant to consider saliency in visualizations for MCDA in different ways: Firstly, by creating anawareness about saliency effects in visualizations using saliency analysis according to, e.g., Matzen et al.(2017) designers can reveal potential risks for biases in visual MCDA. Secondly, this research can informthe design of novel visual MCDA tools and their evaluation. In this context, devising general guidelines onhow to design visualizations for saliency is an interesting direction of more research in the future, which in amore general perspective should analyze the effects of spatial layout and use of visual variables on saliencyin visualizations.
They can inform the design of novel MCDA tools and visualizations for forthcoming research toevaluate the effectiveness of saliency in visualizations for other MCDA tasks.
Funding Open access funding provided by University of Gavle.
Does visual saliency affect decision-making? 1283
Open Access This article is licensed under a Creative Commons Attribution 4.0 International License, which permits use,sharing, adaptation, distribution and reproduction in any medium or format, as long as you give appropriate credit to theoriginal author(s) and the source, provide a link to the Creative Commons licence, and indicate if changes were made. Theimages or other third party material in this article are included in the article’s Creative Commons licence, unless indicatedotherwise in a credit line to the material. If material is not included in the article’s Creative Commons licence and yourintended use is not permitted by statutory regulation or exceeds the permitted use, you will need to obtain permission directlyfrom the copyright holder. To view a copy of this licence, visit http://creativecommons.org/licenses/by/4.0/.
References
Ahlberg C, Shneiderman B (2003) Visual information seeking: tight coupling of dynamic query filters with starfield displays.In: Bederson BB, Shneiderman B (eds) The craft of information visualization, interactive technologies. MorganKaufmann, San Francisco, pp 7–13
Andrienko G, Andrienko N, Jankowski P (2003) Building spatial decision support tools for individuals and groups. J Decis Syst12(2):193–208
Andrienko N, Andrienko G (2003) Informed spatial decisions through coordinated views. Inf Vis 2(4):270–285Andrienko N, Andrienko G, Voss H, Hipolito J, Bernardo F, Kretchmer U (2002) Testing the usability of interactive maps in
CommonGIS. Cartogr Geogr Inf Sci 29(4):325–342Arciniegas G, Janssen R, Omtzigt N (2011) Map-based multicriteria analysis to support interactive land use allocation. Int J
Geogr Inf Sci 25(12):1931–1947Arciniegas G, Janssen R, Rietveld P (2013) Effectiveness of collaborative map-based decision support tools: results of an
experiment. Environ Model Softw 39:159–175Benayoun R, Roy B, Sussman B (1966) Une methode pour guider le choix en presence de points de vue multiples. Note de
Travail, 49Brans JP, Vincke P (1985) A preference ranking organisation method. Manag Sci 31(6):647–657Carenini G, Loyd J (2004) Valuecharts: analyzing linear models expressing preferences and evaluations. In: Proceedings of the
working conference on advanced visual interfaces, AVI ’04. New York, NY, USA. ACM, pp 150–157Clemen RT, Reilly T (2013) Making hard decisions with decision tools. South-Western College Publishing, MasonColson G, de Bruyn C (1989) Models and methods in multiple objectives decision making. Math Comput Model
12(10–11):1201–1211Coulson M, Healey M, Fidler F, Cumming G (2010) Confidence intervals permit, but do not guarantee, better inference than
statistical significance testing. Frontiers Psychol 1(JUL):1–9Cumming G (2014) The new statistics: why and how. Psychol Sci 25(1):7–29Desimone R, Duncan J (1995) Neural mechanisms of selective visual attention. Ann Rev Neurosci 18(1):193–222Dimara E, Bezerianos A, Dragicevic P (2018) Conceptual and methodological issues in evaluating multidimensional
visualizations for decision support. IEEE Trans Vis Comput Graph 24(1):749–759Donk M, van Zoest W (2008) Effects of salience are short-lived. Psychol Sci 19(7):733–739Dragicevic P (2016) Fair statistical communication in HCI. In: Robertson J, Kaptein M (eds) Modern statistical methods for
HCI. Springer, Berlin, pp 291–330Elmqvist N, Dragicevic P, Fekete JD (2008) Rolling the dice: multidimensional visual exploration using scatterplot matrix
navigation. IEEE Trans Vis Comput Graph 14(6):1141–1148Glaze R, Steckel JH, Winer RS (1992) Locally rational decision making: the distracting effect of information on managerial
performance. Manag Sci 38(2):212–226Gratzl S, Lex A, Gehlenborg N, Pfister H, Streit M (2013) LineUp: visual analysis of multi-attribute rankings. IEEE Trans Vis
Comput Graph 19(12):2277–2286Hammond JS, Keeney RL, Raiffa H (1998) Even swaps: a rational method for making trade-offs. Harv Bus Rev 76(2):137–149Hwang C-L, Yoon K (1981) Multiple attribute decision making: methods and applications. Springer-Verlag, HeidelbergInselberg A (1985) The plane with parallel coordinates. Vis Comput 1(4):69–91Ishizaka A, Siraj S, Nemery P (2016) Which energy mix for the UK (United Kingdom)? An evolutive descriptive mapping with
the integrated GAIA (graphical analysis for interactive aid)-AHP (analytic hierarchy process) visualization tool. Energy95:602–611
Itti L, Koch C (2001) Computational modelling of visual attention. Nat Rev Neurosci 2(3):194–203Itti L, Koch C, Niebur E (1998) A model of saliency-based visual attention for rapid scene analysis. IEEE Trans Pattern Anal
Mach Intell 20(11):1254–1259Jankowski P, Andrienko N, Andrienko G (2001) Map-centred exploratory approach to multiple criteria spatial decision
making. Int J Geogr Inf Sci 15(2):101–127Jarvenpaa SL (1990) Graphic displays in decision making—the visual salience effect. J Behav Decis Mak 3(4):247–262Keeney RL (2013) Identifying, prioritizing, and using multiple objectives. EURO J Decis Process 1(1–2):45–67Keeney RL, Raiffa H (1993) Decisions with multiple objectives: preferences and value tradeoffs. Cambridge University Press,
CambridgeKelton AS, Pennington RR, Tuttle BM (2010) The effects of information presentation format on judgment and decision
making: a review of the information systems research. J Inf Syst 24(2):79–105Kirby KN, Gerlanc D (2013) BootES: an R package for bootstrap confidence intervals on effect sizes. Behav Res Methods
45(4):905–927Koch C, Ullman S (1985) Shifts in selective visual attention: towards the underlying neural circuitry. Hum Neurobiol
4(4):219–227Kollat JB, Reed P (2007) A framework for visually interactive decision-making and design using evolutionary multi-objective
optimization (video). Environ Model Softw 22(12):1691–1704
1284 G. Milutinovic et al.
Korhonen PJ, Silvennoinen K, Wallenius J, Oorni A (2013) A careful look at the importance of criteria and weights. Ann OperRes 211(1):565–578
Li HL, Ma LC (2008) Visualizing decision process on spheres based on the even swap concept. Decis Support Syst45(2):354–367
Lohse GL (1997) Consumer eye movement patterns on yellow pages advertising. J Advert 26(1):61–73Lurie NH, Mason CH (2007) Visual representation: implications for decision making. J Mark 71(1):160–177Matzen LE, Haass MJ, Divis KM, Wang Z, Wilson AT (2017) Data visualization saliency model: a tool for evaluating abstract
data visualizations. IEEE Trans Vis Comput Graph 24(1):563–573Milosavljevic M, Navalpakkam V, Koch C, Rangel A (2012) Relative visual saliency differences induce sizable bias in
consumer choice. J Consum Psychol 22(1):67–74Milutinovic G, Seipel S (2018) Visual GISwaps—an interactive visualization framework for geospatial decision making. In:
Bechmann D, Claudio AP, Braz J (eds) Proceedings of the 13th international joint conference on computer vision, imagingand computer graphics theory and applications. SCITEPRESS
Moran J, Desimone R (1985) Selective attention gates visual processing in the extrastriate cortex. Science 229(4715):782–784Orquin JL, Perkovic S, Grunert KG (2018) Visual biases in decision making. Appl Econ Perspect Policy 40(4):523–537Pajer S, Streit M, Torsney-Weir T, Spechtenhauser F, Moller T, Piringer H (2017) WeightLifter: visual weight space
exploration for multi-criteria decision making. IEEE Trans Vis Comput Graph 23(1):611–620Parkhurst D, Law K, Niebur E (2002) Modeling the role of salience in the allocation of overt visual attention. Vis Res
42(1):107–123Parnell GS, Trainor TE (2009) Using the swing weight matrix to weight multiple objectives. In: 19th annual international
symposium of the international council on systems engineering, INCOSE 2009, 1(July 2018), pp 283–298Payne JW (1976) Task complexity and contingent processing in decision making: An information search and protocol analysis.
Organ Behav Hum Perform 16(2):366–387Pu P, Faltings B (2000) Enriching buyers’ experiences: the smartclient approach. In: Conference on human factors in
computing systems—proceedings, pp 289–296Riehmann P, Opolka J, Froehlich B (2012) The product explorer: decision making with ease. In: AVISaaty TL (1980) The analytic hierarchy process. McGraw-Hill, New YorkSalter JD, Campbell C, Journeay M, Sheppard SRJ (2009) The digital workshop: exploring the use of interactive and
immersive visualisation tools in participatory planning. J Environ Manag 90(6):2090–2101Seipel S, Lim NJ (2017) Color map design for visualization in flood risk assessment. Int J Geogr Inf Sci 31(11):2286–2309Siraj S, Mikhailov L, Keane JA (2015) PriEsT: an interactive decision support tool to estimate priorities from pairwise
comparison judgments. Int Trans Oper Res 22(2):217–235Speier C (2006) The influence of information presentation formats on complex task decision-making performance. Int J Hum
Comput Stud 64(11):1115–1131Sun Y, Li S, Bonini N (2010) Attribute salience in graphical representations affects evaluation. Judgm Decis Mak
5(3):151–158Timmermans D (1993) The impact of task complexity on information use in multi-attribute decision making. J Behav Decis
Mak 6(2):95–111Treisman A (1988) Features and objects: the fourteenth Bartlett memorial lecture. Q J Exp Psychol 40A(2):201–237Treisman A, Sato S (1990) Conjunction search revisited. J Exp Psychol Hum Percept Perform 16(3):459–478Treisman AM, Gelade G (1980) A feature-integration theory of attention. Cognit Psychol 12:97–136Underwood G, Foulsham T, van Loon E, Humphreys L, Bloyce J (2006) Eye movements during scene inspection: a test of the
saliency map hypothesis. Eur J Cognit Psychol 18(3):321–342Vallerio M, Hufkens J, Van Impe J, Logist F (2015) An interactive decision-support system for multi-objective optimization of
nonlinear dynamic processes with uncertainty. Expert Syst Appl 42(21):7710–7731Zavadskas EK, Turskis Z, Kildiene S (2014) State of art surveys of overviews on MCDM/MADM methods. Technol Econ Dev
Econ 20(1):165–179
Publisher’s Note Springer Nature remains neutral with regard to jurisdictional claims in published maps and institutionalaffiliations.
Does visual saliency affect decision-making? 1285
Related Documents